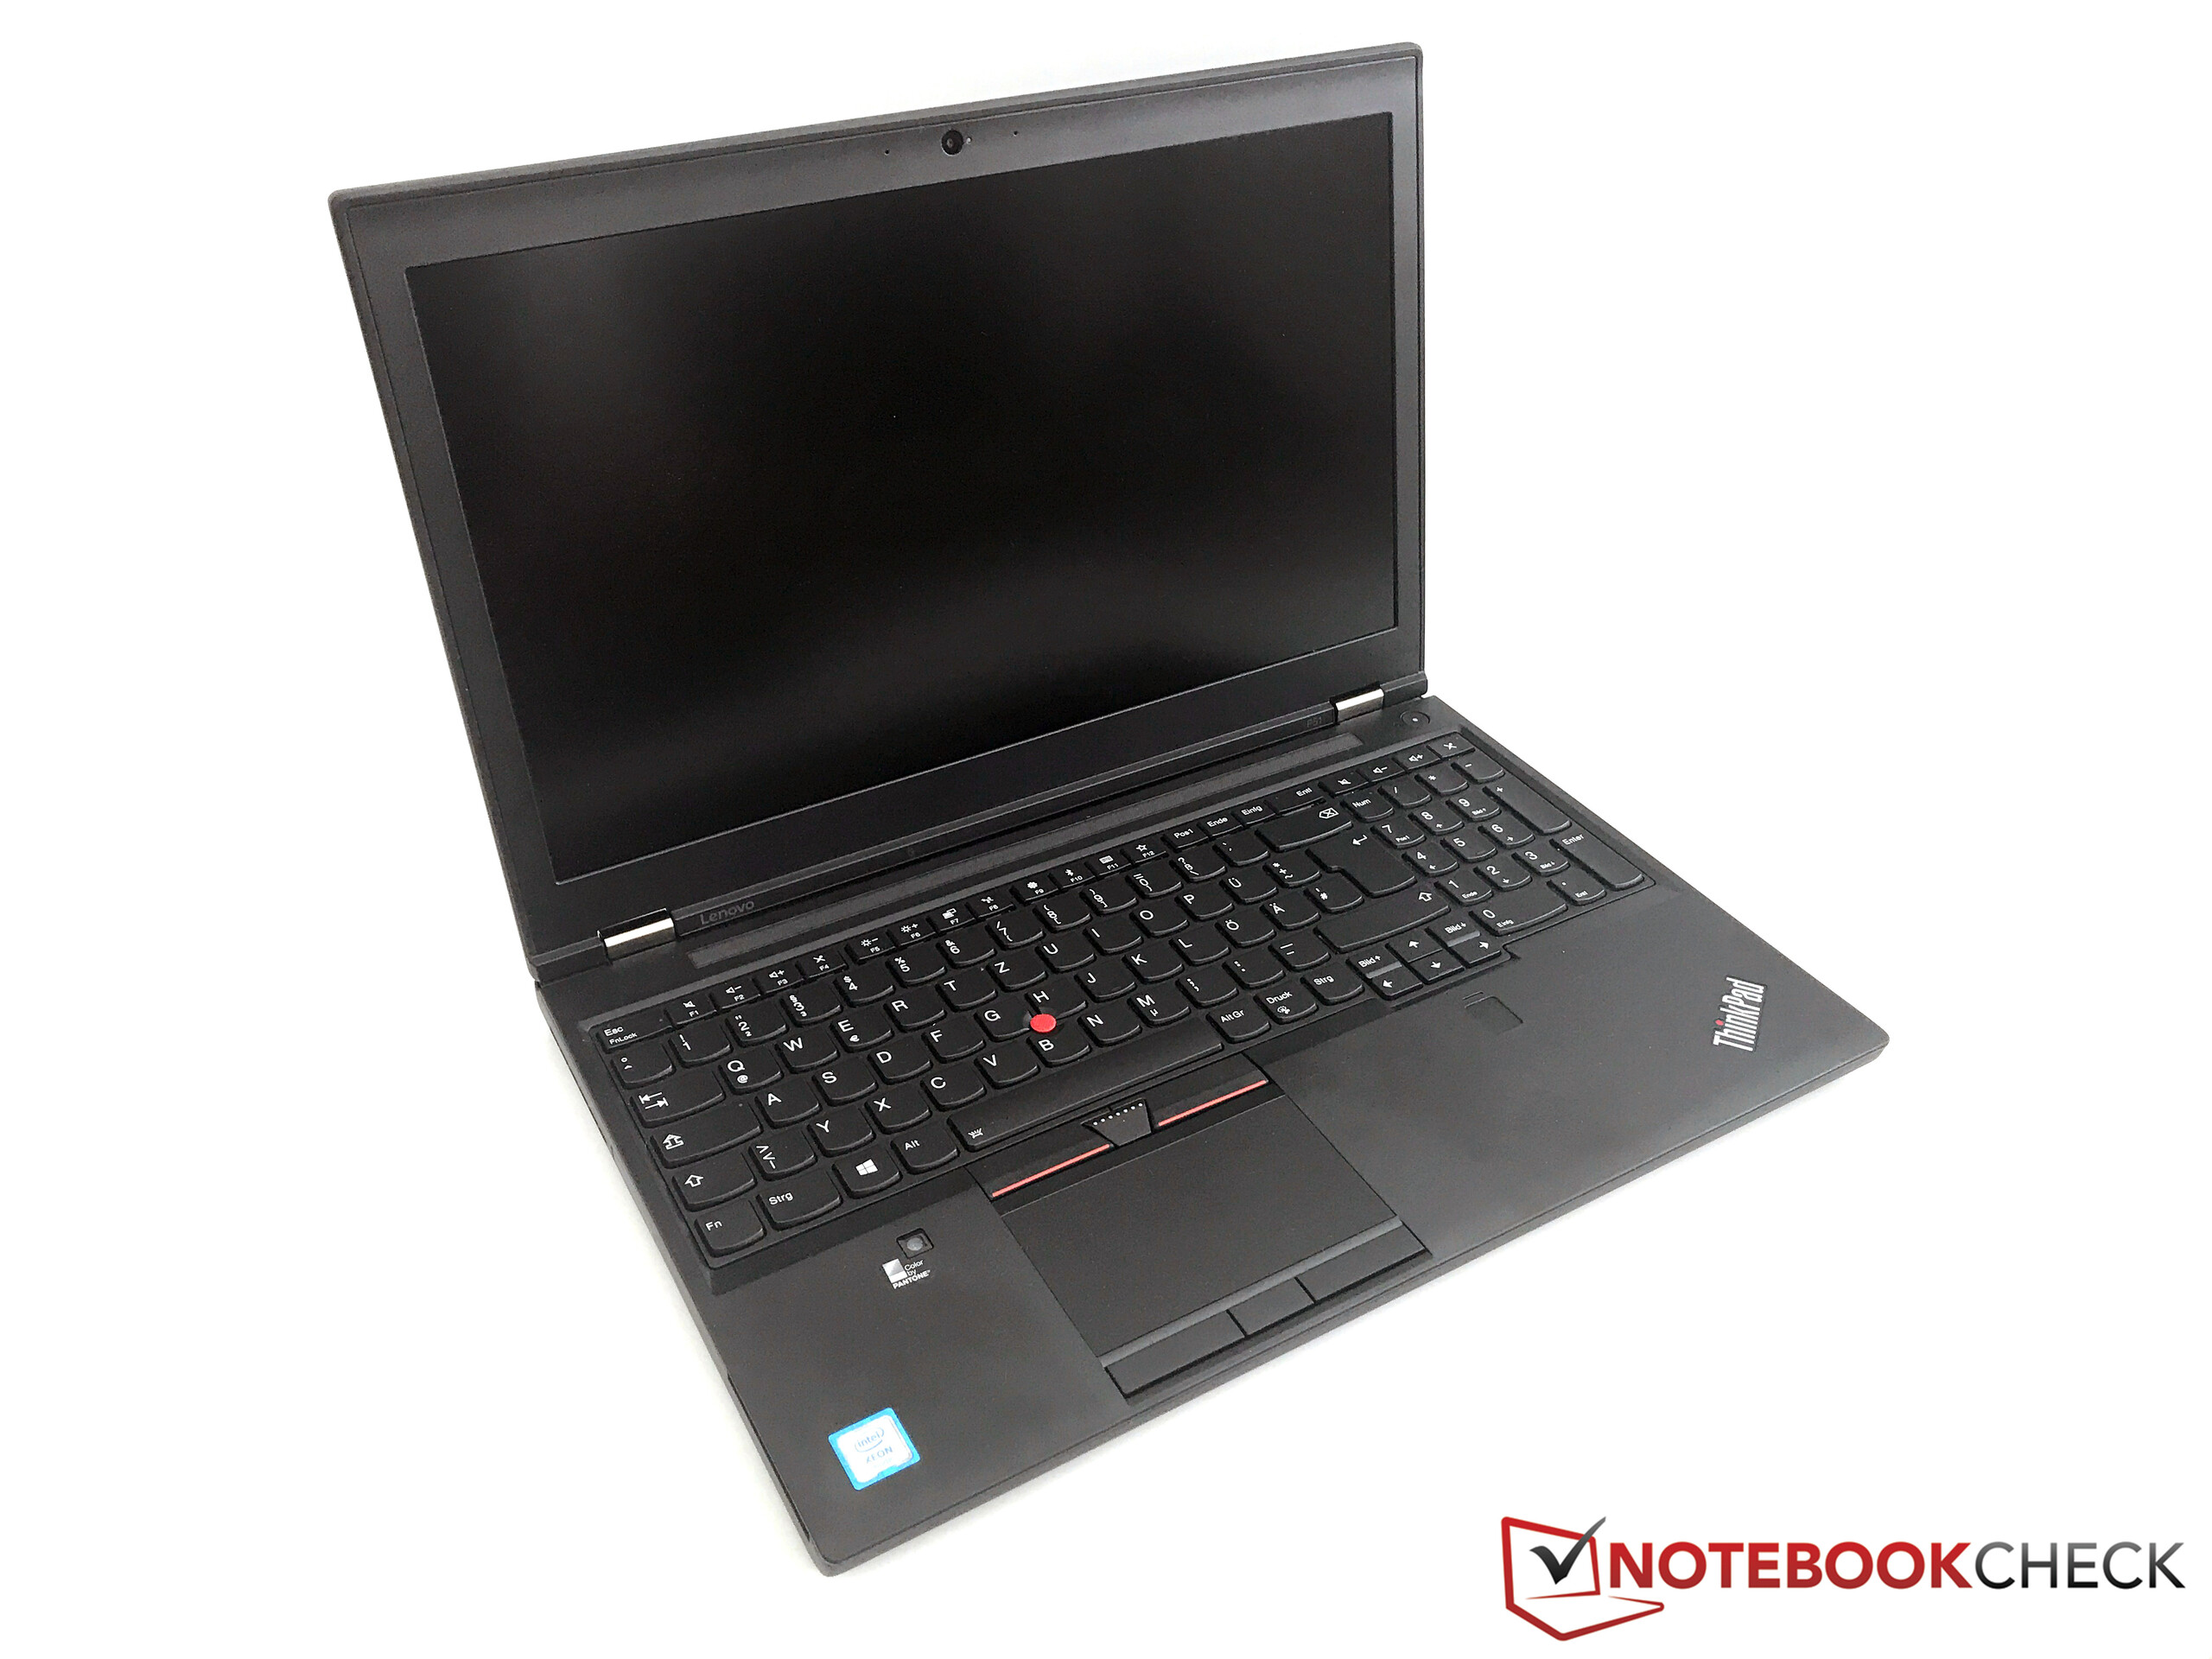
Courte critique du PC portable Lenovo ThinkPad P51 (Xeon, 4K)
| SD Card Reader | |
| average JPG Copy Test (av. of 3 runs) | |
| Dell Precision 5520 UHD | |
| Lenovo ThinkPad P51 20HH0016GE | |
| HP ZBook 15 G3 | |
| Dell Precision 7510 (4K IGZO) | |
| Lenovo ThinkPad P50 | |
| Fujitsu Celsius H760 | |
| Lenovo ThinkPad P51s 20HB000SGE | |
| maximum AS SSD Seq Read Test (1GB) | |
| Dell Precision 5520 UHD | |
| Lenovo ThinkPad P51 20HH0016GE | |
| HP ZBook 15 G3 | |
| Lenovo ThinkPad P50 | |
| Fujitsu Celsius H760 | |
| Lenovo ThinkPad P51s 20HB000SGE | |
| Networking | |
| iperf3 transmit AX12 | |
| Lenovo ThinkPad P51s 20HB000SGE | |
| Lenovo ThinkPad P51 20HH0016GE | |
| Dell Precision 5520 UHD | |
| iperf3 receive AX12 | |
| Lenovo ThinkPad P51s 20HB000SGE | |
| Lenovo ThinkPad P51 20HH0016GE | |
| Dell Precision 5520 UHD | |
| |||||||||||||||||||||||||
Homogénéité de la luminosité: 89 %
Valeur mesurée au centre, sur batterie: 313 cd/m²
Contraste: 881:1 (Valeurs des noirs: 0.36 cd/m²)
ΔE ColorChecker Calman: 2.7 | ∀{0.5-29.43 Ø4.73}
ΔE Greyscale Calman: 3 | ∀{0.09-98 Ø4.97}
99.5% sRGB (Argyll 1.6.3 3D)
87.6% AdobeRGB 1998 (Argyll 1.6.3 3D)
99.3% AdobeRGB 1998 (Argyll 3D)
99.5% sRGB (Argyll 3D)
86.3% Display P3 (Argyll 3D)
Gamma: 2.27
CCT: 6077 K
| Lenovo ThinkPad P51 20HH0016GE LEN40BD, B156ZAN02.1, , 3840x2160, 15.6" | Lenovo ThinkPad P50 LQ156D1JW05, , 3840x2160, 15.6" | Lenovo ThinkPad P50 LP156WF6-SPK1, , 1920x1080, 15.6" | Lenovo ThinkPad P51s 20HB000SGE BOE NV156QUM-N44, , 3840x2160, 15.6" | HP ZBook 15 G3 Samsung SDC5344, , 1920x1080, 15.6" | Dell Precision 7510 (4K IGZO) Sharp LQ156D1, , 3840x2160, 15.6" | Dell Precision 5520 UHD SHP1476, , 3840x2160, 15.6" | Fujitsu Celsius H760 LGD046F LP156WF6-SPP1, , 1920x1080, 15.6" | |
|---|---|---|---|---|---|---|---|---|
| Display | -1% | -52% | -20% | -19% | 0% | -18% | -27% | |
| Display P3 Coverage (%) | 86.3 | 85.8 -1% | 39.13 -55% | 69.7 -19% | 66.8 -23% | 86.2 0% | 67.4 -22% | 63.9 -26% |
| sRGB Coverage (%) | 99.5 | 98.6 -1% | 58.5 -41% | 91.2 -8% | 95.5 -4% | 99.7 0% | 98.5 -1% | 82.4 -17% |
| AdobeRGB 1998 Coverage (%) | 99.3 | 98.2 -1% | 40.45 -59% | 66.8 -33% | 69 -31% | 99 0% | 68.9 -31% | 60.3 -39% |
| Response Times | 9% | -8% | 4% | -37% | -5% | -55% | 2% | |
| Response Time Grey 50% / Grey 80% * (ms) | 40.8 ? | 39.2 ? 4% | 46 ? -13% | 38.4 ? 6% | 54 ? -32% | 40.4 ? 1% | 59.2 ? -45% | 38 ? 7% |
| Response Time Black / White * (ms) | 25.2 ? | 22 ? 13% | 26 ? -3% | 24.8 ? 2% | 35.6 ? -41% | 27.6 ? -10% | 41.6 ? -65% | 26 ? -3% |
| PWM Frequency (Hz) | 217 | 980 ? | 198 ? | 198.4 ? | ||||
| Screen | -38% | -17% | -16% | -42% | -11% | -9% | -21% | |
| Brightness middle (cd/m²) | 317 | 250 -21% | 263 -17% | 317 0% | 306 -3% | 279.2 -12% | 372.4 17% | 341 8% |
| Brightness (cd/m²) | 309 | 250 -19% | 236 -24% | 290 -6% | 289 -6% | 271 -12% | 368 19% | 310 0% |
| Brightness Distribution (%) | 89 | 86 -3% | 78 -12% | 85 -4% | 85 -4% | 83 -7% | 90 1% | 82 -8% |
| Black Level * (cd/m²) | 0.36 | 0.31 14% | 0.34 6% | 0.32 11% | 0.34 6% | 0.266 26% | 0.48 -33% | 0.34 6% |
| Contrast (:1) | 881 | 806 -9% | 774 -12% | 991 12% | 900 2% | 1050 19% | 776 -12% | 1003 14% |
| Colorchecker dE 2000 * | 2.7 | 4.5 -67% | 2.35 13% | 3.6 -33% | 5.1 -89% | 4.14 -53% | 2.6 4% | 3.8 -41% |
| Colorchecker dE 2000 max. * | 4.1 | 9.3 -127% | 6.6 -61% | 9.9 -141% | 6.56 -60% | 5.6 -37% | 10.8 -163% | |
| Greyscale dE 2000 * | 3 | 7.2 -140% | 3.33 -11% | 4.2 -40% | 7.4 -147% | 3.26 -9% | 3.7 -23% | 2 33% |
| Gamma | 2.27 97% | 2.31 95% | 2.38 92% | 2.24 98% | 2.37 93% | 2.19 100% | 2.14 103% | 2.17 101% |
| CCT | 6077 107% | 6399 102% | 6917 94% | 6740 96% | 7263 89% | 6375 102% | 7096 92% | 6581 99% |
| Color Space (Percent of AdobeRGB 1998) (%) | 87.6 | 85 -3% | 37 -58% | 59.5 -32% | 63 -28% | 85.68 -2% | 63 -28% | 54 -38% |
| Color Space (Percent of sRGB) (%) | 99.5 | 98.6 -1% | 58 -42% | 91.1 -8% | 95 -5% | 99.72 0% | 99 -1% | 82.2 -17% |
| Moyenne finale (programmes/paramètres) | -10% /
-24% | -26% /
-23% | -11% /
-14% | -33% /
-36% | -5% /
-8% | -27% /
-17% | -15% /
-19% |
* ... Moindre est la valeur, meilleures sont les performances
Temps de réponse de l'écran
| ↔ Temps de réponse noir à blanc | ||
|---|---|---|
| 25.2 ms ... hausse ↗ et chute ↘ combinées | ↗ 14 ms hausse | 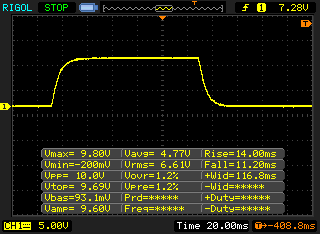 |
| ↘ 11.2 ms chute | ||
| L'écran souffre de latences relativement élevées, insuffisant pour le jeu. En comparaison, tous les appareils testés affichent entre 0.1 (minimum) et 240 (maximum) ms. » 60 % des appareils testés affichent de meilleures performances. Cela signifie que les latences relevées sont moins bonnes que la moyenne (19.9 ms) de tous les appareils testés. | ||
| ↔ Temps de réponse gris 50% à gris 80% | ||
| 40.8 ms ... hausse ↗ et chute ↘ combinées | ↗ 20.8 ms hausse | 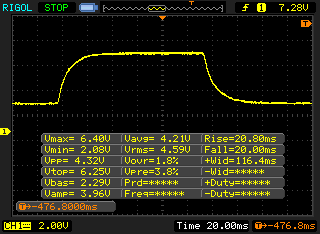 |
| ↘ 20 ms chute | ||
| L'écran souffre de latences très élevées, à éviter pour le jeu. En comparaison, tous les appareils testés affichent entre 0.165 (minimum) et 636 (maximum) ms. » 64 % des appareils testés affichent de meilleures performances. Cela signifie que les latences relevées sont moins bonnes que la moyenne (31.1 ms) de tous les appareils testés. | ||
Scintillement / MLI (Modulation de largeur d'impulsion)
| Scintillement / MLI (Modulation de largeur d'impulsion) non décelé | 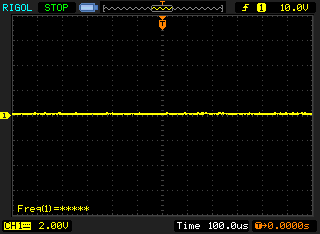 | ||
En comparaison, 52 % des appareils testés n'emploient pas MDI pour assombrir leur écran. Nous avons relevé une moyenne à 7801 (minimum : 5 - maximum : 343500) Hz dans le cas où une MDI était active. | |||
| PCMark 7 - Score | |
| Lenovo ThinkPad P51 20HH0016GE | |
| Lenovo ThinkPad P51s 20HB000SGE | |
| HP ZBook 15 G3 | |
| Lenovo ThinkPad P50 | |
| PCMark 7 Score | 6440 points | |
| PCMark 8 Home Score Accelerated v2 | 3641 points | |
| PCMark 8 Creative Score Accelerated v2 | 6301 points | |
| PCMark 8 Work Score Accelerated v2 | 4256 points | |
Aide | ||
| Lenovo ThinkPad P51 20HH0016GE Samsung PM961 NVMe MZVLW512HMJP | Lenovo ThinkPad P51s 20HB000SGE Samsung SSD PM961 1TB M.2 PCIe 3.0 x4 NVMe (MZVLW1T0) | Lenovo ThinkPad P50 Samsung SM951 MZVPV256HDGL m.2 PCI-e | HP ZBook 15 G3 Samsung SM951 MZVPV512HDGL m.2 PCI-e | Dell Precision 7510 (4K IGZO) Samsung SSD SM951a 512GB M.2 PCIe 3.0 x4 NVMe (MZVKV512) | Dell Precision 5520 UHD Samsung SM961 MZVKW512HMJP m.2 PCI-e | |
|---|---|---|---|---|---|---|
| CrystalDiskMark 3.0 | -15% | 11% | 4% | -1% | -1% | |
| Read Seq (MB/s) | 1705 | 1189 -30% | 1771 4% | 1502 -12% | 1648 -3% | 2253 32% |
| Write Seq (MB/s) | 1541 | 1138 -26% | 1304 -15% | 1538 0% | 1575 2% | 1662 8% |
| Read 512 (MB/s) | 1038 | 782 -25% | 1364 31% | 1164 12% | 1155 11% | 459.1 -56% |
| Write 512 (MB/s) | 1157 | 959 -17% | 1291 12% | 1432 24% | 1561 35% | 1611 39% |
| Read 4k (MB/s) | 61.3 | 54.8 -11% | 60.2 -2% | 59.1 -4% | 53 -14% | 56.1 -8% |
| Write 4k (MB/s) | 176 | 161.4 -8% | 256.7 46% | 207.3 18% | 158.9 -10% | 169.4 -4% |
| Read 4k QD32 (MB/s) | 664 | 642 -3% | 953 44% | 798 20% | 623 -6% | 633 -5% |
| Write 4k QD32 (MB/s) | 560 | 549 -2% | 389.6 -30% | 393.8 -30% | 423 -24% | 506 -10% |

| 3DMark 11 - 1280x720 Performance GPU | |
| MSI GE72VR-6RF16H21 | |
| Lenovo ThinkPad P71-20HK0004GE | |
| Nexoc G739 | |
| MSI GE72 965M Ti | |
| HP ZBook 17 G3 TZV66eA | |
| MSI GL62M 7RD-077 | |
| HP Omen 15-ax007ng | |
| Lenovo ThinkPad P51 20HH0016GE | |
| MSI WE72 7RJ | |
| Lenovo ThinkPad P50 | |
| Lenovo ThinkPad P50 | |
| Dell Precision 5520 UHD | |
| Dell Precision 7510 (4K IGZO) | |
| HP ZBook 15 G3 | |
| Lenovo ThinkPad P51s 20HB000SGE | |
| 3DMark | |
| 1280x720 Cloud Gate Standard Graphics | |
| MSI GE72VR-6RF16H21 | |
| Lenovo ThinkPad P71-20HK0004GE | |
| Nexoc G739 | |
| HP ZBook 17 G3 TZV66eA | |
| MSI GL62M 7RD-077 | |
| MSI GE72 965M Ti | |
| MSI WE72 7RJ | |
| Lenovo ThinkPad P51 20HH0016GE | |
| HP Omen 15-ax007ng | |
| Lenovo ThinkPad P50 | |
| HP ZBook 15 G3 | |
| Dell Precision 5520 UHD | |
| Dell Precision 7510 (4K IGZO) | |
| Lenovo ThinkPad P50 | |
| Lenovo ThinkPad P51s 20HB000SGE | |
| 1920x1080 Fire Strike Graphics | |
| MSI GE72VR-6RF16H21 | |
| Lenovo ThinkPad P71-20HK0004GE | |
| Nexoc G739 | |
| HP ZBook 17 G3 TZV66eA | |
| MSI GL62M 7RD-077 | |
| MSI GE72 965M Ti | |
| HP Omen 15-ax007ng | |
| MSI WE72 7RJ | |
| Lenovo ThinkPad P51 20HH0016GE | |
| Dell Precision 7510 (4K IGZO) | |
| Dell Precision 5520 UHD | |
| Lenovo ThinkPad P50 | |
| HP ZBook 15 G3 | |
| Lenovo ThinkPad P50 | |
| Lenovo ThinkPad P51s 20HB000SGE | |
| Unigine Heaven 4.0 | |
| Extreme Preset OpenGL | |
| Lenovo ThinkPad P71-20HK0004GE | |
| Nexoc G739 | |
| Lenovo ThinkPad P51 20HH0016GE | |
| MSI WE72 7RJ | |
| Lenovo ThinkPad P51s 20HB000SGE | |
| Extreme Preset DX11 | |
| MSI GE72VR-6RF16H21 | |
| Lenovo ThinkPad P71-20HK0004GE | |
| Nexoc G739 | |
| MSI GL62M 7RD-077 | |
| MSI WE72 7RJ | |
| Lenovo ThinkPad P51 20HH0016GE | |
| MSI GE72 965M Ti | |
| HP Omen 15-ax007ng | |
| Lenovo ThinkPad P51s 20HB000SGE | |
| Unigine Valley 1.0 | |
| 1920x1080 Extreme HD DirectX AA:x8 | |
| MSI GE72VR-6RF16H21 | |
| Lenovo ThinkPad P71-20HK0004GE | |
| HP ZBook 17 G3 TZV66eA | |
| MSI WE72 7RJ | |
| MSI GE72 965M Ti | |
| Lenovo ThinkPad P51 20HH0016GE | |
| Lenovo ThinkPad P50 | |
| Lenovo ThinkPad P50 | |
| HP ZBook 15 G3 | |
| Lenovo ThinkPad P51s 20HB000SGE | |
| 1920x1080 Extreme HD Preset OpenGL AA:x8 | |
| Lenovo ThinkPad P71-20HK0004GE | |
| HP ZBook 17 G3 TZV66eA | |
| Lenovo ThinkPad P51 20HH0016GE | |
| MSI WE72 7RJ | |
| HP ZBook 15 G3 | |
| Lenovo ThinkPad P50 | |
| Lenovo ThinkPad P50 | |
| Lenovo ThinkPad P51s 20HB000SGE | |
| SiSoft Sandra 2016 | |
| Image Processing | |
| Lenovo ThinkPad P71-20HK0004GE | |
| HP ZBook 17 G3 TZV66eA | |
| Lenovo ThinkPad P51 20HH0016GE | |
| HP ZBook 15 G3 | |
| Lenovo ThinkPad P50 | |
| Lenovo ThinkPad P50 | |
| Lenovo ThinkPad P51s 20HB000SGE | |
| GP Cryptography (Higher Security AES256+SHA2-512) | |
| Lenovo ThinkPad P71-20HK0004GE | |
| HP ZBook 17 G3 TZV66eA | |
| Lenovo ThinkPad P50 | |
| Lenovo ThinkPad P51 20HH0016GE | |
| HP ZBook 15 G3 | |
| Lenovo ThinkPad P50 | |
| Lenovo ThinkPad P51s 20HB000SGE | |
| GP Financial Analysis (FP High/Double Precision) | |
| Lenovo ThinkPad P71-20HK0004GE | |
| HP ZBook 17 G3 TZV66eA | |
| Lenovo ThinkPad P51 20HH0016GE | |
| HP ZBook 15 G3 | |
| Lenovo ThinkPad P50 | |
| Lenovo ThinkPad P50 | |
| Lenovo ThinkPad P51s 20HB000SGE | |
| 3DMark 06 Standard Score | 29465 points | |
| 3DMark 11 Performance | 7709 points | |
| 3DMark Cloud Gate Standard Score | 20644 points | |
| 3DMark Fire Strike Score | 5275 points | |
| 3DMark Fire Strike Extreme Score | 2665 points | |
| 3DMark Time Spy Score | 1920 points | |
Aide | ||
| Bas | Moyen | Élevé | Ultra | 4K | |
|---|---|---|---|---|---|
| The Witcher 3 (2015) | 66.6 | 37.2 | 20 | 12.7 | |
| Rise of the Tomb Raider (2016) | 71.6 | 41.6 | 35.2 | 13.7 | |
| For Honor (2017) | 54.8 | 51.9 | 37.5 | 14.6 |
Degré de la nuisance sonore
| Au repos |
| 29.6 / 29.6 / 29.6 dB(A) |
| Fortement sollicité |
| 32.2 / 36.6 dB(A) |
 | ||
30 dB silencieux 40 dB(A) audible 50 dB(A) bruyant |
||
min: | ||
| Lenovo ThinkPad P51 20HH0016GE Quadro M2200, E3-1505M v6, Samsung PM961 NVMe MZVLW512HMJP | Lenovo ThinkPad P51s 20HB000SGE Quadro M520, i7-7600U, Samsung SSD PM961 1TB M.2 PCIe 3.0 x4 NVMe (MZVLW1T0) | Lenovo ThinkPad P50 Quadro M2000M, E3-1505M v5, Samsung SM951 MZVPV256HDGL m.2 PCI-e | HP ZBook 15 G3 Quadro M2000M, E3-1505M v5, Samsung SM951 MZVPV512HDGL m.2 PCI-e | Dell Precision 7510 (4K IGZO) Quadro M2000M, E3-1535M v5, Samsung SSD SM951a 512GB M.2 PCIe 3.0 x4 NVMe (MZVKV512) | Dell Precision 5520 UHD Quadro M1200, E3-1505M v6, Samsung SM961 MZVKW512HMJP m.2 PCI-e | Fujitsu Celsius H760 Quadro M2000M, E3-1505M v5, Samsung SM951 MZVPV512 m.2 PCI-e | |
|---|---|---|---|---|---|---|---|
| Noise | -4% | -8% | -14% | -9% | -10% | -10% | |
| arrêt / environnement * (dB) | 29.6 | 29.2 1% | 30 -1% | 30 -1% | 28.2 5% | 28.7 3% | 29 2% |
| Idle Minimum * (dB) | 29.6 | 29.2 1% | 30 -1% | 30 -1% | 29.8 -1% | 28.7 3% | 29 2% |
| Idle Average * (dB) | 29.6 | 29.2 1% | 30 -1% | 30 -1% | 29.8 -1% | 32.1 -8% | 29 2% |
| Idle Maximum * (dB) | 29.6 | 31.1 -5% | 30 -1% | 30 -1% | 31.2 -5% | 32.1 -8% | 29 2% |
| Load Average * (dB) | 32.2 | 36.7 -14% | 42.1 -31% | 45.3 -41% | 37.2 -16% | 41.3 -28% | 43.1 -34% |
| Load Maximum * (dB) | 36.6 | 39.4 -8% | 42.1 -15% | 49.7 -36% | 49.4 -35% | 45.5 -24% | 49.2 -34% |
| Witcher 3 ultra * (dB) | 45.5 |
* ... Moindre est la valeur, meilleures sont les performances
(±) La température maximale du côté supérieur est de 43 °C / 109 F, par rapport à la moyenne de 38.2 °C / 101 F, allant de 22.2 à 69.8 °C pour la classe Workstation.
(-) Le fond chauffe jusqu'à un maximum de 52.2 °C / 126 F, contre une moyenne de 41.1 °C / 106 F
(+) En utilisation inactive, la température moyenne du côté supérieur est de 26.2 °C / 79 F, par rapport à la moyenne du dispositif de 32 °C / 90 F.
(±) Les repose-poignets et le pavé tactile peuvent devenir très chauds au toucher, avec un maximum de 36.1 °C / 97# F.
(-) La température moyenne de la zone de l'appui-paume de dispositifs similaires était de 27.8 °C / 82 F (-8.3 °C / #-15 F).
Lenovo ThinkPad P51 20HH0016GE analyse audio
(-) | haut-parleurs pas très forts (64.5 dB)
Basses 100 - 315 Hz
(±) | basse réduite - en moyenne 12.3% inférieure à la médiane
(±) | la linéarité des basses est moyenne (10.4% delta à la fréquence précédente)
Médiums 400 - 2000 Hz
(+) | médiane équilibrée - seulement 3.9% de la médiane
(+) | les médiums sont linéaires (6.4% delta à la fréquence précédente)
Aiguës 2 - 16 kHz
(+) | des sommets équilibrés - à seulement 2.7% de la médiane
(±) | la linéarité des aigus est moyenne (13.3% delta à la fréquence précédente)
Globalement 100 - 16 000 Hz
(±) | la linéarité du son global est moyenne (24.7% de différence avec la médiane)
Par rapport à la même classe
» 86% de tous les appareils testés de cette catégorie étaient meilleurs, 2% similaires, 12% pires
» Le meilleur avait un delta de 7%, la moyenne était de 17%, le pire était de 35%.
Par rapport à tous les appareils testés
» 75% de tous les appareils testés étaient meilleurs, 5% similaires, 20% pires
» Le meilleur avait un delta de 4%, la moyenne était de 24%, le pire était de 134%.
Lenovo ThinkPad P51s 20HB000SGE analyse audio
(±) | le niveau sonore du haut-parleur est moyen mais bon (75.2# dB)
Basses 100 - 315 Hz
(±) | basse réduite - en moyenne 10.7% inférieure à la médiane
(±) | la linéarité des basses est moyenne (11% delta à la fréquence précédente)
Médiums 400 - 2000 Hz
(+) | médiane équilibrée - seulement 3.9% de la médiane
(±) | la linéarité des médiums est moyenne (10.5% delta à la fréquence précédente)
Aiguës 2 - 16 kHz
(+) | des sommets équilibrés - à seulement 3.1% de la médiane
(±) | la linéarité des aigus est moyenne (7.1% delta à la fréquence précédente)
Globalement 100 - 16 000 Hz
(±) | la linéarité du son global est moyenne (15.6% de différence avec la médiane)
Par rapport à la même classe
» 35% de tous les appareils testés de cette catégorie étaient meilleurs, 11% similaires, 54% pires
» Le meilleur avait un delta de 7%, la moyenne était de 17%, le pire était de 35%.
Par rapport à tous les appareils testés
» 23% de tous les appareils testés étaient meilleurs, 5% similaires, 72% pires
» Le meilleur avait un delta de 4%, la moyenne était de 24%, le pire était de 134%.
| Éteint/en veille | |
| Au repos | |
| Fortement sollicité |
|
Légende:
min: | |
| Lenovo ThinkPad P51 20HH0016GE E3-1505M v6, Quadro M2200, Samsung PM961 NVMe MZVLW512HMJP, IPS, 3840x2160, 15.6" | Lenovo ThinkPad P51s 20HB000SGE i7-7600U, Quadro M520, Samsung SSD PM961 1TB M.2 PCIe 3.0 x4 NVMe (MZVLW1T0), IPS, 3840x2160, 15.6" | Lenovo ThinkPad P50 E3-1505M v5, Quadro M2000M, Samsung SM951 MZVPV256HDGL m.2 PCI-e, IPS, 3840x2160, 15.6" | HP ZBook 15 G3 E3-1505M v5, Quadro M2000M, Samsung SM951 MZVPV512HDGL m.2 PCI-e, UWVA-IPS, 1920x1080, 15.6" | Dell Precision 7510 (4K IGZO) E3-1535M v5, Quadro M2000M, Samsung SSD SM951a 512GB M.2 PCIe 3.0 x4 NVMe (MZVKV512), IGZO IPS, 3840x2160, 15.6" | Dell Precision 5520 UHD E3-1505M v6, Quadro M1200, Samsung SM961 MZVKW512HMJP m.2 PCI-e, IPS, 3840x2160, 15.6" | |
|---|---|---|---|---|---|---|
| Power Consumption | 35% | 0% | 19% | -66% | 6% | |
| Idle Minimum * (Watt) | 8.6 | 5.8 33% | 10.2 -19% | 5.7 34% | 23.9 -178% | 8.9 -3% |
| Idle Average * (Watt) | 15.9 | 10.4 35% | 17.8 -12% | 12.2 23% | 28.9 -82% | 13.6 14% |
| Idle Maximum * (Watt) | 22.1 | 13.5 39% | 18.3 17% | 12.6 43% | 30 -36% | 14.1 36% |
| Load Average * (Watt) | 84.4 | 62.4 26% | 76.9 9% | 83.1 2% | 95.2 -13% | 100.3 -19% |
| Load Maximum * (Watt) | 130.6 | 73.1 44% | 123.5 5% | 138.2 -6% | 157.1 -20% | 126.3 3% |
| Witcher 3 ultra * (Watt) | 100.2 |
* ... Moindre est la valeur, meilleures sont les performances
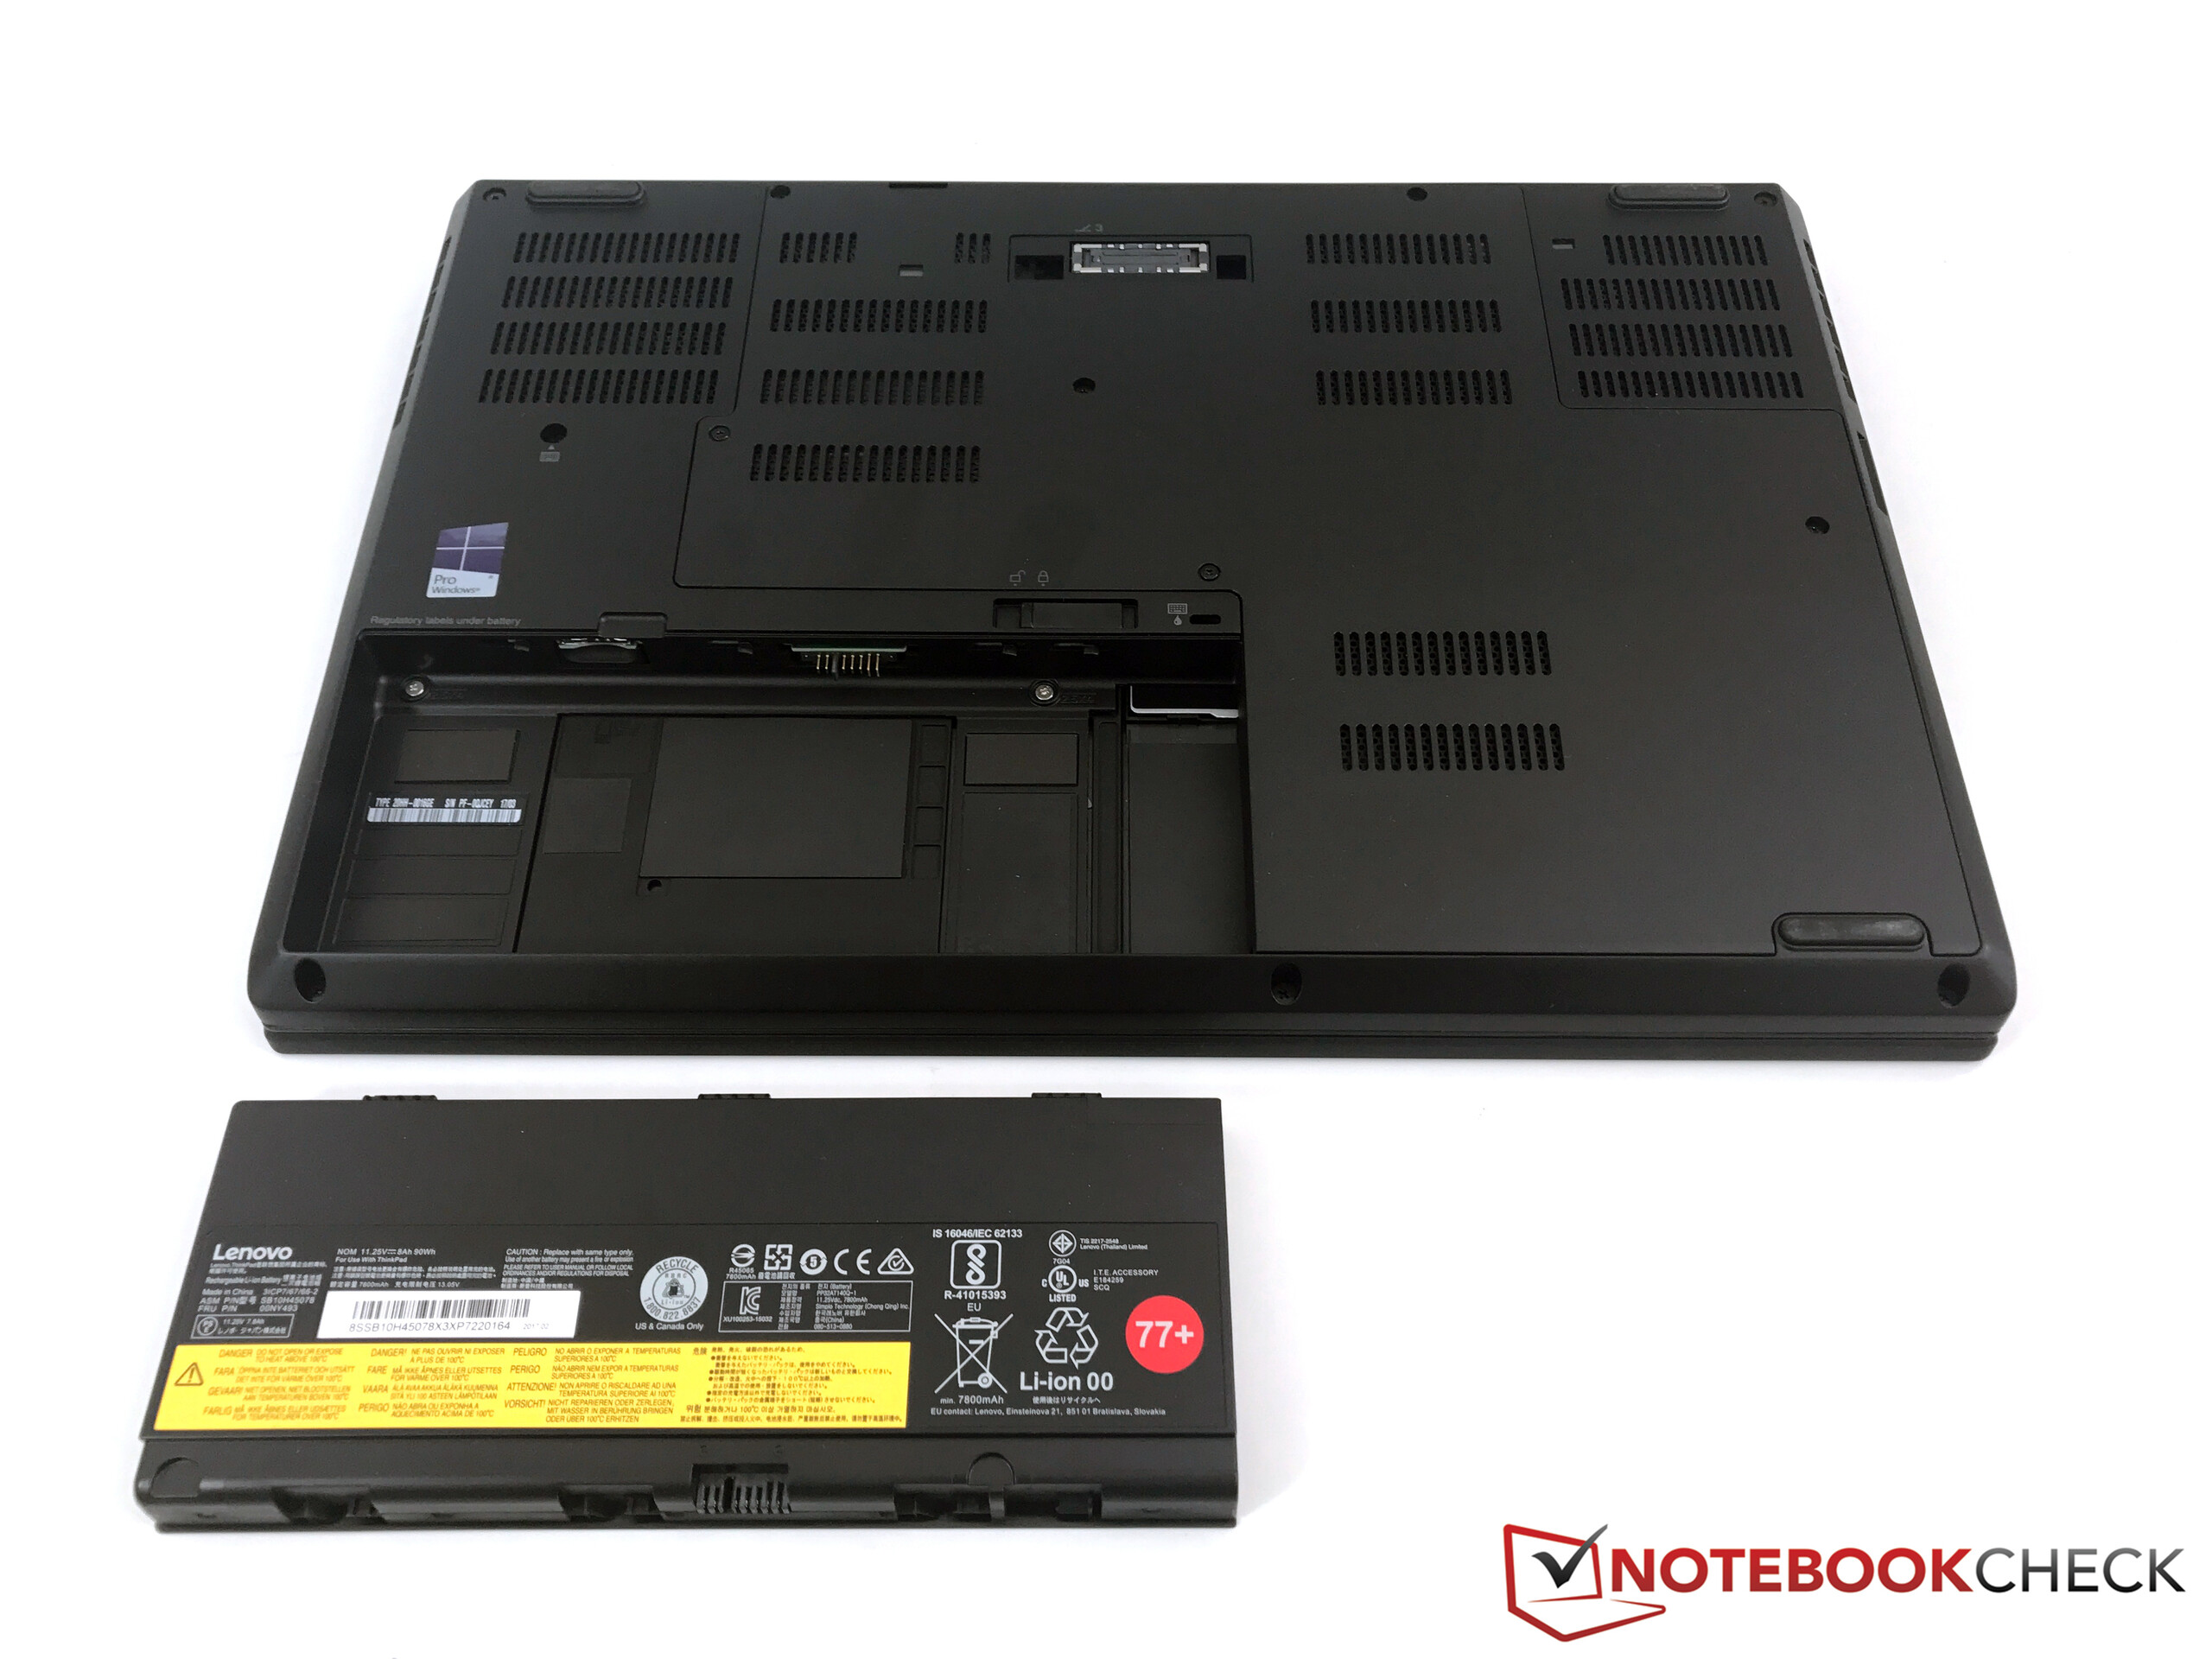
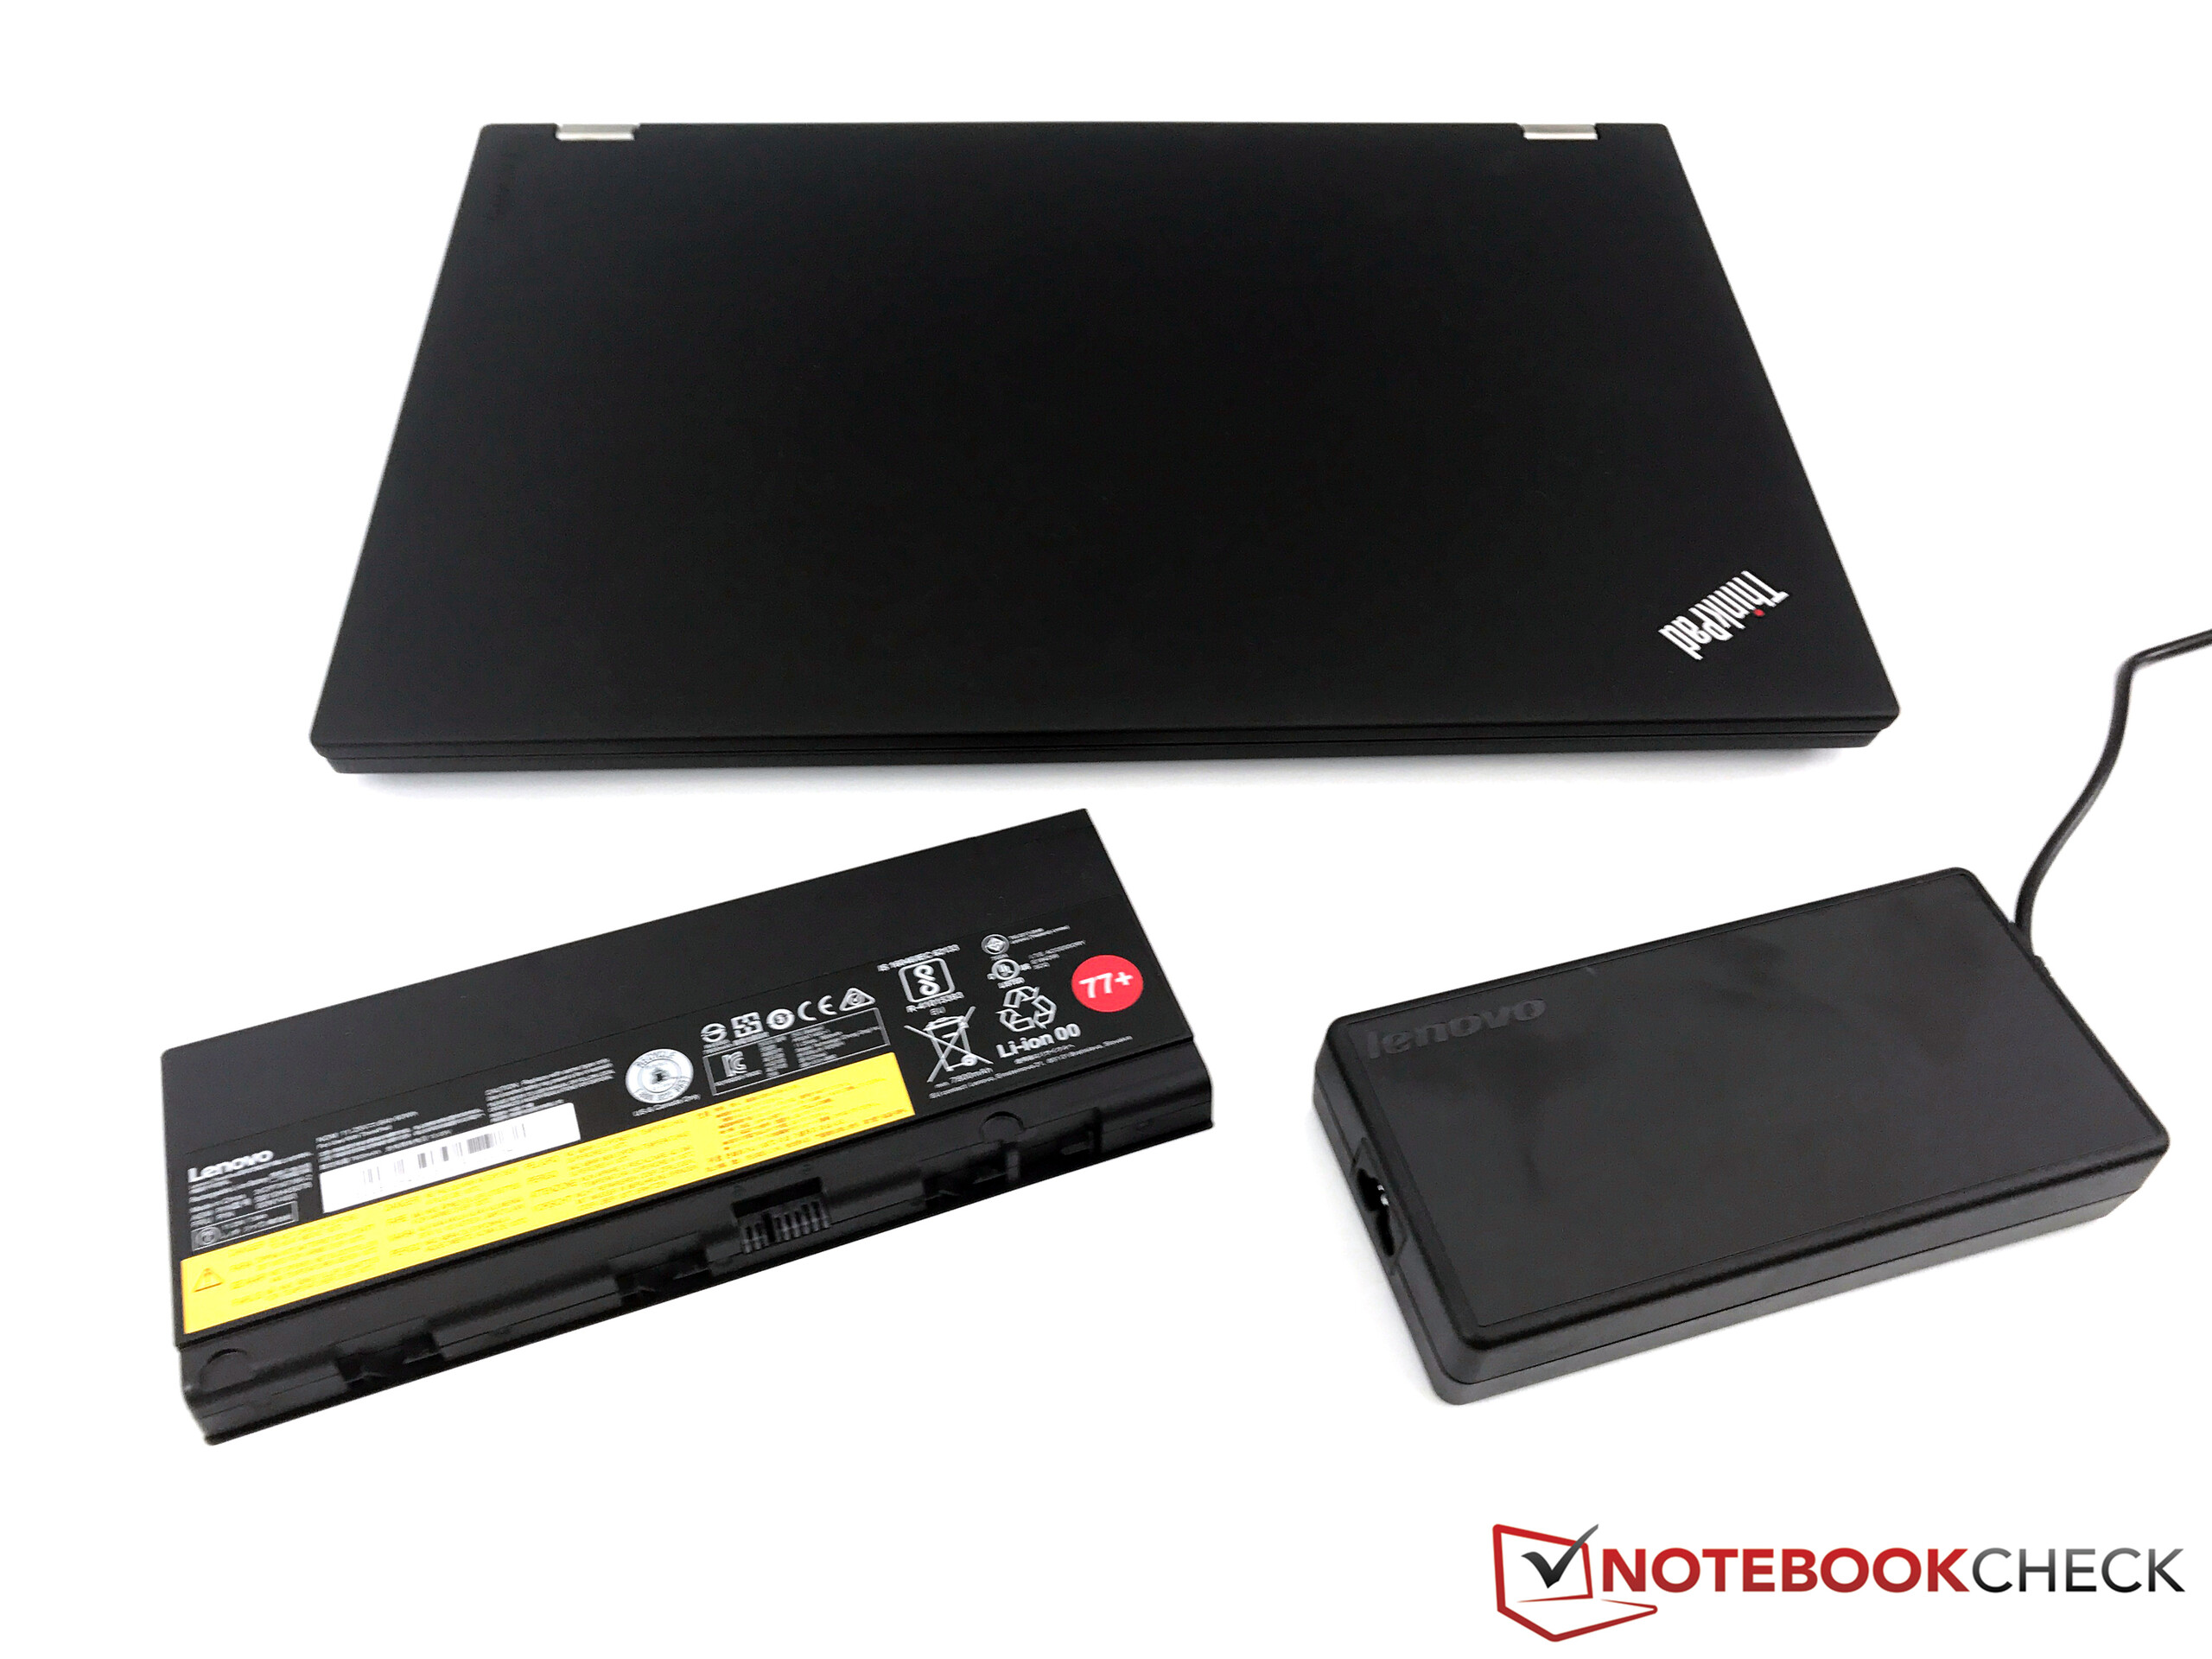
| Lenovo ThinkPad P51 20HH0016GE E3-1505M v6, Quadro M2200, 90 Wh | Lenovo ThinkPad P51s 20HB000SGE i7-7600U, Quadro M520, 104 Wh | Lenovo ThinkPad P50 E3-1505M v5, Quadro M2000M, 90 Wh | HP ZBook 15 G3 E3-1505M v5, Quadro M2000M, 90 Wh | Dell Precision 7510 (4K IGZO) E3-1535M v5, Quadro M2000M, 91 Wh | Dell Precision 5520 UHD E3-1505M v6, Quadro M1200, 97 Wh | Fujitsu Celsius H760 E3-1505M v5, Quadro M2000M, 72 Wh | |
|---|---|---|---|---|---|---|---|
| Autonomie de la batterie | 106% | -26% | -3% | -47% | -34% | -22% | |
| Reader / Idle (h) | 16.4 | 26.4 61% | 9 -45% | 13.7 -16% | 4.5 -73% | 12.1 -26% | 9.3 -43% |
| H.264 (h) | 7.6 | 11.7 54% | 5.5 -28% | 7.5 -1% | 4.6 -39% | ||
| WiFi v1.3 (h) | 6.9 | 11.9 72% | 4.8 -30% | 6.4 -7% | 4 -42% | 4.2 -39% | 5.6 -19% |
| Load (h) | 1.6 | 5.4 238% | 1.6 0% | 1.8 13% | 1.2 -25% | 1 -37% | 1.8 13% |
Points positifs
Points négatifs
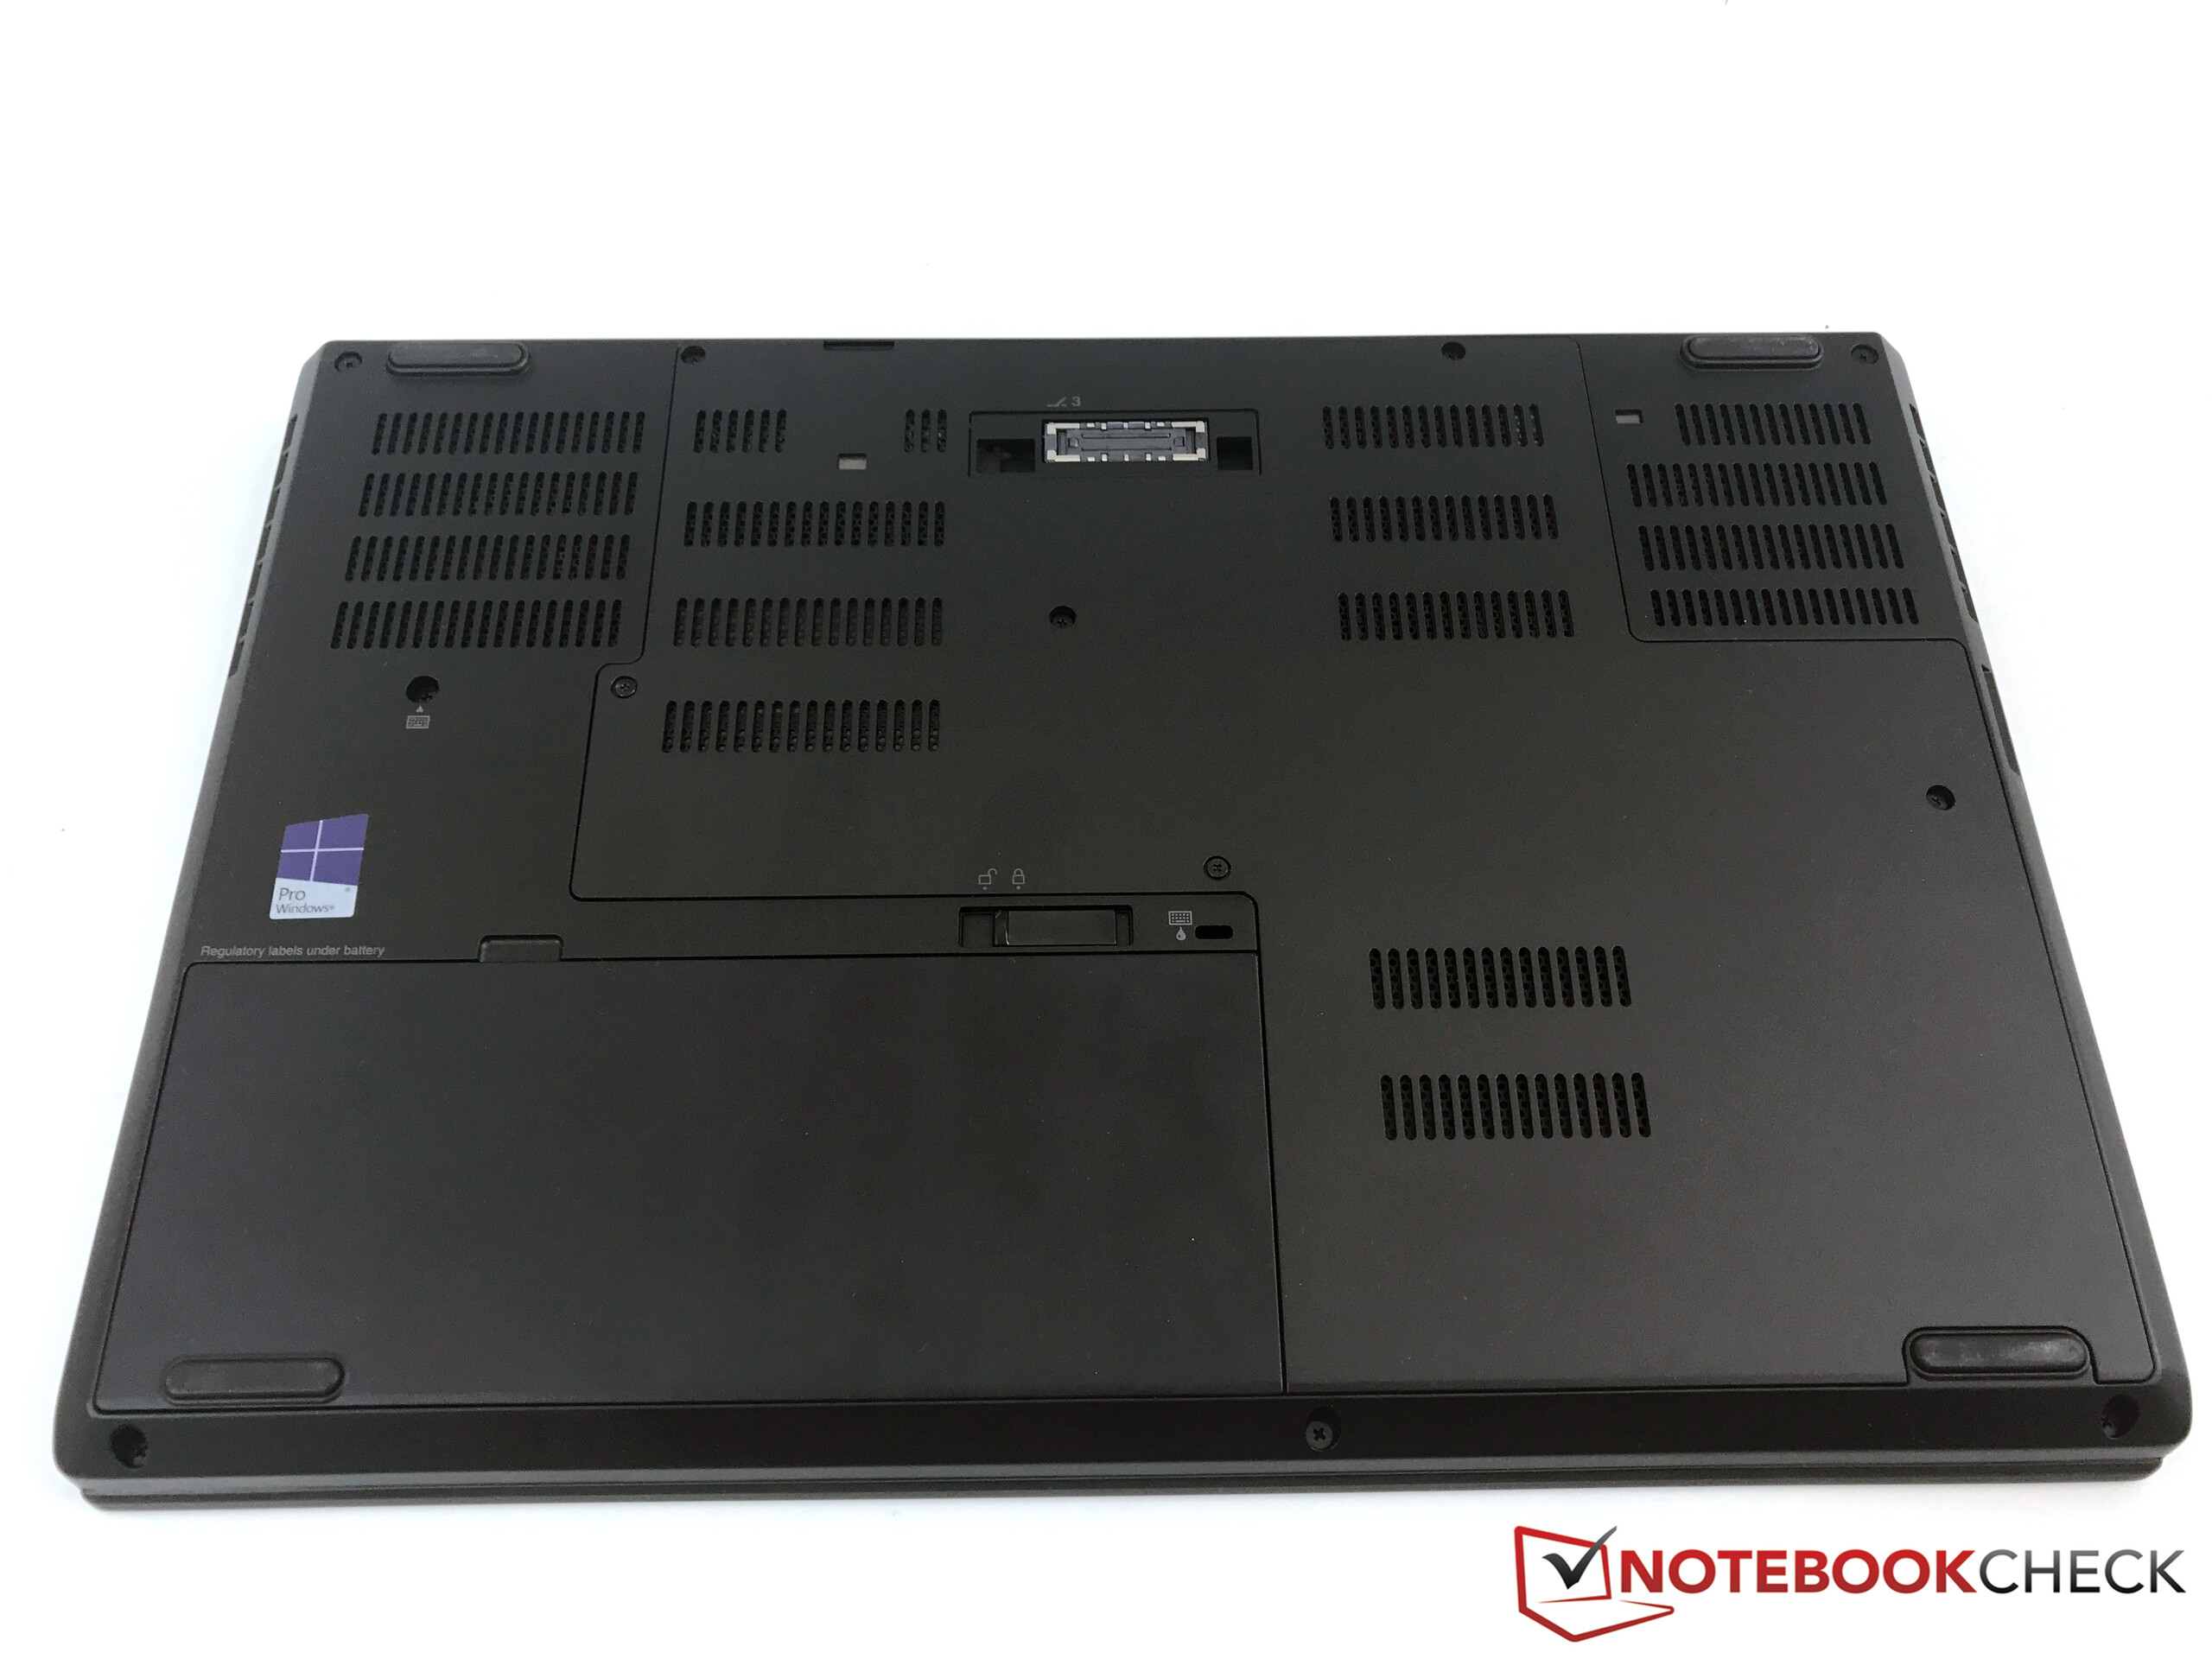
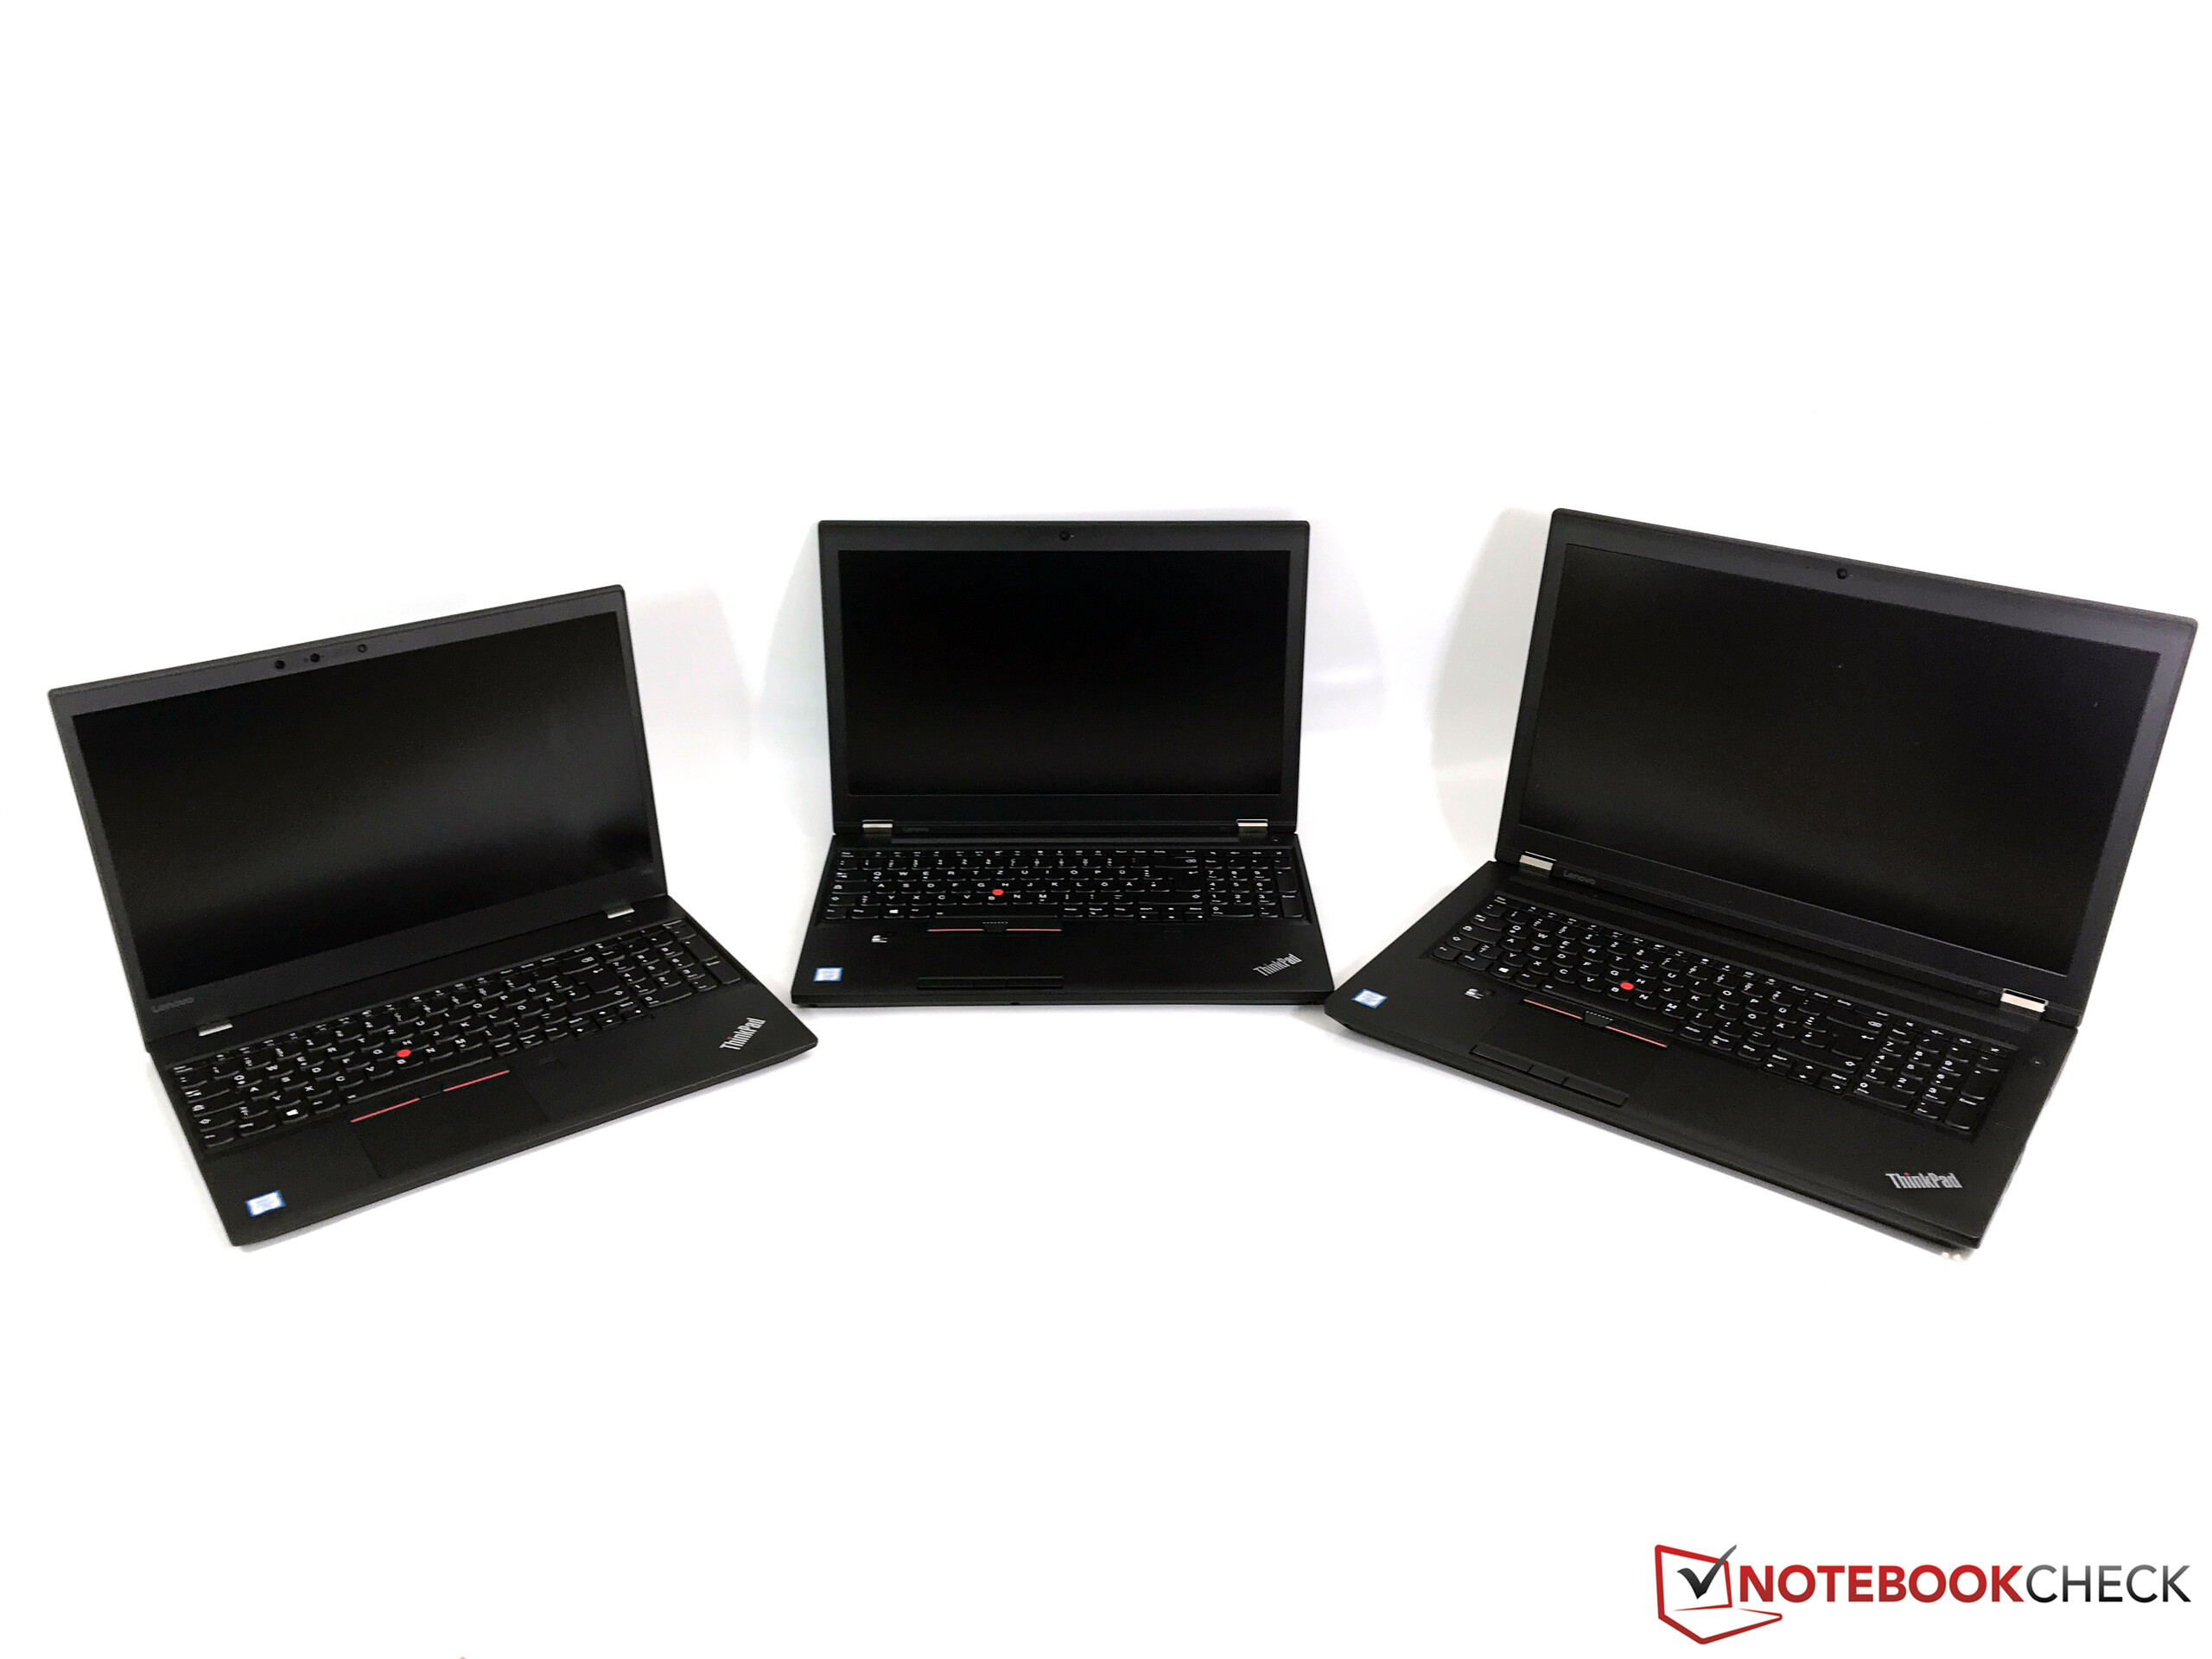
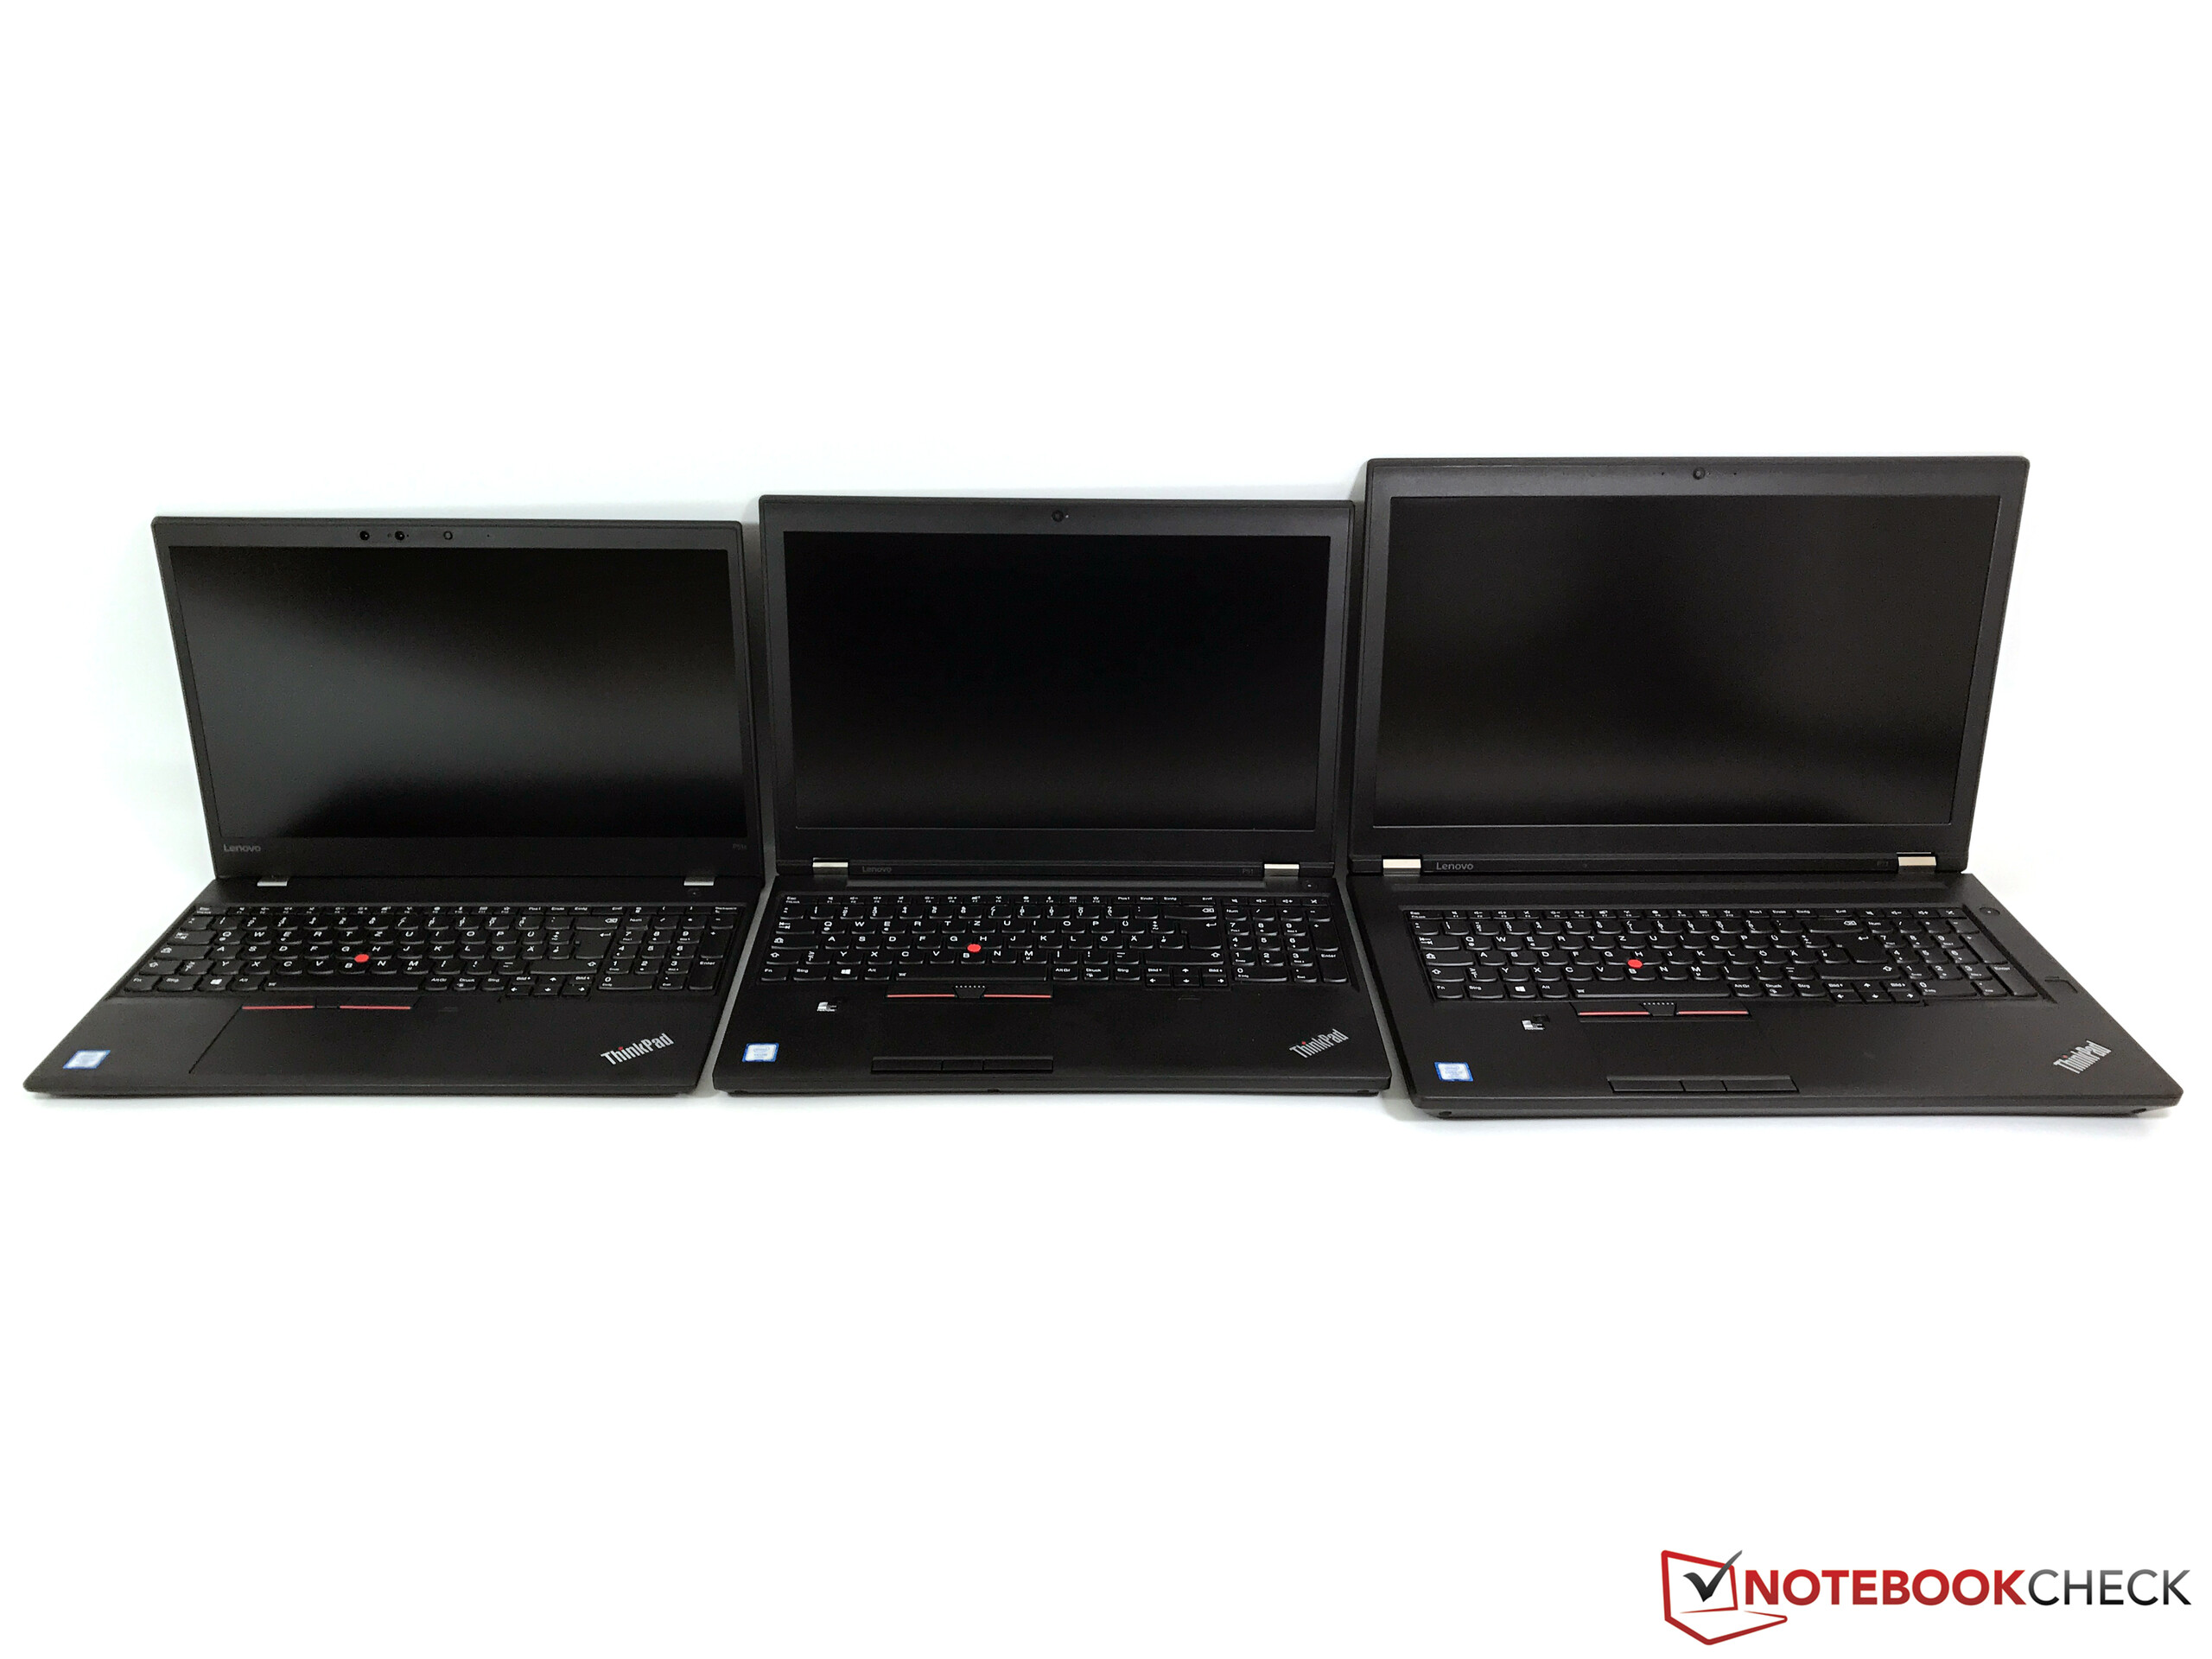
L'an dernier, le ThinkPad P50 de Lenovo était une bonne station de travail, mais avec quelques problèmes. En particulier, les deux écrans proposés ne nous satisfaisaient pas, à cause de leur luminosité trop faible et de l’utilisation de la MLI (version 4k). Le ThinkPad P51 de cette année est la mise à jour Kaby Lake du P50, et utilise la même base.
Une fois de plus, Lenovo propose un appareil très robuste avec de bons périphériques d’entrée et un refroidissement silencieux. Les performances sont meilleures, grâce à la nouvelle configuration, et l’écran est enfin très bon, avec une large couverture colorimétrique. Les problèmes du P50 (WWAN, forte réduction des performances du CPU sur batterie) ont également disparus.
Bonnes performances, bon châssis, excellent écran, le ThinkPad P51 de cette année est une très bonne station de travail mobile, même si certains détails peuvent encore être améliorés.
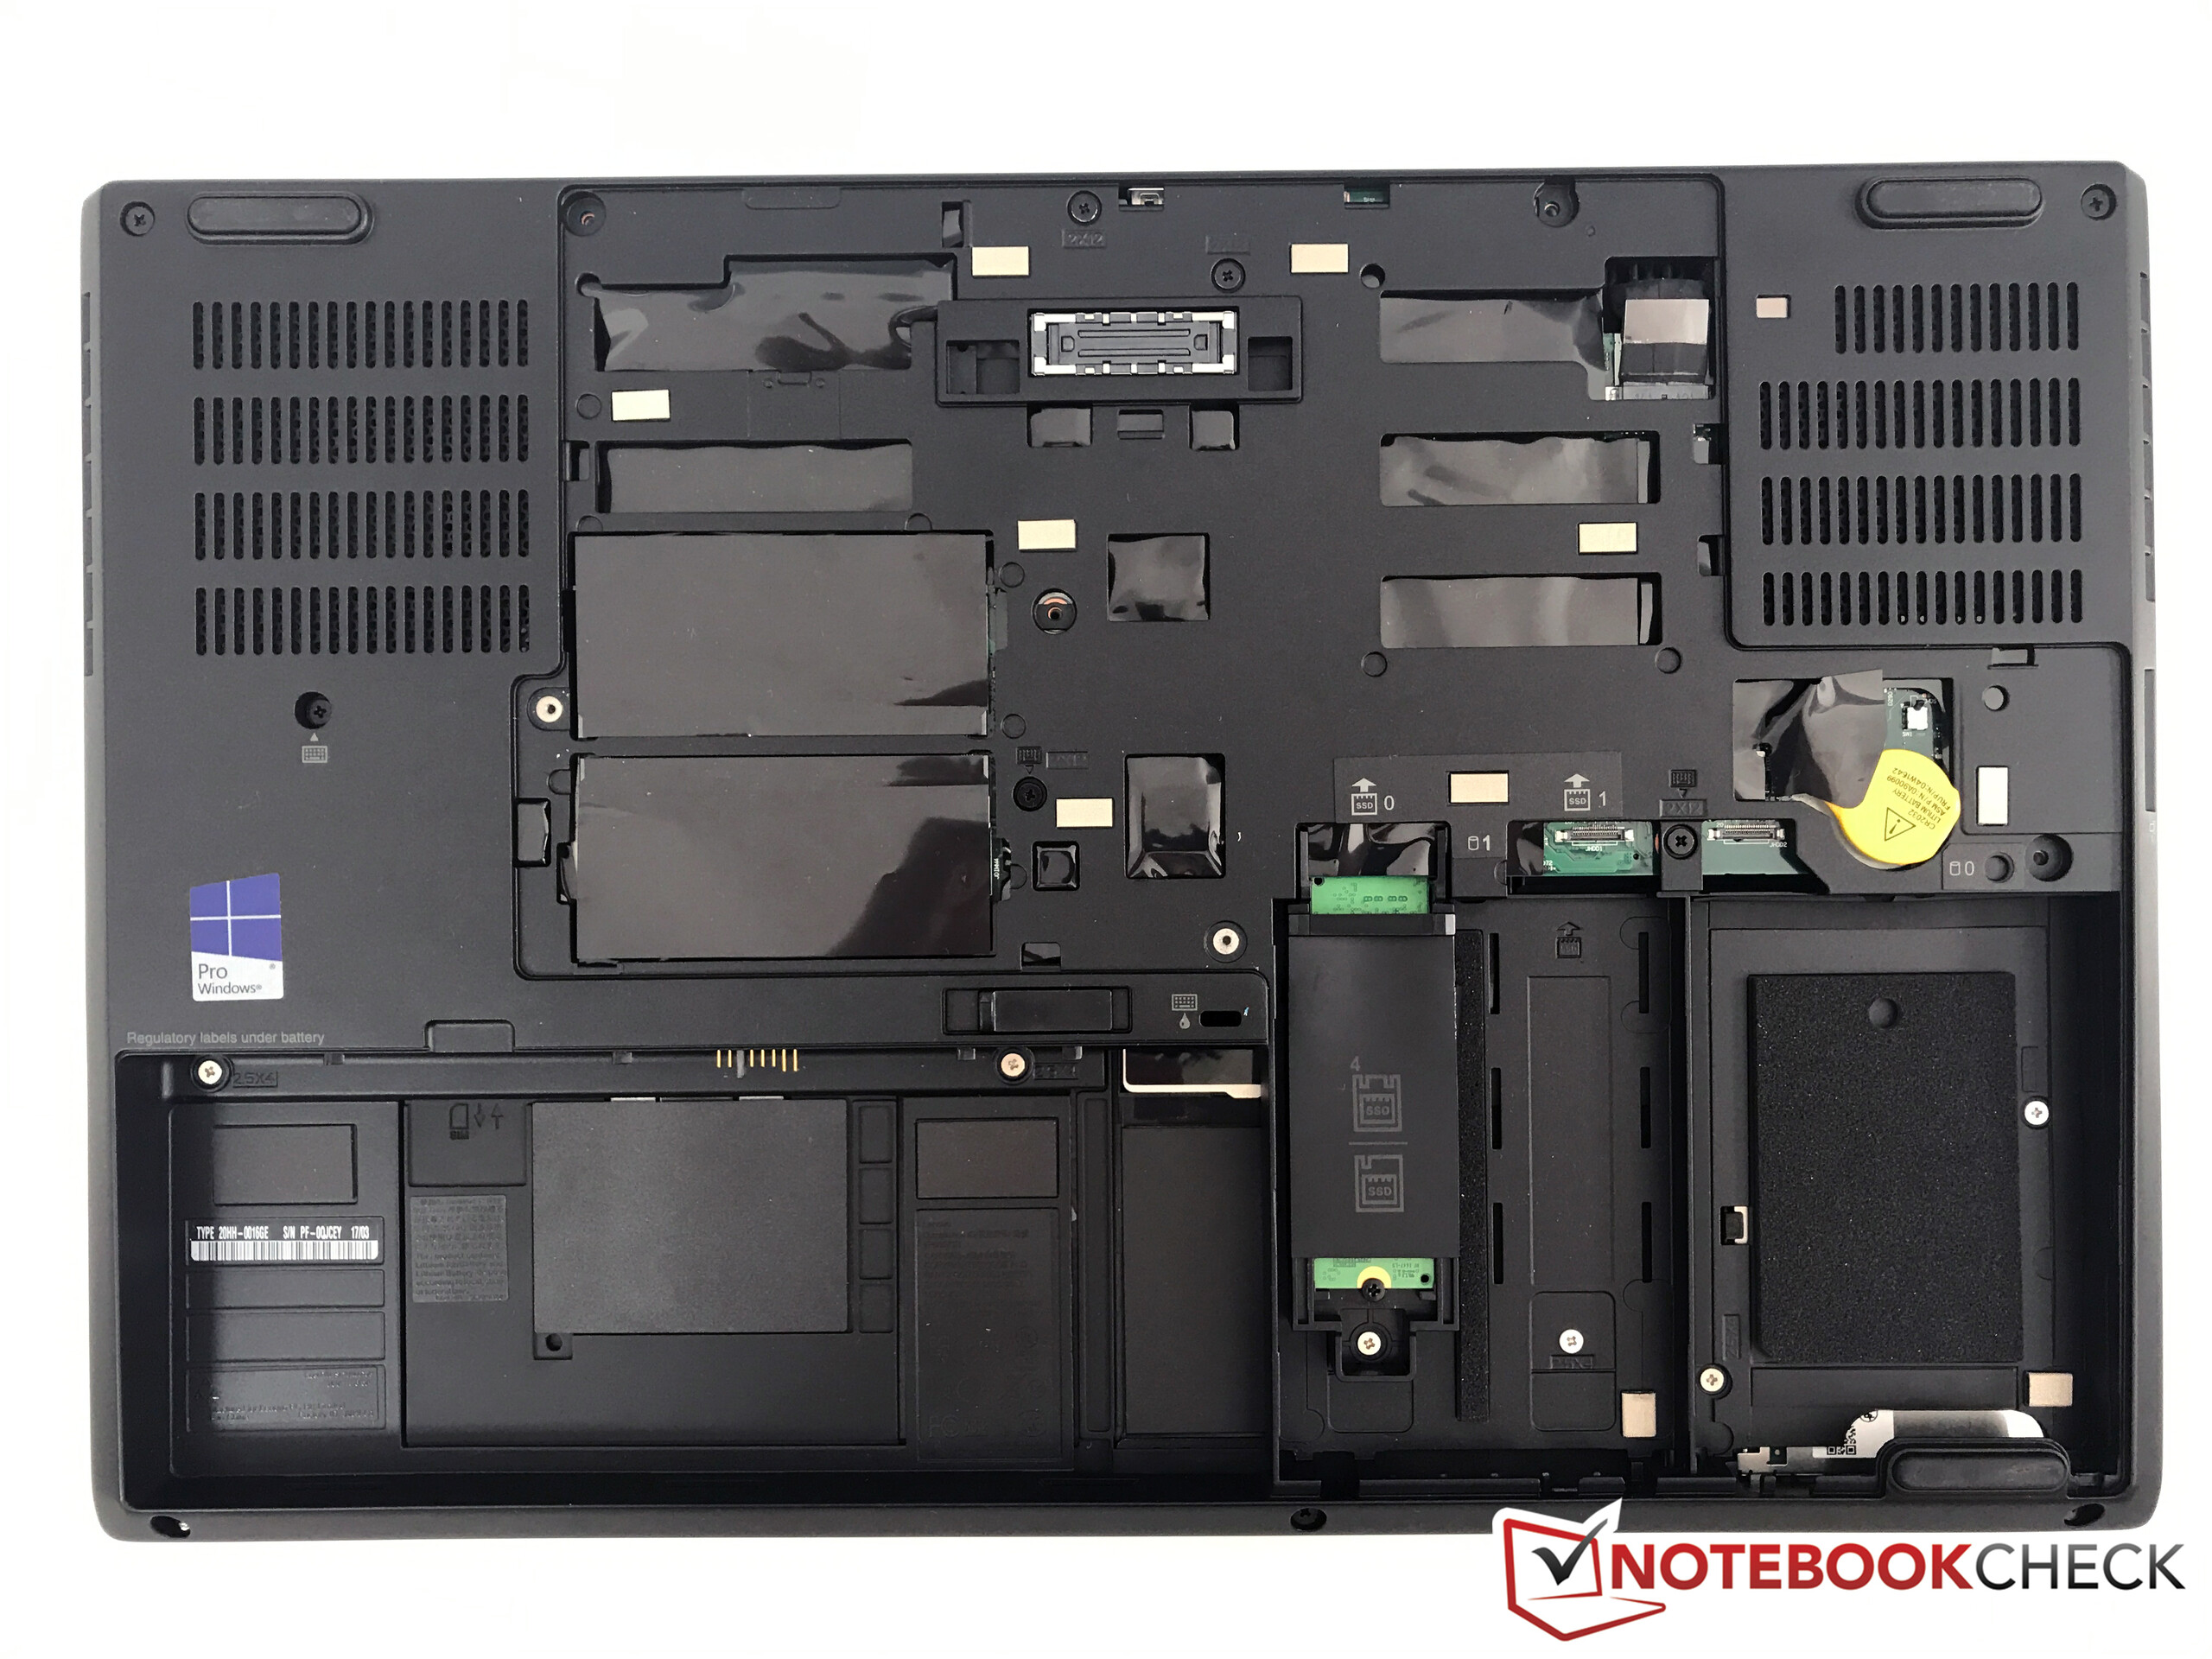
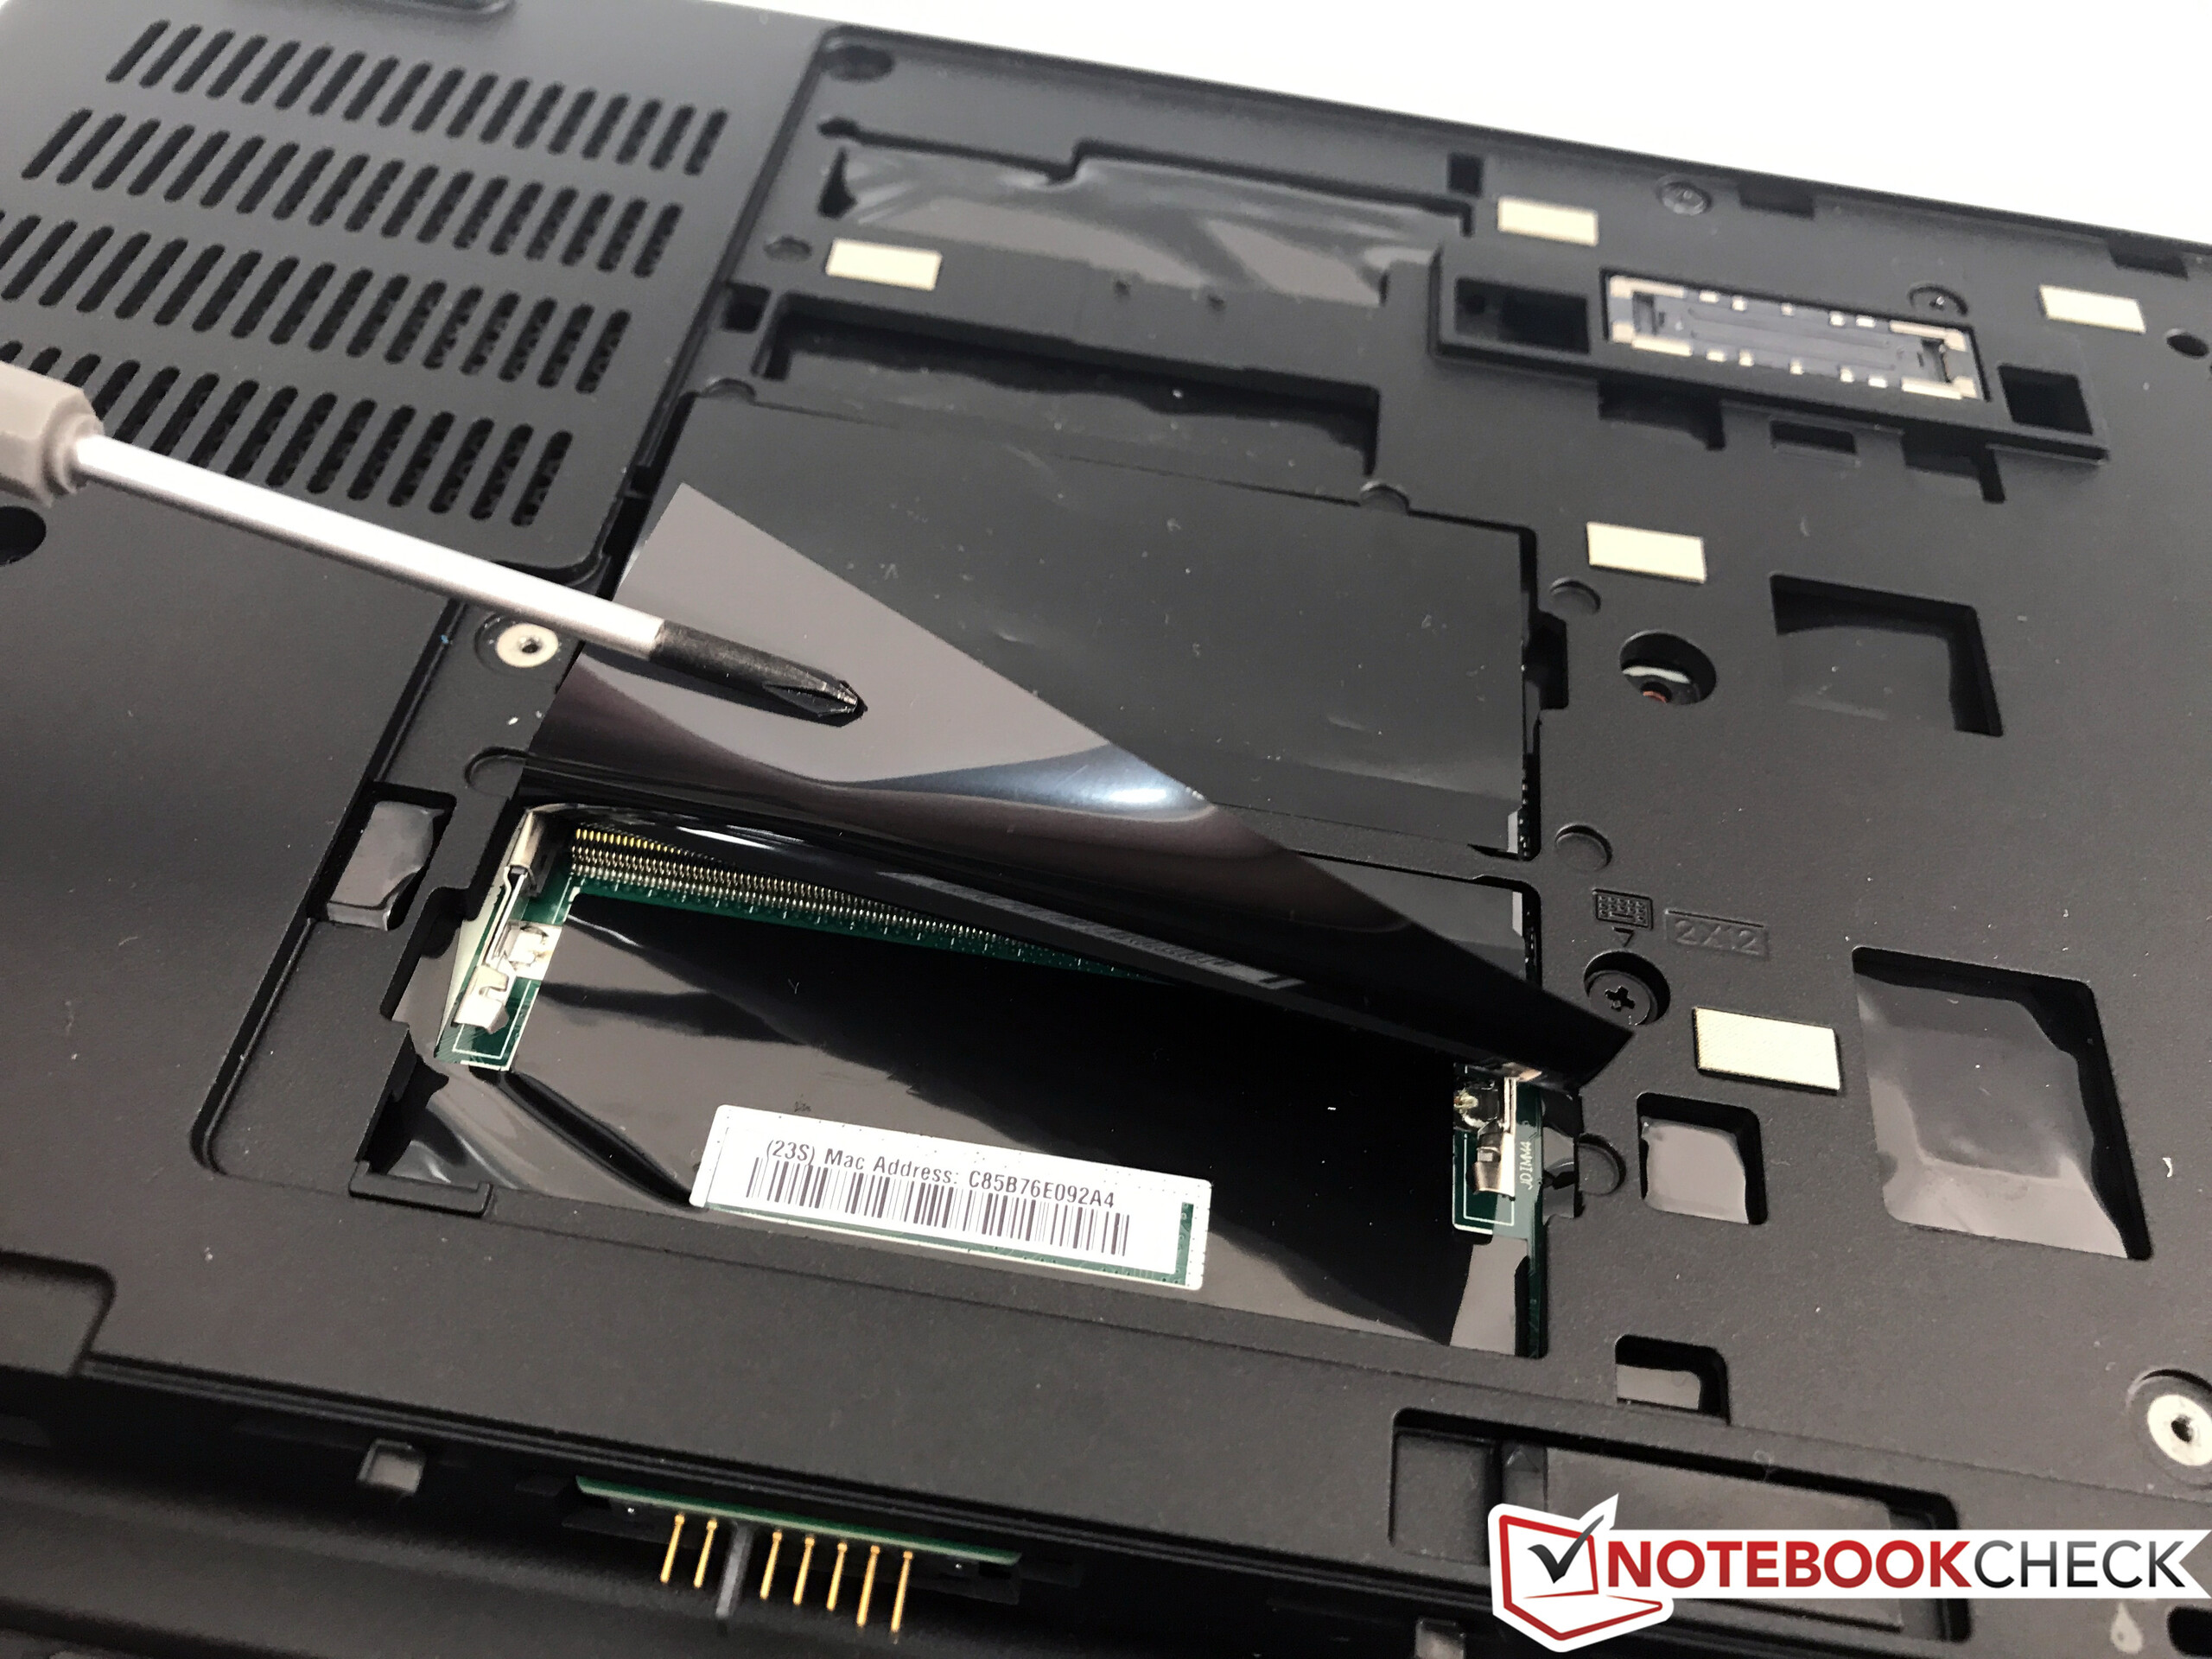
Le ThinkPad P51 n’est pas parfait. En plus de petits soucis (problèmes avec le clic droit du touchpad sur notre modèle de test, haut-parleurs mauvais, maintenance difficile), la calibration par défaut n’est pas réussie. Le système de refroidissement atteint également ses limites quand le CPU et le GPU sont sollicités simultanément, et il n’est pas possible d’utiliser tout le potentiel du processeur Xeon. Un grésillement occasionnel se fait aussi entendre, surtout quand les ventilateurs sont au repos.
Dans l’ensemble, Lenovo propose une très bonne machine, et les modèles à venir de Dell et HP vont avoir maille à partir avec elle.
L’intégralité de cette critique est disponible en anglais en suivant ce lien.
Lenovo ThinkPad P51 20HH0016GE
- 06/18/2017 v6 (old)
Andreas Osthoff
Price comparison
