Test du HP ZBook Studio 16 G11 : station de travail légère et performante
Processeur amélioré et carte graphique RTX Ada.
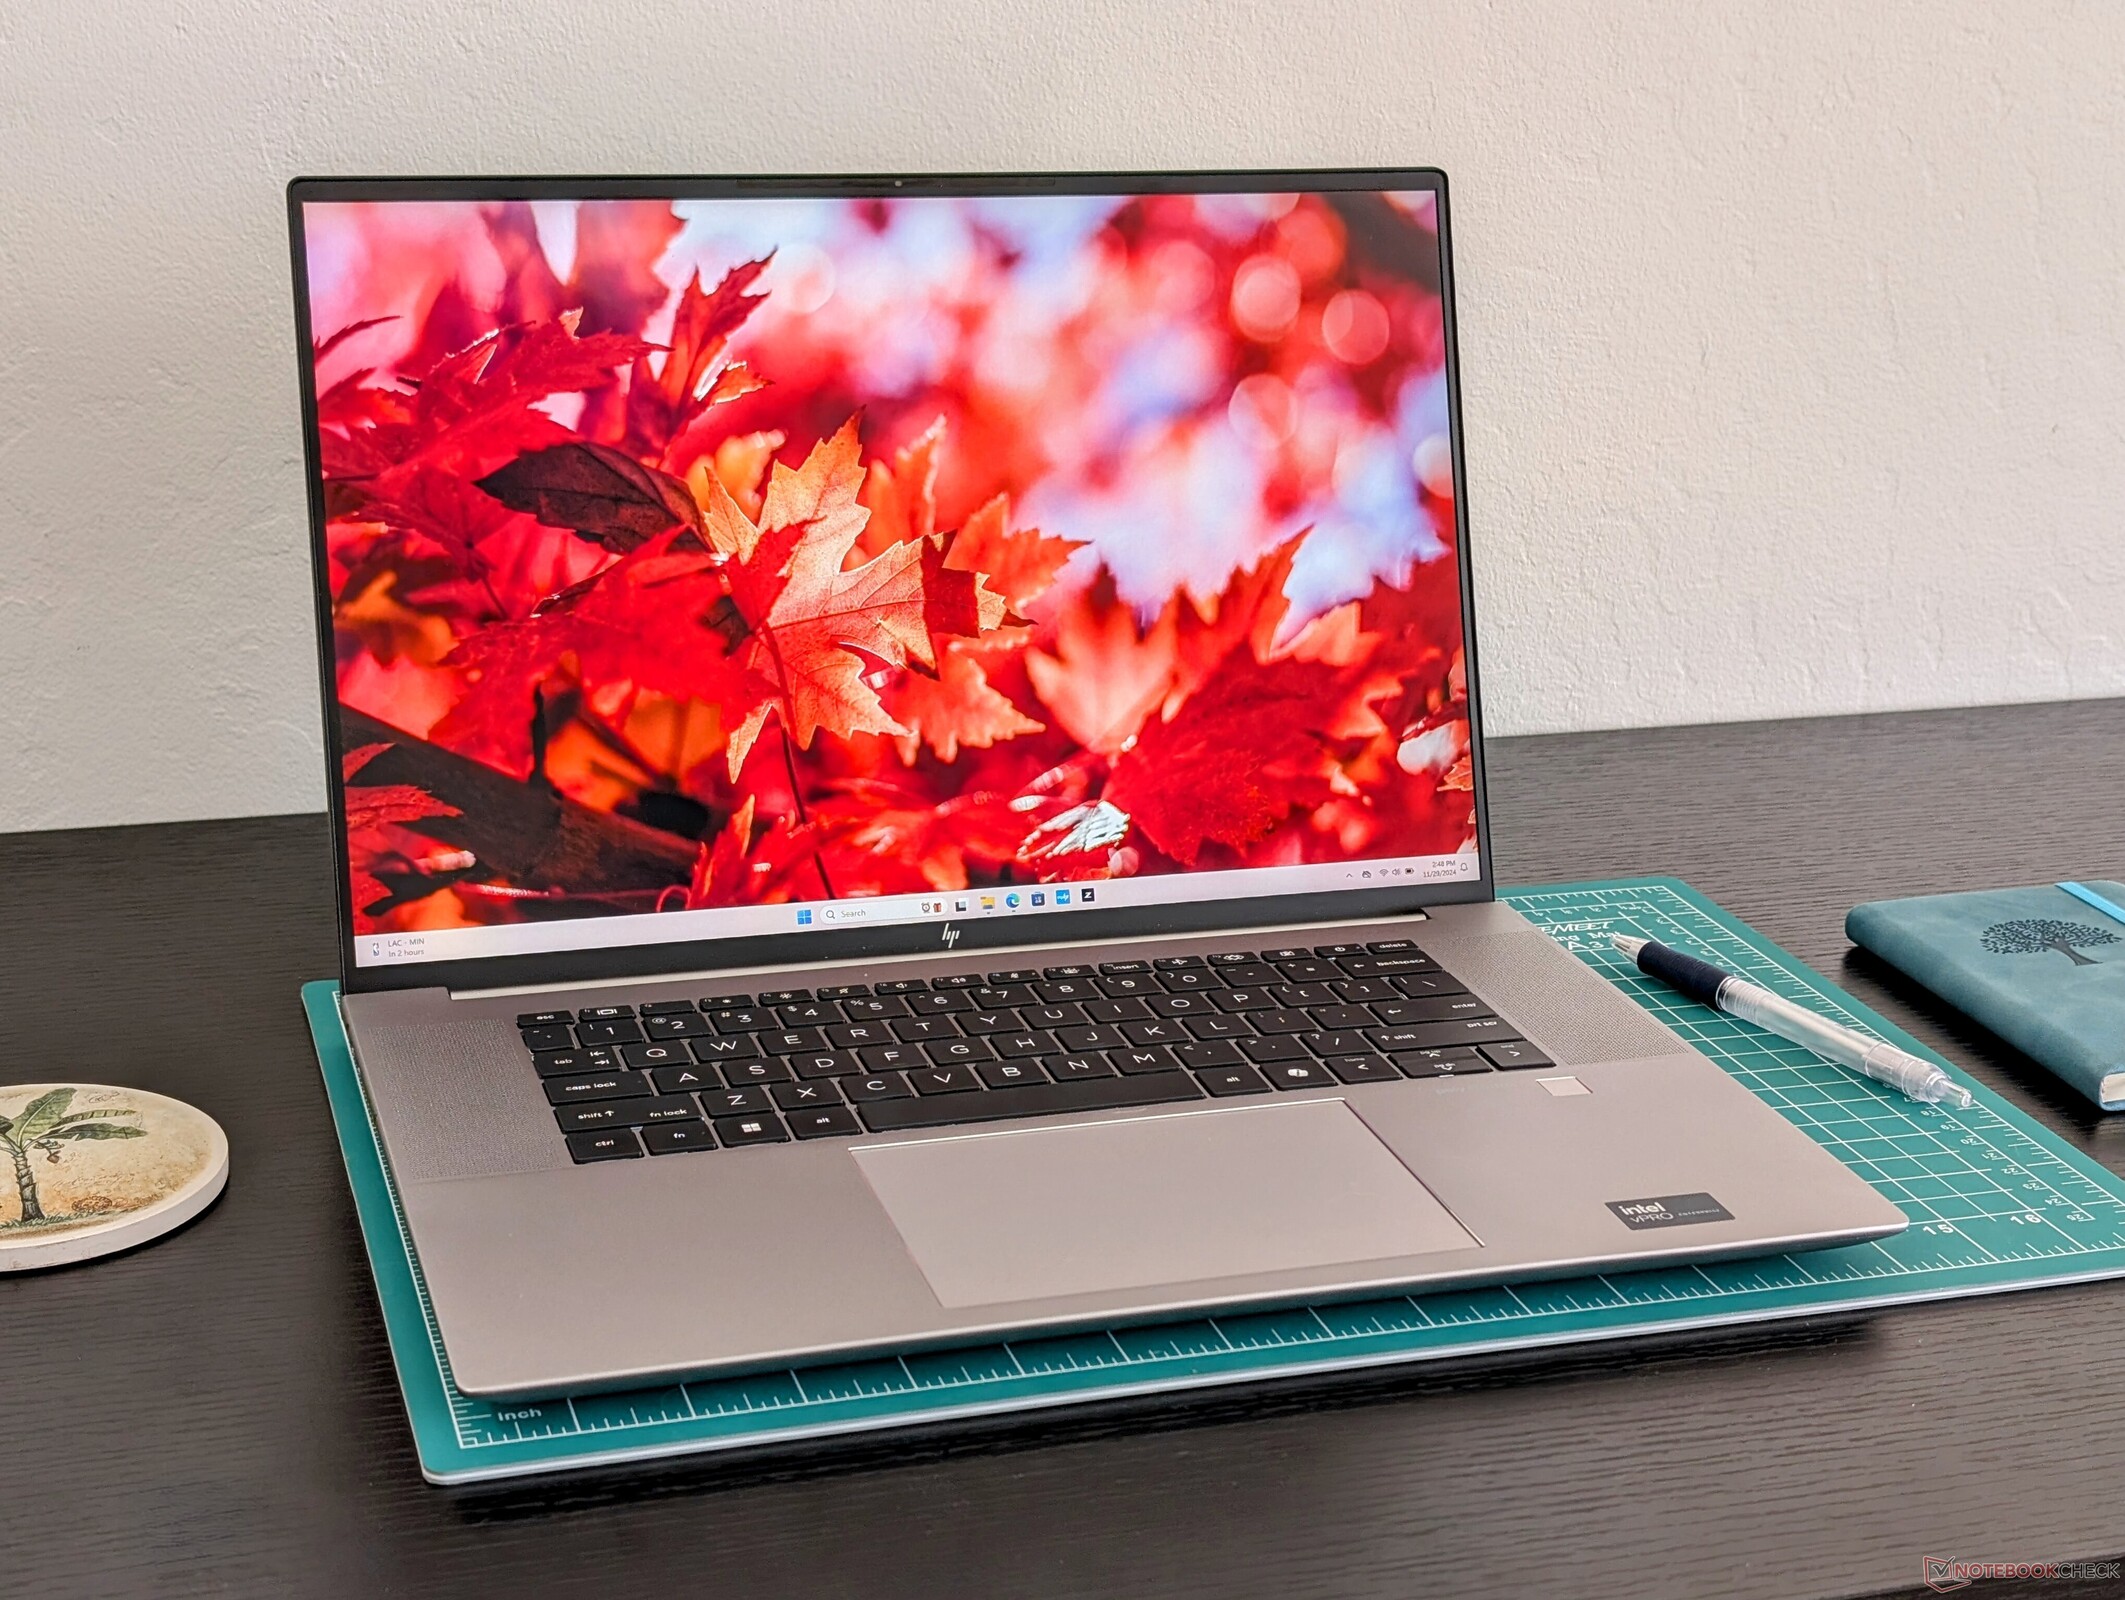
L'une des stations de travail 16 pouces les plus légères de HP bénéficie de nouvelles options de processeur pour des performances nettement plus rapides qu'auparavant. Pour le reste, il s'agit du même design que le ZBook Studio 16 G9 ou G10, pour une expérience utilisateur essentiellement identique.Allen Ngo, 👁 Allen Ngo (traduit par DeepL / Ninh Duy) Publié 🇺🇸 🇪🇸 ...
Verdict - Plus léger que prévu pour une station de travail de 16 pouces
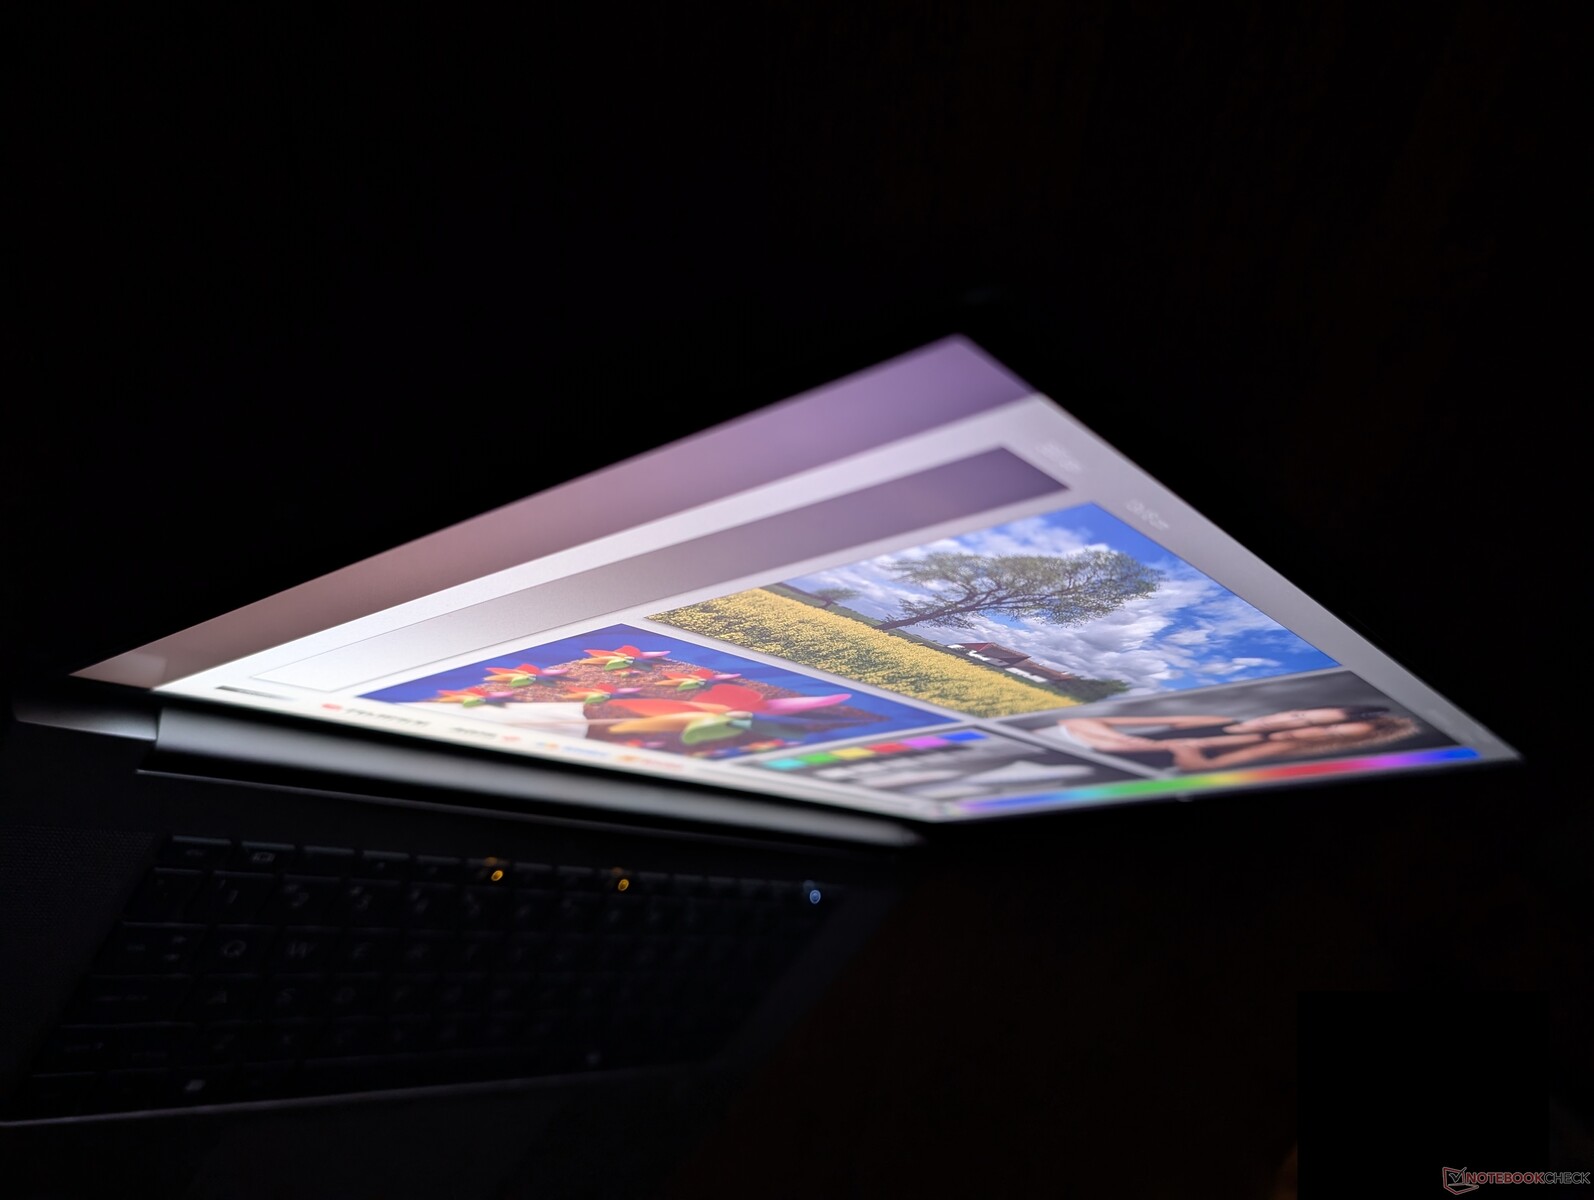
Le ZBook Studio 16 G11 excelle en termes de portabilité et de qualité de fabrication malgré sa finesse et son grand écran de 16 pouces. Les professionnels qui recherchent un produit suffisamment léger pour être transporté sans sacrifier la taille de l'écran ou les performances trouveront beaucoup à redire sur le Studio 16 G11, d'autant plus que les nouvelles options GPU sont nettement plus rapides et plus efficaces que celles disponibles sur le modèle G9.
Malheureusement, le système souffre des mêmes défauts que les modèles G10 ou G9 précédents, puisqu'ils partagent tous le même châssis ou squelette. La webcam floue de 1 mégapixel et l'absence d'obturateur de confidentialité, par exemple, sont révélatrices d'un design vieillissant. D'autres facteurs tels que les températures de fonctionnement du cœur et l'autonomie de la batterie sont respectivement plus chaudes et plus courtes que nous le souhaiterions, tandis que la mise à niveau du CPU d'Alder Lake-H à Meteor Lake-H n'est pas aussi importante que celle du GPU. Les utilisateurs qui ont besoin d'une puissance graphique supplémentaire plus rapide que la RTX 3000 Ada devront se tourner vers des alternatives plus épaisses comme le ZBook Fury 16 qui peuvent être configurés avec des options RTX 5000 Ada.
Nous devons également noter que nous avons rencontré plusieurs problèmes de gel sur notre unité de test. Il peut être intéressant de vérifier votre unité lors de l'achat afin de détecter tout comportement défectueux.
Points positifs
Points négatifs
Prix et disponibilité
Une version inférieure avec le Core Ultra 7 et la RTX 2000 Ada est disponible sur Amazon pour 3200 $. D'autres modèles sont disponibles directement auprès de HP.
Comparaison des alternatives possibles
Image | Modèle | Prix | Poids | Épaisseur | Écran |
|---|---|---|---|---|---|
1. 84.2%  | HP ZBook Studio 16 G11 Intel Core Ultra 9 185H ⎘ NVIDIA RTX 3000 Ada Generation Laptop ⎘ 64 Go Mémoire, 1024 Go SSD | Amazon: Prix de liste: 4300 USD | 1.8 kg | 19 mm | 16.00" 3840x2400 283 PPI IPS |
2. 90.1% v7 (old)  | HP ZBook Studio 16 G9 62U04EA Intel Core i7-12800H ⎘ NVIDIA RTX A2000 Laptop GPU ⎘ 32 Go Mémoire, 1024 Go SSD | Amazon: Prix de liste: 3300€ | 1.8 kg | 19 mm | 16.00" 3840x2400 283 PPI IPS |
3. 85.4%  | HP ZBook Power 16 G11 A AMD Ryzen 7 8845HS ⎘ NVIDIA RTX 2000 Ada Generation Laptop ⎘ 64 Go Mémoire, 2048 Go SSD | Amazon: Prix de liste: 2100 USD | 2.2 kg | 22.9 mm | 16.00" 2560x1600 189 PPI IPS |
4. 85.9%  | Lenovo ThinkPad P16 Gen 2 Intel Core i7-14700HX ⎘ NVIDIA RTX 4000 Ada Generation Laptop ⎘ 32 Go Mémoire, 1024 Go SSD | Amazon: Prix de liste: 3500 USD | 3.1 kg | 30.23 mm | 16.00" 2560x1600 189 PPI IPS |
5. 88.3% v7 (old)  | Dell Precision 5690 Intel Core Ultra 9 185H ⎘ NVIDIA RTX 5000 Ada Generation Laptop ⎘ 32 Go Mémoire, 2048 Go SSD | Amazon: Prix de liste: 5900 USD | 2.3 kg | 22.17 mm | 16.00" 3840x2400 283 PPI OLED |
6. 84.3% v7 (old)  | MSI CreatorPro Z16P B12UKST Intel Core i7-12700H ⎘ NVIDIA RTX A3000 Laptop GPU ⎘ 32 Go Mémoire, 1024 Go SSD | Amazon: Prix de liste: 3500€ | 2.4 kg | 19 mm | 16.00" 2560x1600 189 PPI IPS |
7. 83.5%  | Lenovo ThinkPad P1 Gen 7 21KV001SGE Intel Core Ultra 7 155H ⎘ NVIDIA GeForce RTX 4060 Laptop GPU ⎘ 32 Go Mémoire, 1024 Go SSD | Amazon: Prix de liste: 3239 Euro | 2 kg | 20.5 mm | 16.00" 2560x1600 189 PPI IPS LED |
La dernière fois que nous avons examiné la série ZBook Studio 16, il s'agissait du modèle G9 Modèle G9 en 2022. Pour 2024, le dernier modèle est maintenant le G11 équipé des deux options plus rapides Intel Meteor Lake CPU et Nvidia Ada Lovelace GPU pour remplacer les options Alder Lake et Ampere sur les anciennes versions Studio 16.
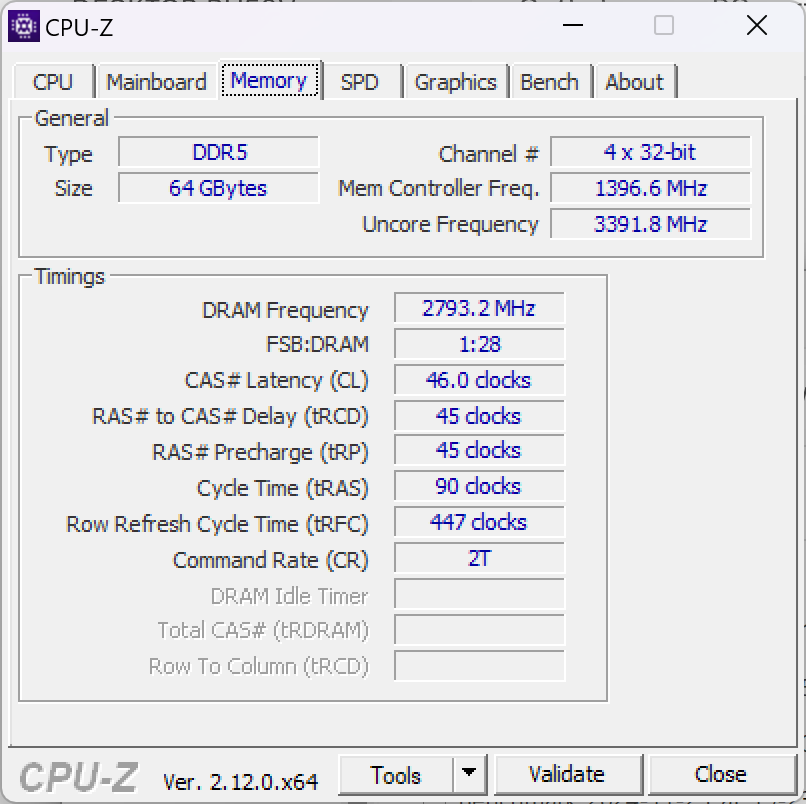
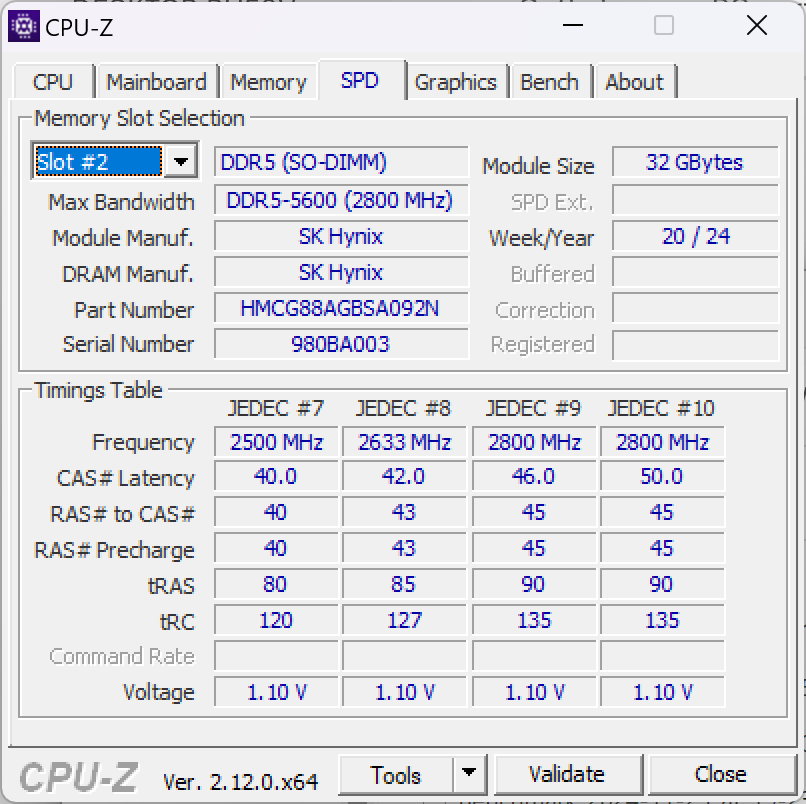
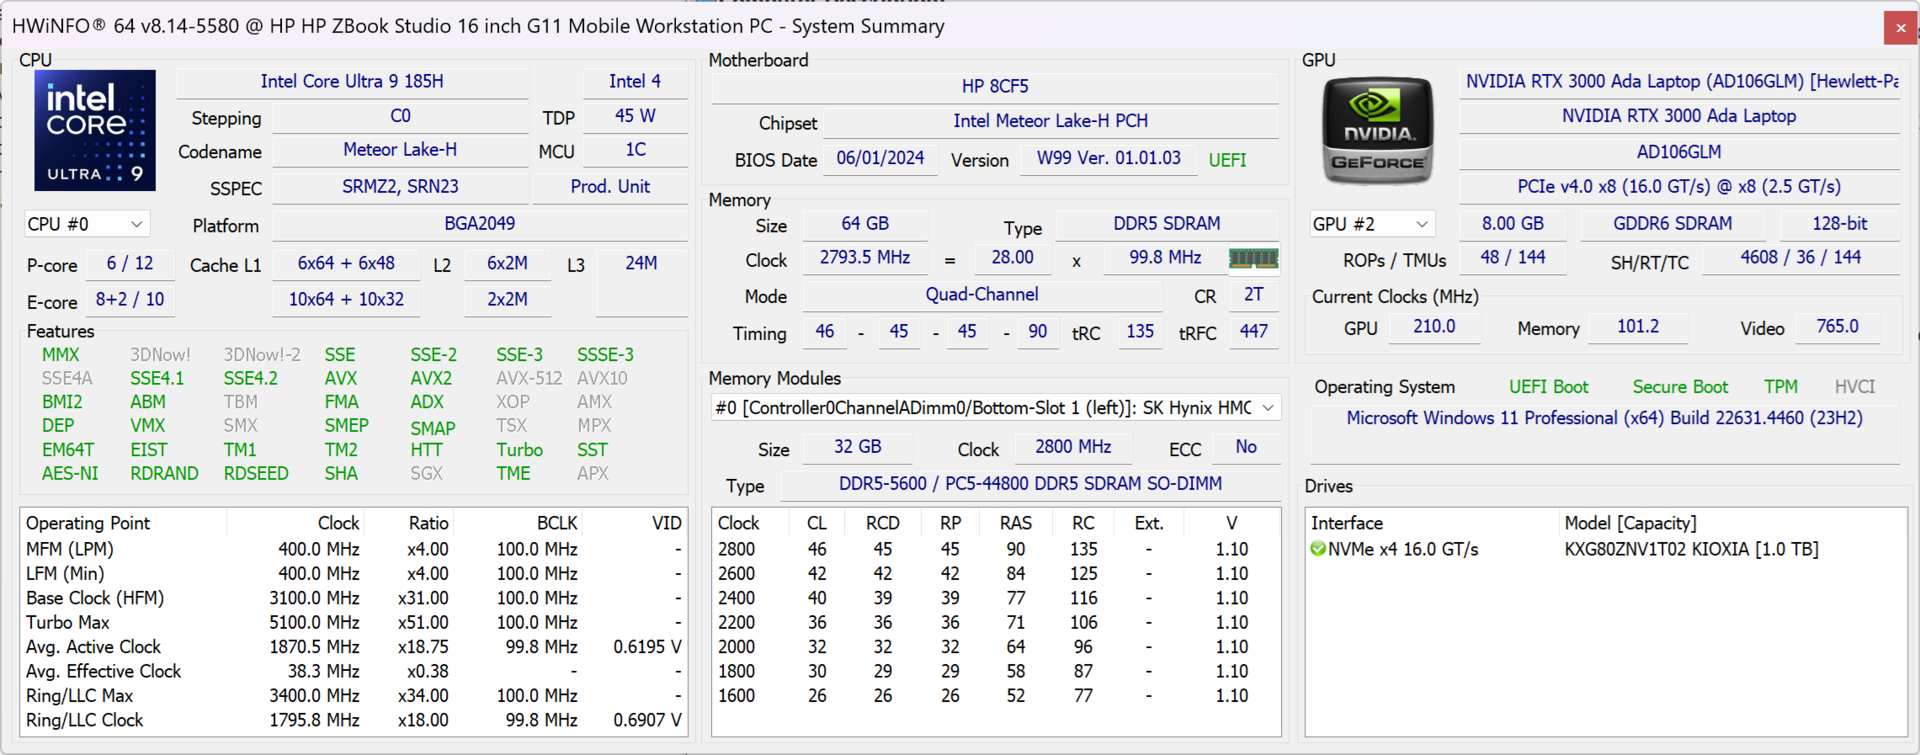
Notre unité de test est la configuration la plus haut de gamme avec le CPU Core Ultra 9 185H vPro, le GPU RTX 3000 Ada et l'écran IPS 2400p 120 Hz pour environ 2800 USD. D'autres SKUs commencent avec le Core Ultra 7 155H, la carte graphique Arc intégrée, GeForce RTX 4070, ou un écran 1200p comme décrit sur la page produit officielle de HP https://www.hp.com/us-en/shop/pdp/hp-zbook-studio-g11-mobile-workstation-pc-customizable-9q574av-mb.
Les alternatives au ZBook Studio 16 G11 comprennent d'autres stations de travail mobiles de 16 pouces comme le Lenovo ThinkPad P16 Gen 2, Dell Precision 5690ou MSI CreatorPro Z16P.
Plus de commentaires sur HP :
Spécifications
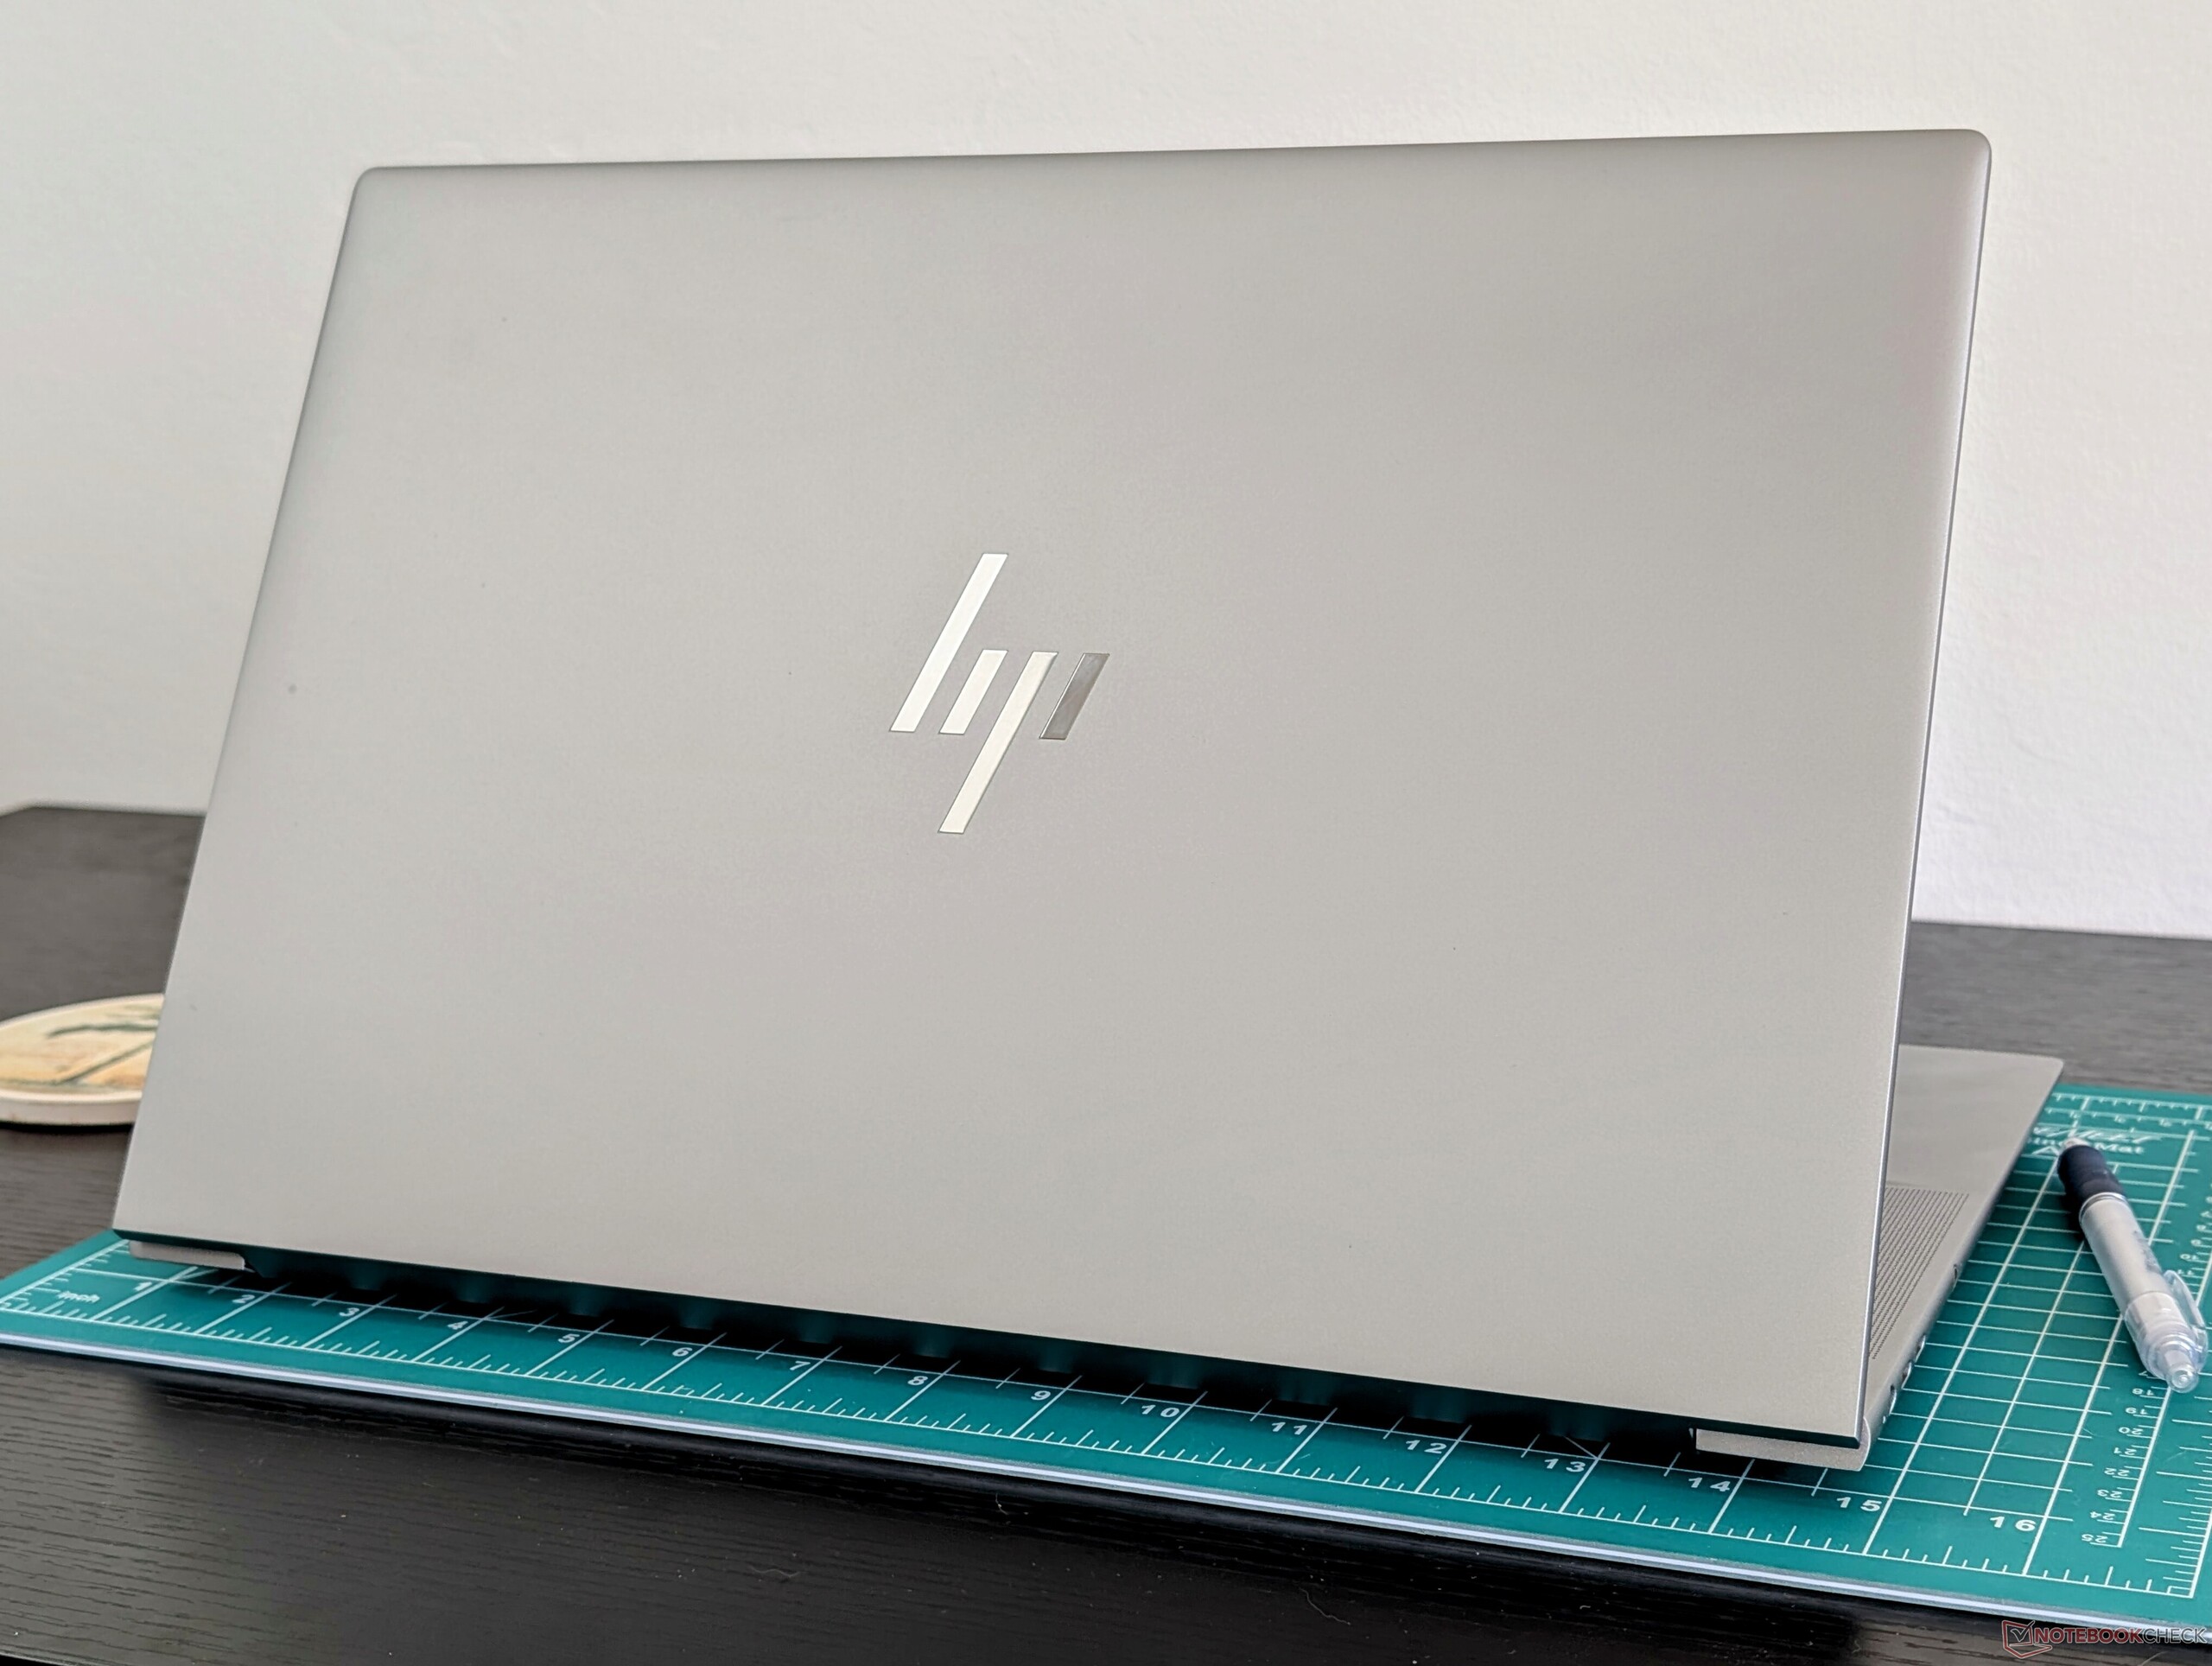
Cas
Le ZBook Studio 16 G11 utilise le même châssis que le ZBook Studio 16 G9, vieux de deux ans. Malgré son âge, il s'agit toujours d'un design solide, remarquable par sa finesse et sa portabilité. Le MSI CreatorPro Z16P ou Dell Precision 5690, par exemple, sont tous deux plus grands et sensiblement plus lourds d'au moins 400 à 500 grammes.
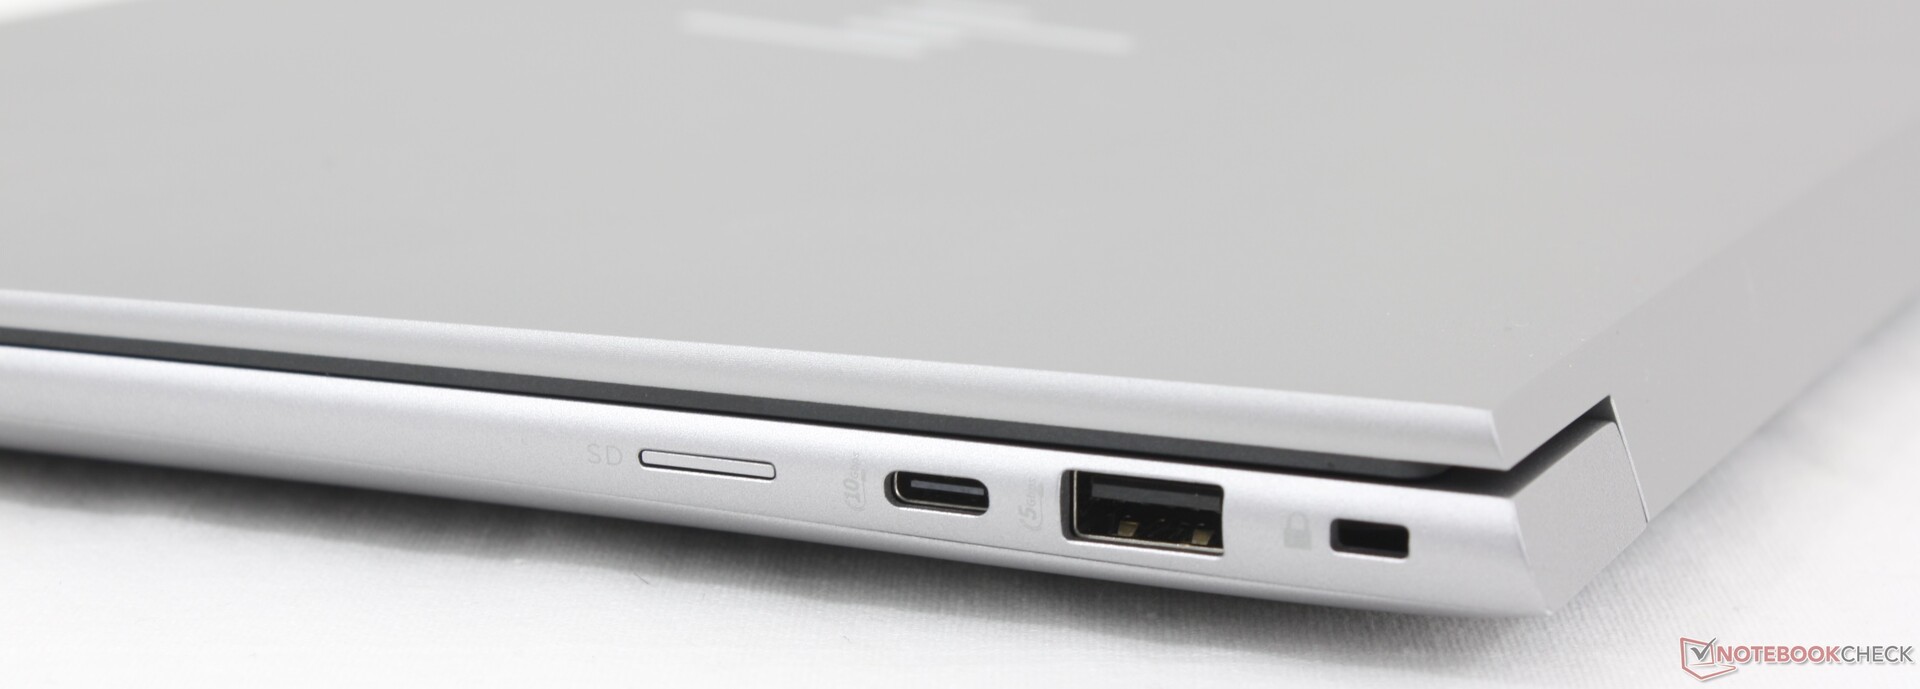
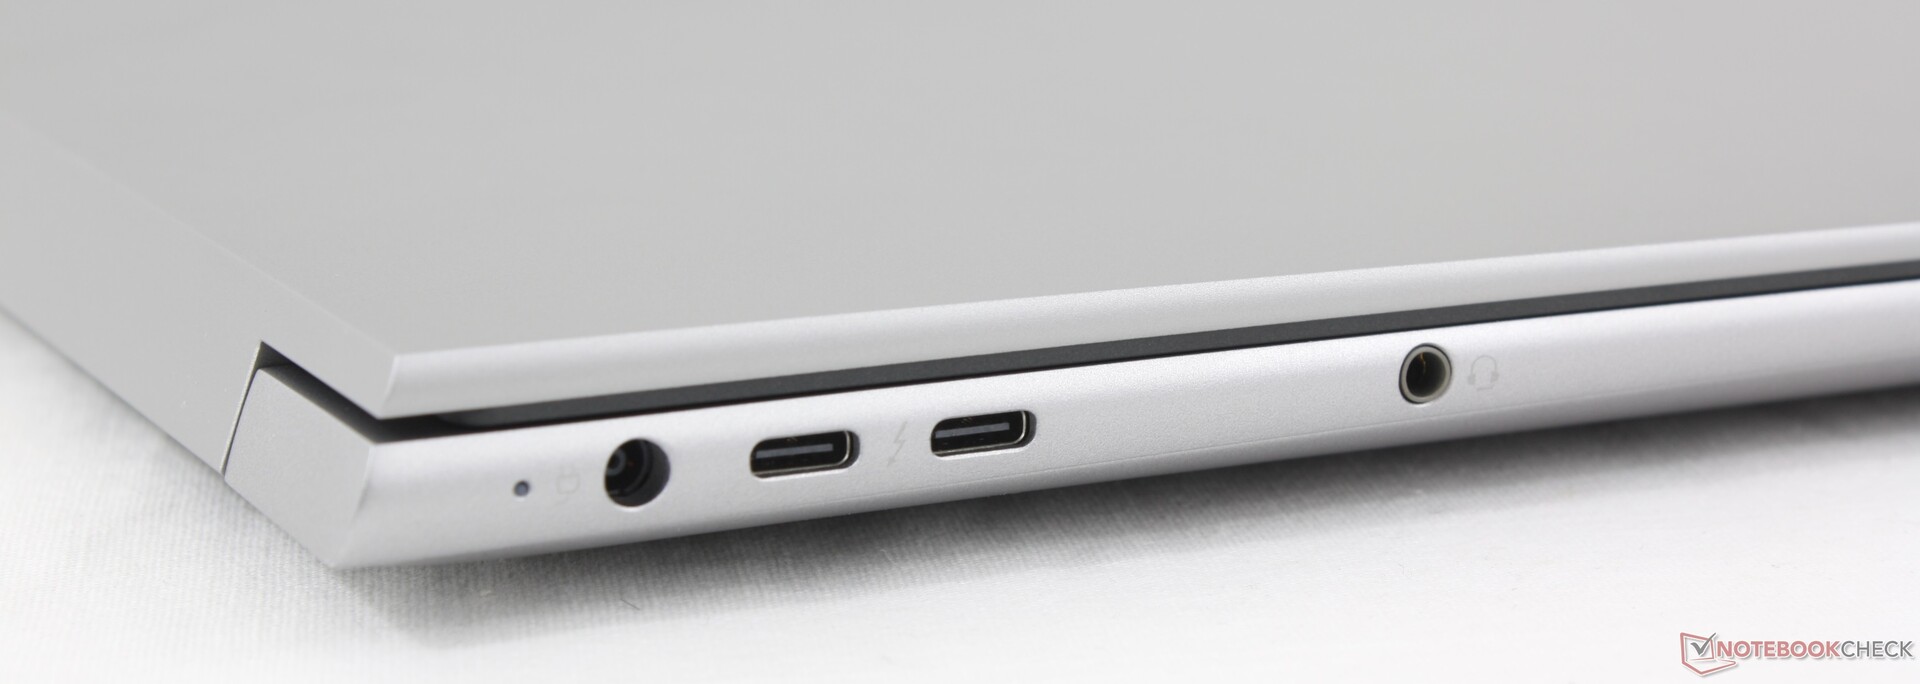
Connectivité
Si les options de port n'ont pas changé, le lecteur MicroSD intégré à notre appareil était cassé et nous n'avons donc pas pu tester ses performances en matière de taux de transfert.
Communication
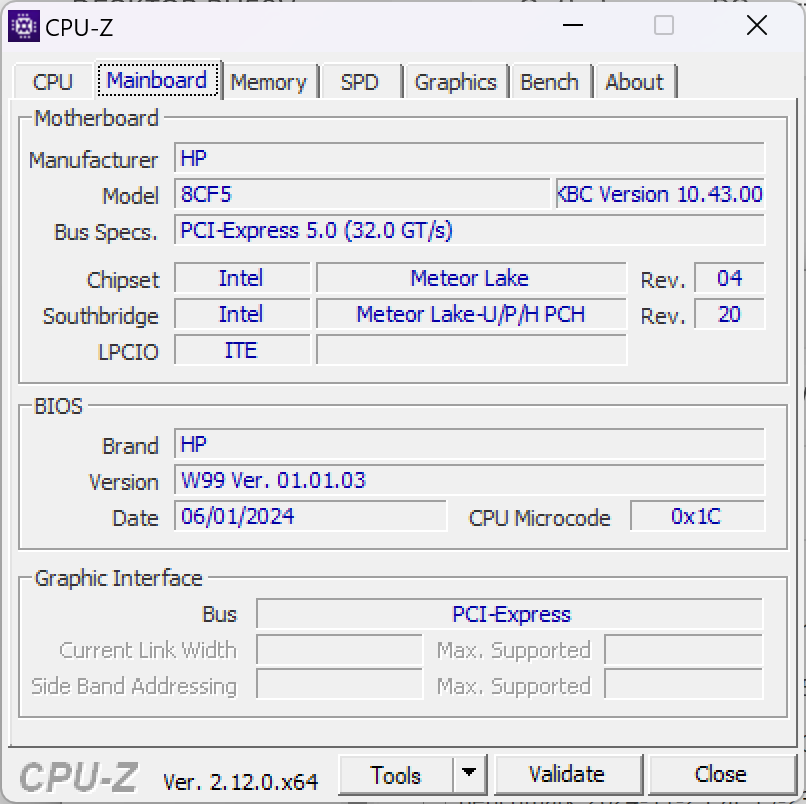
La technologie sans fil est passée du MediaTek Wi-Fi 6E MT7922 à l'Intel BE200 pour prendre en charge à la fois le Wi-Fi 7 et le Bluetooth 5.4.
Webcam
Malheureusement, la webcam reste à 720p ou seulement 1 MP alors que la grande majorité des autres ordinateurs portables ont déjà abandonné les options de 1 MP.


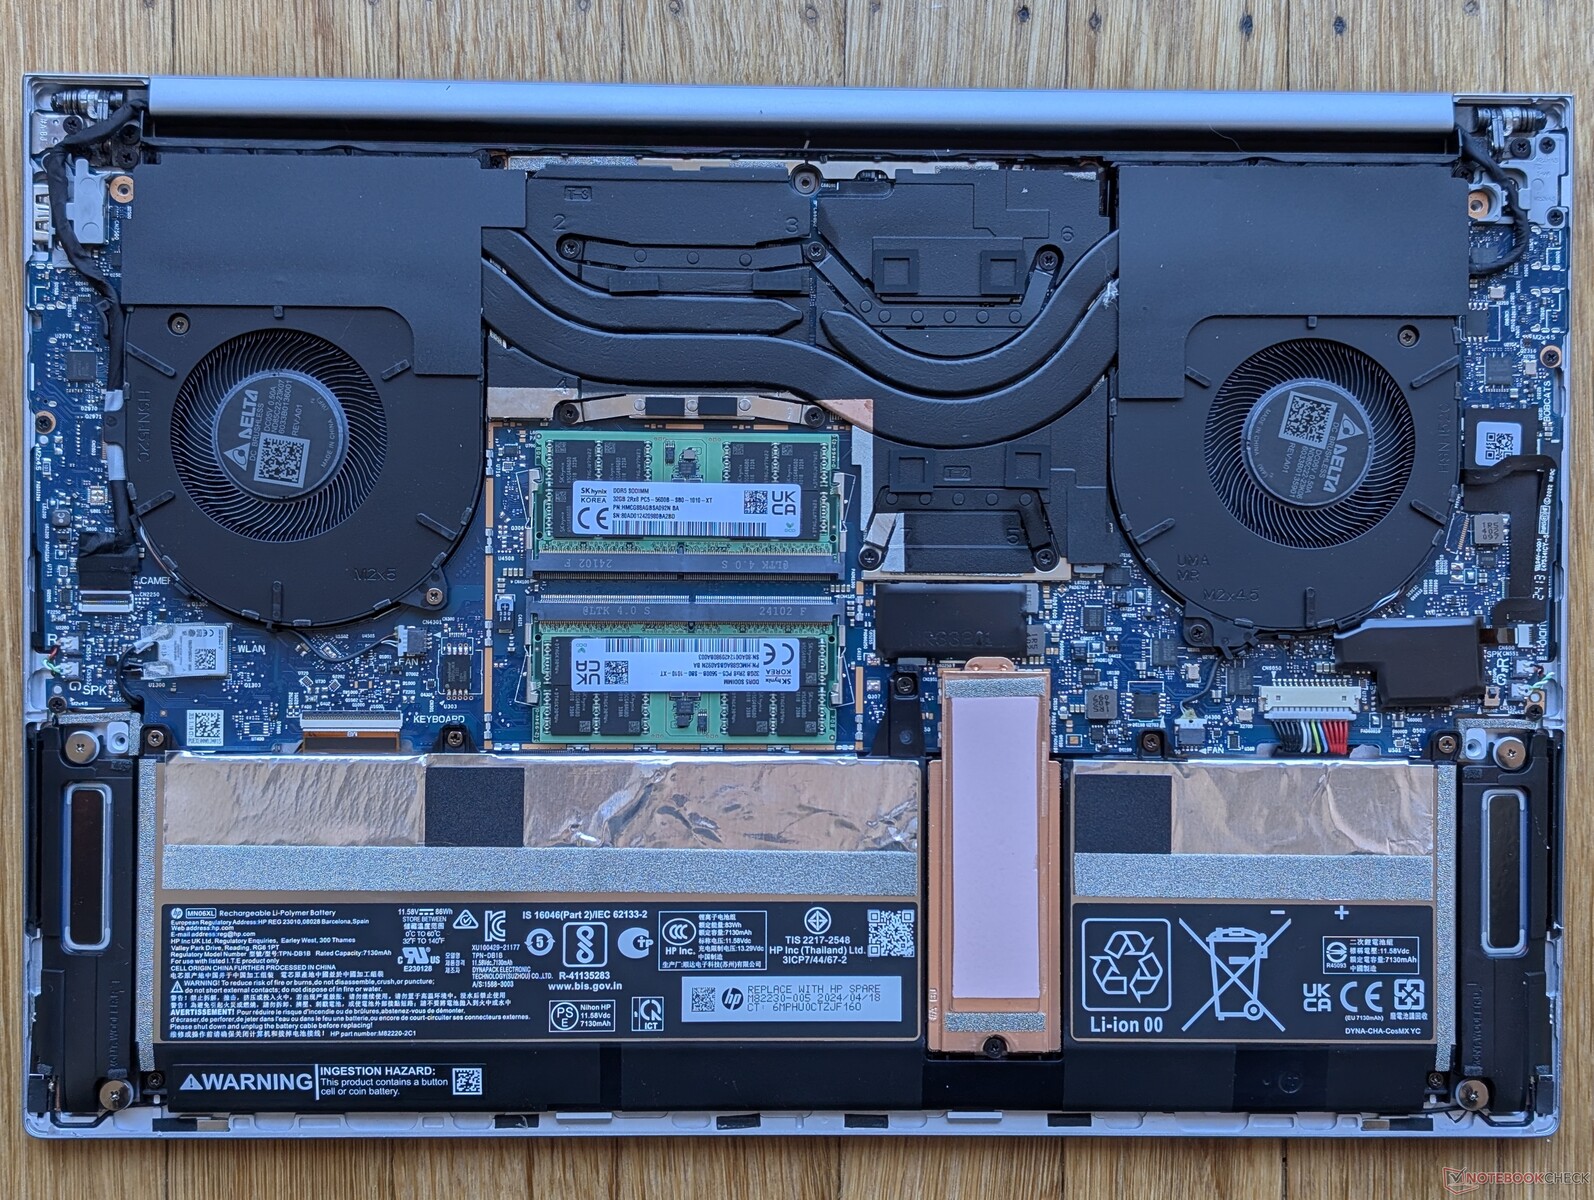
Maintenance
Le panneau inférieur est facilement démontable à l'aide d'un simple tournevis Torx. Contrairement à d'autres grands fabricants, HP fournit une vidéo de maintenance officielle pour un grand nombre de ses modèles, contrairement à d'autres grands fabricants.
Durabilité
HP utilise des plastiques et des métaux recyclés pour tous ses ordinateurs portables fabriqués depuis 2022. La proportion de matériaux recyclés et non recyclés varie toutefois selon les modèles.
L'emballage est principalement composé de carton et de papier, avec un peu de plastique pour l'ordinateur portable et l'adaptateur secteur.
Garantie
Une garantie limitée du fabricant de trois ans s'applique si l'appareil est acheté aux États-Unis.
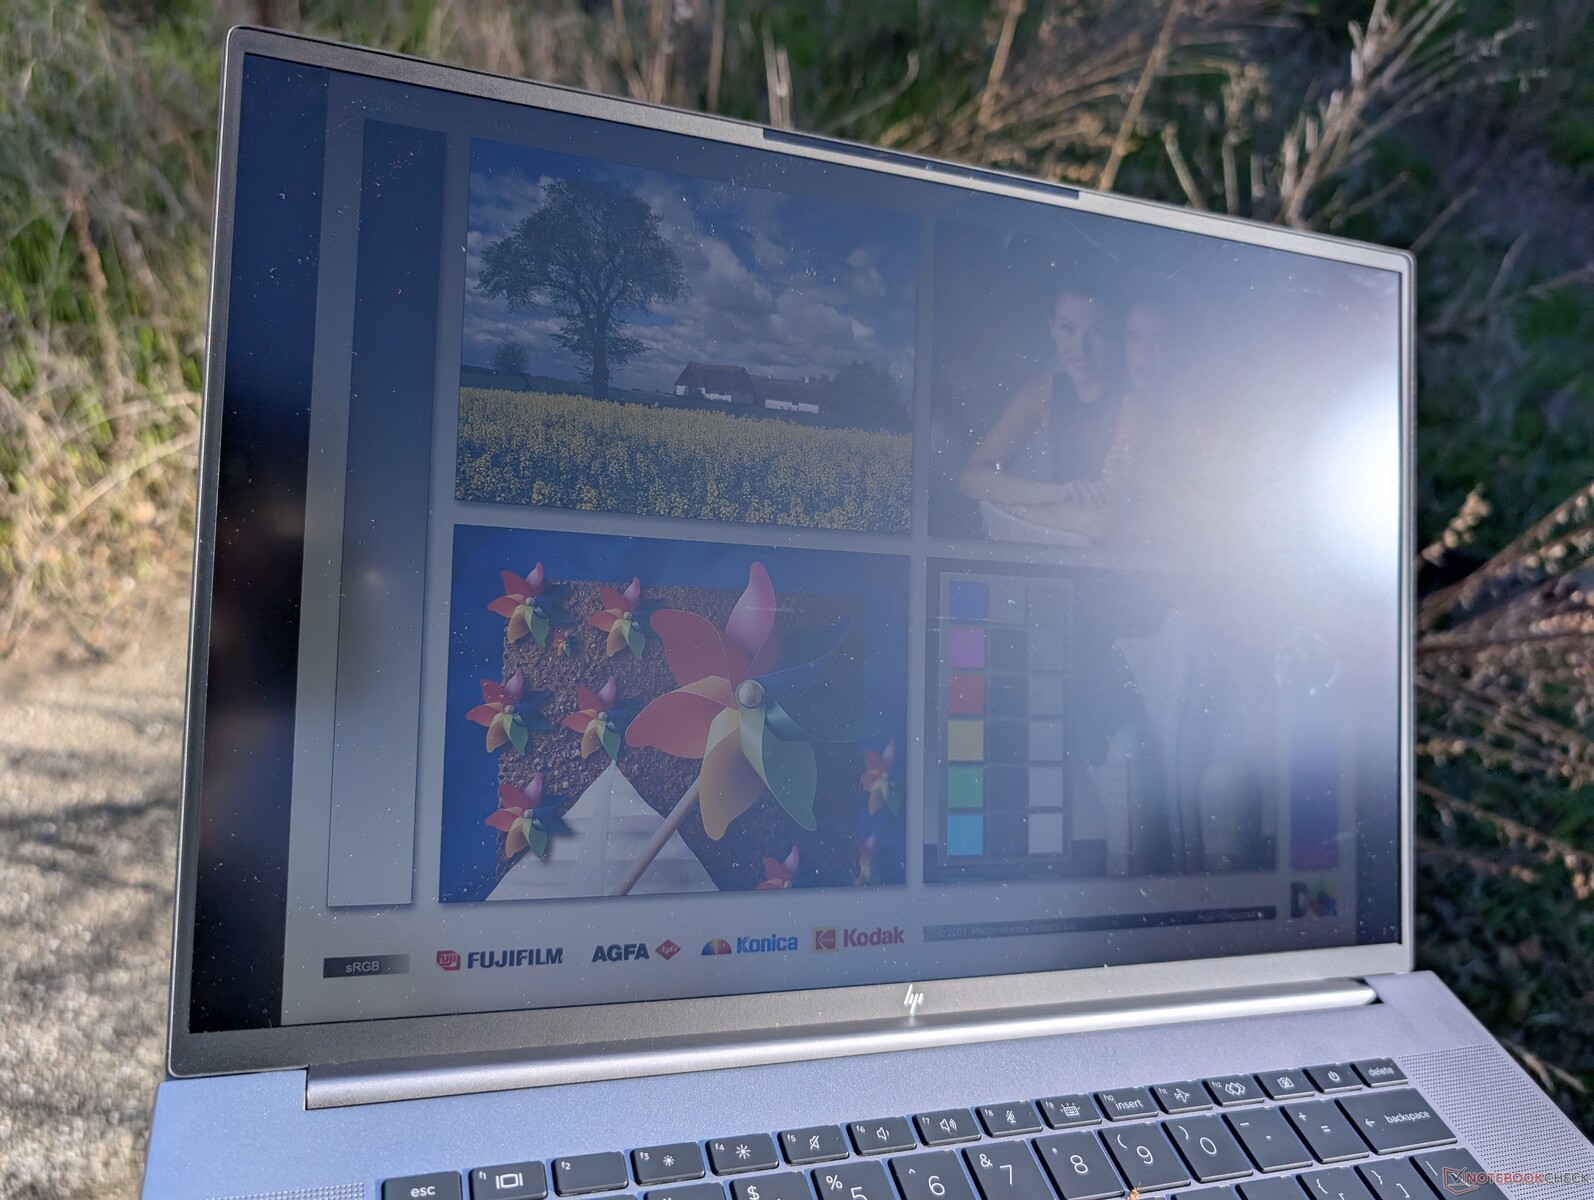
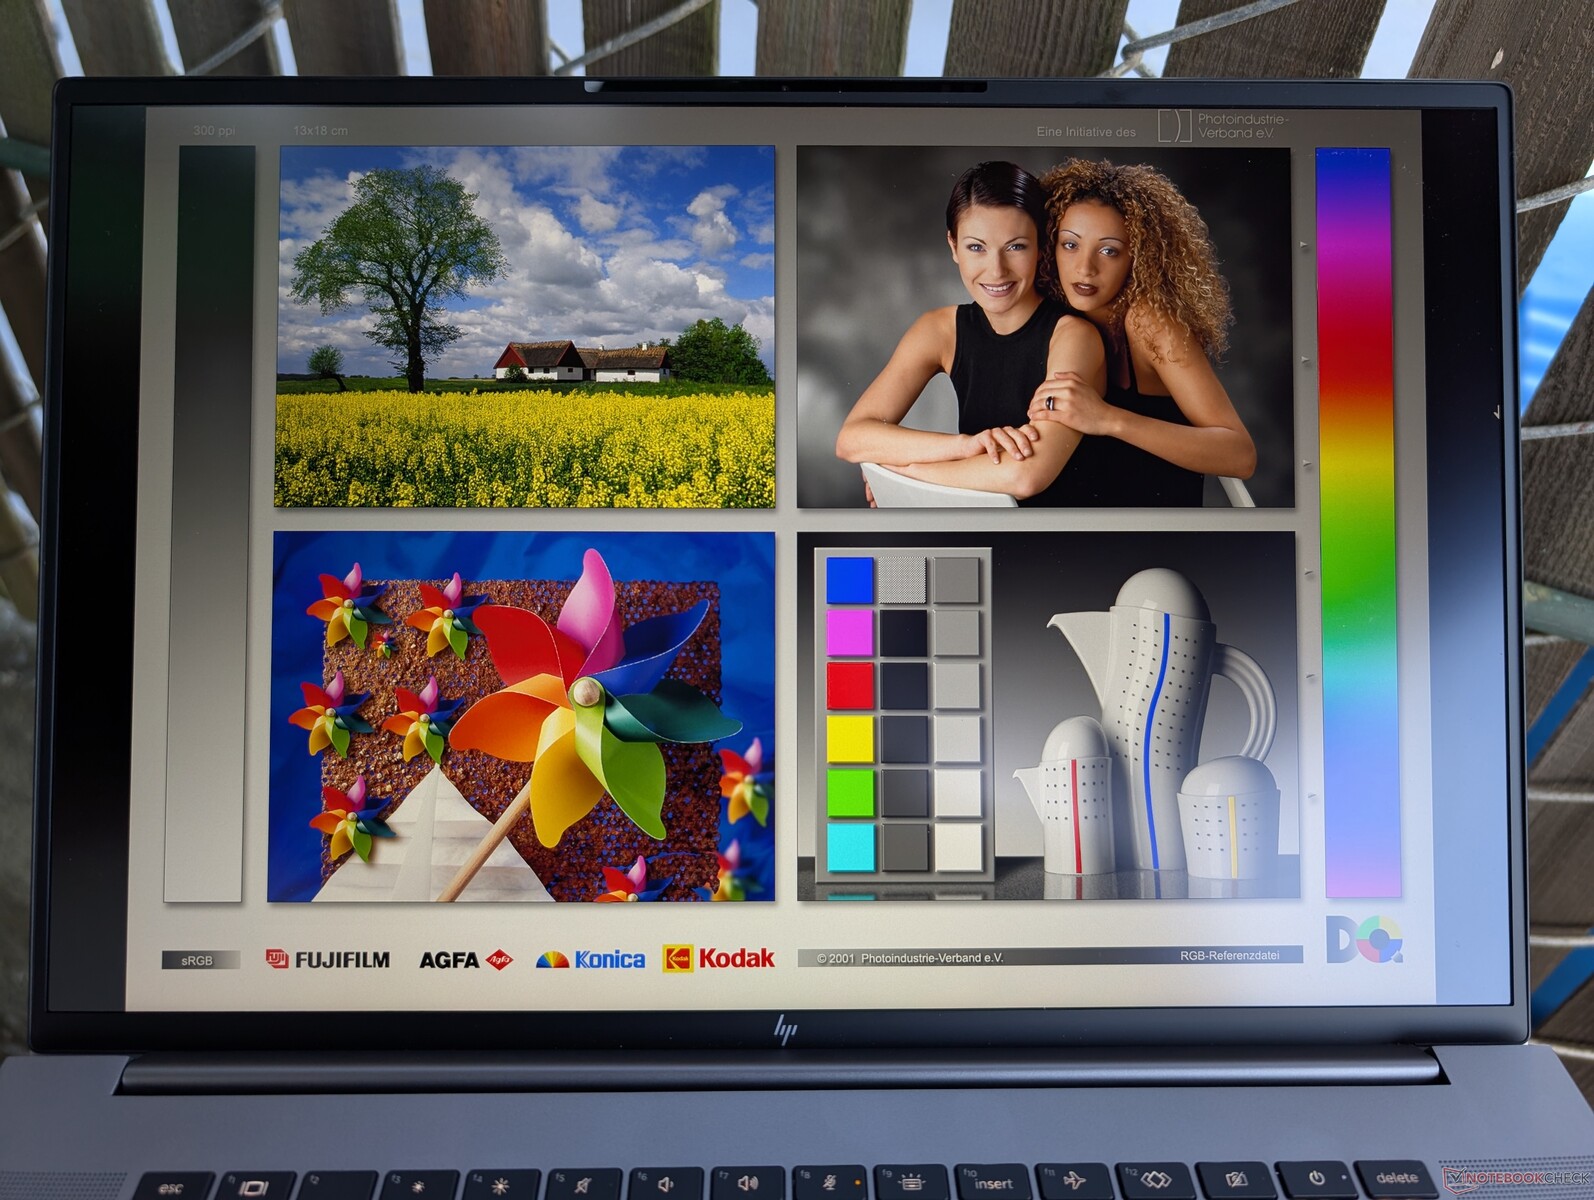
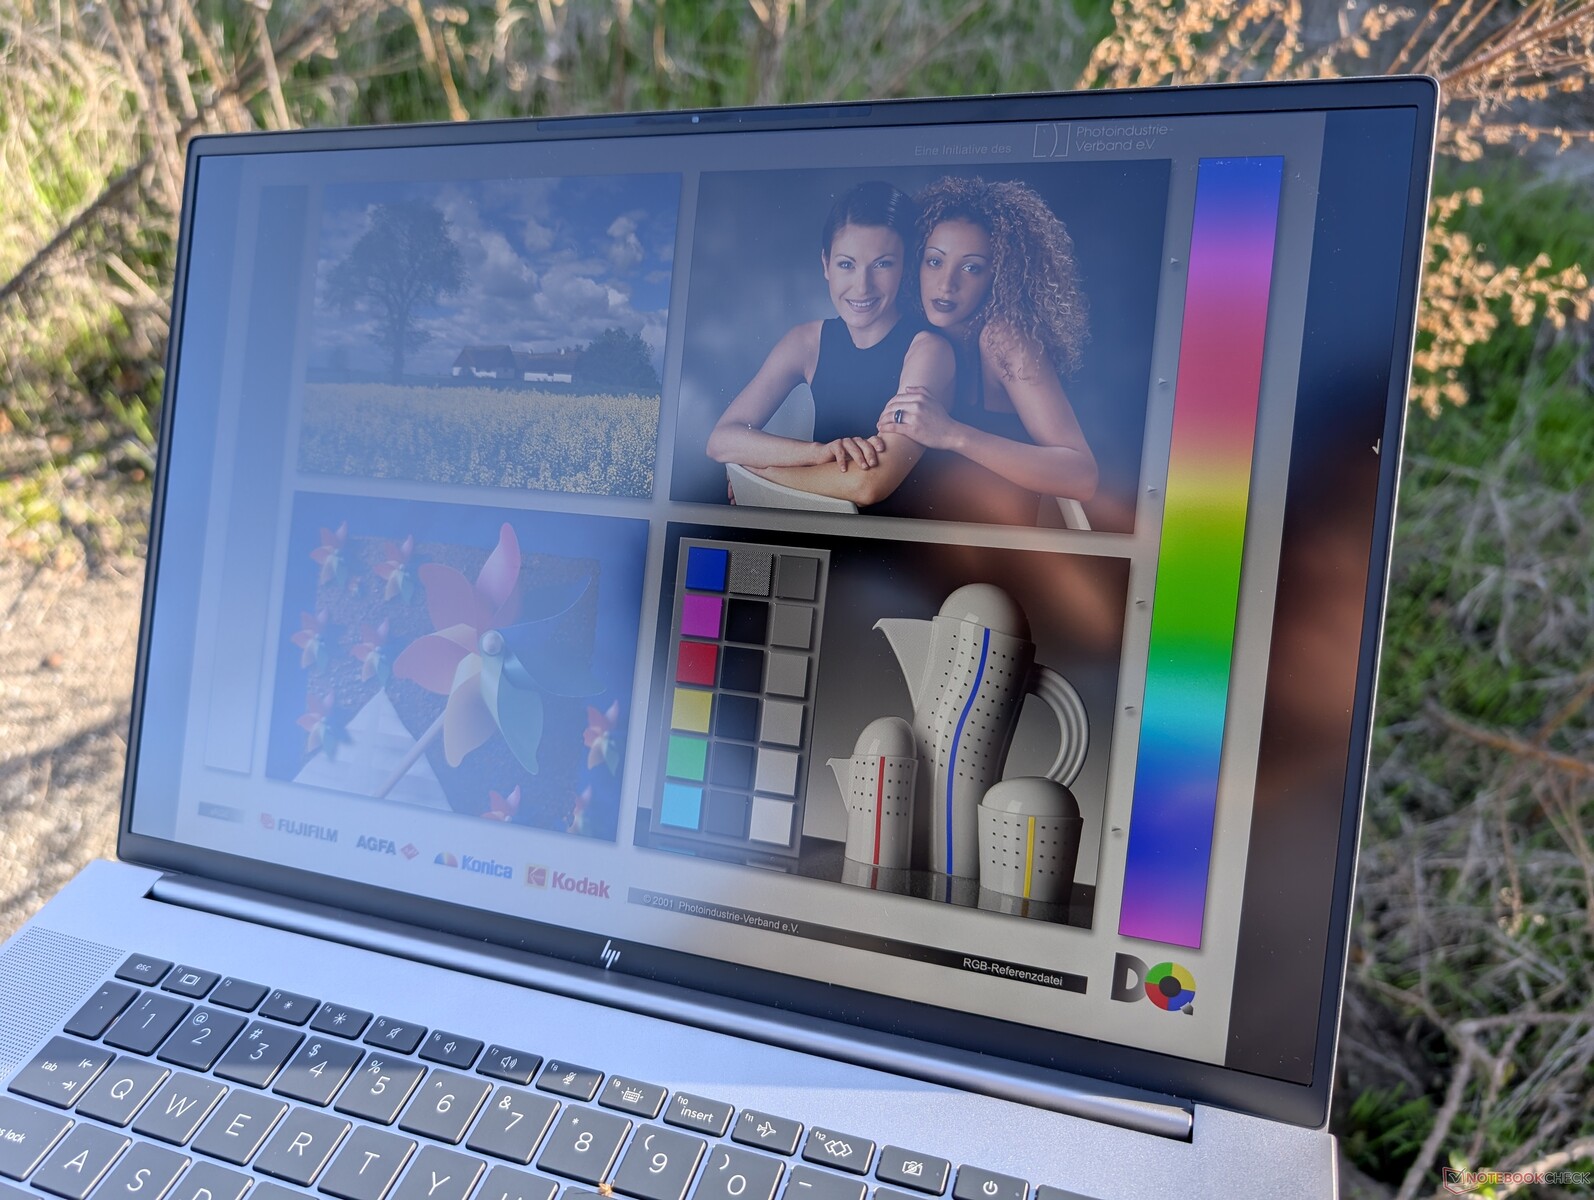
Affichage
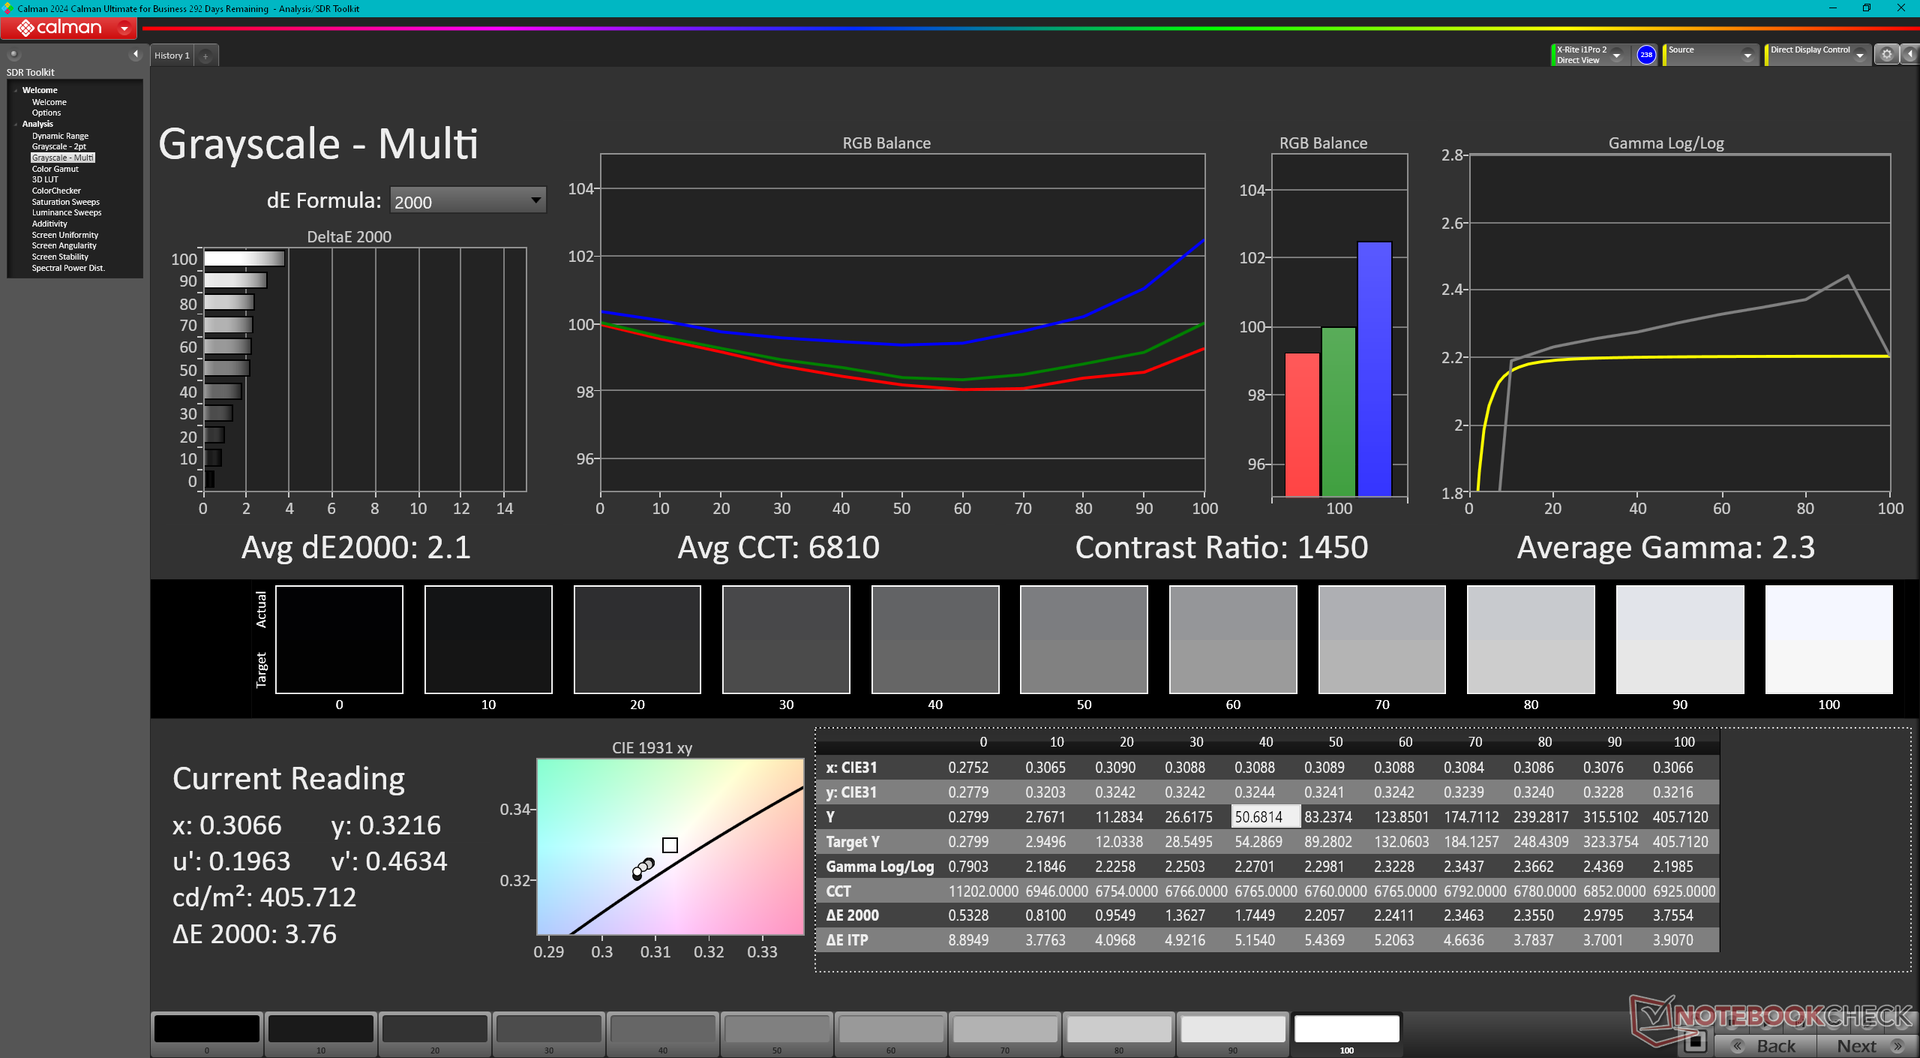
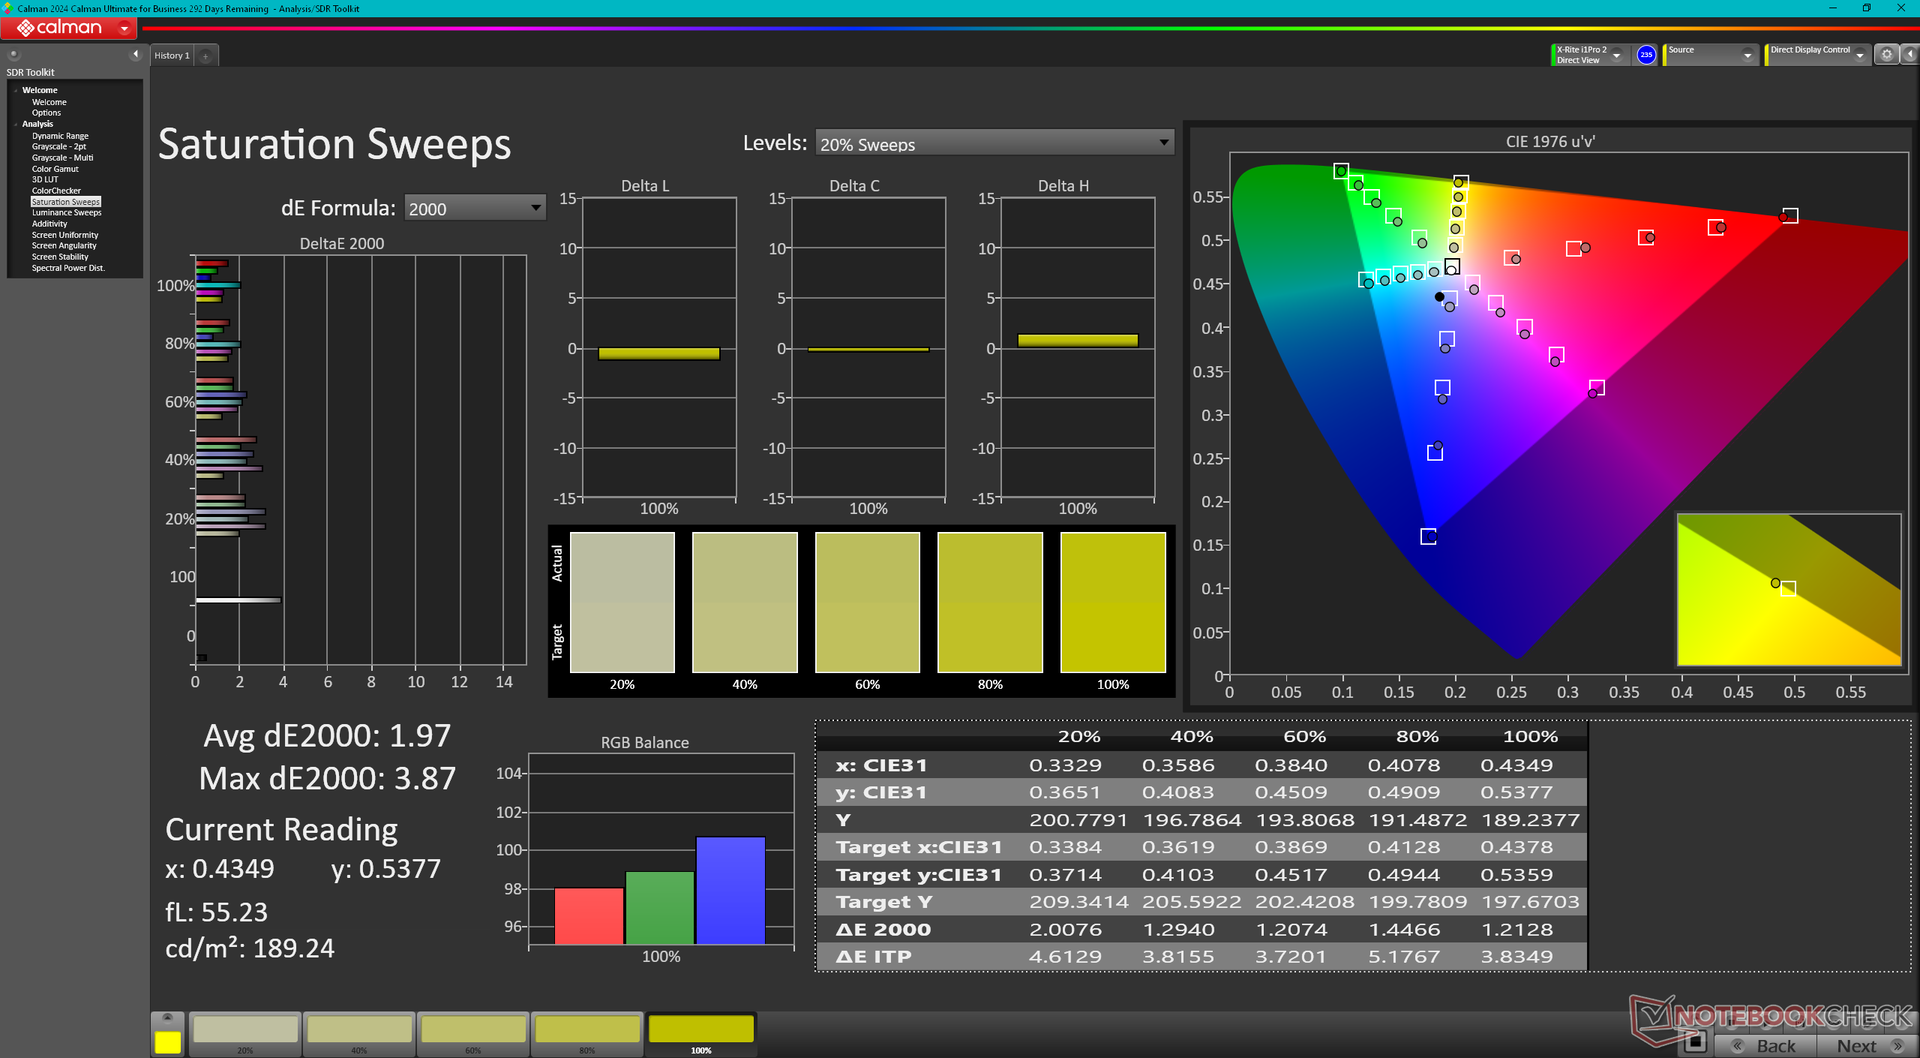
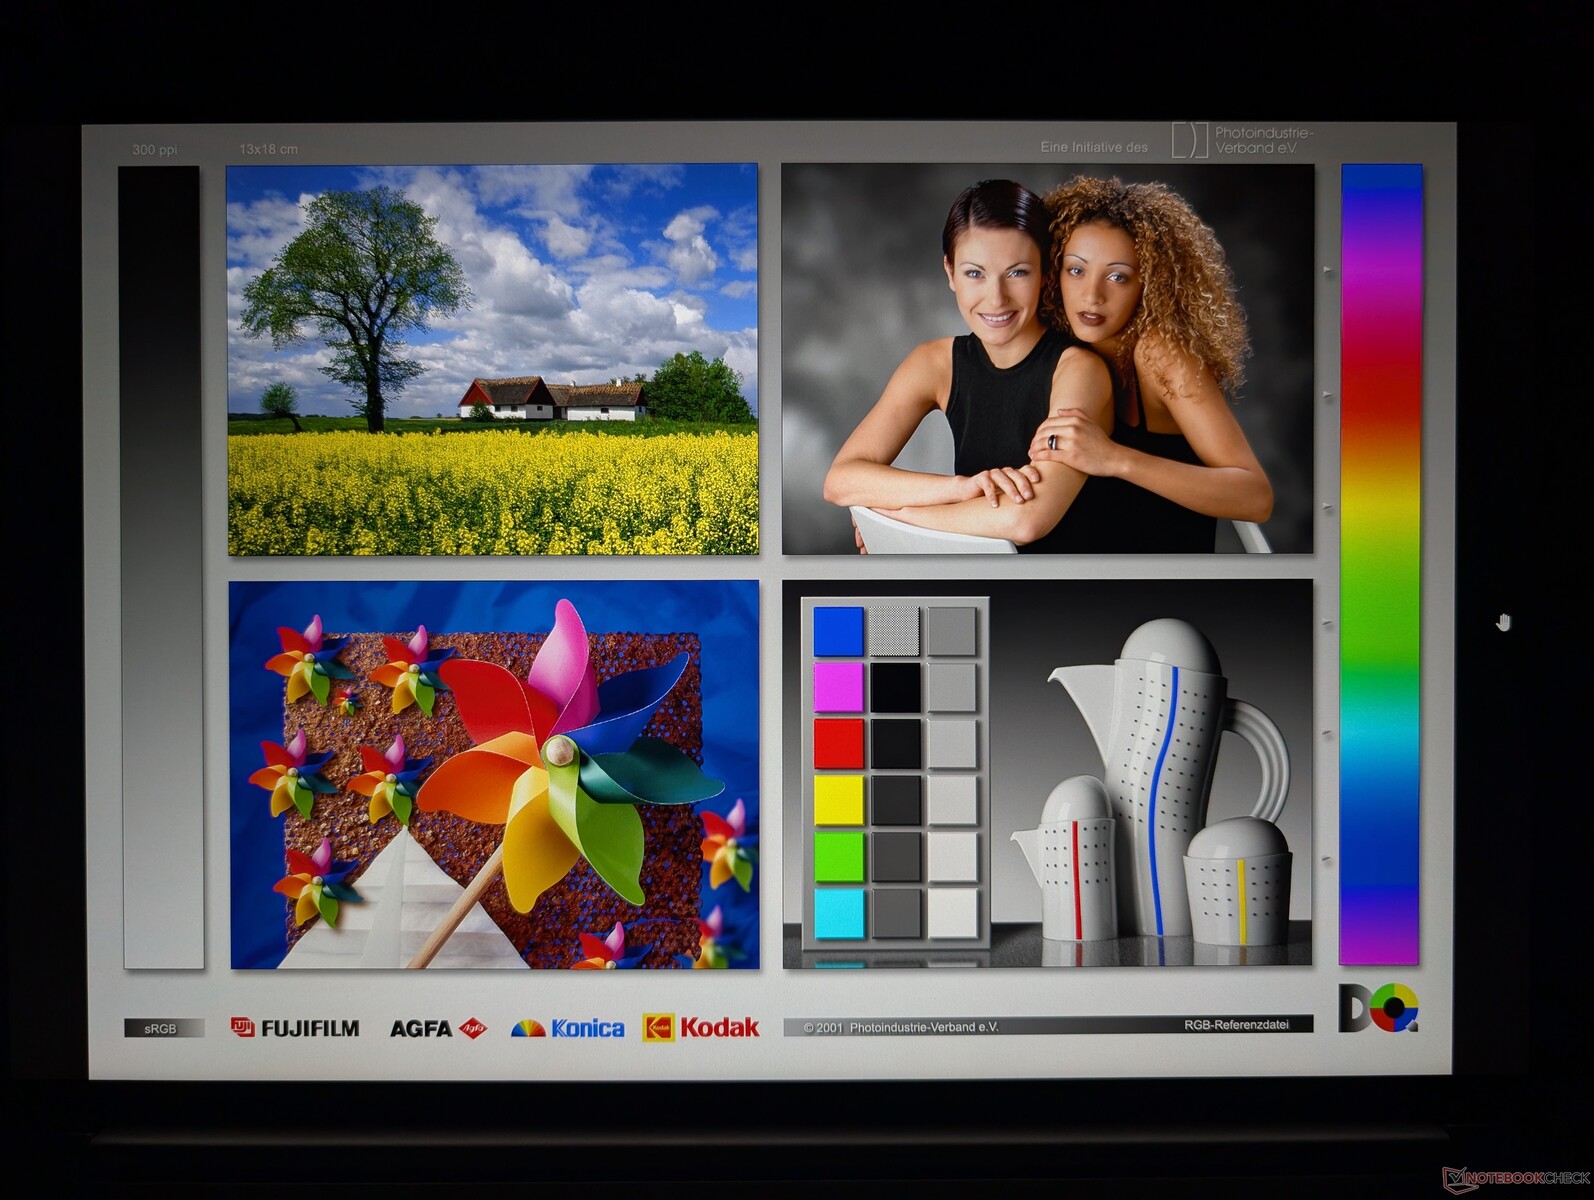
HP a changé de fournisseur de panneaux 4K, passant de BOE pour le Studio 16 G9 à AU Optronics pour notre Studio 16 G11. Leurs attributs principaux sont essentiellement identiques en termes de taux de rafraîchissement (120 Hz) et de couverture des couleurs (100 % DCI-P3). La luminosité, cependant, est plus faible cette fois-ci de près de 30 % et le HDR n'est toujours pas pris en charge. Une option légèrement plus lumineuse de 500 nit est disponible pour y remédier.
Le modèle n'est pas proposé avec des options OLED à l'heure où nous écrivons ces lignes.
| |||||||||||||||||||||||||
Homogénéité de la luminosité: 92 %
Valeur mesurée au centre, sur batterie: 404.3 cd/m²
Contraste: 1444:1 (Valeurs des noirs: 0.28 cd/m²)
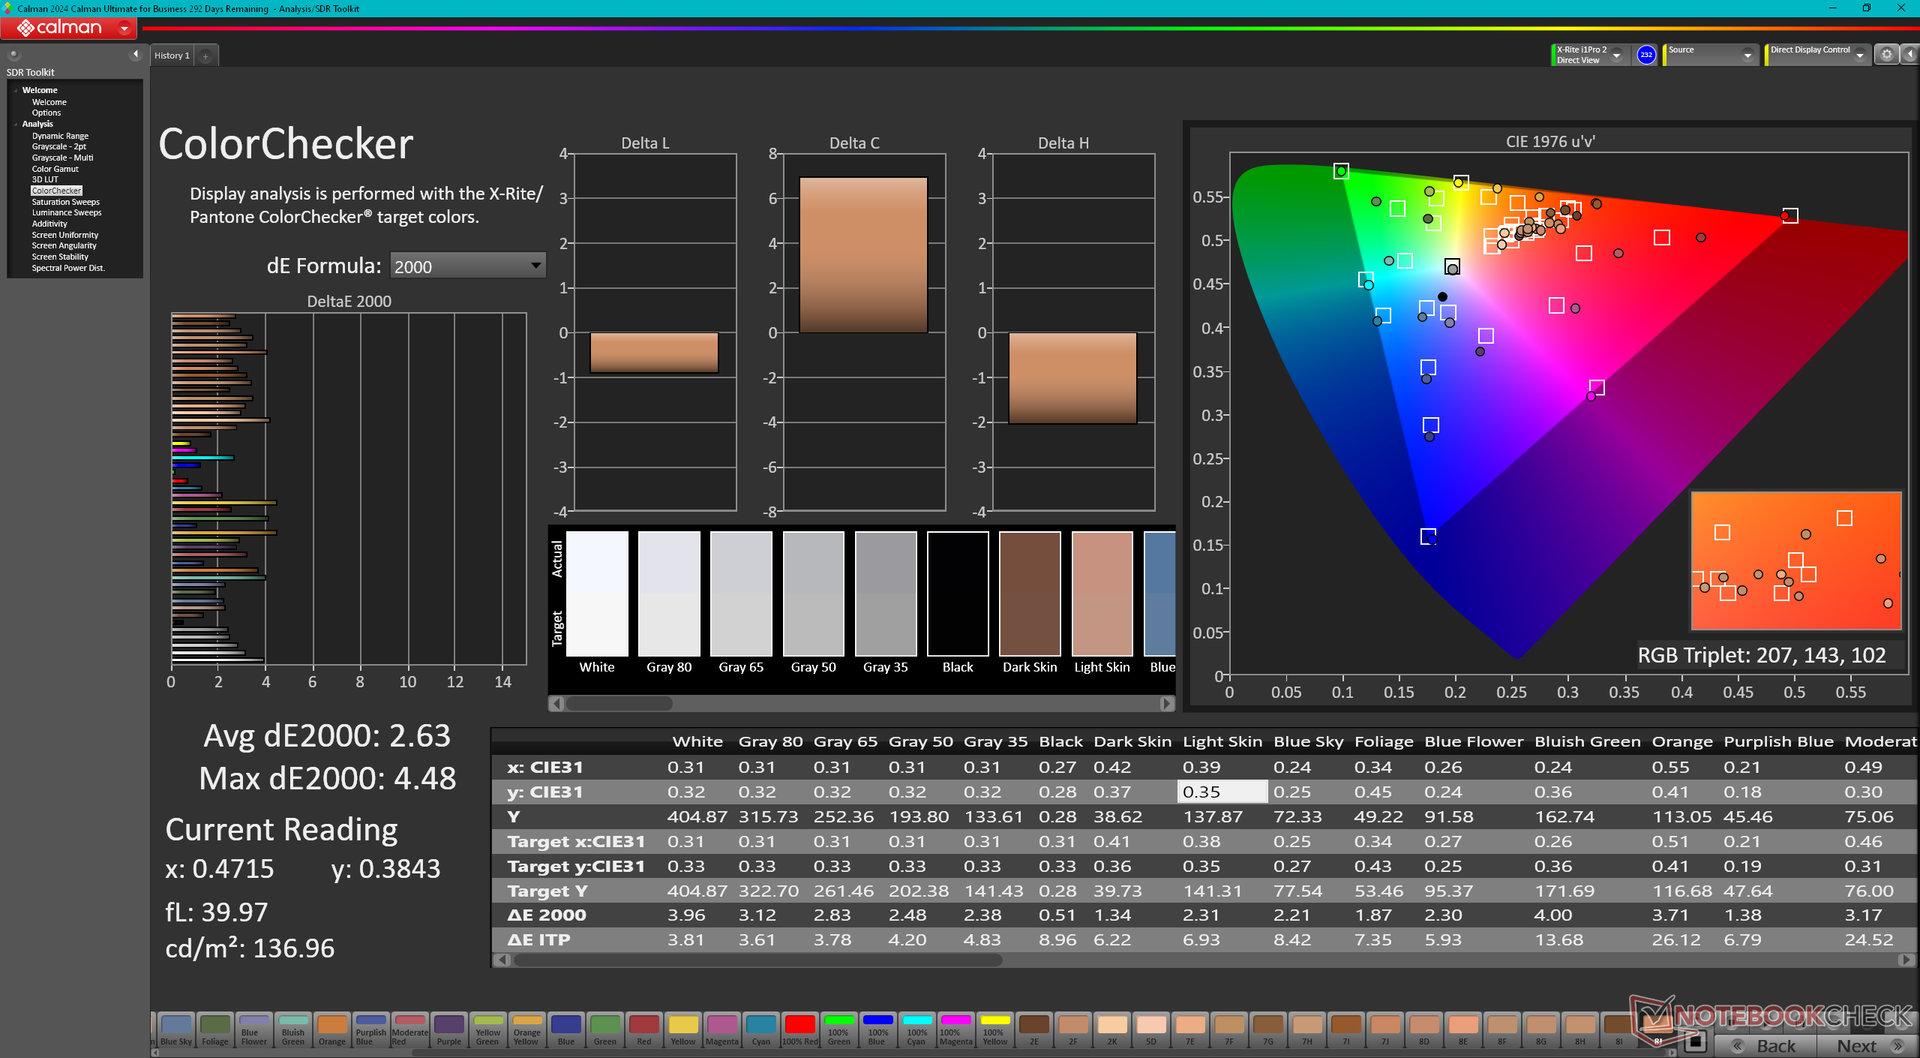
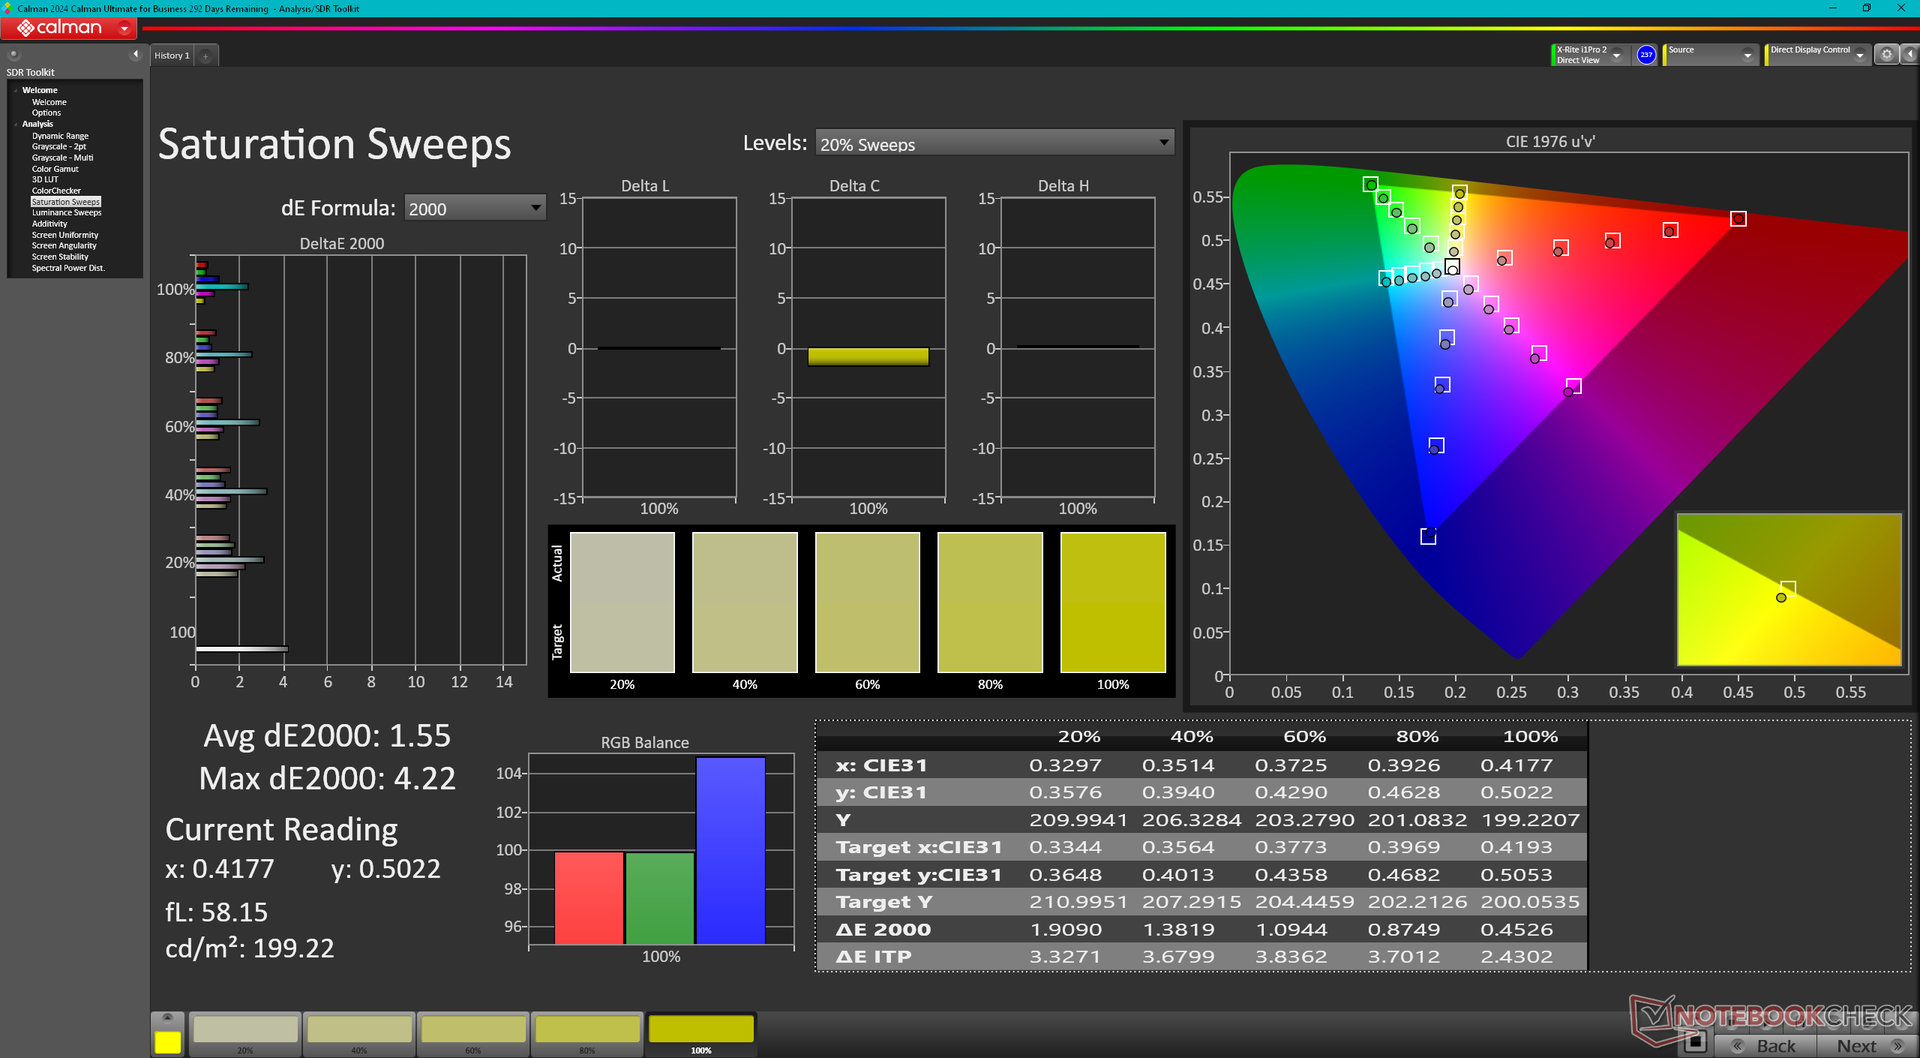
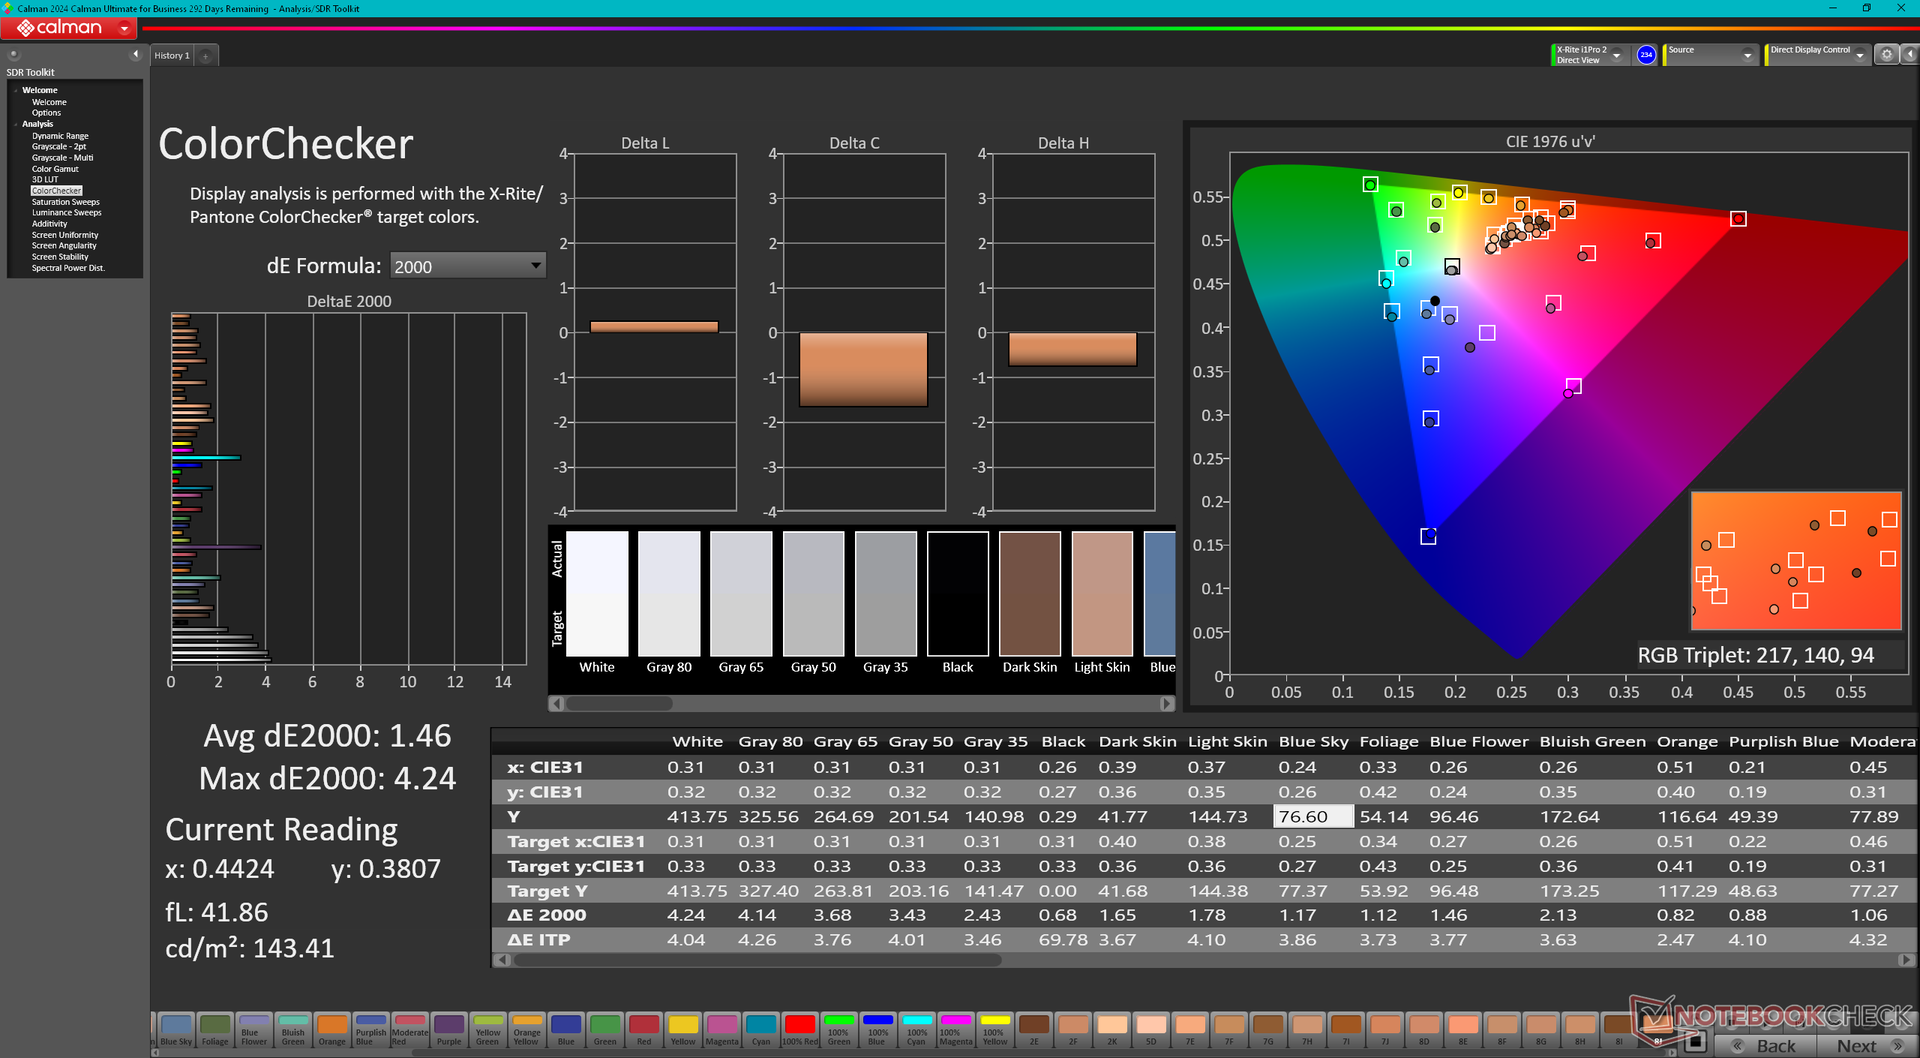
ΔE ColorChecker Calman: 2.63 | ∀{0.5-29.43 Ø4.71}
calibrated: 1.46
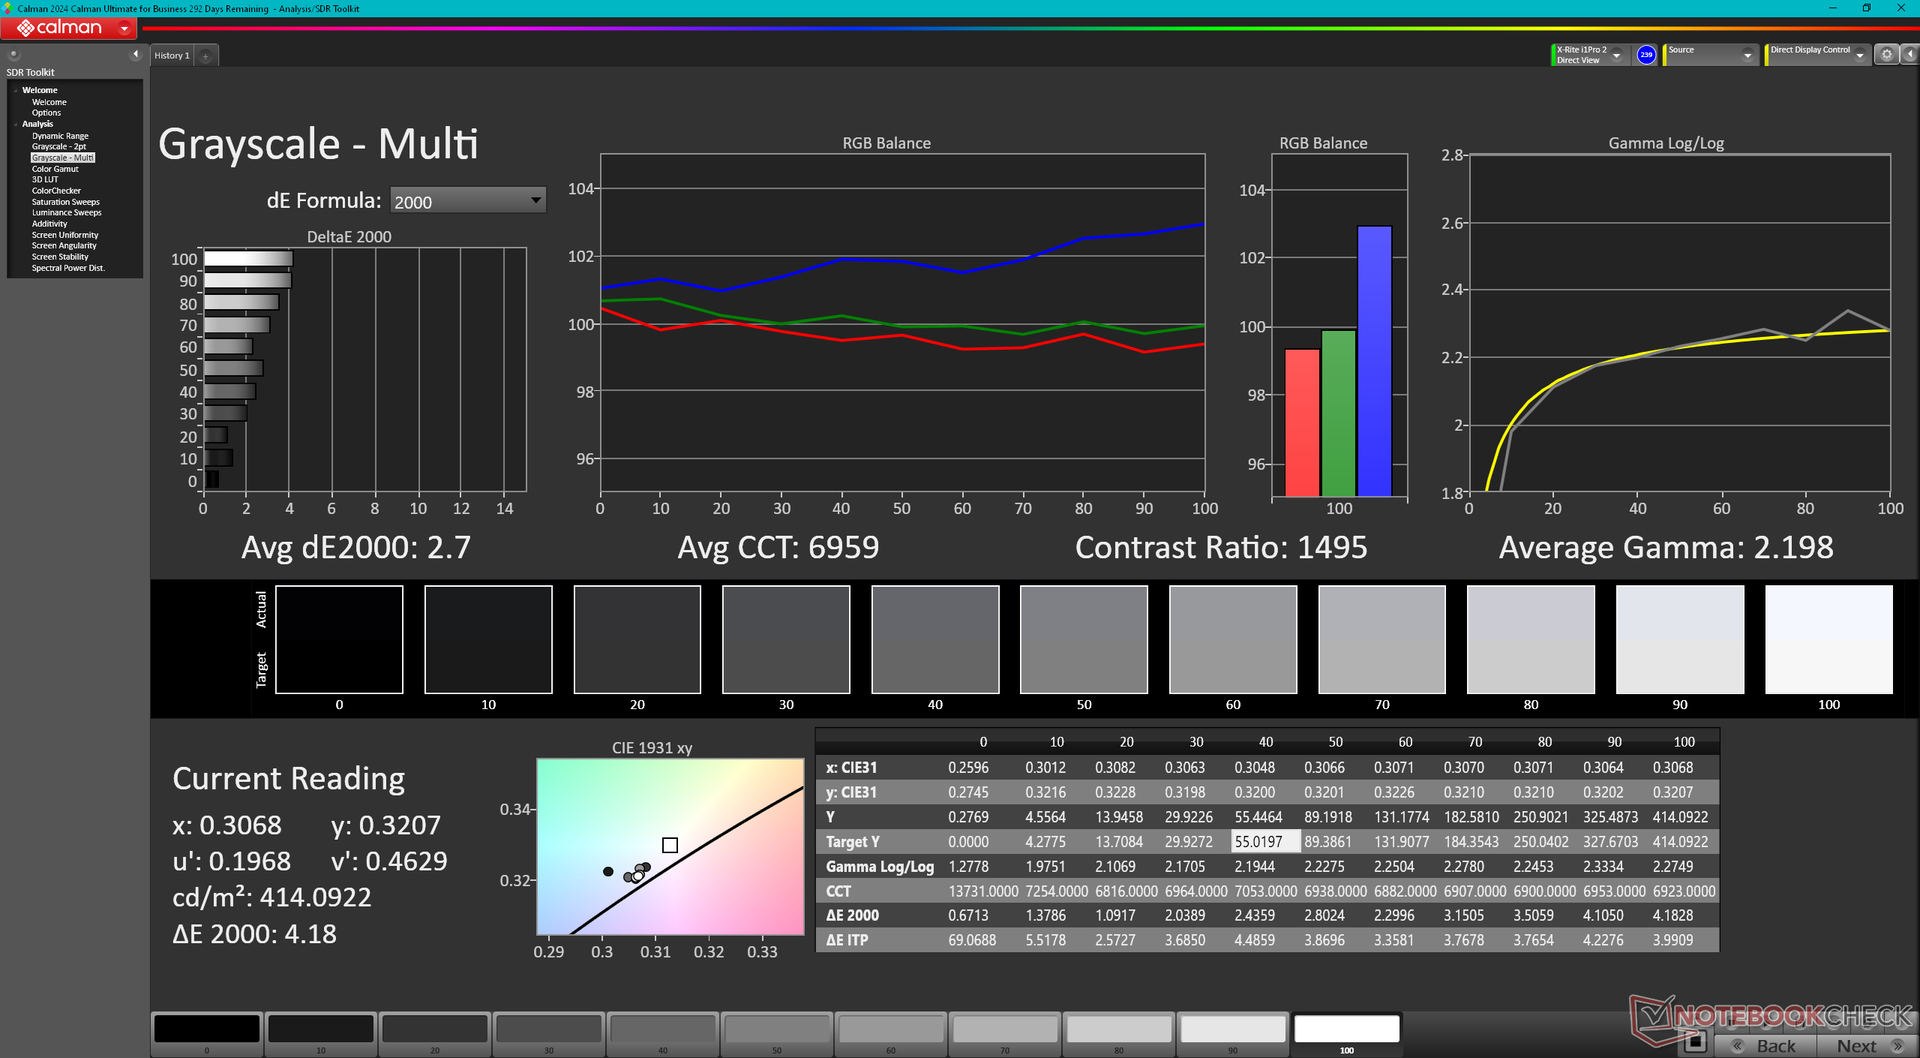
ΔE Greyscale Calman: 2.1 | ∀{0.09-98 Ø4.96}
85.7% AdobeRGB 1998 (Argyll 3D)
99.9% sRGB (Argyll 3D)
97.7% Display P3 (Argyll 3D)
Gamma: 2.3
CCT: 6810 K
| HP ZBook Studio 16 G11 AUO87A8, IPS, 3840x2400, 16", 120 Hz | HP ZBook Studio 16 G9 62U04EA BOE0A52, IPS, 3840x2400, 16", 120 Hz | HP ZBook Power 16 G11 A AUOA0A9, IPS, 2560x1600, 16", 120 Hz | Lenovo ThinkPad P16 Gen 2 NE160QDM-NY1, IPS, 2560x1600, 16", 165 Hz | Dell Precision 5690 Samsung 160YV03, OLED, 3840x2400, 16", 60 Hz | MSI CreatorPro Z16P B12UKST B160QAN02.N, IPS, 2560x1600, 16", 165 Hz | Lenovo ThinkPad P1 Gen 7 21KV001SGE MNG007DA1-9 , IPS LED, 2560x1600, 16", 165 Hz | |
|---|---|---|---|---|---|---|---|
| Display | 0% | -16% | -17% | 5% | 1% | -16% | |
| Display P3 Coverage (%) | 97.7 | 97.5 0% | 69.1 -29% | 68.4 -30% | 99.8 2% | 97.6 0% | 69.4 -29% |
| sRGB Coverage (%) | 99.9 | 99.9 0% | 97.7 -2% | 96.9 -3% | 100 0% | 99.9 0% | 97.6 -2% |
| AdobeRGB 1998 Coverage (%) | 85.7 | 86.3 1% | 71 -17% | 70.6 -18% | 96.6 13% | 87.4 2% | 71.8 -16% |
| Response Times | 17% | 13% | 4% | 86% | 20% | 11% | |
| Response Time Grey 50% / Grey 80% * (ms) | 14.2 ? | 15.3 ? -8% | 13.6 ? 4% | 14.1 ? 1% | 1.7 ? 88% | 12.8 ? 10% | 11.2 ? 21% |
| Response Time Black / White * (ms) | 10.6 ? | 6.1 ? 42% | 8.4 ? 21% | 9.9 ? 7% | 1.7 ? 84% | 7.4 ? 30% | 10.6 ? -0% |
| PWM Frequency (Hz) | 60 ? | ||||||
| Screen | 18% | -20% | 17% | -11% | 10% | -32% | |
| Brightness middle (cd/m²) | 404.3 | 554 37% | 470.7 16% | 531.5 31% | 348.1 -14% | 407 1% | 516 28% |
| Brightness (cd/m²) | 405 | 516 27% | 431 6% | 499 23% | 351 -13% | 388 -4% | 505 25% |
| Brightness Distribution (%) | 92 | 84 -9% | 88 -4% | 89 -3% | 97 5% | 88 -4% | 89 -3% |
| Black Level * (cd/m²) | 0.28 | 0.47 -68% | 0.57 -104% | 0.38 -36% | 0.36 -29% | 0.41 -46% | |
| Contrast (:1) | 1444 | 1179 -18% | 826 -43% | 1399 -3% | 1131 -22% | 1259 -13% | |
| Colorchecker dE 2000 * | 2.63 | 1 62% | 2.16 18% | 1.82 31% | 4.18 -59% | 1.3 51% | 3.5 -33% |
| Colorchecker dE 2000 max. * | 4.48 | 2.4 46% | 4.39 2% | 4.1 8% | 6.68 -49% | 2.5 44% | 8.8 -96% |
| Colorchecker dE 2000 calibrated * | 1.46 | 0.6 59% | 1.37 6% | 0.63 57% | 0.97 34% | 0.7 52% | 1.2 18% |
| Greyscale dE 2000 * | 2.1 | 1.6 24% | 3.7 -76% | 1.2 43% | 1.7 19% | 2.1 -0% | 5.6 -167% |
| Gamma | 2.3 96% | 2.29 96% | 2.38 92% | 2.15 102% | 2.2 100% | 2.26 97% | 2.27 97% |
| CCT | 6810 95% | 6458 101% | 6765 96% | 6484 100% | 6198 105% | 6437 101% | 6071 107% |
| Moyenne finale (programmes/paramètres) | 12% /
14% | -8% /
-14% | 1% /
8% | 27% /
9% | 10% /
9% | -12% /
-22% |
* ... Moindre est la valeur, meilleures sont les performances
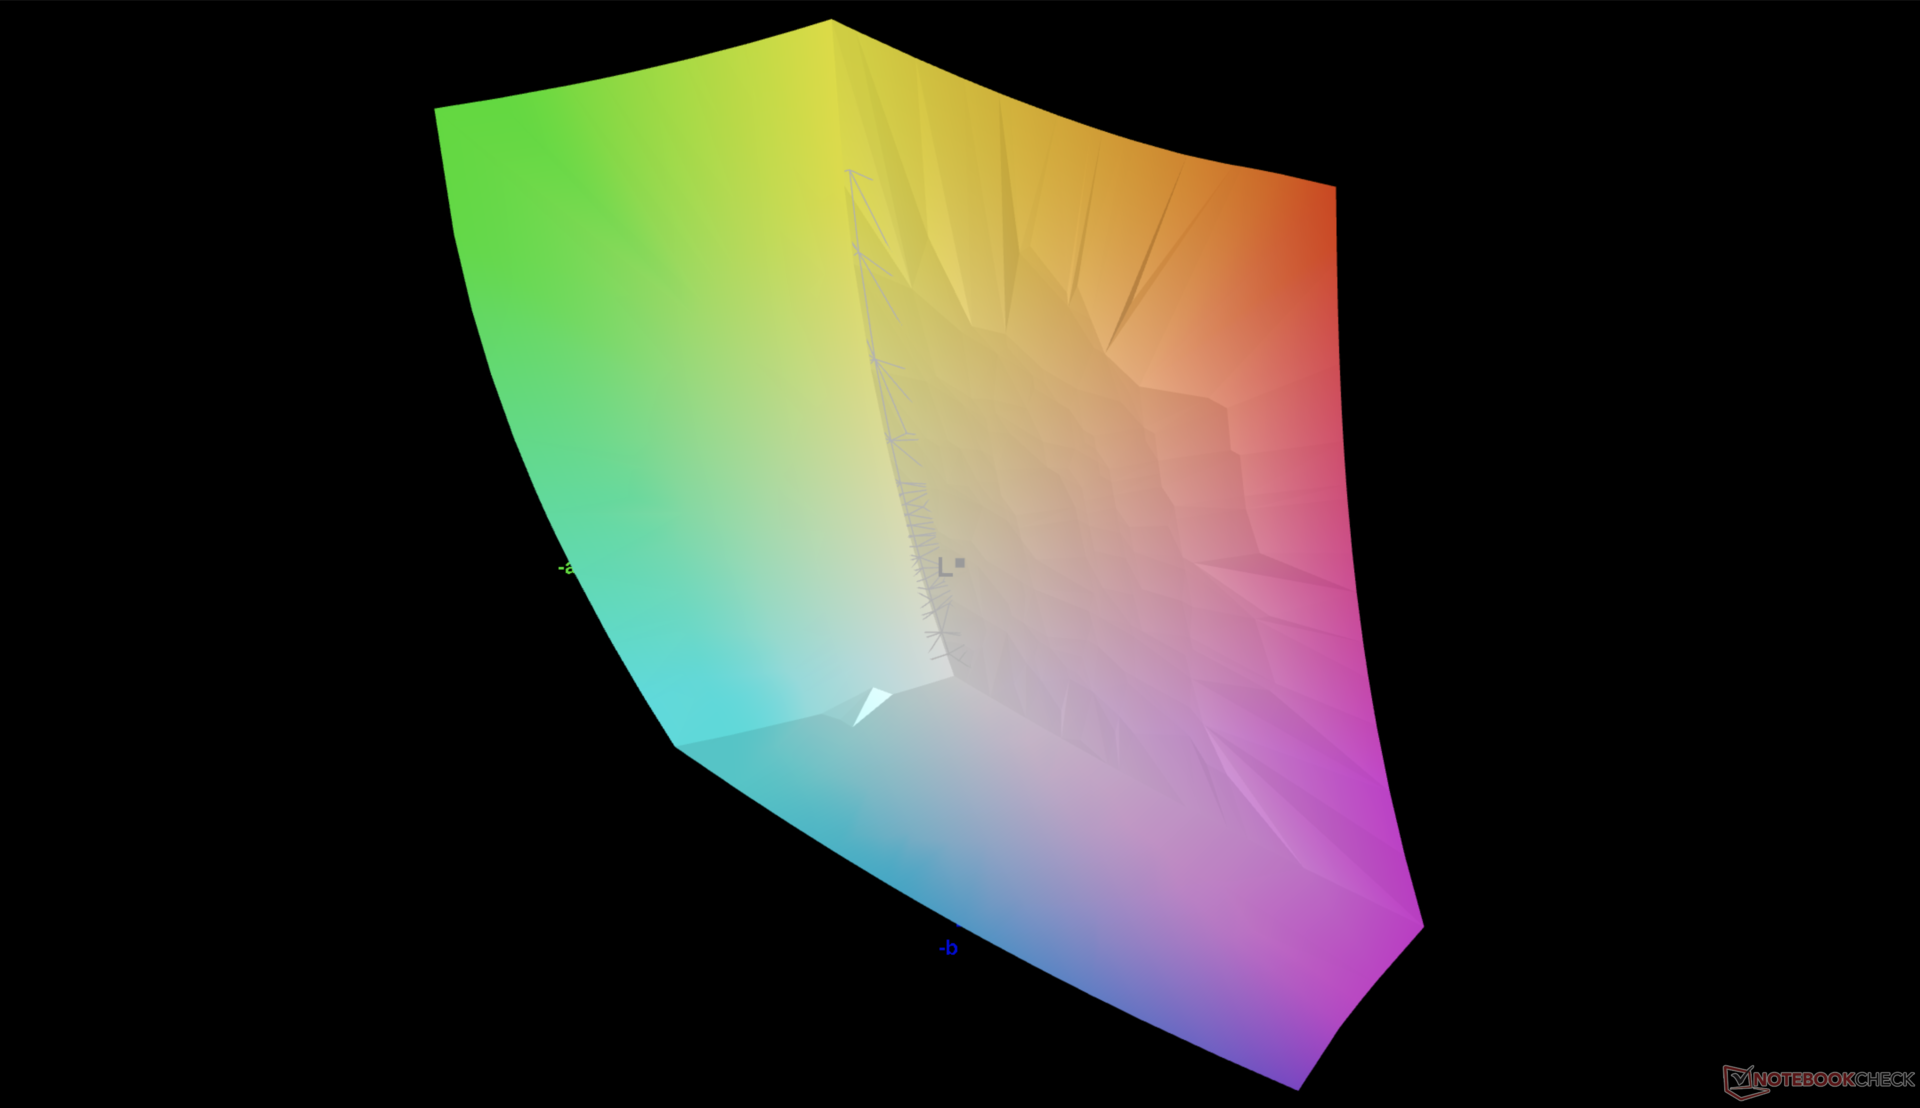
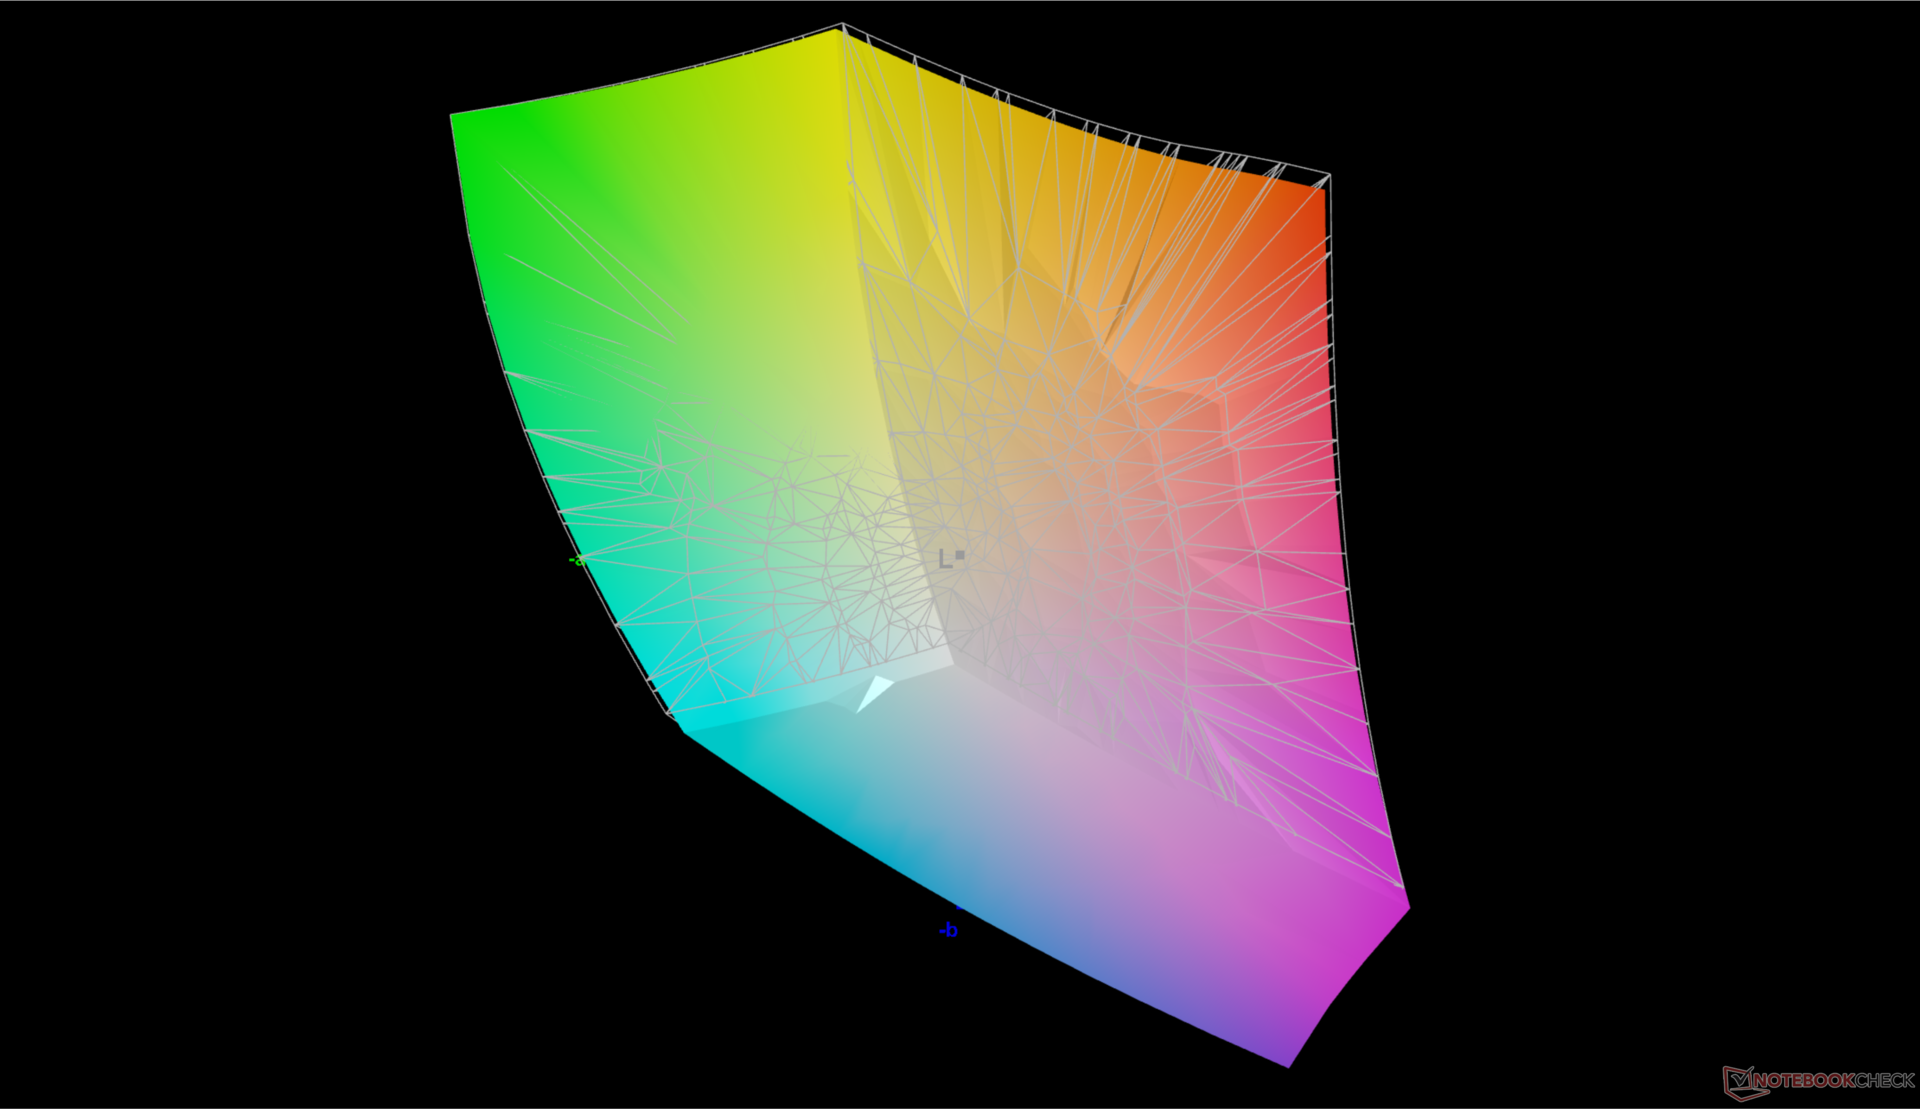
L'écran est précalibré par rapport à la norme P3, avec des valeurs moyennes de deltaE en niveaux de gris et en couleurs de seulement 2,1 et 2,63, respectivement.
Temps de réponse de l'écran
| ↔ Temps de réponse noir à blanc | ||
|---|---|---|
| 10.6 ms ... hausse ↗ et chute ↘ combinées | ↗ 6.1 ms hausse | 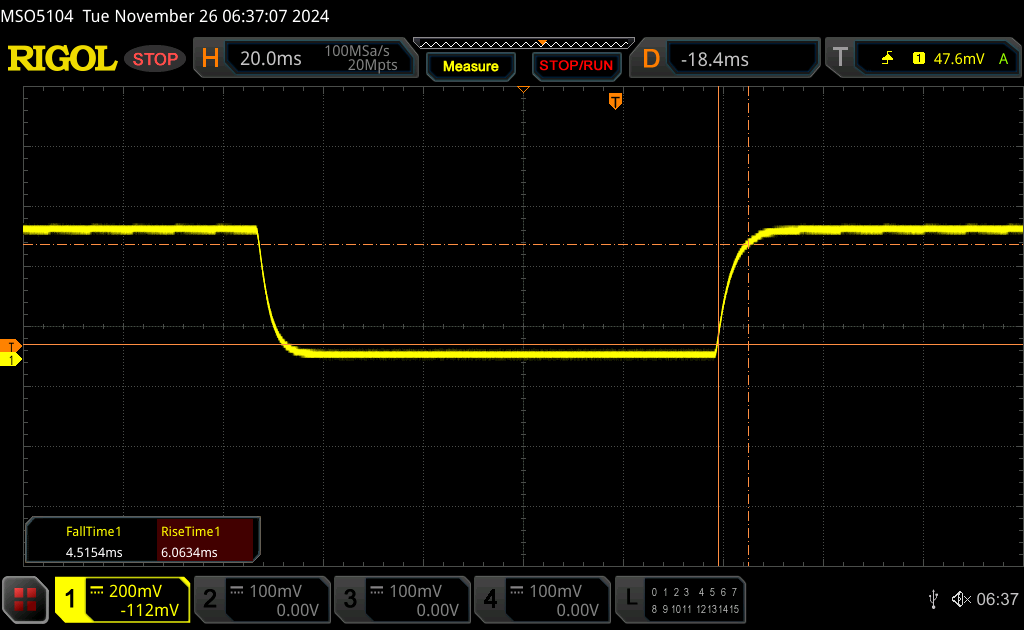 |
| ↘ 4.5 ms chute | ||
| L'écran montre de bons temps de réponse, mais insuffisant pour du jeu compétitif. En comparaison, tous les appareils testés affichent entre 0.1 (minimum) et 240 (maximum) ms. » 29 % des appareils testés affichent de meilleures performances. Cela signifie que les latences relevées sont meilleures que la moyenne (19.8 ms) de tous les appareils testés. | ||
| ↔ Temps de réponse gris 50% à gris 80% | ||
| 14.2 ms ... hausse ↗ et chute ↘ combinées | ↗ 6.9 ms hausse | 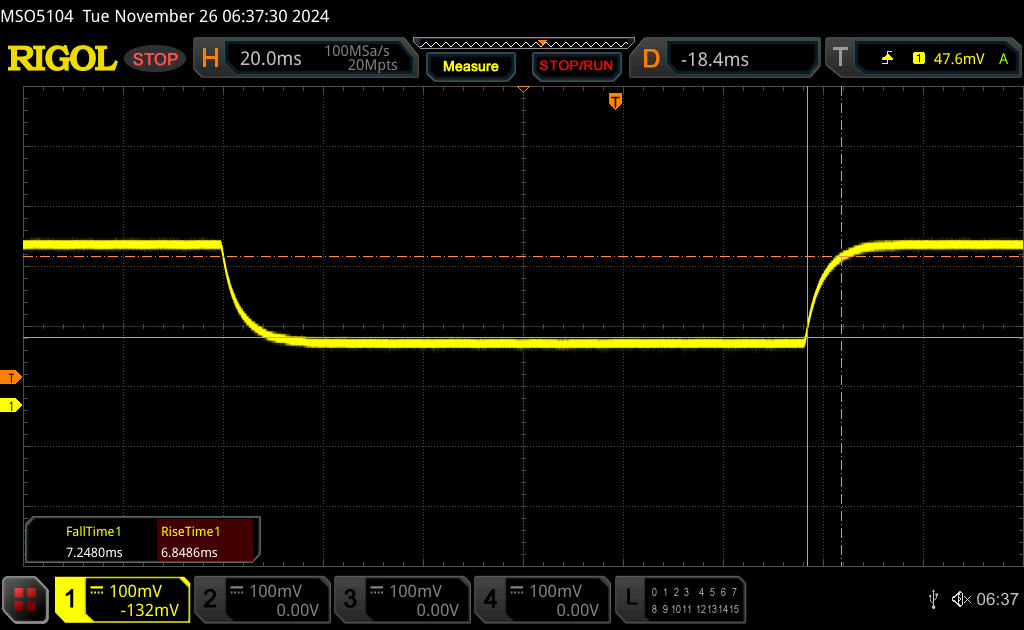 |
| ↘ 7.3 ms chute | ||
| L'écran montre de bons temps de réponse, mais insuffisant pour du jeu compétitif. En comparaison, tous les appareils testés affichent entre 0.165 (minimum) et 636 (maximum) ms. » 28 % des appareils testés affichent de meilleures performances. Cela signifie que les latences relevées sont meilleures que la moyenne (30.9 ms) de tous les appareils testés. | ||
Scintillement / MLI (Modulation de largeur d'impulsion)
| Scintillement / MLI (Modulation de largeur d'impulsion) non décelé |  | ||
En comparaison, 52 % des appareils testés n'emploient pas MDI pour assombrir leur écran. Nous avons relevé une moyenne à 7748 (minimum : 5 - maximum : 343500) Hz dans le cas où une MDI était active. | |||

Performance
Conditions d'essai
Nous avons réglé Windows et MyHP sur le mode Performance avant d'effectuer les tests ci-dessous.
Processeur
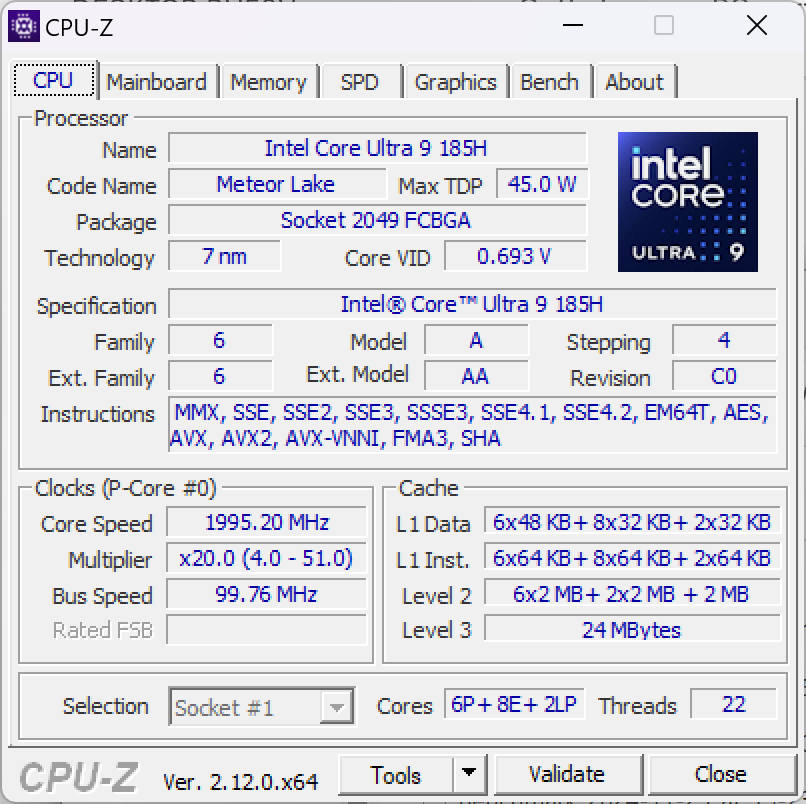
Bien qu'ils ne soient pas aussi rapides que les modèles adjacents de la série Raptor Lake-HX, les modèles Core Ultra 9 185H basé sur Meteor Lake est une légère amélioration par rapport au Core i7-12800H du ZBook Studio 16 G9 d'environ 10 % en ce qui concerne les tâches multithread. Malheureusement, il ne peut pas maintenir les taux d'horloge Turbo Boost très longtemps malgré le facteur de forme relativement grand de 16 pouces.
Cinebench R15 Multi Loop
Cinebench R23: Multi Core | Single Core
Cinebench R20: CPU (Multi Core) | CPU (Single Core)
Cinebench R15: CPU Multi 64Bit | CPU Single 64Bit
Blender: v2.79 BMW27 CPU
7-Zip 18.03: 7z b 4 | 7z b 4 -mmt1
Geekbench 6.7: Multi-Core | Single-Core
Geekbench 5.5: Multi-Core | Single-Core
HWBOT x265 Benchmark v2.2: 4k Preset
LibreOffice : 20 Documents To PDF
R Benchmark 2.5: Overall mean
| Geekbench 6.7 / Multi-Core | |
| Lenovo ThinkPad P16 Gen 2 | |
| Moyenne de la classe Workstation (12721 - 20887, n=23, 2 dernières années) | |
| HP ZBook Fury 16 G10 | |
| HP ZBook Fury 16 G11 | |
| Dell Precision 5000 5680 | |
| Dell Precision 5690 | |
| HP ZBook Studio 16 G11 | |
| Moyenne Intel Core Ultra 9 185H (9140 - 14540, n=21) | |
| Lenovo ThinkPad P1 Gen 7 21KV001SGE | |
| Lenovo ThinkPad P1 G6 21FV001KUS | |
| HP ZBook Power 16 G11 A | |
| Lenovo ThinkPad P1 G6-21FV000DGE | |
| Lenovo ThinkPad P16s G2 21K9000CGE | |
| Lenovo ThinkPad P16v G1 AMD | |
| Geekbench 6.7 / Single-Core | |
| HP ZBook Fury 16 G10 | |
| HP ZBook Fury 16 G11 | |
| Lenovo ThinkPad P16 Gen 2 | |
| Moyenne de la classe Workstation (2389 - 3065, n=23, 2 dernières années) | |
| Lenovo ThinkPad P1 G6 21FV001KUS | |
| Lenovo ThinkPad P1 G6-21FV000DGE | |
| HP ZBook Power 16 G11 A | |
| Dell Precision 5000 5680 | |
| Lenovo ThinkPad P16v G1 AMD | |
| Dell Precision 5690 | |
| HP ZBook Studio 16 G11 | |
| Lenovo ThinkPad P16s G2 21K9000CGE | |
| Moyenne Intel Core Ultra 9 185H (1490 - 2573, n=21) | |
| Lenovo ThinkPad P1 Gen 7 21KV001SGE | |
Cinebench R23: Multi Core | Single Core
Cinebench R20: CPU (Multi Core) | CPU (Single Core)
Cinebench R15: CPU Multi 64Bit | CPU Single 64Bit
Blender: v2.79 BMW27 CPU
7-Zip 18.03: 7z b 4 | 7z b 4 -mmt1
Geekbench 6.7: Multi-Core | Single-Core
Geekbench 5.5: Multi-Core | Single-Core
HWBOT x265 Benchmark v2.2: 4k Preset
LibreOffice : 20 Documents To PDF
R Benchmark 2.5: Overall mean
* ... Moindre est la valeur, meilleures sont les performances
AIDA64: FP32 Ray-Trace | FPU Julia | CPU SHA3 | CPU Queen | FPU SinJulia | FPU Mandel | CPU AES | CPU ZLib | FP64 Ray-Trace | CPU PhotoWorxx
| Performance rating | |
| Lenovo ThinkPad P16 Gen 2 | |
| HP ZBook Power 16 G11 A | |
| Dell Precision 5690 | |
| HP ZBook Studio 16 G11 | |
| Lenovo ThinkPad P1 Gen 7 21KV001SGE | |
| Moyenne Intel Core Ultra 9 185H | |
| MSI CreatorPro Z16P B12UKST | |
| HP ZBook Studio 16 G9 62U04EA | |
| AIDA64 / FP32 Ray-Trace | |
| HP ZBook Power 16 G11 A | |
| Lenovo ThinkPad P16 Gen 2 | |
| Dell Precision 5690 | |
| Lenovo ThinkPad P1 Gen 7 21KV001SGE | |
| HP ZBook Studio 16 G11 | |
| Moyenne Intel Core Ultra 9 185H (9220 - 18676, n=22) | |
| HP ZBook Studio 16 G9 62U04EA | |
| MSI CreatorPro Z16P B12UKST | |
| AIDA64 / FPU Julia | |
| HP ZBook Power 16 G11 A | |
| Lenovo ThinkPad P16 Gen 2 | |
| Dell Precision 5690 | |
| HP ZBook Studio 16 G11 | |
| Lenovo ThinkPad P1 Gen 7 21KV001SGE | |
| Moyenne Intel Core Ultra 9 185H (48865 - 96463, n=22) | |
| HP ZBook Studio 16 G9 62U04EA | |
| MSI CreatorPro Z16P B12UKST | |
| AIDA64 / CPU SHA3 | |
| Lenovo ThinkPad P16 Gen 2 | |
| HP ZBook Power 16 G11 A | |
| Dell Precision 5690 | |
| HP ZBook Studio 16 G11 | |
| Lenovo ThinkPad P1 Gen 7 21KV001SGE | |
| Moyenne Intel Core Ultra 9 185H (2394 - 4534, n=22) | |
| HP ZBook Studio 16 G9 62U04EA | |
| MSI CreatorPro Z16P B12UKST | |
| AIDA64 / CPU Queen | |
| Lenovo ThinkPad P16 Gen 2 | |
| HP ZBook Power 16 G11 A | |
| HP ZBook Studio 16 G9 62U04EA | |
| MSI CreatorPro Z16P B12UKST | |
| Dell Precision 5690 | |
| HP ZBook Studio 16 G11 | |
| Lenovo ThinkPad P1 Gen 7 21KV001SGE | |
| Moyenne Intel Core Ultra 9 185H (66785 - 95241, n=21) | |
| AIDA64 / FPU SinJulia | |
| HP ZBook Power 16 G11 A | |
| Lenovo ThinkPad P16 Gen 2 | |
| Dell Precision 5690 | |
| HP ZBook Studio 16 G11 | |
| Lenovo ThinkPad P1 Gen 7 21KV001SGE | |
| Moyenne Intel Core Ultra 9 185H (7255 - 11392, n=22) | |
| HP ZBook Studio 16 G9 62U04EA | |
| MSI CreatorPro Z16P B12UKST | |
| AIDA64 / FPU Mandel | |
| HP ZBook Power 16 G11 A | |
| Lenovo ThinkPad P16 Gen 2 | |
| Dell Precision 5690 | |
| Lenovo ThinkPad P1 Gen 7 21KV001SGE | |
| HP ZBook Studio 16 G11 | |
| Moyenne Intel Core Ultra 9 185H (24004 - 48020, n=22) | |
| HP ZBook Studio 16 G9 62U04EA | |
| MSI CreatorPro Z16P B12UKST | |
| AIDA64 / CPU AES | |
| MSI CreatorPro Z16P B12UKST | |
| Lenovo ThinkPad P16 Gen 2 | |
| Dell Precision 5690 | |
| Moyenne Intel Core Ultra 9 185H (53116 - 154066, n=22) | |
| HP ZBook Studio 16 G11 | |
| Lenovo ThinkPad P1 Gen 7 21KV001SGE | |
| HP ZBook Power 16 G11 A | |
| HP ZBook Studio 16 G9 62U04EA | |
| AIDA64 / CPU ZLib | |
| Lenovo ThinkPad P16 Gen 2 | |
| Dell Precision 5690 | |
| HP ZBook Studio 16 G11 | |
| Lenovo ThinkPad P1 Gen 7 21KV001SGE | |
| Moyenne Intel Core Ultra 9 185H (678 - 1341, n=22) | |
| HP ZBook Power 16 G11 A | |
| HP ZBook Studio 16 G9 62U04EA | |
| MSI CreatorPro Z16P B12UKST | |
| AIDA64 / FP64 Ray-Trace | |
| HP ZBook Power 16 G11 A | |
| Lenovo ThinkPad P16 Gen 2 | |
| Dell Precision 5690 | |
| Lenovo ThinkPad P1 Gen 7 21KV001SGE | |
| HP ZBook Studio 16 G9 62U04EA | |
| HP ZBook Studio 16 G11 | |
| Moyenne Intel Core Ultra 9 185H (4428 - 10078, n=22) | |
| MSI CreatorPro Z16P B12UKST | |
| AIDA64 / CPU PhotoWorxx | |
| HP ZBook Studio 16 G11 | |
| Dell Precision 5690 | |
| Moyenne Intel Core Ultra 9 185H (44547 - 53918, n=22) | |
| MSI CreatorPro Z16P B12UKST | |
| Lenovo ThinkPad P1 Gen 7 21KV001SGE | |
| HP ZBook Power 16 G11 A | |
| Lenovo ThinkPad P16 Gen 2 | |
| HP ZBook Studio 16 G9 62U04EA | |
Test de stress
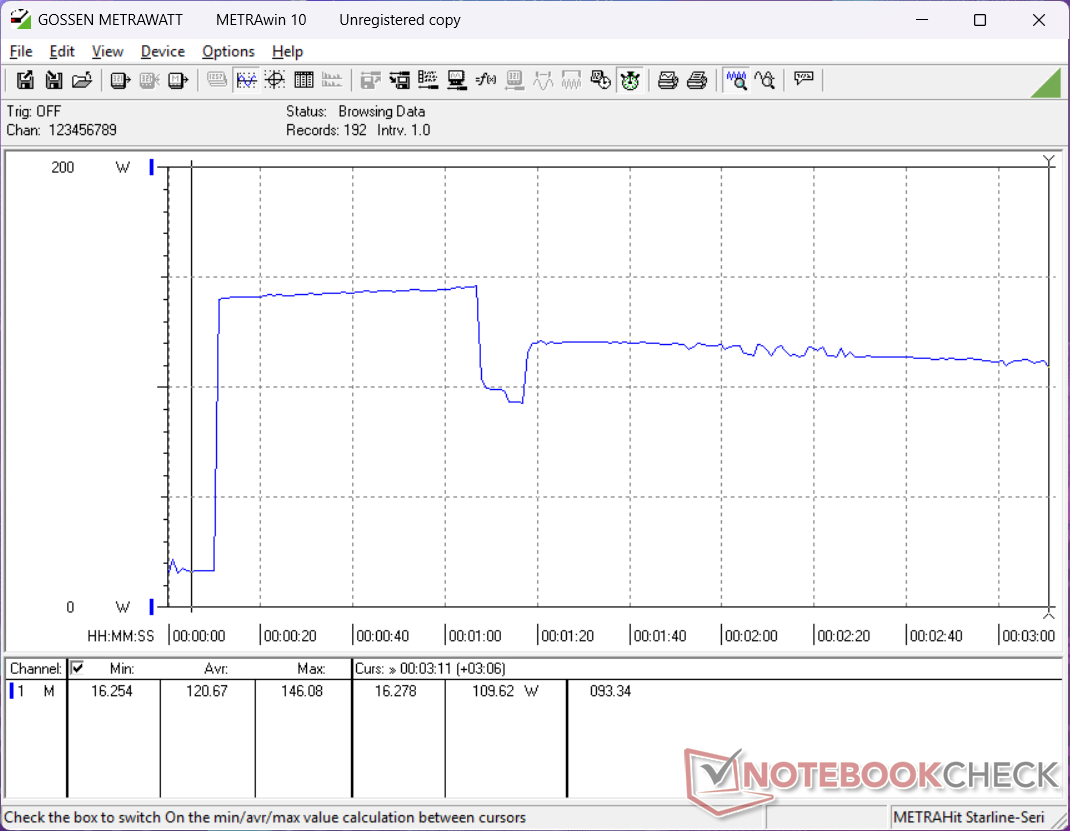
Le potentiel limité de Turbo Boost du système devient évident lorsque l'on examine de plus près ses caractéristiques vitales en temps réel. Lors de l'exécution du test Prime95, par exemple, le processeur atteint presque instantanément 89 C au cours des premières secondes du test. Il passe ensuite rapidement de 3,3 GHz et 89 W à seulement 2,3 GHz et 70 W afin de maintenir la température du cœur en dessous de 100 C.
La température du CPU et du GPU lors de l'exécution de Cyberpunk 2077 se stabilise à 68 C et 70 C, respectivement, contre 75 C et 62 C sur le Dell Precision 5690 plus puissant.
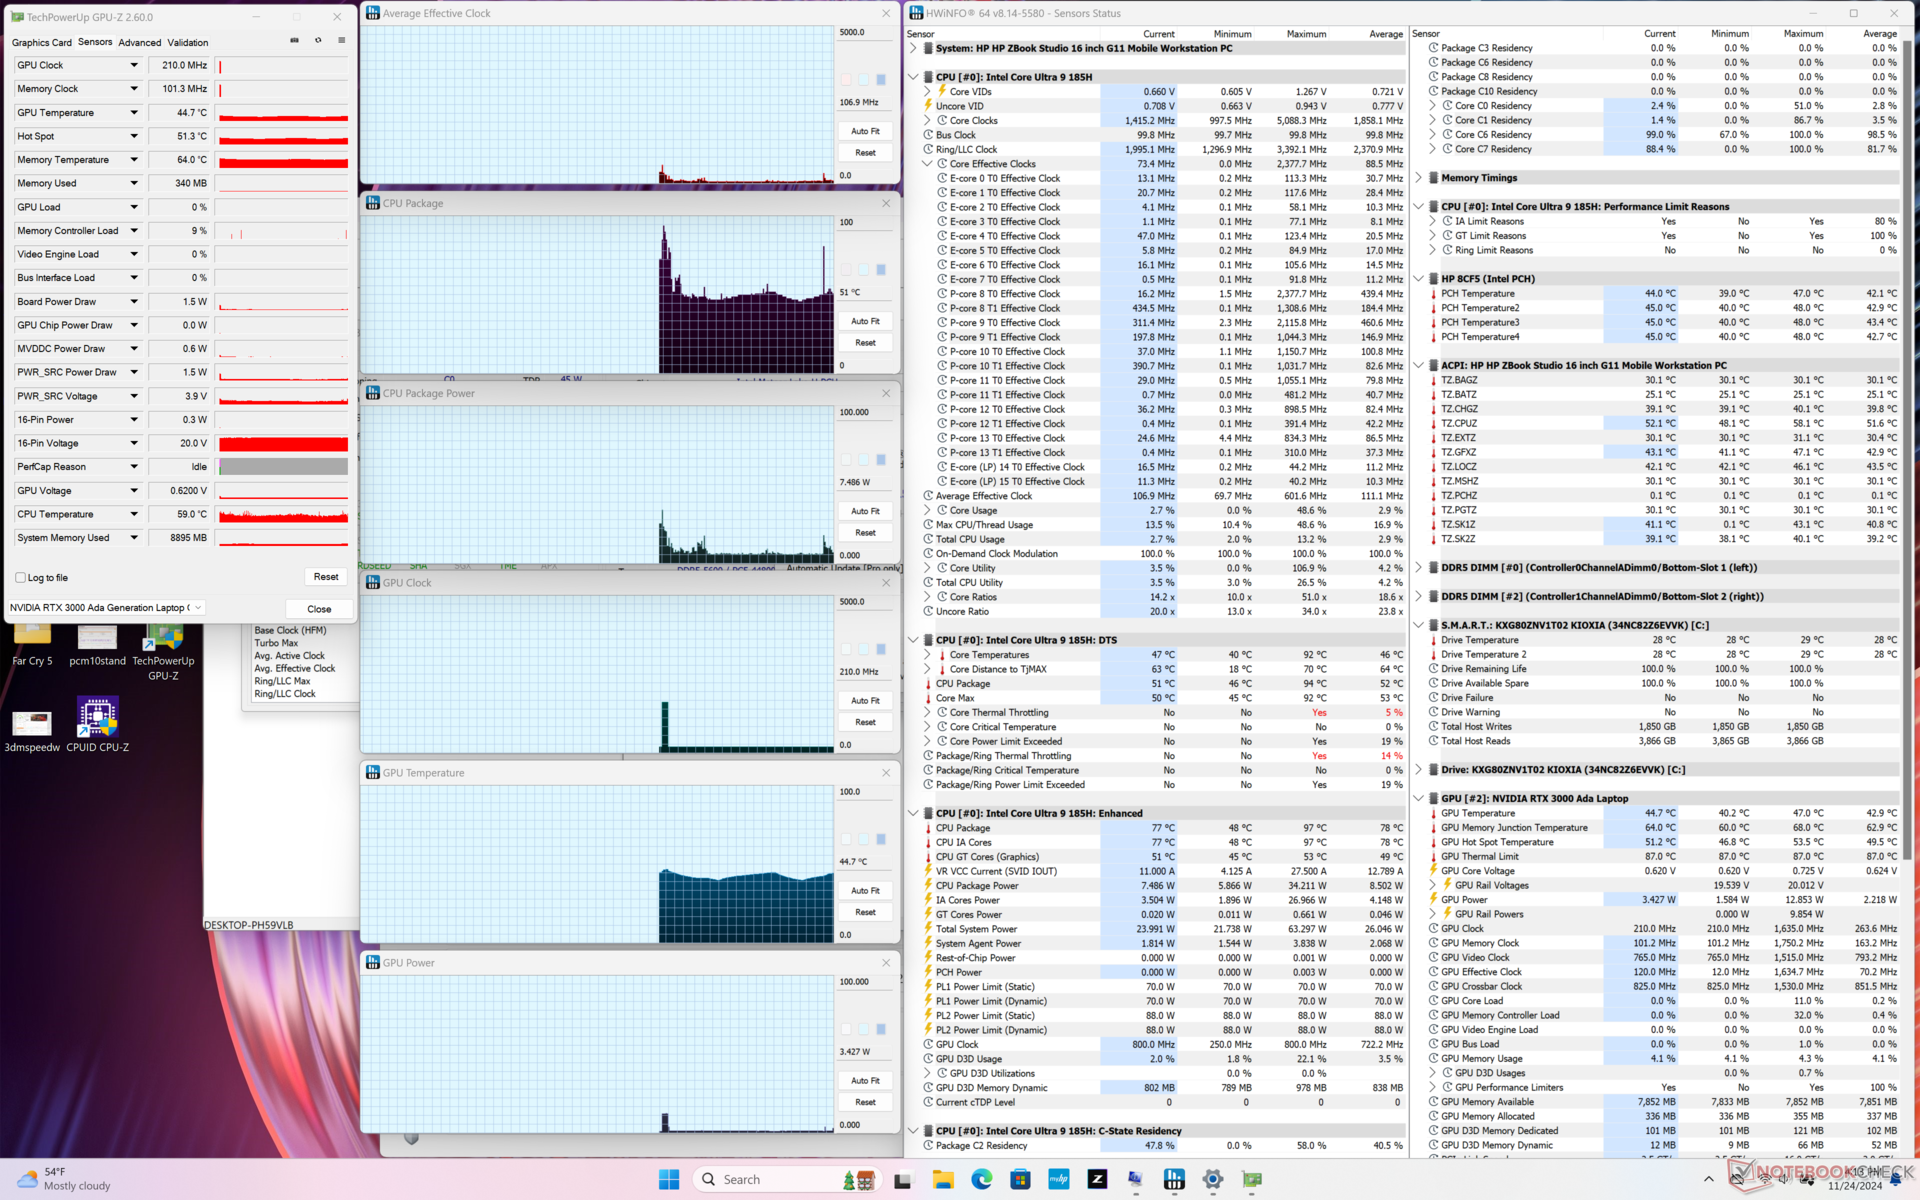
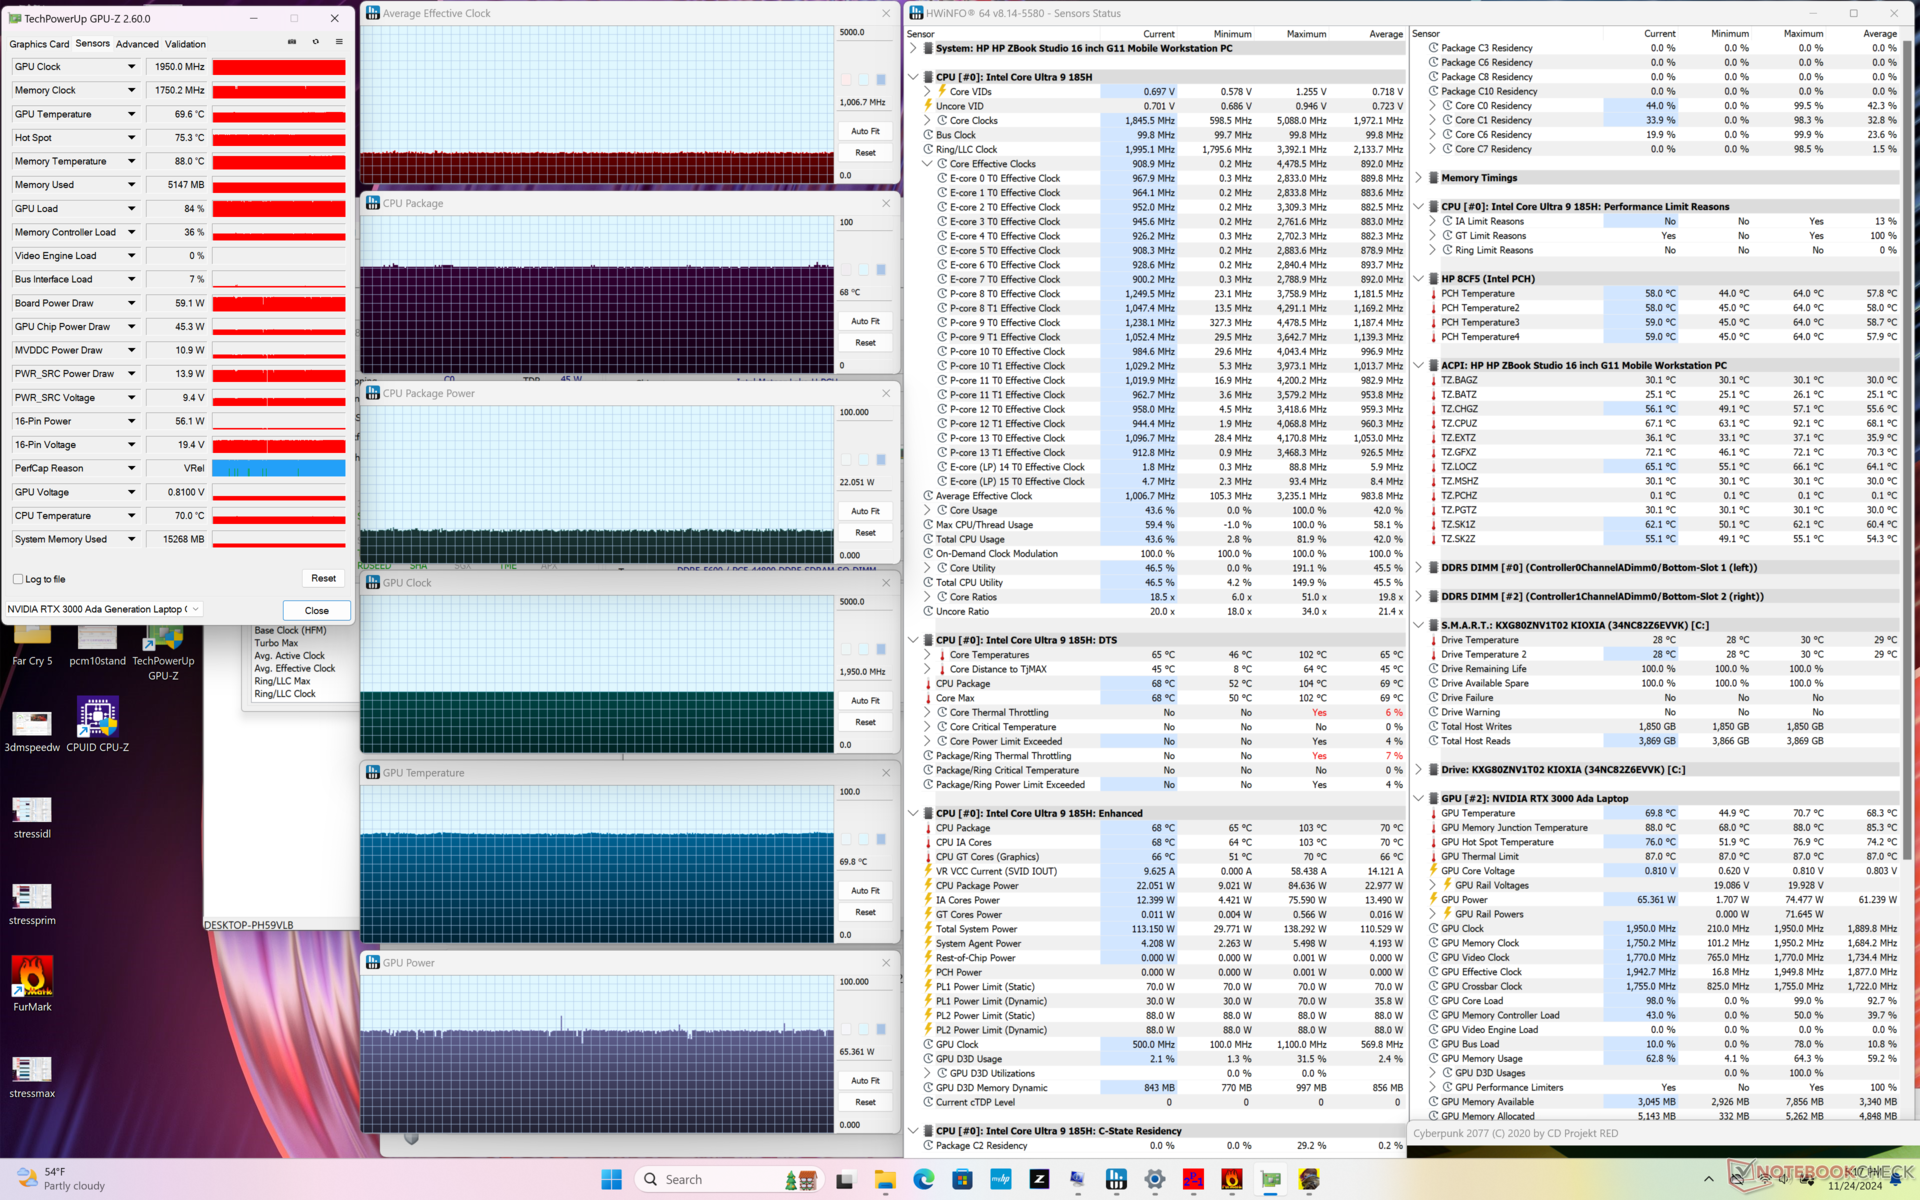
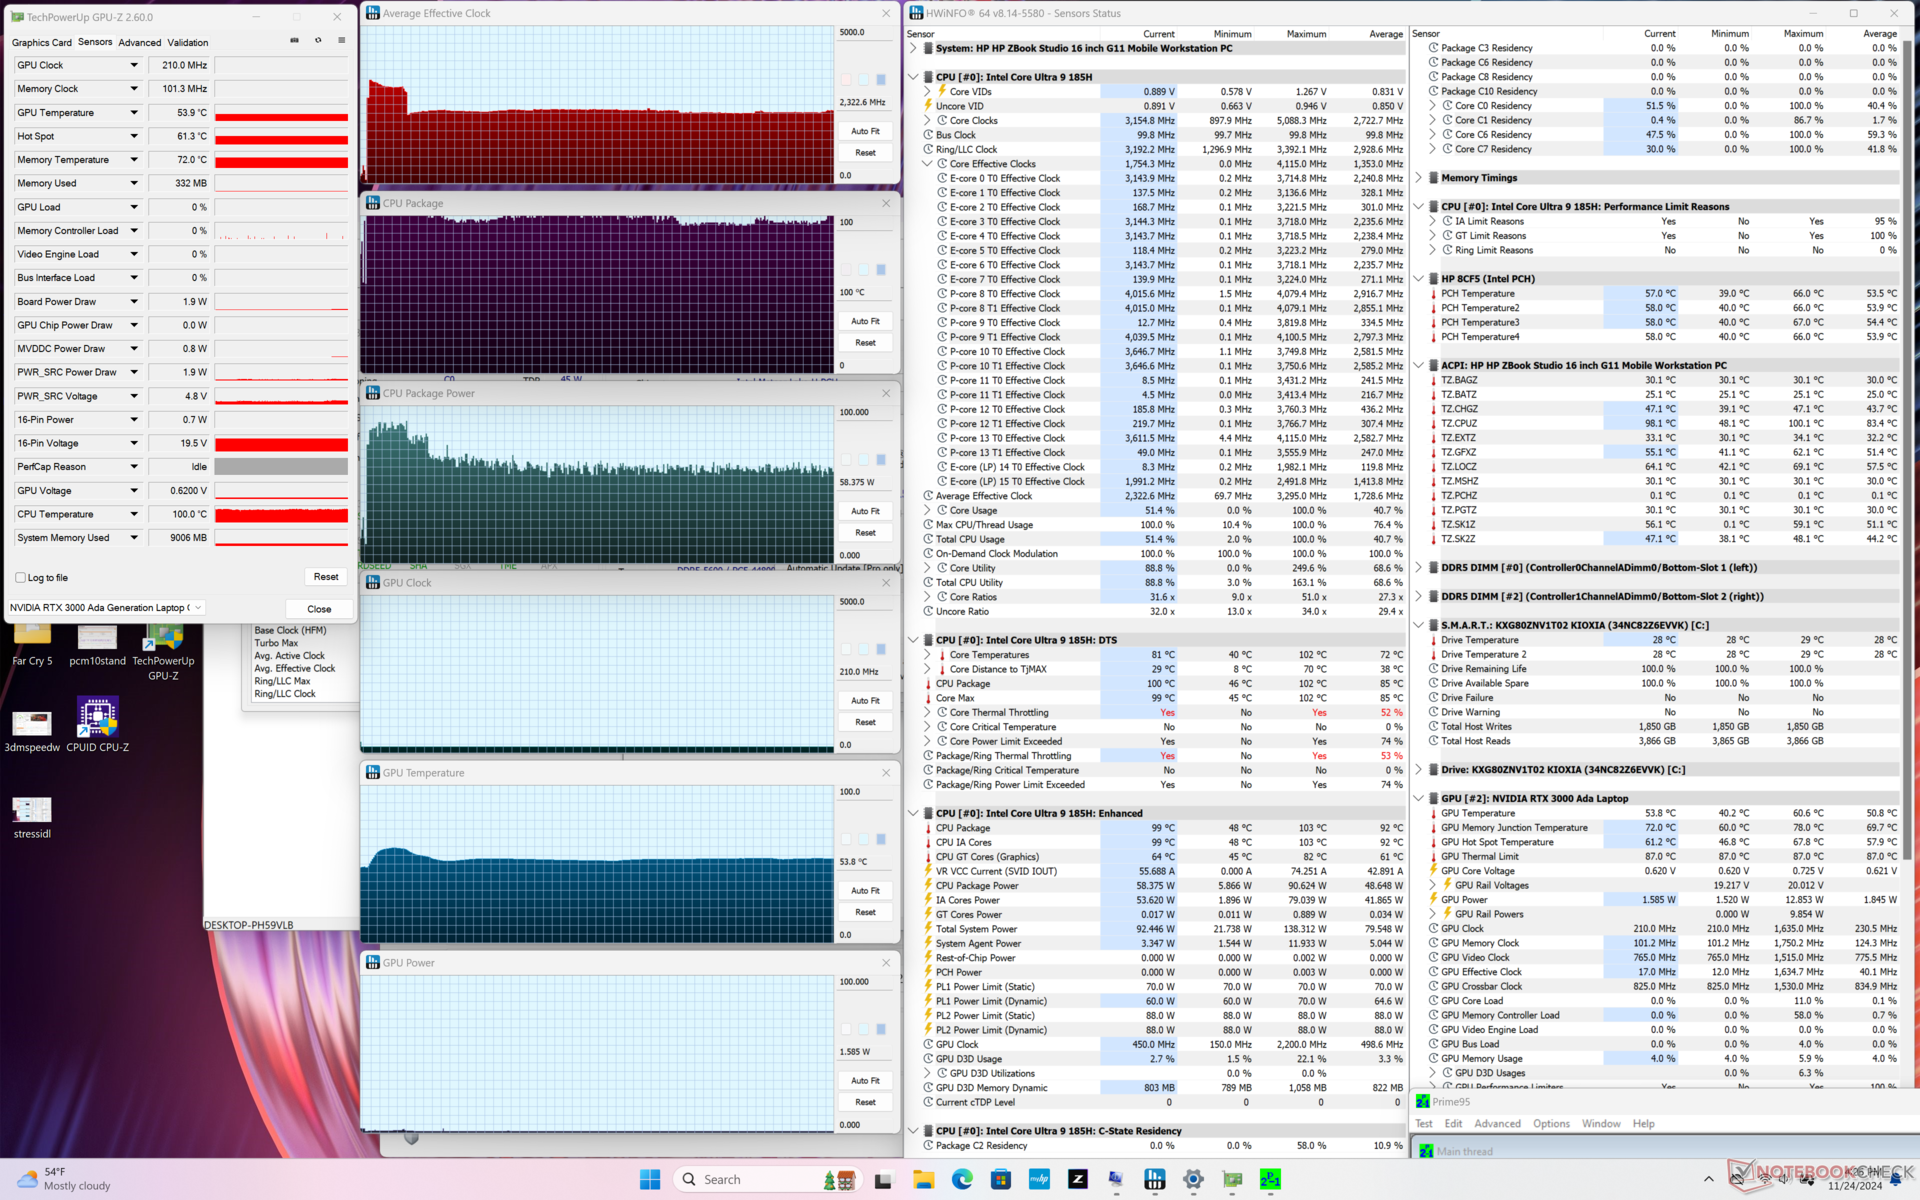
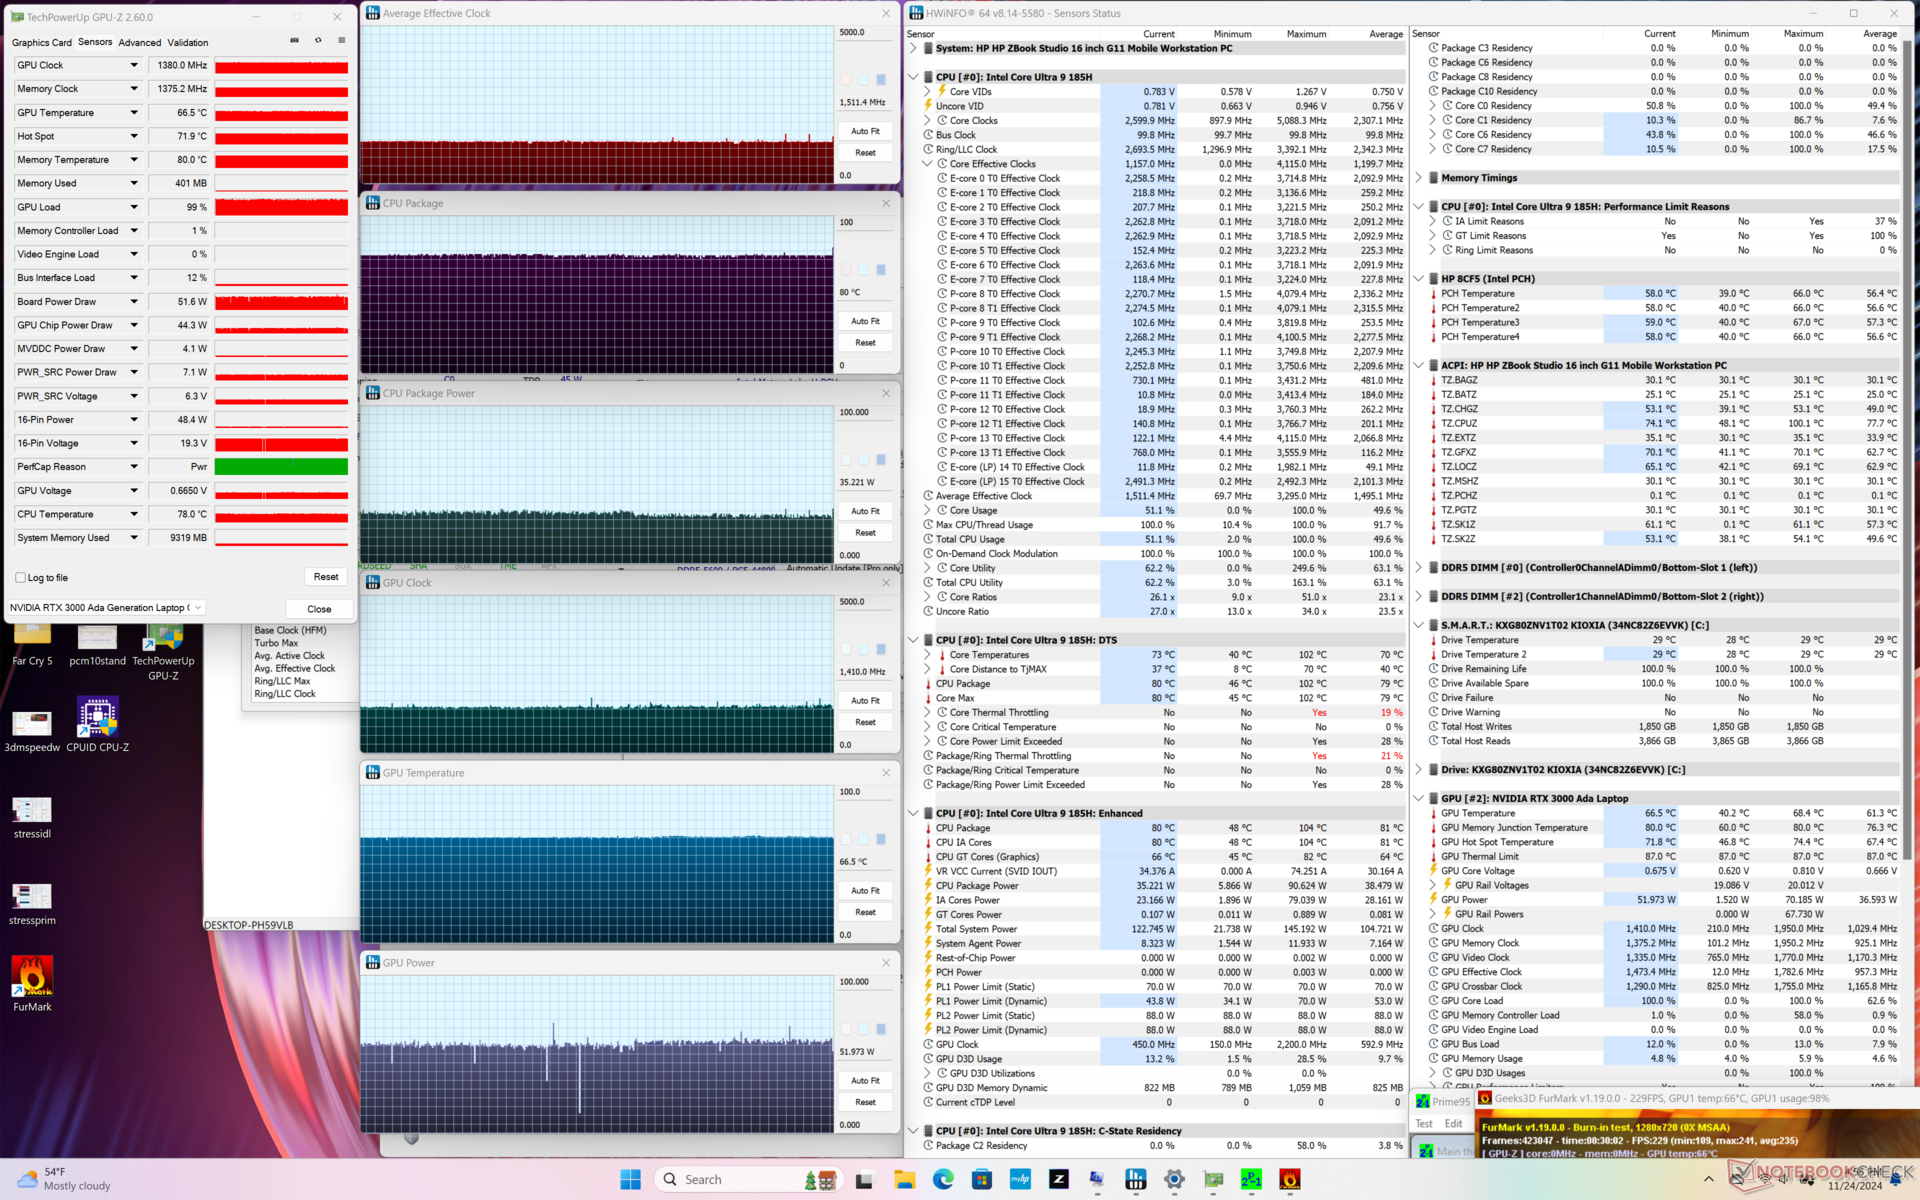
| Horloge moyenne du CPU (GHz) | Horloge du GPU (MHz) | Température moyenne du CPU (°C) | Température moyenne du GPU (°C) | |
| Système en veille | -- | -- | 51 | 45 |
| Prime95 Stress | 2.3 | -- | 99 | 54 |
| Prime95 + FurMark Stress | 1.5 | 1410 | 80 | 67 |
| Cyberpunk 2077 Stress | 1.0 | 1950 | 68 | 70 |
Performance du système
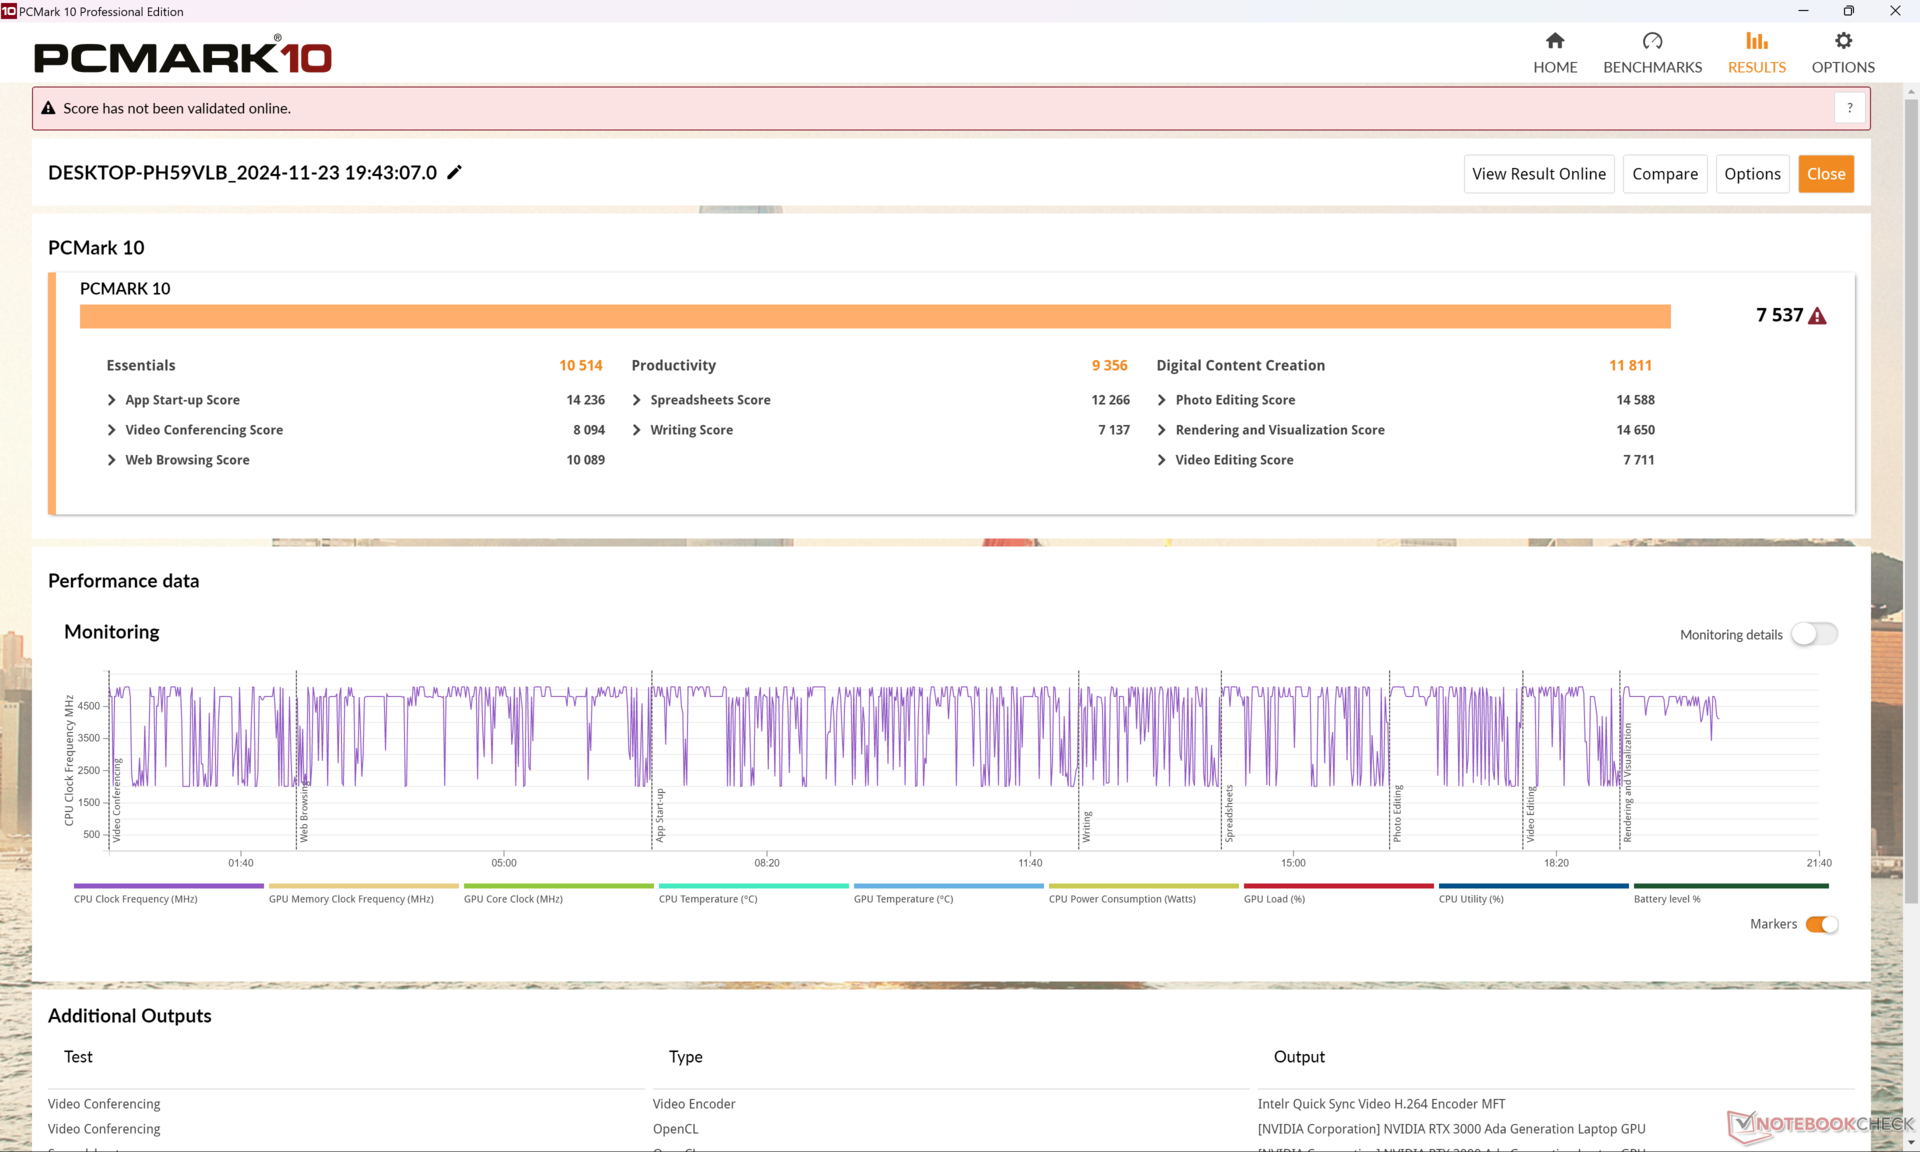
Les scores PCMark sont systématiquement plus élevés que ceux du ZBook Studio 16 G9 sortant, grâce aux améliorations apportées au processeur et au GPU. Toutefois, il convient de noter que nous avons constaté plusieurs blocages et écrans noirs pendant les tests, qui nécessitaient à chaque fois un redémarrage brutal.
CrossMark: Overall | Productivity | Creativity | Responsiveness
WebXPRT 3: Overall
WebXPRT 4: Overall
Mozilla Kraken 1.1: Total
| PCMark 10 / Score | |
| Lenovo ThinkPad P16 Gen 2 | |
| Dell Precision 5690 | |
| HP ZBook Studio 16 G11 | |
| Moyenne Intel Core Ultra 9 185H, NVIDIA RTX 3000 Ada Generation Laptop (7383 - 7537, n=2) | |
| HP ZBook Power 16 G11 A | |
| Lenovo ThinkPad P1 Gen 7 21KV001SGE | |
| MSI CreatorPro Z16P B12UKST | |
| HP ZBook Studio 16 G9 62U04EA | |
| PCMark 10 / Essentials | |
| Lenovo ThinkPad P16 Gen 2 | |
| Dell Precision 5690 | |
| Moyenne Intel Core Ultra 9 185H, NVIDIA RTX 3000 Ada Generation Laptop (10514 - 11137, n=2) | |
| MSI CreatorPro Z16P B12UKST | |
| HP ZBook Studio 16 G11 | |
| HP ZBook Power 16 G11 A | |
| Lenovo ThinkPad P1 Gen 7 21KV001SGE | |
| HP ZBook Studio 16 G9 62U04EA | |
| PCMark 10 / Productivity | |
| Dell Precision 5690 | |
| Lenovo ThinkPad P16 Gen 2 | |
| HP ZBook Power 16 G11 A | |
| HP ZBook Studio 16 G11 | |
| MSI CreatorPro Z16P B12UKST | |
| Moyenne Intel Core Ultra 9 185H, NVIDIA RTX 3000 Ada Generation Laptop (9153 - 9356, n=2) | |
| Lenovo ThinkPad P1 Gen 7 21KV001SGE | |
| HP ZBook Studio 16 G9 62U04EA | |
| PCMark 10 / Digital Content Creation | |
| Lenovo ThinkPad P16 Gen 2 | |
| Dell Precision 5690 | |
| HP ZBook Studio 16 G11 | |
| Lenovo ThinkPad P1 Gen 7 21KV001SGE | |
| Moyenne Intel Core Ultra 9 185H, NVIDIA RTX 3000 Ada Generation Laptop (10716 - 11811, n=2) | |
| HP ZBook Power 16 G11 A | |
| MSI CreatorPro Z16P B12UKST | |
| HP ZBook Studio 16 G9 62U04EA | |
| CrossMark / Overall | |
| Lenovo ThinkPad P16 Gen 2 | |
| MSI CreatorPro Z16P B12UKST | |
| HP ZBook Studio 16 G9 62U04EA | |
| Dell Precision 5690 | |
| HP ZBook Power 16 G11 A | |
| HP ZBook Studio 16 G11 | |
| Moyenne Intel Core Ultra 9 185H, NVIDIA RTX 3000 Ada Generation Laptop (1754 - 1770, n=2) | |
| Lenovo ThinkPad P1 Gen 7 21KV001SGE | |
| CrossMark / Productivity | |
| Lenovo ThinkPad P16 Gen 2 | |
| MSI CreatorPro Z16P B12UKST | |
| Dell Precision 5690 | |
| HP ZBook Studio 16 G9 62U04EA | |
| HP ZBook Power 16 G11 A | |
| HP ZBook Studio 16 G11 | |
| Moyenne Intel Core Ultra 9 185H, NVIDIA RTX 3000 Ada Generation Laptop (1643 - 1686, n=2) | |
| Lenovo ThinkPad P1 Gen 7 21KV001SGE | |
| CrossMark / Creativity | |
| Lenovo ThinkPad P16 Gen 2 | |
| HP ZBook Studio 16 G9 62U04EA | |
| MSI CreatorPro Z16P B12UKST | |
| HP ZBook Power 16 G11 A | |
| Dell Precision 5690 | |
| Moyenne Intel Core Ultra 9 185H, NVIDIA RTX 3000 Ada Generation Laptop (1981 - 2001, n=2) | |
| HP ZBook Studio 16 G11 | |
| Lenovo ThinkPad P1 Gen 7 21KV001SGE | |
| CrossMark / Responsiveness | |
| MSI CreatorPro Z16P B12UKST | |
| Lenovo ThinkPad P16 Gen 2 | |
| HP ZBook Studio 16 G9 62U04EA | |
| Dell Precision 5690 | |
| HP ZBook Studio 16 G11 | |
| Moyenne Intel Core Ultra 9 185H, NVIDIA RTX 3000 Ada Generation Laptop (1438 - 1458, n=2) | |
| HP ZBook Power 16 G11 A | |
| Lenovo ThinkPad P1 Gen 7 21KV001SGE | |
| WebXPRT 3 / Overall | |
| Lenovo ThinkPad P16 Gen 2 | |
| MSI CreatorPro Z16P B12UKST | |
| HP ZBook Power 16 G11 A | |
| HP ZBook Studio 16 G9 62U04EA | |
| HP ZBook Studio 16 G11 | |
| Dell Precision 5690 | |
| Moyenne Intel Core Ultra 9 185H, NVIDIA RTX 3000 Ada Generation Laptop (286 - 295, n=2) | |
| Lenovo ThinkPad P1 Gen 7 21KV001SGE | |
| WebXPRT 4 / Overall | |
| Lenovo ThinkPad P16 Gen 2 | |
| Dell Precision 5690 | |
| MSI CreatorPro Z16P B12UKST | |
| HP ZBook Studio 16 G9 62U04EA | |
| Moyenne Intel Core Ultra 9 185H, NVIDIA RTX 3000 Ada Generation Laptop (261 - 268, n=2) | |
| HP ZBook Studio 16 G11 | |
| Lenovo ThinkPad P1 Gen 7 21KV001SGE | |
| HP ZBook Power 16 G11 A | |
| Mozilla Kraken 1.1 / Total | |
| HP ZBook Power 16 G11 A | |
| Lenovo ThinkPad P1 Gen 7 21KV001SGE | |
| MSI CreatorPro Z16P B12UKST | |
| Moyenne Intel Core Ultra 9 185H, NVIDIA RTX 3000 Ada Generation Laptop (515 - 522, n=2) | |
| HP ZBook Studio 16 G11 | |
| HP ZBook Studio 16 G9 62U04EA | |
| Dell Precision 5690 | |
| Lenovo ThinkPad P16 Gen 2 | |
* ... Moindre est la valeur, meilleures sont les performances
| PCMark 10 Score | 7537 points | |
Aide | ||
| AIDA64 / Memory Copy | |
| Dell Precision 5690 | |
| Moyenne Intel Core Ultra 9 185H (69929 - 95718, n=22) | |
| HP ZBook Studio 16 G11 | |
| Lenovo ThinkPad P1 Gen 7 21KV001SGE | |
| Lenovo ThinkPad P16 Gen 2 | |
| MSI CreatorPro Z16P B12UKST | |
| HP ZBook Studio 16 G9 62U04EA | |
| HP ZBook Power 16 G11 A | |
| AIDA64 / Memory Read | |
| Dell Precision 5690 | |
| HP ZBook Studio 16 G11 | |
| Moyenne Intel Core Ultra 9 185H (64619 - 87768, n=22) | |
| Lenovo ThinkPad P16 Gen 2 | |
| MSI CreatorPro Z16P B12UKST | |
| HP ZBook Studio 16 G9 62U04EA | |
| Lenovo ThinkPad P1 Gen 7 21KV001SGE | |
| HP ZBook Power 16 G11 A | |
| AIDA64 / Memory Write | |
| HP ZBook Power 16 G11 A | |
| HP ZBook Studio 16 G11 | |
| Dell Precision 5690 | |
| Moyenne Intel Core Ultra 9 185H (51114 - 93871, n=22) | |
| MSI CreatorPro Z16P B12UKST | |
| HP ZBook Studio 16 G9 62U04EA | |
| Lenovo ThinkPad P16 Gen 2 | |
| Lenovo ThinkPad P1 Gen 7 21KV001SGE | |
| AIDA64 / Memory Latency | |
| Moyenne Intel Core Ultra 9 185H (121.4 - 259, n=22) | |
| Dell Precision 5690 | |
| Lenovo ThinkPad P1 Gen 7 21KV001SGE | |
| HP ZBook Studio 16 G11 | |
| HP ZBook Power 16 G11 A | |
| MSI CreatorPro Z16P B12UKST | |
| Lenovo ThinkPad P16 Gen 2 | |
| HP ZBook Studio 16 G9 62U04EA | |
* ... Moindre est la valeur, meilleures sont les performances
Latence DPC
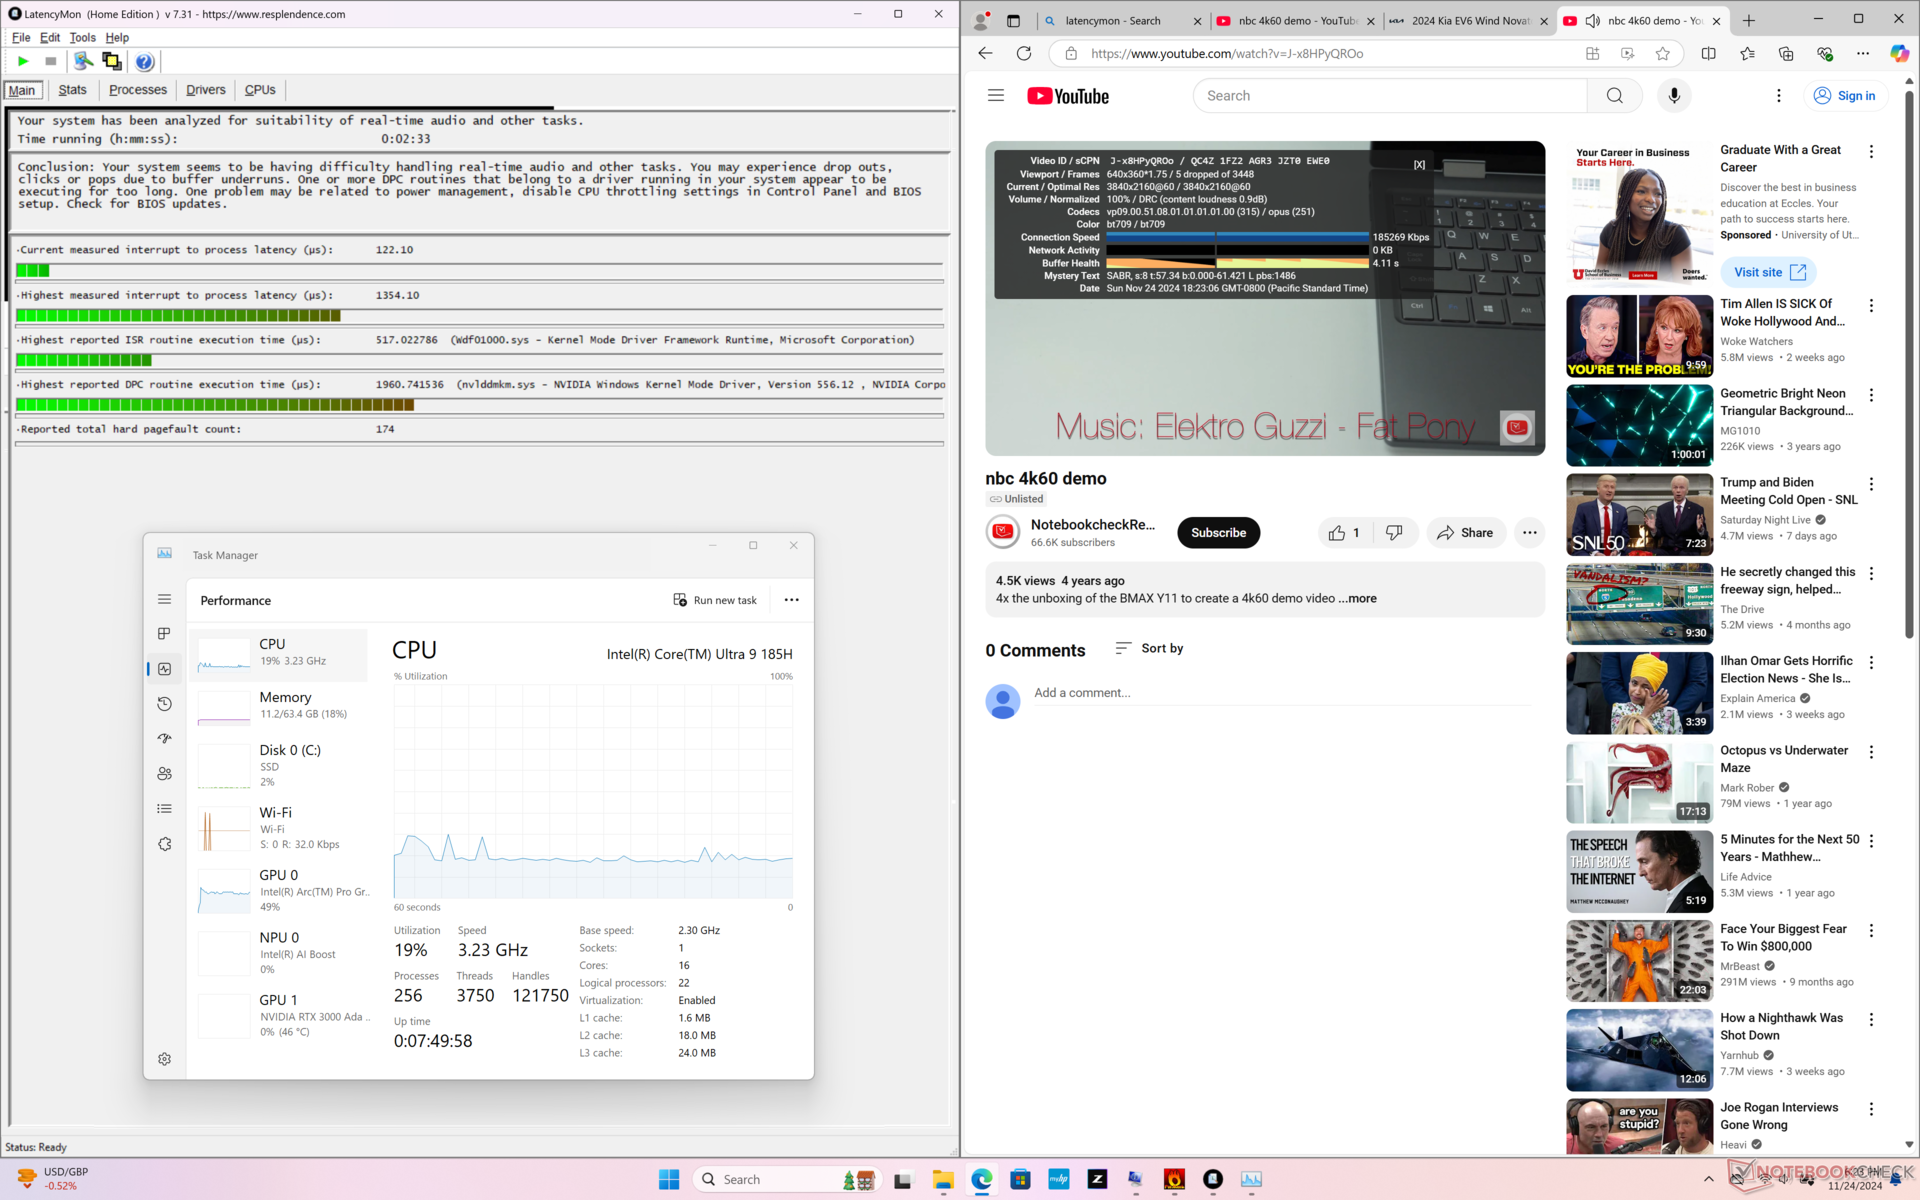
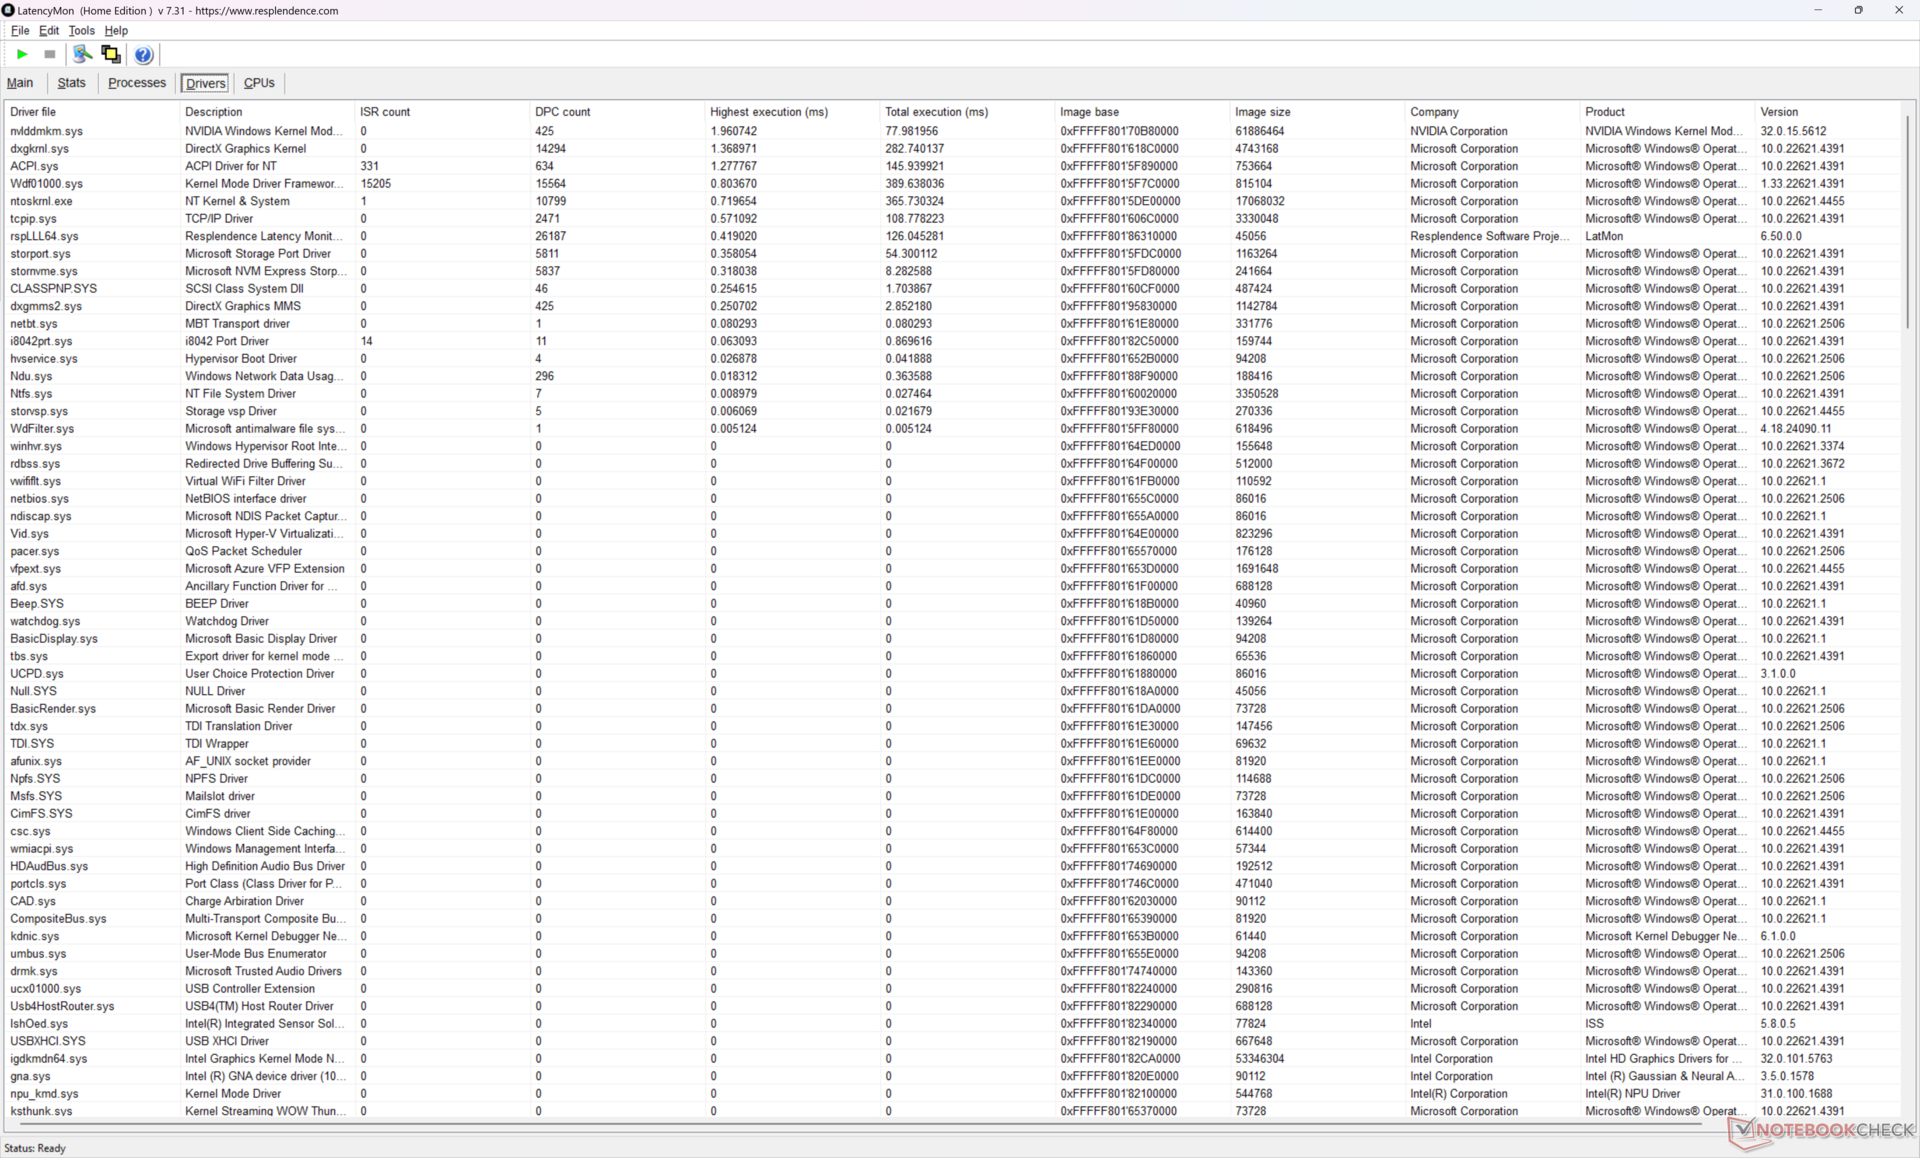
LatencyMon révèle des problèmes mineurs de DPC lors de l'ouverture de plusieurs onglets de notre page d'accueil. la lecture de vidéos 4K à 60 FPS présente également des problèmes mineurs avec 5 images perdues enregistrées dans une fenêtre de 60 secondes.
| DPC Latencies / LatencyMon - interrupt to process latency (max), Web, Youtube, Prime95 | |
| HP ZBook Power 16 G11 A | |
| Lenovo ThinkPad P1 Gen 7 21KV001SGE | |
| HP ZBook Studio 16 G11 | |
| HP ZBook Studio 16 G9 62U04EA | |
| Lenovo ThinkPad P16 Gen 2 | |
| MSI CreatorPro Z16P B12UKST | |
| Dell Precision 5690 | |
* ... Moindre est la valeur, meilleures sont les performances
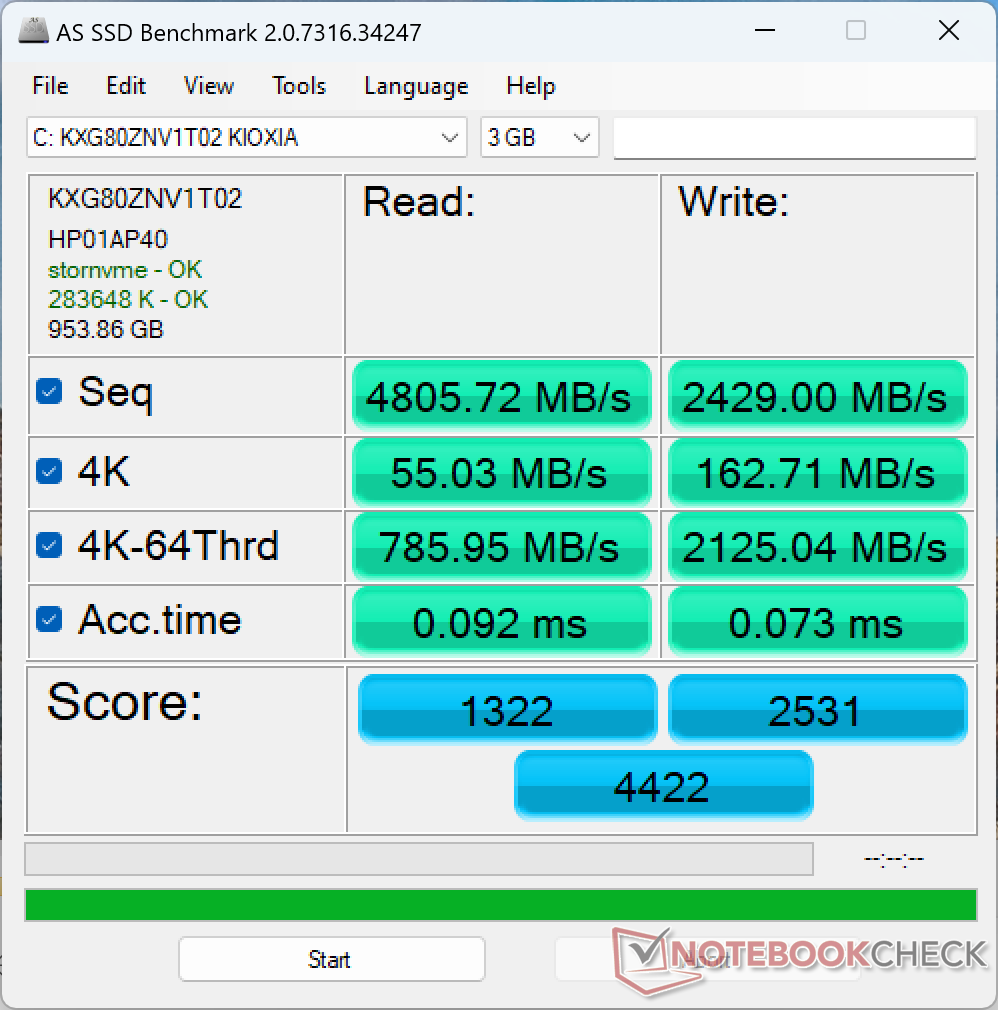
Dispositifs de stockage
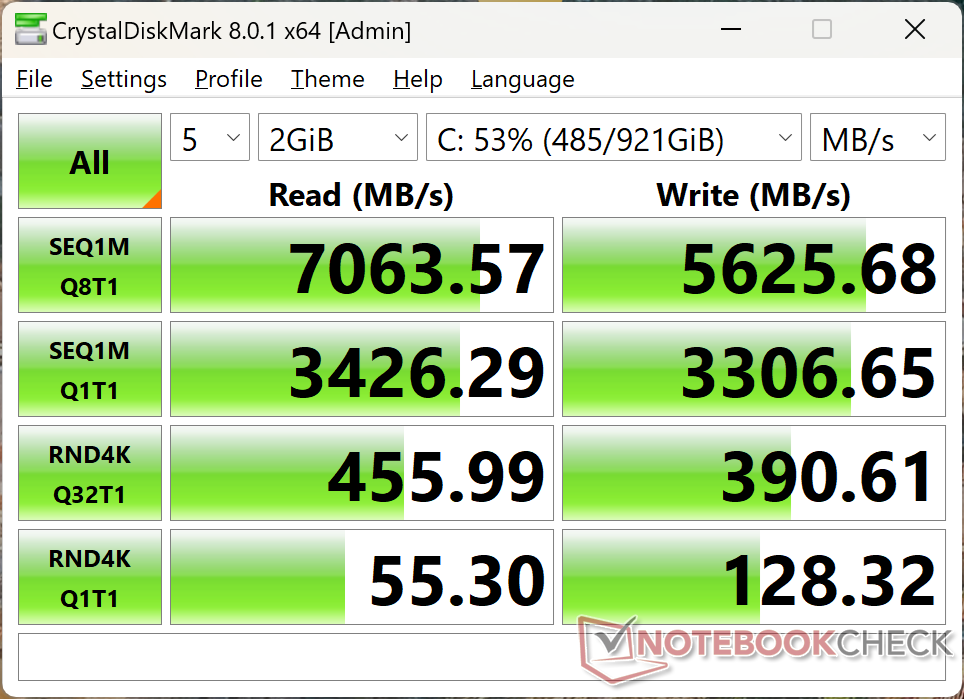
Notre système est livré avec une carte Kioxia XG8 PCIe4 NVMe au lieu du Micron 3400 qui équipait l'ancien ZBook Studio 16 G9. Les performances sont par ailleurs excellentes et aucun problème d'étranglement n'a été détecté.

* ... Moindre est la valeur, meilleures sont les performances
Disk Throttling: DiskSpd Read Loop, Queue Depth 8
Performance du GPU
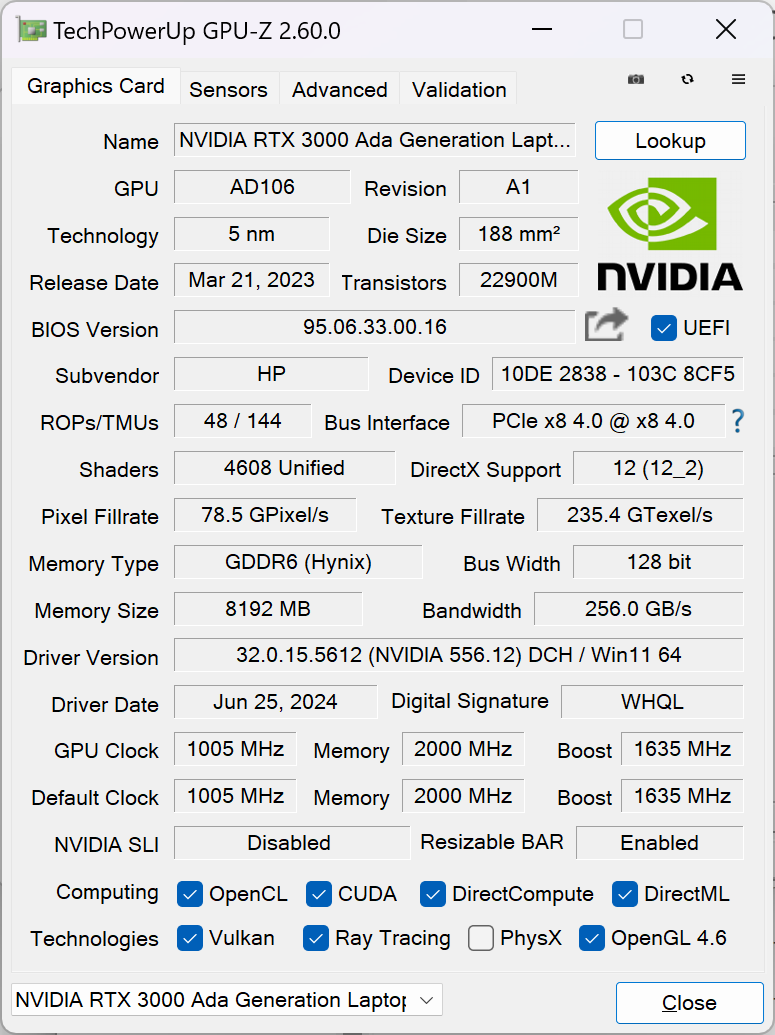
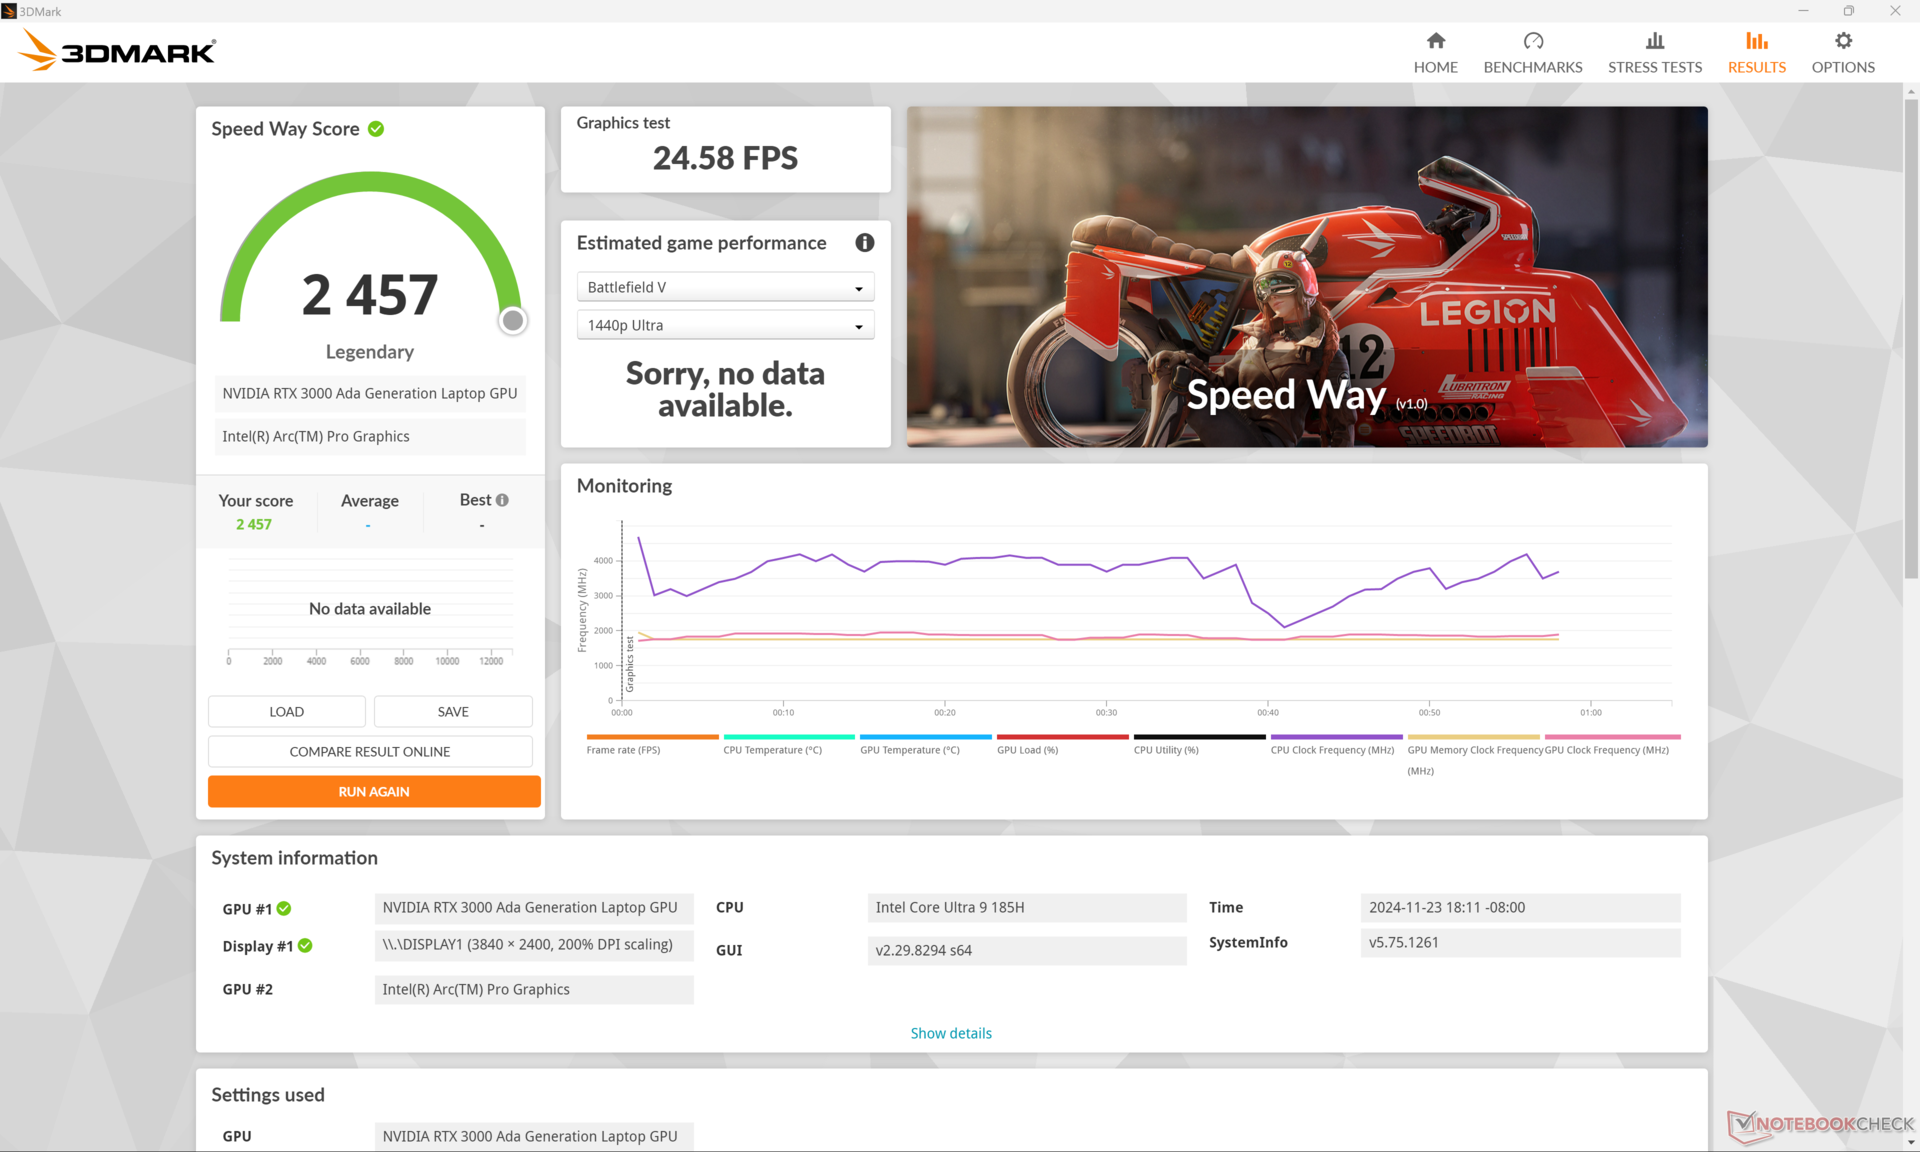
Le nouveau GPU est l'une des principales raisons de passer du ZBook Studio 16 G9 au ZBook Studio 16 G11. Notre RTX 3000 Ada est presque deux fois plus rapide que la RTX A2000 avant de prendre en compte les fonctions d'accélération du ray-tracing.
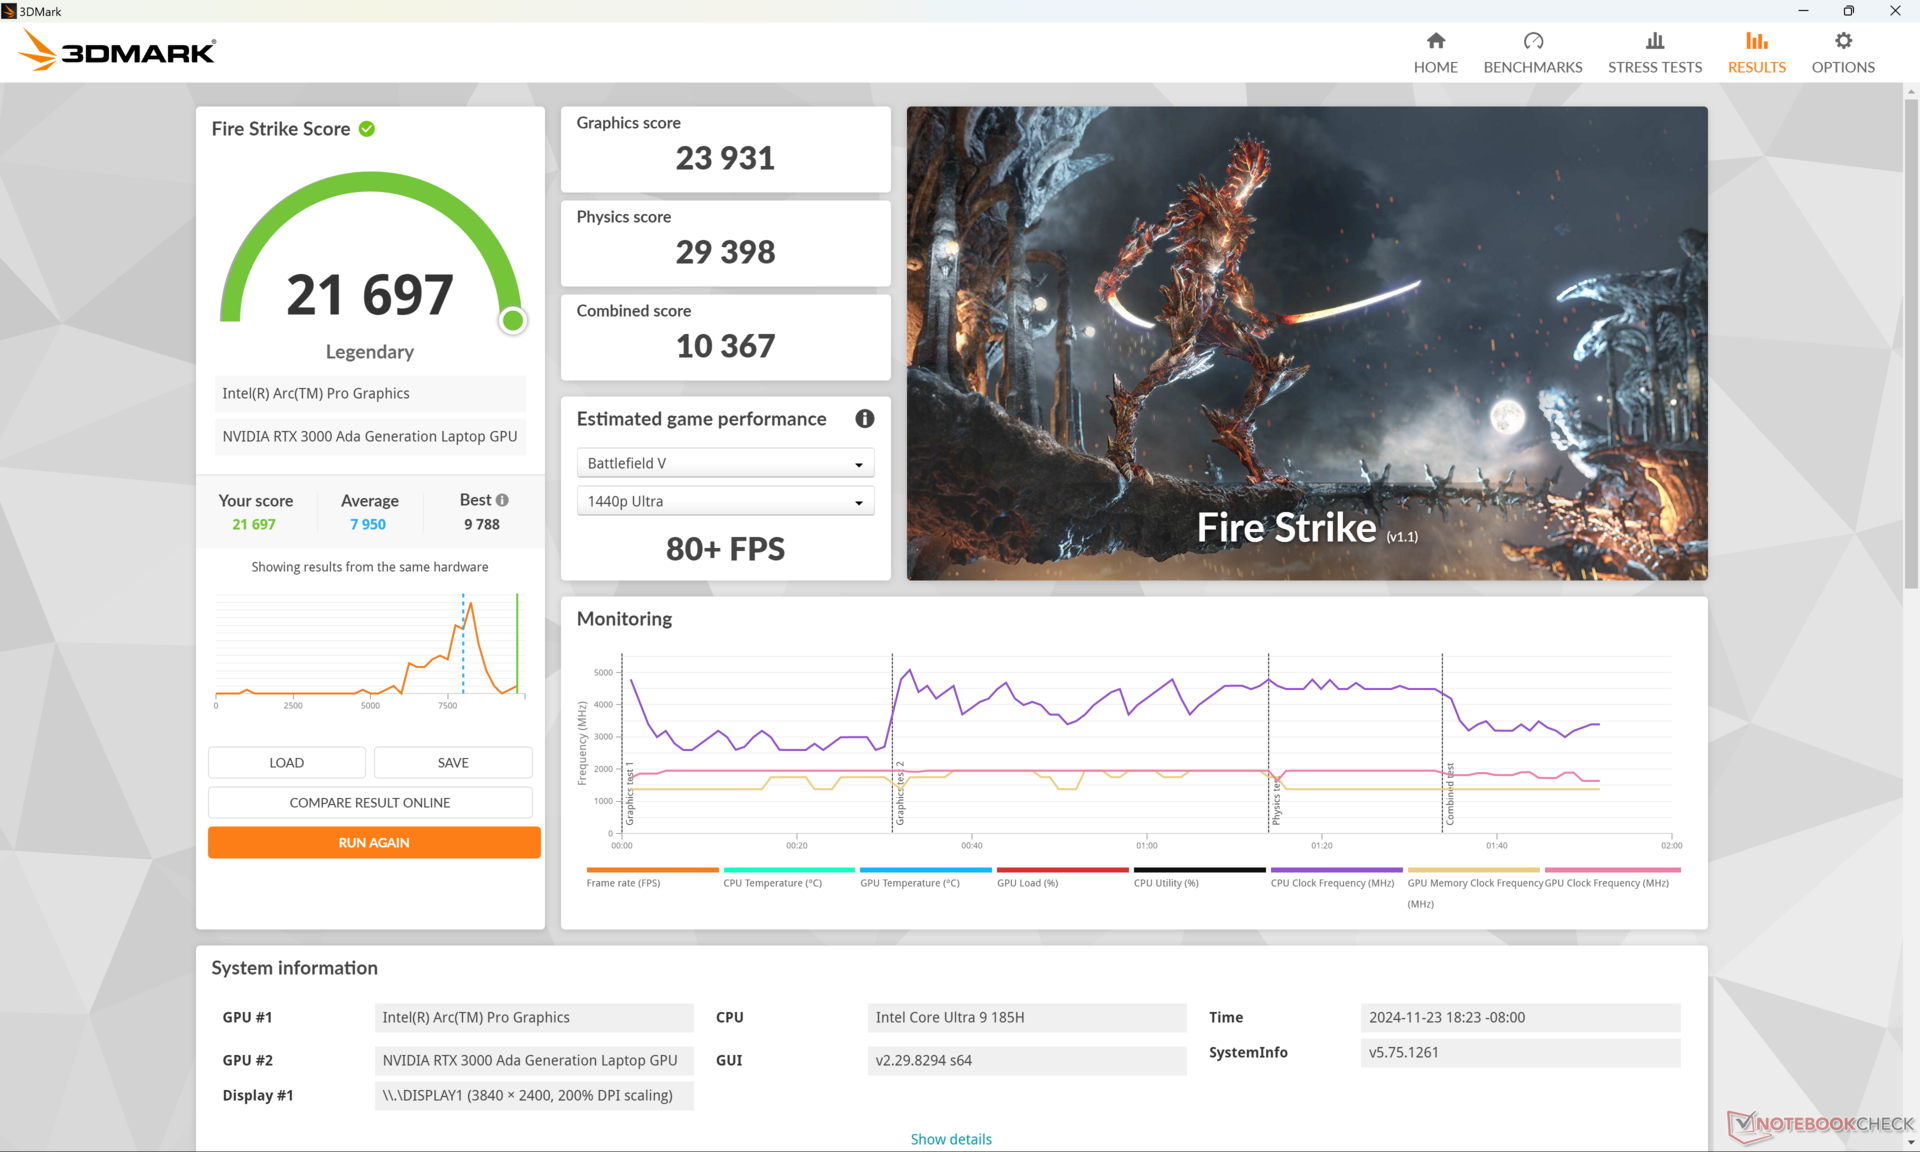
| Profil de puissance | Score graphique | Score physique | Score combiné |
| Mode Performance | 23931 | 29398 | 10367 |
| Mode équilibré | 21021 (-12%) | 27903 (-5%) | 8545 (-18%) |
| Alimentation par batterie | 14313 (-40%) | 12099 (-59%) | 5174 (-50%) |
L'exécution en mode équilibré a un léger impact sur les performances, comme le montrent les résultats de notre site Fire Strike ci-dessus. La différence est beaucoup plus prononcée si vous utilisez la batterie.
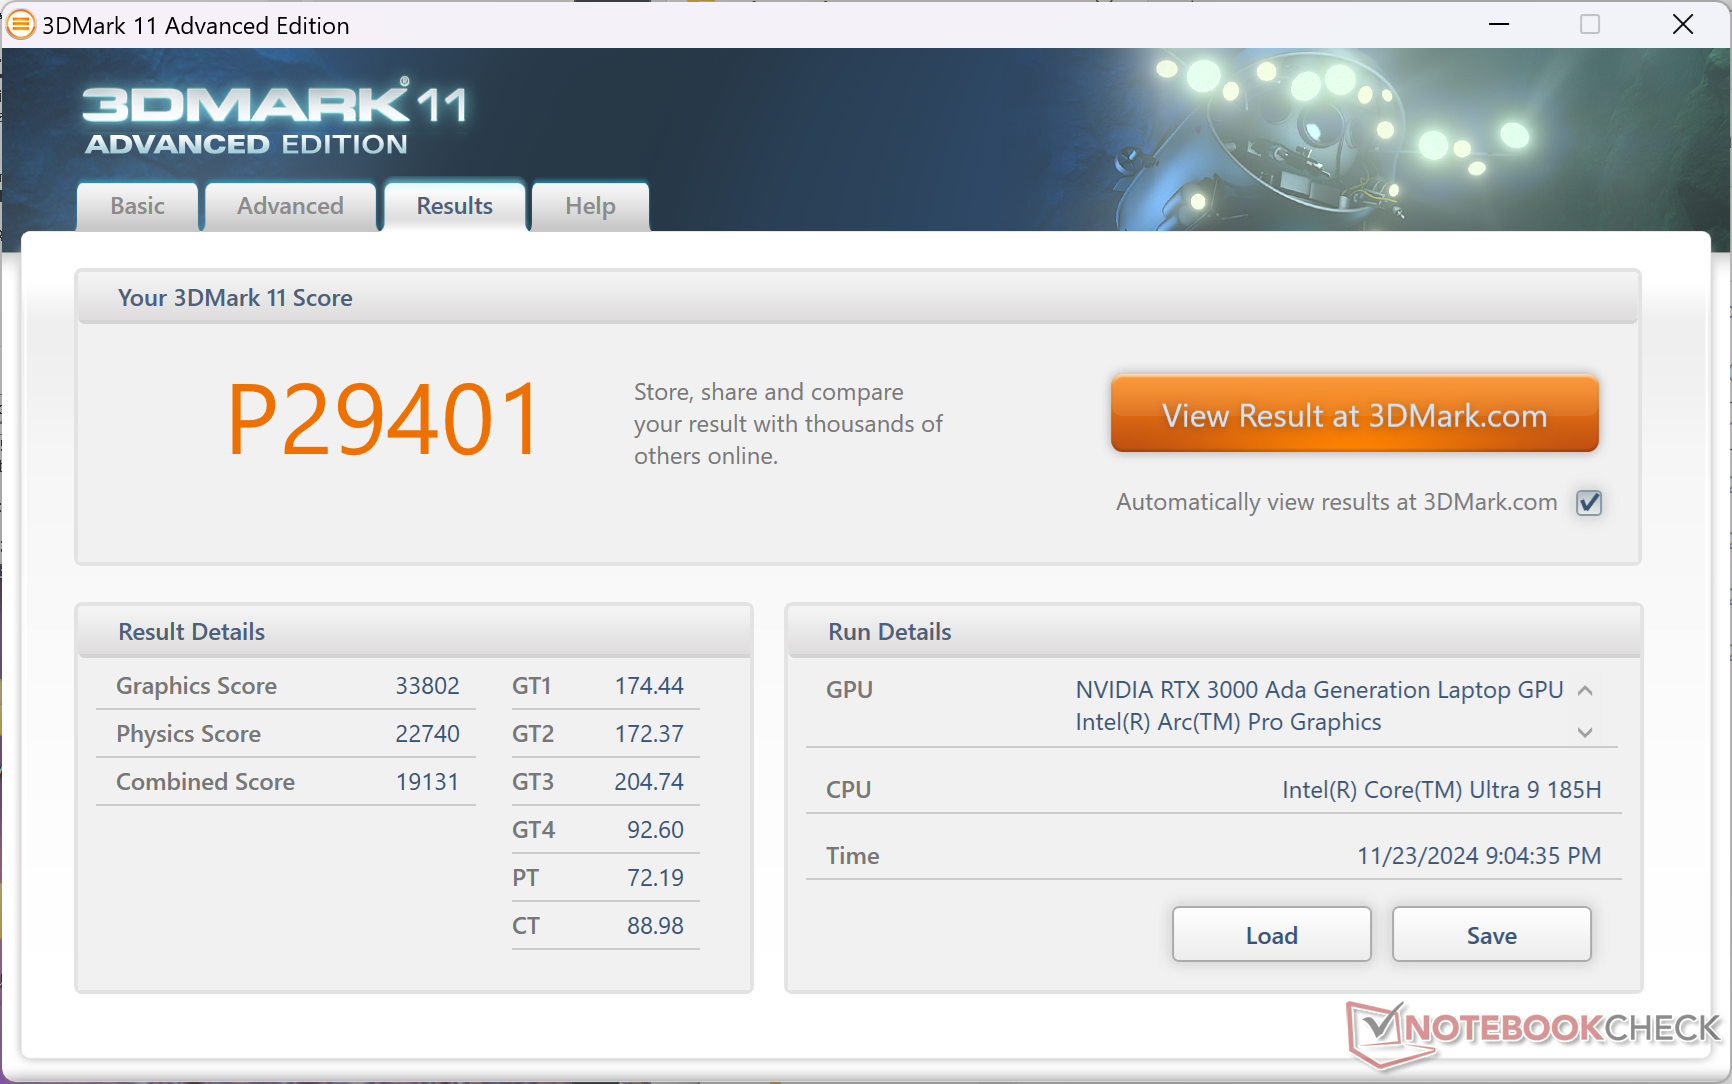

| 3DMark 11 Performance | 29401 points | |
| 3DMark Cloud Gate Standard Score | 34703 points | |
| 3DMark Fire Strike Score | 21697 points | |
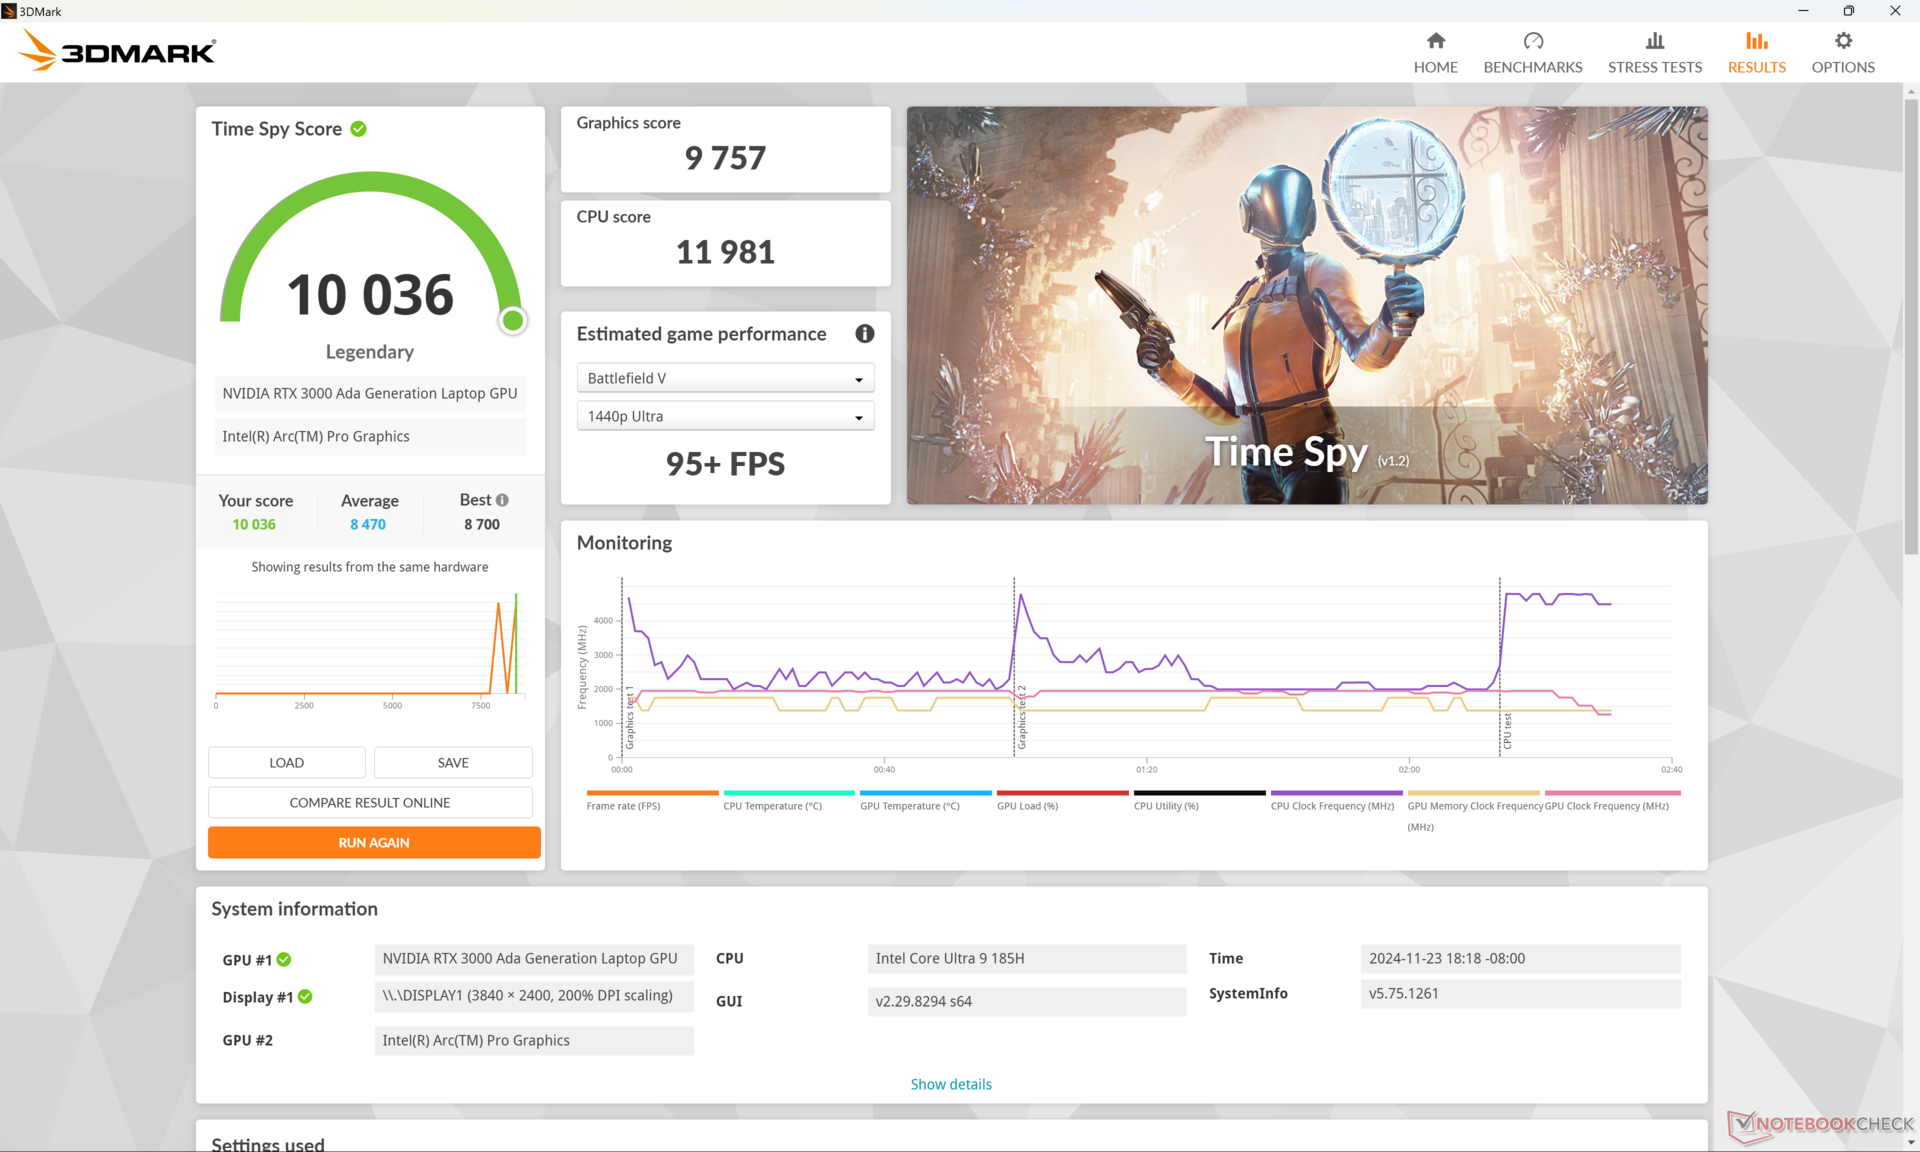
| 3DMark Time Spy Score | 10036 points | |
| 3DMark Steel Nomad Score | 2139 points | |
Aide | ||
* ... Moindre est la valeur, meilleures sont les performances
| Performance rating - Percent | |
| Lenovo ThinkPad P16 Gen 2 | |
| Dell Precision 5690 -1! | |
| HP ZBook Studio 16 G11 | |
| MSI CreatorPro Z16P B12UKST -2! | |
| HP ZBook Studio 16 G9 62U04EA -2! | |
| HP ZBook Power 16 G11 A | |
| Cyberpunk 2077 - 1920x1080 Ultra Preset (FSR off) | |
| Dell Precision 5690 | |
| Lenovo ThinkPad P16 Gen 2 | |
| HP ZBook Studio 16 G11 | |
| HP ZBook Power 16 G11 A | |
| Baldur's Gate 3 - 1920x1080 Ultra Preset AA:T | |
| Lenovo ThinkPad P16 Gen 2 | |
| Dell Precision 5690 | |
| HP ZBook Studio 16 G11 | |
| HP ZBook Power 16 G11 A | |
| GTA V - 1920x1080 Highest AA:4xMSAA + FX AF:16x | |
| Lenovo ThinkPad P16 Gen 2 | |
| HP ZBook Studio 16 G11 | |
| MSI CreatorPro Z16P B12UKST | |
| HP ZBook Power 16 G11 A | |
| HP ZBook Studio 16 G9 62U04EA | |
| Final Fantasy XV Benchmark - 1920x1080 High Quality | |
| Lenovo ThinkPad P16 Gen 2 | |
| Dell Precision 5690 | |
| HP ZBook Studio 16 G11 | |
| HP ZBook Power 16 G11 A | |
| MSI CreatorPro Z16P B12UKST | |
| HP ZBook Studio 16 G9 62U04EA | |
| Strange Brigade - 1920x1080 ultra AA:ultra AF:16 | |
| Lenovo ThinkPad P16 Gen 2 | |
| Dell Precision 5690 | |
| HP ZBook Studio 16 G11 | |
| HP ZBook Power 16 G11 A | |
| MSI CreatorPro Z16P B12UKST | |
| HP ZBook Studio 16 G9 62U04EA | |
| Dota 2 Reborn - 1920x1080 ultra (3/3) best looking | |
| Lenovo ThinkPad P16 Gen 2 | |
| HP ZBook Studio 16 G9 62U04EA | |
| MSI CreatorPro Z16P B12UKST | |
| HP ZBook Studio 16 G11 | |
| Dell Precision 5690 | |
| HP ZBook Power 16 G11 A | |
| X-Plane 11.11 - 1920x1080 high (fps_test=3) | |
| Lenovo ThinkPad P16 Gen 2 | |
| MSI CreatorPro Z16P B12UKST | |
| HP ZBook Studio 16 G9 62U04EA | |
| Dell Precision 5690 | |
| HP ZBook Studio 16 G11 | |
| HP ZBook Power 16 G11 A | |
Les taux de rafraîchissement sont légèrement instables lorsque le moteur tourne au ralenti sur Cyberpunk 2077, même après plusieurs tests.
Cyberpunk 2077 ultra FPS Chart
| Bas | Moyen | Élevé | Ultra | QHD | |
|---|---|---|---|---|---|
| GTA V (2015) | 182.2 | 176 | 163.2 | 96.6 | 76.1 |
| Dota 2 Reborn (2015) | 176.2 | 159.9 | 148.2 | 143.3 | |
| Final Fantasy XV Benchmark (2018) | 189.4 | 128.7 | 97 | 71.3 | |
| X-Plane 11.11 (2018) | 131.3 | 109.7 | 87.1 | ||
| Far Cry 5 (2018) | 154 | 133 | 130 | 118 | 93 |
| Strange Brigade (2018) | 415 | 246 | 192.8 | 172.6 | 118.6 |
| Tiny Tina's Wonderlands (2022) | 194 | 157.7 | 110 | 87.9 | 60.5 |
| F1 22 (2022) | 226 | 212 | 161.1 | 62.8 | 40.7 |
| Baldur's Gate 3 (2023) | 130.6 | 111.8 | 98.4 | 96.7 | 68.7 |
| Cyberpunk 2077 (2023) | 104.6 | 87.9 | 74.2 | 64.3 | 39.6 |
Émissions
Bruit du système
Le bruit et le comportement du ventilateur n'ont pas changé de manière significative par rapport à l'ancien ZBook Studio 16 G9. Lors de l'exécution de charges lourdes comme les jeux, par exemple, le bruit du ventilateur se stabilise autour de 46 à 48 dB(A). Cependant, nous avons pu enregistrer un maximum de 53 dB(A) sur le nouveau modèle G11 si le CPU et le GPU sont également sollicités.
Degré de la nuisance sonore
| Au repos |
| 23.8 / 26.4 / 26.4 dB(A) |
| Fortement sollicité |
| 33.7 / 53.2 dB(A) |
 | ||
30 dB silencieux 40 dB(A) audible 50 dB(A) bruyant |
||
min: | ||
| HP ZBook Studio 16 G11 RTX 3000 Ada Generation Laptop, Ultra 9 185H, Kioxia XG8 KXG80ZNV1T02 | HP ZBook Studio 16 G9 62U04EA RTX A2000 Laptop GPU, i7-12800H, Micron 3400 1TB MTFDKBA1T0TFH | HP ZBook Power 16 G11 A RTX 2000 Ada Generation Laptop, R7 8845HS, Samsung PM9A1 MZVL22T0HBLB | Lenovo ThinkPad P16 Gen 2 RTX 4000 Ada Generation Laptop, i7-14700HX, SK hynix PC801 HFS001TEJ9X162N | Dell Precision 5690 RTX 5000 Ada Generation Laptop, Ultra 9 185H, 2x Samsung PM9A1 1TB (RAID 0) | MSI CreatorPro Z16P B12UKST RTX A3000 Laptop GPU, i7-12700H, Samsung PM9A1 MZVL21T0HCLR | Lenovo ThinkPad P1 Gen 7 21KV001SGE GeForce RTX 4060 Laptop GPU, Ultra 7 155H, Kioxia XG8 KXG8AZNV1T02 | |
|---|---|---|---|---|---|---|---|
| Noise | -3% | 9% | -11% | -4% | -6% | -6% | |
| arrêt / environnement * (dB) | 23.8 | 24 -1% | 23.5 1% | 23.9 -0% | 23.4 2% | 24.1 -1% | 24.7 -4% |
| Idle Minimum * (dB) | 23.8 | 24 -1% | 23.8 -0% | 29.1 -22% | 23.6 1% | 27.1 -14% | 24.7 -4% |
| Idle Average * (dB) | 26.4 | 27.7 -5% | 24.2 8% | 29.1 -10% | 24.9 6% | 27.1 -3% | 24.7 6% |
| Idle Maximum * (dB) | 26.4 | 27.7 -5% | 24.2 8% | 29.1 -10% | 30.9 -17% | 27.1 -3% | 24.7 6% |
| Load Average * (dB) | 33.7 | 39.8 -18% | 25.4 25% | 41 -22% | 40.4 -20% | 42.9 -27% | 43.7 -30% |
| Cyberpunk 2077 ultra * (dB) | 46.1 | 43 7% | 52.8 -15% | 53.2 -15% | |||
| Load Maximum * (dB) | 53.2 | 47.7 10% | 45 15% | 52.9 1% | 51.9 2% | 47 12% | 53.3 -0% |
| Witcher 3 ultra * (dB) | 44.3 | 48.3 | 44 |
* ... Moindre est la valeur, meilleures sont les performances
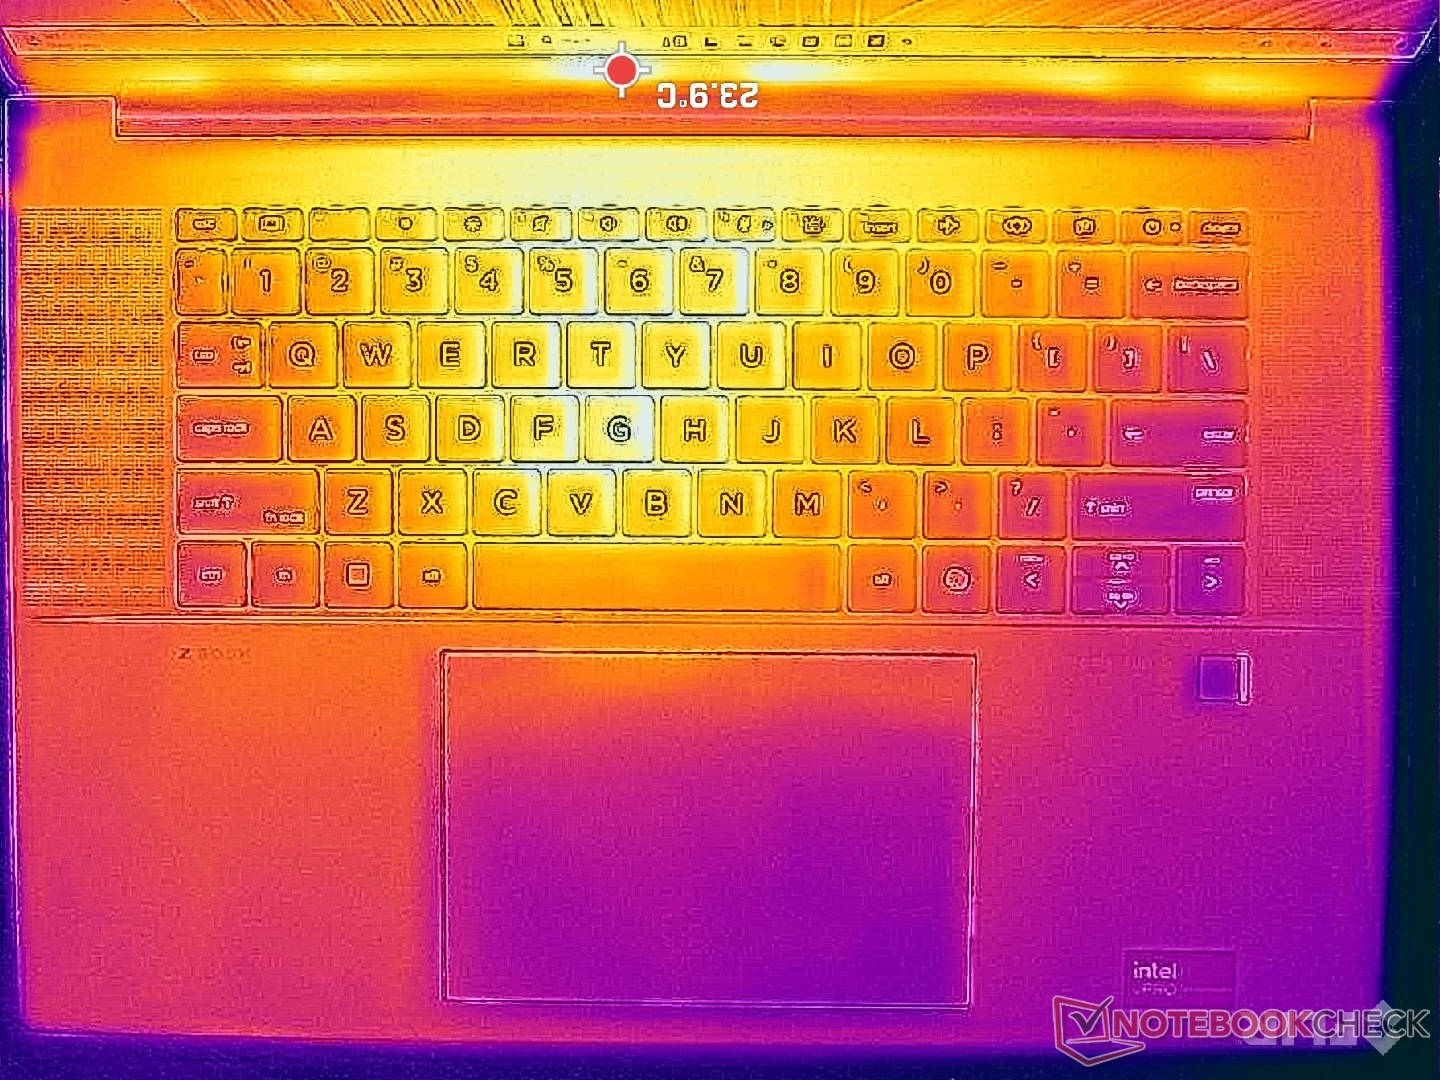
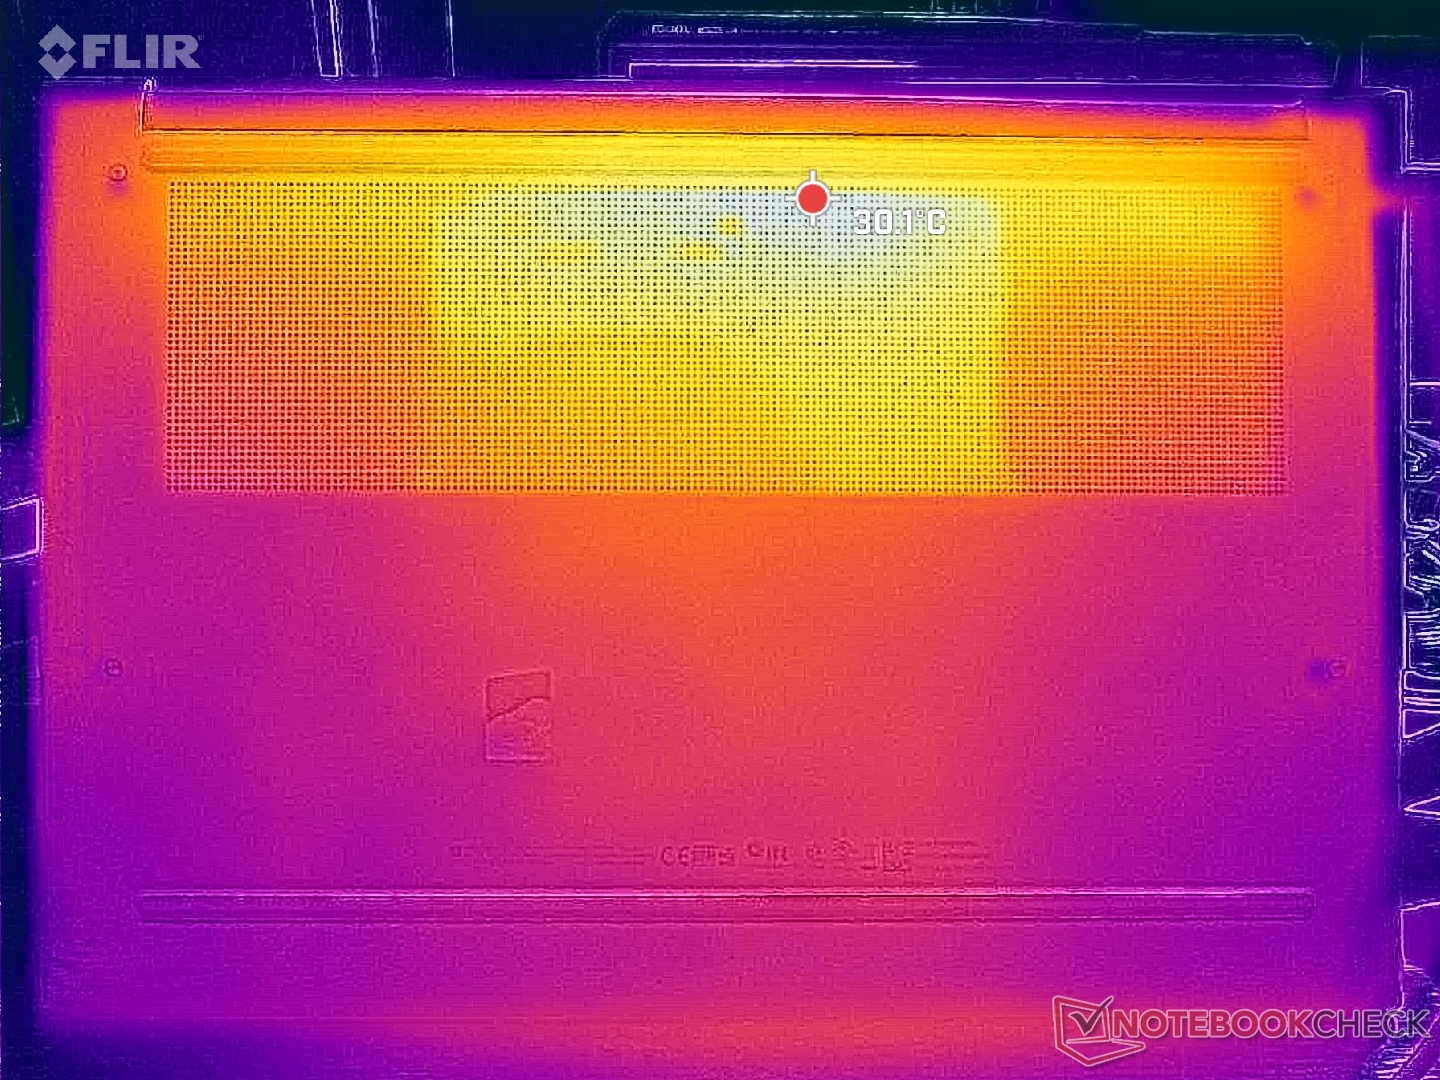
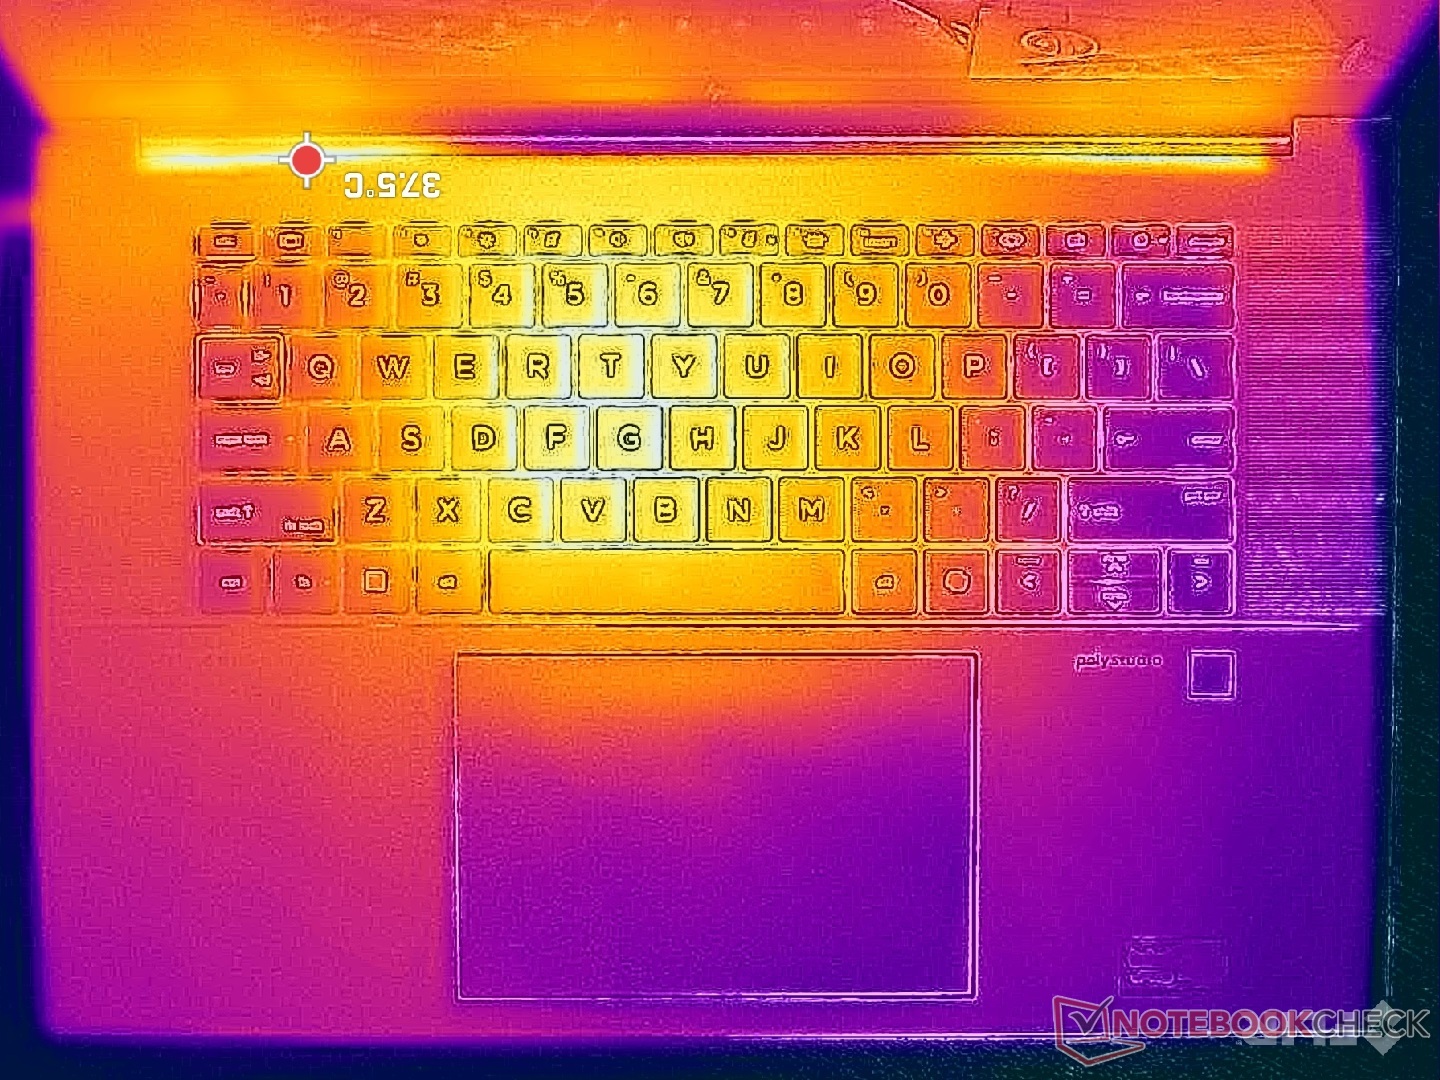
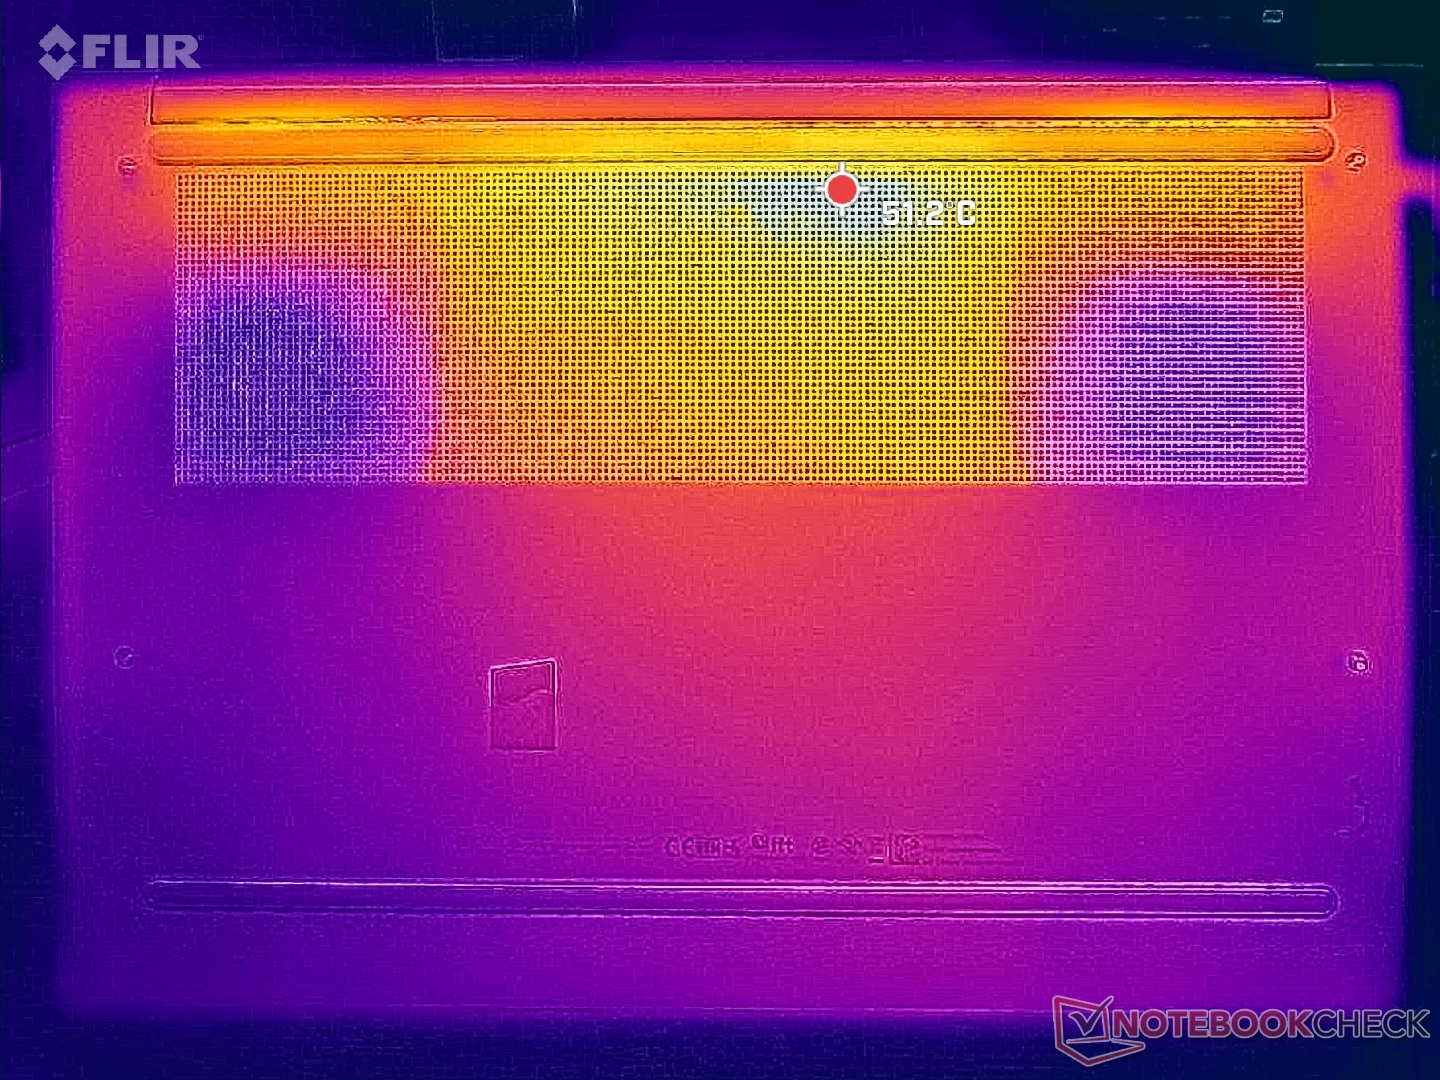
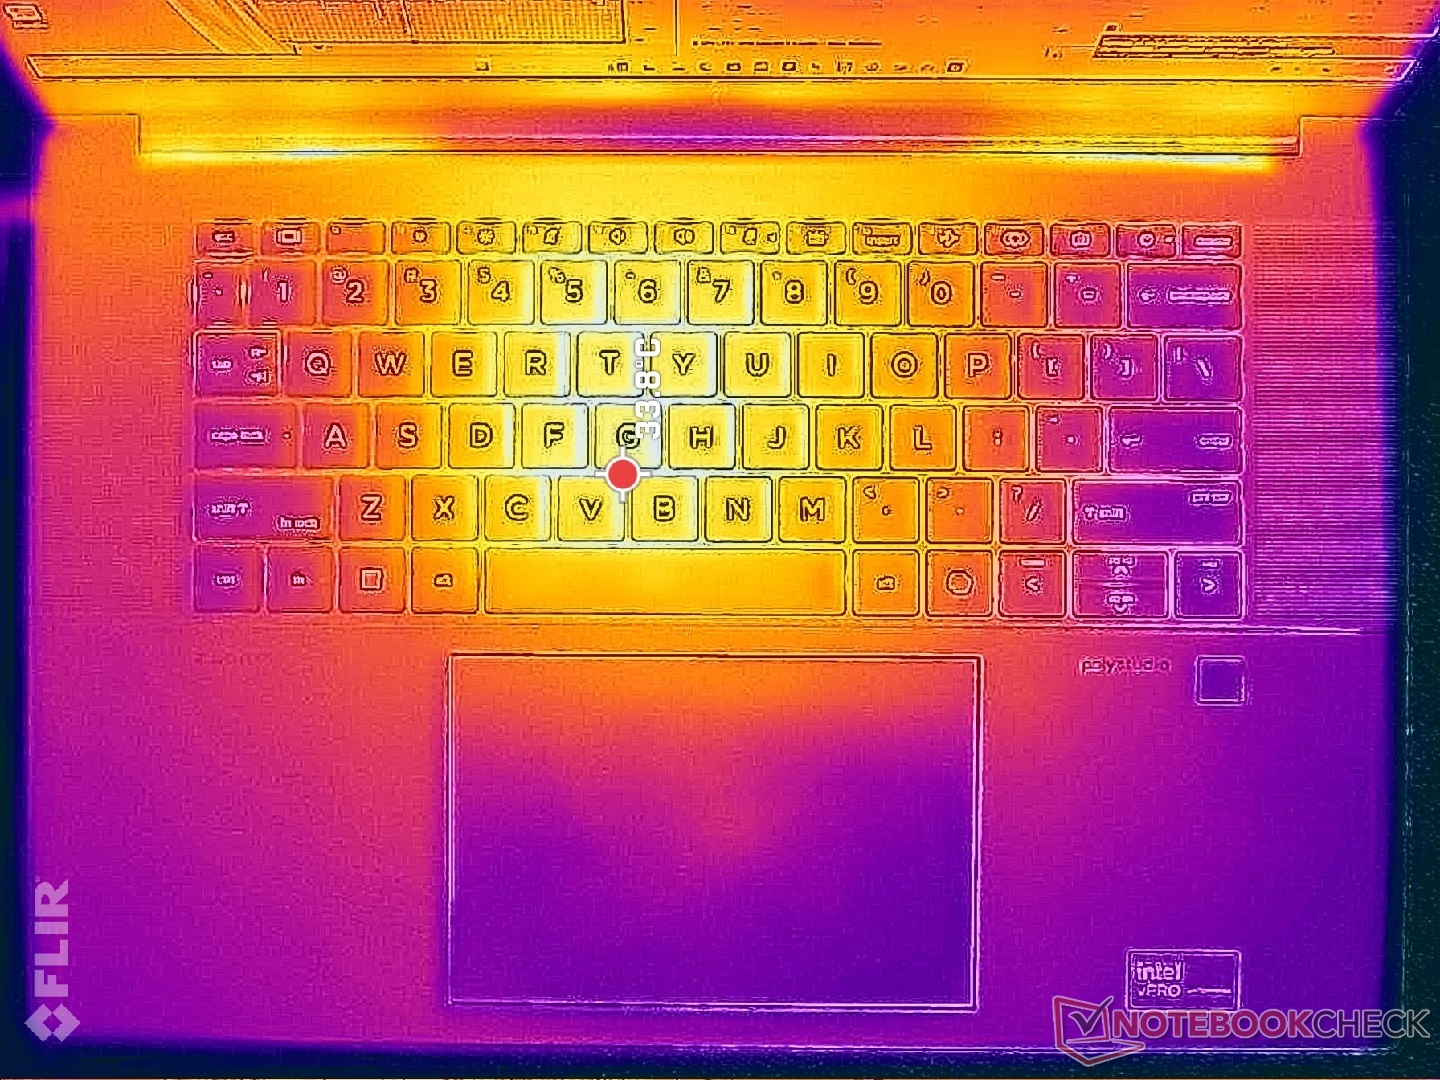
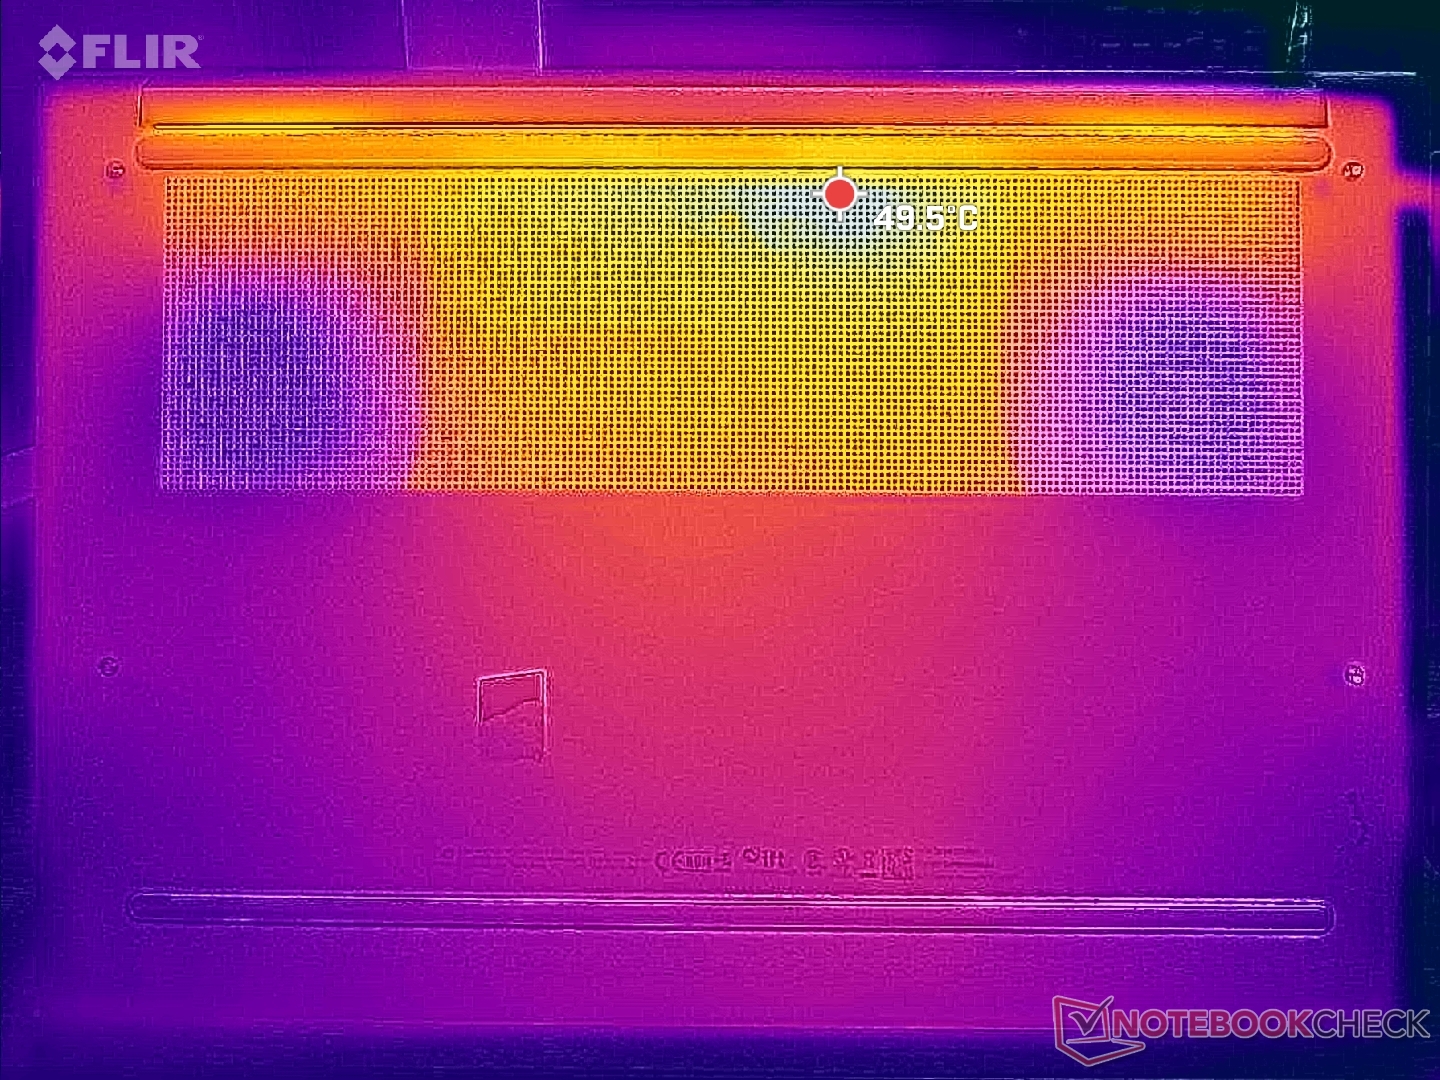
Température
Les températures de surface sont les plus élevées à l'arrière de l'appareil, où les points chauds peuvent atteindre plus de 48°C. Heureusement, le clavier et les repose-paumes restent beaucoup plus frais et plus tolérables, avec une température maximale de 38°C au centre de l'appareil.
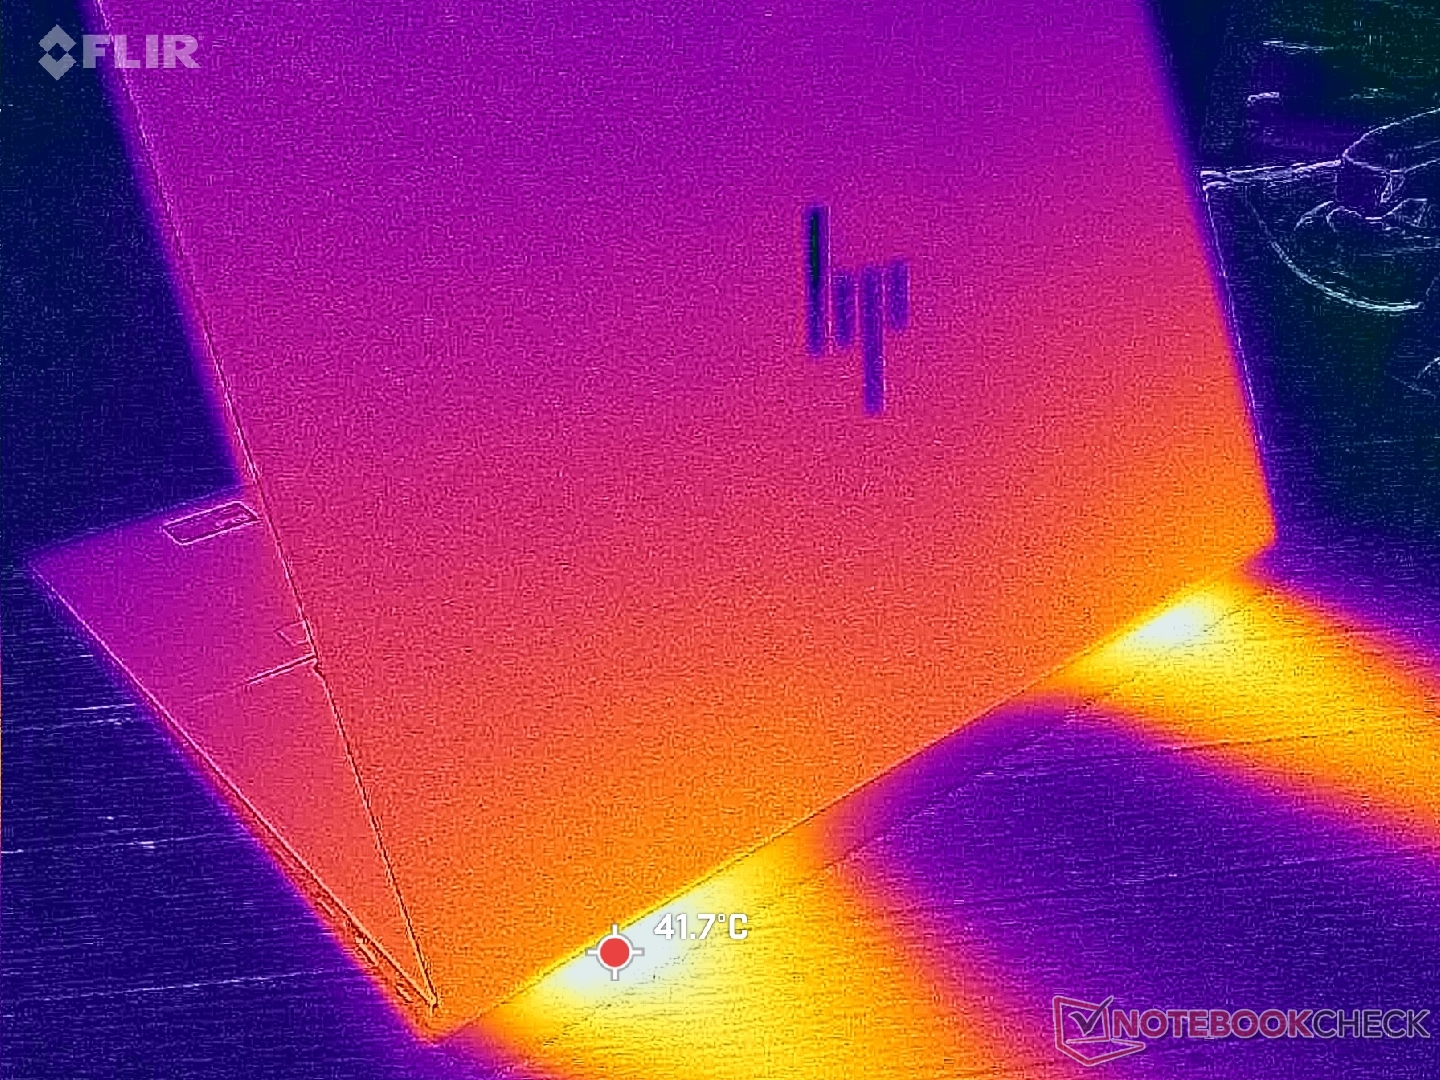
(+) La température maximale du côté supérieur est de 36.6 °C / 98 F, par rapport à la moyenne de 38.2 °C / 101 F, allant de 22.2 à 69.8 °C pour la classe Workstation.
(-) Le fond chauffe jusqu'à un maximum de 47.8 °C / 118 F, contre une moyenne de 41.1 °C / 106 F
(+) En utilisation inactive, la température moyenne du côté supérieur est de 27.2 °C / 81 F, par rapport à la moyenne du dispositif de 32 °C / 90 F.
(+) 3: The average temperature for the upper side is 30.3 °C / 87 F, compared to the average of 32 °C / 90 F for the class Workstation.
(+) Les repose-poignets et le pavé tactile sont plus froids que la température de la peau avec un maximum de 27.4 °C / 81.3 F et sont donc froids au toucher.
(±) La température moyenne de la zone de l'appui-paume de dispositifs similaires était de 27.8 °C / 82 F (+0.4 °C / #0.7 F).
| HP ZBook Studio 16 G11 Intel Core Ultra 9 185H, NVIDIA RTX 3000 Ada Generation Laptop | HP ZBook Studio 16 G9 62U04EA Intel Core i7-12800H, NVIDIA RTX A2000 Laptop GPU | HP ZBook Power 16 G11 A AMD Ryzen 7 8845HS, NVIDIA RTX 2000 Ada Generation Laptop | Lenovo ThinkPad P16 Gen 2 Intel Core i7-14700HX, NVIDIA RTX 4000 Ada Generation Laptop | Dell Precision 5690 Intel Core Ultra 9 185H, NVIDIA RTX 5000 Ada Generation Laptop | MSI CreatorPro Z16P B12UKST Intel Core i7-12700H, NVIDIA RTX A3000 Laptop GPU | Lenovo ThinkPad P1 Gen 7 21KV001SGE Intel Core Ultra 7 155H, NVIDIA GeForce RTX 4060 Laptop GPU | |
|---|---|---|---|---|---|---|---|
| Heat | 2% | 12% | 4% | 5% | -13% | 4% | |
| Maximum Upper Side * (°C) | 36.6 | 38.7 -6% | 40.6 -11% | 46.6 -27% | 46.6 -27% | 56.3 -54% | 50.3 -37% |
| Maximum Bottom * (°C) | 47.8 | 53.4 -12% | 40.6 15% | 51 -7% | 33 31% | 68.3 -43% | 38 21% |
| Idle Upper Side * (°C) | 31.4 | 27.3 13% | 26 17% | 24.8 21% | 32.4 -3% | 25.2 20% | 28.3 10% |
| Idle Bottom * (°C) | 35.6 | 31.6 11% | 26.6 25% | 25.6 28% | 29.4 17% | 25.9 27% | 27.3 23% |
* ... Moindre est la valeur, meilleures sont les performances
Intervenants
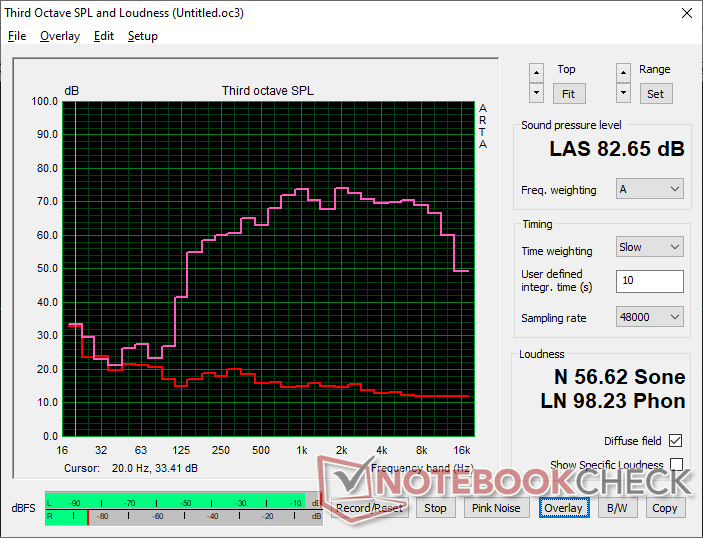
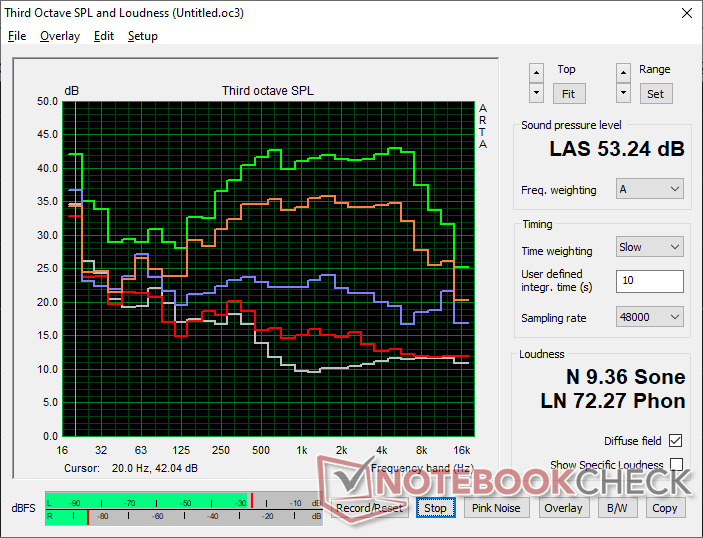
HP ZBook Studio 16 G11 analyse audio
(+) | les haut-parleurs peuvent jouer relativement fort (82.7# dB)
Basses 100 - 315 Hz
(-) | presque aucune basse - en moyenne 17.4% plus bas que la médiane
(±) | la linéarité des basses est moyenne (11.8% delta à la fréquence précédente)
Médiums 400 - 2000 Hz
(+) | médiane équilibrée - seulement 3.4% de la médiane
(±) | la linéarité des médiums est moyenne (7% delta à la fréquence précédente)
Aiguës 2 - 16 kHz
(+) | des sommets équilibrés - à seulement 2.4% de la médiane
(+) | les aigus sont linéaires (2.6% delta à la fréquence précédente)
Globalement 100 - 16 000 Hz
(±) | la linéarité du son global est moyenne (15.2% de différence avec la médiane)
Par rapport à la même classe
» 33% de tous les appareils testés de cette catégorie étaient meilleurs, 10% similaires, 57% pires
» Le meilleur avait un delta de 7%, la moyenne était de 17%, le pire était de 35%.
Par rapport à tous les appareils testés
» 22% de tous les appareils testés étaient meilleurs, 4% similaires, 74% pires
» Le meilleur avait un delta de 4%, la moyenne était de 23%, le pire était de 134%.
Apple MacBook Pro 16 2021 M1 Pro analyse audio
(+) | les haut-parleurs peuvent jouer relativement fort (84.7# dB)
Basses 100 - 315 Hz
(+) | bonne basse - seulement 3.8% loin de la médiane
(+) | les basses sont linéaires (5.2% delta à la fréquence précédente)
Médiums 400 - 2000 Hz
(+) | médiane équilibrée - seulement 1.3% de la médiane
(+) | les médiums sont linéaires (2.1% delta à la fréquence précédente)
Aiguës 2 - 16 kHz
(+) | des sommets équilibrés - à seulement 1.9% de la médiane
(+) | les aigus sont linéaires (2.7% delta à la fréquence précédente)
Globalement 100 - 16 000 Hz
(+) | le son global est linéaire (4.6% différence à la médiane)
Par rapport à la même classe
» 0% de tous les appareils testés de cette catégorie étaient meilleurs, 0% similaires, 100% pires
» Le meilleur avait un delta de 5%, la moyenne était de 17%, le pire était de 45%.
Par rapport à tous les appareils testés
» 0% de tous les appareils testés étaient meilleurs, 0% similaires, 100% pires
» Le meilleur avait un delta de 4%, la moyenne était de 23%, le pire était de 134%.
Gestion de l'énergie
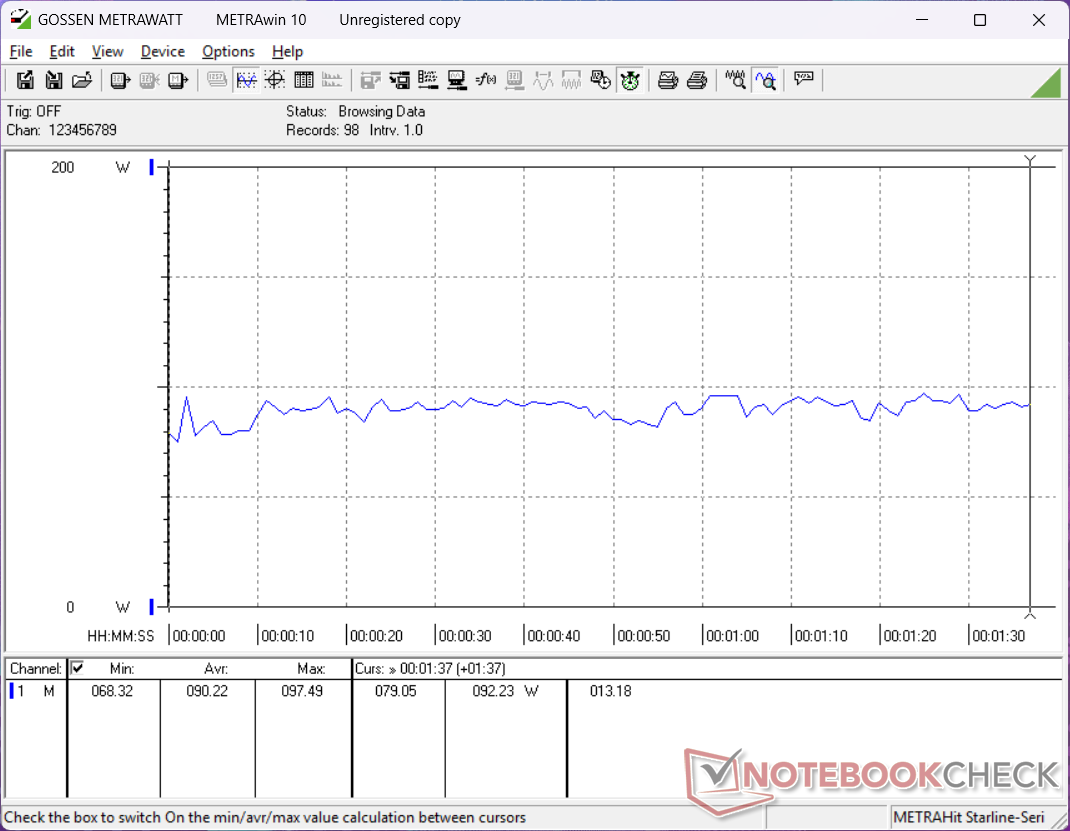
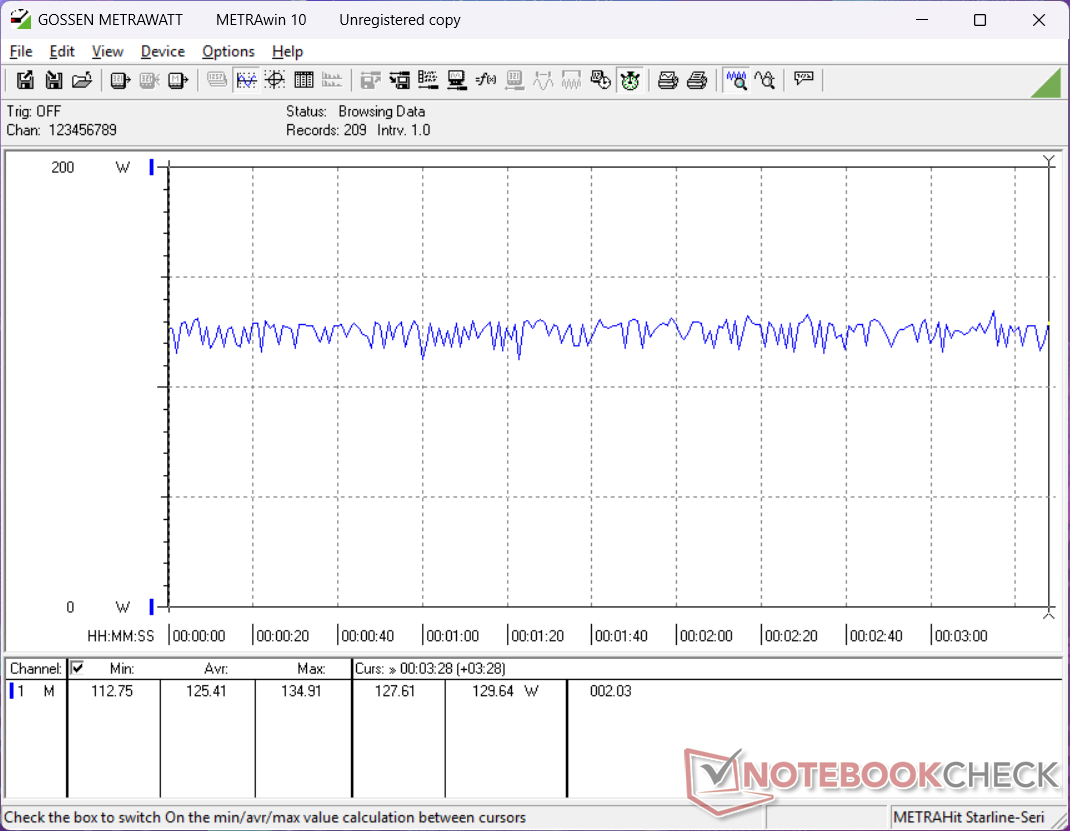
Consommation électrique
Ce modèle est légèrement plus exigeant que le ZBook Studio 16 G9, plus ancien et plus lent. Toutefois, les performances par watt sont nettement supérieures, ce qui justifie la consommation plus élevée pour les chasseurs de performances.
| Éteint/en veille | |
| Au repos | |
| Fortement sollicité |
|
Légende:
min: | |
| HP ZBook Studio 16 G11 Ultra 9 185H, RTX 3000 Ada Generation Laptop, Kioxia XG8 KXG80ZNV1T02, IPS, 3840x2400, 16" | HP ZBook Studio 16 G9 62U04EA i7-12800H, RTX A2000 Laptop GPU, Micron 3400 1TB MTFDKBA1T0TFH, IPS, 3840x2400, 16" | HP ZBook Power 16 G11 A R7 8845HS, RTX 2000 Ada Generation Laptop, Samsung PM9A1 MZVL22T0HBLB, IPS, 2560x1600, 16" | Lenovo ThinkPad P16 Gen 2 i7-14700HX, RTX 4000 Ada Generation Laptop, SK hynix PC801 HFS001TEJ9X162N, IPS, 2560x1600, 16" | Dell Precision 5690 Ultra 9 185H, RTX 5000 Ada Generation Laptop, 2x Samsung PM9A1 1TB (RAID 0), OLED, 3840x2400, 16" | MSI CreatorPro Z16P B12UKST i7-12700H, RTX A3000 Laptop GPU, Samsung PM9A1 MZVL21T0HCLR, IPS, 2560x1600, 16" | Lenovo ThinkPad P1 Gen 7 21KV001SGE Ultra 7 155H, GeForce RTX 4060 Laptop GPU, Kioxia XG8 KXG8AZNV1T02, IPS LED, 2560x1600, 16" | |
|---|---|---|---|---|---|---|---|
| Power Consumption | 8% | 36% | -26% | 9% | 7% | 17% | |
| Idle Minimum * (Watt) | 14 | 7.2 49% | 4.6 67% | 7.9 44% | 7.9 44% | 10.8 23% | 7.3 48% |
| Idle Average * (Watt) | 22.4 | 18.1 19% | 10 55% | 13.1 42% | 12 46% | 16.3 27% | 12.3 45% |
| Idle Maximum * (Watt) | 25.7 | 18.5 28% | 10.6 59% | 24.2 6% | 28.6 -11% | 16.9 34% | 17.9 30% |
| Load Average * (Watt) | 90.2 | 112.8 -25% | 60.9 32% | 127.4 -41% | 98.8 -10% | 111.7 -24% | 78.2 13% |
| Cyberpunk 2077 ultra external monitor * (Watt) | 120.3 | 92.8 23% | 219 -82% | 117.7 2% | |||
| Cyberpunk 2077 ultra * (Watt) | 125.4 | 96.8 23% | 225 -79% | 123.5 2% | |||
| Load Maximum * (Watt) | 142 | 186 -31% | 154.8 -9% | 248.5 -75% | 174.8 -23% | 177.4 -25% | 167.5 -18% |
| Witcher 3 ultra * (Watt) | 106.7 | 144.5 | 152.1 |
* ... Moindre est la valeur, meilleures sont les performances
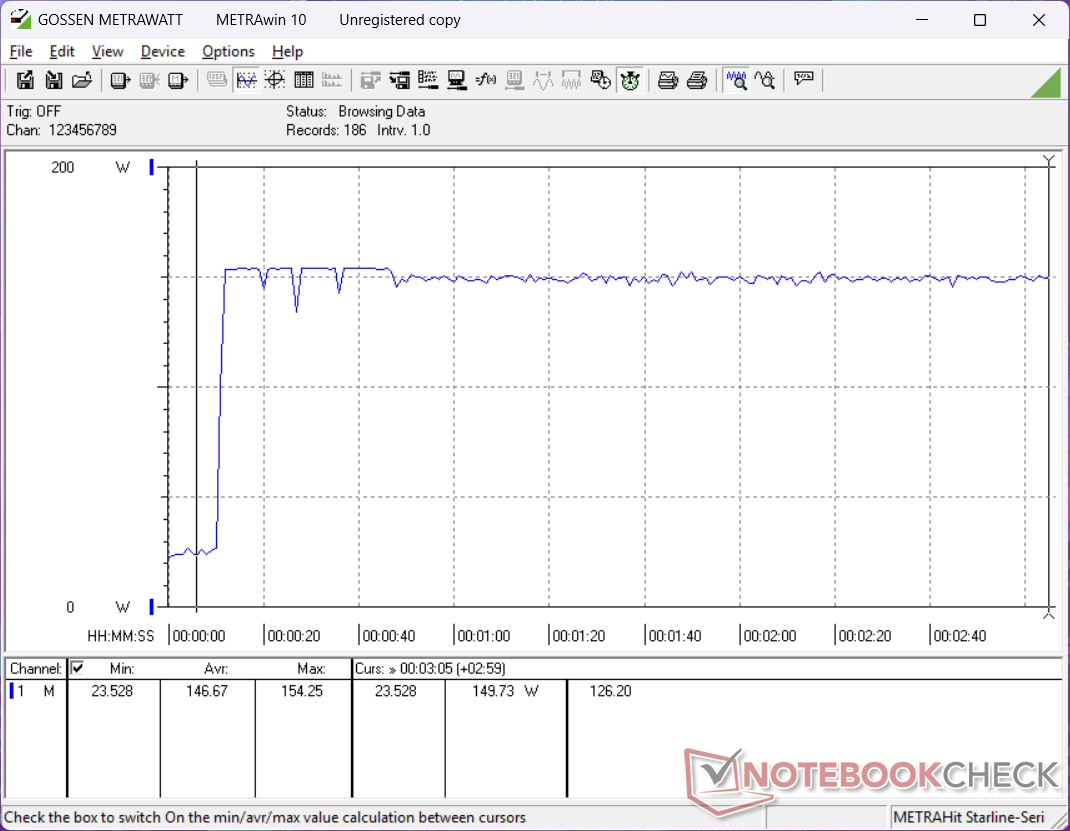
Power Consumption Cyberpunk / Stress Test
Power Consumption external Monitor
Autonomie de la batterie
Les durées d'exécution ne se sont pas améliorées et peuvent même être plus courtes qu'auparavant.
| HP ZBook Studio 16 G11 Ultra 9 185H, RTX 3000 Ada Generation Laptop, 86 Wh | HP ZBook Studio 16 G9 62U04EA i7-12800H, RTX A2000 Laptop GPU, 86 Wh | HP ZBook Power 16 G11 A R7 8845HS, RTX 2000 Ada Generation Laptop, 83 Wh | Lenovo ThinkPad P16 Gen 2 i7-14700HX, RTX 4000 Ada Generation Laptop, 94 Wh | Dell Precision 5690 Ultra 9 185H, RTX 5000 Ada Generation Laptop, 98 Wh | MSI CreatorPro Z16P B12UKST i7-12700H, RTX A3000 Laptop GPU, 90 Wh | Lenovo ThinkPad P1 Gen 7 21KV001SGE Ultra 7 155H, GeForce RTX 4060 Laptop GPU, 90 Wh | |
|---|---|---|---|---|---|---|---|
| Autonomie de la batterie | 31% | 102% | -48% | 92% | 21% | 106% | |
| WiFi v1.3 (h) | 4.8 | 6.3 31% | 9.7 102% | 2.5 -48% | 9.2 92% | 5.8 21% | 9.9 106% |
| H.264 (h) | 8.5 | ||||||
| Load (h) | 1.1 | 1.7 | 1.9 | ||||
| Reader / Idle (h) | 26.1 |
Notebookcheck Rating
HP ZBook Studio 16 G11
- 11/30/2024 v8
Allen Ngo
 Total Sustainability Score:
 Transparency
La sélection des appareils à examiner est effectuée par notre équipe éditoriale. L'échantillon de test a été prêté à l'auteur par le fabricant ou le détaillant pour les besoins de cet examen. Le prêteur n'a pas eu d'influence sur cette évaluation et le fabricant n'a pas reçu de copie de cette évaluation avant sa publication. Il n'y avait aucune obligation de publier cet article. En tant que média indépendant, Notebookcheck n'est pas soumis à l'autorité des fabricants, des détaillants ou des éditeurs.
Voici comment Notebookcheck teste
Chaque année, Notebookcheck examine de manière indépendante des centaines d'ordinateurs portables et de smartphones en utilisant des procédures standardisées afin de garantir que tous les résultats sont comparables. Nous avons continuellement développé nos méthodes de test depuis environ 20 ans et avons établi des normes industrielles dans le processus. Dans nos laboratoires de test, des équipements de mesure de haute qualité sont utilisés par des techniciens et des rédacteurs expérimentés. Ces tests impliquent un processus de validation en plusieurs étapes. Notre système d'évaluation complexe repose sur des centaines de mesures et de points de référence bien fondés, ce qui garantit l'objectivité.
