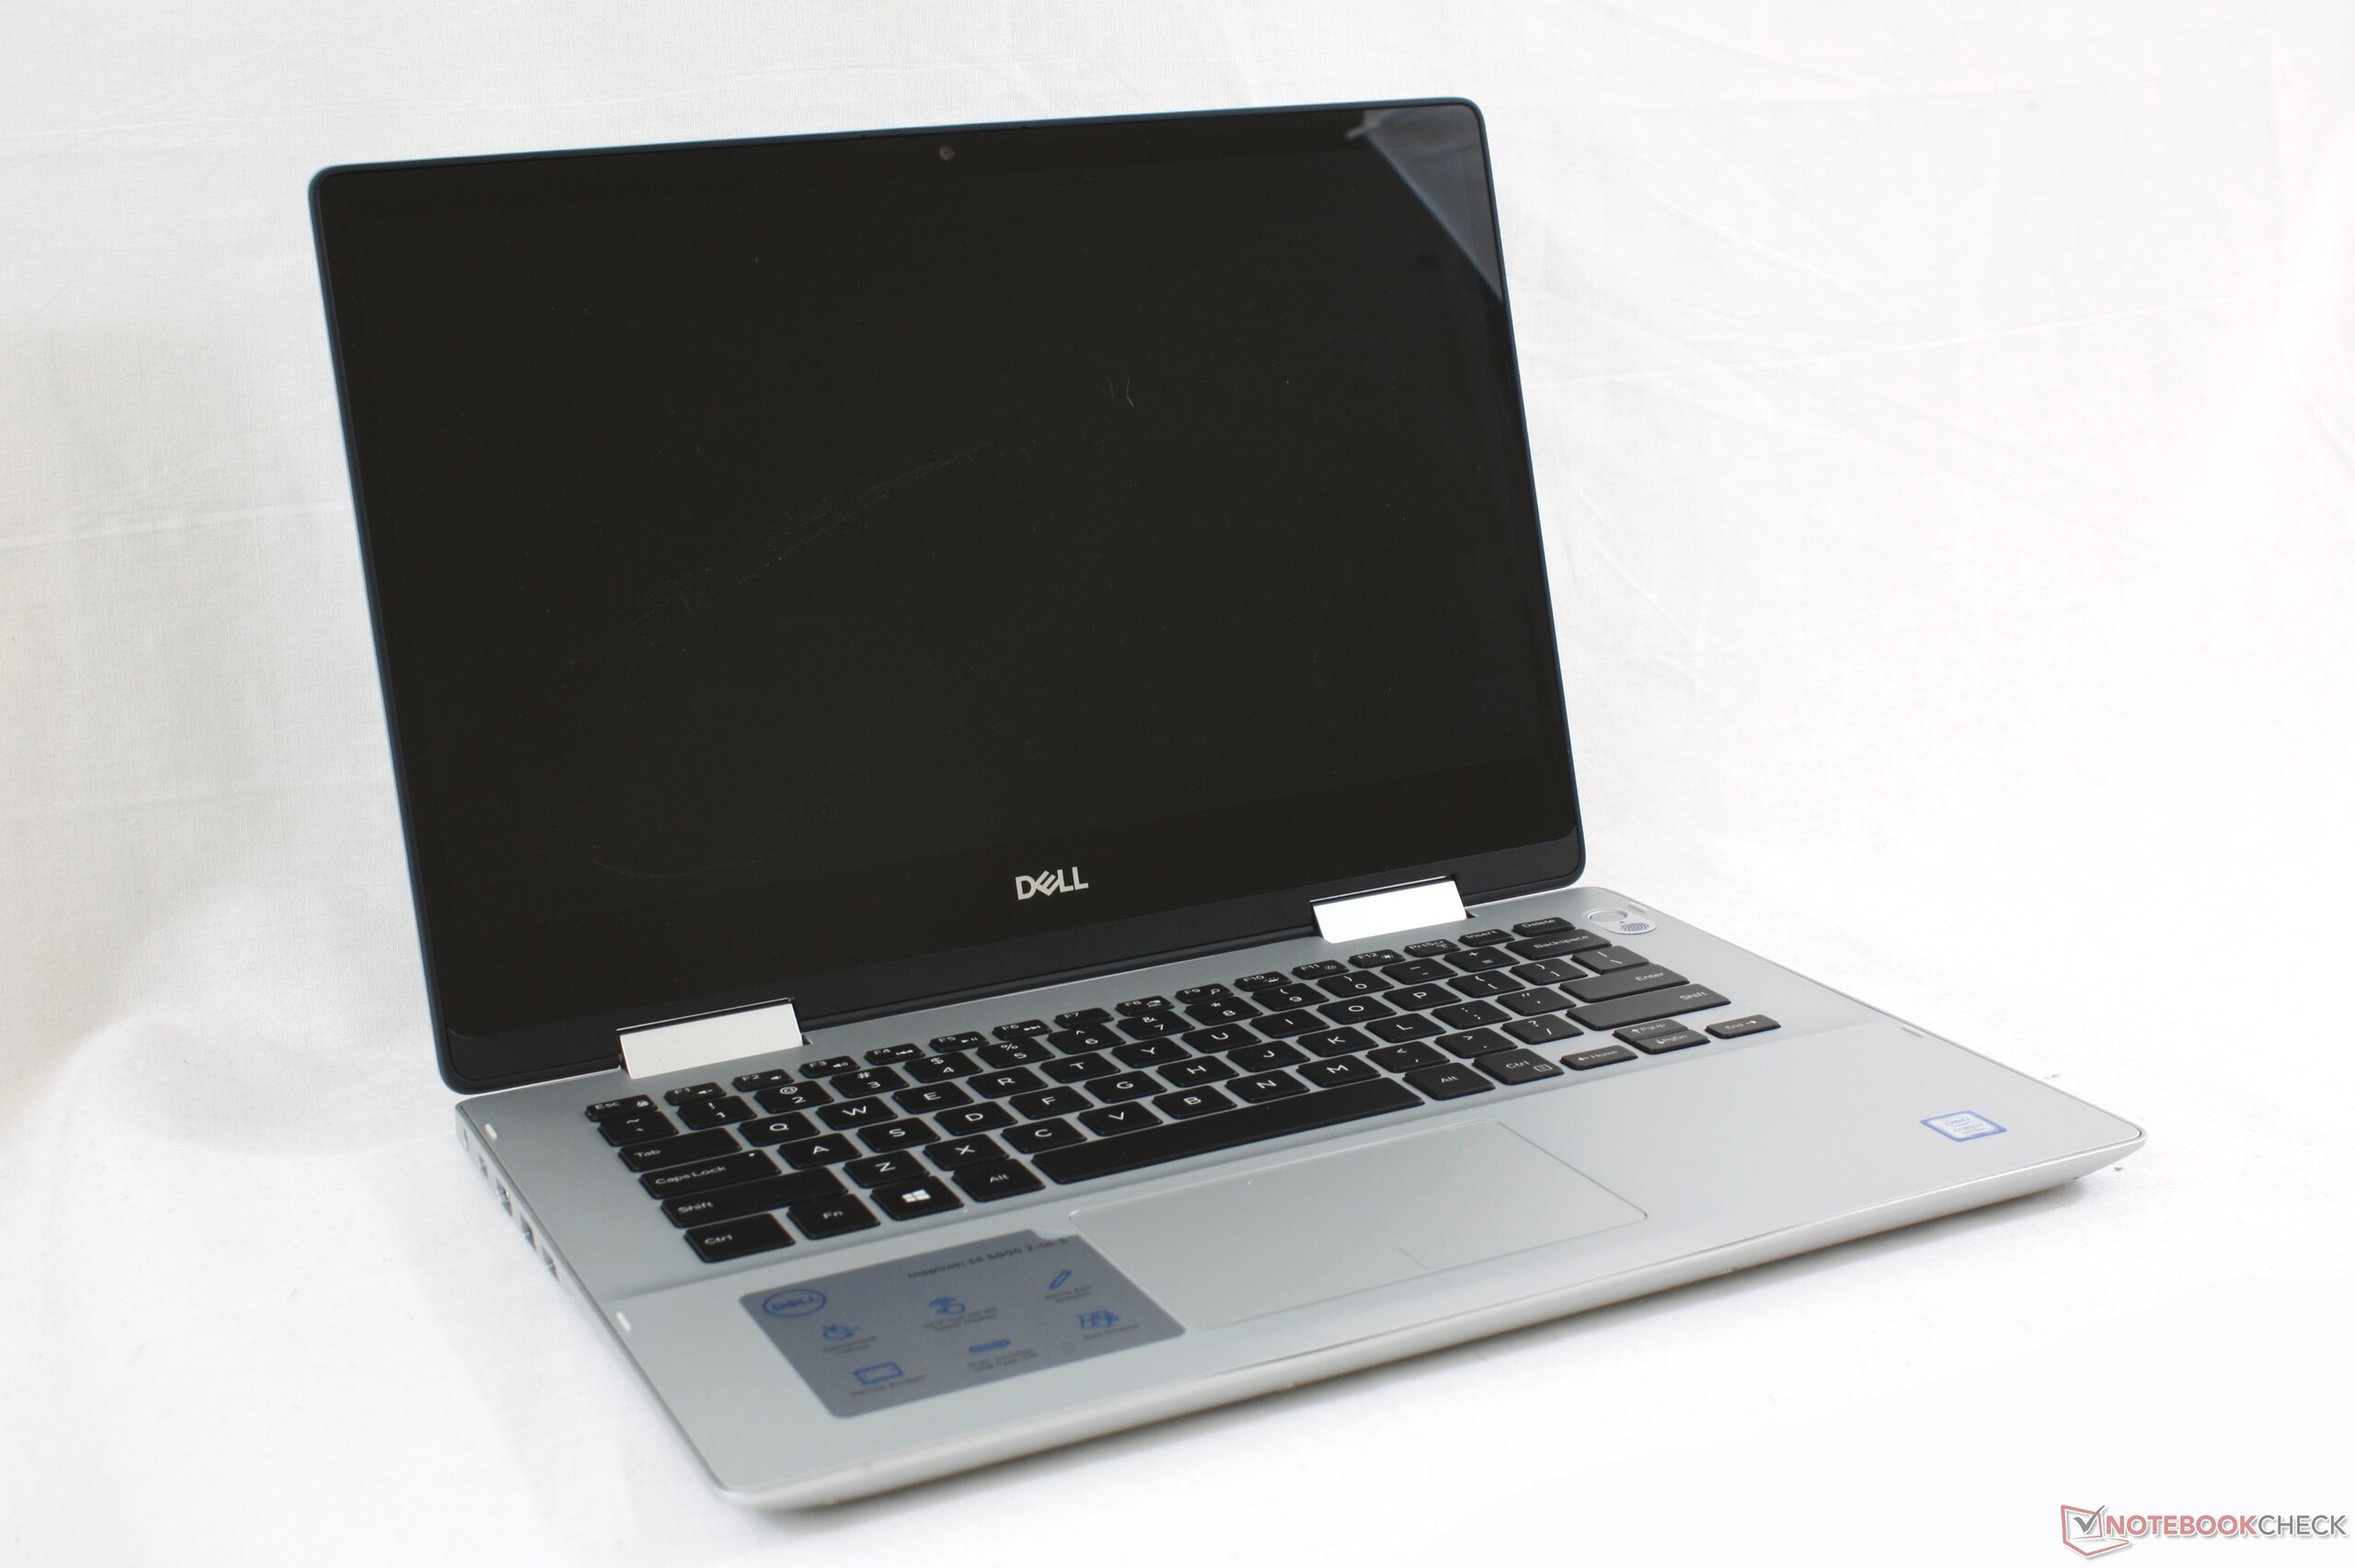
Courte critique du convertible Dell Inspiron 14 5000 5482 2-en-1 (i7-8565U, UHD 620, FHD)
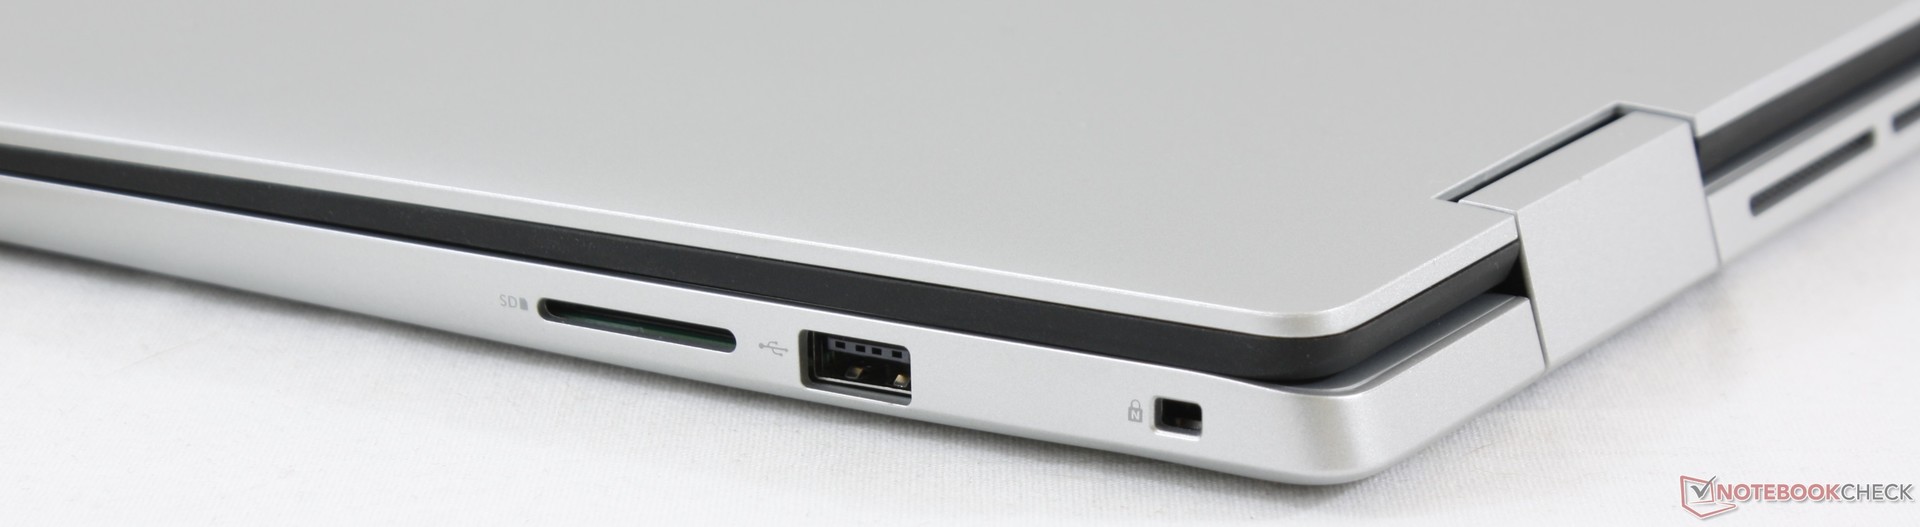
| SD Card Reader | |
| average JPG Copy Test (av. of 3 runs) | |
| Dell XPS 13 9370 i7 UHD (Toshiba Exceria Pro UHS-II) | |
| Dell Inspiron 14 5000 5482 2-in-1 (Toshiba Exceria Pro SDXC 64 GB UHS-II) | |
| Lenovo Yoga 530-14IKB-81EK00CWGE (Toshiba Exceria Pro SDXC 64 GB UHS-II) | |
| Asus VivoBook Flip 14 TP412UA-DB51T (Toshiba Exceria Pro SDXC 64 GB UHS-II) | |
| maximum AS SSD Seq Read Test (1GB) | |
| Dell XPS 13 9370 i7 UHD (Toshiba Exceria Pro UHS-II) | |
| Dell Inspiron 14 5000 5482 2-in-1 (Toshiba Exceria Pro SDXC 64 GB UHS-II) | |
| Lenovo Yoga 530-14IKB-81EK00CWGE (Toshiba Exceria Pro SDXC 64 GB UHS-II) | |
| Asus VivoBook Flip 14 TP412UA-DB51T (Toshiba Exceria Pro SDXC 64 GB UHS-II) | |
| |||||||||||||||||||||||||
Homogénéité de la luminosité: 78 %
Valeur mesurée au centre, sur batterie: 193.6 cd/m²
Contraste: 1139:1 (Valeurs des noirs: 0.17 cd/m²)
ΔE ColorChecker Calman: 6.99 | ∀{0.5-29.43 Ø4.73}
calibrated: 4.86
ΔE Greyscale Calman: 5.7 | ∀{0.09-98 Ø4.97}
58.1% sRGB (Calman 2D)
37.6% AdobeRGB 1998 (Argyll 1.6.3 3D)
41.91% AdobeRGB 1998 (Argyll 3D)
58.6% sRGB (Argyll 3D)
40.57% Display P3 (Argyll 3D)
Gamma: 2.12
CCT: 5845 K
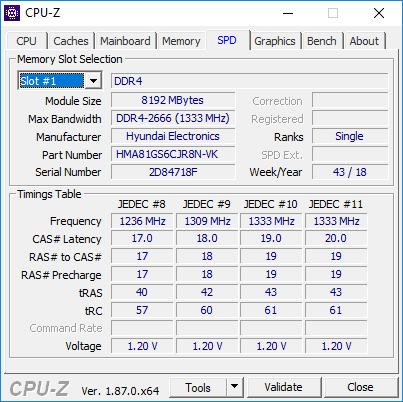
| Dell Inspiron 14 5000 5482 2-in-1 NV14N4H, IPS, 14", 1920x1080 | Lenovo Yoga 530-14IKB-81EK00CWGE InfoVision M140NWF5 R2, IPS, 14", 1920x1080 | Asus VivoBook Flip 14 TP412UA-DB51T AUO B140HAN04.0, IPS, 14", 1920x1080 | Dell XPS 13 9365-4537 2-in-1 Sharp LQ133Z1, IPS, 13.3", 3200x1800 | Lenovo Yoga C930-13IKB B139HAN03_0, IPS, 13.9", 1920x1080 | Huawei Matebook X Pro i5 Tianma XM, IPS, 13.9", 3000x2000 | |
|---|---|---|---|---|---|---|
| Display | 3% | -2% | 59% | 59% | 62% | |
| Display P3 Coverage (%) | 40.57 | 41.52 2% | 39.42 -3% | 64.4 59% | 64.3 58% | 65.9 62% |
| sRGB Coverage (%) | 58.6 | 62.1 6% | 59.2 1% | 92.9 59% | 94.6 61% | 95.2 62% |
| AdobeRGB 1998 Coverage (%) | 41.91 | 42.92 2% | 40.73 -3% | 66.1 58% | 66.2 58% | 67.6 61% |
| Response Times | 17% | 21% | 17% | 24% | 27% | |
| Response Time Grey 50% / Grey 80% * (ms) | 58.8 ? | 45 ? 23% | 38 ? 35% | 48 ? 18% | 40.8 ? 31% | 40.4 ? 31% |
| Response Time Black / White * (ms) | 33.2 ? | 30 ? 10% | 30.8 ? 7% | 28 ? 16% | 27.6 ? 17% | 25.6 ? 23% |
| PWM Frequency (Hz) | 198.4 ? | 520 ? | ||||
| Screen | 36% | 13% | 47% | 14% | 43% | |
| Brightness middle (cd/m²) | 193.6 | 240 24% | 255.5 32% | 348 80% | 316 63% | 442.7 129% |
| Brightness (cd/m²) | 181 | 234 29% | 242 34% | 306 69% | 291 61% | 428 136% |
| Brightness Distribution (%) | 78 | 93 19% | 87 12% | 78 0% | 83 6% | 84 8% |
| Black Level * (cd/m²) | 0.17 | 0.11 35% | 0.29 -71% | 0.2 -18% | 0.36 -112% | 0.31 -82% |
| Contrast (:1) | 1139 | 2182 92% | 881 -23% | 1740 53% | 878 -23% | 1428 25% |
| Colorchecker dE 2000 * | 6.99 | 4.98 29% | 4.18 40% | 2.79 60% | 5.9 16% | 2.24 68% |
| Colorchecker dE 2000 max. * | 23.58 | 10.75 54% | 19.15 19% | 5.53 77% | 12.9 45% | 7.19 70% |
| Colorchecker dE 2000 calibrated * | 4.86 | 3.33 31% | 3.8 22% | 1.3 73% | 1.11 77% | |
| Greyscale dE 2000 * | 5.7 | 3.51 38% | 2.2 61% | 3.47 39% | 8.6 -51% | 9.7 -70% |
| Gamma | 2.12 104% | 2.2 100% | 2.05 107% | 2.54 87% | 2.1 105% | 1.42 155% |
| CCT | 5845 111% | 6606 98% | 6599 98% | 6564 99% | 6854 95% | 6227 104% |
| Color Space (Percent of AdobeRGB 1998) (%) | 37.6 | 40 6% | 37.5 0% | 60 60% | 60.7 61% | 61.6 64% |
| Color Space (Percent of sRGB) (%) | 62 | 59.1 | 93 | 94.5 | 95 | |
| Moyenne finale (programmes/paramètres) | 19% /
27% | 11% /
11% | 41% /
45% | 32% /
24% | 44% /
44% |
* ... Moindre est la valeur, meilleures sont les performances
Temps de réponse de l'écran
| ↔ Temps de réponse noir à blanc | ||
|---|---|---|
| 33.2 ms ... hausse ↗ et chute ↘ combinées | ↗ 20 ms hausse | 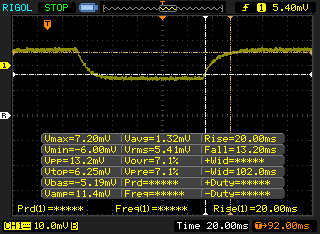 |
| ↘ 13.2 ms chute | ||
| L'écran souffre de latences très élevées, à éviter pour le jeu. En comparaison, tous les appareils testés affichent entre 0.1 (minimum) et 240 (maximum) ms. » 90 % des appareils testés affichent de meilleures performances. Cela signifie que les latences relevées sont moins bonnes que la moyenne (19.9 ms) de tous les appareils testés. | ||
| ↔ Temps de réponse gris 50% à gris 80% | ||
| 58.8 ms ... hausse ↗ et chute ↘ combinées | ↗ 25.6 ms hausse | 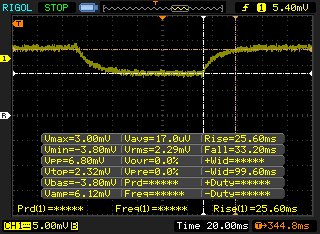 |
| ↘ 33.2 ms chute | ||
| L'écran souffre de latences très élevées, à éviter pour le jeu. En comparaison, tous les appareils testés affichent entre 0.165 (minimum) et 636 (maximum) ms. » 95 % des appareils testés affichent de meilleures performances. Cela signifie que les latences relevées sont moins bonnes que la moyenne (31.1 ms) de tous les appareils testés. | ||
Scintillement / MLI (Modulation de largeur d'impulsion)
| Scintillement / MLI (Modulation de largeur d'impulsion) décelé | 198.4 Hz | ≤ 98 Niveau de luminosité | 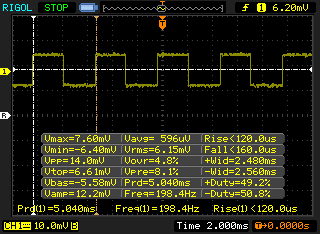 |
Le rétroéclairage de l'écran scintille à la fréquence de 198.4 Hz (certainement du fait de l'utilisation d'une MDI - Modulation de largeur d'impulsion) à un niveau de luminosité inférieur ou égal à 98 % . Aucun scintillement ne devrait être perceptible au-dessus de cette valeur. La fréquence de rafraîchissement de 198.4 Hz est relativement faible, les personnes les plus sensibles devraient percevoir un scintillement et être sujettes à une fatigue oculaire accrue (avec le niveau de luminosité indiqué) En comparaison, 52 % des appareils testés n'emploient pas MDI pour assombrir leur écran. Nous avons relevé une moyenne à 7801 (minimum : 5 - maximum : 343500) Hz dans le cas où une MDI était active. | |||
| wPrime 2.10 - 1024m | |
| HP Spectre Folio 13t-ak000 | |
| Dell XPS 13 9360-4764 | |
| Microsoft Surface Laptop i7 | |
| Dell XPS 13 9370 i7 UHD | |
| Moyenne Intel Core i7-8565U (263 - 420, n=7) | |
| Dell Inspiron 15 7000 7577 | |
| Dell Inspiron 14 5000 5482 2-in-1 | |
* ... Moindre est la valeur, meilleures sont les performances
| PCMark 8 Home Score Accelerated v2 | 3537 points | |
| PCMark 8 Work Score Accelerated v2 | 5032 points | |
| PCMark 10 Score | 4069 points | |
Aide | ||
| Dell Inspiron 14 5000 5482 2-in-1 SK Hynix BC501 NVMe 256 GB | Lenovo Yoga 530-14IKB-81EK00CWGE SK hynix PC401 HFS256GD9TNG | Asus VivoBook Flip 14 TP412UA-DB51T Micron 1100 MTFDDAV256TBN | Dell XPS 13 9365-4537 2-in-1 Toshiba NVMe THNSN5256GPUK | Lenovo Yoga C930-13IKB SK hynix PC401 HFS256GD9TNG | Huawei Matebook X Pro i5 Samsung PM961 MZVLW256HEHP | |
|---|---|---|---|---|---|---|
| AS SSD | 13% | -41% | -22% | -5% | 51% | |
| Seq Read (MB/s) | 576 | 2071 260% | 437.9 -24% | 1342 133% | 1850 221% | 2416 319% |
| Seq Write (MB/s) | 471.6 | 721 53% | 350.3 -26% | 543 15% | 661 40% | 1170 148% |
| 4K Read (MB/s) | 39.48 | 34.44 -13% | 23.31 -41% | 34.77 -12% | 38.04 -4% | 48.33 22% |
| 4K Write (MB/s) | 112.4 | 91 -19% | 64.7 -42% | 85.8 -24% | 95 -15% | 103.1 -8% |
| 4K-64 Read (MB/s) | 522 | 448.2 -14% | 234.3 -55% | 512 -2% | 434.3 -17% | 1039 99% |
| 4K-64 Write (MB/s) | 416.5 | 268.9 -35% | 279.4 -33% | 249.4 -40% | 266.3 -36% | 399.6 -4% |
| Access Time Read * (ms) | 0.046 | 0.046 -0% | 0.079 -72% | 0.169 -267% | 0.069 -50% | 0.058 -26% |
| Access Time Write * (ms) | 0.032 | 0.054 -69% | 0.056 -75% | 0.041 -28% | 0.056 -75% | 0.036 -13% |
| Score Read (Points) | 619 | 690 11% | 301 -51% | 681 10% | 657 6% | 1329 115% |
| Score Write (Points) | 576 | 432 -25% | 379 -34% | 389 -32% | 427 -26% | 620 8% |
| Score Total (Points) | 1520 | 1416 -7% | 839 -45% | 1388 -9% | 1373 -10% | 2575 69% |
| Copy ISO MB/s (MB/s) | 773 | 414.4 -46% | 714 -8% | 539 -30% | 739 -4% | |
| Copy Program MB/s (MB/s) | 344.4 | 364.3 6% | 264.7 -23% | 209.7 -39% | 312.3 -9% | |
| Copy Game MB/s (MB/s) | 536 | 354 -34% | 457.8 -15% | 340 -37% | 486.3 -9% | |
| CrystalDiskMark 5.2 / 6 | 12% | -48% | 1% | 19% | ||
| Write 4K (MB/s) | 111.8 | 123.1 10% | 66.5 -41% | 94.5 -15% | 116.5 4% | |
| Read 4K (MB/s) | 42.6 | 43.24 2% | 24.65 -42% | 39.95 -6% | 42.18 -1% | |
| Write Seq (MB/s) | 716 | 763 7% | 413.2 -42% | 531 -26% | 1079 51% | |
| Read Seq (MB/s) | 1107 | 1632 47% | 465.2 -58% | 1499 35% | 1030 -7% | |
| Write 4K Q32T1 (MB/s) | 451.5 | 268.6 -41% | 227 -50% | 315.3 -30% | 225.7 -50% | |
| Read 4K Q32T1 (MB/s) | 316.8 | 345.2 9% | 188.4 -41% | 279.8 -12% | 302.9 -4% | |
| Write Seq Q32T1 (MB/s) | 809 | 800 -1% | 439.9 -46% | 829 2% | 1174 45% | |
| Read Seq Q32T1 (MB/s) | 1610 | 2620 63% | 533 -67% | 2570 60% | 3394 111% | |
| Write 4K Q8T8 (MB/s) | 332 | |||||
| Read 4K Q8T8 (MB/s) | 488.6 | |||||
| Moyenne finale (programmes/paramètres) | 13% /
13% | -45% /
-44% | -22% /
-22% | -2% /
-3% | 35% /
39% |
* ... Moindre est la valeur, meilleures sont les performances

| 3DMark 06 Standard Score | 10342 points | |
| 3DMark 11 Performance | 1911 points | |
| 3DMark Cloud Gate Standard Score | 8073 points | |
| 3DMark Fire Strike Score | 1025 points | |
Aide | ||
| Bas | Moyen | Élevé | Ultra | |
|---|---|---|---|---|
| BioShock Infinite (2013) | 51.1 | 30.3 | 24.5 | 7.6 |
| Rocket League (2017) | 50.6 | 24.3 | 15.7 | |
| Shadow of the Tomb Raider (2018) | 12 |
| Dell Inspiron 14 5000 5482 2-in-1 UHD Graphics 620, i7-8565U, SK Hynix BC501 NVMe 256 GB | Lenovo Yoga 530-14IKB-81EK00CWGE UHD Graphics 620, i5-8250U, SK hynix PC401 HFS256GD9TNG | Asus VivoBook Flip 14 TP412UA-DB51T UHD Graphics 620, i5-8250U, Micron 1100 MTFDDAV256TBN | Huawei Matebook X Pro i5 GeForce MX150, i5-8250U, Samsung PM961 MZVLW256HEHP | Microsoft Surface Laptop i7 Iris Plus Graphics 640, i7-7660U, Samsung PM971 KUS040202M | Lenovo ThinkPad A485-20MU000CGE Vega 8, R5 PRO 2500U, Samsung SSD PM981 MZVLB256HAHQ | |
|---|---|---|---|---|---|---|
| Noise | -3% | -2% | -3% | -10% | 2% | |
| arrêt / environnement * (dB) | 28.2 | 30.3 -7% | 28.4 -1% | 27.9 1% | 30.5 -8% | 29.3 -4% |
| Idle Minimum * (dB) | 28.2 | 30.3 -7% | 28.4 -1% | 27.9 1% | 30.9 -10% | 29.3 -4% |
| Idle Average * (dB) | 28.2 | 30.3 -7% | 28.4 -1% | 27.9 1% | 30.9 -10% | 29.3 -4% |
| Idle Maximum * (dB) | 29.4 | 30.3 -3% | 28.4 3% | 27.9 5% | 30.9 -5% | 29.6 -1% |
| Load Average * (dB) | 35.8 | 36.1 -1% | 35.7 -0% | 36.2 -1% | 40.2 -12% | 31.6 12% |
| Load Maximum * (dB) | 35.8 | 33.9 5% | 39 -9% | 45.2 -26% | 40.2 -12% | 31.6 12% |
| Witcher 3 ultra * (dB) | 45 |
* ... Moindre est la valeur, meilleures sont les performances
Degré de la nuisance sonore
| Au repos |
| 28.2 / 28.2 / 29.4 dB(A) |
| Fortement sollicité |
| 35.8 / 35.8 dB(A) |
 | ||
30 dB silencieux 40 dB(A) audible 50 dB(A) bruyant |
||
min: | ||
(+) La température maximale du côté supérieur est de 33.2 °C / 92 F, par rapport à la moyenne de 35.4 °C / 96 F, allant de 19.6 à 60 °C pour la classe Convertible.
(±) Le fond chauffe jusqu'à un maximum de 42.6 °C / 109 F, contre une moyenne de 36.9 °C / 98 F
(+) En utilisation inactive, la température moyenne du côté supérieur est de 23.9 °C / 75 F, par rapport à la moyenne du dispositif de 30.3 °C / 87 F.
(+) Les repose-poignets et le pavé tactile sont plus froids que la température de la peau avec un maximum de 24.2 °C / 75.6 F et sont donc froids au toucher.
(+) La température moyenne de la zone de l'appui-paume de dispositifs similaires était de 28 °C / 82.4 F (+3.8 °C / #6.8 F).
Dell Inspiron 14 5000 5482 2-in-1 analyse audio
(-) | haut-parleurs pas très forts (68.2 dB)
Basses 100 - 315 Hz
(-) | presque aucune basse - en moyenne 16.4% plus bas que la médiane
(±) | la linéarité des basses est moyenne (8.9% delta à la fréquence précédente)
Médiums 400 - 2000 Hz
(+) | médiane équilibrée - seulement 4.2% de la médiane
(±) | la linéarité des médiums est moyenne (7.3% delta à la fréquence précédente)
Aiguës 2 - 16 kHz
(+) | des sommets équilibrés - à seulement 3.4% de la médiane
(±) | la linéarité des aigus est moyenne (8.6% delta à la fréquence précédente)
Globalement 100 - 16 000 Hz
(±) | la linéarité du son global est moyenne (20.1% de différence avec la médiane)
Par rapport à la même classe
» 51% de tous les appareils testés de cette catégorie étaient meilleurs, 6% similaires, 44% pires
» Le meilleur avait un delta de 6%, la moyenne était de 20%, le pire était de 57%.
Par rapport à tous les appareils testés
» 52% de tous les appareils testés étaient meilleurs, 8% similaires, 40% pires
» Le meilleur avait un delta de 4%, la moyenne était de 24%, le pire était de 134%.
Apple MacBook 12 (Early 2016) 1.1 GHz analyse audio
(+) | les haut-parleurs peuvent jouer relativement fort (83.6# dB)
Basses 100 - 315 Hz
(±) | basse réduite - en moyenne 11.3% inférieure à la médiane
(±) | la linéarité des basses est moyenne (14.2% delta à la fréquence précédente)
Médiums 400 - 2000 Hz
(+) | médiane équilibrée - seulement 2.4% de la médiane
(+) | les médiums sont linéaires (5.5% delta à la fréquence précédente)
Aiguës 2 - 16 kHz
(+) | des sommets équilibrés - à seulement 2% de la médiane
(+) | les aigus sont linéaires (4.5% delta à la fréquence précédente)
Globalement 100 - 16 000 Hz
(+) | le son global est linéaire (10.2% différence à la médiane)
Par rapport à la même classe
» 7% de tous les appareils testés de cette catégorie étaient meilleurs, 2% similaires, 91% pires
» Le meilleur avait un delta de 5%, la moyenne était de 18%, le pire était de 53%.
Par rapport à tous les appareils testés
» 5% de tous les appareils testés étaient meilleurs, 1% similaires, 94% pires
» Le meilleur avait un delta de 4%, la moyenne était de 24%, le pire était de 134%.
| Éteint/en veille | |
| Au repos | |
| Fortement sollicité |
|
Légende:
min: | |
| Dell Inspiron 14 5000 5482 2-in-1 i7-8565U, UHD Graphics 620, SK Hynix BC501 NVMe 256 GB, IPS, 1920x1080, 14" | Lenovo Yoga 530-14IKB-81EK00CWGE i5-8250U, UHD Graphics 620, SK hynix PC401 HFS256GD9TNG, IPS, 1920x1080, 14" | Asus VivoBook Flip 14 TP412UA-DB51T i5-8250U, UHD Graphics 620, Micron 1100 MTFDDAV256TBN, IPS, 1920x1080, 14" | Dell XPS 13 9365-4537 2-in-1 i5-7Y54, HD Graphics 615, Toshiba NVMe THNSN5256GPUK, IPS, 3200x1800, 13.3" | Lenovo Yoga C930-13IKB i5-8250U, UHD Graphics 620, SK hynix PC401 HFS256GD9TNG, IPS, 1920x1080, 13.9" | Huawei Matebook X Pro i5 i5-8250U, GeForce MX150, Samsung PM961 MZVLW256HEHP, IPS, 3000x2000, 13.9" | |
|---|---|---|---|---|---|---|
| Power Consumption | 13% | 18% | -37% | -10% | -31% | |
| Idle Minimum * (Watt) | 3.4 | 3.3 3% | 3.3 3% | 8.2 -141% | 3.3 3% | 3.5 -3% |
| Idle Average * (Watt) | 6.4 | 5.8 9% | 5.2 19% | 10.8 -69% | 6.8 -6% | 8.9 -39% |
| Idle Maximum * (Watt) | 7.8 | 8 -3% | 5.6 28% | 12.7 -63% | 9.5 -22% | 12.3 -58% |
| Load Average * (Watt) | 36.7 | 29.2 20% | 32.9 10% | 22.6 38% | 40.8 -11% | 54.2 -48% |
| Load Maximum * (Watt) | 49.3 | 31.1 37% | 35.2 29% | 24.6 50% | 57 -16% | 52.1 -6% |
| Witcher 3 ultra * (Watt) | 42.4 |
* ... Moindre est la valeur, meilleures sont les performances
| Dell Inspiron 14 5000 5482 2-in-1 i7-8565U, UHD Graphics 620, 42 Wh | Lenovo Yoga 530-14IKB-81EK00CWGE i5-8250U, UHD Graphics 620, 45 Wh | Asus VivoBook Flip 14 TP412UA-DB51T i5-8250U, UHD Graphics 620, 42 Wh | Dell XPS 13 9365-4537 2-in-1 i5-7Y54, HD Graphics 615, 46 Wh | Lenovo Yoga C930-13IKB i5-8250U, UHD Graphics 620, 60 Wh | Huawei Matebook X Pro i5 i5-8250U, GeForce MX150, 57.4 Wh | |
|---|---|---|---|---|---|---|
| Autonomie de la batterie | 13% | 33% | -6% | 54% | 48% | |
| Reader / Idle (h) | 12.4 | 15.3 23% | 23.9 93% | 20.7 67% | ||
| WiFi v1.3 (h) | 7.2 | 7 -3% | 9.6 33% | 6.8 -6% | 9.2 28% | 9.3 29% |
| Load (h) | 1.5 | 1.8 20% | 2.1 40% | 2.2 47% |
Points positifs
Points négatifs
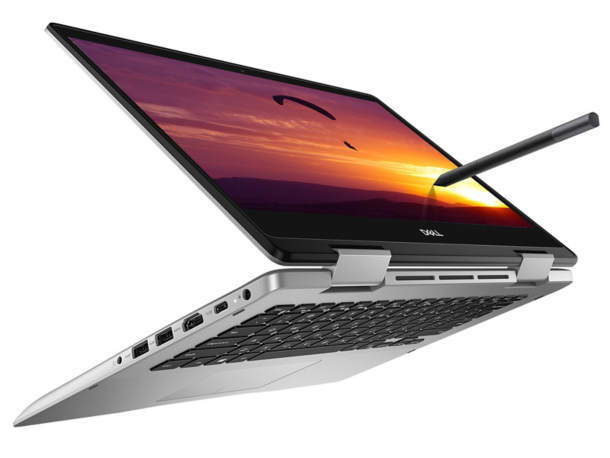
Le dernier convertible Inspiron est un appareil à peu près équilibré, mais peut-être s’arrête-t-il à mi-chemin. En tout cas, il ne propose rien de vraiment mieux que ses concurrents. De petits avantages comme un écran plus lumineux, un stylet WACOM inclus, ou une charge plus rapide auraient pu le rendre plus séduisant, ou lui donner de quoi se différencier.
Mais à cause de son prix d’appel contenu et de son écran tactile 1080p, l’Inspiron 14 5482 2-en-1 pourra servir pour les étudiants, ou comme un appareil multimédia pour la maison, ou pour des voyages occasionnels. Des alternatives comme le Yoga 530 ou le VivoBook Flip 14 sont plus compacts et légers - mais pour un prix légèrement supérieur.
Convertible équilibré d’entrée de gamme, qui pourra séduire les débutants ou les étudiants, voilà comment peut se présenter ce Dell Inspiron. Mais il n’a rien d’extraordinaire, ni même rien qui puisse le sortir du lot.
L’intégralité de cette critique est disponible en anglais en suivant ce lien.
Dell Inspiron 14 5000 5482 2-in-1
- 12/07/2018 v6 (old)
Allen Ngo
Price comparison
