Verdict - L'Evo 15 est un appareil polyvalent et solide
Avec l'Evo 15, XMG livre une fois de plus un solide ordinateur polyvalent qui répond à plusieurs critiques formulées à l'encontre de son prédécesseur. Le Wi-Fi 7 est désormais inclus, et le port USB 2.0 peu performant a été supprimé. Le processeur Arrow Lake offre des performances très élevées et constantes, et les options de maintenance sont également très bonnes.
La dalle IPS mate est bien adaptée aux tâches productives et aux jeux (temps de réponse rapide et 240 Hz), mais son principal inconvénient reste le niveau de noir élevé et le contraste relativement faible qui en résulte. En outre, l'autonomie de la batterie est un peu plus faible qu'auparavant, et les modèles concurrents offrent tout simplement une meilleure endurance.
Points positifs
Points négatifs
Prix et disponibilité
Le XMG Evo 15 M25 peut être configuré chez Bestware à partir de 1 329 €.
Note du traducteur : les ordinateurs portables XMG ne sont pas officiellement disponibles en Amérique du Nord.
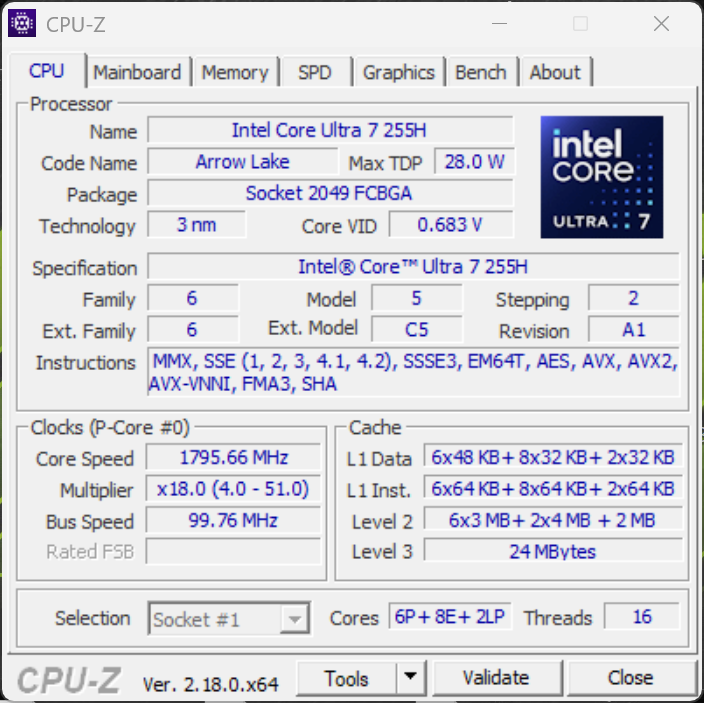
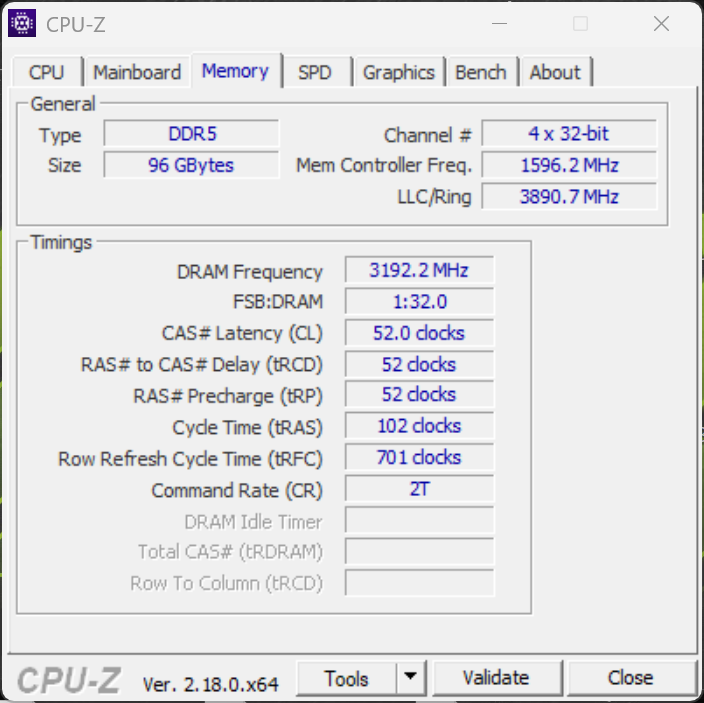
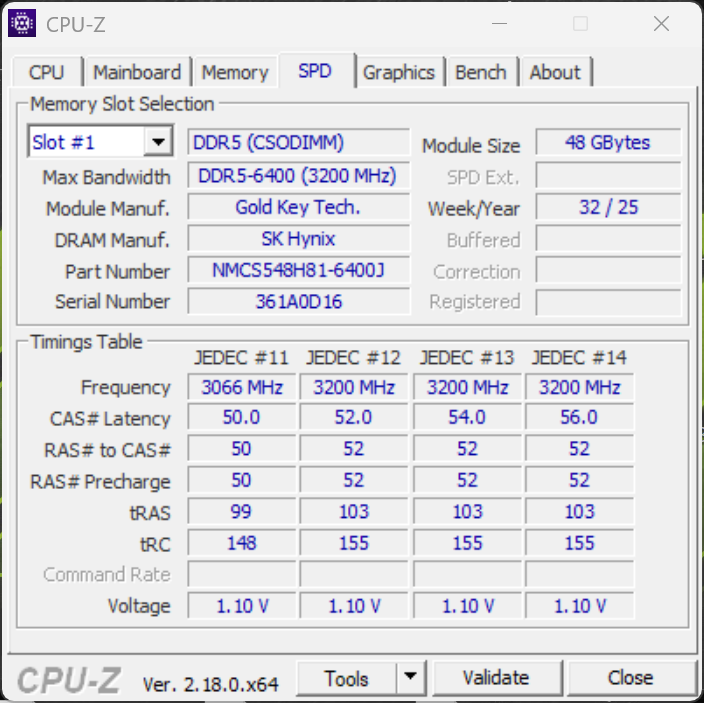
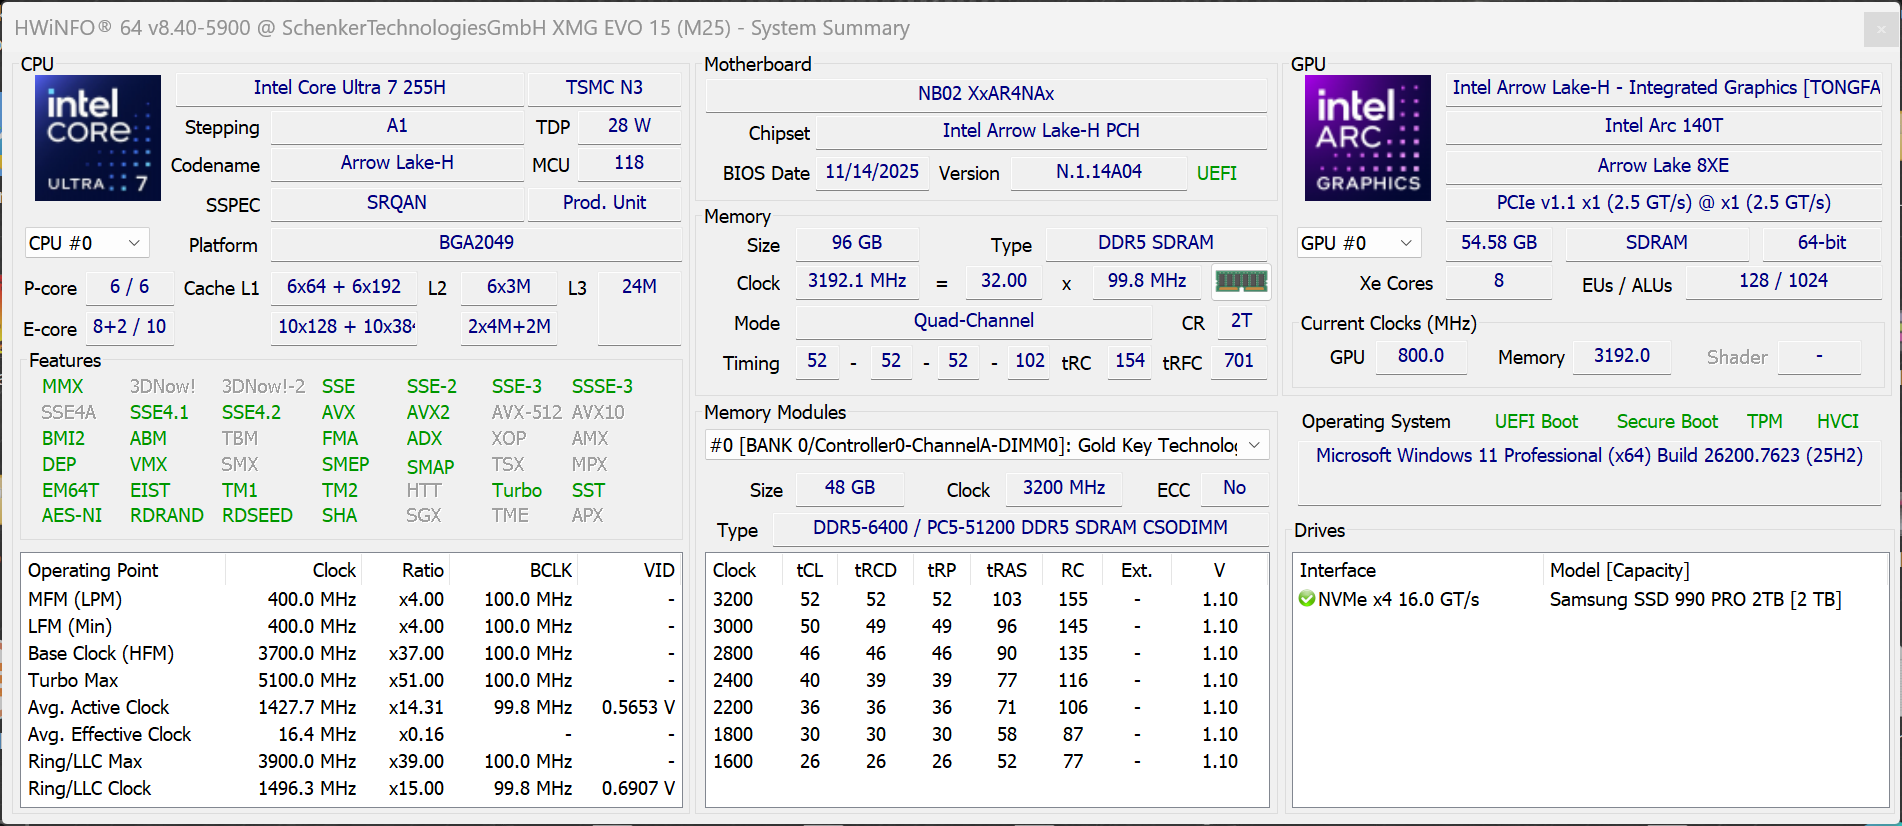
XMG a mis à jour son ordinateur portable 15 pouces Evo 15 et offre à nouveau le choix entre un AMD Ryzen AI 9 HX370 et un Intel Core Ultra 7 255H. Notre configuration de test coûte 2 365 € en raison de la configuration généreuse de la mémoire (la mise à niveau vers 96 Go de RAM coûte actuellement 810 €).
Spécifications
Mallette et équipement
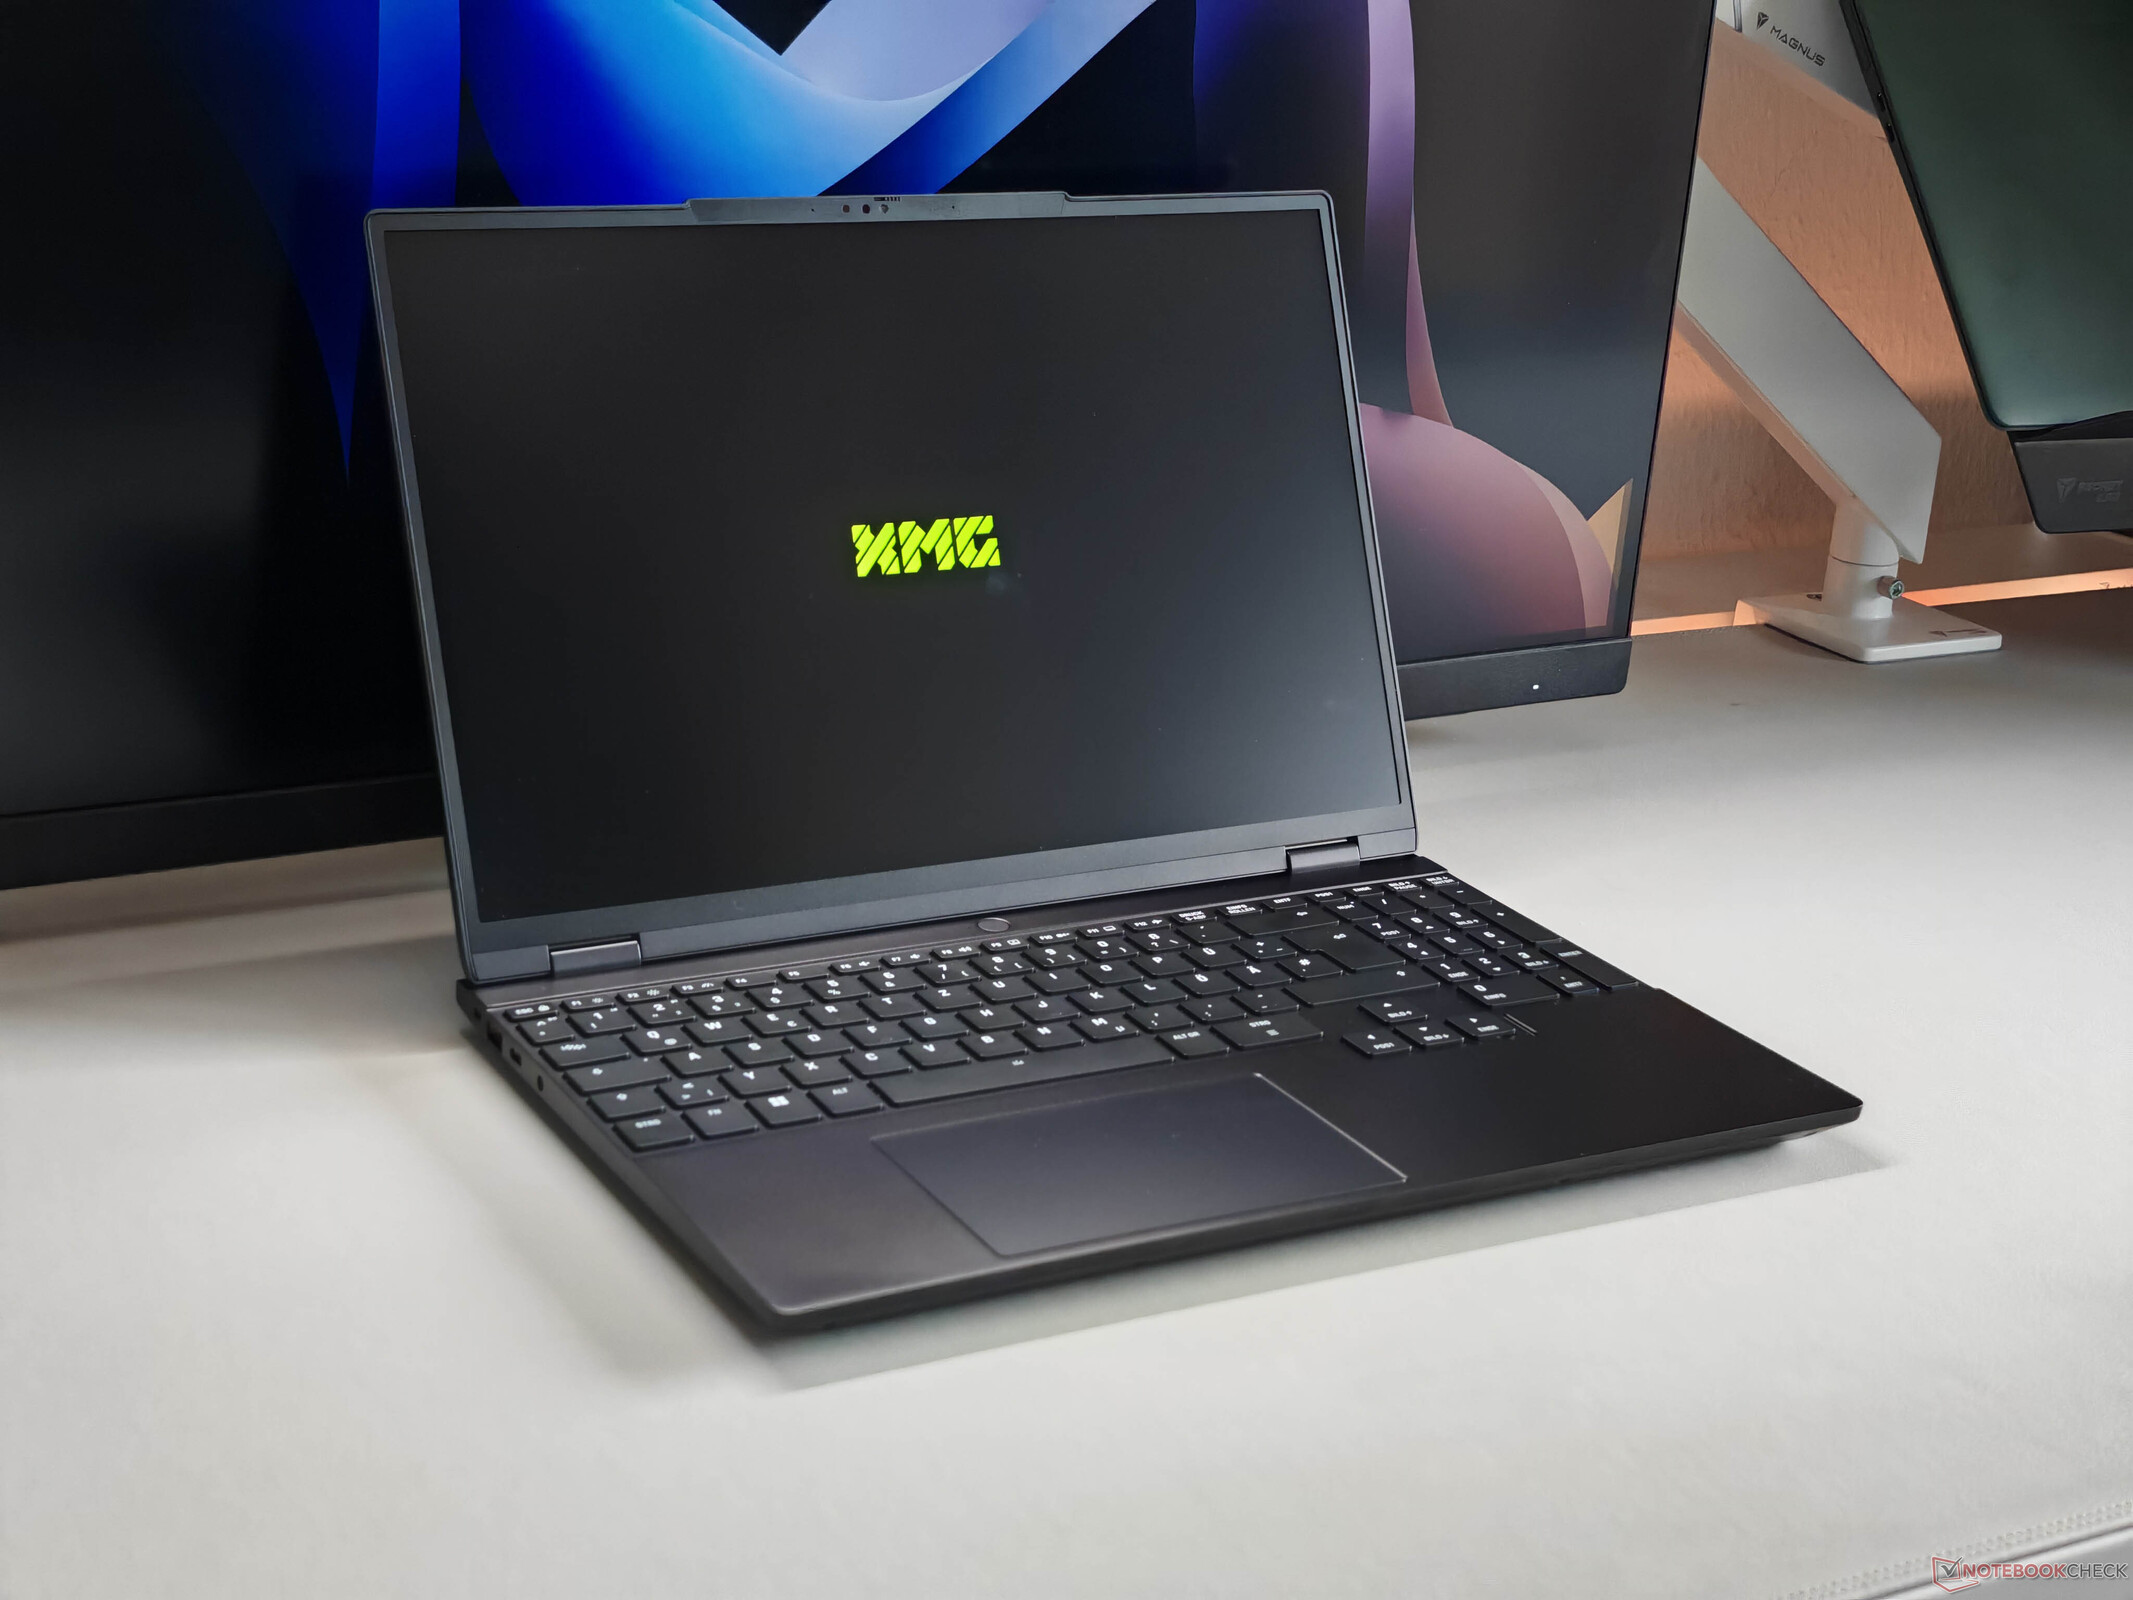
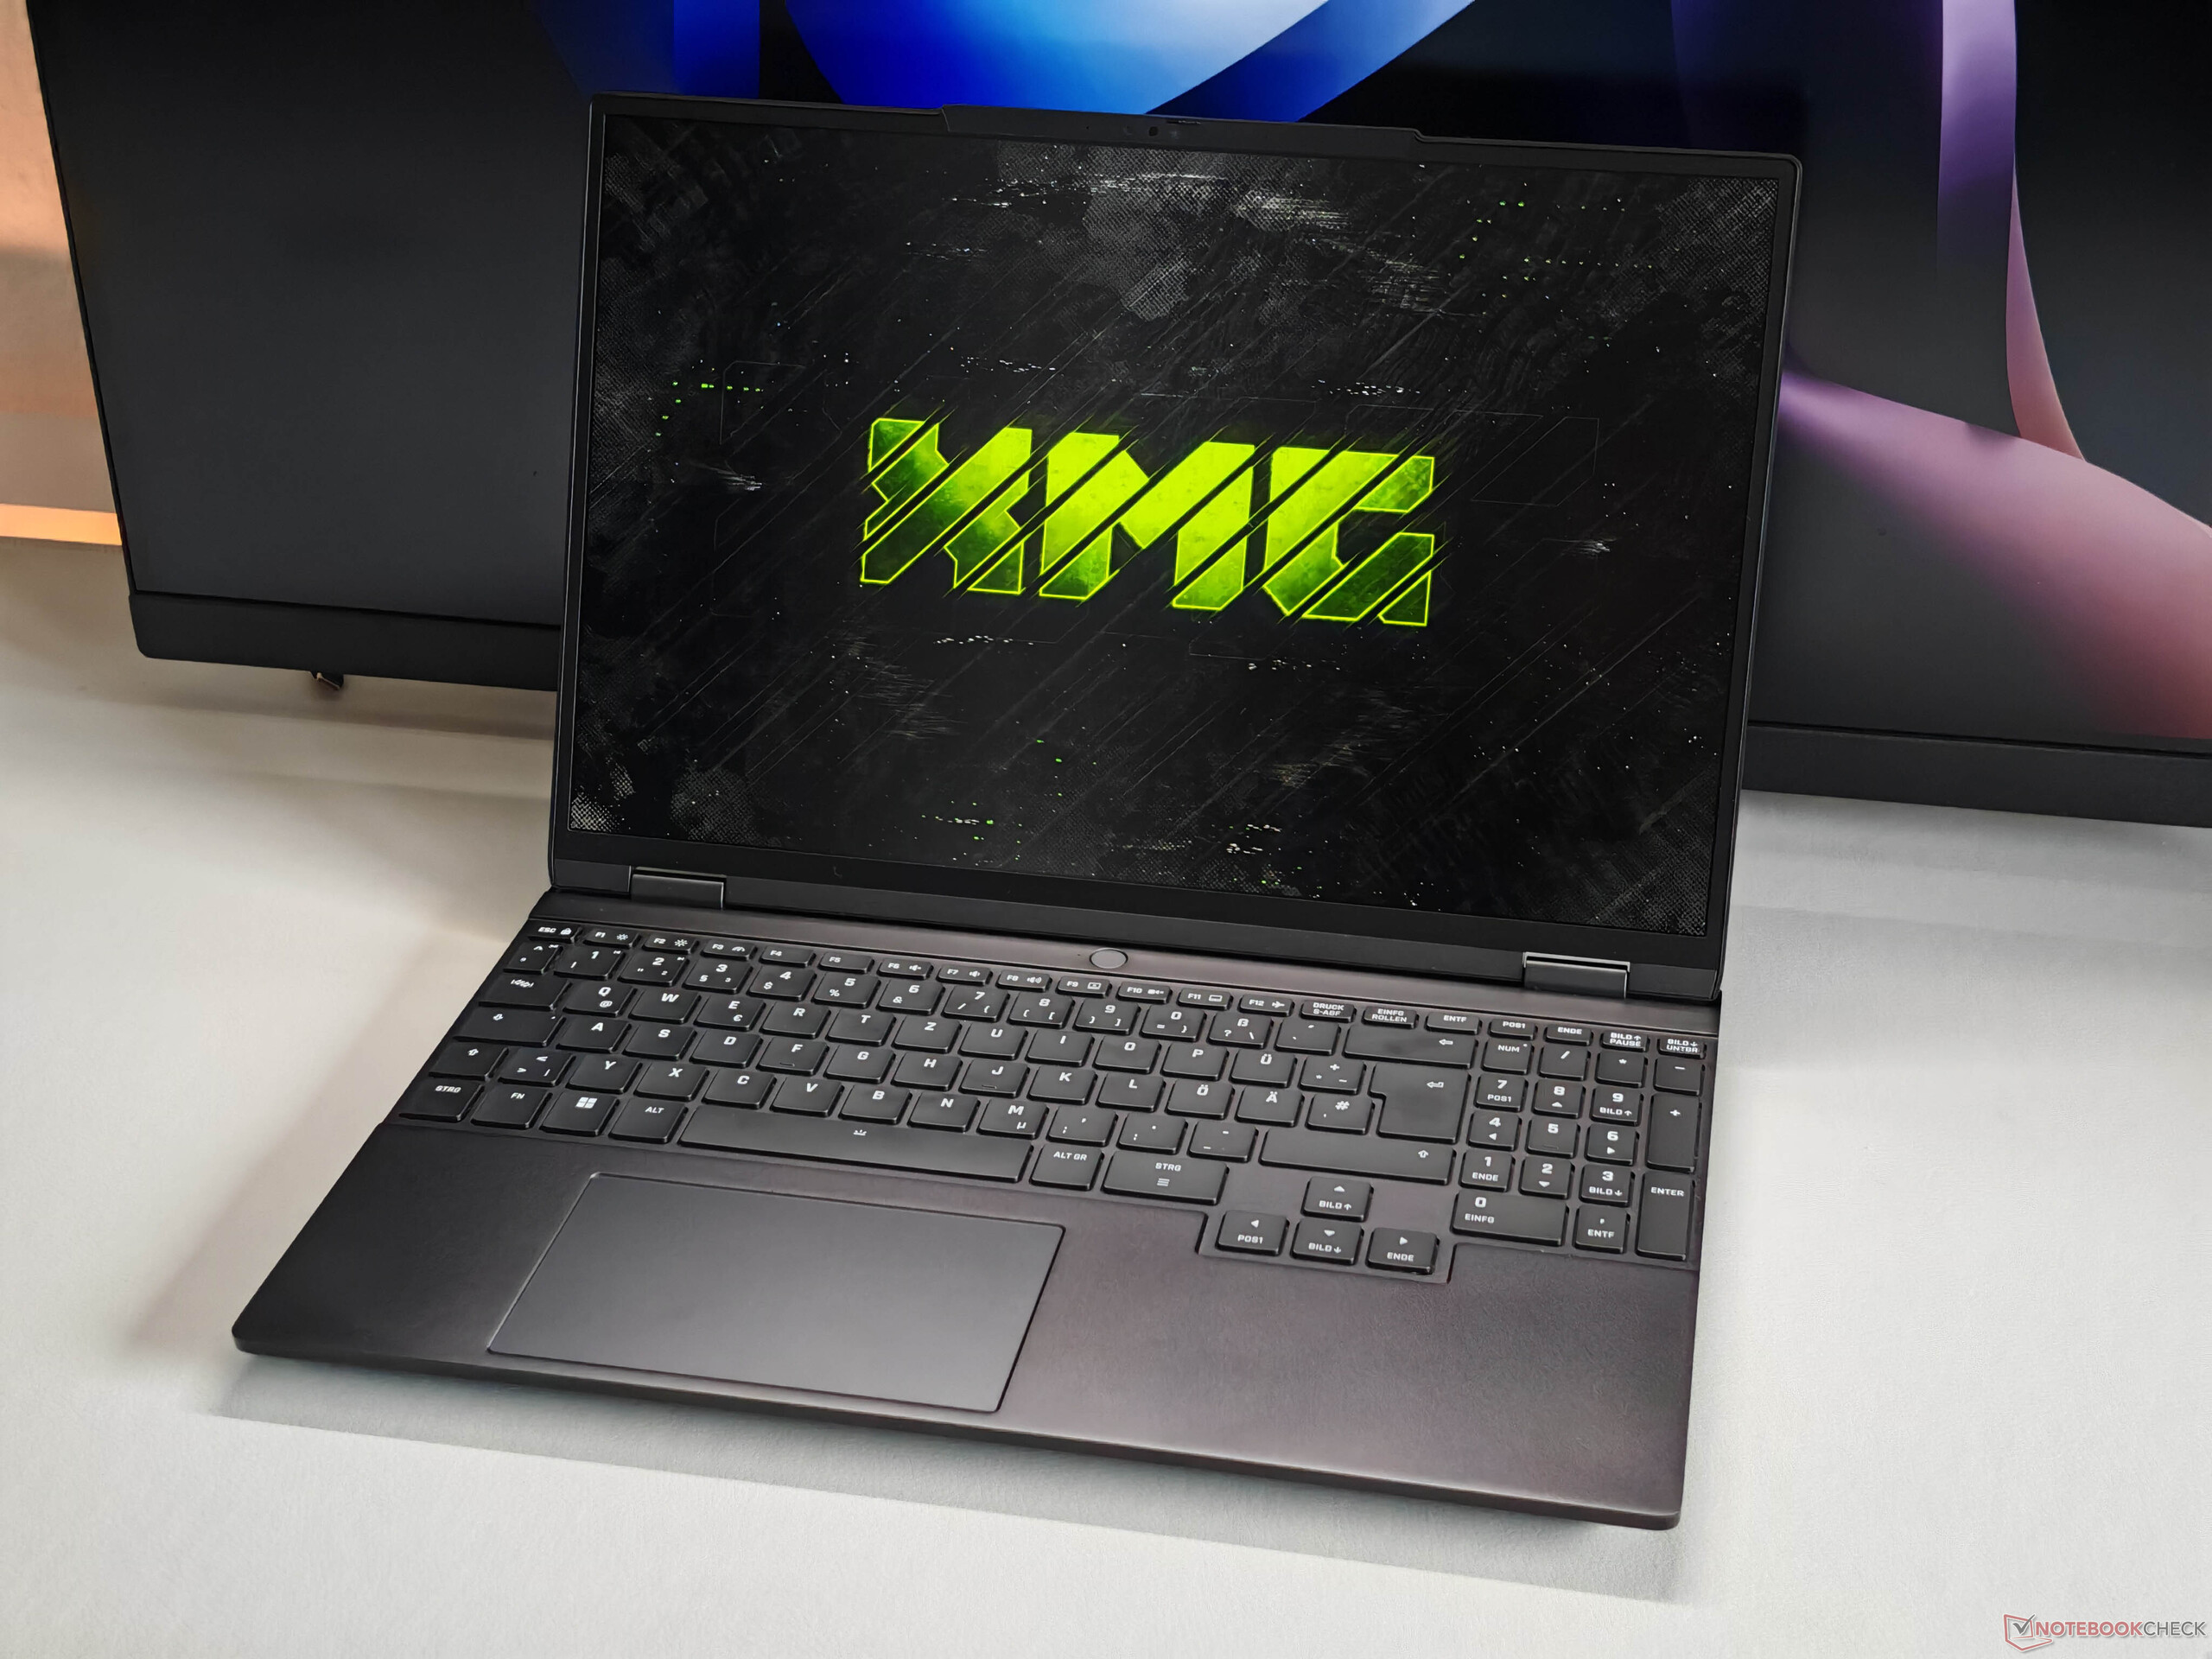
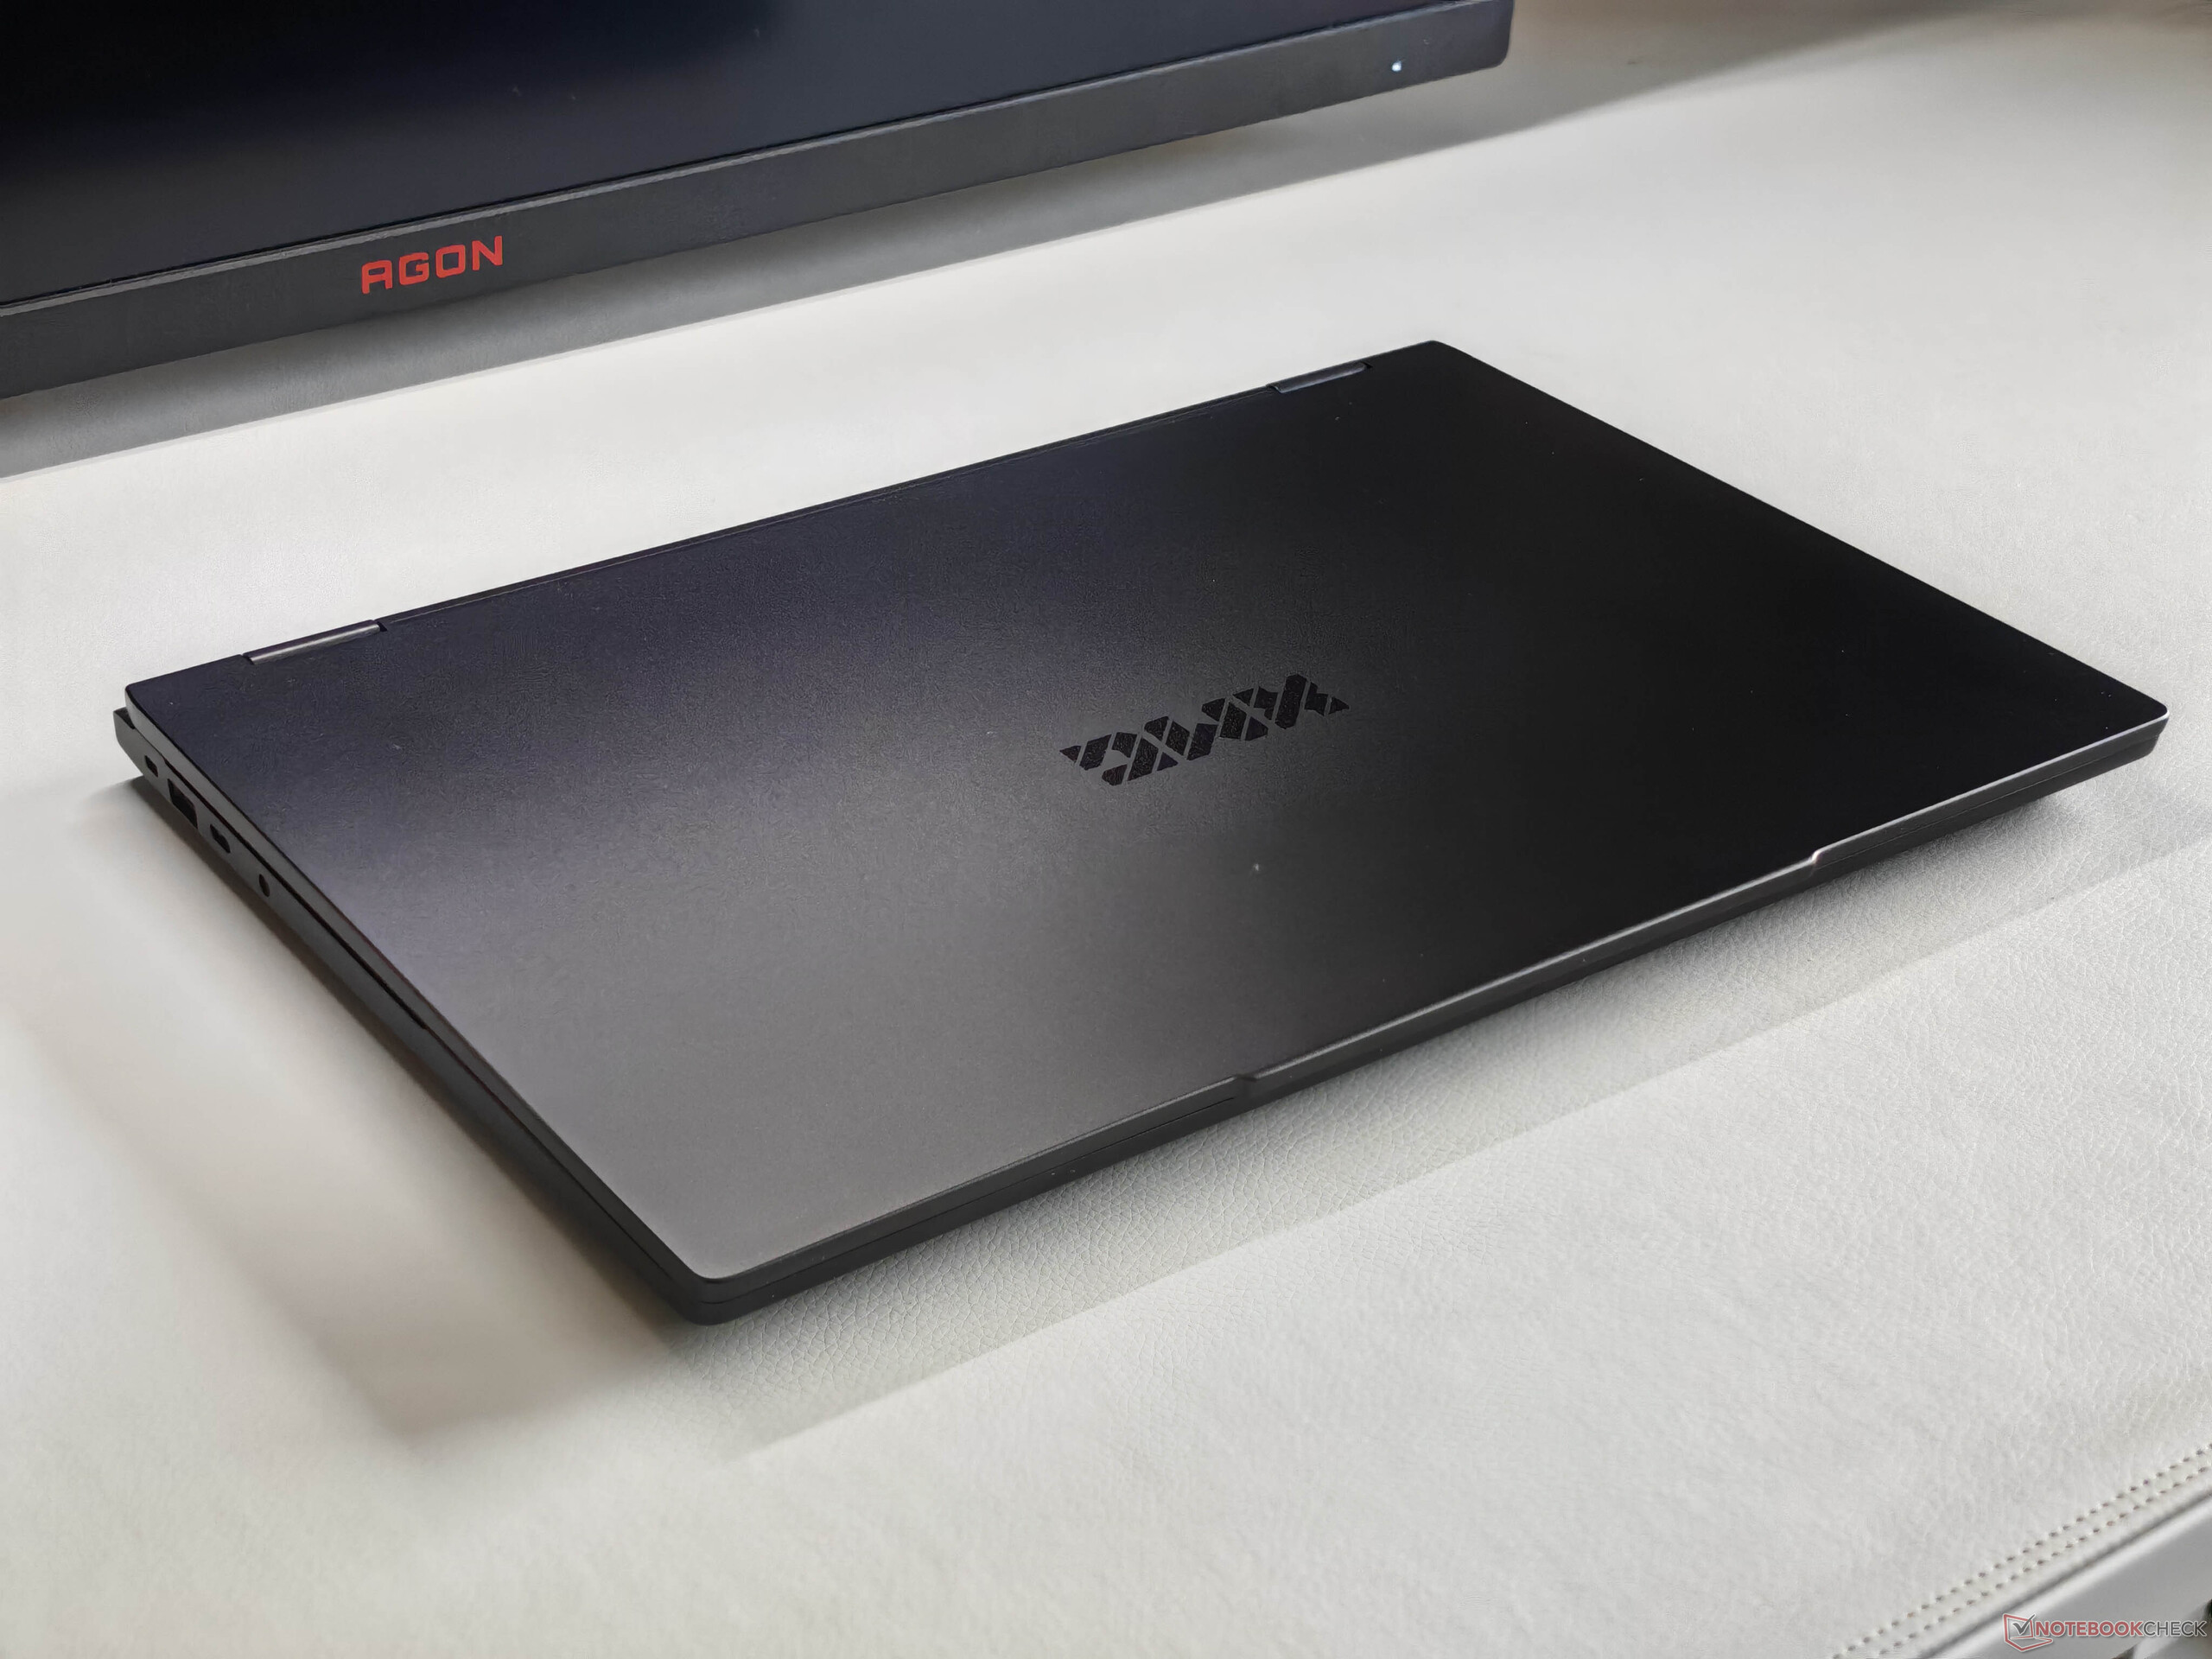
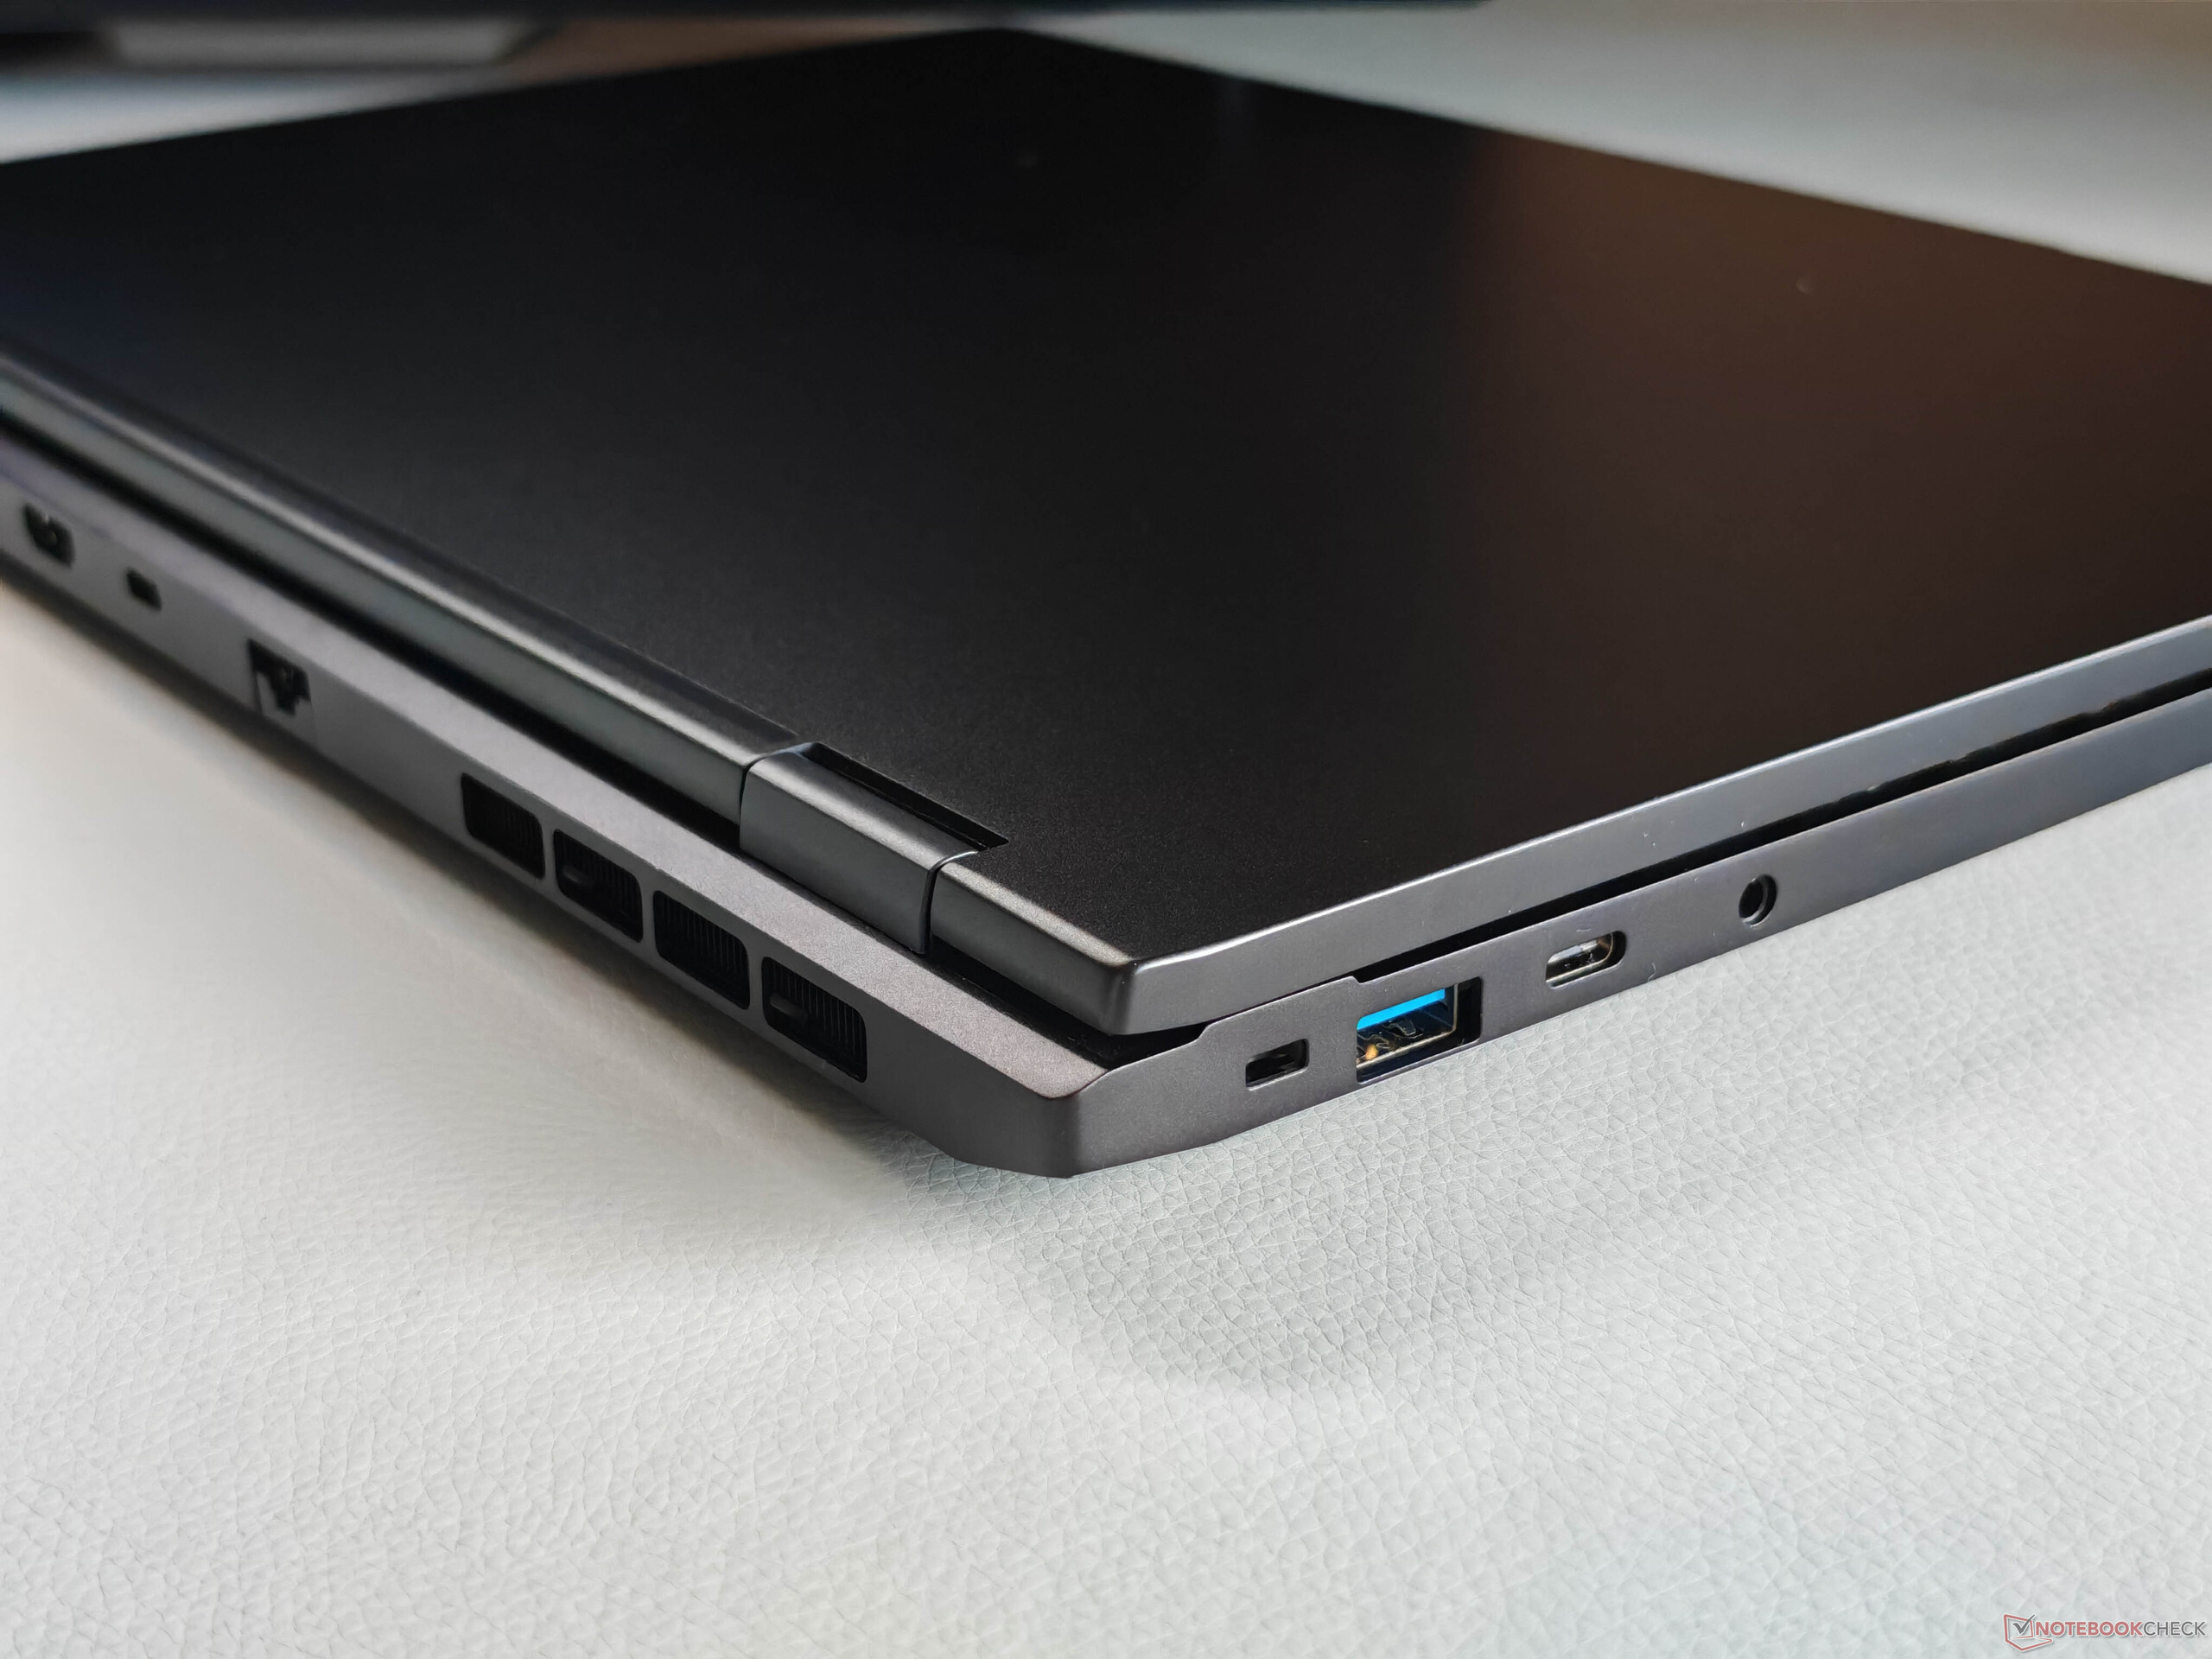
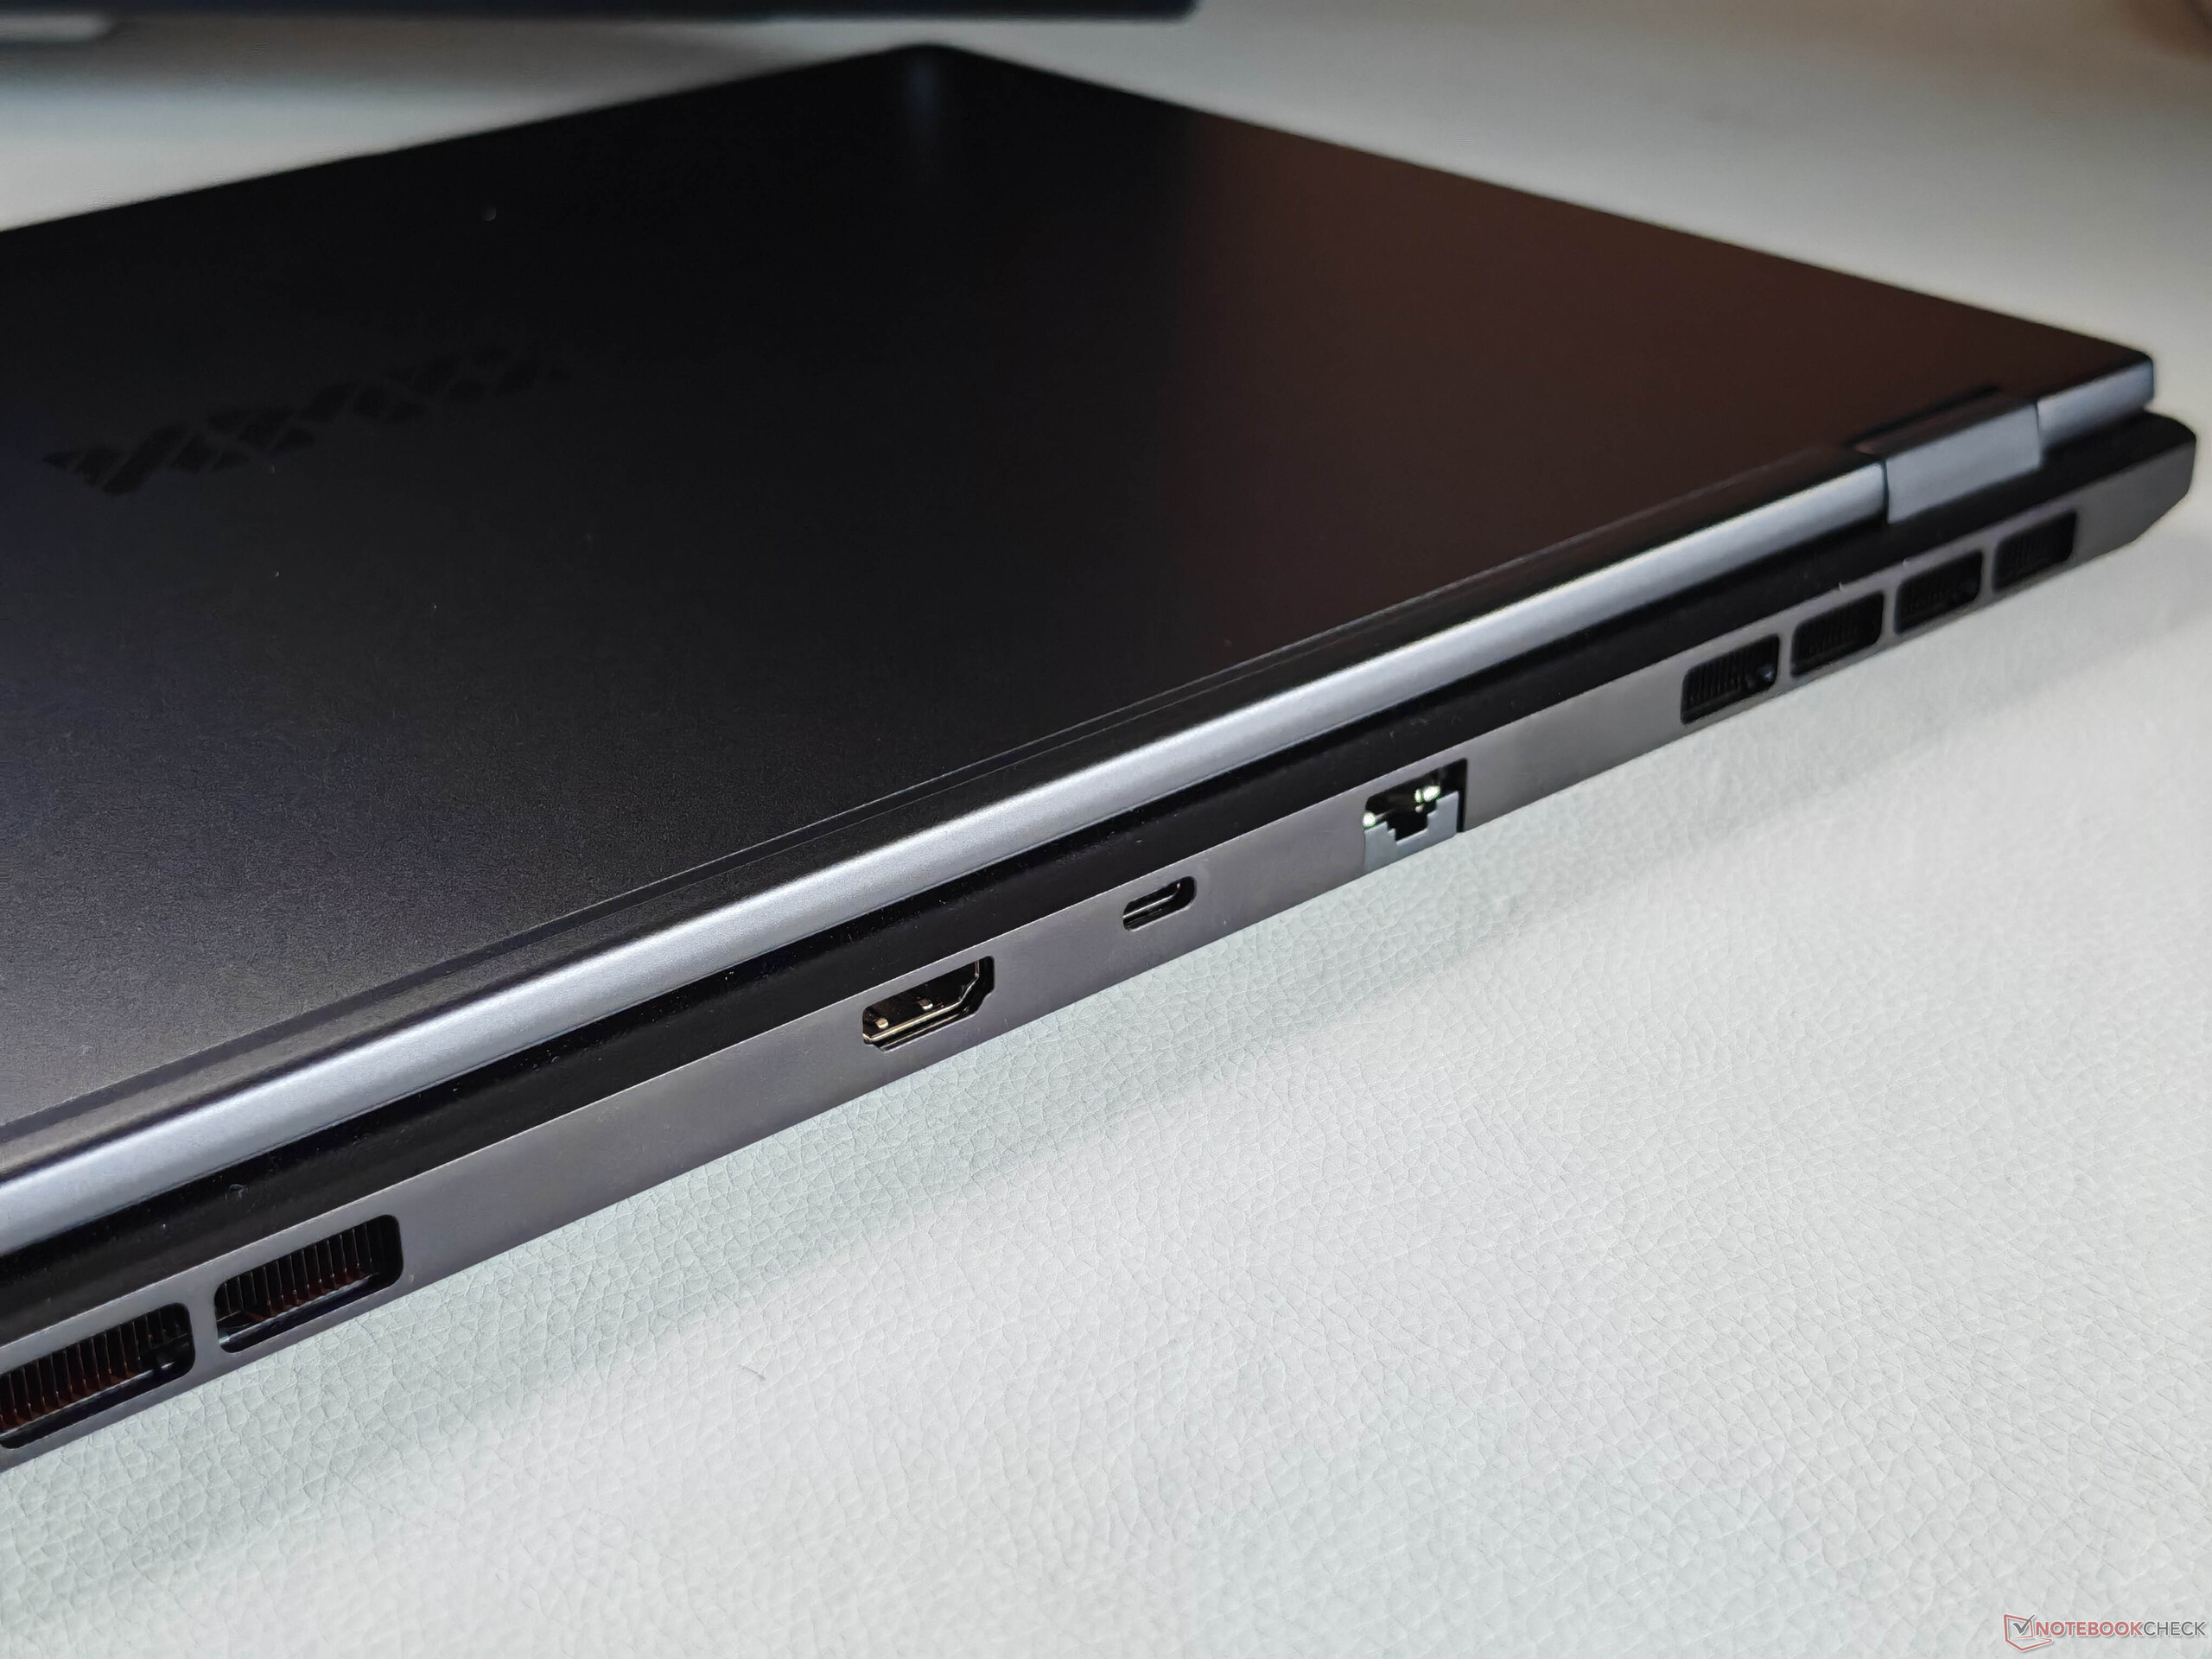
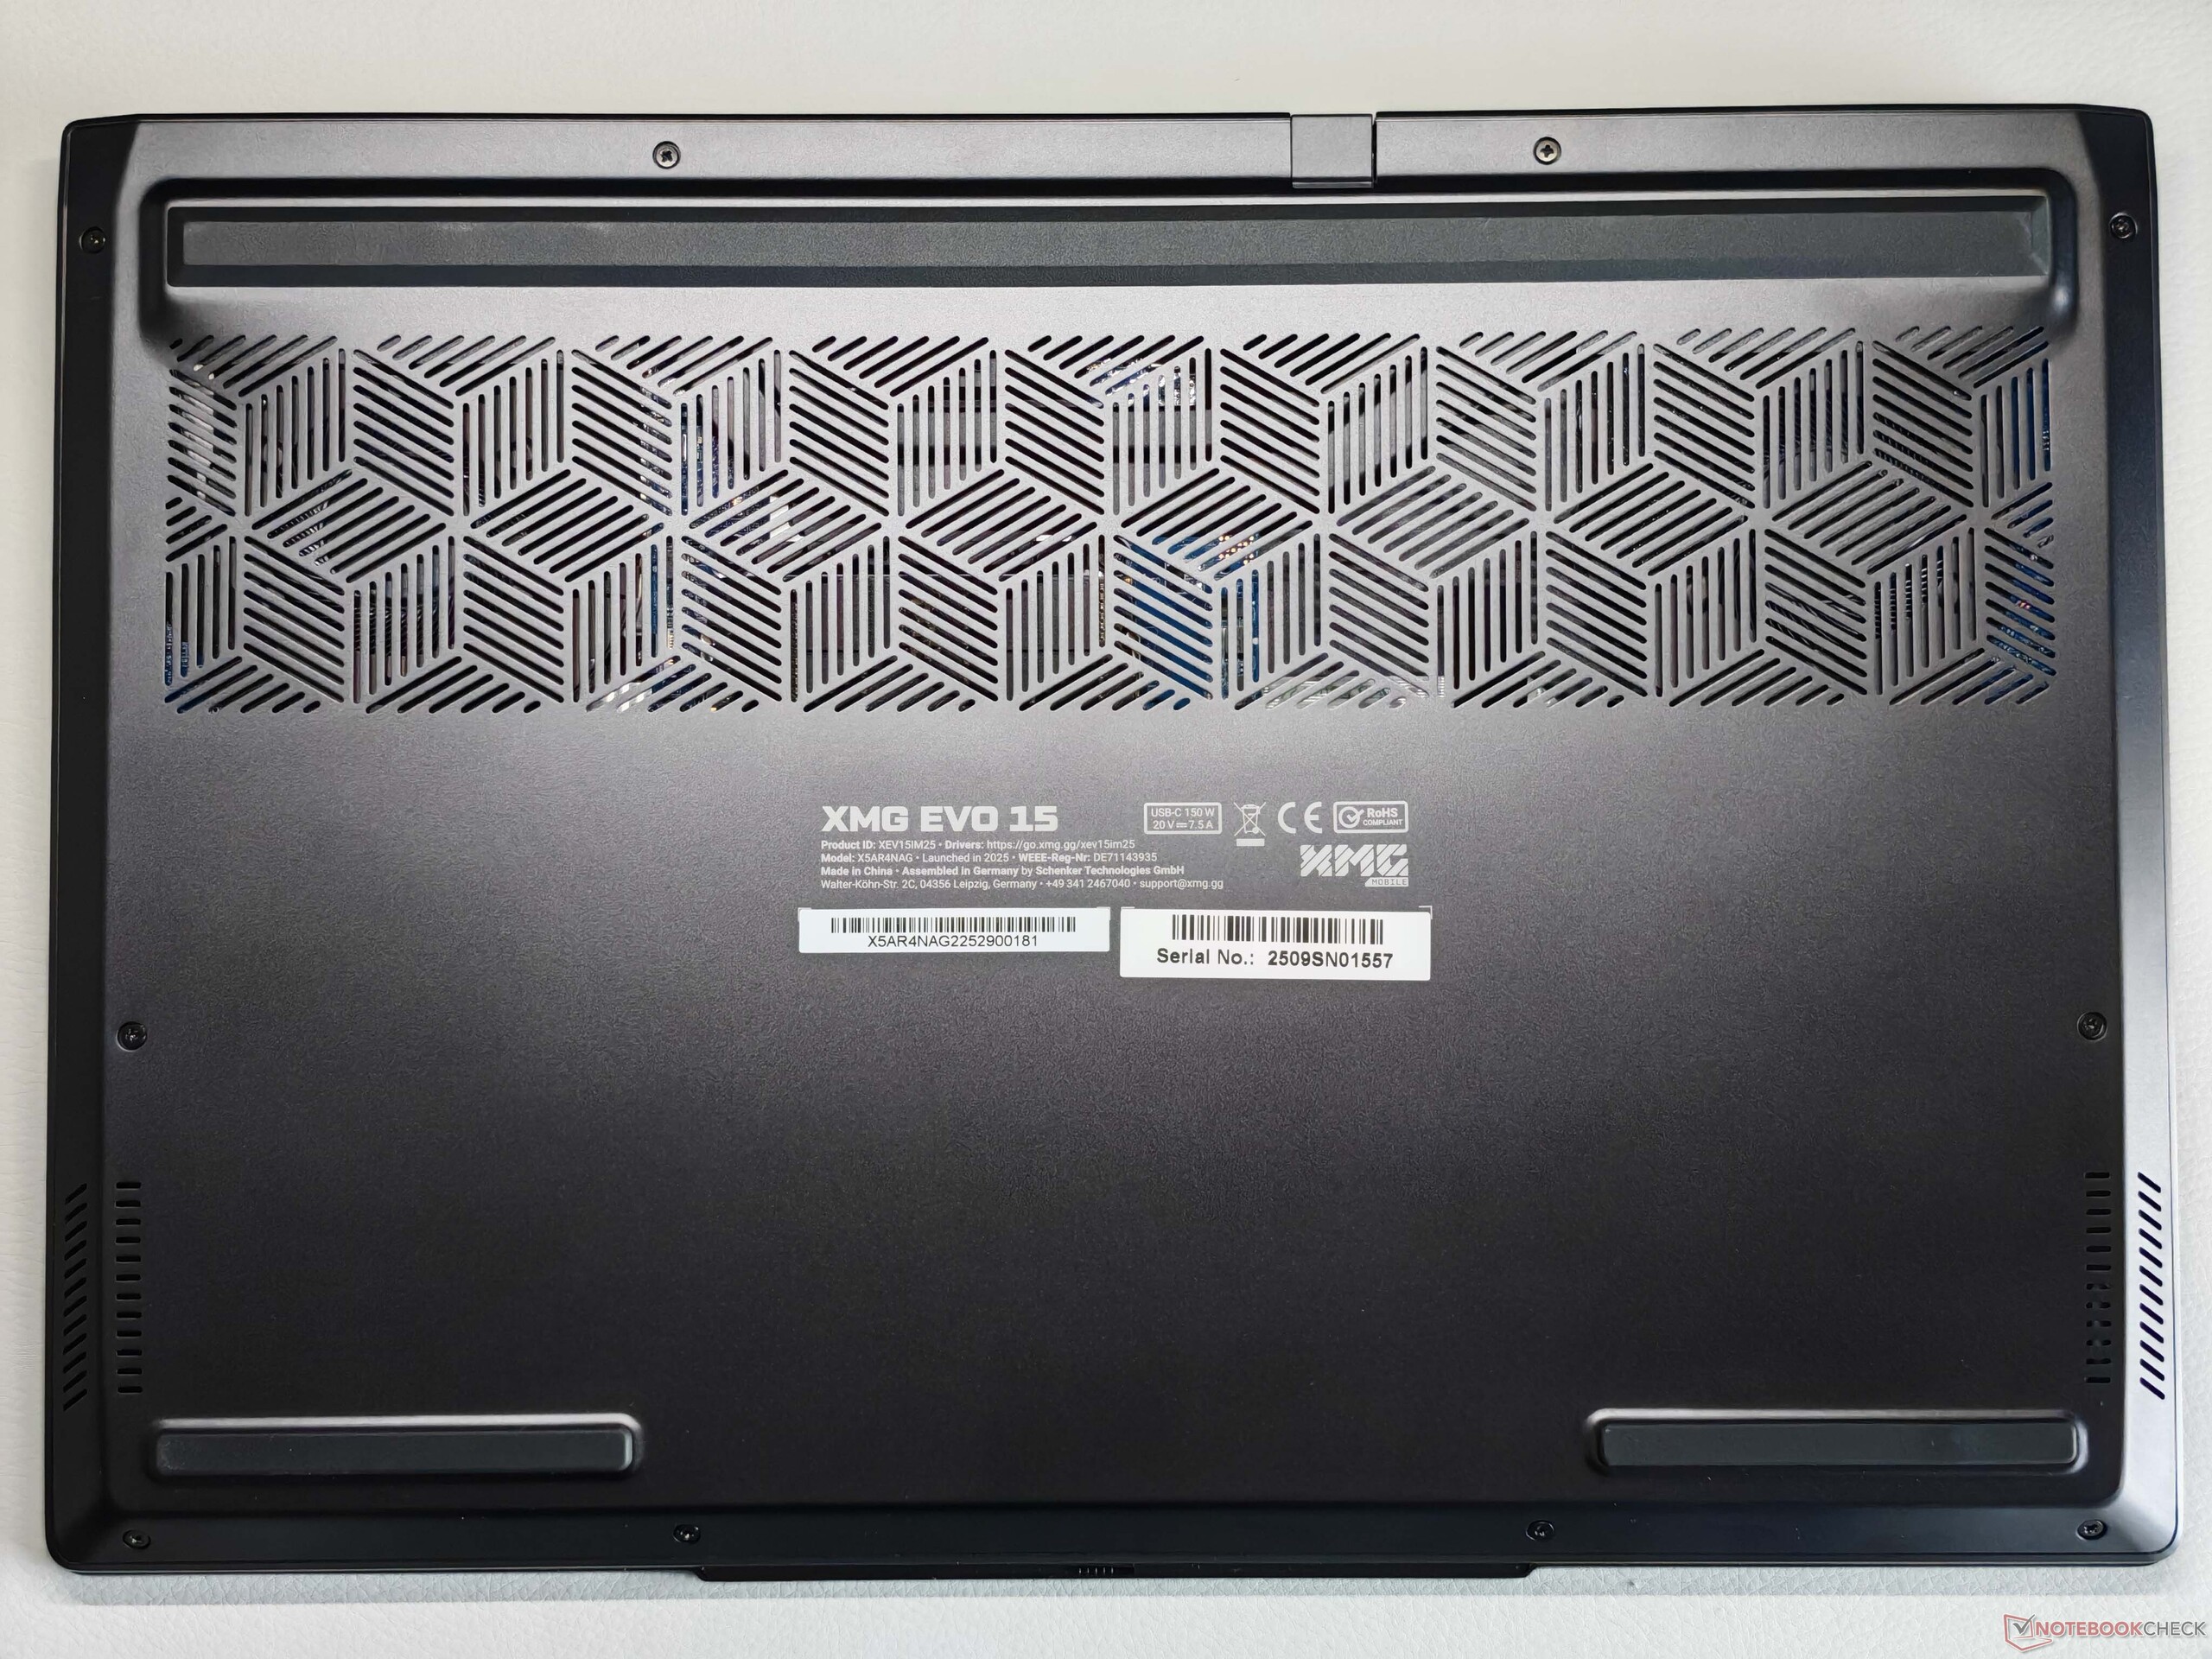
Le châssis n'a pas été modifié par rapport au modèle de l'année dernière le modèle de l'année dernièrel'Evo 15 reste un ordinateur portable très fin et de haute qualité. Le boîtier en aluminium noir est très bien construit et robuste, bien que les traces de doigts deviennent rapidement visibles. Les charnières (angle d'ouverture maximal) sont également bien réglées, avec une oscillation minimale.
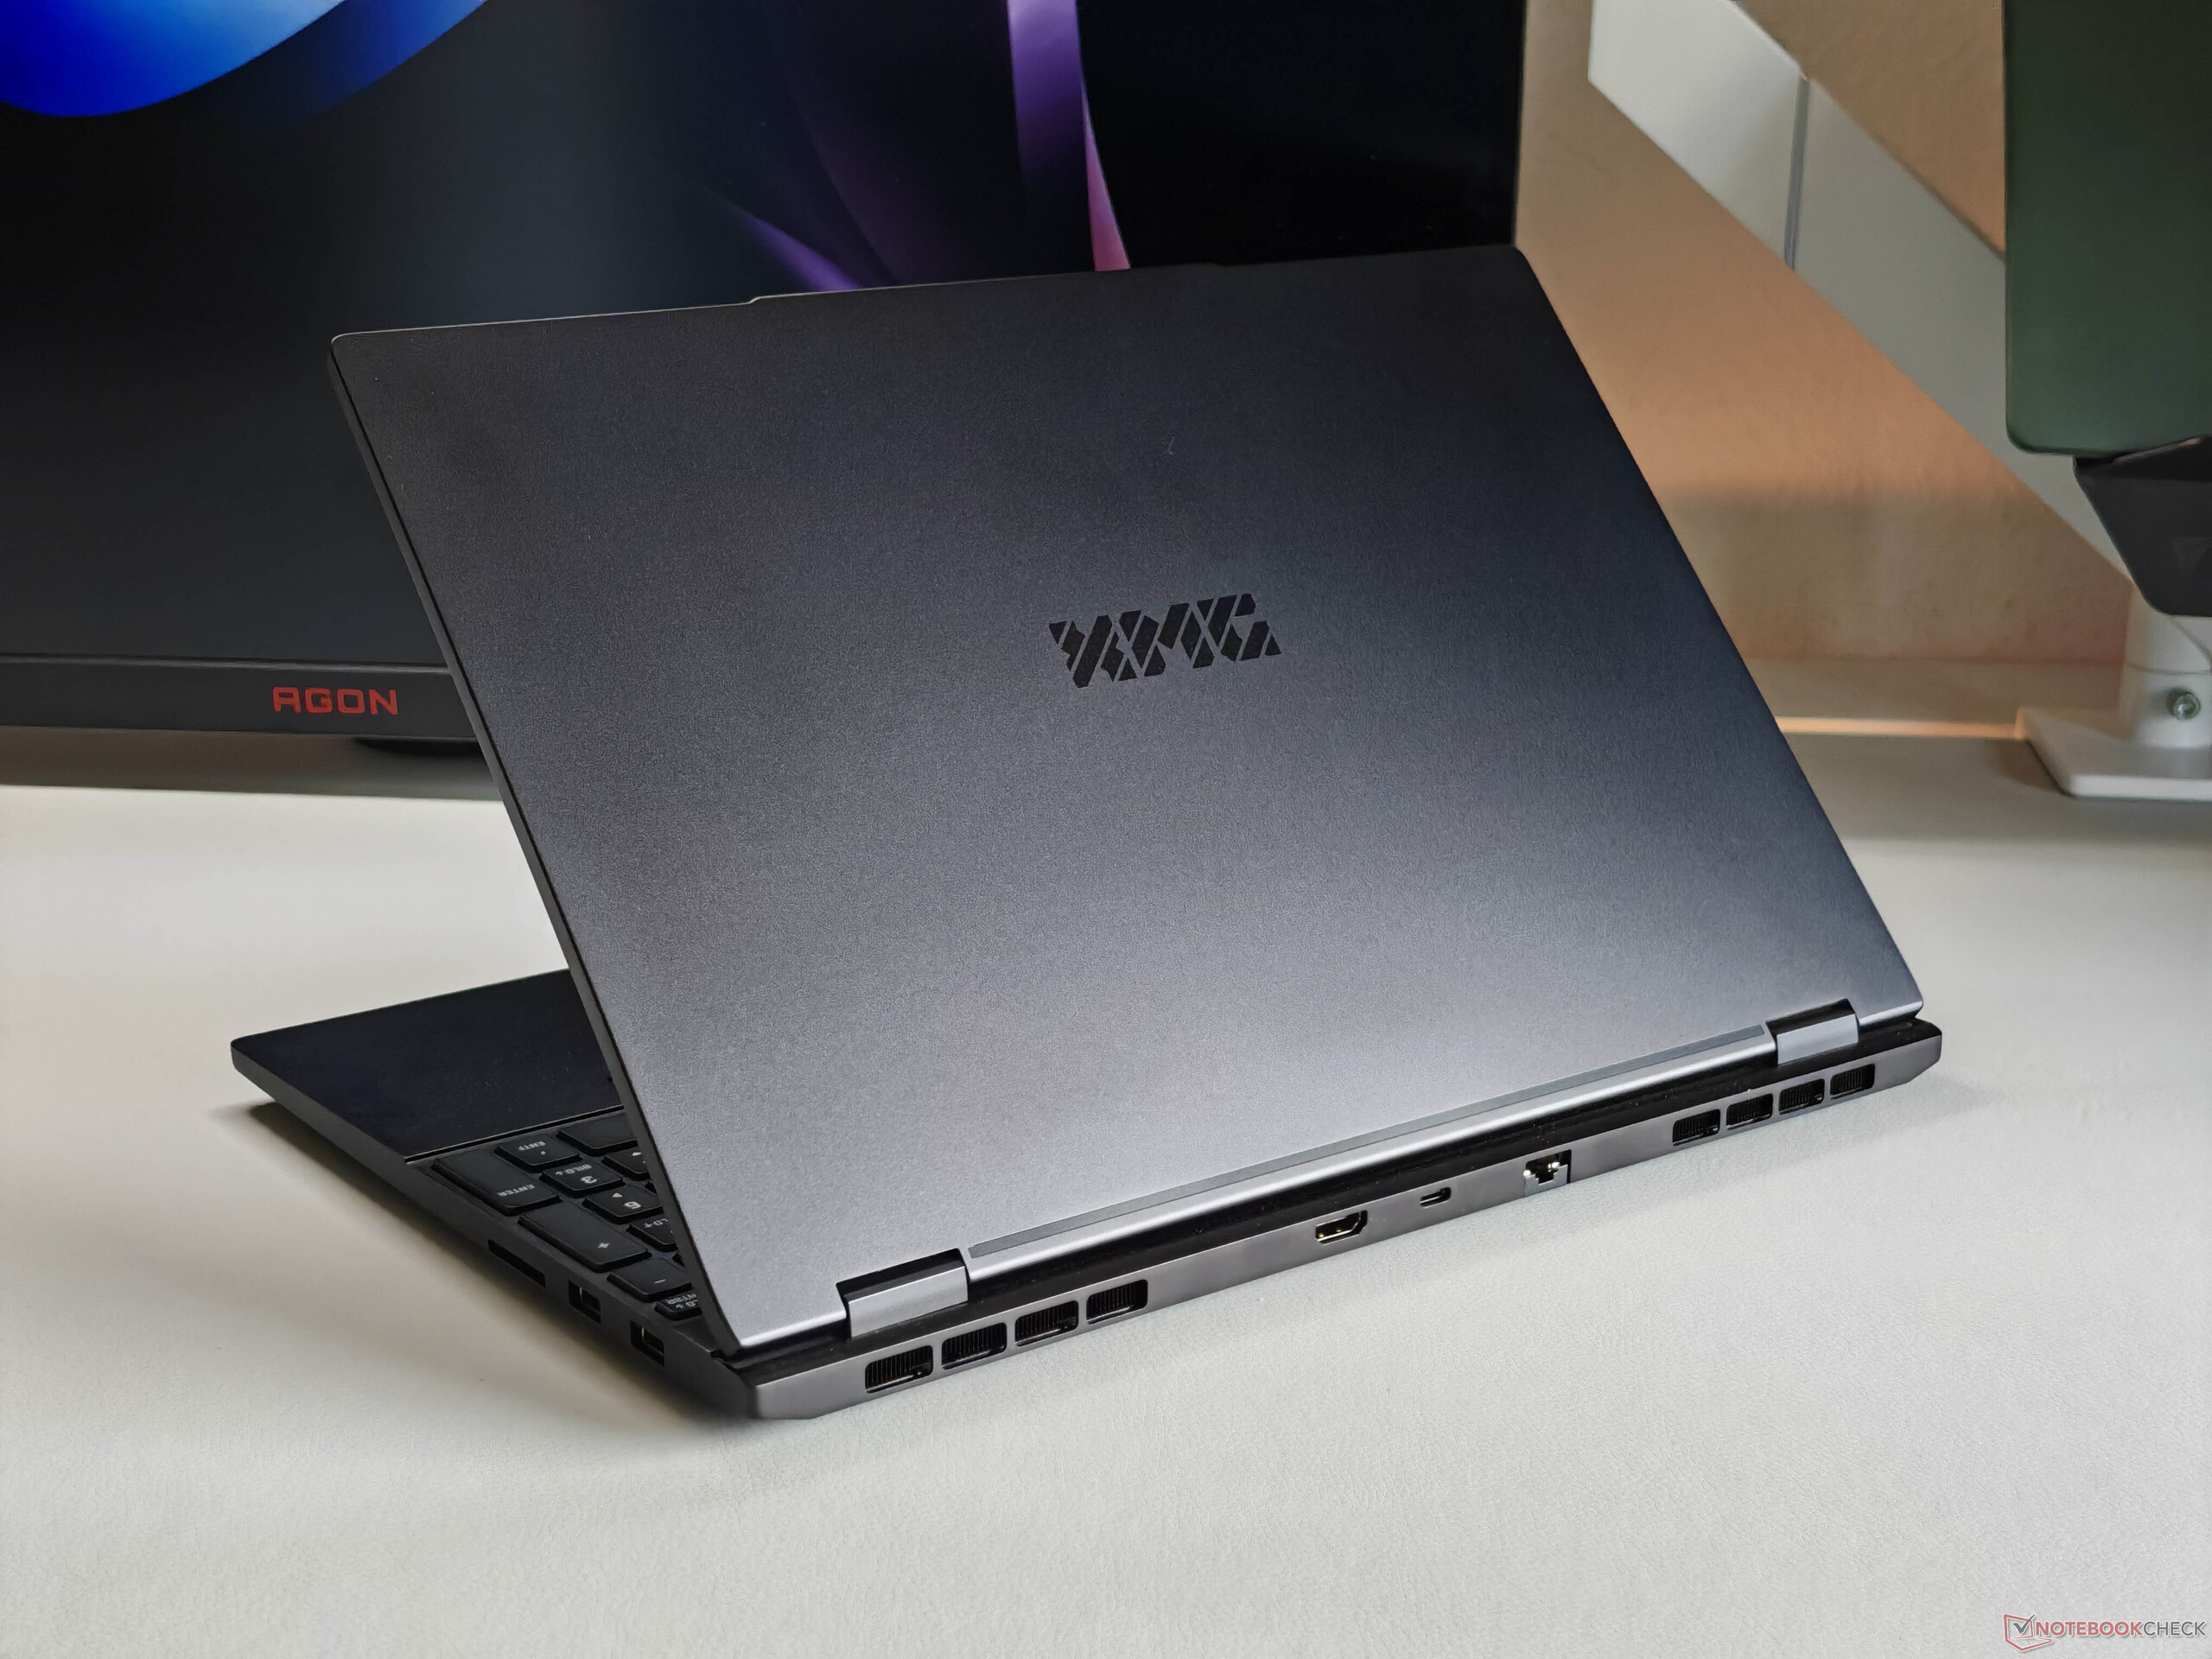
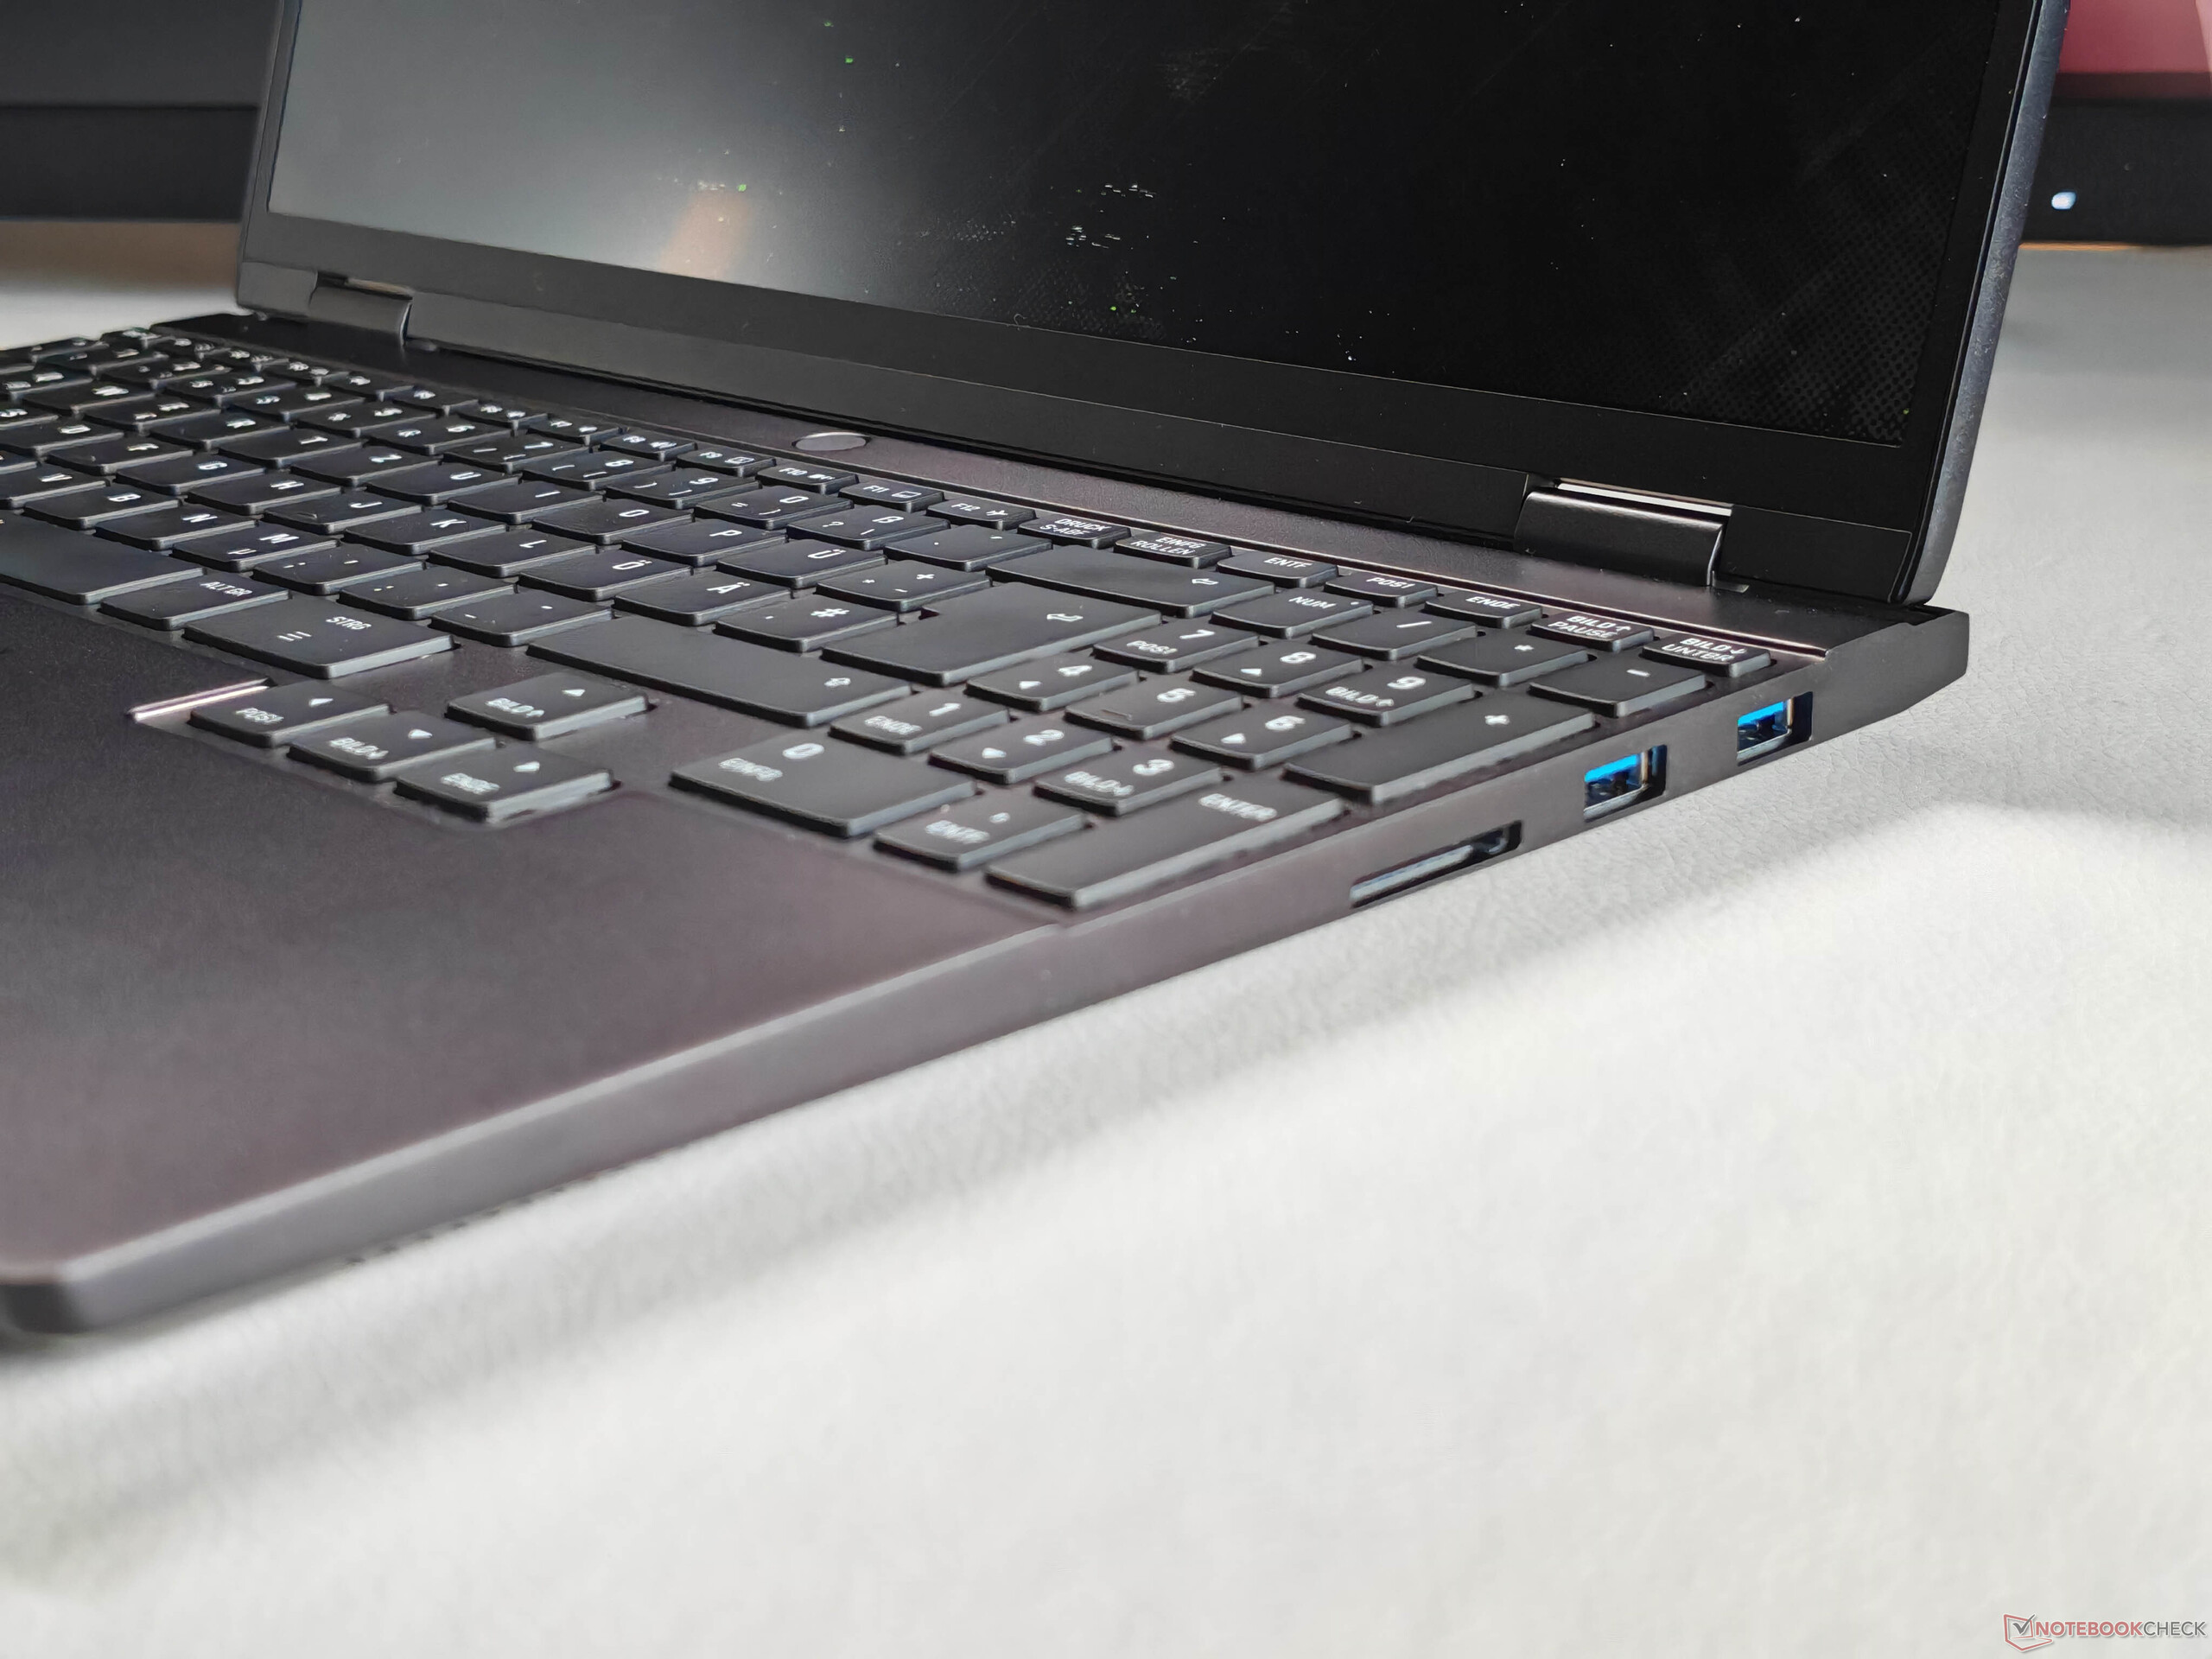
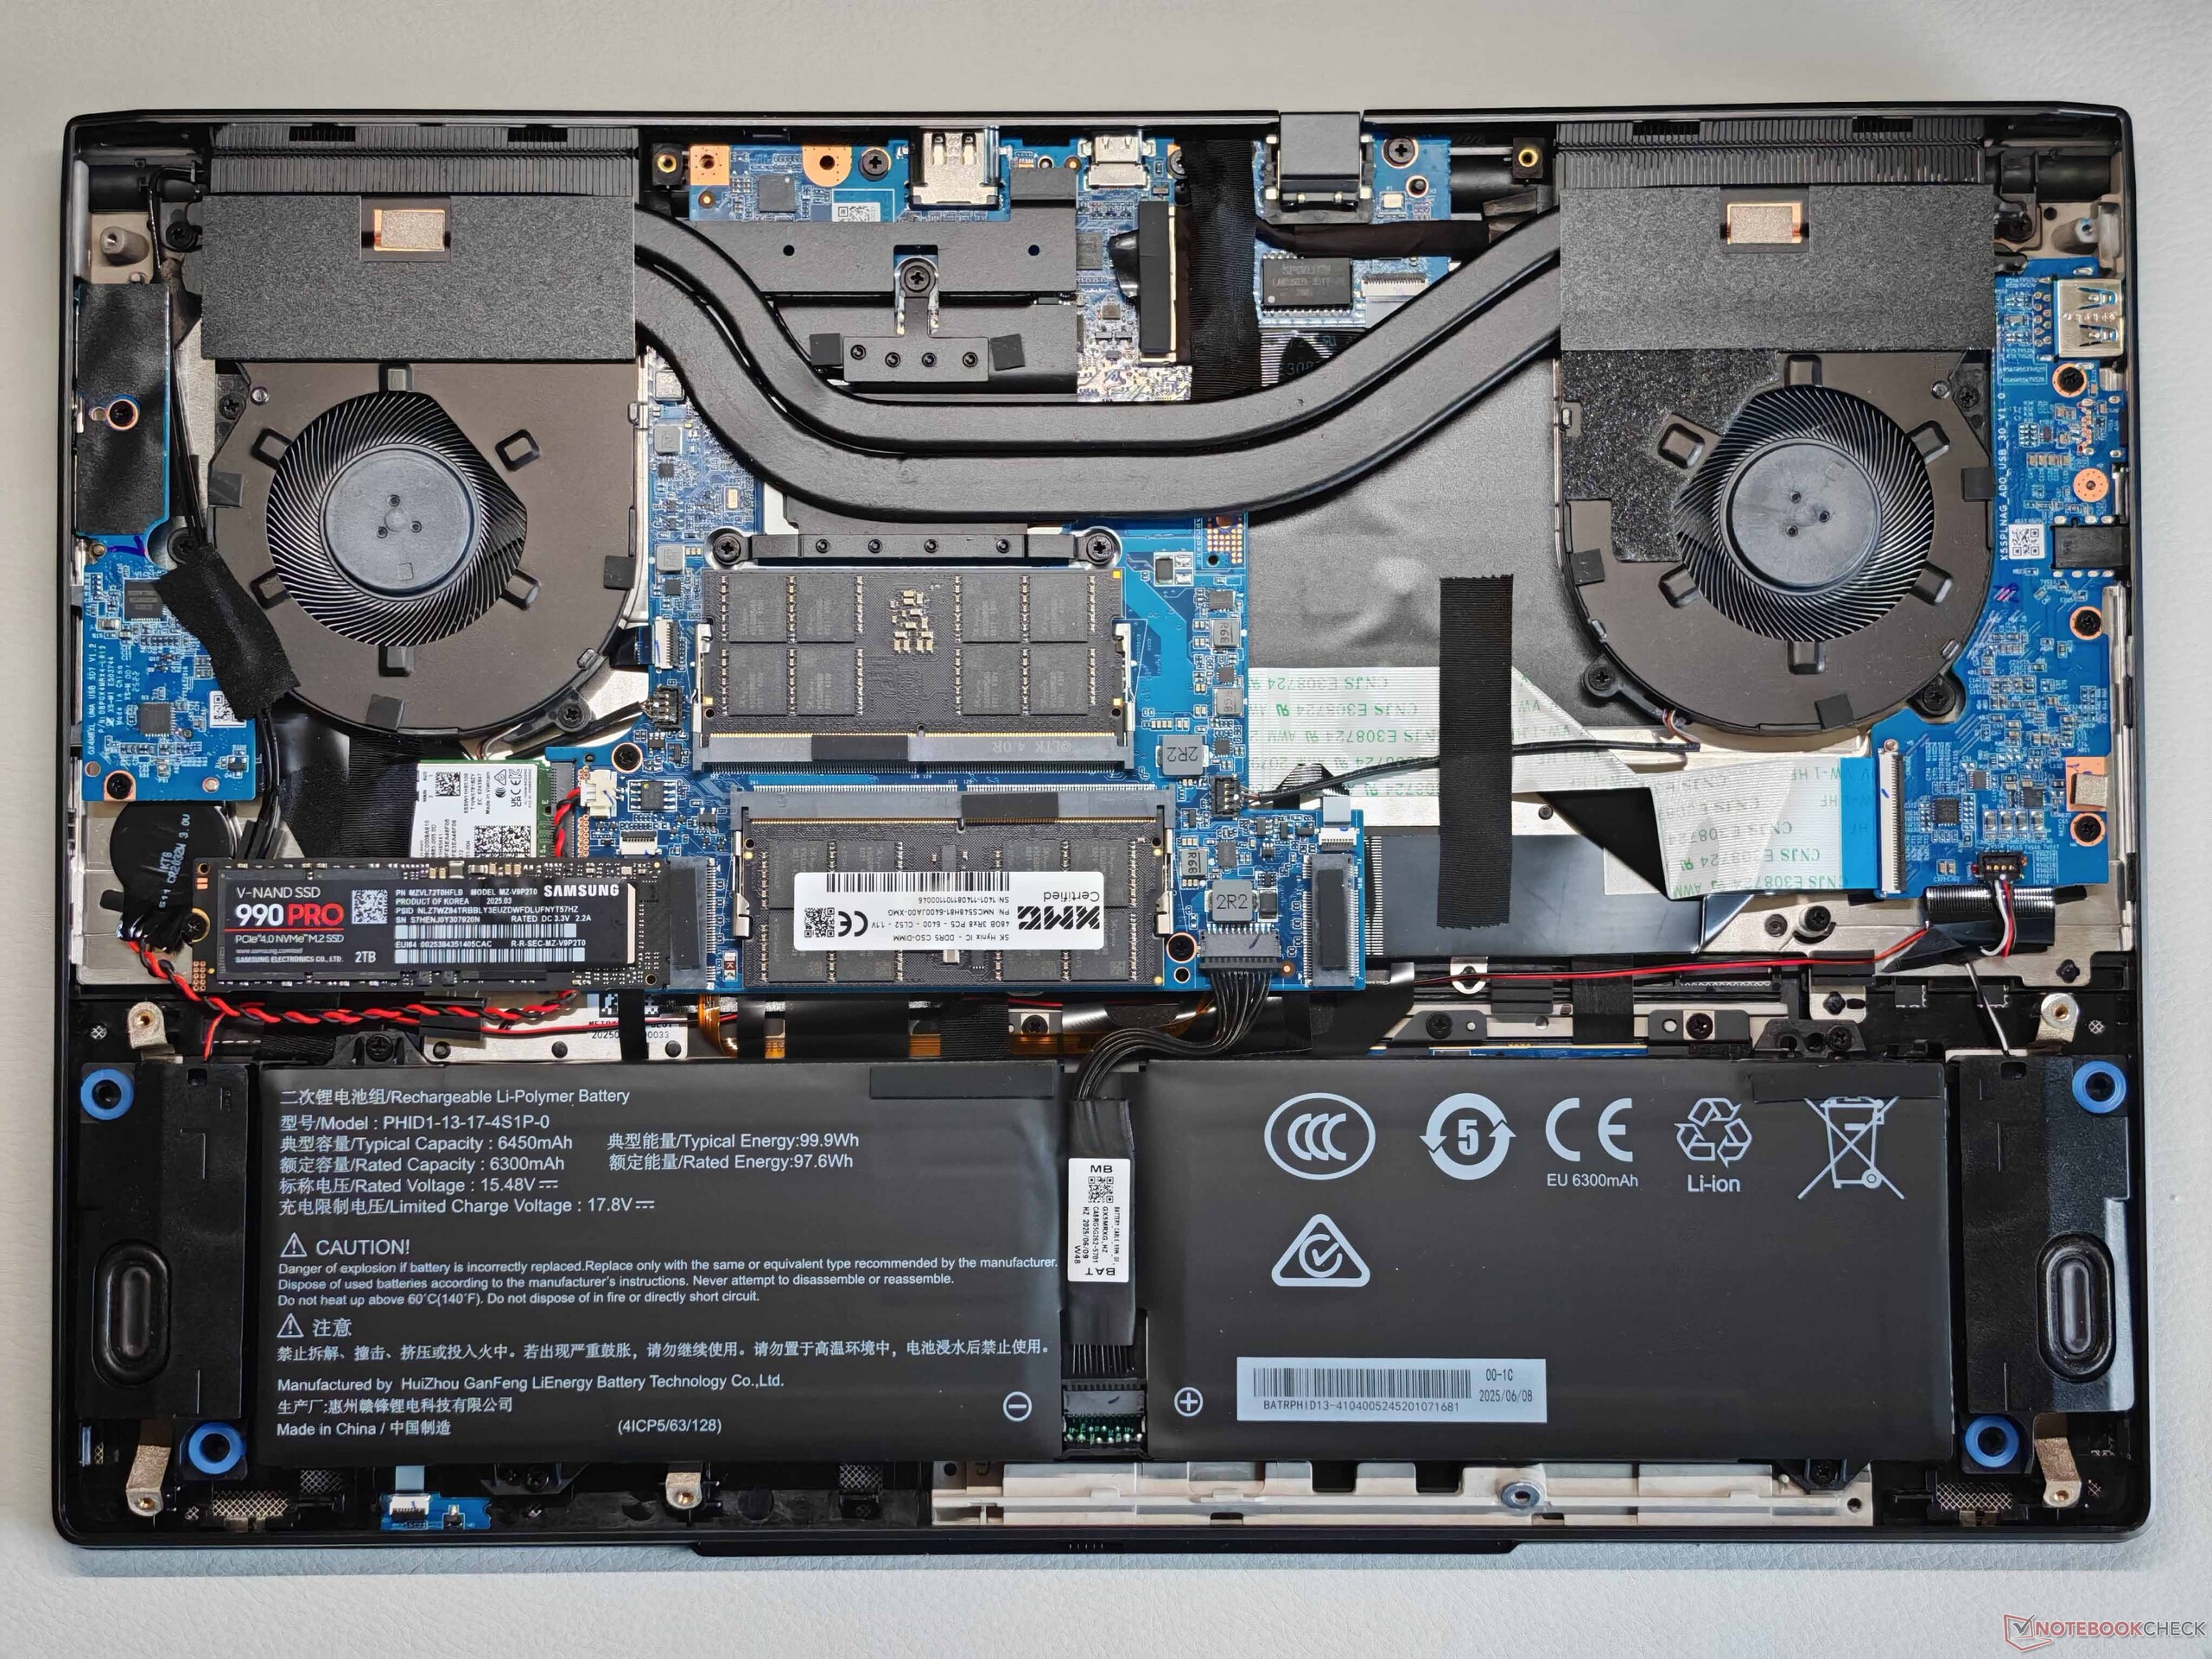
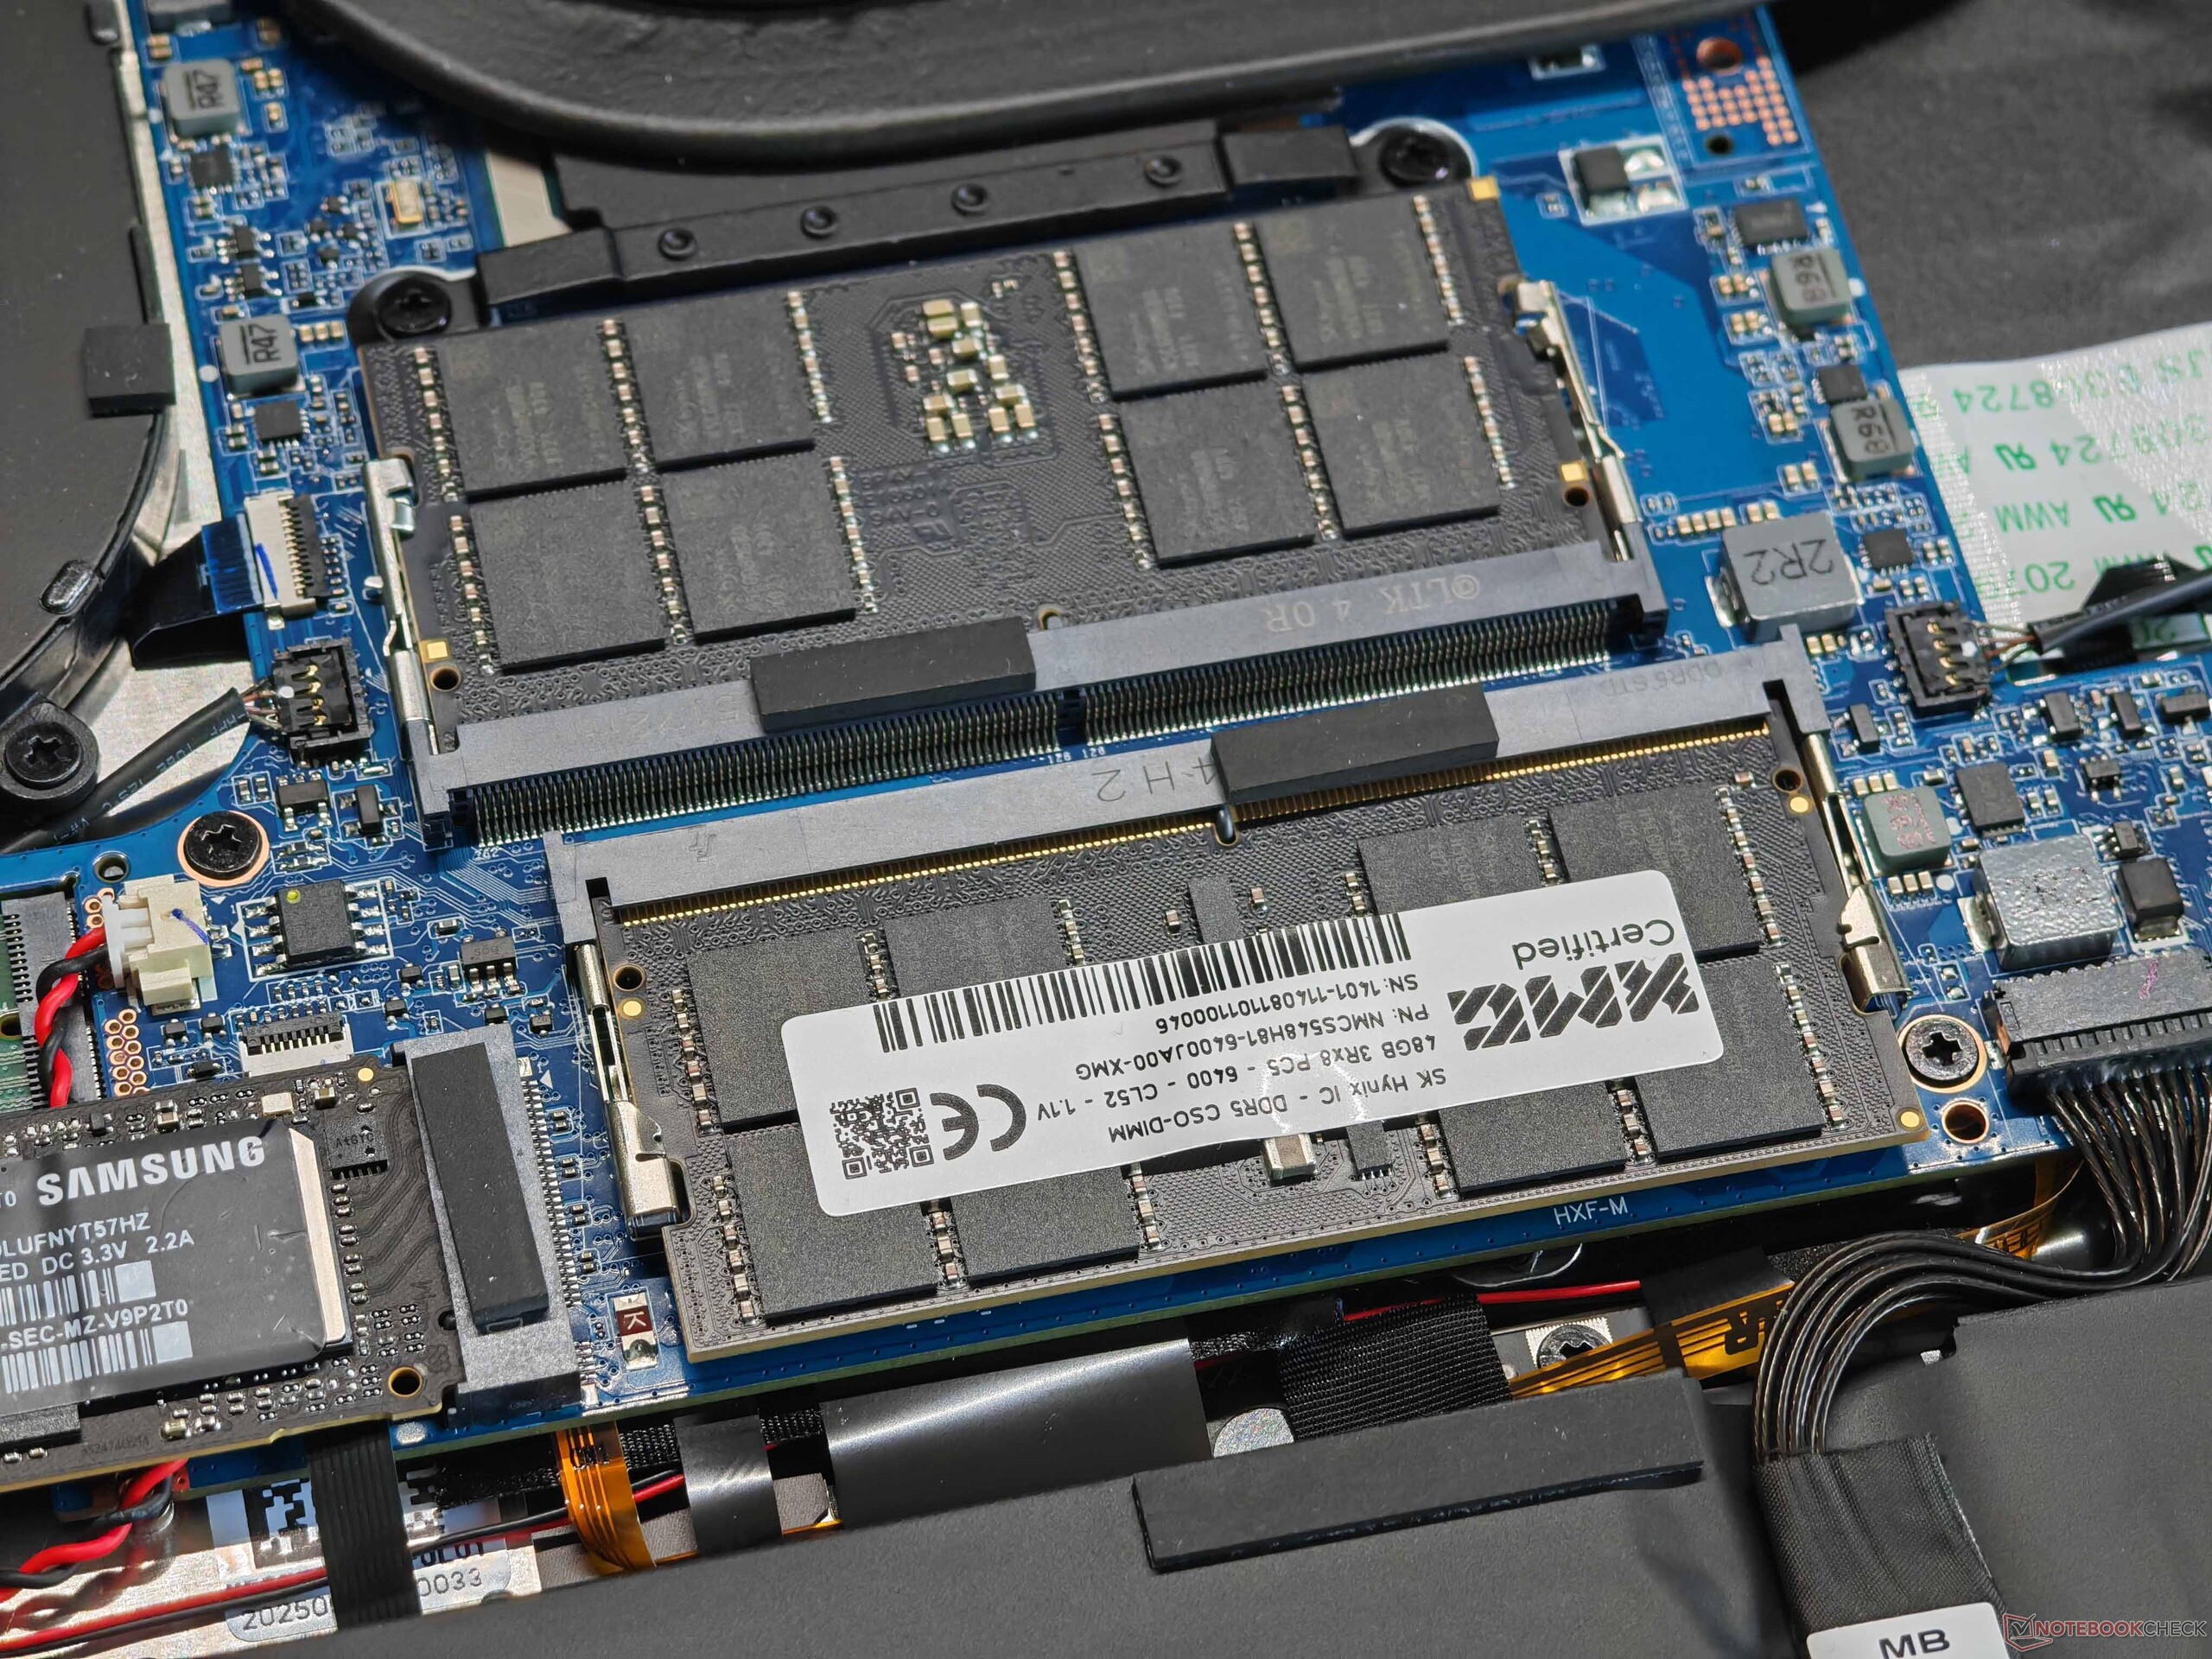
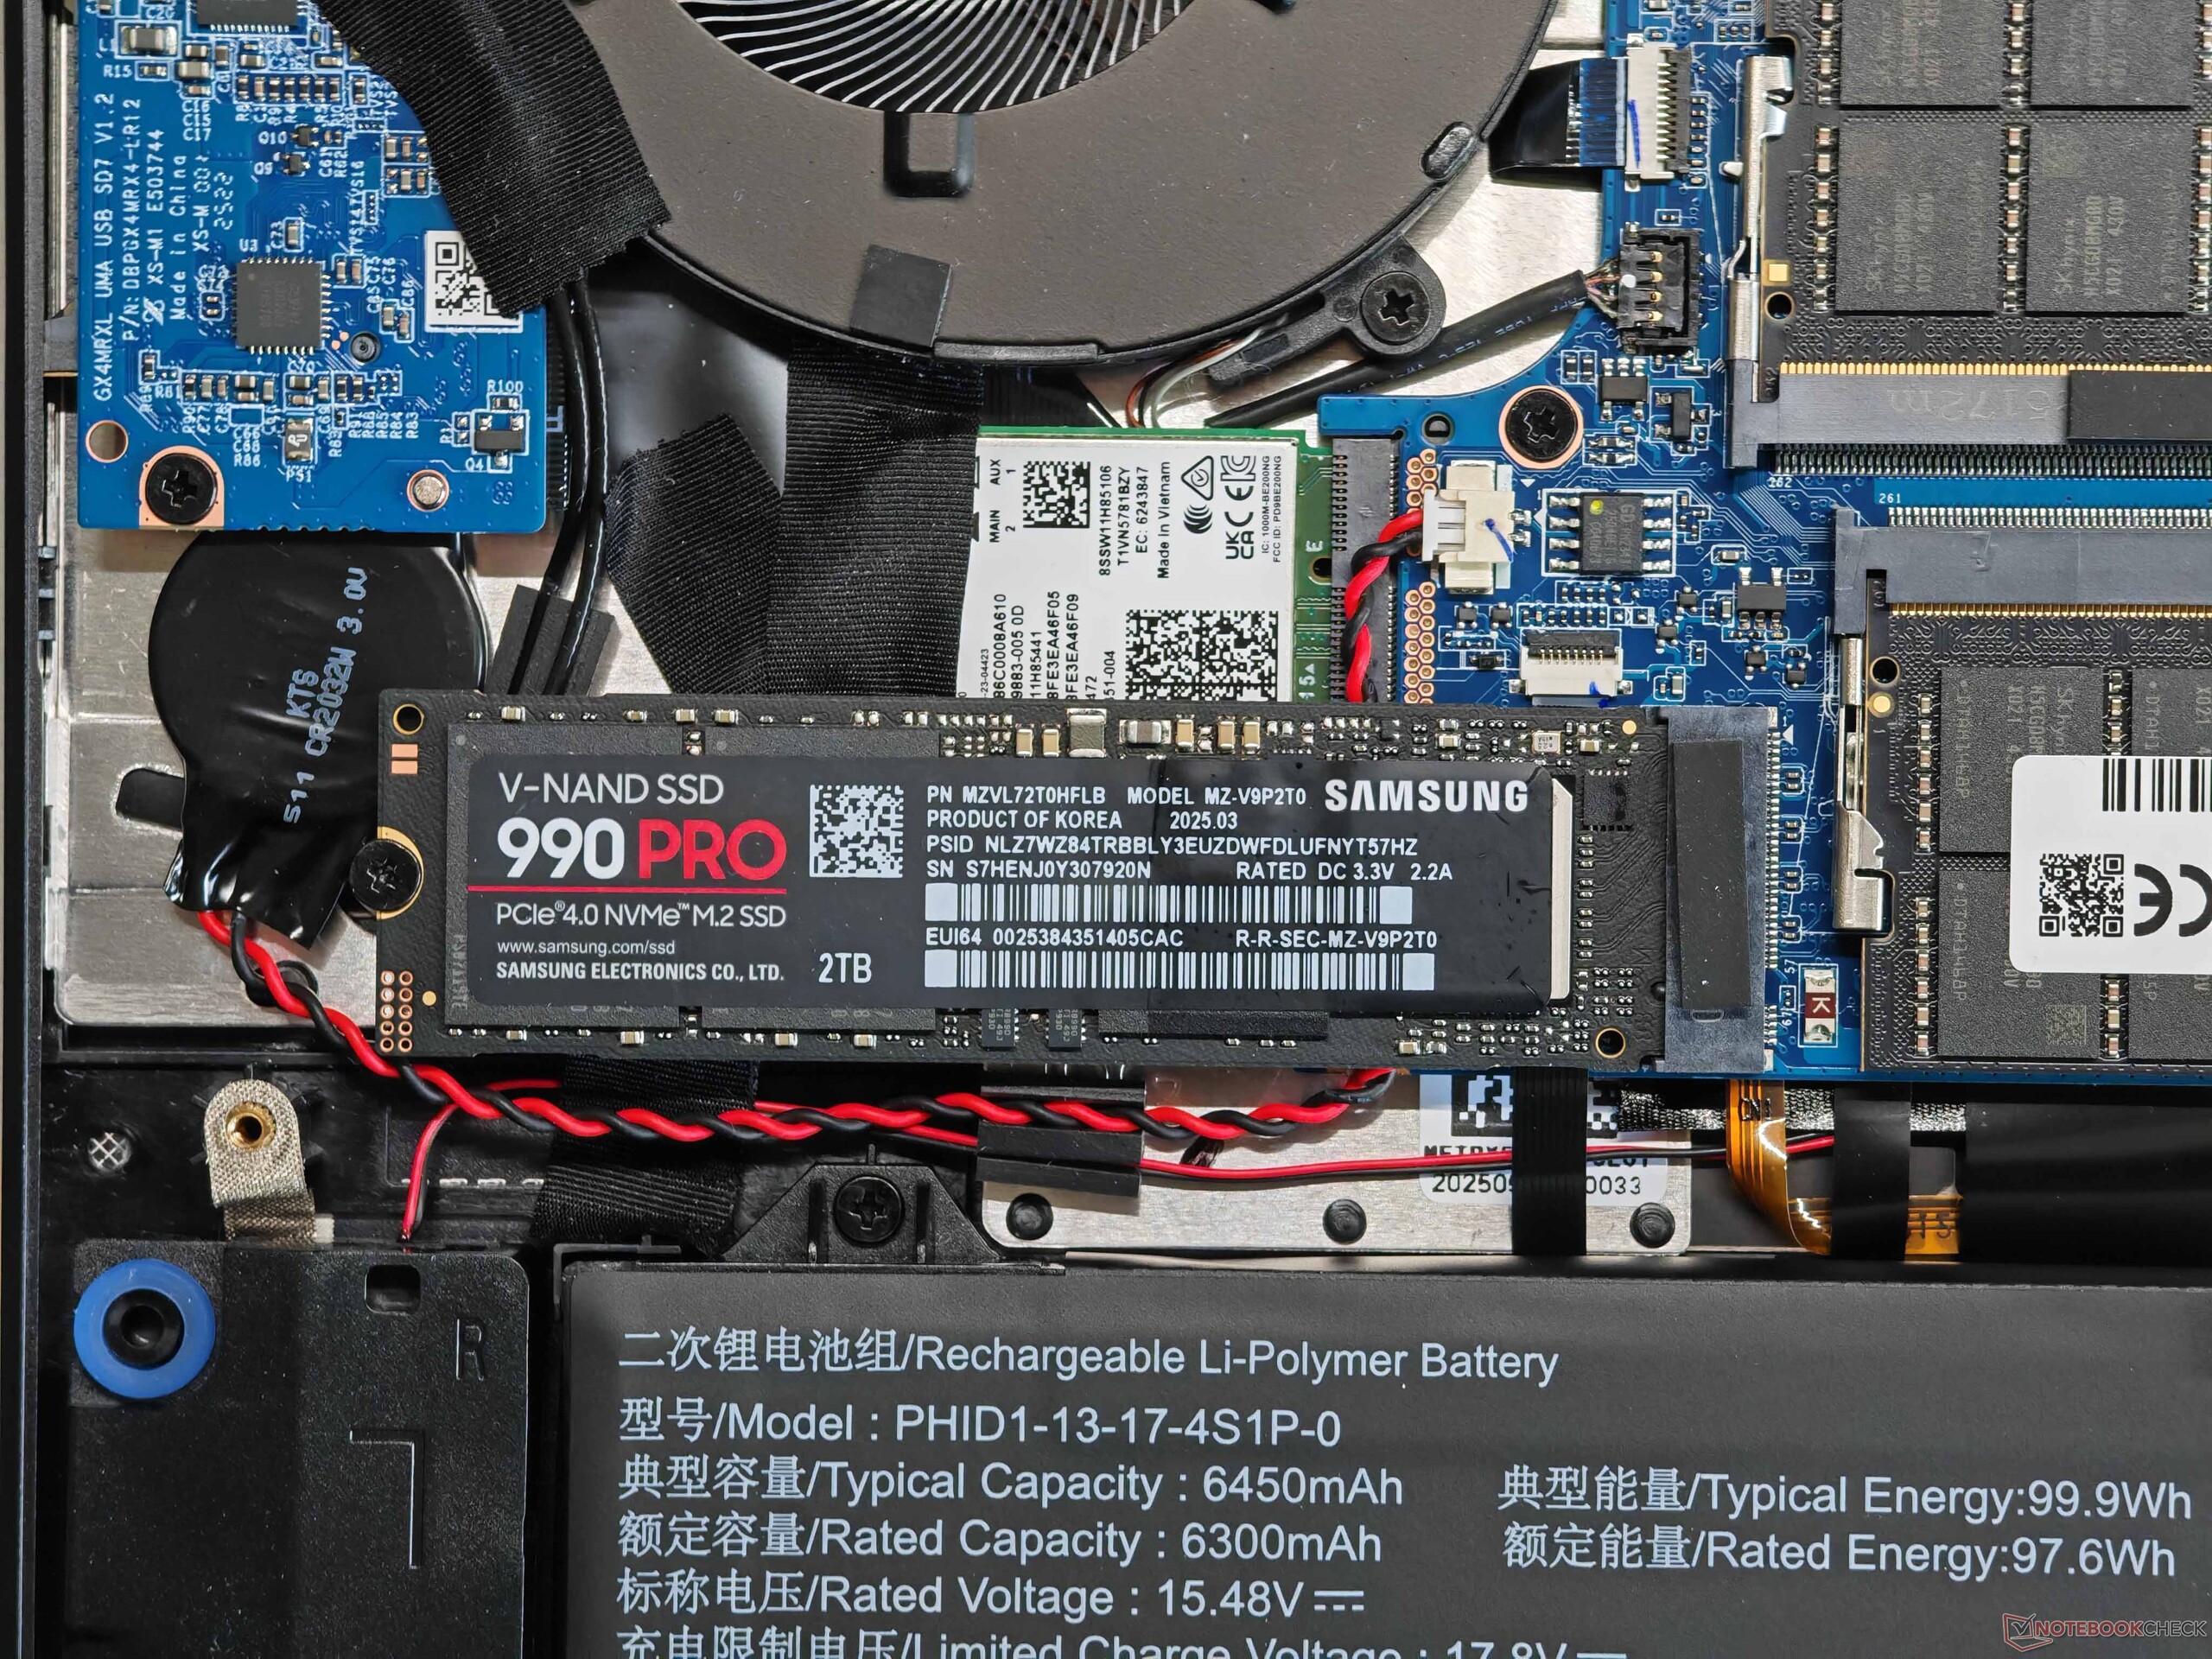
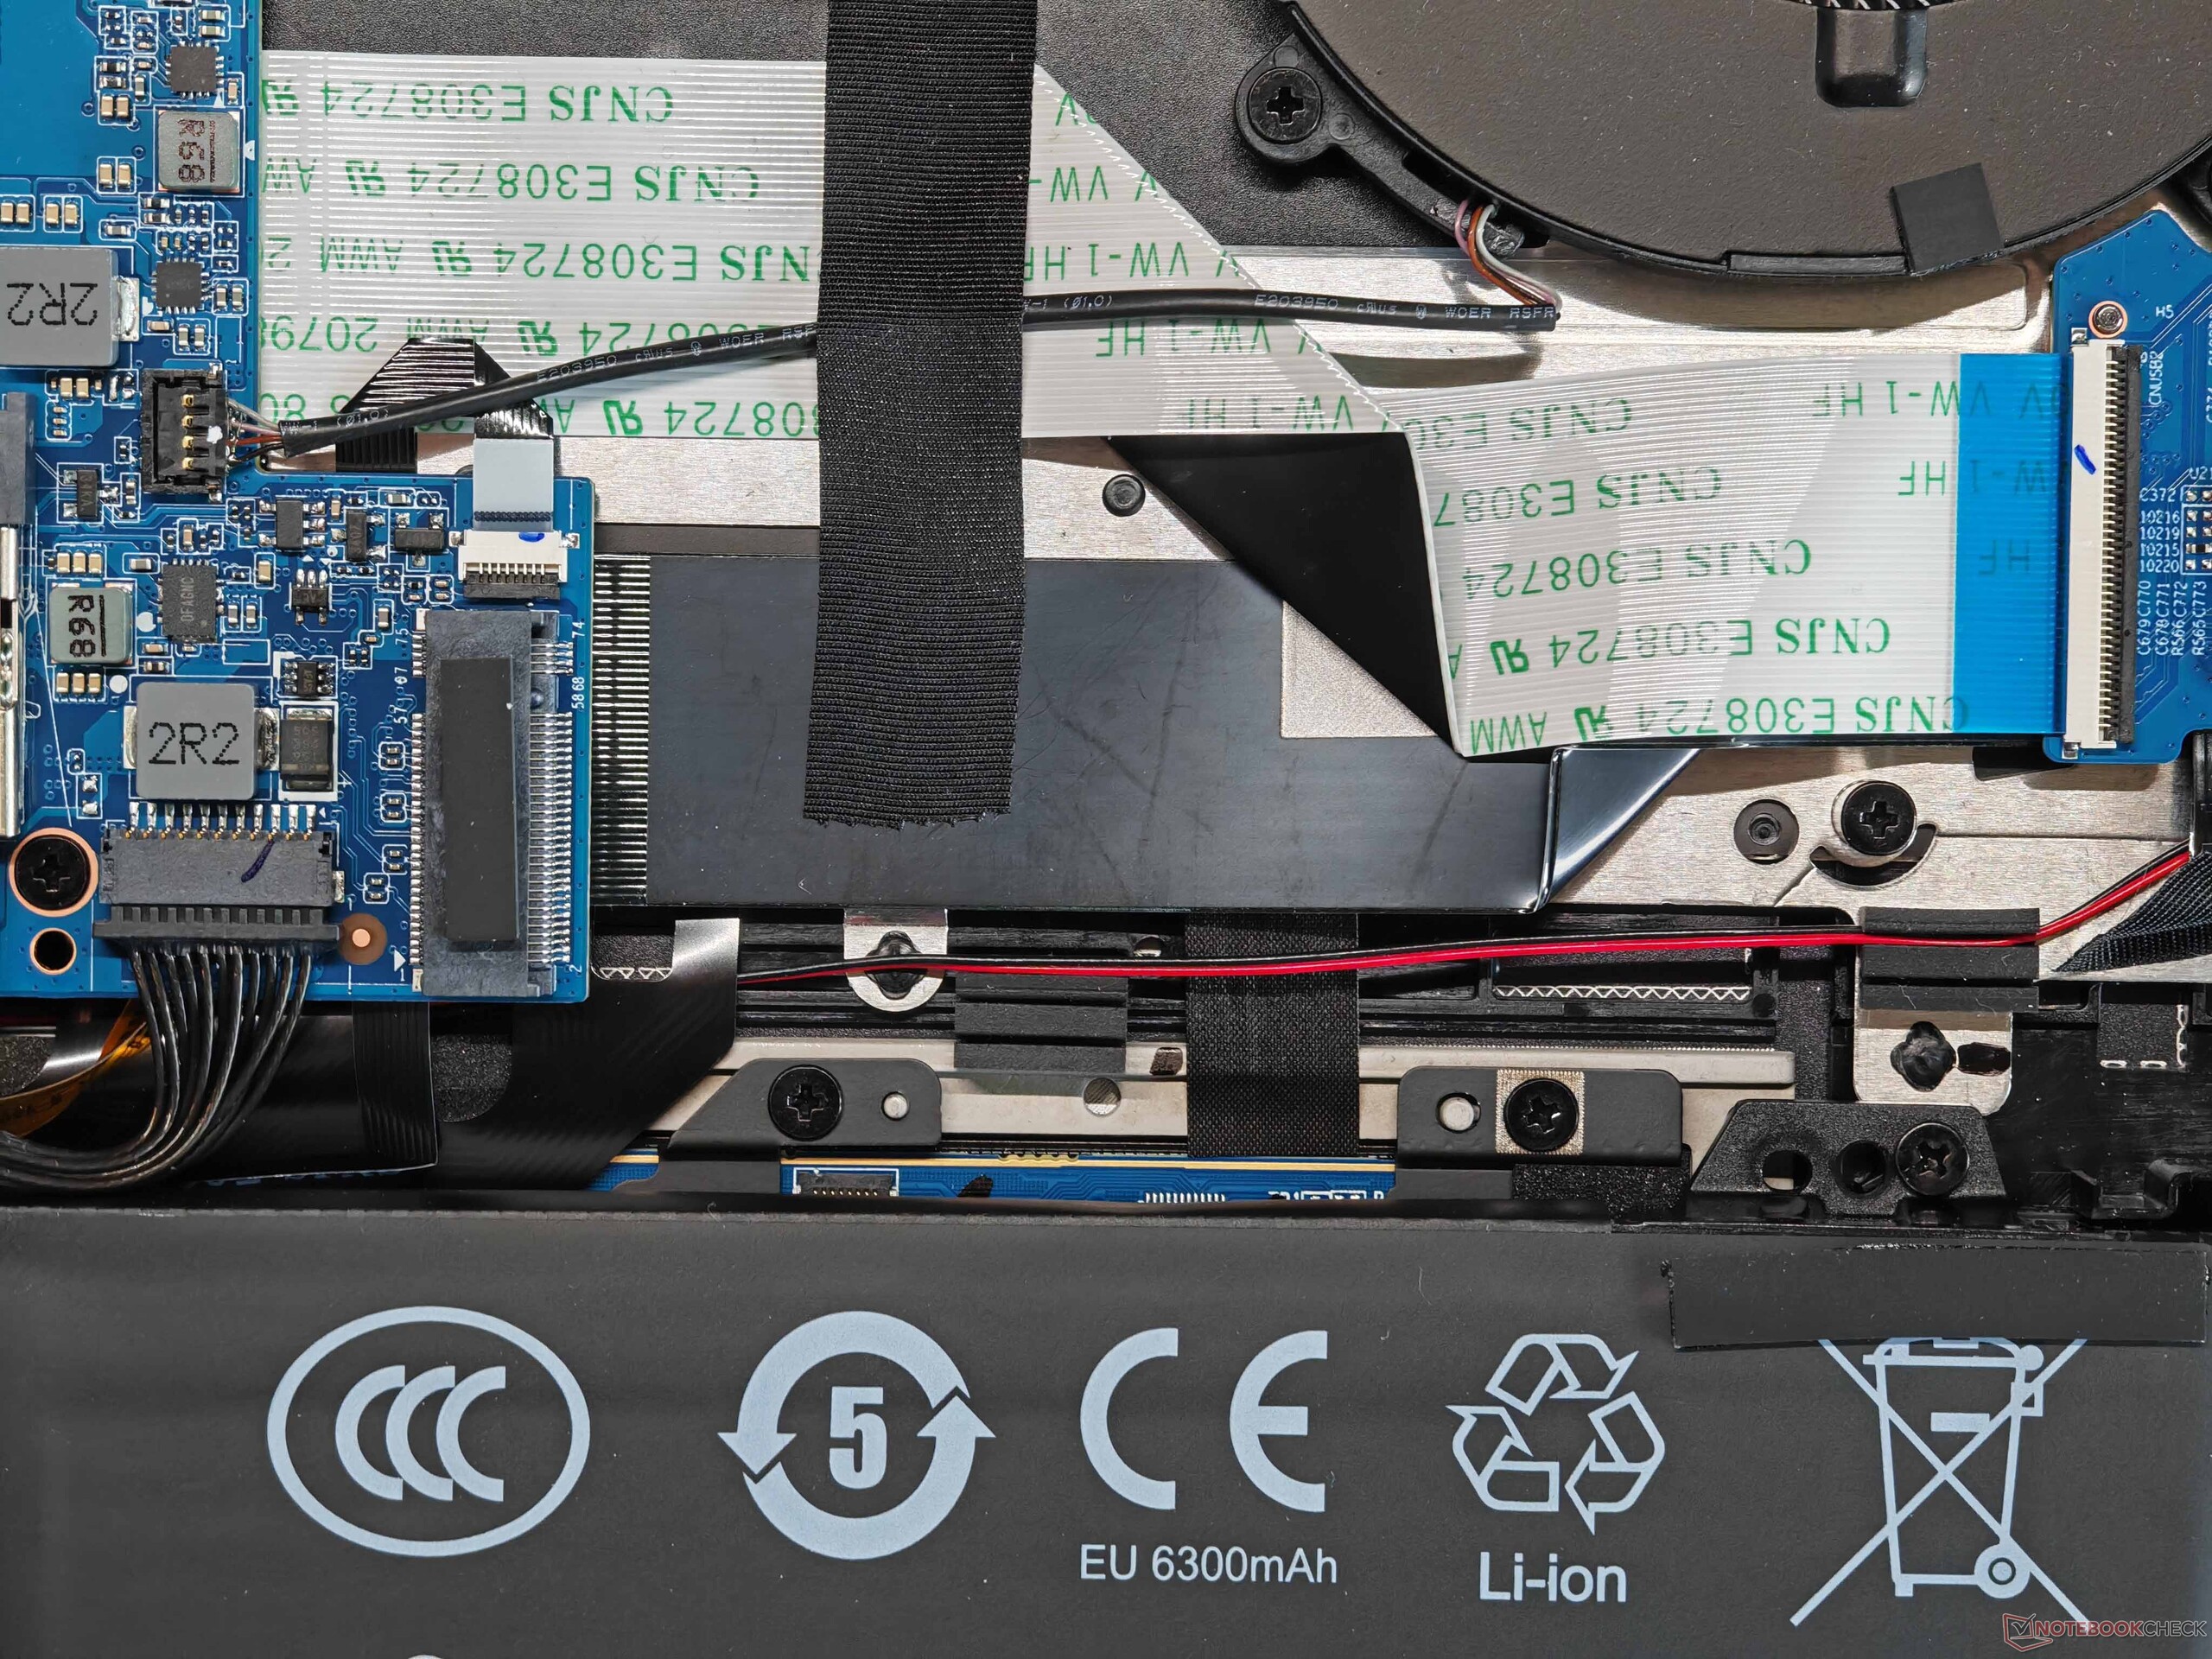
Les options de maintenance sont très bonnes, avec la prise en charge de deux emplacements SO-DIMM, de deux disques SSD et d'un module WLAN remplaçable ; un module Wi-Fi 7 est également disponible. Nous n'avons rencontré aucun problème de taux de transfert lors de nos tests. L'Evo 15 offre un large éventail de ports, dont Thunderbolt 4, HDMI et un lecteur de cartes de taille normale. La webcam 1080p (avec obturateur et module IR) est adéquate pour l'usage auquel elle est destinée.


| SD Card Reader | |
| average JPG Copy Test (av. of 3 runs) | |
| Schenker XMG Evo 15 (M25) (ADATA SD80. Express 512 GB) | |
| Schenker XMG Evo 15 (M25) (Angelbird AV Pro V60) | |
| Moyenne de la classe Multimedia (22.2 - 531, n=41, 2 dernières années) | |
| Microsoft Surface Laptop 7 15 Lunar Lake (Angelbird AV Pro V60) | |
| maximum AS SSD Seq Read Test (1GB) | |
| Schenker XMG Evo 15 (M25) (ADATA SD80. Express 512 GB) | |
| Schenker XMG Evo 15 (M25) (Angelbird AV Pro V60) | |
| Moyenne de la classe Multimedia (27.9 - 1455, n=41, 2 dernières années) | |
| Microsoft Surface Laptop 7 15 Lunar Lake (Angelbird AV Pro V60) | |
| Networking | |
| Schenker XMG Evo 15 (M25) | |
| iperf3 transmit AXE11000 | |
| iperf3 receive AXE11000 | |
| Microsoft Surface Laptop 7 15 Lunar Lake | |
| iperf3 transmit AXE11000 | |
| iperf3 receive AXE11000 | |
| Apple MacBook Air 15 M4 | |
| iperf3 transmit AXE11000 | |
| iperf3 receive AXE11000 | |
| Lenovo ThinkPad X9-15 Aura Edition | |
| iperf3 transmit AXE11000 | |
| iperf3 receive AXE11000 | |
| Lenovo Yoga Slim 7 15ILL9 Aura | |
| iperf3 transmit AXE11000 | |
| iperf3 receive AXE11000 | |
| iperf3 transmit AXE11000 6GHz | |
| iperf3 receive AXE11000 6GHz | |

 Arc 140T, Ultra 7 255H, Samsung 990 Pro 2 TB MZVL72T0HDLB")
 Arc 140T, Ultra 7 255H, Samsung 990 Pro 2 TB MZVL72T0HDLB")
Dispositifs d'entrée
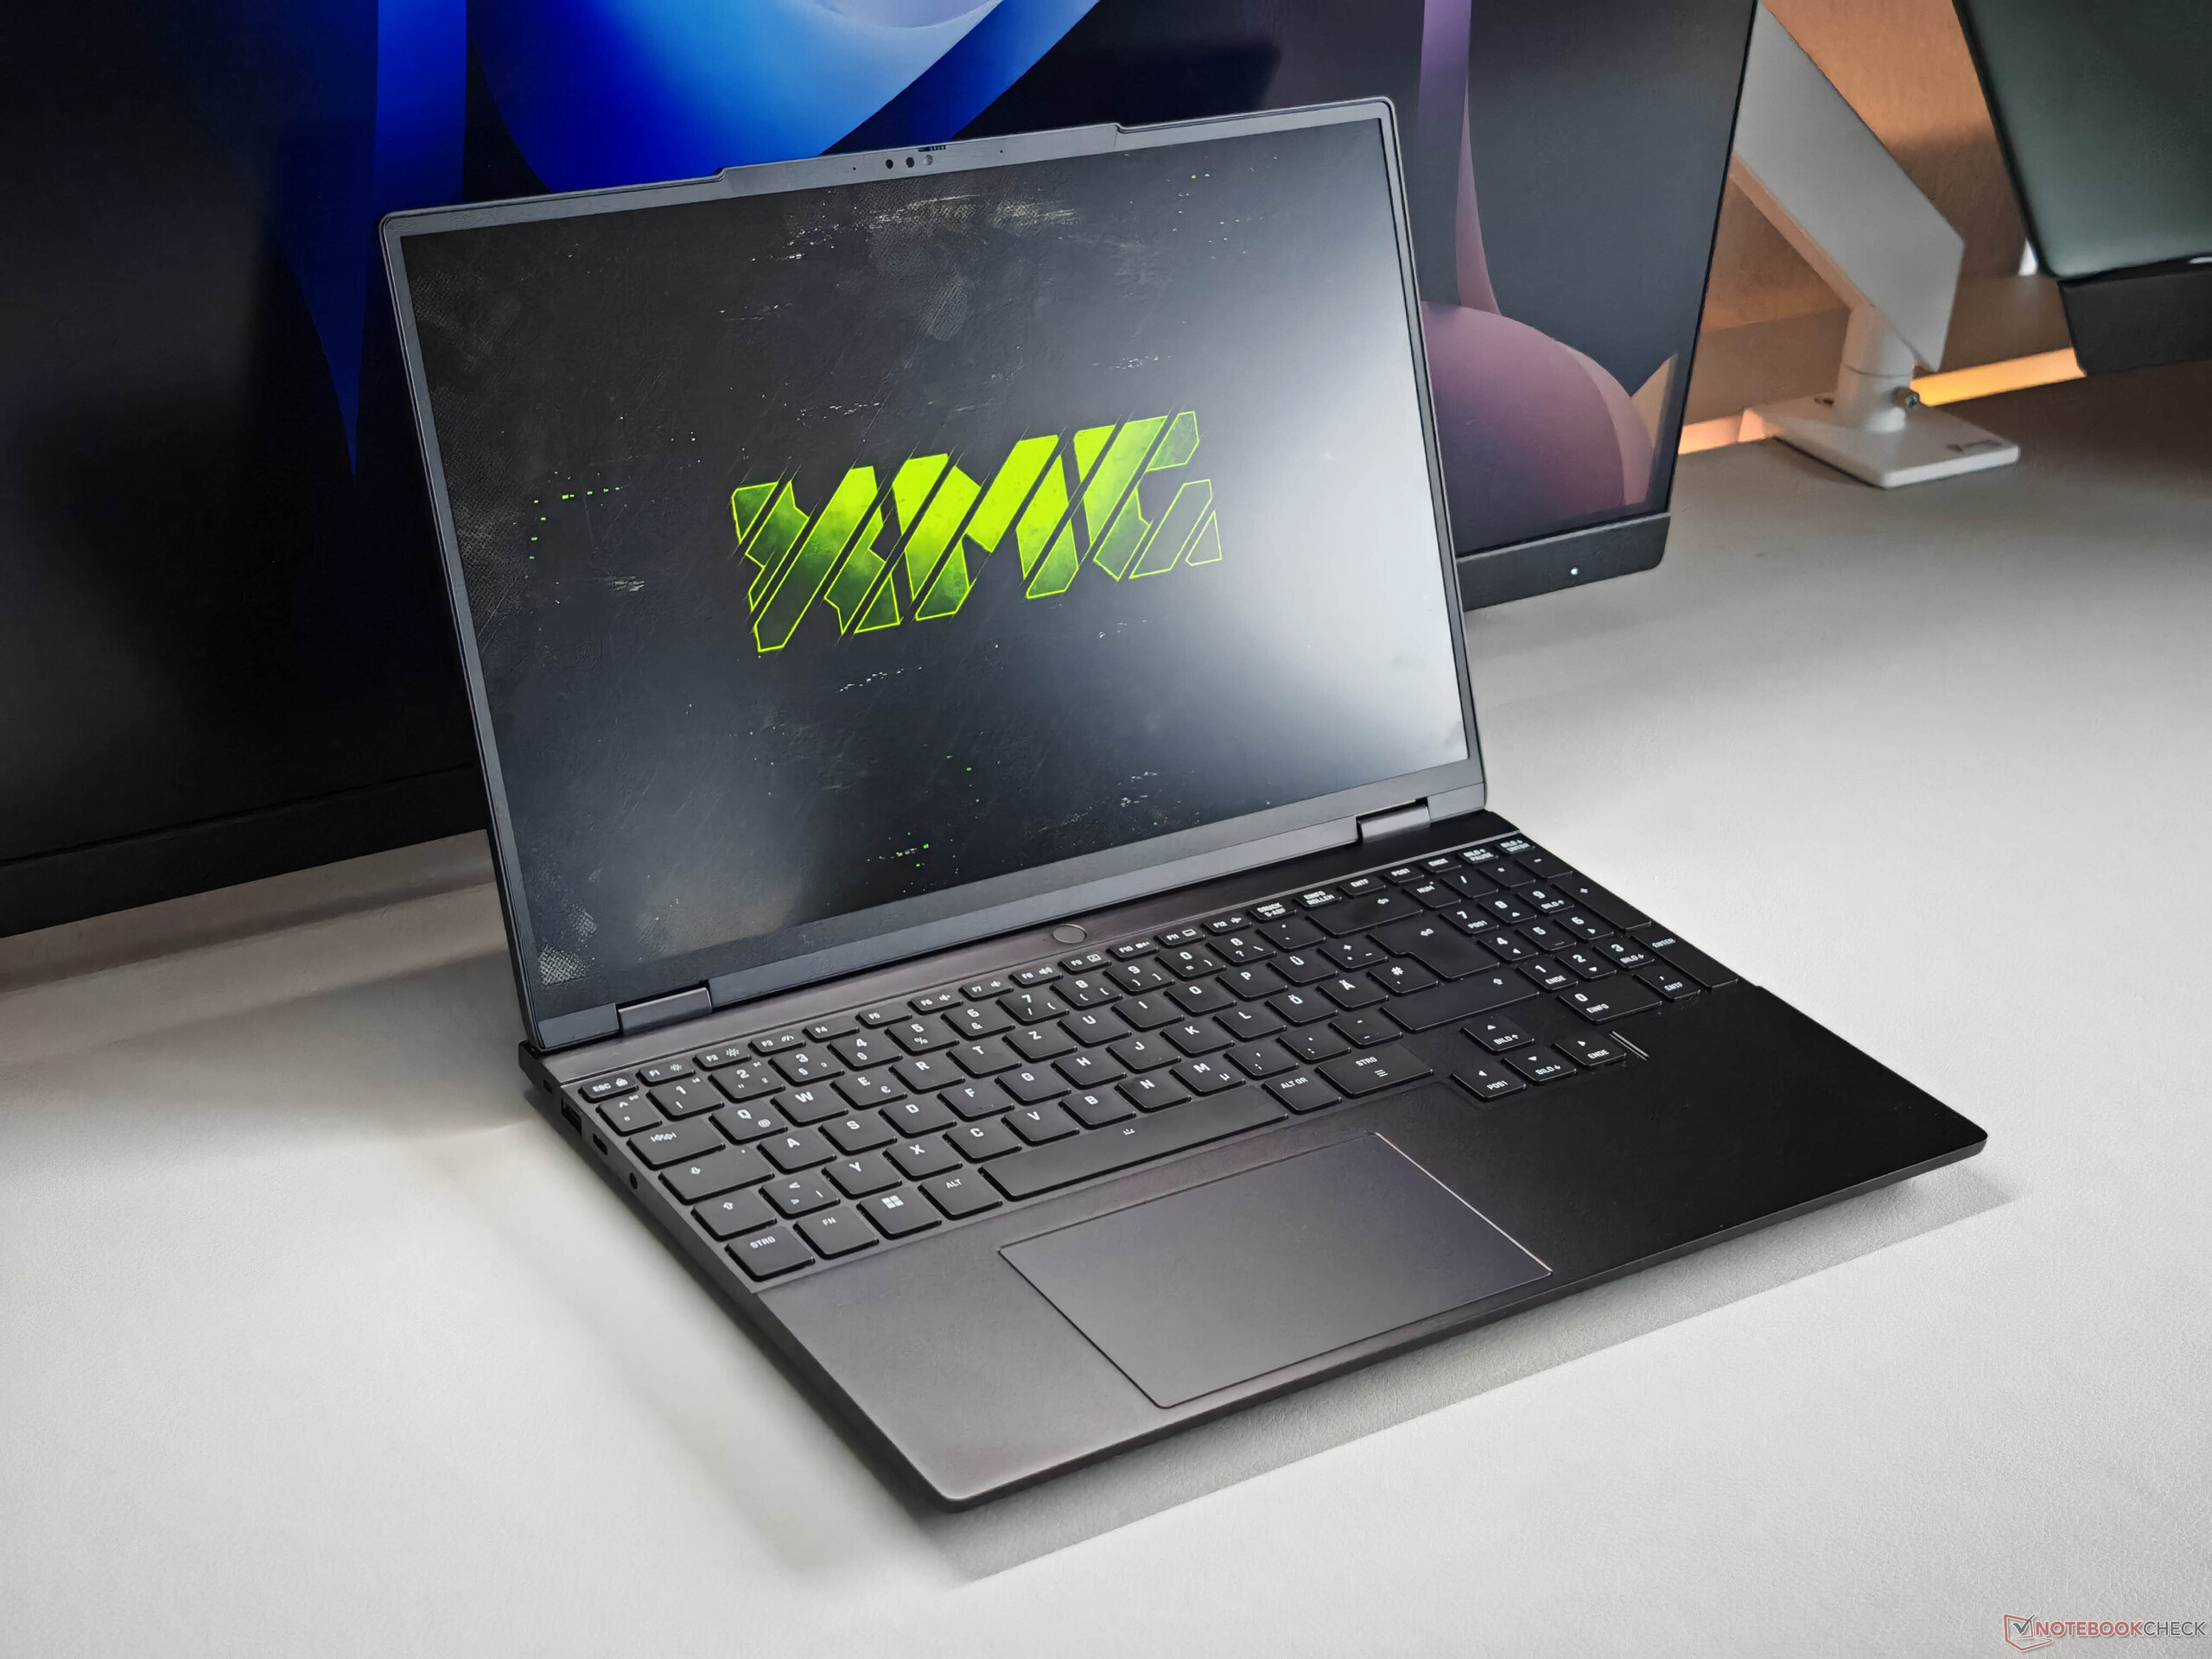
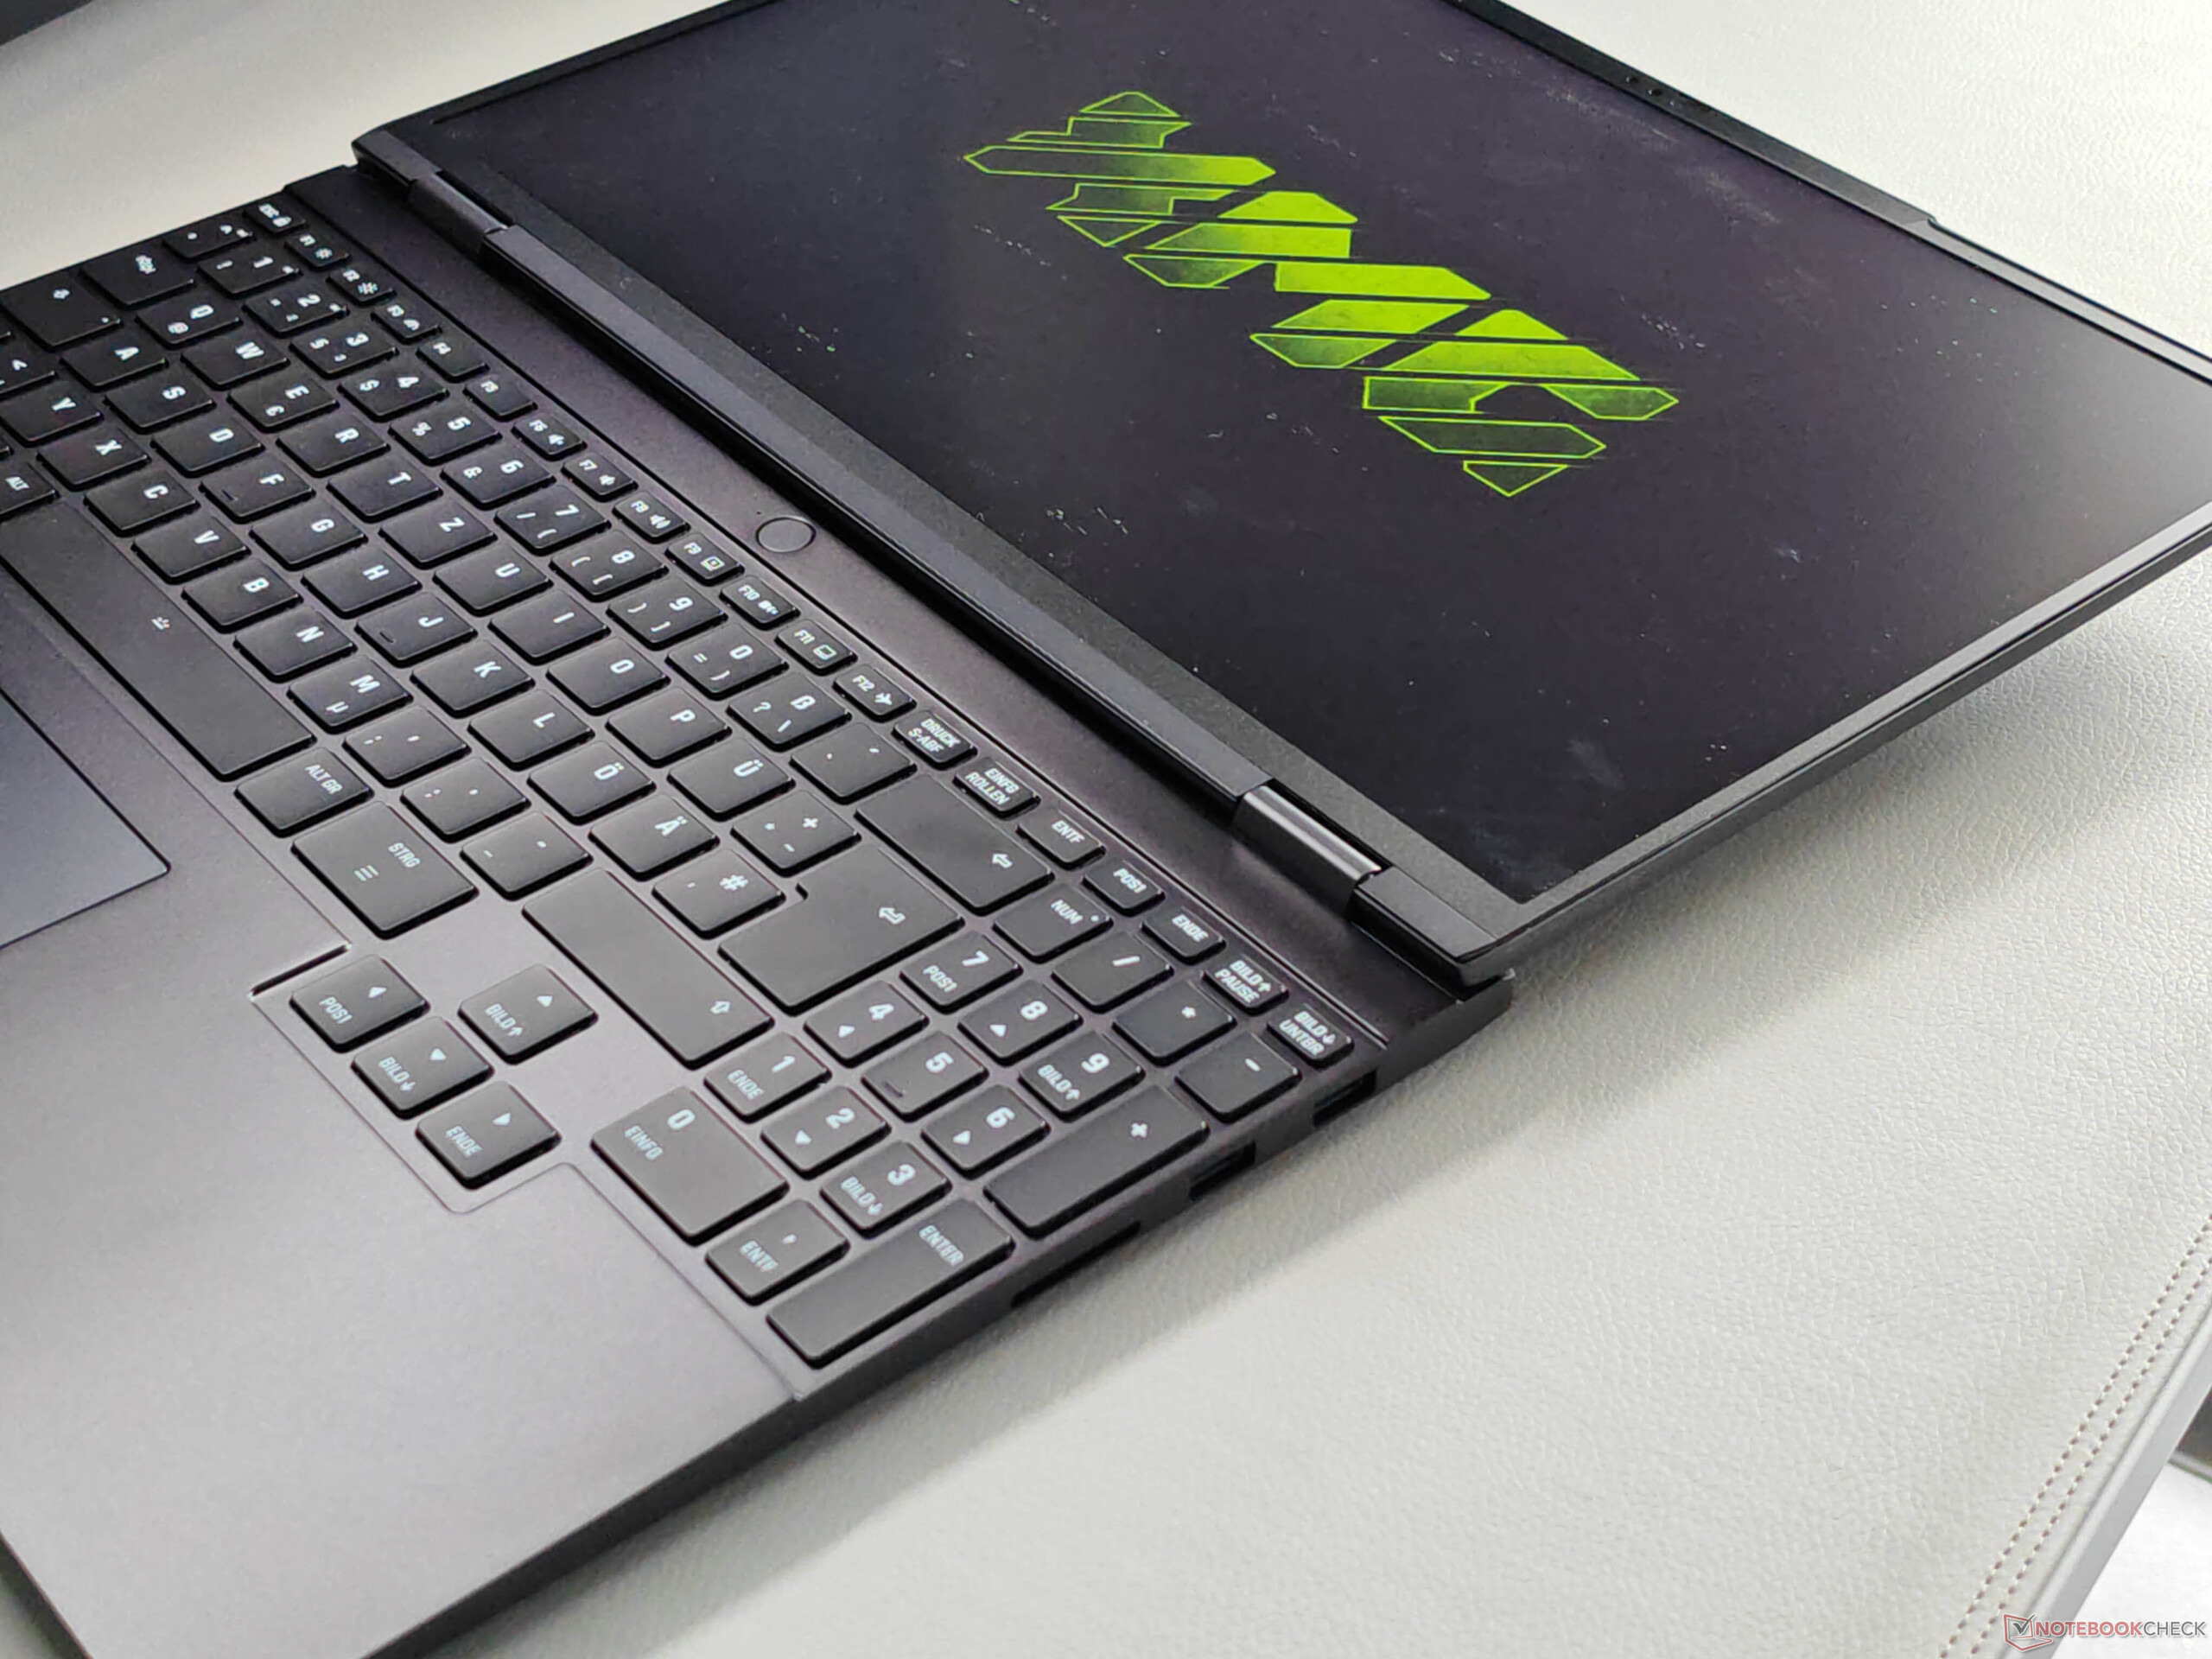
Le clavier s'étend sur toute la largeur du châssis et comprend un pavé numérique dédié ainsi que de grandes touches fléchées. Dans l'ensemble, le confort de frappe est très bon et les textes longs peuvent être tapés sans problème ; seules les grandes touches sont légèrement plus bruyantes. Le rétroéclairage blanc offre quatre niveaux de luminosité.
Le pavé tactile est légèrement décalé vers la gauche et offre de bonnes propriétés de glisse, mais les clics mécaniques dans la zone inférieure sont un peu bruyants.


Écran - IPS avec 240 Hz

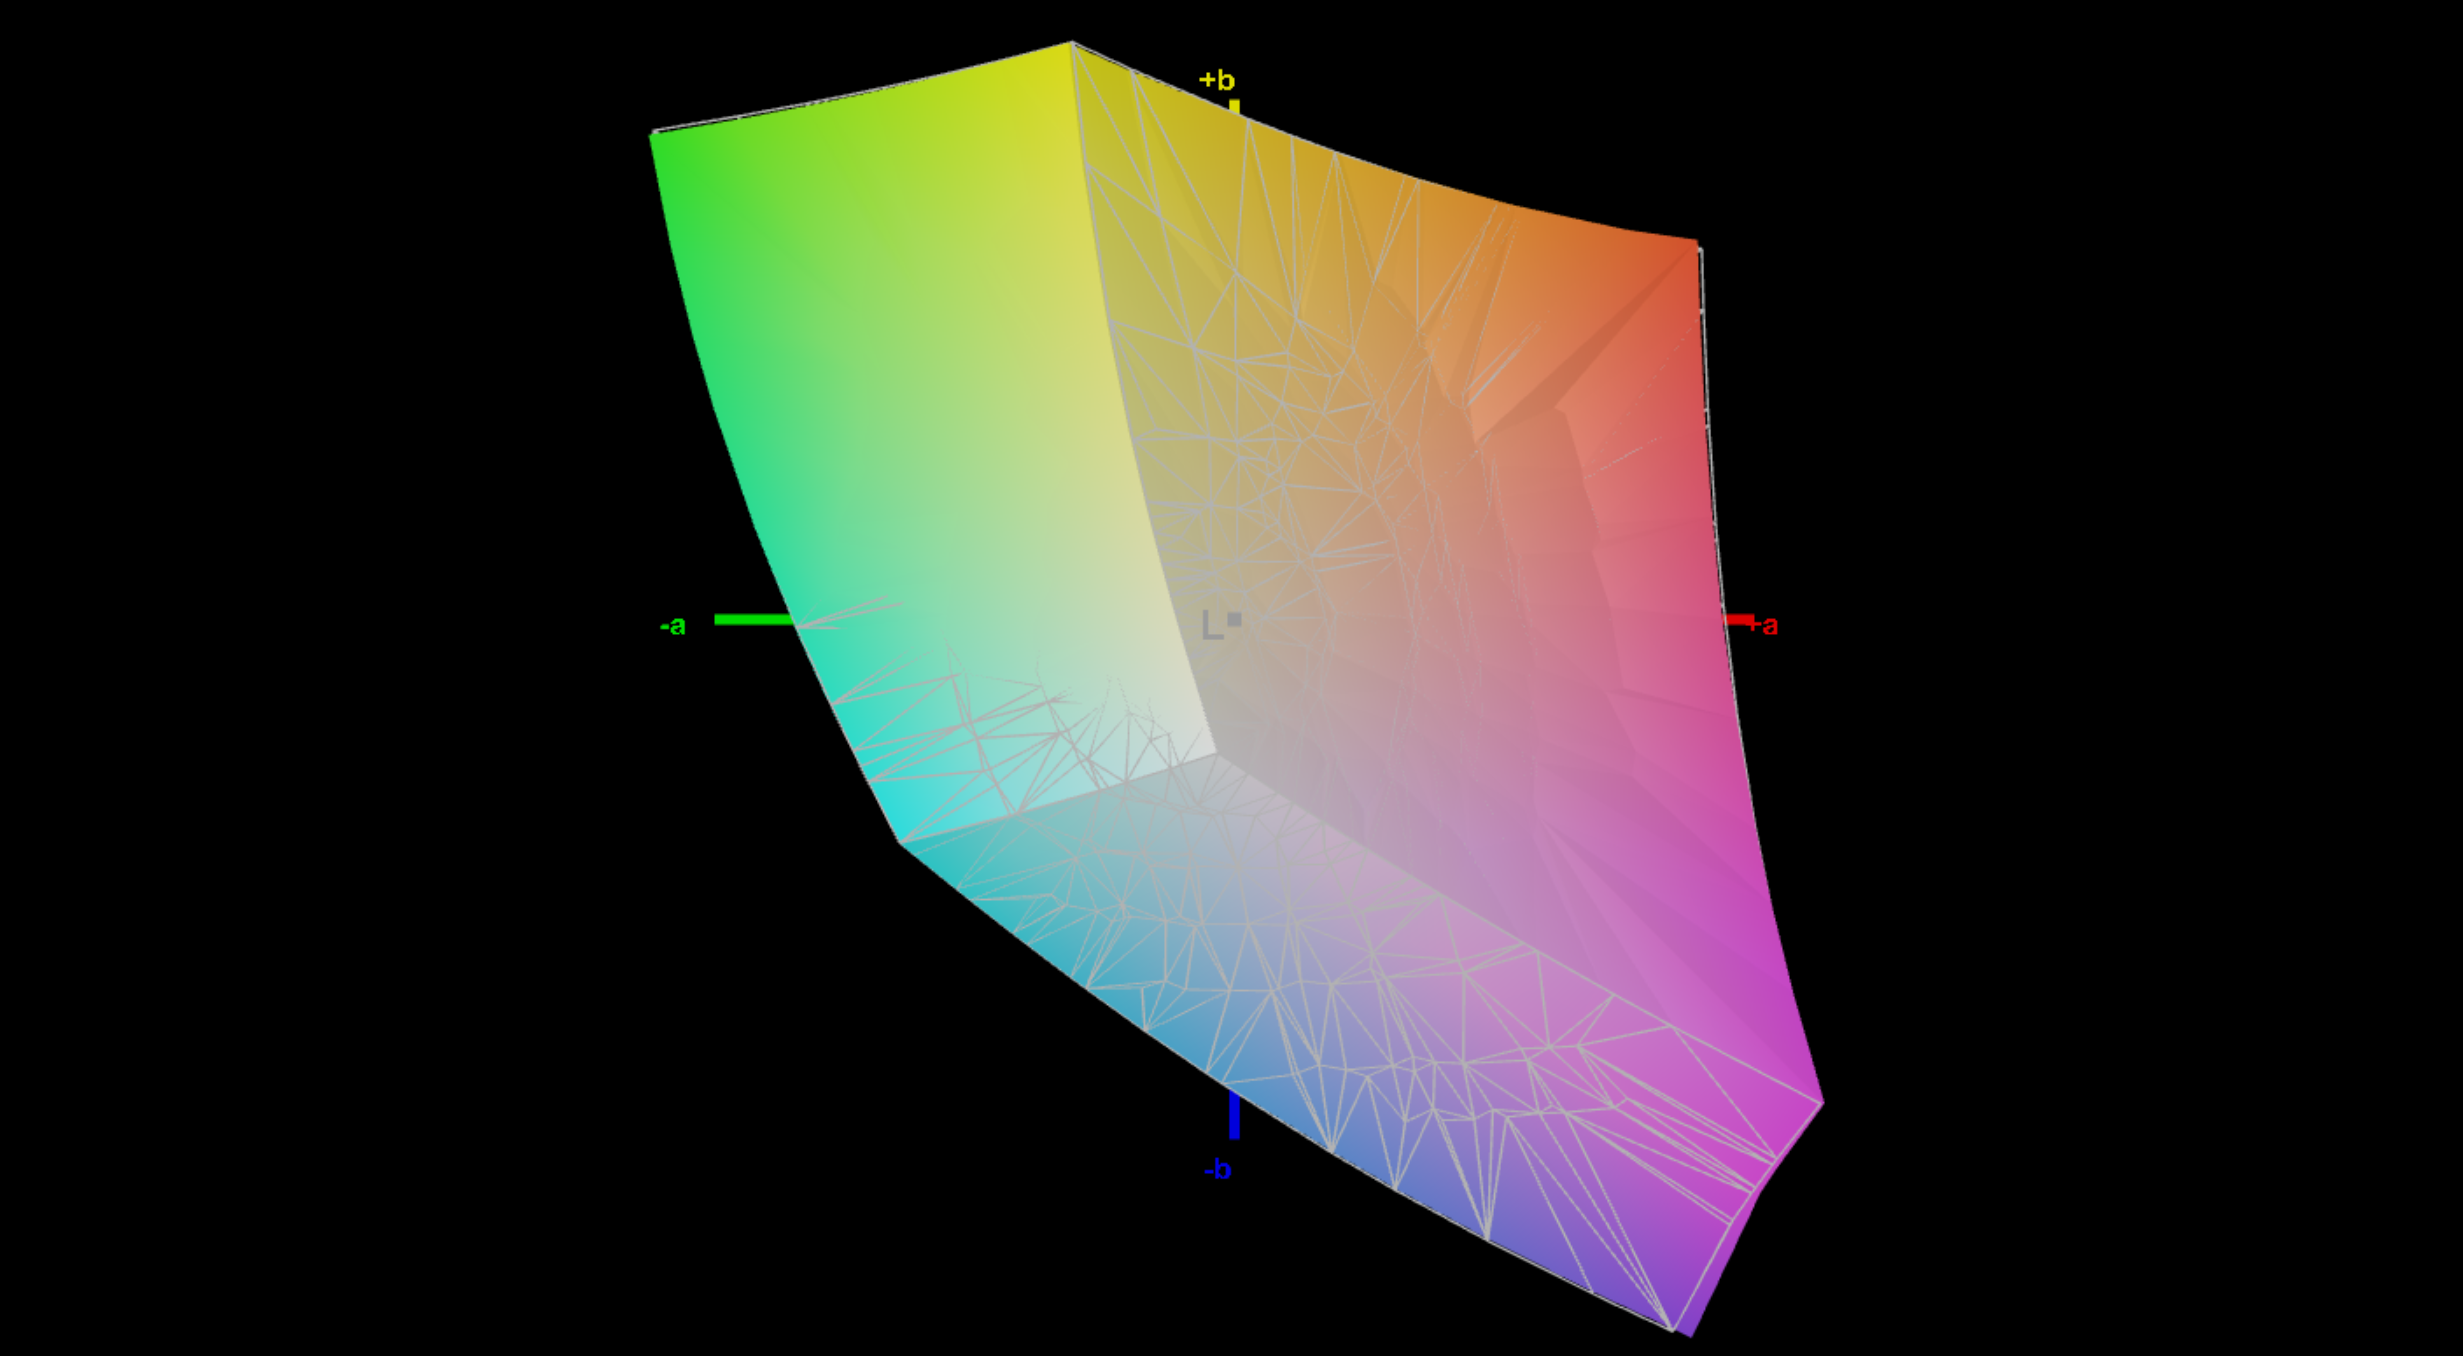
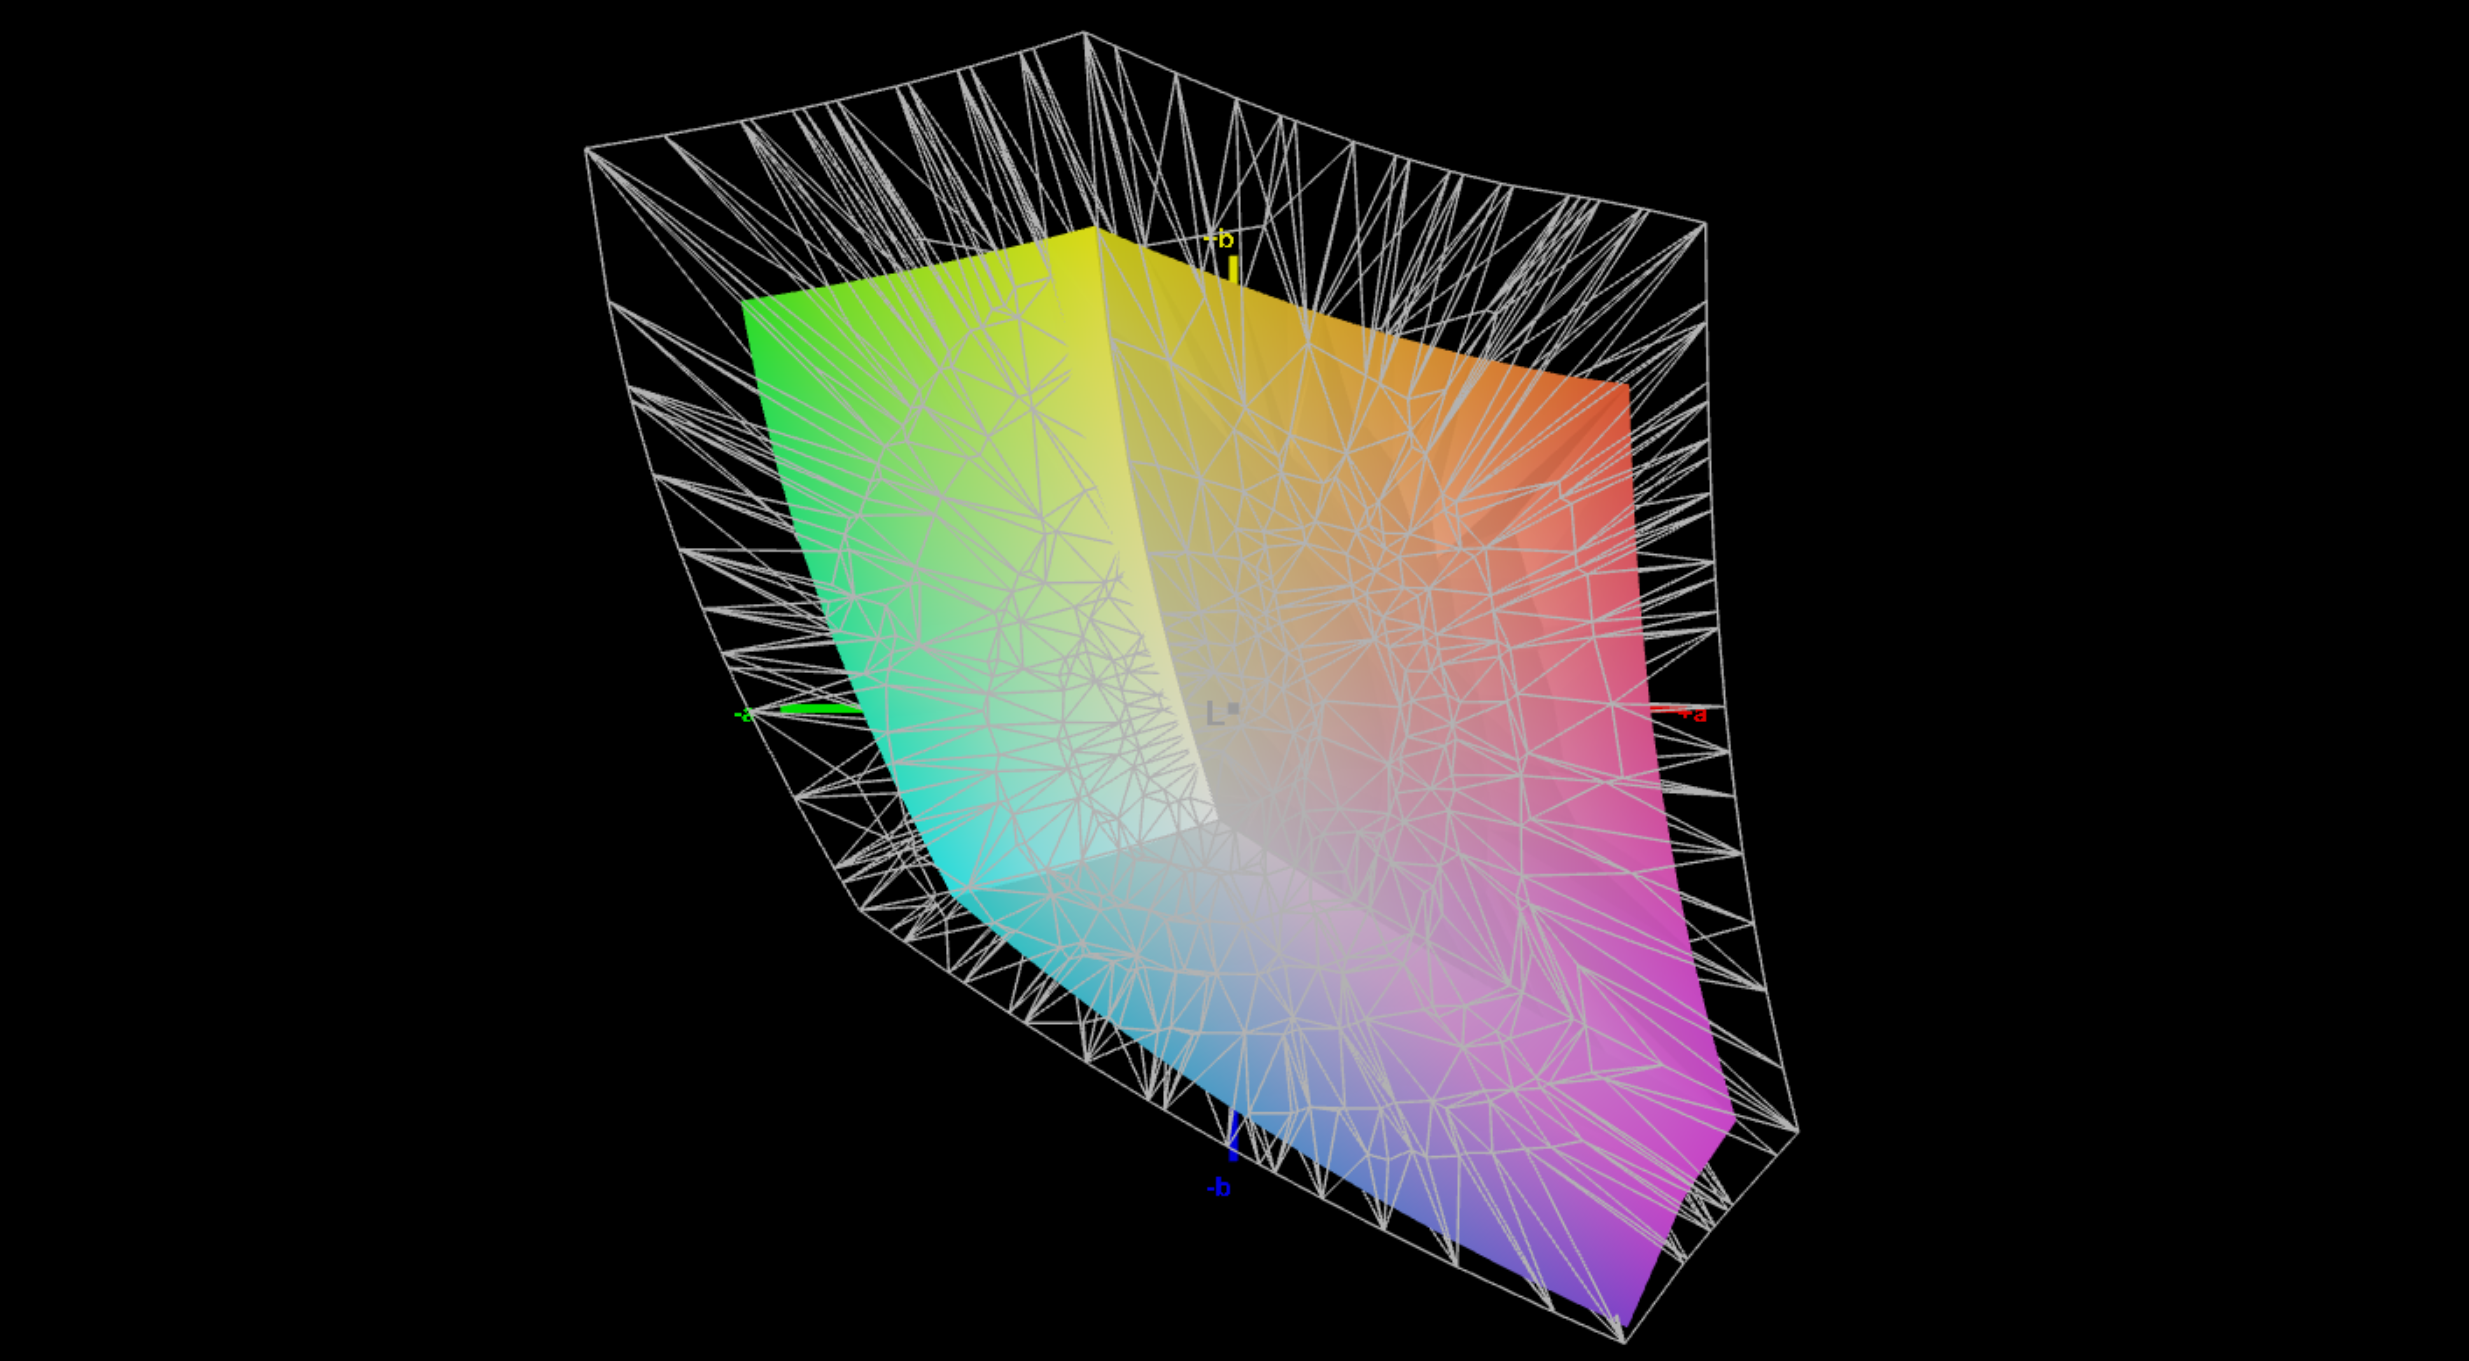
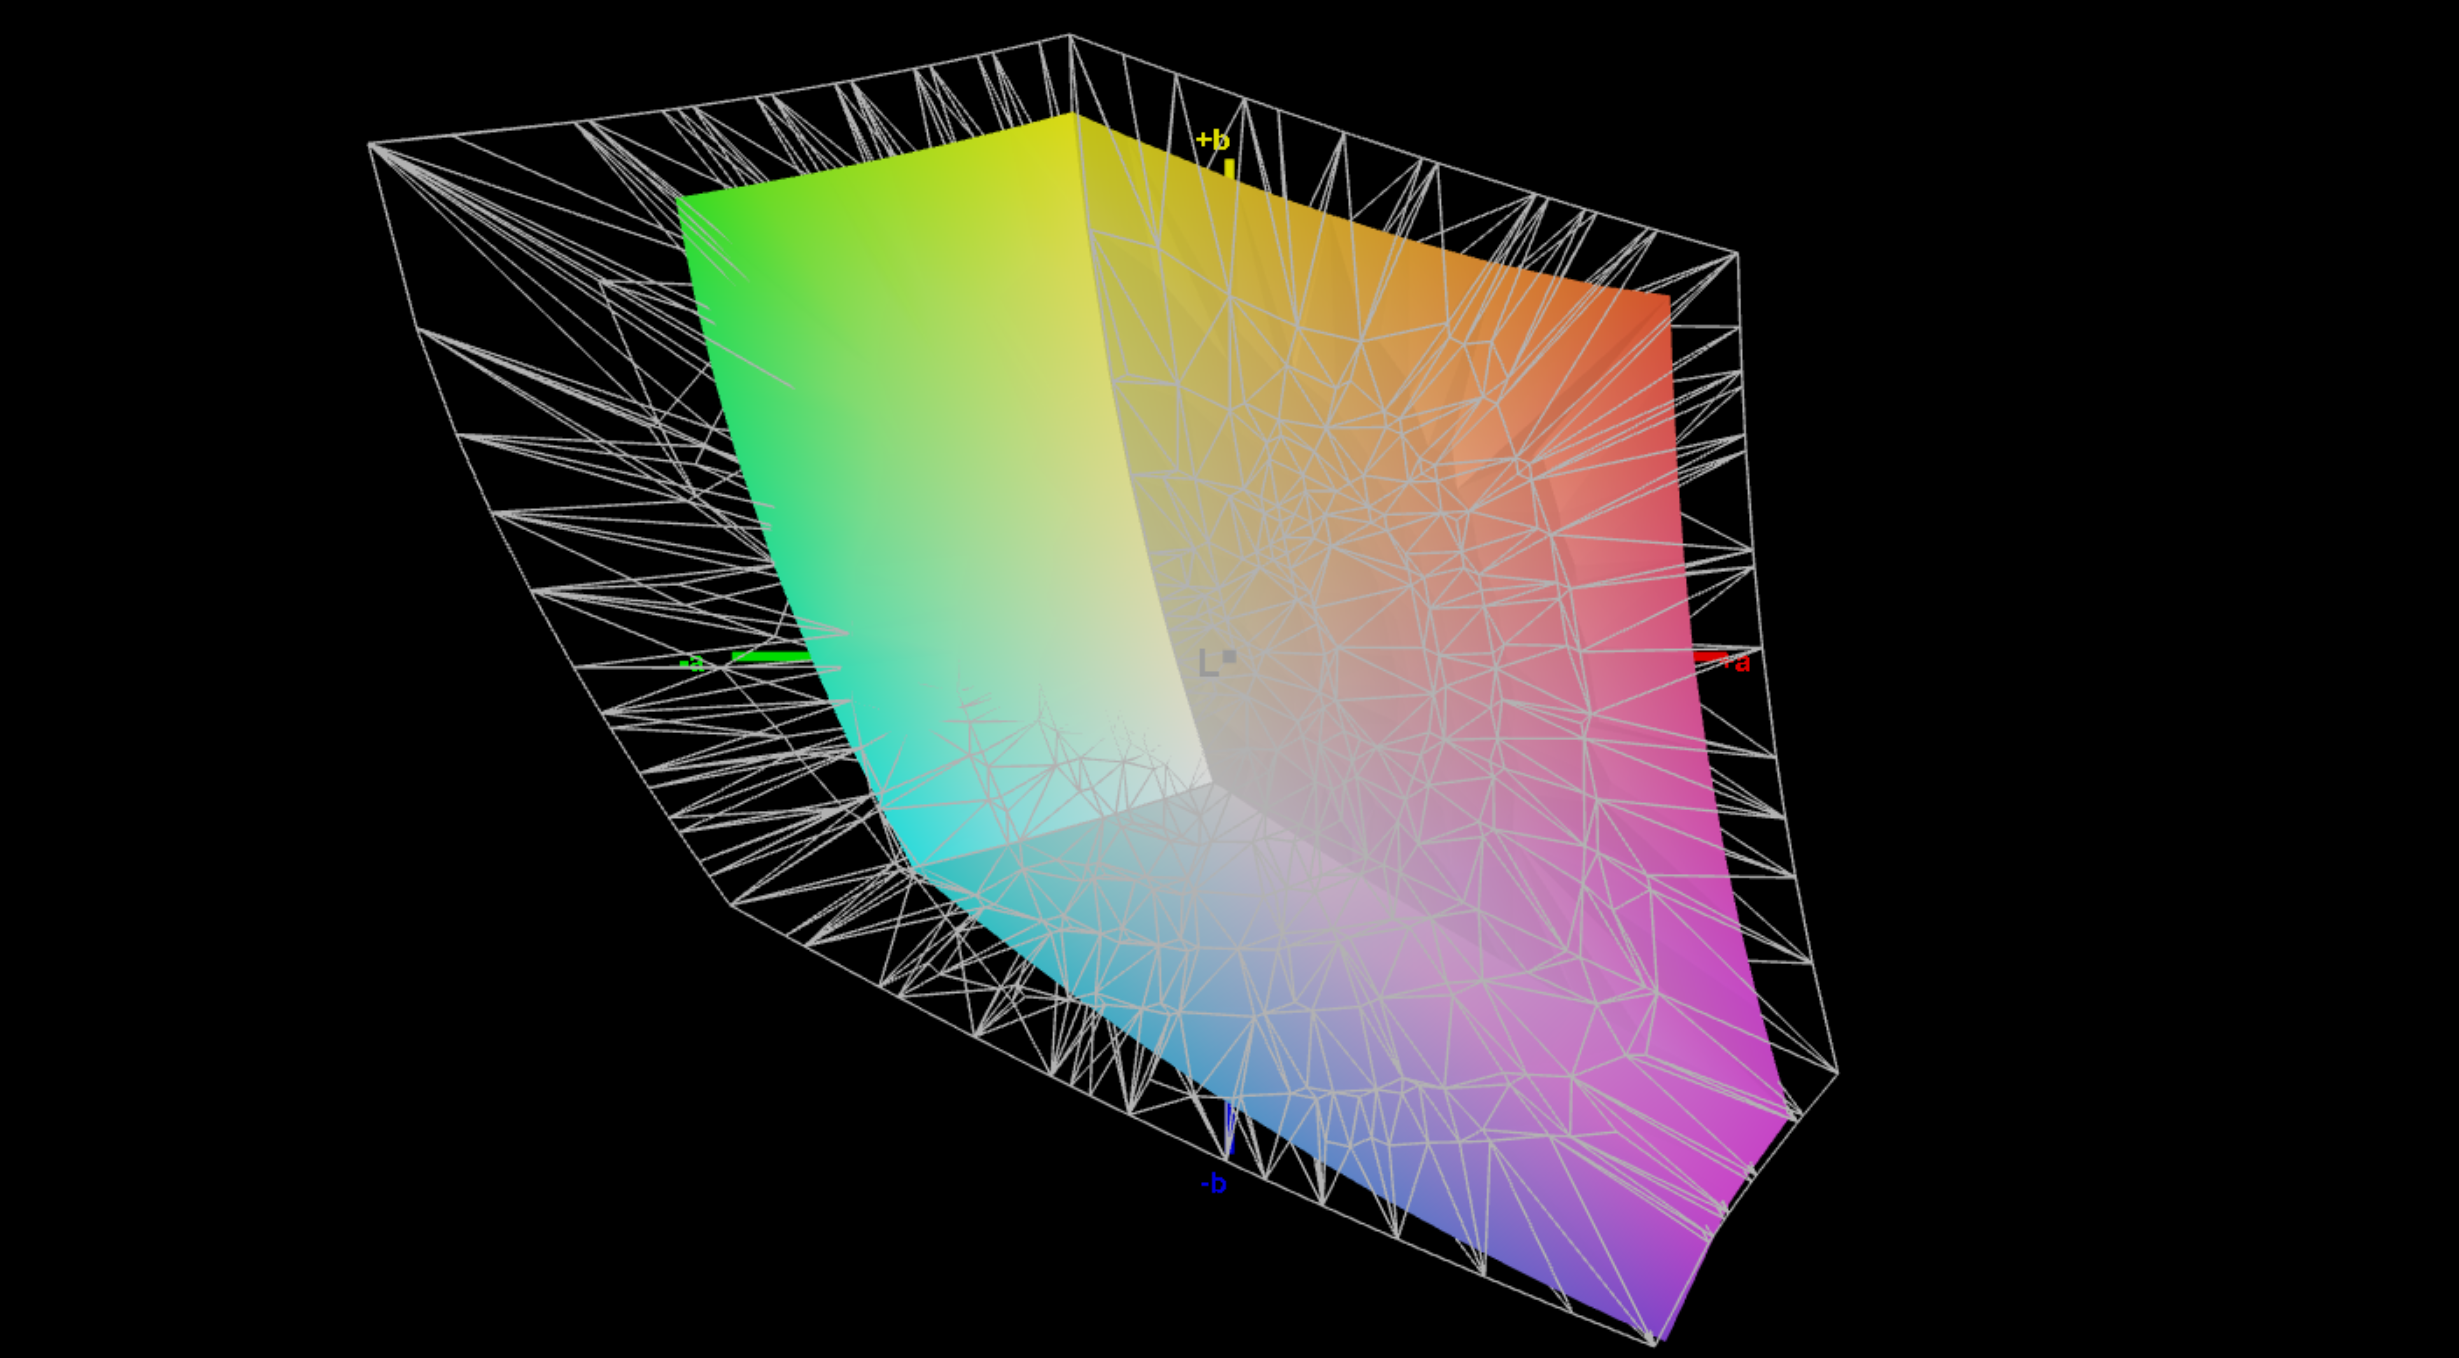
Les spécifications techniques de l'écran IPS mat (2 560 × 1 600 pixels, 16:10) avec un taux de rafraîchissement de 240 Hz n'ont pas changé, bien que l'identification de l'écran soit différente. La qualité subjective de l'image reste très bonne, et même les zones lumineuses ne semblent pas granuleuses. L'espace colorimétrique sRGB est entièrement couvert, mais il ne faut pas s'attendre aux couleurs vives des panneaux OLED brillants. D'autre part, il n'y a aucun problème avec le PWM, et même les effets de halo sont pratiquement absents.
La luminosité spécifiée de 500 cd/m² est une fois de plus clairement dépassée, mais le seul inconvénient restant est le niveau de noir élevé (0,51 cd/m²), ce qui entraîne un rapport de contraste maximal relativement faible d'environ 1 100:1. Le calibrage d'usine est déjà très bon, et nous n'avons pas été en mesure d'obtenir une amélioration supplémentaire avec notre propre calibrage.
| |||||||||||||||||||||||||
Homogénéité de la luminosité: 89 %
Valeur mesurée au centre, sur batterie: 555 cd/m²
Contraste: 1088:1 (Valeurs des noirs: 0.51 cd/m²)
ΔE ColorChecker Calman: 1.4 | ∀{0.5-29.43 Ø4.74}
ΔE Greyscale Calman: 2 | ∀{0.09-98 Ø4.99}
68.5% AdobeRGB 1998 (Argyll 3D)
99.5% sRGB (Argyll 3D)
66.6% Display P3 (Argyll 3D)
Gamma: 2.27
CCT: 6864 K
| Schenker XMG Evo 15 (M25) NE153QDM-NZ2, IPS, 2560x1600, 15.3", 240 Hz | Microsoft Surface Laptop 7 15 Lunar Lake LQ150P1JX61, IPS, 2496x1664, 15", 120 Hz | Apple MacBook Air 15 M4 IPS, 2880x1864, 15.3", 60 Hz | Lenovo ThinkPad X9-15 Aura Edition ATNA53JB01-0, OLED, 2880x1800, 15.3", 120 Hz | Lenovo Yoga Slim 7 15ILL9 Aura CSOT T3 MNF307ZB1-1, IPS, 2880x1800, 15.3", 120 Hz | Schenker XMG Evo 15 (M24) NE153QDM-NZ1, IPS, 2560x1600, 15.3", 240 Hz | |
|---|---|---|---|---|---|---|
| Display | 25% | 26% | 30% | 26% | 7% | |
| Display P3 Coverage (%) | 66.6 | 98.1 47% | 98.7 48% | 100 50% | 98.8 48% | 73.6 11% |
| sRGB Coverage (%) | 99.5 | 100 1% | 100 1% | 100 1% | 100 1% | 100 1% |
| AdobeRGB 1998 Coverage (%) | 68.5 | 87.2 27% | 88.3 29% | 94.6 38% | 87.5 28% | 74.2 8% |
| Response Times | -224% | -173% | 88% | -226% | 7% | |
| Response Time Grey 50% / Grey 80% * (ms) | 10 ? | 33.4 ? -234% | 23.2 ? -132% | 1.46 ? 85% | 27 ? -170% | 4.6 ? 54% |
| Response Time Black / White * (ms) | 4.7 ? | 14.7 ? -213% | 14.7 ? -213% | 0.44 ? 91% | 17.9 ? -281% | 6.6 ? -40% |
| PWM Frequency (Hz) | 1200 ? | |||||
| PWM Amplitude * (%) | 22 | |||||
| Screen | 35% | -4% | 590% | -8% | -19% | |
| Brightness middle (cd/m²) | 555 | 599 8% | 525 -5% | 509 -8% | 509 -8% | 608 10% |
| Brightness (cd/m²) | 545 | 590 8% | 513 -6% | 508 -7% | 479 -12% | 585 7% |
| Brightness Distribution (%) | 89 | 93 4% | 87 -2% | 97 9% | 90 1% | 93 4% |
| Black Level * (cd/m²) | 0.51 | 0.4 22% | 0.32 37% | 0.01 98% | 0.32 37% | 0.61 -20% |
| Contrast (:1) | 1088 | 1498 38% | 1641 51% | 50900 4578% | 1591 46% | 997 -8% |
| Colorchecker dE 2000 * | 1.4 | 0.5 64% | 1.7 -21% | 1.1 21% | 2.47 -76% | 2.1 -50% |
| Colorchecker dE 2000 max. * | 2.7 | 0.9 67% | 4 -48% | 2.5 7% | 4.73 -75% | 4.3 -59% |
| Greyscale dE 2000 * | 2 | 0.6 70% | 2.7 -35% | 1.5 25% | 1.5 25% | 2.7 -35% |
| Gamma | 2.27 97% | 2.16 102% | 2.2 100% | 2.28 96% | 2.19 100% | 2.2 100% |
| CCT | 6864 95% | 6543 99% | 7010 93% | 6294 103% | 6790 96% | 6168 105% |
| Colorchecker dE 2000 calibrated * | 1.06 | 1.2 | ||||
| Moyenne finale (programmes/paramètres) | -55% /
-7% | -50% /
-23% | 236% /
384% | -69% /
-34% | -2% /
-9% |
* ... Moindre est la valeur, meilleures sont les performances


Temps de réponse de l'écran
| ↔ Temps de réponse noir à blanc | ||
|---|---|---|
| 4.7 ms ... hausse ↗ et chute ↘ combinées | ↗ 1.3 ms hausse | 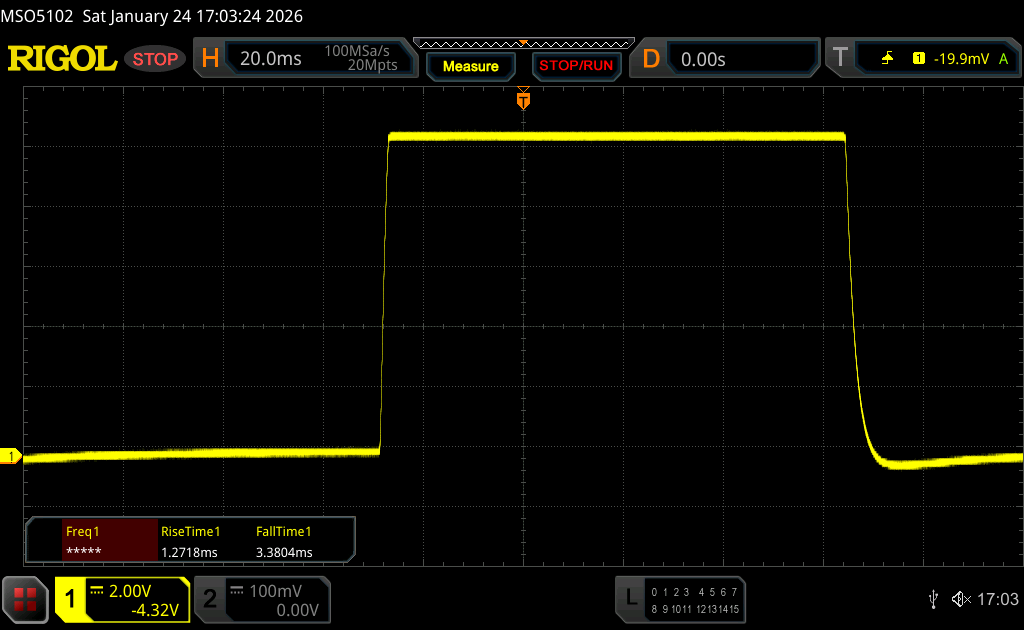 |
| ↘ 3.4 ms chute | ||
| L'écran montre de très faibles temps de réponse, parfait pour le jeu. En comparaison, tous les appareils testés affichent entre 0.1 (minimum) et 240 (maximum) ms. » 17 % des appareils testés affichent de meilleures performances. Cela signifie que les latences relevées sont meilleures que la moyenne (20 ms) de tous les appareils testés. | ||
| ↔ Temps de réponse gris 50% à gris 80% | ||
| 10 ms ... hausse ↗ et chute ↘ combinées | ↗ 3.5 ms hausse | 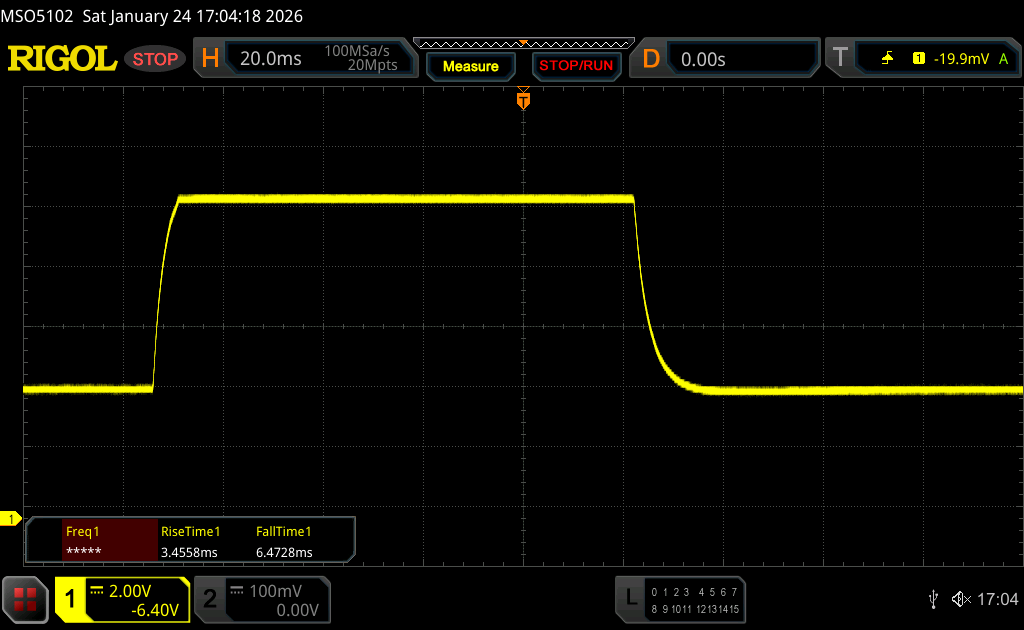 |
| ↘ 6.5 ms chute | ||
| L'écran montre de bons temps de réponse, mais insuffisant pour du jeu compétitif. En comparaison, tous les appareils testés affichent entre 0.165 (minimum) et 636 (maximum) ms. » 23 % des appareils testés affichent de meilleures performances. Cela signifie que les latences relevées sont meilleures que la moyenne (31.3 ms) de tous les appareils testés. | ||
Scintillement / MLI (Modulation de largeur d'impulsion)
| Scintillement / MLI (Modulation de largeur d'impulsion) non décelé |  | ||
En comparaison, 53 % des appareils testés n'emploient pas MDI pour assombrir leur écran. Nous avons relevé une moyenne à 7923 (minimum : 5 - maximum : 343500) Hz dans le cas où une MDI était active. | |||


Performance - Evo 15 avec jusqu'à 128 Go de RAM
Conditions d'essai
Nous avons effectué les tests en mode Overboost (90 W). En utilisation quotidienne, cependant, les deux modes moins puissants, Balanced (35 W) et Enthusiast (45 W), se comportent également très bien, tandis que les ventilateurs restent sensiblement plus silencieux. Remarque : pour accéder aux pleines performances, l'adaptateur d'alimentation doit être connecté au port USB-C arrière ; sinon, la consommation du processeur est limitée à 70 watts.
Processeur
Le Core Ultra 7 255H (Arrow Lake) peut supporter une consommation d'énergie de 90 watts, offrant des performances très bonnes et stables. Applele SoC M4 est clairement supérieur dans les scénarios à un seul cœur, mais le 255H a un net avantage dans les charges à plusieurs cœurs. En mode batterie, plusieurs seuils de consommation s'appliquent : le CPU est généralement autorisé à consommer 40 watts, réduits à 25 watts lorsque le niveau de la batterie tombe en dessous de 70 pour cent, et à seulement 20 watts en dessous de 30 pour cent.
Test d'endurance multiple Cinebench R15
Cinebench 2024: CPU Multi Core | CPU Single Core
Cinebench R23: Multi Core | Single Core
Cinebench R20: CPU (Multi Core) | CPU (Single Core)
Cinebench R15: CPU Multi 64Bit | CPU Single 64Bit
Blender: v2.79 BMW27 CPU
7-Zip 18.03: 7z b 4 | 7z b 4 -mmt1
Geekbench 6.6: Multi-Core | Single-Core
Geekbench 5.5: Multi-Core | Single-Core
HWBOT x265 Benchmark v2.2: 4k Preset
LibreOffice : 20 Documents To PDF
R Benchmark 2.5: Overall mean
| CPU Performance rating | |
| Apple MacBook Air 15 M4 -12! | |
| Schenker XMG Evo 15 (M25) | |
| Moyenne Intel Core Ultra 7 255H | |
| Moyenne de la classe Multimedia | |
| Schenker XMG Evo 15 (M24) | |
| Microsoft Surface Laptop 7 15 Lunar Lake | |
| Lenovo ThinkPad X9-15 Aura Edition | |
| Lenovo Yoga Slim 7 15ILL9 Aura -2! | |
| Cinebench 2024 / CPU Multi Core | |
| Schenker XMG Evo 15 (M25) | |
| Moyenne de la classe Multimedia (327 - 2437, n=77, 2 dernières années) | |
| Moyenne Intel Core Ultra 7 255H (750 - 1201, n=13) | |
| Schenker XMG Evo 15 (M24) | |
| Apple MacBook Air 15 M4 | |
| Lenovo Yoga Slim 7 15ILL9 Aura | |
| Microsoft Surface Laptop 7 15 Lunar Lake | |
| Lenovo ThinkPad X9-15 Aura Edition | |
| Cinebench 2024 / CPU Single Core | |
| Apple MacBook Air 15 M4 | |
| Schenker XMG Evo 15 (M25) | |
| Moyenne de la classe Multimedia (72.5 - 201, n=56, 2 dernières années) | |
| Moyenne Intel Core Ultra 7 255H (119 - 128.1, n=15) | |
| Microsoft Surface Laptop 7 15 Lunar Lake | |
| Lenovo Yoga Slim 7 15ILL9 Aura | |
| Lenovo ThinkPad X9-15 Aura Edition | |
| Schenker XMG Evo 15 (M24) | |
| Cinebench R23 / Multi Core | |
| Schenker XMG Evo 15 (M25) | |
| Moyenne Intel Core Ultra 7 255H (16105 - 22578, n=20) | |
| Moyenne de la classe Multimedia (4861 - 33362, n=75, 2 dernières années) | |
| Schenker XMG Evo 15 (M24) | |
| Apple MacBook Air 15 M4 | |
| Lenovo Yoga Slim 7 15ILL9 Aura | |
| Microsoft Surface Laptop 7 15 Lunar Lake | |
| Lenovo ThinkPad X9-15 Aura Edition | |
| Cinebench R23 / Single Core | |
| Apple MacBook Air 15 M4 | |
| Moyenne Intel Core Ultra 7 255H (1874 - 2152, n=20) | |
| Schenker XMG Evo 15 (M25) | |
| Microsoft Surface Laptop 7 15 Lunar Lake | |
| Lenovo Yoga Slim 7 15ILL9 Aura | |
| Moyenne de la classe Multimedia (1128 - 2459, n=68, 2 dernières années) | |
| Lenovo ThinkPad X9-15 Aura Edition | |
| Schenker XMG Evo 15 (M24) | |
| Cinebench R20 / CPU (Multi Core) | |
| Schenker XMG Evo 15 (M25) | |
| Moyenne Intel Core Ultra 7 255H (6356 - 8860, n=19) | |
| Moyenne de la classe Multimedia (1887 - 12912, n=60, 2 dernières années) | |
| Schenker XMG Evo 15 (M24) | |
| Lenovo Yoga Slim 7 15ILL9 Aura | |
| Microsoft Surface Laptop 7 15 Lunar Lake | |
| Lenovo ThinkPad X9-15 Aura Edition | |
| Cinebench R20 / CPU (Single Core) | |
| Moyenne Intel Core Ultra 7 255H (743 - 826, n=19) | |
| Schenker XMG Evo 15 (M25) | |
| Microsoft Surface Laptop 7 15 Lunar Lake | |
| Lenovo Yoga Slim 7 15ILL9 Aura | |
| Lenovo ThinkPad X9-15 Aura Edition | |
| Moyenne de la classe Multimedia (420 - 853, n=60, 2 dernières années) | |
| Schenker XMG Evo 15 (M24) | |
| Cinebench R15 / CPU Multi 64Bit | |
| Schenker XMG Evo 15 (M25) | |
| Moyenne Intel Core Ultra 7 255H (2414 - 3444, n=19) | |
| Moyenne de la classe Multimedia (856 - 5224, n=65, 2 dernières années) | |
| Schenker XMG Evo 15 (M24) | |
| Microsoft Surface Laptop 7 15 Lunar Lake | |
| Lenovo ThinkPad X9-15 Aura Edition | |
| Cinebench R15 / CPU Single 64Bit | |
| Moyenne Intel Core Ultra 7 255H (258 - 322, n=20) | |
| Schenker XMG Evo 15 (M25) | |
| Lenovo ThinkPad X9-15 Aura Edition | |
| Microsoft Surface Laptop 7 15 Lunar Lake | |
| Moyenne de la classe Multimedia (99.6 - 326, n=63, 2 dernières années) | |
| Schenker XMG Evo 15 (M24) | |
| Blender / v2.79 BMW27 CPU | |
| Lenovo ThinkPad X9-15 Aura Edition | |
| Microsoft Surface Laptop 7 15 Lunar Lake | |
| Lenovo Yoga Slim 7 15ILL9 Aura | |
| Moyenne de la classe Multimedia (100 - 557, n=61, 2 dernières années) | |
| Schenker XMG Evo 15 (M24) | |
| Moyenne Intel Core Ultra 7 255H (156 - 293, n=19) | |
| Schenker XMG Evo 15 (M25) | |
| 7-Zip 18.03 / 7z b 4 | |
| Schenker XMG Evo 15 (M25) | |
| Schenker XMG Evo 15 (M24) | |
| Moyenne Intel Core Ultra 7 255H (42155 - 70397, n=20) | |
| Moyenne de la classe Multimedia (29095 - 130368, n=59, 2 dernières années) | |
| Lenovo Yoga Slim 7 15ILL9 Aura | |
| Microsoft Surface Laptop 7 15 Lunar Lake | |
| Lenovo ThinkPad X9-15 Aura Edition | |
| 7-Zip 18.03 / 7z b 4 -mmt1 | |
| Schenker XMG Evo 15 (M25) | |
| Microsoft Surface Laptop 7 15 Lunar Lake | |
| Moyenne Intel Core Ultra 7 255H (4589 - 6385, n=20) | |
| Lenovo ThinkPad X9-15 Aura Edition | |
| Moyenne de la classe Multimedia (3666 - 7545, n=59, 2 dernières années) | |
| Schenker XMG Evo 15 (M24) | |
| Lenovo Yoga Slim 7 15ILL9 Aura | |
| Geekbench 6.6 / Multi-Core | |
| Schenker XMG Evo 15 (M25) | |
| Moyenne Intel Core Ultra 7 255H (11979 - 17489, n=20) | |
| Apple MacBook Air 15 M4 | |
| Moyenne de la classe Multimedia (4983 - 29415, n=74, 2 dernières années) | |
| Schenker XMG Evo 15 (M24) | |
| Microsoft Surface Laptop 7 15 Lunar Lake | |
| Lenovo ThinkPad X9-15 Aura Edition | |
| Lenovo Yoga Slim 7 15ILL9 Aura | |
| Geekbench 6.6 / Single-Core | |
| Apple MacBook Air 15 M4 | |
| Schenker XMG Evo 15 (M25) | |
| Microsoft Surface Laptop 7 15 Lunar Lake | |
| Moyenne Intel Core Ultra 7 255H (2712 - 2939, n=20) | |
| Moyenne de la classe Multimedia (1534 - 4326, n=70, 2 dernières années) | |
| Lenovo ThinkPad X9-15 Aura Edition | |
| Lenovo Yoga Slim 7 15ILL9 Aura | |
| Schenker XMG Evo 15 (M24) | |
| Geekbench 5.5 / Multi-Core | |
| Schenker XMG Evo 15 (M25) | |
| Moyenne Intel Core Ultra 7 255H (11348 - 17218, n=19) | |
| Moyenne de la classe Multimedia (4652 - 20422, n=59, 2 dernières années) | |
| Schenker XMG Evo 15 (M24) | |
| Microsoft Surface Laptop 7 15 Lunar Lake | |
| Lenovo ThinkPad X9-15 Aura Edition | |
| Lenovo Yoga Slim 7 15ILL9 Aura | |
| Geekbench 5.5 / Single-Core | |
| Schenker XMG Evo 15 (M25) | |
| Microsoft Surface Laptop 7 15 Lunar Lake | |
| Moyenne Intel Core Ultra 7 255H (1938 - 2121, n=19) | |
| Lenovo ThinkPad X9-15 Aura Edition | |
| Lenovo Yoga Slim 7 15ILL9 Aura | |
| Moyenne de la classe Multimedia (805 - 2974, n=59, 2 dernières années) | |
| Schenker XMG Evo 15 (M24) | |
| HWBOT x265 Benchmark v2.2 / 4k Preset | |
| Schenker XMG Evo 15 (M25) | |
| Moyenne Intel Core Ultra 7 255H (13.7 - 26.5, n=19) | |
| Moyenne de la classe Multimedia (5.26 - 36.1, n=59, 2 dernières années) | |
| Schenker XMG Evo 15 (M24) | |
| Lenovo Yoga Slim 7 15ILL9 Aura | |
| Microsoft Surface Laptop 7 15 Lunar Lake | |
| Lenovo ThinkPad X9-15 Aura Edition | |
| LibreOffice / 20 Documents To PDF | |
| Lenovo Yoga Slim 7 15ILL9 Aura | |
| Moyenne de la classe Multimedia (23.9 - 146.7, n=60, 2 dernières années) | |
| Microsoft Surface Laptop 7 15 Lunar Lake | |
| Moyenne Intel Core Ultra 7 255H (41.1 - 61.6, n=19) | |
| Lenovo ThinkPad X9-15 Aura Edition | |
| Schenker XMG Evo 15 (M24) | |
| Schenker XMG Evo 15 (M25) | |
| R Benchmark 2.5 / Overall mean | |
| Moyenne de la classe Multimedia (0.3604 - 0.947, n=59, 2 dernières années) | |
| Lenovo ThinkPad X9-15 Aura Edition | |
| Lenovo Yoga Slim 7 15ILL9 Aura | |
| Microsoft Surface Laptop 7 15 Lunar Lake | |
| Moyenne Intel Core Ultra 7 255H (0.4233 - 0.515, n=19) | |
| Schenker XMG Evo 15 (M24) | |
| Schenker XMG Evo 15 (M25) | |
* ... Moindre est la valeur, meilleures sont les performances
AIDA64: FP32 Ray-Trace | FPU Julia | CPU SHA3 | CPU Queen | FPU SinJulia | FPU Mandel | CPU AES | CPU ZLib | FP64 Ray-Trace | CPU PhotoWorxx
| Performance rating | |
| Schenker XMG Evo 15 (M25) | |
| Moyenne Intel Core Ultra 7 255H | |
| Moyenne de la classe Multimedia | |
| Schenker XMG Evo 15 (M24) | |
| Lenovo Yoga Slim 7 15ILL9 Aura | |
| Lenovo ThinkPad X9-15 Aura Edition | |
| Microsoft Surface Laptop 7 15 Lunar Lake | |
| AIDA64 / FP32 Ray-Trace | |
| Schenker XMG Evo 15 (M25) | |
| Moyenne Intel Core Ultra 7 255H (13863 - 24741, n=17) | |
| Moyenne de la classe Multimedia (2214 - 50388, n=56, 2 dernières années) | |
| Schenker XMG Evo 15 (M24) | |
| Lenovo Yoga Slim 7 15ILL9 Aura | |
| Lenovo ThinkPad X9-15 Aura Edition | |
| Lenovo ThinkPad X9-15 Aura Edition | |
| Lenovo ThinkPad X9-15 Aura Edition | |
| Microsoft Surface Laptop 7 15 Lunar Lake | |
| AIDA64 / FPU Julia | |
| Schenker XMG Evo 15 (M25) | |
| Moyenne Intel Core Ultra 7 255H (71030 - 119222, n=17) | |
| Moyenne de la classe Multimedia (12867 - 201874, n=57, 2 dernières années) | |
| Schenker XMG Evo 15 (M24) | |
| Lenovo Yoga Slim 7 15ILL9 Aura | |
| Lenovo ThinkPad X9-15 Aura Edition | |
| Lenovo ThinkPad X9-15 Aura Edition | |
| Lenovo ThinkPad X9-15 Aura Edition | |
| Microsoft Surface Laptop 7 15 Lunar Lake | |
| AIDA64 / CPU SHA3 | |
| Schenker XMG Evo 15 (M25) | |
| Moyenne Intel Core Ultra 7 255H (3408 - 5548, n=17) | |
| Moyenne de la classe Multimedia (653 - 8623, n=57, 2 dernières années) | |
| Schenker XMG Evo 15 (M24) | |
| Lenovo Yoga Slim 7 15ILL9 Aura | |
| Lenovo ThinkPad X9-15 Aura Edition | |
| Lenovo ThinkPad X9-15 Aura Edition | |
| Lenovo ThinkPad X9-15 Aura Edition | |
| Microsoft Surface Laptop 7 15 Lunar Lake | |
| AIDA64 / CPU Queen | |
| Schenker XMG Evo 15 (M24) | |
| Moyenne de la classe Multimedia (13483 - 181505, n=53, 2 dernières années) | |
| Schenker XMG Evo 15 (M25) | |
| Moyenne Intel Core Ultra 7 255H (59098 - 68460, n=16) | |
| Lenovo Yoga Slim 7 15ILL9 Aura | |
| Lenovo ThinkPad X9-15 Aura Edition | |
| Lenovo ThinkPad X9-15 Aura Edition | |
| Microsoft Surface Laptop 7 15 Lunar Lake | |
| AIDA64 / FPU SinJulia | |
| Schenker XMG Evo 15 (M24) | |
| Moyenne de la classe Multimedia (1240 - 28794, n=57, 2 dernières années) | |
| Schenker XMG Evo 15 (M25) | |
| Moyenne Intel Core Ultra 7 255H (6716 - 9006, n=17) | |
| Lenovo ThinkPad X9-15 Aura Edition | |
| Lenovo ThinkPad X9-15 Aura Edition | |
| Lenovo ThinkPad X9-15 Aura Edition | |
| Microsoft Surface Laptop 7 15 Lunar Lake | |
| Lenovo Yoga Slim 7 15ILL9 Aura | |
| AIDA64 / FPU Mandel | |
| Schenker XMG Evo 15 (M25) | |
| Moyenne Intel Core Ultra 7 255H (37031 - 63347, n=17) | |
| Moyenne de la classe Multimedia (6395 - 105740, n=56, 2 dernières années) | |
| Schenker XMG Evo 15 (M24) | |
| Lenovo Yoga Slim 7 15ILL9 Aura | |
| Lenovo ThinkPad X9-15 Aura Edition | |
| Lenovo ThinkPad X9-15 Aura Edition | |
| Lenovo ThinkPad X9-15 Aura Edition | |
| Microsoft Surface Laptop 7 15 Lunar Lake | |
| AIDA64 / CPU AES | |
| Schenker XMG Evo 15 (M24) | |
| Schenker XMG Evo 15 (M25) | |
| Moyenne Intel Core Ultra 7 255H (58402 - 83568, n=17) | |
| Moyenne de la classe Multimedia (13243 - 126790, n=57, 2 dernières années) | |
| Lenovo Yoga Slim 7 15ILL9 Aura | |
| Lenovo ThinkPad X9-15 Aura Edition | |
| Lenovo ThinkPad X9-15 Aura Edition | |
| Lenovo ThinkPad X9-15 Aura Edition | |
| Microsoft Surface Laptop 7 15 Lunar Lake | |
| AIDA64 / CPU ZLib | |
| Schenker XMG Evo 15 (M25) | |
| Moyenne Intel Core Ultra 7 255H (822 - 1316, n=17) | |
| Moyenne de la classe Multimedia (167.2 - 2022, n=57, 2 dernières années) | |
| Schenker XMG Evo 15 (M24) | |
| Lenovo Yoga Slim 7 15ILL9 Aura | |
| Lenovo ThinkPad X9-15 Aura Edition | |
| Lenovo ThinkPad X9-15 Aura Edition | |
| Lenovo ThinkPad X9-15 Aura Edition | |
| Microsoft Surface Laptop 7 15 Lunar Lake | |
| AIDA64 / FP64 Ray-Trace | |
| Schenker XMG Evo 15 (M25) | |
| Moyenne Intel Core Ultra 7 255H (7384 - 13231, n=17) | |
| Moyenne de la classe Multimedia (1014 - 26875, n=57, 2 dernières années) | |
| Schenker XMG Evo 15 (M24) | |
| Lenovo Yoga Slim 7 15ILL9 Aura | |
| Lenovo ThinkPad X9-15 Aura Edition | |
| Lenovo ThinkPad X9-15 Aura Edition | |
| Lenovo ThinkPad X9-15 Aura Edition | |
| Microsoft Surface Laptop 7 15 Lunar Lake | |
| AIDA64 / CPU PhotoWorxx | |
| Schenker XMG Evo 15 (M25) | |
| Lenovo ThinkPad X9-15 Aura Edition | |
| Lenovo ThinkPad X9-15 Aura Edition | |
| Lenovo ThinkPad X9-15 Aura Edition | |
| Moyenne Intel Core Ultra 7 255H (23836 - 65787, n=17) | |
| Microsoft Surface Laptop 7 15 Lunar Lake | |
| Lenovo Yoga Slim 7 15ILL9 Aura | |
| Moyenne de la classe Multimedia (12860 - 88086, n=57, 2 dernières années) | |
| Schenker XMG Evo 15 (M24) | |
Performance du système
Les performances du système de l'Evo 15 sont excellentes et l'ordinateur portable est extrêmement réactif au quotidien.
PCMark 10: Score | Essentials | Productivity | Digital Content Creation
CrossMark: Overall | Productivity | Creativity | Responsiveness
WebXPRT 3: Overall
WebXPRT 4: Overall
Mozilla Kraken 1.1: Total
| Performance rating | |
| Apple MacBook Air 15 M4 -4! | |
| Schenker XMG Evo 15 (M25) | |
| Moyenne Intel Core Ultra 7 255H, Intel Arc Graphics 140T | |
| Moyenne de la classe Multimedia | |
| Schenker XMG Evo 15 (M24) | |
| Microsoft Surface Laptop 7 15 Lunar Lake | |
| Lenovo ThinkPad X9-15 Aura Edition | |
| Lenovo Yoga Slim 7 15ILL9 Aura | |
| PCMark 10 / Score | |
| Schenker XMG Evo 15 (M25) | |
| Moyenne Intel Core Ultra 7 255H, Intel Arc Graphics 140T (6878 - 9156, n=13) | |
| Moyenne de la classe Multimedia (4325 - 10386, n=53, 2 dernières années) | |
| Schenker XMG Evo 15 (M24) | |
| Microsoft Surface Laptop 7 15 Lunar Lake | |
| Lenovo ThinkPad X9-15 Aura Edition | |
| Lenovo Yoga Slim 7 15ILL9 Aura | |
| PCMark 10 / Essentials | |
| Schenker XMG Evo 15 (M25) | |
| Schenker XMG Evo 15 (M24) | |
| Moyenne Intel Core Ultra 7 255H, Intel Arc Graphics 140T (10637 - 11556, n=13) | |
| Microsoft Surface Laptop 7 15 Lunar Lake | |
| Lenovo ThinkPad X9-15 Aura Edition | |
| Moyenne de la classe Multimedia (8025 - 11664, n=53, 2 dernières années) | |
| Lenovo Yoga Slim 7 15ILL9 Aura | |
| PCMark 10 / Productivity | |
| Schenker XMG Evo 15 (M25) | |
| Moyenne de la classe Multimedia (7323 - 18233, n=53, 2 dernières années) | |
| Moyenne Intel Core Ultra 7 255H, Intel Arc Graphics 140T (7598 - 15694, n=13) | |
| Microsoft Surface Laptop 7 15 Lunar Lake | |
| Lenovo ThinkPad X9-15 Aura Edition | |
| Lenovo Yoga Slim 7 15ILL9 Aura | |
| Schenker XMG Evo 15 (M24) | |
| PCMark 10 / Digital Content Creation | |
| Schenker XMG Evo 15 (M25) | |
| Moyenne Intel Core Ultra 7 255H, Intel Arc Graphics 140T (10461 - 12552, n=13) | |
| Schenker XMG Evo 15 (M24) | |
| Microsoft Surface Laptop 7 15 Lunar Lake | |
| Moyenne de la classe Multimedia (3651 - 16240, n=53, 2 dernières années) | |
| Lenovo ThinkPad X9-15 Aura Edition | |
| Lenovo Yoga Slim 7 15ILL9 Aura | |
| CrossMark / Overall | |
| Apple MacBook Air 15 M4 | |
| Schenker XMG Evo 15 (M25) | |
| Moyenne Intel Core Ultra 7 255H, Intel Arc Graphics 140T (1610 - 2018, n=13) | |
| Schenker XMG Evo 15 (M24) | |
| Moyenne de la classe Multimedia (866 - 2728, n=63, 2 dernières années) | |
| Lenovo ThinkPad X9-15 Aura Edition | |
| Microsoft Surface Laptop 7 15 Lunar Lake | |
| Lenovo Yoga Slim 7 15ILL9 Aura | |
| CrossMark / Productivity | |
| Apple MacBook Air 15 M4 | |
| Schenker XMG Evo 15 (M25) | |
| Schenker XMG Evo 15 (M24) | |
| Moyenne Intel Core Ultra 7 255H, Intel Arc Graphics 140T (1566 - 1908, n=13) | |
| Moyenne de la classe Multimedia (913 - 2489, n=63, 2 dernières années) | |
| Lenovo ThinkPad X9-15 Aura Edition | |
| Microsoft Surface Laptop 7 15 Lunar Lake | |
| Lenovo Yoga Slim 7 15ILL9 Aura | |
| CrossMark / Creativity | |
| Apple MacBook Air 15 M4 | |
| Schenker XMG Evo 15 (M25) | |
| Moyenne Intel Core Ultra 7 255H, Intel Arc Graphics 140T (1827 - 2396, n=13) | |
| Moyenne de la classe Multimedia (907 - 3465, n=63, 2 dernières années) | |
| Lenovo ThinkPad X9-15 Aura Edition | |
| Microsoft Surface Laptop 7 15 Lunar Lake | |
| Schenker XMG Evo 15 (M24) | |
| Lenovo Yoga Slim 7 15ILL9 Aura | |
| CrossMark / Responsiveness | |
| Schenker XMG Evo 15 (M24) | |
| Moyenne Intel Core Ultra 7 255H, Intel Arc Graphics 140T (1194 - 1781, n=13) | |
| Apple MacBook Air 15 M4 | |
| Moyenne de la classe Multimedia (605 - 2024, n=63, 2 dernières années) | |
| Schenker XMG Evo 15 (M25) | |
| Lenovo ThinkPad X9-15 Aura Edition | |
| Microsoft Surface Laptop 7 15 Lunar Lake | |
| Lenovo Yoga Slim 7 15ILL9 Aura | |
| WebXPRT 3 / Overall | |
| Apple MacBook Air 15 M4 | |
| Moyenne de la classe Multimedia (136.4 - 596, n=66, 2 dernières années) | |
| Schenker XMG Evo 15 (M25) | |
| Moyenne Intel Core Ultra 7 255H, Intel Arc Graphics 140T (273 - 327, n=13) | |
| Microsoft Surface Laptop 7 15 Lunar Lake | |
| Lenovo Yoga Slim 7 15ILL9 Aura | |
| Lenovo ThinkPad X9-15 Aura Edition | |
| Schenker XMG Evo 15 (M24) | |
| WebXPRT 4 / Overall | |
| Apple MacBook Air 15 M4 | |
| Schenker XMG Evo 15 (M25) | |
| Moyenne Intel Core Ultra 7 255H, Intel Arc Graphics 140T (247 - 317, n=13) | |
| Microsoft Surface Laptop 7 15 Lunar Lake | |
| Lenovo Yoga Slim 7 15ILL9 Aura | |
| Moyenne de la classe Multimedia (167.3 - 402, n=67, 2 dernières années) | |
| Lenovo ThinkPad X9-15 Aura Edition | |
| Schenker XMG Evo 15 (M24) | |
| Mozilla Kraken 1.1 / Total | |
| Schenker XMG Evo 15 (M24) | |
| Microsoft Surface Laptop 7 15 Lunar Lake | |
| Lenovo Yoga Slim 7 15ILL9 Aura | |
| Lenovo ThinkPad X9-15 Aura Edition | |
| Moyenne de la classe Multimedia (228 - 835, n=70, 2 dernières années) | |
| Schenker XMG Evo 15 (M25) | |
| Moyenne Intel Core Ultra 7 255H, Intel Arc Graphics 140T (427 - 510, n=13) | |
| Apple MacBook Air 15 M4 | |
* ... Moindre est la valeur, meilleures sont les performances
| PCMark 10 Score | 9156 points | |
Aide | ||
| AIDA64 / Memory Copy | |
| Lenovo ThinkPad X9-15 Aura Edition | |
| Lenovo ThinkPad X9-15 Aura Edition | |
| Lenovo ThinkPad X9-15 Aura Edition | |
| Microsoft Surface Laptop 7 15 Lunar Lake | |
| Lenovo Yoga Slim 7 15ILL9 Aura | |
| Schenker XMG Evo 15 (M25) | |
| Moyenne Intel Core Ultra 7 255H (39188 - 110930, n=17) | |
| Moyenne de la classe Multimedia (21158 - 131796, n=57, 2 dernières années) | |
| Schenker XMG Evo 15 (M24) | |
| AIDA64 / Memory Read | |
| Lenovo Yoga Slim 7 15ILL9 Aura | |
| Microsoft Surface Laptop 7 15 Lunar Lake | |
| Lenovo ThinkPad X9-15 Aura Edition | |
| Lenovo ThinkPad X9-15 Aura Edition | |
| Lenovo ThinkPad X9-15 Aura Edition | |
| Schenker XMG Evo 15 (M25) | |
| Moyenne de la classe Multimedia (19699 - 125604, n=57, 2 dernières années) | |
| Moyenne Intel Core Ultra 7 255H (43703 - 90552, n=17) | |
| Schenker XMG Evo 15 (M24) | |
| AIDA64 / Memory Write | |
| Lenovo Yoga Slim 7 15ILL9 Aura | |
| Microsoft Surface Laptop 7 15 Lunar Lake | |
| Lenovo ThinkPad X9-15 Aura Edition | |
| Lenovo ThinkPad X9-15 Aura Edition | |
| Lenovo ThinkPad X9-15 Aura Edition | |
| Schenker XMG Evo 15 (M25) | |
| Moyenne de la classe Multimedia (17733 - 134916, n=57, 2 dernières années) | |
| Moyenne Intel Core Ultra 7 255H (36438 - 87199, n=17) | |
| Schenker XMG Evo 15 (M24) | |
| AIDA64 / Memory Latency | |
| Schenker XMG Evo 15 (M24) | |
| Moyenne Intel Core Ultra 7 255H (107.6 - 147.2, n=17) | |
| Moyenne de la classe Multimedia (7 - 535, n=57, 2 dernières années) | |
| Schenker XMG Evo 15 (M25) | |
| Lenovo ThinkPad X9-15 Aura Edition | |
| Lenovo ThinkPad X9-15 Aura Edition | |
| Lenovo ThinkPad X9-15 Aura Edition | |
| Lenovo Yoga Slim 7 15ILL9 Aura | |
| Microsoft Surface Laptop 7 15 Lunar Lake | |
* ... Moindre est la valeur, meilleures sont les performances
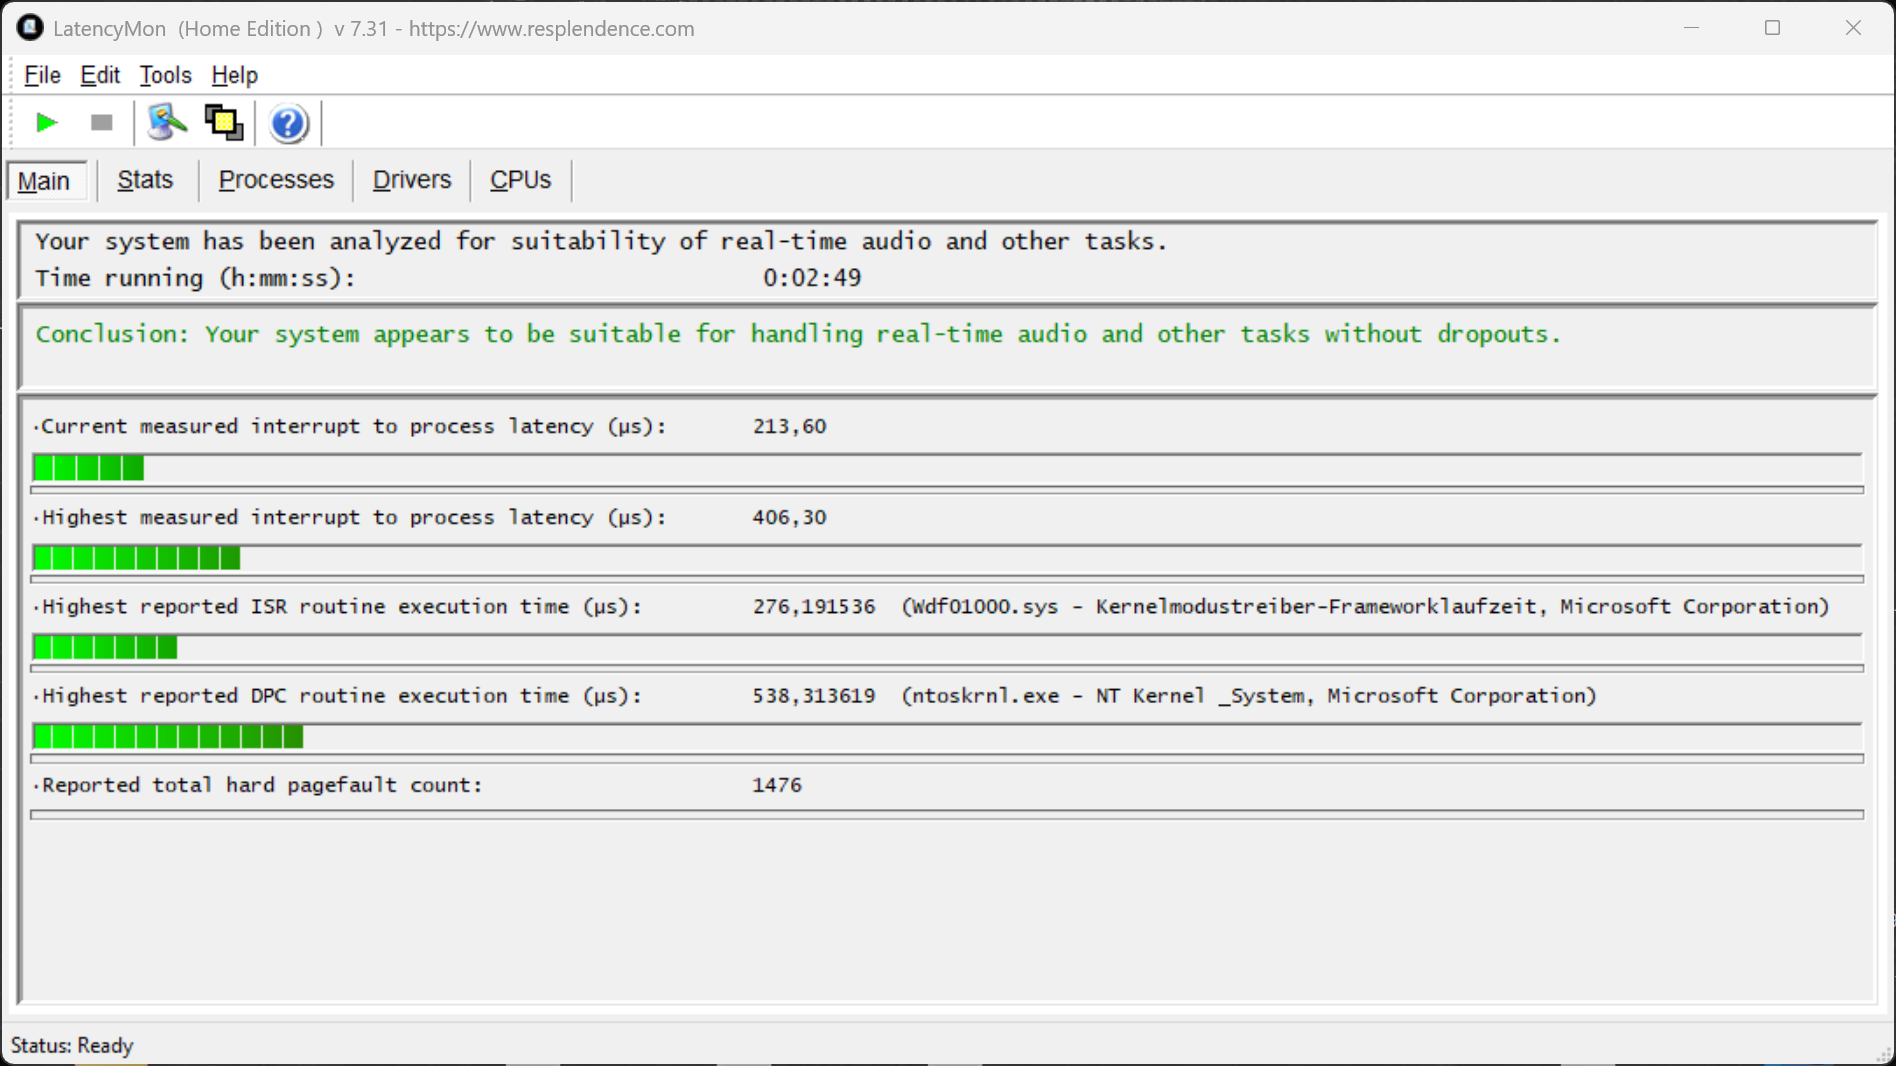
Latences DPC
Lors de notre test de latence standardisé, l'Evo 15 n'a montré aucune limitation lors de l'exécution d'applications audio en temps réel avec la version actuelle du BIOS.
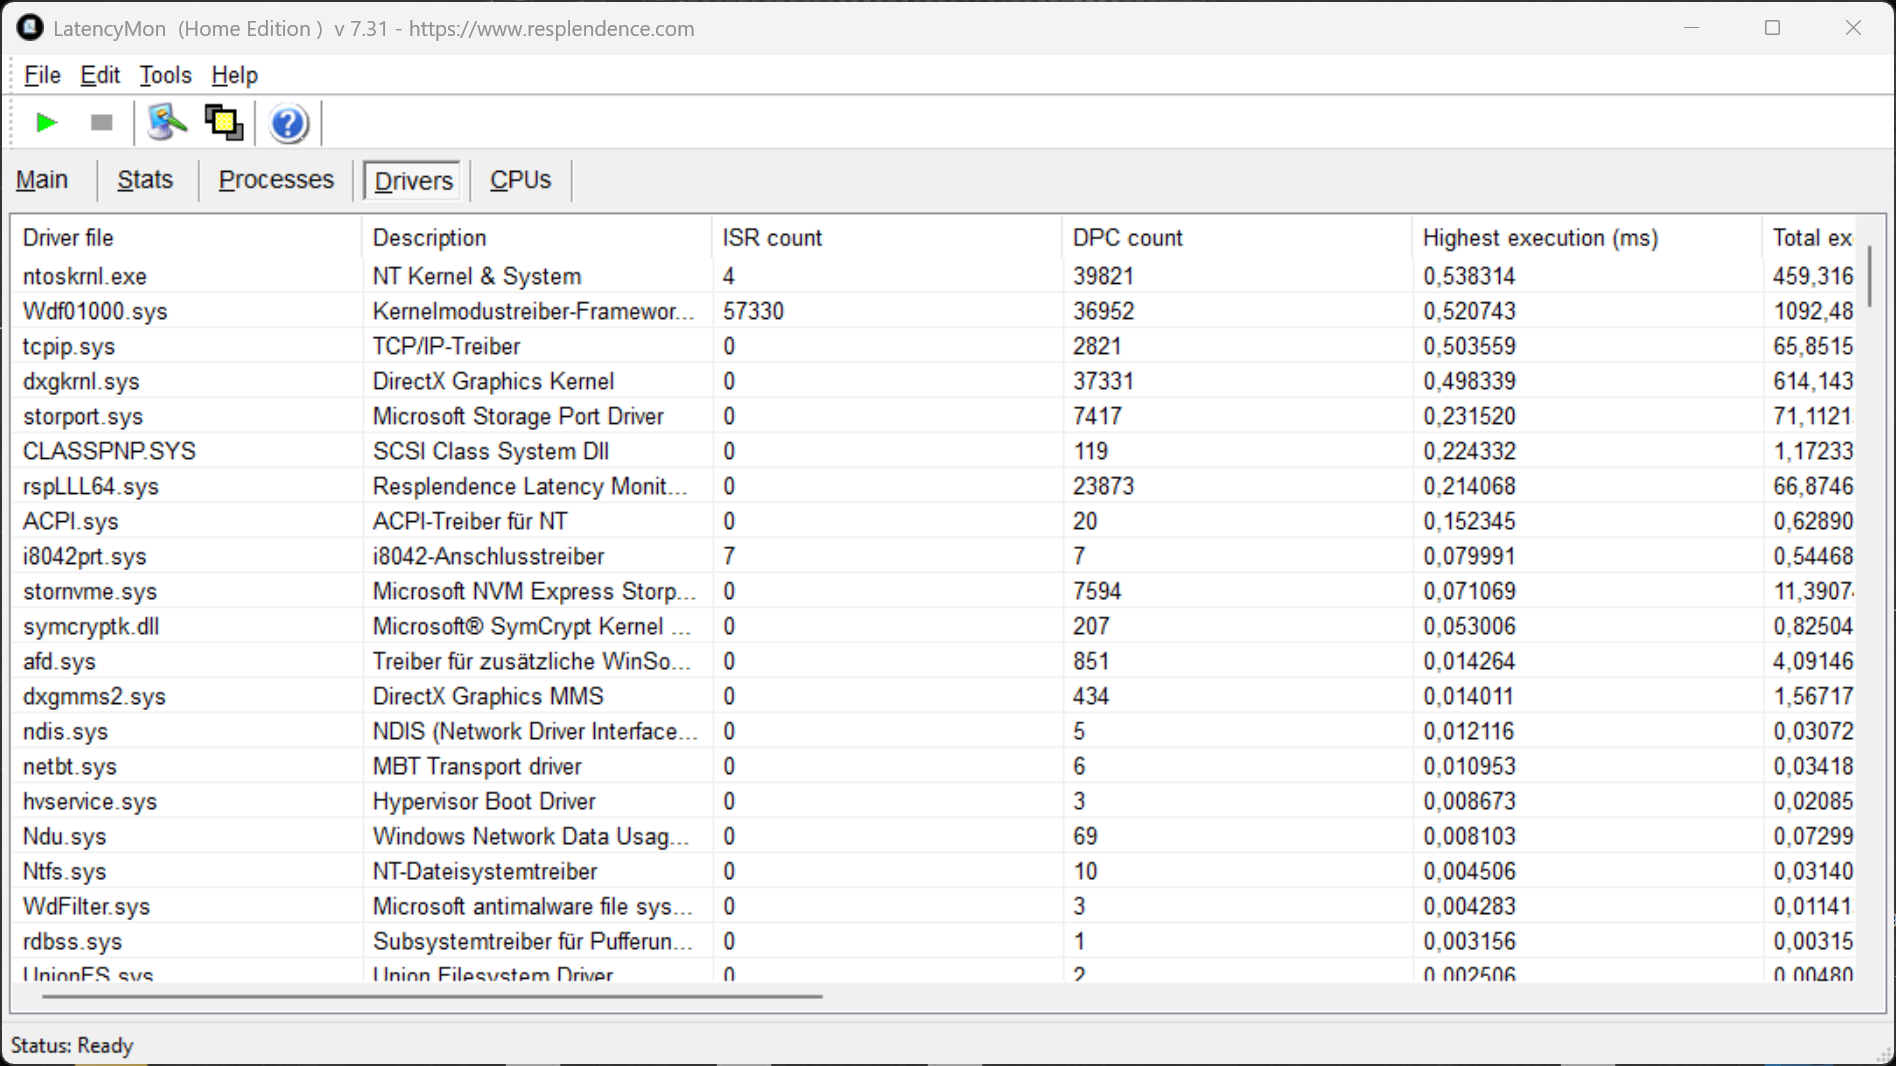
| DPC Latencies / LatencyMon - interrupt to process latency (max), Web, Youtube, Prime95 | |
| Lenovo ThinkPad X9-15 Aura Edition | |
| Schenker XMG Evo 15 (M24) | |
| Microsoft Surface Laptop 7 15 Lunar Lake | |
| Schenker XMG Evo 15 (M25) | |
* ... Moindre est la valeur, meilleures sont les performances
Mémoire de masse
Deux emplacements M.2 2280 à part entière sont disponibles et connectés via PCIe 4.0. Dans notre configuration de test, nous avons installé la version 2 To (1,72 To libres) du Samsung 990 Pro, qui atteint de bons taux de transfert allant jusqu'à 7 Go/s.

* ... Moindre est la valeur, meilleures sont les performances
Performances en lecture continue : Boucle de lecture DiskSpd, profondeur de la file d'attente 8
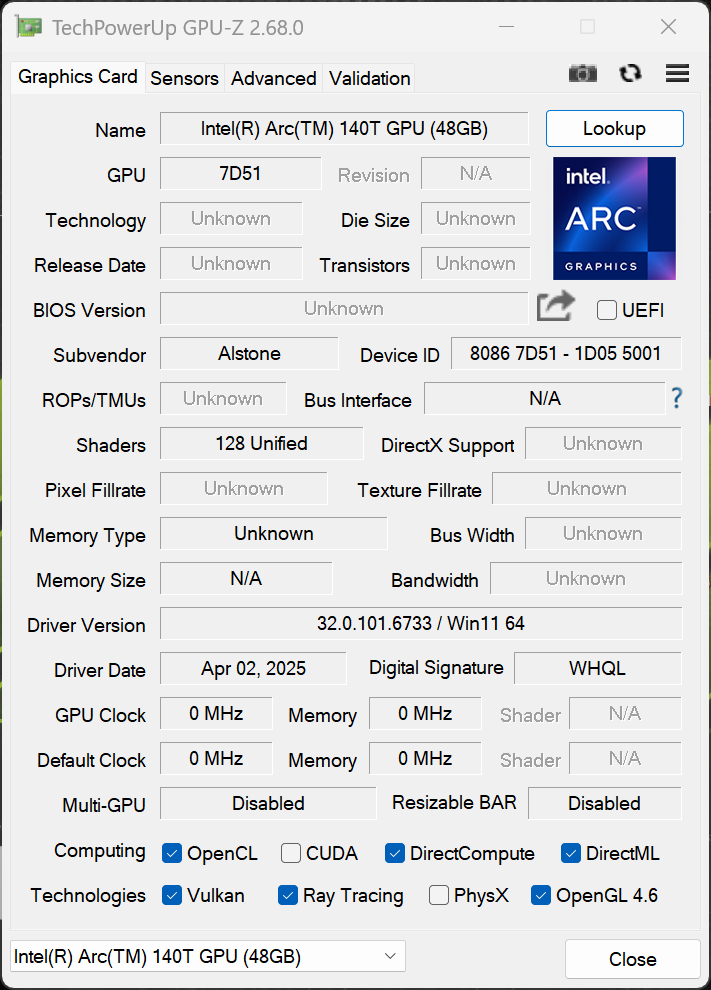
Performance du GPU
Les performances du Arc-140T GPU arc-140T est au niveau attendu et reste parfaitement stable, même sous une charge soutenue. Il est également possible de jouer sur l'Evo 15, même si les jeux ne doivent pas être trop exigeants.
| 3DMark 11 Performance | 13648 points | |
| 3DMark Fire Strike Score | 8561 points | |
| 3DMark Time Spy Score | 4472 points | |
| 3DMark Steel Nomad Score | 875 points | |
| 3DMark Steel Nomad Light Score | 3473 points | |
Aide | ||
| Blender / v3.3 Classroom METAL | |
| Apple MacBook Air 15 M4 | |
| Moyenne de la classe Multimedia (17.8 - 68, n=5, 2 dernières années) | |
| Blender / v3.3 Classroom CPU | |
| Lenovo ThinkPad X9-15 Aura Edition | |
| Microsoft Surface Laptop 7 15 Lunar Lake | |
| Lenovo Yoga Slim 7 15ILL9 Aura | |
| Moyenne de la classe Multimedia (134.5 - 1042, n=64, 2 dernières années) | |
| Apple MacBook Air 15 M4 | |
| Schenker XMG Evo 15 (M24) | |
| Moyenne Intel Arc Graphics 140T (254 - 492, n=20) | |
| Schenker XMG Evo 15 (M25) | |
| Blender / v3.3 Classroom oneAPI/Intel | |
| Moyenne de la classe Multimedia (106 - 401, n=14, 2 dernières années) | |
| Lenovo Yoga Slim 7 15ILL9 Aura | |
| Moyenne Intel Arc Graphics 140T (147 - 396, n=6) | |
* ... Moindre est la valeur, meilleures sont les performances
Cyberpunk 2077 ultra FPS chart
| Bas | Moyen | Élevé | Ultra | QHD | |
|---|---|---|---|---|---|
| GTA V (2015) | 178.7 | 170 | 46.6 | 18.9 | |
| Dota 2 Reborn (2015) | 109.7 | 97.5 | 91.6 | 90.1 | |
| Final Fantasy XV Benchmark (2018) | 91.3 | 45.8 | 32.6 | ||
| X-Plane 11.11 (2018) | 61.8 | 48.5 | 42.4 | ||
| Strange Brigade (2018) | 202 | 82.8 | 69.6 | 58.2 | 41.3 |
| Baldur's Gate 3 (2023) | 40.7 | 32.8 | 28.1 | 27.3 | |
| Cyberpunk 2077 (2023) | 43 | 34.8 | 29.9 | 27.4 | |
| F1 24 (2024) | 93.4 | 85.7 | 64.9 | 20.8 | 13.7 |
Émissions et énergie
Bruit

Pour une utilisation quotidienne, nous recommandons les modes Balanced et Enthusiast, car les ventilateurs restent nettement plus silencieux dans ces réglages. En mode Overboost, le bruit du ventilateur devient clairement audible, atteignant jusqu'à 47,9 dB(A) lors du test de stress et environ 41 dB(A) pendant les jeux ; en comparaison, les autres modes restent nettement plus silencieux(Balanced: 32,9 dB(A), Enthusiast: 36,3 dB(A), batterie : 34,8 dB(A)). Aucun bruit de bobine n'a été observé sur l'unité de test.
Degré de la nuisance sonore
| Au repos |
| 24.5 / 24.5 / 26.9 dB(A) |
| Fortement sollicité |
| 33.9 / 47.9 dB(A) |
 | ||
30 dB silencieux 40 dB(A) audible 50 dB(A) bruyant |
||
min: | ||
| Schenker XMG Evo 15 (M25) Ultra 7 255H, Arc 140T | Microsoft Surface Laptop 7 15 Lunar Lake Core Ultra 7 268V, Arc 140V | Lenovo ThinkPad X9-15 Aura Edition Core Ultra 7 258V, Arc 140V | Lenovo Yoga Slim 7 15ILL9 Aura Core Ultra 7 256V, Arc 140V | Schenker XMG Evo 15 (M24) Ultra 7 155H, Arc 8-Core | |
|---|---|---|---|---|---|
| Noise | 6% | 2% | 7% | 2% | |
| arrêt / environnement * (dB) | 24.5 | 23.9 2% | 24.4 -0% | 23.2 5% | 24.7 -1% |
| Idle Minimum * (dB) | 24.5 | 23.9 2% | 24.4 -0% | 23.2 5% | 24.7 -1% |
| Idle Average * (dB) | 24.5 | 23.9 2% | 24.4 -0% | 23.2 5% | 24.7 -1% |
| Idle Maximum * (dB) | 26.9 | 23.9 11% | 24.4 9% | 26.1 3% | 28.9 -7% |
| Load Average * (dB) | 33.9 | 31.8 6% | 35.8 -6% | 30.9 9% | 32.7 4% |
| Cyberpunk 2077 ultra * (dB) | 41.3 | 38 8% | 39.4 5% | 34.1 17% | 40.4 2% |
| Load Maximum * (dB) | 47.9 | 41.9 13% | 45 6% | 44.3 8% | 40.4 16% |
* ... Moindre est la valeur, meilleures sont les performances
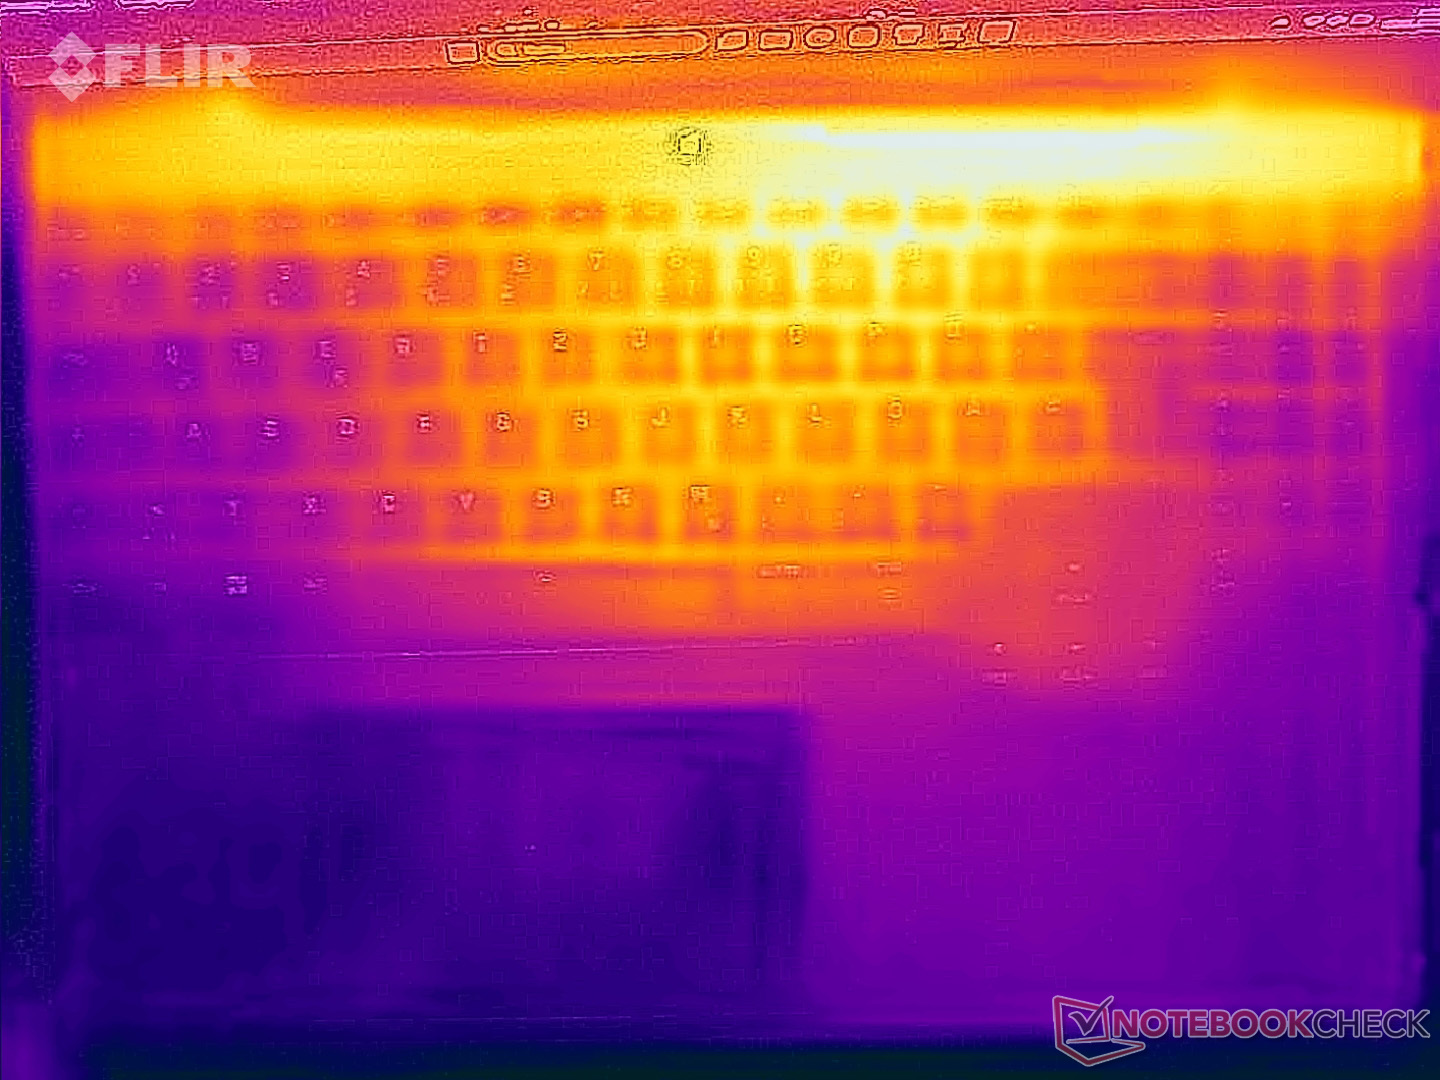
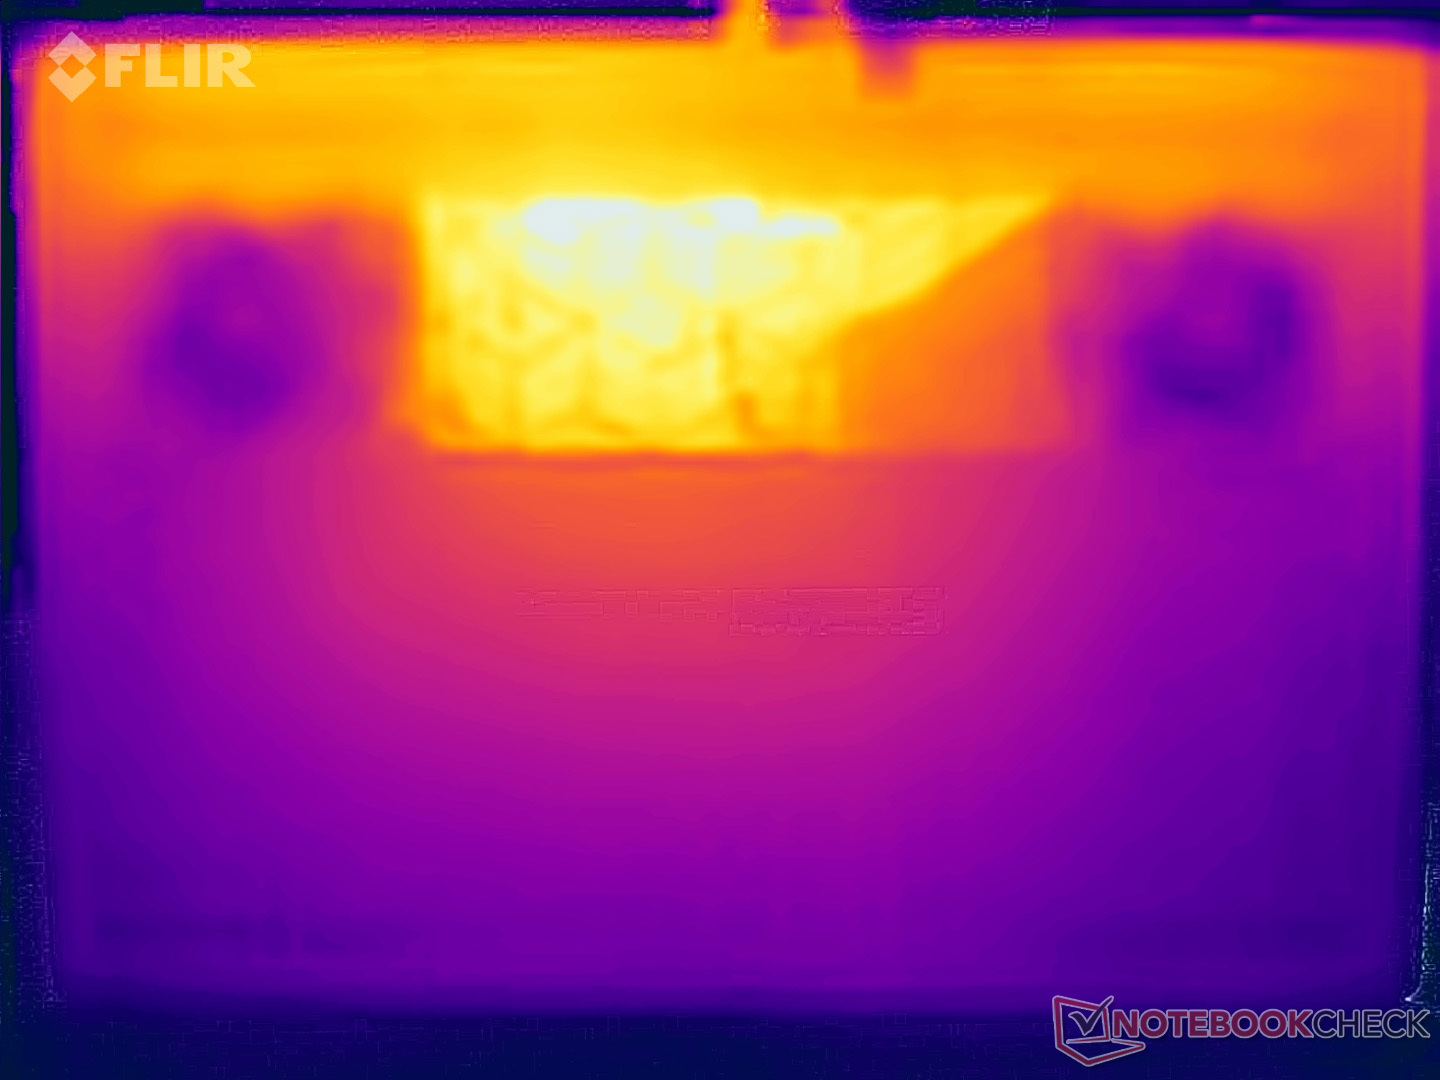
Température
Lorsque l'ordinateur portable est pleinement sollicité en mode Overboost, il ne doit pas être posé sur vos cuisses, car nous avons mesuré des températures de plus de 50 °C sur le dessous. Sinon, il n'y a pas de problème de température et le processeur maintient une consommation constante d'environ 90 watts pendant le test de stress.

(±) La température maximale du côté supérieur est de 42.3 °C / 108 F, par rapport à la moyenne de 36.9 °C / 98 F, allant de 21 à 71 °C pour la classe Multimedia.
(-) Le fond chauffe jusqu'à un maximum de 56 °C / 133 F, contre une moyenne de 39.1 °C / 102 F
(+) En utilisation inactive, la température moyenne du côté supérieur est de 25.7 °C / 78 F, par rapport à la moyenne du dispositif de 31.3 °C / 88 F.
(±) 3: The average temperature for the upper side is 32.8 °C / 91 F, compared to the average of 31.3 °C / 88 F for the class Multimedia.
(+) Les repose-poignets et le pavé tactile sont plus froids que la température de la peau avec un maximum de 28.2 °C / 82.8 F et sont donc froids au toucher.
(±) La température moyenne de la zone de l'appui-paume de dispositifs similaires était de 28.7 °C / 83.7 F (+0.5 °C / #0.9 F).
| Schenker XMG Evo 15 (M25) Ultra 7 255H, Arc 140T | Microsoft Surface Laptop 7 15 Lunar Lake Core Ultra 7 268V, Arc 140V | Apple MacBook Air 15 M4 M4 10-Core, M4 10-Core GPU | Lenovo ThinkPad X9-15 Aura Edition Core Ultra 7 258V, Arc 140V | Lenovo Yoga Slim 7 15ILL9 Aura Core Ultra 7 256V, Arc 140V | Schenker XMG Evo 15 (M24) Ultra 7 155H, Arc 8-Core | |
|---|---|---|---|---|---|---|
| Heat | 13% | 14% | 15% | -4% | -3% | |
| Maximum Upper Side * (°C) | 42.3 | 45.7 -8% | 44.9 -6% | 42.1 -0% | 46.2 -9% | 41.7 1% |
| Maximum Bottom * (°C) | 56 | 42.9 23% | 43.9 22% | 39.5 29% | 41 27% | 49.6 11% |
| Idle Upper Side * (°C) | 27.4 | 23.6 14% | 23.4 15% | 24.5 11% | 34 -24% | 31.1 -14% |
| Idle Bottom * (°C) | 30.5 | 23.1 24% | 23.5 23% | 24.4 20% | 33.8 -11% | 33.1 -9% |
* ... Moindre est la valeur, meilleures sont les performances
Intervenants
Schenker XMG Evo 15 (M25) analyse audio
(+) | les haut-parleurs peuvent jouer relativement fort (84.1# dB)
Basses 100 - 315 Hz
(-) | presque aucune basse - en moyenne 16.3% plus bas que la médiane
(±) | la linéarité des basses est moyenne (13.4% delta à la fréquence précédente)
Médiums 400 - 2000 Hz
(±) | médiane supérieure - en moyenne 5.6% supérieure à la médiane
(+) | les médiums sont linéaires (5.9% delta à la fréquence précédente)
Aiguës 2 - 16 kHz
(+) | des sommets équilibrés - à seulement 4.2% de la médiane
(+) | les aigus sont linéaires (6.5% delta à la fréquence précédente)
Globalement 100 - 16 000 Hz
(±) | la linéarité du son global est moyenne (15.6% de différence avec la médiane)
Par rapport à la même classe
» 38% de tous les appareils testés de cette catégorie étaient meilleurs, 4% similaires, 58% pires
» Le meilleur avait un delta de 5%, la moyenne était de 17%, le pire était de 45%.
Par rapport à tous les appareils testés
» 23% de tous les appareils testés étaient meilleurs, 5% similaires, 72% pires
» Le meilleur avait un delta de 4%, la moyenne était de 24%, le pire était de 134%.
Microsoft Surface Laptop 7 15 Lunar Lake analyse audio
(±) | le niveau sonore du haut-parleur est moyen mais bon (78.8# dB)
Basses 100 - 315 Hz
(±) | basse réduite - en moyenne 9.3% inférieure à la médiane
(±) | la linéarité des basses est moyenne (8.4% delta à la fréquence précédente)
Médiums 400 - 2000 Hz
(+) | médiane équilibrée - seulement 4.4% de la médiane
(+) | les médiums sont linéaires (3% delta à la fréquence précédente)
Aiguës 2 - 16 kHz
(+) | des sommets équilibrés - à seulement 2.4% de la médiane
(+) | les aigus sont linéaires (4.1% delta à la fréquence précédente)
Globalement 100 - 16 000 Hz
(+) | le son global est linéaire (11.4% différence à la médiane)
Par rapport à la même classe
» 3% de tous les appareils testés de cette catégorie étaient meilleurs, 2% similaires, 95% pires
» Le meilleur avait un delta de 7%, la moyenne était de 21%, le pire était de 53%.
Par rapport à tous les appareils testés
» 7% de tous les appareils testés étaient meilleurs, 2% similaires, 91% pires
» Le meilleur avait un delta de 4%, la moyenne était de 24%, le pire était de 134%.
Apple MacBook Air 15 M4 analyse audio
(+) | les haut-parleurs peuvent jouer relativement fort (85.8# dB)
Basses 100 - 315 Hz
(±) | basse réduite - en moyenne 8.2% inférieure à la médiane
(±) | la linéarité des basses est moyenne (9.4% delta à la fréquence précédente)
Médiums 400 - 2000 Hz
(+) | médiane équilibrée - seulement 1.6% de la médiane
(+) | les médiums sont linéaires (2.4% delta à la fréquence précédente)
Aiguës 2 - 16 kHz
(+) | des sommets équilibrés - à seulement 4.2% de la médiane
(+) | les aigus sont linéaires (4.3% delta à la fréquence précédente)
Globalement 100 - 16 000 Hz
(+) | le son global est linéaire (8% différence à la médiane)
Par rapport à la même classe
» 2% de tous les appareils testés de cette catégorie étaient meilleurs, 1% similaires, 97% pires
» Le meilleur avait un delta de 5%, la moyenne était de 18%, le pire était de 53%.
Par rapport à tous les appareils testés
» 2% de tous les appareils testés étaient meilleurs, 1% similaires, 98% pires
» Le meilleur avait un delta de 4%, la moyenne était de 24%, le pire était de 134%.
Lenovo ThinkPad X9-15 Aura Edition analyse audio
(+) | les haut-parleurs peuvent jouer relativement fort (87.5# dB)
Basses 100 - 315 Hz
(±) | basse réduite - en moyenne 12.5% inférieure à la médiane
(+) | les basses sont linéaires (6.8% delta à la fréquence précédente)
Médiums 400 - 2000 Hz
(+) | médiane équilibrée - seulement 3.1% de la médiane
(+) | les médiums sont linéaires (5.3% delta à la fréquence précédente)
Aiguës 2 - 16 kHz
(+) | des sommets équilibrés - à seulement 2.4% de la médiane
(+) | les aigus sont linéaires (3.3% delta à la fréquence précédente)
Globalement 100 - 16 000 Hz
(+) | le son global est linéaire (9.5% différence à la médiane)
Par rapport à la même classe
» 1% de tous les appareils testés de cette catégorie étaient meilleurs, 0% similaires, 99% pires
» Le meilleur avait un delta de 7%, la moyenne était de 21%, le pire était de 53%.
Par rapport à tous les appareils testés
» 4% de tous les appareils testés étaient meilleurs, 1% similaires, 96% pires
» Le meilleur avait un delta de 4%, la moyenne était de 24%, le pire était de 134%.
Lenovo Yoga Slim 7 15ILL9 Aura analyse audio
(+) | les haut-parleurs peuvent jouer relativement fort (83.5# dB)
Basses 100 - 315 Hz
(+) | bonne basse - seulement 4.1% loin de la médiane
(+) | les basses sont linéaires (5.5% delta à la fréquence précédente)
Médiums 400 - 2000 Hz
(+) | médiane équilibrée - seulement 1.7% de la médiane
(+) | les médiums sont linéaires (1.6% delta à la fréquence précédente)
Aiguës 2 - 16 kHz
(+) | des sommets équilibrés - à seulement 2.4% de la médiane
(+) | les aigus sont linéaires (4.9% delta à la fréquence précédente)
Globalement 100 - 16 000 Hz
(+) | le son global est linéaire (5.3% différence à la médiane)
Par rapport à la même classe
» 1% de tous les appareils testés de cette catégorie étaient meilleurs, 1% similaires, 98% pires
» Le meilleur avait un delta de 5%, la moyenne était de 17%, le pire était de 45%.
Par rapport à tous les appareils testés
» 0% de tous les appareils testés étaient meilleurs, 0% similaires, 100% pires
» Le meilleur avait un delta de 4%, la moyenne était de 24%, le pire était de 134%.
Consommation électrique

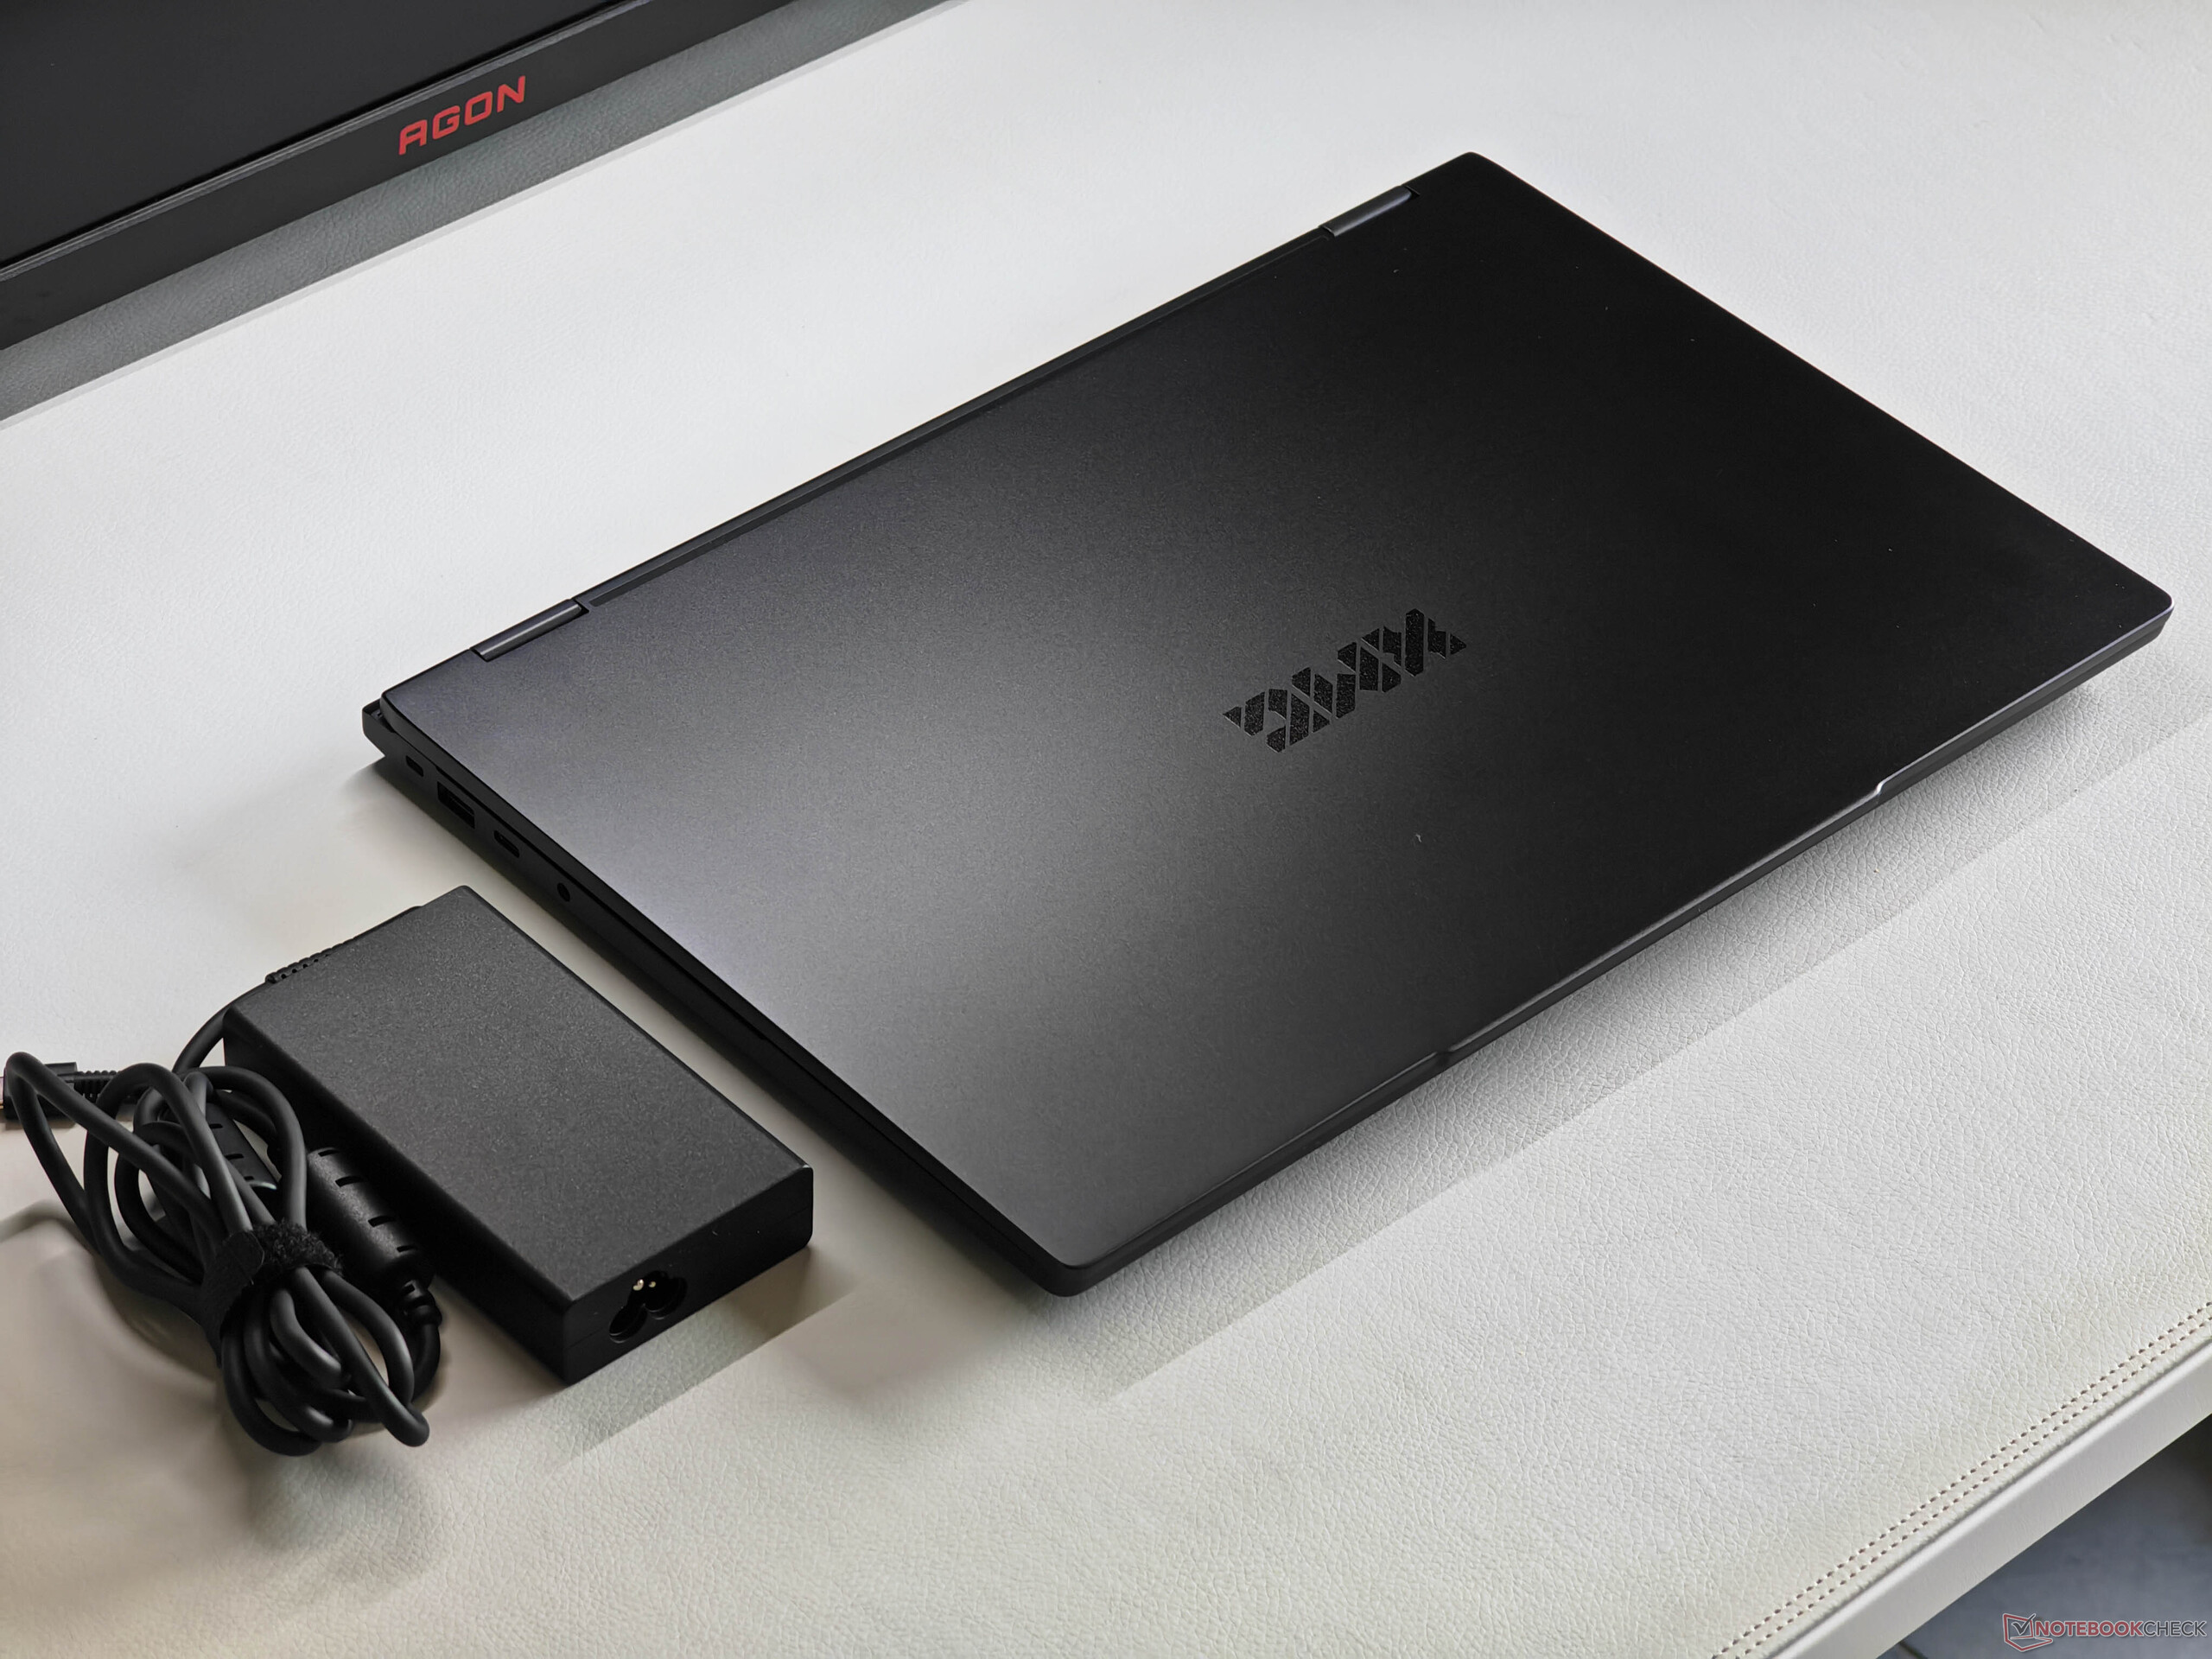
La consommation maximale d'énergie en mode veille a augmenté d'environ 2 watts par rapport au modèle précédent modèle précédent. Lors du test de stress, nous avons mesuré un pic de 132,9 watts, et à la fin du test, la consommation était encore d'environ 125 watts. L'adaptateur de 150 watts fourni est donc suffisant.
| Éteint/en veille | |
| Au repos | |
| Fortement sollicité |
|
Légende:
min: | |
| Schenker XMG Evo 15 (M25) Ultra 7 255H, Arc 140T, Samsung 990 Pro 2 TB MZVL72T0HDLB, IPS, 2560x1600, 15.3" | Microsoft Surface Laptop 7 15 Lunar Lake Core Ultra 7 268V, Arc 140V, Samsung PM9C1a MZ9L81T0HDLB, IPS, 2496x1664, 15" | Apple MacBook Air 15 M4 M4 10-Core, M4 10-Core GPU, Apple SSD AP1024Z, IPS, 2880x1864, 15.3" | Lenovo ThinkPad X9-15 Aura Edition Core Ultra 7 258V, Arc 140V, WD PC SN740 SDDQMQD-1T00, OLED, 2880x1800, 15.3" | Lenovo Yoga Slim 7 15ILL9 Aura Core Ultra 7 256V, Arc 140V, , IPS, 2880x1800, 15.3" | Schenker XMG Evo 15 (M24) Ultra 7 155H, Arc 8-Core, Samsung 990 Pro 1 TB, IPS, 2560x1600, 15.3" | Moyenne Intel Arc Graphics 140T | Moyenne de la classe Multimedia | |
|---|---|---|---|---|---|---|---|---|
| Power Consumption | 46% | 56% | 59% | 46% | 15% | 29% | 25% | |
| Idle Minimum * (Watt) | 9.3 | 3.2 66% | 2.2 76% | 2.4 74% | 3.4 63% | 7.7 17% | 6.59 ? 29% | 5.72 ? 38% |
| Idle Average * (Watt) | 15.1 | 8.7 42% | 11.5 24% | 3.9 74% | 8.8 42% | 13.2 13% | 9.52 ? 37% | 10.1 ? 33% |
| Idle Maximum * (Watt) | 15.6 | 9 42% | 11.6 26% | 5.1 67% | 9.3 40% | 13.7 12% | 12.9 ? 17% | 12.1 ? 22% |
| Load Average * (Watt) | 77.5 | 44.7 42% | 34.5 55% | 42.5 45% | 45.4 41% | 76.2 2% | 57.7 ? 26% | 66 ? 15% |
| Cyberpunk 2077 ultra external monitor * (Watt) | 80.9 | 49.3 39% | 26.2 68% | 40.2 50% | 44.8 45% | 72.7 10% | ||
| Cyberpunk 2077 ultra * (Watt) | 86.9 | 51.1 41% | 24.4 72% | 43.5 50% | 49.4 43% | 76.7 12% | ||
| Load Maximum * (Watt) | 132.7 | 64.6 51% | 37.5 72% | 64.4 51% | 66.3 50% | 78.1 41% | 87.9 ? 34% | 112.1 ? 16% |
* ... Moindre est la valeur, meilleures sont les performances
consommation d'énergie Cyberpunk / Stress test
consommation d'énergie avec moniteur externe
Durée de vie de la batterie
Parallèlement à l'augmentation de la consommation d'énergie en mode veille, les durées de fonctionnement de la batterie sont également un peu plus courtes qu'auparavant. Lors du test WLAN, nous avons mesuré un peu plus de 9 heures à 150 cd/m² et environ 7 heures à pleine luminosité.

Notebookcheck note globale
Schenker XMG Evo 15 (M25)
- 01/27/2026 v8
Andreas Osthoff
 Total Sustainability Score:
 Comparaison des alternatives possibles
Image | Modèle | Prix | Poids | Épaisseur | Écran |
|---|---|---|---|---|---|
1. 85.2%  | Schenker XMG Evo 15 (M25) Intel Core Ultra 7 255H ⎘ Intel Arc Graphics 140T ⎘ 32 Go Mémoire, 2048 Go SSD | Amazon: | 1.8 kg | 22 mm | 15.30" 2560x1600 197 PPI IPS |
2. 87.4%  | Microsoft Surface Laptop 7 15 Lunar Lake Intel Core Ultra 7 268V ⎘ Intel Arc Graphics 140V ⎘ 32 Go Mémoire, 1024 Go SSD | Amazon: Prix de liste: 2760€ | 1.7 kg | 18.3 mm | 15.00" 2496x1664 200 PPI IPS |
3. 91.2%  | Apple MacBook Air 15 M4 Apple M4 10-Core ⎘ Apple M4 10-core GPU ⎘ 16 Go Mémoire, 1024 Go SSD | Amazon: Prix de liste: 1999€ | 1.5 kg | 11.5 mm | 15.30" 2880x1864 224 PPI IPS |
4. 90.1%  | Lenovo ThinkPad X9-15 Aura Edition Intel Core Ultra 7 258V ⎘ Intel Arc Graphics 140V ⎘ 32 Go Mémoire, 1024 Go SSD | Amazon: $3,997.01 Prix de liste: 1989€ | 1.4 kg | 17.7 mm | 15.30" 2880x1800 222 PPI OLED |
5. 84.3%  | Lenovo Yoga Slim 7 15ILL9 Aura Intel Core Ultra 7 256V ⎘ Intel Arc Graphics 140V ⎘ 16 Go Mémoire | Amazon: Prix de liste: 1380 USD | 1.5 kg | 13.9 mm | 15.30" 2880x1800 222 PPI IPS |
Transparency
La sélection des appareils à examiner est effectuée par notre équipe éditoriale. L'échantillon de test a été prêté à l'auteur par le fabricant ou le détaillant pour les besoins de cet examen. Le prêteur n'a pas eu d'influence sur cette évaluation et le fabricant n'a pas reçu de copie de cette évaluation avant sa publication. Il n'y avait aucune obligation de publier cet article. En tant que média indépendant, Notebookcheck n'est pas soumis à l'autorité des fabricants, des détaillants ou des éditeurs.
Voici comment Notebookcheck teste
Chaque année, Notebookcheck examine de manière indépendante des centaines d'ordinateurs portables et de smartphones en utilisant des procédures standardisées afin de garantir que tous les résultats sont comparables. Nous avons continuellement développé nos méthodes de test depuis environ 20 ans et avons établi des normes industrielles dans le processus. Dans nos laboratoires de test, des équipements de mesure de haute qualité sont utilisés par des techniciens et des rédacteurs expérimentés. Ces tests impliquent un processus de validation en plusieurs étapes. Notre système d'évaluation complexe repose sur des centaines de mesures et de points de référence bien fondés, ce qui garantit l'objectivité.