Critiques du Intel Core Ultra 7 255H processeur
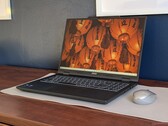
Test du MSI Venture 16 AI A2HMTG : basique, bon marché, professionnel
Le Venture 16 AI, moins connu, ne dispose pas de toutes les fonctions sophistiquées des modèles Prestige ou Summit, plus coûteux, pour les utilisateurs de bureau qui souhaitent simplement un ordinateur portable de base équipé d'un Intel Core H.
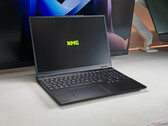
Intel Core Ultra 7 255H, Arc 140T, 16", 2.1 kgTest du XMG Evo 15 (M25) : une bonne alternative Windows au MacBook Air 15 ?
Le XMG Evo 15 est un ordinateur portable fin de 15 pouces doté d'un processeur Intel Arrow Lake, d'un écran IPS mat et lumineux et de caractéristiques générales solides. Il s'agit d'un ordinateur polyvalent et compétent qui ne présente pas de faiblesses majeures. Il est disponible avec un processeur Intel ou AMD.
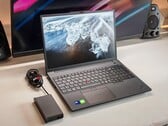
Intel Core Ultra 7 255H, Arc 140T, 15.3", 1.8 kgTest du Lenovo ThinkPad P16v Gen 3 : station de travail mobile avec Nvidia RTX PRO 2000
Le ThinkPad P16v Gen 3 est une station de travail mobile de Lenovo. Des économies ont été réalisées dans certains domaines, tels que les matériaux du boîtier ou les performances graphiques et de refroidissement. Néanmoins, le prix est de plus de 2800 euros (~$3248). Dans notre test, nous verrons si cela est justifié.
Intel Core Ultra 7 255H, NVIDIA RTX PRO 2000 Blackwell Generation Laptop, 16", 2.2 kgTest du Lenovo ThinkPad P1 16 Gen 8 : première de la série Tandem OLED
Le ThinkPad P1 Gen 8 peut sembler identique au modèle de la génération précédente, mais la nouvelle option d'écran OLED en tandem peut améliorer considérablement l'expérience de visionnage HDR pour ceux qui l'apprécient.
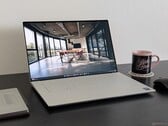
Intel Core Ultra 7 255H, NVIDIA RTX PRO 2000 Blackwell Generation Laptop, 16", 1.9 kgTest du Dell 16 Premium : plus rapide et plus efficace que le XPS 16
Le Dell 16 Premium s'inscrit dans la continuité de la série avec un matériel similaire mais des options Intel et Nvidia plus récentes pour des performances encore plus rapides qu'auparavant.
Intel Core Ultra 7 255H, NVIDIA GeForce RTX 5070 Laptop, 16.3", 2.3 kgHP ZBook 8 G1i 14: Intel Arc Graphics 140T, 14.00", 1.7 kg
Critique » Test du HP ZBook 8 G1i 14 : le successeur du Firefly qui mise sur l'Intel ARC
Asus ZenBook 14 OLED UX3405CA, Ultra 7 255H: Intel Arc Graphics 140T, 14.00", 1.3 kg
Critique » Test de l'Asus ZenBook 14 OLED UX3405CA, l'ultraportable Intel reprend du poil de la bête
Eurocom Blitz Ultra 2 14: Intel Arc Graphics 140T, 14.00", 1.6 kg
Critique » Test de l'Eurocom Blitz Ultra 2 14 : une grande facilité d'utilisation au détriment du poids
Dell 14 Premium: Intel Arc Graphics 140T, 14.50", 1.7 kg
Critique » Test du Dell 14 Premium : un XPS 14 en tout excepté le nom
Honor MagicBook Art 14 2025: Intel Arc Graphics 140T, 14.60", 1 kg
Critique » Test du Honor MagicBook Art 14 2025 : ultrabook de 1 kg avec Arrow Lake et d'excellents périphériques d'entrée
Lenovo ThinkPad E14 G7-21SYS00H00: Intel Arc Graphics 140T, 14.00", 1.4 kg
Critique » Test du Lenovo ThinkPad E14 G7 : le PC portable de bureau abordable se démarque avec son écran 120 Hz
Lenovo ThinkBook 14 Gen 8 21SJ007SGE: Intel Arc Graphics 140T, 14.00", 1.5 kg
Critique » Test du ThinkBook 14 Gen 8 IAL : PC poratble Lenovo abordable plus évolutif que la plupart des ThinkPads
Lenovo Yoga Pro 9 16IAH G10 RTX 5060: NVIDIA GeForce RTX 5060 Laptop, 16.00", 1.9 kg
Critique » Test du Lenovo Yoga Pro 9i 16IAH G10 Aura Edition : PC portable multimédia impressionnant avec son OLED de 1 100 cd/m²
Lenovo Yoga Book 9 14IAH10: Intel Arc Graphics 140T, 14.00", 1.2 kg
Critique » Test du Lenovo Yoga Book 9 14IAH10 : double écran, sans poids doublé
Xiaomi RedmiBook Pro 14 2025: Intel Arc Graphics 140T, 14.00", 1.4 kg
Critique » Test du Xiaomi RedmiBook Pro 14 2025 : maintenant avec Arrow Lake et 16 heures d'autonomie
Lenovo ThinkPad P16v G3 21RS000DGE: NVIDIA RTX PRO 2000 Blackwell Generation Laptop, 16.00", 2.2 kg
Autres tests » Lenovo ThinkPad P16v G3 21RS000DGE
Acer Swift X 14 OLED SFX14-73G: NVIDIA GeForce RTX 5060 Laptop, 14.50", 1.6 kg
Autres tests » Acer Swift X 14 OLED SFX14-73G
Lenovo ThinkPad E14 G7-21SYS00H00: Intel Arc Graphics 140T, 14.00", 1.4 kg
Autres tests » Lenovo ThinkPad E14 G7-21SYS00H00
Dell Pro Max 16 MC16250: NVIDIA RTX PRO 500 Blackwell Generation Laptop, 16.00", 2.2 kg
Autres tests » Dell Pro Max 16 MC16250
Dell 16 Premium, RTX 5060: NVIDIA GeForce RTX 5060 Laptop, 16.30", 2.3 kg
Autres tests » Dell 16 Premium, RTX 5060
Lenovo ThinkPad P16v G3: NVIDIA RTX PRO 1000 Blackwell Generation Laptop, 16.00", 2.1 kg
Autres tests » Lenovo ThinkPad P16v G3
HP Omen 16-am0000: NVIDIA GeForce RTX 5070 Laptop, 16.00", 2.4 kg
Autres tests » HP Omen 16-am0000
Lenovo ThinkPad P1 Gen 8: NVIDIA RTX PRO 2000 Blackwell Generation Laptop, 16.00", 1.9 kg
Autres tests » Lenovo ThinkPad P1 Gen 8
Acer Predator Helios Neo 14 AI PHN14-71: NVIDIA GeForce RTX 5070 Laptop, 14.50", 1.9 kg
Autres tests » Acer Predator Helios Neo 14 AI PHN14-71
Asus Expertbook B5405: Intel Arc Graphics 140T, 14.00", 1.4 kg
Autres tests » Asus Expertbook B5405
Honor MagicBook Art 14 2025: Intel Arc Graphics 140T, 14.60", 1 kg
Autres tests » Honor MagicBook Art 14 2025
Dell 14 Premium: Intel Arc Graphics 140T, 14.50", 1.7 kg
Autres tests » Dell 14 Premium
Acer Aspire Vero 16 AV16-71P: Intel Arc Graphics 140T, 16.00", 1.8 kg
Autres tests » Acer Aspire Vero 16 AV16-71P
Asus Vivobook S16 S3607CA: Intel Arc Graphics 140T, 16.00", 1.7 kg
Autres tests » Asus Vivobook S16 S3607CA
Lenovo Yoga Pro 9 16IAH G10 RTX 5060: NVIDIA GeForce RTX 5060 Laptop, 16.00", 1.9 kg
Autres tests » Lenovo Yoga Pro 9 16IAH G10 RTX 5060
Lenovo Yoga Pro 9 16IAH10: NVIDIA GeForce RTX 5070 Laptop, 16.00", 1.9 kg
Autres tests » Lenovo Yoga Pro 9 16IAH10
Dell 16 Premium DA16250: NVIDIA GeForce RTX 5070 Laptop, 16.30", 2.3 kg
Autres tests » Dell 16 Premium DA16250
Dell 14 Premium DA14250: NVIDIA GeForce RTX 4050 Laptop GPU, 14.50", 1.7 kg
Autres tests » Dell 14 Premium DA14250
LG gram Pro 16Z90TP: Intel Arc Graphics 140T, 16.00", 1.2 kg
Autres tests » LG gram Pro 16Z90TP
Asus Vivobook S14 S3407CA: Intel Arc Graphics 140T, 14.00", 1.4 kg
Autres tests » Asus Vivobook S14 S3407CA
Lenovo Yoga Book 9 14IAH10: Intel Arc Graphics 140T, 14.00", 1.2 kg
Autres tests » Lenovo Yoga Book 9 14IAH10
Asus VivoBook S16 OLED S5606CA: Intel Arc Graphics 140T, 16.00", 1.5 kg
Autres tests » Asus VivoBook S16 OLED S5606CA
Asus Zenbook 14 OLED UX3405CA: Intel Arc Graphics 140T, 14.00", 1.3 kg
Autres tests » Asus Zenbook 14 OLED UX3405CA
LG gram Pro 2-in-1 16T90TP: Intel Arc Graphics 140T, 16.00", 1.4 kg
Autres tests » LG gram Pro 2-in-1 16T90TP
MSI Venture 16 AI A2HMTG: Intel Arc Graphics 140T, 16.00", 2.1 kg
» Le MSI Venture 16 est étonnamment rapide pour un ordinateur portable de bureau à petit budget
» L'ordinateur portable de bureau MSI Venture 16, moins connu, n'offre que le strict minimum en termes de fonctionnalités
Lenovo ThinkPad P16v G3 21RS000DGE: NVIDIA RTX PRO 2000 Blackwell Generation Laptop, 16.00", 2.2 kg
» La station de travail mobile ThinkPad P16v Gen 3 de Lenovo réduit les coûts aux mauvais endroits
» Pourquoi les stations de travail mobiles comme le ThinkPad P16v Gen 3 ne sont-elles pas équipées des composants les plus rapides ?
Lenovo ThinkPad P1 Gen 8: NVIDIA RTX PRO 2000 Blackwell Generation Laptop, 16.00", 1.9 kg
» Le Lenovo ThinkPad P1 Gen 8 avec OLED en tandem est incroyablement lumineux à près de 1500 nits
» Lenovo ThinkPad P1 Gen 8 abandonne le port de l'adaptateur secteur et passe à une recharge USB-C plus petite uniquement
Dell 16 Premium DA16250: NVIDIA GeForce RTX 5070 Laptop, 16.30", 2.3 kg
» Un petit adaptateur USB-C de 130 W alimente le Dell 16 Premium avec le Core Ultra H et la carte graphique RTX 5070
» Le processeur du Dell 16 Premium fonctionne 15 à 20 % plus vite que sur le XPS 16 9640, mais il y a un problème
» Dell 16 Premium 60 W GeForce La RTX 5070 est à la fois étonnante et décevante
HP ZBook 8 G1i 14: Intel Arc Graphics 140T, 14.00", 1.7 kg
» Le retour d'une ancienne norme : HP réintroduit le port RJ45-Ethernet dans de nombreux modèles d'entreprise
Asus ZenBook 14 OLED UX3405CA, Ultra 7 255H: Intel Arc Graphics 140T, 14.00", 1.3 kg
» Le ZenBook 14 OLED d'Intel est équipé du Wi-Fi 7, mais la version AMD offre des vitesses de transfert plus élevées
» Le ZenBook 14 est-il meilleur avec Intel ou AMD cette année ?
Eurocom Blitz Ultra 2 14: Intel Arc Graphics 140T, 14.00", 1.6 kg
» L'Eurocom Blitz Ultra 2 est doté de caractéristiques standard que la plupart des autres ordinateurs portables de 14 pouces n'ont pas
Honor MagicBook Art 14 2025: Intel Arc Graphics 140T, 14.60", 1 kg
» Honor annonce une luminosité maximale de 1600 nits pour le MagicBook Art 14 2025, mais nous n'avons mesuré que 740 nits
Dell 14 Premium: Intel Arc Graphics 140T, 14.50", 1.7 kg
» Le XPS 14 se perpétue à travers le Dell 14 Premium avec très peu de changements
» Le Dell 14 Premium coûte aussi cher que le Razer Blade 14, plus léger et plus puissant
Honor MagicBook Art 14 2025: Intel Arc Graphics 140T, 14.60", 1 kg
» Honorle nouveau MagicBook Art 14 2025 d'Apple dispose d'un meilleur clavier que les ThinkPads modernes
Lenovo ThinkPad E14 G7-21SYS00H00: Intel Arc Graphics 140T, 14.00", 1.4 kg
» Lenovo ThinkPad E14 & ThinkBook 14 - Comparaison entre professionnels et particuliers
» Lenovo propose enfin un meilleur écran 120 Hz pour le ThinkPad E14 abordable
» Ordinateur portable de bureau de 14 pouces avec d'excellentes options de maintenance : Le ThinkPad E14 G7 offre 2 SSD et 2 emplacements RAM
Lenovo ThinkBook 14 Gen 8 21SJ007SGE: Intel Arc Graphics 140T, 14.00", 1.5 kg
» Cet ordinateur portable ThinkBook de Lenovo est un rêve d'évolutivité - et il est abordable
Lenovo ThinkPad E16 G3-21SSS00E00: Intel Arc Graphics 140T
» Le ThinkPad E16 G3 est-il équipé d'un Core Ultra 7 255H ? Nous l'avons testé
Khadas Mind 2s: Intel Arc Graphics 140T, 0.4 kg
» Revue du mini-PC modulaire Khadas Mind 2s : Un remplacement d'ordinateur de bureau portable qui tient dans la poche
Lenovo Yoga Book 9 14IAH10: Intel Arc Graphics 140T, 14.00", 1.2 kg
» Lenovo Yoga Book 9 14 L'étranglement du processeur Arrow Lake est un peu plus prononcé que nous le souhaiterions
» Le dernier Lenovo Yoga Book 9 14 pèse encore moins que la version 13 pouces plus petite tout en offrant des écrans plus grands