Test du Lenovo Legion Pro 7 16 (2024) : la crème de la crème des PC portables RTX 4080
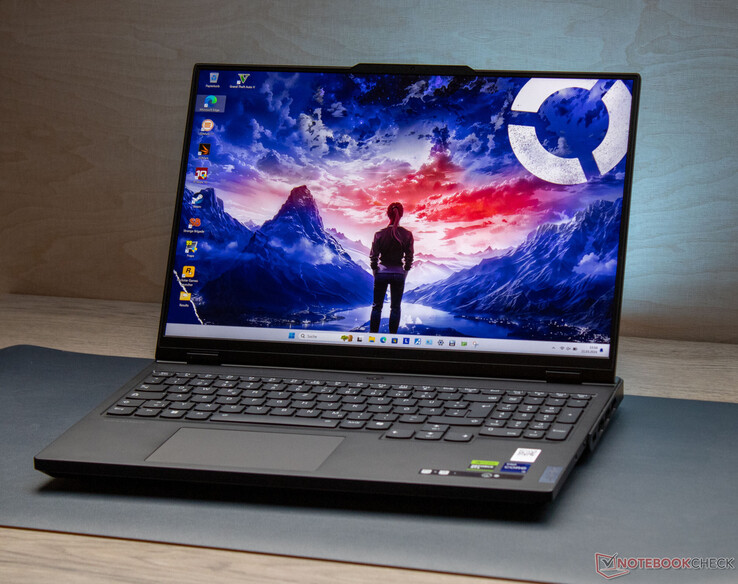
Le Legion Pro 7, un ordinateur portable de 16 pouces destiné aux joueurs et aux créateurs, se situe au sommet du spectre des performances. Il est doté d'un matériel puissant et approprié, avec un processeur Core i9-14900HX, a GeForce RTX 408032 Go de RAM et un écran IPS aux couleurs vives et précises (couverture DCI-P3, Dolby Vision, G-Sync) au format 16:10. Le Legion Pro est en concurrence avec les modèles suivants MSI Vector 16 HX A14Vl'Alienware Alienware m16 R1 AMDl'Alienware m16 R1 AMD HP Omen 16 (2024).
Le Legion Pro 7 16IRX9H est le successeur du Legion Pro 7 16IRX8H et partage le même design extérieur. Veuillez vous référer à notre test du 16IRX8H pour plus de détails sur le châssis, les caractéristiques et les périphériques d'entrée.
Comparaison avec les concurrents potentiels
Note | Date | Modèle | Poids | Épaisseur | Taille | Résolution | Prix |
|---|---|---|---|---|---|---|---|
| 89.5 % v7 (old) | 03/24 | Lenovo Legion Pro 7 16IRX9H i9-14900HX, GeForce RTX 4080 Laptop GPU | 2.7 kg | 21.95 mm | 16.00" | 2560x1600 | |
| 89.2 % v7 (old) | 08/23 | Alienware m16 R1 AMD R9 7845HX, GeForce RTX 4080 Laptop GPU | 3.1 kg | 25.4 mm | 16.00" | 2560x1600 | |
| 88 % v7 (old) | 02/24 | MSI Vector 16 HX A14V i9-14900HX, GeForce RTX 4080 Laptop GPU | 2.7 kg | 28.55 mm | 16.00" | 2560x1600 | |
| 86.7 % v7 (old) | 02/24 | HP Omen 16 (2024) i9-14900HX, GeForce RTX 4080 Laptop GPU | 2.4 kg | 23.5 mm | 16.10" | 2560x1440 |
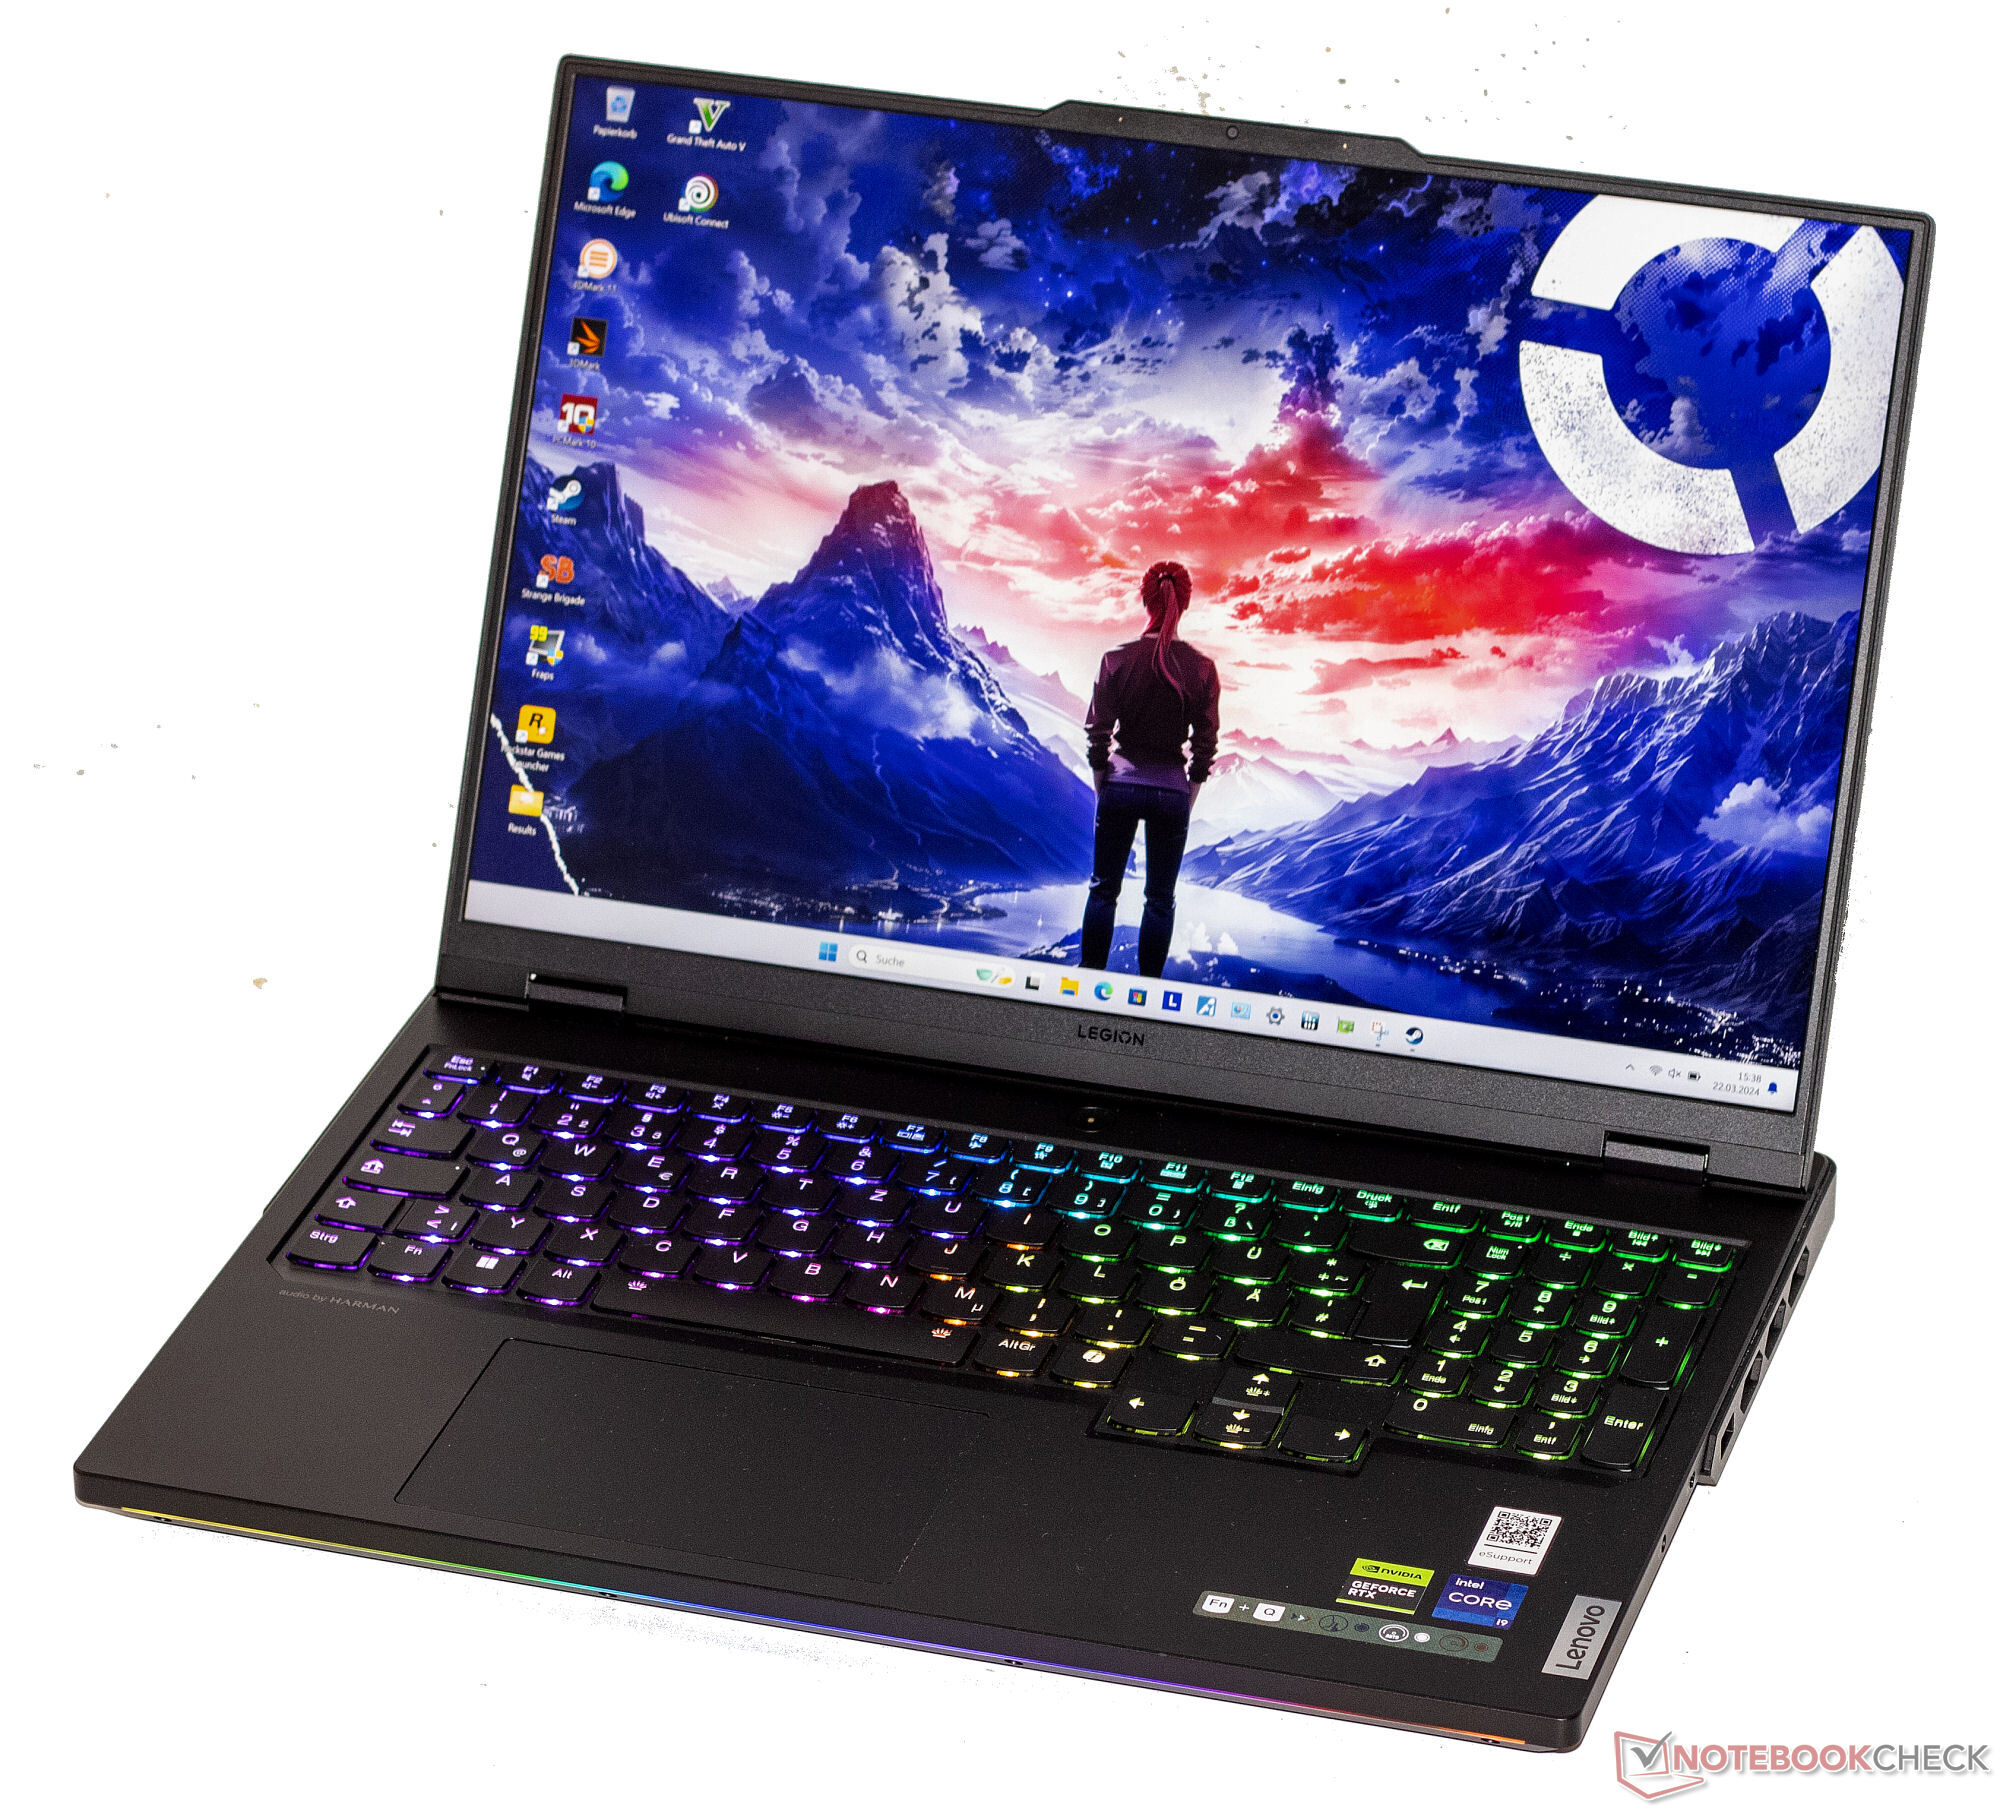
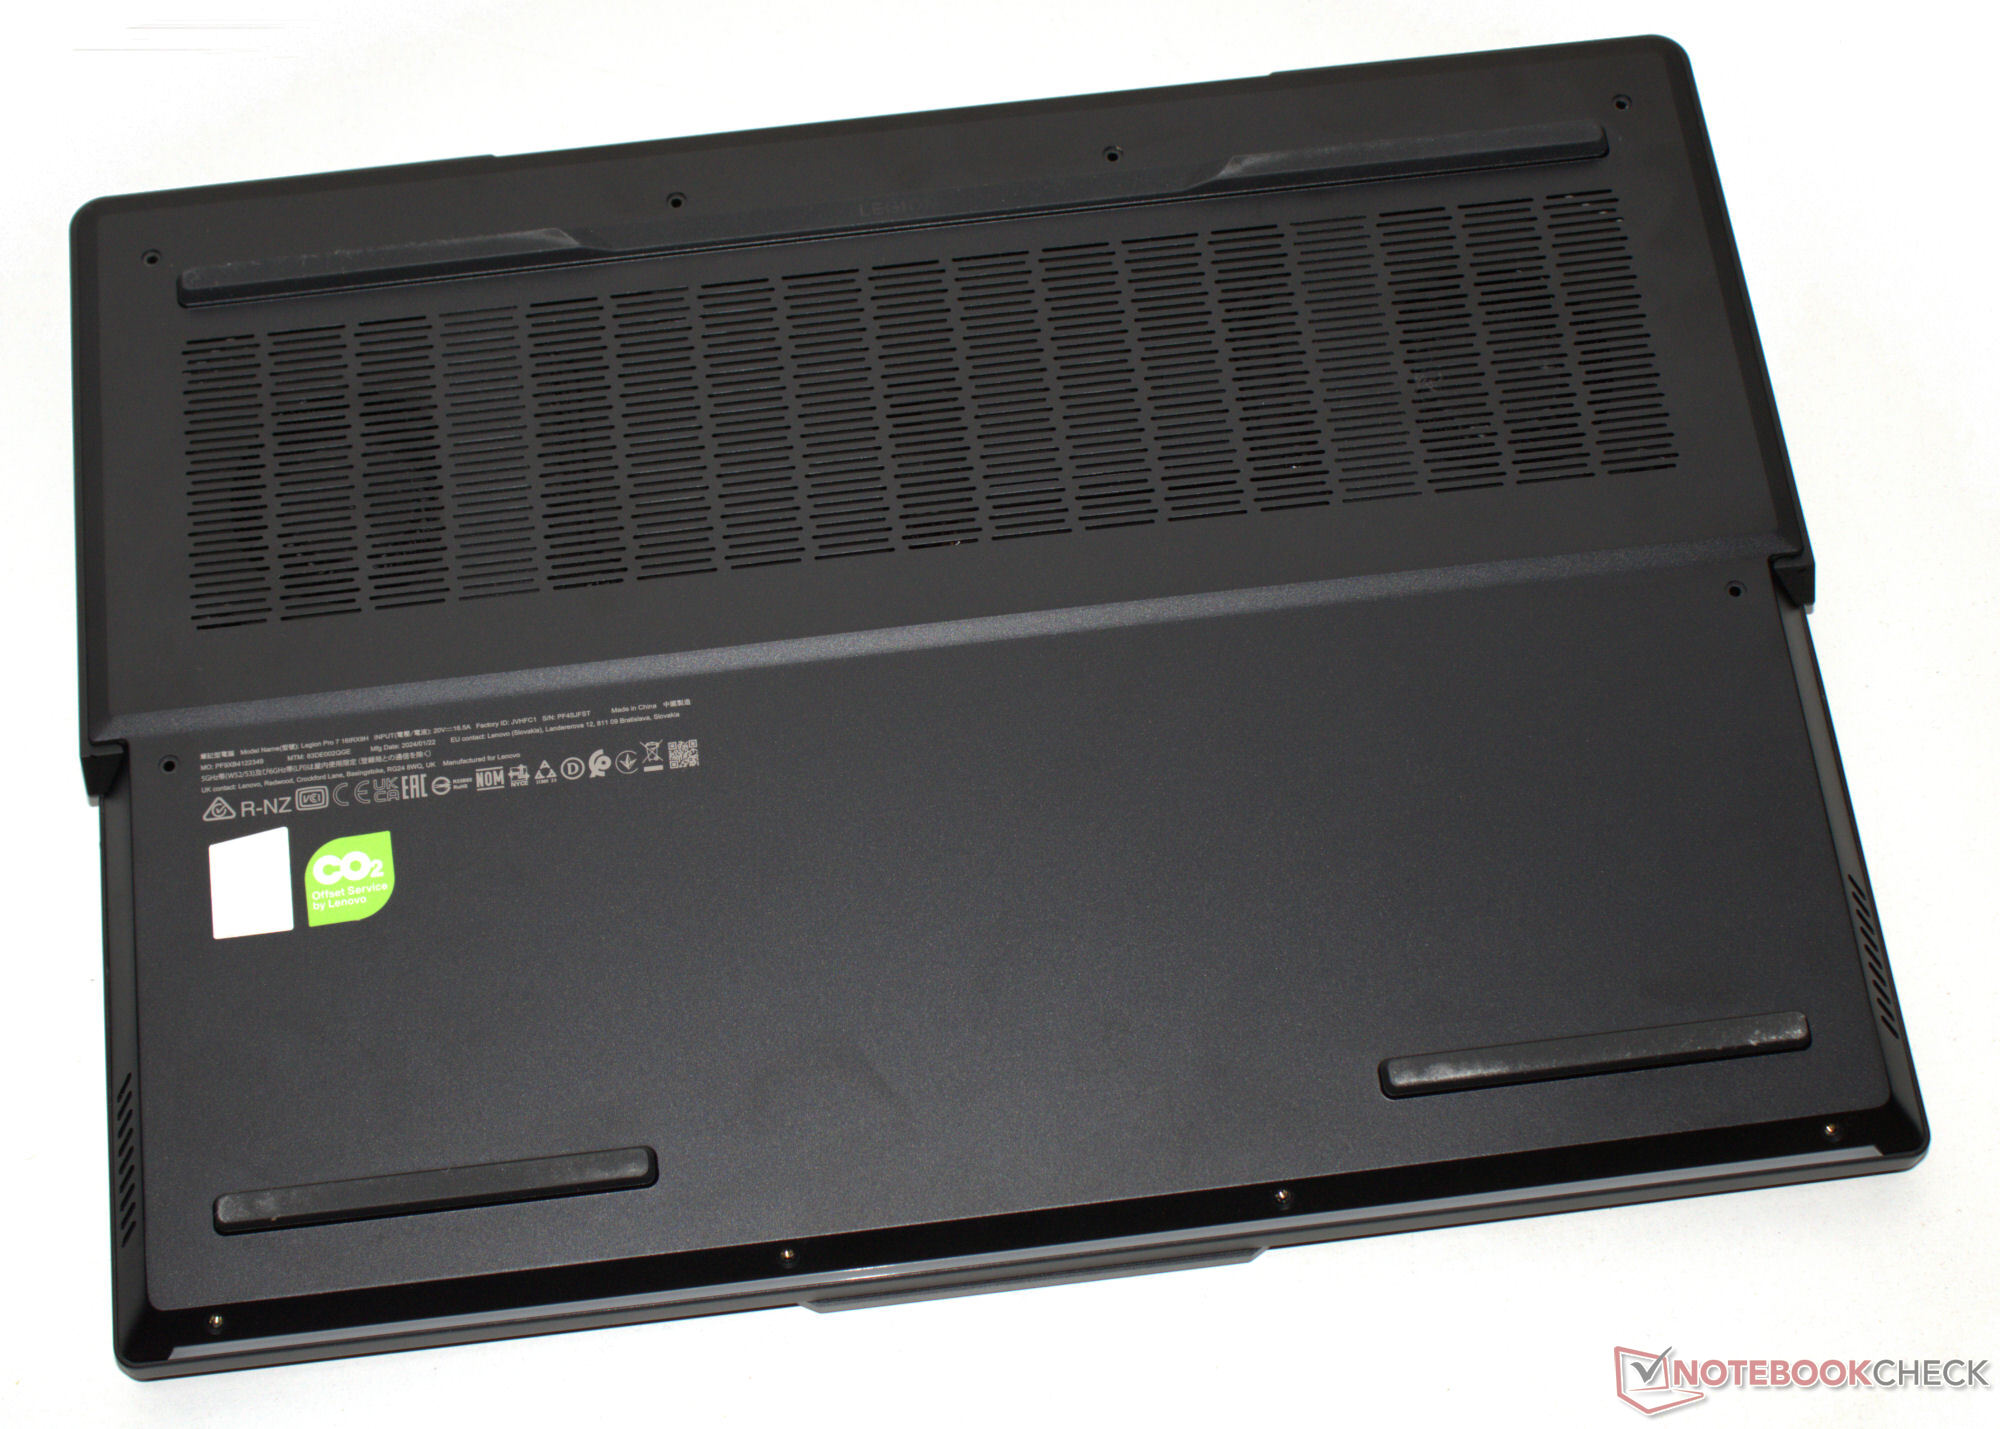
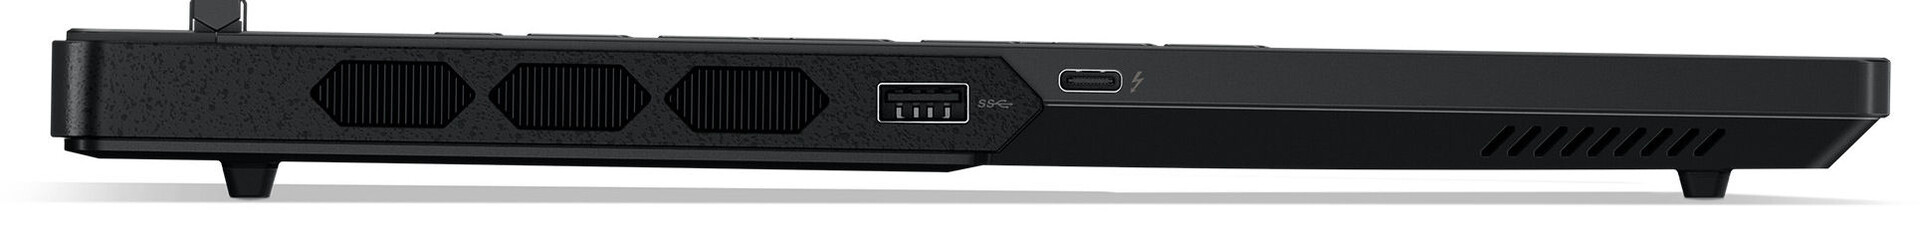
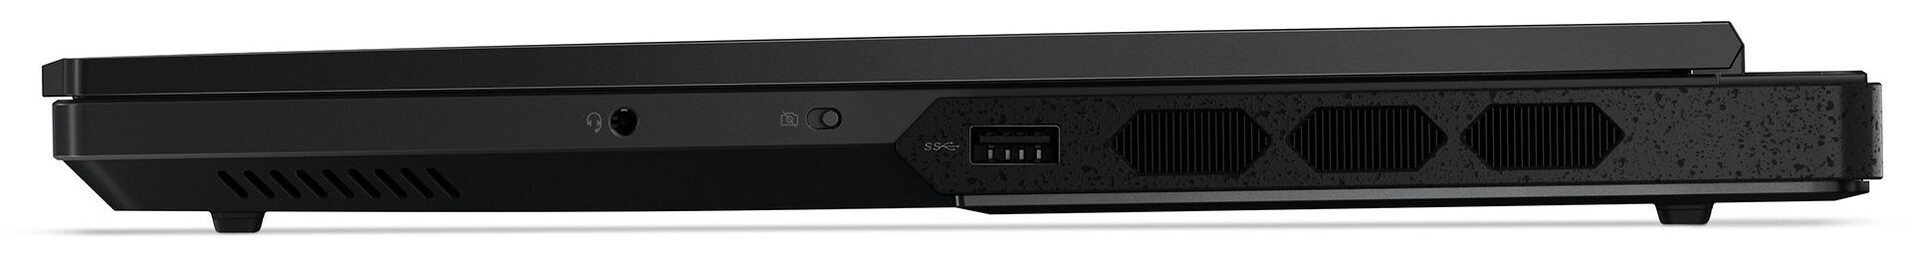
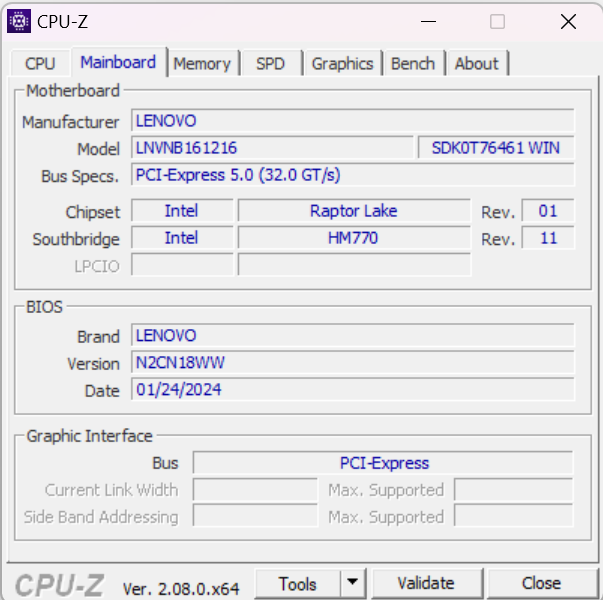
Châssis et spécifications - Livré avec Thunderbolt 4
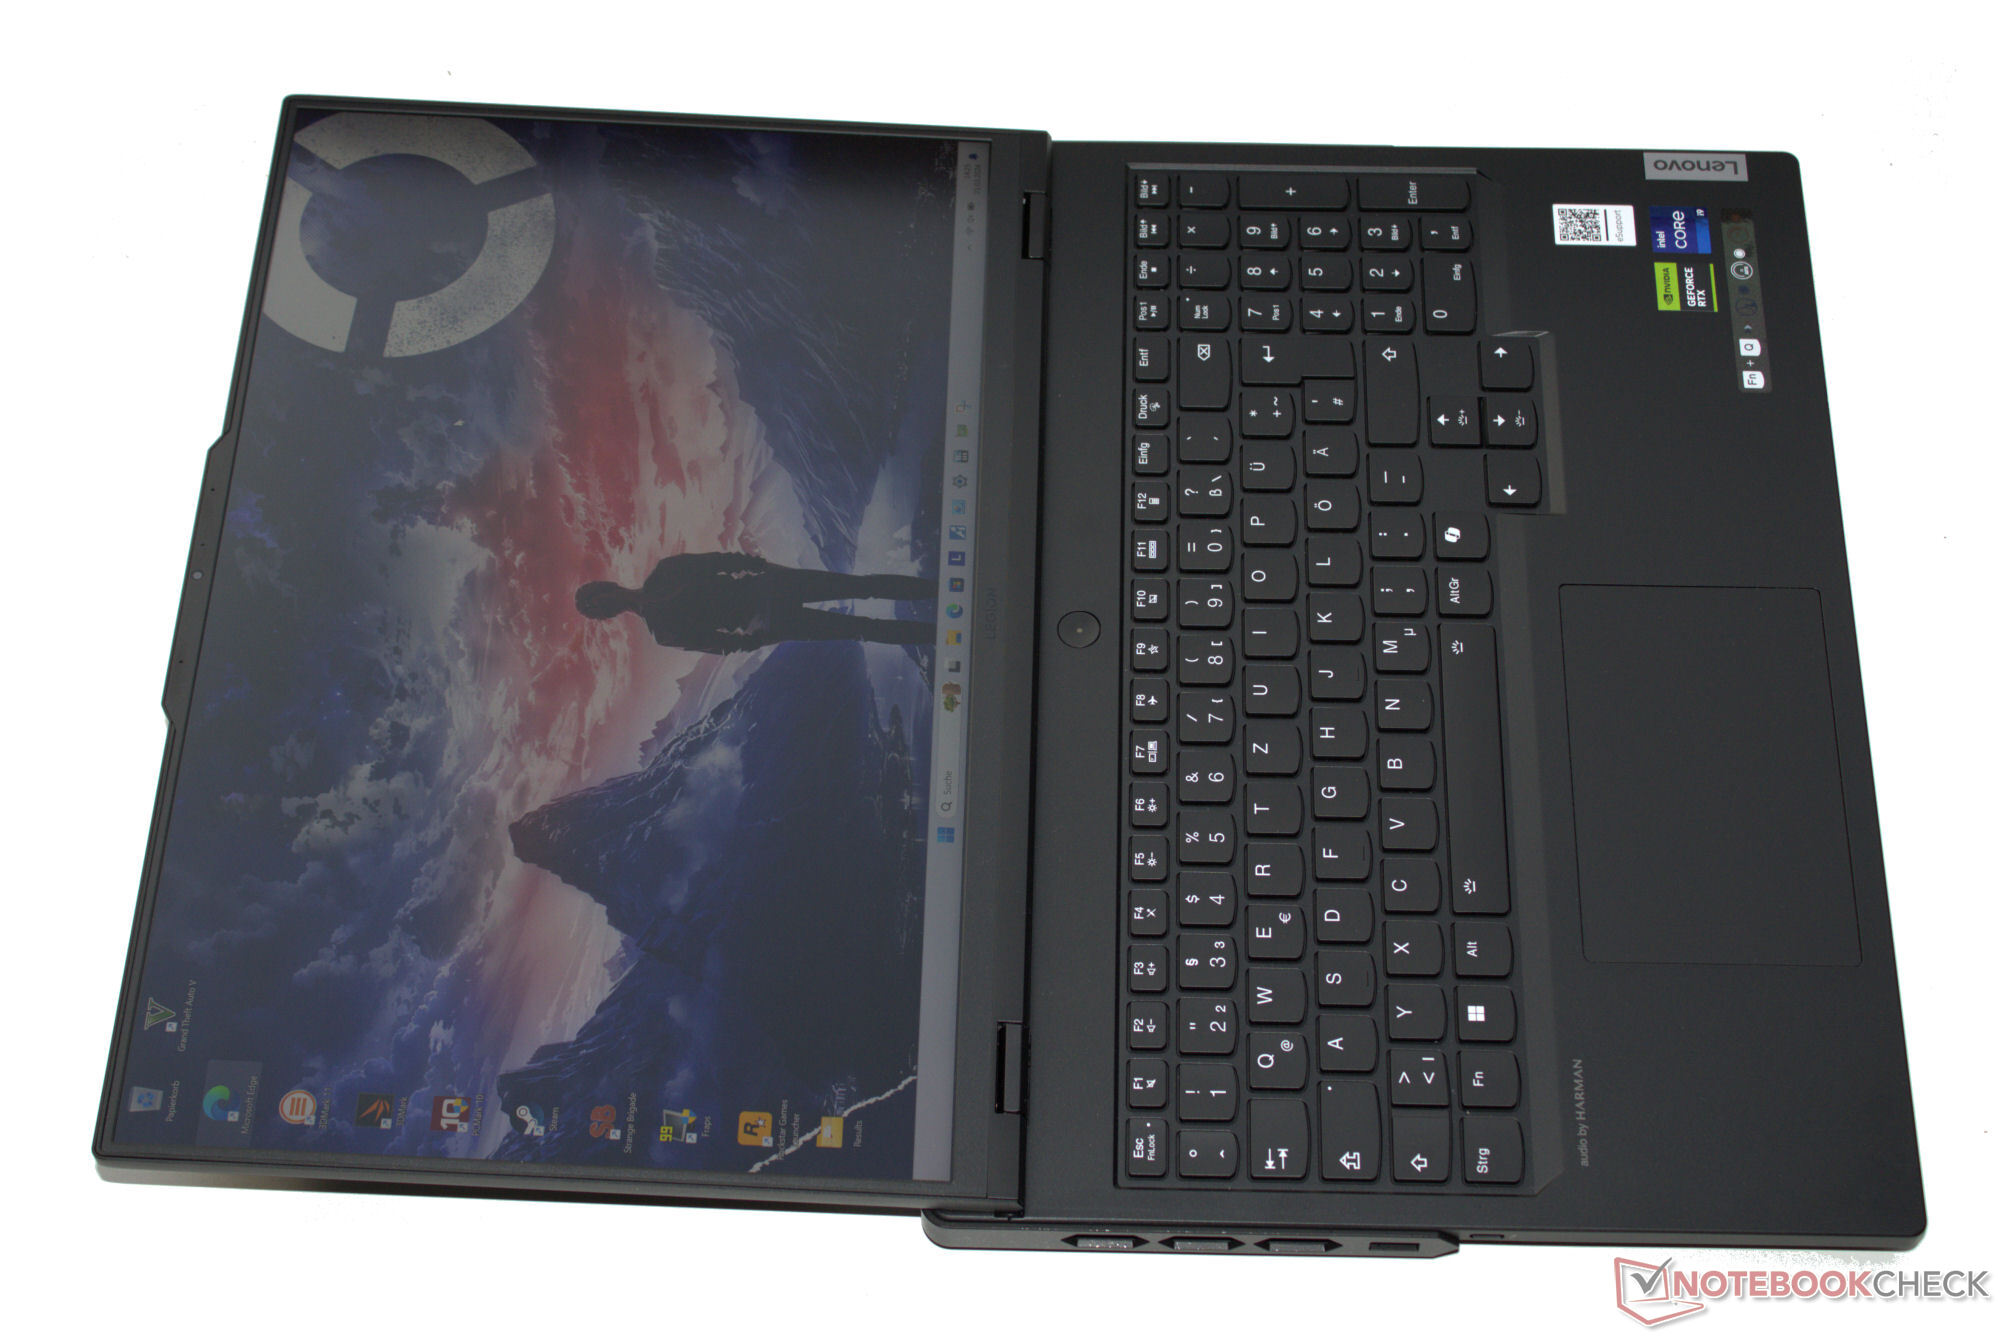
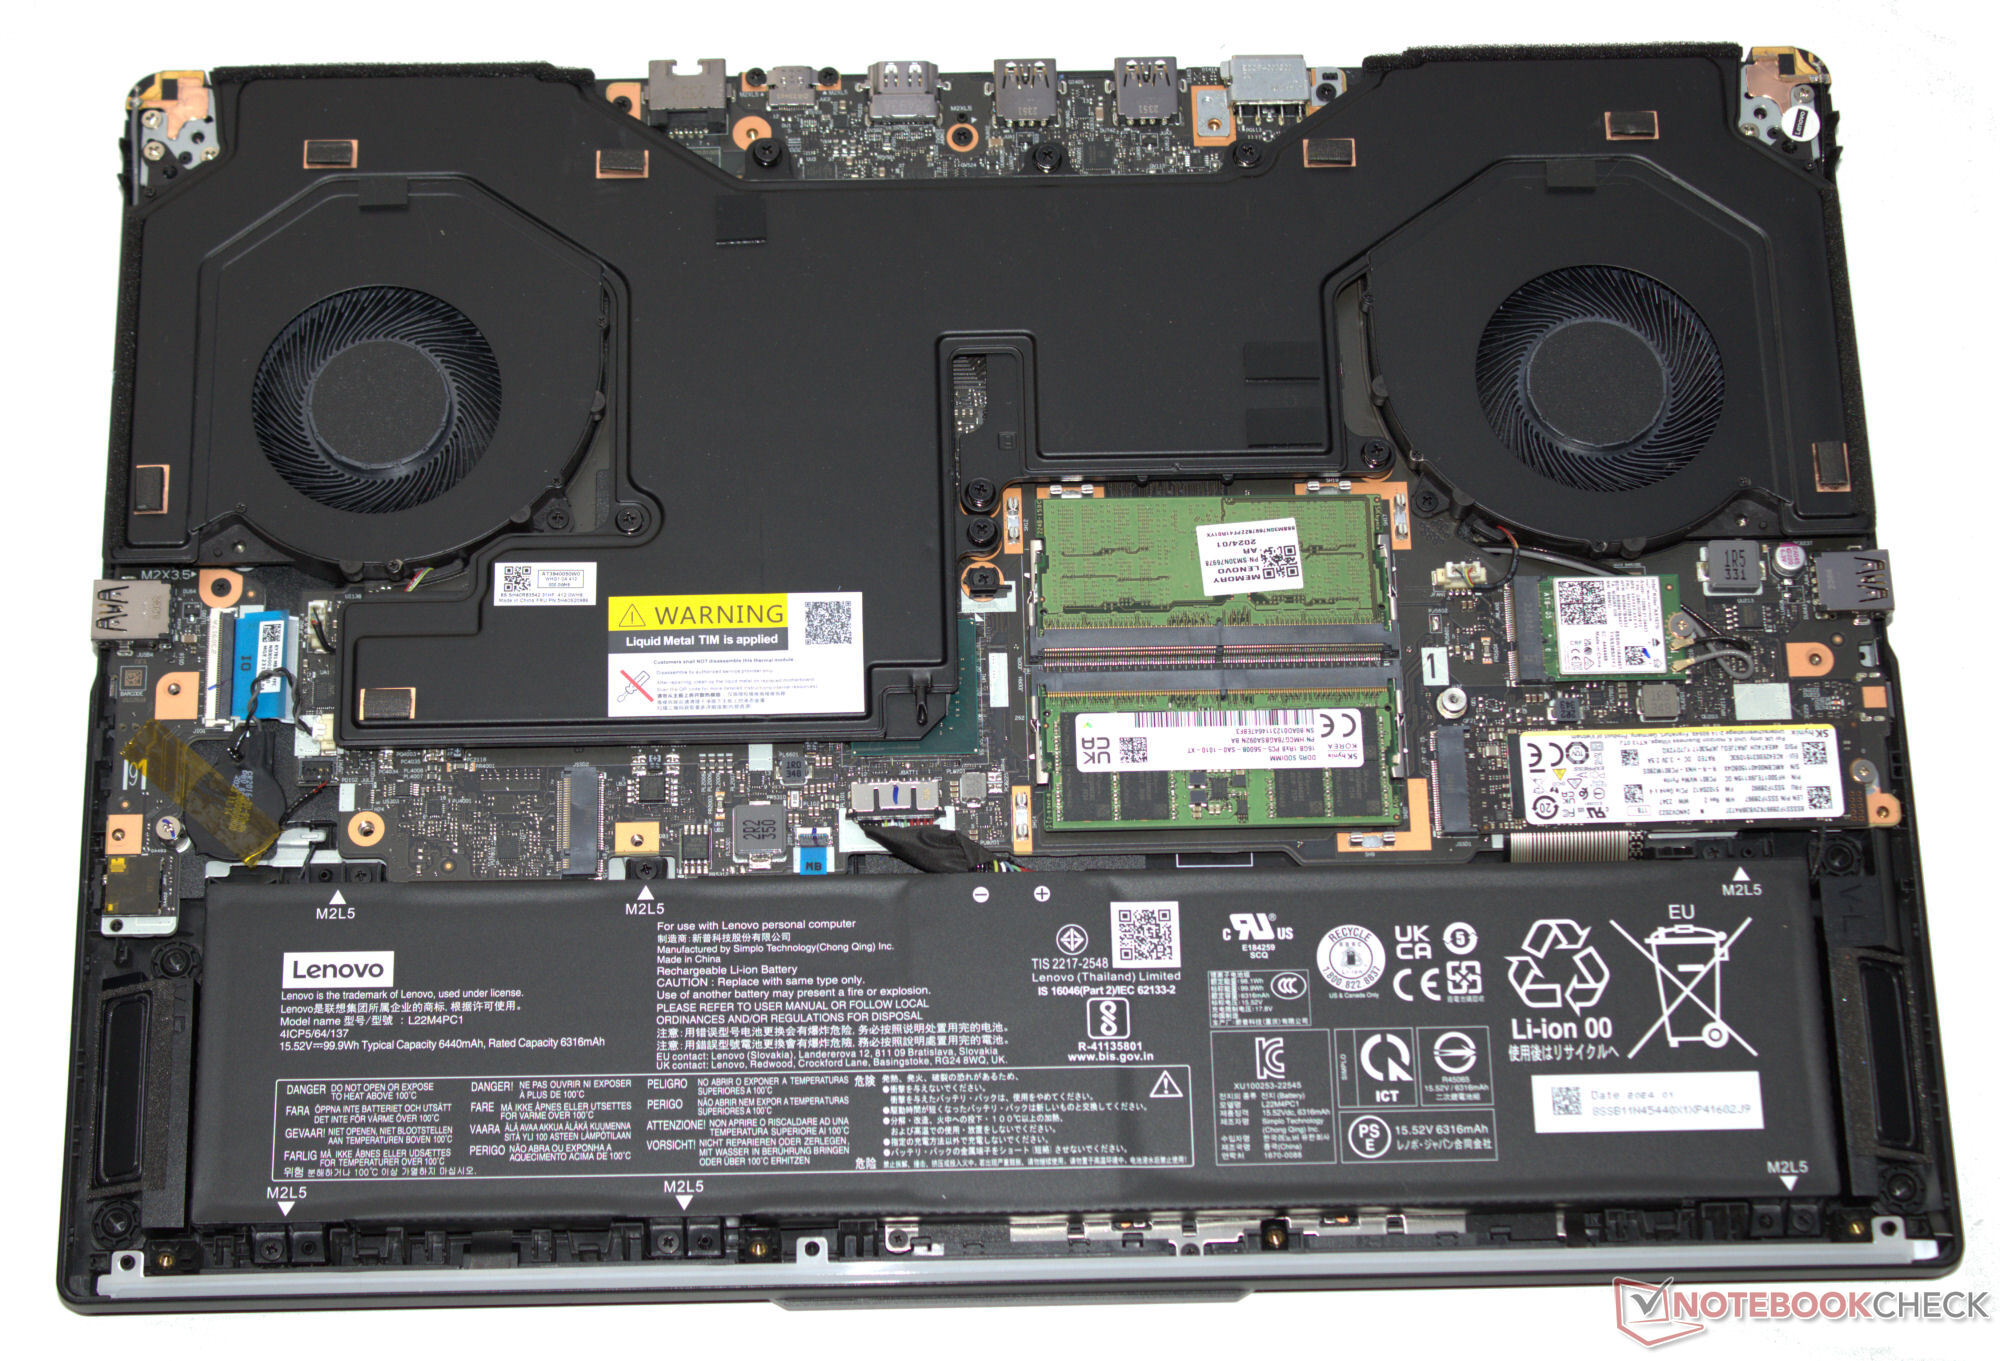
Le matériel du Legionest logé dans un châssis robuste en aluminium noir mat à la surface lisse. Le rétroéclairage du clavier et une bande LED orientée vers l'utilisateur ajoutent une touche de couleur. Les charnières rigides avec un angle d'ouverture maximal de 180 degrés méritent un coup de chapeau. La batterie (vissée et non collée) et le reste des composants internes sont accessibles une fois le capot inférieur retiré.
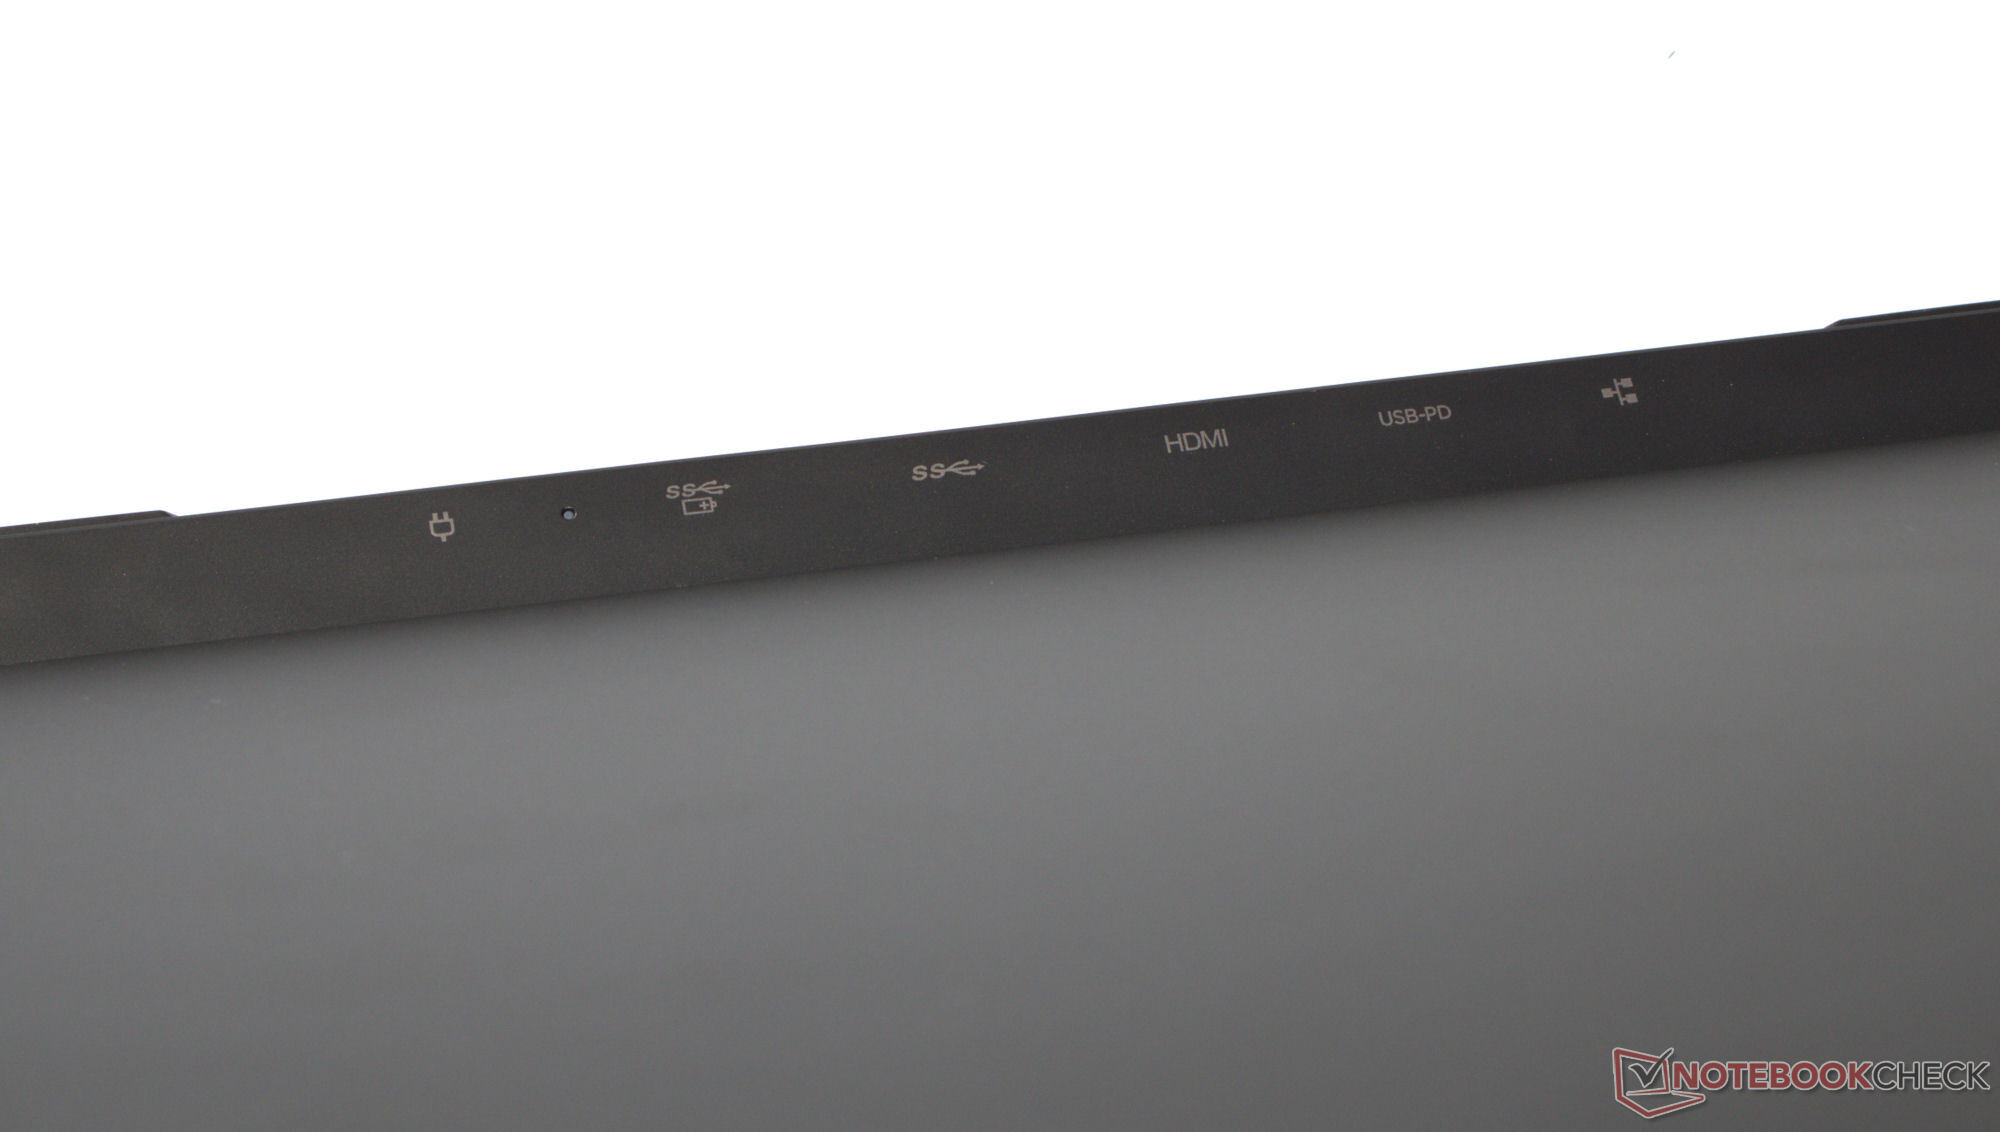
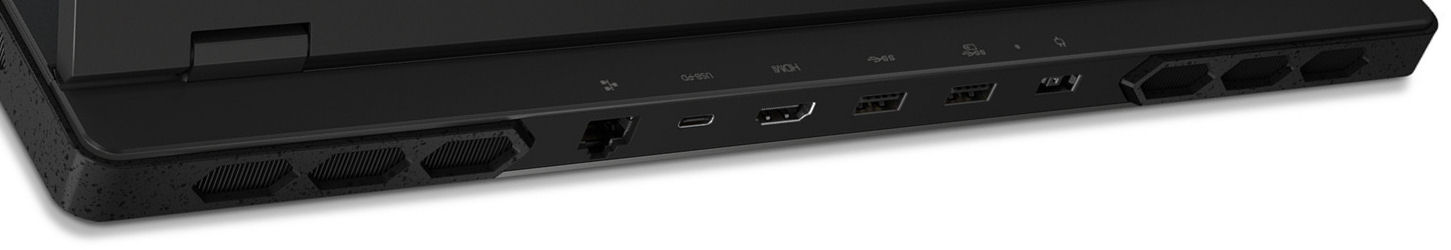
Le portable ne manque pas d'entrées/sorties, avec quatre ports USB-A (USB 3.2 Gen 1) et deux ports USB-C (1 x Thunderbolt 4, 1 x USB 3.2 Gen 2 ; 1 x PD, 2 x DP). Il offre un total de trois sorties vidéo (1x HDMI, 2x DP). La webcam 1080p de 2,1 Mpx est équipée d'un obturateur de confidentialité et produit des résultats très décents. Il n'y a pas de lecteur de carte mémoire à bord.
Dans des conditions optimales (pas d'autres appareils Wi-Fi à proximité, courte distance entre l'ordinateur portable et le PC serveur), le Legion Pro 7 atteint de très bons débits de données Wi-Fi. L'ordinateur portable utilise une puce Killer AX1675i Wi-Fi 6E (alias Intel AX211). La connectivité filaire est assurée par un contrôleur Realtek RTL8168/8111.
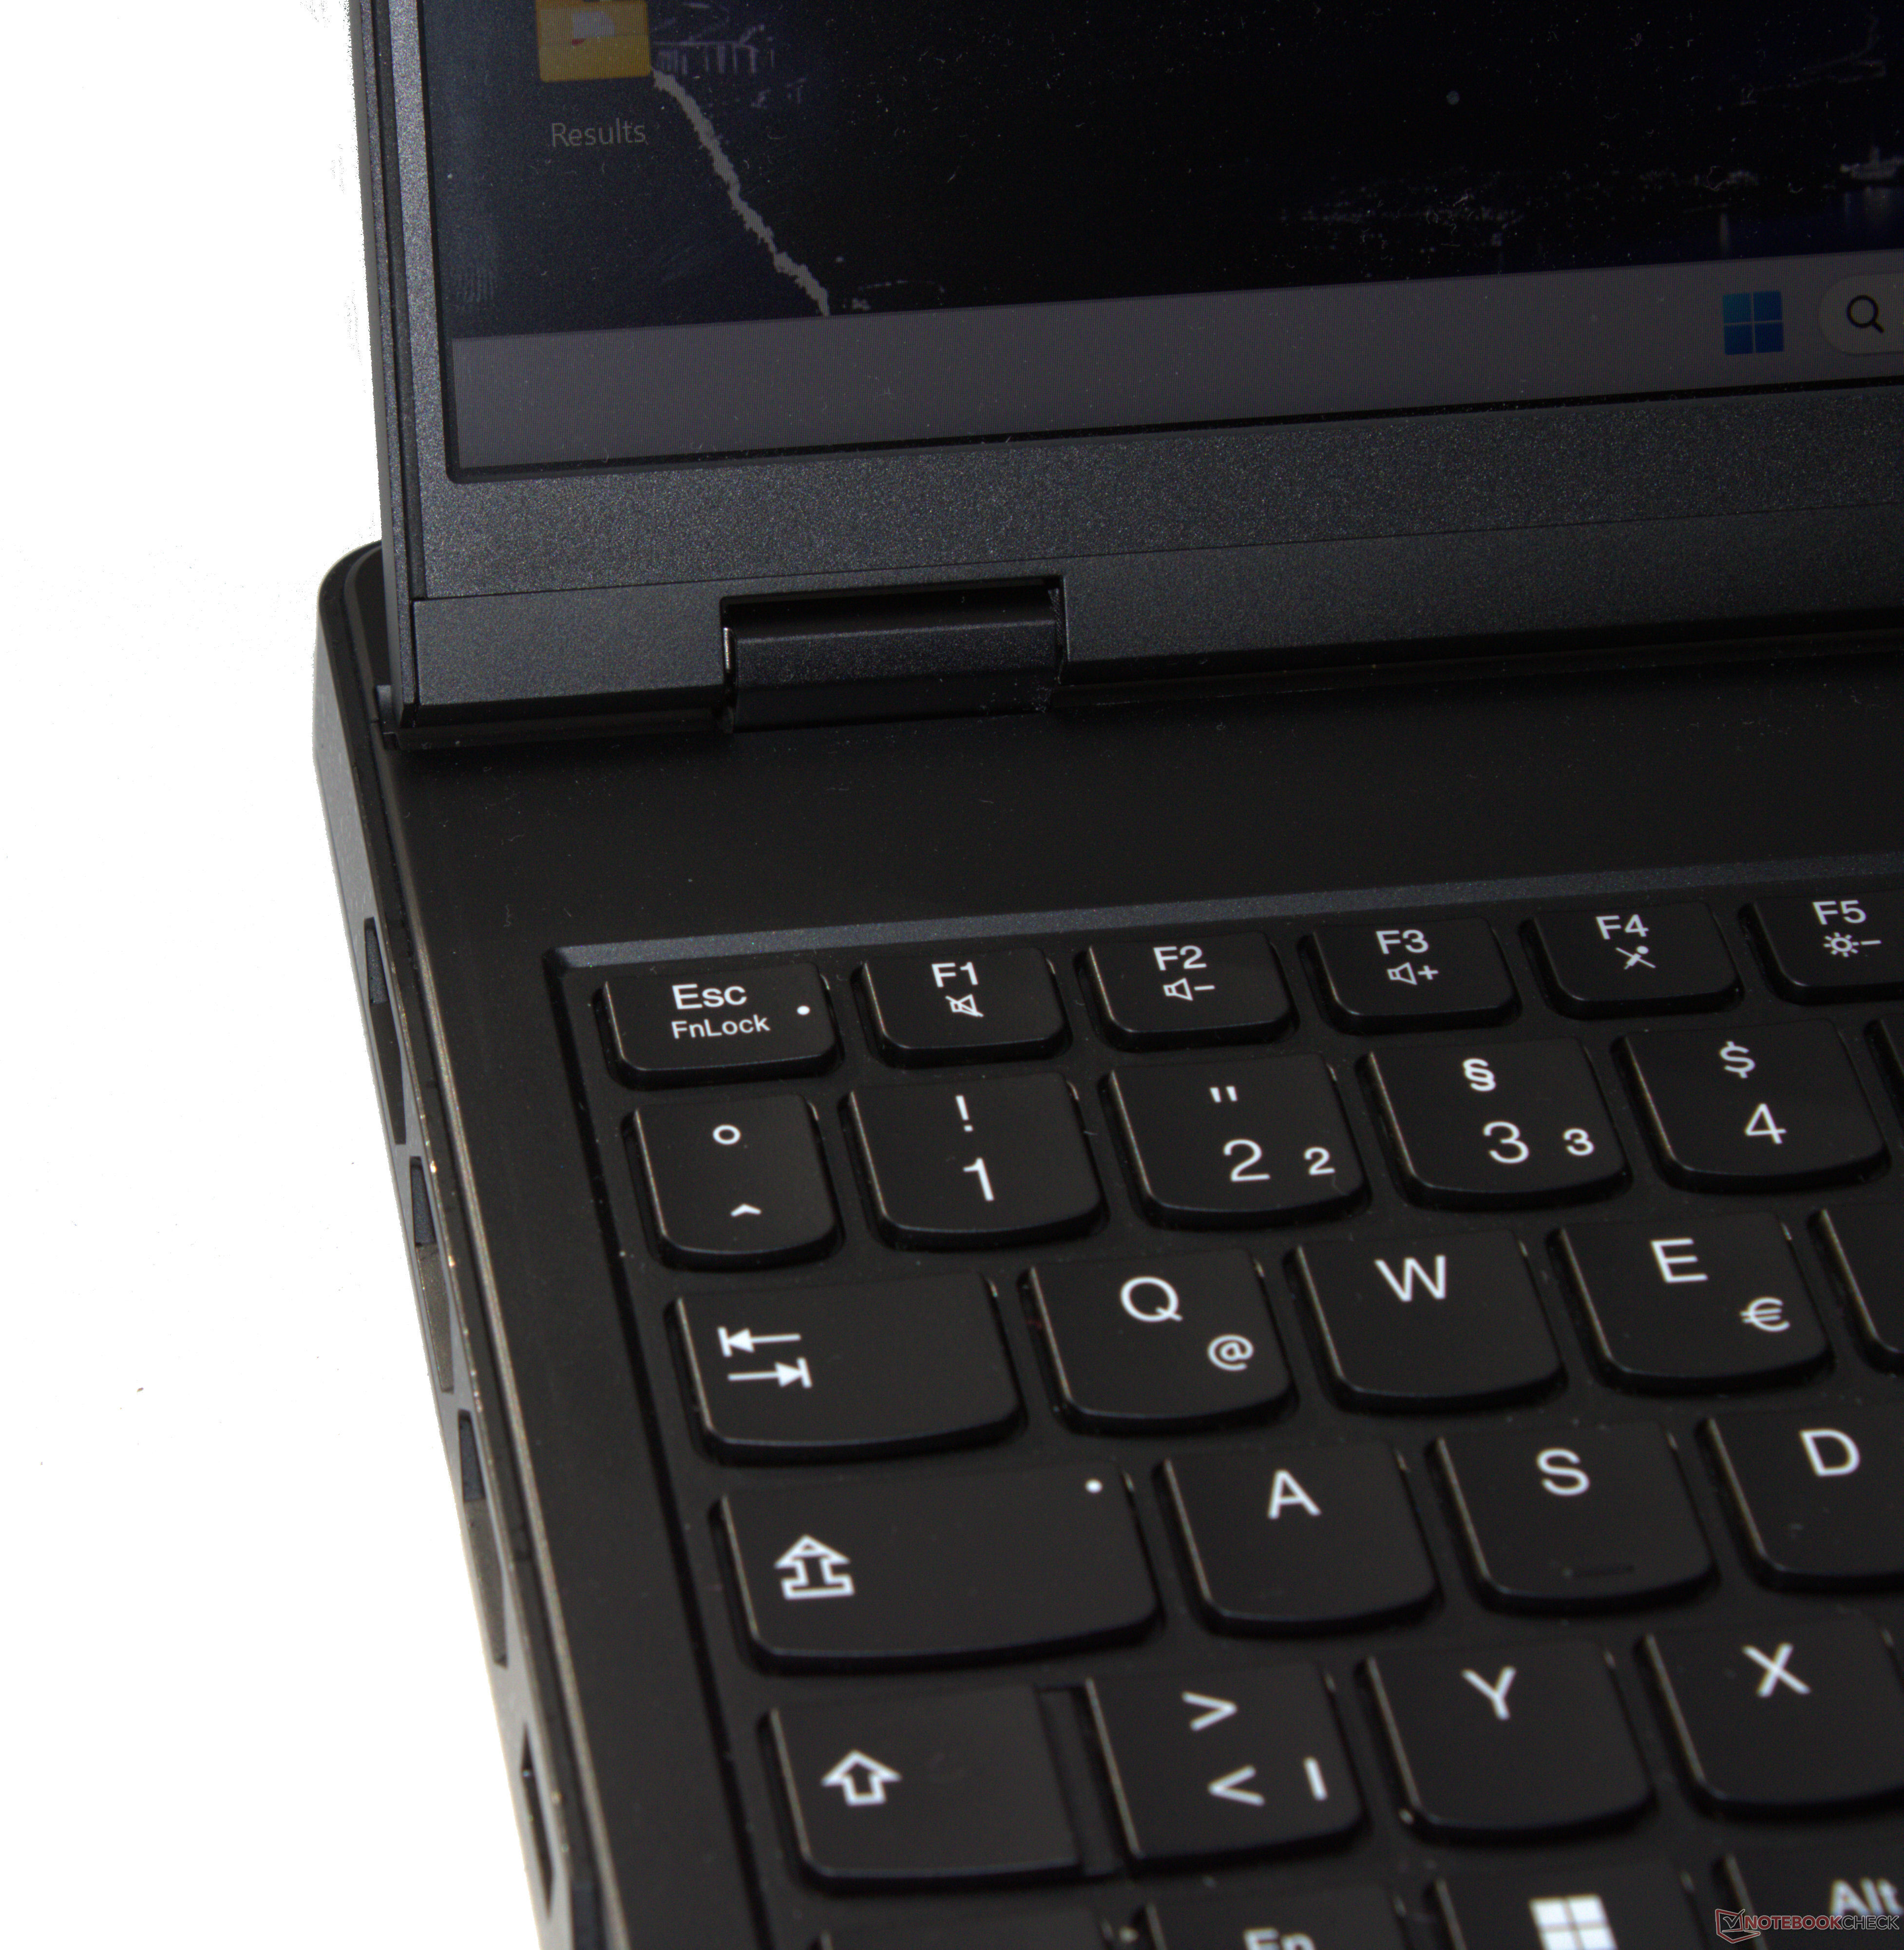
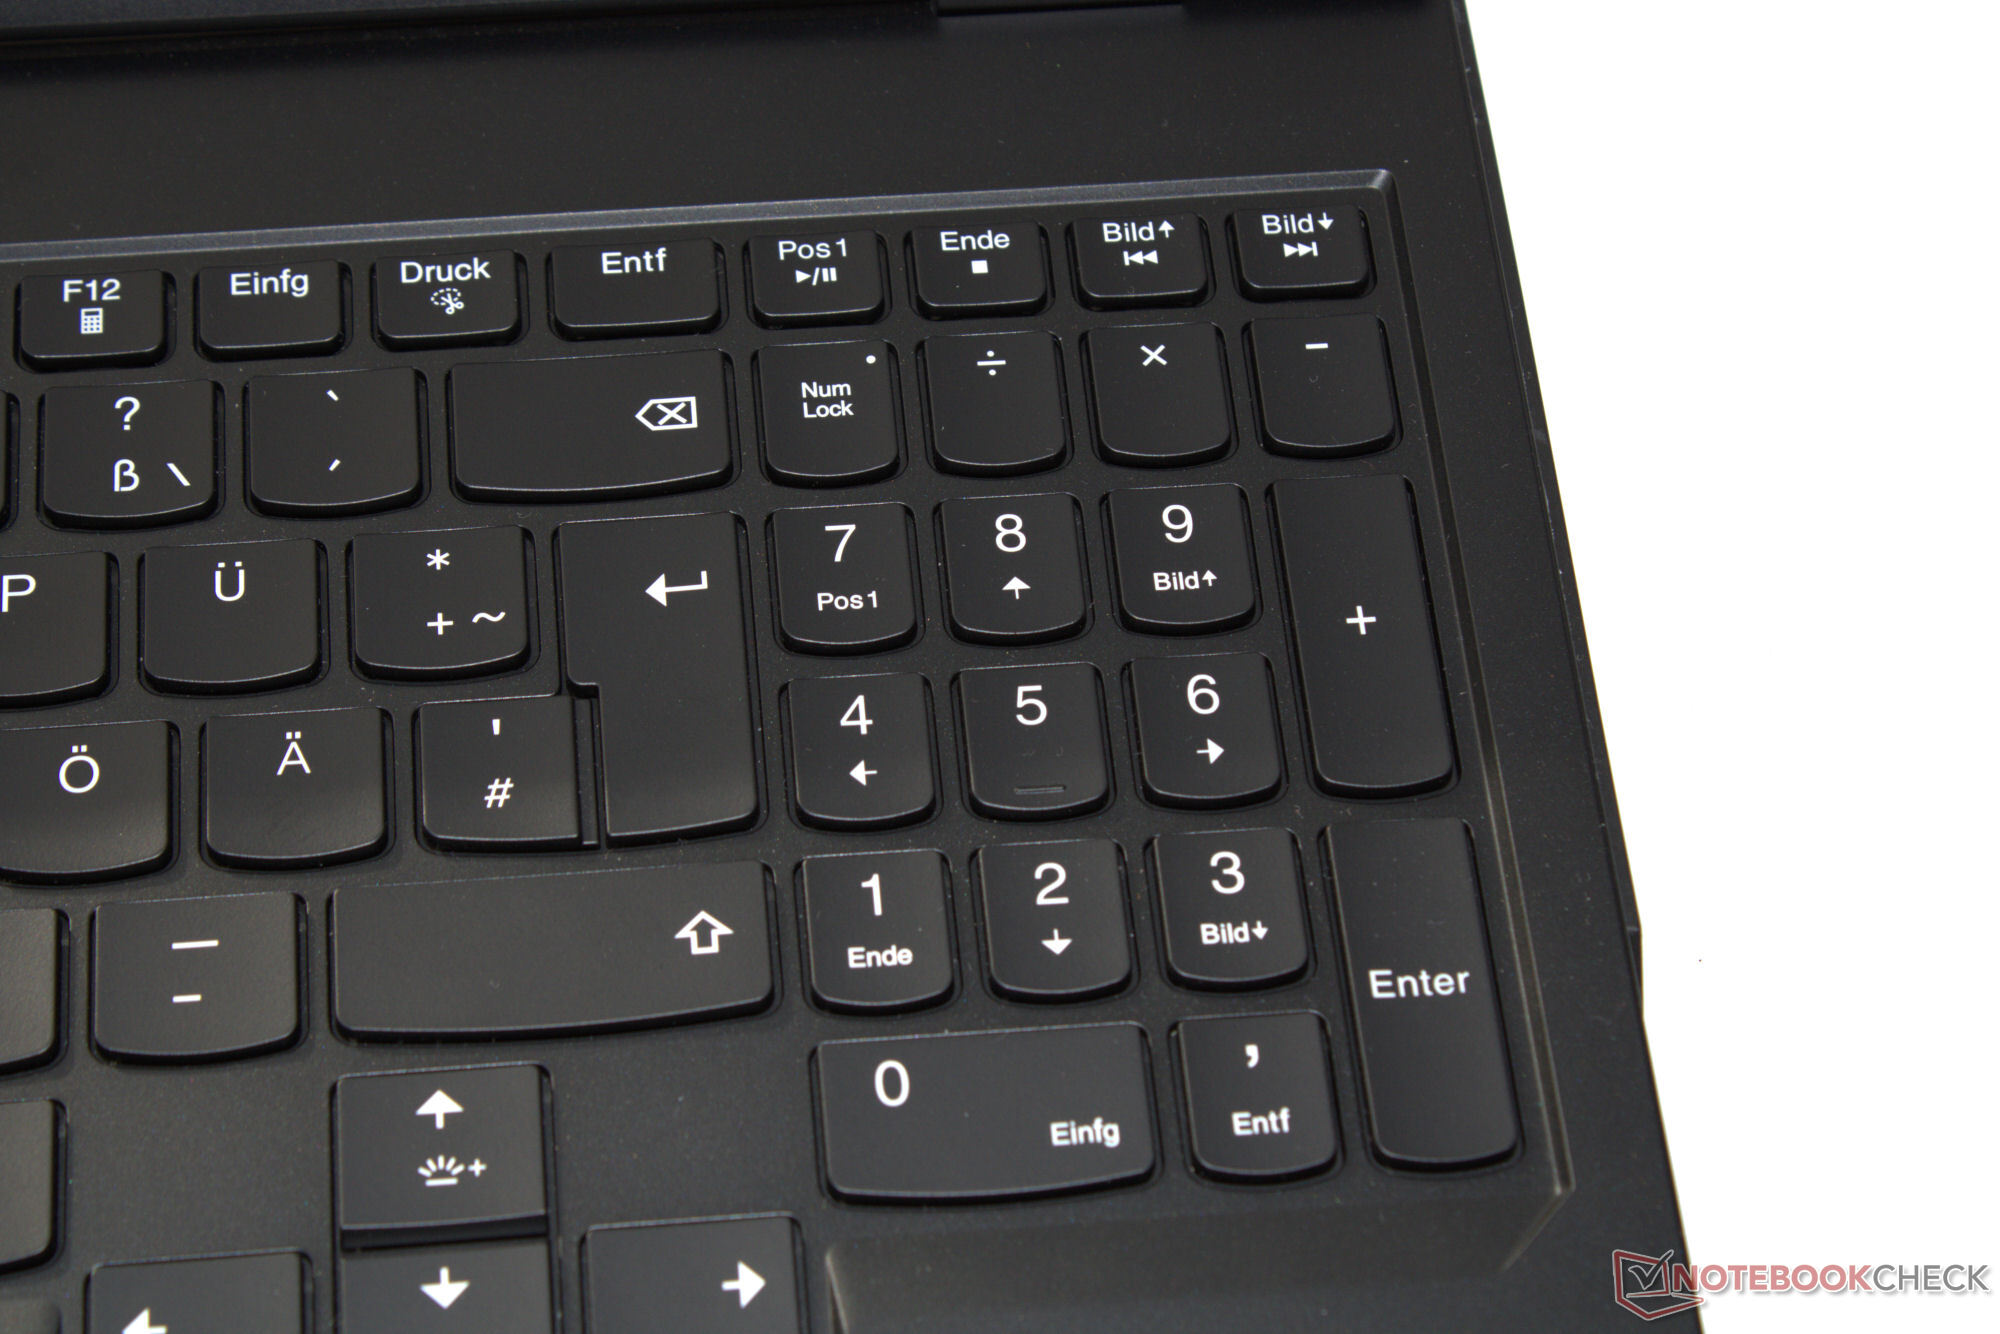
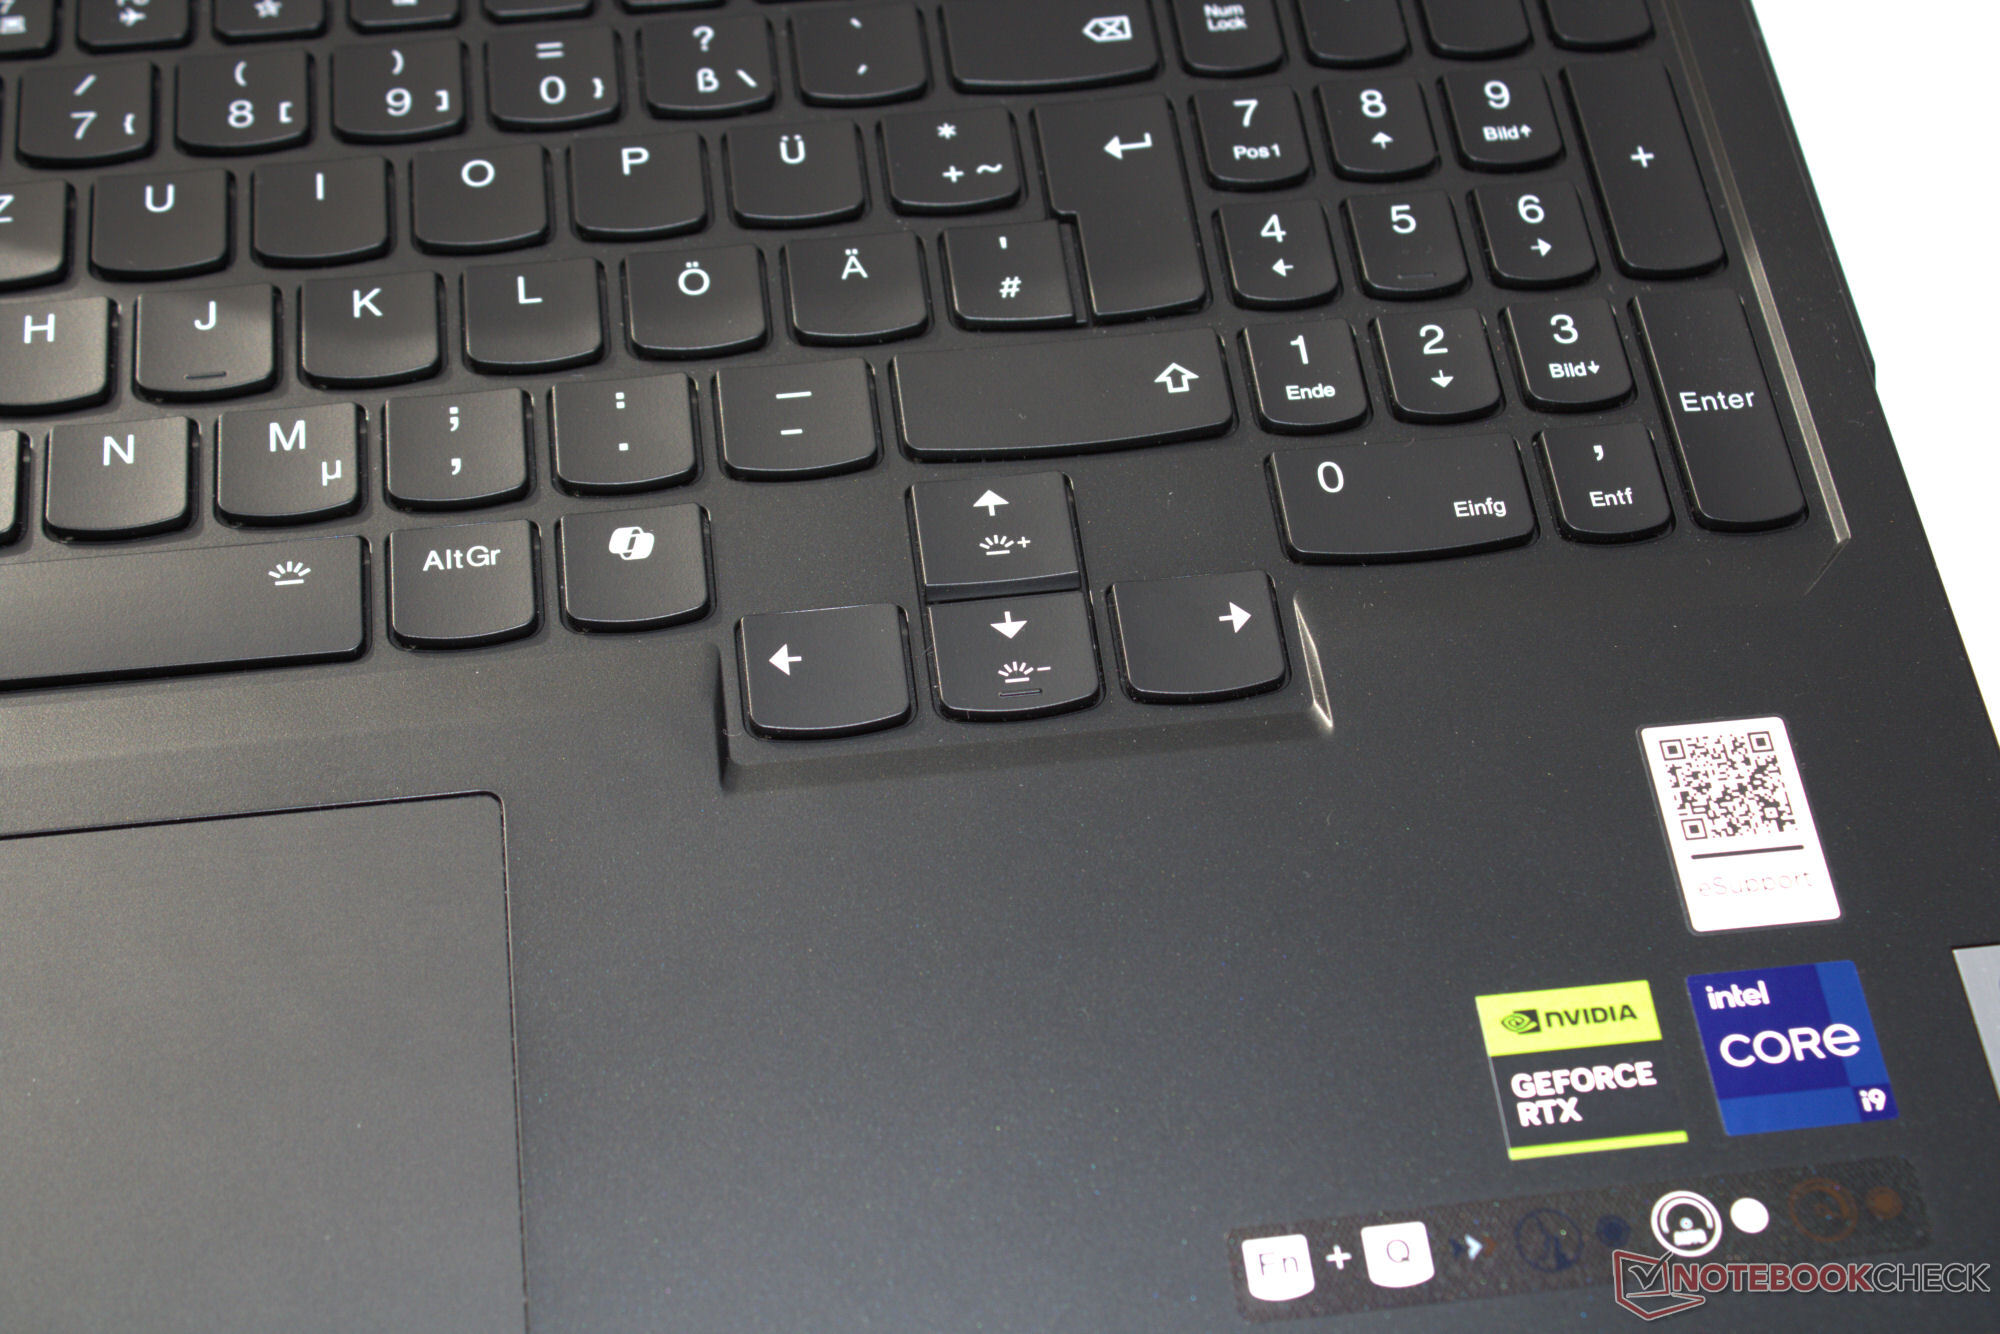


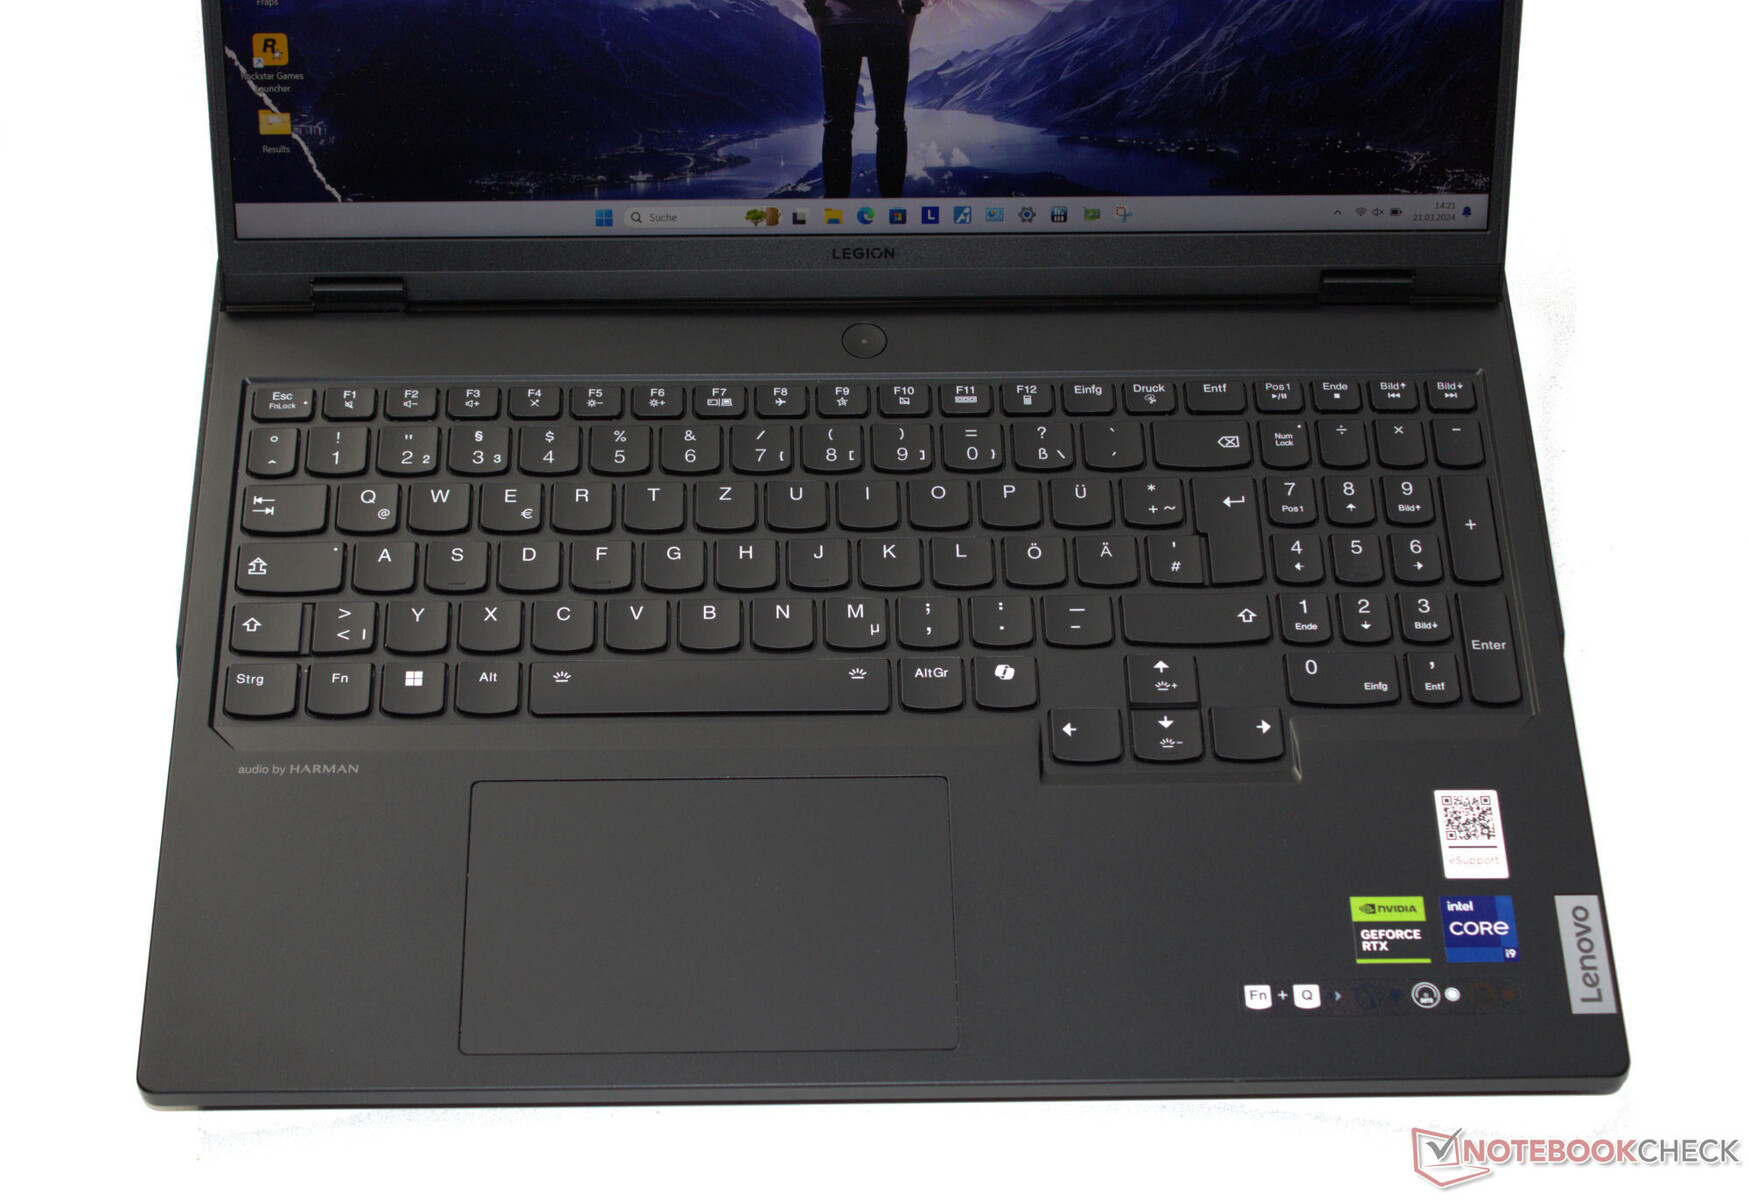
Périphériques d'entrée - Équipé d'un clavier à effleurement
Les touches chiclet concaves avec éclairage RGB par touche ont une résistance agréablement ferme et un point d'actionnement clair. Le clavier fléchit très légèrement lorsque vous tapez, mais cela n'affecte pas l'expérience de la frappe. Les touches fléchées sont de taille normale. Pour le contrôle de la souris, l'ordinateur portable est équipé d'un pavé tactile multitouch (mesurant environ 12 x 7,5 cm) avec une course courte et un point de clic distinct.
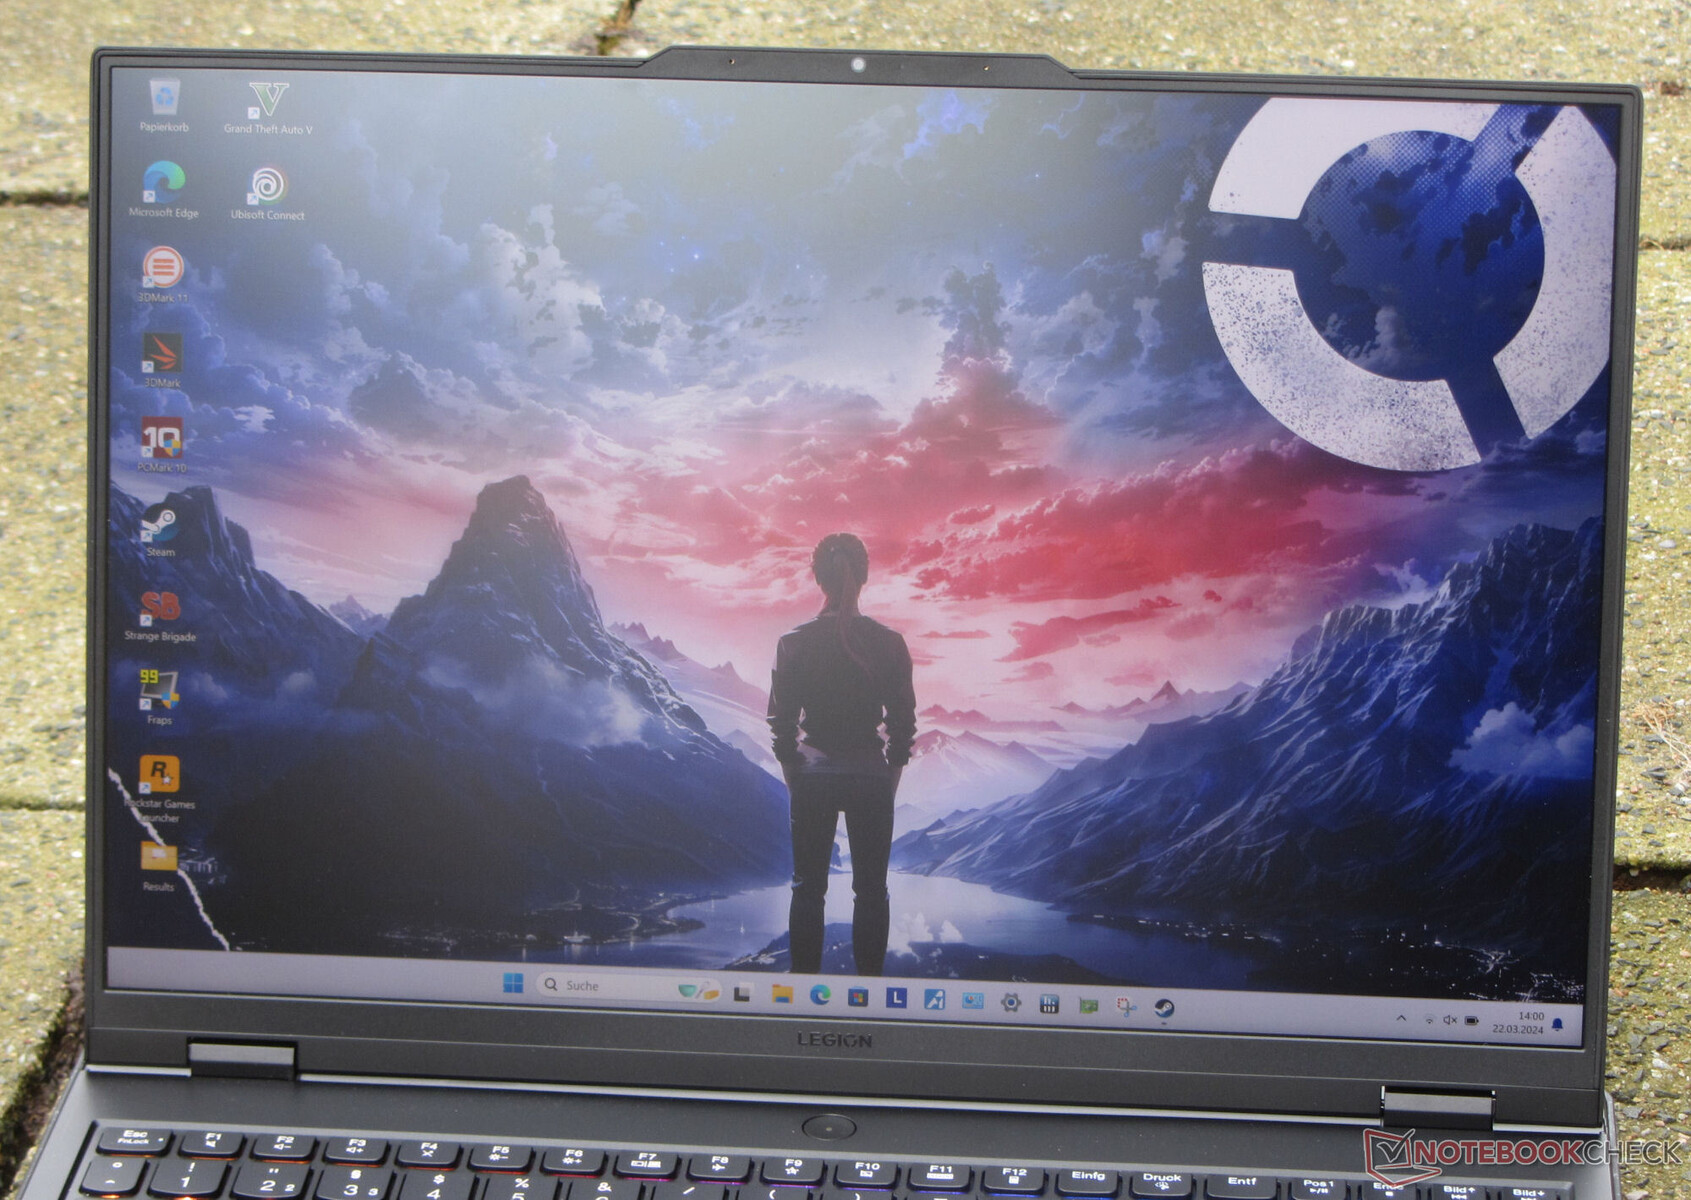
Affichage - 16:10, DCI-P3, Dolby Vision
L'écran IPS mat de 16 pouces (résolution 2 560 x 1 600) au format 16:10 est compatible avec G-Sync, Dolby Vision, un temps de réponse rapide et l'absence de scintillement PWM. La luminosité et le contraste de l'écran 240 Hz atteignent également des niveaux qui peuvent être considérés comme bons (> 300 cd/m² et 1 000:1 respectivement). Lenovo ne propose pas d'autres options d'affichage.
| |||||||||||||||||||||||||
Homogénéité de la luminosité: 88 %
Valeur mesurée au centre, sur batterie: 487 cd/m²
Contraste: 1160:1 (Valeurs des noirs: 0.42 cd/m²)
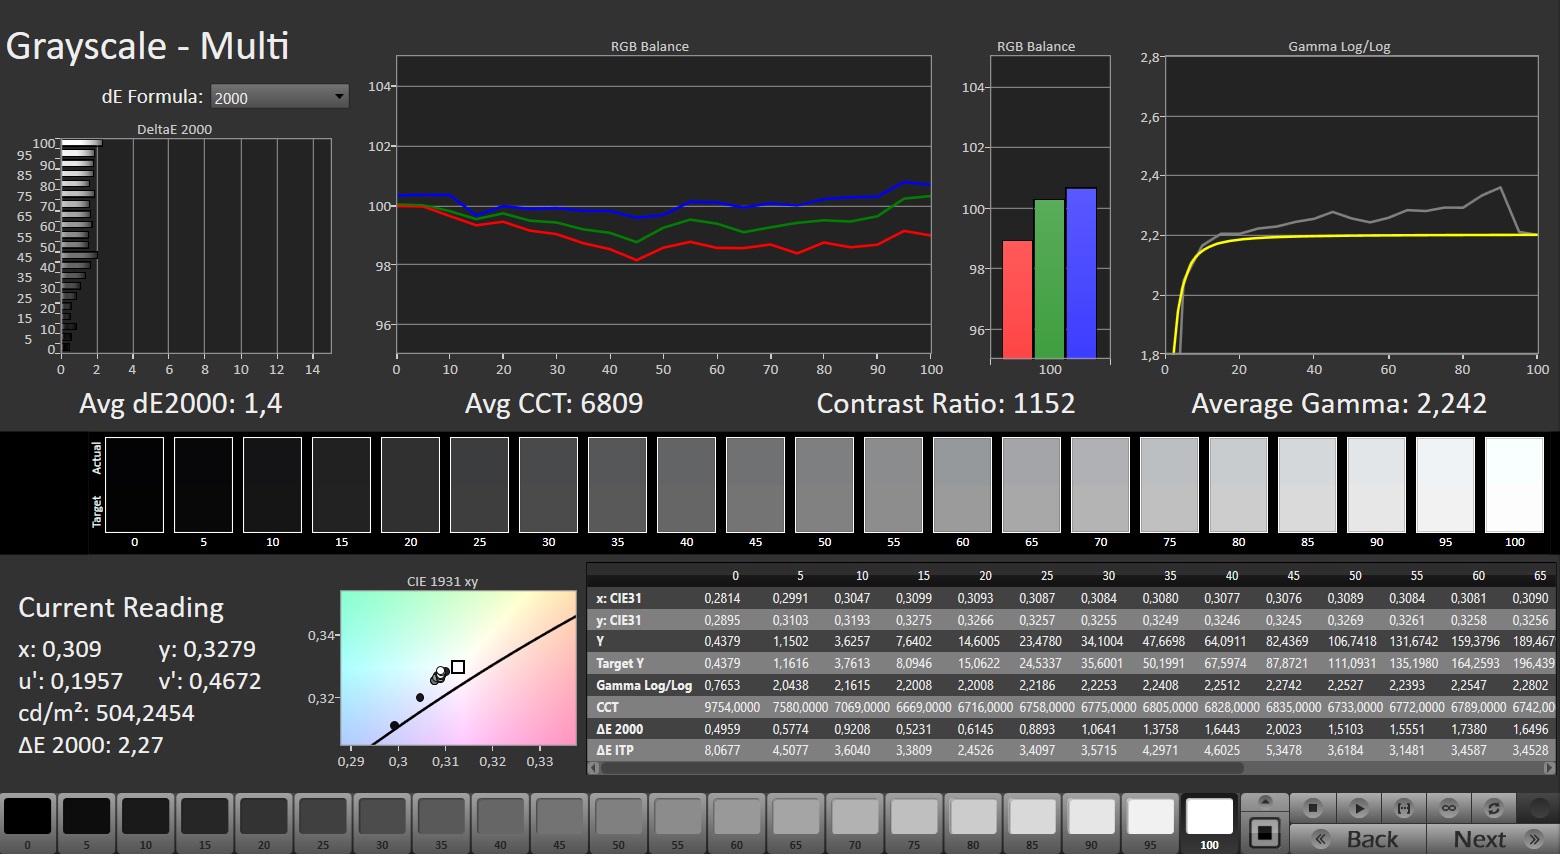
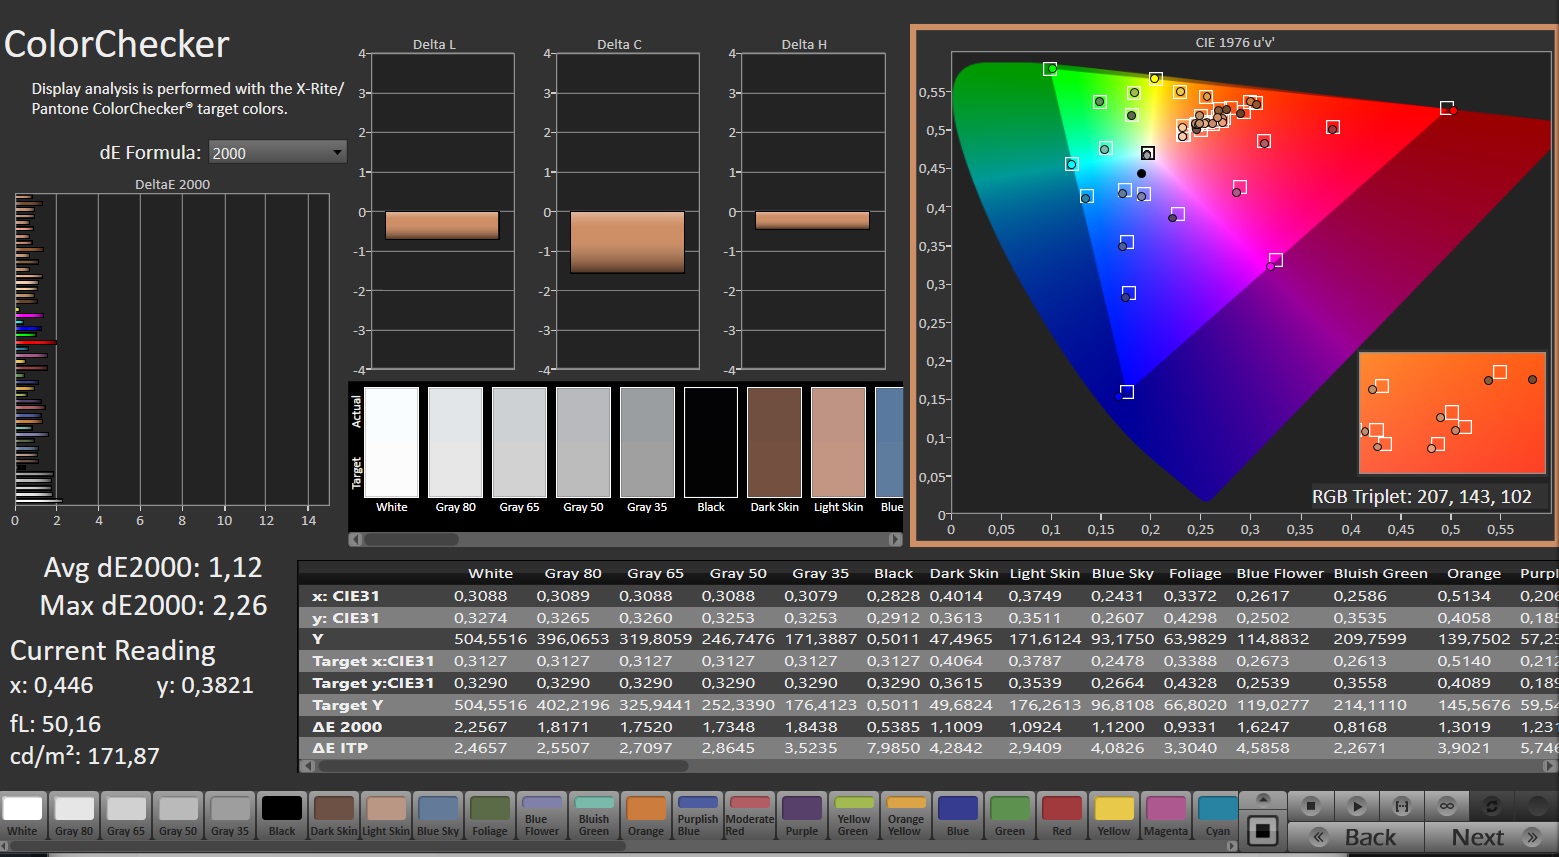
ΔE ColorChecker Calman: 1.12 | ∀{0.5-29.43 Ø4.76}
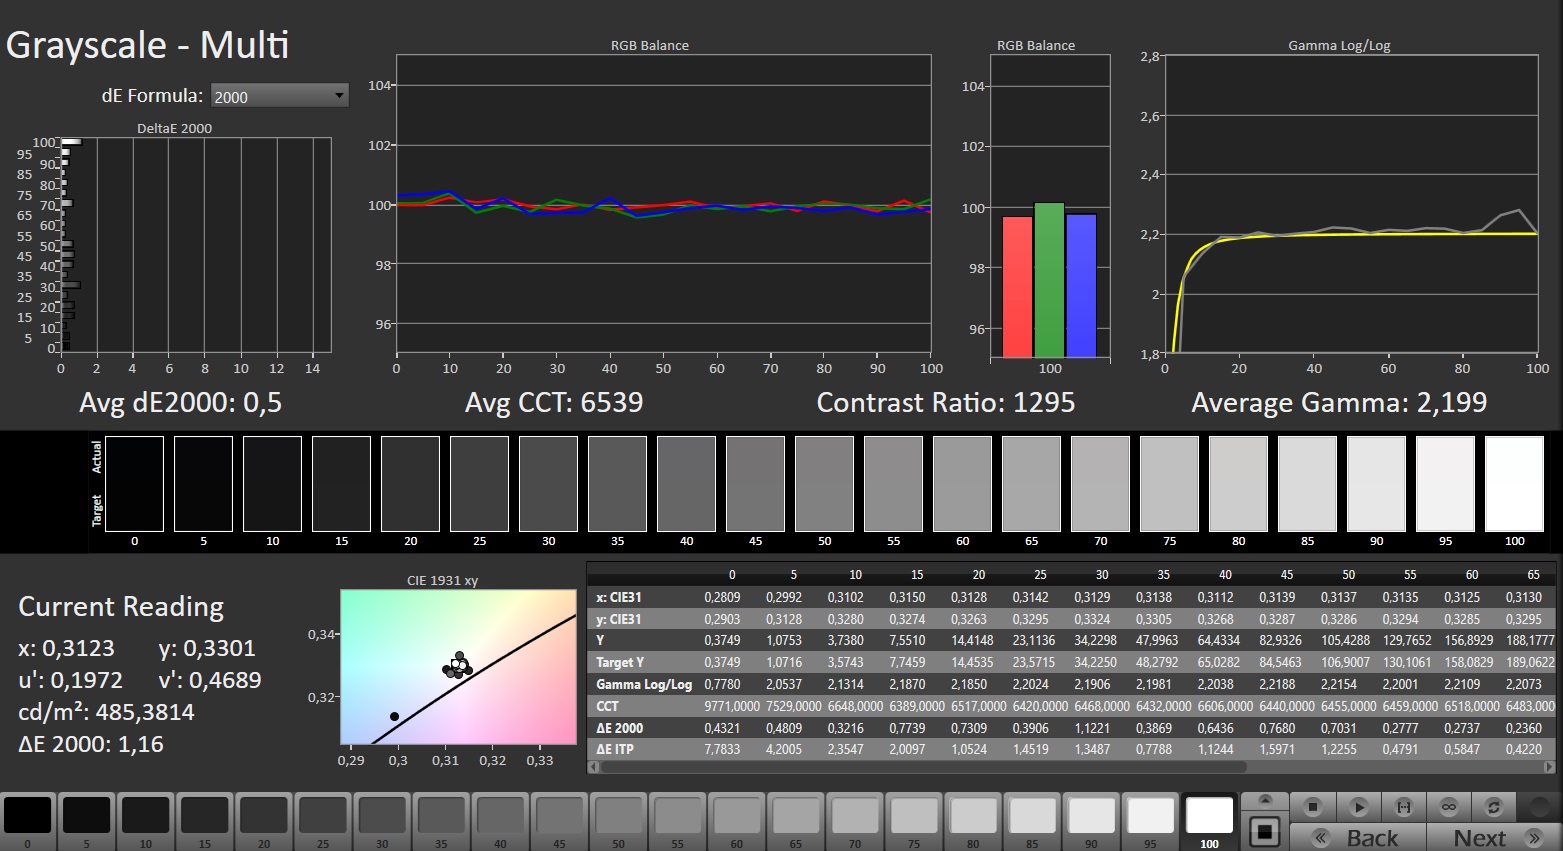
calibrated: 0.54
ΔE Greyscale Calman: 1.4 | ∀{0.09-98 Ø5}
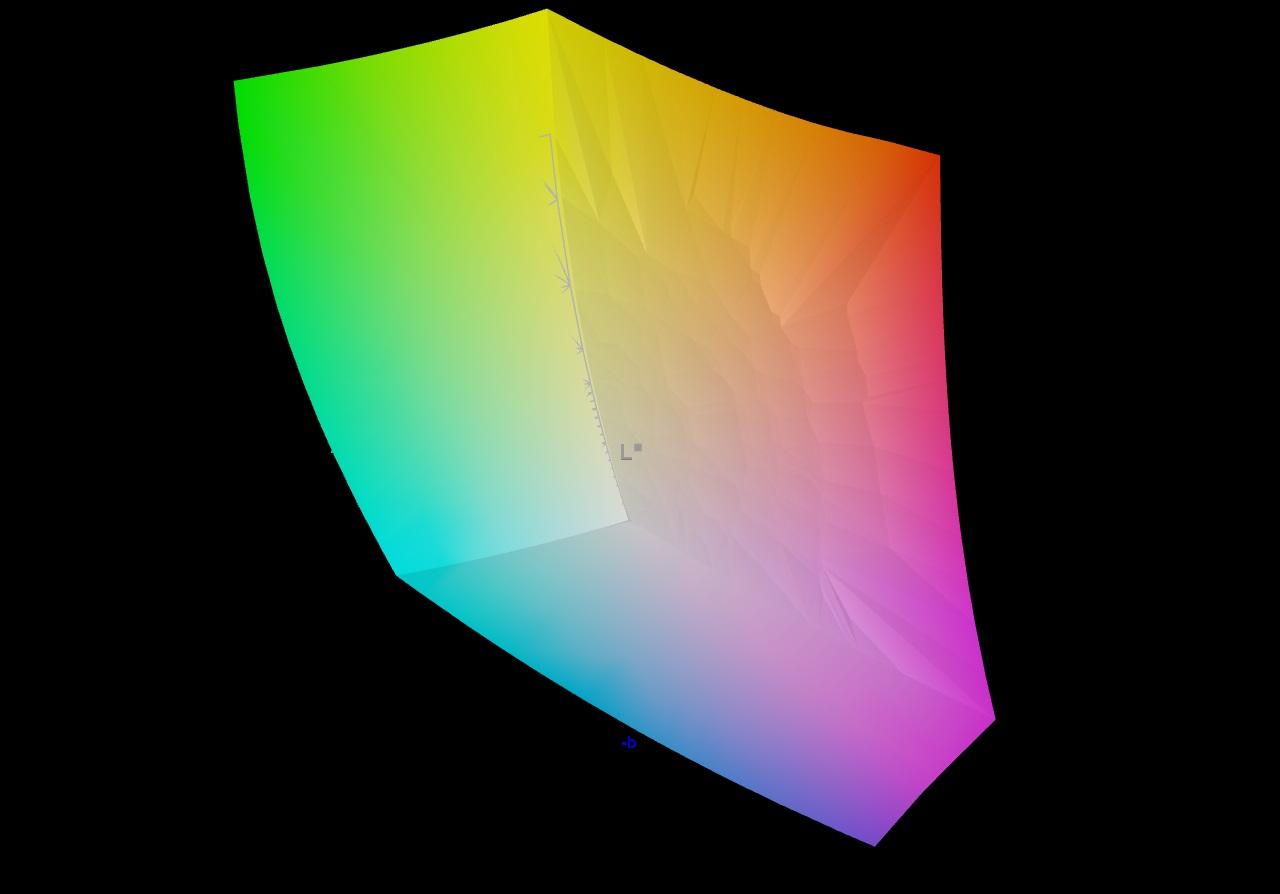
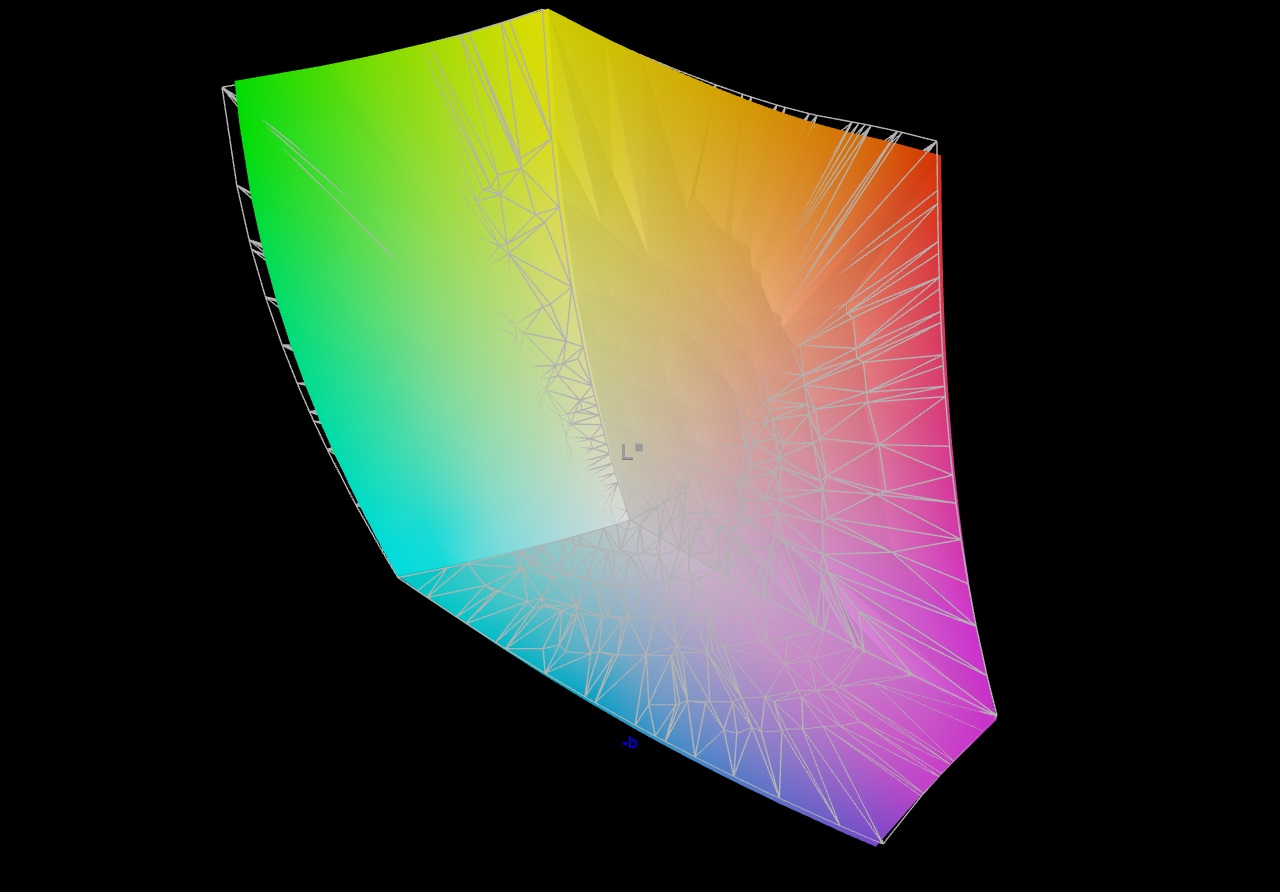
86.7% AdobeRGB 1998 (Argyll 3D)
99.9% sRGB (Argyll 3D)
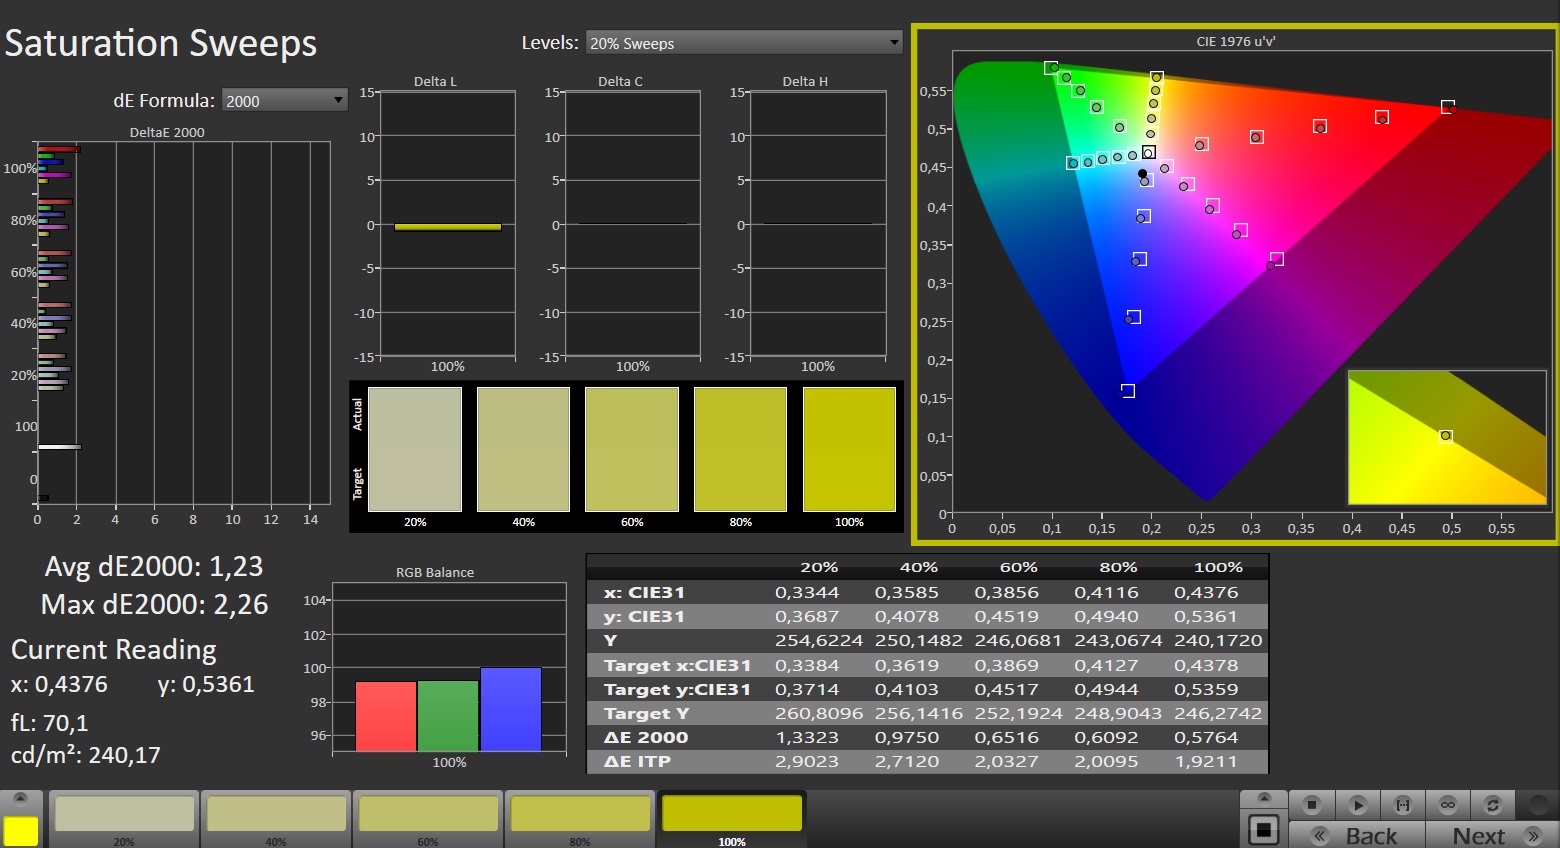
98.5% Display P3 (Argyll 3D)
Gamma: 2.242
CCT: 6809 K
| Lenovo Legion Pro 7 16IRX9H BOE CQ NE16QDM-NZB, IPS, 2560x1600, 16" | Alienware m16 R1 AMD BOE NE16NZ4, IPS, 2560x1600, 16" | MSI Vector 16 HX A14V Chi Mei N160GME-GTB, IPS, 2560x1600, 16" | HP Omen 16 (2024) BOE BOE0B7D, IPS, 2560x1440, 16.1" | Lenovo Legion Pro 7 16IRX8H MNG007DA2-3 (CSO1628), IPS, 2560x1600, 16" | |
|---|---|---|---|---|---|
| Display | 1% | -1% | -17% | -16% | |
| Display P3 Coverage (%) | 98.5 | 98.6 0% | 95.4 -3% | 68.6 -30% | 69.1 -30% |
| sRGB Coverage (%) | 99.9 | 99.9 0% | 99.7 0% | 98.6 -1% | 99.7 0% |
| AdobeRGB 1998 Coverage (%) | 86.7 | 88.9 3% | 85.4 -1% | 70.6 -19% | 71.2 -18% |
| Response Times | 3% | -21% | -36% | 0% | |
| Response Time Grey 50% / Grey 80% * (ms) | 12.6 ? | 5.1 ? 60% | 5.7 ? 55% | 14.1 ? -12% | 12.3 ? 2% |
| Response Time Black / White * (ms) | 5.8 ? | 9 ? -55% | 11.4 ? -97% | 9.3 ? -60% | 5.9 ? -2% |
| PWM Frequency (Hz) | |||||
| Screen | -109% | -73% | -46% | 3% | |
| Brightness middle (cd/m²) | 487 | 329 -32% | 557.2 14% | 292 -40% | 511 5% |
| Brightness (cd/m²) | 460 | 317 -31% | 506 10% | 291 -37% | 469 2% |
| Brightness Distribution (%) | 88 | 89 1% | 83 -6% | 85 -3% | 86 -2% |
| Black Level * (cd/m²) | 0.42 | 0.32 24% | 0.41 2% | 0.24 43% | 0.4 5% |
| Contrast (:1) | 1160 | 1028 -11% | 1359 17% | 1217 5% | 1278 10% |
| Colorchecker dE 2000 * | 1.12 | 3.71 -231% | 2.91 -160% | 2.36 -111% | 0.95 15% |
| Colorchecker dE 2000 max. * | 2.26 | 7.23 -220% | 5.94 -163% | 4.08 -81% | 2.07 8% |
| Colorchecker dE 2000 calibrated * | 0.54 | 2.82 -422% | 1.63 -202% | 0.93 -72% | 0.91 -69% |
| Greyscale dE 2000 * | 1.4 | 2.2 -57% | 3.8 -171% | 3 -114% | 0.6 57% |
| Gamma | 2.242 98% | 2.3 96% | 2.23 99% | 2.101 105% | 2.176 101% |
| CCT | 6809 95% | 6270 104% | 6408 101% | 5976 109% | 6545 99% |
| Moyenne finale (programmes/paramètres) | -35% /
-69% | -32% /
-50% | -33% /
-38% | -4% /
-1% |
* ... Moindre est la valeur, meilleures sont les performances
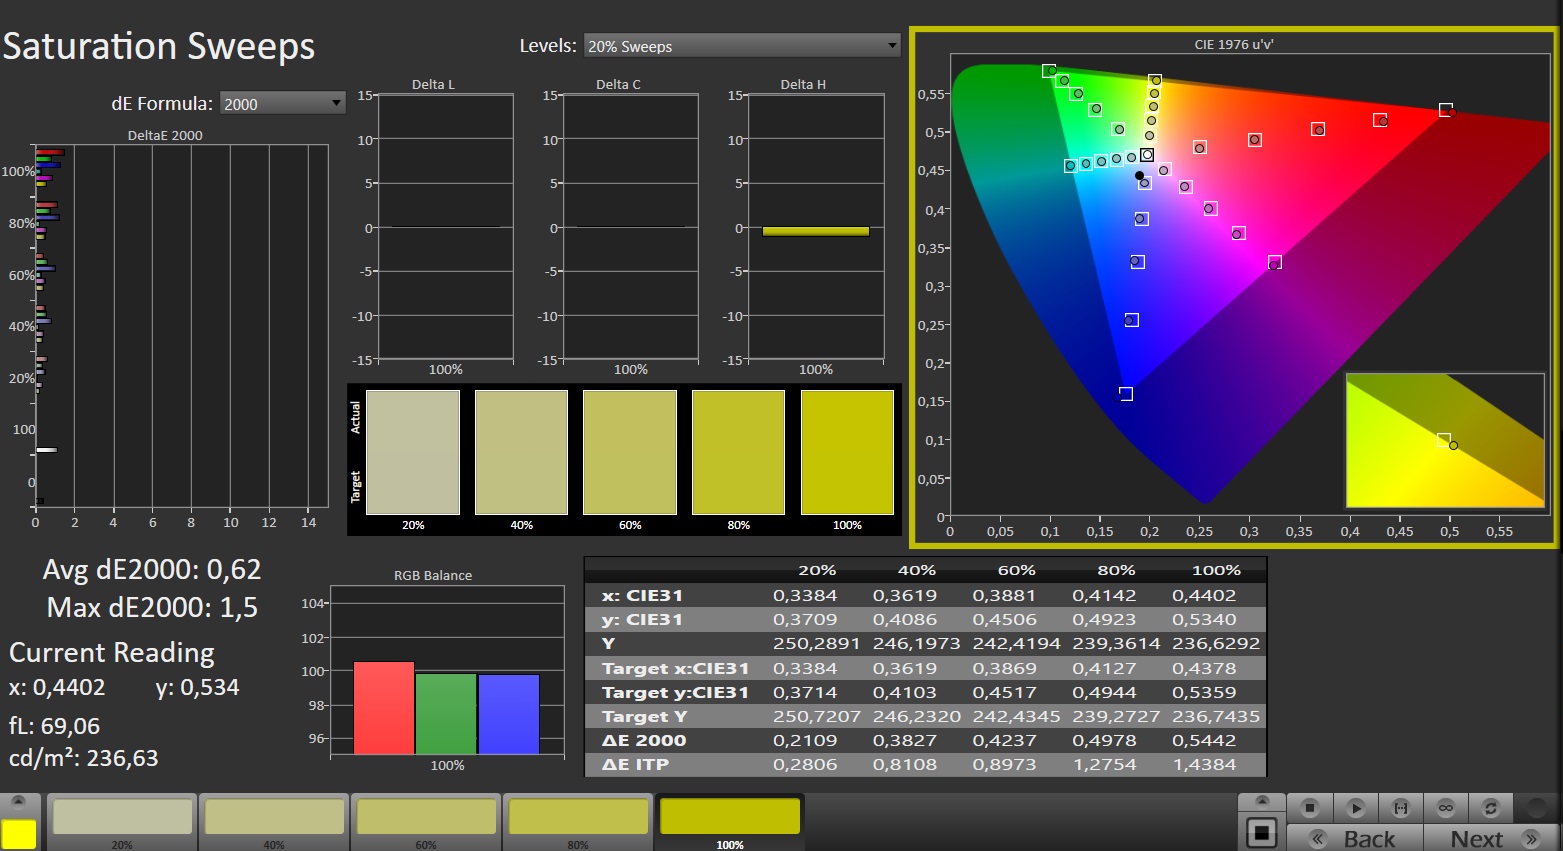
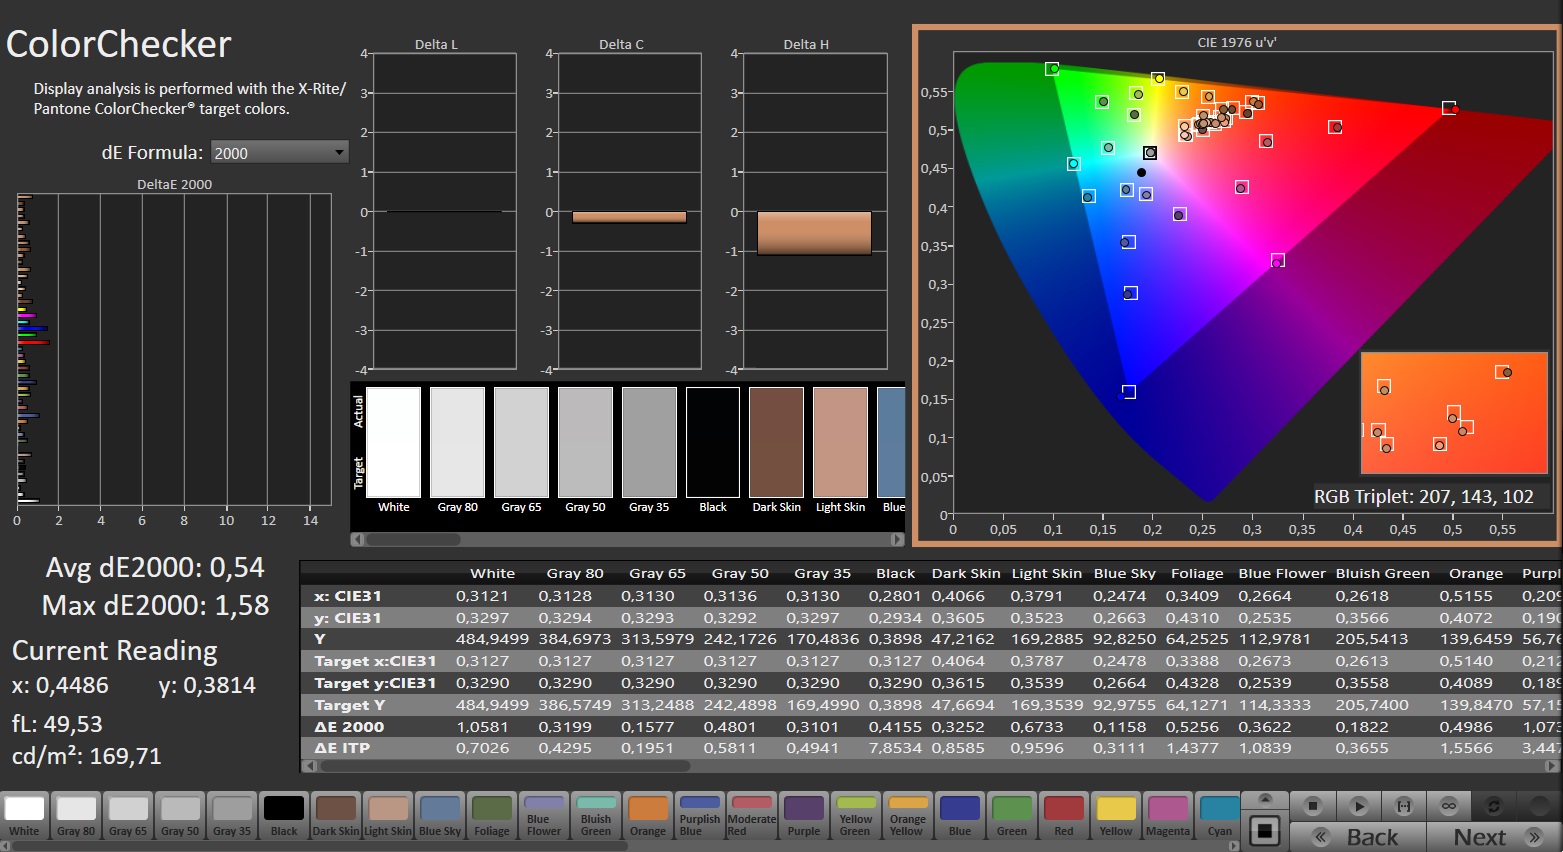
L'écran présentait déjà une reproduction fantastique des couleurs dès sa sortie de l'emballage. Il présentait un Delta E d'environ 1,1, ce qui correspondait au niveau cible de moins de 3. L'étalonnage de l'écran a permis de réduire la différence de couleur moyenne à 0,54 et d'obtenir une échelle de gris plus équilibrée. L'écran est capable de couvrir entièrement les gammes sRGB et DCI-P3, mais pas l'espace colorimétrique AdobeRGB. Ce résultat est similaire à celui offert par les écrans de la plupart des ordinateurs portables concurrents.

Temps de réponse de l'écran
| ↔ Temps de réponse noir à blanc | ||
|---|---|---|
| 5.8 ms ... hausse ↗ et chute ↘ combinées | ↗ 2.1 ms hausse | 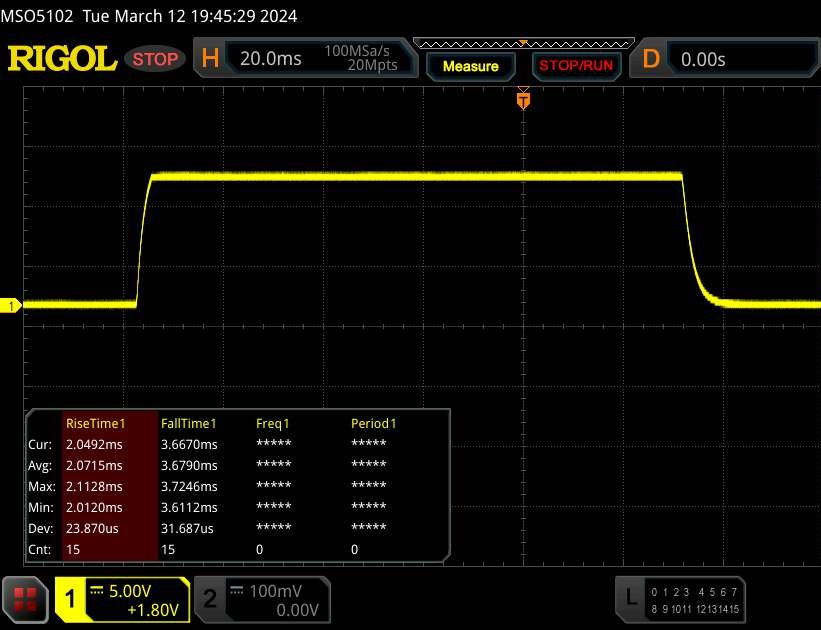 |
| ↘ 3.7 ms chute | ||
| L'écran montre de très faibles temps de réponse, parfait pour le jeu. En comparaison, tous les appareils testés affichent entre 0.1 (minimum) et 240 (maximum) ms. » 17 % des appareils testés affichent de meilleures performances. Cela signifie que les latences relevées sont meilleures que la moyenne (20.1 ms) de tous les appareils testés. | ||
| ↔ Temps de réponse gris 50% à gris 80% | ||
| 12.6 ms ... hausse ↗ et chute ↘ combinées | ↗ 6 ms hausse | 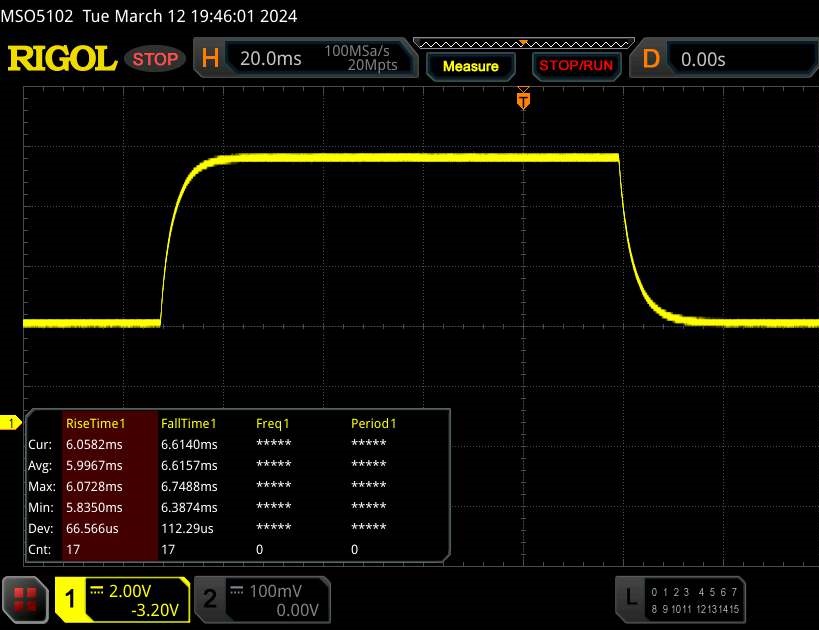 |
| ↘ 6.6 ms chute | ||
| L'écran montre de bons temps de réponse, mais insuffisant pour du jeu compétitif. En comparaison, tous les appareils testés affichent entre 0.165 (minimum) et 636 (maximum) ms. » 25 % des appareils testés affichent de meilleures performances. Cela signifie que les latences relevées sont meilleures que la moyenne (31.4 ms) de tous les appareils testés. | ||
Scintillement / MLI (Modulation de largeur d'impulsion)
| Scintillement / MLI (Modulation de largeur d'impulsion) non décelé | 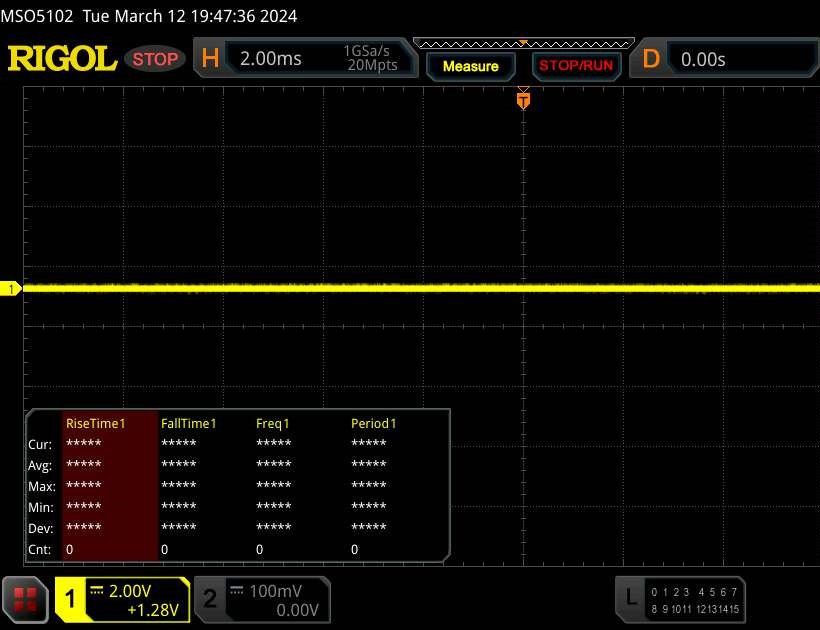 | ||
En comparaison, 53 % des appareils testés n'emploient pas MDI pour assombrir leur écran. Nous avons relevé une moyenne à 8002 (minimum : 5 - maximum : 343500) Hz dans le cas où une MDI était active. | |||
L'écran IPS présente un grand angle de vision et est lisible dans n'importe quelle position. Il est possible d'utiliser l'écran à l'extérieur, à condition que le soleil ne soit pas trop fort.
Leistung - Matériel haut de gamme d'Intel et de Nvidia
Le Lenovo Legion Pro 7 est un ordinateur portable haute performance de 16 pouces conçu pour les joueurs et les créateurs. La puissance de calcul nécessaire est fournie par Raptor Lake et Ada Lovelace. Notre modèle d'évaluation est disponible pour un peu moins de 3 000 € (environ 3 245 $) avec une remise pour les établissements d'enseignement. Aucune autre variante n'est encore disponible au moment de la rédaction de cet article.
Conditions d'essai
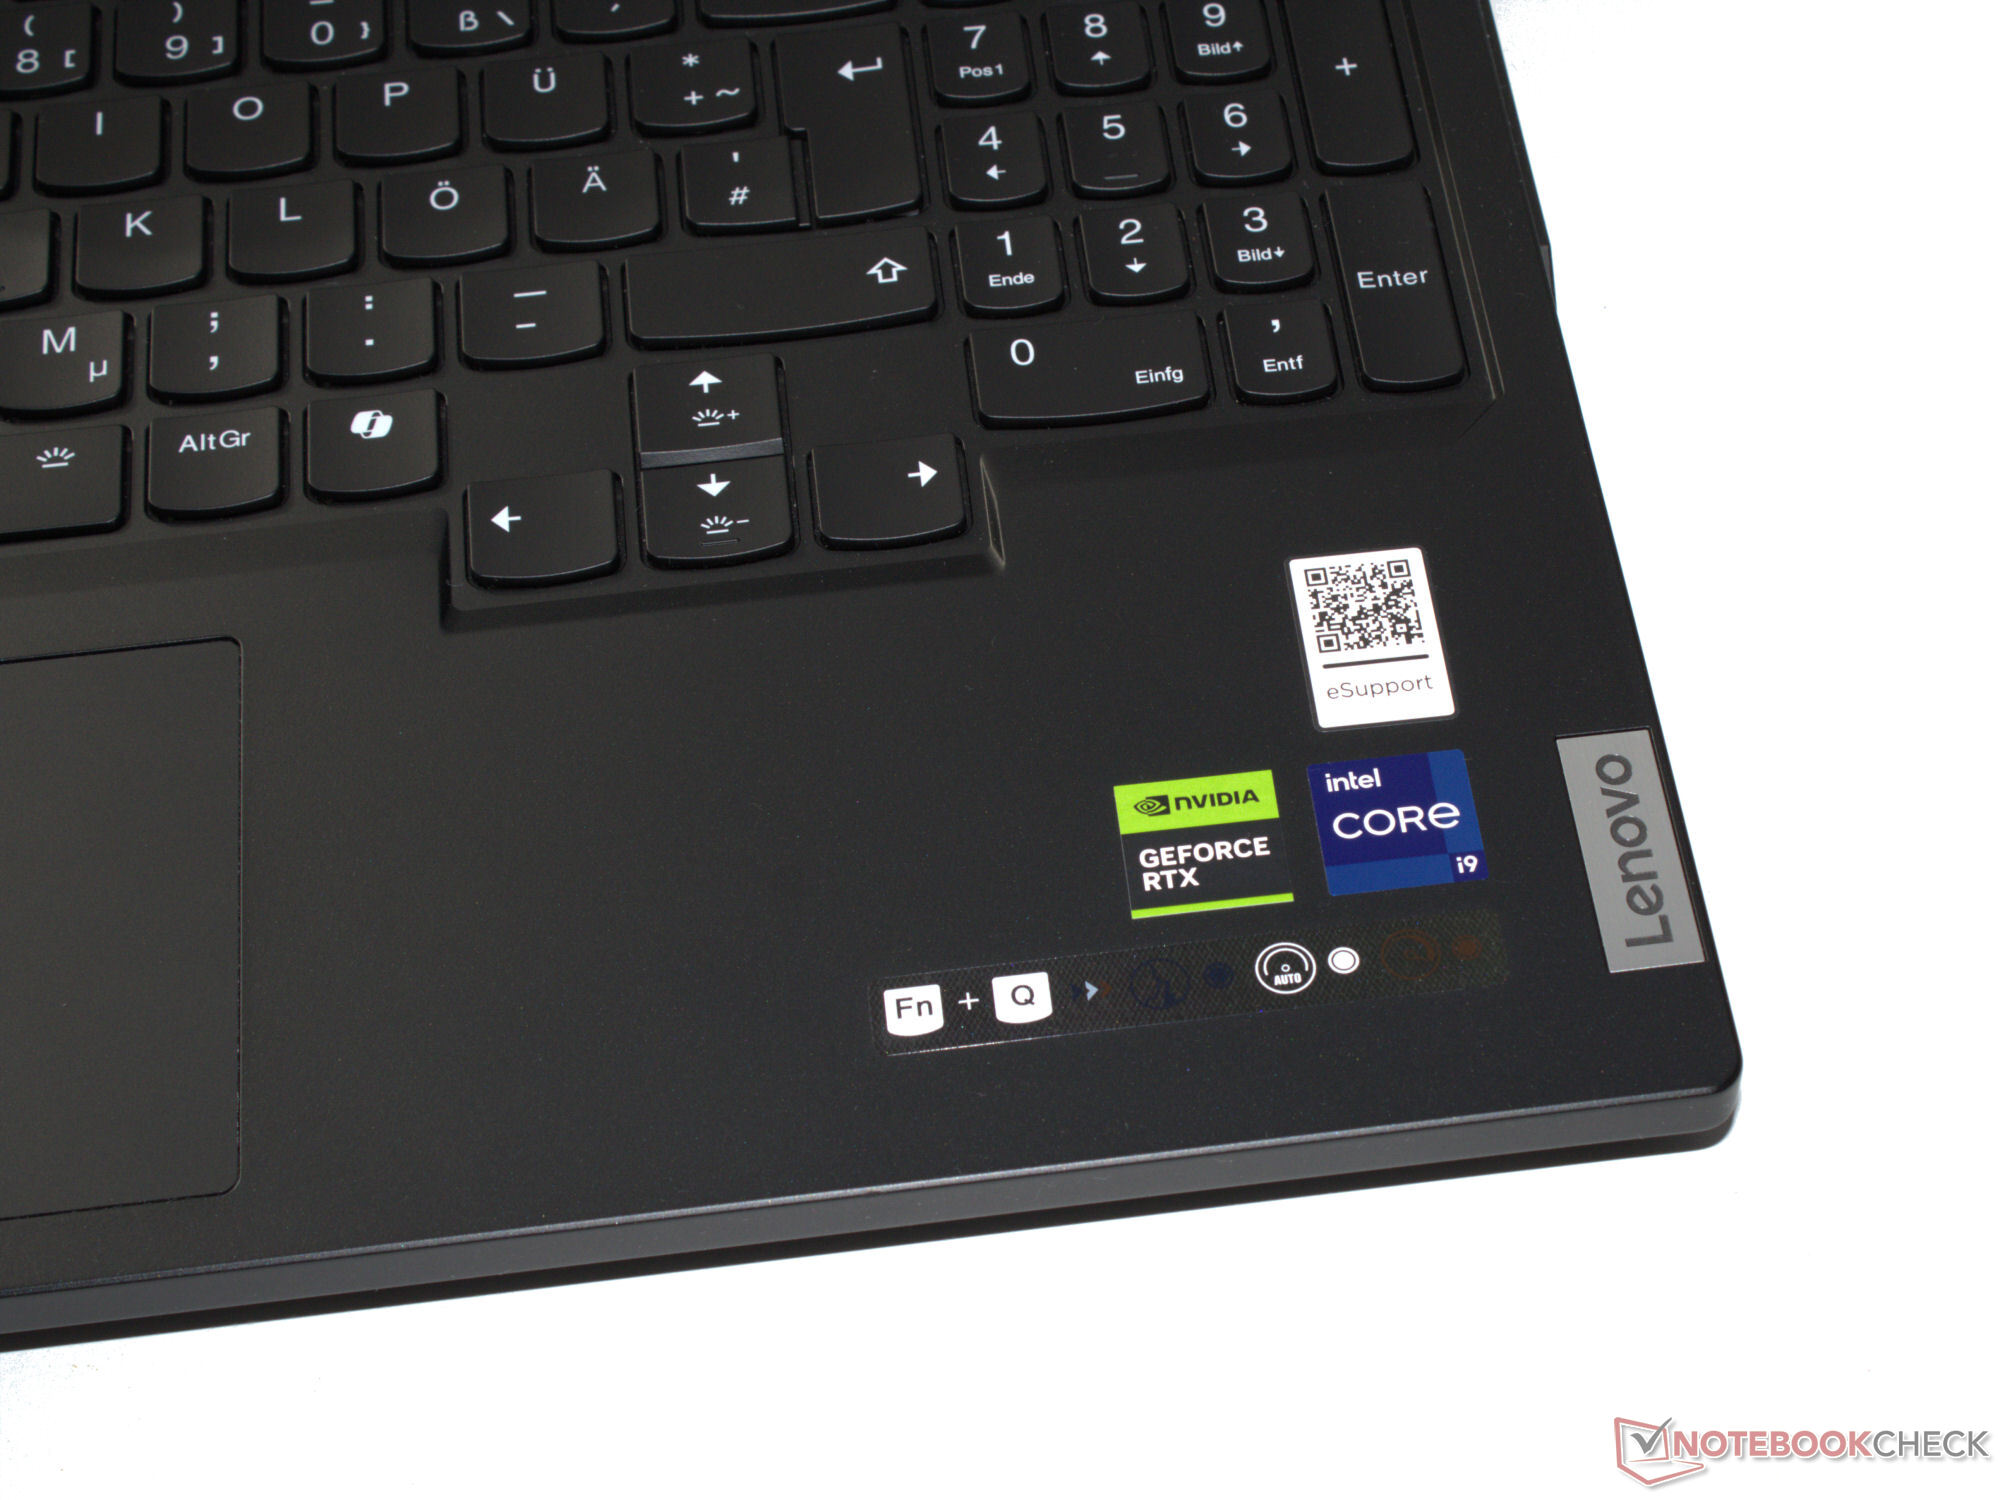
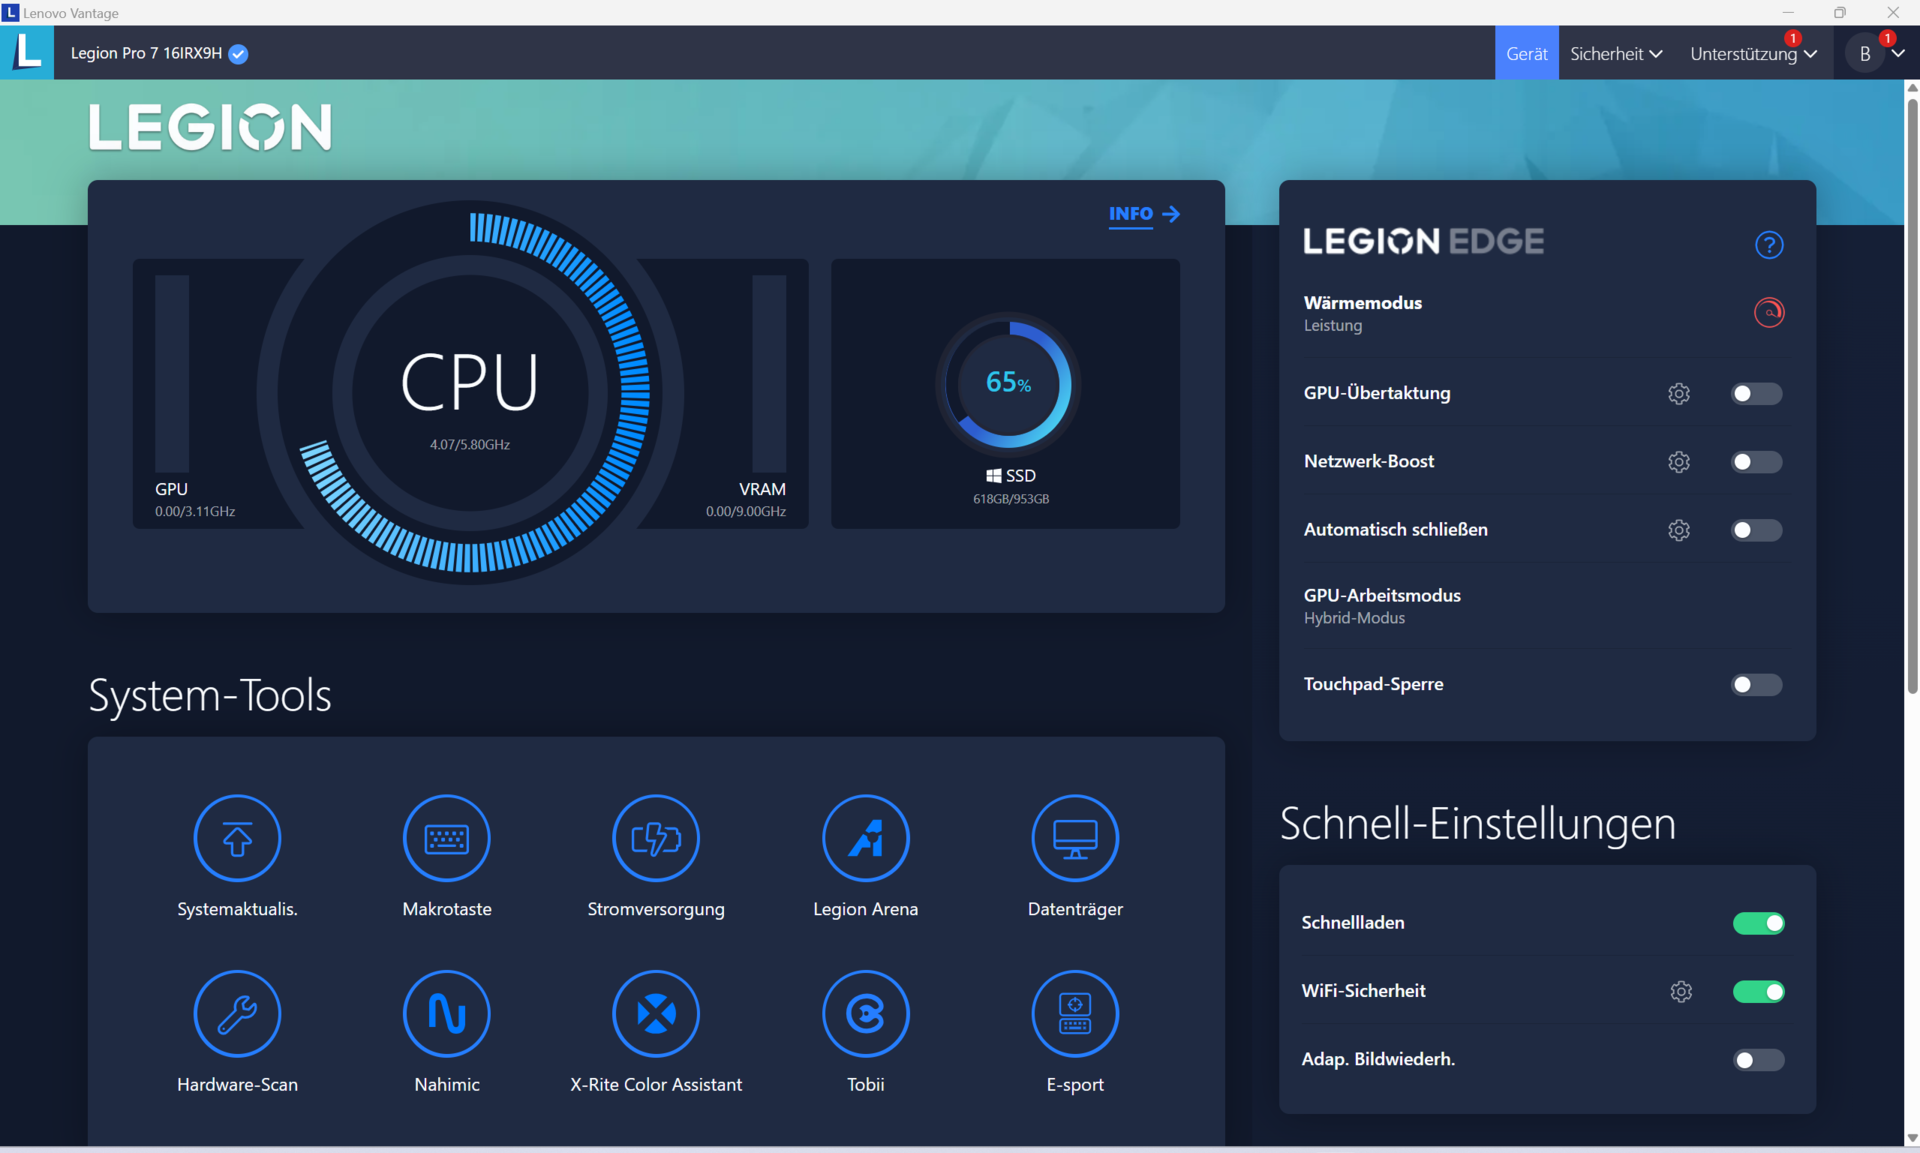
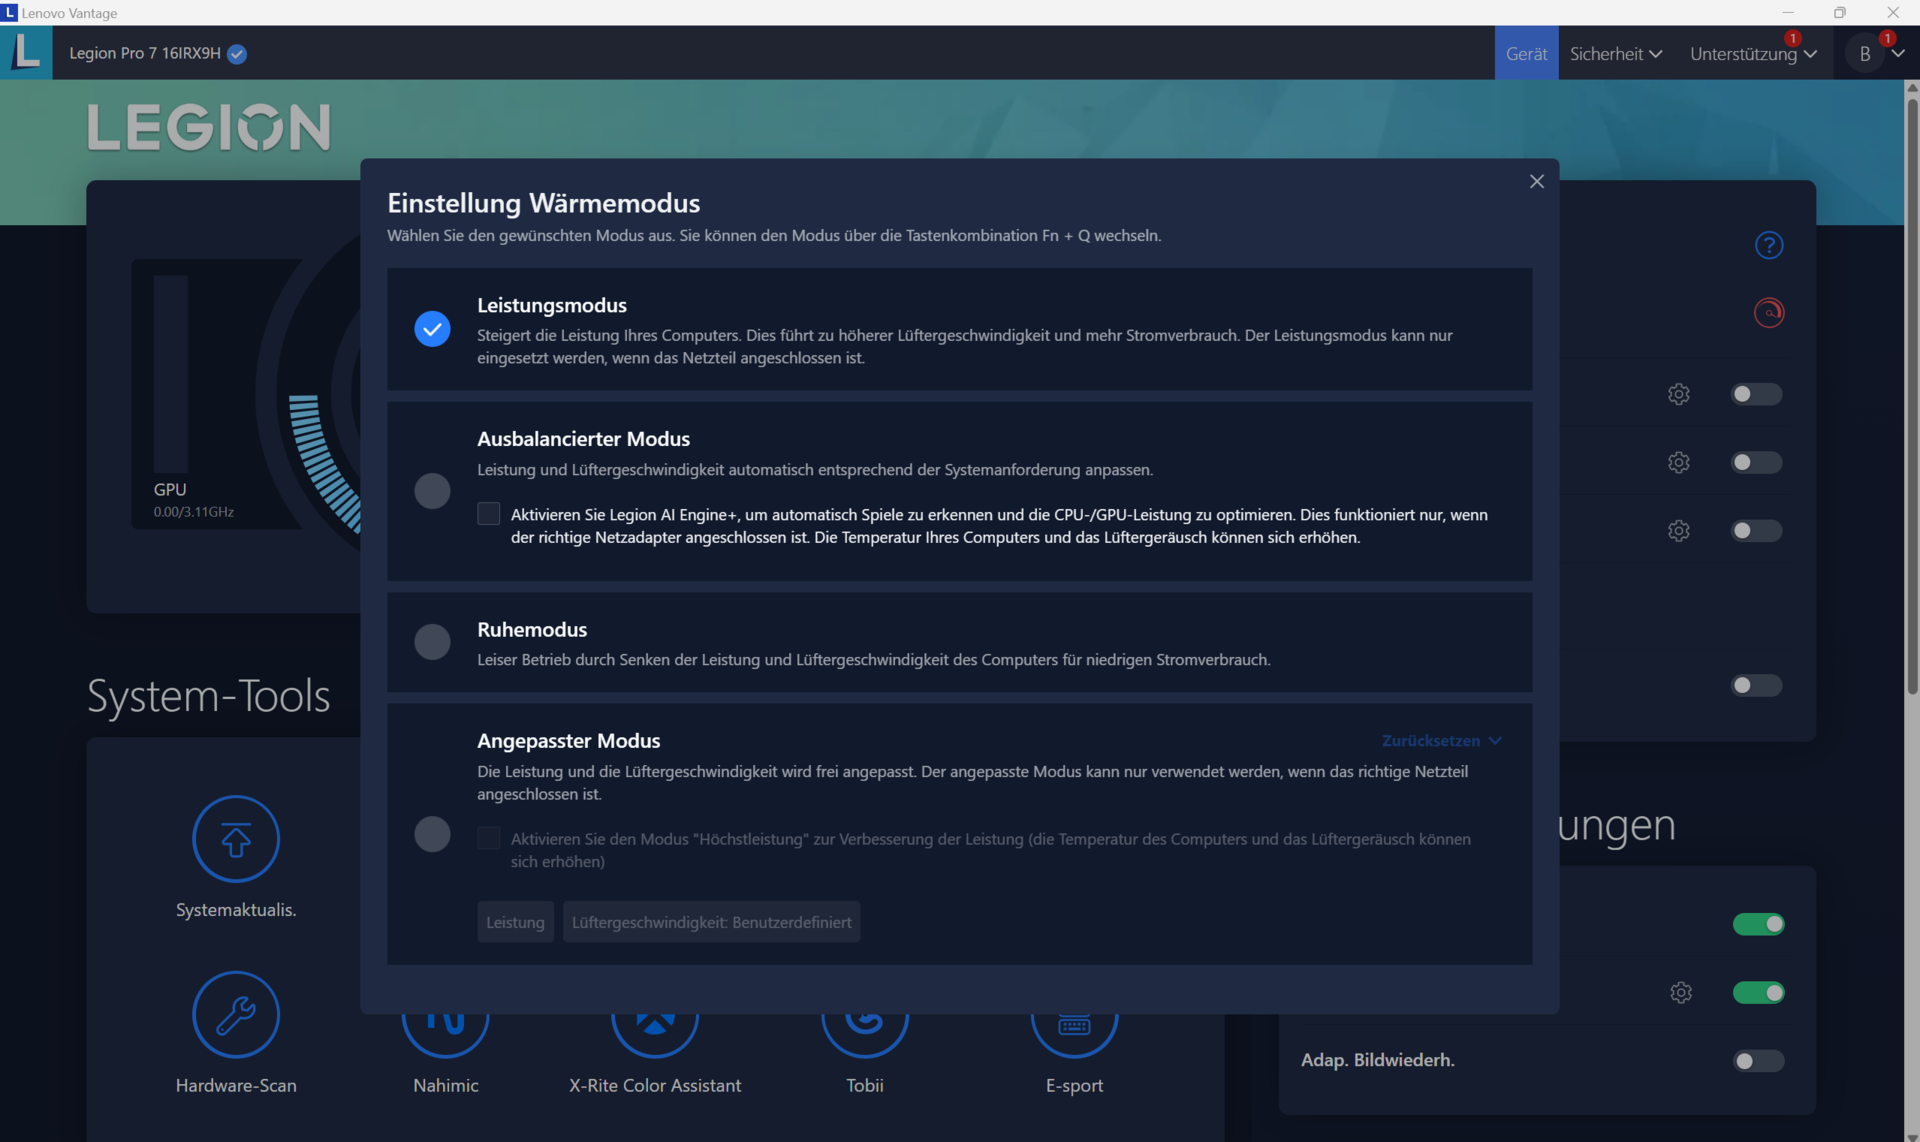
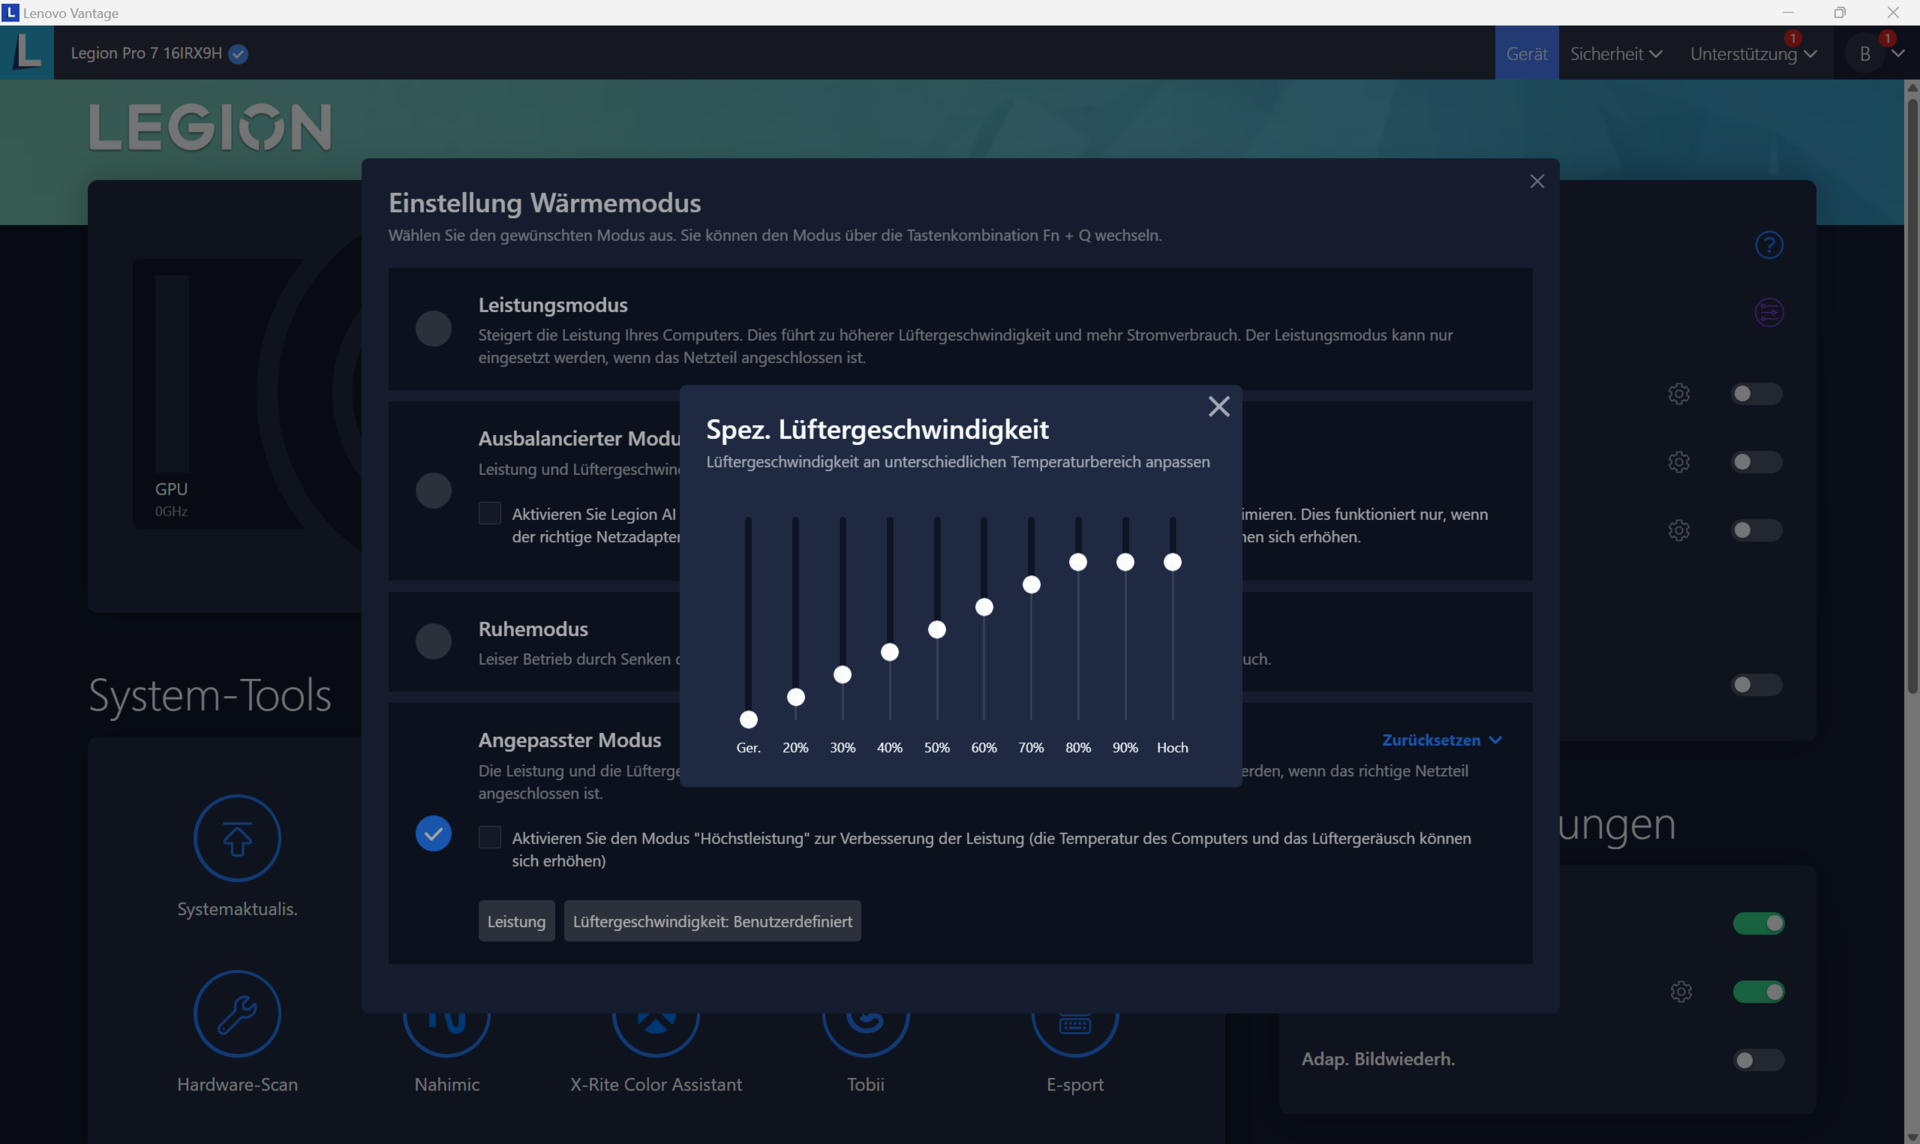
L'ordinateur portable offre trois modes de performance spécifiques au fabricant (voir tableau). Vous pouvez passer de l'un à l'autre en utilisant la combinaison de touches Fn + Q. Nous avons utilisé les modes Performance et Silence pour nos tests de performance et de batterie.
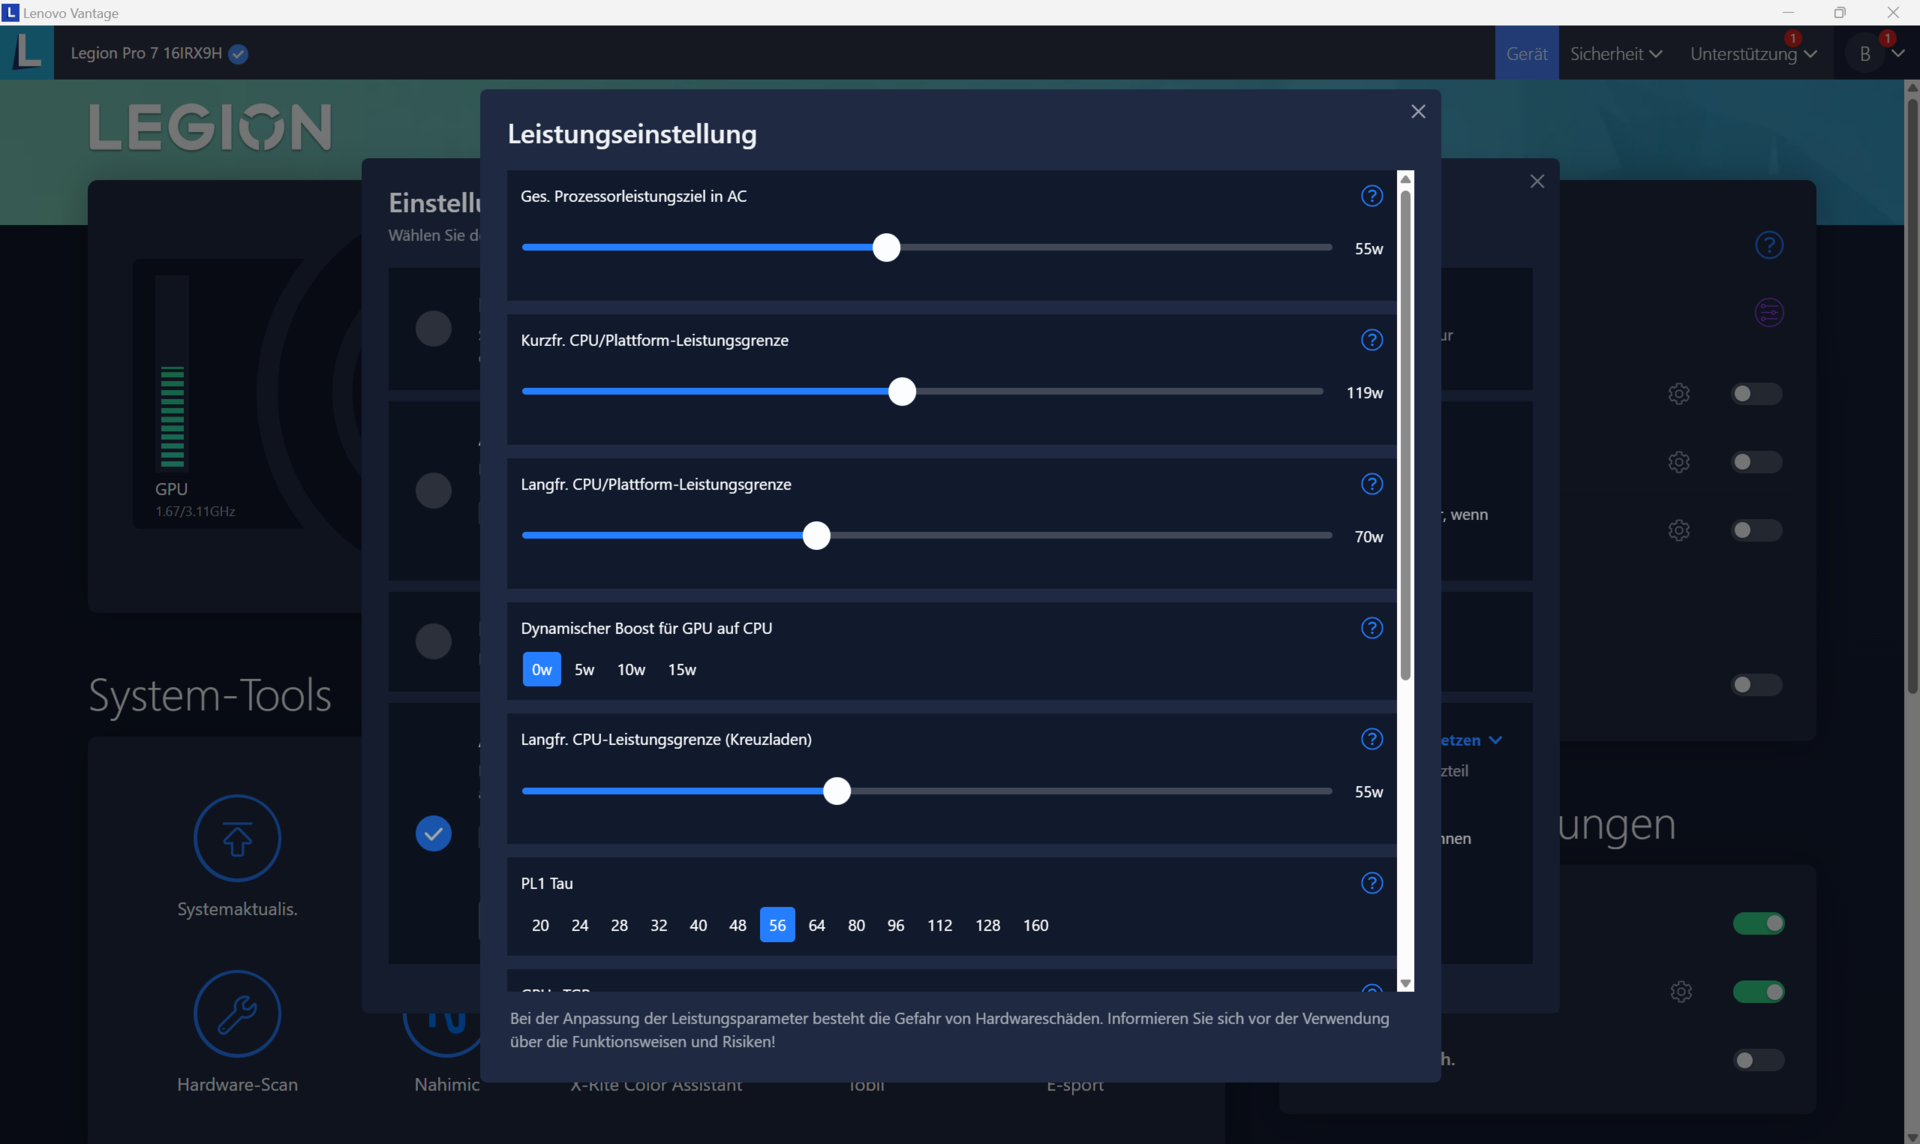
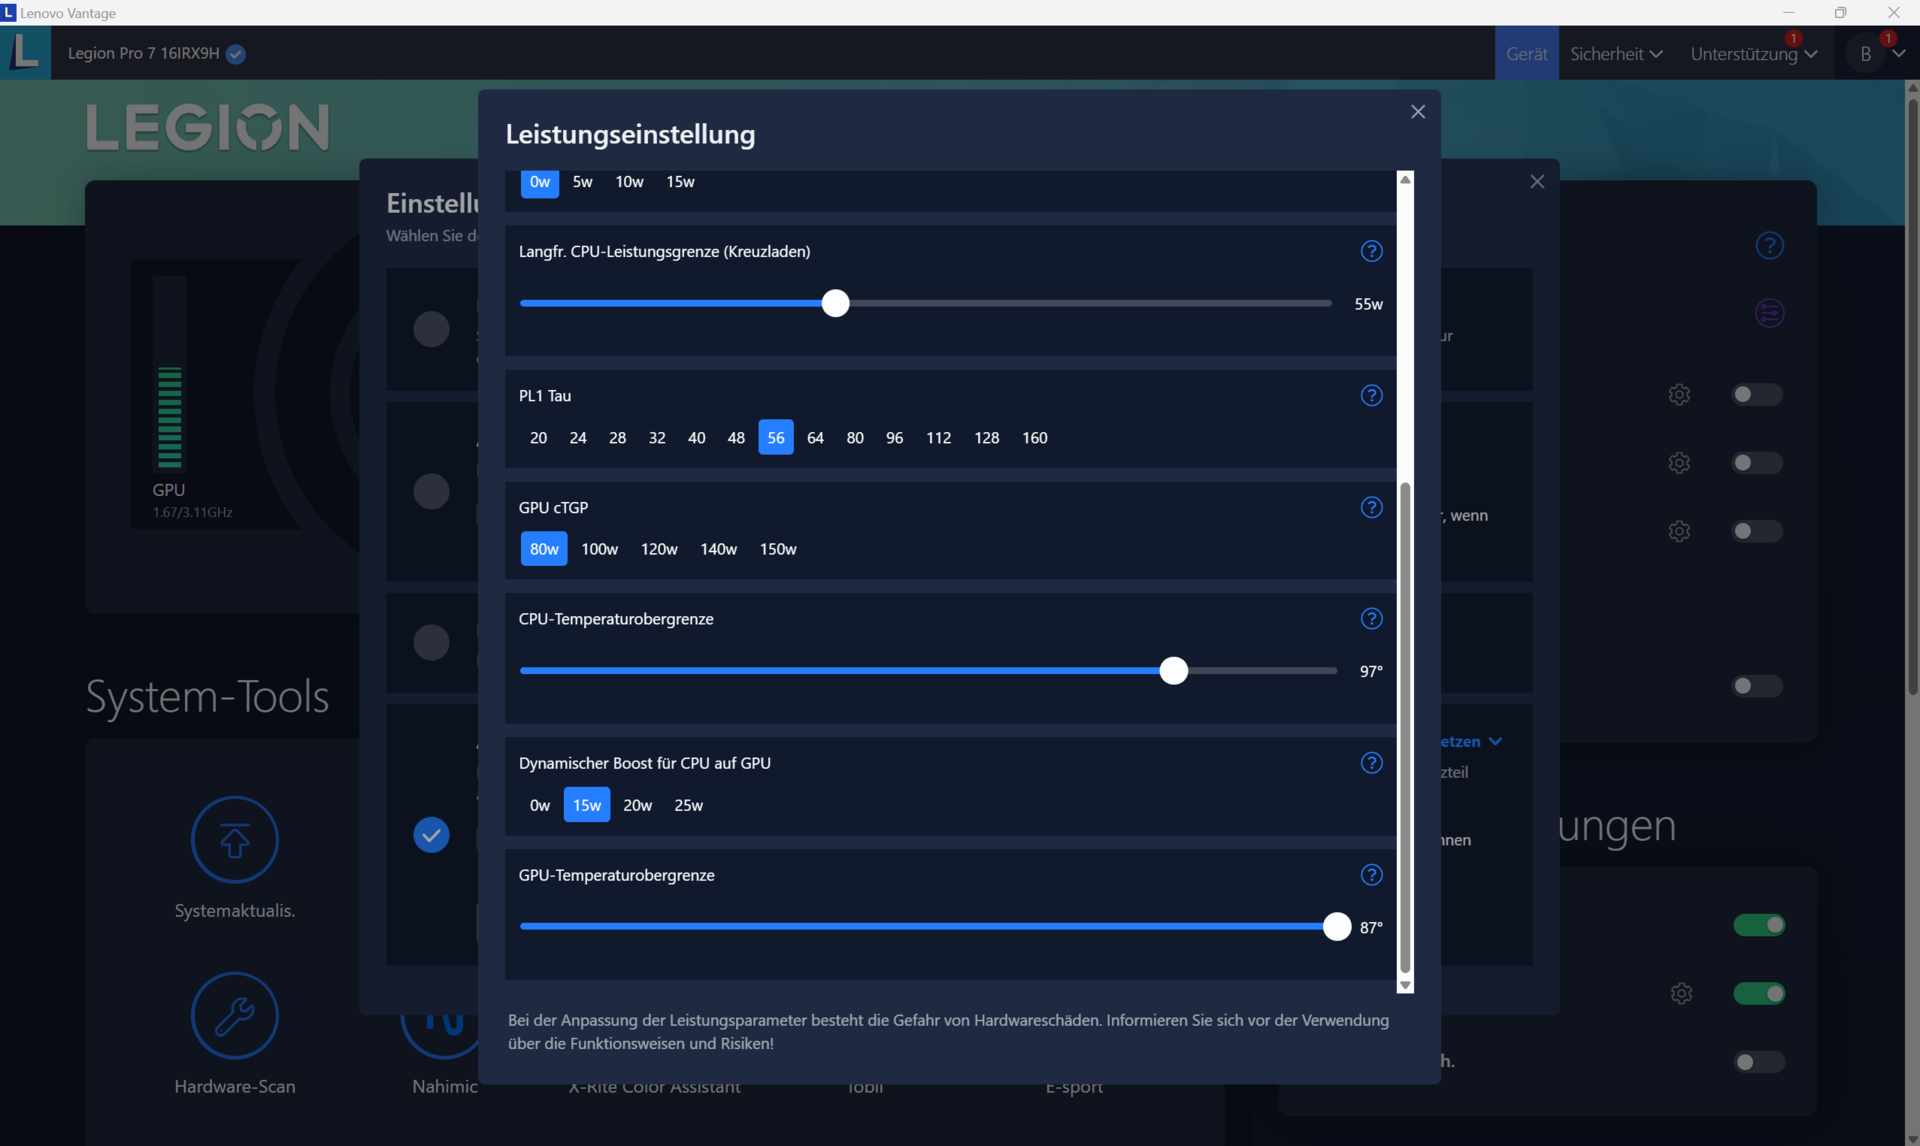
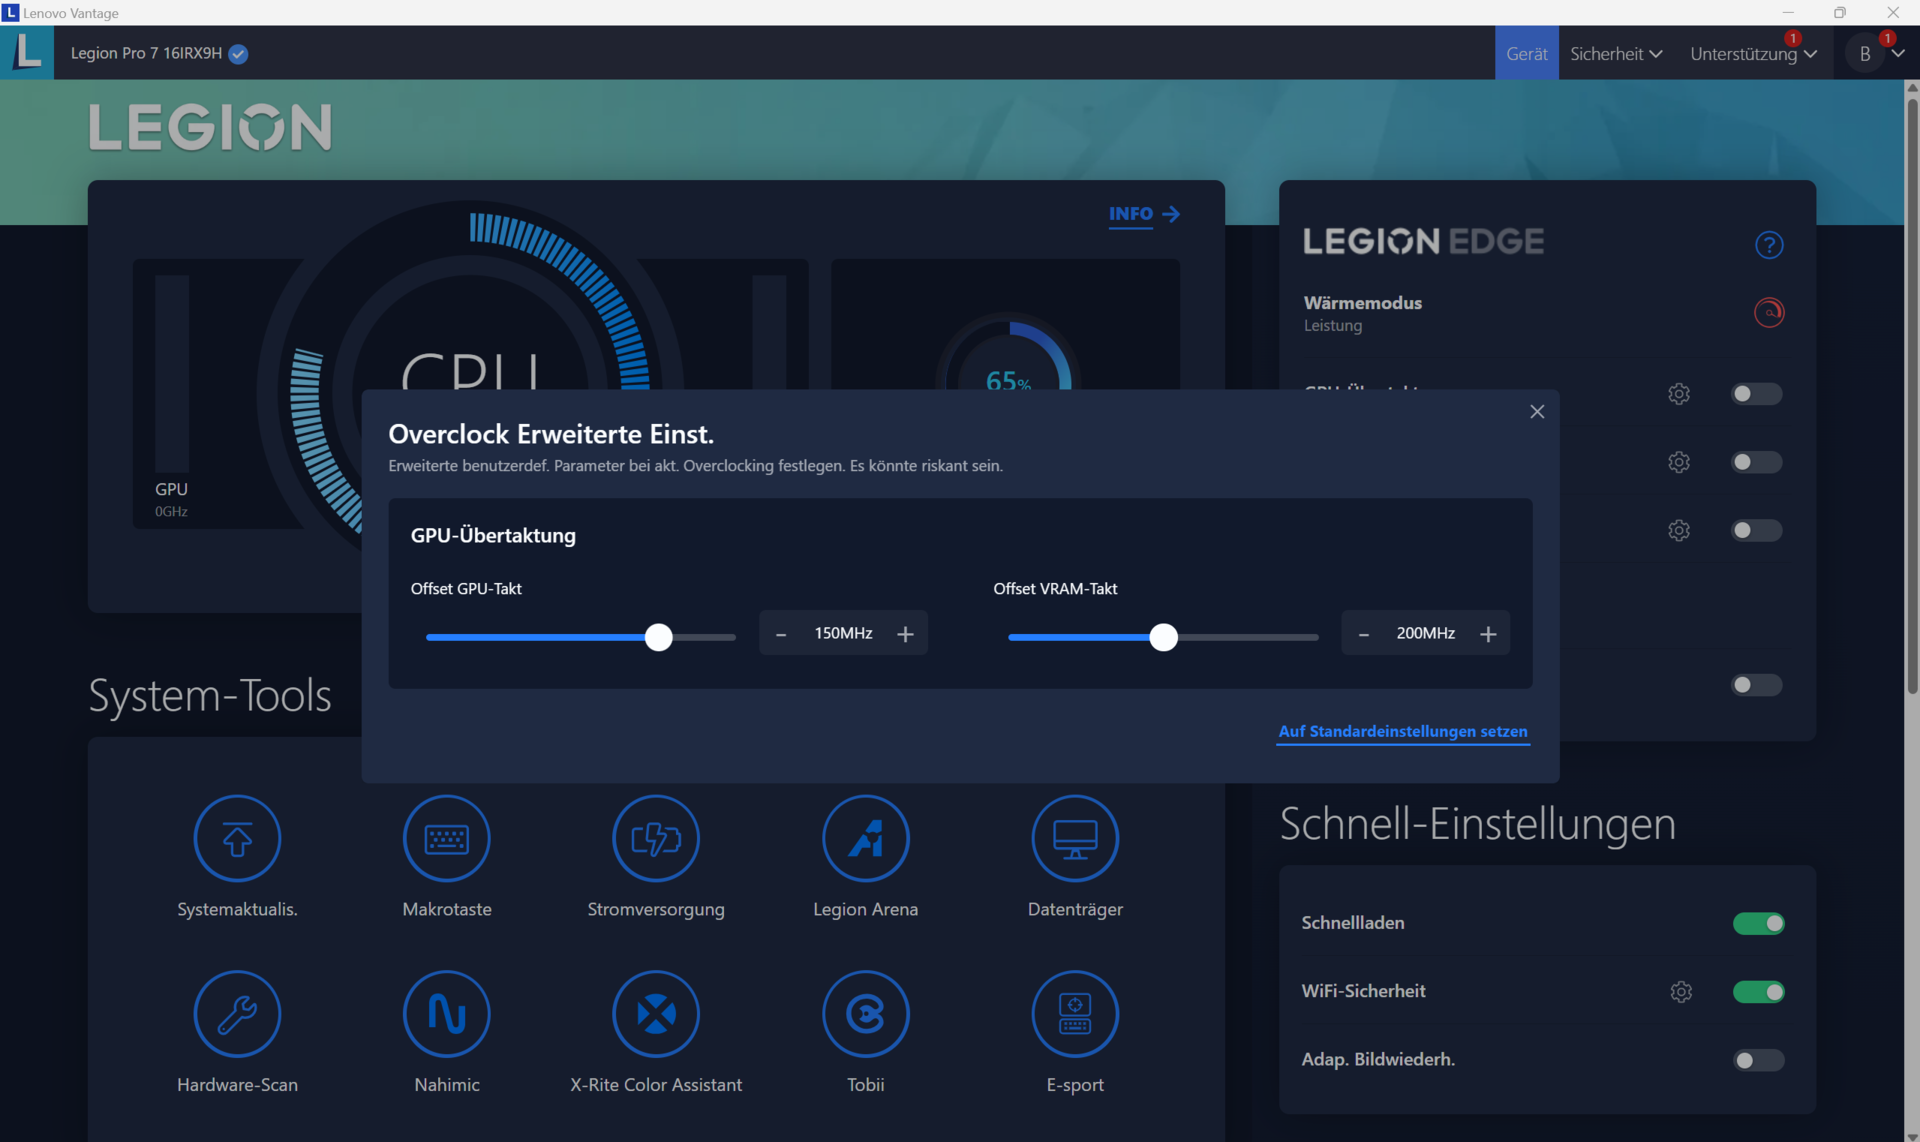
Un quatrième mode est également disponible dans Lenovo Vantage (le centre de contrôle de l'ordinateur portable) : Le mode personnalisé. Ce mode vous permet de spécifier les paramètres de performance du processeur (limite de puissance) et de la carte graphique (TGP, Dynamic Boost et limite de température) ainsi que d'ajuster la vitesse du ventilateur. De plus, il est possible d'overclocker le GPU et la mémoire graphique indépendamment du profil sélectionné.
| Mode performance | Mode équilibré | Mode silencieux | |
|---|---|---|---|
| Limite de puissance 1 (HWInfo) | 130 Watt | 80 Watt | 55 Watt |
| Limite de puissance 2 (HWInfo) | 185 Watt | 119 Watt | 65 Watt |
| Bruit (Witcher 3) | 54 dB(A) | 45 dB(A) | 33 dB(A) |
| Performance (Witcher 3) | ~184 fps | ~160 fps | 40 fps (verrouillé) |

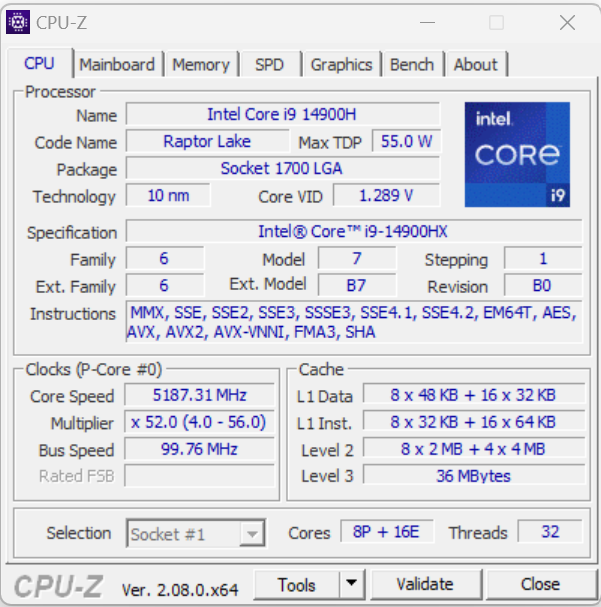
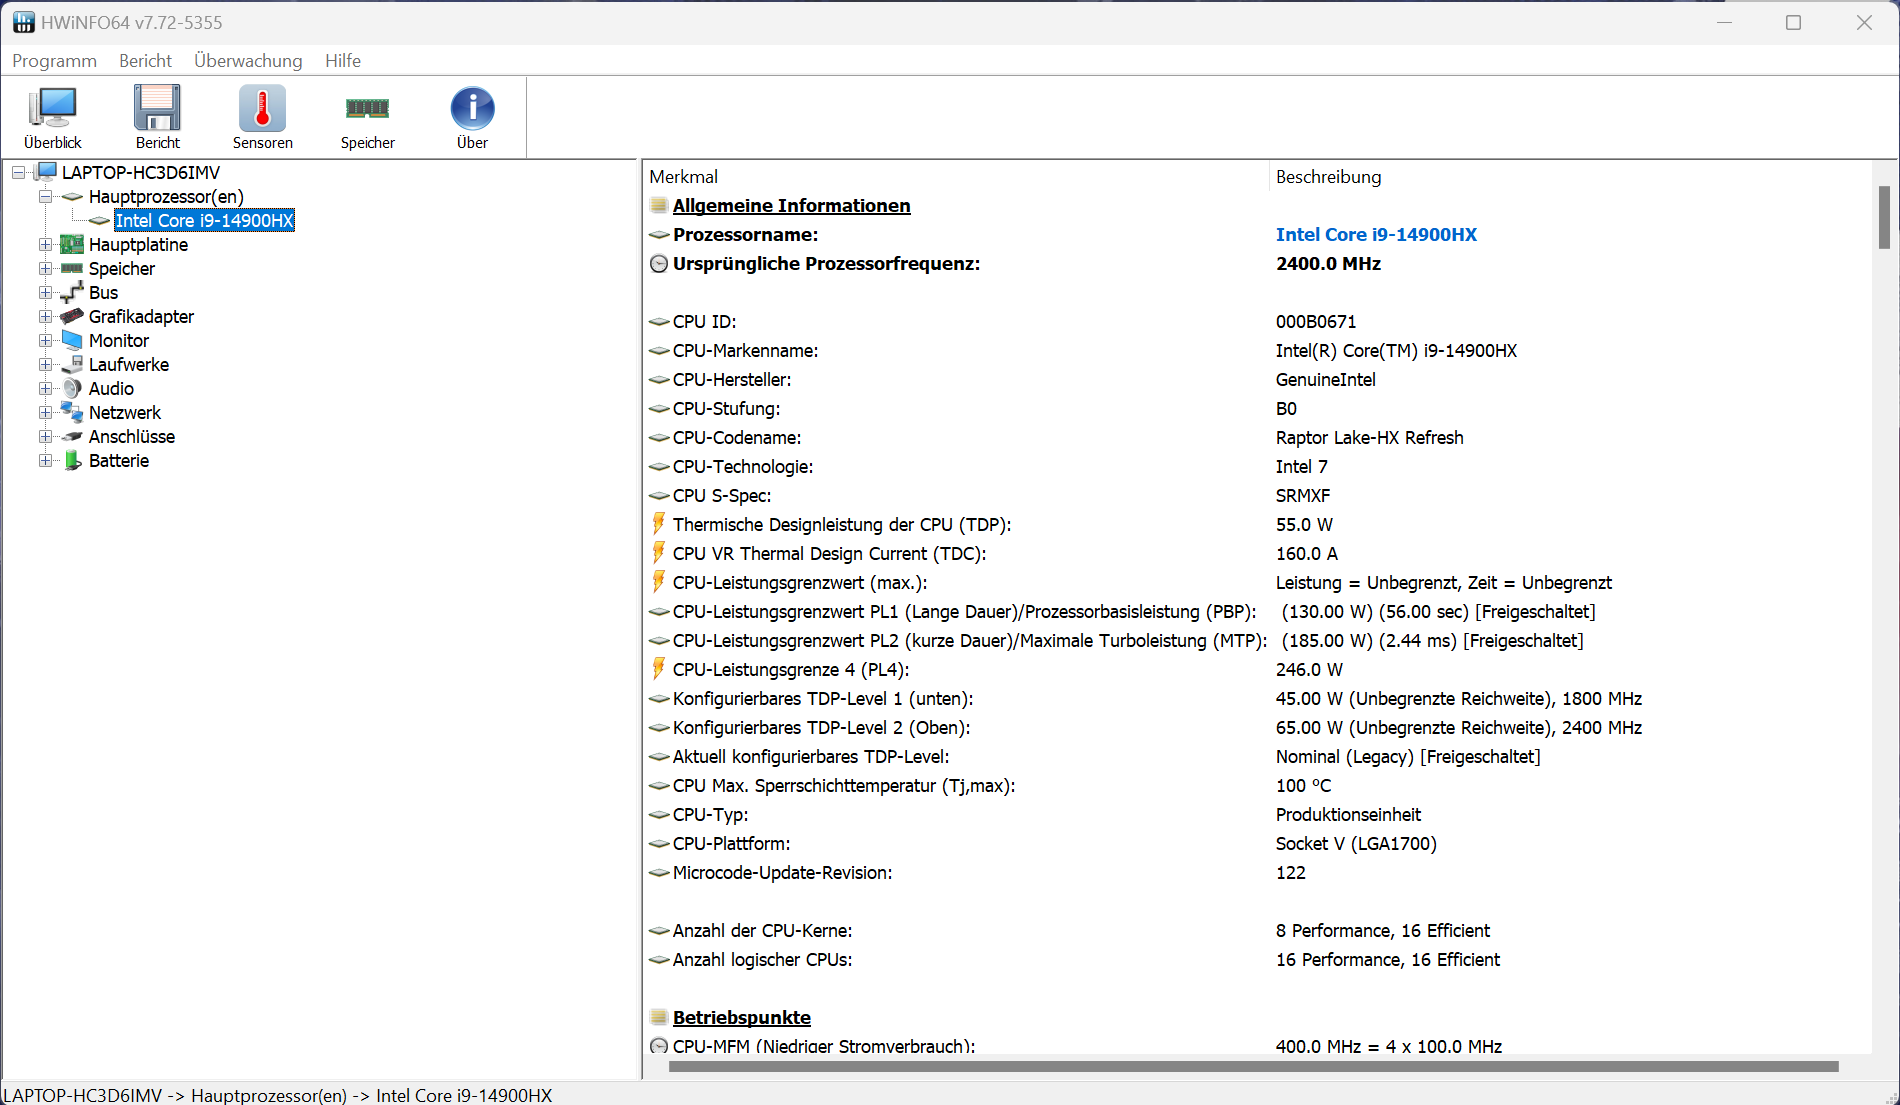
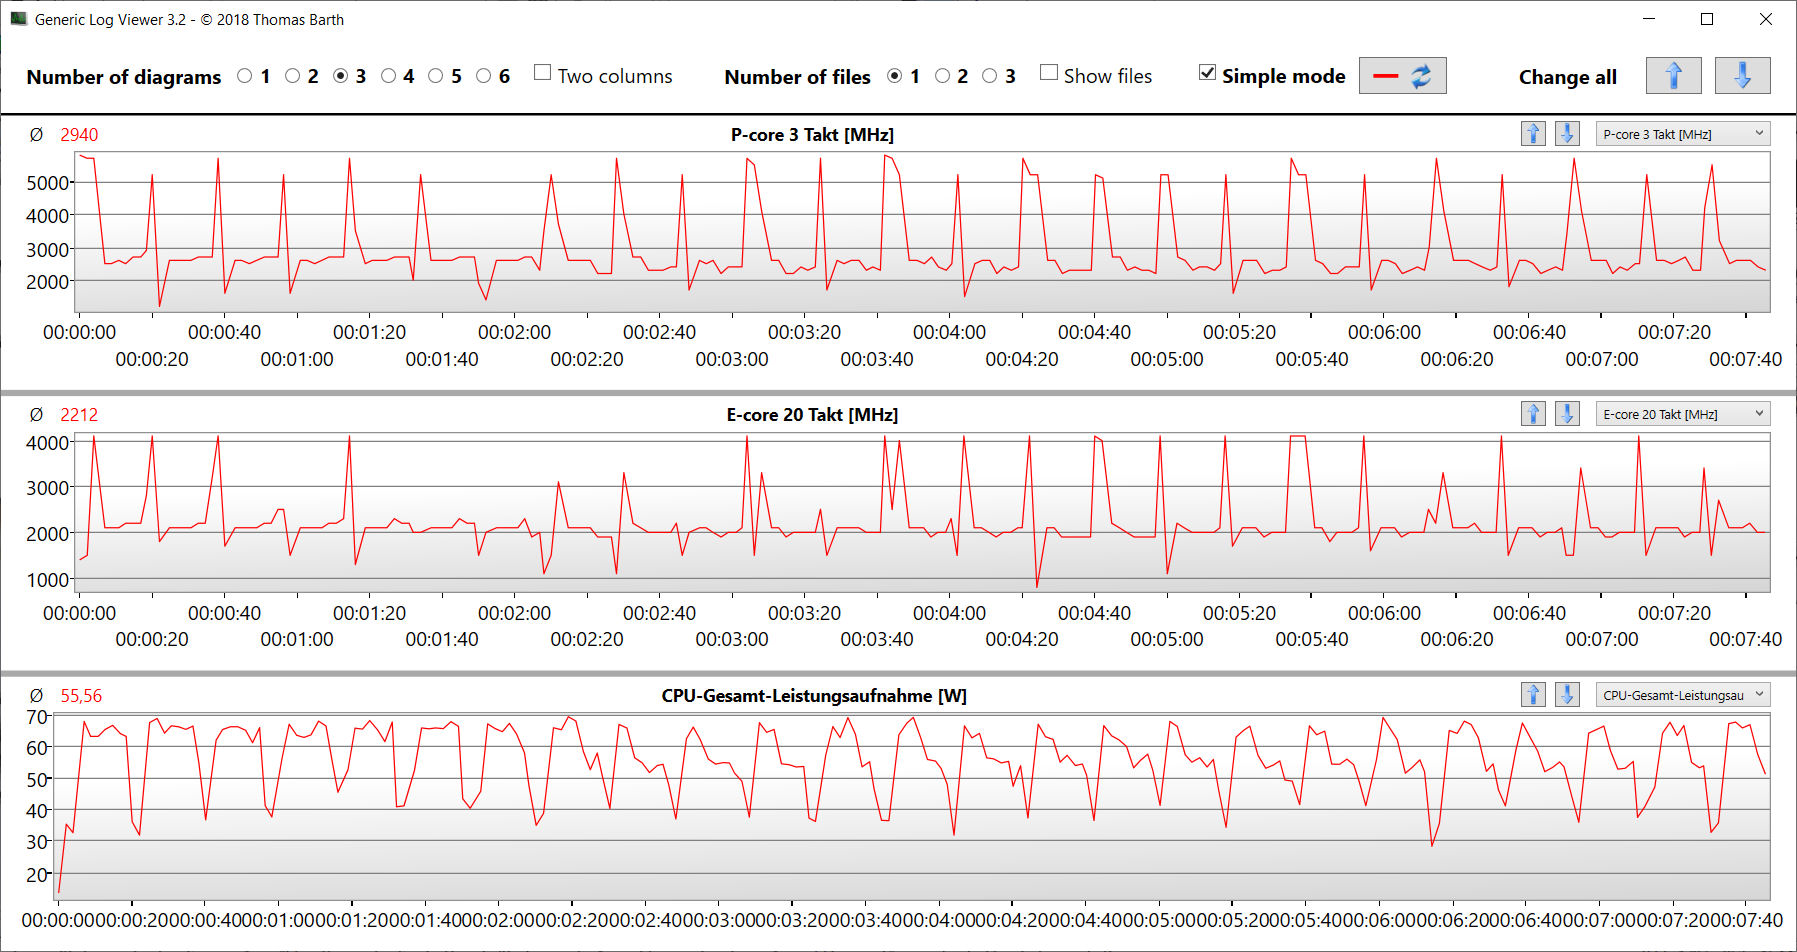
Processeur
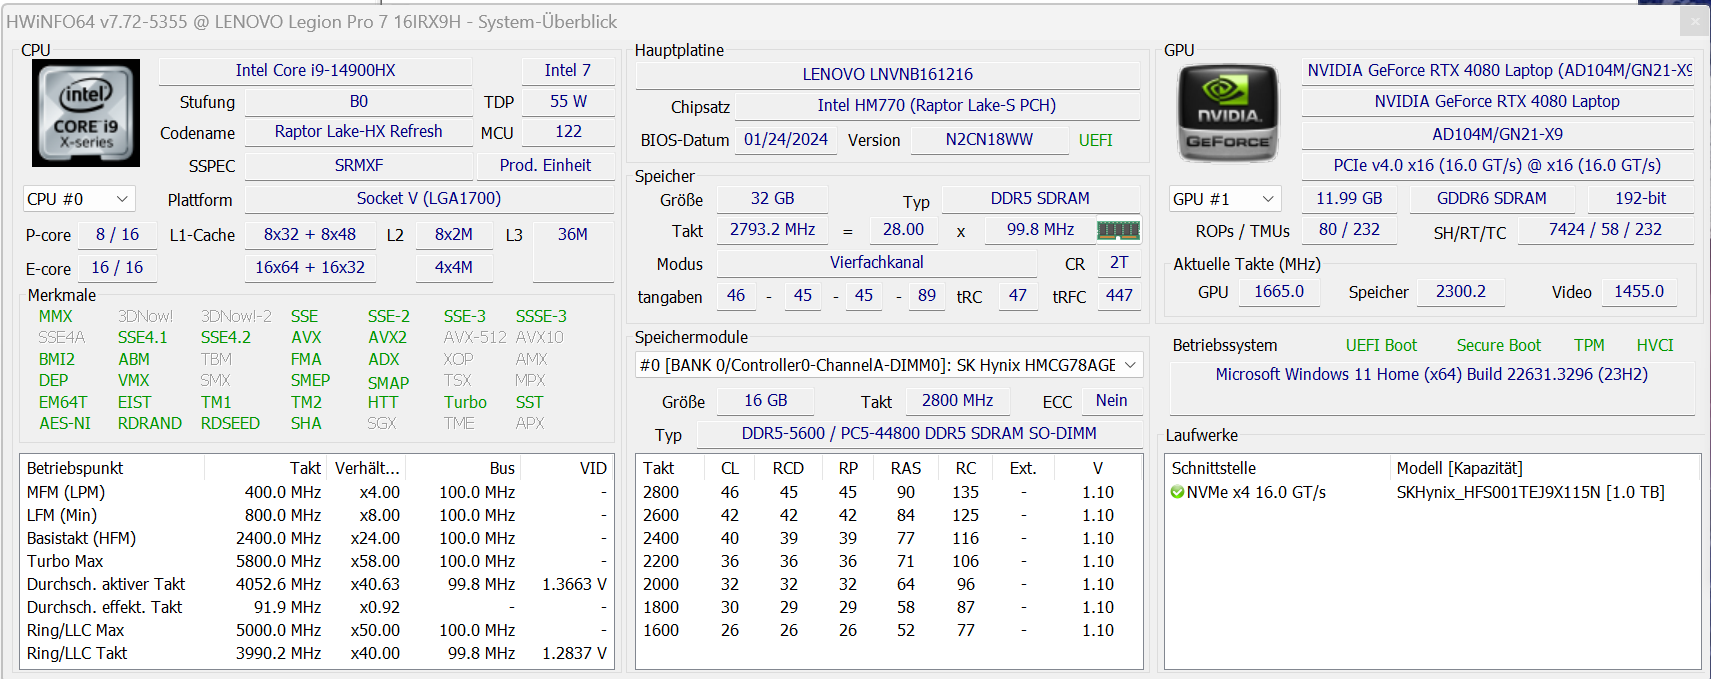
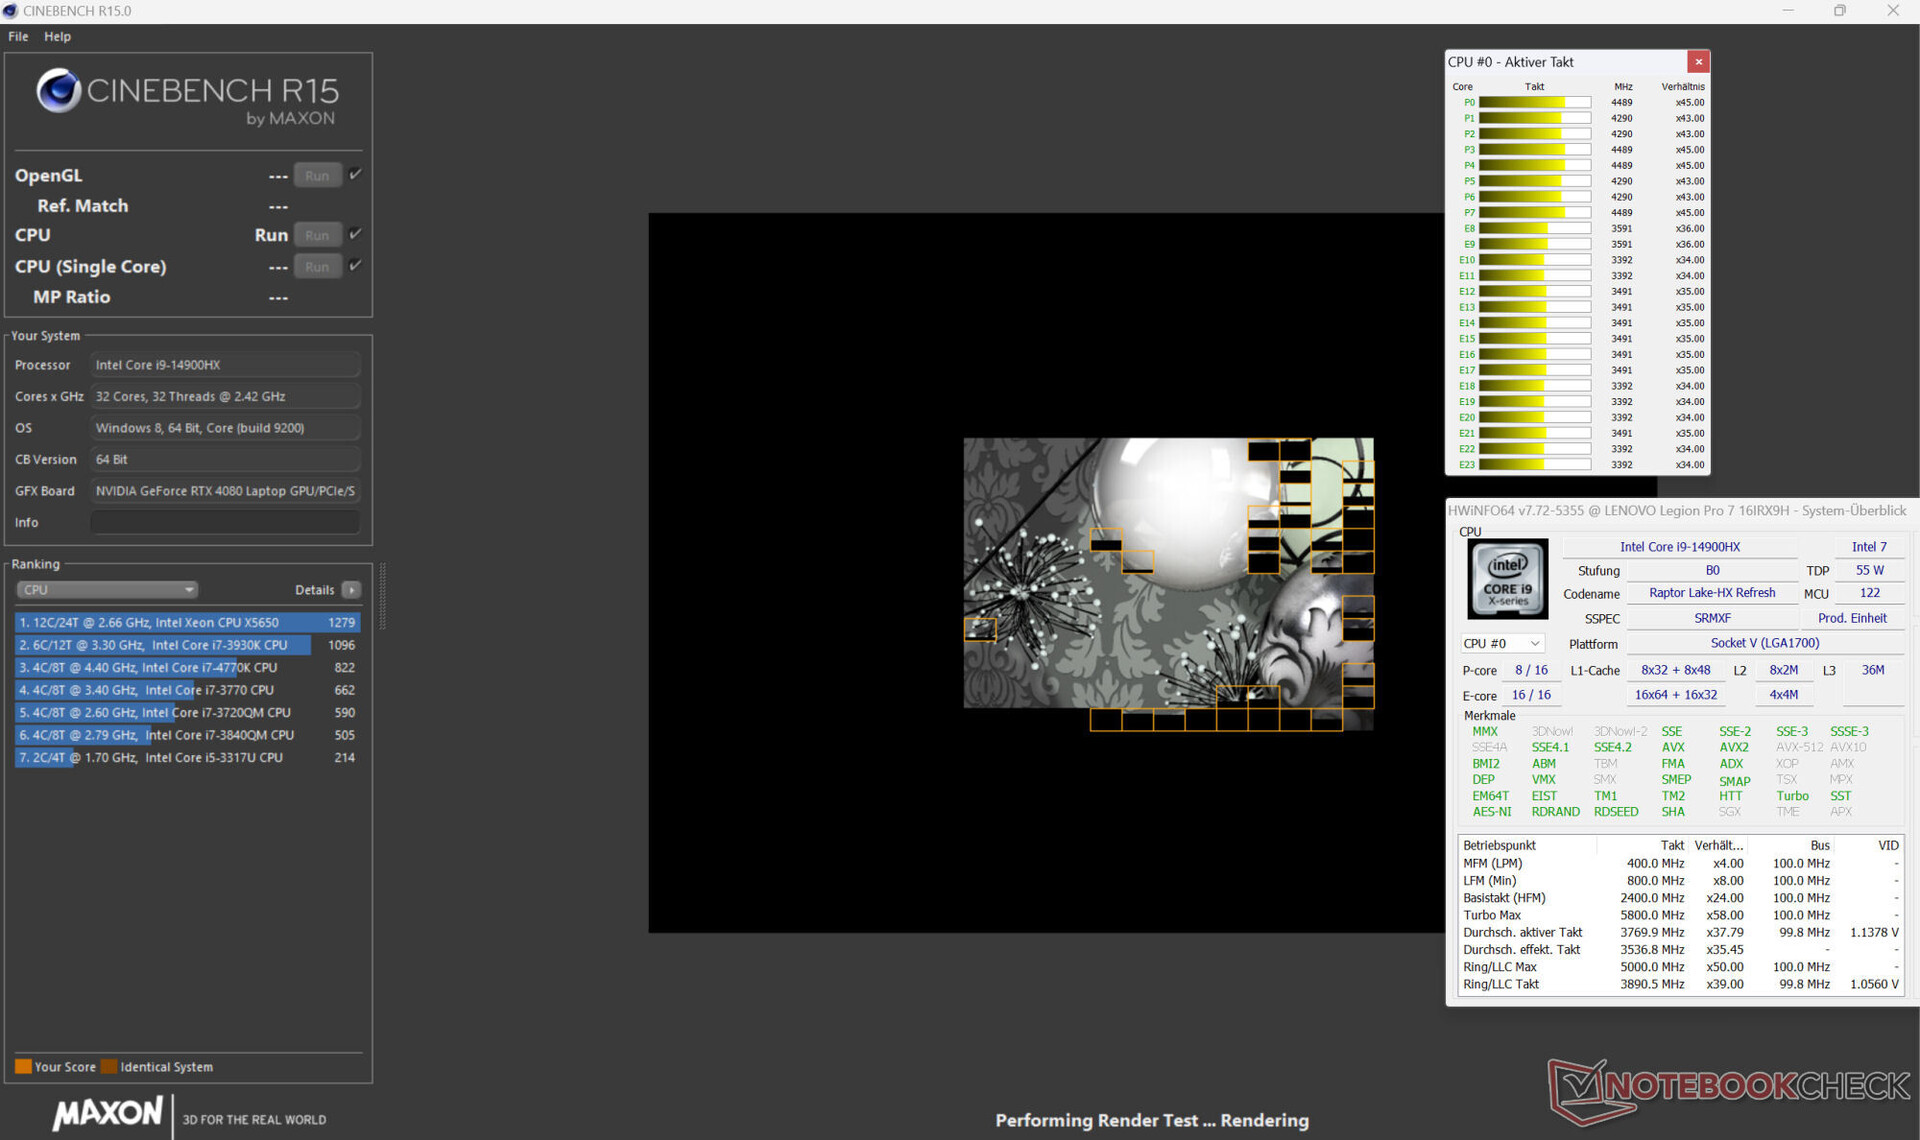
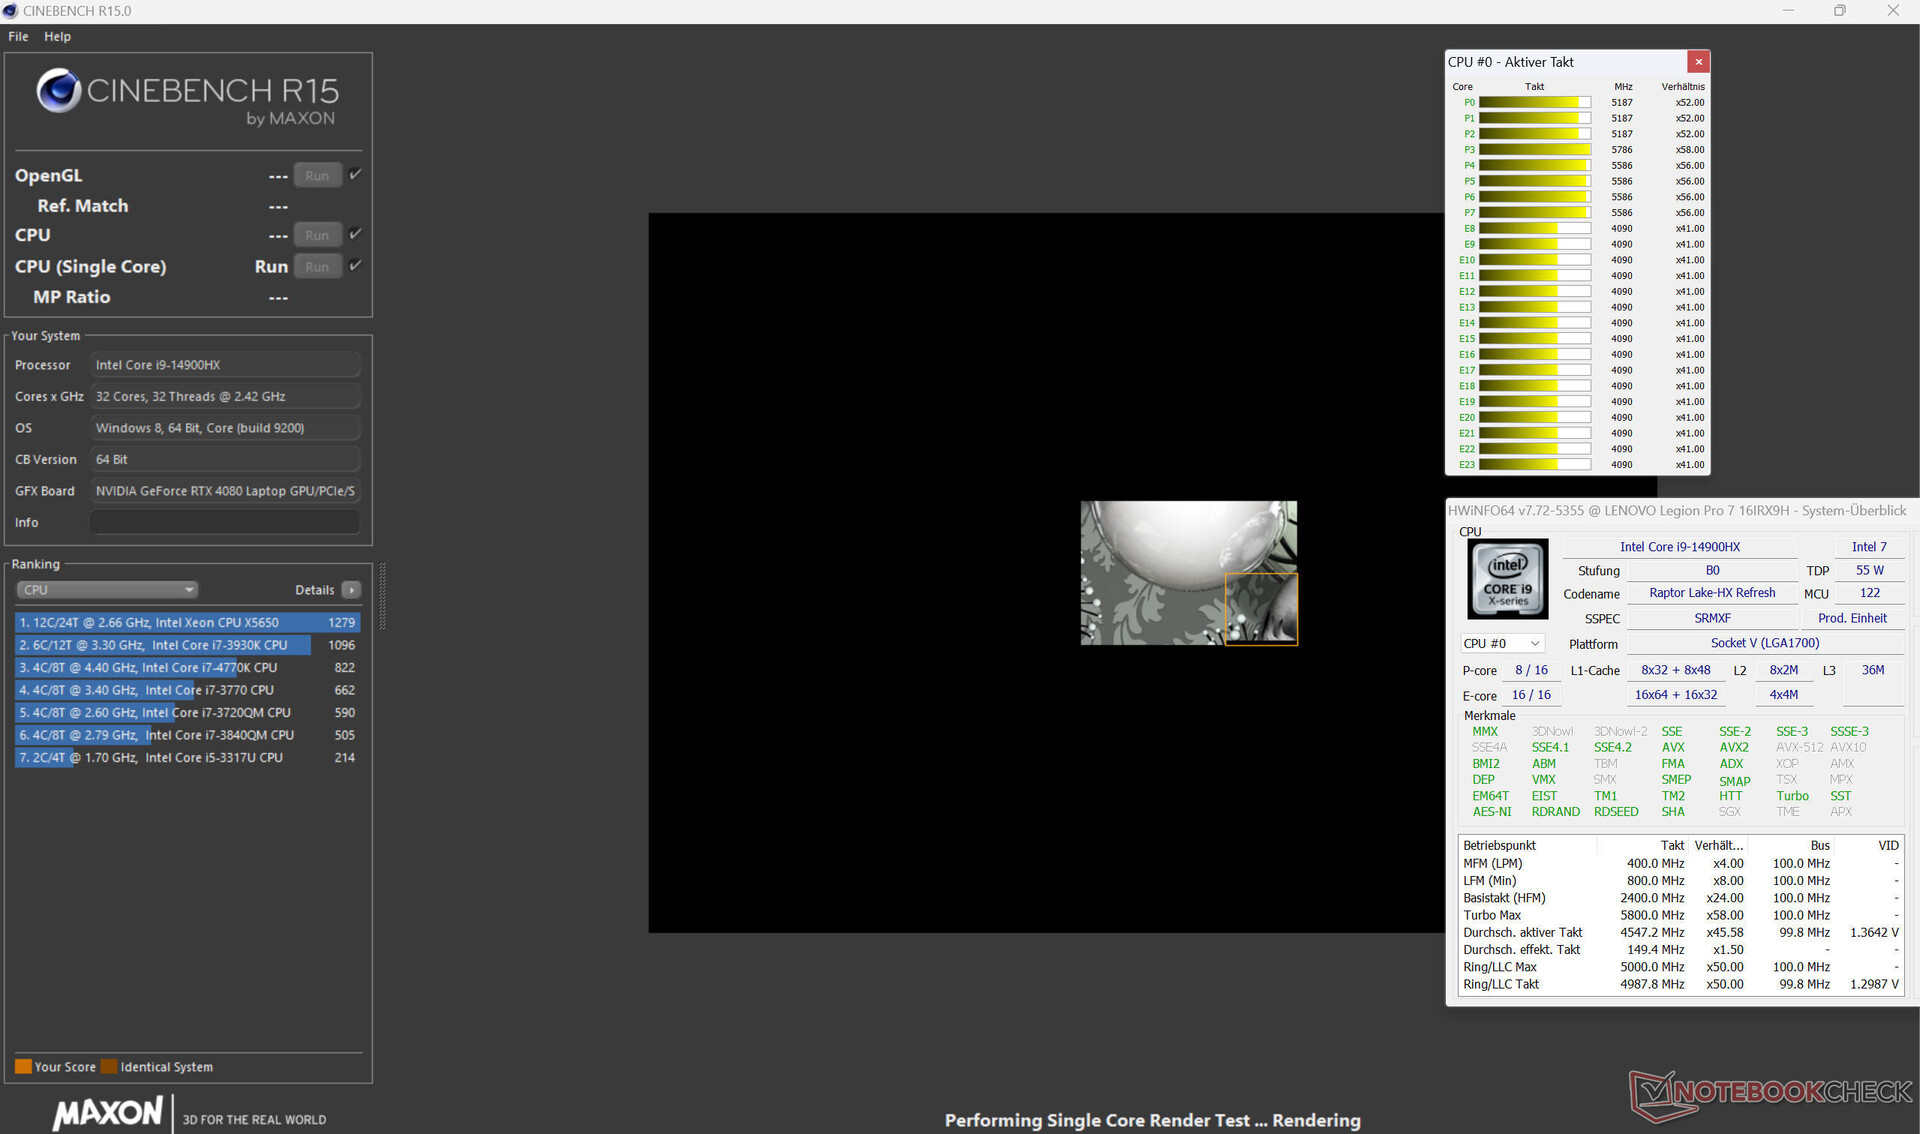
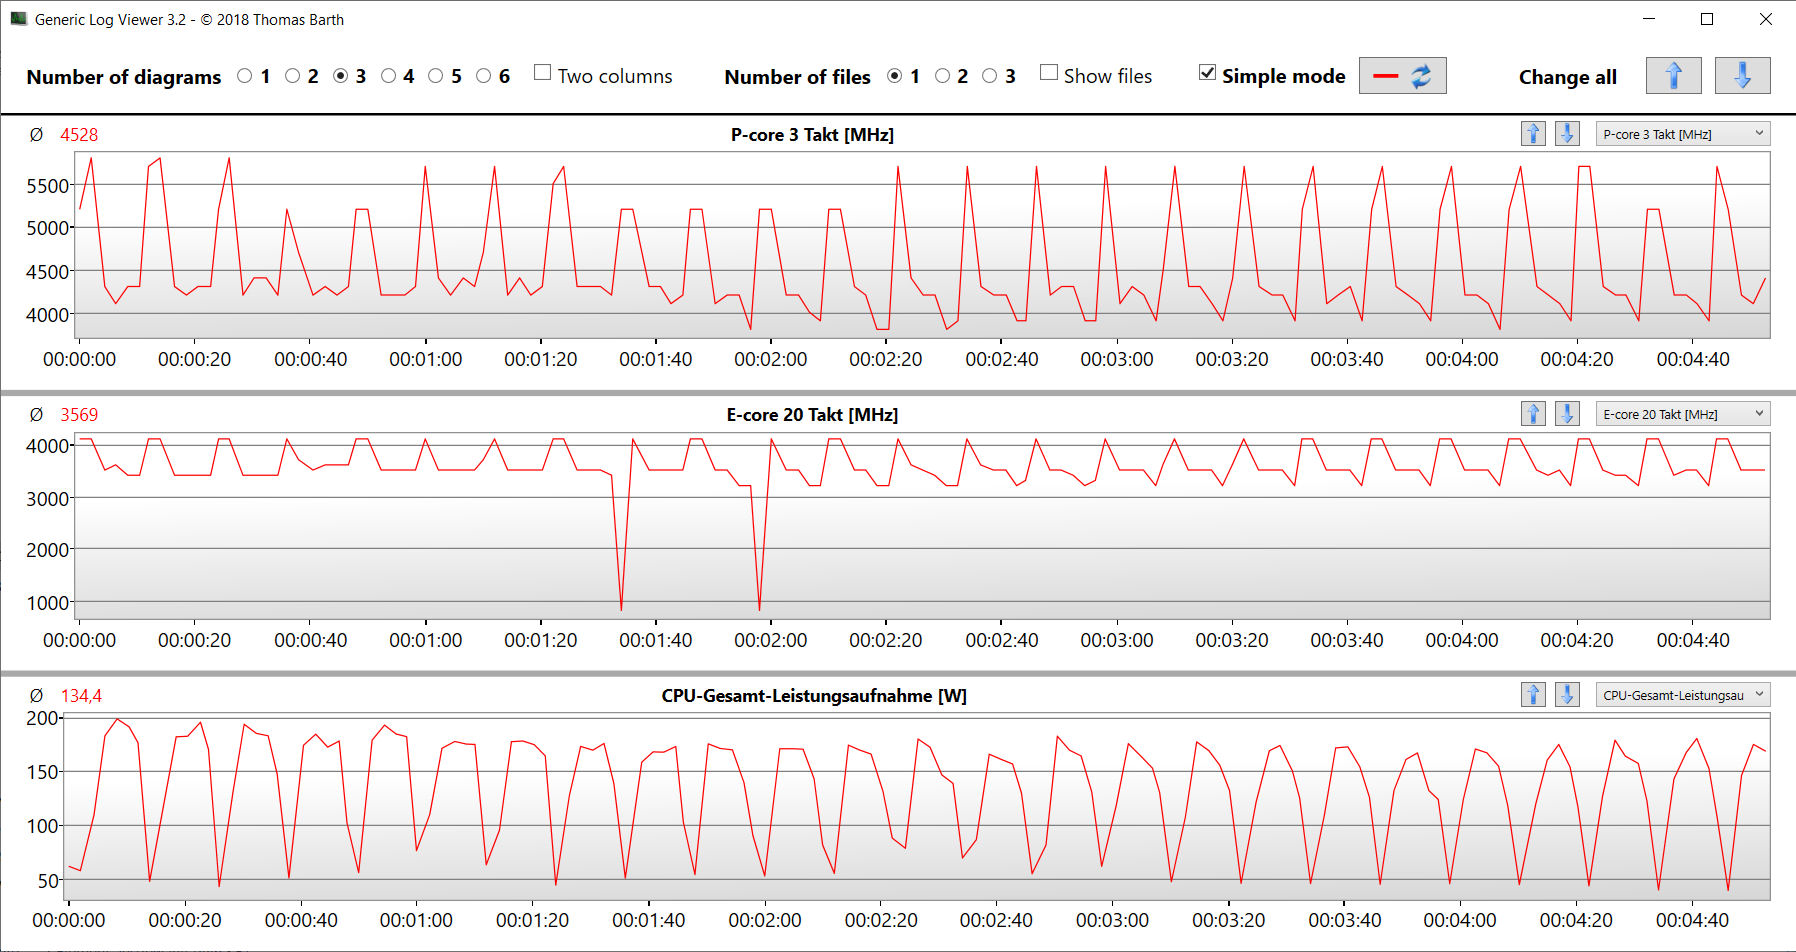
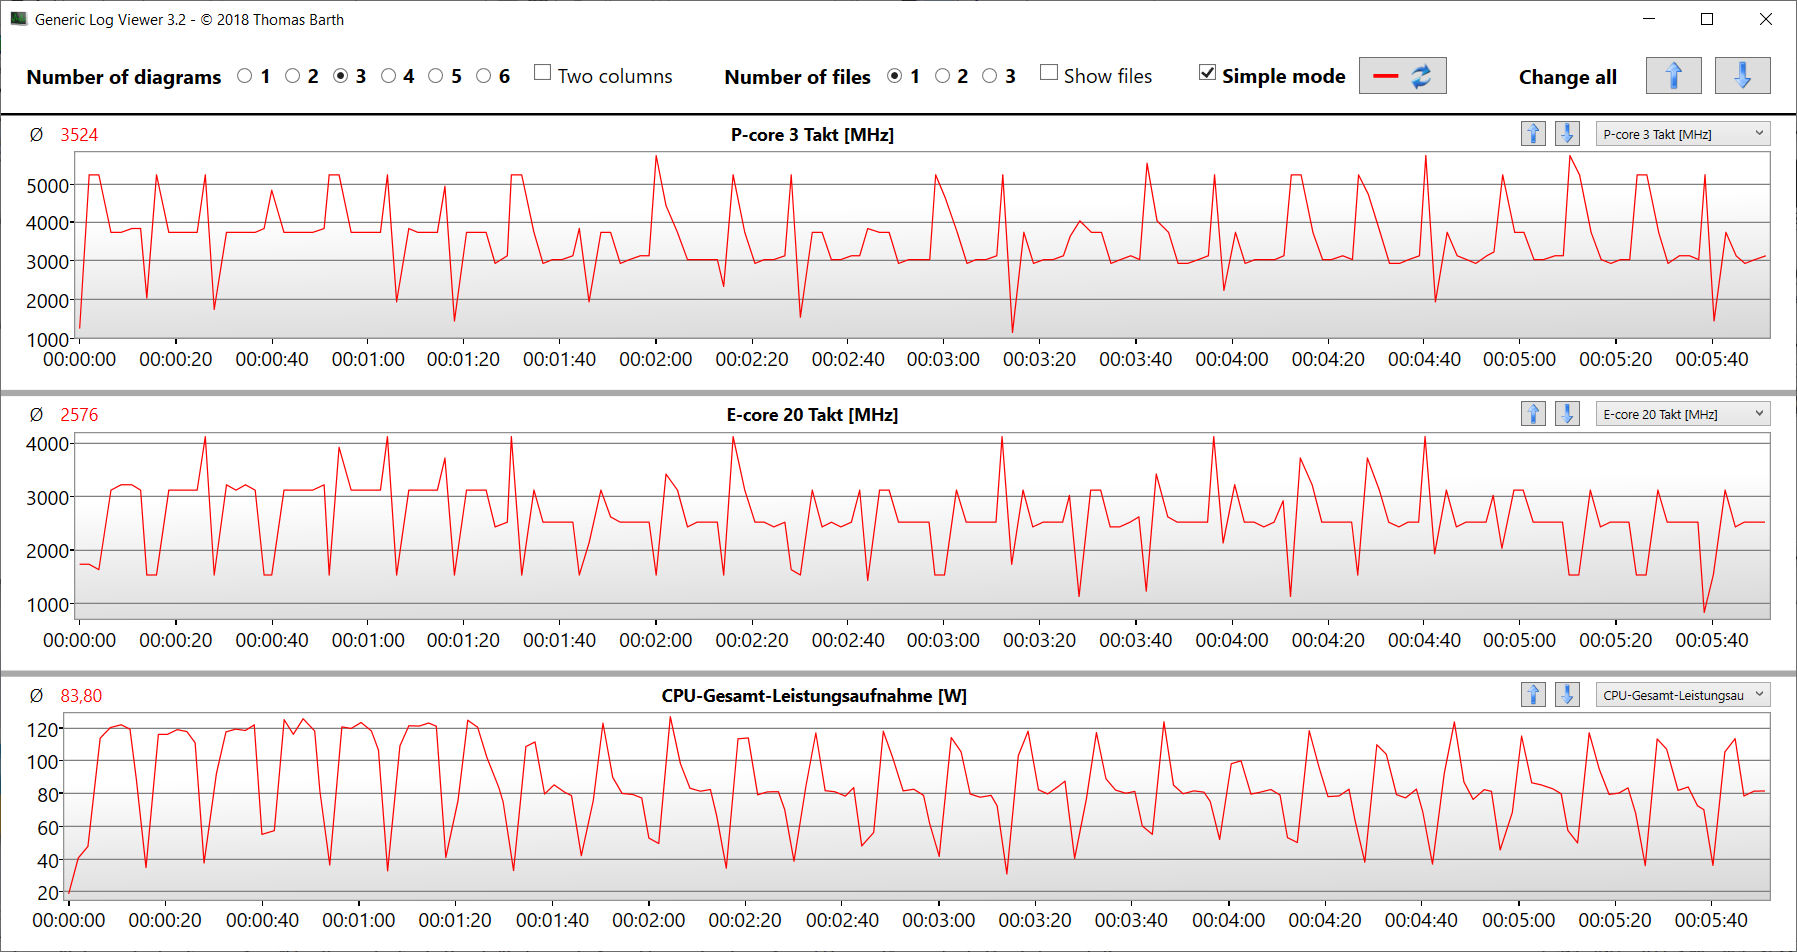
Les 24 cœurs de CPU (8P + 16E = 32 threads) des processeurs Core i9-14900HX (Raptor Lake) ont atteint des vitesses d'horloge maximales de 5,8 GHz (P) et de 4,1 GHz (E). Le processeur a géré une charge multithread soutenue (exécution de Cinebench 15 en boucle) à des vitesses d'horloge constamment élevées. En mode performance, les résultats obtenus sont supérieurs à ce que le processeur peut faire en moyenne. En mode batterie, les performances d'un seul thread n'ont pas beaucoup diminué (307 points dans CB15), mais les performances multithread ont pris un coup significatif (2 482 points dans CB15).
Vous pouvez consulter cette analyse pour plus d'informations sur le Core i9.
Cinebench R15 Multi Sustained load
* ... Moindre est la valeur, meilleures sont les performances
AIDA64: FP32 Ray-Trace | FPU Julia | CPU SHA3 | CPU Queen | FPU SinJulia | FPU Mandel | CPU AES | CPU ZLib | FP64 Ray-Trace | CPU PhotoWorxx
| Performance rating | |
| Alienware m16 R1 AMD | |
| MSI Vector 16 HX A14V | |
| Lenovo Legion Pro 7 16IRX9H | |
| Lenovo Legion Pro 7 16IRX8H | |
| Moyenne Intel Core i9-14900HX | |
| Moyenne de la classe Gaming | |
| HP Omen 16 (2024) | |
| AIDA64 / FP32 Ray-Trace | |
| Alienware m16 R1 AMD | |
| Moyenne de la classe Gaming (10227 - 85542, n=128, 2 dernières années) | |
| MSI Vector 16 HX A14V | |
| Lenovo Legion Pro 7 16IRX9H | |
| Lenovo Legion Pro 7 16IRX8H | |
| Moyenne Intel Core i9-14900HX (13098 - 33474, n=36) | |
| HP Omen 16 (2024) | |
| AIDA64 / FPU Julia | |
| Alienware m16 R1 AMD | |
| MSI Vector 16 HX A14V | |
| Lenovo Legion Pro 7 16IRX9H | |
| Lenovo Legion Pro 7 16IRX8H | |
| Moyenne de la classe Gaming (51376 - 238426, n=128, 2 dernières années) | |
| Moyenne Intel Core i9-14900HX (67573 - 166040, n=36) | |
| HP Omen 16 (2024) | |
| AIDA64 / CPU SHA3 | |
| Alienware m16 R1 AMD | |
| Lenovo Legion Pro 7 16IRX9H | |
| MSI Vector 16 HX A14V | |
| Lenovo Legion Pro 7 16IRX8H | |
| Moyenne Intel Core i9-14900HX (3589 - 7979, n=36) | |
| Moyenne de la classe Gaming (2180 - 9817, n=128, 2 dernières années) | |
| HP Omen 16 (2024) | |
| AIDA64 / CPU Queen | |
| Alienware m16 R1 AMD | |
| Lenovo Legion Pro 7 16IRX9H | |
| MSI Vector 16 HX A14V | |
| Moyenne Intel Core i9-14900HX (118405 - 148966, n=36) | |
| Lenovo Legion Pro 7 16IRX8H | |
| HP Omen 16 (2024) | |
| Moyenne de la classe Gaming (49785 - 173351, n=128, 2 dernières années) | |
| AIDA64 / FPU SinJulia | |
| Alienware m16 R1 AMD | |
| Lenovo Legion Pro 7 16IRX9H | |
| MSI Vector 16 HX A14V | |
| Lenovo Legion Pro 7 16IRX8H | |
| Moyenne Intel Core i9-14900HX (10475 - 18517, n=36) | |
| Moyenne de la classe Gaming (4424 - 33636, n=128, 2 dernières années) | |
| HP Omen 16 (2024) | |
| AIDA64 / FPU Mandel | |
| Alienware m16 R1 AMD | |
| MSI Vector 16 HX A14V | |
| Lenovo Legion Pro 7 16IRX9H | |
| Moyenne de la classe Gaming (25115 - 128721, n=128, 2 dernières années) | |
| Lenovo Legion Pro 7 16IRX8H | |
| Moyenne Intel Core i9-14900HX (32543 - 83662, n=36) | |
| HP Omen 16 (2024) | |
| AIDA64 / CPU AES | |
| Moyenne Intel Core i9-14900HX (86964 - 241777, n=36) | |
| Lenovo Legion Pro 7 16IRX9H | |
| MSI Vector 16 HX A14V | |
| Lenovo Legion Pro 7 16IRX8H | |
| Alienware m16 R1 AMD | |
| Moyenne de la classe Gaming (39258 - 247074, n=128, 2 dernières années) | |
| HP Omen 16 (2024) | |
| AIDA64 / CPU ZLib | |
| Lenovo Legion Pro 7 16IRX9H | |
| MSI Vector 16 HX A14V | |
| Lenovo Legion Pro 7 16IRX8H | |
| Moyenne Intel Core i9-14900HX (1054 - 2292, n=36) | |
| Alienware m16 R1 AMD | |
| Moyenne de la classe Gaming (574 - 2531, n=128, 2 dernières années) | |
| HP Omen 16 (2024) | |
| AIDA64 / FP64 Ray-Trace | |
| Alienware m16 R1 AMD | |
| Moyenne de la classe Gaming (5509 - 45446, n=128, 2 dernières années) | |
| MSI Vector 16 HX A14V | |
| Lenovo Legion Pro 7 16IRX9H | |
| Lenovo Legion Pro 7 16IRX8H | |
| Moyenne Intel Core i9-14900HX (6809 - 18349, n=36) | |
| HP Omen 16 (2024) | |
| AIDA64 / CPU PhotoWorxx | |
| HP Omen 16 (2024) | |
| MSI Vector 16 HX A14V | |
| Lenovo Legion Pro 7 16IRX8H | |
| Lenovo Legion Pro 7 16IRX9H | |
| Moyenne Intel Core i9-14900HX (23903 - 54702, n=36) | |
| Moyenne de la classe Gaming (10805 - 62916, n=128, 2 dernières années) | |
| Alienware m16 R1 AMD | |
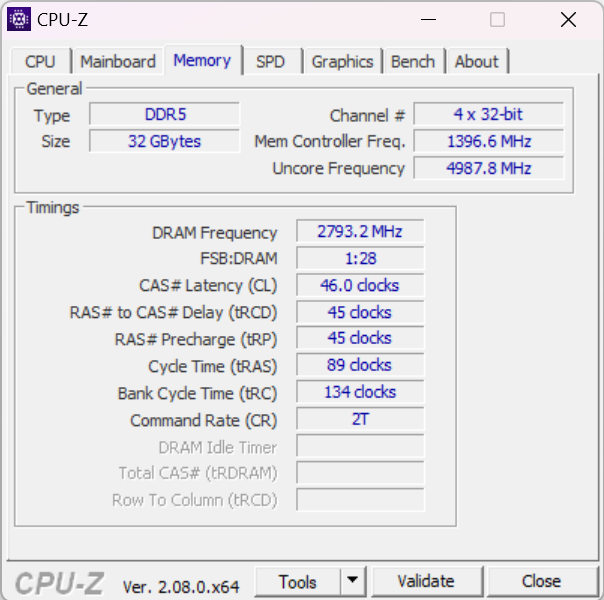
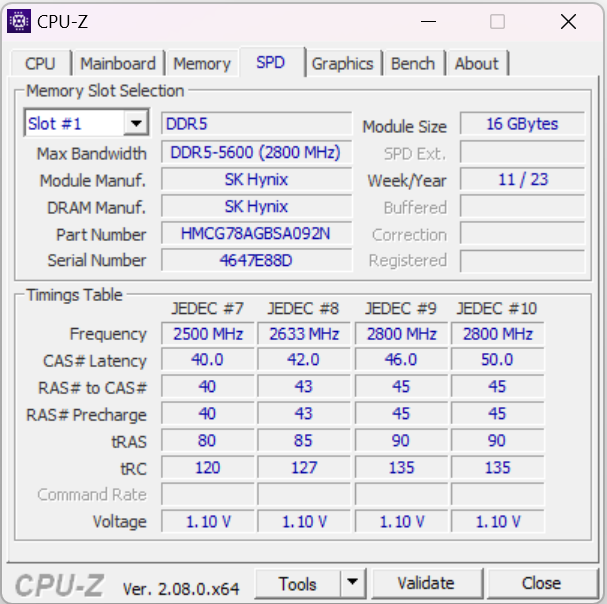
Performance du système
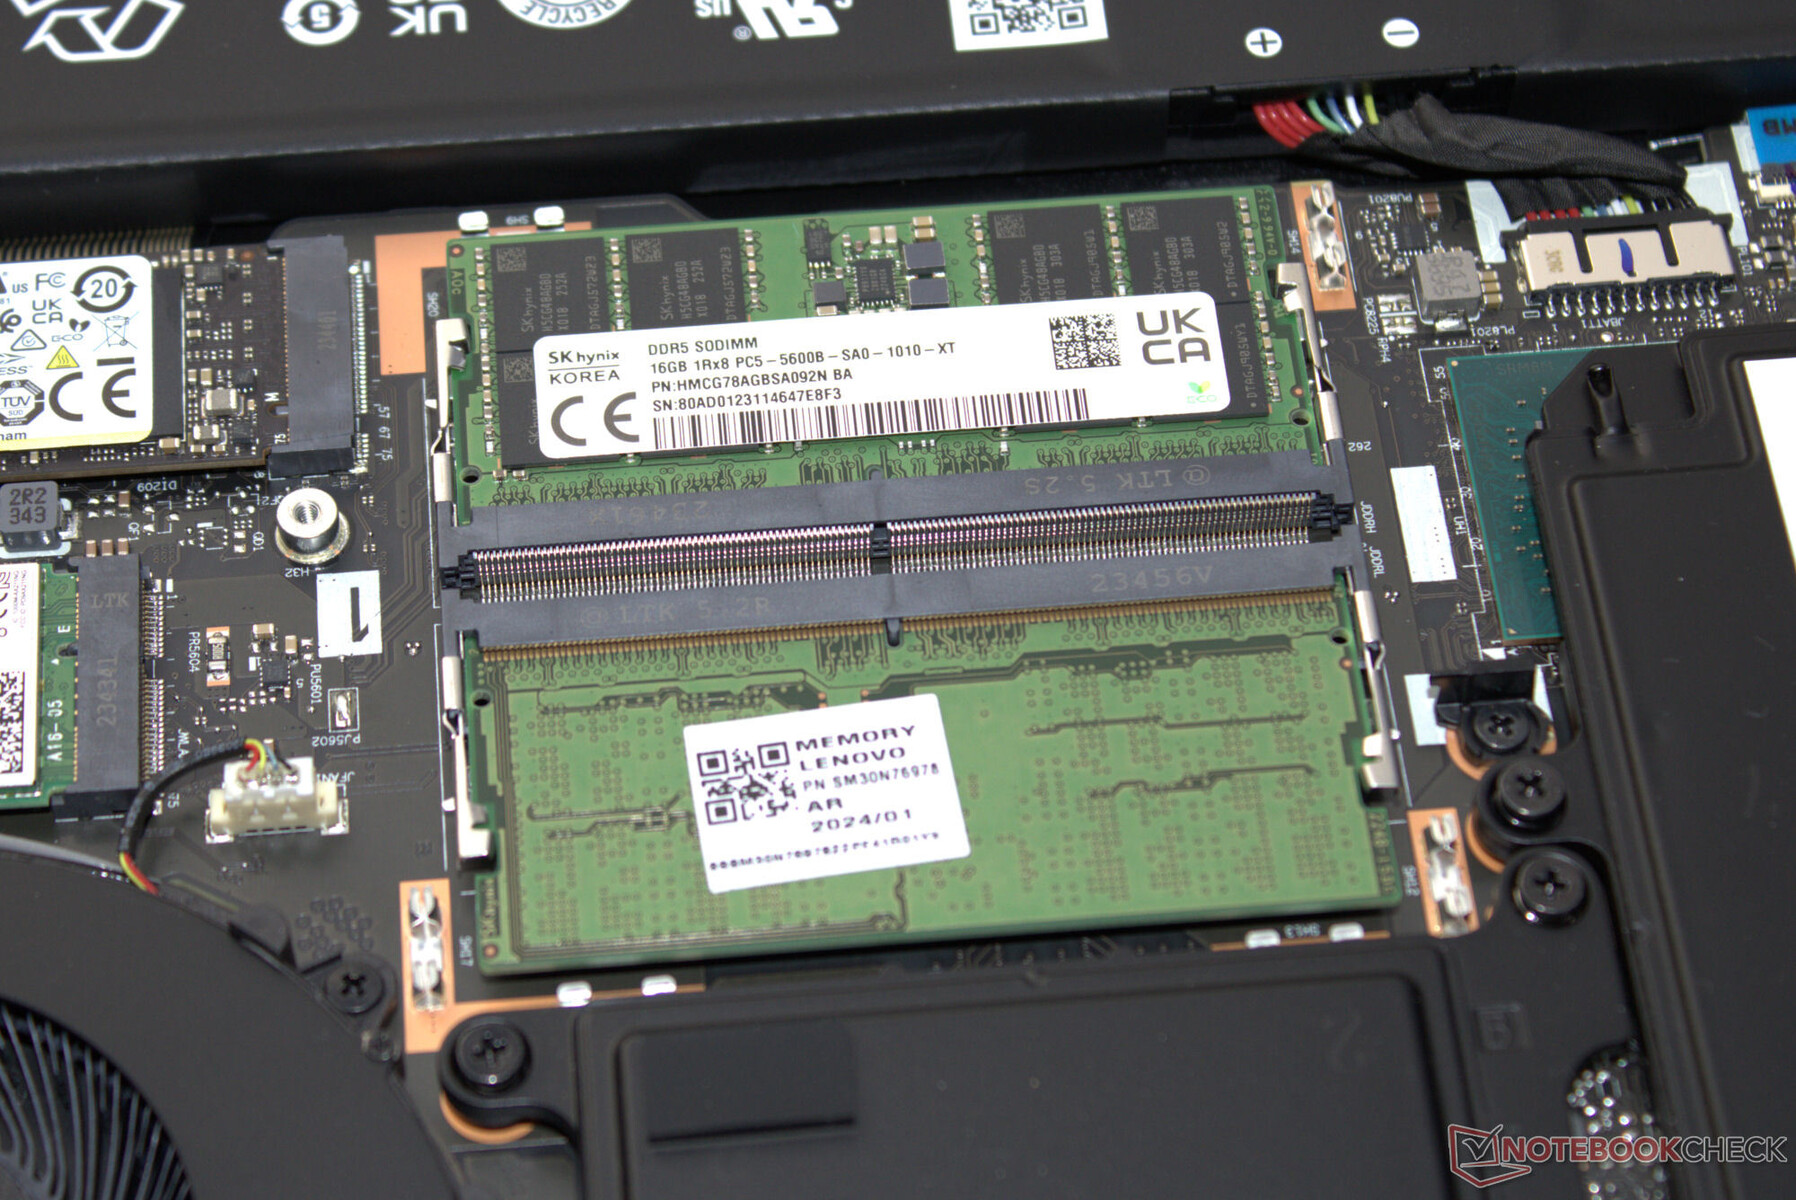
Ce système fluide ne manque pas de performances informatiques. Le Legion Pro 7 peut gérer sans effort des tâches telles que les jeux, le streaming et le rendu. Les taux de transfert de la mémoire se situent à un niveau normal pour de la RAM DDR5-5600.
CrossMark: Overall | Productivity | Creativity | Responsiveness
WebXPRT 3: Overall
WebXPRT 4: Overall
Mozilla Kraken 1.1: Total
| PCMark 10 / Score | |
| Lenovo Legion Pro 7 16IRX9H | |
| HP Omen 16 (2024) | |
| Alienware m16 R1 AMD | |
| Moyenne Intel Core i9-14900HX, NVIDIA GeForce RTX 4080 Laptop GPU (7703 - 9223, n=7) | |
| MSI Vector 16 HX A14V | |
| Moyenne de la classe Gaming (5828 - 10060, n=110, 2 dernières années) | |
| Lenovo Legion Pro 7 16IRX8H | |
| PCMark 10 / Essentials | |
| Lenovo Legion Pro 7 16IRX9H | |
| Lenovo Legion Pro 7 16IRX8H | |
| Moyenne Intel Core i9-14900HX, NVIDIA GeForce RTX 4080 Laptop GPU (11255 - 12600, n=7) | |
| Alienware m16 R1 AMD | |
| MSI Vector 16 HX A14V | |
| HP Omen 16 (2024) | |
| Moyenne de la classe Gaming (8810 - 12600, n=114, 2 dernières années) | |
| PCMark 10 / Productivity | |
| HP Omen 16 (2024) | |
| Lenovo Legion Pro 7 16IRX9H | |
| Lenovo Legion Pro 7 16IRX8H | |
| Alienware m16 R1 AMD | |
| Moyenne Intel Core i9-14900HX, NVIDIA GeForce RTX 4080 Laptop GPU (6662 - 11410, n=7) | |
| Moyenne de la classe Gaming (6662 - 16716, n=112, 2 dernières années) | |
| MSI Vector 16 HX A14V | |
| PCMark 10 / Digital Content Creation | |
| MSI Vector 16 HX A14V | |
| Alienware m16 R1 AMD | |
| Moyenne Intel Core i9-14900HX, NVIDIA GeForce RTX 4080 Laptop GPU (14211 - 16246, n=7) | |
| HP Omen 16 (2024) | |
| Lenovo Legion Pro 7 16IRX9H | |
| Moyenne de la classe Gaming (7505 - 19351, n=112, 2 dernières années) | |
| Lenovo Legion Pro 7 16IRX8H | |
| CrossMark / Overall | |
| Lenovo Legion Pro 7 16IRX9H | |
| HP Omen 16 (2024) | |
| MSI Vector 16 HX A14V | |
| Moyenne Intel Core i9-14900HX, NVIDIA GeForce RTX 4080 Laptop GPU (1992 - 2334, n=7) | |
| Alienware m16 R1 AMD | |
| Moyenne de la classe Gaming (1247 - 2344, n=110, 2 dernières années) | |
| CrossMark / Productivity | |
| Lenovo Legion Pro 7 16IRX9H | |
| HP Omen 16 (2024) | |
| MSI Vector 16 HX A14V | |
| Moyenne Intel Core i9-14900HX, NVIDIA GeForce RTX 4080 Laptop GPU (1812 - 2204, n=7) | |
| Alienware m16 R1 AMD | |
| Moyenne de la classe Gaming (1299 - 2211, n=110, 2 dernières années) | |
| CrossMark / Creativity | |
| Lenovo Legion Pro 7 16IRX9H | |
| MSI Vector 16 HX A14V | |
| Moyenne Intel Core i9-14900HX, NVIDIA GeForce RTX 4080 Laptop GPU (2327 - 2500, n=7) | |
| HP Omen 16 (2024) | |
| Moyenne de la classe Gaming (1275 - 2729, n=110, 2 dernières années) | |
| Alienware m16 R1 AMD | |
| CrossMark / Responsiveness | |
| Lenovo Legion Pro 7 16IRX9H | |
| HP Omen 16 (2024) | |
| MSI Vector 16 HX A14V | |
| Moyenne Intel Core i9-14900HX, NVIDIA GeForce RTX 4080 Laptop GPU (1520 - 2254, n=7) | |
| Alienware m16 R1 AMD | |
| Moyenne de la classe Gaming (1030 - 2330, n=110, 2 dernières années) | |
| WebXPRT 3 / Overall | |
| Lenovo Legion Pro 7 16IRX8H | |
| Lenovo Legion Pro 7 16IRX8H | |
| Alienware m16 R1 AMD | |
| Lenovo Legion Pro 7 16IRX9H | |
| Moyenne Intel Core i9-14900HX, NVIDIA GeForce RTX 4080 Laptop GPU (310 - 345, n=7) | |
| HP Omen 16 (2024) | |
| MSI Vector 16 HX A14V | |
| Moyenne de la classe Gaming (237 - 532, n=113, 2 dernières années) | |
| WebXPRT 4 / Overall | |
| Lenovo Legion Pro 7 16IRX9H | |
| Moyenne Intel Core i9-14900HX, NVIDIA GeForce RTX 4080 Laptop GPU (300 - 321, n=7) | |
| HP Omen 16 (2024) | |
| Lenovo Legion Pro 7 16IRX8H | |
| MSI Vector 16 HX A14V | |
| Moyenne de la classe Gaming (176.4 - 345, n=111, 2 dernières années) | |
| Alienware m16 R1 AMD | |
| Mozilla Kraken 1.1 / Total | |
| Alienware m16 R1 AMD | |
| Moyenne de la classe Gaming (397 - 674, n=120, 2 dernières années) | |
| Lenovo Legion Pro 7 16IRX8H | |
| Lenovo Legion Pro 7 16IRX8H | |
| MSI Vector 16 HX A14V | |
| Moyenne Intel Core i9-14900HX, NVIDIA GeForce RTX 4080 Laptop GPU (437 - 446, n=7) | |
| Lenovo Legion Pro 7 16IRX9H | |
| HP Omen 16 (2024) | |
* ... Moindre est la valeur, meilleures sont les performances
| PCMark 10 Score | 8923 points | |
Aide | ||
| AIDA64 / Memory Copy | |
| HP Omen 16 (2024) | |
| Lenovo Legion Pro 7 16IRX9H | |
| MSI Vector 16 HX A14V | |
| Moyenne Intel Core i9-14900HX (38028 - 83392, n=36) | |
| Moyenne de la classe Gaming (21750 - 108104, n=128, 2 dernières années) | |
| Alienware m16 R1 AMD | |
| AIDA64 / Memory Read | |
| HP Omen 16 (2024) | |
| Lenovo Legion Pro 7 16IRX9H | |
| MSI Vector 16 HX A14V | |
| Moyenne Intel Core i9-14900HX (43306 - 87568, n=36) | |
| Moyenne de la classe Gaming (22956 - 104349, n=128, 2 dernières années) | |
| Alienware m16 R1 AMD | |
| AIDA64 / Memory Write | |
| HP Omen 16 (2024) | |
| MSI Vector 16 HX A14V | |
| Moyenne de la classe Gaming (22297 - 133486, n=128, 2 dernières années) | |
| Moyenne Intel Core i9-14900HX (37146 - 80589, n=36) | |
| Lenovo Legion Pro 7 16IRX9H | |
| Alienware m16 R1 AMD | |
| AIDA64 / Memory Latency | |
| Moyenne de la classe Gaming (75.3 - 259, n=128, 2 dernières années) | |
| Alienware m16 R1 AMD | |
| Moyenne Intel Core i9-14900HX (76.1 - 105, n=36) | |
| HP Omen 16 (2024) | |
| MSI Vector 16 HX A14V | |
| Lenovo Legion Pro 7 16IRX9H | |
* ... Moindre est la valeur, meilleures sont les performances
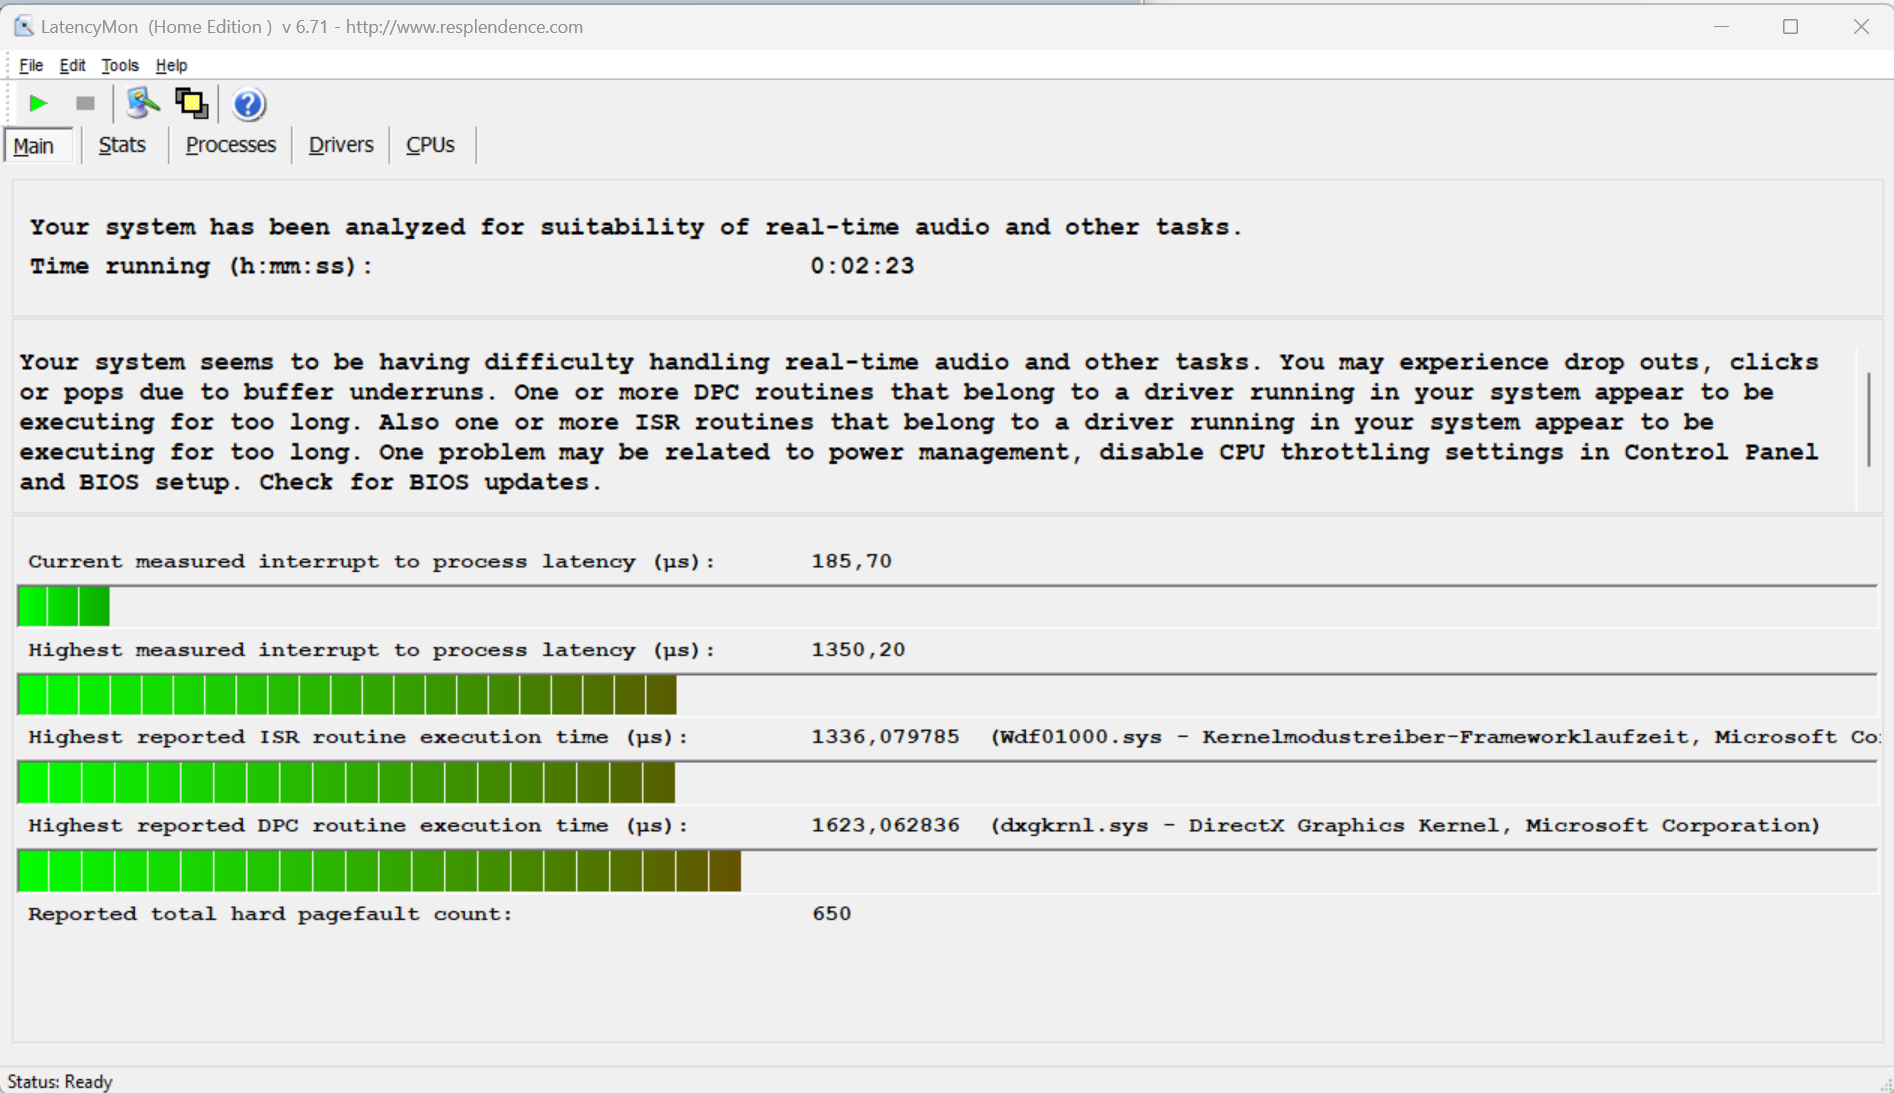
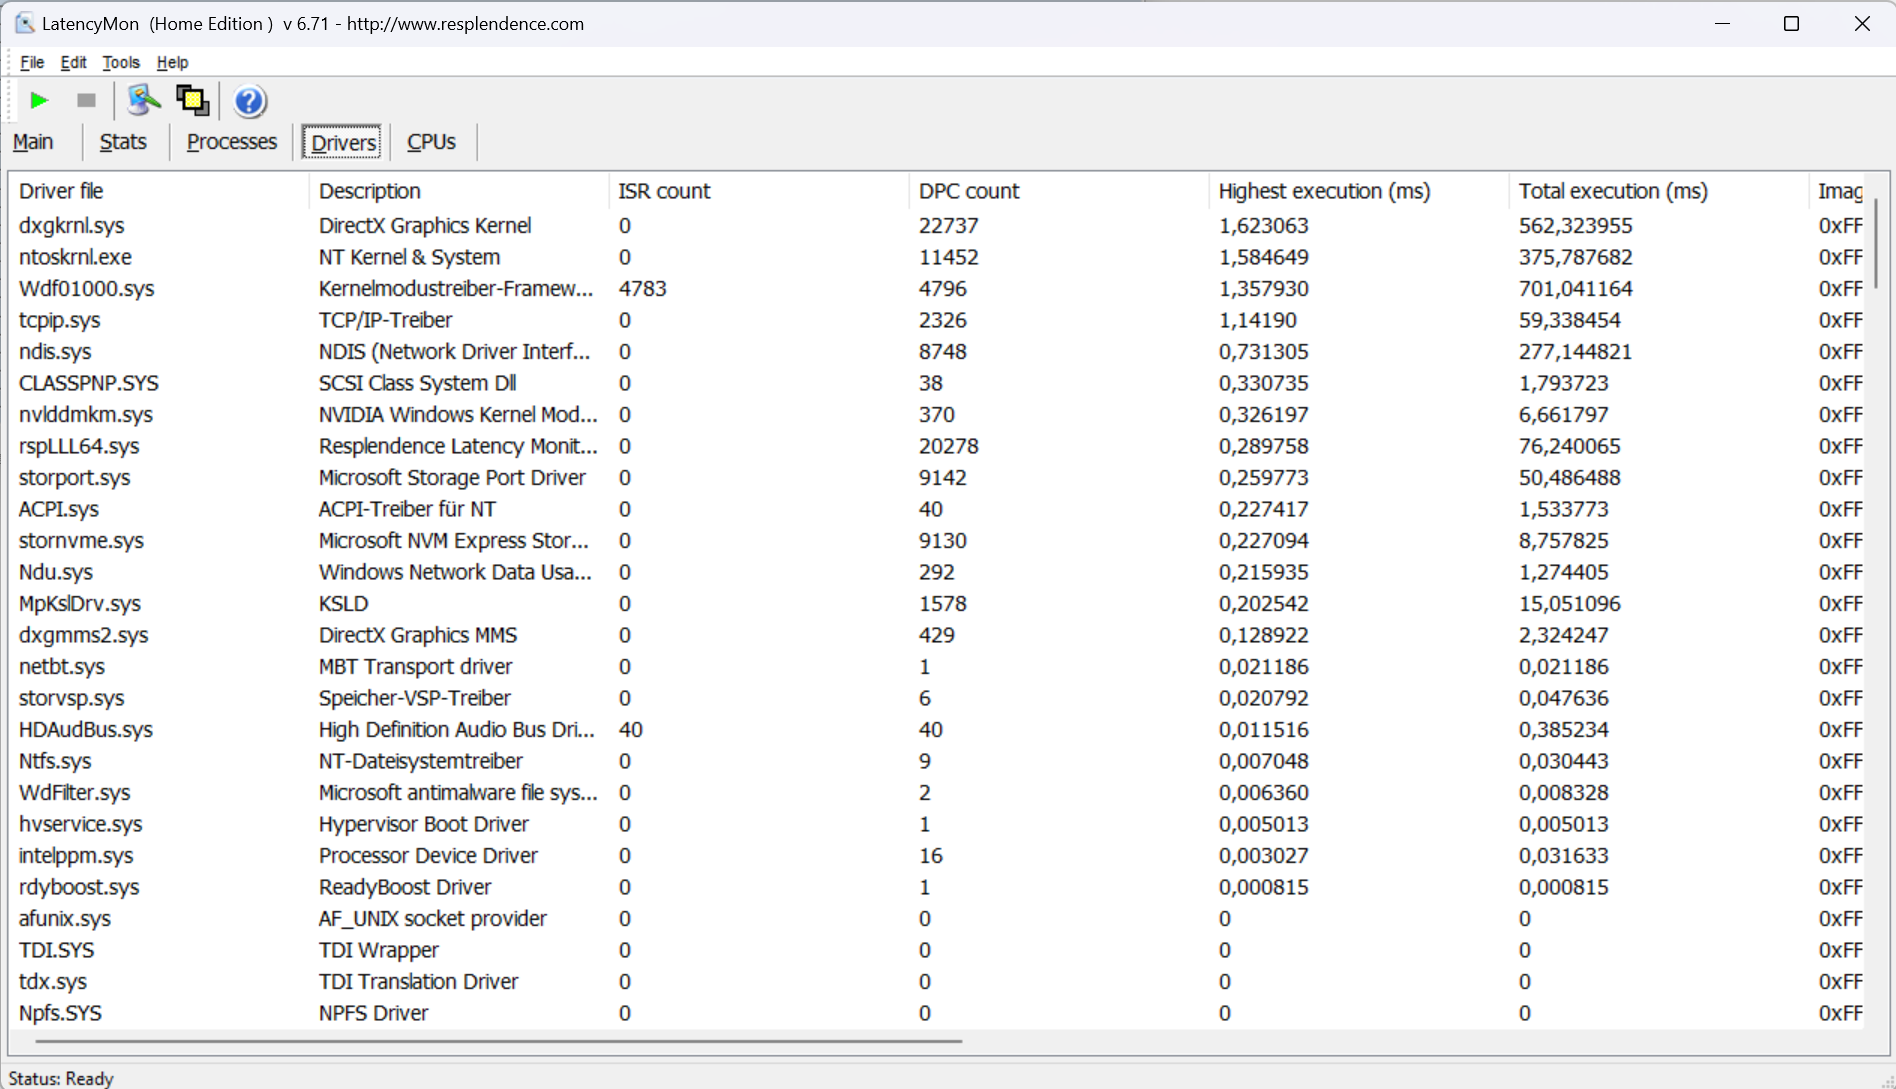
Latence DPC
Latency Monitor a révélé quelques problèmes lors du test de latence (navigation web, lecture vidéo 4K, charge élevée Prime95). Le système ne semble pas adapté aux tâches vidéo et audio en temps réel. Espérons que les prochaines mises à jour logicielles seront en mesure d'améliorer la situation.
| DPC Latencies / LatencyMon - interrupt to process latency (max), Web, Youtube, Prime95 | |
| Alienware m16 R1 AMD | |
| MSI Vector 16 HX A14V | |
| Lenovo Legion Pro 7 16IRX9H | |
| HP Omen 16 (2024) | |
| Lenovo Legion Pro 7 16IRX8H | |
* ... Moindre est la valeur, meilleures sont les performances
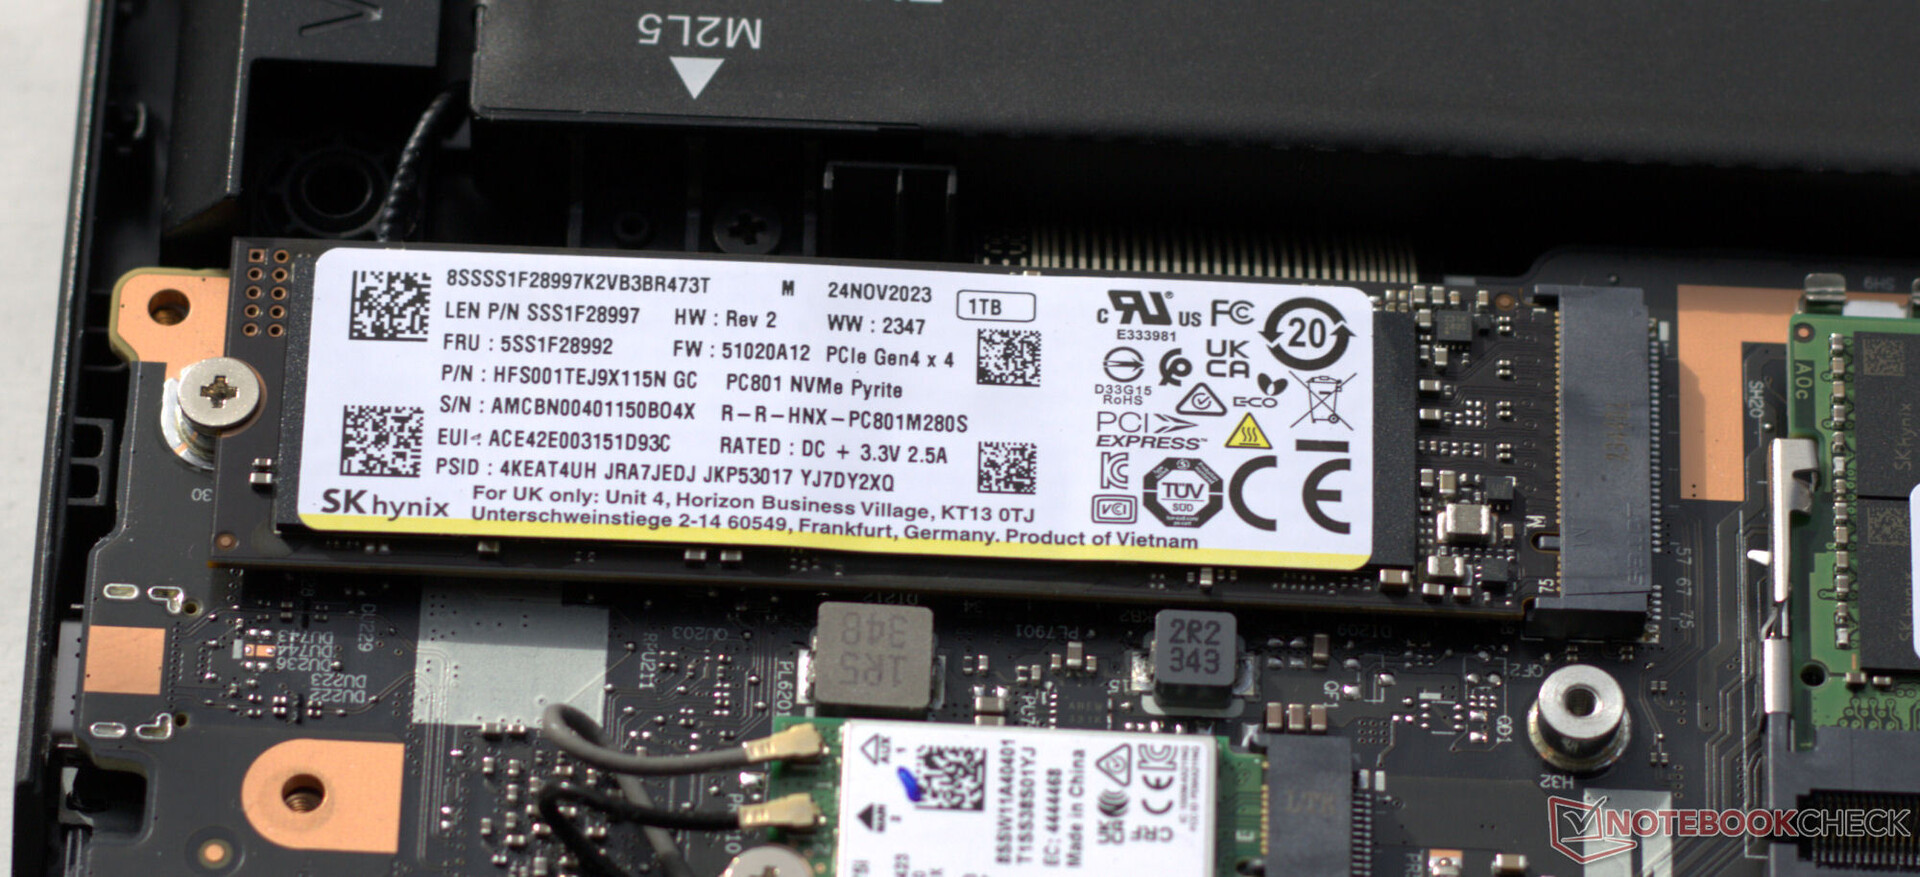
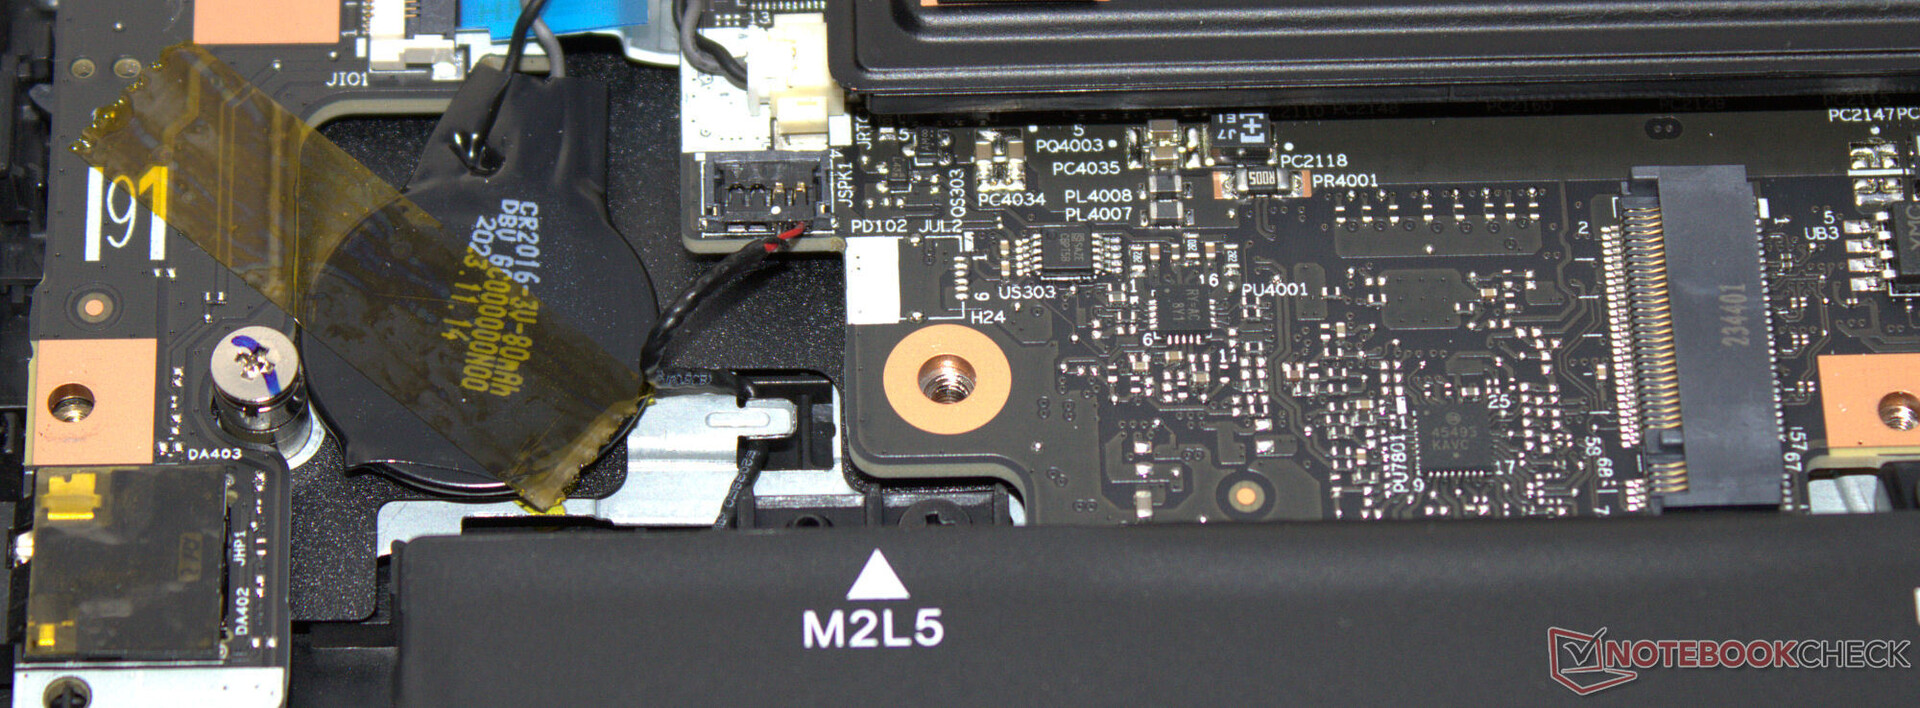
Mémoire de masse
Le site Legion peut accueillir deux disques durs PCIe 4.0. Le SK Hynix M.2 2280 SSD (1 To) de notre unité de test a fourni d'excellentes vitesses de lecture et d'écriture. Autre point positif, il n'y a pas eu d'étranglement thermique lors de nos tests.

* ... Moindre est la valeur, meilleures sont les performances
Sustained load Read: DiskSpd Read Loop, Queue Depth 8
Carte graphique
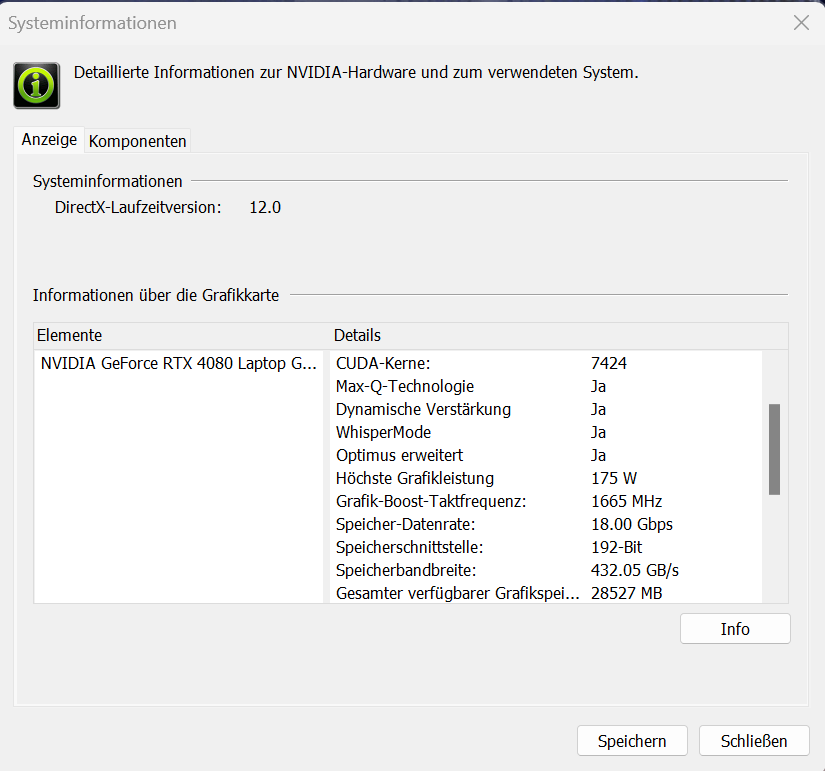
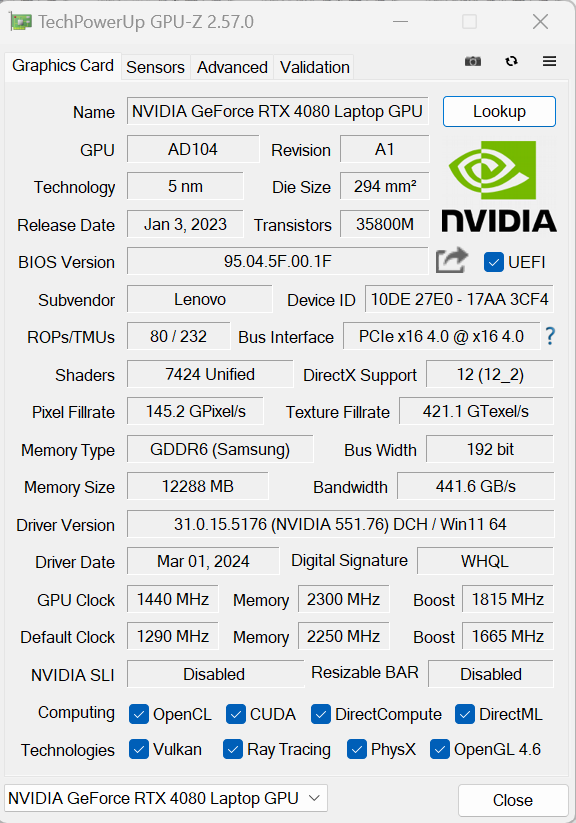
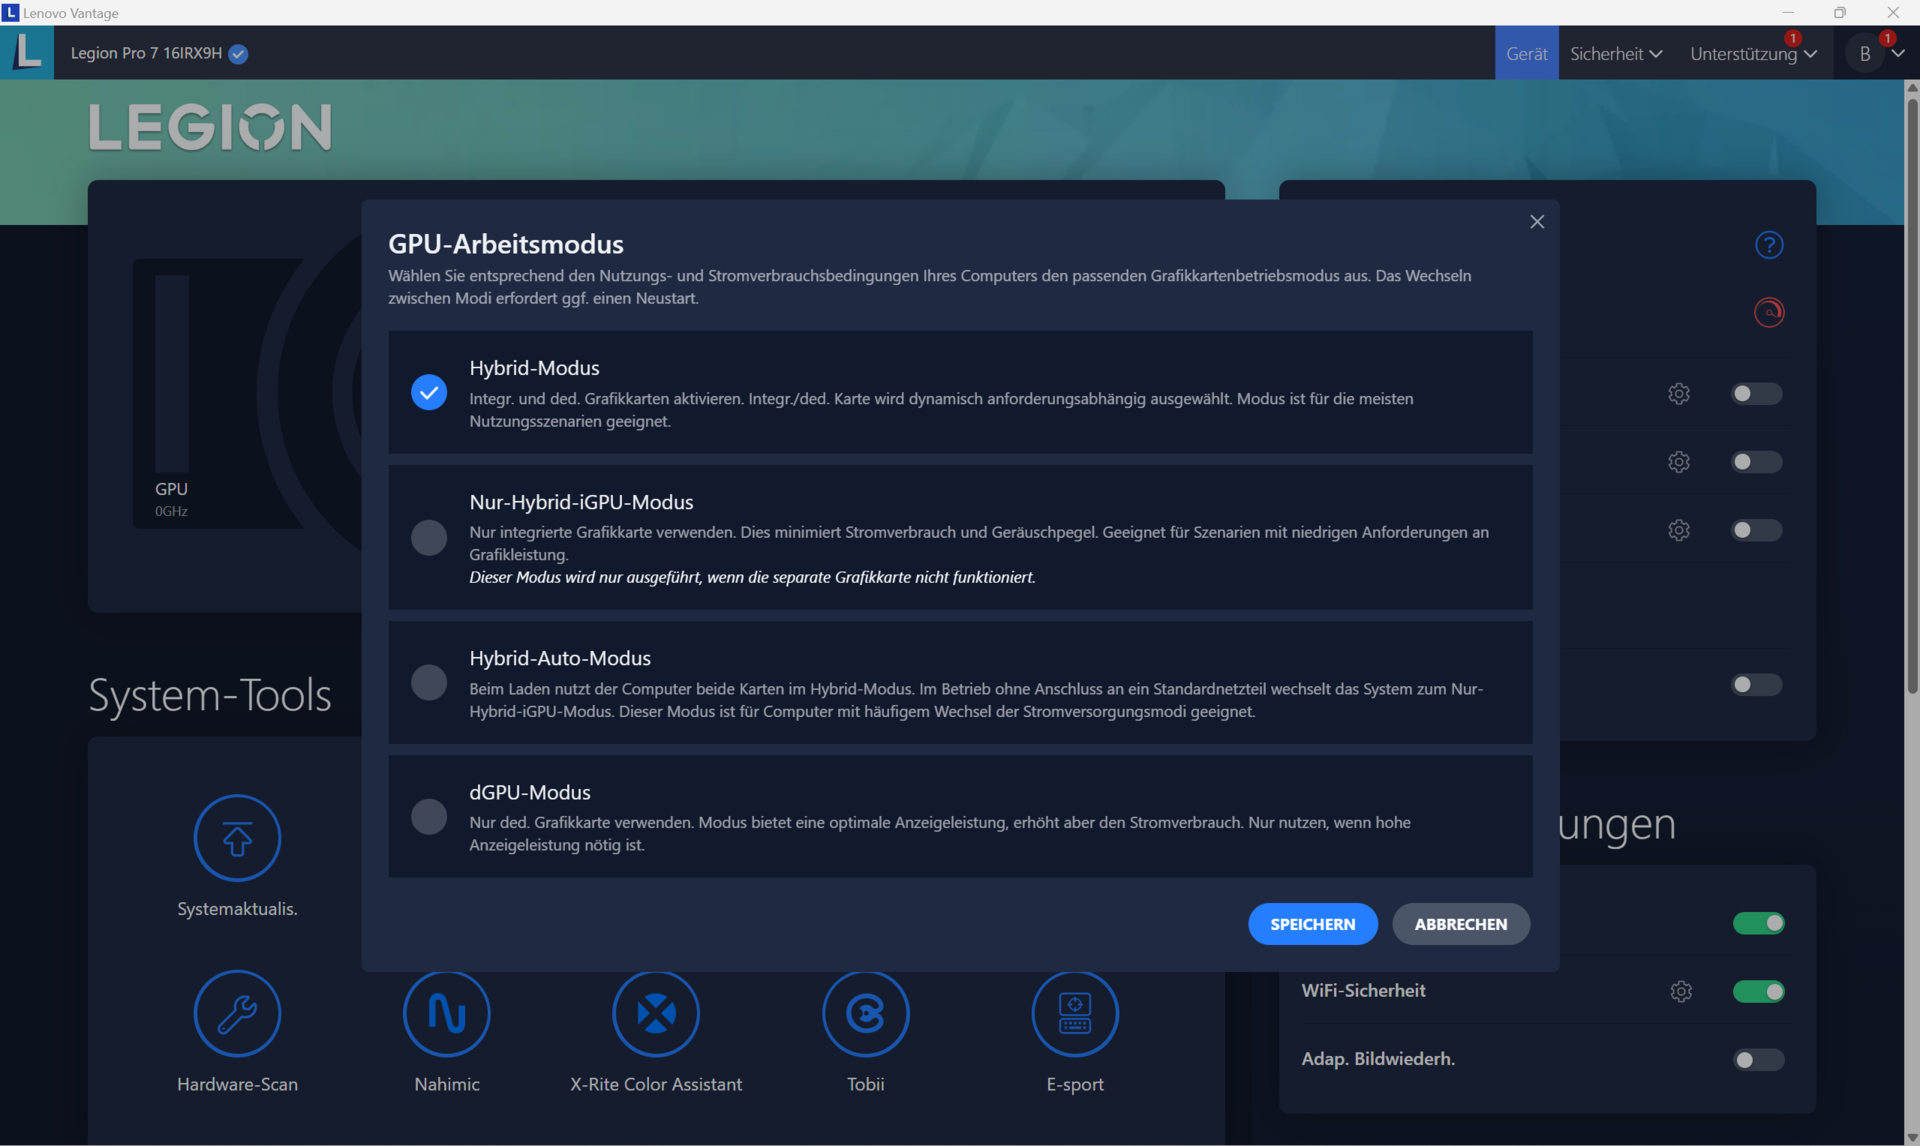
Lenovo a équipé le Legion Pro 7 d'une carte graphique GeForce RTX 4080 (7 424 unités d'ombrage, un bus mémoire de 192 bits, 12 Go de GDDR6, 175 watts), qui est actuellement le numéro deux de la gamme de GPU mobiles de Nvidia. Les scores de référence et les taux de rafraîchissement obtenus lors de nos tests sont supérieurs à ce que la RTX 4080 Laptop peut faire en moyenne. Certains de ces résultats sont les meilleurs que nous ayons vus avec une RTX 4080 jusqu'à présent. Le passage du mode dGPU-only au mode Optimus ne nécessite pas de redémarrage ; le mode Optimus avancé est également pris en charge.
La carte graphique est suffisamment puissante pour les jeux en QHD avec des paramètres élevés à maximaux. Avec l'aide de DLSS 3 et Frame Generation, vous pouvez également atteindre des résolutions plus élevées avec des paramètres maximums et avec le ray tracing activé - mais seulement dans les jeux qui prennent en charge ces fonctionnalités.
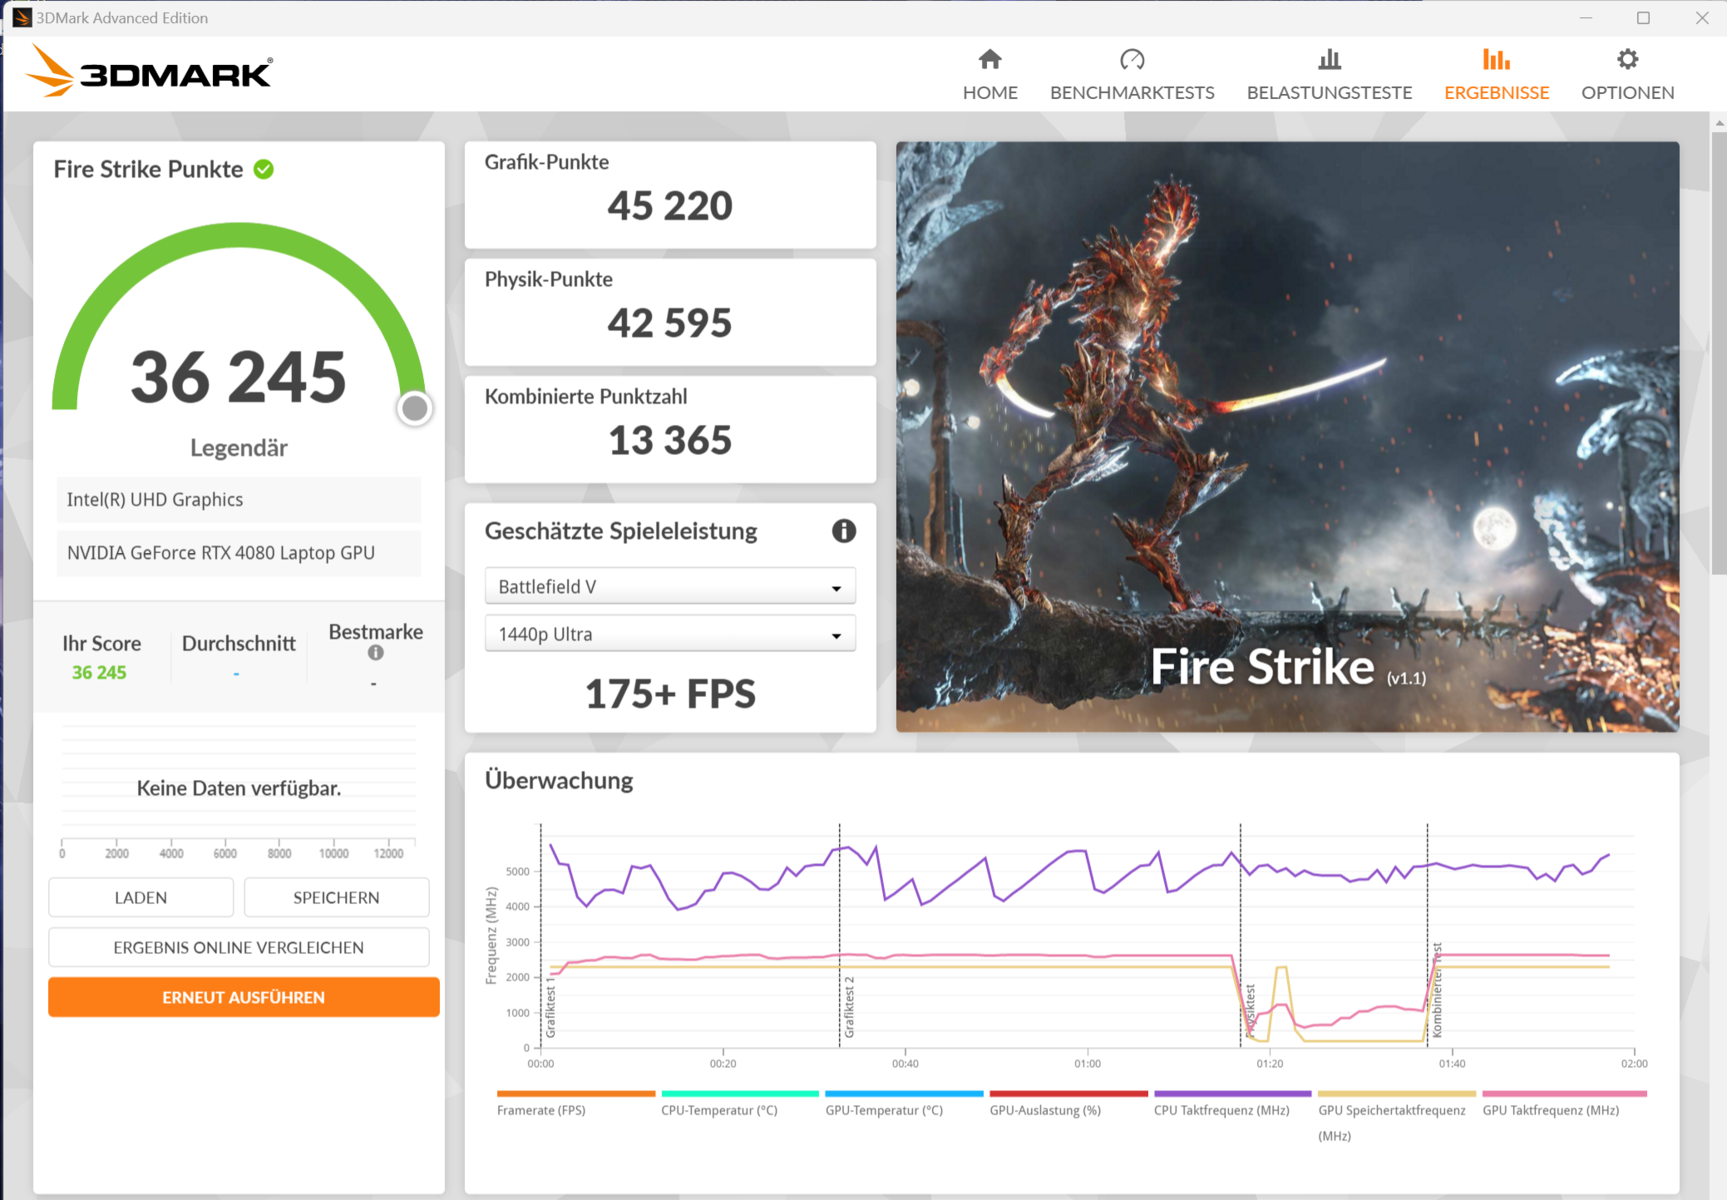
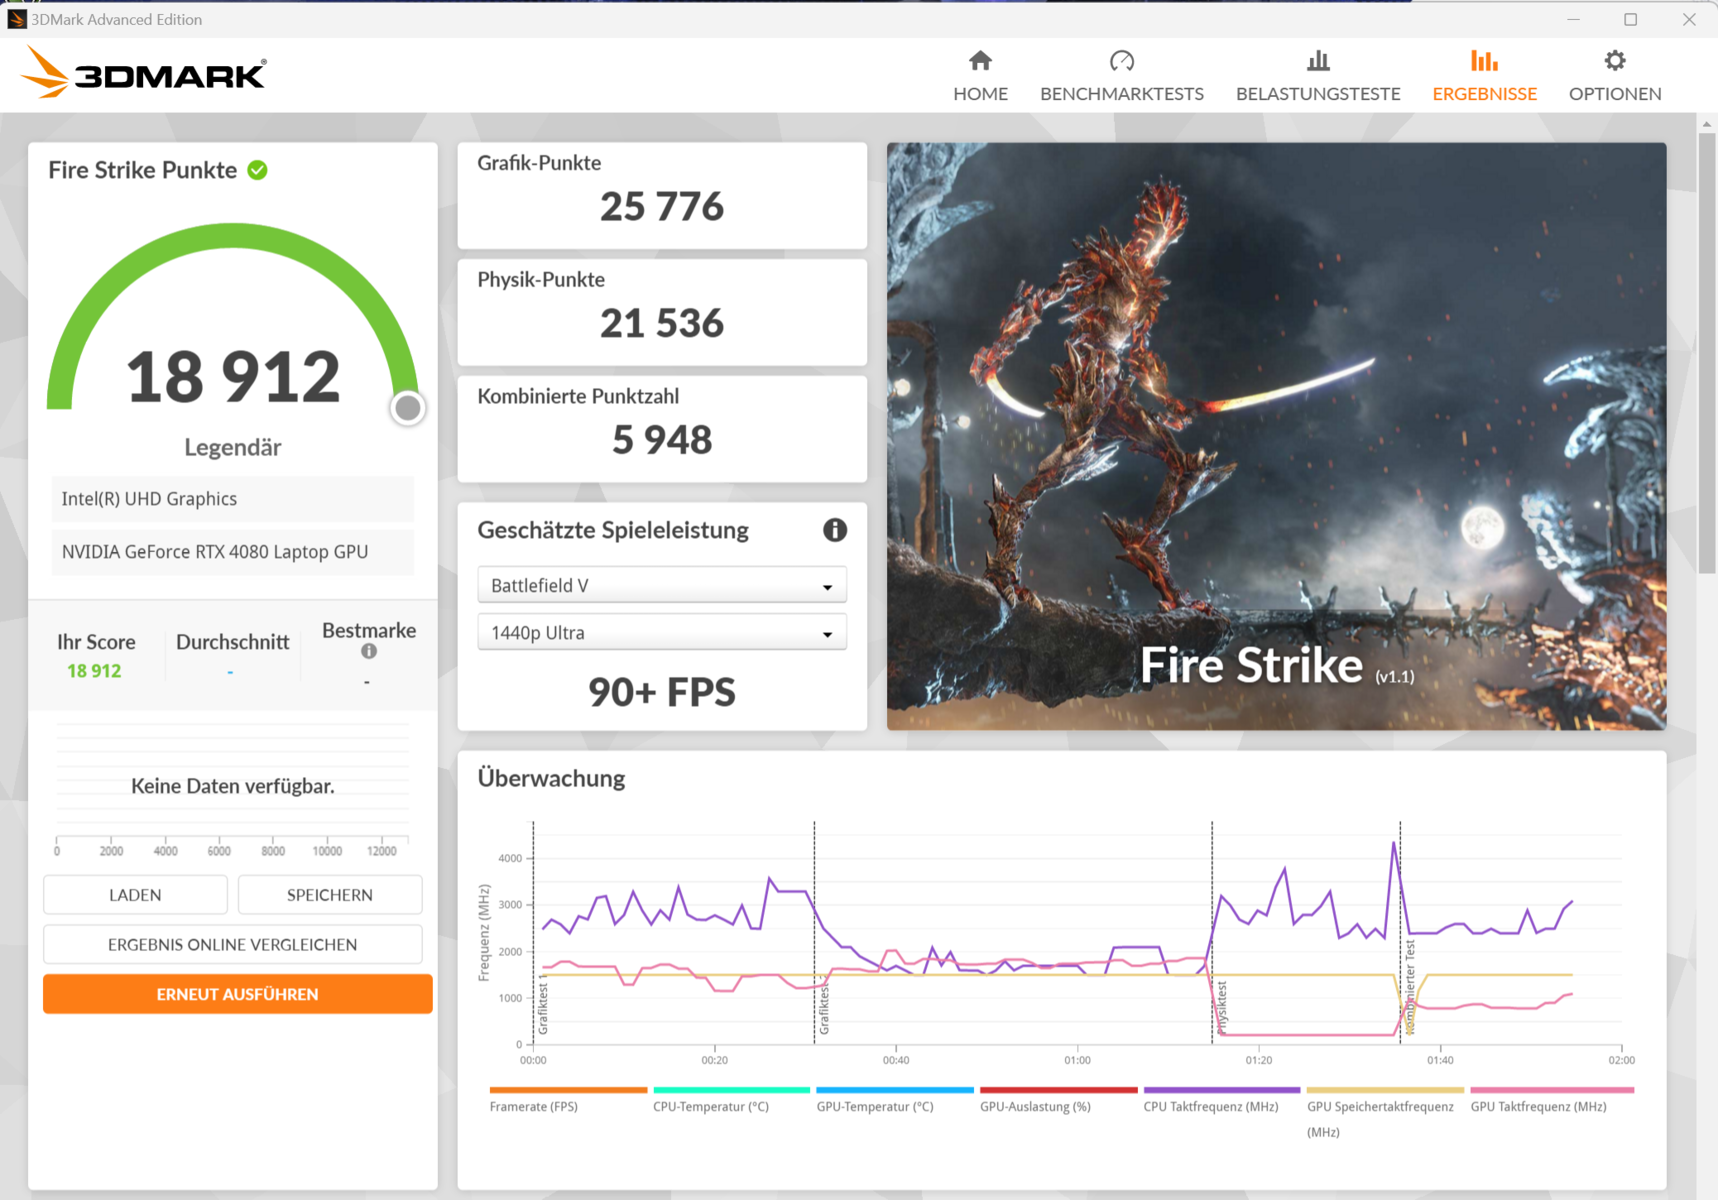
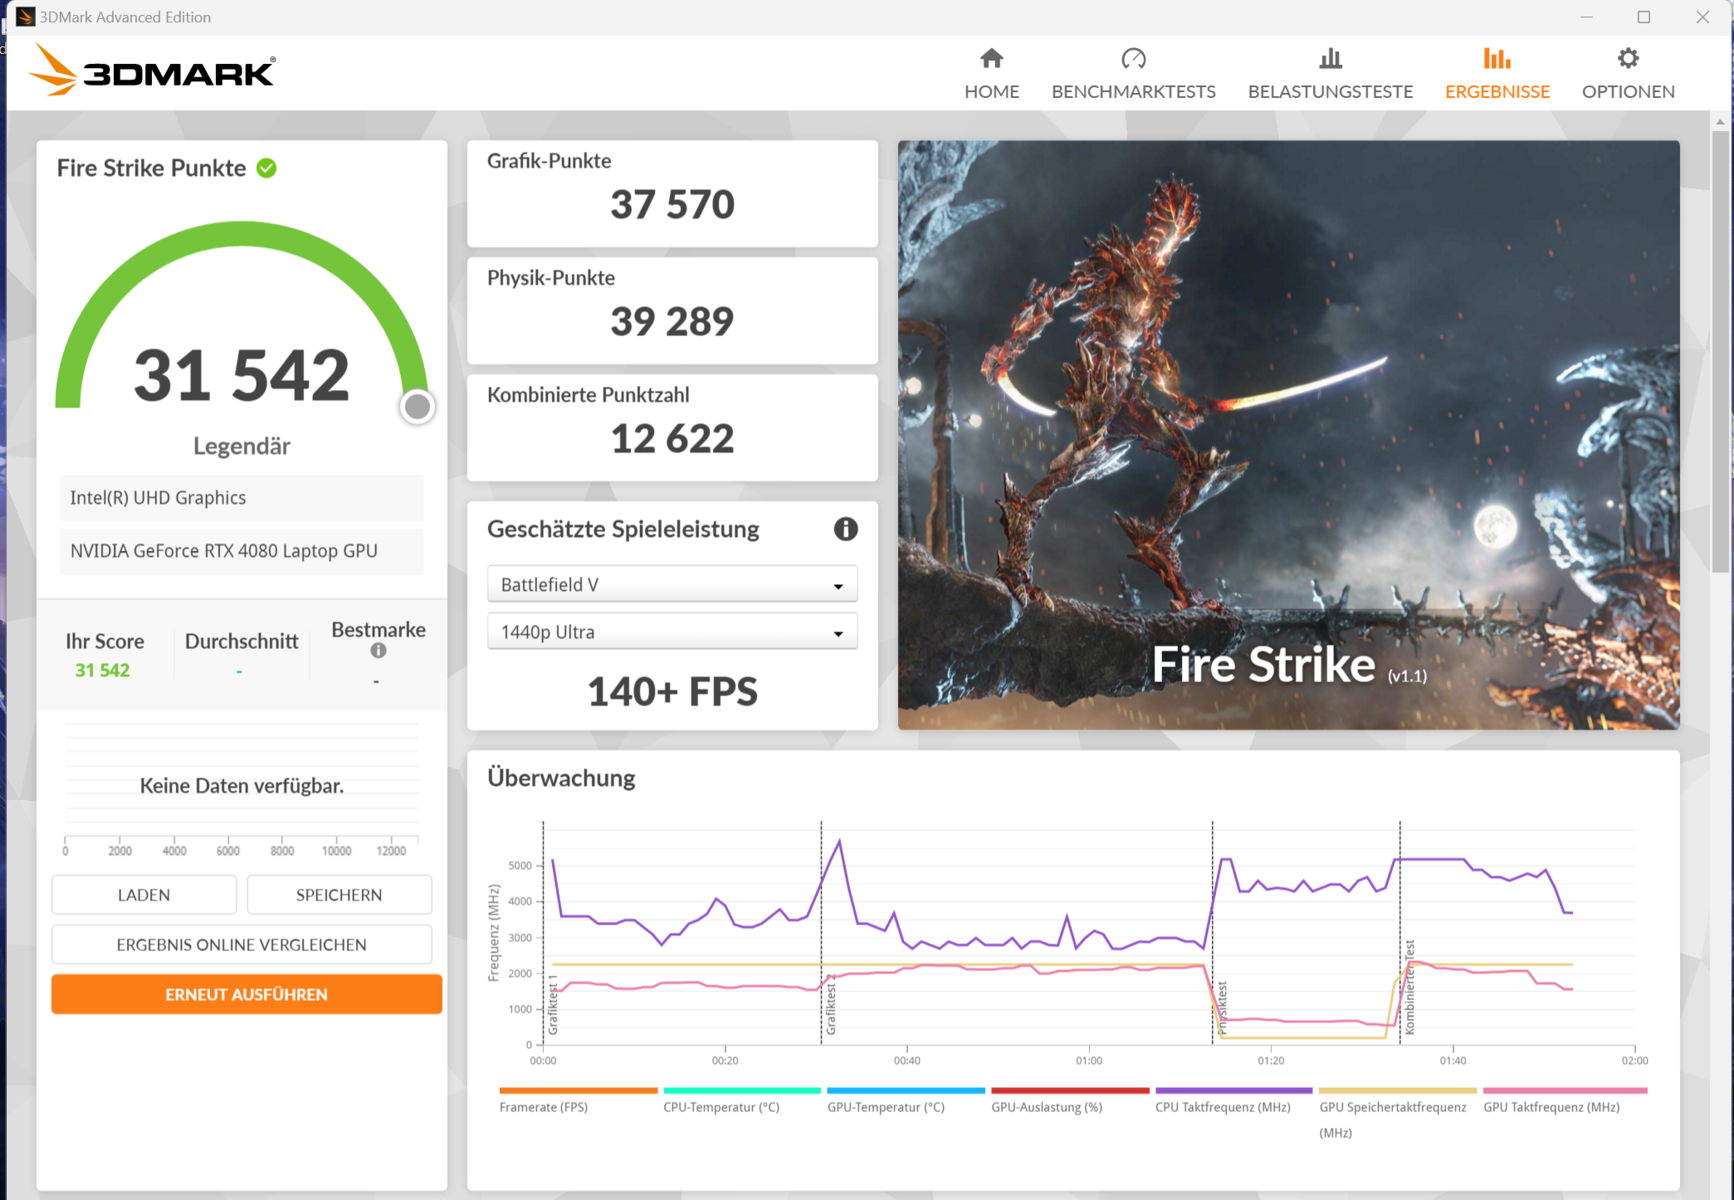
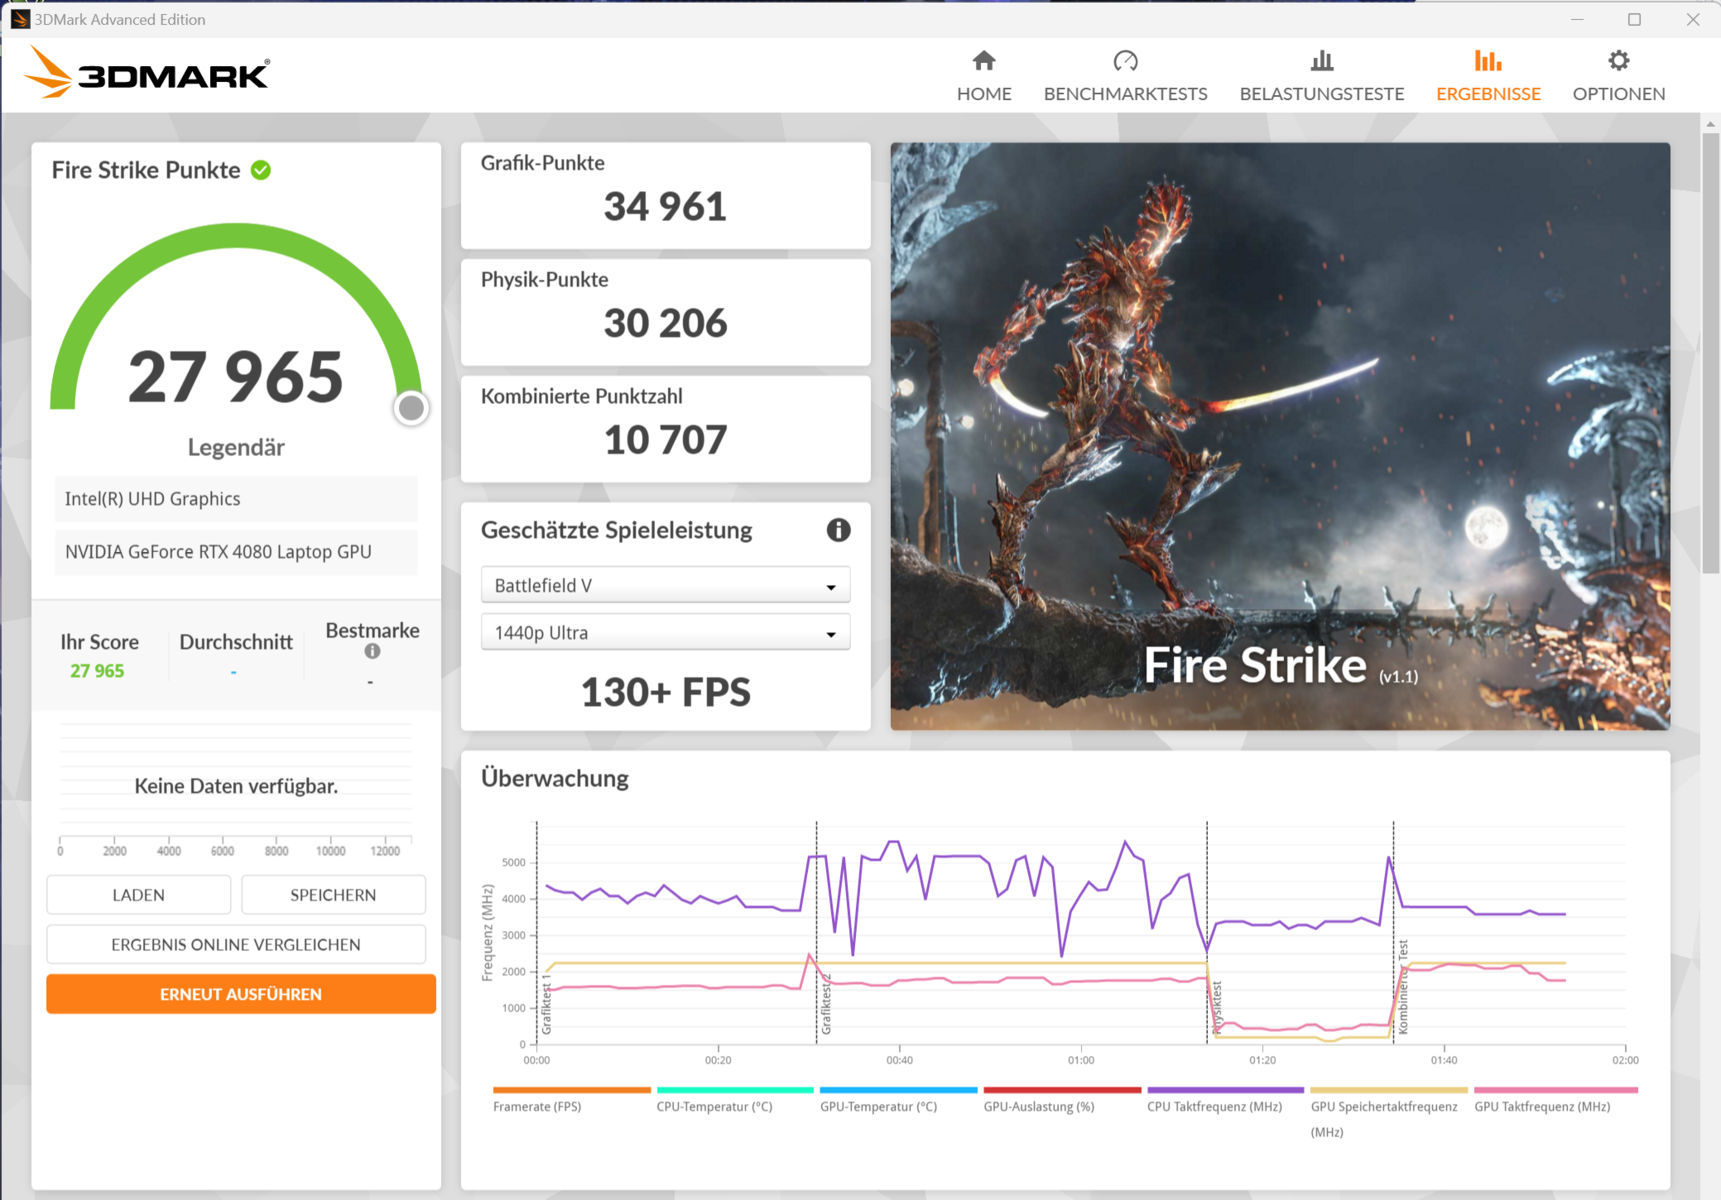
| 3DMark 11 Performance | 46847 points | |
| 3DMark Fire Strike Score | 36245 points | |
| 3DMark Time Spy Score | 19518 points | |
Aide | ||
* ... Moindre est la valeur, meilleures sont les performances
| Performance rating - Percent | |
| Lenovo Legion Pro 7 16IRX9H | |
| MSI Vector 16 HX A14V | |
| Alienware m16 R1 AMD -1! | |
| Moyenne NVIDIA GeForce RTX 4080 Laptop GPU | |
| Moyenne de la classe Gaming | |
| HP Omen 16 (2024) | |
| The Witcher 3 - 1920x1080 Ultra Graphics & Postprocessing (HBAO+) | |
| Lenovo Legion Pro 7 16IRX9H | |
| MSI Vector 16 HX A14V | |
| Alienware m16 R1 AMD | |
| Moyenne NVIDIA GeForce RTX 4080 Laptop GPU (130.4 - 186.1, n=20) | |
| Moyenne de la classe Gaming (83.7 - 240, n=32, 2 dernières années) | |
| HP Omen 16 (2024) | |
| GTA V - 1920x1080 Highest AA:4xMSAA + FX AF:16x | |
| Lenovo Legion Pro 7 16IRX9H | |
| MSI Vector 16 HX A14V | |
| Moyenne NVIDIA GeForce RTX 4080 Laptop GPU (102.9 - 152.7, n=21) | |
| Moyenne de la classe Gaming (47.9 - 186.9, n=117, 2 dernières années) | |
| HP Omen 16 (2024) | |
| Final Fantasy XV Benchmark - 1920x1080 High Quality | |
| MSI Vector 16 HX A14V | |
| Lenovo Legion Pro 7 16IRX9H | |
| Alienware m16 R1 AMD | |
| Moyenne NVIDIA GeForce RTX 4080 Laptop GPU (129 - 182.1, n=23) | |
| Moyenne de la classe Gaming (37.9 - 215, n=122, 2 dernières années) | |
| HP Omen 16 (2024) | |
| Strange Brigade - 1920x1080 ultra AA:ultra AF:16 | |
| Alienware m16 R1 AMD | |
| MSI Vector 16 HX A14V | |
| Lenovo Legion Pro 7 16IRX9H | |
| Moyenne NVIDIA GeForce RTX 4080 Laptop GPU (239 - 357, n=22) | |
| Moyenne de la classe Gaming (76.3 - 456, n=112, 2 dernières années) | |
| HP Omen 16 (2024) | |
| Dota 2 Reborn - 1920x1080 ultra (3/3) best looking | |
| Lenovo Legion Pro 7 16IRX9H | |
| MSI Vector 16 HX A14V | |
| Alienware m16 R1 AMD | |
| Moyenne NVIDIA GeForce RTX 4080 Laptop GPU (133 - 194.7, n=23) | |
| HP Omen 16 (2024) | |
| Moyenne de la classe Gaming (65.1 - 248, n=129, 2 dernières années) | |
| Call of Duty Modern Warfare 3 2023 - 1920x1080 Extreme Preset | |
| Moyenne NVIDIA GeForce RTX 4080 Laptop GPU (153 - 171, n=3) | |
| Lenovo Legion Pro 7 16IRX9H | |
| Moyenne de la classe Gaming (27 - 205, n=9, 2 dernières années) | |
| Skull & Bones | |
| 1920x1080 Ultra High Preset AA:T | |
| Lenovo Legion Pro 7 16IRX9H | |
| Moyenne NVIDIA GeForce RTX 4080 Laptop GPU (96 - 115, n=3) | |
| Moyenne de la classe Gaming (47 - 118, n=9, 2 dernières années) | |
| 2560x1440 Ultra High Preset AA:T | |
| Lenovo Legion Pro 7 16IRX9H | |
| Moyenne NVIDIA GeForce RTX 4080 Laptop GPU (76 - 91, n=3) | |
| Moyenne de la classe Gaming (37 - 98, n=7, 2 dernières années) | |
| Assassin's Creed Mirage | |
| 1920x1080 Ultra High Preset (Adaptive Quality Off) | |
| Lenovo Legion Pro 7 16IRX9H | |
| Moyenne NVIDIA GeForce RTX 4080 Laptop GPU (129 - 157, n=3) | |
| Moyenne de la classe Gaming (60 - 160, n=6, 2 dernières années) | |
| 2560x1440 Ultra High Preset (Adaptive Quality Off) | |
| Lenovo Legion Pro 7 16IRX9H | |
| Moyenne NVIDIA GeForce RTX 4080 Laptop GPU (112 - 136, n=3) | |
| Moyenne de la classe Gaming (44 - 136, n=6, 2 dernières années) | |
| Avatar Frontiers of Pandora | |
| 1920x1080 Ultra Preset AA:T | |
| Moyenne NVIDIA GeForce RTX 4080 Laptop GPU (87 - 97, n=4) | |
| Lenovo Legion Pro 7 16IRX9H | |
| Moyenne de la classe Gaming (28 - 103, n=6, 2 dernières années) | |
| 2560x1440 Ultra Preset AA:T | |
| Moyenne NVIDIA GeForce RTX 4080 Laptop GPU (59 - 66, n=4) | |
| Lenovo Legion Pro 7 16IRX9H | |
| Moyenne de la classe Gaming (18 - 70, n=6, 2 dernières années) | |
| Last Epoch | |
| 1920x1080 Ultra Preset AA:T | |
| Lenovo Legion Pro 7 16IRX9H | |
| Moyenne NVIDIA GeForce RTX 4080 Laptop GPU (156.5 - 204, n=2) | |
| Moyenne de la classe Gaming (12.6 - 204, n=7, 2 dernières années) | |
| 2560x1440 Ultra Preset AA:T | |
| Lenovo Legion Pro 7 16IRX9H | |
| Moyenne NVIDIA GeForce RTX 4080 Laptop GPU (127.4 - 139, n=2) | |
| Moyenne de la classe Gaming (15.3 - 139, n=4, 2 dernières années) | |
| Alone in the Dark | |
| 1920x1080 Cinematic Preset | |
| Lenovo Legion Pro 7 16IRX9H | |
| Moyenne NVIDIA GeForce RTX 4080 Laptop GPU (120 - 176.4, n=2) | |
| Moyenne de la classe Gaming (13.6 - 189.9, n=6, 2 dernières années) | |
| 2560x1440 Cinematic Preset | |
| Lenovo Legion Pro 7 16IRX9H | |
| Moyenne de la classe Gaming (64.7 - 133.6, n=4, 2 dernières années) | |
| Moyenne NVIDIA GeForce RTX 4080 Laptop GPU (86 - 91.6, n=2) | |
| Horizon Forbidden West | |
| 1920x1080 Very High Preset AA:T | |
| Lenovo Legion Pro 7 16IRX9H | |
| Moyenne NVIDIA GeForce RTX 4080 Laptop GPU (89.2 - 103.5, n=2) | |
| Moyenne de la classe Gaming (14.7 - 140.3, n=21, 2 dernières années) | |
| 2560x1440 Very High Preset AA:T | |
| Lenovo Legion Pro 7 16IRX9H | |
| Moyenne NVIDIA GeForce RTX 4080 Laptop GPU (71 - 83.7, n=2) | |
| Moyenne de la classe Gaming (24.1 - 100.9, n=18, 2 dernières années) | |
Witcher 3 FPS chart
| Bas | Moyen | Élevé | Ultra | QHD | |
|---|---|---|---|---|---|
| GTA V (2015) | 187.2 | 186.6 | 186.5 | 152 | 135.3 |
| The Witcher 3 (2015) | 628.4 | 518.3 | 342.2 | 186.1 | 142.6 |
| Dota 2 Reborn (2015) | 229 | 211 | 197.3 | 183.5 | |
| Final Fantasy XV Benchmark (2018) | 232 | 211 | 173.1 | 139.3 | |
| X-Plane 11.11 (2018) | 196.4 | 162.3 | 127.5 | ||
| Strange Brigade (2018) | 538 | 446 | 377 | 339 | 243 |
| Cyberpunk 2077 (2023) | 152.3 | 137.2 | 126.7 | 118.3 | 79.1 |
| Assassin's Creed Mirage (2023) | 208 | 207 | 199 | 157 | 136 |
| Call of Duty Modern Warfare 3 2023 (2023) | 224 | 205 | 164 | 153 | 110 |
| Avatar Frontiers of Pandora (2023) | 141 | 130 | 114 | 89 | 59 |
| Skull & Bones (2024) | 161 | 151 | 135 | 112 | 89 |
| Last Epoch (2024) | 248 | 237 | 229 | 204 | 139 |
| Alone in the Dark (2024) | 249 | 230 | 214 | 176.4 | 91.6 |
| Horizon Forbidden West (2024) | 153.3 | 145.5 | 108.1 | 103.5 | 83.7 |
Émissions et gestion de l'énergie - L'ordinateur portable Lenovo peut fonctionner silencieusement
Émissions sonores
Le niveau de bruit a atteint 56 dB(A) sous charge en mode Performance. Le mode équilibré offre un bon compromis entre le bruit et les performances ; le mode silencieux ménage vos nerfs mais entraîne une baisse considérable des performances. L'ordinateur portable est généralement silencieux et parfois même silencieux au repos et en utilisation quotidienne (par exemple, applications bureautiques, navigation sur Internet). Il est dommage que nous ayons remarqué un gémissement électronique (doux) provenant occasionnellement de l'intérieur de notre unité d'évaluation.
Degré de la nuisance sonore
| Au repos |
| 25 / 30 / 45 dB(A) |
| Fortement sollicité |
| 50 / 56 dB(A) |
 | ||
30 dB silencieux 40 dB(A) audible 50 dB(A) bruyant |
||
min: | ||
| Lenovo Legion Pro 7 16IRX9H i9-14900HX, GeForce RTX 4080 Laptop GPU | Alienware m16 R1 AMD R9 7845HX, GeForce RTX 4080 Laptop GPU | MSI Vector 16 HX A14V i9-14900HX, GeForce RTX 4080 Laptop GPU | HP Omen 16 (2024) i9-14900HX, GeForce RTX 4080 Laptop GPU | Lenovo Legion Pro 7 16IRX8H i9-13900HX, GeForce RTX 4080 Laptop GPU | |
|---|---|---|---|---|---|
| Noise | 13% | -7% | 7% | 4% | |
| arrêt / environnement * (dB) | 24 | 22.9 5% | 23.2 3% | 25 -4% | 24 -0% |
| Idle Minimum * (dB) | 25 | 22.9 8% | 33.5 -34% | 29 -16% | 26 -4% |
| Idle Average * (dB) | 30 | 29.7 1% | 33.5 -12% | 30 -0% | 28 7% |
| Idle Maximum * (dB) | 45 | 29.7 34% | 33.5 26% | 31 31% | 34 24% |
| Load Average * (dB) | 50 | 29.8 40% | 52.1 -4% | 46 8% | 47 6% |
| Witcher 3 ultra * (dB) | 54 | 54.7 -1% | 62 -15% | 47 13% | 55 -2% |
| Load Maximum * (dB) | 56 | 54.7 2% | 62 -11% | 47 16% | 56 -0% |
* ... Moindre est la valeur, meilleures sont les performances
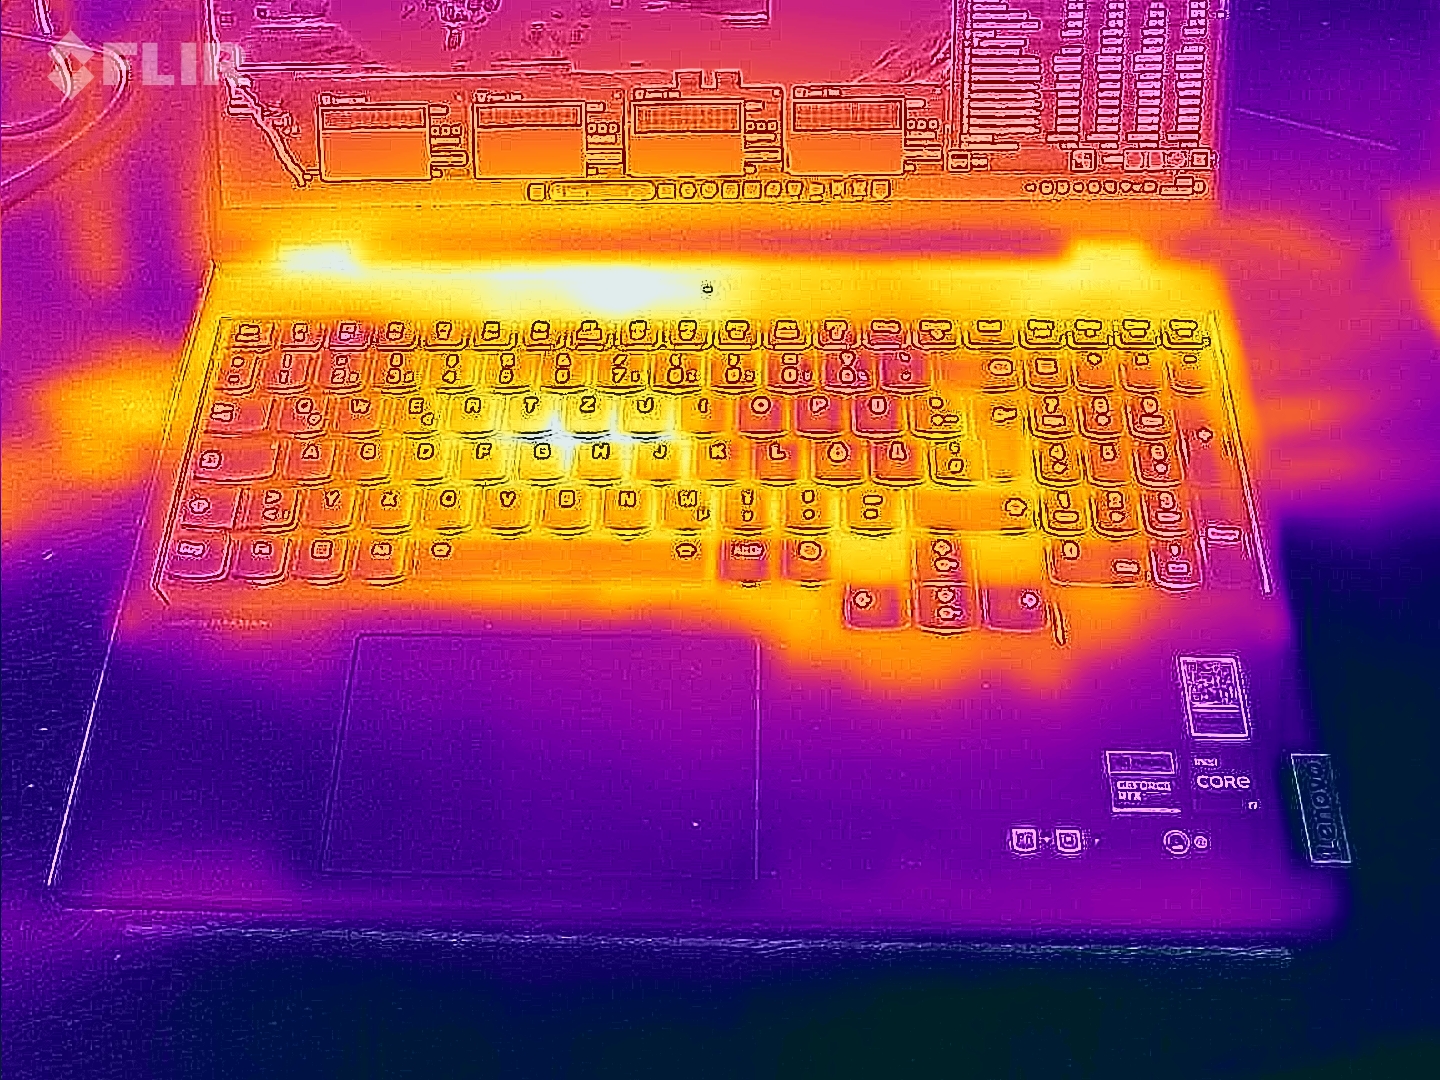
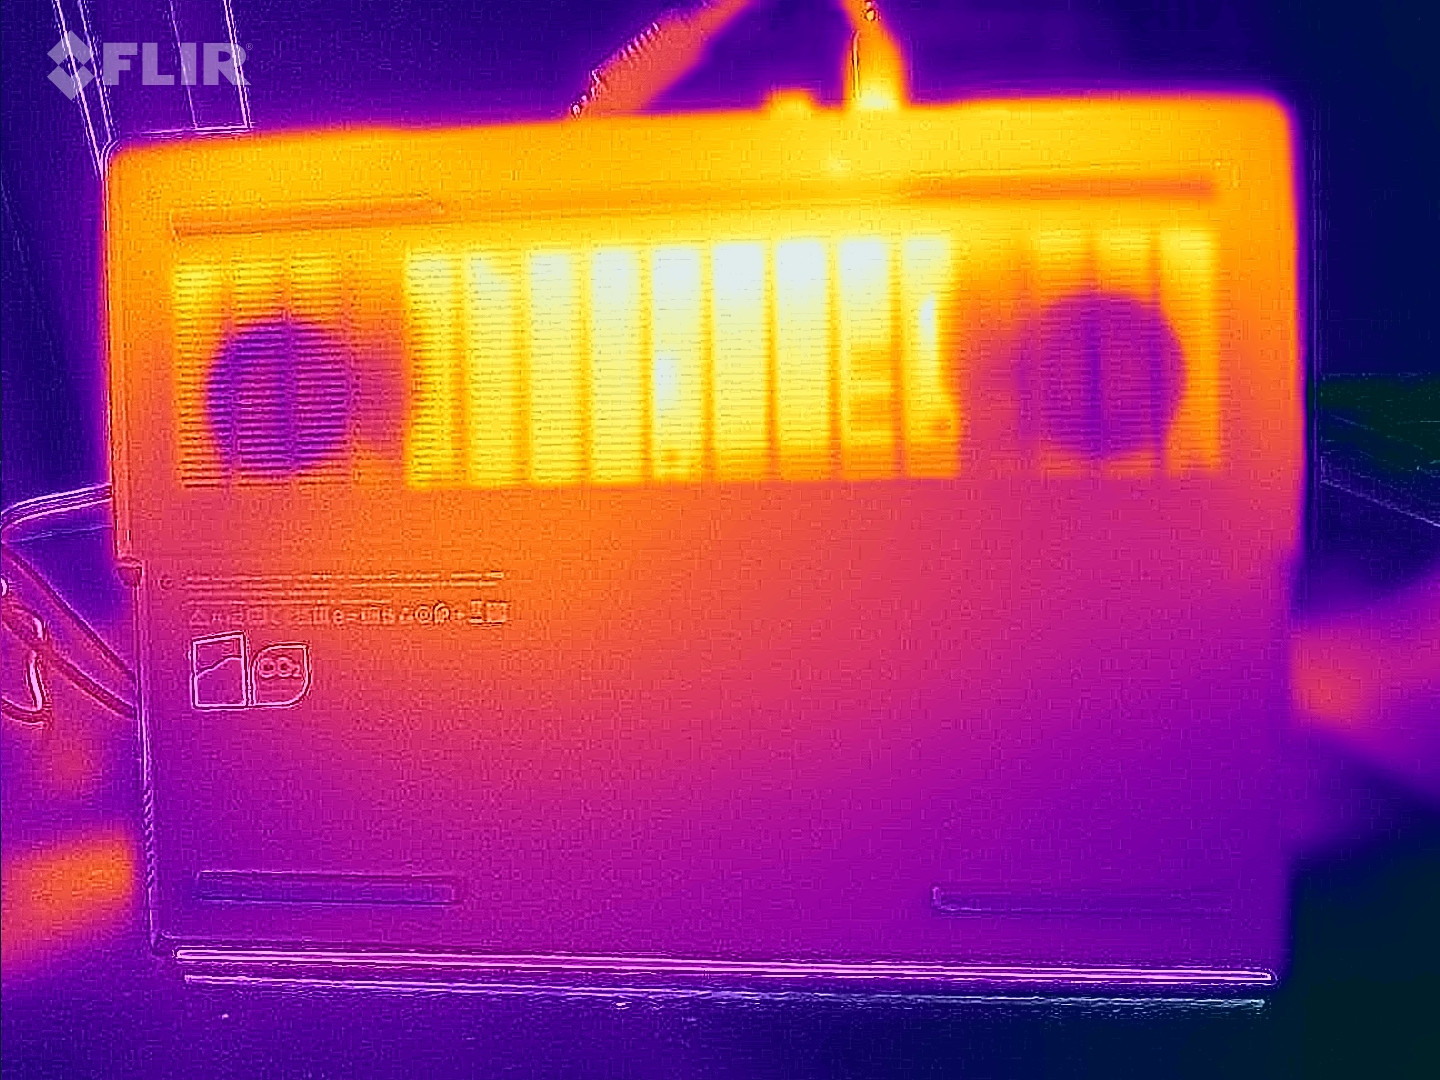
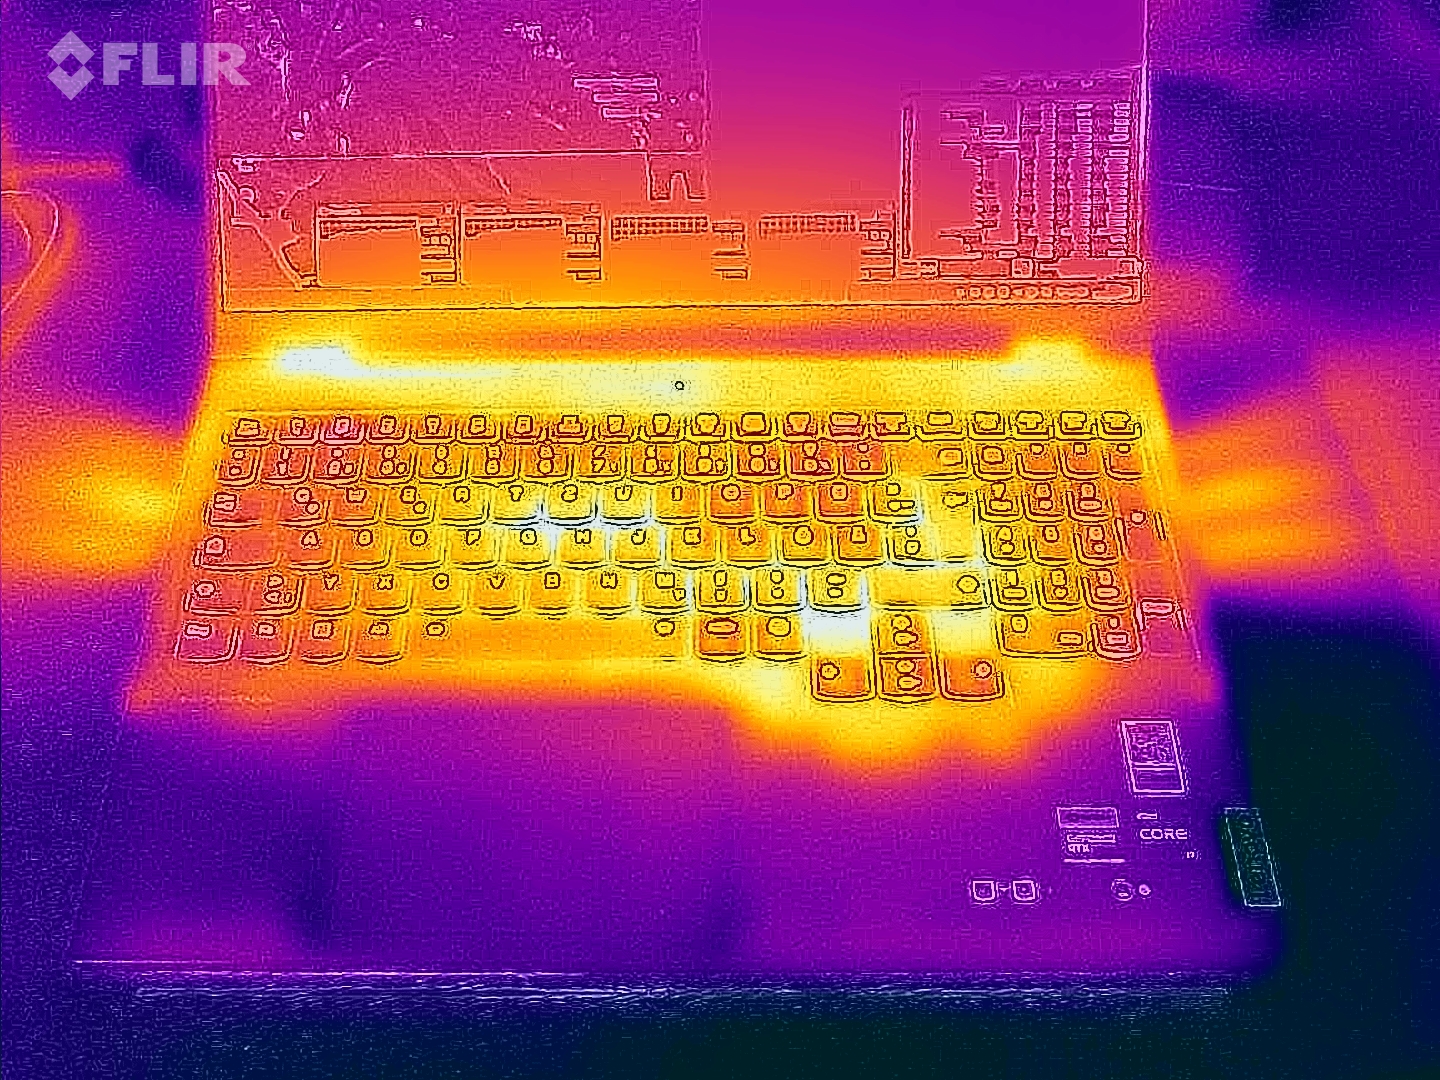
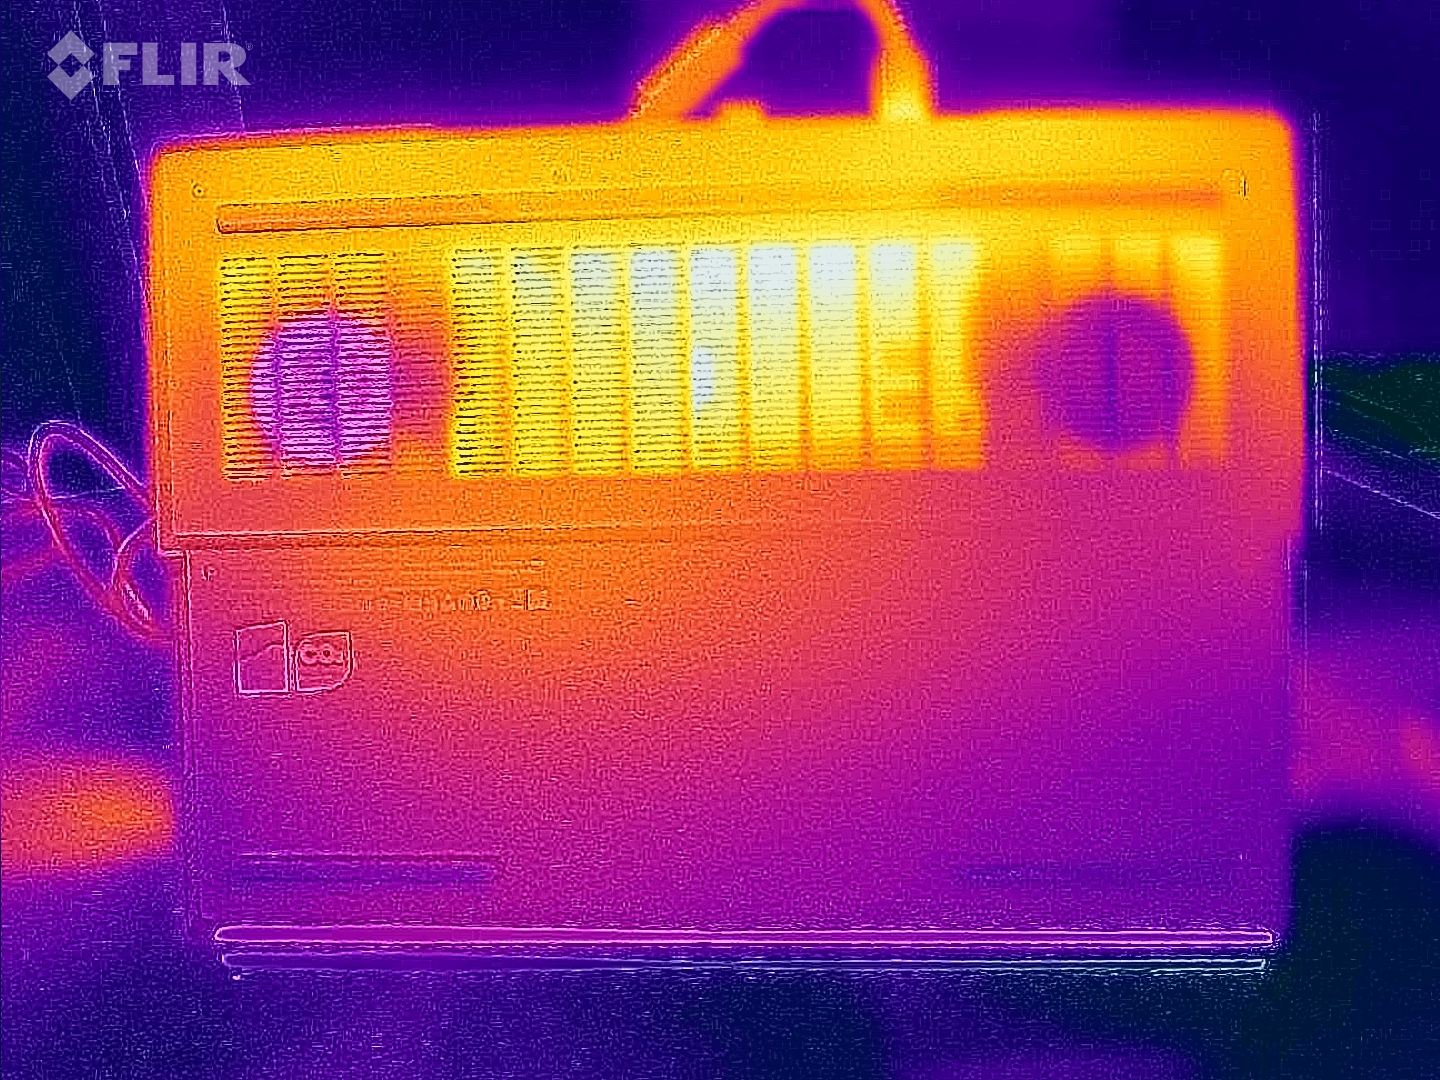
Température
L'ordinateur portable est devenu sensiblement plus chaud pendant le test de stress et le test Witcher 3. Certains points du châssis ont même dépassé les 50°C (122°F). La température du châssis est restée dans une fourchette confortable lors de l'utilisation quotidienne, comme les applications bureautiques et la navigation sur Internet.
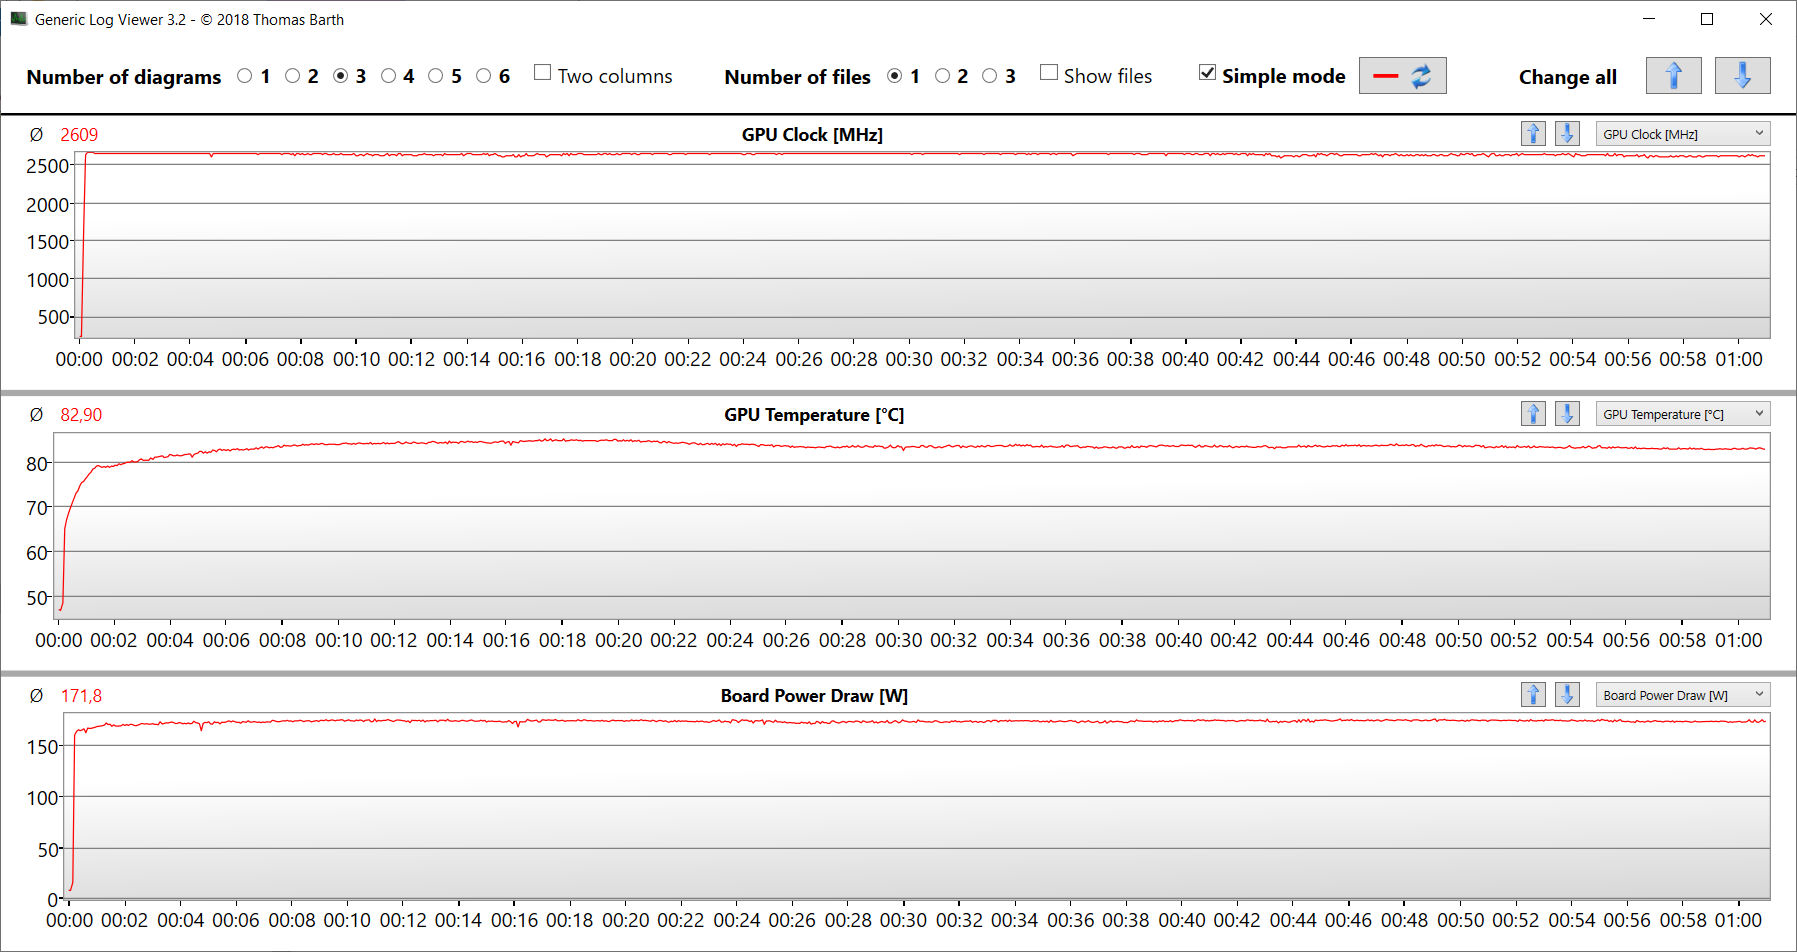
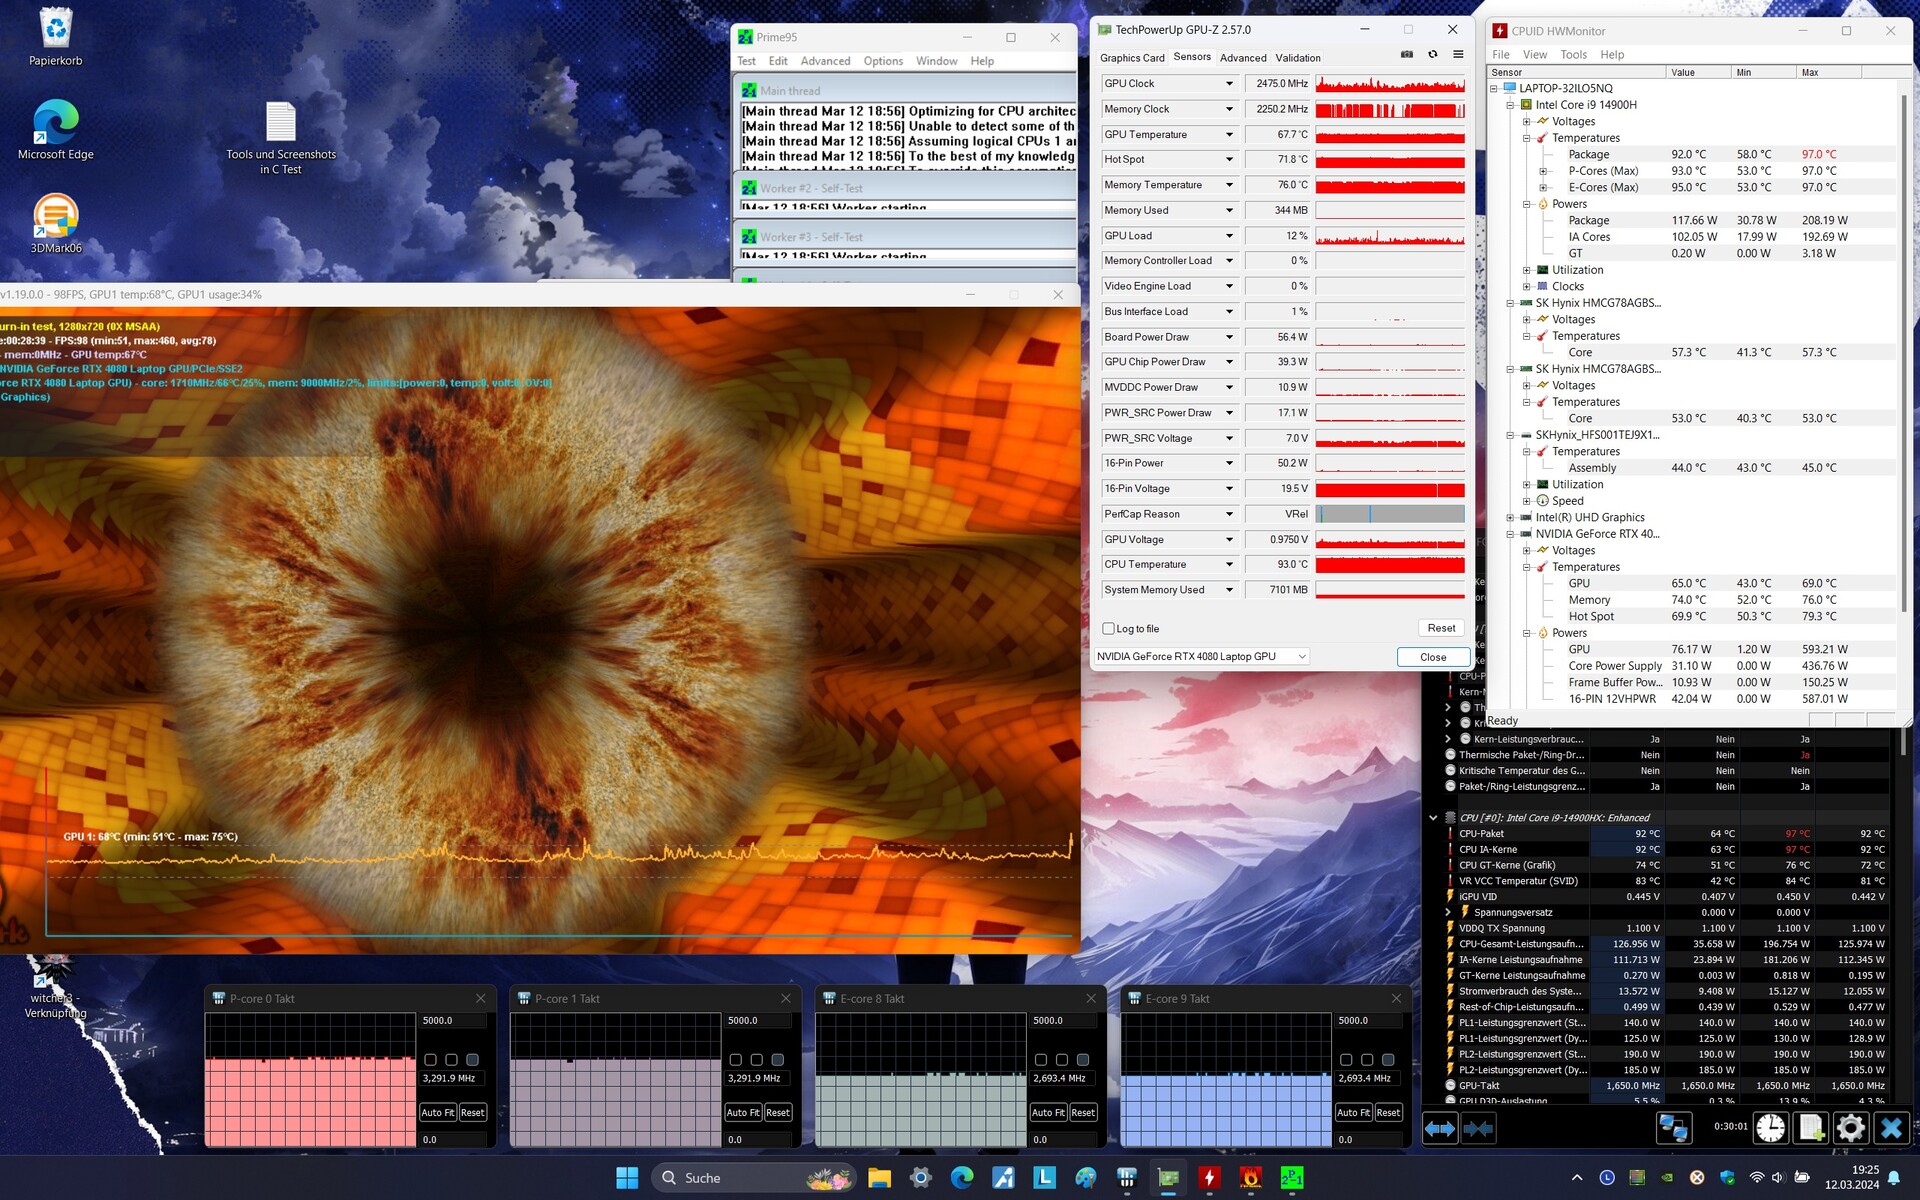
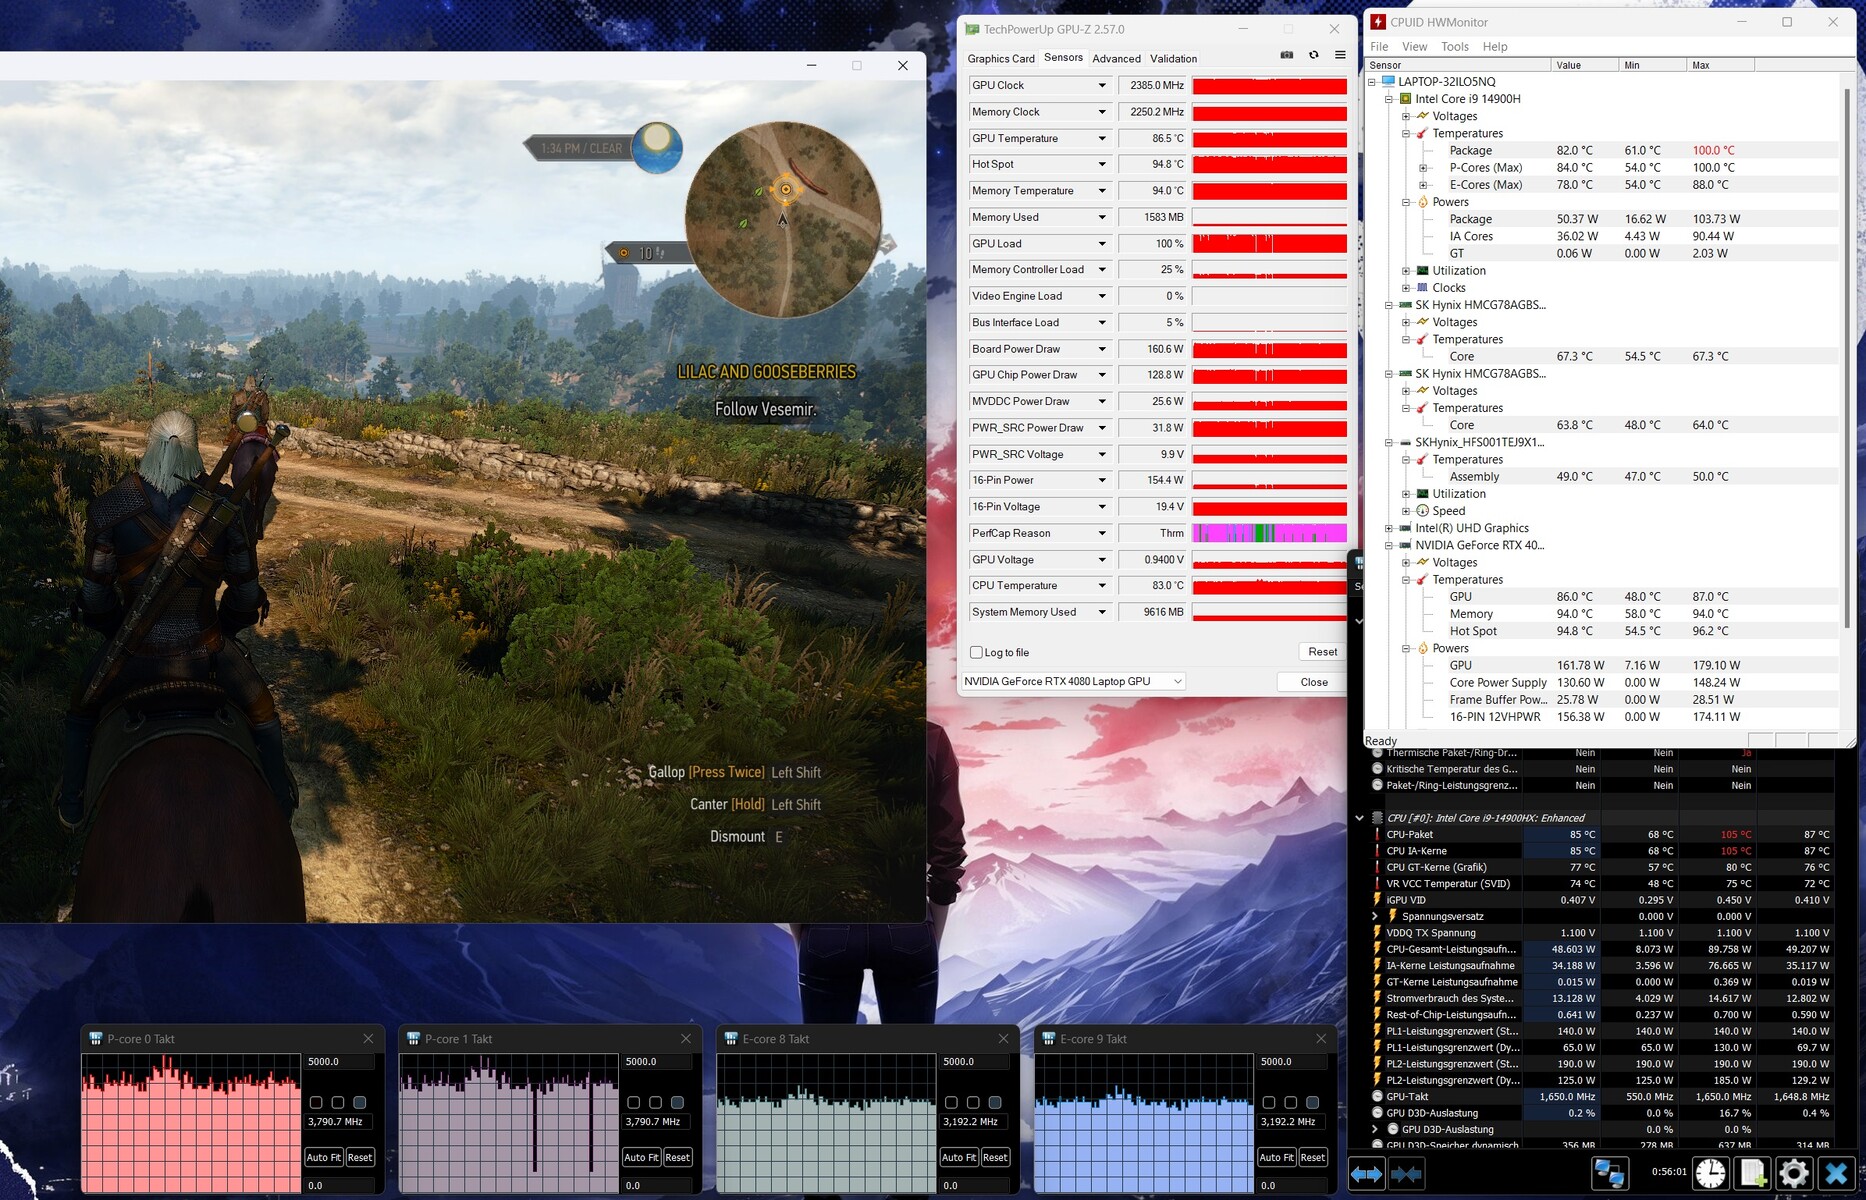
Notre test de stress consiste à faire tourner Prime95 et FurMark simultanément pendant une période prolongée et est conçu pour déterminer la stabilité d'un système à pleine charge. Le CPU et le GPU ont pu maintenir des vitesses d'horloge élevées pendant le test.
(-) La température maximale du côté supérieur est de 46 °C / 115 F, par rapport à la moyenne de 40.4 °C / 105 F, allant de 21.2 à 68.8 °C pour la classe Gaming.
(-) Le fond chauffe jusqu'à un maximum de 49 °C / 120 F, contre une moyenne de 43.3 °C / 110 F
(±) En utilisation inactive, la température moyenne du côté supérieur est de 33.3 °C / 92 F, par rapport à la moyenne du dispositif de 33.9 °C / 93 F.
(-) En jouant à The Witcher 3, la température moyenne du côté supérieur est de 42.7 °C / 109 F, alors que la moyenne de l'appareil est de 33.9 °C / 93 F.
(-) Les repose-poignets et le pavé tactile peuvent devenir très chauds au toucher, avec un maximum de 40 °C / 104# F.
(-) La température moyenne de la zone de l'appui-paume de dispositifs similaires était de 28.8 °C / 83.8 F (-11.2 °C / #-20.2 F).
| Lenovo Legion Pro 7 16IRX9H i9-14900HX, GeForce RTX 4080 Laptop GPU | Alienware m16 R1 AMD R9 7845HX, GeForce RTX 4080 Laptop GPU | MSI Vector 16 HX A14V i9-14900HX, GeForce RTX 4080 Laptop GPU | HP Omen 16 (2024) i9-14900HX, GeForce RTX 4080 Laptop GPU | Lenovo Legion Pro 7 16IRX8H i9-13900HX, GeForce RTX 4080 Laptop GPU | |
|---|---|---|---|---|---|
| Heat | 5% | 26% | 12% | 1% | |
| Maximum Upper Side * (°C) | 46 | 48 -4% | 36.4 21% | 47 -2% | 48 -4% |
| Maximum Bottom * (°C) | 49 | 39 20% | 35.6 27% | 57 -16% | 49 -0% |
| Idle Upper Side * (°C) | 38 | 37 3% | 26.6 30% | 25 34% | 40 -5% |
| Idle Bottom * (°C) | 37 | 36.2 2% | 27 27% | 26 30% | 33 11% |
* ... Moindre est la valeur, meilleures sont les performances
Intervenants
Les haut-parleurs stéréo produisent un son de qualité, tout bien considéré.
Lenovo Legion Pro 7 16IRX9H analyse audio
(+) | les haut-parleurs peuvent jouer relativement fort (84# dB)
Basses 100 - 315 Hz
(±) | basse réduite - en moyenne 8.9% inférieure à la médiane
(±) | la linéarité des basses est moyenne (7.4% delta à la fréquence précédente)
Médiums 400 - 2000 Hz
(+) | médiane équilibrée - seulement 2.8% de la médiane
(+) | les médiums sont linéaires (4% delta à la fréquence précédente)
Aiguës 2 - 16 kHz
(+) | des sommets équilibrés - à seulement 3% de la médiane
(+) | les aigus sont linéaires (5% delta à la fréquence précédente)
Globalement 100 - 16 000 Hz
(+) | le son global est linéaire (8.4% différence à la médiane)
Par rapport à la même classe
» 2% de tous les appareils testés de cette catégorie étaient meilleurs, 1% similaires, 97% pires
» Le meilleur avait un delta de 6%, la moyenne était de 18%, le pire était de 132%.
Par rapport à tous les appareils testés
» 2% de tous les appareils testés étaient meilleurs, 1% similaires, 97% pires
» Le meilleur avait un delta de 4%, la moyenne était de 24%, le pire était de 134%.
HP Omen 16 (2024) analyse audio
(±) | le niveau sonore du haut-parleur est moyen mais bon (78# dB)
Basses 100 - 315 Hz
(-) | presque aucune basse - en moyenne 15.2% plus bas que la médiane
(±) | la linéarité des basses est moyenne (14.3% delta à la fréquence précédente)
Médiums 400 - 2000 Hz
(+) | médiane équilibrée - seulement 4.8% de la médiane
(+) | les médiums sont linéaires (5% delta à la fréquence précédente)
Aiguës 2 - 16 kHz
(+) | des sommets équilibrés - à seulement 2% de la médiane
(+) | les aigus sont linéaires (4.1% delta à la fréquence précédente)
Globalement 100 - 16 000 Hz
(+) | le son global est linéaire (14.7% différence à la médiane)
Par rapport à la même classe
» 28% de tous les appareils testés de cette catégorie étaient meilleurs, 7% similaires, 65% pires
» Le meilleur avait un delta de 6%, la moyenne était de 18%, le pire était de 132%.
Par rapport à tous les appareils testés
» 19% de tous les appareils testés étaient meilleurs, 4% similaires, 77% pires
» Le meilleur avait un delta de 4%, la moyenne était de 24%, le pire était de 134%.
Consommation électrique
Il n'y a pas de surprise en ce qui concerne la consommation d'énergie. Les niveaux d'utilisation sont typiques du matériel utilisé. Le Legion Pro 7 a terminé notre test Witcher 3 et notre test de stress avec un niveau constant de consommation d'énergie. Le chargeur de 330 watts fourni est suffisamment puissant pour l'ordinateur portable.
| Éteint/en veille | |
| Au repos | |
| Fortement sollicité |
|
Légende:
min: | |
Power consumption Witcher 3 / Stress test
Power consumption with external monitor
Durée de vie de la batterie
L'ordinateur portable de 16 pouces a duré 6h13 dans notre test Wi-Fi réaliste, qui simule une charge en accédant à des sites web à l'aide d'un script. Le site Legion dispose de la meilleure autonomie parmi tous les appareils de notre comparatif.
Points positifs
Points négatifs
Verdict - Un ordinateur portable haut de gamme performant

Avec le Legion Pro 7, Lenovo propose un puissant ordinateur portable de 16 pouces pour les joueurs et les créateurs. L'ordinateur portable est équipé d'un écran QHD+ de 16 pouces (2 560 x 1 600 pixels, DCI-P3, G-Sync, HDR, 240 Hz) au format 16:10, idéal pour le travail.
Le Lenovo Legion Pro 7 16IRX9H offre une grande puissance à un prix raisonnable.
Le GeForce RTX 4080 et le Core i9-14900HX qu'il renferme ont réussi à obtenir leurs meilleurs résultats dans certains tests - les deux puces sont sans aucun doute capables de tourner à plein régime en permanence. Il est impossible d'éviter les fortes quantités de chaleur et de bruit propres à cette catégorie d'ordinateurs portables. Toutefois, un mode silencieux permet d'atténuer ces problèmes, au détriment des performances.
Deux ports USB-C (1x Thunderbolt 4, 1x USB 3.2 Gen 2) facilitent l'intégration de l'ordinateur portable dans une configuration de travail existante et ouvrent des options d'extension (par exemple, GPU externe, docks). Les deux ports sont capables d'émettre un signal DisplayPort, et l'un d'entre eux prend même en charge Power Delivery. L'autonomie de la batterie est plutôt correcte.
Le MSI Vector 16 HX A14V
est une alternative qui mérite d'être considérée. Ses performances sont comparables à celles de l'ordinateur Legion, mais son autonomie est légèrement inférieure.<br>Prix et disponibilité
En Europe, le modèle Lenovo Legion Pro 7 présenté ici est disponible à partir de €2,999 (US$3,245) Campuspoint.de und Notebooksbilliger.de après avoir pris en compte les remises spéciales pour les étudiants et les éducateurs.
Bien que le nouveau Legion Pro 7 ne soit pas encore disponible aux États-Unis, vous pouvez trouver son prédécesseur pour environ 2 490 $ US sur Amazon US. Ce modèle particulier est équipé d'un Core i9-13900HX de dernière génération, mais il est en grande partie identique.
Lenovo Legion Pro 7 16IRX9H
- 03/25/2024 v7 (old)
Sascha Mölck
Transparency
La sélection des appareils à examiner est effectuée par notre équipe éditoriale. L'échantillon de test a été prêté à l'auteur par le fabricant ou le détaillant pour les besoins de cet examen. Le prêteur n'a pas eu d'influence sur cette évaluation et le fabricant n'a pas reçu de copie de cette évaluation avant sa publication. Il n'y avait aucune obligation de publier cet article. En tant que média indépendant, Notebookcheck n'est pas soumis à l'autorité des fabricants, des détaillants ou des éditeurs.
Voici comment Notebookcheck teste
Chaque année, Notebookcheck examine de manière indépendante des centaines d'ordinateurs portables et de smartphones en utilisant des procédures standardisées afin de garantir que tous les résultats sont comparables. Nous avons continuellement développé nos méthodes de test depuis environ 20 ans et avons établi des normes industrielles dans le processus. Dans nos laboratoires de test, des équipements de mesure de haute qualité sont utilisés par des techniciens et des rédacteurs expérimentés. Ces tests impliquent un processus de validation en plusieurs étapes. Notre système d'évaluation complexe repose sur des centaines de mesures et de points de référence bien fondés, ce qui garantit l'objectivité.Price comparison

