Test de l'Alienware m16 R1 : les débuts de l'AMD Ryzen 9 7845HX

Après avoir lancé le 15,6 pouces Alienware m15de 15,6 pouces, l'Alienware m17 de 17 pouces Alienware m17et l'Alienware m18 de 18 pouces Alienware m18dell est maintenant prêt à livrer l'Alienware m16 de 16 pouces, équipé des derniers GPU Nvidia Ada Lovelace et d'un choix de processeurs Intel 13th gen Raptor Lake ou AMD Zen 4. L'Alienware m16 se distingue du récent Alienware x16 qui est un modèle encore plus fin avec des spécifications et des caractéristiques différentes.
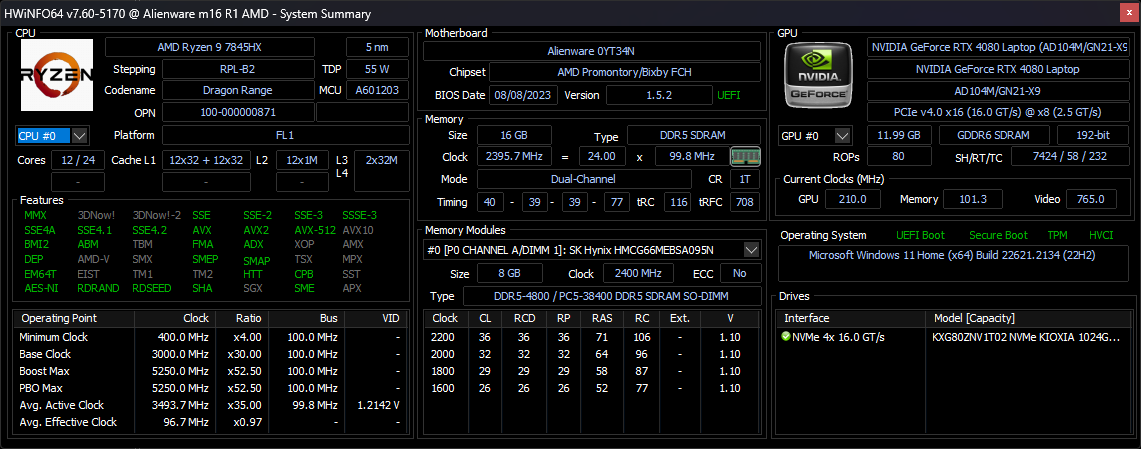
Notre unité de test est une configuration AMD de milieu de gamme supérieure avec le Ryzen 9 7845HX, un GPU RTX 4080 de 175 W GeForce et un écran IPS 1600p240 pour un prix d'environ 2350 USD. Les SKU moins chers sont équipés du CPU Ryzen 7 7745HX et du GPU Radeon RX 7600M pour 2150 USD, tandis que les plus chers avec le Ryzen 9 7945HX et la RTX 4090 peuvent se vendre à plus de 3100 USD en fonction des préférences en matière de RAM et de SSD. Les versions Intel proposent les mêmes options d'affichage et de GPU Nvidia, mais avec les Core i7-13700HX ou i9-13900HX.
Parmi les concurrents, on trouve d'autres ordinateurs portables de jeu de 16 pouces comme le HP Omen 16, Lenovo Legion Pro 7 16, Asus ROG Strix G16ou le Razer Blade 16.
Plus d'avis Dell :
Comparaison avec les concurrents potentiels
Note | Date | Modèle | Poids | Épaisseur | Taille | Résolution | Prix |
|---|---|---|---|---|---|---|---|
| 89.2 % v7 (old) | 08/23 | Alienware m16 R1 AMD R9 7845HX, GeForce RTX 4080 Laptop GPU | 3.1 kg | 25.4 mm | 16.00" | 2560x1600 | |
| 88.4 % v7 (old) | 06/23 | Alienware x16 R1 i9-13900HK, GeForce RTX 4080 Laptop GPU | 2.6 kg | 18.57 mm | 16.00" | 2560x1600 | |
| 87.9 % v7 (old) | 08/23 | HP Omen Transcend 16 i9-13900HX, GeForce RTX 4070 Laptop GPU | 2.3 kg | 19.8 mm | 16.00" | 2560x1600 | |
| 88.8 % v7 (old) | 06/23 | Lenovo Legion Pro 7 RTX4090 i9-13900HX, GeForce RTX 4090 Laptop GPU | 2.7 kg | 26 mm | 16.00" | 2560x1600 | |
| 88.4 % v7 (old) | 03/23 | Asus ROG Strix G16 G614JZ i9-13980HX, GeForce RTX 4080 Laptop GPU | 2.4 kg | 30.4 mm | 16.00" | 2560x1600 | |
| 91.2 % v7 (old) | 02/23 | Razer Blade 16 Early 2023 i9-13950HX, GeForce RTX 4080 Laptop GPU | 2.4 kg | 21.99 mm | 16.00" | 2560x1600 |
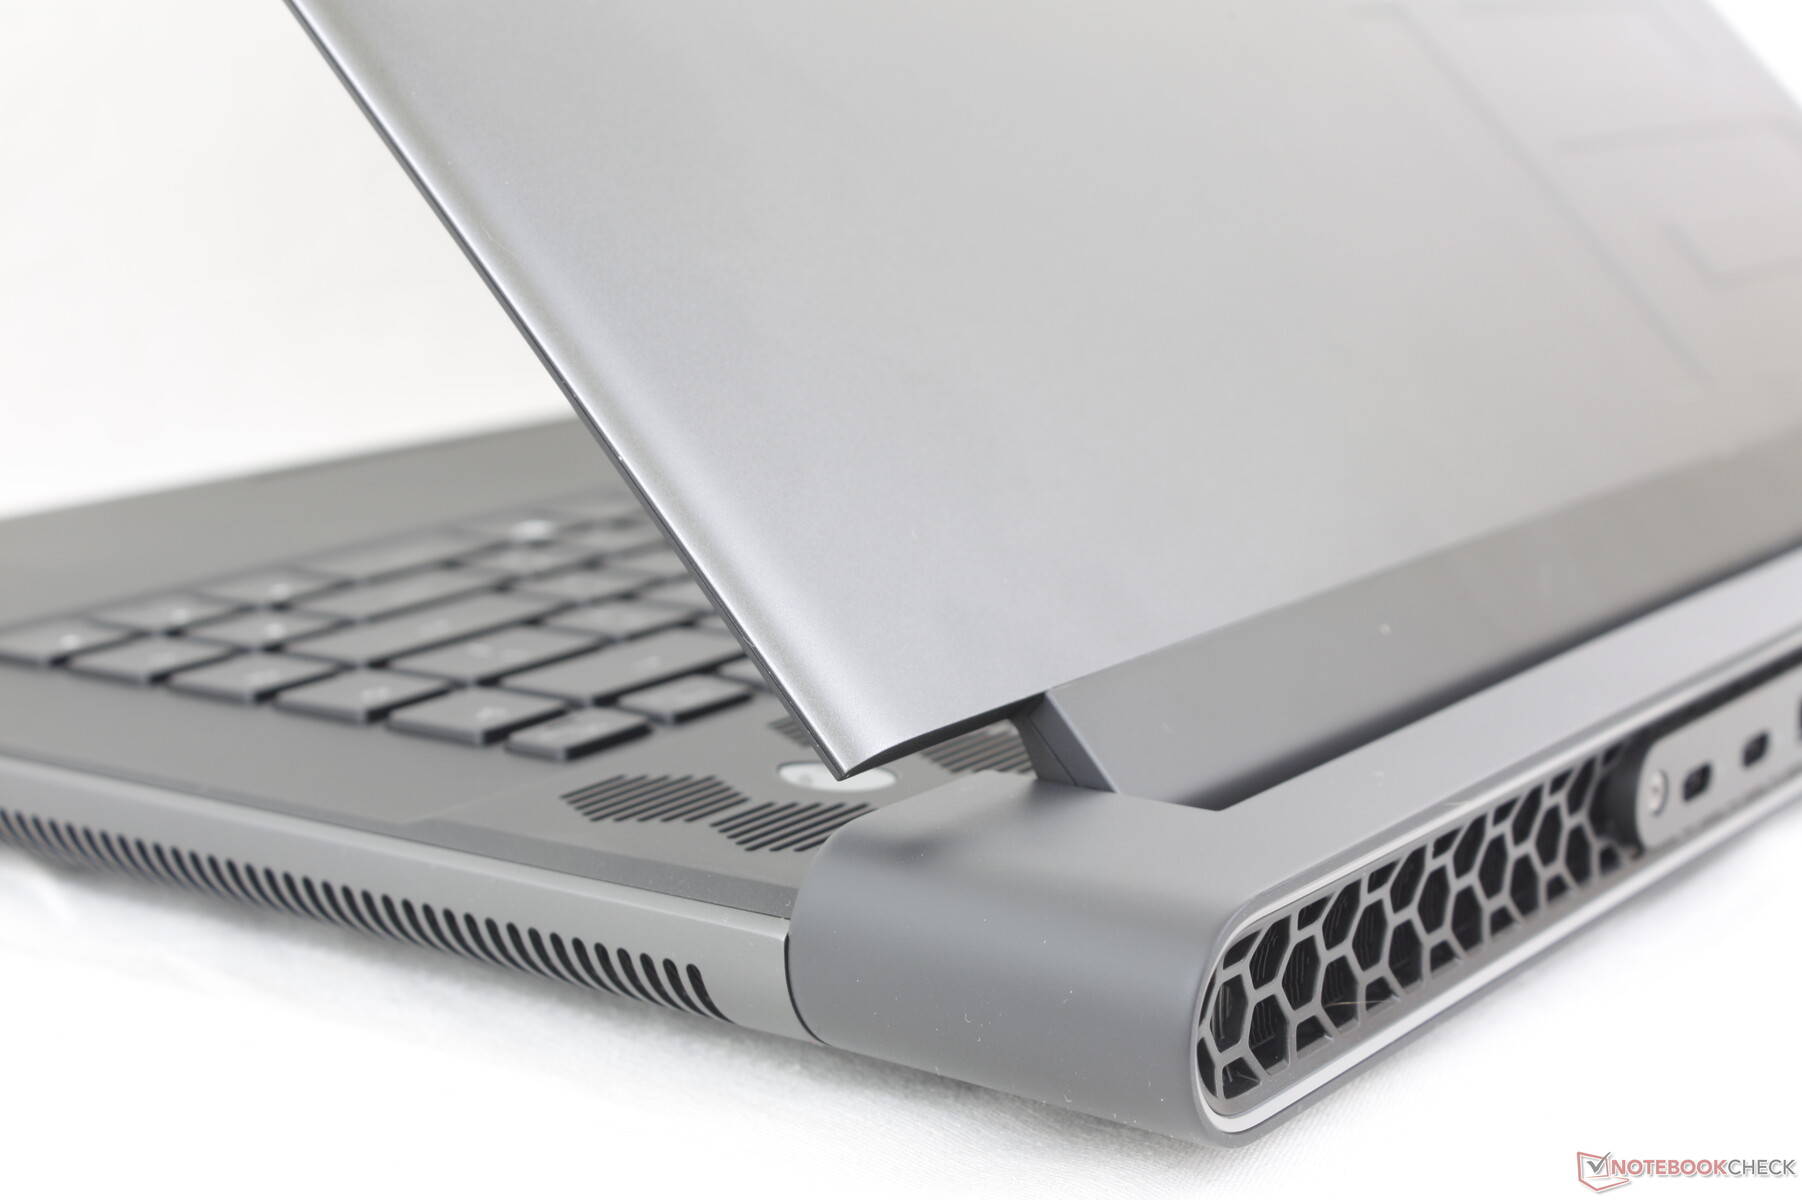
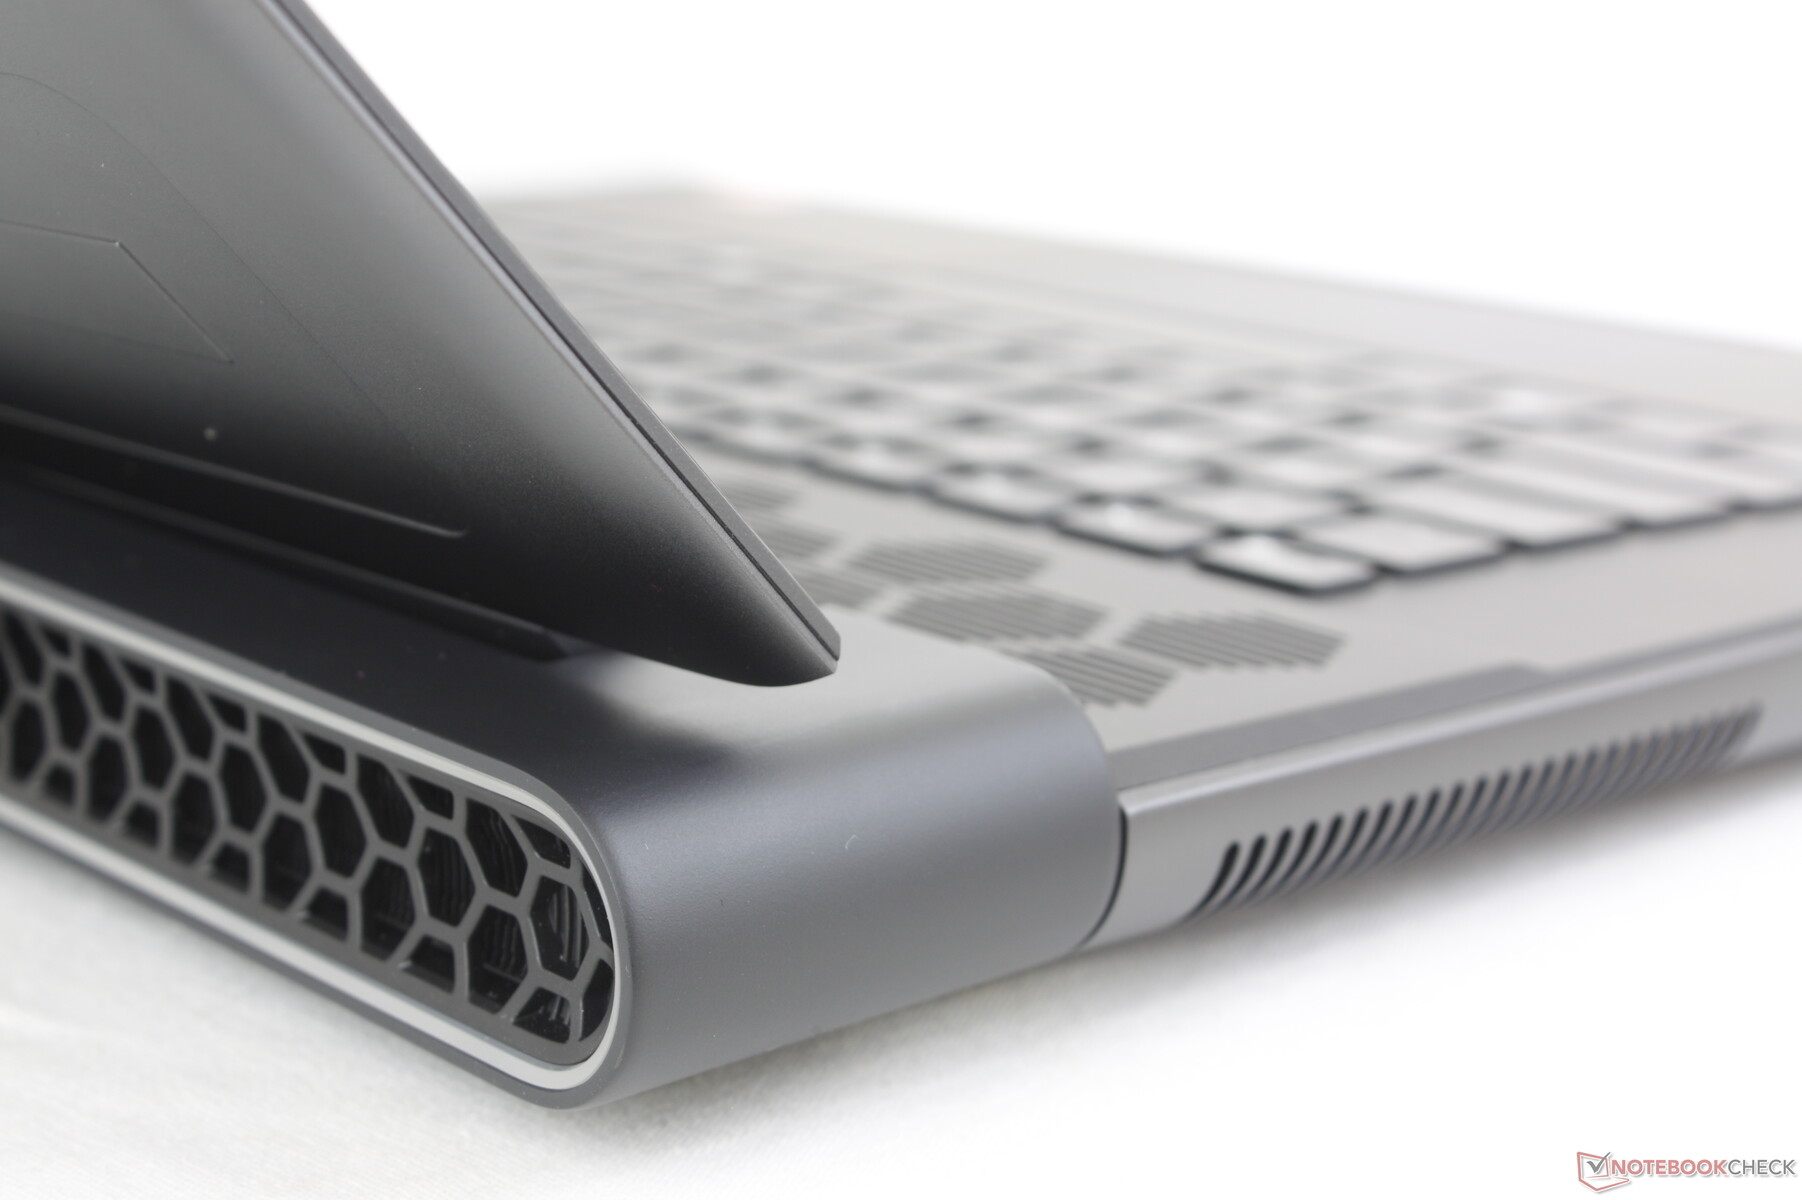
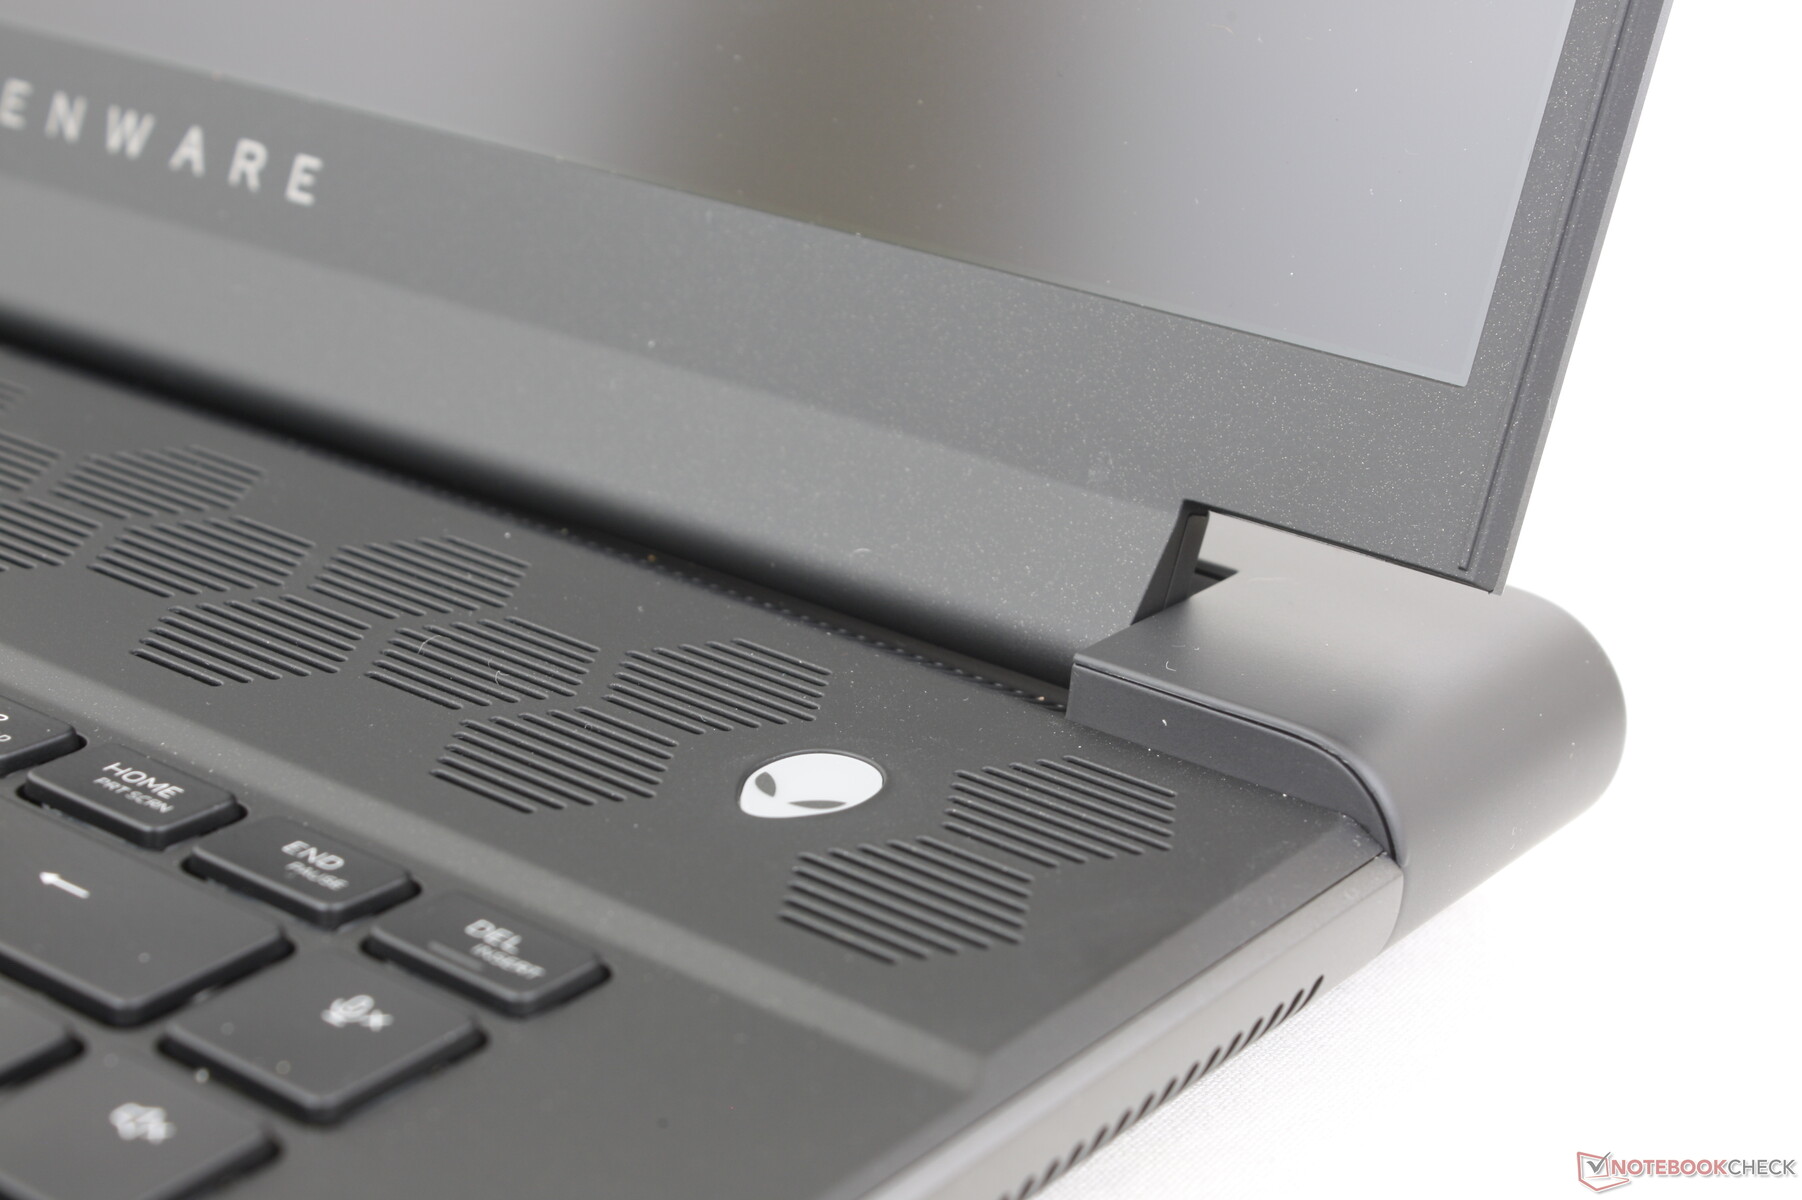
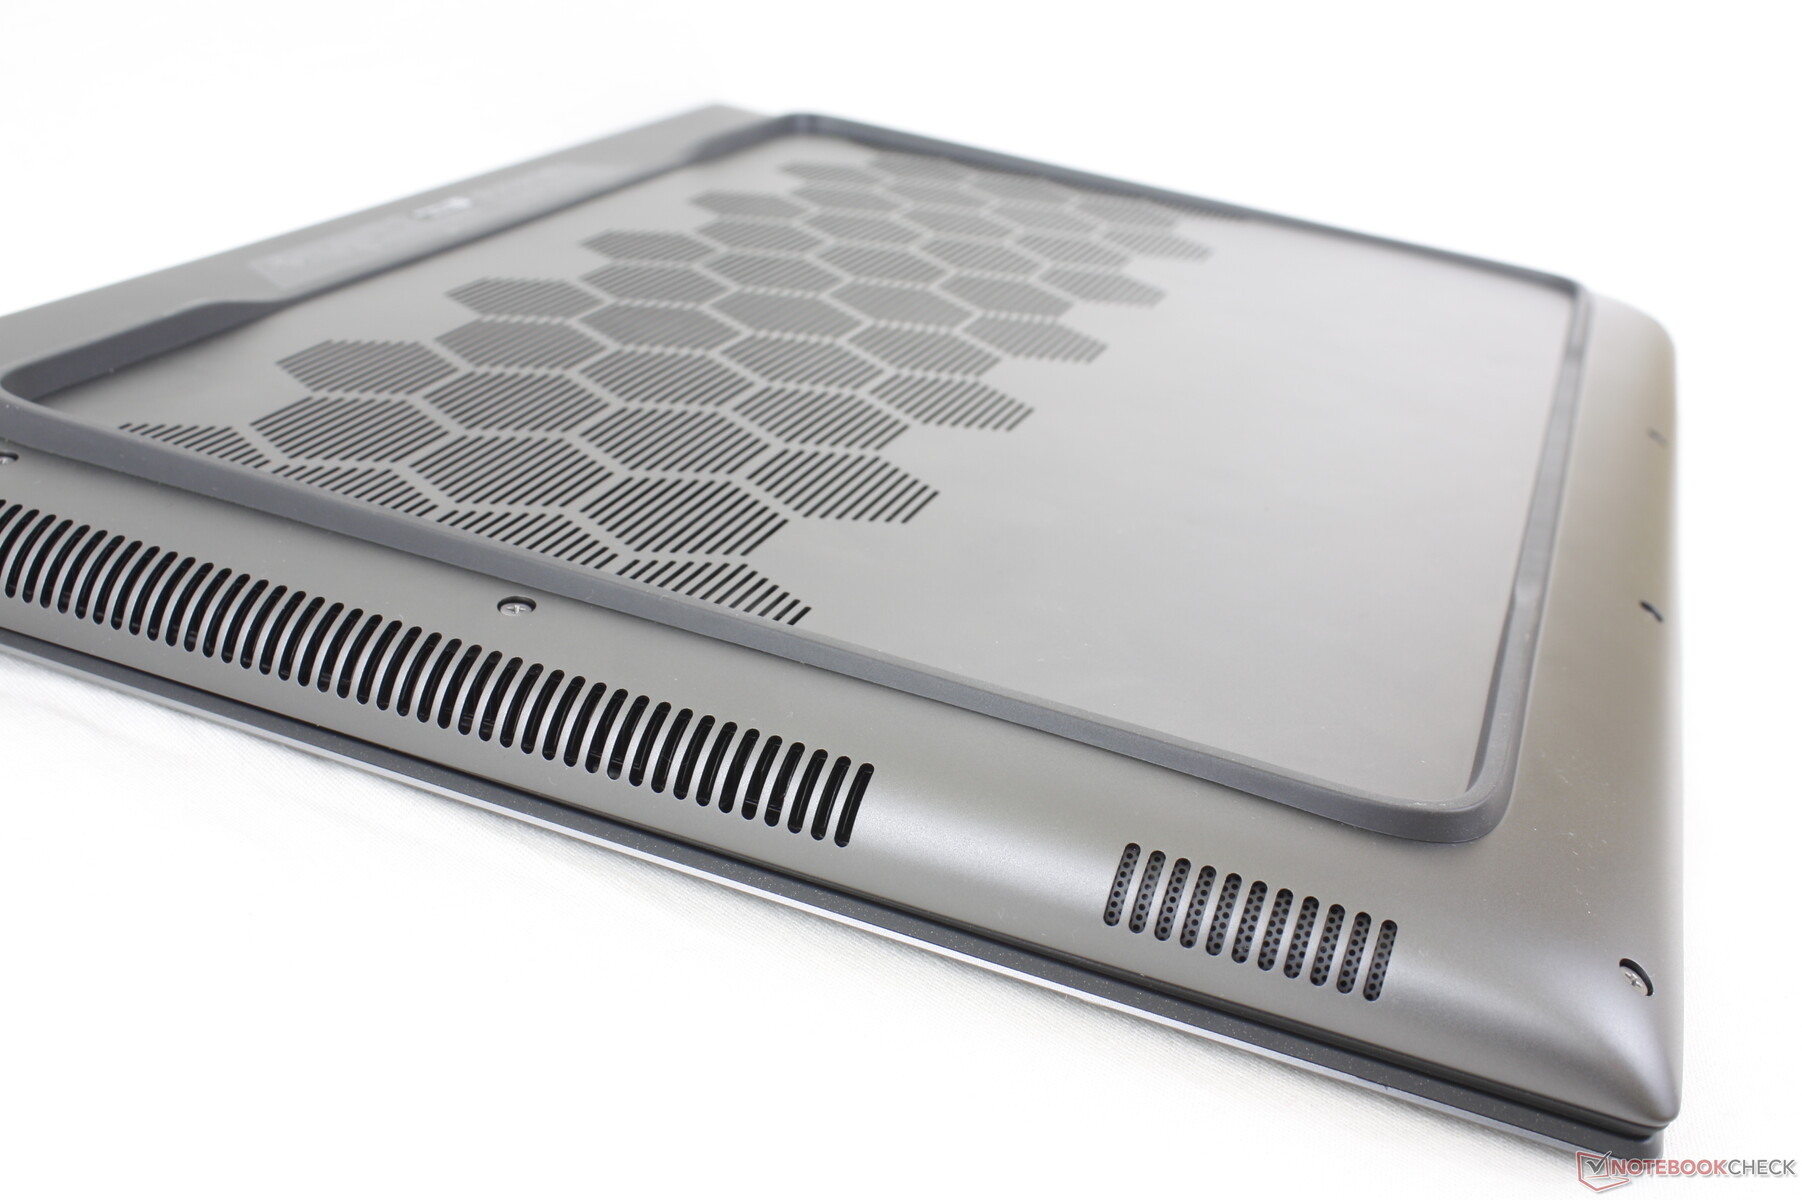
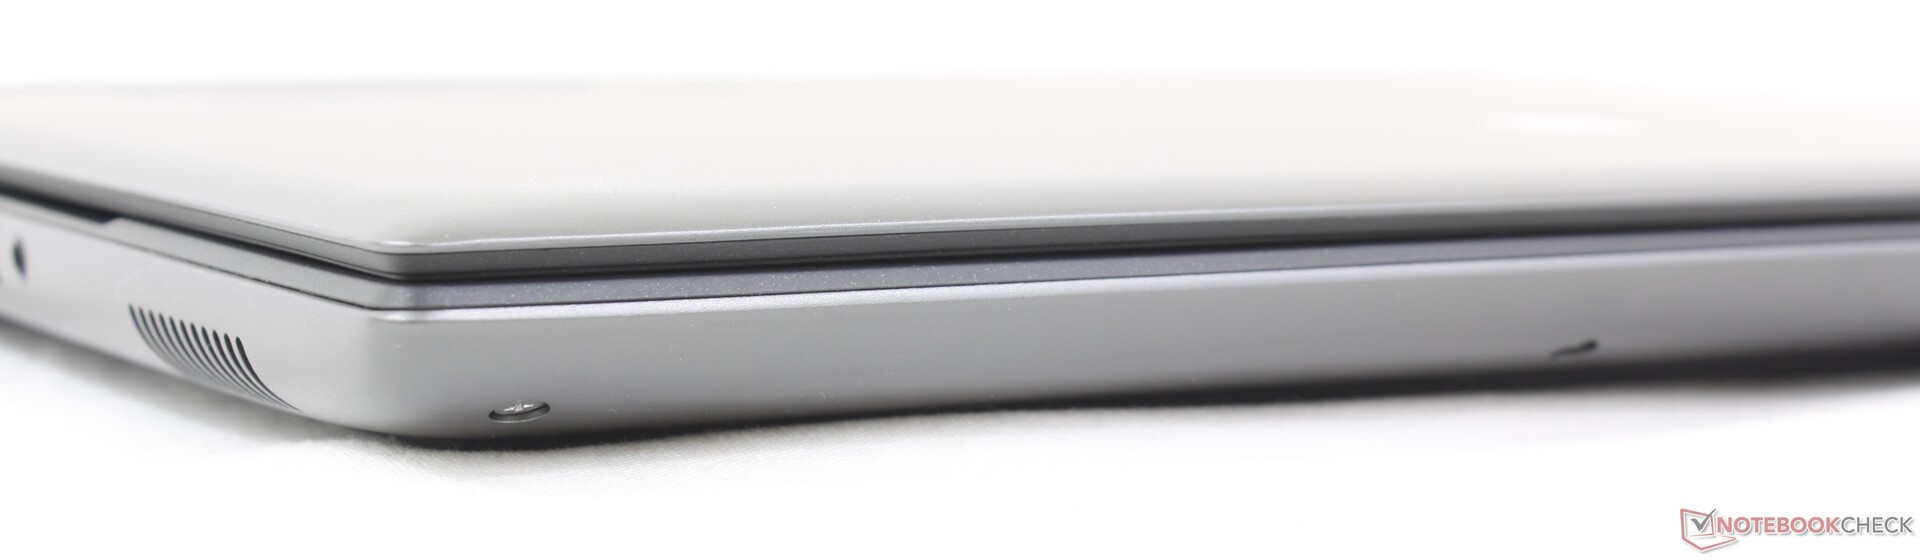
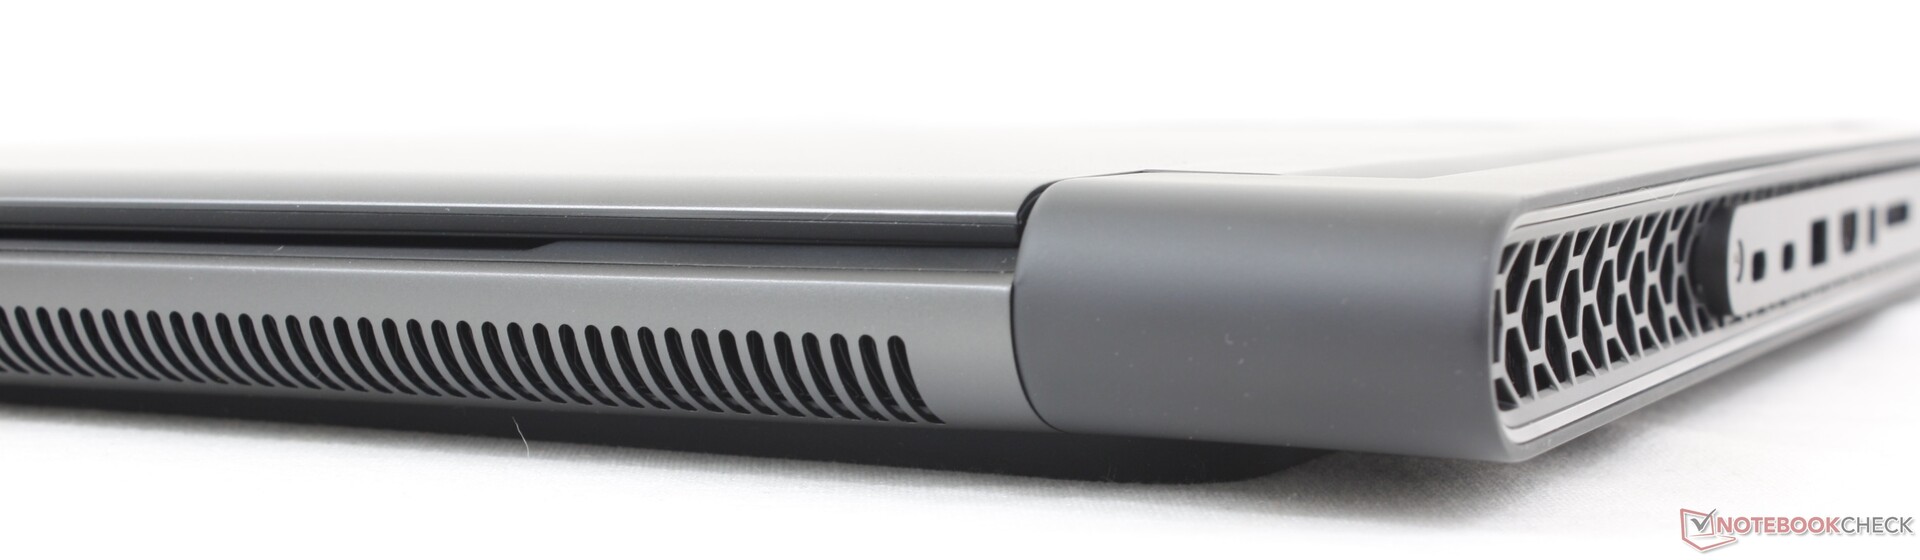
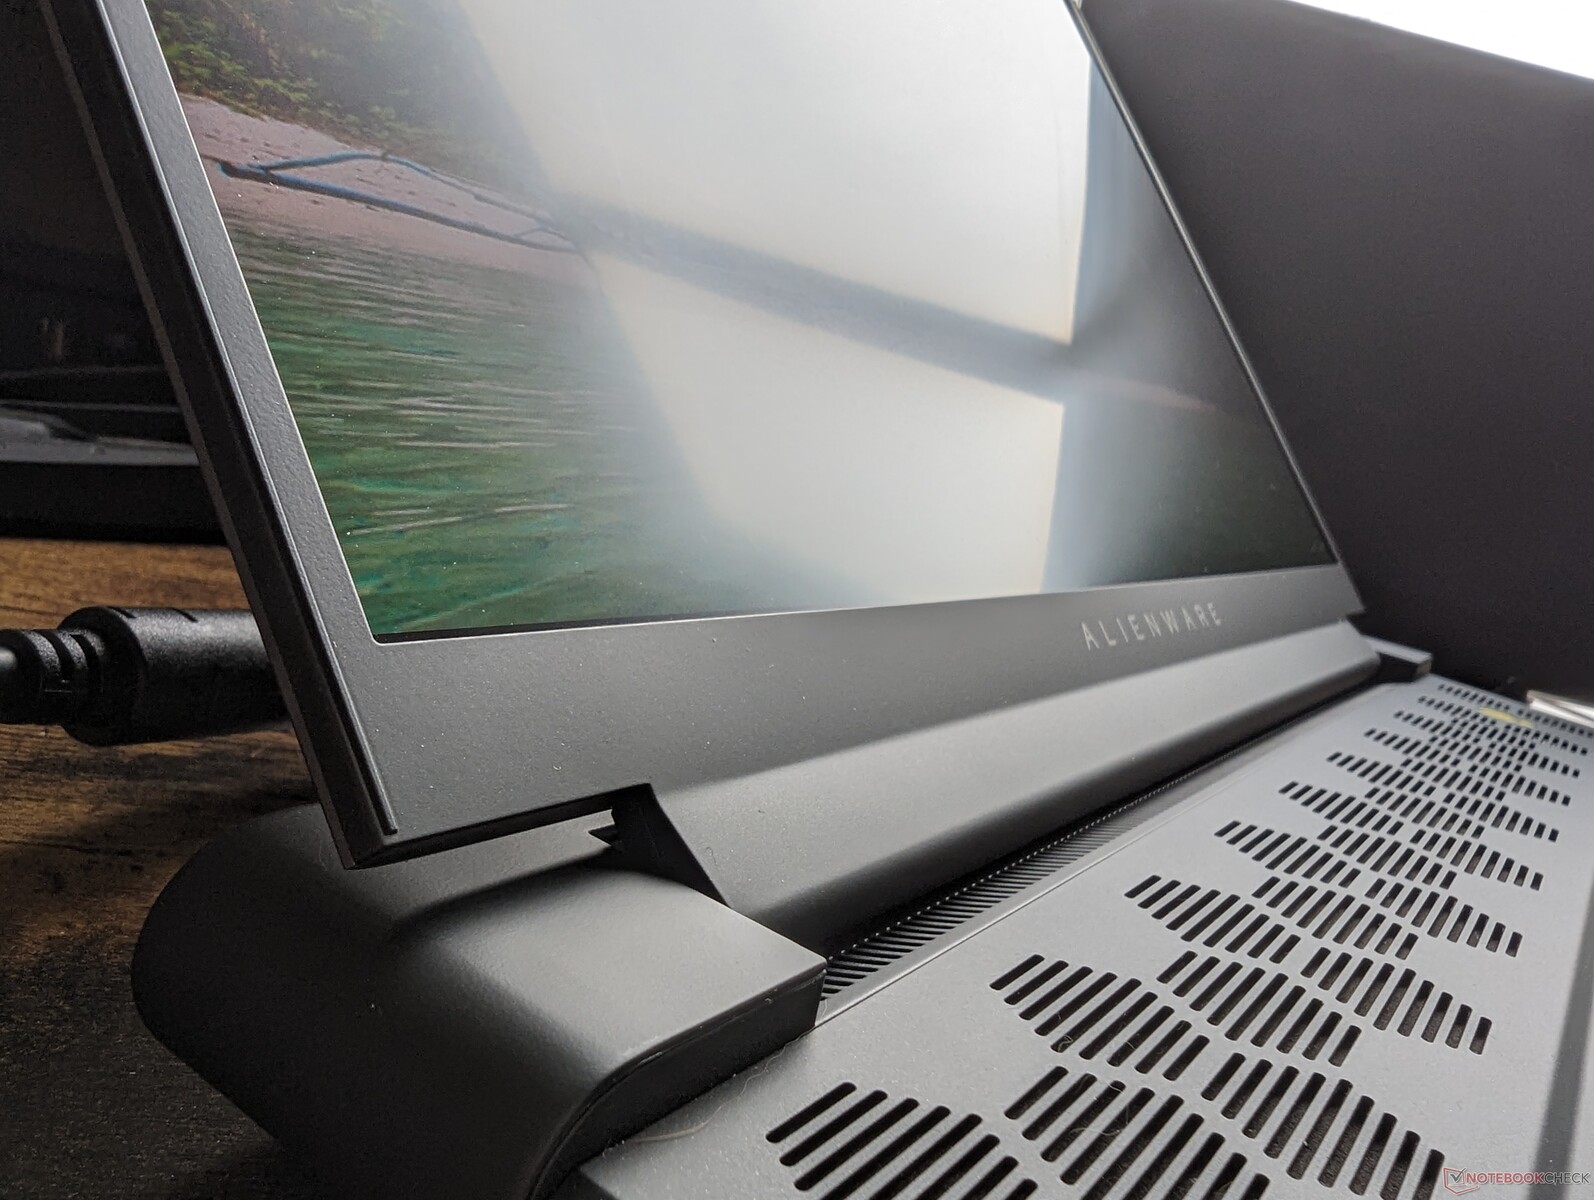
Boîtier - Indéniablement Alienware
Le châssis est essentiellement une version plus épaisse de l'Alienware x16 R1, les deux modèles étant basés sur le même design industriel Legend 3.0. Le pied périphérique caoutchouté, le couvercle extérieur en aluminium, les grilles de ventilation hexagonales, l'anneau LED arrière et le plateau de clavier noir mat sont une combinaison que l'on ne retrouve sur aucun modèle concurrent. La base, le couvercle et les charnières sont tous fermes, sans grincement audible lorsque l'on tente de les tordre ou de les plier, pour une première impression plus forte que celle d'un Asus TUF Gaming A16, qui n'est pas un modèle de base Asus TUF Gaming A16 ou Lenovo Legion Pro 7 16.
Les repose-poignets, le clickpad et les touches du clavier noirs continuent d'être des aimants à empreintes digitales. Dell ne propose pas d'autres options de couleur que Dark Metallic Moon pour le moment.
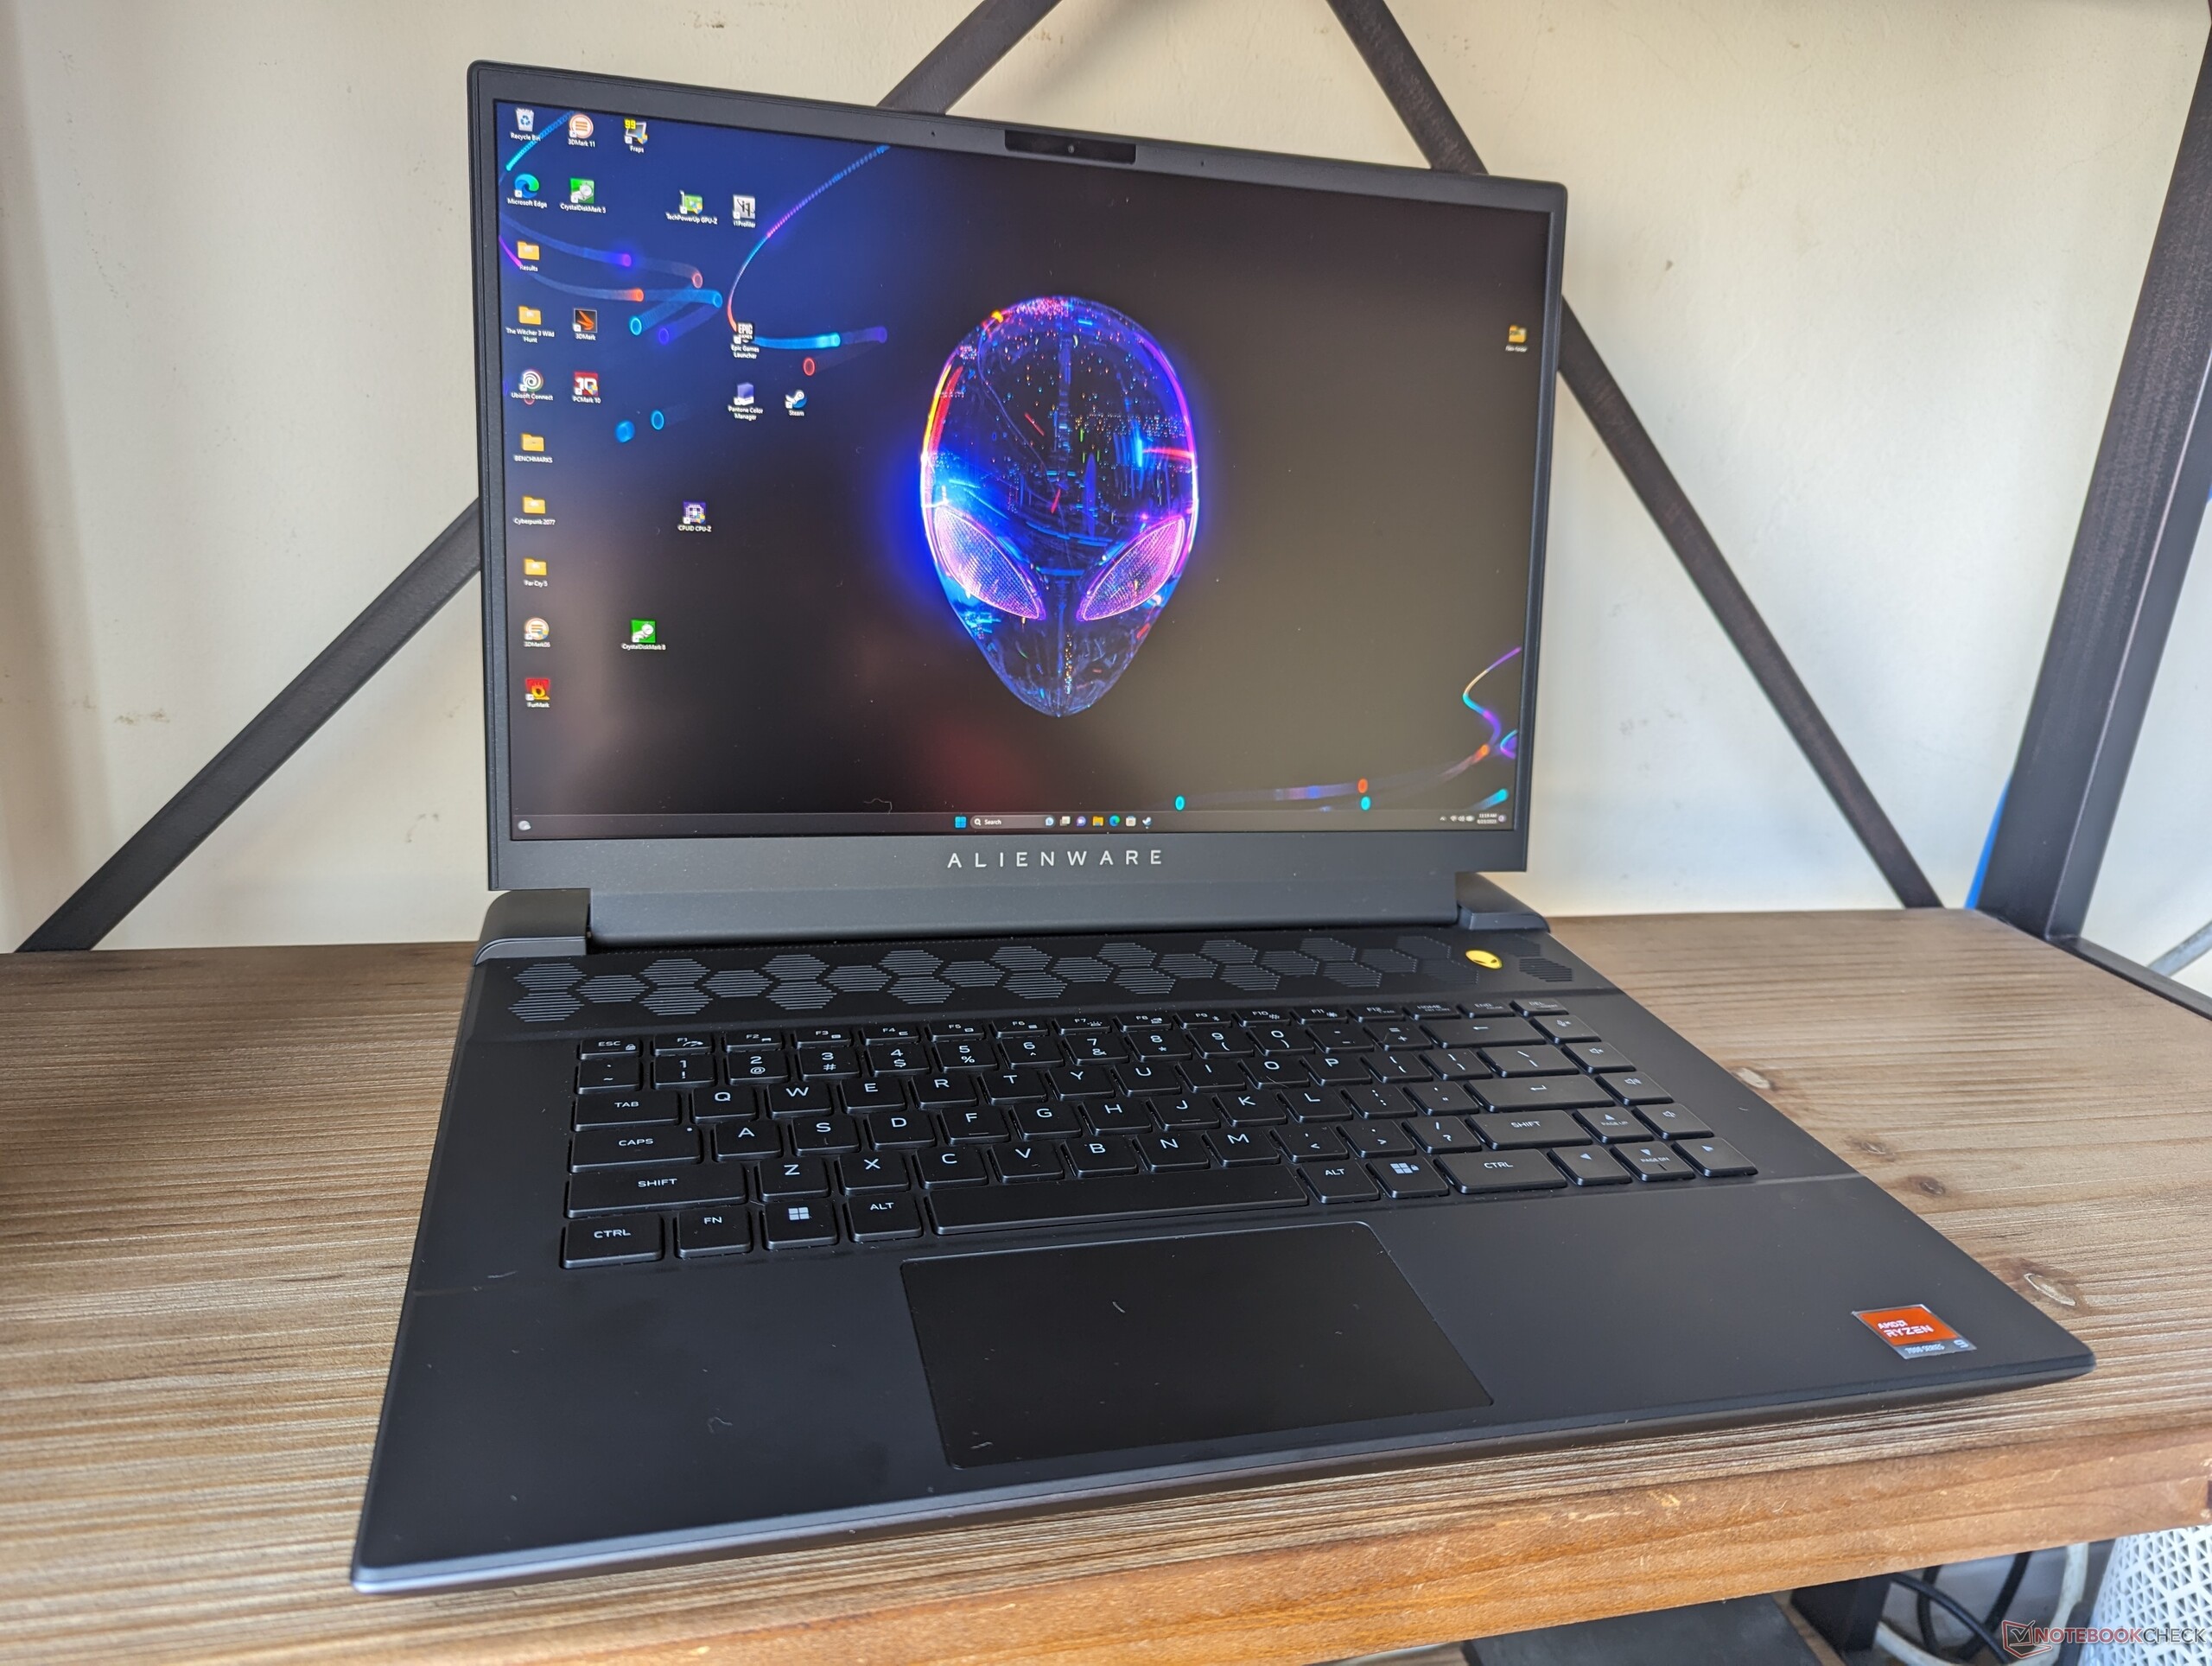
L'Alienware m16 R1 est l'un des ordinateurs portables de jeu de 16 pouces les plus lourds et également l'un des plus grands en termes de longueur et de largeur en raison de son arrière étendu. Son design dense lui confère une grande robustesse, au détriment de la portabilité. Le Legion Pro 7par exemple, est 400 g plus léger et son encombrement est beaucoup plus réduit, tout en offrant des CPU de classe HX et des GPU haut de gamme similaires.
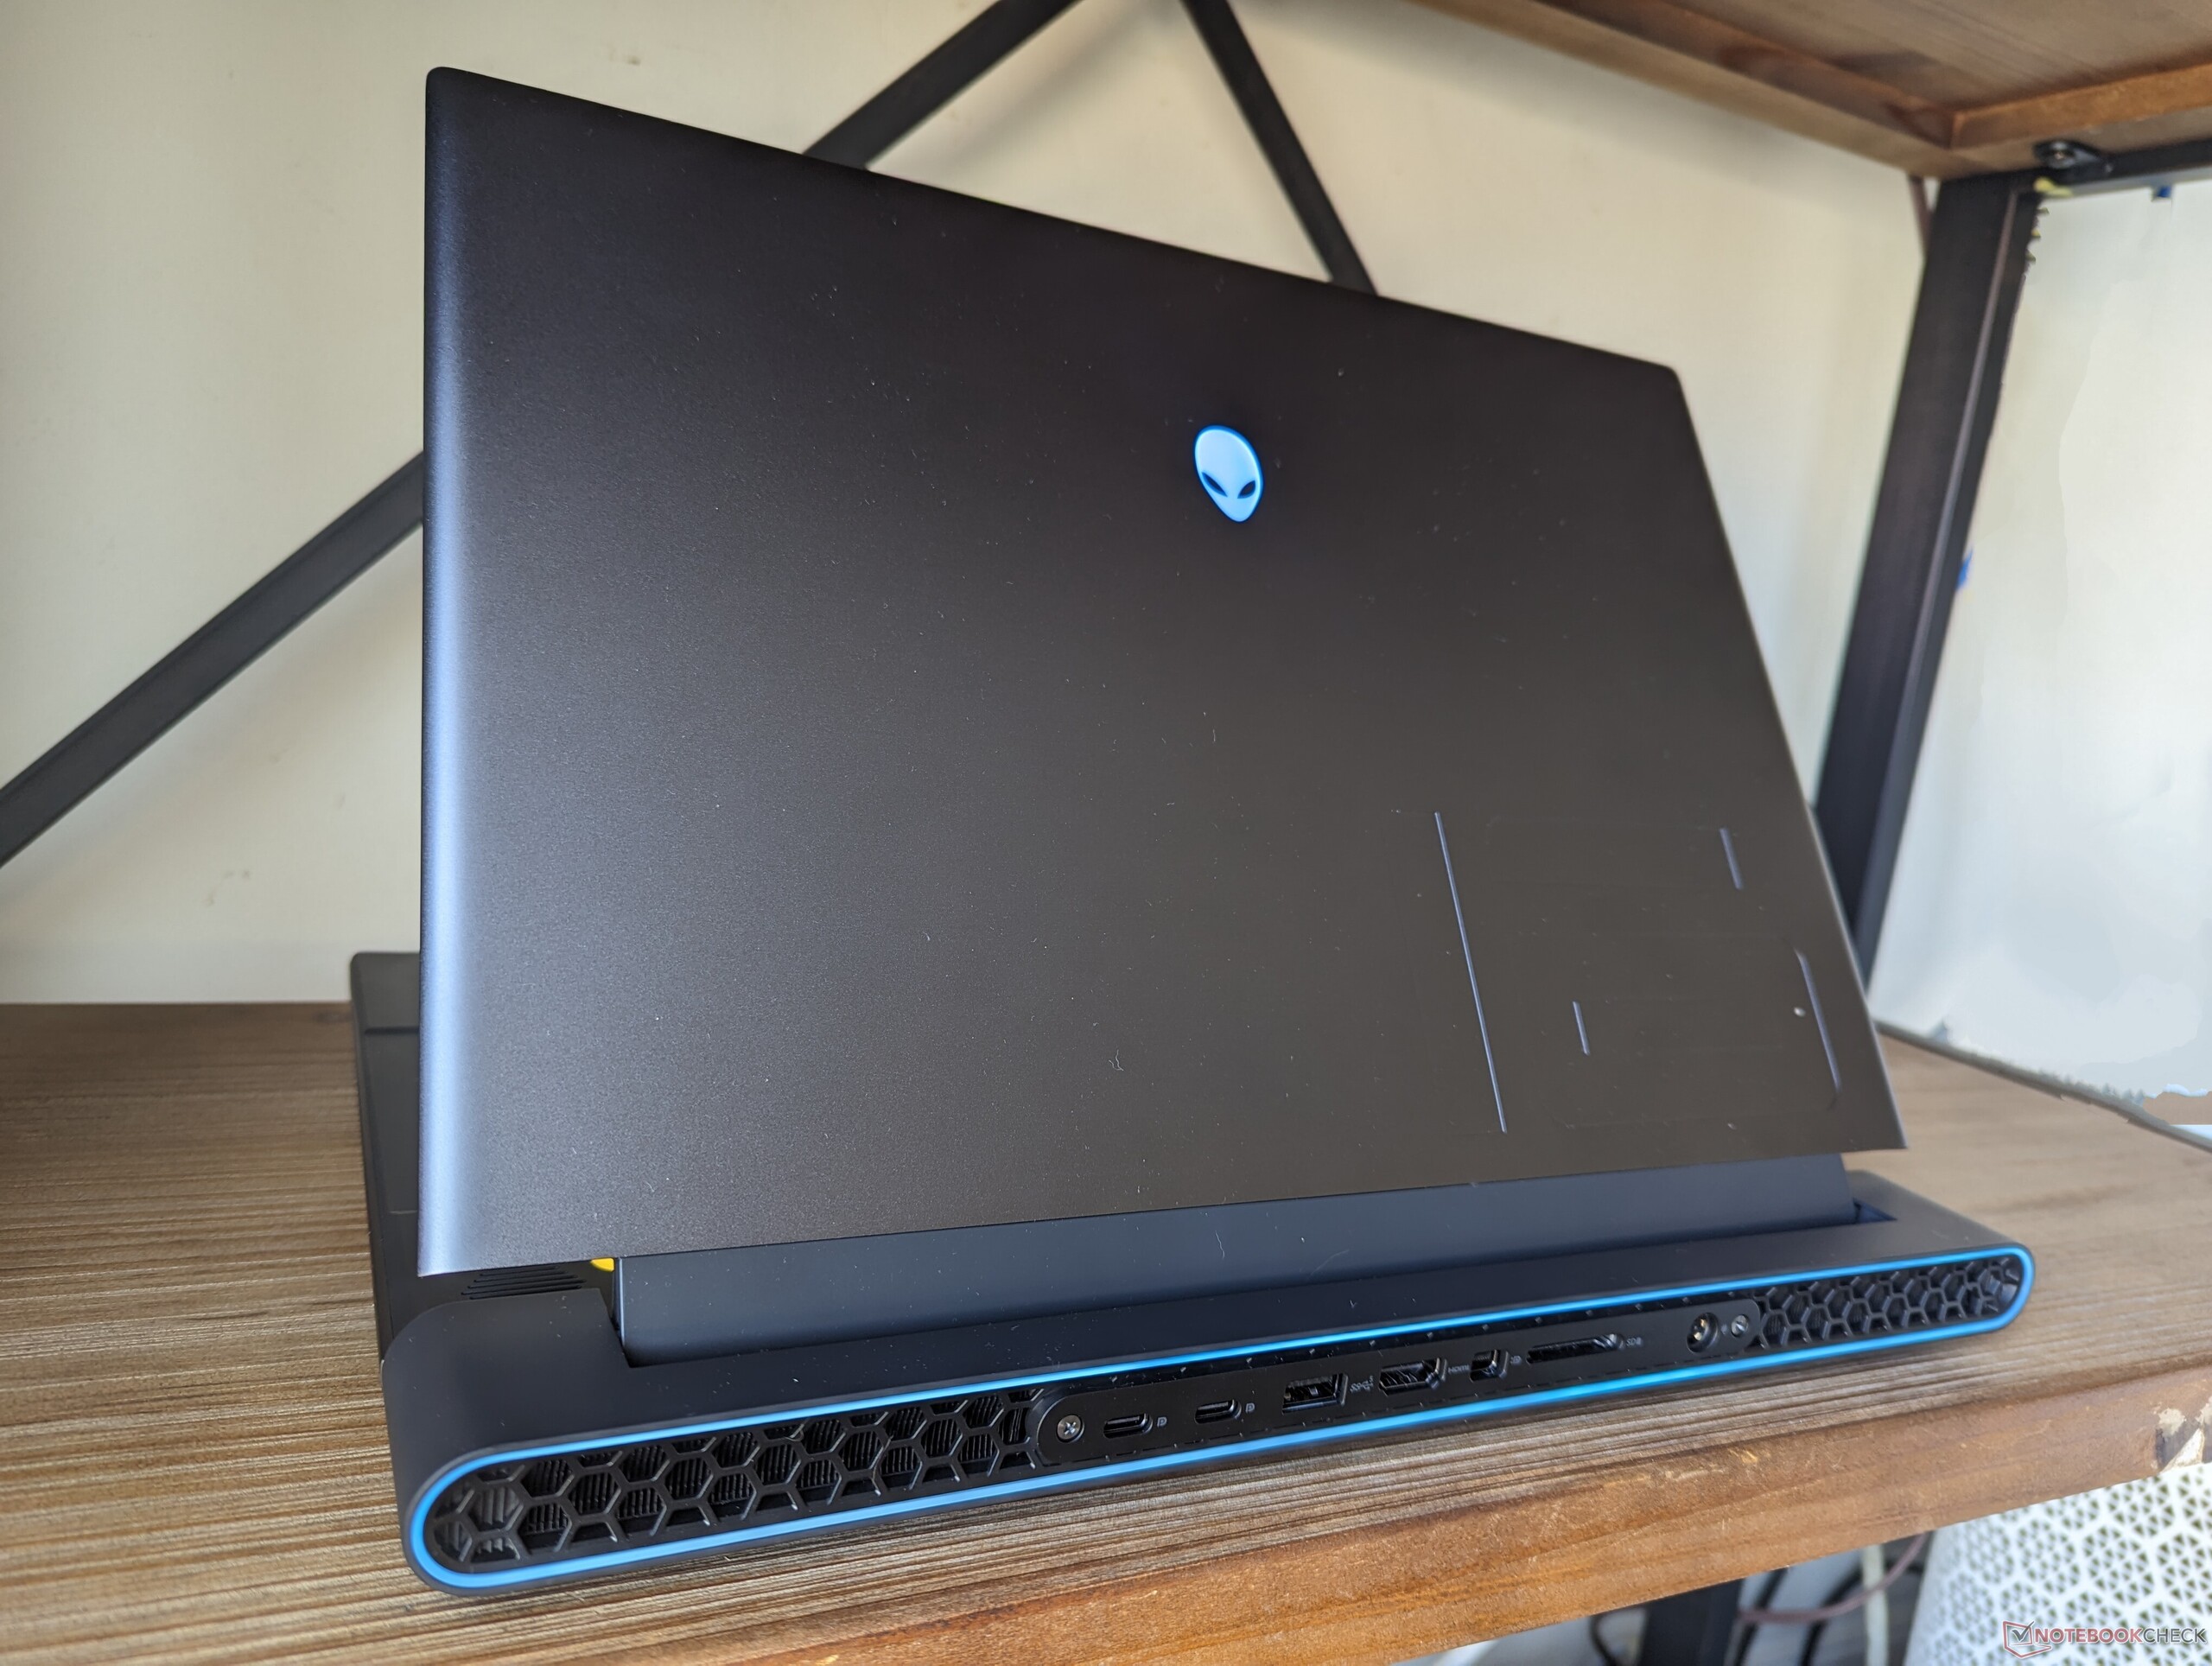
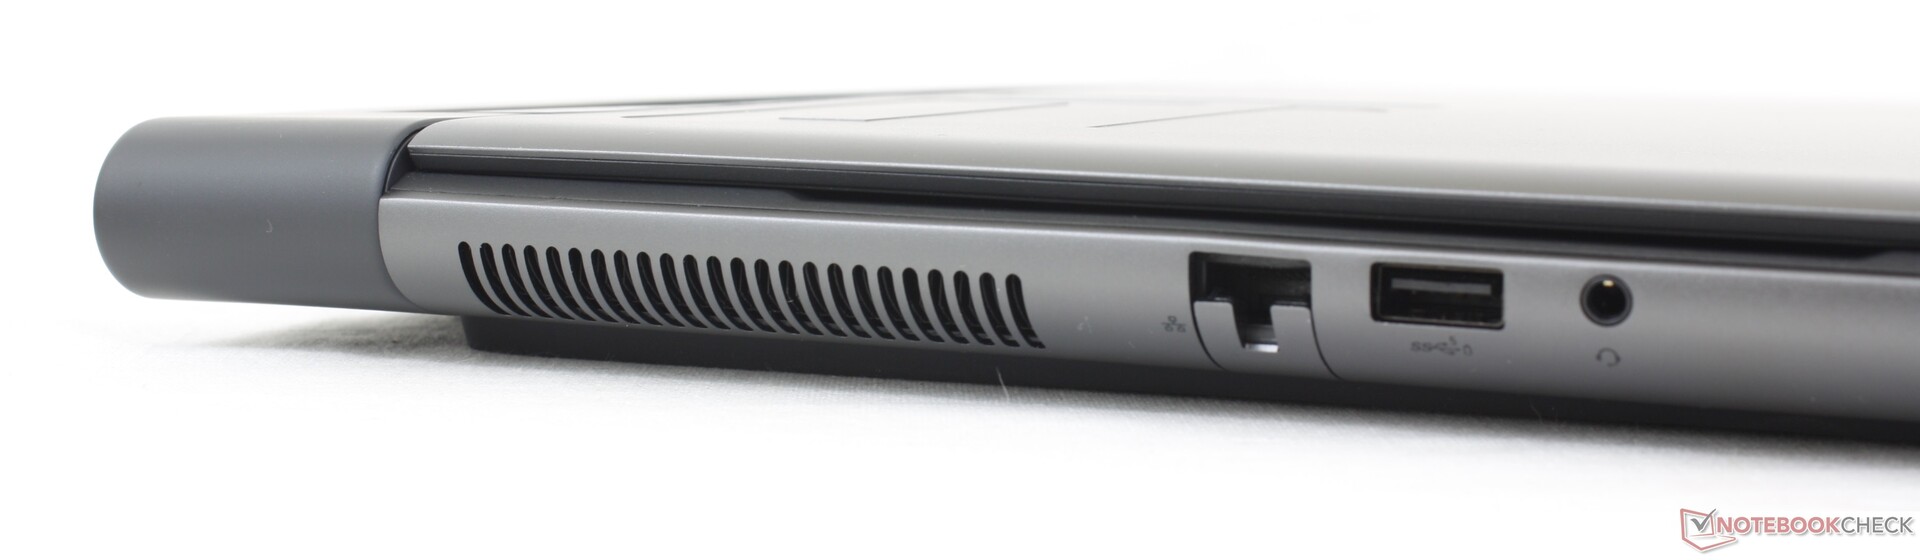
Connectivité - Thunderbolt pour les versions Intel uniquement
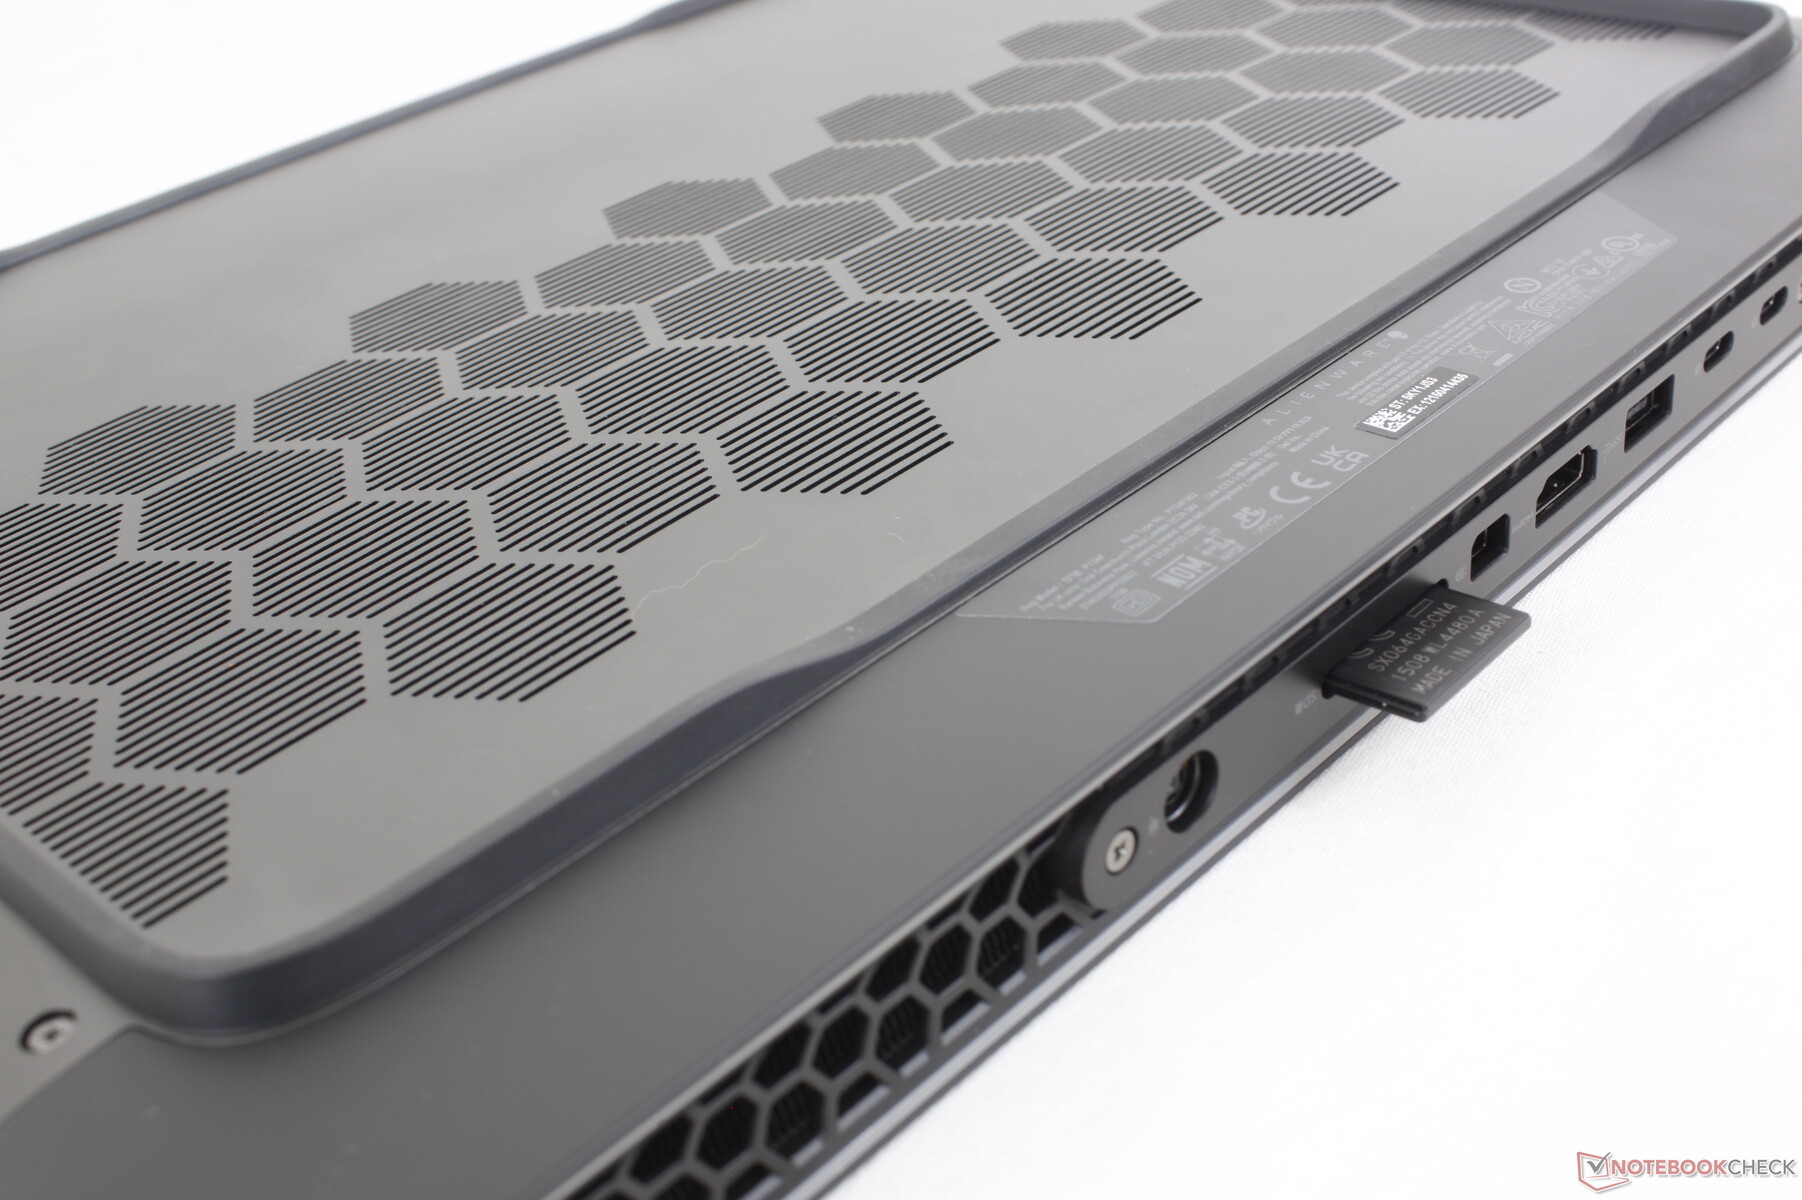
Les options de port comprennent tout ce que l'on trouve sur l'Alienware x16 R1, plus RJ-45 et un lecteur SD de taille normale au lieu de MicroSD. Quelques ports ont également été déplacés sur le bord gauche alors qu'ils sont tous entassés à l'arrière sur le x16. Le mini-port d'affichage est également remarquable car il n'est pas courant sur les nouveaux ordinateurs portables de jeu.
Les ports USB4 et Thunderbolt ne sont pas supportés sur notre modèle AMD.
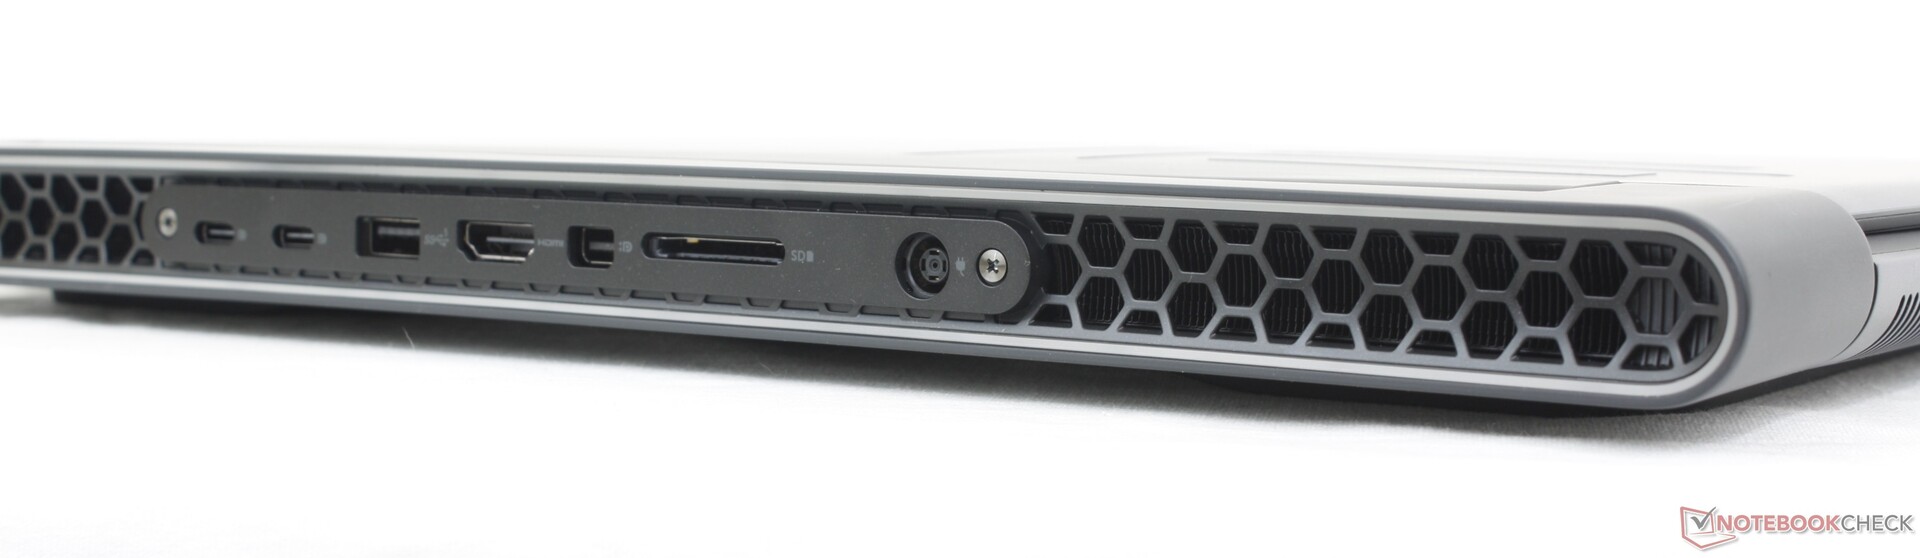
Lecteur de carte SD
Les taux de transfert à partir du lecteur de carte SD sont plus rapides que sur la plupart des autres ordinateurs portables de jeu, ce qui devrait satisfaire les créateurs de contenu. Le transfert de 1 Go de photos de notre carte de test UHS-II vers le bureau prend à peine plus de 5 secondes.
| SD Card Reader | |
| average JPG Copy Test (av. of 3 runs) | |
| Alienware m16 R1 AMD (Toshiba Exceria Pro SDXC 64 GB UHS-II) | |
| Razer Blade 16 Early 2023 (AV PRO microSD 128 GB V60) | |
| Alienware x16 R1 (AV PRO microSD 128 GB V60) | |
| maximum AS SSD Seq Read Test (1GB) | |
| Alienware x16 R1 (AV PRO microSD 128 GB V60) | |
| Alienware m16 R1 AMD (Toshiba Exceria Pro SDXC 64 GB UHS-II) | |
| Razer Blade 16 Early 2023 (AV PRO microSD 128 GB V60) | |
Communication
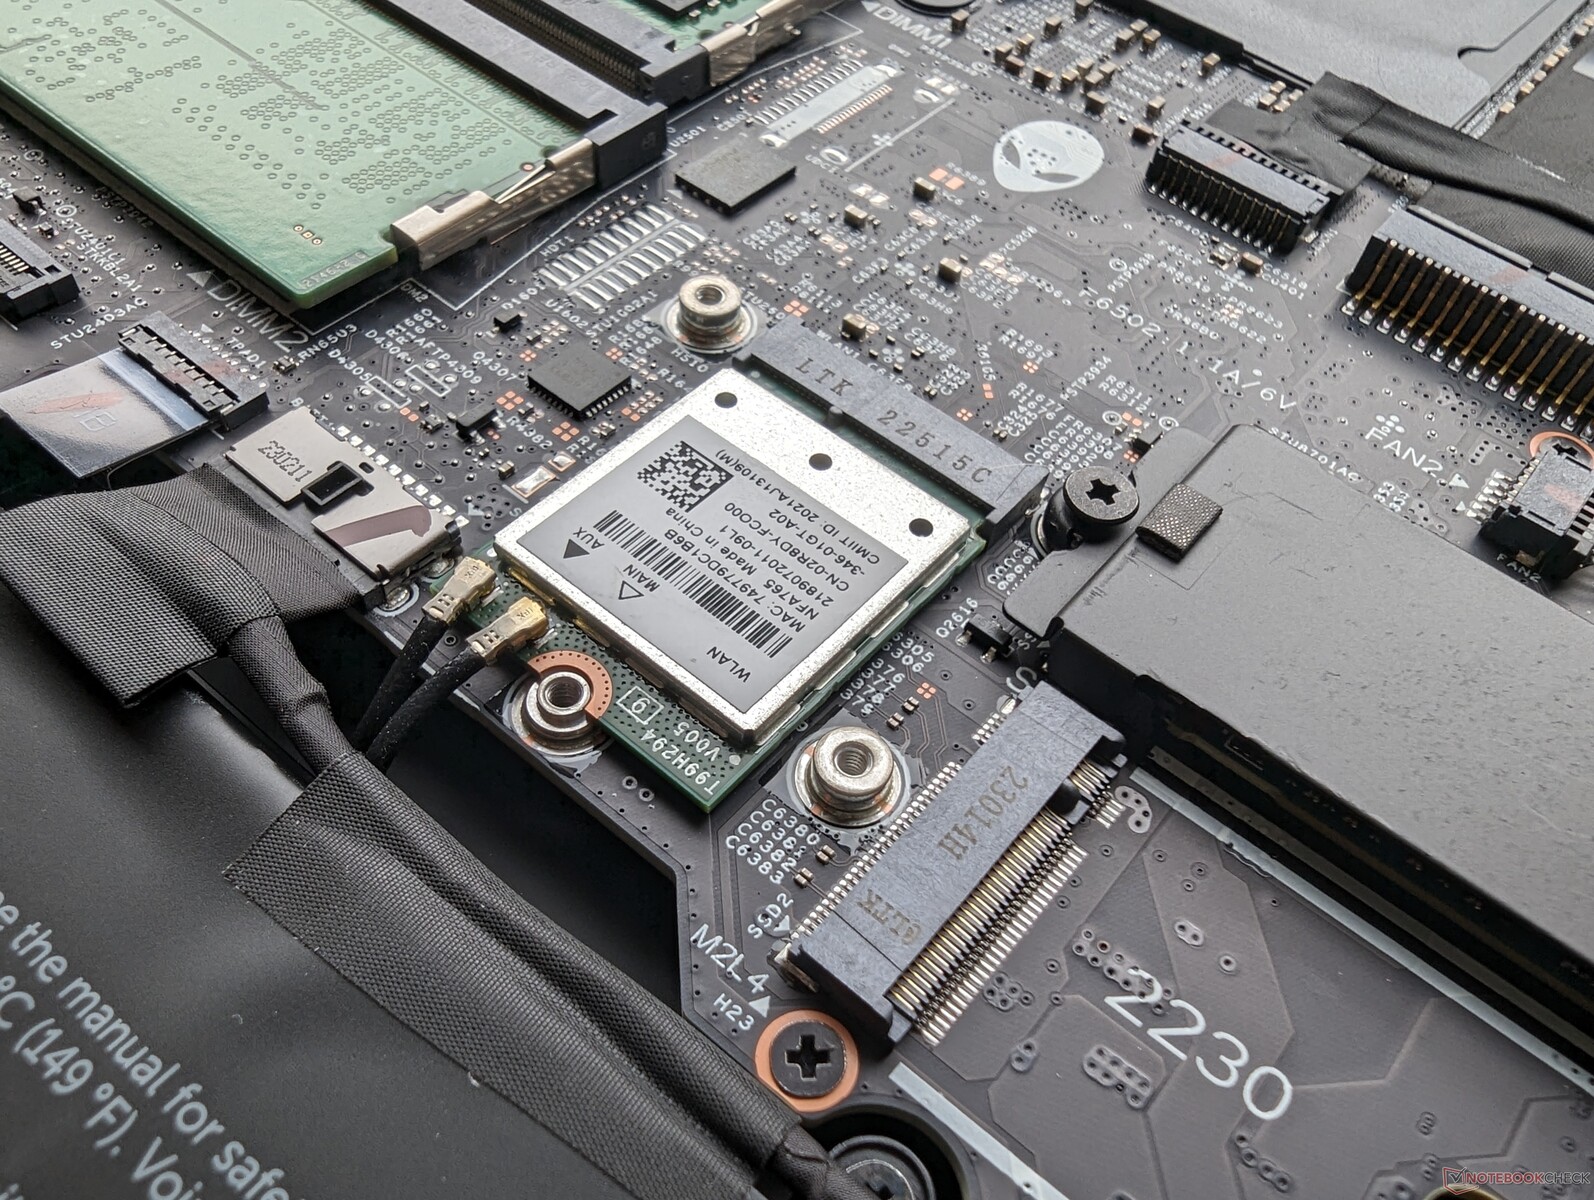
Les modèles AMD sont équipés du Qualcomm WCN685x et les modèles Intel du Killer AX1675, tous deux dotés d'une connectivité Wi-Fi 6E. Les performances sont à la fois régulières et fiables lorsqu'elles sont couplées à notre réseau 6 GHz.
| Networking | |
| iperf3 transmit AXE11000 | |
| Lenovo Legion Pro 7 RTX4090 | |
| Asus ROG Strix G16 G614JZ | |
| Alienware m16 R1 AMD | |
| HP Omen Transcend 16 | |
| Razer Blade 16 Early 2023 | |
| Alienware x16 R1 | |
| iperf3 receive AXE11000 | |
| Lenovo Legion Pro 7 RTX4090 | |
| Asus ROG Strix G16 G614JZ | |
| Alienware m16 R1 AMD | |
| HP Omen Transcend 16 | |
| Razer Blade 16 Early 2023 | |
| Alienware x16 R1 | |
| iperf3 transmit AXE11000 6GHz | |
| Alienware m16 R1 AMD | |
| HP Omen Transcend 16 | |
| Razer Blade 16 Early 2023 | |
| Alienware x16 R1 | |
| iperf3 receive AXE11000 6GHz | |
| Alienware m16 R1 AMD | |
| HP Omen Transcend 16 | |
| Razer Blade 16 Early 2023 | |
| Alienware x16 R1 | |
Webcam
Il y a une webcam de 2 MP avec IR et pas d'obturateur de confidentialité comme sur l'Alienware x16.


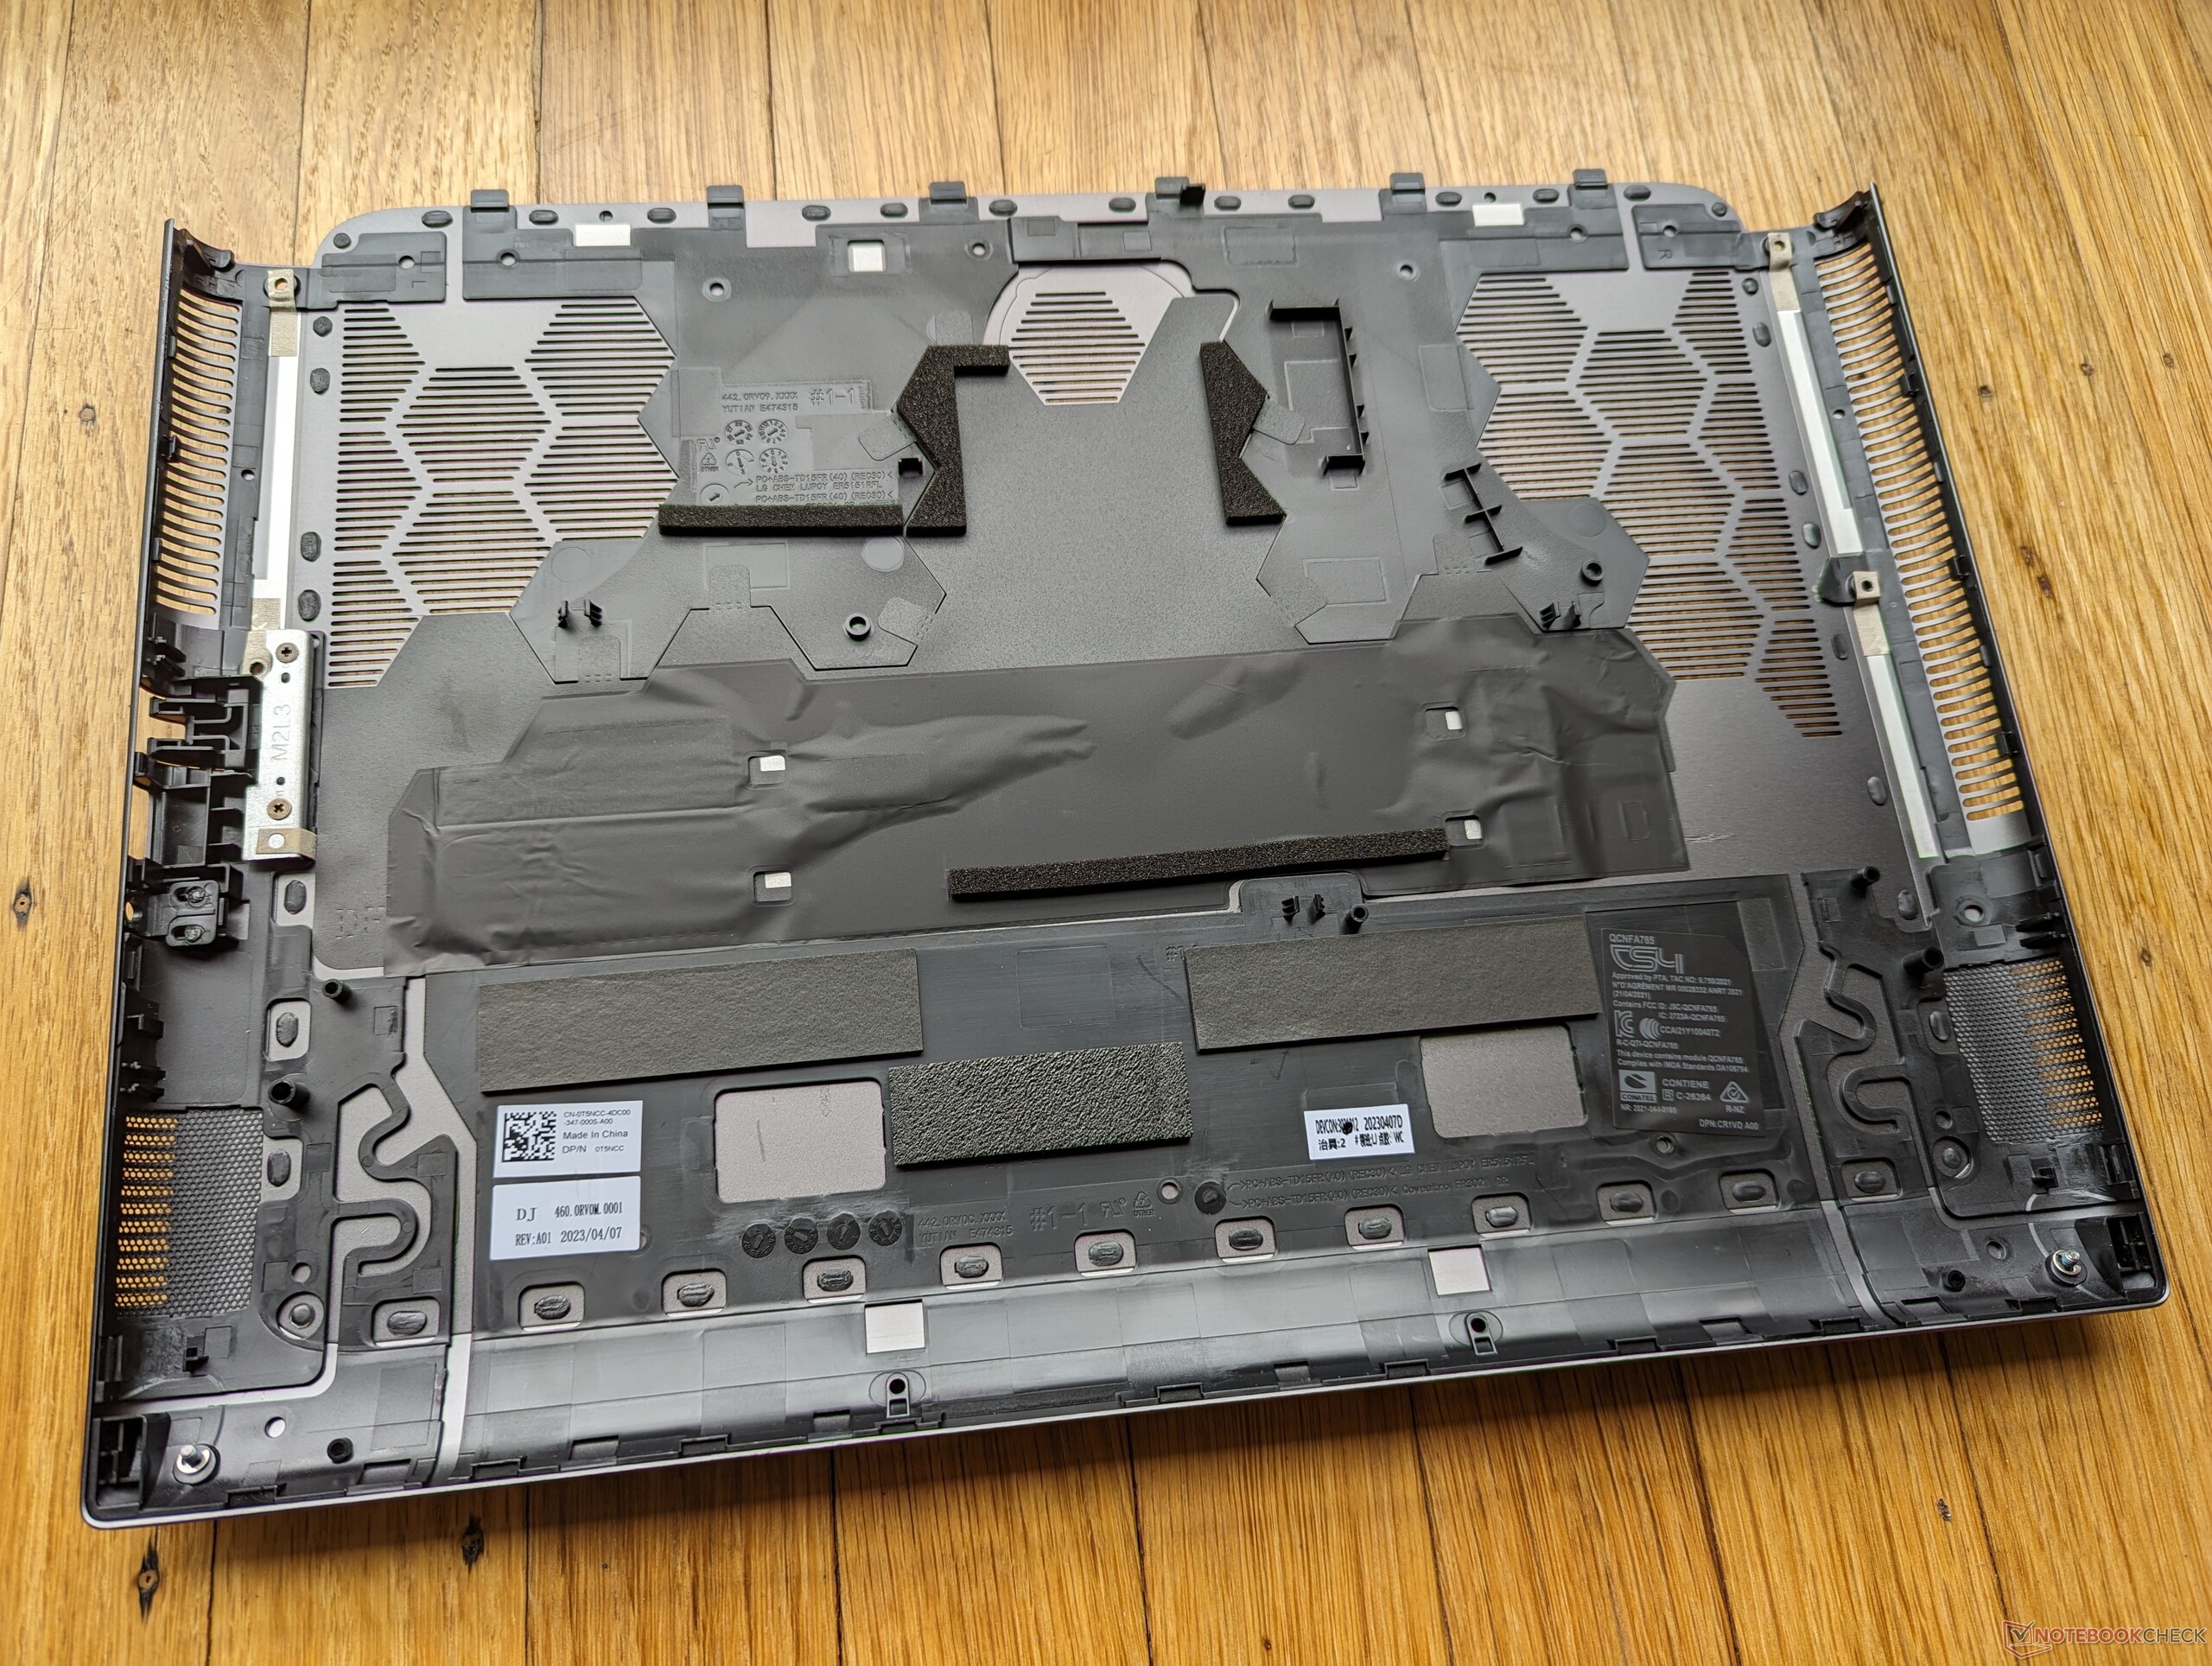
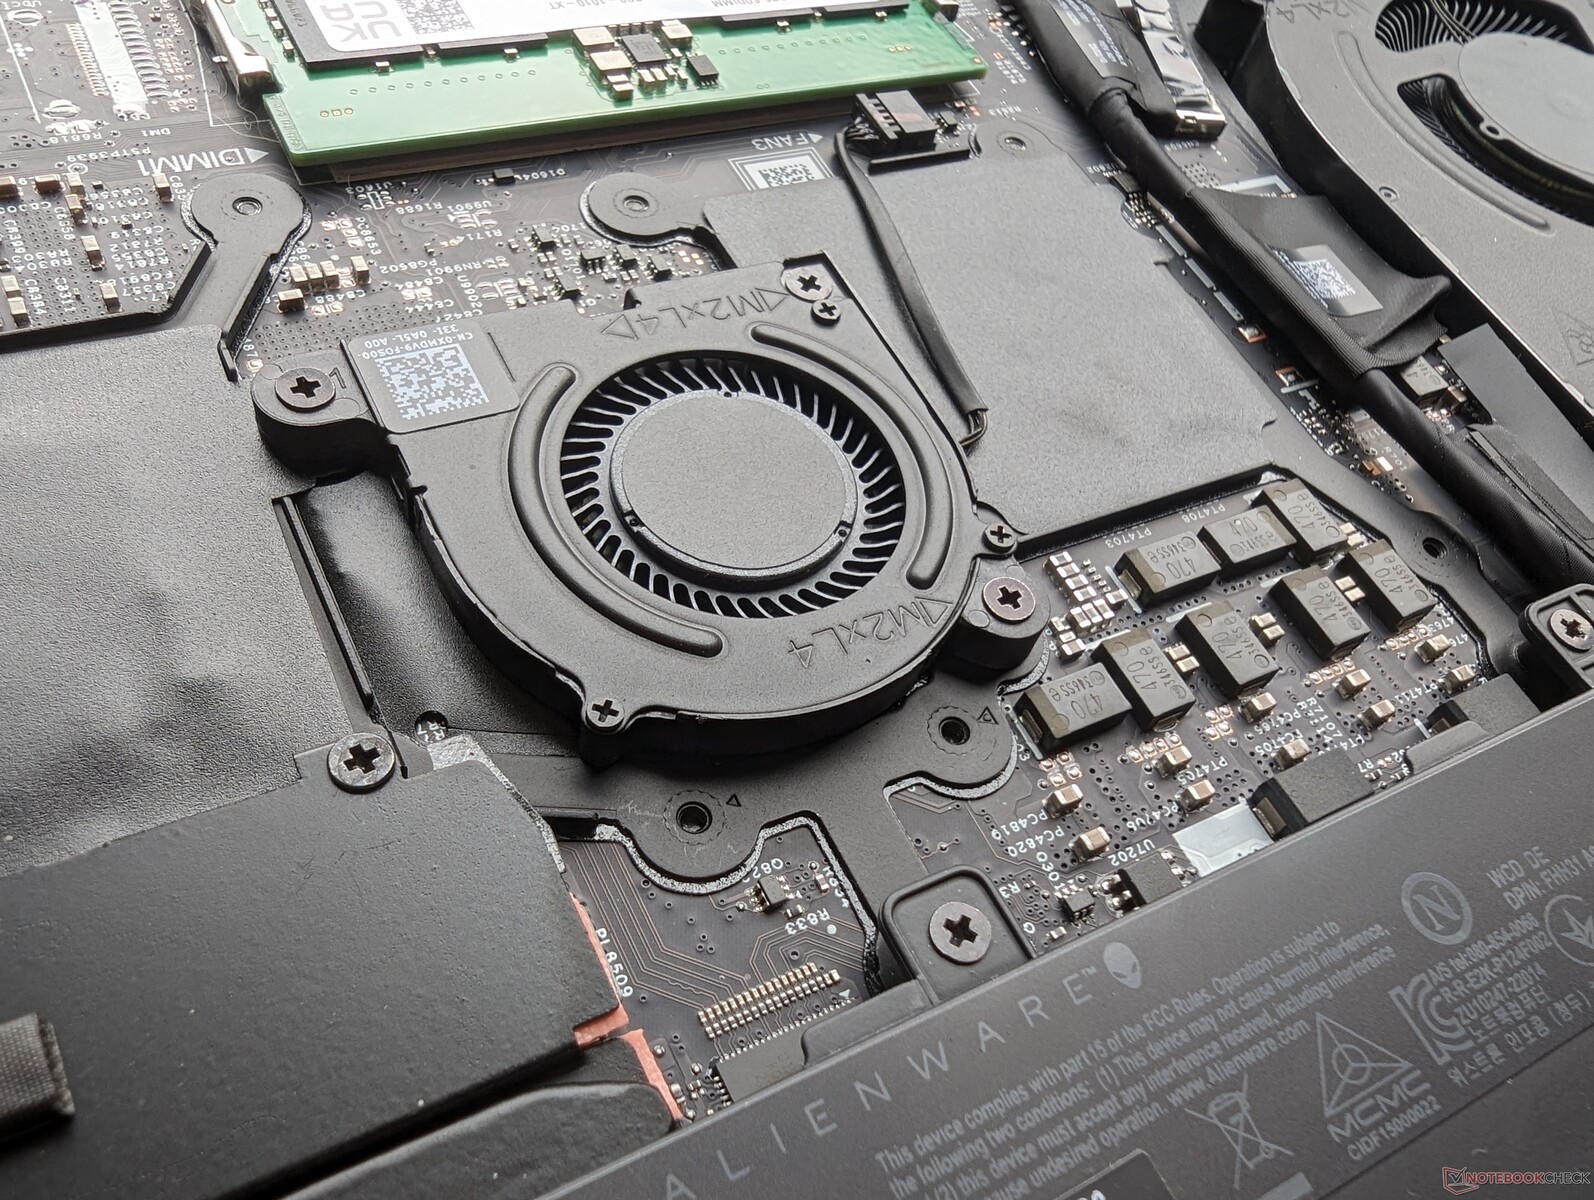
Maintenance
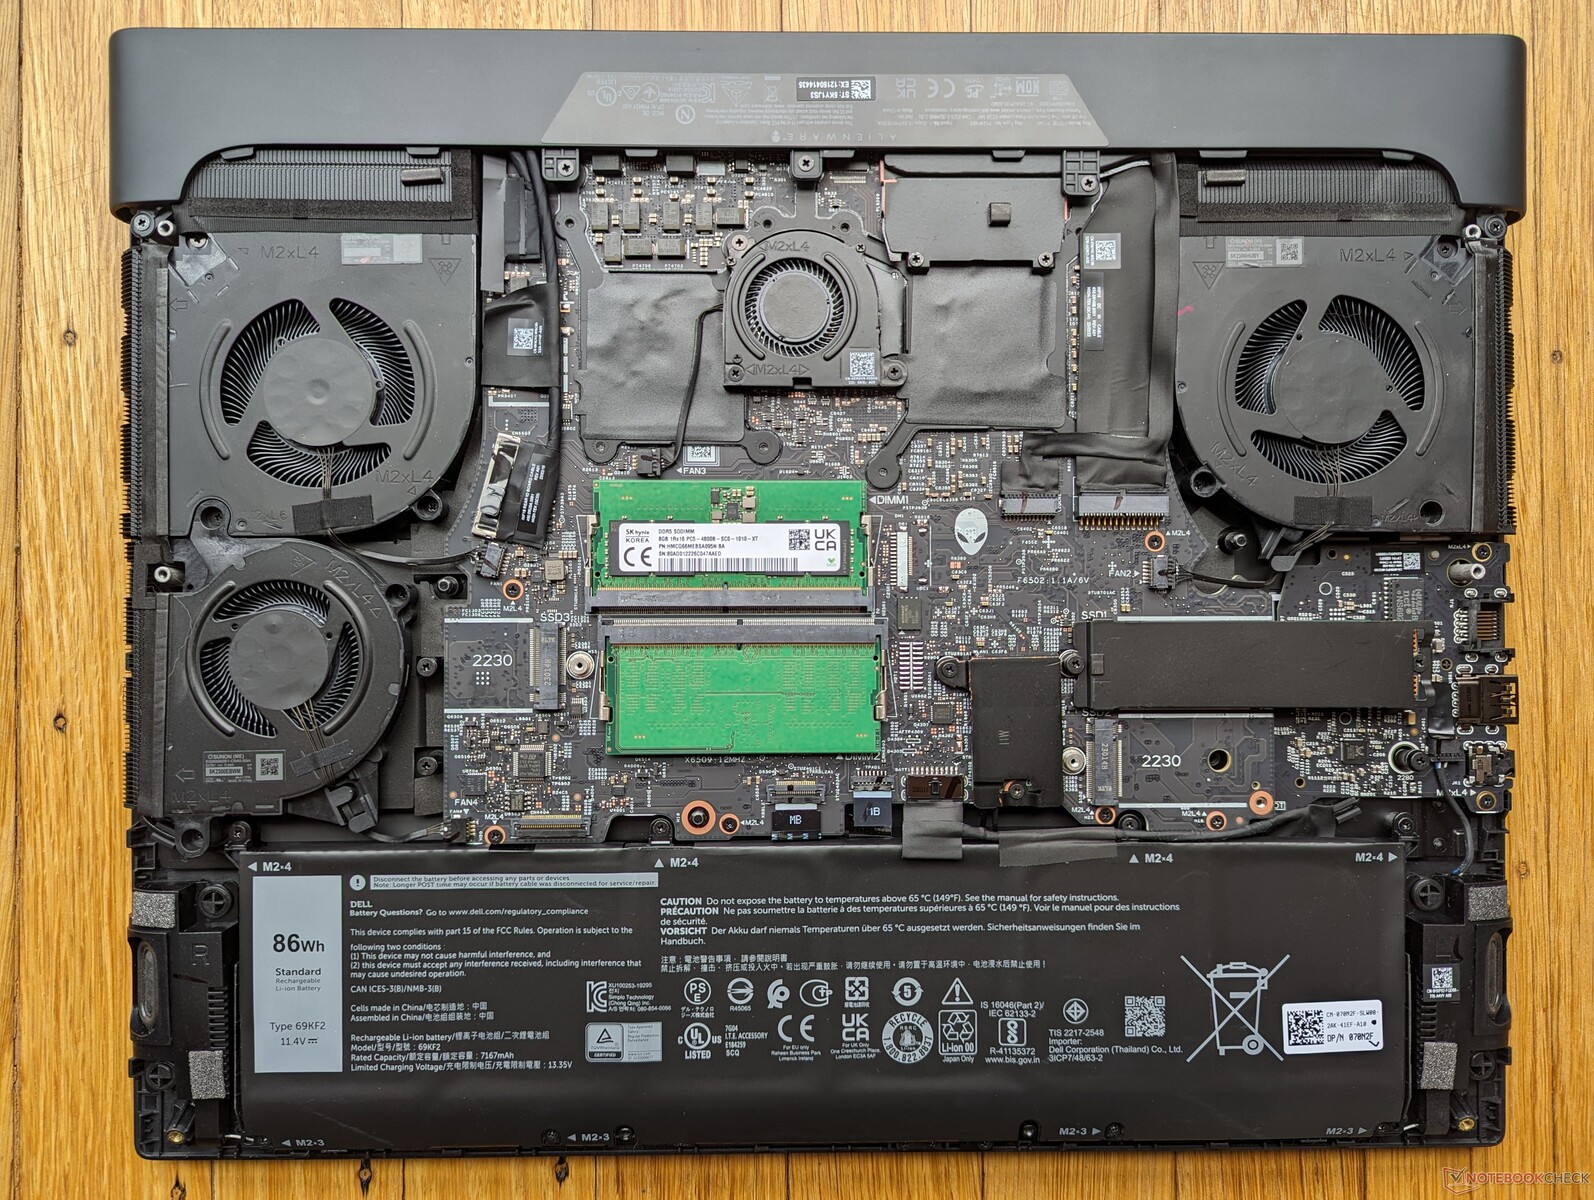
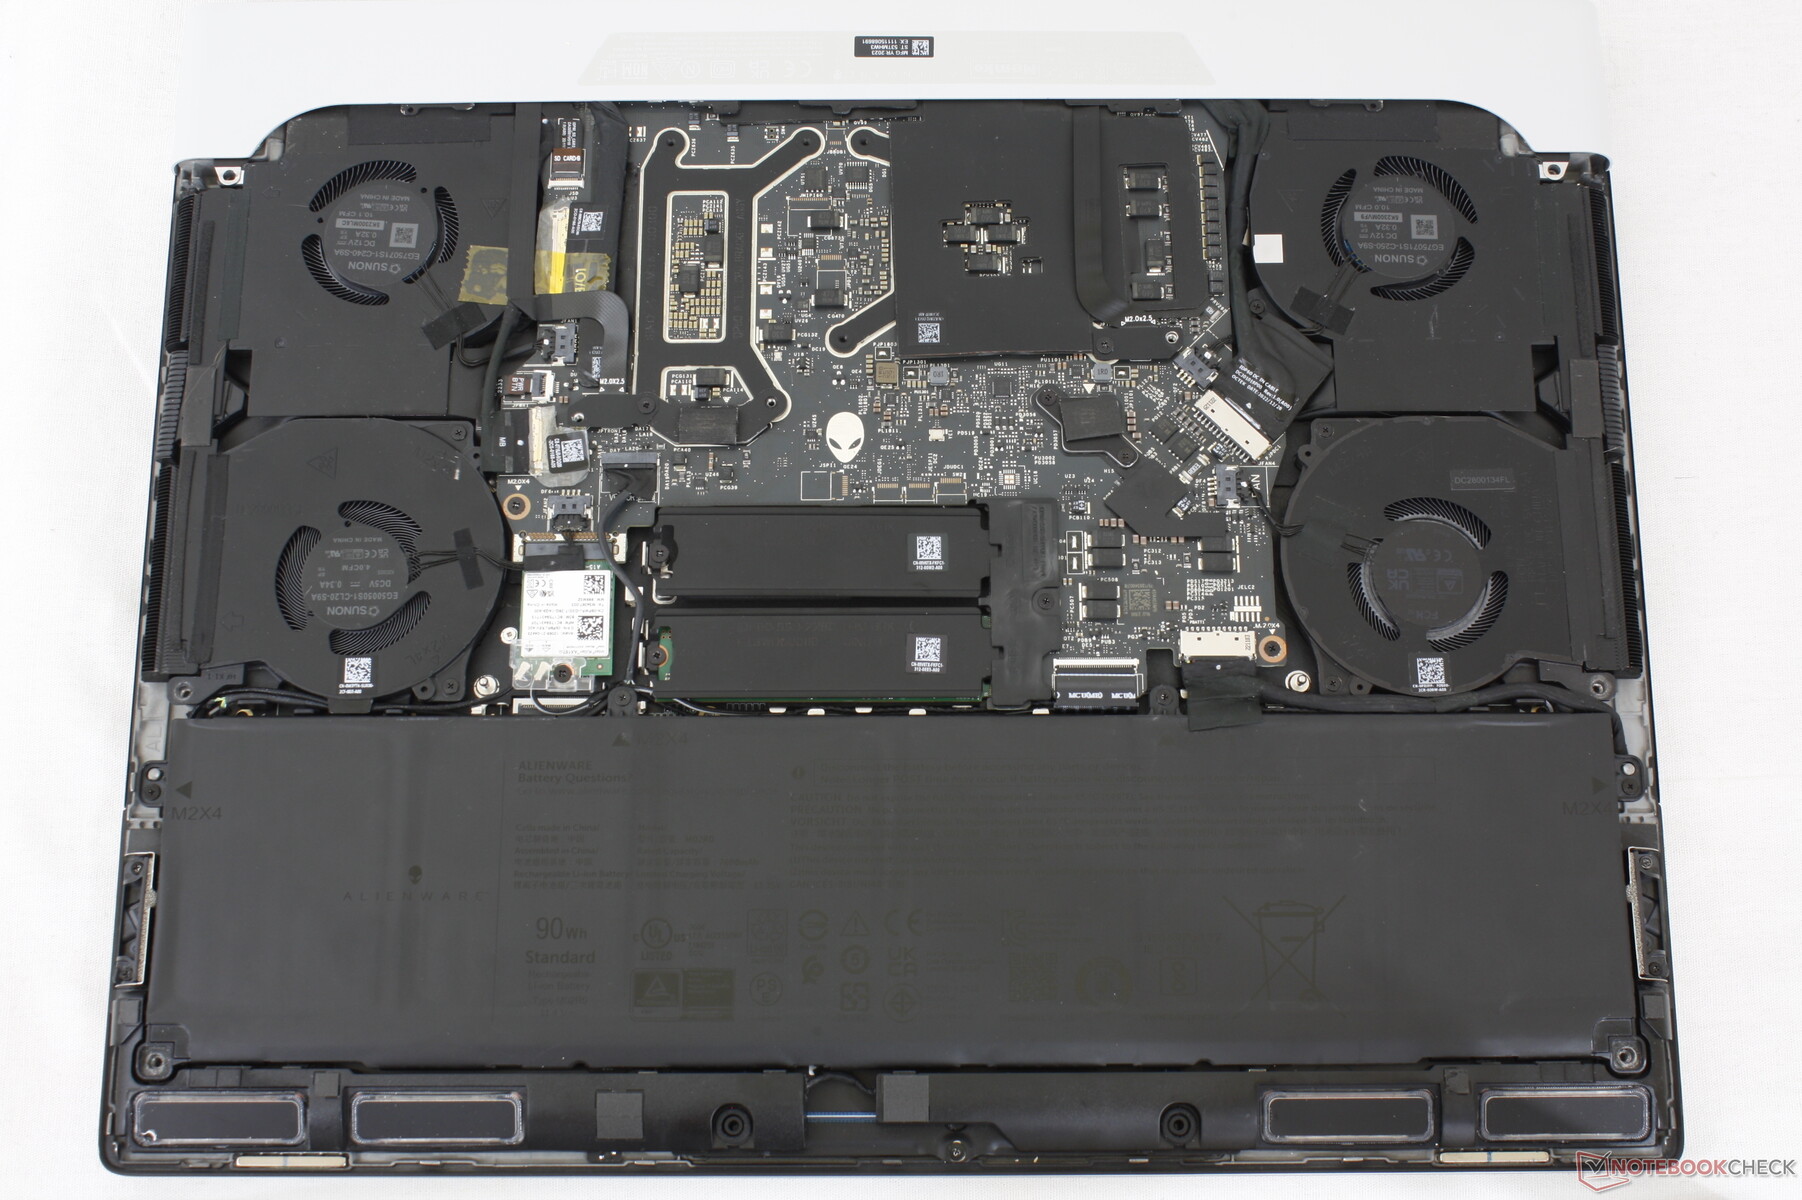
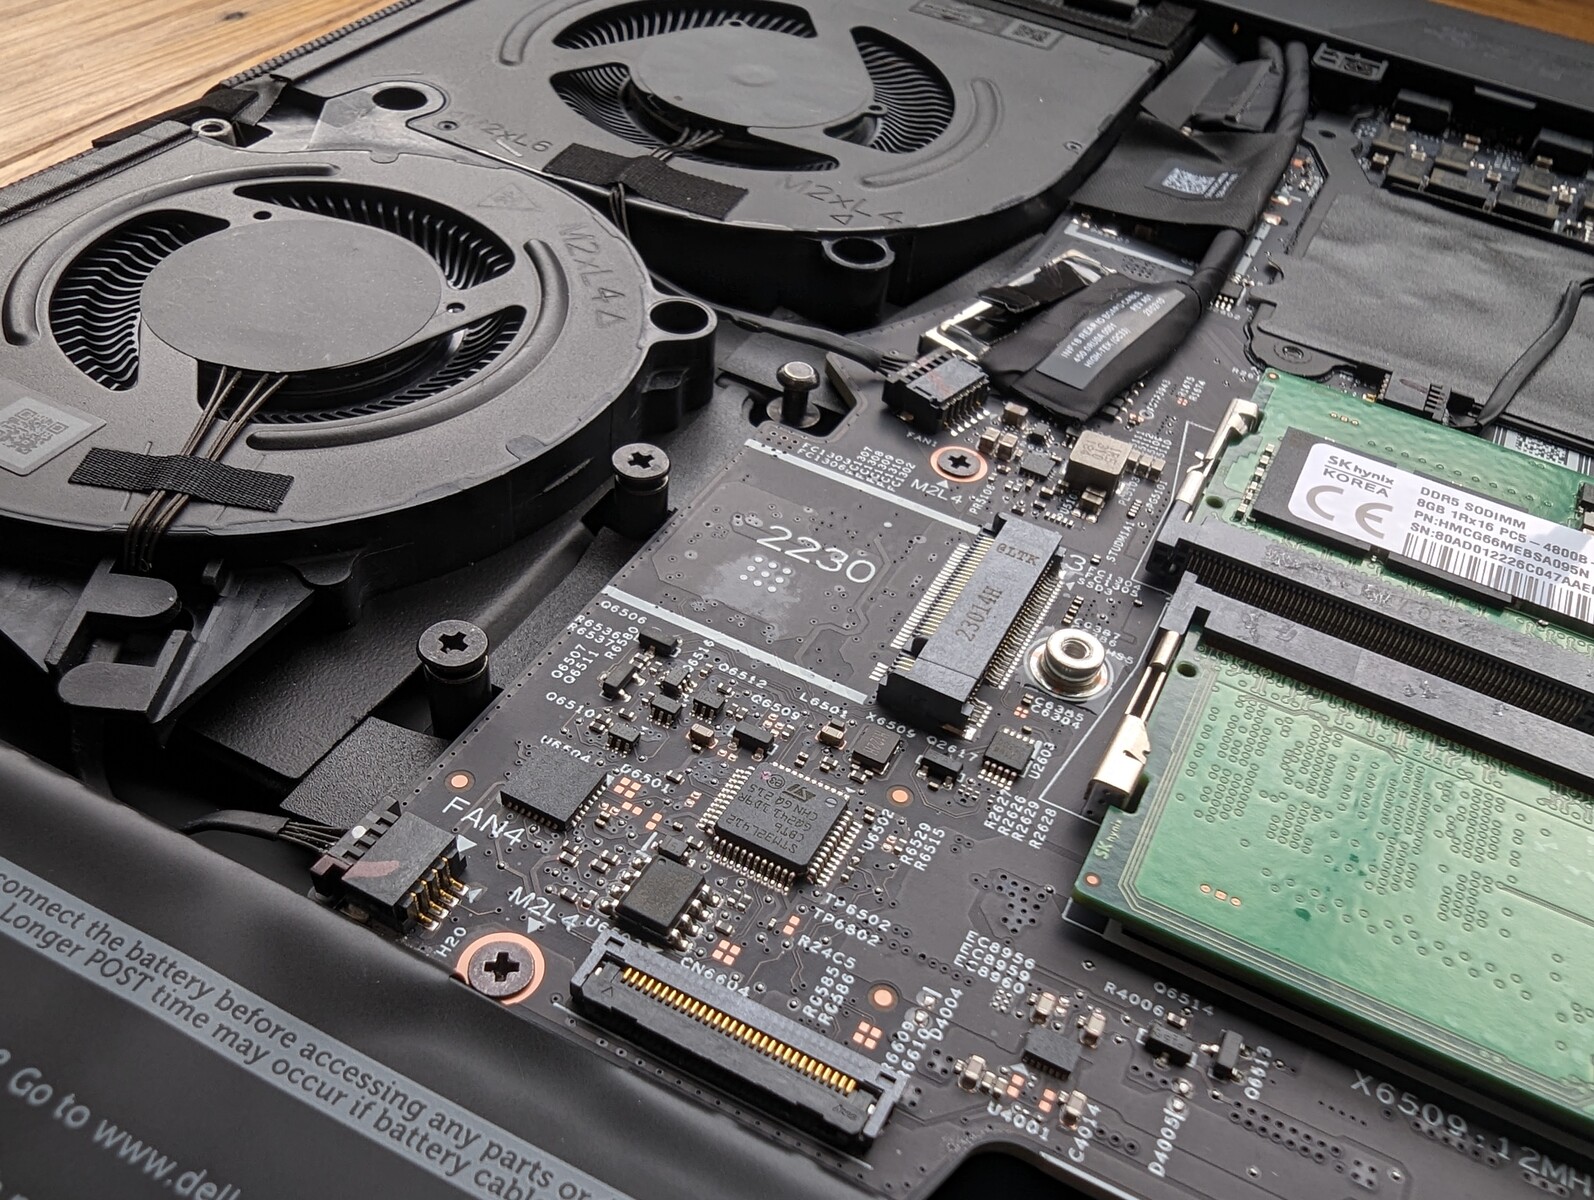
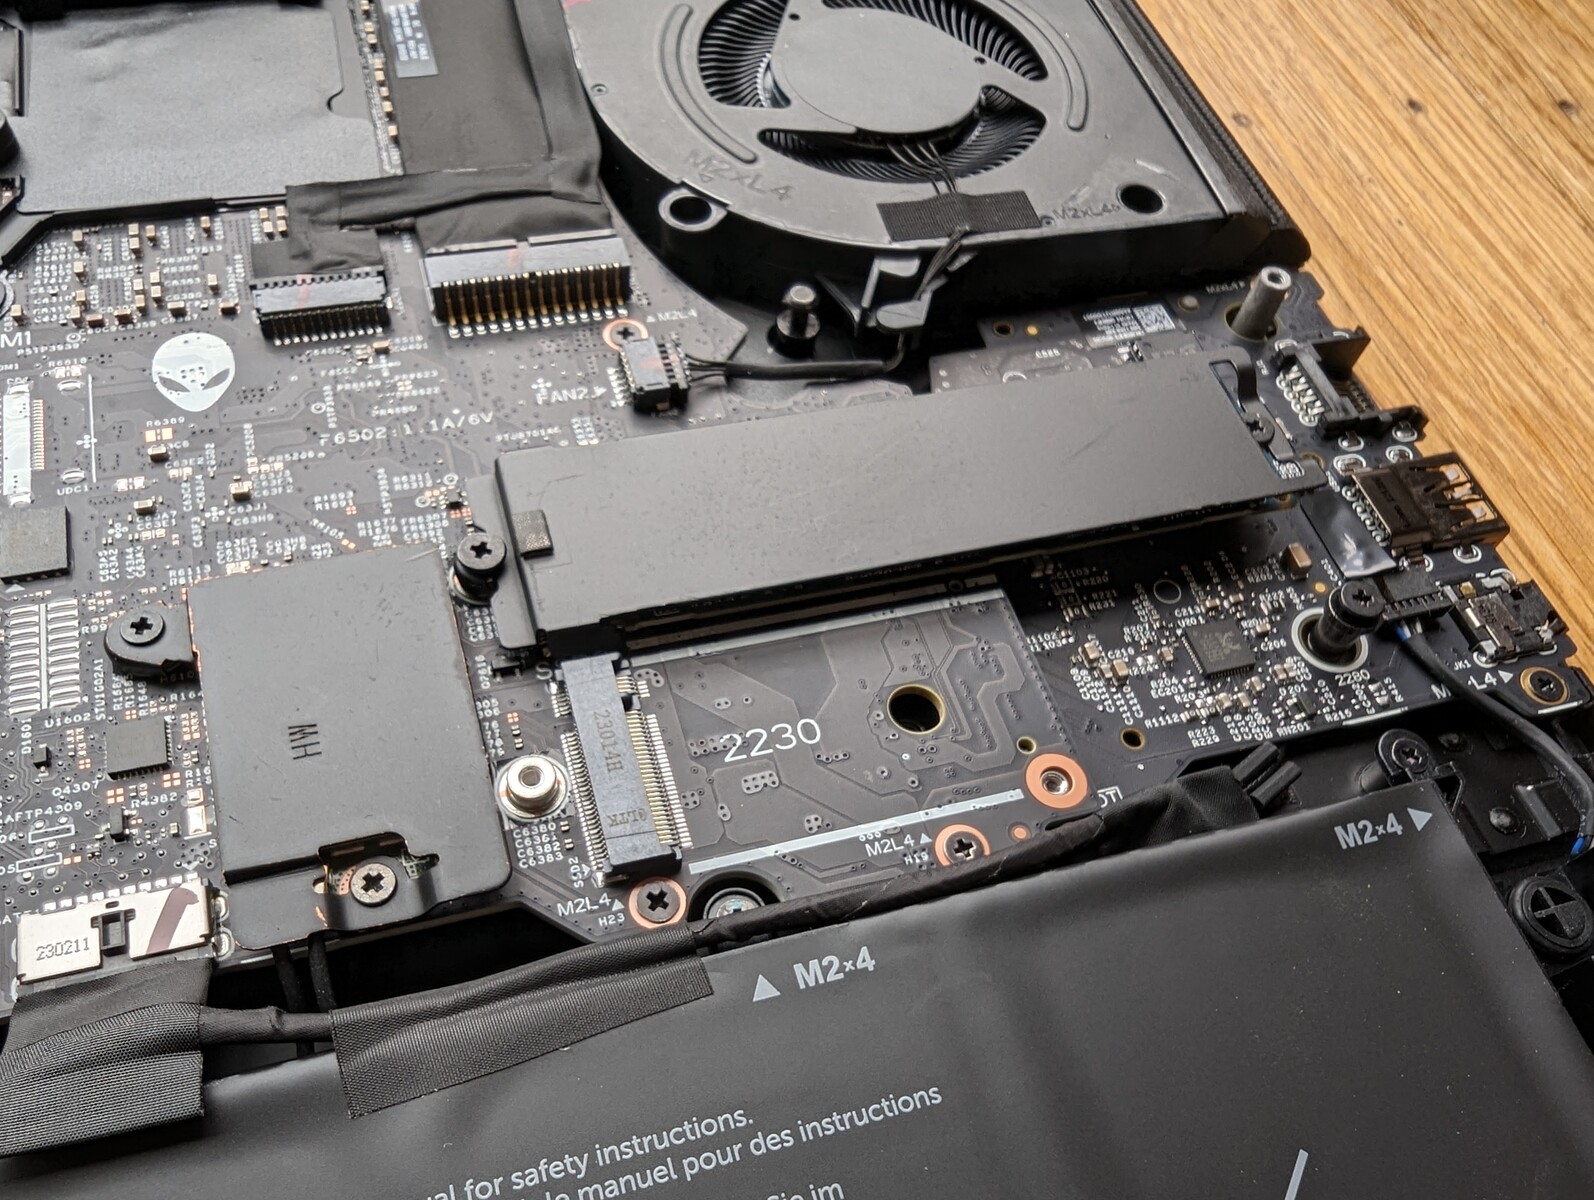
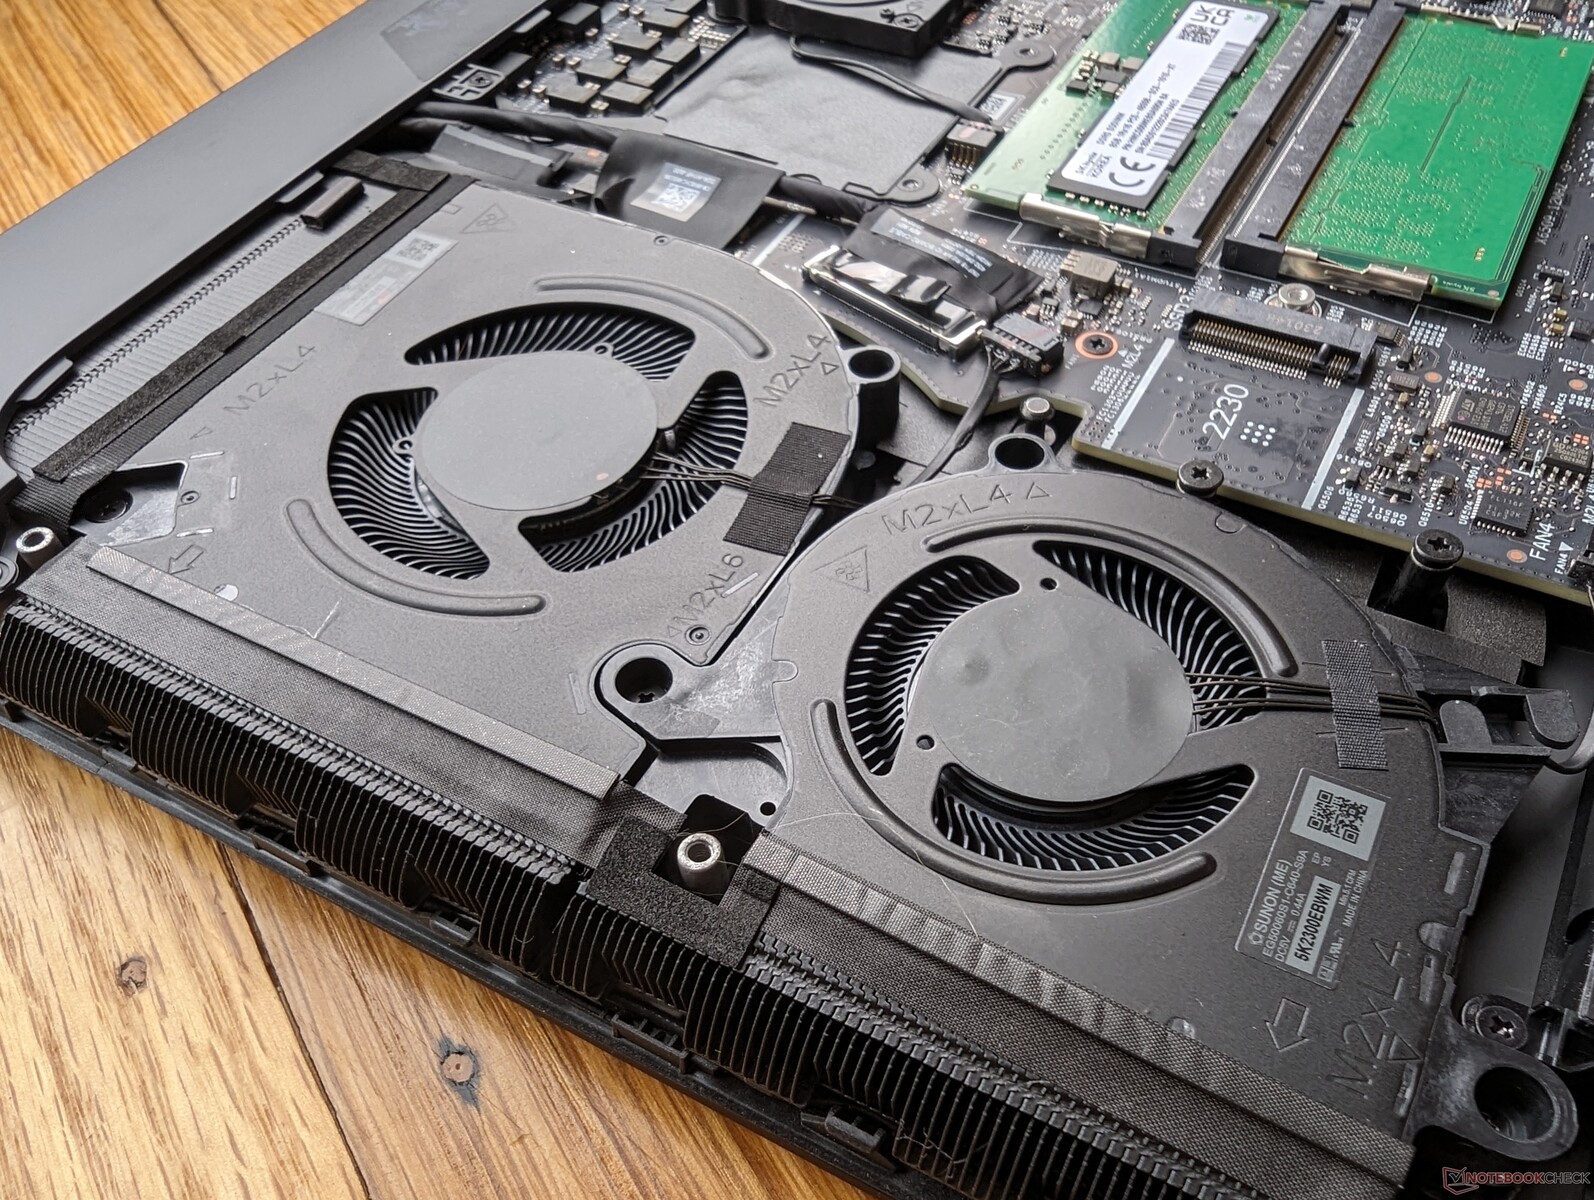
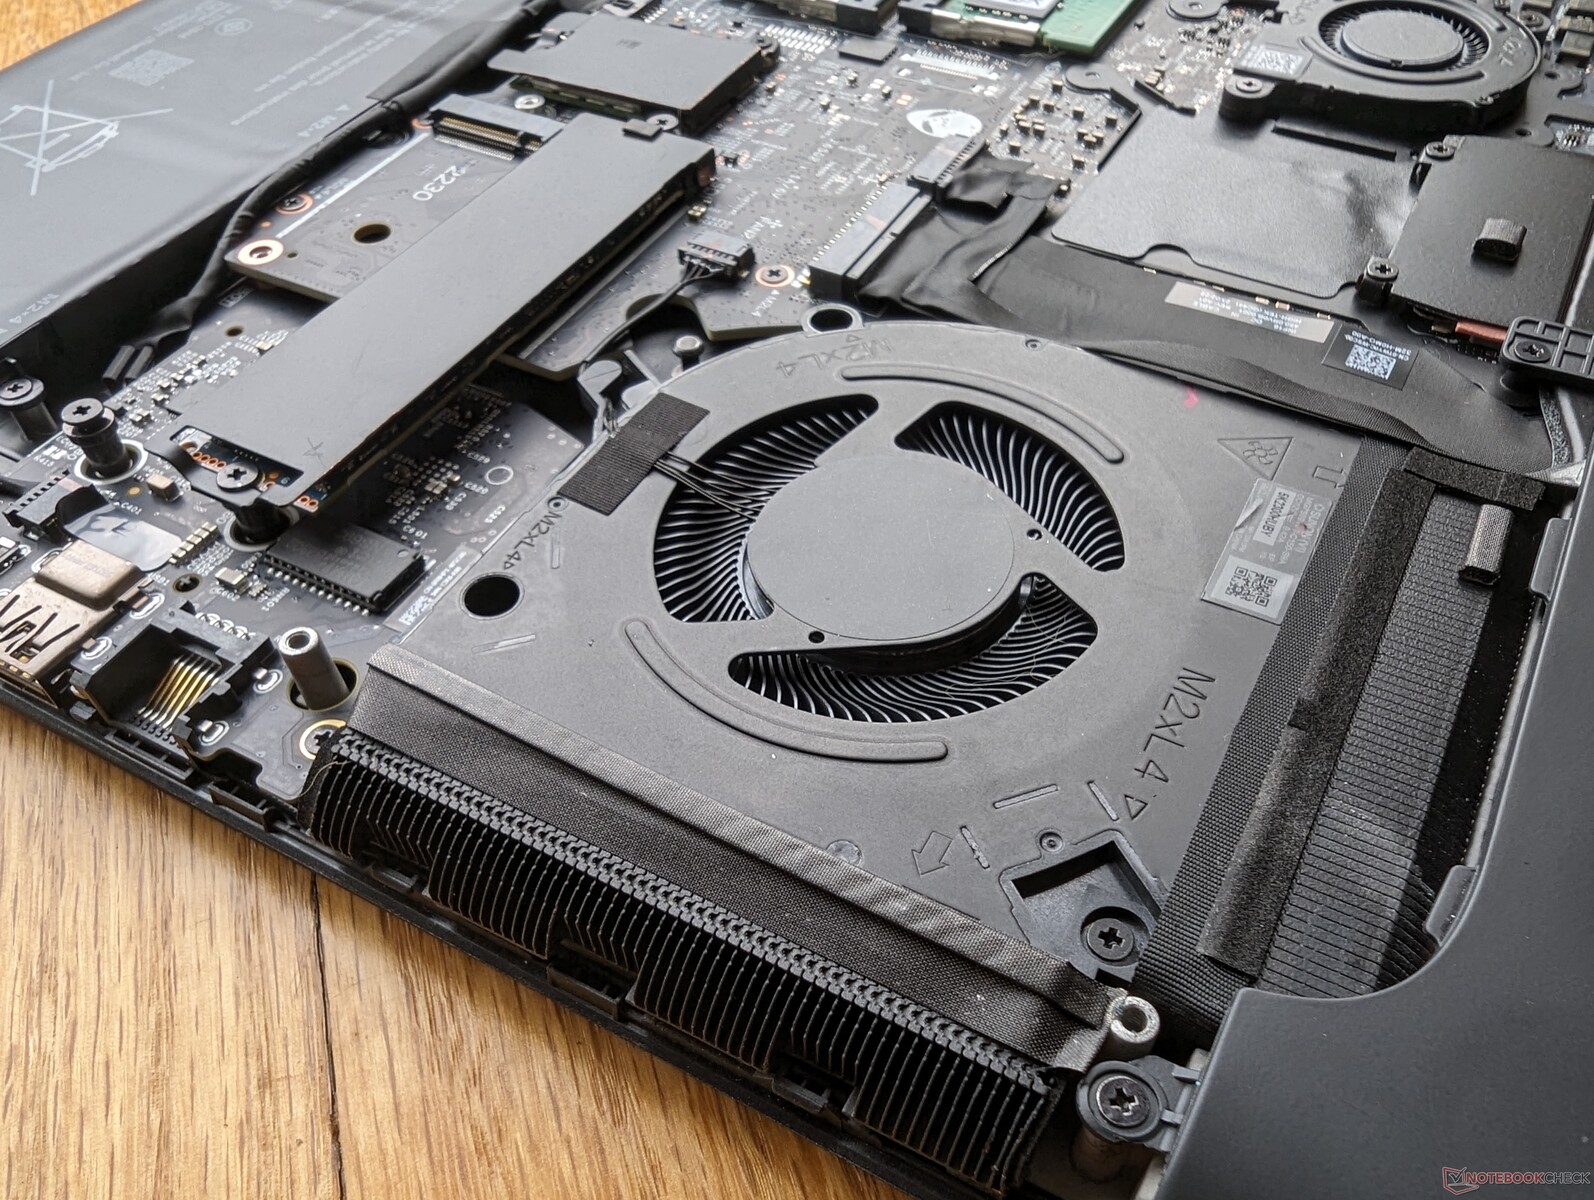
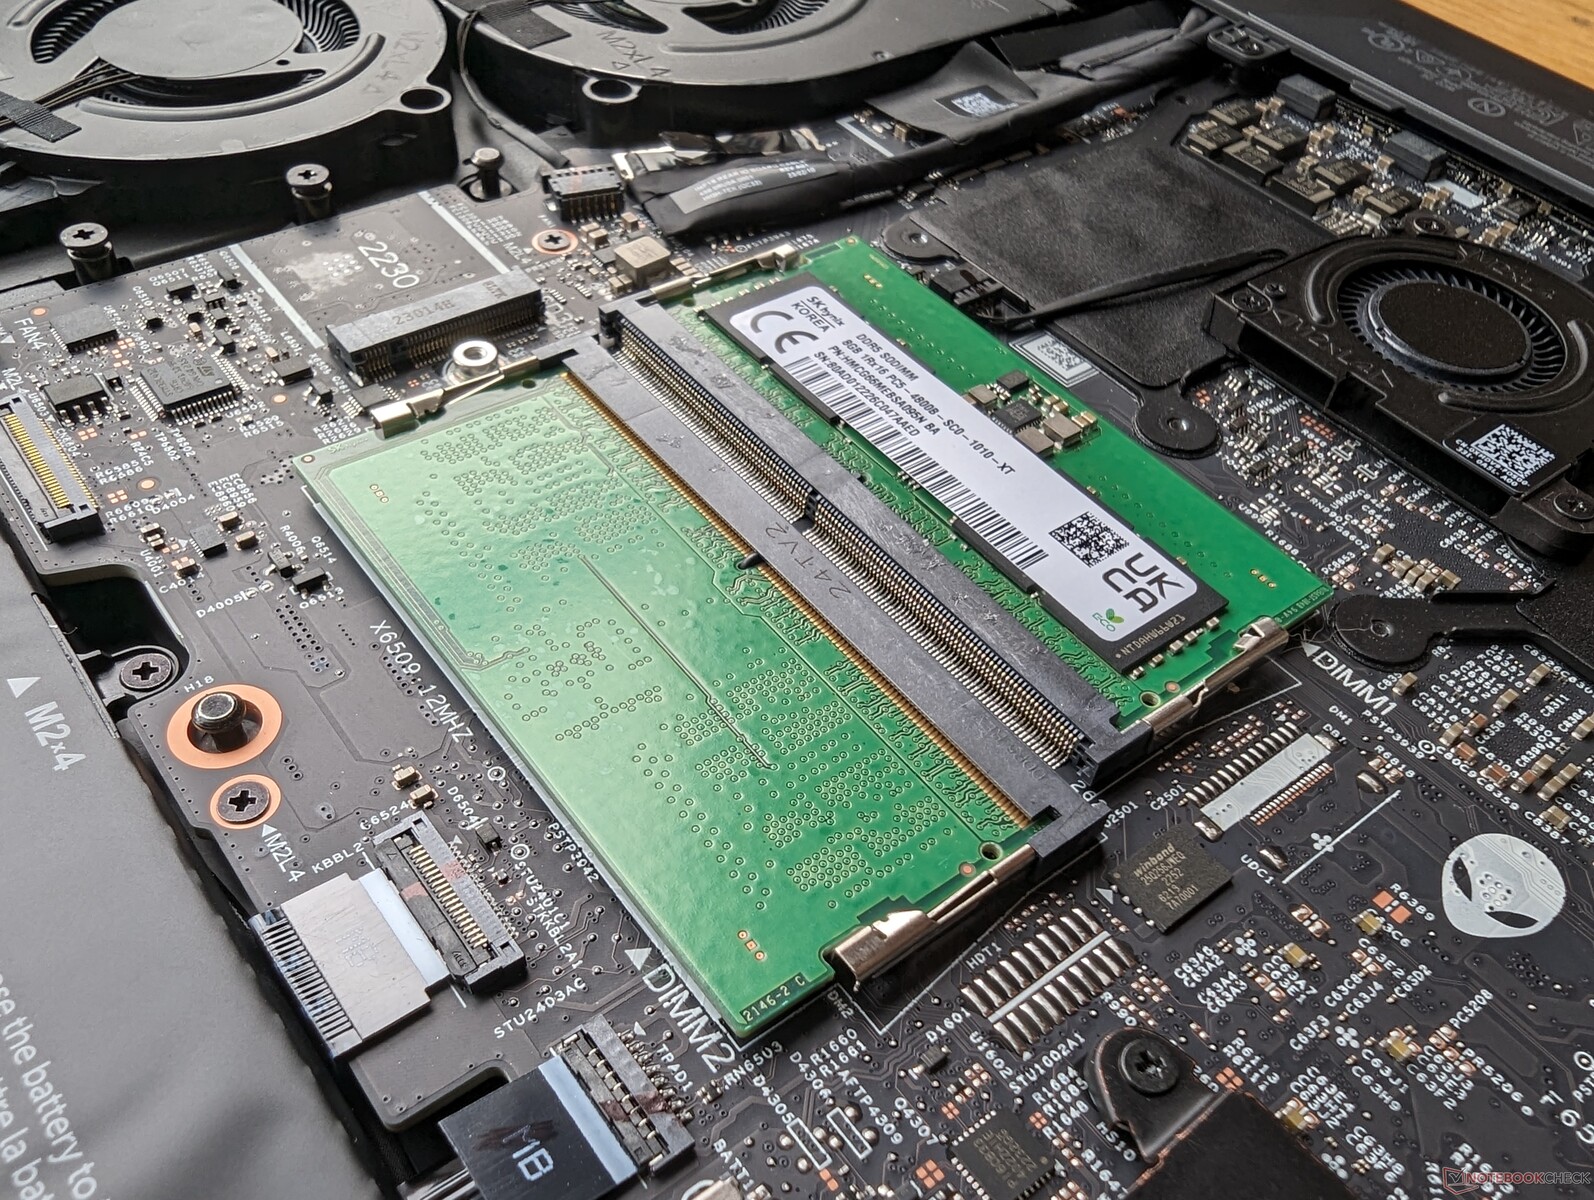
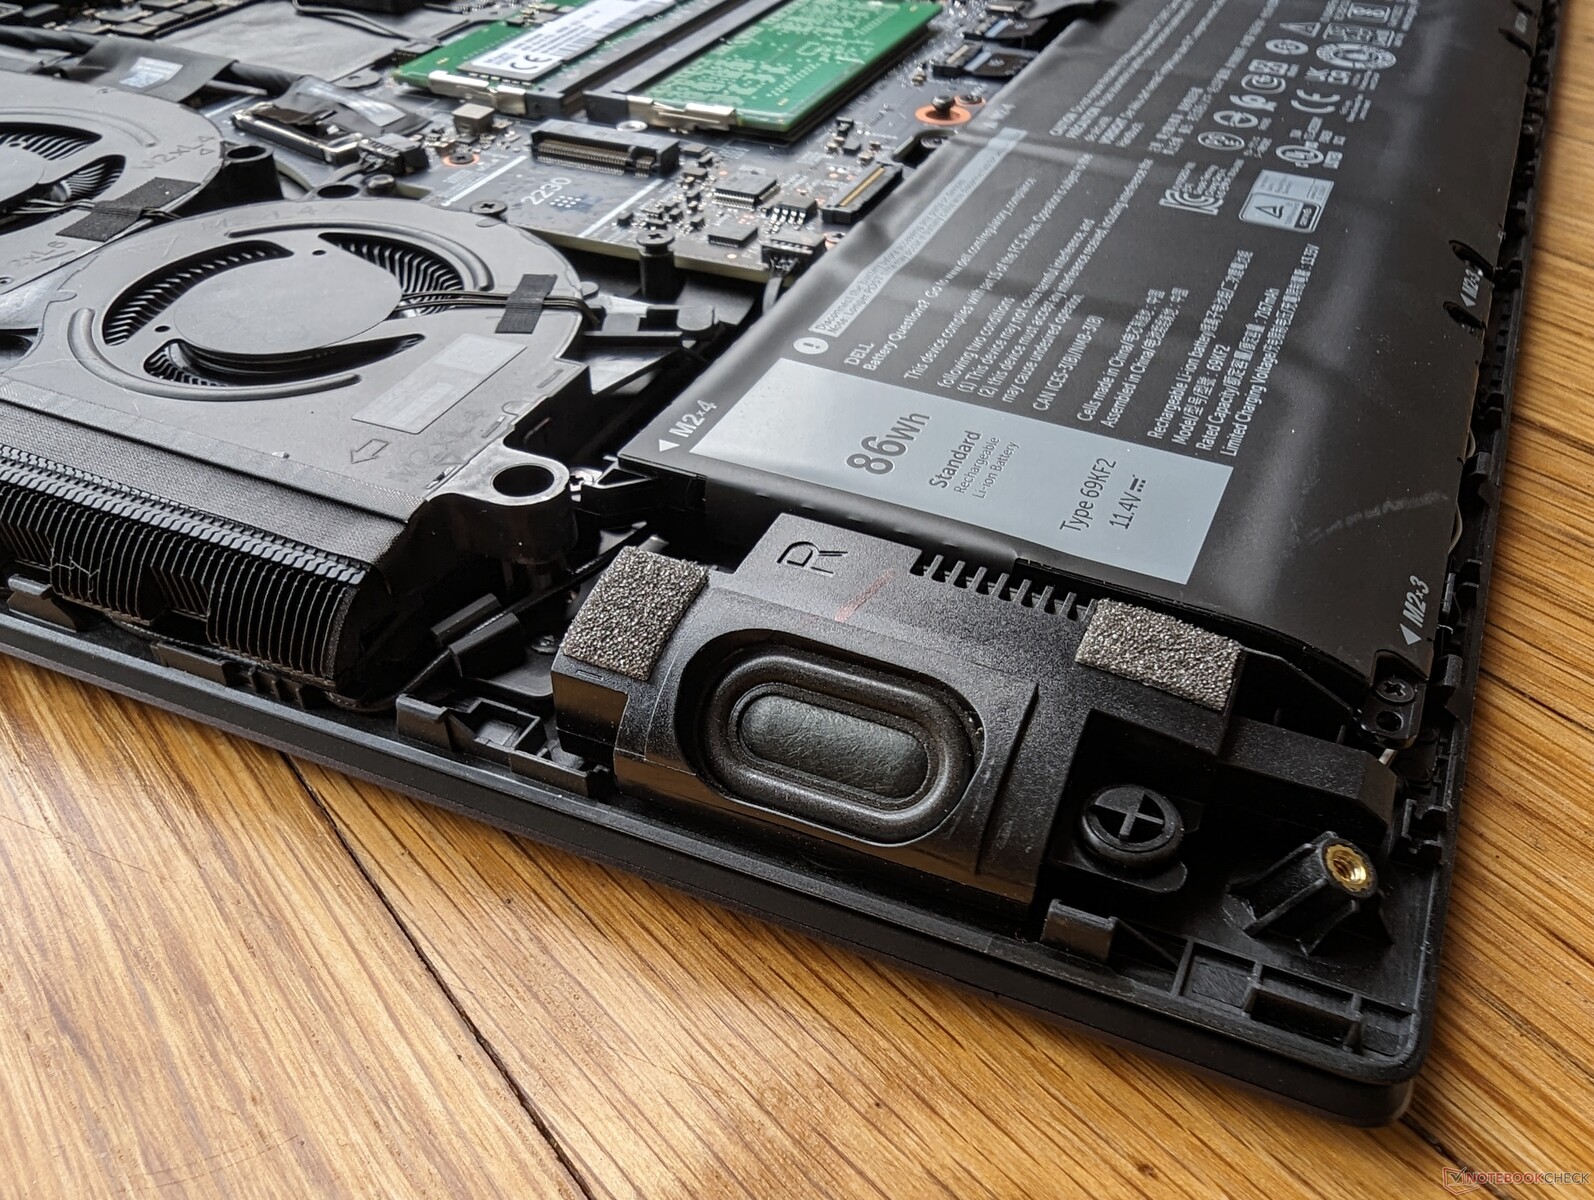
Le panneau inférieur est fixé par 8 vis Phillips pour faciliter l'entretien. Les utilisateurs ont un accès direct à trois baies de stockage, à deux emplacements SODIMM et au module WLAN amovible. Notez que la carte mère est à l'envers, ce qui signifie que les processeurs se trouvent sur le côté opposé.
Le design de la carte mère est complètement différent de celui de l'Alienware x16, même si les deux modèles partagent de nombreuses caractéristiques externes. Elle ressemble plutôt à celle de l'Alienware m18.
Accessoires et garantie
La boîte contient deux autocollants portant le logo Alienware, ainsi que l'adaptateur secteur et les documents habituels. Une garantie constructeur limitée d'un an s'applique si l'appareil est acheté aux États-Unis.
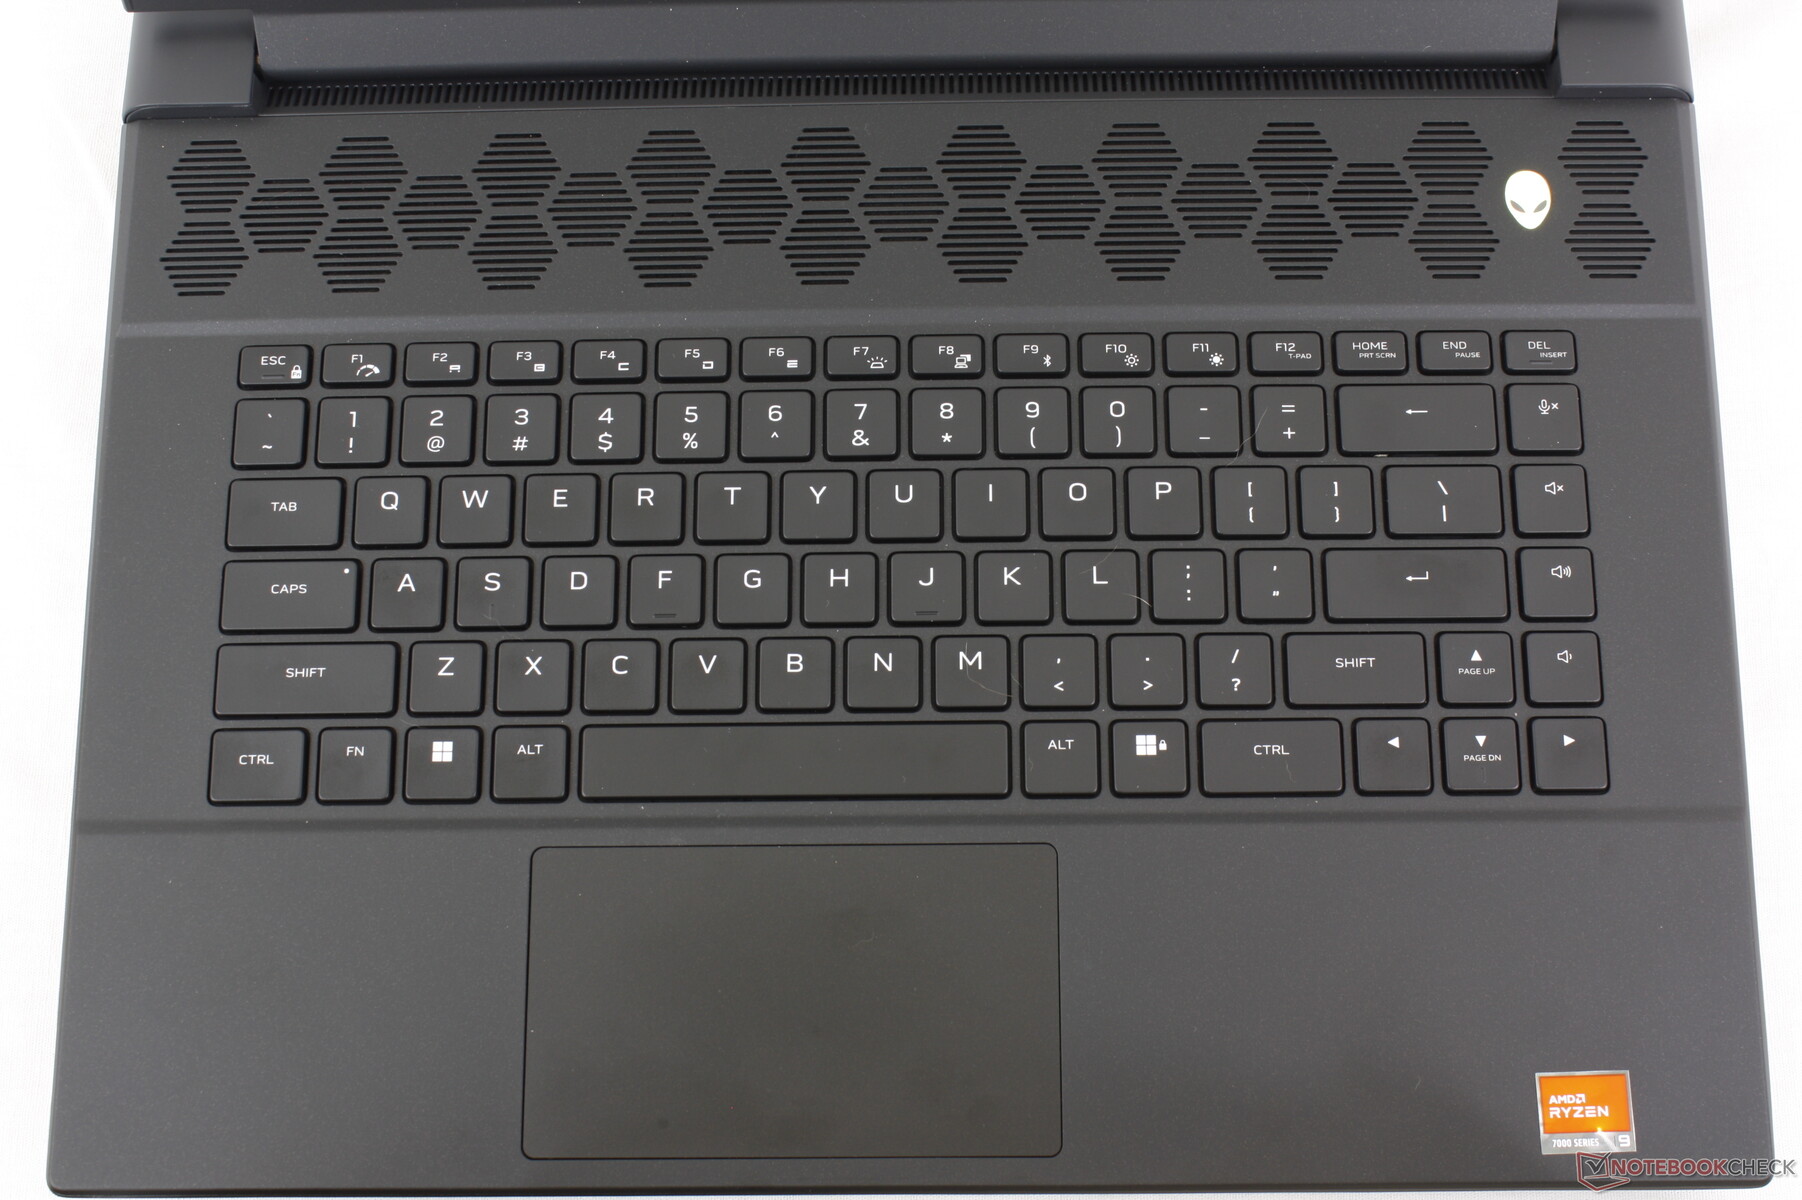
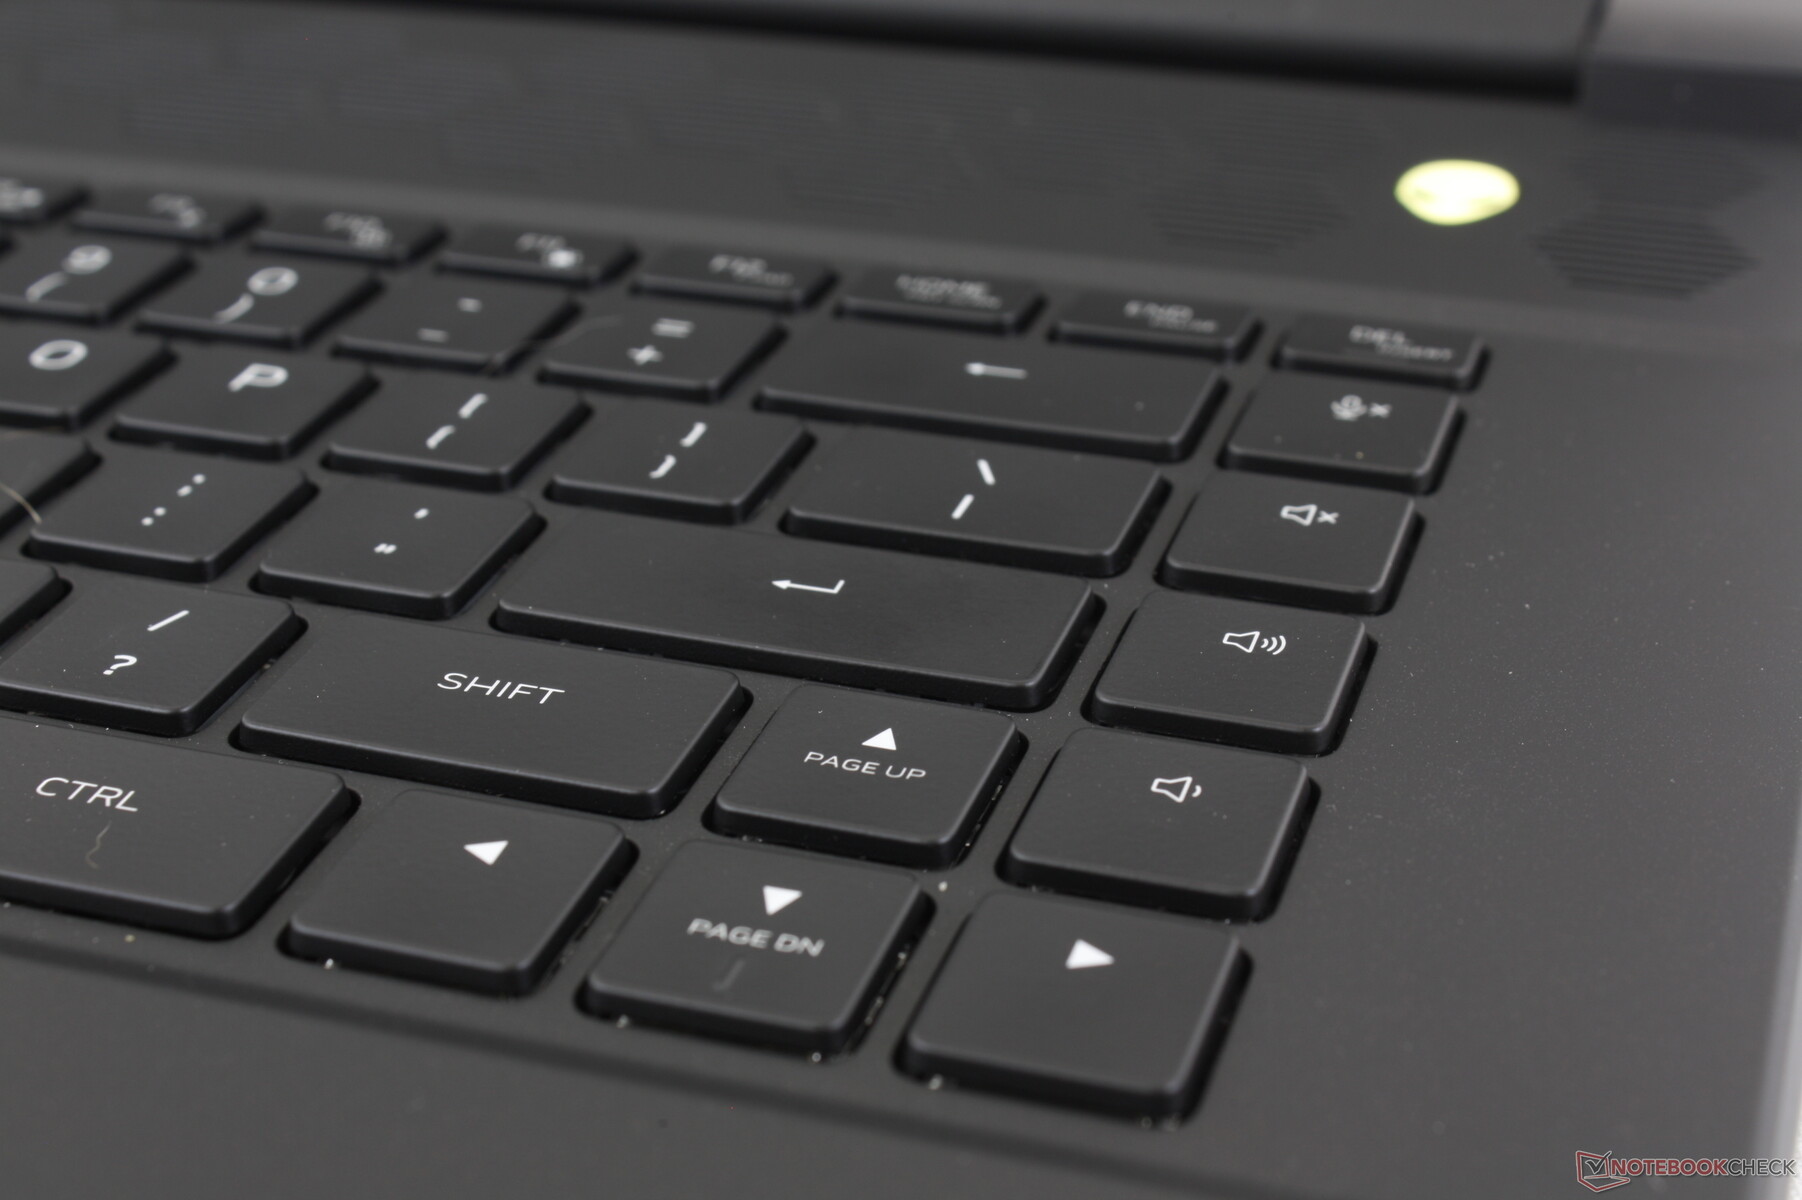
Dispositifs d'entrée - mécaniques ou standard disponibles
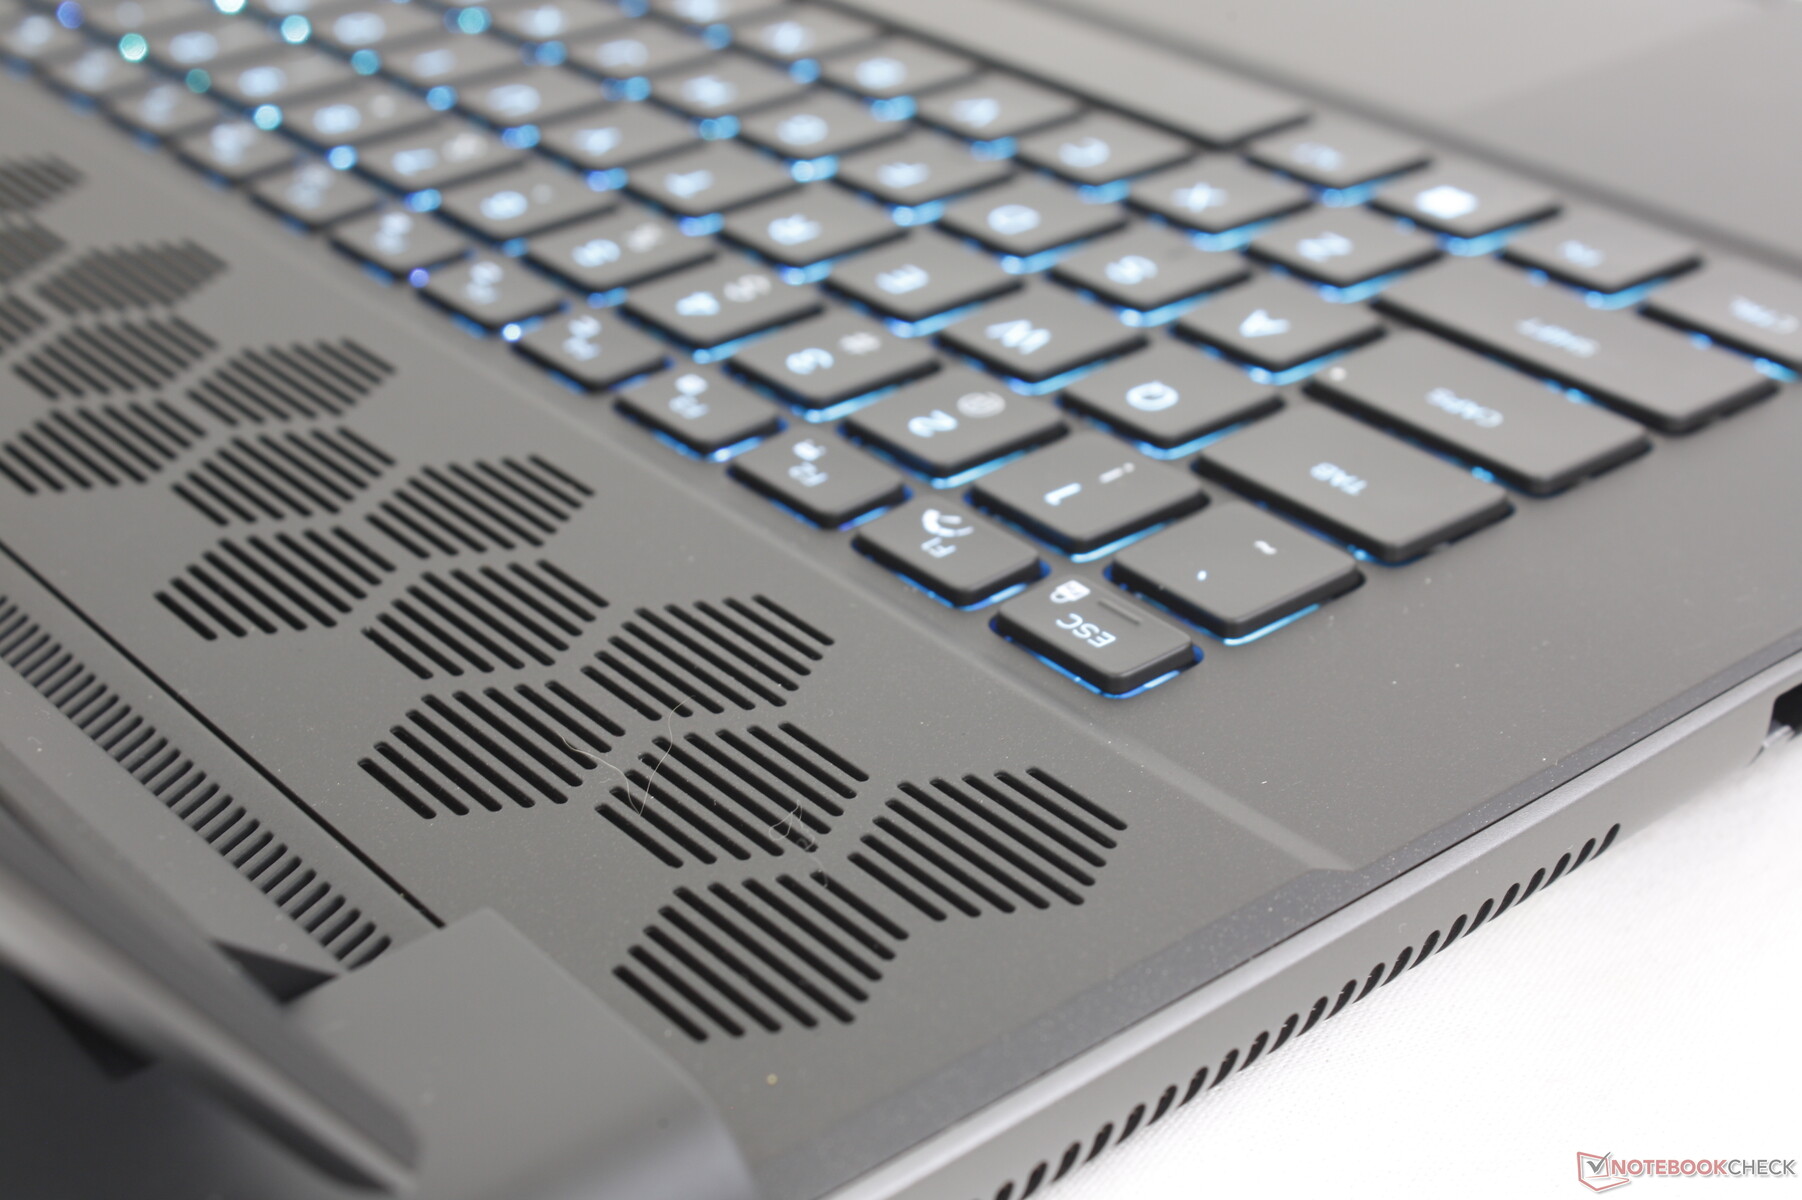
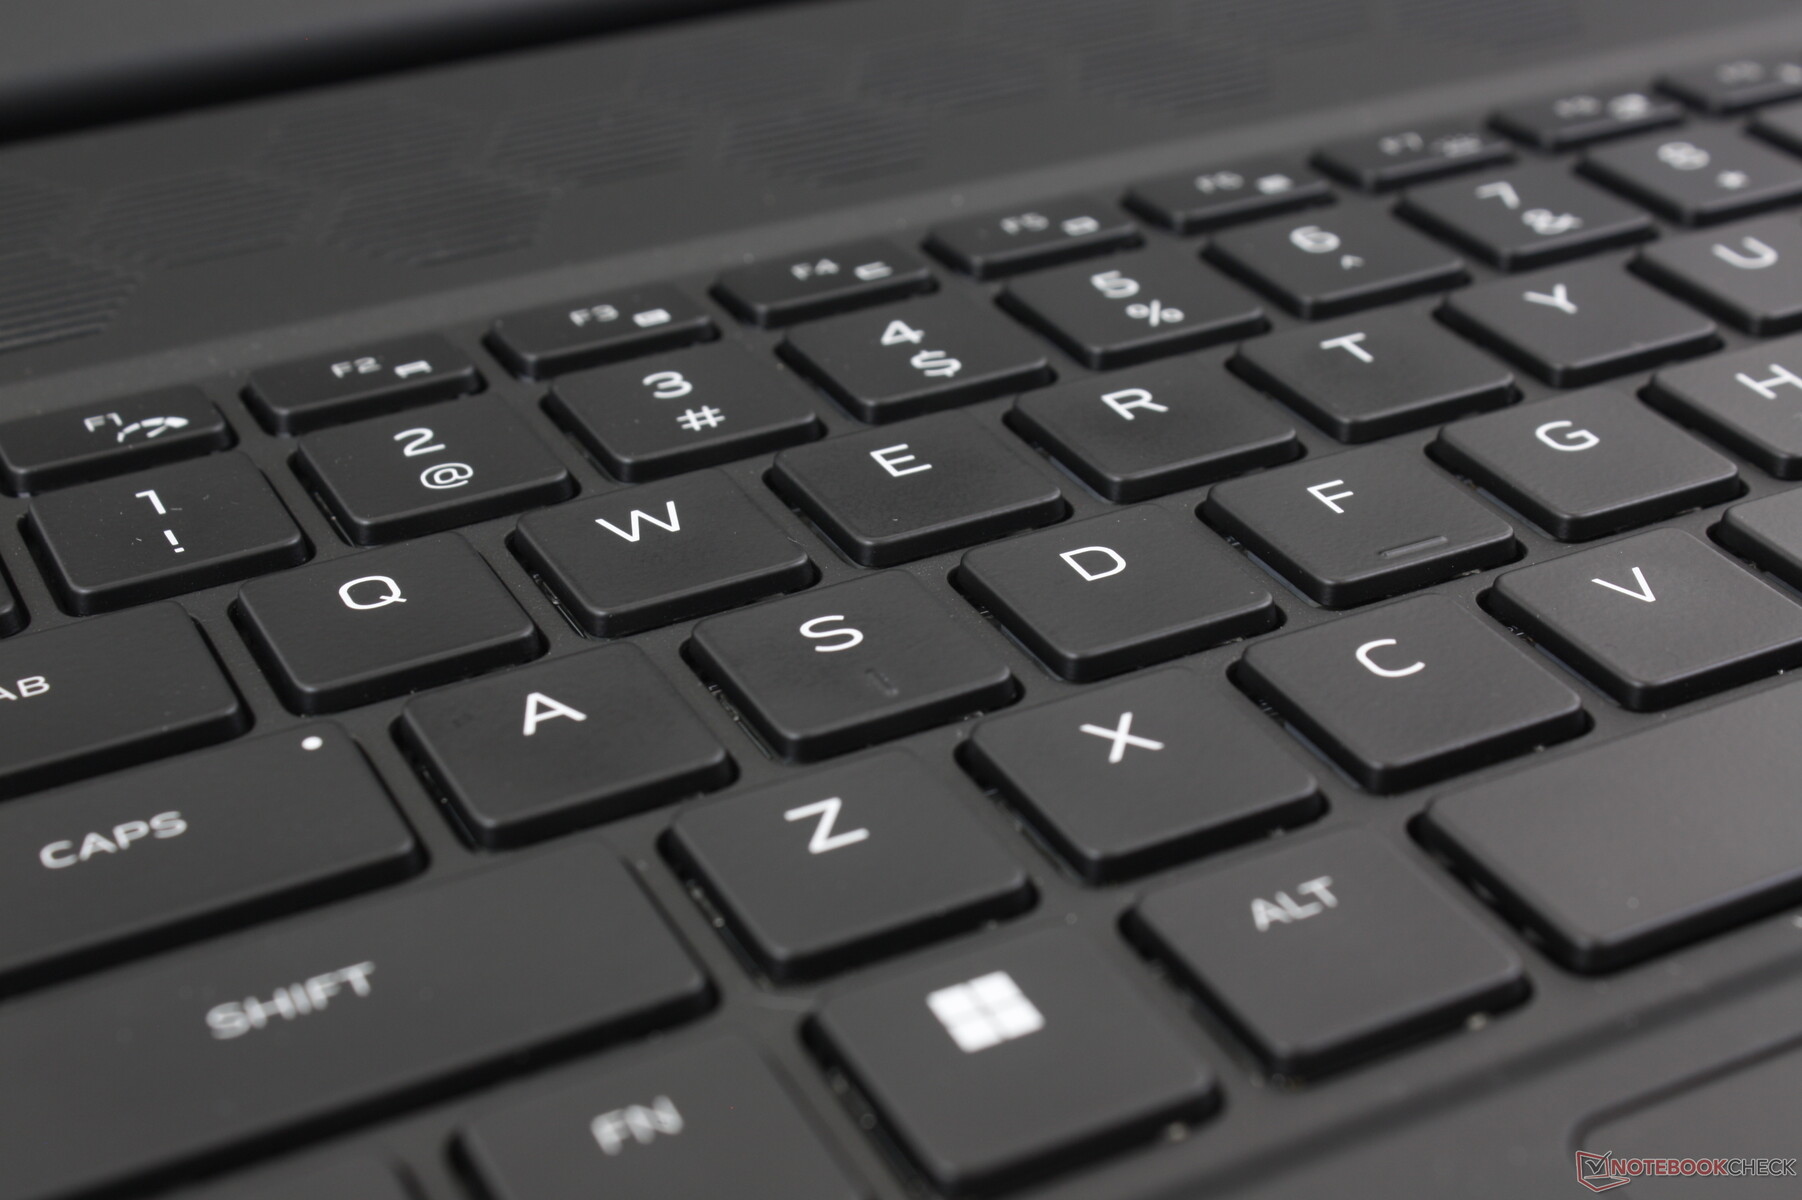
Clavier
Les utilisateurs peuvent configurer soit un clavier à membrane standard, soit un clavier mécanique CherryMX à profil ultra bas avec éclairage RVB par touche. Le clavier CherryMX a été introduit il y a quelques années sur le modèle Alienware x17 R1 et il reste l'un de nos claviers préférés sur un ordinateur portable de jeu pour son retour d'information et son grand débattement. Le principal inconvénient, bien sûr, est le claquement aigu et très bruyant. Pour les environnements sensibles au bruit, comme les bibliothèques, les salles de classe ou les dortoirs, il est préférable d'opter pour le clavier standard.
Le rétroéclairage illumine toutes les touches et tous les symboles, ce qui n'était pas le cas sur les anciens modèles ce n'était pas le cas sur les anciens modèles.
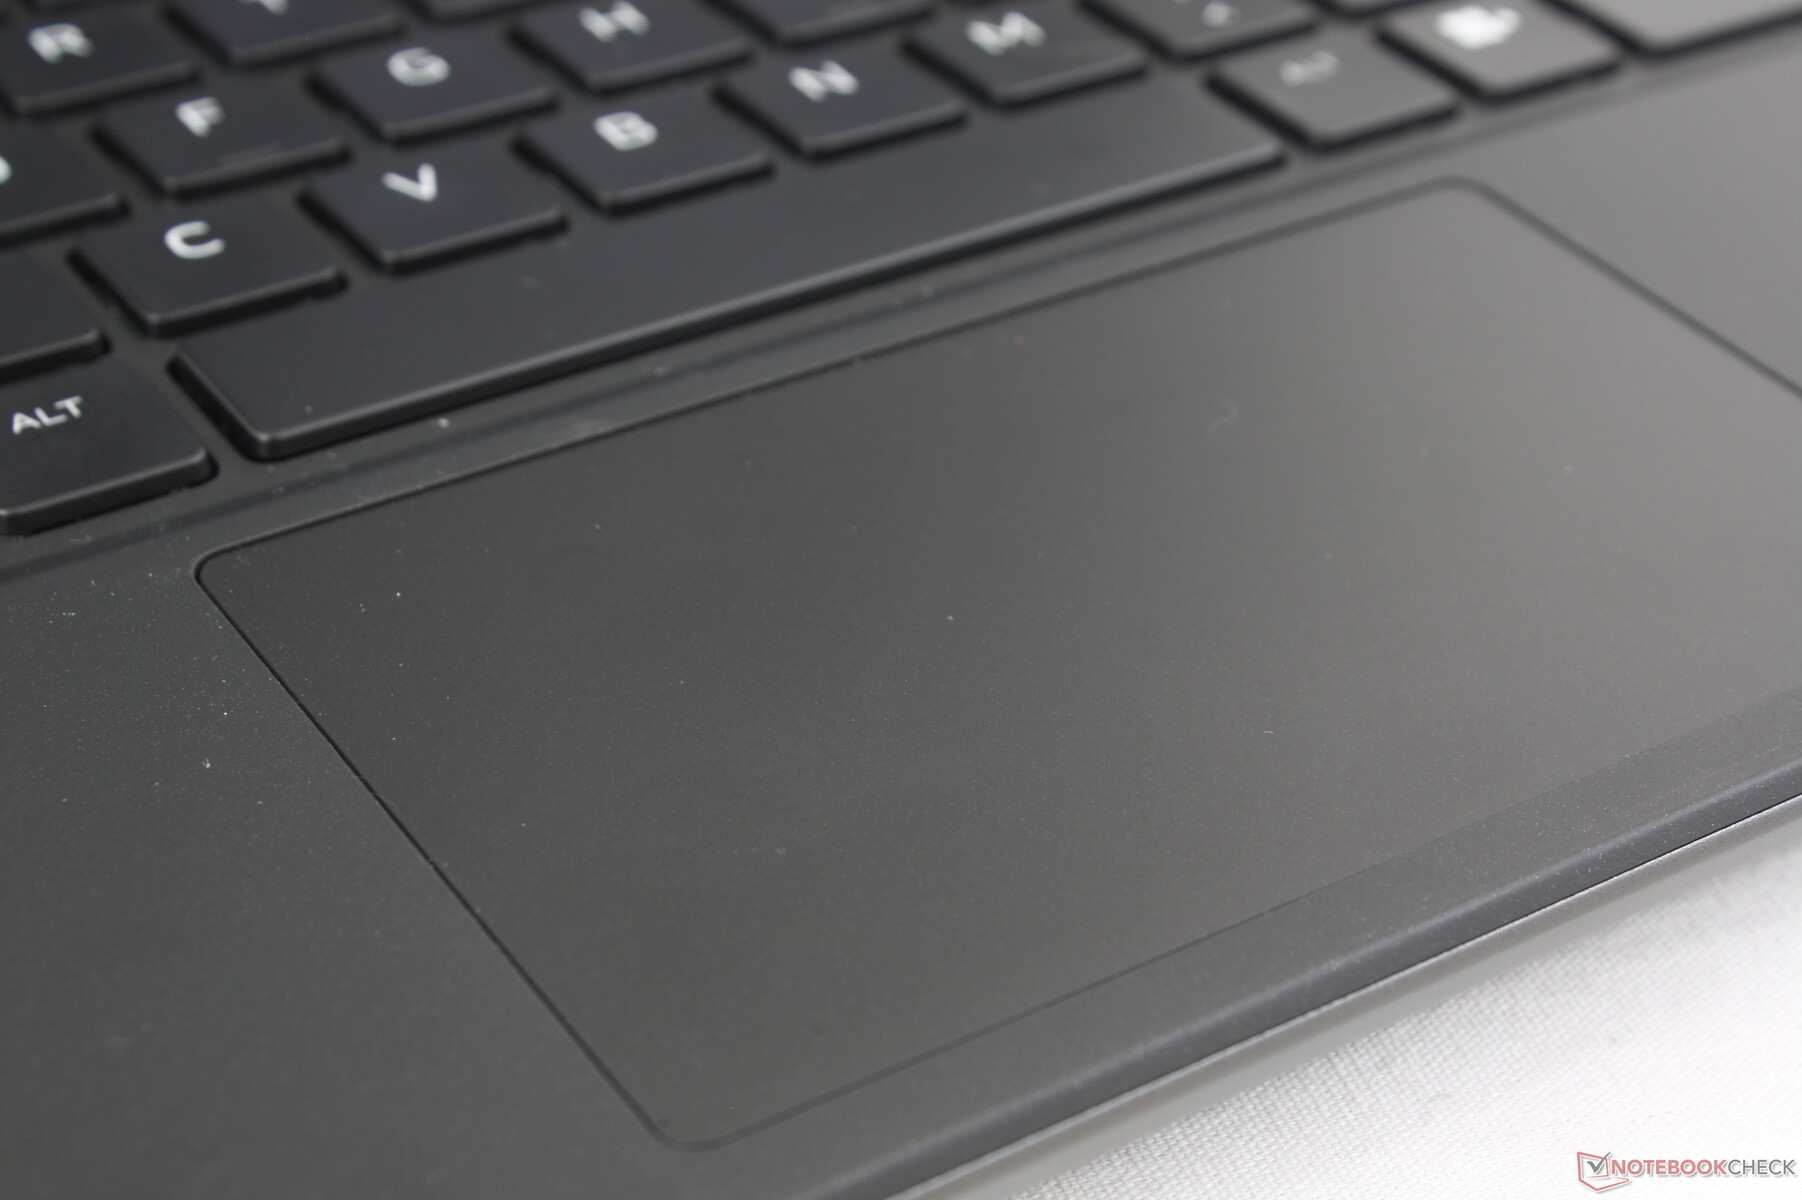
Pavé tactile
Le pavé numérique est relativement petit (11,3 x 6,6 cm) car une grande partie du clavier est occupée par les grandes grilles d'aération. Les pavés tactiles du HP Omen Transcend 16 et du Razer Blade 16, par exemple, sont plus spacieux (respectivement 12,5 x 8 cm et 17 x 9,7 cm). La traction est par ailleurs fluide et le retour d'information est ferme et percutant lorsque l'on appuie sur le clavier, malgré la surface restreinte.
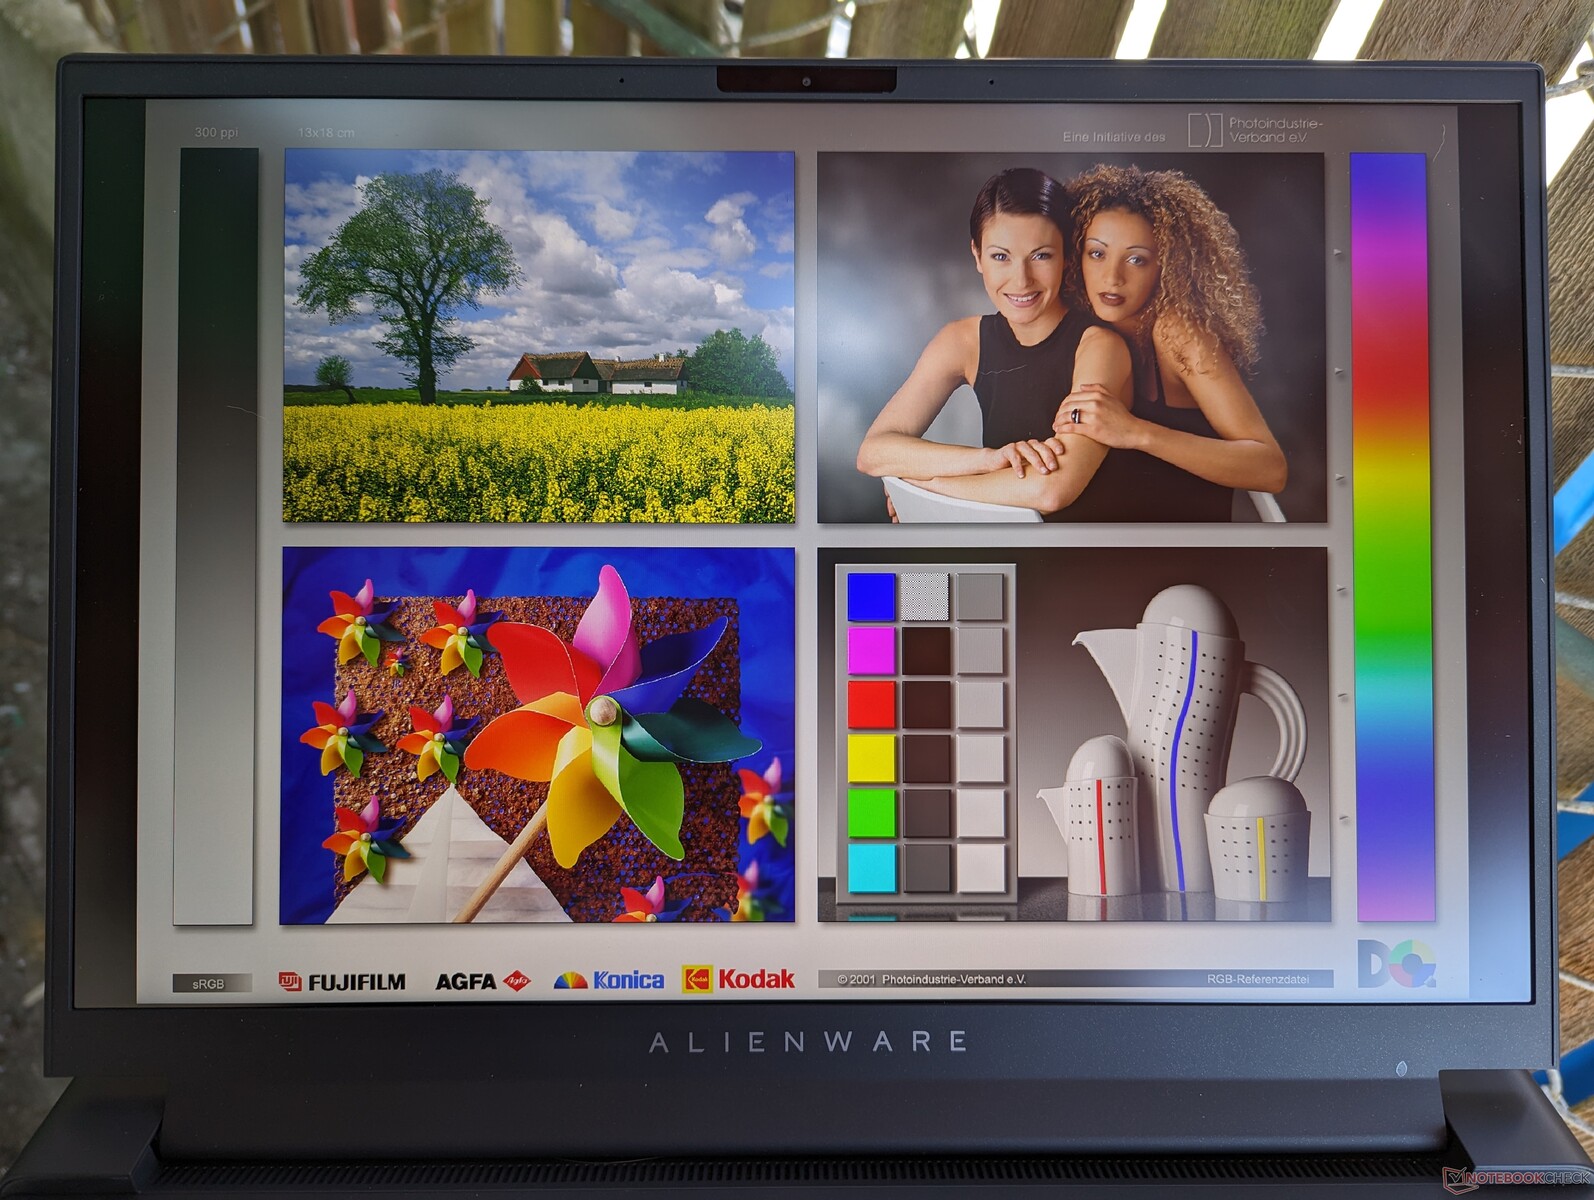
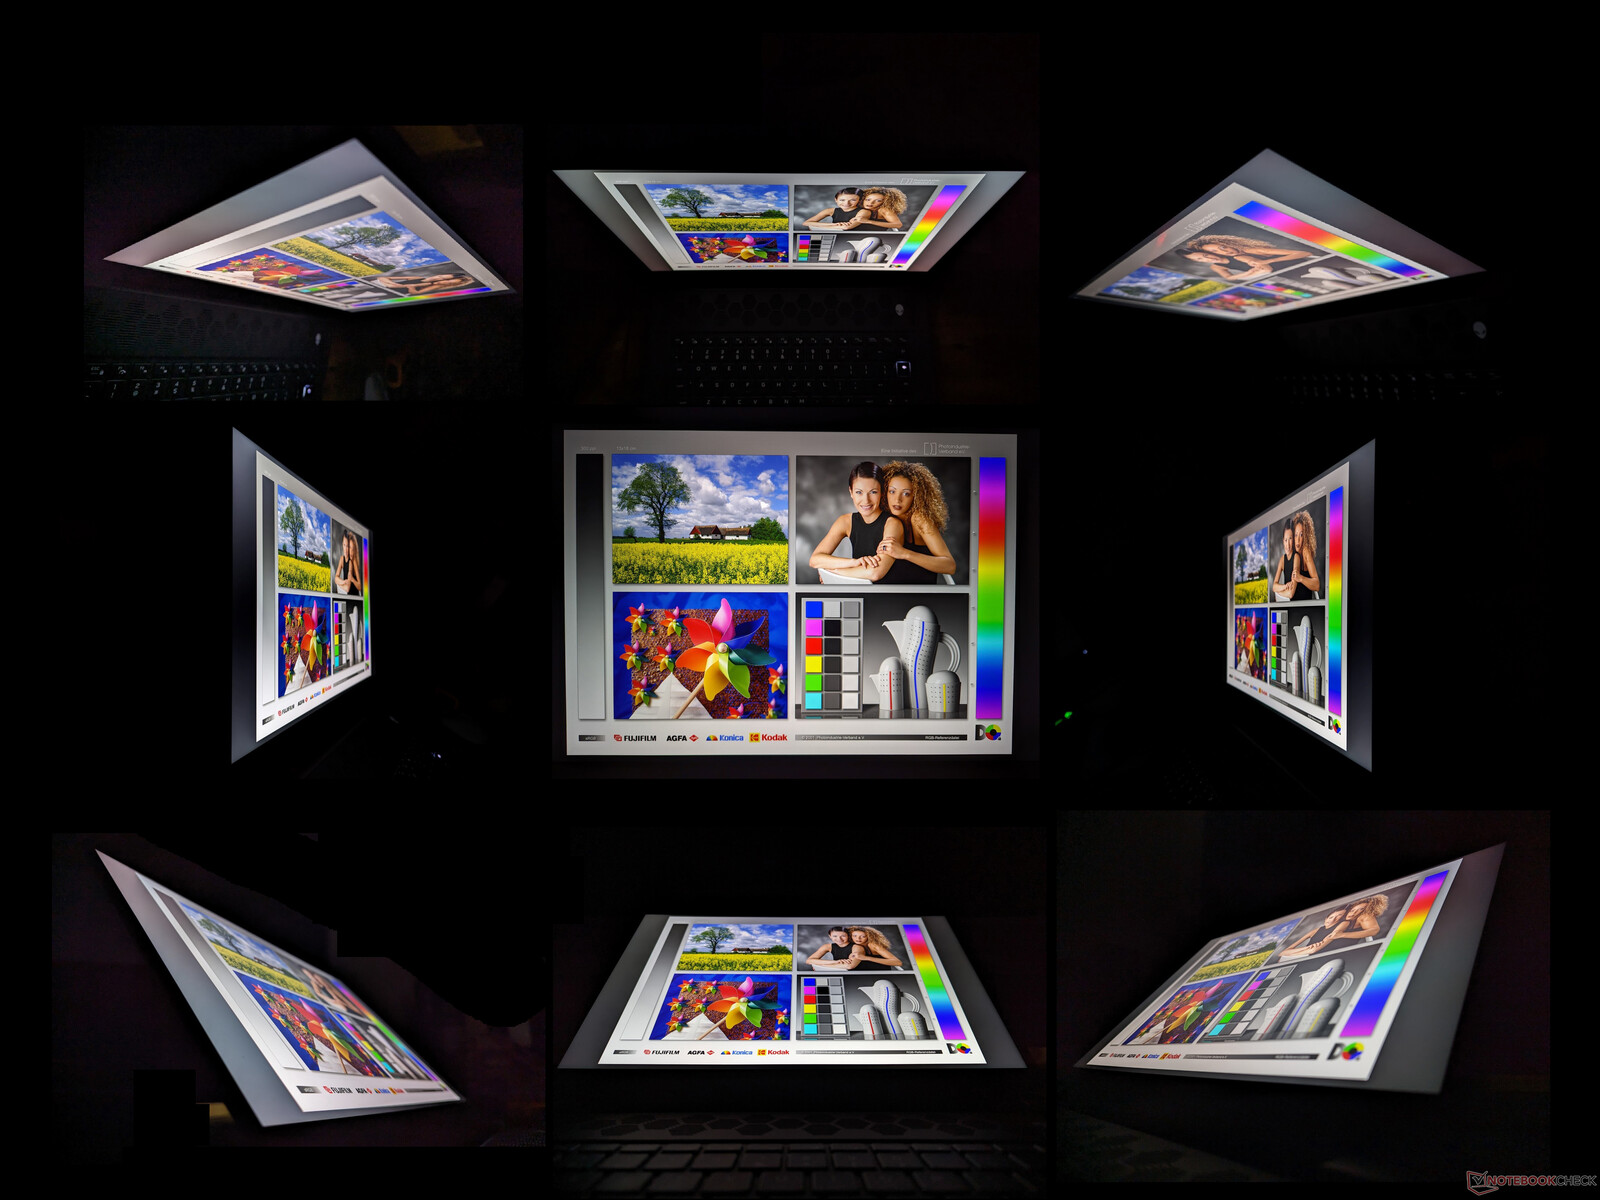
Affichage
Trois options d'affichage sont disponibles :
- 2560 x 1600, 165 Hz, 3 ms, IPS, 100% sRGB
- 2560 x 1600, 240 Hz, 3 ms, IPS, 100% DCI-P3
- 1920 x 1200, 480 Hz, 3 ms, IPS, 100% DCI-P3
Notre appareil est configuré avec l'option en gras ci-dessus qui, selon nous, est la meilleure pour ce modèle car elle offre des couleurs P3 complètes, des taux de rafraîchissement rapides et une haute résolution tout-en-un. L'option 1200p offre des taux de rafraîchissement encore plus rapides, mais les avantages deviennent de plus en plus marginaux après 240 Hz.
L'Alienware m16 R1 utilise la même dalle BOE NE16NZ4 que l'Alienware x16 R1.Alienware x16 R1 et l'expérience visuelle est donc essentiellement identique entre les deux modèles. Ce panneau haut de gamme est adapté à la fois au jeu et à la création de contenu avec des couleurs plus larges que le panneau MNG007DA2-3 sur le Legion Pro 7. Cependant, les écrans du Razer Blade 16 Early 2023 ou de l'ordinateur HP Omen Transcend 16 sont nettement plus lumineux, ce qui peut s'avérer utile pour les contenus HDR.

| |||||||||||||||||||||||||
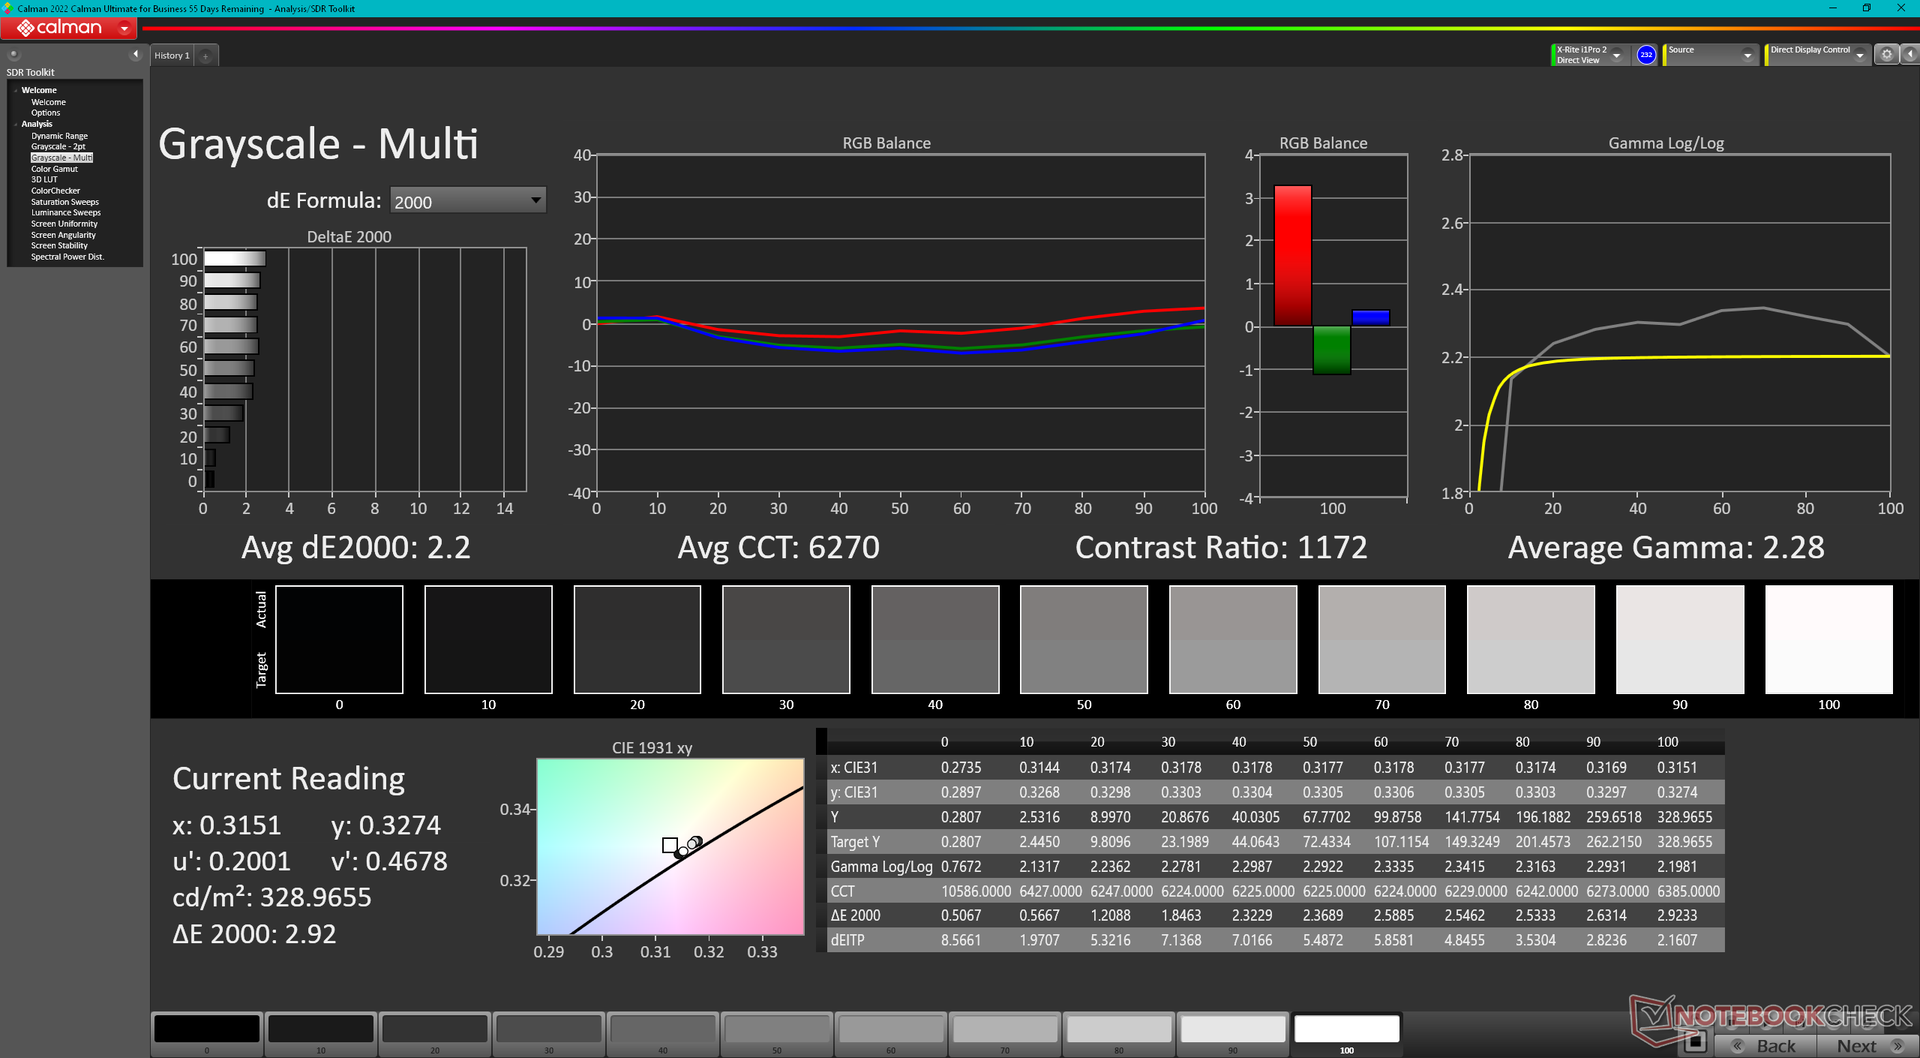
Homogénéité de la luminosité: 89 %
Valeur mesurée au centre, sur batterie: 329 cd/m²
Contraste: 1028:1 (Valeurs des noirs: 0.32 cd/m²)
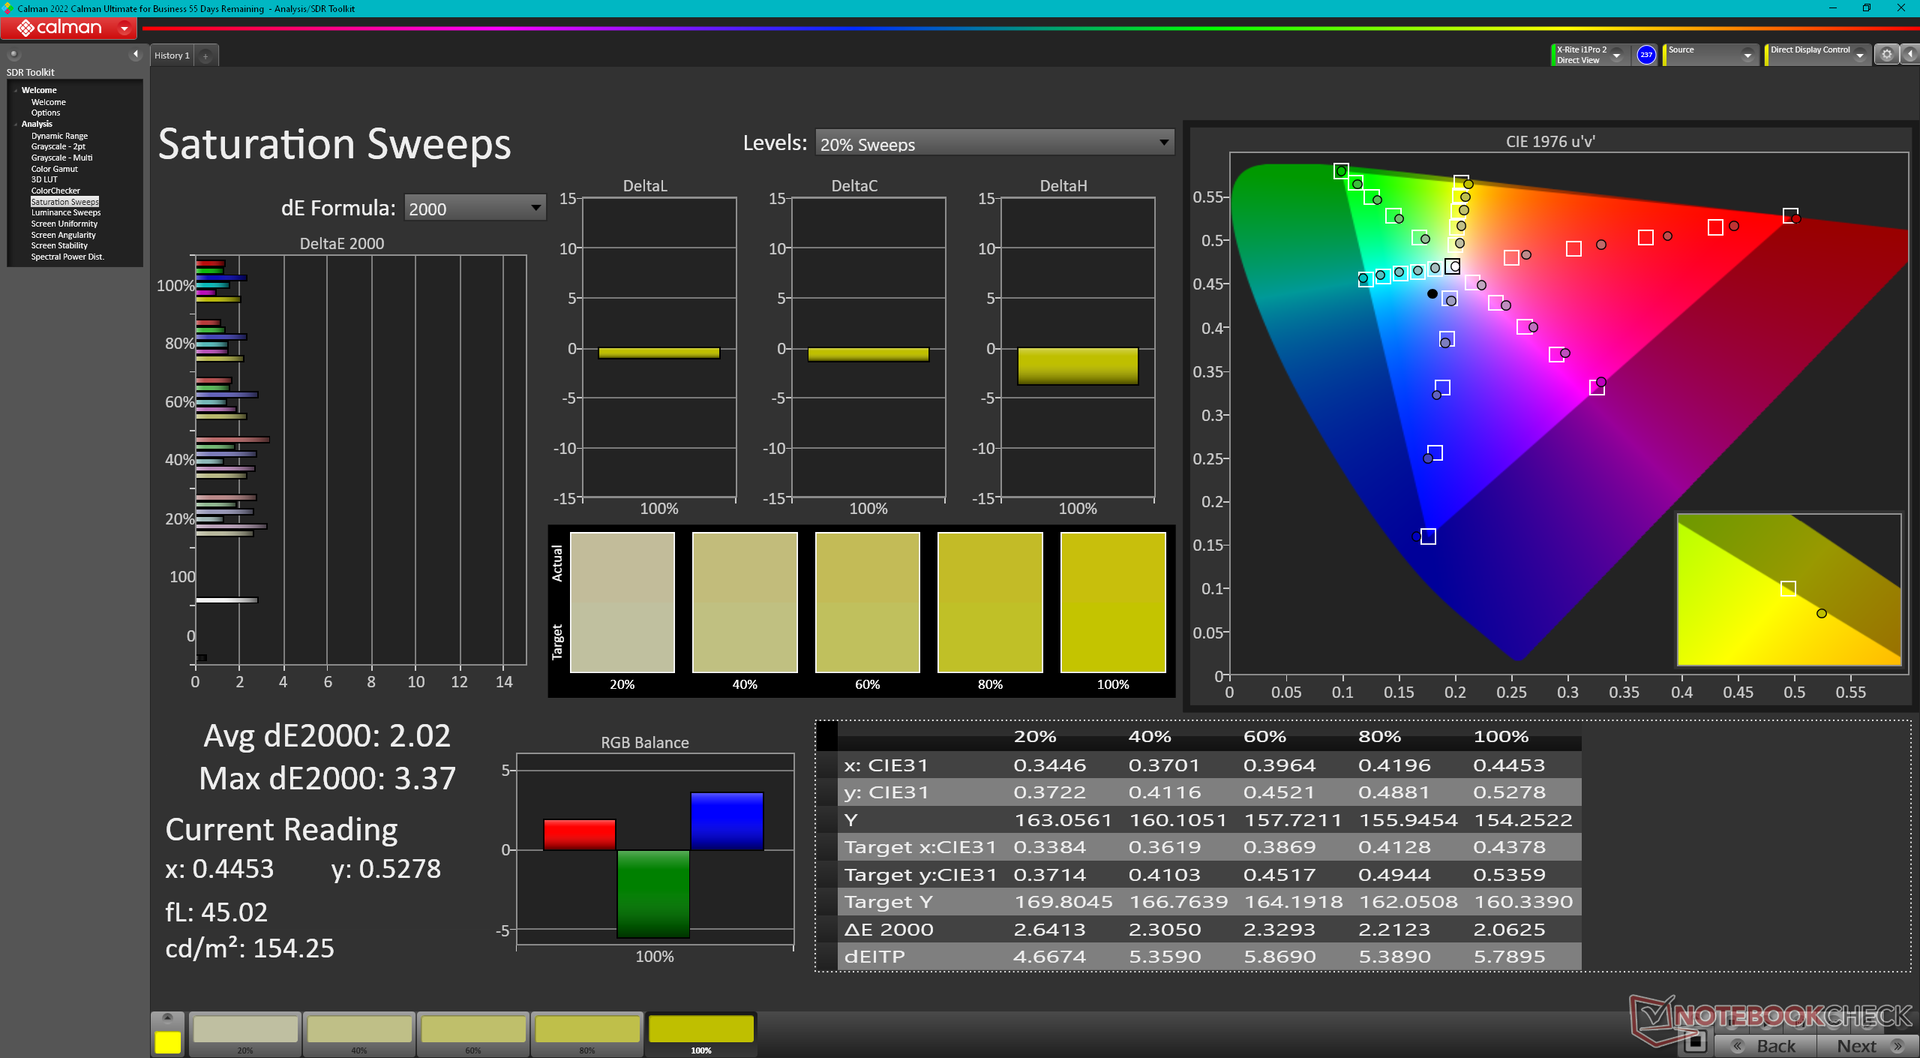
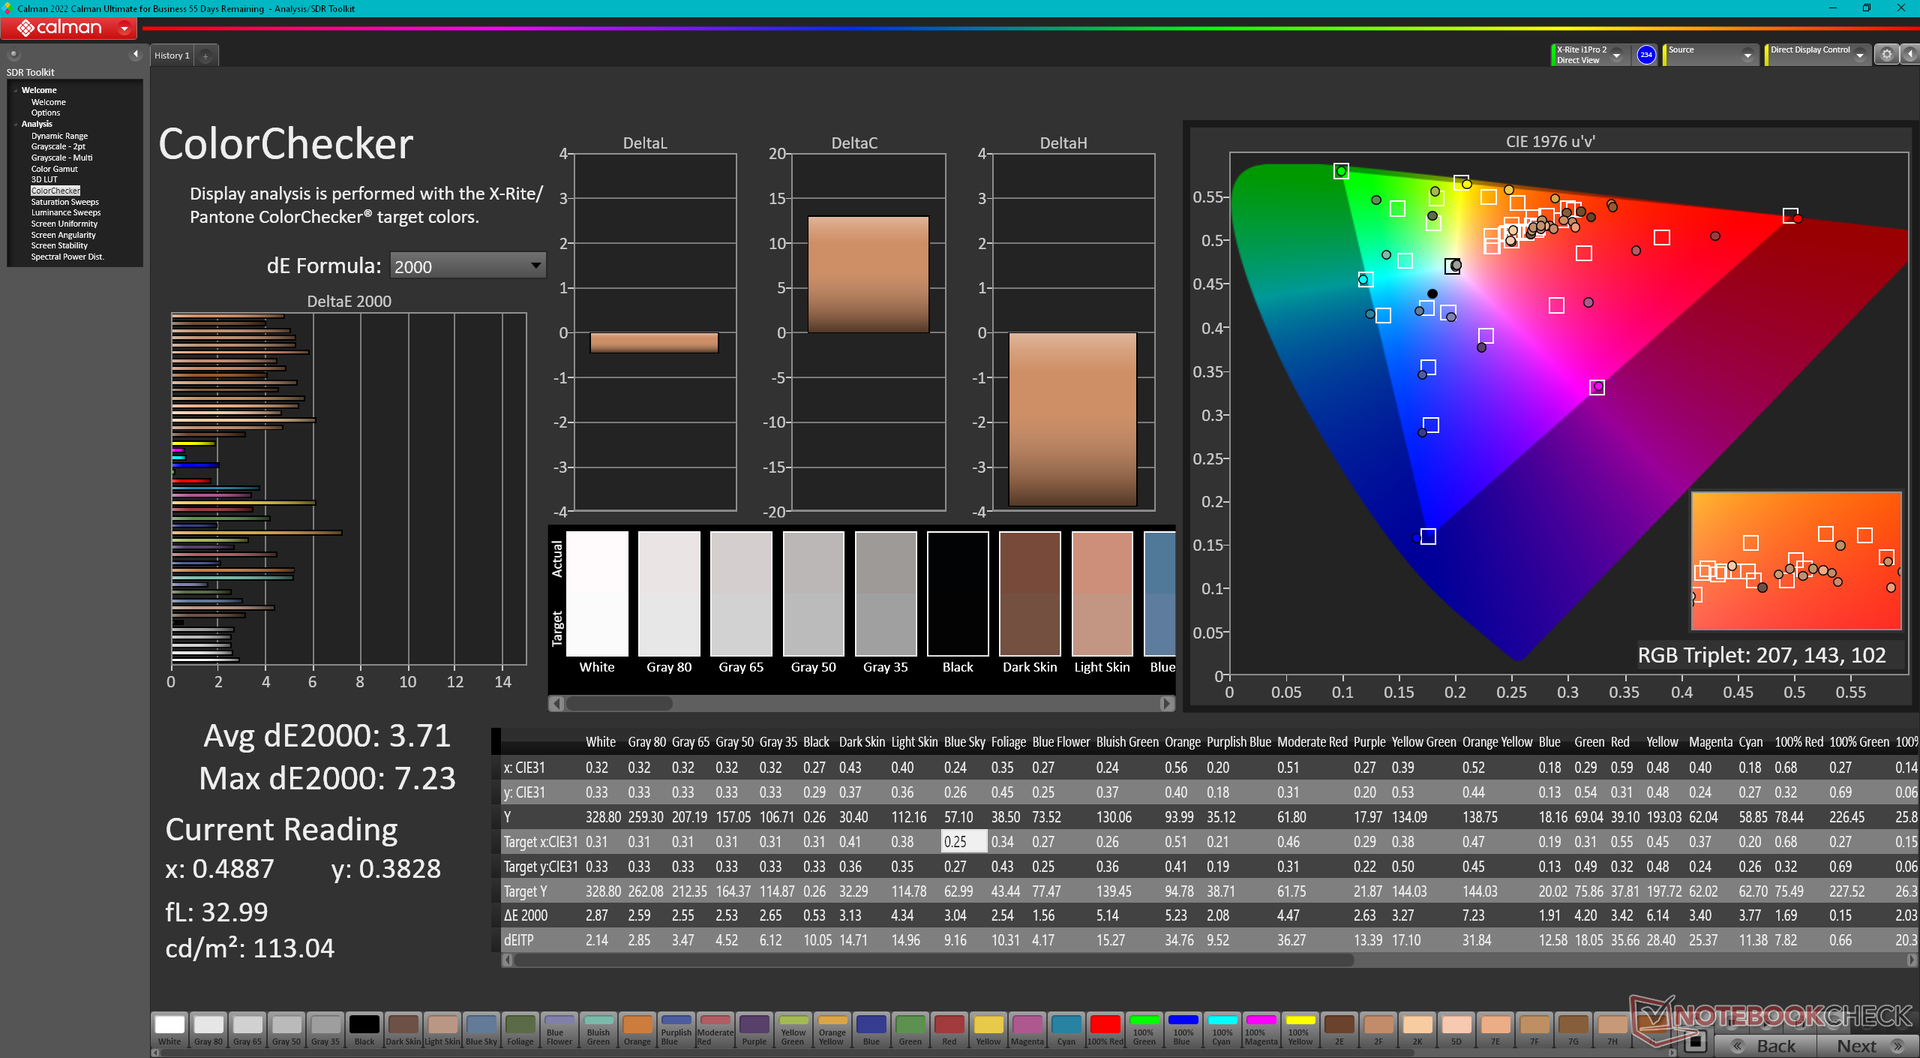
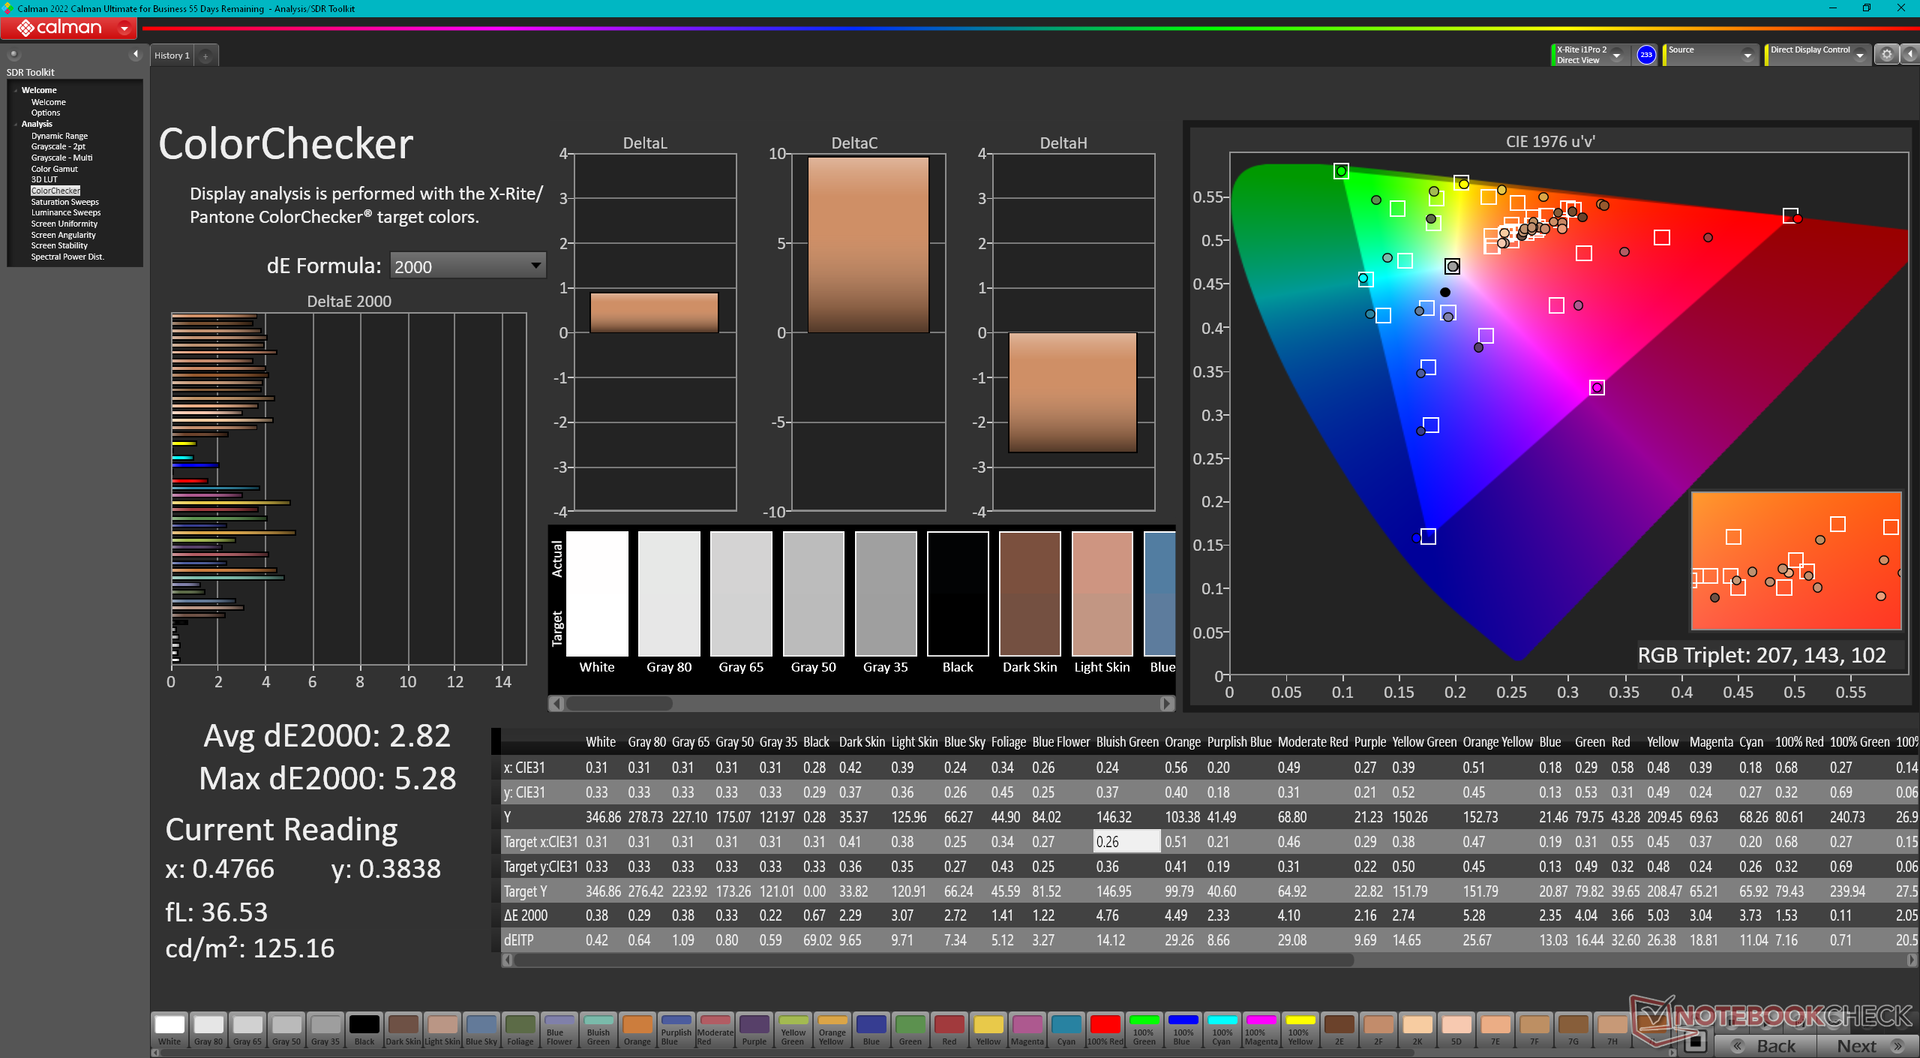
ΔE ColorChecker Calman: 3.71 | ∀{0.5-29.43 Ø4.71}
calibrated: 2.82
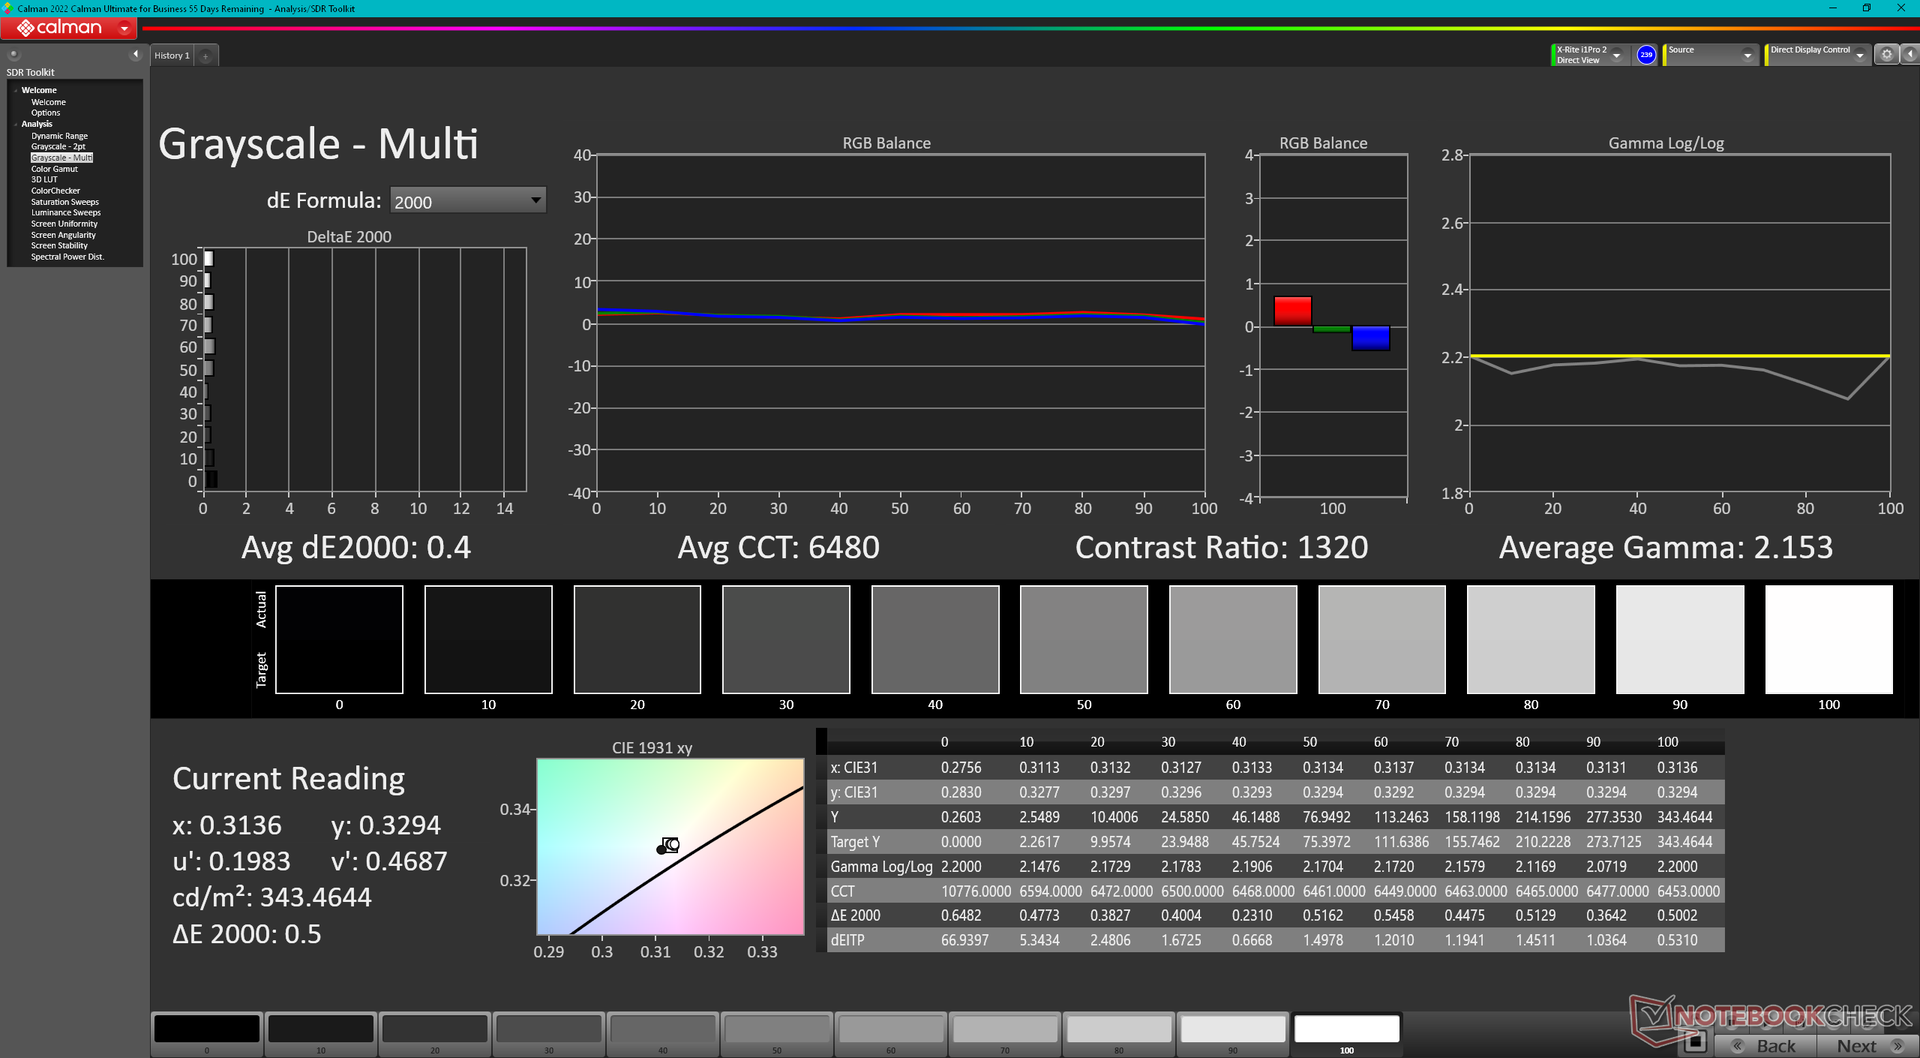
ΔE Greyscale Calman: 2.2 | ∀{0.09-98 Ø4.96}
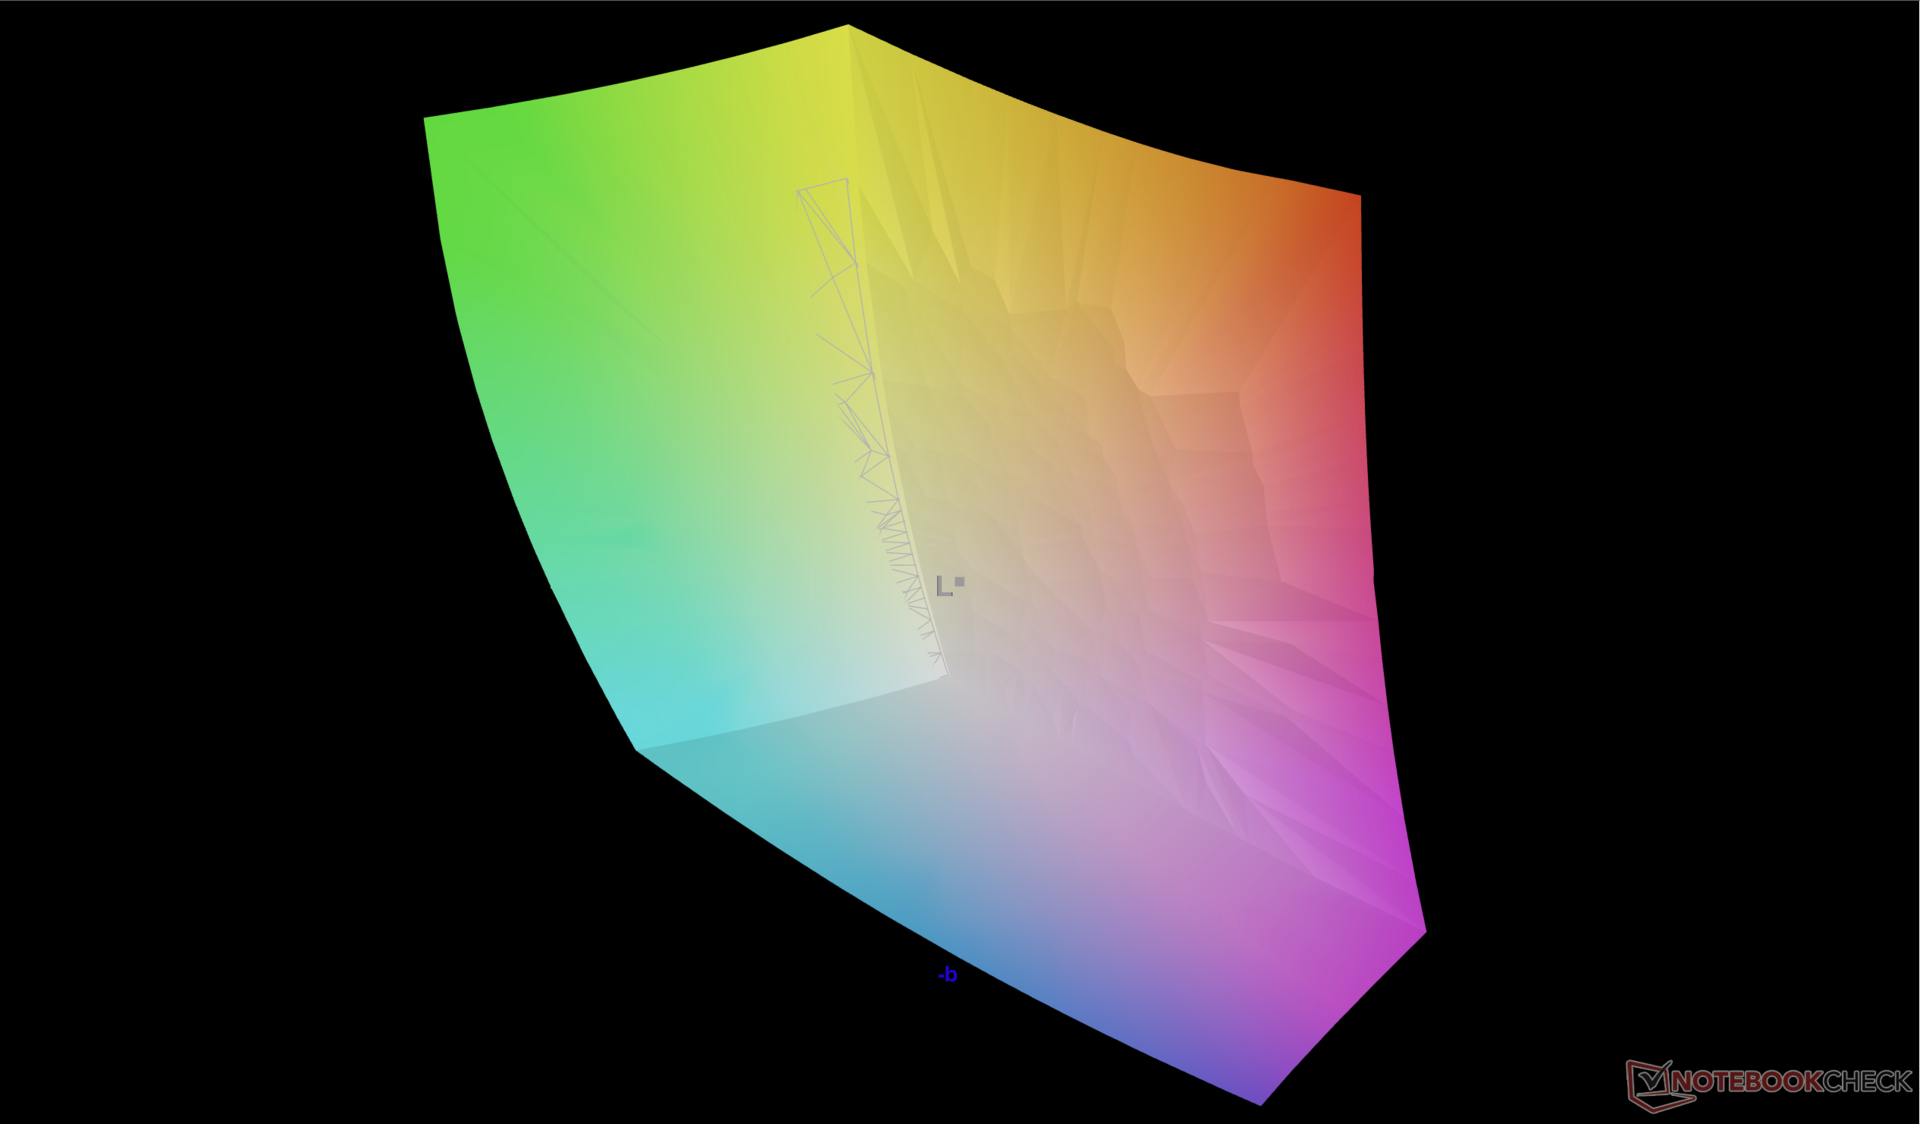
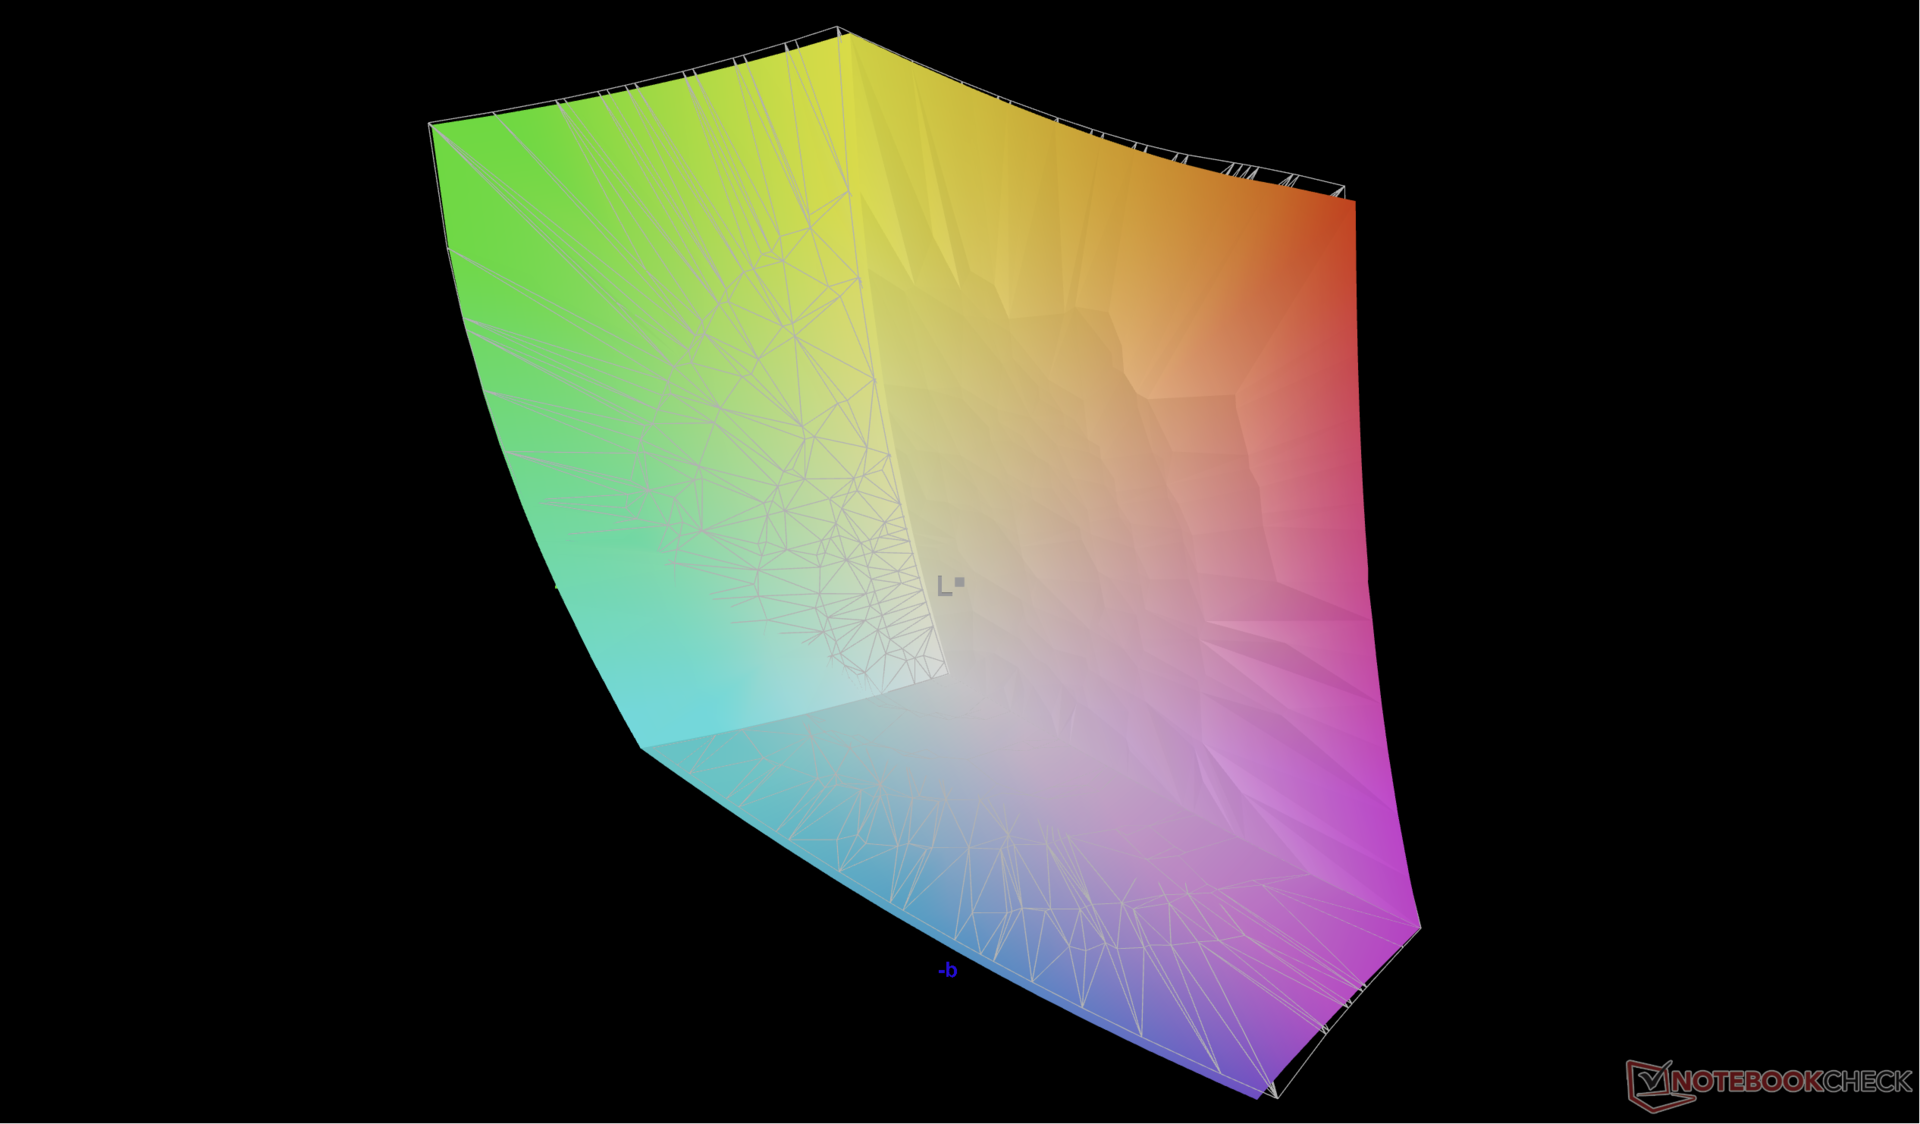
88.9% AdobeRGB 1998 (Argyll 3D)
99.9% sRGB (Argyll 3D)
98.6% Display P3 (Argyll 3D)
Gamma: 2.3
CCT: 6270 K
| Alienware m16 R1 AMD BOE NE16NZ4, IPS, 2560x1600, 16" | Alienware x16 R1 BOE NE16NZ4, IPS, 2560x1600, 16" | HP Omen Transcend 16 AUOA3A6, Mini-LED, 2560x1600, 16" | Lenovo Legion Pro 7 RTX4090 MNG007DA2-3 (CSO1628), IPS, 2560x1600, 16" | Asus ROG Strix G16 G614JZ TL160ADMP03-0, IPS, 2560x1600, 16" | Razer Blade 16 Early 2023 CSOT T3 MNG007DA4-1, IPS, 2560x1600, 16" | |
|---|---|---|---|---|---|---|
| Display | 0% | 0% | -16% | -2% | 0% | |
| Display P3 Coverage (%) | 98.6 | 99.2 1% | 99.2 1% | 69.5 -30% | 97 -2% | 98.5 0% |
| sRGB Coverage (%) | 99.9 | 100 0% | 100 0% | 99.8 0% | 99.9 0% | 100 0% |
| AdobeRGB 1998 Coverage (%) | 88.9 | 88.6 0% | 87.6 -1% | 71.6 -19% | 84.9 -4% | 89.7 1% |
| Response Times | -7% | -316% | -33% | 14% | -31% | |
| Response Time Grey 50% / Grey 80% * (ms) | 5.1 ? | 5.1 ? -0% | 26.4 ? -418% | 10.9 ? -114% | 5.1 ? -0% | 6.6 ? -29% |
| Response Time Black / White * (ms) | 9 ? | 10.3 ? -14% | 28.2 ? -213% | 4.6 ? 49% | 6.6 ? 27% | 12 ? -33% |
| PWM Frequency (Hz) | 3506 ? | |||||
| Screen | 18% | 224% | 23% | 23% | 18% | |
| Brightness middle (cd/m²) | 329 | 302.2 -8% | 791.1 140% | 491 49% | 470 43% | 456.8 39% |
| Brightness (cd/m²) | 317 | 285 -10% | 800 152% | 472 49% | 459 45% | 437 38% |
| Brightness Distribution (%) | 89 | 89 0% | 95 7% | 91 2% | 93 4% | 83 -7% |
| Black Level * (cd/m²) | 0.32 | 0.26 19% | 0.04 87% | 0.4 -25% | 0.42 -31% | 0.35 -9% |
| Contrast (:1) | 1028 | 1162 13% | 19778 1824% | 1228 19% | 1119 9% | 1305 27% |
| Colorchecker dE 2000 * | 3.71 | 1.63 56% | 4.37 -18% | 1.6 57% | 1.86 50% | 3.7 -0% |
| Colorchecker dE 2000 max. * | 7.23 | 4.13 43% | 10.39 -44% | 5.15 29% | 3.87 46% | 6.42 11% |
| Colorchecker dE 2000 calibrated * | 2.82 | 1.17 59% | 1.04 63% | 0.97 66% | 0.93 67% | 0.66 77% |
| Greyscale dE 2000 * | 2.2 | 2.5 -14% | 6.5 -195% | 3 -36% | 2.7 -23% | 2.6 -18% |
| Gamma | 2.3 96% | 2.23 99% | 2.28 96% | 2.211 100% | 2.246 98% | 2.3 96% |
| CCT | 6270 104% | 6590 99% | 6000 108% | 6979 93% | 6711 97% | 6108 106% |
| Moyenne finale (programmes/paramètres) | 4% /
10% | -31% /
99% | -9% /
7% | 12% /
17% | -4% /
7% |
* ... Moindre est la valeur, meilleures sont les performances
L'écran est calibré de manière satisfaisante par rapport à la norme P3, avec des valeurs moyennes de DeltaE en niveaux de gris et en couleurs de seulement 2,2 et 3,71, respectivement. En calibrant nous-mêmes l'écran avec un colorimètre X-Rite, nous améliorerions encore les niveaux de gris avec un deltaE moyen de seulement 0,4 pour des couleurs plus précises dans l'ensemble. Notre profil ICM calibré peut être téléchargé gratuitement ci-dessus.
Temps de réponse de l'écran
| ↔ Temps de réponse noir à blanc | ||
|---|---|---|
| 9 ms ... hausse ↗ et chute ↘ combinées | ↗ 4.8 ms hausse | 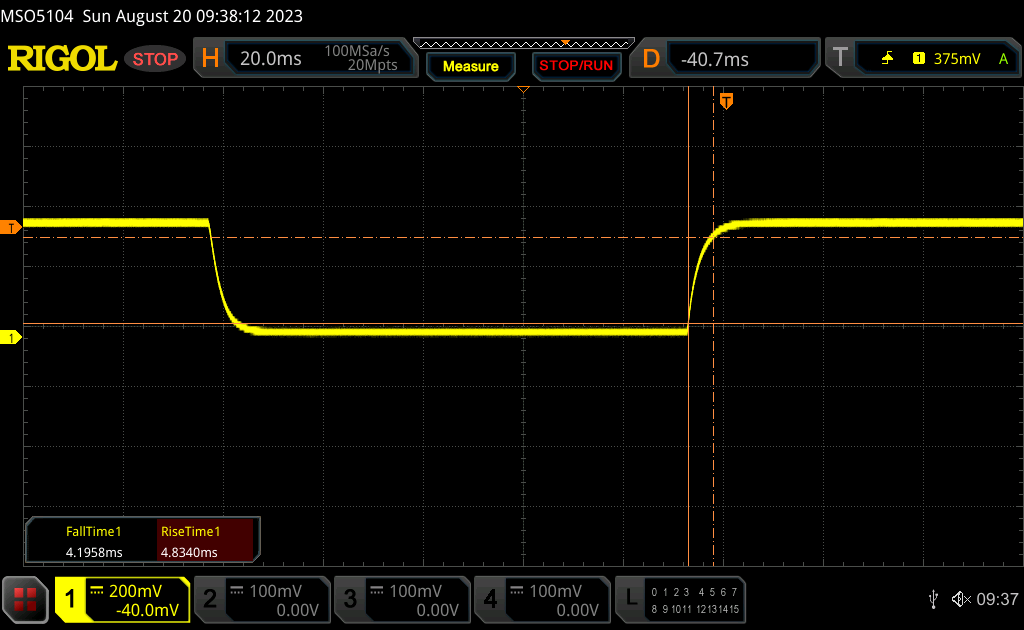 |
| ↘ 4.2 ms chute | ||
| L'écran montre de faibles temps de réponse, un bon écran pour jouer. En comparaison, tous les appareils testés affichent entre 0.1 (minimum) et 240 (maximum) ms. » 25 % des appareils testés affichent de meilleures performances. Cela signifie que les latences relevées sont meilleures que la moyenne (19.8 ms) de tous les appareils testés. | ||
| ↔ Temps de réponse gris 50% à gris 80% | ||
| 5.1 ms ... hausse ↗ et chute ↘ combinées | ↗ 2.5 ms hausse | 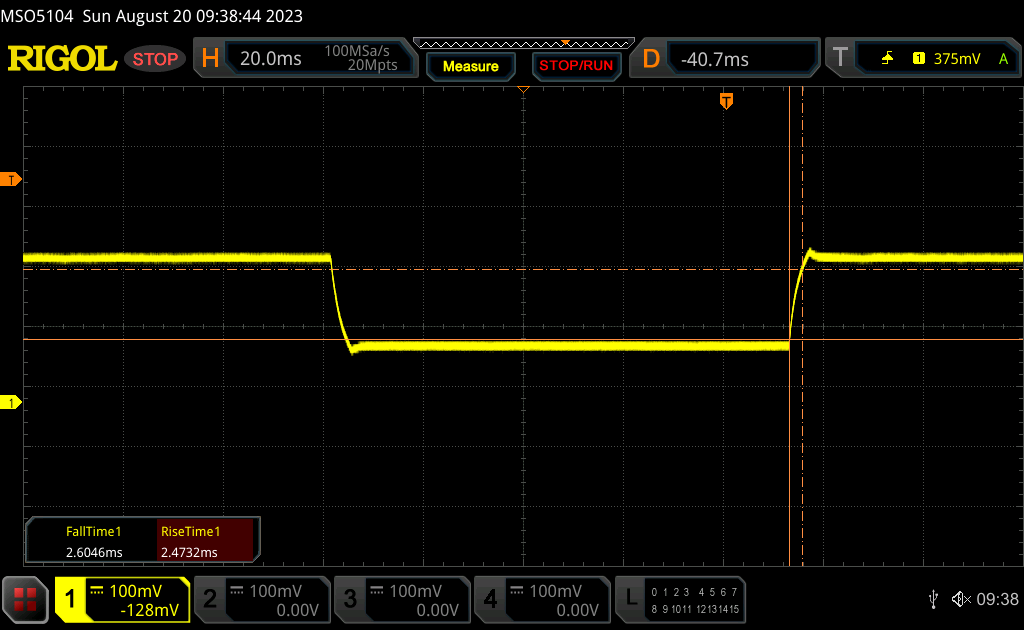 |
| ↘ 2.6 ms chute | ||
| L'écran montre de très faibles temps de réponse, parfait pour le jeu. En comparaison, tous les appareils testés affichent entre 0.165 (minimum) et 636 (maximum) ms. » 17 % des appareils testés affichent de meilleures performances. Cela signifie que les latences relevées sont meilleures que la moyenne (31 ms) de tous les appareils testés. | ||
Scintillement / MLI (Modulation de largeur d'impulsion)
| Scintillement / MLI (Modulation de largeur d'impulsion) non décelé | 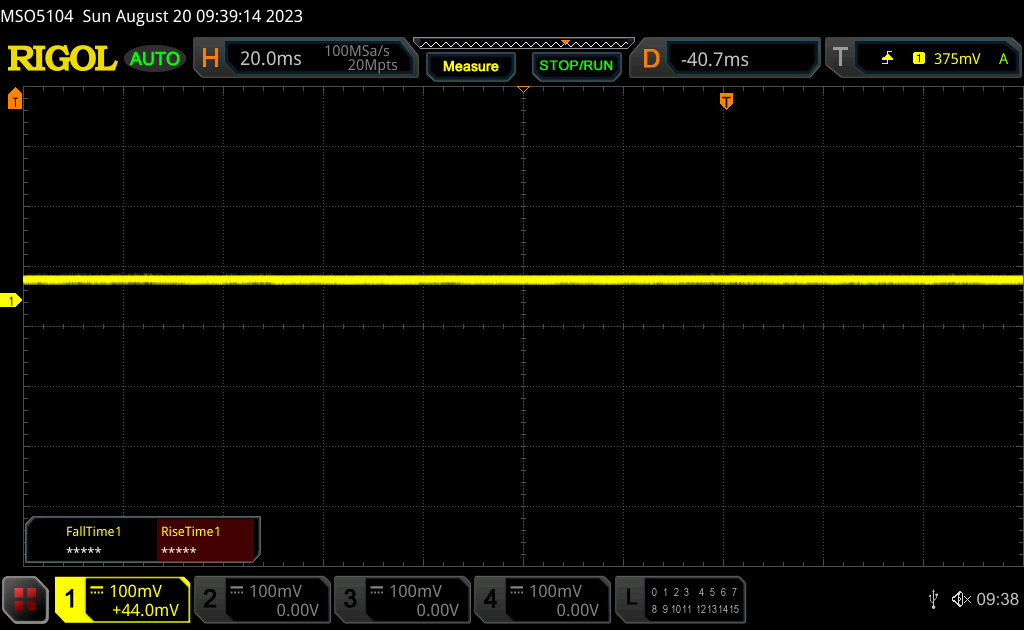 | ||
En comparaison, 52 % des appareils testés n'emploient pas MDI pour assombrir leur écran. Nous avons relevé une moyenne à 7754 (minimum : 5 - maximum : 343500) Hz dans le cas où une MDI était active. | |||
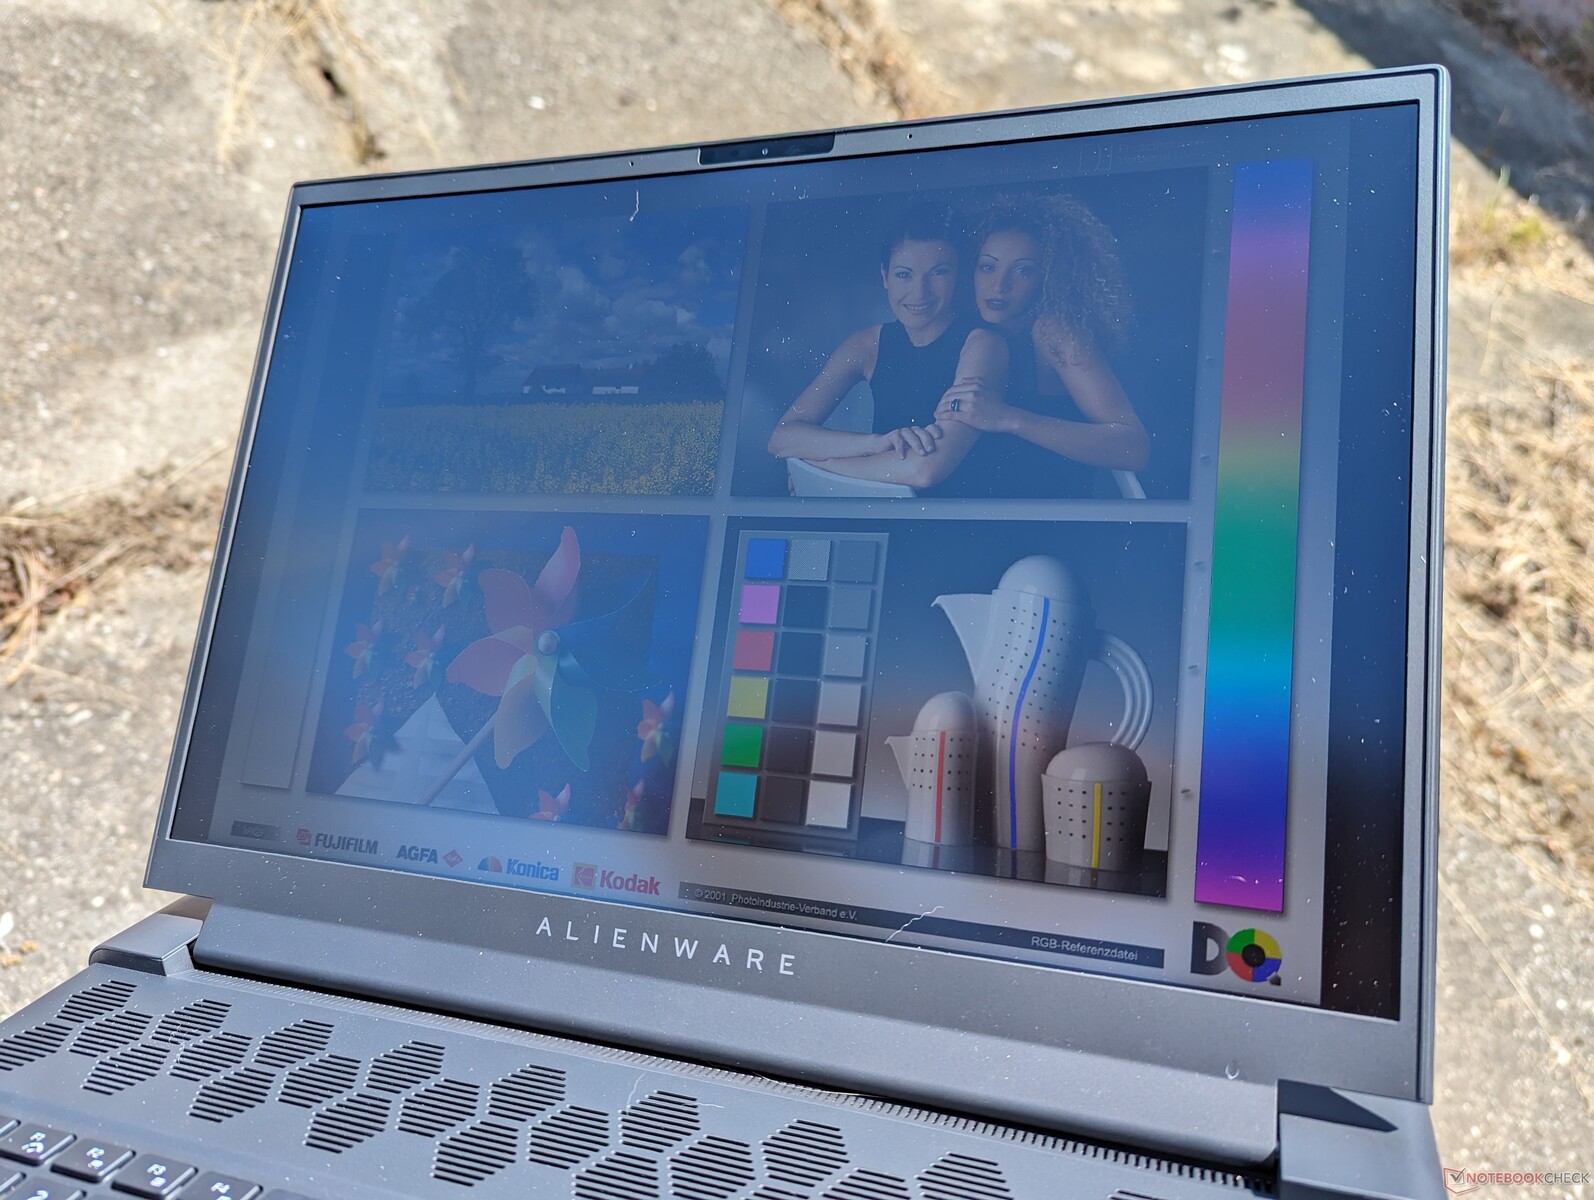
La visibilité à l'extérieur n'est décente qu'à l'ombre. L'Omen Transcend 16 et son écran mini-LED est plus de deux fois plus lumineux si la visibilité extérieure est un problème.
Performance - AMD ou Intel ?
Conditions d'essai
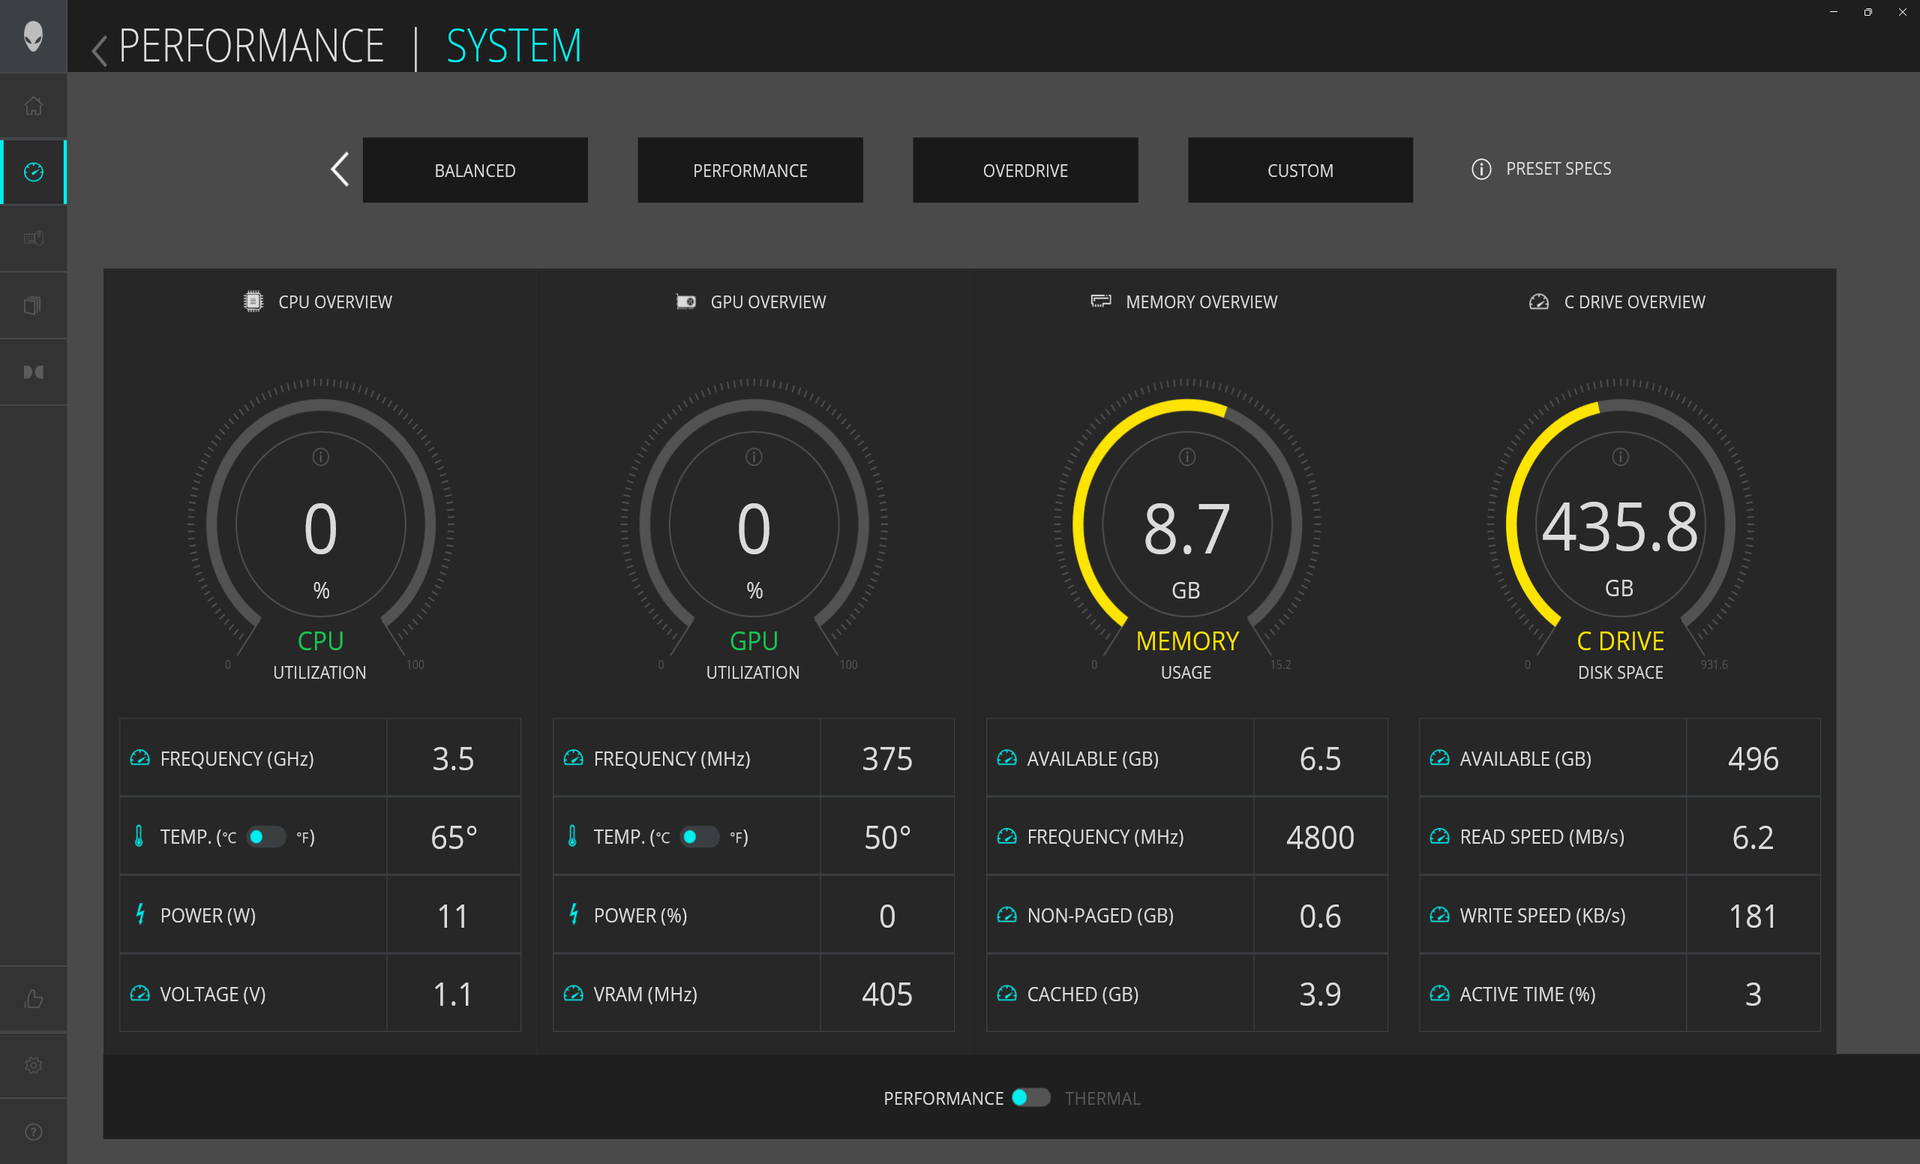
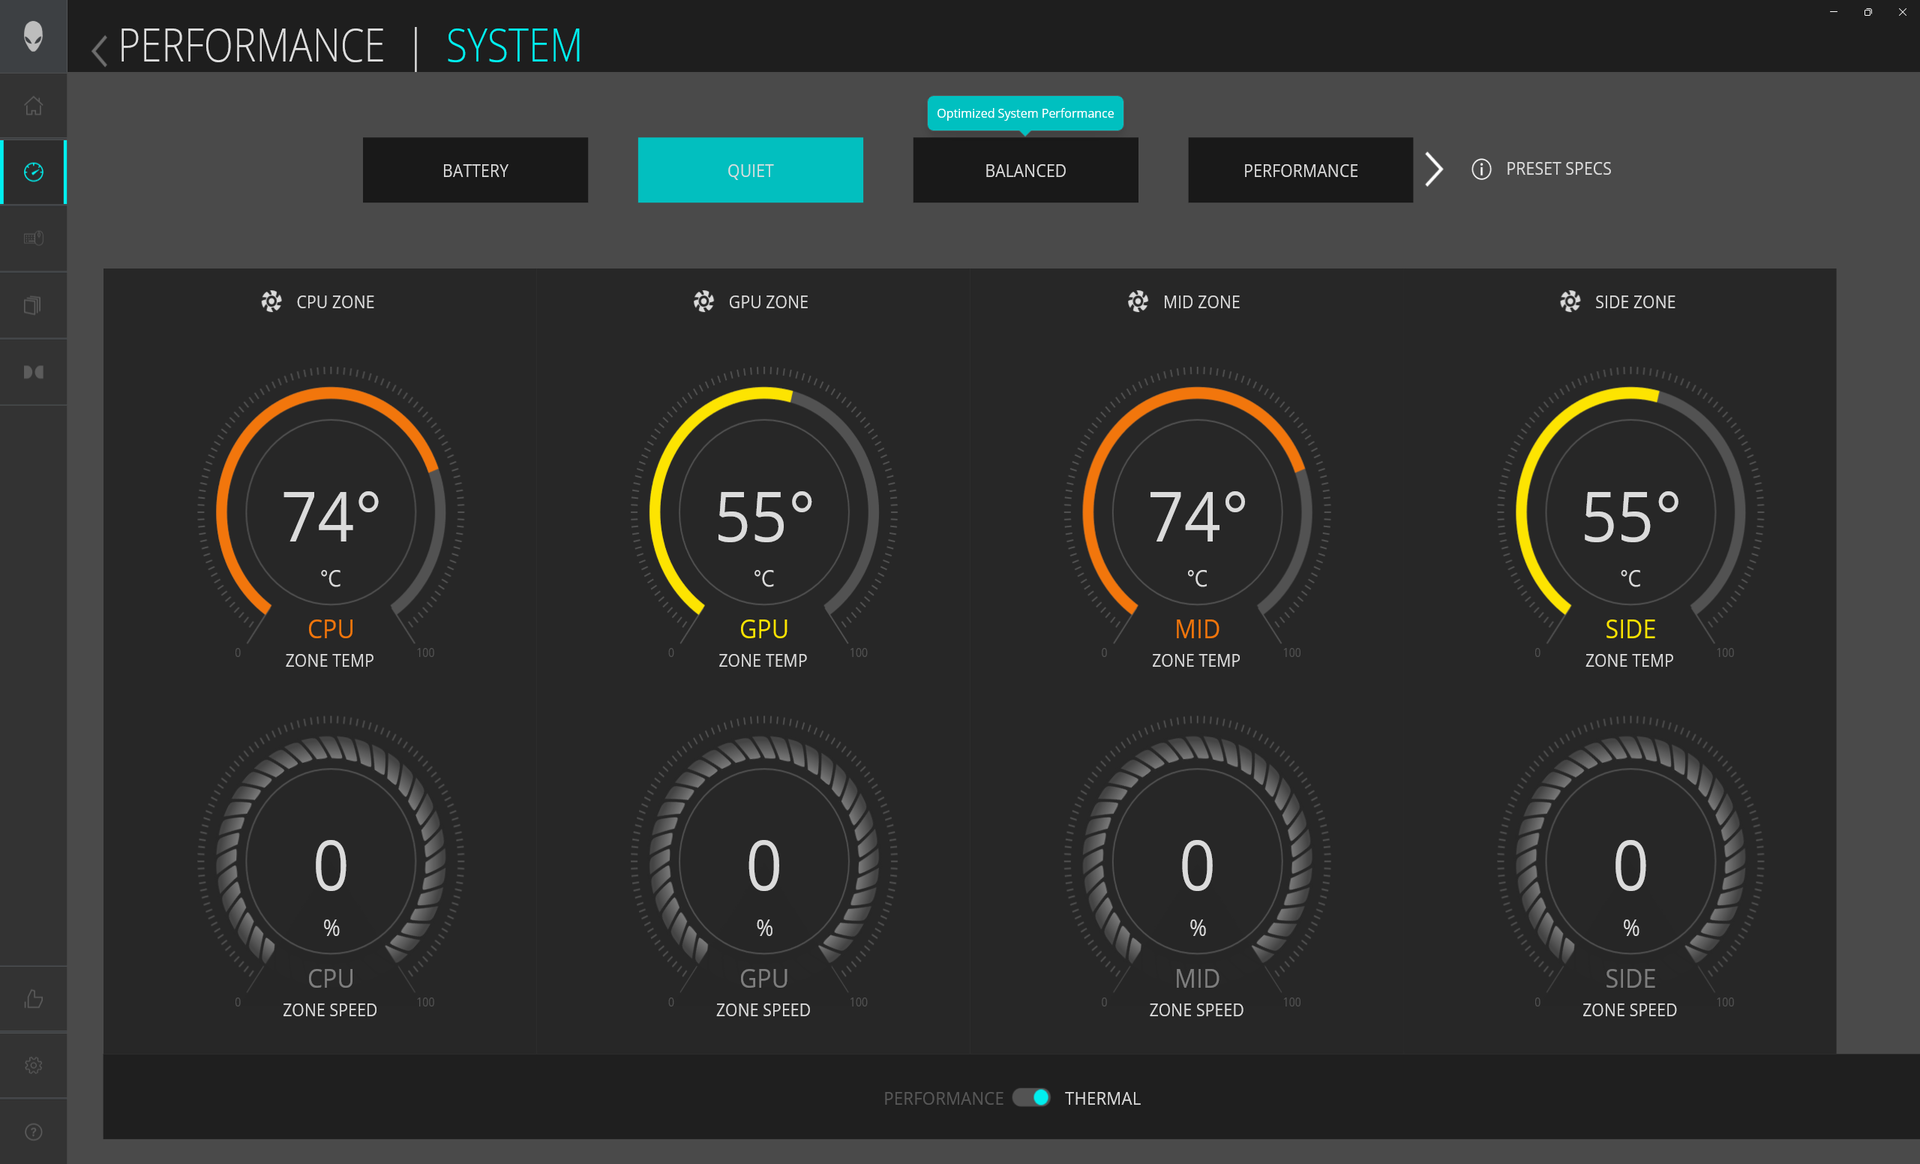
Nous avons réglé notre unité en mode Overdrive via le centre de commande Alienware et le GPU en mode dGPU avant d'effectuer les tests de référence ci-dessous. Les utilisateurs doivent se familiariser avec le Command Center car il s'agit du centre de contrôle des fonctionnalités du système liées aux performances, aux données vitales et à l'éclairage. Le Command Center ne doit pas être confondu avec My Alienware, le logiciel de garantie et d'assistance.
Advanced Optimus ou MUX est pris en charge. G-Sync, cependant, n' est pas pris en charge sur l'affichage interne pour les versions AMD de l'Alienware m16, car cette fonctionnalité est actuellement exclusive aux versions Intel. Elle est remplacée par FreeSync.
Processeur
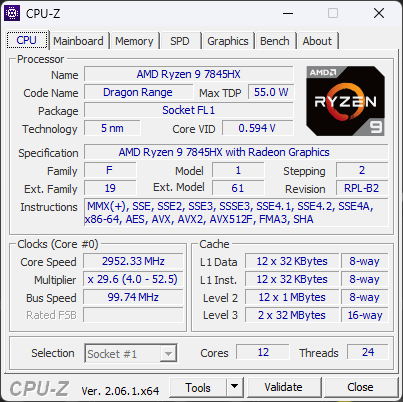
Le Ryzen 9 7845HX est plus proche de l'impressionnant Ryzen 9 7945HX que du Ryzen 7 7745HX. Les performances multithread sont environ 20 à 25 % plus lentes que celles de la Ryzen 9 7945HX et environ 50 % plus rapides que celles de la Ryzen 7 7745HX. Le processeur est donc juste en dessous du concurrent Core i9-13900HX mais bien plus que le Core i7-13700HX. L'idée de se contenter d'un processeur moins performant en optant pour AMD au lieu d'Intel ne s'applique pas à cette génération.
La durabilité des performances est excellente, comme le montrent les résultats stables de Cinebench R15 xT ci-dessous.
Cinebench R15 Multi Loop
Cinebench R23: Multi Core | Single Core
Cinebench R20: CPU (Multi Core) | CPU (Single Core)
Cinebench R15: CPU Multi 64Bit | CPU Single 64Bit
Blender: v2.79 BMW27 CPU
7-Zip 18.03: 7z b 4 | 7z b 4 -mmt1
Geekbench 5.5: Multi-Core | Single-Core
HWBOT x265 Benchmark v2.2: 4k Preset
LibreOffice : 20 Documents To PDF
R Benchmark 2.5: Overall mean
* ... Moindre est la valeur, meilleures sont les performances
AIDA64: FP32 Ray-Trace | FPU Julia | CPU SHA3 | CPU Queen | FPU SinJulia | FPU Mandel | CPU AES | CPU ZLib | FP64 Ray-Trace | CPU PhotoWorxx
| Performance rating | |
| Alienware m16 R1 AMD | |
| Moyenne AMD Ryzen 9 7845HX | |
| Lenovo Legion Pro 7 RTX4090 | |
| Asus ROG Strix G16 G614JZ | |
| HP Omen Transcend 16 | |
| Razer Blade 16 Early 2023 | |
| Alienware x16 R1 | |
| AIDA64 / FP32 Ray-Trace | |
| Alienware m16 R1 AMD | |
| Moyenne AMD Ryzen 9 7845HX (n=1) | |
| Asus ROG Strix G16 G614JZ | |
| Lenovo Legion Pro 7 RTX4090 | |
| Razer Blade 16 Early 2023 | |
| Razer Blade 16 Early 2023 | |
| Razer Blade 16 Early 2023 | |
| HP Omen Transcend 16 | |
| Alienware x16 R1 | |
| AIDA64 / FPU Julia | |
| Alienware m16 R1 AMD | |
| Moyenne AMD Ryzen 9 7845HX (n=1) | |
| Lenovo Legion Pro 7 RTX4090 | |
| Asus ROG Strix G16 G614JZ | |
| Razer Blade 16 Early 2023 | |
| Razer Blade 16 Early 2023 | |
| Razer Blade 16 Early 2023 | |
| HP Omen Transcend 16 | |
| Alienware x16 R1 | |
| AIDA64 / CPU SHA3 | |
| Alienware m16 R1 AMD | |
| Moyenne AMD Ryzen 9 7845HX (n=1) | |
| Lenovo Legion Pro 7 RTX4090 | |
| Asus ROG Strix G16 G614JZ | |
| Razer Blade 16 Early 2023 | |
| Razer Blade 16 Early 2023 | |
| Razer Blade 16 Early 2023 | |
| HP Omen Transcend 16 | |
| Alienware x16 R1 | |
| AIDA64 / CPU Queen | |
| Alienware m16 R1 AMD | |
| Moyenne AMD Ryzen 9 7845HX (n=1) | |
| Asus ROG Strix G16 G614JZ | |
| Lenovo Legion Pro 7 RTX4090 | |
| Razer Blade 16 Early 2023 | |
| Razer Blade 16 Early 2023 | |
| HP Omen Transcend 16 | |
| Alienware x16 R1 | |
| AIDA64 / FPU SinJulia | |
| Alienware m16 R1 AMD | |
| Moyenne AMD Ryzen 9 7845HX (n=1) | |
| Asus ROG Strix G16 G614JZ | |
| Razer Blade 16 Early 2023 | |
| Razer Blade 16 Early 2023 | |
| Razer Blade 16 Early 2023 | |
| Lenovo Legion Pro 7 RTX4090 | |
| HP Omen Transcend 16 | |
| Alienware x16 R1 | |
| AIDA64 / FPU Mandel | |
| Alienware m16 R1 AMD | |
| Moyenne AMD Ryzen 9 7845HX (n=1) | |
| Lenovo Legion Pro 7 RTX4090 | |
| Asus ROG Strix G16 G614JZ | |
| Razer Blade 16 Early 2023 | |
| Razer Blade 16 Early 2023 | |
| Razer Blade 16 Early 2023 | |
| HP Omen Transcend 16 | |
| Alienware x16 R1 | |
| AIDA64 / CPU ZLib | |
| Lenovo Legion Pro 7 RTX4090 | |
| Asus ROG Strix G16 G614JZ | |
| Razer Blade 16 Early 2023 | |
| Razer Blade 16 Early 2023 | |
| Razer Blade 16 Early 2023 | |
| Alienware m16 R1 AMD | |
| Moyenne AMD Ryzen 9 7845HX (n=1) | |
| HP Omen Transcend 16 | |
| Alienware x16 R1 | |
| AIDA64 / FP64 Ray-Trace | |
| Alienware m16 R1 AMD | |
| Moyenne AMD Ryzen 9 7845HX (n=1) | |
| Asus ROG Strix G16 G614JZ | |
| Lenovo Legion Pro 7 RTX4090 | |
| Razer Blade 16 Early 2023 | |
| Razer Blade 16 Early 2023 | |
| Razer Blade 16 Early 2023 | |
| HP Omen Transcend 16 | |
| Alienware x16 R1 | |
| AIDA64 / CPU PhotoWorxx | |
| Razer Blade 16 Early 2023 | |
| Razer Blade 16 Early 2023 | |
| Razer Blade 16 Early 2023 | |
| Lenovo Legion Pro 7 RTX4090 | |
| HP Omen Transcend 16 | |
| Alienware x16 R1 | |
| Asus ROG Strix G16 G614JZ | |
| Alienware m16 R1 AMD | |
| Moyenne AMD Ryzen 9 7845HX (n=1) | |
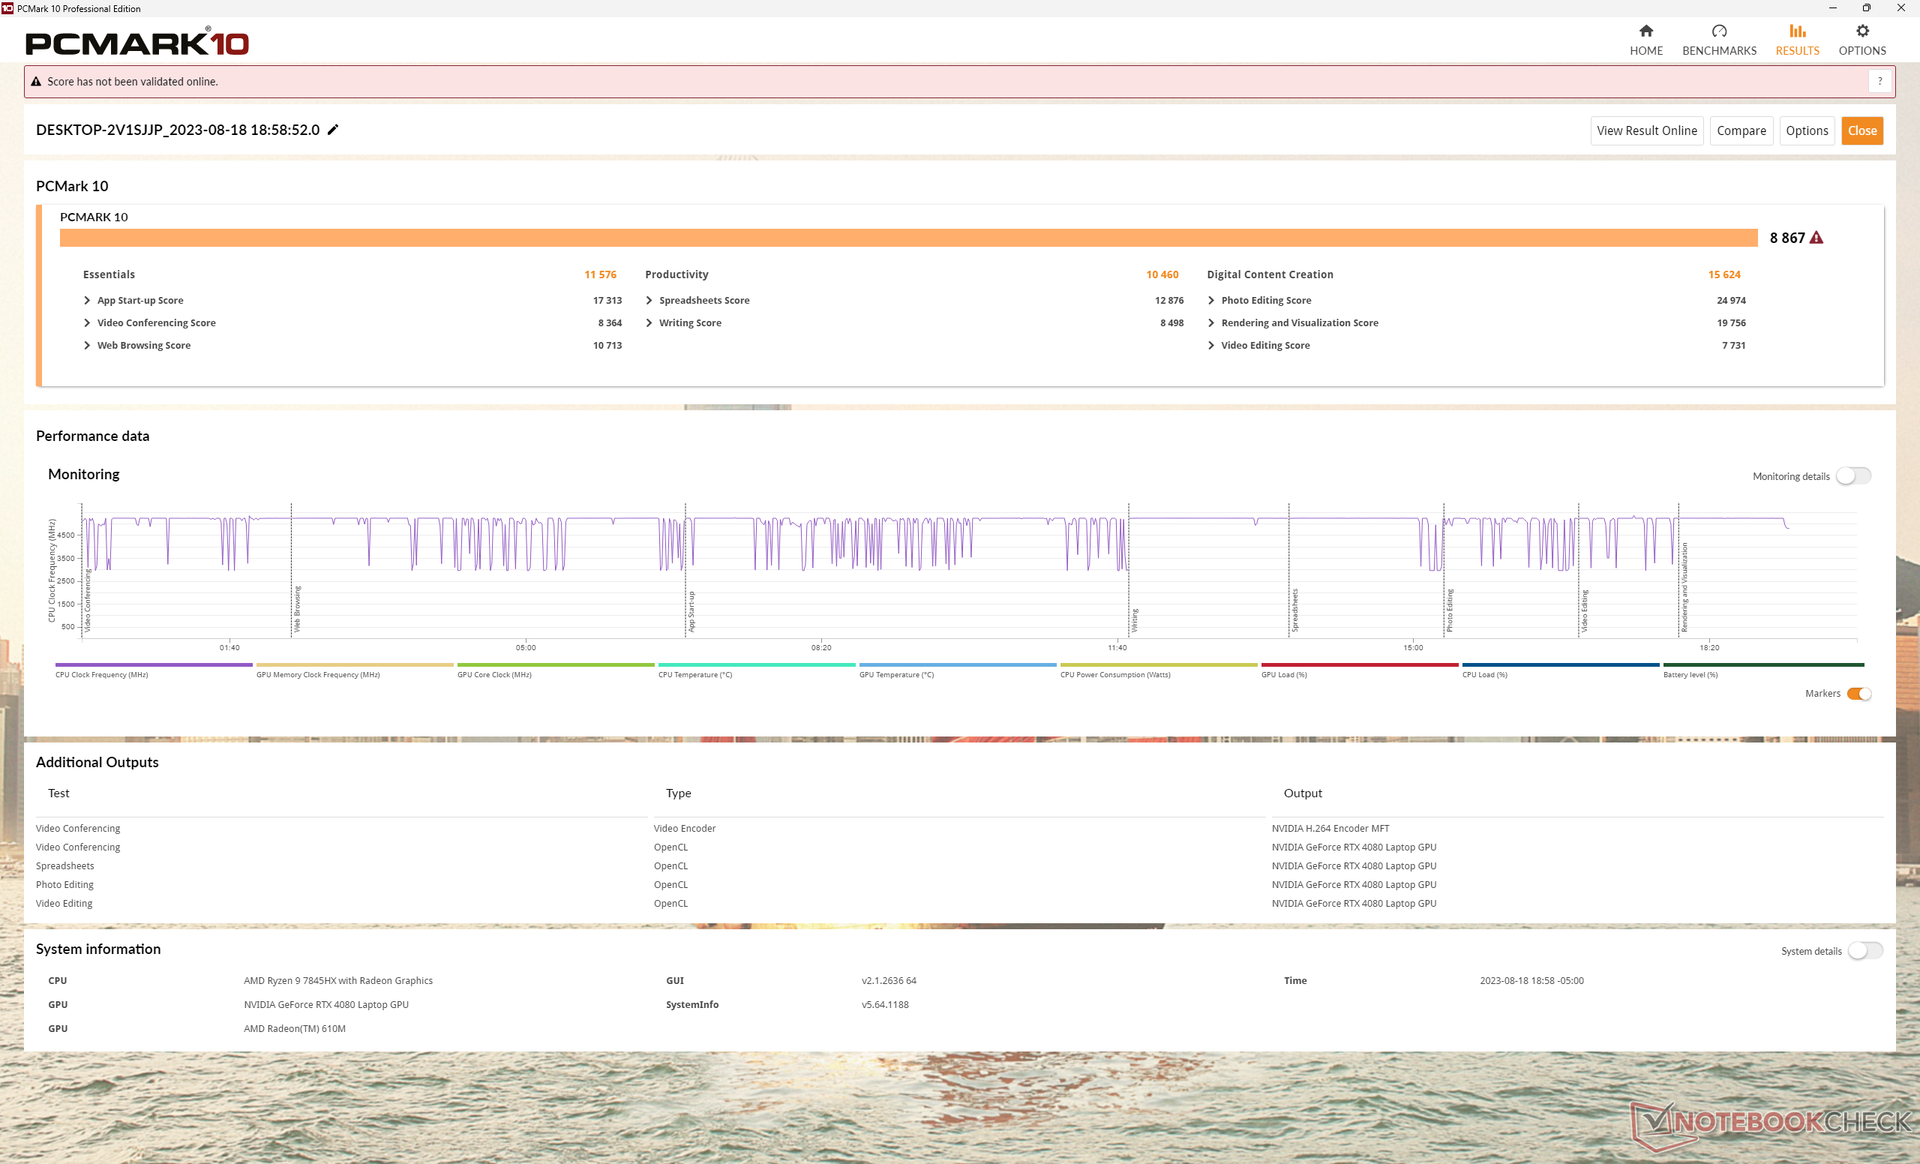
Performance du système
Les scores PCMark sont parmi les plus élevés de tous les ordinateurs portables de jeu. La marge la plus importante se trouve dans le sous-test Productivité qui se concentre sur les performances du processeur.
Malheureusement, nous avons rencontré plusieurs problèmes de sortie de veille sur notre unité de test. Le système redémarrait parfois sans raison en ouvrant le couvercle ou affichait l'écran bleu de la mort, même après avoir mis à jour les derniers pilotes de Dell et Nvidia au moment de l'examen.
CrossMark: Overall | Productivity | Creativity | Responsiveness
| PCMark 10 / Score | |
| Alienware m16 R1 AMD | |
| Moyenne AMD Ryzen 9 7845HX, NVIDIA GeForce RTX 4080 Laptop GPU (n=1) | |
| Alienware x16 R1 | |
| Lenovo Legion Pro 7 RTX4090 | |
| HP Omen Transcend 16 | |
| Razer Blade 16 Early 2023 | |
| Asus ROG Strix G16 G614JZ | |
| PCMark 10 / Essentials | |
| Asus ROG Strix G16 G614JZ | |
| Alienware m16 R1 AMD | |
| Moyenne AMD Ryzen 9 7845HX, NVIDIA GeForce RTX 4080 Laptop GPU (n=1) | |
| HP Omen Transcend 16 | |
| Alienware x16 R1 | |
| Lenovo Legion Pro 7 RTX4090 | |
| Razer Blade 16 Early 2023 | |
| PCMark 10 / Productivity | |
| Alienware m16 R1 AMD | |
| Moyenne AMD Ryzen 9 7845HX, NVIDIA GeForce RTX 4080 Laptop GPU (n=1) | |
| Alienware x16 R1 | |
| HP Omen Transcend 16 | |
| Lenovo Legion Pro 7 RTX4090 | |
| Razer Blade 16 Early 2023 | |
| Asus ROG Strix G16 G614JZ | |
| PCMark 10 / Digital Content Creation | |
| Alienware m16 R1 AMD | |
| Moyenne AMD Ryzen 9 7845HX, NVIDIA GeForce RTX 4080 Laptop GPU (n=1) | |
| Lenovo Legion Pro 7 RTX4090 | |
| Razer Blade 16 Early 2023 | |
| Alienware x16 R1 | |
| HP Omen Transcend 16 | |
| Asus ROG Strix G16 G614JZ | |
| CrossMark / Overall | |
| Asus ROG Strix G16 G614JZ | |
| Alienware m16 R1 AMD | |
| Moyenne AMD Ryzen 9 7845HX, NVIDIA GeForce RTX 4080 Laptop GPU (n=1) | |
| HP Omen Transcend 16 | |
| Alienware x16 R1 | |
| Razer Blade 16 Early 2023 | |
| CrossMark / Productivity | |
| Asus ROG Strix G16 G614JZ | |
| Alienware m16 R1 AMD | |
| Moyenne AMD Ryzen 9 7845HX, NVIDIA GeForce RTX 4080 Laptop GPU (n=1) | |
| Alienware x16 R1 | |
| HP Omen Transcend 16 | |
| Razer Blade 16 Early 2023 | |
| CrossMark / Creativity | |
| Asus ROG Strix G16 G614JZ | |
| HP Omen Transcend 16 | |
| Alienware m16 R1 AMD | |
| Moyenne AMD Ryzen 9 7845HX, NVIDIA GeForce RTX 4080 Laptop GPU (n=1) | |
| Alienware x16 R1 | |
| Razer Blade 16 Early 2023 | |
| CrossMark / Responsiveness | |
| Asus ROG Strix G16 G614JZ | |
| Alienware x16 R1 | |
| Alienware m16 R1 AMD | |
| Moyenne AMD Ryzen 9 7845HX, NVIDIA GeForce RTX 4080 Laptop GPU (n=1) | |
| HP Omen Transcend 16 | |
| Razer Blade 16 Early 2023 | |
| PCMark 10 Score | 8867 points | |
Aide | ||
| AIDA64 / Memory Copy | |
| Razer Blade 16 Early 2023 | |
| Razer Blade 16 Early 2023 | |
| Razer Blade 16 Early 2023 | |
| Lenovo Legion Pro 7 RTX4090 | |
| HP Omen Transcend 16 | |
| Alienware x16 R1 | |
| Asus ROG Strix G16 G614JZ | |
| Alienware m16 R1 AMD | |
| Moyenne AMD Ryzen 9 7845HX (n=1) | |
| AIDA64 / Memory Read | |
| Lenovo Legion Pro 7 RTX4090 | |
| Razer Blade 16 Early 2023 | |
| Razer Blade 16 Early 2023 | |
| Razer Blade 16 Early 2023 | |
| HP Omen Transcend 16 | |
| Asus ROG Strix G16 G614JZ | |
| Alienware x16 R1 | |
| Alienware m16 R1 AMD | |
| Moyenne AMD Ryzen 9 7845HX (n=1) | |
| AIDA64 / Memory Write | |
| Alienware x16 R1 | |
| Razer Blade 16 Early 2023 | |
| Razer Blade 16 Early 2023 | |
| Razer Blade 16 Early 2023 | |
| Lenovo Legion Pro 7 RTX4090 | |
| HP Omen Transcend 16 | |
| Asus ROG Strix G16 G614JZ | |
| Alienware m16 R1 AMD | |
| Moyenne AMD Ryzen 9 7845HX (n=1) | |
| AIDA64 / Memory Latency | |
| Alienware x16 R1 | |
| Razer Blade 16 Early 2023 | |
| Razer Blade 16 Early 2023 | |
| Razer Blade 16 Early 2023 | |
| Alienware m16 R1 AMD | |
| Moyenne AMD Ryzen 9 7845HX (n=1) | |
| HP Omen Transcend 16 | |
| Asus ROG Strix G16 G614JZ | |
| Lenovo Legion Pro 7 RTX4090 | |
* ... Moindre est la valeur, meilleures sont les performances
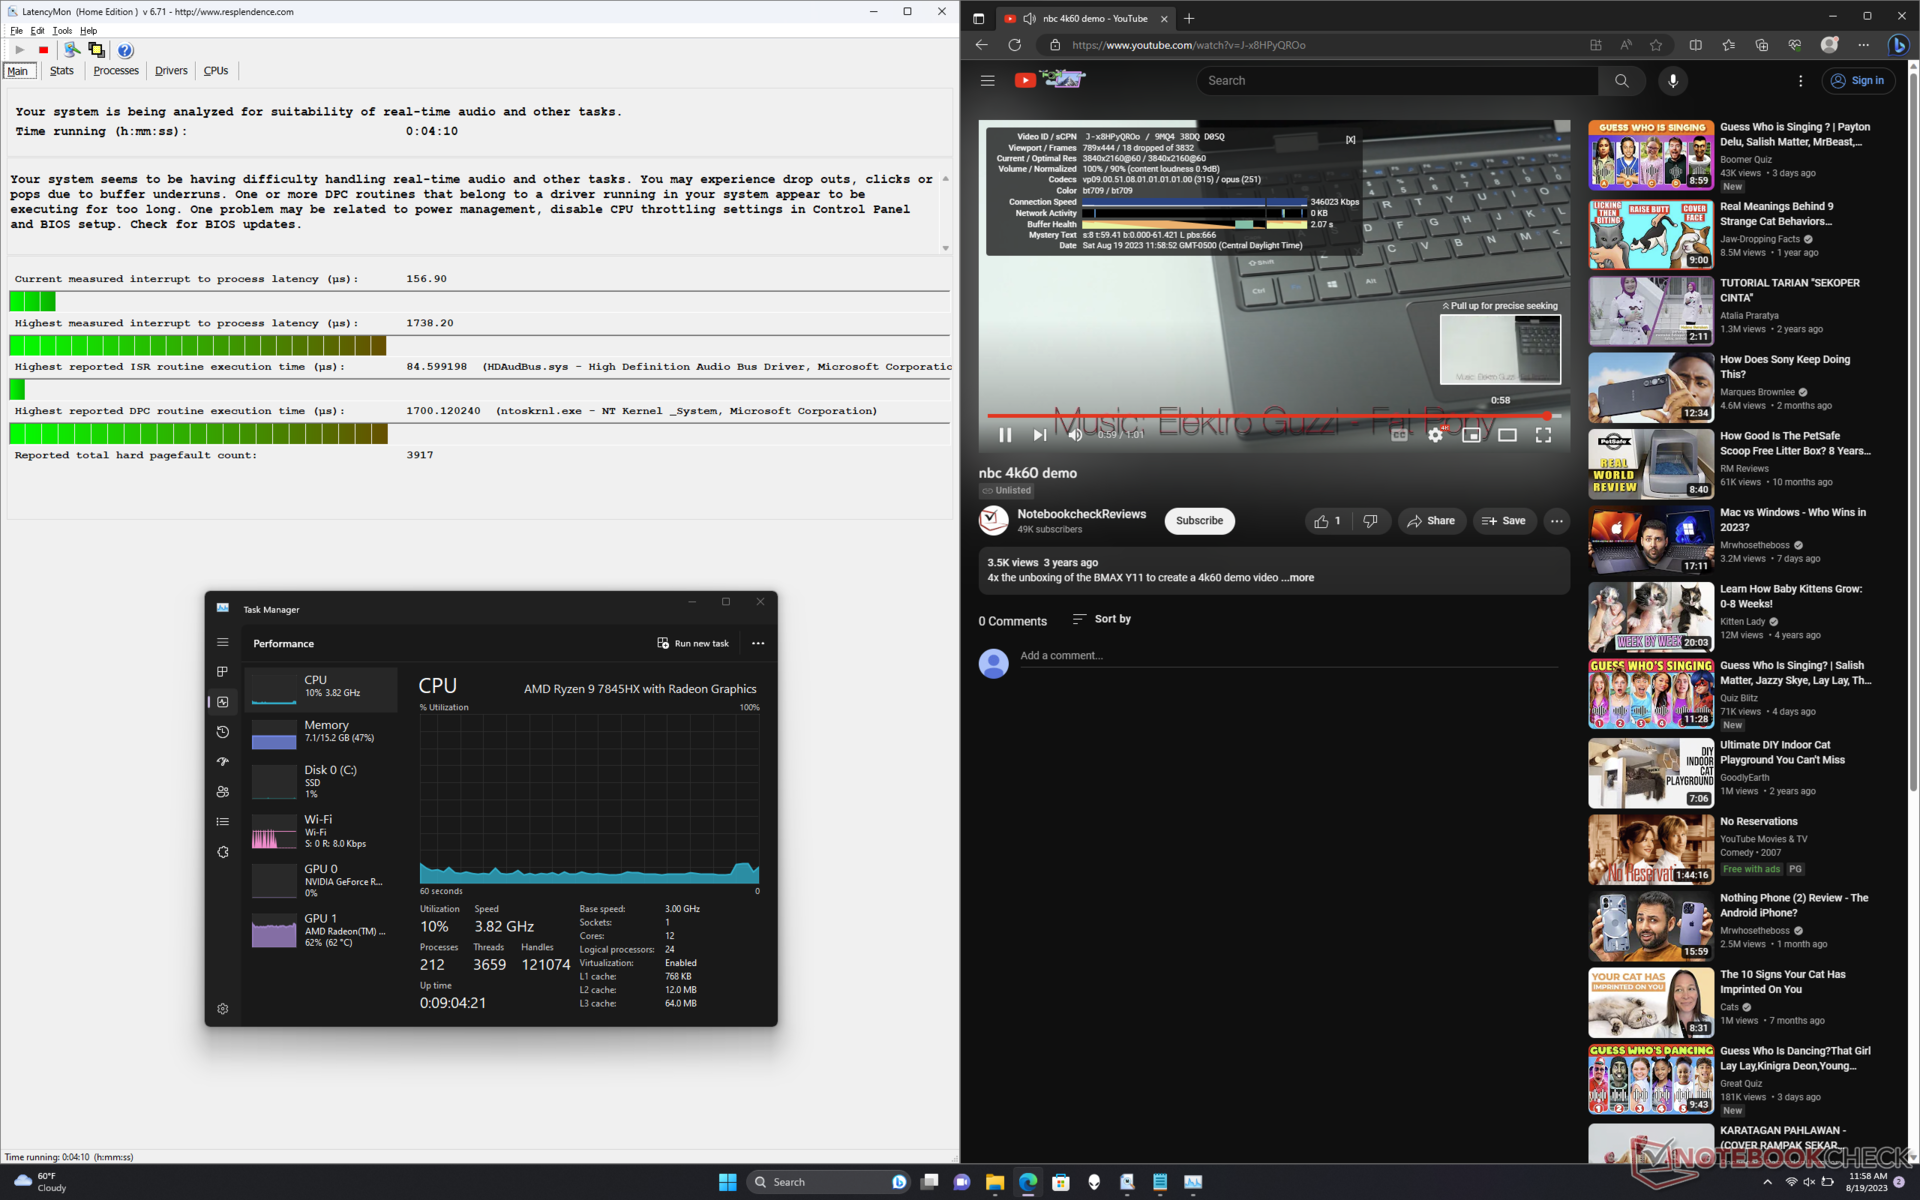
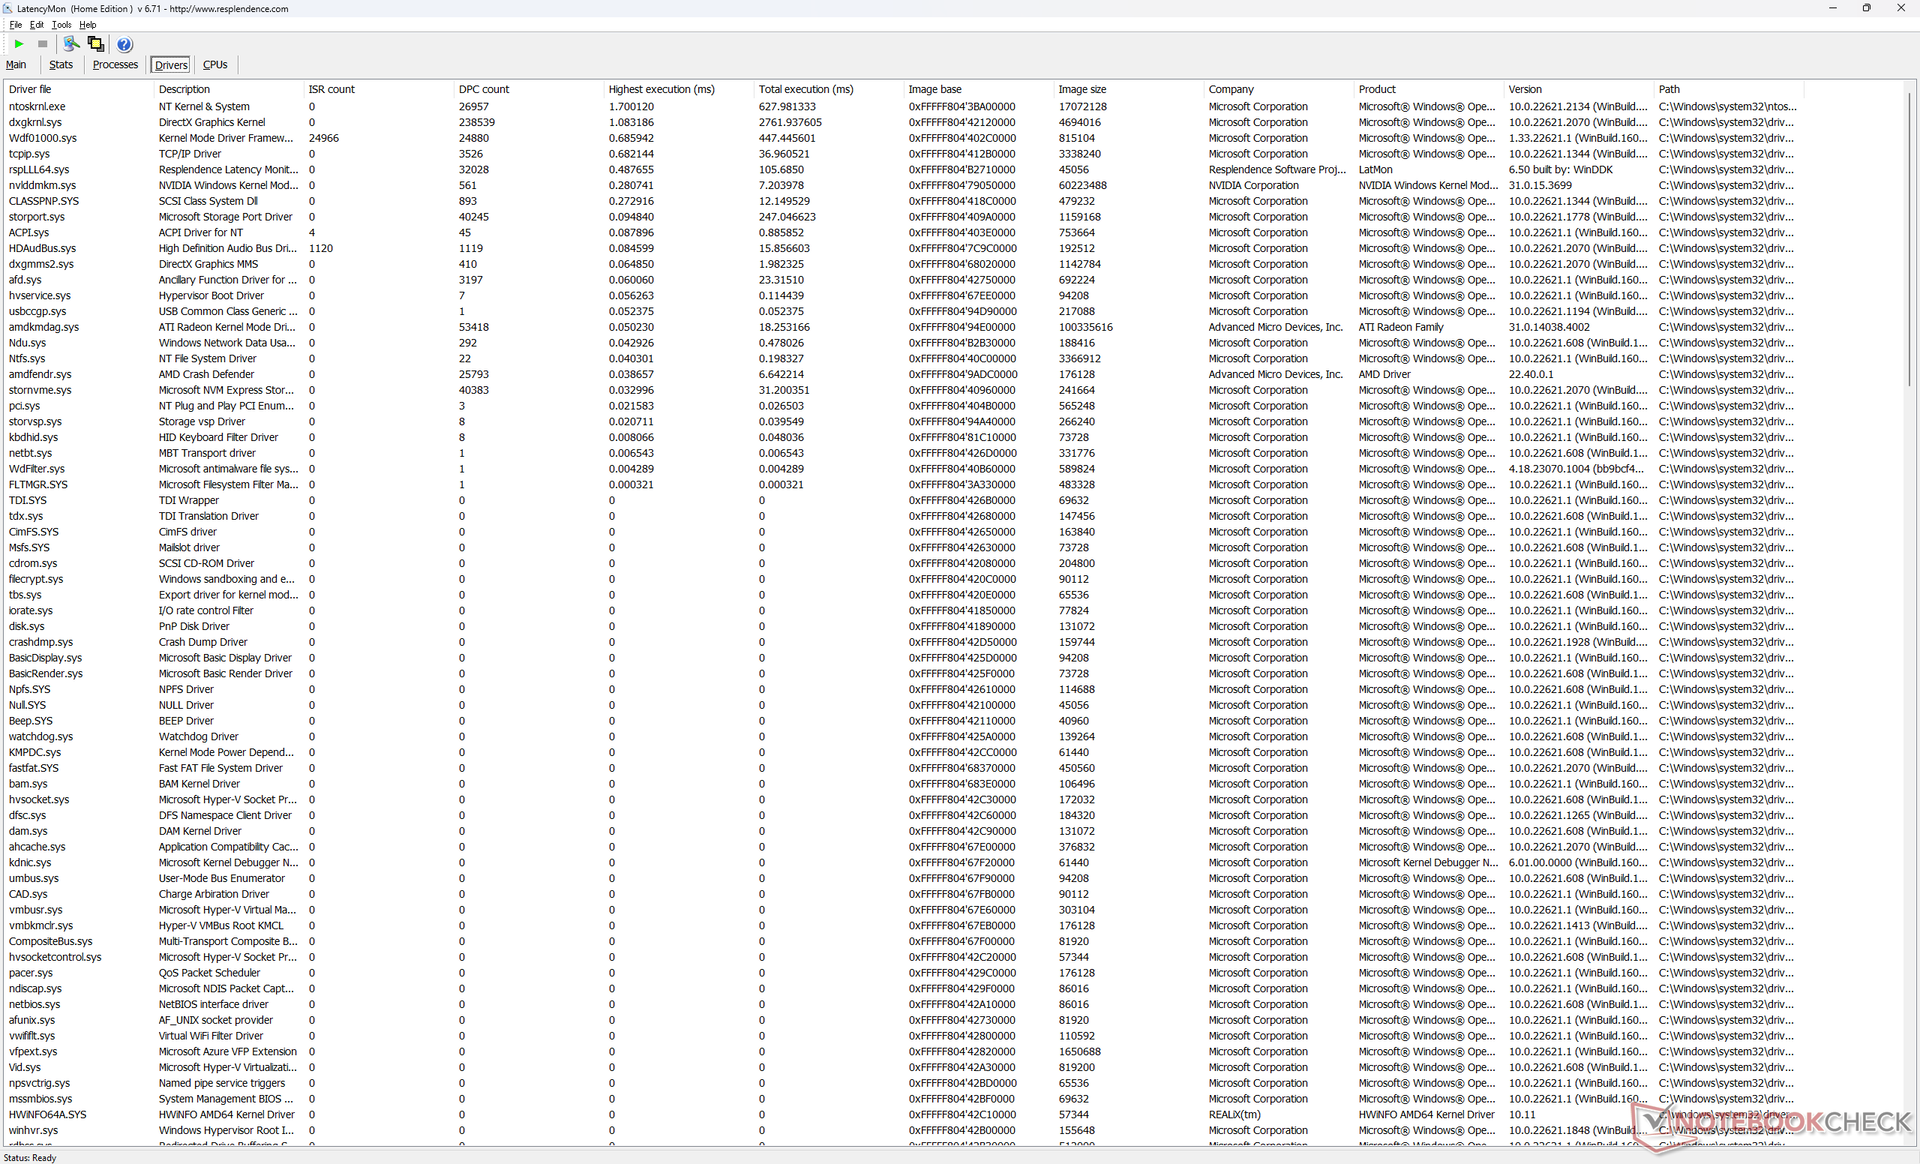
Latence DPC
LatencyMon révèle de légers problèmes de DPC liés à ntoskrnl.exe. En outre, la lecture de vidéos 4K à 60 FPS est imparfaite, avec 18 images perdues enregistrées au cours d'un test vidéo d'une minute, ce qui suggère un bogue potentiel dans l'accélération matérielle d'AMD. Les résultats ne se sont pas améliorés, même après plusieurs tests.
| DPC Latencies / LatencyMon - interrupt to process latency (max), Web, Youtube, Prime95 | |
| Lenovo Legion Pro 7 RTX4090 | |
| Asus ROG Strix G16 G614JZ | |
| Razer Blade 16 Early 2023 | |
| Alienware m16 R1 AMD | |
| HP Omen Transcend 16 | |
| Alienware x16 R1 | |
* ... Moindre est la valeur, meilleures sont les performances
Dispositifs de stockage
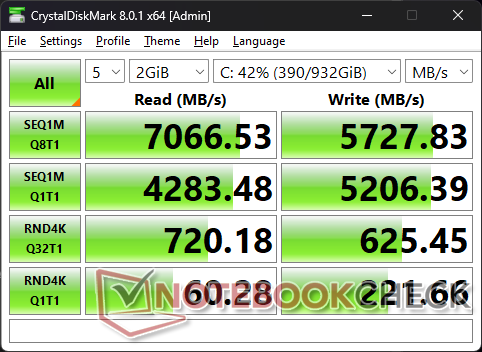
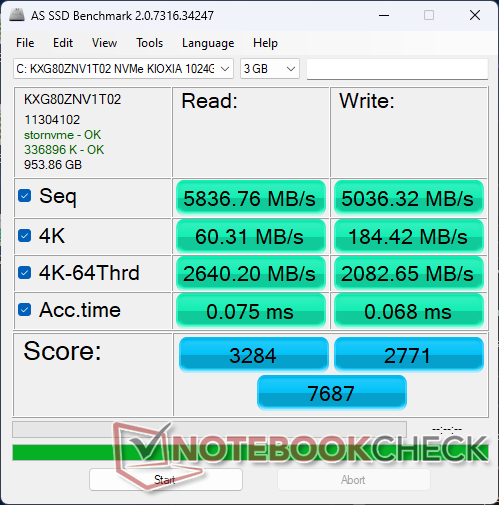
Notre unité est livrée avec un disque dur haut de gamme de 1 To Kioxia KXG80ZNV1T02 offrant des vitesses de lecture et d'écriture séquentielles allant jusqu'à 7000 Mo/s et 5600 Mo/s, respectivement, selon le fabricant. Le disque est capable de maintenir des taux de transfert maximums de plus de 6500 Mo/s pendant des périodes prolongées sans aucun problème d'étranglement.
Il est possible d'installer jusqu'à trois disques durs SSD M.2 dans les modèles Alienware x16 et HP Omen 16 ne peuvent en accueillir que deux chacun. Le troisième disque doit toutefois avoir une longueur de 30 mm.

| Drive Performance rating - Percent | |
| Alienware x16 R1 | |
| Lenovo Legion Pro 7 RTX4090 | |
| Alienware m16 R1 AMD | |
| Razer Blade 16 Early 2023 | |
| HP Omen Transcend 16 | |
| Asus ROG Strix G16 G614JZ | |
* ... Moindre est la valeur, meilleures sont les performances
Disk Throttling: DiskSpd Read Loop, Queue Depth 8
Performance du GPU - 175 W TGP Graphics
Les performances graphiques sont environ 5 à 10 % plus rapides que celles d'un ordinateur portable de jeu moyen de notre base de données équipé du même GPU RTX 4080 même GPU RTX 4080 alors que l'Alienware vise un TGP relativement élevé de 175 W. En fait, les performances sont seulement 5 % plus lentes que celles de l'Alienware.Asus Zephyrus Duo 16 fonctionnant avec la RTX 4090.
Le passage à la SKU RTX 4090 devrait augmenter les performances de seulement 10 % par rapport à notre RTX 4080, tandis que le passage à la SKU RTX 4070 devrait diminuer les performances de manière plus significative, jusqu'à 30 à 40 %, d'après notre expérience avec la SKU HP Omen Transcend 16. Les passionnés devraient donc envisager des unités de stockage avec la RTX 4080 au minimum.
Il est intéressant de noter qu'il n'y a que des différences de performances mineures entre les modes Balanced, Performance et Overdrive, comme le montrent les scores Fire Strike dans le tableau ci-dessous. Il est important de noter que les modes diffèrent de manière significative en termes de bruit de ventilateur.
| Profil de puissance | Score graphique | Score physique | Score combiné |
| Puissance de la batterie | 22290 (-50%) | 30178 (-17%) | 9109 (-35%) |
| Mode équilibré | 43406 (-3%) | 35237 (-4%) | 14721 (+5%) |
| Mode Performance | 44306 (-1%) | 36106 (-1%) | 13682 (-3%) |
| Mode surmultiplié | 44782 | 36557 | 14045 |
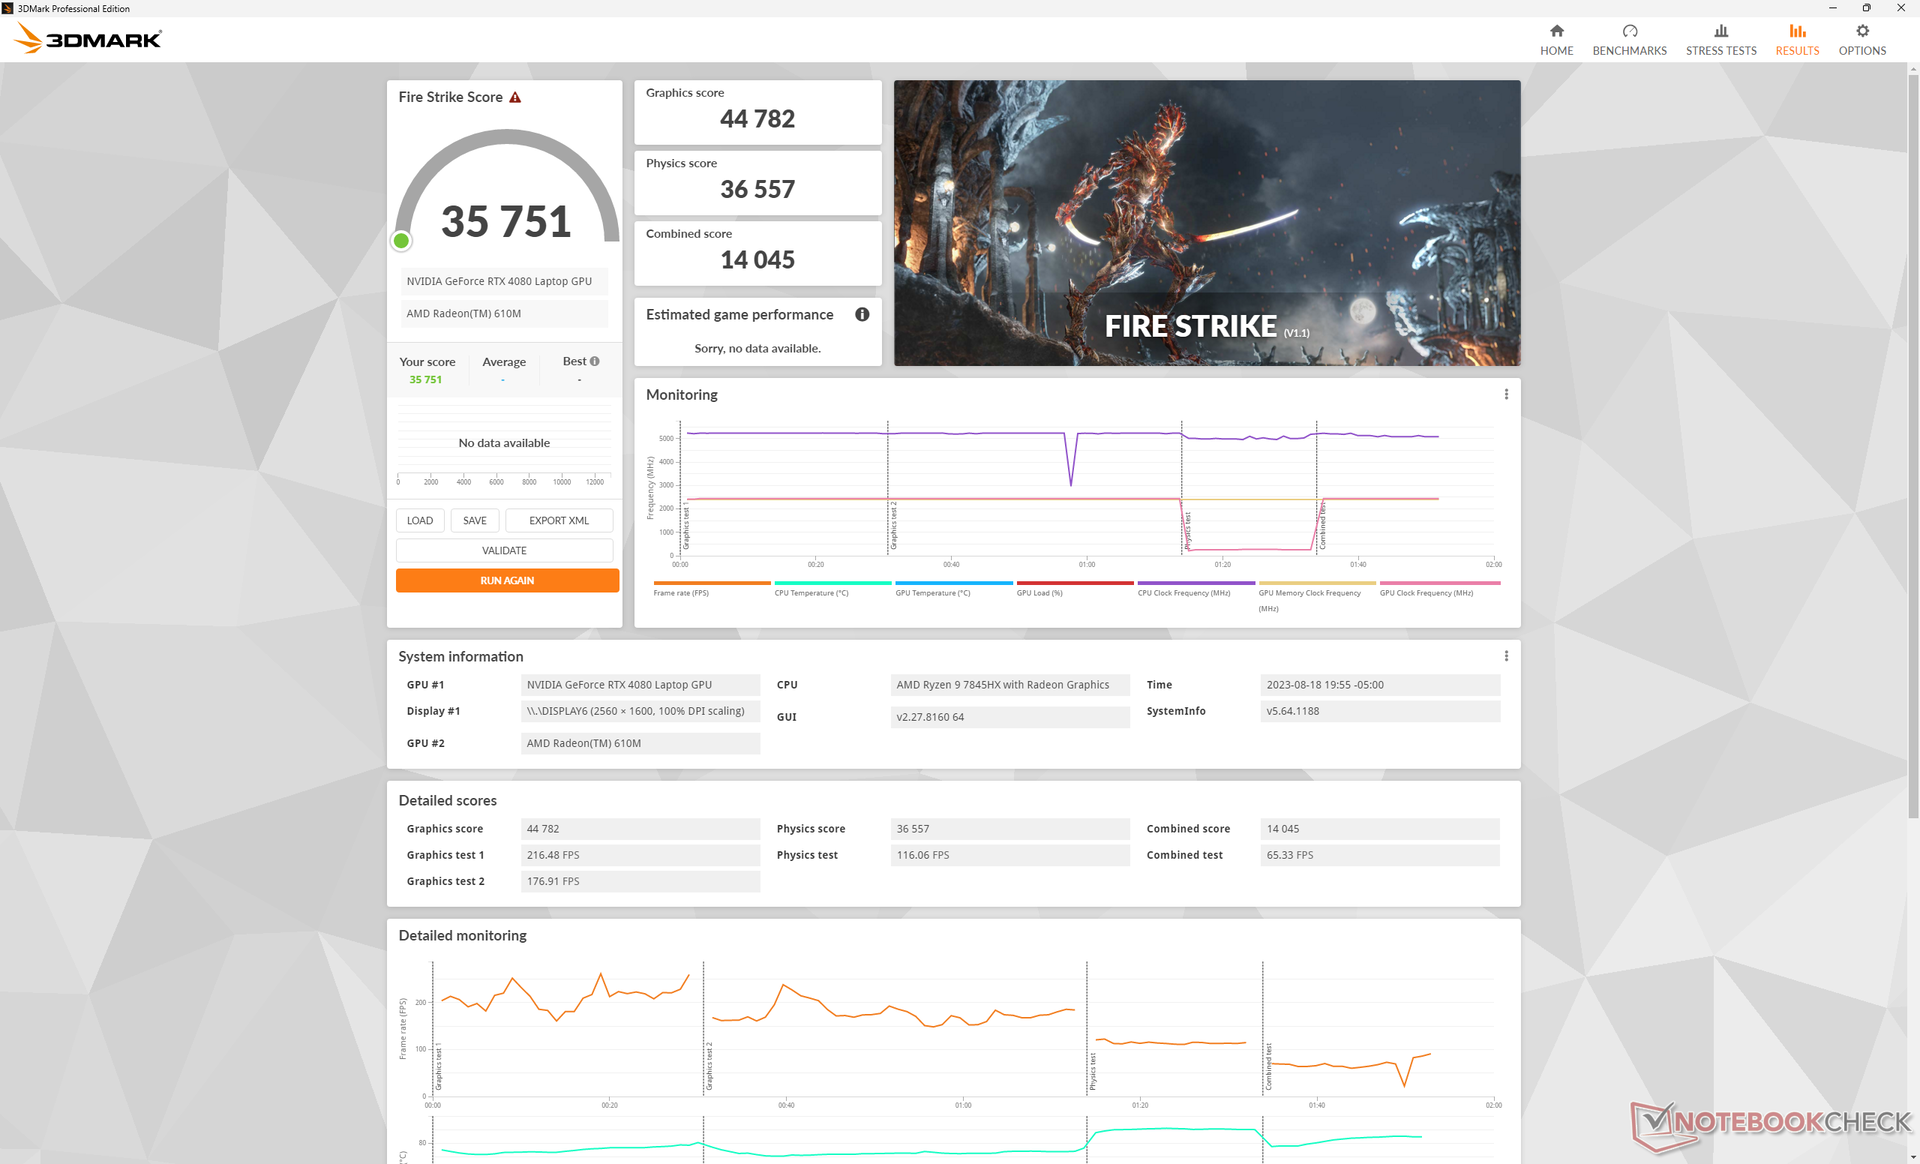

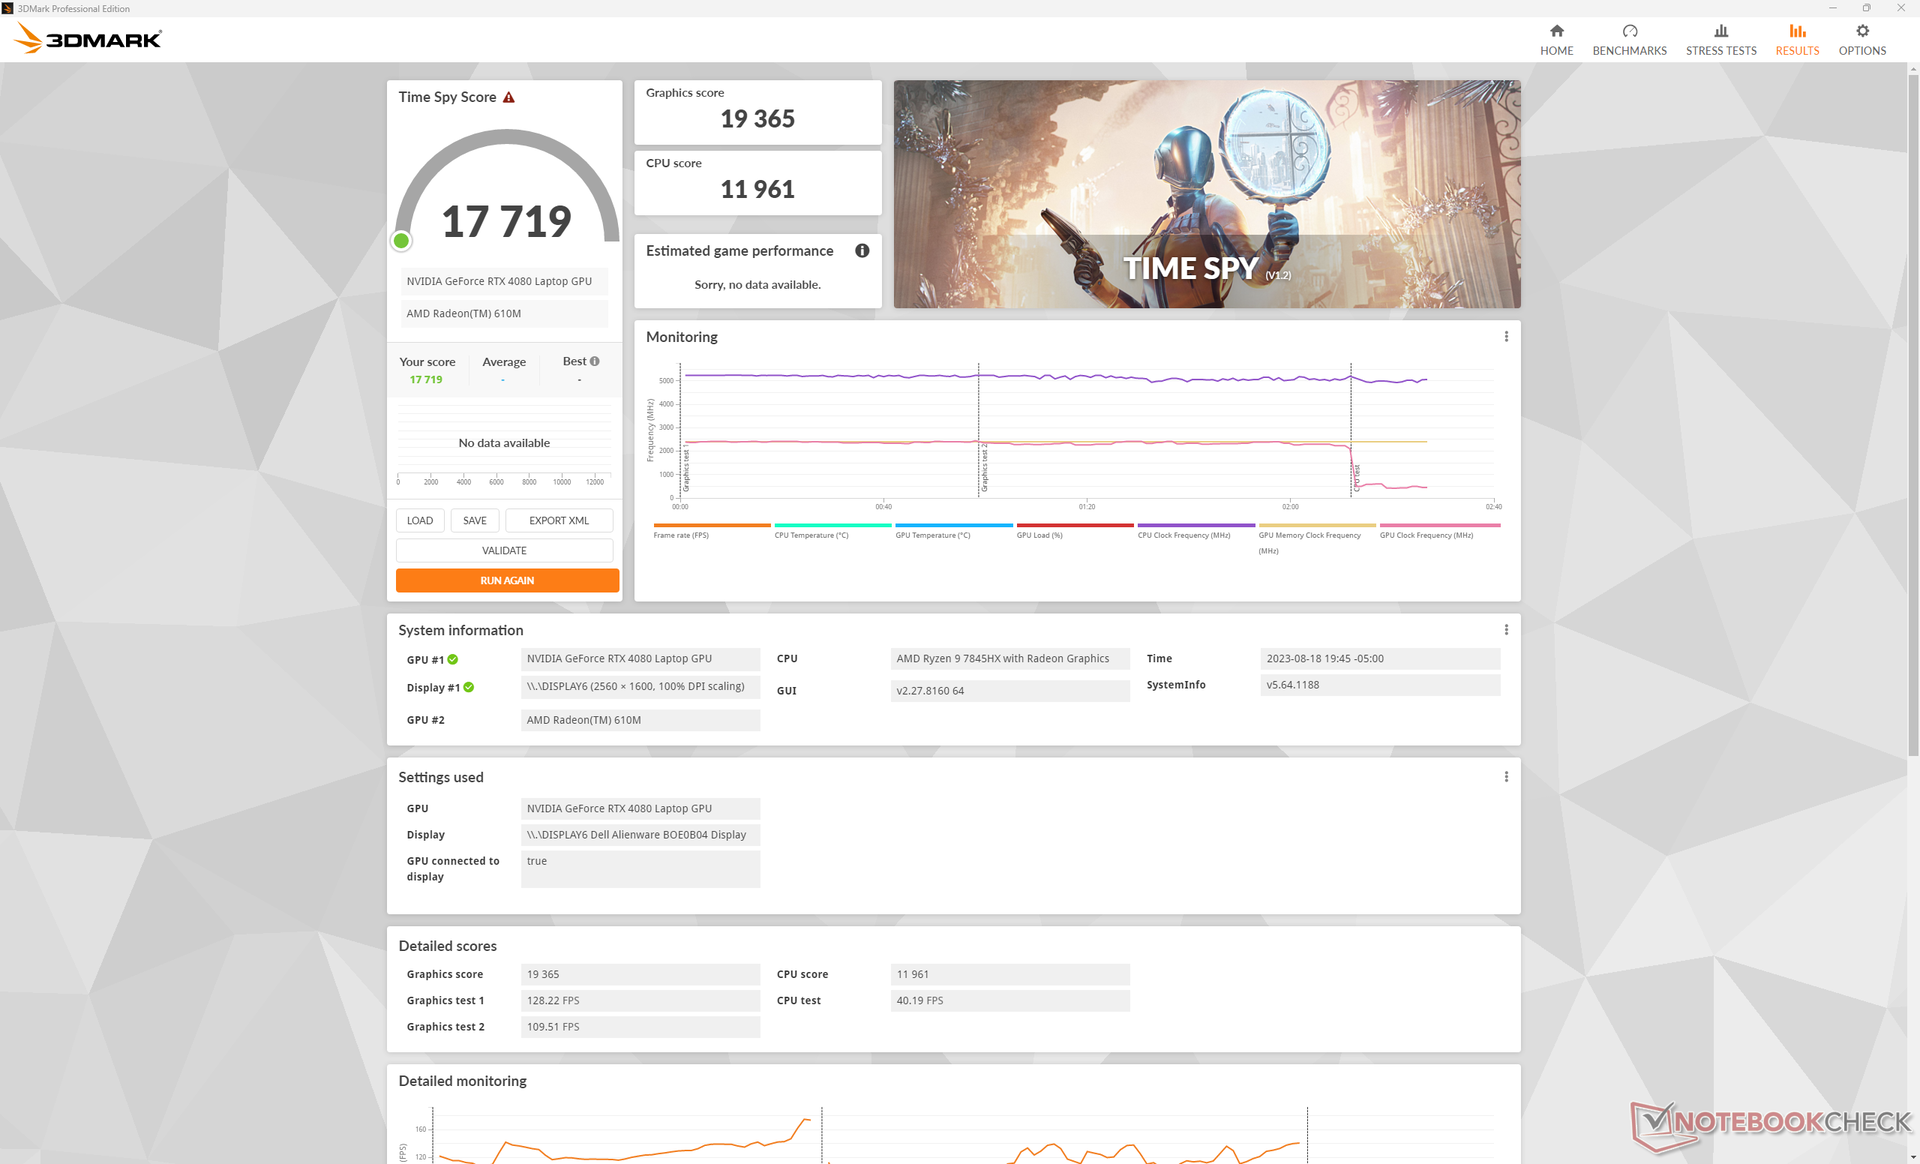
| 3DMark 11 Performance | 40681 points | |
| 3DMark Fire Strike Score | 35751 points | |
| 3DMark Time Spy Score | 17719 points | |
Aide | ||
* ... Moindre est la valeur, meilleures sont les performances
Performance des jeux
Les performances dans les jeux sont excellentes, avec des résultats 5 à 10 % plus rapides que d'autres ordinateurs portables équipés du même GPU RTX 4080, comme le prédit 3DMark. Les avantages s'étendent également aux paramètres graphiques inférieurs, ce qui peut aider les joueurs qui préfèrent maximiser les taux de trame plutôt que la résolution. La RTX 4080 mobile est suffisamment puissante pour jouer à n'importe quel titre actuel en résolution native QHD+ à plus de 60 FPS, même si elle est beaucoup plus faible qu'une rTX 4080 de bureau.
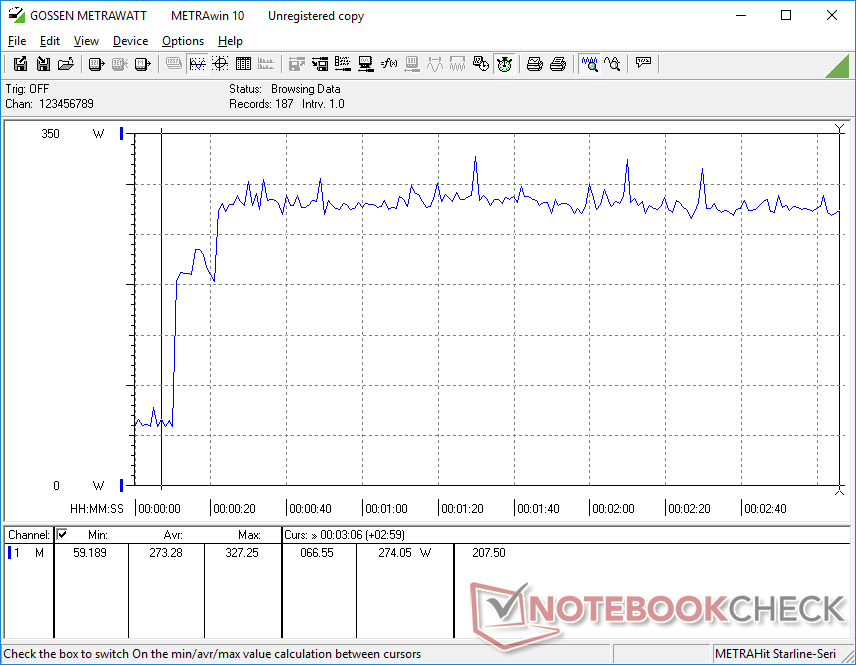
La stabilité des performances est malheureusement imparfaite. Sur Witcher 3, par exemple, les taux de rafraîchissement tombaient parfois à 70 FPS avant de remonter à plus de 150 FPS, comme le montre le graphique ci-dessous. Cela suggère une mauvaise optimisation des ressources d'arrière-plan qui peuvent interrompre l'application en cours.
Witcher 3 FPS Chart
| Bas | Moyen | Élevé | Ultra | QHD | 4K | |
|---|---|---|---|---|---|---|
| The Witcher 3 (2015) | 573.1 | 452.2 | 349.3 | 169.7 | 121.5 | |
| Dota 2 Reborn (2015) | 229 | 191.8 | 180.4 | 164.7 | 161 | |
| Final Fantasy XV Benchmark (2018) | 230 | 218 | 167.6 | 131.6 | 76.1 | |
| X-Plane 11.11 (2018) | 171.1 | 149 | 113.1 | 95 | ||
| Far Cry 5 (2018) | 160 | 145 | 141 | 136 | 131 | 91 |
| Strange Brigade (2018) | 572 | 461 | 400 | 357 | 248 | 123.1 |
| Cyberpunk 2077 1.6 (2022) | 154 | 151.4 | 137.5 | 128.3 | 84.5 | 39.7 |
| Tiny Tina's Wonderlands (2022) | 317.1 | 265.9 | 201.1 | 160.8 | 112.9 | 59 |
| F1 22 (2022) | 323 | 296 | 285 | 124.2 | 78.1 | 39.5 |
| Returnal (2023) | 128 | 122 | 117 | 107 | 80 | 44 |
Émissions
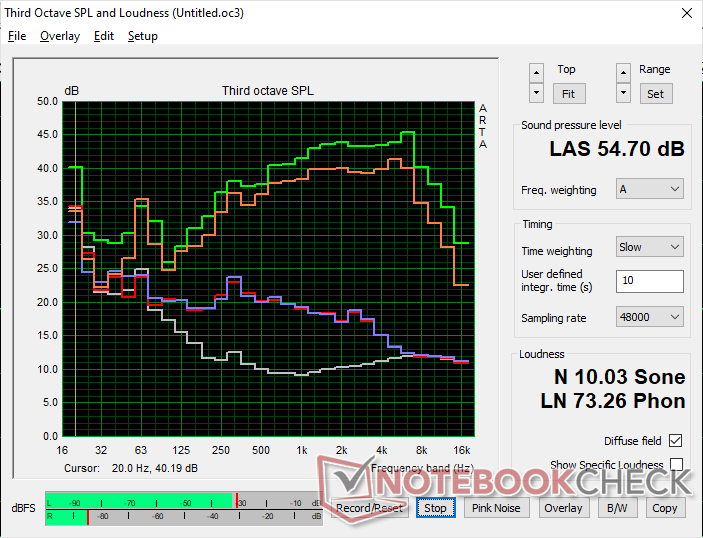
Bruit du système - De grandes différences entre les profils de puissance
Les ventilateurs sont presque toujours actifs à un peu moins de 30 dB(A) sur un fond silencieux de 23 dB(A). Bien qu'audible, le bruit est au moins régulier car les ventilateurs n'émettent pas de pulsations plus fortes lors de l'exécution de charges peu exigeantes telles que les navigateurs ou la vidéo.
Le bruit des ventilateurs en mode équilibré, performance ou overdrive peut atteindre 49,4 dB(A), 51 dB(A) et 54,7 dB(A), respectivement. Étant donné que la perte de performances en mode équilibré est minime, les utilisateurs peuvent envisager de jouer en mode équilibré plutôt qu'en mode Performance ou Overdrive pour bénéficier d'un bruit de ventilateur nettement plus silencieux. D'autres ordinateurs portables de jeu de 16 pouces comme le Razer Blade 16 ou l'Omen Transcend 16 ont tendance à se stabiliser dans la fourchette basse à moyenne de 50 dB(A) lors de l'exécution des jeux.
Degré de la nuisance sonore
| Au repos |
| 22.9 / 29.7 / 29.7 dB(A) |
| Fortement sollicité |
| 29.8 / 54.7 dB(A) |
 | ||
30 dB silencieux 40 dB(A) audible 50 dB(A) bruyant |
||
min: | ||
| Alienware m16 R1 AMD GeForce RTX 4080 Laptop GPU, R9 7845HX, Kioxia XG8 KXG80ZNV1T02 | Alienware x16 R1 GeForce RTX 4080 Laptop GPU, i9-13900HK, SK hynix PC801 HFS001TEJ9X101N | HP Omen Transcend 16 GeForce RTX 4070 Laptop GPU, i9-13900HX, SK hynix PC801 HFS002TEJ9X101N | Lenovo Legion Pro 7 RTX4090 GeForce RTX 4090 Laptop GPU, i9-13900HX, Samsung PM9A1 MZVL21T0HCLR | Asus ROG Strix G16 G614JZ GeForce RTX 4080 Laptop GPU, i9-13980HX, WD PC SN560 SDDPNQE-1T00 | Razer Blade 16 Early 2023 GeForce RTX 4080 Laptop GPU, i9-13950HX, SSSTC CA6-8D1024 | |
|---|---|---|---|---|---|---|
| Noise | 0% | -11% | -17% | -9% | 4% | |
| arrêt / environnement * (dB) | 22.9 | 22.7 1% | 22.9 -0% | 25 -9% | 25 -9% | 23 -0% |
| Idle Minimum * (dB) | 22.9 | 23.1 -1% | 29.1 -27% | 28 -22% | 26 -14% | 23 -0% |
| Idle Average * (dB) | 29.7 | 25.8 13% | 29.1 2% | 30 -1% | 28 6% | 23 23% |
| Idle Maximum * (dB) | 29.7 | 25.8 13% | 29.1 2% | 38 -28% | 30 -1% | 23.6 21% |
| Load Average * (dB) | 29.8 | 39.3 -32% | 45.7 -53% | 48 -61% | 48 -61% | 39 -31% |
| Witcher 3 ultra * (dB) | 54.7 | 49.9 9% | 54.3 1% | 53 3% | 49 10% | 51.6 6% |
| Load Maximum * (dB) | 54.7 | 54.8 -0% | 54.3 1% | 55 -1% | 52 5% | 51.3 6% |
* ... Moindre est la valeur, meilleures sont les performances
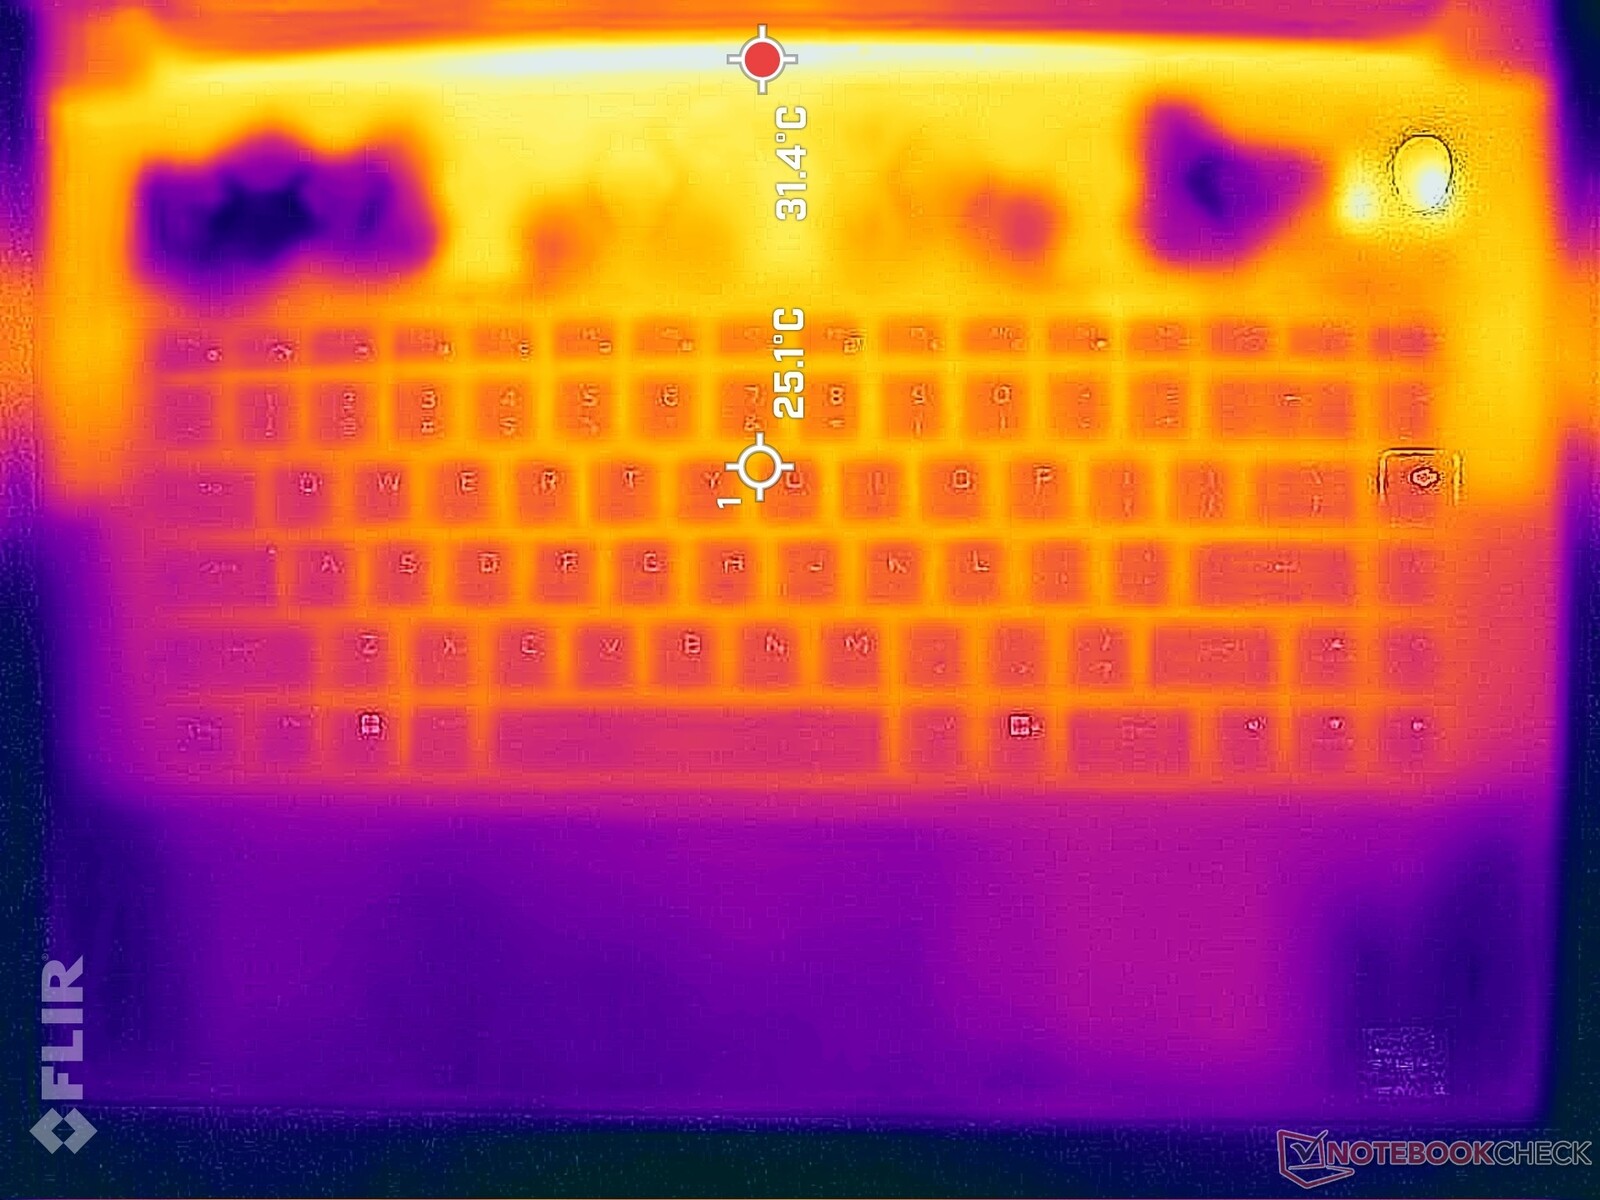
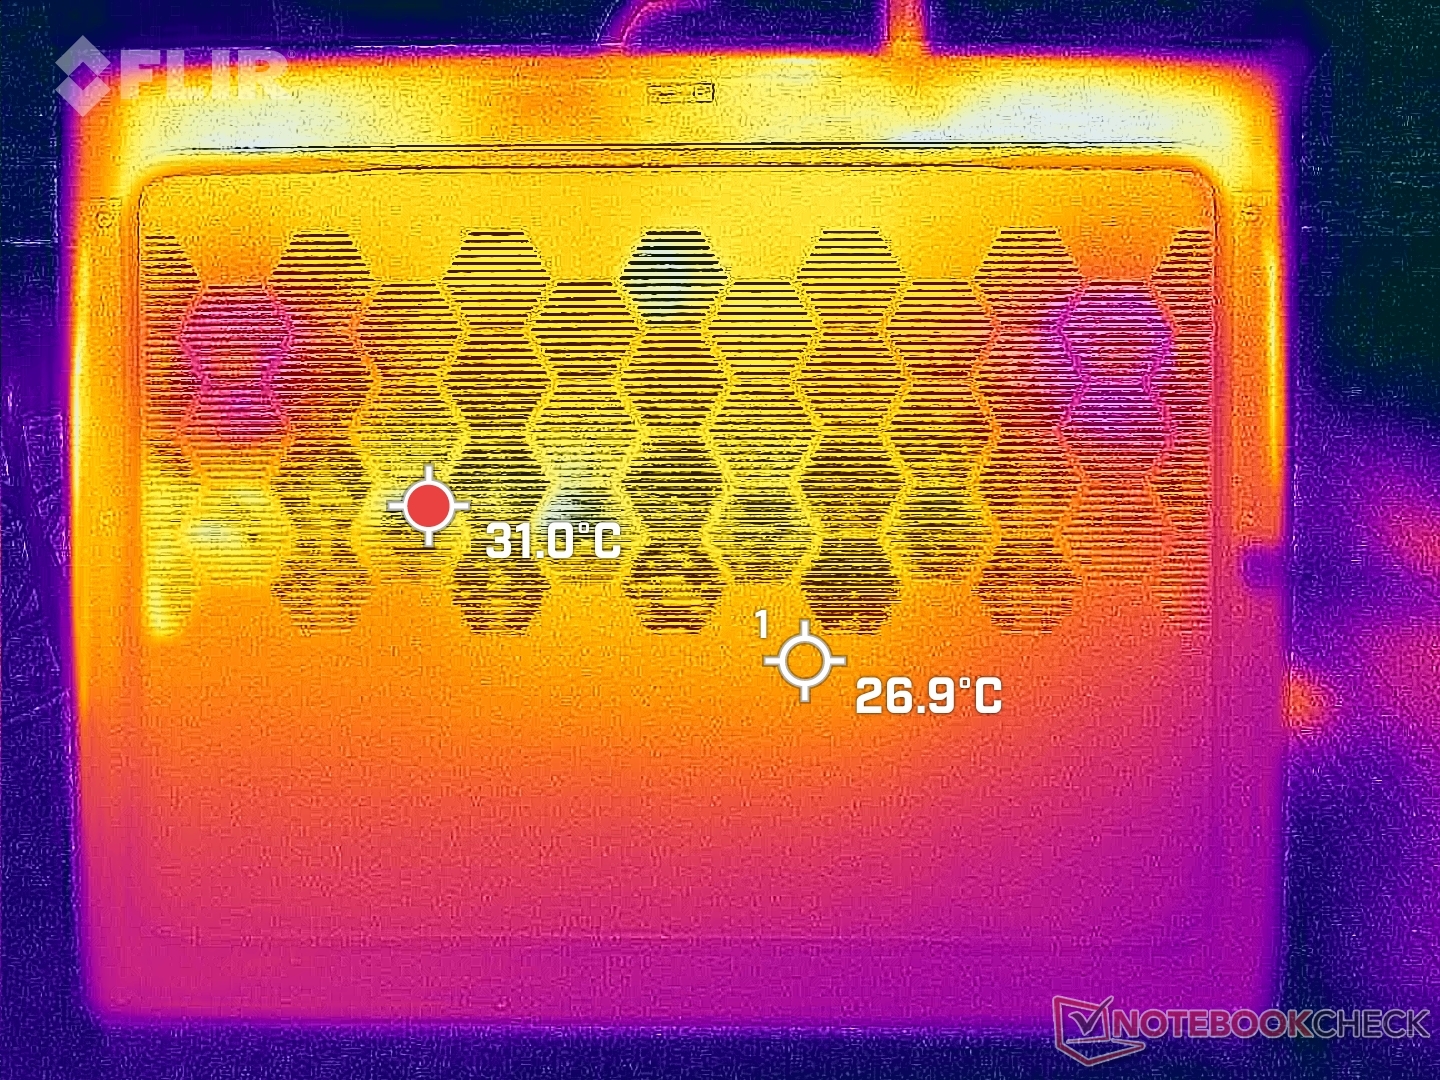
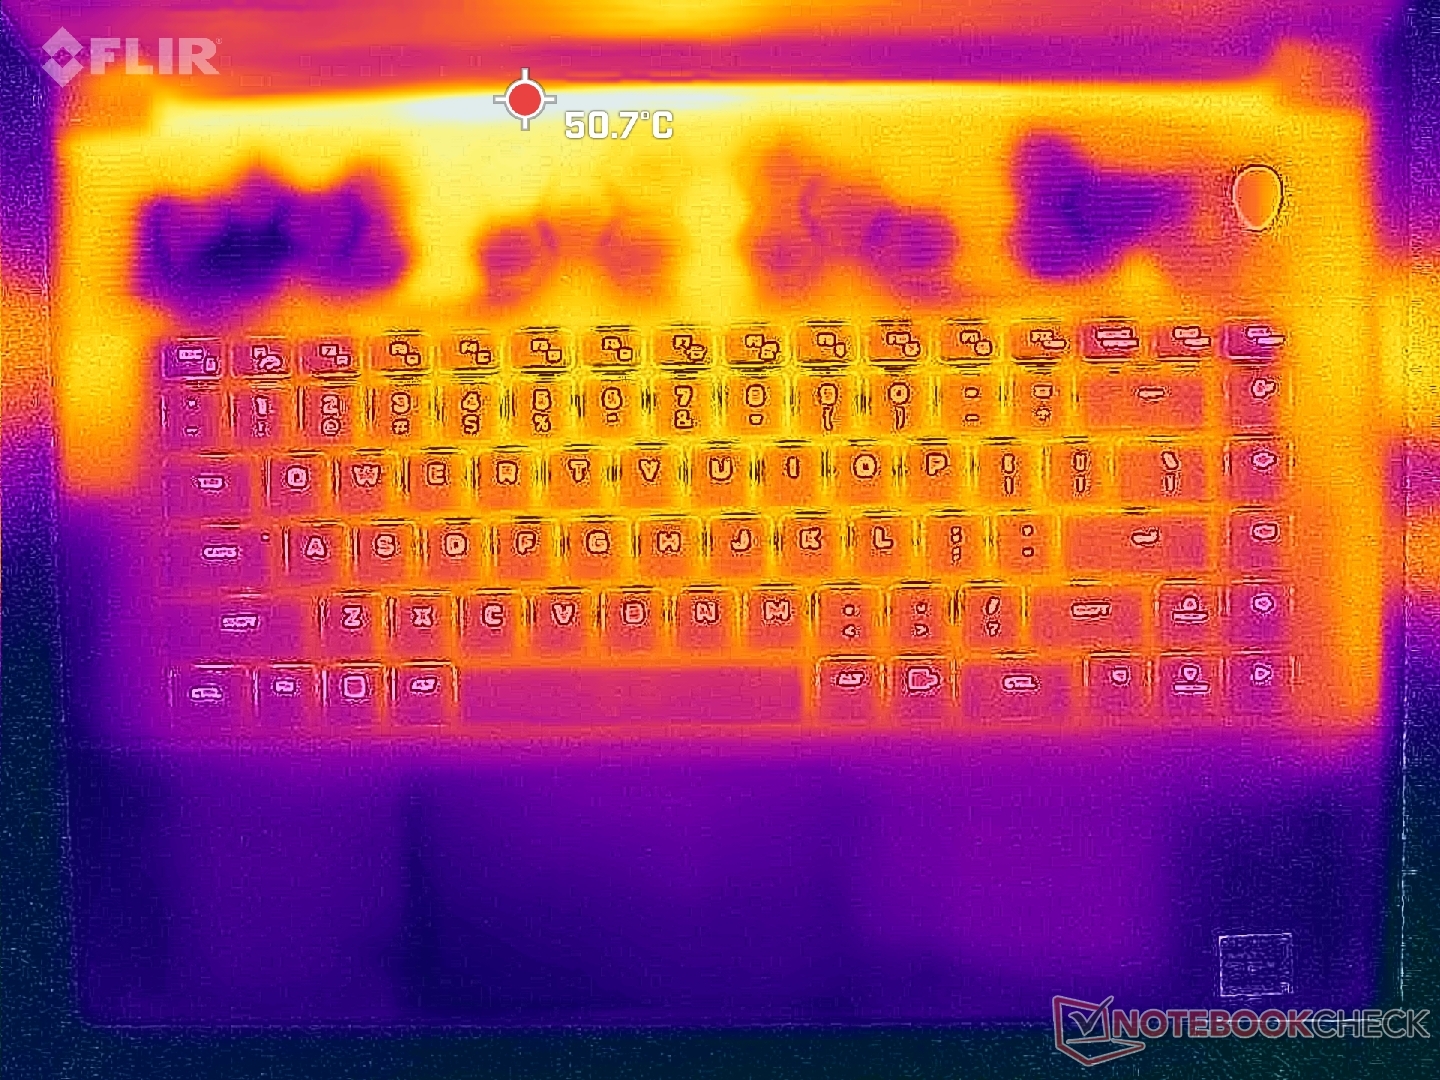
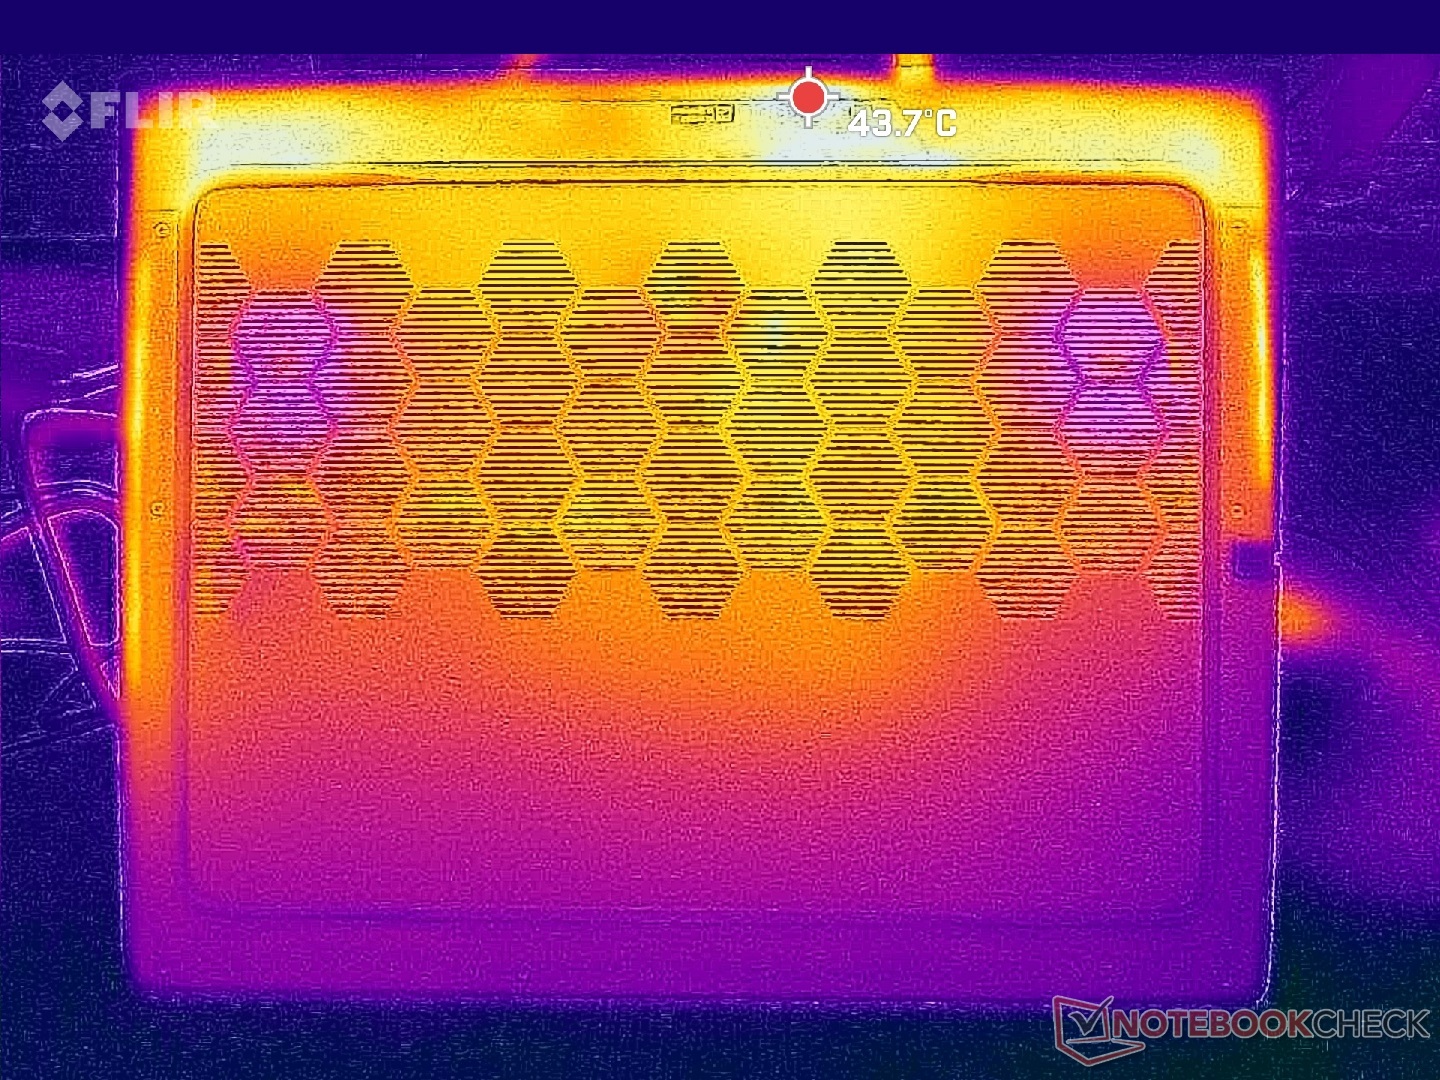
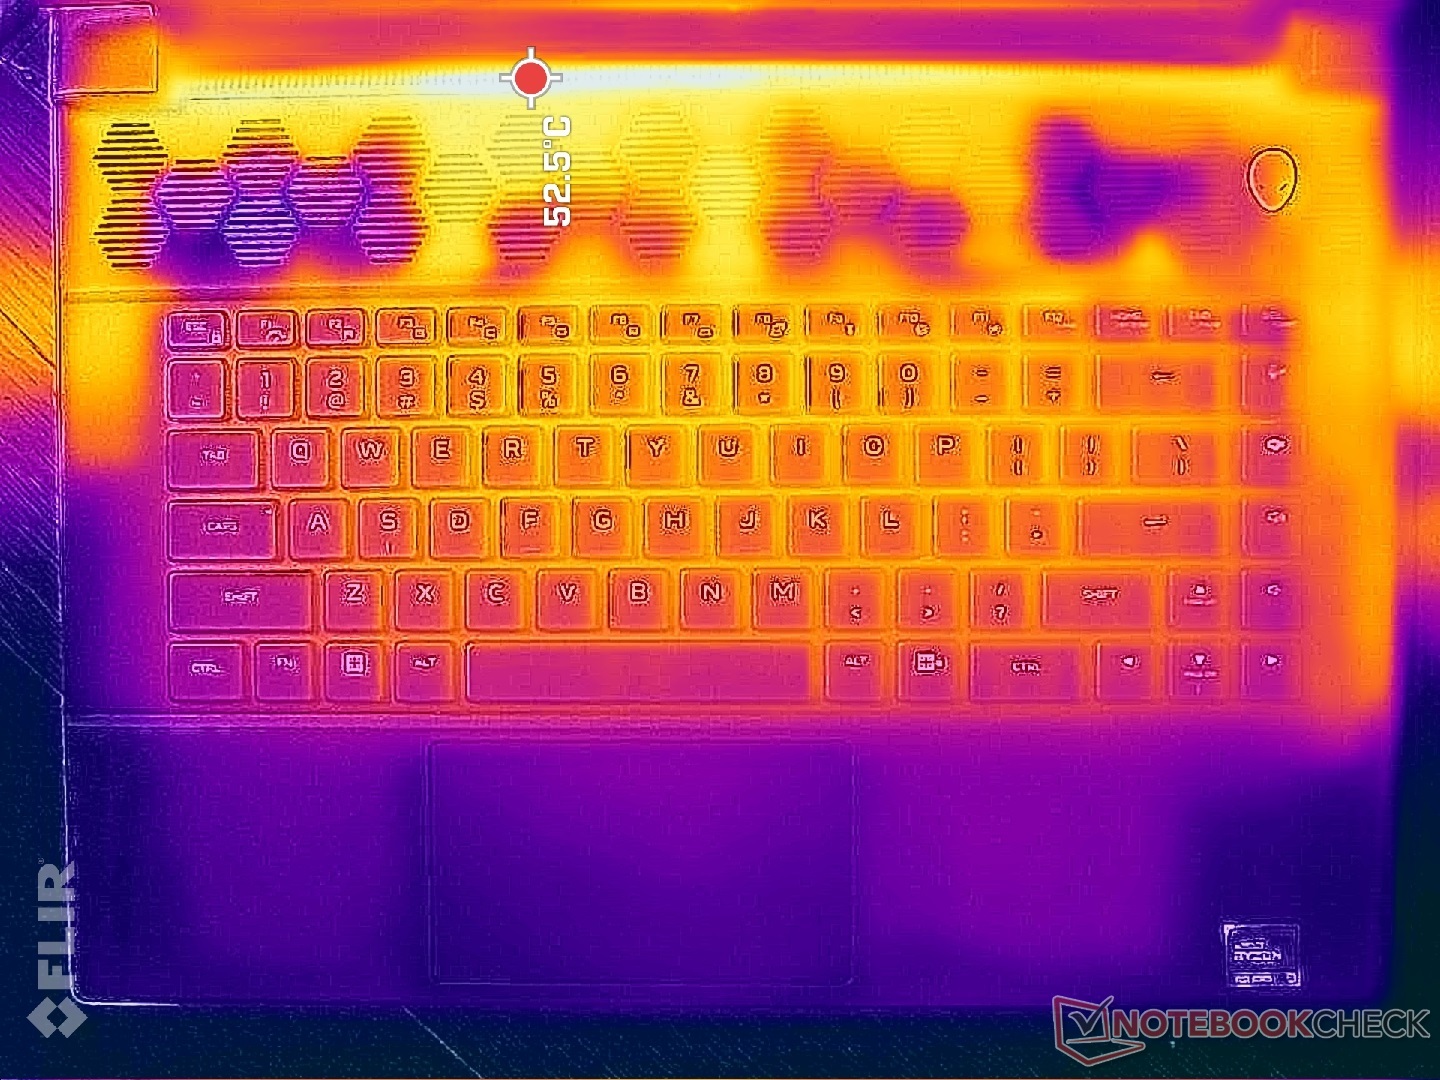
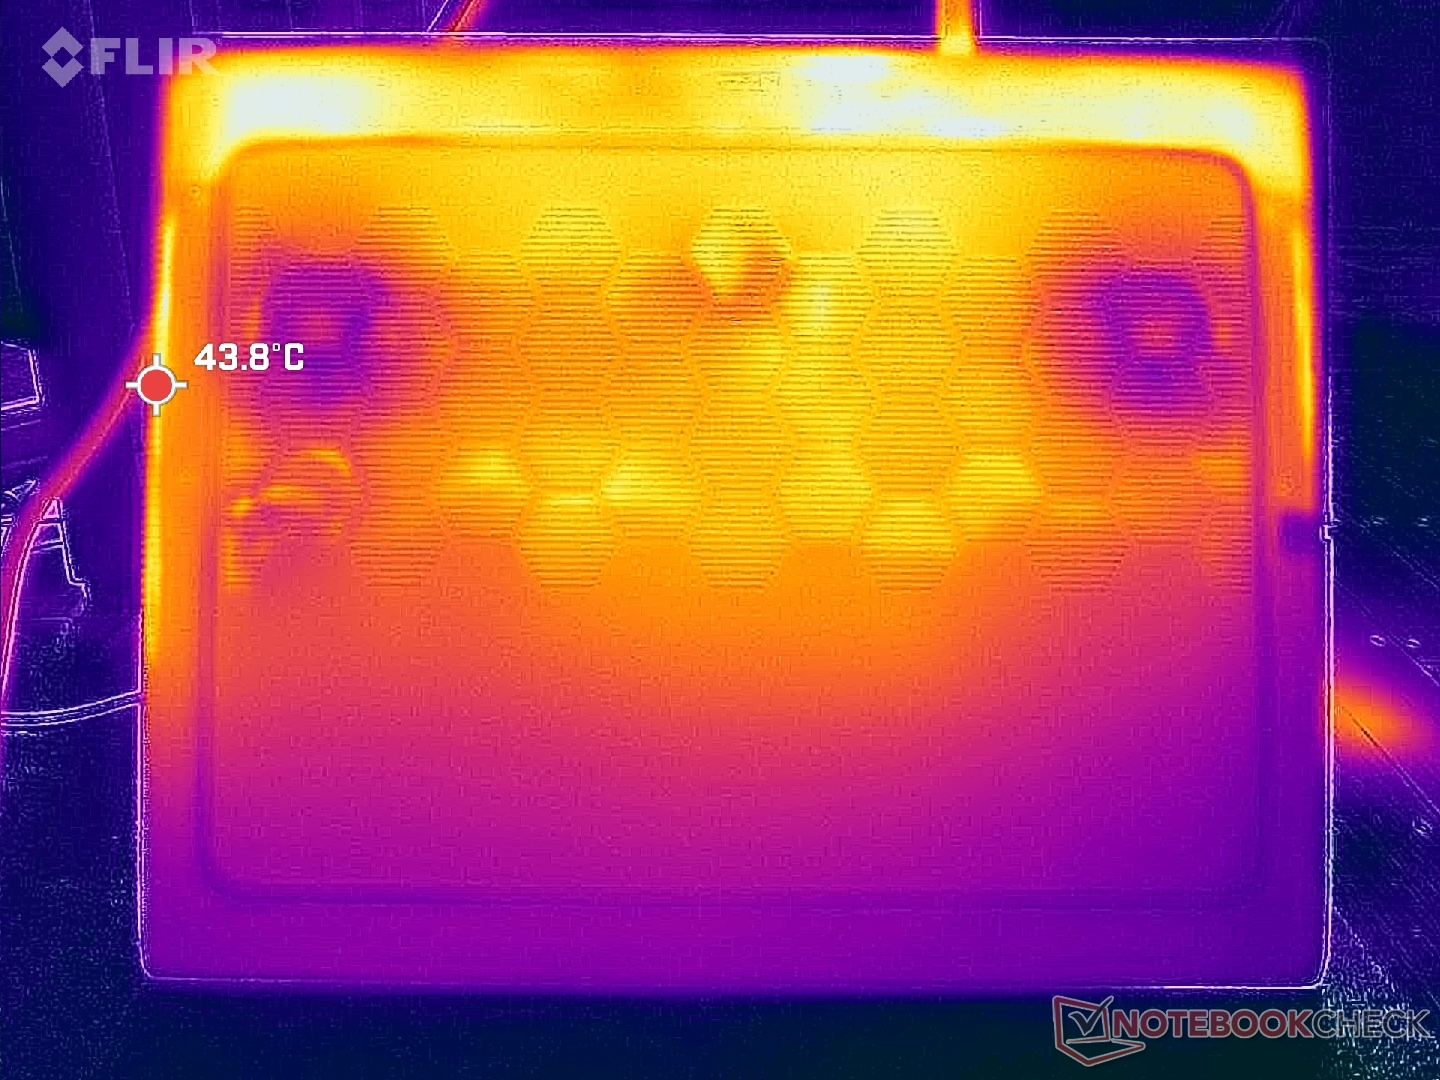
Température
Les températures de surface peuvent être très élevées, jusqu'à 50°C à l'arrière. Heureusement, les repose-poignets et les zones du clavier restent plus froids au toucher pour un meilleur confort, en partie grâce aux larges grilles d'aération. Le centre du clavier, par exemple, atteint 42 °C pendant les jeux, contre 46 °C sur le Lenovo Legion Pro 7 16.
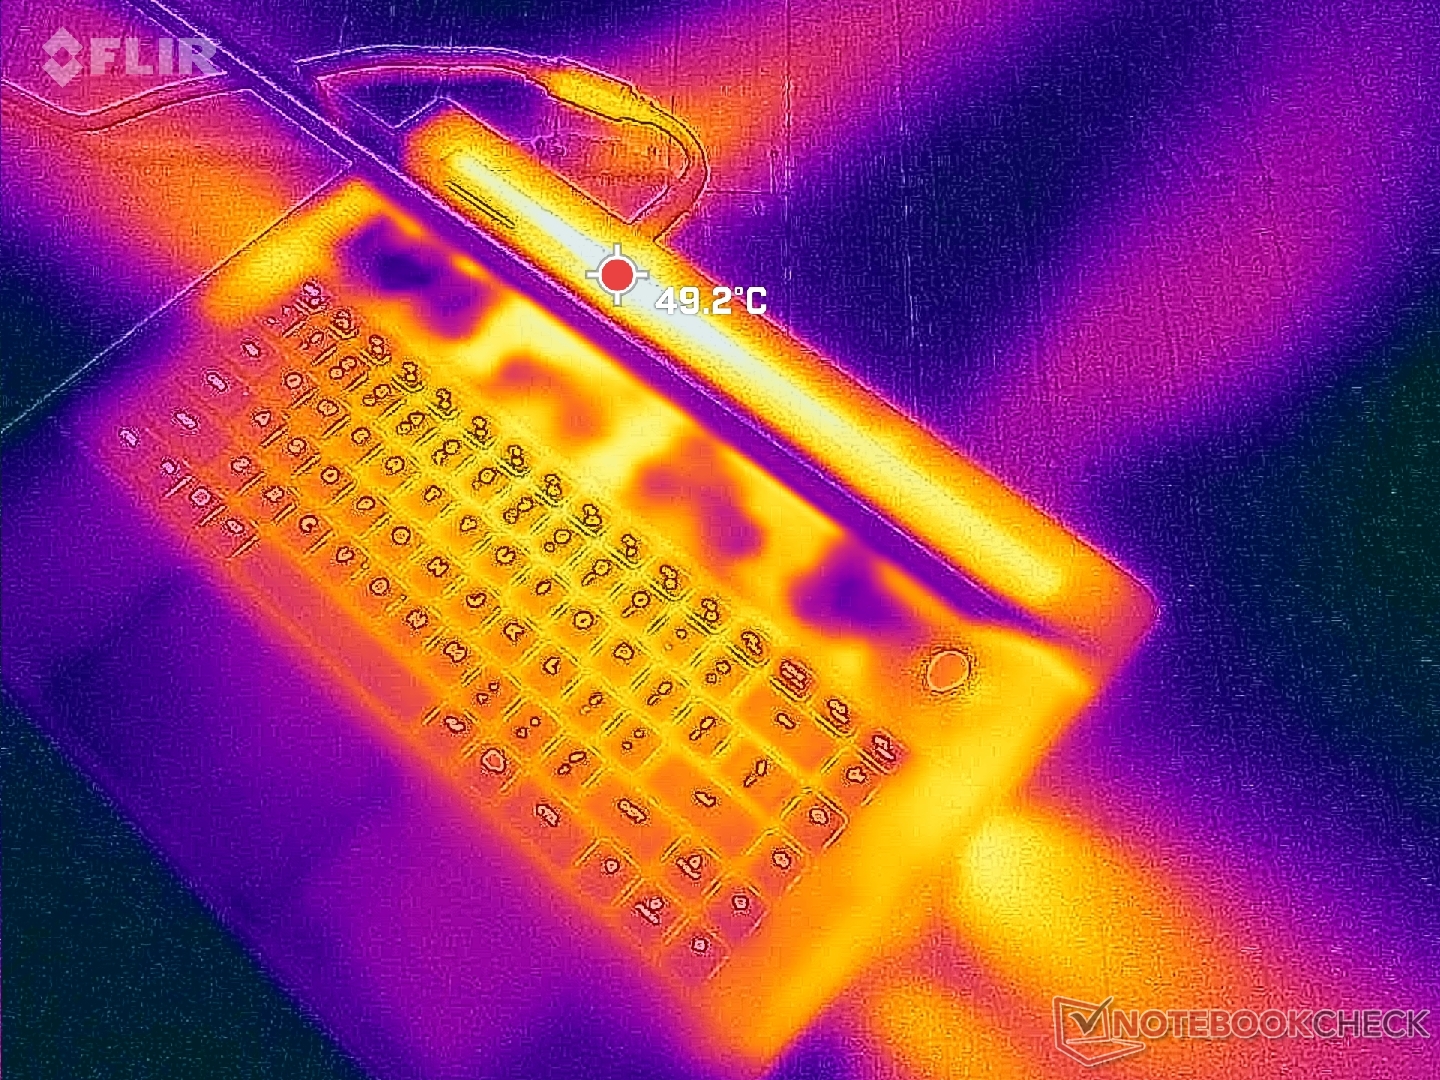
(-) La température maximale du côté supérieur est de 48 °C / 118 F, par rapport à la moyenne de 40.4 °C / 105 F, allant de 21.2 à 68.8 °C pour la classe Gaming.
(+) Le fond chauffe jusqu'à un maximum de 39 °C / 102 F, contre une moyenne de 43.2 °C / 110 F
(±) En utilisation inactive, la température moyenne du côté supérieur est de 32.2 °C / 90 F, par rapport à la moyenne du dispositif de 33.9 °C / 93 F.
(-) En jouant à The Witcher 3, la température moyenne du côté supérieur est de 38.1 °C / 101 F, alors que la moyenne de l'appareil est de 33.9 °C / 93 F.
(+) Les repose-poignets et le pavé tactile sont plus froids que la température de la peau avec un maximum de 30.4 °C / 86.7 F et sont donc froids au toucher.
(±) La température moyenne de la zone de l'appui-paume de dispositifs similaires était de 28.8 °C / 83.8 F (-1.6 °C / #-2.9 F).
| Alienware m16 R1 AMD AMD Ryzen 9 7845HX, NVIDIA GeForce RTX 4080 Laptop GPU | Alienware x16 R1 Intel Core i9-13900HK, NVIDIA GeForce RTX 4080 Laptop GPU | HP Omen Transcend 16 Intel Core i9-13900HX, NVIDIA GeForce RTX 4070 Laptop GPU | Lenovo Legion Pro 7 RTX4090 Intel Core i9-13900HX, NVIDIA GeForce RTX 4090 Laptop GPU | Asus ROG Strix G16 G614JZ Intel Core i9-13980HX, NVIDIA GeForce RTX 4080 Laptop GPU | Razer Blade 16 Early 2023 Intel Core i9-13950HX, NVIDIA GeForce RTX 4080 Laptop GPU | |
|---|---|---|---|---|---|---|
| Heat | -5% | 1% | -10% | -6% | 12% | |
| Maximum Upper Side * (°C) | 48 | 47.2 2% | 47.4 1% | 53 -10% | 54 -13% | 40 17% |
| Maximum Bottom * (°C) | 39 | 47.8 -23% | 54.4 -39% | 59 -51% | 55 -41% | 37.6 4% |
| Idle Upper Side * (°C) | 37 | 36.8 1% | 28.4 23% | 34 8% | 29 22% | 32.4 12% |
| Idle Bottom * (°C) | 36.2 | 35.8 1% | 29.2 19% | 32 12% | 33 9% | 31.4 13% |
* ... Moindre est la valeur, meilleures sont les performances
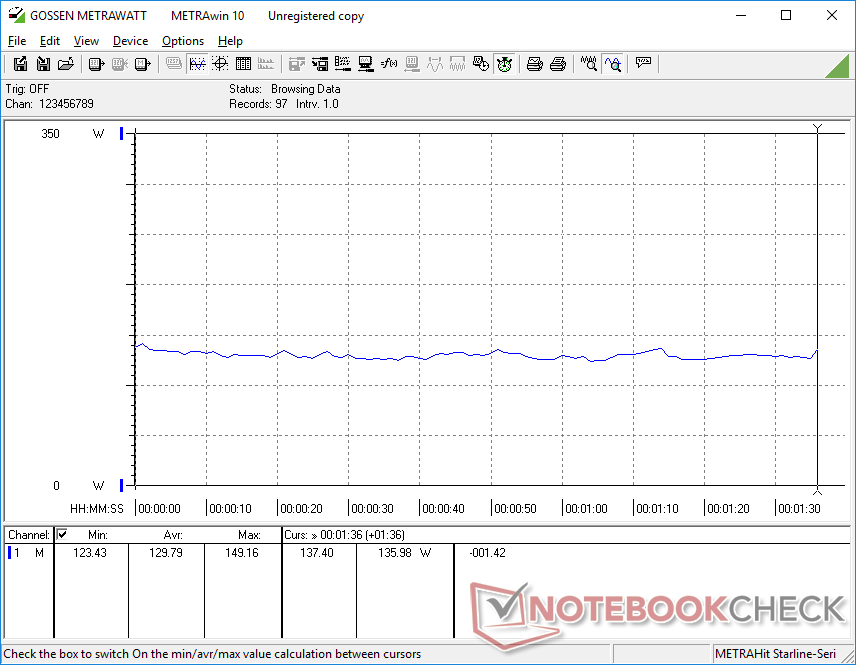
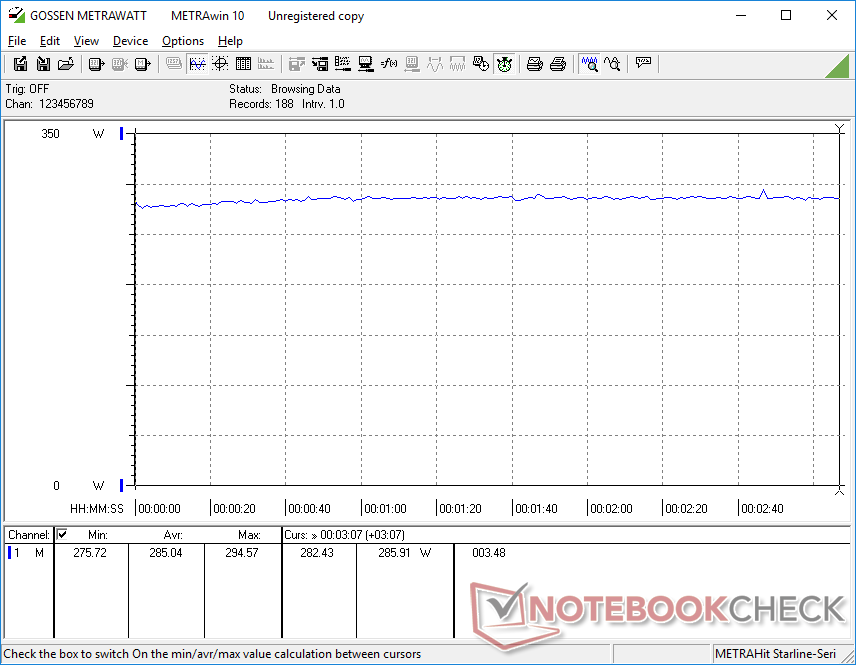
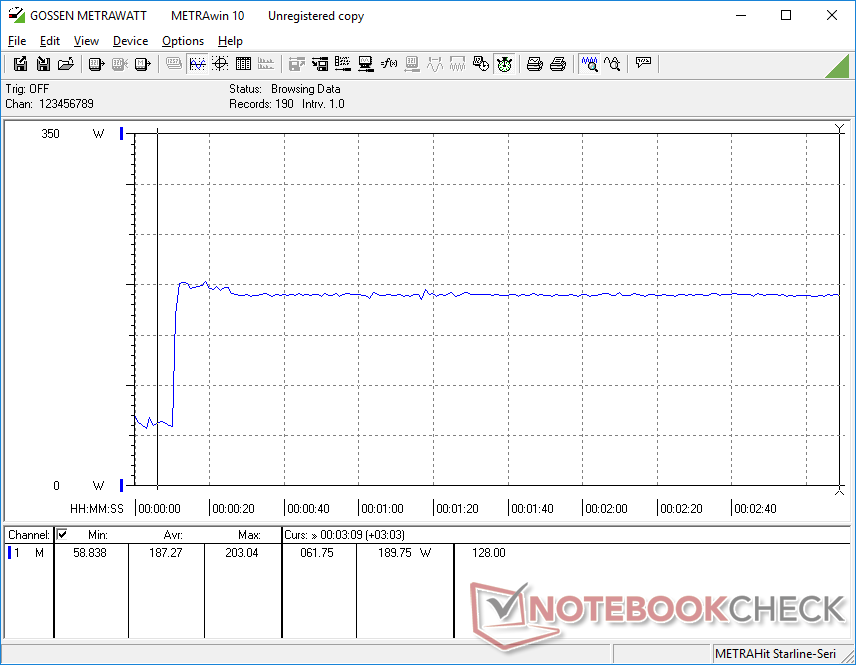
Test de stress
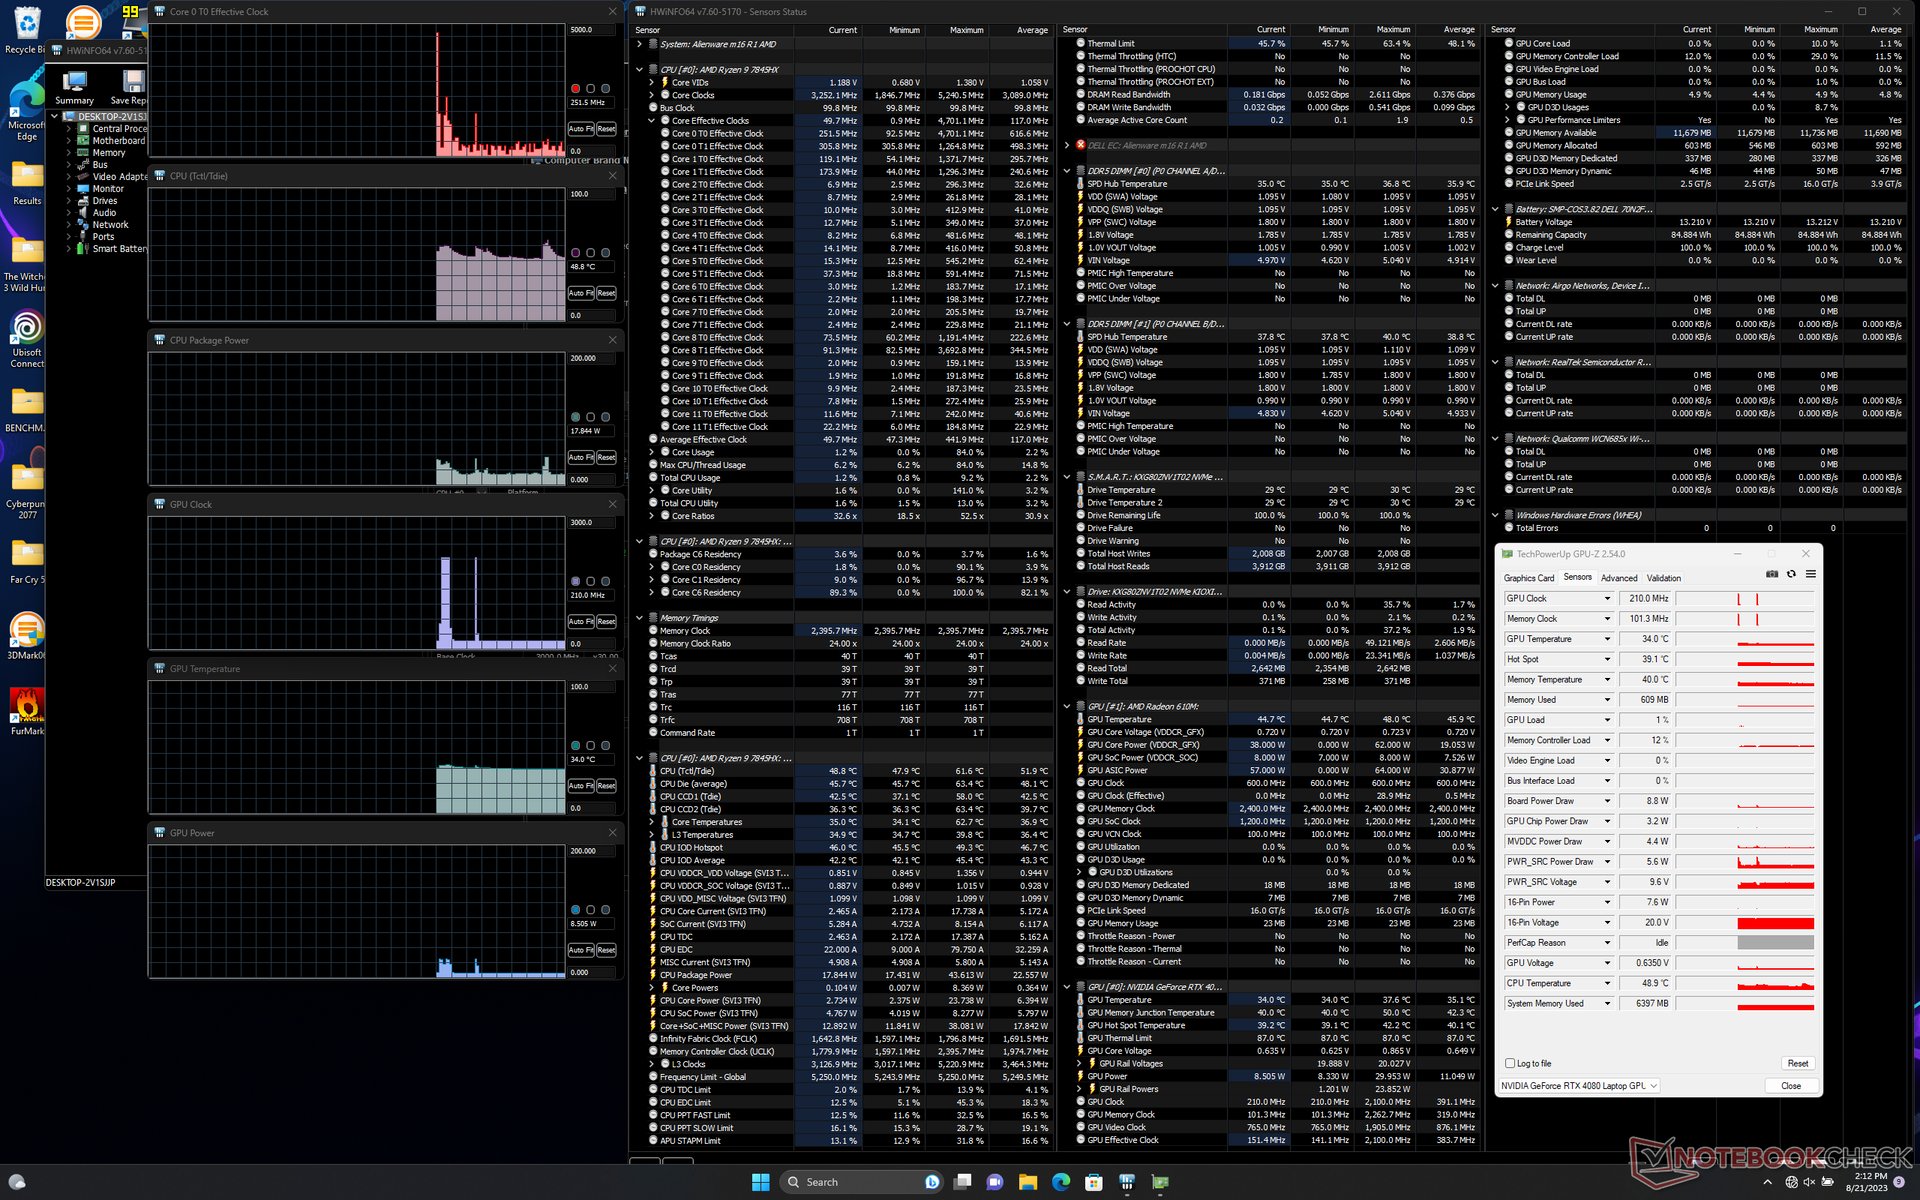
En lançant Prime95, le CPU passe à 5 GHz, 132 W et 99 C pendant plusieurs secondes avant de se stabiliser à 4,6 GHz, 118 W et 85 C.
En mode Witcher 3 en mode Overdrive, le GPU se stabilise à 2430 MHz d'horloge, 2263 MHz de VRAM et 158 W de consommation d'énergie, contre 2415 MHz d'horloge, 2250 MHz de VRAM et 156 W en mode Balanced, selon GPU-Z. Les très légères différences de performances entre les deux modes correspondent à nos observations sur Fire Strike mentionnées ci-dessus. La température du cœur devrait être plus élevée de quelques degrés en mode Balanced qu'en mode Overdrive, car les ventilateurs sont nettement plus silencieux en mode Balanced.
Notez que si le GPU est prévu pour une puissance de 175 W TGP, nous n'avons pu atteindre que 160 W dans des conditions de jeu réelles.
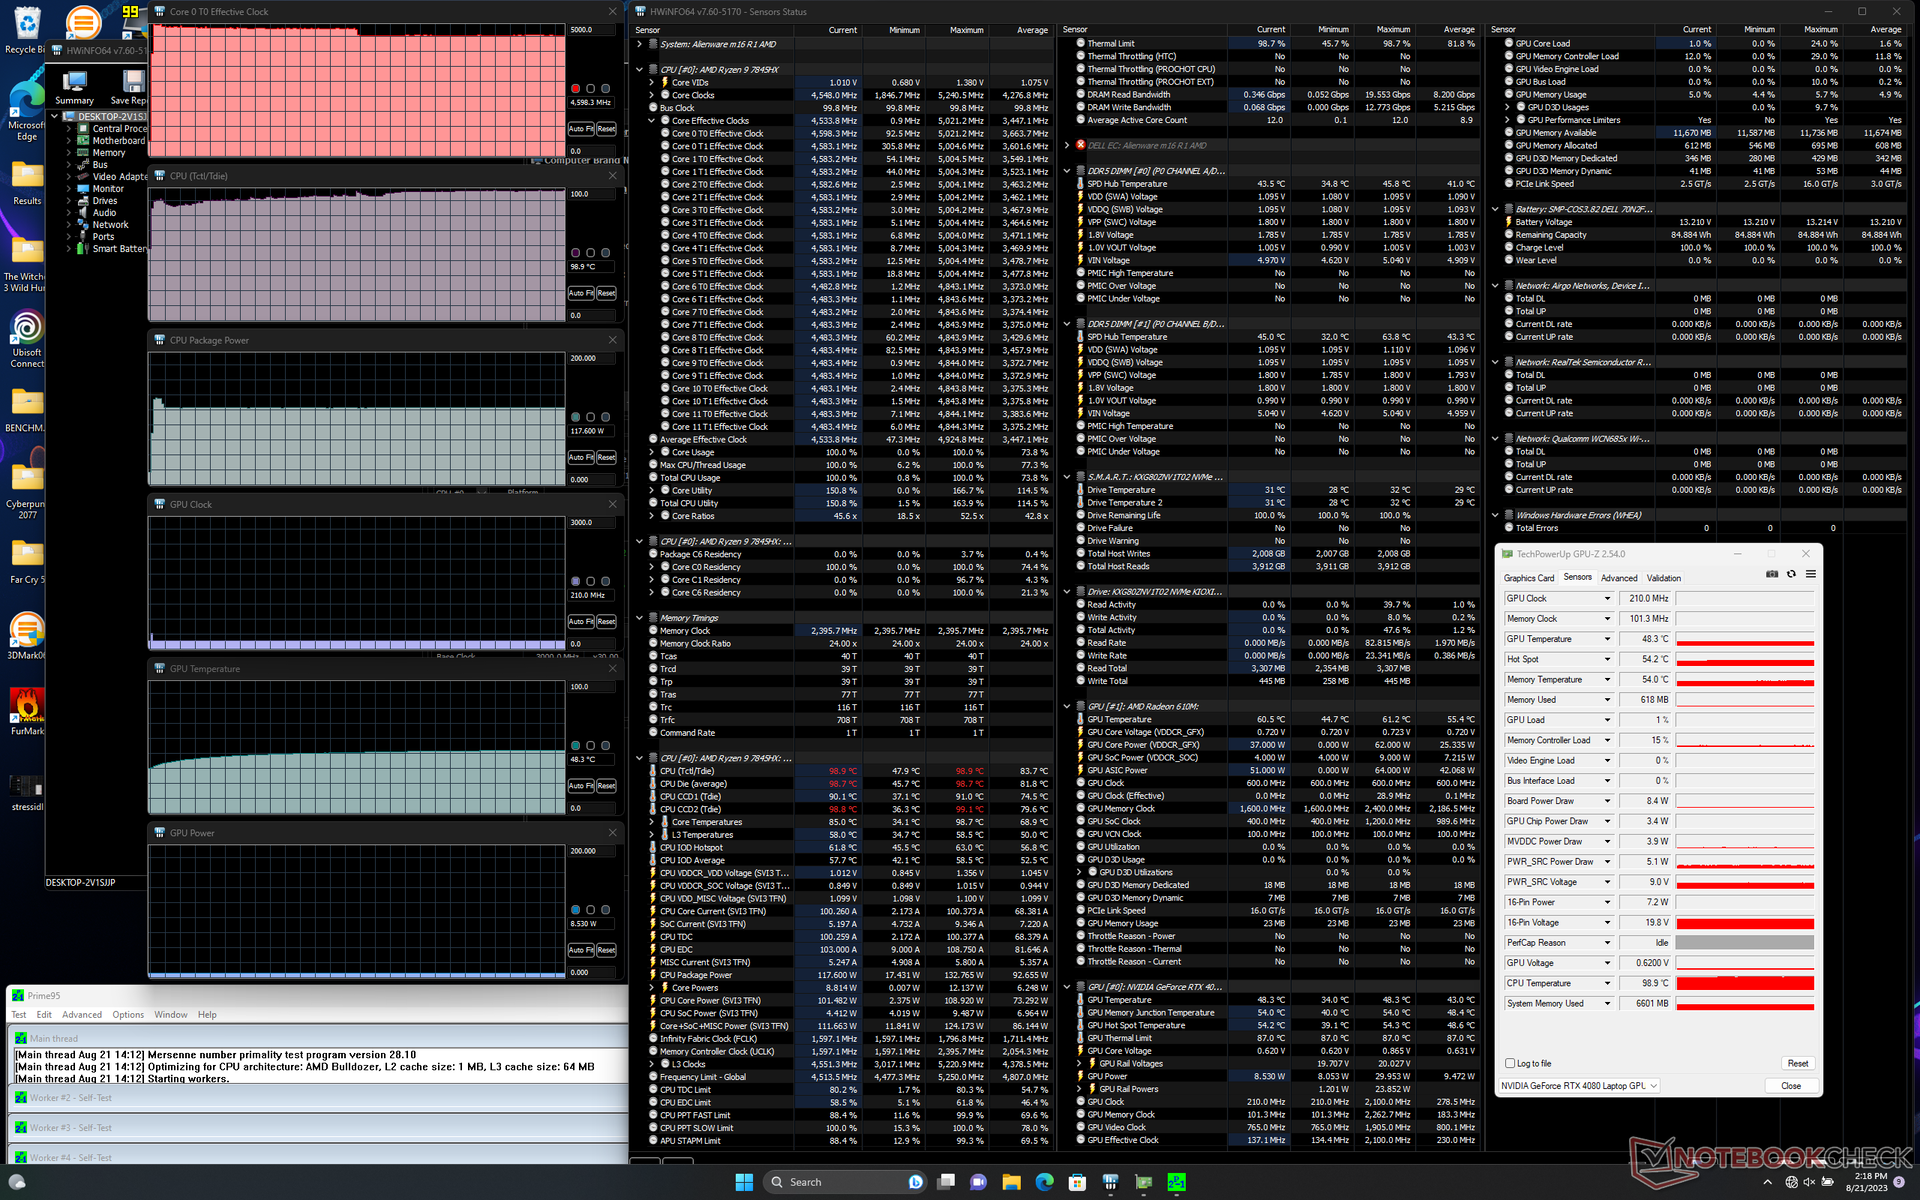
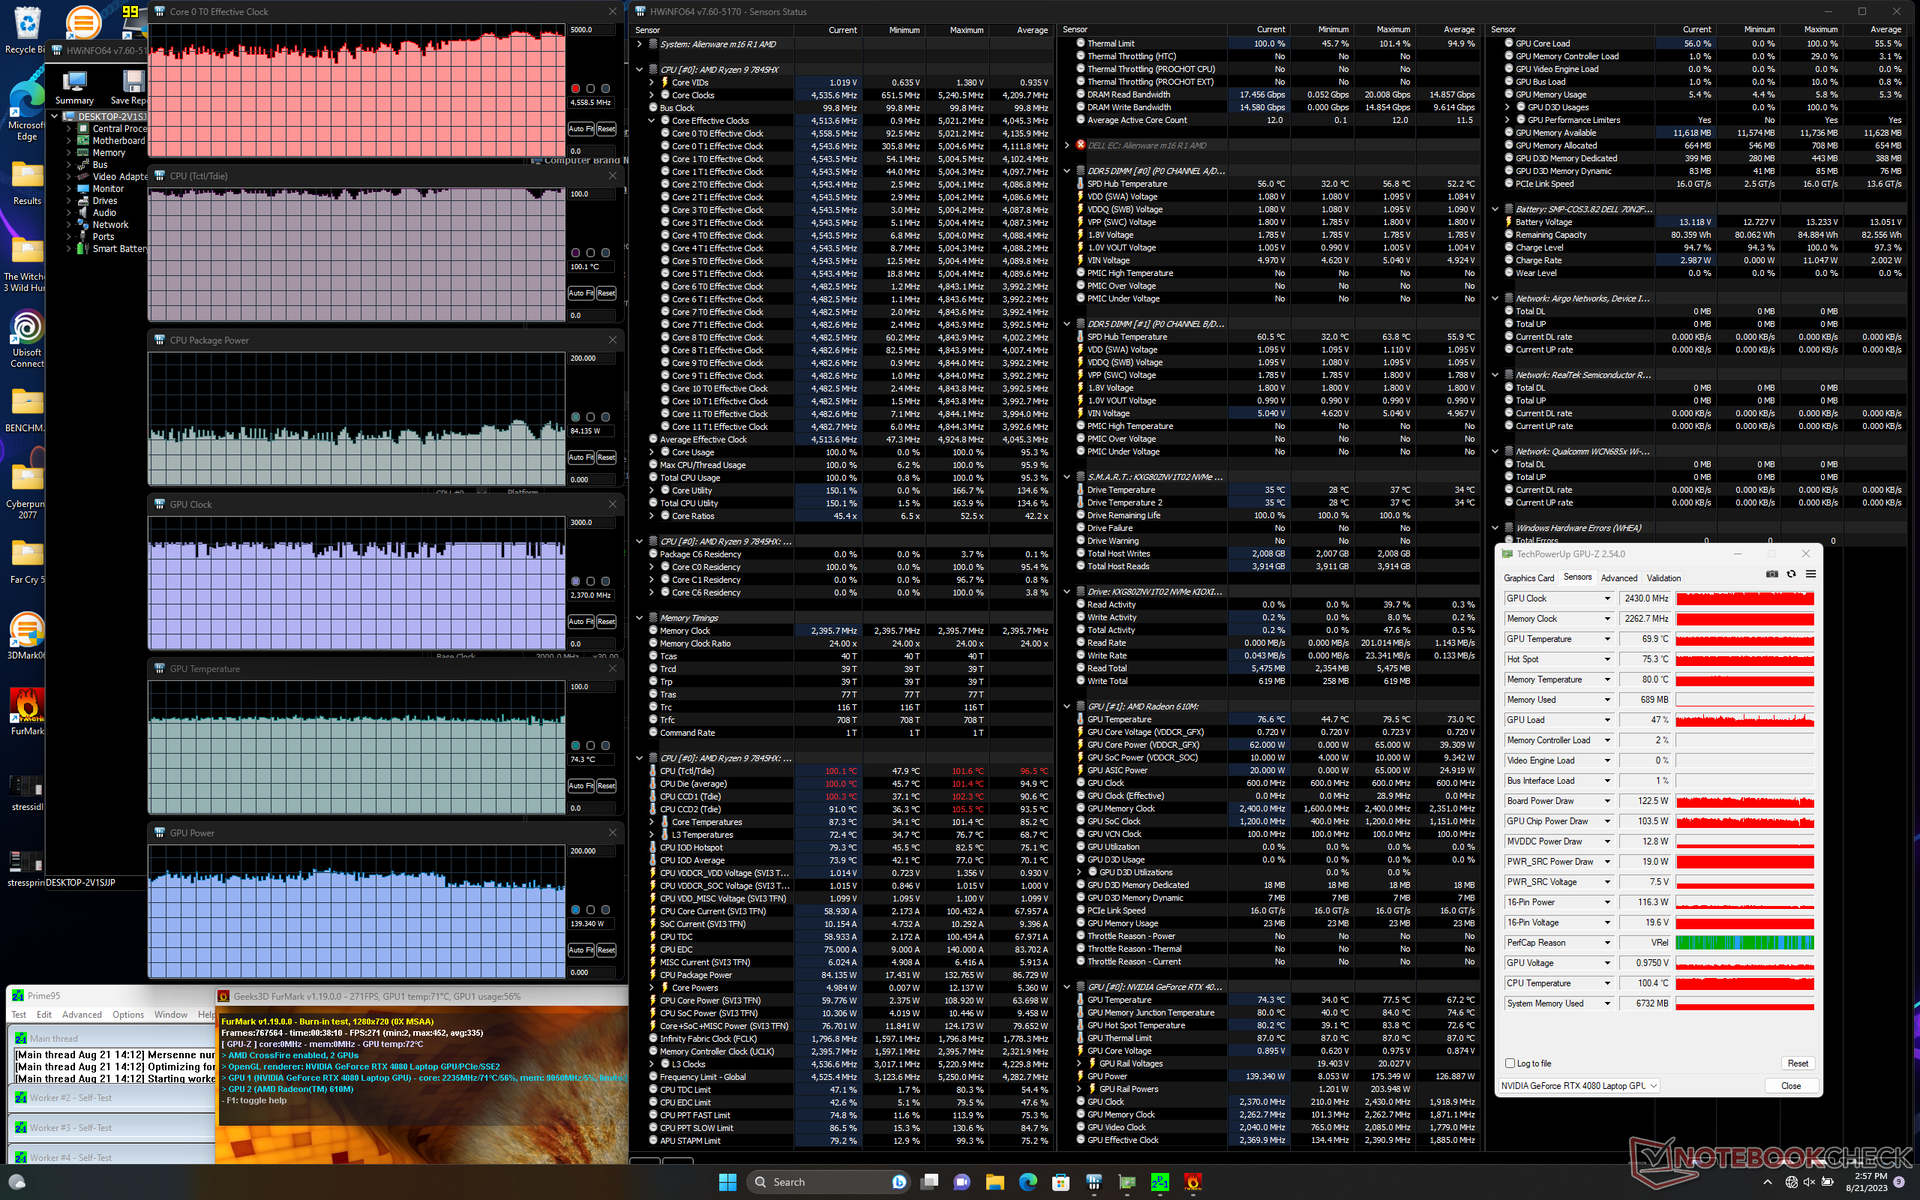
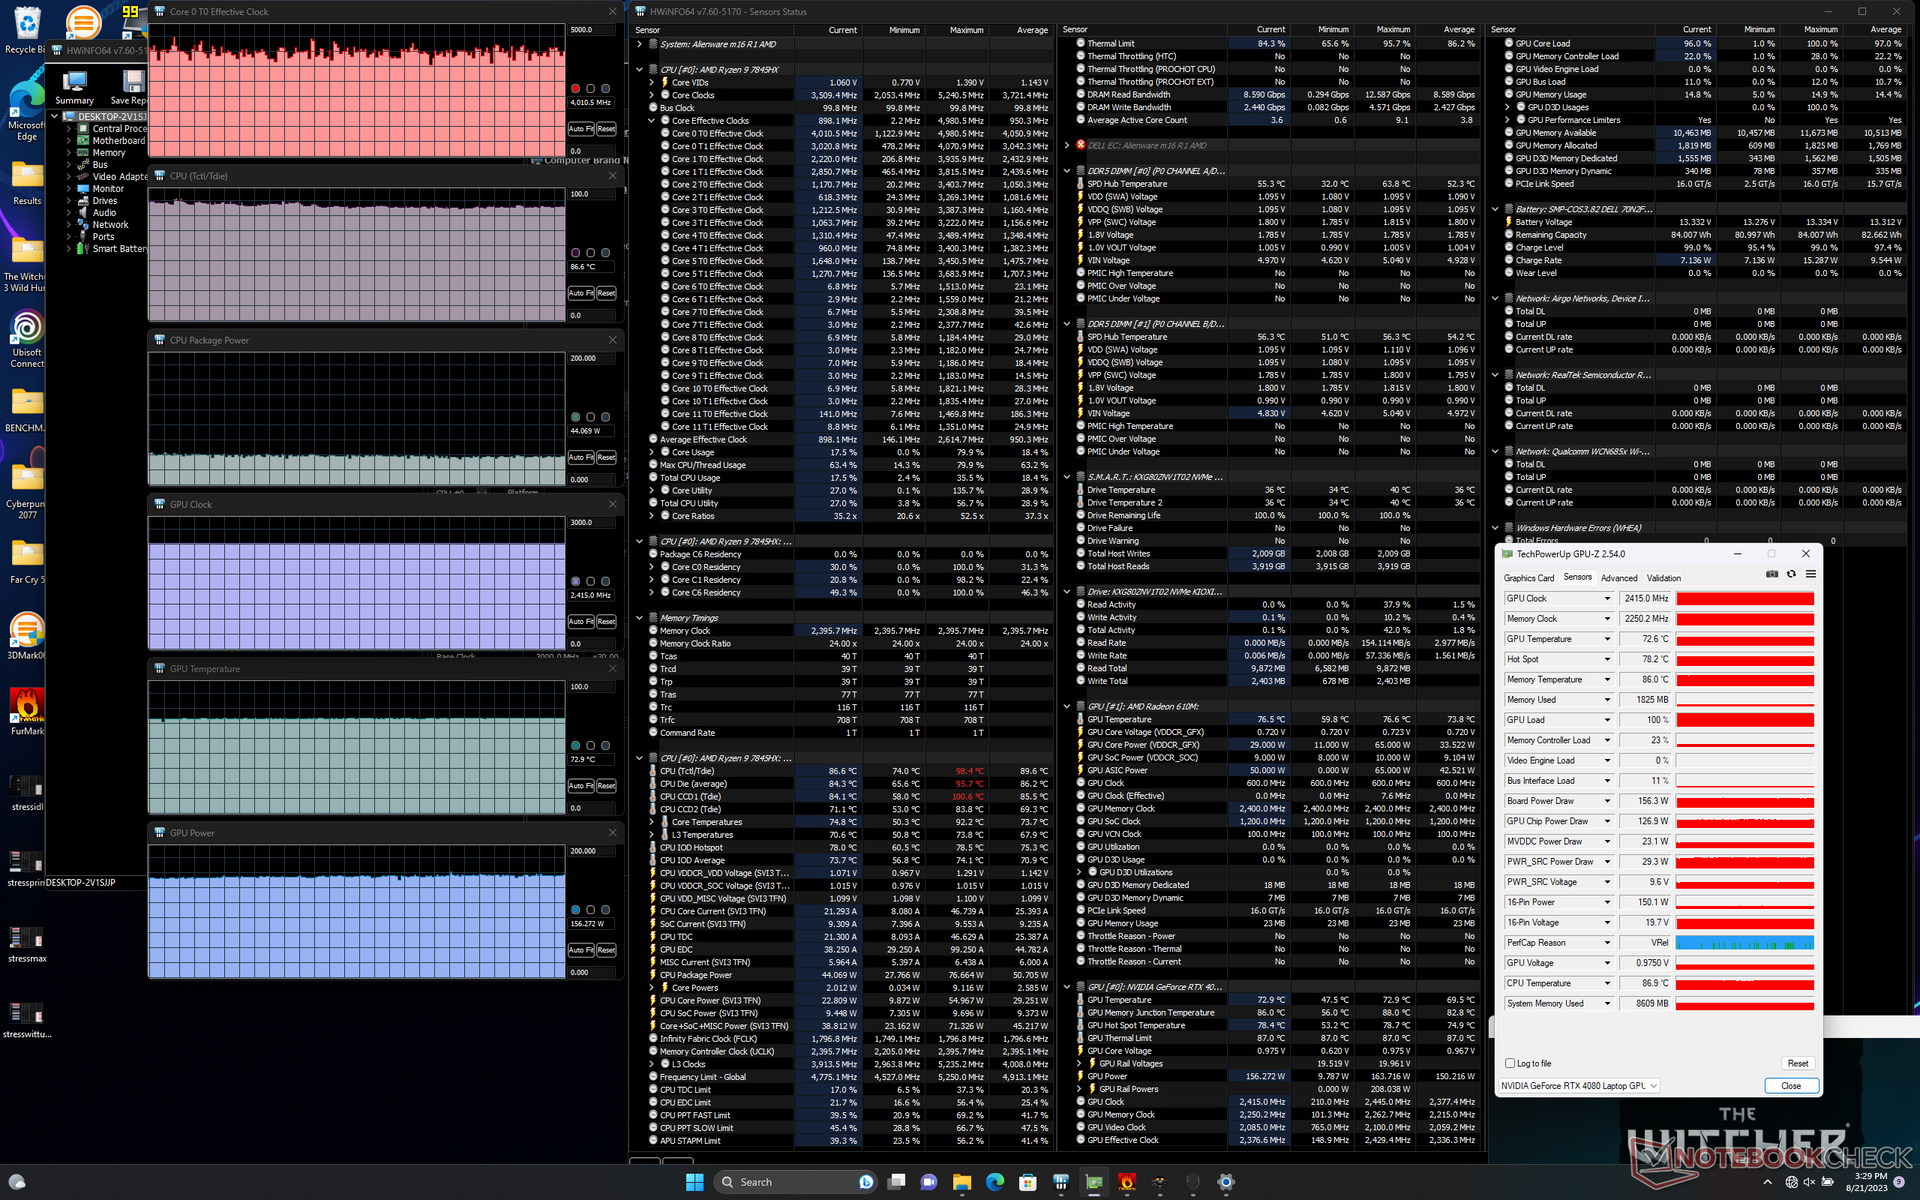
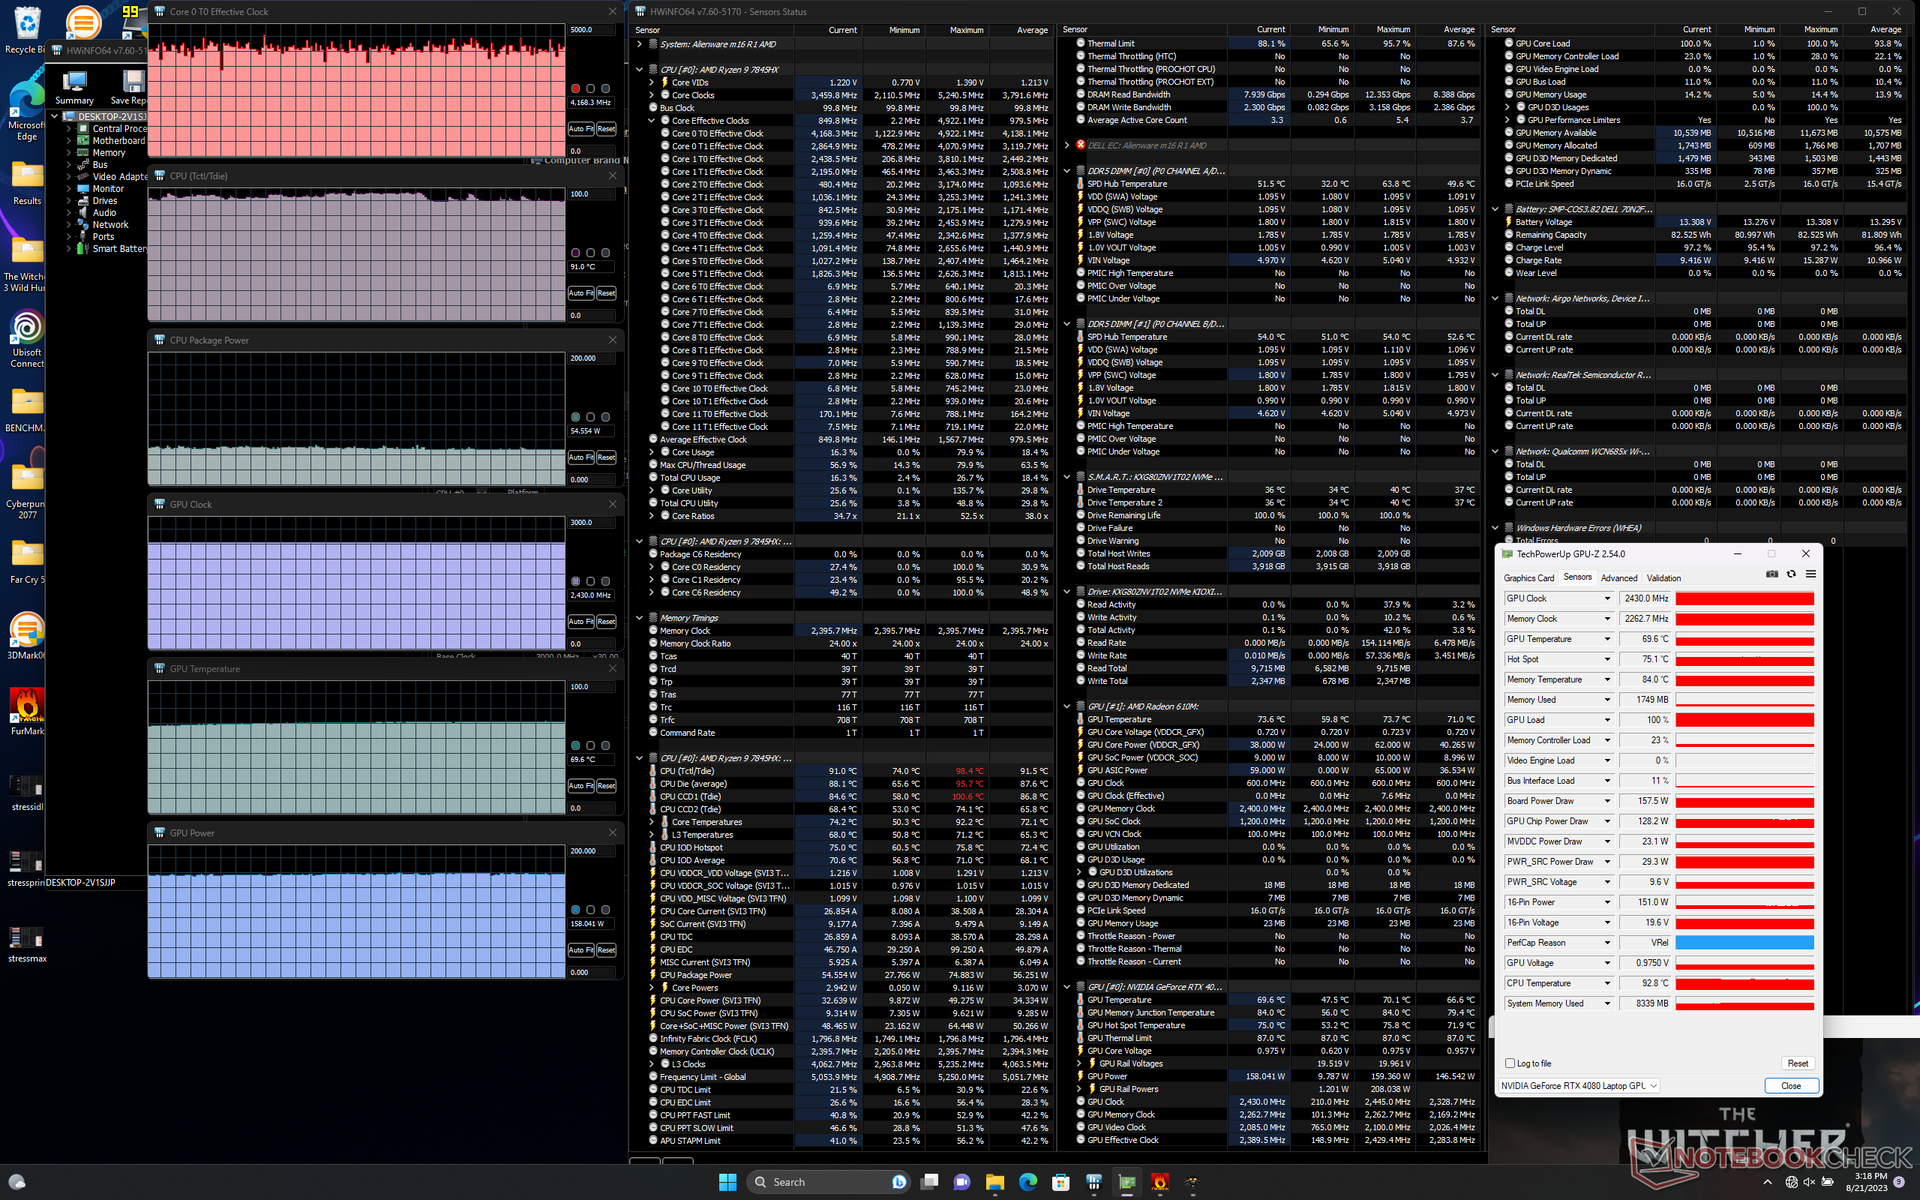
| Horloge du CPU (GHz) | Horloge du GPU (MHz) | Température moyenne du CPU (°C) | Température moyenne du GPU (°C) | |
| Système en veille | -- | - | 49 | 34 |
| Prime95 Stress | 4.6 | -- | 85 | 49 |
| Prime95 + FurMark Stress | ~4.0 - 4.6 | ~2430 | 87 | 74 |
| Witcher 3 Stress(mode équilibré) | ~4.1 | 2415 | 75 | 73 |
| Witcher 3 Stress (mode Overdrive) | ~4.1 | 2430 | 74 | 70 |
Intervenants
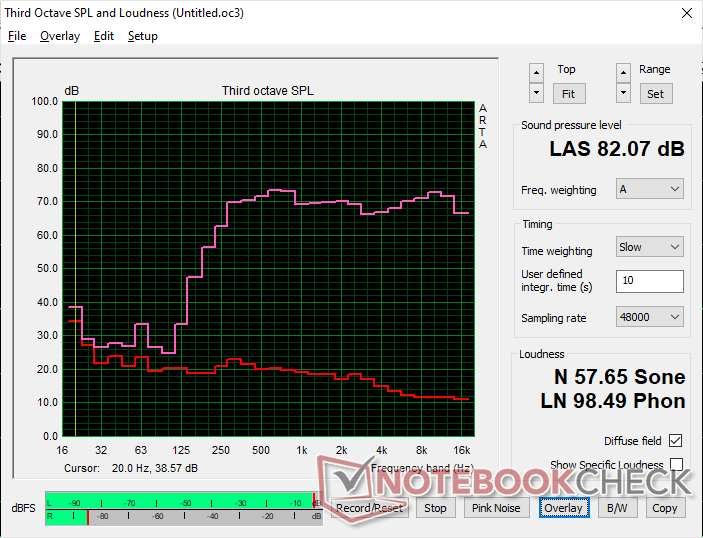
Alienware m16 R1 AMD analyse audio
(+) | les haut-parleurs peuvent jouer relativement fort (82.1# dB)
Basses 100 - 315 Hz
(-) | presque aucune basse - en moyenne 20.6% plus bas que la médiane
(-) | les basses ne sont pas linéaires (15.3% delta à la fréquence précédente)
Médiums 400 - 2000 Hz
(+) | médiane équilibrée - seulement 1.4% de la médiane
(+) | les médiums sont linéaires (2.1% delta à la fréquence précédente)
Aiguës 2 - 16 kHz
(+) | des sommets équilibrés - à seulement 1.9% de la médiane
(+) | les aigus sont linéaires (2.9% delta à la fréquence précédente)
Globalement 100 - 16 000 Hz
(+) | le son global est linéaire (13.9% différence à la médiane)
Par rapport à la même classe
» 22% de tous les appareils testés de cette catégorie étaient meilleurs, 7% similaires, 70% pires
» Le meilleur avait un delta de 6%, la moyenne était de 18%, le pire était de 132%.
Par rapport à tous les appareils testés
» 16% de tous les appareils testés étaient meilleurs, 4% similaires, 80% pires
» Le meilleur avait un delta de 4%, la moyenne était de 23%, le pire était de 134%.
Apple MacBook Pro 16 2021 M1 Pro analyse audio
(+) | les haut-parleurs peuvent jouer relativement fort (84.7# dB)
Basses 100 - 315 Hz
(+) | bonne basse - seulement 3.8% loin de la médiane
(+) | les basses sont linéaires (5.2% delta à la fréquence précédente)
Médiums 400 - 2000 Hz
(+) | médiane équilibrée - seulement 1.3% de la médiane
(+) | les médiums sont linéaires (2.1% delta à la fréquence précédente)
Aiguës 2 - 16 kHz
(+) | des sommets équilibrés - à seulement 1.9% de la médiane
(+) | les aigus sont linéaires (2.7% delta à la fréquence précédente)
Globalement 100 - 16 000 Hz
(+) | le son global est linéaire (4.6% différence à la médiane)
Par rapport à la même classe
» 0% de tous les appareils testés de cette catégorie étaient meilleurs, 0% similaires, 100% pires
» Le meilleur avait un delta de 5%, la moyenne était de 17%, le pire était de 45%.
Par rapport à tous les appareils testés
» 0% de tous les appareils testés étaient meilleurs, 0% similaires, 100% pires
» Le meilleur avait un delta de 4%, la moyenne était de 23%, le pire était de 134%.
Gestion de l'énergie
Consommation électrique
Les ordinateurs portables Alienware ont toujours eu une consommation d'énergie parmi les plus élevées et notre Alienware m16 R1 n'est pas différent. Le simple fait de tourner au ralenti sur l'ordinateur de bureau consomme entre 39 et 69 W, contre moins de la moitié sur le Lenovo Legion Pro 7 ou l'Asus ROG Strix G16. Ces niveaux élevés de fonctionnement au ralenti sont probablement à l'origine des résultats décevants de l'autonomie de la batterie dans la section suivante.
La consommation d'énergie en jeu est de 285 W en moyenne, ce qui est encore une fois plus élevé que la plupart des autres ordinateurs portables de jeu, y compris même l'Alienware x16 de Dell.
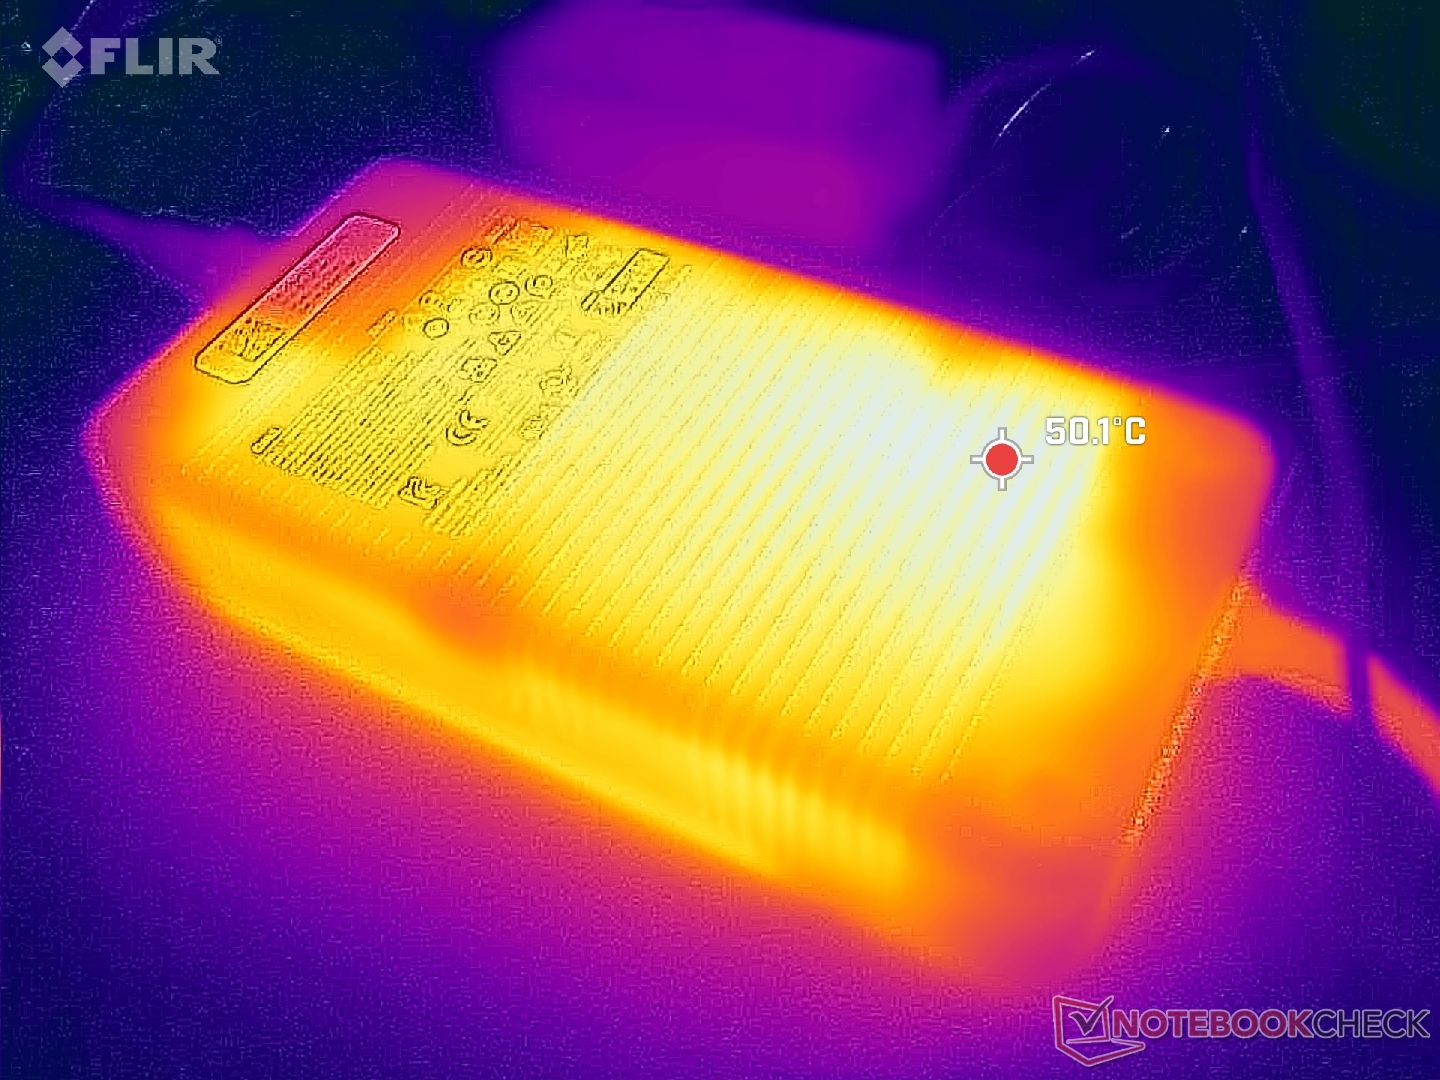
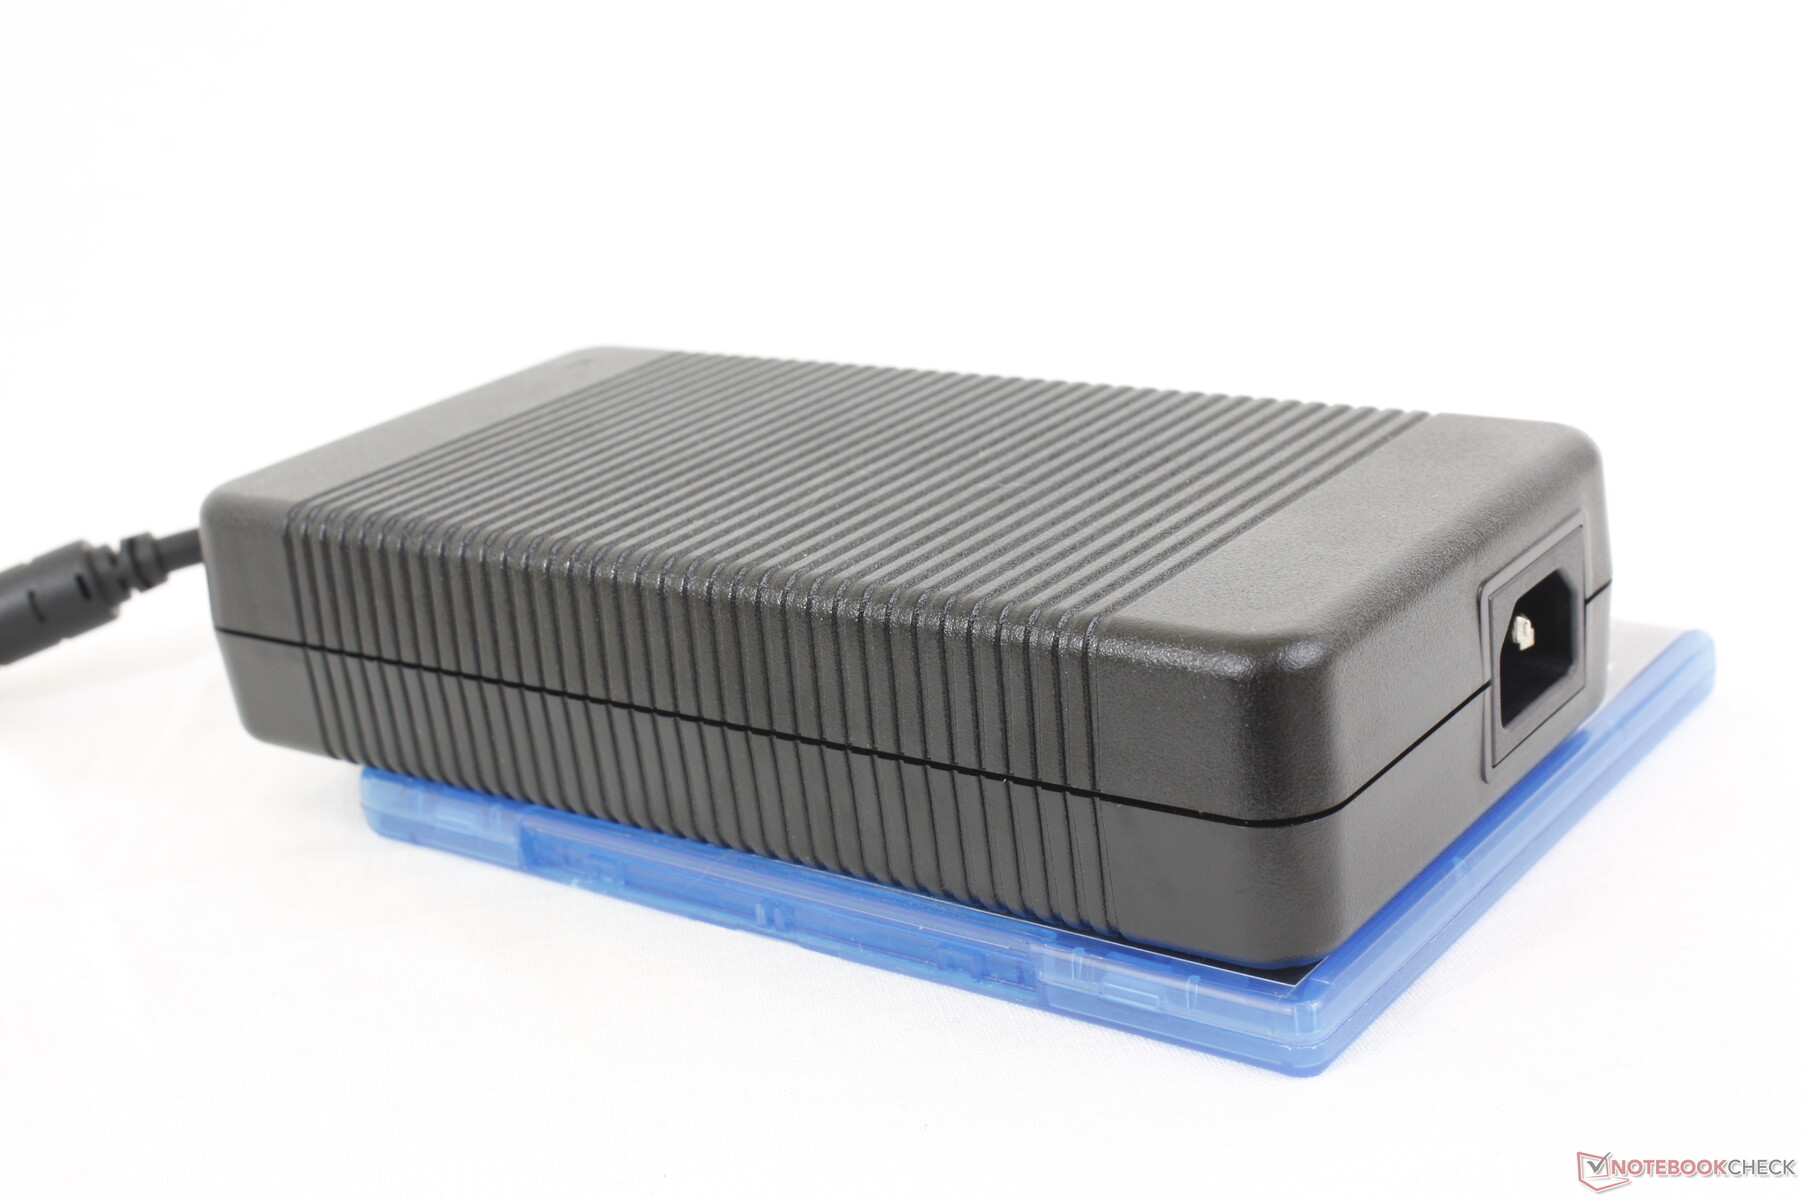
L'adaptateur secteur de 330 W est grand (~20 x 10 x 4,5 cm) et encombrant. En comparaison, l'adaptateur GaN 330 W AC actuellement livré avec les derniers ordinateurs portables Razer est nettement plus portable.
| Éteint/en veille | |
| Au repos | |
| Fortement sollicité |
|
Légende:
min: | |
| Alienware m16 R1 AMD R9 7845HX, GeForce RTX 4080 Laptop GPU, Kioxia XG8 KXG80ZNV1T02, IPS, 2560x1600, 16" | Alienware x16 R1 i9-13900HK, GeForce RTX 4080 Laptop GPU, SK hynix PC801 HFS001TEJ9X101N, IPS, 2560x1600, 16" | HP Omen Transcend 16 i9-13900HX, GeForce RTX 4070 Laptop GPU, SK hynix PC801 HFS002TEJ9X101N, Mini-LED, 2560x1600, 16" | Lenovo Legion Pro 7 RTX4090 i9-13900HX, GeForce RTX 4090 Laptop GPU, Samsung PM9A1 MZVL21T0HCLR, IPS, 2560x1600, 16" | Asus ROG Strix G16 G614JZ i9-13980HX, GeForce RTX 4080 Laptop GPU, WD PC SN560 SDDPNQE-1T00, IPS, 2560x1600, 16" | Razer Blade 16 Early 2023 i9-13950HX, GeForce RTX 4080 Laptop GPU, SSSTC CA6-8D1024, IPS, 2560x1600, 16" | |
|---|---|---|---|---|---|---|
| Power Consumption | 21% | 27% | 23% | 35% | 29% | |
| Idle Minimum * (Watt) | 39 | 25.2 35% | 19.2 51% | 20 49% | 10 74% | 15.2 61% |
| Idle Average * (Watt) | 44.6 | 29.9 33% | 22.7 49% | 25 44% | 16 64% | 22.8 49% |
| Idle Maximum * (Watt) | 68.1 | 49.8 27% | 55.4 19% | 35 49% | 27 60% | 49.8 27% |
| Load Average * (Watt) | 129.8 | 105.4 19% | 128.4 1% | 136 -5% | 129 1% | 121.2 7% |
| Witcher 3 ultra * (Watt) | 285 | 263 8% | 206 28% | 282 1% | 247 13% | 242 15% |
| Load Maximum * (Watt) | 327.3 | 313.8 4% | 292 11% | 320 2% | 342 -4% | 273.7 16% |
* ... Moindre est la valeur, meilleures sont les performances
Power Consumption Witcher 3 / Stresstest
Power Consumption external Monitor
Autonomie de la batterie
L'autonomie de la batterie reste médiocre, avec un peu moins de 4 heures de navigation sur le réseau local sans fil dans le monde réel, en utilisant le profil d'alimentation équilibré avec l'iGPU actif. Nous avons même essayé d'utiliser le profil d'alimentation spécial "Battery" via Alienware Command Center et nos résultats ne se sont toujours pas améliorés. Les modèles concurrents comme le Lenovo Legion Pro 7 ou l'Asus ROG Strix G16 sont capables de durer beaucoup plus longtemps.
Il faut un peu plus de 2 heures pour recharger l'ordinateur de sa capacité maximale. Le système peut également être rechargé via l'USB-C, bien qu'à un rythme plus lent.
| Alienware m16 R1 AMD R9 7845HX, GeForce RTX 4080 Laptop GPU, 86 Wh | Alienware x16 R1 i9-13900HK, GeForce RTX 4080 Laptop GPU, 90 Wh | HP Omen Transcend 16 i9-13900HX, GeForce RTX 4070 Laptop GPU, 97 Wh | Lenovo Legion Pro 7 RTX4090 i9-13900HX, GeForce RTX 4090 Laptop GPU, 99.9 Wh | Asus ROG Strix G16 G614JZ i9-13980HX, GeForce RTX 4080 Laptop GPU, 90 Wh | Razer Blade 16 Early 2023 i9-13950HX, GeForce RTX 4080 Laptop GPU, 95.2 Wh | |
|---|---|---|---|---|---|---|
| Autonomie de la batterie | 13% | 41% | 38% | 100% | 88% | |
| Reader / Idle (h) | 4 | 7.3 83% | 6.3 58% | 8.9 123% | ||
| WiFi v1.3 (h) | 3.7 | 2.5 -32% | 4.2 14% | 5.1 38% | 9.7 162% | 6.1 65% |
| Load (h) | 0.8 | 0.7 -13% | 1.2 50% | 1.1 38% | 1.4 75% |
Points positifs
Points négatifs
Verdict - Rapide et riche en fonctionnalités, mais nécessitant des optimisations
L'Alienware m16 R1 offre une puissance et des fonctionnalités incroyables pour un ordinateur portable de 16 pouces. Nous parlons ici de métal liquide, de chambre à vapeur, de quatre ventilateurs, de trois baies SSD, d'un clavier mécanique CherryMX, d'une carte graphique de 175 W, d'une mémoire vive évolutive et même d'options de CPU et de GPU Intel et AMD. Les modèles concurrents de 16 pouces pour le jeu, comme le HP Omen Transcend 16, Razer Blade 16ou l'Asus Zephyrus M16 Asus Zephyrus M16 ont comparativement moins de fonctionnalités et sont généralement plus lents, même lorsqu'ils sont configurés avec le même GPU que notre configuration de test. Les ingénieurs d'Alienware méritent d'être félicités pour la densité de l'Alienware m16 R1.
D'un autre côté, la longue liste de fonctionnalités intégrées peut aussi jouer contre le portable car l'Alienware m16 est à la fois plus lourd et plus grand que beaucoup d'autres alternatives par des marges importantes. L'autonomie de la batterie en particulier souffre beaucoup, quel que soit le réglage du profil d'alimentation. Si vous tenez à la portabilité, vous devriez peut-être regarder ailleurs. De plus, le modèle ne dispose pas de certaines fonctionnalités populaires comme l'OLED et le mini-LED.
L'Alienware m16 R1 est indéniablement rapide et doté de nombreuses fonctionnalités, avec des résultats supérieurs à la moyenne. Cependant, les avantages en termes de performances se font au prix d'un poids plus important et d'une taille plus grande.
Les bugs que nous avons rencontrés au cours de notre examen méritent d'être mentionnés. Les sauts d'images lors de la lecture de vidéos 4K, les bégaiements de la fréquence d'images lors des jeux et les problèmes de sortie de veille sont regrettables si l'on considère qu'Alienware est censé être une marque de passionnés. Dell est peut-être en train d'en faire un peu plus qu'il ne peut en faire avec ses nombreuses configurations Intel-Nvidia, AMD-Nvidia et AMD-AMD qui peuvent rendre la résolution des problèmes assez délicate.
Prix et disponibilité
Dell commercialise désormais son modèle Alienware m16 en version Intel et AMD. La version AMD commence à 1700 USD et peut atteindre plus de 3000 à 4000 USD si elle est entièrement configurée.
Alienware m16 R1 AMD
- 08/23/2023 v7 (old)
Allen Ngo
Transparency
La sélection des appareils à examiner est effectuée par notre équipe éditoriale. L'échantillon de test a été prêté à l'auteur par le fabricant ou le détaillant pour les besoins de cet examen. Le prêteur n'a pas eu d'influence sur cette évaluation et le fabricant n'a pas reçu de copie de cette évaluation avant sa publication. Il n'y avait aucune obligation de publier cet article. En tant que média indépendant, Notebookcheck n'est pas soumis à l'autorité des fabricants, des détaillants ou des éditeurs.
Voici comment Notebookcheck teste
Chaque année, Notebookcheck examine de manière indépendante des centaines d'ordinateurs portables et de smartphones en utilisant des procédures standardisées afin de garantir que tous les résultats sont comparables. Nous avons continuellement développé nos méthodes de test depuis environ 20 ans et avons établi des normes industrielles dans le processus. Dans nos laboratoires de test, des équipements de mesure de haute qualité sont utilisés par des techniciens et des rédacteurs expérimentés. Ces tests impliquent un processus de validation en plusieurs étapes. Notre système d'évaluation complexe repose sur des centaines de mesures et de points de référence bien fondés, ce qui garantit l'objectivité.Price comparison

