Test du MSI Vector 16 HX : les performances d'un Titan sans le prix d'un Titan

À ne pas confondre avec le défunt Maingear Vector, le MSI Vector 16 HX succède au GP68 de l'année dernière en introduisant de nouvelles options de CPU Intel Raptor Lake-HX de 14e génération et un design de châssis révisé par rapport au vieillissant GP66 de 15,6 pouces. Le modèle a fait ses débuts plus tôt cette année au CES 2024 aux côtés d'une foule d'autres annonces comme les MSI Claw et Titan 18 HX.
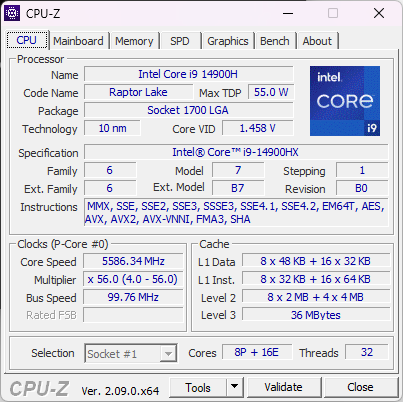
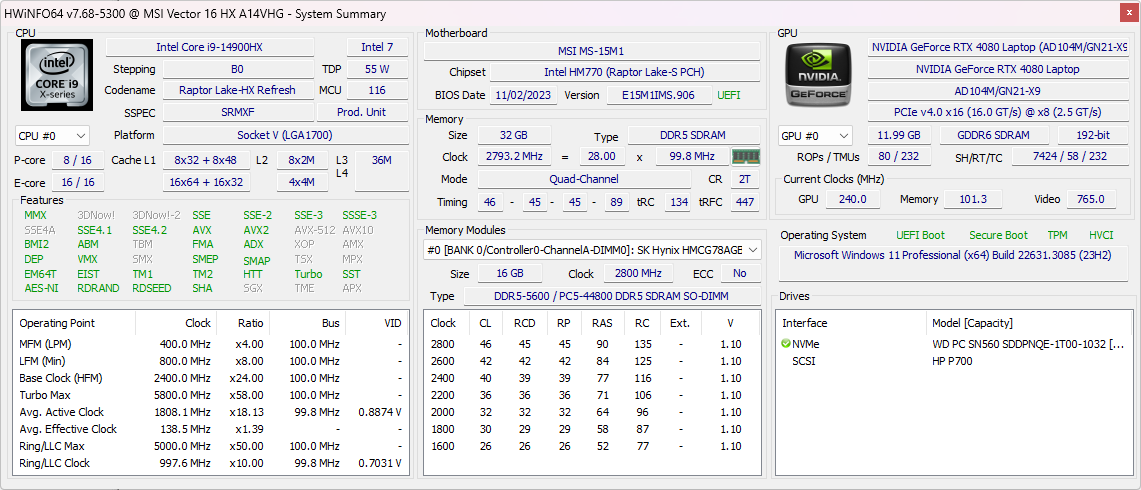
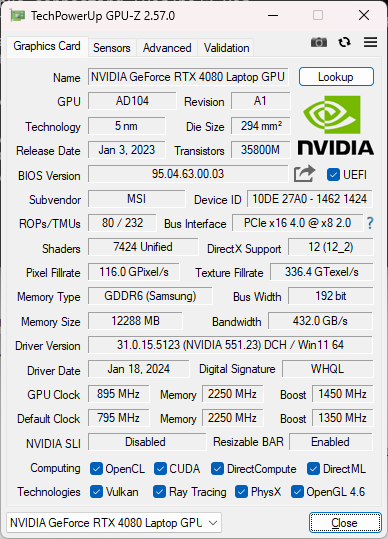
Notre unité d'évaluation est une configuration haut de gamme avec un processeur Core i9-14900HX, un GPU RTX 4080 175
GeForce et un écran IPS 1600p 240 Hz pour un prix de détail d'environ 2700 USD. D'autres configurations peuvent être trouvées avec des cartes graphiques RTX 4090, 4070, ou 4060 et un écran 1200p 144 Hz, mais toutes les options pour le moment incluent le même CPU Core i9-14900HX.Les alternatives au Vector 16 HX comprennent d'autres ordinateurs portables de jeu de 16 pouces de milieu de gamme à haut de gamme comme le Lenovo Legion 5i 16,Asus TUF Gaming A16 , Alienware m16 R1ou HP Omen 16.
Plus d'avis sur MSI :
Comparaison avec les concurrents potentiels
Note | Date | Modèle | Poids | Épaisseur | Taille | Résolution | Prix |
|---|---|---|---|---|---|---|---|
| 88 % v7 (old) | 02/24 | MSI Vector 16 HX A14V i9-14900HX, GeForce RTX 4080 Laptop GPU | 2.7 kg | 28.55 mm | 16.00" | 2560x1600 | |
| 86.9 % v7 (old) | 03/22 | MSI Vector GP66 12UGS i9-12900H, GeForce RTX 3070 Ti Laptop GPU | 2.3 kg | 23.4 mm | 15.60" | 1920x1080 | |
| 89.1 % v7 (old) | 02/24 | Lenovo Legion 5 16IRX G9 i7-14650HX, GeForce RTX 4060 Laptop GPU | 2.4 kg | 25.2 mm | 16.00" | 2560x1600 | |
| 85.1 % v7 (old) | 09/23 | HP Victus 16-r0077ng i7-13700H, GeForce RTX 4070 Laptop GPU | 2.4 kg | 24 mm | 16.10" | 1920x1080 | |
| 86.9 % v7 (old) | 06/23 | Asus TUF Gaming A16 FA617XS R9 7940HS, Radeon RX 7600S | 2.2 kg | 22.1 mm | 16.00" | 1920x1200 | |
| 86.1 % v7 (old) | 10/22 | Dell G16 7620 i7-12700H, GeForce RTX 3060 Laptop GPU | 2.6 kg | 26.9 mm | 16.00" | 2560x1600 |
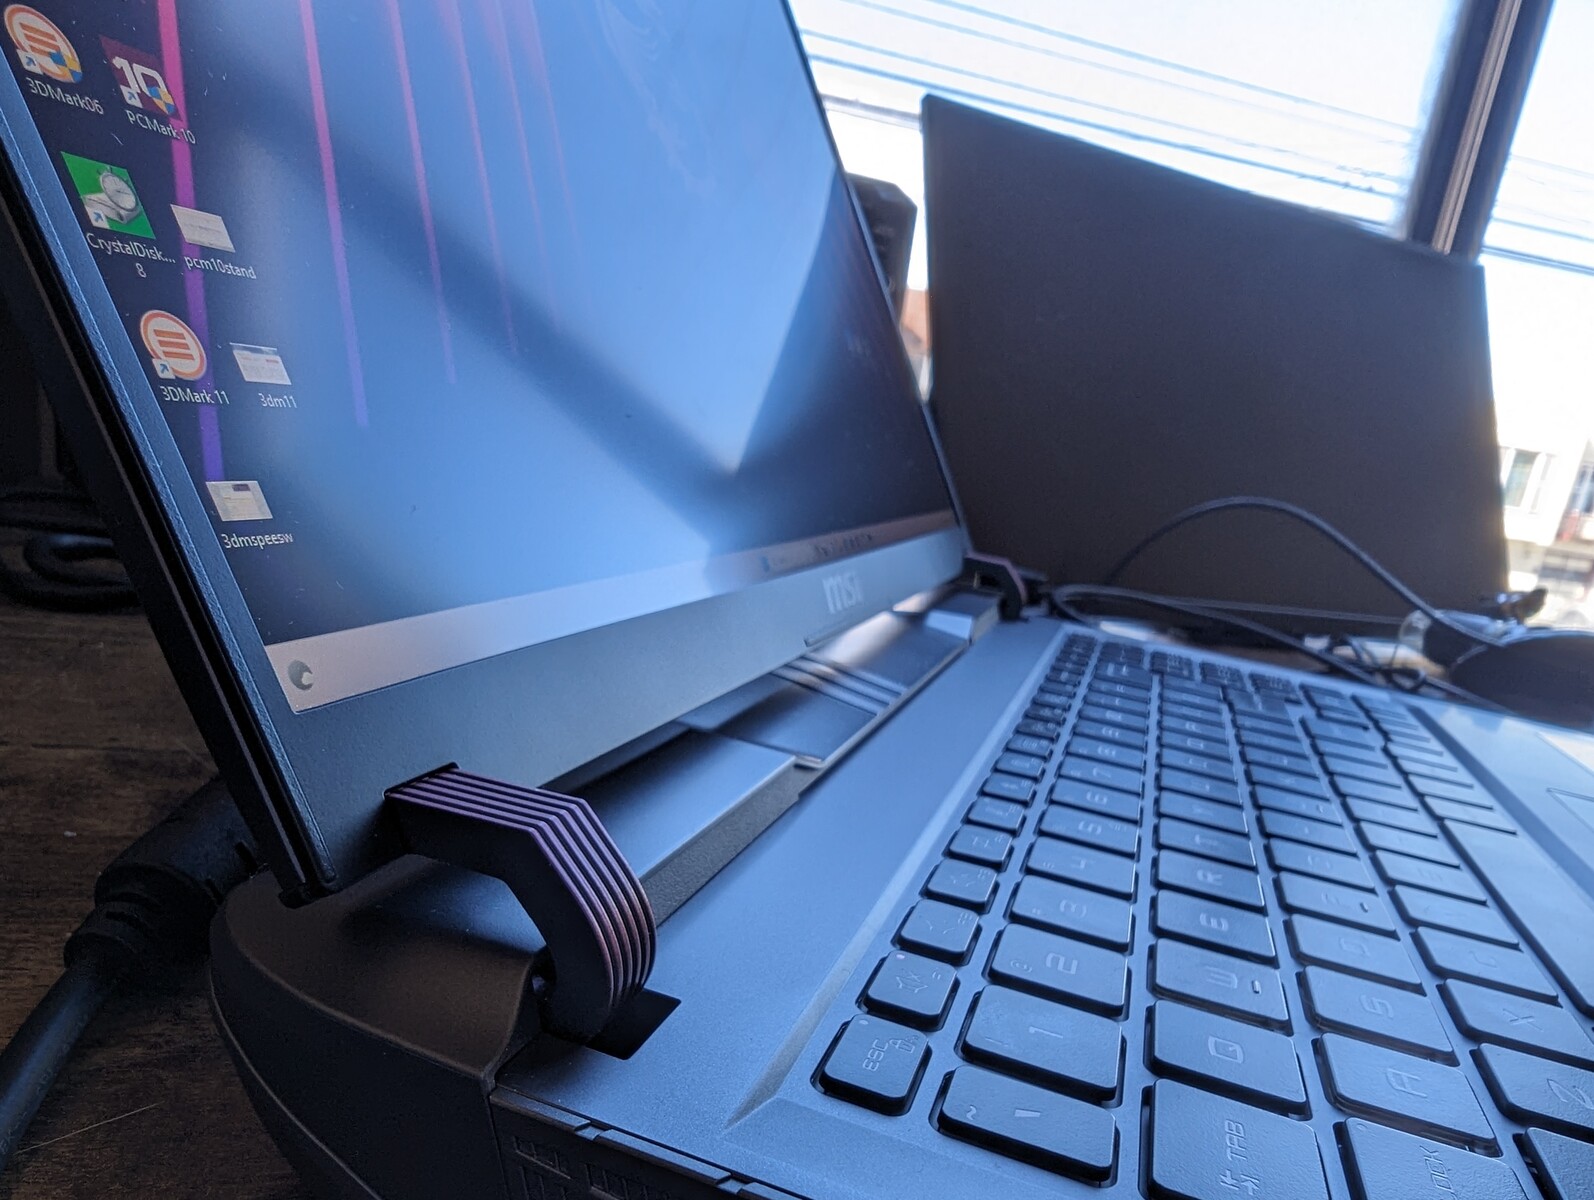
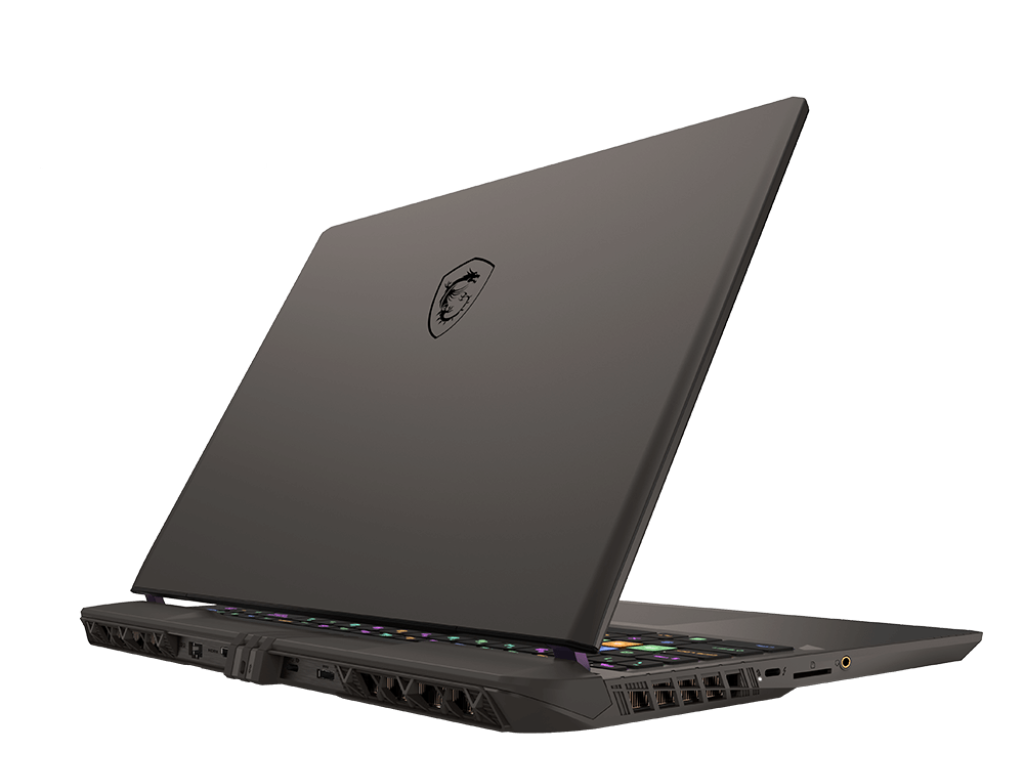
Boîtier - Solide, mais rien d'extraordinaire
A part le couvercle extérieur en alliage métallique, la plupart de la base est en plastique pour une expérience moins luxueuse comparée à la Titan HX plus chère. La série Vector n'est pas supposée être le haut de gamme, mais nous nous attendions à un peu plus compte tenu du prix de ~2000$. Son clavier et son panneau inférieur n'ont pas la même qualité que ceux du Razer Blade 16 ou de l'Alienware m16 R1 Alienware m16 R1.
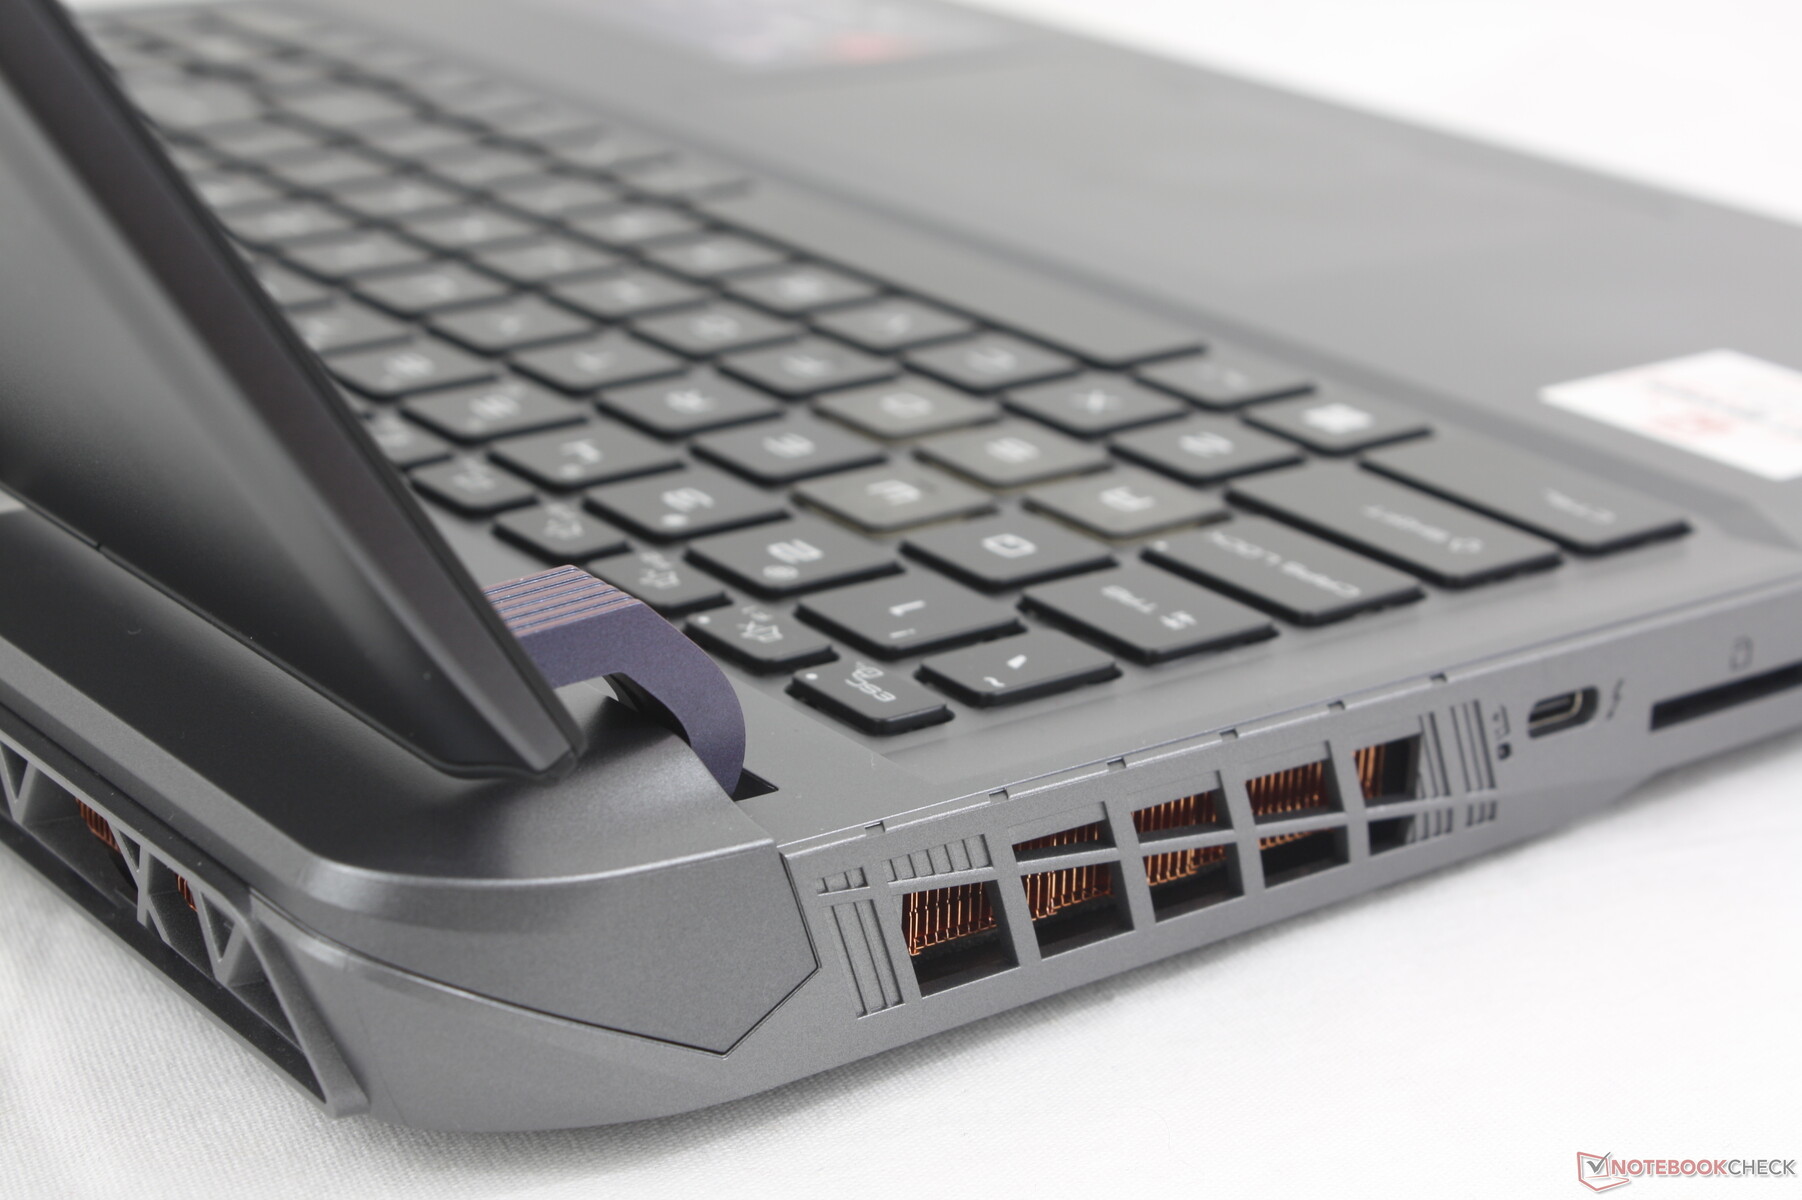
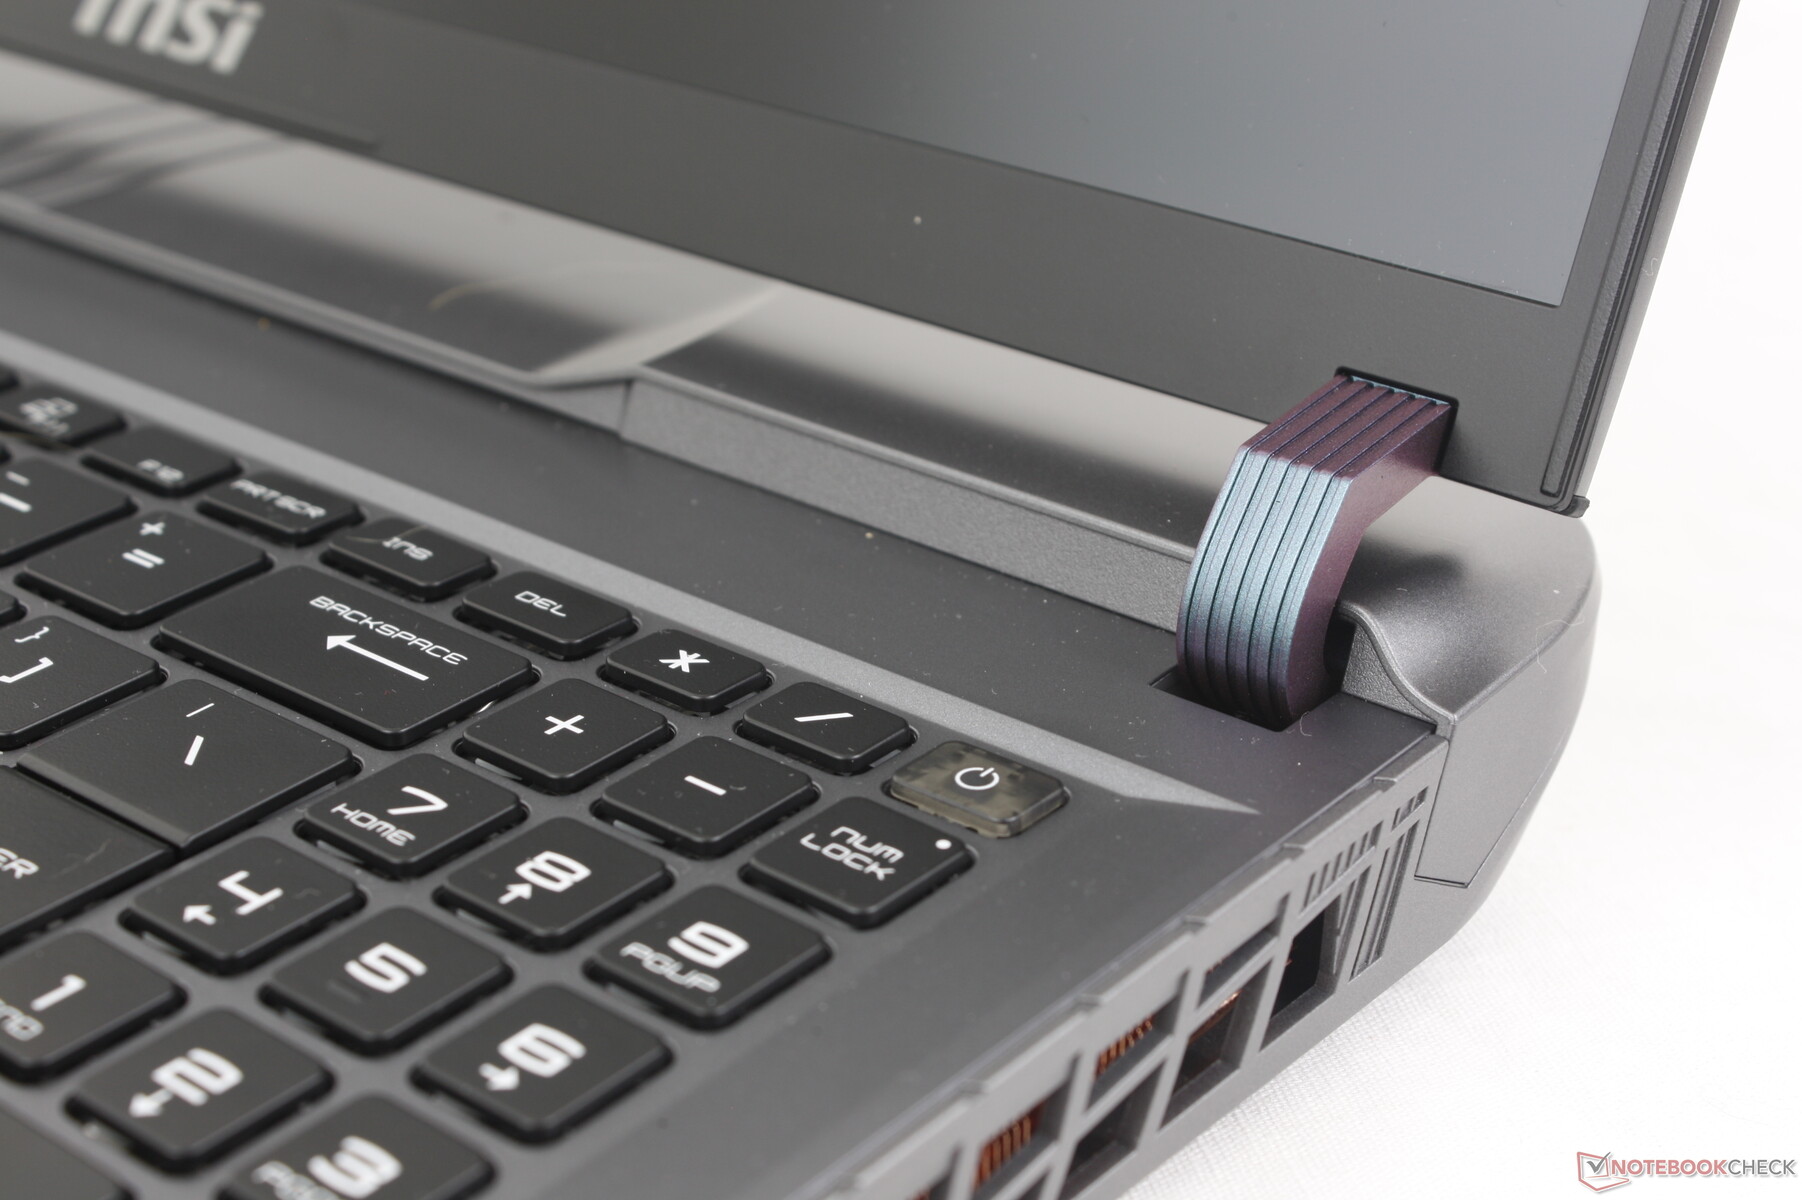
Heureusement, la rigidité du châssis est excellente de haut en bas, y compris le couvercle où elle a tendance à être sensiblement plus faible sur d'autres ordinateurs portables. Les charnières redessinées, en particulier, sont maintenant beaucoup plus grandes et plus fermes qu'auparavant, rappelant les charnières de l'Asus Strix Scar 17 et de l'Alienware m16 R1 Asus Strix Scar 17. Cependant, leur courbure limite l'angle maximal d'ouverture de l'écran à 130 degrés.
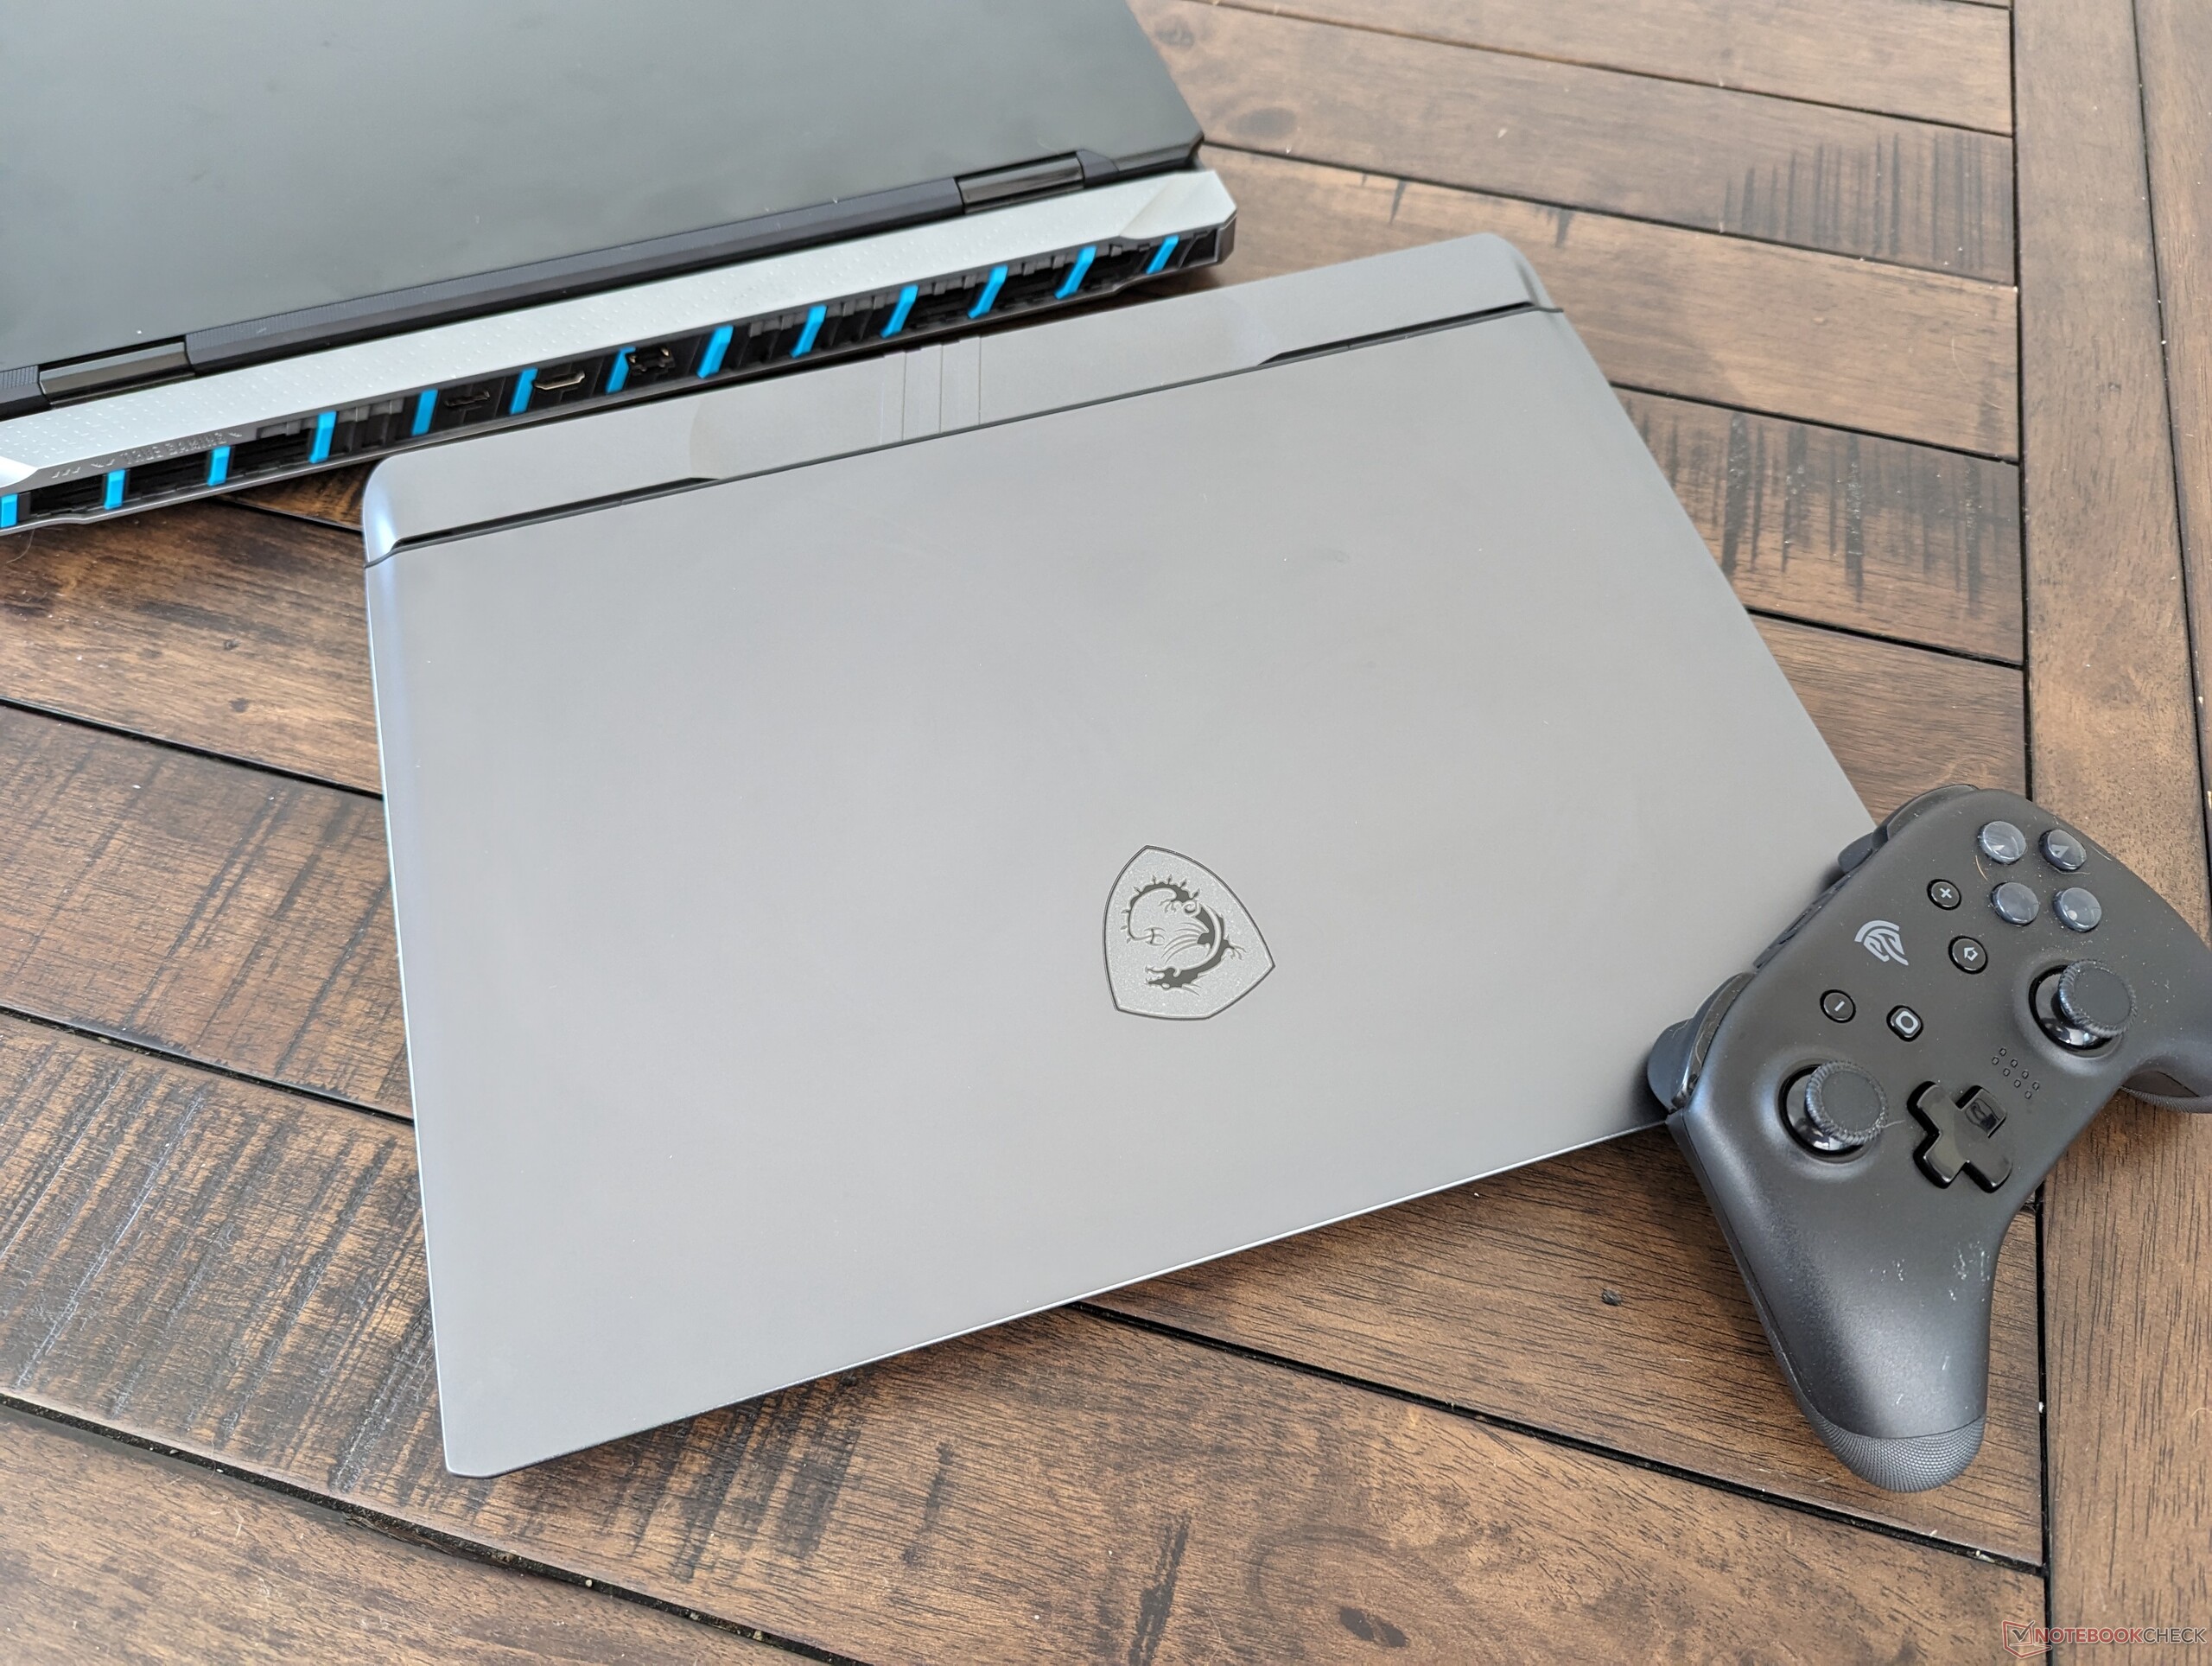
Le Vector 16 HX est un gros ordinateur portable et il n'y a pas moyen d'y échapper. Son objectif ambitieux de 175 W TGP (ou 240 W avec le CPU) nécessite une solution de refroidissement plus puissante et un châssis plus grand que la plupart des autres modèles de 16 pouces. Le MSI est encore plus grand et plus lourd que le Dell G16 7620 de l'année dernière Dell G16 7620 de l'année dernière, qui était déjà assez imposant. Heureusement, il n'est pas aussi lourd que le Razer Blade 18 ou l'Asus ROG Strix Scar 18 Asus ROG Strix Scar 18mais il n'est pas vraiment portable non plus.
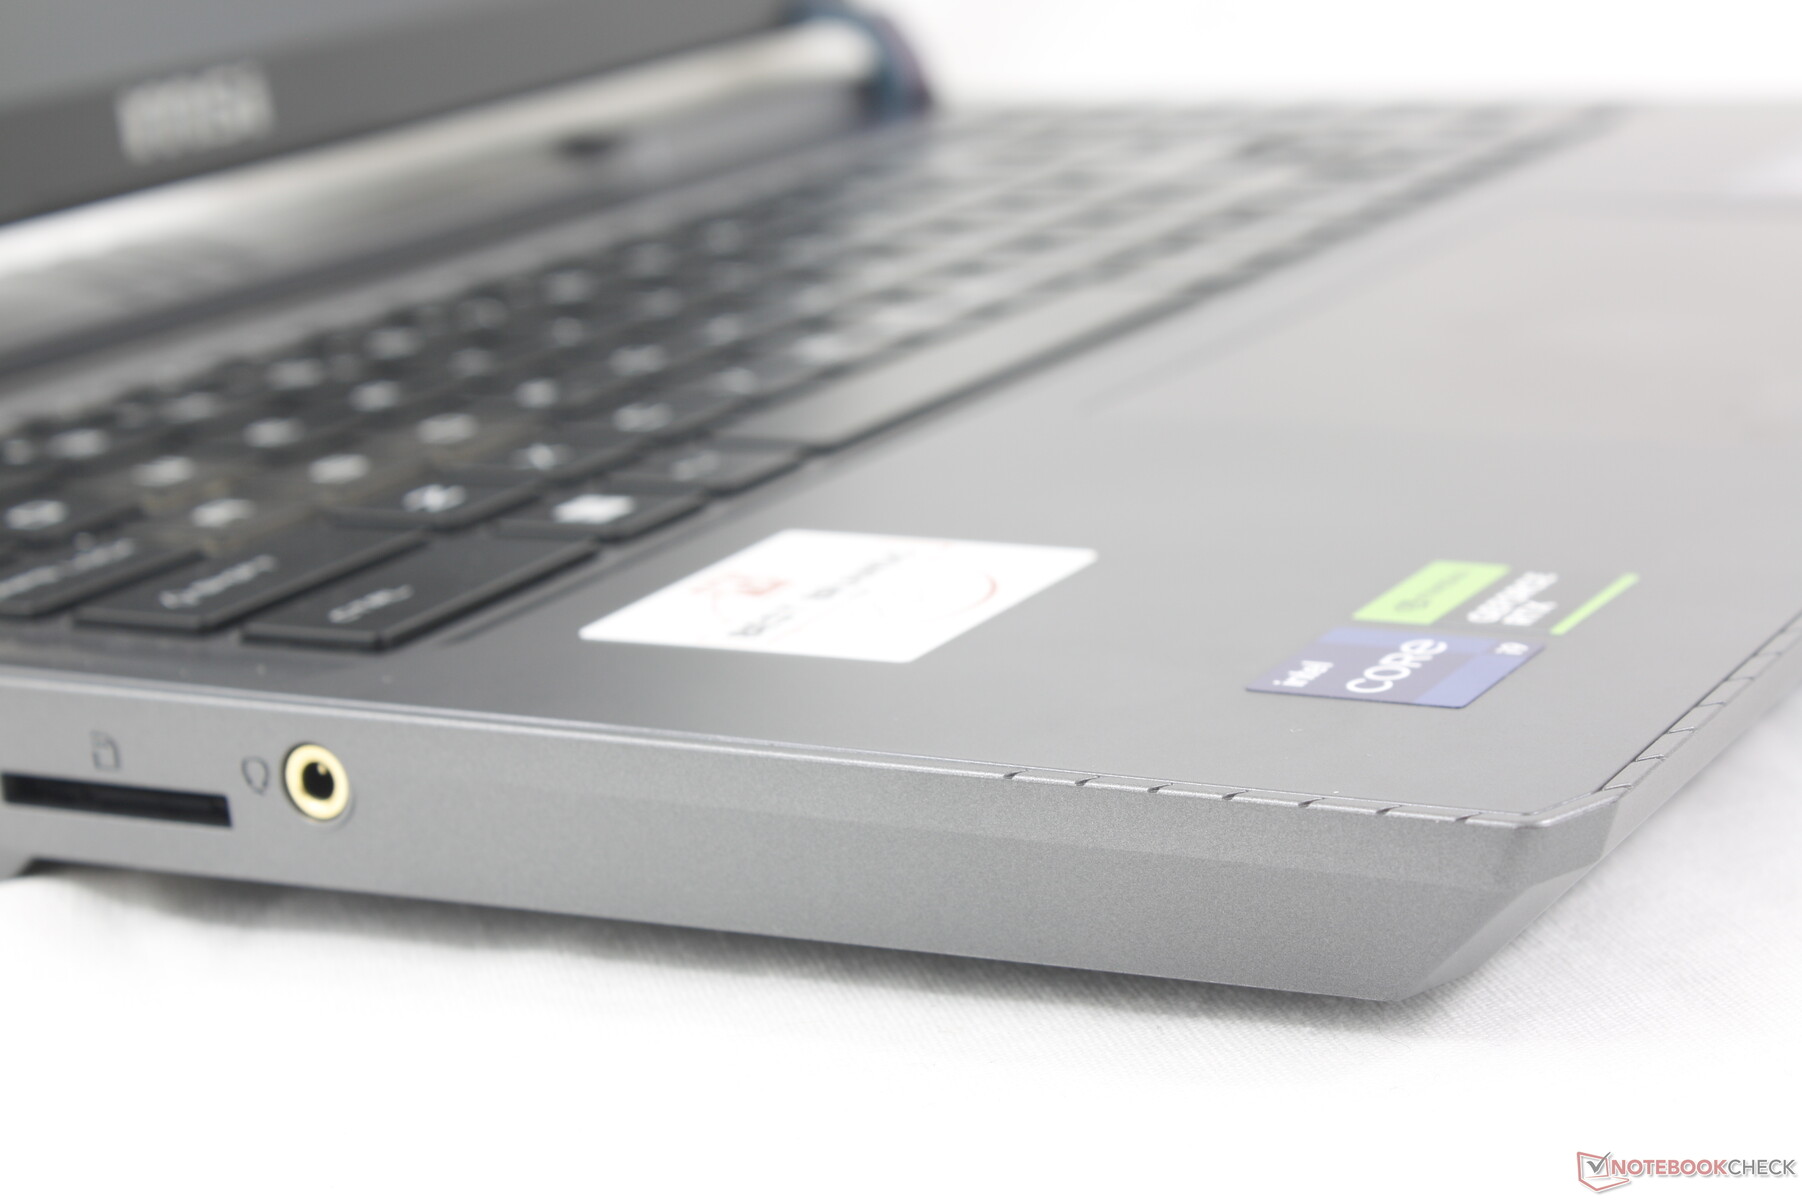
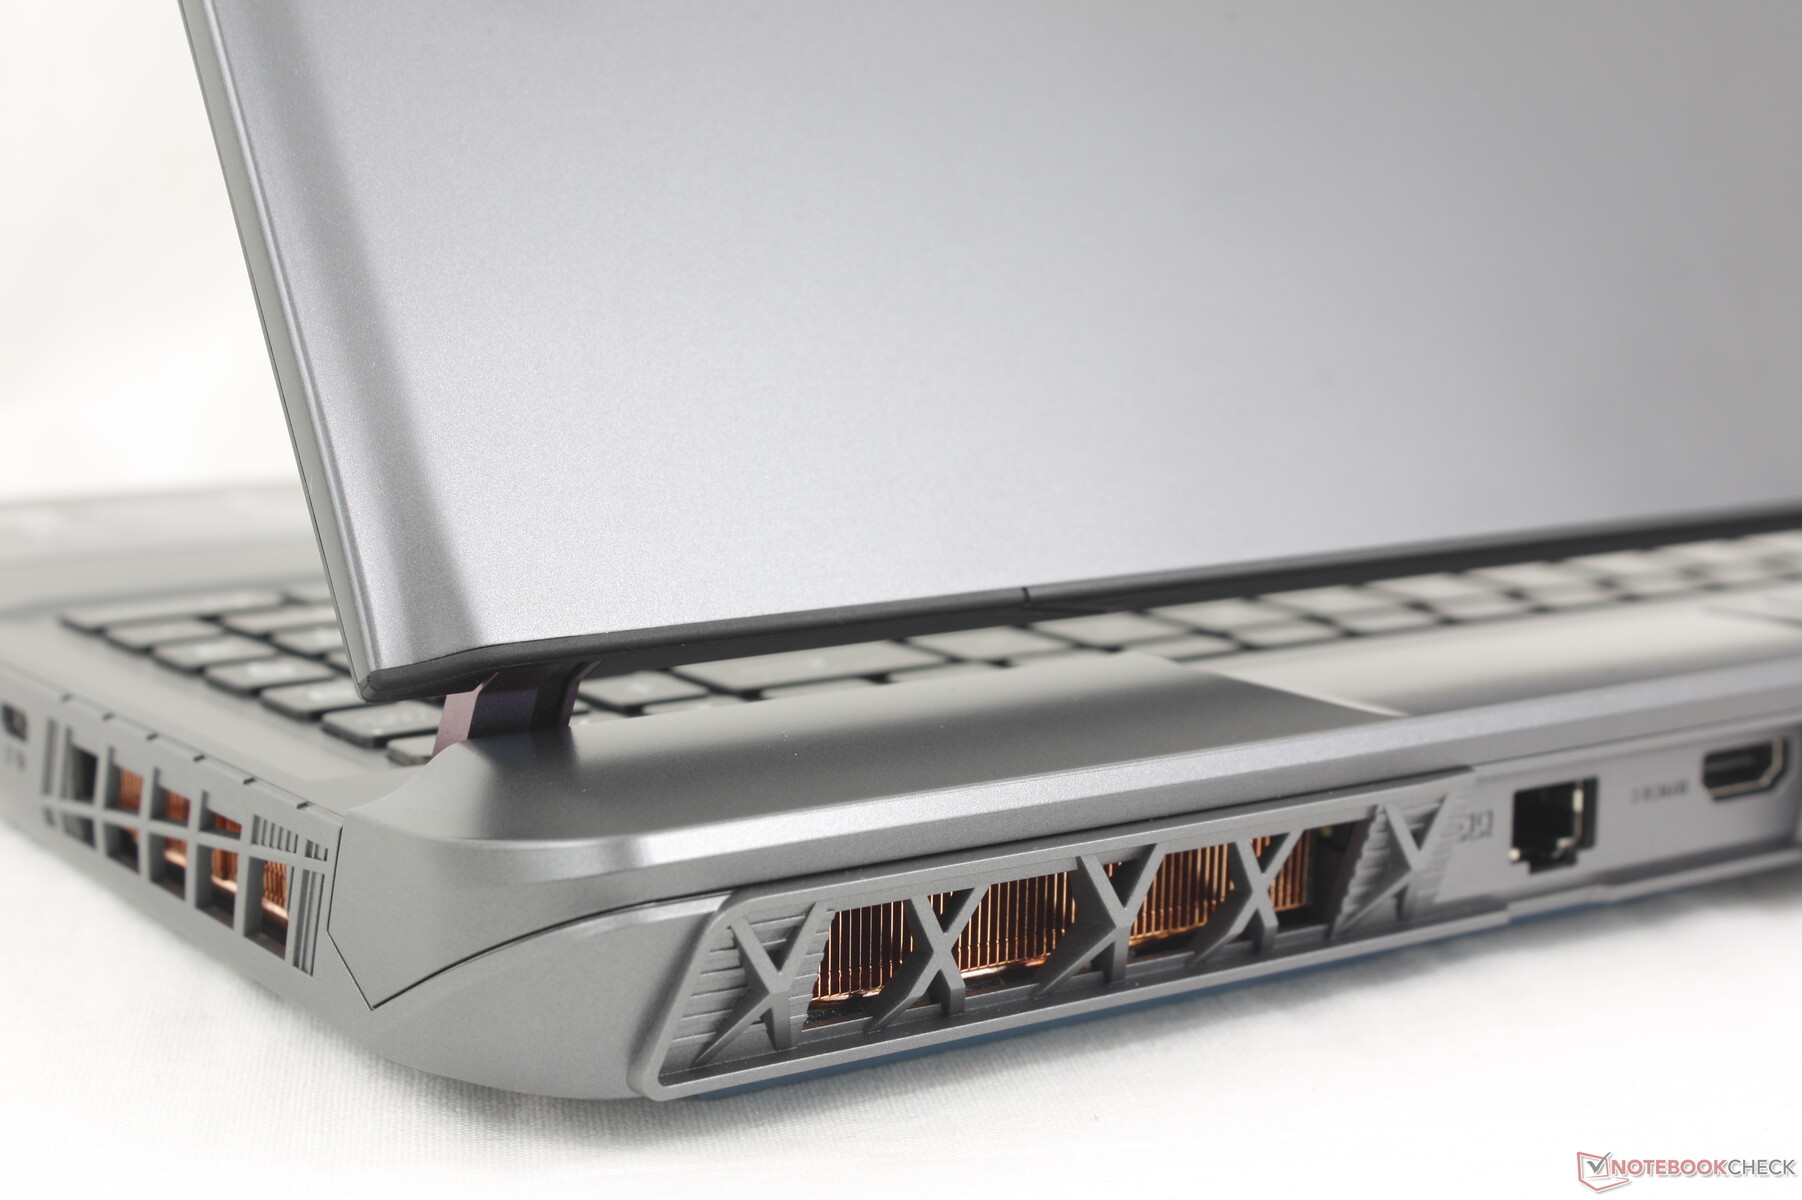
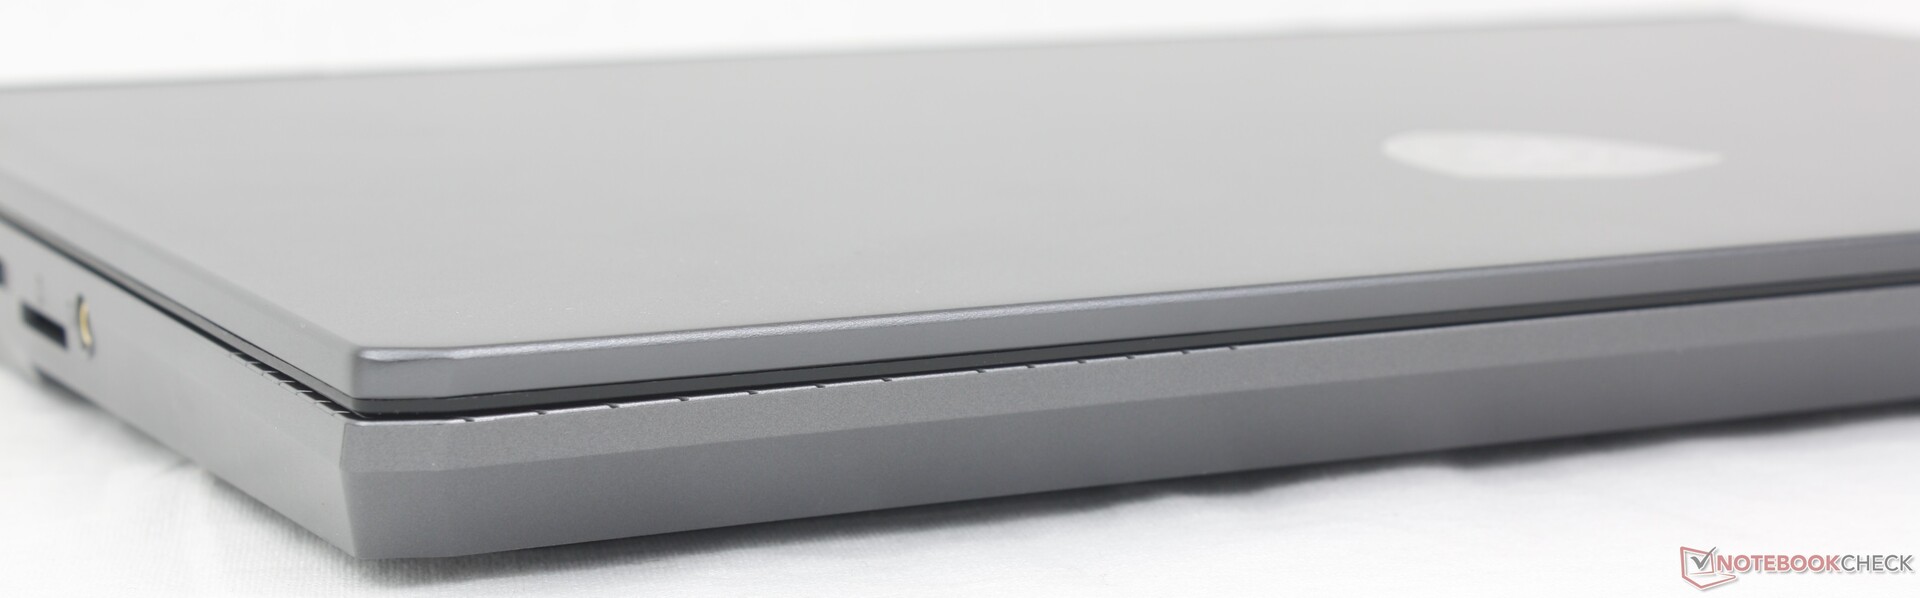
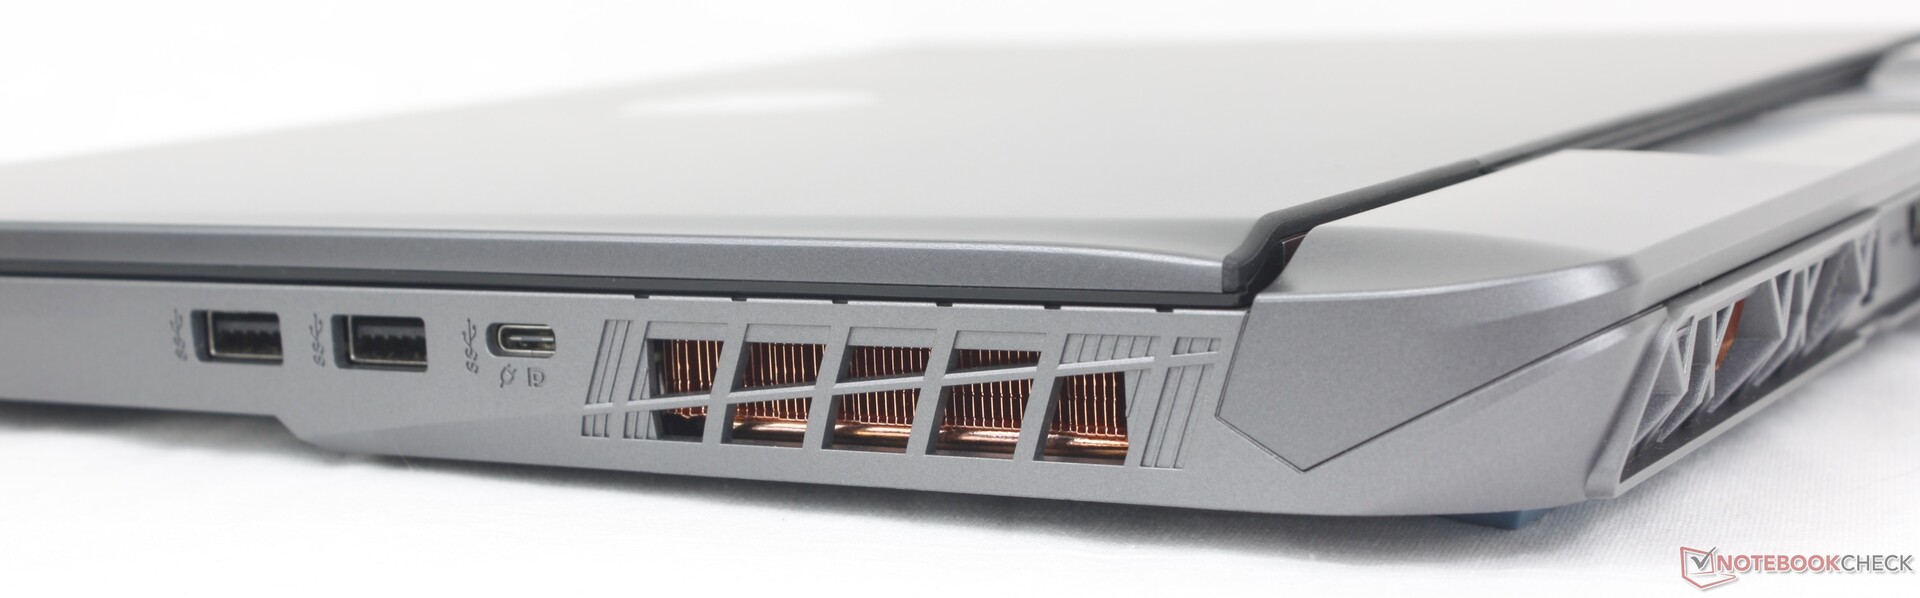
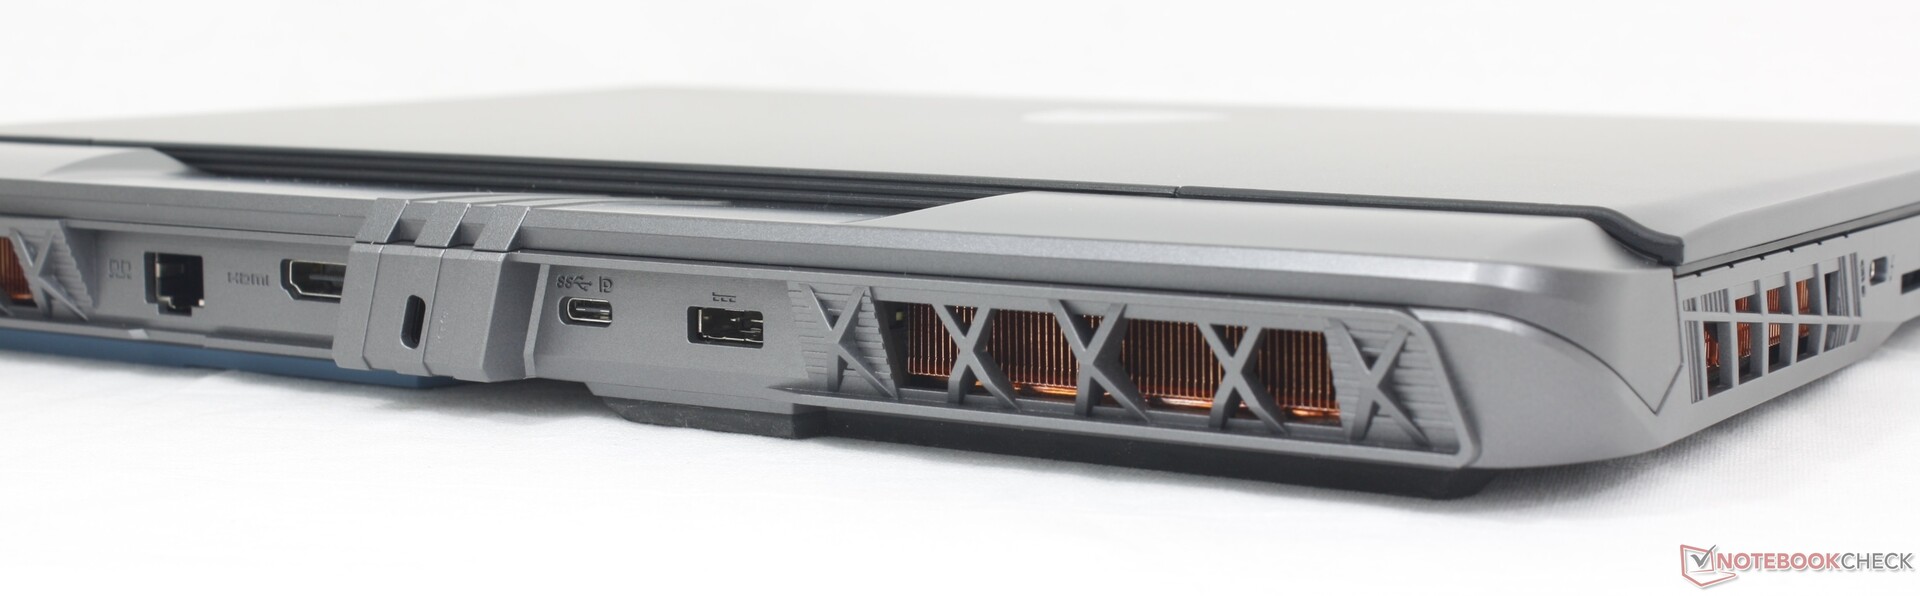
Connectivité
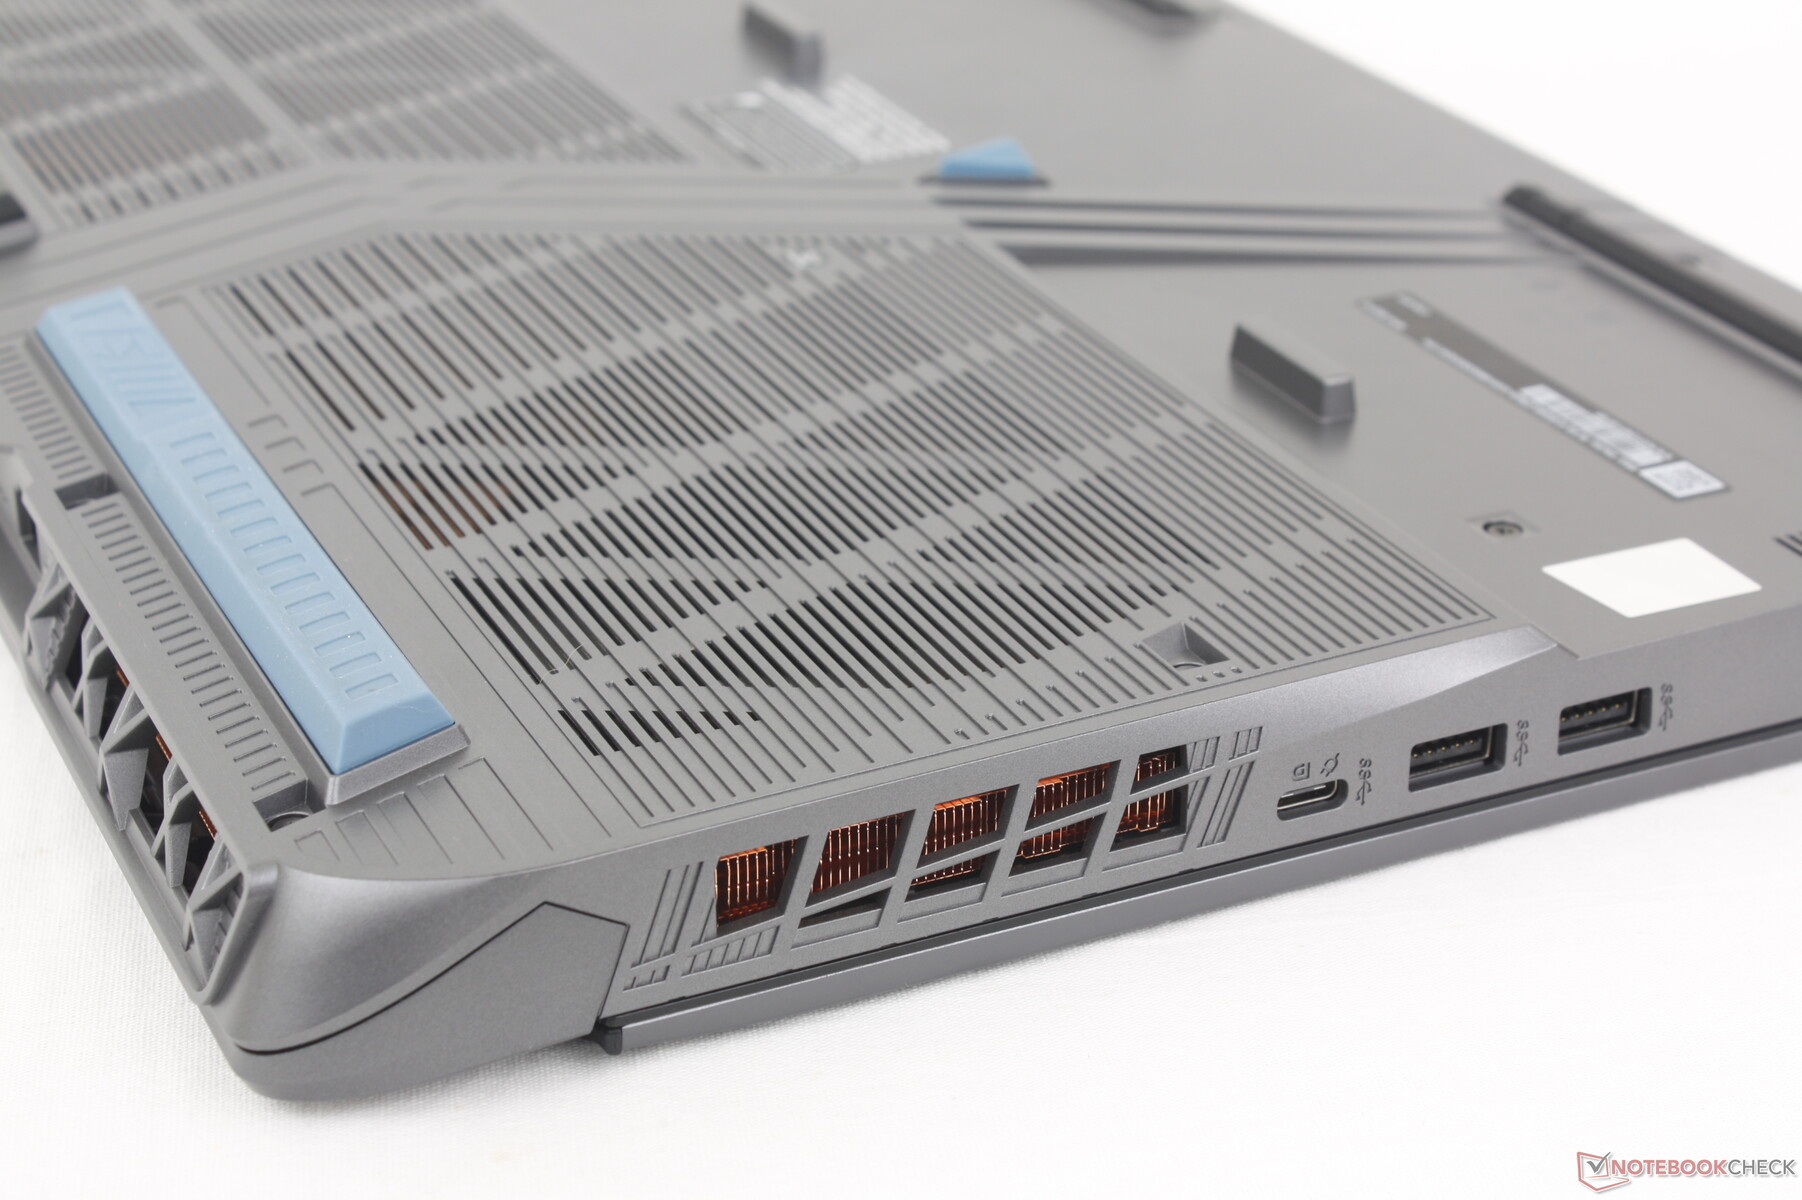
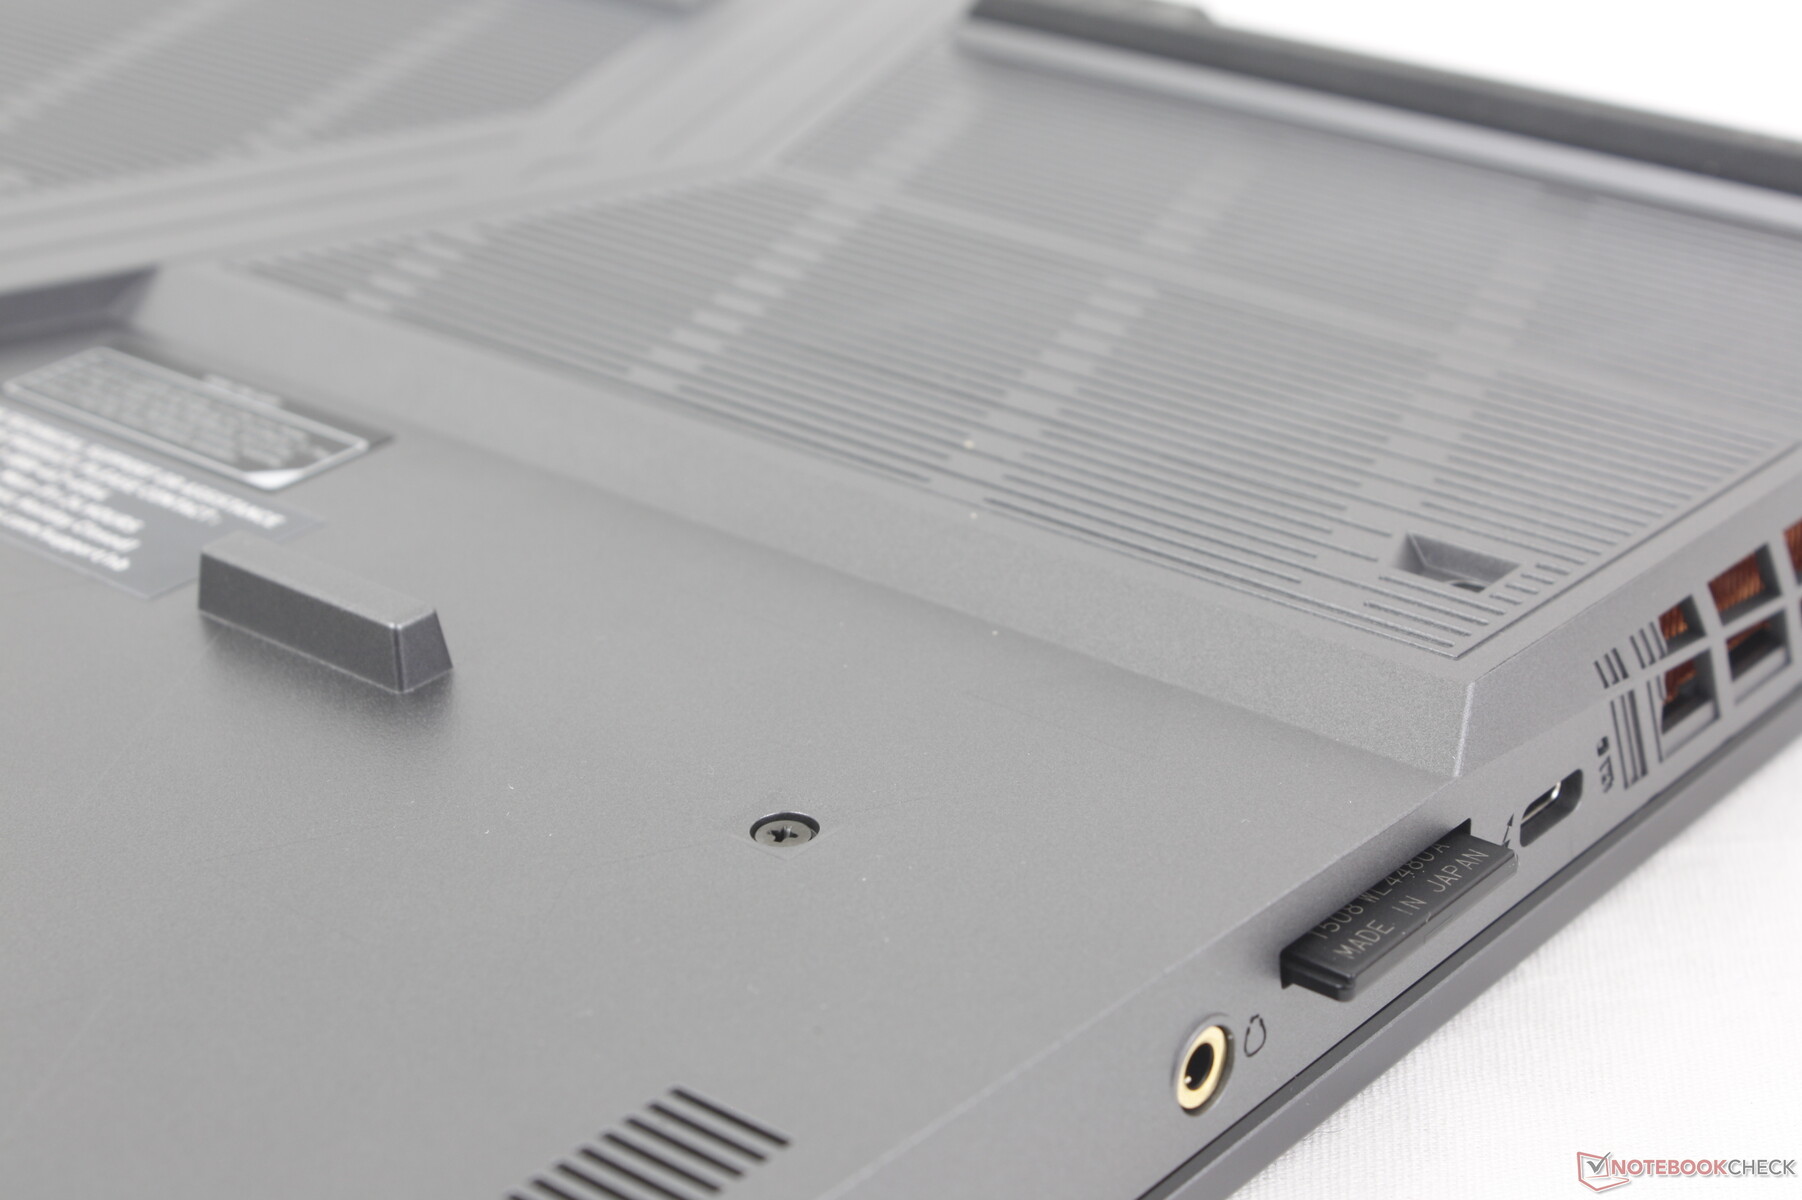
MSI a revu les ports par rapport au GP66. Les nouveautés du Vector 16 HX sont le lecteur de carte SD et les ports USB-C supplémentaires, désormais avec un support Thunderbolt adéquat. En contrepartie, le nouveau modèle dispose de moins de ports USB-A et a abandonné le mini-port d'affichage dédié. Cela reste un avantage par rapport à des concurrents comme le Dell G16 ou l'Asus TUF Gaming A16 Asus TUF Gaming A16 qui ont moins de ports USB-C ou n'ont pas de lecteur de carte SD.
Notez que le port de l'adaptateur secteur est identique à celui du Titan 18 HX, même si les tailles des adaptateurs secteur sont différentes.
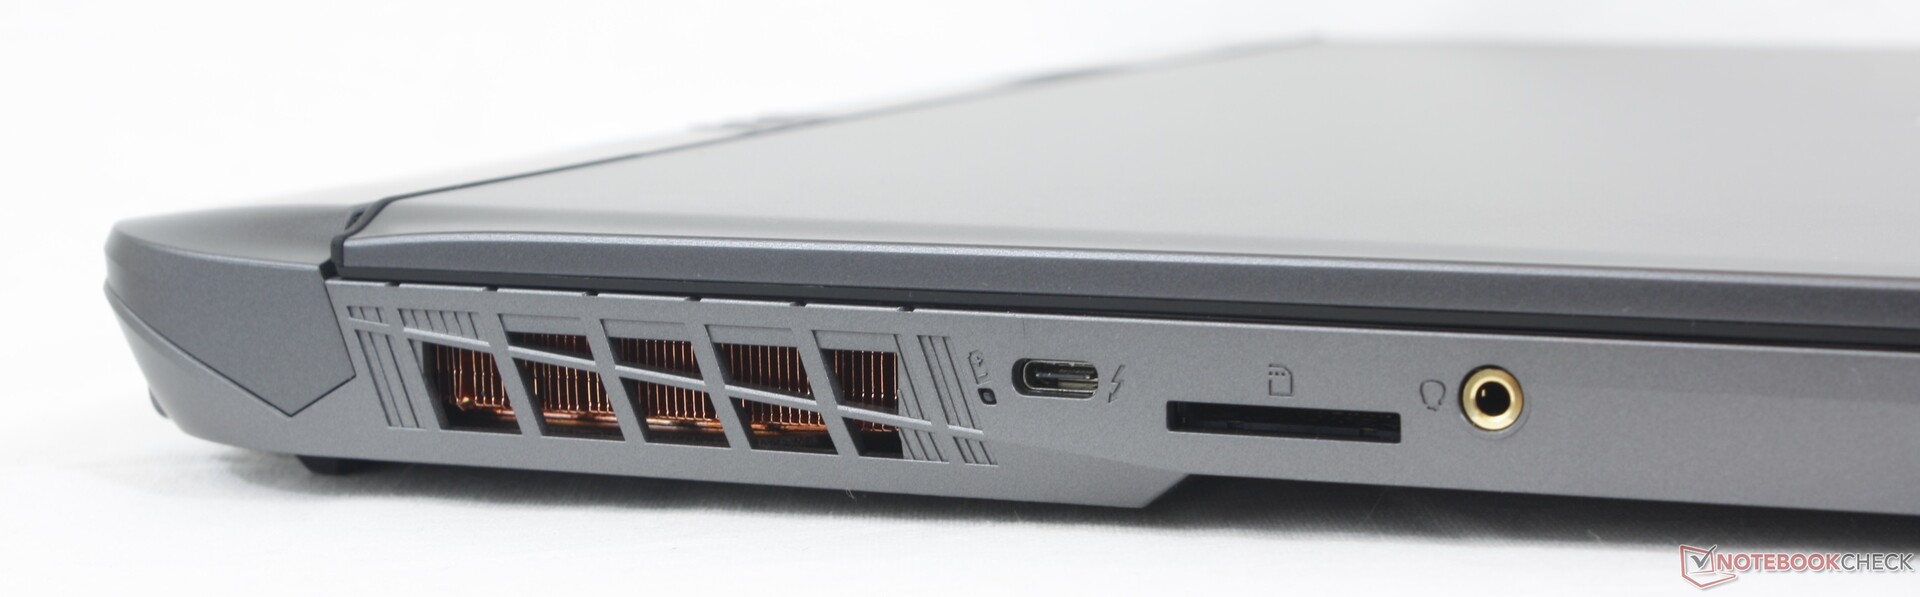
Lecteur de carte SD
Les taux de transfert à partir du lecteur de carte SD intégré sont satisfaisants (environ 90 Mo/s), soit deux à trois fois plus rapides que le lecteur de carte présent sur les nouveaux ordinateurs portables de Lenovo Lenovo Legion 5 16. Cependant, le lecteur du MSI n'est pas à ressort et une carte SD insérée peut donc être difficile à retirer avec des doigts larges.
| SD Card Reader | |
| average JPG Copy Test (av. of 3 runs) | |
| MSI Vector 16 HX A14V (Toshiba Exceria Pro SDXC 64 GB UHS-II) | |
| Lenovo Legion 5 16IRX G9 | |
| maximum AS SSD Seq Read Test (1GB) | |
| MSI Vector 16 HX A14V (Toshiba Exceria Pro SDXC 64 GB UHS-II) | |
| Lenovo Legion 5 16IRX G9 | |
Communication
Le Killer BE1750x est compatible avec le Wi-Fi 7 et le Bluetooth 5.4, même si les routeurs Wi-Fi 7 ne sont pas encore très répandus. Il s'agit donc plutôt d'un gage de pérennité, puisque la plupart des utilisateurs n'ont pas encore de routeurs Wi-Fi 7. Les taux de transfert sont néanmoins stables et fiables lorsqu'ils sont couplés à notre routeur de test Asus AXE11000 Wi-Fi 6E.
| Networking | |
| iperf3 transmit AX12 | |
| MSI Vector GP66 12UGS | |
| iperf3 receive AX12 | |
| MSI Vector GP66 12UGS | |
| iperf3 transmit AXE11000 | |
| Lenovo Legion 5 16IRX G9 | |
| MSI Vector 16 HX A14V | |
| Dell G16 7620 | |
| Asus TUF Gaming A16 FA617XS | |
| HP Victus 16-r0077ng | |
| iperf3 receive AXE11000 | |
| Lenovo Legion 5 16IRX G9 | |
| MSI Vector 16 HX A14V | |
| Dell G16 7620 | |
| Asus TUF Gaming A16 FA617XS | |
| HP Victus 16-r0077ng | |
| iperf3 transmit AXE11000 6GHz | |
| MSI Vector 16 HX A14V | |
| iperf3 receive AXE11000 6GHz | |
| MSI Vector 16 HX A14V | |
Webcam
La webcam intégrée n'est que de 1 mégapixel, car le Vector n'est pas conçu pour des vidéoconférences fréquentes. L'infrarouge n'est pas non plus pris en charge, mais elle comprend au moins un obturateur physique pour préserver la confidentialité.


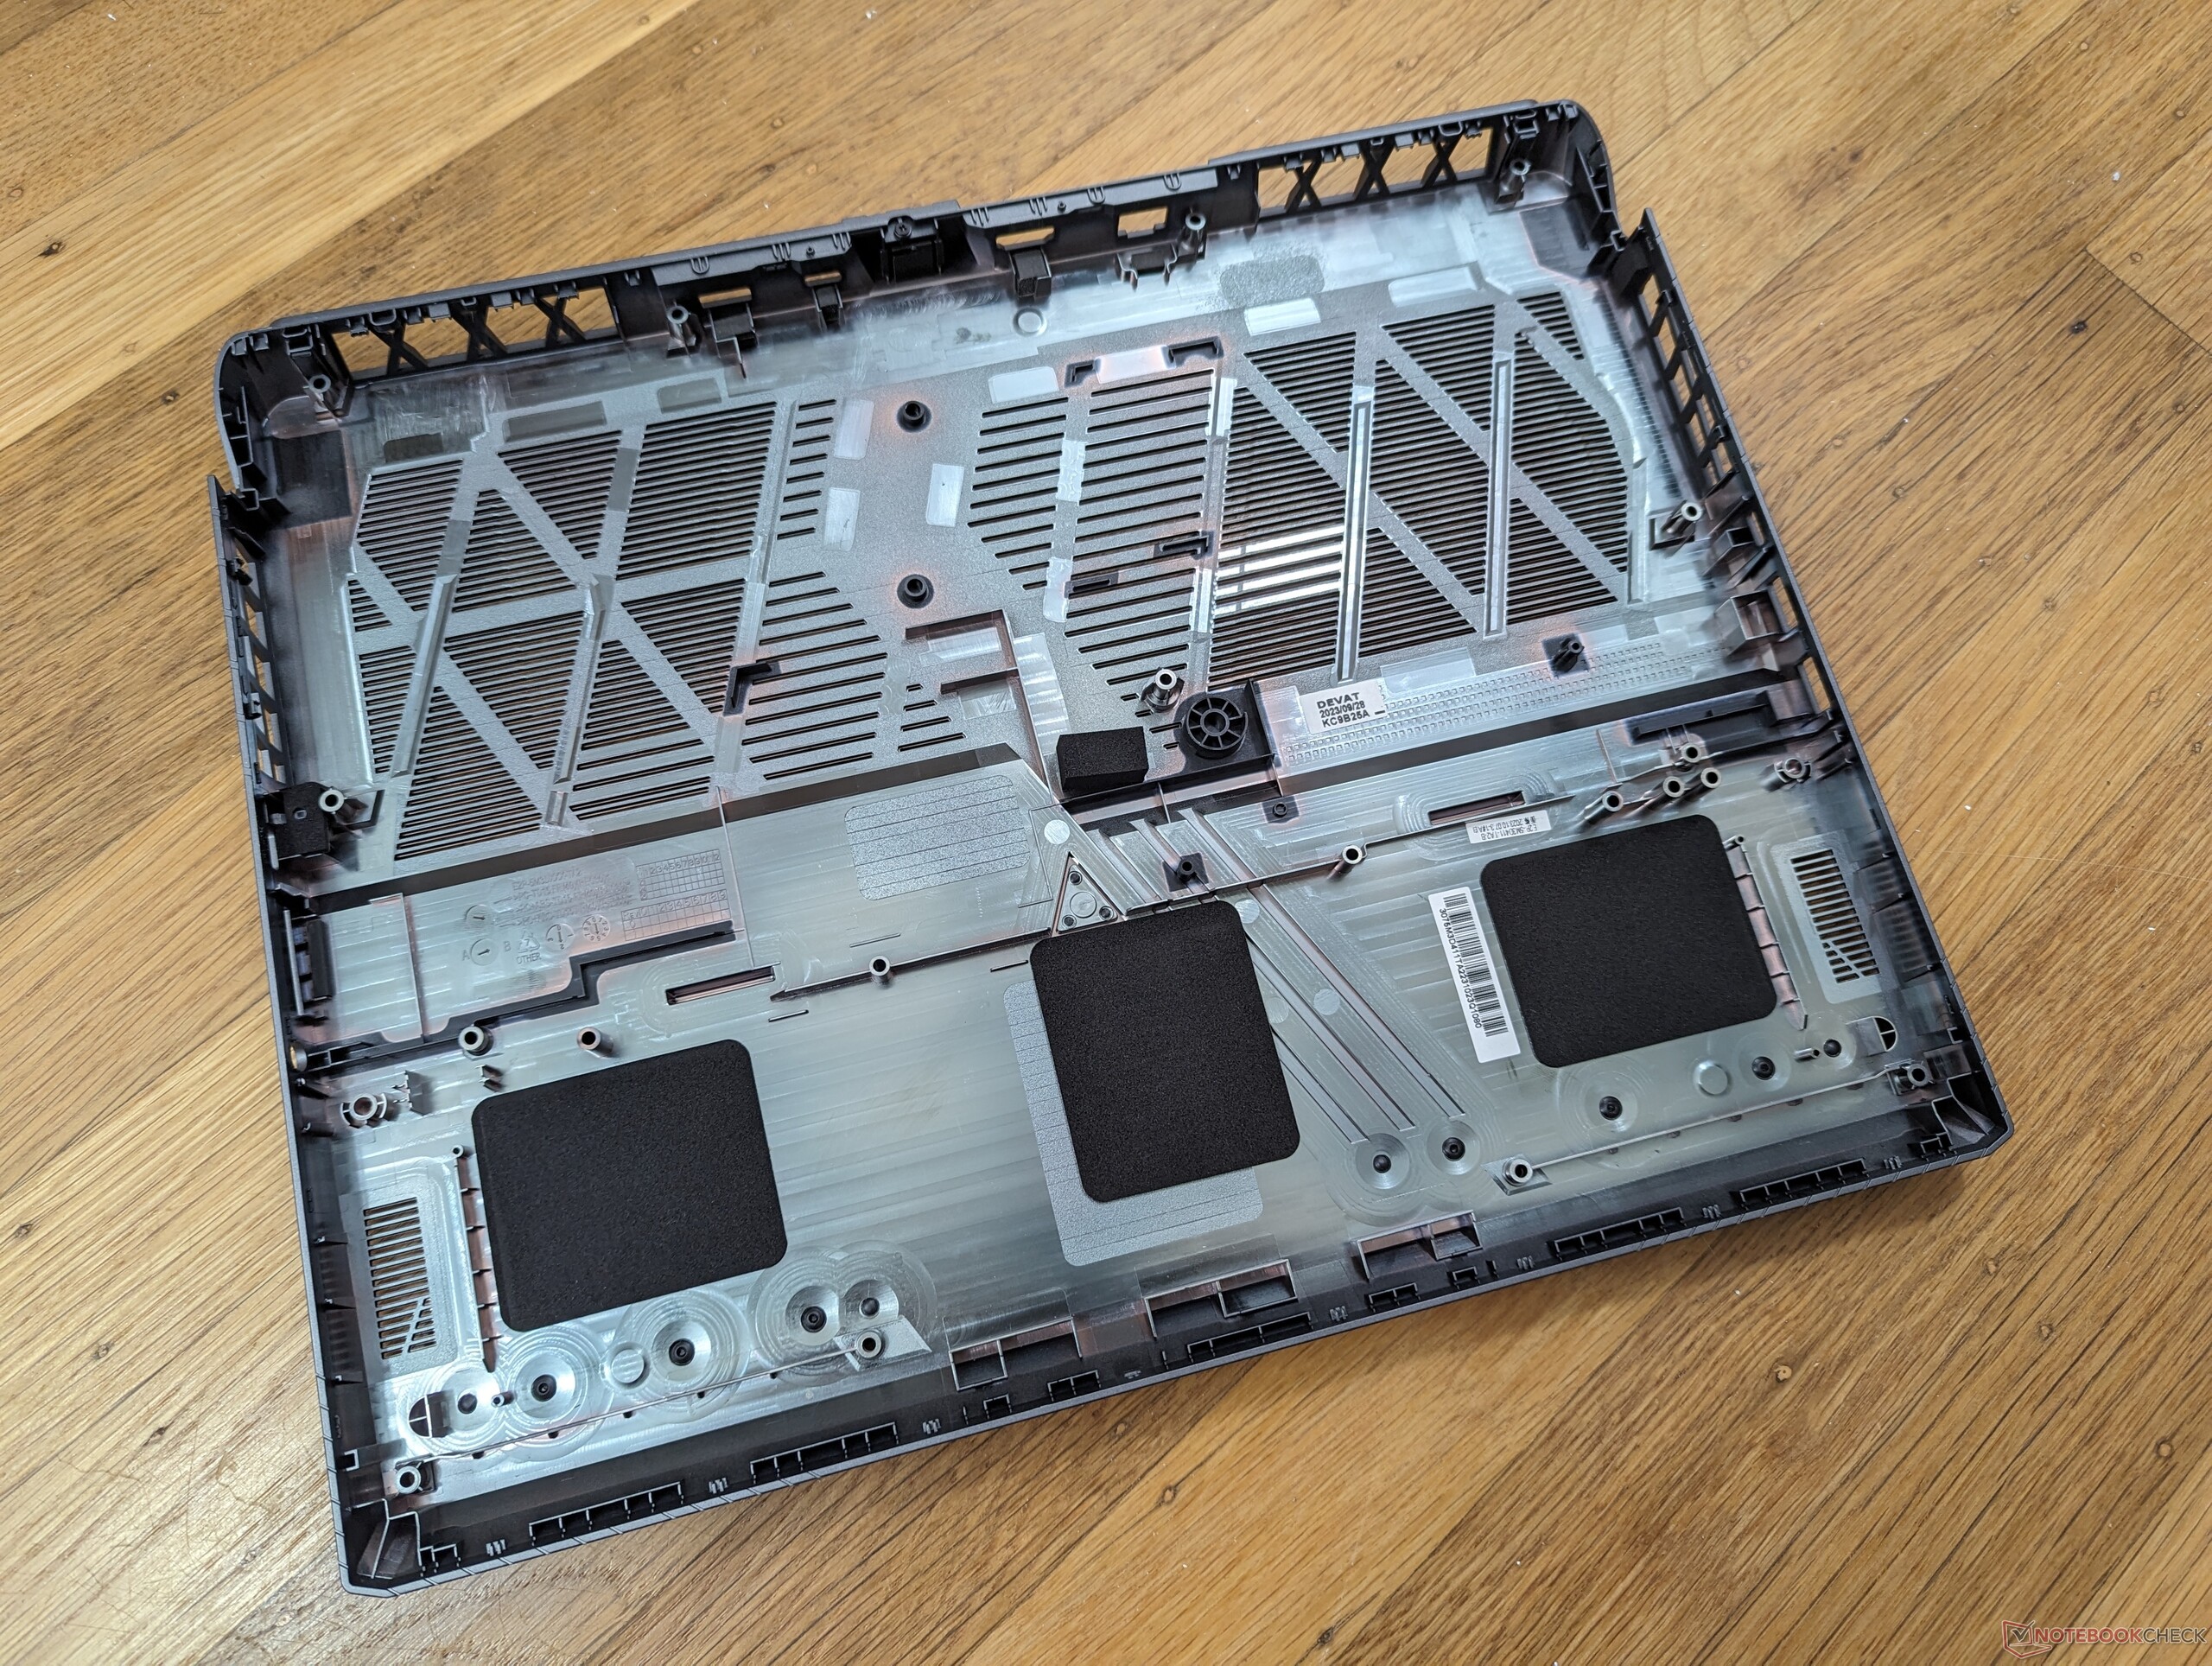
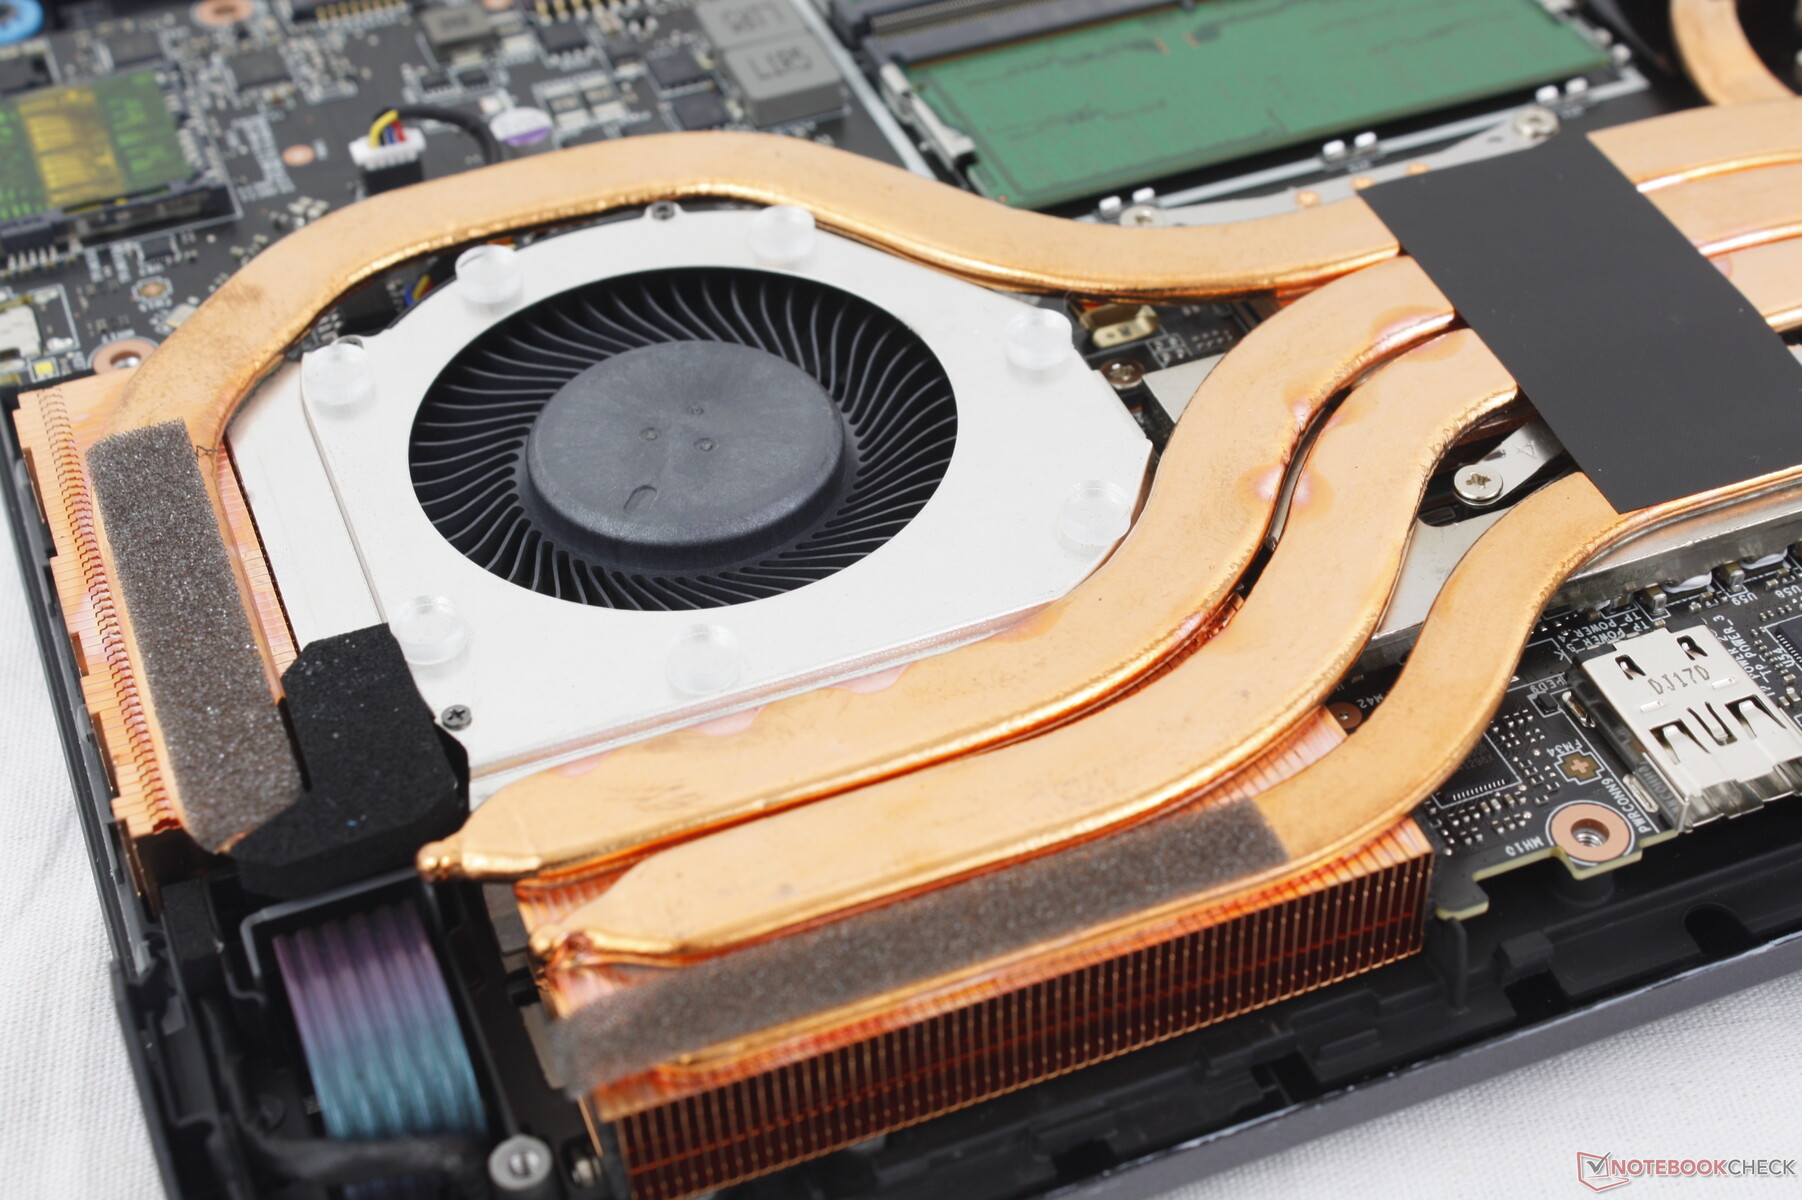
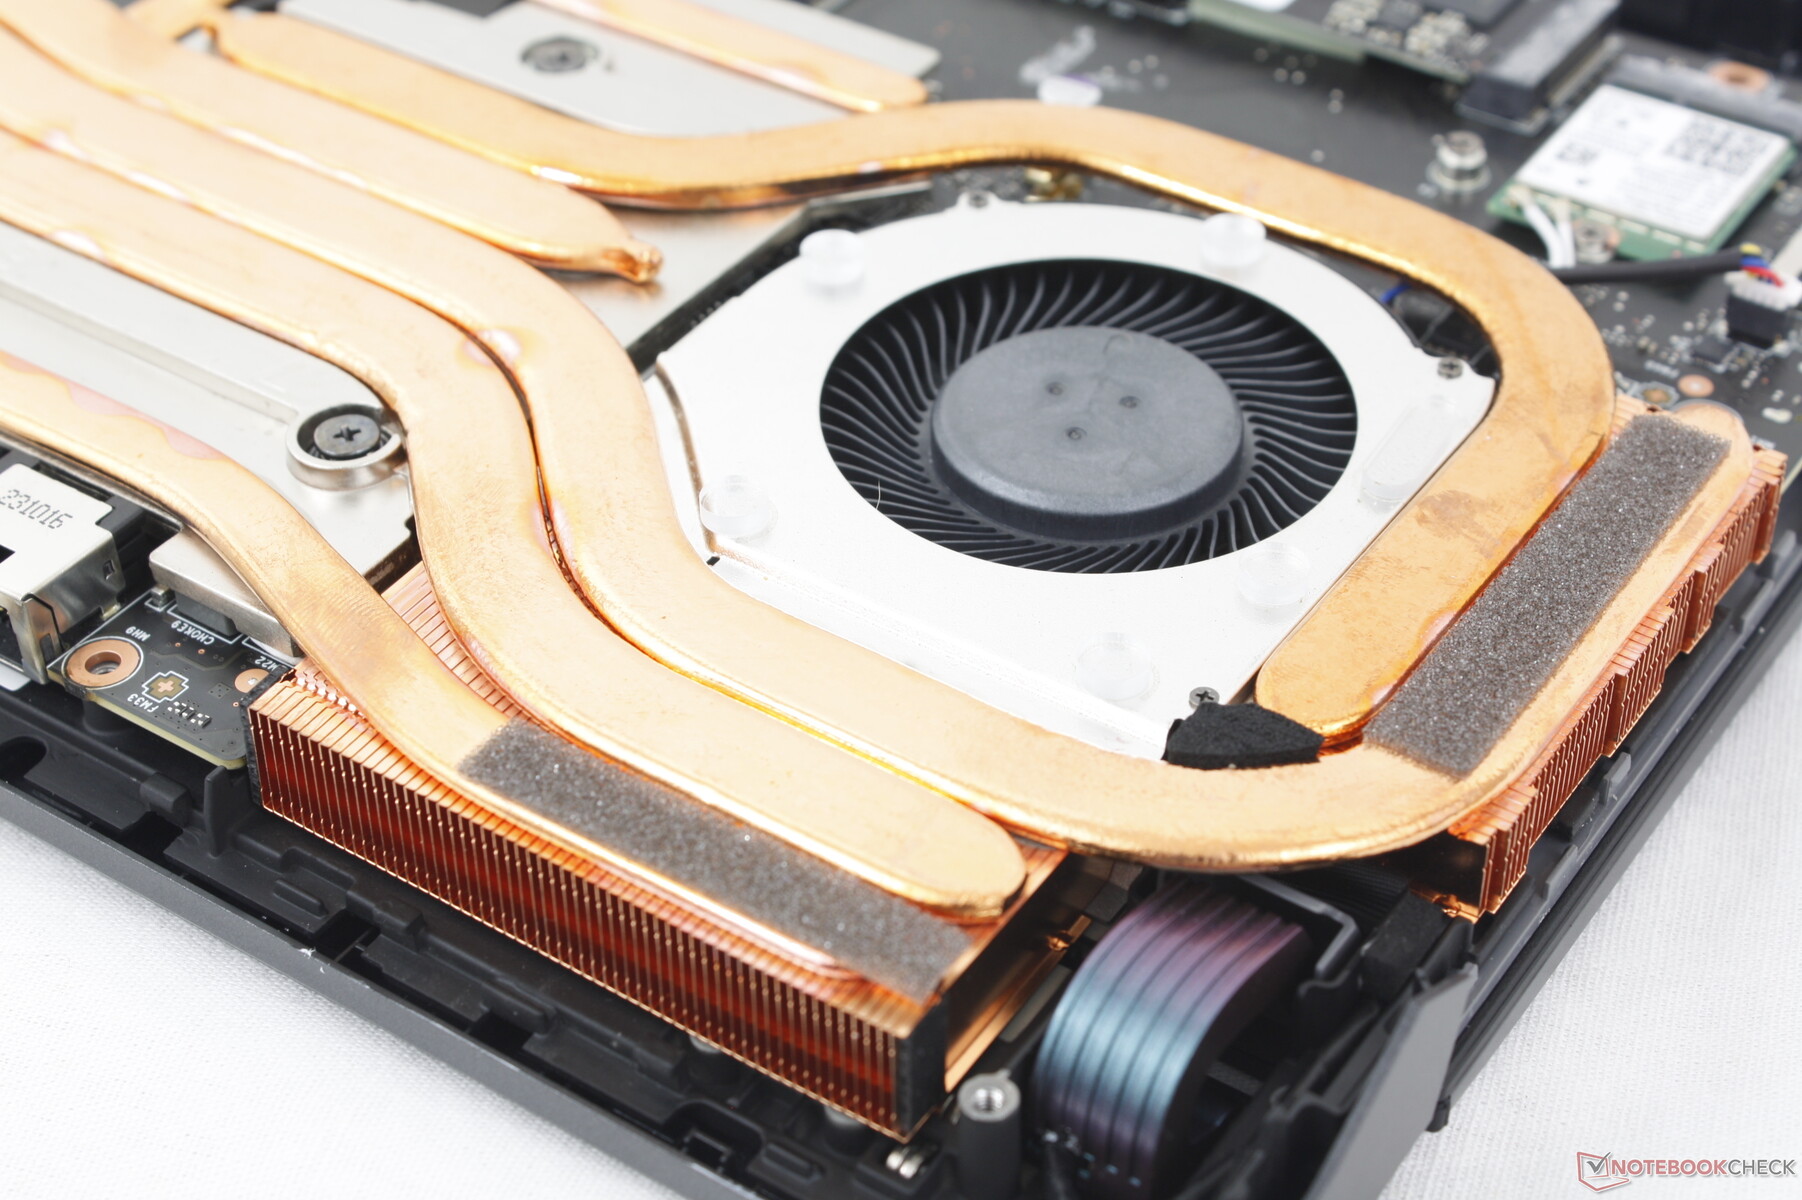
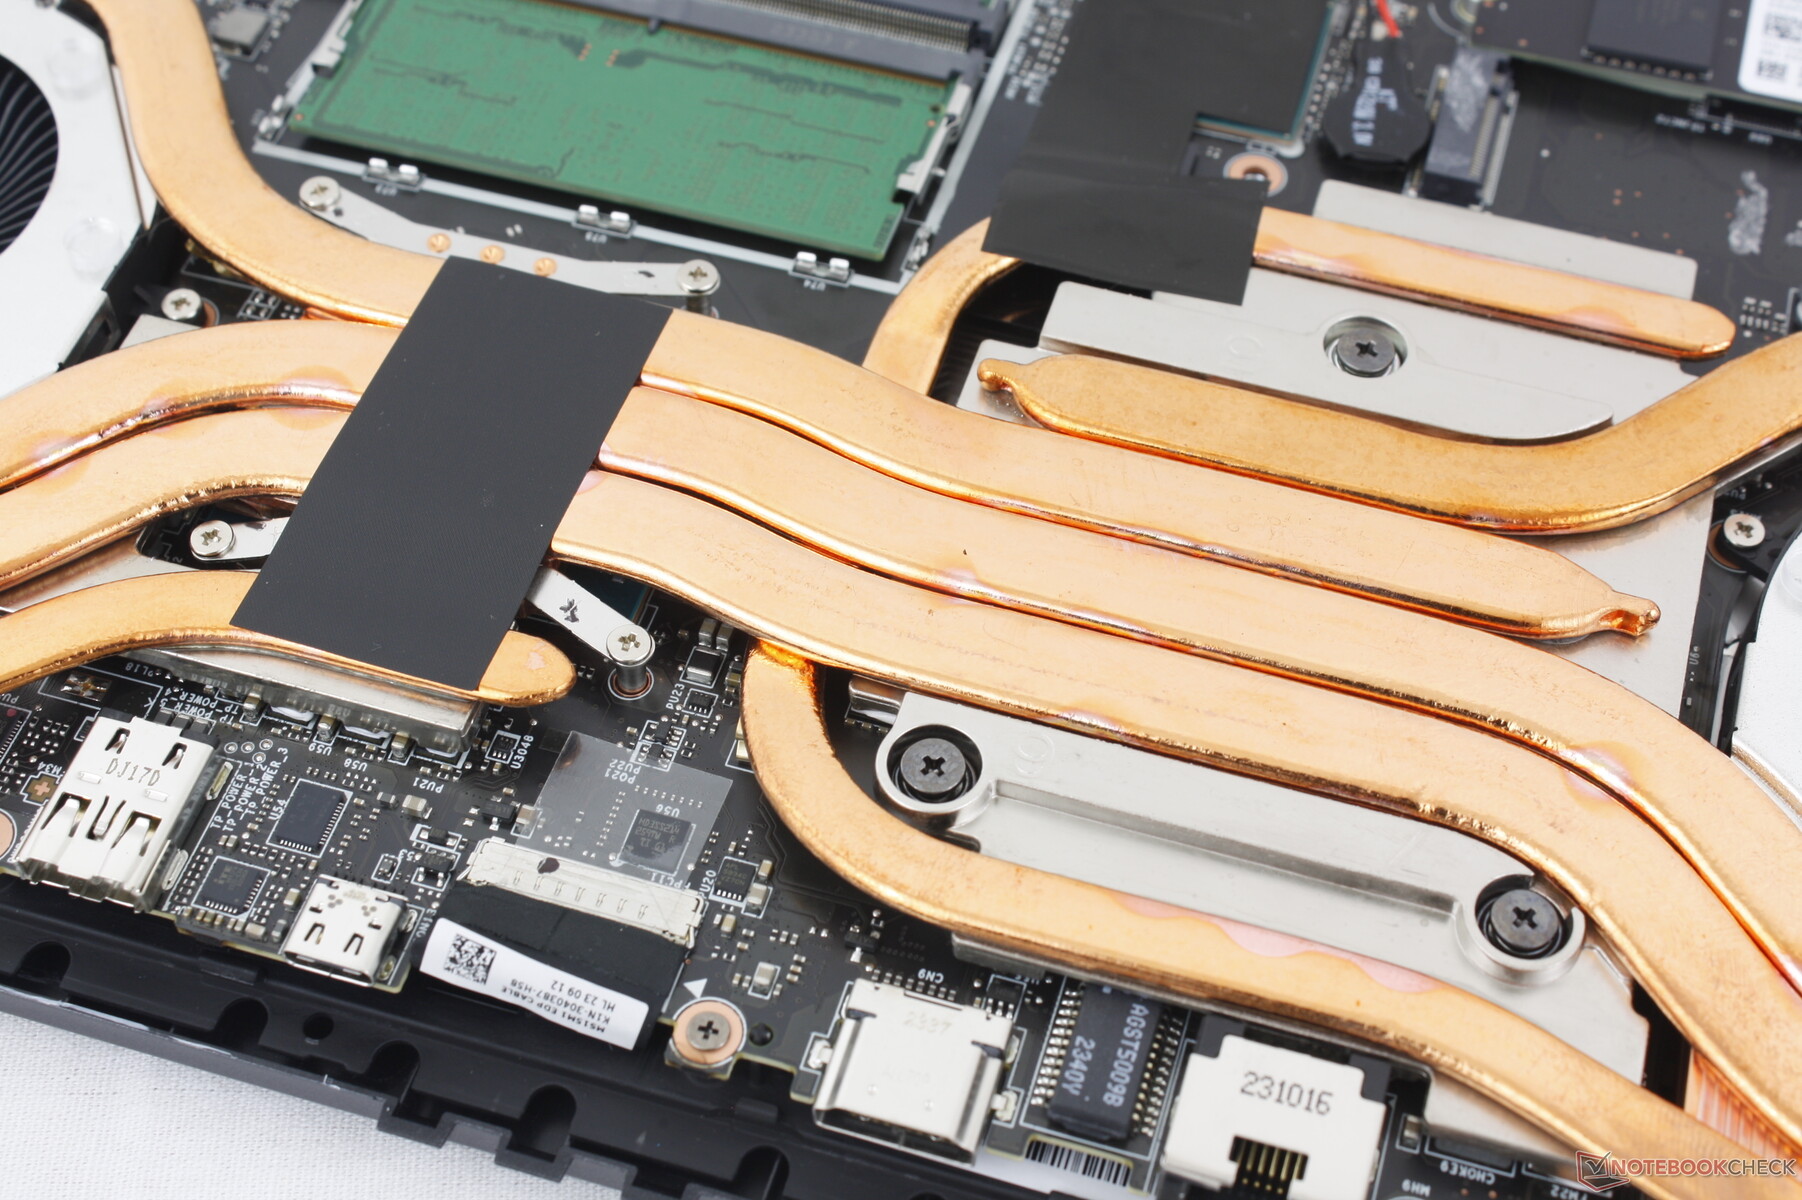
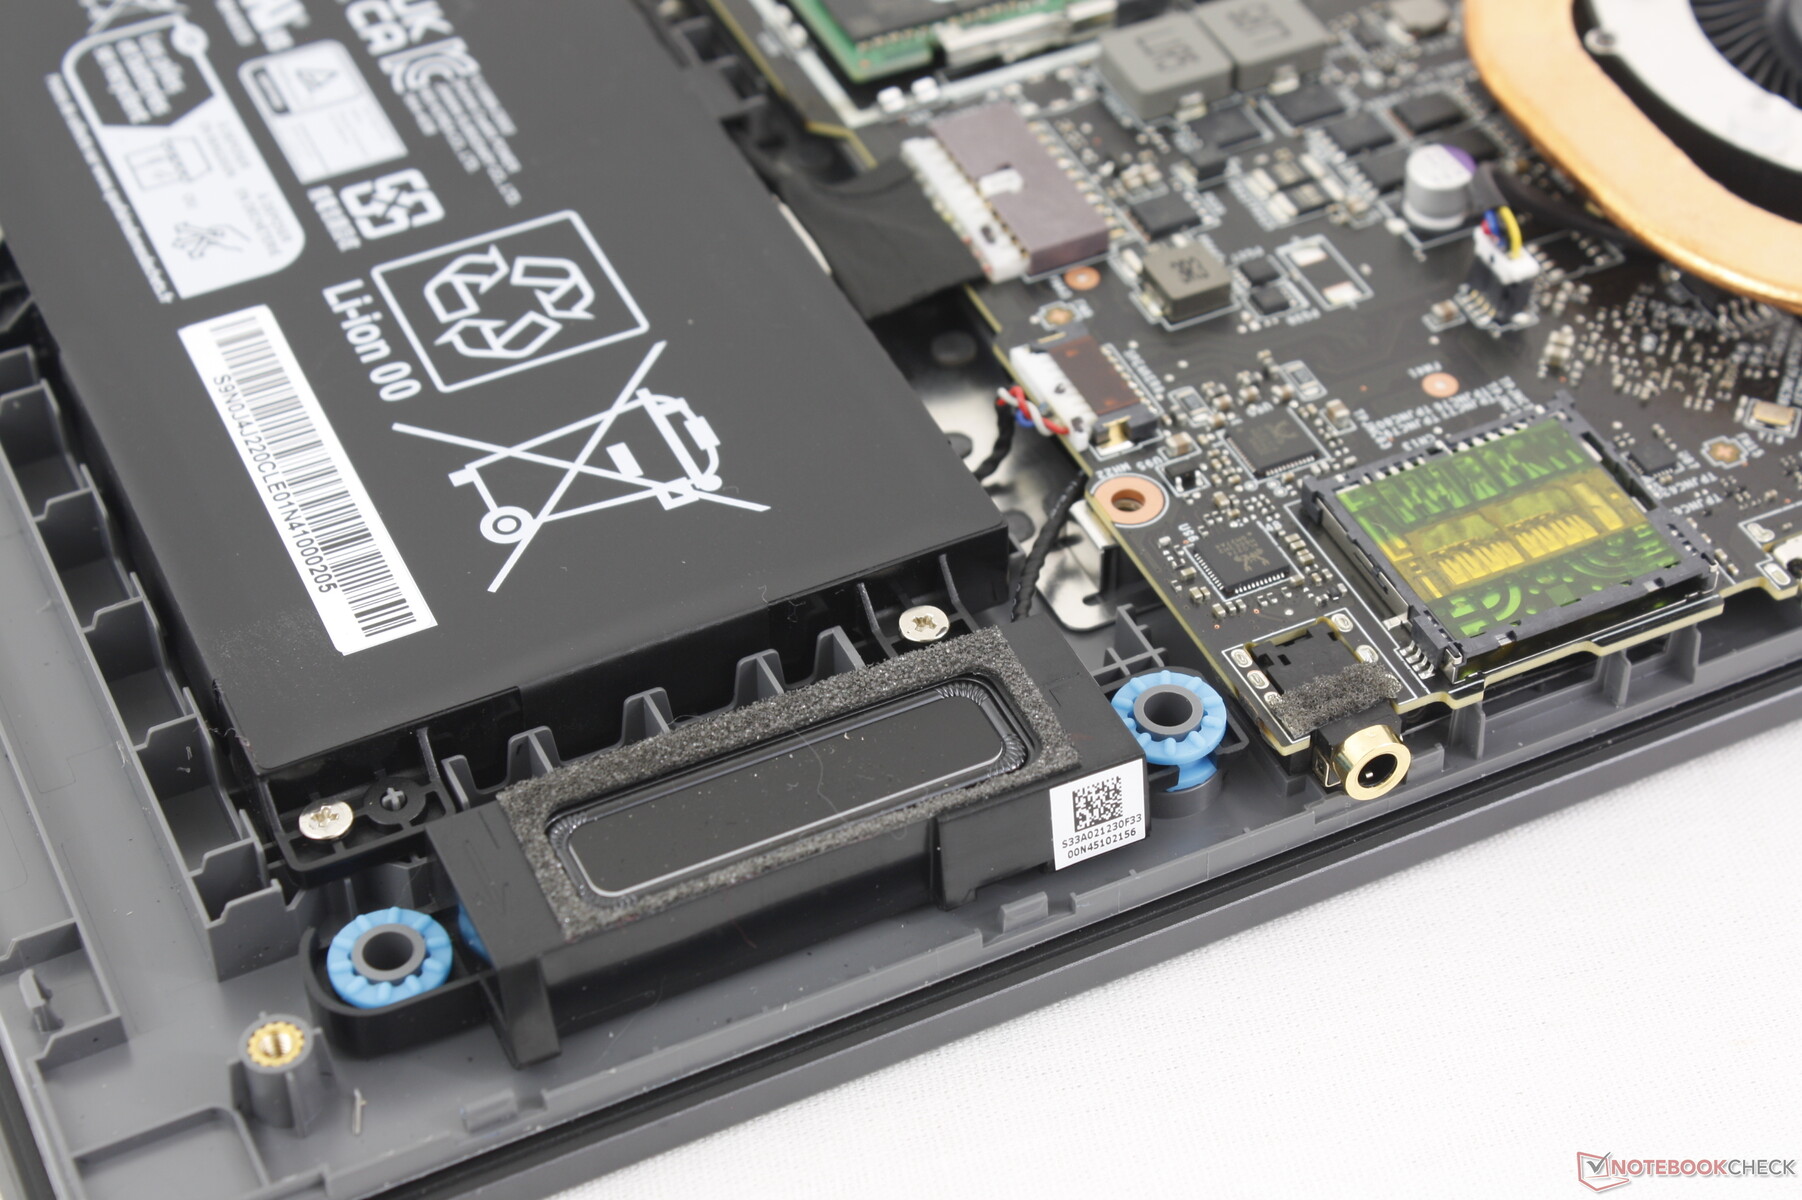
Maintenance
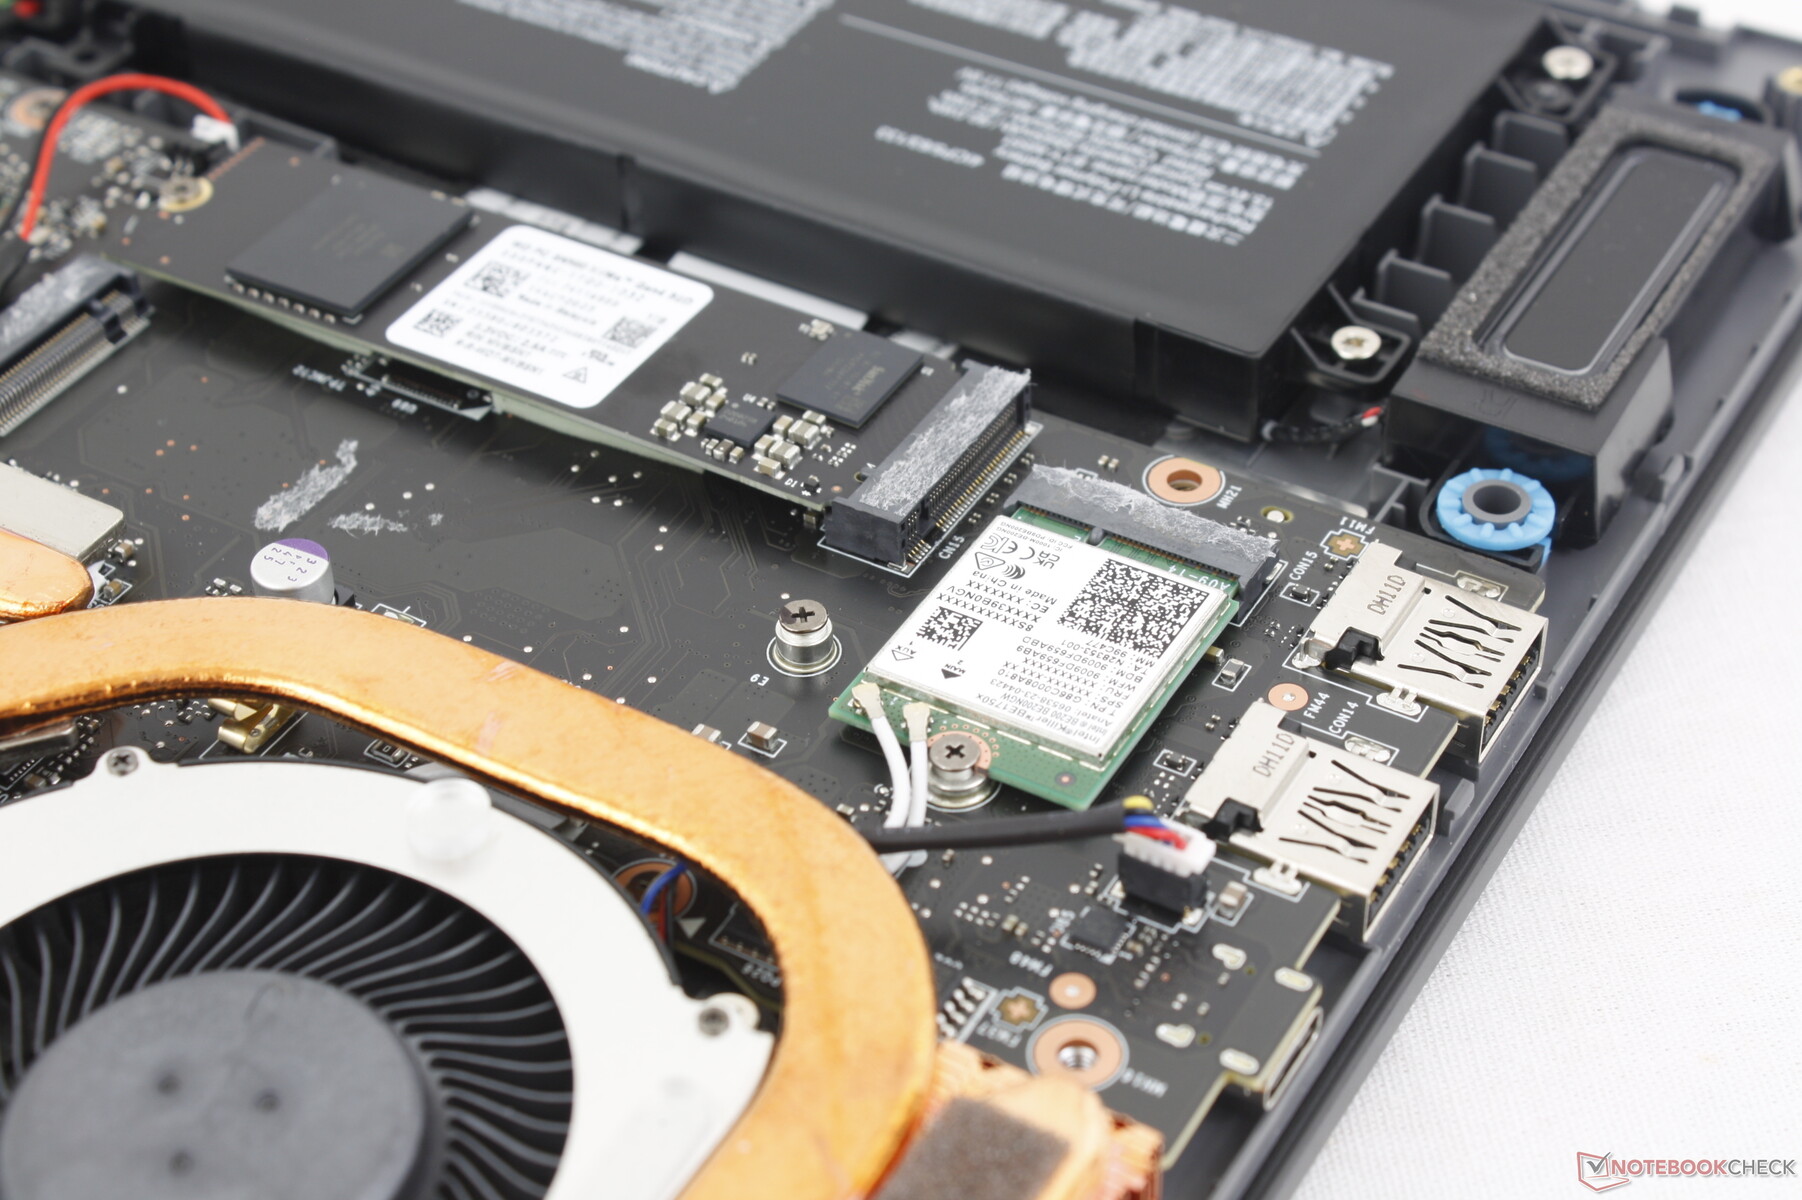
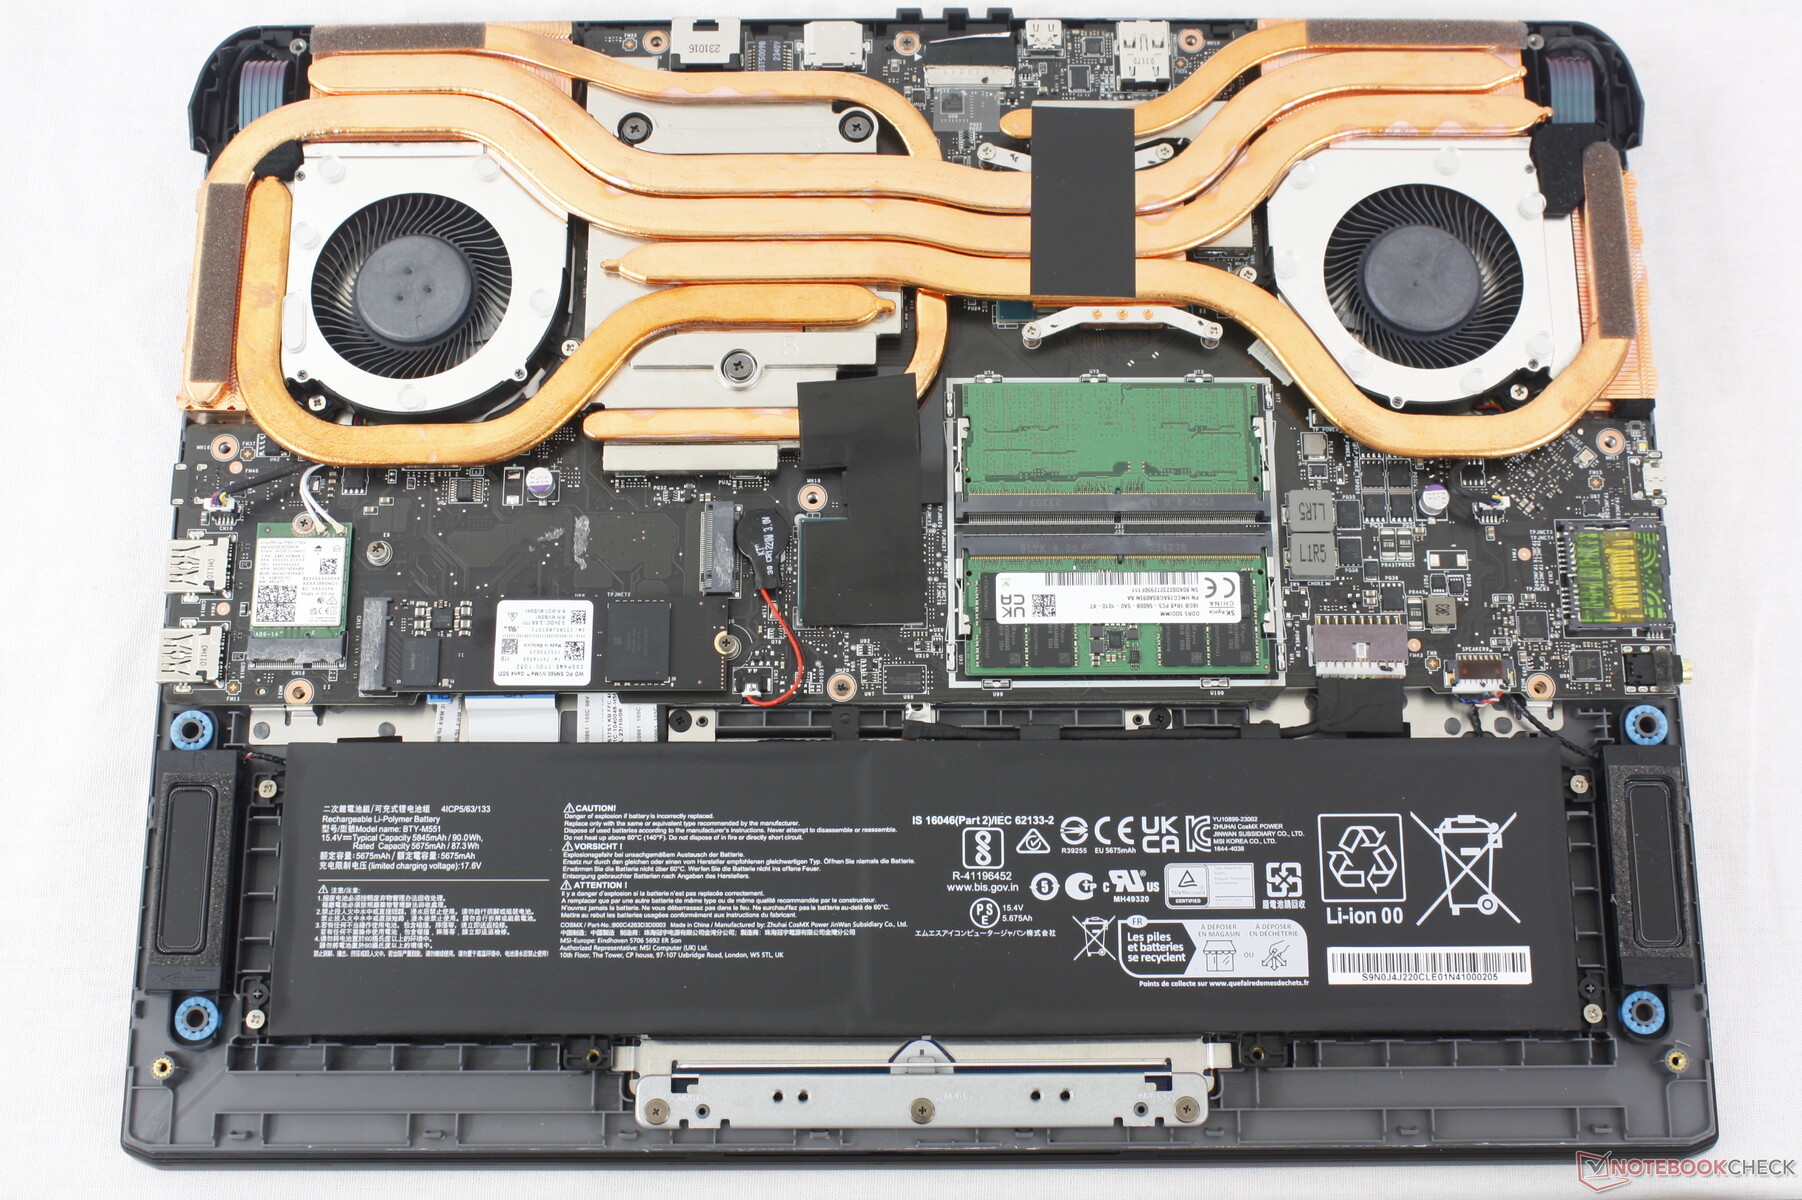
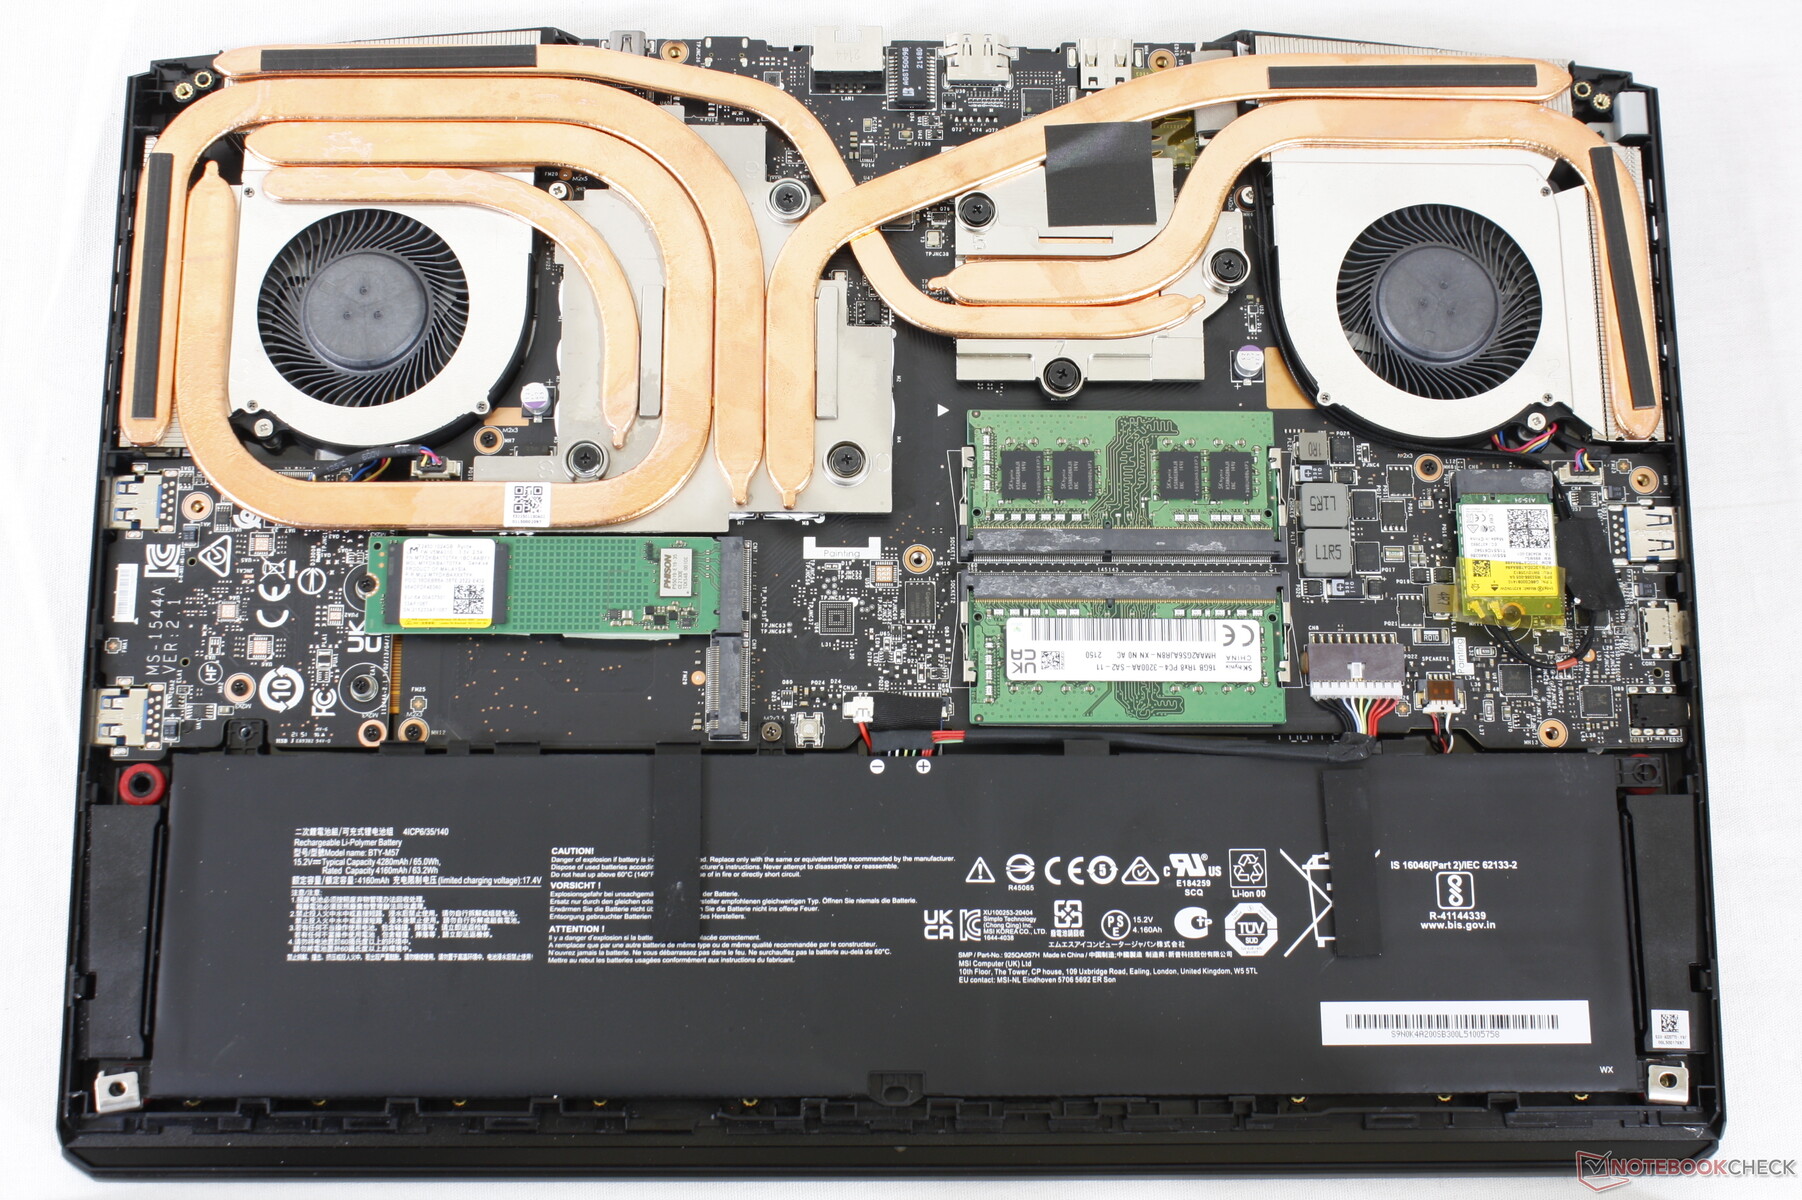
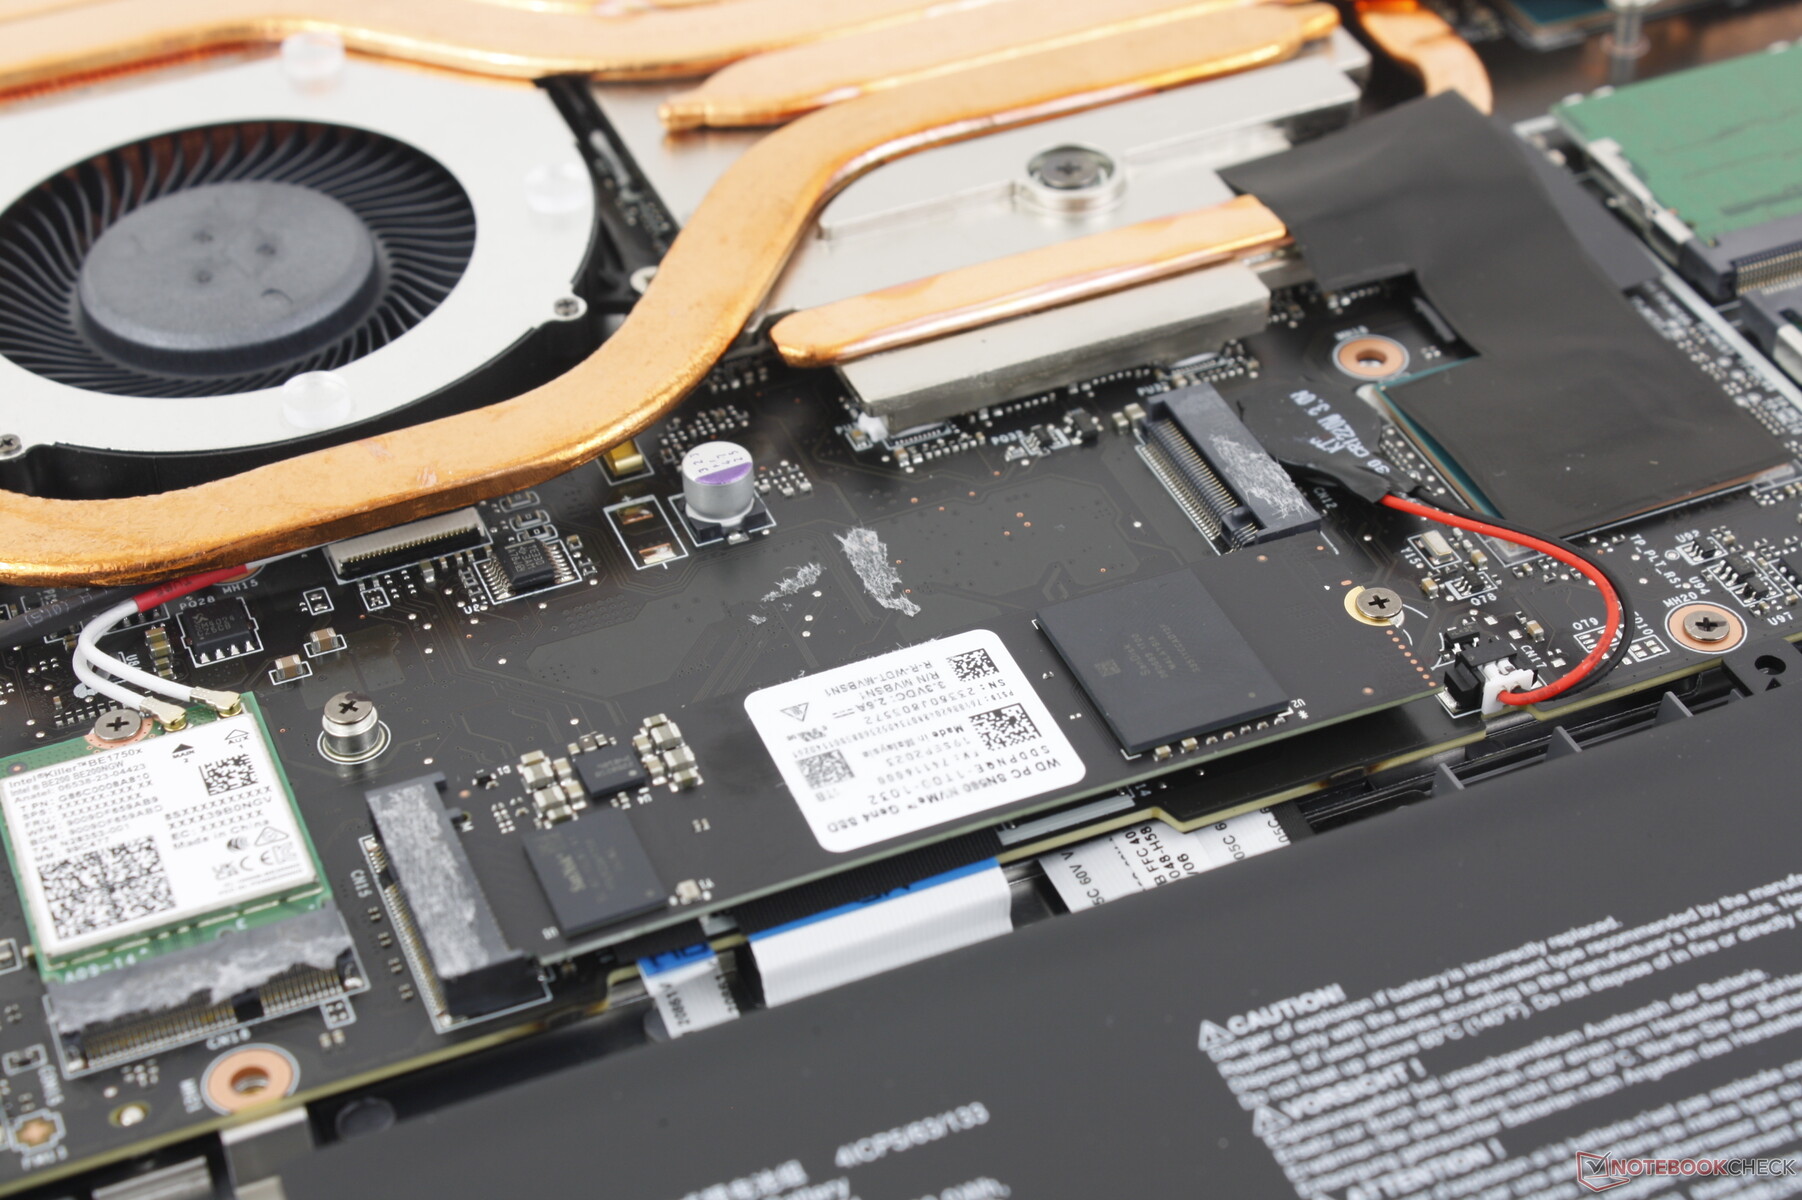
Le panneau inférieur est fixé par 13 vis Phillips. Malheureusement, le retrait du panneau peut s'avérer difficile, car les bords et les coins présentent des courbes importantes qui rendent l'opération plus fastidieuse qu'elle ne devrait l'être. En comparaison, le panneau inférieur du Razer Blade 16 est beaucoup plus plat et comporte moins de loquets, ce qui facilite le retrait. Il est recommandé d'utiliser un bord plat pour l'entretien du Vector 16 HX.
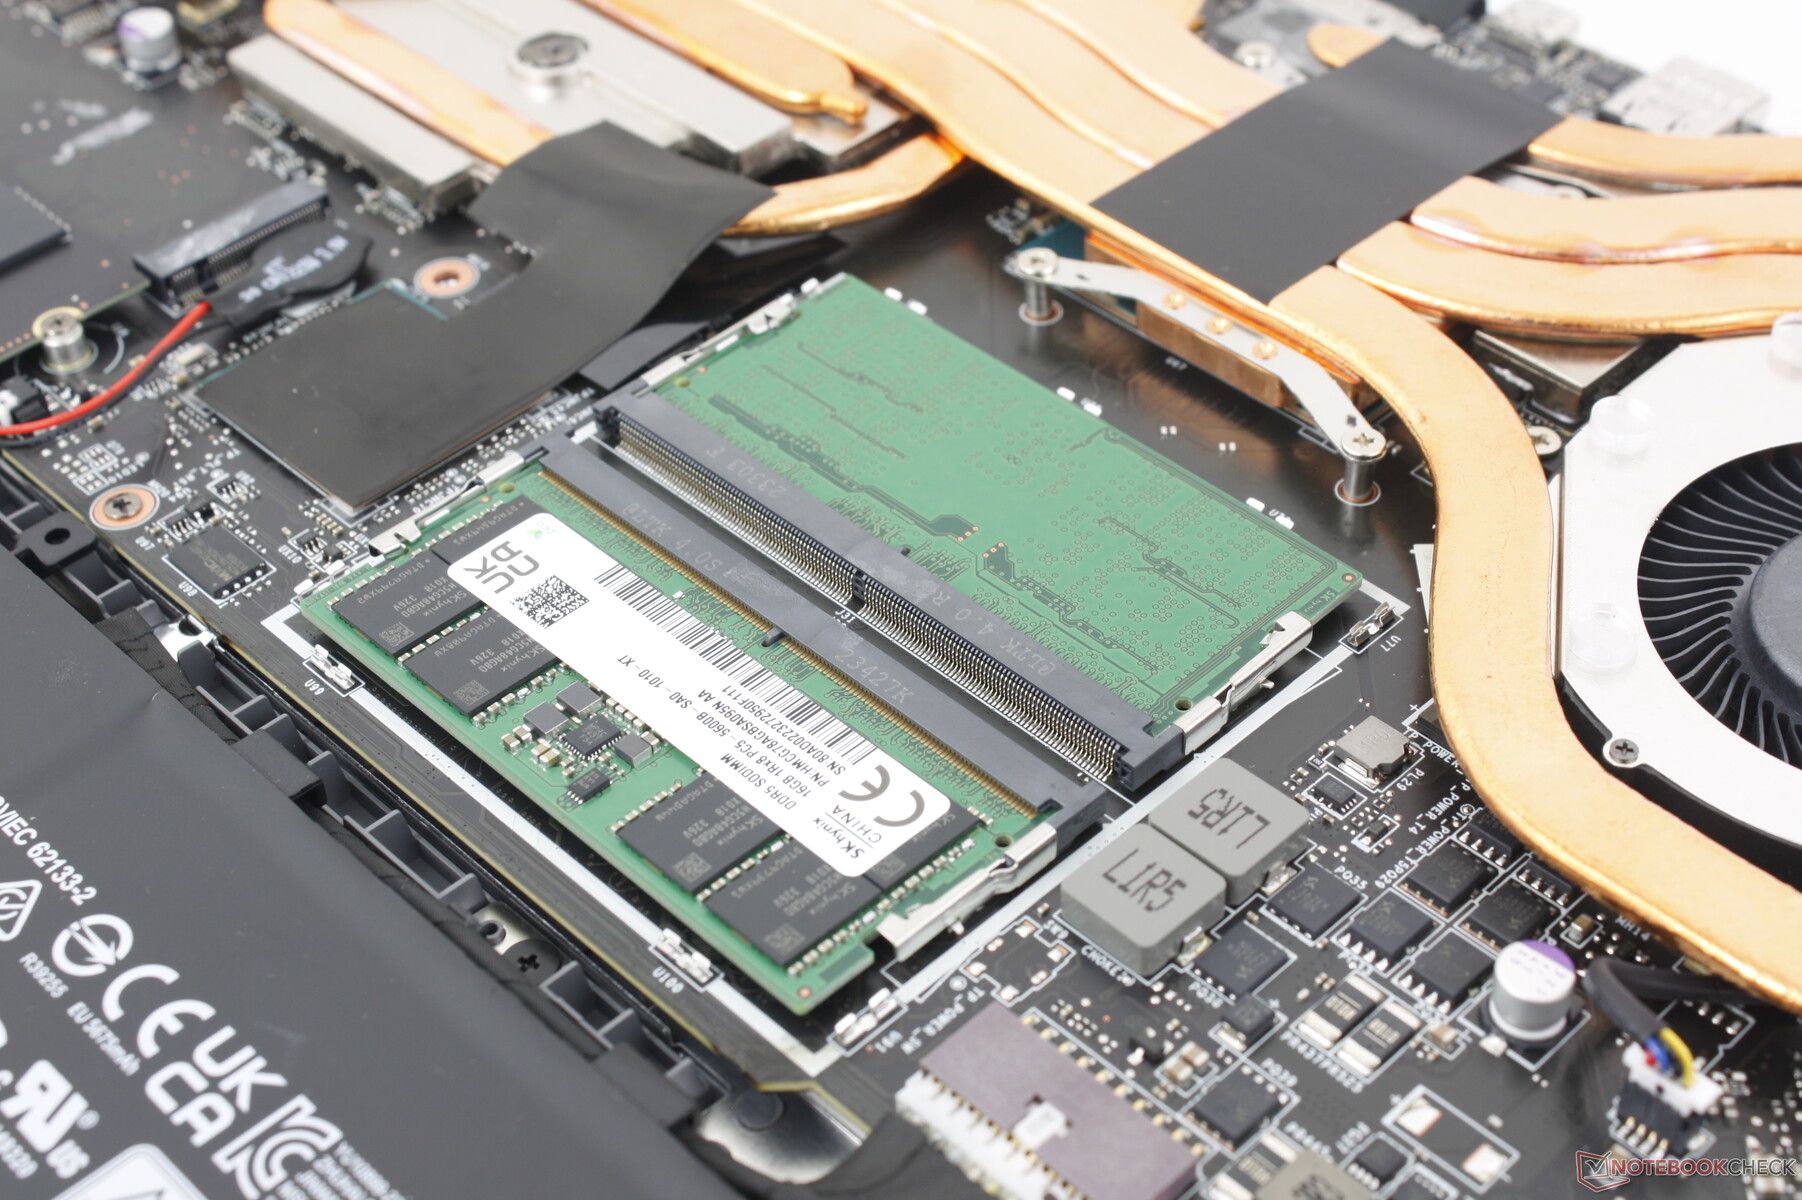
Une fois à l'intérieur, les utilisateurs auront accès à 2 baies de stockage M.2, 2 emplacements SODIMM, la batterie et le module WLAN comme sur l'ancien Vector GP66.
Accessoires et garantie
La boîte ne contient pas d'autres éléments que l'adaptateur secteur et la documentation. La garantie limitée habituelle d'un an du fabricant s'applique si l'appareil est acheté aux États-Unis.
Dispositifs d'entrée - simples et fonctionnels
Clavier
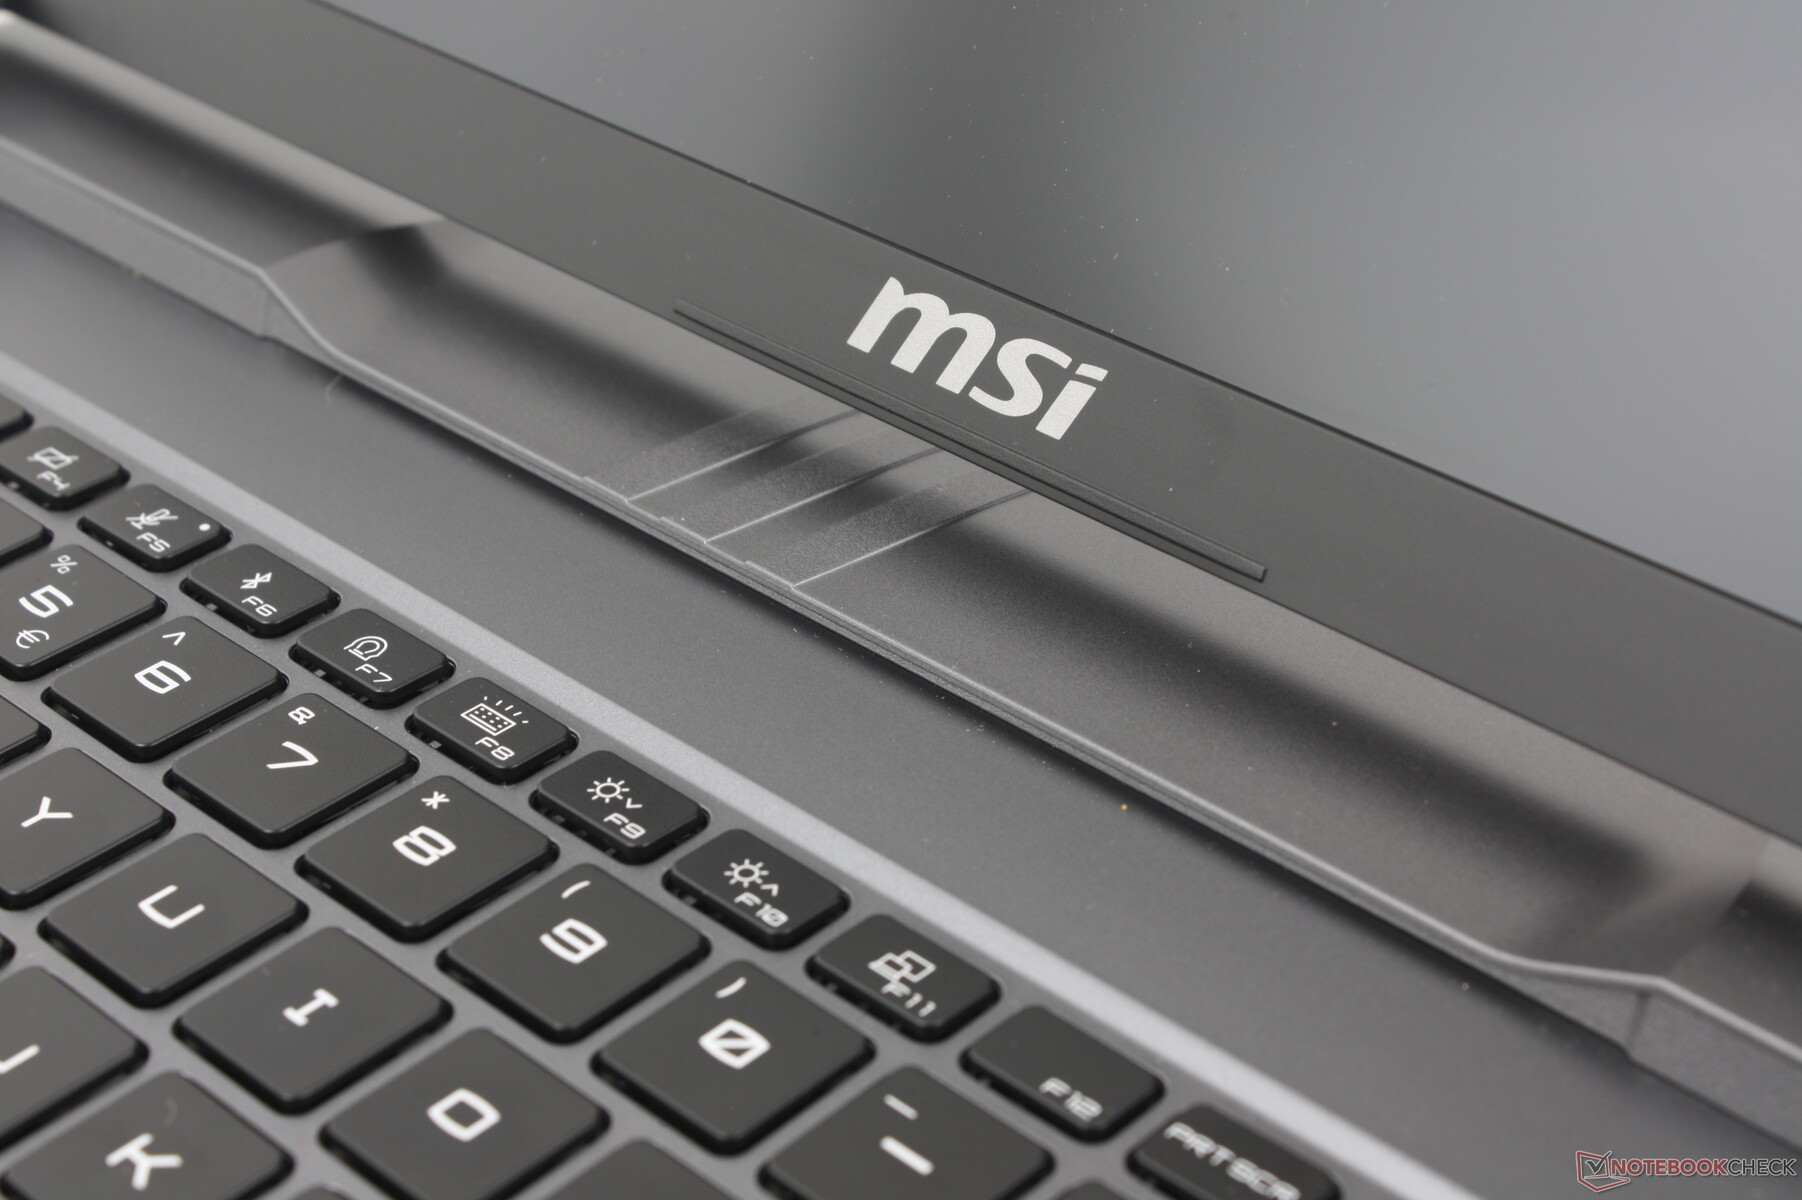
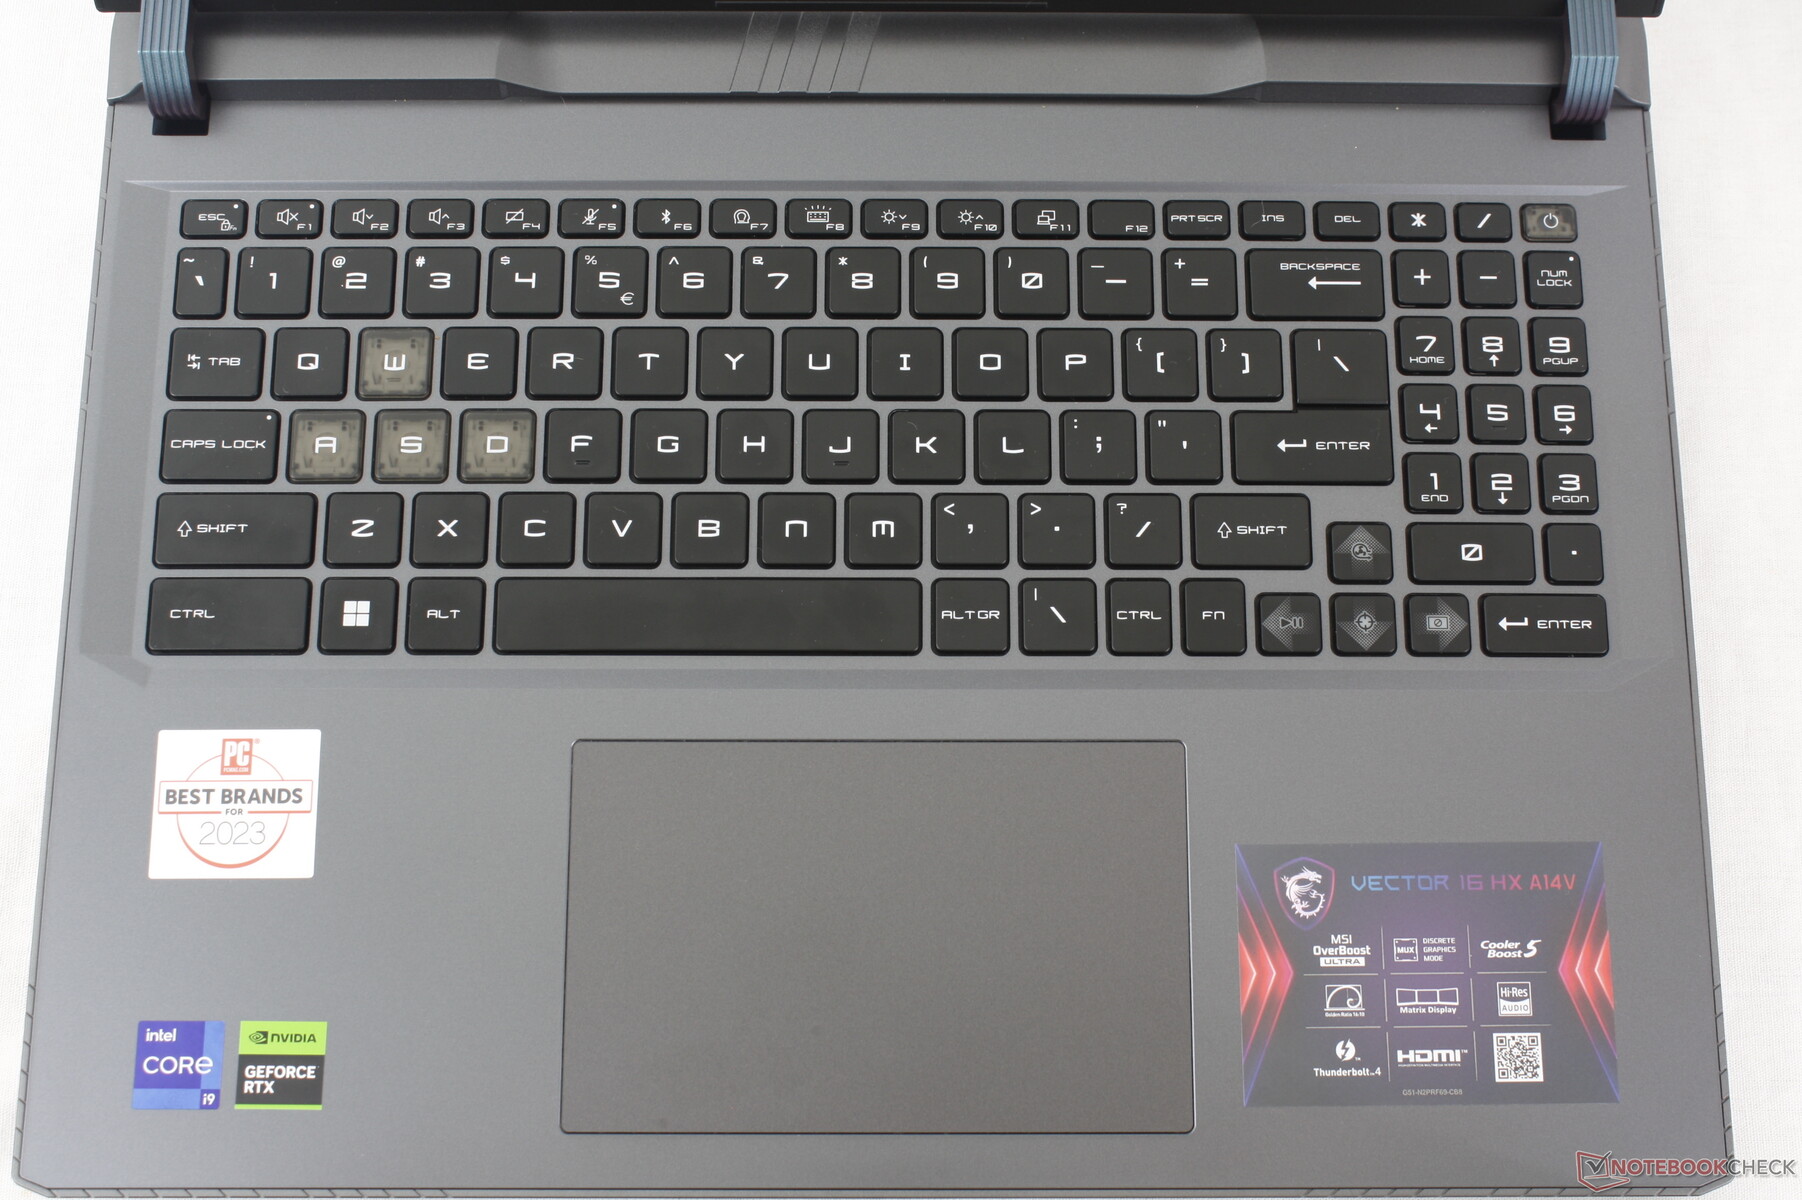
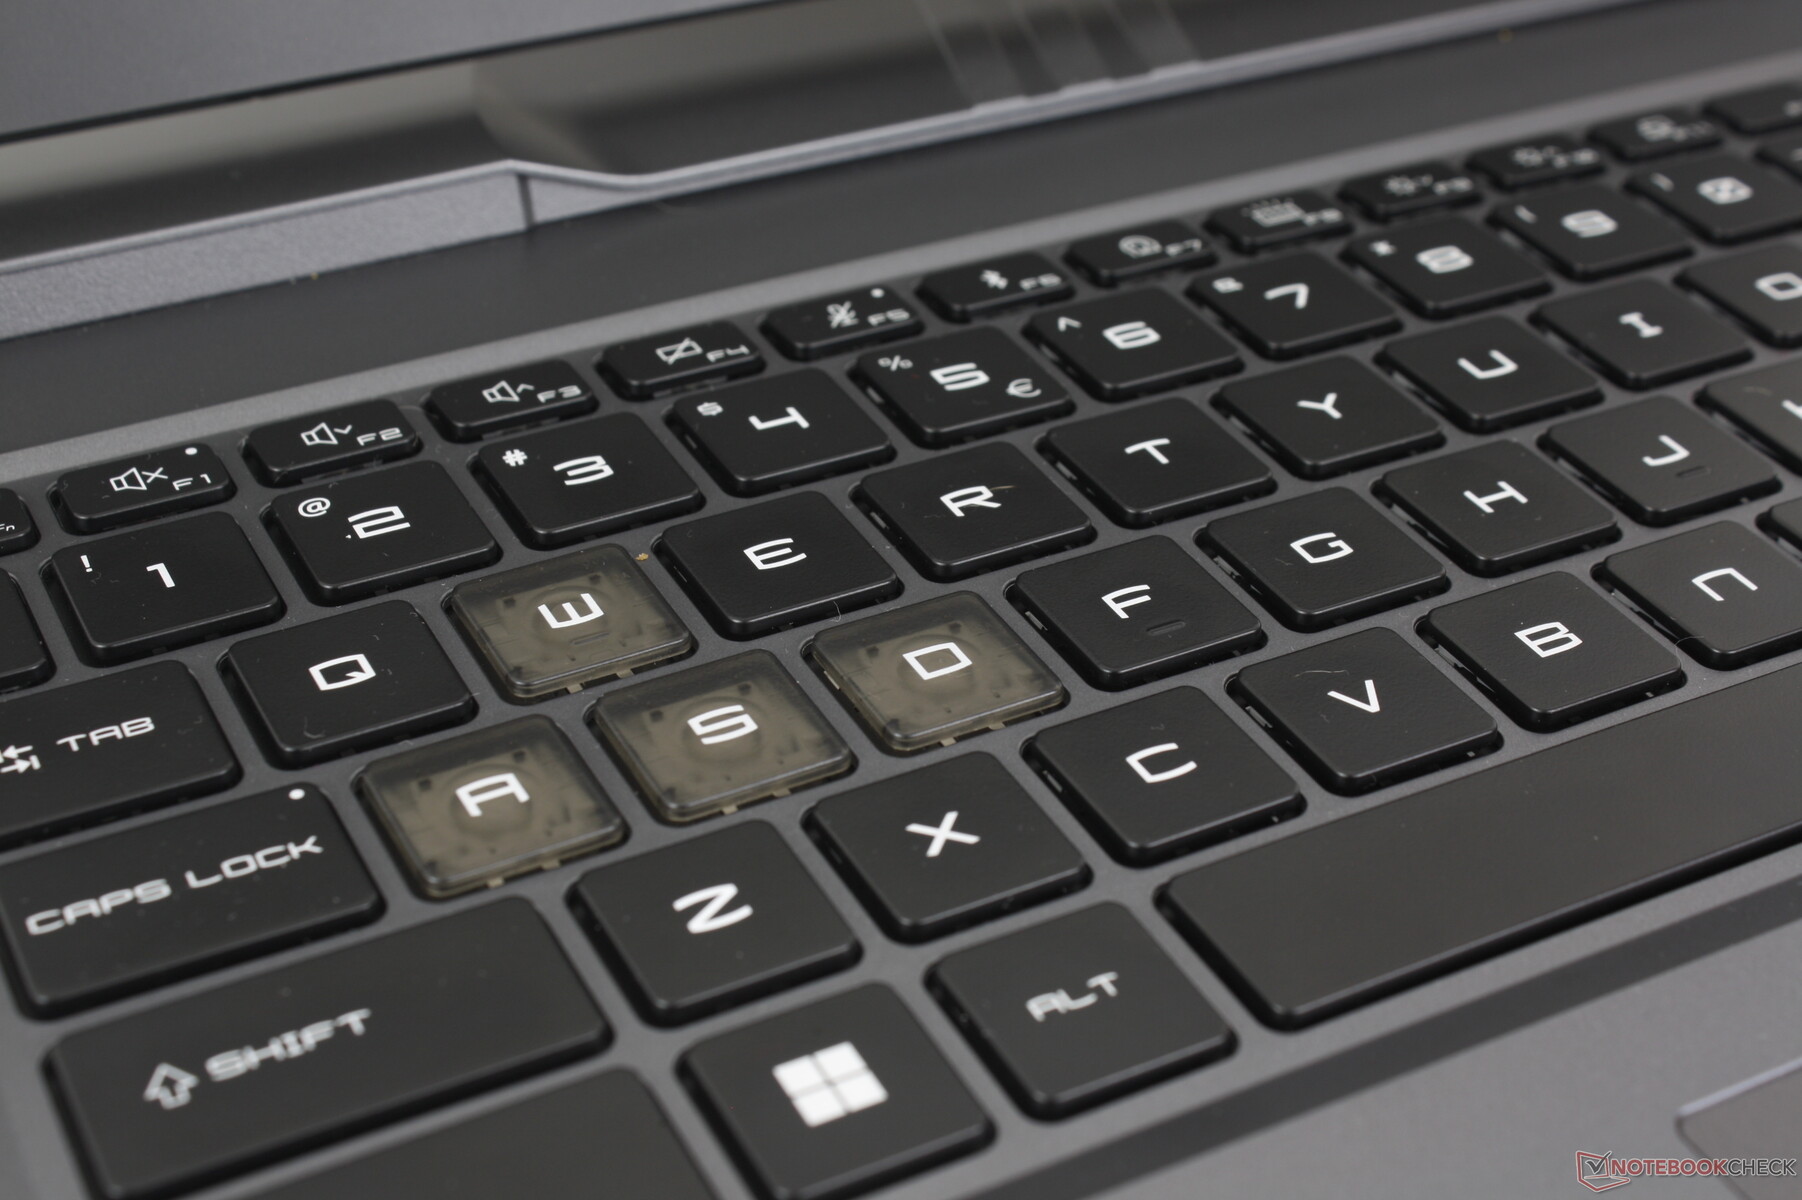
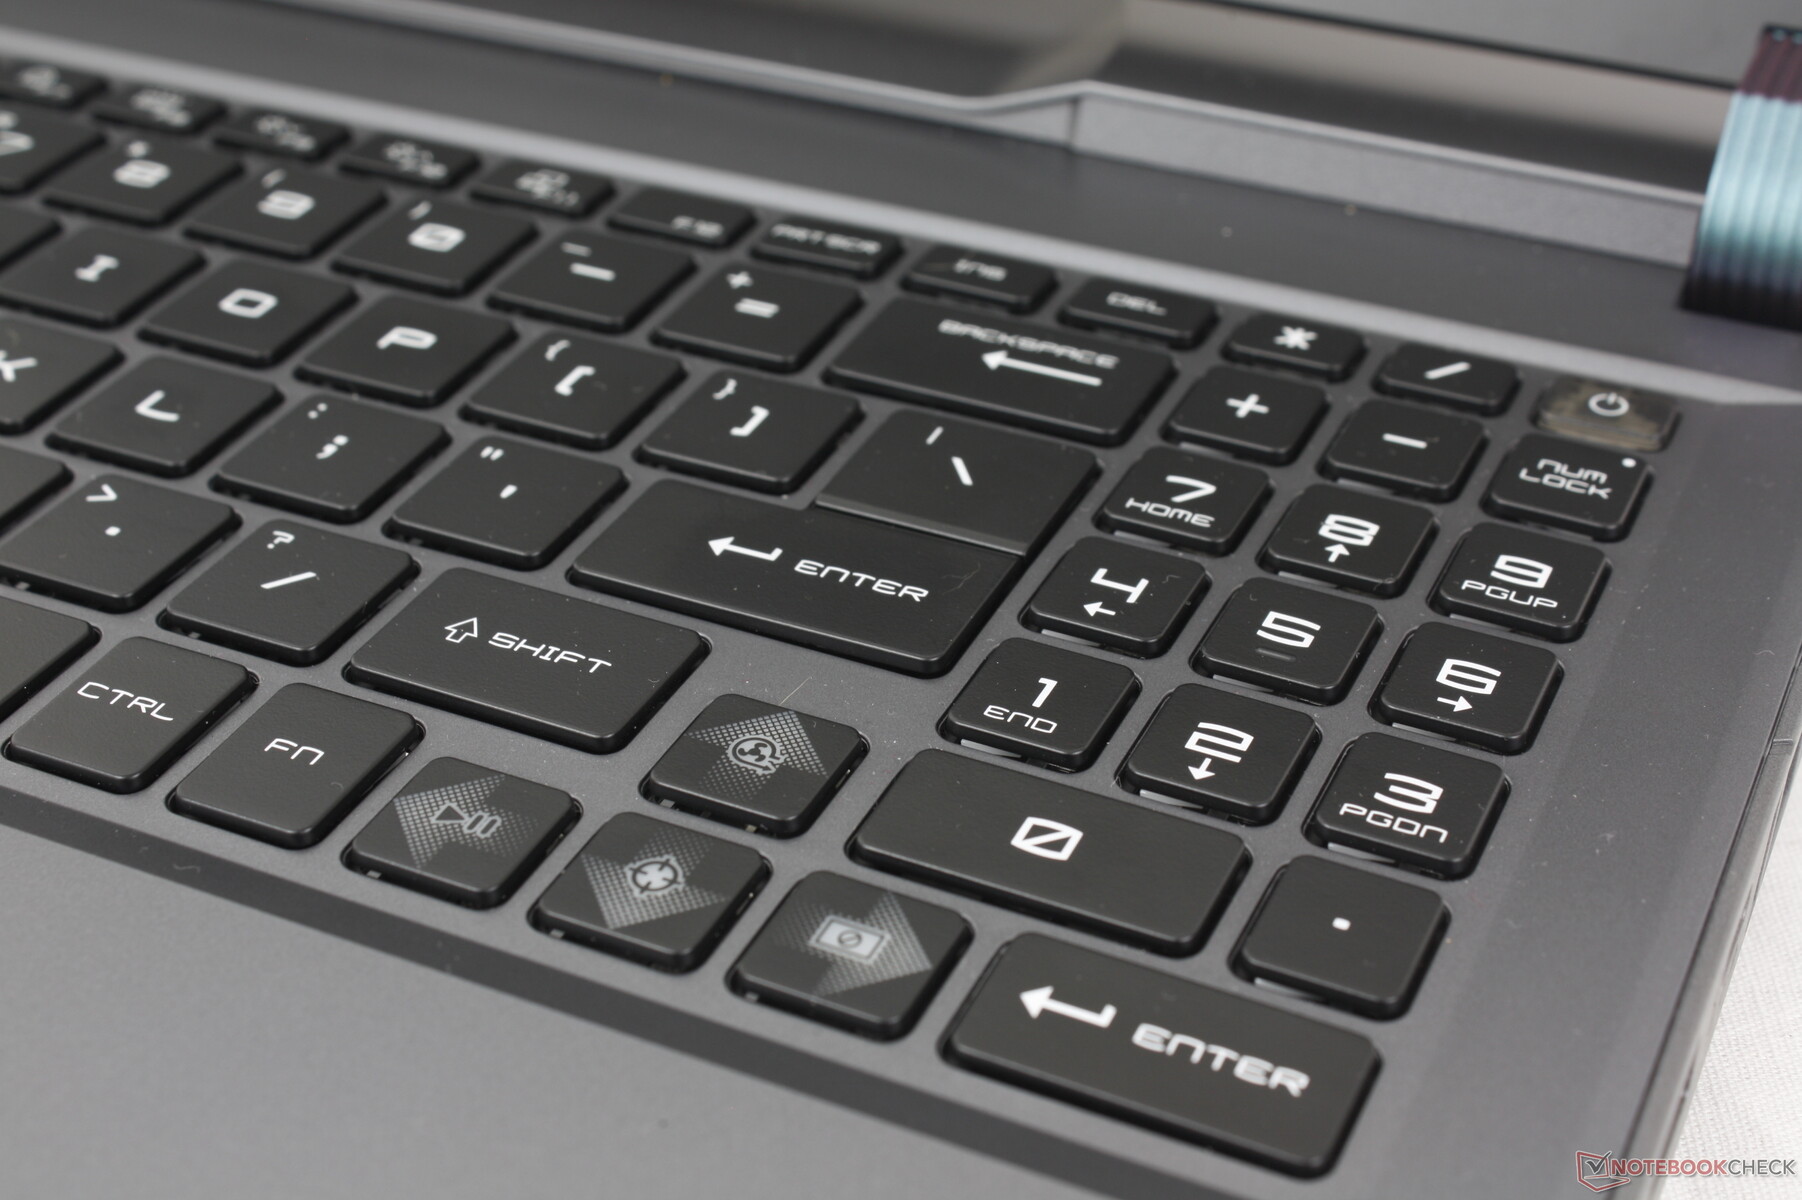
MSI a revu la disposition du clavier par rapport à l'ancien modèle Vector GP66 plus ancien. Les touches Fn/Ctrl du GP66 sont maintenant séparées et il y a un nouveau pavé numérique alors que beaucoup d'autres ordinateurs portables de jeu n'ont pas de pavé numérique. Malheureusement, les touches fléchées sont plus petites qu'auparavant et les touches étroites du pavé numérique ne sont pas très confortables à utiliser. Leur implémentation donne l'impression d'avoir été pensée après coup par rapport aux touches QWERTY, qui sont par ailleurs plus grandes et plus confortables.
L'éclairage RVB par touche est fourni en standard pour illuminer toutes les touches et tous les symboles.
Pavé tactile
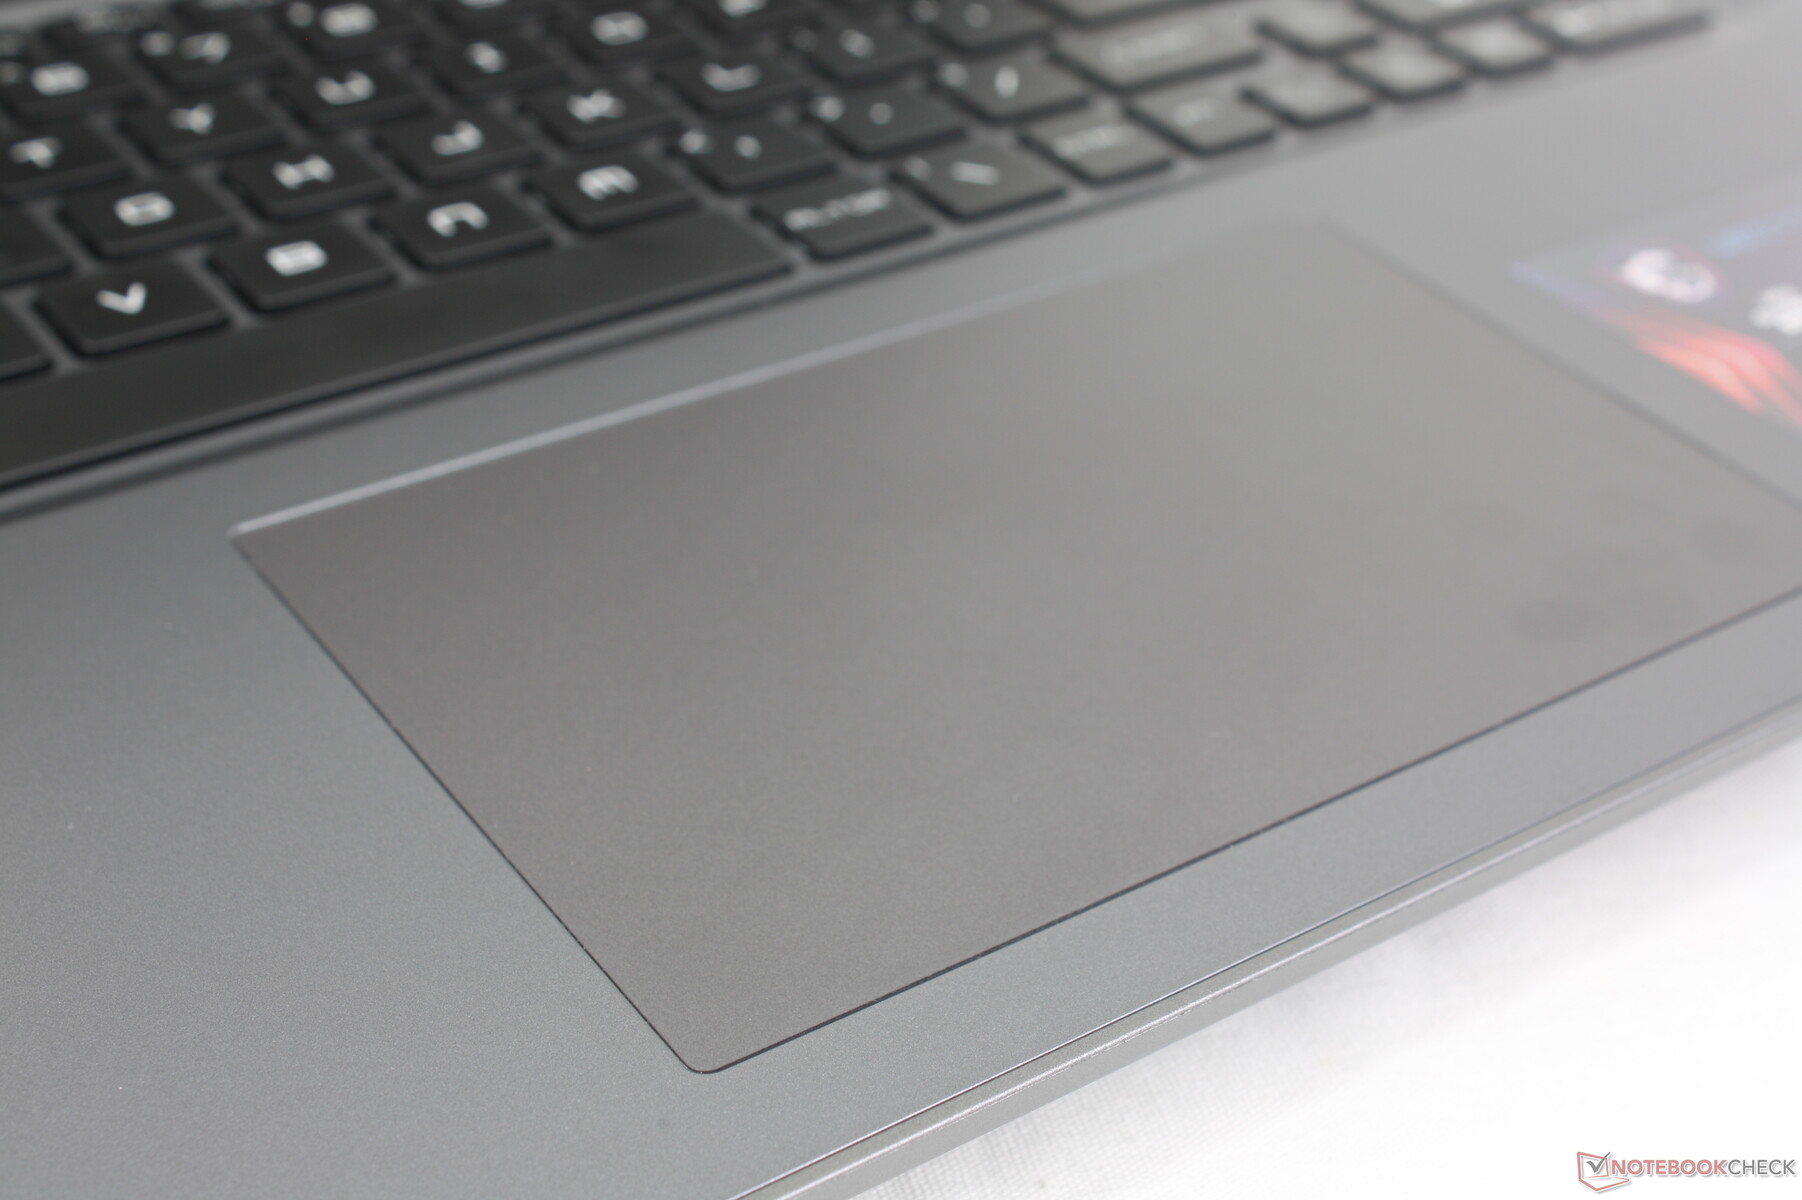
Avec des dimensions d'environ 13,2 x 8,2 cm, le pavé tactile est plus spacieux que celui du Dell G16 7620 (10,5 x 6 cm) et de l'ancien Vector GP66 (10,5 x 6,5 cm). La traction est très douce, avec seulement un très léger collage lorsque vous glissez à faible vitesse. Le retour d'information lors de l'appui sur le clavier est également assez ferme, malgré le bruit relativement silencieux. Les pavés tactiles sont généralement médiocres sur les ordinateurs portables de jeu, mais nous sommes heureux de voir qu'il y en a un qui est à peu près décent sur le Vector 16 HX.
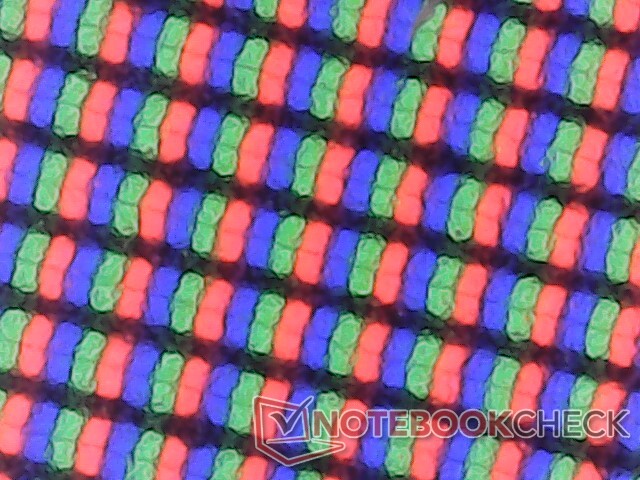
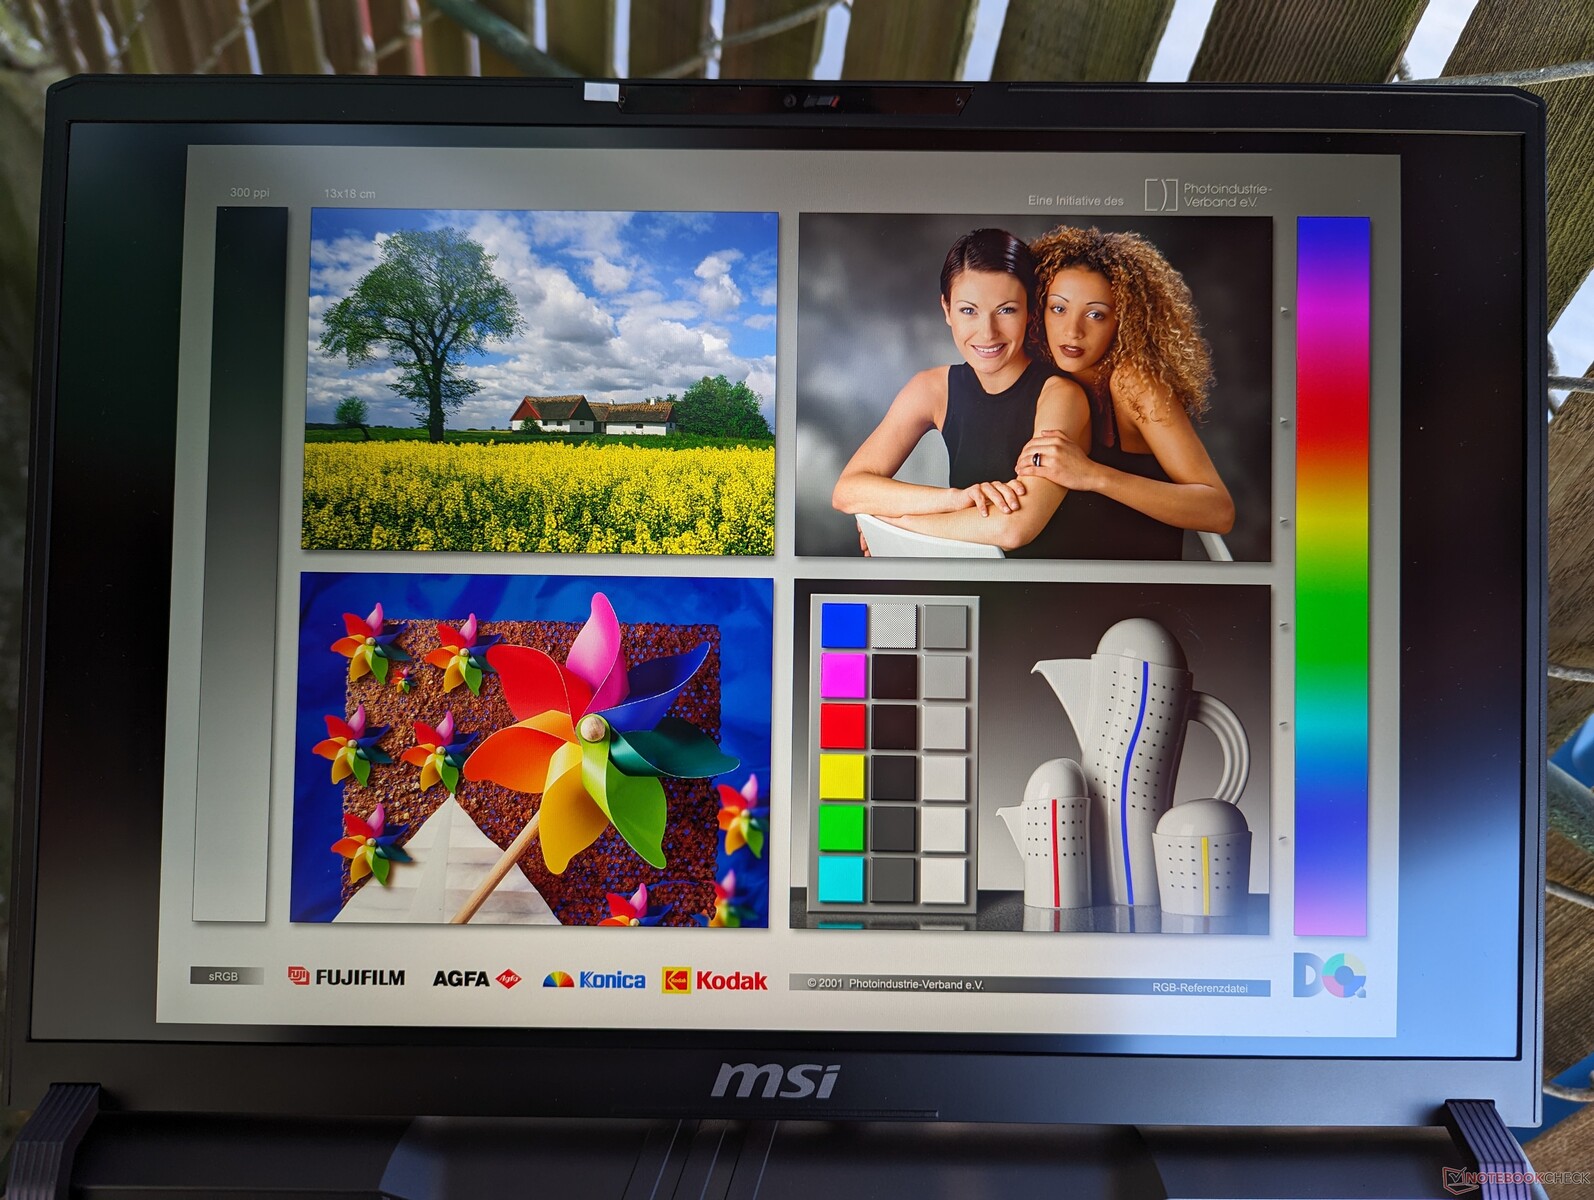
Affichage - Tout IPS sans G-Sync
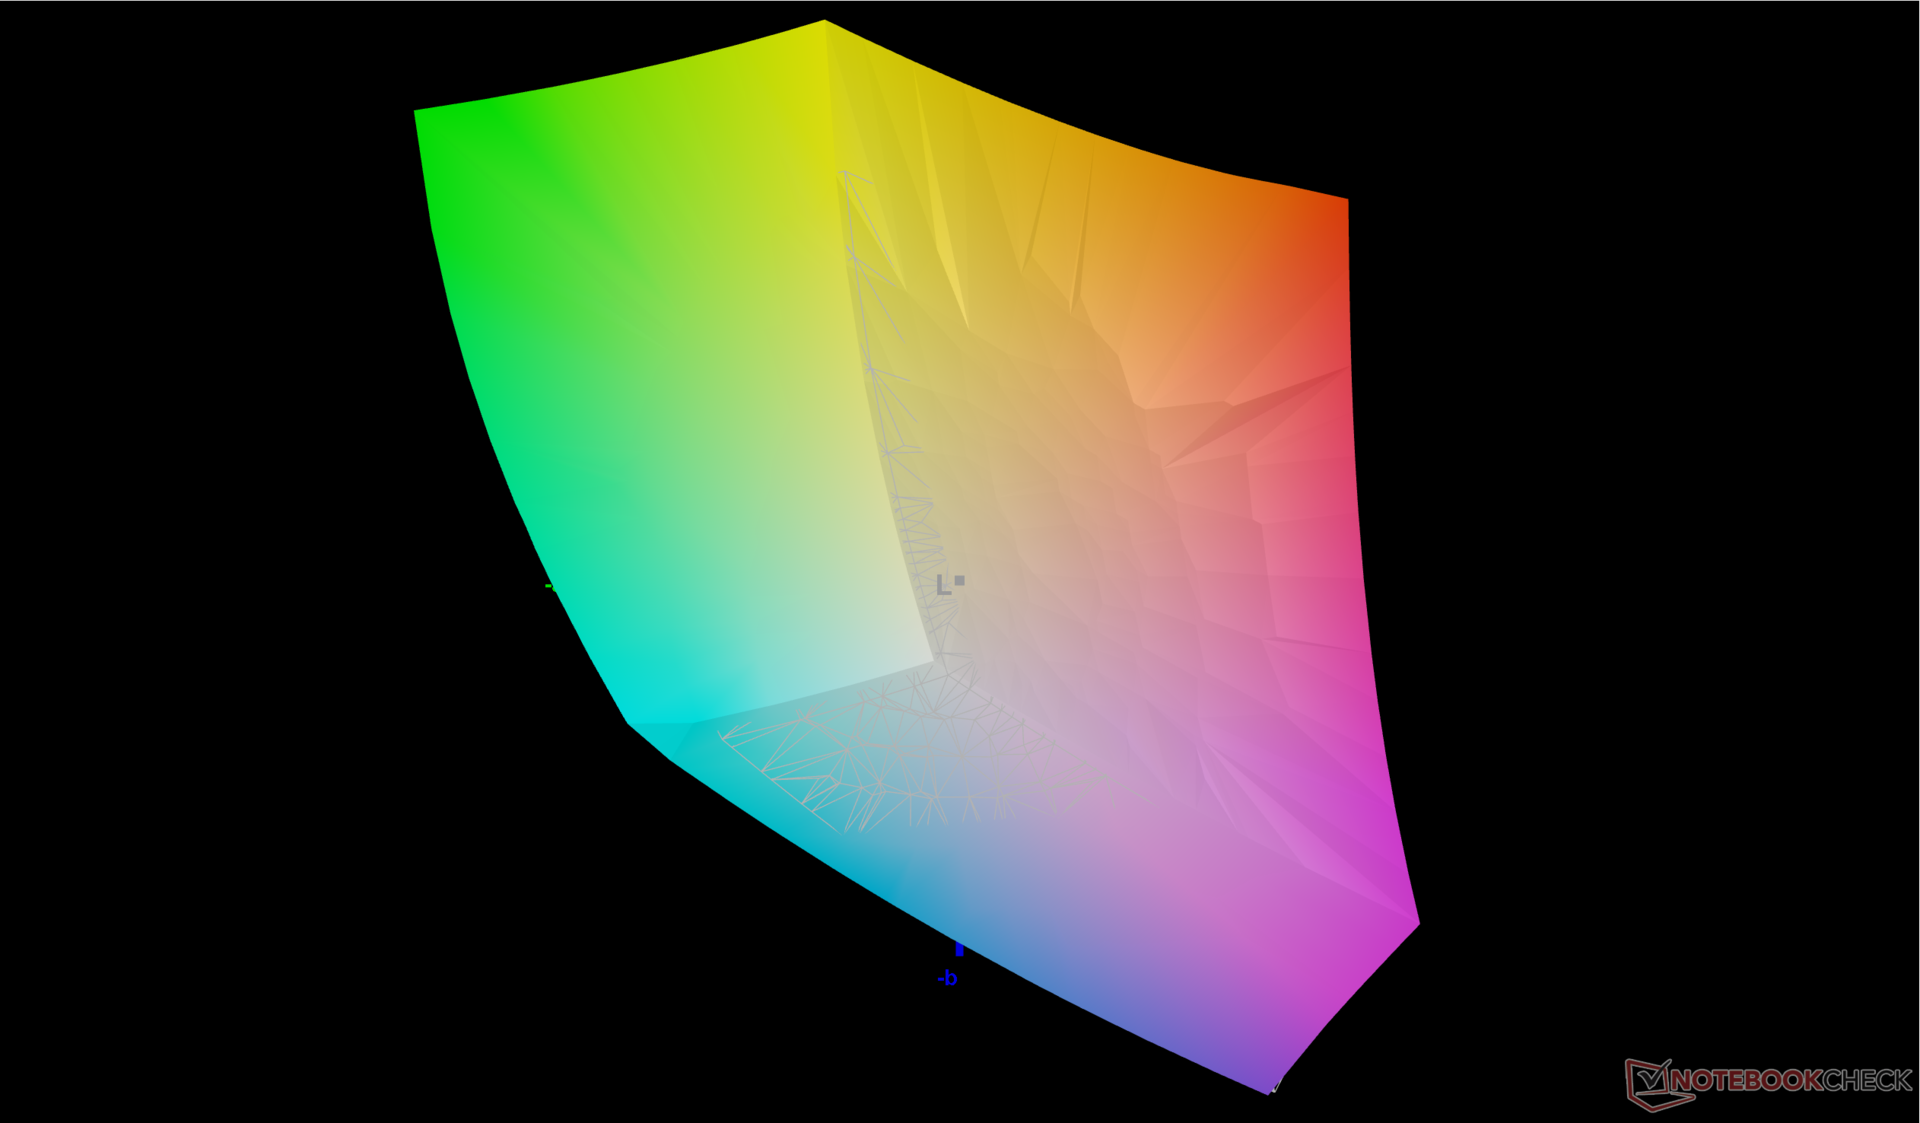
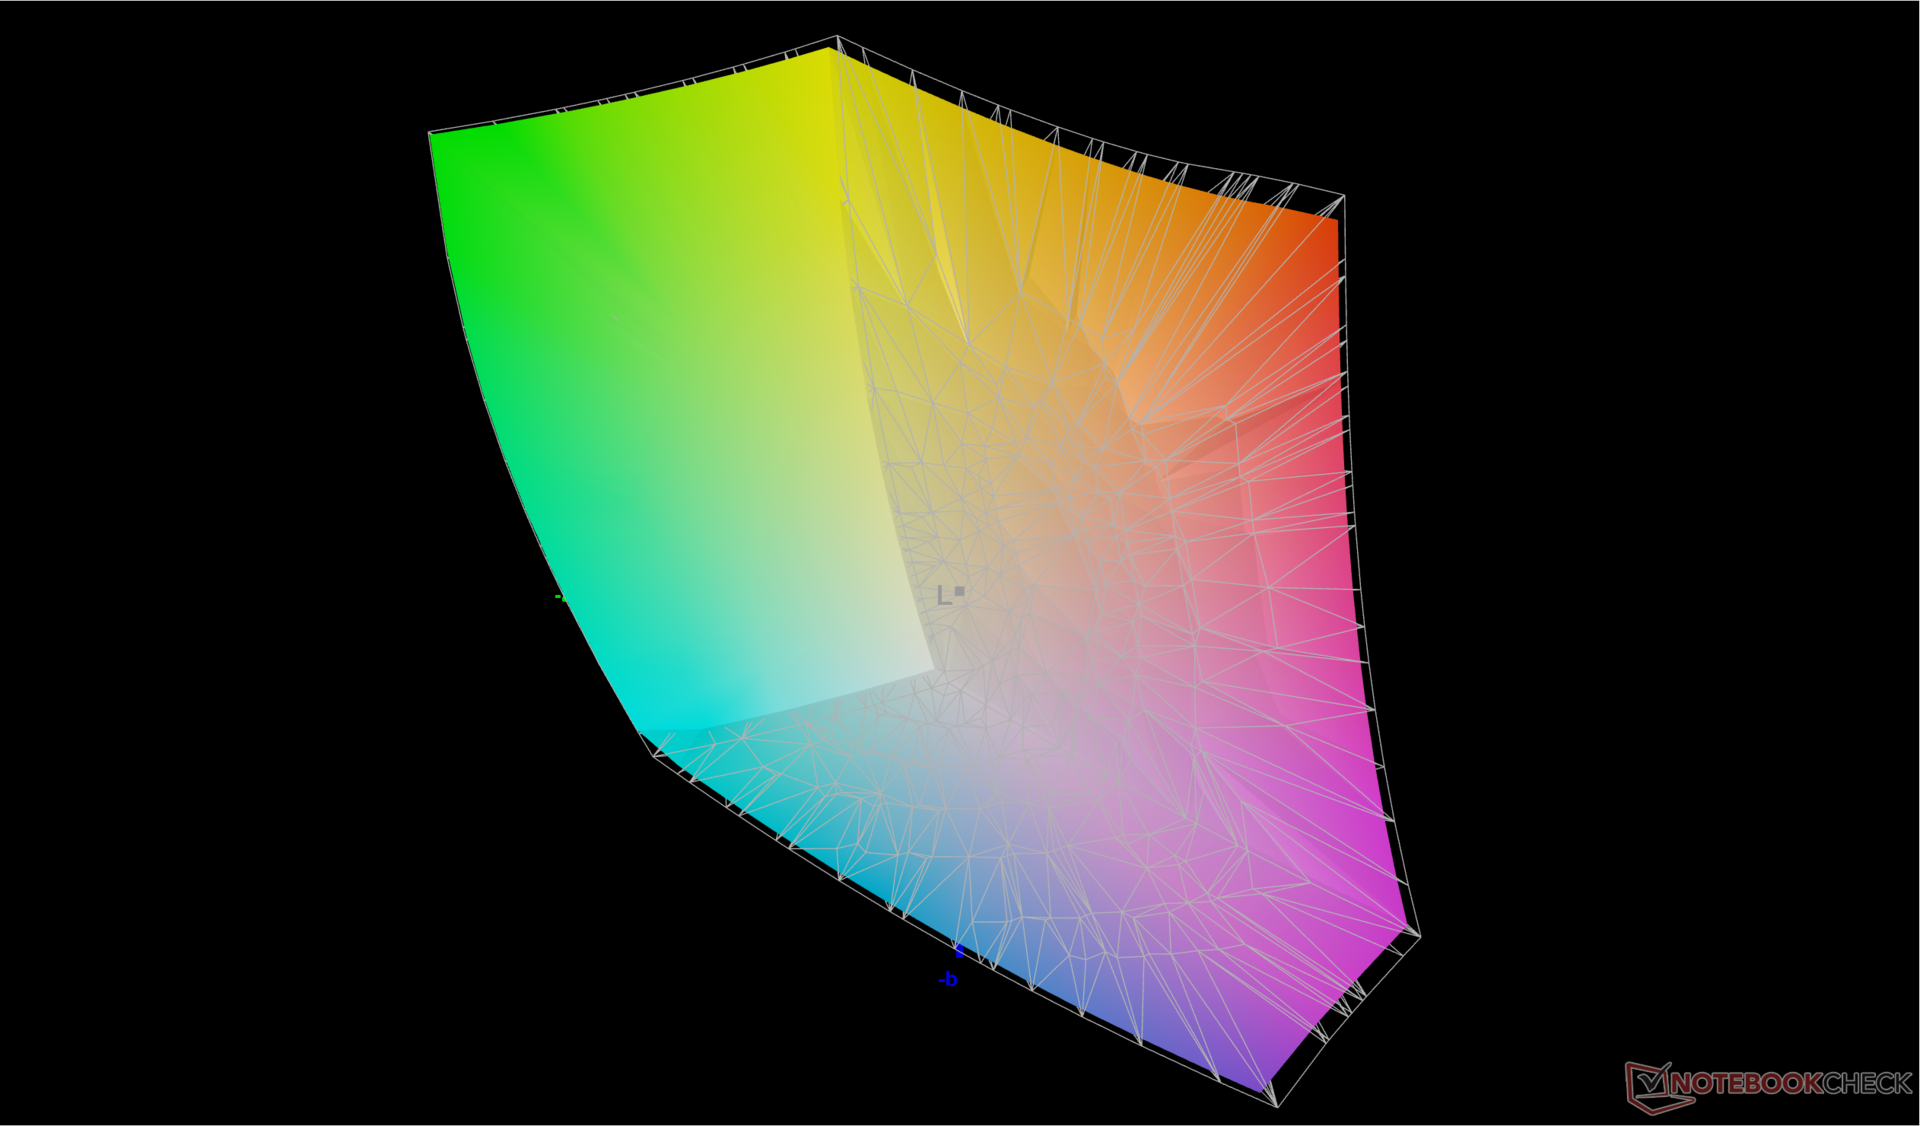
Il s'agit du premier système de notre base de données à être livré avec le panneau haut de gamme Chi Mei N160GME-GTB. Ses propriétés sont très similaires à celles du NE160QDM-NZ3 que l'on trouve sur le récent Lenovo Legion 5 16 mais avec une amélioration notable : une couverture DCI-P3 complète au lieu de sRGB uniquement. Autrement, les utilisateurs peuvent s'attendre au même taux de rafraîchissement natif de 240 Hz, au même rapport de contraste de ~1300:1 et aux mêmes temps de réponse rapides que sur la machine Lenovo.
La technologie G-Sync est absente de toutes les configurations actuelles du Vector 16 HX. Le taux de rafraîchissement est également fixé à 60 Hz ou 240 Hz, alors que les écrans à taux de rafraîchissement variable sont de plus en plus courants.
Gardez à l'esprit que la configuration 1200p 144 Hz, moins chère, aura probablement des attributs différents de notre configuration 1600p 240 Hz en termes de luminosité, de couleurs, etc.
| |||||||||||||||||||||||||
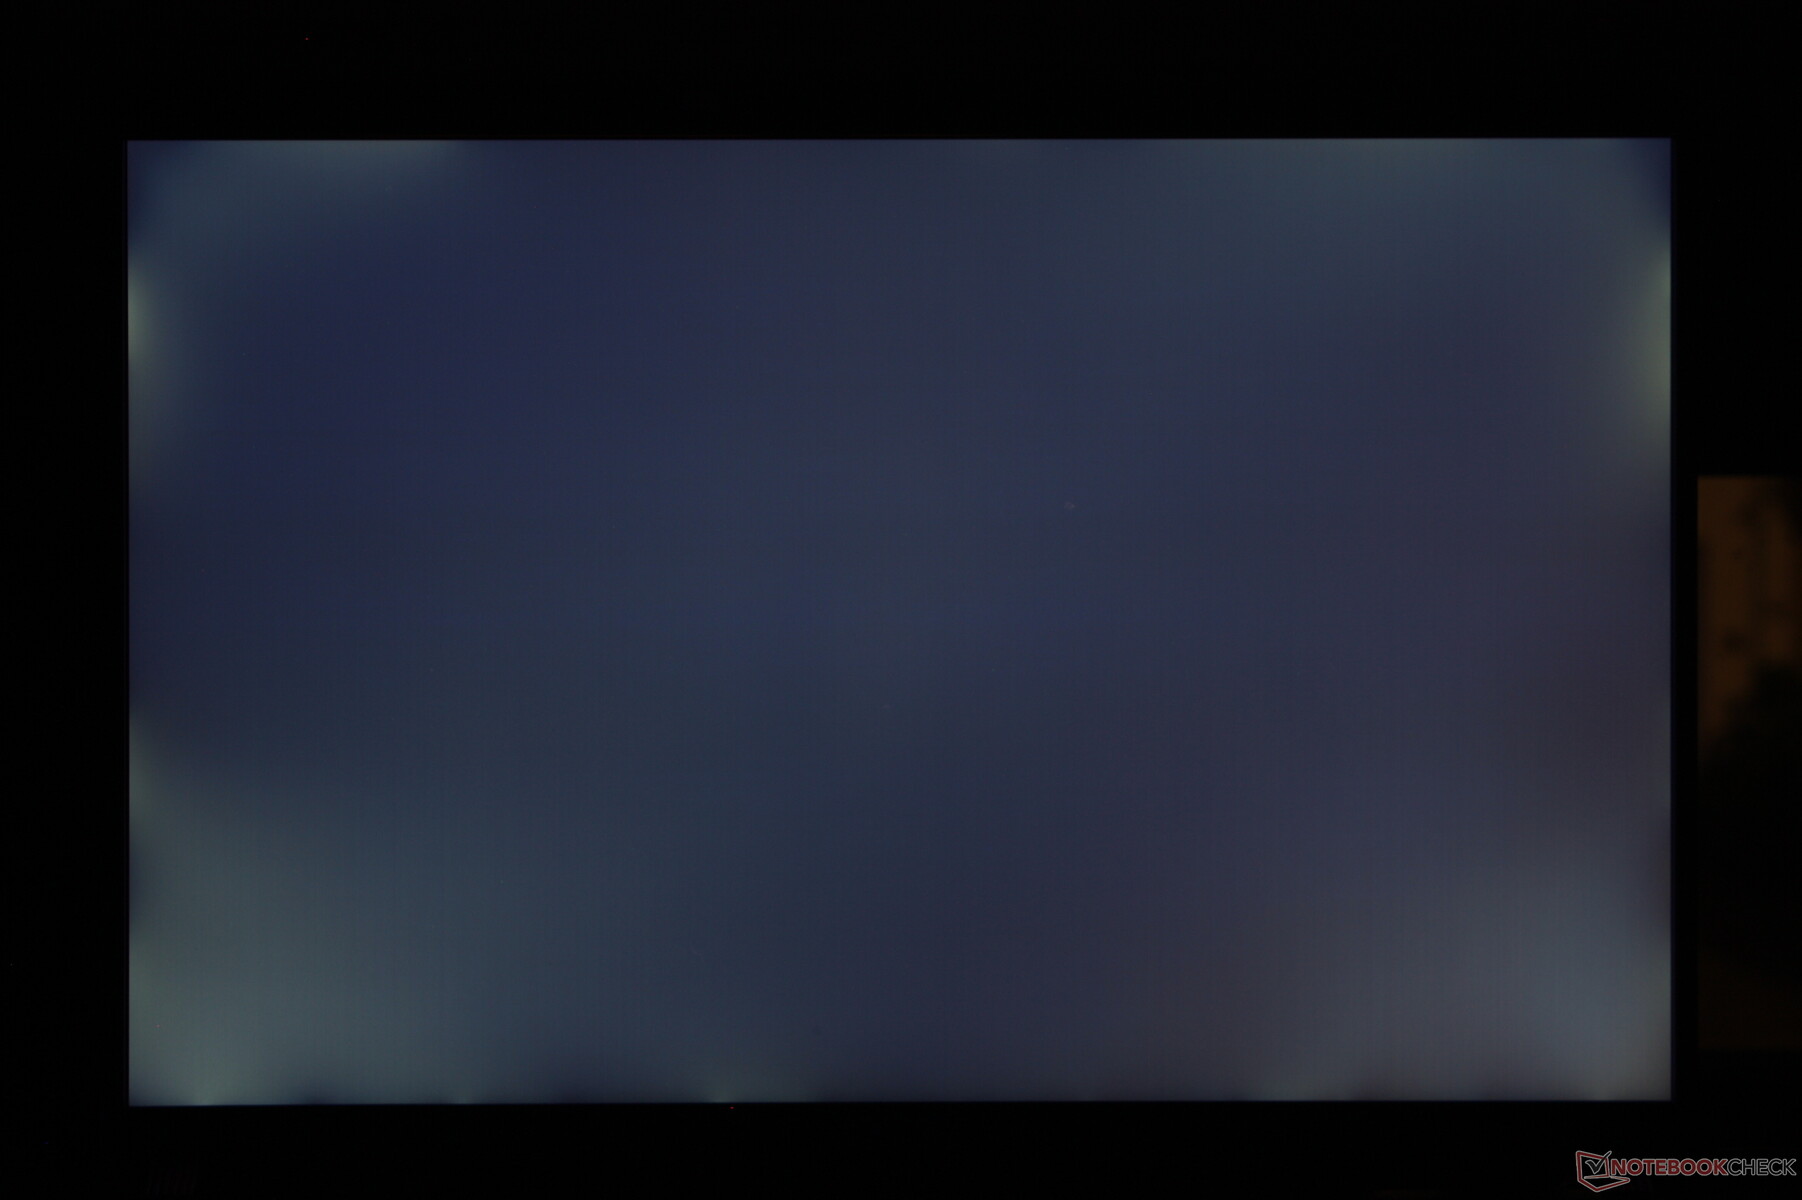
Homogénéité de la luminosité: 83 %
Valeur mesurée au centre, sur batterie: 557.2 cd/m²
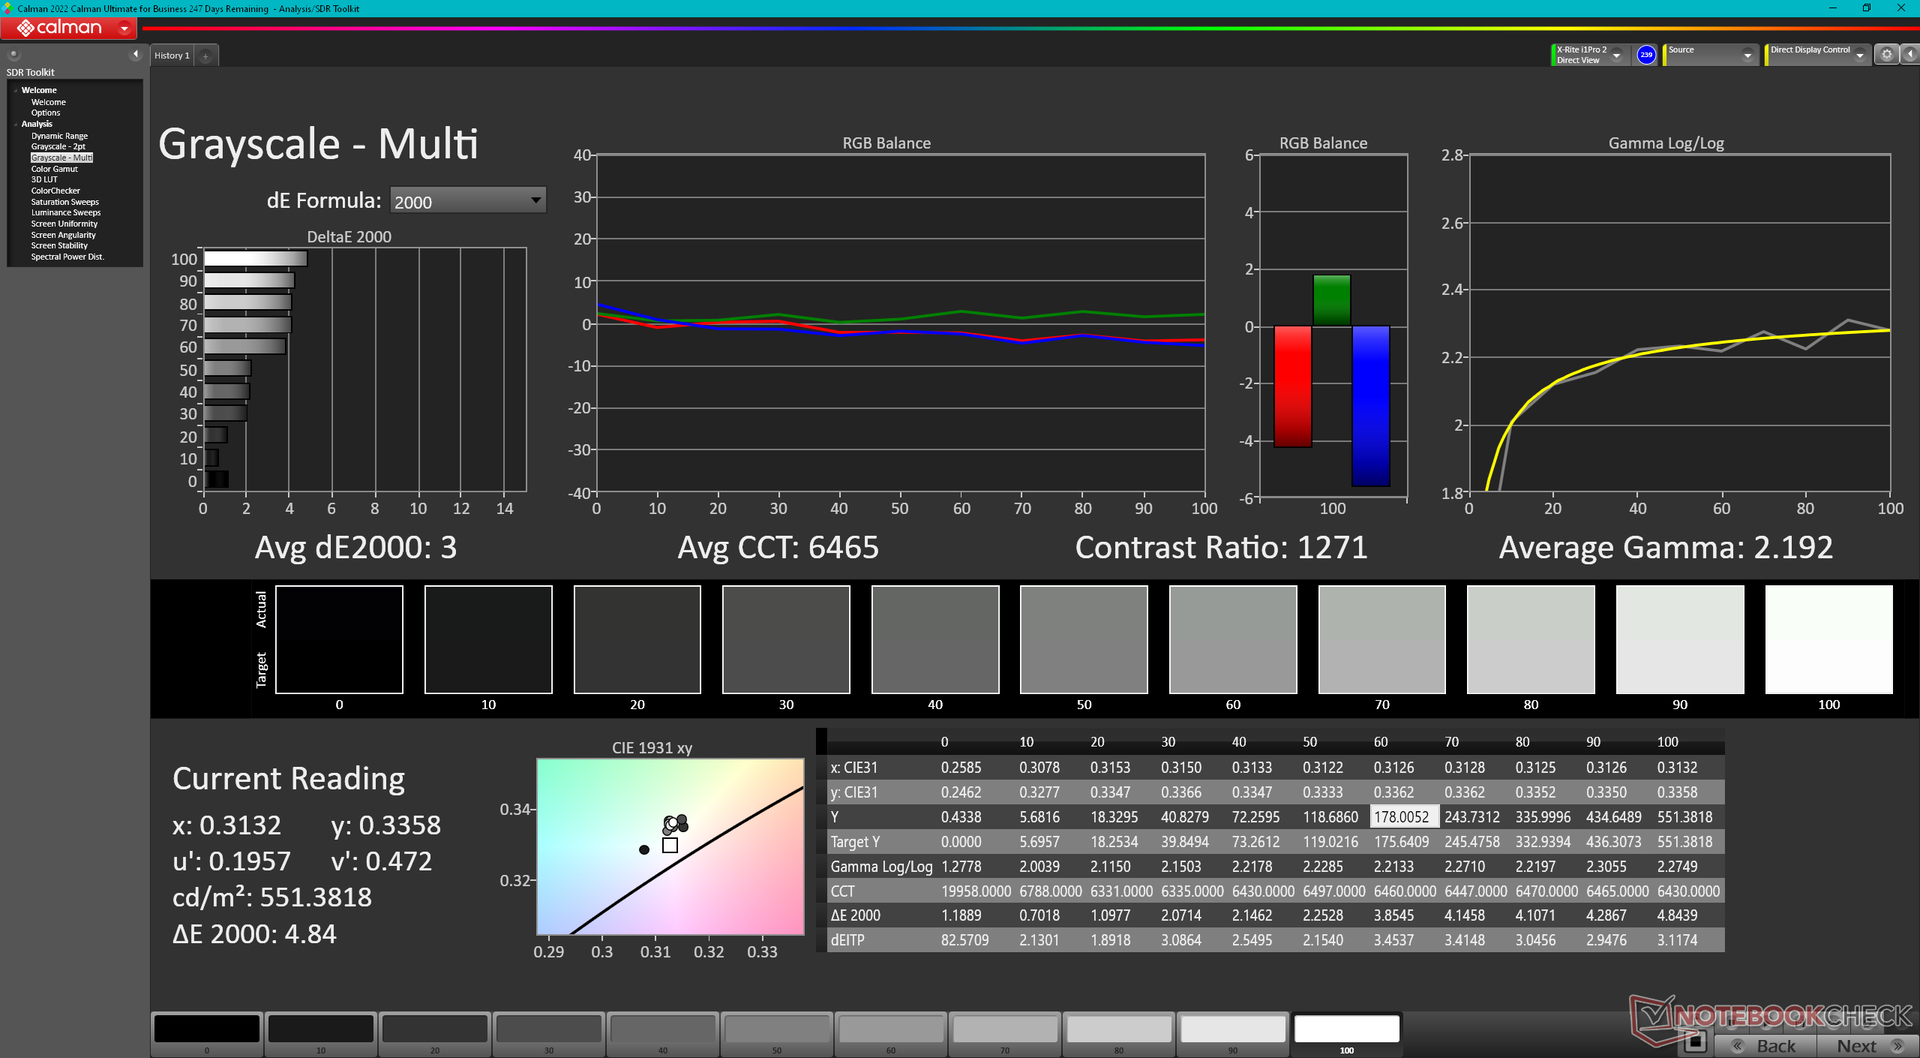
Contraste: 1359:1 (Valeurs des noirs: 0.41 cd/m²)
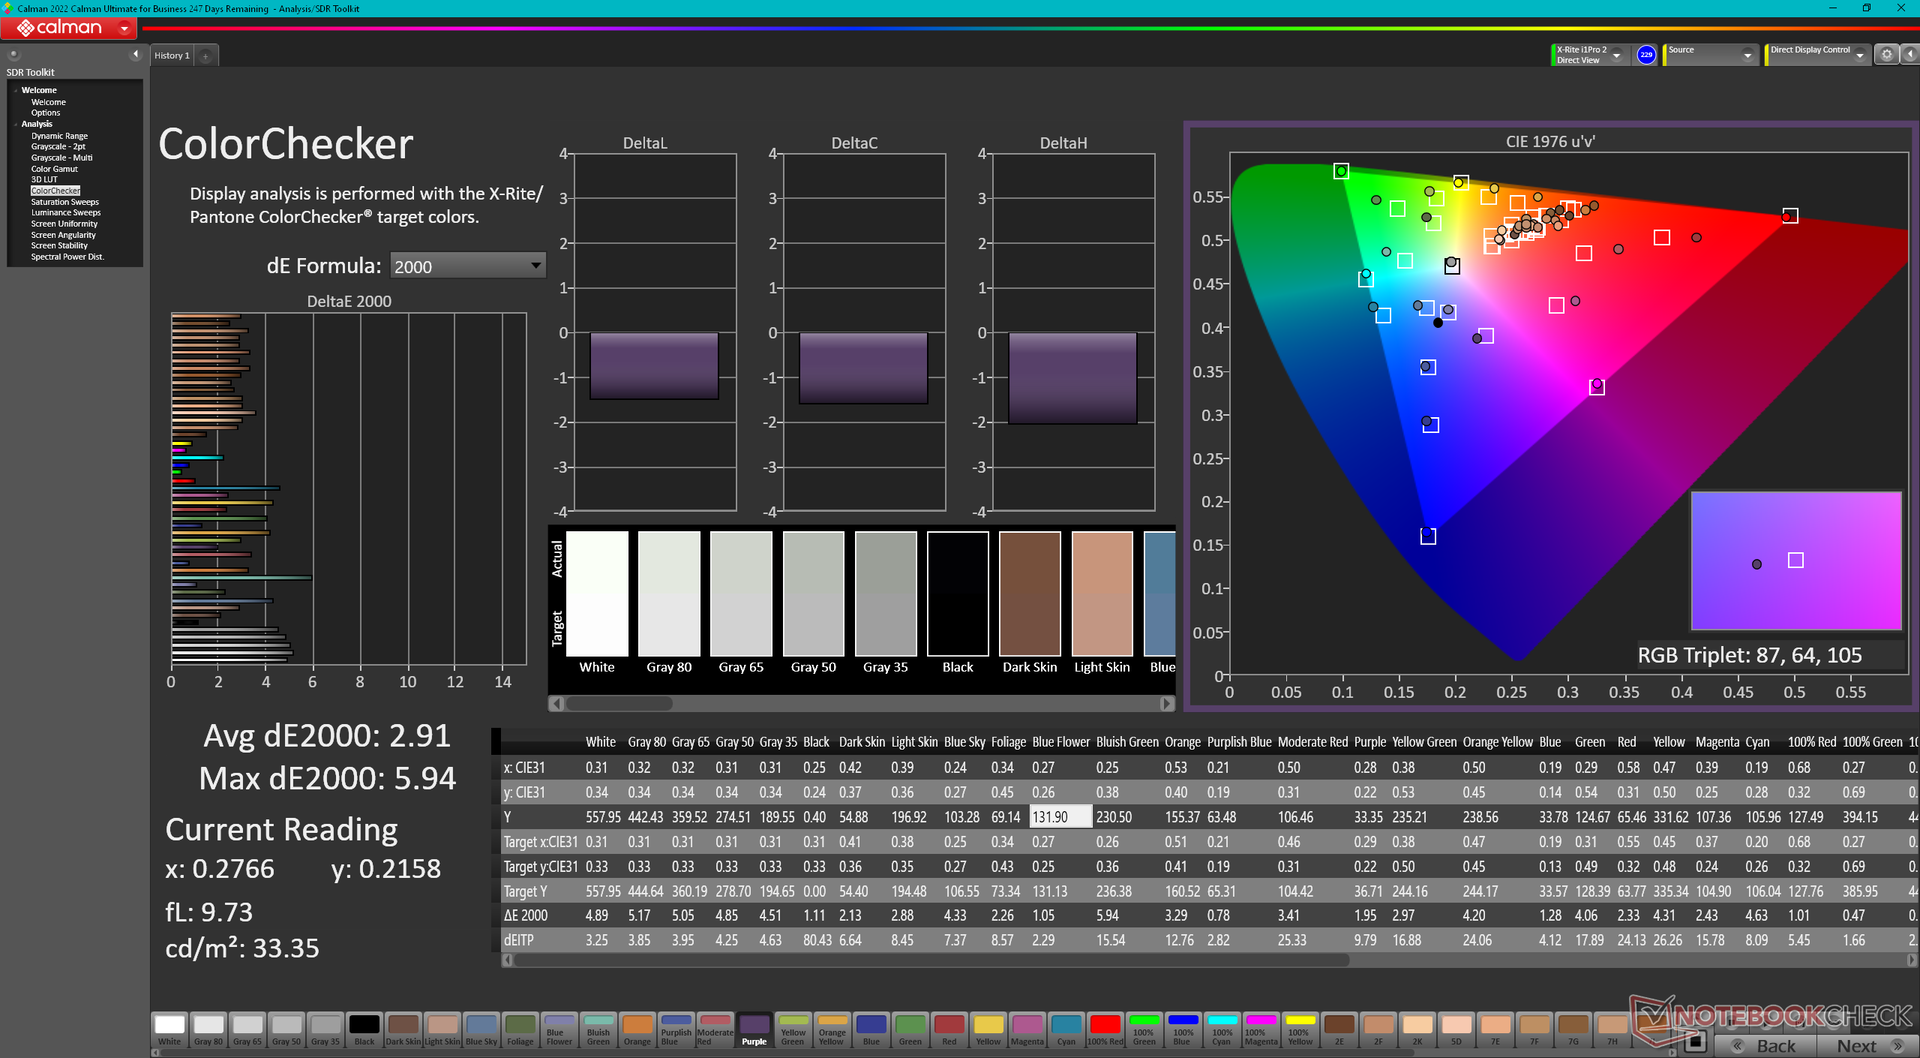
ΔE ColorChecker Calman: 2.91 | ∀{0.5-29.43 Ø4.73}
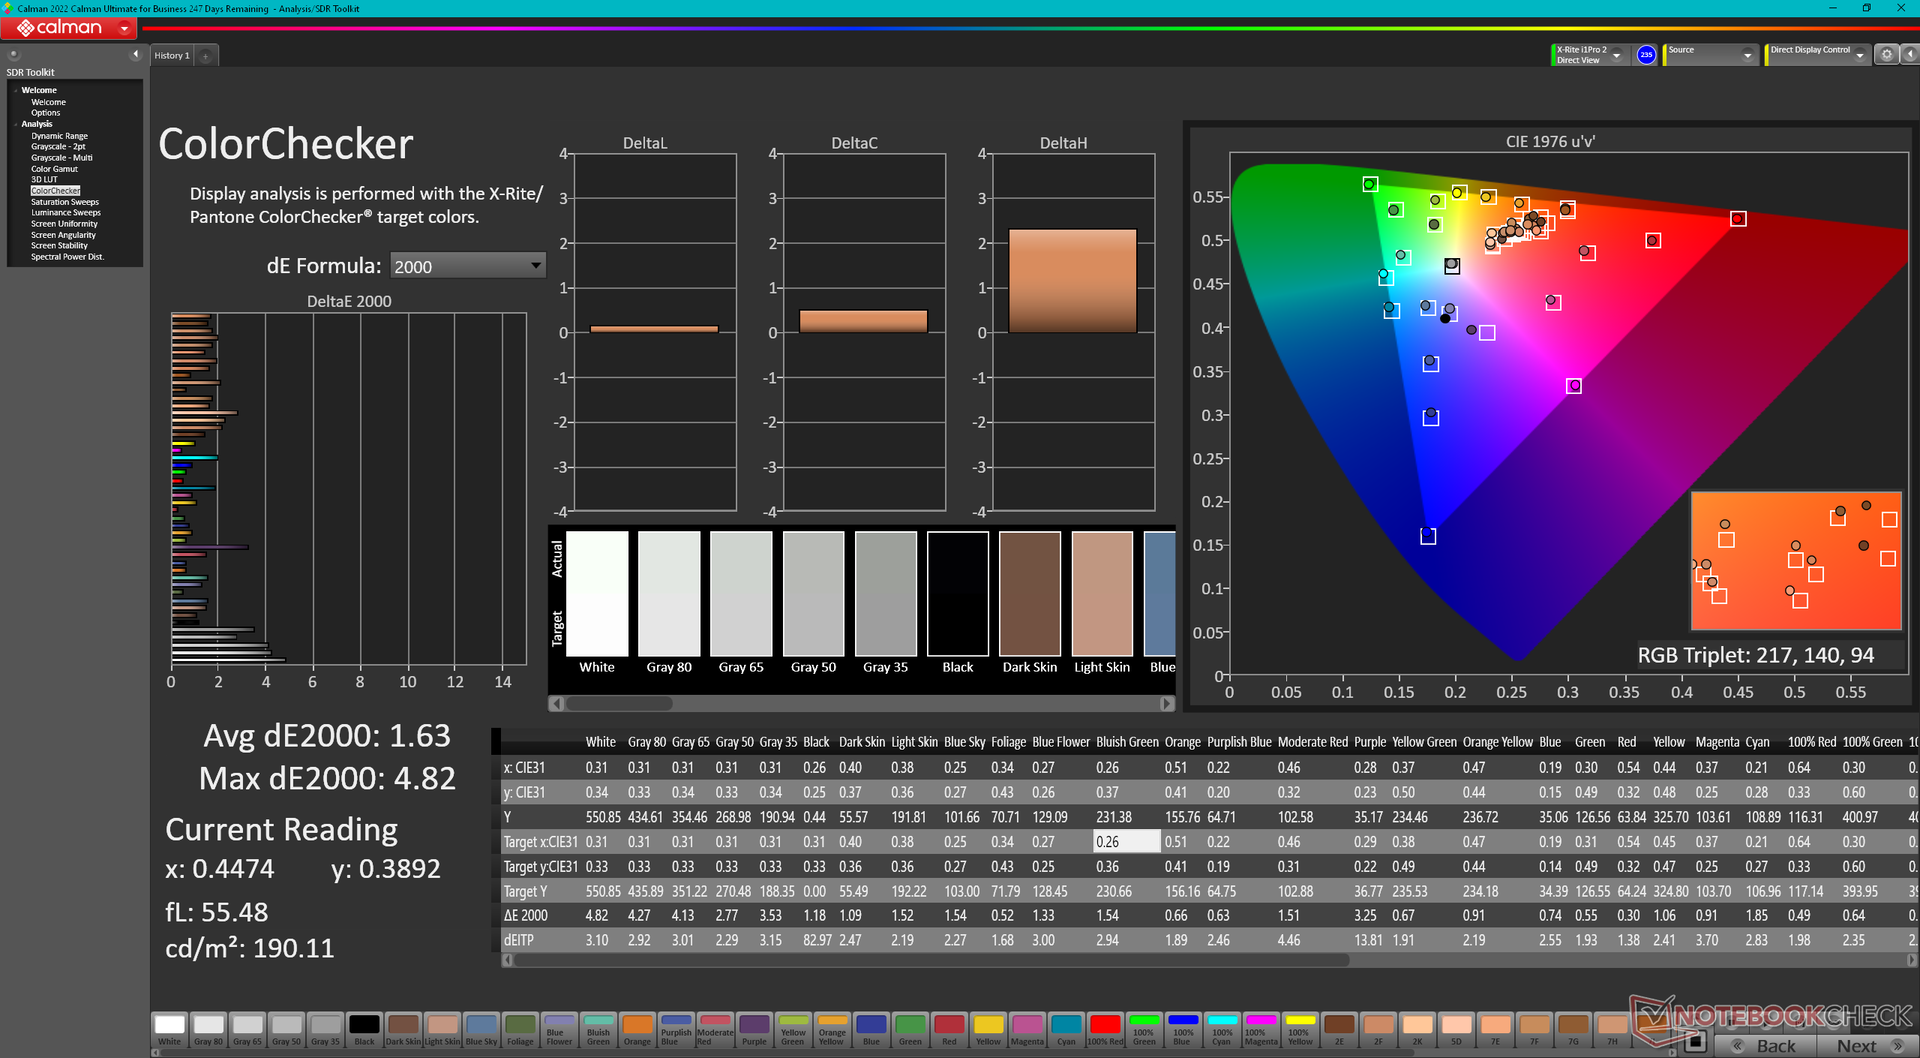
calibrated: 1.63
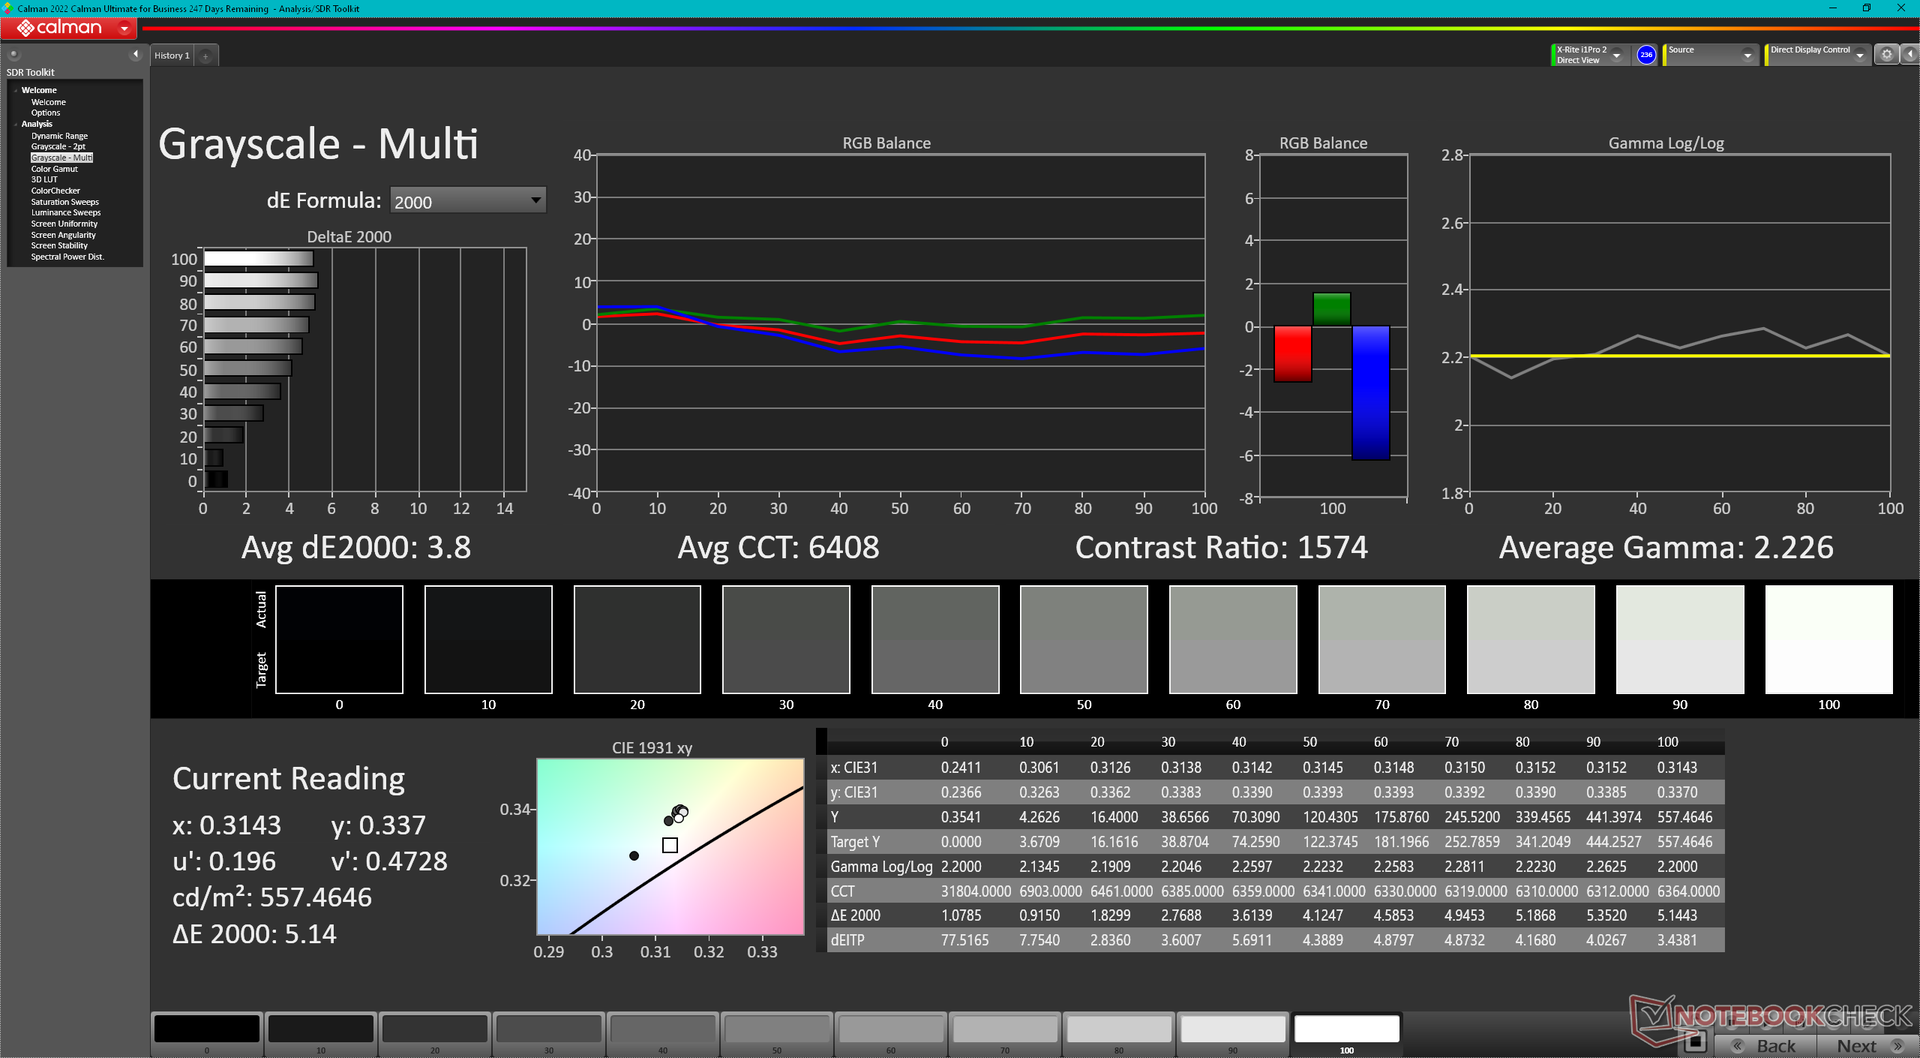
ΔE Greyscale Calman: 3.8 | ∀{0.09-98 Ø4.97}
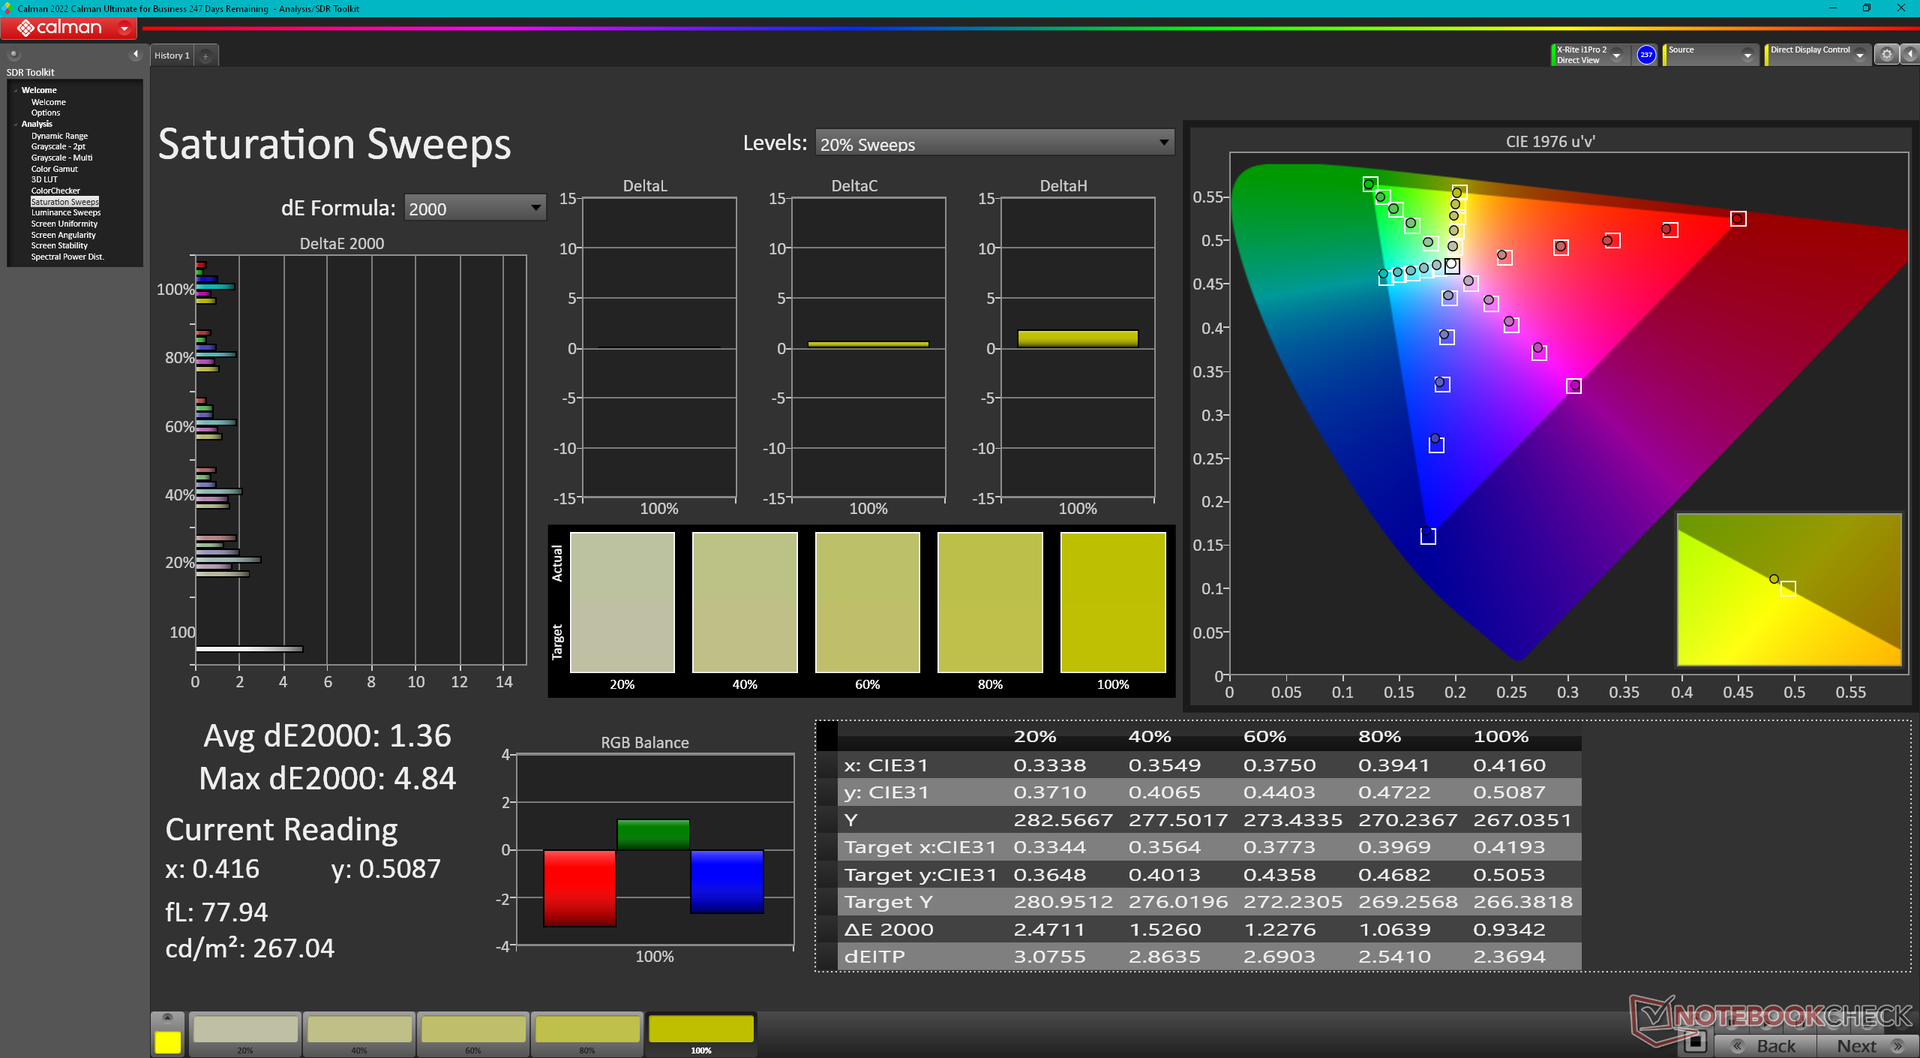
85.4% AdobeRGB 1998 (Argyll 3D)
99.7% sRGB (Argyll 3D)
95.4% Display P3 (Argyll 3D)
Gamma: 2.23
CCT: 6408 K
| MSI Vector 16 HX A14V Chi Mei N160GME-GTB, IPS, 2560x1600, 16" | MSI Vector GP66 12UGS BOE NE156FHM-NZ3, IPS, 1920x1080, 15.6" | Lenovo Legion 5 16IRX G9 NE160QDM-NZ3, IPS, 2560x1600, 16" | HP Victus 16-r0077ng CMN162D, IPS, 1920x1080, 16.1" | Asus TUF Gaming A16 FA617XS BOE NE160WUM-NX2, IPS, 1920x1200, 16" | Dell G16 7620 BOE NE16QDM, IPS, 2560x1600, 16" | |
|---|---|---|---|---|---|---|
| Display | -14% | -12% | -17% | -15% | -16% | |
| Display P3 Coverage (%) | 95.4 | 70.1 -27% | 72.4 -24% | 66.7 -30% | 69.3 -27% | 68.3 -28% |
| sRGB Coverage (%) | 99.7 | 99.5 0% | 100 0% | 98 -2% | 97.3 -2% | 98 -2% |
| AdobeRGB 1998 Coverage (%) | 85.4 | 72.1 -16% | 74.1 -13% | 69 -19% | 70.7 -17% | 70.5 -17% |
| Response Times | 7% | -48% | -53% | -81% | -21% | |
| Response Time Grey 50% / Grey 80% * (ms) | 5.7 ? | 5.8 ? -2% | 12.5 ? -119% | 13.3 ? -133% | 15.6 ? -174% | 8.6 ? -51% |
| Response Time Black / White * (ms) | 11.4 ? | 9.6 ? 16% | 8.7 ? 24% | 8.2 ? 28% | 10 ? 12% | 10.4 ? 9% |
| PWM Frequency (Hz) | ||||||
| Screen | -3% | 29% | 17% | 13% | 5% | |
| Brightness middle (cd/m²) | 557.2 | 353.1 -37% | 526 -6% | 308 -45% | 301 -46% | 369.4 -34% |
| Brightness (cd/m²) | 506 | 325 -36% | 500 -1% | 285 -44% | 294 -42% | 348 -31% |
| Brightness Distribution (%) | 83 | 85 2% | 87 5% | 85 2% | 94 13% | 83 0% |
| Black Level * (cd/m²) | 0.41 | 0.38 7% | 0.33 20% | 0.25 39% | 0.21 49% | 0.32 22% |
| Contrast (:1) | 1359 | 929 -32% | 1594 17% | 1232 -9% | 1433 5% | 1154 -15% |
| Colorchecker dE 2000 * | 2.91 | 2.24 23% | 1.2 59% | 1.3 55% | 1.79 38% | 1.78 39% |
| Colorchecker dE 2000 max. * | 5.94 | 5 16% | 2.1 65% | 2.76 54% | 3.48 41% | 4.41 26% |
| Colorchecker dE 2000 calibrated * | 1.63 | 1.02 37% | 1 39% | 0.92 44% | 1.2 26% | 1.22 25% |
| Greyscale dE 2000 * | 3.8 | 4 -5% | 1.3 66% | 1.7 55% | 2.5 34% | 3.2 16% |
| Gamma | 2.23 99% | 2.24 98% | 2.23 99% | 2.167 102% | 2.265 97% | 2.2 100% |
| CCT | 6408 101% | 6864 95% | 6391 102% | 6767 96% | 6157 106% | 6750 96% |
| Moyenne finale (programmes/paramètres) | -3% /
-4% | -10% /
9% | -18% /
-0% | -28% /
-6% | -11% /
-3% |
* ... Moindre est la valeur, meilleures sont les performances
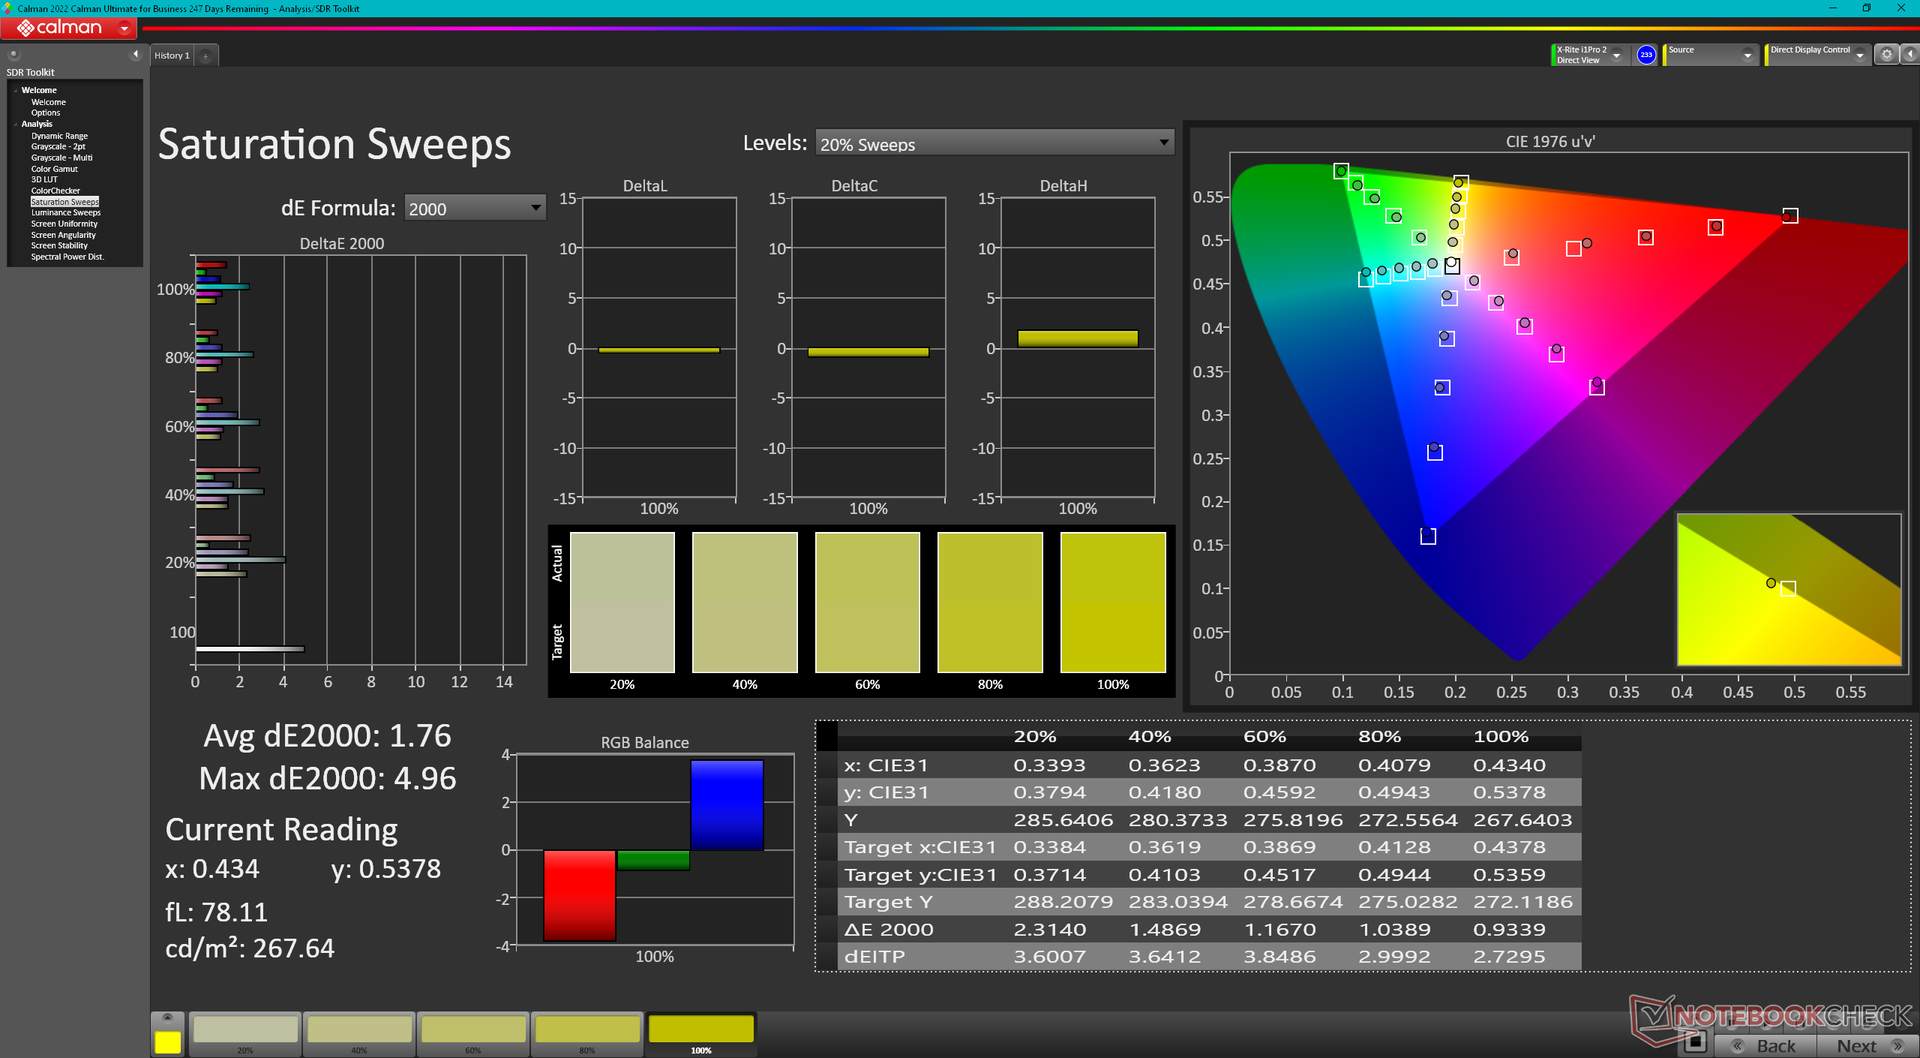
Bien que l'écran ne soit pas pré-calibré, ses couleurs sont déjà relativement précises. Les valeurs moyennes de deltaE en niveaux de gris et en couleurs ne sont que de 3,8 et 2,91, respectivement, par rapport à la norme P3. Notre profil ICM calibré est disponible gratuitement ci-dessus pour améliorer la précision et se rapprocher de la norme deltaE <2.
Temps de réponse de l'écran
| ↔ Temps de réponse noir à blanc | ||
|---|---|---|
| 11.4 ms ... hausse ↗ et chute ↘ combinées | ↗ 6.5 ms hausse | 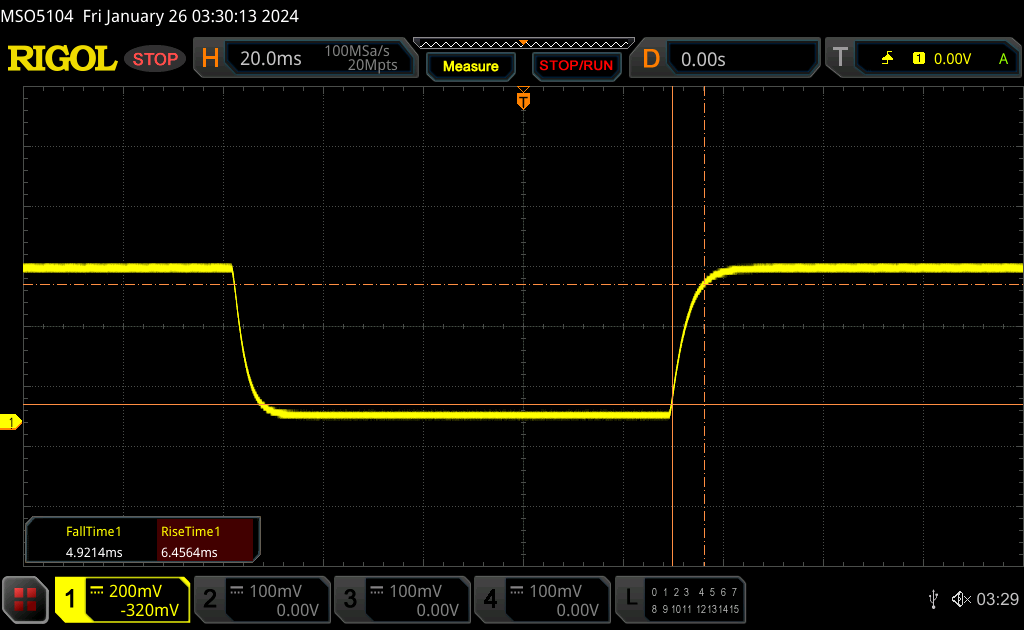 |
| ↘ 4.9 ms chute | ||
| L'écran montre de bons temps de réponse, mais insuffisant pour du jeu compétitif. En comparaison, tous les appareils testés affichent entre 0.1 (minimum) et 240 (maximum) ms. » 31 % des appareils testés affichent de meilleures performances. Cela signifie que les latences relevées sont meilleures que la moyenne (19.9 ms) de tous les appareils testés. | ||
| ↔ Temps de réponse gris 50% à gris 80% | ||
| 5.7 ms ... hausse ↗ et chute ↘ combinées | ↗ 2.8 ms hausse | 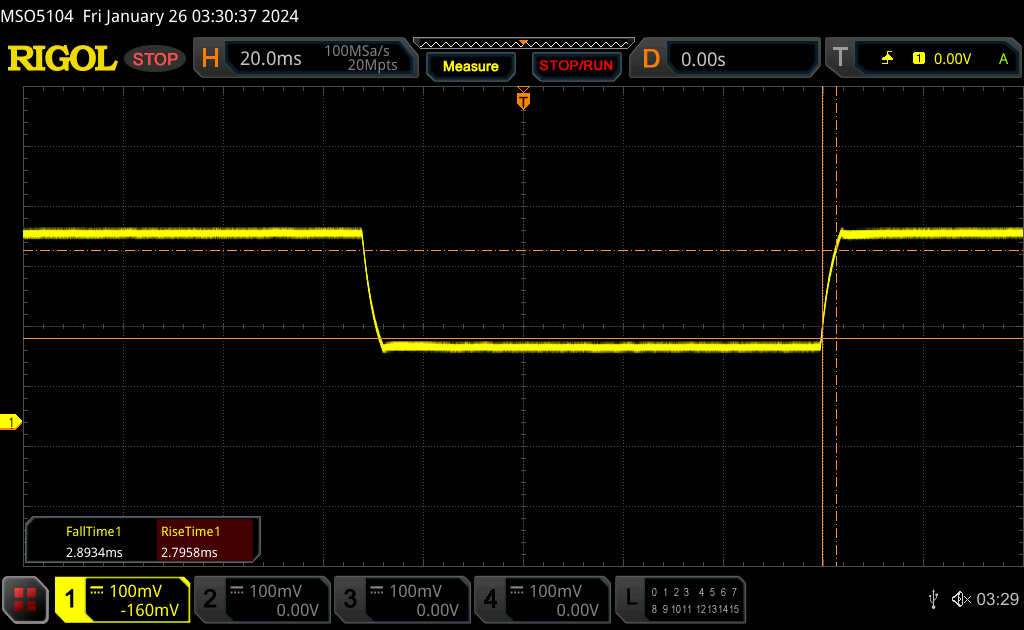 |
| ↘ 2.9 ms chute | ||
| L'écran montre de très faibles temps de réponse, parfait pour le jeu. En comparaison, tous les appareils testés affichent entre 0.165 (minimum) et 636 (maximum) ms. » 18 % des appareils testés affichent de meilleures performances. Cela signifie que les latences relevées sont meilleures que la moyenne (31.1 ms) de tous les appareils testés. | ||
Scintillement / MLI (Modulation de largeur d'impulsion)
| Scintillement / MLI (Modulation de largeur d'impulsion) non décelé | 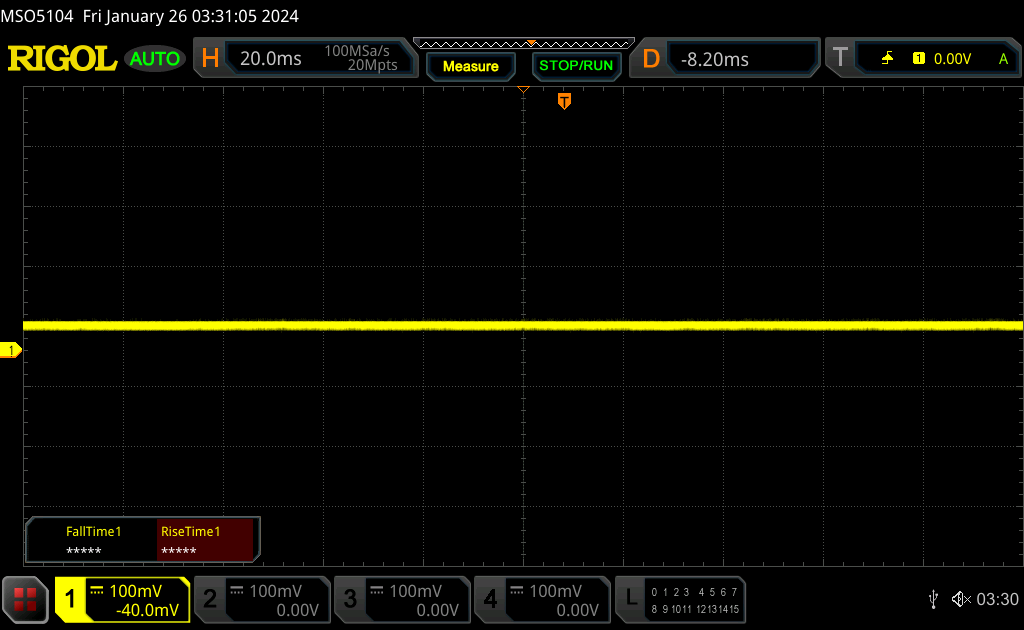 | ||
En comparaison, 52 % des appareils testés n'emploient pas MDI pour assombrir leur écran. Nous avons relevé une moyenne à 7798 (minimum : 5 - maximum : 343500) Hz dans le cas où une MDI était active. | |||
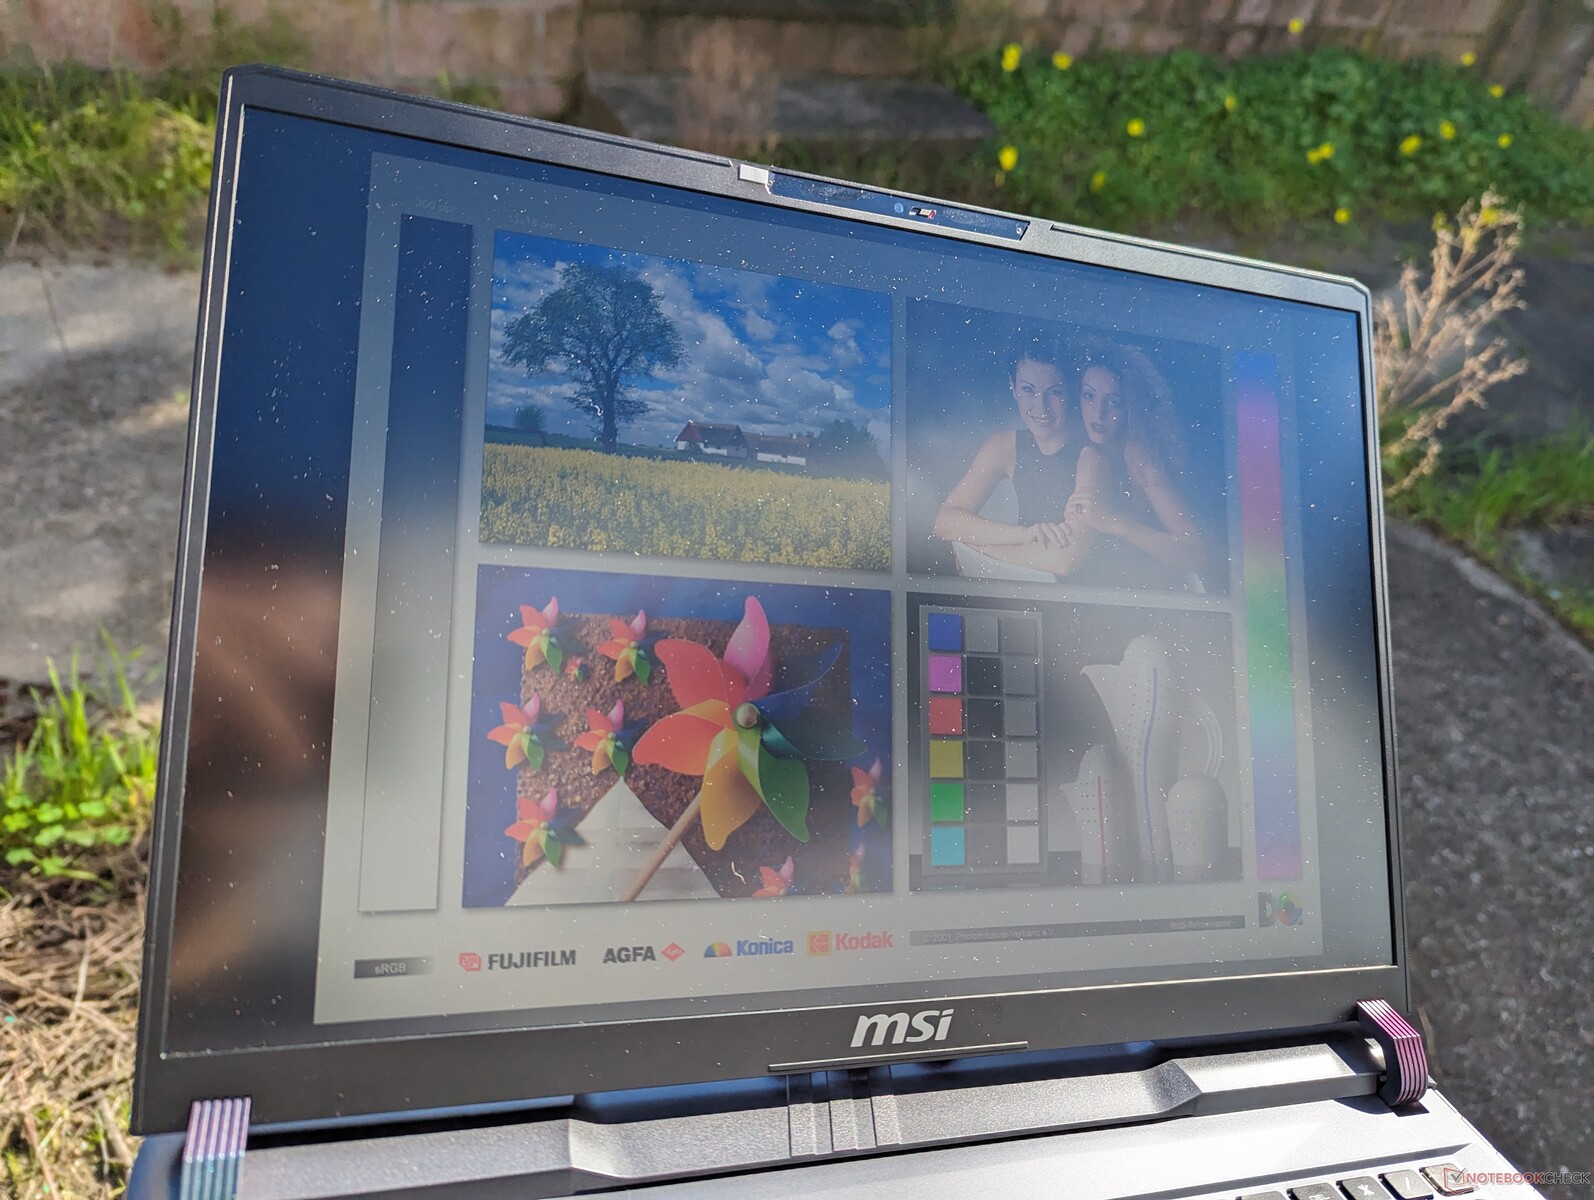
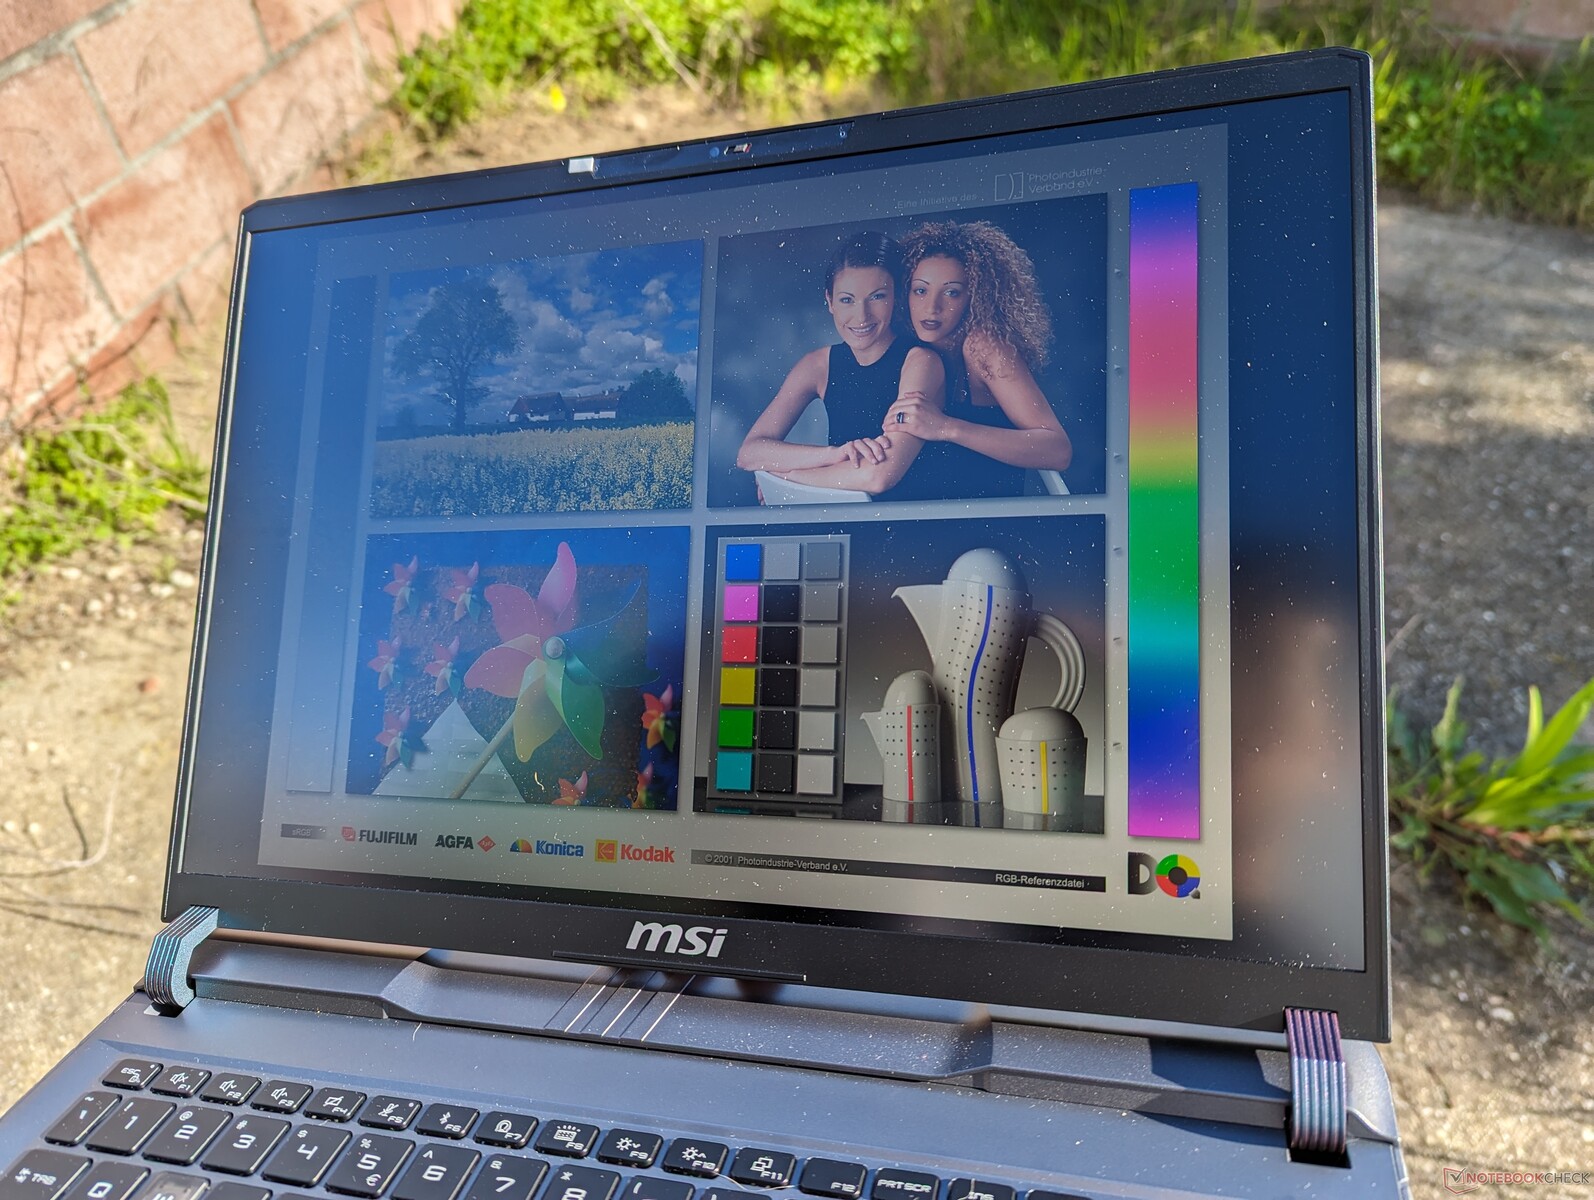
L'écran mat est relativement lumineux pour une dalle IPS, avec environ 550 nits, contre seulement 300 nits sur le HP Victus 16 ou de l'Asus TUF Gaming A16. La visibilité est tolérable à l'ombre, mais l'écran reste trop sombre dans des conditions extérieures plus lumineuses.
Performance
Conditions d'essai
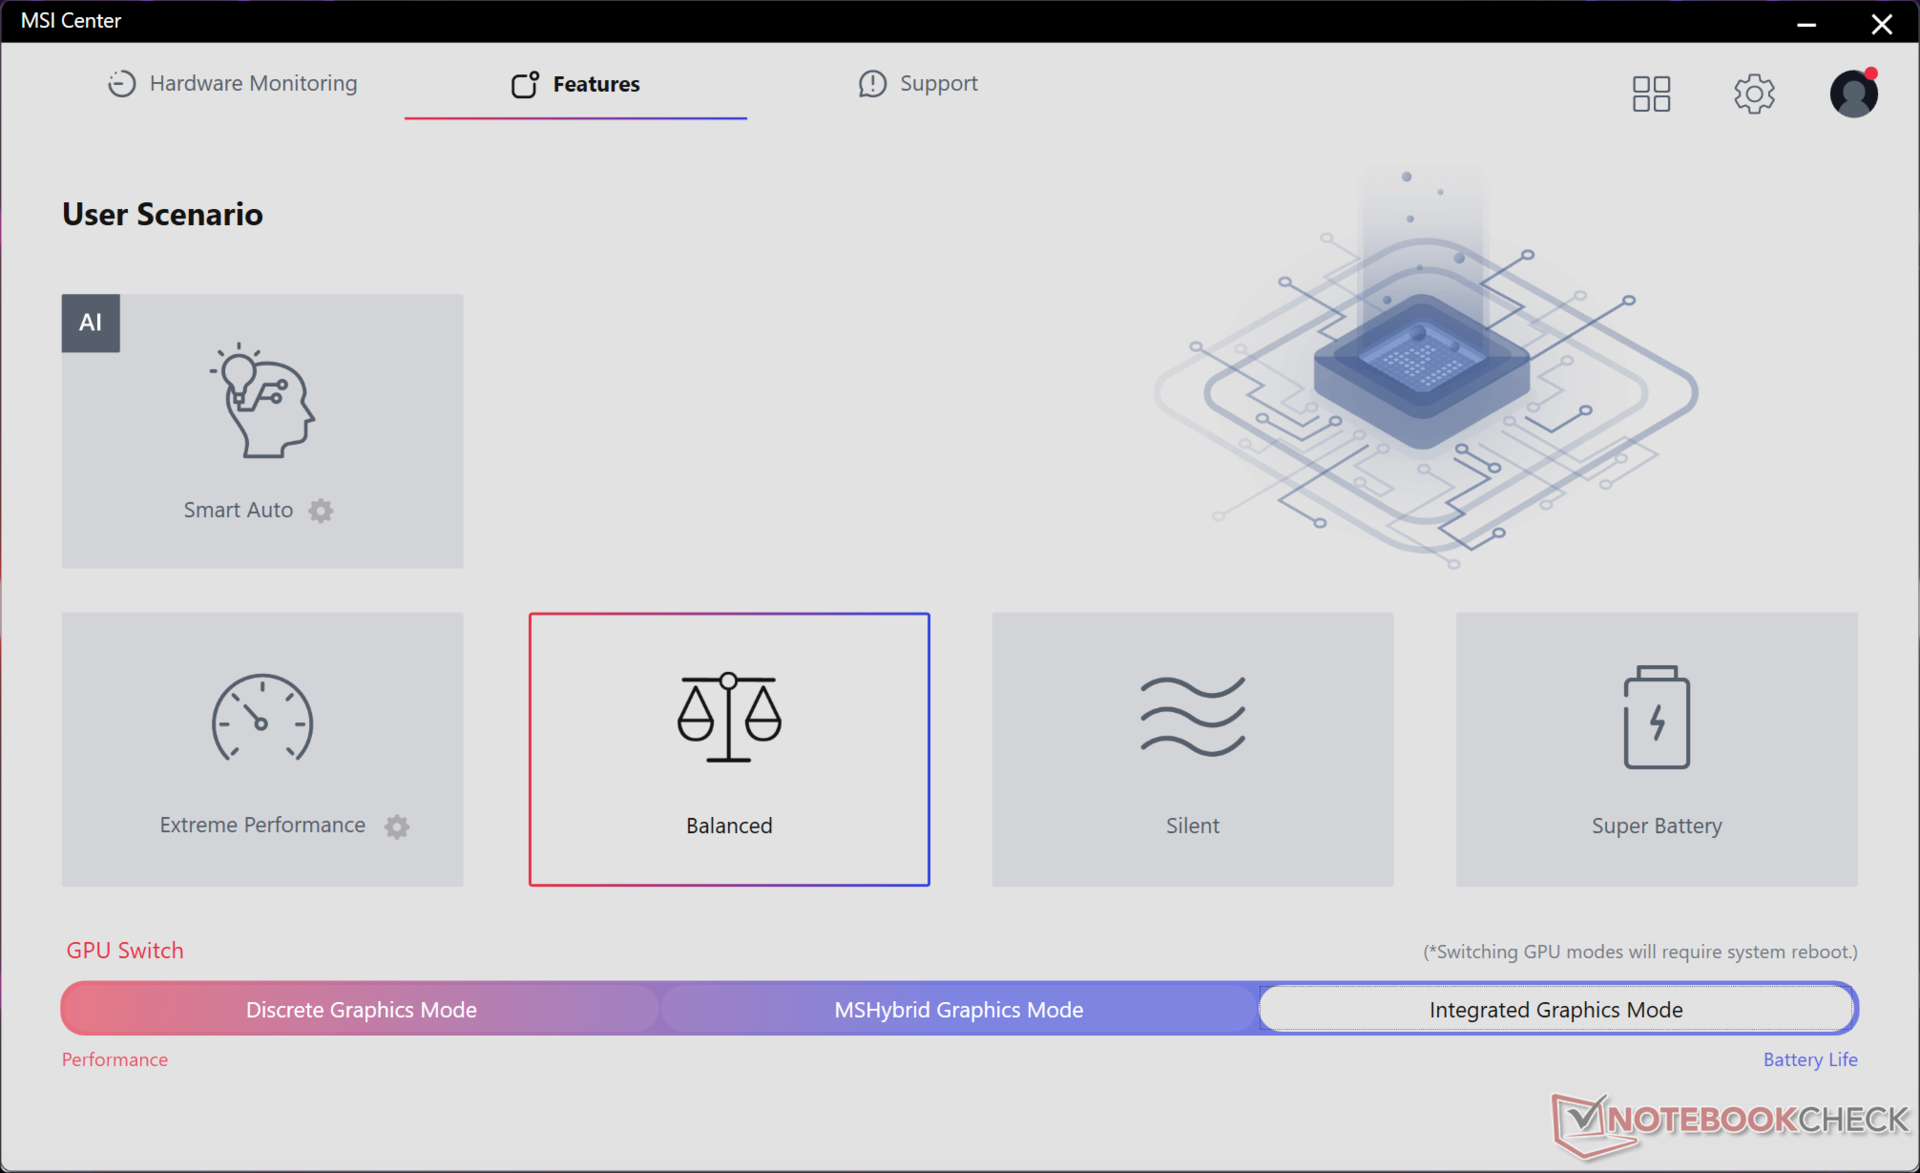
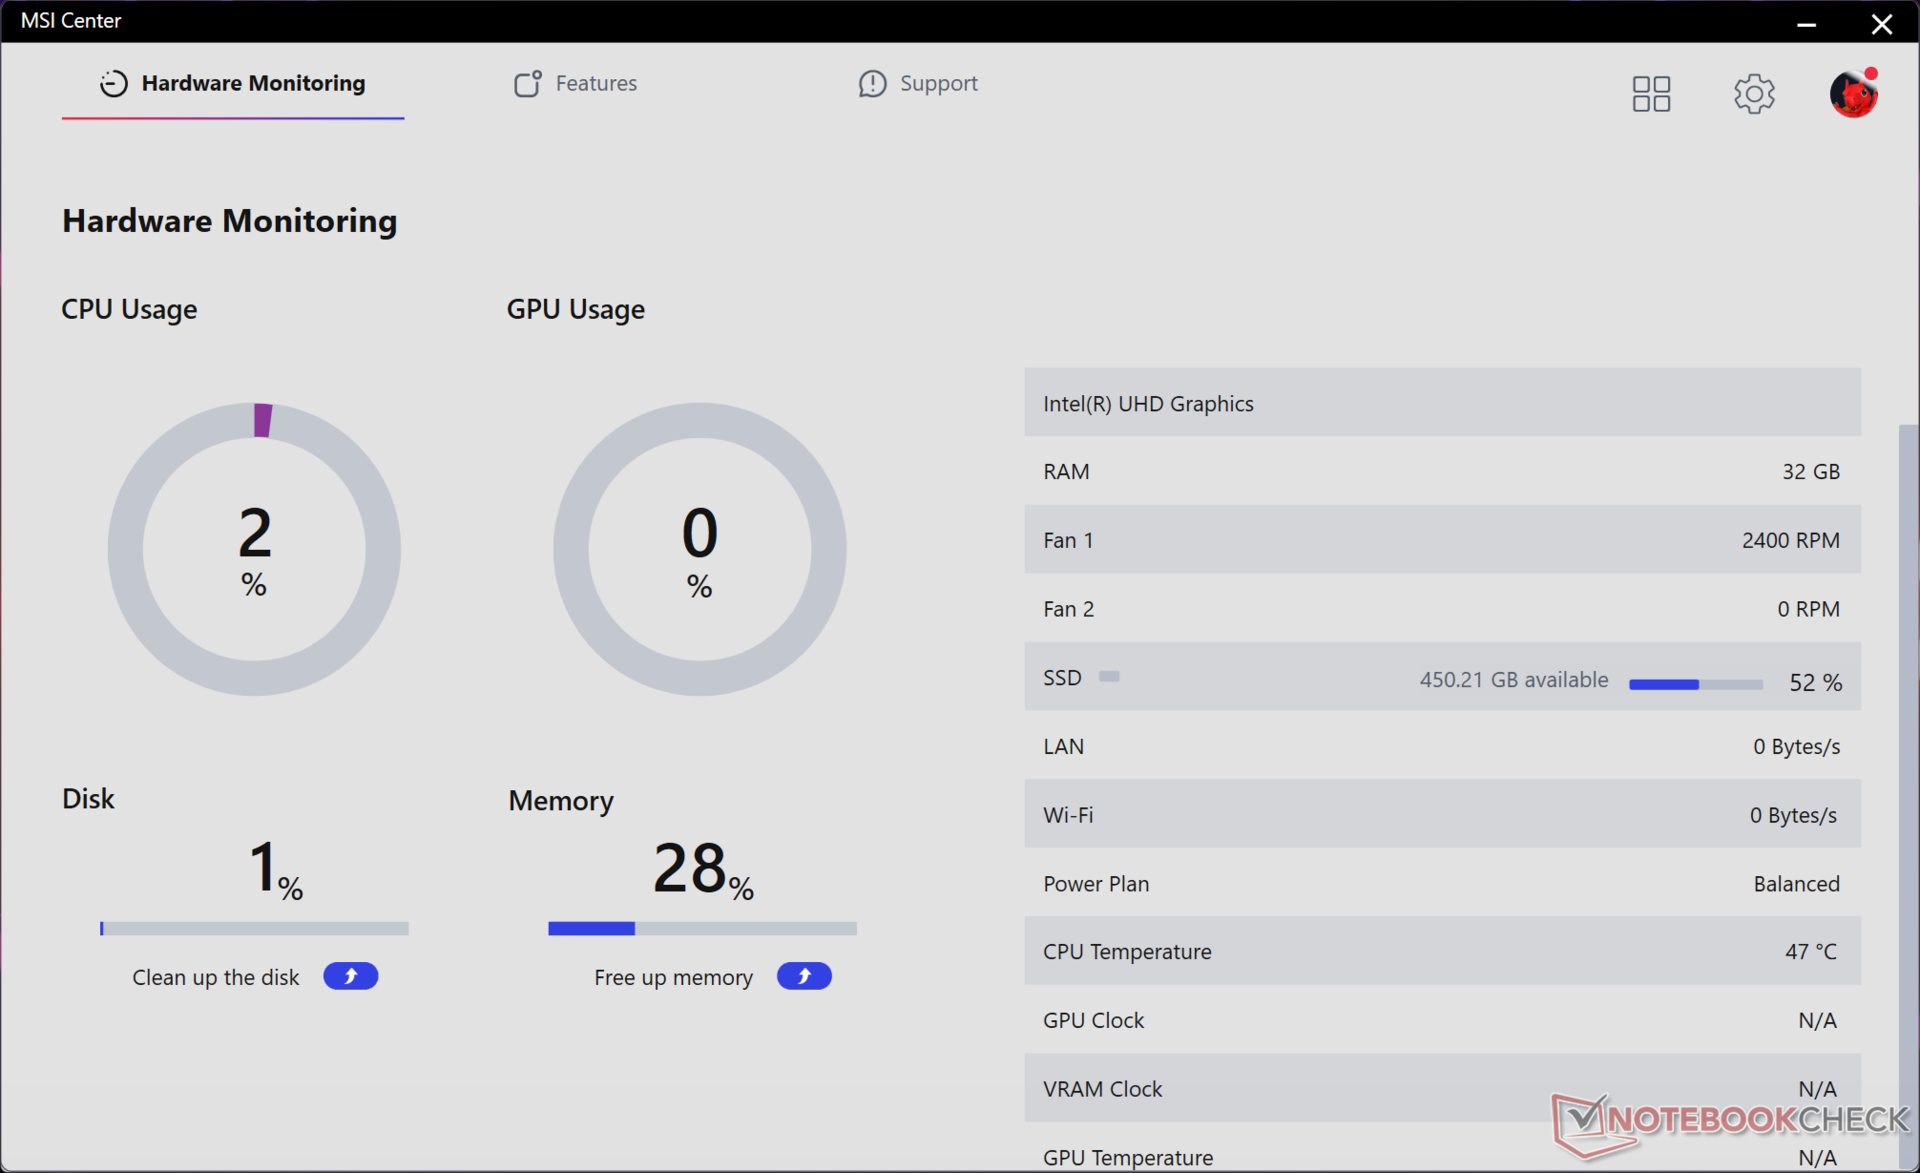
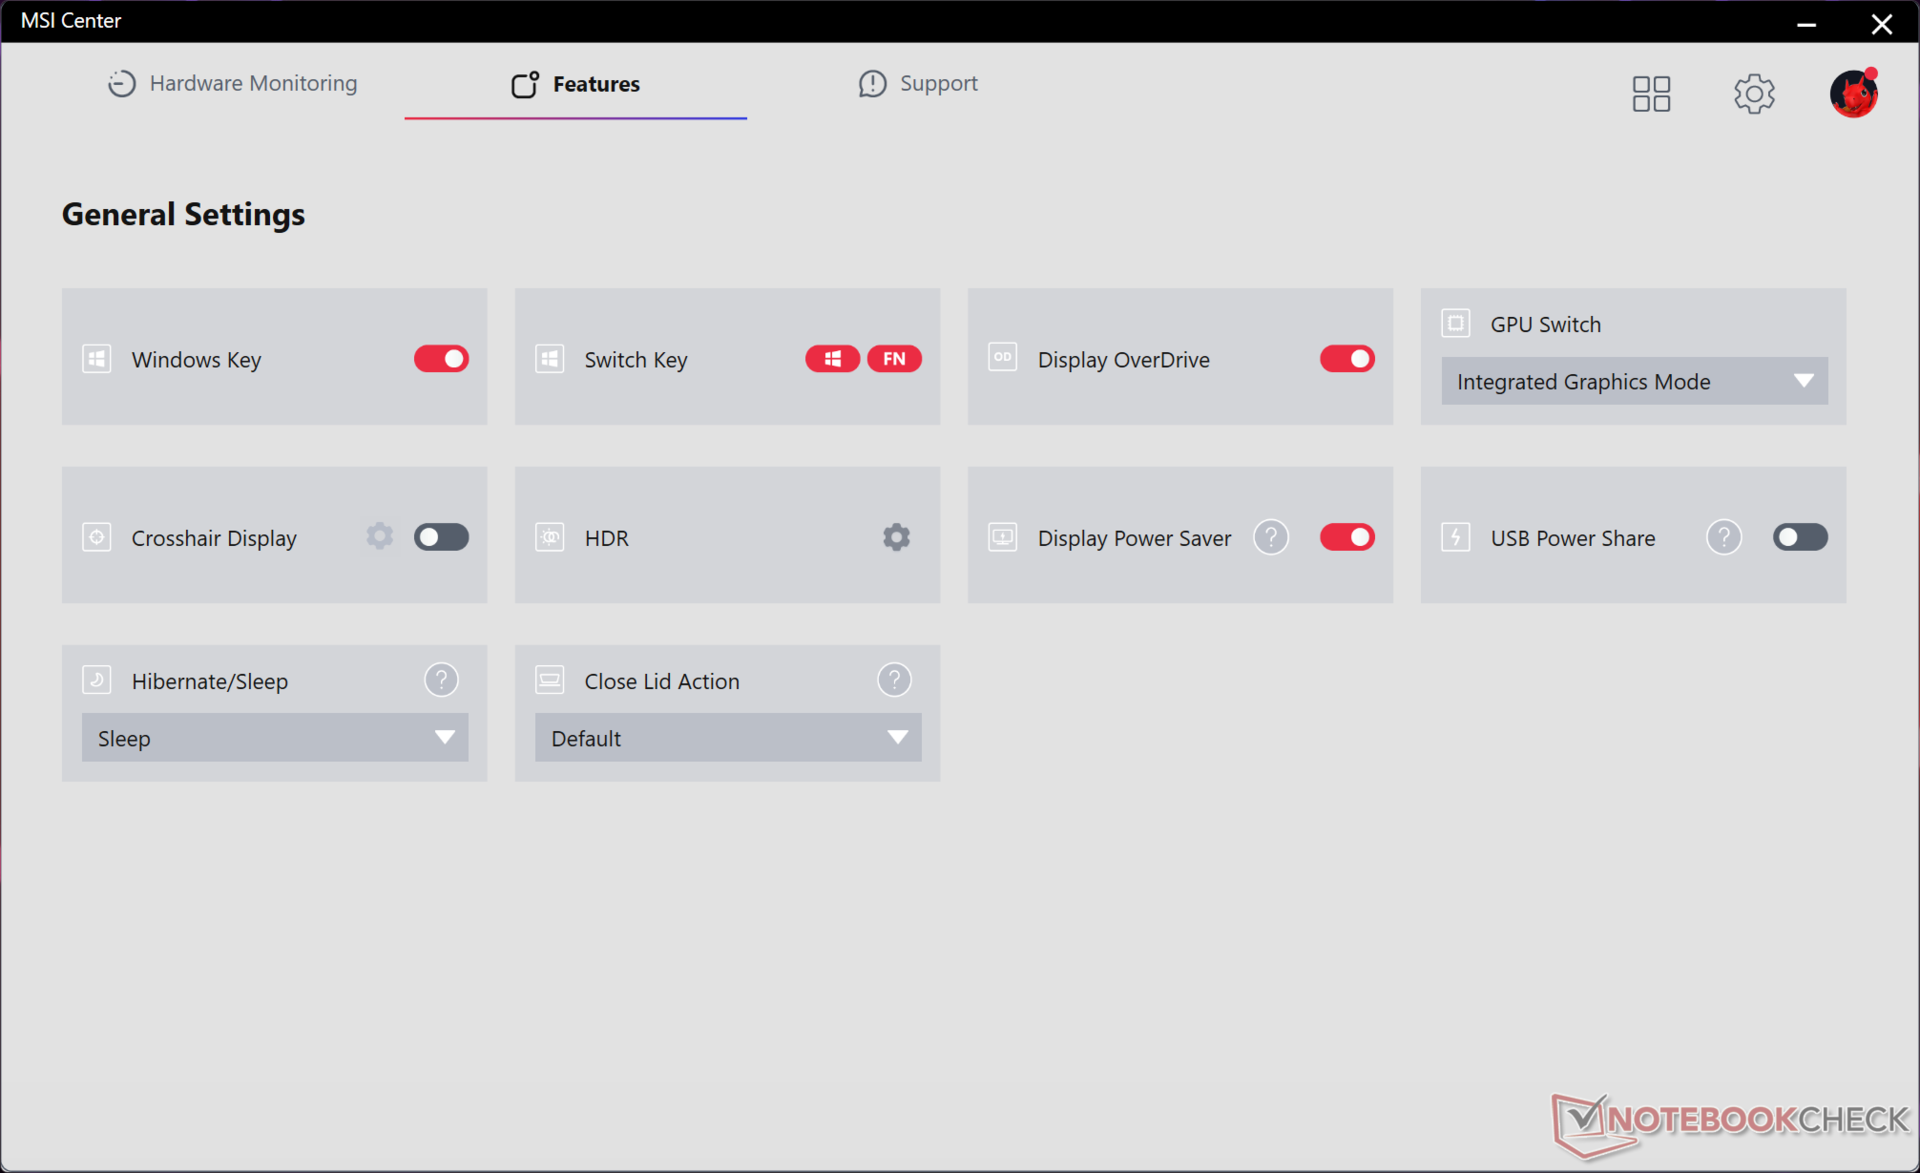
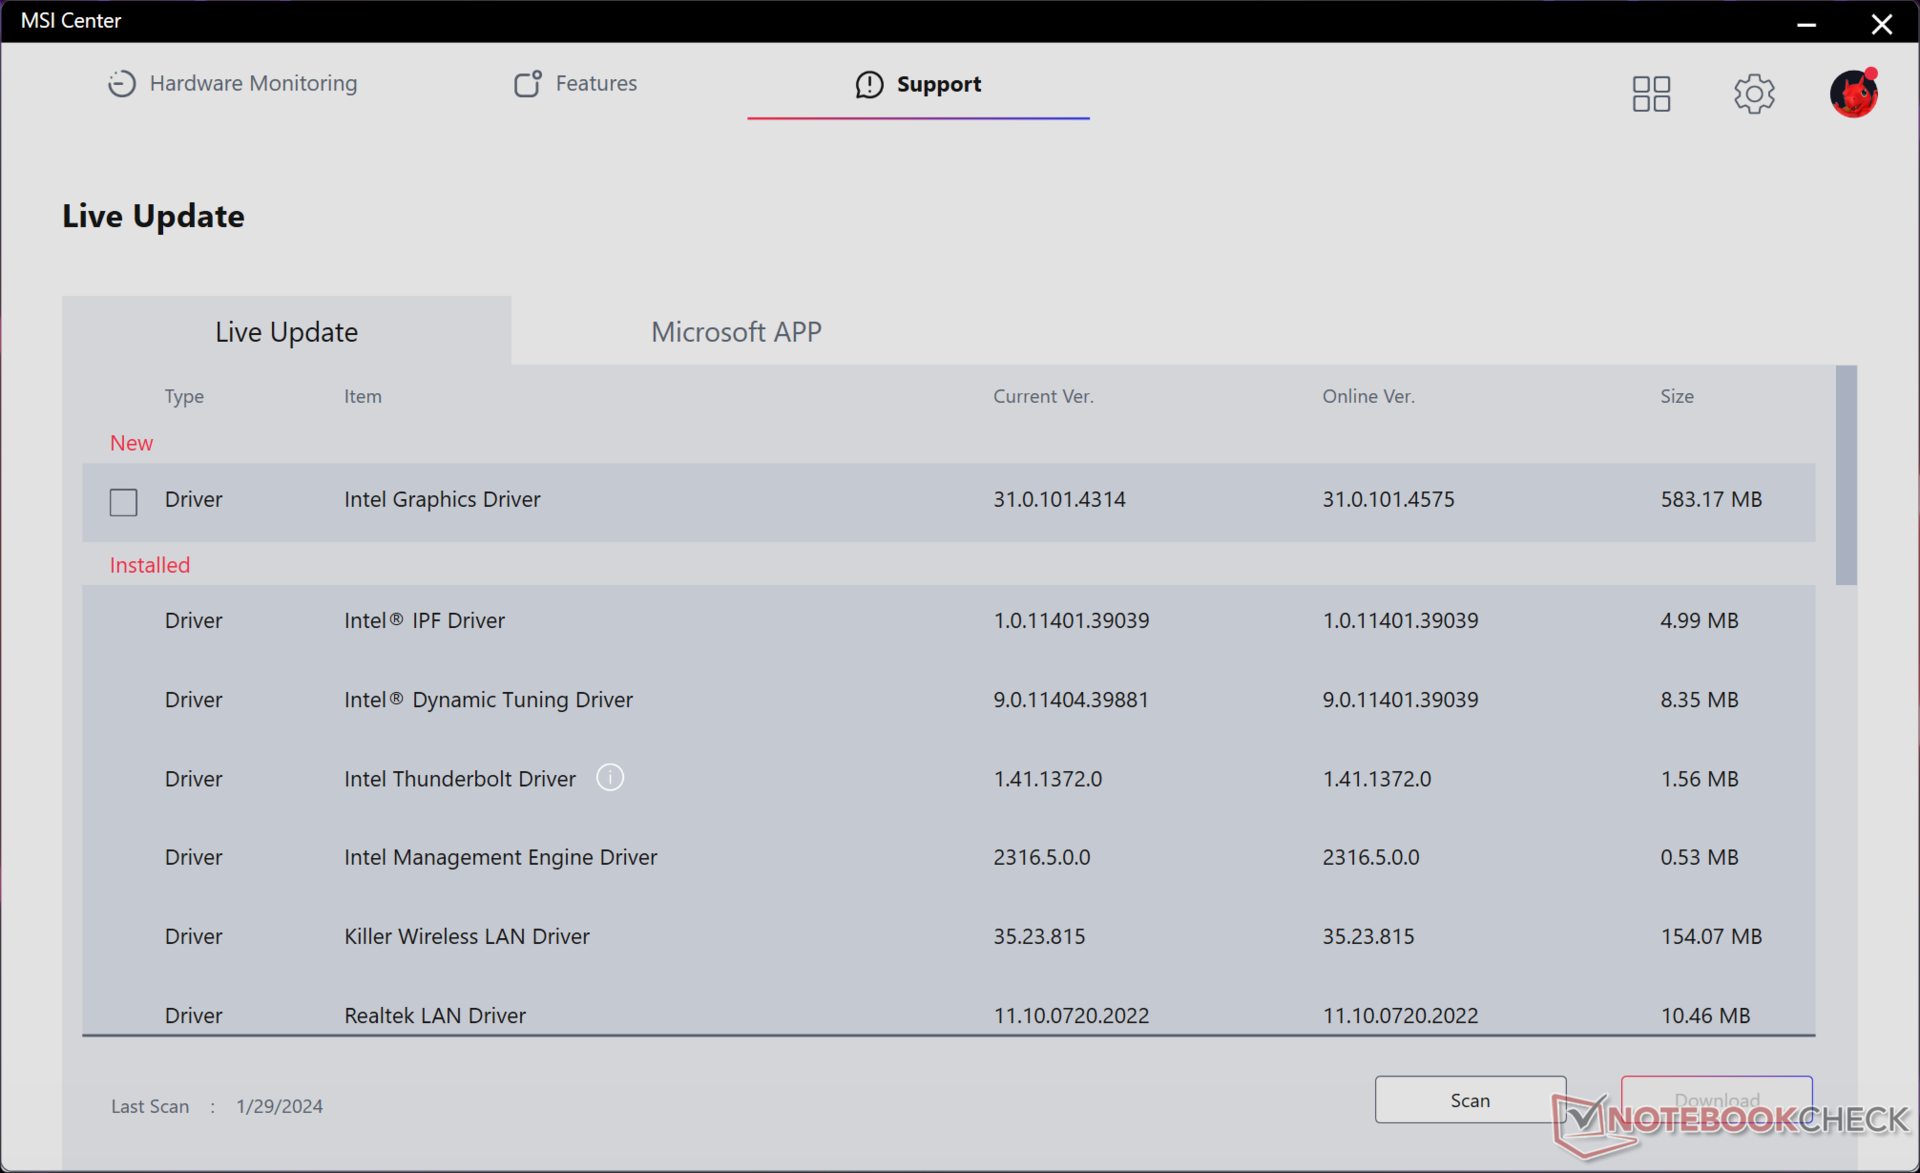
Nous avons réglé notre unité en mode dGPU et en mode Extreme Performance avec Cooler Boost actif avant d'effectuer les tests de référence ci-dessous. Les propriétaires doivent se familiariser avec le logiciel MSI Center préinstallé, car il s'agit de la plaque tournante pour les mises à jour du système, les données vitales du système, le basculement des fonctionnalités et l'ajustement des paramètres MUX et des profils d'alimentation. Le passage du mode dGPU au mode iGPU nécessite un redémarrage qui peut prendre plus de temps qu'un démarrage à froid classique.
Processeur
A l'instar de la Titan 18 HX, le processeur Core i9-14900HX n'est qu'une amélioration mineure par rapport à la dernière génération Core i9-13980HX de 10 %. Les avantages d'une année sur l'autre ne sont donc que marginaux, d'autant plus que la série Raptor Lake-HX de la 14e génération ne dispose pas du nouveau NPU dédié que l'on trouve sur la série Meteor Lake de la 14e génération. Bien entendu, le Core i9-13980HX était l'un des CPU mobiles les plus rapides de 2023 et le Core i9-14900HX n'est donc absolument pas en reste. Les utilisateurs qui mettent à niveau des ordinateurs portables de jeu Intel de 12e génération ou plus anciens devraient encore constater des hausses de performances significatives.
Cinebench R15 Multi Loop
Cinebench R23: Multi Core | Single Core
Cinebench R20: CPU (Multi Core) | CPU (Single Core)
Cinebench R15: CPU Multi 64Bit | CPU Single 64Bit
Blender: v2.79 BMW27 CPU
7-Zip 18.03: 7z b 4 | 7z b 4 -mmt1
Geekbench 6.7: Multi-Core | Single-Core
Geekbench 5.5: Multi-Core | Single-Core
HWBOT x265 Benchmark v2.2: 4k Preset
LibreOffice : 20 Documents To PDF
R Benchmark 2.5: Overall mean
| CPU Performance rating | |
| MSI Vector 16 HX A14V | |
| Asus Zephyrus Duo 16 GX650PY-NM006W -2! | |
| Moyenne Intel Core i9-14900HX | |
| Alienware m16 R1 AMD | |
| Lenovo Legion 5 16IRX G9 | |
| Alienware m16 R1 Intel | |
| Lenovo Legion Pro 5 16ARX8 -2! | |
| Asus TUF Gaming A16 FA617XS -2! | |
| MSI Vector GP66 12UGS -2! | |
| Lenovo Legion Slim 7 16APH8 | |
| Lenovo LOQ 16IRH8 | |
| Dell G16 7620 -2! | |
| HP Victus 16-r0077ng | |
| Geekbench 6.7 / Multi-Core | |
| MSI Vector 16 HX A14V | |
| Moyenne Intel Core i9-14900HX (13158 - 19665, n=37) | |
| Lenovo Legion 5 16IRX G9 | |
| Alienware m16 R1 Intel | |
| Lenovo LOQ 16IRH8 | |
| Lenovo Legion Slim 7 16APH8 | |
| Alienware m16 R1 AMD | |
| HP Victus 16-r0077ng | |
| Geekbench 6.7 / Single-Core | |
| MSI Vector 16 HX A14V | |
| Moyenne Intel Core i9-14900HX (2419 - 3129, n=37) | |
| Lenovo Legion 5 16IRX G9 | |
| Alienware m16 R1 AMD | |
| Alienware m16 R1 Intel | |
| Lenovo Legion Slim 7 16APH8 | |
| Lenovo LOQ 16IRH8 | |
| HP Victus 16-r0077ng | |
Cinebench R23: Multi Core | Single Core
Cinebench R20: CPU (Multi Core) | CPU (Single Core)
Cinebench R15: CPU Multi 64Bit | CPU Single 64Bit
Blender: v2.79 BMW27 CPU
7-Zip 18.03: 7z b 4 | 7z b 4 -mmt1
Geekbench 6.7: Multi-Core | Single-Core
Geekbench 5.5: Multi-Core | Single-Core
HWBOT x265 Benchmark v2.2: 4k Preset
LibreOffice : 20 Documents To PDF
R Benchmark 2.5: Overall mean
* ... Moindre est la valeur, meilleures sont les performances
AIDA64: FP32 Ray-Trace | FPU Julia | CPU SHA3 | CPU Queen | FPU SinJulia | FPU Mandel | CPU AES | CPU ZLib | FP64 Ray-Trace | CPU PhotoWorxx
| Performance rating | |
| MSI Vector 16 HX A14V | |
| Moyenne Intel Core i9-14900HX | |
| Asus TUF Gaming A16 FA617XS | |
| Lenovo Legion 5 16IRX G9 | |
| Dell G16 7620 | |
| HP Victus 16-r0077ng | |
| MSI Vector GP66 12UGS | |
| AIDA64 / FP32 Ray-Trace | |
| MSI Vector 16 HX A14V | |
| Asus TUF Gaming A16 FA617XS | |
| Moyenne Intel Core i9-14900HX (13098 - 33474, n=36) | |
| Lenovo Legion 5 16IRX G9 | |
| Dell G16 7620 | |
| HP Victus 16-r0077ng | |
| MSI Vector GP66 12UGS | |
| AIDA64 / FPU Julia | |
| MSI Vector 16 HX A14V | |
| Moyenne Intel Core i9-14900HX (67573 - 166040, n=36) | |
| Asus TUF Gaming A16 FA617XS | |
| Lenovo Legion 5 16IRX G9 | |
| Dell G16 7620 | |
| HP Victus 16-r0077ng | |
| MSI Vector GP66 12UGS | |
| AIDA64 / CPU SHA3 | |
| MSI Vector 16 HX A14V | |
| Moyenne Intel Core i9-14900HX (3589 - 7979, n=36) | |
| Asus TUF Gaming A16 FA617XS | |
| Lenovo Legion 5 16IRX G9 | |
| Dell G16 7620 | |
| HP Victus 16-r0077ng | |
| MSI Vector GP66 12UGS | |
| AIDA64 / CPU Queen | |
| MSI Vector 16 HX A14V | |
| Moyenne Intel Core i9-14900HX (118405 - 148966, n=36) | |
| Asus TUF Gaming A16 FA617XS | |
| MSI Vector GP66 12UGS | |
| Dell G16 7620 | |
| Lenovo Legion 5 16IRX G9 | |
| HP Victus 16-r0077ng | |
| AIDA64 / FPU SinJulia | |
| MSI Vector 16 HX A14V | |
| Asus TUF Gaming A16 FA617XS | |
| Moyenne Intel Core i9-14900HX (10475 - 18517, n=36) | |
| Lenovo Legion 5 16IRX G9 | |
| Dell G16 7620 | |
| MSI Vector GP66 12UGS | |
| HP Victus 16-r0077ng | |
| AIDA64 / FPU Mandel | |
| MSI Vector 16 HX A14V | |
| Asus TUF Gaming A16 FA617XS | |
| Moyenne Intel Core i9-14900HX (32543 - 83662, n=36) | |
| Lenovo Legion 5 16IRX G9 | |
| HP Victus 16-r0077ng | |
| Dell G16 7620 | |
| MSI Vector GP66 12UGS | |
| AIDA64 / CPU AES | |
| Moyenne Intel Core i9-14900HX (86964 - 241777, n=36) | |
| MSI Vector 16 HX A14V | |
| MSI Vector GP66 12UGS | |
| Lenovo Legion 5 16IRX G9 | |
| Asus TUF Gaming A16 FA617XS | |
| Dell G16 7620 | |
| HP Victus 16-r0077ng | |
| AIDA64 / CPU ZLib | |
| MSI Vector 16 HX A14V | |
| Moyenne Intel Core i9-14900HX (1054 - 2292, n=36) | |
| Lenovo Legion 5 16IRX G9 | |
| Asus TUF Gaming A16 FA617XS | |
| MSI Vector GP66 12UGS | |
| Dell G16 7620 | |
| HP Victus 16-r0077ng | |
| AIDA64 / FP64 Ray-Trace | |
| MSI Vector 16 HX A14V | |
| Asus TUF Gaming A16 FA617XS | |
| Moyenne Intel Core i9-14900HX (6809 - 18349, n=36) | |
| Lenovo Legion 5 16IRX G9 | |
| Dell G16 7620 | |
| HP Victus 16-r0077ng | |
| MSI Vector GP66 12UGS | |
| AIDA64 / CPU PhotoWorxx | |
| MSI Vector 16 HX A14V | |
| Moyenne Intel Core i9-14900HX (23903 - 54702, n=36) | |
| HP Victus 16-r0077ng | |
| Dell G16 7620 | |
| Lenovo Legion 5 16IRX G9 | |
| Asus TUF Gaming A16 FA617XS | |
| MSI Vector GP66 12UGS | |
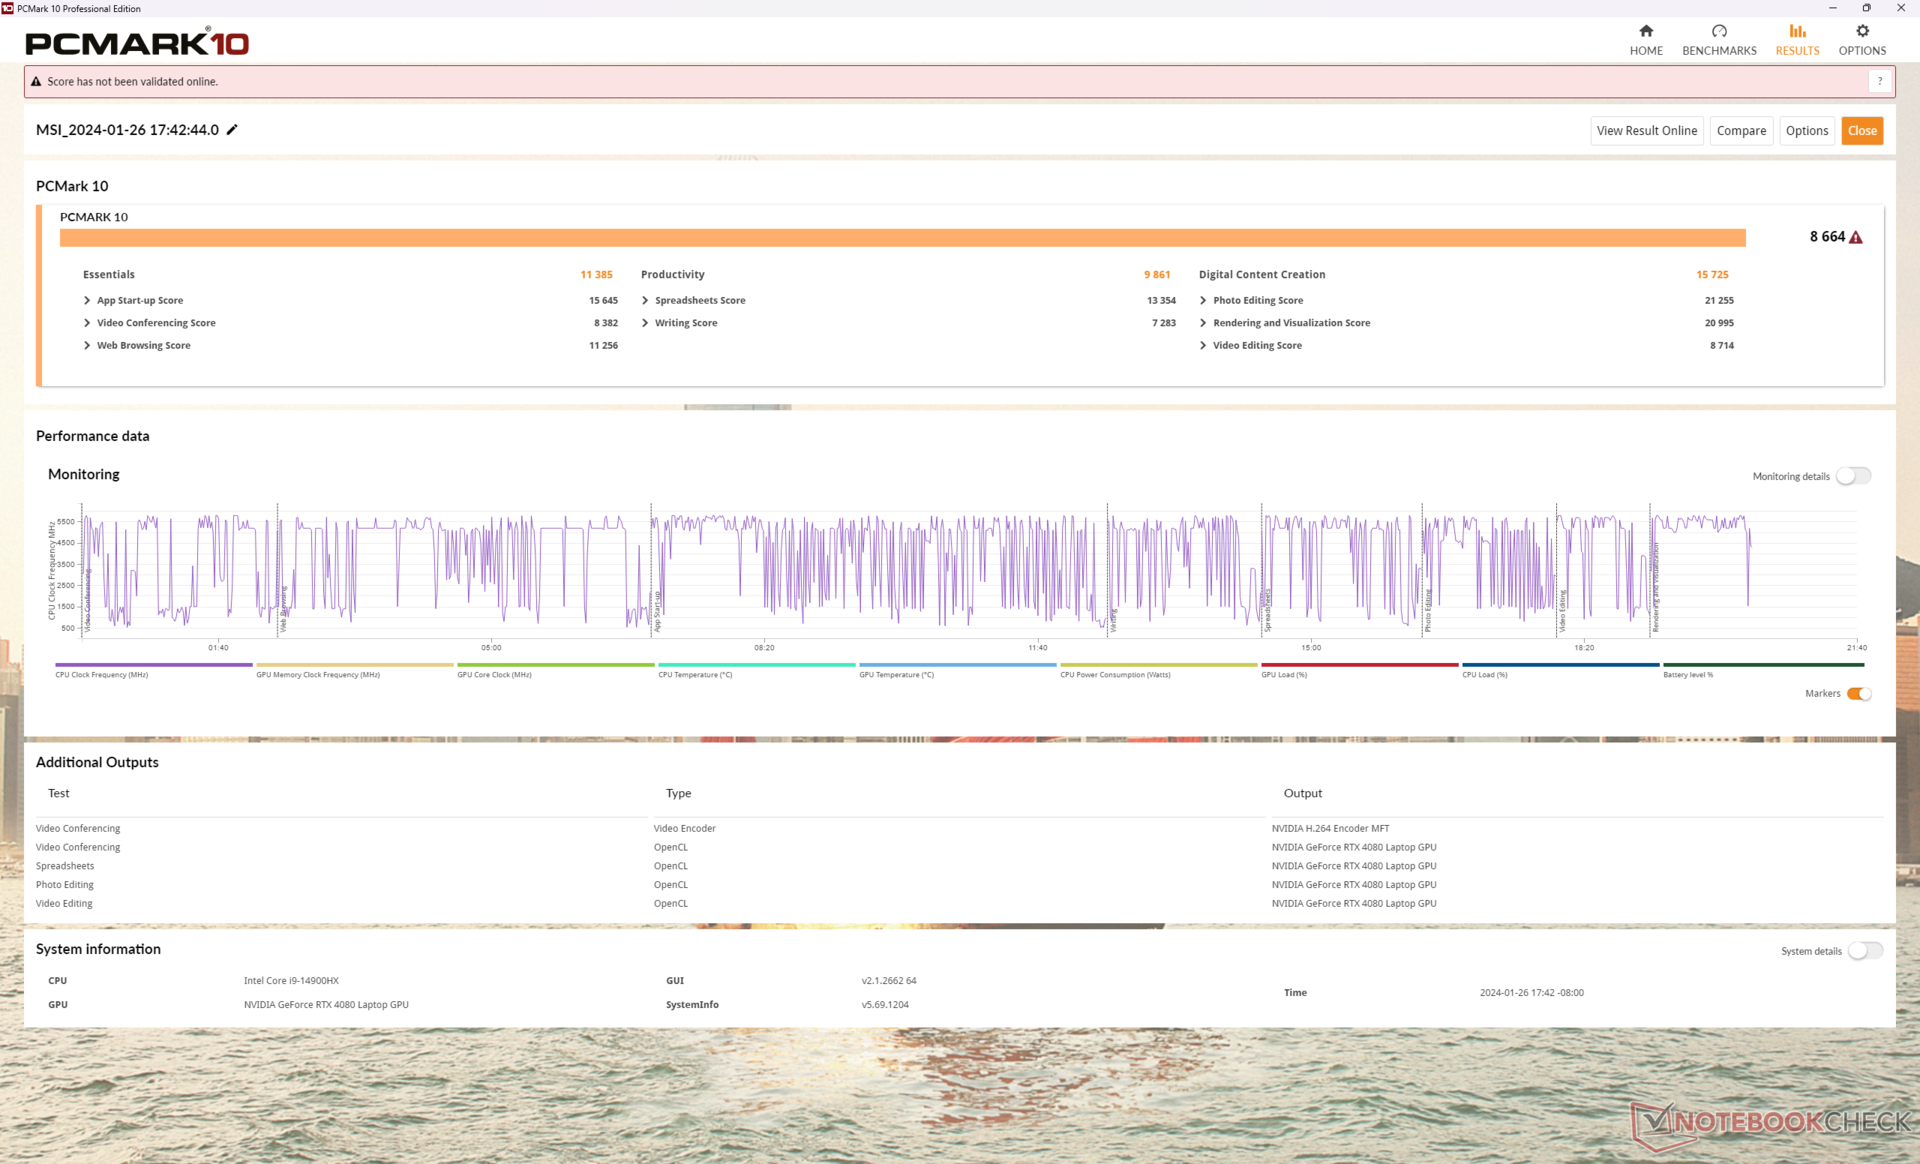
Performance du système
Les résultats PCMark sont parmi les plus élevés de tous les ordinateurs portables de jeu de milieu de gamme supérieur, grâce au nouveau CPU de la 14e génération et au GPU RTX 4080 de 175 W à pleine puissance GeForce. Les performances de la RAM sont également plus rapides que prévu, avec des vitesses de lecture et d'écriture supérieures d'environ 70 % à celles de l'ancien Vector GP66.
CrossMark: Overall | Productivity | Creativity | Responsiveness
WebXPRT 3: Overall
WebXPRT 4: Overall
Mozilla Kraken 1.1: Total
| PCMark 10 / Score | |
| Moyenne Intel Core i9-14900HX, NVIDIA GeForce RTX 4080 Laptop GPU (7703 - 9223, n=7) | |
| MSI Vector 16 HX A14V | |
| MSI Vector GP66 12UGS | |
| Asus TUF Gaming A16 FA617XS | |
| Lenovo Legion 5 16IRX G9 | |
| Dell G16 7620 | |
| HP Victus 16-r0077ng | |
| PCMark 10 / Essentials | |
| Moyenne Intel Core i9-14900HX, NVIDIA GeForce RTX 4080 Laptop GPU (11255 - 12600, n=7) | |
| MSI Vector 16 HX A14V | |
| MSI Vector GP66 12UGS | |
| Asus TUF Gaming A16 FA617XS | |
| Lenovo Legion 5 16IRX G9 | |
| HP Victus 16-r0077ng | |
| Dell G16 7620 | |
| PCMark 10 / Productivity | |
| Asus TUF Gaming A16 FA617XS | |
| Moyenne Intel Core i9-14900HX, NVIDIA GeForce RTX 4080 Laptop GPU (6662 - 11410, n=7) | |
| MSI Vector GP66 12UGS | |
| MSI Vector 16 HX A14V | |
| Lenovo Legion 5 16IRX G9 | |
| HP Victus 16-r0077ng | |
| Dell G16 7620 | |
| PCMark 10 / Digital Content Creation | |
| MSI Vector 16 HX A14V | |
| Moyenne Intel Core i9-14900HX, NVIDIA GeForce RTX 4080 Laptop GPU (14211 - 16246, n=7) | |
| MSI Vector GP66 12UGS | |
| Lenovo Legion 5 16IRX G9 | |
| Asus TUF Gaming A16 FA617XS | |
| Dell G16 7620 | |
| HP Victus 16-r0077ng | |
| CrossMark / Overall | |
| MSI Vector 16 HX A14V | |
| Moyenne Intel Core i9-14900HX, NVIDIA GeForce RTX 4080 Laptop GPU (1992 - 2334, n=7) | |
| Lenovo Legion 5 16IRX G9 | |
| Dell G16 7620 | |
| Asus TUF Gaming A16 FA617XS | |
| CrossMark / Productivity | |
| MSI Vector 16 HX A14V | |
| Moyenne Intel Core i9-14900HX, NVIDIA GeForce RTX 4080 Laptop GPU (1812 - 2204, n=7) | |
| Lenovo Legion 5 16IRX G9 | |
| Asus TUF Gaming A16 FA617XS | |
| Dell G16 7620 | |
| CrossMark / Creativity | |
| MSI Vector 16 HX A14V | |
| Moyenne Intel Core i9-14900HX, NVIDIA GeForce RTX 4080 Laptop GPU (2327 - 2500, n=7) | |
| Lenovo Legion 5 16IRX G9 | |
| Asus TUF Gaming A16 FA617XS | |
| Dell G16 7620 | |
| CrossMark / Responsiveness | |
| MSI Vector 16 HX A14V | |
| Moyenne Intel Core i9-14900HX, NVIDIA GeForce RTX 4080 Laptop GPU (1520 - 2254, n=7) | |
| Lenovo Legion 5 16IRX G9 | |
| Dell G16 7620 | |
| Asus TUF Gaming A16 FA617XS | |
| WebXPRT 3 / Overall | |
| Moyenne Intel Core i9-14900HX, NVIDIA GeForce RTX 4080 Laptop GPU (310 - 345, n=7) | |
| MSI Vector 16 HX A14V | |
| Lenovo Legion 5 16IRX G9 | |
| MSI Vector GP66 12UGS | |
| HP Victus 16-r0077ng | |
| HP Victus 16-r0077ng | |
| Dell G16 7620 | |
| WebXPRT 4 / Overall | |
| Moyenne Intel Core i9-14900HX, NVIDIA GeForce RTX 4080 Laptop GPU (300 - 321, n=7) | |
| MSI Vector 16 HX A14V | |
| Lenovo Legion 5 16IRX G9 | |
| Asus TUF Gaming A16 FA617XS | |
| Dell G16 7620 | |
| HP Victus 16-r0077ng | |
| HP Victus 16-r0077ng | |
| Mozilla Kraken 1.1 / Total | |
| Dell G16 7620 | |
| HP Victus 16-r0077ng | |
| HP Victus 16-r0077ng | |
| MSI Vector GP66 12UGS | |
| Asus TUF Gaming A16 FA617XS | |
| Lenovo Legion 5 16IRX G9 | |
| MSI Vector 16 HX A14V | |
| Moyenne Intel Core i9-14900HX, NVIDIA GeForce RTX 4080 Laptop GPU (437 - 446, n=7) | |
* ... Moindre est la valeur, meilleures sont les performances
| PCMark 10 Score | 8664 points | |
Aide | ||
| AIDA64 / Memory Copy | |
| MSI Vector 16 HX A14V | |
| Moyenne Intel Core i9-14900HX (38028 - 83392, n=36) | |
| HP Victus 16-r0077ng | |
| Lenovo Legion 5 16IRX G9 | |
| Asus TUF Gaming A16 FA617XS | |
| Dell G16 7620 | |
| MSI Vector GP66 12UGS | |
| AIDA64 / Memory Read | |
| MSI Vector 16 HX A14V | |
| Moyenne Intel Core i9-14900HX (43306 - 87568, n=36) | |
| Lenovo Legion 5 16IRX G9 | |
| HP Victus 16-r0077ng | |
| Dell G16 7620 | |
| Asus TUF Gaming A16 FA617XS | |
| MSI Vector GP66 12UGS | |
| AIDA64 / Memory Write | |
| MSI Vector 16 HX A14V | |
| Asus TUF Gaming A16 FA617XS | |
| Moyenne Intel Core i9-14900HX (37146 - 80589, n=36) | |
| HP Victus 16-r0077ng | |
| Dell G16 7620 | |
| Lenovo Legion 5 16IRX G9 | |
| MSI Vector GP66 12UGS | |
| AIDA64 / Memory Latency | |
| Dell G16 7620 | |
| HP Victus 16-r0077ng | |
| MSI Vector GP66 12UGS | |
| Asus TUF Gaming A16 FA617XS | |
| Lenovo Legion 5 16IRX G9 | |
| Moyenne Intel Core i9-14900HX (76.1 - 105, n=36) | |
| MSI Vector 16 HX A14V | |
* ... Moindre est la valeur, meilleures sont les performances
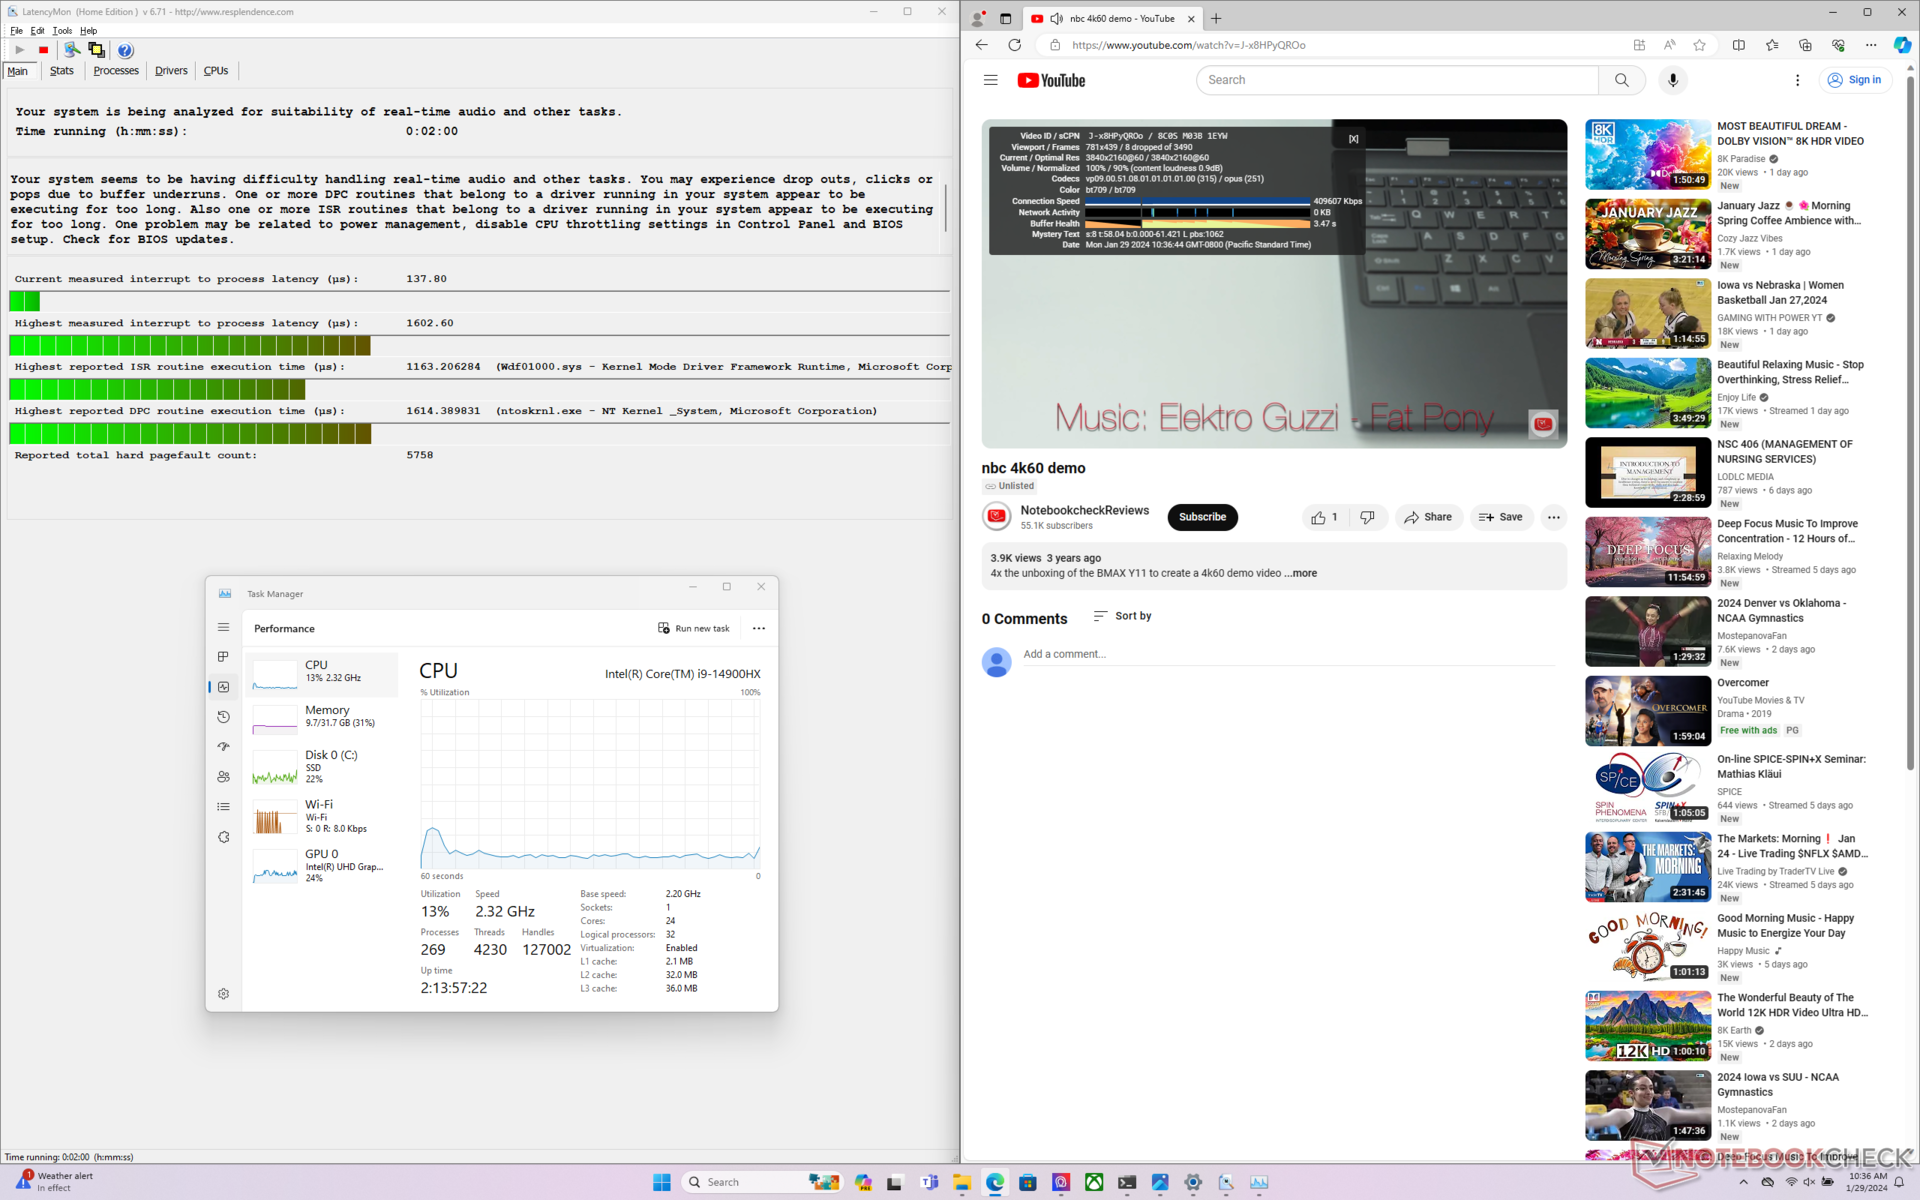
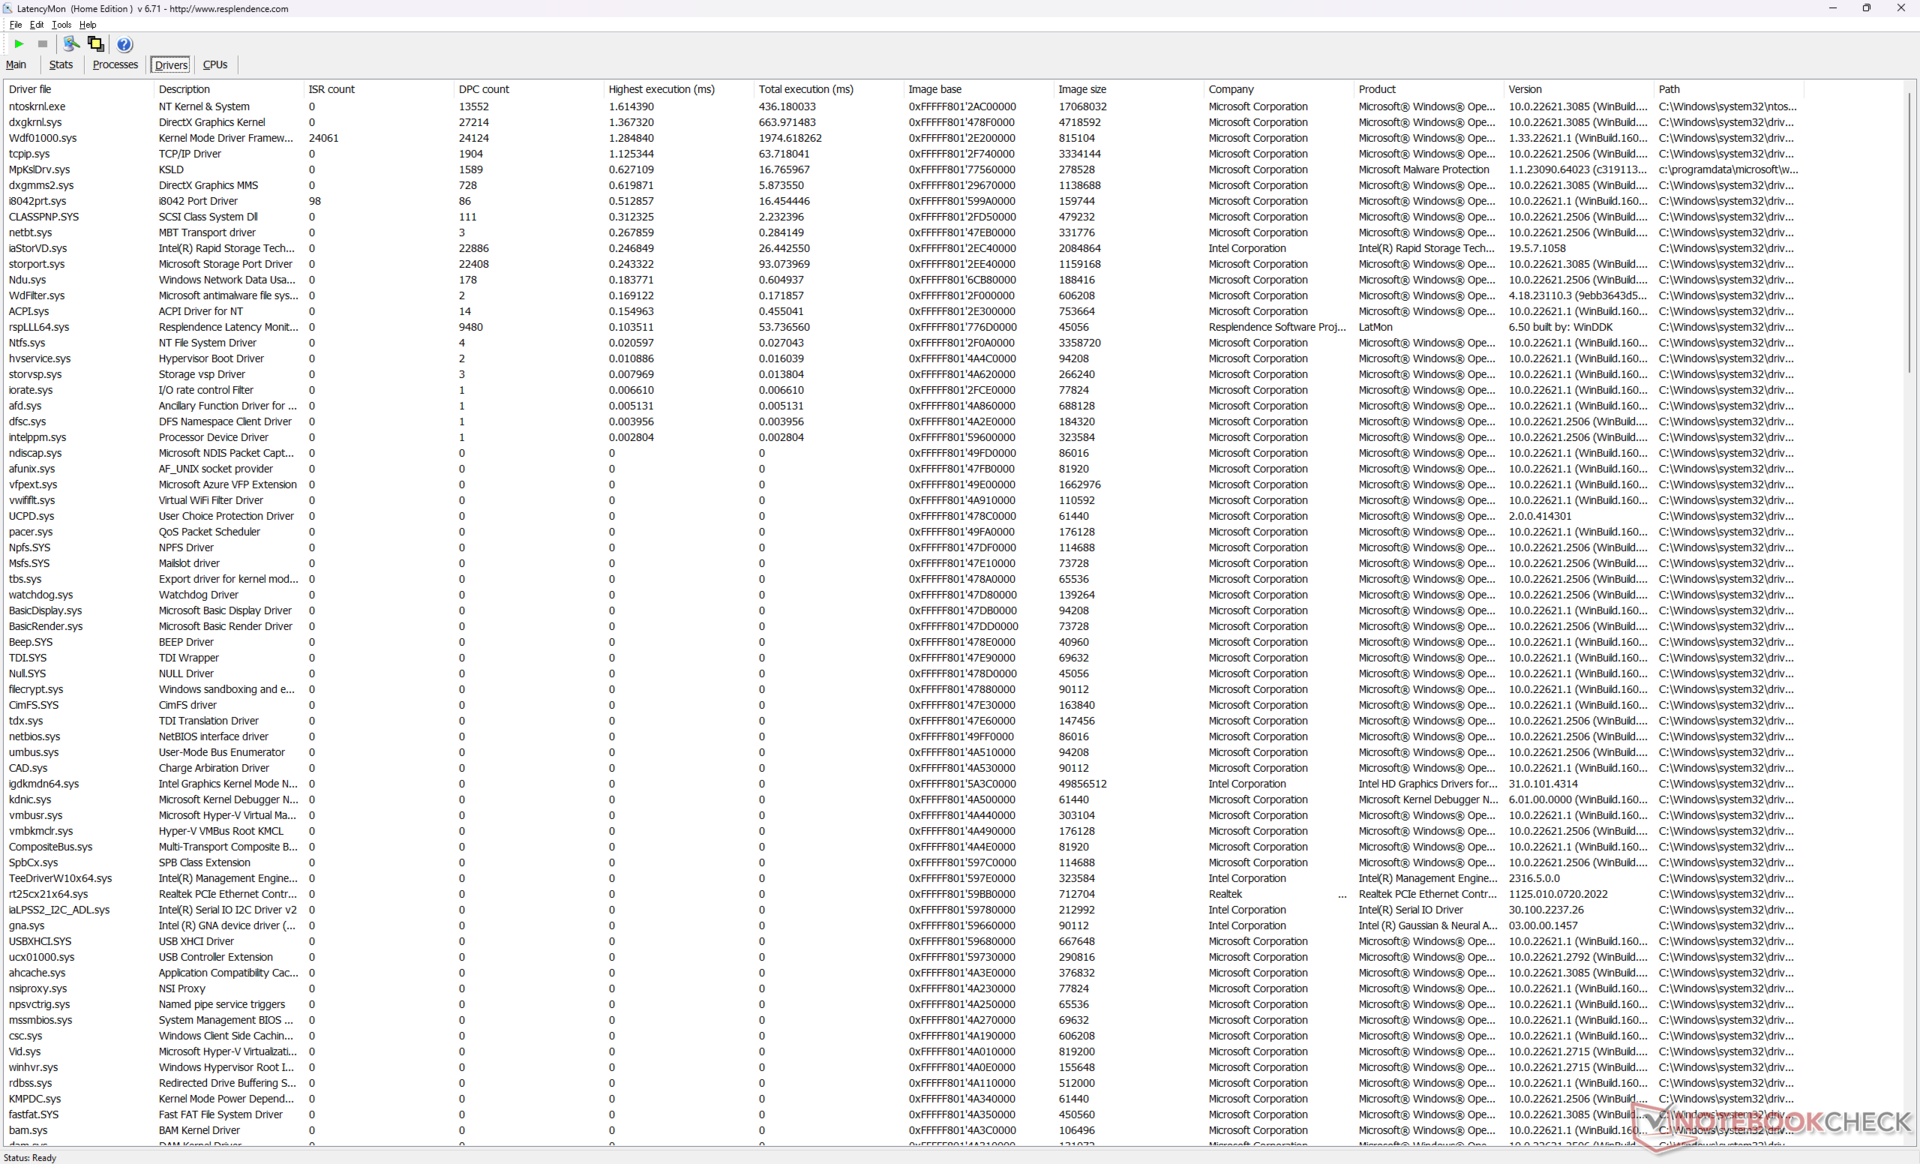
Latence DPC
LatencyMon révèle des problèmes de DPC lors de l'ouverture de plusieurs onglets de notre page d'accueil, ainsi que 8 images perdues au cours d'une vidéo de test 4K60 d'une minute. Les images perdues se produisent à intervalles presque réguliers, ce qui suggère un problème lié à l'activité en arrière-plan ou à un pilote sous-jacent.
| DPC Latencies / LatencyMon - interrupt to process latency (max), Web, Youtube, Prime95 | |
| MSI Vector GP66 12UGS | |
| Lenovo Legion 5 16IRX G9 | |
| HP Victus 16-r0077ng | |
| MSI Vector 16 HX A14V | |
| Asus TUF Gaming A16 FA617XS | |
| Dell G16 7620 | |
* ... Moindre est la valeur, meilleures sont les performances
Dispositifs de stockage
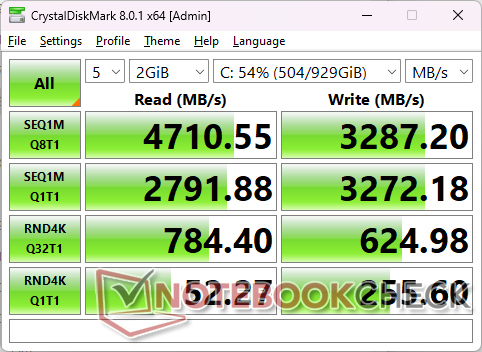
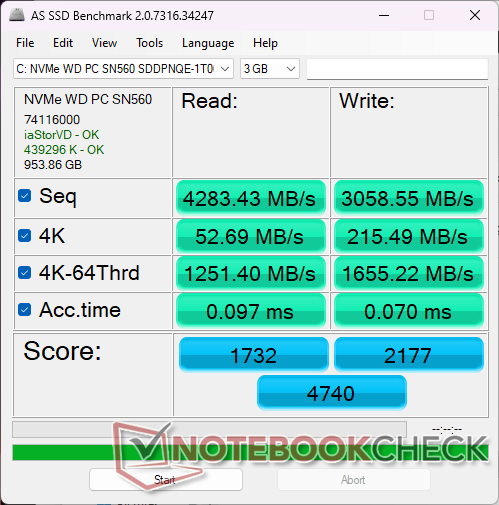
Notre unité de test est configurée avec le modèle de milieu de gamme de 1 To Western Digital PC SN560 PCIe4 x4 NVMe SSD pour des taux de transfert stables d'environ 4900 Mo/s, même en cas de stress. Le modèle prend également en charge les disques SSD PCIe5 x4, comme sur le Titan 18 HX plus grand, mais la faible disponibilité des disques SSD PCIe5 signifie que la grande majorité des configurations dans la nature pour le moment ne sont livrées qu'avec des disques PCIe4.

| Drive Performance rating - Percent | |
| Lenovo Legion 5 16IRX G9 | |
| Dell G16 7620 | |
| MSI Vector GP66 12UGS | |
| HP Victus 16-r0077ng | |
| MSI Vector 16 HX A14V | |
| Asus TUF Gaming A16 FA617XS | |
* ... Moindre est la valeur, meilleures sont les performances
Disk Throttling: DiskSpd Read Loop, Queue Depth 8
Performances du GPU - Là où le Vector brille
Alors que la plupart des autres ordinateurs portables de jeu visent des valeurs TGP inférieures, y compris le GP66 sortant, le Vector 16 HX vise le maximum de 175 W pour des performances plus rapides. Par conséquent, notre système MSI est environ 8 à 10 % plus rapide que l'ordinateur portable moyen de notre base de données équipé de la même carte graphique mobile le même GPU mobile GeForce RTX 4080 GPU. La marge n'est pas très grande, mais les utilisateurs intensifs et les joueurs qui veulent tirer le maximum de performances GPU de leur machine voudront considérer le Vector 16 HX plutôt que des alternatives avec les mêmes options graphiques comme le HP Omen 16.
La mise à niveau vers la RTX 4090 devrait augmenter les performances graphiques d'environ 10 %, tandis que le passage à la RTX 4070 et à la RTX 4060 devrait diminuer les performances d'environ 30 à 35 % et 40 à 45 %, respectivement.
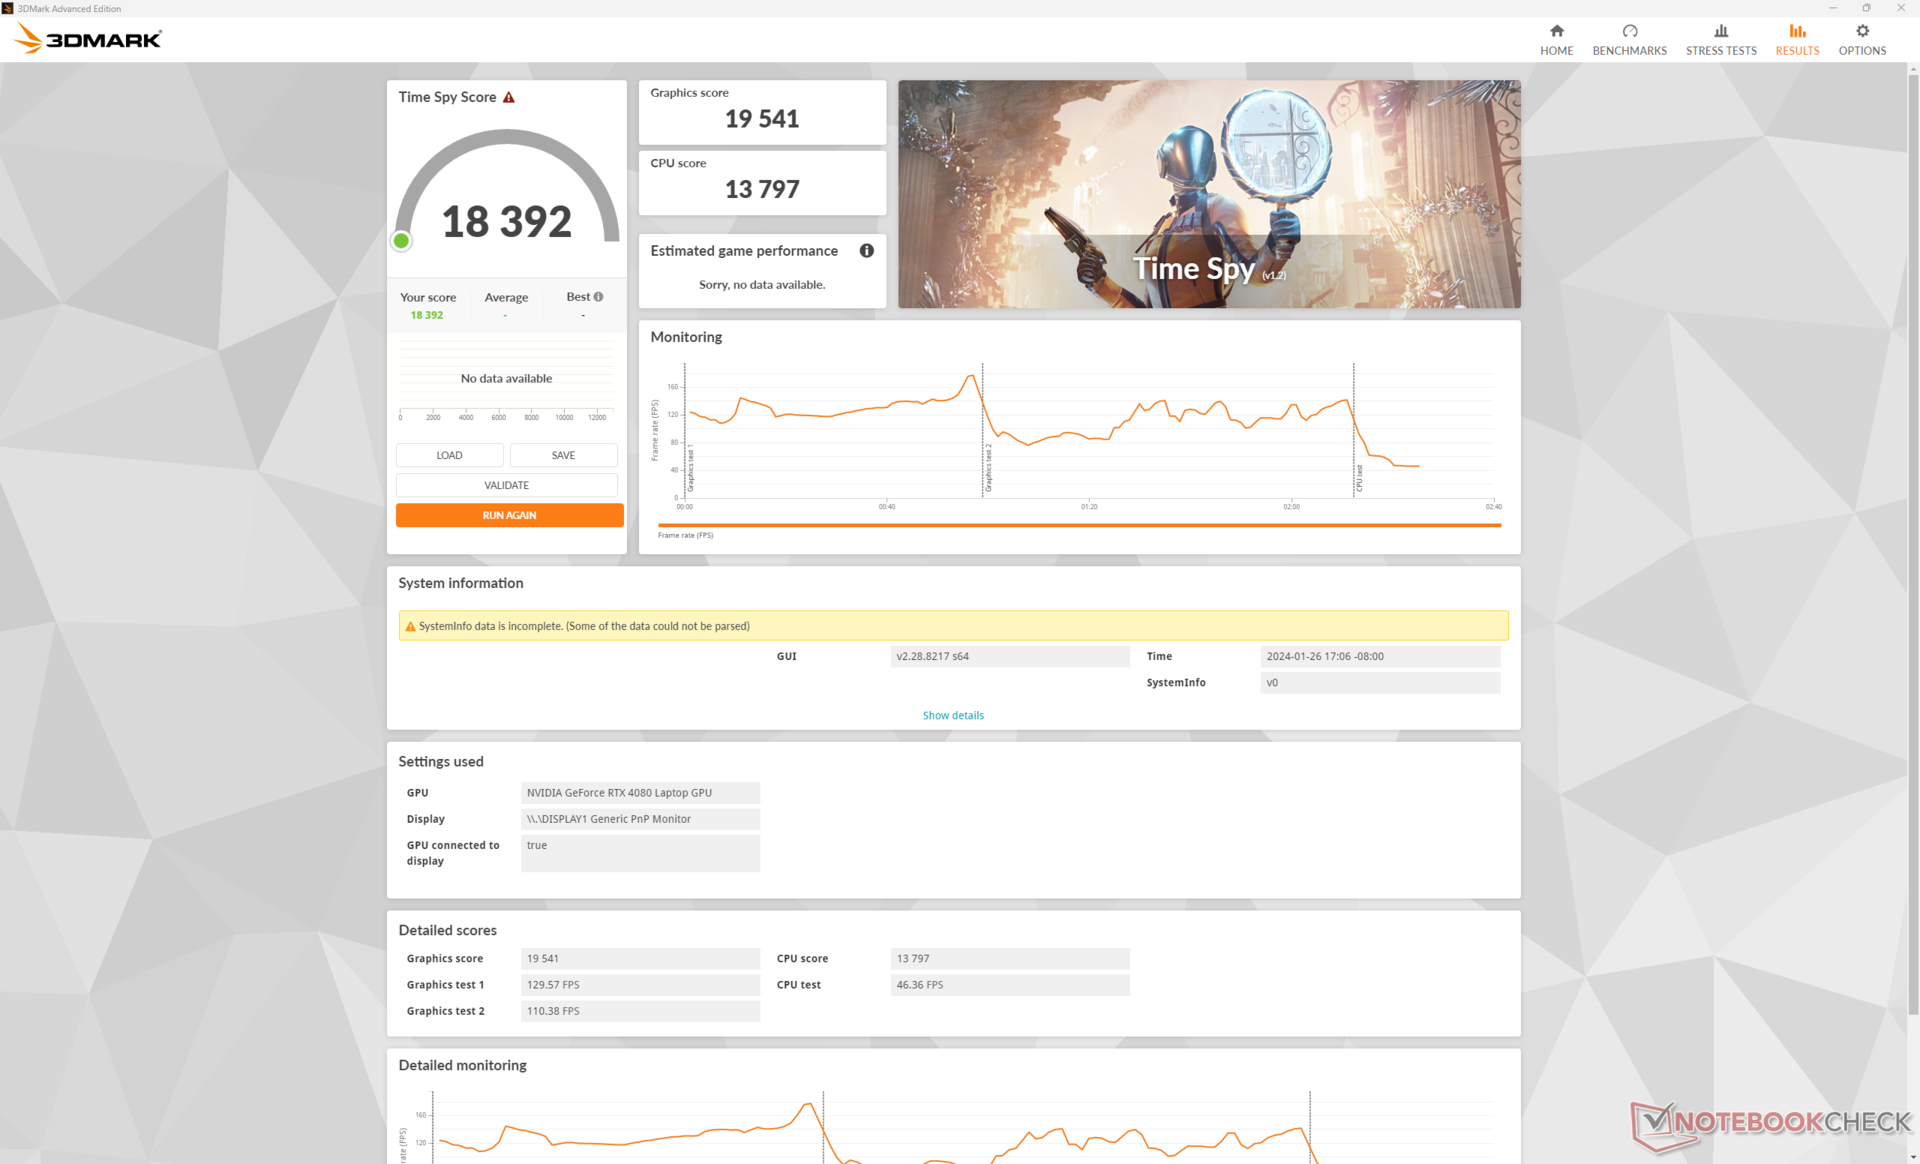
| Profil de puissance | Score physique | Score graphique | Score combiné |
| Performance extrême (avec Cooler Boost activé) | 13797 | 19541 | 18392 |
| Performances extrêmes (avec Cooler Boost désactivé) | 14118 (-0%) | 19471 (-0%) | 18423 (-0%) |
| Mode équilibré | 13858 (-0%) | 16466 (-16%) | 16013 (-13%) |
| Alimentation par batterie | 8307 (-40%) | 8955 (-54%) | 8851 (-52%) |
Comme sur les autres portables de jeu MSI avec Cooler Boost, les performances semblent ne pas être affectées par la fonctionnalité tant que vous êtes en mode Extreme Performance d'après nos scores sur Time Spy dans le tableau ci-dessus. En revanche, si vous passez en mode équilibré, les performances graphiques seront réduites d'environ 16 %.
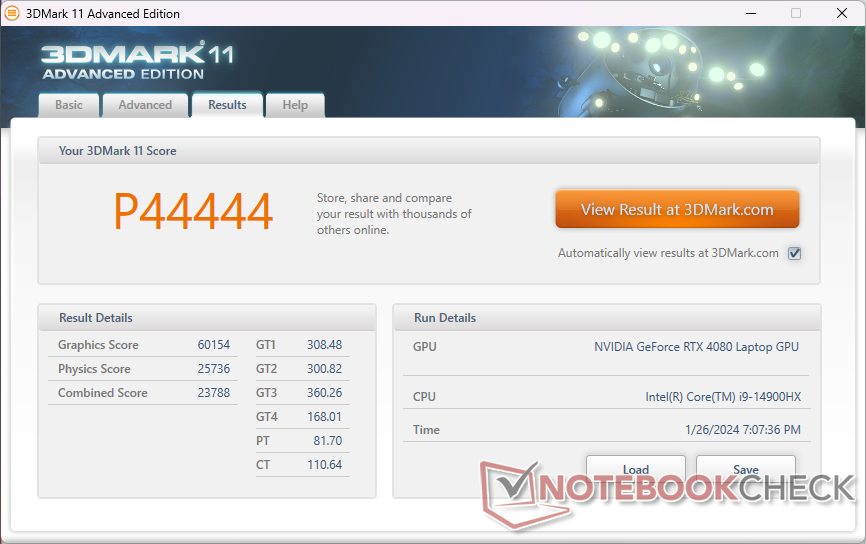
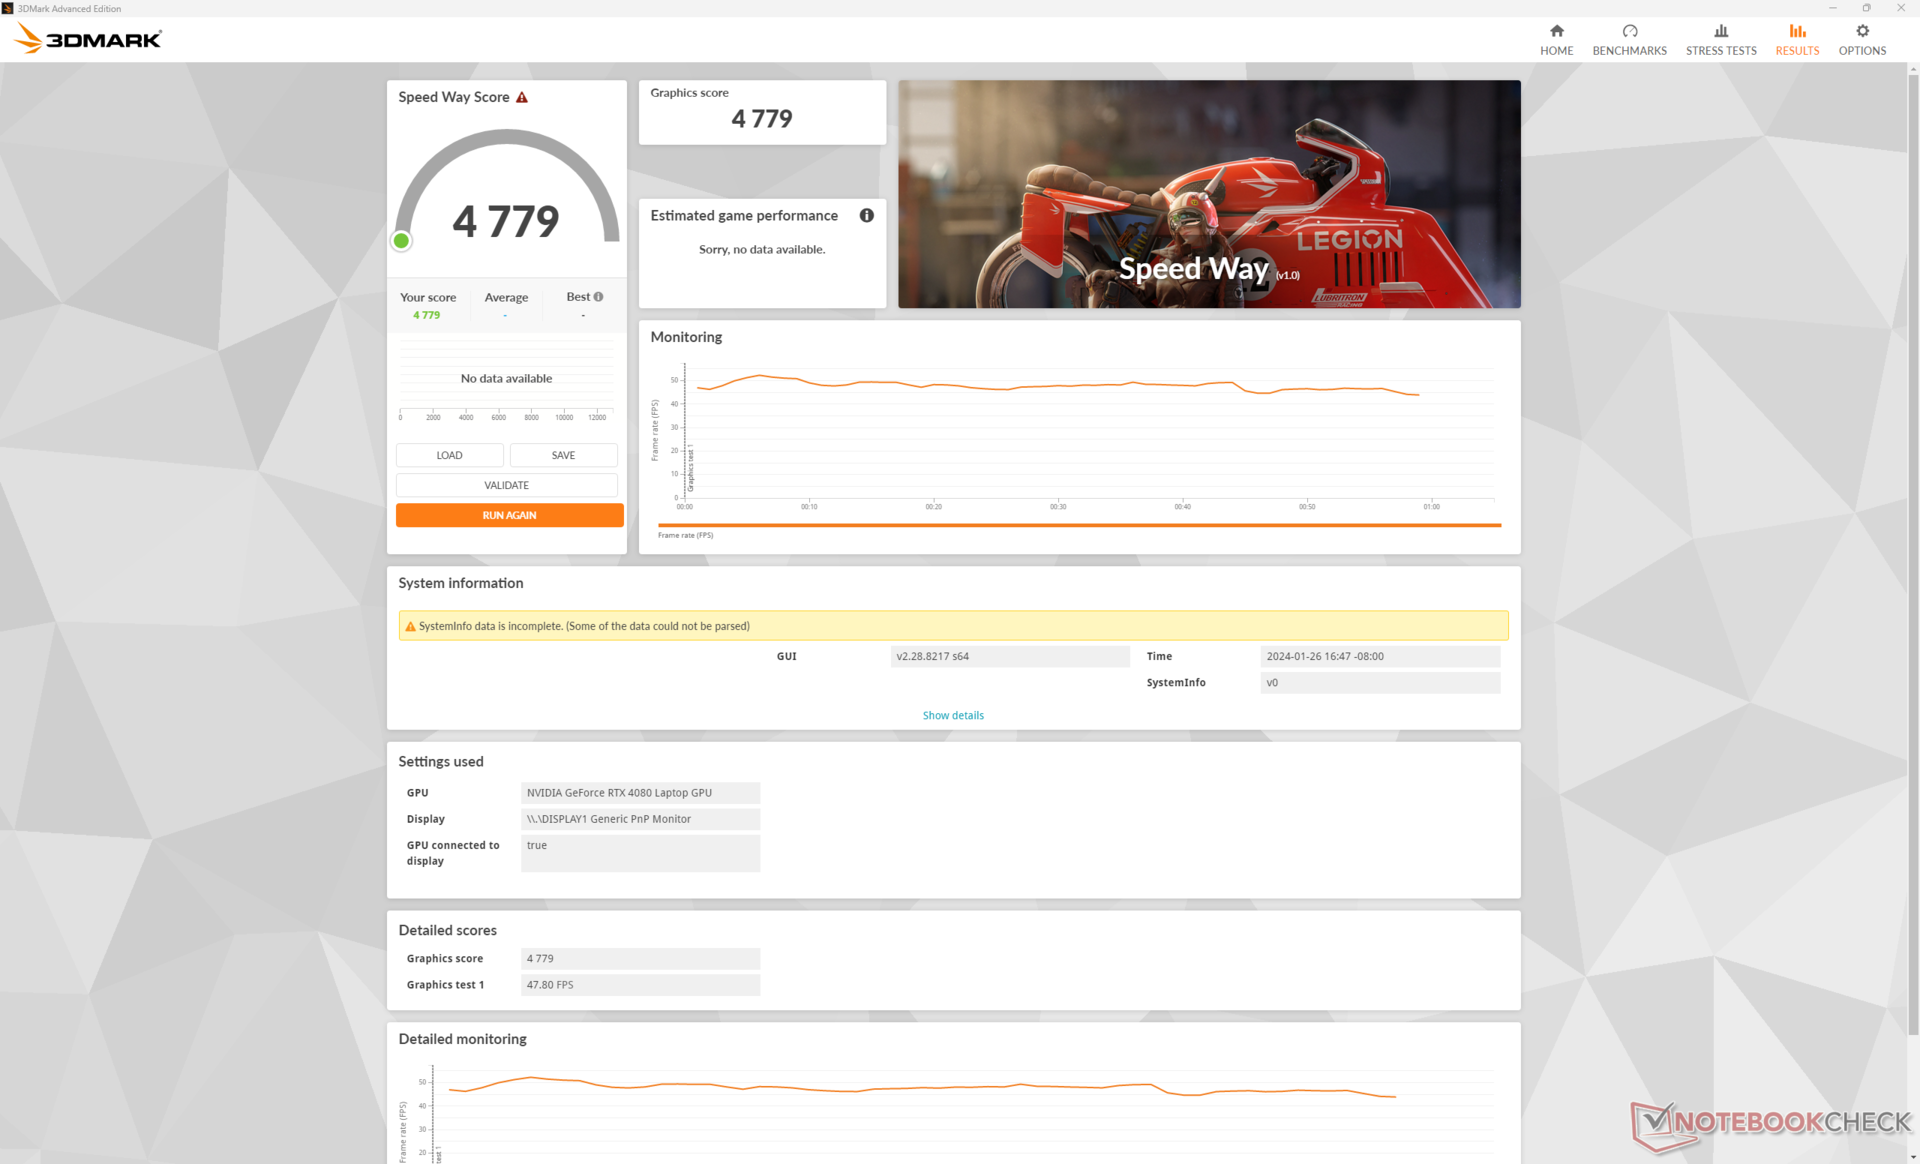
| 3DMark 11 Performance | 44444 points | |
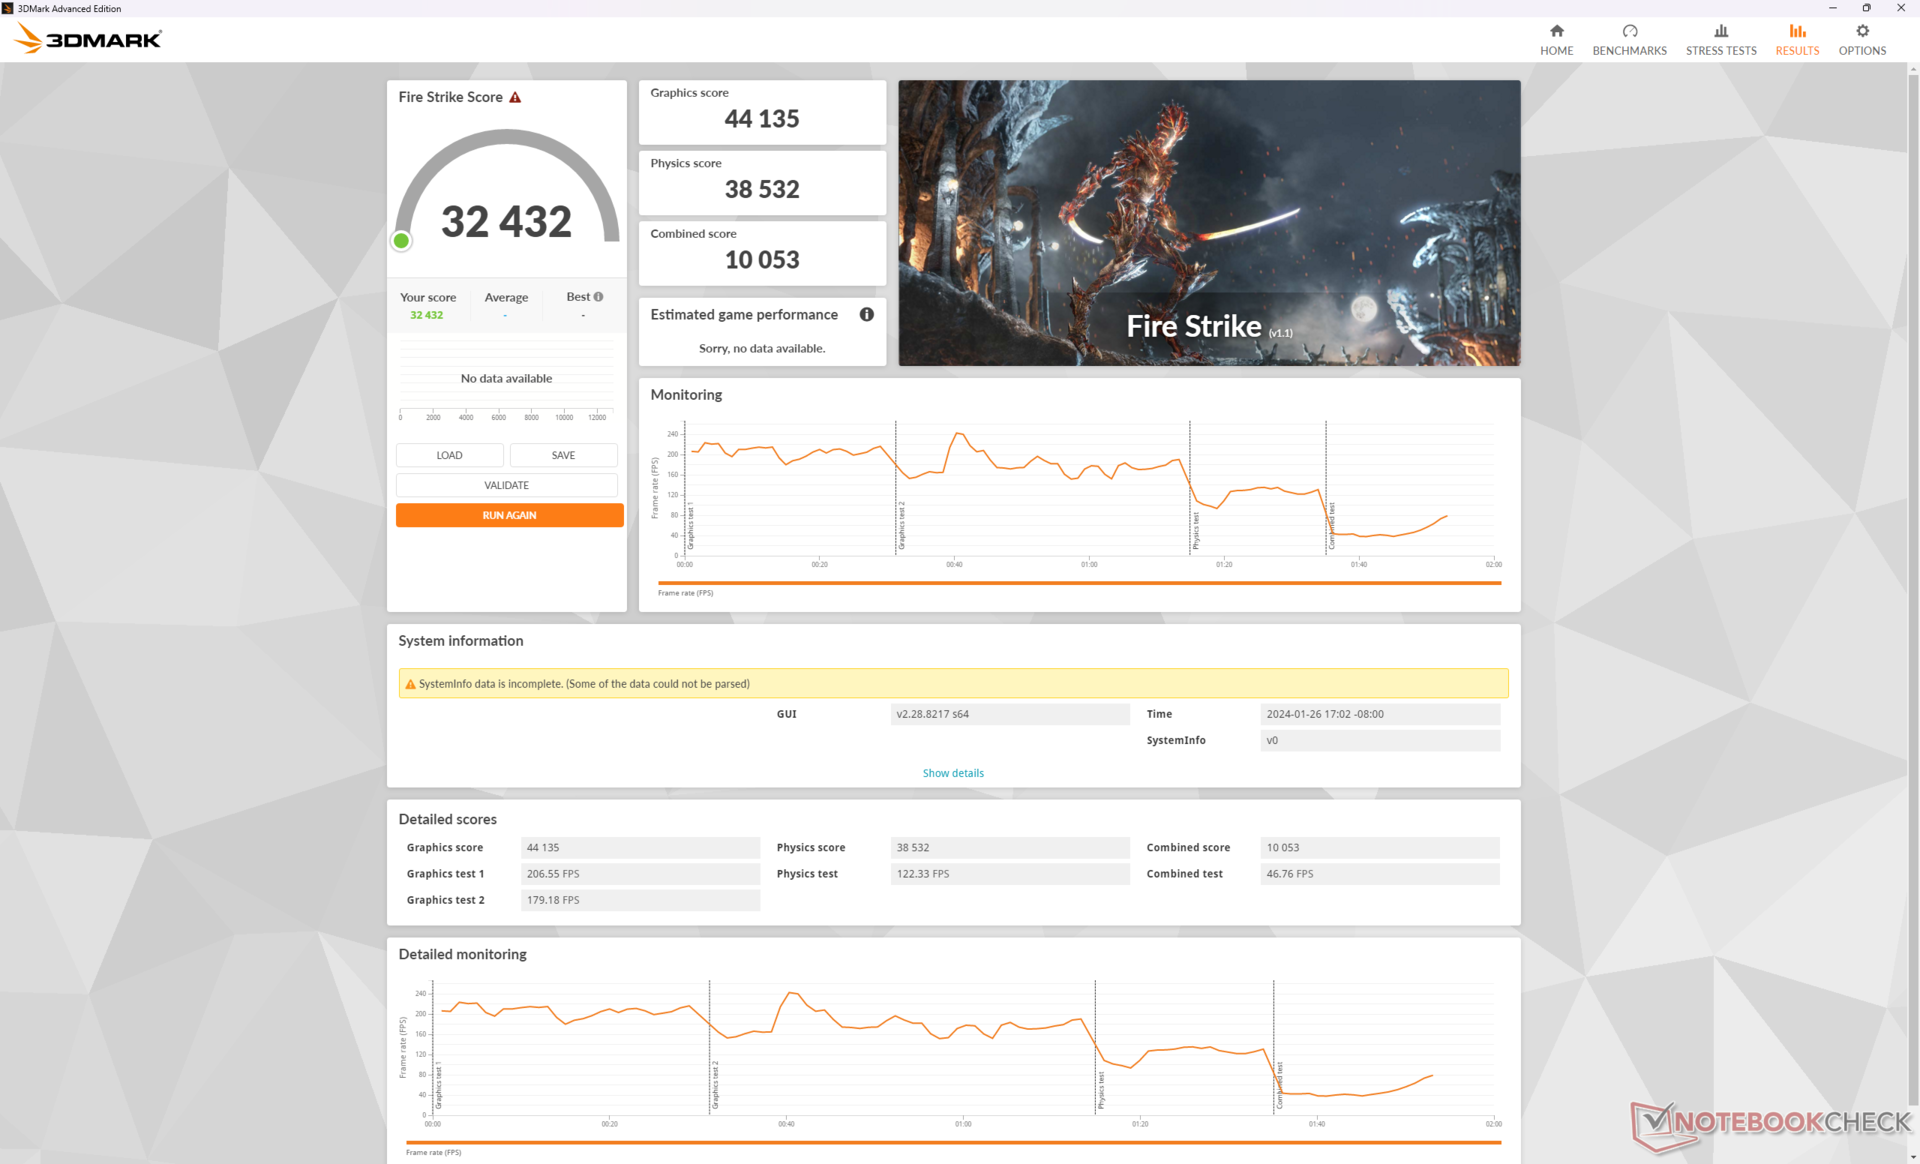
| 3DMark Fire Strike Score | 32432 points | |
| 3DMark Time Spy Score | 18392 points | |
Aide | ||
* ... Moindre est la valeur, meilleures sont les performances
Performances des jeux
Tous les titres actuels tournent sans problème à la résolution d'affichage native de 1600p avec la plupart des paramètres au maximum. Cependant, vous pouvez envisager d'activer v-sync ou de limiter la fréquence d'images à 120 en raison de l'absence de G-Sync. Baldur's Gate, par exemple, affiche une moyenne de 129 FPS à 1440p, ce qui peut entraîner des déchirures d'écran sur l'écran 240 Hz si les fréquences d'images sont débloquées.
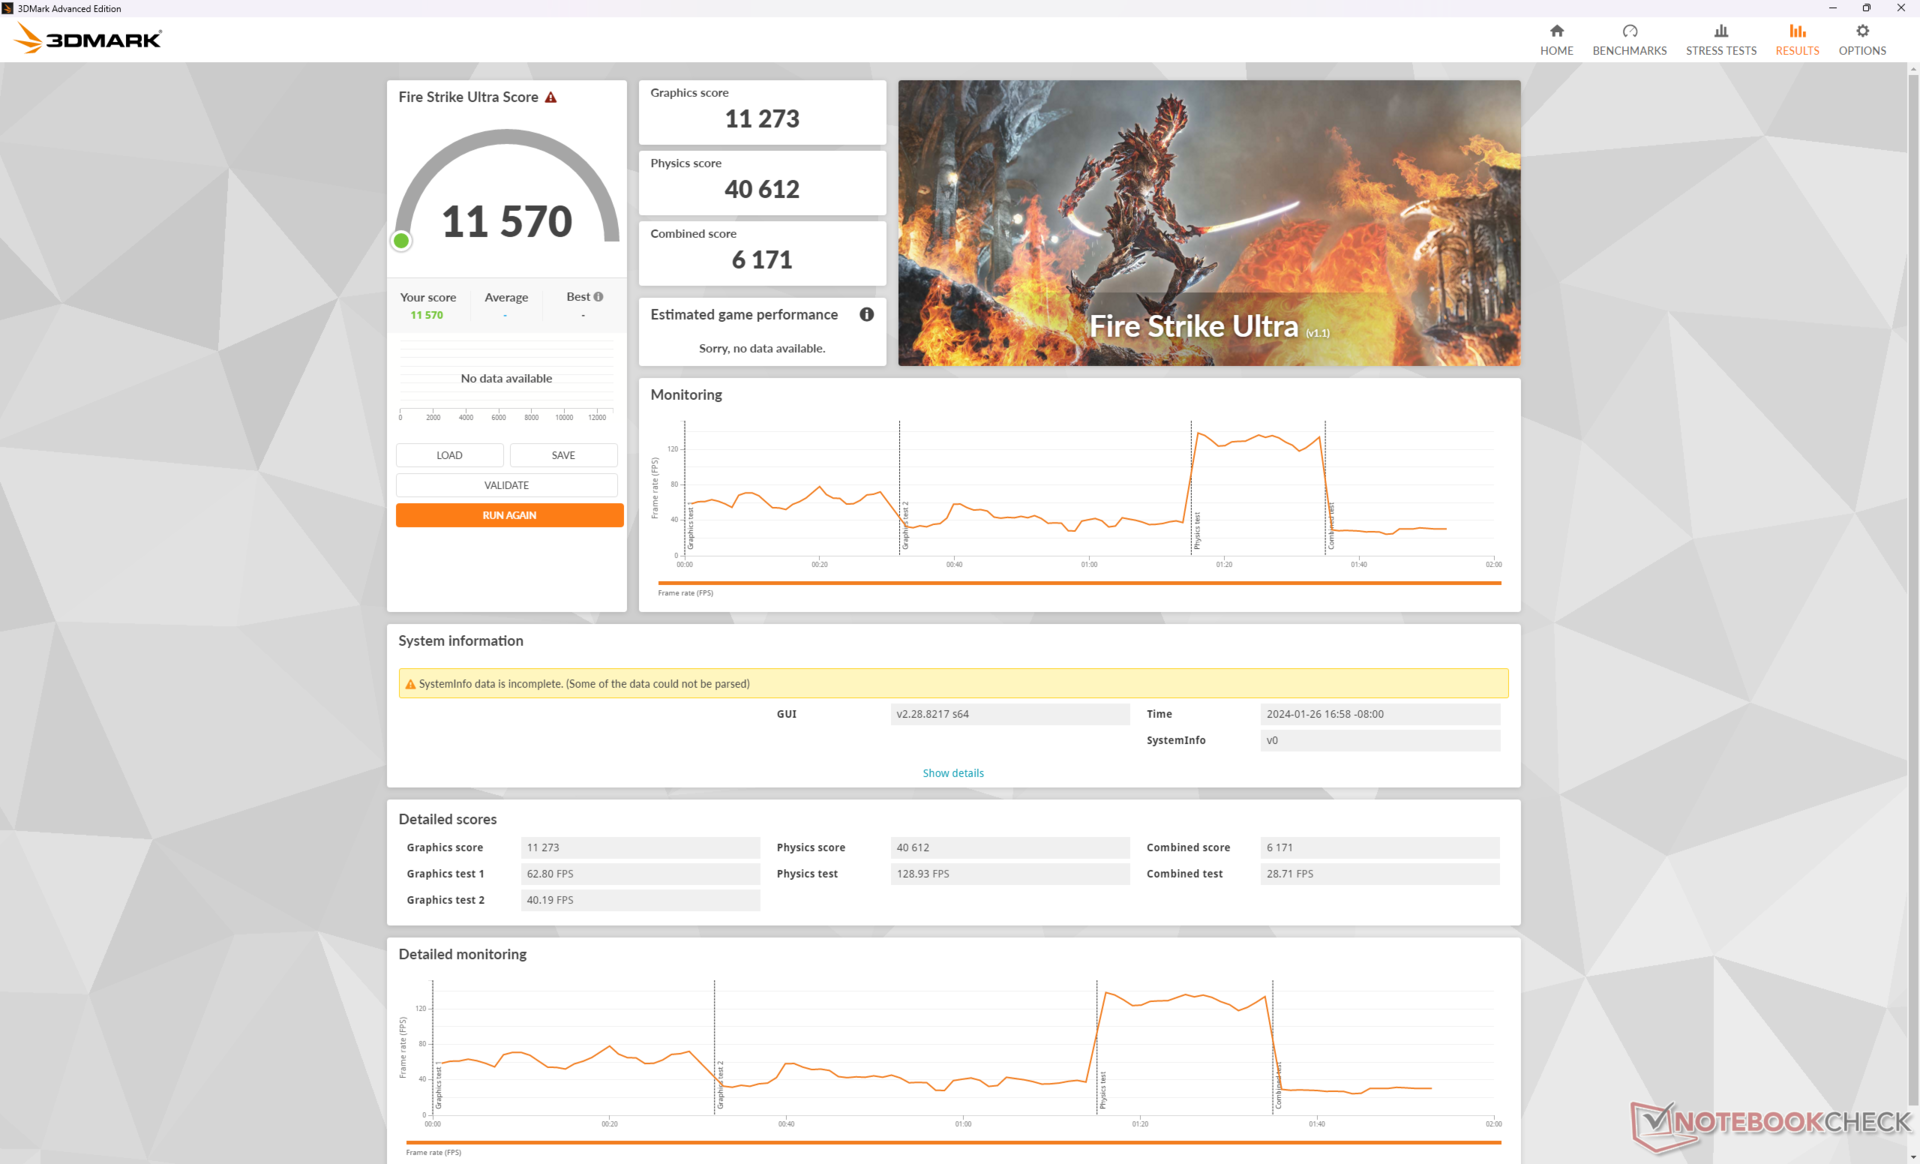
DLSS est recommandé si vous jouez en 4K car la RTX 4080 mobile est significativement plus faible que son homologue de bureau homologue de bureau. Cyberpunk 2077 n'aurait que 18,5 FPS en moyenne avec les paramètres 4K Ultra RT natifs, mais l'activation de DLSS Auto et de la génération d'images ferait grimper la moyenne à 75,8 FPS.
| Performance rating - Percent | |
| MSI Vector 16 HX A14V | |
| Lenovo Legion 5 16IRX G9 | |
| MSI Vector GP66 12UGS | |
| HP Victus 16-r0077ng | |
| Dell G16 7620 | |
| Asus TUF Gaming A16 FA617XS | |
| The Witcher 3 - 1920x1080 Ultra Graphics & Postprocessing (HBAO+) | |
| MSI Vector 16 HX A14V | |
| MSI Vector GP66 12UGS | |
| HP Victus 16-r0077ng | |
| Asus TUF Gaming A16 FA617XS | |
| Lenovo Legion 5 16IRX G9 | |
| Dell G16 7620 | |
| GTA V - 1920x1080 Highest AA:4xMSAA + FX AF:16x | |
| MSI Vector 16 HX A14V | |
| MSI Vector GP66 12UGS | |
| Lenovo Legion 5 16IRX G9 | |
| HP Victus 16-r0077ng | |
| Dell G16 7620 | |
| Asus TUF Gaming A16 FA617XS | |
| Final Fantasy XV Benchmark - 1920x1080 High Quality | |
| MSI Vector 16 HX A14V | |
| MSI Vector GP66 12UGS | |
| HP Victus 16-r0077ng | |
| Lenovo Legion 5 16IRX G9 | |
| Dell G16 7620 | |
| Asus TUF Gaming A16 FA617XS | |
| Strange Brigade - 1920x1080 ultra AA:ultra AF:16 | |
| MSI Vector 16 HX A14V | |
| MSI Vector GP66 12UGS | |
| Lenovo Legion 5 16IRX G9 | |
| HP Victus 16-r0077ng | |
| Asus TUF Gaming A16 FA617XS | |
| Dell G16 7620 | |
| Dota 2 Reborn - 1920x1080 ultra (3/3) best looking | |
| MSI Vector 16 HX A14V | |
| Lenovo Legion 5 16IRX G9 | |
| MSI Vector GP66 12UGS | |
| Dell G16 7620 | |
| HP Victus 16-r0077ng | |
| Asus TUF Gaming A16 FA617XS | |
| X-Plane 11.11 - 1920x1080 high (fps_test=3) | |
| MSI Vector 16 HX A14V | |
| Lenovo Legion 5 16IRX G9 | |
| MSI Vector GP66 12UGS | |
| Dell G16 7620 | |
| HP Victus 16-r0077ng | |
| Asus TUF Gaming A16 FA617XS | |
| Baldur's Gate 3 | |
| 1920x1080 High Preset AA:T | |
| MSI Vector 16 HX A14V | |
| Moyenne NVIDIA GeForce RTX 4080 Laptop GPU (122.2 - 183.5, n=4) | |
| Framework Laptop 16 | |
| Lenovo ThinkPad Z16 Gen 2 | |
| 1920x1080 Ultra Preset AA:T | |
| MSI Vector 16 HX A14V | |
| Moyenne NVIDIA GeForce RTX 4080 Laptop GPU (111.8 - 181.2, n=7) | |
| Framework Laptop 16 | |
| Lenovo ThinkPad Z16 Gen 2 | |
| 2560x1440 Ultra Preset AA:T | |
| MSI Vector 16 HX A14V | |
| Moyenne NVIDIA GeForce RTX 4080 Laptop GPU (88.3 - 129.3, n=7) | |
| Framework Laptop 16 | |
| Lenovo ThinkPad Z16 Gen 2 | |
| 3840x2160 Ultra Preset AA:T | |
| MSI Vector 16 HX A14V | |
| Moyenne NVIDIA GeForce RTX 4080 Laptop GPU (48.8 - 68.4, n=5) | |
| Framework Laptop 16 | |
Witcher 3 FPS Chart
| Bas | Moyen | Élevé | Ultra | QHD | 4K | |
|---|---|---|---|---|---|---|
| GTA V (2015) | 187.1 | 185.7 | 181.9 | 136.5 | 128.8 | 158.6 |
| The Witcher 3 (2015) | 640 | 513.3 | 384.6 | 183.3 | 121.2 | |
| Dota 2 Reborn (2015) | 217 | 194.8 | 186.7 | 175 | 168.4 | |
| Final Fantasy XV Benchmark (2018) | 232 | 219 | 178.8 | 142 | 79.5 | |
| X-Plane 11.11 (2018) | 204 | 177.4 | 137.7 | 118.1 | ||
| Far Cry 5 (2018) | 180 | 167 | 161 | 154 | 97 | |
| Strange Brigade (2018) | 505 | 405 | 378 | 349 | 248 | 123.2 |
| Tiny Tina's Wonderlands (2022) | 344 | 297.1 | 212.8 | 167.1 | 114.8 | 60.3 |
| F1 22 (2022) | 339 | 324 | 297 | 81.2 | 76.9 | 39.6 |
| Baldur's Gate 3 (2023) | 228.5 | 204.3 | 183.5 | 181.2 | 129.3 | 68.4 |
| Cyberpunk 2077 (2023) | 143.4 | 135.3 | 127.1 | 118.6 | 79.4 | 36.6 |
Emissions - Loud And Proud
Bruit du système
Le système est assez bruyant, même lorsqu'il tourne au ralenti sur le bureau en mode équilibré ou silencieux. Le bruit du ventilateur en mode Witcher 3 en mode Extreme Performance s'établit à 62 dB(A), quel que soit le réglage de Cooler Boost. La plage de 60+ dB(A) est celle des ordinateurs portables les plus bruyants de notre base de données, à tel point qu'il est recommandé d'utiliser un casque pour une meilleure expérience de jeu.
Si vous jouez en mode équilibré, le bruit du ventilateur sera réduit à 54 dB(A). Bien que le bruit reste élevé, il est loin d'être aussi grave qu'en mode Extreme Performance. Les utilisateurs peuvent donc souhaiter jouer en mode équilibré plutôt qu'en mode performances extrêmes, même si cela entraîne une baisse de 16 % des performances du GPU, comme indiqué ci-dessus.
Degré de la nuisance sonore
| Au repos |
| 33.5 / 33.5 / 33.5 dB(A) |
| Fortement sollicité |
| 52.1 / 62 dB(A) |
 | ||
30 dB silencieux 40 dB(A) audible 50 dB(A) bruyant |
||
min: | ||
| MSI Vector 16 HX A14V GeForce RTX 4080 Laptop GPU, i9-14900HX, WD PC SN560 SDDPNQE-1T00 | MSI Vector GP66 12UGS GeForce RTX 3070 Ti Laptop GPU, i9-12900H | Lenovo Legion 5 16IRX G9 GeForce RTX 4060 Laptop GPU, i7-14650HX, Samsung PM9A1 MZVL21T0HCLR | HP Victus 16-r0077ng GeForce RTX 4070 Laptop GPU, i7-13700H, Kioxia XG8 KXG80ZNV1T02 | Asus TUF Gaming A16 FA617XS Radeon RX 7600S, R9 7940HS, Micron 2400 MTFDKBA512QFM | Dell G16 7620 GeForce RTX 3060 Laptop GPU, i7-12700H, WDC PC SN810 512GB | |
|---|---|---|---|---|---|---|
| Noise | 17% | 11% | 14% | 15% | 18% | |
| arrêt / environnement * (dB) | 23.2 | 22.9 1% | 24 -3% | 25 -8% | 25 -8% | 23.2 -0% |
| Idle Minimum * (dB) | 33.5 | 23.4 30% | 24 28% | 28 16% | 25 25% | 28.3 16% |
| Idle Average * (dB) | 33.5 | 23.4 30% | 28.8 14% | 29 13% | 26 22% | 28.8 14% |
| Idle Maximum * (dB) | 33.5 | 27.4 18% | 32 4% | 30 10% | 28 16% | 28.9 14% |
| Load Average * (dB) | 52.1 | 36 31% | 45.5 13% | 43 17% | 43 17% | 32.4 38% |
| Witcher 3 ultra * (dB) | 62 | 58.2 6% | 53.1 14% | 46 26% | 51 18% | 48.3 22% |
| Load Maximum * (dB) | 62 | 58 6% | 55.7 10% | 48 23% | 53 15% | 48.1 22% |
* ... Moindre est la valeur, meilleures sont les performances
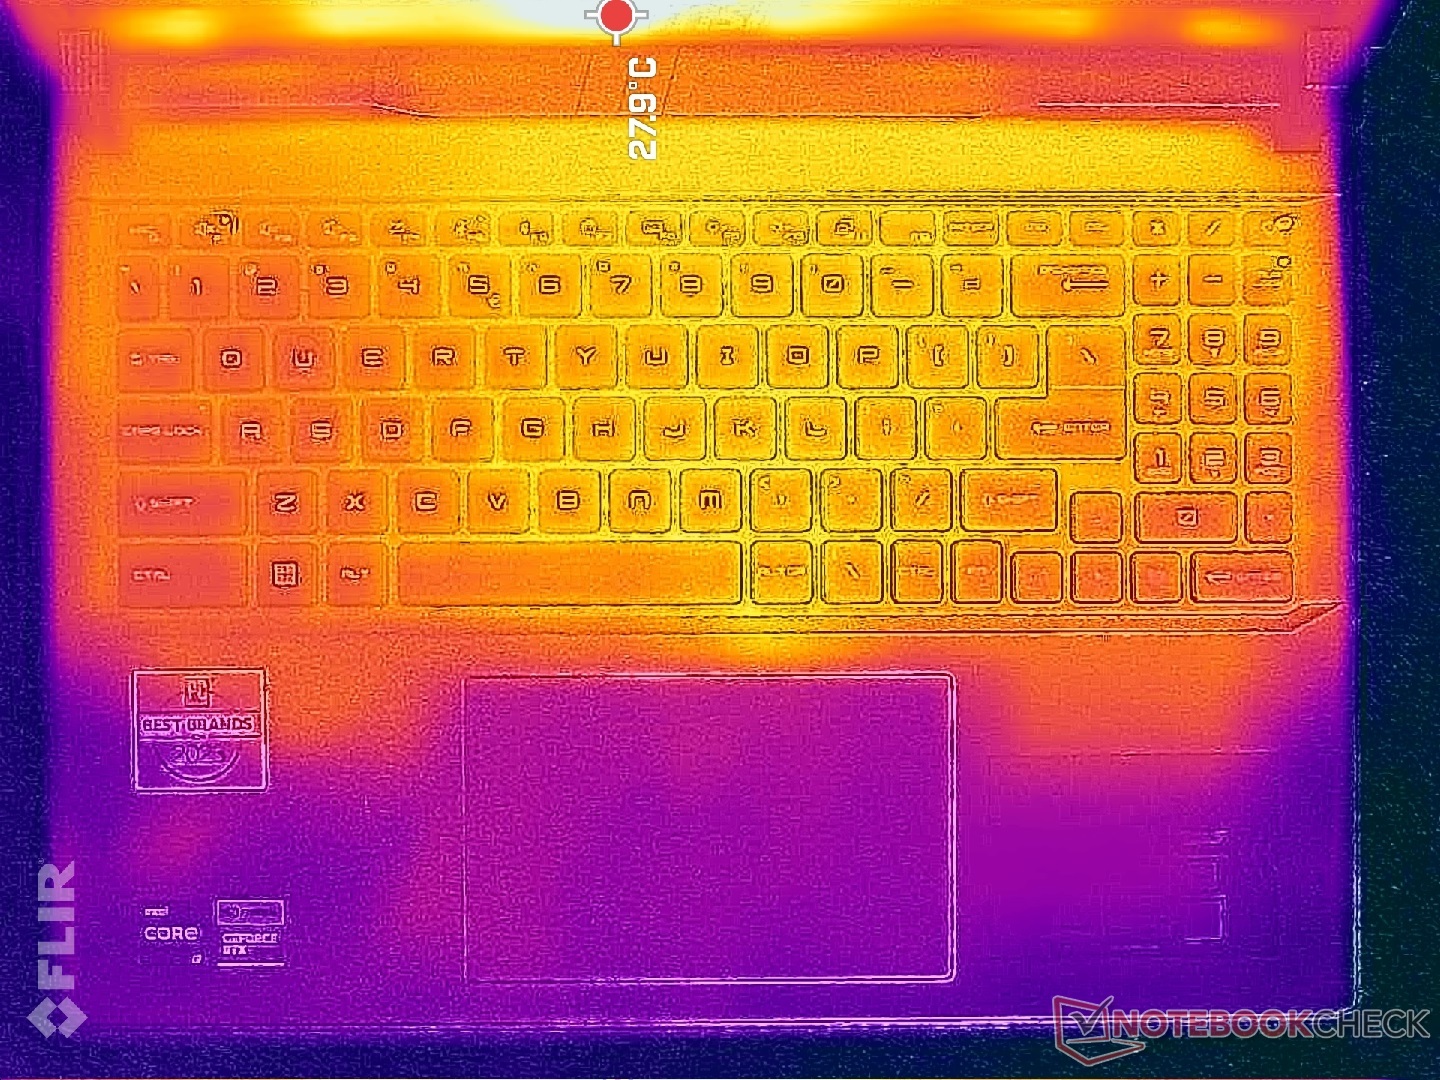
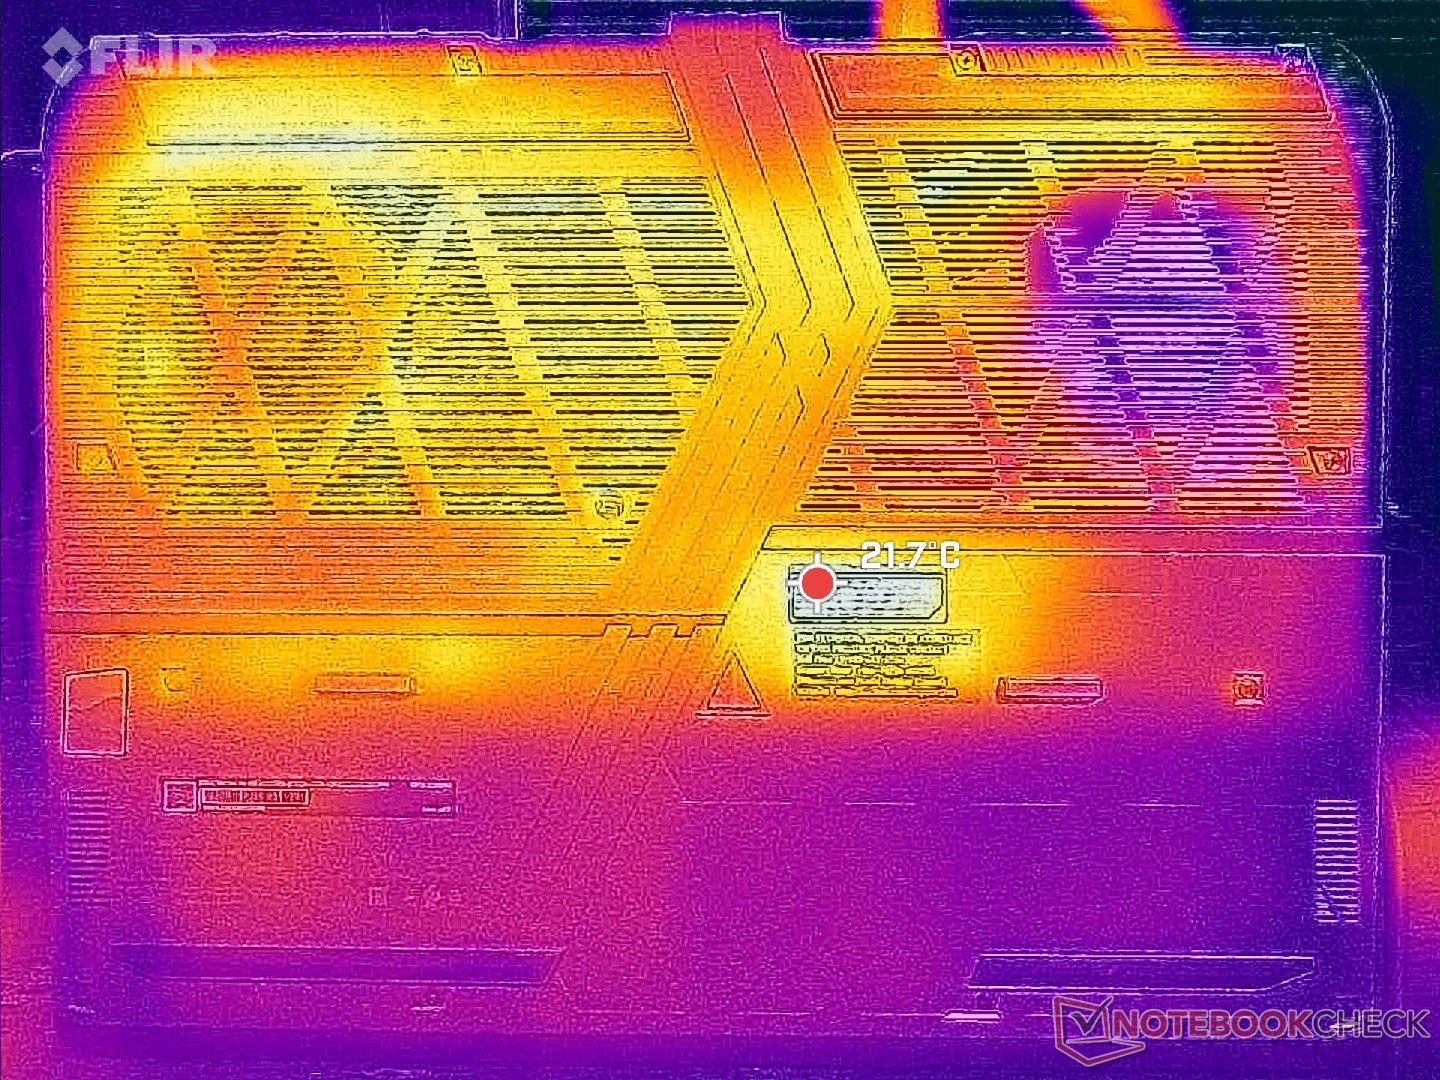
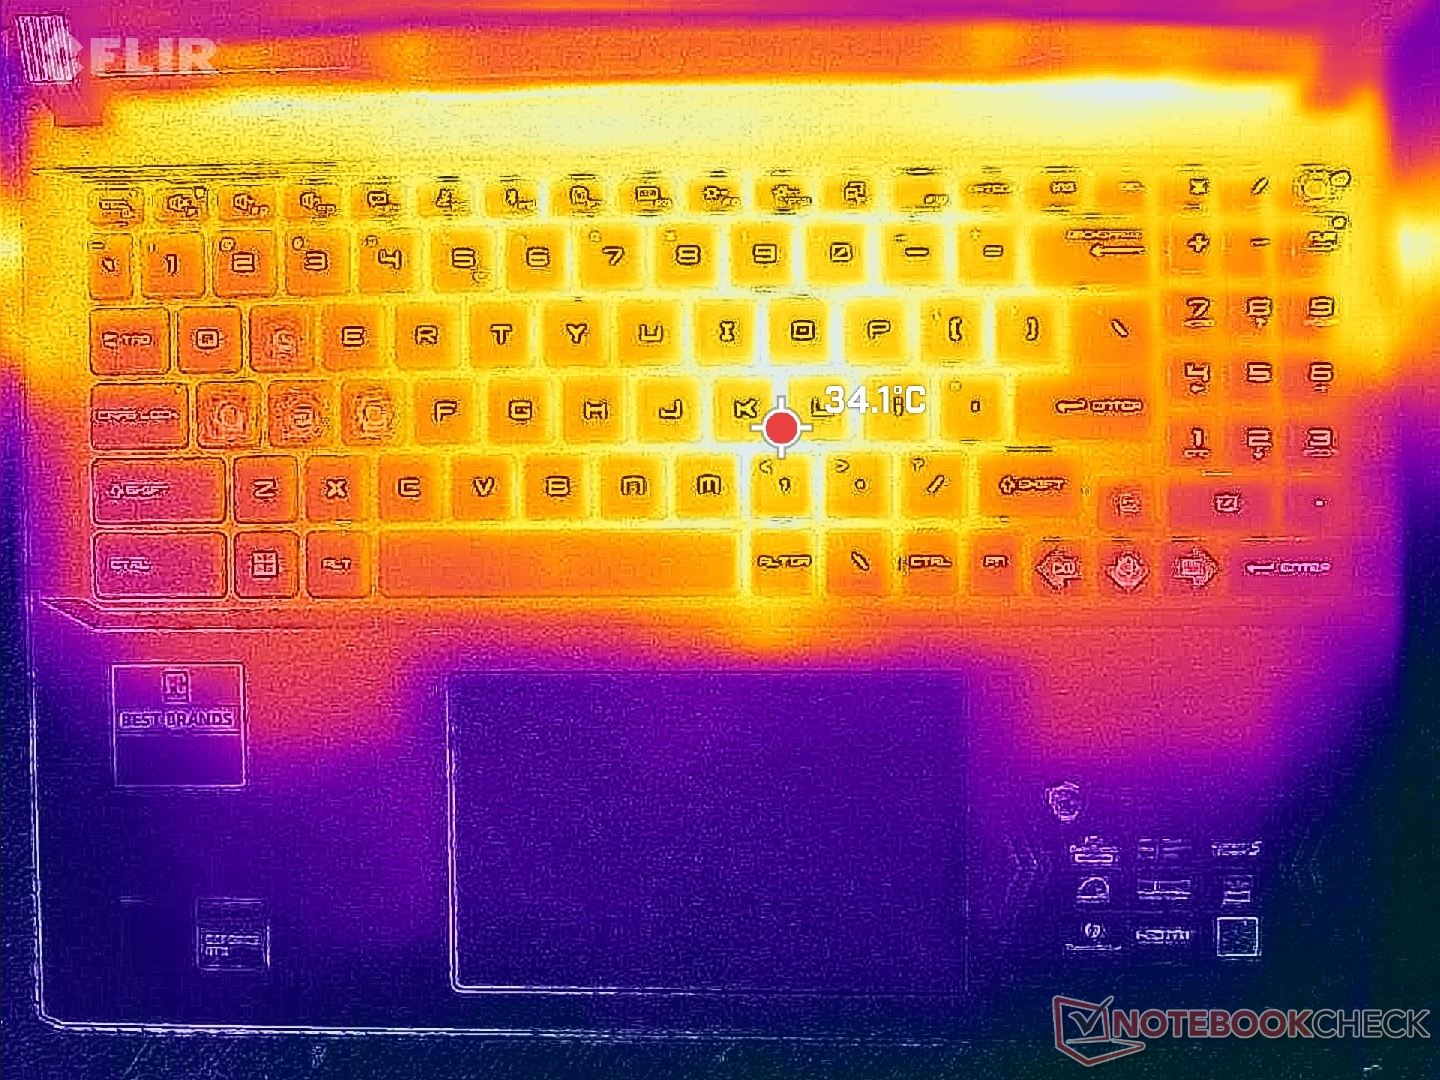
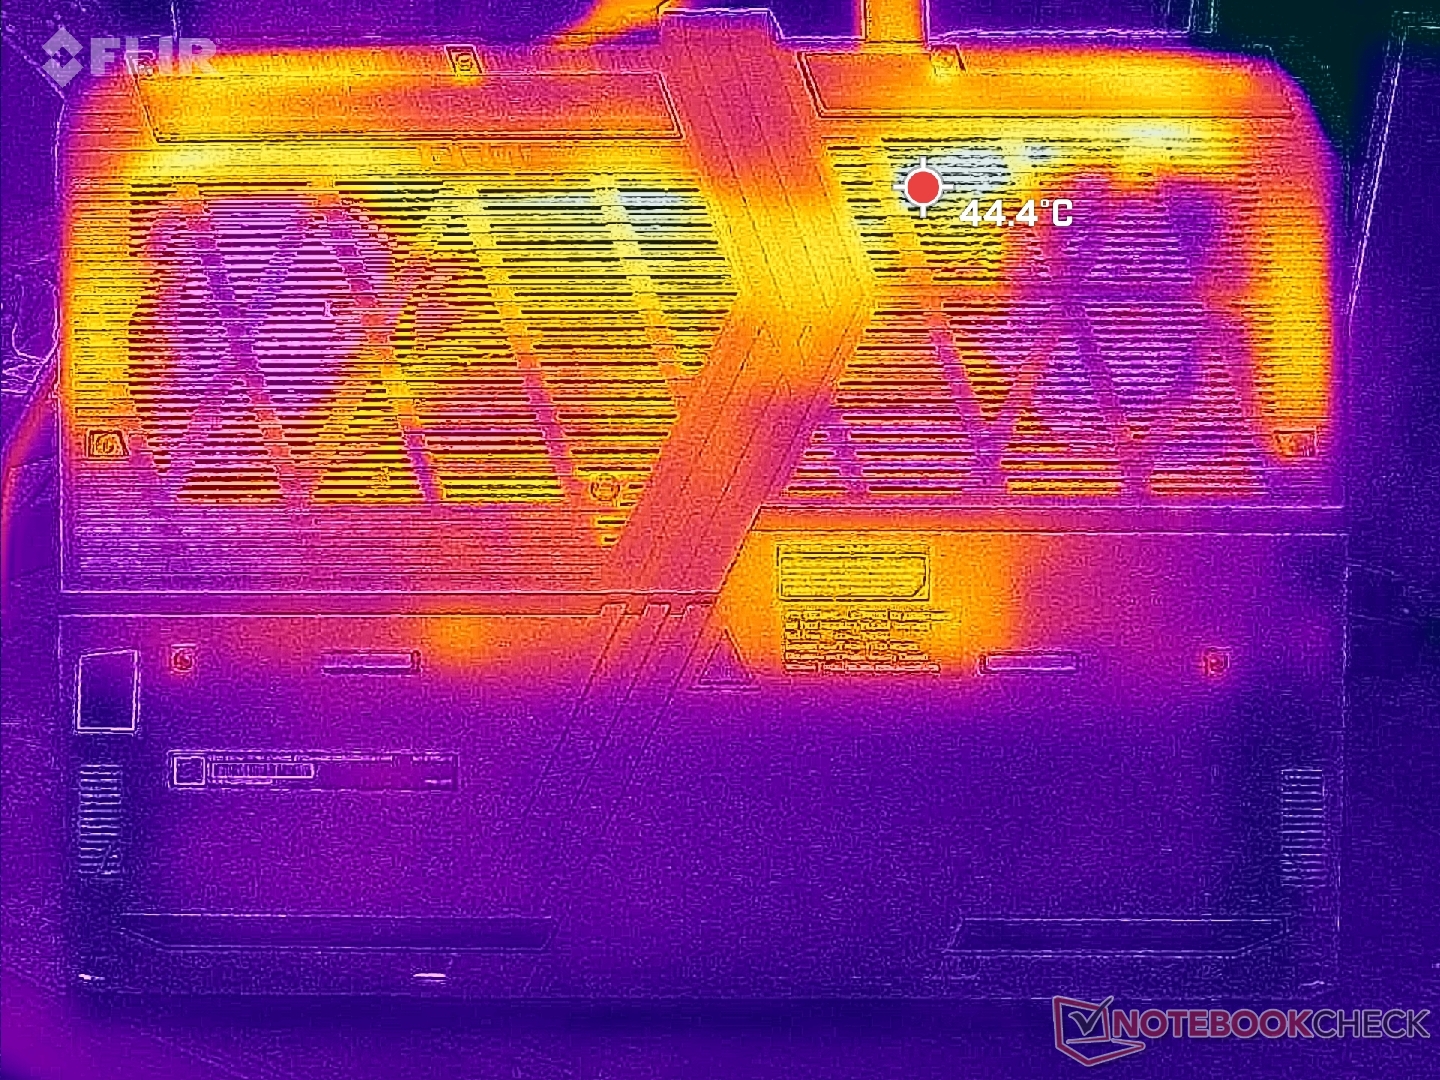
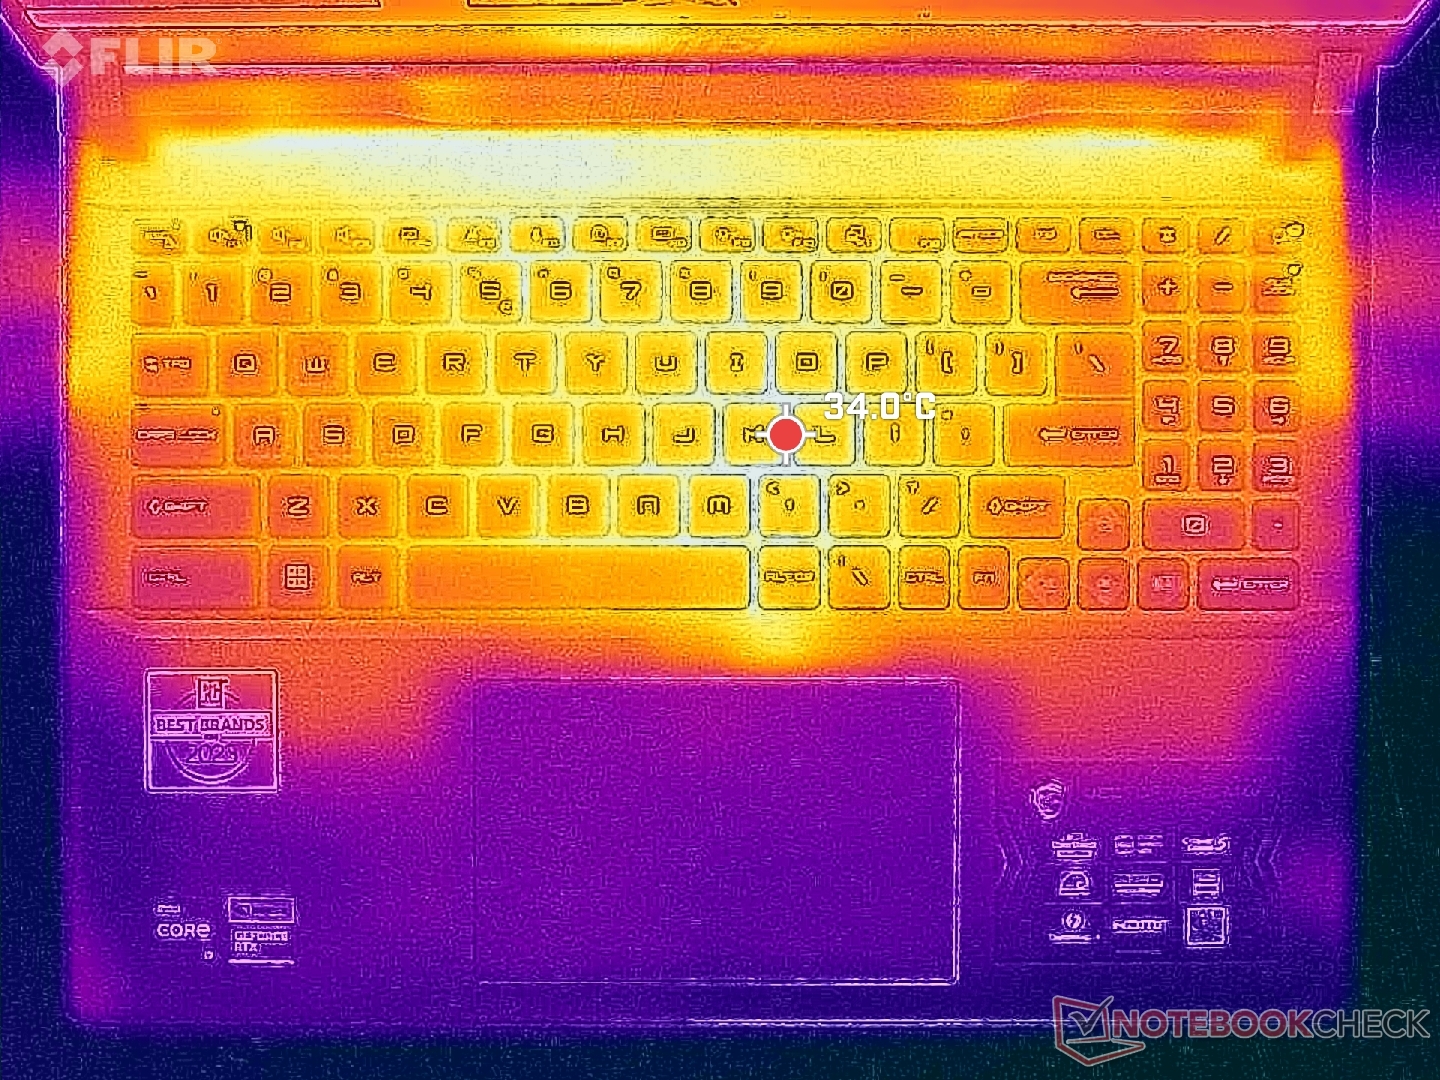
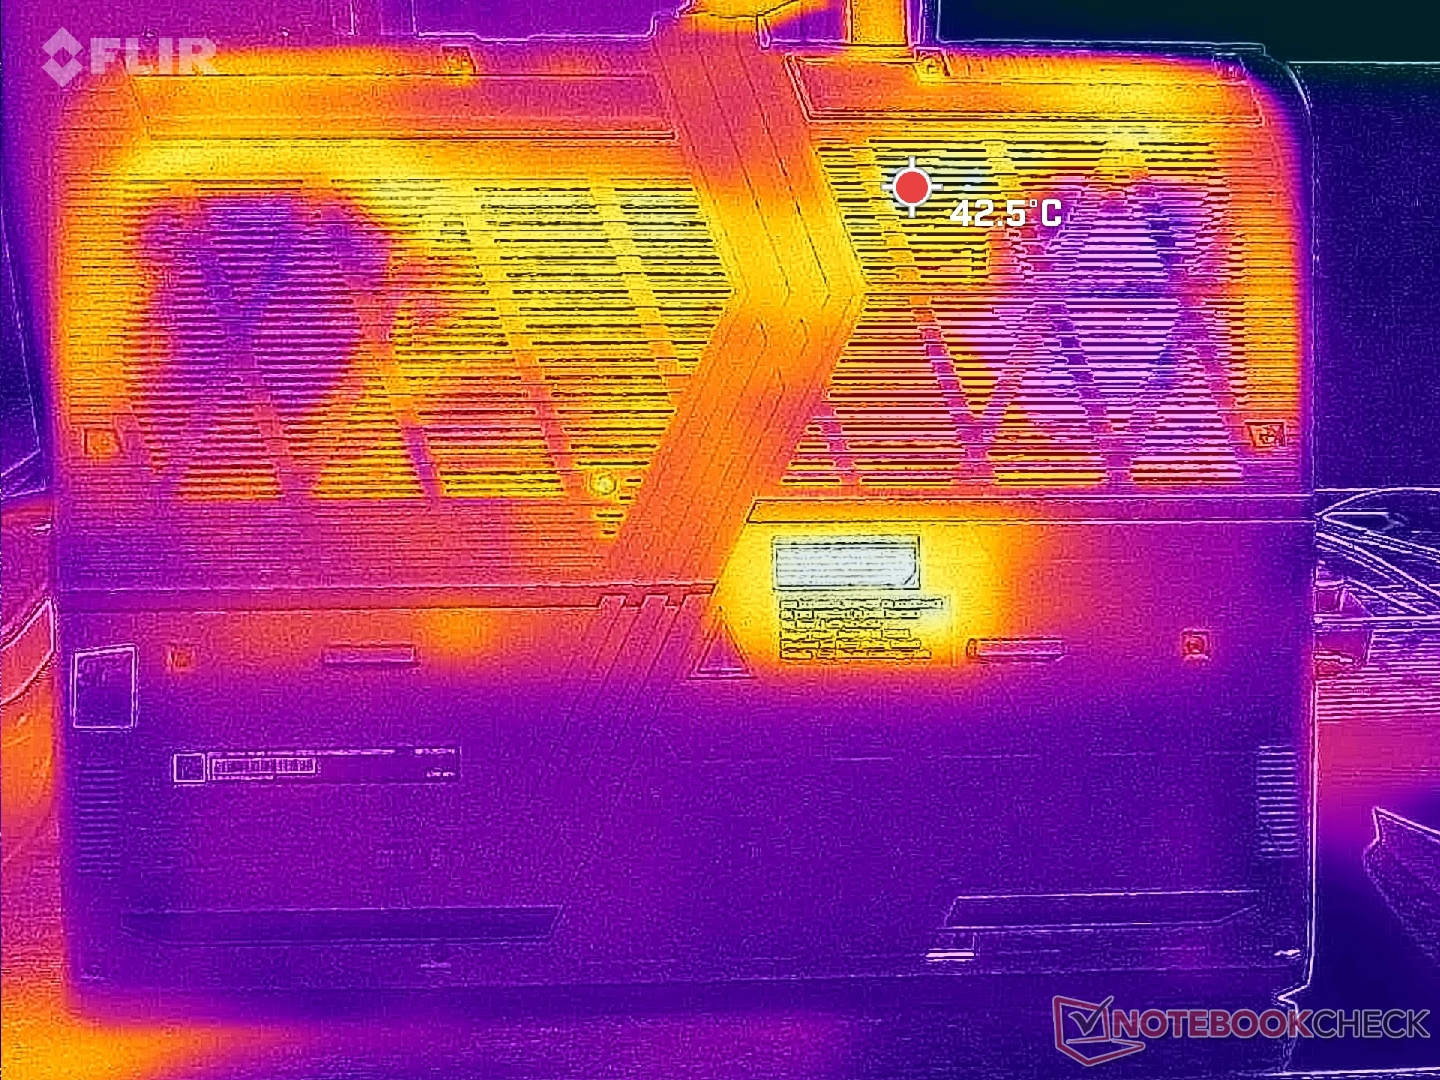
Température
Les températures de surface sont inférieures à celles de la plupart des autres ordinateurs portables de jeu grâce à la base en plastique, aux nombreuses grilles d'aération et au design épais du châssis. En fait, c'est l'un des ordinateurs portables de jeu les plus frais que nous ayons testé avec une RTX 4080. Lorsque vous utilisez Witcher 3le point chaud au centre du clavier n'atteint que 34°C, contre 39°C sur le Legion 5i 16 G9 ou l'ancien Vector GP66 Vector GP66.
(+) La température maximale du côté supérieur est de 36.4 °C / 98 F, par rapport à la moyenne de 40.4 °C / 105 F, allant de 21.2 à 68.8 °C pour la classe Gaming.
(+) Le fond chauffe jusqu'à un maximum de 35.6 °C / 96 F, contre une moyenne de 43.2 °C / 110 F
(+) En utilisation inactive, la température moyenne du côté supérieur est de 24.5 °C / 76 F, par rapport à la moyenne du dispositif de 33.9 °C / 93 F.
(+) En jouant à The Witcher 3, la température moyenne du côté supérieur est de 30.4 °C / 87 F, alors que la moyenne de l'appareil est de 33.9 °C / 93 F.
(+) Les repose-poignets et le pavé tactile sont plus froids que la température de la peau avec un maximum de 24 °C / 75.2 F et sont donc froids au toucher.
(+) La température moyenne de la zone de l'appui-paume de dispositifs similaires était de 28.8 °C / 83.8 F (+4.8 °C / #8.6 F).
| MSI Vector 16 HX A14V Intel Core i9-14900HX, NVIDIA GeForce RTX 4080 Laptop GPU | MSI Vector GP66 12UGS Intel Core i9-12900H, NVIDIA GeForce RTX 3070 Ti Laptop GPU | Lenovo Legion 5 16IRX G9 Intel Core i7-14650HX, NVIDIA GeForce RTX 4060 Laptop GPU | HP Victus 16-r0077ng Intel Core i7-13700H, NVIDIA GeForce RTX 4070 Laptop GPU | Asus TUF Gaming A16 FA617XS AMD Ryzen 9 7940HS, AMD Radeon RX 7600S | Dell G16 7620 Intel Core i7-12700H, NVIDIA GeForce RTX 3060 Laptop GPU | |
|---|---|---|---|---|---|---|
| Heat | -25% | -20% | -35% | -26% | -15% | |
| Maximum Upper Side * (°C) | 36.4 | 40.2 -10% | 40.4 -11% | 51 -40% | 53 -46% | 47.6 -31% |
| Maximum Bottom * (°C) | 35.6 | 43.8 -23% | 43.8 -23% | 54 -52% | 48 -35% | 54 -52% |
| Idle Upper Side * (°C) | 26.6 | 34.8 -31% | 30.3 -14% | 37 -39% | 30 -13% | 23 14% |
| Idle Bottom * (°C) | 27 | 37 -37% | 35.3 -31% | 29 -7% | 30 -11% | 24.6 9% |
* ... Moindre est la valeur, meilleures sont les performances
Test de stress
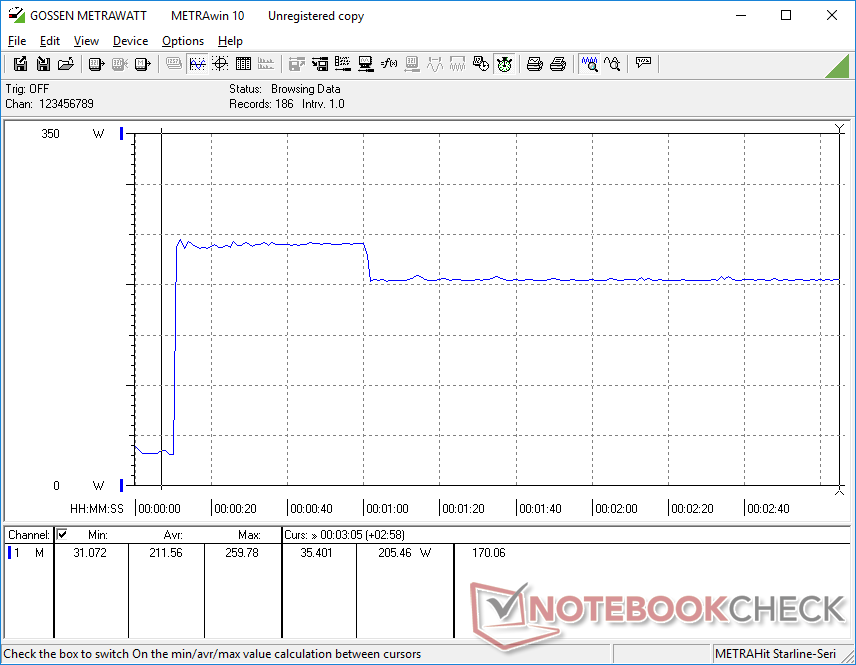
Lors de l'initialisation du stress Prime95, le CPU passe à 4,2 GHz et 180 W jusqu'à ce que la température du cœur atteigne 87 C environ une minute plus tard. Ensuite, il redescend à ~3,3 GHz, 140 W et 82 C. Les résultats restent les mêmes même si Cooler Boost est activé.
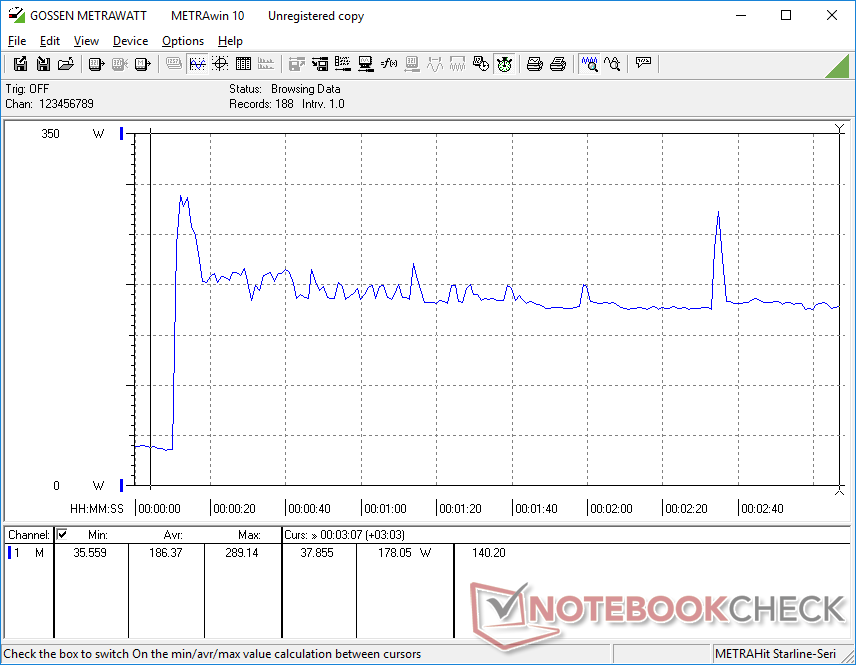
En exécutant Witcher 3 en mode Extreme Performance pour représenter des charges de jeu typiques, le GPU atteindrait des valeurs constantes de 2535 MHz, une température de 77 C et une consommation de 165 W selon HWiNFO. Les résultats restent pratiquement les mêmes quel que soit le réglage de Cooler Boost. En revanche, le passage au mode équilibré, plus silencieux, réduit l'horloge du GPU et la consommation d'énergie de la carte à seulement 2055 MHz et 120 W, respectivement, ce qui reflète la baisse notable des performances mentionnée dans la section Performances du GPU ci-dessus.
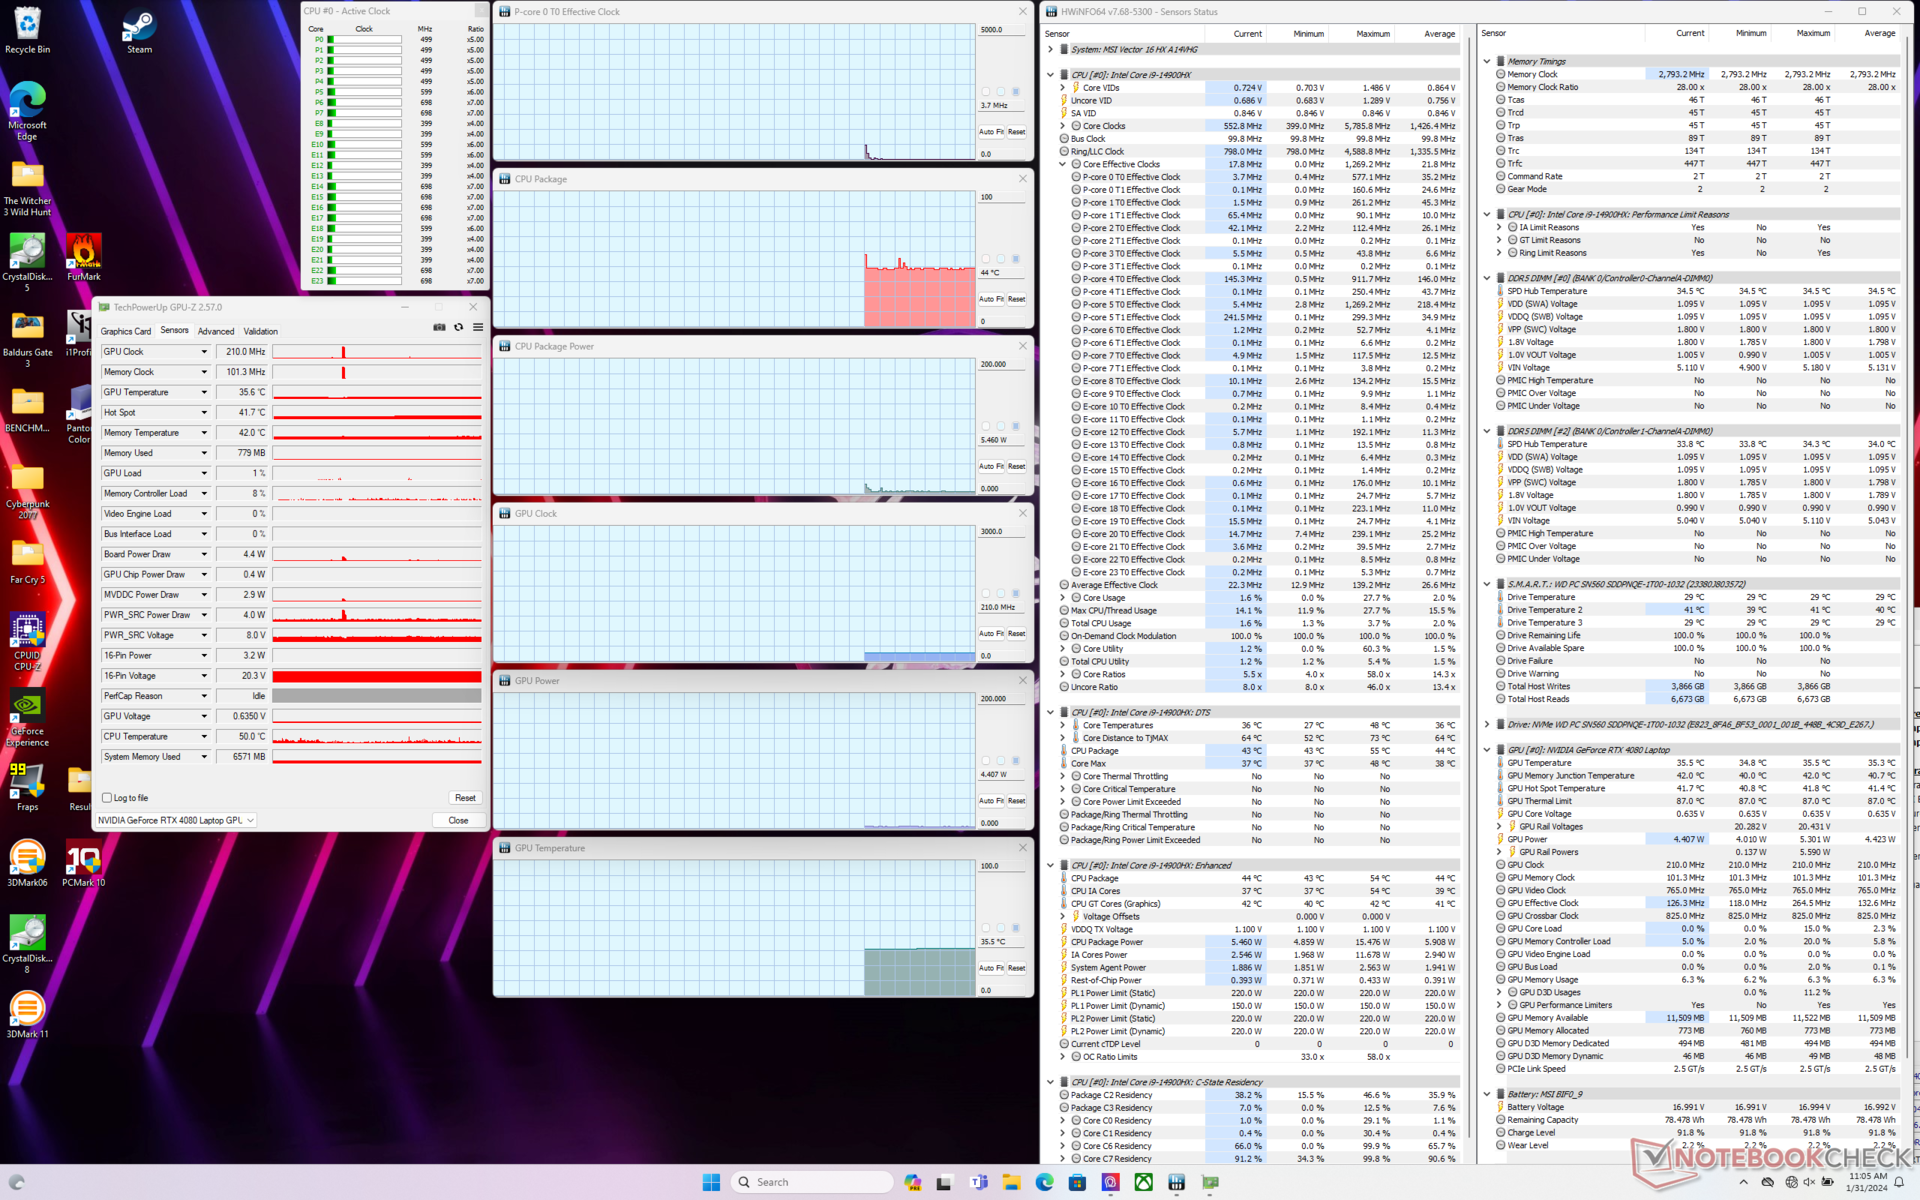
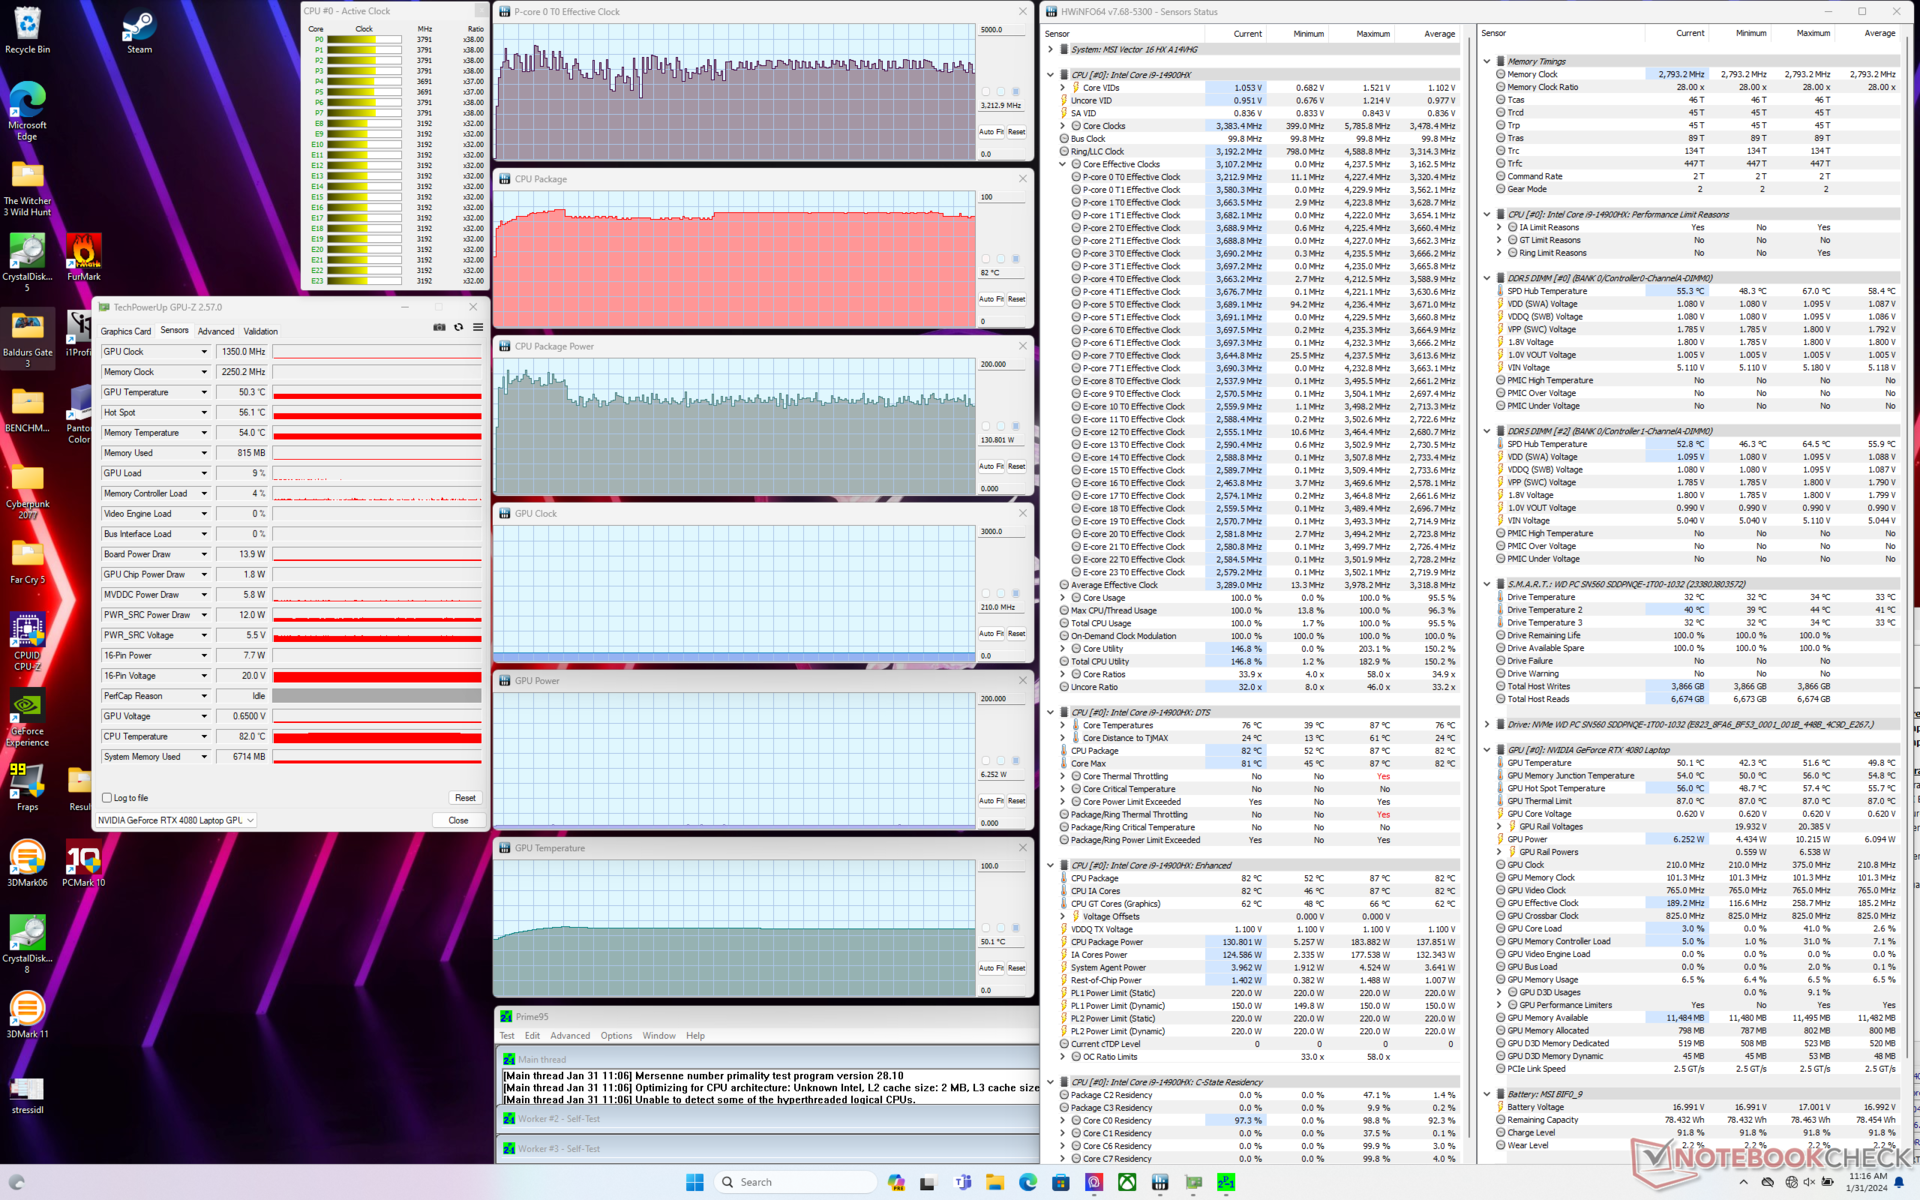
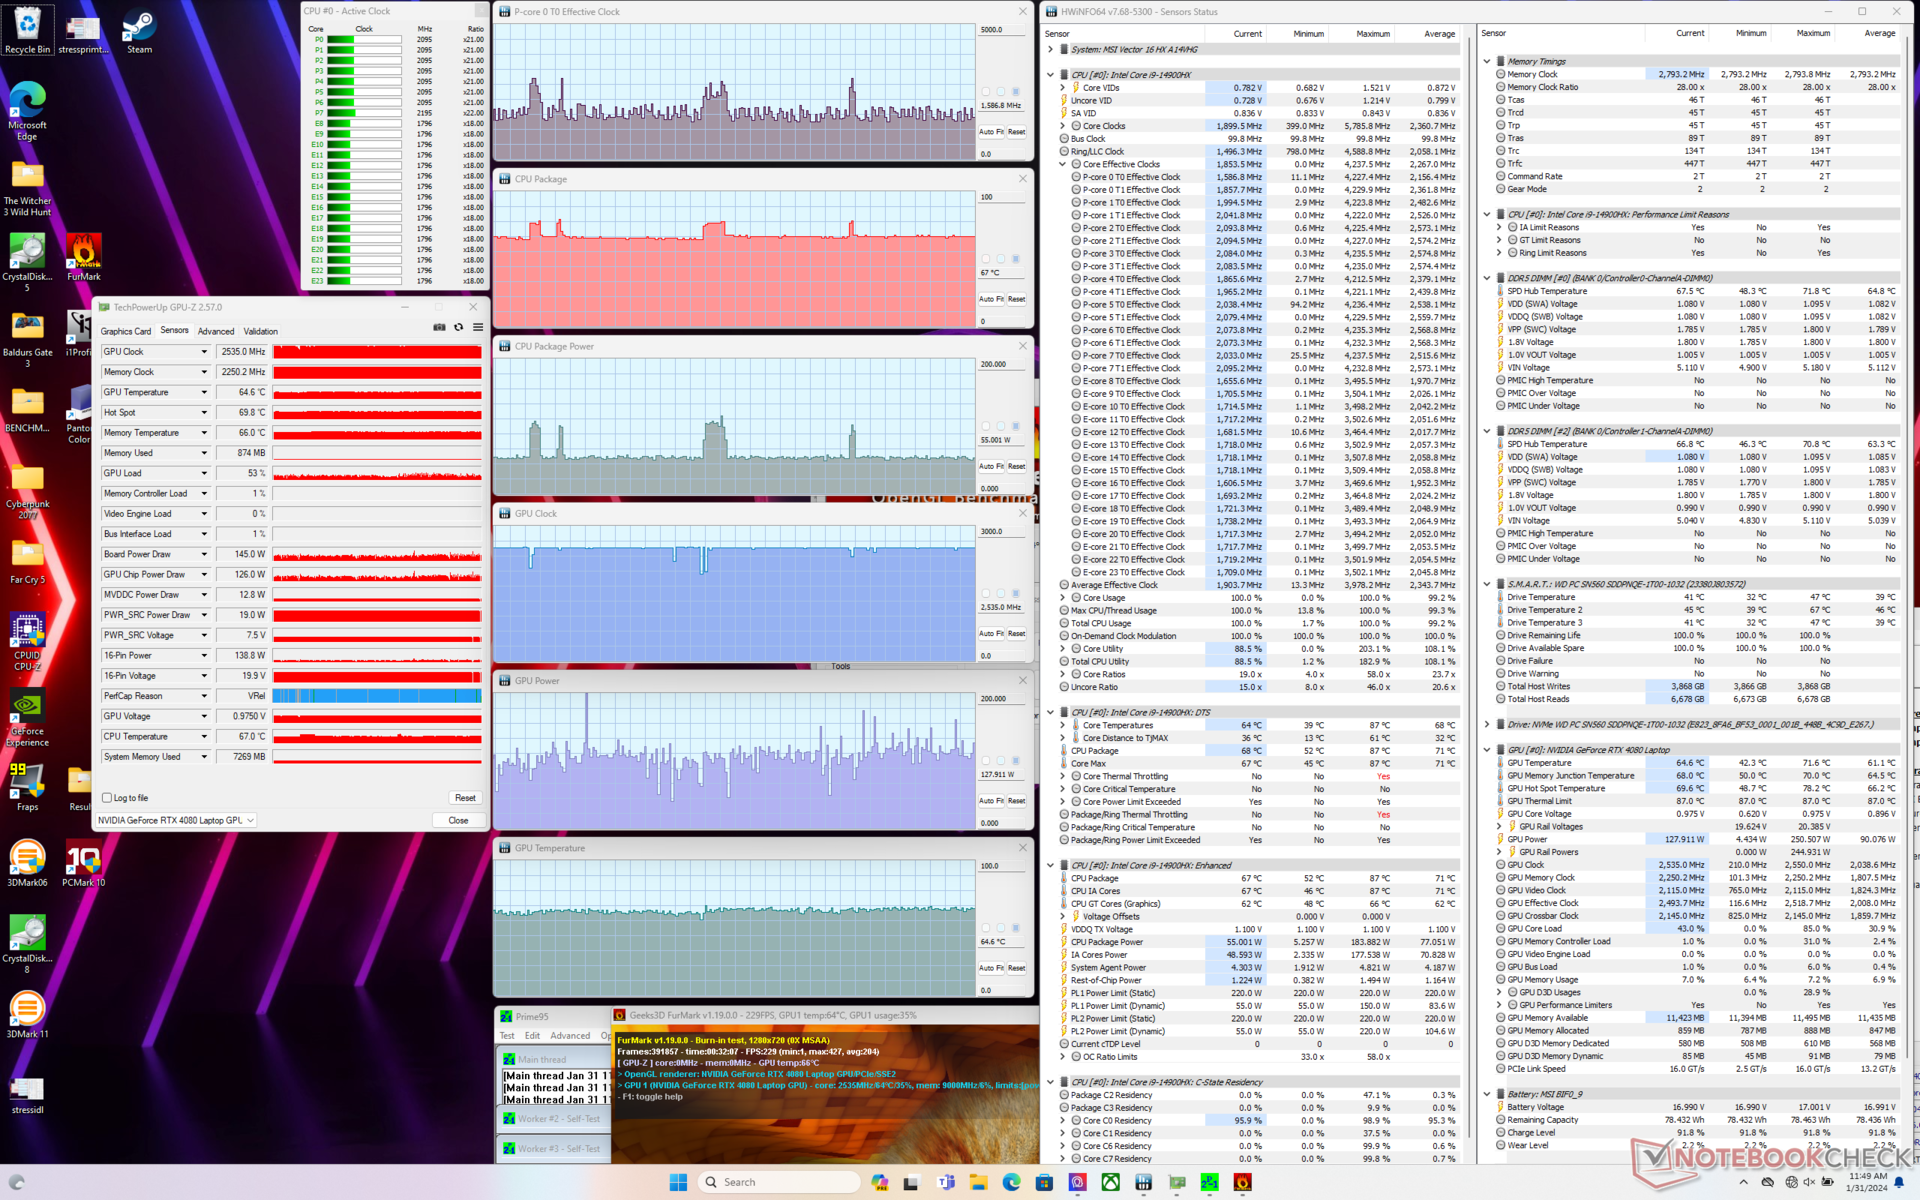
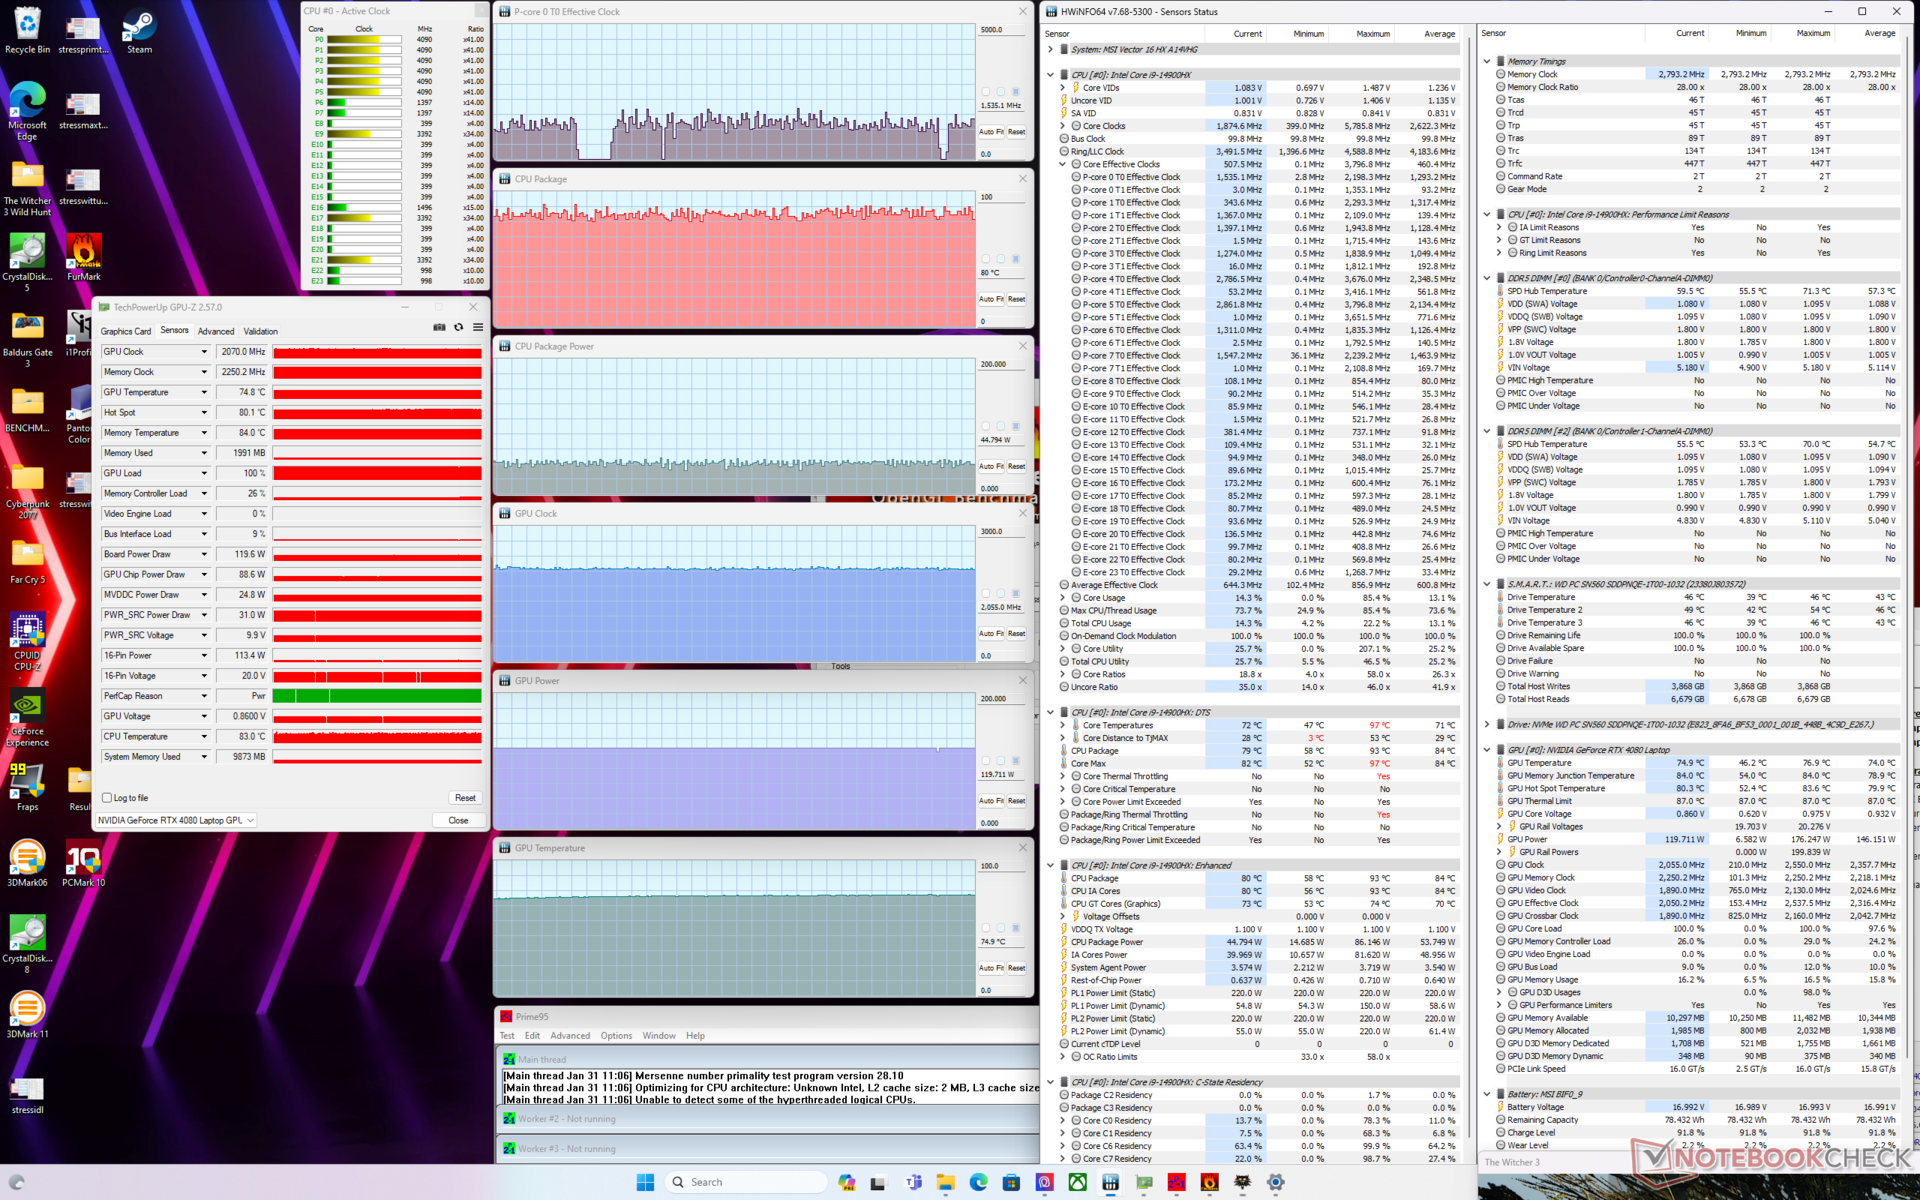
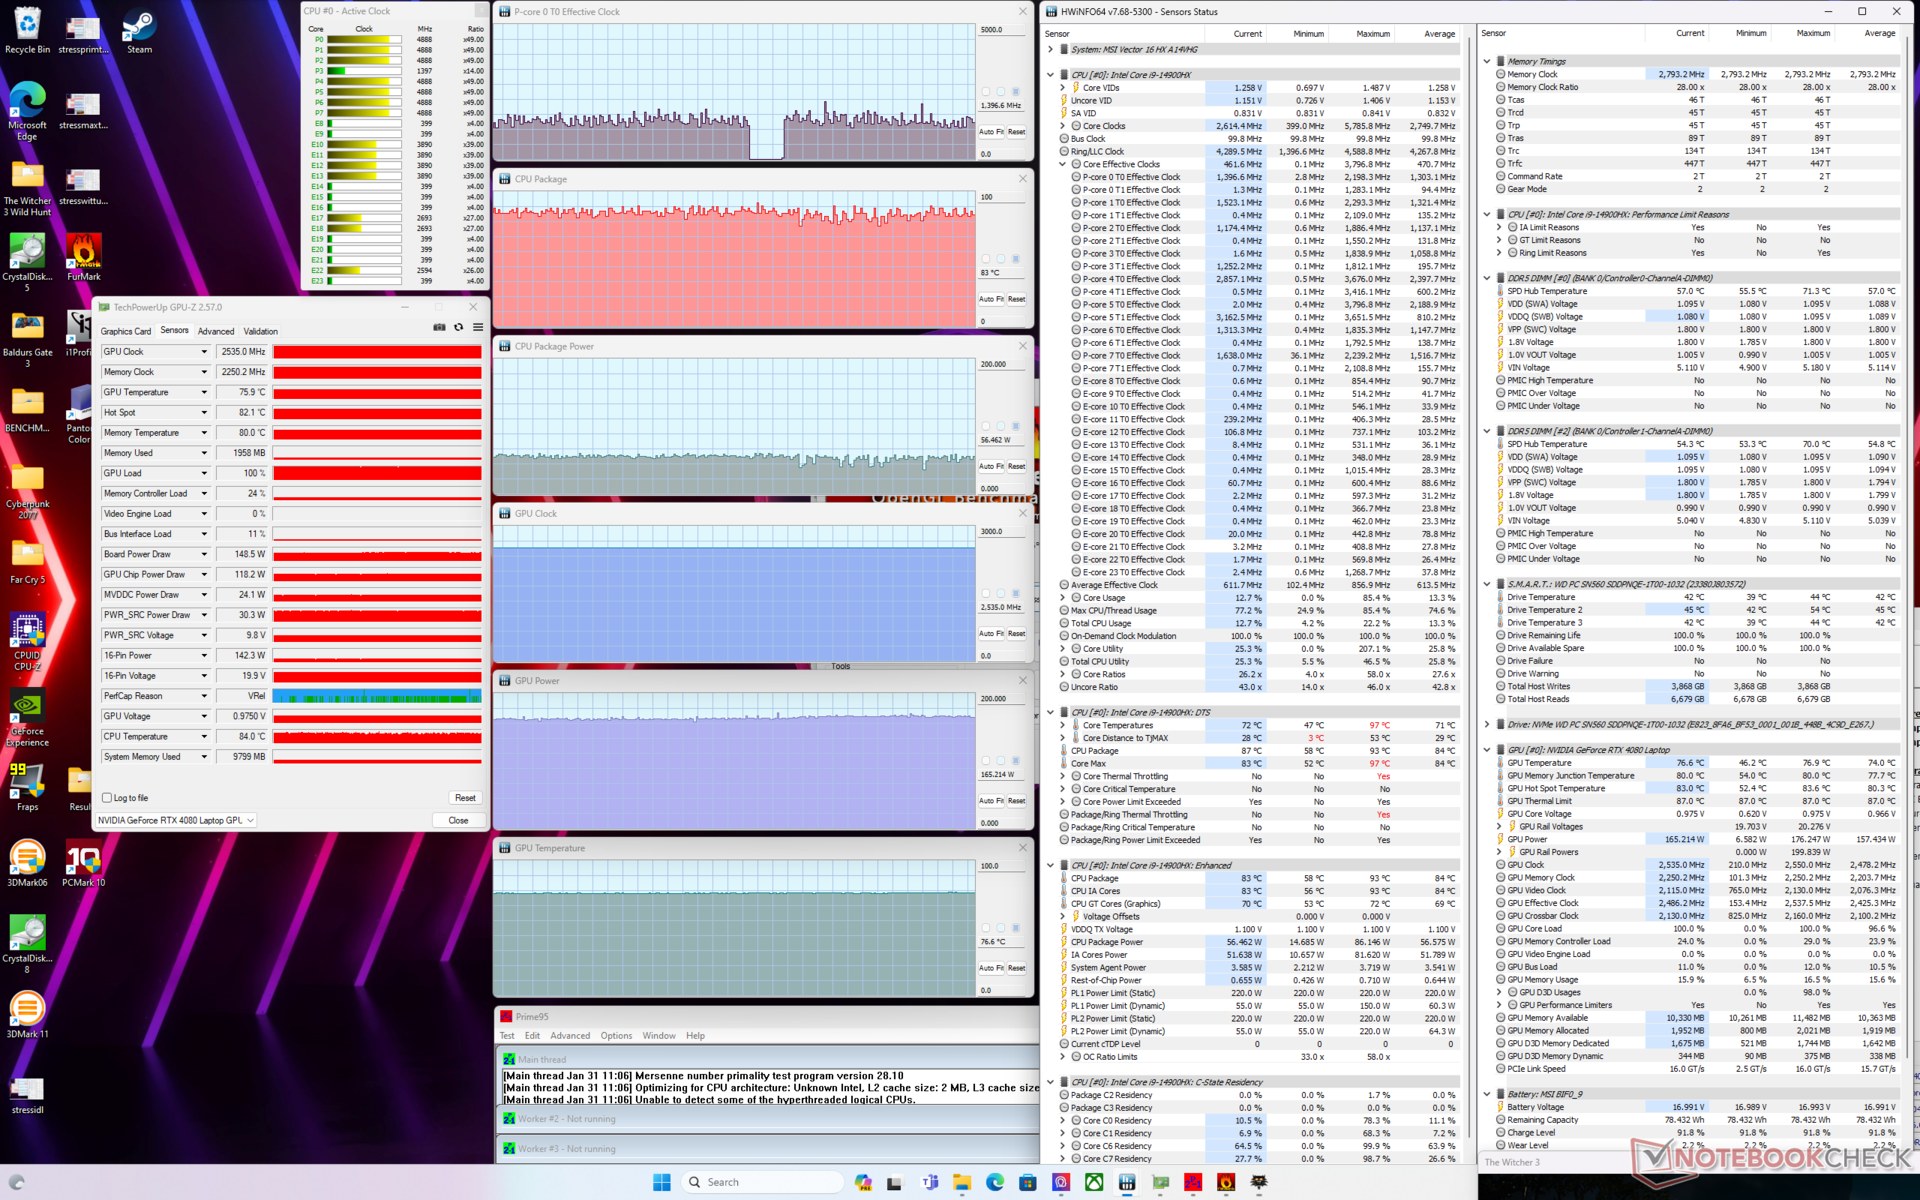
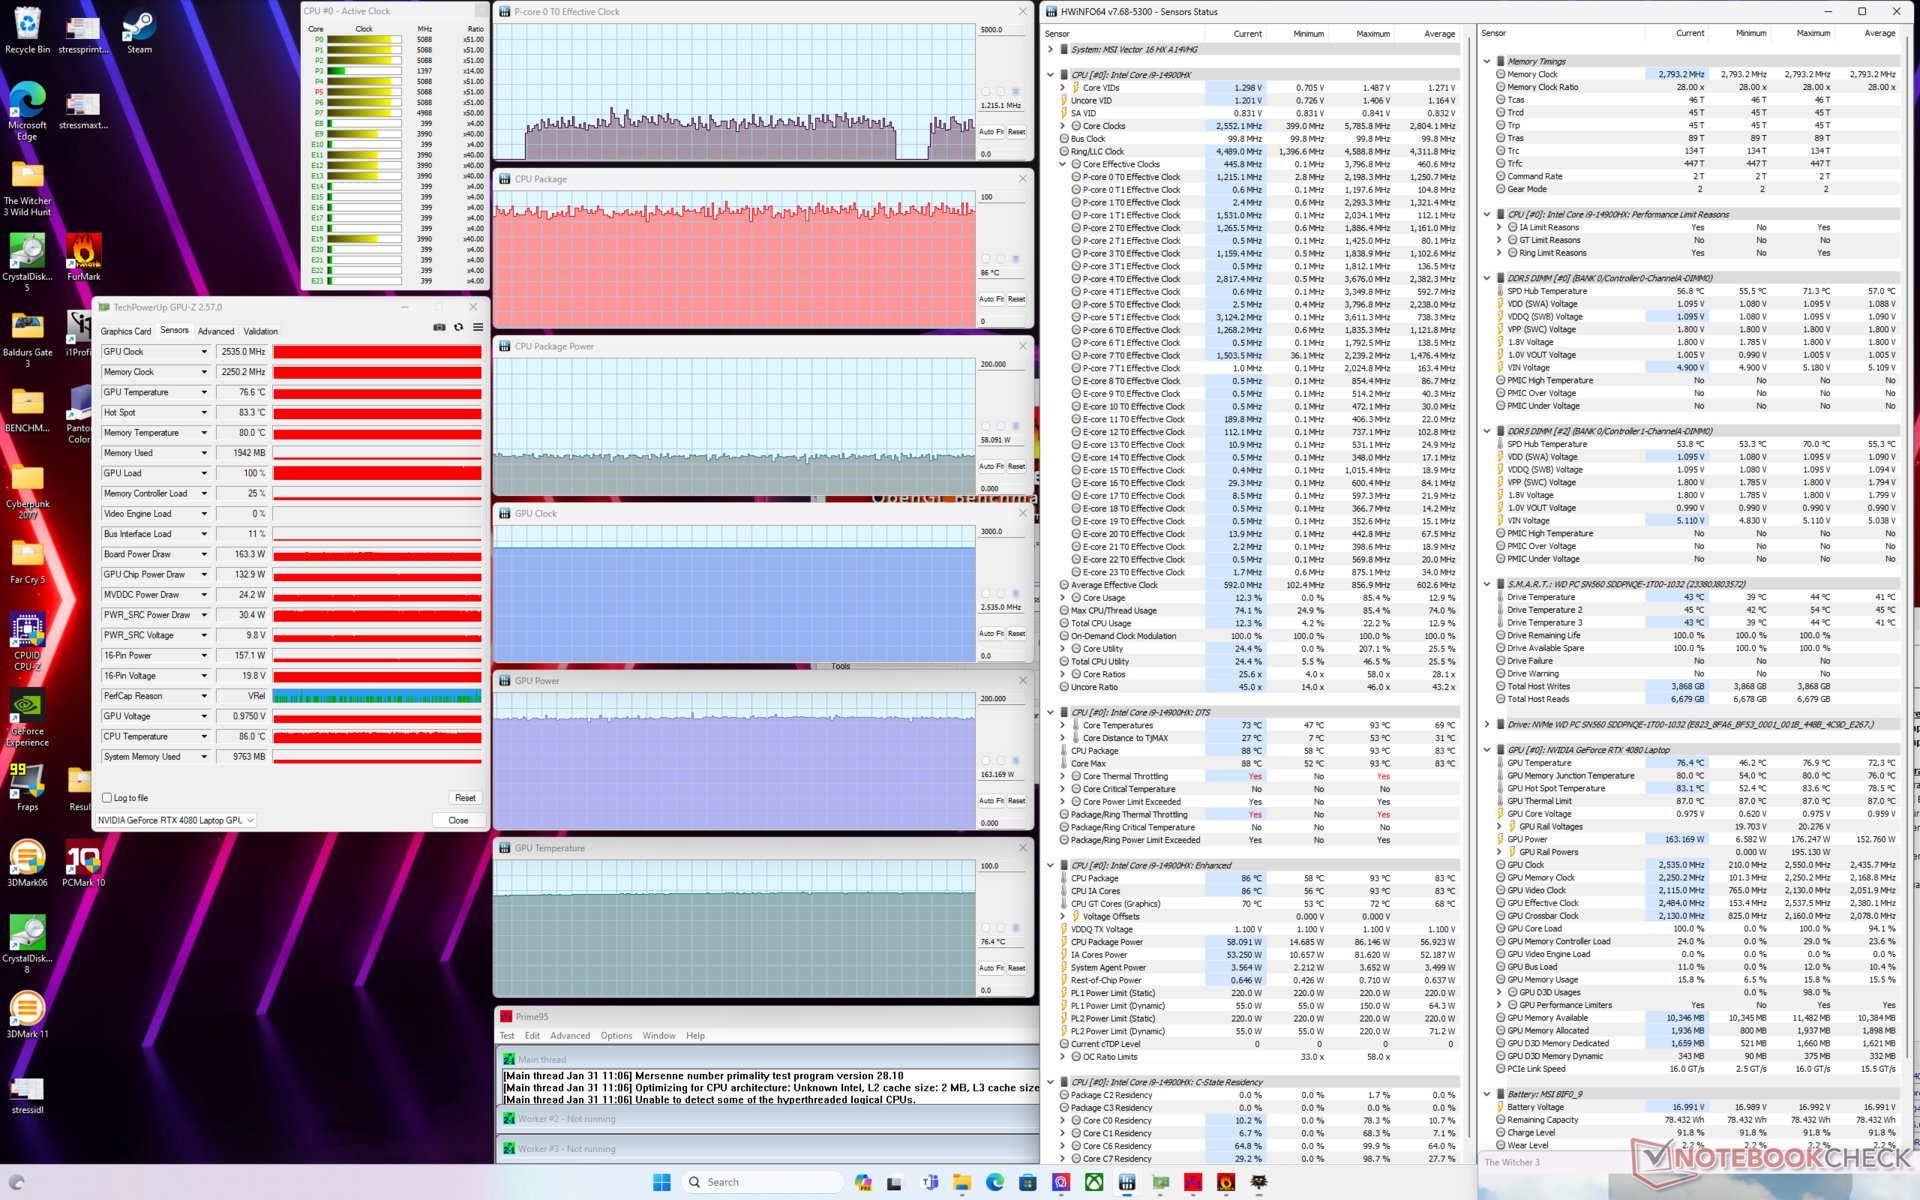
| Horloge du CPU (GHz) | Horloge du GPU (MHz) | Température moyenne du CPU (°C) | Température moyenne du GPU (°C) | |
| Système en veille | -- | -- | 44 | 36 |
| Prime95 Stress | 3.3 | -- | 82 | 50 |
| Prime95 + FurMark Stress (Performance extrême avec Cooler Boost activé) | ~1.7 | 2535 | 67 | 65 |
| Witcher 3 Stress (mode équilibré) | ~1.5 | 2055 | 81 | 75 |
| Witcher 3 Stress(performances extrêmes avec Cooler Boost désactivé) | ~1,5 | 2535 | 83 | 77 |
| Witcher 3 Stress(Performance extrême avec Cooler Boost activé) | ~1.5 | 2535 | 85 | 77 |
Intervenants
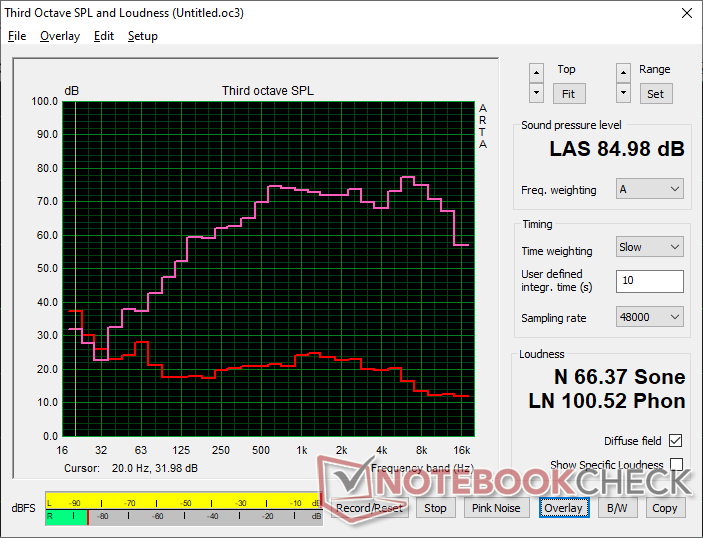
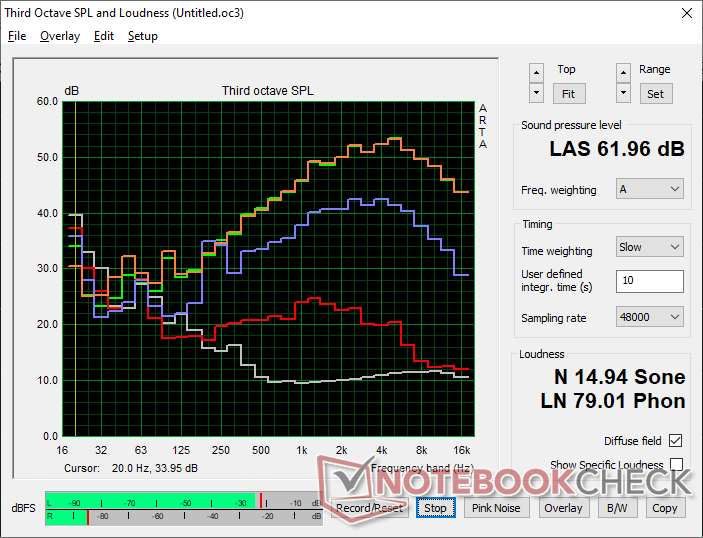
MSI Vector 16 HX A14V analyse audio
(+) | les haut-parleurs peuvent jouer relativement fort (85# dB)
Basses 100 - 315 Hz
(±) | basse réduite - en moyenne 12.7% inférieure à la médiane
(+) | les basses sont linéaires (6.8% delta à la fréquence précédente)
Médiums 400 - 2000 Hz
(+) | médiane équilibrée - seulement 3% de la médiane
(+) | les médiums sont linéaires (3.6% delta à la fréquence précédente)
Aiguës 2 - 16 kHz
(+) | des sommets équilibrés - à seulement 3.1% de la médiane
(+) | les aigus sont linéaires (6.7% delta à la fréquence précédente)
Globalement 100 - 16 000 Hz
(+) | le son global est linéaire (12.6% différence à la médiane)
Par rapport à la même classe
» 16% de tous les appareils testés de cette catégorie étaient meilleurs, 3% similaires, 81% pires
» Le meilleur avait un delta de 6%, la moyenne était de 18%, le pire était de 132%.
Par rapport à tous les appareils testés
» 11% de tous les appareils testés étaient meilleurs, 2% similaires, 86% pires
» Le meilleur avait un delta de 4%, la moyenne était de 24%, le pire était de 134%.
Apple MacBook Pro 16 2021 M1 Pro analyse audio
(+) | les haut-parleurs peuvent jouer relativement fort (84.7# dB)
Basses 100 - 315 Hz
(+) | bonne basse - seulement 3.8% loin de la médiane
(+) | les basses sont linéaires (5.2% delta à la fréquence précédente)
Médiums 400 - 2000 Hz
(+) | médiane équilibrée - seulement 1.3% de la médiane
(+) | les médiums sont linéaires (2.1% delta à la fréquence précédente)
Aiguës 2 - 16 kHz
(+) | des sommets équilibrés - à seulement 1.9% de la médiane
(+) | les aigus sont linéaires (2.7% delta à la fréquence précédente)
Globalement 100 - 16 000 Hz
(+) | le son global est linéaire (4.6% différence à la médiane)
Par rapport à la même classe
» 0% de tous les appareils testés de cette catégorie étaient meilleurs, 0% similaires, 100% pires
» Le meilleur avait un delta de 5%, la moyenne était de 17%, le pire était de 45%.
Par rapport à tous les appareils testés
» 0% de tous les appareils testés étaient meilleurs, 0% similaires, 100% pires
» Le meilleur avait un delta de 4%, la moyenne était de 24%, le pire était de 134%.
Gestion de l'énergie
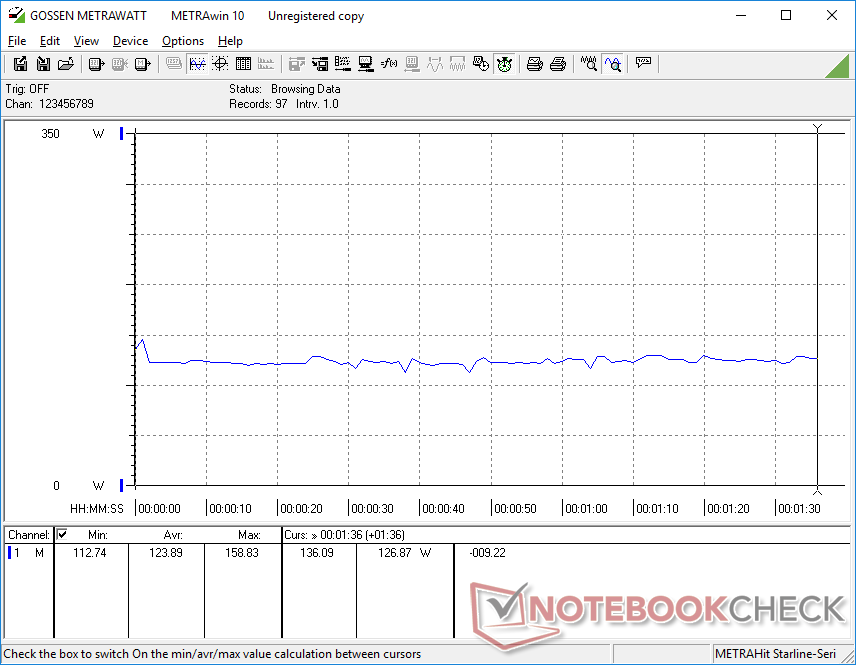
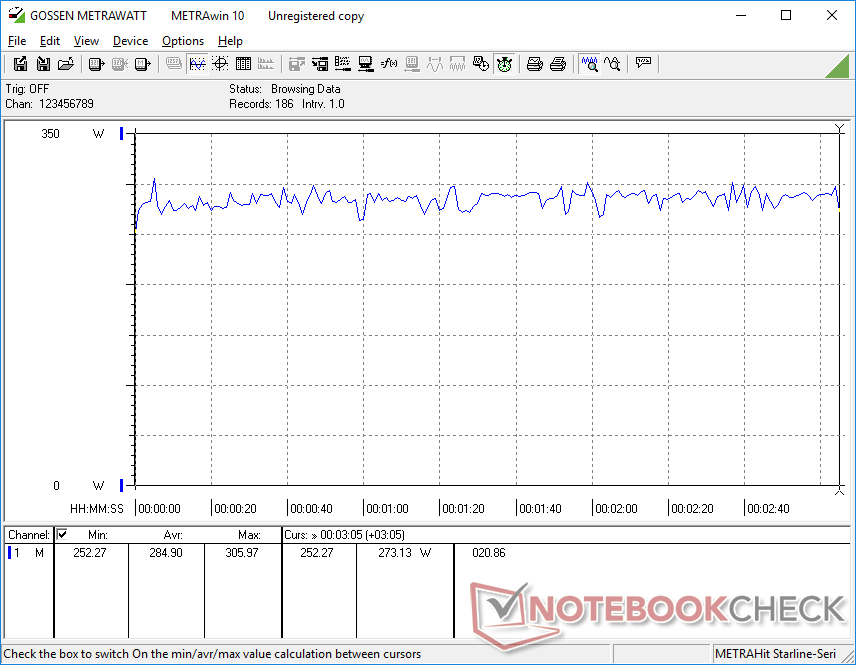
Consommation électrique
Le Vector 16 HX est peut-être plus rapide que le Vector GP66 sortant, mais il est aussi beaucoup plus gourmand en énergie. L'exécution de Witcher 3 et Prime95 demande respectivement 27 % et 58 % de puissance en plus par rapport à l'ancien modèle. Malgré cela, les gains de performance sont bien plus importants que les gains de puissance, ce qui permet d'obtenir de meilleures performances par watt.
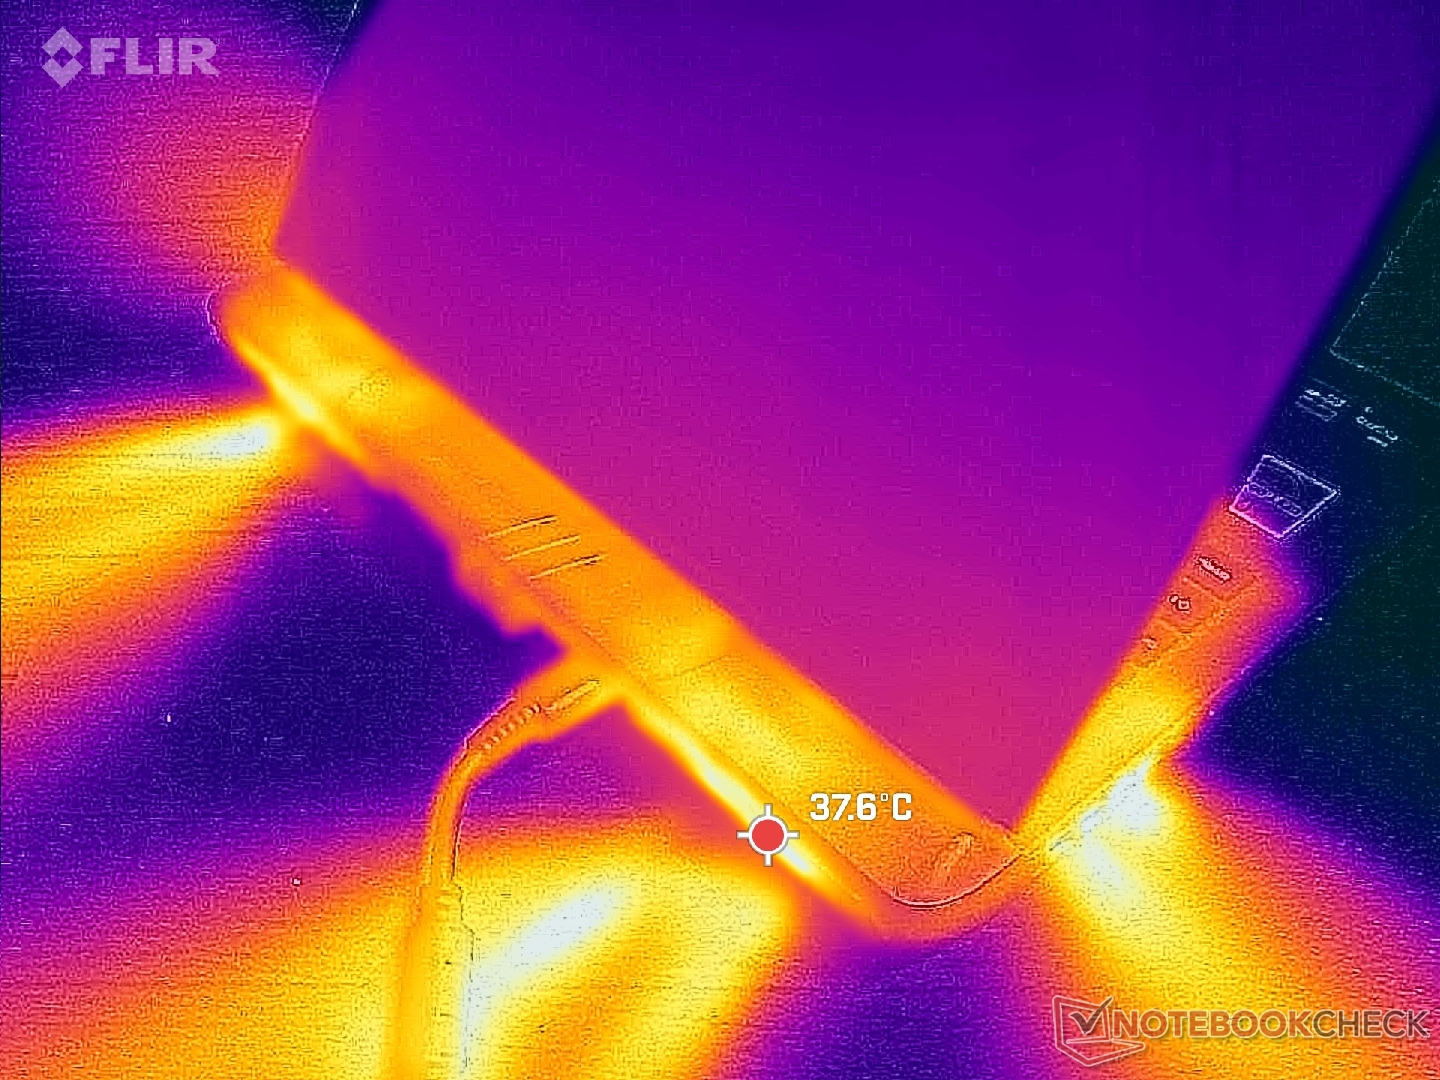
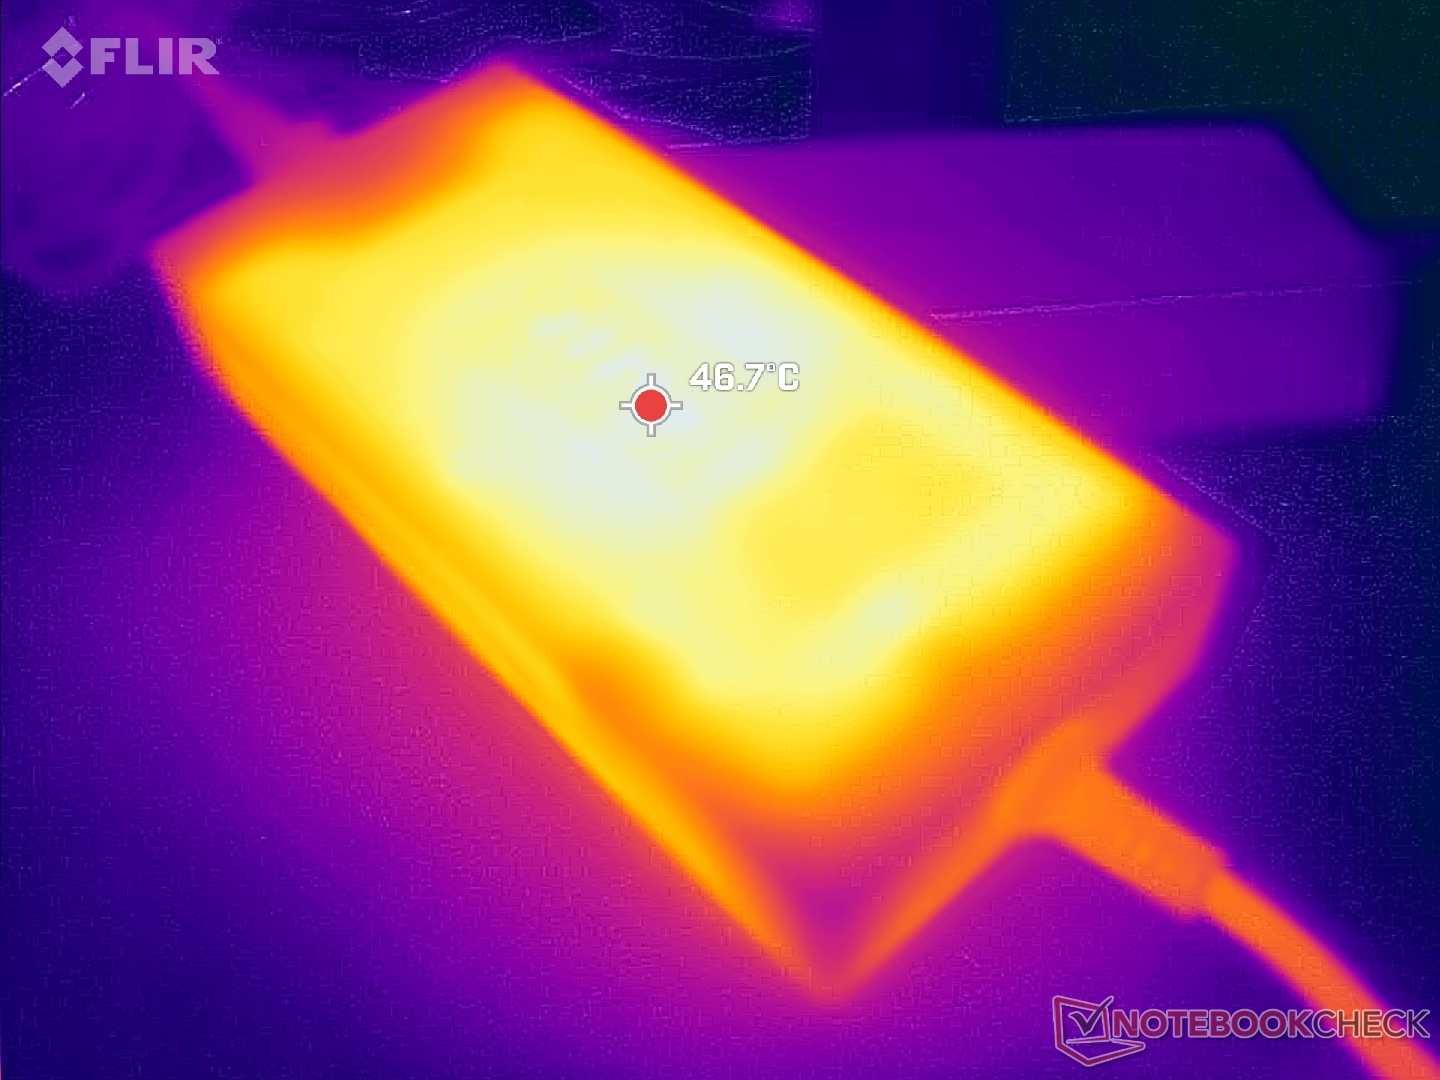
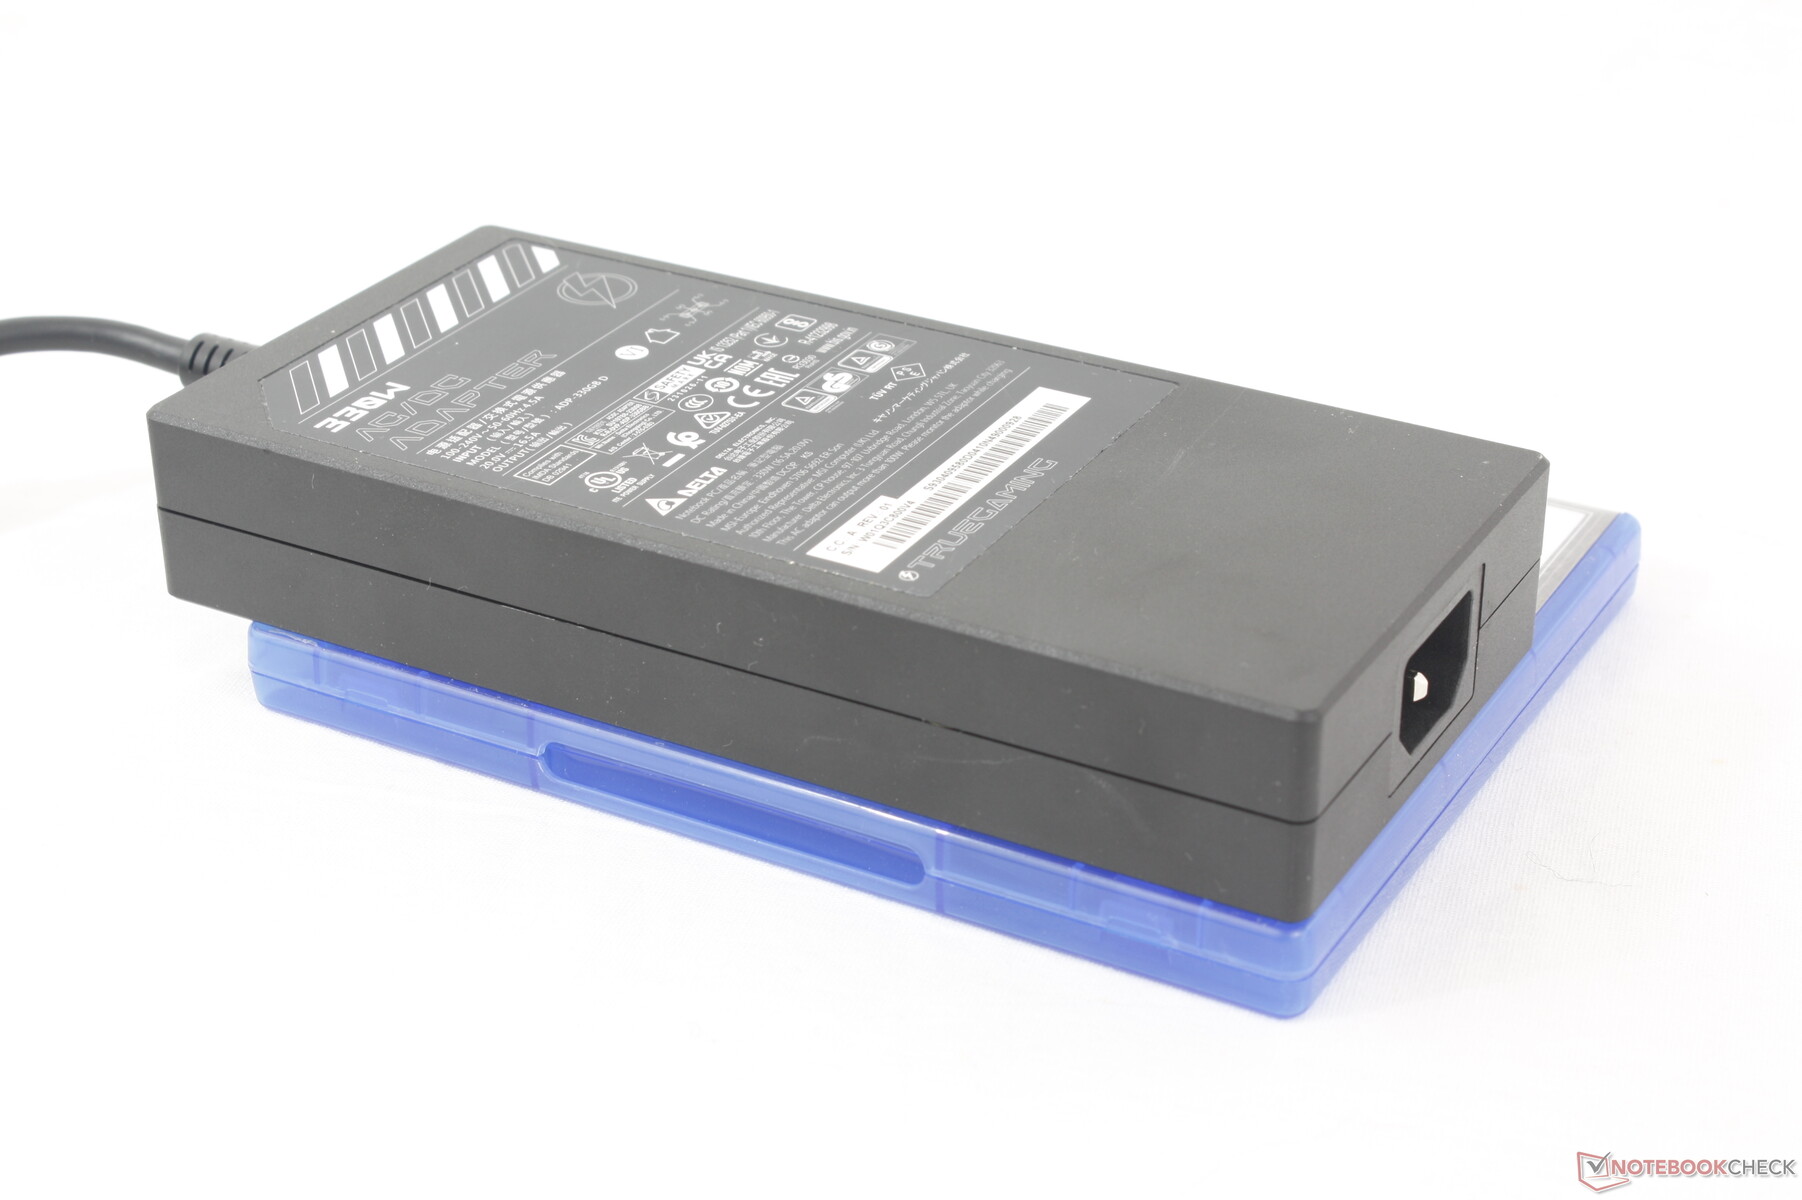
Le système est livré avec un adaptateur secteur de 280 W ou 330 W selon la configuration. Le nouvel adaptateur de 330 W est relativement fin (~18,5 x 8,5 x 3,2 cm), ce qui correspond à peu près à la taille de l'adaptateur de 280 W de l'ancien GP66 (~18 x 8,5 x 3,5 cm).
| Éteint/en veille | |
| Au repos | |
| Fortement sollicité |
|
Légende:
min: | |
| MSI Vector 16 HX A14V i9-14900HX, GeForce RTX 4080 Laptop GPU, WD PC SN560 SDDPNQE-1T00, IPS, 2560x1600, 16" | MSI Vector GP66 12UGS i9-12900H, GeForce RTX 3070 Ti Laptop GPU, , IPS, 1920x1080, 15.6" | Lenovo Legion 5 16IRX G9 i7-14650HX, GeForce RTX 4060 Laptop GPU, Samsung PM9A1 MZVL21T0HCLR, IPS, 2560x1600, 16" | HP Victus 16-r0077ng i7-13700H, GeForce RTX 4070 Laptop GPU, Kioxia XG8 KXG80ZNV1T02, IPS, 1920x1080, 16.1" | Asus TUF Gaming A16 FA617XS R9 7940HS, Radeon RX 7600S, Micron 2400 MTFDKBA512QFM, IPS, 1920x1200, 16" | Dell G16 7620 i7-12700H, GeForce RTX 3060 Laptop GPU, WDC PC SN810 512GB, IPS, 2560x1600, 16" | |
|---|---|---|---|---|---|---|
| Power Consumption | -2% | 20% | 38% | 47% | 18% | |
| Idle Minimum * (Watt) | 15.8 | 17.5 -11% | 15.4 3% | 8 49% | 7 56% | 14.4 9% |
| Idle Average * (Watt) | 23.3 | 20.1 14% | 19.7 15% | 13 44% | 10 57% | 17.8 24% |
| Idle Maximum * (Watt) | 30 | 47.3 -58% | 20.7 31% | 22 27% | 15 50% | 31.5 -5% |
| Load Average * (Watt) | 123.9 | 107.3 13% | 102.6 17% | 86 31% | 86 31% | 101.2 18% |
| Witcher 3 ultra * (Watt) | 285 | 225 21% | 191.3 33% | 141.8 50% | 160.6 44% | 176.9 38% |
| Load Maximum * (Watt) | 306 | 277.7 9% | 246.6 19% | 233 24% | 172 44% | 242.9 21% |
* ... Moindre est la valeur, meilleures sont les performances
Power Consumption Witcher 3 / Stresstest
Power Consumption external Monitor
Autonomie de la batterie
Si la capacité de la batterie a augmenté de manière significative, passant de 65 Wh à 90 Wh par rapport à l'ancien modèle Vector GP66, il n'en va pas de même pour les durées d'utilisation. La navigation WLAN sur le profil d'alimentation équilibré avec l'iGPU actif dure encore environ 5,5 heures avant l'arrêt automatique. D'autres systèmes de 16 pouces, comme le Lenovo Legion 5 16 ou le HP Victus 16, ont une durée de vie d'environ 5,5 heures HP Victus 16 sont capables de durer quatre heures de plus chacun en comparaison.
Le chargement d'un ordinateur vide à sa pleine capacité prend près de 2,5 heures avec l'adaptateur secteur fourni. Le système peut être rechargé par USB-C via le port situé le long du bord droit.
| MSI Vector 16 HX A14V i9-14900HX, GeForce RTX 4080 Laptop GPU, 90 Wh | MSI Vector GP66 12UGS i9-12900H, GeForce RTX 3070 Ti Laptop GPU, 65 Wh | Lenovo Legion 5 16IRX G9 i7-14650HX, GeForce RTX 4060 Laptop GPU, 80 Wh | HP Victus 16-r0077ng i7-13700H, GeForce RTX 4070 Laptop GPU, 83 Wh | Asus TUF Gaming A16 FA617XS R9 7940HS, Radeon RX 7600S, 90 Wh | Dell G16 7620 i7-12700H, GeForce RTX 3060 Laptop GPU, 84 Wh | |
|---|---|---|---|---|---|---|
| Autonomie de la batterie | -17% | -4% | 29% | 60% | -31% | |
| Reader / Idle (h) | 10.7 | 7.9 -26% | 20.3 90% | 7.1 -34% | ||
| WiFi v1.3 (h) | 5.5 | 5.7 4% | 7.4 35% | 7.1 29% | 12.4 125% | 5 -9% |
| Load (h) | 1.4 | 1 -29% | 0.8 -43% | 0.9 -36% | 0.7 -50% | |
| H.264 (h) | 9.6 | 12.4 |
Points positifs
Points négatifs
Verdict - Fast and Chonky
Les ordinateurs portables de jeu se situent entre portabilité et performance, la tendance actuelle étant à la portabilité. Le MSI Vector 16 HX privilégie ouvertement les performances, même si cela signifie un système plus épais, plus grand et plus bruyant. En effet, il s'agit de l'un des ordinateurs portables de jeu de 16 pouces les plus grands et les plus bruyants actuellement disponibles sur le marché.
Le MSI Vector 16 HX n'a pas froid aux yeux lorsqu'il s'agit du bruit des ventilateurs ou de la taille. En revanche, il surpasse les autres ordinateurs portables de jeu équipés du même GPU GeForce RTX 4080 ou 4090 en termes de performances.
La taille imposante et les ventilateurs bruyants ne sont pas inutiles, car le modèle excelle en termes de performances. Le GPU RTX 4080 de 175 W GeForce RTX 4080 DE 175 W de 175 W est environ 10 % plus rapide que la moyenne, ce qui lui permet de rivaliser avec certains ordinateurs portables équipés de la RTX 4090. Ce seul fait attirera probablement les chasseurs de performances qui ne voient pas d'inconvénient à sacrifier un peu de portabilité pour cette puissance supplémentaire. Le châssis est rigide et le couvercle est solide, ce qui n'est pas le cas de beaucoup d'autres modèles plus fins.
Quelques aspects pourraient certainement être améliorés. Si MSI veut s'en tenir à un grand design, il faudrait faciliter l'entretien et envisager un refroidissement liquide ou une chambre à vapeur afin de réduire le bruit des ventilateurs. Le pavé numérique ou au moins les touches fléchées devraient être plus grandes, à l'instar des touches fléchées des ordinateurs portables Lenovo Legion 5 16.
Prix et disponibilité
MSI Vector 16 HX A14V
- 02/03/2024 v7 (old)
Allen Ngo
Transparency
La sélection des appareils à examiner est effectuée par notre équipe éditoriale. L'échantillon de test a été prêté à l'auteur par le fabricant ou le détaillant pour les besoins de cet examen. Le prêteur n'a pas eu d'influence sur cette évaluation et le fabricant n'a pas reçu de copie de cette évaluation avant sa publication. Il n'y avait aucune obligation de publier cet article. En tant que média indépendant, Notebookcheck n'est pas soumis à l'autorité des fabricants, des détaillants ou des éditeurs.
Voici comment Notebookcheck teste
Chaque année, Notebookcheck examine de manière indépendante des centaines d'ordinateurs portables et de smartphones en utilisant des procédures standardisées afin de garantir que tous les résultats sont comparables. Nous avons continuellement développé nos méthodes de test depuis environ 20 ans et avons établi des normes industrielles dans le processus. Dans nos laboratoires de test, des équipements de mesure de haute qualité sont utilisés par des techniciens et des rédacteurs expérimentés. Ces tests impliquent un processus de validation en plusieurs étapes. Notre système d'évaluation complexe repose sur des centaines de mesures et de points de référence bien fondés, ce qui garantit l'objectivité.Price comparison

