Test du HP Omen 16 (2024) : PC portable de jeu QHD avec Core i9 et RTX 4080 pour 3 200 €
La dernière incarnation de l'Omen 16 - un ordinateur portable de jeu haut de gamme - partage le même châssis et en grande partie le même matériel que son prédécesseur prédécesseur. Le processeur a été amélioré : Raptor Lake Refresh remplace le Raptor Lake original. La GeForce RTX 4080, Core i9-14900HX et 32 Go de RAM font grimper le prix de l'ordinateur portable à 3 200 € (3 446 USD). L'Omen 16 est confronté à des ordinateurs portables de jeu tels que le MSI Vector 16 HX A14Vle Acer Predator Helios 18 et le Alienware m16 R1.
Comparaison avec les concurrents potentiels
Note | Date | Modèle | Poids | Épaisseur | Taille | Résolution | Prix |
|---|---|---|---|---|---|---|---|
| 86.7 % v7 (old) | 02/24 | HP Omen 16 (2024) i9-14900HX, GeForce RTX 4080 Laptop GPU | 2.4 kg | 23.5 mm | 16.10" | 2560x1440 | |
| 88 % v7 (old) | 02/24 | MSI Vector 16 HX A14V i9-14900HX, GeForce RTX 4080 Laptop GPU | 2.7 kg | 28.55 mm | 16.00" | 2560x1600 | |
| 89.2 % v7 (old) | 08/23 | Alienware m16 R1 AMD R9 7845HX, GeForce RTX 4080 Laptop GPU | 3.1 kg | 25.4 mm | 16.00" | 2560x1600 | |
| 88.3 % v7 (old) | 10/23 | Acer Predator Helios 18 N23Q2 i9-13900HX, GeForce RTX 4080 Laptop GPU | 3.2 kg | 29.15 mm | 18.00" | 2560x1600 |
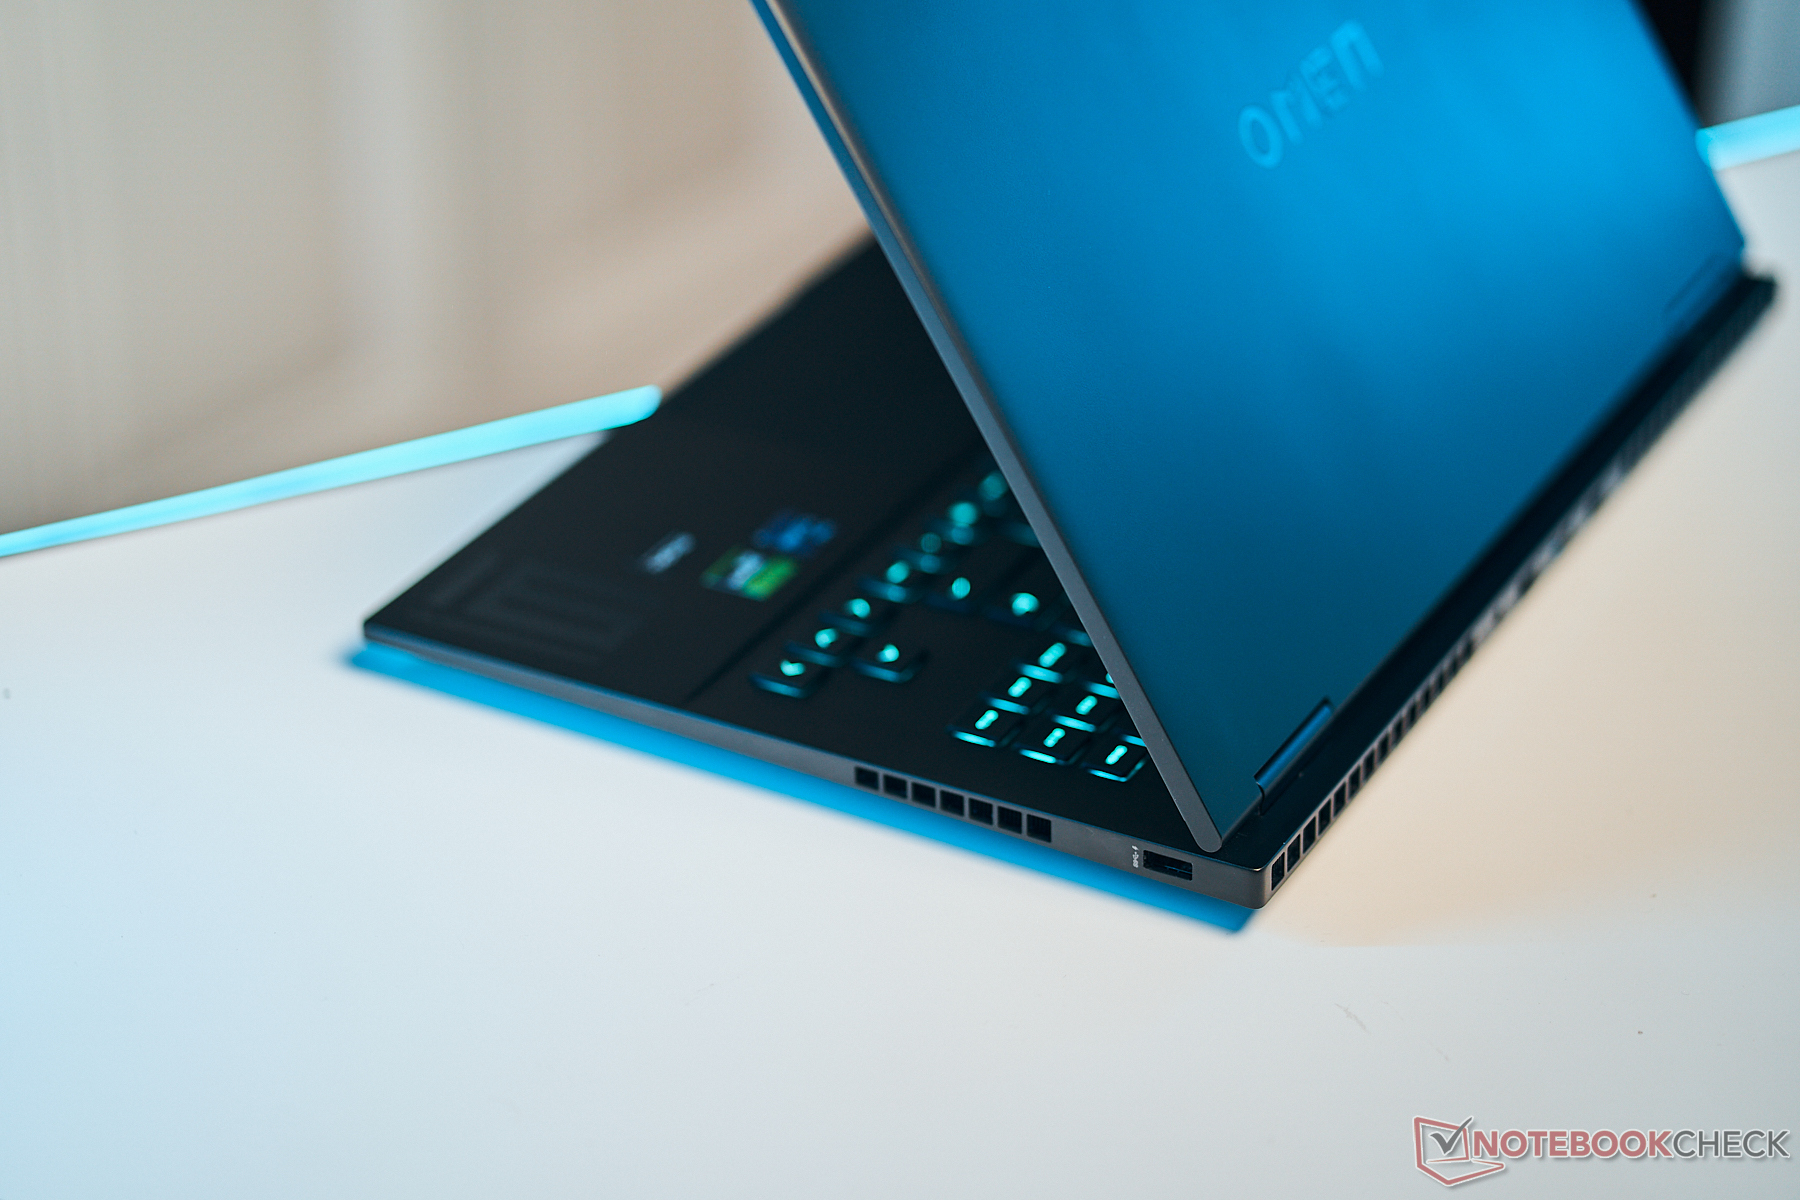
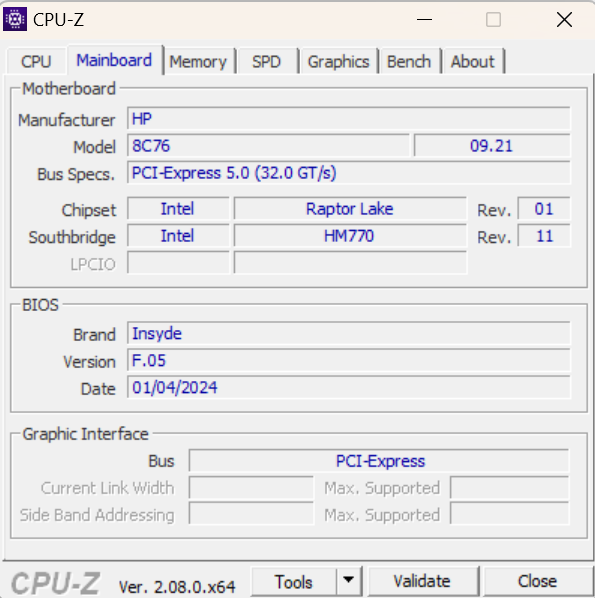
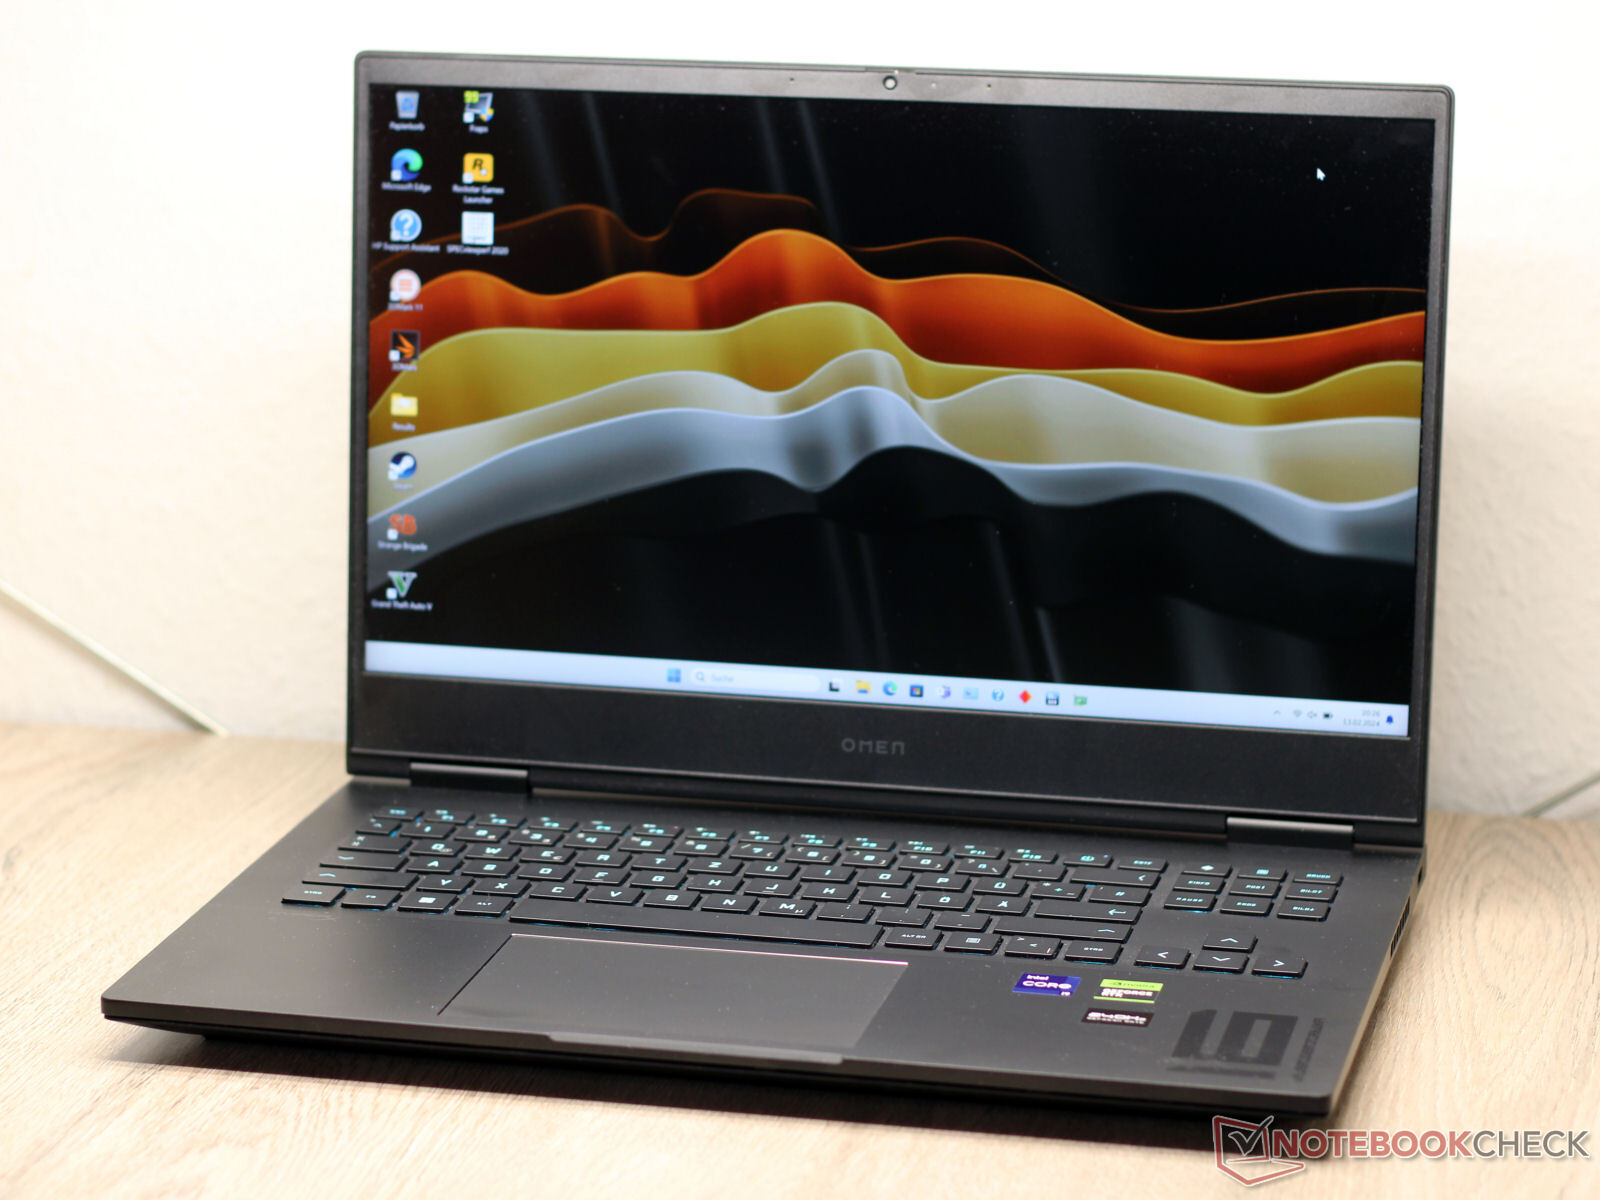
Mallette et spécifications - Ordinateur portable HP avec Thunderbolt 4
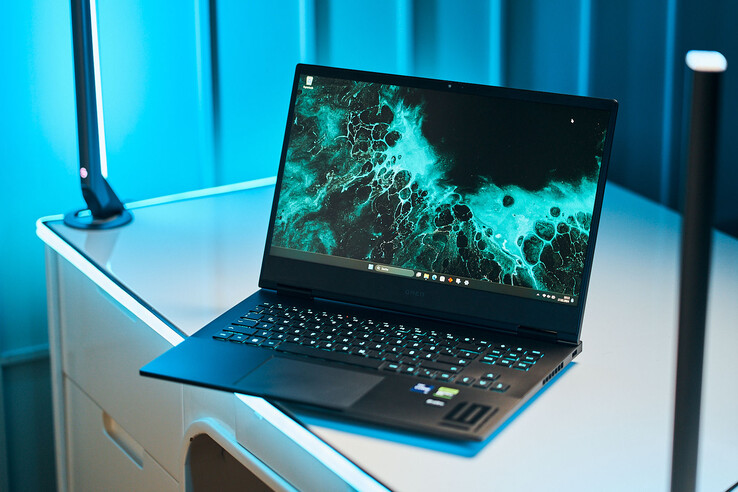
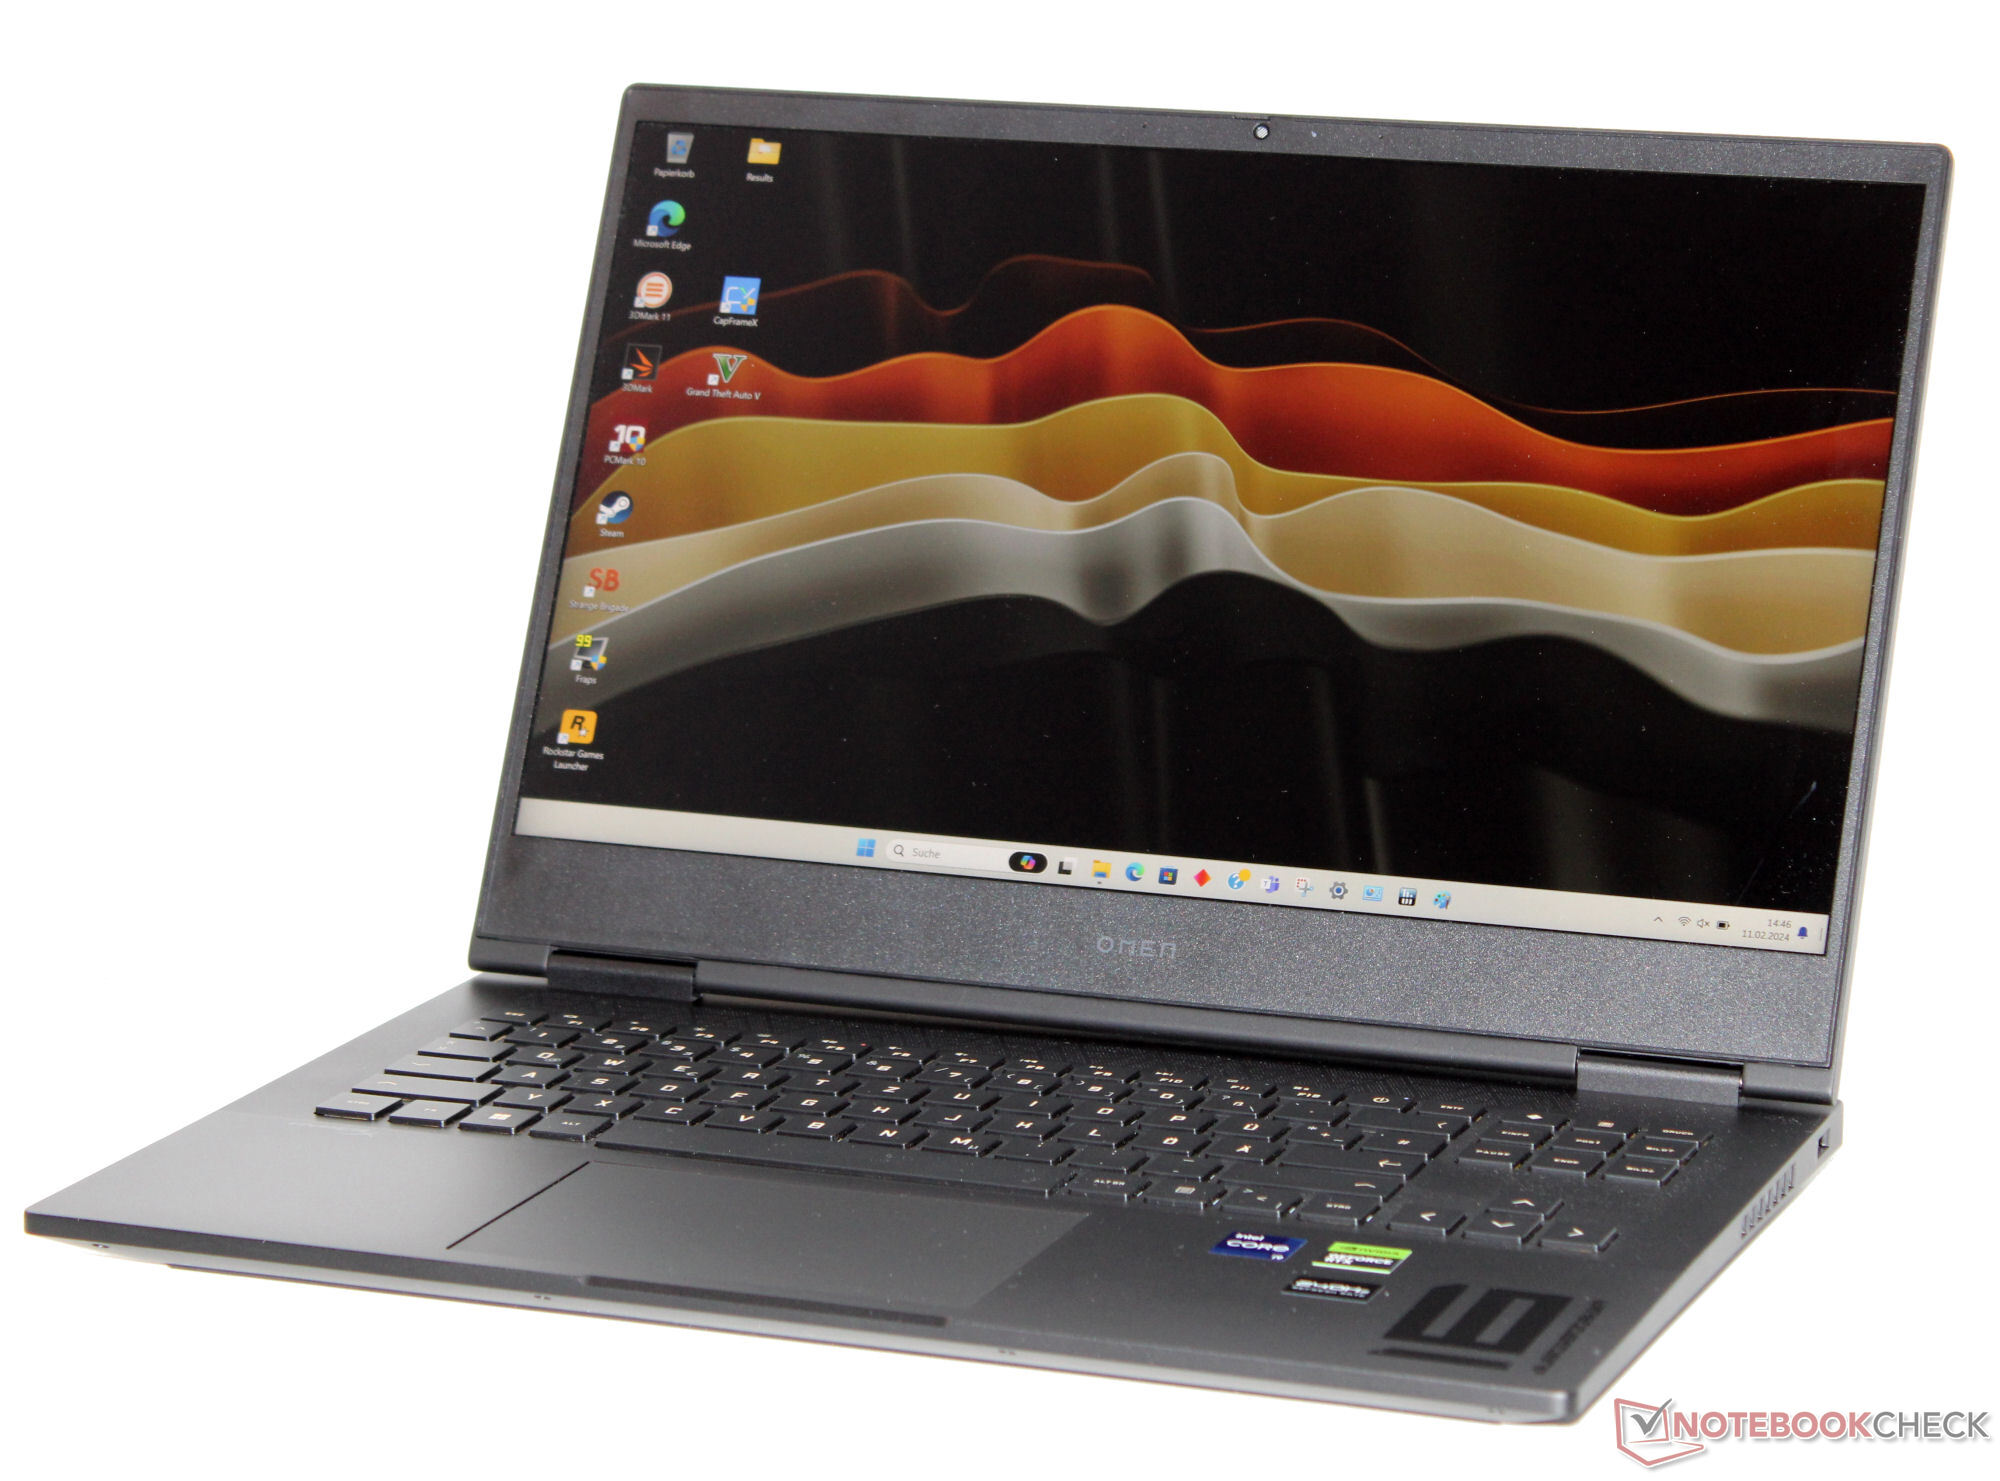
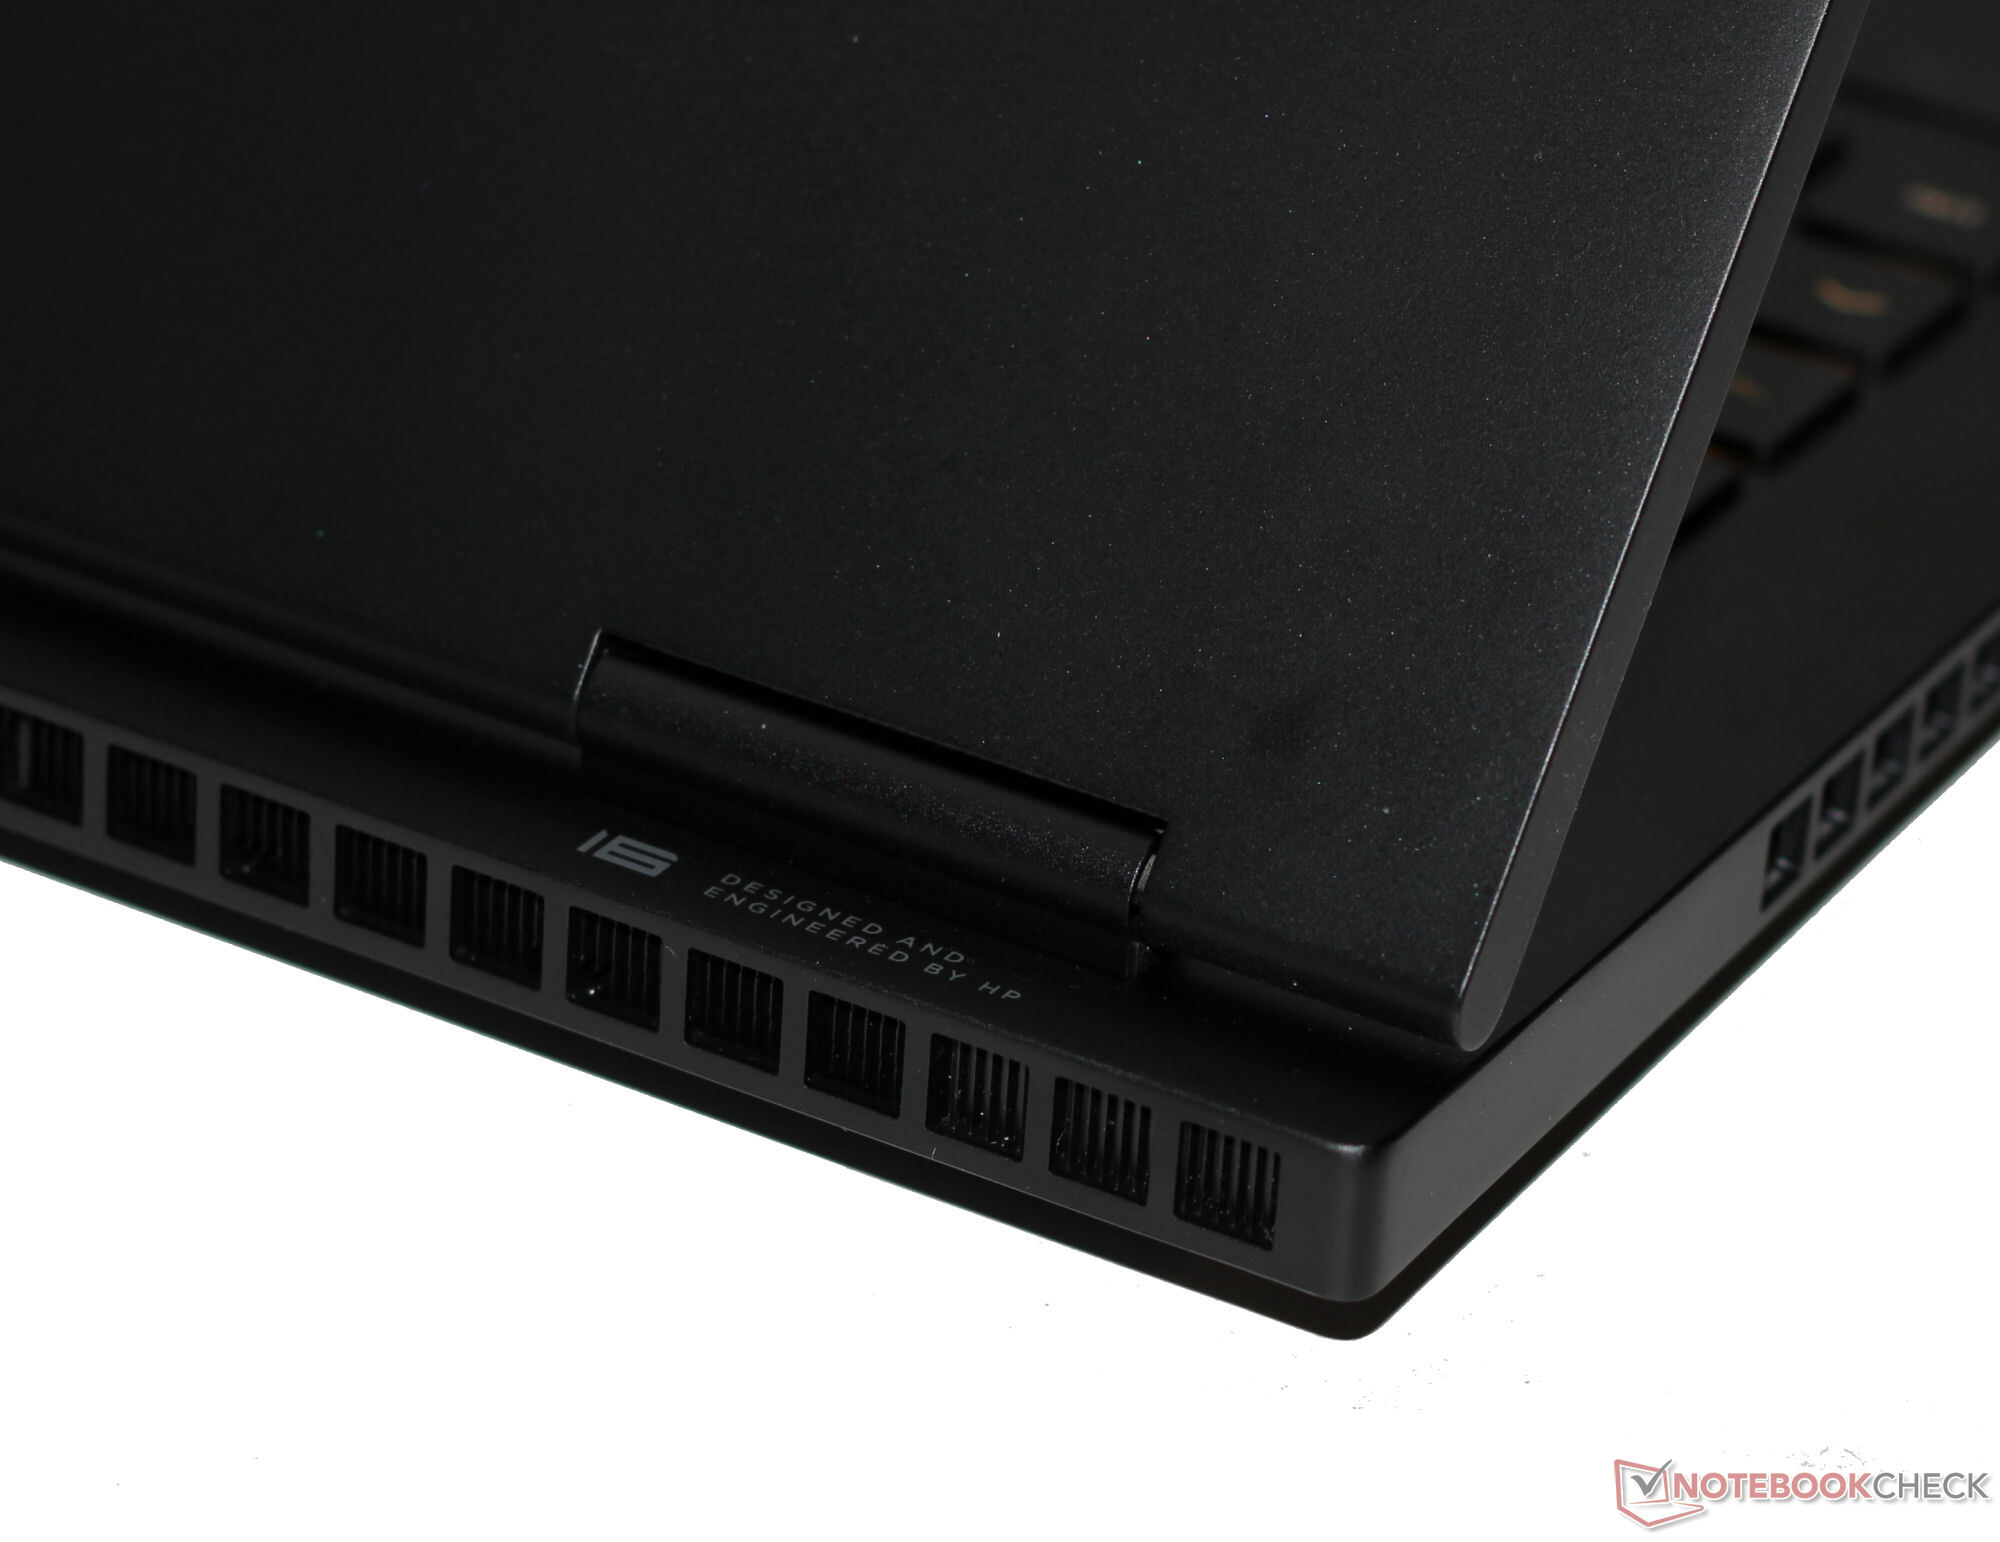
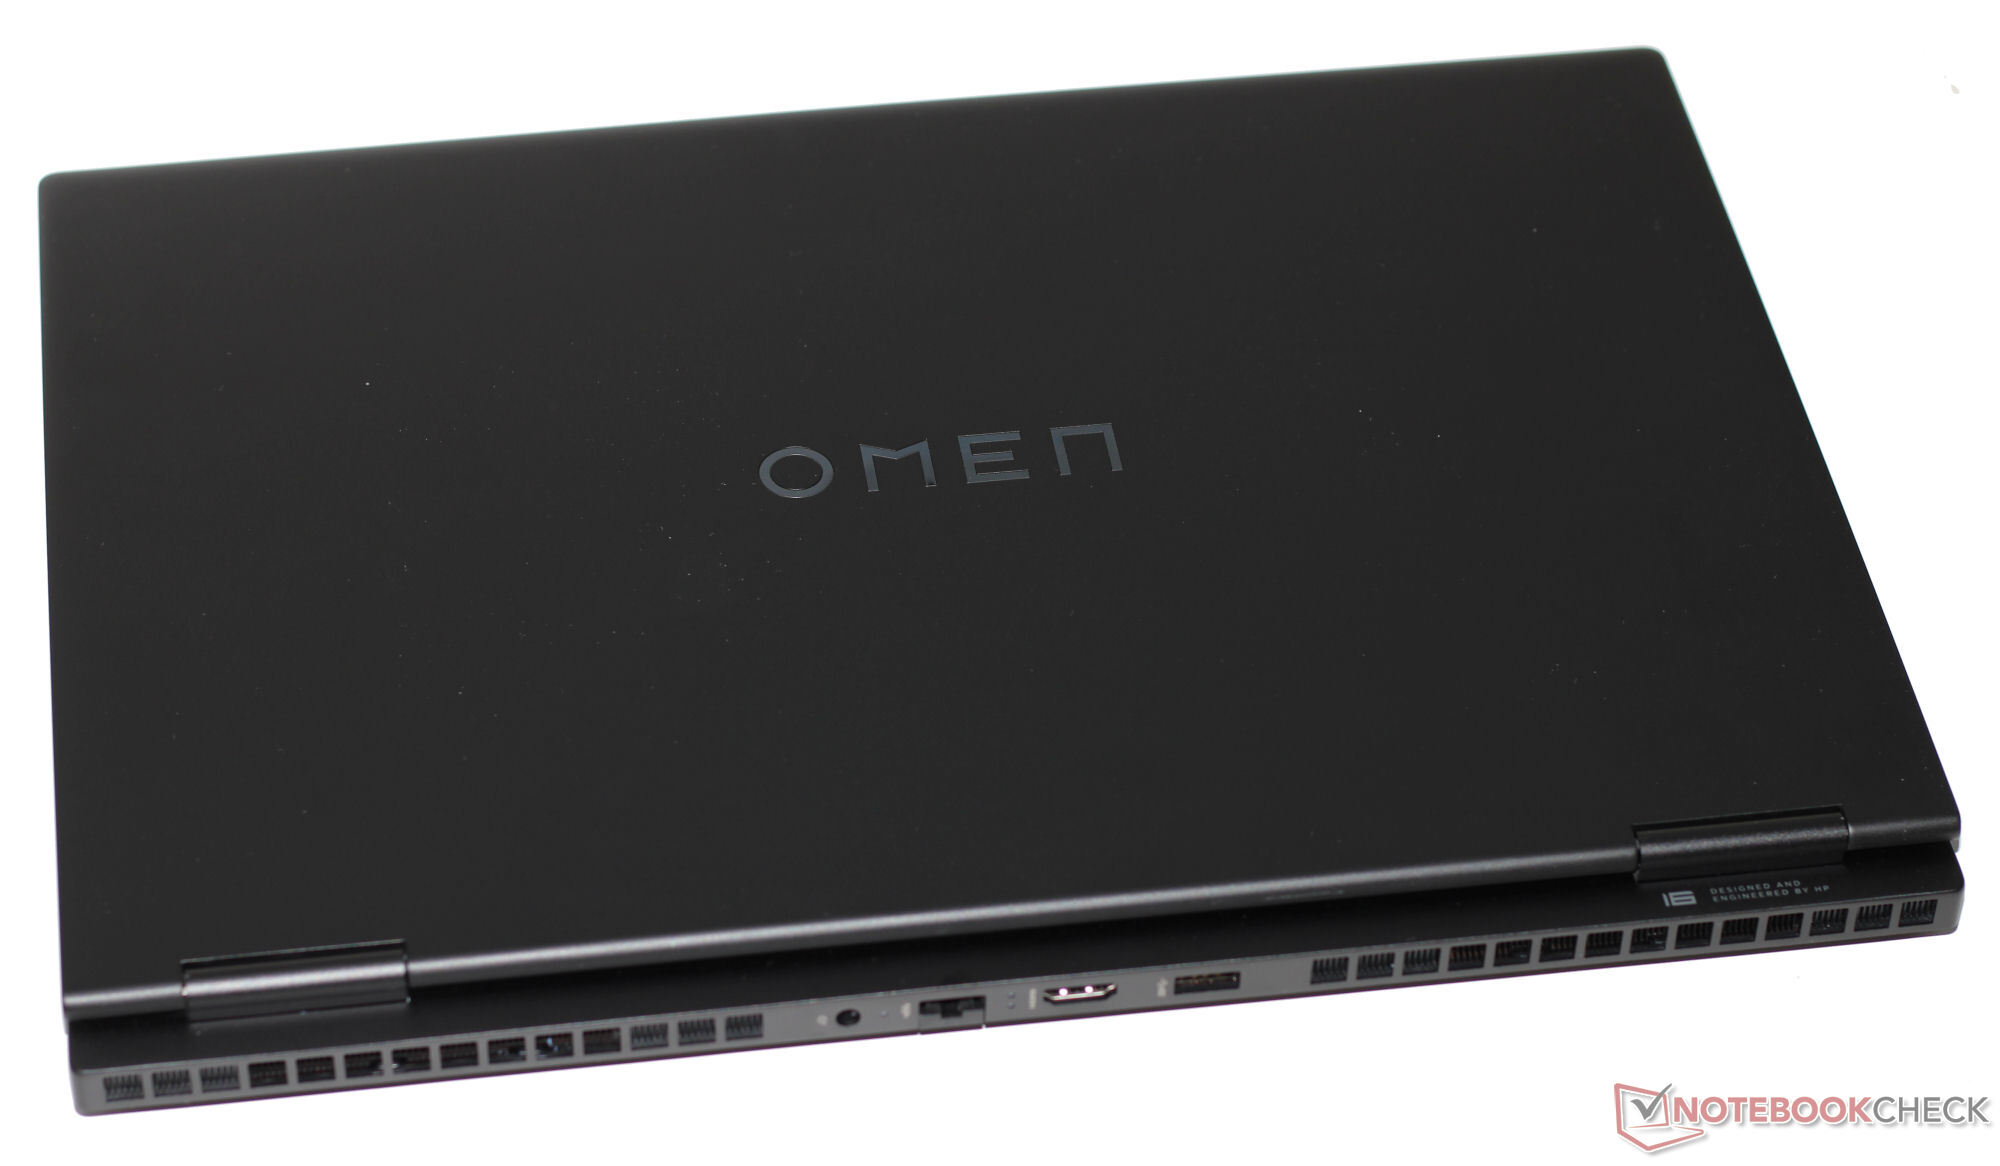
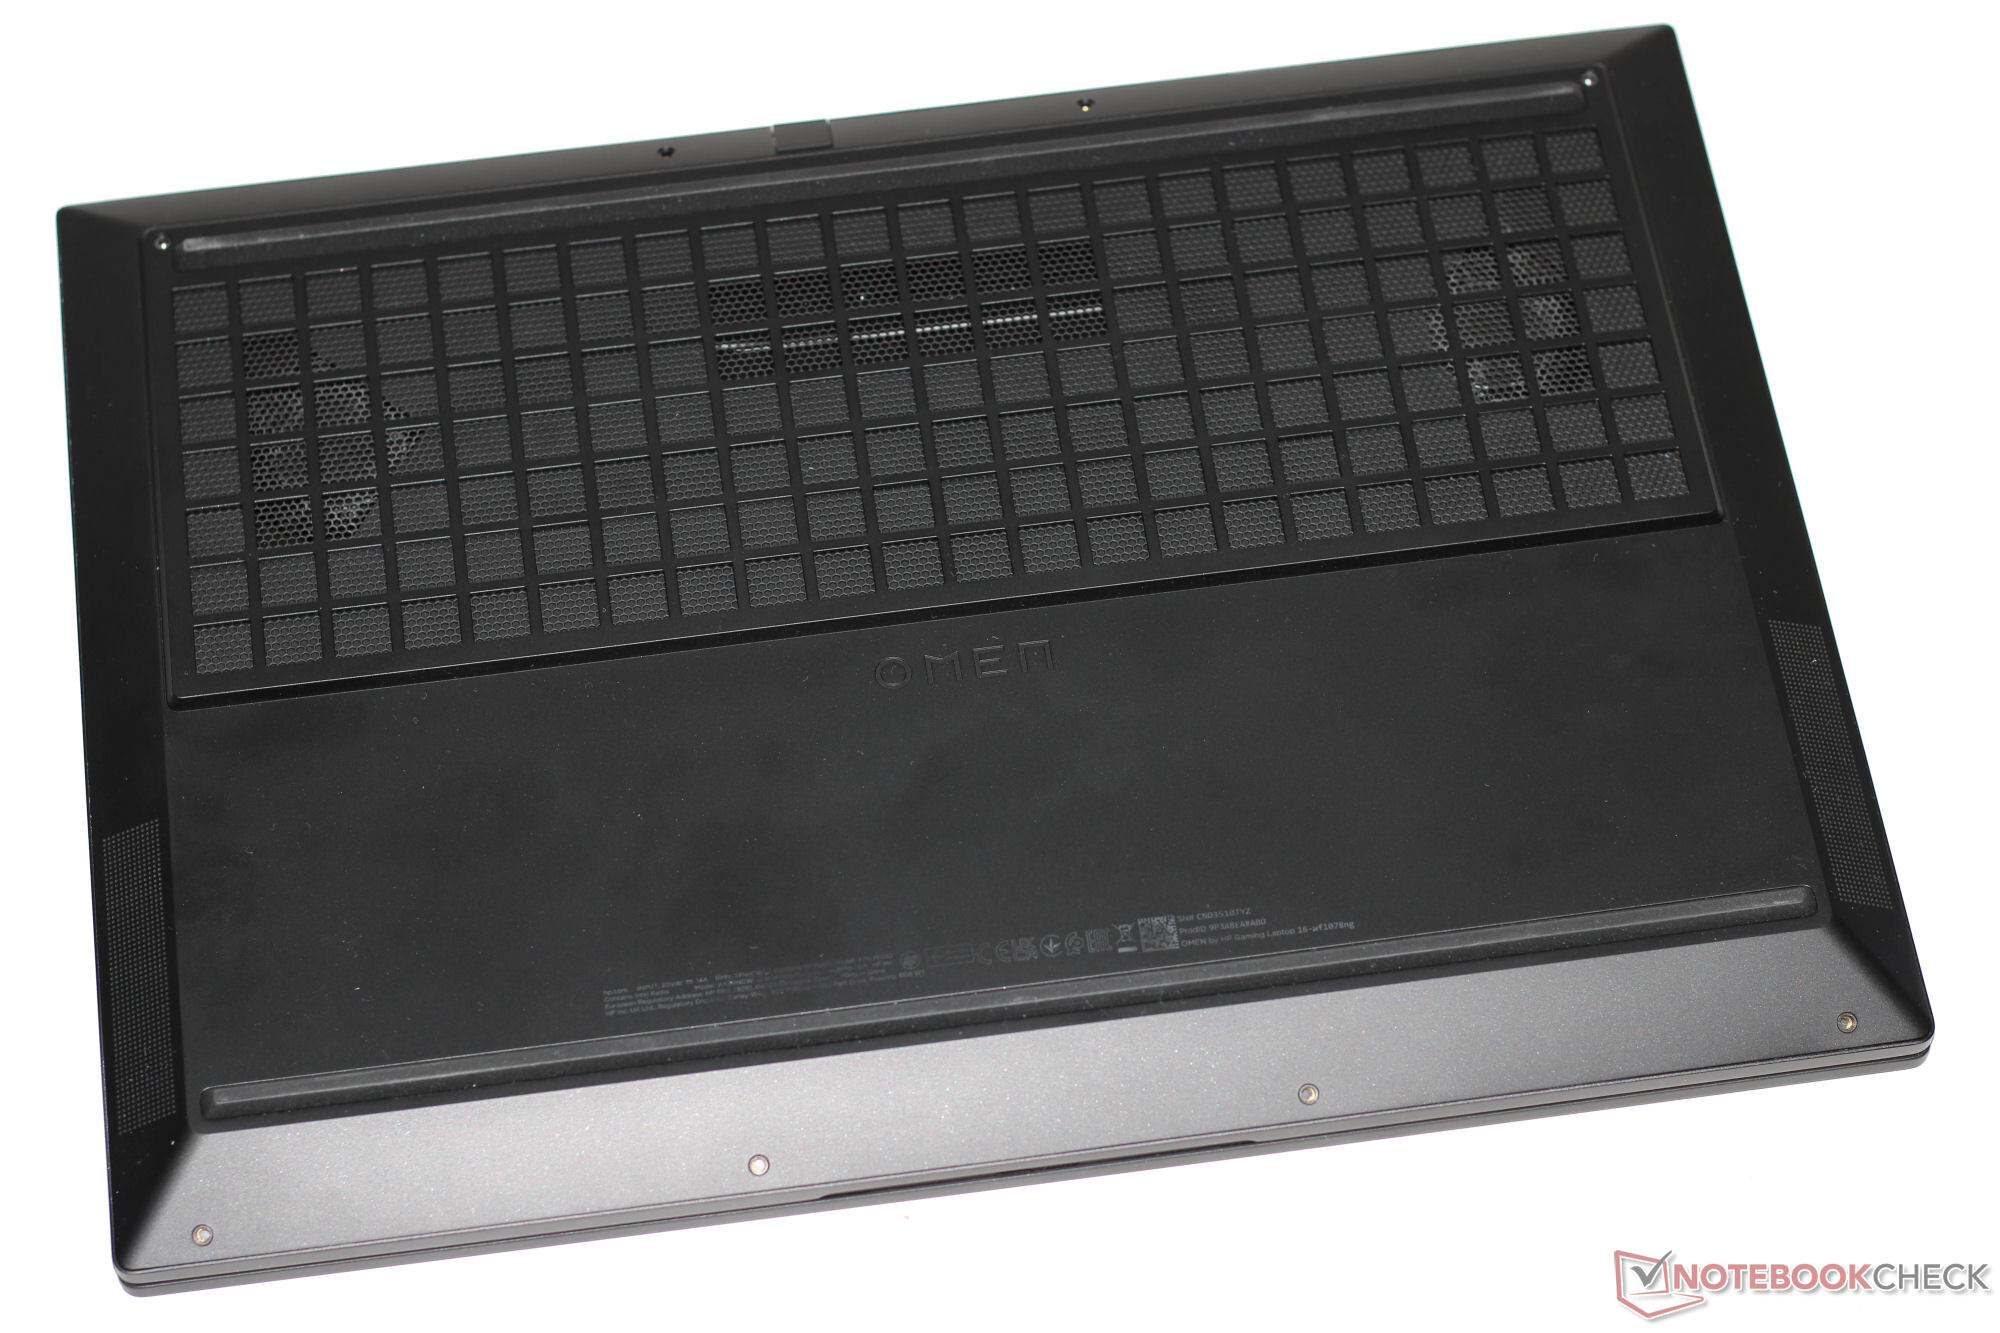
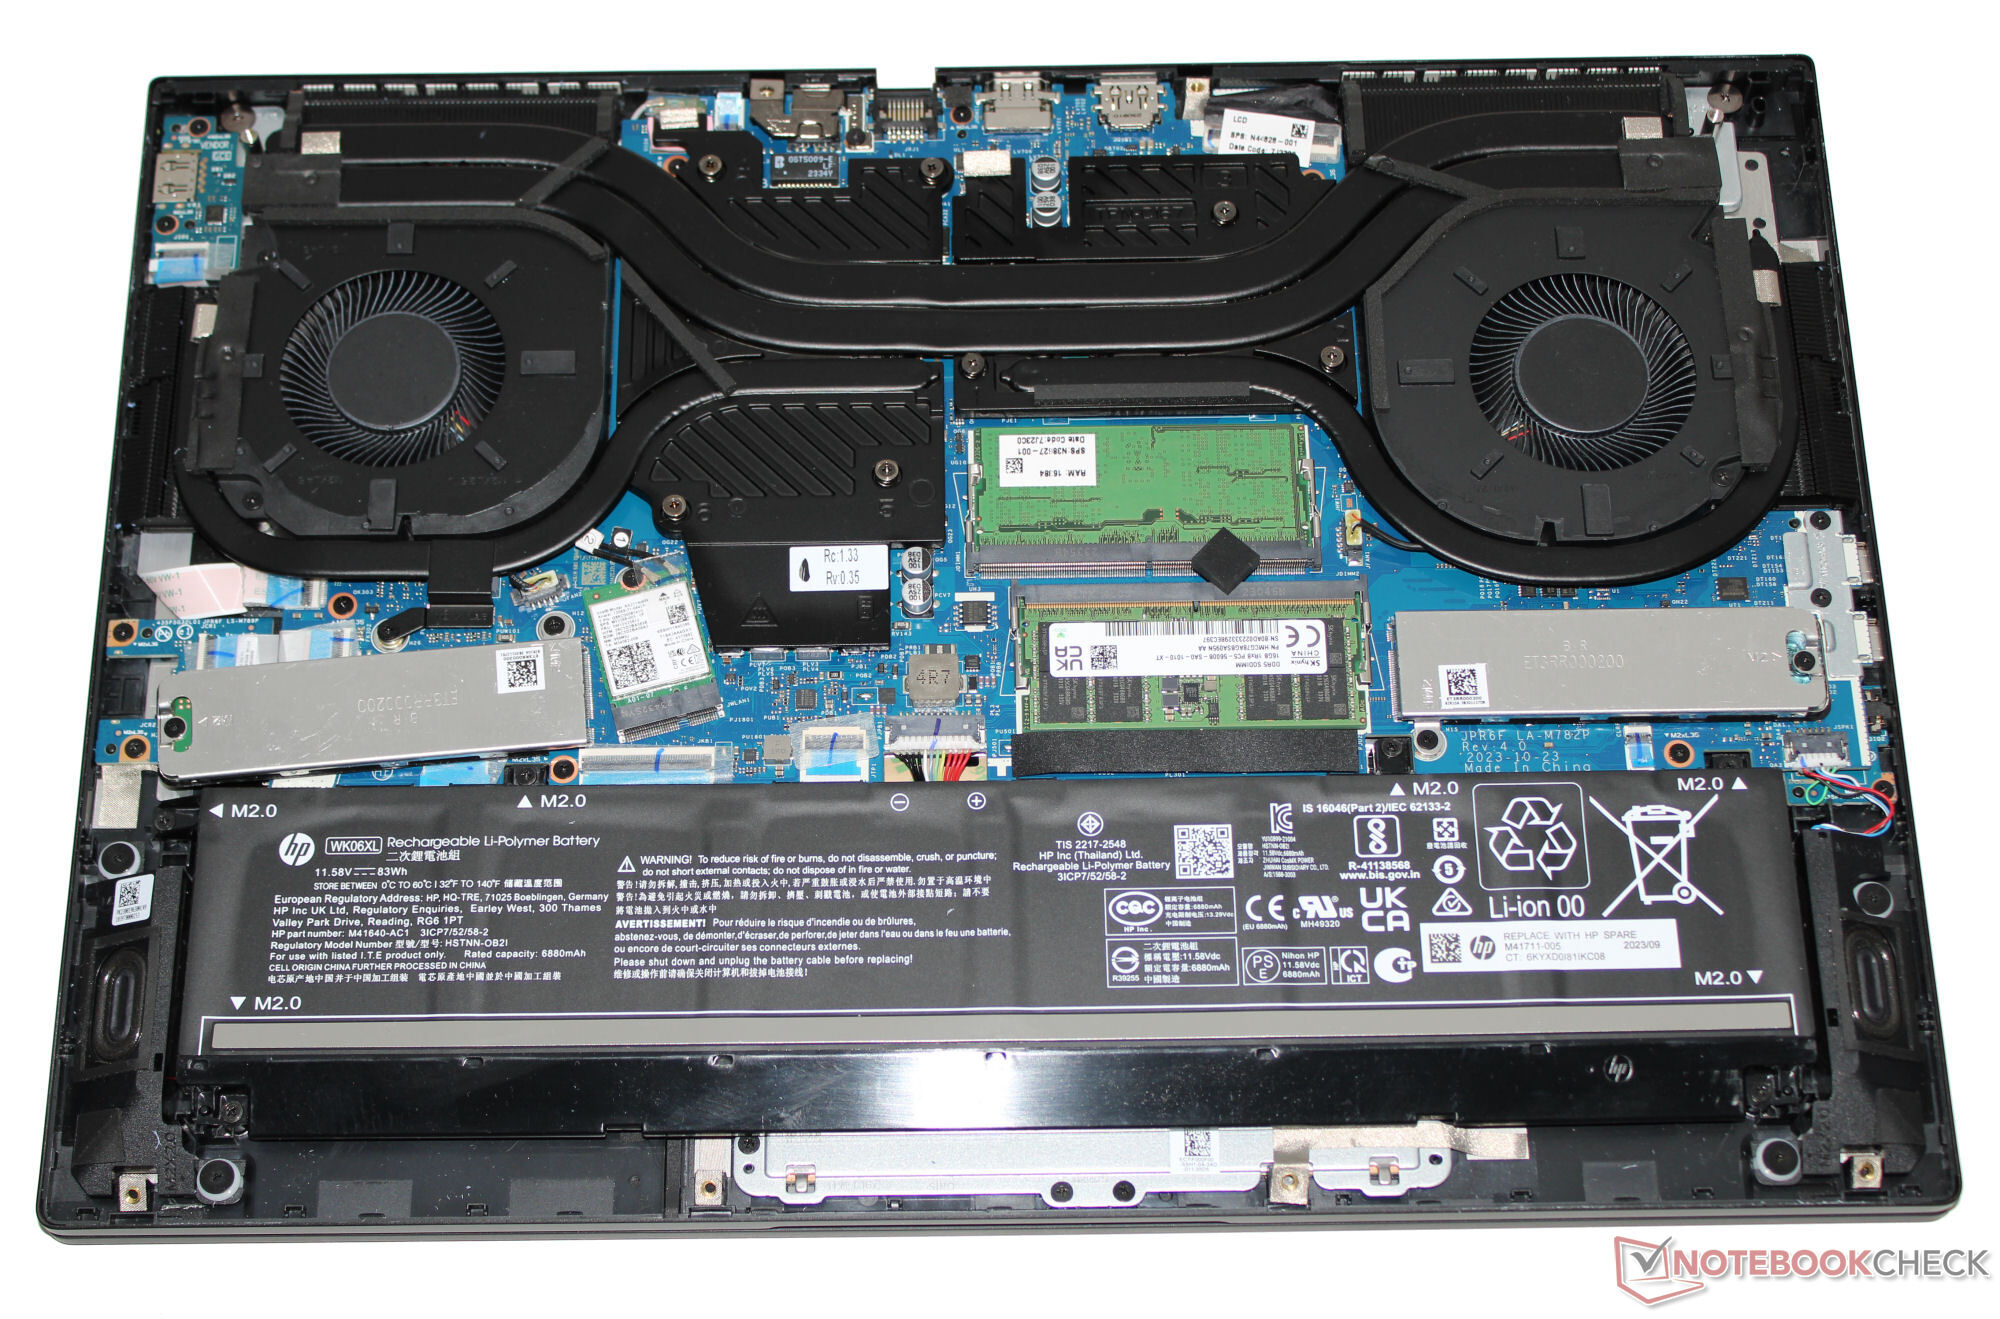
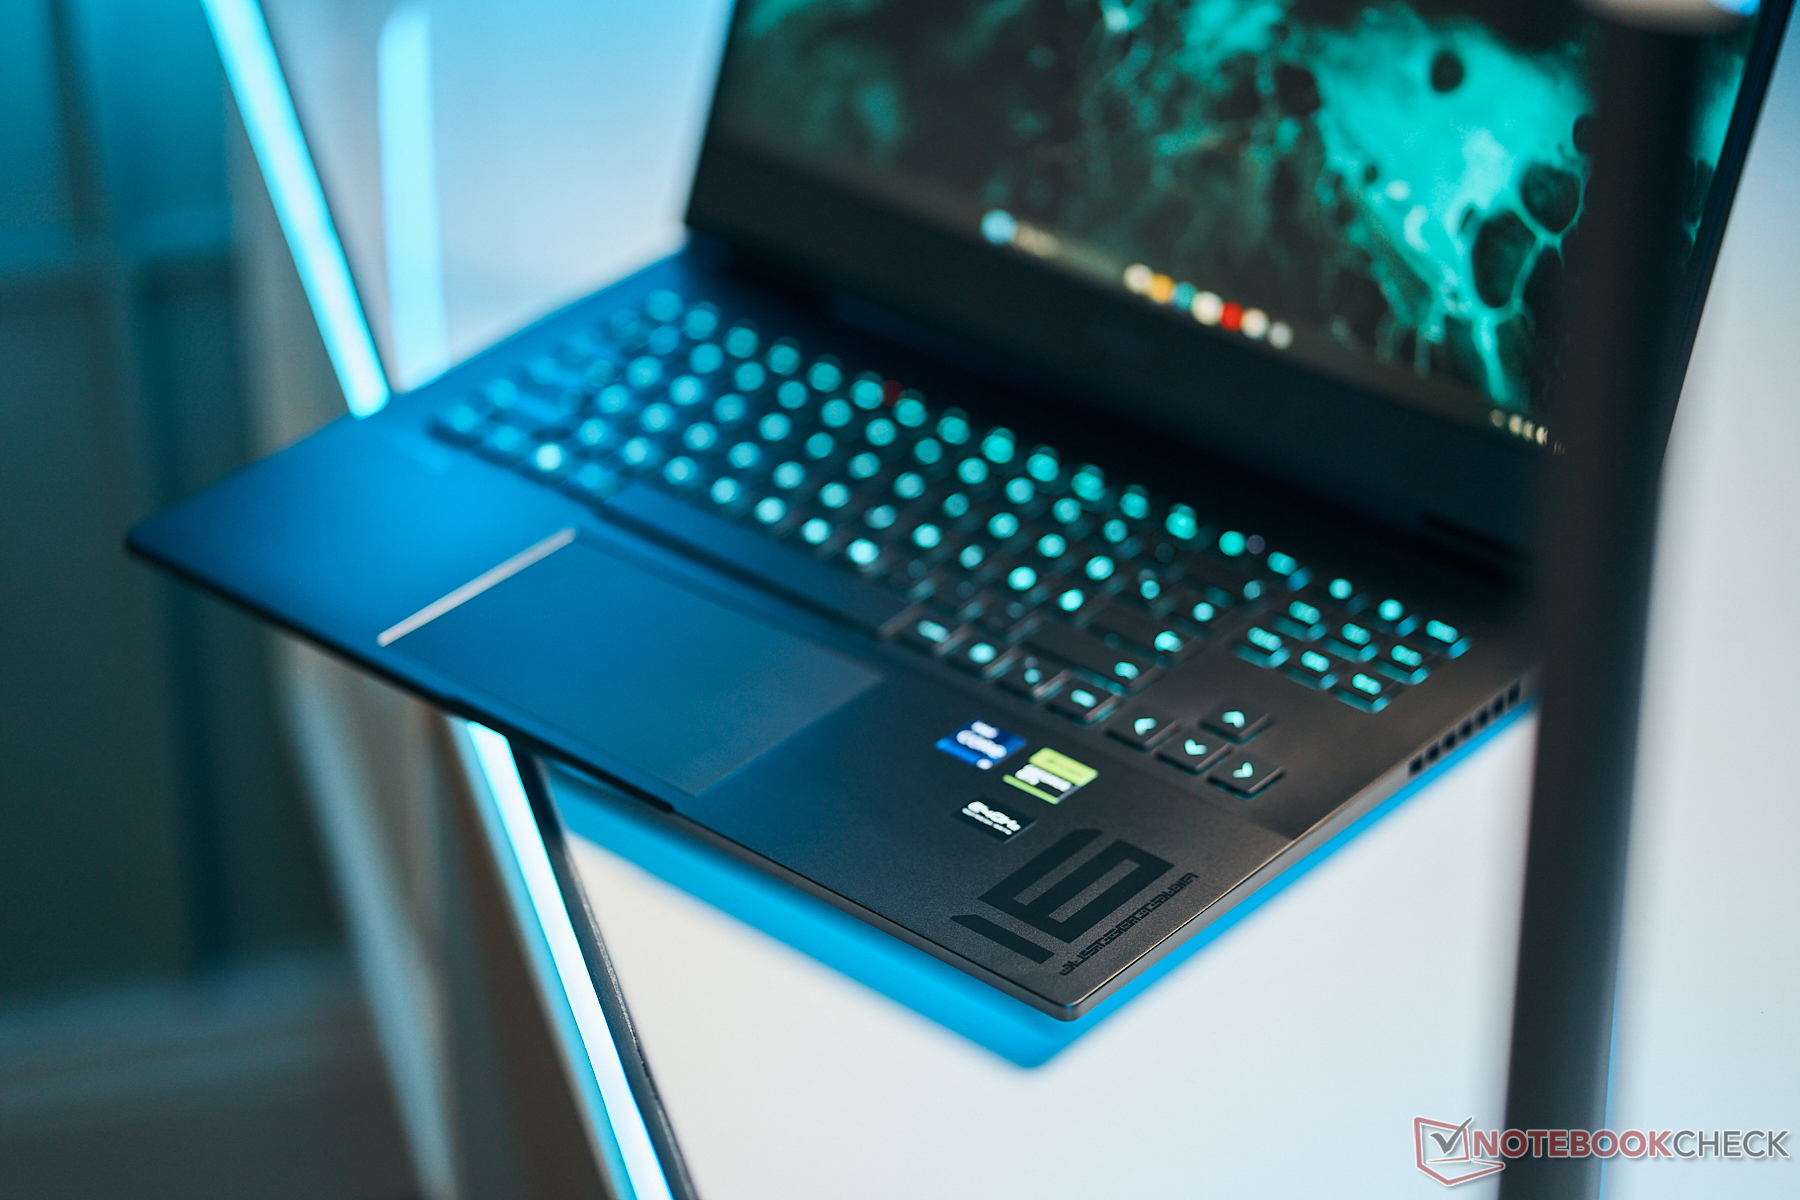
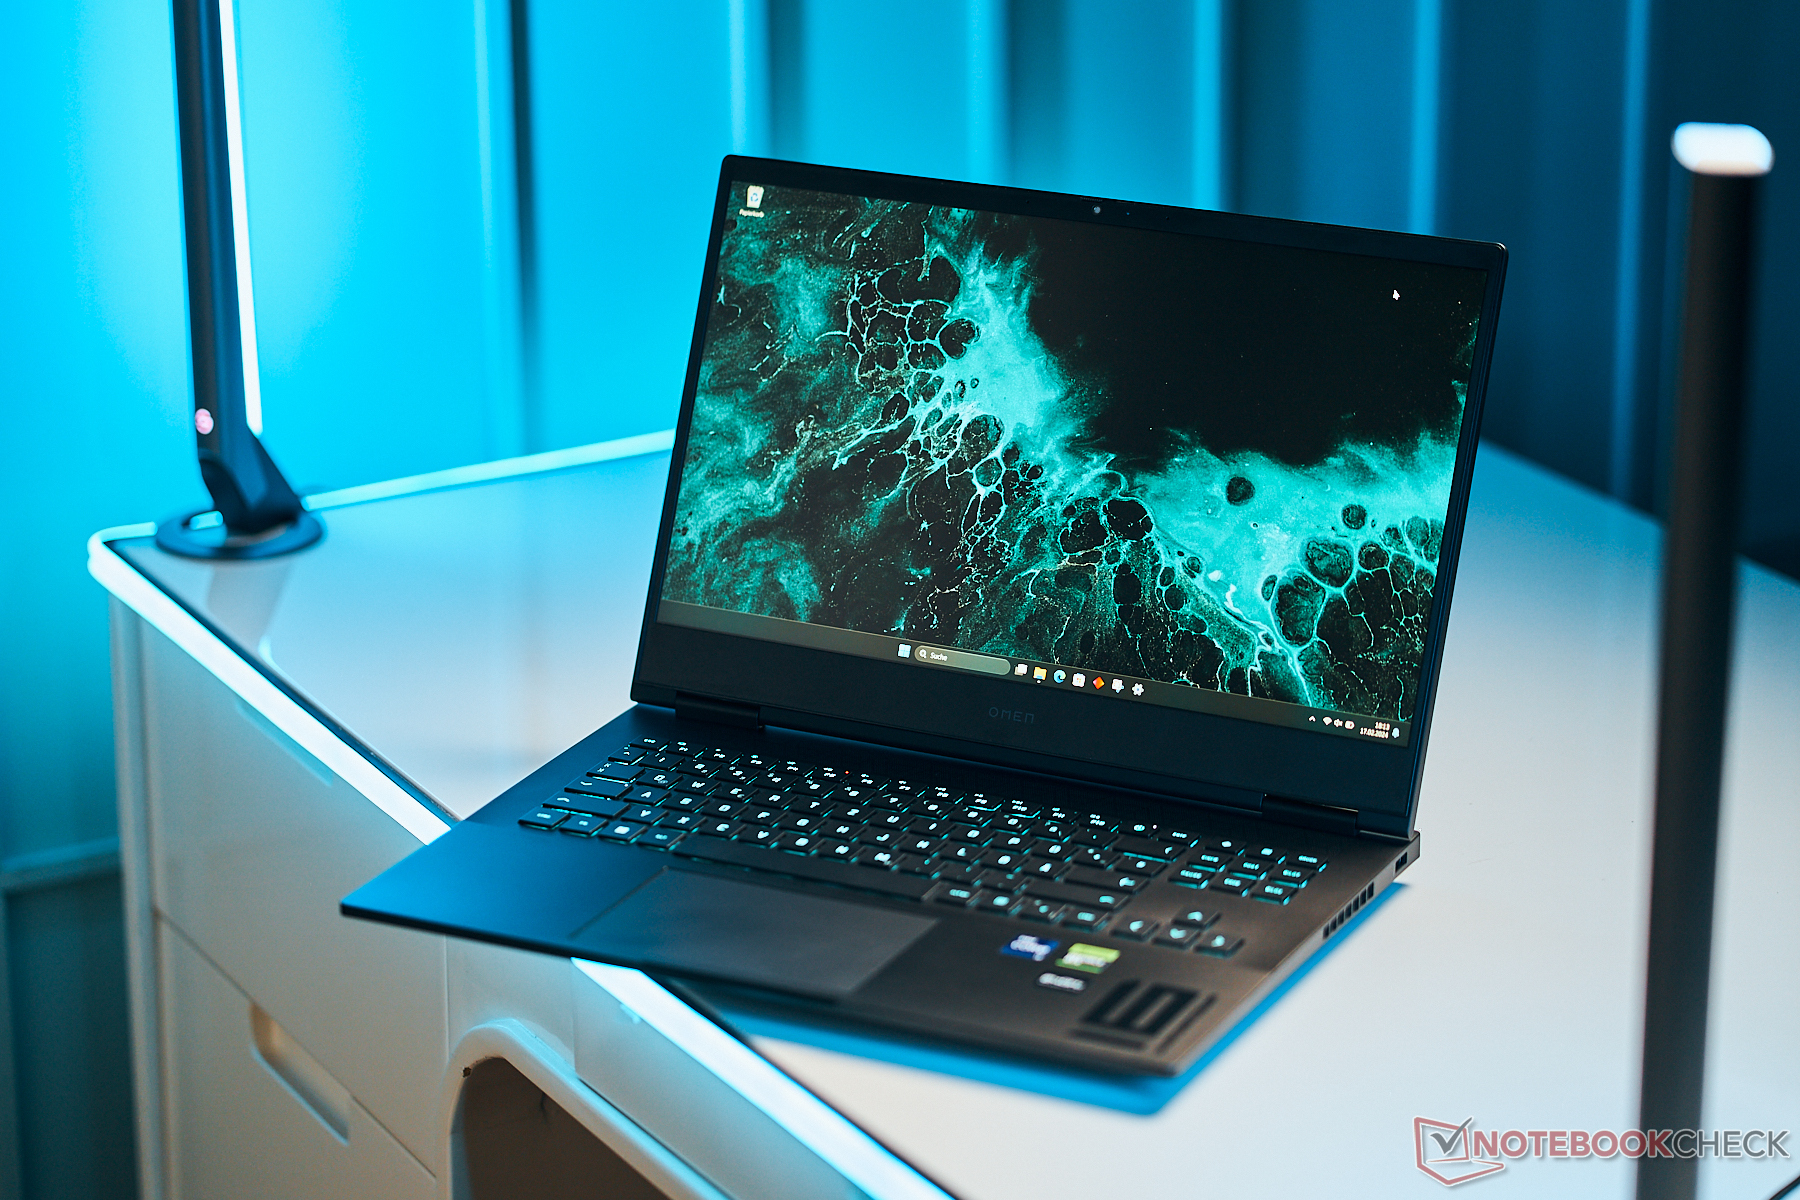
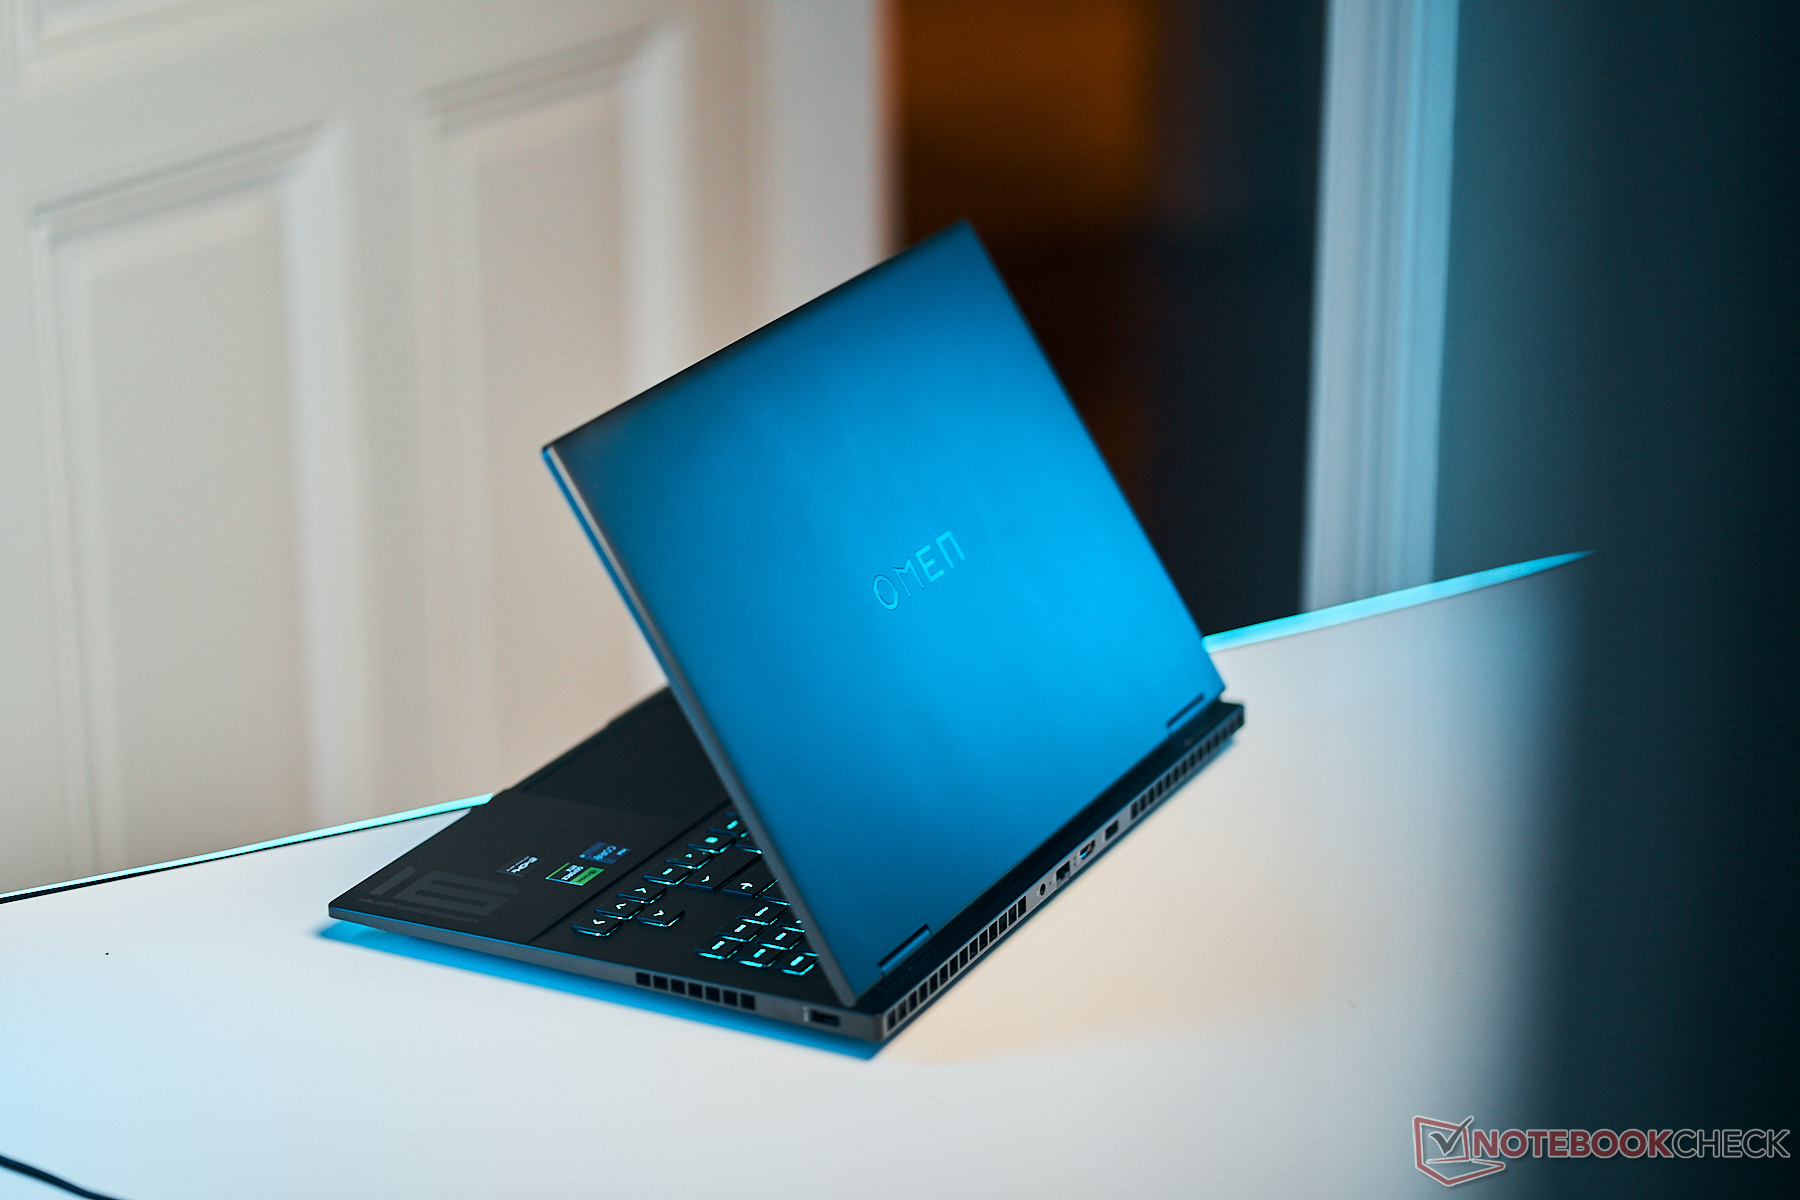
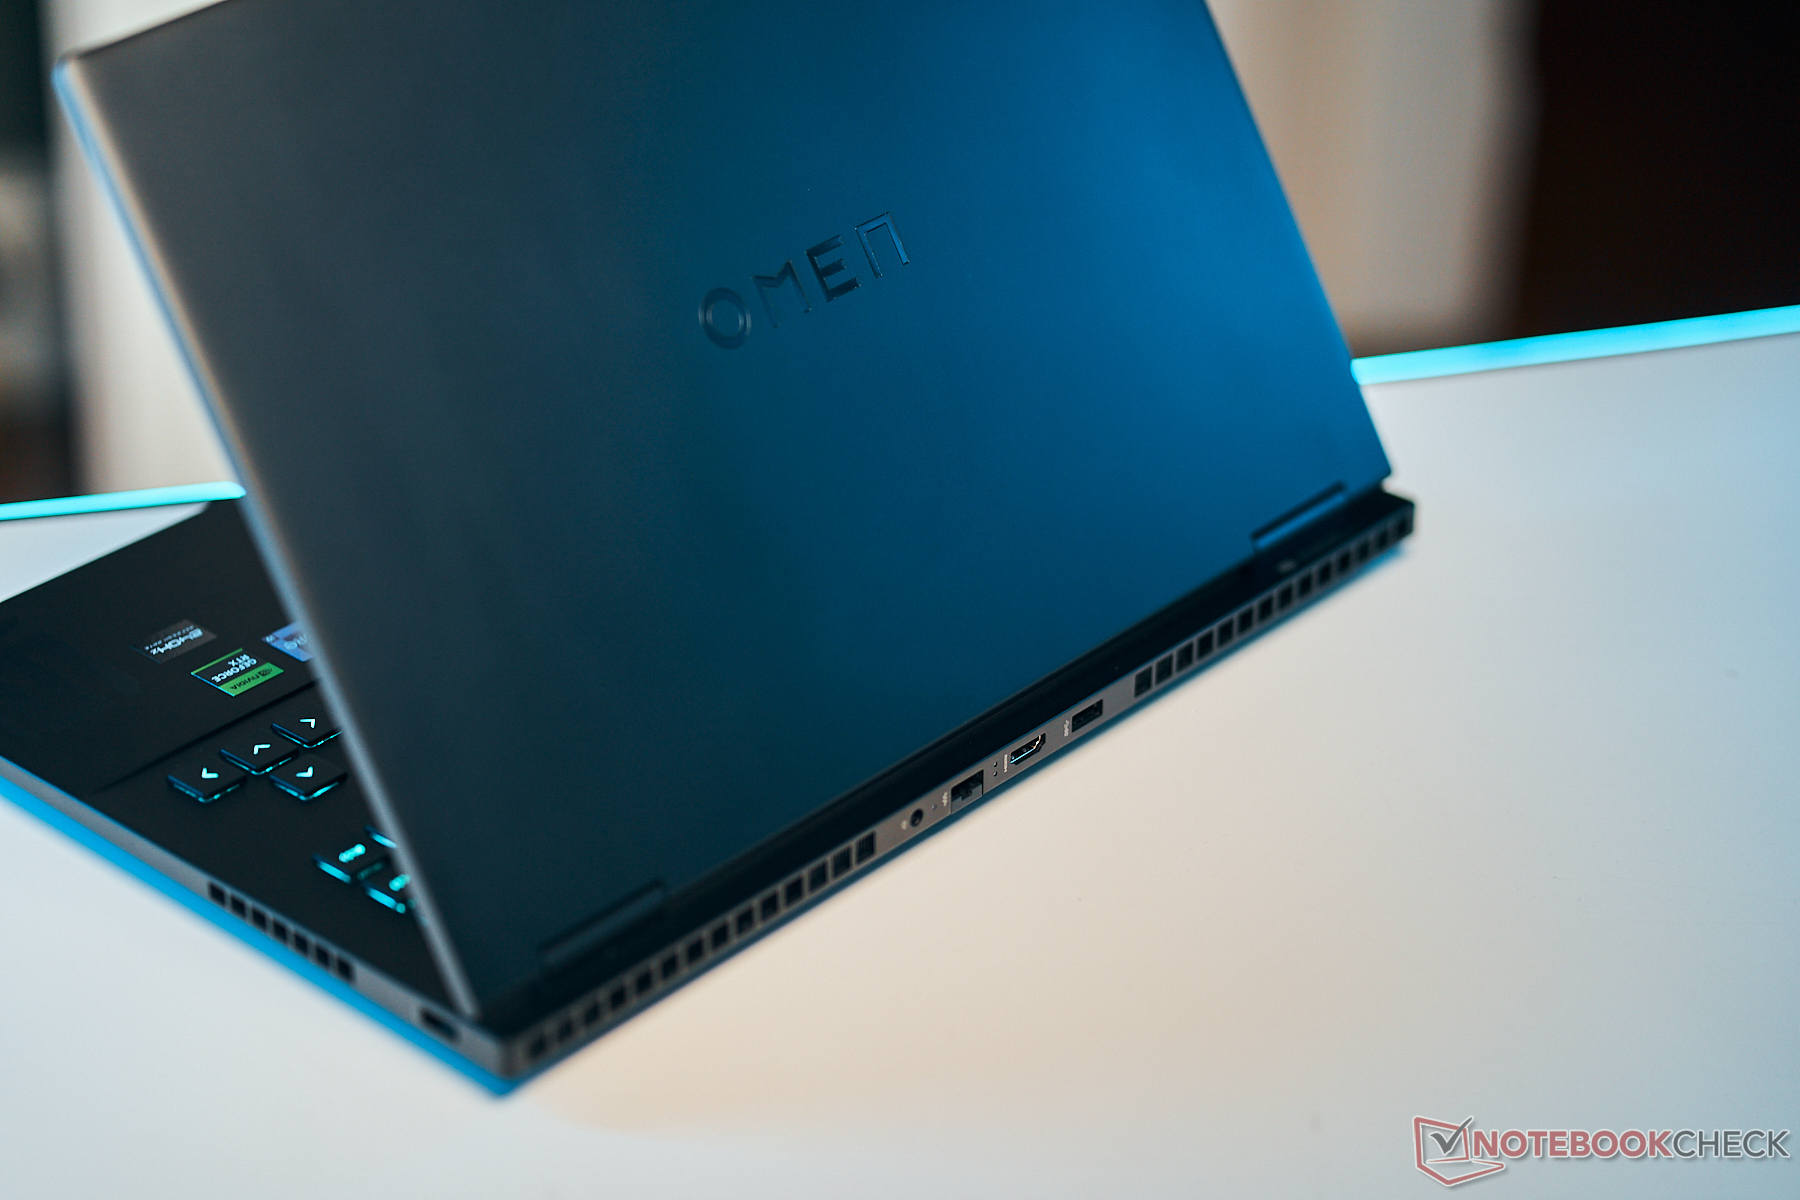
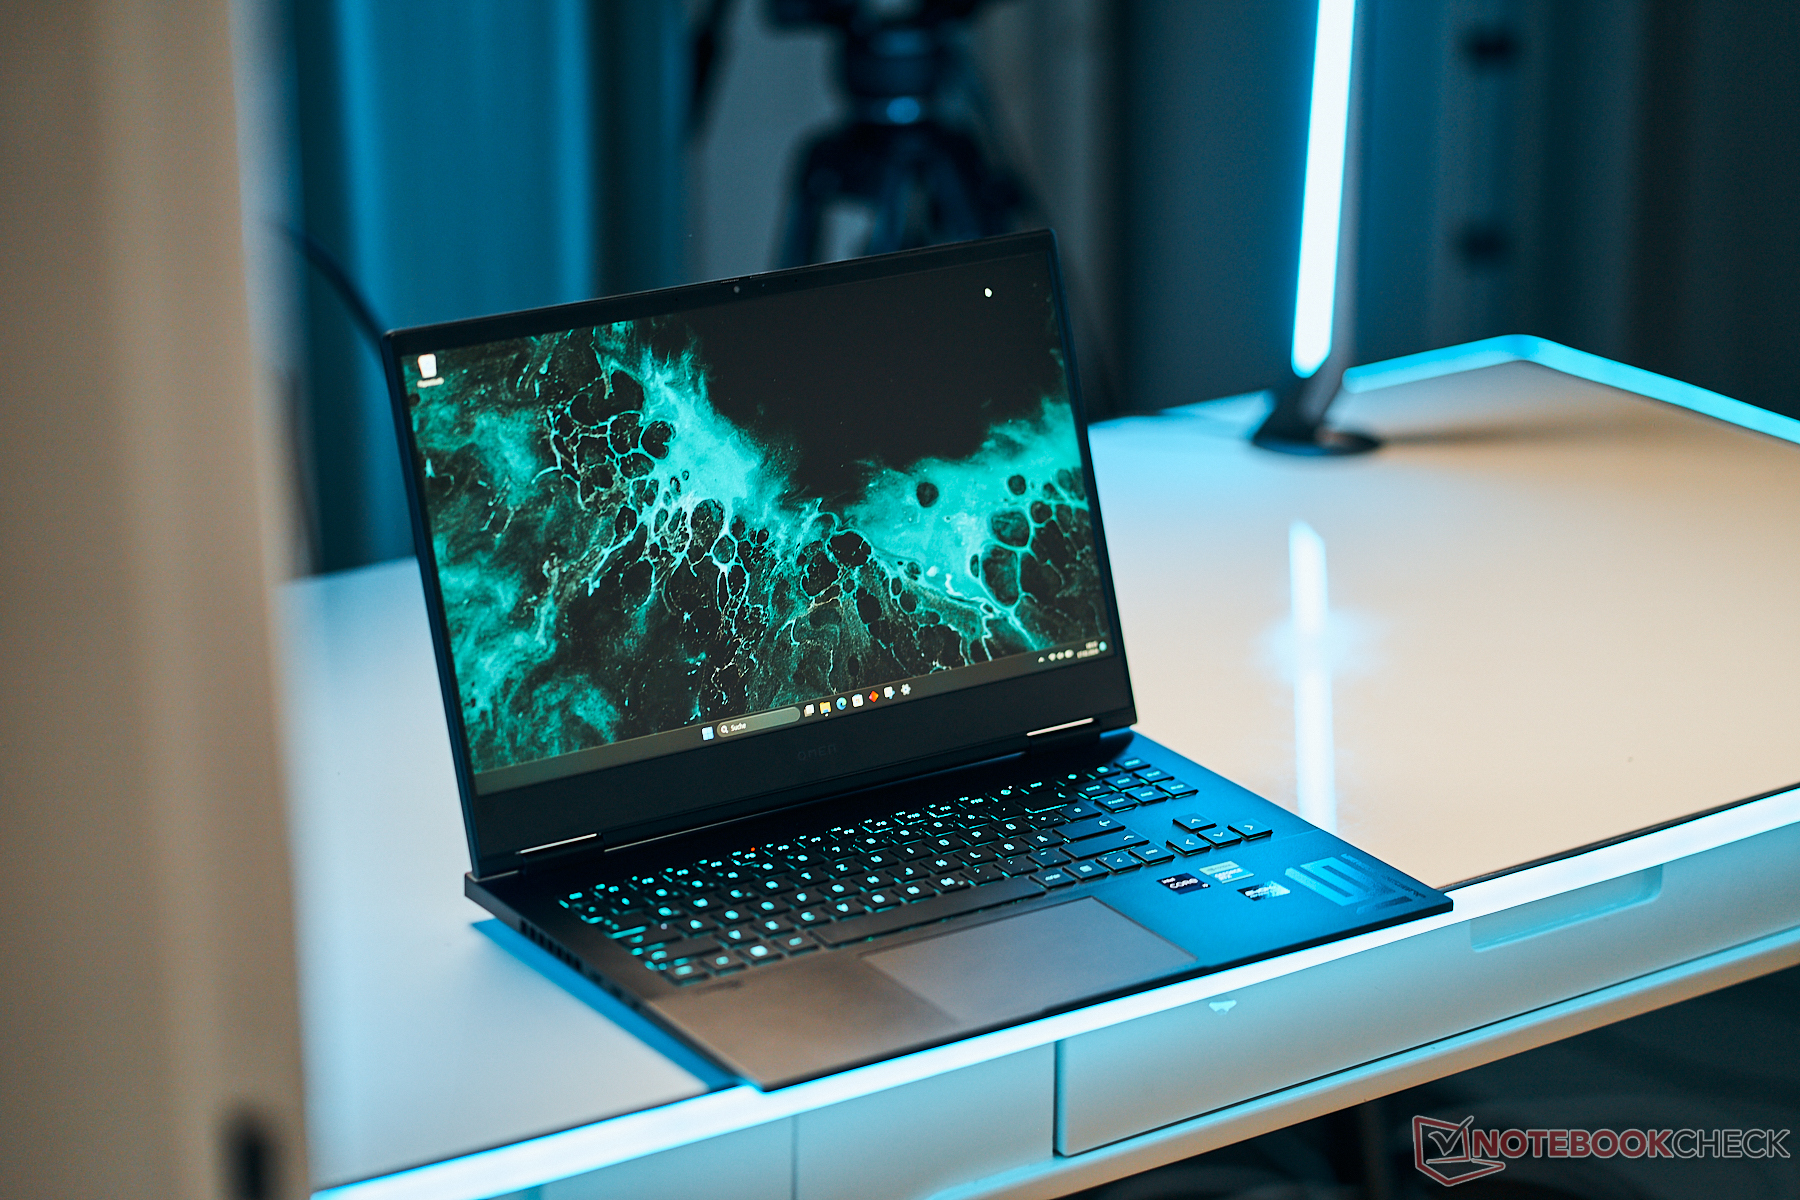
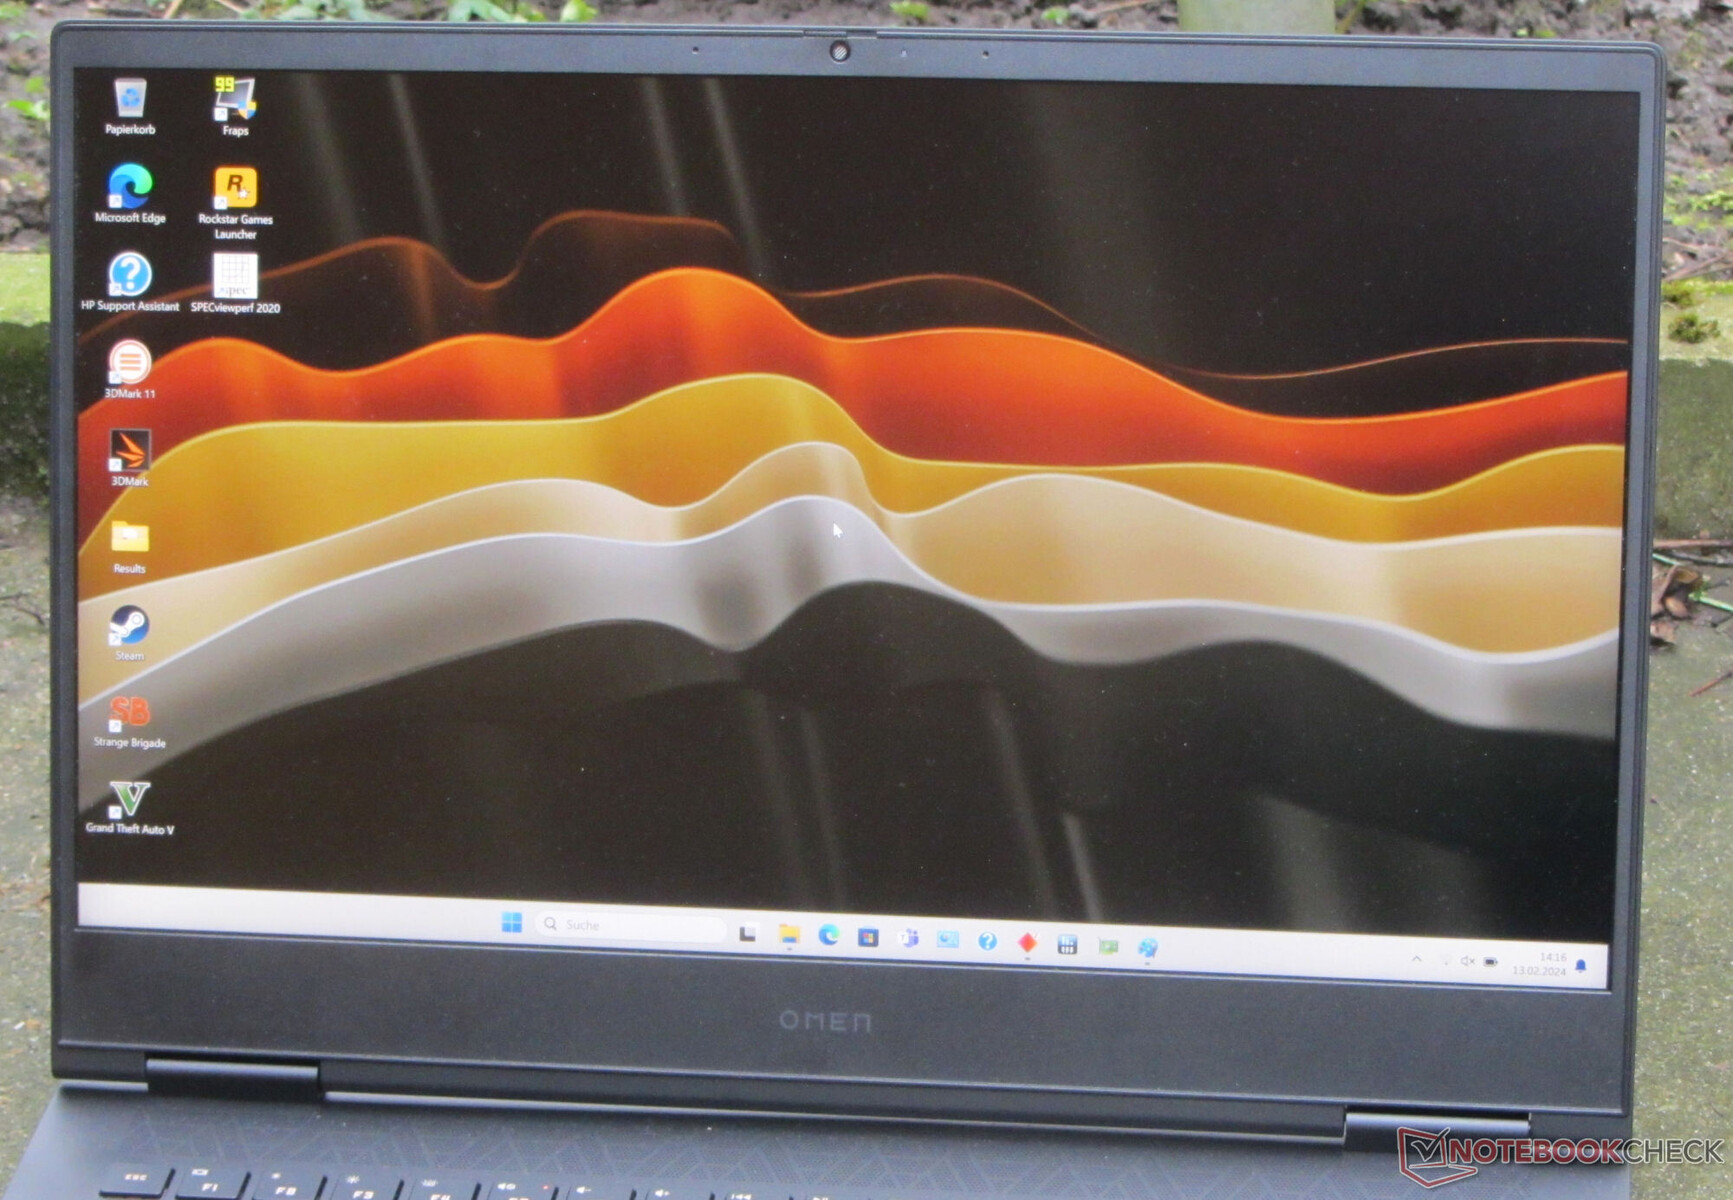
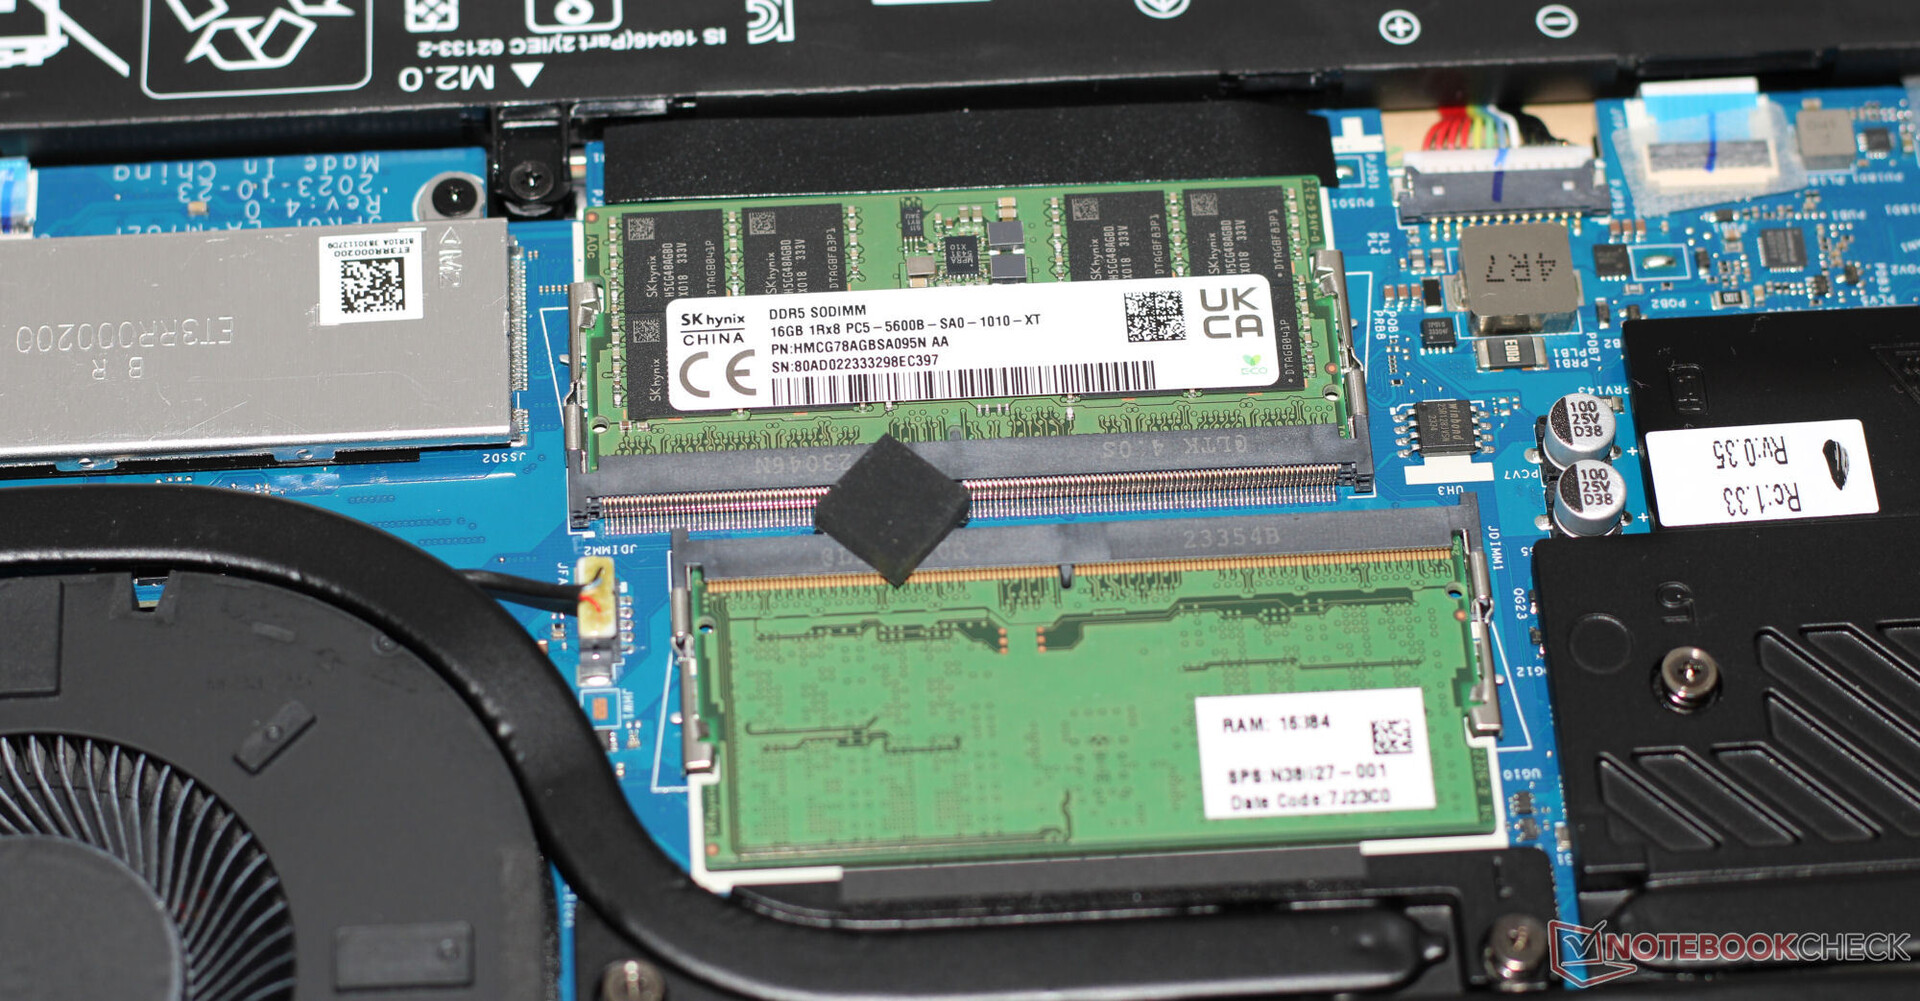
HP conserve le même châssis noir mat avec des surfaces lisses que son prédécesseur Test du HP Omen 16 2023 : la GeForce RTX 4080 à 145 W . Un couvercle en plastique contraste avec une base en aluminium. Le châssis ne présente pas de motifs frappants ni d'éléments LED, à l'exception de l'éclairage du clavier. La batterie (vissée et non collée) et le reste du matériel sont accessibles une fois le couvercle inférieur retiré.
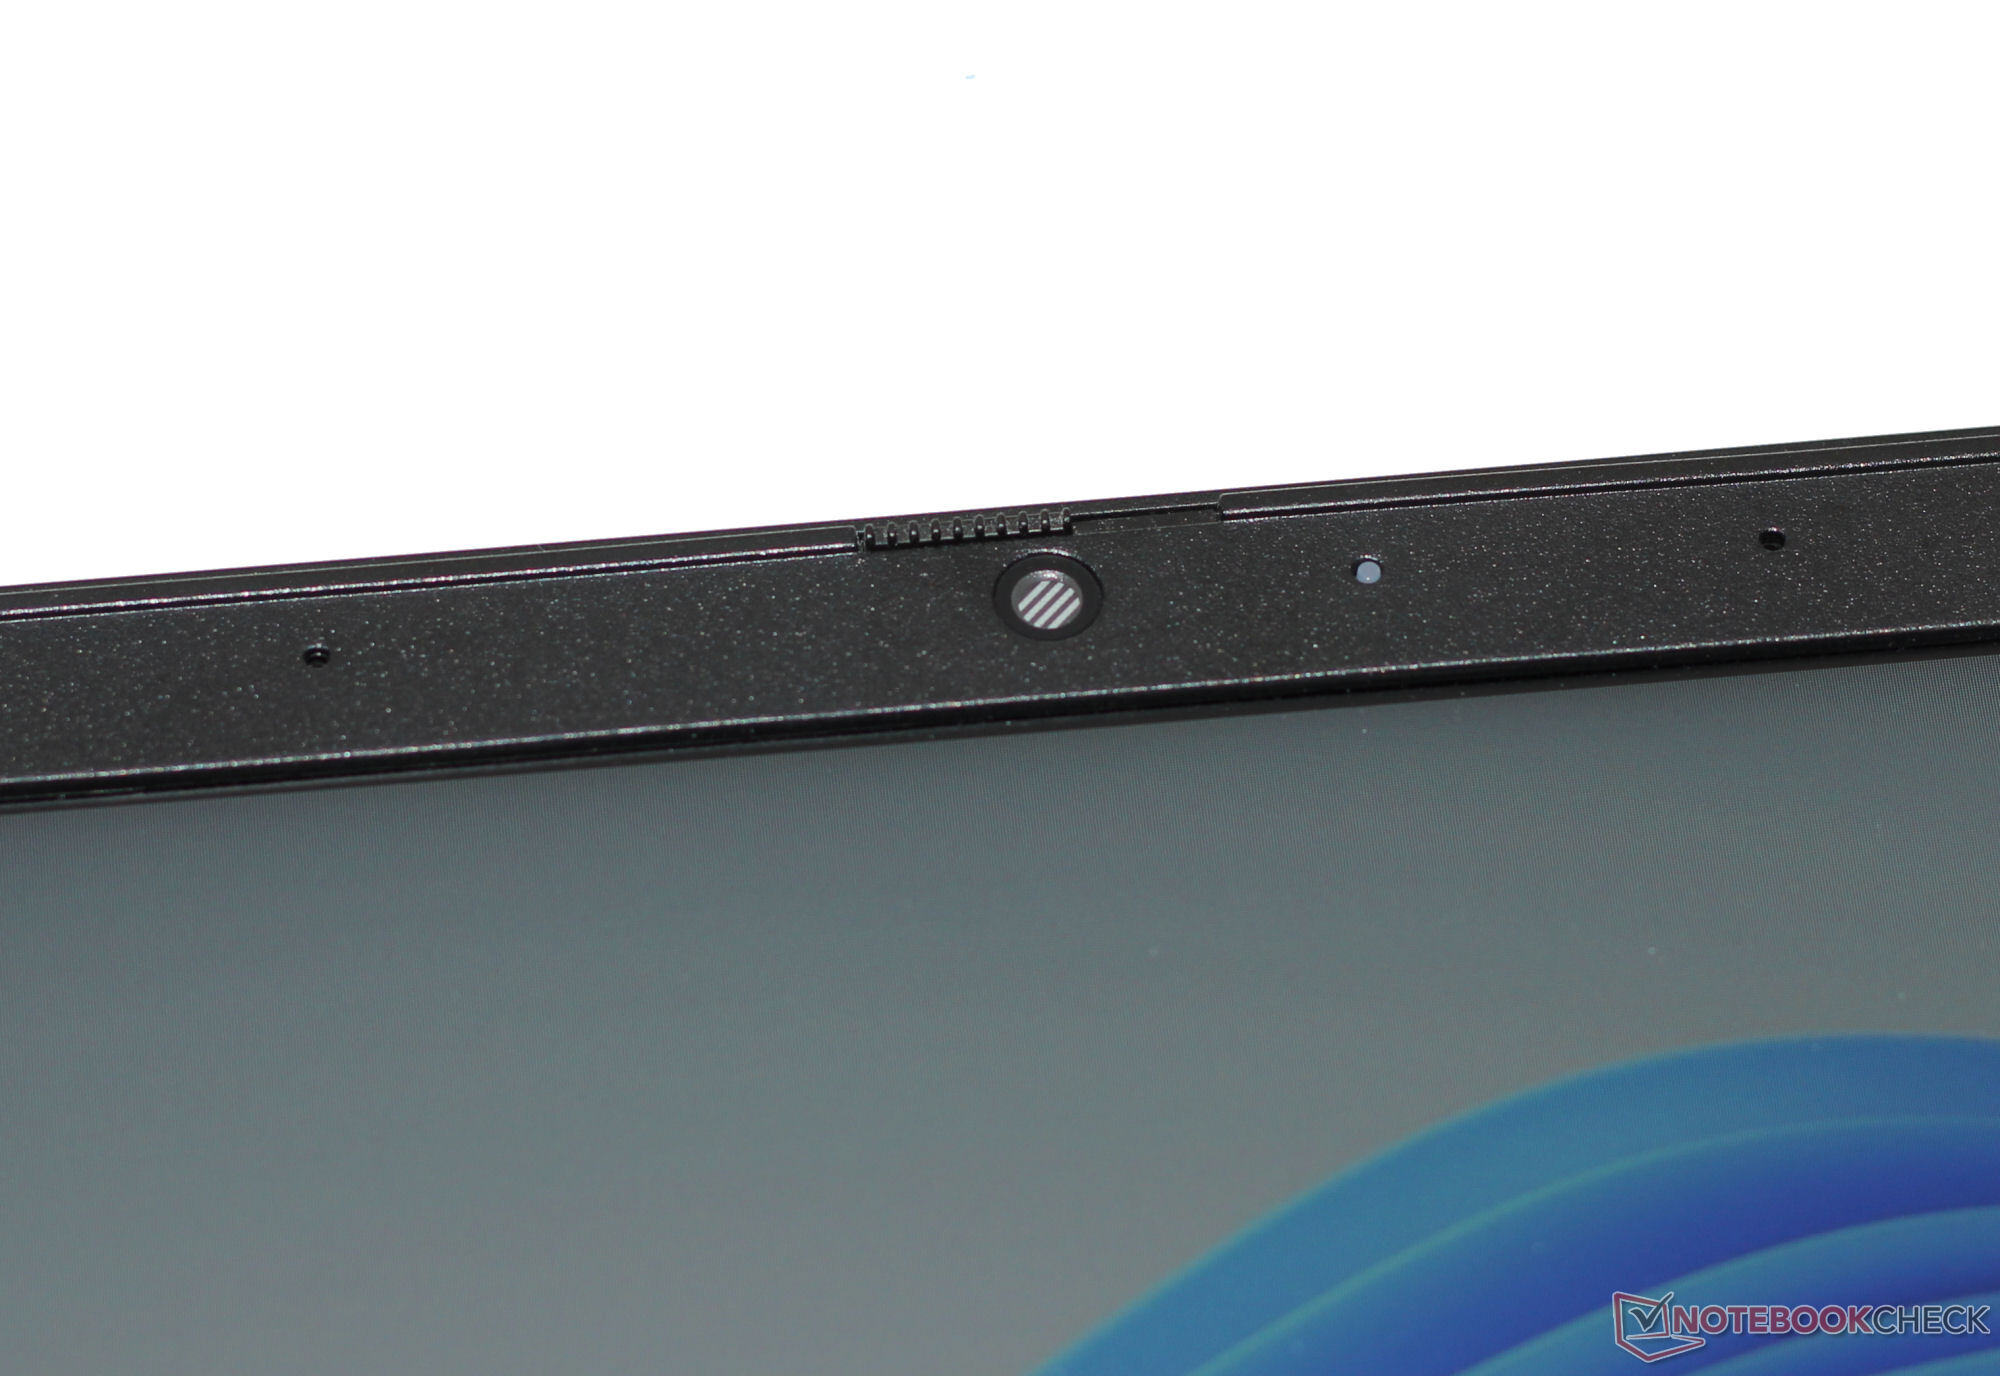
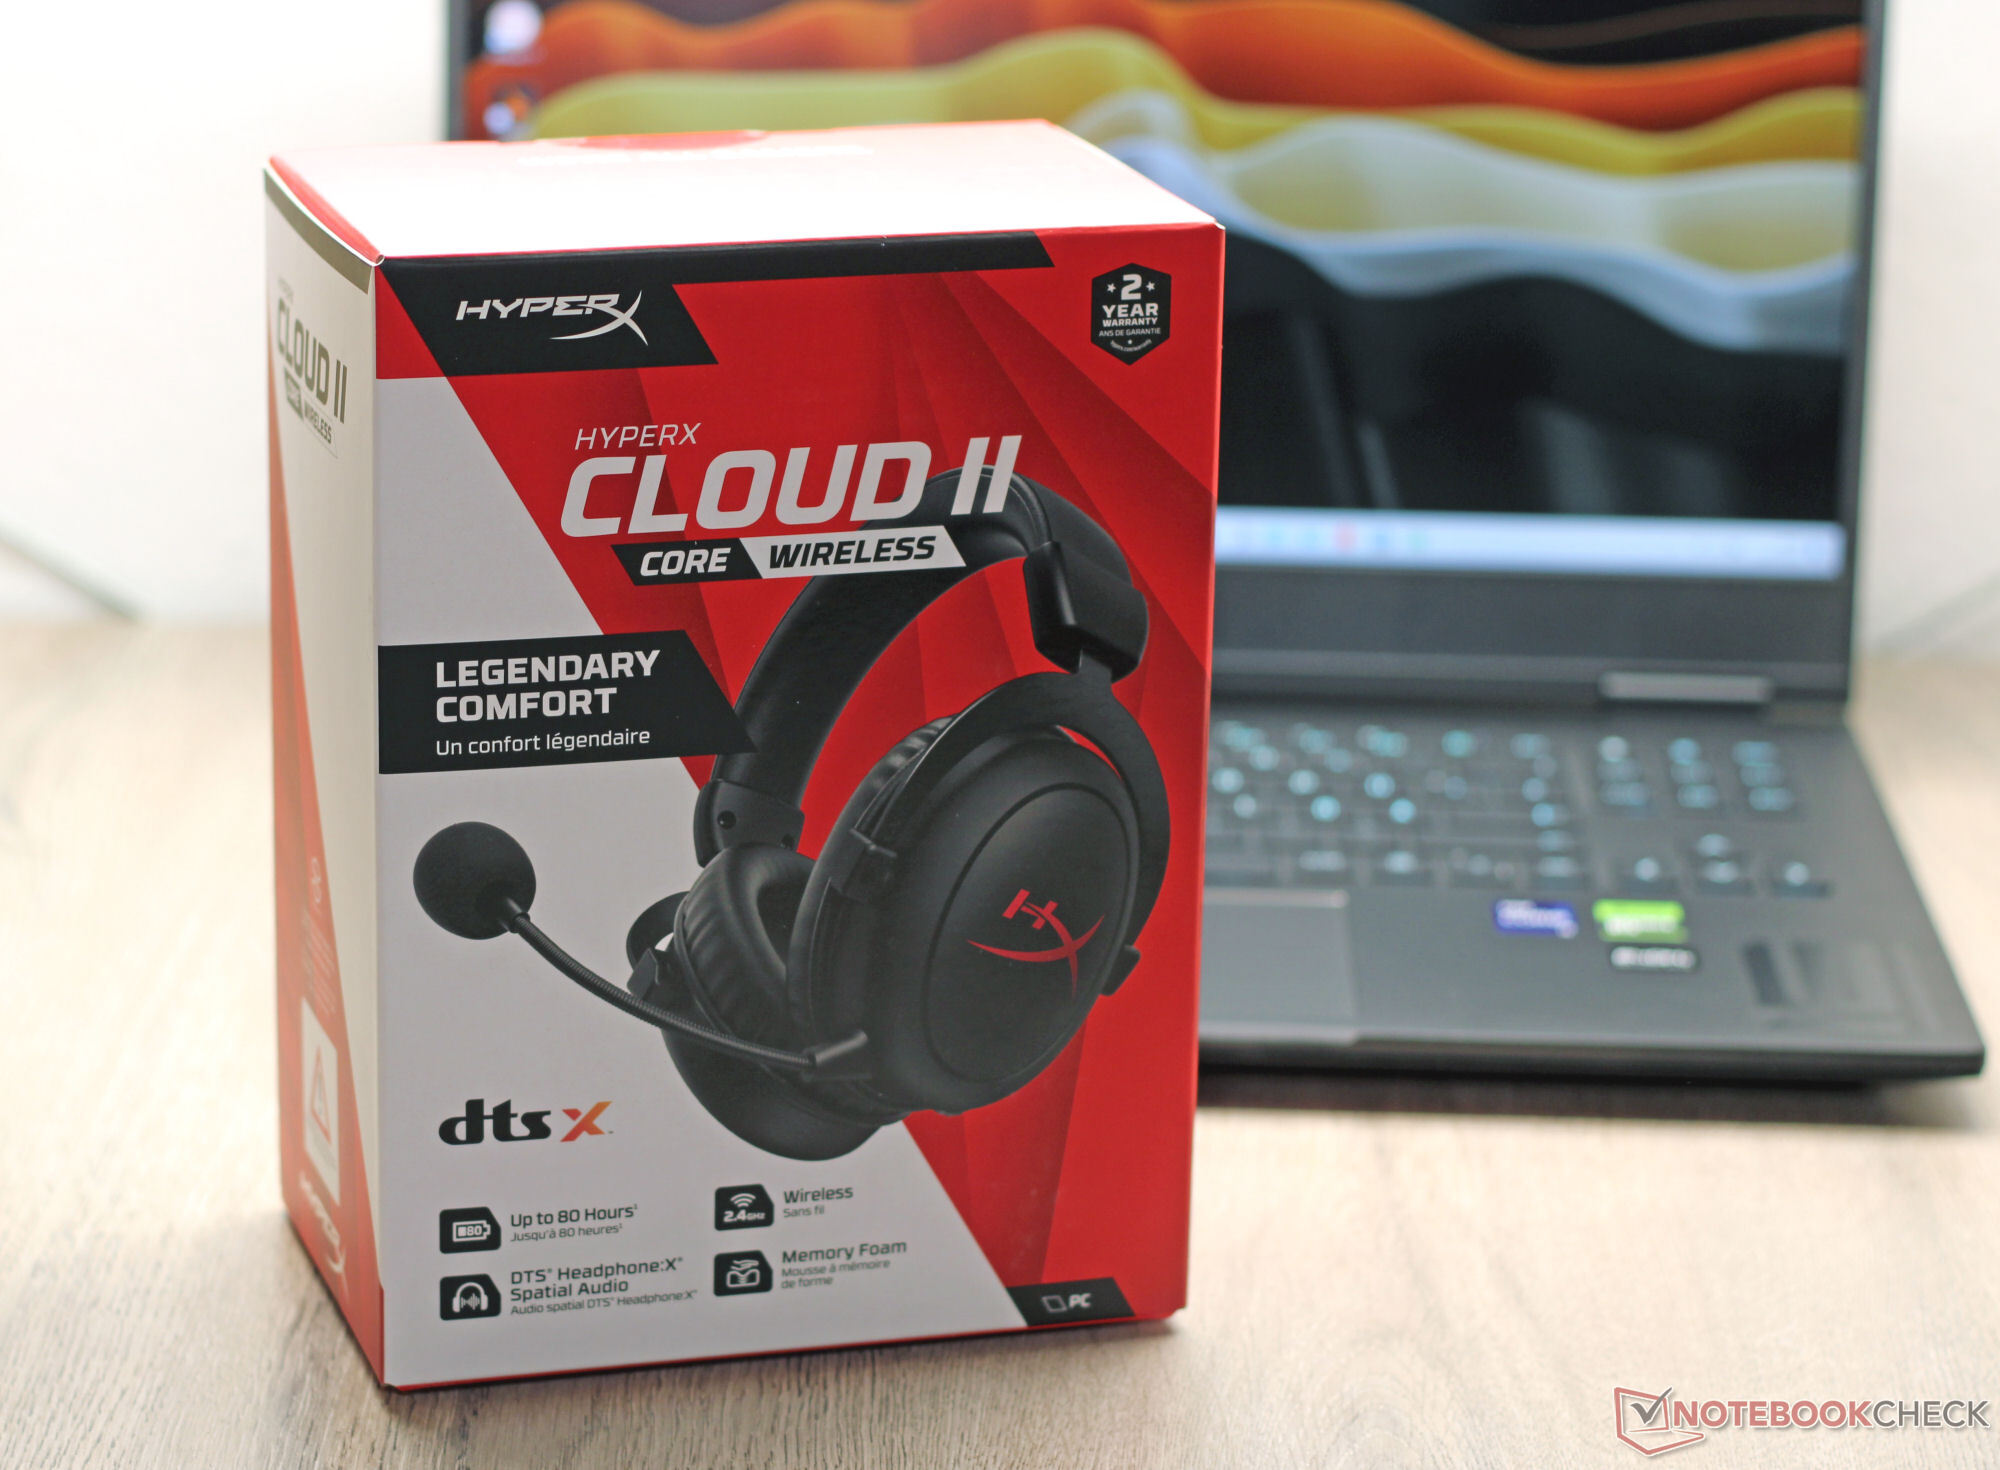
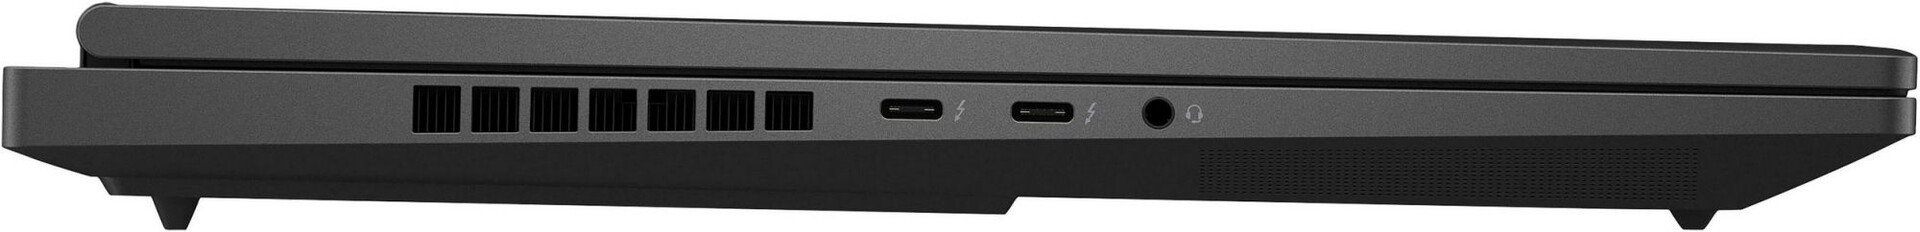
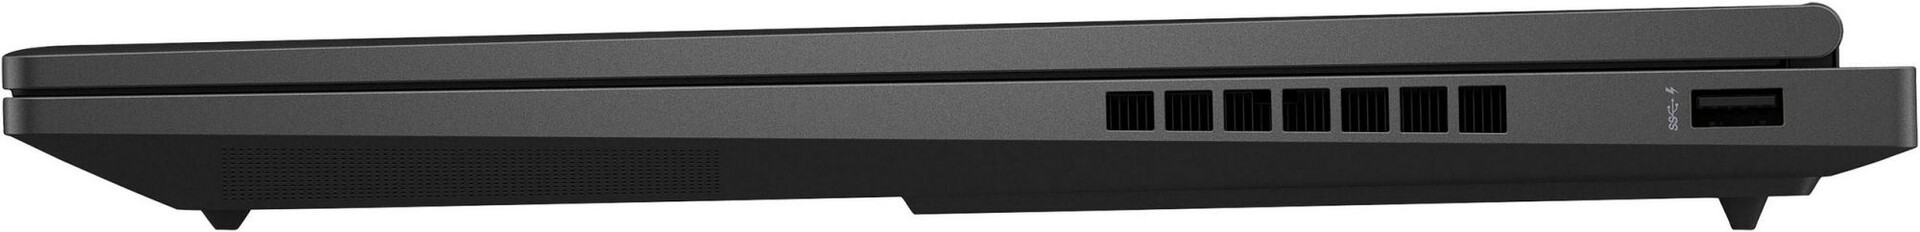
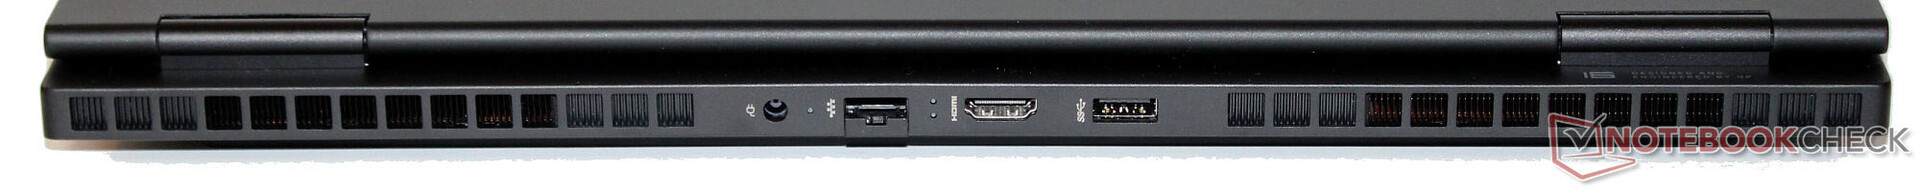
L'ordinateur portable HP est équipé de deux ports USB-A (USB 3.2 Gen 1) et de deux ports USB-C (Thunderbolt 4/USB4). Ces derniers prennent en charge Power Delivery et peuvent émettre un signal DisplayPort. Au total, l'Omen 16 dispose de trois sorties vidéo (1x HDMI, 2x DP). HP n'a pas équipé l'appareil d'un lecteur de carte mémoire. La webcam (2,1 MP, maximum 1 920 x 1 080 pixels, avec obturateur privé) offre une qualité d'image standard. Le portable est livré avec un casque sans fil HyperX Cloud II Core.
L'Omen 16 est équipé d'un module Intel Wi-Fi 6E AX211 et peut atteindre d'excellentes vitesses de transfert Wi-Fi dans des conditions optimales (pas d'appareils Wi-Fi dans l'environnement immédiat, courte distance entre l'ordinateur portable et le PC serveur). Les connexions filaires sont gérées par un contrôleur Ethernet Realtek RTL8168/8111 (1 Gbit/s).


 GeForce RTX 4080 Laptop GPU, i9-14900HX, SK hynix PC801 HFS001TEJ9X101N")
 GeForce RTX 4080 Laptop GPU, i9-14900HX, SK hynix PC801 HFS001TEJ9X101N")
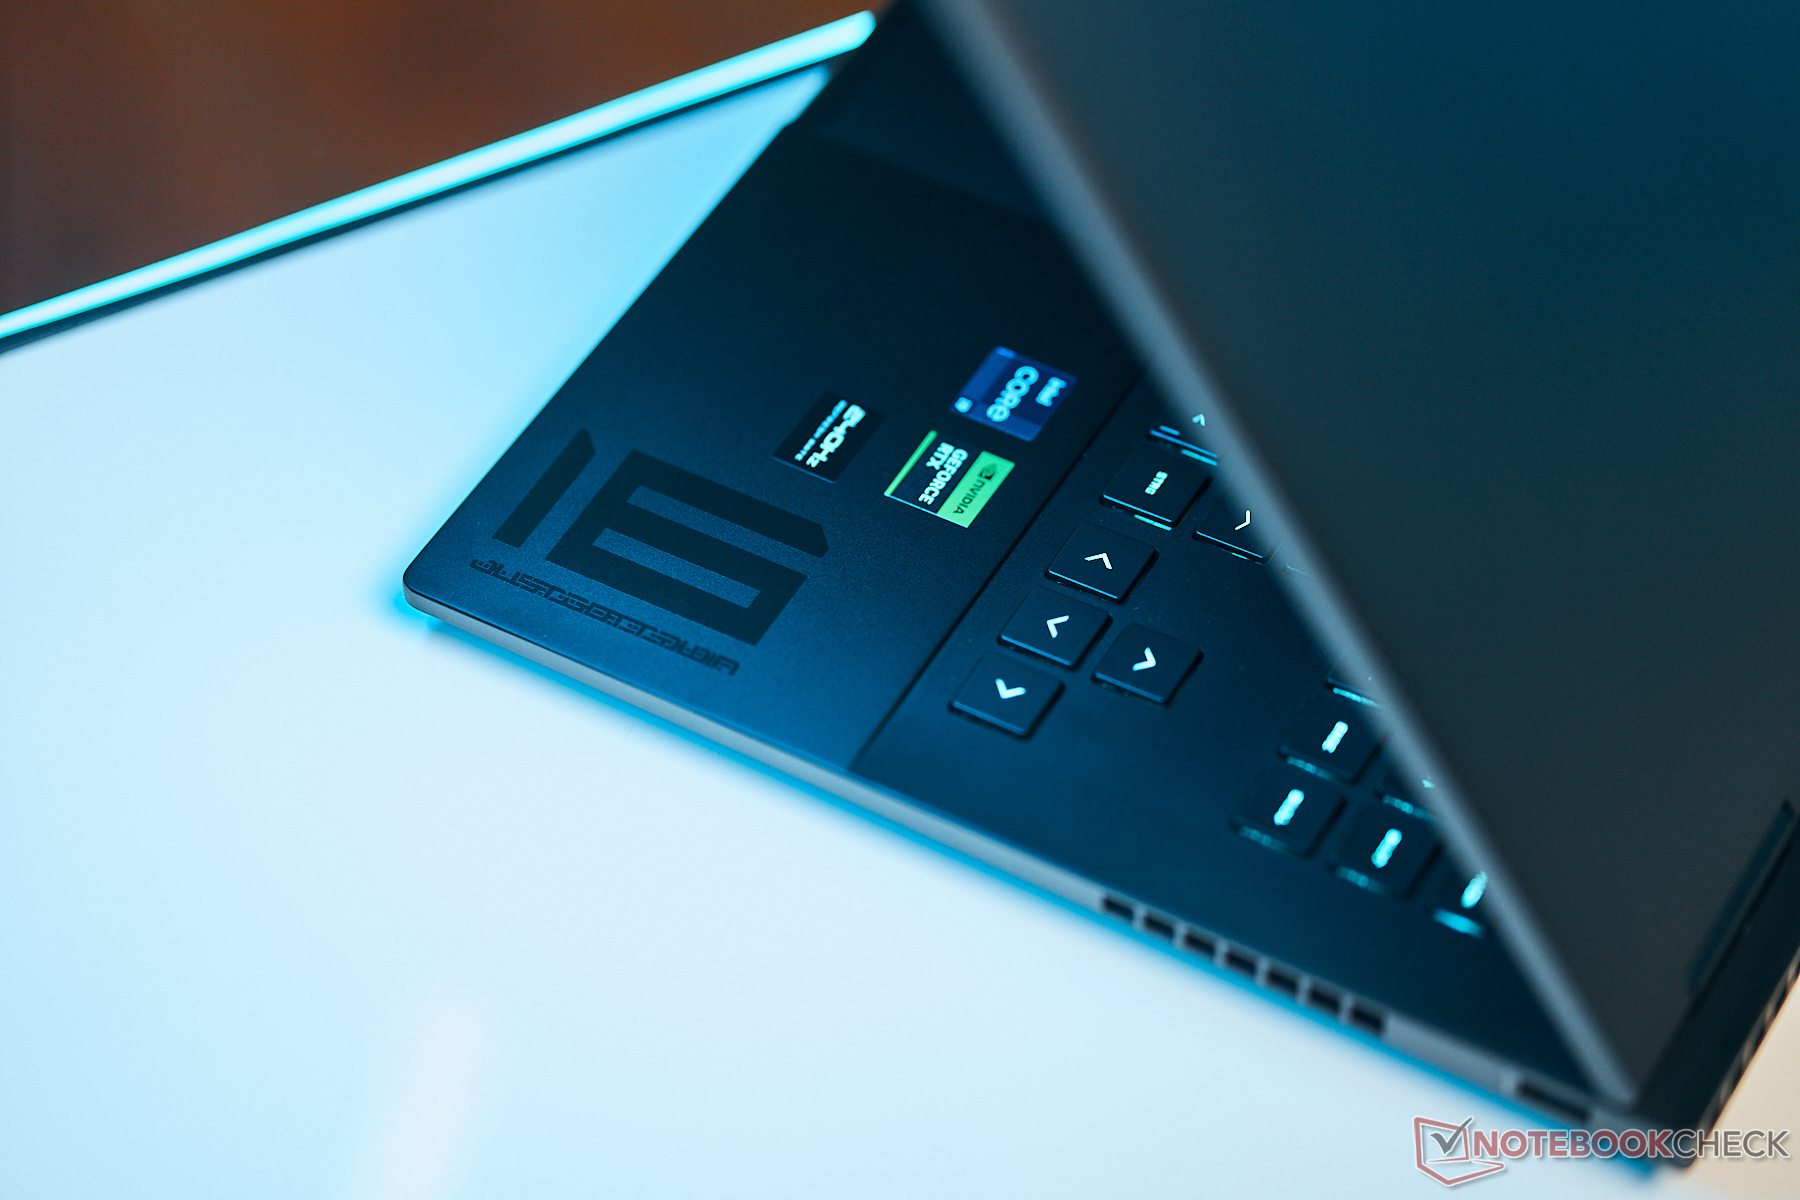
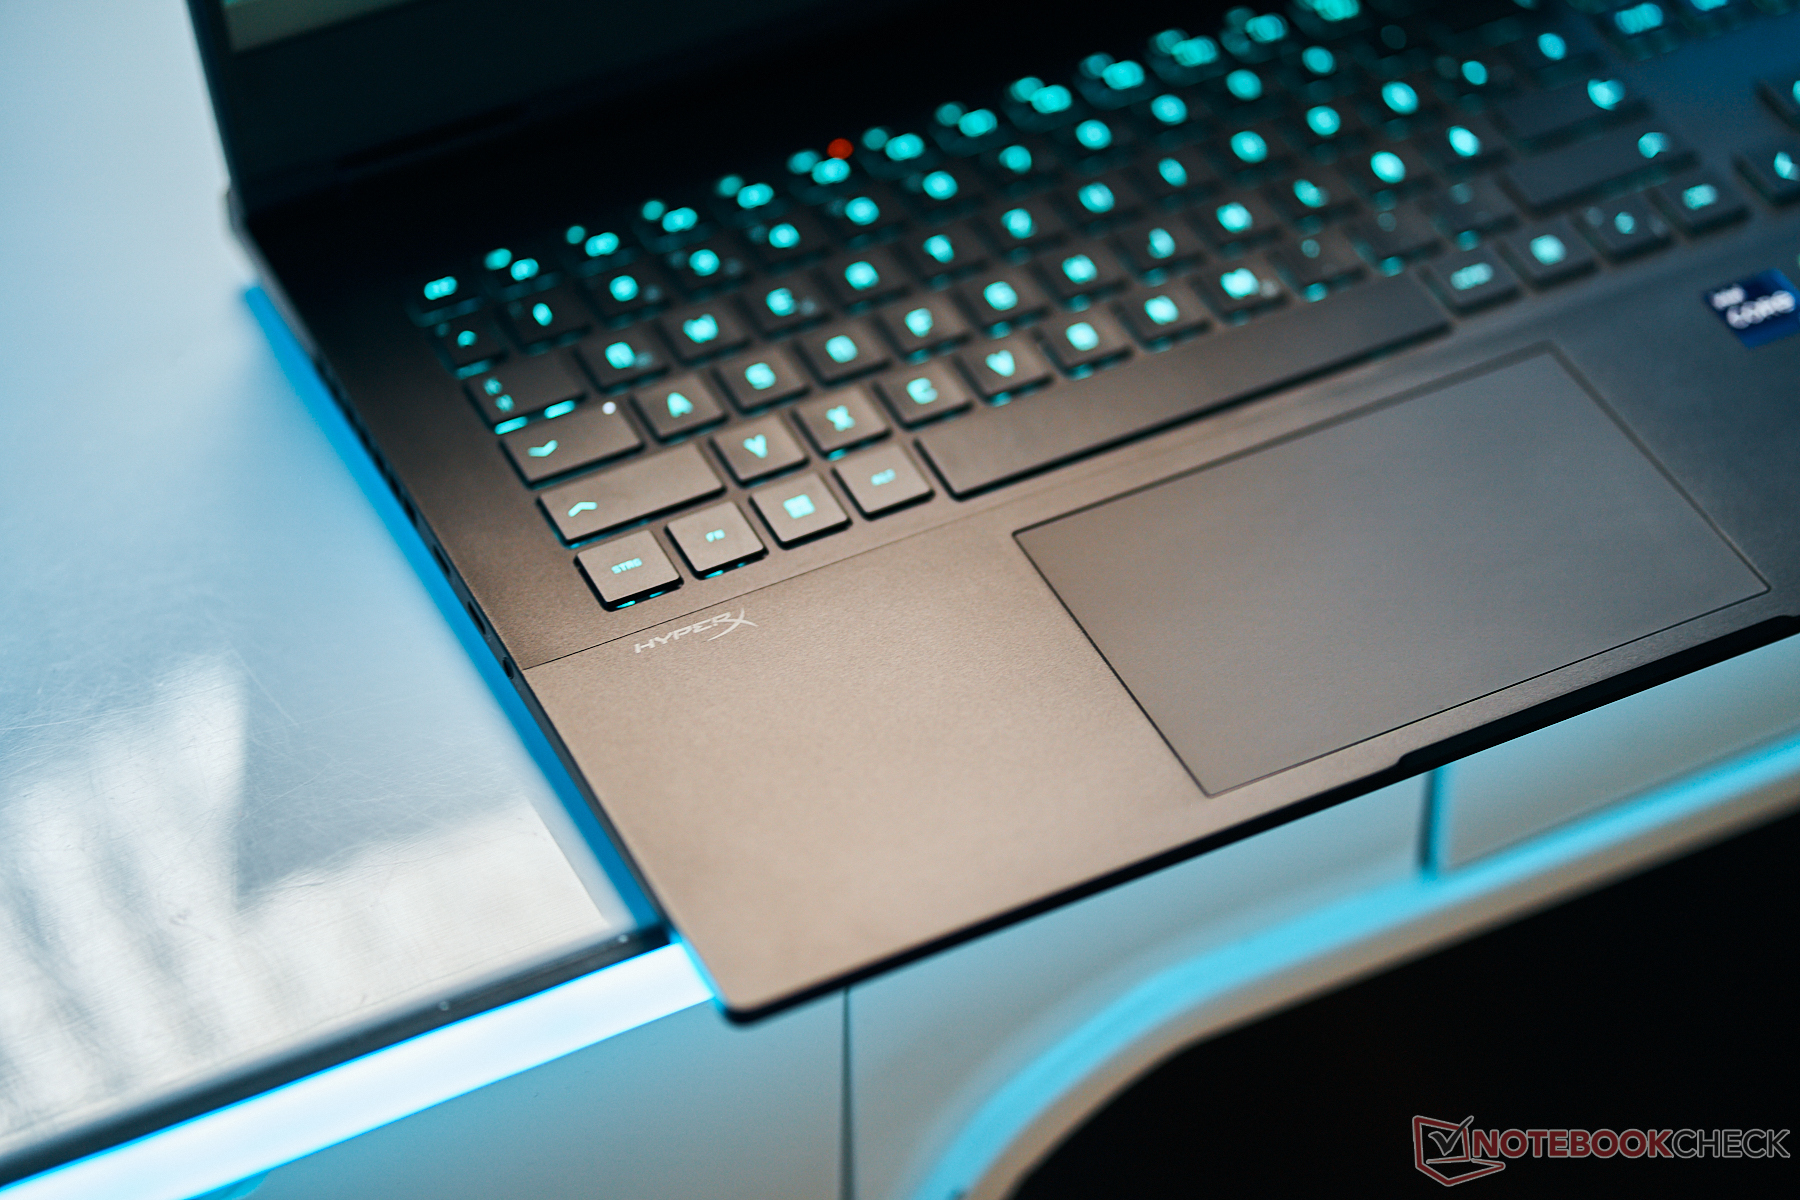
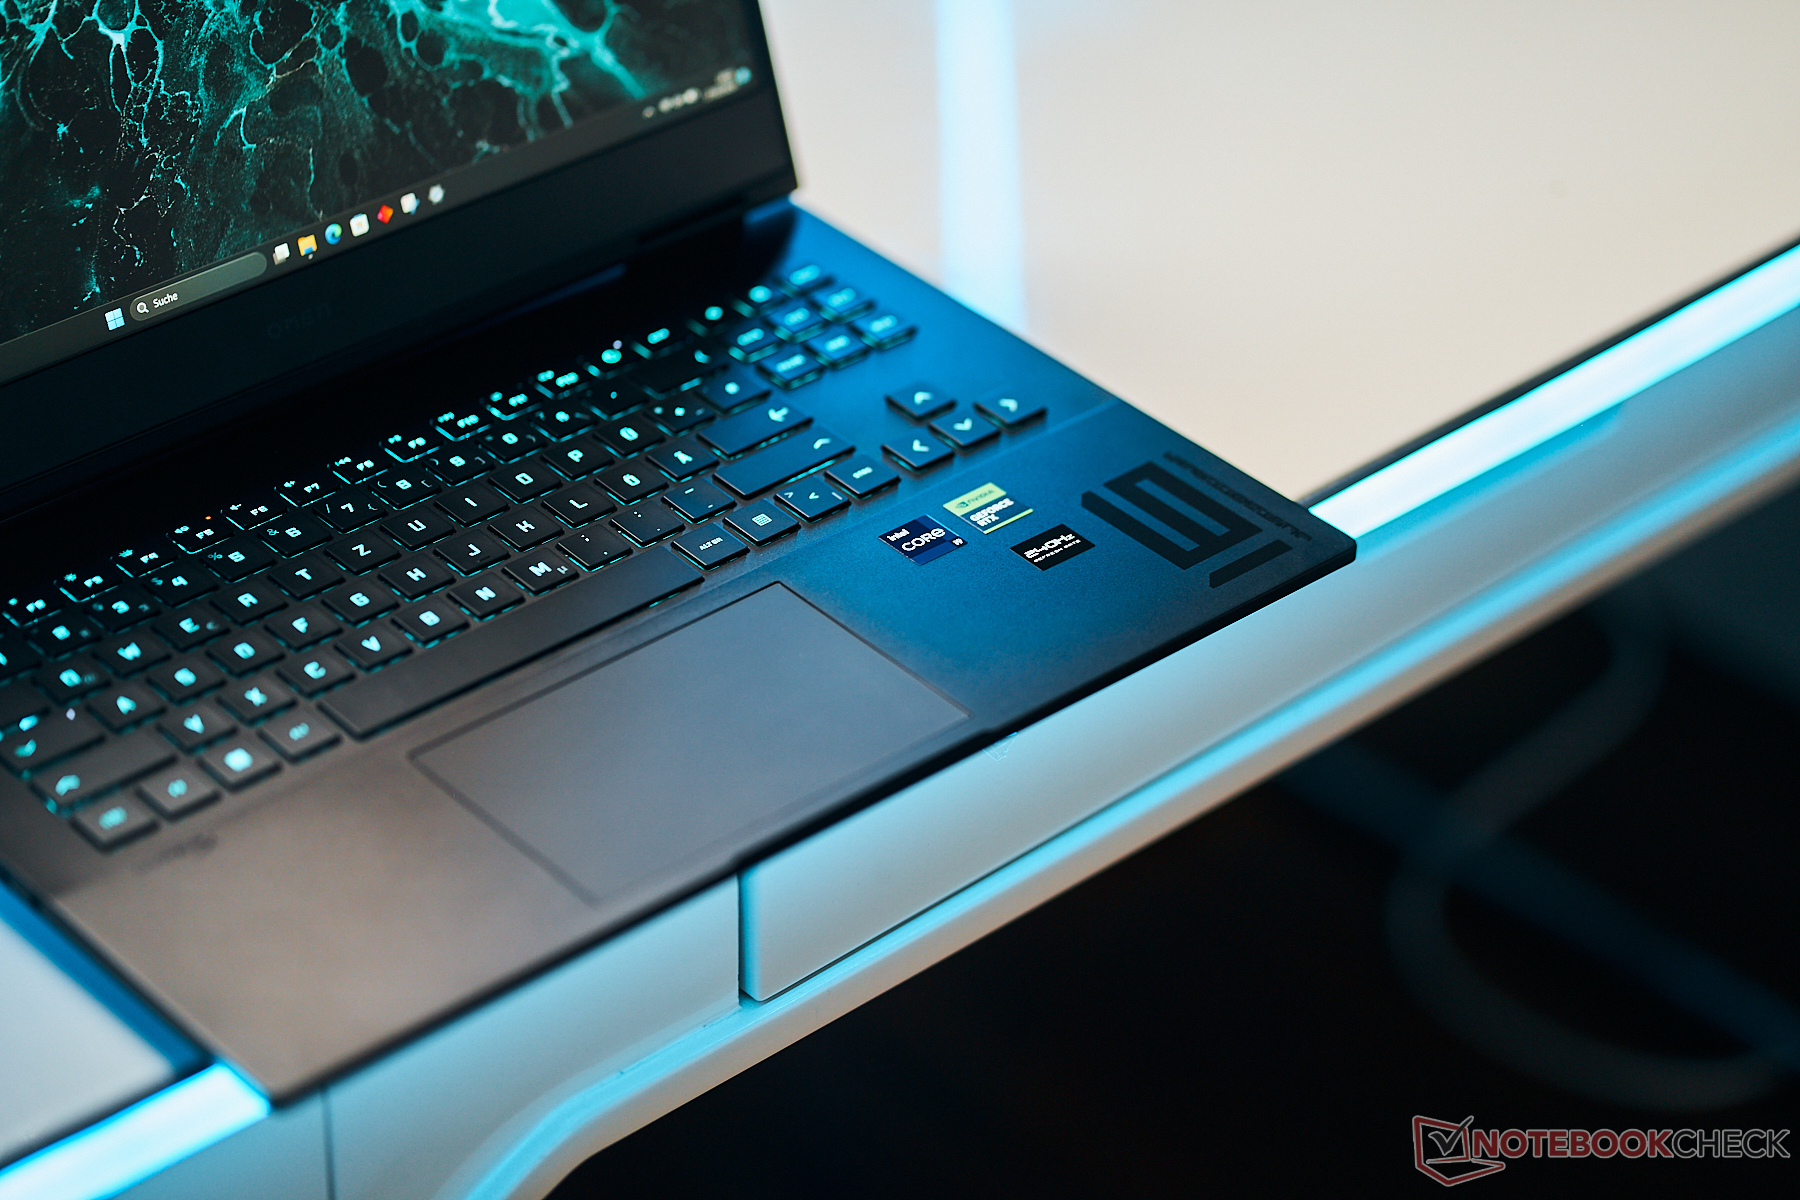
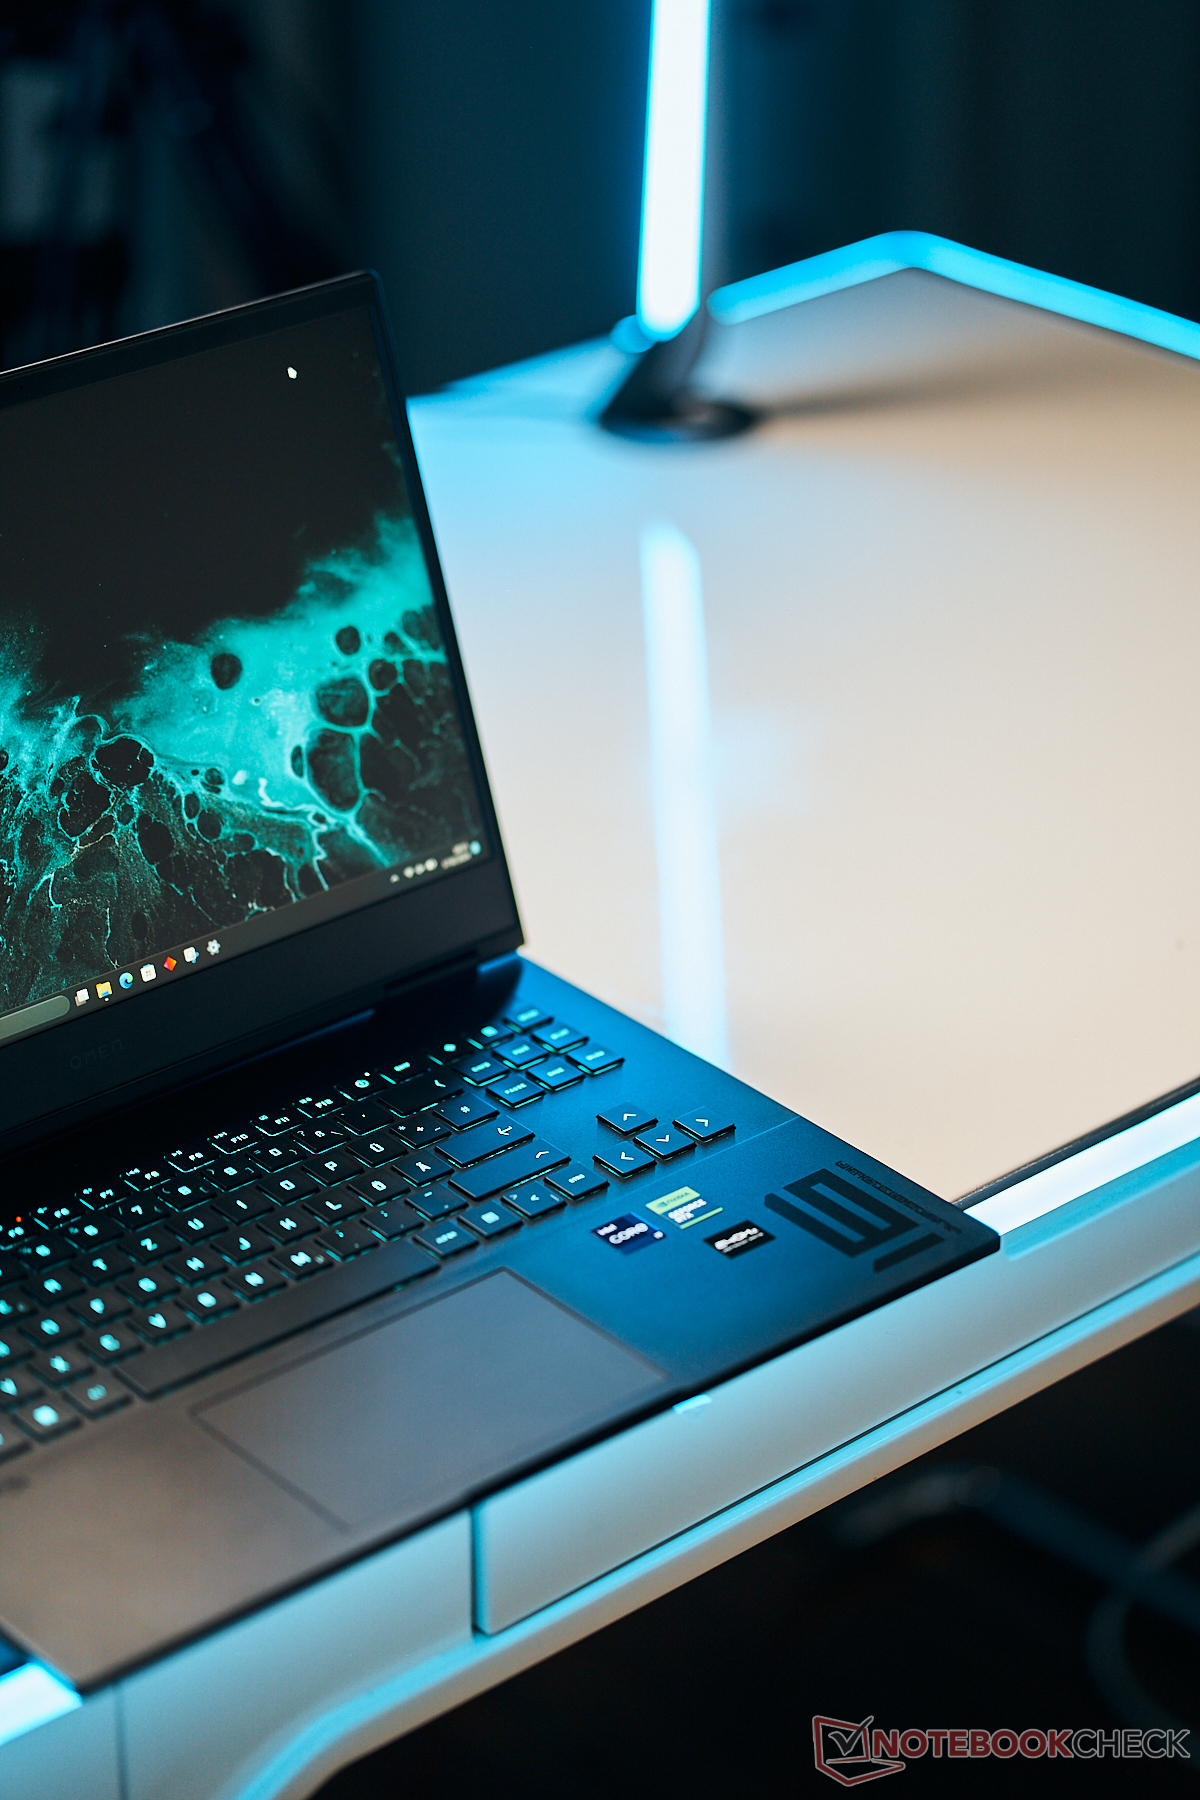
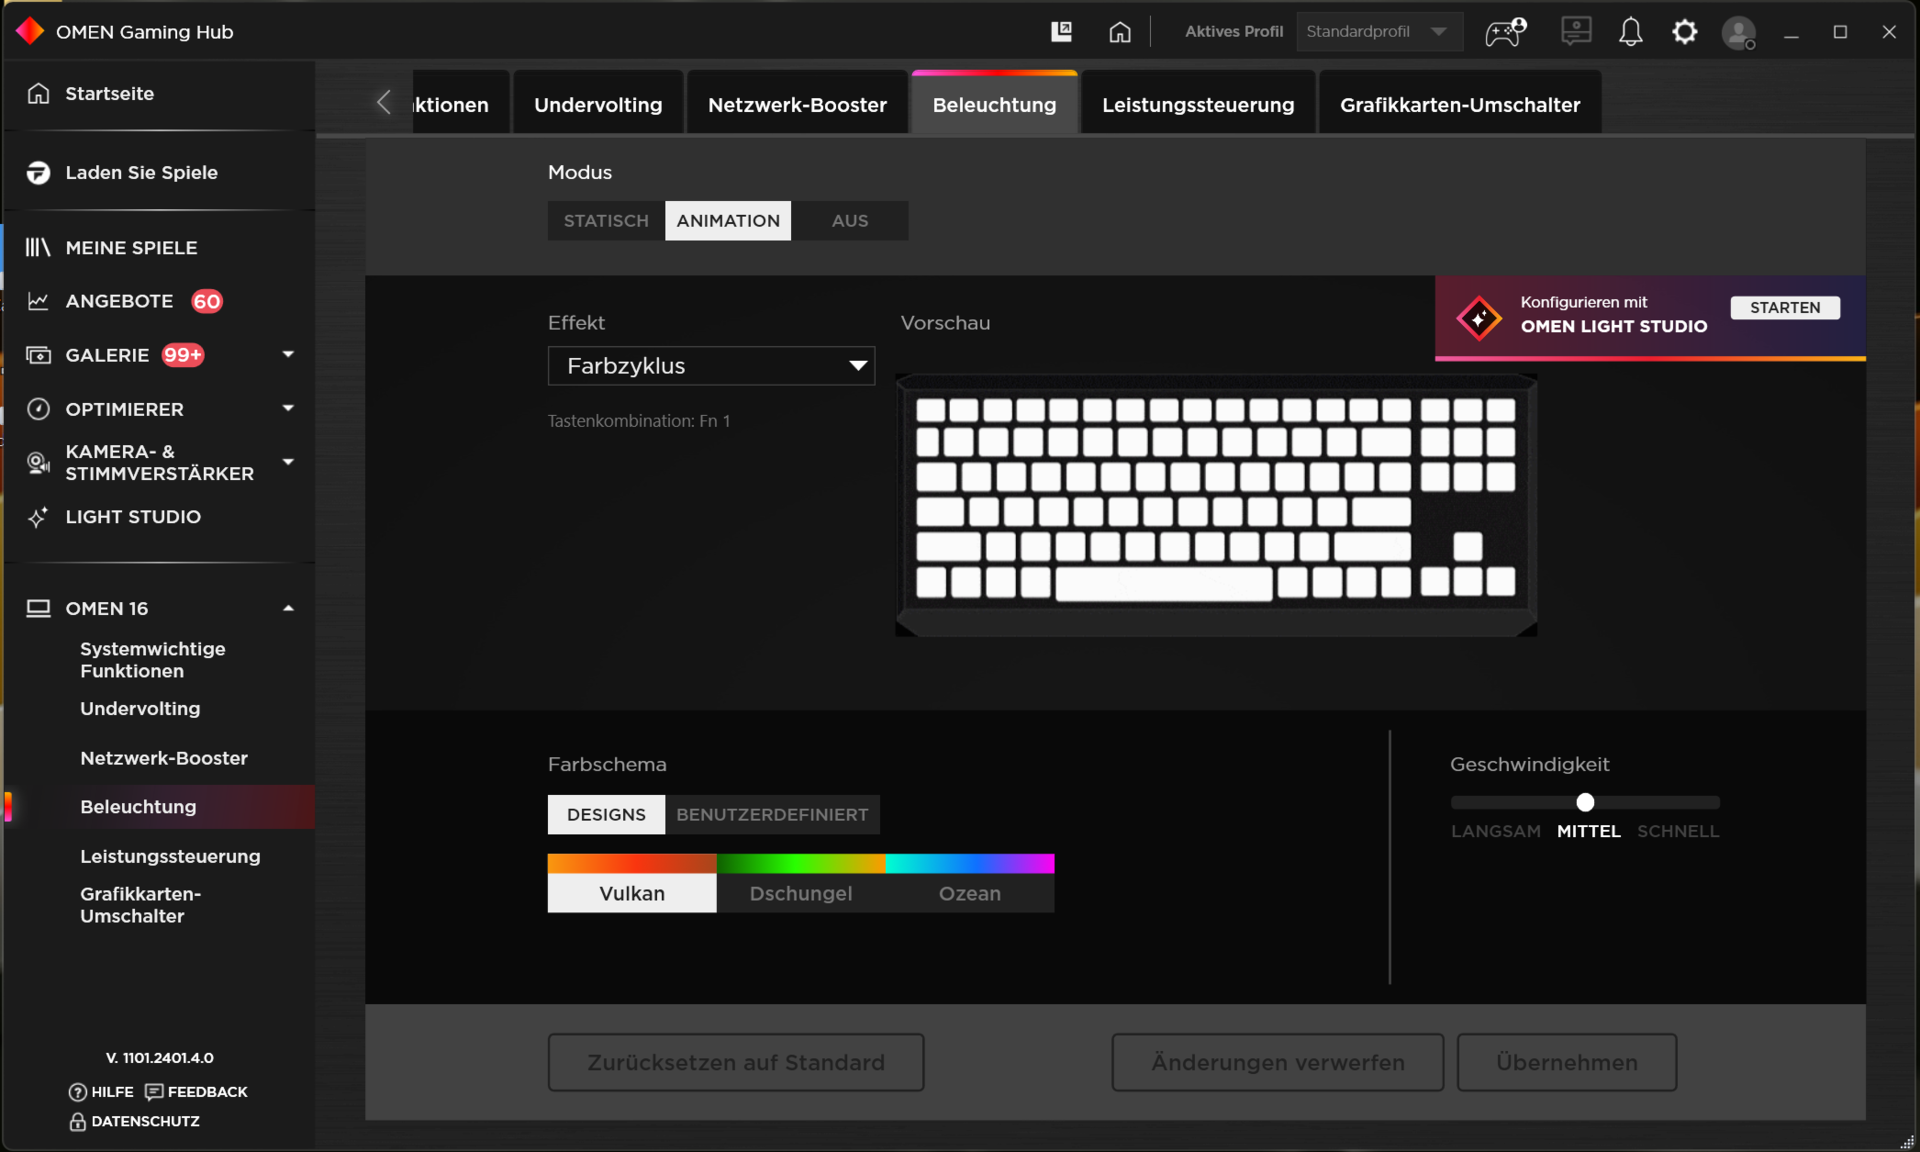
Périphériques d'entrée - Omen propose un éclairage RVB par touche
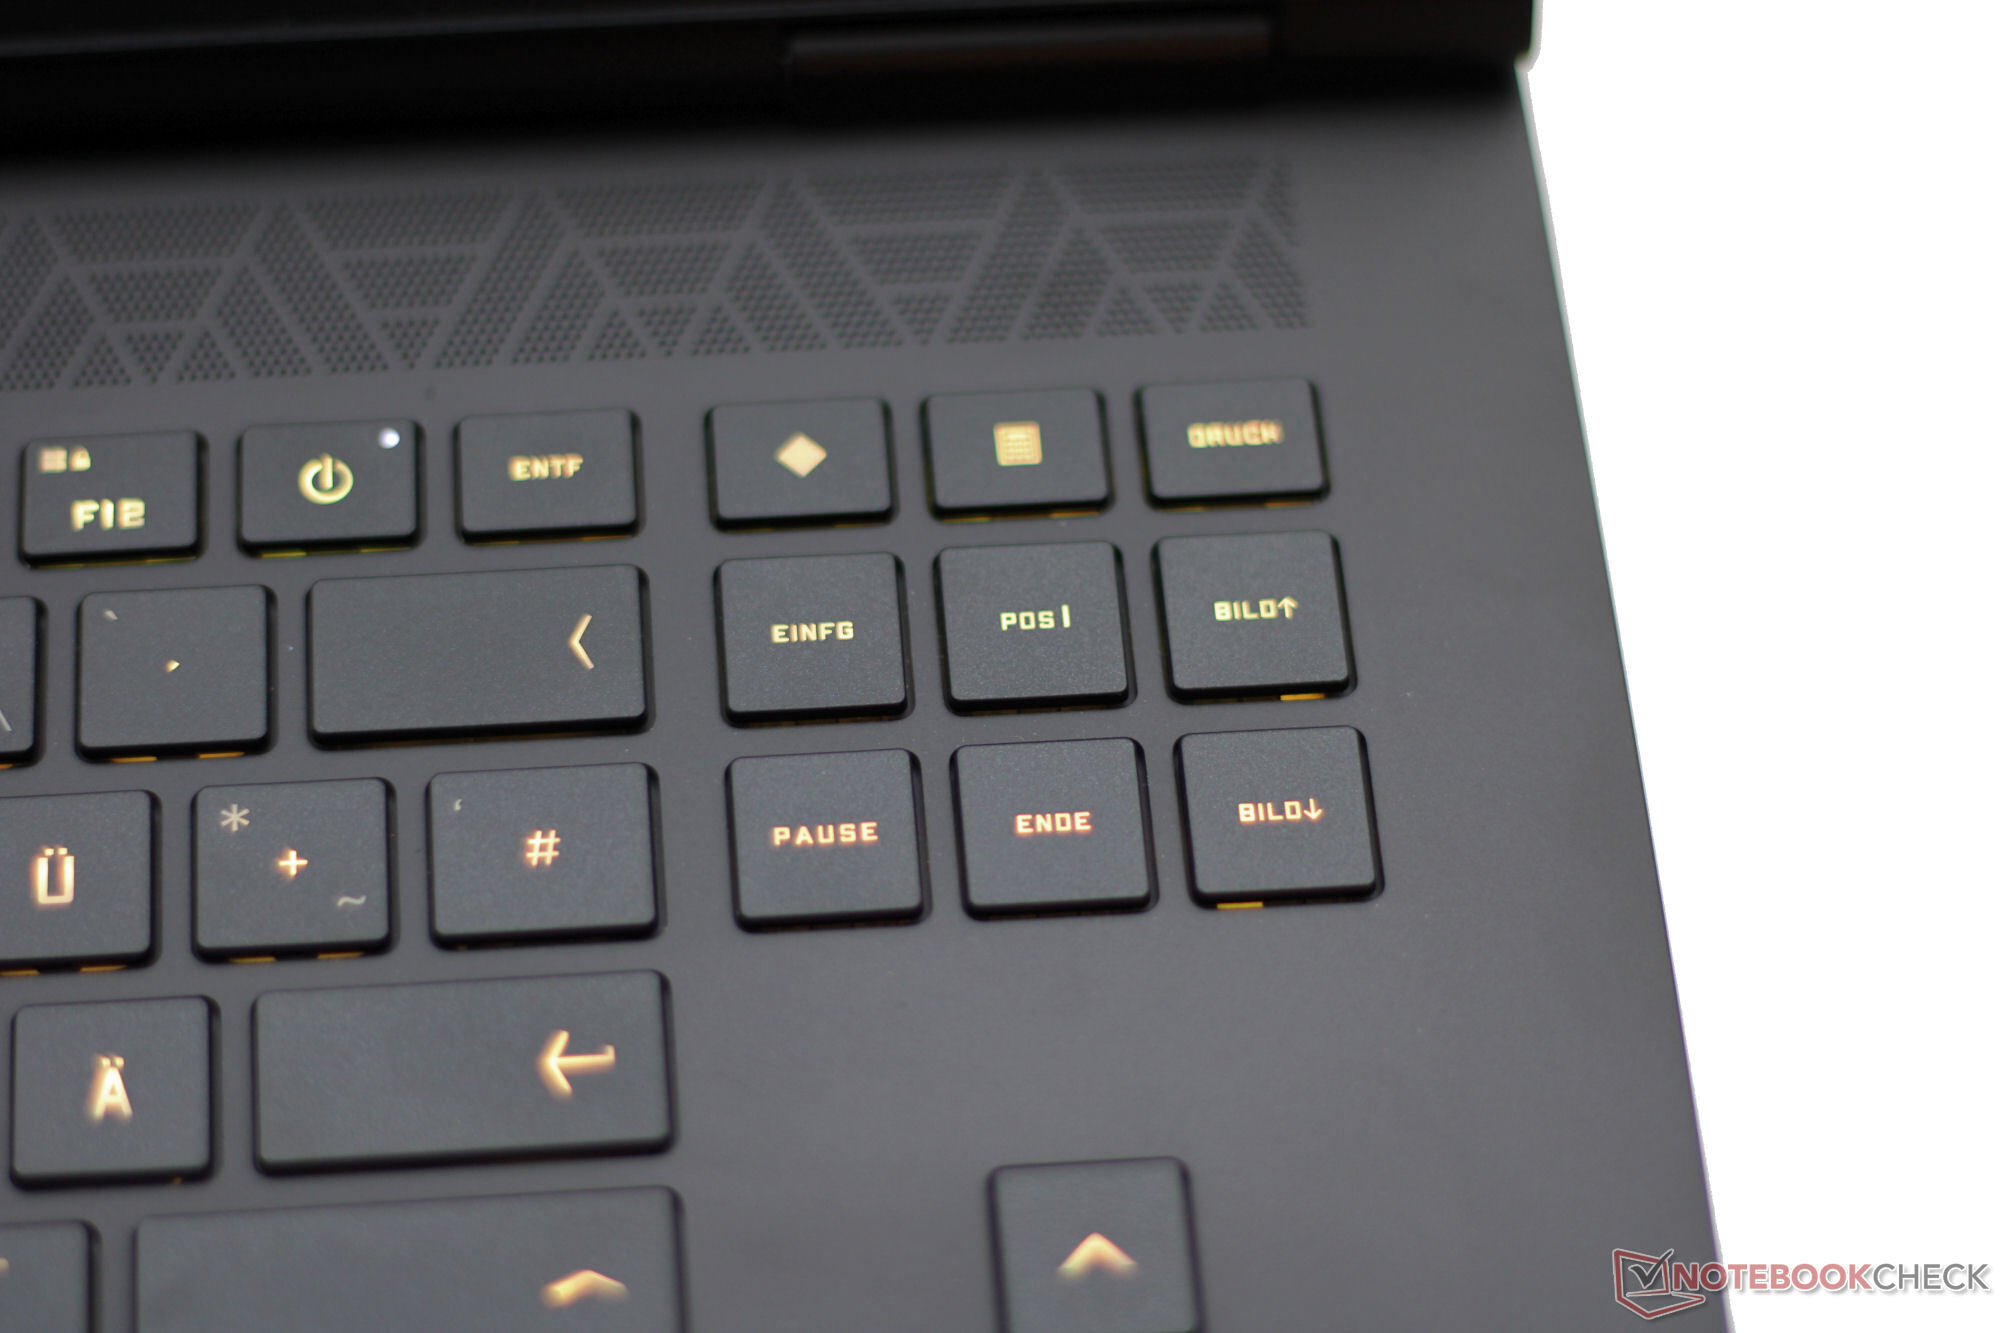
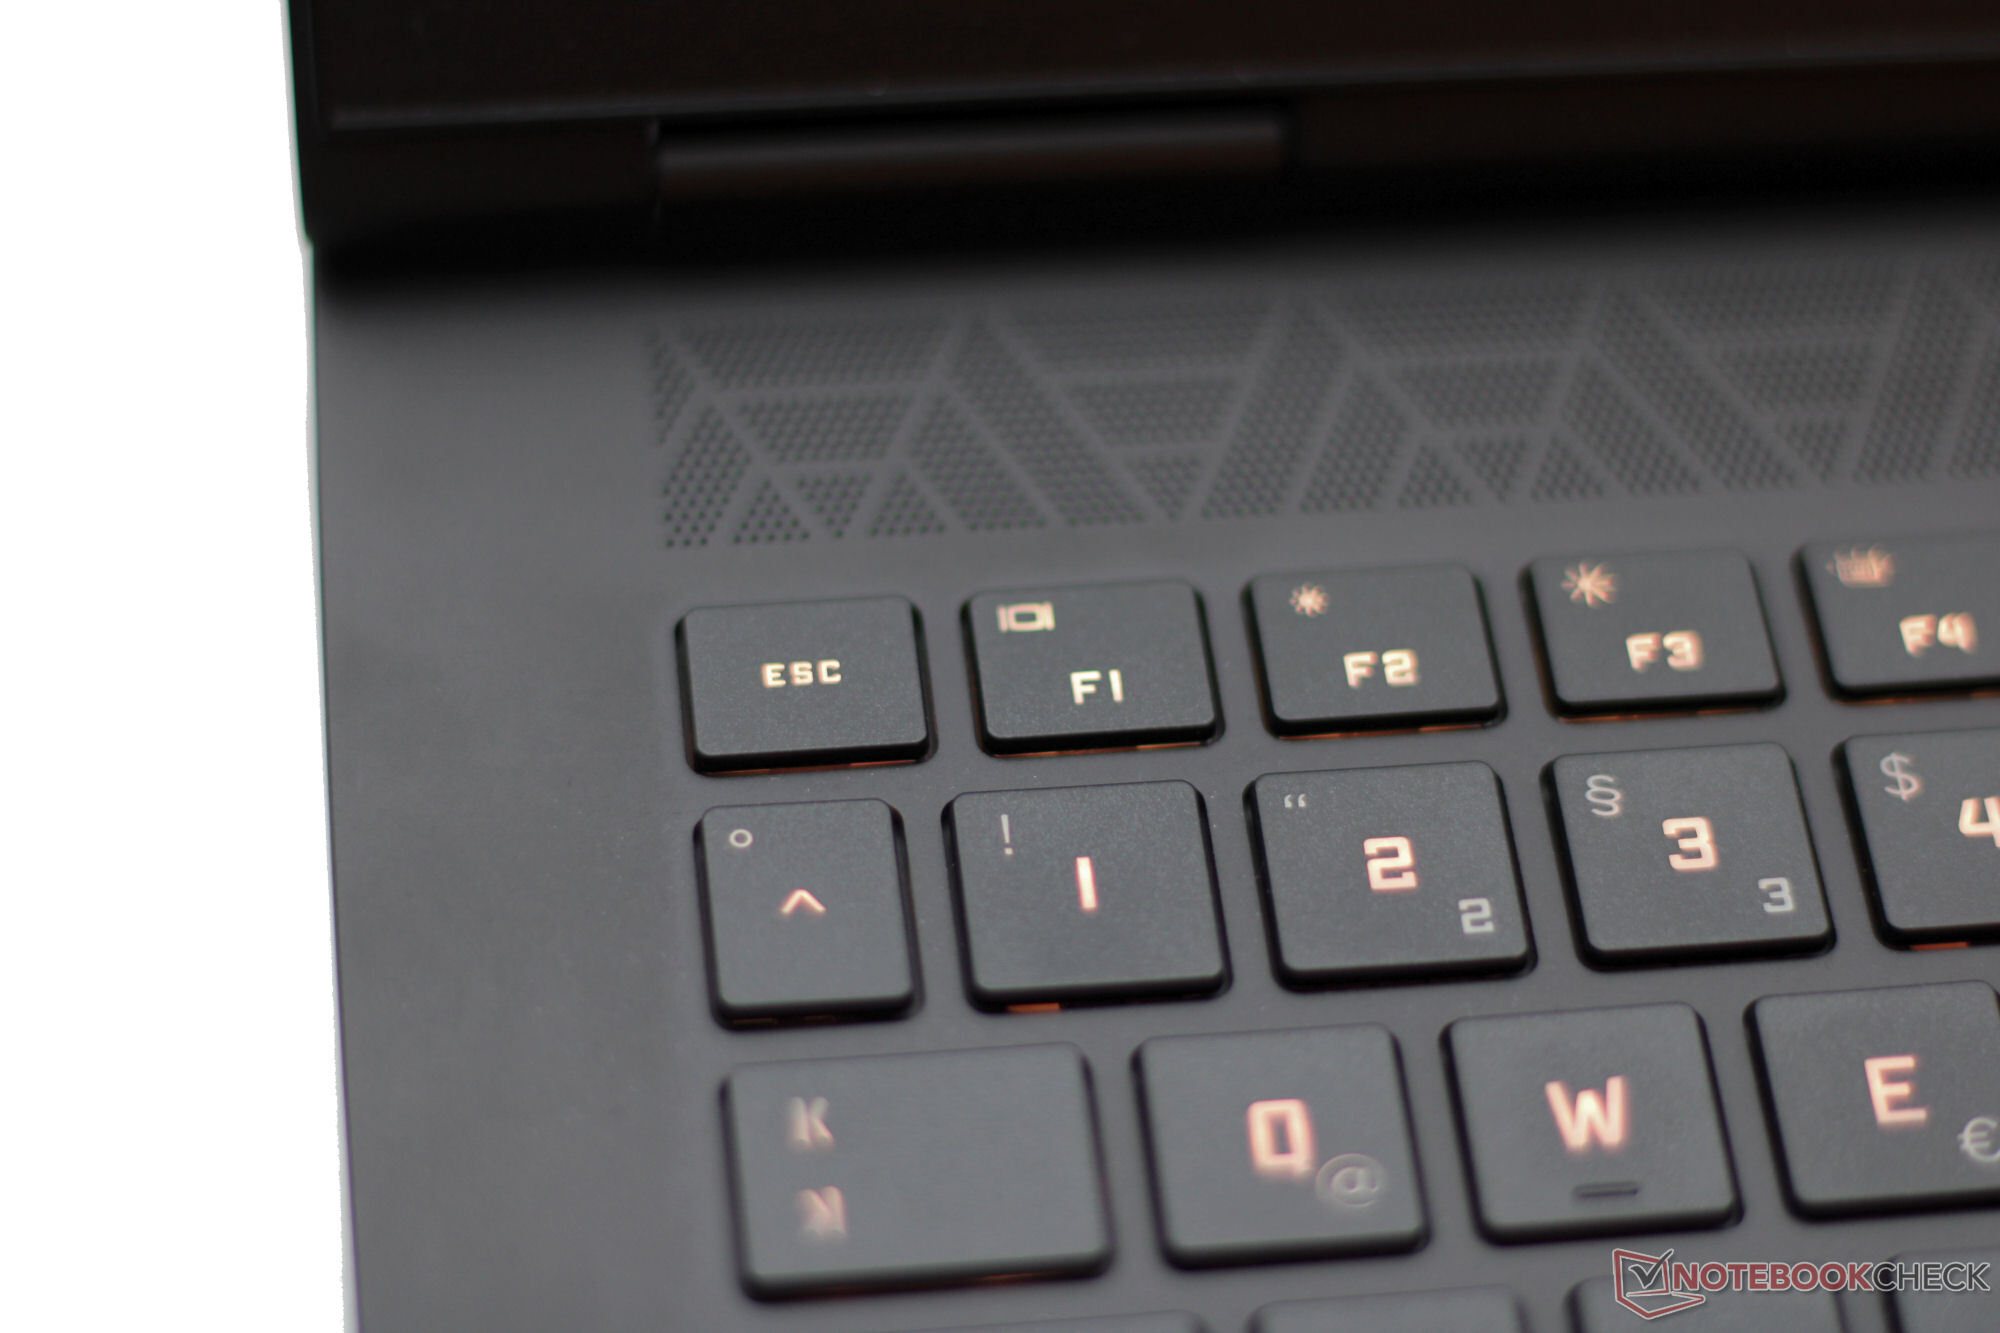
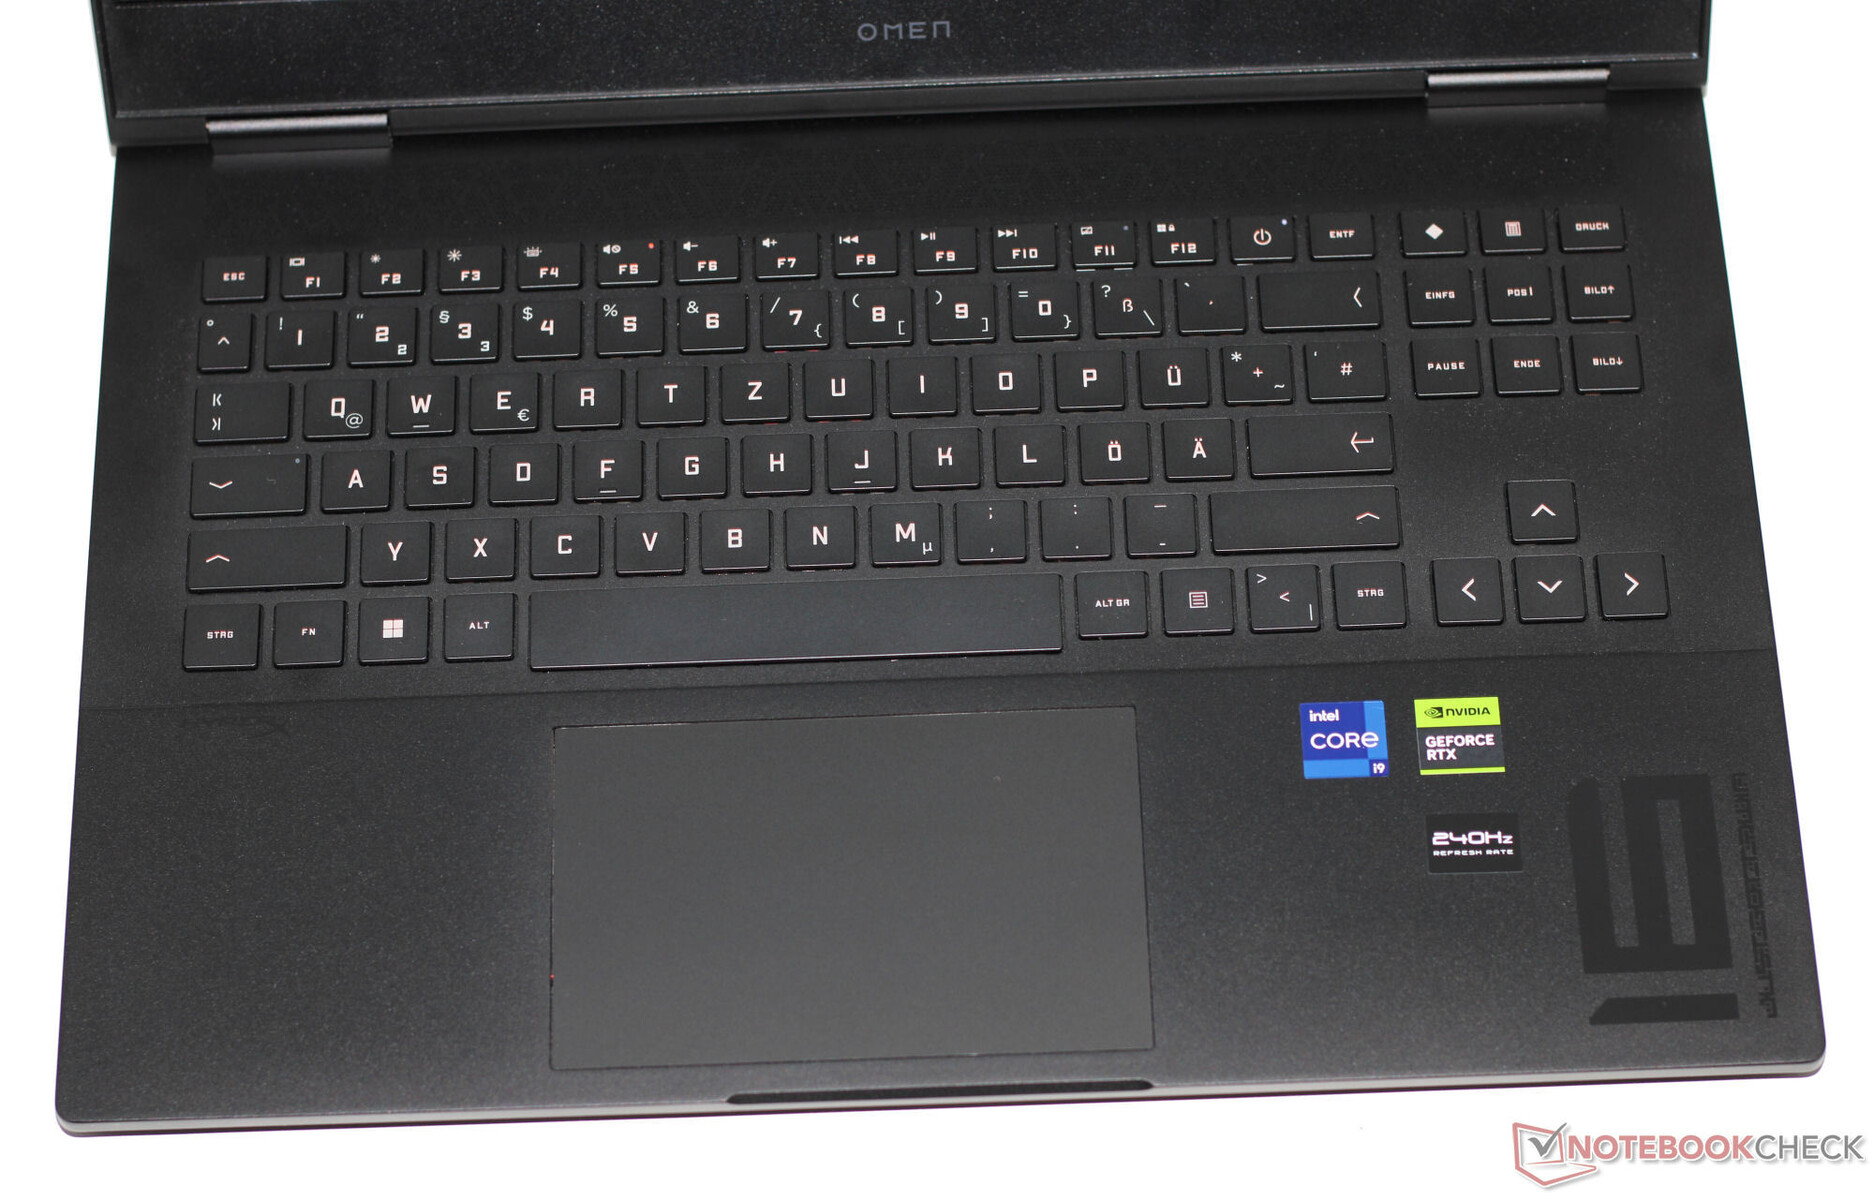
Le clavier chiclet rétroéclairé RGB de l'Omen 16 n'a pas de pavé numérique. L'espace habituellement réservé au pavé numérique est désormais occupé par les touches de contrôle ainsi que par les grandes touches fléchées séparées. Les touches concaves sont faciles à presser, offrent une course modérée et un point d'actionnement clair, et présentent également une résistance décente. Mesurant environ 12,5 x 8 cm (4,9 x 3,1 in), le pavé tactile a une course courte et un point de clic distinct.
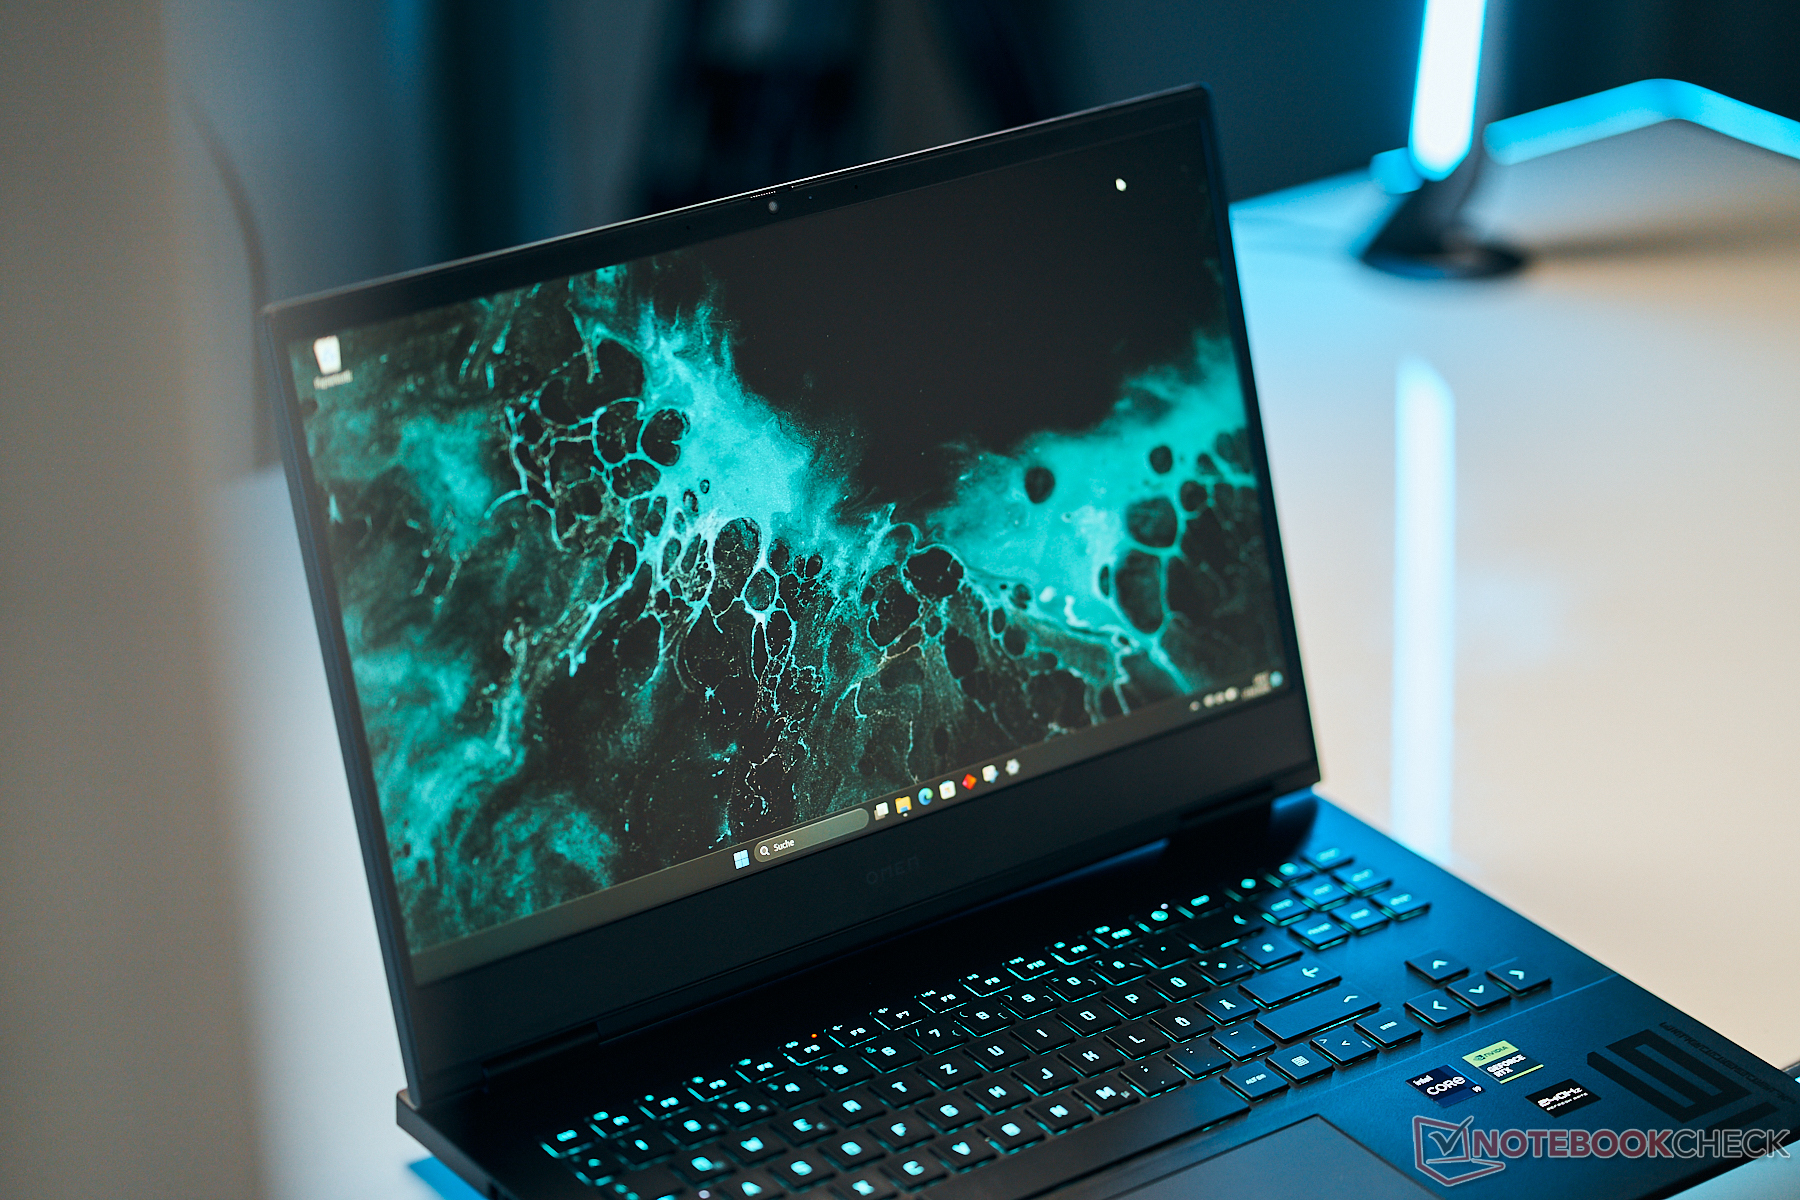
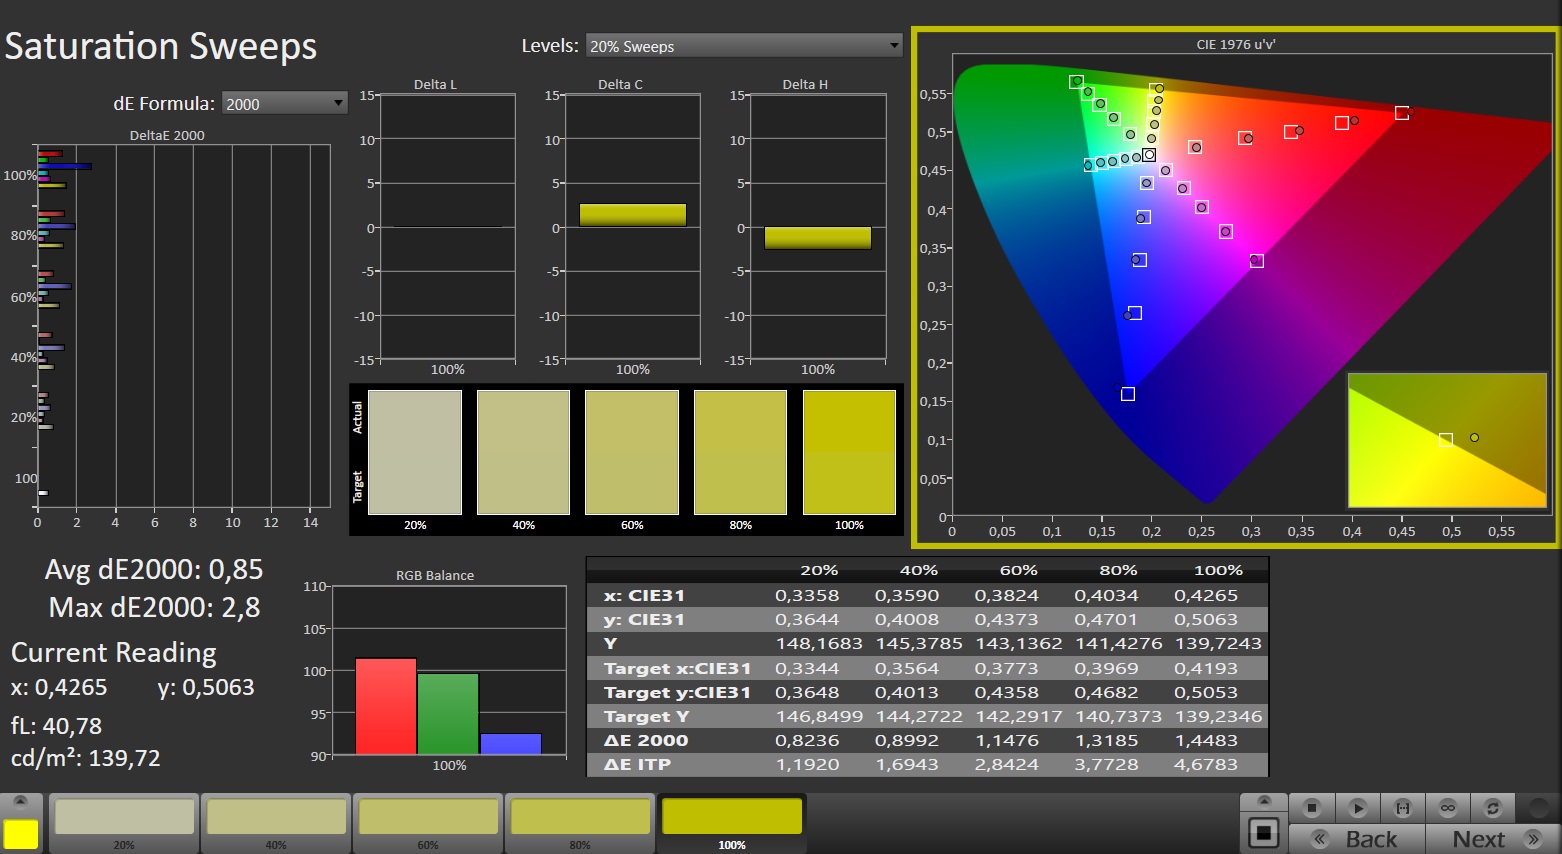
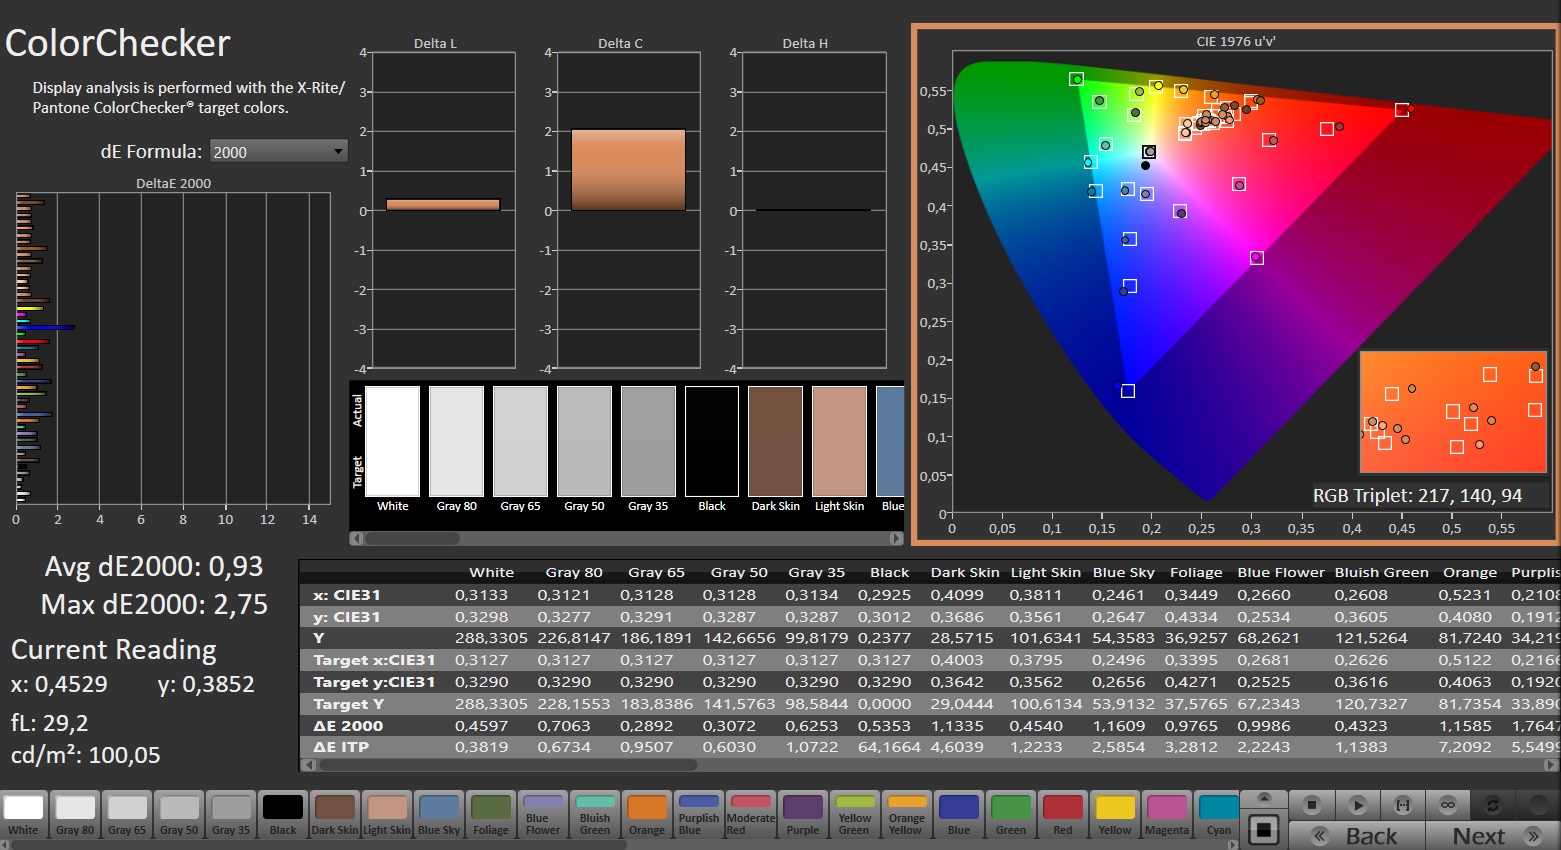
Écran - Panneau QHD avec couverture sRGB complète
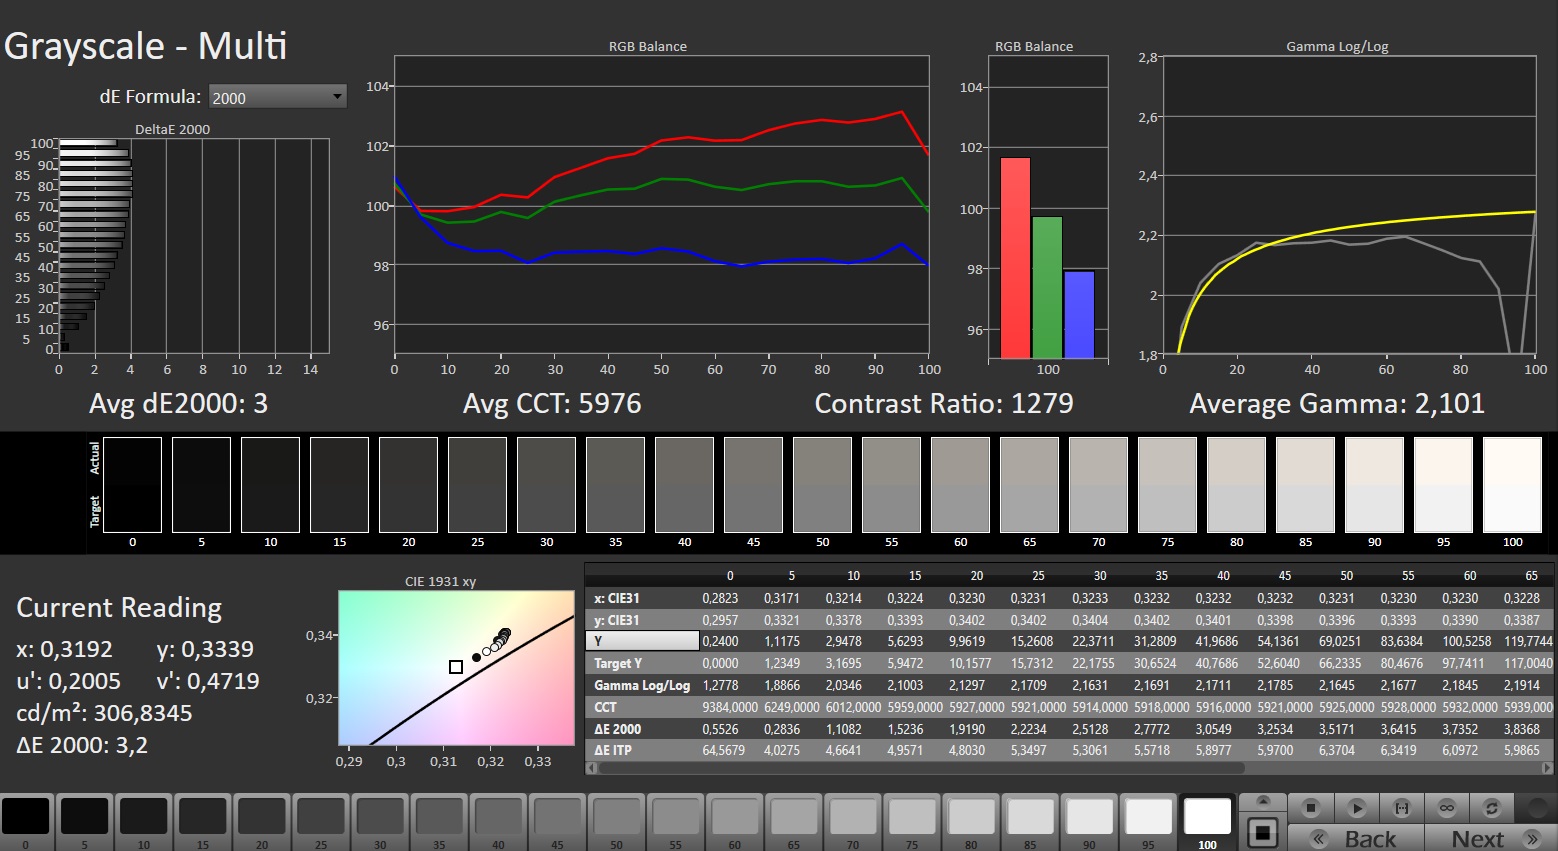
L'écran IPS de 16,1 pouces (1440p) au format 16:9 ne présente pas de scintillement PWM, prend en charge la technologie G-Sync et offre des temps de réponse rapides. Bien que le rapport de contraste de l'écran soit suffisamment bon (> 1 000:1), la luminosité maximale est légèrement inférieure au niveau visé (> 300 cd/m²).

| |||||||||||||||||||||||||
Homogénéité de la luminosité: 85 %
Valeur mesurée au centre, sur batterie: 292 cd/m²
Contraste: 1217:1 (Valeurs des noirs: 0.24 cd/m²)
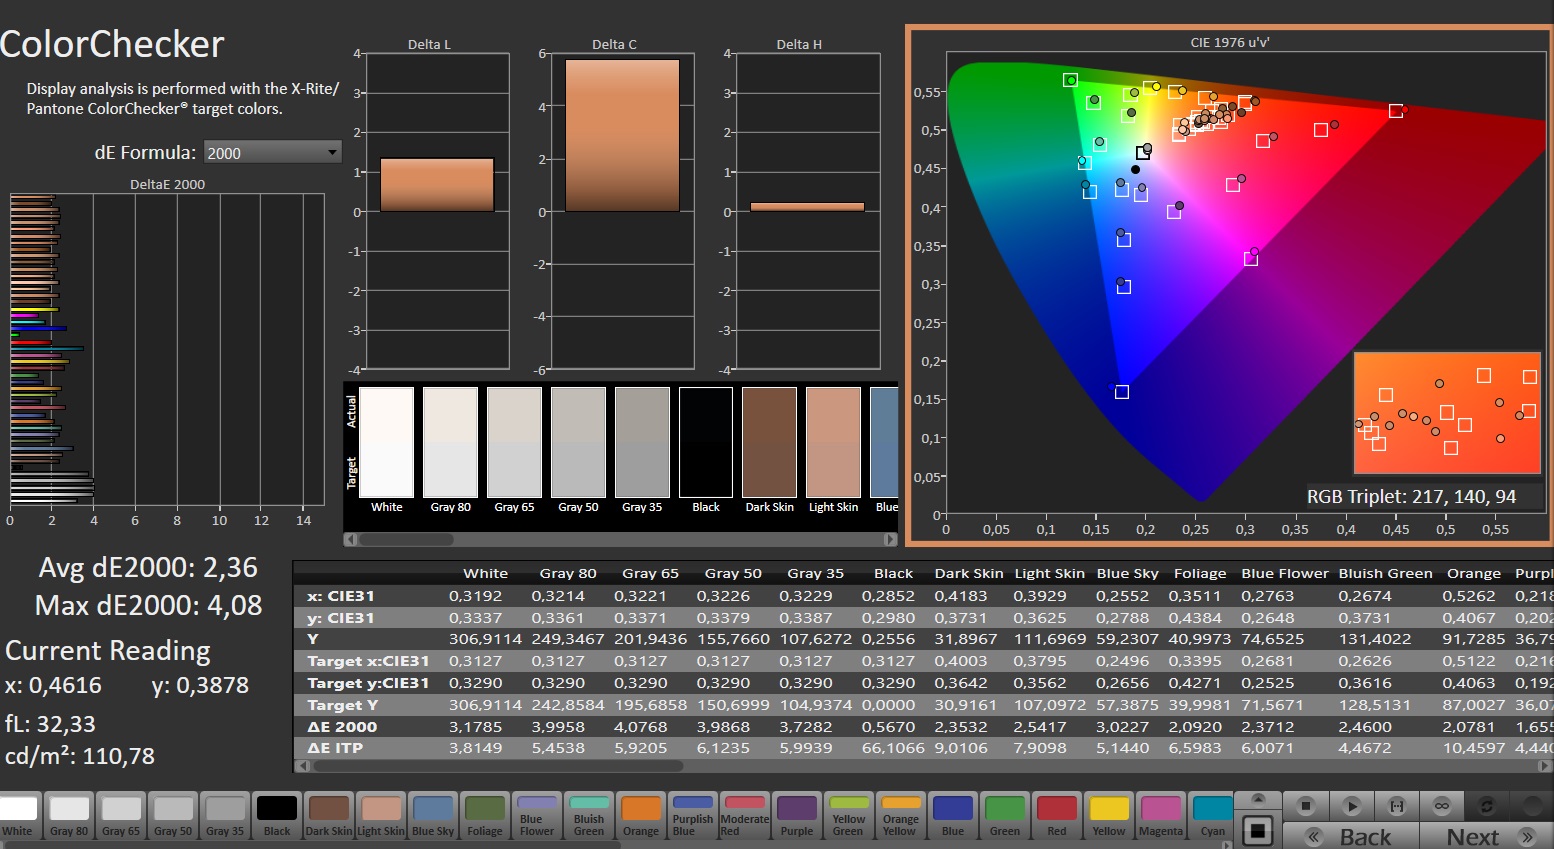
ΔE ColorChecker Calman: 2.36 | ∀{0.5-29.43 Ø4.71}
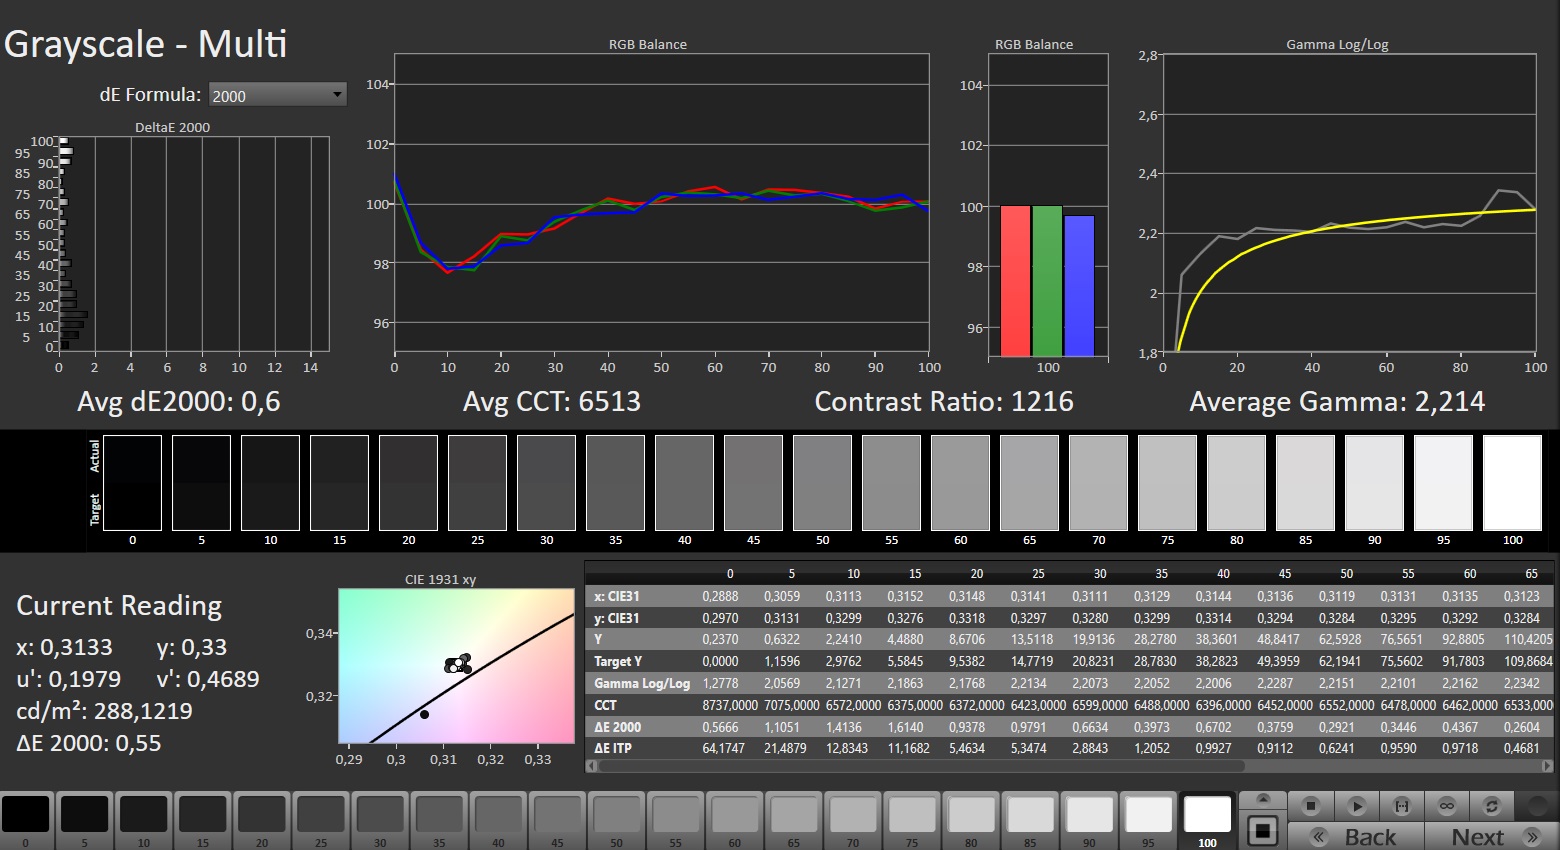
calibrated: 0.93
ΔE Greyscale Calman: 3 | ∀{0.09-98 Ø4.96}
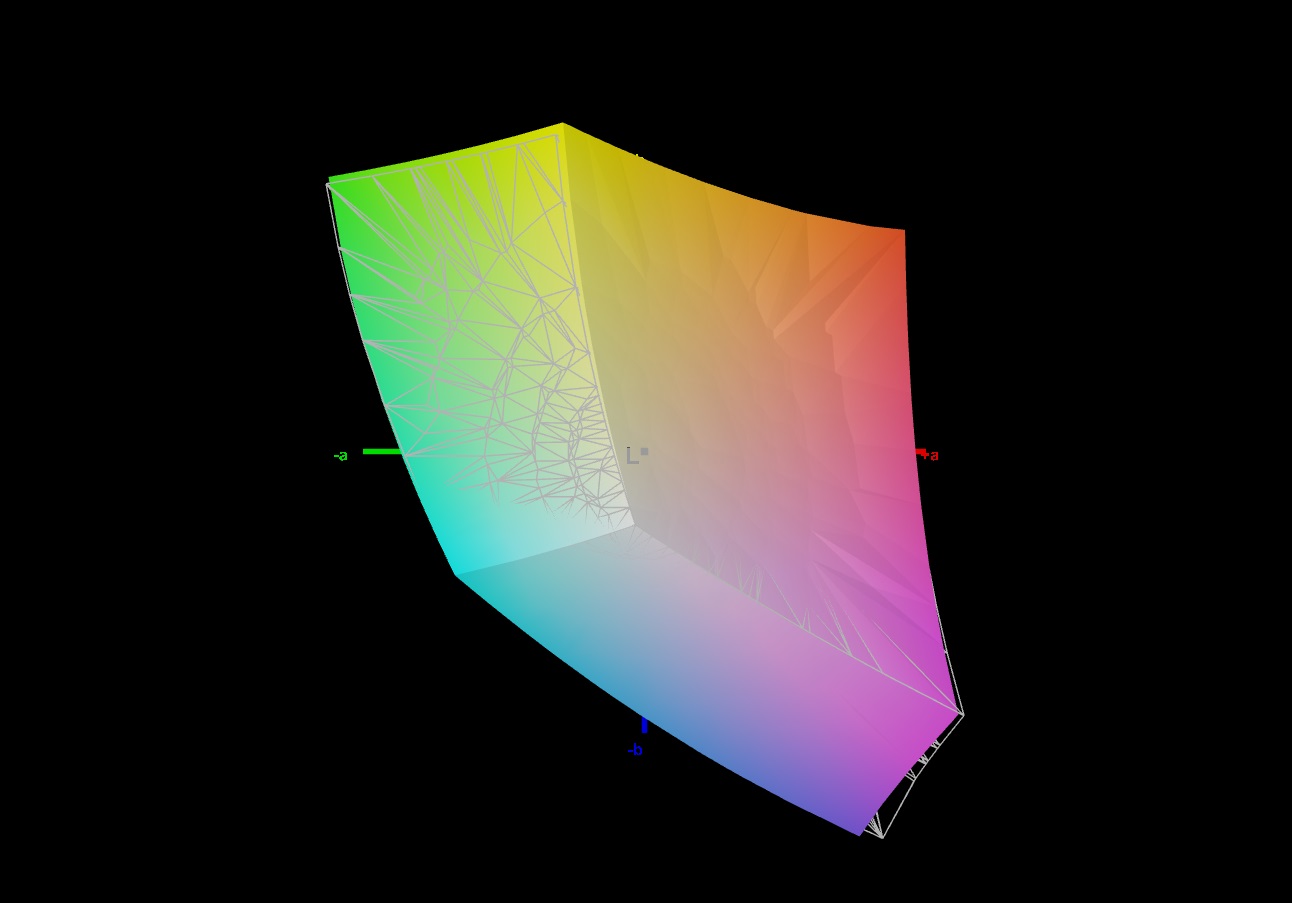
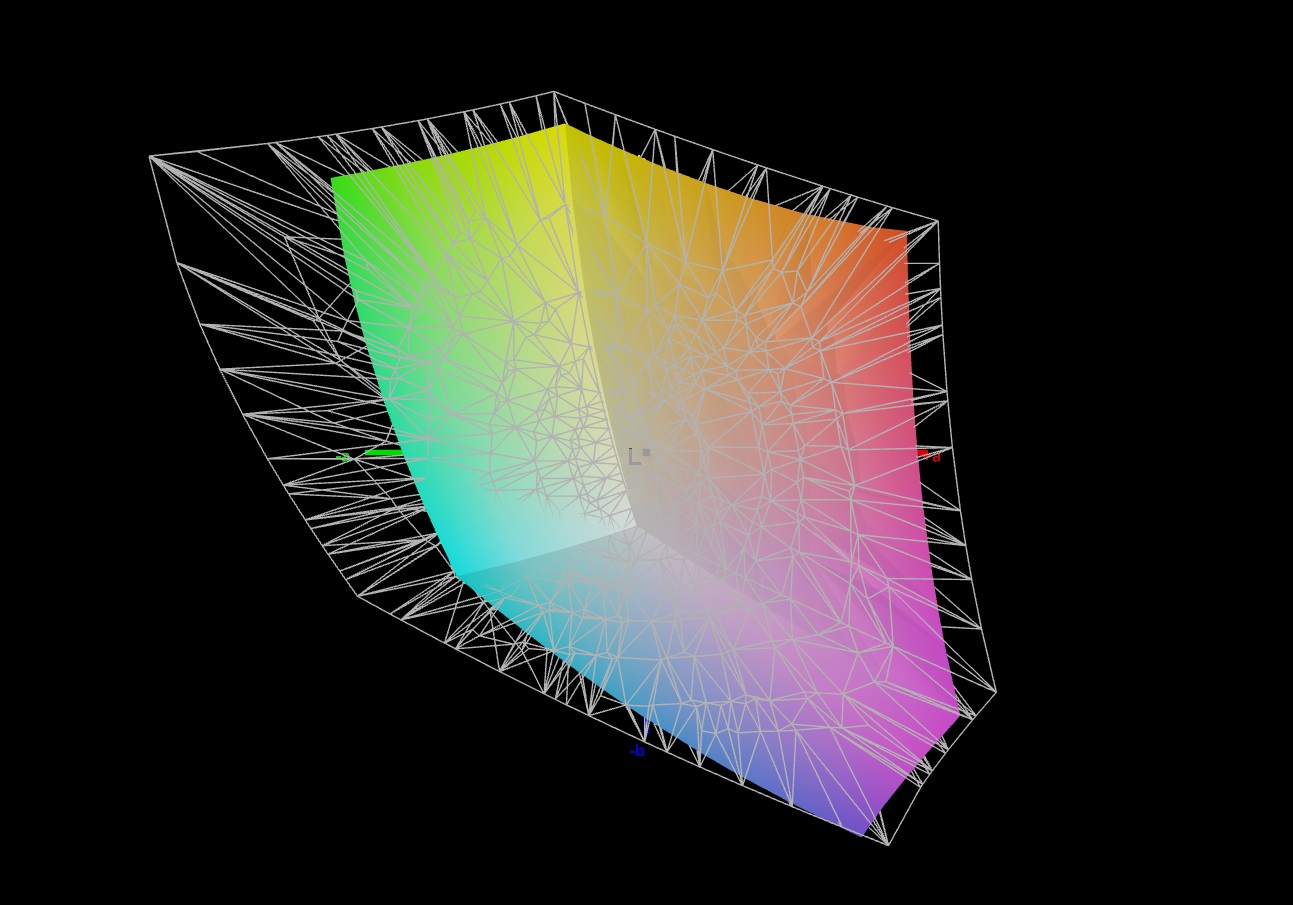
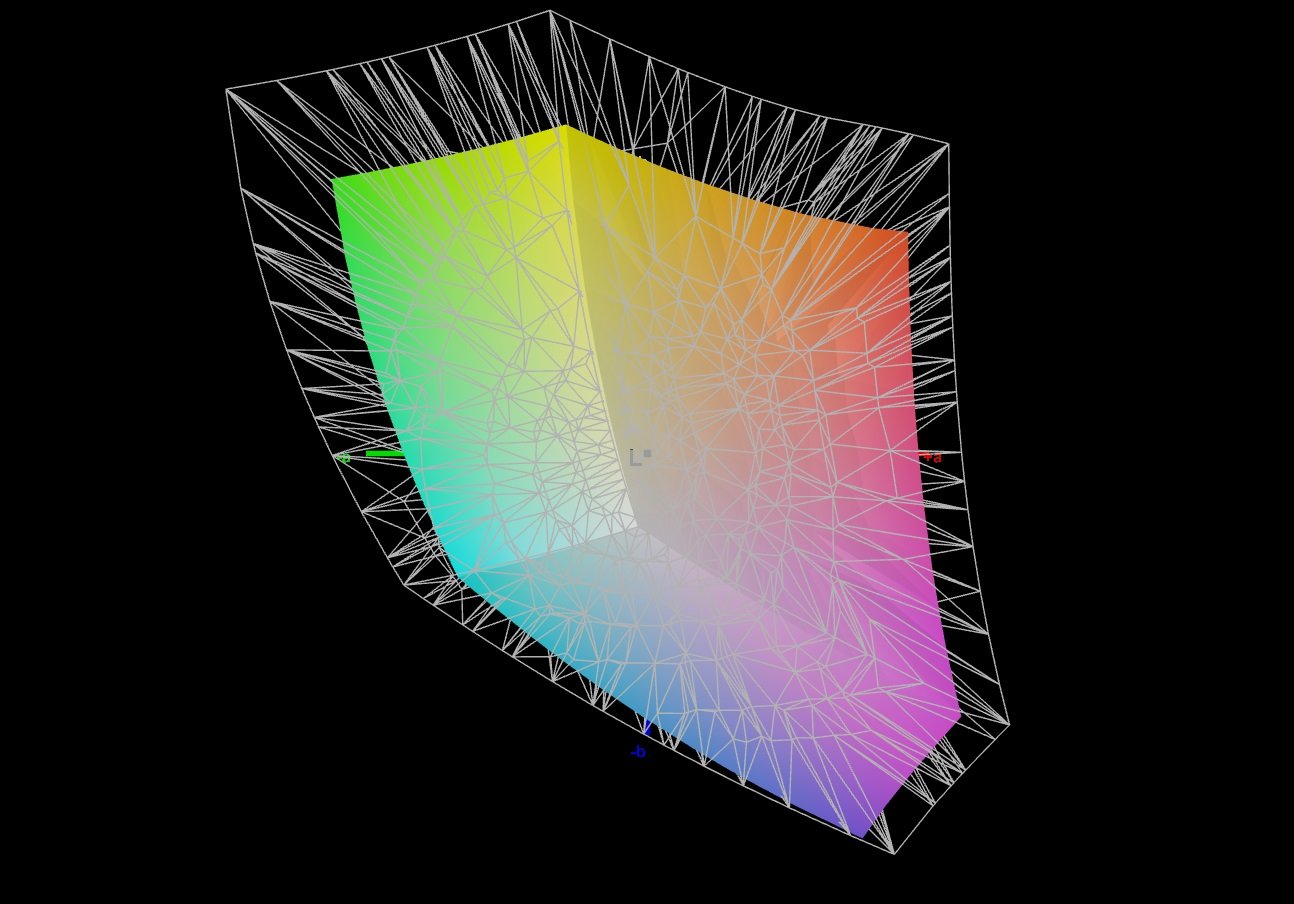
70.6% AdobeRGB 1998 (Argyll 3D)
98.6% sRGB (Argyll 3D)
68.6% Display P3 (Argyll 3D)
Gamma: 2.101
CCT: 5976 K
| HP Omen 16 (2024) BOE BOE0B7D, IPS, 2560x1440, 16.1" | MSI Vector 16 HX A14V Chi Mei N160GME-GTB, IPS, 2560x1600, 16" | Alienware m16 R1 AMD BOE NE16NZ4, IPS, 2560x1600, 16" | Acer Predator Helios 18 N23Q2 AUO45A8 (B180QAN01.2), IPS, 2560x1600, 18" | HP Omen 16-wf000 BOE0B7D, IPS, 2560x1440, 16.1" | |
|---|---|---|---|---|---|
| Display | 20% | 24% | 25% | 1% | |
| Display P3 Coverage (%) | 68.6 | 95.4 39% | 98.6 44% | 99.8 45% | 69 1% |
| sRGB Coverage (%) | 98.6 | 99.7 1% | 99.9 1% | 100 1% | 99.2 1% |
| AdobeRGB 1998 Coverage (%) | 70.6 | 85.4 21% | 88.9 26% | 91.8 30% | 71.2 1% |
| Response Times | 19% | 34% | -23% | 32% | |
| Response Time Grey 50% / Grey 80% * (ms) | 14.1 ? | 5.7 ? 60% | 5.1 ? 64% | 7.6 ? 46% | 4.6 ? 67% |
| Response Time Black / White * (ms) | 9.3 ? | 11.4 ? -23% | 9 ? 3% | 17.8 ? -91% | 9.7 ? -4% |
| PWM Frequency (Hz) | 2509 | ||||
| Screen | -7% | -37% | -27% | 1% | |
| Brightness middle (cd/m²) | 292 | 557.2 91% | 329 13% | 360 23% | 310.9 6% |
| Brightness (cd/m²) | 291 | 506 74% | 317 9% | 355 22% | 296 2% |
| Brightness Distribution (%) | 85 | 83 -2% | 89 5% | 92 8% | 91 7% |
| Black Level * (cd/m²) | 0.24 | 0.41 -71% | 0.32 -33% | 0.21 12% | 0.35 -46% |
| Contrast (:1) | 1217 | 1359 12% | 1028 -16% | 1714 41% | 888 -27% |
| Colorchecker dE 2000 * | 2.36 | 2.91 -23% | 3.71 -57% | 3.82 -62% | 2.18 8% |
| Colorchecker dE 2000 max. * | 4.08 | 5.94 -46% | 7.23 -77% | 7.38 -81% | 3.58 12% |
| Colorchecker dE 2000 calibrated * | 0.93 | 1.63 -75% | 2.82 -203% | 2.24 -141% | 0.52 44% |
| Greyscale dE 2000 * | 3 | 3.8 -27% | 2.2 27% | 5.06 -69% | 2.8 7% |
| Gamma | 2.101 105% | 2.23 99% | 2.3 96% | 2.52 87% | 2.18 101% |
| CCT | 5976 109% | 6408 101% | 6270 104% | 5657 115% | 6002 108% |
| Moyenne finale (programmes/paramètres) | 11% /
2% | 7% /
-14% | -8% /
-15% | 11% /
6% |
* ... Moindre est la valeur, meilleures sont les performances
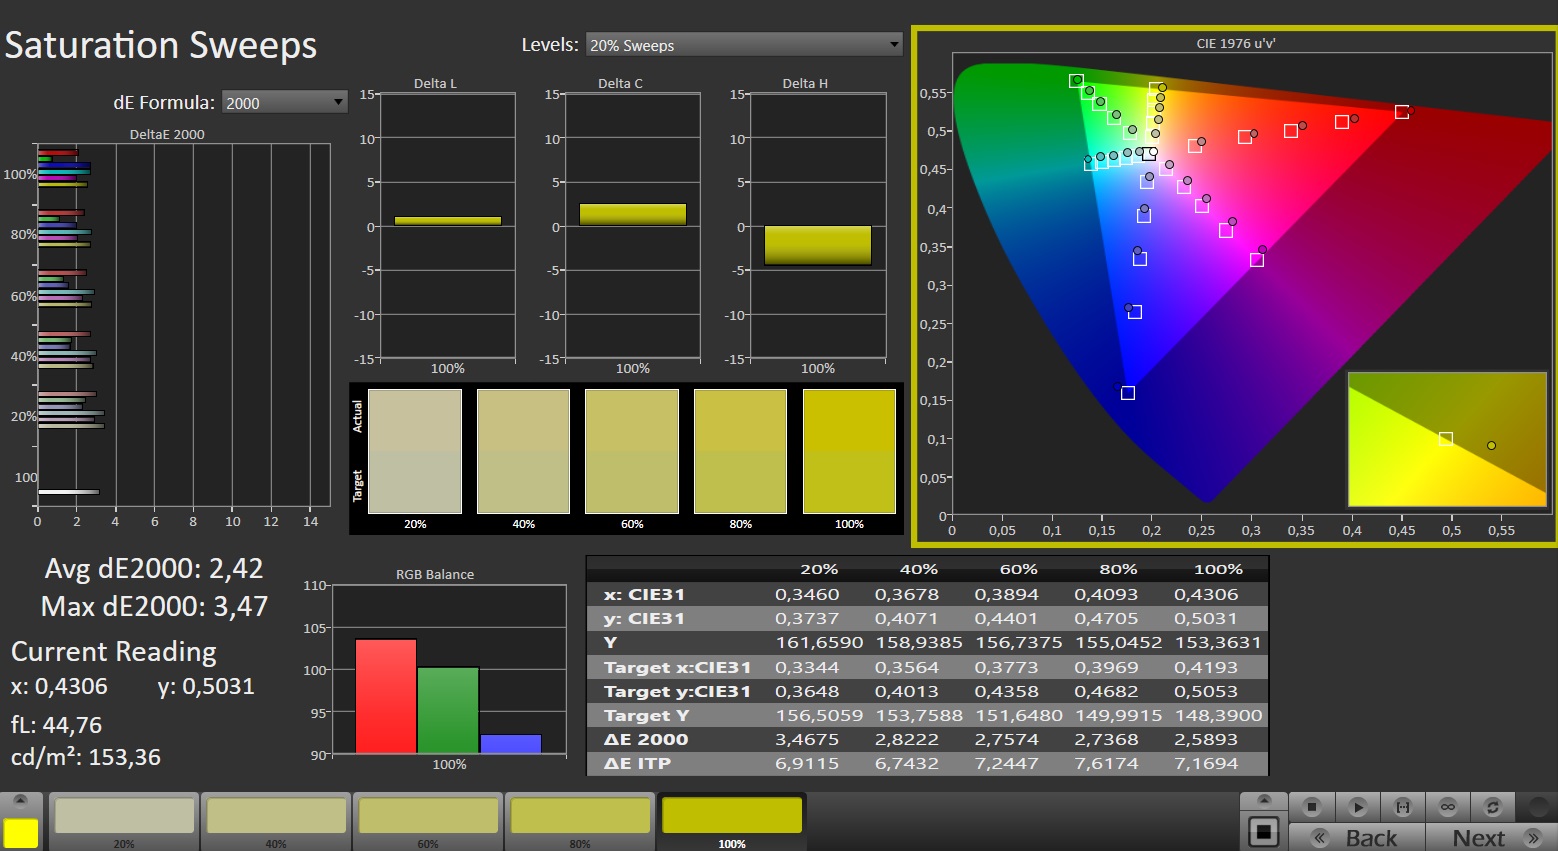
L'écran offre une excellente reproduction des couleurs dès sa sortie de l'emballage. Avec une différence de couleur moyenne d'environ 2,4, il se situe à un niveau que nous considérons comme bon (Delta E < 3). L'étalonnage de l'écran a permis de réduire le Delta E moyen à 0,93 et d'obtenir une échelle de gris plus équilibrée. L'écran peut reproduire l'intégralité de l'espace colorimétrique sRGB, mais ne couvre pas l'intégralité de l'espace AdobeRGB et DCI-P3. Les écrans des appareils concurrents ont plus à offrir dans ce domaine.
Temps de réponse de l'écran
| ↔ Temps de réponse noir à blanc | ||
|---|---|---|
| 9.3 ms ... hausse ↗ et chute ↘ combinées | ↗ 4.6 ms hausse | 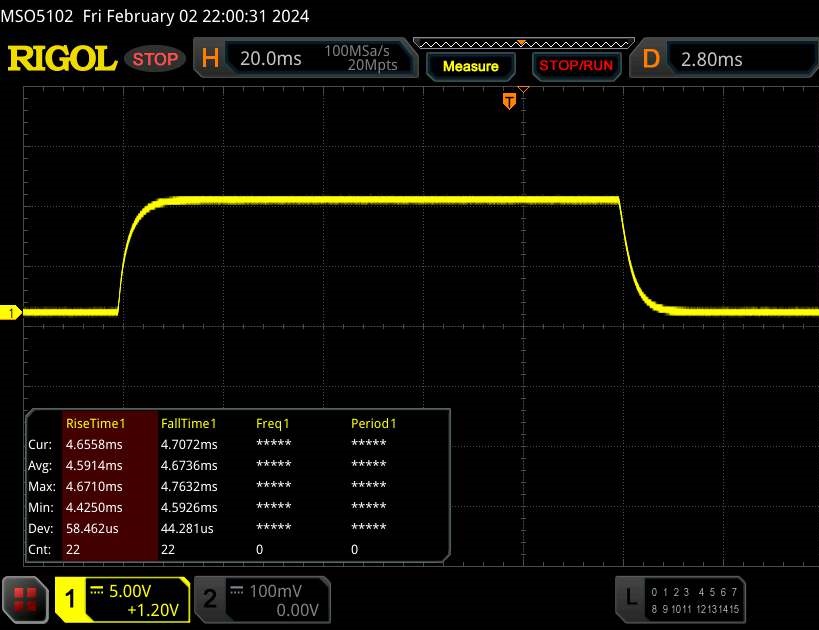 |
| ↘ 4.7 ms chute | ||
| L'écran montre de faibles temps de réponse, un bon écran pour jouer. En comparaison, tous les appareils testés affichent entre 0.1 (minimum) et 240 (maximum) ms. » 26 % des appareils testés affichent de meilleures performances. Cela signifie que les latences relevées sont meilleures que la moyenne (19.8 ms) de tous les appareils testés. | ||
| ↔ Temps de réponse gris 50% à gris 80% | ||
| 14.1 ms ... hausse ↗ et chute ↘ combinées | ↗ 6.7 ms hausse | 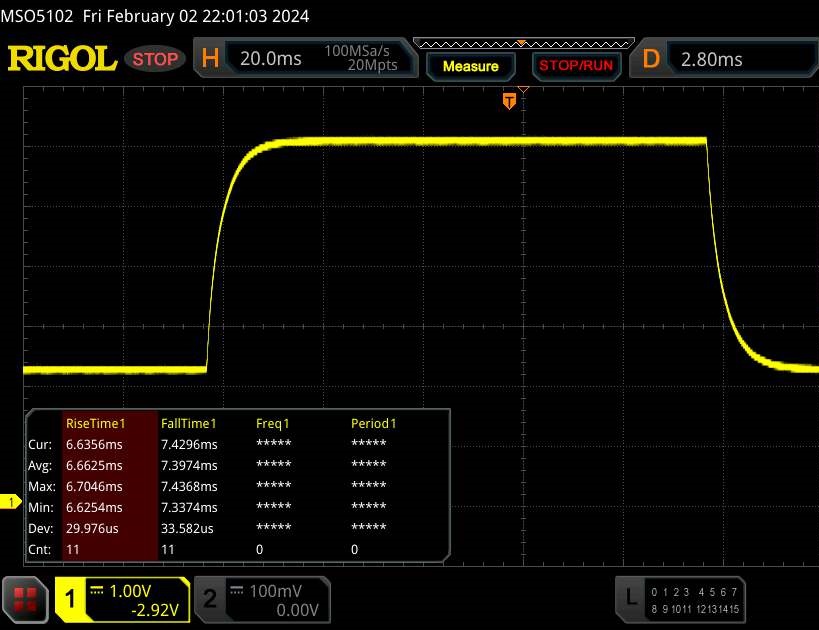 |
| ↘ 7.4 ms chute | ||
| L'écran montre de bons temps de réponse, mais insuffisant pour du jeu compétitif. En comparaison, tous les appareils testés affichent entre 0.165 (minimum) et 636 (maximum) ms. » 28 % des appareils testés affichent de meilleures performances. Cela signifie que les latences relevées sont meilleures que la moyenne (31 ms) de tous les appareils testés. | ||
Scintillement / MLI (Modulation de largeur d'impulsion)
| Scintillement / MLI (Modulation de largeur d'impulsion) non décelé | 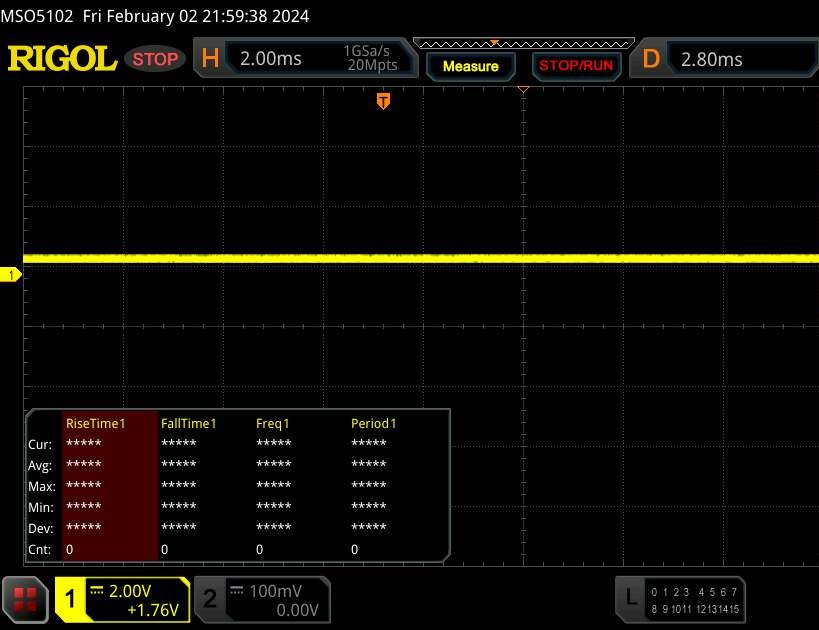 | ||
En comparaison, 52 % des appareils testés n'emploient pas MDI pour assombrir leur écran. Nous avons relevé une moyenne à 7757 (minimum : 5 - maximum : 343500) Hz dans le cas où une MDI était active. | |||
Grâce à son grand angle de vision, l'écran IPS est lisible dans n'importe quelle position. Il est également possible d'utiliser l'écran à l'extérieur, à condition que le soleil ne soit pas trop fort.
Performance - Propulsé par Raptor Lake et Ada Lovelace
Le HP Omen 16 est un ordinateur portable de jeu QHD qui fait également bonne figure dans d'autres applications gourmandes en performances. La puissance de calcul nécessaire est fournie par Raptor Lake et Ada Lovelace. Le modèle Omen tel qu'il est spécifié coûte environ 3 200 € (3 446 $). Des configurations moins chères sont disponibles à partir de 1 900 euros (2 760 dollars).
Conditions d'essai
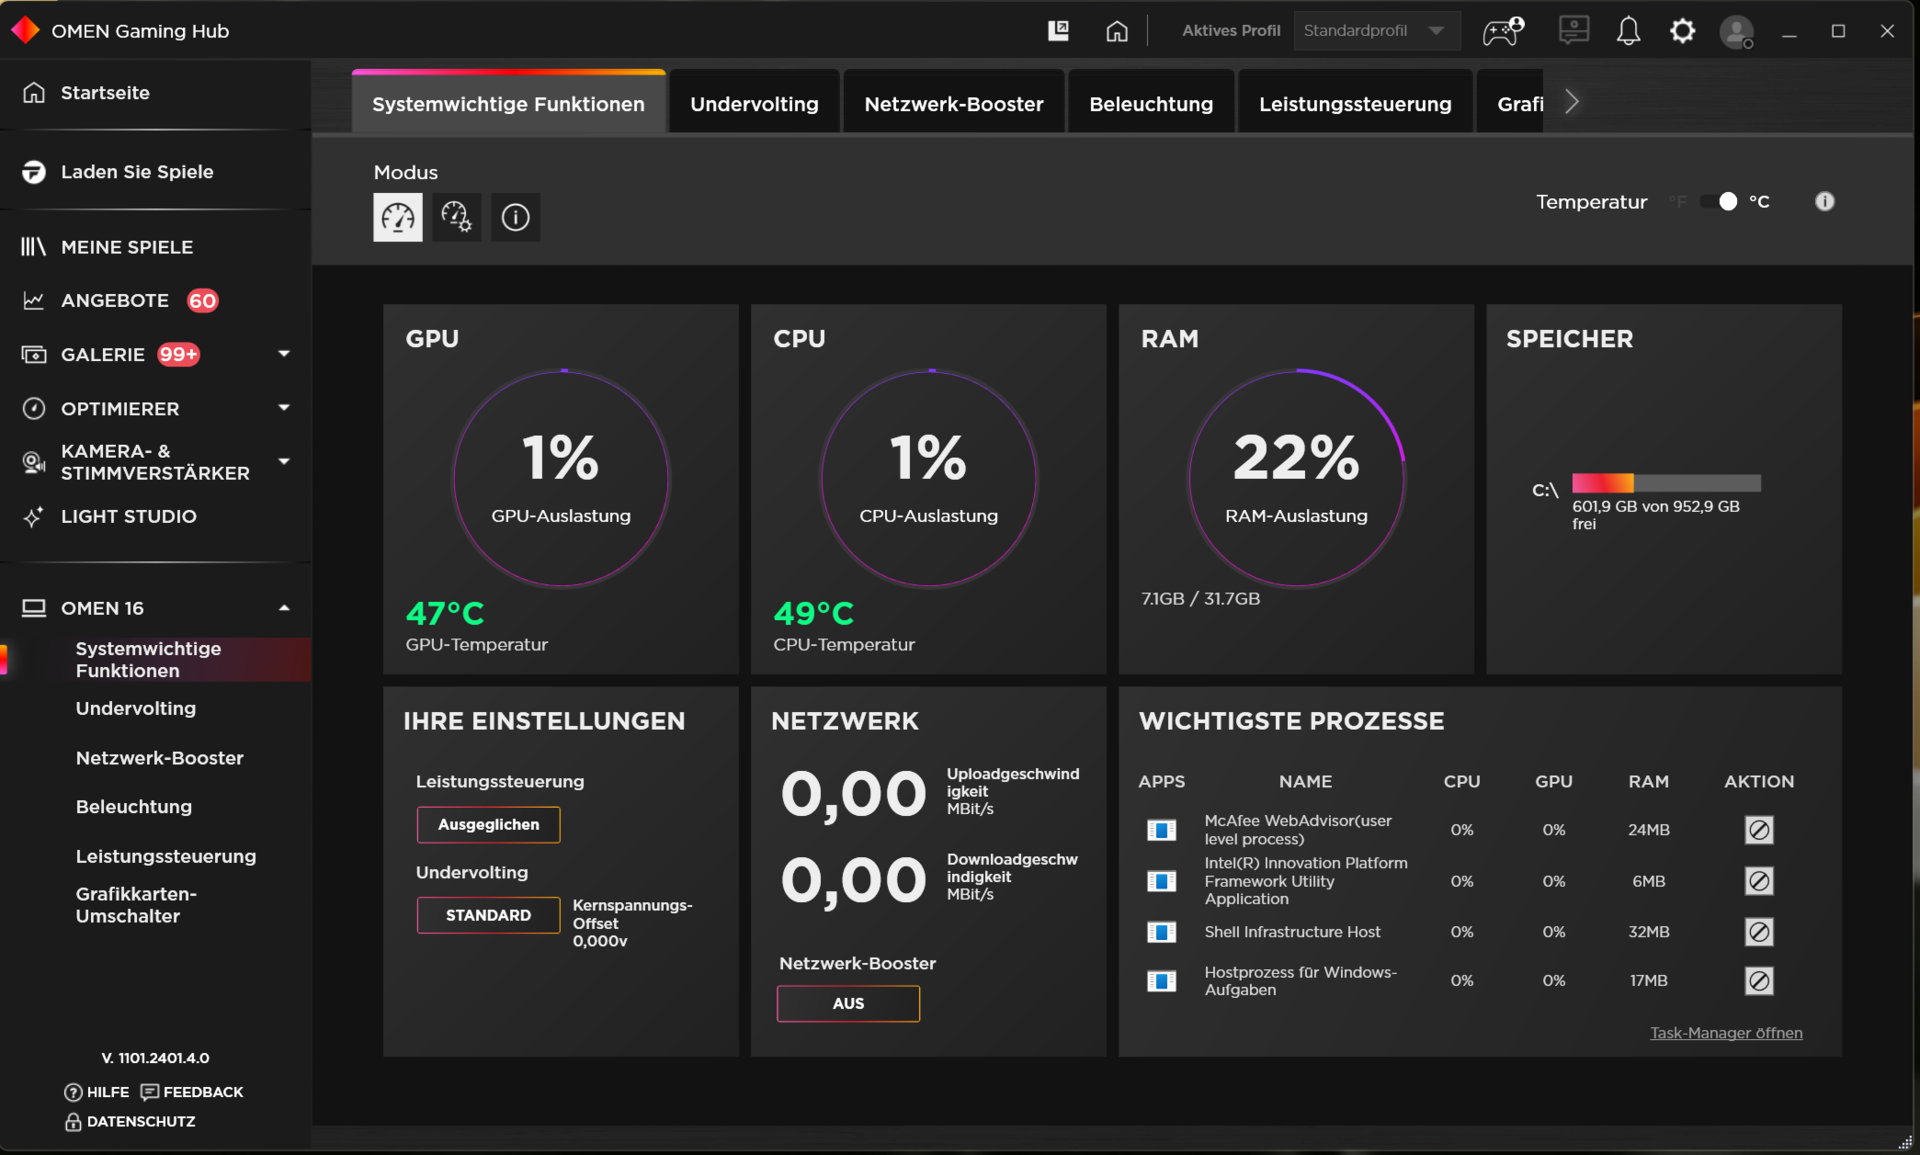
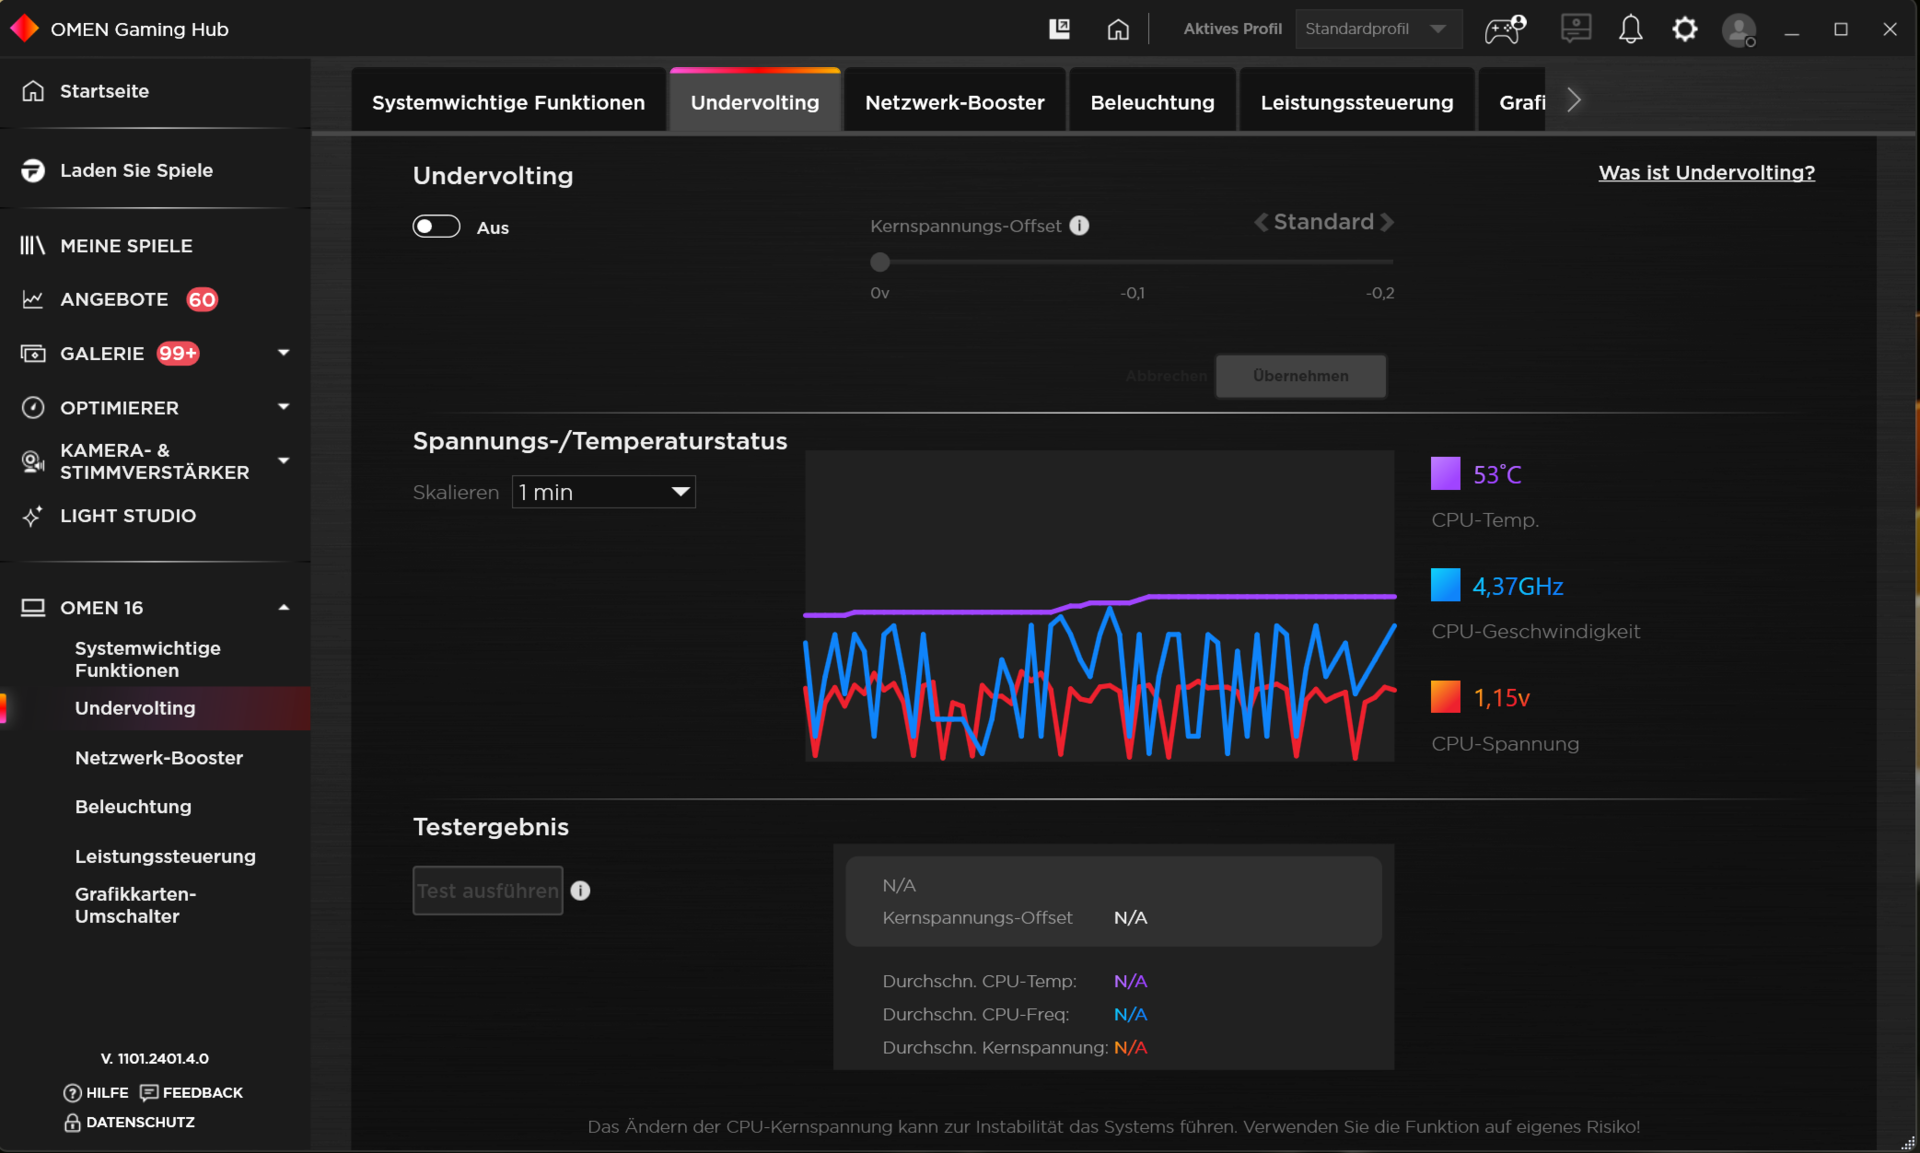
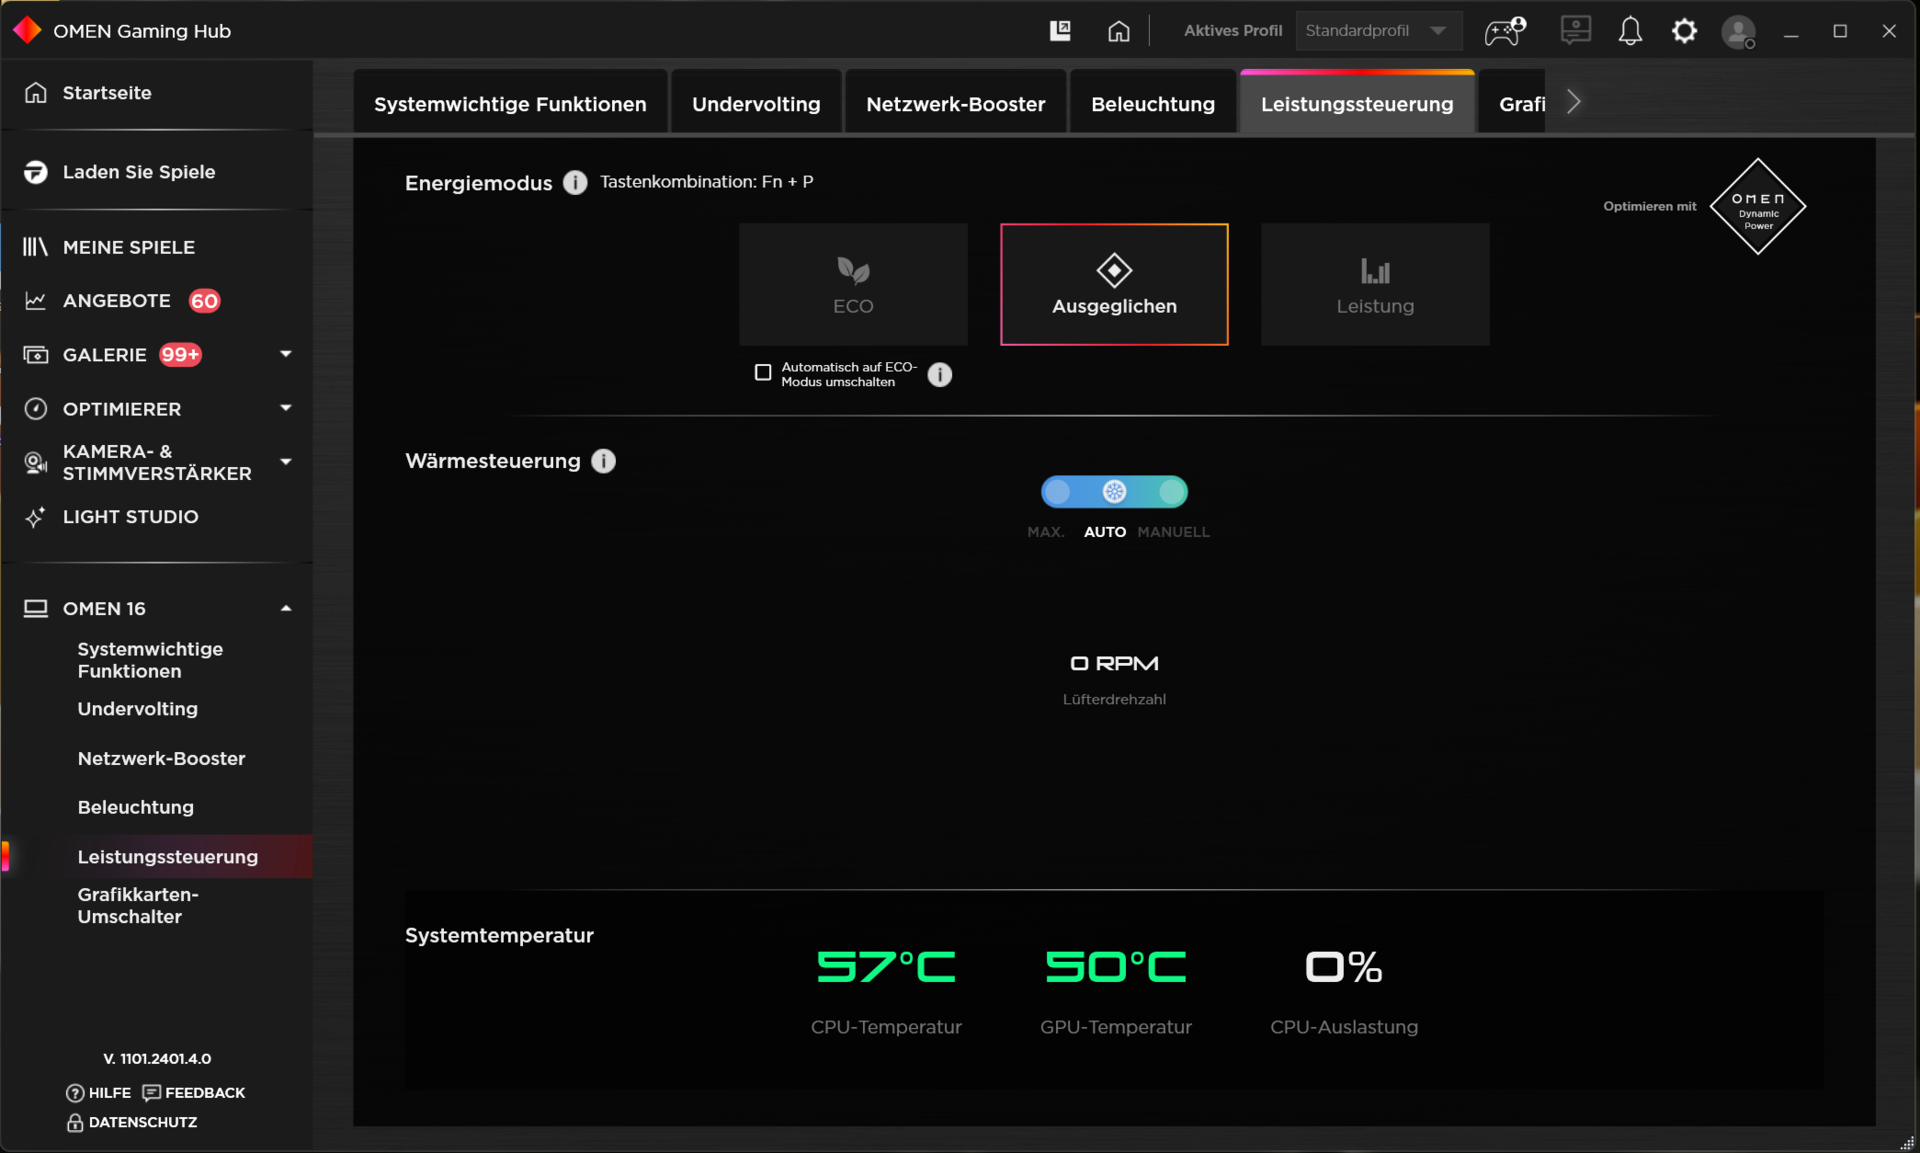
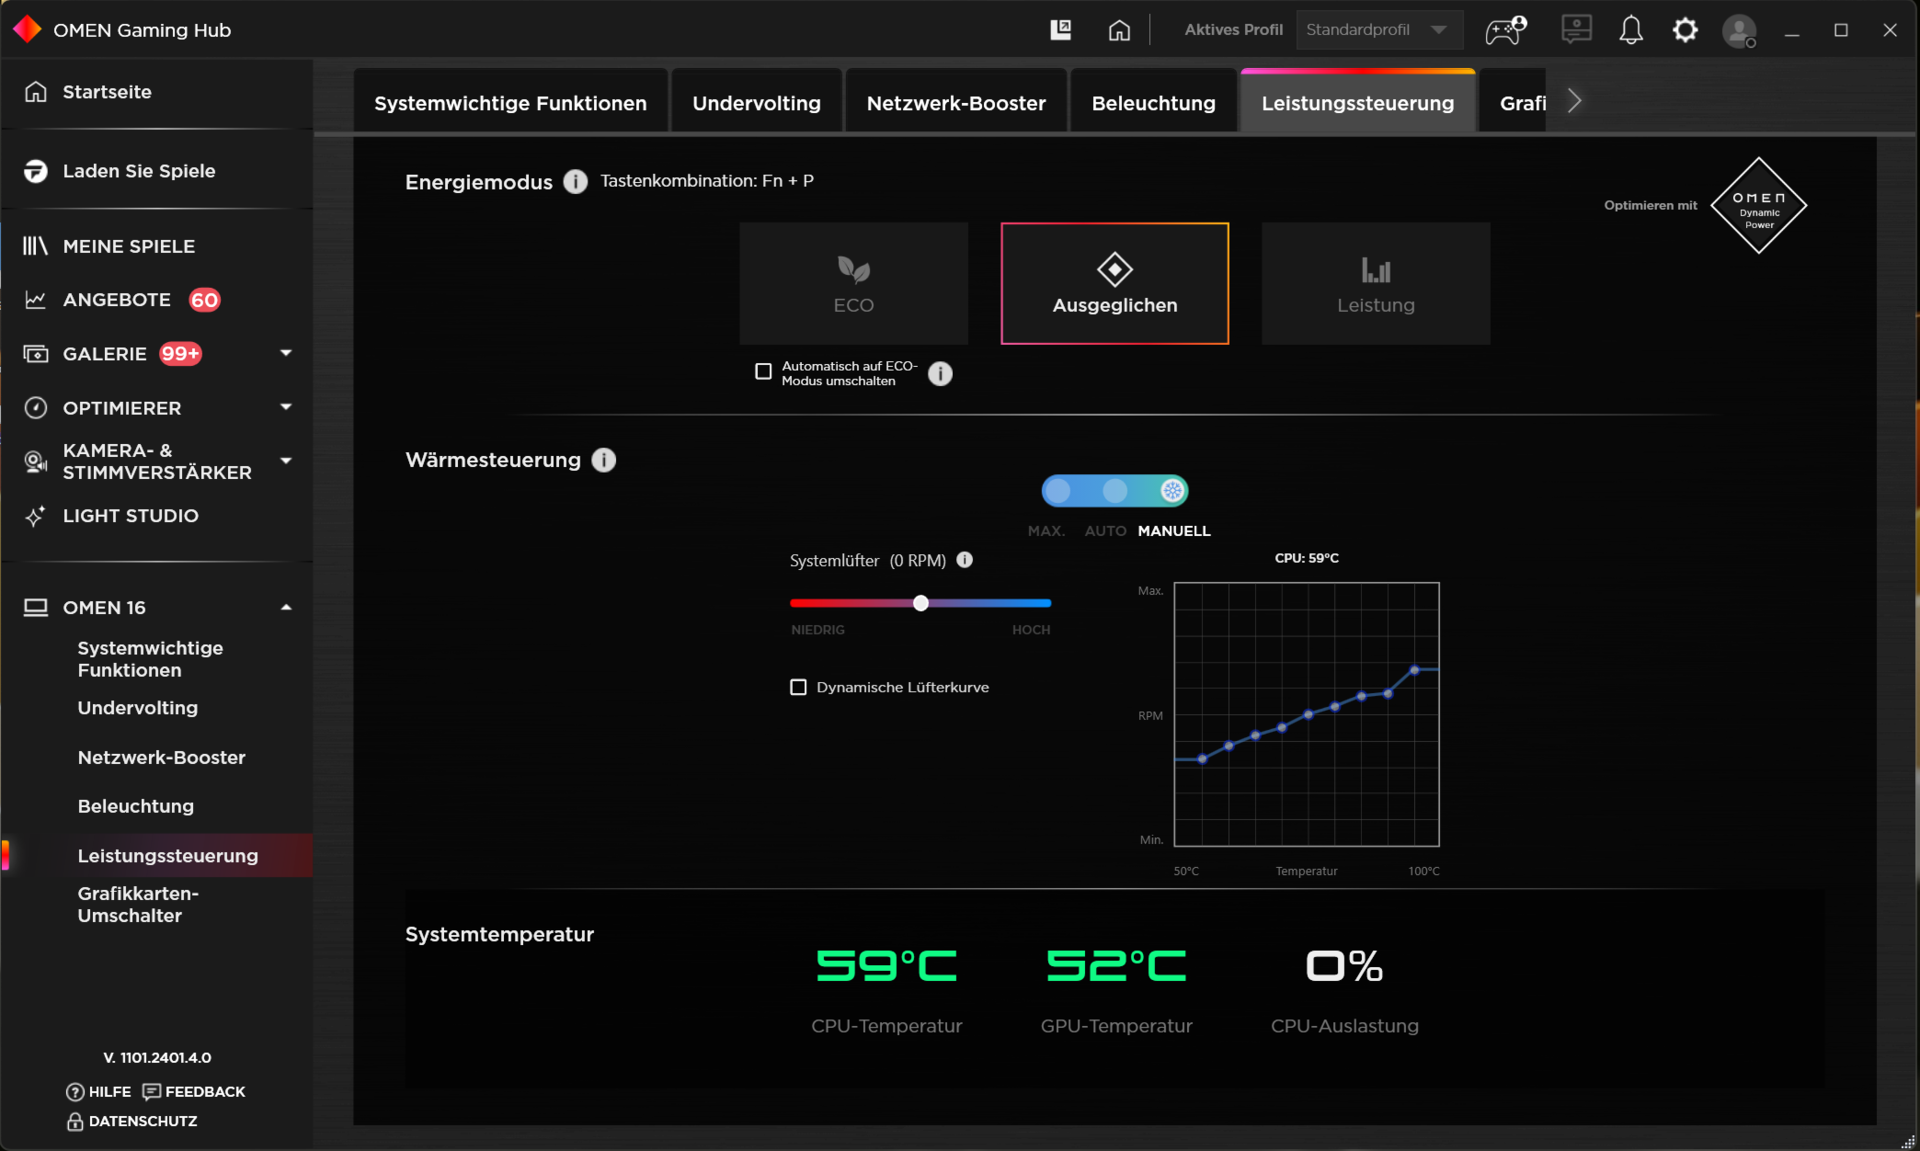
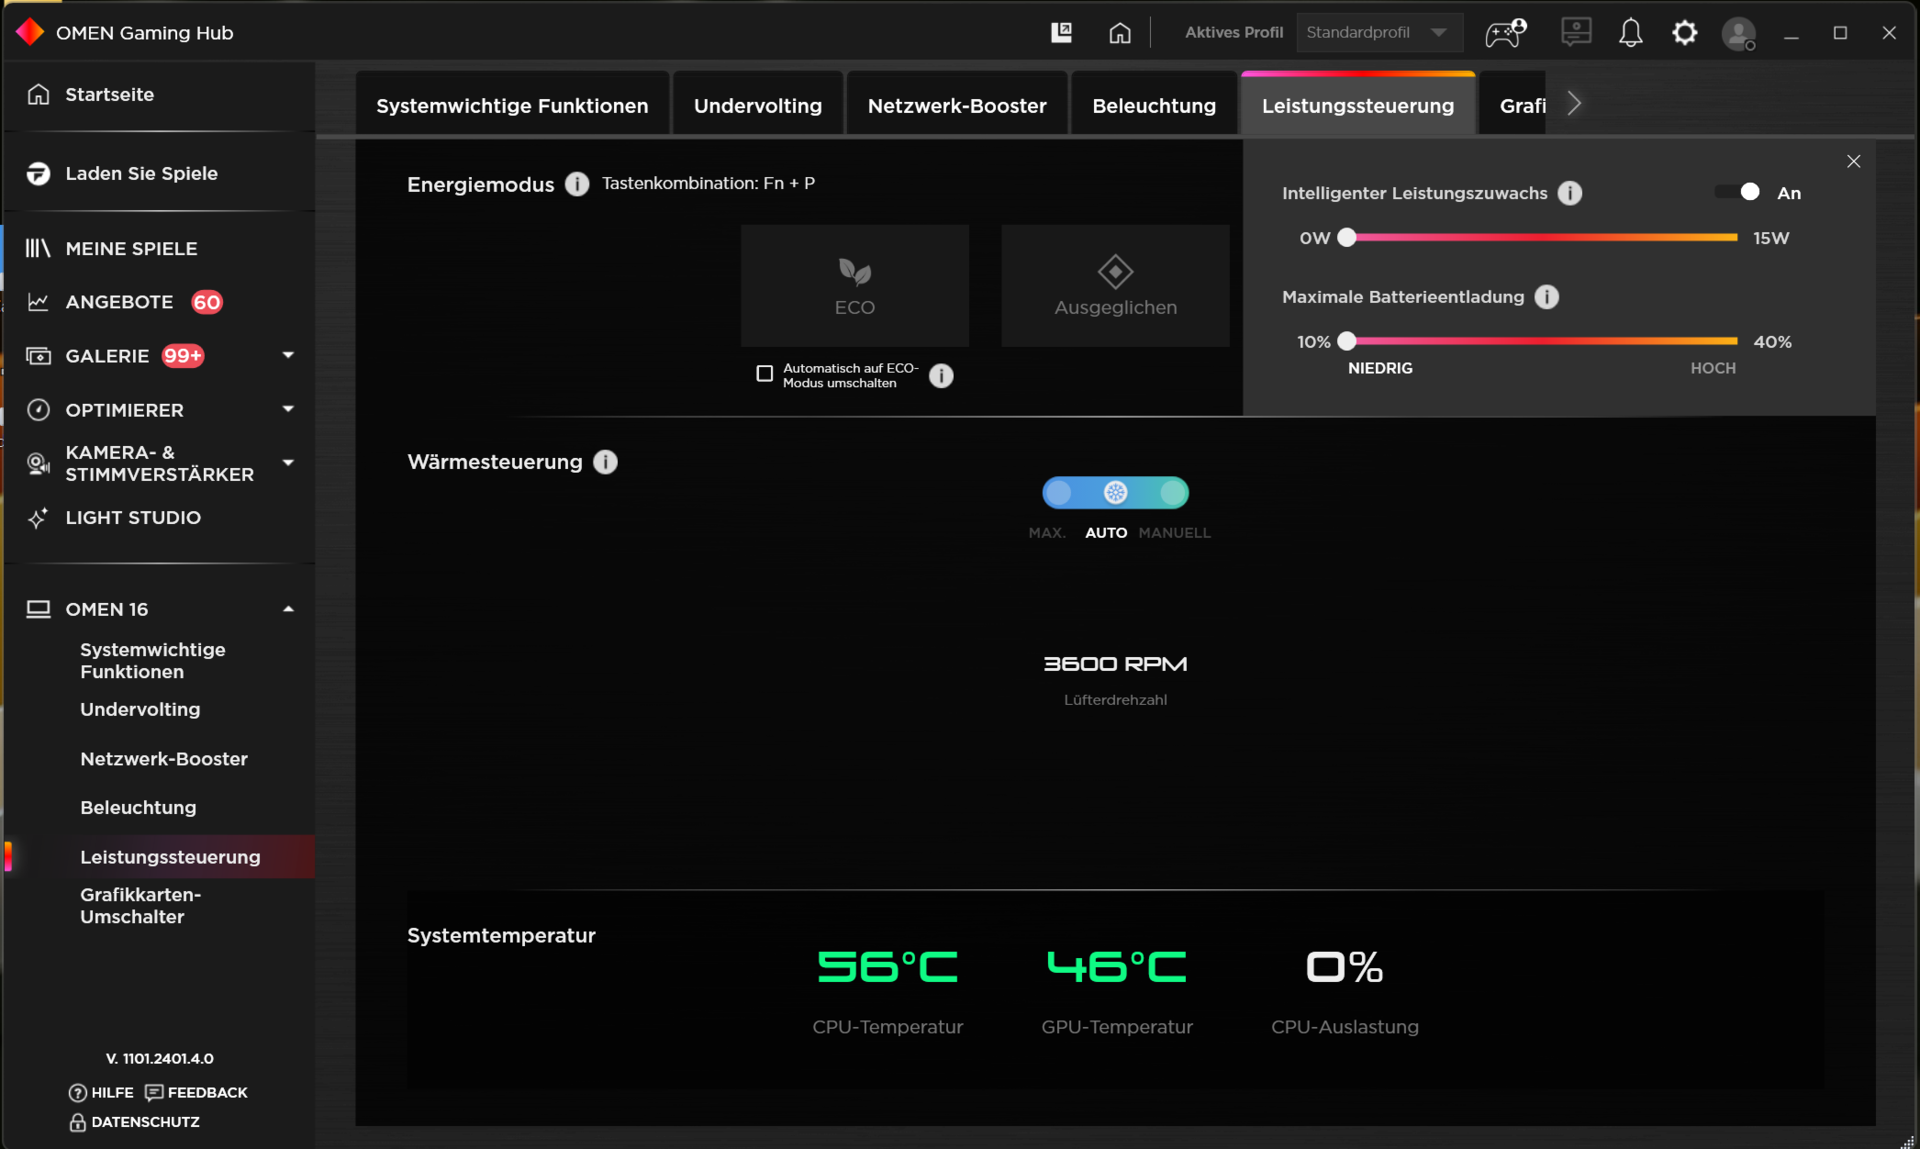
L'Omen Gaming Hub préinstallé est le centre de contrôle de l'ordinateur portable. Outre la sélection d'un mode d'alimentation (voir tableau), vous pouvez utiliser le logiciel pour sous-volter le CPU et spécifier une courbe de ventilateur personnalisée, entre autres choses. En appuyant sur la combinaison de touches Fn + P, vous pouvez également basculer rapidement entre les trois modes spécifiques à HP. Les modes Balanced et ECO ont été utilisés respectivement pour nos benchmarks et notre test de batterie.
| Performance | Équilibré | ECO | |
|---|---|---|---|
| Limite de puissance 1 (HWInfo) | 130 Watt | 130 Watt | 130 Watt |
| Limite de puissance 2 (HWInfo) | 130 Watt | 130 Watt | 130 Watt |
| Bruit (Witcher 3) | 58 dB(A) | 47 dB(A) | 39 dB(A) |
| Performance (Witcher 3) | ~ 164 fps | ~ 142 fps | 60 fps (verrouillé) |
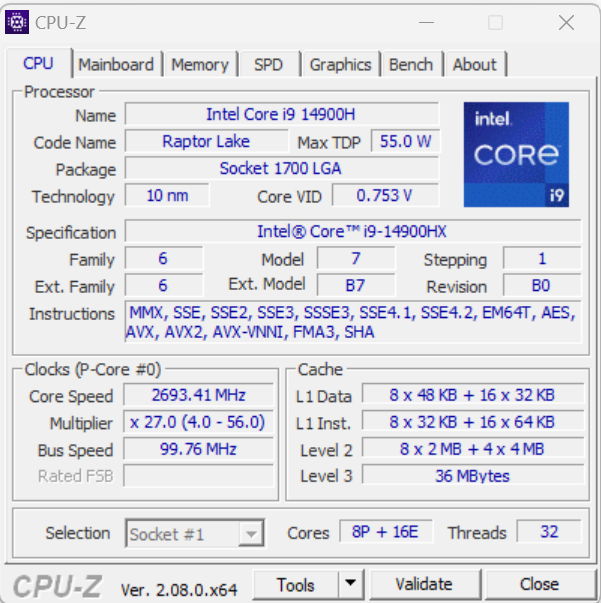
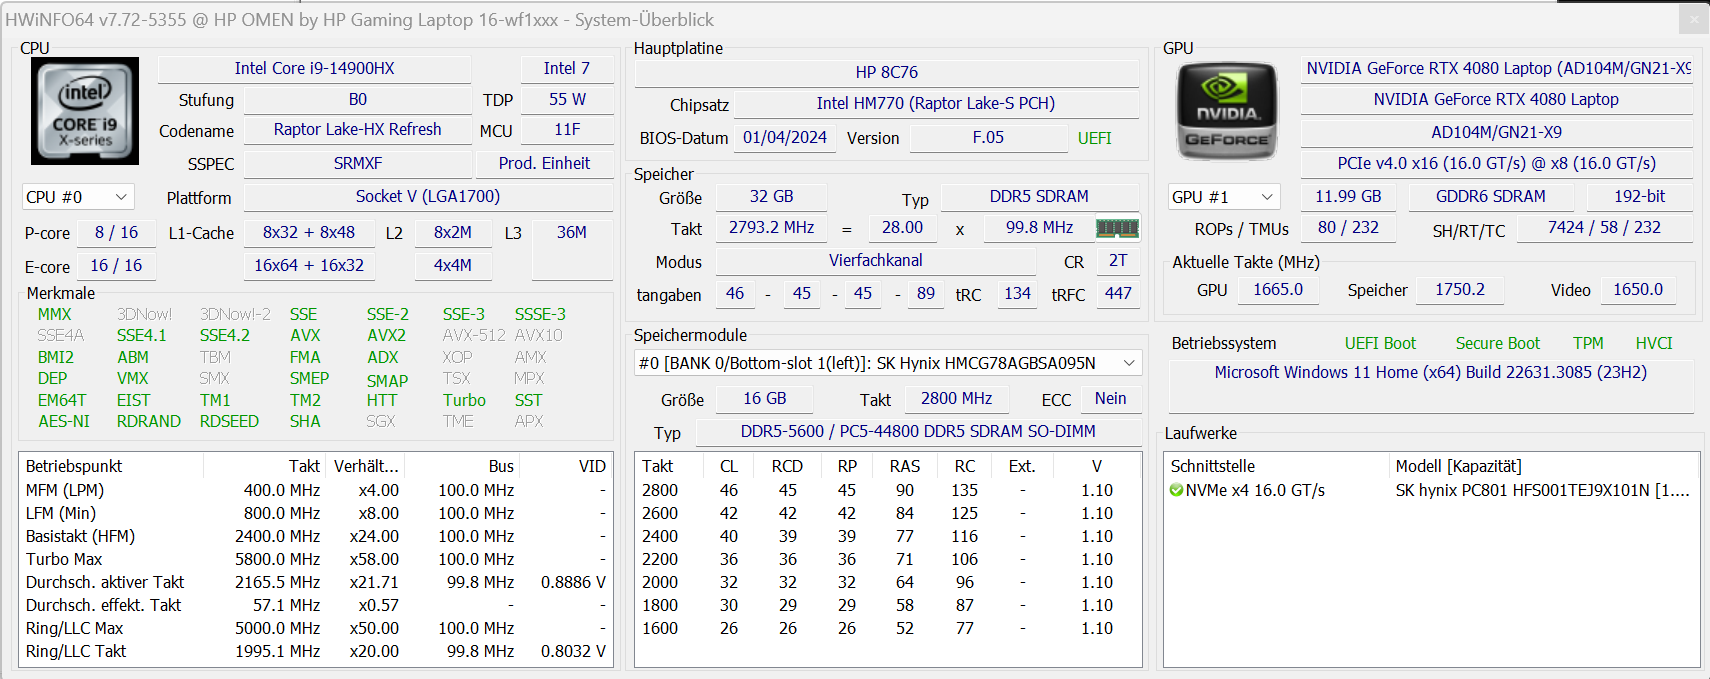
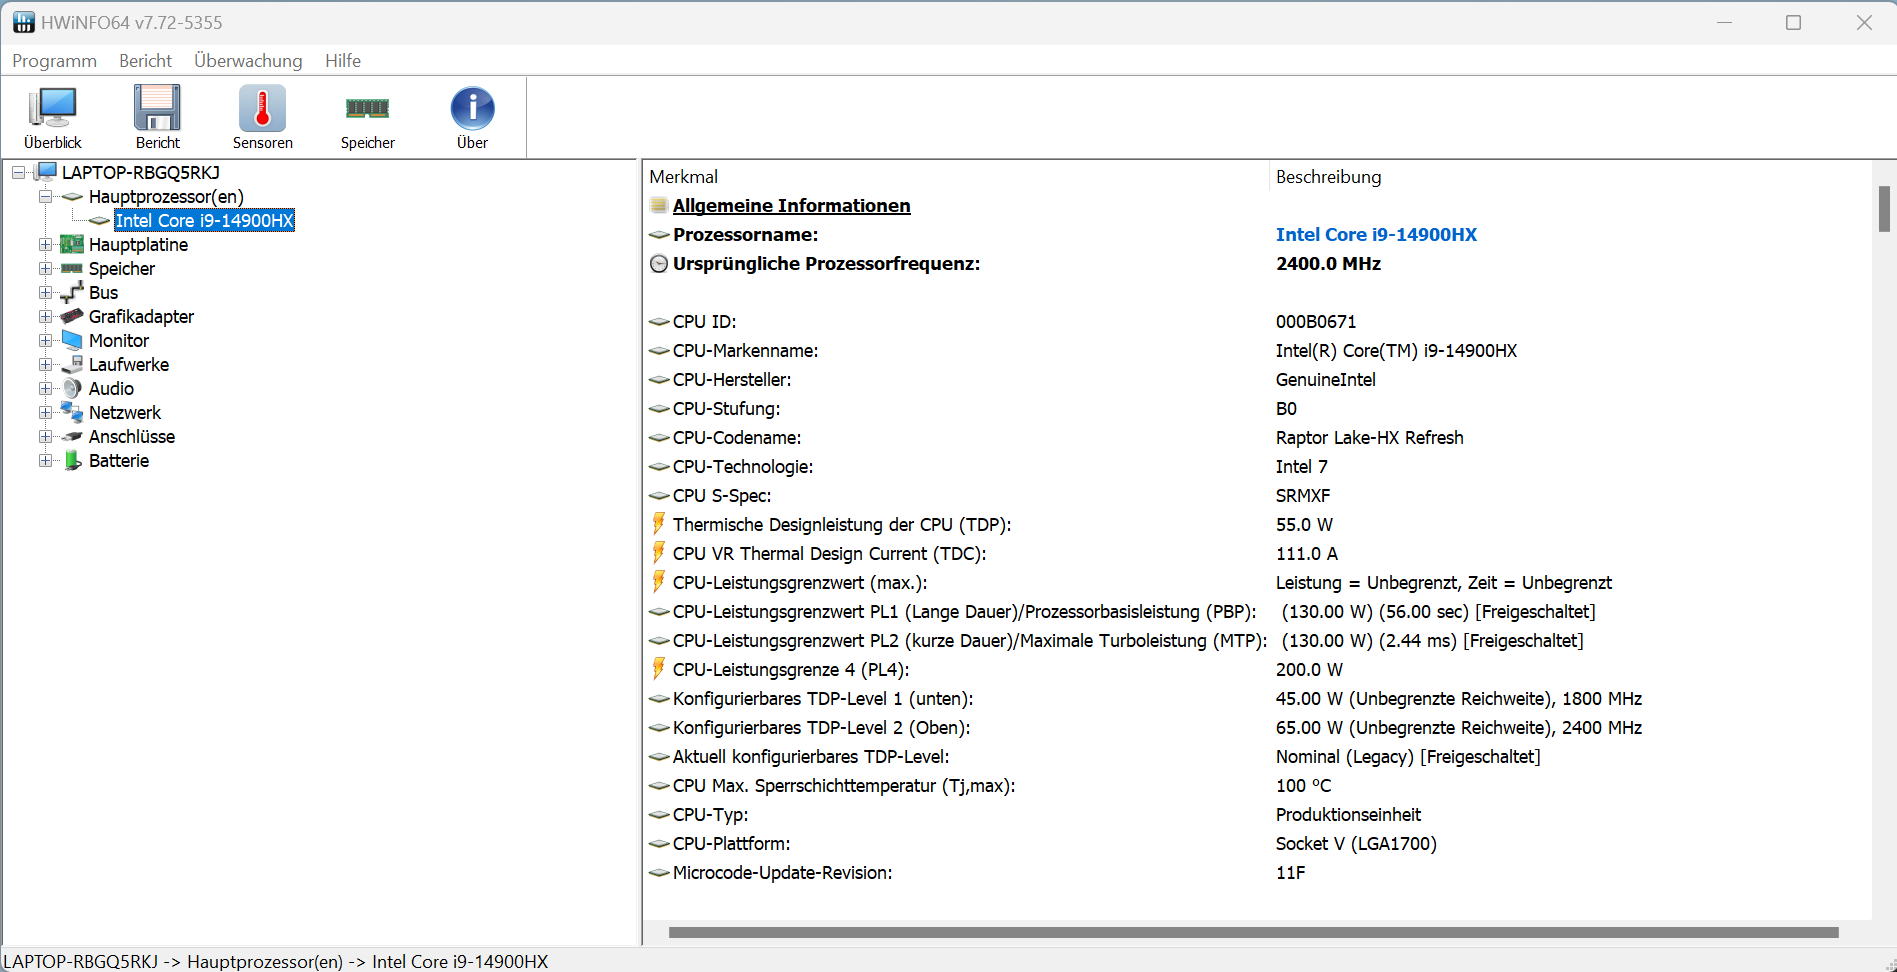
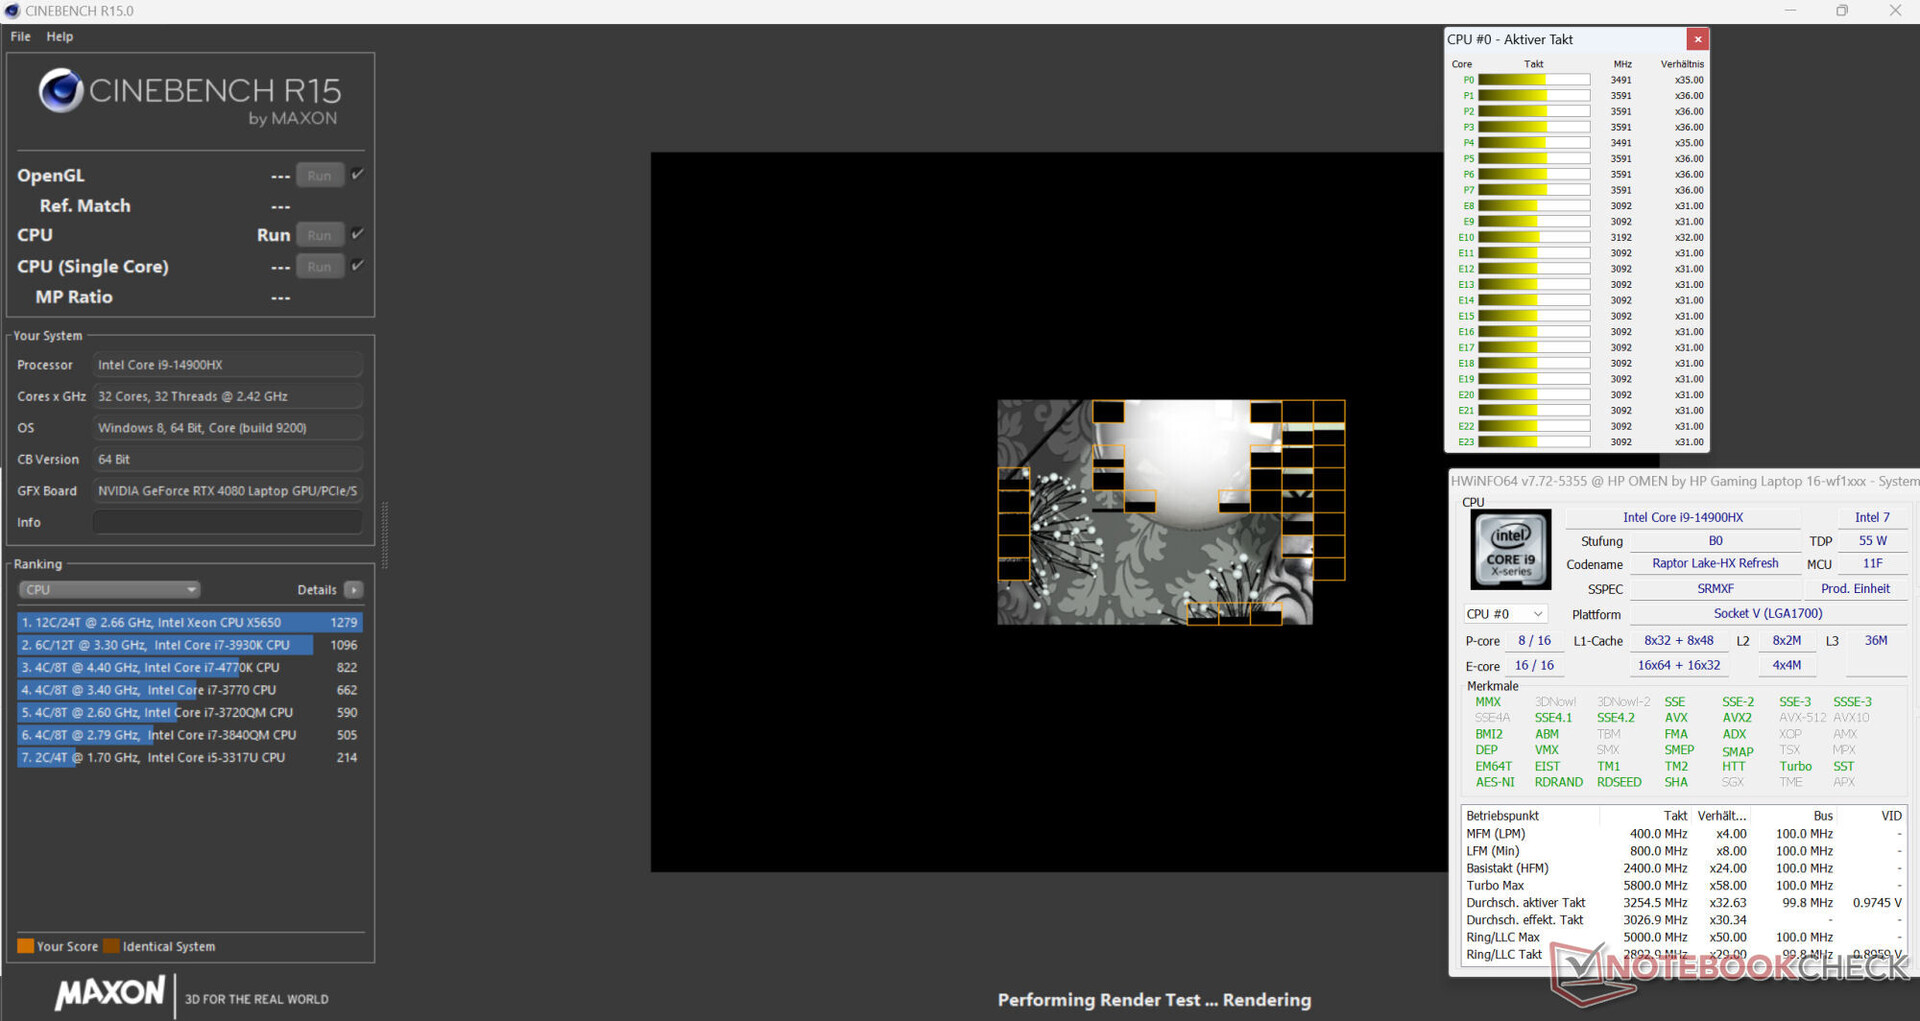
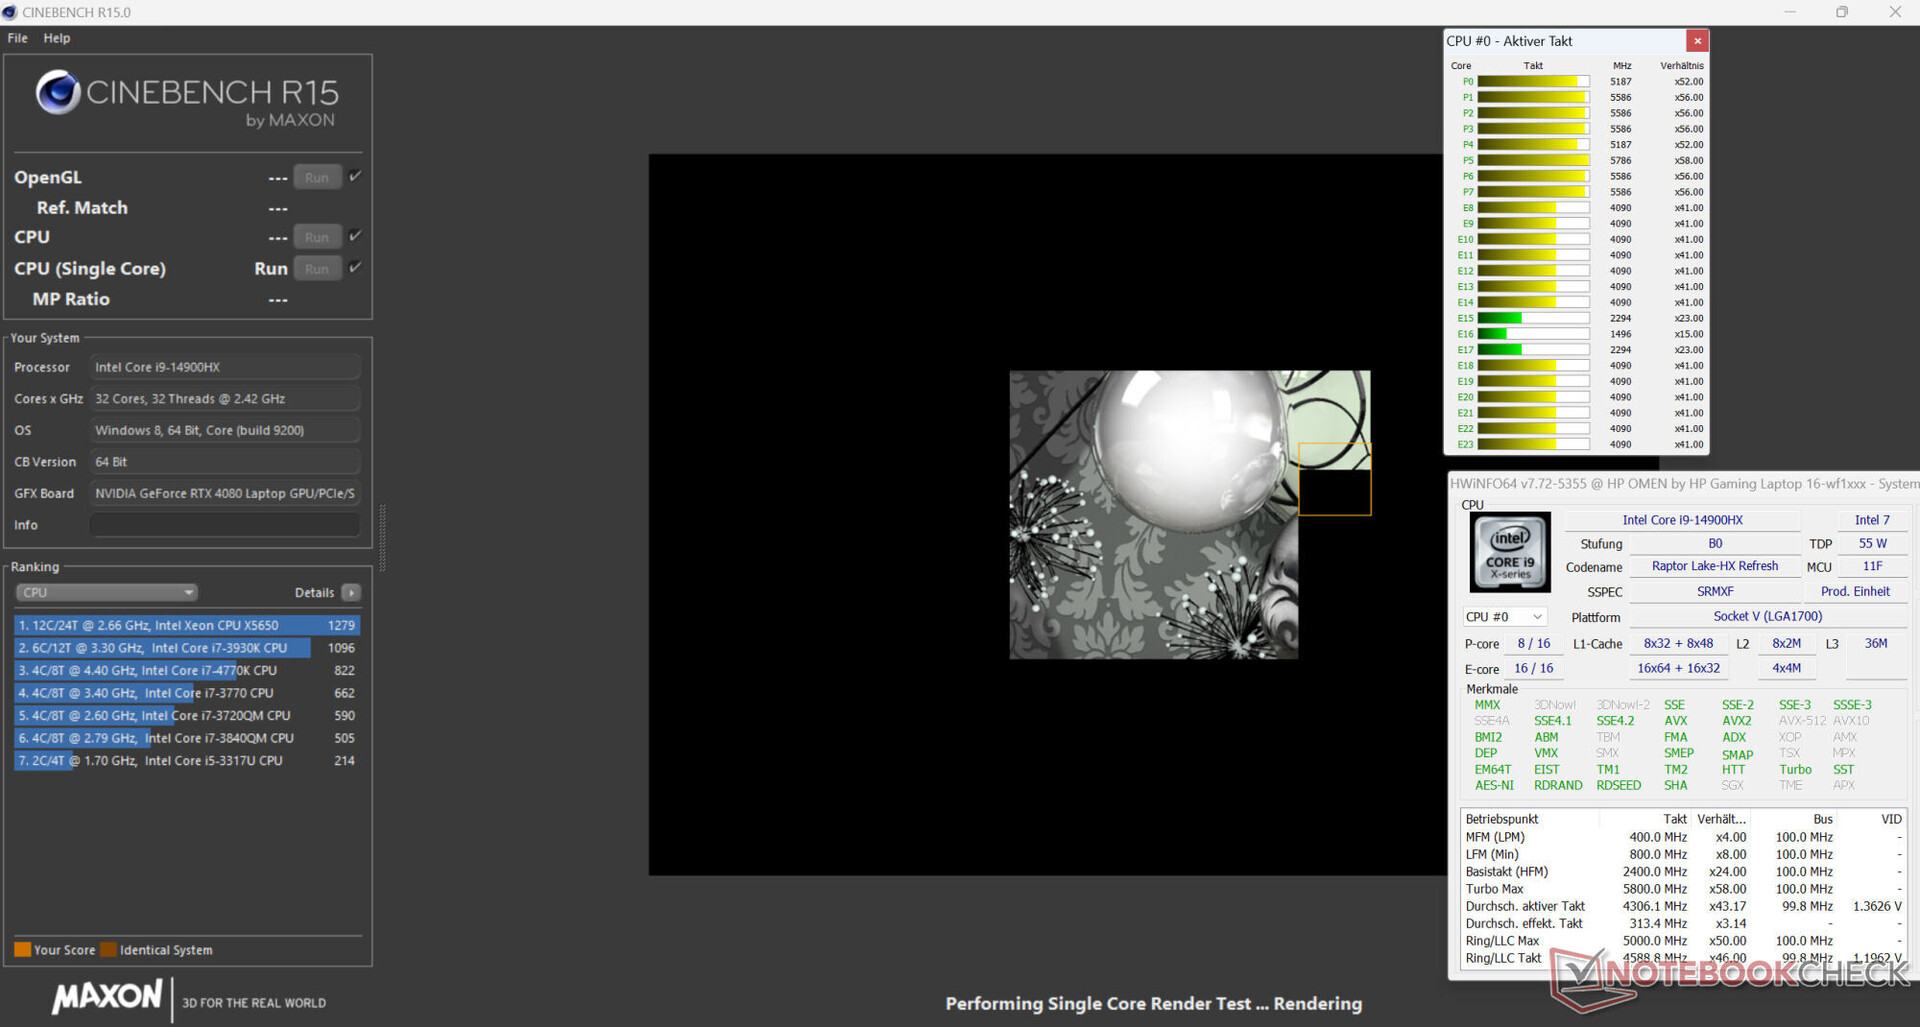
Processeur
Le Core i9-14900HX contient 8 cœurs P et 16 cœurs E, soit un total de 32 threads. Les cœurs P et E ont une vitesse d'horloge maximale de 5,8 GHz et 4,1 GHz respectivement. En mode équilibré, les résultats des tests sont inférieurs à la moyenne du processeur. Le passage en mode Performance n'apporte qu'une légère amélioration.
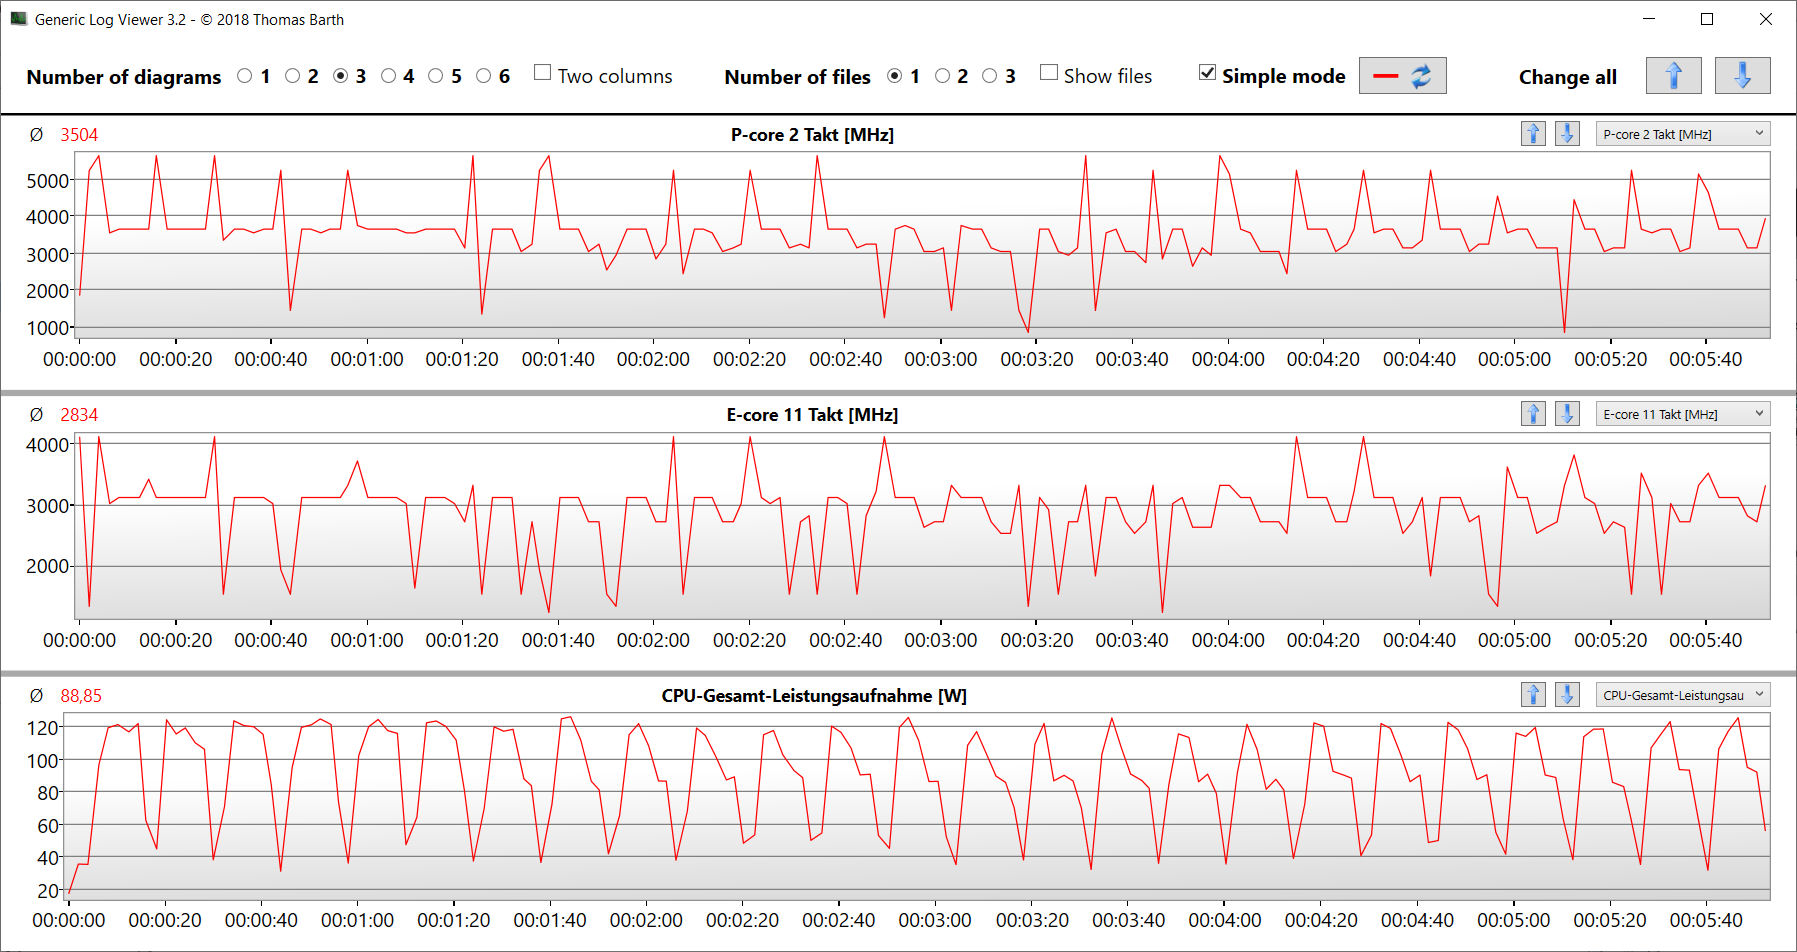
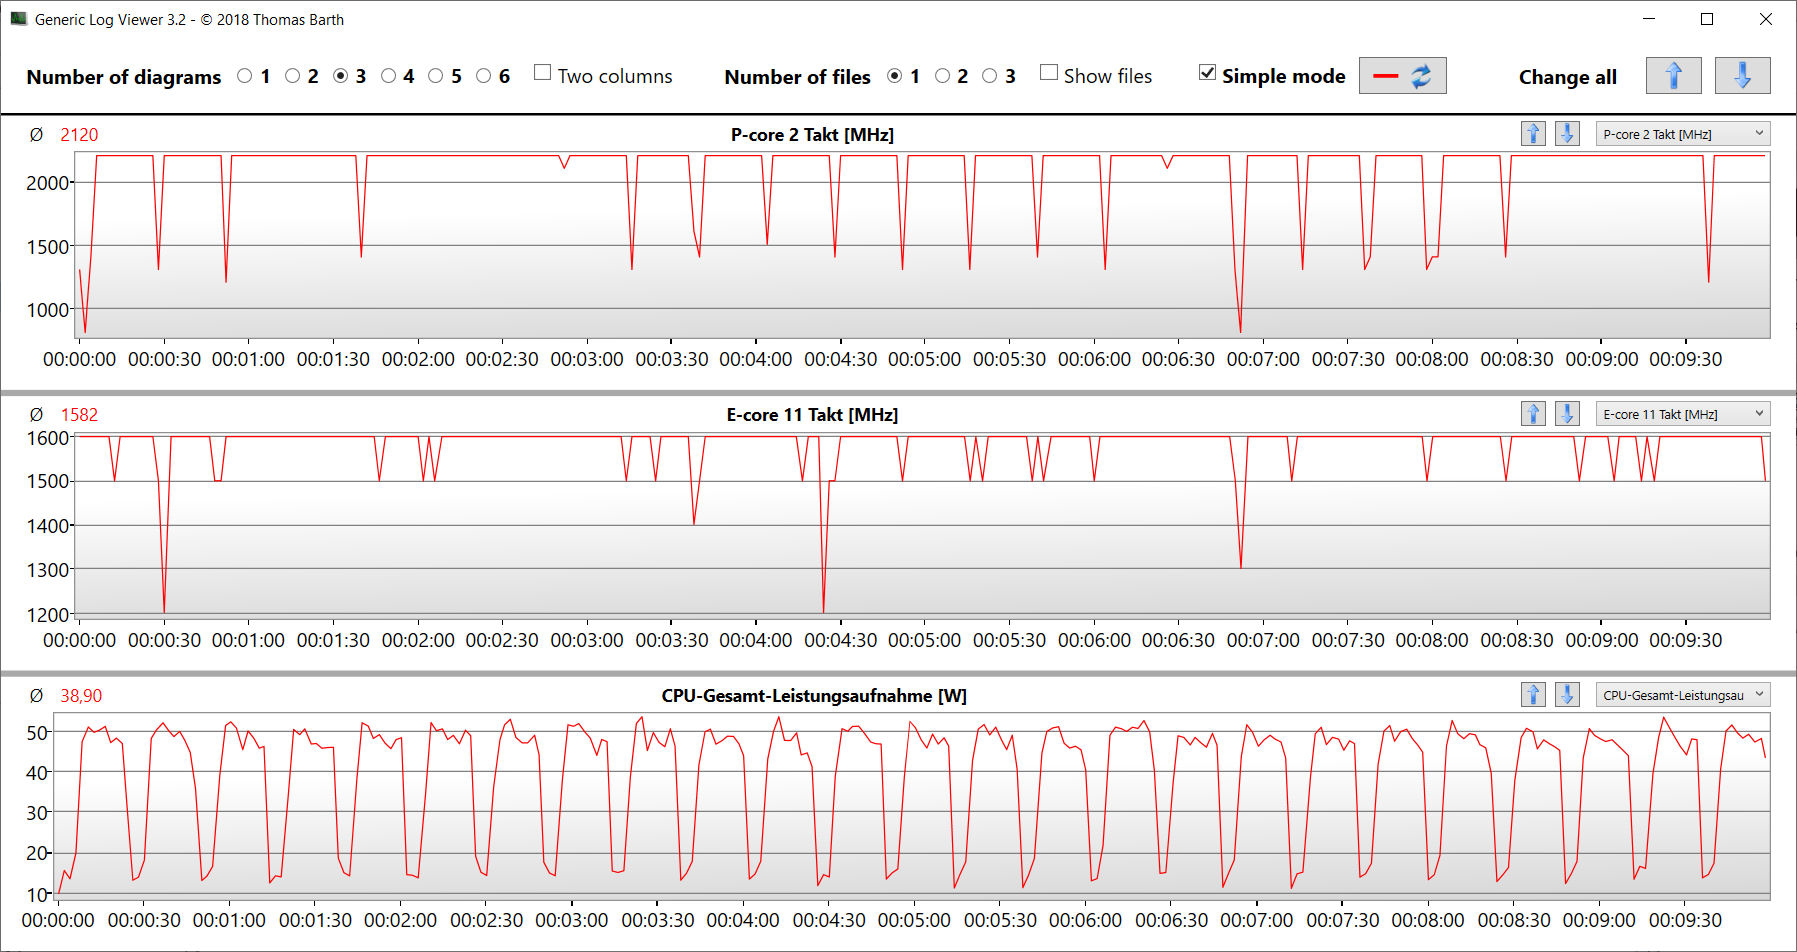
L'écart s'est creusé sous une charge multithread soutenue (boucle CB15). Au début de la quatrième exécution, la vitesse d'horloge a chuté de manière significative avant de se stabiliser à un niveau relativement constant pour le reste du test. En mode Performance, la vitesse d'horloge a été maintenue à son niveau initial. Sur batterie, le score le plus pertinent pour un seul thread (206 points ; CB15) a diminué dans une moindre mesure que le score pour plusieurs threads (1 596 ; CB15).
Reportez-vous à notre analyse pour plus d'informations sur le Core i9.
Cinebench R15 Multi Sustained Load
| CPU Performance rating - Percent | |
| MSI Vector 16 HX A14V | |
| Acer Predator Helios 18 N23Q2 | |
| Moyenne Intel Core i9-14900HX | |
| HP Omen 16 (2024) | |
| HP Omen 16 (2024) | |
| Alienware m16 R1 AMD | |
| Moyenne de la classe Gaming | |
| HP Omen 16-wf000 -3! | |
| Cinebench R20 | |
| CPU (Multi Core) | |
| MSI Vector 16 HX A14V | |
| Acer Predator Helios 18 N23Q2 | |
| Moyenne Intel Core i9-14900HX (6579 - 13832, n=37) | |
| Alienware m16 R1 AMD | |
| Moyenne de la classe Gaming (4029 - 16433, n=106, 2 dernières années) | |
| HP Omen 16 (2024) | |
| HP Omen 16 (2024) (Leistung) | |
| HP Omen 16-wf000 | |
| CPU (Single Core) | |
| HP Omen 16 (2024) (Leistung) | |
| HP Omen 16 (2024) | |
| MSI Vector 16 HX A14V | |
| Moyenne Intel Core i9-14900HX (657 - 859, n=37) | |
| Acer Predator Helios 18 N23Q2 | |
| Moyenne de la classe Gaming (442 - 913, n=106, 2 dernières années) | |
| HP Omen 16-wf000 | |
| Alienware m16 R1 AMD | |
| Cinebench R15 | |
| CPU Multi 64Bit | |
| Acer Predator Helios 18 N23Q2 | |
| MSI Vector 16 HX A14V | |
| Moyenne Intel Core i9-14900HX (3263 - 5589, n=38) | |
| Alienware m16 R1 AMD | |
| HP Omen 16 (2024) (Leistung) | |
| Moyenne de la classe Gaming (1578 - 6330, n=105, 2 dernières années) | |
| HP Omen 16 (2024) | |
| HP Omen 16-wf000 | |
| CPU Single 64Bit | |
| HP Omen 16 (2024) (Leistung) | |
| HP Omen 16 (2024) | |
| MSI Vector 16 HX A14V | |
| Moyenne Intel Core i9-14900HX (247 - 323, n=37) | |
| Moyenne de la classe Gaming (188.8 - 350, n=106, 2 dernières années) | |
| Alienware m16 R1 AMD | |
| Acer Predator Helios 18 N23Q2 | |
| HP Omen 16-wf000 | |
| Blender - v2.79 BMW27 CPU | |
| HP Omen 16 (2024) | |
| Moyenne de la classe Gaming (79 - 330, n=104, 2 dernières années) | |
| HP Omen 16 (2024) (Leistung) | |
| Moyenne Intel Core i9-14900HX (91 - 206, n=37) | |
| Alienware m16 R1 AMD | |
| Acer Predator Helios 18 N23Q2 | |
| MSI Vector 16 HX A14V | |
| Geekbench 6.7 | |
| Multi-Core | |
| MSI Vector 16 HX A14V (6.2.1) | |
| Acer Predator Helios 18 N23Q2 | |
| Moyenne Intel Core i9-14900HX (13158 - 19665, n=37) | |
| HP Omen 16 (2024) (6.2.1, Leistung) | |
| HP Omen 16 (2024) (6.2.1) | |
| Moyenne de la classe Gaming (6625 - 22850, n=106, 2 dernières années) | |
| Alienware m16 R1 AMD | |
| Single-Core | |
| HP Omen 16 (2024) (6.2.1) | |
| HP Omen 16 (2024) (6.2.1, Leistung) | |
| MSI Vector 16 HX A14V (6.2.1) | |
| Moyenne Intel Core i9-14900HX (2419 - 3129, n=37) | |
| Acer Predator Helios 18 N23Q2 | |
| Moyenne de la classe Gaming (1490 - 3259, n=106, 2 dernières années) | |
| Alienware m16 R1 AMD | |
| HWBOT x265 Benchmark v2.2 - 4k Preset | |
| MSI Vector 16 HX A14V | |
| Acer Predator Helios 18 N23Q2 | |
| Alienware m16 R1 AMD | |
| Moyenne Intel Core i9-14900HX (16.8 - 38.9, n=37) | |
| Moyenne de la classe Gaming (11.5 - 44.4, n=105, 2 dernières années) | |
| HP Omen 16 (2024) (Leistung) | |
| HP Omen 16 (2024) | |
| HP Omen 16-wf000 | |
| LibreOffice - 20 Documents To PDF | |
| Moyenne de la classe Gaming (33.2 - 88.8, n=105, 2 dernières années) | |
| Acer Predator Helios 18 N23Q2 | |
| MSI Vector 16 HX A14V (6.3.4.2) | |
| HP Omen 16-wf000 | |
| HP Omen 16 (2024) (6.3.4.2) | |
| HP Omen 16 (2024) (6.3.4.2, Leistung) | |
| Moyenne Intel Core i9-14900HX (19 - 85.1, n=37) | |
| Alienware m16 R1 AMD | |
| R Benchmark 2.5 - Overall mean | |
| HP Omen 16-wf000 | |
| Moyenne de la classe Gaming (0.3439 - 0.759, n=106, 2 dernières années) | |
| Alienware m16 R1 AMD | |
| Acer Predator Helios 18 N23Q2 | |
| Moyenne Intel Core i9-14900HX (0.3604 - 0.4859, n=37) | |
| MSI Vector 16 HX A14V | |
| HP Omen 16 (2024) (Leistung) | |
| HP Omen 16 (2024) | |
* ... Moindre est la valeur, meilleures sont les performances
AIDA64: FP32 Ray-Trace | FPU Julia | CPU SHA3 | CPU Queen | FPU SinJulia | FPU Mandel | CPU AES | CPU ZLib | FP64 Ray-Trace | CPU PhotoWorxx
| Performance rating | |
| Alienware m16 R1 AMD | |
| Acer Predator Helios 18 N23Q2 | |
| MSI Vector 16 HX A14V | |
| Moyenne de la classe Gaming | |
| Moyenne Intel Core i9-14900HX | |
| HP Omen 16 (2024) | |
| HP Omen 16 (2024) | |
| HP Omen 16-wf000 | |
| AIDA64 / FP32 Ray-Trace | |
| Alienware m16 R1 AMD (v6.85.6300) | |
| Moyenne de la classe Gaming (10227 - 85542, n=105, 2 dernières années) | |
| MSI Vector 16 HX A14V (v6.92.6600) | |
| Acer Predator Helios 18 N23Q2 (v6.85.6300) | |
| Moyenne Intel Core i9-14900HX (13098 - 33474, n=36) | |
| HP Omen 16 (2024) (v6.92.6600, Leistung) | |
| HP Omen 16-wf000 (v6.85.6300) | |
| HP Omen 16 (2024) (v6.92.6600) | |
| AIDA64 / FPU Julia | |
| Alienware m16 R1 AMD (v6.85.6300) | |
| MSI Vector 16 HX A14V (v6.92.6600) | |
| Moyenne de la classe Gaming (51376 - 238426, n=105, 2 dernières années) | |
| Acer Predator Helios 18 N23Q2 (v6.85.6300) | |
| Moyenne Intel Core i9-14900HX (67573 - 166040, n=36) | |
| HP Omen 16 (2024) (v6.92.6600, Leistung) | |
| HP Omen 16-wf000 (v6.85.6300) | |
| HP Omen 16 (2024) (v6.92.6600) | |
| AIDA64 / CPU SHA3 | |
| Alienware m16 R1 AMD (v6.85.6300) | |
| MSI Vector 16 HX A14V (v6.92.6600) | |
| Acer Predator Helios 18 N23Q2 (v6.85.6300) | |
| Moyenne de la classe Gaming (2180 - 10115, n=105, 2 dernières années) | |
| Moyenne Intel Core i9-14900HX (3589 - 7979, n=36) | |
| HP Omen 16 (2024) (v6.92.6600, Leistung) | |
| HP Omen 16 (2024) (v6.92.6600) | |
| HP Omen 16-wf000 (v6.85.6300) | |
| AIDA64 / CPU Queen | |
| Alienware m16 R1 AMD (v6.85.6300) | |
| MSI Vector 16 HX A14V (v6.92.6600) | |
| Moyenne Intel Core i9-14900HX (118405 - 148966, n=36) | |
| Acer Predator Helios 18 N23Q2 (v6.85.6300) | |
| HP Omen 16 (2024) (v6.92.6600) | |
| HP Omen 16 (2024) (v6.92.6600, Leistung) | |
| Moyenne de la classe Gaming (49785 - 173351, n=90, 2 dernières années) | |
| HP Omen 16-wf000 (v6.85.6300) | |
| AIDA64 / FPU SinJulia | |
| Alienware m16 R1 AMD (v6.85.6300) | |
| MSI Vector 16 HX A14V (v6.92.6600) | |
| Acer Predator Helios 18 N23Q2 (v6.85.6300) | |
| Moyenne Intel Core i9-14900HX (10475 - 18517, n=36) | |
| Moyenne de la classe Gaming (4424 - 33636, n=105, 2 dernières années) | |
| HP Omen 16 (2024) (v6.92.6600, Leistung) | |
| HP Omen 16 (2024) (v6.92.6600) | |
| HP Omen 16-wf000 (v6.85.6300) | |
| AIDA64 / FPU Mandel | |
| Alienware m16 R1 AMD (v6.85.6300) | |
| Moyenne de la classe Gaming (25115 - 128721, n=105, 2 dernières années) | |
| MSI Vector 16 HX A14V (v6.92.6600) | |
| Acer Predator Helios 18 N23Q2 (v6.85.6300) | |
| Moyenne Intel Core i9-14900HX (32543 - 83662, n=36) | |
| HP Omen 16 (2024) (v6.92.6600, Leistung) | |
| HP Omen 16-wf000 (v6.85.6300) | |
| HP Omen 16 (2024) (v6.92.6600) | |
| AIDA64 / CPU AES | |
| Acer Predator Helios 18 N23Q2 (v6.85.6300) | |
| Moyenne Intel Core i9-14900HX (86964 - 241777, n=36) | |
| MSI Vector 16 HX A14V (v6.92.6600) | |
| HP Omen 16 (2024) (v6.92.6600, Leistung) | |
| Alienware m16 R1 AMD (v6.85.6300) | |
| Moyenne de la classe Gaming (39258 - 247074, n=105, 2 dernières années) | |
| HP Omen 16-wf000 (v6.85.6300) | |
| HP Omen 16 (2024) (v6.92.6600) | |
| AIDA64 / CPU ZLib | |
| MSI Vector 16 HX A14V (v6.92.6600) | |
| Acer Predator Helios 18 N23Q2 (v6.85.6300) | |
| Moyenne Intel Core i9-14900HX (1054 - 2292, n=36) | |
| Alienware m16 R1 AMD (v6.85.6300) | |
| HP Omen 16 (2024) (v6.92.6600, Leistung) | |
| Moyenne de la classe Gaming (574 - 2531, n=105, 2 dernières années) | |
| HP Omen 16-wf000 (v6.85.6300) | |
| HP Omen 16 (2024) (v6.92.6600) | |
| AIDA64 / FP64 Ray-Trace | |
| Alienware m16 R1 AMD (v6.85.6300) | |
| Moyenne de la classe Gaming (5509 - 45446, n=105, 2 dernières années) | |
| MSI Vector 16 HX A14V (v6.92.6600) | |
| Acer Predator Helios 18 N23Q2 (v6.85.6300) | |
| Moyenne Intel Core i9-14900HX (6809 - 18349, n=36) | |
| HP Omen 16 (2024) (v6.92.6600, Leistung) | |
| HP Omen 16-wf000 (v6.85.6300) | |
| HP Omen 16 (2024) (v6.92.6600) | |
| AIDA64 / CPU PhotoWorxx | |
| Acer Predator Helios 18 N23Q2 (v6.85.6300) | |
| HP Omen 16 (2024) (v6.92.6600, Leistung) | |
| HP Omen 16 (2024) (v6.92.6600) | |
| MSI Vector 16 HX A14V (v6.92.6600) | |
| Moyenne Intel Core i9-14900HX (23903 - 54702, n=36) | |
| Moyenne de la classe Gaming (12271 - 89891, n=105, 2 dernières années) | |
| HP Omen 16-wf000 (v6.85.6300) | |
| Alienware m16 R1 AMD (v6.85.6300) | |
Performance du système
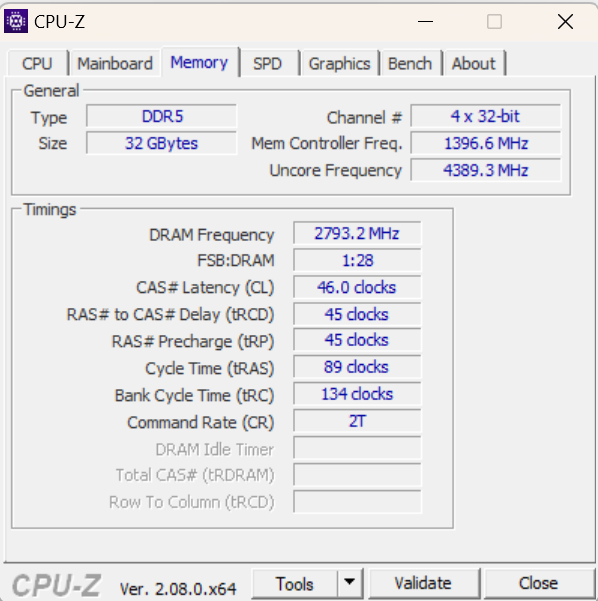
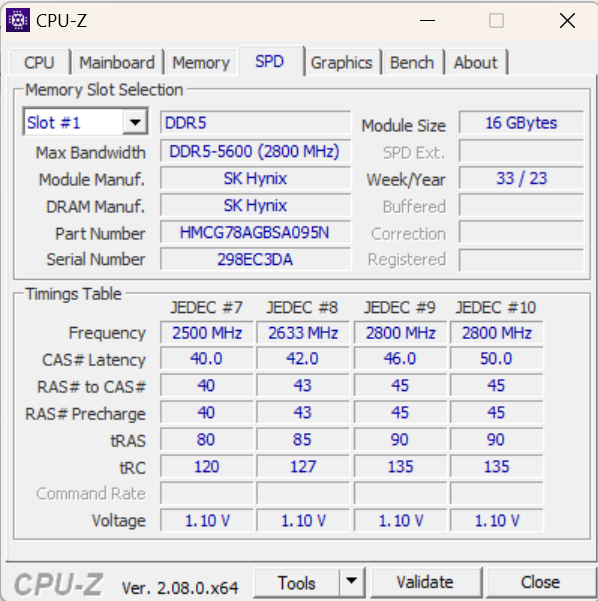
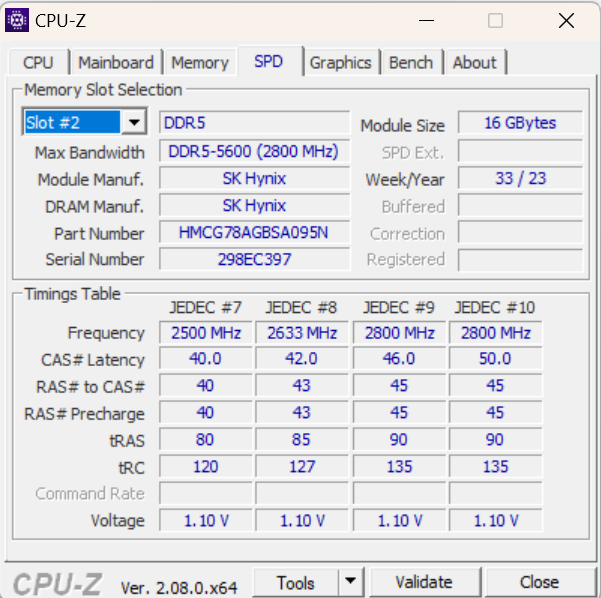
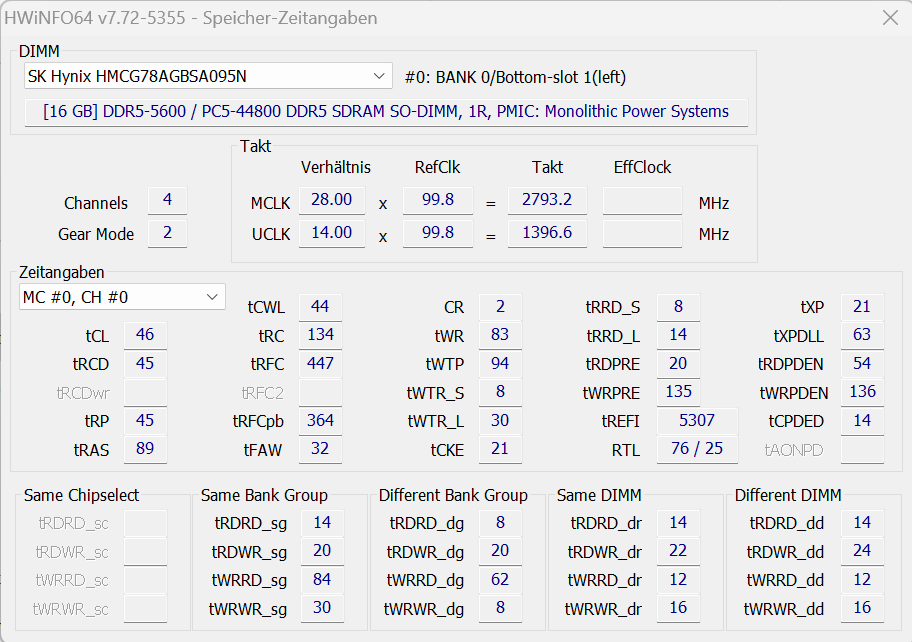
Ce système rapide se caractérise par une grande puissance de traitement. Le matériel est capable de gérer des tâches telles que les jeux et le rendu sans effort. Les vitesses de transfert de la mémoire se situent à un niveau typique pour de la RAM DDR5-5600.
CrossMark: Overall | Productivity | Creativity | Responsiveness
WebXPRT 3: Overall
WebXPRT 4: Overall
Mozilla Kraken 1.1: Total
| PCMark 10 / Score | |
| HP Omen 16 (2024) | |
| Alienware m16 R1 AMD | |
| Moyenne Intel Core i9-14900HX, NVIDIA GeForce RTX 4080 Laptop GPU (7703 - 9223, n=7) | |
| MSI Vector 16 HX A14V | |
| Acer Predator Helios 18 N23Q2 | |
| Moyenne de la classe Gaming (5828 - 12414, n=93, 2 dernières années) | |
| HP Omen 16-wf000 | |
| PCMark 10 / Essentials | |
| Moyenne Intel Core i9-14900HX, NVIDIA GeForce RTX 4080 Laptop GPU (11255 - 12600, n=7) | |
| Alienware m16 R1 AMD | |
| MSI Vector 16 HX A14V | |
| HP Omen 16 (2024) | |
| Acer Predator Helios 18 N23Q2 | |
| Moyenne de la classe Gaming (8810 - 11935, n=97, 2 dernières années) | |
| HP Omen 16-wf000 | |
| PCMark 10 / Productivity | |
| HP Omen 16 (2024) | |
| Moyenne de la classe Gaming (6845 - 25323, n=95, 2 dernières années) | |
| Acer Predator Helios 18 N23Q2 | |
| Alienware m16 R1 AMD | |
| Moyenne Intel Core i9-14900HX, NVIDIA GeForce RTX 4080 Laptop GPU (6662 - 11410, n=7) | |
| MSI Vector 16 HX A14V | |
| HP Omen 16-wf000 | |
| PCMark 10 / Digital Content Creation | |
| MSI Vector 16 HX A14V | |
| Alienware m16 R1 AMD | |
| Moyenne Intel Core i9-14900HX, NVIDIA GeForce RTX 4080 Laptop GPU (14211 - 16246, n=7) | |
| HP Omen 16 (2024) | |
| Acer Predator Helios 18 N23Q2 | |
| Moyenne de la classe Gaming (7602 - 19954, n=95, 2 dernières années) | |
| HP Omen 16-wf000 | |
| CrossMark / Overall | |
| HP Omen 16 (2024) | |
| Acer Predator Helios 18 N23Q2 | |
| MSI Vector 16 HX A14V | |
| Moyenne Intel Core i9-14900HX, NVIDIA GeForce RTX 4080 Laptop GPU (1992 - 2334, n=7) | |
| Alienware m16 R1 AMD | |
| Moyenne de la classe Gaming (1366 - 2409, n=94, 2 dernières années) | |
| HP Omen 16-wf000 | |
| CrossMark / Productivity | |
| HP Omen 16 (2024) | |
| Acer Predator Helios 18 N23Q2 | |
| MSI Vector 16 HX A14V | |
| Moyenne Intel Core i9-14900HX, NVIDIA GeForce RTX 4080 Laptop GPU (1812 - 2204, n=7) | |
| Alienware m16 R1 AMD | |
| Moyenne de la classe Gaming (1386 - 2254, n=94, 2 dernières années) | |
| HP Omen 16-wf000 | |
| CrossMark / Creativity | |
| MSI Vector 16 HX A14V | |
| Acer Predator Helios 18 N23Q2 | |
| Moyenne Intel Core i9-14900HX, NVIDIA GeForce RTX 4080 Laptop GPU (2327 - 2500, n=7) | |
| HP Omen 16 (2024) | |
| Moyenne de la classe Gaming (1343 - 2786, n=94, 2 dernières années) | |
| Alienware m16 R1 AMD | |
| HP Omen 16-wf000 | |
| CrossMark / Responsiveness | |
| HP Omen 16 (2024) | |
| Acer Predator Helios 18 N23Q2 | |
| MSI Vector 16 HX A14V | |
| Moyenne Intel Core i9-14900HX, NVIDIA GeForce RTX 4080 Laptop GPU (1520 - 2254, n=7) | |
| Alienware m16 R1 AMD | |
| Moyenne de la classe Gaming (1226 - 2334, n=94, 2 dernières années) | |
| HP Omen 16-wf000 | |
| WebXPRT 3 / Overall | |
| Alienware m16 R1 AMD | |
| Moyenne Intel Core i9-14900HX, NVIDIA GeForce RTX 4080 Laptop GPU (310 - 345, n=7) | |
| HP Omen 16 (2024) | |
| MSI Vector 16 HX A14V | |
| Acer Predator Helios 18 N23Q2 | |
| Moyenne de la classe Gaming (220 - 532, n=98, 2 dernières années) | |
| HP Omen 16-wf000 | |
| WebXPRT 4 / Overall | |
| Moyenne Intel Core i9-14900HX, NVIDIA GeForce RTX 4080 Laptop GPU (300 - 321, n=7) | |
| HP Omen 16 (2024) | |
| MSI Vector 16 HX A14V | |
| Moyenne de la classe Gaming (165 - 354, n=98, 2 dernières années) | |
| Alienware m16 R1 AMD | |
| HP Omen 16-wf000 | |
| Mozilla Kraken 1.1 / Total | |
| HP Omen 16-wf000 | |
| Alienware m16 R1 AMD | |
| Moyenne de la classe Gaming (391 - 590, n=100, 2 dernières années) | |
| Acer Predator Helios 18 N23Q2 | |
| MSI Vector 16 HX A14V | |
| Moyenne Intel Core i9-14900HX, NVIDIA GeForce RTX 4080 Laptop GPU (437 - 446, n=7) | |
| HP Omen 16 (2024) | |
* ... Moindre est la valeur, meilleures sont les performances
| PCMark 10 Score | 8915 points | |
Aide | ||
| AIDA64 / Memory Copy | |
| HP Omen 16 (2024) | |
| Acer Predator Helios 18 N23Q2 | |
| MSI Vector 16 HX A14V | |
| Moyenne Intel Core i9-14900HX (38028 - 83392, n=36) | |
| Moyenne de la classe Gaming (21750 - 129946, n=105, 2 dernières années) | |
| HP Omen 16-wf000 | |
| Alienware m16 R1 AMD | |
| AIDA64 / Memory Read | |
| HP Omen 16 (2024) | |
| Acer Predator Helios 18 N23Q2 | |
| MSI Vector 16 HX A14V | |
| Moyenne Intel Core i9-14900HX (43306 - 87568, n=36) | |
| Moyenne de la classe Gaming (22956 - 118858, n=105, 2 dernières années) | |
| HP Omen 16-wf000 | |
| Alienware m16 R1 AMD | |
| AIDA64 / Memory Write | |
| HP Omen 16 (2024) | |
| MSI Vector 16 HX A14V | |
| Moyenne de la classe Gaming (22297 - 135096, n=105, 2 dernières années) | |
| Acer Predator Helios 18 N23Q2 | |
| Moyenne Intel Core i9-14900HX (37146 - 80589, n=36) | |
| HP Omen 16-wf000 | |
| Alienware m16 R1 AMD | |
| AIDA64 / Memory Latency | |
| Moyenne de la classe Gaming (75.3 - 259, n=105, 2 dernières années) | |
| Alienware m16 R1 AMD | |
| HP Omen 16-wf000 | |
| Moyenne Intel Core i9-14900HX (76.1 - 105, n=36) | |
| HP Omen 16 (2024) | |
| Acer Predator Helios 18 N23Q2 | |
| MSI Vector 16 HX A14V | |
* ... Moindre est la valeur, meilleures sont les performances
Latence DPC
Notre test standardisé Latency Monitor (surf sur le web, lecture vidéo 4K et Prime95 High-load) a révélé quelques problèmes. Le système ne semble pas adapté à l'édition vidéo et audio en temps réel. Espérons que les prochaines mises à jour logicielles apporteront des améliorations.
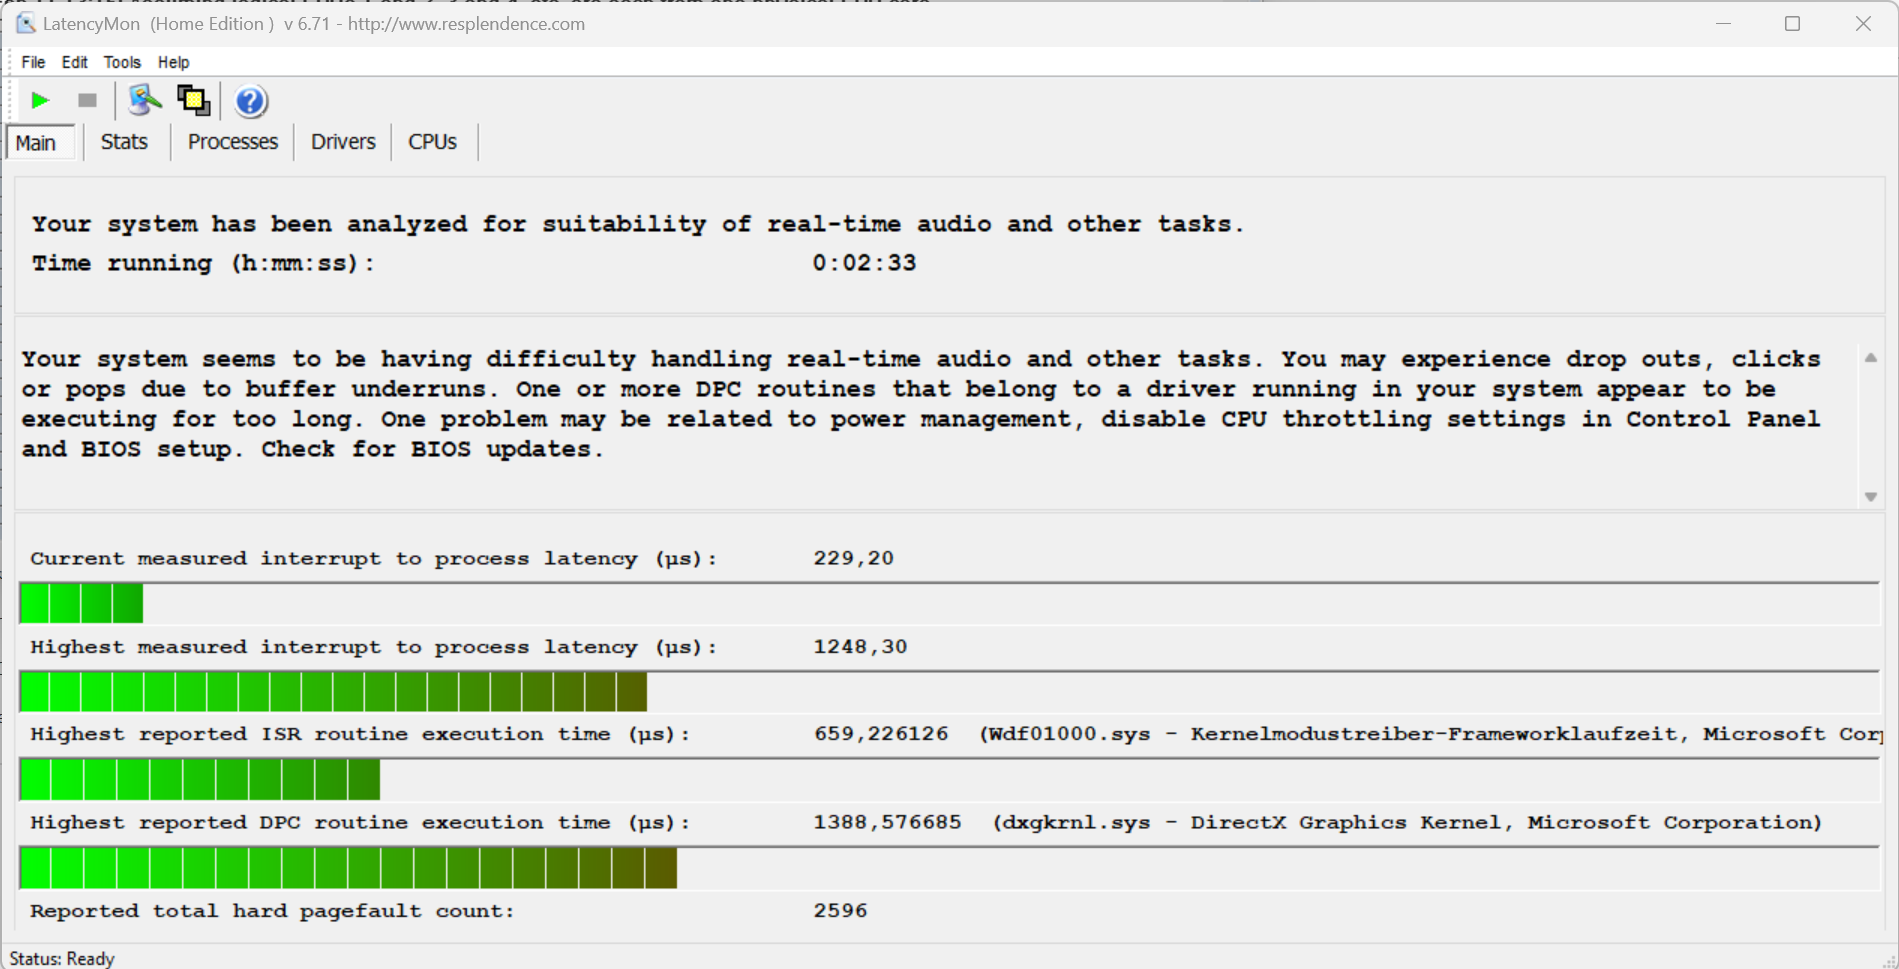
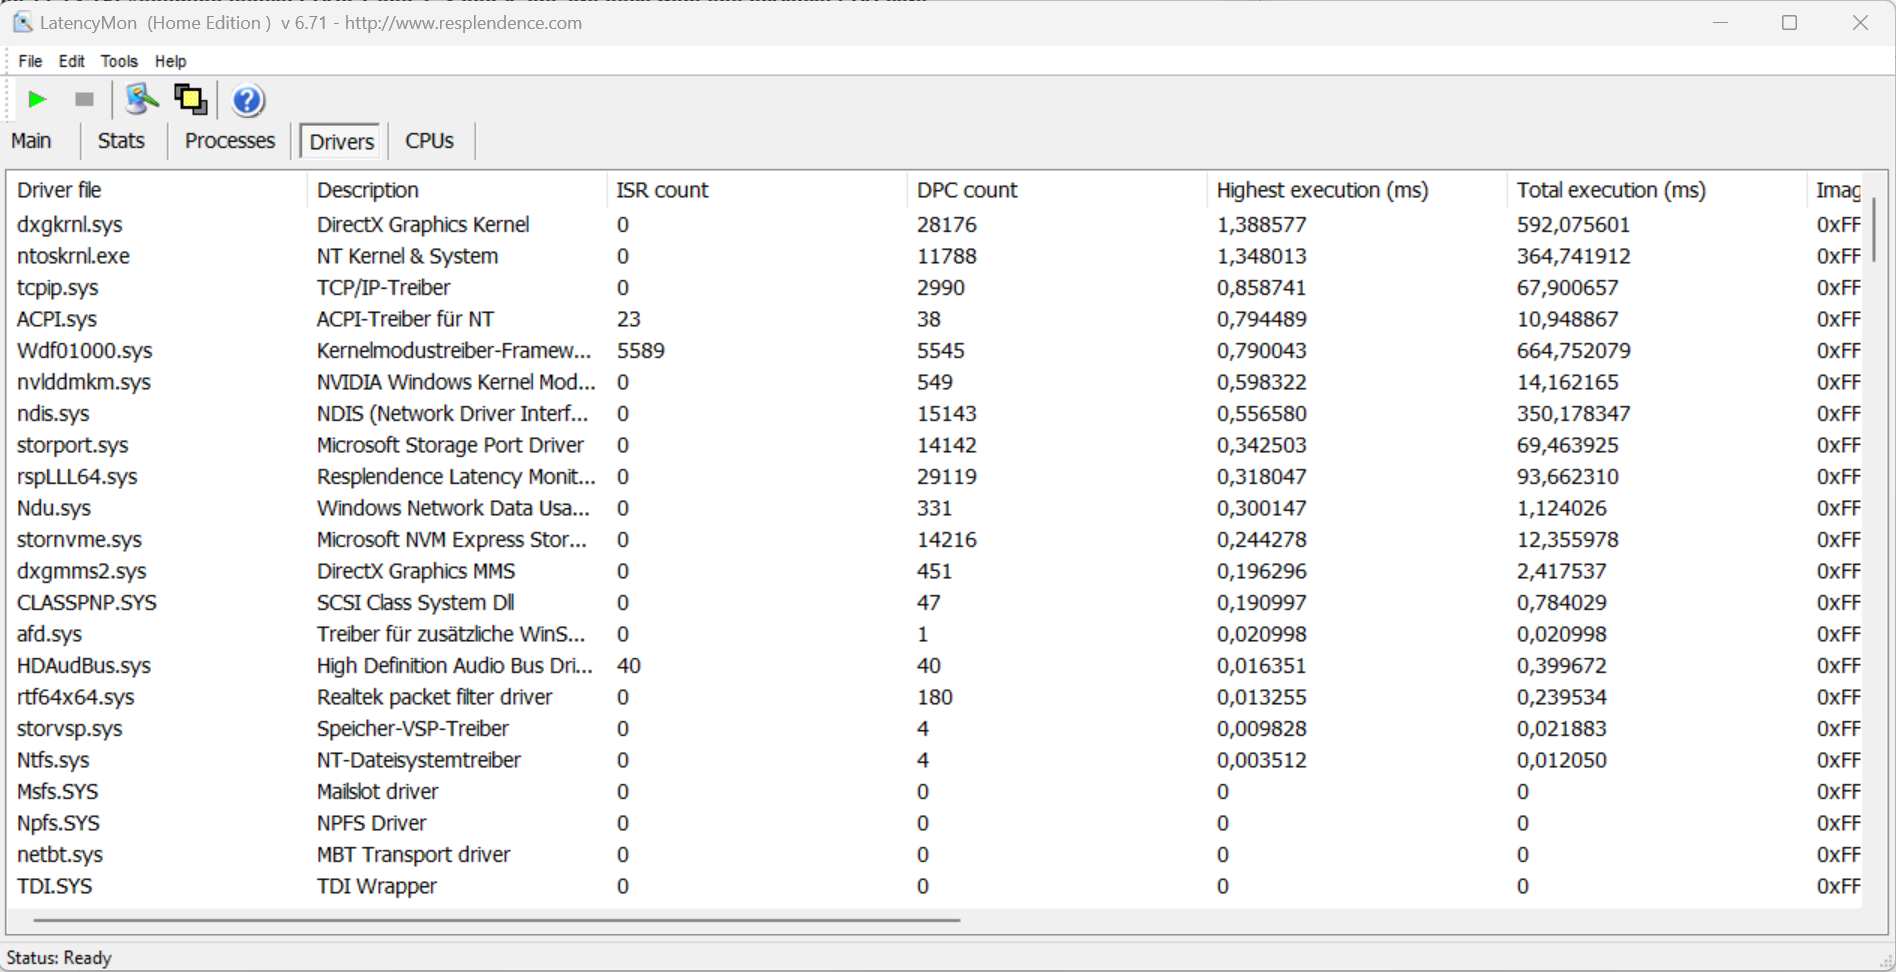
| DPC Latencies / LatencyMon - interrupt to process latency (max), Web, Youtube, Prime95 | |
| Acer Predator Helios 18 N23Q2 | |
| HP Omen 16-wf000 | |
| Alienware m16 R1 AMD | |
| MSI Vector 16 HX A14V | |
| HP Omen 16 (2024) | |
* ... Moindre est la valeur, meilleures sont les performances
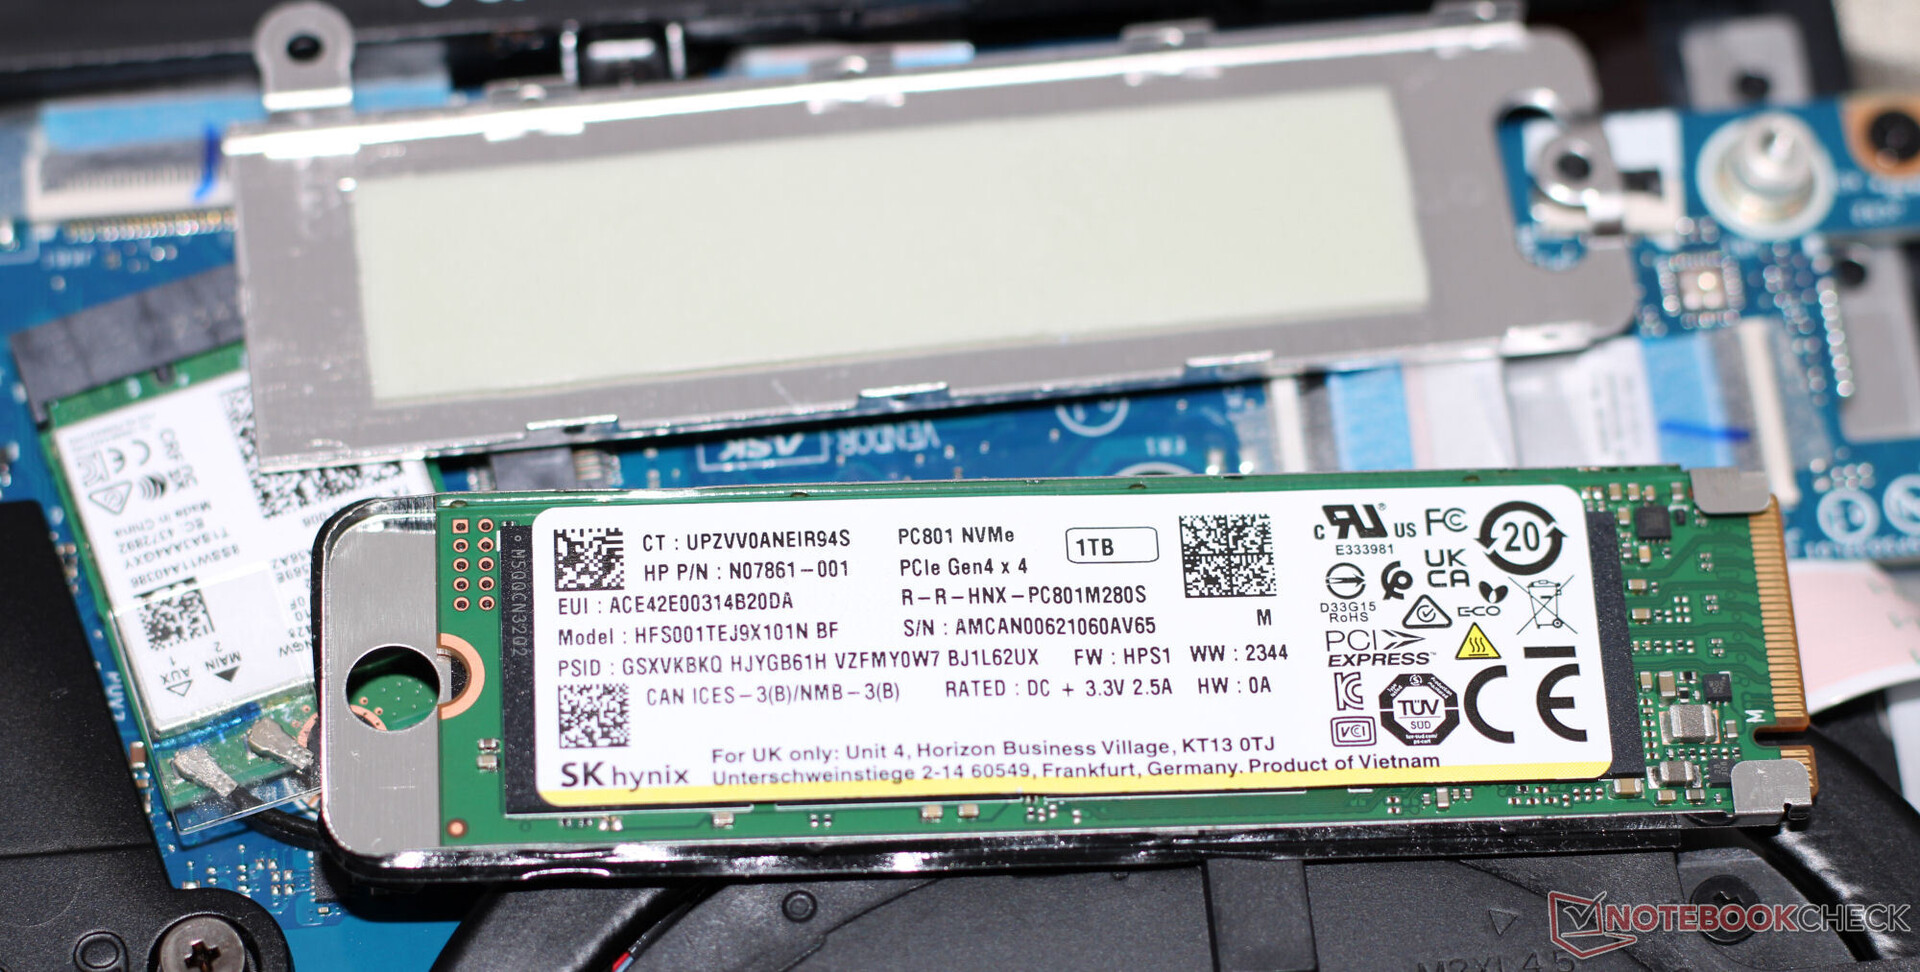
Mémoire de masse
L'Omen 16 peut accueillir un total de deux disques SSD PCIe 4.0 M.2-2280. Le disque SK Hynix de 1 To de notre unité d'évaluation offre d'excellentes vitesses de transfert et n'a pas subi d'étranglement thermique lors de nos tests.

* ... Moindre est la valeur, meilleures sont les performances
Sustained Load Read: DiskSpd Read Loop, Queue Depth 8
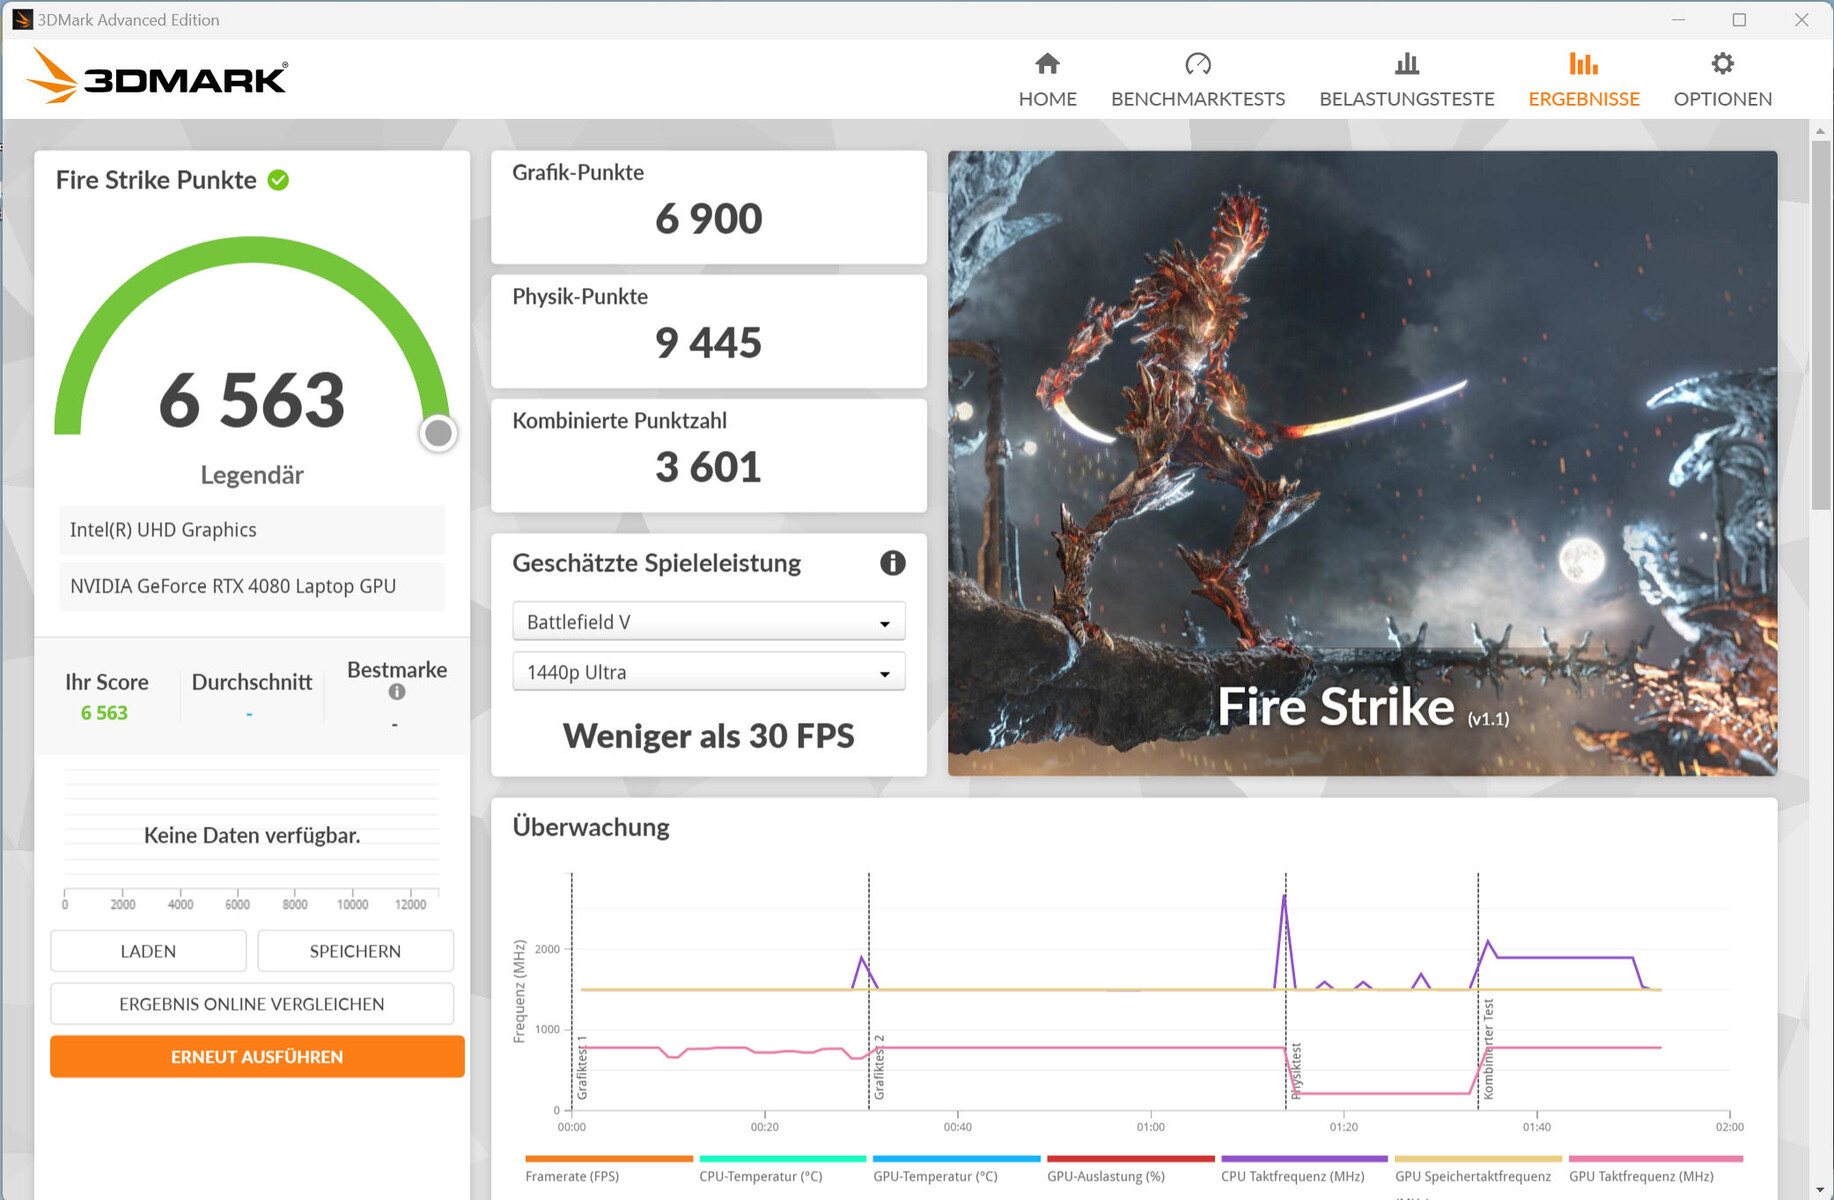
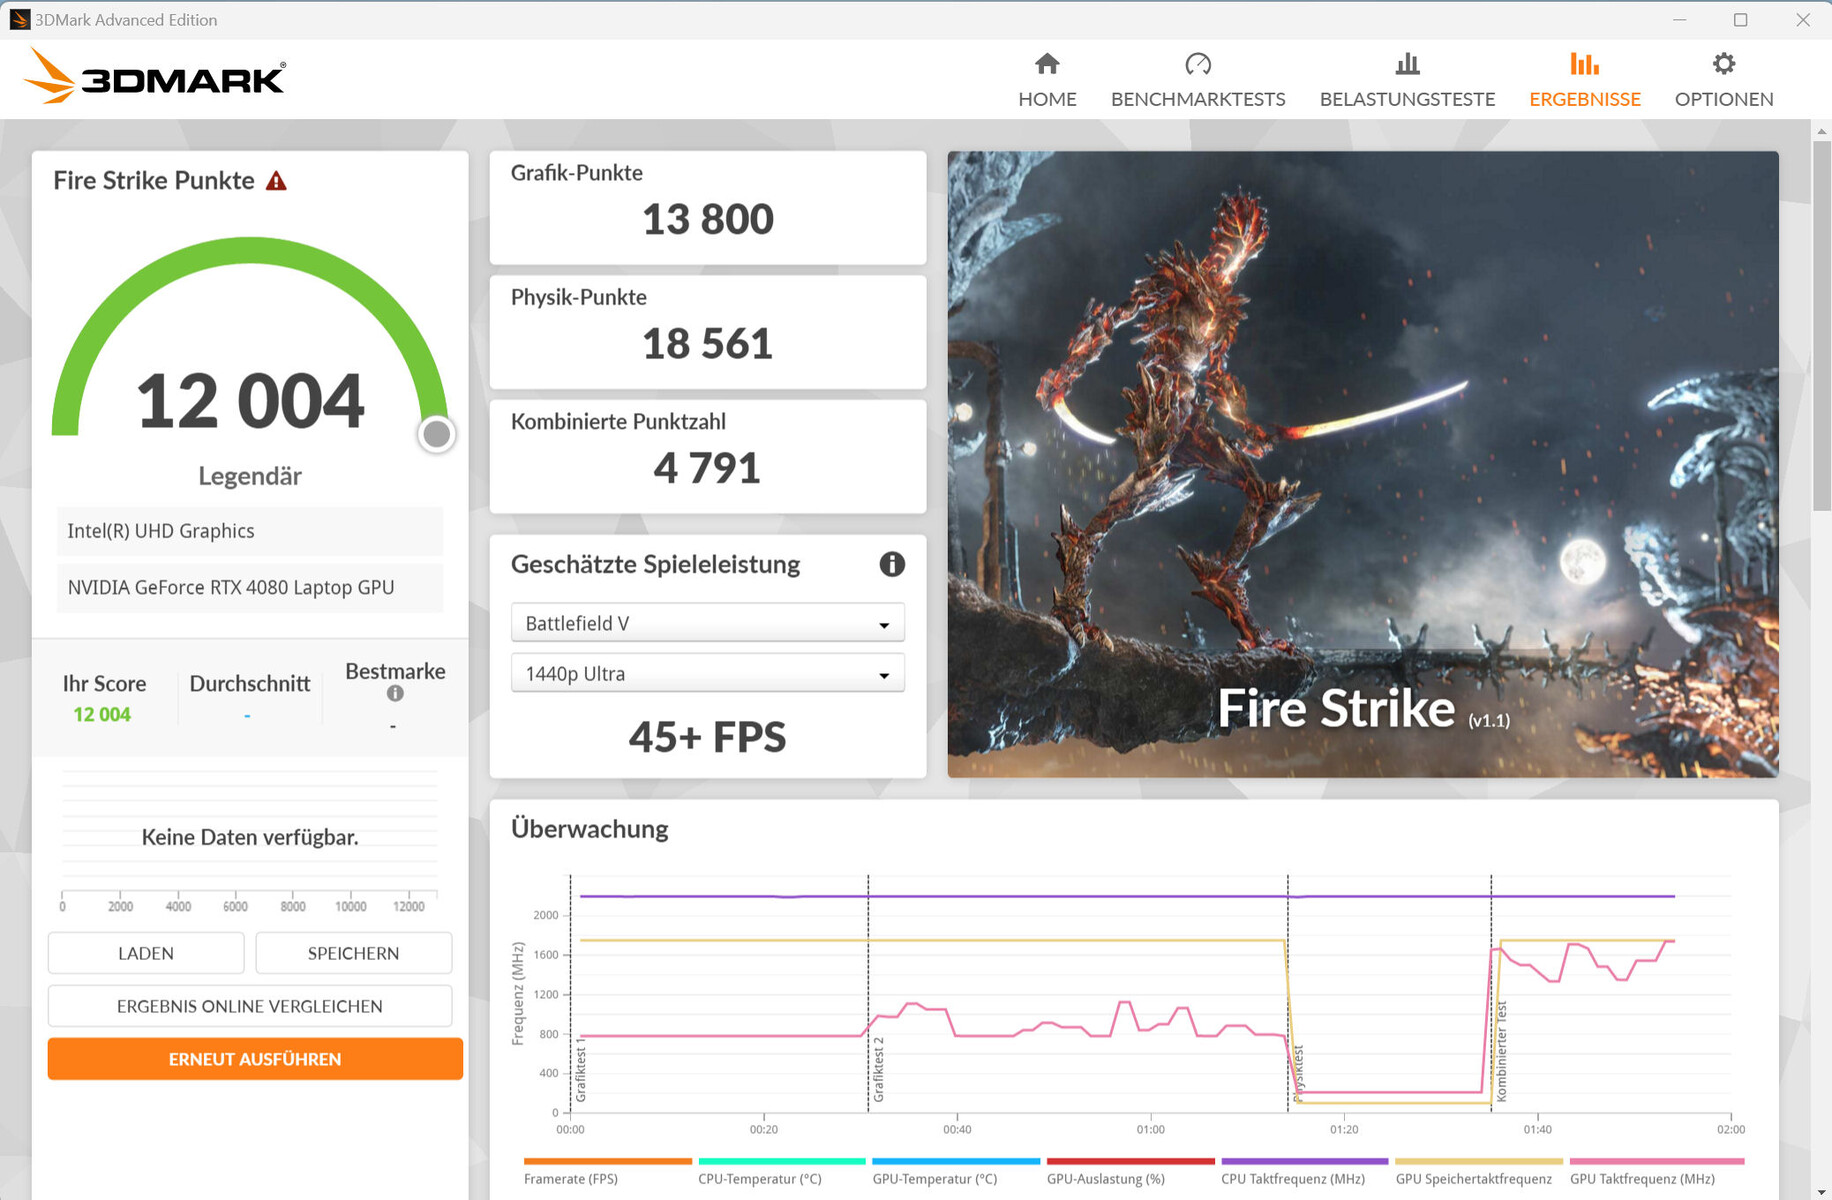
Carte graphique
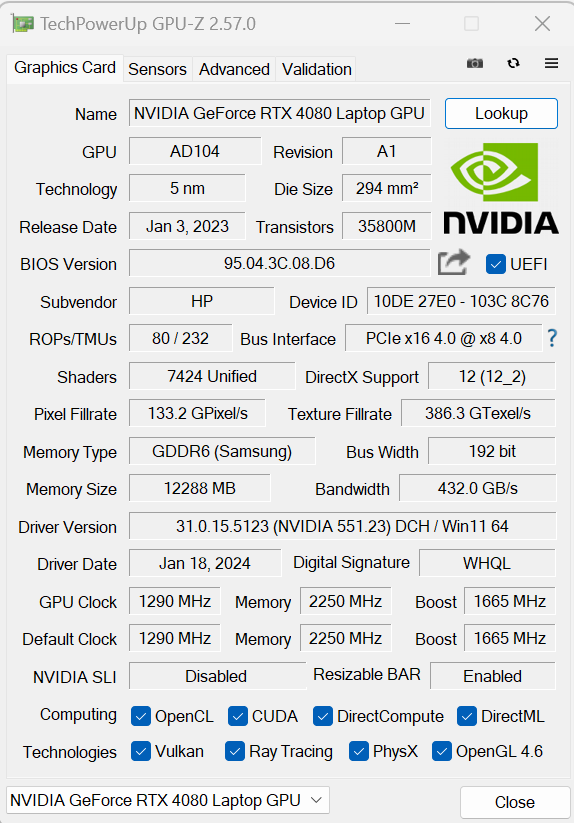
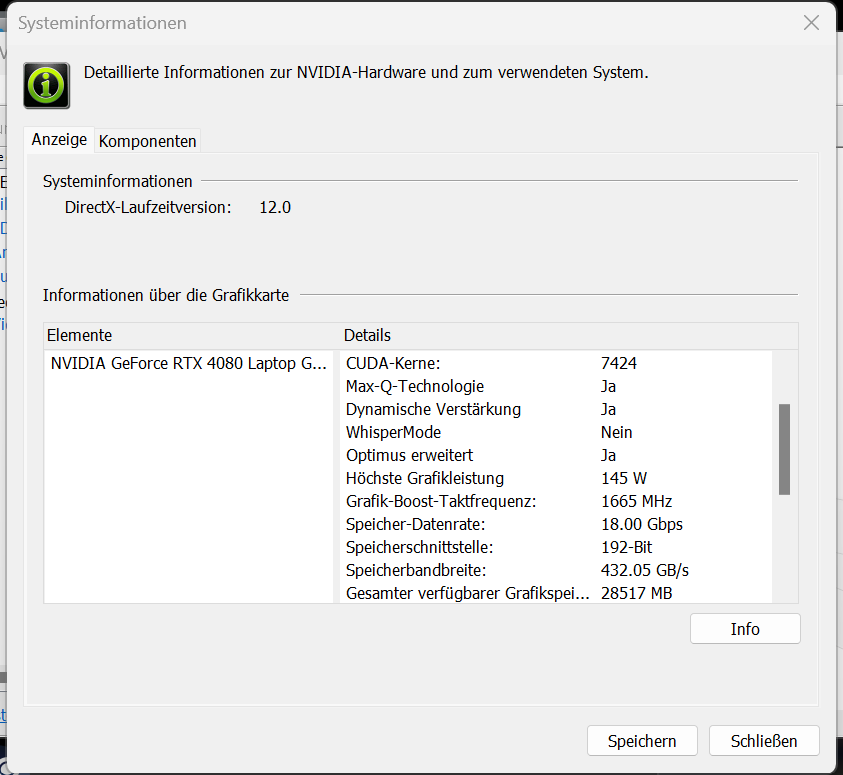
La carte GeForce RTX 4080 comprend 7 424 cœurs CUDA, un bus mémoire de 192 bits et 12 288 Mo de mémoire GDDR6. HP a attribué à la carte graphique un TGP de 145 watts - inférieur au TGP maximum de 175 watts spécifié par Nvidia.
Les résultats des benchmarks et les taux de rafraîchissement obtenus avec l'Omen 16 sont inférieurs à ce que nous avons vu avec la RTX 4080 Laptop en moyenne. Le passage en mode Performance permet d'améliorer les performances. Le GPU vous permet de jouer avec une résolution QHD et des paramètres élevés à maximaux. Avec l'aide de DLSS 3 et Frame Generation, il est également possible d'activer des paramètres maximaux et des effets de ray tracing supplémentaires à des résolutions plus élevées - bien que vous ne puissiez le faire que dans les jeux avec le support approprié.


| 3DMark Performance rating - Percent | |
| MSI Vector 16 HX A14V | |
| Alienware m16 R1 AMD | |
| Acer Predator Helios 18 N23Q2 | |
| Moyenne NVIDIA GeForce RTX 4080 Laptop GPU | |
| HP Omen 16-wf000 | |
| HP Omen 16 (2024) | |
| Moyenne de la classe Gaming | |
| HP Omen 16 (2024) | |
| 3DMark 11 - 1280x720 Performance GPU | |
| MSI Vector 16 HX A14V | |
| Acer Predator Helios 18 N23Q2 | |
| Moyenne NVIDIA GeForce RTX 4080 Laptop GPU (45199 - 63128, n=24) | |
| Alienware m16 R1 AMD | |
| HP Omen 16-wf000 | |
| HP Omen 16 (2024) (Leistung) | |
| Moyenne de la classe Gaming (21841 - 80022, n=104, 2 dernières années) | |
| HP Omen 16 (2024) | |
| 3DMark | |
| 1920x1080 Fire Strike Graphics | |
| Alienware m16 R1 AMD | |
| MSI Vector 16 HX A14V | |
| Acer Predator Helios 18 N23Q2 | |
| Moyenne NVIDIA GeForce RTX 4080 Laptop GPU (33058 - 45220, n=23) | |
| HP Omen 16 (2024) (Leistung) | |
| Moyenne de la classe Gaming (12242 - 62849, n=115, 2 dernières années) | |
| HP Omen 16-wf000 | |
| HP Omen 16 (2024) | |
| 2560x1440 Time Spy Graphics | |
| MSI Vector 16 HX A14V | |
| Alienware m16 R1 AMD | |
| Acer Predator Helios 18 N23Q2 | |
| Moyenne NVIDIA GeForce RTX 4080 Laptop GPU (13282 - 19663, n=23) | |
| HP Omen 16-wf000 | |
| HP Omen 16 (2024) (Leistung) | |
| Moyenne de la classe Gaming (5012 - 26212, n=115, 2 dernières années) | |
| HP Omen 16 (2024) | |
| 3DMark 11 Performance | 35380 points | |
| 3DMark Cloud Gate Standard Score | 51266 points | |
| 3DMark Fire Strike Score | 27191 points | |
| 3DMark Time Spy Score | 13636 points | |
Aide | ||
| Blender | |
| v3.3 Classroom OPTIX/RTX | |
| Moyenne de la classe Gaming (9 - 32, n=106, 2 dernières années) | |
| HP Omen 16-wf000 (3.3.3) | |
| HP Omen 16 (2024) (3.3.3) | |
| Alienware m16 R1 AMD (3.3.3) | |
| Moyenne NVIDIA GeForce RTX 4080 Laptop GPU (13 - 20, n=22) | |
| Acer Predator Helios 18 N23Q2 (3.3.3) | |
| MSI Vector 16 HX A14V (3.3.3) | |
| HP Omen 16 (2024) (3.3.3, Leistung) | |
| v3.3 Classroom CUDA | |
| Moyenne de la classe Gaming (15 - 228, n=106, 2 dernières années) | |
| HP Omen 16 (2024) (3.3.3) | |
| Alienware m16 R1 AMD (3.3.3) | |
| HP Omen 16 (2024) (3.3.3, Leistung) | |
| Moyenne NVIDIA GeForce RTX 4080 Laptop GPU (21 - 28, n=23) | |
| HP Omen 16-wf000 (3.3.3) | |
| MSI Vector 16 HX A14V (3.3.3) | |
| Acer Predator Helios 18 N23Q2 (3.3.3) | |
| v3.3 Classroom CPU | |
| HP Omen 16-wf000 (3.3.3) | |
| HP Omen 16 (2024) (3.3.3) | |
| Moyenne de la classe Gaming (122 - 565, n=102, 2 dernières années) | |
| Moyenne NVIDIA GeForce RTX 4080 Laptop GPU (177 - 337, n=23) | |
| HP Omen 16 (2024) (3.3.3, Leistung) | |
| Acer Predator Helios 18 N23Q2 (3.3.3) | |
| Alienware m16 R1 AMD (3.3.3) | |
| MSI Vector 16 HX A14V (3.3.3) | |
| Geekbench 5.5 | |
| OpenCL Score | |
| Alienware m16 R1 AMD | |
| Acer Predator Helios 18 N23Q2 | |
| Moyenne NVIDIA GeForce RTX 4080 Laptop GPU (146413 - 189320, n=23) | |
| Moyenne de la classe Gaming (80702 - 277970, n=101, 2 dernières années) | |
| HP Omen 16 (2024) (Leistung) | |
| HP Omen 16-wf000 | |
| MSI Vector 16 HX A14V | |
| HP Omen 16 (2024) | |
| Vulkan Score 5.5 | |
| Moyenne de la classe Gaming (18857 - 246759, n=76, 2 dernières années) | |
| HP Omen 16 (2024) (Leistung) | |
| Moyenne NVIDIA GeForce RTX 4080 Laptop GPU (9296 - 122085, n=15) | |
| HP Omen 16 (2024) | |
| HP Omen 16-wf000 | |
| MSI Vector 16 HX A14V | |
| Geekbench 6.7 | |
| GPU Vulkan | |
| HP Omen 16 (2024) (6.2.1, Leistung) | |
| HP Omen 16 (2024) (6.2.1) | |
| Moyenne NVIDIA GeForce RTX 4080 Laptop GPU (104581 - 159261, n=11) | |
| Moyenne de la classe Gaming (7562 - 244348, n=59, 2 dernières années) | |
| MSI Vector 16 HX A14V (6.2.1) | |
| GPU OpenCL | |
| Alienware m16 R1 AMD | |
| Acer Predator Helios 18 N23Q2 | |
| HP Omen 16 (2024) (6.2.1, Leistung) | |
| Moyenne NVIDIA GeForce RTX 4080 Laptop GPU (136770 - 181484, n=15) | |
| HP Omen 16 (2024) (6.2.1) | |
| Moyenne de la classe Gaming (67235 - 253130, n=103, 2 dernières années) | |
| MSI Vector 16 HX A14V (6.2.1) | |
| V-Ray 5 Benchmark | |
| GPU RTX | |
| Moyenne de la classe Gaming (1146 - 4363, n=33, 2 dernières années) | |
| MSI Vector 16 HX A14V (5.0.1) | |
| Alienware m16 R1 AMD (5.0.1) | |
| HP Omen 16 (2024) (5.0.1, Leistung) | |
| HP Omen 16-wf000 (5.0.1) | |
| Moyenne NVIDIA GeForce RTX 4080 Laptop GPU (2128 - 2843, n=17) | |
| HP Omen 16 (2024) (5.0.1) | |
| GPU CUDA | |
| Moyenne de la classe Gaming (887 - 3288, n=33, 2 dernières années) | |
| Alienware m16 R1 AMD (5.0.1) | |
| MSI Vector 16 HX A14V (5.0.1) | |
| HP Omen 16-wf000 (5.0.1) | |
| Moyenne NVIDIA GeForce RTX 4080 Laptop GPU (1647 - 2112, n=17) | |
| HP Omen 16 (2024) (5.0.1, Leistung) | |
| HP Omen 16 (2024) | |
| CPU | |
| MSI Vector 16 HX A14V (5.0.1) | |
| Moyenne de la classe Gaming (5864 - 30302, n=32, 2 dernières années) | |
| Alienware m16 R1 AMD (5.0.1) | |
| HP Omen 16 (2024) (5.0.1, Leistung) | |
| Moyenne NVIDIA GeForce RTX 4080 Laptop GPU (11906 - 21823, n=17) | |
| HP Omen 16 (2024) (5.0.1) | |
| HP Omen 16-wf000 (5.0.1) | |
| V-Ray Benchmark Next 4.10 | |
| GPU | |
| Acer Predator Helios 18 N23Q2 (v4.10.07 ) | |
| Moyenne NVIDIA GeForce RTX 4080 Laptop GPU (812 - 1036, n=16) | |
| HP Omen 16 (2024) (v4.10.07, Leistung) | |
| MSI Vector 16 HX A14V (v4.10.07 ) | |
| Moyenne de la classe Gaming (427 - 1627, n=99, 2 dernières années) | |
| HP Omen 16 (2024) (v4.10.07 ) | |
| CPU | |
| MSI Vector 16 HX A14V (v4.10.07 ) | |
| Acer Predator Helios 18 N23Q2 (v4.10.07 ) | |
| Moyenne NVIDIA GeForce RTX 4080 Laptop GPU (19636 - 31653, n=16) | |
| Moyenne de la classe Gaming (10048 - 45327, n=97, 2 dernières années) | |
| HP Omen 16 (2024) (v4.10.07, Leistung) | |
| HP Omen 16 (2024) (v4.10.07 ) | |
* ... Moindre est la valeur, meilleures sont les performances
| Performance rating - Percent | |
| Acer Predator Helios 18 N23Q2 | |
| MSI Vector 16 HX A14V | |
| Alienware m16 R1 AMD -1! | |
| HP Omen 16 (2024) | |
| Moyenne NVIDIA GeForce RTX 4080 Laptop GPU | |
| Moyenne de la classe Gaming | |
| HP Omen 16-wf000 | |
| HP Omen 16 (2024) | |
| The Witcher 3 - 1920x1080 Ultra Graphics & Postprocessing (HBAO+) | |
| Moyenne de la classe Gaming (104.7 - 240, n=7, 2 dernières années) | |
| MSI Vector 16 HX A14V | |
| Acer Predator Helios 18 N23Q2 | |
| Alienware m16 R1 AMD | |
| Moyenne NVIDIA GeForce RTX 4080 Laptop GPU (130.4 - 186.1, n=20) | |
| HP Omen 16 (2024) (Leistung) | |
| HP Omen 16-wf000 | |
| HP Omen 16 (2024) | |
| GTA V - 1920x1080 Highest AA:4xMSAA + FX AF:16x | |
| Acer Predator Helios 18 N23Q2 | |
| MSI Vector 16 HX A14V | |
| HP Omen 16 (2024) (Leistung) | |
| Moyenne de la classe Gaming (48.3 - 186.9, n=94, 2 dernières années) | |
| Moyenne NVIDIA GeForce RTX 4080 Laptop GPU (102.9 - 152.7, n=21) | |
| HP Omen 16-wf000 | |
| HP Omen 16 (2024) | |
| Final Fantasy XV Benchmark - 1920x1080 High Quality | |
| Acer Predator Helios 18 N23Q2 (1.3) | |
| MSI Vector 16 HX A14V (1.3) | |
| Alienware m16 R1 AMD (1.3) | |
| HP Omen 16 (2024) (1.3, Leistung) | |
| Moyenne NVIDIA GeForce RTX 4080 Laptop GPU (129 - 182.1, n=23) | |
| HP Omen 16-wf000 (1.3) | |
| Moyenne de la classe Gaming (41 - 215, n=95, 2 dernières années) | |
| HP Omen 16 (2024) (1.3) | |
| Strange Brigade - 1920x1080 ultra AA:ultra AF:16 | |
| Alienware m16 R1 AMD (1.47.22.14 D3D12) | |
| MSI Vector 16 HX A14V (1.47.22.14 D3D12) | |
| Acer Predator Helios 18 N23Q2 (1.47.22.14 D3D12) | |
| Moyenne NVIDIA GeForce RTX 4080 Laptop GPU (239 - 357, n=22) | |
| HP Omen 16 (2024) (1.47.22.14 D3D12, Leistung) | |
| HP Omen 16-wf000 (1.47.22.14 D3D12) | |
| Moyenne de la classe Gaming (76.3 - 458, n=87, 2 dernières années) | |
| HP Omen 16 (2024) (1.47.22.14 D3D12) | |
| Dota 2 Reborn - 1920x1080 ultra (3/3) best looking | |
| Acer Predator Helios 18 N23Q2 | |
| MSI Vector 16 HX A14V | |
| HP Omen 16 (2024) (Leistung) | |
| Alienware m16 R1 AMD | |
| Moyenne NVIDIA GeForce RTX 4080 Laptop GPU (133 - 194.7, n=23) | |
| HP Omen 16 (2024) | |
| HP Omen 16-wf000 | |
| Moyenne de la classe Gaming (84.8 - 248, n=107, 2 dernières années) | |
| X-Plane 11.11 - 1920x1080 high (fps_test=3) | |
| Acer Predator Helios 18 N23Q2 | |
| HP Omen 16 (2024) (Leistung) | |
| MSI Vector 16 HX A14V | |
| HP Omen 16 (2024) | |
| Moyenne NVIDIA GeForce RTX 4080 Laptop GPU (89.3 - 143.5, n=25) | |
| HP Omen 16-wf000 | |
| Alienware m16 R1 AMD | |
| Moyenne de la classe Gaming (55.5 - 143.5, n=109, 2 dernières années) | |
| Enshrouded | |
| 1920x1080 Max. Quality AA:FX | |
| HP Omen 16 (2024) (Leistung) | |
| Moyenne NVIDIA GeForce RTX 4080 Laptop GPU (67.6 - 82.6, n=3) | |
| HP Omen 16 (2024) | |
| Moyenne de la classe Gaming (n=12 dernières années) | |
| 2560x1440 Max. Quality AA:FX | |
| HP Omen 16 (2024) (Leistung) | |
| Moyenne NVIDIA GeForce RTX 4080 Laptop GPU (52.8 - 64.5, n=3) | |
| HP Omen 16 (2024) | |
| Ready or Not | |
| 2560x1440 Epic Preset | |
| Moyenne NVIDIA GeForce RTX 4080 Laptop GPU (102.1 - 128, n=3) | |
| HP Omen 16 (2024) (Leistung) | |
| HP Omen 16 (2024) | |
| 1920x1080 Epic Preset | |
| Moyenne NVIDIA GeForce RTX 4080 Laptop GPU (118.6 - 202, n=3) | |
| HP Omen 16 (2024) (Leistung) | |
| HP Omen 16 (2024) | |
| Helldivers 2 | |
| 2560x1440 Ultra Preset | |
| Moyenne de la classe Gaming (81.3 - 140.1, n=5, 2 dernières années) | |
| HP Omen 16 (2024) (Leistung) | |
| Moyenne NVIDIA GeForce RTX 4080 Laptop GPU (85.7 - 106, n=3) | |
| HP Omen 16 (2024) | |
| 1920x1080 Ultra Preset | |
| HP Omen 16 (2024) (Leistung) | |
| Moyenne NVIDIA GeForce RTX 4080 Laptop GPU (100.8 - 132.3, n=3) | |
| Moyenne de la classe Gaming (18.4 - 153.8, n=5, 2 dernières années) | |
| HP Omen 16 (2024) | |
| The Finals | |
| 1920x1080 Epic Preset + Epic RTX Global Illumination | |
| HP Omen 16 (2024) (Leistung) | |
| Moyenne NVIDIA GeForce RTX 4080 Laptop GPU (147.8 - 181.5, n=3) | |
| HP Omen 16 (2024) | |
| 2560x1440 Epic Preset | |
| HP Omen 16 (2024) (Leistung) | |
| Moyenne NVIDIA GeForce RTX 4080 Laptop GPU (104.7 - 128.5, n=3) | |
| HP Omen 16 (2024) | |
| Moyenne de la classe Gaming (n=12 dernières années) | |
| 1920x1080 Epic Preset | |
| HP Omen 16 (2024) (Leistung) | |
| Moyenne NVIDIA GeForce RTX 4080 Laptop GPU (143.9 - 192.5, n=3) | |
| HP Omen 16 (2024) | |
| Moyenne de la classe Gaming (n=12 dernières années) | |
Witcher 3 FPS chart
| Bas | Moyen | Élevé | Ultra | QHD | |
|---|---|---|---|---|---|
| GTA V (2015) | 184.2 | 181.1 | 173.8 | 109.7 | 100 |
| The Witcher 3 (2015) | 485 | 384 | 246 | 142 | 102.5 |
| Dota 2 Reborn (2015) | 215 | 191.6 | 177 | 163.4 | |
| Final Fantasy XV Benchmark (2018) | 183.9 | 152.8 | 129 | 98 | |
| X-Plane 11.11 (2018) | 177.3 | 156.2 | 126.9 | ||
| Strange Brigade (2018) | 382 | 307 | 263 | 239 | 179.5 |
| Cyberpunk 2077 (2023) | 111.3 | 96.4 | 94.1 | 83.9 | 56.2 |
| The Finals (2023) | 188.9 | 179.3 | 170.7 | 143.9 | 104.7 |
| Ready or Not (2023) | 267 | 127.6 | 121.5 | 118.6 | 102.1 |
| Enshrouded (2024) | 103.3 | 90.9 | 77.7 | 67.6 | 52.8 |
| Helldivers 2 (2024) | 110.6 | 110.4 | 103.9 | 100.8 | 85.7 |
Émissions et alimentation - L'ordinateur portable HP dispose d'une autonomie décente
Émissions sonores
En mode équilibré, le niveau de bruit a atteint 47 dB(A) à pleine charge. L'utilisation du mode Performance a entraîné un niveau sonore nettement plus élevé de 58 dB(A). L'Omen 16 a fonctionné à un niveau sonore confortable de 39 dB(A) en mode ECO - au détriment de la performance.
Les ventilateurs tournent en permanence, même lorsque l'ordinateur portable est au repos ou lorsqu'il effectue des tâches quotidiennes (par exemple, des applications bureautiques et Internet). Cela est dû à l'option "Fan Always On" de HP dans le BIOS. En la désactivant, vous permettrez aux deux ventilateurs de s'arrêter de tourner de temps en temps.
Degré de la nuisance sonore
| Au repos |
| 29 / 30 / 31 dB(A) |
| Fortement sollicité |
| 46 / 47 dB(A) |
 | ||
30 dB silencieux 40 dB(A) audible 50 dB(A) bruyant |
||
min: | ||
| HP Omen 16 (2024) GeForce RTX 4080 Laptop GPU, i9-14900HX, SK hynix PC801 HFS001TEJ9X101N | MSI Vector 16 HX A14V GeForce RTX 4080 Laptop GPU, i9-14900HX, WD PC SN560 SDDPNQE-1T00 | Alienware m16 R1 AMD GeForce RTX 4080 Laptop GPU, R9 7845HX, Kioxia XG8 KXG80ZNV1T02 | Acer Predator Helios 18 N23Q2 GeForce RTX 4080 Laptop GPU, i9-13900HX, Samsung PM9A1 MZVL22T0HBLB | HP Omen 16-wf000 GeForce RTX 4080 Laptop GPU, i7-13700HX, SK hynix PC801 HFS002TEJ9X101N | |
|---|---|---|---|---|---|
| Noise | -15% | 5% | 4% | -1% | |
| arrêt / environnement * (dB) | 25 | 23.2 7% | 22.9 8% | 23 8% | 23 8% |
| Idle Minimum * (dB) | 29 | 33.5 -16% | 22.9 21% | 23 21% | 29.6 -2% |
| Idle Average * (dB) | 30 | 33.5 -12% | 29.7 1% | 23 23% | 29.8 1% |
| Idle Maximum * (dB) | 31 | 33.5 -8% | 29.7 4% | 23 26% | 30.4 2% |
| Load Average * (dB) | 46 | 52.1 -13% | 29.8 35% | 45.26 2% | 33.8 27% |
| Witcher 3 ultra * (dB) | 47 | 62 -32% | 54.7 -16% | 59.82 -27% | 57 -21% |
| Load Maximum * (dB) | 47 | 62 -32% | 54.7 -16% | 59.94 -28% | 58.3 -24% |
* ... Moindre est la valeur, meilleures sont les performances
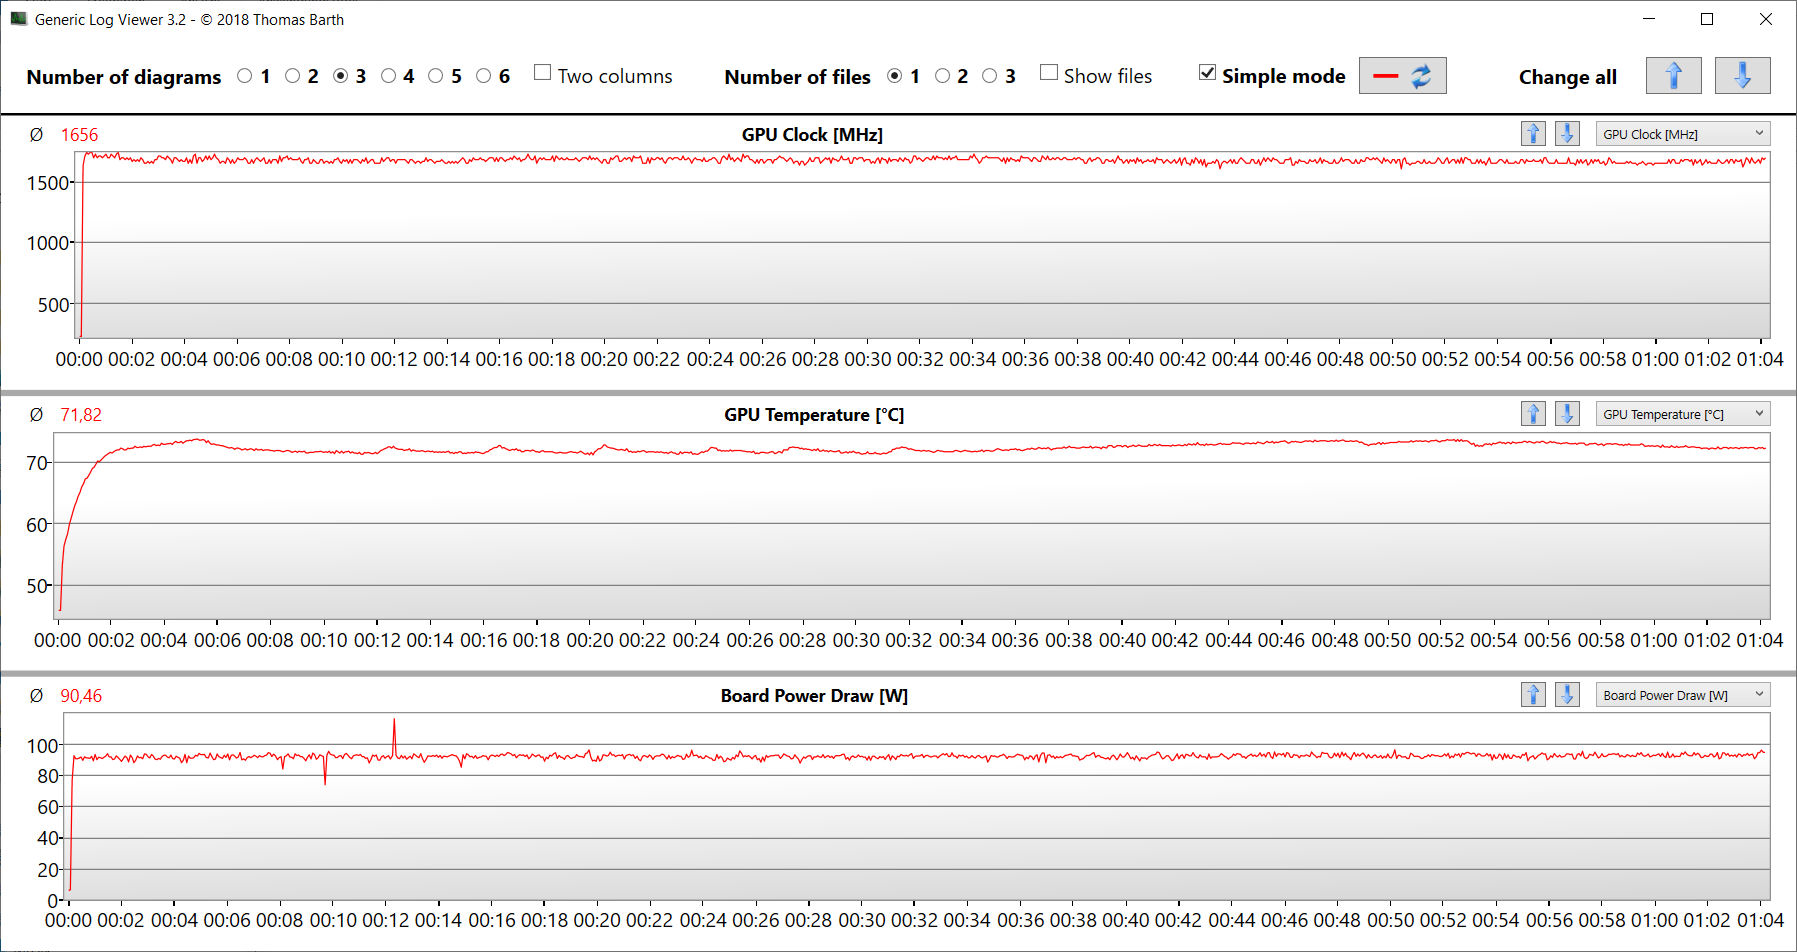
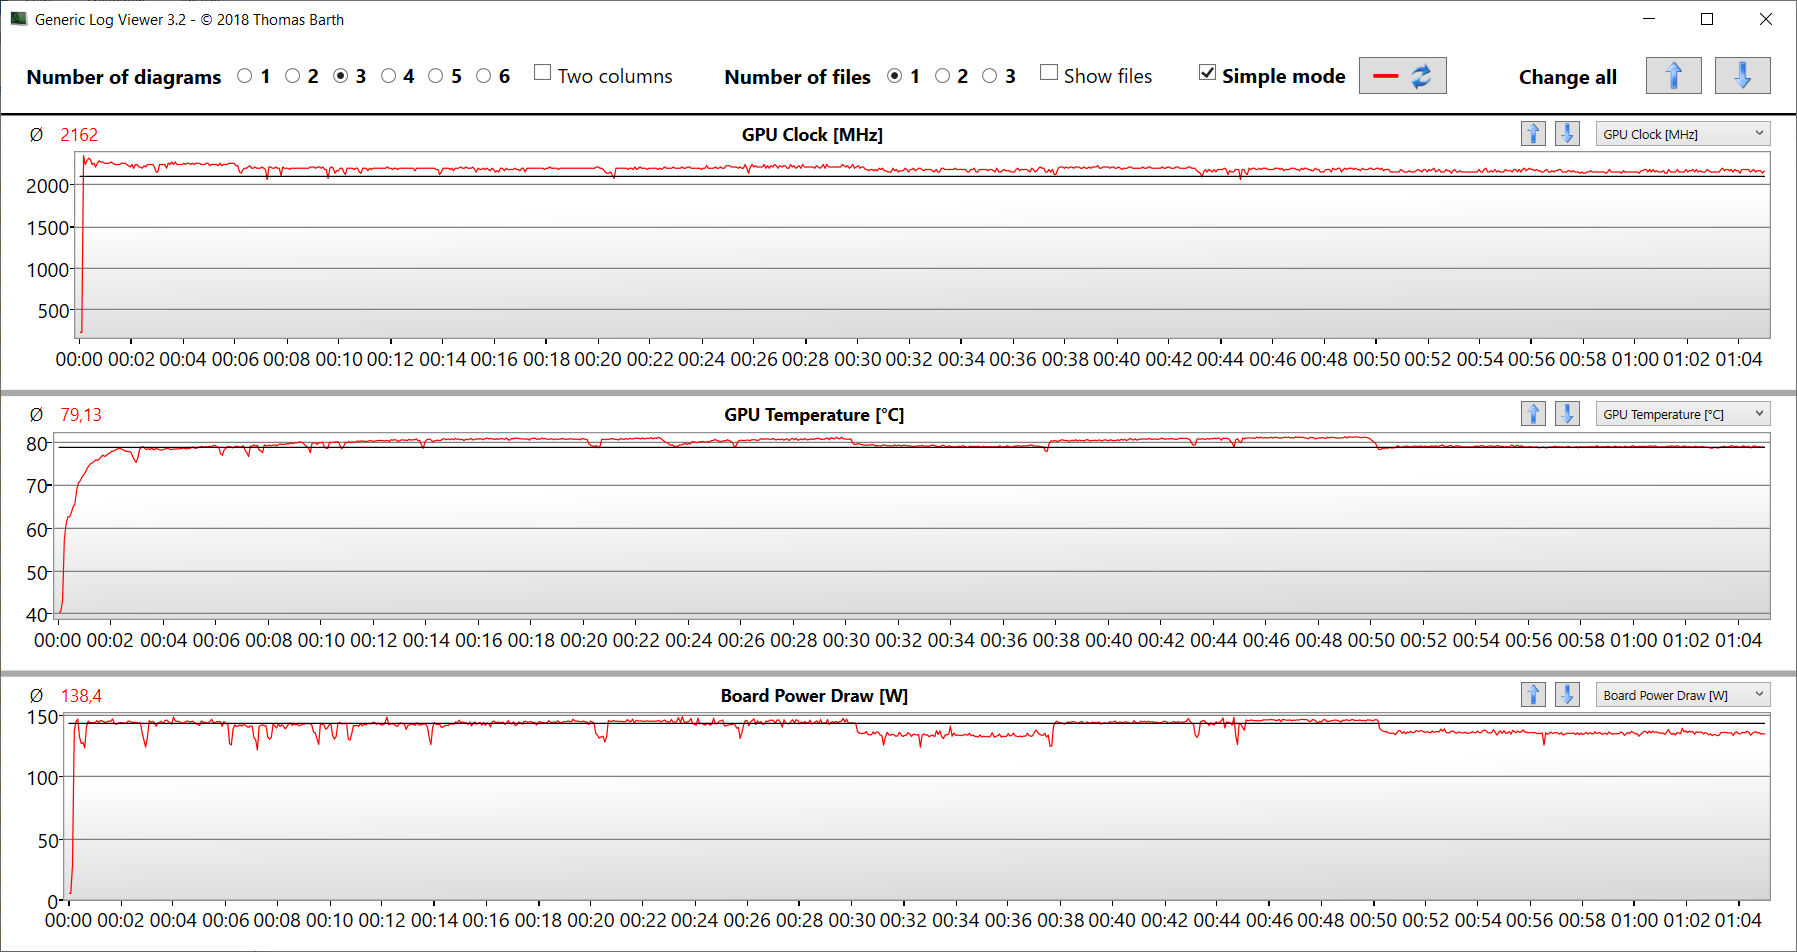
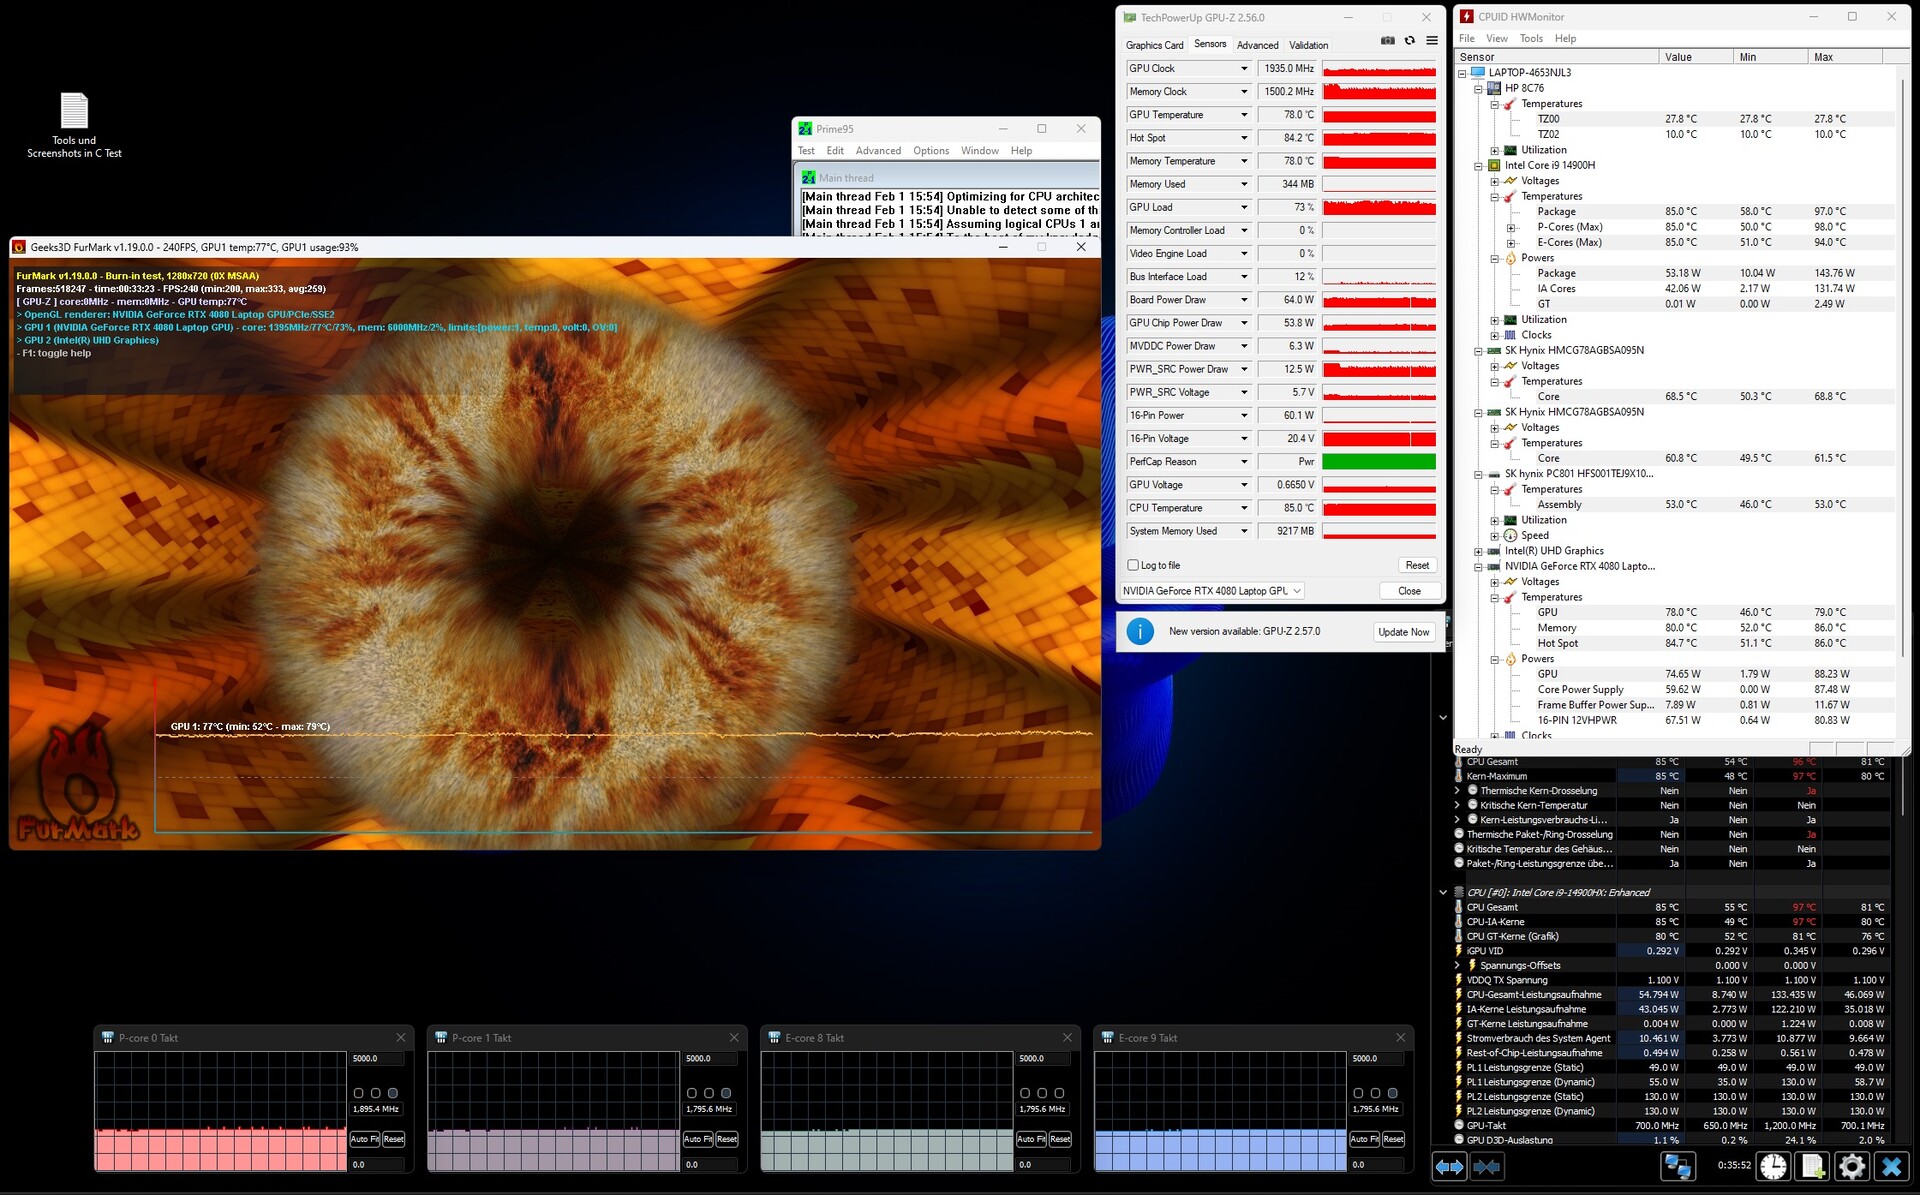
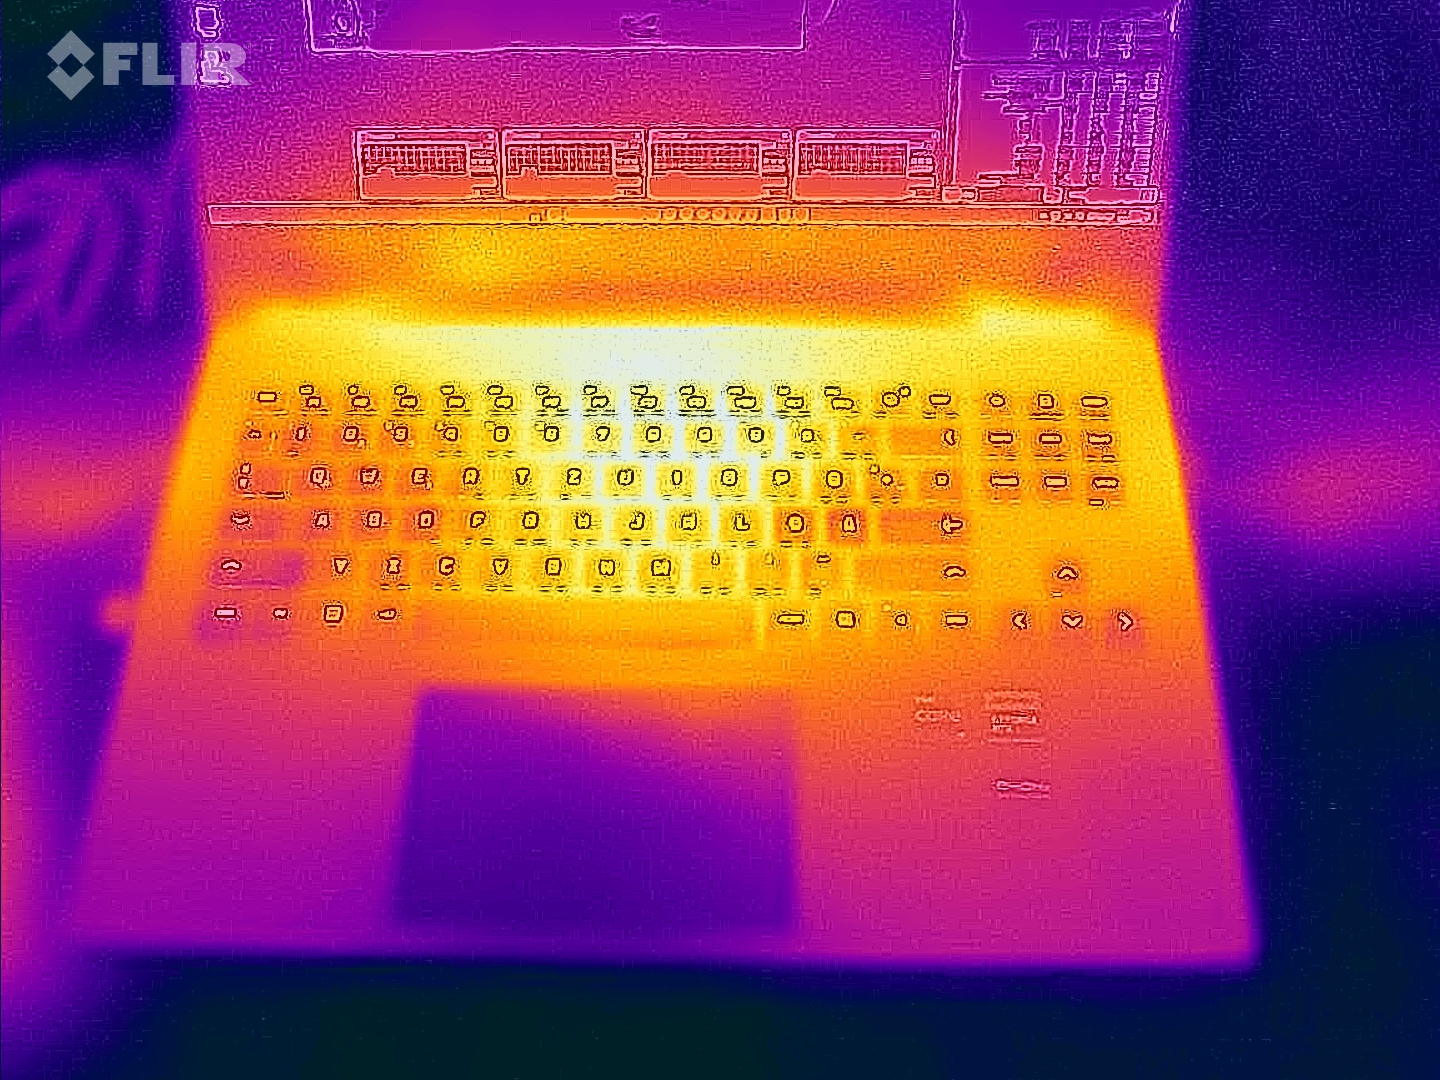
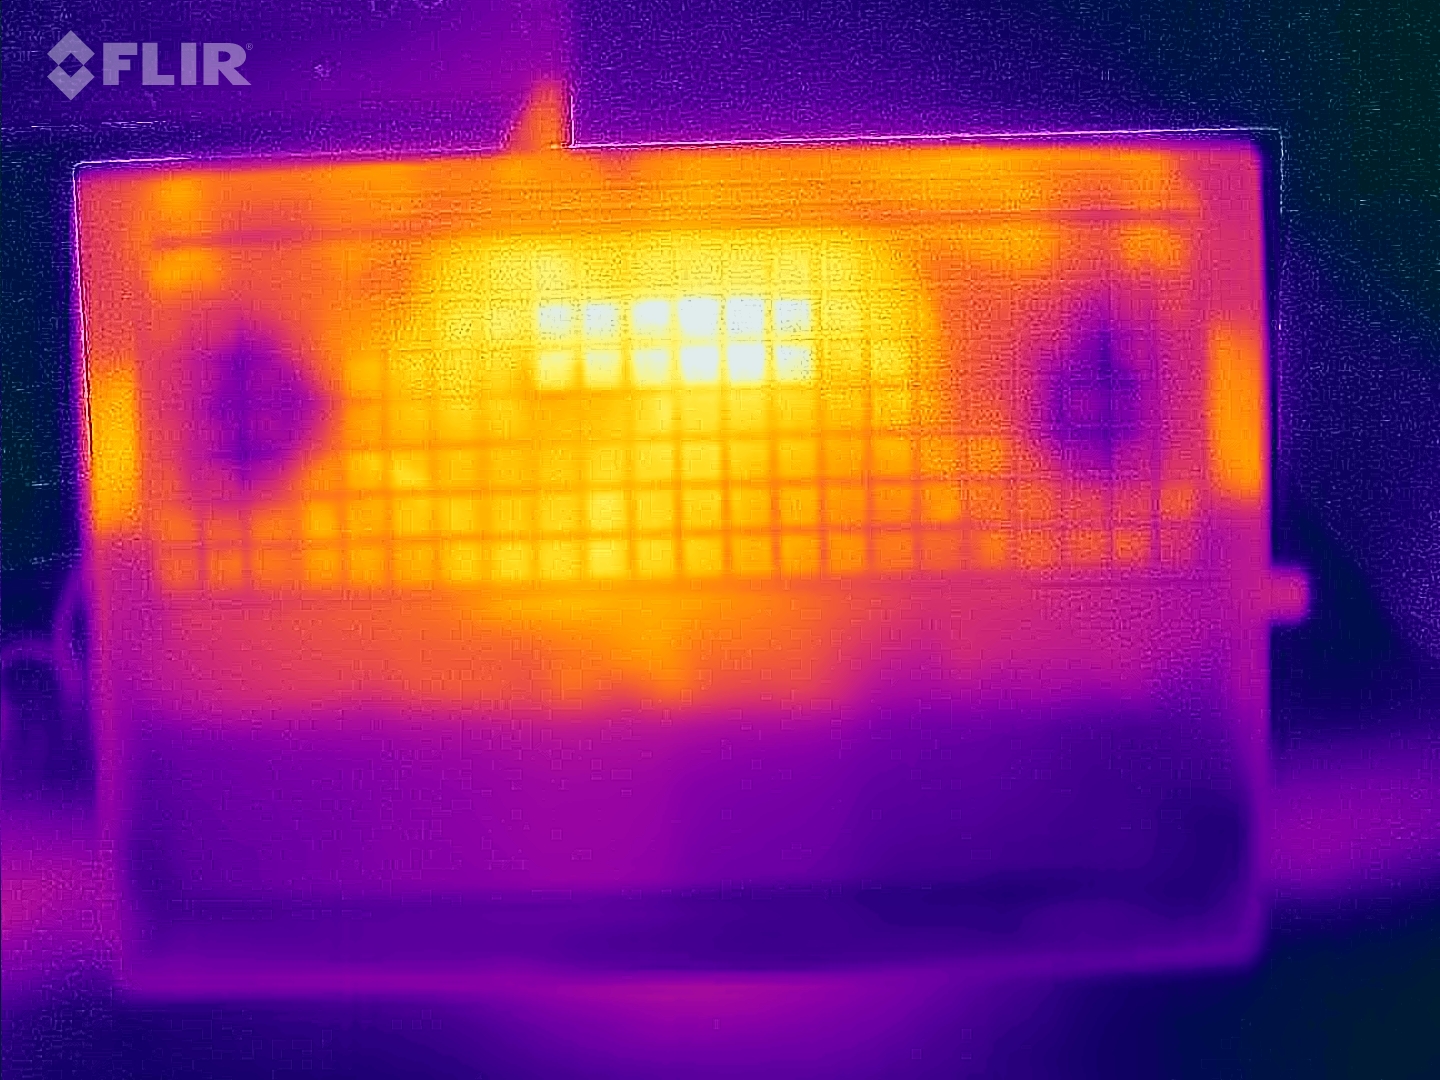
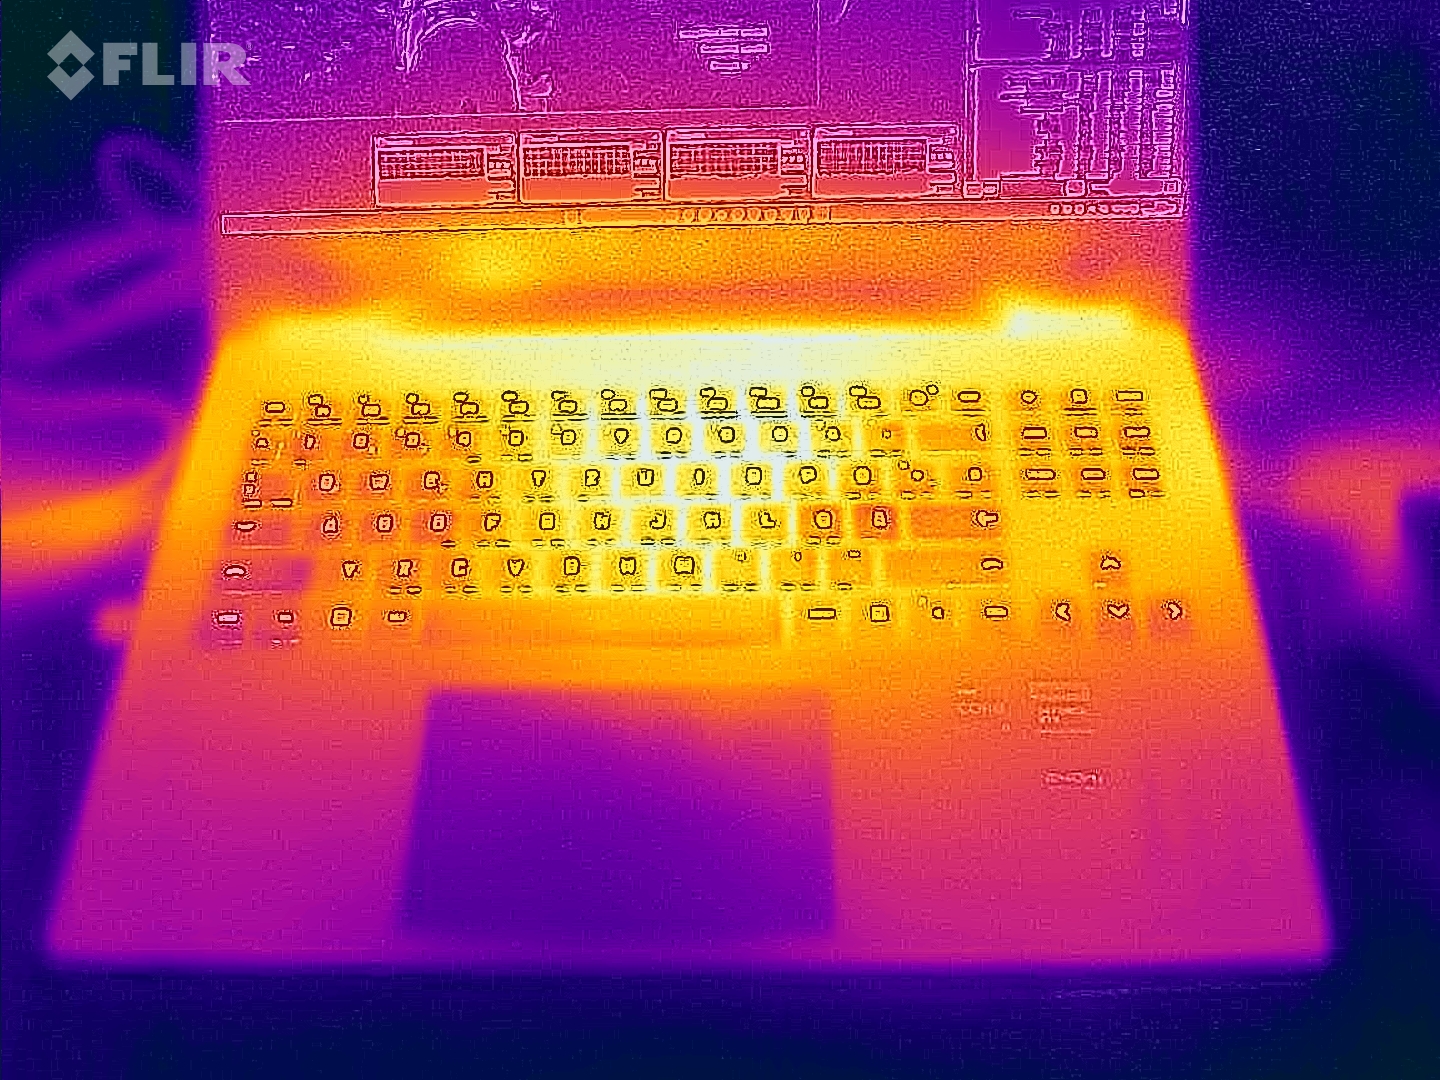
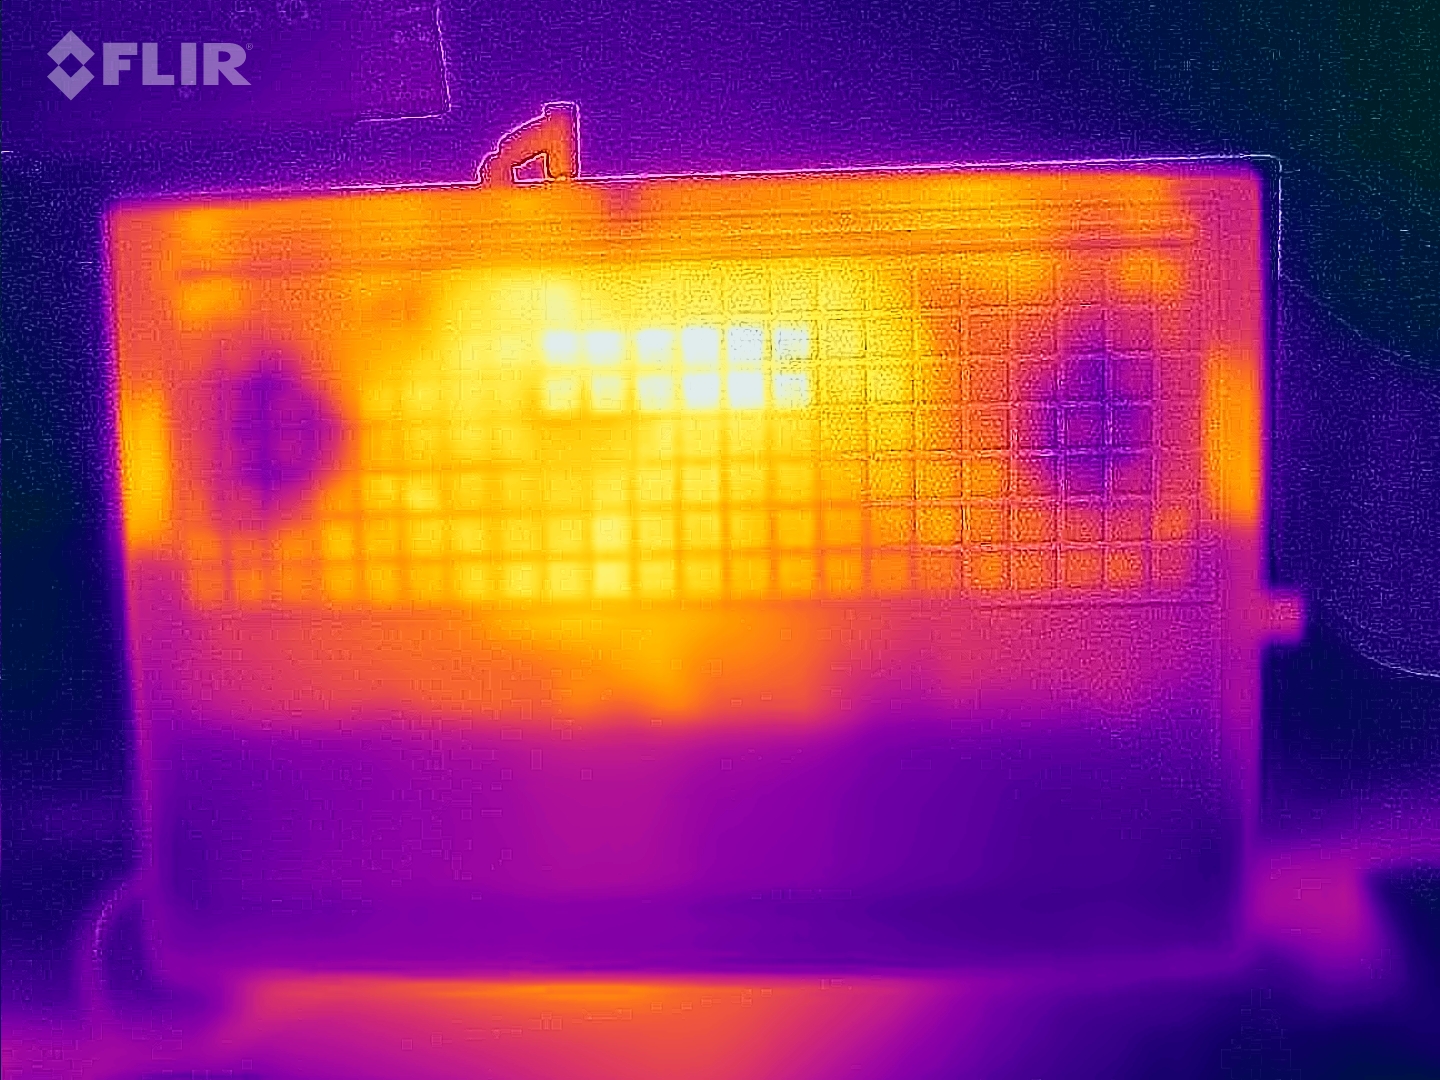
Température
Notre test de stress et notre test Witcher 3 ont provoqué une augmentation sensible de la température de l'ordinateur portable, la température de la peau dépassant 50 °C à certains endroits. Les températures sont toutefois restées dans une fourchette acceptable dans le cadre d'une utilisation quotidienne.
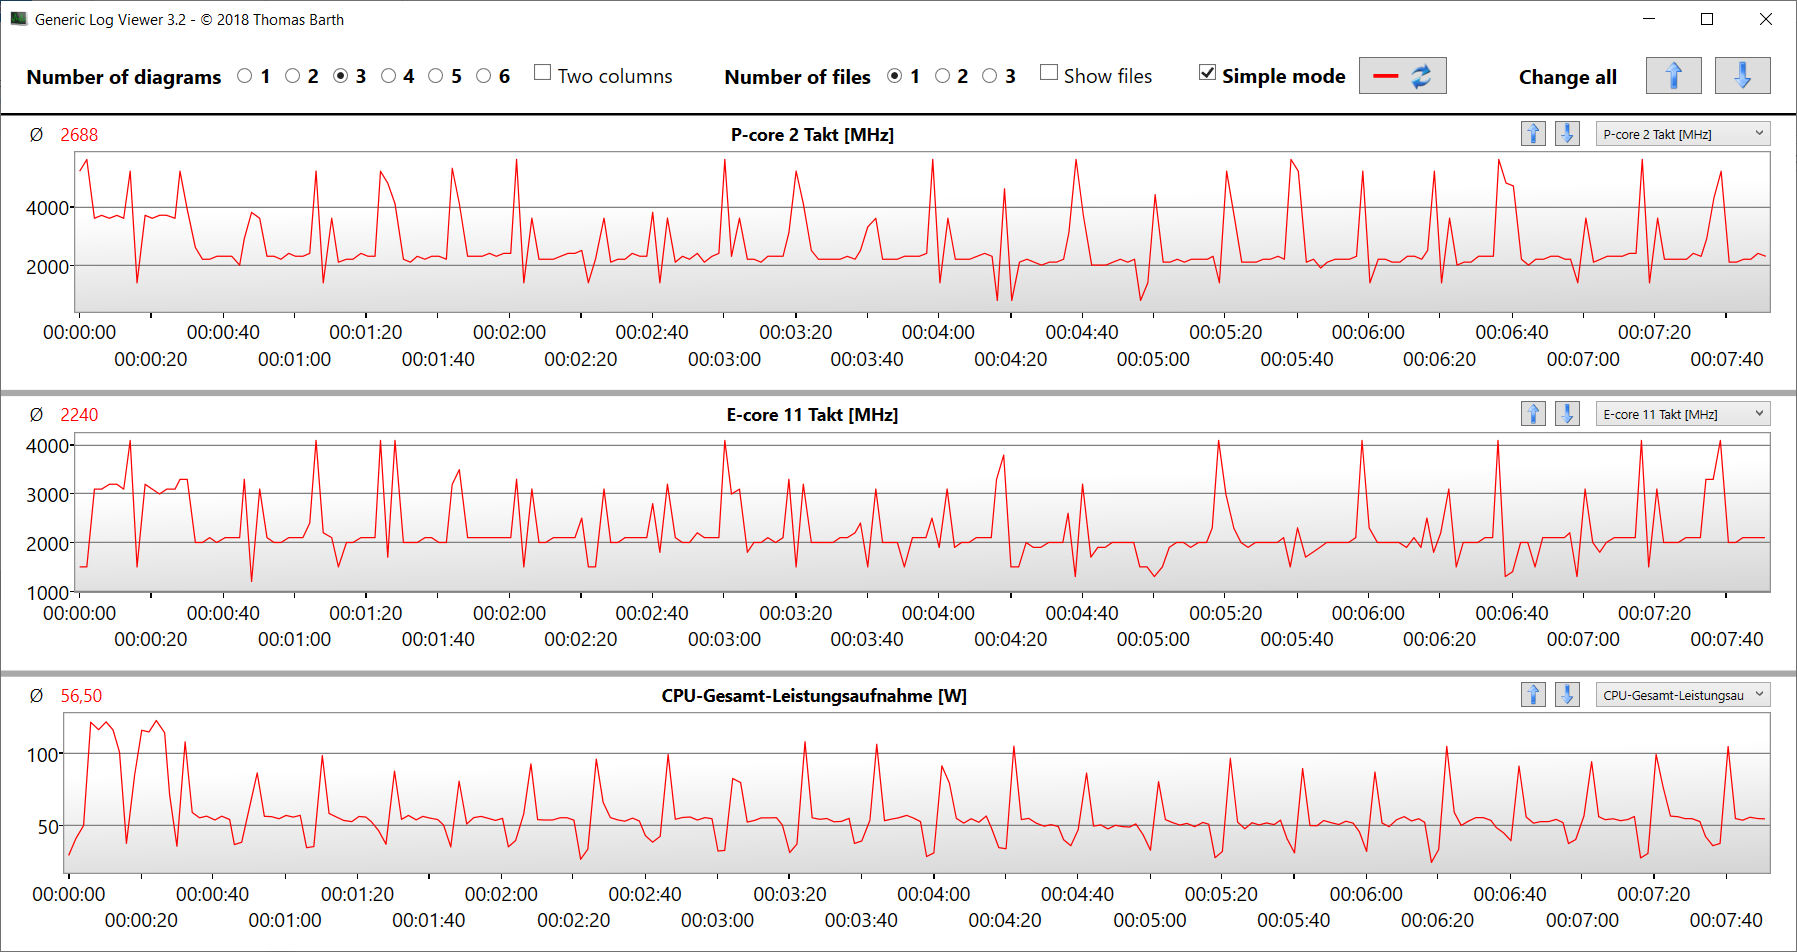
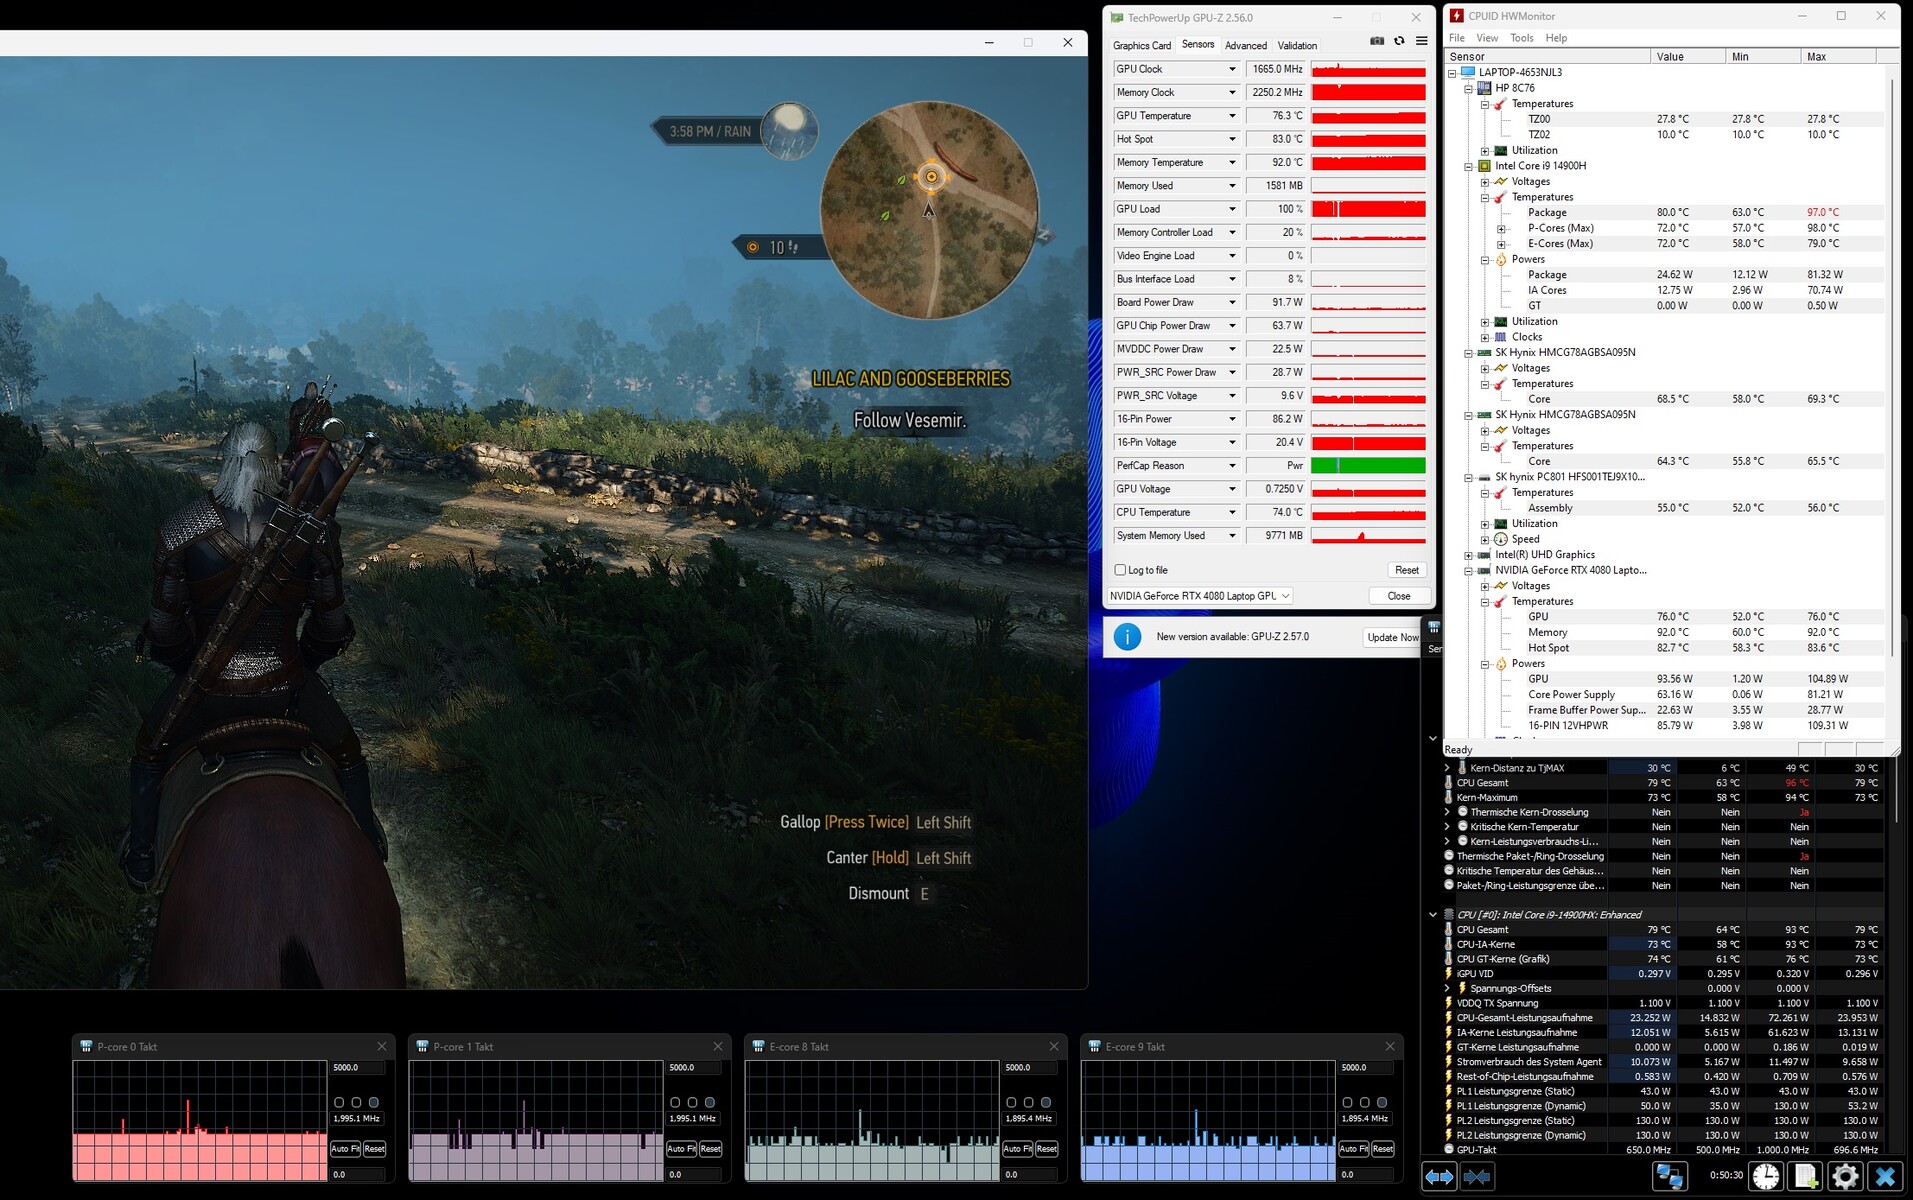
Notre test de stress implique l'exécution de Prime95 et FurMark pendant une période prolongée et représente un scénario extrême conçu pour évaluer la stabilité du système à pleine charge. Les vitesses d'horloge du CPU ont chuté assez rapidement des 3,4 GHz (P) et 2,9 GHz (E) initiaux à environ 1,8 à 1,9 GHz (P et E), puis sont restées à ce niveau. Le GPU a fonctionné à des vitesses comprises entre 1,9 et 2 GHz.
(-) La température maximale du côté supérieur est de 47 °C / 117 F, par rapport à la moyenne de 40.4 °C / 105 F, allant de 21.2 à 68.8 °C pour la classe Gaming.
(-) Le fond chauffe jusqu'à un maximum de 57 °C / 135 F, contre une moyenne de 43.2 °C / 110 F
(+) En utilisation inactive, la température moyenne du côté supérieur est de 23.9 °C / 75 F, par rapport à la moyenne du dispositif de 33.9 °C / 93 F.
(-) En jouant à The Witcher 3, la température moyenne du côté supérieur est de 39.3 °C / 103 F, alors que la moyenne de l'appareil est de 33.9 °C / 93 F.
(+) Les repose-poignets et le pavé tactile atteignent la température maximale de la peau (35 °C / 95 F) et ne sont donc pas chauds.
(-) La température moyenne de la zone de l'appui-paume de dispositifs similaires était de 28.8 °C / 83.8 F (-6.2 °C / #-11.2 F).
| HP Omen 16 (2024) Intel Core i9-14900HX, NVIDIA GeForce RTX 4080 Laptop GPU | MSI Vector 16 HX A14V Intel Core i9-14900HX, NVIDIA GeForce RTX 4080 Laptop GPU | Alienware m16 R1 AMD AMD Ryzen 9 7845HX, NVIDIA GeForce RTX 4080 Laptop GPU | Acer Predator Helios 18 N23Q2 Intel Core i9-13900HX, NVIDIA GeForce RTX 4080 Laptop GPU | HP Omen 16-wf000 Intel Core i7-13700HX, NVIDIA GeForce RTX 4080 Laptop GPU | |
|---|---|---|---|---|---|
| Heat | 13% | -14% | -15% | -3% | |
| Maximum Upper Side * (°C) | 47 | 36.4 23% | 48 -2% | 35 26% | 45 4% |
| Maximum Bottom * (°C) | 57 | 35.6 38% | 39 32% | 56 2% | 48.8 14% |
| Idle Upper Side * (°C) | 25 | 26.6 -6% | 37 -48% | 34 -36% | 29.2 -17% |
| Idle Bottom * (°C) | 26 | 27 -4% | 36.2 -39% | 39 -50% | 28.8 -11% |
* ... Moindre est la valeur, meilleures sont les performances
Intervenants
Les haut-parleurs stéréo produisent un son correct dans l'ensemble, mais manquent de basses.
HP Omen 16 (2024) analyse audio
(±) | le niveau sonore du haut-parleur est moyen mais bon (78# dB)
Basses 100 - 315 Hz
(-) | presque aucune basse - en moyenne 15.2% plus bas que la médiane
(±) | la linéarité des basses est moyenne (14.3% delta à la fréquence précédente)
Médiums 400 - 2000 Hz
(+) | médiane équilibrée - seulement 4.8% de la médiane
(+) | les médiums sont linéaires (5% delta à la fréquence précédente)
Aiguës 2 - 16 kHz
(+) | des sommets équilibrés - à seulement 2% de la médiane
(+) | les aigus sont linéaires (4.1% delta à la fréquence précédente)
Globalement 100 - 16 000 Hz
(+) | le son global est linéaire (14.7% différence à la médiane)
Par rapport à la même classe
» 29% de tous les appareils testés de cette catégorie étaient meilleurs, 7% similaires, 64% pires
» Le meilleur avait un delta de 6%, la moyenne était de 18%, le pire était de 132%.
Par rapport à tous les appareils testés
» 19% de tous les appareils testés étaient meilleurs, 4% similaires, 77% pires
» Le meilleur avait un delta de 4%, la moyenne était de 23%, le pire était de 134%.
MSI Vector 16 HX A14V analyse audio
(+) | les haut-parleurs peuvent jouer relativement fort (85# dB)
Basses 100 - 315 Hz
(±) | basse réduite - en moyenne 12.7% inférieure à la médiane
(+) | les basses sont linéaires (6.8% delta à la fréquence précédente)
Médiums 400 - 2000 Hz
(+) | médiane équilibrée - seulement 3% de la médiane
(+) | les médiums sont linéaires (3.6% delta à la fréquence précédente)
Aiguës 2 - 16 kHz
(+) | des sommets équilibrés - à seulement 3.1% de la médiane
(+) | les aigus sont linéaires (6.7% delta à la fréquence précédente)
Globalement 100 - 16 000 Hz
(+) | le son global est linéaire (12.6% différence à la médiane)
Par rapport à la même classe
» 16% de tous les appareils testés de cette catégorie étaient meilleurs, 4% similaires, 81% pires
» Le meilleur avait un delta de 6%, la moyenne était de 18%, le pire était de 132%.
Par rapport à tous les appareils testés
» 11% de tous les appareils testés étaient meilleurs, 3% similaires, 86% pires
» Le meilleur avait un delta de 4%, la moyenne était de 23%, le pire était de 134%.
Consommation électrique
L'Omen 16 n'a présenté aucun problème lié à l'utilisation de l'énergie, les niveaux se situant dans la plage normale pour le matériel à l'intérieur. L'ordinateur portable a consommé une quantité constante d'énergie lors de notre test Witcher 3 et de notre test de stress. D'une puissance de 280 watts, le chargeur est suffisamment puissant pour l'Omen.
| Éteint/en veille | |
| Au repos | |
| Fortement sollicité |
|
Légende:
min: | |
Power consumption Witcher 3 / Stress test
Power consumption with external monitor
Durée de vie de la batterie
L'ordinateur portable de 16 pouces a réussi à tenir 5h52 lors de notre test Wi-Fi réaliste (accès à des sites web avec un script pour simuler une charge) - un résultat décent. L'Omen offre donc la meilleure autonomie de notre comparatif et surpasse son prédécesseur de 45 minutes.
Points positifs
Points négatifs
Verdict - Une bête de jeu solide
Les jeux, la diffusion en continu et le rendu sont autant de domaines dans lesquels le HP Omen 16 est compétent. Le Core i9-14900HX et la GeForce RTX 4080 offrent les performances nécessaires, tandis que le SSD PCIe 4.0 de 1 To garantit des temps de chargement courts. Les émissions de chaleur et de bruit sont généralement élevées sur ce type d'ordinateur portable. Mais l'Omen 16 est capable de les maintenir à un niveau modéré - en renonçant à la performance.
Le HP Omen 16 (2024) est un ordinateur portable de jeu solide et puissant qui se concentre sur l'essentiel.
Contrairement à la tendance qui consiste à utiliser des écrans 16:10, HP a décidé de s'en tenir à un rapport d'aspect 16:9. La dalle de 16,1 pouces (2 560 x 1 440 pixels, sRGB, IPS, 240 Hz, G-Sync) a laissé une excellente impression dans l'ensemble. Néanmoins, l'écran d'un ordinateur portable coûtant 3 200 € (3 446 $ US) devrait offrir davantage en termes de luminosité et de couverture des couleurs.
Les deux ports USB-C (Thunderbolt 4) facilitent l'intégration de l'ordinateur portable dans les configurations de stations de travail existantes et ouvrent des options d'extension (par exemple, GPU externe, station d'accueil). Les deux ports peuvent émettre un signal DisplayPort et prennent en charge Power Delivery. L'autonomie de la batterie de l'ordinateur portable est également satisfaisante.
Le MSI Vector 16 HX A14V est une alternative potentielle à l'Omen 16. Avec la même combinaison CPU/GPU, le Vector 16 offre plus de performances et dispose d'un écran beaucoup plus lumineux et vibrant (DCI-P3, 16:10). Cependant, le Vector n'a qu'un seul port Thunderbolt 4 et un écran qui ne supporte pas G-Sync.
Prix et disponibilité
En Allemagne, le HP Omen 16-wf1078ng est disponible auprès de détaillants tels que Office-Partner.de et Otto.de au prix de €3,200 (US$3,446). Vous pouvez également trouver un modèle moins sophistiqué avec un Core i7-13700HX et une RTX 4060 pour 1 500 $ US sur Amazon US.
HP Omen 16 (2024)
- 02/16/2024 v7 (old)
Sascha Mölck
Transparency
La sélection des appareils à examiner est effectuée par notre équipe éditoriale. L'échantillon de test a été prêté à l'auteur par le fabricant ou le détaillant pour les besoins de cet examen. Le prêteur n'a pas eu d'influence sur cette évaluation et le fabricant n'a pas reçu de copie de cette évaluation avant sa publication. Il n'y avait aucune obligation de publier cet article. En tant que média indépendant, Notebookcheck n'est pas soumis à l'autorité des fabricants, des détaillants ou des éditeurs.
Voici comment Notebookcheck teste
Chaque année, Notebookcheck examine de manière indépendante des centaines d'ordinateurs portables et de smartphones en utilisant des procédures standardisées afin de garantir que tous les résultats sont comparables. Nous avons continuellement développé nos méthodes de test depuis environ 20 ans et avons établi des normes industrielles dans le processus. Dans nos laboratoires de test, des équipements de mesure de haute qualité sont utilisés par des techniciens et des rédacteurs expérimentés. Ces tests impliquent un processus de validation en plusieurs étapes. Notre système d'évaluation complexe repose sur des centaines de mesures et de points de référence bien fondés, ce qui garantit l'objectivité.Price comparison

