Test du Zotac ZBOX Magnus : GeForce RTX 3070 Mobile, Tiger Lake et boîtier de 2,65 litres
Sous le label Zotac ZBOX, le fabricant propose un certain nombre de PC compacts destinés à divers scénarios d'utilisation individuels. En combinaison avec l'ajout du label Magnus, l'orientation est celle d'un PC de jeu, ce qui se reflète également dans les composants intégrés. La version actuelle du Magnus EN173070C contient un processeur Intel Core i7-11800Hqui est censé garantir un fonctionnement rapide pour les jeux en combinaison avec le processeur Nvidia GeForce RTX 3070 Laptopde Nvidia. Cette combinaison n'est pas nouvelle pour nous en tant que plateforme d'évaluation d'ordinateurs portables, et nous pouvons déjà donner une estimation approximative des performances à attendre
Dans notre configuration matérielle, le Magnus EN173070C coûte près de 1650 euros (~1743 dollars). Cependant, comme il s'agit toujours d'un système barebone, vous devez également calculer pour le SSD, la RAM et la licence Windows. En fonction des composants que vous choisissez, la facture totale peut facilement dépasser les 2000 euros (~$2113). Ceux pour qui les performances de la Nvidia GeForce RTX 3070 Laptopne sont pas suffisantes, ils peuvent également se procurer la version EN173080C du Magnus, qui contient un GPU plus rapide avec la technologie Nvidia GeForce RTX 3080 Laptopgraphique. Le processeur reste le même avec le Intel Core i7-11800H. Vous pouvez également vous procurer le Magnus EN153060C, qui offre des performances légèrement inférieures et comprend leIntel Core i5-11400Het Nvidia GeForce RTX 3060 LaptopgPU.

Zotac ZBOX Magnus EN173070C en détail
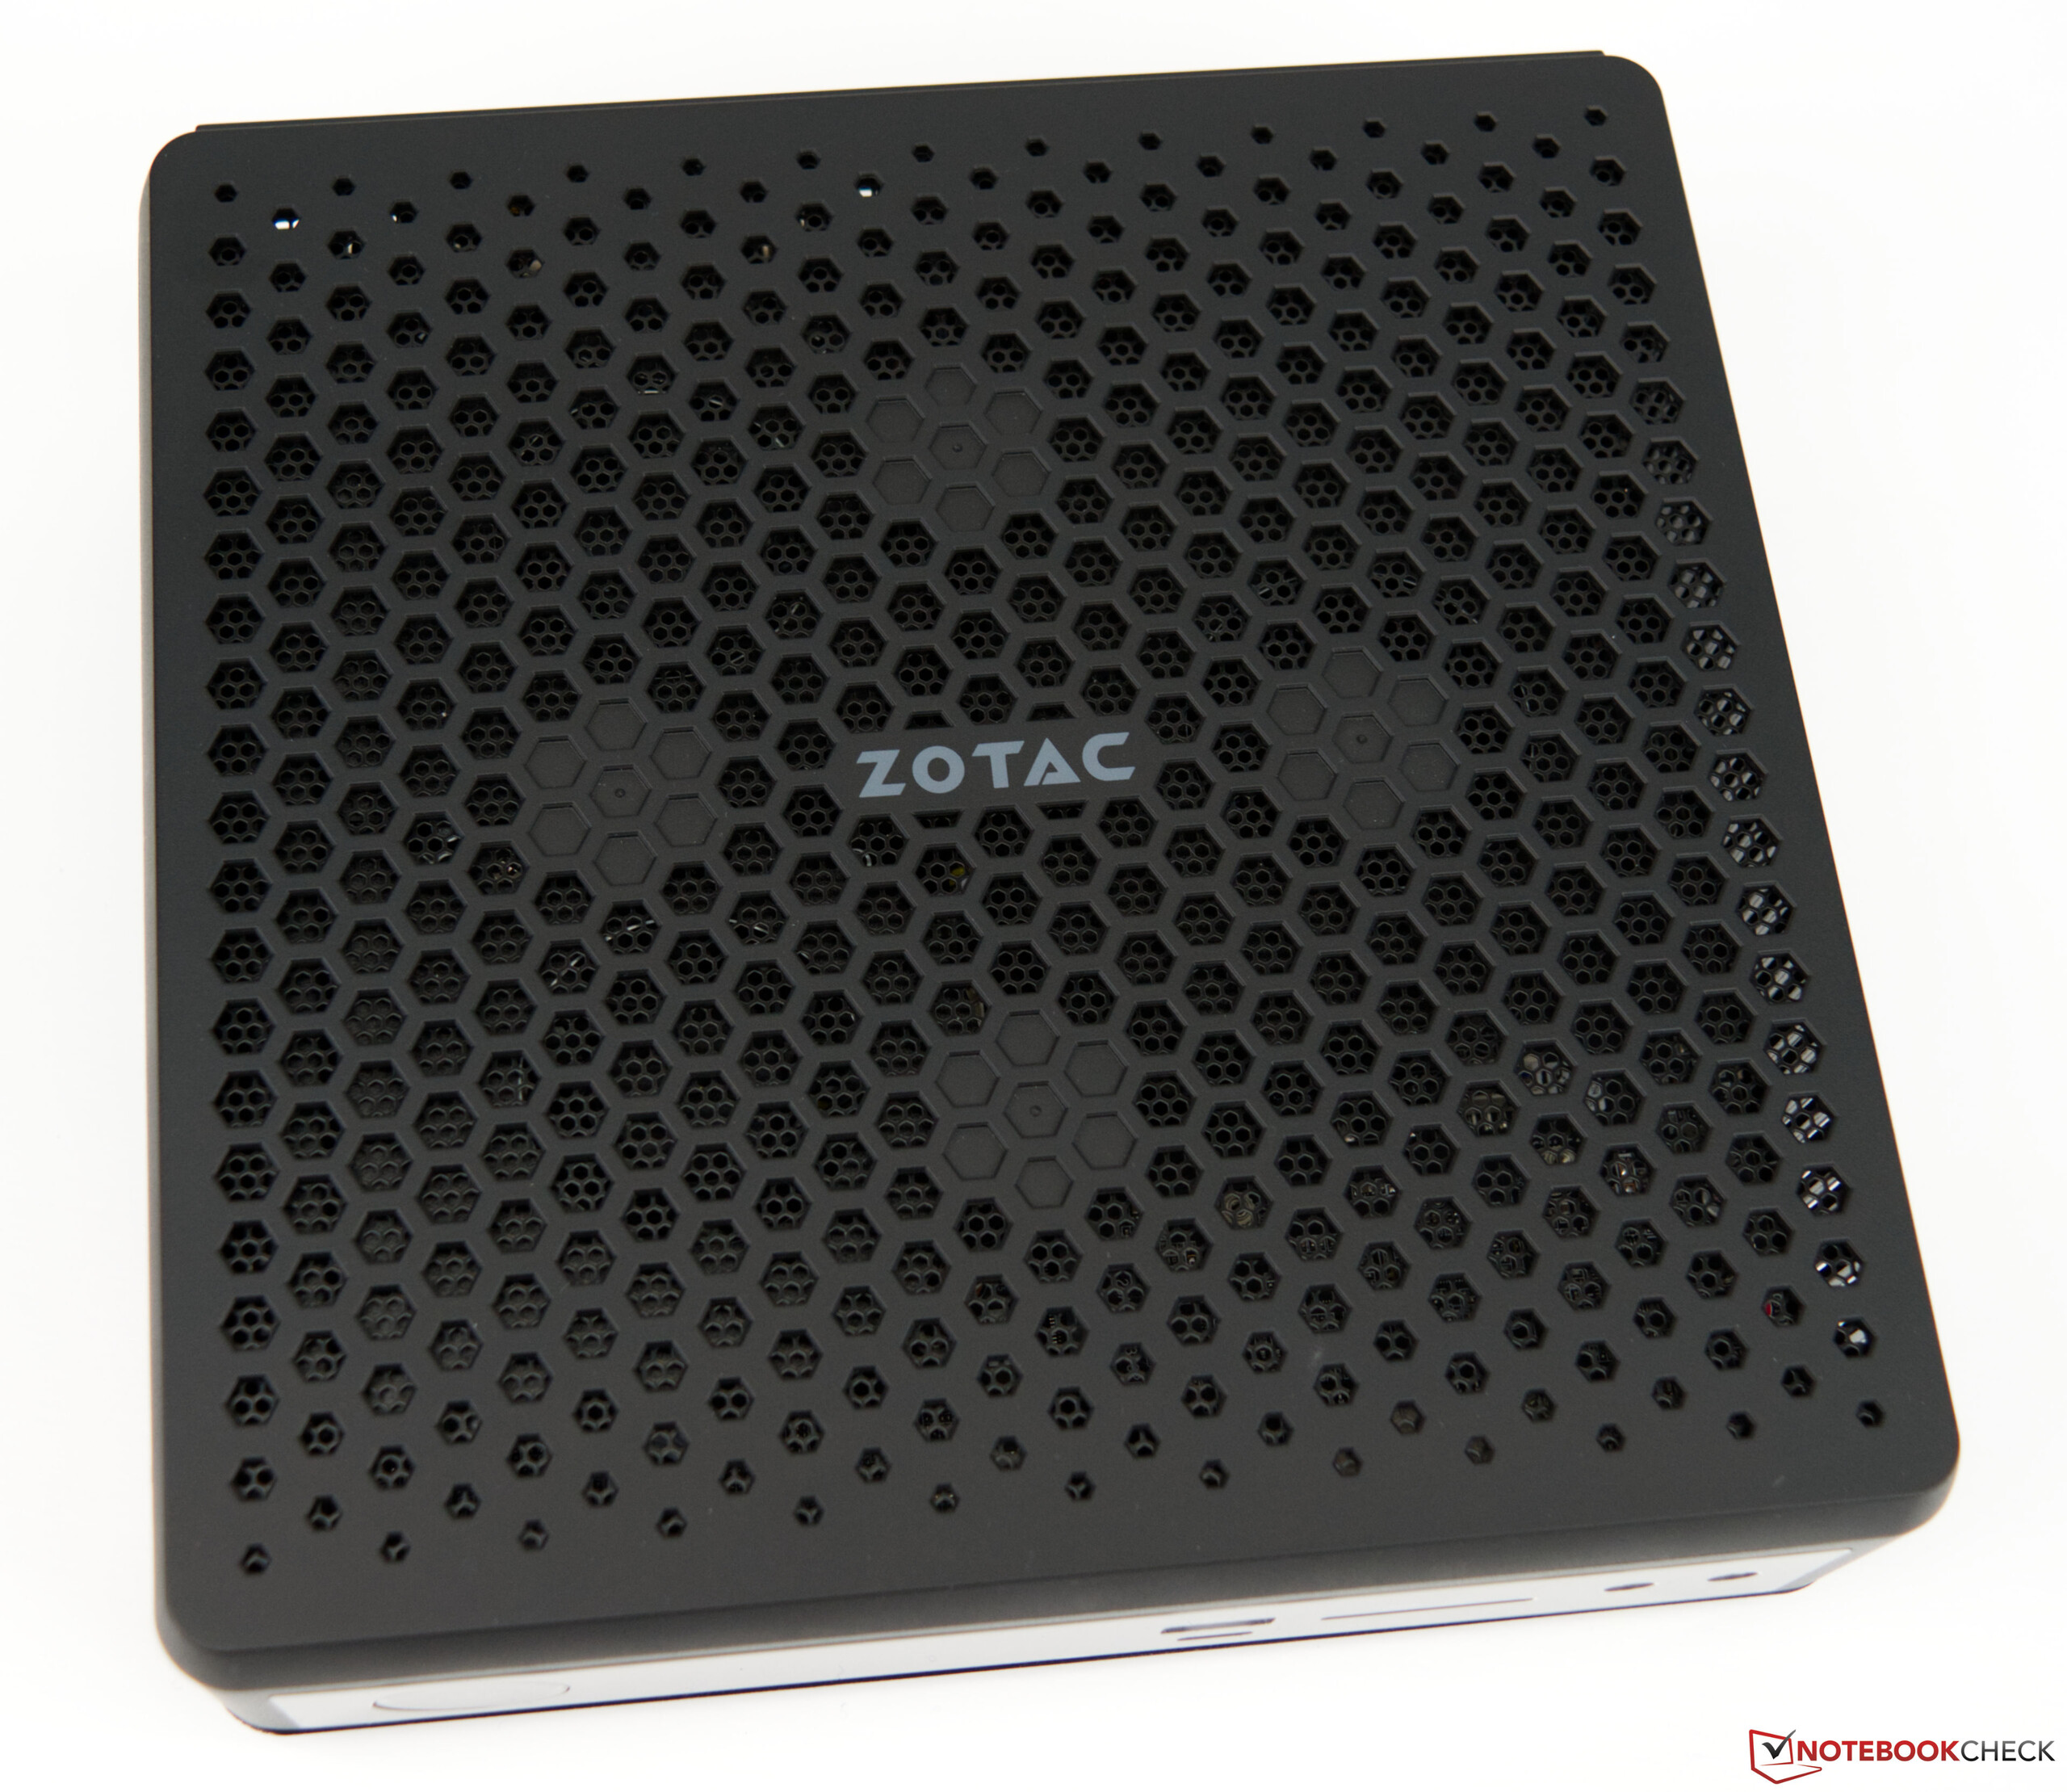
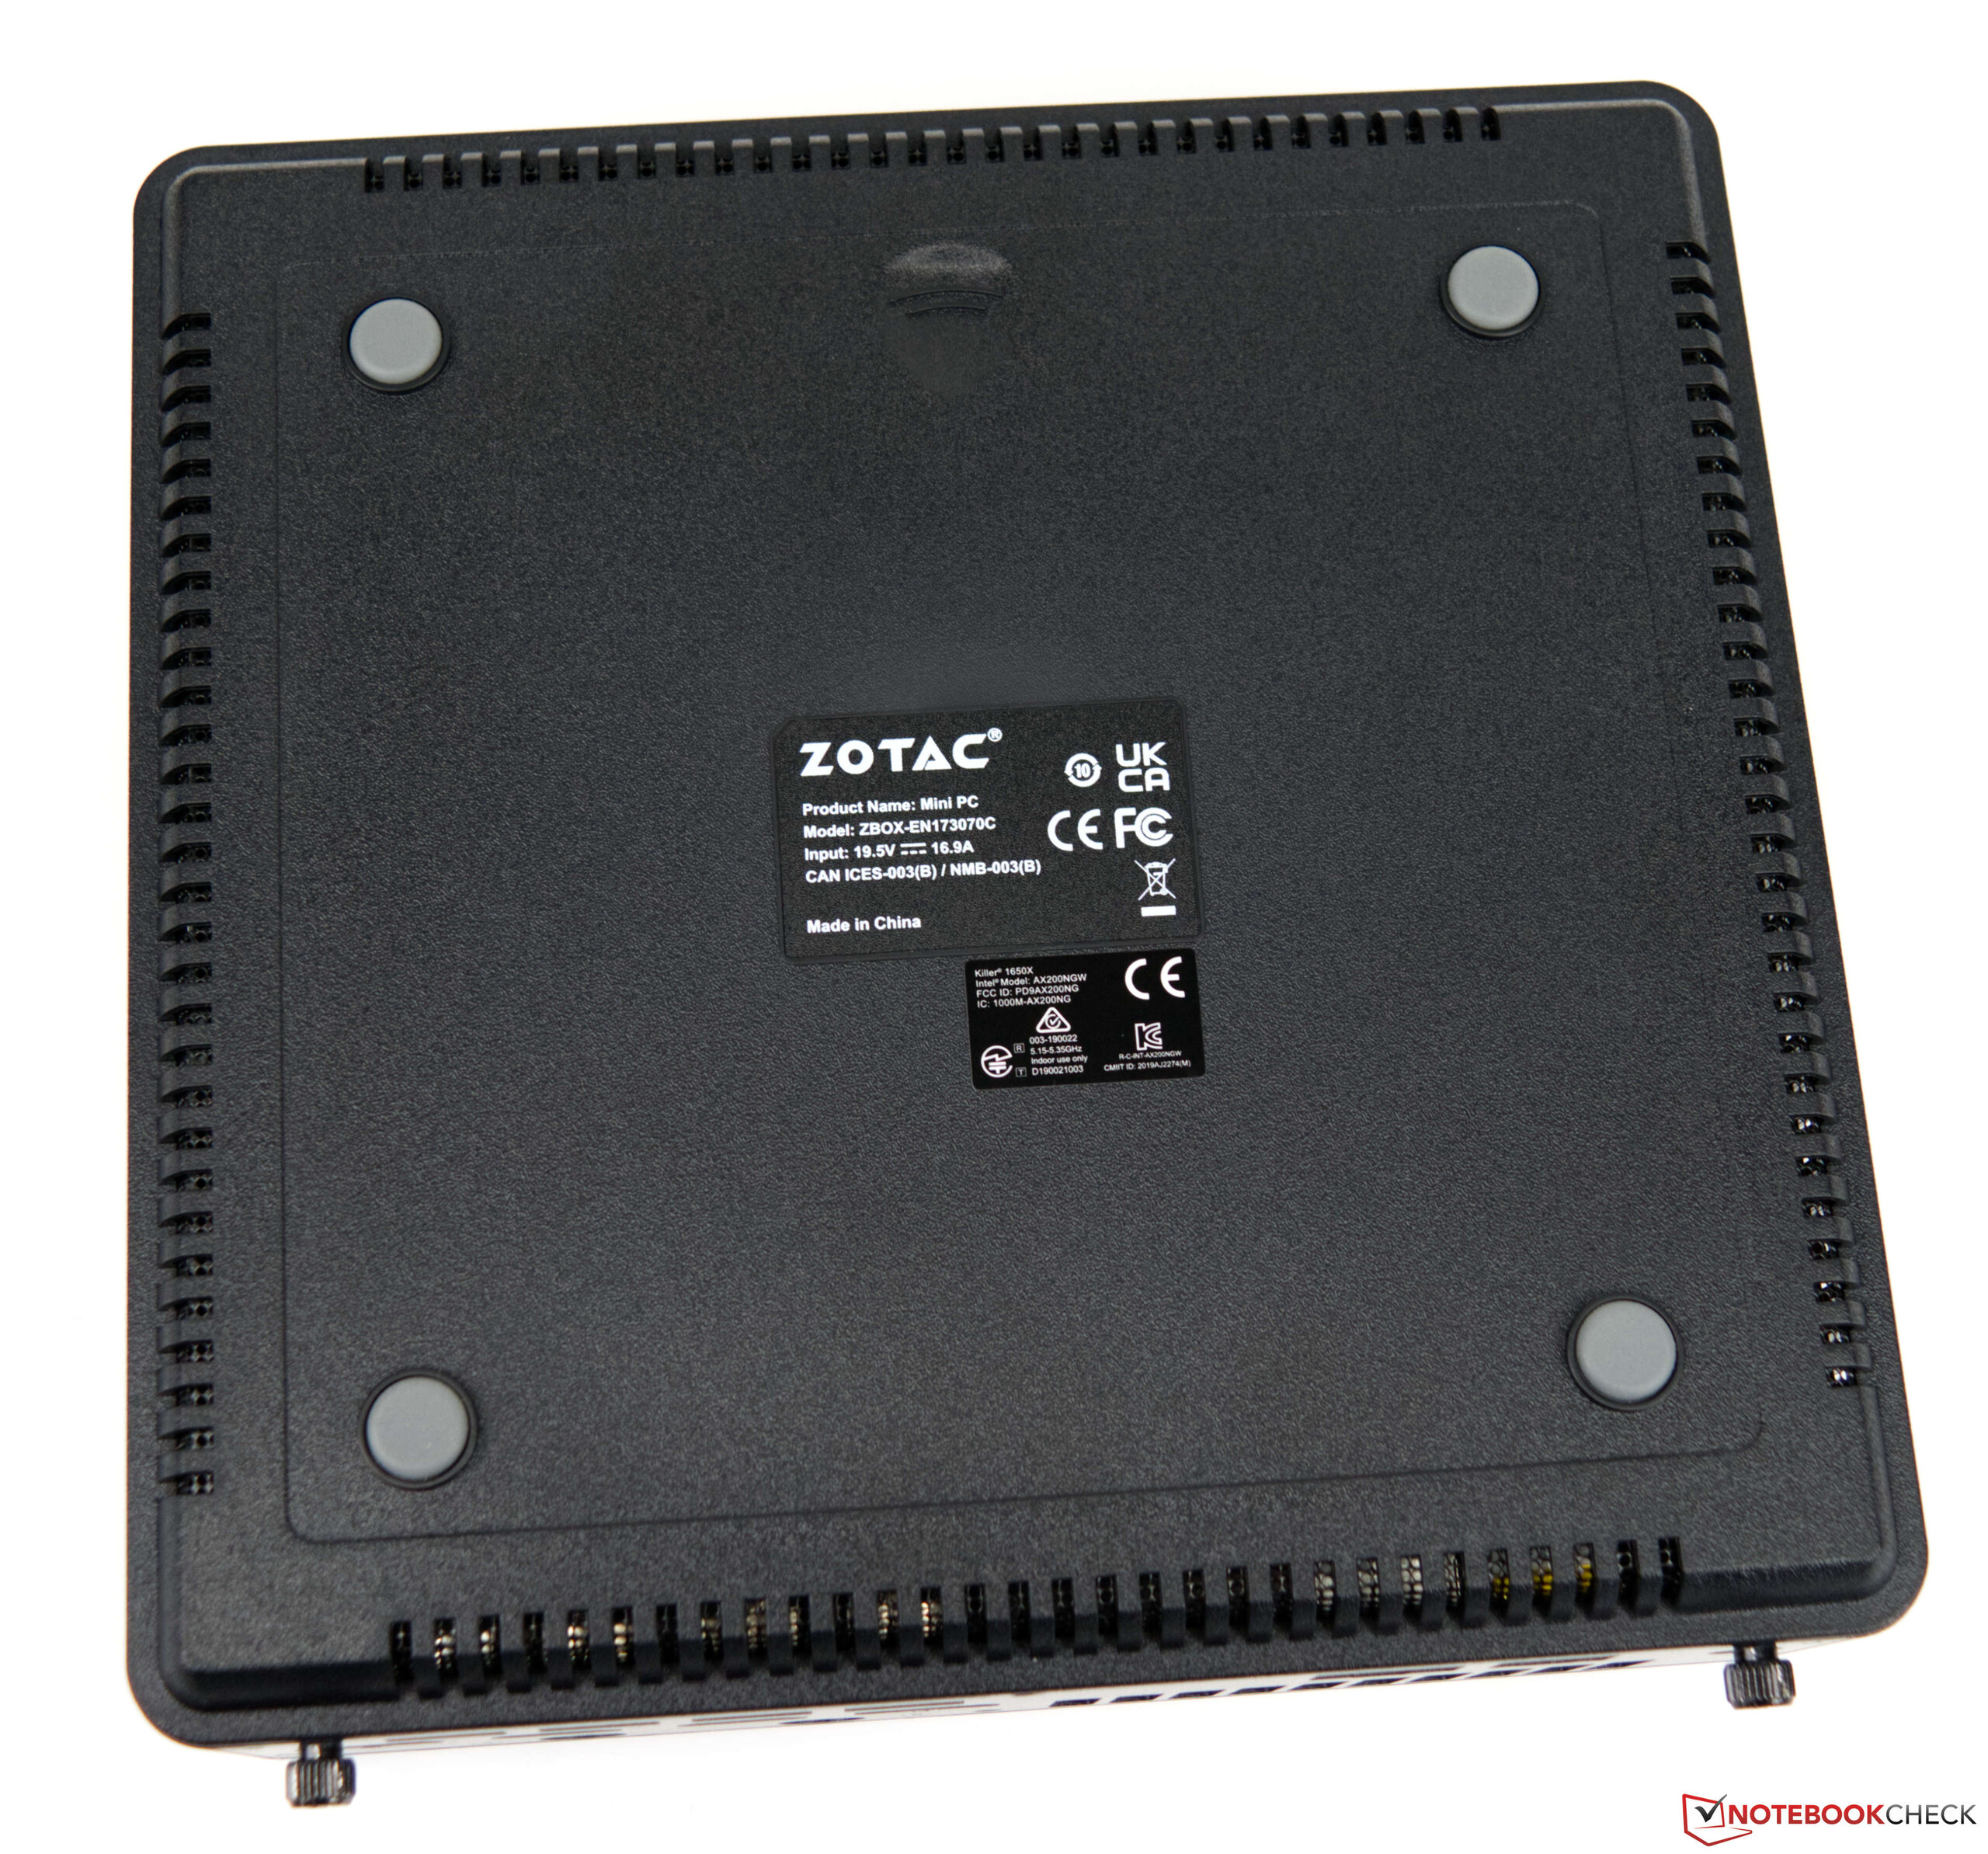
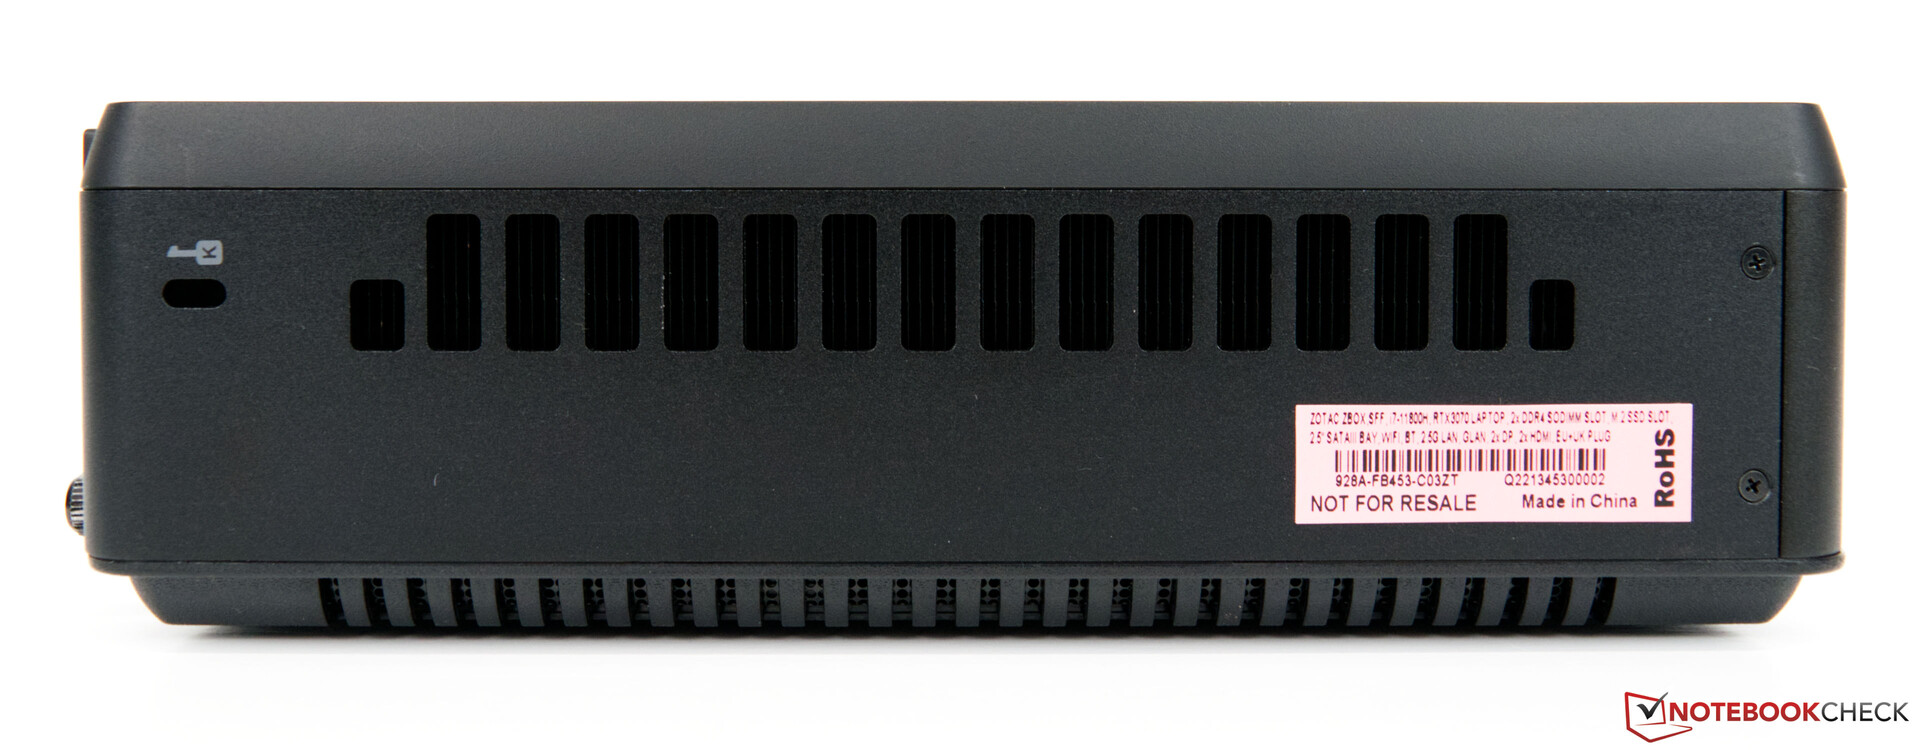
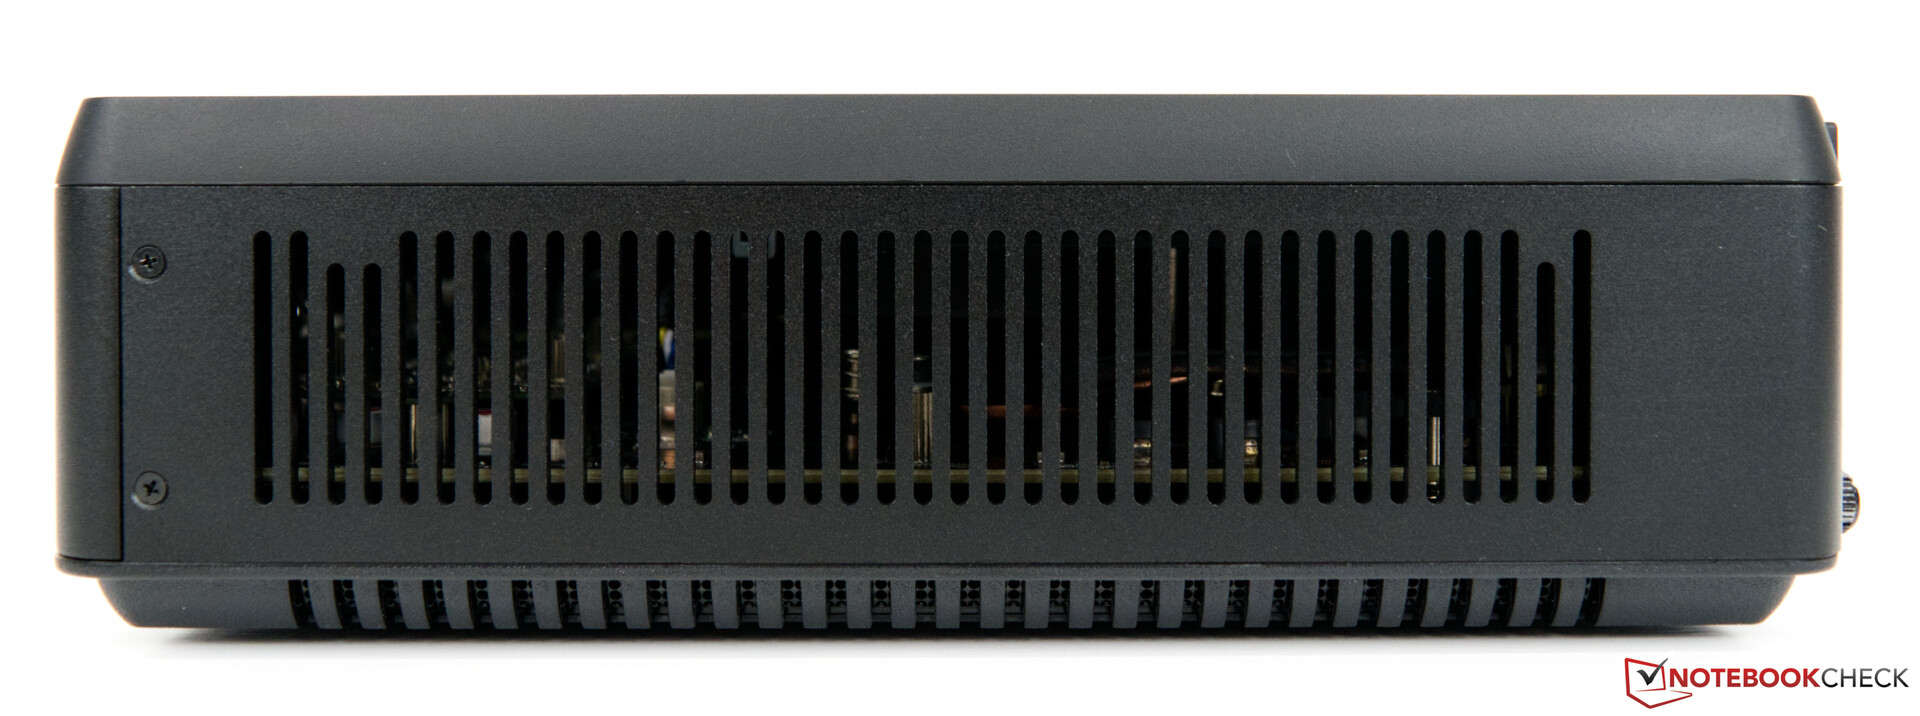
Cas
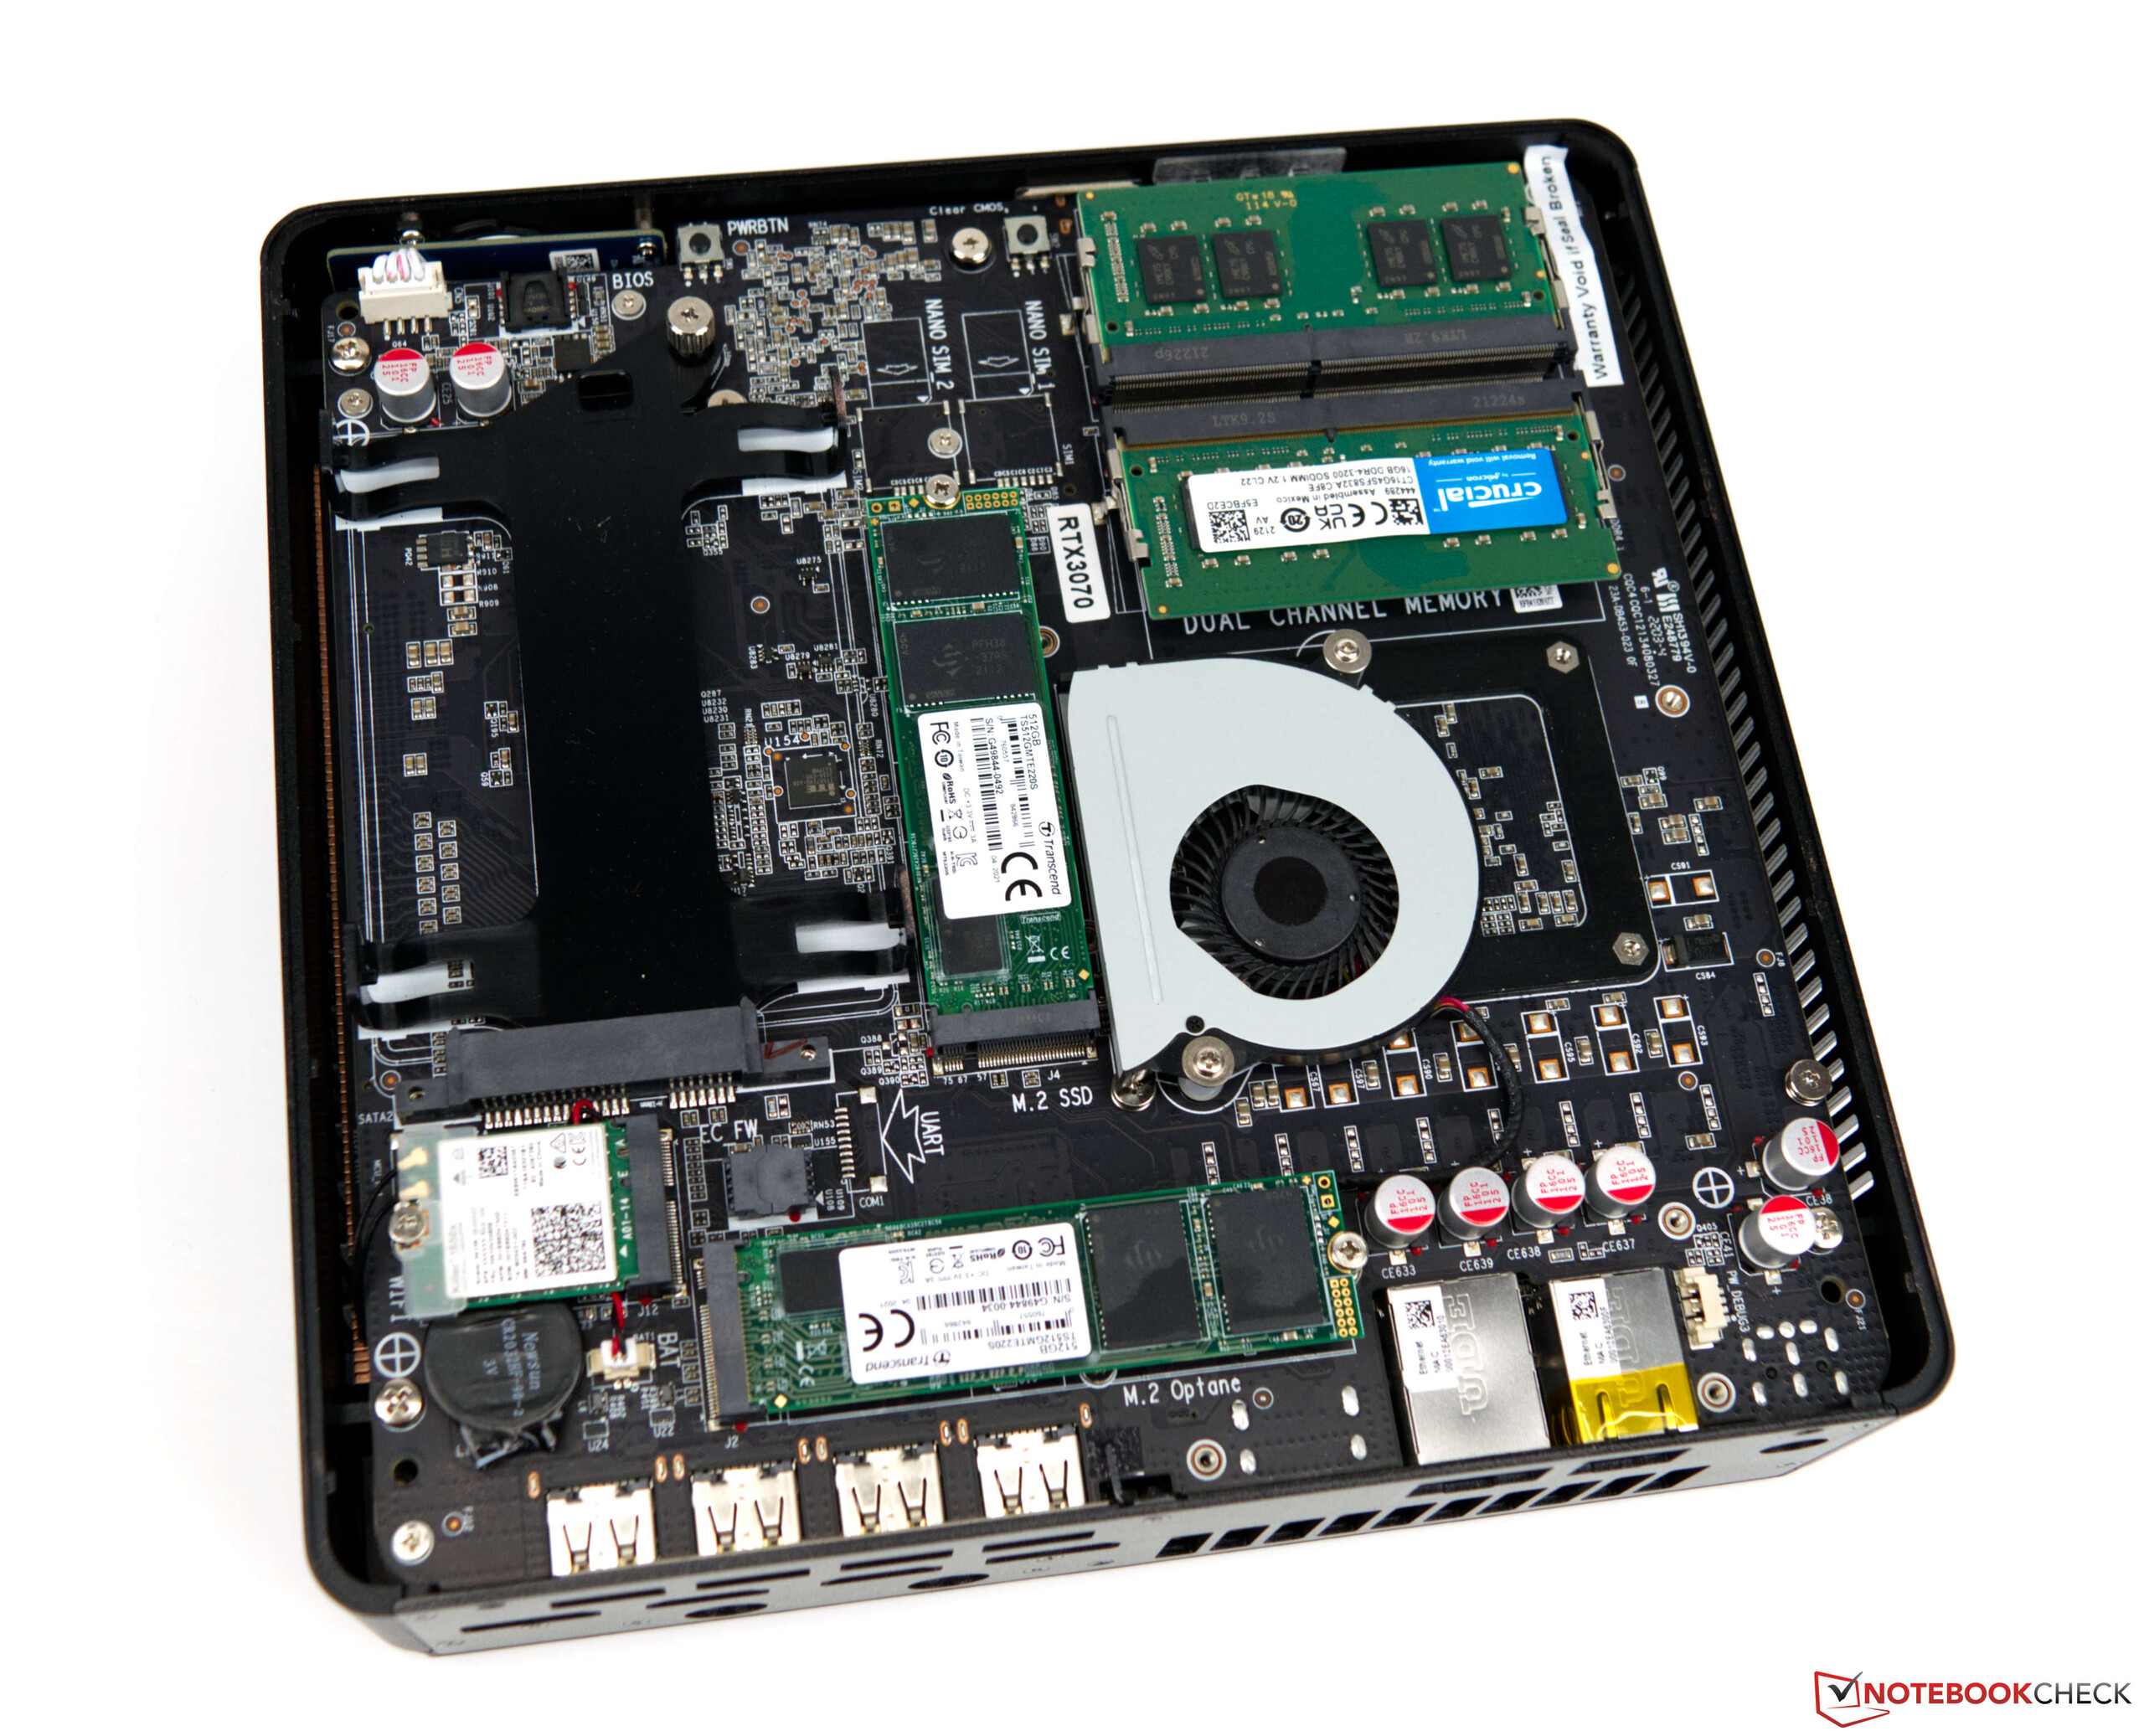
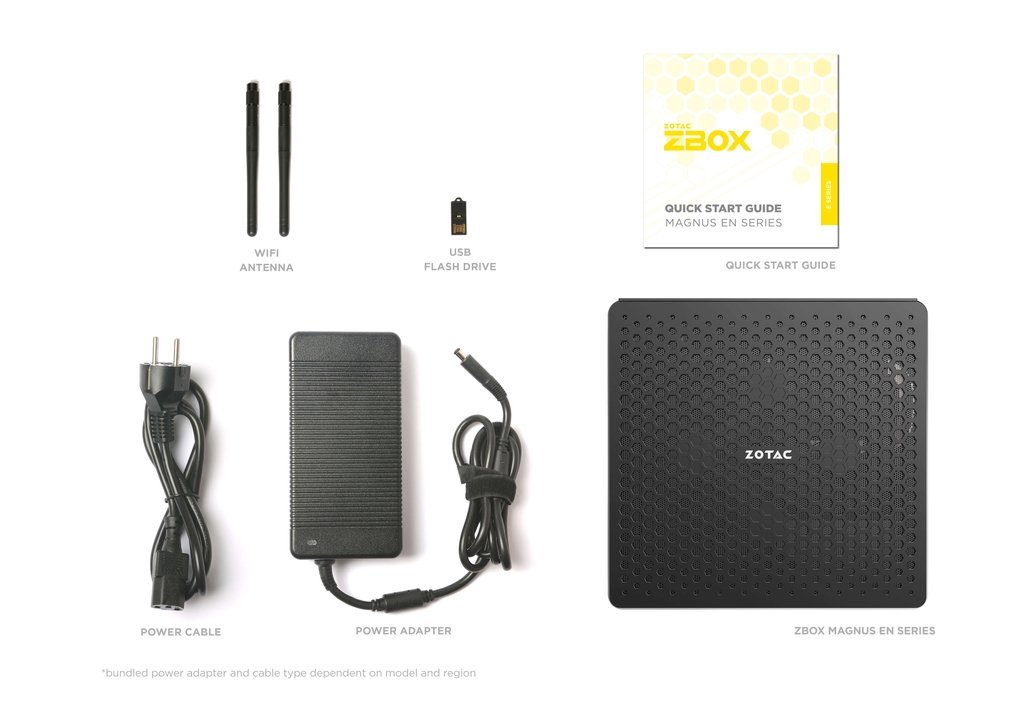
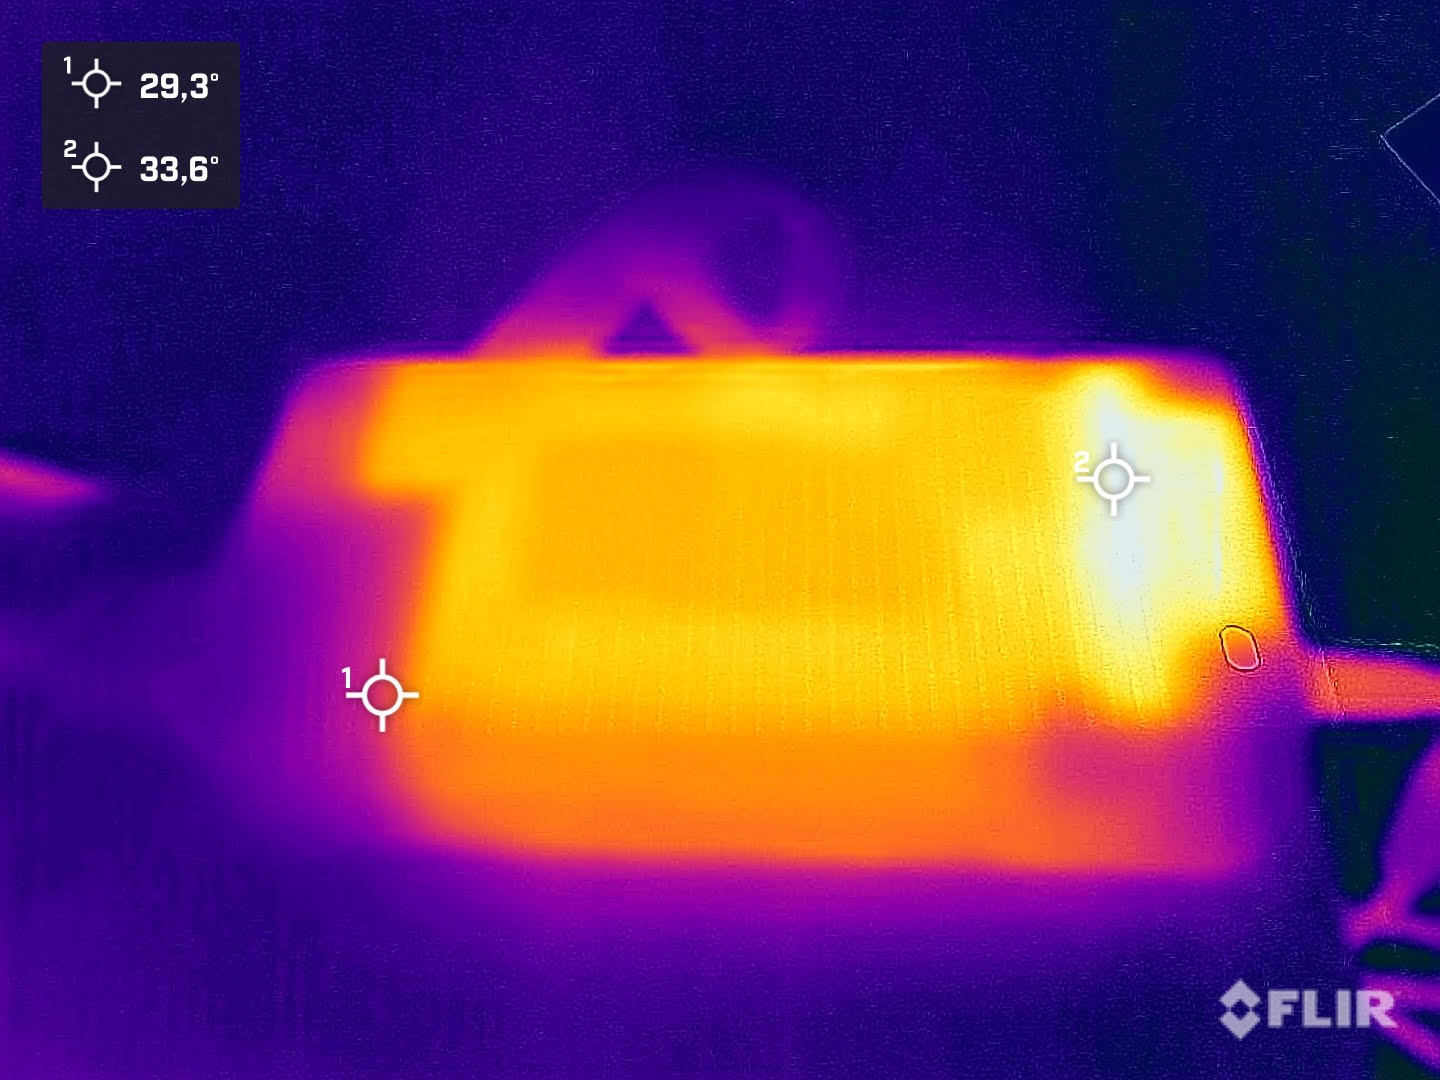
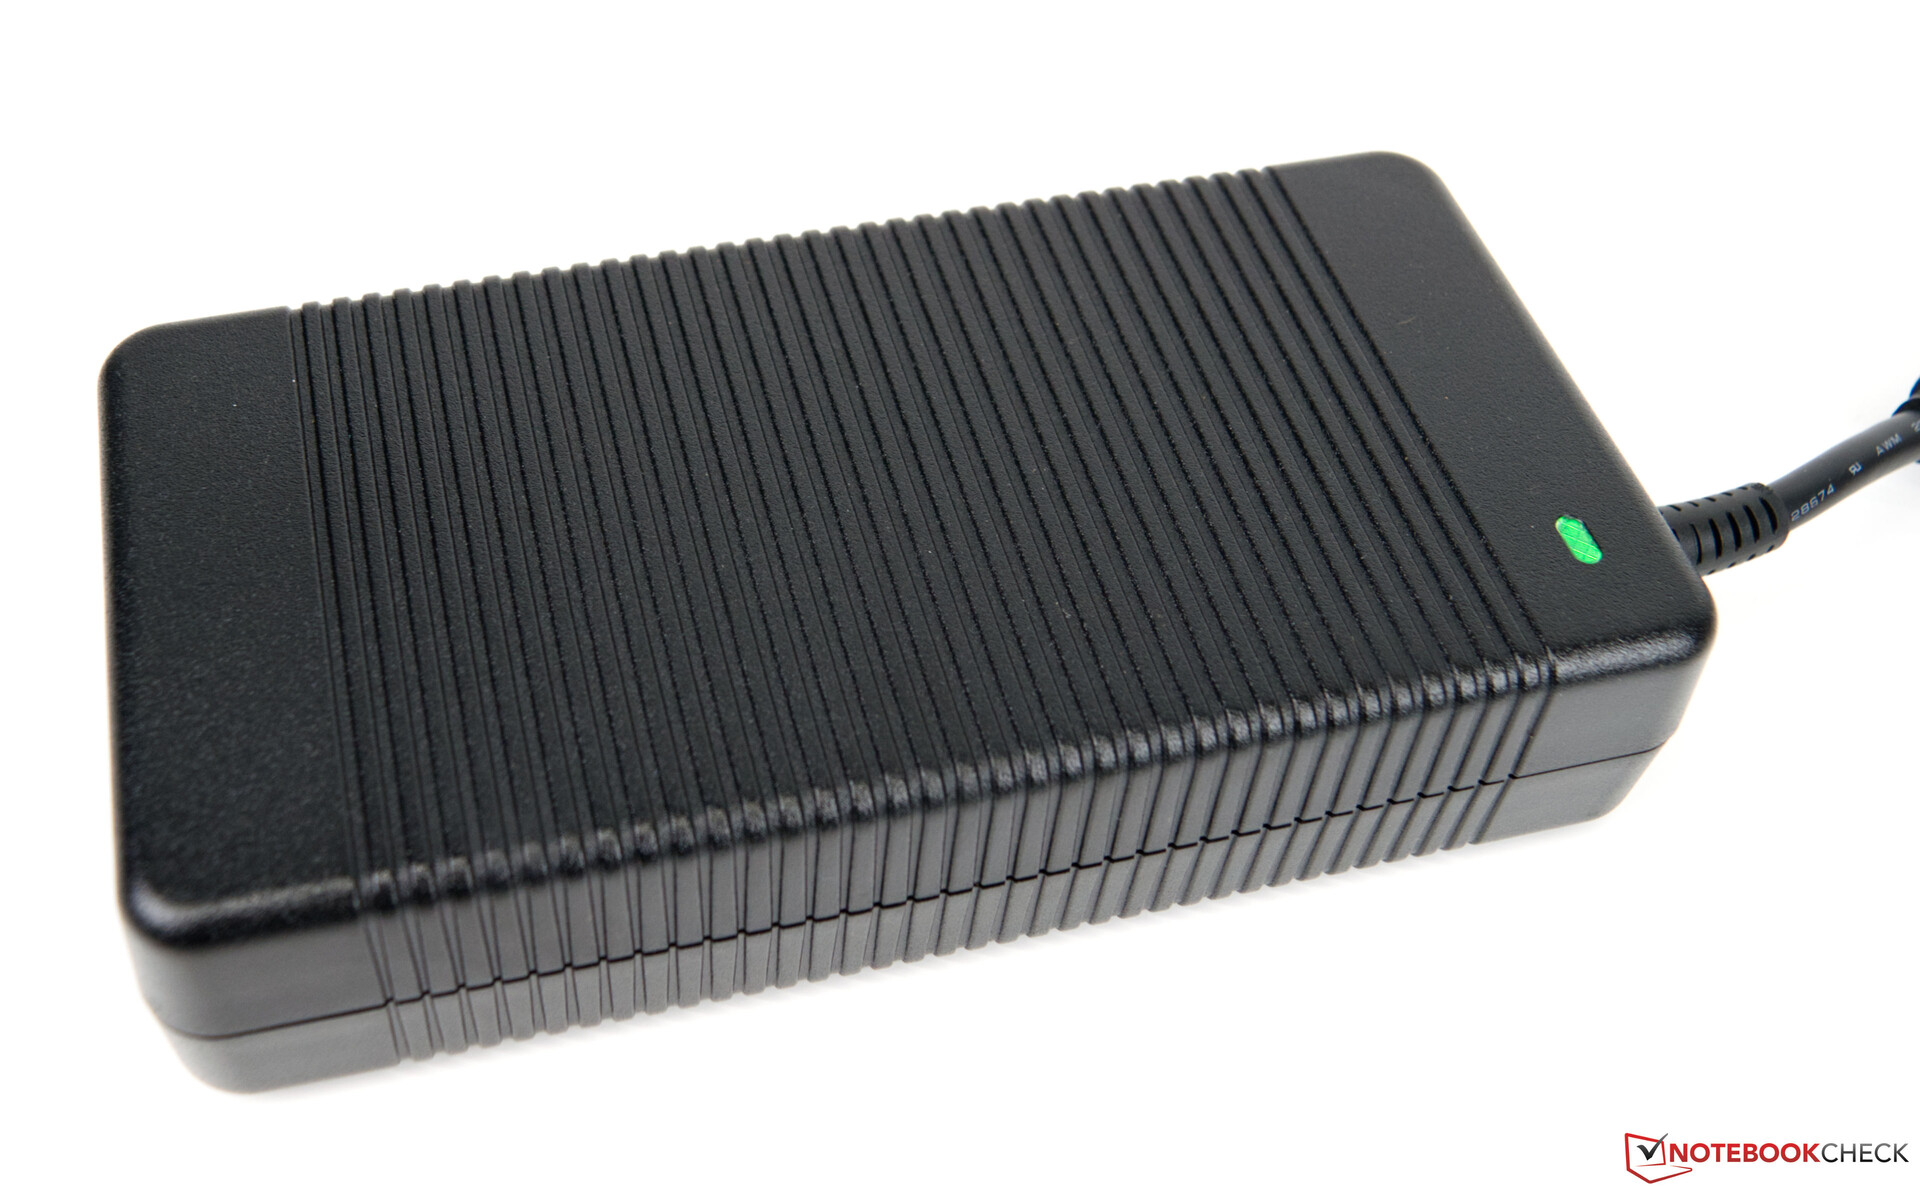
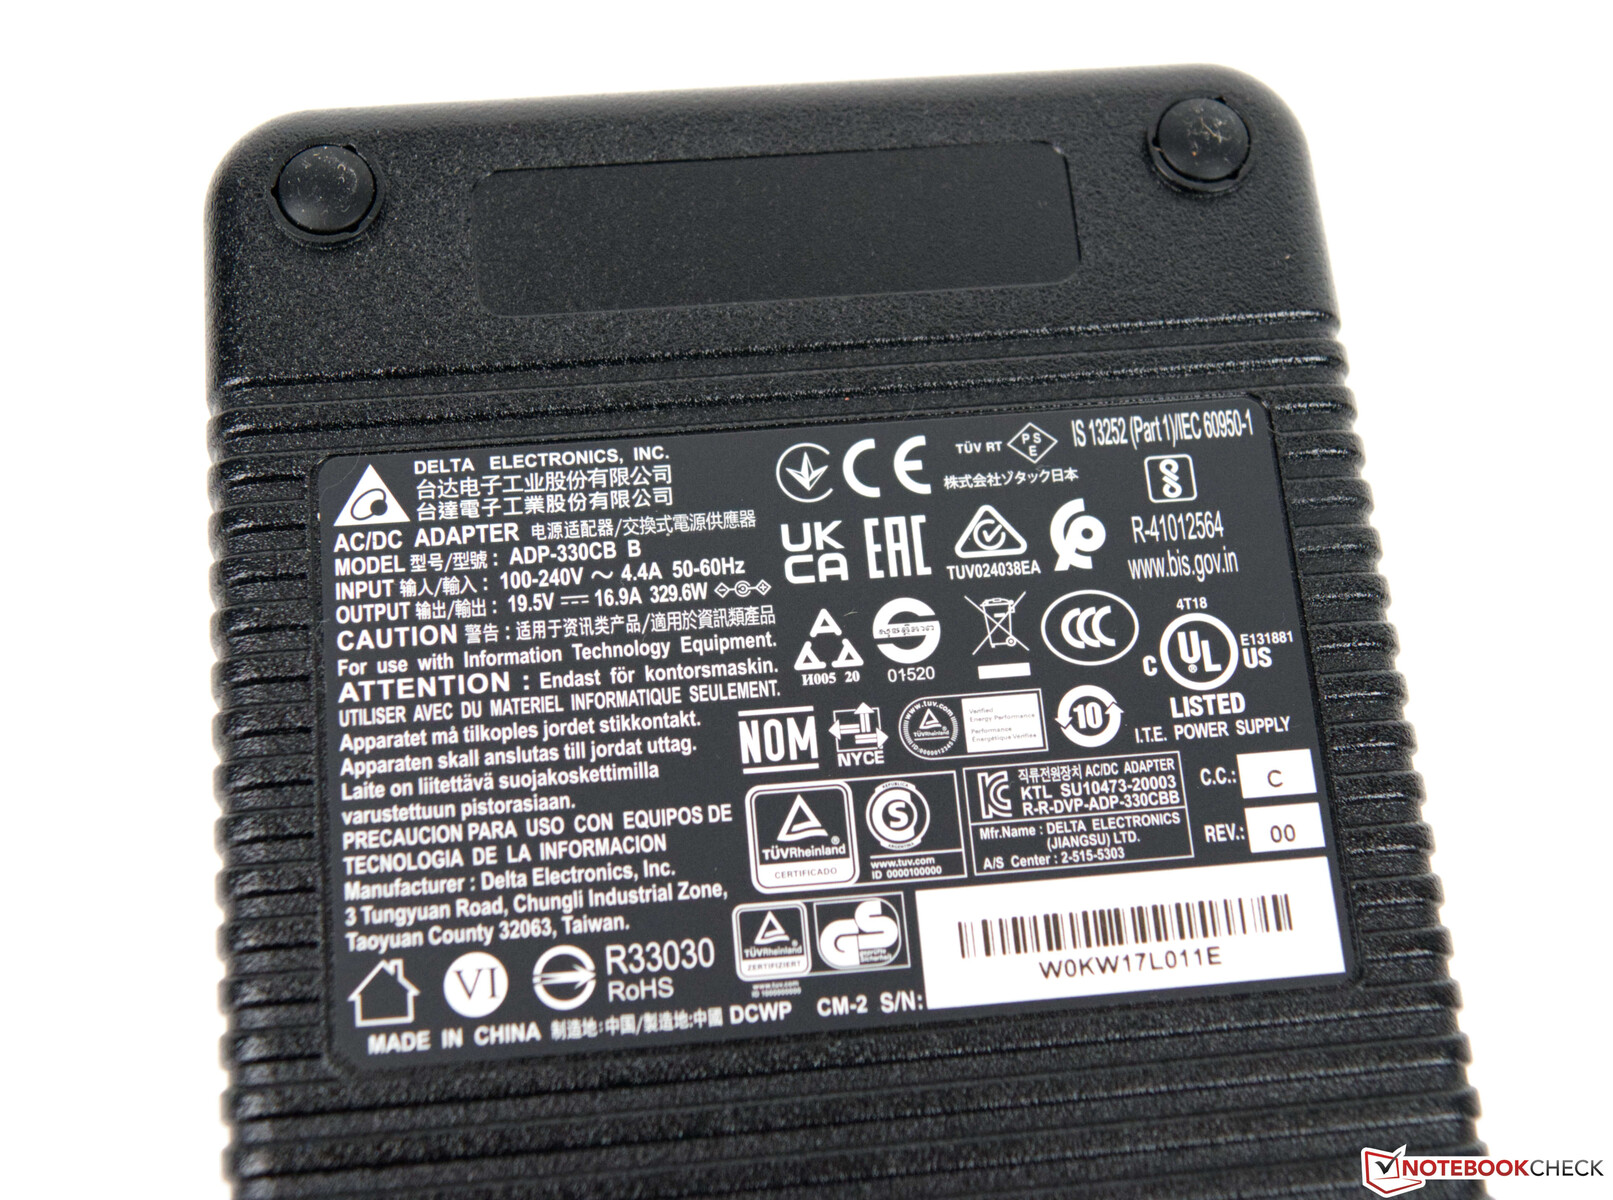
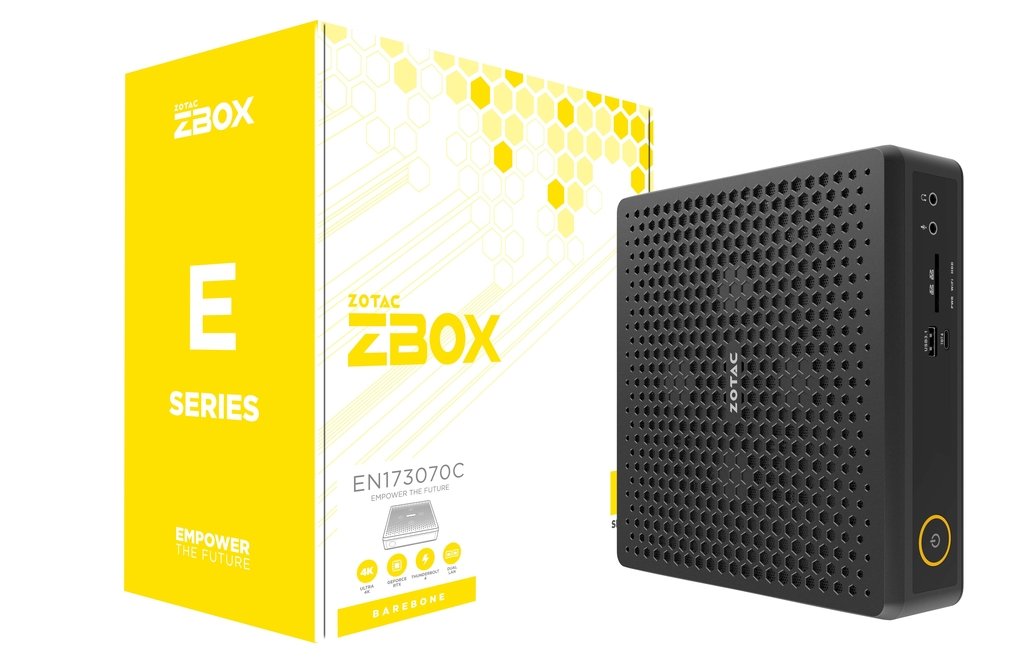
Visuellement, on peut clairement distinguer le Zotac ZBOX Magnus EN173070C. Le Zotac ZBOX Magnus EN72080V était déjà basé sur ce boîtier compact, qui n'a subi que des modifications minimes en façade. Il est également possible de se passer complètement de RGB, comme le montre ici Zotac. Ceux qui aiment un design simple et compact seront satisfaits. Le boîtier est en plastique et a laissé une très bonne impression haptique dans notre esprit. Avec la RAM ajoutée et les deux SSD M.2, le système pèse un peu moins de 1,8 kilogramme (~4 lb). S'y ajoute le bloc d'alimentation de 330 watts, qui pèse 1,3 kilogramme (~2,9 lb). En termes de taille, le bloc d'alimentation est environ deux fois moins grand que le Magnus EN173070C lui-même, qui n'a pas besoin de beaucoup d'espace avec un encombrement de 21 x 20,3 cm (~8,3 x 8 in). Avec une hauteur de seulement 6,22 cm (~2,45 in), l'appareil est également relativement mince.
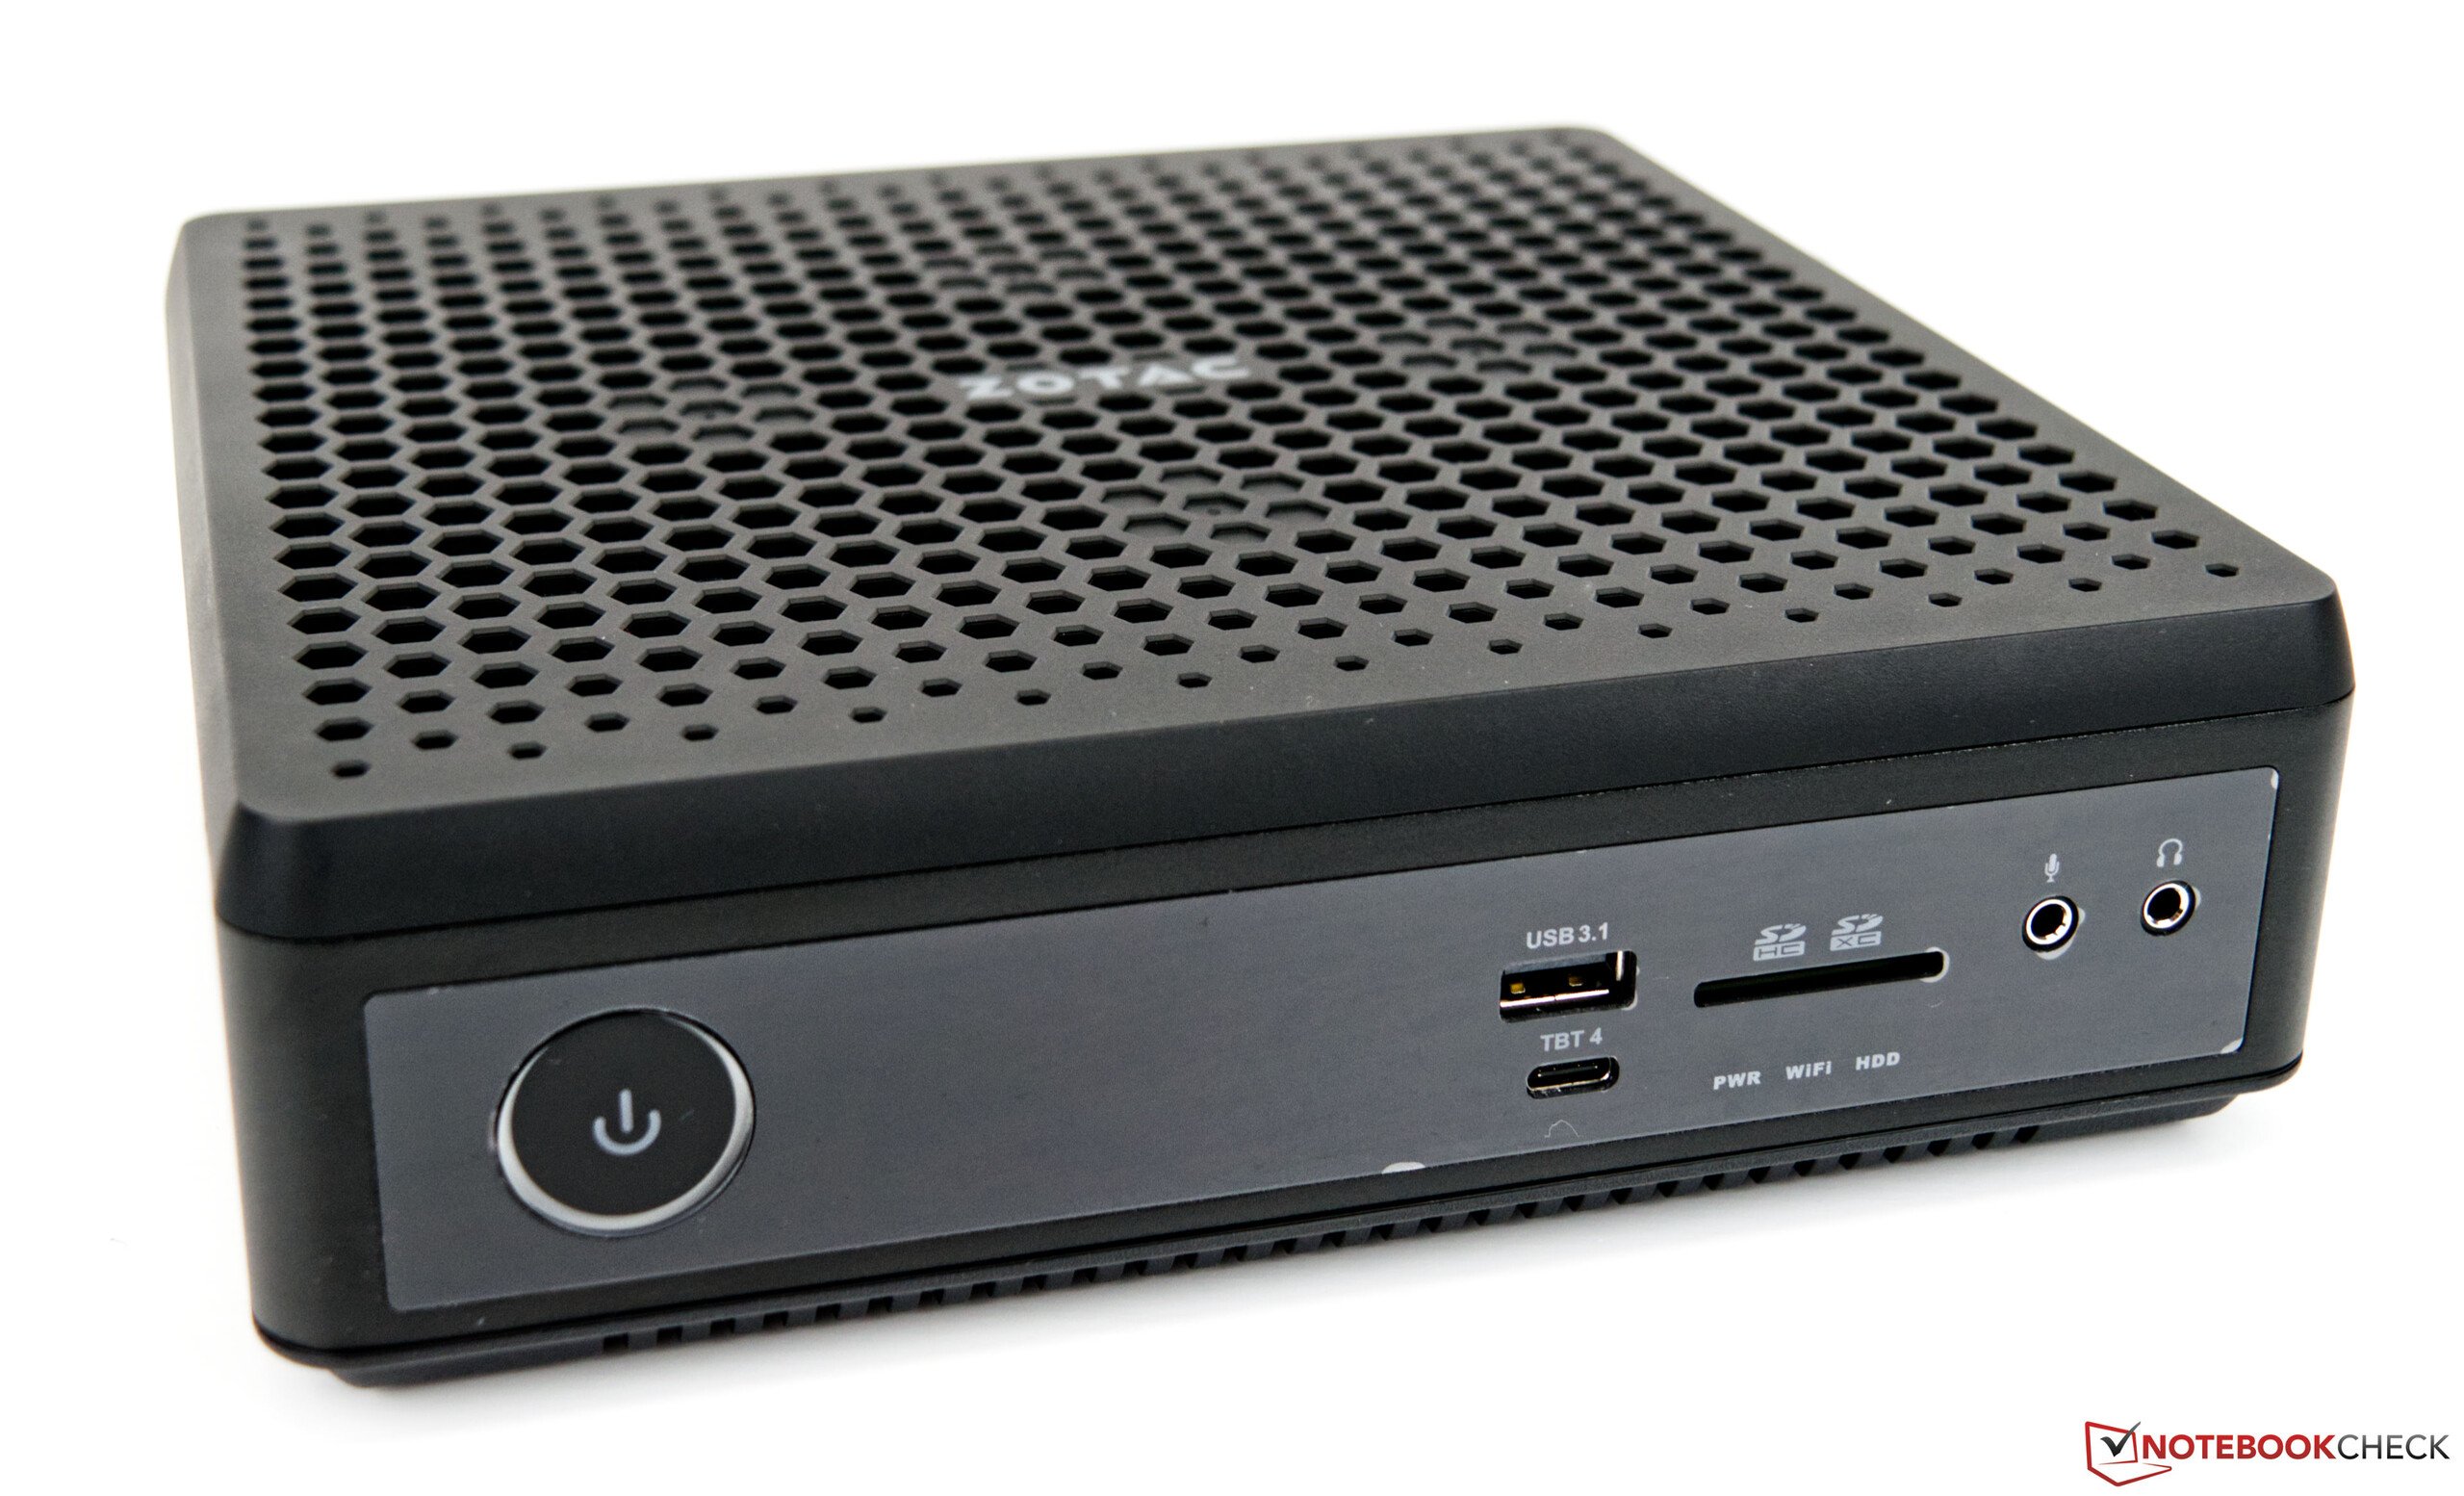
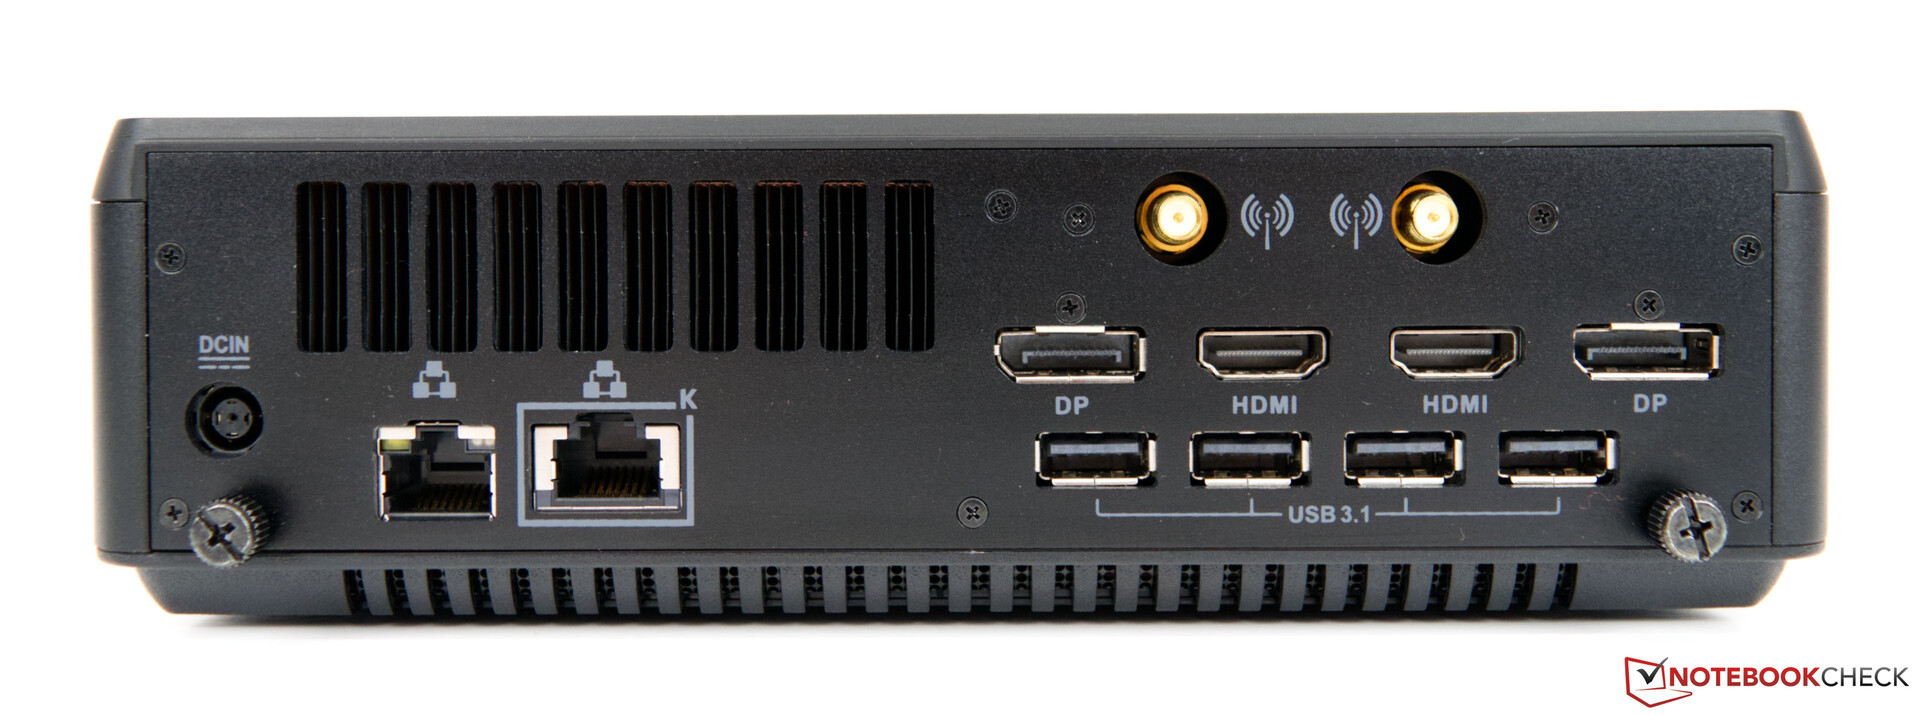
Équipement de connexion
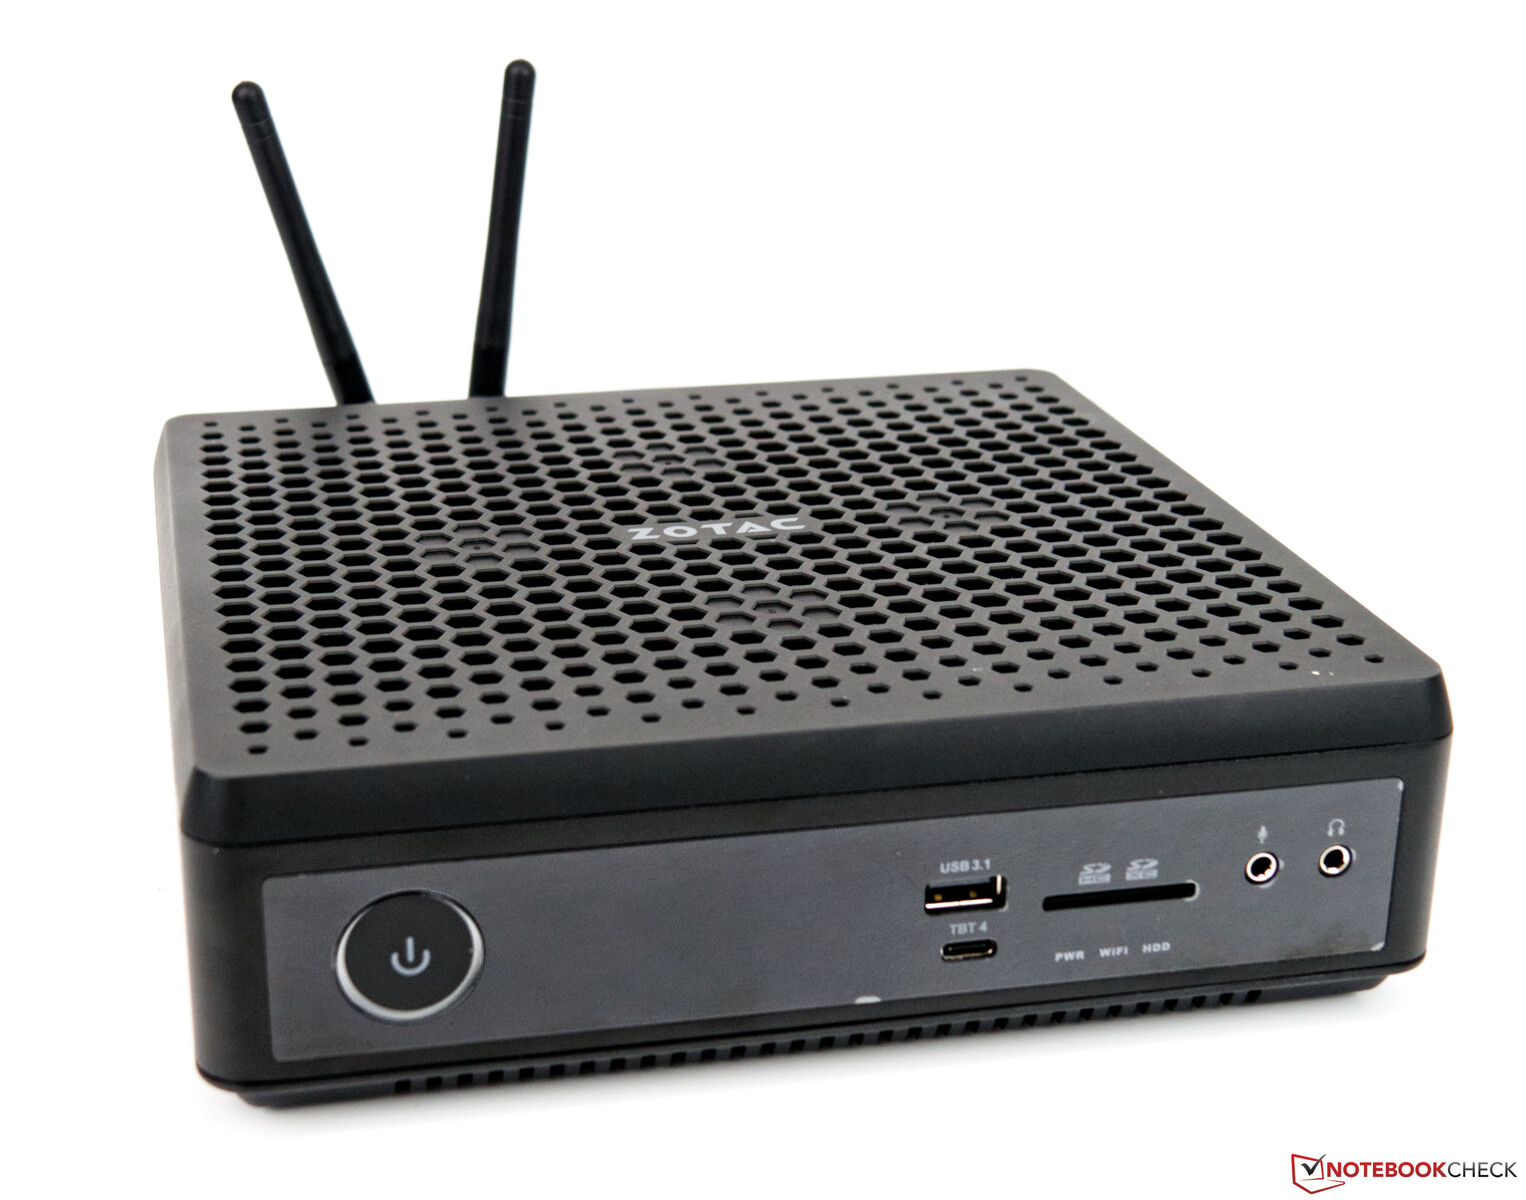
Le Zotac ZBOX Magnus EN173070C offre une grande variété de connexions externes, mais cela devrait également être attendu d'un PC de bureau. Il y a un total de cinq ports USB de type A et une seule connexion de type C, qui prend en charge Thunderbolt 4. Cependant, cette dernière a une limitation dans la mesure où elle est uniquement destinée aux données. En outre, vous pouvez faire fonctionner jusqu'à quatre écrans externes simultanément. Pour les connecter, il existe deux ports DisplayPort et deux ports HDMI. Par ailleurs, les utilisateurs n'ont pas non plus à se passer d'un lecteur de carte SD.
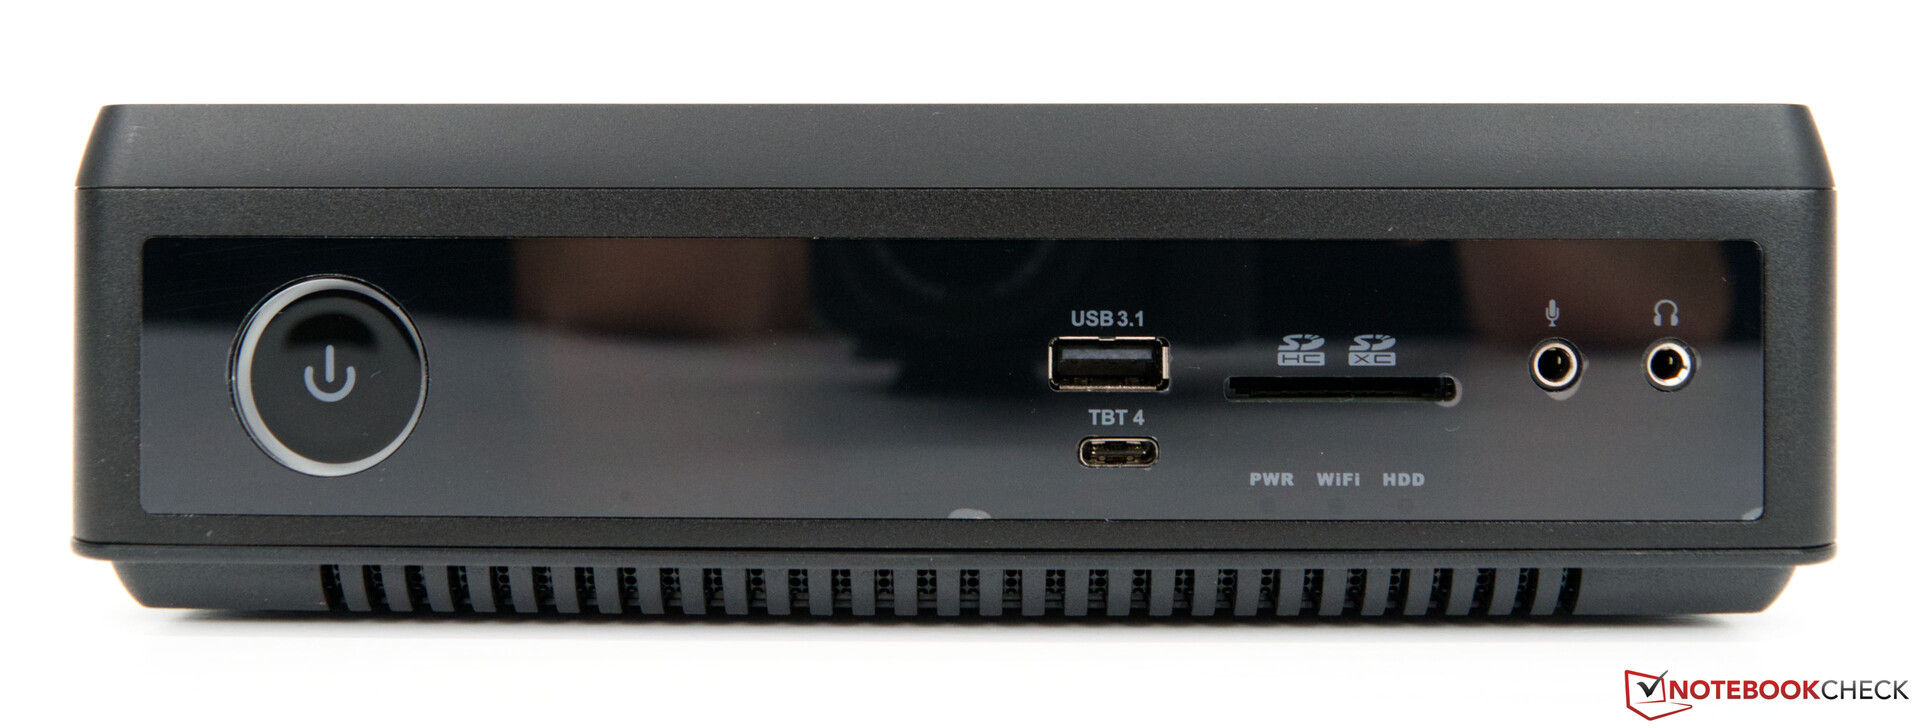
Lecteur de carte SD
Le lecteur de carte SD à l'intérieur offre des vitesses USB-3 et n'est pas en mesure d'utiliser la pleine performance de notre carte de test (AV Pro SD microSD 128 GB V60). En revanche, le NUC Intel Dragon Canyond'Intel Dragon Canyon montre ce qui est possible avec le support UHS II.
| SD Card Reader | |
| average JPG Copy Test (av. of 3 runs) | |
| Intel Dragon Canyon NUC | |
| Zotac ZBOX Magnus EN173070C (AV Pro SD microSD 128 GB V60) | |
| maximum AS SSD Seq Read Test (1GB) | |
| Intel Dragon Canyon NUC | |
| Zotac ZBOX Magnus EN173070C (AV Pro SD microSD 128 GB V60) | |
Communication
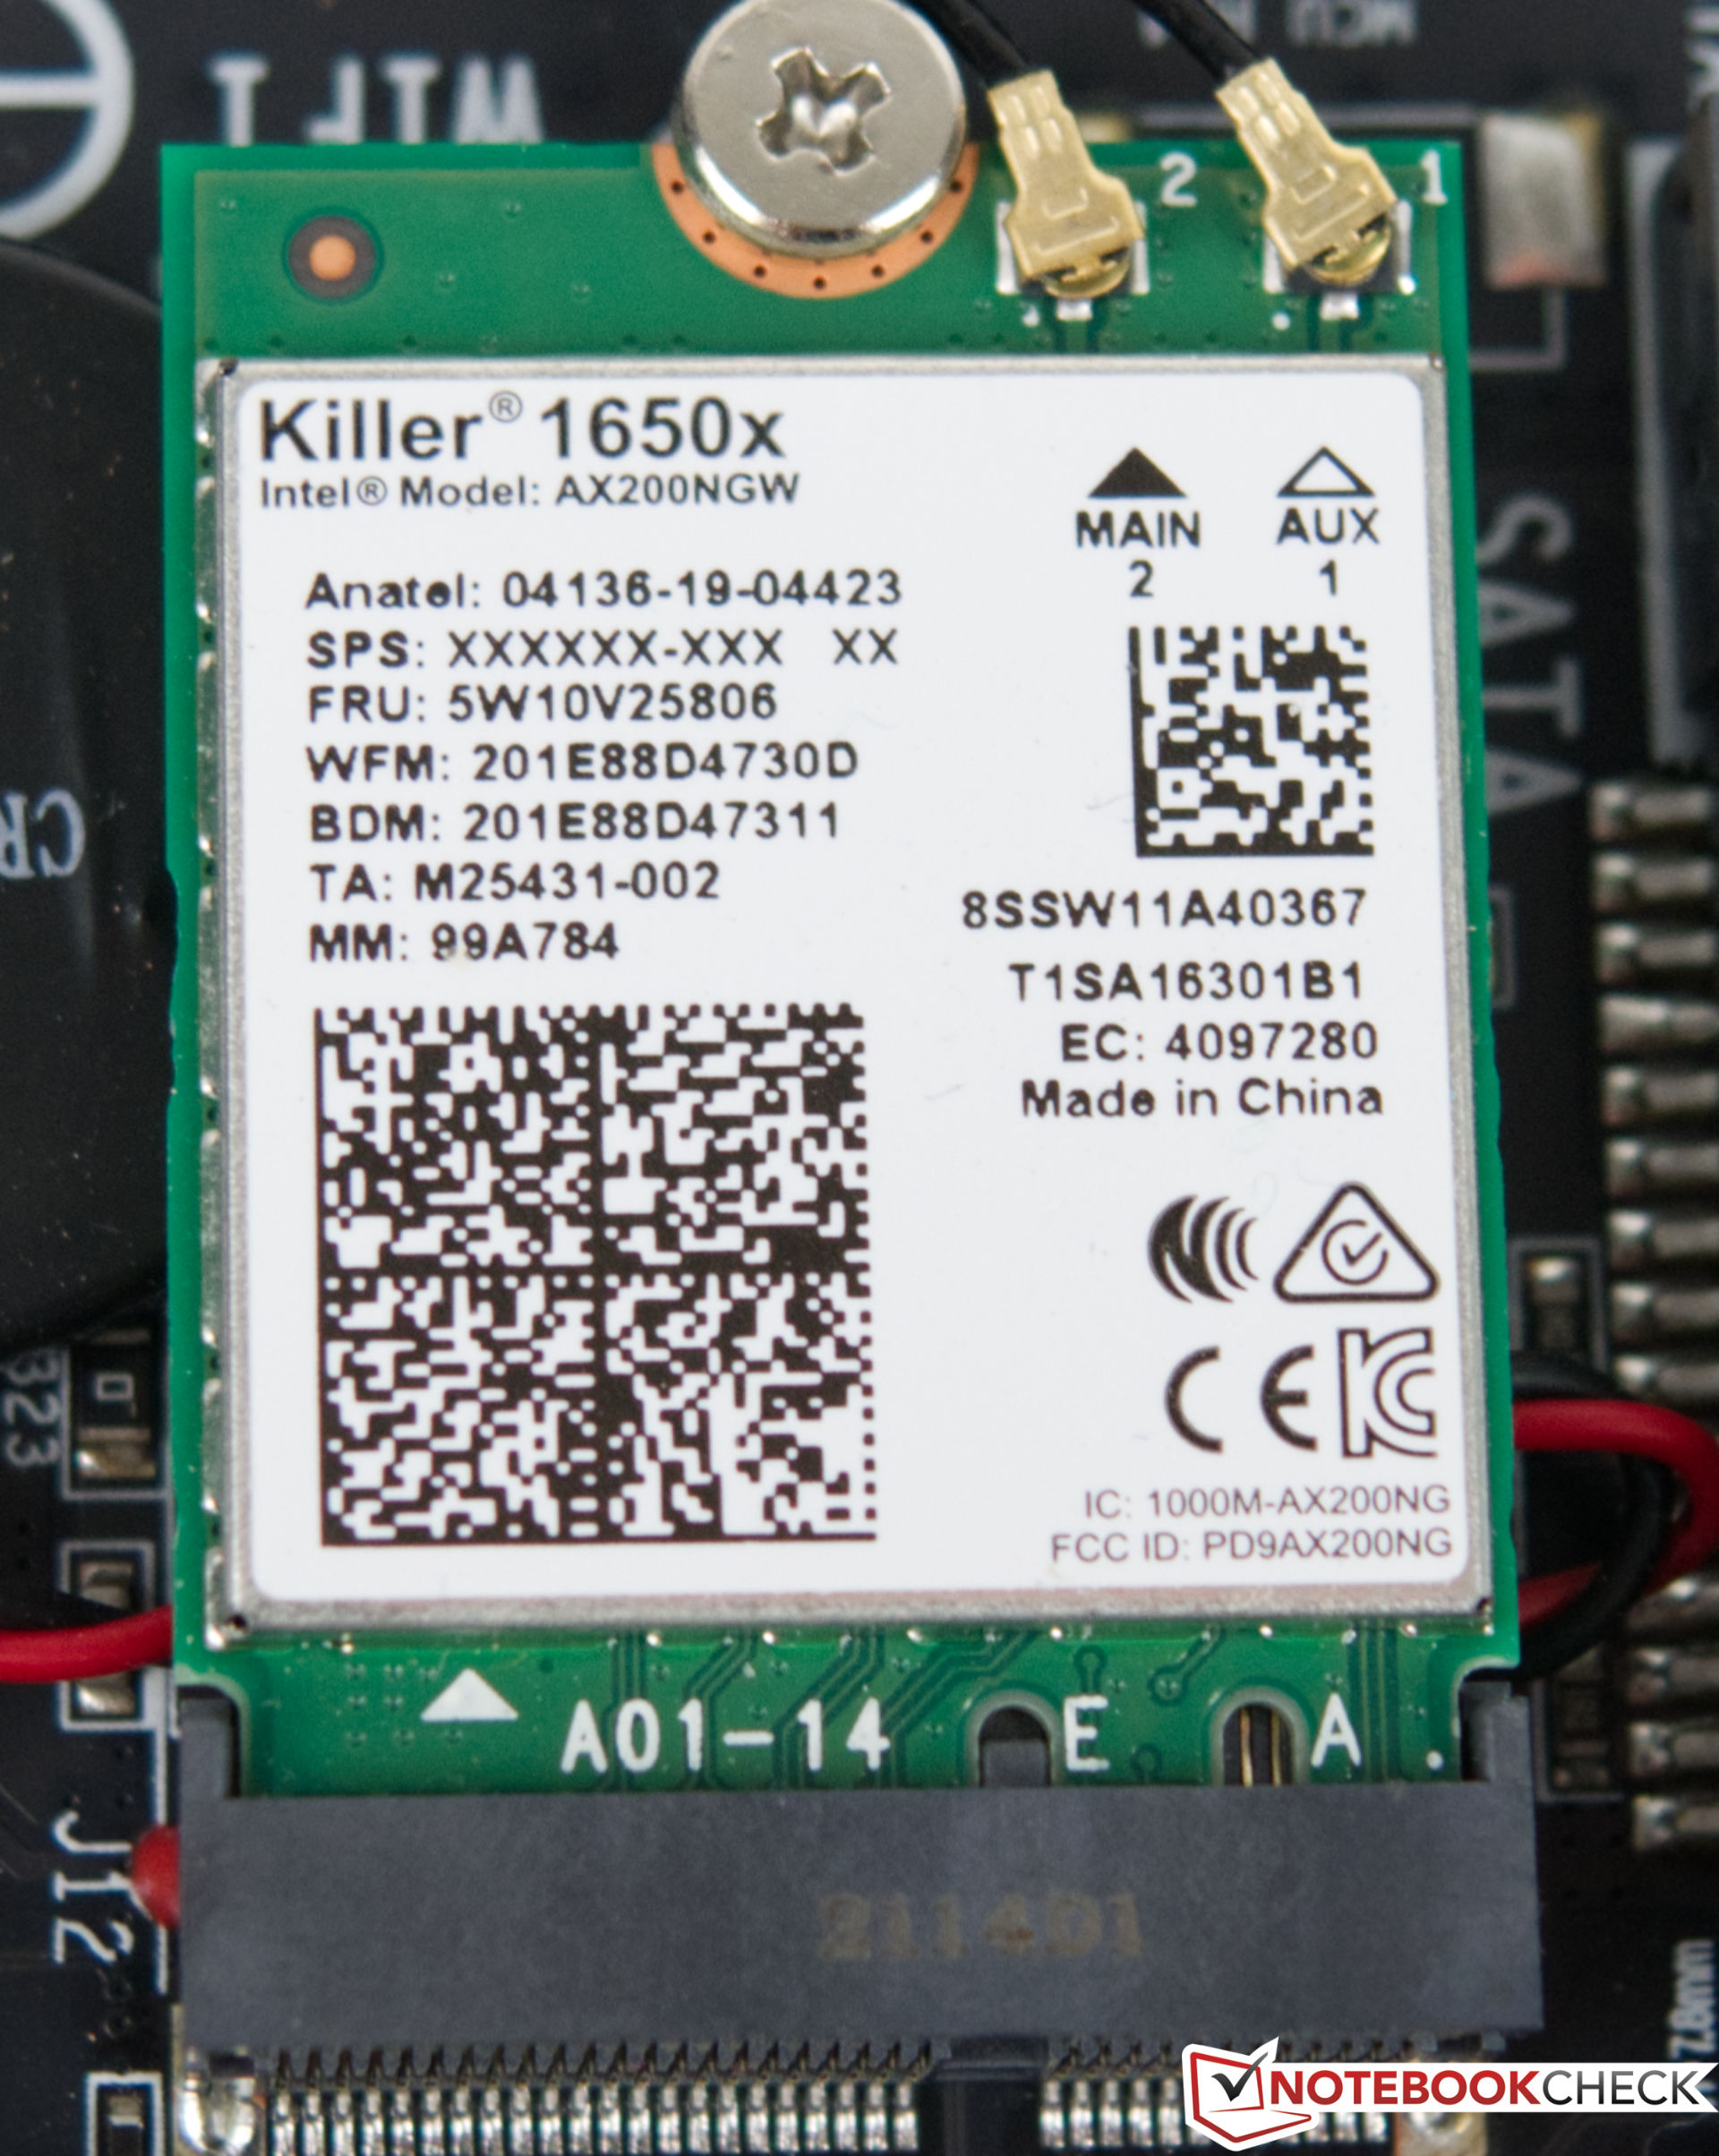
Zotac utilise un module WLAN de Killer dans le Magnus EN173070C. L'AX1650x offre le Wi-Fi 6 et fait un très bon travail dans notre test. Les performances restent stables même sur une longue période et il n'y a pas de variations significatives. Cependant, dans la comparaison directe, le NUC Intel Dragon Canyonavec le Intel Wi-Fi 6E AX211 est capable de fournir de meilleures valeurs. Nous avons effectué le test dans des conditions optimales en utilisant le routeur de jeu WLAN Asus GT-AXE1000WiFi-6E.
Performance
Processeur
Le Zotac ZBOX Magnus EN173070C utilise un processeur Intel Core i7-118HH.Intel Core i7-11800HcPU. Ce processeur est vraiment destiné aux ordinateurs portables et offre 8 cœurs et 16 threads à une vitesse d'horloge maximale de 4,6 GHz. Le SoC, qui appartient à la série Tiger Lake, fait un bon travail dans ce système compact. Zotac définit la valeur PL1 à 55 watts, et le système est capable de consommer jusqu'à 69 watts pendant une courte période. Bien que la performance ne soit pas vraiment reflétée dans les résultats, le SoC de notre unité de test fonctionne au niveau d'un Intel Core i9-10900Kpendant la charge d'un seul cœur, et parfois même, il est capable de le dépasser. D'autre part, l'Intel Core i7-11800H est surpassé par leAMD Ryzen 9 5900HXdans de nombreux tests. Nous ne nous attendons à une augmentation sensible des performances qu'avec les SoCs Alder Lake P d'Intel. Peut-être que Zotac prévoit déjà une petite mise à niveau dans un avenir proche ici, qui devrait améliorer les performances dans tous les domaines.
* ... Moindre est la valeur, meilleures sont les performances
AIDA64: FP32 Ray-Trace | FPU Julia | CPU SHA3 | CPU Queen | FPU SinJulia | FPU Mandel | CPU AES | CPU ZLib | FP64 Ray-Trace | CPU PhotoWorxx
| Performance rating | |
| Moyenne de la classe Desktop | |
| Minisforum EliteMini HX90 | |
| AMD Ryzen 7 5800X | |
| Zotac ZBOX Magnus EN173070C | |
| Moyenne Intel Core i7-11800H | |
| Intel Core i5-12600K | |
| Intel Ghost Canyon NUC (RTX 2070) -1! | |
| AIDA64 / FP32 Ray-Trace | |
| Moyenne de la classe Desktop (12248 - 84577, n=21, 2 dernières années) | |
| AMD Ryzen 7 5800X | |
| Minisforum EliteMini HX90 | |
| Moyenne Intel Core i7-11800H (8772 - 15961, n=20) | |
| Zotac ZBOX Magnus EN173070C | |
| Intel Ghost Canyon NUC (RTX 2070) | |
| Intel Core i5-12600K | |
| AIDA64 / FPU Julia | |
| Moyenne de la classe Desktop (65152 - 246125, n=21, 2 dernières années) | |
| Minisforum EliteMini HX90 | |
| AMD Ryzen 7 5800X | |
| Moyenne Intel Core i7-11800H (39404 - 65636, n=20) | |
| Zotac ZBOX Magnus EN173070C | |
| Intel Ghost Canyon NUC (RTX 2070) | |
| Intel Core i5-12600K | |
| AIDA64 / CPU SHA3 | |
| Moyenne de la classe Desktop (2982 - 10804, n=21, 2 dernières années) | |
| Moyenne Intel Core i7-11800H (2599 - 4439, n=20) | |
| Zotac ZBOX Magnus EN173070C | |
| Minisforum EliteMini HX90 | |
| Intel Core i5-12600K | |
| Intel Ghost Canyon NUC (RTX 2070) | |
| AMD Ryzen 7 5800X | |
| AIDA64 / CPU Queen | |
| Moyenne de la classe Desktop (76512 - 187912, n=18, 2 dernières années) | |
| AMD Ryzen 7 5800X | |
| Minisforum EliteMini HX90 | |
| Moyenne Intel Core i7-11800H (85233 - 91941, n=20) | |
| Zotac ZBOX Magnus EN173070C | |
| Intel Core i5-12600K | |
| AIDA64 / FPU SinJulia | |
| Moyenne de la classe Desktop (6443 - 35251, n=21, 2 dernières années) | |
| AMD Ryzen 7 5800X | |
| Minisforum EliteMini HX90 | |
| Intel Core i5-12600K | |
| Zotac ZBOX Magnus EN173070C | |
| Intel Ghost Canyon NUC (RTX 2070) | |
| Moyenne Intel Core i7-11800H (6420 - 9792, n=20) | |
| AIDA64 / FPU Mandel | |
| Moyenne de la classe Desktop (31697 - 129745, n=21, 2 dernières années) | |
| Minisforum EliteMini HX90 | |
| AMD Ryzen 7 5800X | |
| Moyenne Intel Core i7-11800H (23365 - 39464, n=20) | |
| Zotac ZBOX Magnus EN173070C | |
| Intel Ghost Canyon NUC (RTX 2070) | |
| Intel Core i5-12600K | |
| AIDA64 / CPU AES | |
| Moyenne de la classe Desktop (57777 - 513073, n=21, 2 dernières années) | |
| Minisforum EliteMini HX90 | |
| Zotac ZBOX Magnus EN173070C | |
| Moyenne Intel Core i7-11800H (74617 - 149388, n=20) | |
| AMD Ryzen 7 5800X | |
| Intel Core i5-12600K | |
| Intel Ghost Canyon NUC (RTX 2070) | |
| AIDA64 / CPU ZLib | |
| Moyenne de la classe Desktop (887 - 2674, n=21, 2 dernières années) | |
| Intel Core i5-12600K | |
| AMD Ryzen 7 5800X | |
| Minisforum EliteMini HX90 | |
| Zotac ZBOX Magnus EN173070C | |
| Intel Ghost Canyon NUC (RTX 2070) | |
| Moyenne Intel Core i7-11800H (461 - 830, n=43) | |
| AIDA64 / FP64 Ray-Trace | |
| Moyenne de la classe Desktop (6471 - 44013, n=21, 2 dernières années) | |
| AMD Ryzen 7 5800X | |
| Minisforum EliteMini HX90 | |
| Moyenne Intel Core i7-11800H (4545 - 8717, n=21) | |
| Zotac ZBOX Magnus EN173070C | |
| Intel Ghost Canyon NUC (RTX 2070) | |
| Intel Core i5-12600K | |
| AIDA64 / CPU PhotoWorxx | |
| Intel Core i5-12600K | |
| Moyenne de la classe Desktop (38071 - 63949, n=21, 2 dernières années) | |
| AMD Ryzen 7 5800X | |
| Zotac ZBOX Magnus EN173070C | |
| Intel Ghost Canyon NUC (RTX 2070) | |
| Moyenne Intel Core i7-11800H (11898 - 26757, n=21) | |
| Minisforum EliteMini HX90 | |
Zotac ZBOX Magnus pendant la boucle multiple de Cinebench R15
La construction compacte nécessite un système de refroidissement bien conçu et efficace. Zotac offre exactement cela ici, puisque nous ne mesurons pas de forte perte de performance à charge constante lors de la boucle de charge répétée de Cinebench R15.
Solution de stockage et de performance des applications
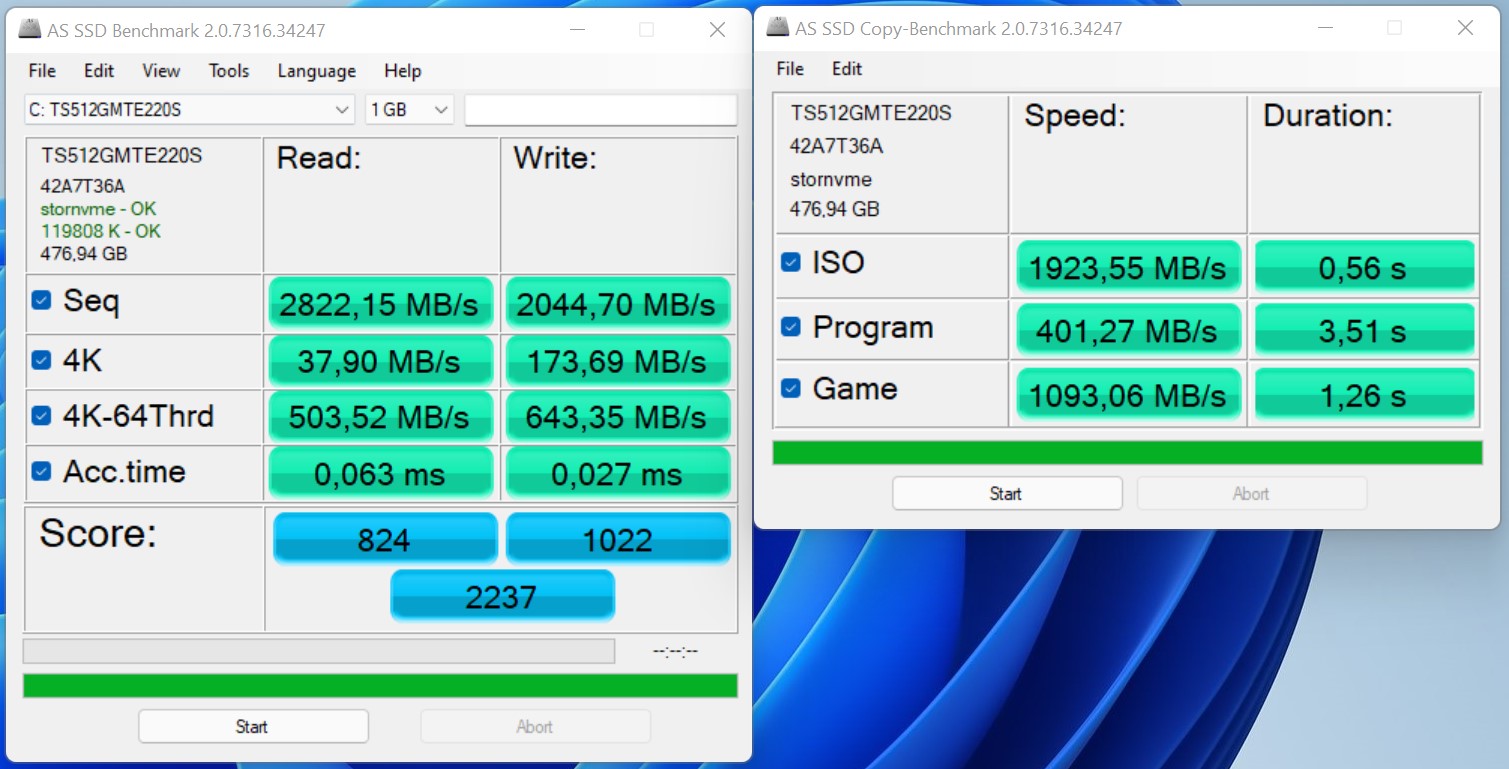
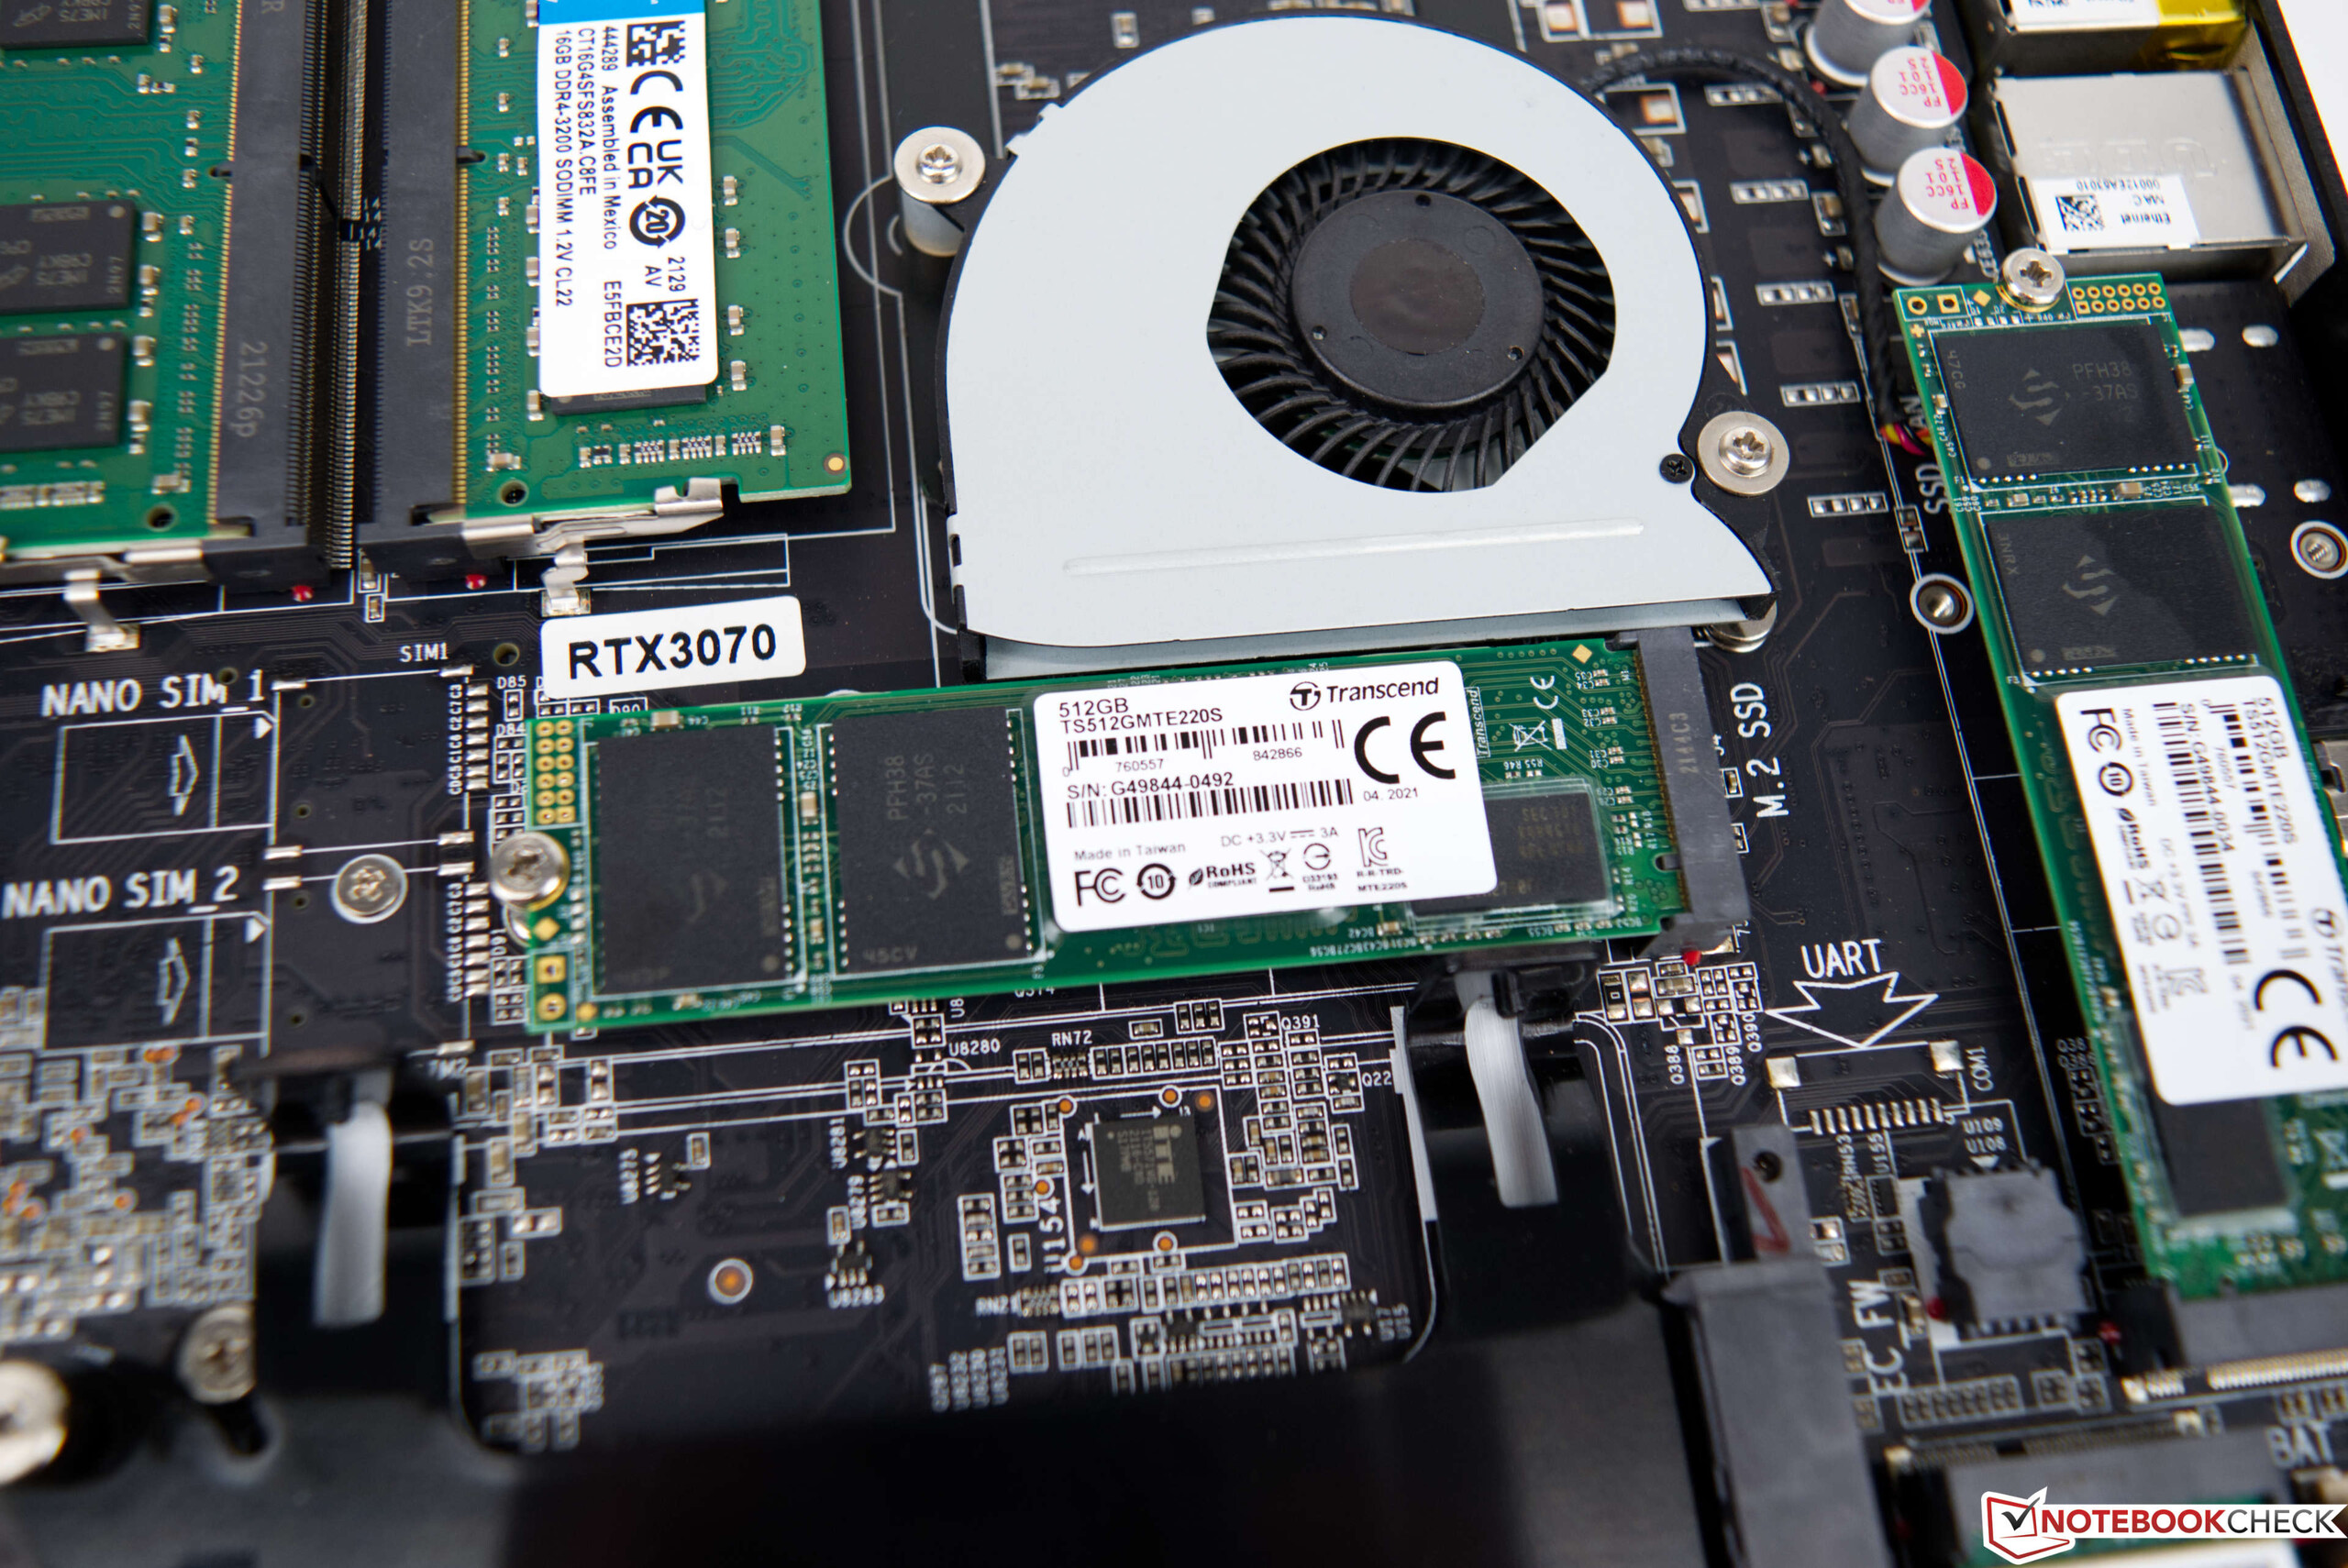
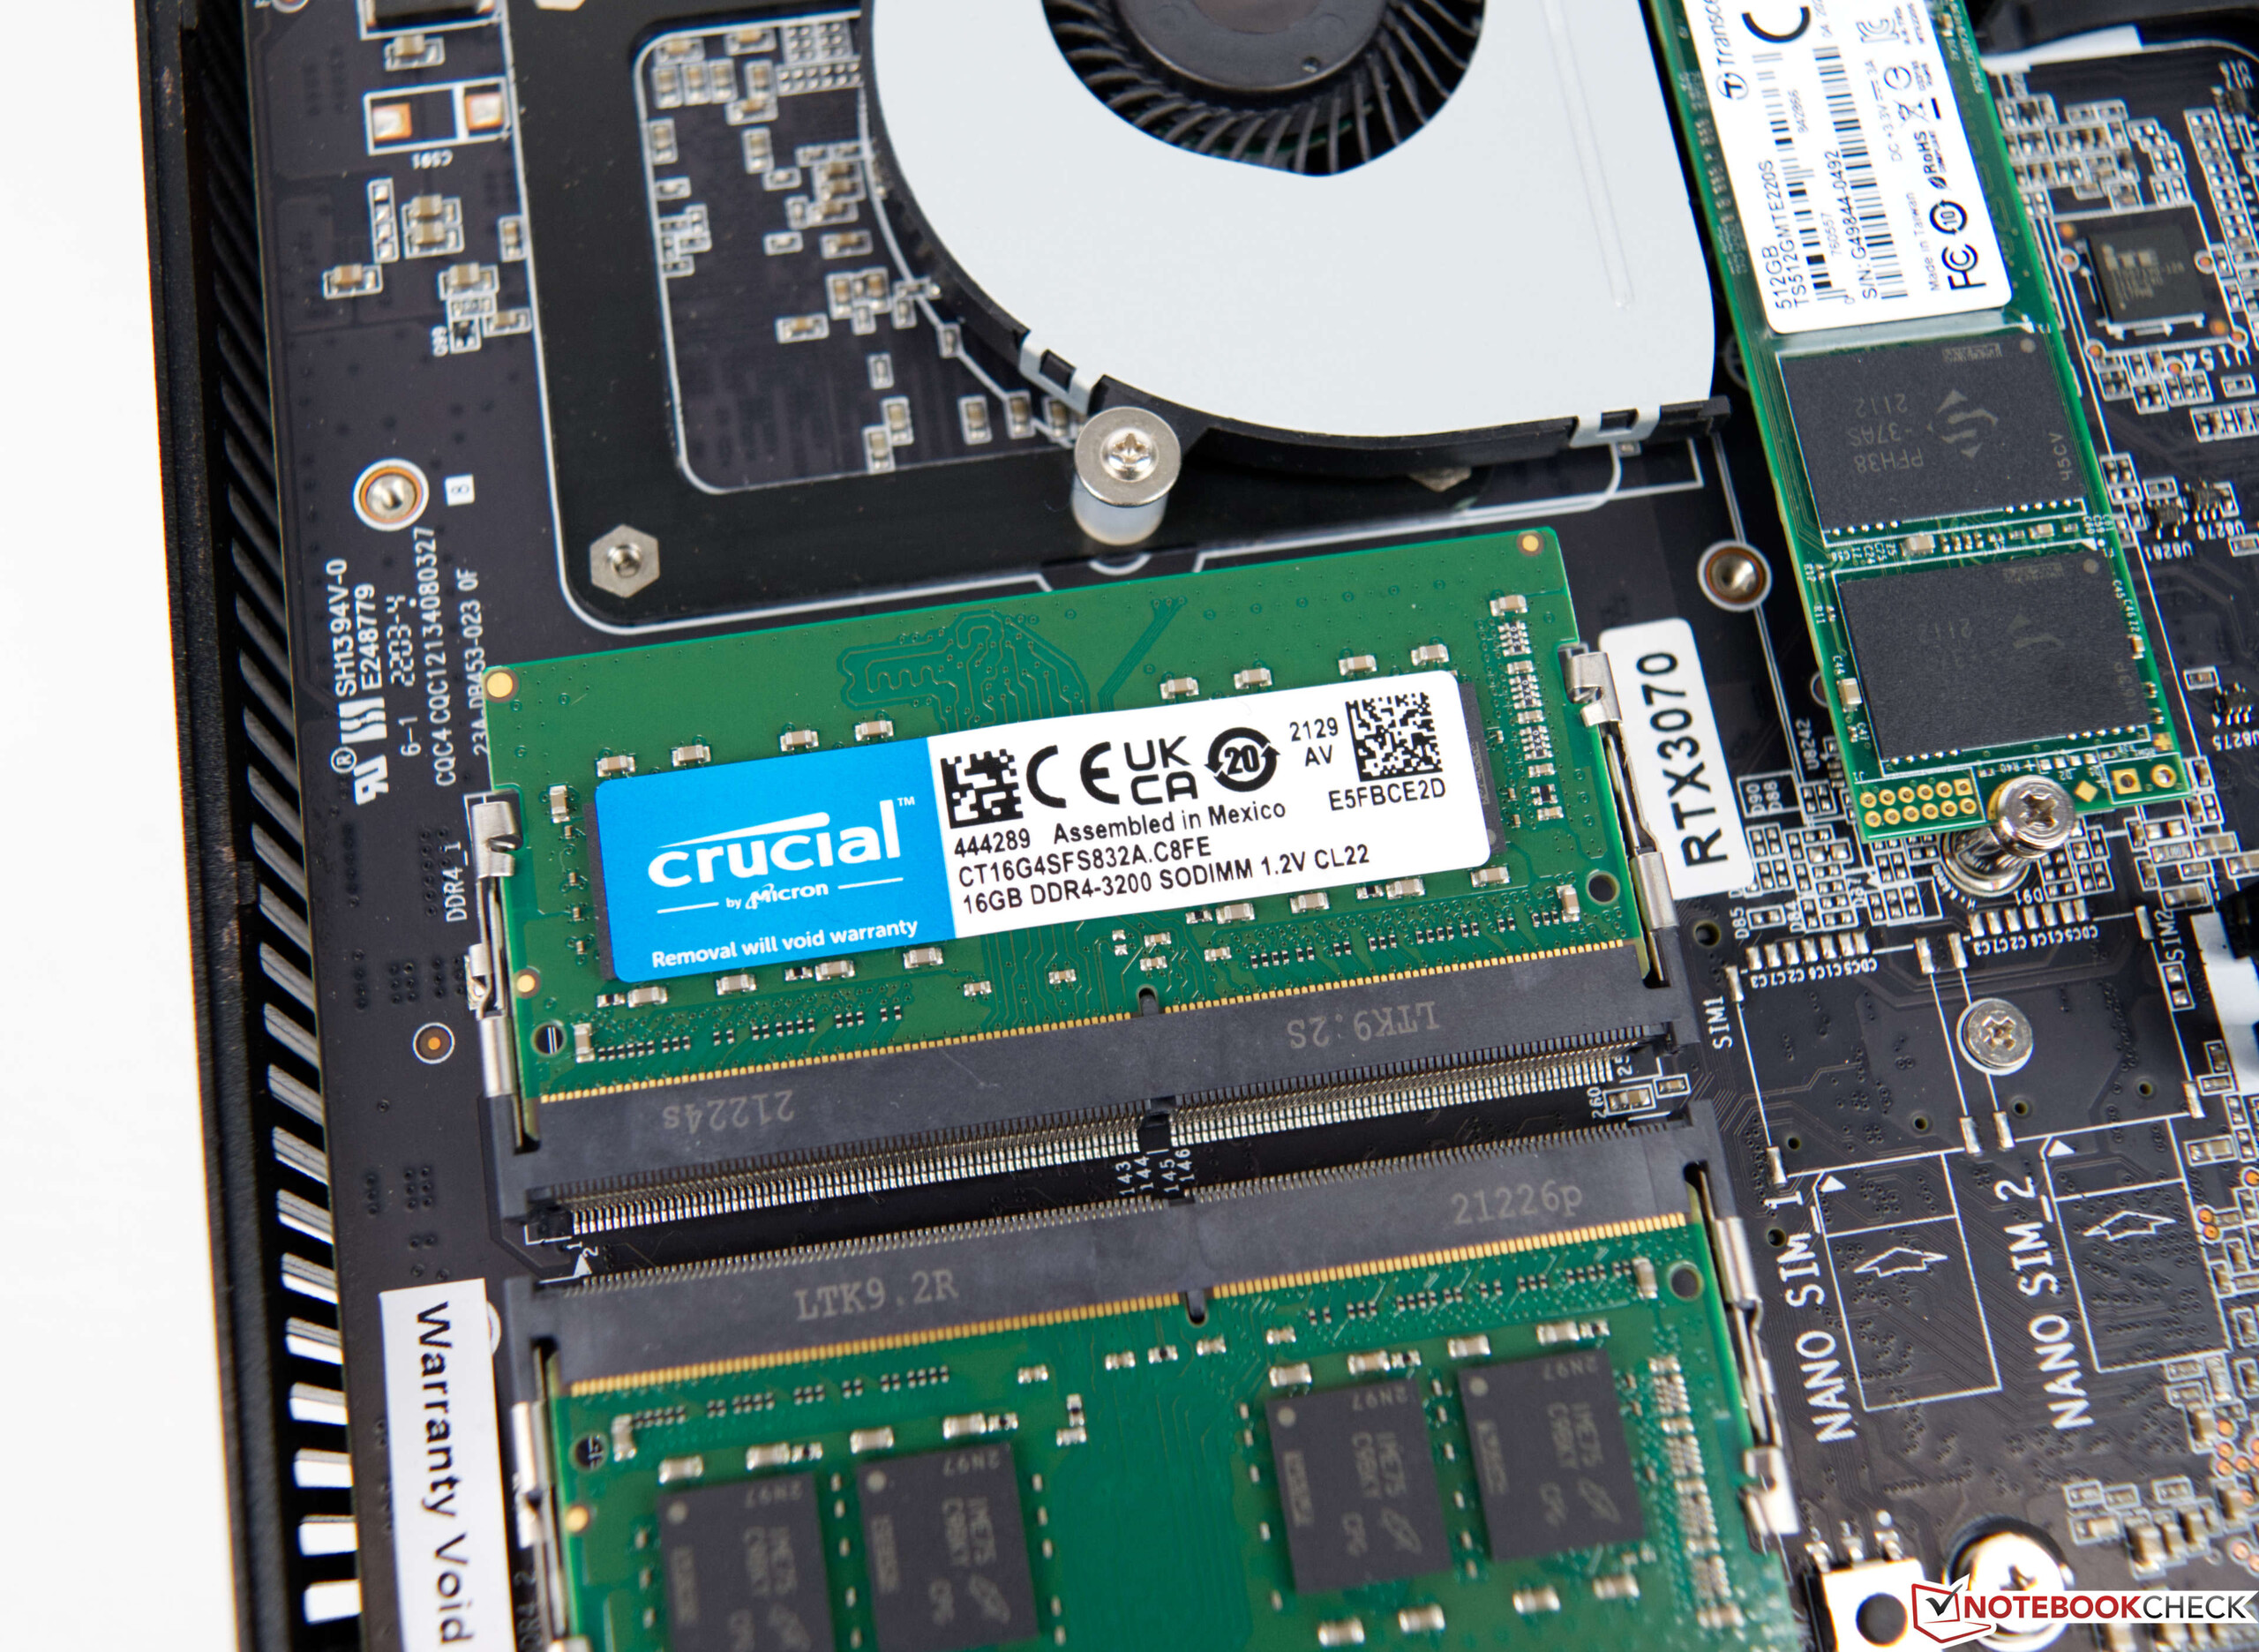
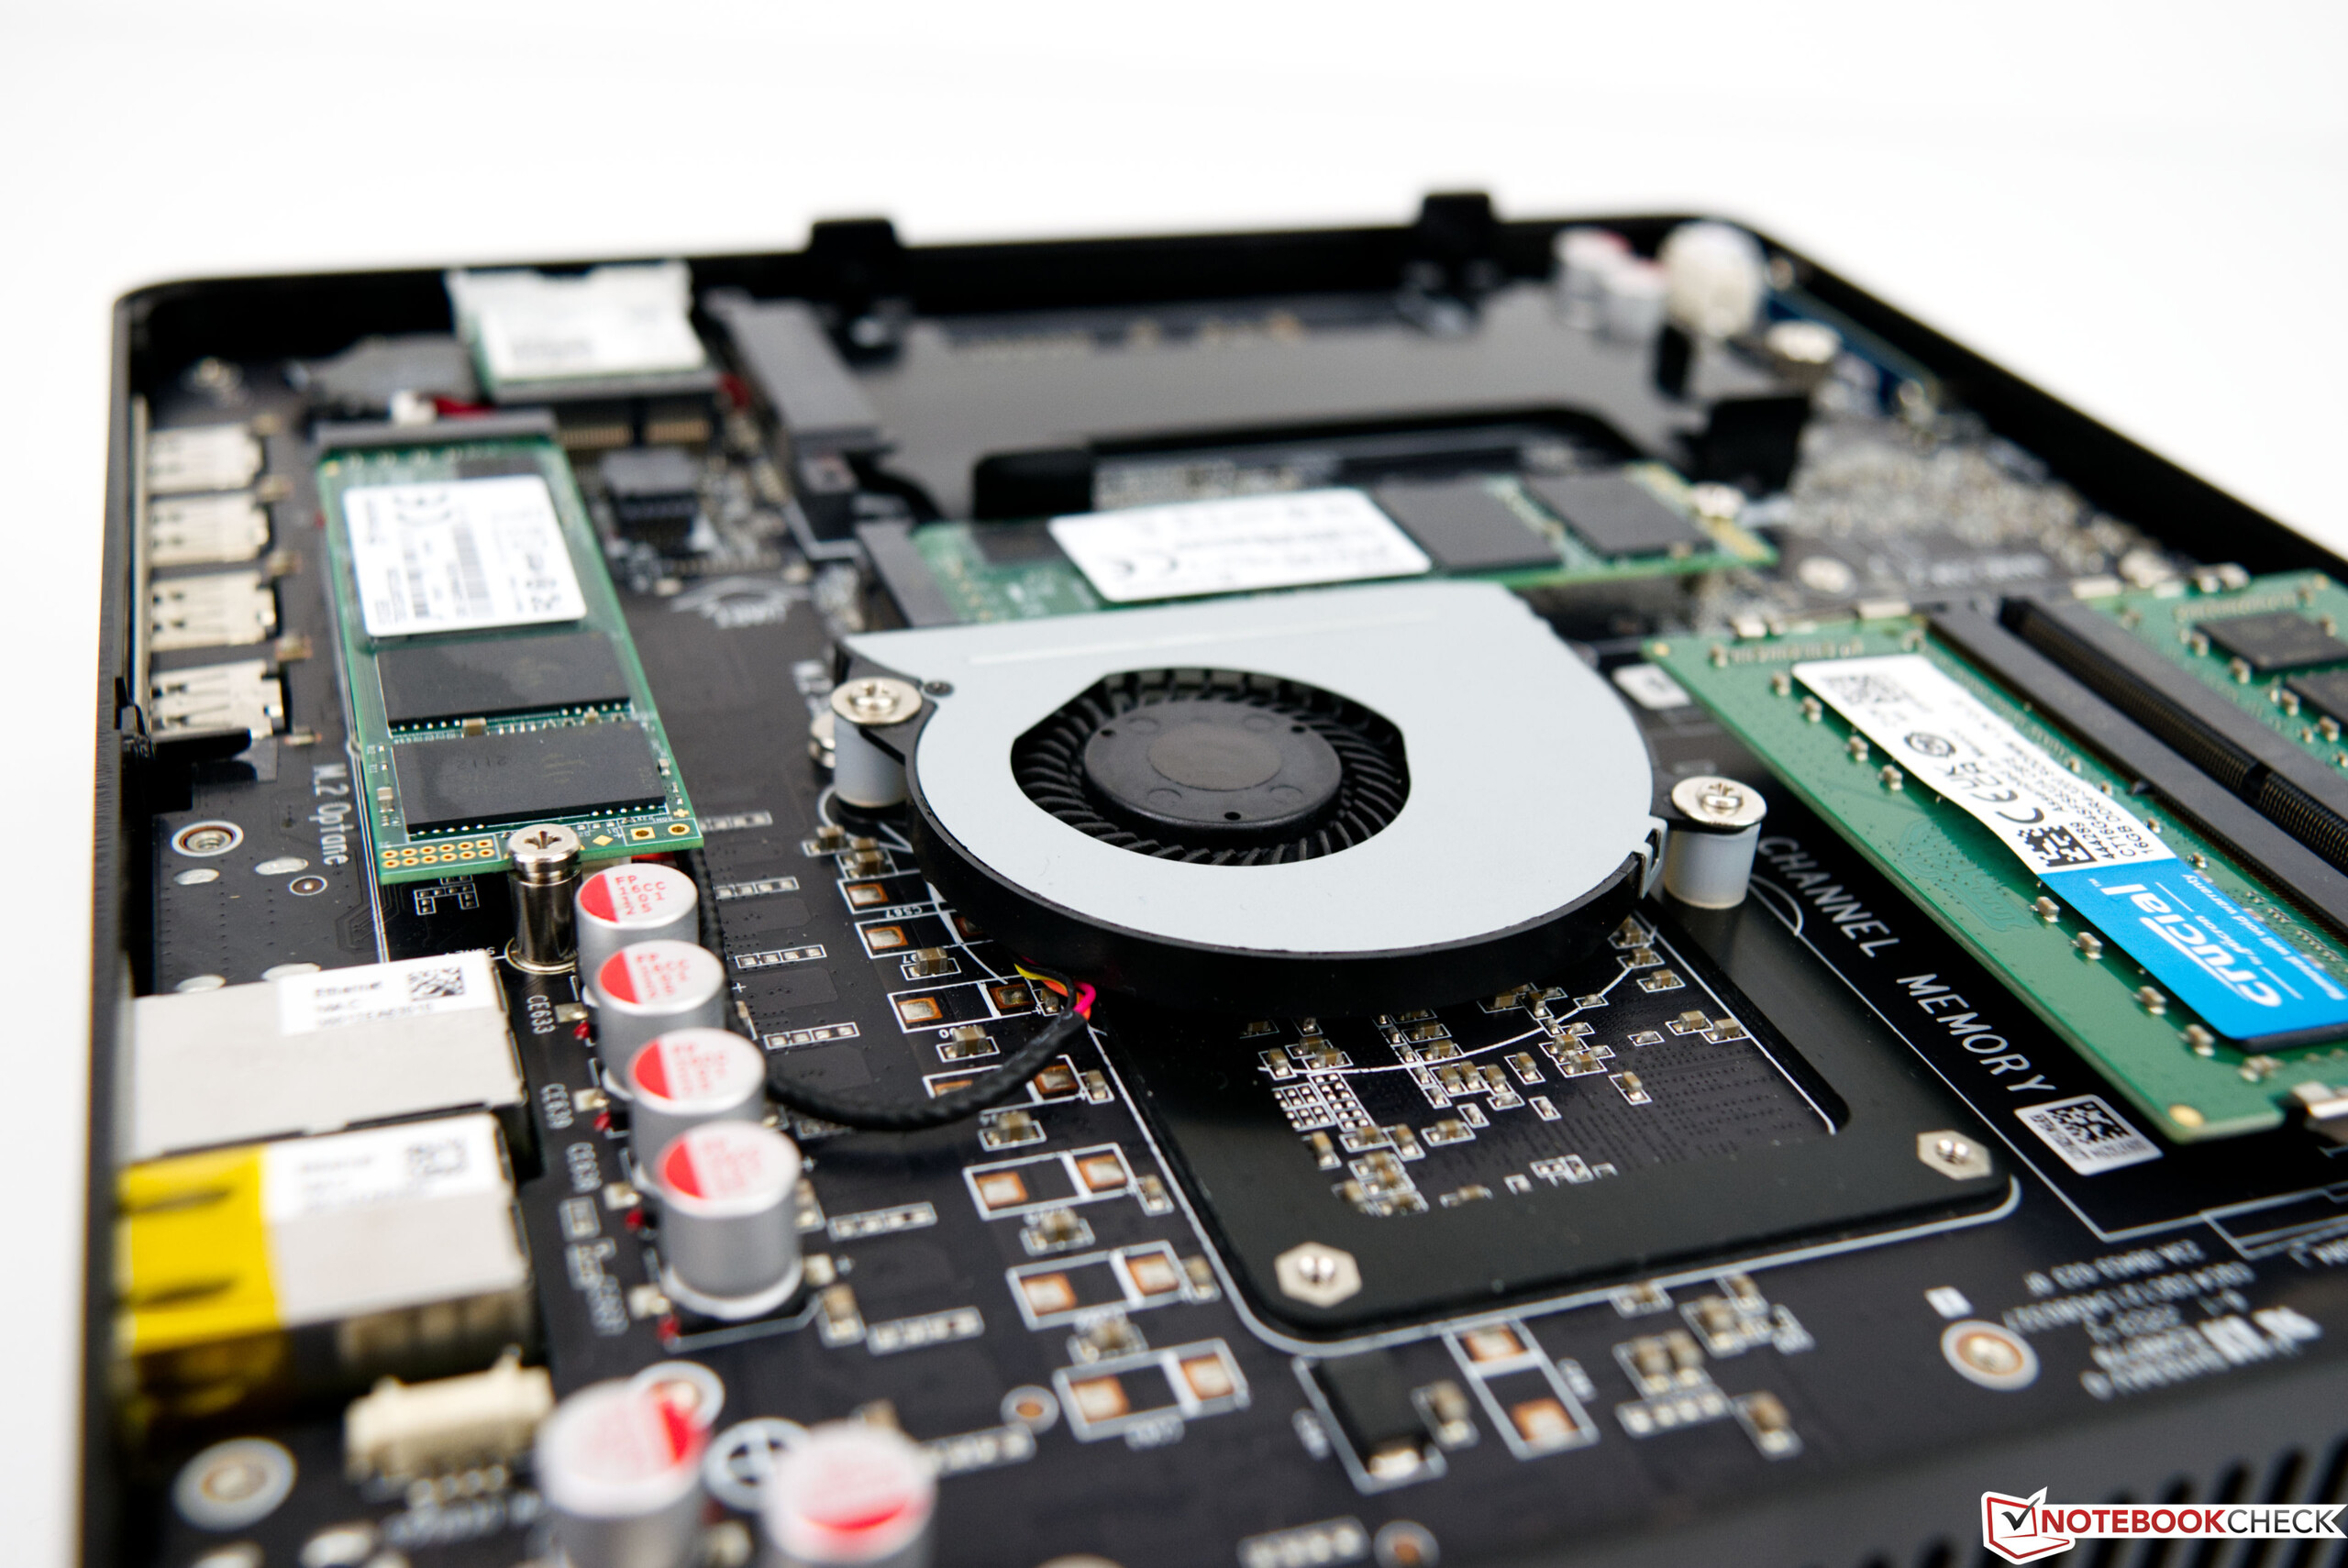
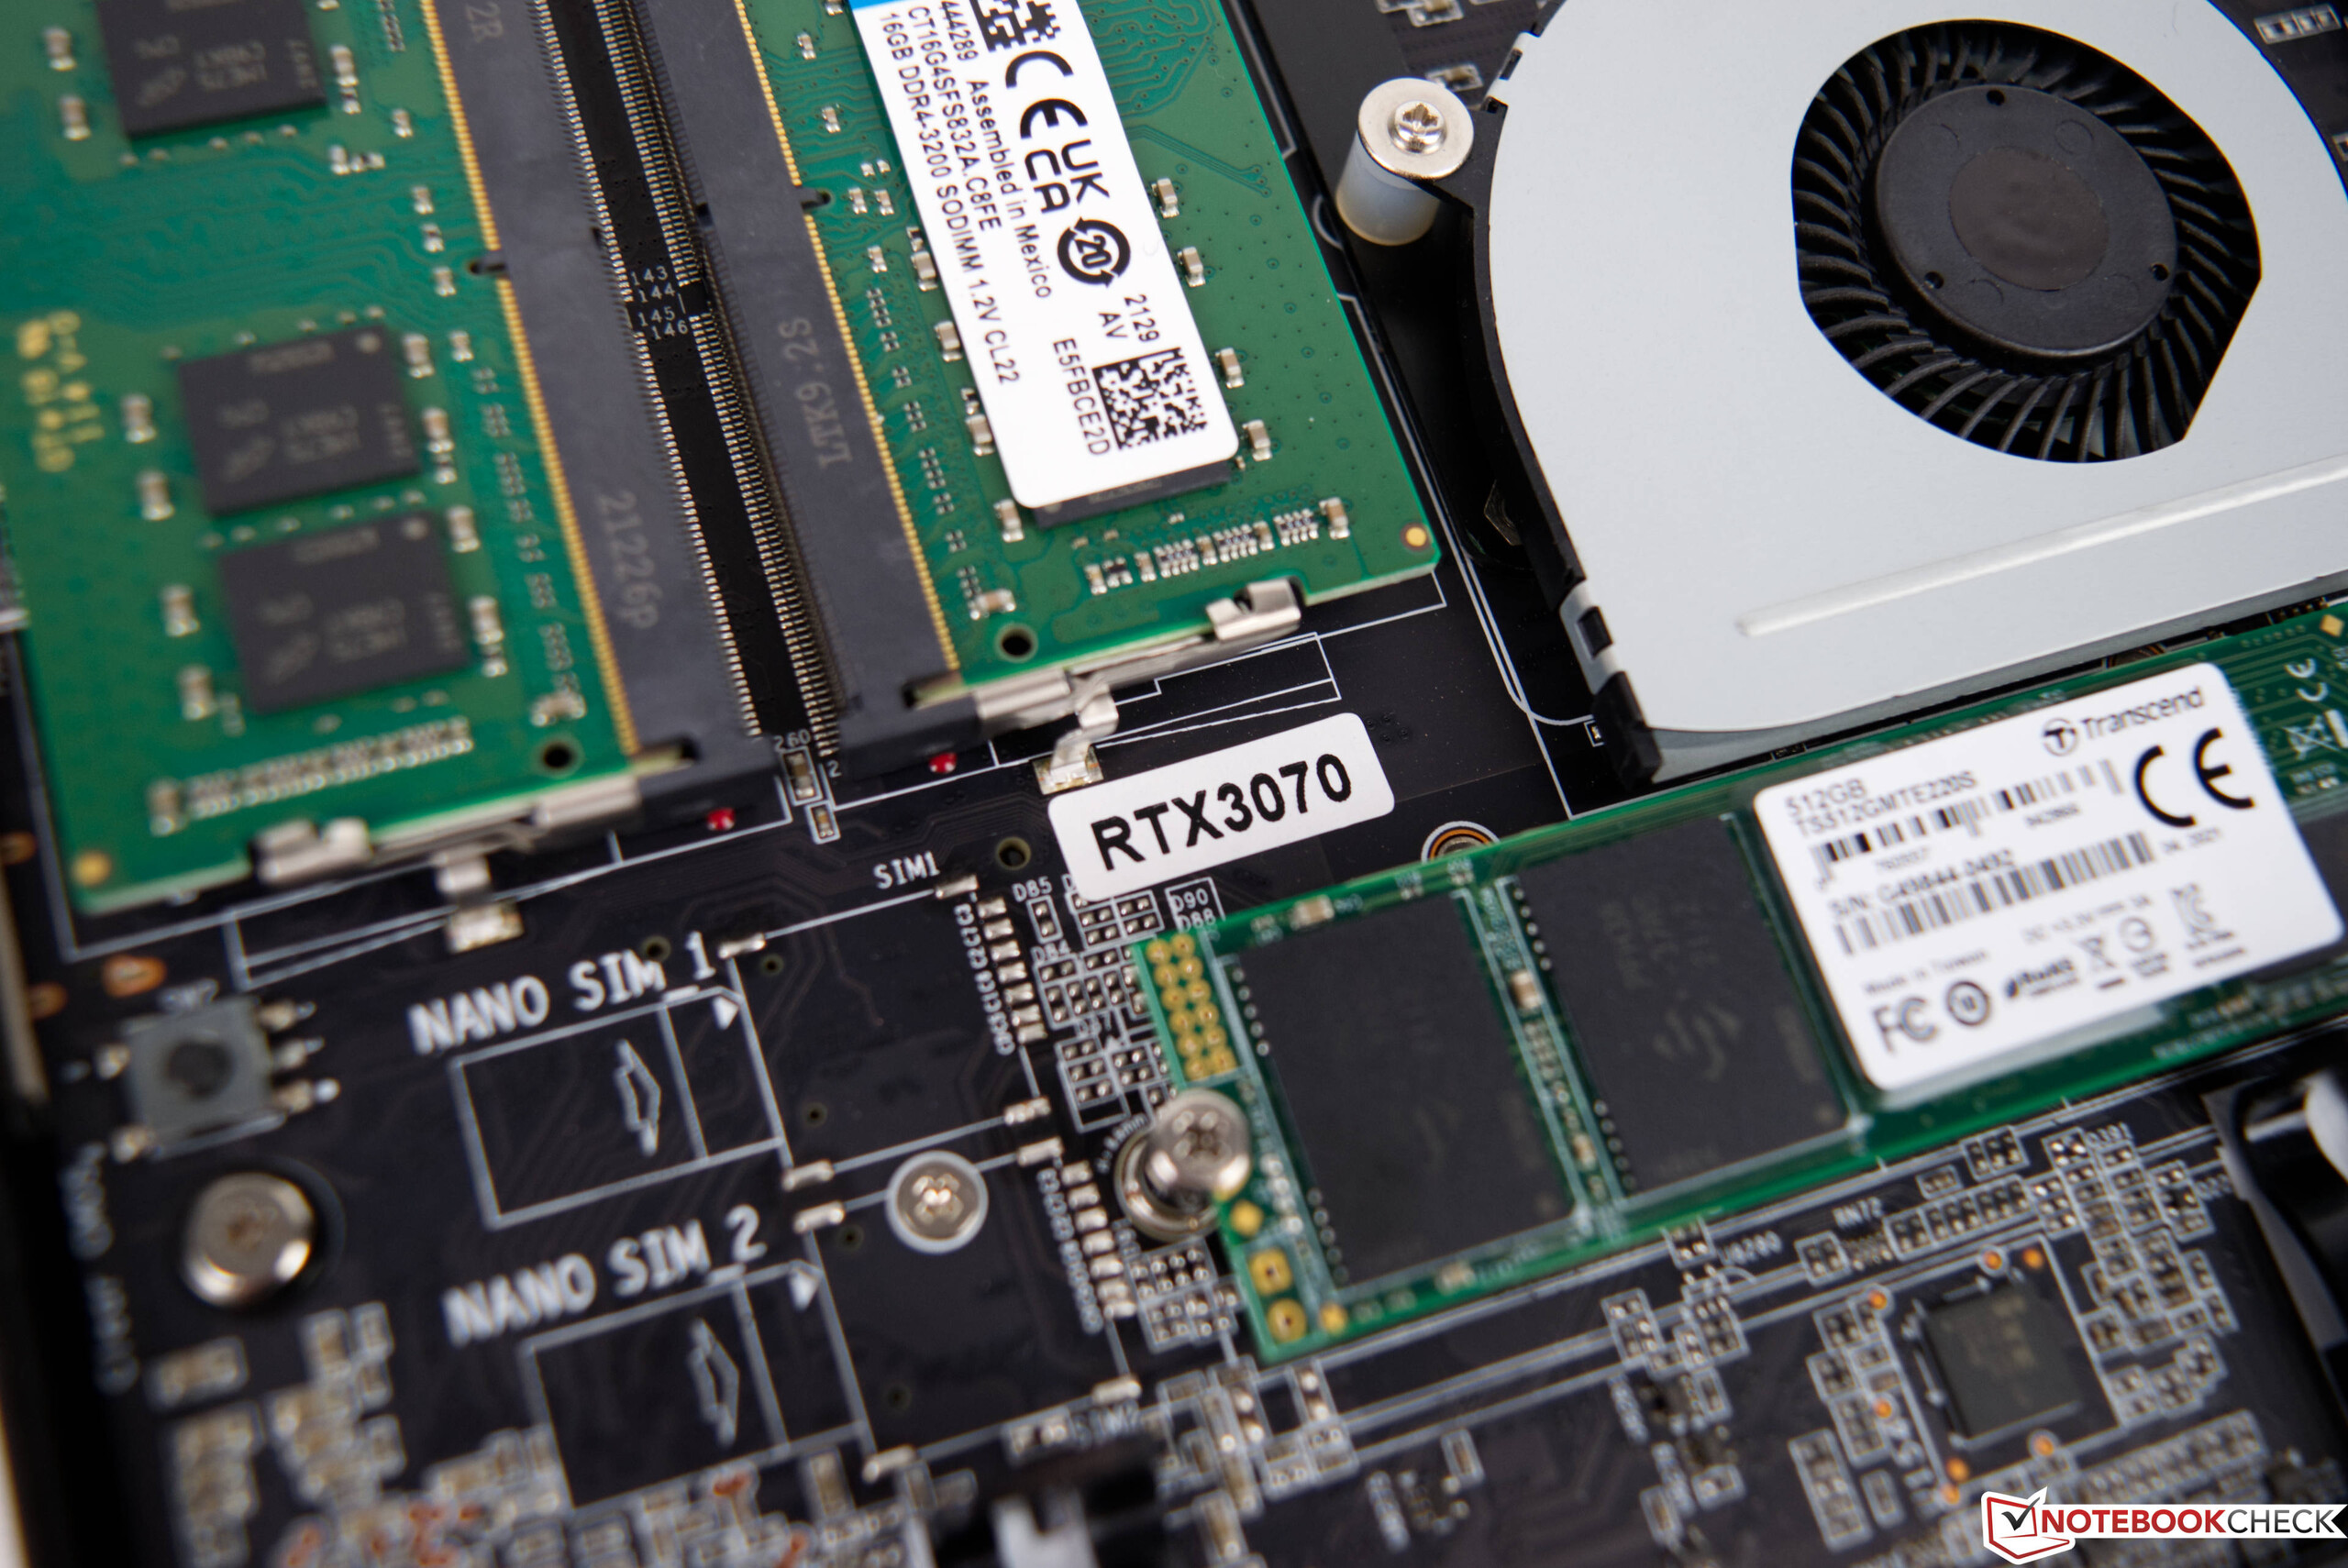
Dans les benchmarks d'application, nous constatons une nette augmentation des performances par rapport au Zotac ZBOX Magus EN72080V. Ensemble, le nouveau SoC et la carte graphique nettement plus rapide assurent ce bon résultat. Dans l'ensemble, le Zotac ZBOX Magnus EN173070C est même légèrement plus rapide que le NUC Intel Dragon Canyon avec son GPU de bureau de taille normale et son CPU Alder Lake plus récent. Dans les tests de rendu, la GeForce RTX 3070 Mobile est capable de gagner les points décisifs par rapport à la GeForce RTX 3060. En regardant subjectivement, les vitesses en fonctionnement quotidien sont très bonnes. Que vous surfiez sur Internet, regardiez des vidéos ou jouiez à des jeux, la ZBOX Magnus EN173070C de Zotac maîtrise toutes ces tâches sans aucun problème. Pour cet examen, nous avons équipé le mini PC de 32 Go de DDR4-RAM et de deux SSD de 512 Go. Les modèles de Transcend offrent des performances solides. Cependant, vous pouvez encore gagner quelques points de pourcentage en termes de performances en utilisant des SSD encore plus rapides. Le boîtier peut accueillir jusqu'à trois solutions de stockage. En plus des deux connexions M.2 qui ne sont pas seulement limitées à 80 mm de longueur, vous pouvez également installer un disque de 2,5 pouces.
| DPC Latencies / LatencyMon - interrupt to process latency (max), Web, Youtube, Prime95 | |
| Zotac ZBOX Magnus EN173070C, Intel Core i7-11800H | |
| Minisforum EliteMini HX90, AMD Ryzen 9 5900HX | |
* ... Moindre est la valeur, meilleures sont les performances
3D et performances de jeu
Pour un PC de jeu, une carte graphique rapide est indispensable pour obtenir des taux d'images fluides. Dans notre cas, il s'agit d'une carte graphique rapide avec 8 Go de VRAM avec le modèle Nvidia GeForce RTX 3070 Mobile. Dans le même temps, vous ne pouvez pas vraiment le comparer aux versions de bureau de la même nomenclature. Au contraire, la version mobile de la GeForce RTX 3070atteint une performance similaire à celle d'une Nvidia GeForce RTX 3060. La comparaison directe avec le NUC Beast Canyon d'Intel l'illustre très bien.
En ce qui concerne le classement du TDP, Zotac va de l'avant en autorisant jusqu'à 125 watts en charge. Ainsi, les performances de la carte graphique dédiée ne sont pas limitées artificiellement, comme c'est souvent le cas dans les ordinateurs portables compacts. Cela conduit également à un résultat parfois bon par rapport aux performances moyennes de la carte graphique. Les jeux que nous avons testés peuvent être reproduits à des niveaux de détail maximum en résolution FHD et QHD sans aucun problème. Cependant, lorsque la résolution se rapproche de la 4K, les choses peuvent parfois devenir tendues. Mais il existe encore de nombreux jeux qui peuvent également être reproduits sans problème dans cette haute résolution
Vous trouverez d'autres comparaisons et bancs d'essai dans notre article sur le GPU tableau comparatif.
| Bas | Moyen | Élevé | Ultra | QHD | 4K | |
|---|---|---|---|---|---|---|
| GTA V (2015) | 182.7 | 177.1 | 167.5 | 104.9 | 94.4 | 100.8 |
| The Witcher 3 (2015) | 435 | 331 | 190.1 | 105.5 | 70.7 | |
| Dota 2 Reborn (2015) | 164.4 | 148.3 | 142.9 | 133.9 | 127.7 | |
| Rise of the Tomb Raider (2016) | 302 | 216 | 141.9 | 116.2 | 55.4 | |
| Final Fantasy XV Benchmark (2018) | 190.1 | 139 | 101 | 75.3 | 43.5 | |
| X-Plane 11.11 (2018) | 136.6 | 121.2 | 95.7 | 82.3 | ||
| Far Cry 5 (2018) | 159 | 136 | 129 | 120 | 101 | 55 |
| Strange Brigade (2018) | 437 | 267 | 216 | 186.7 | 137.3 | 78.1 |
| Shadow of the Tomb Raider (2018) | 169.6 | 146.4 | 142.5 | 133.7 | 95.1 | 50.8 |
| Far Cry New Dawn (2019) | 134 | 116 | 112 | 100 | 91 | 57 |
| Metro Exodus (2019) | 177.1 | 123 | 94 | 74.6 | 58.7 | 36.6 |
| Control (2019) | 240 | 128 | 93.7 | 60.9 | 30.3 | |
| Borderlands 3 (2019) | 135.5 | 117.3 | 101 | 84.6 | 62.2 | 34.2 |
| F1 2020 (2020) | 315 | 267 | 238 | 165.8 | 123.6 | 68.3 |
| Dirt 5 (2020) | 227 | 153 | 123 | 96 | 75 | 49 |
| F1 2021 (2021) | 367 | 309 | 246 | 122.7 | 88.3 | 49.8 |
| Alan Wake Remastered (2021) | 119.2 | 118.2 | 118.2 | 113.1 | ||
| Far Cry 6 (2021) | 127.5 | 109.5 | 99 | 99.8 | 79.2 | 41 |
| Guardians of the Galaxy (2021) | 123 | 124 | 122 | 120 | 102 | 55 |
| Riders Republic (2021) | 174 | 144 | 118 | 107 | 77 | 40 |
| Forza Horizon 5 (2021) | 213 | 141 | 129 | 82 | 70 | 48 |
| Farming Simulator 22 (2021) | 205 | 161.1 | 138.8 | 132.8 | 124.8 | 79.2 |
| God of War (2022) | 122.2 | 109.4 | 88.1 | 61.7 | 50.7 | 33.8 |
| Rainbow Six Extraction (2022) | 241 | 182 | 181 | 149 | 97 | 49 |
| GRID Legends (2022) | 194 | 189 | 158 | 123 | 95 | 62 |
| Cyberpunk 2077 1.6 (2022) | 139 | 116 | 92 | 76 | 47 | 22 |
| Elex 2 (2022) | 98.4 | 95.1 | 87.3 | 79.5 | 61.8 | 34.5 |
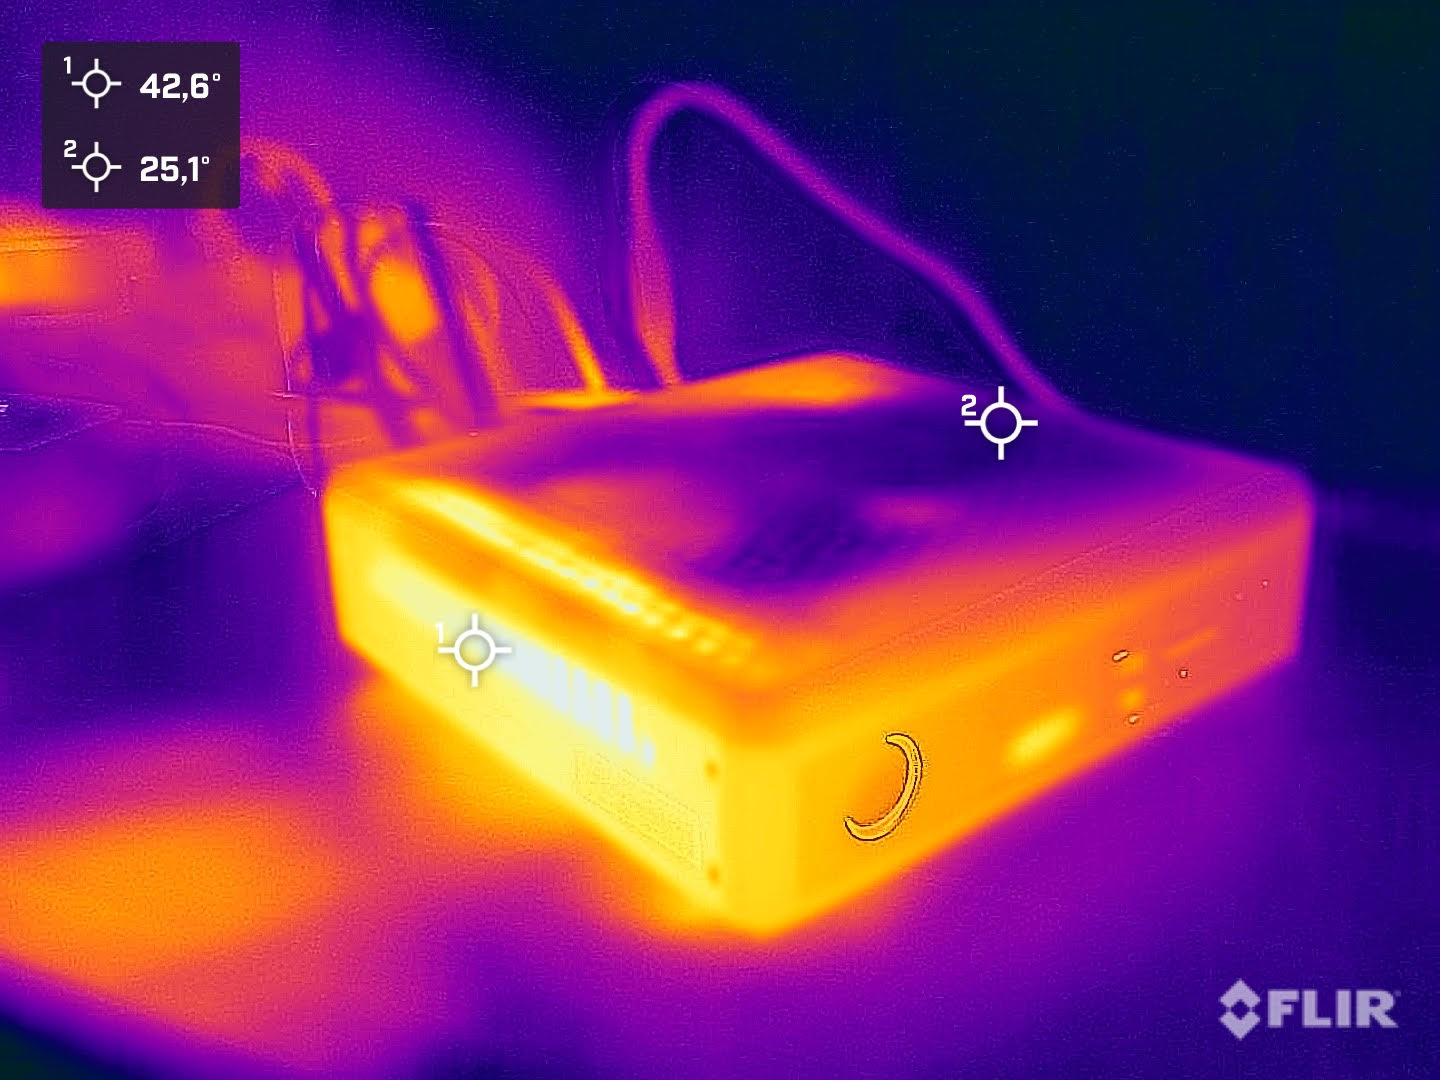
Émissions
Émissions sonores
Lorsque vous achetez un ordinateur portable de jeu, vous êtes généralement conscient de l'augmentation du niveau de bruit que cela entraîne. Cependant, les choses sont souvent différentes pour un PC de bureau, car les systèmes de refroidissement plus grands sont en mesure de dissiper la chaleur plus efficacement et silencieusement. Mais comme Zotac utilise ici un boîtier très compact, les ventilateurs intégrés doivent travailler très fort en charge. Les niveaux sonores en charge nous rappellent ceux d'un ordinateur portable de jeu moyen. À 45 dB(A), l'appareil est clairement audible. À faible charge, nous mesurons encore 41 dB(A). En mode 2D, les ventilateurs ronronnent tranquillement et sont à peine perceptibles.
Degré de la nuisance sonore
| Au repos |
| 32.7 / 32.8 / 32.8 dB(A) |
| Fortement sollicité |
| 41.7 / 45.4 dB(A) |
 | ||
30 dB silencieux 40 dB(A) audible 50 dB(A) bruyant |
||
min: | ||
| Zotac ZBOX Magnus EN173070C GeForce RTX 3070 Laptop GPU, i7-11800H, Transcend M.2 SSD 2200S TS512GMTE220S | Zotac Magnus One (ECM73070C) GeForce RTX 3070, i7-10700, Phison 512GB PA6620060U | Minisforum EliteMini HX90 Vega 8, R9 5900HX, Kingston OM8PCP3512F-AB | |
|---|---|---|---|
| Noise | -4% | 10% | |
| arrêt / environnement * (dB) | 30.7 | 30 2% | 30.8 -0% |
| Idle Minimum * (dB) | 32.7 | 33.58 -3% | |
| Idle Average * (dB) | 32.8 | 31.6 4% | |
| Idle Maximum * (dB) | 32.8 | ||
| Load Average * (dB) | 41.7 | 44.25 -6% | |
| Load Maximum * (dB) | 45.4 | 48.72 -7% | 33.4 26% |
* ... Moindre est la valeur, meilleures sont les performances
Températures
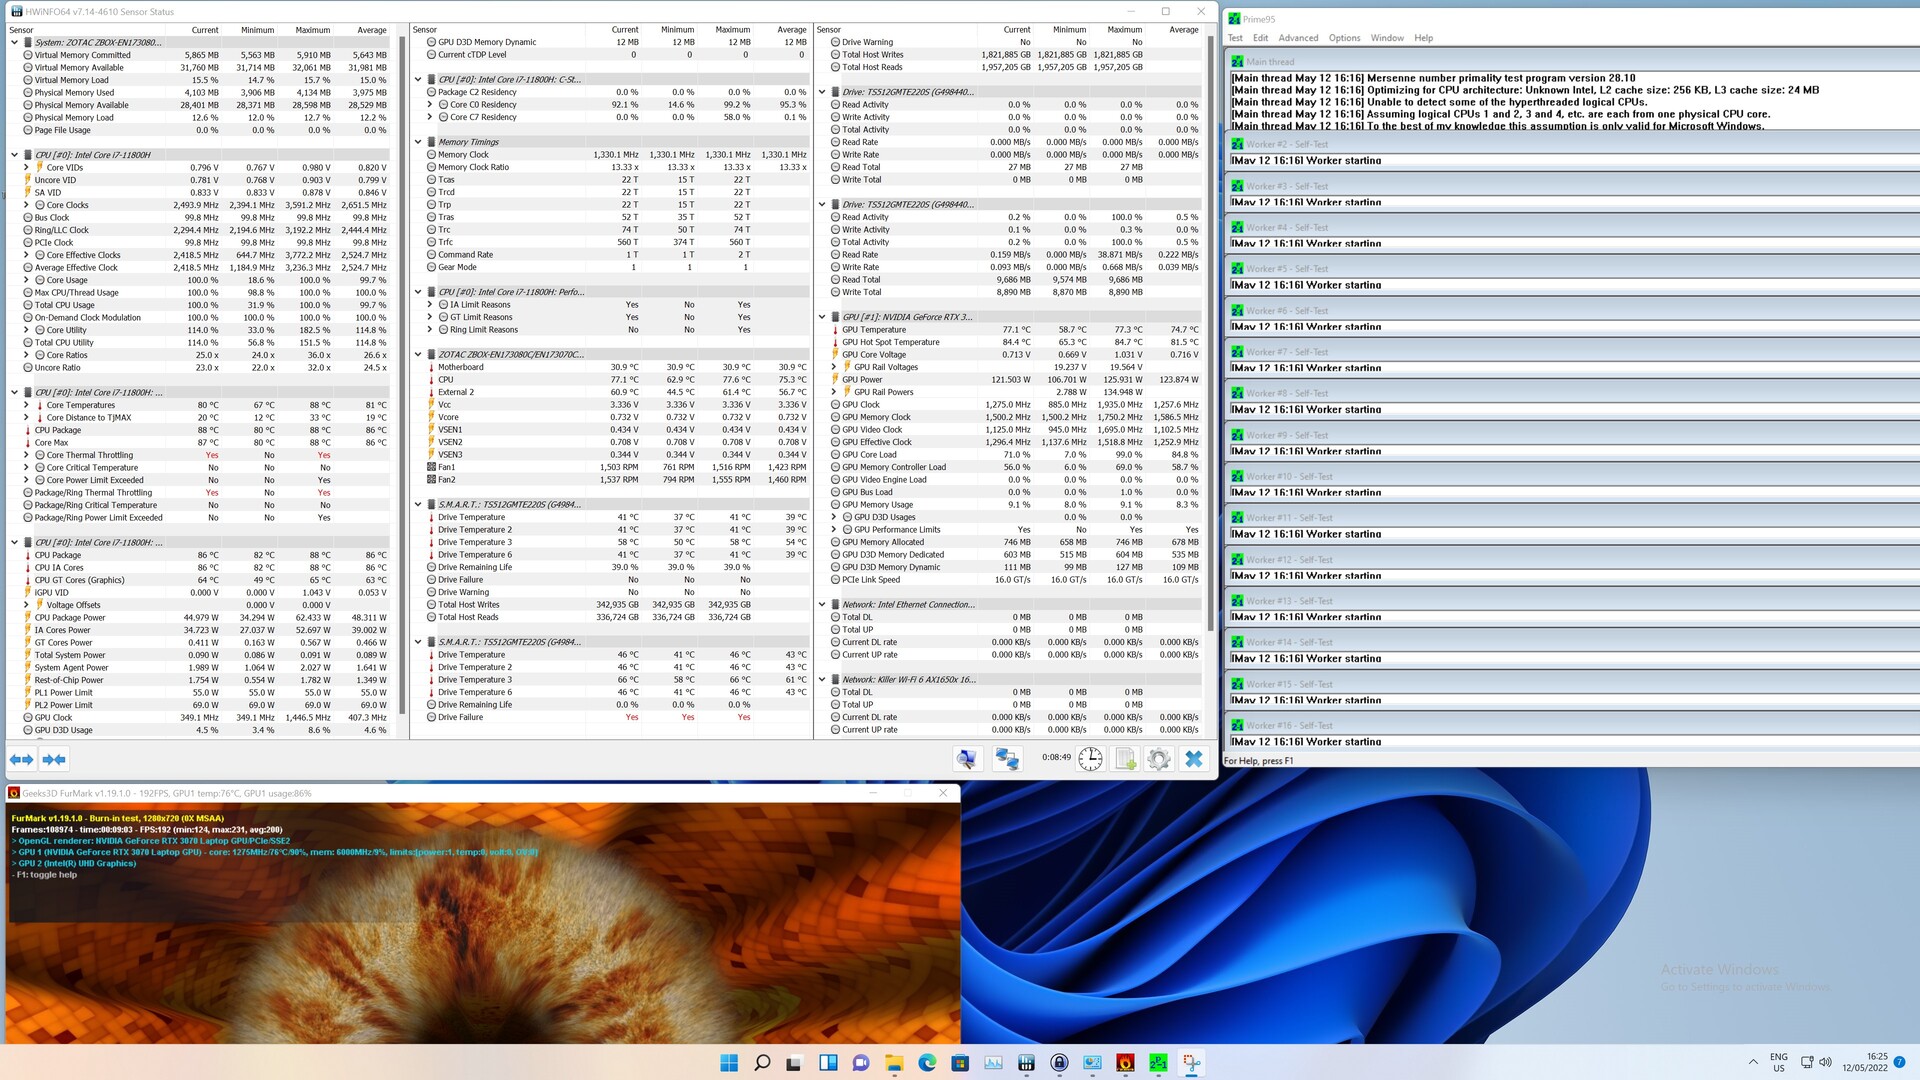
Pendant le test de stress, nous avons soumis le système aux niveaux de charge les plus élevés avec Prime95 et FurMark. Dans ce scénario catastrophe, le Intel Core i7-11800Hatteint une température maximale de 88 °C (190 °F). Dans la carte graphique, nous mesurons une valeur légèrement inférieure à 77 °C (171 °F). La vitesse d'horloge du processeur est de 2,6 GHz, ce qui est supérieur à la vitesse d'horloge de base de 2,3 GHz. La charge constante de tous les composants n'a pas d'effet négatif, et un benchmark 3D juste après donne un résultat identique par rapport au démarrage à froid.
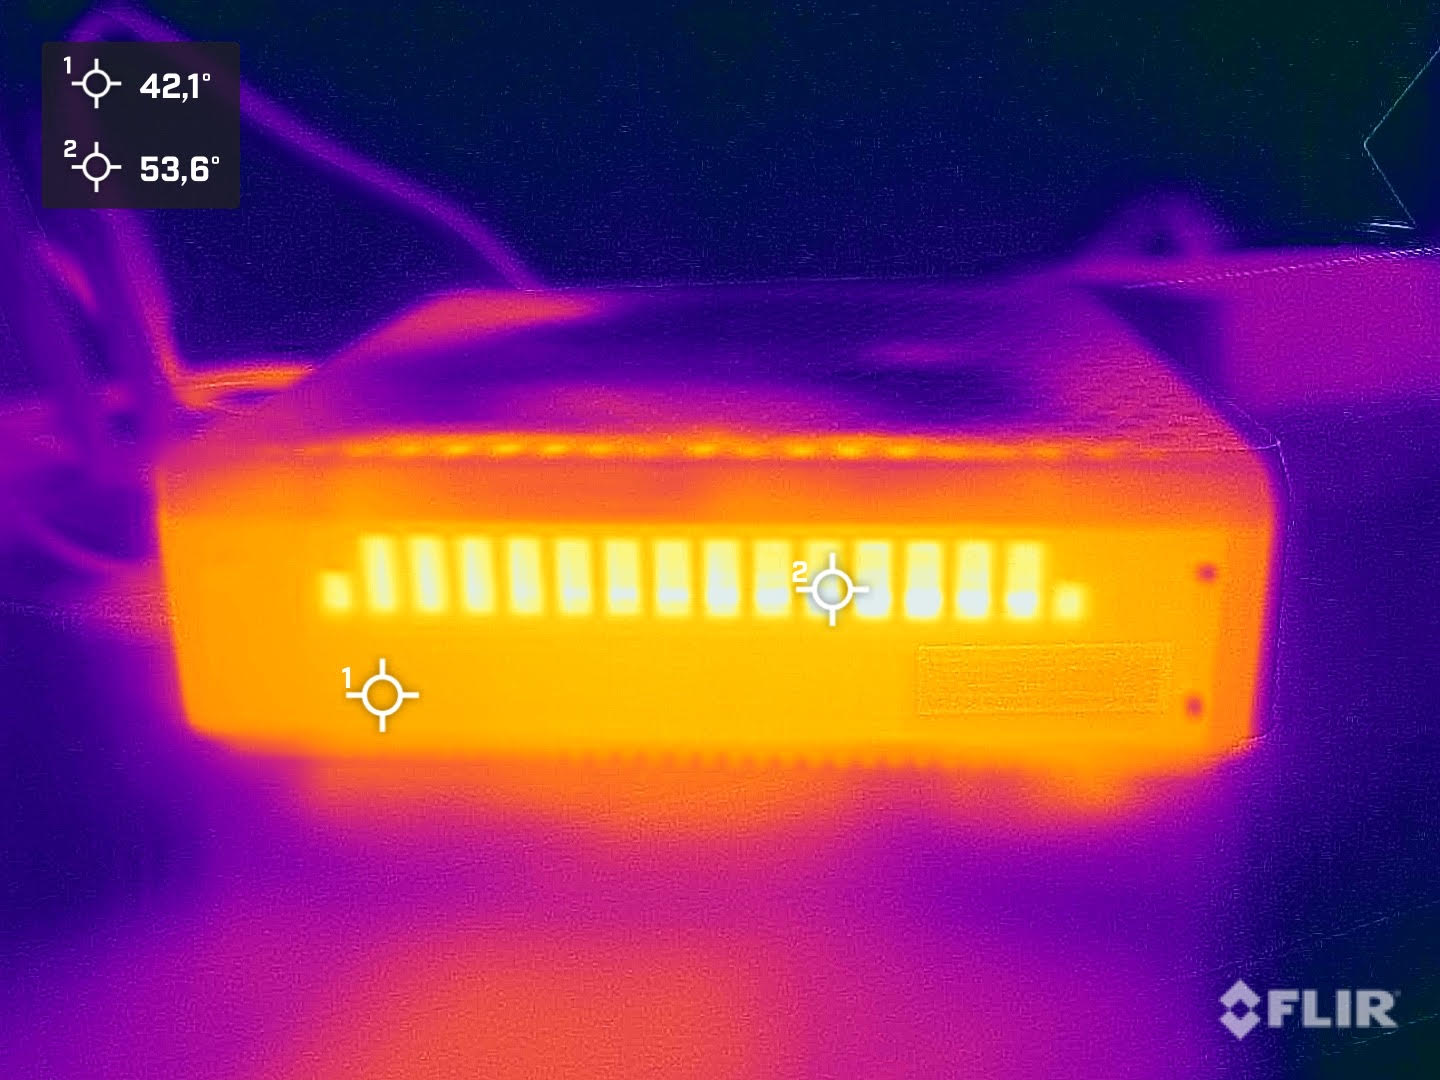
Consommation d'énergie
En mode veille, la consommation d'énergie du Zotac ZBOX Magnus EN173070C se situe entre 31 et 41 watts. Pour un système de bureau, ce sont de très bonnes valeurs. En revanche, par rapport aux ordinateurs portables équipés de manière similaire, ces valeurs sont beaucoup trop élevées. En charge, nous avons mesuré 214 watts en moyenne. Dans le même temps, l'alimentation lourde est capable de gérer facilement la consommation de pointe de seulement 231 watts que nous avons mesurée.
| Au repos | |
| Fortement sollicité |
|
Légende:
min: | |
Power Consumption With External Monitor
Points positifs
Points négatifs
Verdict - Un PC de jeu ultracompact
Avec le ZBOX Magnus EN173070C, Zotac propose une bonne mise à niveau du produit. Le rapideIntel Core i7-11800Hoffre une très bonne vitesse de fonctionnement, et le Nvidia GeForce RTX 3070 Mobileest également capable de produire une bonne performance sans être étranglé artificiellement. La totalité des 125 watts est disponible ici, ce qui signifie que même la Nvidia GeForce RTX 3080 Mobile est souvent dépassée. Cependant, il faut tout de même considérer que les niveaux de performance sont dans la gamme d'uneNvidia GeForce RTX 3060 DesktopgPU. Mais si l'on considère la compacité du boîtier de seulement 2,65 litres, il est étonnant de voir ce que Zotac peut offrir ici avec ses ZBOX.
Tout cela a bien sûr aussi son prix. Comparé à des ordinateurs portables de jeu abordables tels que le Acer Nitro5 AN515le prix est du même ordre. Parfois, il faut même payer plus, car un SSD et la RAM ne sont pas inclus dans l'équipement de base. À 1650 euros (~1743 $), Zotac demande un prix élevé. D'un autre côté, vous obtenez également un PC de jeu ultracompact que vous pouvez ranger ou emporter avec vous tout aussi facilement qu'un ordinateur portable.
Les performances de jeu ont pu nous convaincre, et la variété des connexions est également suffisante. Dans le même temps, il faut également garder à l'esprit que vous pouvez uniquement transférer des données via Thunderbolt 4, mais que vous ne pouvez pas l'utiliser pour faire fonctionner une carte graphique externe. C'est dommage à notre avis, car cela vous permettrait autrement d'augmenter les performances 3D sans avoir à acheter un tout nouvel appareil.
Le Zotac ZBOX Magnus EN173070C est un PC de jeu très rapide basé sur des composants mobiles. Toutefois, avant de l'acheter, vous devez vous familiariser avec les caractéristiques d'un système barebone.
En termes de niveau sonore, le Zotac ZBOX Magnus EN173070C perd par rapport aux PC de bureau classiques. En charge, les ventilateurs doivent monter considérablement en régime, mais le bruit des ventilateurs reste relativement confortable et pas trop aigu. Une alternative est proposée par Intel avec le Dragon Canyon NUCqui est un autre système barebone, tout comme le ZBOX Magnus EN173070C. Bien que l'appareil ne soit pas aussi compact, il peut également être équipé de cartes graphiques de bureau classiques. Comme d'habitude, le client a le choix et doit décider des paramètres les plus importants pour son achat.
Prix et disponibilité
Alors que la ZBOX Magnus EN173070C de Zotac est listée sur le site de Zotac USet dans beaucoup d'autres sites spécifiques aux pays, il semble être difficile à trouver pour l'achat aux Etats-Unis. Le modèle le plus répandu aux Etats-Unis semble être leMini PC ZOTAC Magnus ONE ECM7307LH, qui utilise un boîtier différent et inclut déjà la RAM, le SSD et le disque dur pour $2130 sur Amazon.

