Notebookcheck Logo

Test de l'Intel NUC 12 Dragon Canyon avec Intel Core i9-12900

PC de jeu ou cheval de trait ? L'actuel kit Intel NUC 12 Extreme comprend le Compute Element que nous connaissons déjà. Pourtant, il y a encore quelques changements essentiels, puisqu'avec un CPU socké basé sur le LGA1700, le Compute Element peut même accueillir différents processeurs. Avec le Core i9-12900 d'Intel préinstallé, vous obtenez actuellement un système vraiment rapide et compact.

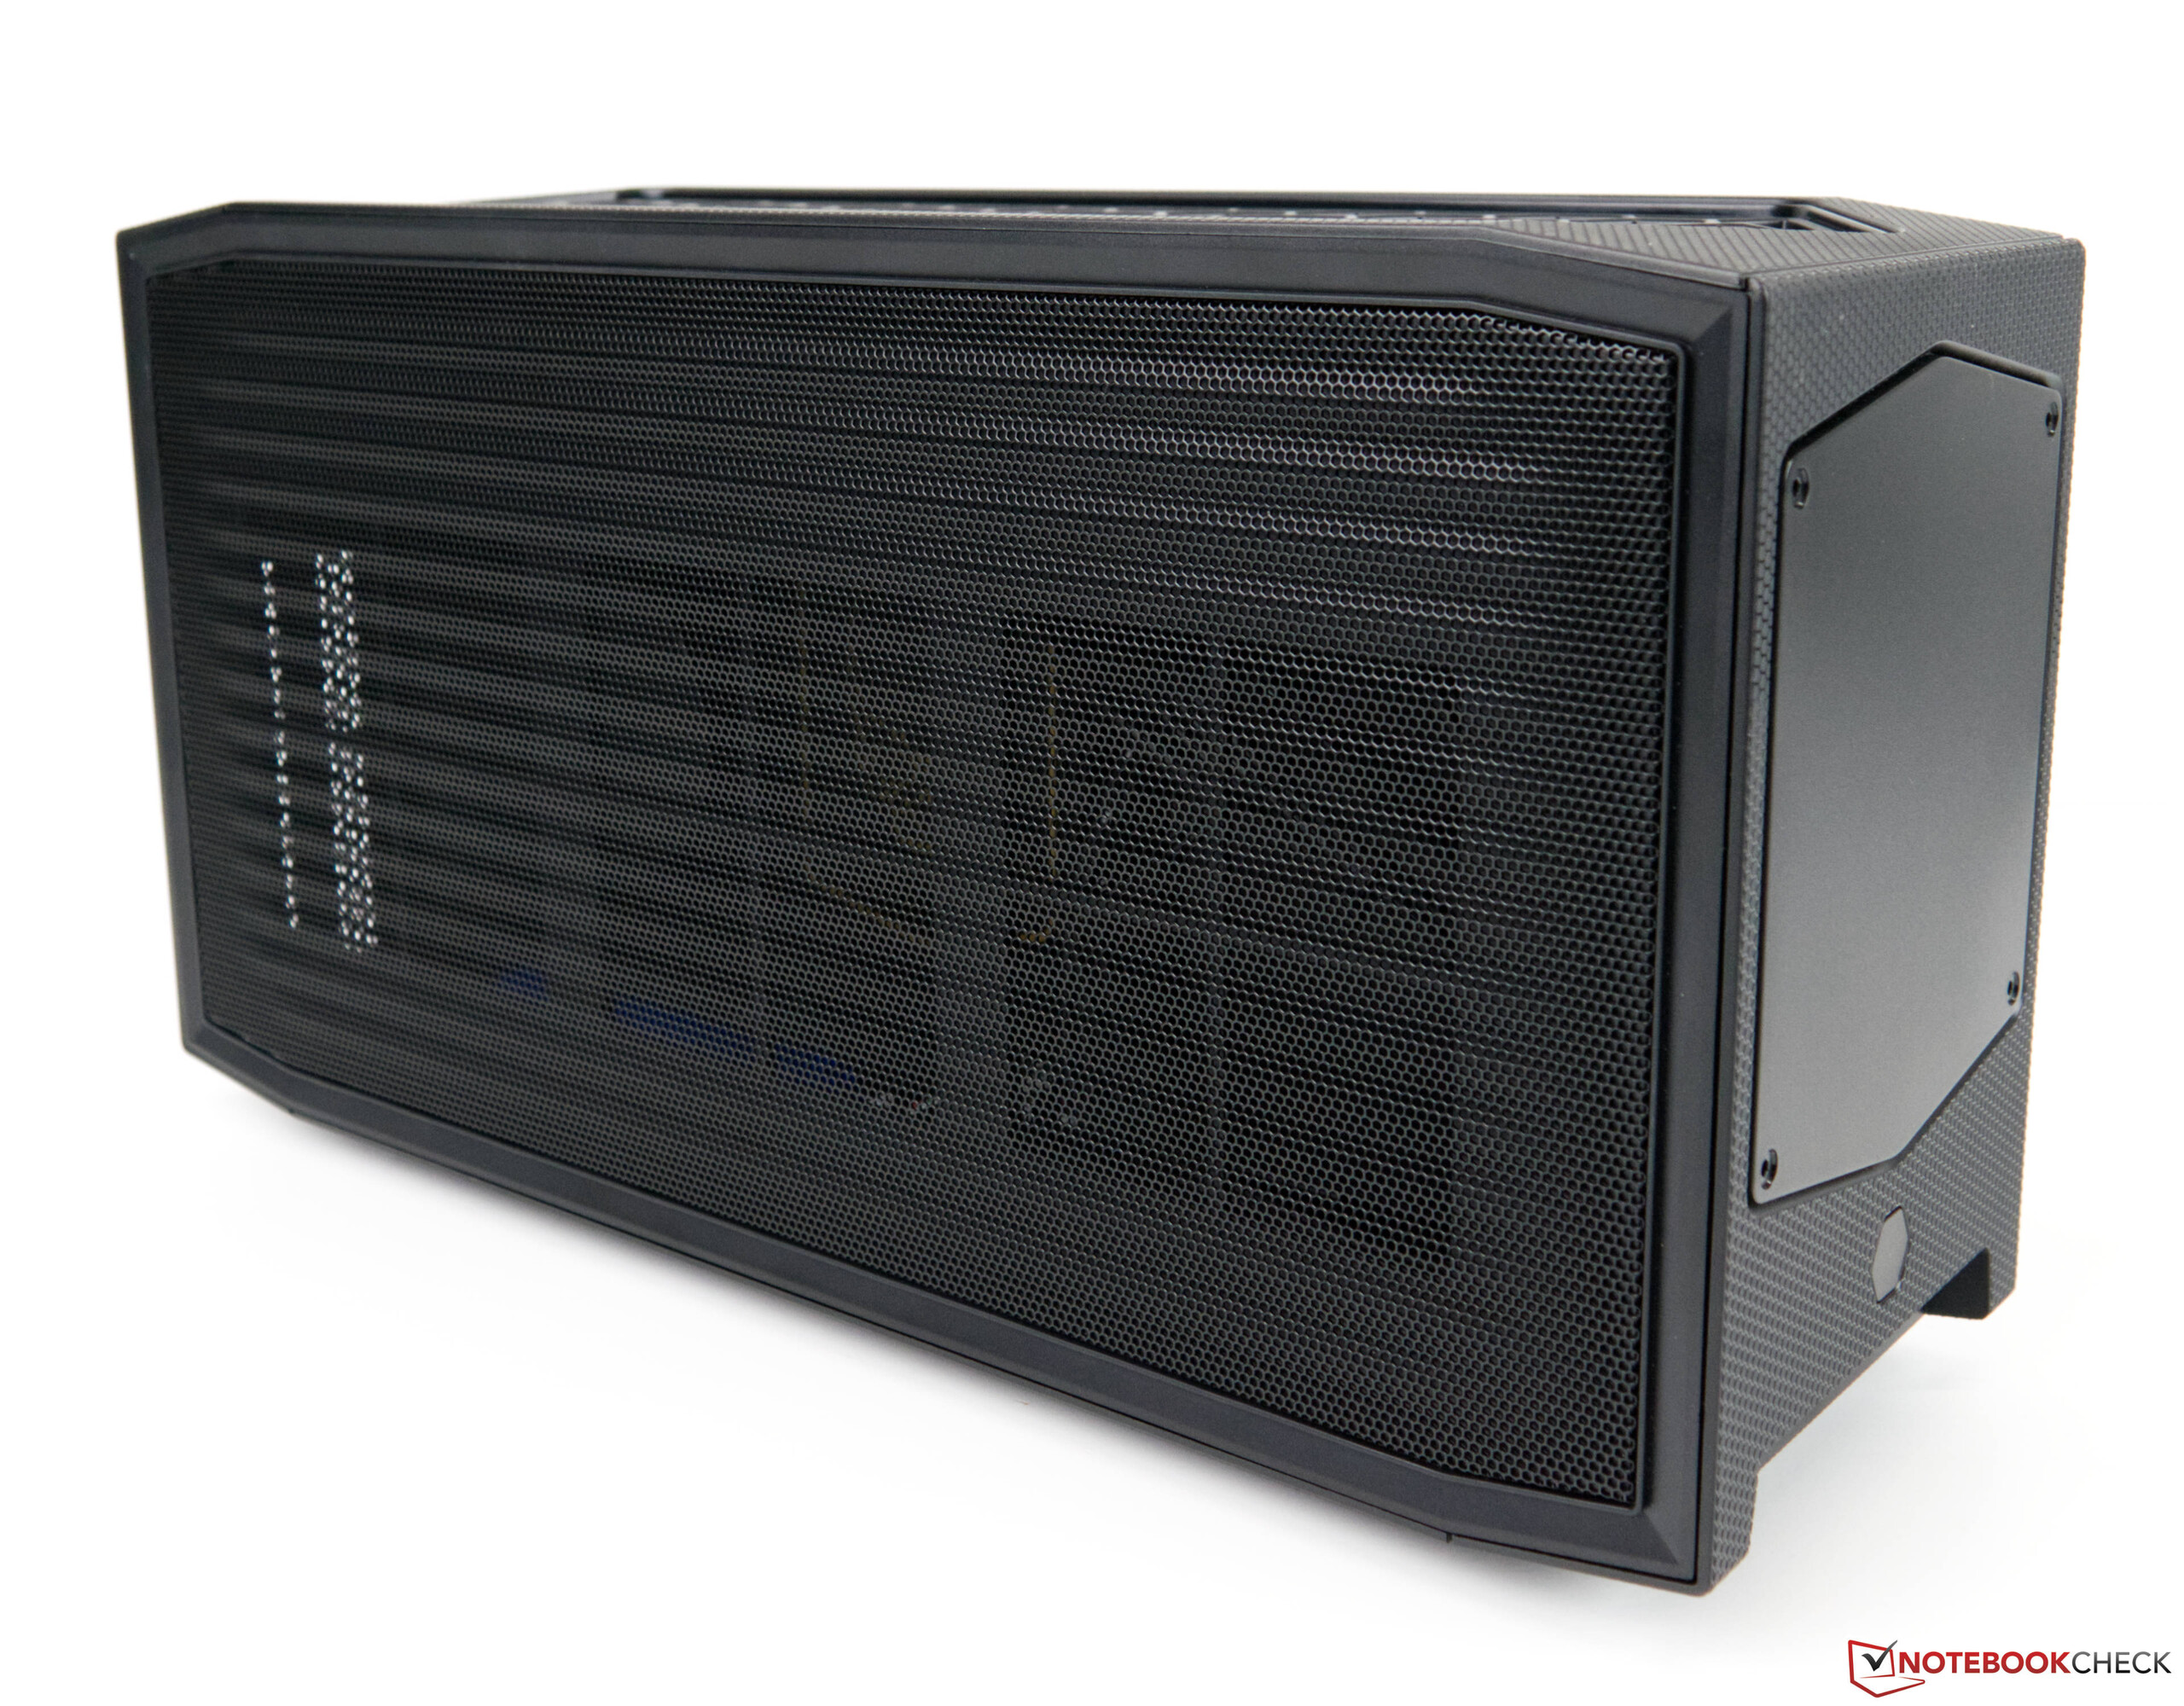
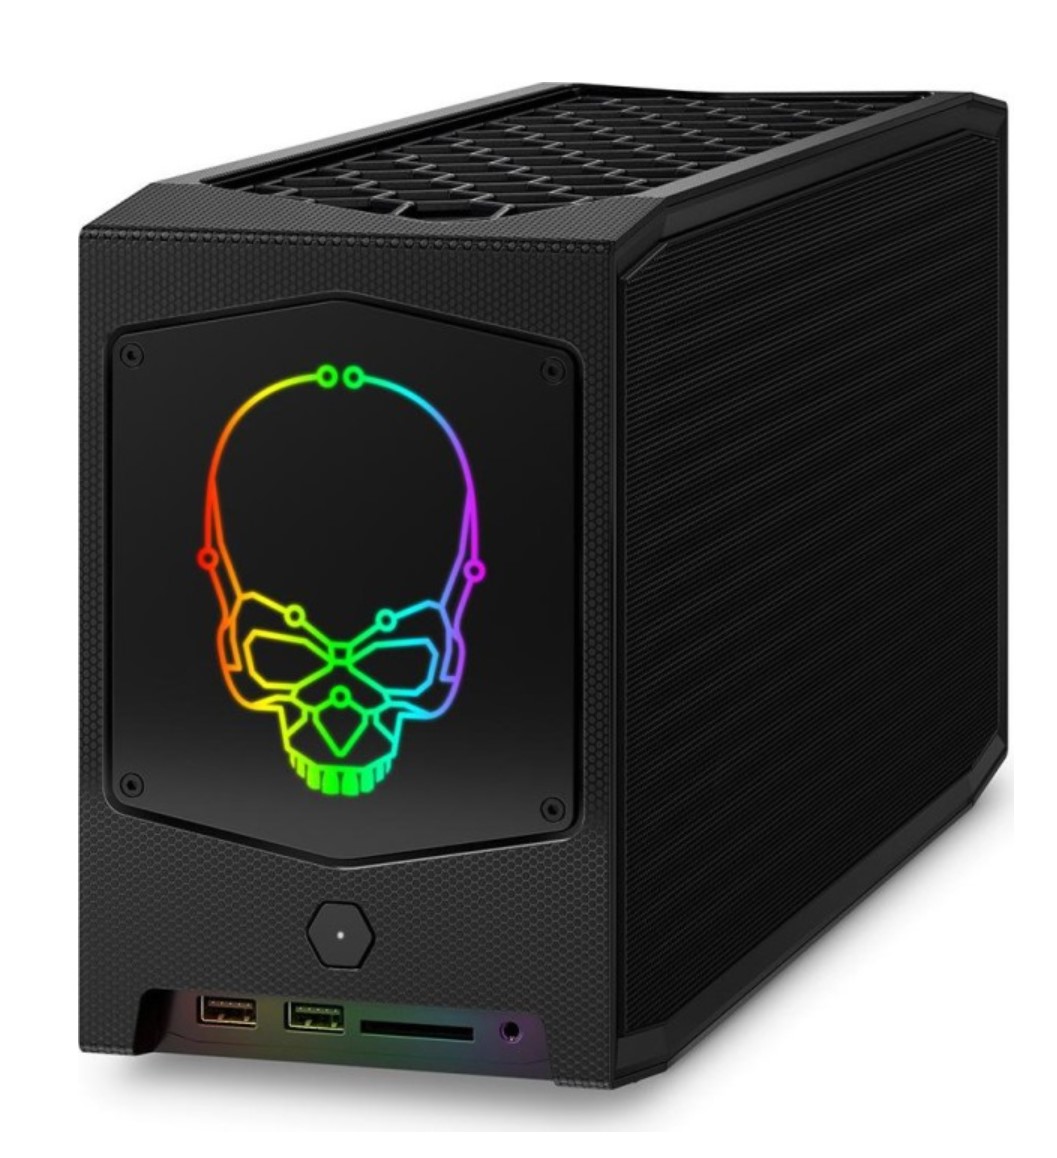
Le kit Intel NUC Extreme est connu depuis un certain temps déjà. Avec sa construction compacte et son bon équipement, il se distingue de la masse, et le design de l'ordinateur de bureau compact peut être facilement reconnu, sansaucun doute.

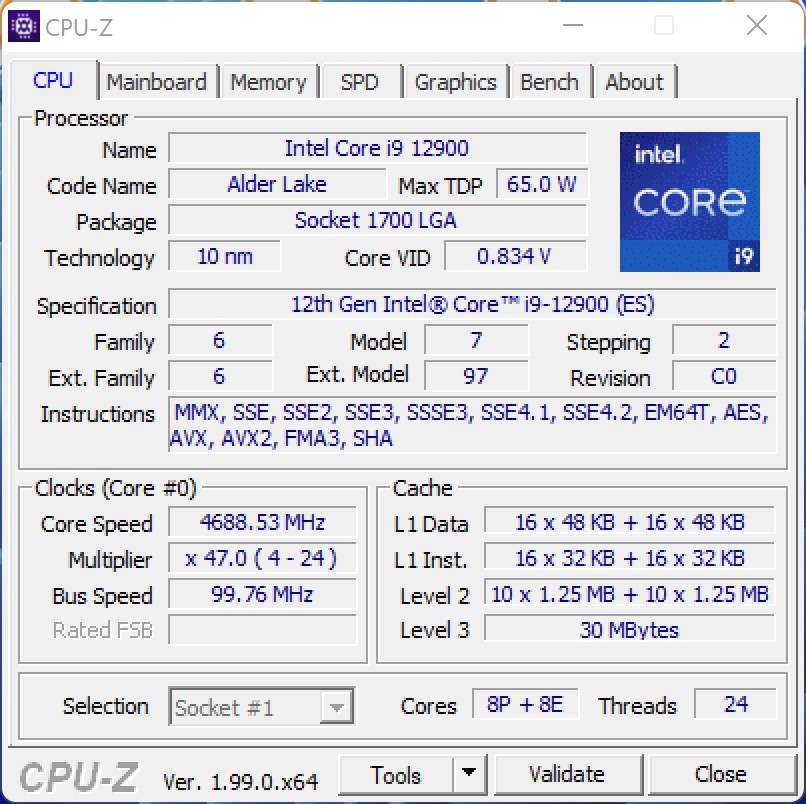
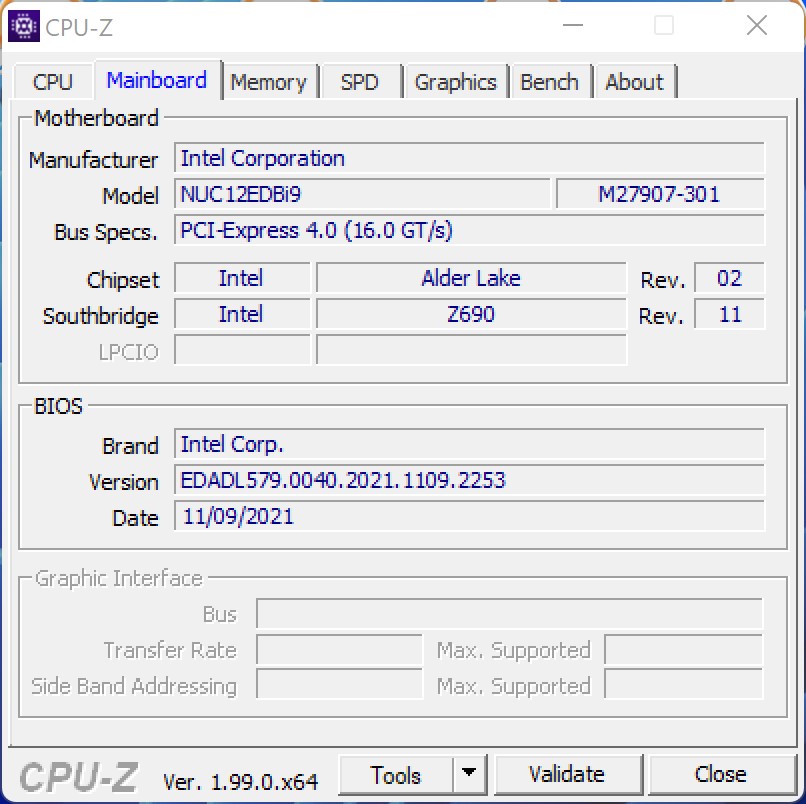
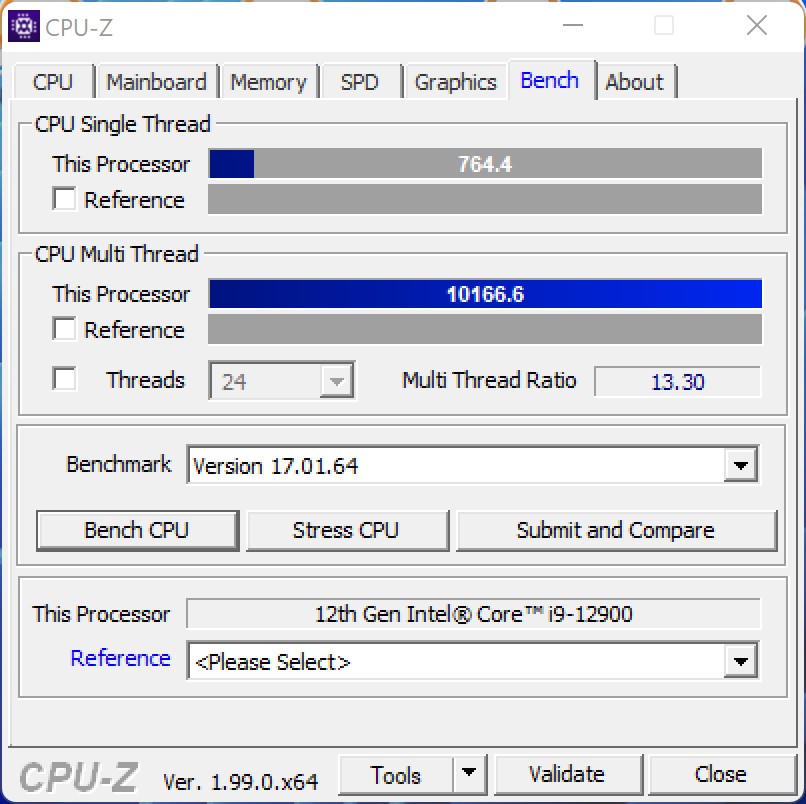
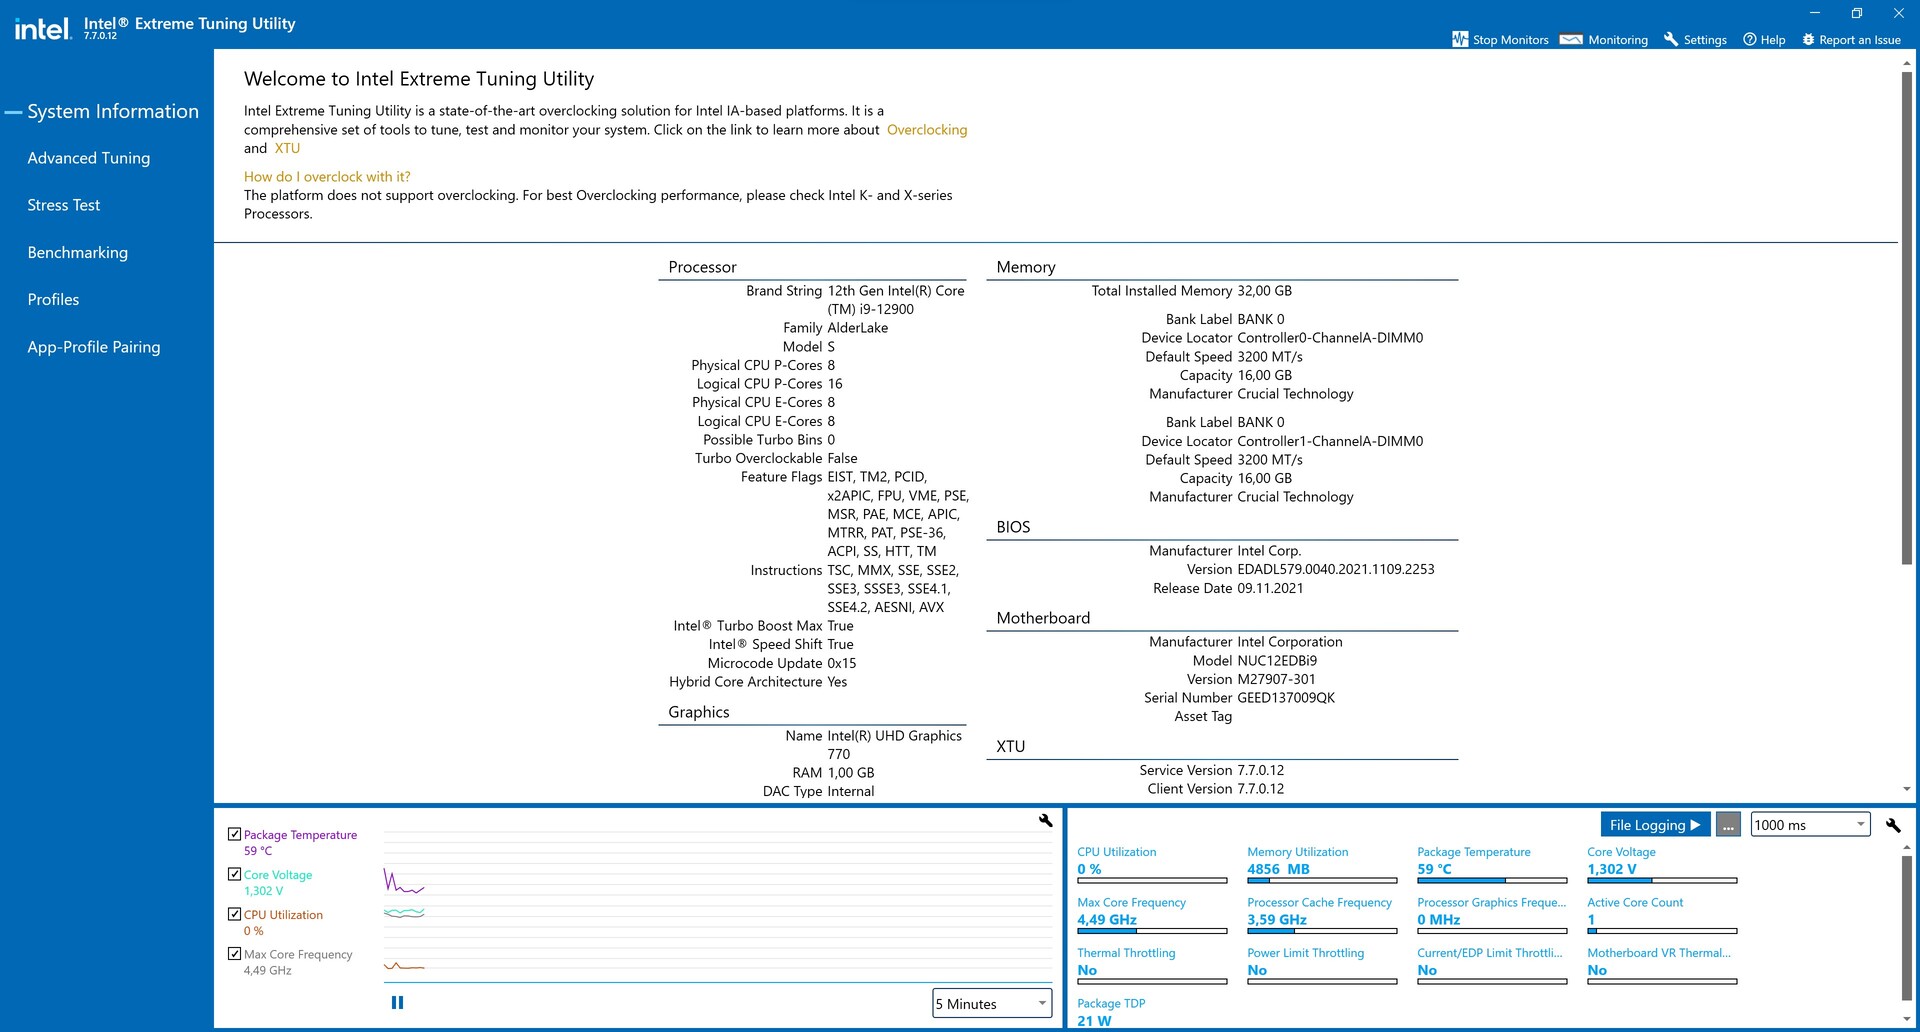
Nous avons récemment jeté un coup d'œil détaillé au Intel NUC 11 Extreme Kit alias Beast Canyon et avons déjà été surpris par ses puissantes capacités à ce moment-là. Avec l'Intel NUC 12 Extreme Kit alias Dragon Canyon, Intel présente maintenant le successeur, montrant qu'il y a encore plus de puissance maintenant avec le nouveau CPU. Mais on pouvait également s'y attendre en raison des progrès réalisés dans le développement de la puce, puisque Alder Lake présente un avantage significatif par rapport à l'ancienne plateforme Tiger Lake. Elle utilise toujours le Compute Element que nous connaissons déjà, qui combine tous les composants importants d'un PC. Pour la première fois, Intel prend la direction d'utiliser un CPU socké tel que nous le connaissons dans le segment standard des ordinateurs de bureau. Il s'agit du processeur Intel Core i9-12900 de l'actuelle série S d'Alder Lake. Tout comme l'Intel Core i9-12900K, le processeur offre les cœurs P et E que nous connaissons déjà, qui sont capables de fonctionner sur jusqu'à 24 threads simultanément. Cependant, avec un TDP légèrement inférieur, nous nous attendons également à une performance légèrement inférieure. Vous trouverez plus de détails à ce sujet dans le segment des performances plus bas.

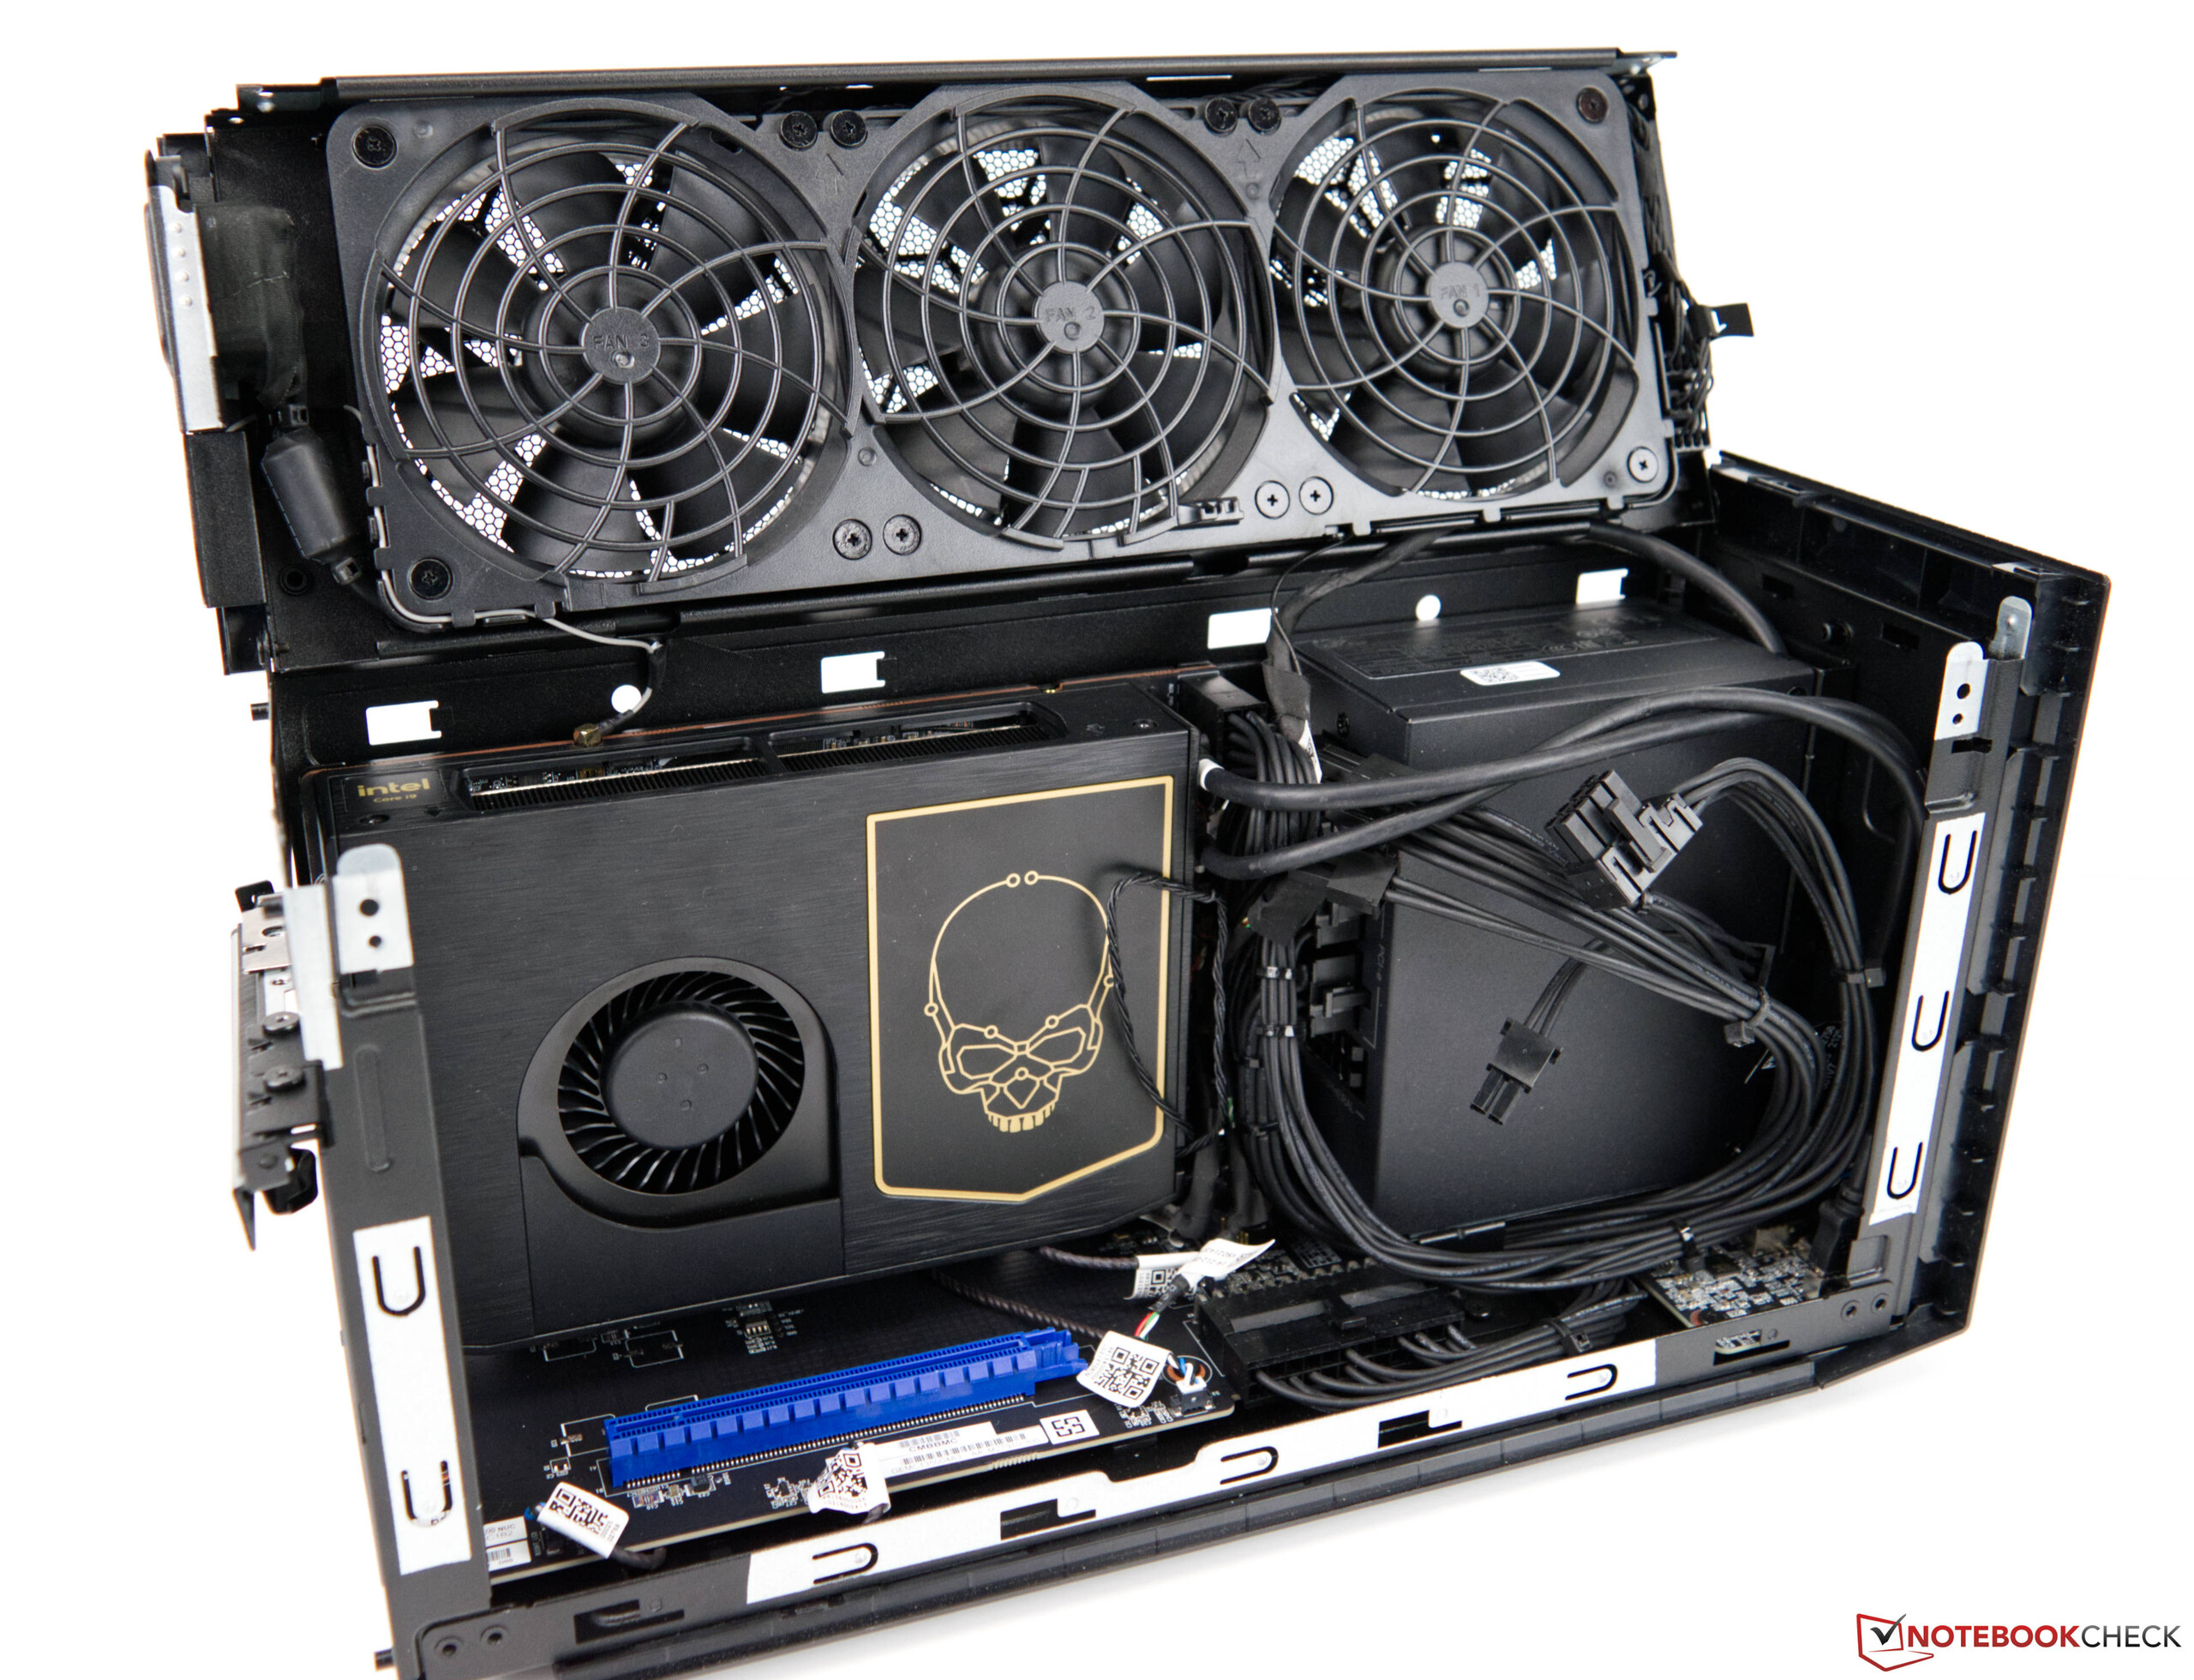
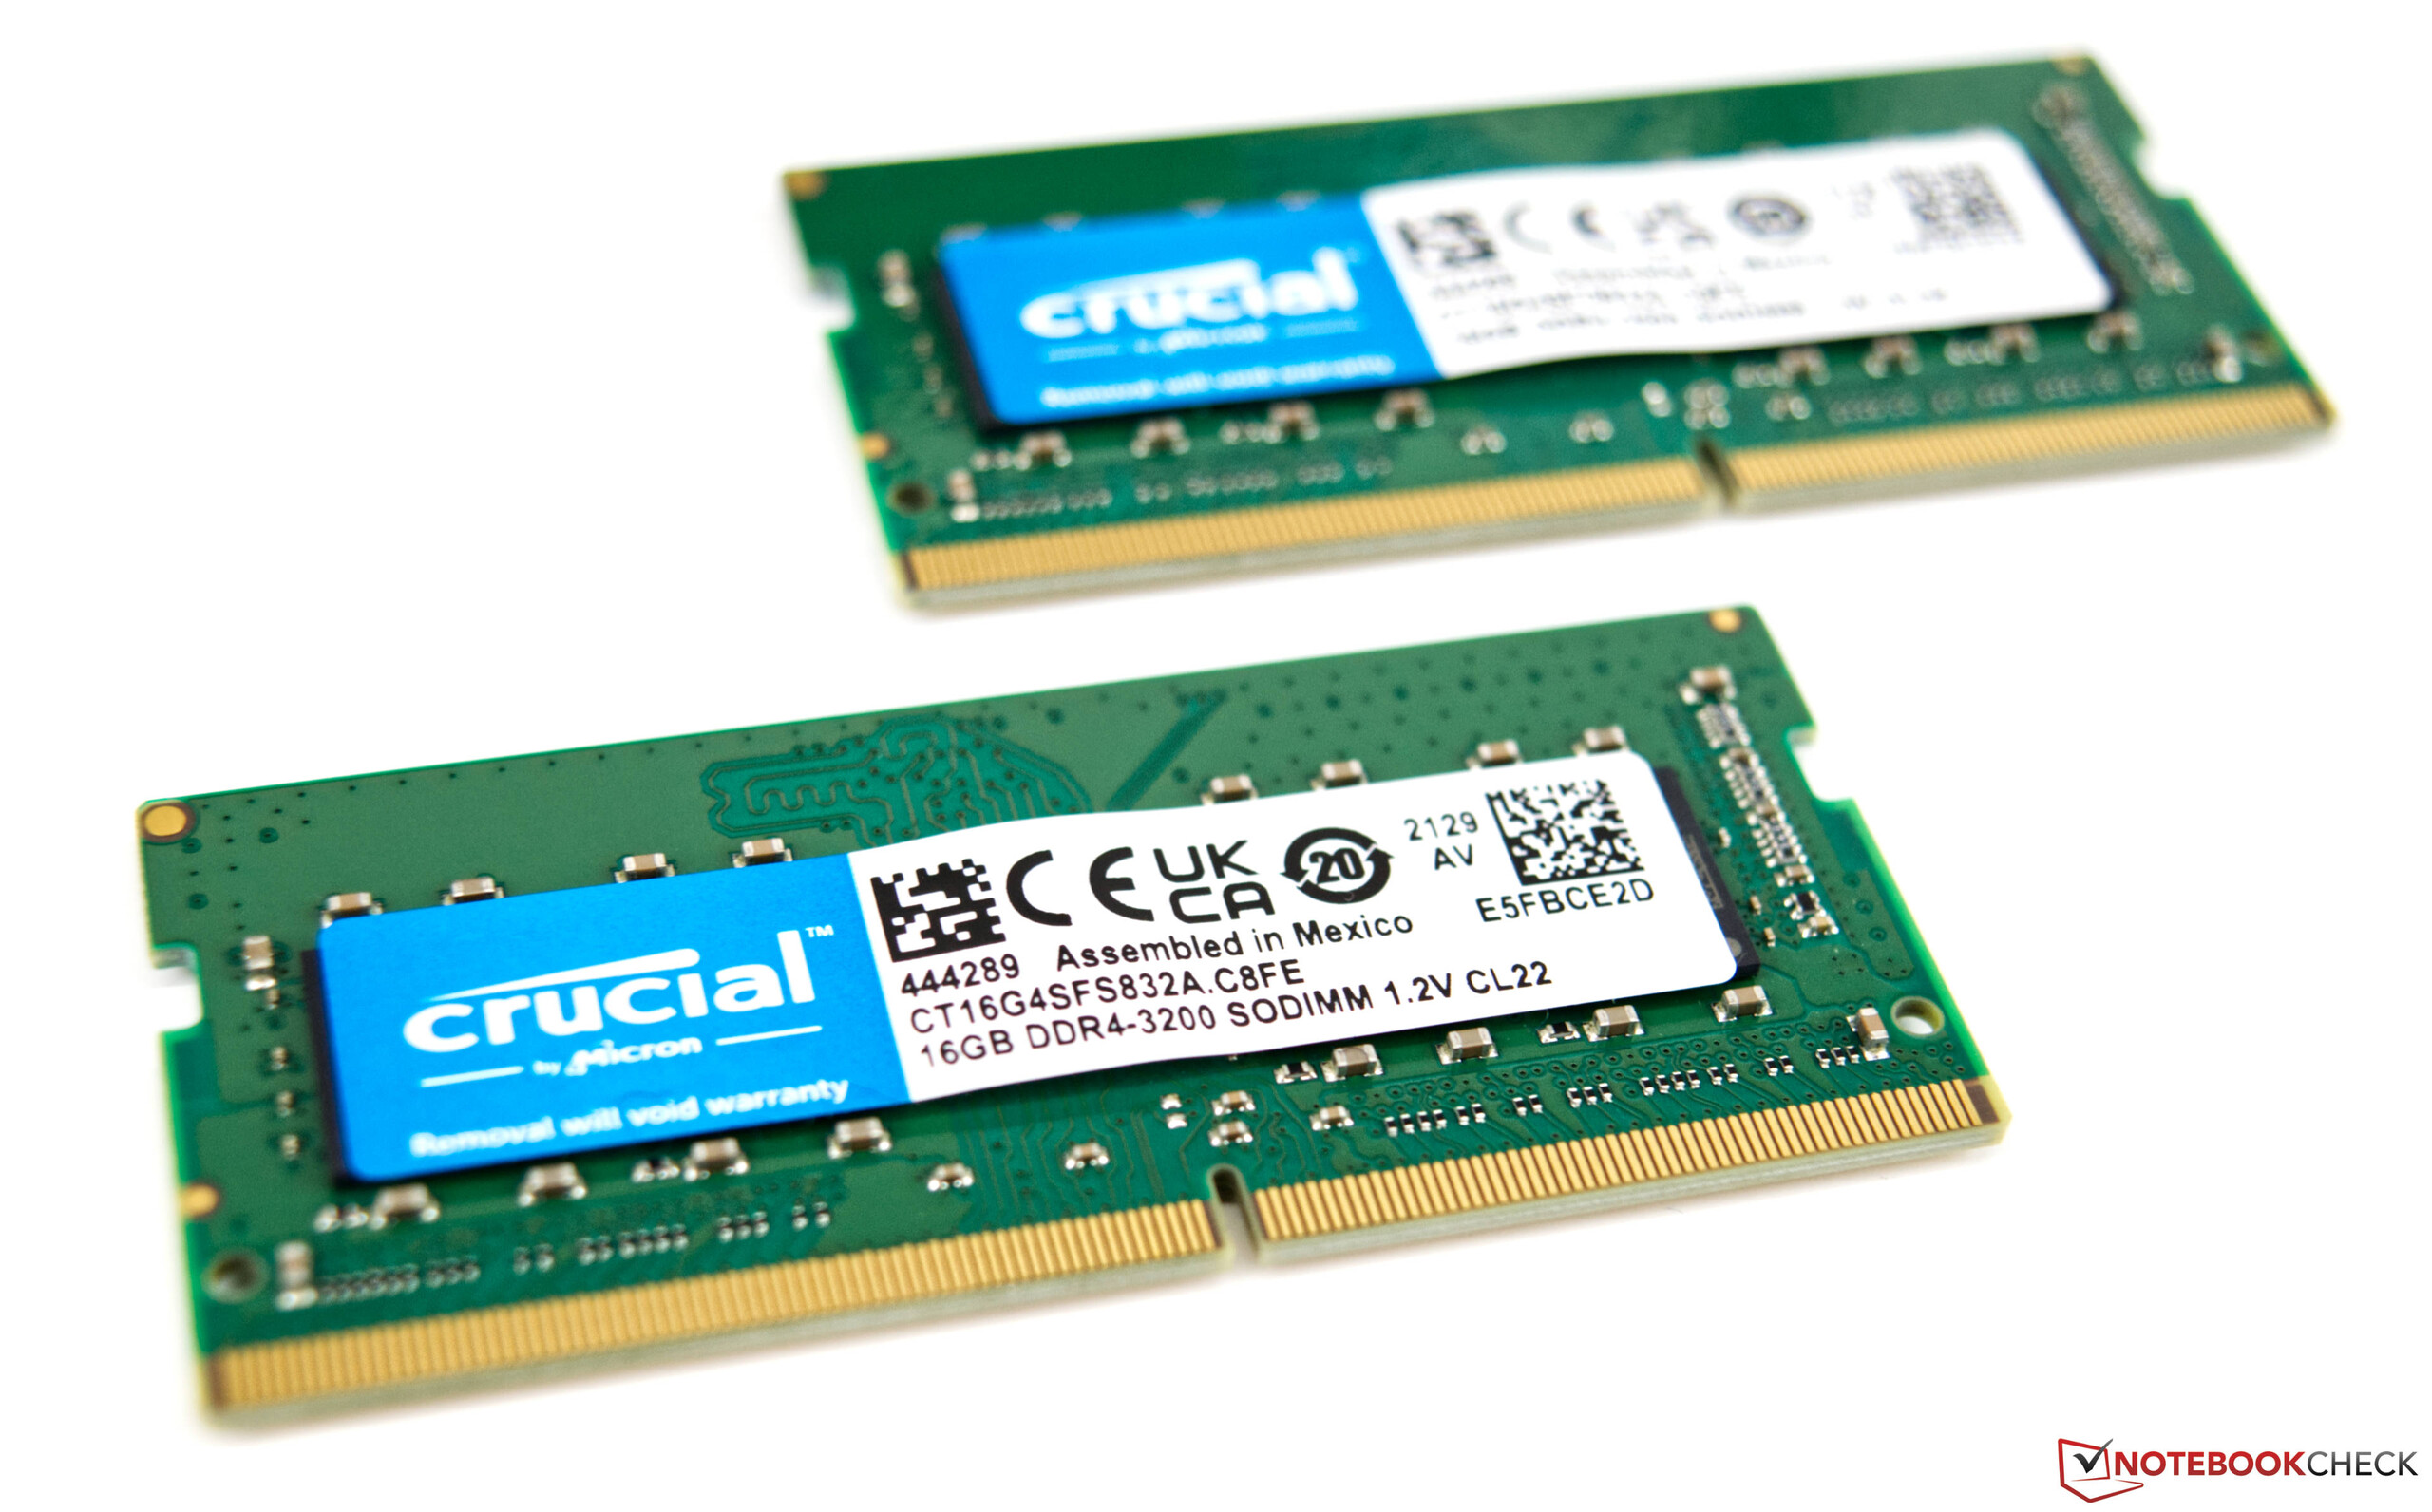
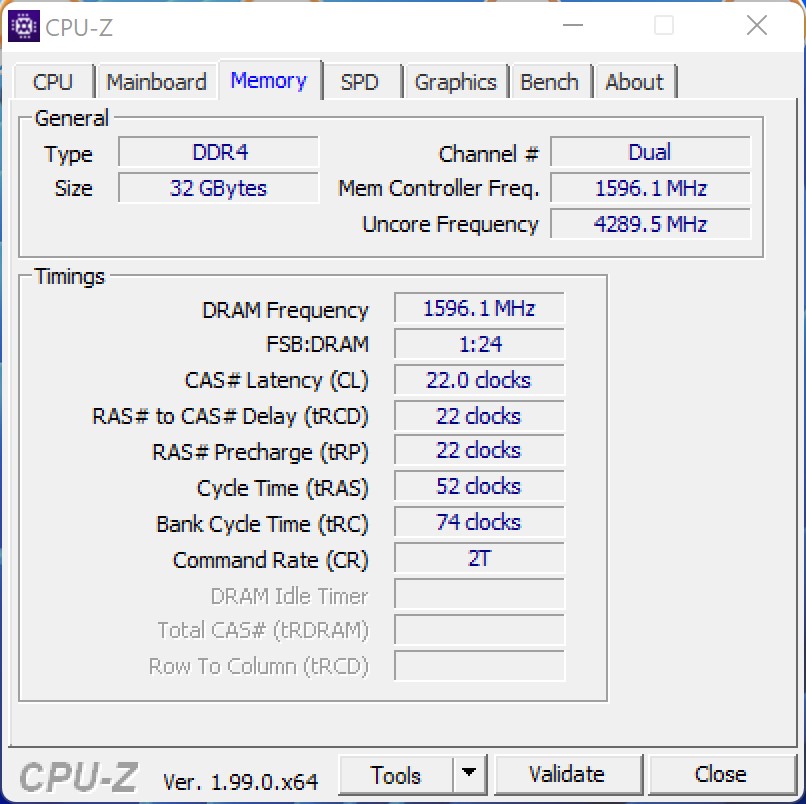
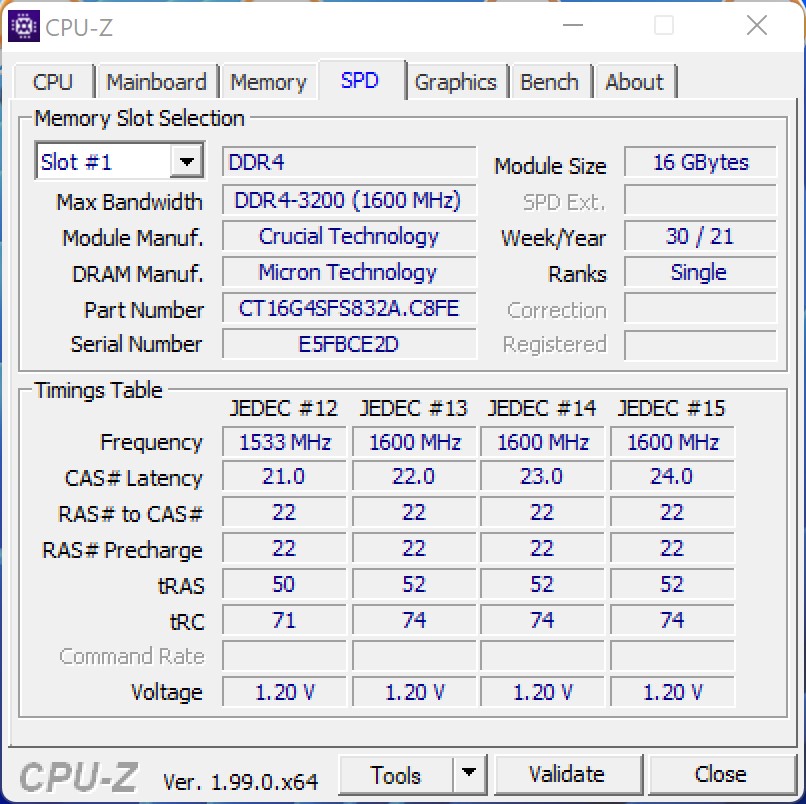
Lorsque vous achetez le kit Intel NUC 12 Extreme, vous devez tenir compte du fait qu'il s'agit d'un système barebone. Le SSD, la RAM et une carte graphique dédiée ne sont pas inclus. Pour ces derniers, nous avons examiné nos propres fournitures et équipé le système d'un SSD NVME de 512 Go et de 32 Go de RAM DDR4. En ce qui concerne la carte graphique dédiée, nous avons délibérément opté pour la Nvidia GeForce RTX 3060, afin de permettre une comparaison équitable avec le kit Intel NUC 11 Extreme.

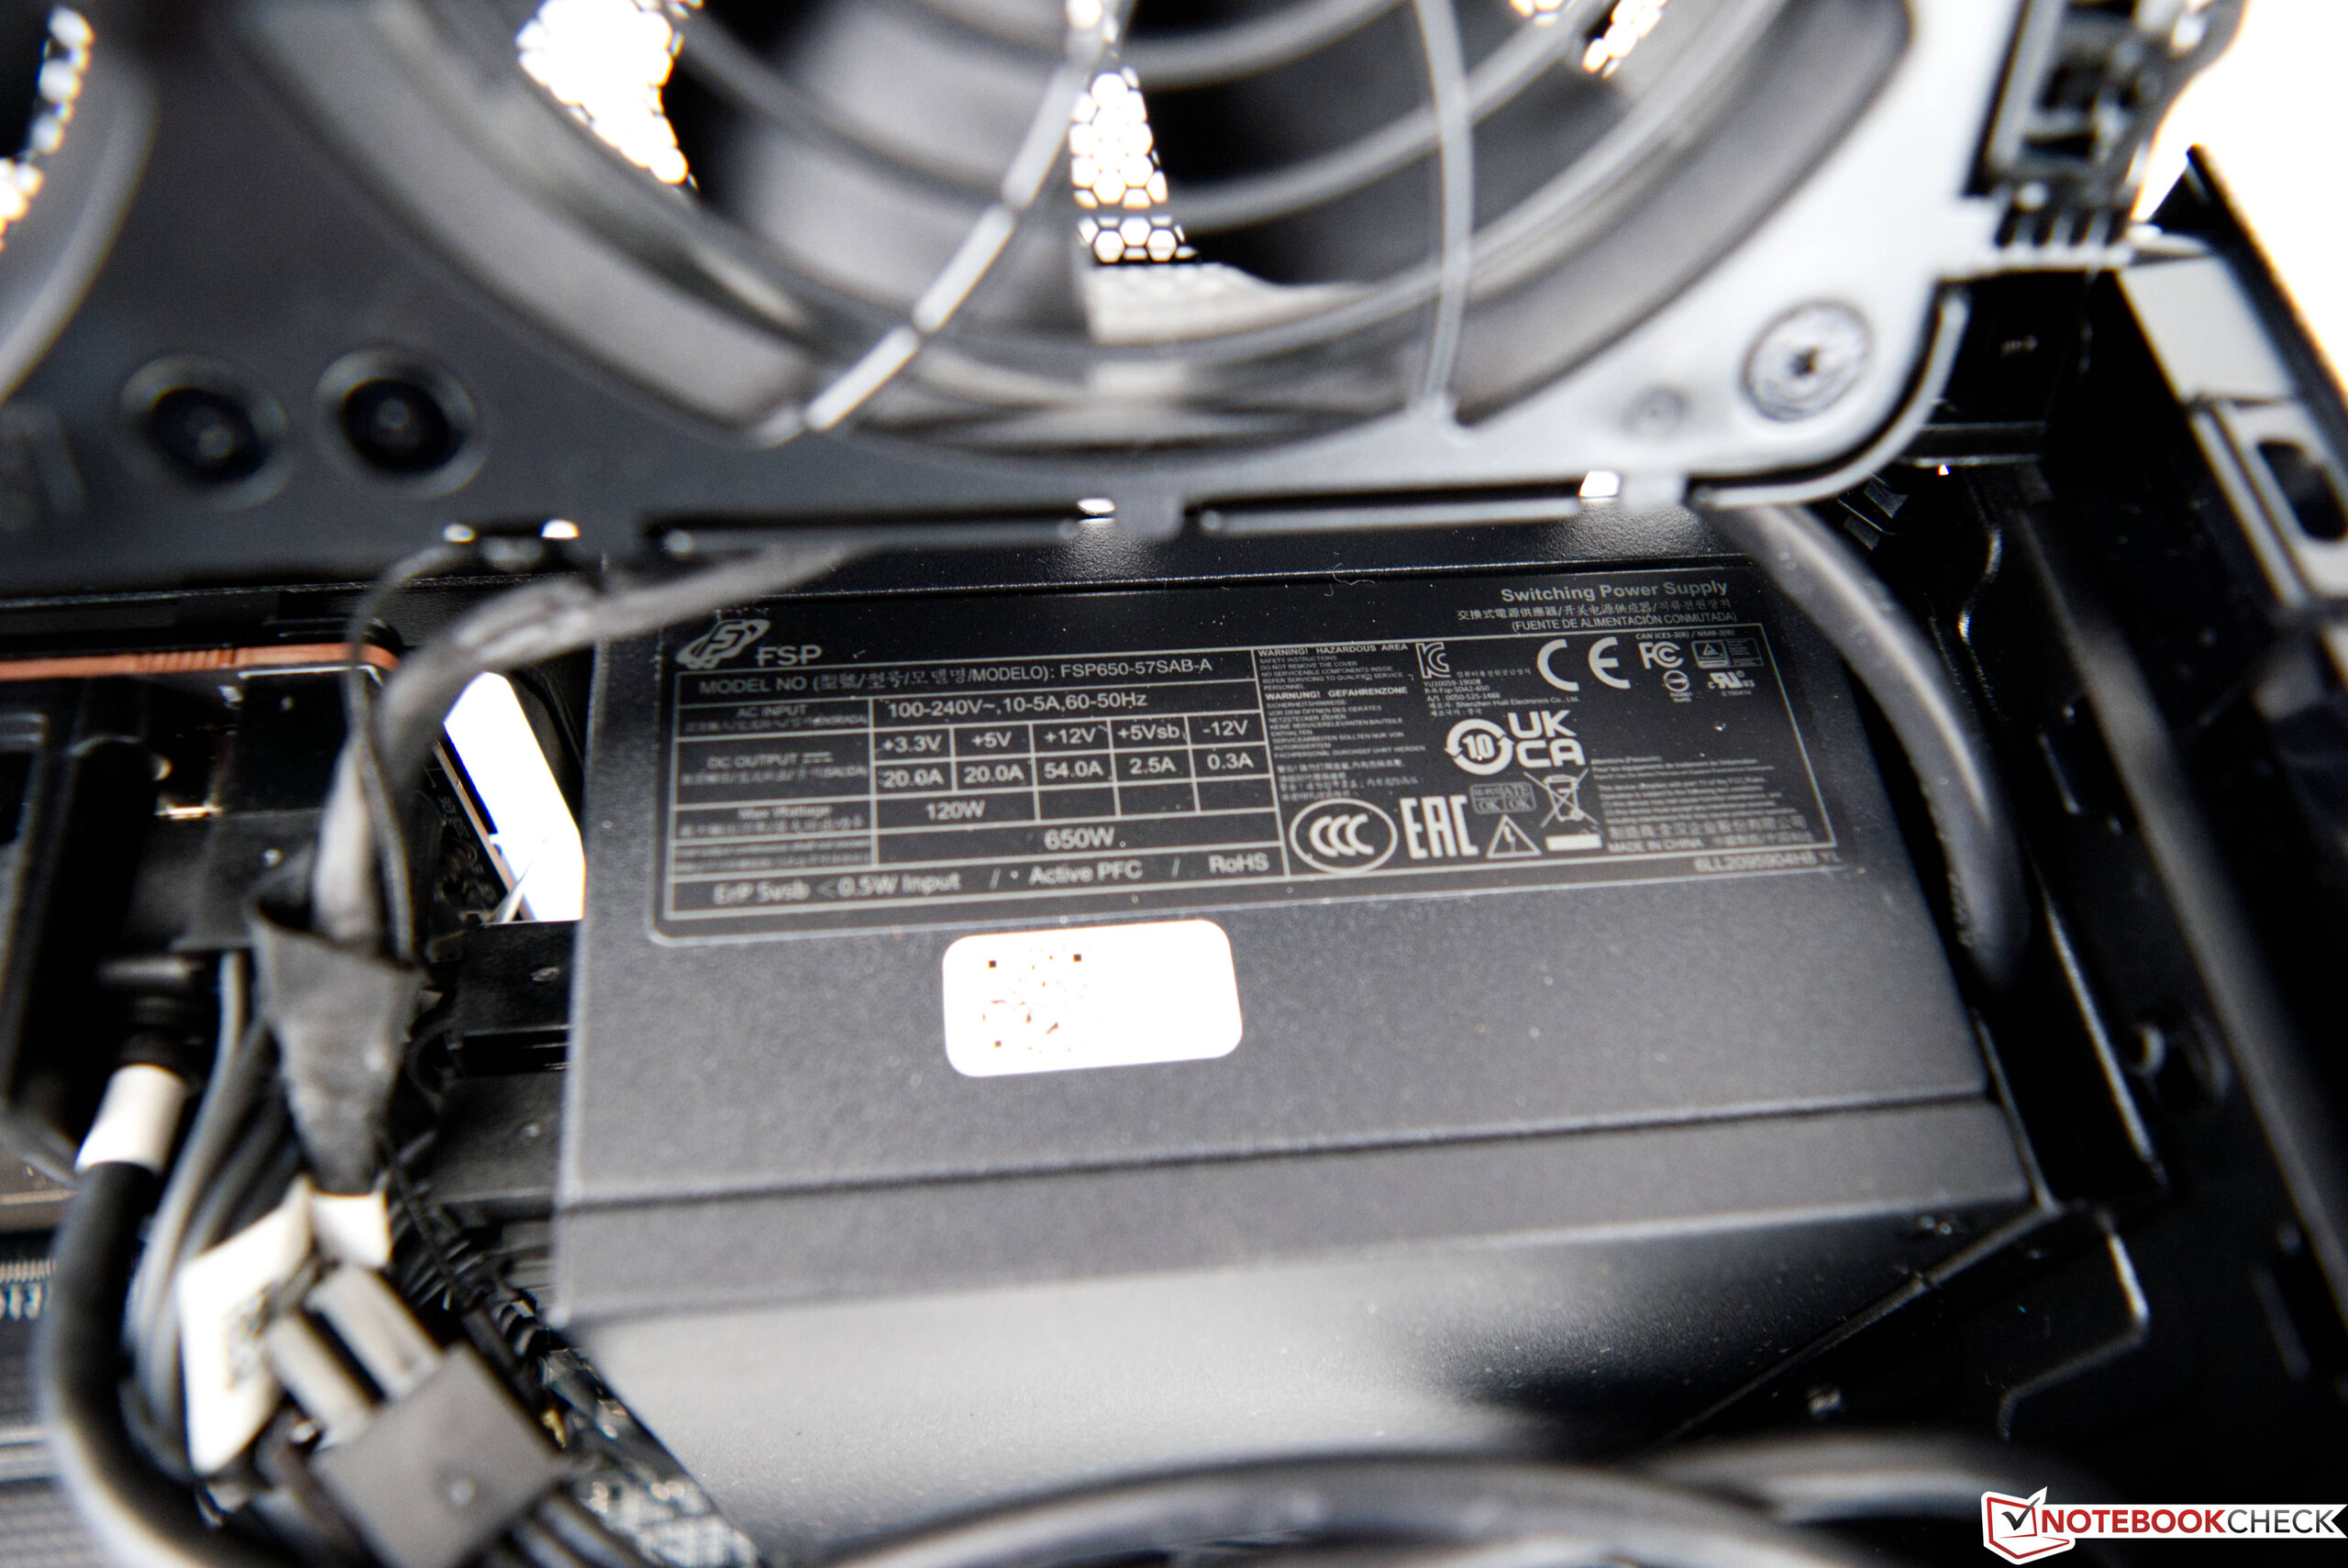
Pour une carte graphique dédiée, vous pouvez utiliser des modèles d'une longueur maximale de 30,5 cm (~12 in). L'alimentation SFX de 650 watts offre une puissance suffisante pour faire fonctionner également les modèles haut de gamme actuels. Toutefois, le refroidissement de ces accélérateurs de pixels ne devrait pas occuper plus de deux emplacements. Vous pouvez actuellement vous procurer le kit Intel NUC 12 Extreme pour 1450 euros (~1589 $).

Intel Dragon Canyon NUC - RTX 3060
Processeur
Intel Core i9-12900 16 x 2.4 - 5.1 GHz, 202 W PL2 / Short Burst, 65 W PL1 / Sustained, Alder Lake
Carte graphique
NVIDIA GeForce RTX 3060 - 12 Go VRAM, Processeur: 1777 MHz, Mémoire: 15000 MHz, GDDR6, Nvidia 511.79
Mémoire
32 Go 
, DDR4-3200
Carte mère
Intel Z690 (Alder Lake-S PCH)
Disque dur
Transcend M.2 SSD 2200S TS512GMTE220S, 512 Go 
Connexions
1 USB 2.0, 10 USB 3.1 Gen2, 2 Thunderbolt, 1 HDMI, 1 DisplayPort, Lecteur de cartes mémoires: SDXC with UHS-II support
Réseau
Aquantia AQtion 10Gbit Network Adapter (10/100/1000/2500/5000/10000MBit/s), Intel Wi-Fi 6E AX211 (a/b/g/h/n = Wi-Fi 4/ac = Wi-Fi 5/ax = Wi-Fi 6/ Wi-Fi 6E 6 GHz), Bluetooth 5.2
Taille
Hauteur x Largeur x Profondeur (en mm): 189 x 120 x 357
Fonctionnalités additionnelles
36 Mois Garantie
Prix
0 euros
Remarque : le fabricant peut utiliser des composants provenant de différents fournisseurs, notamment des panneaux d'affichage, des lecteurs ou des clés USB ayant des spécifications similaires.


Intel NUC 12 Extreme Kit Dragon Canyon
SO-DIMM 32-GB DDR4-3200
Transcend 512 GB NVME-SSD

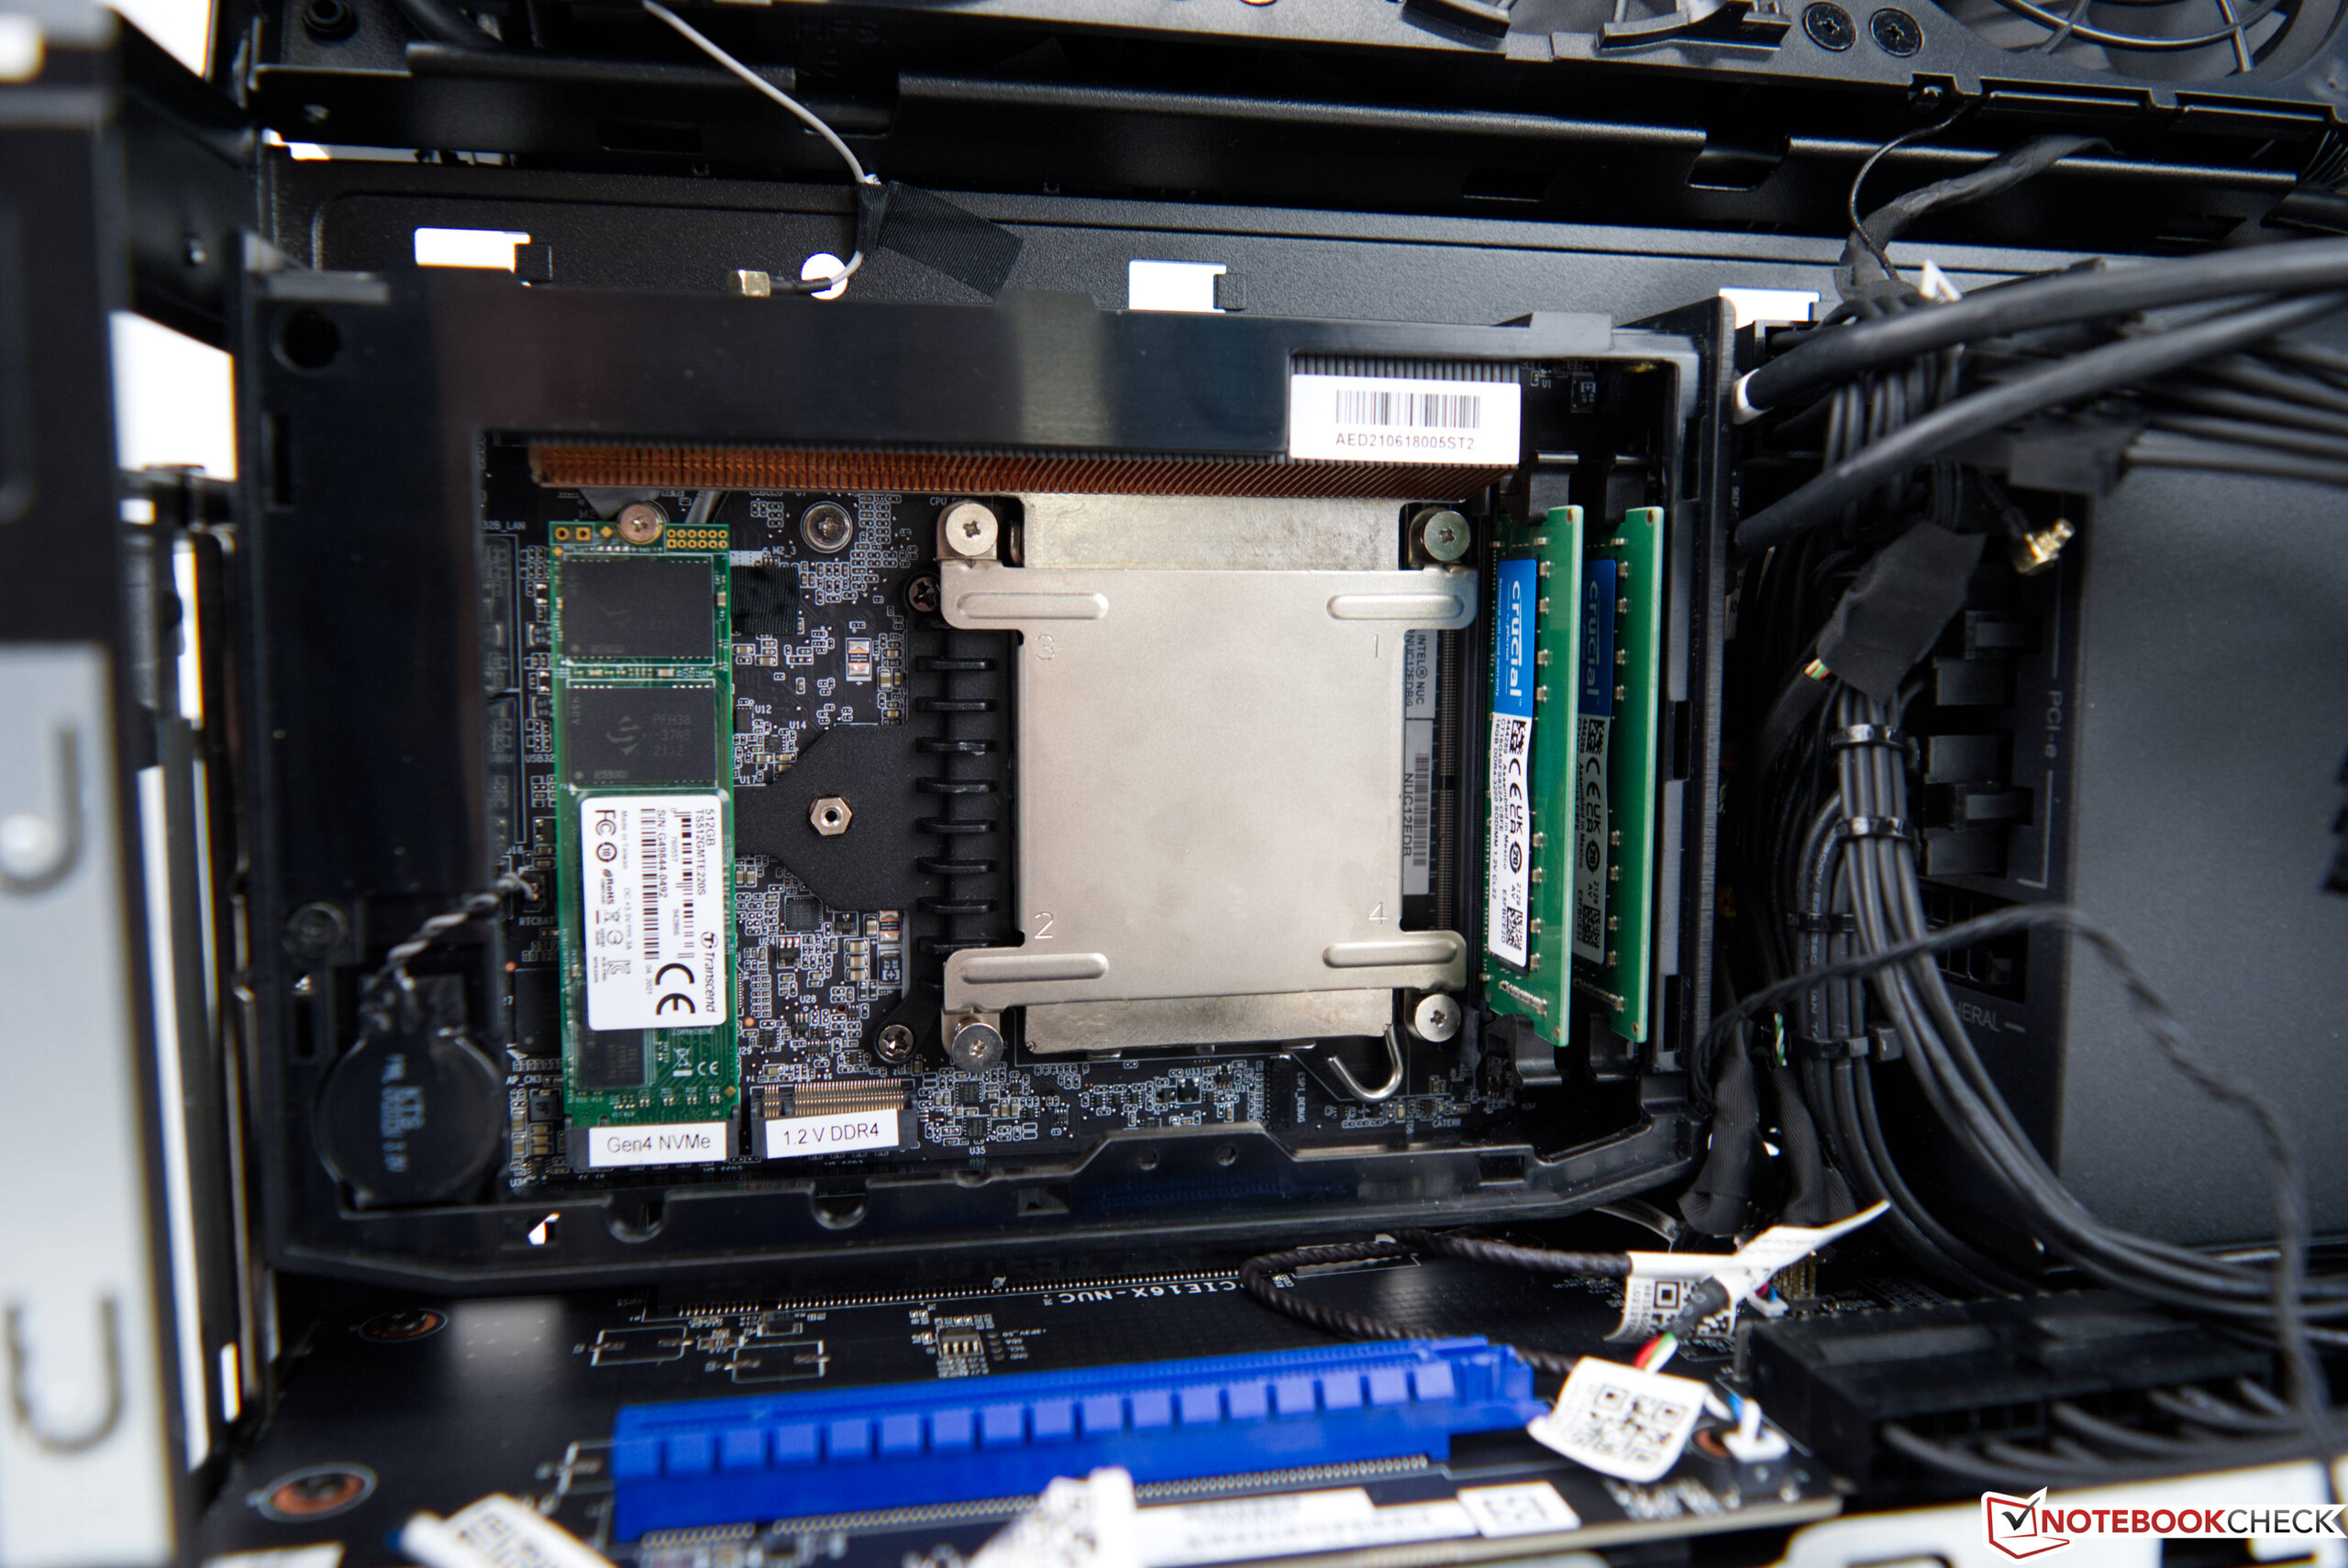
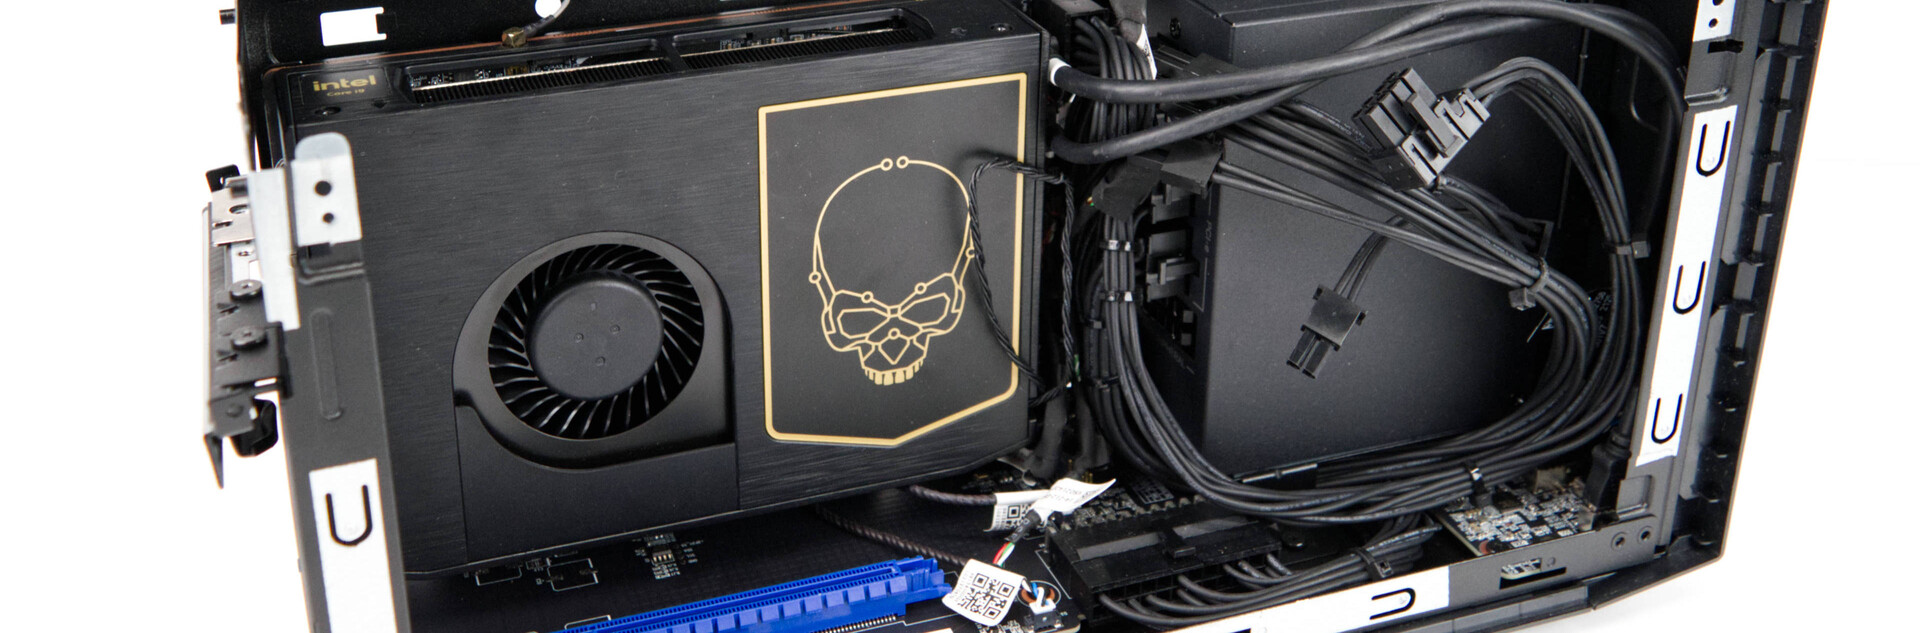
L'Intel NUC 12 Extreme Compute Element en détail

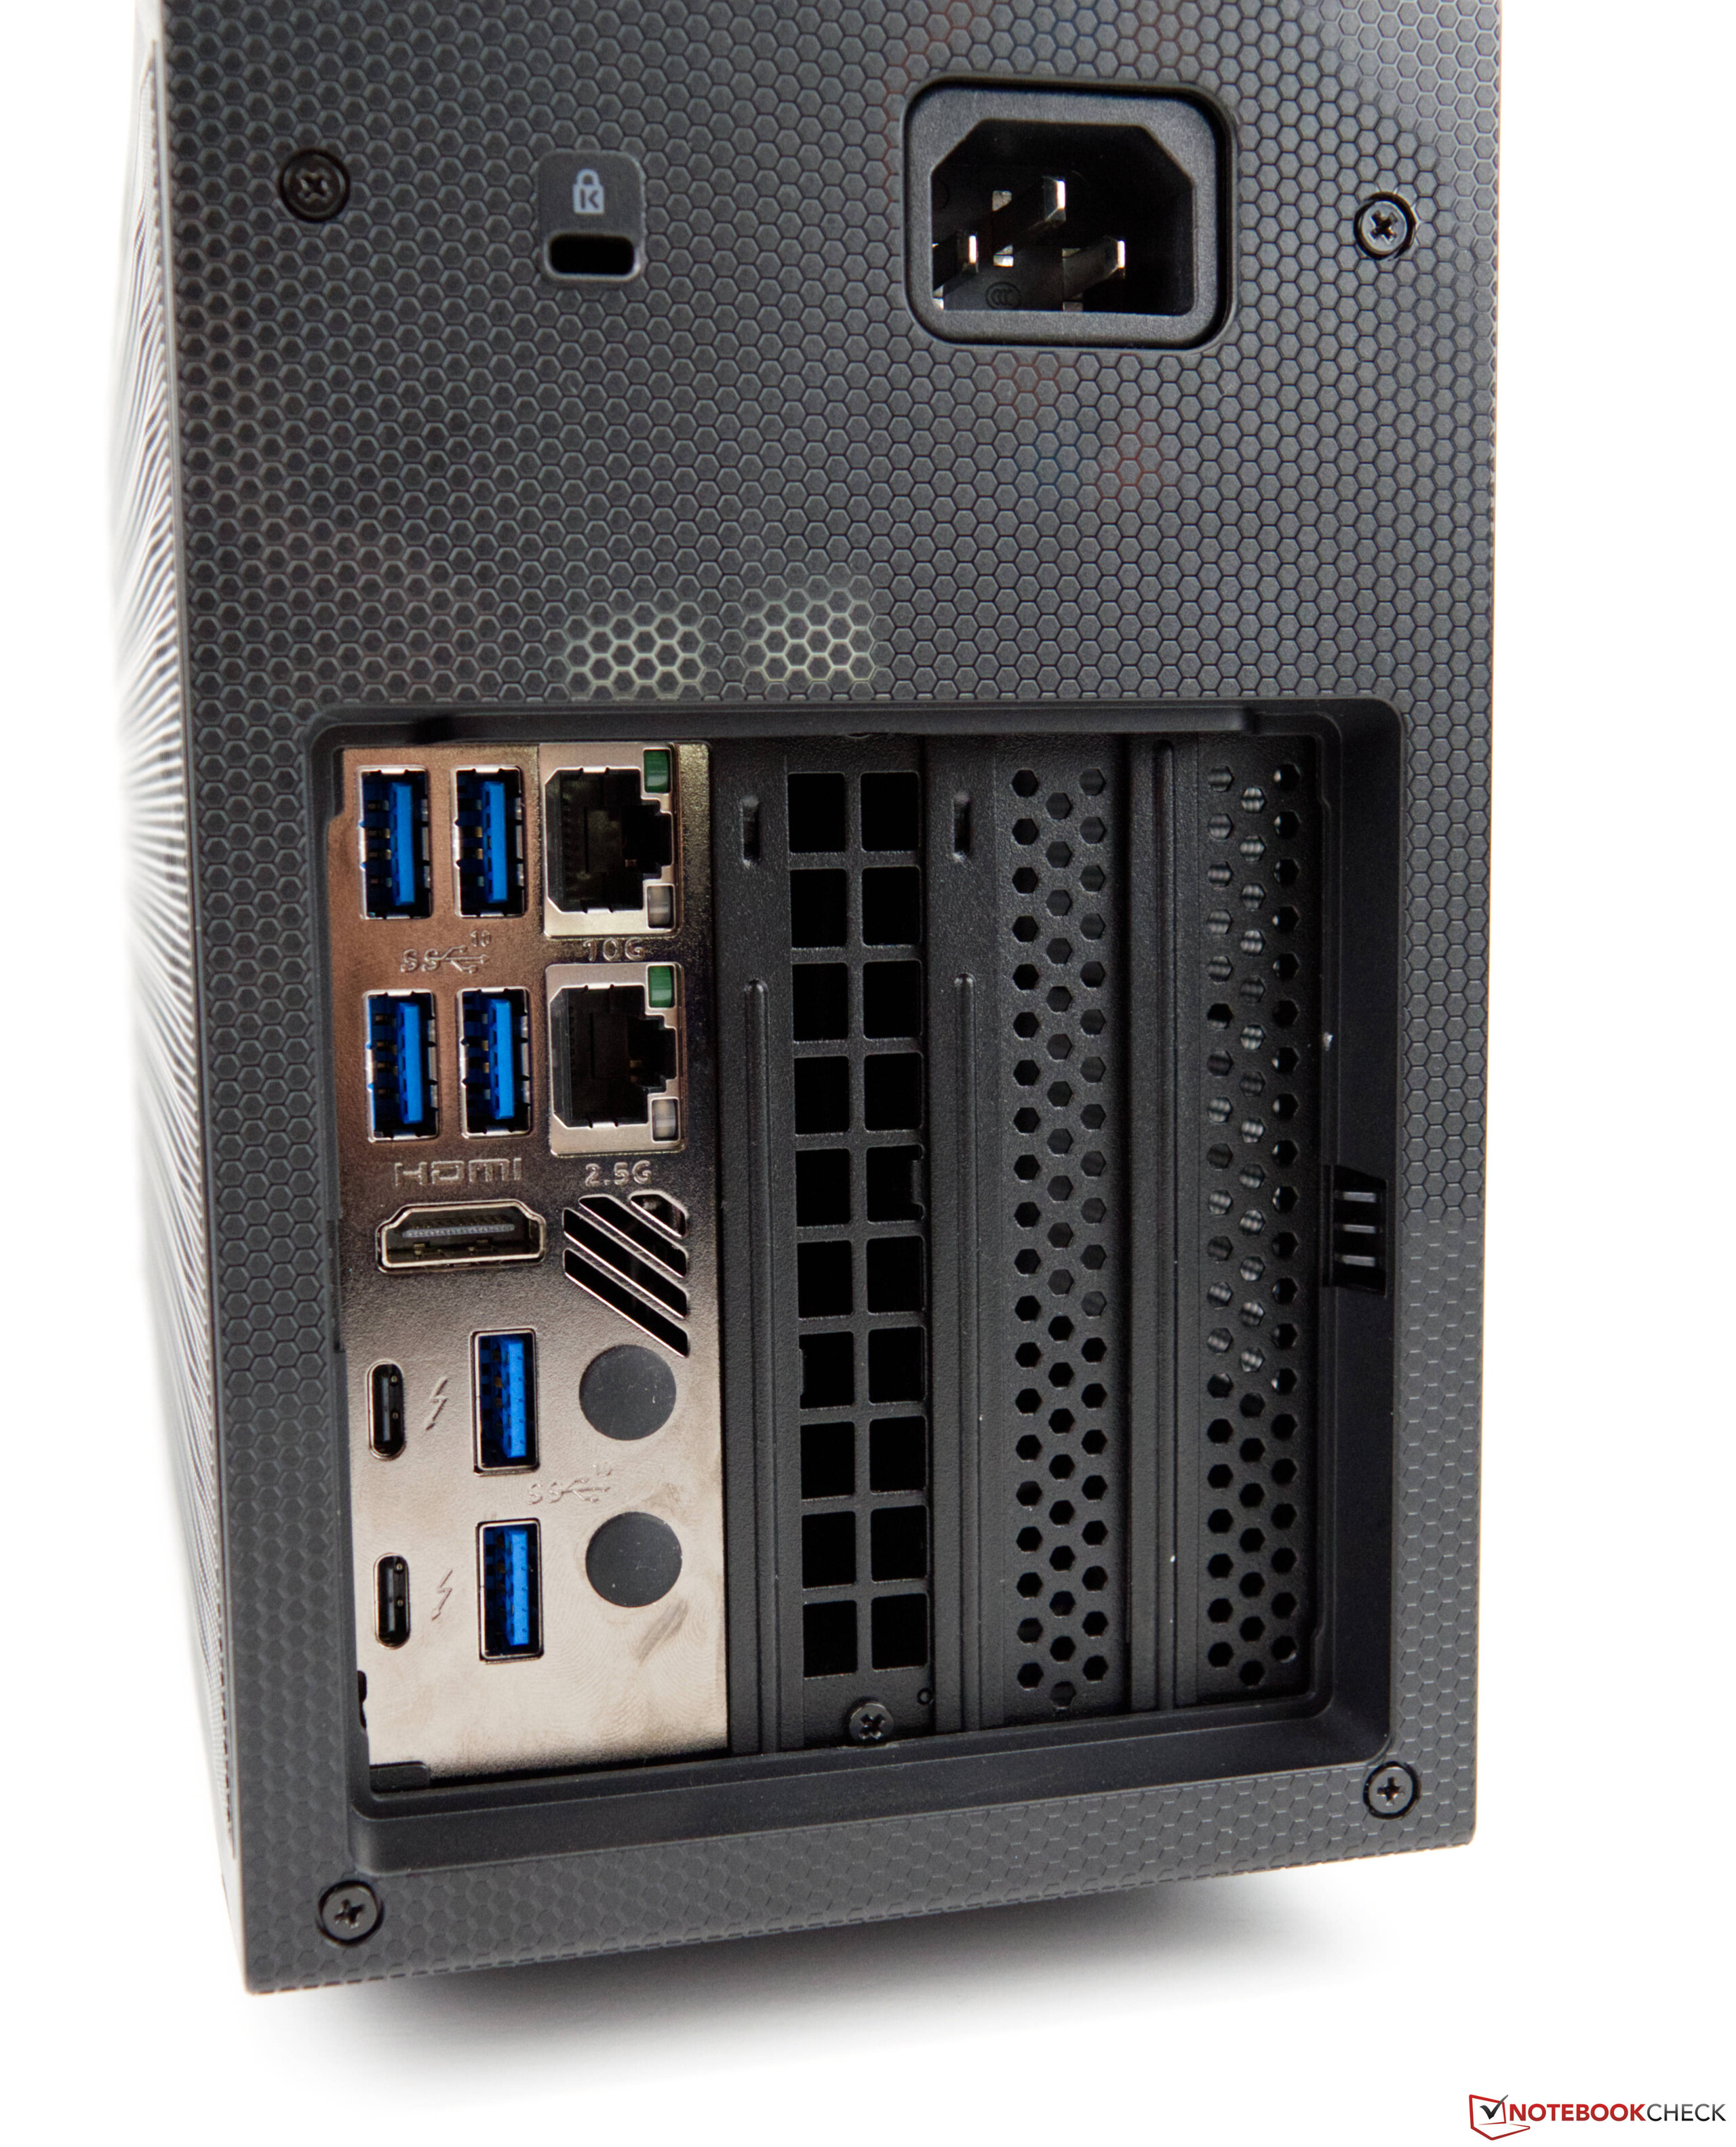
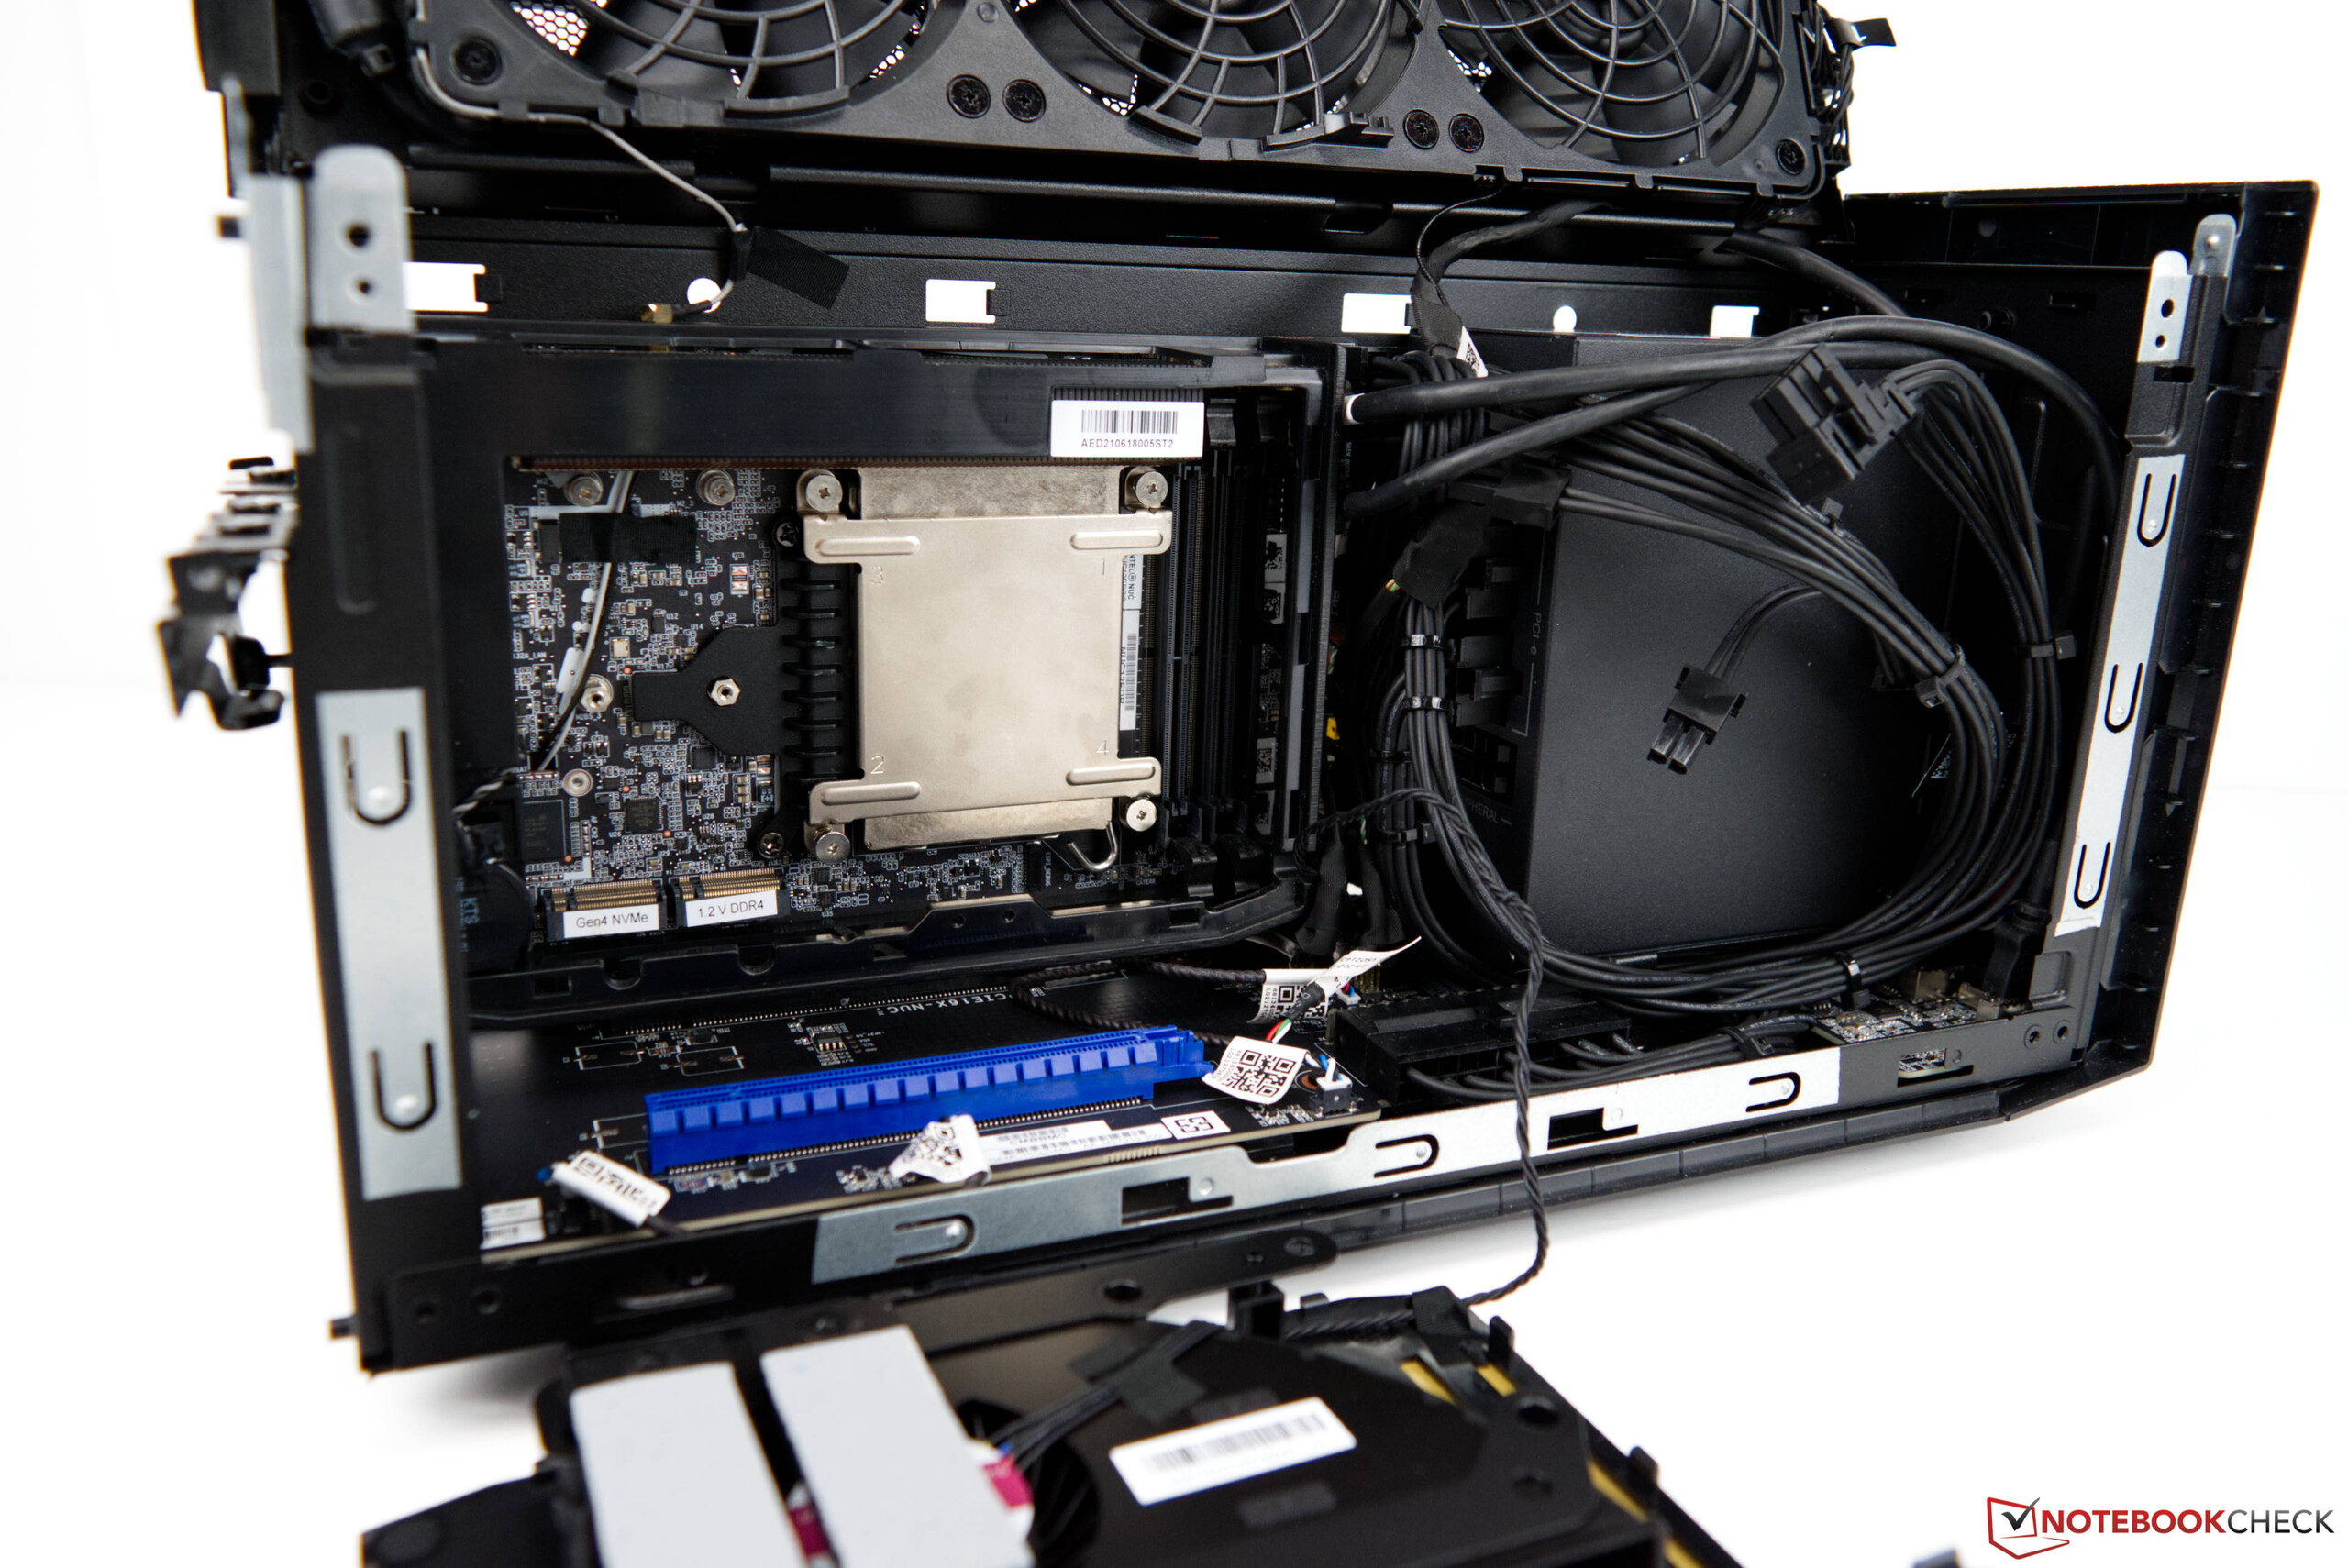
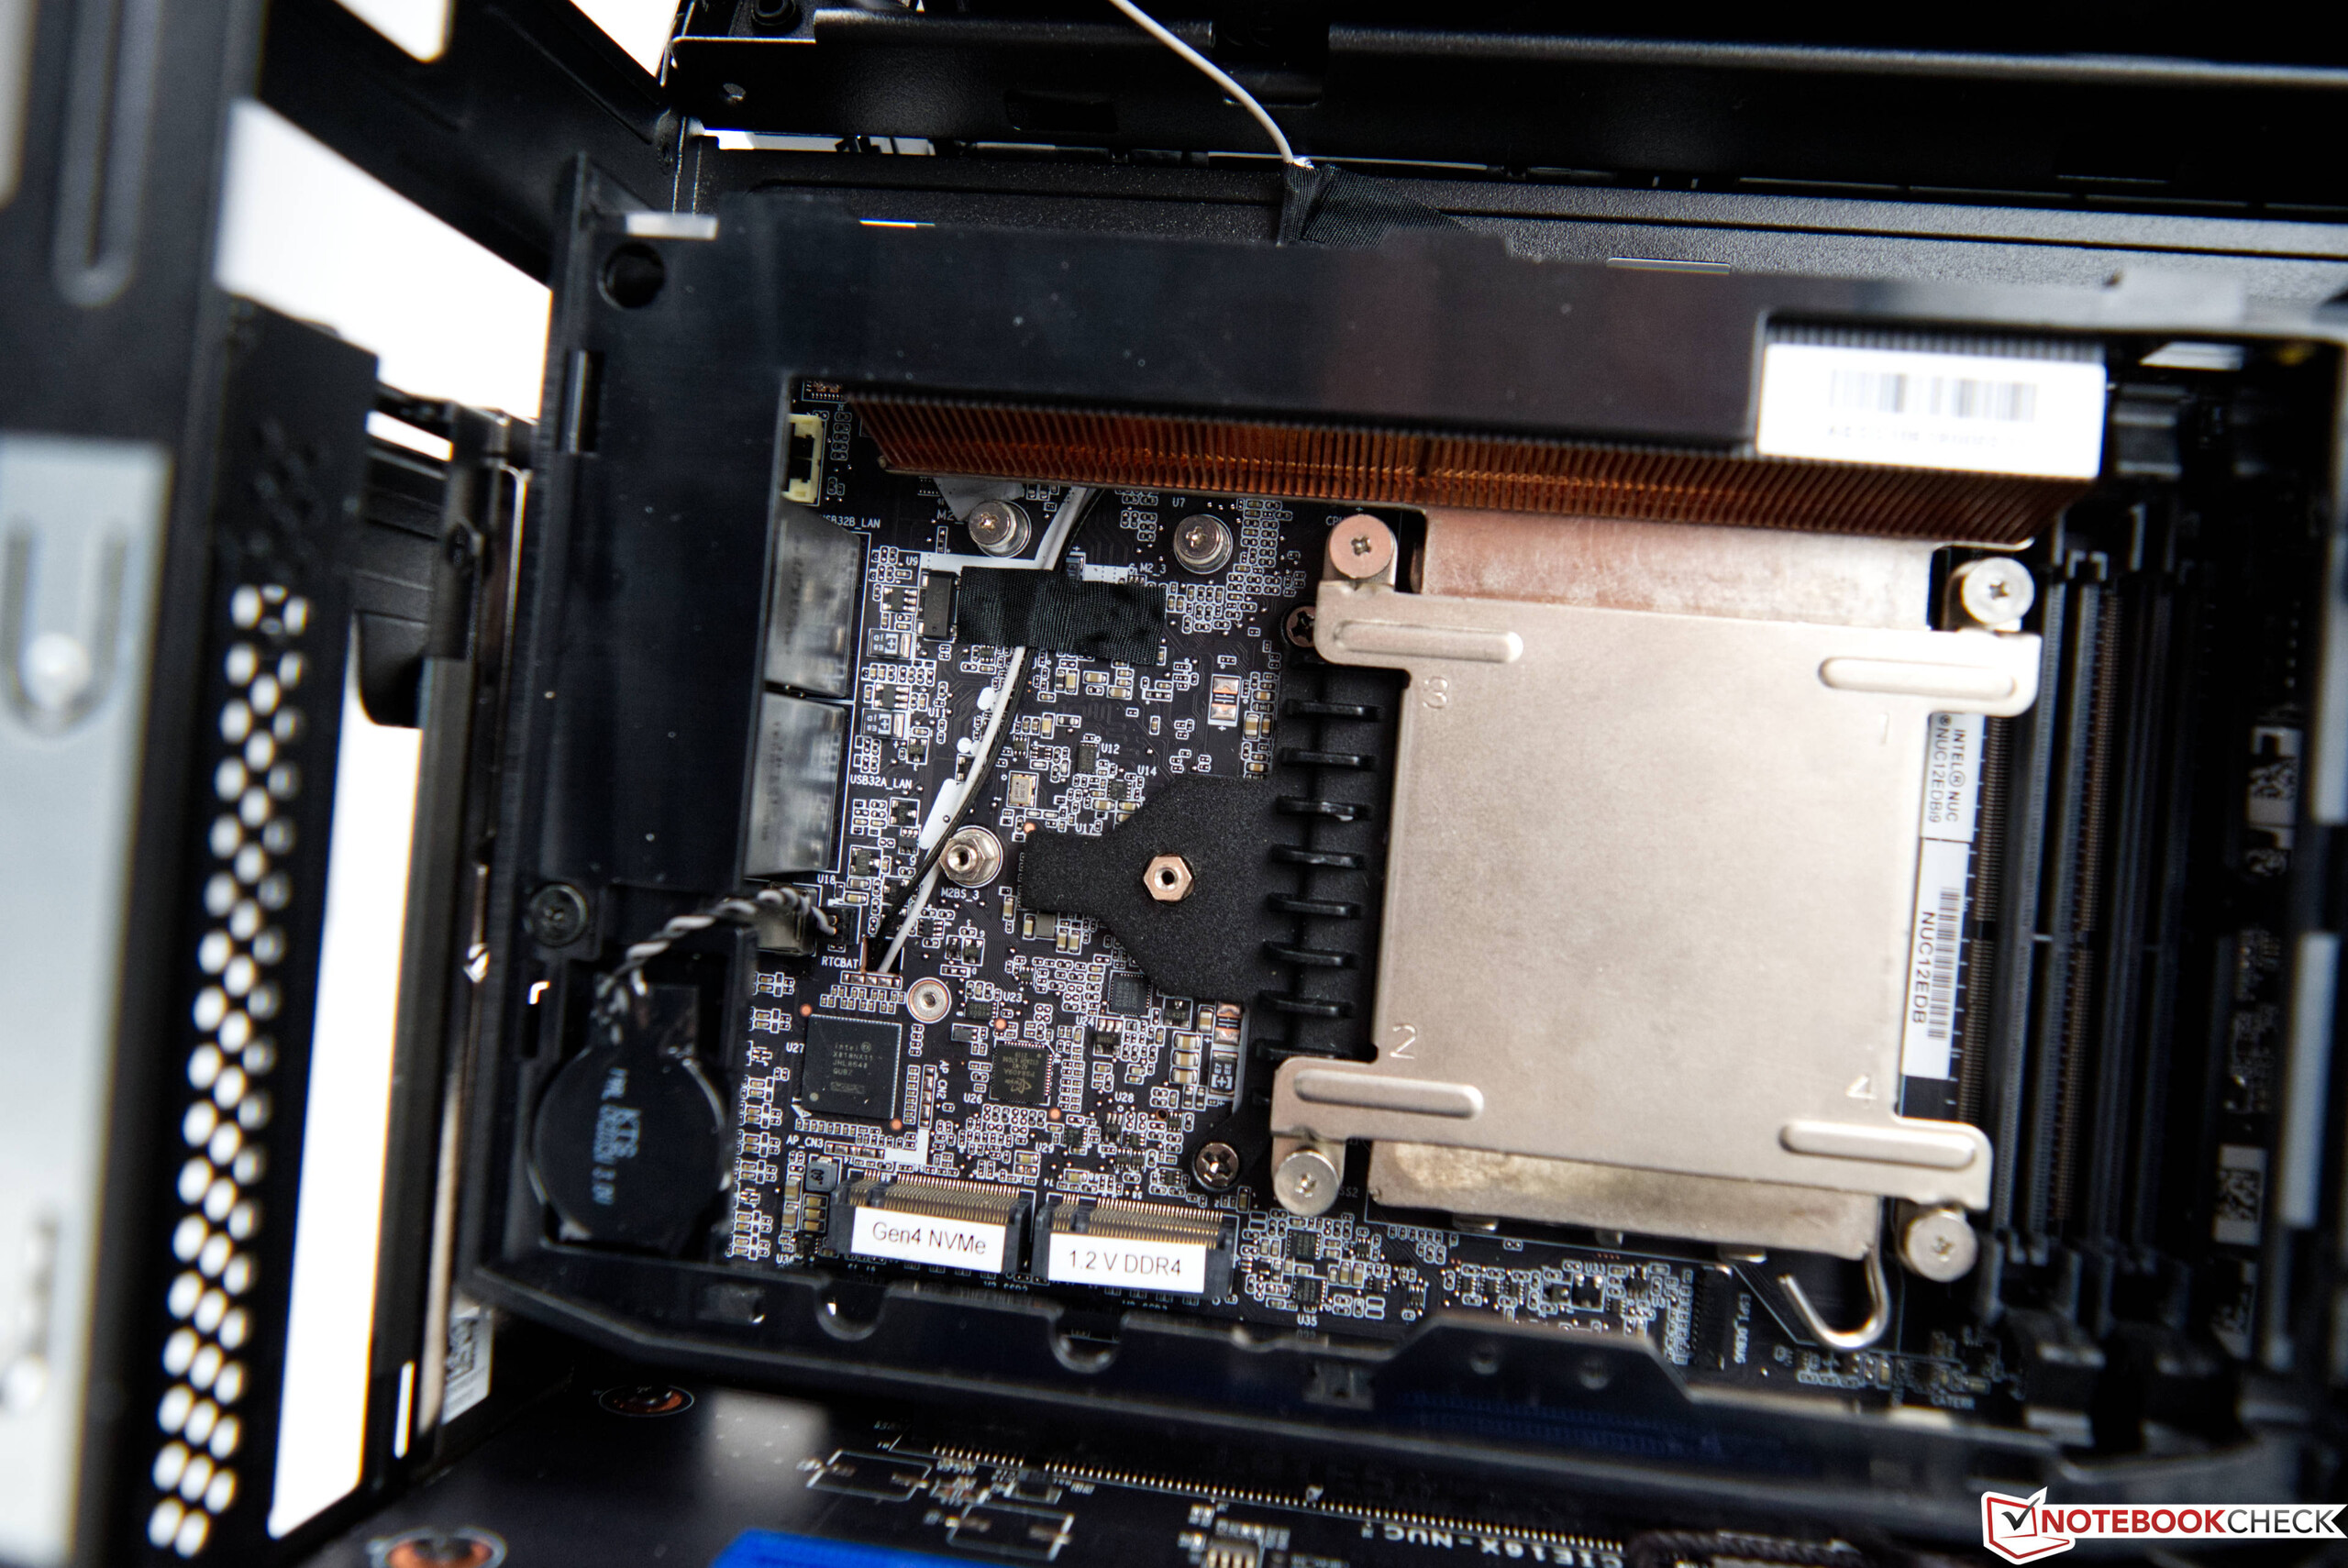
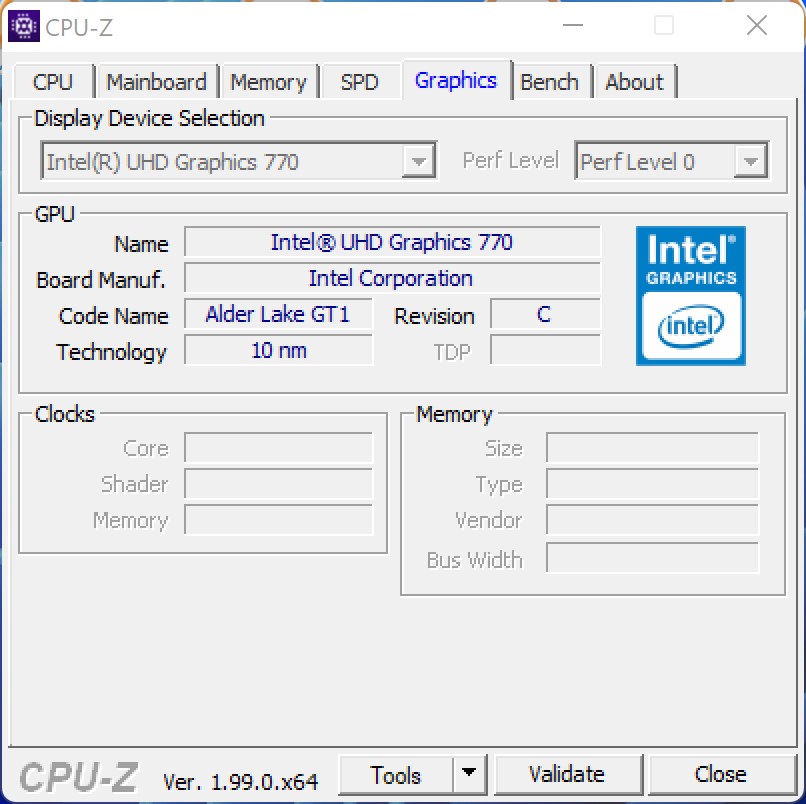
Avec le Core i9-12900 d'Intel, leNUC 12 Extreme offre un SoC à 16 cœurs et 24 threads basé sur la série S d'Alder Lake. Comme nous l'avons déjà indiqué, le Core i9-12900 utilise un mélange de cœurs P et E. Contrairement au Kit Intel NUC 11 Extreme auparavant, c'est désormais un processeur de bureau de taille normale qui est utilisé. Toutes les connexions externes continuent d'être placées sur le Compute Element, qui est logé dans le système sous la forme connue d'une carte PCI Express. À l'arrière, on trouve six connexions USB 3.1 Gen2 Type-A et deux USB-C qui prennent en charge Thunderbolt 4. Avec HDMI ou Thunderbolt, vous pouvez faire fonctionner jusqu'à trois écrans en même temps. Il existe des connexions 10G et 2,5G pour la mise en réseau filaire. En outre, l'Intel WiFi 6E AX211 communique selon la norme la plus récente. Le Compute Element lui-même offre de l'espace pour deux modules de RAM SO-DIMM d'une capacité maximale de 64 Go chacun, et il y a également de l'espace pour deux SSD M.2.

Performances du WLAN

Dans le test WLAN, l'Intel WiFi 6E AX211 est capable d'atteindre de très bons taux de transfert dans la gamme 6 GHz en combinaison avec notre routeur de test ASUS GT-AXE11000. Dans notre test, nous mesurons un bon 1850 Mbit/s en moyenne lors de l'envoi ou de la réception de données.

Networking
iperf3 transmit AXE11000 6GHz
Intel Dragon Canyon NUC - RTX 3060
Intel Wi-Fi 6E AX211
1851 (1799min - 1897max) MBit/s
Moyenne de la classe
  (229 - 1961, n=403)
1384 MBit/s -25%
Moyenne Intel Wi-Fi 6E AX211
  (632 - 1851, n=174)
1369 MBit/s -26%
Minisforum EliteMini TH50
MediaTek MT7921
866 (502min - 950max) MBit/s -53%
iperf3 receive AXE11000 6GHz
Intel Dragon Canyon NUC - RTX 3060
Intel Wi-Fi 6E AX211
1848 (1731min - 1888max) MBit/s
Moyenne Intel Wi-Fi 6E AX211
  (883 - 1857, n=173)
1488 MBit/s -19%
Moyenne de la classe
  (390 - 1858, n=404)
1431 MBit/s -23%
Minisforum EliteMini TH50
MediaTek MT7921
776 (482min - 881max) MBit/s -58%
iperf3 receive AX12
MSI Vector GP66 12UGS
Intel Wi-Fi 6E AX211
1462 (1366min - 1531max) MBit/s
Moyenne Intel Wi-Fi 6E AX211
  (1178 - 1623, n=4)
1409 MBit/s
Alienware x14 i7 RTX 3060
Intel Wi-Fi 6E AX211
1371 (1221min - 1483max) MBit/s
Moyenne de la classe
  (5 - 2374, n=2624)
621 MBit/s
iperf3 transmit AX12
MSI Vector GP66 12UGS
Intel Wi-Fi 6E AX211
1501 (755min - 1562max) MBit/s
Alienware x14 i7 RTX 3060
Intel Wi-Fi 6E AX211
1410 (1239min - 1603max) MBit/s
Moyenne Intel Wi-Fi 6E AX211
  (1003 - 1501, n=4)
1320 MBit/s
Moyenne de la classe
  (5.59 - 2371, n=2621)
587 MBit/s

Benchmarks des processeurs

Le processeur Intel Core i9-12900 est un modèle de bureau de la série S d'Alder Lake. La consommation électrique PL1 est de 65 watts, qui peut être augmentée jusqu'à la valeur PL2 de 202 watts.

L'Intel Core i9-12900 fait honneur à sa catégorie dans le test, en surpassant les performances du Intel Core i9-11900KBde 15%, si l'on considère les résultats de tous les benchmarks (évaluation des performances). Lorsqu'on le compare à des systèmes de bureau standard, l'Intel Core i9-12900 de l'Intel NUC 12 Extreme Kit est également capable de tenir le coup face à un AMD Ryzen 7 5800X ou Intel Core i9-11900K. D'autre part, le Intel Core i7-12700Kest capable de battre notre Dragon Canyon NUC, et nous voyons un premier signe d'une performance légèrement étranglée en raison du très petit système de refroidissement. Toutefois, l'inconvénient reste dans les limites, et l'Intel Core i7-12700K était à peine 10% plus rapide dans le test

Vous pouvez trouver d'autres comparaisons et benchmarks dans notre Tableau comparatif des CPU.

CPU-Z
CPU-Z
CPU-Z
CPU-Z
CPU-Z
CPU-Z
XTU
XTU - référence
Performance Rating - Percent
Intel Core i9-12900K, NVIDIA Titan RTX
i9-12900K, 3200 MHz
63.4 pt
Intel Core i7-12700K, NVIDIA Titan RTX
i7-12700K, 2700 MHz
59.4 pt
Intel Core i9-12900, NVIDIA GeForce RTX 3060
i9-12900, 2400 MHz
54.3 pt
AMD Ryzen 7 5800X, NVIDIA Titan RTX
R7 5800X, 3800 MHz
54.2 pt
Intel Core i9-11900K, NVIDIA Titan RTX
i9-11900K, 3500 MHz
52.4 pt
AMD Ryzen 9 3950X, NVIDIA Titan RTX
R9 3950X, 3500 MHz
51.4 pt
Intel Core i9-10900K, NVIDIA Titan RTX
i9-10900K, 3700 MHz
50.9 pt
Intel Core i9-11900KB, NVIDIA GeForce RTX 3060
i9-11900KB, 3300 MHz
48.1 pt
Intel Core i5-11600K, NVIDIA Titan RTX
i5-11600K, 3900 MHz
47.7 pt
AMD Ryzen 7 3800XT, NVIDIA Titan RTX
R7 3800XT, 3900 MHz
46.9 pt
Intel Core i9-9980HK, NVIDIA GeForce RTX 2070 (Desktop)
i9-9980HK, 2400 MHz
43.7 pt
Intel Core i5-10600K, NVIDIA Titan RTX
i5-10600K, 4100 MHz
42.2 pt
Cinebench R15
CPU Single 64Bit
Intel Core i9-12900K, NVIDIA Titan RTX
i9-12900K, 3200 MHz
286 Points +9%
Intel Core i7-12700K, NVIDIA Titan RTX
i7-12700K, 2700 MHz
272 Points +4%
AMD Ryzen 7 5800X, NVIDIA Titan RTX
R7 5800X, 3800 MHz
266 Points +2%
Intel Core i9-11900K, NVIDIA Titan RTX
i9-11900K, 3500 MHz
262 Points 0%
Intel Core i9-12900, NVIDIA GeForce RTX 3060
i9-12900, 2400 MHz
262 Points
Intel Core i9-11900KB, NVIDIA GeForce RTX 3060
i9-11900KB, 3300 MHz
247 Points -6%
Intel Core i5-11600K, NVIDIA Titan RTX
i5-11600K, 3900 MHz
242 Points -8%
Intel Core i9-10900K, NVIDIA Titan RTX
i9-10900K, 3700 MHz
224 Points -15%
AMD Ryzen 7 3800XT, NVIDIA Titan RTX
R7 3800XT, 3900 MHz
219 Points -16%
Intel Core i9-9980HK, NVIDIA GeForce RTX 2070 (Desktop)
i9-9980HK, 2400 MHz
215 Points -18%
AMD Ryzen 9 3950X, NVIDIA Titan RTX
R9 3950X, 3500 MHz
209 Points -20%
Intel Core i5-10600K, NVIDIA Titan RTX
i5-10600K, 4100 MHz
205 Points -22%
CPU Multi 64Bit
Intel Core i9-12900K, NVIDIA Titan RTX
i9-12900K, 3200 MHz
4057 Points +23%
AMD Ryzen 9 3950X, NVIDIA Titan RTX
R9 3950X, 3500 MHz
4002 Points +21%
Intel Core i7-12700K, NVIDIA Titan RTX
i7-12700K, 2700 MHz
3325 Points +1%
Intel Core i9-12900, NVIDIA GeForce RTX 3060
i9-12900, 2400 MHz
3299 Points
Intel Core i9-10900K, NVIDIA Titan RTX
i9-10900K, 3700 MHz
2620 Points -21%
AMD Ryzen 7 5800X, NVIDIA Titan RTX
R7 5800X, 3800 MHz
2616 Points -21%
Intel Core i9-11900K, NVIDIA Titan RTX
i9-11900K, 3500 MHz
2436 Points -26%
AMD Ryzen 7 3800XT, NVIDIA Titan RTX
R7 3800XT, 3900 MHz
2230 Points -32%
Intel Core i9-11900KB, NVIDIA GeForce RTX 3060
i9-11900KB, 3300 MHz
2027 Points -39%
Intel Core i5-11600K, NVIDIA Titan RTX
i5-11600K, 3900 MHz
1738 Points -47%
Intel Core i9-9980HK, NVIDIA GeForce RTX 2070 (Desktop)
i9-9980HK, 2400 MHz
1607 Points -51%
Intel Core i5-10600K, NVIDIA Titan RTX
i5-10600K, 4100 MHz
1452 Points -56%
Cinebench R20
CPU (Single Core)
Intel Core i9-12900K, NVIDIA Titan RTX
i9-12900K, 3200 MHz
766 Points +9%
Intel Core i7-12700K, NVIDIA Titan RTX
i7-12700K, 2700 MHz
731 Points +4%
Intel Core i9-12900, NVIDIA GeForce RTX 3060
i9-12900, 2400 MHz
703 Points
Intel Core i9-11900K, NVIDIA Titan RTX
i9-11900K, 3500 MHz
647 Points -8%
Intel Core i9-11900KB, NVIDIA GeForce RTX 3060
i9-11900KB, 3300 MHz
629 Points -11%
AMD Ryzen 7 5800X, NVIDIA Titan RTX
R7 5800X, 3800 MHz
625 Points -11%
Intel Core i5-11600K, NVIDIA Titan RTX
i5-11600K, 3900 MHz
595 Points -15%
AMD Ryzen 7 3800XT, NVIDIA Titan RTX
R7 3800XT, 3900 MHz
544 Points -23%
Intel Core i9-10900K, NVIDIA Titan RTX
i9-10900K, 3700 MHz
532 Points -24%
AMD Ryzen 9 3950X, NVIDIA Titan RTX
R9 3950X, 3500 MHz
520 Points -26%
Intel Core i9-9980HK, NVIDIA GeForce RTX 2070 (Desktop)
i9-9980HK, 2400 MHz
504 Points -28%
Intel Core i5-10600K, NVIDIA Titan RTX
i5-10600K, 4100 MHz
464 Points -34%
CPU (Multi Core)
Intel Core i9-12900K, NVIDIA Titan RTX
i9-12900K, 3200 MHz
10240 Points +43%
AMD Ryzen 9 3950X, NVIDIA Titan RTX
R9 3950X, 3500 MHz
9075 Points +26%
Intel Core i7-12700K, NVIDIA Titan RTX
i7-12700K, 2700 MHz
8648 Points +20%
Intel Core i9-12900, NVIDIA GeForce RTX 3060
i9-12900, 2400 MHz
7179 Points
Intel Core i9-10900K, NVIDIA Titan RTX
i9-10900K, 3700 MHz
6381 Points -11%
AMD Ryzen 7 5800X, NVIDIA Titan RTX
R7 5800X, 3800 MHz
6068 Points -15%
Intel Core i9-11900K, NVIDIA Titan RTX
i9-11900K, 3500 MHz
5997 Points -16%
AMD Ryzen 7 3800XT, NVIDIA Titan RTX
R7 3800XT, 3900 MHz
5120 Points -29%
Intel Core i9-11900KB, NVIDIA GeForce RTX 3060
i9-11900KB, 3300 MHz
4644 Points -35%
Intel Core i5-11600K, NVIDIA Titan RTX
i5-11600K, 3900 MHz
4349 Points -39%
Intel Core i5-10600K, NVIDIA Titan RTX
i5-10600K, 4100 MHz
3443 Points -52%
Intel Core i9-9980HK, NVIDIA GeForce RTX 2070 (Desktop)
i9-9980HK, 2400 MHz
3357 Points -53%
Cinebench R11.5
CPU Single 64Bit
Intel Core i9-12900K, NVIDIA Titan RTX
i9-12900K, 3200 MHz
3.49 Points +10%
Intel Core i7-12700K, NVIDIA Titan RTX
i7-12700K, 2700 MHz
3.29 Points +4%
Intel Core i9-12900, NVIDIA GeForce RTX 3060
i9-12900, 2400 MHz
3.16 Points
Intel Core i9-11900K, NVIDIA Titan RTX
i9-11900K, 3500 MHz
3.1 Points -2%
AMD Ryzen 7 5800X, NVIDIA Titan RTX
R7 5800X, 3800 MHz
3.09 Points -2%
Intel Core i5-11600K, NVIDIA Titan RTX
i5-11600K, 3900 MHz
2.87 Points -9%
Intel Core i9-11900KB, NVIDIA GeForce RTX 3060
i9-11900KB, 3300 MHz
2.84 Points -10%
Intel Core i9-10900K, NVIDIA Titan RTX
i9-10900K, 3700 MHz
2.56 Points -19%
Intel Core i9-9980HK, NVIDIA GeForce RTX 2070 (Desktop)
i9-9980HK, 2400 MHz
2.4 Points -24%
AMD Ryzen 9 3950X, NVIDIA Titan RTX
R9 3950X, 3500 MHz
2.37 Points -25%
AMD Ryzen 7 3800XT, NVIDIA Titan RTX
R7 3800XT, 3900 MHz
2.36 Points -25%
Intel Core i5-10600K, NVIDIA Titan RTX
i5-10600K, 4100 MHz
2.19 Points -31%
CPU Multi 64Bit
Intel Core i9-12900K, NVIDIA Titan RTX
i9-12900K, 3200 MHz
47.06 Points +21%
AMD Ryzen 9 3950X, NVIDIA Titan RTX
R9 3950X, 3500 MHz
43.68 Points +12%
Intel Core i9-12900, NVIDIA GeForce RTX 3060
i9-12900, 2400 MHz
38.96 Points
Intel Core i7-12700K, NVIDIA Titan RTX
i7-12700K, 2700 MHz
38.38 Points -1%
AMD Ryzen 7 5800X, NVIDIA Titan RTX
R7 5800X, 3800 MHz
29.31 Points -25%
Intel Core i9-10900K, NVIDIA Titan RTX
i9-10900K, 3700 MHz
29.03 Points -25%
Intel Core i9-11900K, NVIDIA Titan RTX
i9-11900K, 3500 MHz
26.76 Points -31%
AMD Ryzen 7 3800XT, NVIDIA Titan RTX
R7 3800XT, 3900 MHz
24.18 Points -38%
Intel Core i9-11900KB, NVIDIA GeForce RTX 3060
i9-11900KB, 3300 MHz
22.07 Points -43%
Intel Core i5-11600K, NVIDIA Titan RTX
i5-11600K, 3900 MHz
19.32 Points -50%
Intel Core i9-9980HK, NVIDIA GeForce RTX 2070 (Desktop)
i9-9980HK, 2400 MHz
18.04 Points -54%
Intel Core i5-10600K, NVIDIA Titan RTX
i5-10600K, 4100 MHz
15.76 Points -60%
Cinebench R10
Rendering Single CPUs 64Bit
Intel Core i9-12900K, NVIDIA Titan RTX
i9-12900K, 3200 MHz
16144 Points +10%
Intel Core i7-12700K, NVIDIA Titan RTX
i7-12700K, 2700 MHz
15179 Points +4%
Intel Core i9-12900, NVIDIA GeForce RTX 3060
i9-12900, 2400 MHz
14610 Points
Intel Core i9-11900K, NVIDIA Titan RTX
i9-11900K, 3500 MHz
14149 Points -3%
AMD Ryzen 7 5800X, NVIDIA Titan RTX
R7 5800X, 3800 MHz
13039 Points -11%
Intel Core i5-11600K, NVIDIA Titan RTX
i5-11600K, 3900 MHz
12957 Points -11%
Intel Core i9-11900KB, NVIDIA GeForce RTX 3060
i9-11900KB, 3300 MHz
12508 Points -14%
Intel Core i9-10900K, NVIDIA Titan RTX
i9-10900K, 3700 MHz
10625 Points -27%
AMD Ryzen 9 3950X, NVIDIA Titan RTX
R9 3950X, 3500 MHz
10580 Points -28%
AMD Ryzen 7 3800XT, NVIDIA Titan RTX
R7 3800XT, 3900 MHz
10497 Points -28%
Intel Core i9-9980HK, NVIDIA GeForce RTX 2070 (Desktop)
i9-9980HK, 2400 MHz
10359 Points -29%
Intel Core i5-10600K, NVIDIA Titan RTX
i5-10600K, 4100 MHz
9594 Points -34%
Rendering Multiple CPUs 64Bit
Intel Core i9-12900K, NVIDIA Titan RTX
i9-12900K, 3200 MHz
112749 Points +5%
Intel Core i9-12900, NVIDIA GeForce RTX 3060
i9-12900, 2400 MHz
107565 Points
Intel Core i7-12700K, NVIDIA Titan RTX
i7-12700K, 2700 MHz
102539 Points -5%
AMD Ryzen 9 3950X, NVIDIA Titan RTX
R9 3950X, 3500 MHz
86232 Points -20%
AMD Ryzen 7 5800X, NVIDIA Titan RTX
R7 5800X, 3800 MHz
83426 Points -22%
Intel Core i9-11900K, NVIDIA Titan RTX
i9-11900K, 3500 MHz
80613 Points -25%
Intel Core i9-10900K, NVIDIA Titan RTX
i9-10900K, 3700 MHz
80495 Points -25%
AMD Ryzen 7 3800XT, NVIDIA Titan RTX
R7 3800XT, 3900 MHz
68388 Points -36%
Intel Core i9-11900KB, NVIDIA GeForce RTX 3060
i9-11900KB, 3300 MHz
67183 Points -38%
Intel Core i5-11600K, NVIDIA Titan RTX
i5-11600K, 3900 MHz
64663 Points -40%
Intel Core i9-9980HK, NVIDIA GeForce RTX 2070 (Desktop)
i9-9980HK, 2400 MHz
55742 Points -48%
Intel Core i5-10600K, NVIDIA Titan RTX
i5-10600K, 4100 MHz
51816 Points -52%
Blender - v2.79 BMW27 CPU
Intel Core i9-9980HK, NVIDIA GeForce RTX 2070 (Desktop)
i9-9980HK, 2400 MHz
317.4 Seconds * -21%
Intel Core i5-10600K, NVIDIA Titan RTX
i5-10600K, 4100 MHz
302.4 Seconds * -15%
Intel Core i5-11600K, NVIDIA Titan RTX
i5-11600K, 3900 MHz
264.5 Seconds * -1%
Intel Core i9-11900KB, NVIDIA GeForce RTX 3060
i9-11900KB, 3300 MHz
262.7 Seconds * -0%
Intel Core i9-12900, NVIDIA GeForce RTX 3060
i9-12900, 2400 MHz
262.7 Seconds *
AMD Ryzen 7 3800XT, NVIDIA Titan RTX
R7 3800XT, 3900 MHz
222.7 Seconds * +15%
AMD Ryzen 7 5800X, NVIDIA Titan RTX
R7 5800X, 3800 MHz
196.8 Seconds * +25%
Intel Core i9-11900K, NVIDIA Titan RTX
i9-11900K, 3500 MHz
190.3 Seconds * +28%
Intel Core i9-10900K, NVIDIA Titan RTX
i9-10900K, 3700 MHz
167.3 Seconds * +36%
Intel Core i7-12700K, NVIDIA Titan RTX
i7-12700K, 2700 MHz
152.3 Seconds * +42%
AMD Ryzen 9 3950X, NVIDIA Titan RTX
R9 3950X, 3500 MHz
125.8 Seconds * +52%
Intel Core i9-12900K, NVIDIA Titan RTX
i9-12900K, 3200 MHz
121.1 Seconds * +54%
wPrime 2.10
32m
Intel Core i9-12900K, NVIDIA Titan RTX
i9-12900K, 3200 MHz
4.924 s * -84%
Intel Core i5-11600K, NVIDIA Titan RTX
i5-11600K, 3900 MHz
4.919 s * -84%
Intel Core i5-10600K, NVIDIA Titan RTX
i5-10600K, 4100 MHz
4.648 s * -74%
AMD Ryzen 9 3950X, NVIDIA Titan RTX
R9 3950X, 3500 MHz
4.112 s * -54%
Intel Core i9-11900K, NVIDIA Titan RTX
i9-11900K, 3500 MHz
3.982 s * -49%
Intel Core i9-9980HK, NVIDIA GeForce RTX 2070 (Desktop)
i9-9980HK, 2400 MHz
3.788 s * -42%
AMD Ryzen 7 3800XT, NVIDIA Titan RTX
R7 3800XT, 3900 MHz
3.74 s * -40%
Intel Core i9-10900K, NVIDIA Titan RTX
i9-10900K, 3700 MHz
3.582 s * -34%
Intel Core i9-11900KB, NVIDIA GeForce RTX 3060
i9-11900KB, 3300 MHz
3.416 s * -28%
AMD Ryzen 7 5800X, NVIDIA Titan RTX
R7 5800X, 3800 MHz
3.037 s * -14%
Intel Core i9-12900, NVIDIA GeForce RTX 3060
i9-12900, 2400 MHz
2.67 s *
Intel Core i7-12700K, NVIDIA Titan RTX
i7-12700K, 2700 MHz
2.659 s * -0%
1024m
Intel Core i9-12900, NVIDIA GeForce RTX 3060
i9-12900, 2400 MHz
211.8 s *
Intel Core i9-12900K, NVIDIA Titan RTX
i9-12900K, 3200 MHz
190.6 s * +10%
Intel Core i7-12700K, NVIDIA Titan RTX
i7-12700K, 2700 MHz
171.2 s * +19%
Intel Core i9-9980HK, NVIDIA GeForce RTX 2070 (Desktop)
i9-9980HK, 2400 MHz
120.2 s * +43%
Intel Core i5-10600K, NVIDIA Titan RTX
i5-10600K, 4100 MHz
113.2 s * +47%
Intel Core i5-11600K, NVIDIA Titan RTX
i5-11600K, 3900 MHz
107.6 s * +49%
Intel Core i9-11900KB, NVIDIA GeForce RTX 3060
i9-11900KB, 3300 MHz
102.2 s * +52%
AMD Ryzen 7 5800X, NVIDIA Titan RTX
R7 5800X, 3800 MHz
86.1 s * +59%
AMD Ryzen 7 3800XT, NVIDIA Titan RTX
R7 3800XT, 3900 MHz
81.4 s * +62%
Intel Core i9-11900K, NVIDIA Titan RTX
i9-11900K, 3500 MHz
77.9 s * +63%
Intel Core i9-10900K, NVIDIA Titan RTX
i9-10900K, 3700 MHz
66.3 s * +69%
AMD Ryzen 9 3950X, NVIDIA Titan RTX
R9 3950X, 3500 MHz
44.86 s * +79%
X264 HD Benchmark 4.0
Pass 1
Intel Core i9-12900K, NVIDIA Titan RTX
i9-12900K, 3200 MHz
368.5 (366min - 369max) fps +19%
Intel Core i7-12700K, NVIDIA Titan RTX
i7-12700K, 2700 MHz
349.5 (349min - 352max) fps +13%
AMD Ryzen 7 5800X, NVIDIA Titan RTX
R7 5800X, 3800 MHz
339 (338min - 341max) fps +9%
Intel Core i9-12900, NVIDIA GeForce RTX 3060
i9-12900, 2400 MHz
310 (303min - 324max) fps
Intel Core i9-11900K, NVIDIA Titan RTX
i9-11900K, 3500 MHz
309.5 (308min - 311max) fps 0%
Intel Core i5-11600K, NVIDIA Titan RTX
i5-11600K, 3900 MHz
299 (294min - 299max) fps -4%
Intel Core i9-10900K, NVIDIA Titan RTX
i9-10900K, 3700 MHz
289.5 (289min - 291max) fps -7%
Intel Core i9-11900KB, NVIDIA GeForce RTX 3060
i9-11900KB, 3300 MHz
272.5 (271min - 279max) fps -12%
AMD Ryzen 7 3800XT, NVIDIA Titan RTX
R7 3800XT, 3900 MHz
271 (270min - 273max) fps -13%
AMD Ryzen 9 3950X, NVIDIA Titan RTX
R9 3950X, 3500 MHz
265 (265min - 266max) fps -15%
Intel Core i5-10600K, NVIDIA Titan RTX
i5-10600K, 4100 MHz
251.5 (250min - 253max) fps -19%
Intel Core i9-9980HK, NVIDIA GeForce RTX 2070 (Desktop)
i9-9980HK, 2400 MHz
237.5 (236min - 239max) fps -23%
Pass 2
Intel Core i9-12900K, NVIDIA Titan RTX
i9-12900K, 3200 MHz
206 (206min - 206max) fps +40%
Intel Core i7-12700K, NVIDIA Titan RTX
i7-12700K, 2700 MHz
179 (179min - 179max) fps +21%
AMD Ryzen 9 3950X, NVIDIA Titan RTX
R9 3950X, 3500 MHz
168 (168min - 169max) fps +14%
AMD Ryzen 7 5800X, NVIDIA Titan RTX
R7 5800X, 3800 MHz
152 (151min - 152max) fps +3%
Intel Core i9-10900K, NVIDIA Titan RTX
i9-10900K, 3700 MHz
149 (149min - 149max) fps +1%
Intel Core i9-12900, NVIDIA GeForce RTX 3060
i9-12900, 2400 MHz
147.5 (134min - 173max) fps
Intel Core i9-11900K, NVIDIA Titan RTX
i9-11900K, 3500 MHz
137 (137min - 137max) fps -7%
AMD Ryzen 7 3800XT, NVIDIA Titan RTX
R7 3800XT, 3900 MHz
119 (118min - 119max) fps -19%
Intel Core i9-11900KB, NVIDIA GeForce RTX 3060
i9-11900KB, 3300 MHz
106 (101min - 108max) fps -28%
Intel Core i5-11600K, NVIDIA Titan RTX
i5-11600K, 3900 MHz
101 (101min - 101max) fps -32%
Intel Core i9-9980HK, NVIDIA GeForce RTX 2070 (Desktop)
i9-9980HK, 2400 MHz
92.8 (89.1min - 100max) fps -37%
Intel Core i5-10600K, NVIDIA Titan RTX
i5-10600K, 4100 MHz
88.2 (88min - 88.2max) fps -40%
WinRAR - Result
AMD Ryzen 7 5800X, NVIDIA Titan RTX
R7 5800X, 3800 MHz
15604 KB/s +45%
Intel Core i9-12900K, NVIDIA Titan RTX
i9-12900K, 3200 MHz
10792 KB/s 0%
Intel Core i9-12900, NVIDIA GeForce RTX 3060
i9-12900, 2400 MHz
10739 KB/s
Intel Core i7-12700K, NVIDIA Titan RTX
i7-12700K, 2700 MHz
10389 KB/s -3%
Intel Core i9-10900K, NVIDIA Titan RTX
i9-10900K, 3700 MHz
9739 KB/s -9%
Intel Core i9-11900KB, NVIDIA GeForce RTX 3060
i9-11900KB, 3300 MHz
9584 KB/s -11%
Intel Core i9-11900K, NVIDIA Titan RTX
i9-11900K, 3500 MHz
9030 KB/s -16%
Intel Core i5-11600K, NVIDIA Titan RTX
i5-11600K, 3900 MHz
7850 KB/s -27%
AMD Ryzen 7 3800XT, NVIDIA Titan RTX
R7 3800XT, 3900 MHz
7467 KB/s -30%
AMD Ryzen 9 3950X, NVIDIA Titan RTX
R9 3950X, 3500 MHz
7409 KB/s -31%
Intel Core i9-9980HK, NVIDIA GeForce RTX 2070 (Desktop)
i9-9980HK, 2400 MHz
7266 KB/s -32%
Intel Core i5-10600K, NVIDIA Titan RTX
i5-10600K, 4100 MHz
6536 KB/s -39%
TrueCrypt
AES Mean 100MB
Intel Core i9-12900K, NVIDIA Titan RTX
i9-12900K, 3200 MHz
18.5 GB/s +8%
Intel Core i9-12900, NVIDIA GeForce RTX 3060
i9-12900, 2400 MHz
17.2 GB/s
Intel Core i7-12700K, NVIDIA Titan RTX
i7-12700K, 2700 MHz
15.7 GB/s -9%
AMD Ryzen 7 5800X, NVIDIA Titan RTX
R7 5800X, 3800 MHz
15 GB/s -13%
Intel Core i9-10900K, NVIDIA Titan RTX
i9-10900K, 3700 MHz
14.6 GB/s -15%
Intel Core i9-11900K, NVIDIA Titan RTX
i9-11900K, 3500 MHz
13 GB/s -24%
Intel Core i9-11900KB, NVIDIA GeForce RTX 3060
i9-11900KB, 3300 MHz
11.6 GB/s -33%
AMD Ryzen 7 3800XT, NVIDIA Titan RTX
R7 3800XT, 3900 MHz
11.4 GB/s -34%
AMD Ryzen 9 3950X, NVIDIA Titan RTX
R9 3950X, 3500 MHz
10.8 GB/s -37%
Intel Core i9-9980HK, NVIDIA GeForce RTX 2070 (Desktop)
i9-9980HK, 2400 MHz
10.1 GB/s -41%
Intel Core i5-11600K, NVIDIA Titan RTX
i5-11600K, 3900 MHz
9.7 GB/s -44%
Intel Core i5-10600K, NVIDIA Titan RTX
i5-10600K, 4100 MHz
8 GB/s -53%
Twofish Mean 100MB
Intel Core i9-12900K, NVIDIA Titan RTX
i9-12900K, 3200 MHz
3.7 GB/s +9%
AMD Ryzen 9 3950X, NVIDIA Titan RTX
R9 3950X, 3500 MHz
3.6 GB/s +6%
Intel Core i9-12900, NVIDIA GeForce RTX 3060
i9-12900, 2400 MHz
3.4 GB/s
Intel Core i7-12700K, NVIDIA Titan RTX
i7-12700K, 2700 MHz
2.8 GB/s -18%
Intel Core i9-10900K, NVIDIA Titan RTX
i9-10900K, 3700 MHz
2.6 GB/s -24%
AMD Ryzen 7 3800XT, NVIDIA Titan RTX
R7 3800XT, 3900 MHz
2 GB/s -41%
AMD Ryzen 7 5800X, NVIDIA Titan RTX
R7 5800X, 3800 MHz
2 GB/s -41%
Intel Core i9-11900K, NVIDIA Titan RTX
i9-11900K, 3500 MHz
1.9 GB/s -44%
Intel Core i9-9980HK, NVIDIA GeForce RTX 2070 (Desktop)
i9-9980HK, 2400 MHz
1.7 GB/s -50%
Intel Core i9-11900KB, NVIDIA GeForce RTX 3060
i9-11900KB, 3300 MHz
1.7 GB/s -50%
Intel Core i5-11600K, NVIDIA Titan RTX
i5-11600K, 3900 MHz
1.5 GB/s -56%
Intel Core i5-10600K, NVIDIA Titan RTX
i5-10600K, 4100 MHz
1.4 GB/s -59%
Serpent Mean 100MB
AMD Ryzen 9 3950X, NVIDIA Titan RTX
R9 3950X, 3500 MHz
2.3 GB/s +21%
Intel Core i9-12900K, NVIDIA Titan RTX
i9-12900K, 3200 MHz
1.9 GB/s 0%
Intel Core i9-12900, NVIDIA GeForce RTX 3060
i9-12900, 2400 MHz
1.9 GB/s
Intel Core i7-12700K, NVIDIA Titan RTX
i7-12700K, 2700 MHz
1.6 GB/s -16%
Intel Core i9-10900K, NVIDIA Titan RTX
i9-10900K, 3700 MHz
1.5 GB/s -21%
AMD Ryzen 7 5800X, NVIDIA Titan RTX
R7 5800X, 3800 MHz
1.3 GB/s -32%
AMD Ryzen 7 3800XT, NVIDIA Titan RTX
R7 3800XT, 3900 MHz
1.2 GB/s -37%
Intel Core i9-11900K, NVIDIA Titan RTX
i9-11900K, 3500 MHz
1.2 GB/s -37%
Intel Core i9-11900KB, NVIDIA GeForce RTX 3060
i9-11900KB, 3300 MHz
1.1 GB/s -42%
Intel Core i9-9980HK, NVIDIA GeForce RTX 2070 (Desktop)
i9-9980HK, 2400 MHz
1 GB/s -47%
Intel Core i5-11600K, NVIDIA Titan RTX
i5-11600K, 3900 MHz
0.9 GB/s -53%
Intel Core i5-10600K, NVIDIA Titan RTX
i5-10600K, 4100 MHz
0.82 GB/s -57%
Geekbench 5.5
Multi-Core
Intel Core i9-12900K, NVIDIA Titan RTX
i9-12900K, 3200 MHz
17854 Points +100%
Intel Core i7-12700K, NVIDIA Titan RTX
i7-12700K, 2700 MHz
15557 Points +74%
AMD Ryzen 9 3950X, NVIDIA Titan RTX
R9 3950X, 3500 MHz
12363 Points +39%
Intel Core i9-10900K, NVIDIA Titan RTX
i9-10900K, 3700 MHz
11414 Points +28%
AMD Ryzen 7 5800X, NVIDIA Titan RTX
R7 5800X, 3800 MHz
11354 Points +27%
Intel Core i9-11900K, NVIDIA Titan RTX
i9-11900K, 3500 MHz
11035 Points +24%
AMD Ryzen 7 3800XT, NVIDIA Titan RTX
R7 3800XT, 3900 MHz
8948 Points 0%
Intel Core i9-11900KB, NVIDIA GeForce RTX 3060
i9-11900KB, 3300 MHz
8924 Points 0%
Intel Core i9-12900, NVIDIA GeForce RTX 3060
i9-12900, 2400 MHz
8924 Points
Intel Core i5-11600K, NVIDIA Titan RTX
i5-11600K, 3900 MHz
8523 Points -4%
Intel Core i9-9980HK, NVIDIA GeForce RTX 2070 (Desktop)
i9-9980HK, 2400 MHz
7568 Points -15%
Intel Core i5-10600K, NVIDIA Titan RTX
i5-10600K, 4100 MHz
7248 Points -19%
Single-Core
Intel Core i9-12900K, NVIDIA Titan RTX
i9-12900K, 3200 MHz
2042 Points +23%
Intel Core i7-12700K, NVIDIA Titan RTX
i7-12700K, 2700 MHz
1890 Points +14%
Intel Core i9-11900K, NVIDIA Titan RTX
i9-11900K, 3500 MHz
1885 Points +14%
Intel Core i5-11600K, NVIDIA Titan RTX
i5-11600K, 3900 MHz
1752 Points +6%
AMD Ryzen 7 5800X, NVIDIA Titan RTX
R7 5800X, 3800 MHz
1665 Points +1%
Intel Core i9-11900KB, NVIDIA GeForce RTX 3060
i9-11900KB, 3300 MHz
1656 Points 0%
Intel Core i9-12900, NVIDIA GeForce RTX 3060
i9-12900, 2400 MHz
1656 Points
Intel Core i9-10900K, NVIDIA Titan RTX
i9-10900K, 3700 MHz
1449 Points -12%
Intel Core i9-9980HK, NVIDIA GeForce RTX 2070 (Desktop)
i9-9980HK, 2400 MHz
1378 Points -17%
AMD Ryzen 7 3800XT, NVIDIA Titan RTX
R7 3800XT, 3900 MHz
1353 Points -18%
AMD Ryzen 9 3950X, NVIDIA Titan RTX
R9 3950X, 3500 MHz
1306 Points -21%
Intel Core i5-10600K, NVIDIA Titan RTX
i5-10600K, 4100 MHz
1286 Points -22%
Geekbench 5.0
5.0 Multi-Core
Intel Core i9-12900K, NVIDIA Titan RTX
i9-12900K, 3200 MHz
17959 Points +103%
Intel Core i7-12700K, NVIDIA Titan RTX
i7-12700K, 2700 MHz
15440 Points +75%
AMD Ryzen 9 3950X, NVIDIA Titan RTX
R9 3950X, 3500 MHz
12976 Points +47%
Intel Core i9-10900K, NVIDIA Titan RTX
i9-10900K, 3700 MHz
11407 Points +29%
AMD Ryzen 7 5800X, NVIDIA Titan RTX
R7 5800X, 3800 MHz
11246 Points +27%
Intel Core i9-11900K, NVIDIA Titan RTX
i9-11900K, 3500 MHz
11008 Points +24%
AMD Ryzen 7 3800XT, NVIDIA Titan RTX
R7 3800XT, 3900 MHz
9163 Points +4%
Intel Core i9-11900KB, NVIDIA GeForce RTX 3060
i9-11900KB, 3300 MHz
8845 Points 0%
Intel Core i9-12900, NVIDIA GeForce RTX 3060
i9-12900, 2400 MHz
8845 Points
Intel Core i5-11600K, NVIDIA Titan RTX
i5-11600K, 3900 MHz
8542 Points -3%
Intel Core i9-9980HK, NVIDIA GeForce RTX 2070 (Desktop)
i9-9980HK, 2400 MHz
7540 Points -15%
Intel Core i5-10600K, NVIDIA Titan RTX
i5-10600K, 4100 MHz
7237 Points -18%
5.0 Single-Core
Intel Core i9-12900K, NVIDIA Titan RTX
i9-12900K, 3200 MHz
1968 Points +20%
Intel Core i9-11900K, NVIDIA Titan RTX
i9-11900K, 3500 MHz
1863 Points +14%
Intel Core i7-12700K, NVIDIA Titan RTX
i7-12700K, 2700 MHz
1835 Points +12%
Intel Core i5-11600K, NVIDIA Titan RTX
i5-11600K, 3900 MHz
1731 Points +6%
AMD Ryzen 7 5800X, NVIDIA Titan RTX
R7 5800X, 3800 MHz
1673 Points +2%
Intel Core i9-11900KB, NVIDIA GeForce RTX 3060
i9-11900KB, 3300 MHz
1638 Points 0%
Intel Core i9-12900, NVIDIA GeForce RTX 3060
i9-12900, 2400 MHz
1638 Points
Intel Core i9-10900K, NVIDIA Titan RTX
i9-10900K, 3700 MHz
1440 Points -12%
AMD Ryzen 7 3800XT, NVIDIA Titan RTX
R7 3800XT, 3900 MHz
1360 Points -17%
Intel Core i9-9980HK, NVIDIA GeForce RTX 2070 (Desktop)
i9-9980HK, 2400 MHz
1355 Points -17%
AMD Ryzen 9 3950X, NVIDIA Titan RTX
R9 3950X, 3500 MHz
1315 Points -20%
Intel Core i5-10600K, NVIDIA Titan RTX
i5-10600K, 4100 MHz
1281 Points -22%
Geekbench 4.4
64 Bit Single-Core Score
Intel Core i9-12900K, NVIDIA Titan RTX
i9-12900K, 3200 MHz
8665 Points +24%
Intel Core i7-12700K, NVIDIA Titan RTX
i7-12700K, 2700 MHz
8133 Points +16%
Intel Core i9-11900K, NVIDIA Titan RTX
i9-11900K, 3500 MHz
7976 Points +14%
Intel Core i5-11600K, NVIDIA Titan RTX
i5-11600K, 3900 MHz
7438 Points +6%
AMD Ryzen 7 5800X, NVIDIA Titan RTX
R7 5800X, 3800 MHz
7333 Points +5%
Intel Core i9-11900KB, NVIDIA GeForce RTX 3060
i9-11900KB, 3300 MHz
6991 Points 0%
Intel Core i9-12900, NVIDIA GeForce RTX 3060
i9-12900, 2400 MHz
6991 Points
Intel Core i9-10900K, NVIDIA Titan RTX
i9-10900K, 3700 MHz
6348 Points -9%
Intel Core i9-9980HK, NVIDIA GeForce RTX 2070 (Desktop)
i9-9980HK, 2400 MHz
5969 Points -15%
AMD Ryzen 7 3800XT, NVIDIA Titan RTX
R7 3800XT, 3900 MHz
5830 Points -17%
Intel Core i5-10600K, NVIDIA Titan RTX
i5-10600K, 4100 MHz
5821 Points -17%
AMD Ryzen 9 3950X, NVIDIA Titan RTX
R9 3950X, 3500 MHz
5749 Points -18%
64 Bit Multi-Core Score
Intel Core i9-12900K, NVIDIA Titan RTX
i9-12900K, 3200 MHz
63583 Points +75%
Intel Core i7-12700K, NVIDIA Titan RTX
i7-12700K, 2700 MHz
55786 Points +54%
AMD Ryzen 9 3950X, NVIDIA Titan RTX
R9 3950X, 3500 MHz
48962 Points +35%
AMD Ryzen 7 5800X, NVIDIA Titan RTX
R7 5800X, 3800 MHz
44131 Points +22%
Intel Core i9-10900K, NVIDIA Titan RTX
i9-10900K, 3700 MHz
43058 Points +19%
Intel Core i9-11900K, NVIDIA Titan RTX
i9-11900K, 3500 MHz
42329 Points +17%
Intel Core i9-11900KB, NVIDIA GeForce RTX 3060
i9-11900KB, 3300 MHz
36310 Points 0%
Intel Core i9-12900, NVIDIA GeForce RTX 3060
i9-12900, 2400 MHz
36310 Points
AMD Ryzen 7 3800XT, NVIDIA Titan RTX
R7 3800XT, 3900 MHz
35526 Points -2%
Intel Core i5-11600K, NVIDIA Titan RTX
i5-11600K, 3900 MHz
33266 Points -8%
Intel Core i9-9980HK, NVIDIA GeForce RTX 2070 (Desktop)
i9-9980HK, 2400 MHz
29385 Points -19%
Intel Core i5-10600K, NVIDIA Titan RTX
i5-10600K, 4100 MHz
28391 Points -22%
3DMark 11 - 1280x720 Performance Physics
Intel Core i9-12900K, NVIDIA Titan RTX
i9-12900K, 3200 MHz
28211 Points +16%
Intel Core i7-12700K, NVIDIA Titan RTX
i7-12700K, 2700 MHz
26765 Points +10%
Intel Core i9-12900, NVIDIA GeForce RTX 3060
i9-12900, 2400 MHz
24314 Points
AMD Ryzen 7 5800X, NVIDIA Titan RTX
R7 5800X, 3800 MHz
23381 Points -4%
Intel Core i9-10900K, NVIDIA Titan RTX
i9-10900K, 3700 MHz
22140 Points -9%
Intel Core i9-11900K, NVIDIA Titan RTX
i9-11900K, 3500 MHz
21175 Points -13%
AMD Ryzen 9 3950X, NVIDIA Titan RTX
R9 3950X, 3500 MHz
21016 Points -14%
AMD Ryzen 7 3800XT, NVIDIA Titan RTX
R7 3800XT, 3900 MHz
18905 Points -22%
Intel Core i9-11900KB, NVIDIA GeForce RTX 3060
i9-11900KB, 3300 MHz
17803 Points -27%
Intel Core i5-11600K, NVIDIA Titan RTX
i5-11600K, 3900 MHz
17381 Points -29%
Intel Core i9-9980HK, NVIDIA GeForce RTX 2070 (Desktop)
i9-9980HK, 2400 MHz
16422 Points -32%
Intel Core i5-10600K, NVIDIA Titan RTX
i5-10600K, 4100 MHz
15961 Points -34%
7-Zip 18.03
7z b 4
AMD Ryzen 9 3950X, NVIDIA Titan RTX
R9 3950X, 3500 MHz
99467 MIPS +98%
Intel Core i9-12900K, NVIDIA Titan RTX
i9-12900K, 3200 MHz
97671 MIPS +95%
Intel Core i7-12700K, NVIDIA Titan RTX
i7-12700K, 2700 MHz
81369 MIPS +62%
AMD Ryzen 7 5800X, NVIDIA Titan RTX
R7 5800X, 3800 MHz
74306 MIPS +48%
Intel Core i9-10900K, NVIDIA Titan RTX
i9-10900K, 3700 MHz
70968 MIPS +42%
Intel Core i9-11900K, NVIDIA Titan RTX
i9-11900K, 3500 MHz
62746 MIPS +25%
AMD Ryzen 7 3800XT, NVIDIA Titan RTX
R7 3800XT, 3900 MHz
59247 MIPS +18%
Intel Core i9-11900KB, NVIDIA GeForce RTX 3060
i9-11900KB, 3300 MHz
50152 MIPS 0%
Intel Core i9-12900, NVIDIA GeForce RTX 3060
i9-12900, 2400 MHz
50152 MIPS
Intel Core i5-11600K, NVIDIA Titan RTX
i5-11600K, 3900 MHz
45322 MIPS -10%
Intel Core i9-9980HK, NVIDIA GeForce RTX 2070 (Desktop)
i9-9980HK, 2400 MHz
44081 MIPS -12%
Intel Core i5-10600K, NVIDIA Titan RTX
i5-10600K, 4100 MHz
40379 MIPS -19%
7z b 4 -mmt1
AMD Ryzen 7 5800X, NVIDIA Titan RTX
R7 5800X, 3800 MHz
6970 MIPS +17%
Intel Core i9-11900K, NVIDIA Titan RTX
i9-11900K, 3500 MHz
6652 MIPS +11%
Intel Core i9-12900K, NVIDIA Titan RTX
i9-12900K, 3200 MHz
6571 MIPS +10%
Intel Core i5-11600K, NVIDIA Titan RTX
i5-11600K, 3900 MHz
6136 MIPS +3%
Intel Core i7-12700K, NVIDIA Titan RTX
i7-12700K, 2700 MHz
6117 MIPS +2%
Intel Core i9-11900KB, NVIDIA GeForce RTX 3060
i9-11900KB, 3300 MHz
5979 MIPS 0%
Intel Core i9-12900, NVIDIA GeForce RTX 3060
i9-12900, 2400 MHz
5979 MIPS
Intel Core i9-10900K, NVIDIA Titan RTX
i9-10900K, 3700 MHz
5954 MIPS 0%
Intel Core i9-9980HK, NVIDIA GeForce RTX 2070 (Desktop)
i9-9980HK, 2400 MHz
5642 MIPS -6%
AMD Ryzen 7 3800XT, NVIDIA Titan RTX
R7 3800XT, 3900 MHz
5516 MIPS -8%
AMD Ryzen 9 3950X, NVIDIA Titan RTX
R9 3950X, 3500 MHz
5340 MIPS -11%
Intel Core i5-10600K, NVIDIA Titan RTX
i5-10600K, 4100 MHz
5289 MIPS -12%
HWBOT x265 Benchmark v2.2 - 4k Preset
Intel Core i9-12900K, NVIDIA Titan RTX
i9-12900K, 3200 MHz
30 fps +108%
Intel Core i7-12700K, NVIDIA Titan RTX
i7-12700K, 2700 MHz
26.1 fps +81%
Intel Core i9-10900K, NVIDIA Titan RTX
i9-10900K, 3700 MHz
21 fps +46%
AMD Ryzen 7 5800X, NVIDIA Titan RTX
R7 5800X, 3800 MHz
20.8 fps +44%
Intel Core i9-11900K, NVIDIA Titan RTX
i9-11900K, 3500 MHz
19.8 fps +38%
AMD Ryzen 7 3800XT, NVIDIA Titan RTX
R7 3800XT, 3900 MHz
16.1 fps +12%
AMD Ryzen 9 3950X, NVIDIA Titan RTX
R9 3950X, 3500 MHz
15.8 fps +10%
Intel Core i5-11600K, NVIDIA Titan RTX
i5-11600K, 3900 MHz
14.7 fps +2%
Intel Core i9-11900KB, NVIDIA GeForce RTX 3060
i9-11900KB, 3300 MHz
14.4 fps 0%
Intel Core i9-12900, NVIDIA GeForce RTX 3060
i9-12900, 2400 MHz
14.4 fps
Intel Core i5-10600K, NVIDIA Titan RTX
i5-10600K, 4100 MHz
12.2 fps -15%
Intel Core i9-9980HK, NVIDIA GeForce RTX 2070 (Desktop)
i9-9980HK, 2400 MHz
11.4 fps -21%
R Benchmark 2.5 - Overall mean
Intel Core i5-10600K, NVIDIA Titan RTX
i5-10600K, 4100 MHz
0.593 sec * -11%
Intel Core i9-9980HK, NVIDIA GeForce RTX 2070 (Desktop)
i9-9980HK, 2400 MHz
0.541 sec * -1%
Intel Core i9-11900KB, NVIDIA GeForce RTX 3060
i9-11900KB, 3300 MHz
0.535 sec * -0%
Intel Core i9-12900, NVIDIA GeForce RTX 3060
i9-12900, 2400 MHz
0.535 sec *
Intel Core i9-10900K, NVIDIA Titan RTX
i9-10900K, 3700 MHz
0.528 sec * +1%
AMD Ryzen 9 3950X, NVIDIA Titan RTX
R9 3950X, 3500 MHz
0.524 sec * +2%
AMD Ryzen 7 3800XT, NVIDIA Titan RTX
R7 3800XT, 3900 MHz
0.512 sec * +4%
Intel Core i5-11600K, NVIDIA Titan RTX
i5-11600K, 3900 MHz
0.506 sec * +5%
Intel Core i9-11900K, NVIDIA Titan RTX
i9-11900K, 3500 MHz
0.4733 sec * +12%
AMD Ryzen 7 5800X, NVIDIA Titan RTX
R7 5800X, 3800 MHz
0.4509 sec * +16%
Intel Core i7-12700K, NVIDIA Titan RTX
i7-12700K, 2700 MHz
0.423 sec * +21%
Intel Core i9-12900K, NVIDIA Titan RTX
i9-12900K, 3200 MHz
0.4216 sec * +21%
LibreOffice - 20 Documents To PDF
Intel Core i9-10900K, NVIDIA Titan RTX
i9-10900K, 3700 MHz
76 s * -69%
Intel Core i9-11900K, NVIDIA Titan RTX
i9-11900K, 3500 MHz
72.5 s * -61%
AMD Ryzen 9 3950X, NVIDIA Titan RTX
R9 3950X, 3500 MHz
53.6 s * -19%
Intel Core i5-10600K, NVIDIA Titan RTX
i5-10600K, 4100 MHz
46.06 s * -3%
Intel Core i9-9980HK, NVIDIA GeForce RTX 2070 (Desktop)
i9-9980HK, 2400 MHz
45.23 s * -1%
Intel Core i9-11900KB, NVIDIA GeForce RTX 3060
i9-11900KB, 3300 MHz
44.9 s * -0%
Intel Core i9-12900, NVIDIA GeForce RTX 3060
i9-12900, 2400 MHz
44.9 s *
AMD Ryzen 7 3800XT, NVIDIA Titan RTX
R7 3800XT, 3900 MHz
44.78 s * -0%
AMD Ryzen 7 5800X, NVIDIA Titan RTX
R7 5800X, 3800 MHz
43.31 s * +4%
Intel Core i9-12900K, NVIDIA Titan RTX
i9-12900K, 3200 MHz
40.6 s * +10%
Intel Core i7-12700K, NVIDIA Titan RTX
i7-12700K, 2700 MHz
39.8 s * +11%
Intel Core i5-11600K, NVIDIA Titan RTX
i5-11600K, 3900 MHz
39.7 s * +12%
WebXPRT 3 - Overall
Intel Core i9-12900K, NVIDIA Titan RTX
i9-12900K, 3200 MHz
320 Points +19%
Intel Core i7-12700K, NVIDIA Titan RTX
i7-12700K, 2700 MHz
306 Points +14%
AMD Ryzen 7 5800X, NVIDIA Titan RTX
R7 5800X, 3800 MHz
296 Points +10%
Intel Core i5-11600K, NVIDIA Titan RTX
i5-11600K, 3900 MHz
280 Points +4%
Intel Core i9-11900KB, NVIDIA GeForce RTX 3060
i9-11900KB, 3300 MHz
269 Points 0%
Intel Core i9-12900, NVIDIA GeForce RTX 3060
i9-12900, 2400 MHz
269 Points
Intel Core i9-10900K, NVIDIA Titan RTX
i9-10900K, 3700 MHz
255 Points -5%
AMD Ryzen 7 3800XT, NVIDIA Titan RTX
R7 3800XT, 3900 MHz
249 Points -7%
AMD Ryzen 9 3950X, NVIDIA Titan RTX
R9 3950X, 3500 MHz
239 Points -11%
Intel Core i5-10600K, NVIDIA Titan RTX
i5-10600K, 4100 MHz
239 Points -11%
Intel Core i9-9980HK, NVIDIA GeForce RTX 2070 (Desktop)
i9-9980HK, 2400 MHz
233 Points -13%
Intel Core i9-11900K, NVIDIA Titan RTX
i9-11900K, 3500 MHz
217 Points -19%
Mozilla Kraken 1.1 - Total
Intel Core i5-10600K, NVIDIA Titan RTX
i5-10600K, 4100 MHz
760 ms * -26%
Intel Core i9-9980HK, NVIDIA GeForce RTX 2070 (Desktop)
i9-9980HK, 2400 MHz
754 ms * -25%
Intel Core i9-10900K, NVIDIA Titan RTX
i9-10900K, 3700 MHz
709 ms * -18%
AMD Ryzen 9 3950X, NVIDIA Titan RTX
R9 3950X, 3500 MHz
706 ms * -17%
AMD Ryzen 7 3800XT, NVIDIA Titan RTX
R7 3800XT, 3900 MHz
683 ms * -13%
Intel Core i9-11900KB, NVIDIA GeForce RTX 3060
i9-11900KB, 3300 MHz
602 ms * -0%
Intel Core i9-12900, NVIDIA GeForce RTX 3060
i9-12900, 2400 MHz
602 ms *
Intel Core i5-11600K, NVIDIA Titan RTX
i5-11600K, 3900 MHz
587 ms * +2%
AMD Ryzen 7 5800X, NVIDIA Titan RTX
R7 5800X, 3800 MHz
558 ms * +7%
Intel Core i9-11900K, NVIDIA Titan RTX
i9-11900K, 3500 MHz
544 ms * +10%
Intel Core i7-12700K, NVIDIA Titan RTX
i7-12700K, 2700 MHz
496 ms * +18%
Intel Core i9-12900K, NVIDIA Titan RTX
i9-12900K, 3200 MHz
481 ms * +20%
3DMark
3840x2160 Fire Strike Ultra Physics
Intel Core i9-12900K, NVIDIA Titan RTX
i9-12900K, 3200 MHz
39462 Points +4%
Intel Core i9-12900, NVIDIA GeForce RTX 3060
i9-12900, 2400 MHz
37967 Points
Intel Core i7-12700K, NVIDIA Titan RTX
i7-12700K, 2700 MHz
37324 Points -2%
AMD Ryzen 9 3950X, NVIDIA Titan RTX
R9 3950X, 3500 MHz
31881 Points -16%
AMD Ryzen 7 5800X, NVIDIA Titan RTX
R7 5800X, 3800 MHz
31095 Points -18%
Intel Core i9-10900K, NVIDIA Titan RTX
i9-10900K, 3700 MHz
29374 Points -23%
Intel Core i9-11900K, NVIDIA Titan RTX
i9-11900K, 3500 MHz
27685 Points -27%
AMD Ryzen 7 3800XT, NVIDIA Titan RTX
R7 3800XT, 3900 MHz
25286 Points -33%
Intel Core i9-11900KB, NVIDIA GeForce RTX 3060
i9-11900KB, 3300 MHz
23921 Points -37%
Intel Core i5-11600K, NVIDIA Titan RTX
i5-11600K, 3900 MHz
23190 Points -39%
Intel Core i9-9980HK, NVIDIA GeForce RTX 2070 (Desktop)
i9-9980HK, 2400 MHz
21864 Points -42%
Intel Core i5-10600K, NVIDIA Titan RTX
i5-10600K, 4100 MHz
19942 Points -47%
1920x1080 Fire Strike Physics
Intel Core i9-12900K, NVIDIA Titan RTX
i9-12900K, 3200 MHz
39112 Points +11%
Intel Core i7-12700K, NVIDIA Titan RTX
i7-12700K, 2700 MHz
37079 Points +5%
Intel Core i9-12900, NVIDIA GeForce RTX 3060
i9-12900, 2400 MHz
35153 Points
AMD Ryzen 9 3950X, NVIDIA Titan RTX
R9 3950X, 3500 MHz
32004 Points -9%
AMD Ryzen 7 5800X, NVIDIA Titan RTX
R7 5800X, 3800 MHz
30938 Points -12%
Intel Core i9-10900K, NVIDIA Titan RTX
i9-10900K, 3700 MHz
29805 Points -15%
Intel Core i9-11900K, NVIDIA Titan RTX
i9-11900K, 3500 MHz
28927 Points -18%
AMD Ryzen 7 3800XT, NVIDIA Titan RTX
R7 3800XT, 3900 MHz
25132 Points -29%
Intel Core i9-11900KB, NVIDIA GeForce RTX 3060
i9-11900KB, 3300 MHz
24327 Points -31%
Intel Core i5-11600K, NVIDIA Titan RTX
i5-11600K, 3900 MHz
22631 Points -36%
Intel Core i9-9980HK, NVIDIA GeForce RTX 2070 (Desktop)
i9-9980HK, 2400 MHz
21706 Points -38%
Intel Core i5-10600K, NVIDIA Titan RTX
i5-10600K, 4100 MHz
20040 Points -43%
2560x1440 Time Spy CPU
Intel Core i9-12900K, NVIDIA Titan RTX
i9-12900K, 3200 MHz
18431 Points +22%
Intel Core i7-12700K, NVIDIA Titan RTX
i7-12700K, 2700 MHz
17185 Points +14%
Intel Core i9-12900, NVIDIA GeForce RTX 3060
i9-12900, 2400 MHz
15095 Points
Intel Core i9-10900K, NVIDIA Titan RTX
i9-10900K, 3700 MHz
14326 Points -5%
Intel Core i9-11900K, NVIDIA Titan RTX
i9-11900K, 3500 MHz
13433 Points -11%
AMD Ryzen 9 3950X, NVIDIA Titan RTX
R9 3950X, 3500 MHz
12404 Points -18%
AMD Ryzen 7 5800X, NVIDIA Titan RTX
R7 5800X, 3800 MHz
11599 Points -23%
AMD Ryzen 7 3800XT, NVIDIA Titan RTX
R7 3800XT, 3900 MHz
10302 Points -32%
Intel Core i9-11900KB, NVIDIA GeForce RTX 3060
i9-11900KB, 3300 MHz
10035 Points -34%
Intel Core i5-11600K, NVIDIA Titan RTX
i5-11600K, 3900 MHz
9482 Points -37%
Intel Core i9-9980HK, NVIDIA GeForce RTX 2070 (Desktop)
i9-9980HK, 2400 MHz
9417 Points -38%
Intel Core i5-10600K, NVIDIA Titan RTX
i5-10600K, 4100 MHz
8290 Points -45%

* ... Moindre est la valeur, meilleures sont les performances

Le kit Intel NUC 12 Extreme dans la boucle multiple Cinebench R15

Dans le test de charge avec la boucle Cinebench R15 Mult, nous constatons une baisse significative des performances après l'exécution initiale, avant de continuer à se stabiliser à 2 592 points. Cependant, par rapport aux deux prédécesseurs, il y a toujours un net avantage de performance, même à pleine charge.

017034051068085010201190136015301700187020402210238025502720289030603230Tooltip
Intel Dragon Canyon NUC - RTX 3060 Intel Core i9-12900, Intel Core i9-12900: Ø2592 (2433.39-3346.44)
Intel Ghost Canyon NUC (RTX 2070) Intel Core i9-9980HK, Intel Core i9-9980HK: Ø1463 (1410.79-1593.44)
Intel Beast Canyon NUC Intel Core i9-11900KB, Intel Core i9-11900KB: Ø1800 (1776.75-1859.25)

Performances des applications

Dans les benchmarks d'application, l'avantage en termes de performances pures par rapport au modèle précédent s'avère nettement plus faible que prévu. Cependant, en regardant subjectivement, le Beast Canyon NUC de l'époque et le Dragon Canyon NUC actuel ont une vitesse opérationnelle très élevée et laissent une très bonne impression dans l'utilisation quotidienne. Si vous installez un SSD rapide, le système est déjà prêt à être utilisé après quelques secondes. Nous n'avons pas rencontré de longs temps d'attente dans notre configuration de test. Mais si vous le comparez aux systèmes haut de gamme actuels, ils dépasseront toujours le kit Intel NUC 12 Extreme. Le GPU utilisé a un impact important ici. Dans le même temps, notre unité de test est toujours 14% plus rapide qu'un système basé sur un AMD Ryzen 9 5900X avec le même GPU

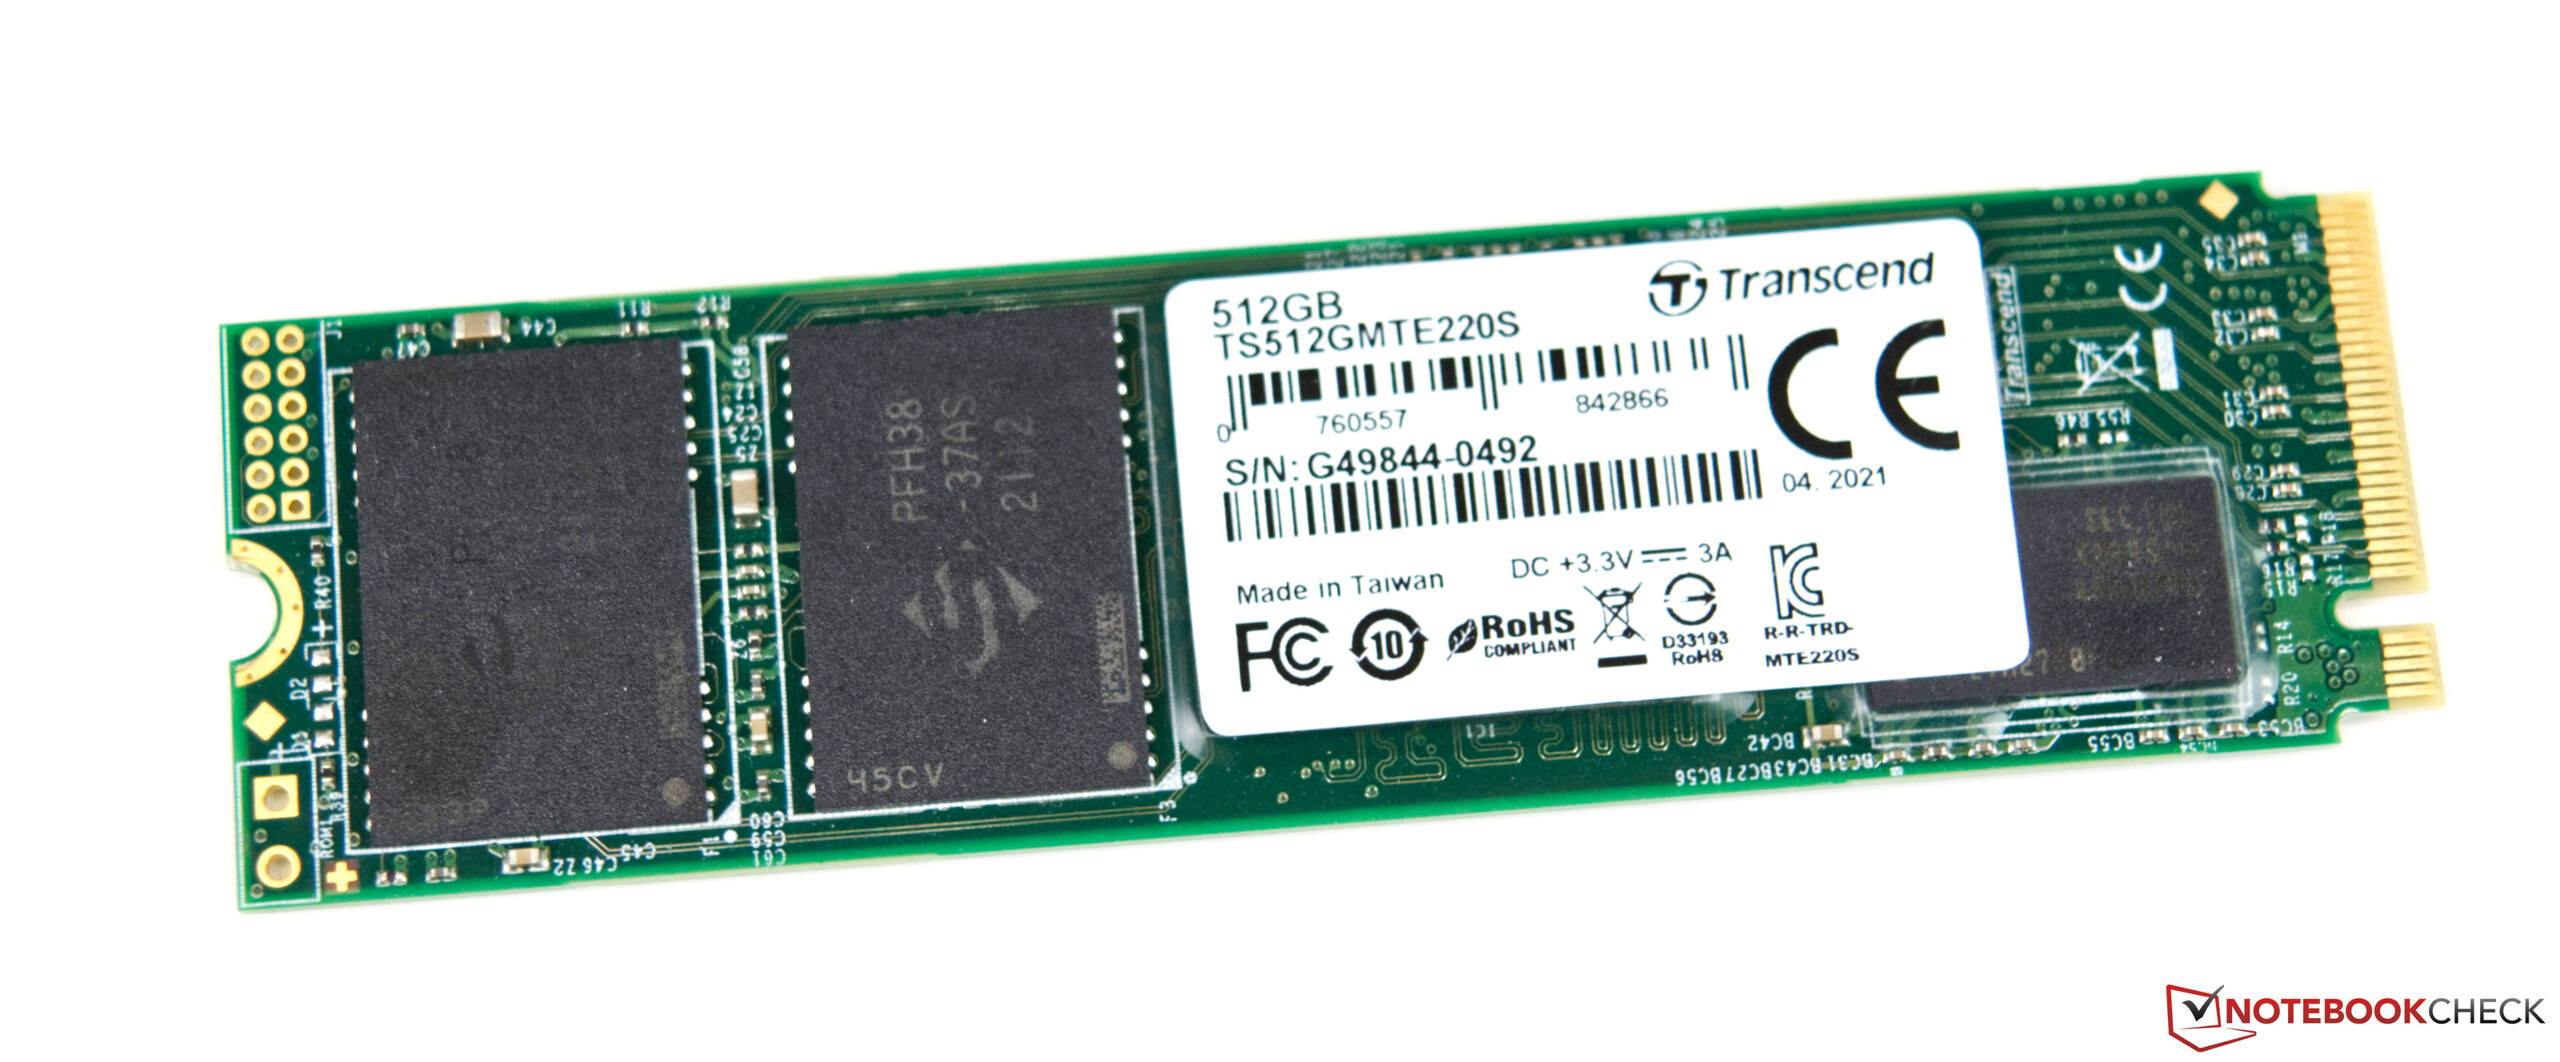
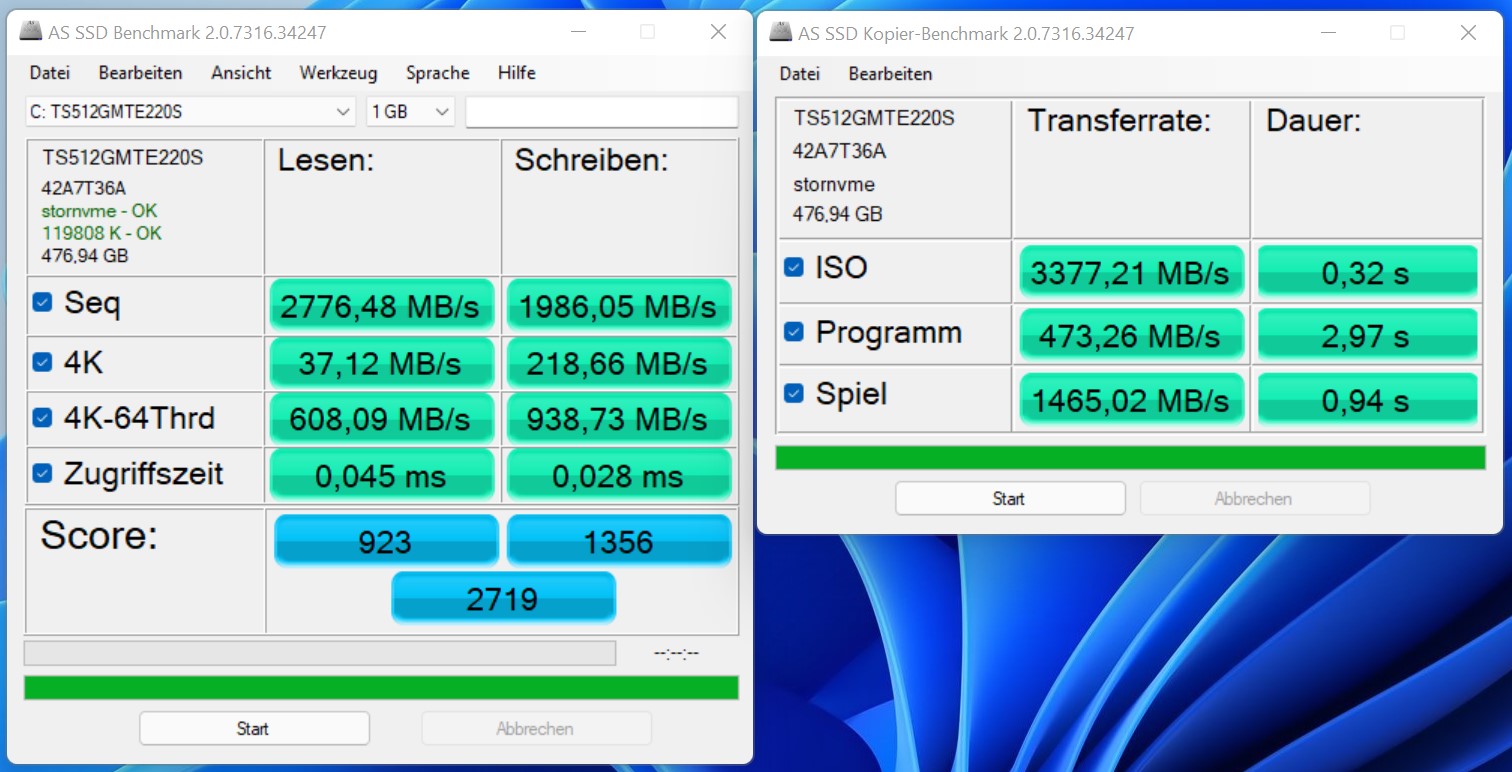
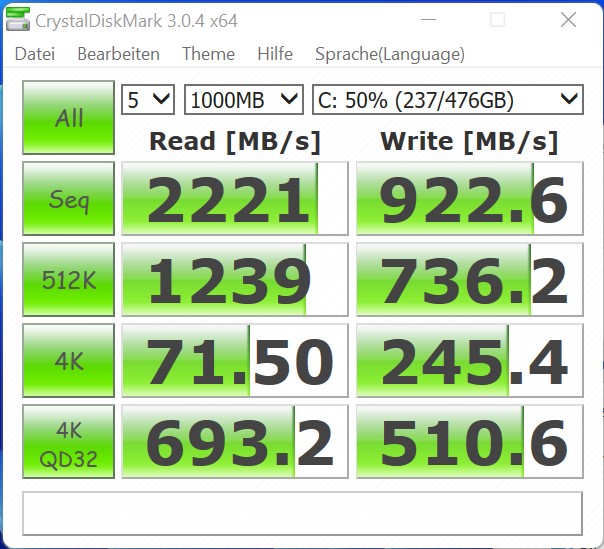
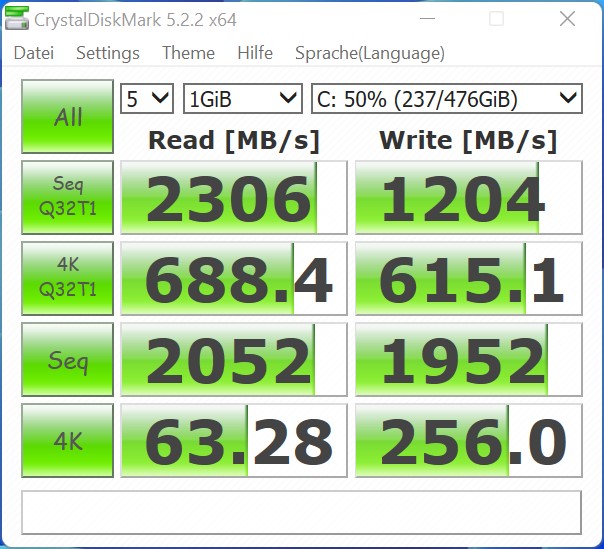
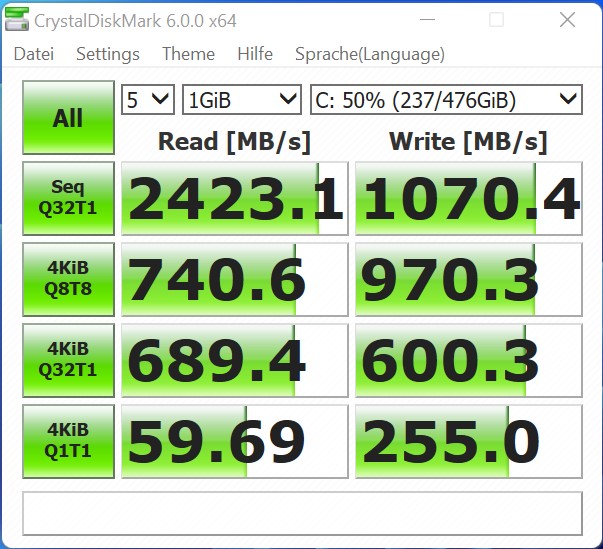
Nous avons équipé le système barebone d'un SSD NVMe de 512 Go. Lors de notre test, le modèle de Transcend a fourni des performances solides. Vous pouvez insérer un total de deux SSD M.2-2280 dans le Compute Element.

AS SSD
AS SSD
MDP 3
MDP 3
MDP 5
MDP 5
MDP 6
MDP 6
Performance Rating - Percent
Intel Core i7-12700K, Intel Core i7-12700K
NVIDIA Titan RTX
98.4 pt
Intel Core i9-12900K, Intel Core i9-12900K
NVIDIA Titan RTX
98.2 pt
Intel Core i9-11900K, Intel Core i9-11900K
NVIDIA Titan RTX
93.1 pt
Intel Core i5-11600K, Intel Core i5-11600K
NVIDIA Titan RTX
91.5 pt
Intel Core i9-10900K, Intel Core i9-10900K
NVIDIA Titan RTX
89.9 pt
Intel Core i5-10600K, Intel Core i5-10600K
NVIDIA Titan RTX
87.5 pt
AMD Ryzen 9 3950X, AMD Ryzen 9 3950X
NVIDIA Titan RTX
86.2 pt
Corsair One i160, Intel Core i9-9900K
NVIDIA GeForce RTX 2080 Ti (Desktop)
62 pt
Intel Dragon Canyon NUC - RTX 3060, Intel Core i9-12900
NVIDIA GeForce RTX 3060
47 pt
Intel Beast Canyon NUC, Intel Core i9-11900KB
NVIDIA GeForce RTX 3060
44.4 pt
Intel Ghost Canyon NUC (RTX 2070), Intel Core i9-9980HK
NVIDIA GeForce RTX 2070 (Desktop)
44.1 pt
Inno3D GeForce RTX 3060 Twin X2, AMD Ryzen 9 5900X -1!
NVIDIA GeForce RTX 3060
41.3 pt
PCMark 10 - Score
Intel Core i9-12900K, Intel Core i9-12900K
NVIDIA Titan RTX
8604 Points +6%
Intel Core i7-12700K, Intel Core i7-12700K
NVIDIA Titan RTX
8430 Points +4%
Intel Dragon Canyon NUC - RTX 3060, Intel Core i9-12900
NVIDIA GeForce RTX 3060
8083 Points
AMD Ryzen 9 3950X, AMD Ryzen 9 3950X
NVIDIA Titan RTX
7869 Points -3%
Intel Core i9-11900K, Intel Core i9-11900K
NVIDIA Titan RTX
7745 Points -4%
Intel Core i5-11600K, Intel Core i5-11600K
NVIDIA Titan RTX
7740 Points -4%
Intel Core i9-10900K, Intel Core i9-10900K
NVIDIA Titan RTX
7641 Points -5%
Corsair One i160, Intel Core i9-9900K
NVIDIA GeForce RTX 2080 Ti (Desktop)
7329 Points -9%
Intel Beast Canyon NUC, Intel Core i9-11900KB
NVIDIA GeForce RTX 3060
7281 Points -10%
Intel Core i5-10600K, Intel Core i5-10600K
NVIDIA Titan RTX
7279 Points -10%
Intel Ghost Canyon NUC (RTX 2070), Intel Core i9-9980HK
NVIDIA GeForce RTX 2070 (Desktop)
6939 Points -14%
SPECviewperf 12
1900x1060 Solidworks (sw-03)
Intel Core i9-11900K, Intel Core i9-11900K
NVIDIA Titan RTX
182 fps +148%
Intel Core i9-12900K, Intel Core i9-12900K
NVIDIA Titan RTX
174 fps +137%
Intel Core i9-10900K, Intel Core i9-10900K
NVIDIA Titan RTX
172.2 fps +135%
Intel Core i5-11600K, Intel Core i5-11600K
NVIDIA Titan RTX
171 fps +133%
Intel Core i7-12700K, Intel Core i7-12700K
NVIDIA Titan RTX
167 fps +128%
Intel Core i5-10600K, Intel Core i5-10600K
NVIDIA Titan RTX
158.2 fps +116%
AMD Ryzen 9 3950X, AMD Ryzen 9 3950X
NVIDIA Titan RTX
157.6 fps +115%
Corsair One i160, Intel Core i9-9900K
NVIDIA GeForce RTX 2080 Ti (Desktop)
83.7 fps +14%
Intel Dragon Canyon NUC - RTX 3060, Intel Core i9-12900
NVIDIA GeForce RTX 3060
73.3 fps
Intel Beast Canyon NUC, Intel Core i9-11900KB
NVIDIA GeForce RTX 3060
71.6 fps -2%
Intel Ghost Canyon NUC (RTX 2070), Intel Core i9-9980HK
NVIDIA GeForce RTX 2070 (Desktop)
59.2 fps -19%
Inno3D GeForce RTX 3060 Twin X2, AMD Ryzen 9 5900X
NVIDIA GeForce RTX 3060
56.1 fps -23%
1900x1060 Siemens NX (snx-02)
Intel Core i7-12700K, Intel Core i7-12700K
NVIDIA Titan RTX
289 fps +2840%
Intel Core i9-12900K, Intel Core i9-12900K
NVIDIA Titan RTX
287 fps +2820%
Intel Core i9-10900K, Intel Core i9-10900K
NVIDIA Titan RTX
263.3 fps +2579%
Intel Core i5-10600K, Intel Core i5-10600K
NVIDIA Titan RTX
259.1 fps +2536%
AMD Ryzen 9 3950X, AMD Ryzen 9 3950X
NVIDIA Titan RTX
254.8 fps +2492%
Intel Core i5-11600K, Intel Core i5-11600K
NVIDIA Titan RTX
251 fps +2453%
Intel Core i9-11900K, Intel Core i9-11900K
NVIDIA Titan RTX
245 fps +2392%
Corsair One i160, Intel Core i9-9900K
NVIDIA GeForce RTX 2080 Ti (Desktop)
12.72 fps +29%
Intel Dragon Canyon NUC - RTX 3060, Intel Core i9-12900
NVIDIA GeForce RTX 3060
9.83 fps
Intel Ghost Canyon NUC (RTX 2070), Intel Core i9-9980HK
NVIDIA GeForce RTX 2070 (Desktop)
9.08 fps -8%
Inno3D GeForce RTX 3060 Twin X2, AMD Ryzen 9 5900X
NVIDIA GeForce RTX 3060
8.98 fps -9%
Intel Beast Canyon NUC, Intel Core i9-11900KB
NVIDIA GeForce RTX 3060
8.75 fps -11%
1900x1060 Showcase (showcase-01)
Intel Core i9-11900K, Intel Core i9-11900K
NVIDIA Titan RTX
203 fps +74%
Intel Core i5-11600K, Intel Core i5-11600K
NVIDIA Titan RTX
202 fps +73%
Intel Core i9-12900K, Intel Core i9-12900K
NVIDIA Titan RTX
200 fps +71%
Intel Core i7-12700K, Intel Core i7-12700K
NVIDIA Titan RTX
200 fps +71%
Intel Core i5-10600K, Intel Core i5-10600K
NVIDIA Titan RTX
196.1 fps +68%
Intel Core i9-10900K, Intel Core i9-10900K
NVIDIA Titan RTX
192.4 fps +64%
AMD Ryzen 9 3950X, AMD Ryzen 9 3950X
NVIDIA Titan RTX
188.3 fps +61%
Corsair One i160, Intel Core i9-9900K
NVIDIA GeForce RTX 2080 Ti (Desktop)
182.3 fps +56%
Intel Ghost Canyon NUC (RTX 2070), Intel Core i9-9980HK
NVIDIA GeForce RTX 2070 (Desktop)
118.5 fps +1%
Intel Dragon Canyon NUC - RTX 3060, Intel Core i9-12900
NVIDIA GeForce RTX 3060
117 fps
Inno3D GeForce RTX 3060 Twin X2, AMD Ryzen 9 5900X
NVIDIA GeForce RTX 3060
114 fps -3%
Intel Beast Canyon NUC, Intel Core i9-11900KB
NVIDIA GeForce RTX 3060
113 fps -3%
1900x1060 Medical (medical-01)
Intel Core i9-12900K, Intel Core i9-12900K
NVIDIA Titan RTX
108 fps +120%
Intel Core i7-12700K, Intel Core i7-12700K
NVIDIA Titan RTX
106 fps +115%
Intel Core i5-10600K, Intel Core i5-10600K
NVIDIA Titan RTX
94.6 fps +92%
Intel Core i9-10900K, Intel Core i9-10900K
NVIDIA Titan RTX
94.5 fps +92%
Intel Core i5-11600K, Intel Core i5-11600K
NVIDIA Titan RTX
88.7 fps +80%
AMD Ryzen 9 3950X, AMD Ryzen 9 3950X
NVIDIA Titan RTX
88.1 fps +79%
Intel Core i9-11900K, Intel Core i9-11900K
NVIDIA Titan RTX
87.8 fps +78%
Corsair One i160, Intel Core i9-9900K
NVIDIA GeForce RTX 2080 Ti (Desktop)
56.6 fps +15%
Intel Dragon Canyon NUC - RTX 3060, Intel Core i9-12900
NVIDIA GeForce RTX 3060
49.2 fps
Intel Beast Canyon NUC, Intel Core i9-11900KB
NVIDIA GeForce RTX 3060
40.9 fps -17%
Intel Ghost Canyon NUC (RTX 2070), Intel Core i9-9980HK
NVIDIA GeForce RTX 2070 (Desktop)
40.14 fps -18%
Inno3D GeForce RTX 3060 Twin X2, AMD Ryzen 9 5900X
NVIDIA GeForce RTX 3060
36.5 fps -26%
1900x1060 Maya (maya-04)
Intel Core i9-12900K, Intel Core i9-12900K
NVIDIA Titan RTX
211 fps +8%
Intel Core i7-12700K, Intel Core i7-12700K
NVIDIA Titan RTX
204 fps +4%
Intel Core i9-11900K, Intel Core i9-11900K
NVIDIA Titan RTX
199 fps +2%
Intel Dragon Canyon NUC - RTX 3060, Intel Core i9-12900
NVIDIA GeForce RTX 3060
196 fps
Intel Beast Canyon NUC, Intel Core i9-11900KB
NVIDIA GeForce RTX 3060
191 fps -3%
Corsair One i160, Intel Core i9-9900K
NVIDIA GeForce RTX 2080 Ti (Desktop)
190.9 fps -3%
Intel Core i9-10900K, Intel Core i9-10900K
NVIDIA Titan RTX
188.7 fps -4%
Intel Core i5-11600K, Intel Core i5-11600K
NVIDIA Titan RTX
186 fps -5%
Inno3D GeForce RTX 3060 Twin X2, AMD Ryzen 9 5900X
NVIDIA GeForce RTX 3060
173 fps -12%
AMD Ryzen 9 3950X, AMD Ryzen 9 3950X
NVIDIA Titan RTX
172.2 fps -12%
Intel Ghost Canyon NUC (RTX 2070), Intel Core i9-9980HK
NVIDIA GeForce RTX 2070 (Desktop)
171 fps -13%
Intel Core i5-10600K, Intel Core i5-10600K
NVIDIA Titan RTX
169.4 fps -14%
1900x1060 Energy (energy-01)
Intel Core i9-12900K, Intel Core i9-12900K
NVIDIA Titan RTX
30.1 fps +184%
Intel Core i7-12700K, Intel Core i7-12700K
NVIDIA Titan RTX
29.9 fps +182%
Intel Core i5-10600K, Intel Core i5-10600K
NVIDIA Titan RTX
28.77 fps +171%
Intel Core i9-10900K, Intel Core i9-10900K
NVIDIA Titan RTX
28.72 fps +171%
Intel Core i5-11600K, Intel Core i5-11600K
NVIDIA Titan RTX
28.3 fps +167%
Intel Core i9-11900K, Intel Core i9-11900K
NVIDIA Titan RTX
28.2 fps +166%
AMD Ryzen 9 3950X, AMD Ryzen 9 3950X
NVIDIA Titan RTX
28.18 fps +166%
Corsair One i160, Intel Core i9-9900K
NVIDIA GeForce RTX 2080 Ti (Desktop)
16.72 fps +58%
Intel Ghost Canyon NUC (RTX 2070), Intel Core i9-9980HK
NVIDIA GeForce RTX 2070 (Desktop)
11.49 fps +8%
Intel Dragon Canyon NUC - RTX 3060, Intel Core i9-12900
NVIDIA GeForce RTX 3060
10.6 fps
Intel Beast Canyon NUC, Intel Core i9-11900KB
NVIDIA GeForce RTX 3060
10 fps -6%
Inno3D GeForce RTX 3060 Twin X2, AMD Ryzen 9 5900X
NVIDIA GeForce RTX 3060
9.89 fps -7%
1900x1060 Creo (creo-01)
Intel Core i9-12900K, Intel Core i9-12900K
NVIDIA Titan RTX
187 fps +229%
Intel Core i7-12700K, Intel Core i7-12700K
NVIDIA Titan RTX
182 fps +220%
Intel Core i9-11900K, Intel Core i9-11900K
NVIDIA Titan RTX
173 fps +204%
Intel Core i5-11600K, Intel Core i5-11600K
NVIDIA Titan RTX
164 fps +188%
Intel Core i9-10900K, Intel Core i9-10900K
NVIDIA Titan RTX
157.2 fps +176%
Intel Core i5-10600K, Intel Core i5-10600K
NVIDIA Titan RTX
142.7 fps +151%
AMD Ryzen 9 3950X, AMD Ryzen 9 3950X
NVIDIA Titan RTX
134.8 fps +137%
Corsair One i160, Intel Core i9-9900K
NVIDIA GeForce RTX 2080 Ti (Desktop)
72.2 fps +27%
Intel Dragon Canyon NUC - RTX 3060, Intel Core i9-12900
NVIDIA GeForce RTX 3060
56.9 fps
Inno3D GeForce RTX 3060 Twin X2, AMD Ryzen 9 5900X
NVIDIA GeForce RTX 3060
52.4 fps -8%
Intel Ghost Canyon NUC (RTX 2070), Intel Core i9-9980HK
NVIDIA GeForce RTX 2070 (Desktop)
52.2 fps -8%
Intel Beast Canyon NUC, Intel Core i9-11900KB
NVIDIA GeForce RTX 3060
49.4 fps -13%
1900x1060 Catia (catia-04)
Intel Core i9-12900K, Intel Core i9-12900K
NVIDIA Titan RTX
290 fps +274%
Intel Core i7-12700K, Intel Core i7-12700K
NVIDIA Titan RTX
285 fps +268%
Intel Core i9-11900K, Intel Core i9-11900K
NVIDIA Titan RTX
269 fps +247%
Intel Core i5-11600K, Intel Core i5-11600K
NVIDIA Titan RTX
251 fps +224%
Intel Core i9-10900K, Intel Core i9-10900K
NVIDIA Titan RTX
225.2 fps +191%
AMD Ryzen 9 3950X, AMD Ryzen 9 3950X
NVIDIA Titan RTX
218.4 fps +182%
Intel Core i5-10600K, Intel Core i5-10600K
NVIDIA Titan RTX
215.5 fps +178%
Corsair One i160, Intel Core i9-9900K
NVIDIA GeForce RTX 2080 Ti (Desktop)
120.8 fps +56%
Intel Ghost Canyon NUC (RTX 2070), Intel Core i9-9980HK
NVIDIA GeForce RTX 2070 (Desktop)
78.3 fps +1%
Intel Dragon Canyon NUC - RTX 3060, Intel Core i9-12900
NVIDIA GeForce RTX 3060
77.5 fps
Intel Beast Canyon NUC, Intel Core i9-11900KB
NVIDIA GeForce RTX 3060
77 fps -1%
Inno3D GeForce RTX 3060 Twin X2, AMD Ryzen 9 5900X
NVIDIA GeForce RTX 3060
73.9 fps -5%
1900x1060 3ds Max (3dsmax-05)
Intel Core i7-12700K, Intel Core i7-12700K
NVIDIA Titan RTX
302 fps +41%
Intel Core i9-10900K, Intel Core i9-10900K
NVIDIA Titan RTX
297.4 fps +39%
Intel Core i5-10600K, Intel Core i5-10600K
NVIDIA Titan RTX
296.9 fps +39%
Intel Core i9-11900K, Intel Core i9-11900K
NVIDIA Titan RTX
289 fps +35%
Intel Core i5-11600K, Intel Core i5-11600K
NVIDIA Titan RTX
288 fps +35%
AMD Ryzen 9 3950X, AMD Ryzen 9 3950X
NVIDIA Titan RTX
274.5 fps +28%
Corsair One i160, Intel Core i9-9900K
NVIDIA GeForce RTX 2080 Ti (Desktop)
271.8 fps +27%
Intel Core i9-12900K, Intel Core i9-12900K
NVIDIA Titan RTX
262 fps +22%
Inno3D GeForce RTX 3060 Twin X2, AMD Ryzen 9 5900X
NVIDIA GeForce RTX 3060
217 fps +1%
Intel Dragon Canyon NUC - RTX 3060, Intel Core i9-12900
NVIDIA GeForce RTX 3060
214 fps
Intel Beast Canyon NUC, Intel Core i9-11900KB
NVIDIA GeForce RTX 3060
201 fps -6%
Intel Ghost Canyon NUC (RTX 2070), Intel Core i9-9980HK
NVIDIA GeForce RTX 2070 (Desktop)
180.8 fps -16%
SPECviewperf 13
Solidworks (sw-04)
Intel Core i9-12900K, Intel Core i9-12900K
NVIDIA Titan RTX
199 fps +86%
Intel Core i9-11900K, Intel Core i9-11900K
NVIDIA Titan RTX
198 fps +85%
Intel Core i7-12700K, Intel Core i7-12700K
NVIDIA Titan RTX
193 fps +80%
Intel Core i5-11600K, Intel Core i5-11600K
NVIDIA Titan RTX
185 fps +73%
Intel Core i9-10900K, Intel Core i9-10900K
NVIDIA Titan RTX
166.2 fps +55%
Intel Core i5-10600K, Intel Core i5-10600K
NVIDIA Titan RTX
153.9 fps +44%
AMD Ryzen 9 3950X, AMD Ryzen 9 3950X
NVIDIA Titan RTX
153.2 fps +43%
Corsair One i160, Intel Core i9-9900K
NVIDIA GeForce RTX 2080 Ti (Desktop)
116.3 fps +9%
Intel Dragon Canyon NUC - RTX 3060, Intel Core i9-12900
NVIDIA GeForce RTX 3060
107 fps
Intel Beast Canyon NUC, Intel Core i9-11900KB
NVIDIA GeForce RTX 3060
104 fps -3%
Intel Ghost Canyon NUC (RTX 2070), Intel Core i9-9980HK
NVIDIA GeForce RTX 2070 (Desktop)
85.4 fps -20%
Inno3D GeForce RTX 3060 Twin X2, AMD Ryzen 9 5900X
NVIDIA GeForce RTX 3060
84.9 fps -21%
Siemens NX (snx-03)
Intel Core i9-12900K, Intel Core i9-12900K
NVIDIA Titan RTX
516 fps +2815%
Intel Core i7-12700K, Intel Core i7-12700K
NVIDIA Titan RTX
513 fps +2798%
Intel Core i9-10900K, Intel Core i9-10900K
NVIDIA Titan RTX
472.9 fps +2572%
Intel Core i5-10600K, Intel Core i5-10600K
NVIDIA Titan RTX
469.1 fps +2550%
AMD Ryzen 9 3950X, AMD Ryzen 9 3950X
NVIDIA Titan RTX
460 fps +2499%
Intel Core i5-11600K, Intel Core i5-11600K
NVIDIA Titan RTX
453 fps +2459%
Intel Core i9-11900K, Intel Core i9-11900K
NVIDIA Titan RTX
450 fps +2442%
Corsair One i160, Intel Core i9-9900K
NVIDIA GeForce RTX 2080 Ti (Desktop)
23.03 fps +30%
Intel Dragon Canyon NUC - RTX 3060, Intel Core i9-12900
NVIDIA GeForce RTX 3060
17.7 fps
Intel Ghost Canyon NUC (RTX 2070), Intel Core i9-9980HK
NVIDIA GeForce RTX 2070 (Desktop)
16.33 fps -8%
Inno3D GeForce RTX 3060 Twin X2, AMD Ryzen 9 5900X
NVIDIA GeForce RTX 3060
16.2 fps -8%
Intel Beast Canyon NUC, Intel Core i9-11900KB
NVIDIA GeForce RTX 3060
15.8 fps -11%
Showcase (showcase-02)
Intel Core i9-12900K, Intel Core i9-12900K
NVIDIA Titan RTX
199 fps +70%
Intel Core i7-12700K, Intel Core i7-12700K
NVIDIA Titan RTX
199 fps +70%
Intel Core i5-10600K, Intel Core i5-10600K
NVIDIA Titan RTX
195.1 fps +67%
Intel Core i9-10900K, Intel Core i9-10900K
NVIDIA Titan RTX
194.1 fps +66%
Intel Core i9-11900K, Intel Core i9-11900K
NVIDIA Titan RTX
194 fps +66%
Intel Core i5-11600K, Intel Core i5-11600K
NVIDIA Titan RTX
193 fps +65%
AMD Ryzen 9 3950X, AMD Ryzen 9 3950X
NVIDIA Titan RTX
186.8 fps +60%
Corsair One i160, Intel Core i9-9900K
NVIDIA GeForce RTX 2080 Ti (Desktop)
182.6 fps +56%
Intel Ghost Canyon NUC (RTX 2070), Intel Core i9-9980HK
NVIDIA GeForce RTX 2070 (Desktop)
118.5 fps +1%
Intel Dragon Canyon NUC - RTX 3060, Intel Core i9-12900
NVIDIA GeForce RTX 3060
117 fps
Inno3D GeForce RTX 3060 Twin X2, AMD Ryzen 9 5900X
NVIDIA GeForce RTX 3060
115 fps -2%
Intel Beast Canyon NUC, Intel Core i9-11900KB
NVIDIA GeForce RTX 3060
113 fps -3%
Medical (medical-02)
Intel Core i7-12700K, Intel Core i7-12700K
NVIDIA Titan RTX
93.7 fps +68%
Intel Core i9-12900K, Intel Core i9-12900K
NVIDIA Titan RTX
93.6 fps +68%
AMD Ryzen 9 3950X, AMD Ryzen 9 3950X
NVIDIA Titan RTX
90.3 fps +62%
Intel Core i9-11900K, Intel Core i9-11900K
NVIDIA Titan RTX
90 fps +62%
Intel Core i5-11600K, Intel Core i5-11600K
NVIDIA Titan RTX
90 fps +62%
Intel Core i5-10600K, Intel Core i5-10600K
NVIDIA Titan RTX
89.7 fps +61%
Intel Core i9-10900K, Intel Core i9-10900K
NVIDIA Titan RTX
88.7 fps +59%
Corsair One i160, Intel Core i9-9900K
NVIDIA GeForce RTX 2080 Ti (Desktop)
85 fps +53%
Intel Ghost Canyon NUC (RTX 2070), Intel Core i9-9980HK
NVIDIA GeForce RTX 2070 (Desktop)
56.4 fps +1%
Intel Dragon Canyon NUC - RTX 3060, Intel Core i9-12900
NVIDIA GeForce RTX 3060
55.7 fps
Inno3D GeForce RTX 3060 Twin X2, AMD Ryzen 9 5900X
NVIDIA GeForce RTX 3060
55 fps -1%
Intel Beast Canyon NUC, Intel Core i9-11900KB
NVIDIA GeForce RTX 3060
54.4 fps -2%
Maya (maya-05)
Intel Core i9-12900K, Intel Core i9-12900K
NVIDIA Titan RTX
505 fps +80%
Intel Core i7-12700K, Intel Core i7-12700K
NVIDIA Titan RTX
500 fps +78%
Intel Core i9-11900K, Intel Core i9-11900K
NVIDIA Titan RTX
454 fps +62%
Intel Core i5-11600K, Intel Core i5-11600K
NVIDIA Titan RTX
449 fps +60%
Intel Core i9-10900K, Intel Core i9-10900K
NVIDIA Titan RTX
405.9 fps +44%
Corsair One i160, Intel Core i9-9900K
NVIDIA GeForce RTX 2080 Ti (Desktop)
402 fps +43%
AMD Ryzen 9 3950X, AMD Ryzen 9 3950X
NVIDIA Titan RTX
394.9 fps +41%
Intel Core i5-10600K, Intel Core i5-10600K
NVIDIA Titan RTX
387.5 fps +38%
Intel Ghost Canyon NUC (RTX 2070), Intel Core i9-9980HK
NVIDIA GeForce RTX 2070 (Desktop)
281 fps 0%
Intel Dragon Canyon NUC - RTX 3060, Intel Core i9-12900
NVIDIA GeForce RTX 3060
281 fps
Intel Beast Canyon NUC, Intel Core i9-11900KB
NVIDIA GeForce RTX 3060
262 fps -7%
Inno3D GeForce RTX 3060 Twin X2, AMD Ryzen 9 5900X
NVIDIA GeForce RTX 3060
261 fps -7%
Energy (energy-02)
Intel Core i5-11600K, Intel Core i5-11600K
NVIDIA Titan RTX
53.9 fps +293%
Intel Core i9-11900K, Intel Core i9-11900K
NVIDIA Titan RTX
53.7 fps +292%
Intel Core i5-10600K, Intel Core i5-10600K
NVIDIA Titan RTX
53.3 fps +289%
Intel Core i9-10900K, Intel Core i9-10900K
NVIDIA Titan RTX
53.2 fps +288%
Intel Core i9-12900K, Intel Core i9-12900K
NVIDIA Titan RTX
52.7 fps +285%
Intel Core i7-12700K, Intel Core i7-12700K
NVIDIA Titan RTX
52.6 fps +284%
AMD Ryzen 9 3950X, AMD Ryzen 9 3950X
NVIDIA Titan RTX
52.4 fps +282%
Corsair One i160, Intel Core i9-9900K
NVIDIA GeForce RTX 2080 Ti (Desktop)
31.93 fps +133%
Intel Ghost Canyon NUC (RTX 2070), Intel Core i9-9980HK
NVIDIA GeForce RTX 2070 (Desktop)
21.83 fps +59%
Intel Beast Canyon NUC, Intel Core i9-11900KB
NVIDIA GeForce RTX 3060
13.7 fps 0%
Intel Dragon Canyon NUC - RTX 3060, Intel Core i9-12900
NVIDIA GeForce RTX 3060
13.7 fps
Inno3D GeForce RTX 3060 Twin X2, AMD Ryzen 9 5900X
NVIDIA GeForce RTX 3060
13.6 fps -1%
Creo (creo-02)
Intel Core i9-12900K, Intel Core i9-12900K
NVIDIA Titan RTX
389 fps +104%
Intel Core i7-12700K, Intel Core i7-12700K
NVIDIA Titan RTX
388 fps +103%
Intel Core i9-11900K, Intel Core i9-11900K
NVIDIA Titan RTX
355 fps +86%
Intel Core i5-11600K, Intel Core i5-11600K
NVIDIA Titan RTX
354 fps +85%
Intel Core i9-10900K, Intel Core i9-10900K
NVIDIA Titan RTX
336.3 fps +76%
Intel Core i5-10600K, Intel Core i5-10600K
NVIDIA Titan RTX
331.7 fps +74%
AMD Ryzen 9 3950X, AMD Ryzen 9 3950X
NVIDIA Titan RTX
328.8 fps +72%
Corsair One i160, Intel Core i9-9900K
NVIDIA GeForce RTX 2080 Ti (Desktop)
286.1 fps +50%
Intel Dragon Canyon NUC - RTX 3060, Intel Core i9-12900
NVIDIA GeForce RTX 3060
191 fps
Intel Ghost Canyon NUC (RTX 2070), Intel Core i9-9980HK
NVIDIA GeForce RTX 2070 (Desktop)
183.8 fps -4%
Inno3D GeForce RTX 3060 Twin X2, AMD Ryzen 9 5900X
NVIDIA GeForce RTX 3060
181 fps -5%
Intel Beast Canyon NUC, Intel Core i9-11900KB
NVIDIA GeForce RTX 3060
172 fps -10%
Catia (catia-05)
Intel Core i9-12900K, Intel Core i9-12900K
NVIDIA Titan RTX
467 fps +336%
Intel Core i7-12700K, Intel Core i7-12700K
NVIDIA Titan RTX
459 fps +329%
Intel Core i9-11900K, Intel Core i9-11900K
NVIDIA Titan RTX
415 fps +288%
Intel Core i5-11600K, Intel Core i5-11600K
NVIDIA Titan RTX
397 fps +271%
Intel Core i9-10900K, Intel Core i9-10900K
NVIDIA Titan RTX
362.1 fps +238%
AMD Ryzen 9 3950X, AMD Ryzen 9 3950X
NVIDIA Titan RTX
355.2 fps +232%
Intel Core i5-10600K, Intel Core i5-10600K
NVIDIA Titan RTX
341.7 fps +219%
Corsair One i160, Intel Core i9-9900K
NVIDIA GeForce RTX 2080 Ti (Desktop)
177.3 fps +66%
Intel Ghost Canyon NUC (RTX 2070), Intel Core i9-9980HK
NVIDIA GeForce RTX 2070 (Desktop)
113.7 fps +6%
Inno3D GeForce RTX 3060 Twin X2, AMD Ryzen 9 5900X
NVIDIA GeForce RTX 3060
109 fps +2%
Intel Dragon Canyon NUC - RTX 3060, Intel Core i9-12900
NVIDIA GeForce RTX 3060
107 fps
Intel Beast Canyon NUC, Intel Core i9-11900KB
NVIDIA GeForce RTX 3060
104 fps -3%
3ds Max (3dsmax-06)
Intel Core i7-12700K, Intel Core i7-12700K
NVIDIA Titan RTX
303 fps +46%
Intel Core i5-10600K, Intel Core i5-10600K
NVIDIA Titan RTX
294.4 fps +42%
Intel Core i9-10900K, Intel Core i9-10900K
NVIDIA Titan RTX
292.5 fps +41%
Intel Core i5-11600K, Intel Core i5-11600K
NVIDIA Titan RTX
288 fps +39%
Intel Core i9-11900K, Intel Core i9-11900K
NVIDIA Titan RTX
287 fps +39%
AMD Ryzen 9 3950X, AMD Ryzen 9 3950X
NVIDIA Titan RTX
274.5 fps +33%
Corsair One i160, Intel Core i9-9900K
NVIDIA GeForce RTX 2080 Ti (Desktop)
265.9 fps +28%
Intel Core i9-12900K, Intel Core i9-12900K
NVIDIA Titan RTX
265 fps +28%
Inno3D GeForce RTX 3060 Twin X2, AMD Ryzen 9 5900X
NVIDIA GeForce RTX 3060
215 fps +4%
Intel Dragon Canyon NUC - RTX 3060, Intel Core i9-12900
NVIDIA GeForce RTX 3060
207 fps
Intel Beast Canyon NUC, Intel Core i9-11900KB
NVIDIA GeForce RTX 3060
202 fps -2%
Intel Ghost Canyon NUC (RTX 2070), Intel Core i9-9980HK
NVIDIA GeForce RTX 2070 (Desktop)
178.6 fps -14%

3D et performances de jeu

Comme l'Intel Core i9-12900 n'offre qu'un simple iGPU avec l'Intel UHD Graphics 770, les performances 3D pour les jeux vidéo exigeants ne sont tout simplement pas au rendez-vous. Cependant, vous pouvez installer une carte graphique dédiée dans le boîtier, ce qui transformera le NUC en un PC de jeu très compact. Parce que nous avons déjà testé leNUC Beast Canyonavec une Nvidia GeForce RTX 3060 à l'époque, nous avons décidé d'utiliser également un modèle de la RTX 3060 pour le NUC Dragon Canyon. En combinaison avec le processeur Alder Lake, les performances augmentent d'environ 4% en mode gaming. Ce résultat ne justifie pas une mise à niveau, il ne devrait donc être pertinent que pour un nouvel achat

La coopération avec le Nvidia GeForce RTX 3060d'INNO 3D fonctionne très bien. Tous les jeux actuels peuvent être appréciés à des taux d'images suffisants en résolution 1440 sans aucun problème. Parfois, vous pouvez même jouer à de nombreux jeux en 2160p. Cependant, étant donné que l'augmentation de la résolution et les niveaux de détail plus élevés concernent davantage les limites du GPU, les performances du CPU ne sont que secondaires, ce qui explique la faible augmentation des performances par rapport au NUC Beast Canyon

Vous pouvez trouver d'autres comparaisons et benchmarks dans notre article sur le GTableau comparatif des GPU.

Ceux qui souhaitent équiper leur NUC Dragon Canyon d'une carte graphique dédiée doivent se renseigner au préalable sur les dimensions exactes du GPU. La carte graphique ne peut pas avoir une conception de refroidissement qui prend plus de deux fentes, et vous devriez également noter la longueur maximale de 30,5 cm (12 in).

Performance Rating - Percent
Zotac Magnus One (ECM73070C)
NVIDIA GeForce RTX 3070, i7-10700, Phison 512GB PA6620060U
88.8 pt
Inno3D GeForce RTX 3060 Twin X2
NVIDIA GeForce RTX 3060, R9 5900X, Corsair MP600
88.1 pt
Intel Dragon Canyon NUC - RTX 3060
NVIDIA GeForce RTX 3060, i9-12900, Transcend M.2 SSD 2200S TS512GMTE220S
87.7 pt
Intel Beast Canyon NUC
NVIDIA GeForce RTX 3060, i9-11900KB, Sabrent Rocket 4.0 500GB
84.4 pt
Intel Ghost Canyon NUC (RTX 2070)
GeForce RTX 2070 (Desktop), i9-9980HK, Kingston KC2500 1 TB SKC2500M81000G
75.9 pt
Borderlands 3
1280x720 Very Low Overall Quality (DX11)
Intel Dragon Canyon NUC - RTX 3060
NVIDIA GeForce RTX 3060, i9-12900, Transcend M.2 SSD 2200S TS512GMTE220S
185 fps
Inno3D GeForce RTX 3060 Twin X2
NVIDIA GeForce RTX 3060, R9 5900X, Corsair MP600
172 fps -7%
Intel Beast Canyon NUC
NVIDIA GeForce RTX 3060, i9-11900KB, Sabrent Rocket 4.0 500GB
156 fps -16%
Intel Ghost Canyon NUC (RTX 2070)
GeForce RTX 2070 (Desktop), i9-9980HK, Kingston KC2500 1 TB SKC2500M81000G
152 fps -18%
Zotac Magnus One (ECM73070C)
NVIDIA GeForce RTX 3070, i7-10700, Phison 512GB PA6620060U
149 fps -19%
1920x1080 Badass Overall Quality (DX11)
Intel Beast Canyon NUC
NVIDIA GeForce RTX 3060, i9-11900KB, Sabrent Rocket 4.0 500GB
100 fps +18%
Zotac Magnus One (ECM73070C)
NVIDIA GeForce RTX 3070, i7-10700, Phison 512GB PA6620060U
98.8 fps +17%
Intel Dragon Canyon NUC - RTX 3060
NVIDIA GeForce RTX 3060, i9-12900, Transcend M.2 SSD 2200S TS512GMTE220S
84.7 fps
Inno3D GeForce RTX 3060 Twin X2
NVIDIA GeForce RTX 3060, R9 5900X, Corsair MP600
78.5 fps -7%
Intel Ghost Canyon NUC (RTX 2070)
GeForce RTX 2070 (Desktop), i9-9980HK, Kingston KC2500 1 TB SKC2500M81000G
70.9 fps -16%
Metro Exodus
1280x720 Low Quality AF:4x
Intel Dragon Canyon NUC - RTX 3060
NVIDIA GeForce RTX 3060, i9-12900, Transcend M.2 SSD 2200S TS512GMTE220S
207 (93.55min - 336.7max) fps
Inno3D GeForce RTX 3060 Twin X2
NVIDIA GeForce RTX 3060, R9 5900X, Corsair MP600
202 (94.16min - 331.35max) fps -2%
Intel Beast Canyon NUC
NVIDIA GeForce RTX 3060, i9-11900KB, Sabrent Rocket 4.0 500GB
198 (96.07min - 323.73max) fps -4%
Intel Ghost Canyon NUC (RTX 2070)
GeForce RTX 2070 (Desktop), i9-9980HK, Kingston KC2500 1 TB SKC2500M81000G
181 (100.48min - 268.67max) fps -13%
Zotac Magnus One (ECM73070C)
NVIDIA GeForce RTX 3070, i7-10700, Phison 512GB PA6620060U
166 (92.98min - 251.64max) fps -20%
1920x1080 Ultra Quality AF:16x
Zotac Magnus One (ECM73070C)
NVIDIA GeForce RTX 3070, i7-10700, Phison 512GB PA6620060U
93.1 (45.73min - 151.06max) fps +43%
Intel Dragon Canyon NUC - RTX 3060
NVIDIA GeForce RTX 3060, i9-12900, Transcend M.2 SSD 2200S TS512GMTE220S
65.3 (34.71min - 117.86max) fps
Intel Ghost Canyon NUC (RTX 2070)
GeForce RTX 2070 (Desktop), i9-9980HK, Kingston KC2500 1 TB SKC2500M81000G
60.9 (33.61min - 92.62max) fps -7%
Intel Beast Canyon NUC
NVIDIA GeForce RTX 3060, i9-11900KB, Sabrent Rocket 4.0 500GB
59.8 (30.99min - 119.9max) fps -8%
Inno3D GeForce RTX 3060 Twin X2
NVIDIA GeForce RTX 3060, R9 5900X, Corsair MP600
55.1 (32.45min - 87.42max) fps -16%
Far Cry New Dawn
1280x720 Low Preset
Inno3D GeForce RTX 3060 Twin X2
NVIDIA GeForce RTX 3060, R9 5900X, Corsair MP600
163 (117min - 259max) fps +1%
Intel Dragon Canyon NUC - RTX 3060
NVIDIA GeForce RTX 3060, i9-12900, Transcend M.2 SSD 2200S TS512GMTE220S
161 (119min - 232max) fps
Intel Beast Canyon NUC
NVIDIA GeForce RTX 3060, i9-11900KB, Sabrent Rocket 4.0 500GB
144 (82min - 218max) fps -11%
Intel Ghost Canyon NUC (RTX 2070)
GeForce RTX 2070 (Desktop), i9-9980HK, Kingston KC2500 1 TB SKC2500M81000G
128 (92min - 190max) fps -20%
Zotac Magnus One (ECM73070C)
NVIDIA GeForce RTX 3070, i7-10700, Phison 512GB PA6620060U
126 (96min - 186max) fps -22%
1920x1080 Ultra Preset
Intel Dragon Canyon NUC - RTX 3060
NVIDIA GeForce RTX 3060, i9-12900, Transcend M.2 SSD 2200S TS512GMTE220S
113 (86min - 148max) fps
Inno3D GeForce RTX 3060 Twin X2
NVIDIA GeForce RTX 3060, R9 5900X, Corsair MP600
112 (83min - 146max) fps -1%
Intel Beast Canyon NUC
NVIDIA GeForce RTX 3060, i9-11900KB, Sabrent Rocket 4.0 500GB
102 (72min - 145max) fps -10%
Zotac Magnus One (ECM73070C)
NVIDIA GeForce RTX 3070, i7-10700, Phison 512GB PA6620060U
95 (66min - 149max) fps -16%
Intel Ghost Canyon NUC (RTX 2070)
GeForce RTX 2070 (Desktop), i9-9980HK, Kingston KC2500 1 TB SKC2500M81000G
79 (61min - 99max) fps -30%
Far Cry 5
1280x720 Low Preset AA:T
Inno3D GeForce RTX 3060 Twin X2
NVIDIA GeForce RTX 3060, R9 5900X, Corsair MP600
196 (146min - 267max) fps +2%
Intel Dragon Canyon NUC - RTX 3060
NVIDIA GeForce RTX 3060, i9-12900, Transcend M.2 SSD 2200S TS512GMTE220S
193 (135min - 251max) fps
Intel Beast Canyon NUC
NVIDIA GeForce RTX 3060, i9-11900KB, Sabrent Rocket 4.0 500GB
170 (105min - 231max) fps -12%
Zotac Magnus One (ECM73070C)
NVIDIA GeForce RTX 3070, i7-10700, Phison 512GB PA6620060U
150 (118min - 203max) fps -22%
Intel Ghost Canyon NUC (RTX 2070)
GeForce RTX 2070 (Desktop), i9-9980HK, Kingston KC2500 1 TB SKC2500M81000G
147 (119min - 193max) fps -24%
1920x1080 Ultra Preset AA:T
Inno3D GeForce RTX 3060 Twin X2
NVIDIA GeForce RTX 3060, R9 5900X, Corsair MP600
132 (109min - 150max) fps 0%
Intel Dragon Canyon NUC - RTX 3060
NVIDIA GeForce RTX 3060, i9-12900, Transcend M.2 SSD 2200S TS512GMTE220S
132 (114min - 150max) fps
Intel Beast Canyon NUC
NVIDIA GeForce RTX 3060, i9-11900KB, Sabrent Rocket 4.0 500GB
122 (93min - 151max) fps -8%
Zotac Magnus One (ECM73070C)
NVIDIA GeForce RTX 3070, i7-10700, Phison 512GB PA6620060U
117 (89min - 155max) fps -11%
Intel Ghost Canyon NUC (RTX 2070)
GeForce RTX 2070 (Desktop), i9-9980HK, Kingston KC2500 1 TB SKC2500M81000G
86 (68min - 111max) fps -35%
X-Plane 11.11
1280x720 low (fps_test=1)
Inno3D GeForce RTX 3060 Twin X2
NVIDIA GeForce RTX 3060, R9 5900X, Corsair MP600
160 fps +6%
Intel Beast Canyon NUC
NVIDIA GeForce RTX 3060, i9-11900KB, Sabrent Rocket 4.0 500GB
151 fps 0%
Intel Dragon Canyon NUC - RTX 3060
NVIDIA GeForce RTX 3060, i9-12900, Transcend M.2 SSD 2200S TS512GMTE220S
151 fps
Intel Ghost Canyon NUC (RTX 2070)
GeForce RTX 2070 (Desktop), i9-9980HK, Kingston KC2500 1 TB SKC2500M81000G
127 fps -16%
Zotac Magnus One (ECM73070C)
NVIDIA GeForce RTX 3070, i7-10700, Phison 512GB PA6620060U
124 fps -18%
1920x1080 high (fps_test=3)
Inno3D GeForce RTX 3060 Twin X2
NVIDIA GeForce RTX 3060, R9 5900X, Corsair MP600
112 fps +7%
Intel Beast Canyon NUC
NVIDIA GeForce RTX 3060, i9-11900KB, Sabrent Rocket 4.0 500GB
105 fps 0%
Intel Dragon Canyon NUC - RTX 3060
NVIDIA GeForce RTX 3060, i9-12900, Transcend M.2 SSD 2200S TS512GMTE220S
105 fps
Intel Ghost Canyon NUC (RTX 2070)
GeForce RTX 2070 (Desktop), i9-9980HK, Kingston KC2500 1 TB SKC2500M81000G
92.7 fps -12%
Zotac Magnus One (ECM73070C)
NVIDIA GeForce RTX 3070, i7-10700, Phison 512GB PA6620060U
91 fps -13%
Final Fantasy XV Benchmark
1280x720 Lite Quality
Inno3D GeForce RTX 3060 Twin X2
NVIDIA GeForce RTX 3060, R9 5900X, Corsair MP600
210 fps +7%
Intel Beast Canyon NUC
NVIDIA GeForce RTX 3060, i9-11900KB, Sabrent Rocket 4.0 500GB
196 fps 0%
Intel Dragon Canyon NUC - RTX 3060
NVIDIA GeForce RTX 3060, i9-12900, Transcend M.2 SSD 2200S TS512GMTE220S
196 fps
Intel Ghost Canyon NUC (RTX 2070)
GeForce RTX 2070 (Desktop), i9-9980HK, Kingston KC2500 1 TB SKC2500M81000G
193 (94min - 237max) fps -2%
Zotac Magnus One (ECM73070C)
NVIDIA GeForce RTX 3070, i7-10700, Phison 512GB PA6620060U
167 fps -15%
1920x1080 High Quality
Zotac Magnus One (ECM73070C)
NVIDIA GeForce RTX 3070, i7-10700, Phison 512GB PA6620060U
112 fps +26%
Intel Ghost Canyon NUC (RTX 2070)
GeForce RTX 2070 (Desktop), i9-9980HK, Kingston KC2500 1 TB SKC2500M81000G
90.6 (56min - 138max) fps +2%
Inno3D GeForce RTX 3060 Twin X2
NVIDIA GeForce RTX 3060, R9 5900X, Corsair MP600
88.6 fps 0%
Intel Beast Canyon NUC
NVIDIA GeForce RTX 3060, i9-11900KB, Sabrent Rocket 4.0 500GB
88.6 fps 0%
Intel Dragon Canyon NUC - RTX 3060
NVIDIA GeForce RTX 3060, i9-12900, Transcend M.2 SSD 2200S TS512GMTE220S
88.6 fps
Dota 2 Reborn
1280x720 min (0/3) fastest
Inno3D GeForce RTX 3060 Twin X2
NVIDIA GeForce RTX 3060, R9 5900X, Corsair MP600
202.1 (165min) fps +13%
Intel Beast Canyon NUC
NVIDIA GeForce RTX 3060, i9-11900KB, Sabrent Rocket 4.0 500GB
178.3 (153.2min) fps 0%
Intel Dragon Canyon NUC - RTX 3060
NVIDIA GeForce RTX 3060, i9-12900, Transcend M.2 SSD 2200S TS512GMTE220S
178.3 (153.2min) fps
Zotac Magnus One (ECM73070C)
NVIDIA GeForce RTX 3070, i7-10700, Phison 512GB PA6620060U
164.2 (143.5min) fps -8%
Intel Ghost Canyon NUC (RTX 2070)
GeForce RTX 2070 (Desktop), i9-9980HK, Kingston KC2500 1 TB SKC2500M81000G
155.6 (135.2min) fps -13%
1920x1080 ultra (3/3) best looking
Inno3D GeForce RTX 3060 Twin X2
NVIDIA GeForce RTX 3060, R9 5900X, Corsair MP600
159.7 (126.4min) fps +9%
Intel Beast Canyon NUC
NVIDIA GeForce RTX 3060, i9-11900KB, Sabrent Rocket 4.0 500GB
147.1 (126min) fps 0%
Intel Dragon Canyon NUC - RTX 3060
NVIDIA GeForce RTX 3060, i9-12900, Transcend M.2 SSD 2200S TS512GMTE220S
147.1 (126min) fps
Intel Ghost Canyon NUC (RTX 2070)
GeForce RTX 2070 (Desktop), i9-9980HK, Kingston KC2500 1 TB SKC2500M81000G
130.3 (114.9min) fps -11%
Zotac Magnus One (ECM73070C)
NVIDIA GeForce RTX 3070, i7-10700, Phison 512GB PA6620060U
129.7 (113.4min) fps -12%
3DMark
Fire Strike Extreme Graphics
Zotac Magnus One (ECM73070C)
NVIDIA GeForce RTX 3070, i7-10700, Phison 512GB PA6620060U
15597 Points +52%
Inno3D GeForce RTX 3060 Twin X2
NVIDIA GeForce RTX 3060, R9 5900X, Corsair MP600
10330 Points +1%
Intel Dragon Canyon NUC - RTX 3060
NVIDIA GeForce RTX 3060, i9-12900, Transcend M.2 SSD 2200S TS512GMTE220S
10244 Points
Intel Beast Canyon NUC
NVIDIA GeForce RTX 3060, i9-11900KB, Sabrent Rocket 4.0 500GB
10181 Points -1%
Intel Ghost Canyon NUC (RTX 2070)
GeForce RTX 2070 (Desktop), i9-9980HK, Kingston KC2500 1 TB SKC2500M81000G
9979 Points -3%
1920x1080 Fire Strike Graphics
Zotac Magnus One (ECM73070C)
NVIDIA GeForce RTX 3070, i7-10700, Phison 512GB PA6620060U
30090 Points +37%
Intel Dragon Canyon NUC - RTX 3060
NVIDIA GeForce RTX 3060, i9-12900, Transcend M.2 SSD 2200S TS512GMTE220S
21984 Points
Inno3D GeForce RTX 3060 Twin X2
NVIDIA GeForce RTX 3060, R9 5900X, Corsair MP600
21847 Points -1%
Intel Beast Canyon NUC
NVIDIA GeForce RTX 3060, i9-11900KB, Sabrent Rocket 4.0 500GB
21379 Points -3%
Intel Ghost Canyon NUC (RTX 2070)
GeForce RTX 2070 (Desktop), i9-9980HK, Kingston KC2500 1 TB SKC2500M81000G
20775 Points -5%
2560x1440 Time Spy Graphics
Zotac Magnus One (ECM73070C)
NVIDIA GeForce RTX 3070, i7-10700, Phison 512GB PA6620060U
12668 Points +48%
Intel Ghost Canyon NUC (RTX 2070)
GeForce RTX 2070 (Desktop), i9-9980HK, Kingston KC2500 1 TB SKC2500M81000G
8631 Points +1%
Intel Dragon Canyon NUC - RTX 3060
NVIDIA GeForce RTX 3060, i9-12900, Transcend M.2 SSD 2200S TS512GMTE220S
8578 Points
Inno3D GeForce RTX 3060 Twin X2
NVIDIA GeForce RTX 3060, R9 5900X, Corsair MP600
8559 Points 0%
Intel Beast Canyon NUC
NVIDIA GeForce RTX 3060, i9-11900KB, Sabrent Rocket 4.0 500GB
8525 Points -1%
3DMark 11
1280x720 Performance GPU
Zotac Magnus One (ECM73070C)
NVIDIA GeForce RTX 3070, i7-10700, Phison 512GB PA6620060U
40950 Points +40%
Intel Dragon Canyon NUC - RTX 3060
NVIDIA GeForce RTX 3060, i9-12900, Transcend M.2 SSD 2200S TS512GMTE220S
29172 Points
Intel Beast Canyon NUC
NVIDIA GeForce RTX 3060, i9-11900KB, Sabrent Rocket 4.0 500GB
28939 Points -1%
Intel Ghost Canyon NUC (RTX 2070)
GeForce RTX 2070 (Desktop), i9-9980HK, Kingston KC2500 1 TB SKC2500M81000G
28828 Points -1%
Inno3D GeForce RTX 3060 Twin X2
NVIDIA GeForce RTX 3060, R9 5900X, Corsair MP600
28072 Points -4%
1280x720 Performance
Zotac Magnus One (ECM73070C)
NVIDIA GeForce RTX 3070, i7-10700, Phison 512GB PA6620060U
29057 Points +5%
Intel Dragon Canyon NUC - RTX 3060
NVIDIA GeForce RTX 3060, i9-12900, Transcend M.2 SSD 2200S TS512GMTE220S
27726 Points
Inno3D GeForce RTX 3060 Twin X2
NVIDIA GeForce RTX 3060, R9 5900X, Corsair MP600
26986 Points -3%
Intel Beast Canyon NUC
NVIDIA GeForce RTX 3060, i9-11900KB, Sabrent Rocket 4.0 500GB
25149 Points -9%
Intel Ghost Canyon NUC (RTX 2070)
GeForce RTX 2070 (Desktop), i9-9980HK, Kingston KC2500 1 TB SKC2500M81000G
24131 Points -13%

Intel NUC 12 Dragon Canyon + Nvidia GeForce RTX 3060

Bas Moyen Élevé UltraQHD4K
GTA V (2015) 186 181 177 104 81.4 82.3
The Witcher 3 (2015) 462 305 178 91.3 62.5
Dota 2 Reborn (2015) 178.3 161.7 155.6 147.1 116.1
Final Fantasy XV Benchmark (2018) 196 123 88.6 64.8 38
X-Plane 11.11 (2018) 151 133 105 88.5
Far Cry 5 (2018) 193 153 139 132 94 48
Strange Brigade (2018) 491 230 180 154 116 66.8
Far Cry New Dawn (2019) 161 132 126 113 92 51
Metro Exodus (2019) 207 113 83.7 65.3 51.7 32.2
Borderlands 3 (2019) 185 148 104 84.7 60.3 33.3
F1 2020 (2020) 355 259 208 142 106 60.2
F1 2021 (2021) 419 261 206 96.9 72 40.9
Far Cry 6 (2021) 167 129 110 96 70.5 39.3

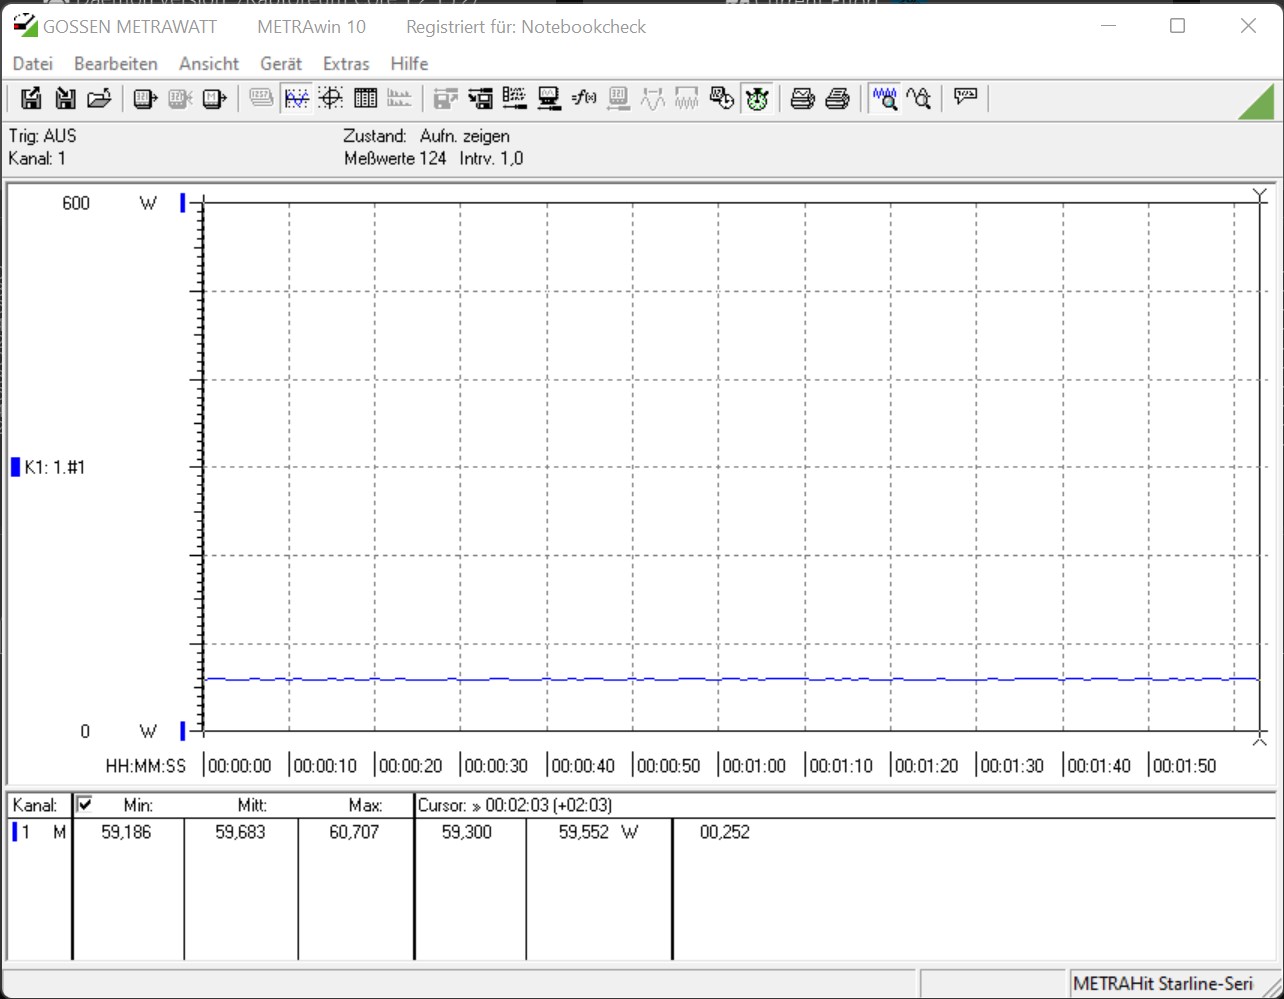
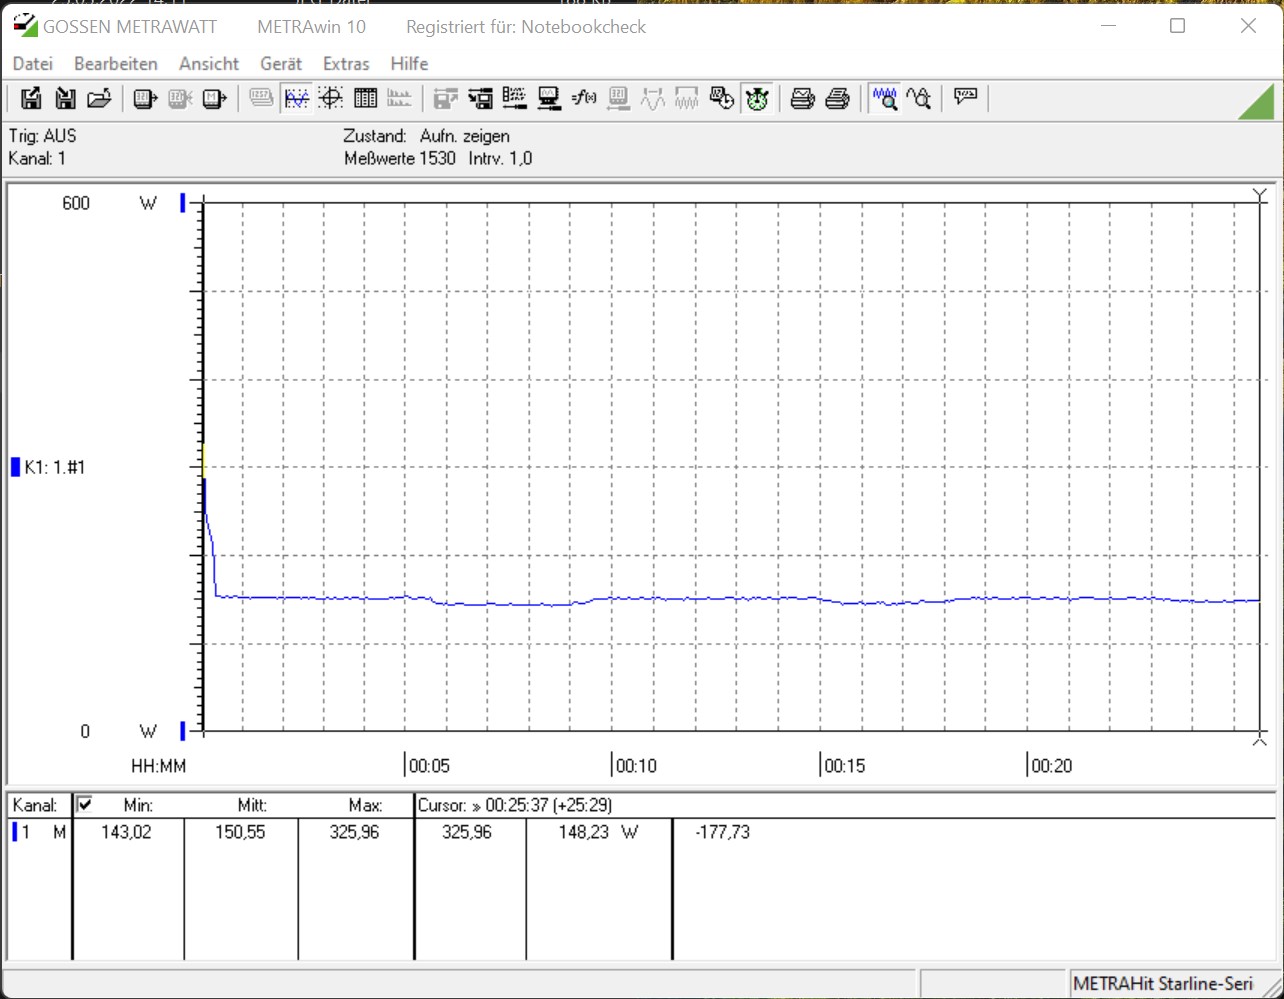
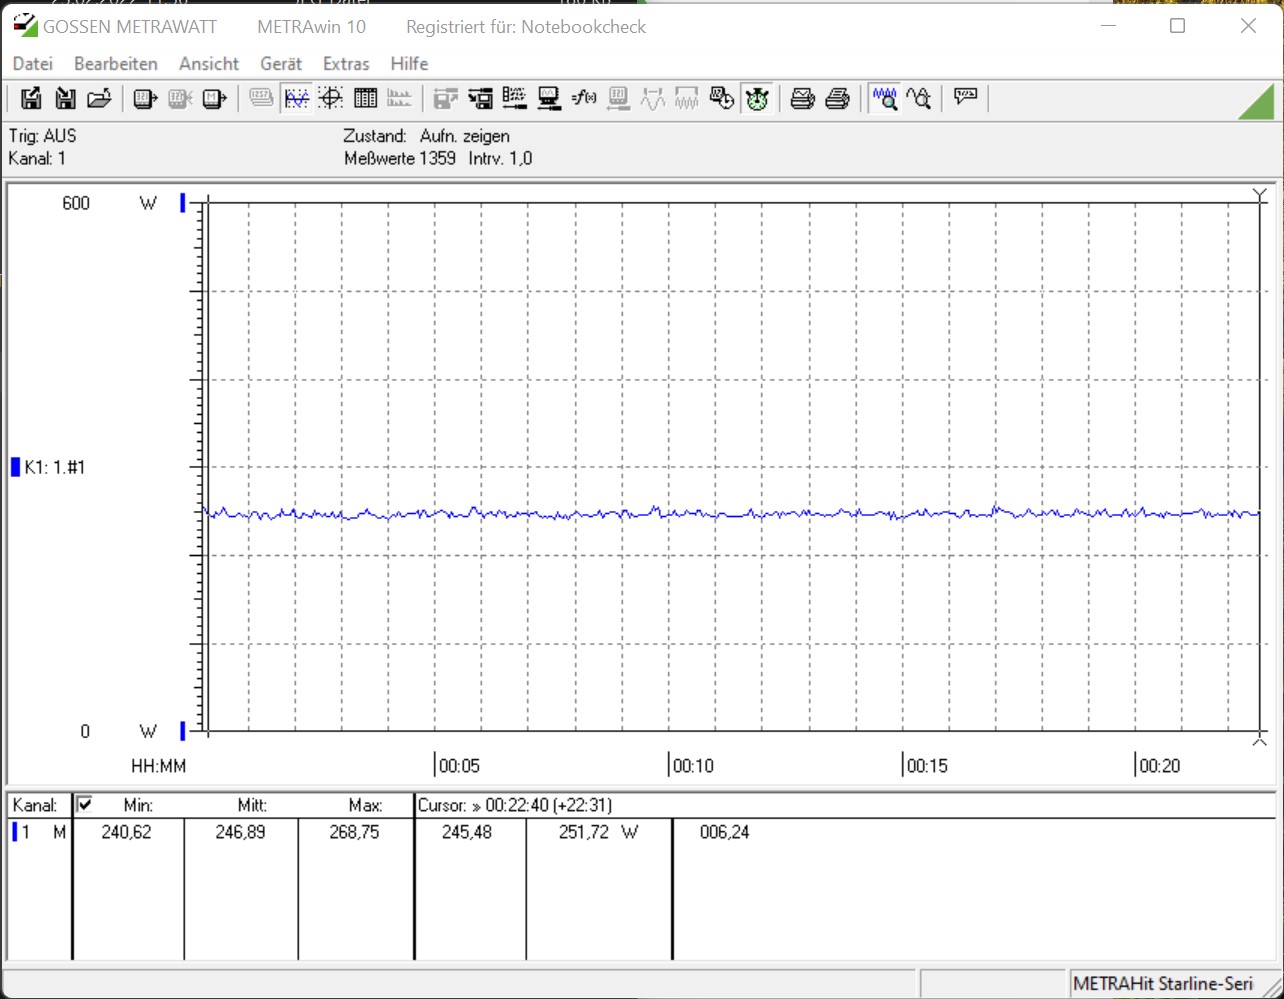
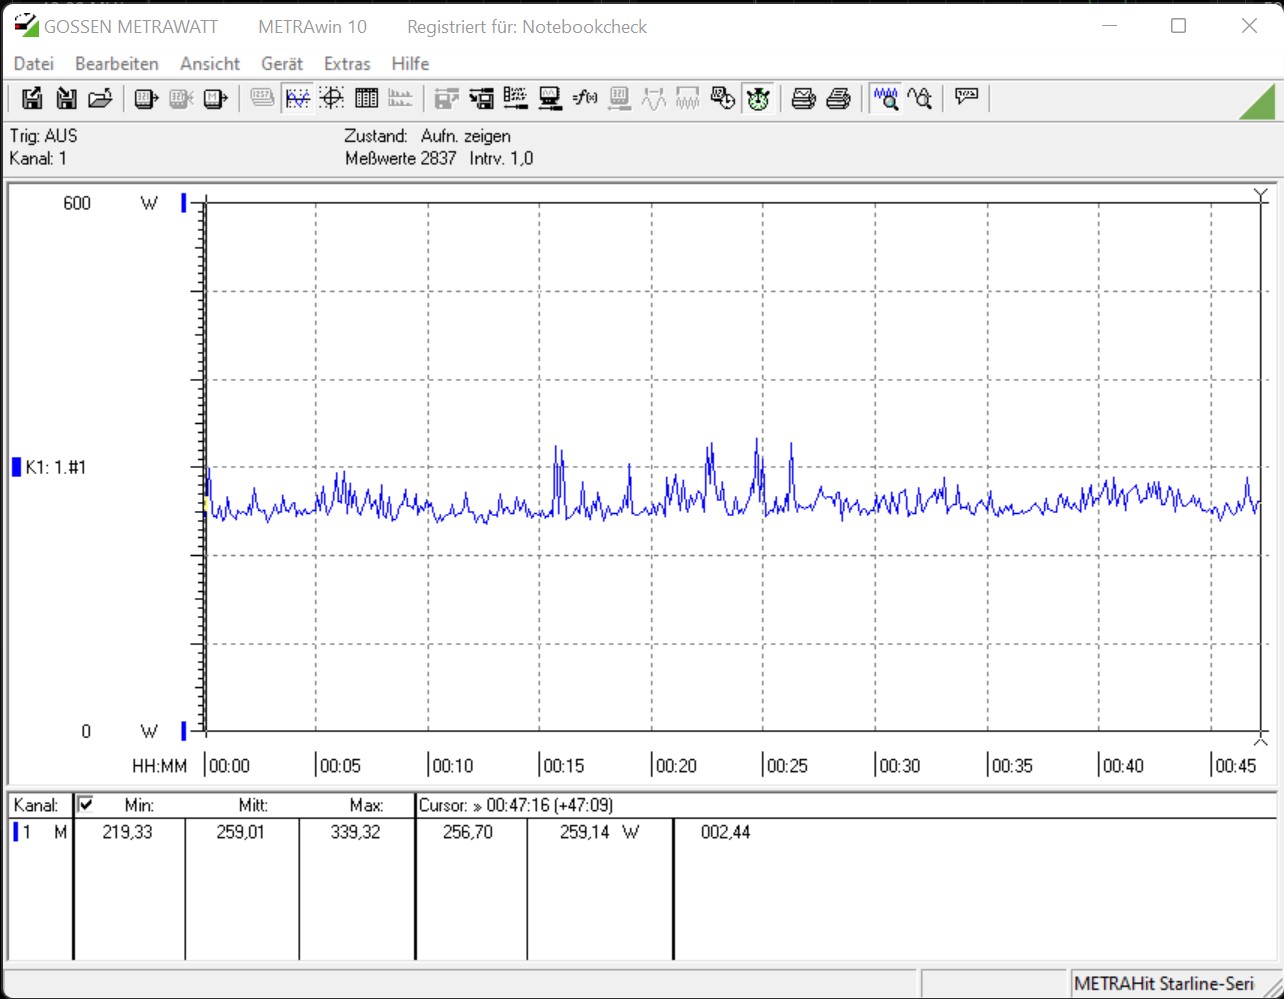
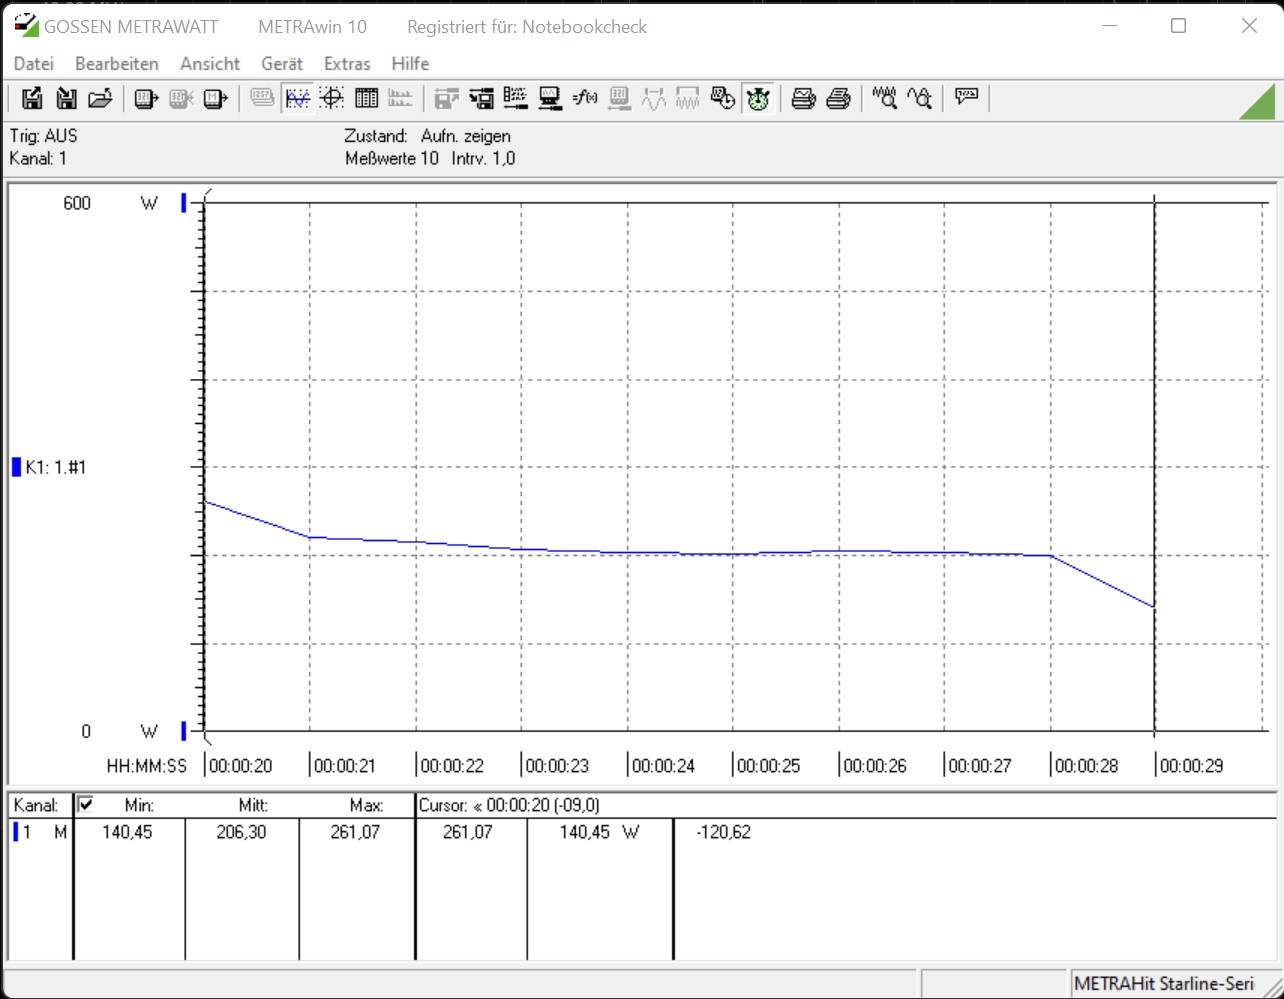
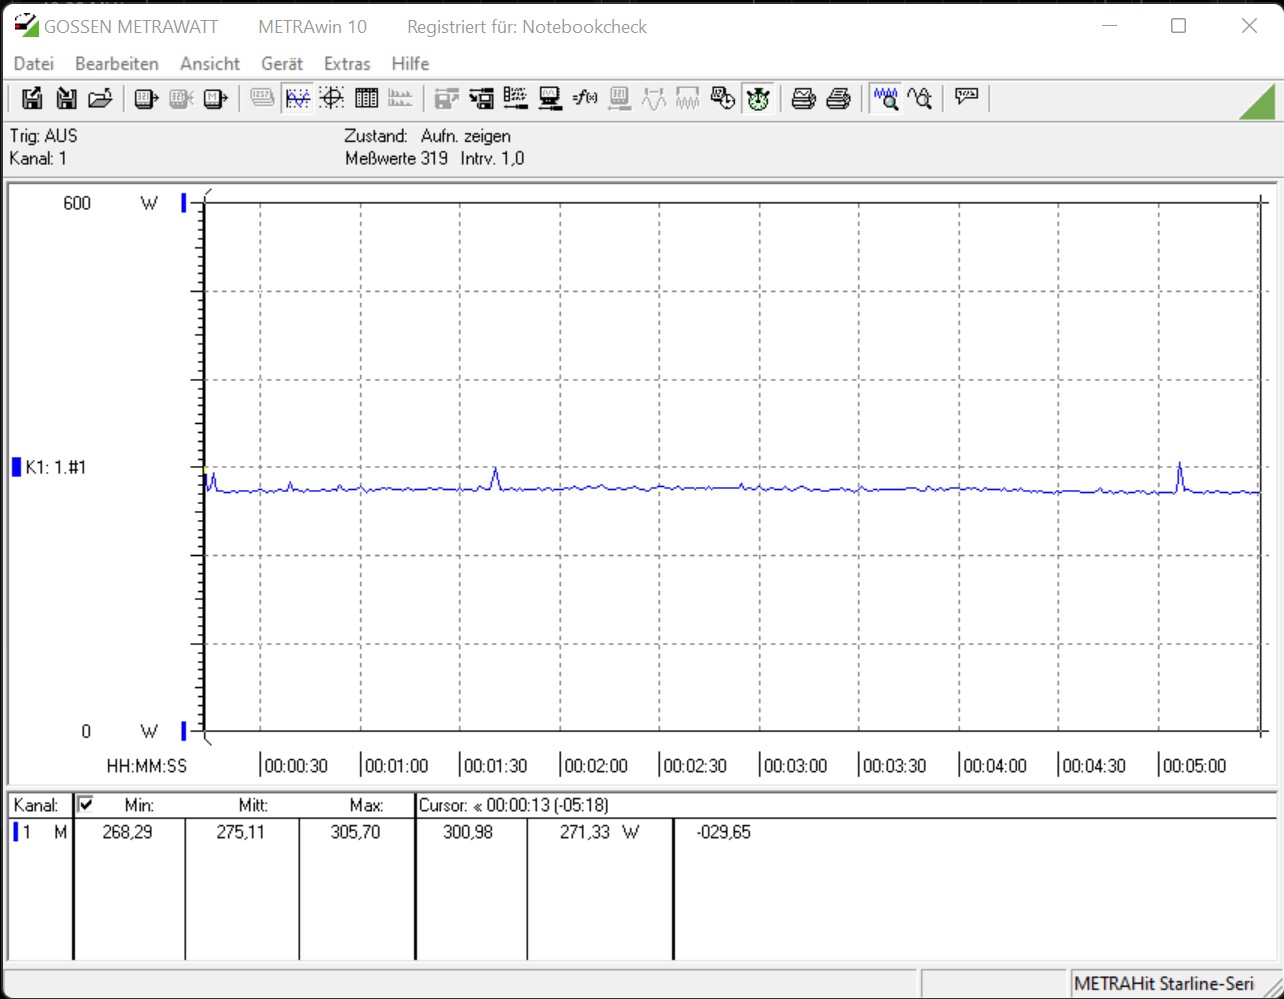
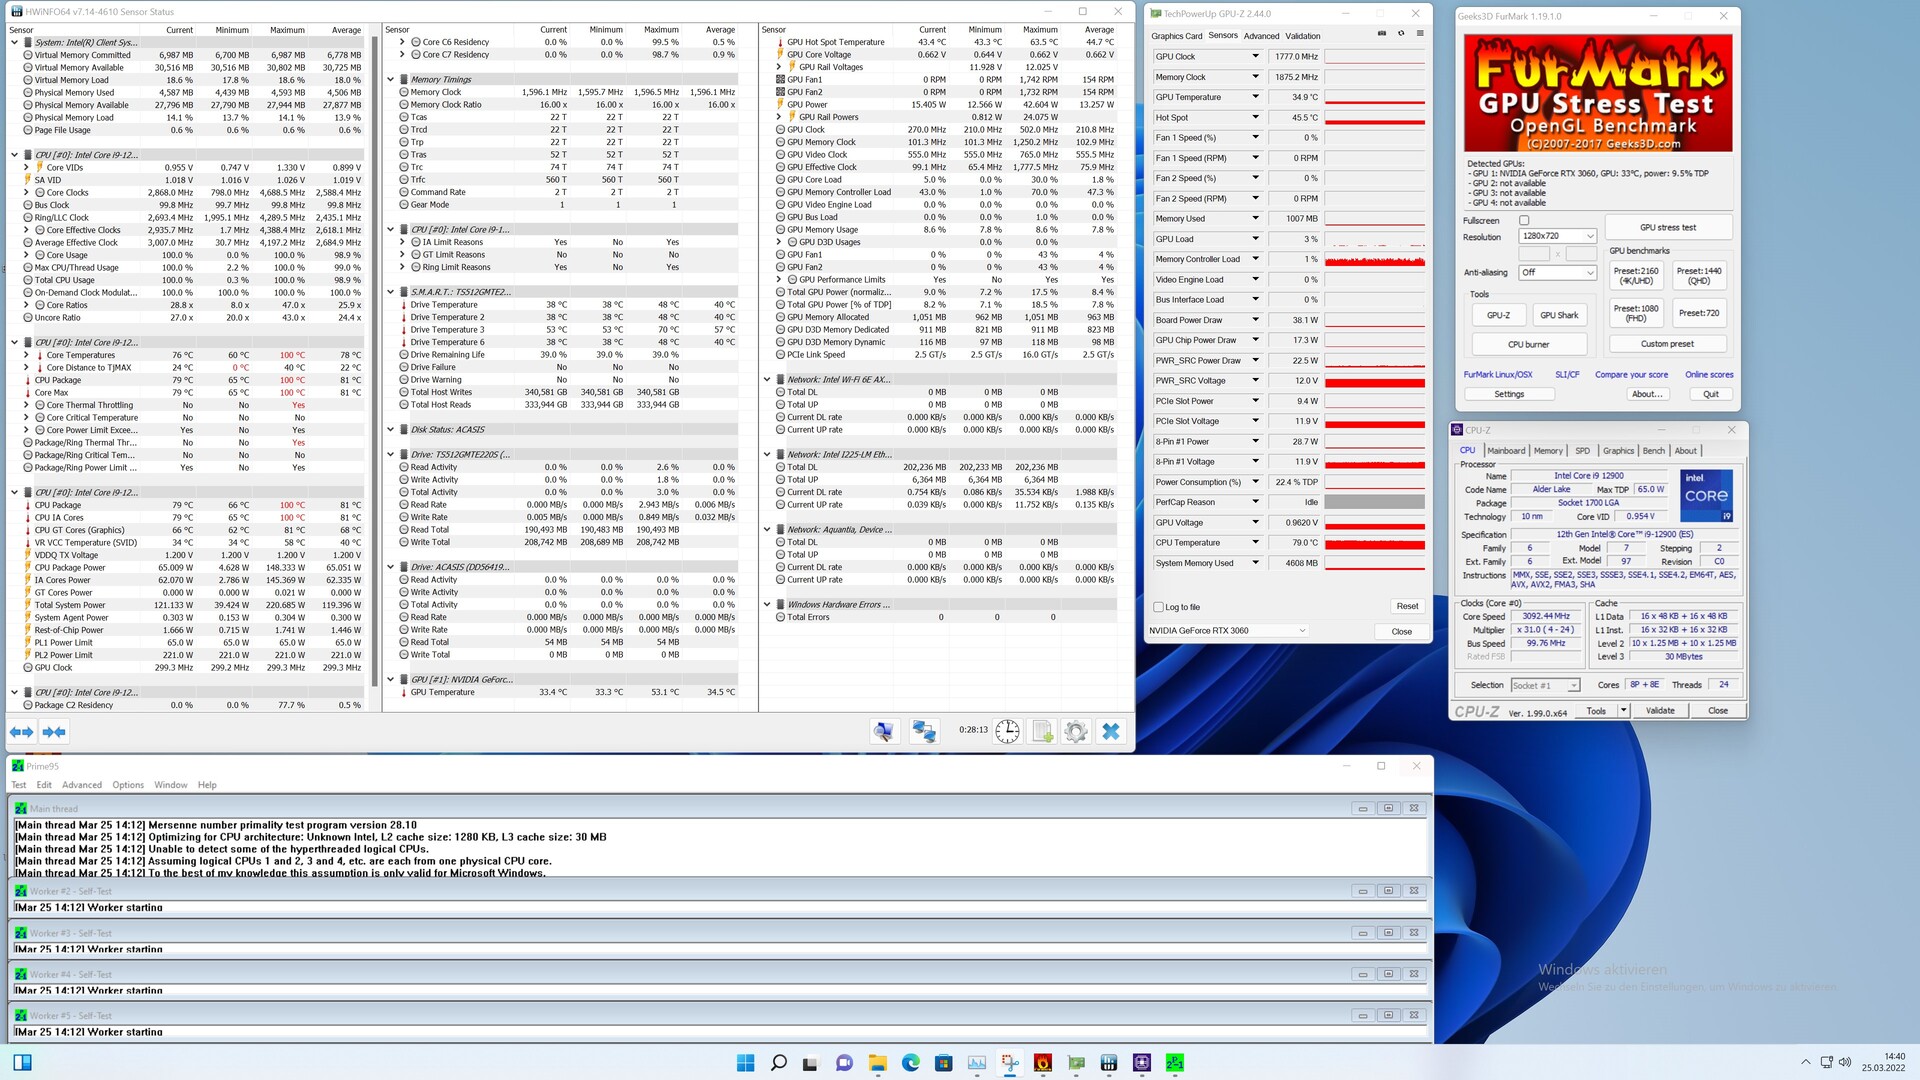
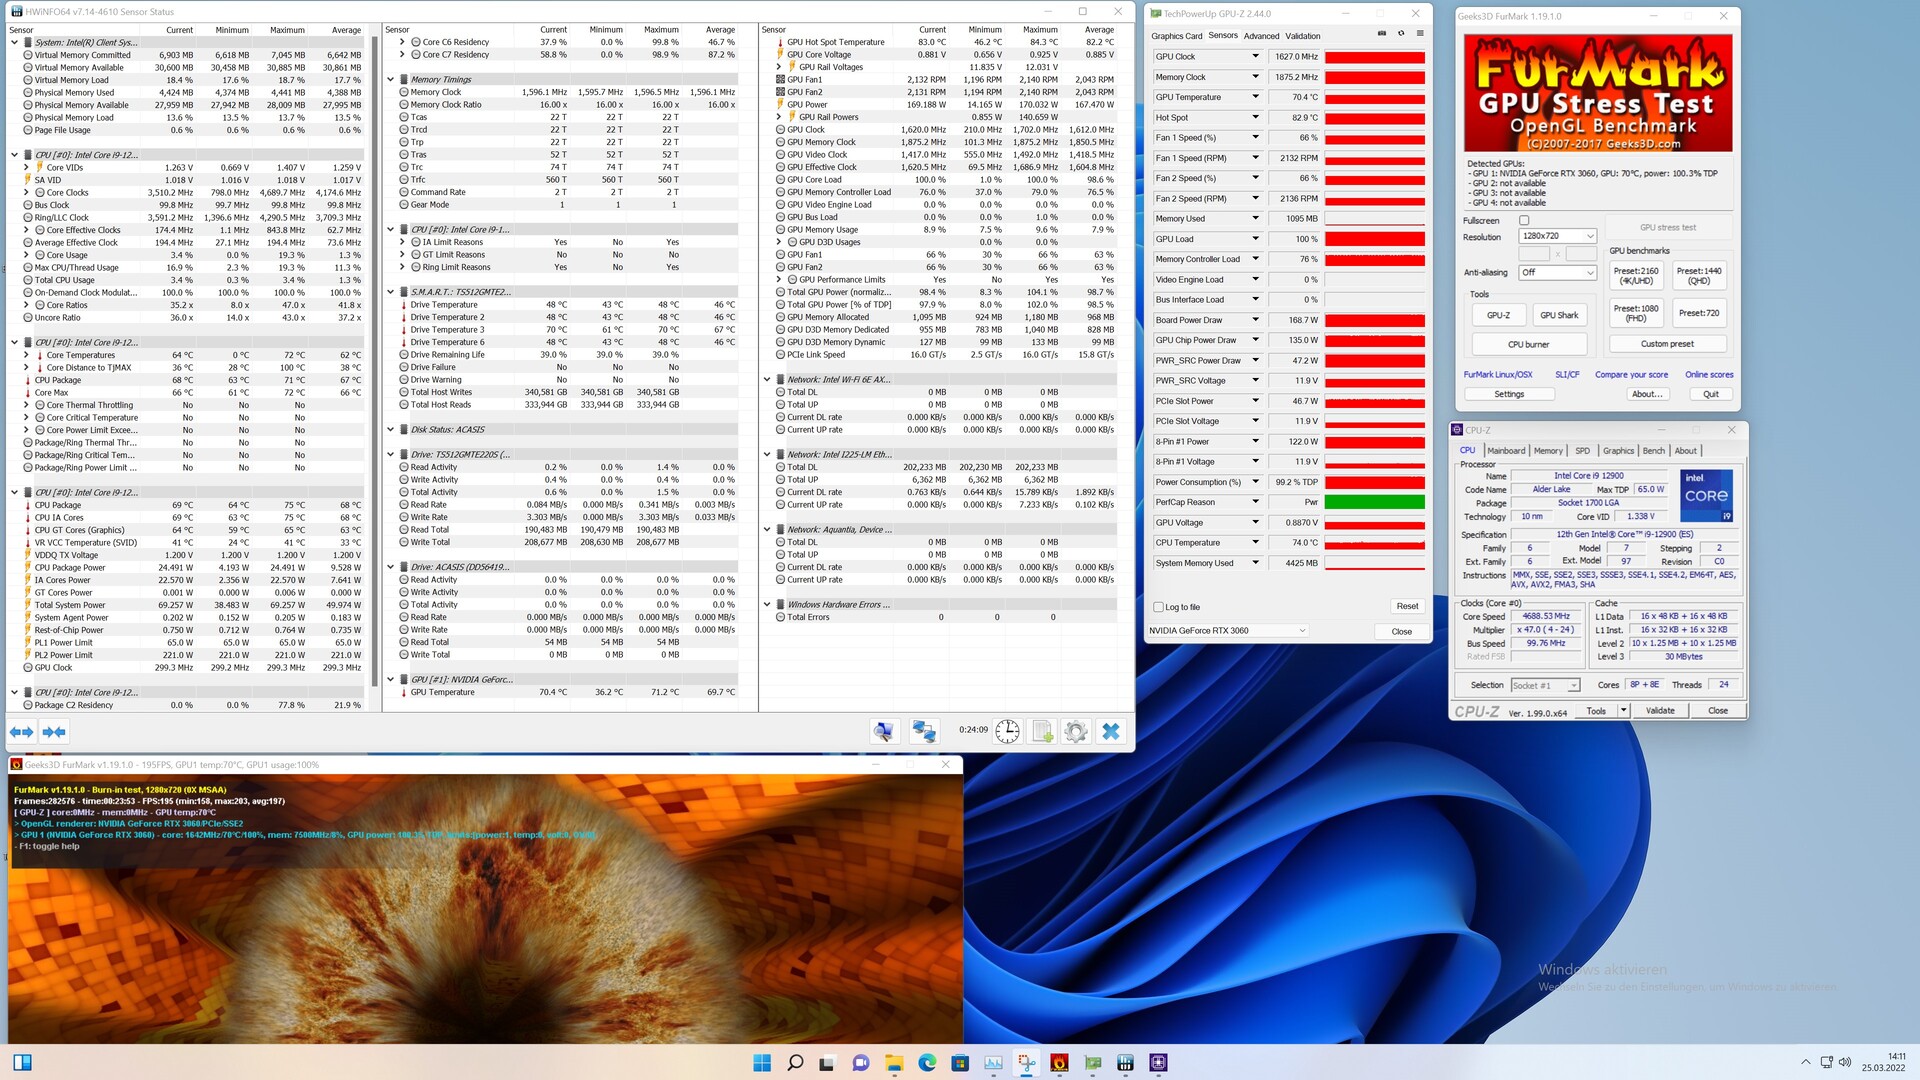
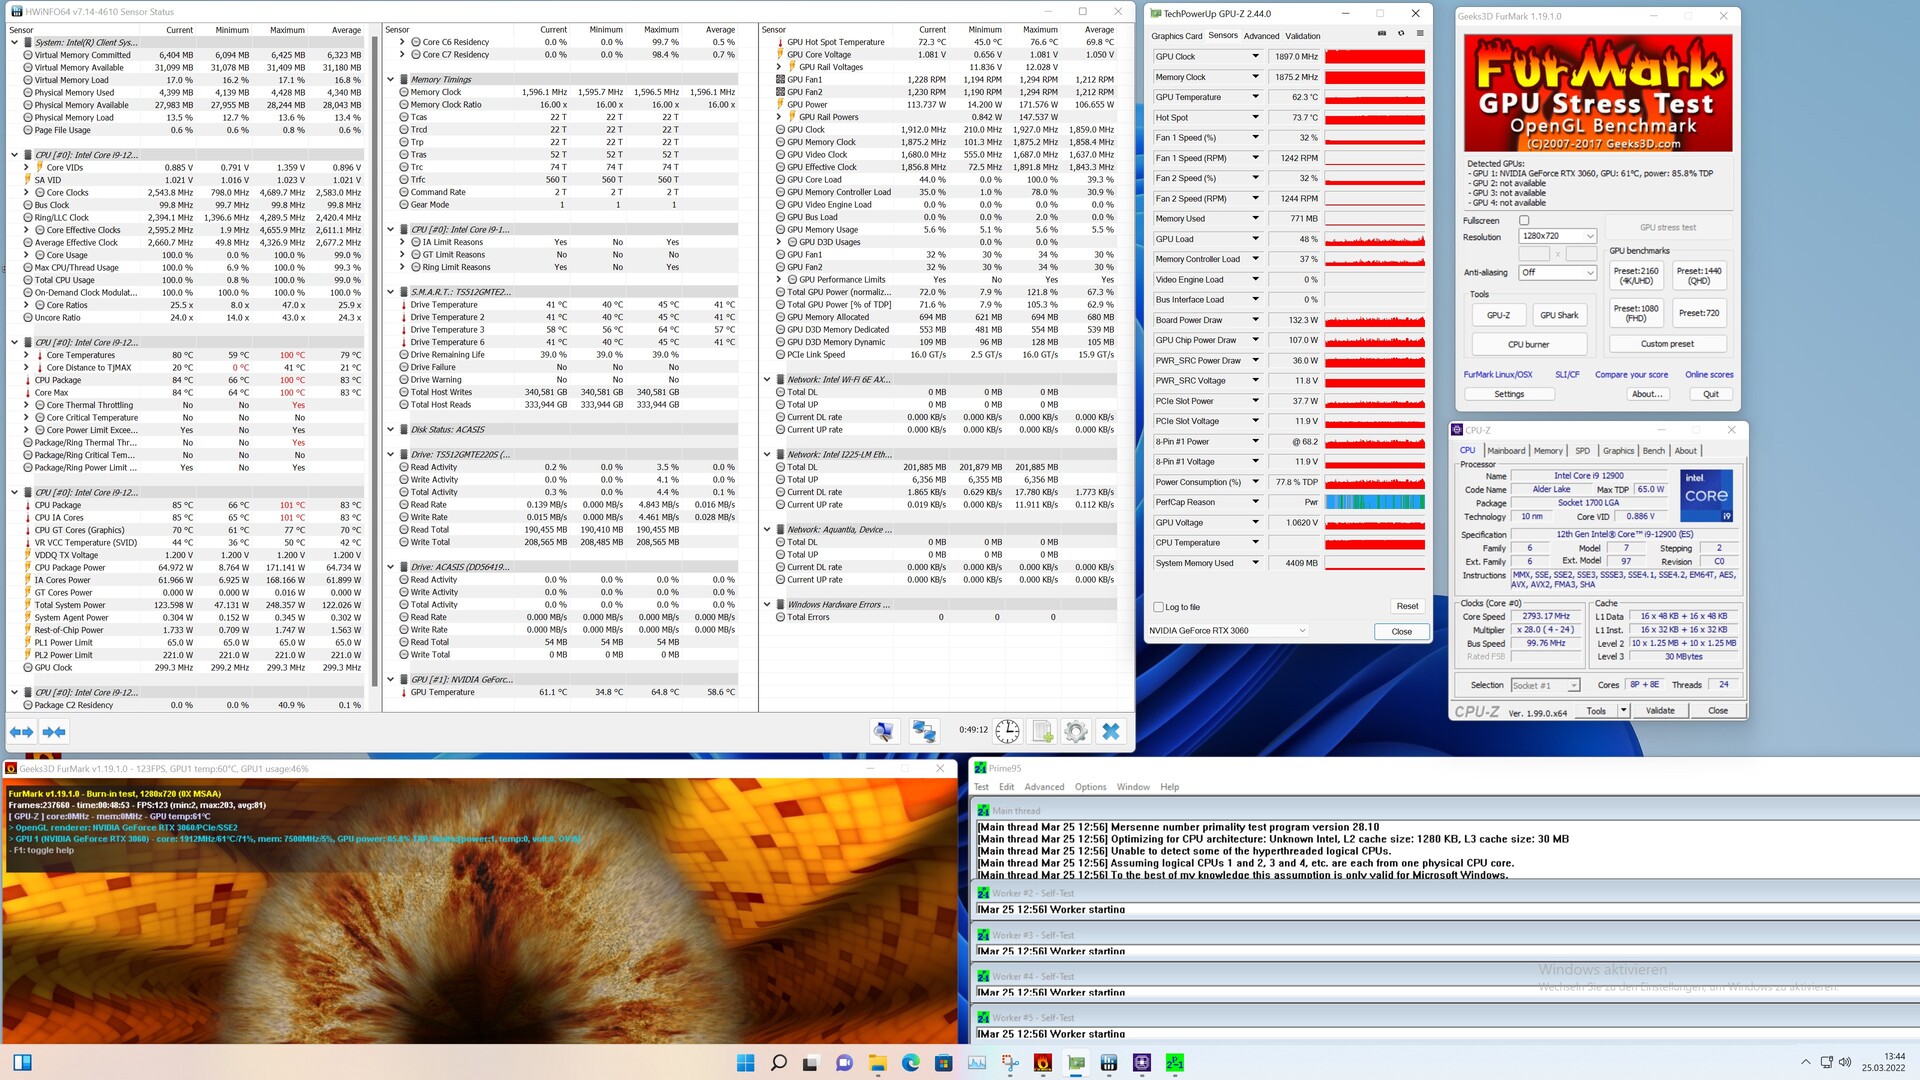
Consommation d'énergie, développement de la chaleur et bruit de l'Intel NUC 12 Dragon Canyon

Intel NUC 12 Dragon Canyon pendant le test de stress

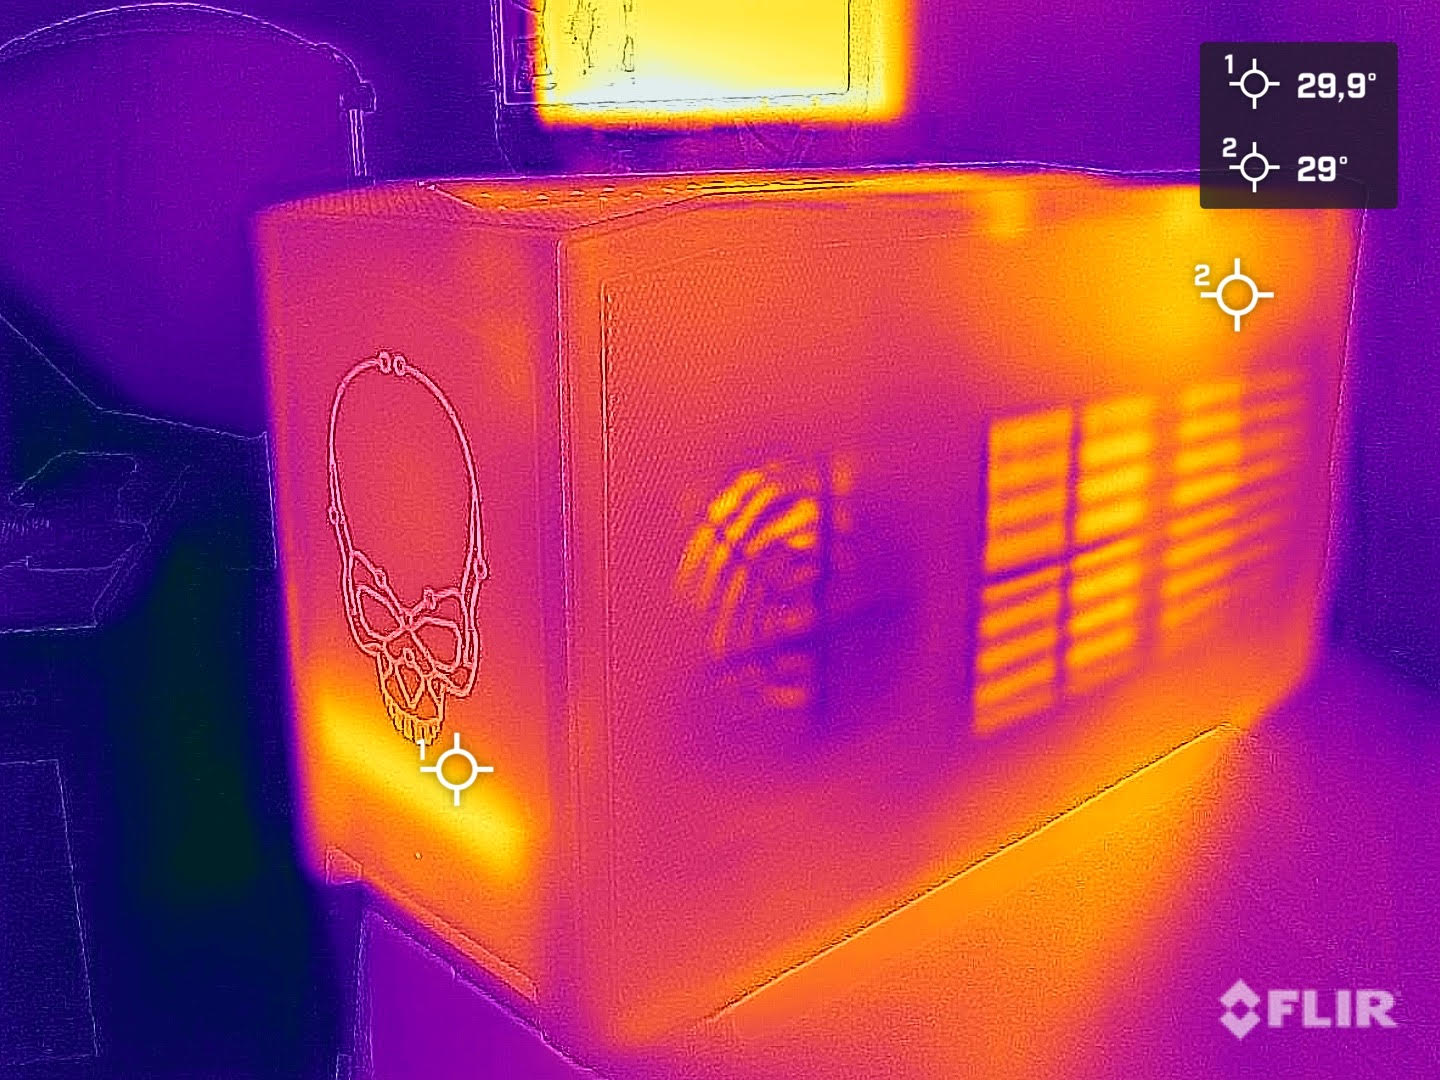
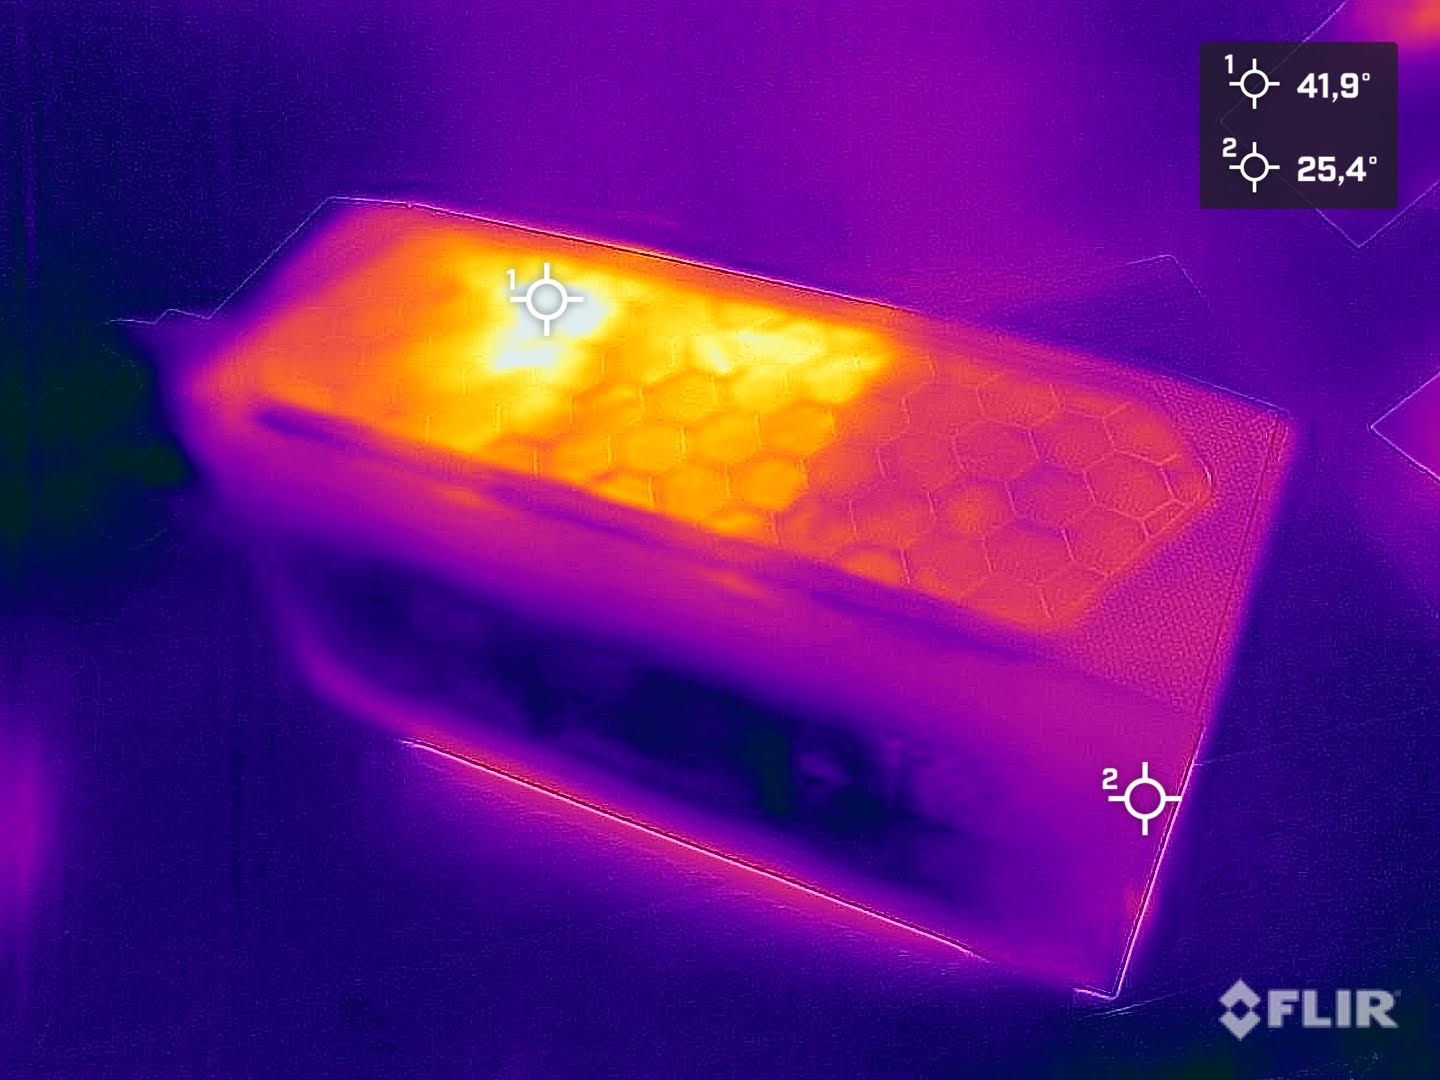
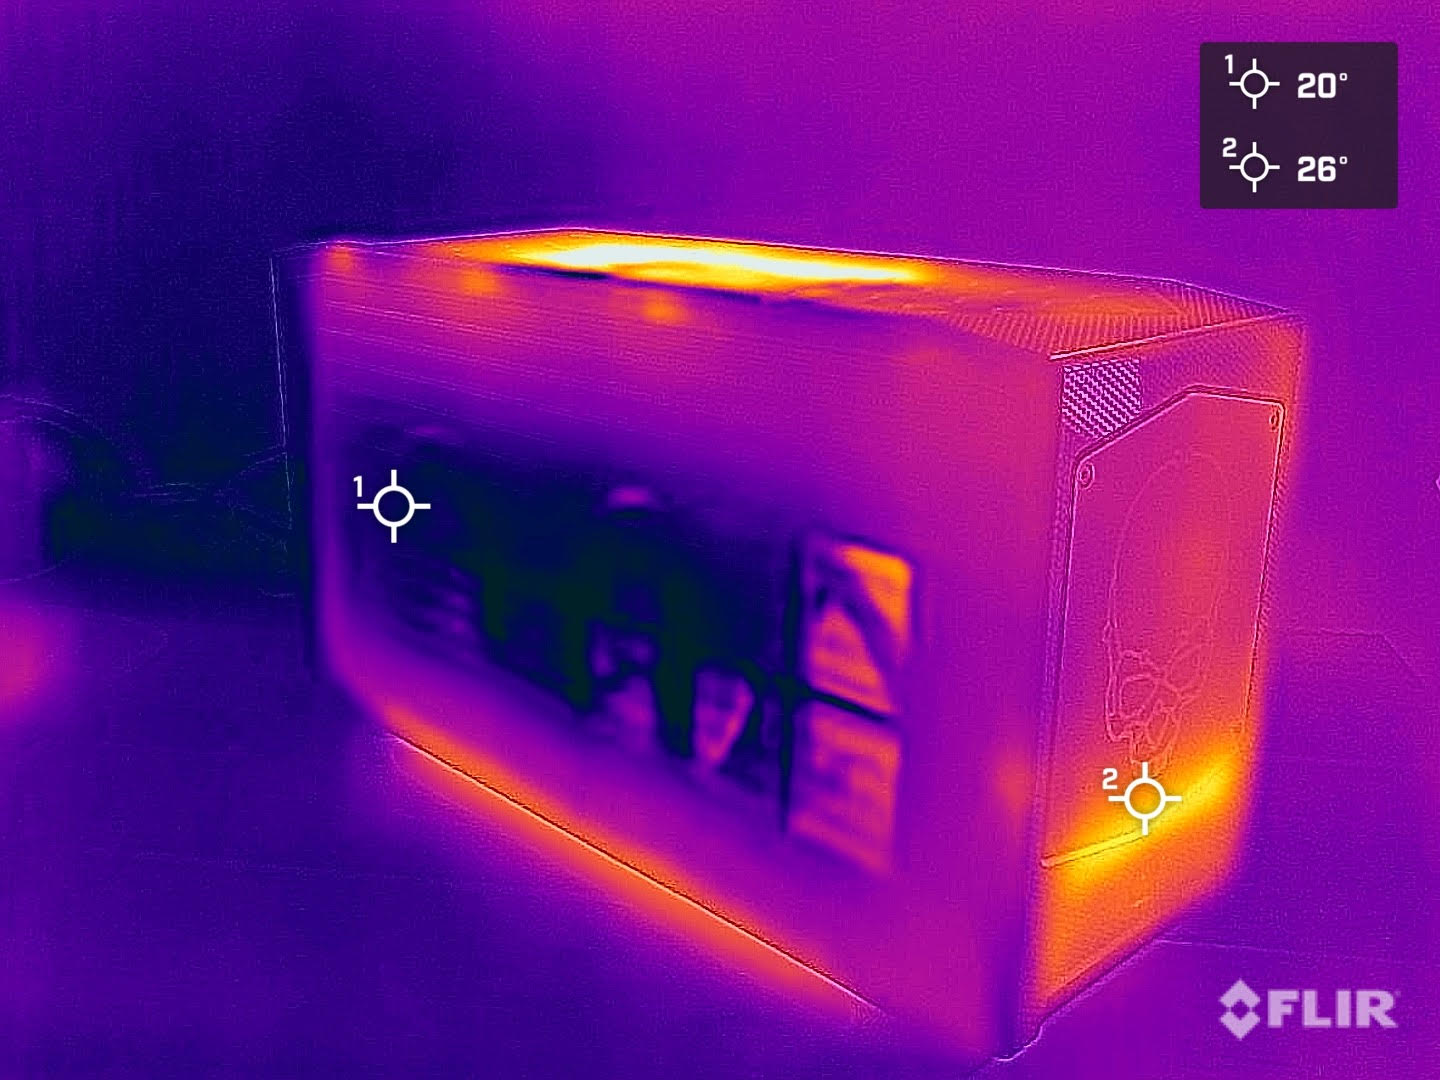
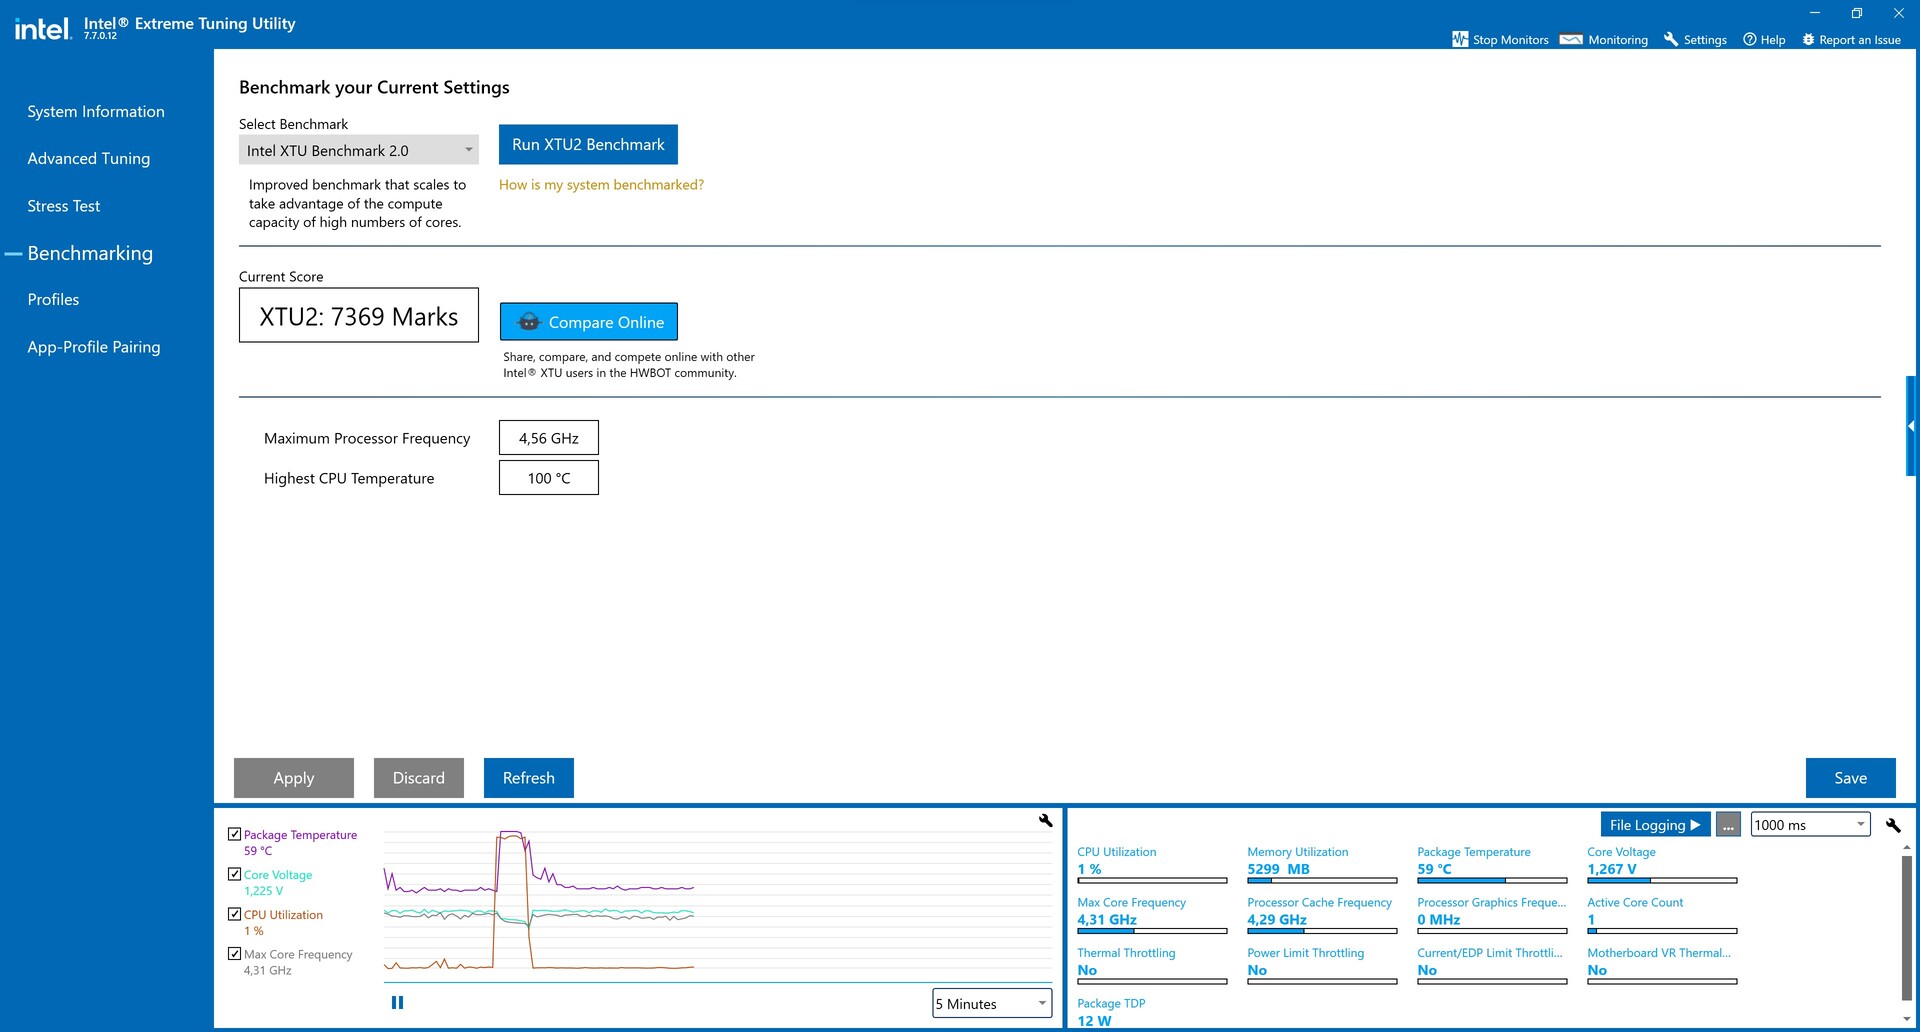
Dans l'Intel NUC 12 Extreme Kit, l'Intel Core i9-12900 apporte une consommation d'énergie significativement plus élevée par rapport à l'Intel NUC 11 Extreme Kit. En raison du TDP plus élevé du Intel Core i9-12900 par rapport au Intel Core i9-11900KB ce résultat était déjà attendu. En comparaison avec les deux autres systèmes Alder Lake que nous avons également listés ici, la consommation d'énergie du NUC Intel Dragon Canyon s'avère cependant significativement plus faible. La raison en est simple : l'unité de refroidissement relativement petite atteint rapidement ses limites avec l'Intel Core i9-12900 sous charge, de sorte que les performances du processeur doivent être réduites. En charge, la température limite de 100 °C est presque toujours atteinte rapidement. Dans le test de stress avec Prime95, la limite de température est déjà atteinte après quelques secondes. Cependant, l'Intel Core i9-12900 tourne toujours à près de 2,6 GHz en moyenne, ce qui est encore légèrement supérieur à la vitesse d'horloge de base (2,4 GHz). Nous devons également mentionner que la limite de température n'est atteinte que très brièvement. Sur l'ensemble du test, la température moyenne est de 78 °C, ce qui est une valeur raisonnable dans l'ensemble. Nous observons également une image similaire lors de la charge simultanée du CPU et du GPU

La construction compacte présente un gros inconvénient. Le NUC Beast Canyon d'Intel pouvait déjà être entendu clairement sous charge. Intel fait un peu mieux avec le Dragon Canyon NUC, bien qu'il soit encore clairement audible à 45.1 dB(A) à pleine charge. Mais en fonctionnement à vide ou sous faible charge, le système reste silencieux pour la plupart. Nous entendons seulement le ronronnement des ventilateurs de temps en temps, mais en raison de sa basse fréquence, le bruit du ventilateur est relativement confortable.

Degré de la nuisance sonore

Au repos
30.2 / 30.4 / 30.8 dB(A)
Fortement sollicité
/ 45.1 dB(A)
  red to green bar
 
 
30 dB
silencieux
40 dB(A)
audible
50 dB(A)
bruyant
 
min: dark, med: mid, max: light   Earthworks M23R, Arta (à 15 cm de distance)   bruit ambiant: 30.2 dB(A)
Power Consumption
1920x1080 The Witcher 3 ultra (external Monitor)
Intel Core i9-12900K
NVIDIA Titan RTX, i9-12900K, Intel Optane 905P 480GB 2.5 (Idle: 70.5 W)
463 (439min - 490max) Watt * -68%
AMD Ryzen 9 3950X
NVIDIA Titan RTX, R9 3950X, Intel Optane 905P 480GB 2.5 (Idle: 95 W)
423.6 (400min - 442max) Watt * -54%
Intel Core i7-12700K
NVIDIA Titan RTX, i7-12700K, Intel Optane 905P 480GB 2.5 (Idle: 81 W)
419.7 (402min - 454max) Watt * -53%
Intel Core i9-10900K
NVIDIA Titan RTX, i9-10900K, WDC PC SN720 SDAQNTW-512G (Idle: 52.3 W)
396.2 (380min - 475max) Watt * -44%
Intel Core i5-10600K
NVIDIA Titan RTX, i5-10600K (Idle: 52.2 W)
386.9 (380min - 404max) Watt * -41%
Corsair One i160
GeForce RTX 2080 Ti (Desktop), i9-9900K, Samsung PM961 NVMe MZVLW512HMJP (Idle: 51.5 W)
359 (348min - 374max) Watt * -31%
Intel Dragon Canyon NUC - RTX 3060
NVIDIA GeForce RTX 3060, i9-12900, Transcend M.2 SSD 2200S TS512GMTE220S
275 (270min, 270P1 - 306max) Watt *
Intel Ghost Canyon NUC (RTX 2070)
GeForce RTX 2070 (Desktop), i9-9980HK, Kingston KC2500 1 TB SKC2500M81000G (Idle: 33.1 W)
237.1 (227min - 263max) Watt * +14%
Intel Beast Canyon NUC
NVIDIA GeForce RTX 3060, i9-11900KB, Sabrent Rocket 4.0 500GB (Idle: 32 W)
229.9 (219min - 254max) Watt * +16%
Prime95 V2810 Stress (external Monitor)
Intel Core i7-12700K
NVIDIA Titan RTX, i7-12700K, Intel Optane 905P 480GB 2.5 (Idle: 81 W)
281 (250min - 366max) Watt * -86%
Intel Core i9-12900K
NVIDIA Titan RTX, i9-12900K, Intel Optane 905P 480GB 2.5 (Idle: 70.5 W)
279.6 (261min - 357max) Watt * -85%
Intel Core i9-10900K
NVIDIA Titan RTX, i9-10900K, WDC PC SN720 SDAQNTW-512G (Idle: 52.3 W)
275.7 (254min - 385max) Watt * -83%
Intel Core i5-10600K
NVIDIA Titan RTX, i5-10600K (Idle: 52.2 W)
204.4 (191min - 261max) Watt * -35%
AMD Ryzen 9 3950X
NVIDIA Titan RTX, R9 3950X, Intel Optane 905P 480GB 2.5 (Idle: 95 W)
198.8 (185min - 240max) Watt * -32%
Intel Dragon Canyon NUC - RTX 3060
NVIDIA GeForce RTX 3060, i9-12900, Transcend M.2 SSD 2200S TS512GMTE220S
151 (143min, 144P1 - 326max) Watt *
Intel Beast Canyon NUC
NVIDIA GeForce RTX 3060, i9-11900KB, Sabrent Rocket 4.0 500GB (Idle: 34 W)
112.9 (108min - 135max) Watt * +25%
Intel Ghost Canyon NUC (RTX 2070)
GeForce RTX 2070 (Desktop), i9-9980HK, Kingston KC2500 1 TB SKC2500M81000G (Idle: 33.1 W)
109.4 (107min - 151max) Watt * +28%
Cinebench R15 Multi (external Monitor)
Intel Core i9-12900K
NVIDIA Titan RTX, i9-12900K, Intel Optane 905P 480GB 2.5 (Idle: 70.5 W)
324.4 Watt * -57%
Intel Core i7-12700K
NVIDIA Titan RTX, i7-12700K, Intel Optane 905P 480GB 2.5 (Idle: 81 W)
278.2 (151min - 298max) Watt * -35%
Intel Core i9-10900K
NVIDIA Titan RTX, i9-10900K, WDC PC SN720 SDAQNTW-512G (Idle: 52.3 W)
268.5 (265min - 270max) Watt * -30%
AMD Ryzen 9 3950X
NVIDIA Titan RTX, R9 3950X, Intel Optane 905P 480GB 2.5 (Idle: 95 W)
219.5 (218min - 225max) Watt * -7%
Intel Dragon Canyon NUC - RTX 3060
NVIDIA GeForce RTX 3060, i9-12900, Transcend M.2 SSD 2200S TS512GMTE220S
206 (140min, 145P1 - 261max) Watt *
Intel Core i5-10600K
NVIDIA Titan RTX, i5-10600K (Idle: 52.2 W)
172.5 (170min - 176max) Watt * +16%
Intel Beast Canyon NUC
NVIDIA GeForce RTX 3060, i9-11900KB, Sabrent Rocket 4.0 500GB (Idle: 32 W)
123.9 (73min - 147max) Watt * +40%
Temperatures - CPU Temperature Prime95
Intel Dragon Canyon NUC - RTX 3060
NVIDIA GeForce RTX 3060, i9-12900, Transcend M.2 SSD 2200S TS512GMTE220S
100 °C
Intel Core i9-10900K
NVIDIA Titan RTX, i9-10900K, WDC PC SN720 SDAQNTW-512G
88 °C -12%
AMD Ryzen 9 3950X
NVIDIA Titan RTX, R9 3950X, Intel Optane 905P 480GB 2.5
83.8 °C -16%
Intel Core i5-10600K
NVIDIA Titan RTX, i5-10600K
70 °C -30%

* ... Moindre est la valeur, meilleures sont les performances

Intel NUC 12 Extreme Kit Dragon Canyon - consommation d'énergie au ralenti
Intel NUC 12 Extreme Kit Dragon Canyon - consommation électrique Prime95
Intel NUC 12 Extreme Kit Dragon Canyon - consommation électrique FurMark
Intel NUC 12 Extreme Kit Dragon Canyon - consommation électrique Prime95 et FurMark
Intel NUC 12 Extreme Kit Dragon Canyon - consommation d'énergie Cinebench R15 nT
Intel NUC 12 Extreme Kit Dragon Canyon - consommation d'énergie The Witcher 3 (Ultra preset)
Intel NUC 12 Extreme Kit Dragon Canyon - Stress test Prime95 solo
Intel NUC 12 Extreme Kit Dragon Canyon - Test de résistance FurMark solo
Intel NUC 12 Extreme Kit Dragon Canyon - Test de stress Prime95 et FurMark

Points positifs

+ boîtier robuste et compact
+ Core i9 à 16 cœurs et 24 threads
+ processeur socké
+ hautes performances du système
+ bloc d'alimentation 650 W avec facteur de forme SFX
+ nombreuses options de connexion
+ 2 x Thunderbolt 4
+ Lecteur de cartes SD UHS-II
+ Wi-Fi 6E
+ lAN 10Gbe

Points négatifs

- clairement audible sous charge
- l'unité de refroidissement atteint rapidement ses limites
- compatibilité limitée avec les cartes d'extension

Verdict - Une bête de somme compacte

Test du NUC Intel Dragon Canyon - NUC12DCMi9. Unité de test fournie par Intel Allemagne.

L'Intel NUC 12 Dragon Canyon est une petite mise à jour de l'Intel NUC 11 Extreme Kit alias Beast Canyon. Avec le nouveau CPU Alder Lake, Intel effectue une certaine maintenance du produit, en retirant l'ancien processeur Tiger Lake. En outre, il y a pour la première fois un CPU socké dans le Compute Element, permettant l'utilisation de différents processeurs. En termes de performances pures, ce que l'Intel Core i9-12900 est capable de fournir est légèrement meilleur que le Intel Core i9-11900KB. En même temps, la construction compacte n'offre qu'un espace limité pour un refroidissement approprié. En charge, cela atteint très vite ses limites avec un Intel Core i9-12900 non accéléré, le faisant atteindre à plusieurs reprises la limite de température.

À ce stade, le prix d'achat du système barebone est de 1450 euros (~1585 dollars). Si vous incluez le reste des composants tels que la RAM, le SSD et le GPU, l'Intel NUC 12 Dragon Canyon n'est pas beaucoup plus cher que d'autres systèmes complets. C'est donc au client qu'incombe la responsabilité du choix. Si vous aimez le design de l'Intel NUC 12 Dragon Canyon, vous pouvez le choisir sans aucune réserve. La variété des connexions le rend pérenne et leur nombre est également suffisant. Il y a même un lecteur de carte SD rapide qui prend en charge la norme UHS-II.

Avec le kit Intel NUC 12 Extreme, alias Dragon Canyon, Intel place à nouveau la barre plus haut pour ses appareilscompacts en termesde performances.

Enfin, il nous reste à répondre à la question que nous avons posée au début. Si l'on en juge uniquement par son apparence, nous considérerions plutôt l'Intel NUC 12 Dragon Canyon comme faisant partie du segment des jeux. En raison des performances du processeur Alder Lake et de l'iGPU, le système convient également comme PC de bureau haut de gamme. Dans le même temps, vous avez également la possibilité d'insérer une carte graphique professionnelle, ce qui transforme le système en une station de travail complète. Vous pouvez alors facilement utiliser le petit Intel NUC Dragon Canyon pour le traitement d'images et de vidéos

L'alternative à l'Intel NUC 12 Extreme Kit Dragon Canyon serait de construire un système vous-même, ce qui coûterait probablement à peu près le même prix. Avec leZotac Magnus Oneil y a aussi une bonne alternative si vous voulez un PC de jeu très compact.

Please share our article, every link counts!
> Revues et rapports de ordinateurs portatifs et smartphones, ordiphones > Critiques > Test de l'Intel NUC 12 Dragon Canyon avec Intel Core i9-12900
Sebastian Bade, 2022-04- 6 (Update: 2022-04- 6)