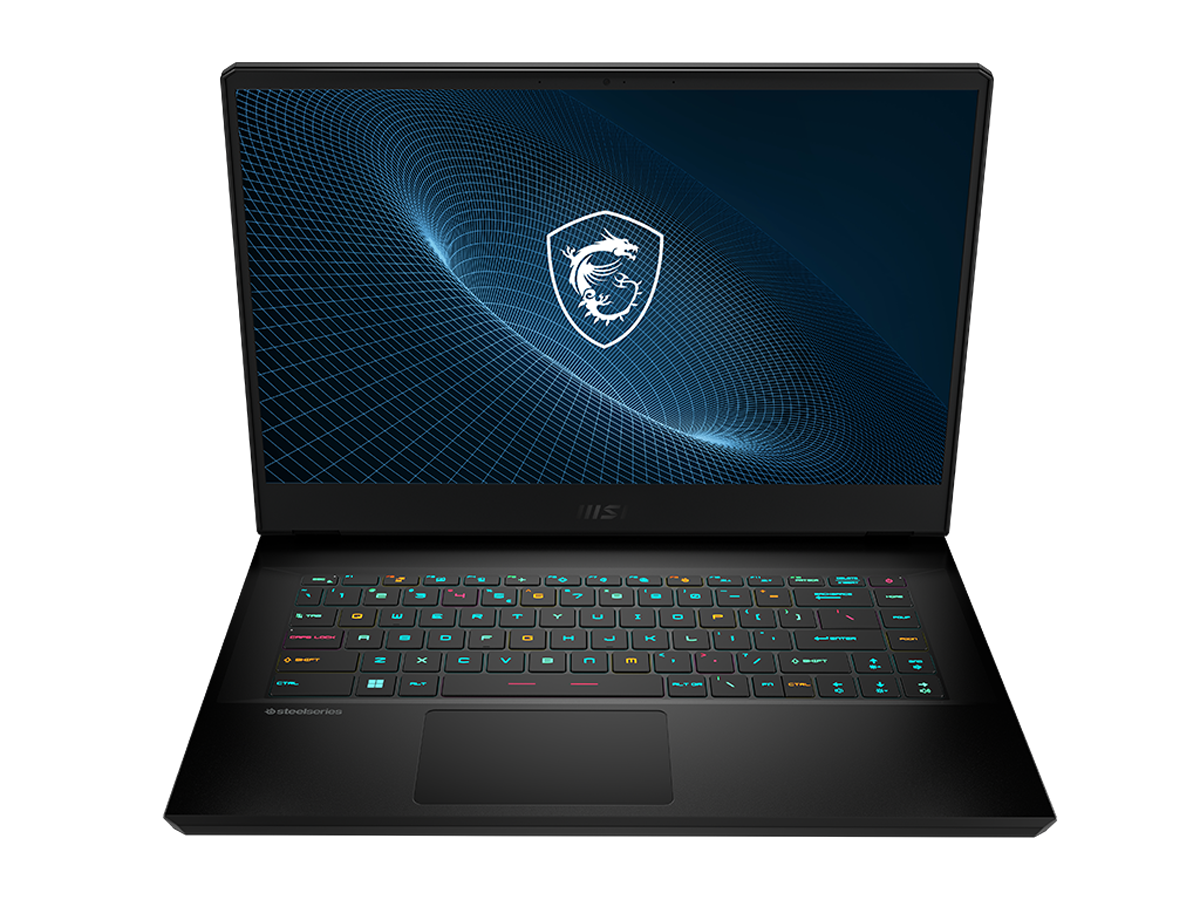
Test de l'ordinateur portable MSI Vector GP66 12UGS : 150 W TGP GeForce RTX 3070 Ti sweet spot
MSI a été l'un des premiers acteurs majeurs à proposer des ordinateurs portables de jeu Alder Lake-H de 12e génération au début du mois dernier. Bien que les nouveaux modèles MSI soient visuellement presque identiques aux modèles de 11e génération de l'année dernière, ils sont dotés de processeurs et de GPU plus rapides ainsi que de nouvelles options d'affichage que les passionnés peuvent apprécier.
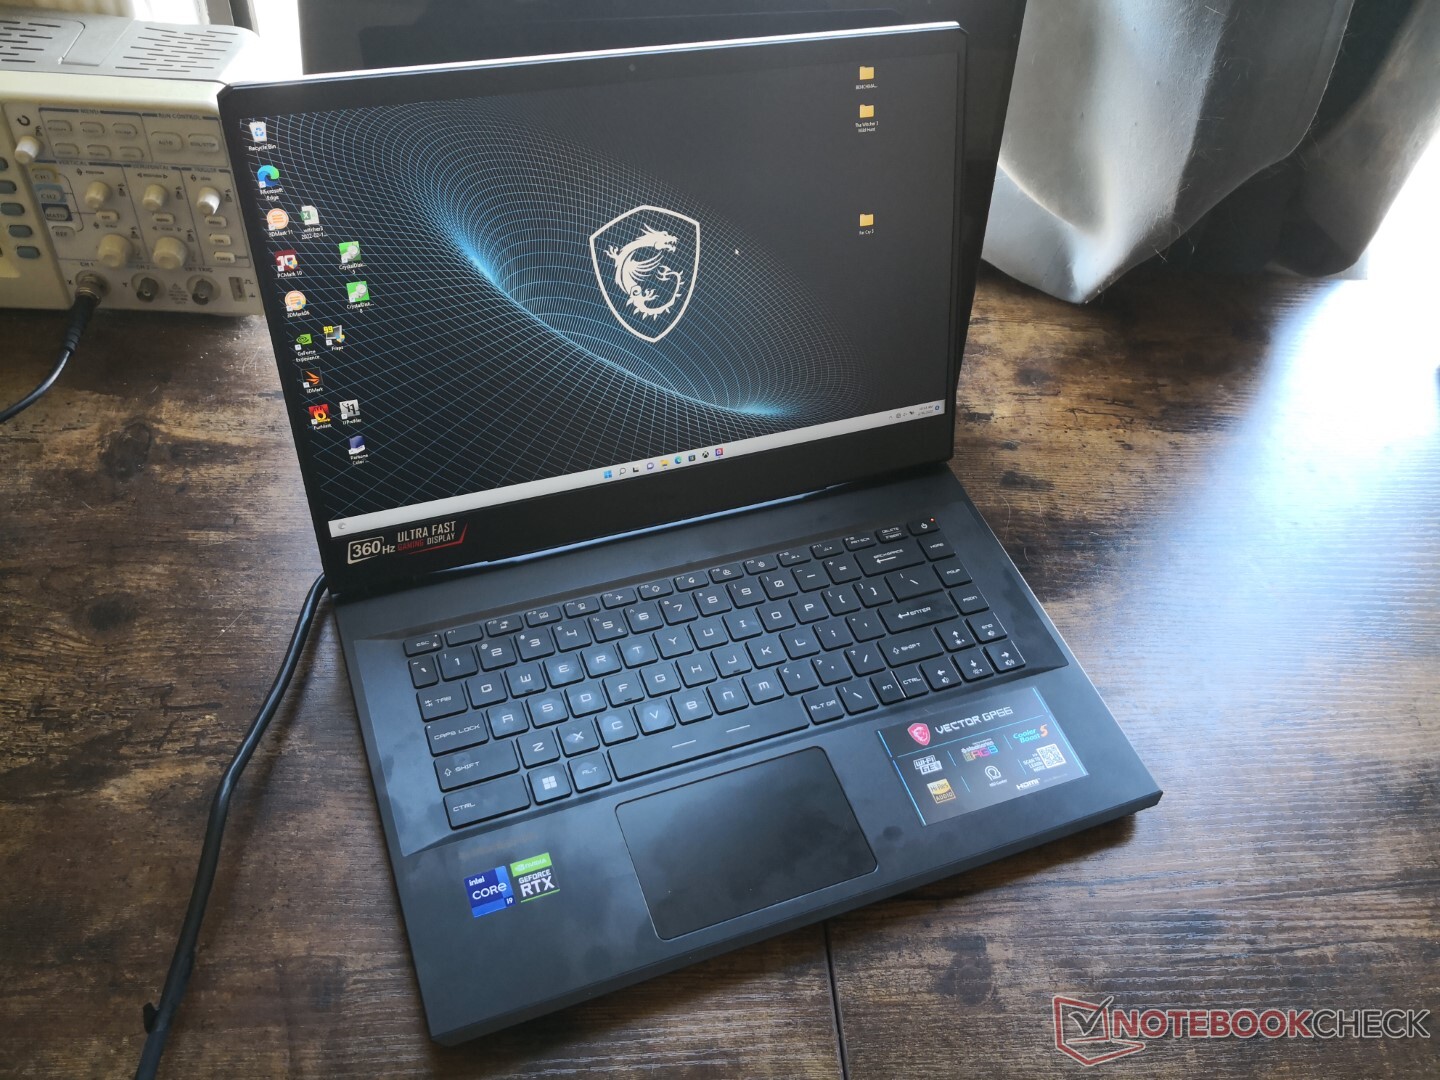
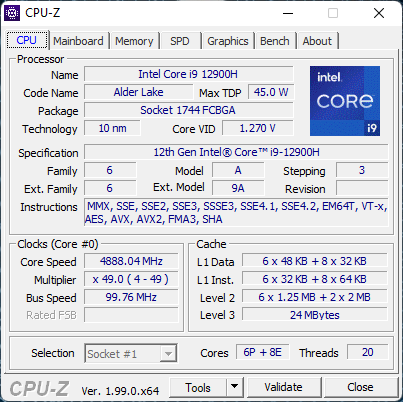
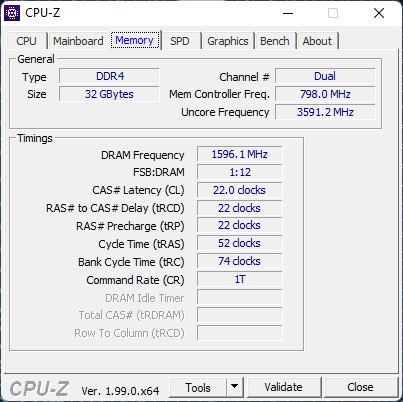
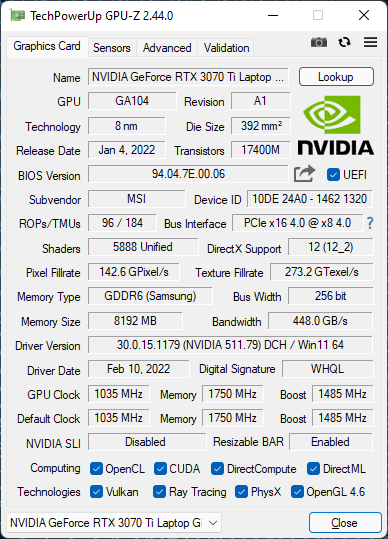
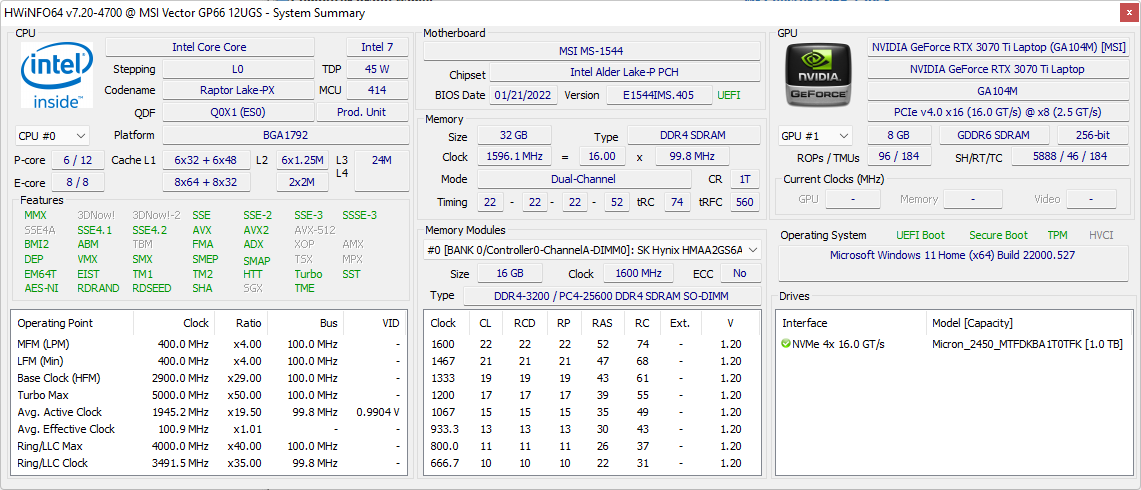
L'unité examinée aujourd'hui est le Vector GP66 qui succède au GP66 Leopard. Notre configuration spécifique avec le CPU Core i9-12900H, le GPU 150 W GeForce RTX 3070 Ti, 32 Go de RAM, un écran IPS 1080p 360 Hz et un SSD NVMe de 1 To peut être trouvée en ligne pour environ 2400 USD. D'autres SKU sont disponibles avec le RTX 3060, RTX 3080, un écran QHD 165 Hz ou FHD 144 Hz, ou le Core i7-12700H à la place.
Les alternatives au MSI Vector incluent d'autres ordinateurs portables de jeu de 15,6 pouces de milieu de gamme, comme les modèles suivants Série Asus ROG Strix, Le modèle de base Razer Blade 15, La série Dell G15ou la Lenovo Legion S7 series. Le MSI Vector ne doit pas être confondu avec le Maingear Vector.
Plus de commentaires sur MSI :
Comparaison avec les concurrents potentiels
Note | Date | Modèle | Poids | Épaisseur | Taille | Résolution | Prix |
|---|---|---|---|---|---|---|---|
| 86.9 % v7 (old) | 03/22 | MSI Vector GP66 12UGS i9-12900H, GeForce RTX 3070 Ti Laptop GPU | 2.3 kg | 23.4 mm | 15.60" | 1920x1080 | |
| 85.4 % v7 (old) | 12/21 | MSI GP66 Leopard 11UH-028 i7-11800H, GeForce RTX 3080 Laptop GPU | 2.3 kg | 23.4 mm | 15.60" | 1920x1080 | |
| 79.2 % v7 (old) | 09/21 | MSI Katana GF66 11UG-220 i7-11800H, GeForce RTX 3070 Laptop GPU | 2.3 kg | 25 mm | 15.60" | 1920x1080 | |
| 85.9 % v7 (old) | 06/21 | Asus TUF Gaming F15 FX506HM i7-11800H, GeForce RTX 3060 Laptop GPU | 2.3 kg | 24.9 mm | 15.60" | 1920x1080 | |
| 85.5 % v7 (old) | 03/21 | Razer Blade 15 Base Edition 2021, i7-10750H RTX 3060 i7-10750H, GeForce RTX 3060 Laptop GPU | 2.1 kg | 19.9 mm | 15.60" | 1920x1080 | |
| 84.7 % v7 (old) | 06/21 | Alienware m15 R5 Ryzen Edition R7 5800H, GeForce RTX 3060 Laptop GPU | 2.5 kg | 22.85 mm | 15.60" | 1920x1080 |
Cas
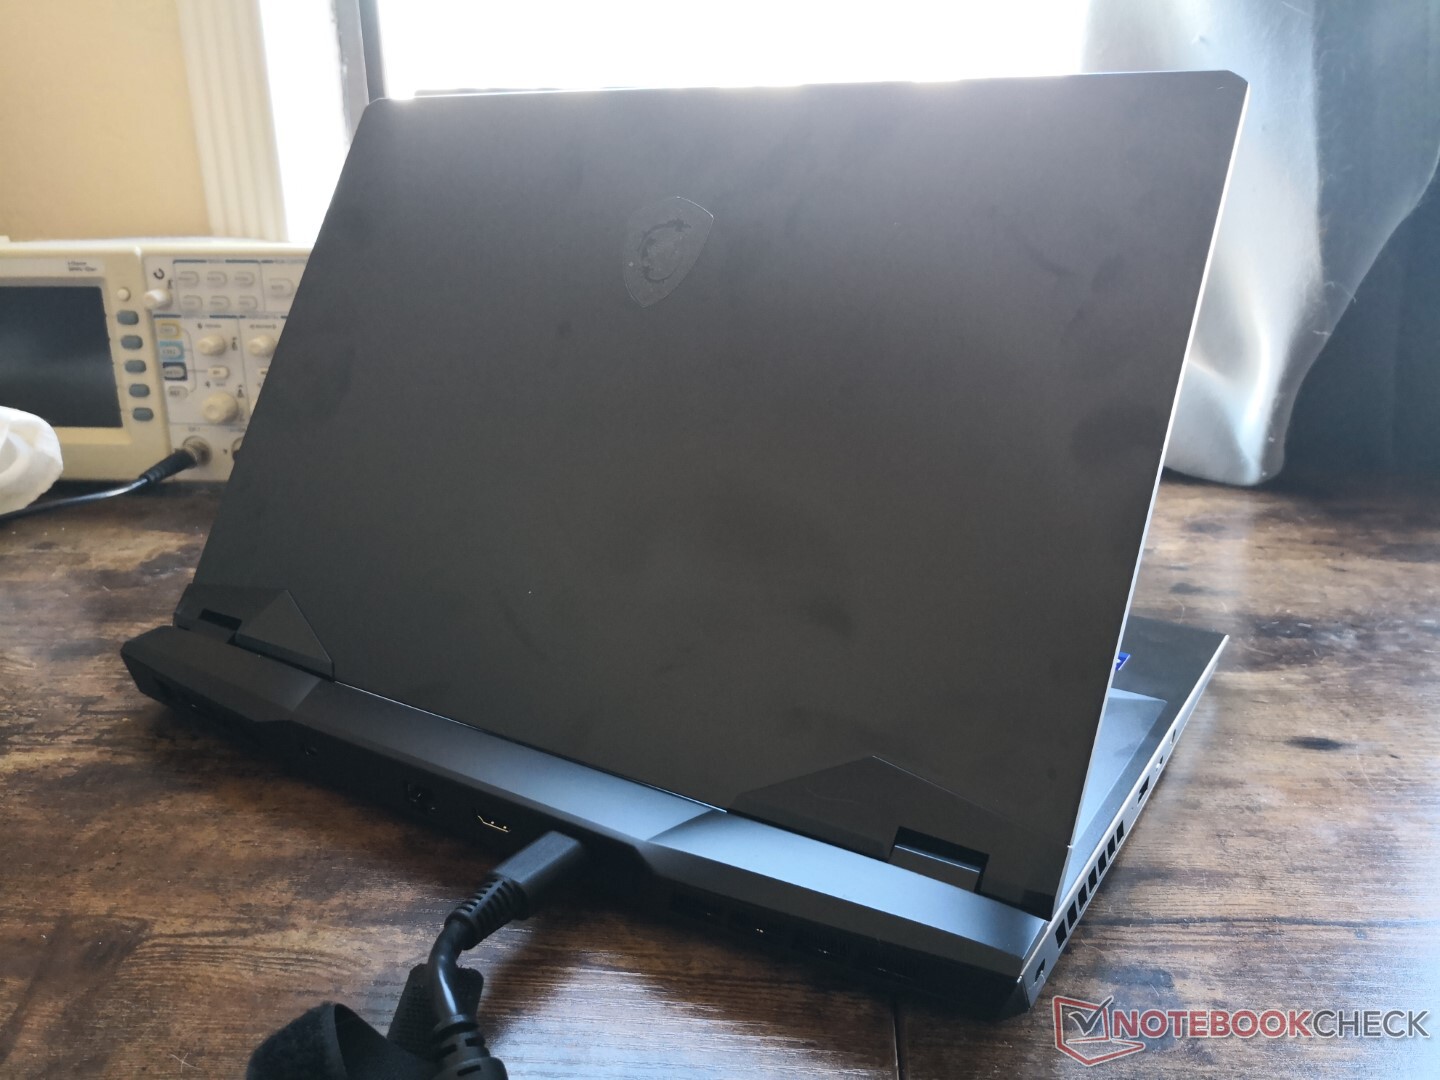
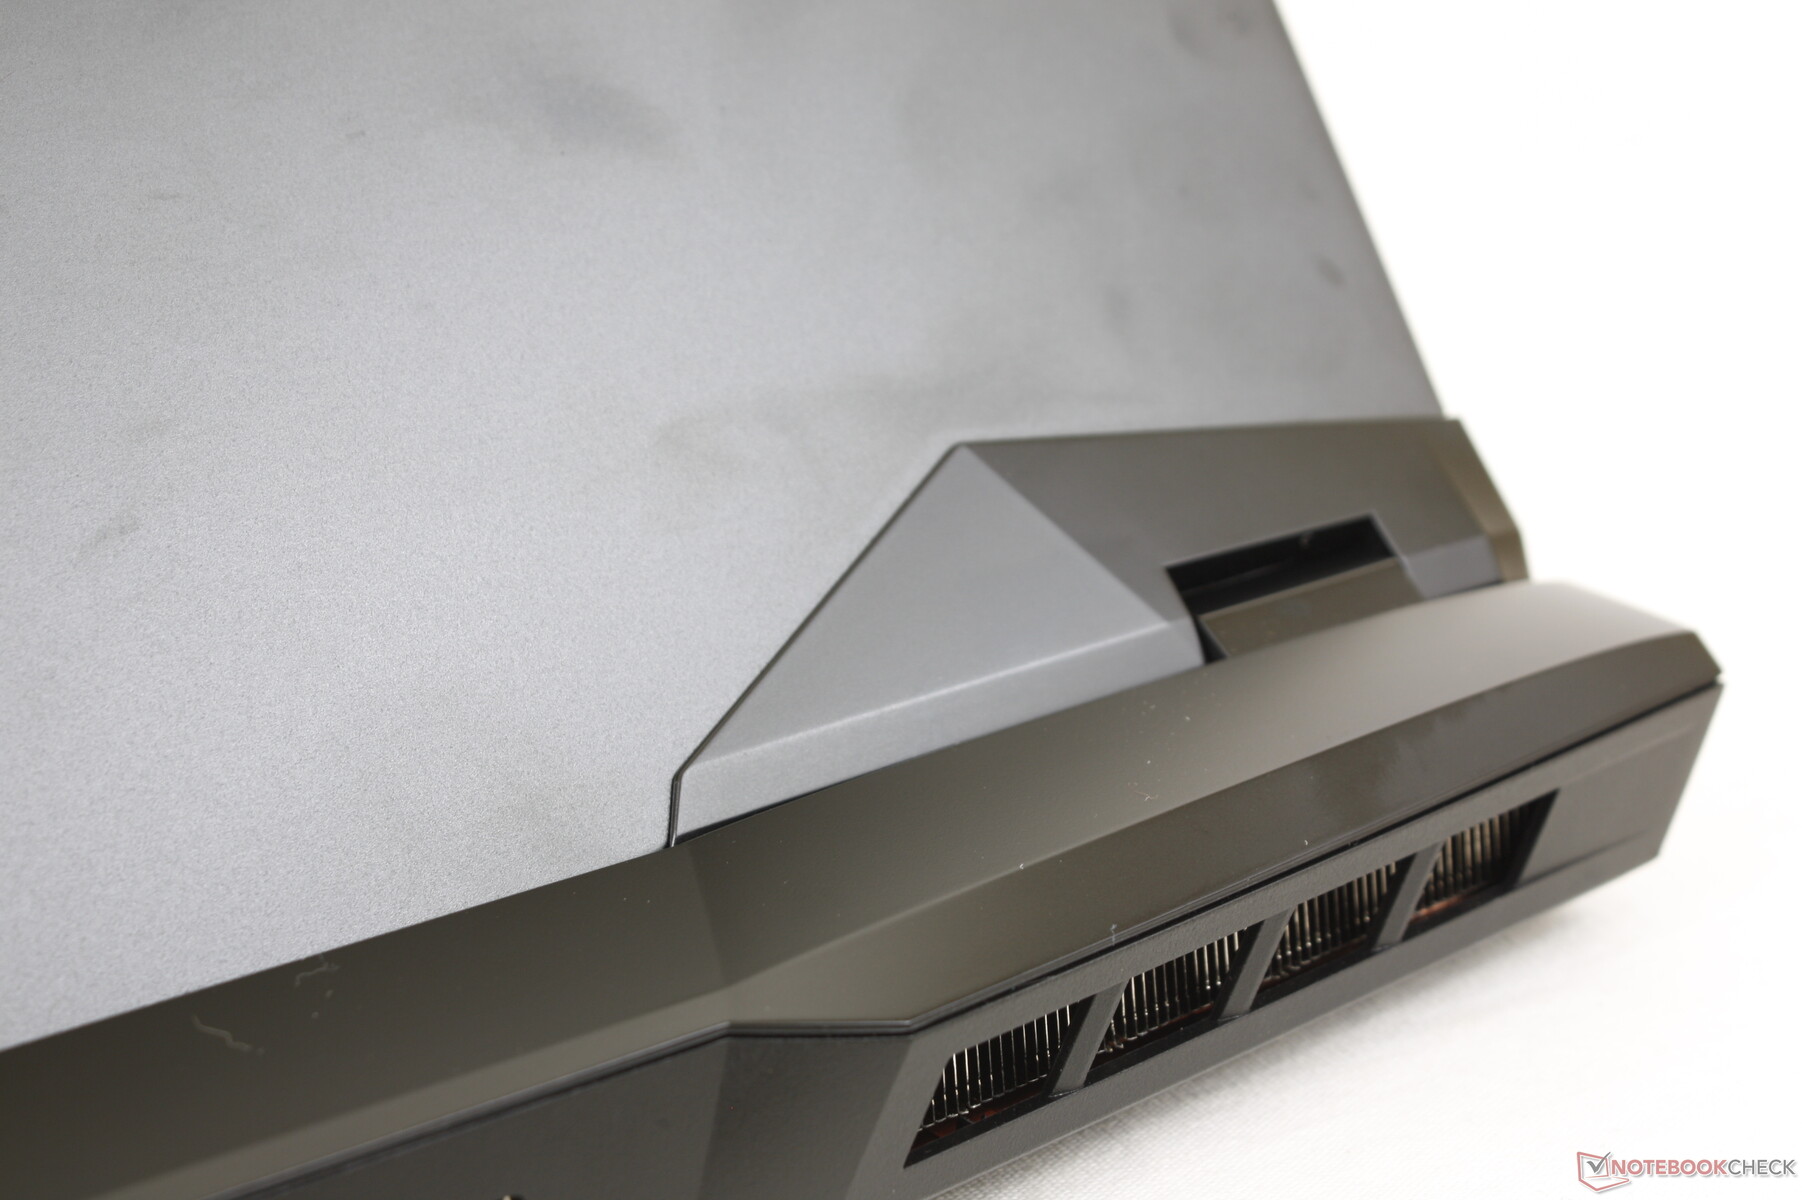
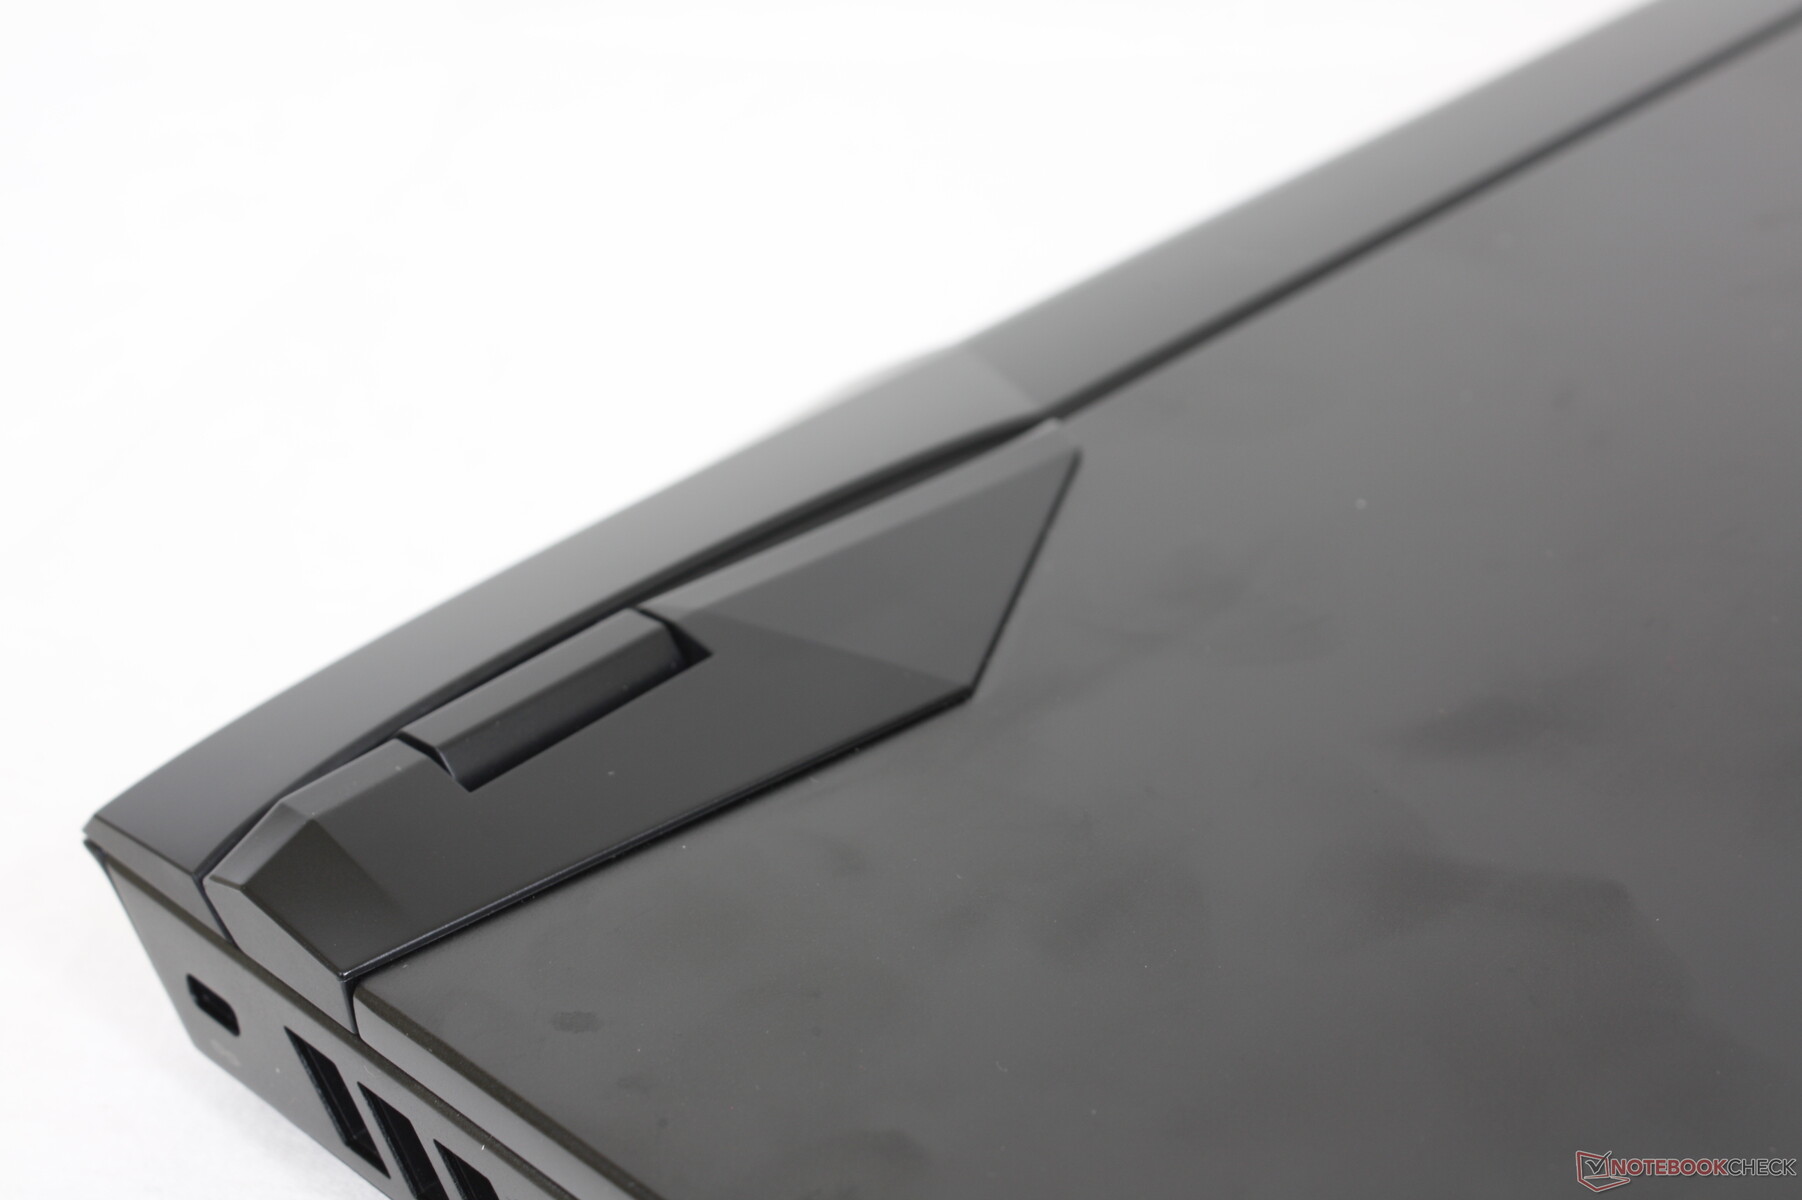
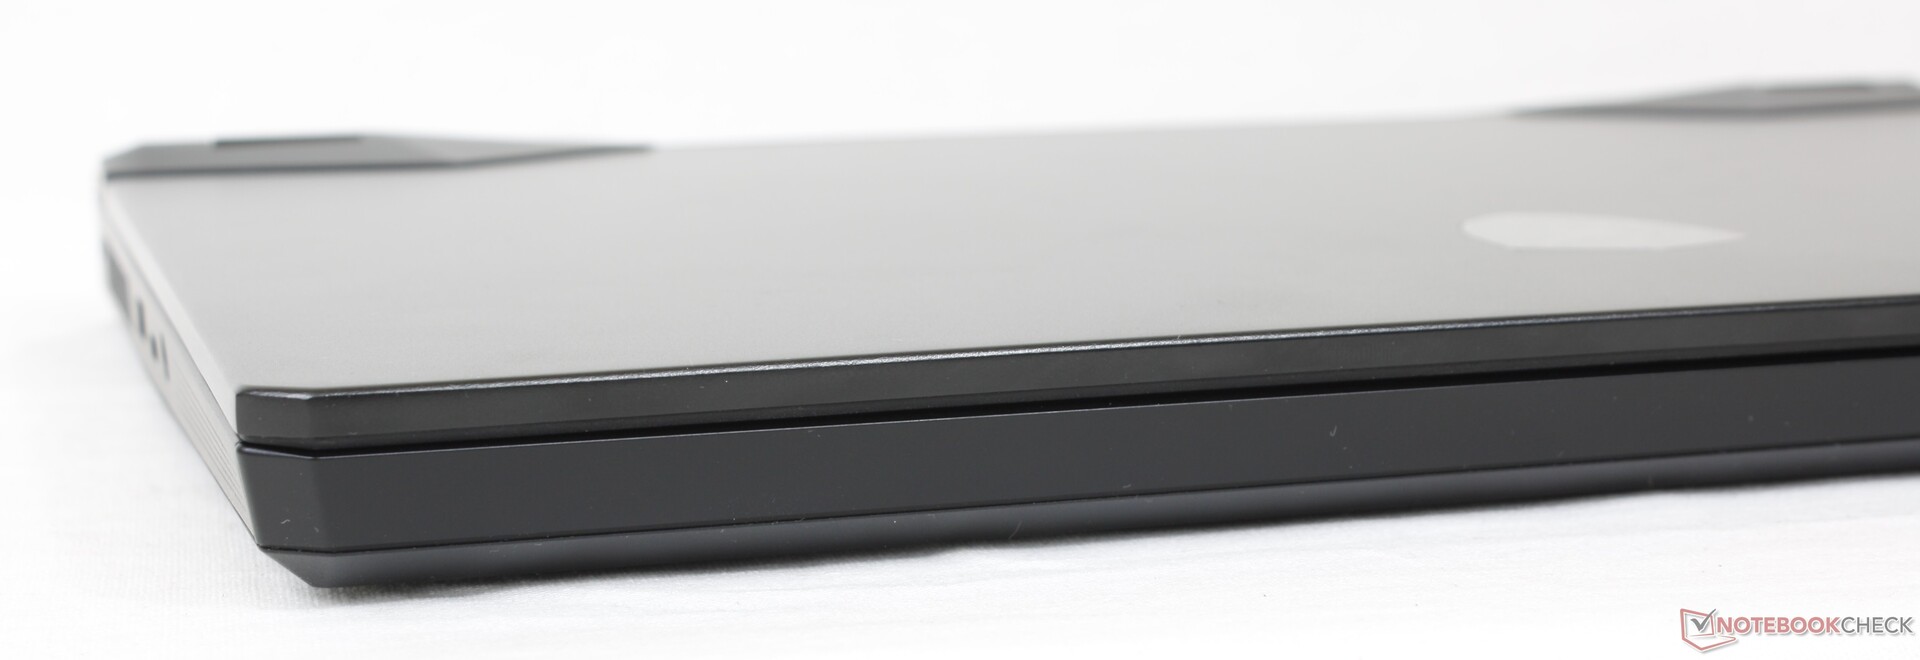
MSI a redessiné son GP66 au début de l'année dernière et il est donc encore trop tôt pour un autre rafraîchissement visuel. Ainsi, nous vous recommandons de consulter nos avis existants sur le GP66 avec Intel 10e génération et GP66 avec Intel 11ème génération car la plupart de nos commentaires sur le châssis sont toujours valables pour notre modèle GP66 12ème génération Intel. Il existe cependant quelques différences mineures concernant les ports, que nous allons aborder dans la section suivante.
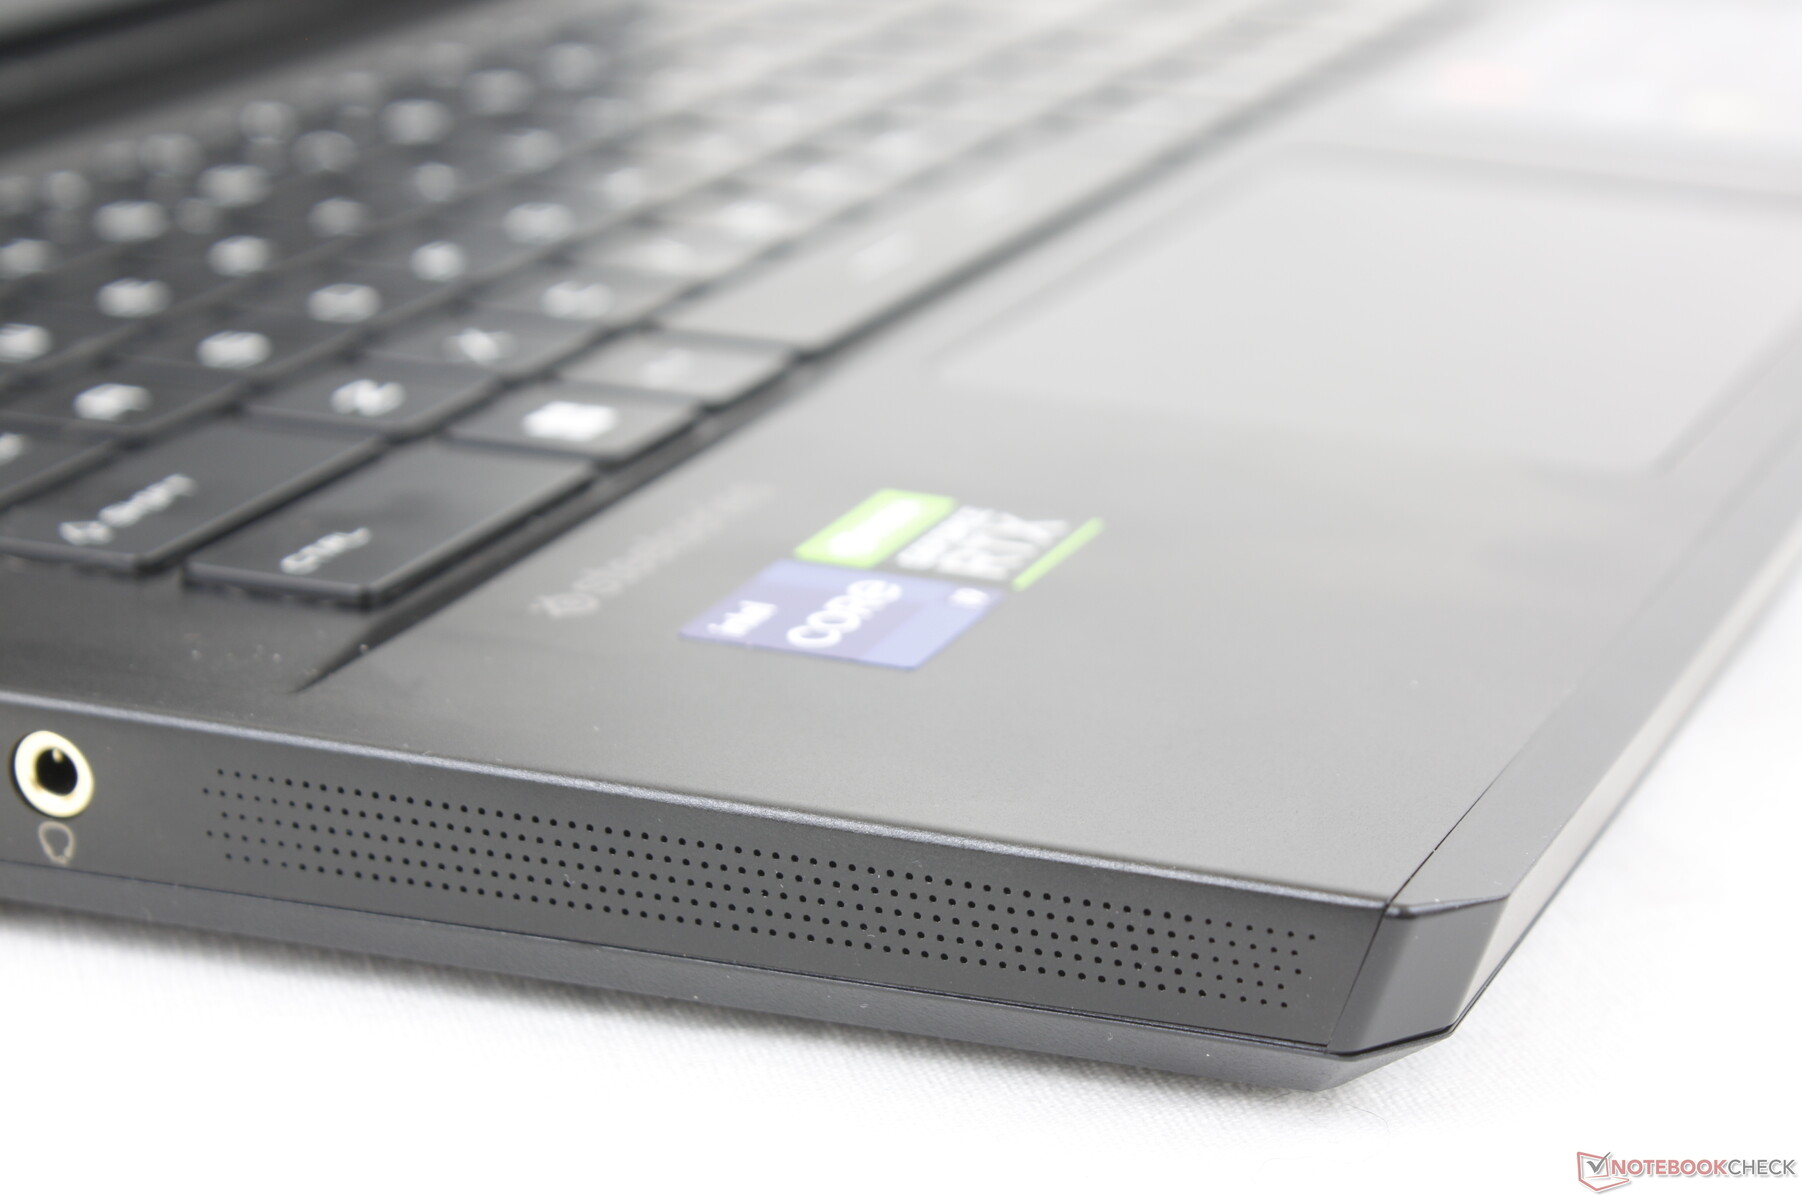
L'absence de changements majeurs signifie que le GP66 Vector 2022 souffre toujours des mêmes défauts que nous avons trouvés sur notre GP66 Leopard 2021. En particulier, la pièce de bordure avant de notre appareil se détachait parfois, laissant une première impression peu positive. Le design visuel est autrement un dérivé plus élégant et plus subtil des grandes séries GE ou GT.
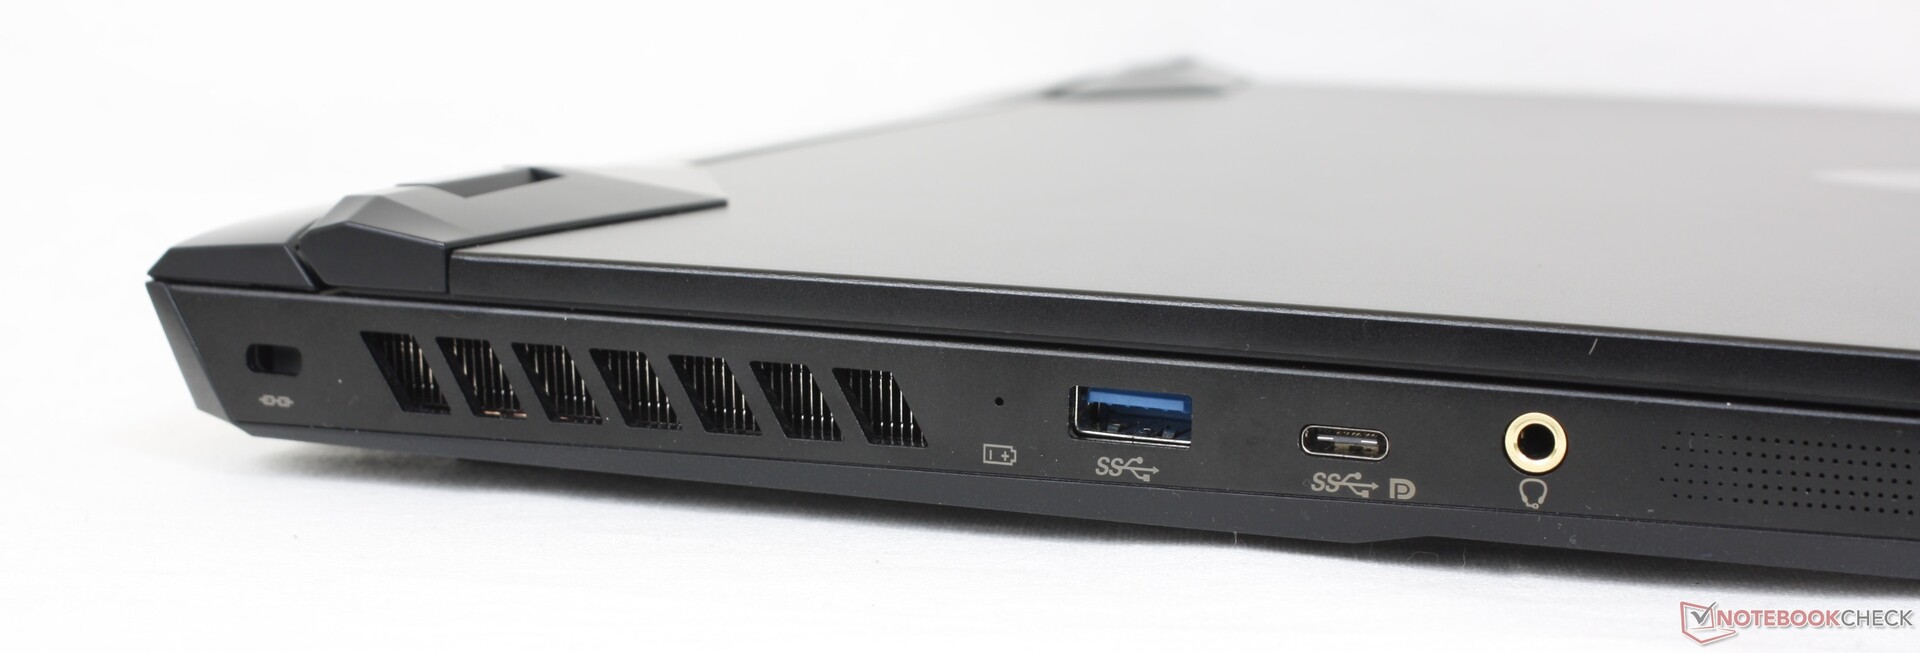
Connectivité
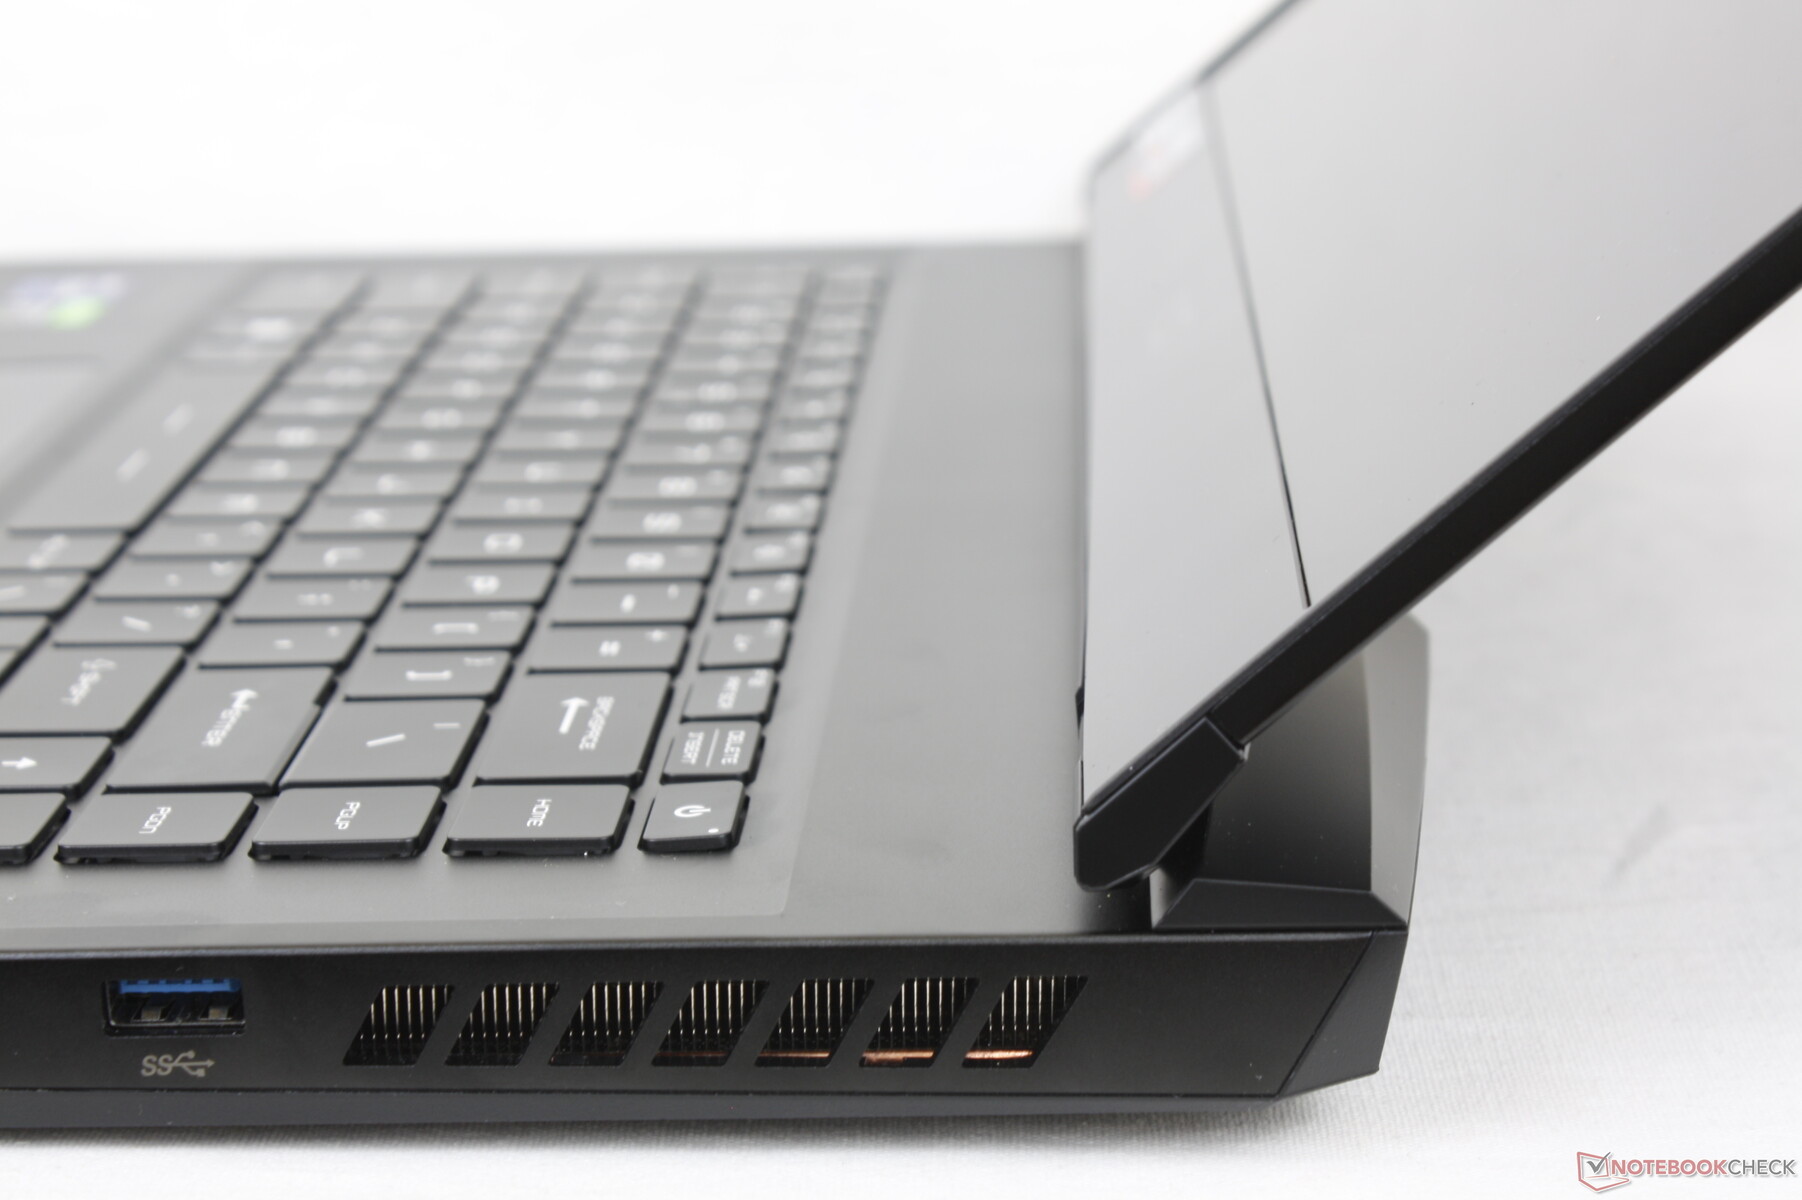
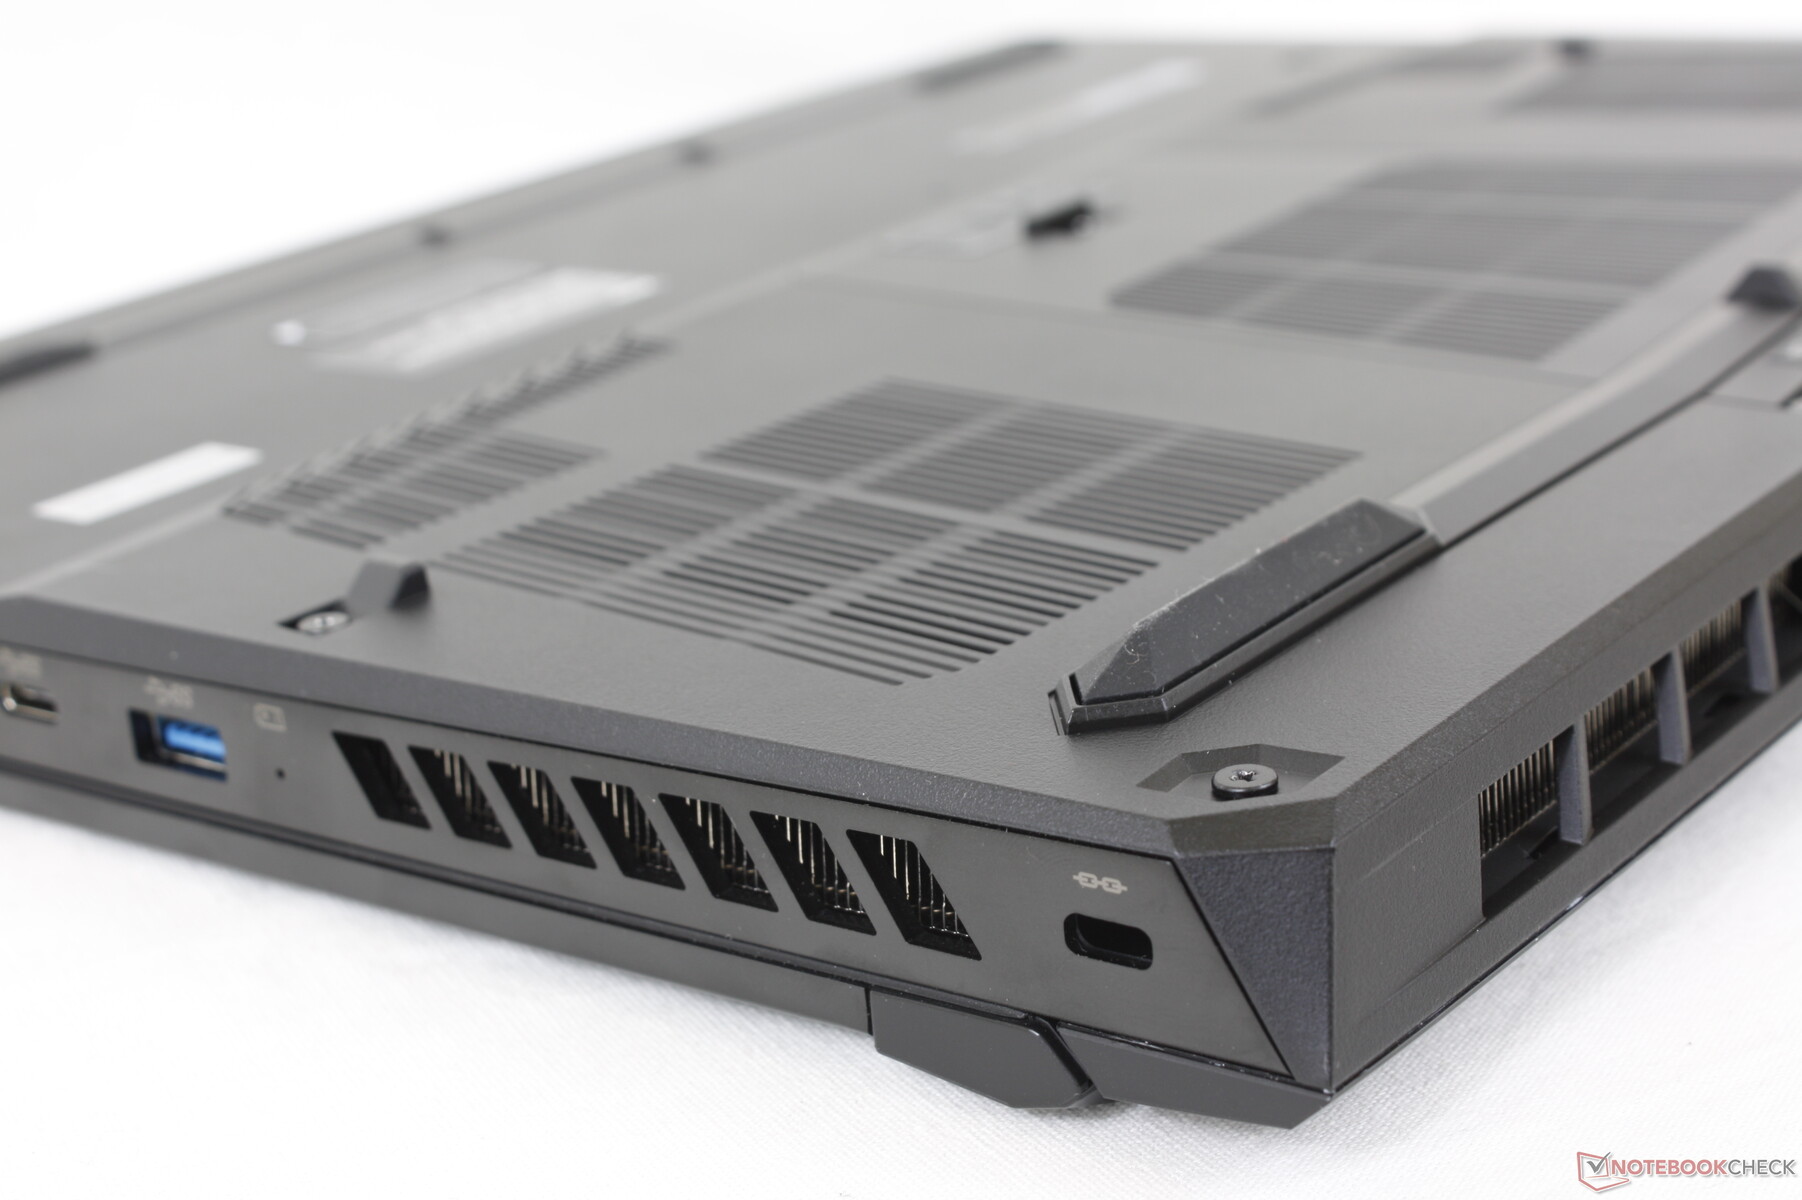
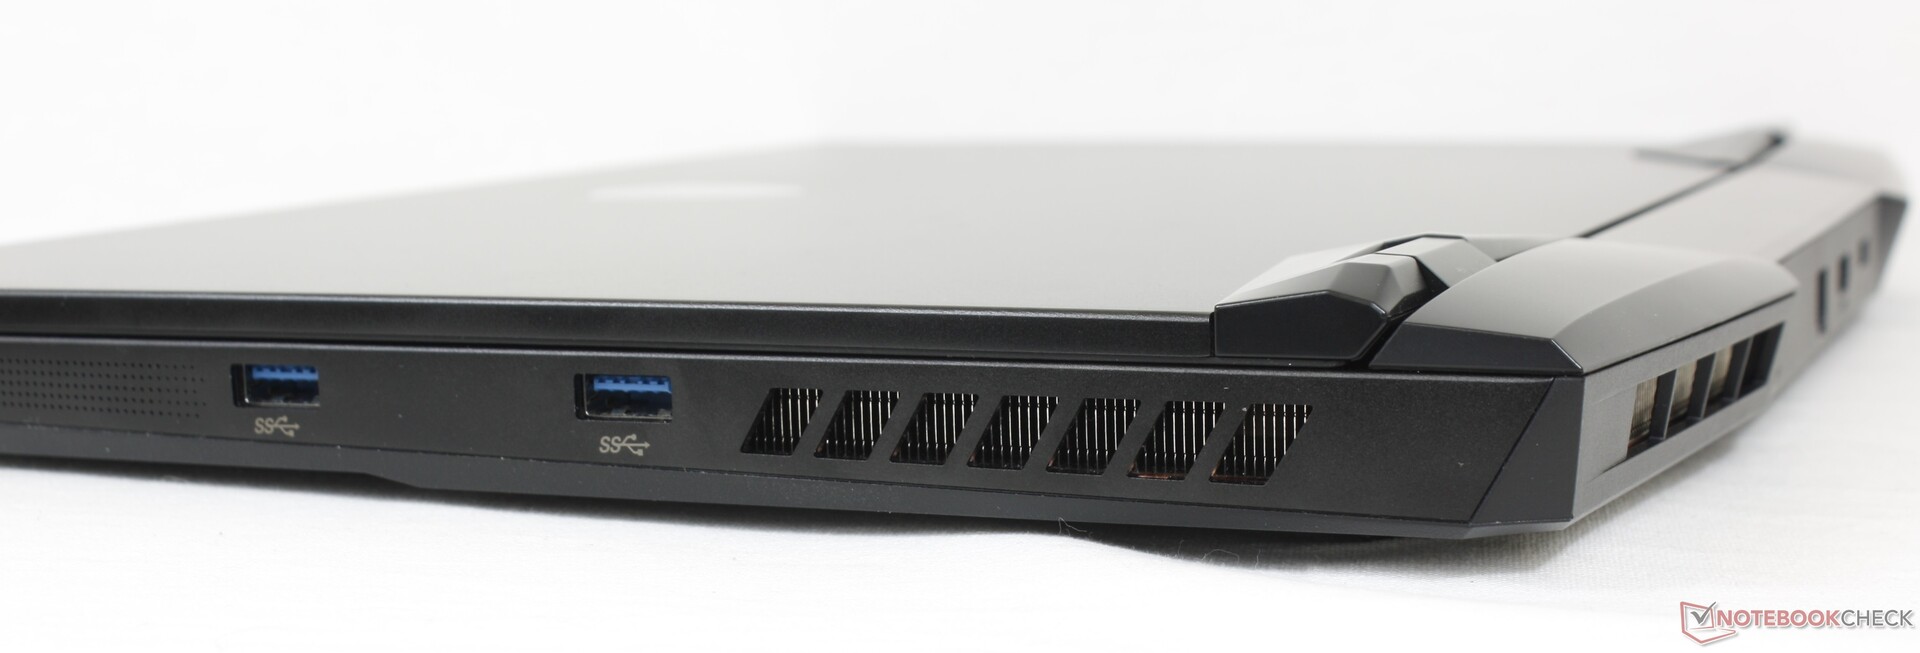
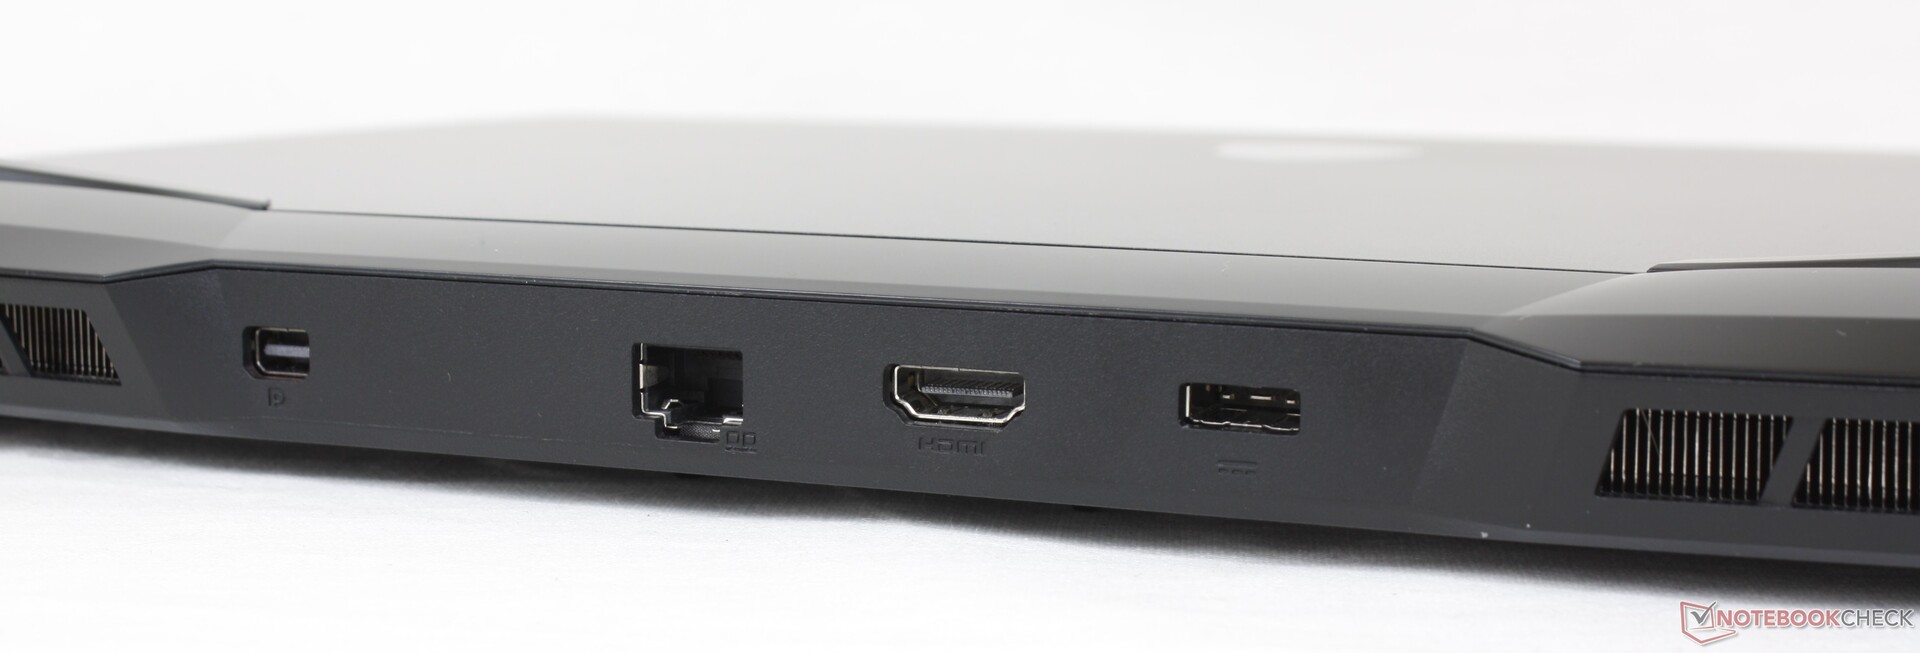
Les options de port sont légèrement différentes de ce qui était proposé sur le GP66 Leopard. Tout d'abord, le port USB-C qui se trouvait à l'arrière du GP66 Leopard se trouve désormais sur le bord gauche pour un accès plus facile. De plus, un mini-DisplayPort a été ajouté pour une compatibilité accrue avec les moniteurs externes prenant en charge la synchronisation adaptative
Notez que le port USB-C ne prend toujours pas en charge Thunderbolt. Les utilisateurs devront passer aux séries GS, GE ou GT de MSI, plus onéreuses, pour bénéficier d'une telle fonctionnalité.
Communication
Webcam
La caméra reste en 720p et ne prend pas en charge l'IR ou Windows Hello. Les ordinateurs portables MSI continuent d'utiliser un obturateur électronique au lieu d'un obturateur physique, contrairement à la plupart des Ultrabooks ou des ordinateurs portables professionnels.


Maintenance
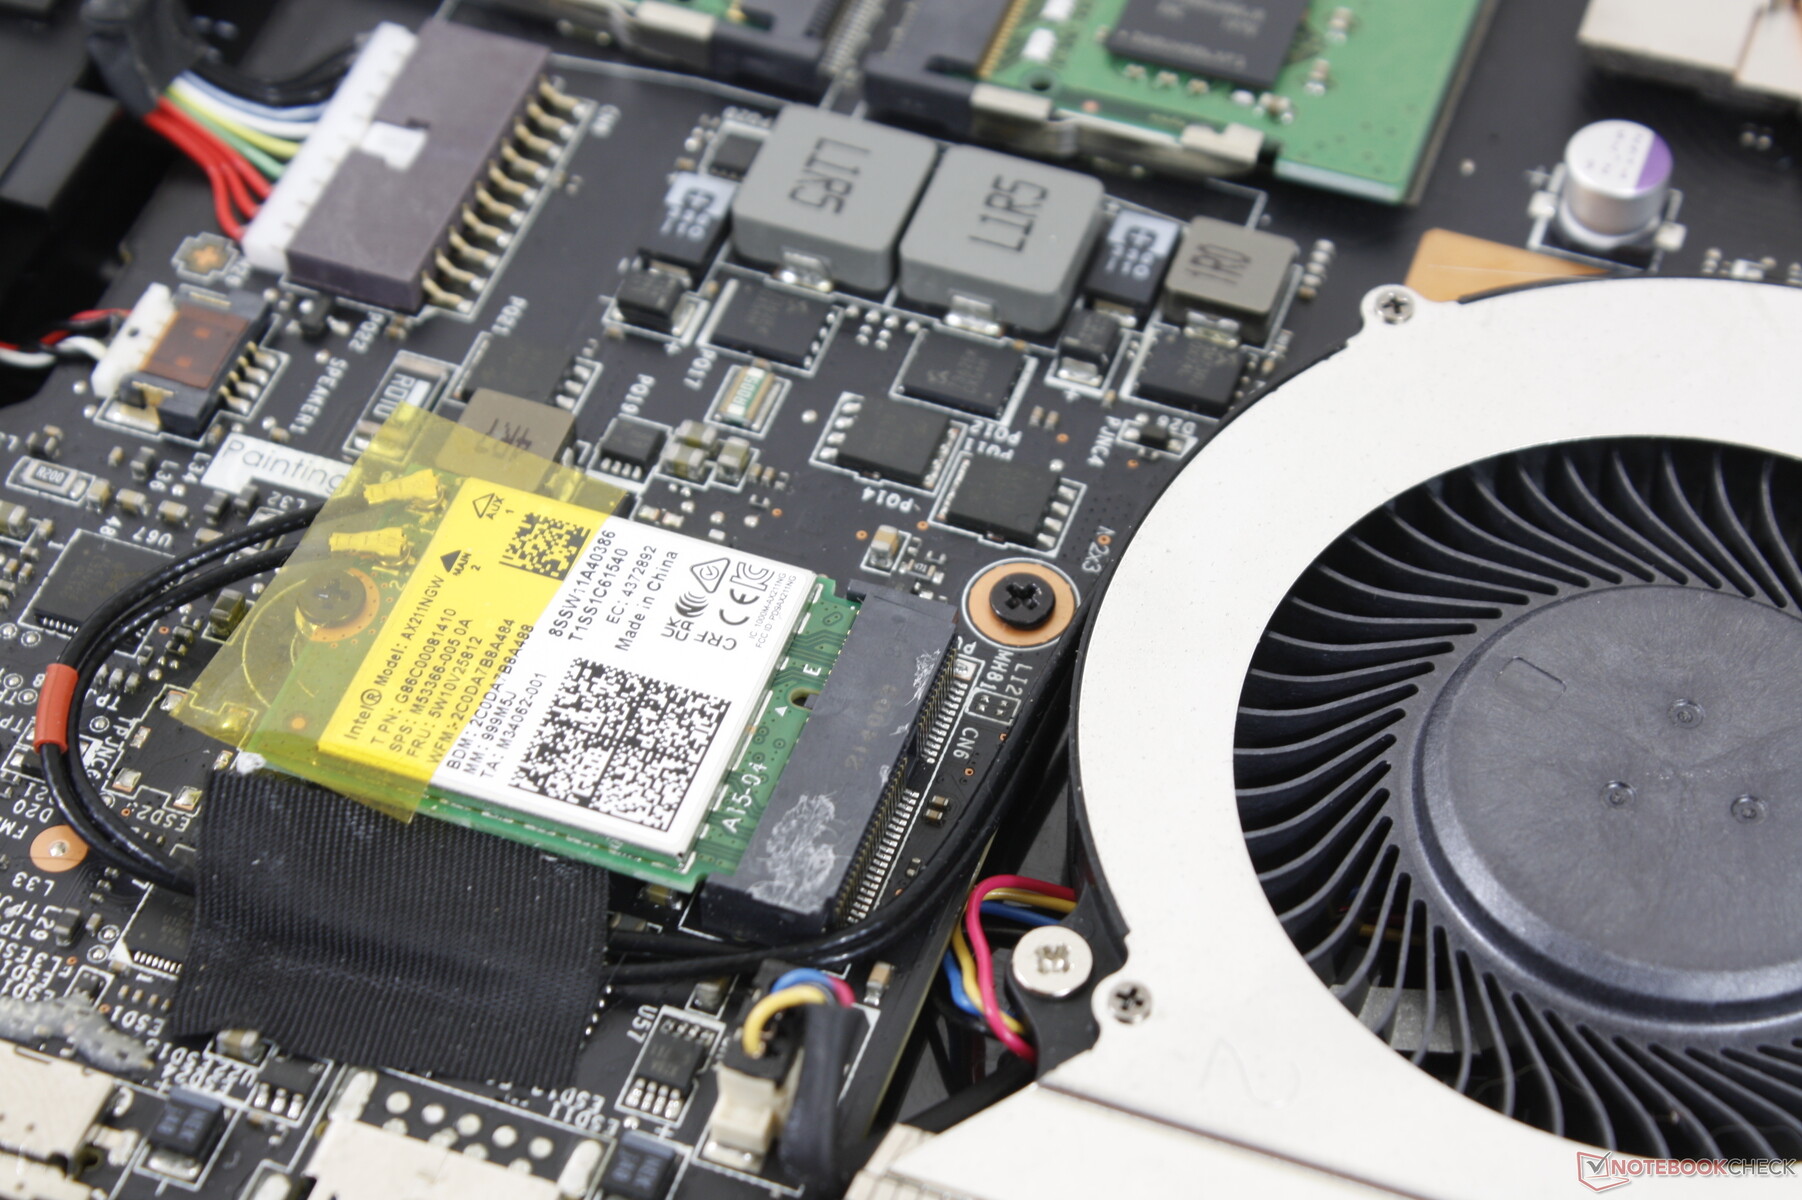
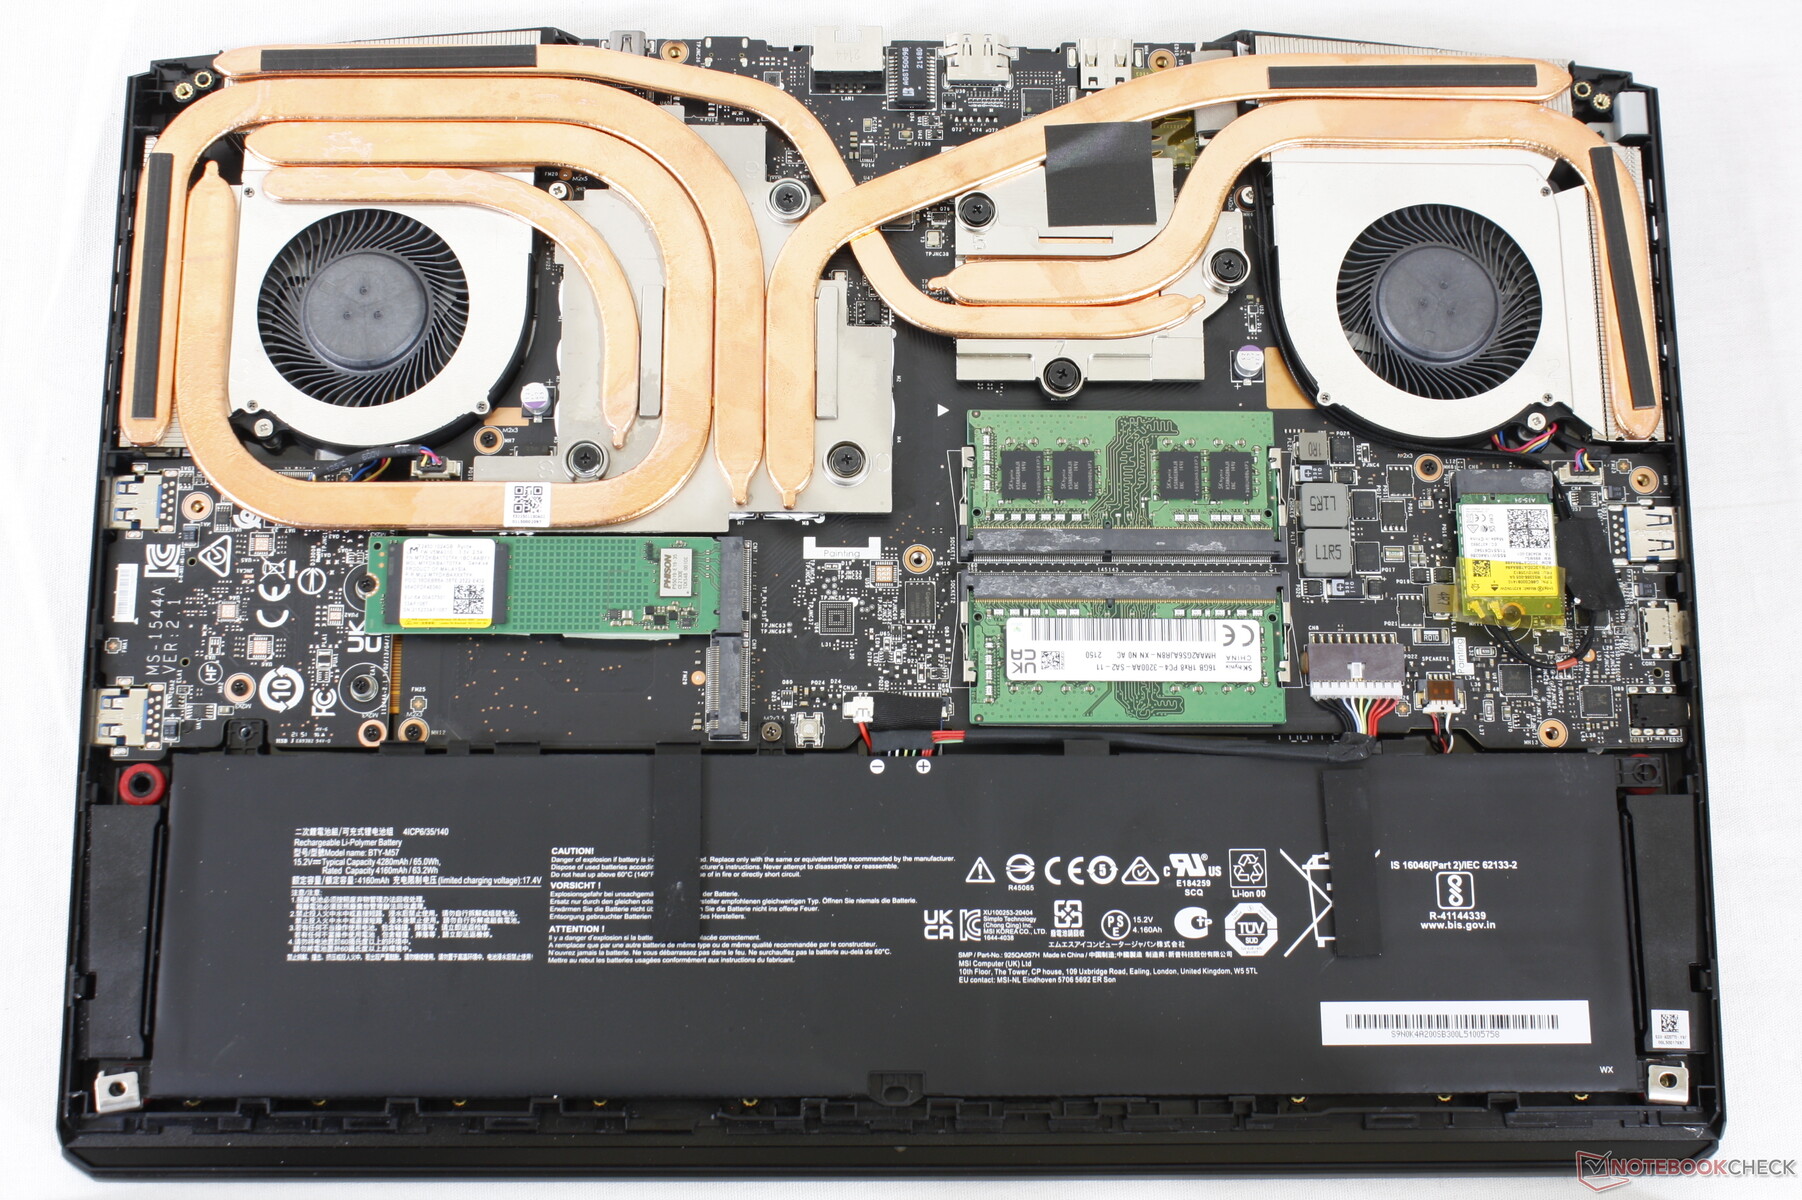
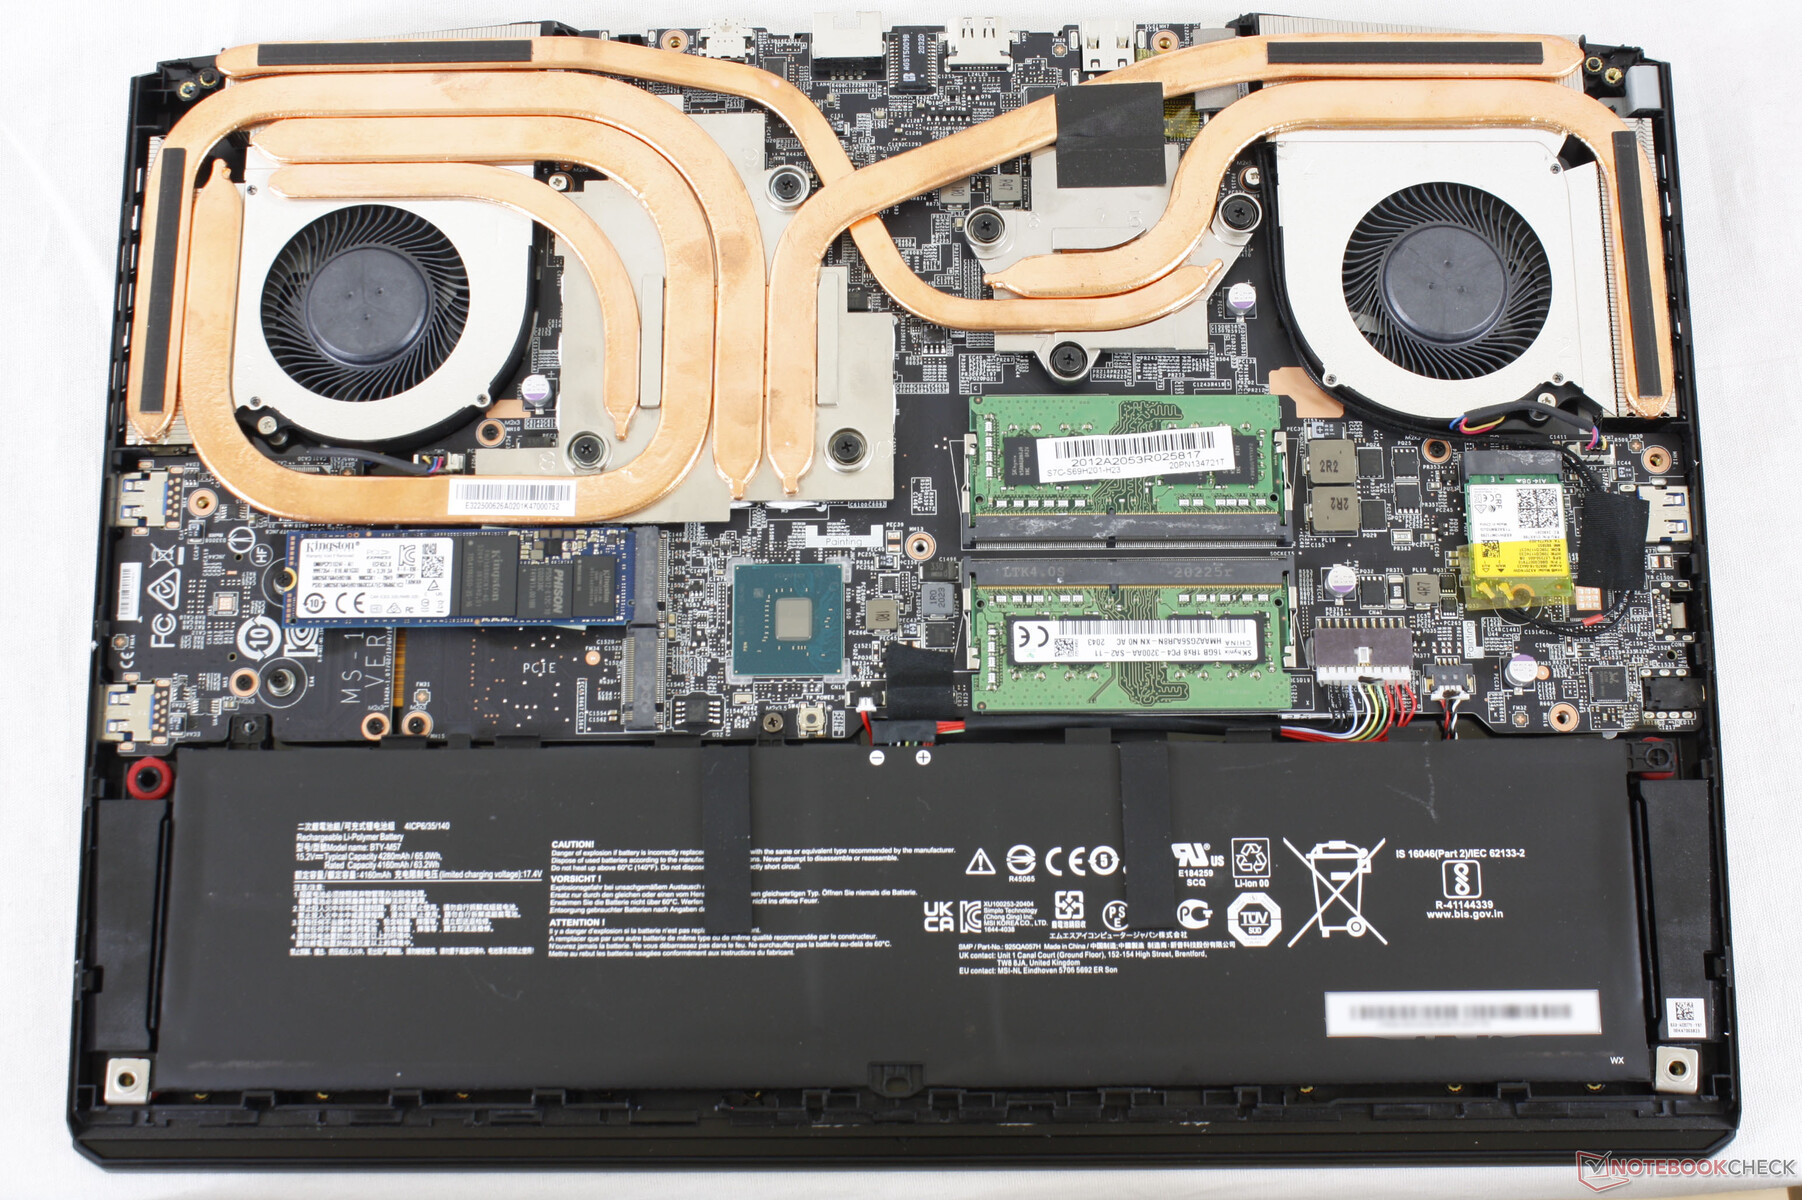
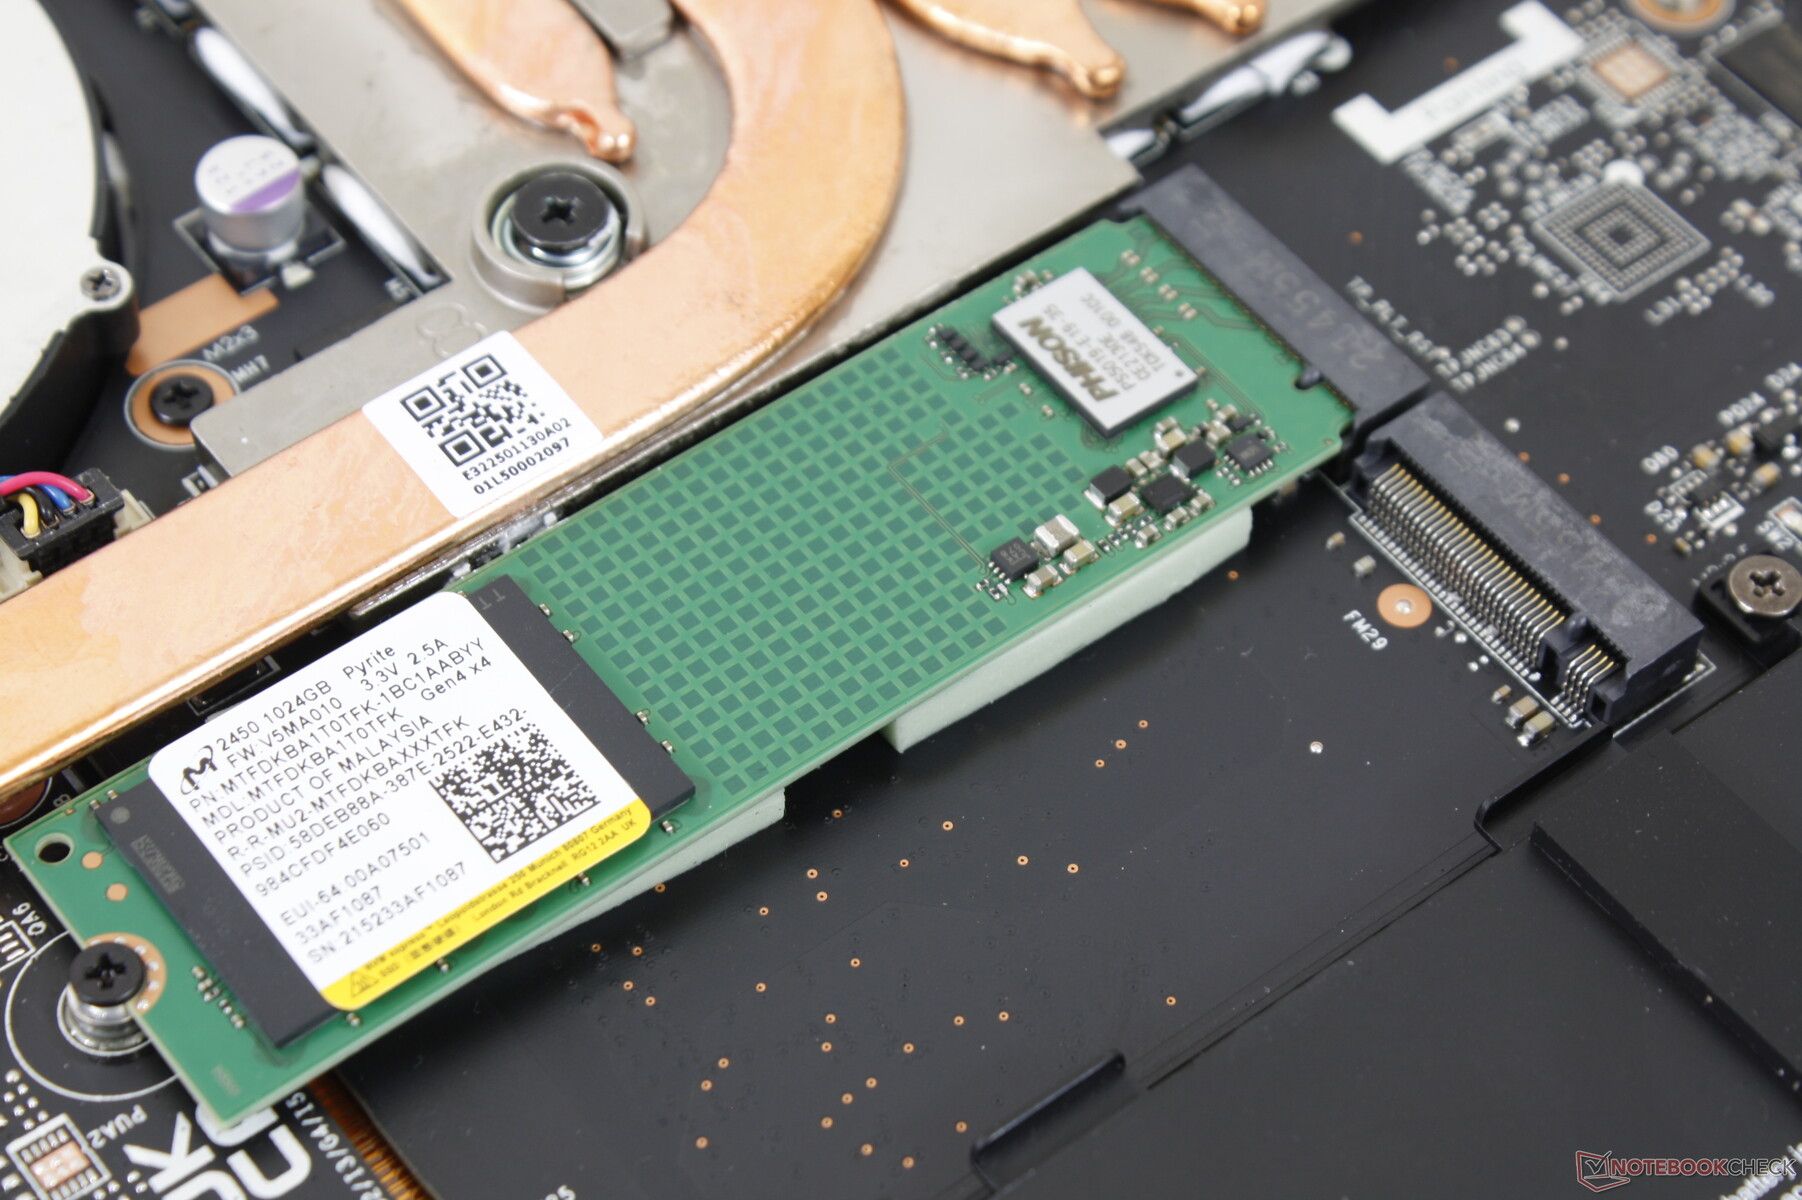
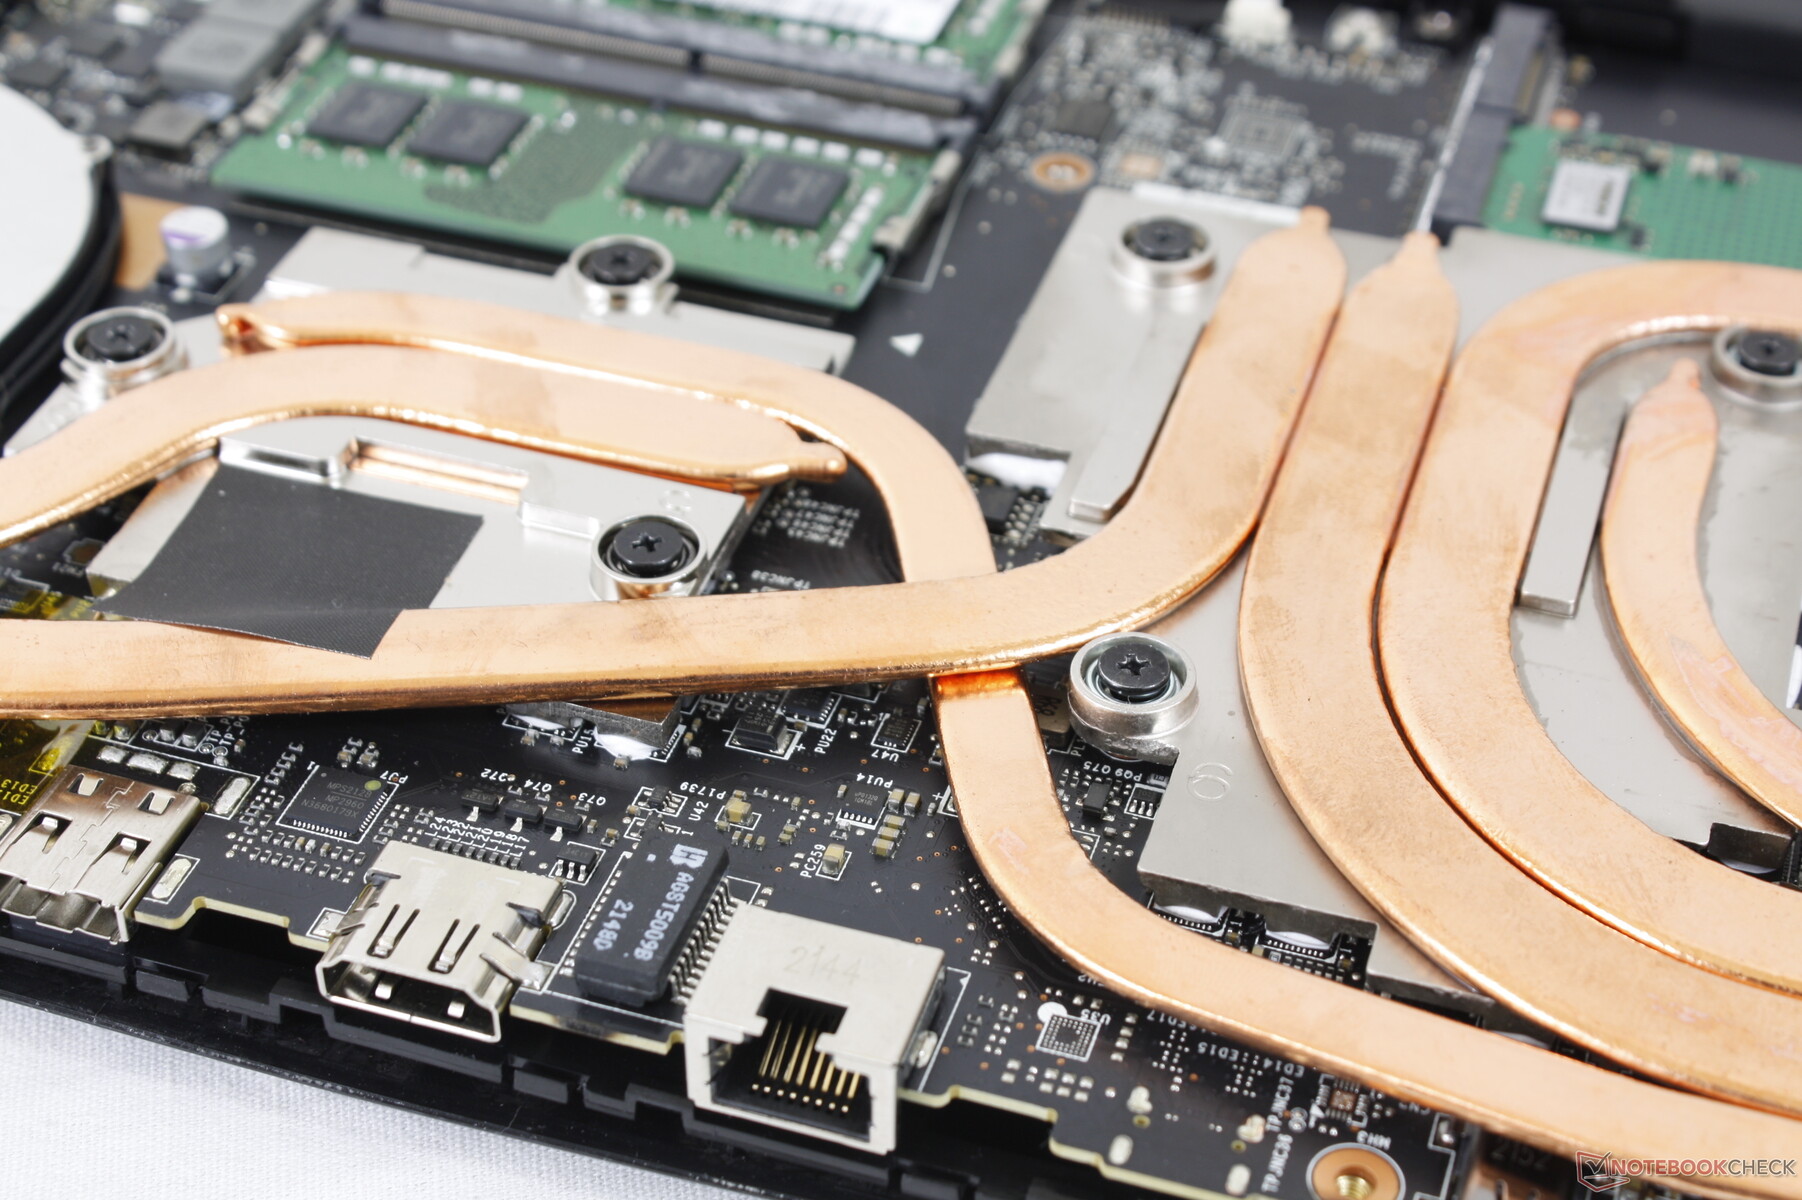
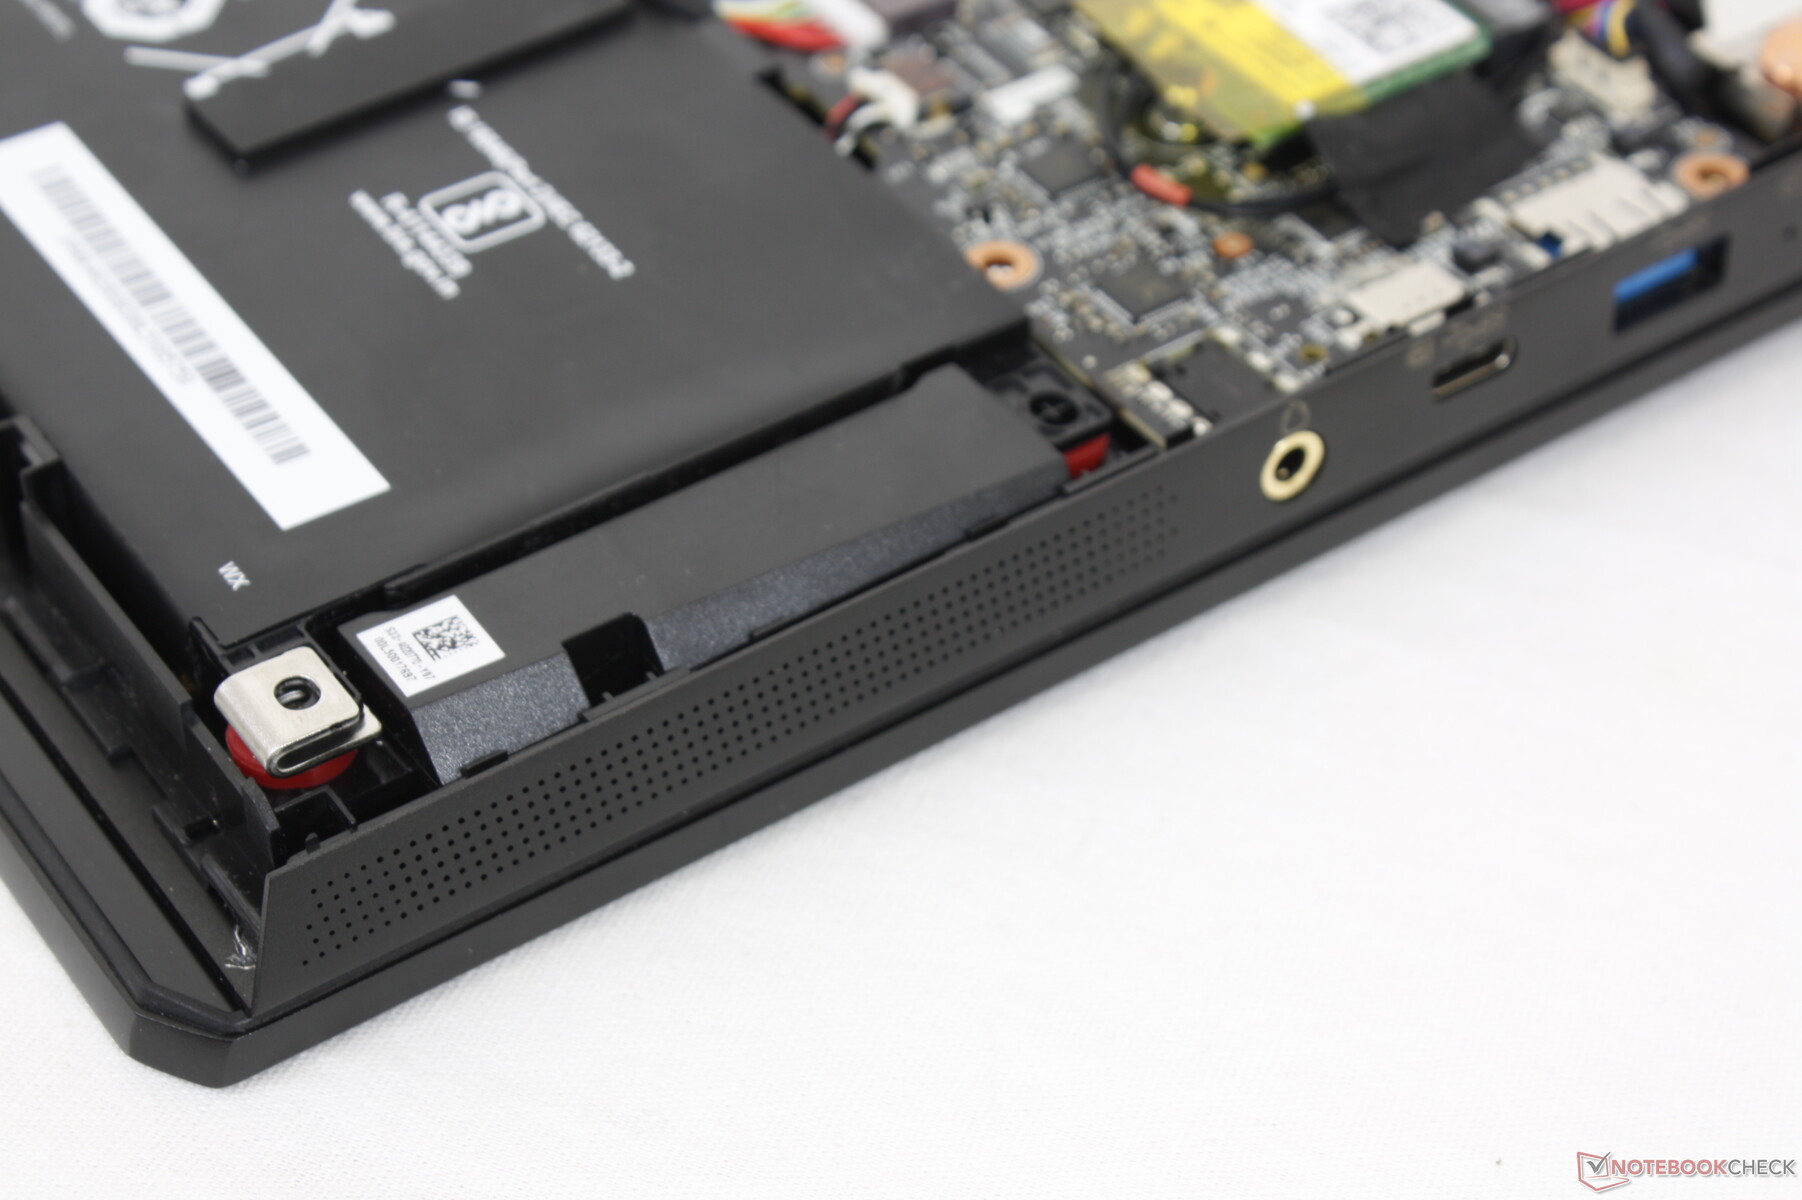
Le panneau inférieur est fixé par 11 vis Philips, sans aucun pied en caoutchouc pour faciliter l'entretien. Notez qu'un autocollant "sceau d'usine" doit être brisé, cependant.
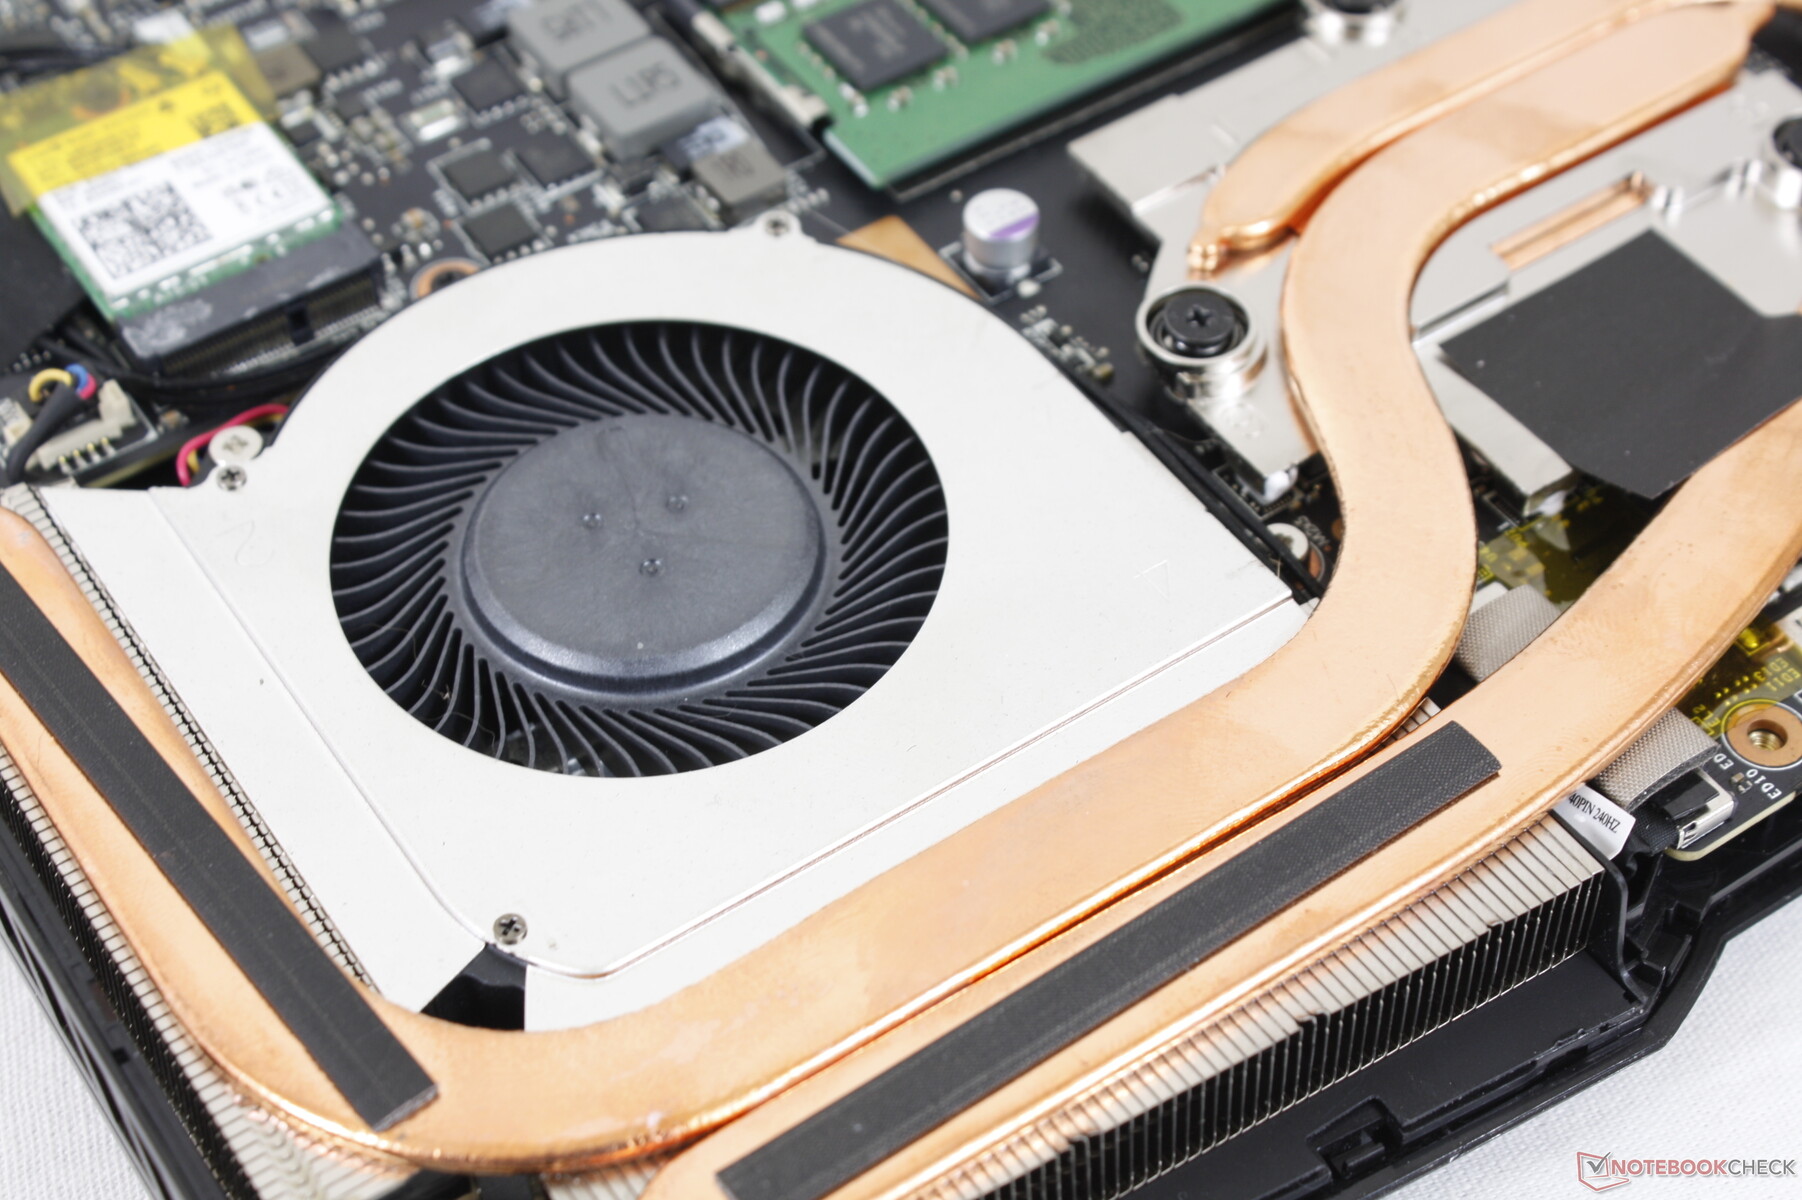
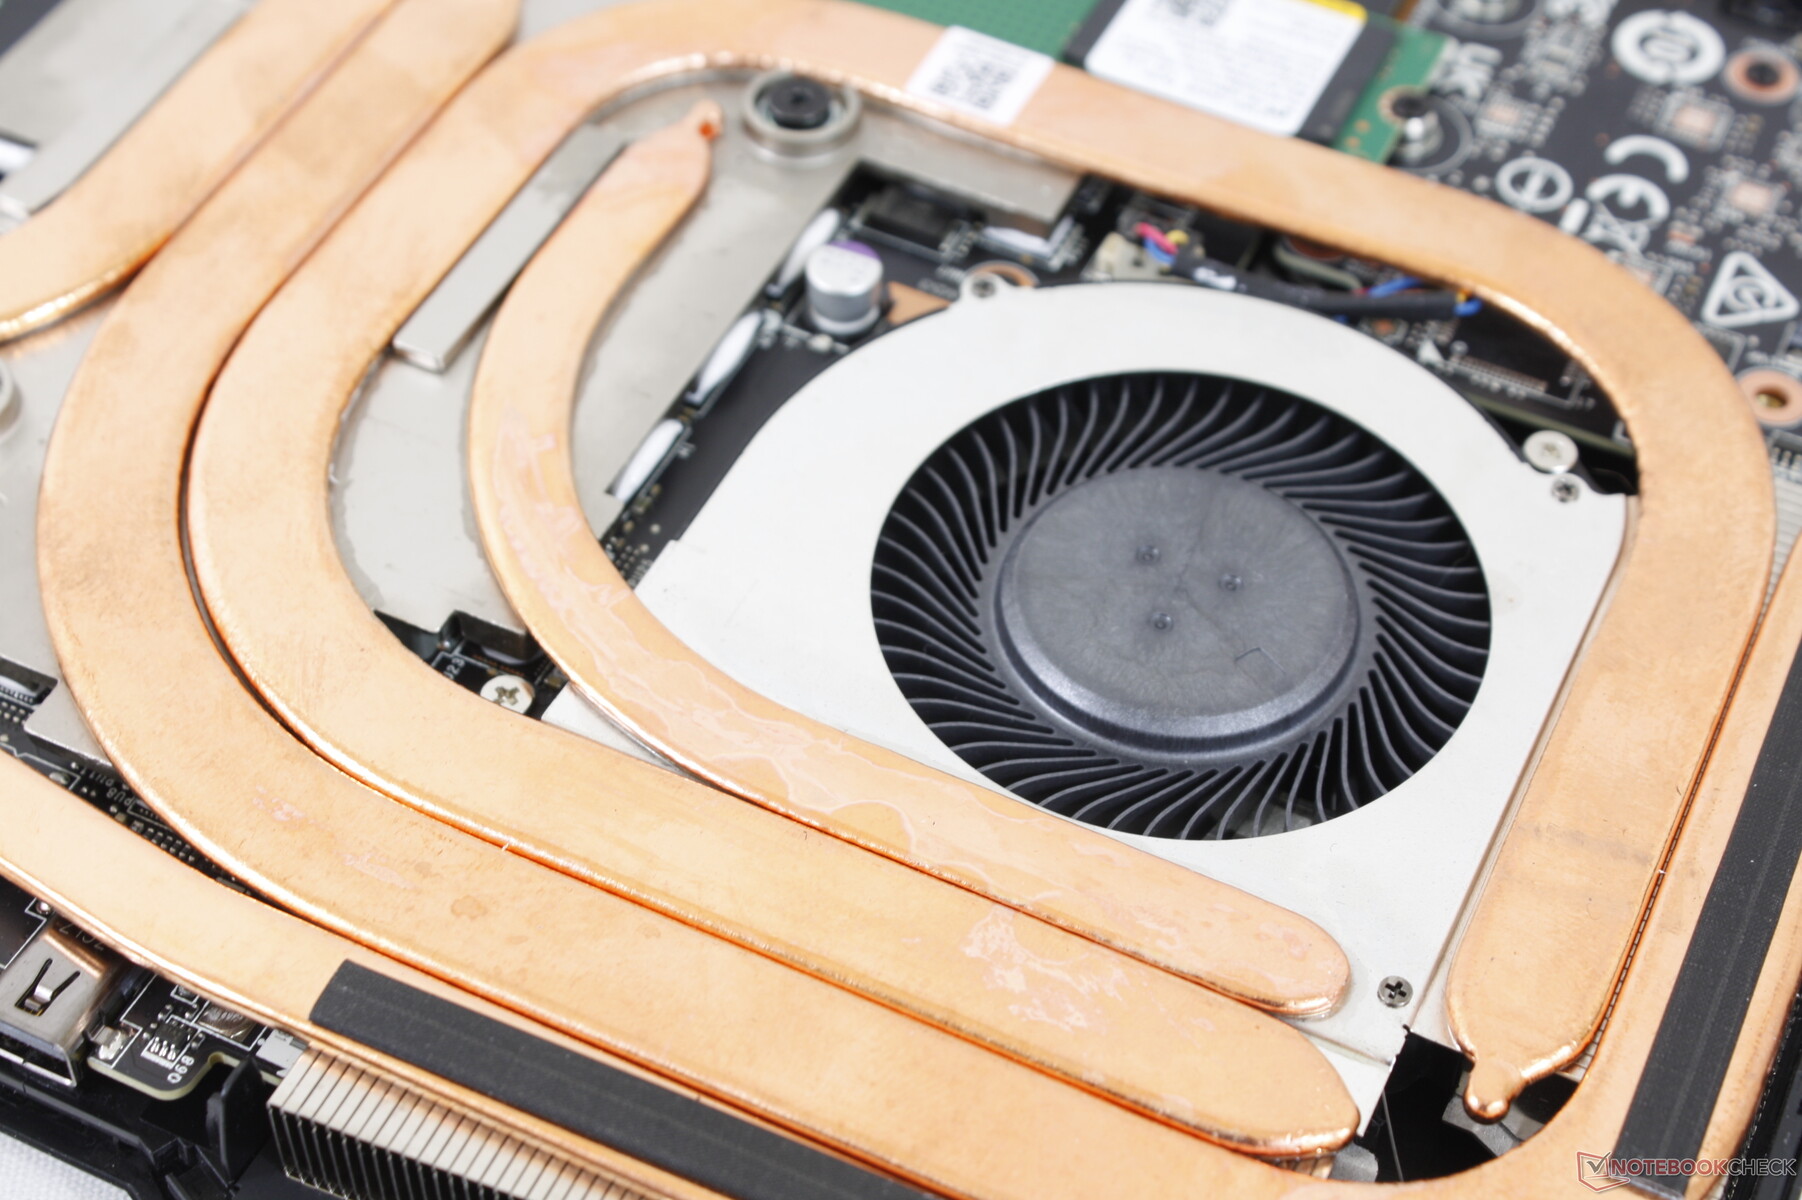
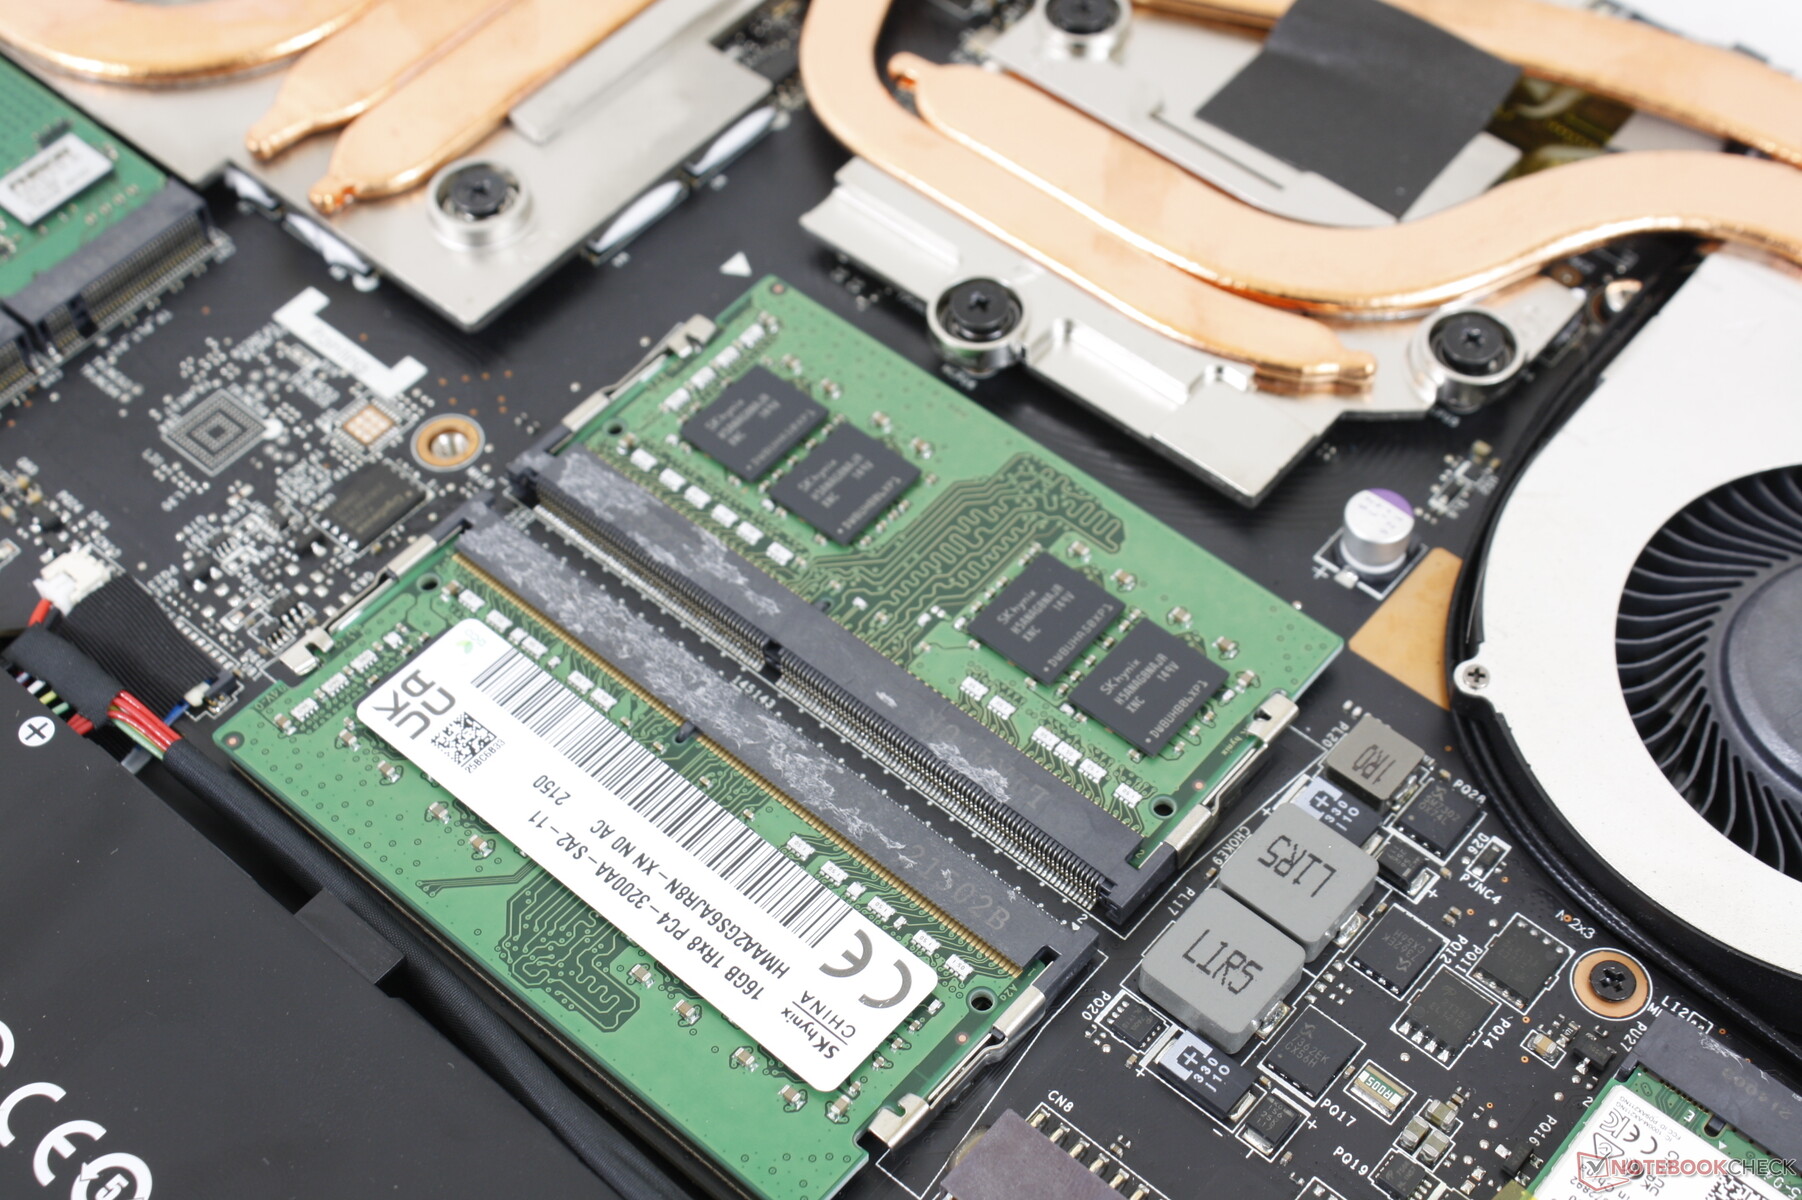
La disposition interne est essentiellement identique à celle du GP66 Leopard comme indiqué ci-dessous. Les utilisateurs ont un accès direct aux deux slots SODIMM et aux deux slots M.2 2280 PCIe4 x4. Les ordinateurs portables haut de gamme comme leGM7AG8P peuvent prendre en charge de la RAM DDR5 plus rapide.
Accessoires et garantie
Il n'y a pas d'autres éléments dans la boîte, à part l'adaptateur secteur et les documents. La garantie limitée habituelle d'un an s'applique aux États-Unis
Périphériques d'entrée
Clavier et pavé tactile
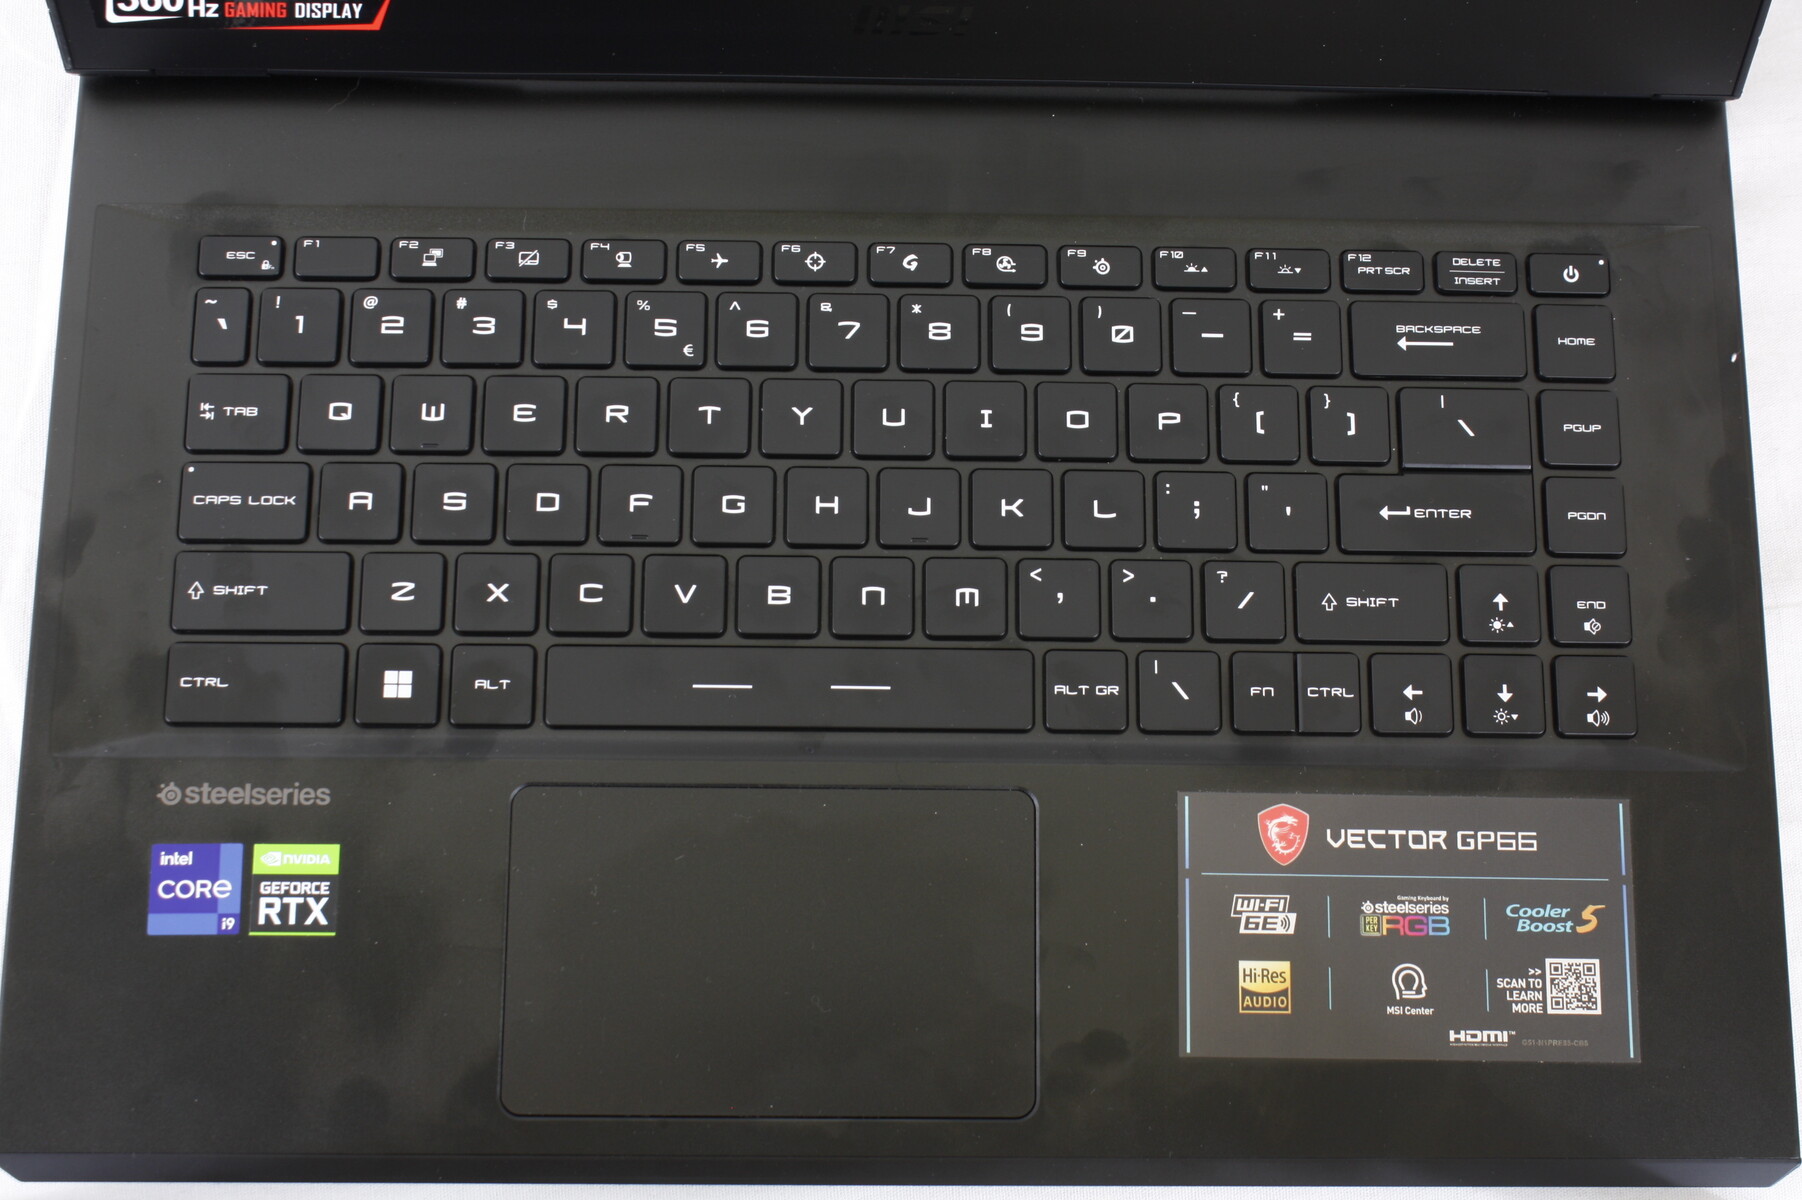
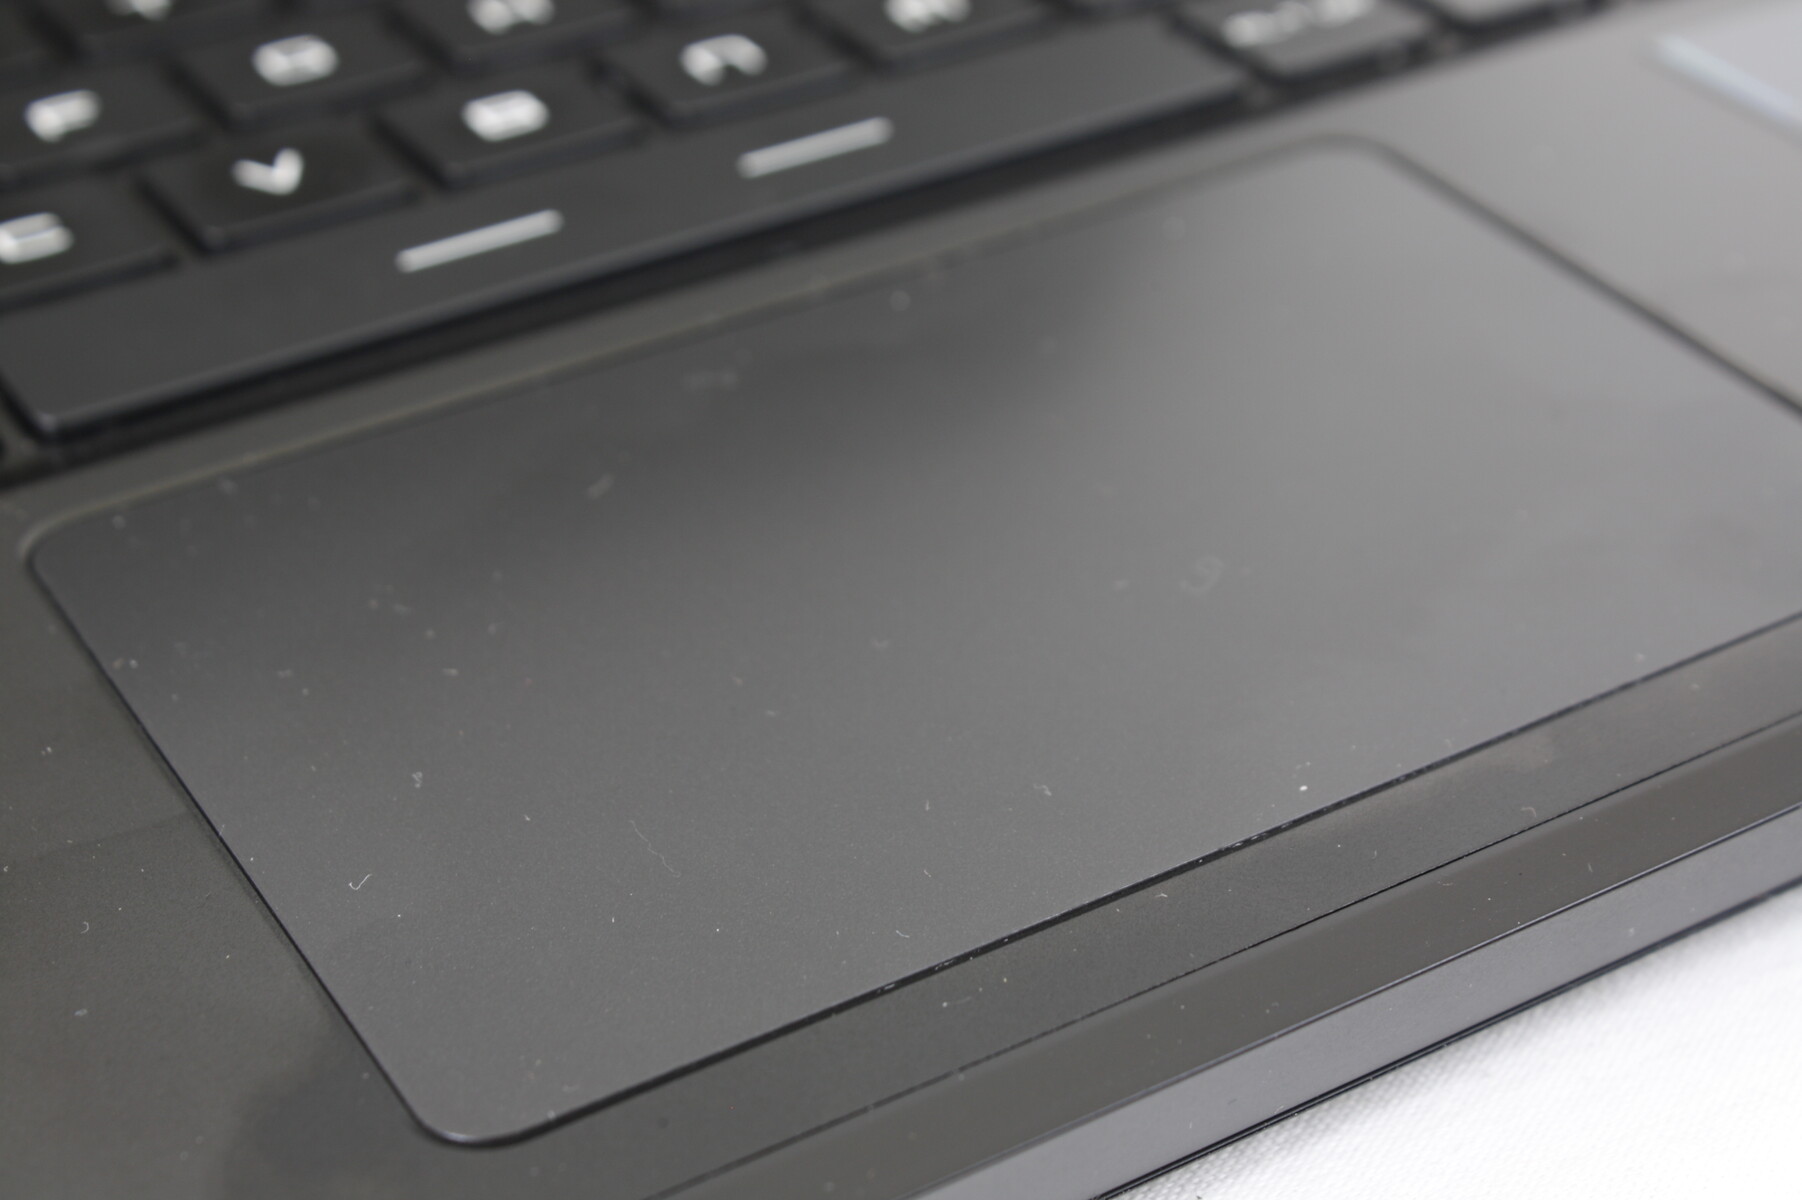
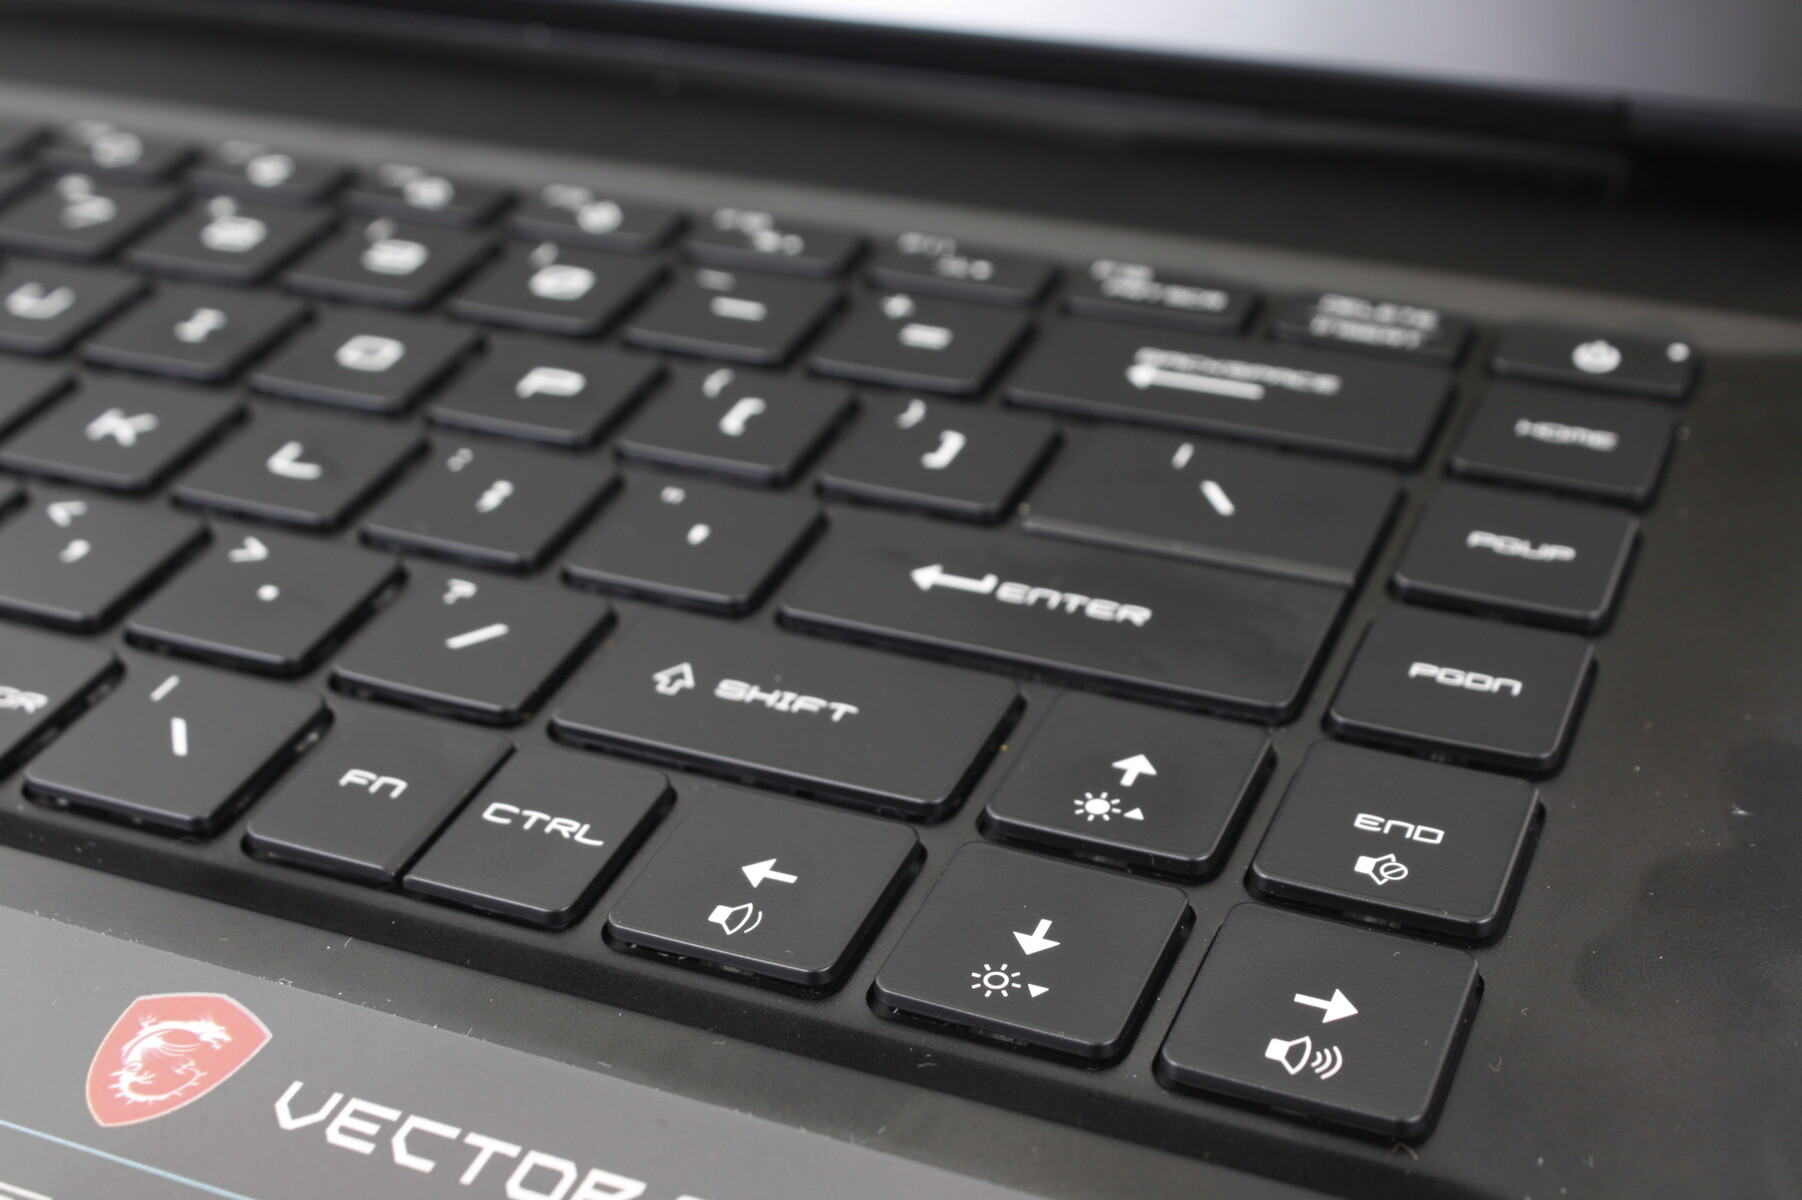
Le clavier à éclairage RVB par touche et le pavé tactile (10,5 x 6,5 cm) restent inchangés par rapport au 2020 GP66 Leopard original. Bien que la frappe soit satisfaisante, voire un peu molle, le clic sur le pavé tactile est toujours trop spongieux. Le contrôle du curseur était plus facile sur l'ancienne GP65 car il intégrait des boutons de souris physiques qui ont été abandonnés lors de la transition vers le design du GP66.

Afficher
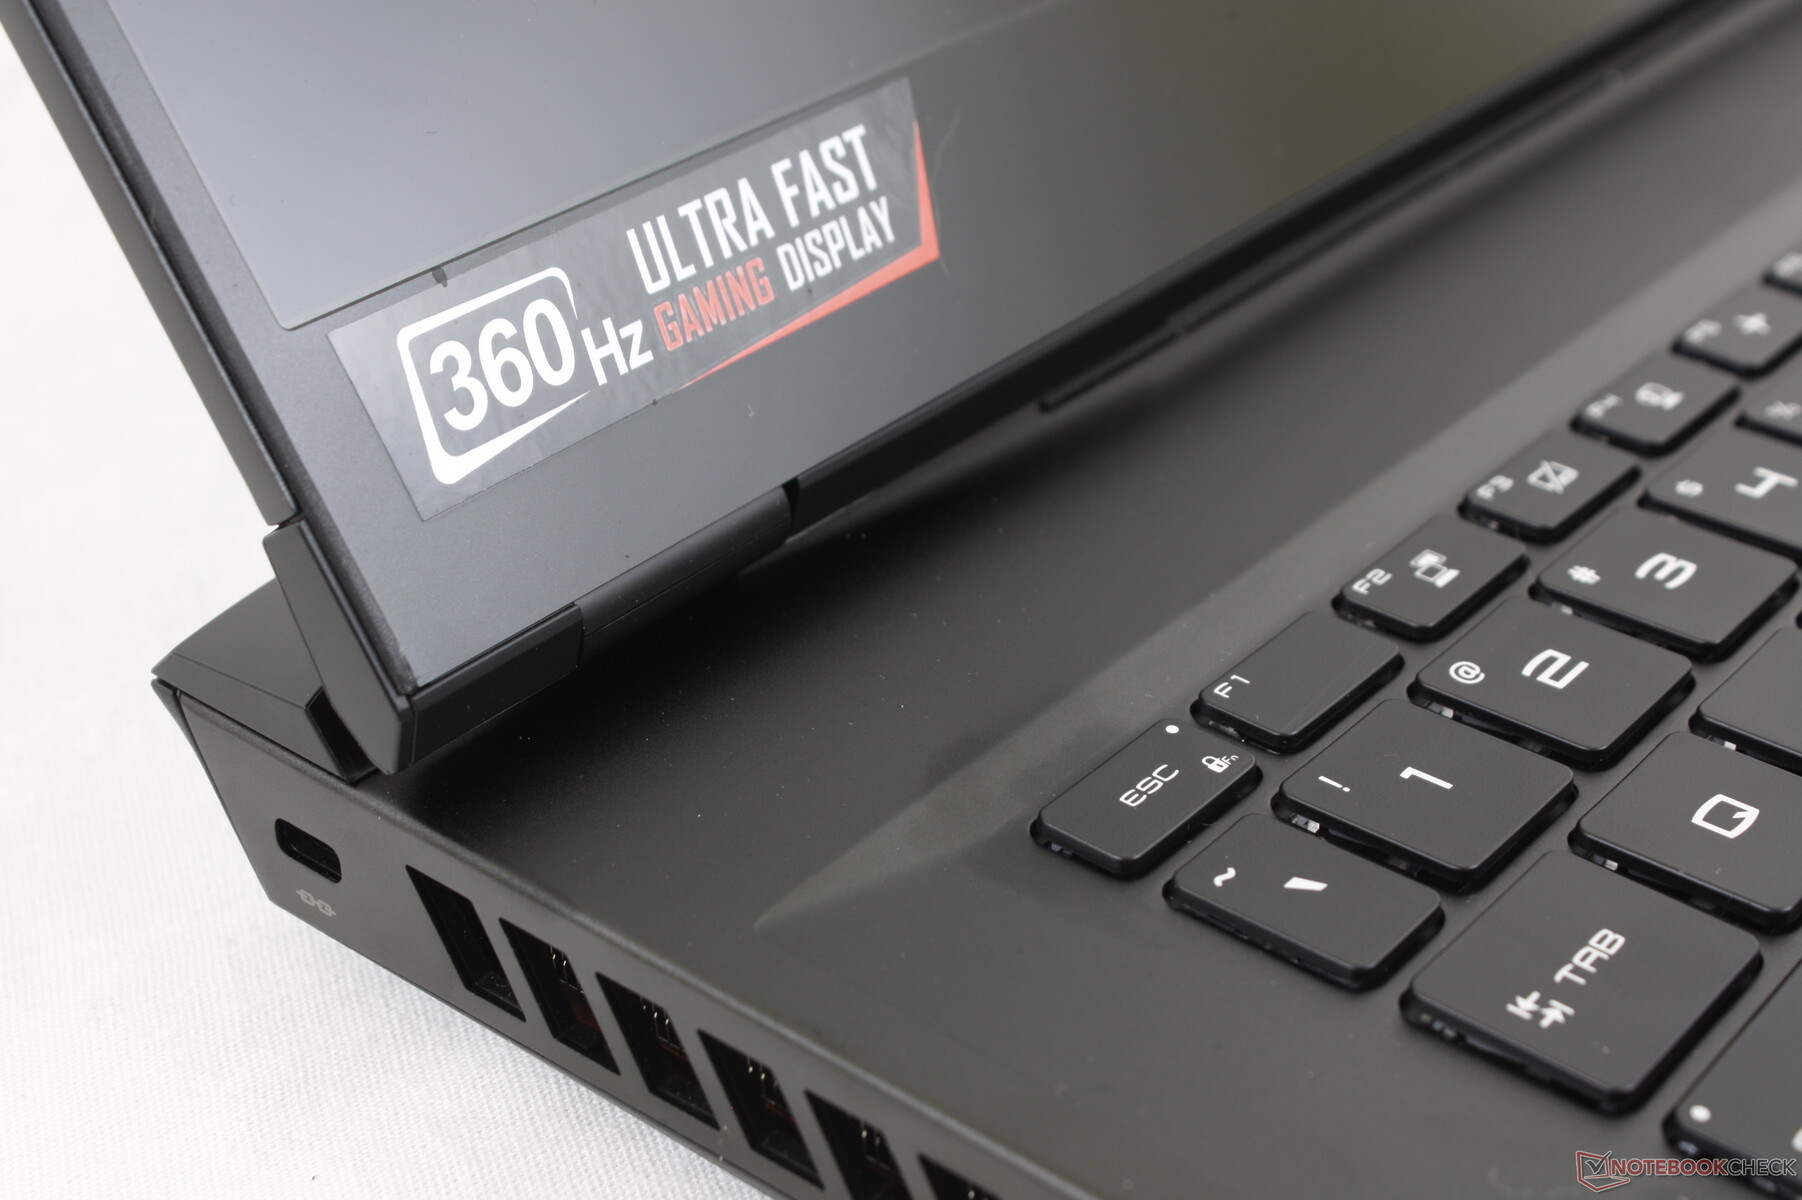
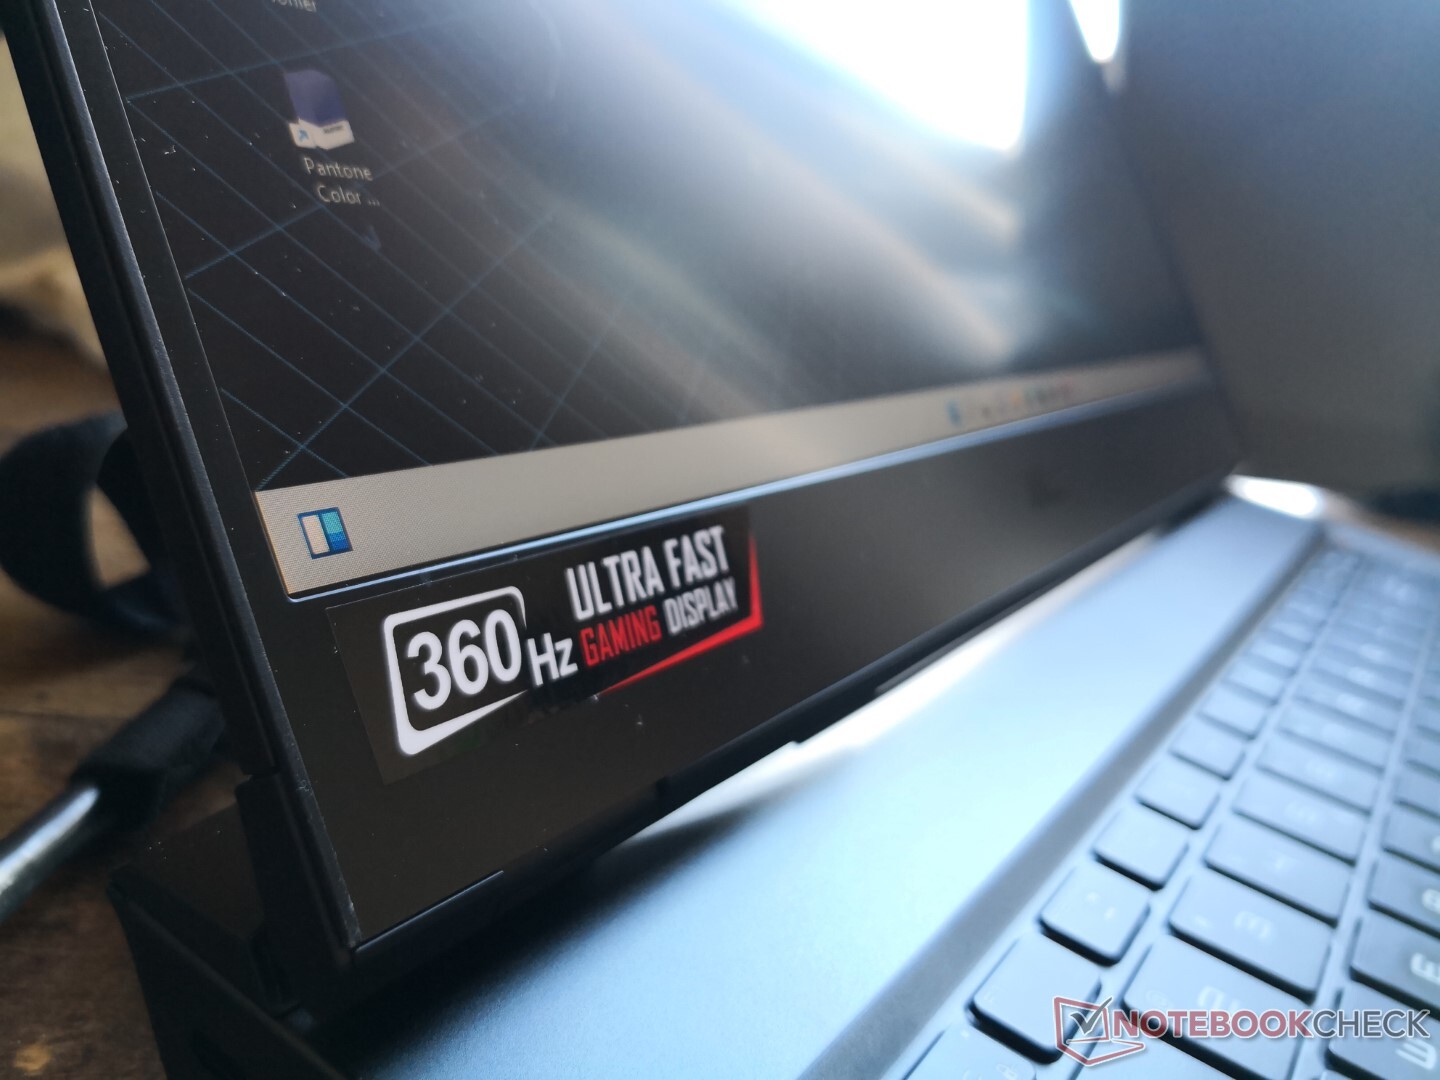
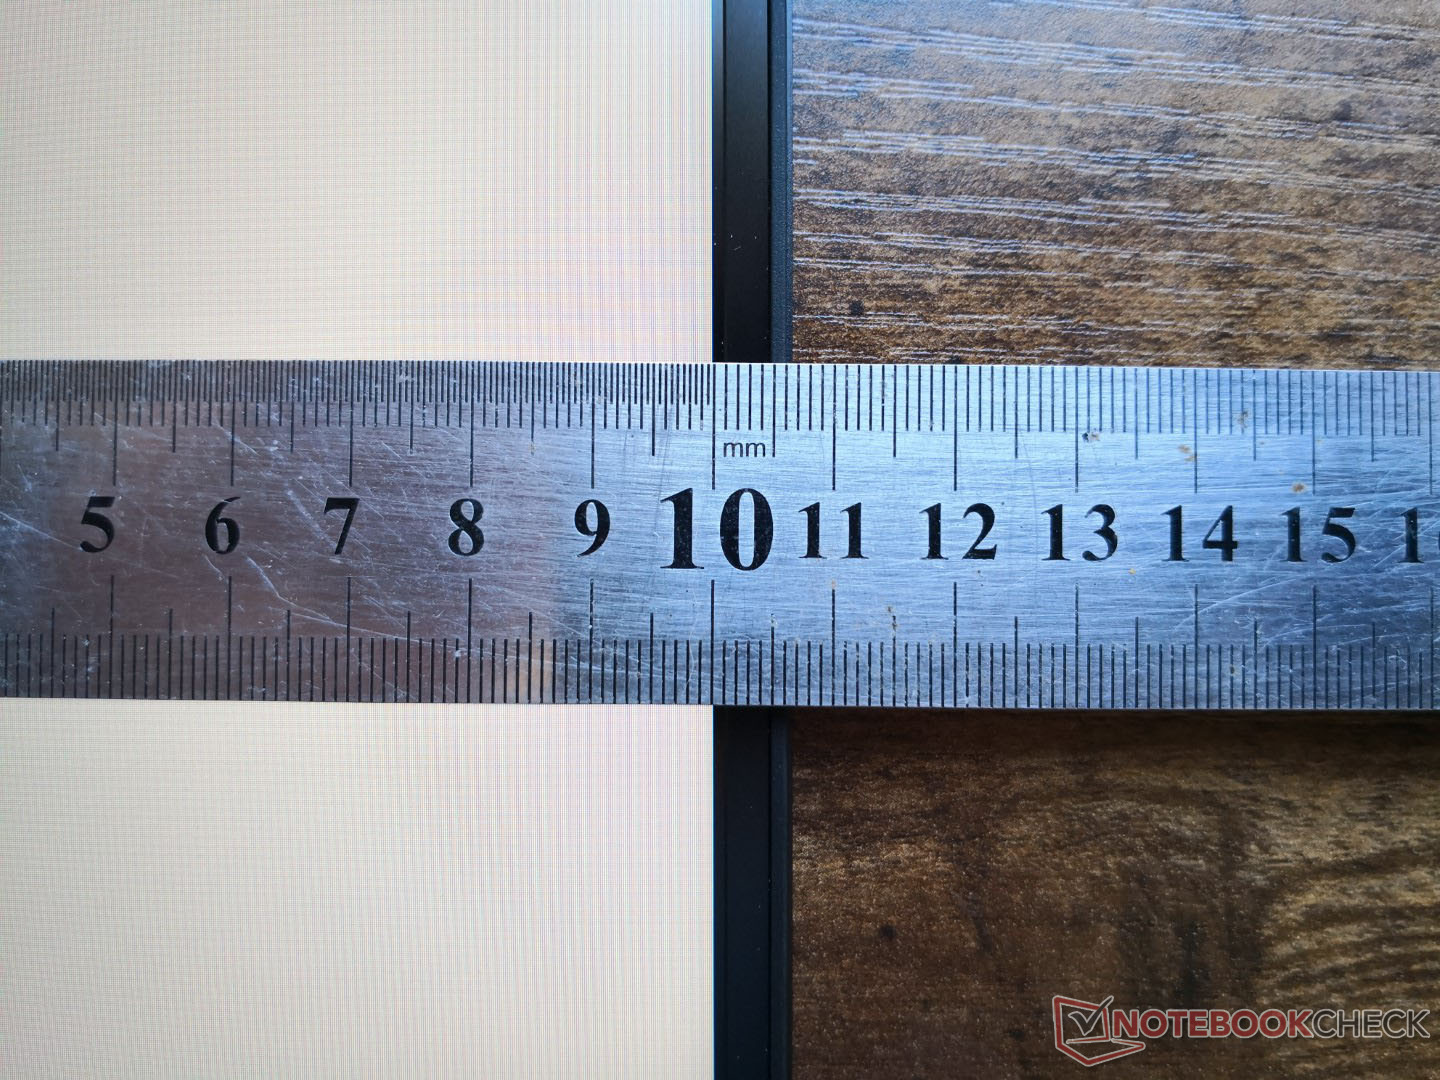
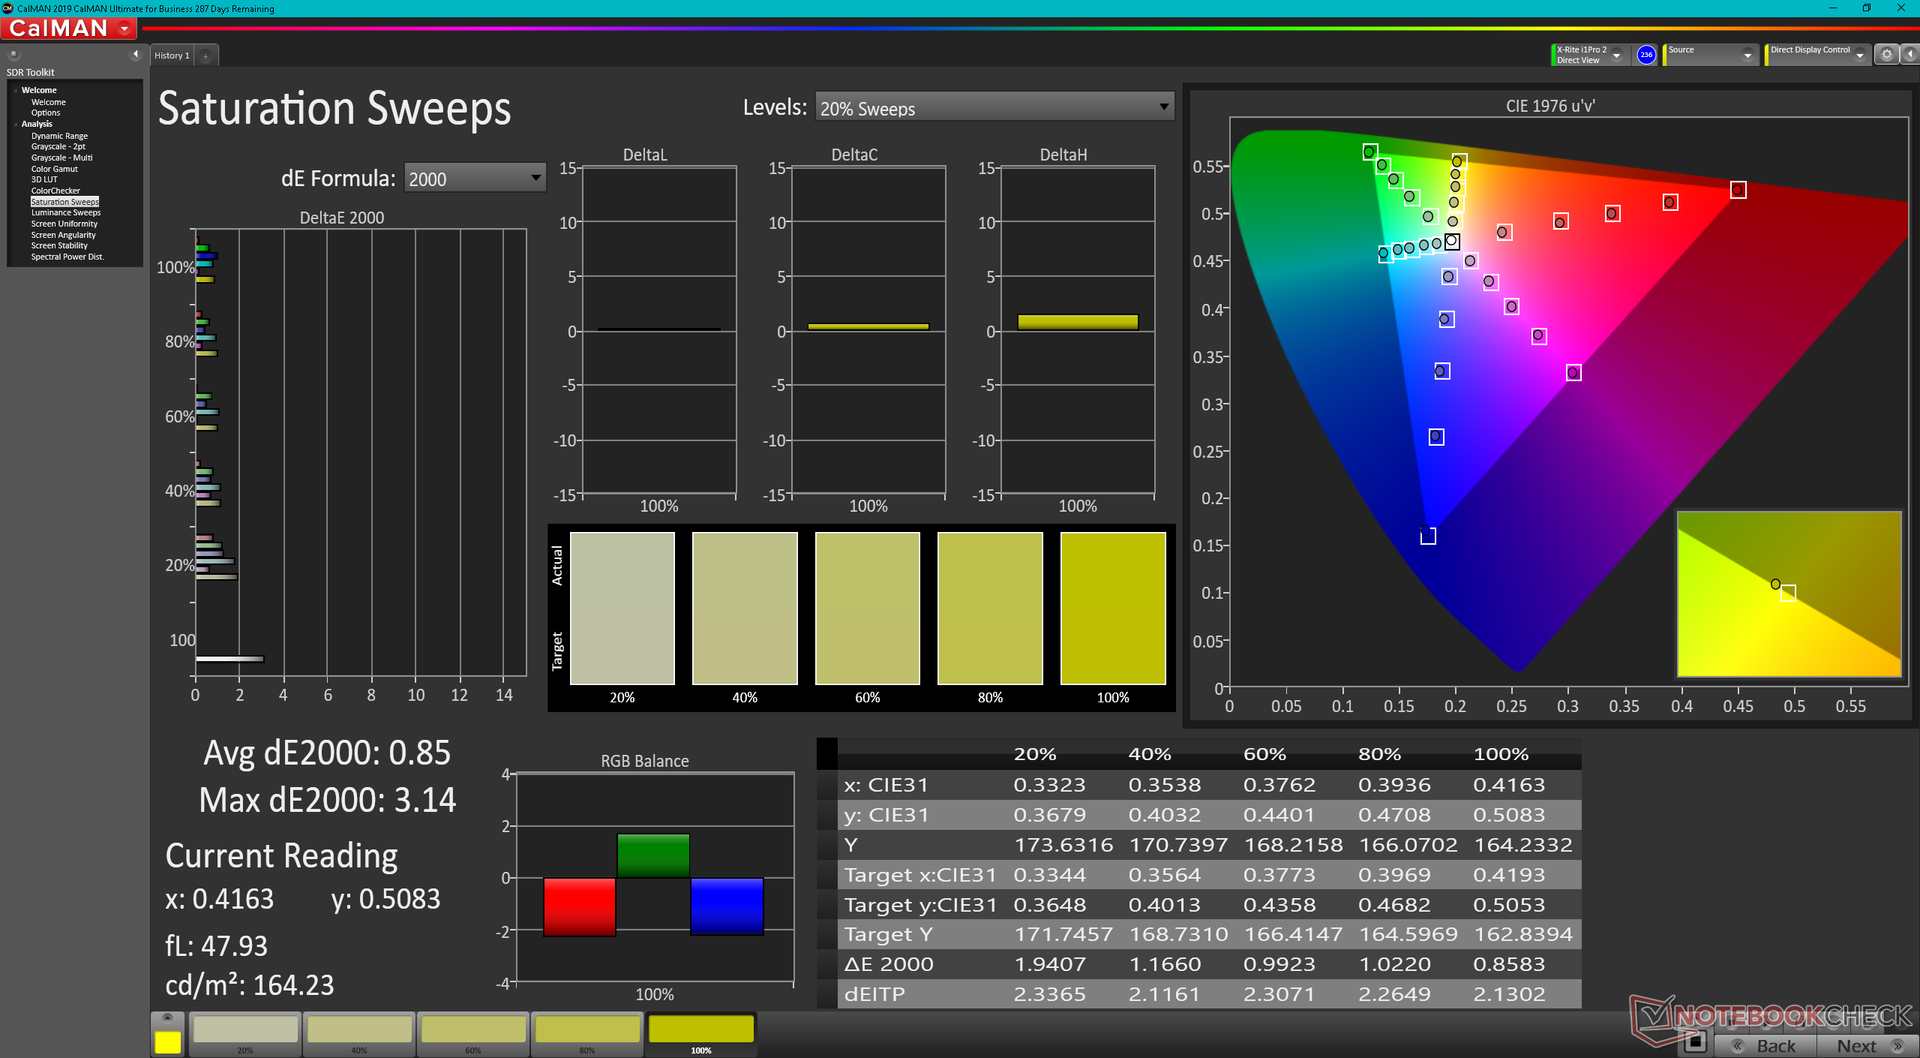
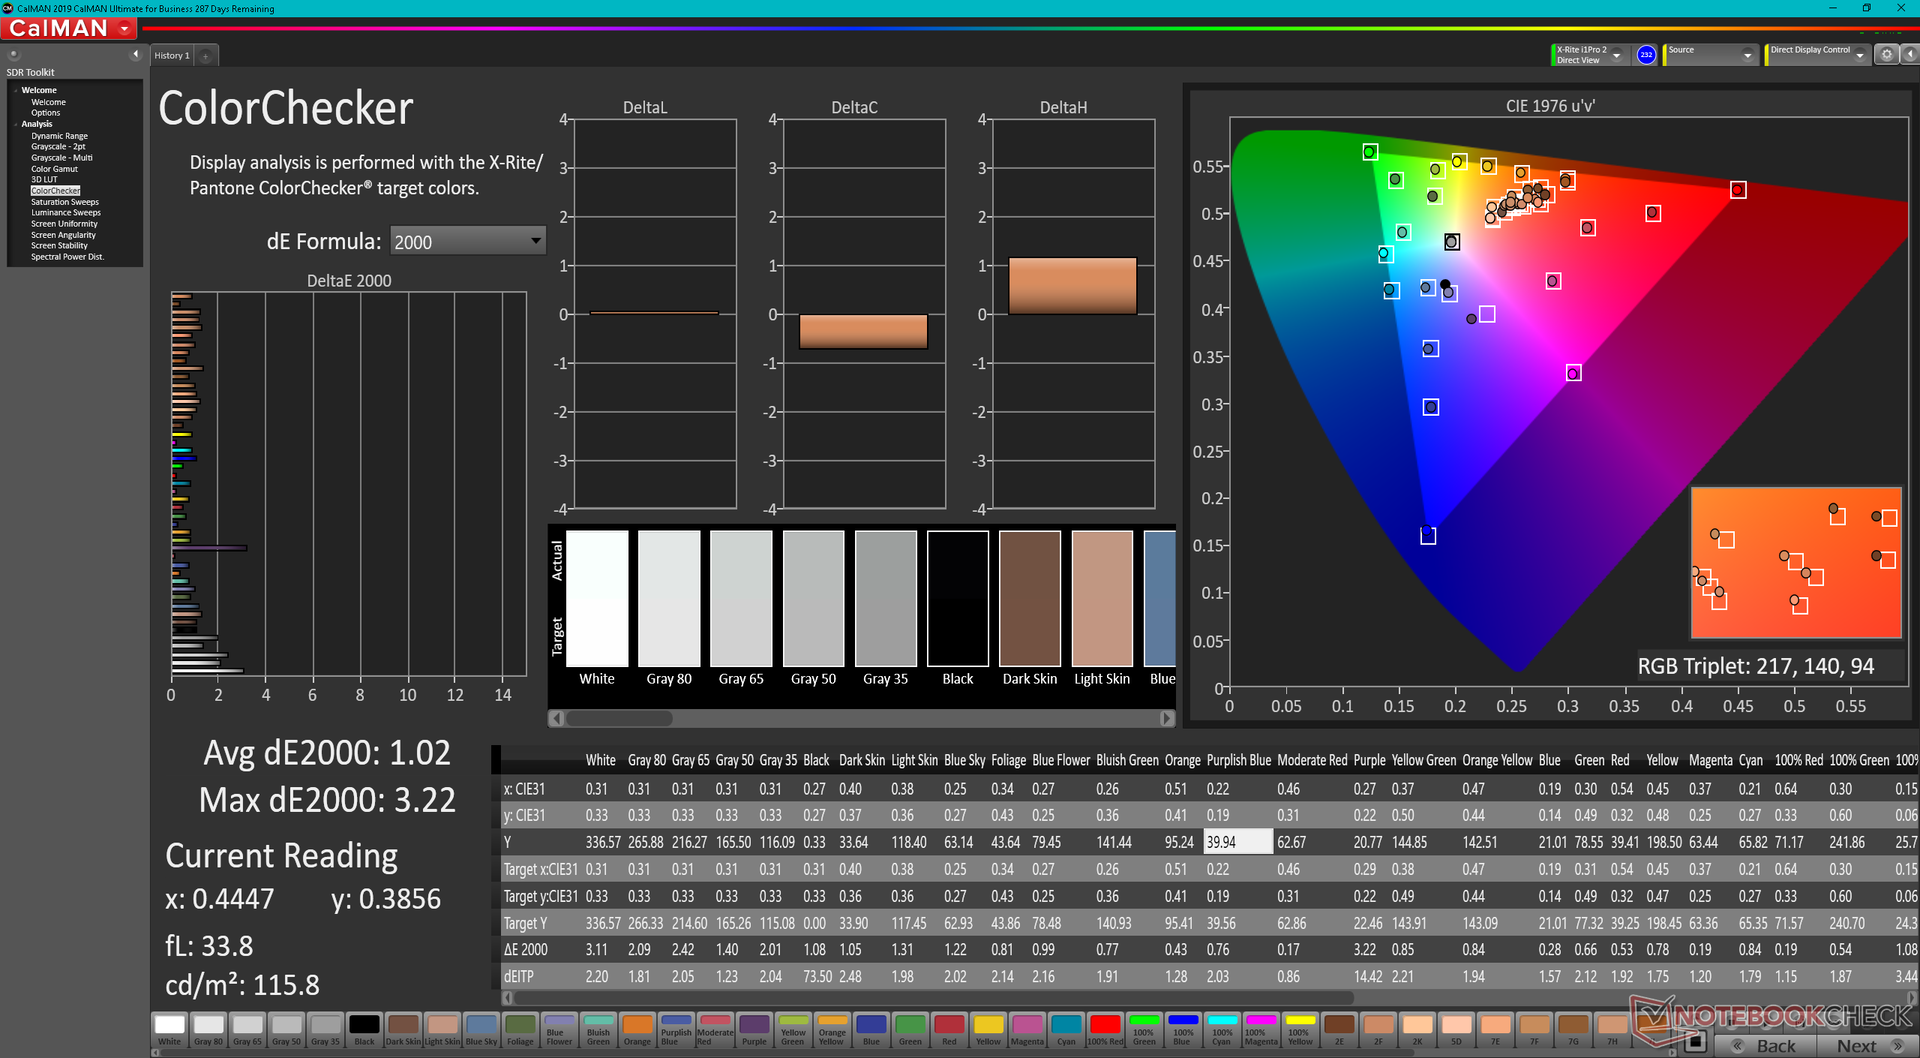
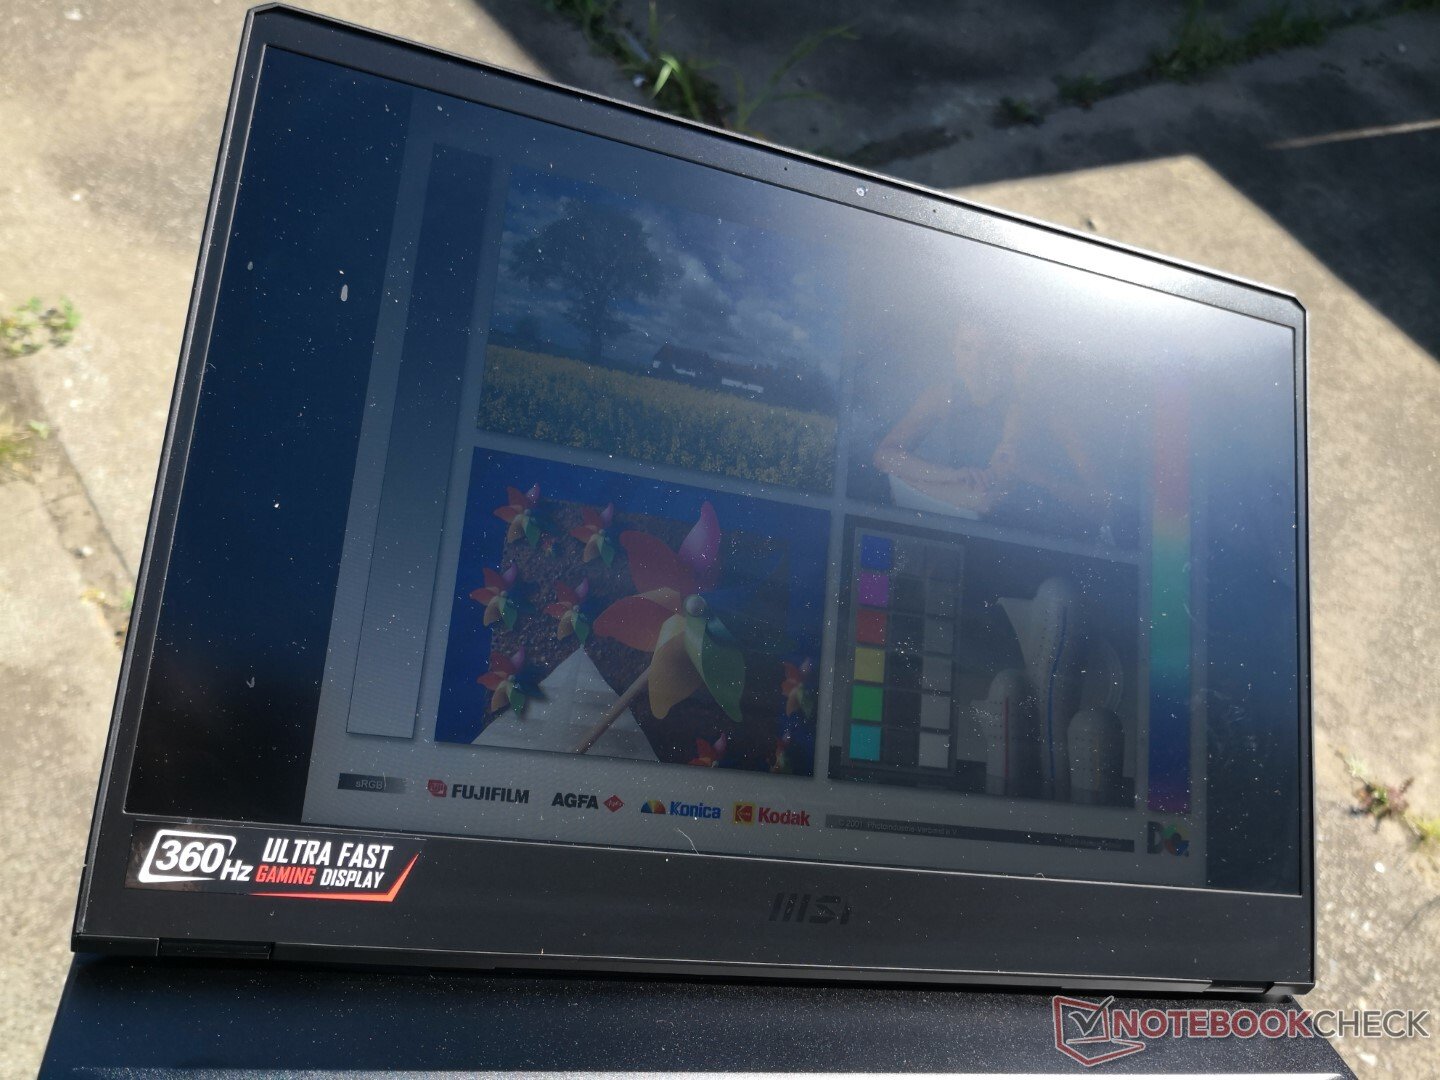
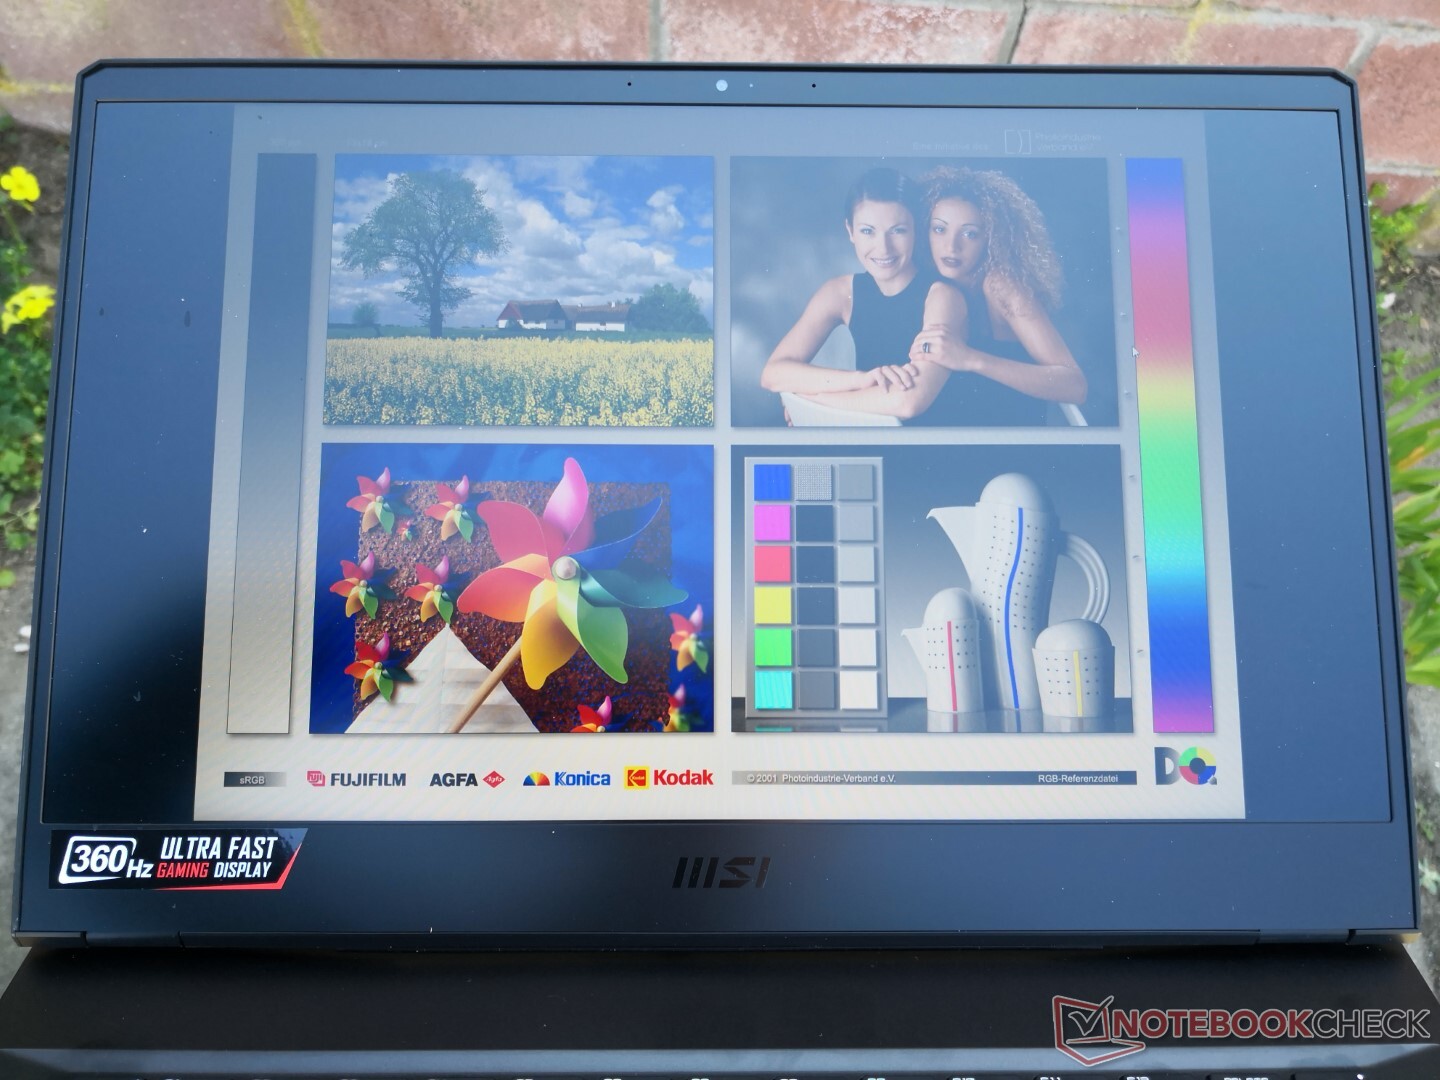
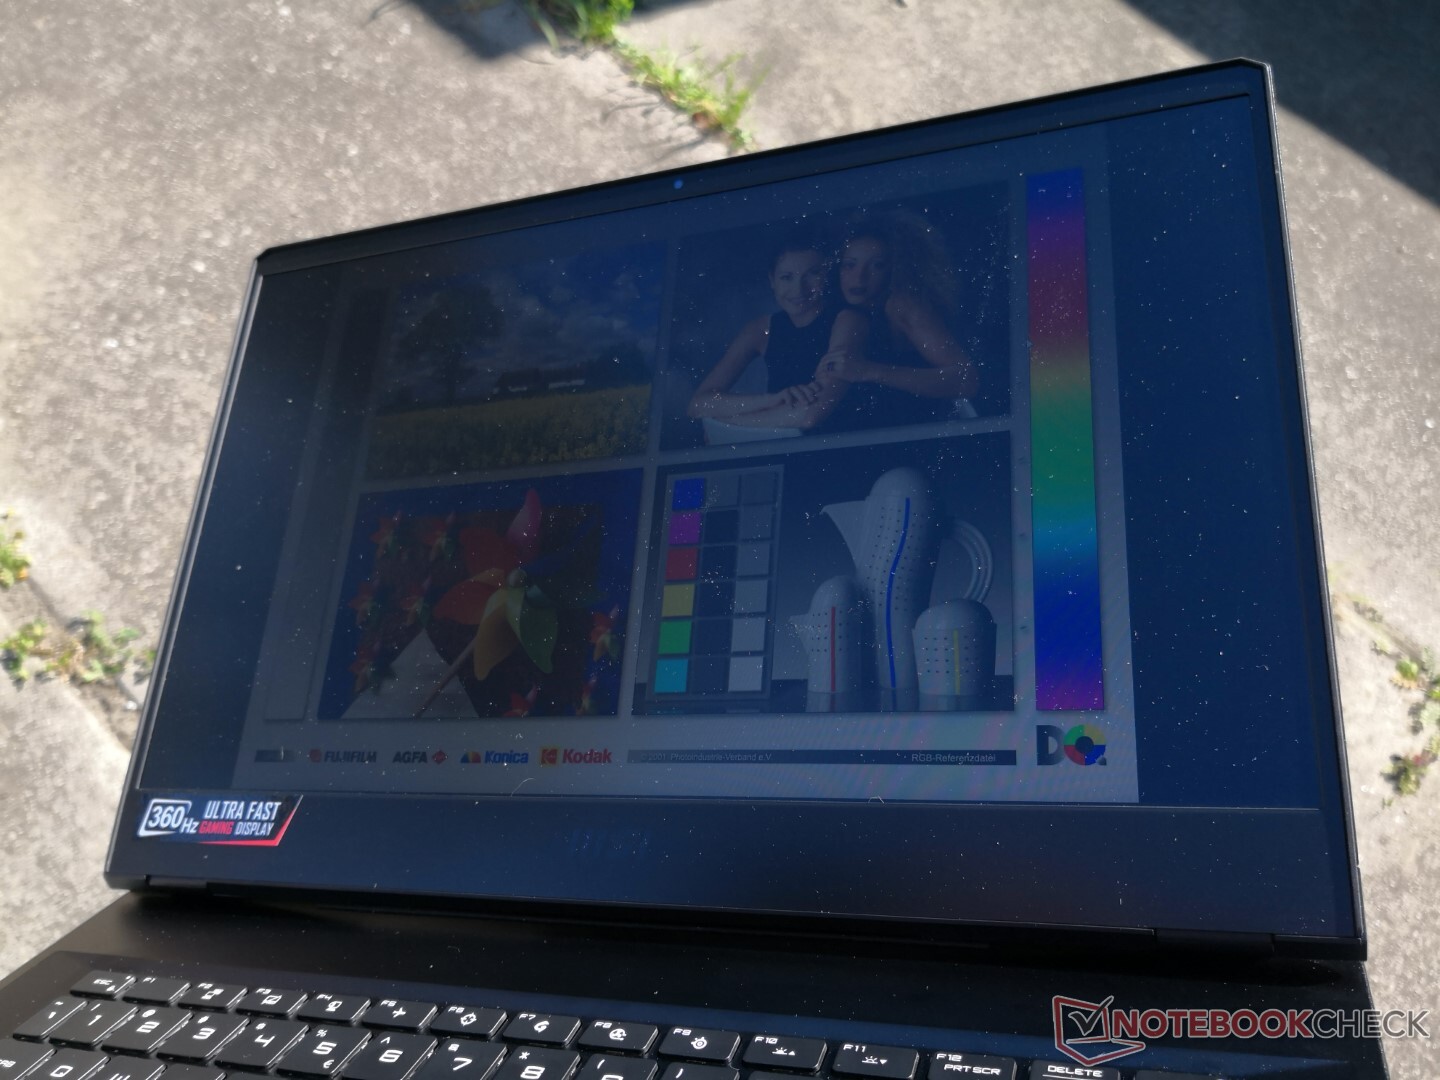
Le Vector GP66 est le premier ordinateur portable de notre base de données à être équipé de la dalle IPS 360 Hz BOE NE156FHM-NZ3, contrairement à la dalle IPS 144 Hz LG LP156WFG-SPB3 de notre ancien GP66 Leopard. La dalle BOE offre des taux de rafraîchissement et des temps de réponse de gris à gris plus rapides tout en conservant la même couverture sRGB complète et le même rapport de contraste que la dalle LG susmentionnée. La luminosité maximale est légèrement inférieure, mais pas de façon notable. Il s'agit d'une dalle haut de gamme adaptée à un PC de jeu de milieu de gamme.
Gardez à l'esprit que MSI offre également une option 144 Hz plus lente sur les SKUs moins chers du Vector GP66. Les couleurs sur cette dalle 144 Hz sont nettement moins bonnes, avec seulement ~60% de sRGB, et il serait donc sage d'éviter ces SKU si la qualité d'affichage est une priorité.

| |||||||||||||||||||||||||
Homogénéité de la luminosité: 85 %
Valeur mesurée au centre, sur batterie: 353.1 cd/m²
Contraste: 929:1 (Valeurs des noirs: 0.38 cd/m²)
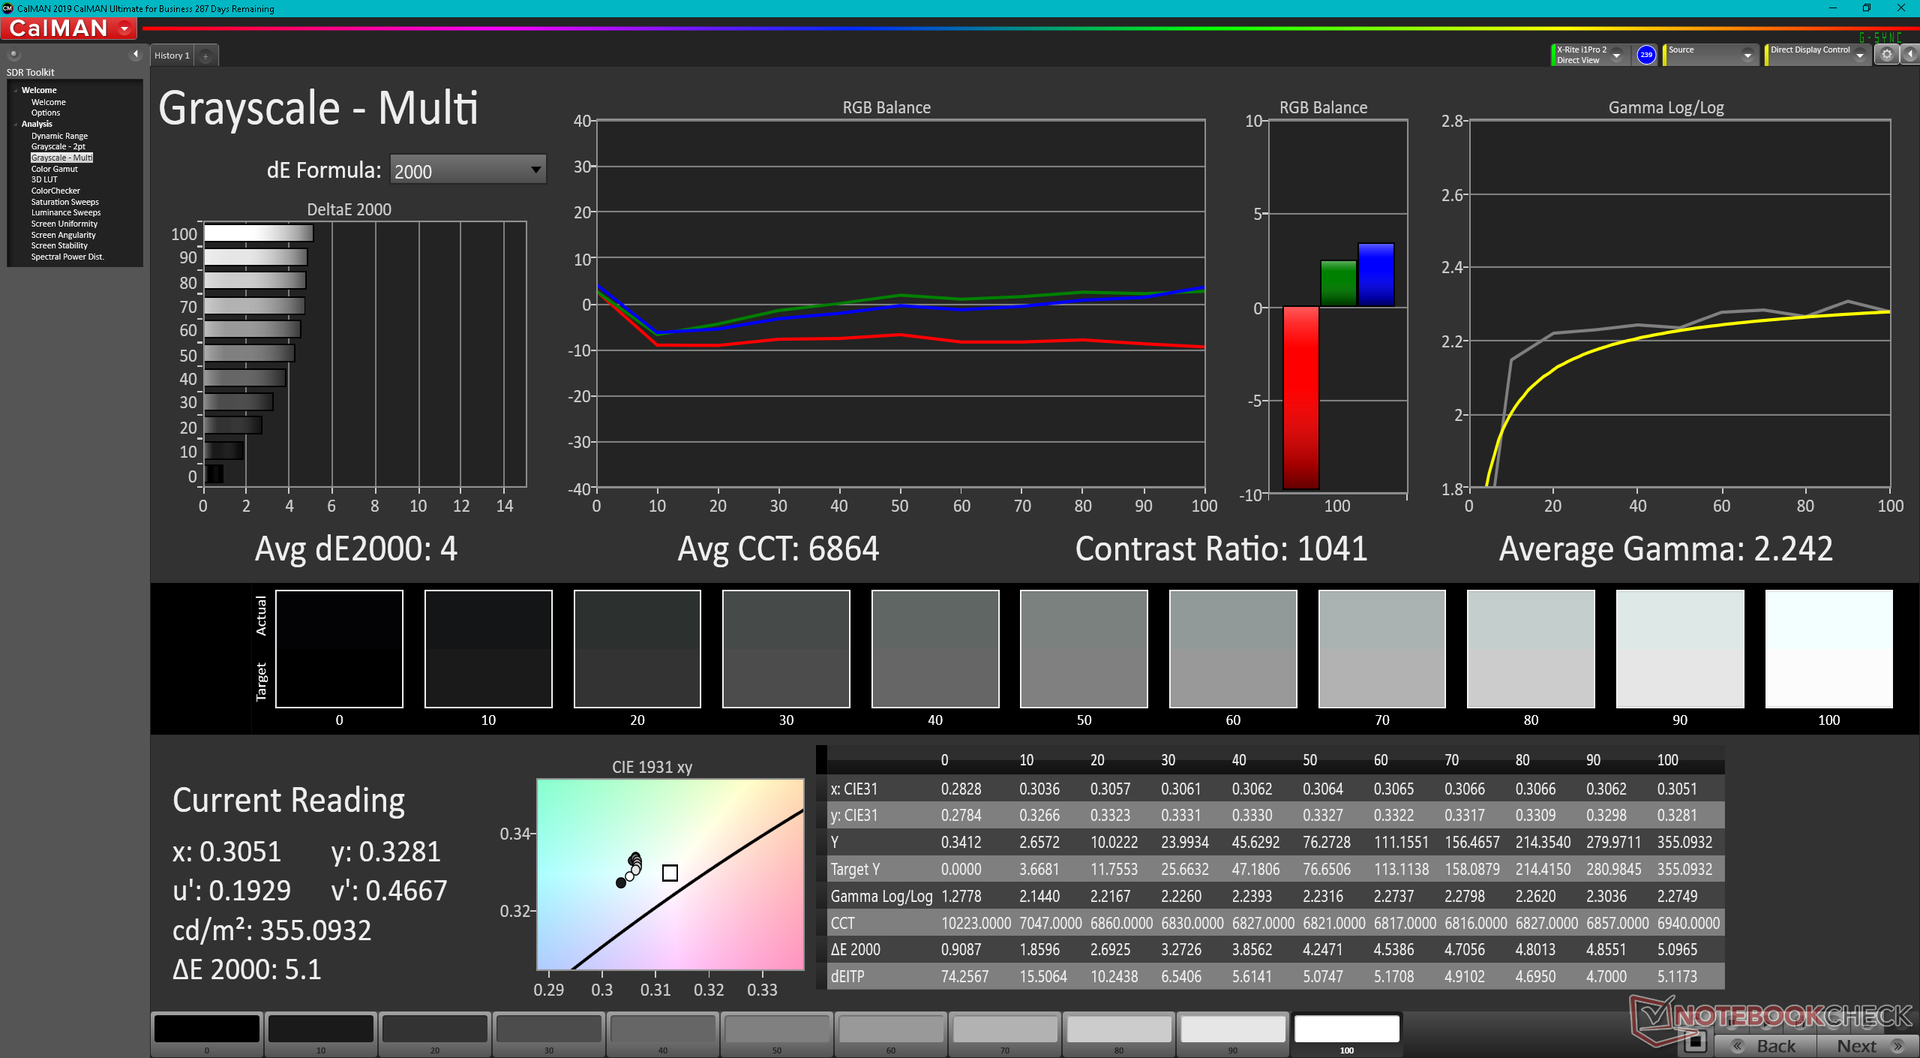
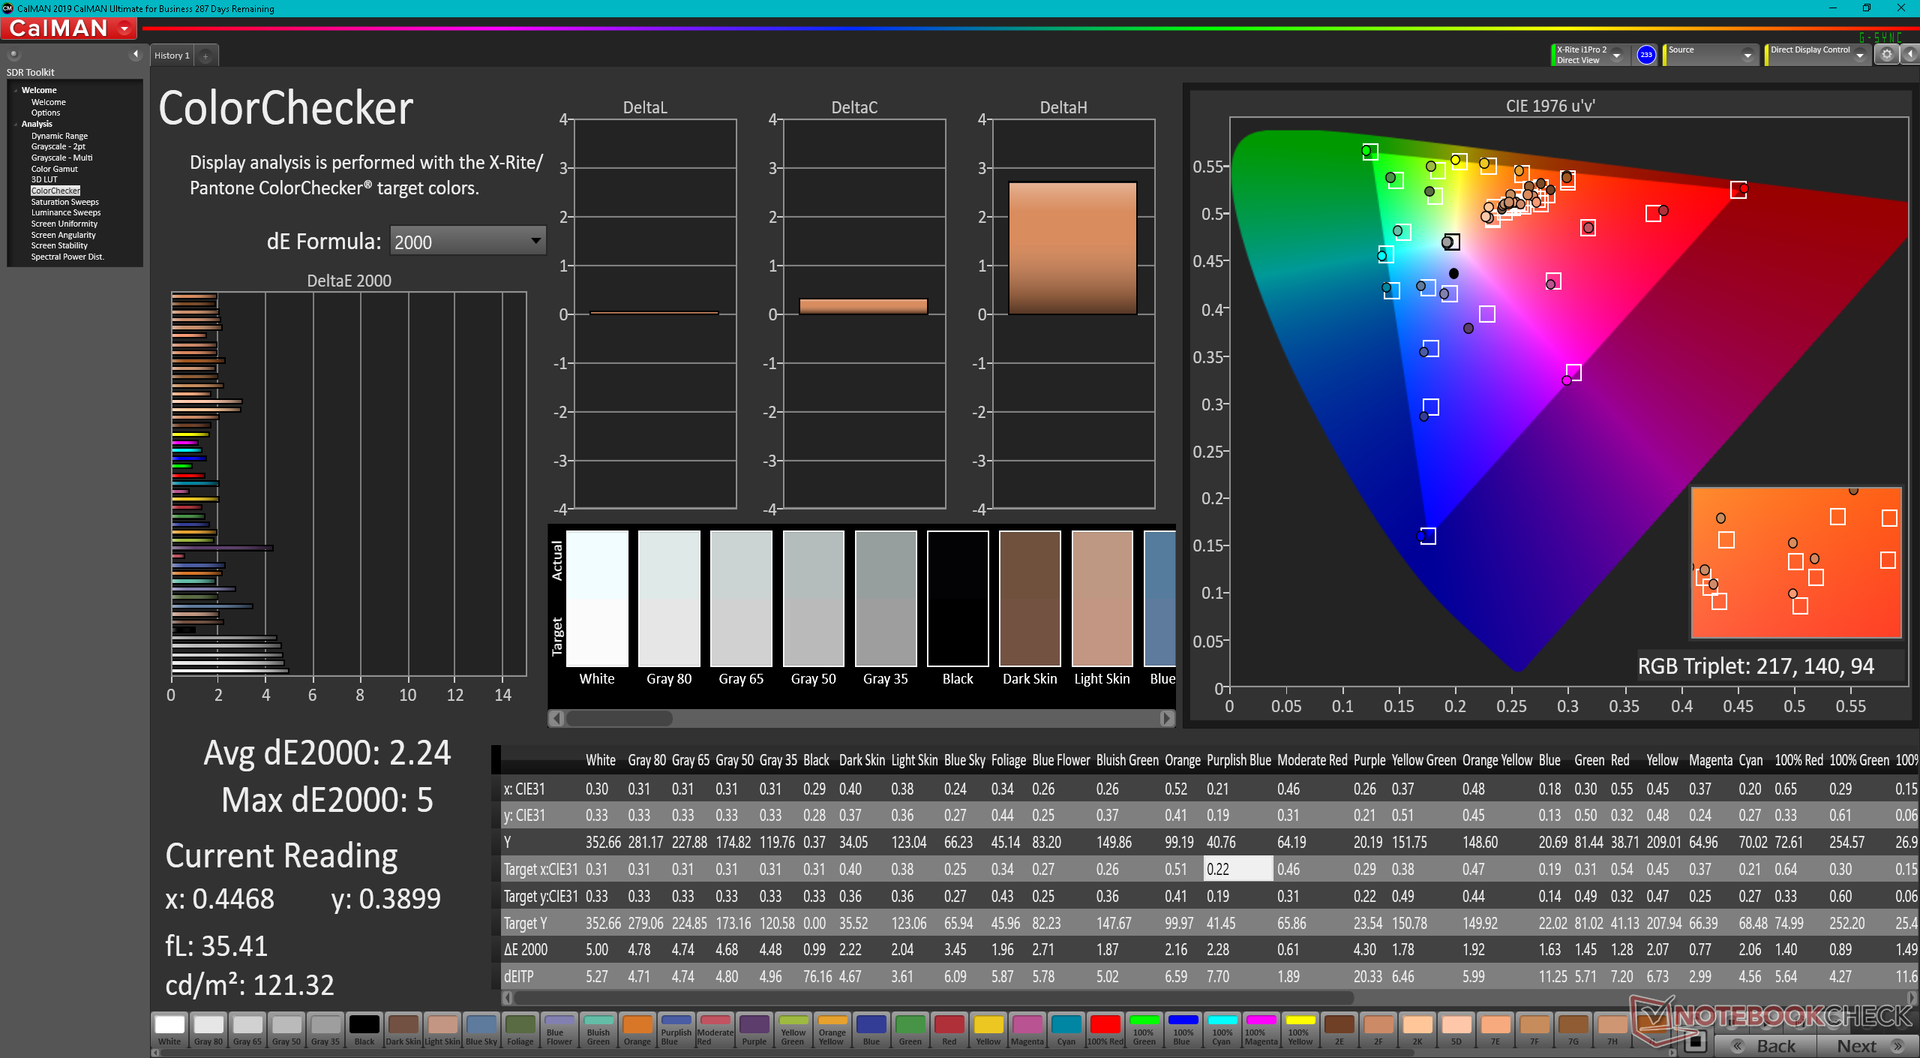
ΔE ColorChecker Calman: 2.24 | ∀{0.5-29.43 Ø4.72}
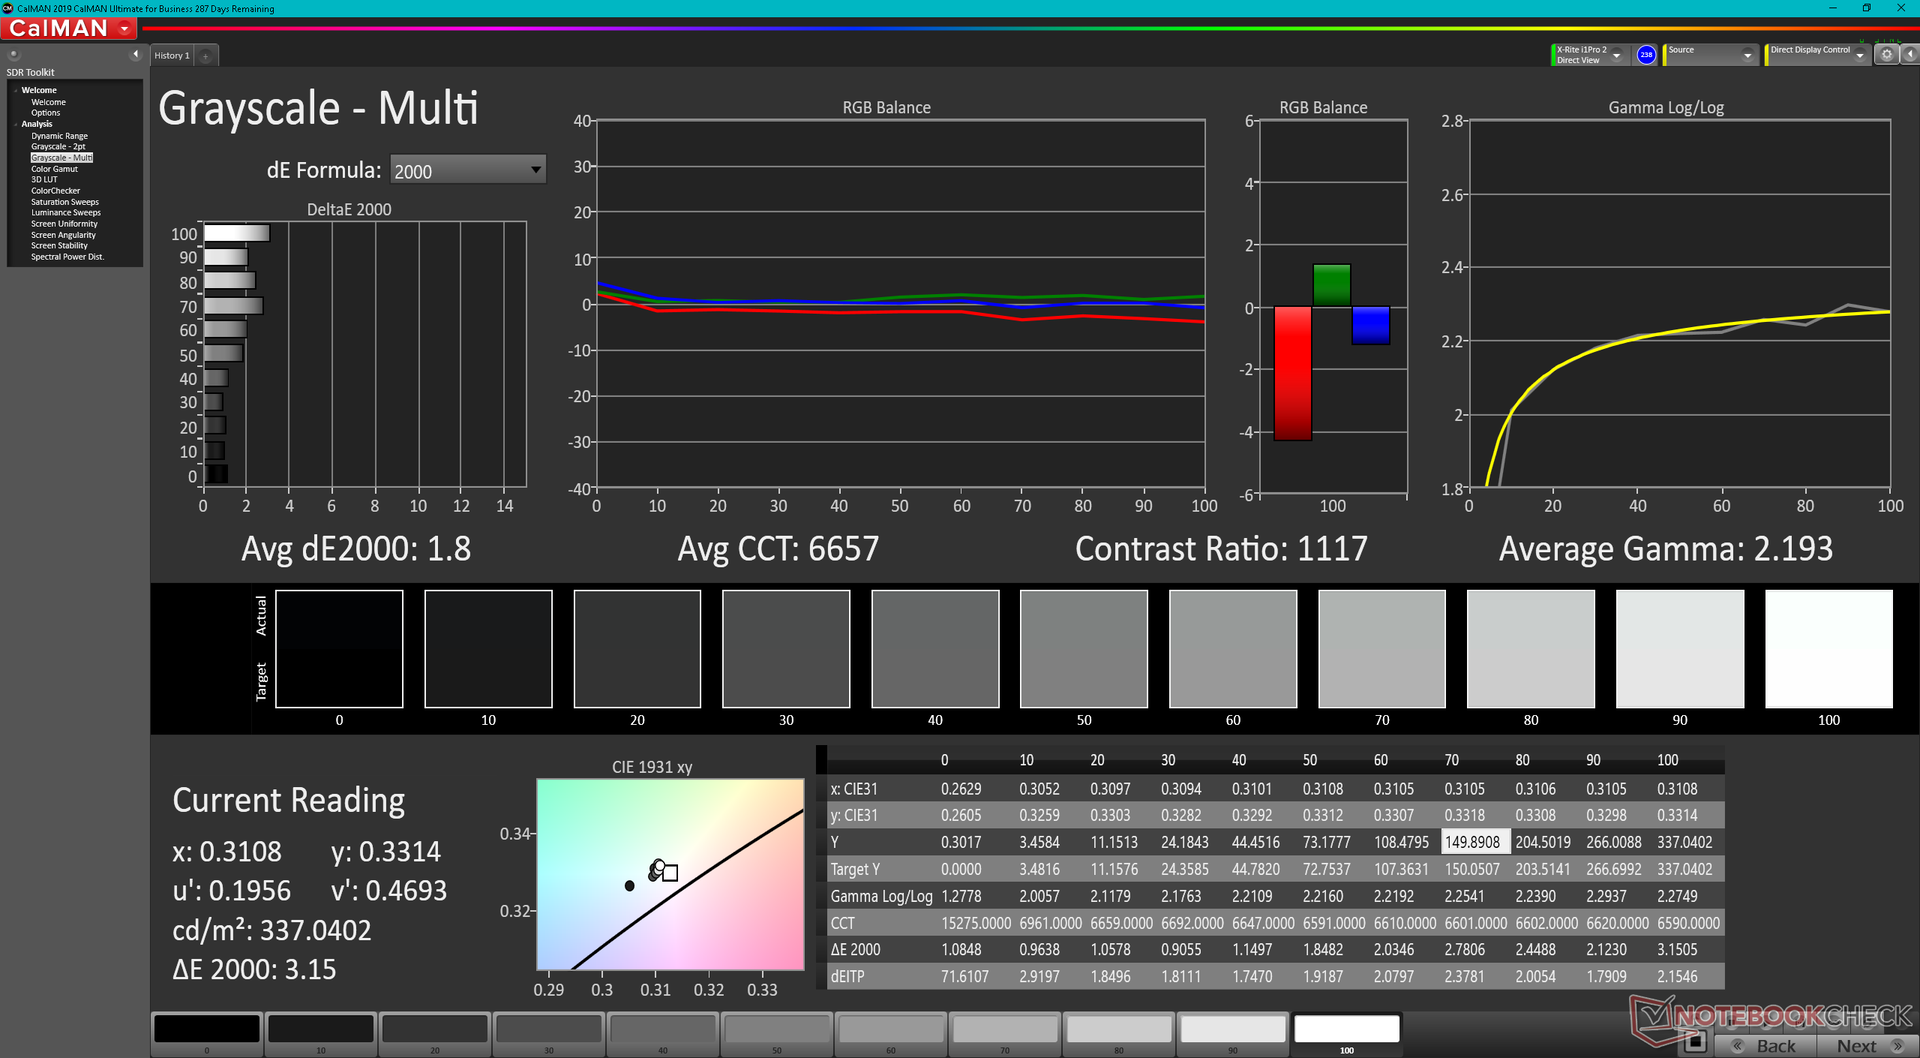
calibrated: 1.02
ΔE Greyscale Calman: 4 | ∀{0.09-98 Ø4.97}
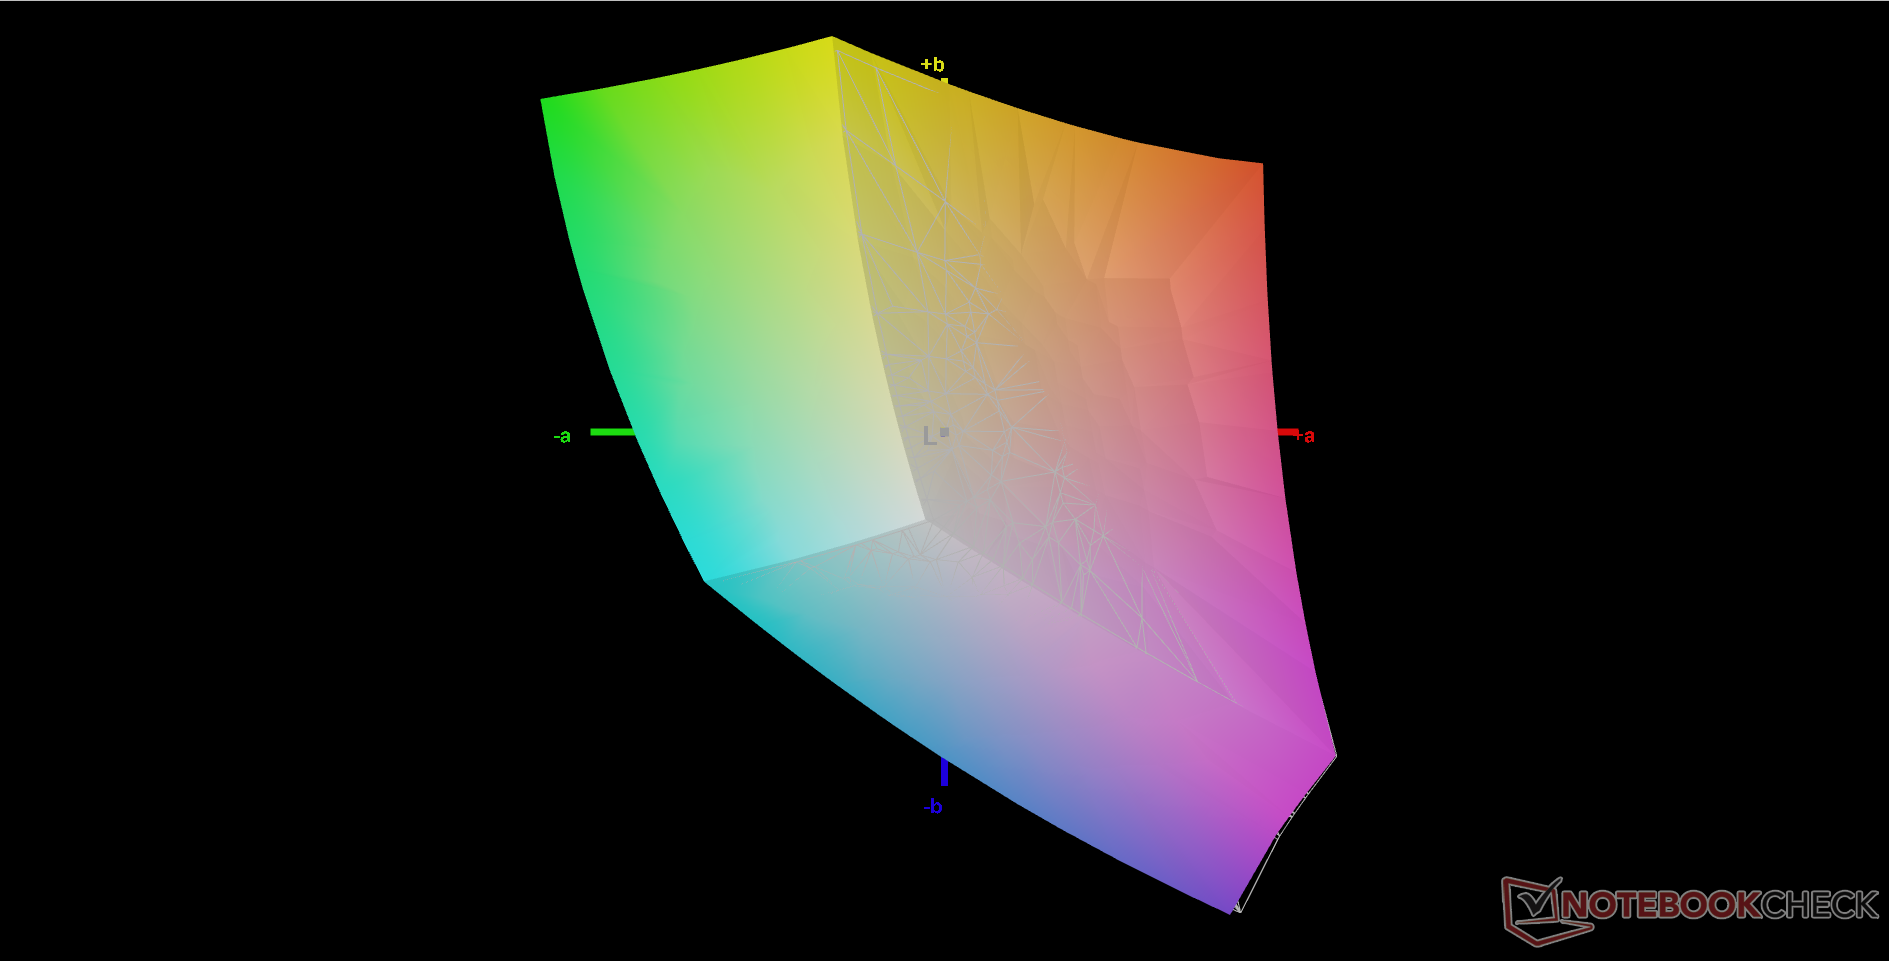
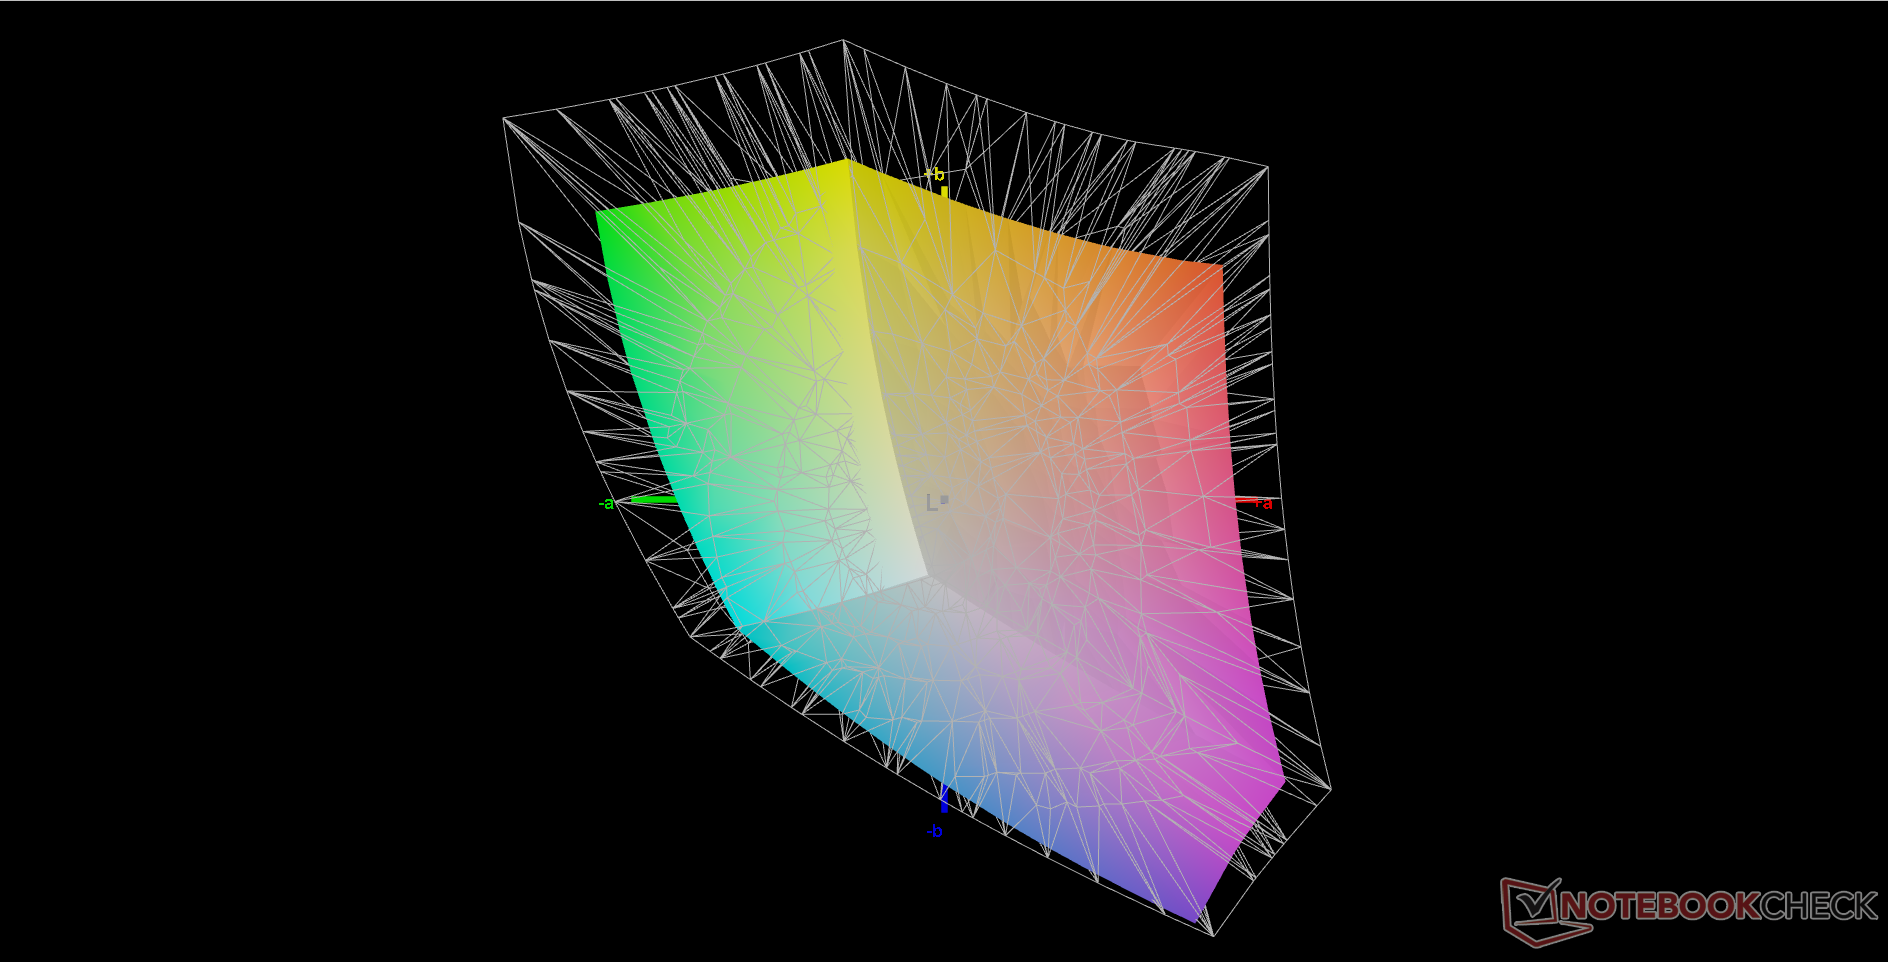
72.1% AdobeRGB 1998 (Argyll 3D)
99.5% sRGB (Argyll 3D)
70.1% Display P3 (Argyll 3D)
Gamma: 2.24
CCT: 6864 K
| MSI Vector GP66 12UGS BOE NE156FHM-NZ3, IPS, 1920x1080, 15.6" | MSI GP66 Leopard 11UH-028 LGD0625 (LP156WFG-SPB3), IPS, 1920x1080, 15.6" | MSI Katana GF66 11UG-220 AU Optronics B156HAN08.0, IPS, 1920x1080, 15.6" | Asus TUF Gaming F15 FX506HM Chi Mei N156HRA-EA1, IPS, 1920x1080, 15.6" | Razer Blade 15 Base Edition 2021, i7-10750H RTX 3060 BOE NV156FHM-N4K, IPS, 1920x1080, 15.6" | Alienware m15 R5 Ryzen Edition B156HAN, IPS, 1920x1080, 15.6" | |
|---|---|---|---|---|---|---|
| Display | -6% | -7% | -39% | -8% | ||
| Display P3 Coverage (%) | 70.1 | 65.2 -7% | 65.4 -7% | 41.9 -40% | 64.3 -8% | |
| sRGB Coverage (%) | 99.5 | 95.8 -4% | 91.3 -8% | 62.9 -37% | 91.8 -8% | |
| AdobeRGB 1998 Coverage (%) | 72.1 | 66 -8% | 66.7 -7% | 43.3 -40% | 65.5 -9% | |
| Response Times | -77% | -23% | -258% | -28% | 22% | |
| Response Time Grey 50% / Grey 80% * (ms) | 5.8 ? | 14 ? -141% | 7.4 ? -28% | 28.4 ? -390% | 8.8 ? -52% | 4 ? 31% |
| Response Time Black / White * (ms) | 9.6 ? | 10.8 ? -13% | 11.2 ? -17% | 21.6 ? -125% | 10 ? -4% | 8.4 ? 12% |
| PWM Frequency (Hz) | 1000 ? | |||||
| Screen | -21% | -30% | -71% | -32% | 2% | |
| Brightness middle (cd/m²) | 353.1 | 390 10% | 307 -13% | 268.3 -24% | 317.2 -10% | 329 -7% |
| Brightness (cd/m²) | 325 | 362 11% | 321 -1% | 257 -21% | 306 -6% | 321 -1% |
| Brightness Distribution (%) | 85 | 87 2% | 83 -2% | 84 -1% | 89 5% | 92 8% |
| Black Level * (cd/m²) | 0.38 | 0.41 -8% | 0.27 29% | 0.34 11% | 0.31 18% | 0.27 29% |
| Contrast (:1) | 929 | 951 2% | 1137 22% | 789 -15% | 1023 10% | 1219 31% |
| Colorchecker dE 2000 * | 2.24 | 2.66 -19% | 4.67 -108% | 5.05 -125% | 4.37 -95% | 2.78 -24% |
| Colorchecker dE 2000 max. * | 5 | 7.14 -43% | 7.53 -51% | 15.43 -209% | 6.62 -32% | 4.88 2% |
| Colorchecker dE 2000 calibrated * | 1.02 | 2.56 -151% | 2.41 -136% | 3.21 -215% | 2.67 -162% | 1.63 -60% |
| Greyscale dE 2000 * | 4 | 3.63 9% | 4.5 -13% | 5.5 -38% | 4.5 -13% | 2.5 37% |
| Gamma | 2.24 98% | 2.57 86% | 2.276 97% | 2.35 94% | 2.4 92% | 2.106 104% |
| CCT | 6864 95% | 6894 94% | 6824 95% | 7392 88% | 7418 88% | 6201 105% |
| Color Space (Percent of AdobeRGB 1998) (%) | 59.2 | 76 | ||||
| Color Space (Percent of sRGB) (%) | 91.4 | 99 | ||||
| Moyenne finale (programmes/paramètres) | -35% /
-26% | -20% /
-24% | -123% /
-91% | -23% /
-26% | 12% /
5% |
* ... Moindre est la valeur, meilleures sont les performances
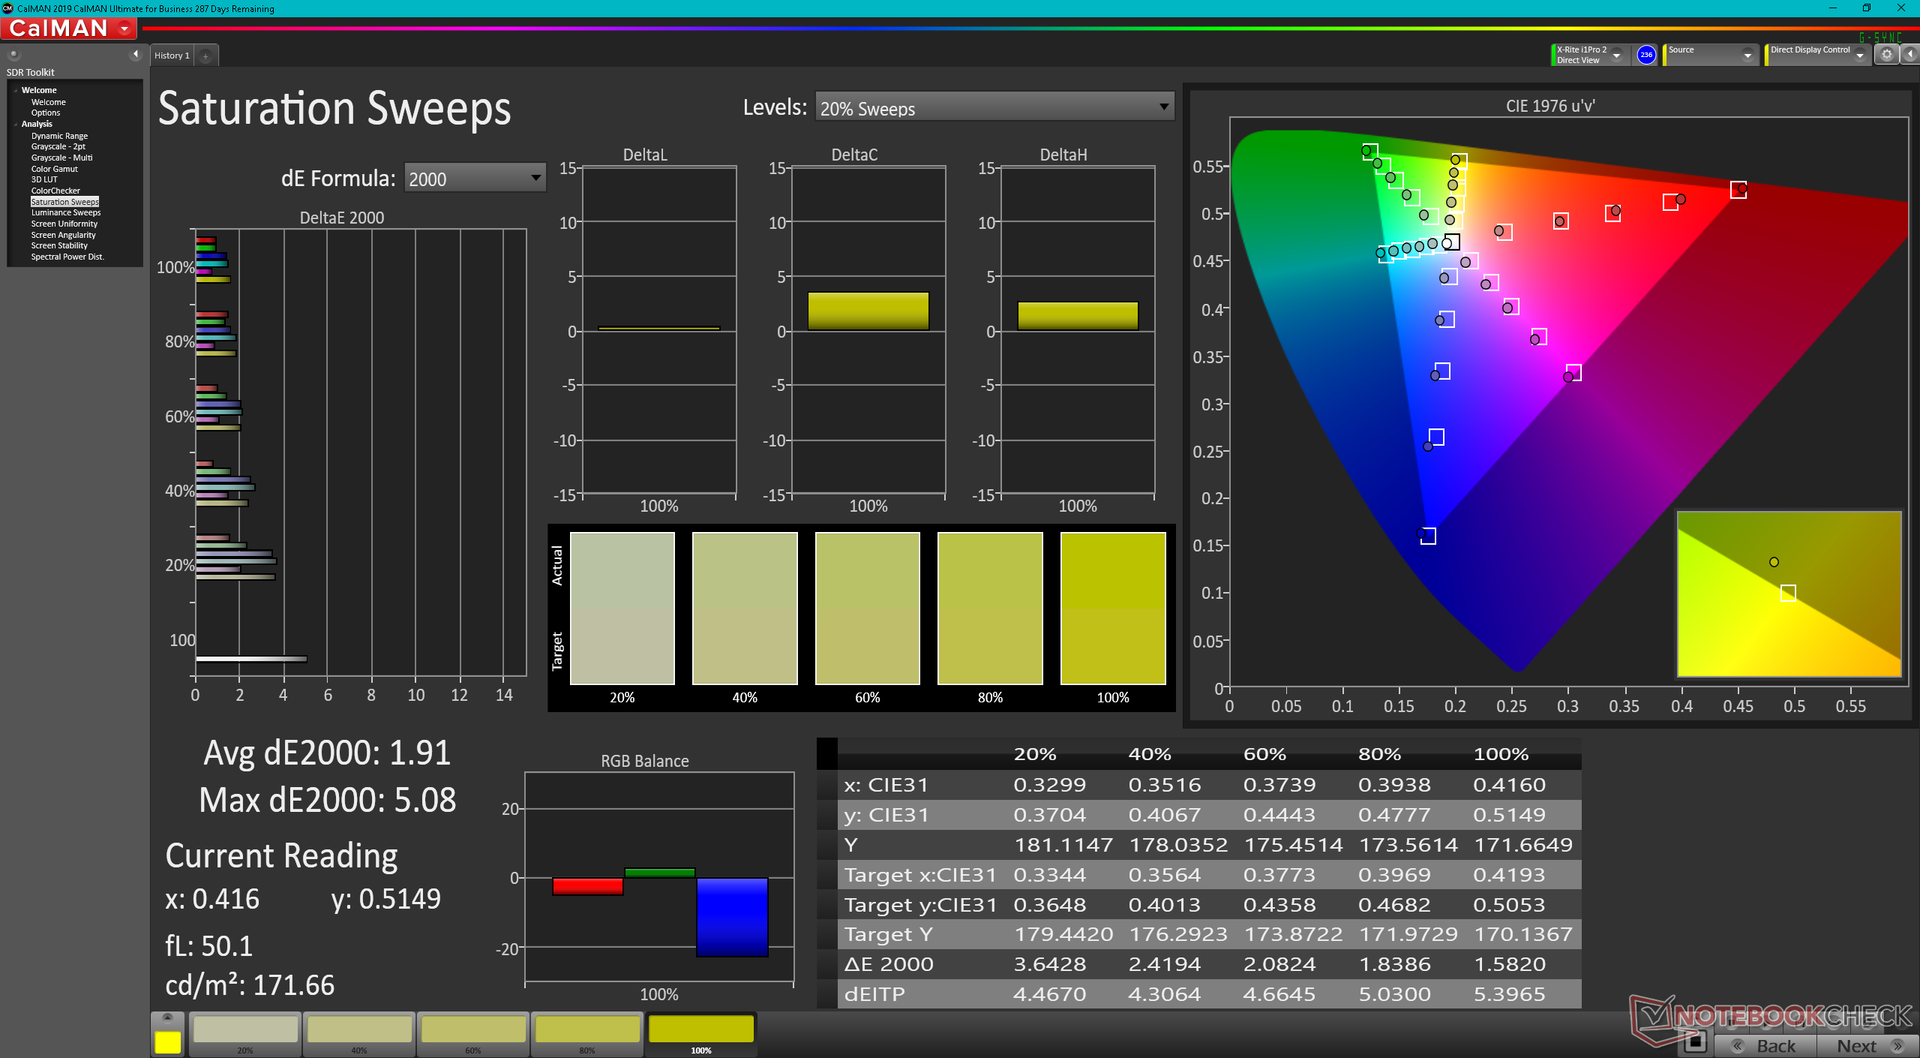
Le panneau couvre l'ensemble de sRGB et même un peu plus de AdobeRGB par rapport aux panneaux sur le GF66 Katana ou GP66 Leopard. Nous sommes heureux de voir un panneau de haute qualité ici, par opposition au Chi Mei sur le Asus TUF Gaming F15 qui couvre un gamut beaucoup plus étroit
L'écran est correctement calibré dès sa sortie de l'emballage, même si sa température de couleur pourrait être légèrement plus chaude. Un étalonnage au colorimètre X-Rite permet d'améliorer les valeurs DeltaE moyennes des niveaux de gris et des couleurs, qui passent de 4 et 2,24 à seulement 1,8 et 1,02, respectivement
Temps de réponse de l'écran
| ↔ Temps de réponse noir à blanc | ||
|---|---|---|
| 9.6 ms ... hausse ↗ et chute ↘ combinées | ↗ 5.2 ms hausse | 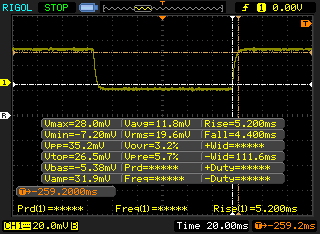 |
| ↘ 4.4 ms chute | ||
| L'écran montre de faibles temps de réponse, un bon écran pour jouer. En comparaison, tous les appareils testés affichent entre 0.1 (minimum) et 240 (maximum) ms. » 26 % des appareils testés affichent de meilleures performances. Cela signifie que les latences relevées sont meilleures que la moyenne (19.8 ms) de tous les appareils testés. | ||
| ↔ Temps de réponse gris 50% à gris 80% | ||
| 5.8 ms ... hausse ↗ et chute ↘ combinées | ↗ 3.4 ms hausse | 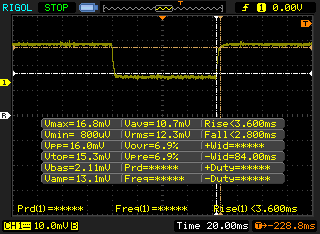 |
| ↘ 2.4 ms chute | ||
| L'écran montre de très faibles temps de réponse, parfait pour le jeu. En comparaison, tous les appareils testés affichent entre 0.165 (minimum) et 636 (maximum) ms. » 18 % des appareils testés affichent de meilleures performances. Cela signifie que les latences relevées sont meilleures que la moyenne (31 ms) de tous les appareils testés. | ||
Scintillement / MLI (Modulation de largeur d'impulsion)
| Scintillement / MLI (Modulation de largeur d'impulsion) non décelé | 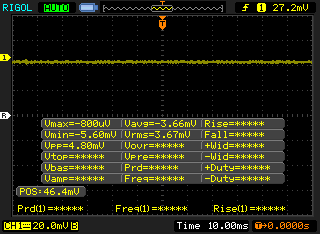 | ||
En comparaison, 52 % des appareils testés n'emploient pas MDI pour assombrir leur écran. Nous avons relevé une moyenne à 7753 (minimum : 5 - maximum : 343500) Hz dans le cas où une MDI était active. | |||

Performance
Conditions d'essai
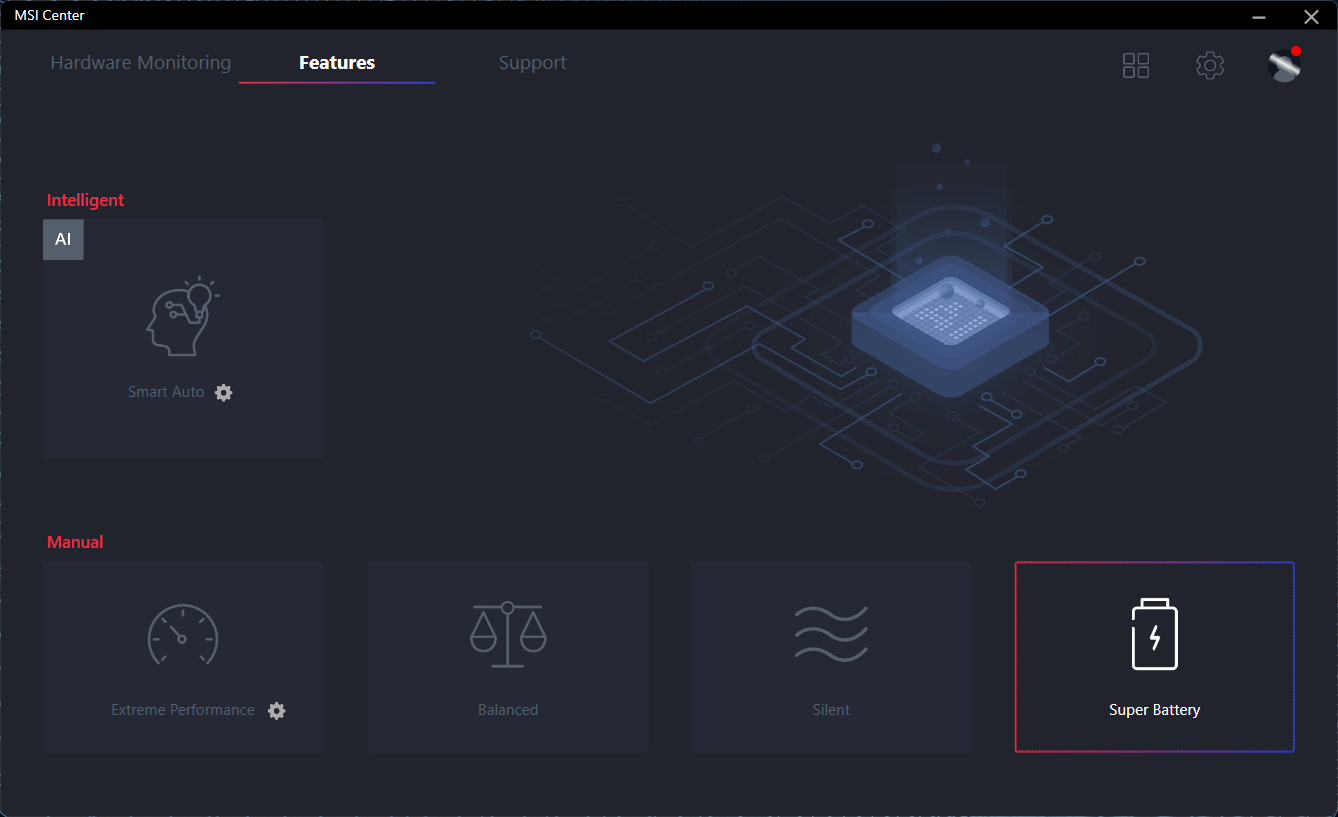
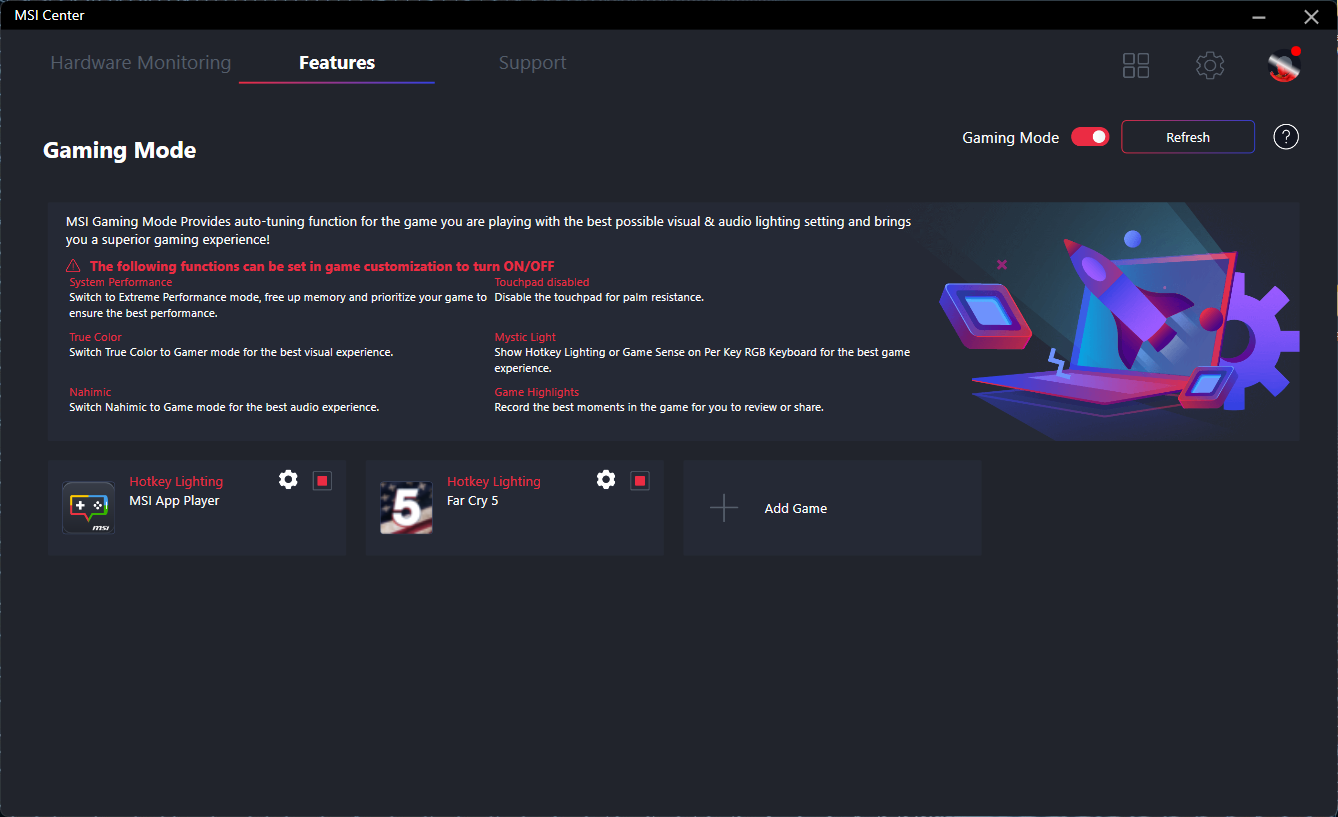
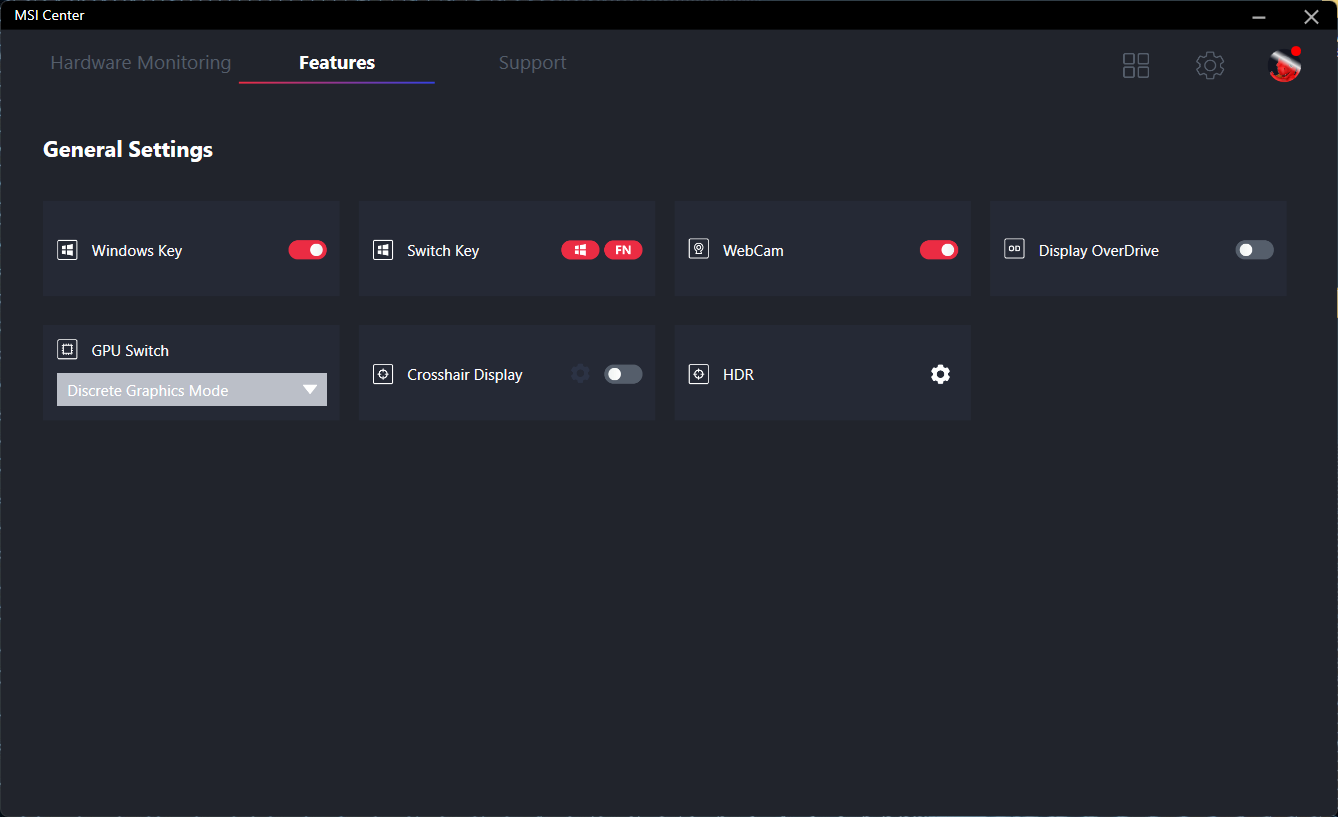
Notre appareil a été réglé en mode Performance extrême avec le GPU discret actif via le logiciel MSI Center pour obtenir les meilleurs scores possibles. Nous recommandons vivement aux utilisateurs de se familiariser avec ce logiciel car de nombreuses fonctions importantes sont activées ici, notamment MSHybrid, la surveillance du matériel, HDR et d'autres paramètres de qualité de vie. Pour les effets d'éclairage du clavier, les utilisateurs doivent se fier au logiciel SteelSeries GG préinstallé
Un redémarrage est nécessaire pour passer du mode MSHybrid au mode GPU discret.
Processeur
Le site Core i9-12900H est environ 25 % et 35 % plus rapide dans les applications monofilaires et multifilaires, respectivement, par rapport à la dernière génération du Core i7-11800H de dernière génération équipant le GP66 Leopard. Les performances globales peuvent même dépasser celles des ordinateurs de bureau les plus gourmands en énergie, lesCore i9-11900K. La série H du Zen 3 d'AMD détenait la couronne des performances avant le lancement de la série H d'Alder Lake d'Intel.
Vous trouverez plus d'informations sur Alder Lake dans notre aperçu de la plate-forme ici.
Cinebench R15 Multi Loop
Cinebench R23: Multi Core | Single Core
Cinebench R15: CPU Multi 64Bit | CPU Single 64Bit
Blender: v2.79 BMW27 CPU
7-Zip 18.03: 7z b 4 | 7z b 4 -mmt1
Geekbench 5.5: Multi-Core | Single-Core
HWBOT x265 Benchmark v2.2: 4k Preset
LibreOffice : 20 Documents To PDF
R Benchmark 2.5: Overall mean
| Cinebench R20 / CPU (Multi Core) | |
| Intel Core i9-12900K | |
| MSI Vector GP66 12UGS | |
| MSI MEG Z590 ACE | |
| Moyenne Intel Core i9-12900H (2681 - 7471, n=28) | |
| Eurocom Nightsky ARX315 | |
| MSI GP66 Leopard 11UH-028 | |
| HP ZBook Fury 15 G8 | |
| MSI Alpha 15 B5EEK-008 | |
| MSI Delta 15 A5EFK | |
| Alienware m15 R4 | |
| MSI GE65 Raider 9SF-049US | |
| Razer Blade 15 Advanced Model Early 2021 | |
| Cinebench R20 / CPU (Single Core) | |
| Intel Core i9-12900K | |
| MSI Vector GP66 12UGS | |
| Moyenne Intel Core i9-12900H (624 - 738, n=28) | |
| MSI MEG Z590 ACE | |
| HP ZBook Fury 15 G8 | |
| Eurocom Nightsky ARX315 | |
| MSI GP66 Leopard 11UH-028 | |
| MSI Delta 15 A5EFK | |
| MSI Alpha 15 B5EEK-008 | |
| Alienware m15 R4 | |
| Razer Blade 15 Advanced Model Early 2021 | |
| MSI GE65 Raider 9SF-049US | |
| Cinebench R23 / Multi Core | |
| Intel Core i9-12900K | |
| MSI Vector GP66 12UGS | |
| MSI MEG Z590 ACE | |
| Moyenne Intel Core i9-12900H (7359 - 19648, n=28) | |
| Eurocom Nightsky ARX315 | |
| MSI GP66 Leopard 11UH-028 | |
| HP ZBook Fury 15 G8 | |
| MSI Alpha 15 B5EEK-008 | |
| MSI Delta 15 A5EFK | |
| Razer Blade 15 Advanced Model Early 2021 | |
| Cinebench R23 / Single Core | |
| Intel Core i9-12900K | |
| MSI Vector GP66 12UGS | |
| Moyenne Intel Core i9-12900H (1634 - 1930, n=28) | |
| MSI MEG Z590 ACE | |
| HP ZBook Fury 15 G8 | |
| Eurocom Nightsky ARX315 | |
| MSI GP66 Leopard 11UH-028 | |
| MSI Delta 15 A5EFK | |
| MSI Alpha 15 B5EEK-008 | |
| Razer Blade 15 Advanced Model Early 2021 | |
| Cinebench R15 / CPU Multi 64Bit | |
| Intel Core i9-12900K | |
| Moyenne Intel Core i9-12900H (1395 - 3077, n=28) | |
| MSI Vector GP66 12UGS | |
| MSI MEG Z590 ACE | |
| Eurocom Nightsky ARX315 | |
| MSI Delta 15 A5EFK | |
| MSI GP66 Leopard 11UH-028 | |
| MSI Alpha 15 B5EEK-008 | |
| HP ZBook Fury 15 G8 | |
| MSI GE65 Raider 9SF-049US | |
| Alienware m15 R4 | |
| Razer Blade 15 Advanced Model Early 2021 | |
| Cinebench R15 / CPU Single 64Bit | |
| Intel Core i9-12900K | |
| MSI Vector GP66 12UGS | |
| Moyenne Intel Core i9-12900H (235 - 277, n=29) | |
| MSI MEG Z590 ACE | |
| Eurocom Nightsky ARX315 | |
| HP ZBook Fury 15 G8 | |
| MSI Delta 15 A5EFK | |
| MSI Alpha 15 B5EEK-008 | |
| MSI GP66 Leopard 11UH-028 | |
| Alienware m15 R4 | |
| Razer Blade 15 Advanced Model Early 2021 | |
| MSI GE65 Raider 9SF-049US | |
| Blender / v2.79 BMW27 CPU | |
| Razer Blade 15 Advanced Model Early 2021 | |
| Alienware m15 R4 | |
| HP ZBook Fury 15 G8 | |
| MSI Alpha 15 B5EEK-008 | |
| MSI GP66 Leopard 11UH-028 | |
| MSI Delta 15 A5EFK | |
| Moyenne Intel Core i9-12900H (160 - 451, n=28) | |
| Eurocom Nightsky ARX315 | |
| MSI Vector GP66 12UGS | |
| MSI MEG Z590 ACE | |
| Intel Core i9-12900K | |
| 7-Zip 18.03 / 7z b 4 | |
| Intel Core i9-12900K | |
| Eurocom Nightsky ARX315 | |
| MSI Vector GP66 12UGS | |
| MSI MEG Z590 ACE | |
| Moyenne Intel Core i9-12900H (34684 - 76677, n=28) | |
| MSI Delta 15 A5EFK | |
| MSI Alpha 15 B5EEK-008 | |
| MSI GP66 Leopard 11UH-028 | |
| HP ZBook Fury 15 G8 | |
| Alienware m15 R4 | |
| Razer Blade 15 Advanced Model Early 2021 | |
| 7-Zip 18.03 / 7z b 4 -mmt1 | |
| Intel Core i9-12900K | |
| Eurocom Nightsky ARX315 | |
| MSI MEG Z590 ACE | |
| MSI Vector GP66 12UGS | |
| Moyenne Intel Core i9-12900H (5302 - 6289, n=28) | |
| HP ZBook Fury 15 G8 | |
| MSI Delta 15 A5EFK | |
| MSI GP66 Leopard 11UH-028 | |
| MSI Alpha 15 B5EEK-008 | |
| Alienware m15 R4 | |
| Razer Blade 15 Advanced Model Early 2021 | |
| Geekbench 5.5 / Multi-Core | |
| Intel Core i9-12900K | |
| MSI Vector GP66 12UGS | |
| Moyenne Intel Core i9-12900H (8519 - 14376, n=31) | |
| MSI MEG Z590 ACE | |
| Eurocom Nightsky ARX315 | |
| MSI GP66 Leopard 11UH-028 | |
| MSI Delta 15 A5EFK | |
| MSI Alpha 15 B5EEK-008 | |
| Alienware m15 R4 | |
| Razer Blade 15 Advanced Model Early 2021 | |
| Geekbench 5.5 / Single-Core | |
| Intel Core i9-12900K | |
| MSI Vector GP66 12UGS | |
| Moyenne Intel Core i9-12900H (1631 - 1897, n=31) | |
| MSI MEG Z590 ACE | |
| Eurocom Nightsky ARX315 | |
| MSI GP66 Leopard 11UH-028 | |
| MSI Delta 15 A5EFK | |
| MSI Alpha 15 B5EEK-008 | |
| Alienware m15 R4 | |
| Razer Blade 15 Advanced Model Early 2021 | |
| HWBOT x265 Benchmark v2.2 / 4k Preset | |
| Intel Core i9-12900K | |
| MSI Vector GP66 12UGS | |
| MSI MEG Z590 ACE | |
| Eurocom Nightsky ARX315 | |
| Moyenne Intel Core i9-12900H (8.05 - 22.5, n=28) | |
| MSI Delta 15 A5EFK | |
| MSI GP66 Leopard 11UH-028 | |
| MSI Alpha 15 B5EEK-008 | |
| HP ZBook Fury 15 G8 | |
| Alienware m15 R4 | |
| Razer Blade 15 Advanced Model Early 2021 | |
| LibreOffice / 20 Documents To PDF | |
| MSI Alpha 15 B5EEK-008 | |
| Razer Blade 15 Advanced Model Early 2021 | |
| MSI Delta 15 A5EFK | |
| HP ZBook Fury 15 G8 | |
| Alienware m15 R4 | |
| MSI GP66 Leopard 11UH-028 | |
| Eurocom Nightsky ARX315 | |
| Moyenne Intel Core i9-12900H (36.8 - 59.8, n=28) | |
| MSI MEG Z590 ACE | |
| Intel Core i9-12900K | |
| MSI Vector GP66 12UGS | |
| R Benchmark 2.5 / Overall mean | |
| Razer Blade 15 Advanced Model Early 2021 | |
| Alienware m15 R4 | |
| MSI GP66 Leopard 11UH-028 | |
| HP ZBook Fury 15 G8 | |
| MSI Alpha 15 B5EEK-008 | |
| MSI Delta 15 A5EFK | |
| Eurocom Nightsky ARX315 | |
| MSI MEG Z590 ACE | |
| Moyenne Intel Core i9-12900H (0.4218 - 0.506, n=28) | |
| MSI Vector GP66 12UGS | |
| Intel Core i9-12900K | |
* ... Moindre est la valeur, meilleures sont les performances
AIDA64: FP32 Ray-Trace | FPU Julia | CPU SHA3 | CPU Queen | FPU SinJulia | FPU Mandel | CPU AES | CPU ZLib | FP64 Ray-Trace | CPU PhotoWorxx
| Performance rating | |
| MSI GP66 Leopard 11UH-028 | |
| Alienware m15 R5 Ryzen Edition | |
| Moyenne Intel Core i9-12900H | |
| MSI Vector GP66 12UGS | |
| MSI Katana GF66 11UG-220 -9! | |
| Asus TUF Gaming F15 FX506HM -9! | |
| AIDA64 / FP32 Ray-Trace | |
| MSI GP66 Leopard 11UH-028 | |
| Alienware m15 R5 Ryzen Edition | |
| Moyenne Intel Core i9-12900H (4074 - 18289, n=29) | |
| MSI Vector GP66 12UGS | |
| AIDA64 / FPU Julia | |
| Alienware m15 R5 Ryzen Edition | |
| MSI GP66 Leopard 11UH-028 | |
| Moyenne Intel Core i9-12900H (22307 - 93236, n=29) | |
| MSI Vector GP66 12UGS | |
| AIDA64 / CPU SHA3 | |
| MSI GP66 Leopard 11UH-028 | |
| Alienware m15 R5 Ryzen Edition | |
| Moyenne Intel Core i9-12900H (1378 - 4215, n=29) | |
| MSI Vector GP66 12UGS | |
| AIDA64 / CPU Queen | |
| MSI Vector GP66 12UGS | |
| Moyenne Intel Core i9-12900H (78172 - 111241, n=28) | |
| Alienware m15 R5 Ryzen Edition | |
| MSI GP66 Leopard 11UH-028 | |
| AIDA64 / FPU SinJulia | |
| Alienware m15 R5 Ryzen Edition | |
| MSI GP66 Leopard 11UH-028 | |
| MSI Vector GP66 12UGS | |
| Moyenne Intel Core i9-12900H (5709 - 10410, n=29) | |
| AIDA64 / FPU Mandel | |
| Alienware m15 R5 Ryzen Edition | |
| MSI GP66 Leopard 11UH-028 | |
| Moyenne Intel Core i9-12900H (11257 - 45581, n=29) | |
| MSI Vector GP66 12UGS | |
| AIDA64 / CPU AES | |
| MSI GP66 Leopard 11UH-028 | |
| Alienware m15 R5 Ryzen Edition | |
| MSI Vector GP66 12UGS | |
| Moyenne Intel Core i9-12900H (31935 - 151546, n=29) | |
| AIDA64 / CPU ZLib | |
| MSI Vector GP66 12UGS | |
| Moyenne Intel Core i9-12900H (449 - 1193, n=29) | |
| MSI GP66 Leopard 11UH-028 | |
| Alienware m15 R5 Ryzen Edition | |
| Asus TUF Gaming F15 FX506HM | |
| MSI Katana GF66 11UG-220 | |
| AIDA64 / FP64 Ray-Trace | |
| MSI GP66 Leopard 11UH-028 | |
| Alienware m15 R5 Ryzen Edition | |
| Moyenne Intel Core i9-12900H (2235 - 10511, n=29) | |
| MSI Vector GP66 12UGS | |
| AIDA64 / CPU PhotoWorxx | |
| Moyenne Intel Core i9-12900H (20960 - 48269, n=30) | |
| MSI Vector GP66 12UGS | |
| MSI GP66 Leopard 11UH-028 | |
| Alienware m15 R5 Ryzen Edition | |
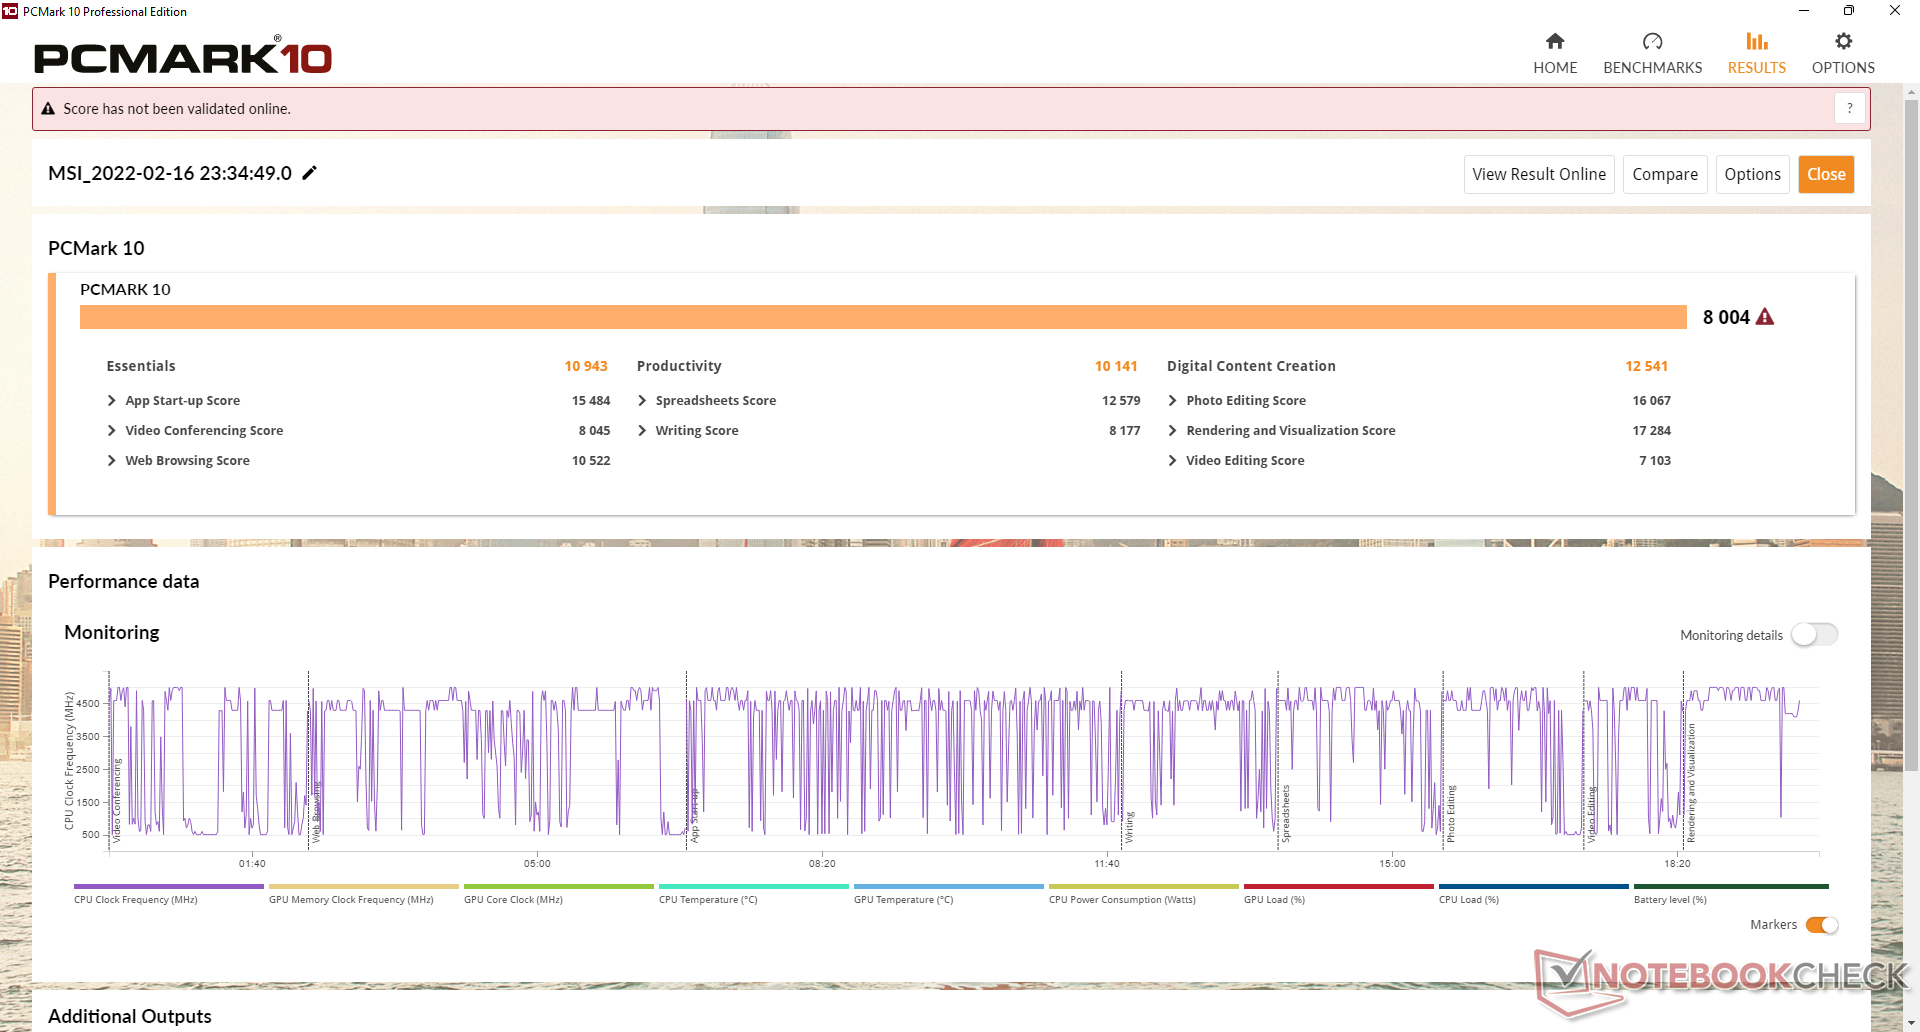
Performance du système
Les résultats de PCMark sont parmi les plus élevés de notre base de données, avec un peu plus de 8000 points. Le siteMSI Raider GE76 équipé du Core i9-12900HK débloqué et de la RTX 3080 Ti plus rapide de GeForce obtiendrait des scores essentiellement identiques à ceux de notre GP66
Il convient de noter que nous avons rencontré des problèmes de réveil et de sommeil avec notre unité de test, l'écran restant parfois noir lors du passage d'un mode GPU à l'autre ou lors du passage en mode sommeil. Un redémarrage brutal était alors nécessaire.
| PCMark 10 / Score | |
| MSI Vector GP66 12UGS | |
| Moyenne Intel Core i9-12900H, NVIDIA GeForce RTX 3070 Ti Laptop GPU (7087 - 8072, n=6) | |
| MSI GP66 Leopard 11UH-028 | |
| Asus TUF Gaming F15 FX506HM | |
| MSI Katana GF66 11UG-220 | |
| Alienware m15 R5 Ryzen Edition | |
| Razer Blade 15 Base Edition 2021, i7-10750H RTX 3060 | |
| PCMark 10 / Essentials | |
| MSI Vector GP66 12UGS | |
| Moyenne Intel Core i9-12900H, NVIDIA GeForce RTX 3070 Ti Laptop GPU (10266 - 11663, n=6) | |
| Asus TUF Gaming F15 FX506HM | |
| MSI GP66 Leopard 11UH-028 | |
| Razer Blade 15 Base Edition 2021, i7-10750H RTX 3060 | |
| Alienware m15 R5 Ryzen Edition | |
| MSI Katana GF66 11UG-220 | |
| PCMark 10 / Productivity | |
| Moyenne Intel Core i9-12900H, NVIDIA GeForce RTX 3070 Ti Laptop GPU (9402 - 10742, n=6) | |
| MSI Vector GP66 12UGS | |
| MSI Katana GF66 11UG-220 | |
| Alienware m15 R5 Ryzen Edition | |
| Asus TUF Gaming F15 FX506HM | |
| MSI GP66 Leopard 11UH-028 | |
| Razer Blade 15 Base Edition 2021, i7-10750H RTX 3060 | |
| PCMark 10 / Digital Content Creation | |
| MSI Vector GP66 12UGS | |
| Moyenne Intel Core i9-12900H, NVIDIA GeForce RTX 3070 Ti Laptop GPU (10009 - 12541, n=6) | |
| MSI GP66 Leopard 11UH-028 | |
| MSI Katana GF66 11UG-220 | |
| Asus TUF Gaming F15 FX506HM | |
| Alienware m15 R5 Ryzen Edition | |
| Razer Blade 15 Base Edition 2021, i7-10750H RTX 3060 | |
| PCMark 10 Score | 8004 points | |
Aide | ||
| AIDA64 / Memory Copy | |
| Moyenne Intel Core i9-12900H (34438 - 74264, n=29) | |
| MSI Vector GP66 12UGS | |
| MSI GP66 Leopard 11UH-028 | |
| Alienware m15 R5 Ryzen Edition | |
| AIDA64 / Memory Read | |
| Moyenne Intel Core i9-12900H (36365 - 74642, n=29) | |
| MSI GP66 Leopard 11UH-028 | |
| MSI Vector GP66 12UGS | |
| Alienware m15 R5 Ryzen Edition | |
| AIDA64 / Memory Write | |
| Moyenne Intel Core i9-12900H (32276 - 67858, n=29) | |
| MSI Vector GP66 12UGS | |
| MSI GP66 Leopard 11UH-028 | |
| Alienware m15 R5 Ryzen Edition | |
| AIDA64 / Memory Latency | |
| MSI GP66 Leopard 11UH-028 | |
| MSI Vector GP66 12UGS | |
| Moyenne Intel Core i9-12900H (74.7 - 118.1, n=28) | |
| Alienware m15 R5 Ryzen Edition | |
| Asus TUF Gaming F15 FX506HM | |
| MSI Katana GF66 11UG-220 | |
| MSI Katana GF66 11UG-220 | |
* ... Moindre est la valeur, meilleures sont les performances
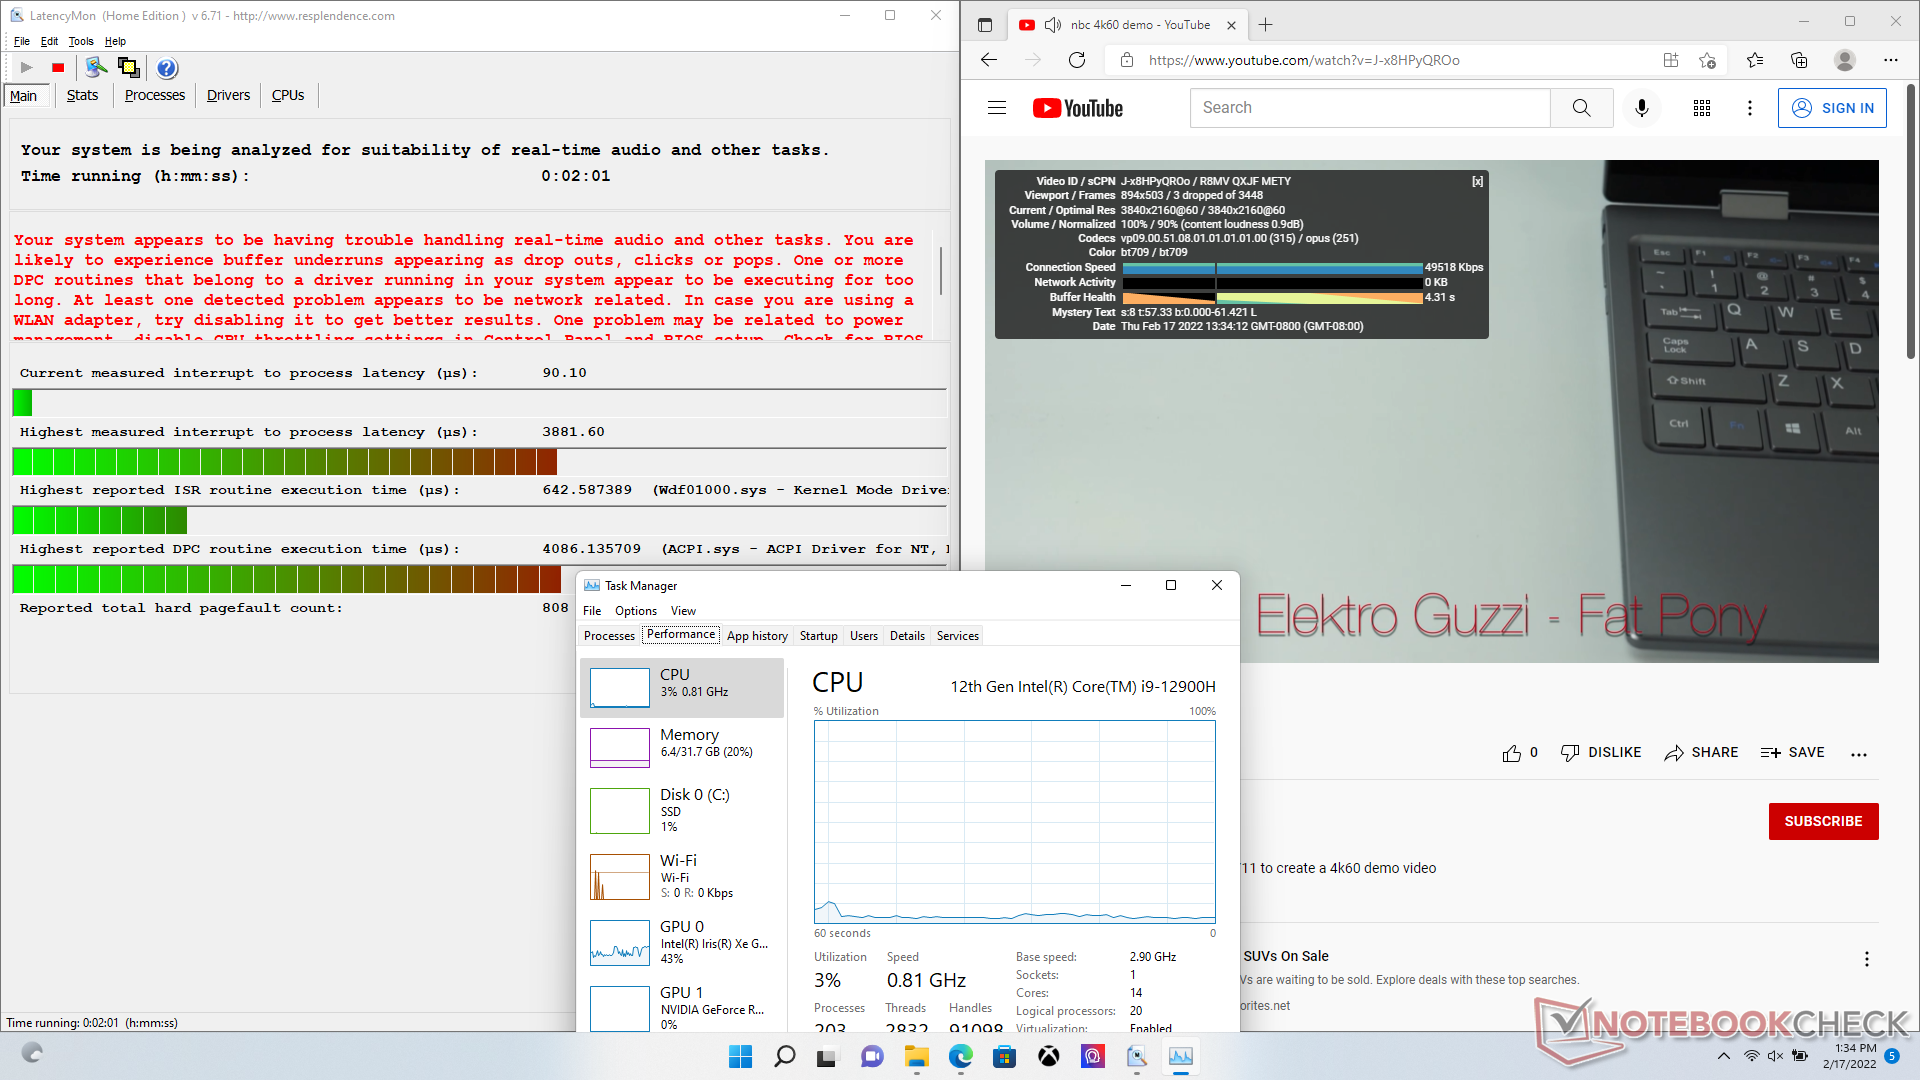
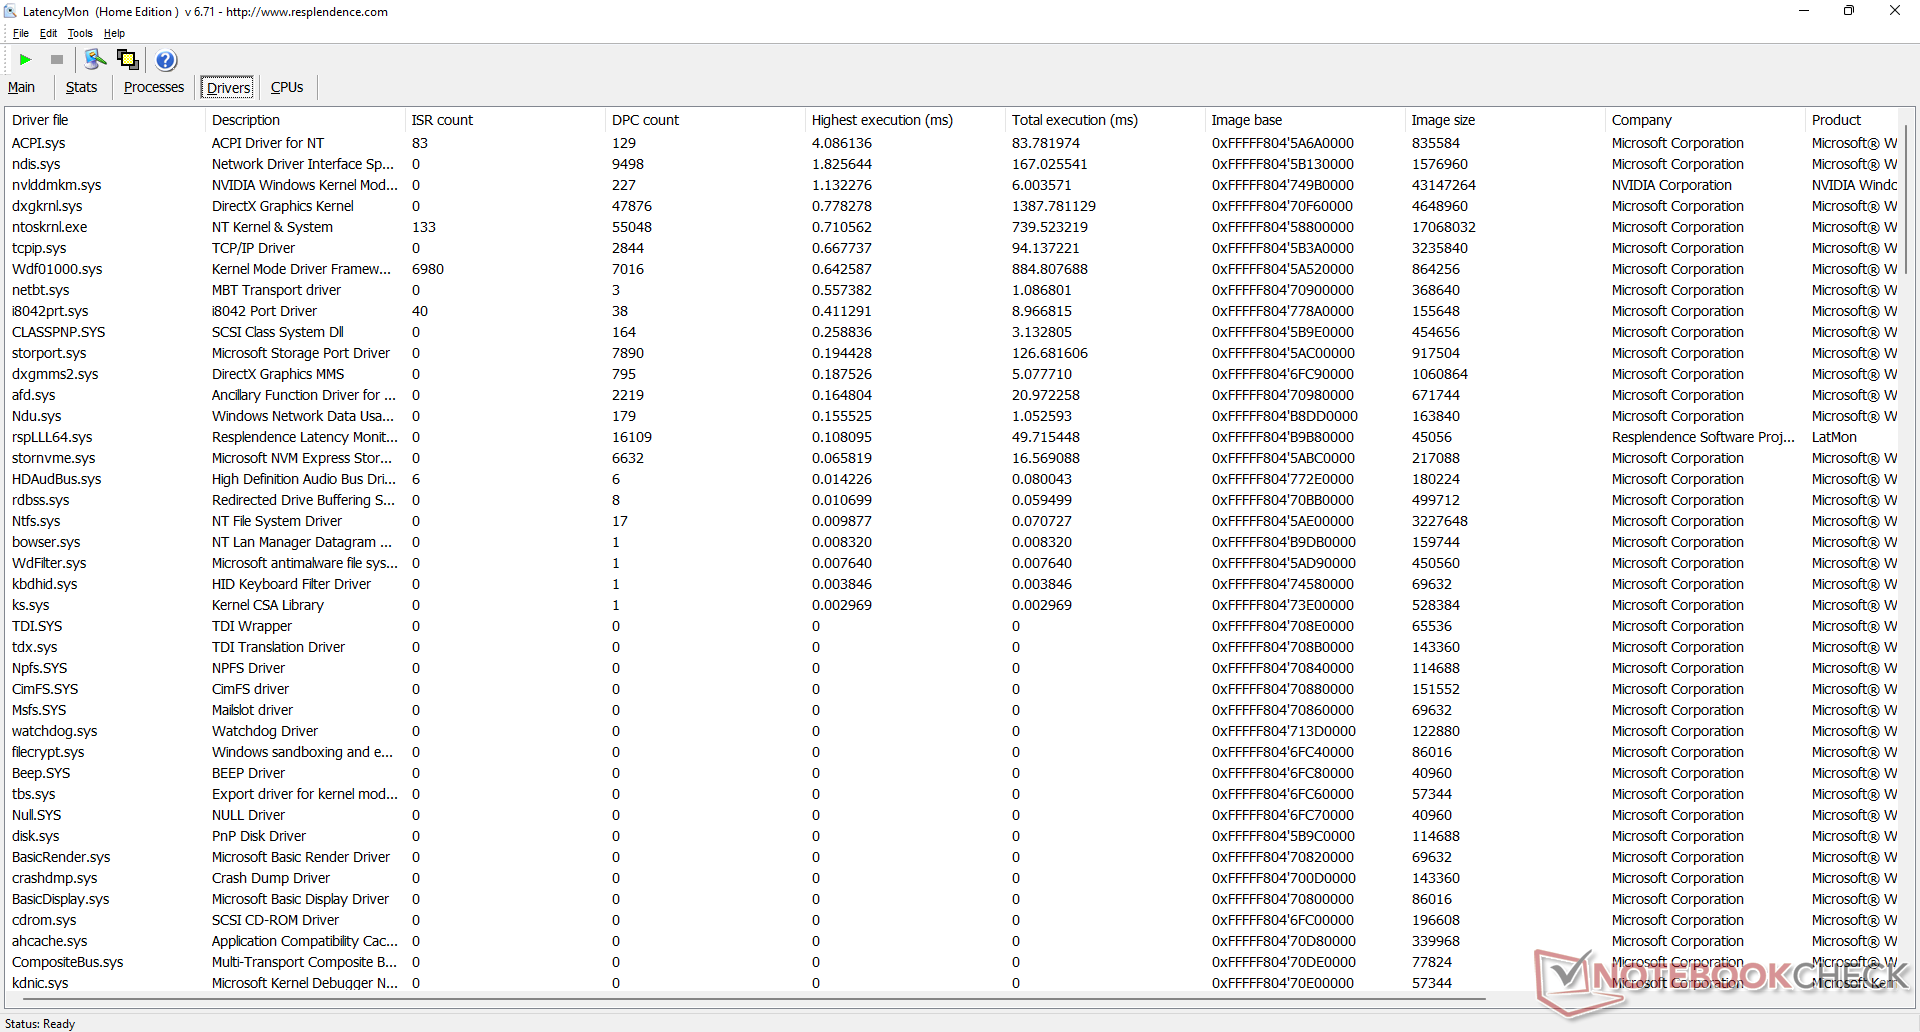
Latence DPC
LatencyMon révèle des problèmes de CPD lors de l'ouverture de plusieurs onglets de navigateur sur notre page d'accueil. la lecture de vidéos 4K à 60 FPS est autrement fluide, avec seulement 3 images perdues pendant notre test vidéo d'une minute.
| DPC Latencies / LatencyMon - interrupt to process latency (max), Web, Youtube, Prime95 | |
| MSI Vector GP66 12UGS | |
| Asus TUF Gaming F15 FX506HM | |
| MSI Katana GF66 11UG-220 | |
| MSI GP66 Leopard 11UH-028 | |
| Razer Blade 15 Base Edition 2021, i7-10750H RTX 3060 | |
| Alienware m15 R5 Ryzen Edition | |
* ... Moindre est la valeur, meilleures sont les performances
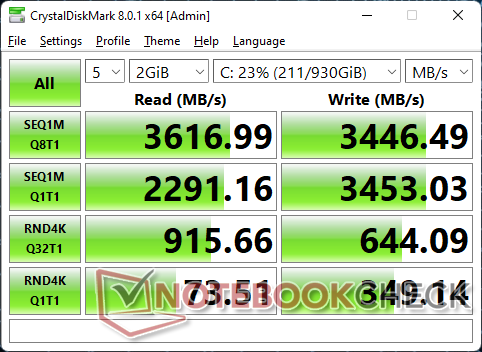
Périphériques de stockage
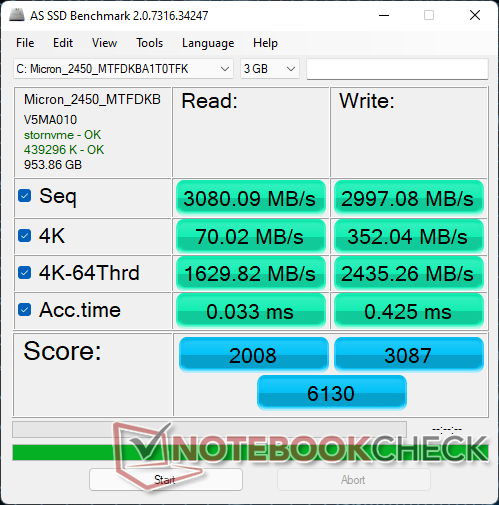
Notre unité de test est équipée du budget micron 2450 MTFDKBA1T0TFK 1 To PCIe4 x4 NVMe SSD. Contrairement à de nombreux autres SSD PCIe4 x4 qui peuvent atteindre des taux de transfert supérieurs à 7000 Mo/s, le Micron 2450 de 1 To ne promet que 3500 Mo/s en lecture et 3000 Mo/s en écriture pour être comparable à la plupart des SSD PCIe3 x4. Bien sûr, les utilisateurs peuvent toujours remplacer ou installer un disque PCIe4 x4 plus rapide s'ils le souhaitent, comme c'était le cas avec notre GP66 Leopard. Les modèles MSI haut de gamme comme les séries GT ou GS sont plus susceptibles d'être livrés avec des disques PCIe4 plus rapides de Samsung
Le disque de notre échantillon n'aurait aucun problème à maintenir son taux de lecture maximum de 3500 MB/s pendant de longues périodes.

* ... Moindre est la valeur, meilleures sont les performances
Disk Throttling: DiskSpd Read Loop, Queue Depth 8
Performances du GPU
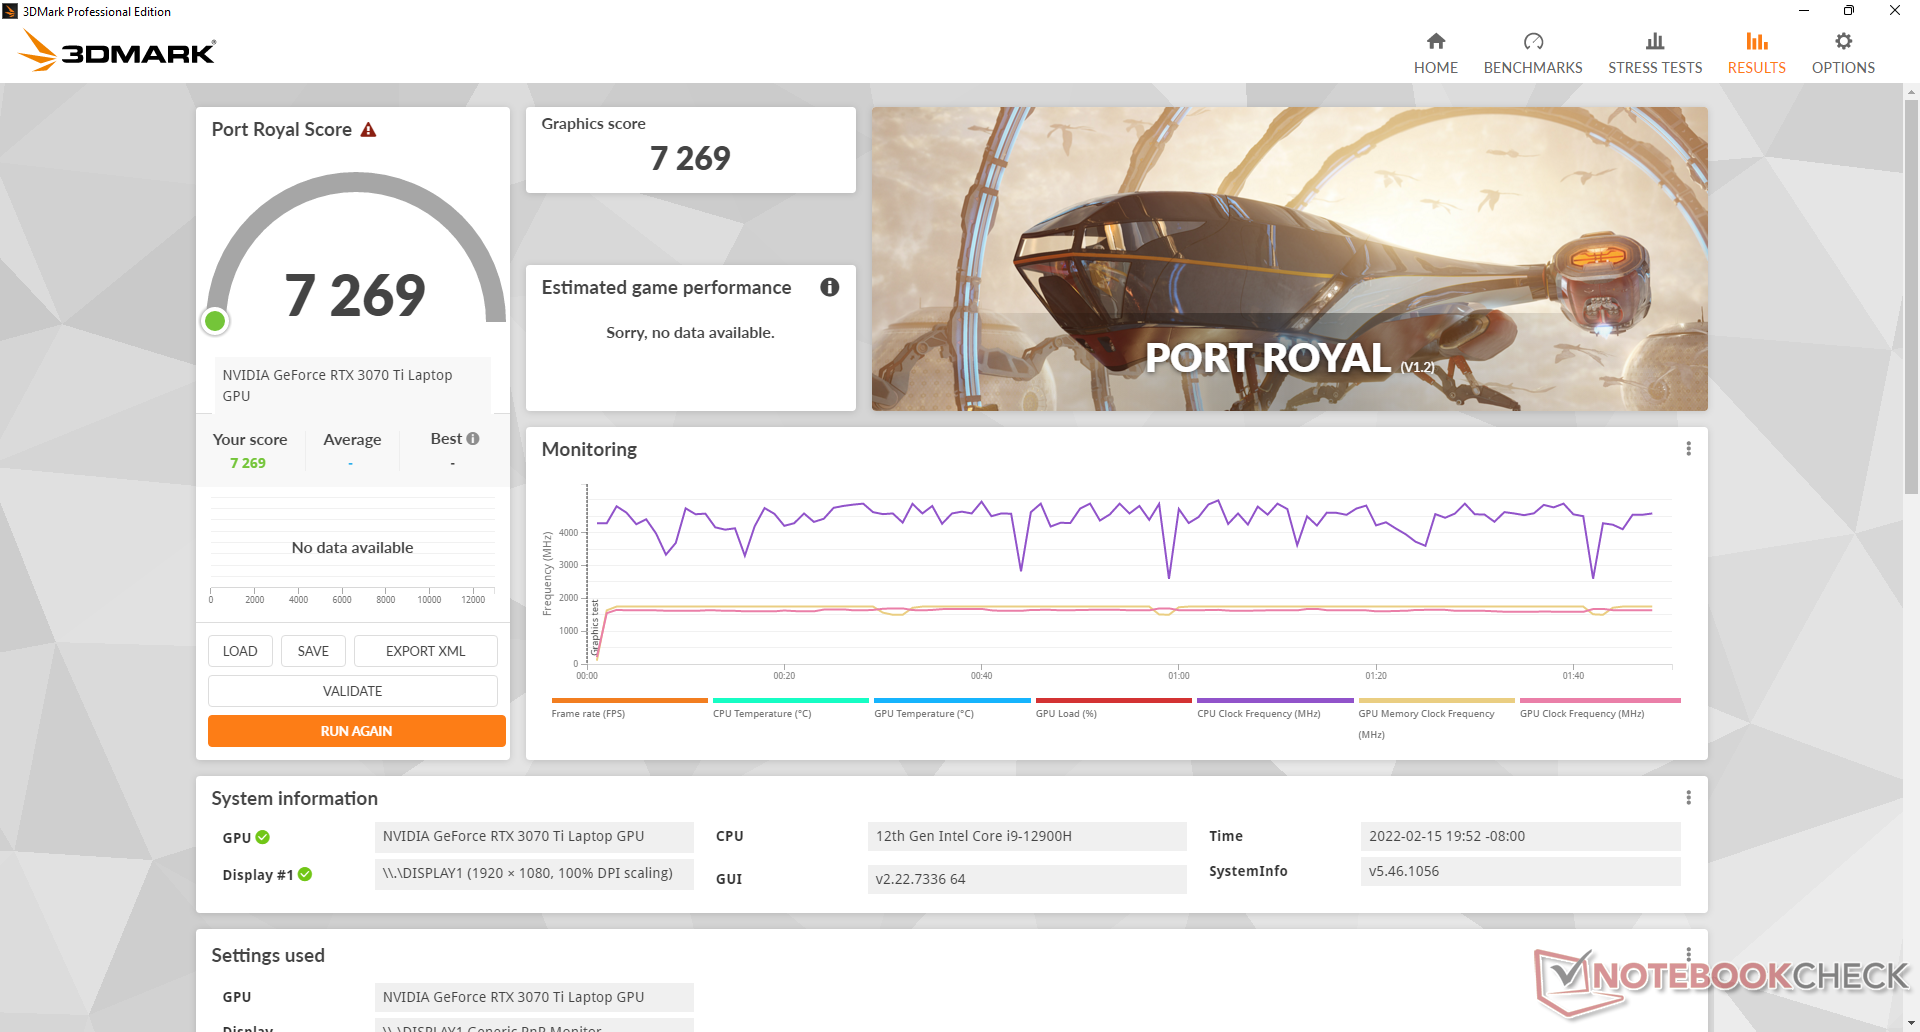
Les performances graphiques ne sont qu'environ 5 à 10 % plus faibles que celles de la mobile GeForce RTX 3080 Ti ou environ 15 à 20 % plus rapide que la mobile GeForce RTX 3070 comme on peut le constater sur la carte ADATA XPG Xenia 15. Ces résultats placent notre GeForce RTX 3070 Ti mobile dans une fourchette de 5 à 15 pour cent de la de bureau GeForce RTX 3070.
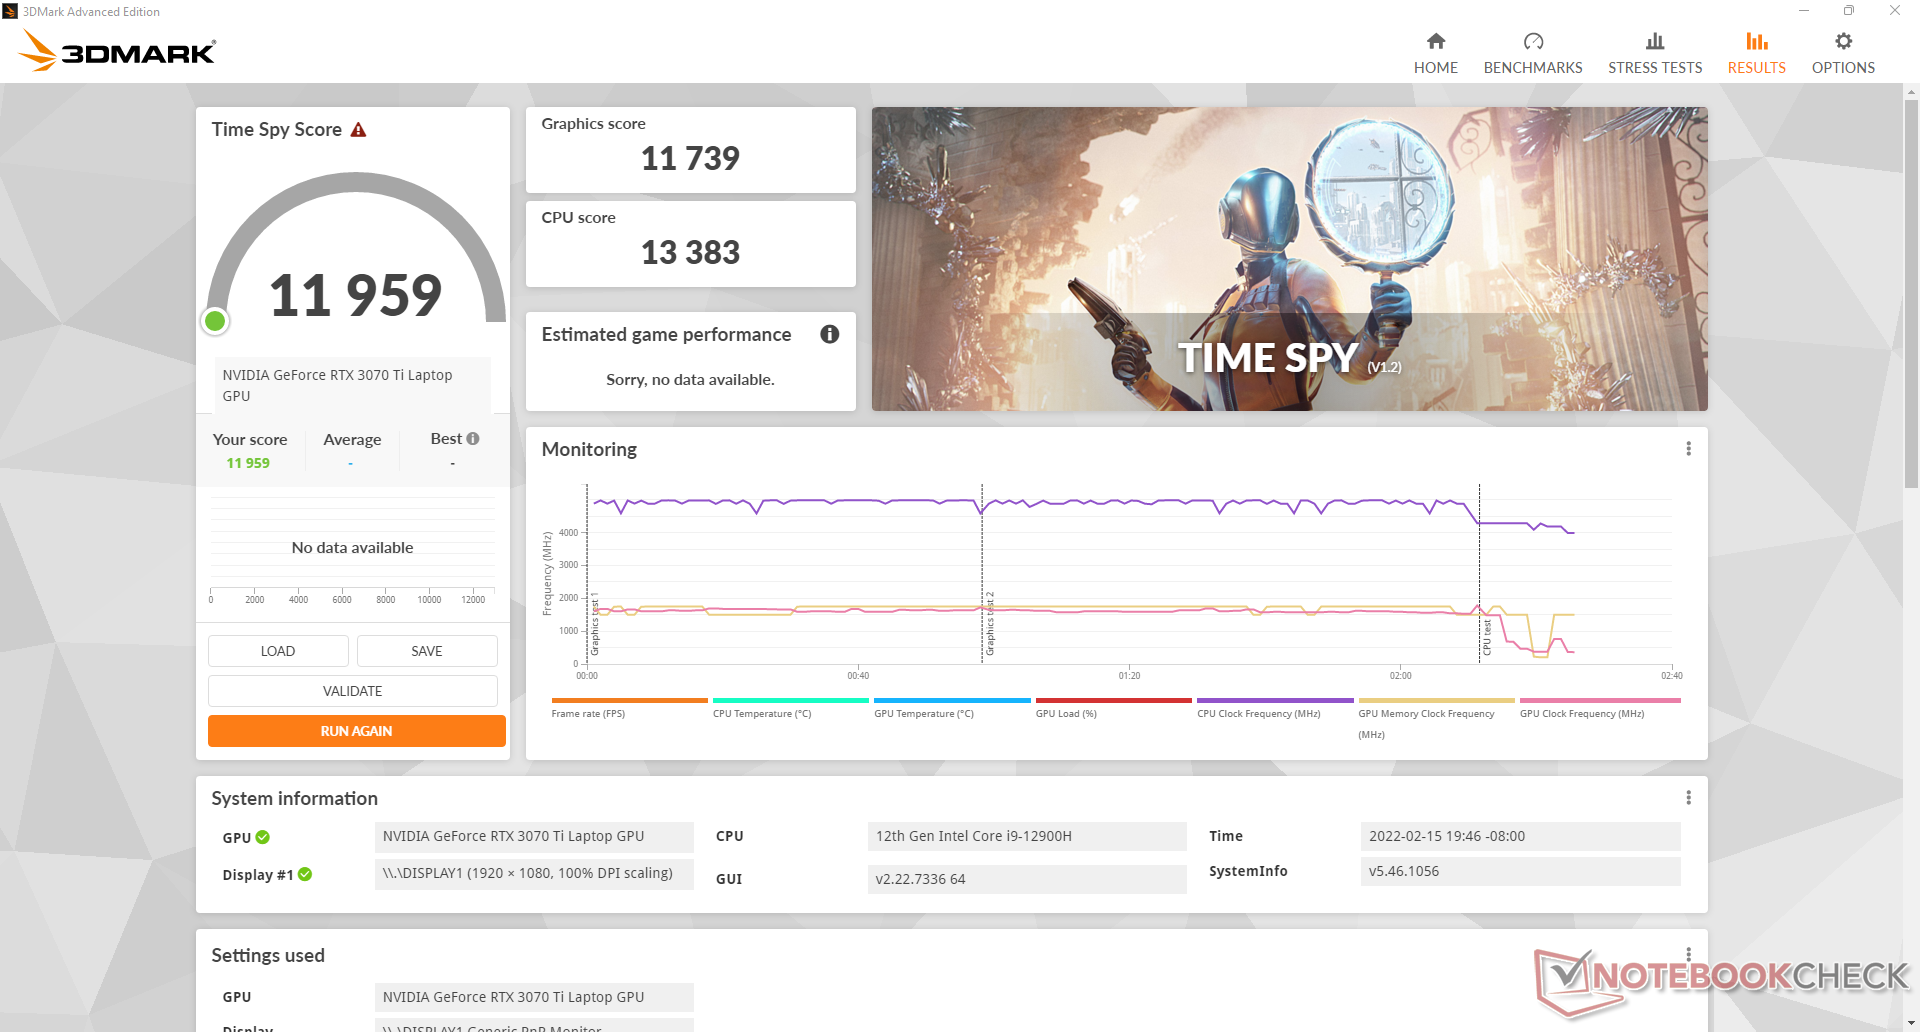
L'utilisation du mode MSHybrid au lieu du mode dGPU n'entraînera pas de déficit de performance. Le score graphique de Time Spy en mode MSHybrid est essentiellement le même que celui du mode dGPU (11880 points contre 11739 points).
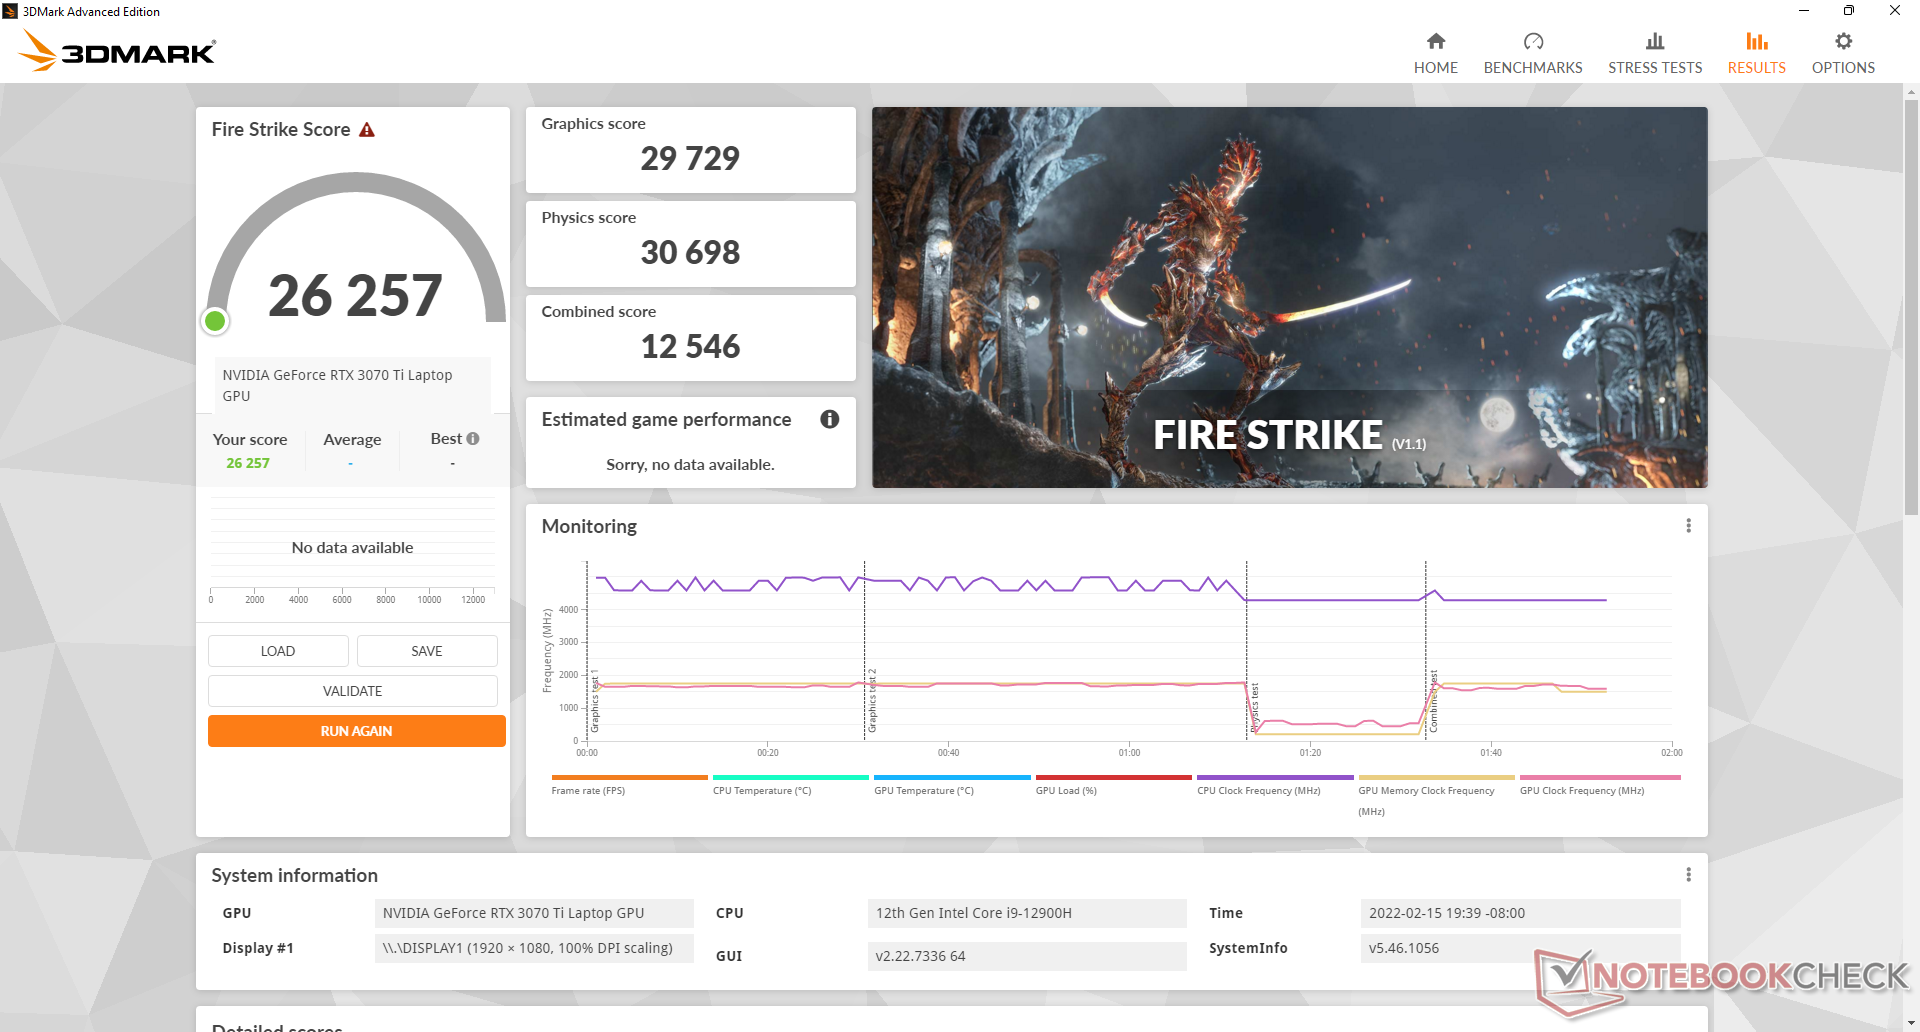
Les performances graphiques en mode équilibré ne sont réduites que de 4 à 5 %, avec pour contrepartie un bruit de ventilateur beaucoup plus faible et des processeurs et surfaces plus chauds. Notre score graphique Fire Strike tombe à 28508 points contre 29729 points en mode équilibré.
Notez que les scores 3DMark sont jusqu'à 20 pour cent plus rapides que sur le MSI GS66 équipé de la même GeForce RTX 3070 Ti en raison de la cible TGP plus élevée de notre GP66 (150 W contre 105 W).
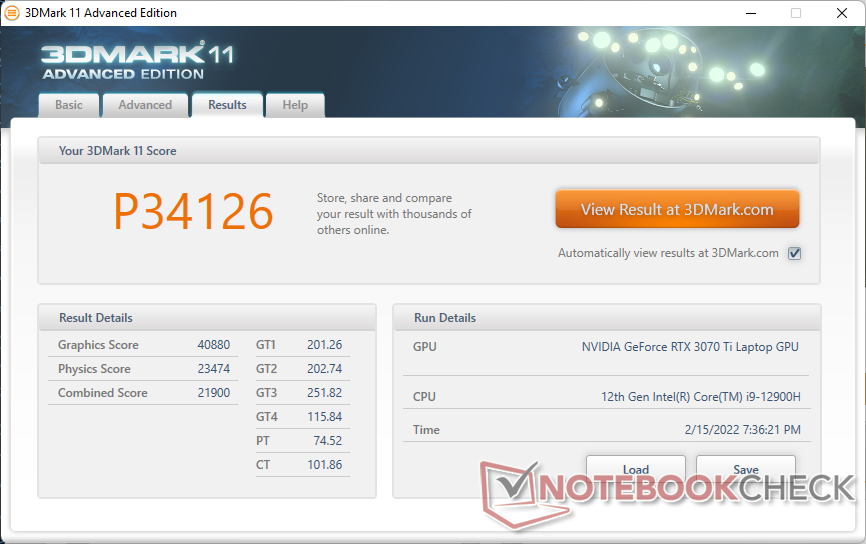
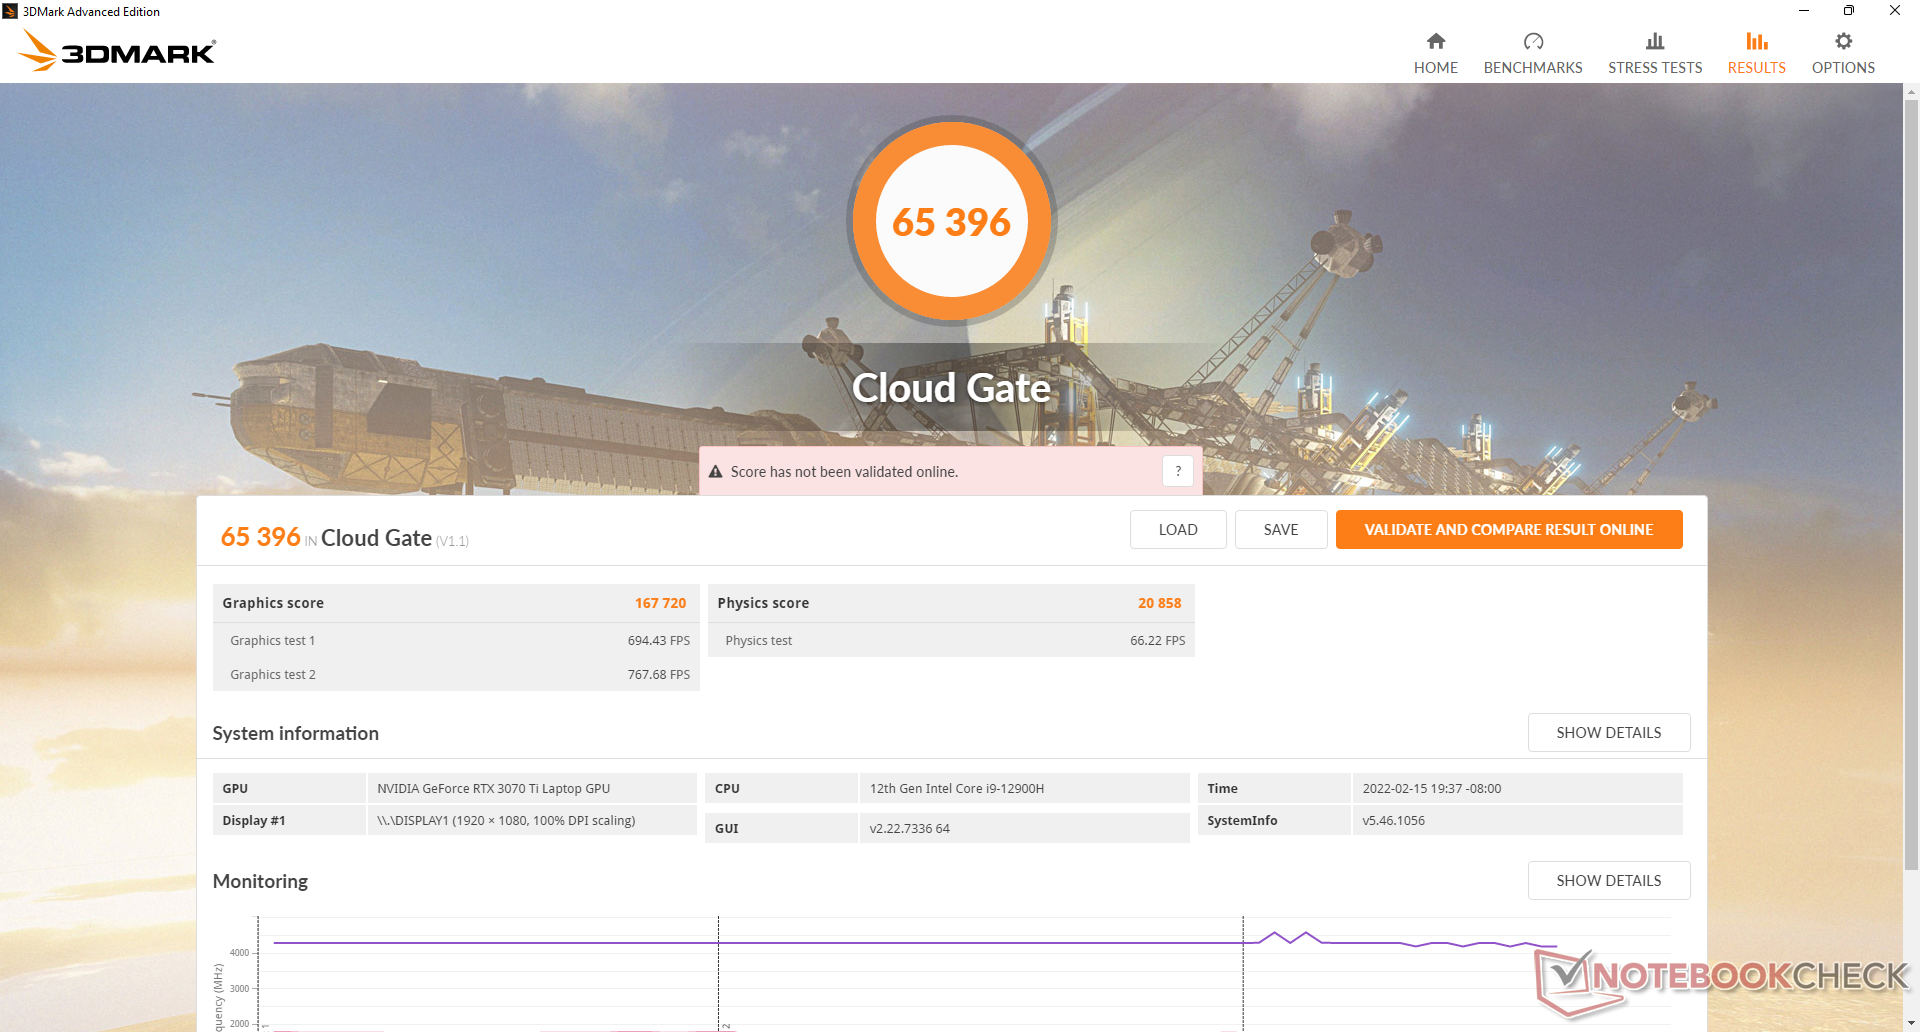
| 3DMark 11 Performance | 34126 points | |
| 3DMark Cloud Gate Standard Score | 65396 points | |
| 3DMark Fire Strike Score | 26257 points | |
| 3DMark Time Spy Score | 11959 points | |
Aide | ||
Witcher 3 FPS Chart
| Bas | Moyen | Élevé | Ultra | |
|---|---|---|---|---|
| GTA V (2015) | 185 | 184 | 179 | 123 |
| The Witcher 3 (2015) | 492.3 | 360 | 223.9 | 114.6 |
| Dota 2 Reborn (2015) | 185 | 169 | 164 | 155 |
| Final Fantasy XV Benchmark (2018) | 207 | 152 | 115 | |
| X-Plane 11.11 (2018) | 161 | 143 | 112 | |
| Far Cry 5 (2018) | 180 | 152 | 145 | 136 |
| Strange Brigade (2018) | 471 | 298 | 244 | 213 |
Émissions
Bruit du système
Le bruit du ventilateur dépend fortement des quatre profils d'alimentation MSI Center : Super Battery, Silent, Balanced, et Extreme Performance. Il y aura toujours un certain bruit de ventilateur à environ 26,8 dB(A) contre un arrière-plan silencieux de 24,7 dB(A), même lorsqu'il est réglé sur le mode Silencieux, mais ce niveau est suffisamment bas pour être difficile à remarquer lors d'une utilisation quotidienne. Nous recommandons ce mode si vous vous contentez de naviguer sur le Web ou de diffuser des vidéos en continu, car les ventilateurs pulsent beaucoup moins souvent que dans les deux autres modes plus rapides
Le jeu en mode équilibré se traduit par un bruit de ventilateur d'un peu moins de 40 dB(A), contre 58 dB(A) en mode performances extrêmes. Les performances du GPU seront un peu plus lentes en mode équilibré, mais l'économie de bruit est significative. La gamme supérieure de 50 dB(A) est généralement plus bruyante que la plupart des autres ordinateurs portables de jeu que nous avons testés.
Degré de la nuisance sonore
| Au repos |
| 23.4 / 23.4 / 27.4 dB(A) |
| Fortement sollicité |
| 36 / 58 dB(A) |
 | ||
30 dB silencieux 40 dB(A) audible 50 dB(A) bruyant |
||
min: | ||
| MSI Vector GP66 12UGS GeForce RTX 3070 Ti Laptop GPU, i9-12900H | MSI GP66 Leopard 11UH-028 GeForce RTX 3080 Laptop GPU, i7-11800H, Samsung PM9A1 MZVL21T0HCLR | MSI Katana GF66 11UG-220 GeForce RTX 3070 Laptop GPU, i7-11800H, Kingston OM8PDP3512B-AI1 | Asus TUF Gaming F15 FX506HM GeForce RTX 3060 Laptop GPU, i7-11800H, SK Hynix HFM001TD3JX013N | Razer Blade 15 Base Edition 2021, i7-10750H RTX 3060 GeForce RTX 3060 Laptop GPU, i7-10750H, Samsung SSD PM981a MZVLB512HBJQ | Alienware m15 R5 Ryzen Edition GeForce RTX 3060 Laptop GPU, R7 5800H, Toshiba KBG40ZNS512G NVMe | |
|---|---|---|---|---|---|---|
| Noise | 1% | -19% | 7% | -0% | -5% | |
| arrêt / environnement * (dB) | 22.9 | 23 -0% | 25 -9% | 24.8 -8% | 25.3 -10% | 24 -5% |
| Idle Minimum * (dB) | 23.4 | 23 2% | 34 -45% | 24.6 -5% | 25.4 -9% | 24 -3% |
| Idle Average * (dB) | 23.4 | 23 2% | 35 -50% | 24.9 -6% | 25.4 -9% | 25 -7% |
| Idle Maximum * (dB) | 27.4 | 30.11 -10% | 36 -31% | 24.9 9% | 25.4 7% | 35 -28% |
| Load Average * (dB) | 36 | 41.86 -16% | 48 -33% | 27.1 25% | 42.5 -18% | 44 -22% |
| Witcher 3 ultra * (dB) | 58.2 | 47.79 18% | 46 21% | 46.4 20% | 42 28% | 48 18% |
| Load Maximum * (dB) | 58 | 53 9% | 49 16% | 49 16% | 52.2 10% | 50 14% |
* ... Moindre est la valeur, meilleures sont les performances
Température
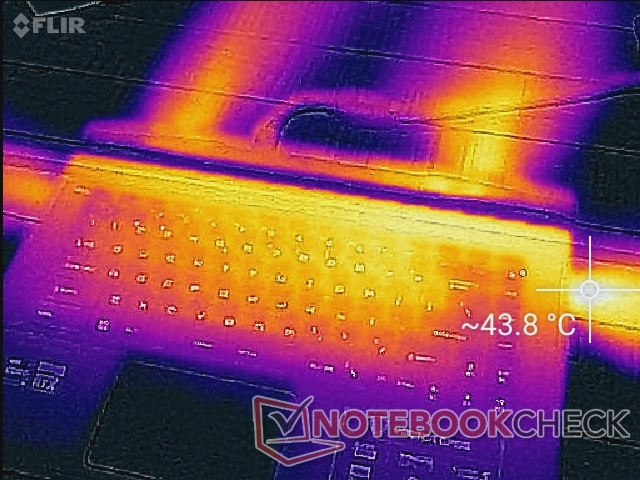
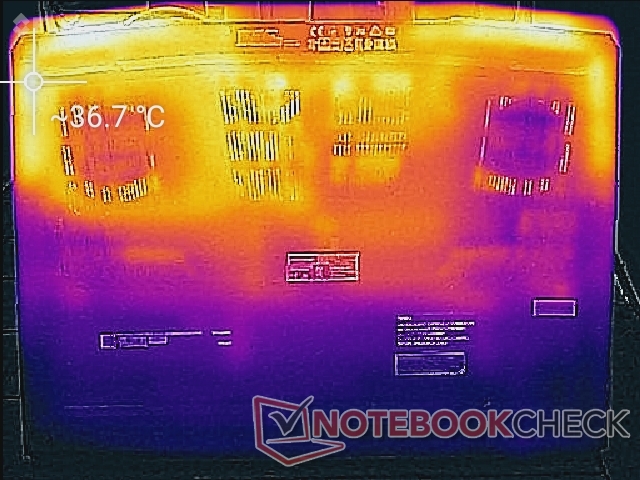
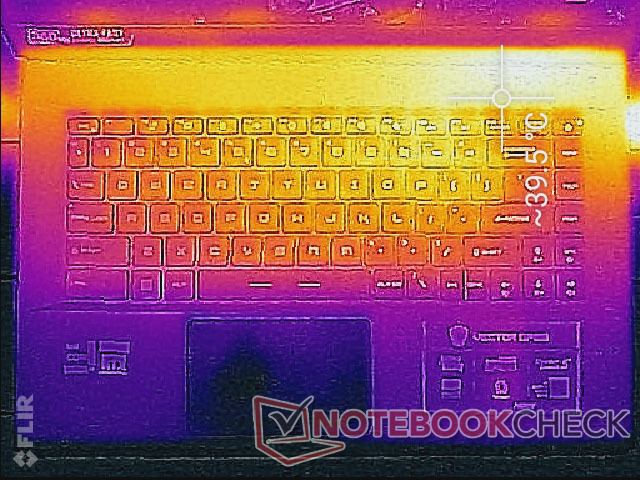
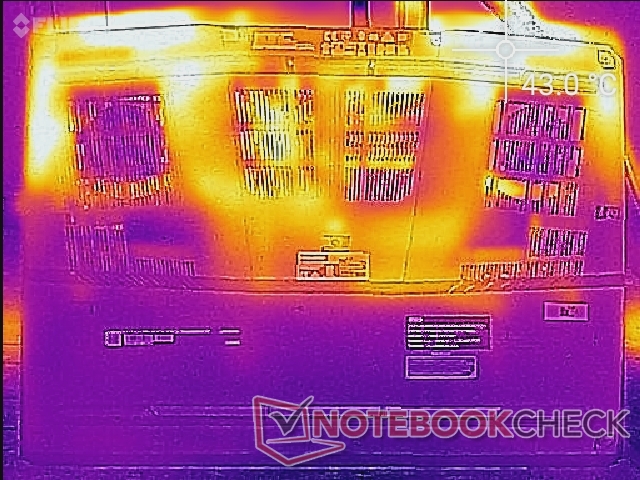
Les températures de surface dépendent fortement du réglage du profil d'alimentation du MSI Center. En mode équilibré, les points chauds peuvent atteindre 49°C, contre 42°C seulement en mode performances extrêmes, car le mode performances extrêmes implique un régime maximal plus élevé du ventilateur
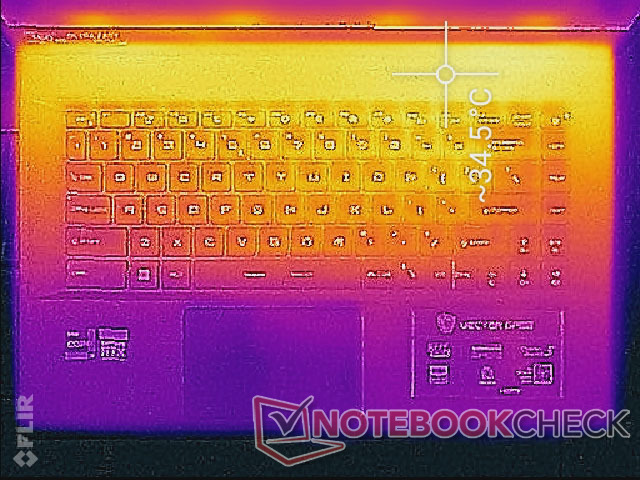
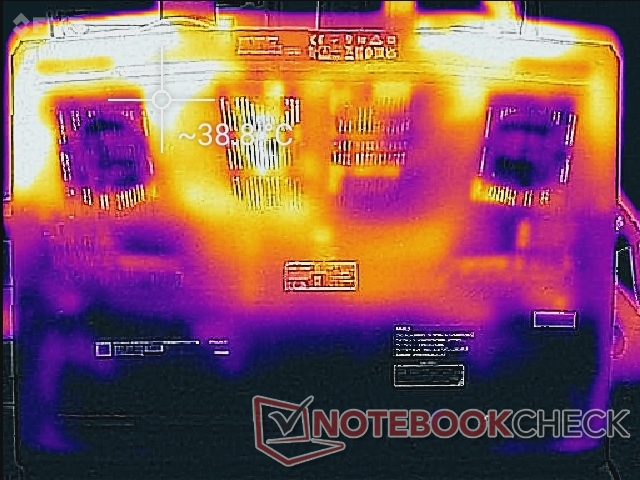
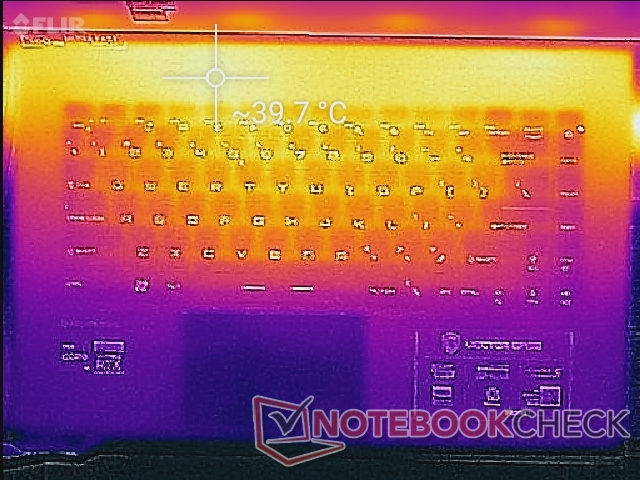
Les points chauds sont concentrés le long des quadrants arrière du châssis comme le montrent nos cartes de température ci-dessous. Les touches du clavier et les repose-poignets peuvent être chauds mais jamais gênants ou inconfortables. L'écran plus fin GS66 ou Razer Blade 15 plus fins, ont des claviers et des repose-poignets plus chauds de plus de quelques degrés chacun en moyenne.
(±) La température maximale du côté supérieur est de 40.2 °C / 104 F, par rapport à la moyenne de 40.4 °C / 105 F, allant de 21.2 à 68.8 °C pour la classe Gaming.
(±) Le fond chauffe jusqu'à un maximum de 43.8 °C / 111 F, contre une moyenne de 43.2 °C / 110 F
(+) En utilisation inactive, la température moyenne du côté supérieur est de 29.6 °C / 85 F, par rapport à la moyenne du dispositif de 33.9 °C / 93 F.
(+) En jouant à The Witcher 3, la température moyenne du côté supérieur est de 30.7 °C / 87 F, alors que la moyenne de l'appareil est de 33.9 °C / 93 F.
(+) Les repose-poignets et le pavé tactile sont plus froids que la température de la peau avec un maximum de 24.8 °C / 76.6 F et sont donc froids au toucher.
(+) La température moyenne de la zone de l'appui-paume de dispositifs similaires était de 28.8 °C / 83.8 F (+4 °C / #7.2 F).
| MSI Vector GP66 12UGS Intel Core i9-12900H, NVIDIA GeForce RTX 3070 Ti Laptop GPU | MSI GP66 Leopard 11UH-028 Intel Core i7-11800H, NVIDIA GeForce RTX 3080 Laptop GPU | MSI Katana GF66 11UG-220 Intel Core i7-11800H, NVIDIA GeForce RTX 3070 Laptop GPU | Asus TUF Gaming F15 FX506HM Intel Core i7-11800H, NVIDIA GeForce RTX 3060 Laptop GPU | Razer Blade 15 Base Edition 2021, i7-10750H RTX 3060 Intel Core i7-10750H, NVIDIA GeForce RTX 3060 Laptop GPU | Alienware m15 R5 Ryzen Edition AMD Ryzen 7 5800H, NVIDIA GeForce RTX 3060 Laptop GPU | |
|---|---|---|---|---|---|---|
| Heat | -2% | -8% | 8% | -6% | -21% | |
| Maximum Upper Side * (°C) | 40.2 | 49 -22% | 56 -39% | 46.4 -15% | 45.2 -12% | 62 -54% |
| Maximum Bottom * (°C) | 43.8 | 47 -7% | 49 -12% | 45.4 -4% | 48 -10% | 61 -39% |
| Idle Upper Side * (°C) | 34.8 | 31 11% | 36 -3% | 26 25% | 34.4 1% | 36 -3% |
| Idle Bottom * (°C) | 37 | 33 11% | 28 24% | 27.4 26% | 37.2 -1% | 33 11% |
* ... Moindre est la valeur, meilleures sont les performances
Test de stress
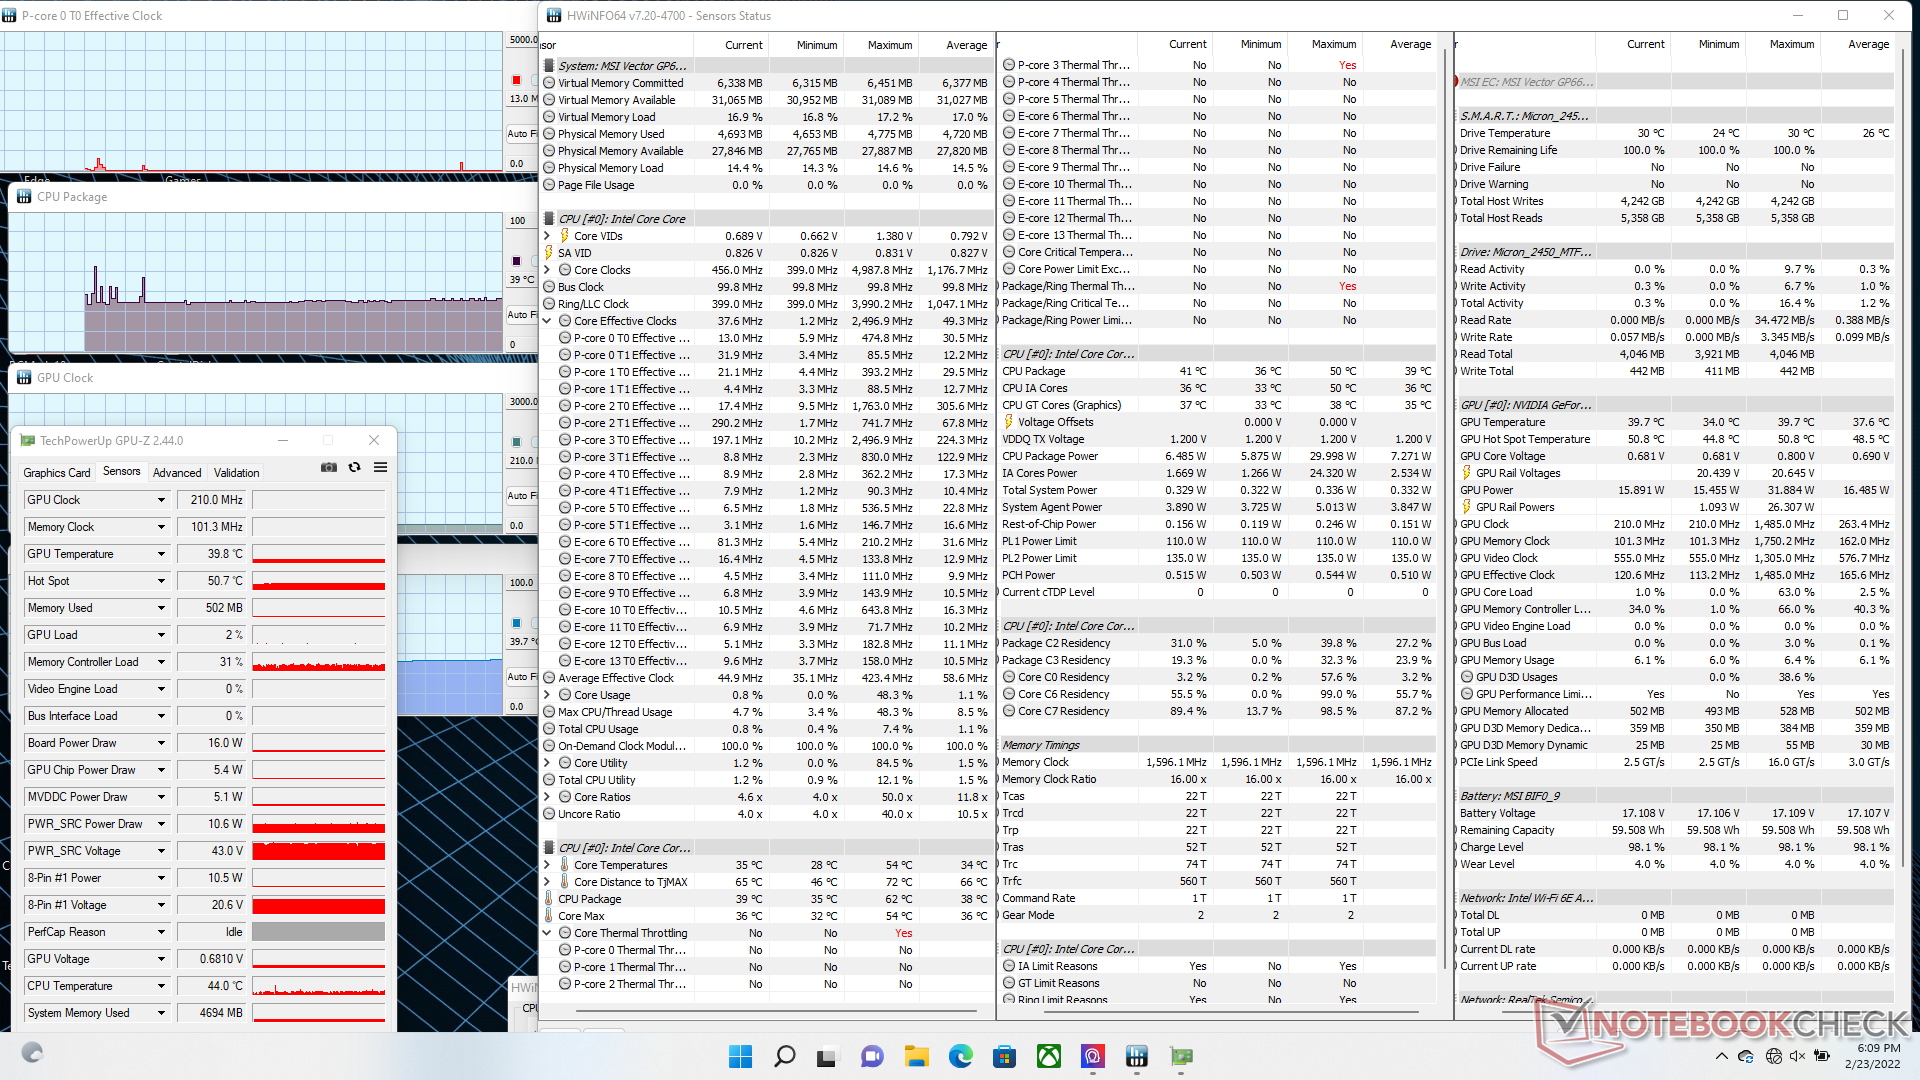
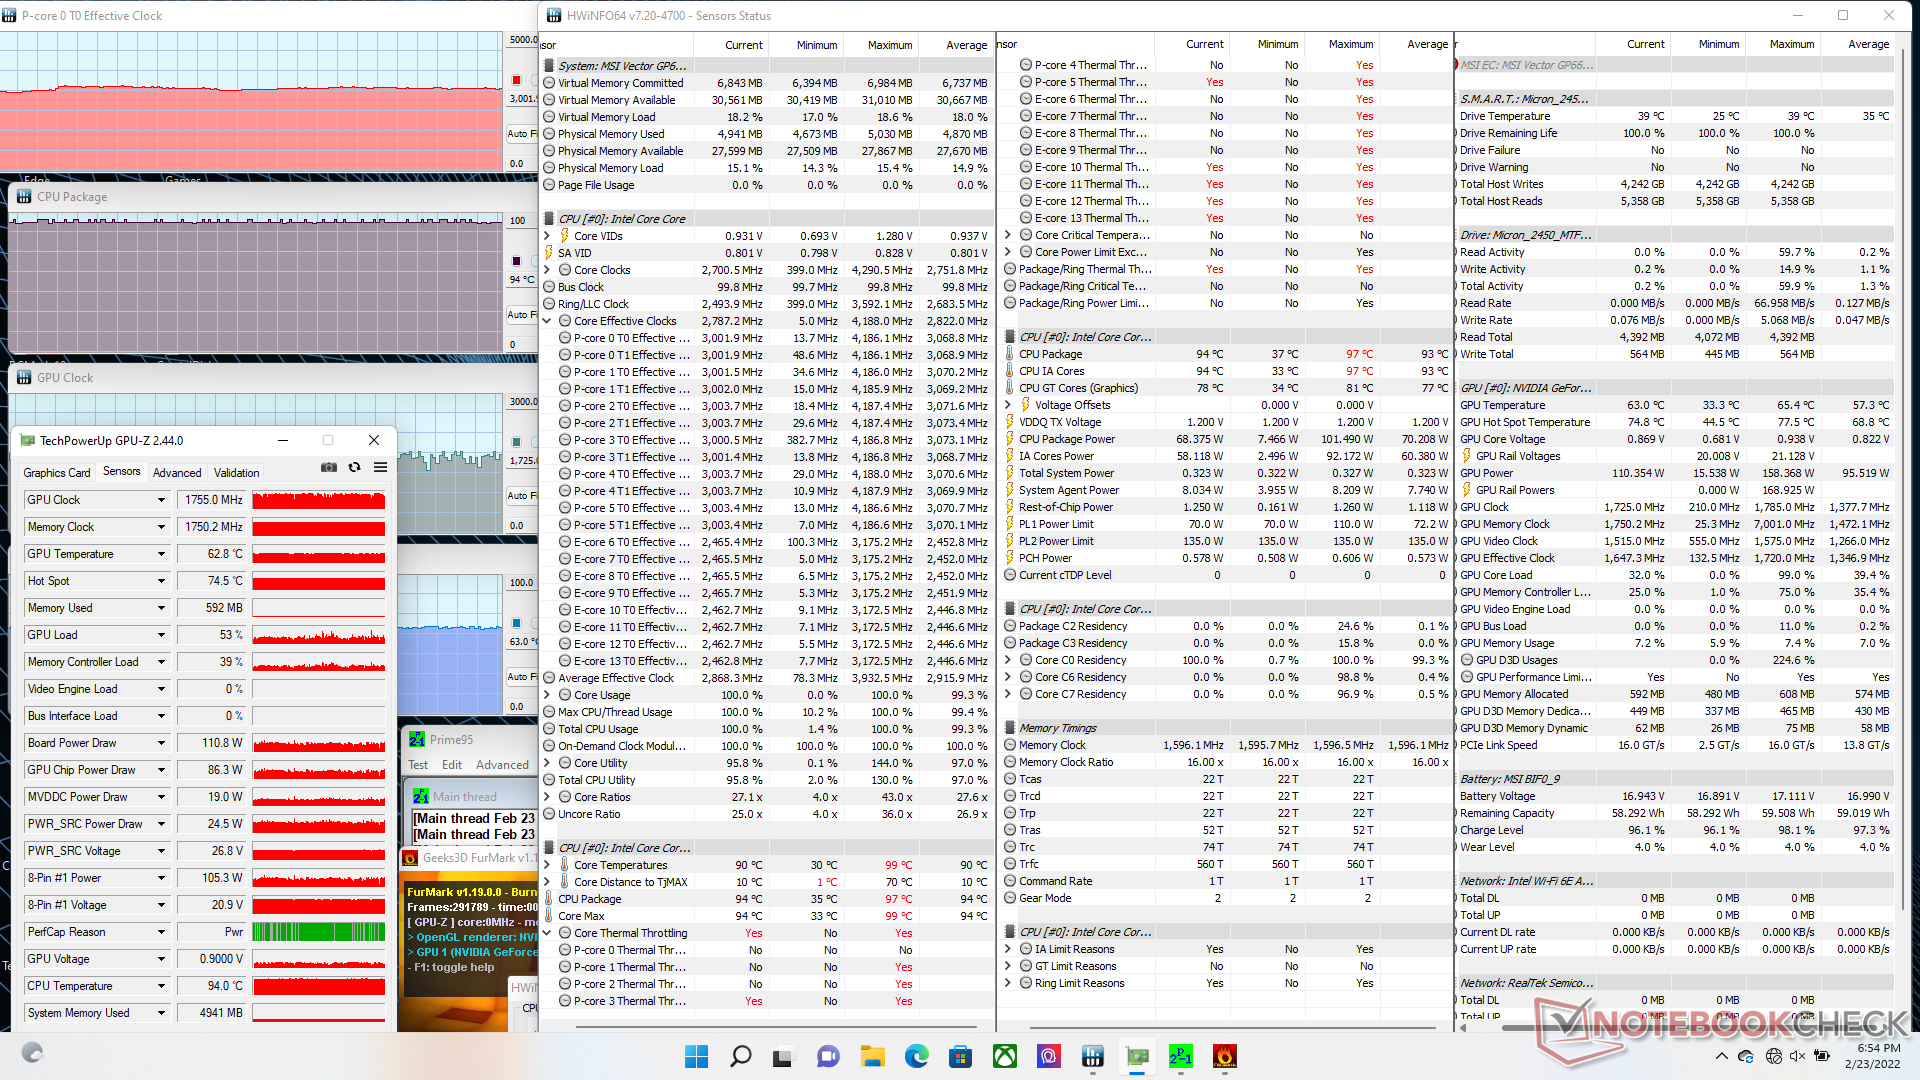
Lors d'un test Prime95 avec le profil Performance extrême, les fréquences d'horloge du processeur sont montées à 4,2 GHz pendant une seconde ou deux avant de retomber rapidement à 3,7 GHz. Après une minute ou deux, les fréquences d'horloge baissaient encore plus pour atteindre seulement 3 GHz afin de maintenir une température du cœur de 90 C. La puissance de l'ensemble du CPU atteignait initialement 100 W au démarrage de Prime95 avant de baisser et de se stabiliser à 70 W. Le même CPU Core i9-12900H dans le modèle plus grand d'Uniwill Technology GM7AGP Uniwill Technology GM7AG8P fonctionnerait à la fois plus rapidement (3,2 GHz contre 3,0 GHz) et plus froidement (80 C contre 90 C), respectivement, et à un TDP stable plus élevé (75 W contre 70 W) que ce que nous avons enregistré sur notre Vector GP66.
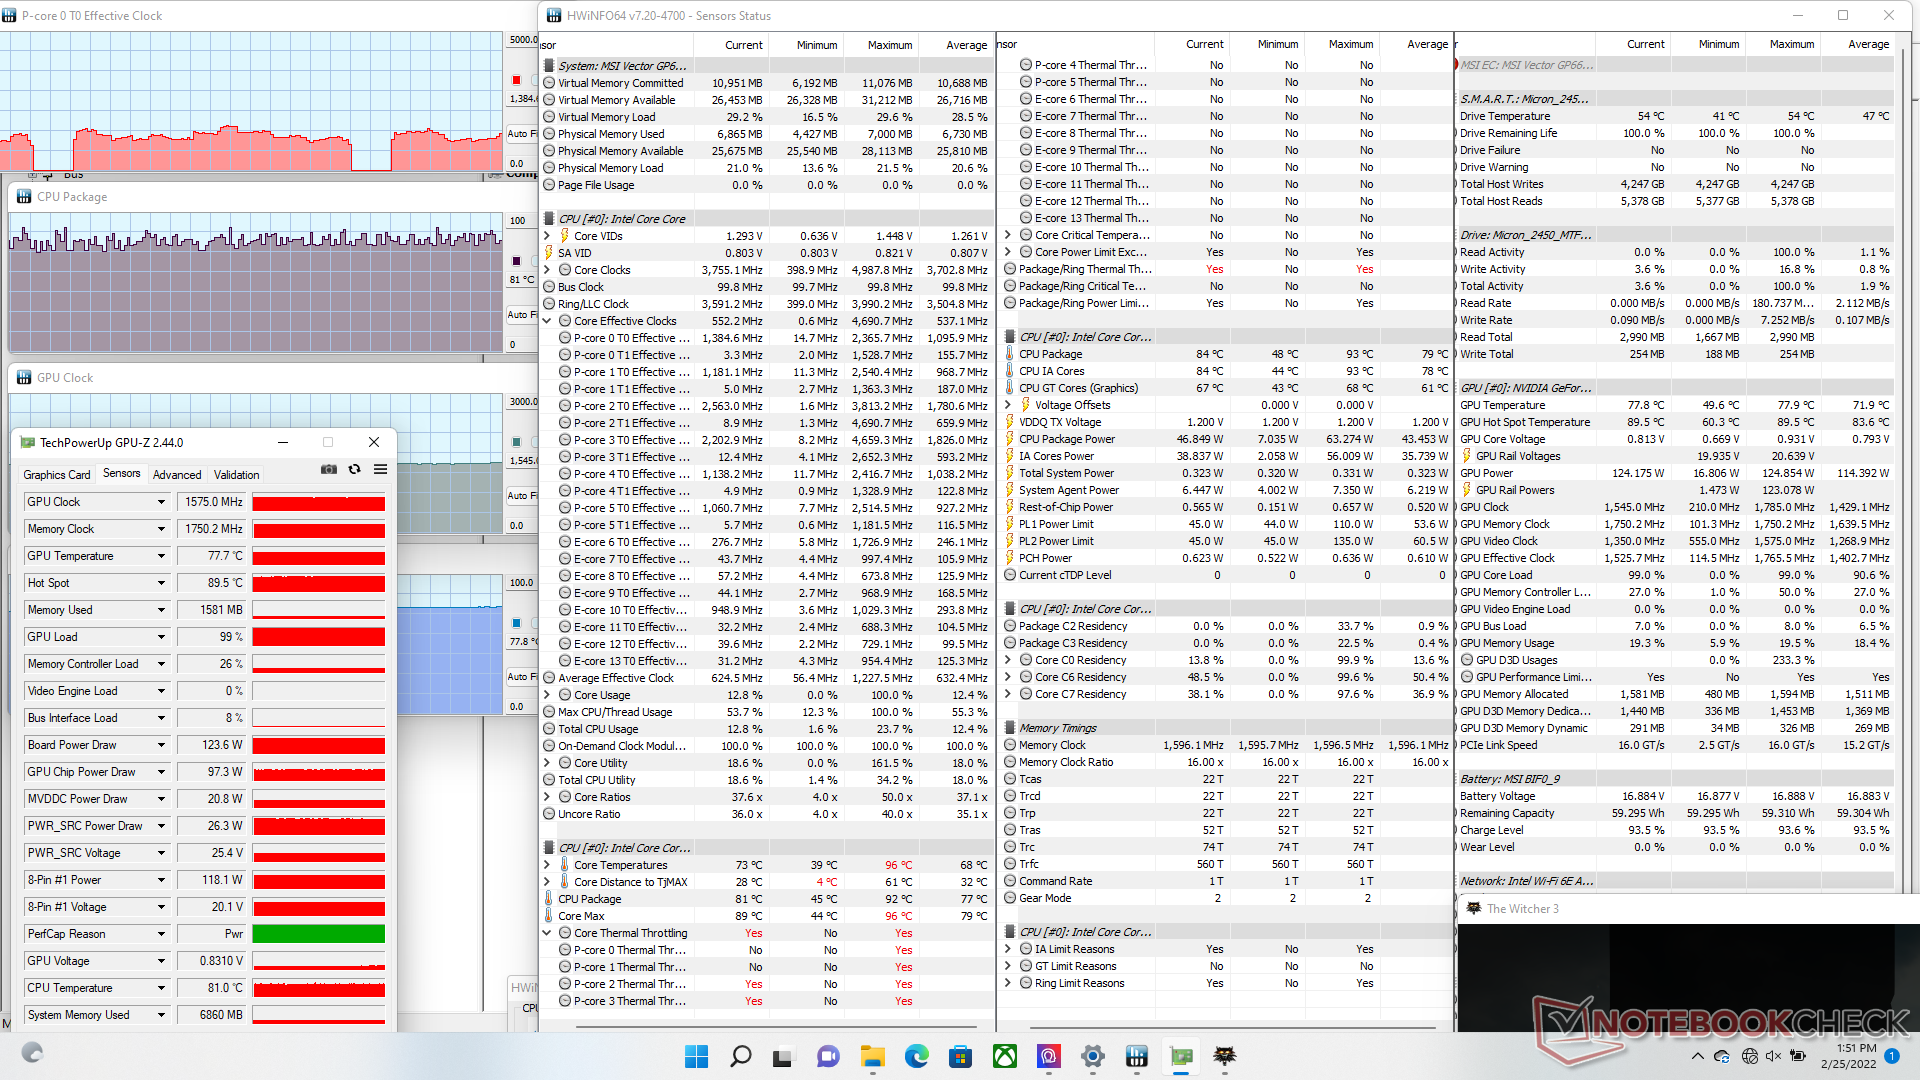
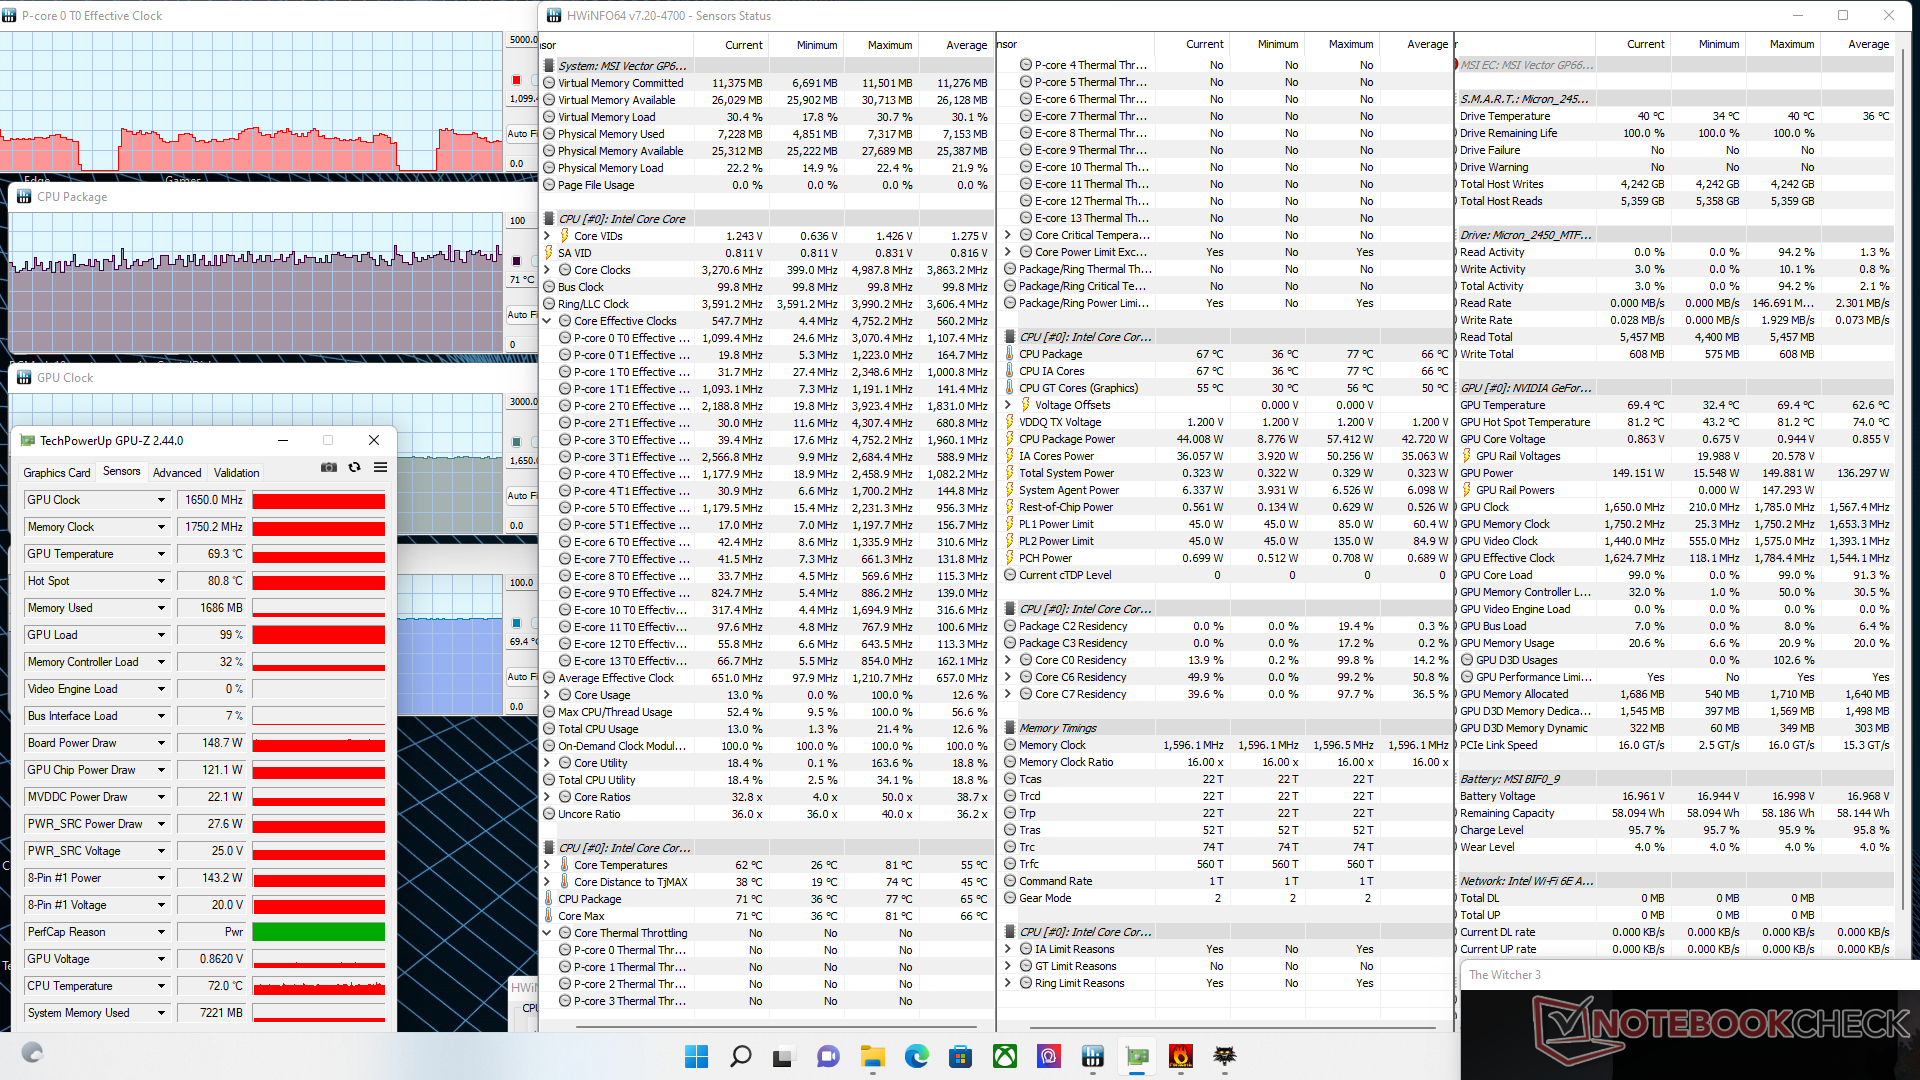
Les températures du CPU et du GPU se sont stabilisées à 71 °C et 70 °C, respectivement, avec le profil Performance extrême. Si l'on passe au profil équilibré, les températures du CPU et du GPU sont plus élevées, respectivement 85 C et 78 C, et la fréquence d'horloge du GPU est légèrement plus lente (1650 MHz contre 1755 MHz). Les fréquences d'horloge sont néanmoins significativement plus rapides que ce que nous avons observé sur le MSI GS66 (1155 MHz) qui est livré avec le même GPU GeForce RTX 3070 Ti, mais avec un TGP inférieur (105 W contre 150 W).
Le fonctionnement sur batterie limitera considérablement les performances. Un test sur Fire Strike sur batteries donnerait des résultats de 10913 points pour la physique et 6061 points pour le graphique, contre 30698 et 29729 points sur secteur.
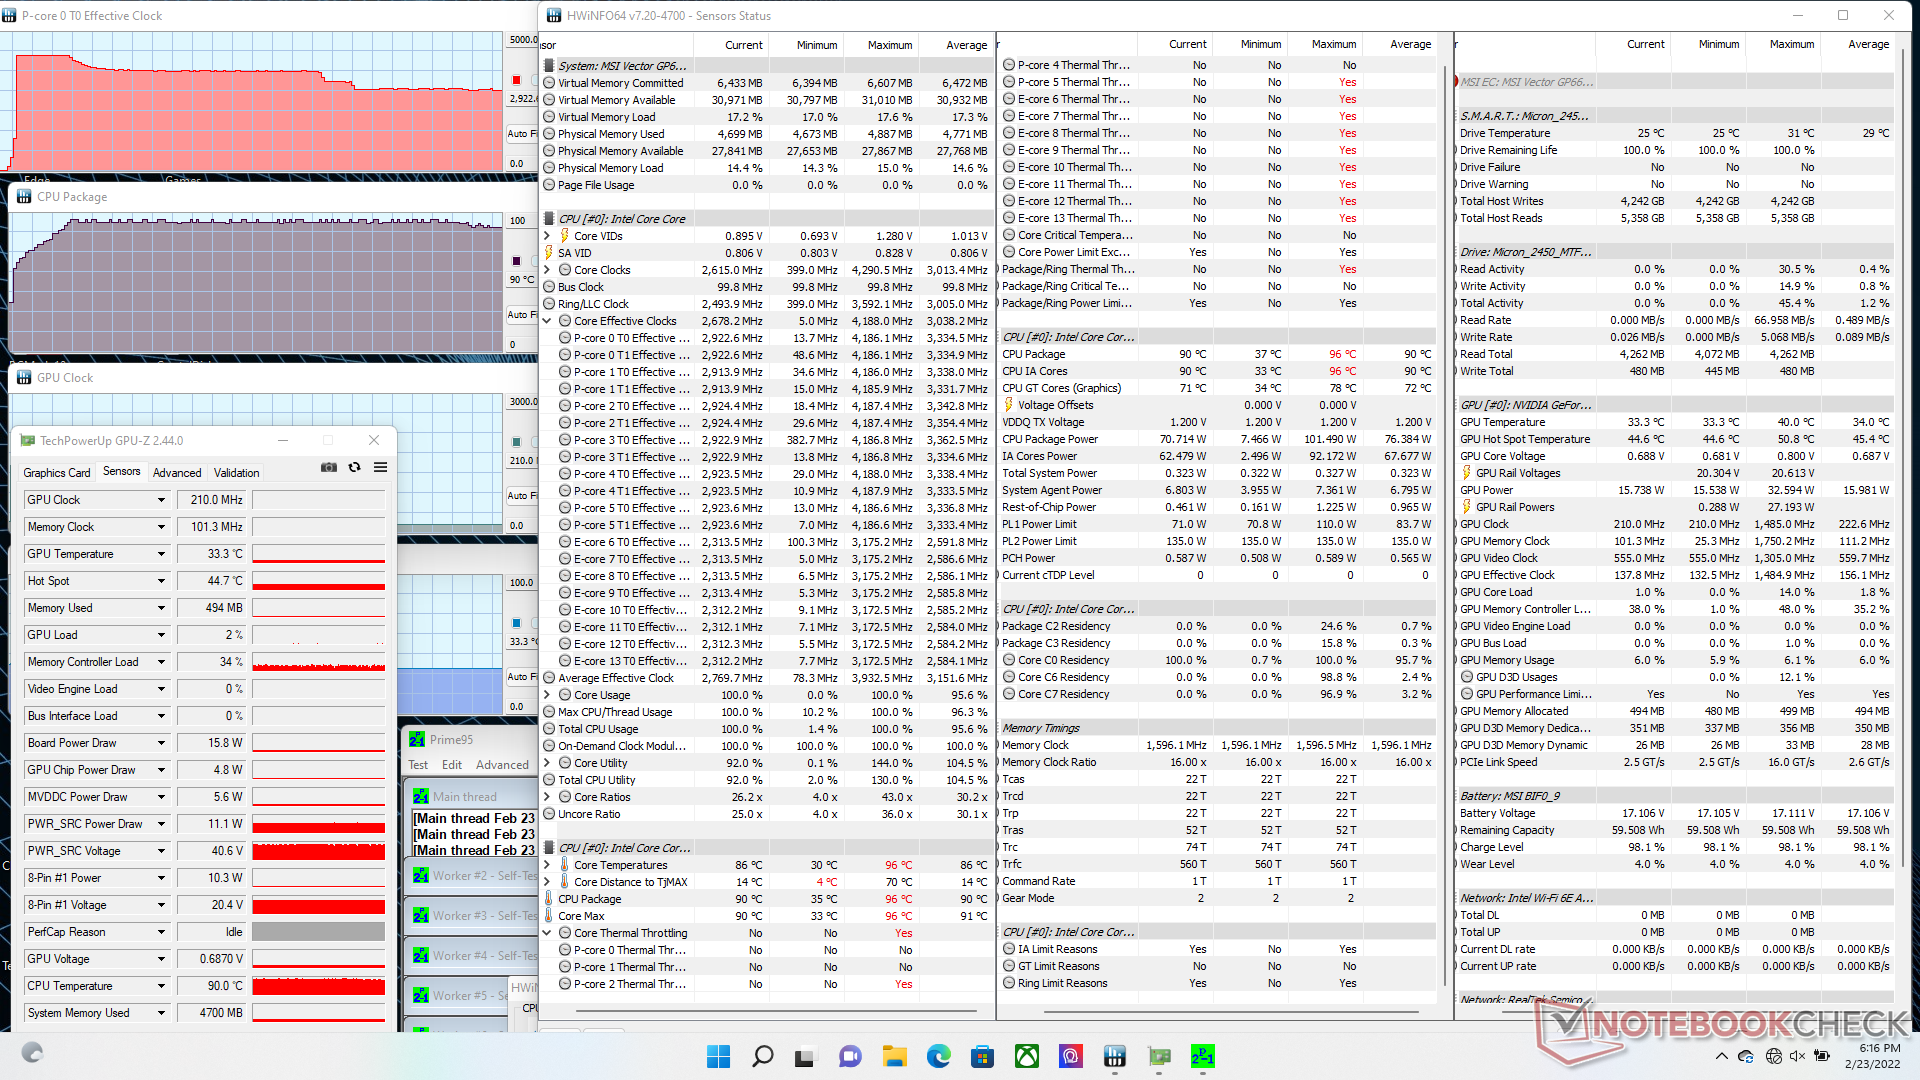
| Horloge du CPU (GHz) | Horloge du GPU (MHz) | Température moyenne du CPU (°C) | Température moyenne du GPU (°C) | |
| Système au repos (mode équilibré) | -- | -- | 39 | 40 |
| Prime95 Stress (mode Performance extrême) | 3.0 | -- | 90 | 33 |
| Prime95 + FurMark Stress (mode Performance extrême) | 3.0 | 1755 | 94 | 63 |
| Witcher 3 Stress (mode Performance Extrême) | ~1.0 | 1650 | 71 | 70 |
| Witcher 3 Stress (mode équilibré) | ~1.0 | 1515 | 85 | 78 |
Haut-parleurs
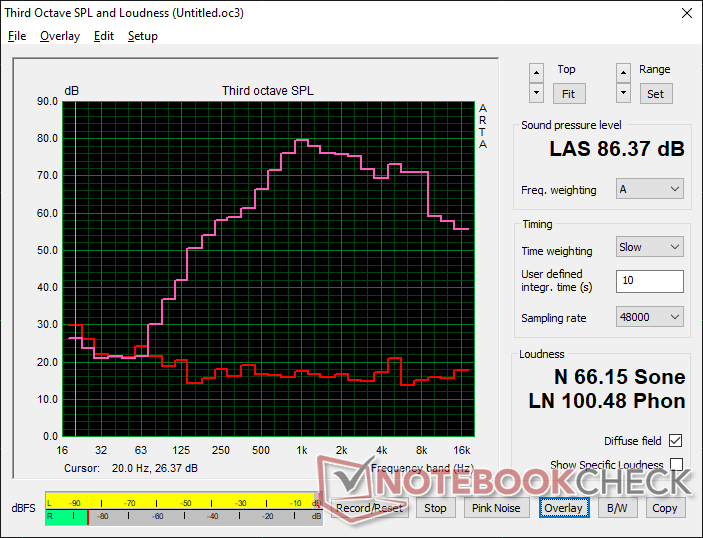
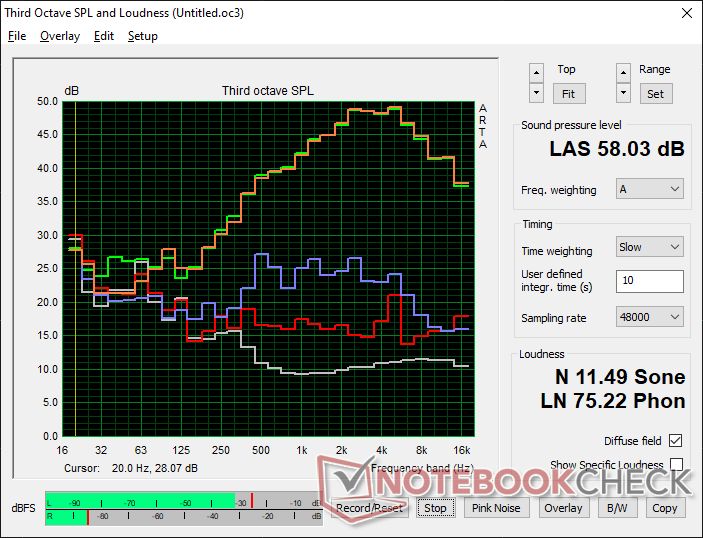
MSI Vector GP66 12UGS analyse audio
(+) | les haut-parleurs peuvent jouer relativement fort (86.4# dB)
Basses 100 - 315 Hz
(-) | presque aucune basse - en moyenne 19.2% plus bas que la médiane
(±) | la linéarité des basses est moyenne (9.1% delta à la fréquence précédente)
Médiums 400 - 2000 Hz
(±) | médiane supérieure - en moyenne 6.5% supérieure à la médiane
(+) | les médiums sont linéaires (5.8% delta à la fréquence précédente)
Aiguës 2 - 16 kHz
(+) | des sommets équilibrés - à seulement 3.7% de la médiane
(+) | les aigus sont linéaires (6.5% delta à la fréquence précédente)
Globalement 100 - 16 000 Hz
(±) | la linéarité du son global est moyenne (18.1% de différence avec la médiane)
Par rapport à la même classe
» 57% de tous les appareils testés de cette catégorie étaient meilleurs, 8% similaires, 35% pires
» Le meilleur avait un delta de 6%, la moyenne était de 18%, le pire était de 132%.
Par rapport à tous les appareils testés
» 38% de tous les appareils testés étaient meilleurs, 8% similaires, 54% pires
» Le meilleur avait un delta de 4%, la moyenne était de 23%, le pire était de 134%.
Apple MacBook Pro 16 2021 M1 Pro analyse audio
(+) | les haut-parleurs peuvent jouer relativement fort (84.7# dB)
Basses 100 - 315 Hz
(+) | bonne basse - seulement 3.8% loin de la médiane
(+) | les basses sont linéaires (5.2% delta à la fréquence précédente)
Médiums 400 - 2000 Hz
(+) | médiane équilibrée - seulement 1.3% de la médiane
(+) | les médiums sont linéaires (2.1% delta à la fréquence précédente)
Aiguës 2 - 16 kHz
(+) | des sommets équilibrés - à seulement 1.9% de la médiane
(+) | les aigus sont linéaires (2.7% delta à la fréquence précédente)
Globalement 100 - 16 000 Hz
(+) | le son global est linéaire (4.6% différence à la médiane)
Par rapport à la même classe
» 0% de tous les appareils testés de cette catégorie étaient meilleurs, 0% similaires, 100% pires
» Le meilleur avait un delta de 5%, la moyenne était de 17%, le pire était de 45%.
Par rapport à tous les appareils testés
» 0% de tous les appareils testés étaient meilleurs, 0% similaires, 100% pires
» Le meilleur avait un delta de 4%, la moyenne était de 23%, le pire était de 134%.
Gestion de l'énergie
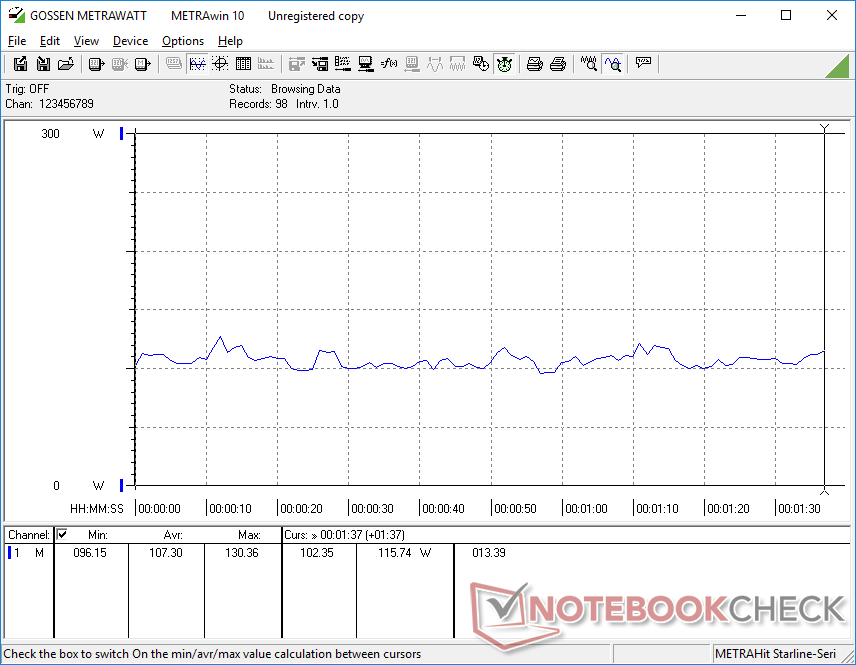
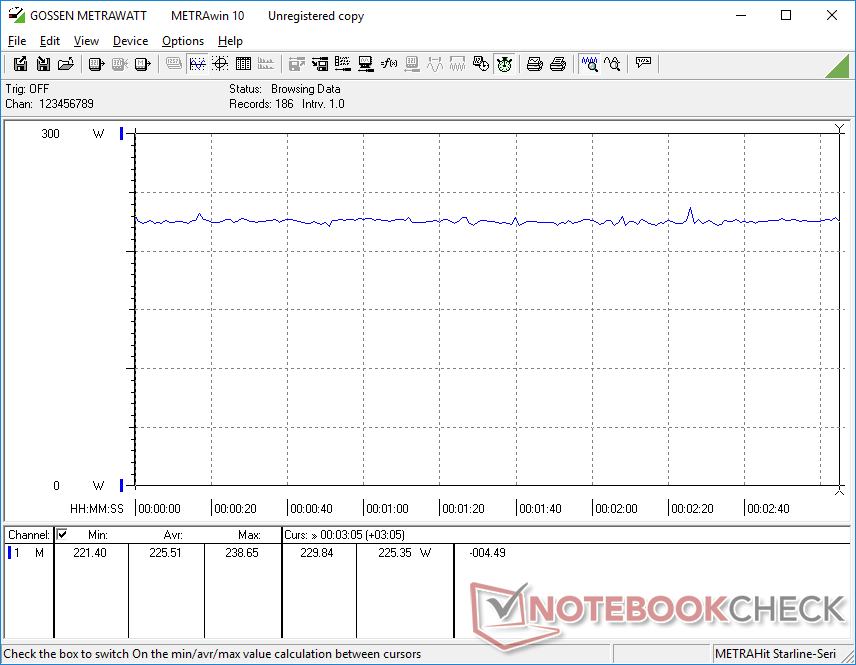
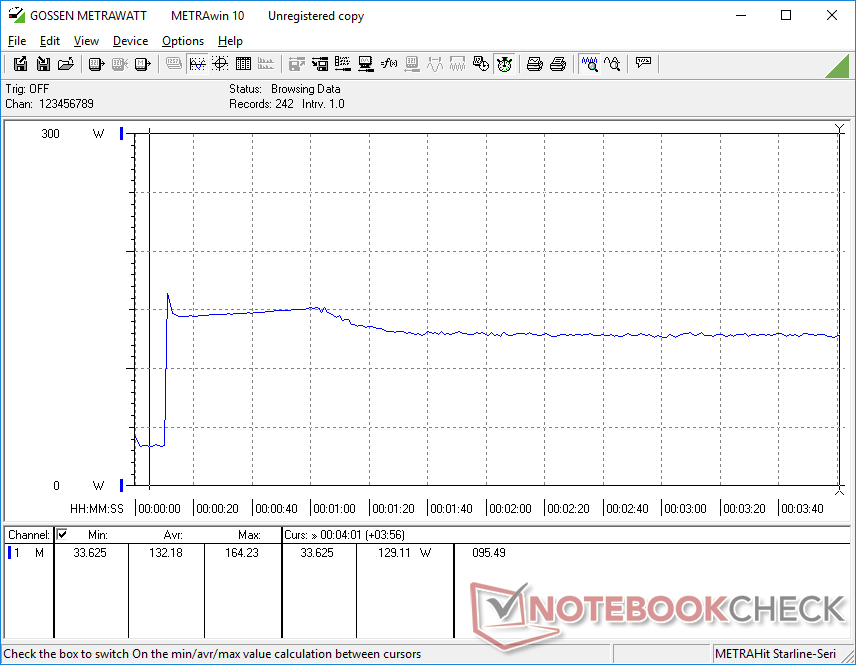
Consommation d'énergie
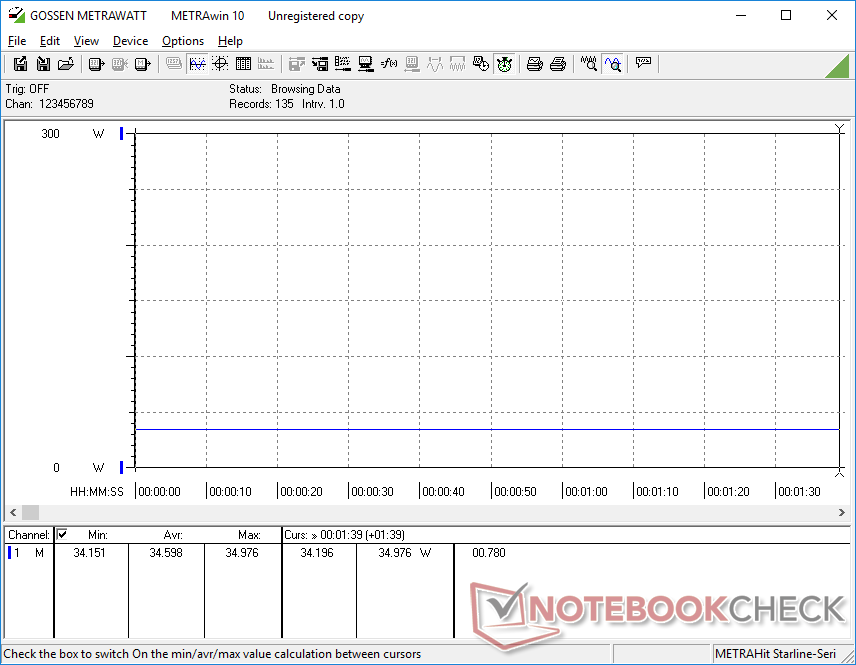
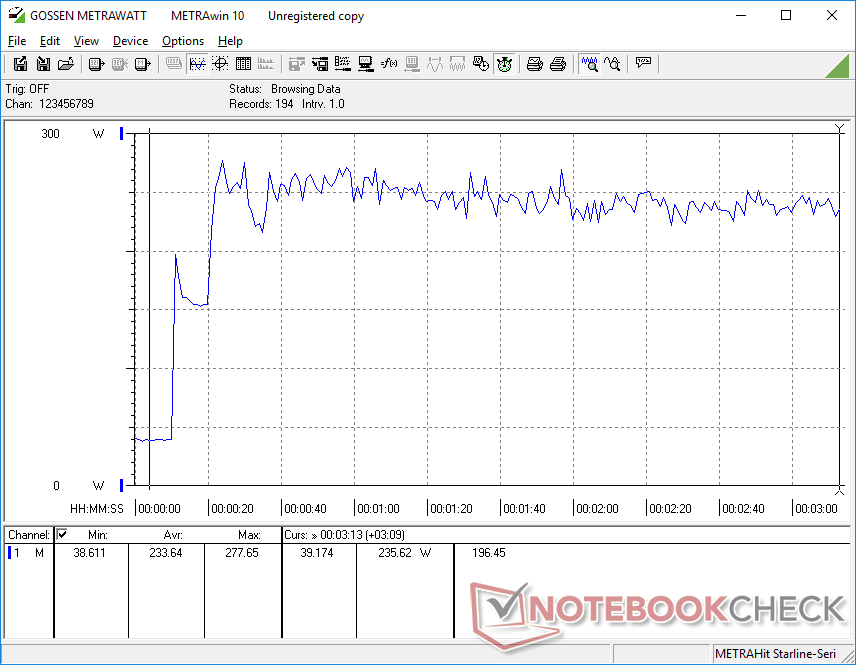
Attendez-vous à une consommation d'énergie globalement plus élevée sur le Vector GP66 par rapport au GP66 Leopard de l'année dernière en raison de son taux de rafraîchissement natif de l'écran plus élevé (360 Hz contre 144 Hz), des objectifs PL du CPU plus élevés (70 W contre 45 W) et d'un TGP plus élevé (150 W contre 140 W). Les jeux en cours d'exécution tireront environ 20 W de plus de la prise pour être plus exigeants que de nombreux autres ordinateurs portables de jeu de 17 pouces équipés de graphiques RTX 3080 de GeForce. Bien que les utilisateurs obtiennent des performances plus élevées d'une année sur l'autre, notamment en ce qui concerne le processeur, les performances par watt ne sont peut-être pas si meilleures que cela.
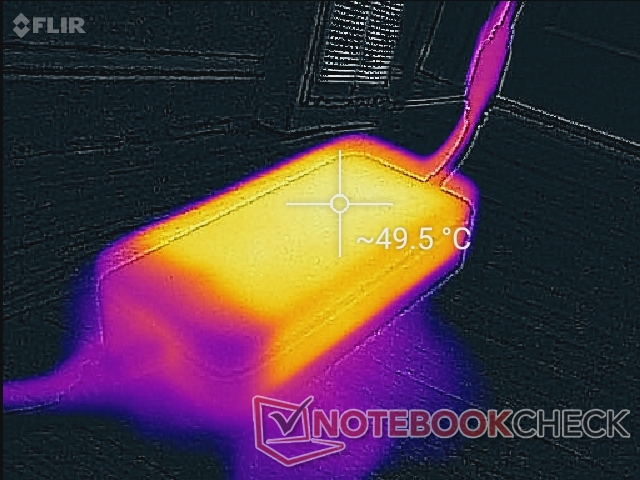
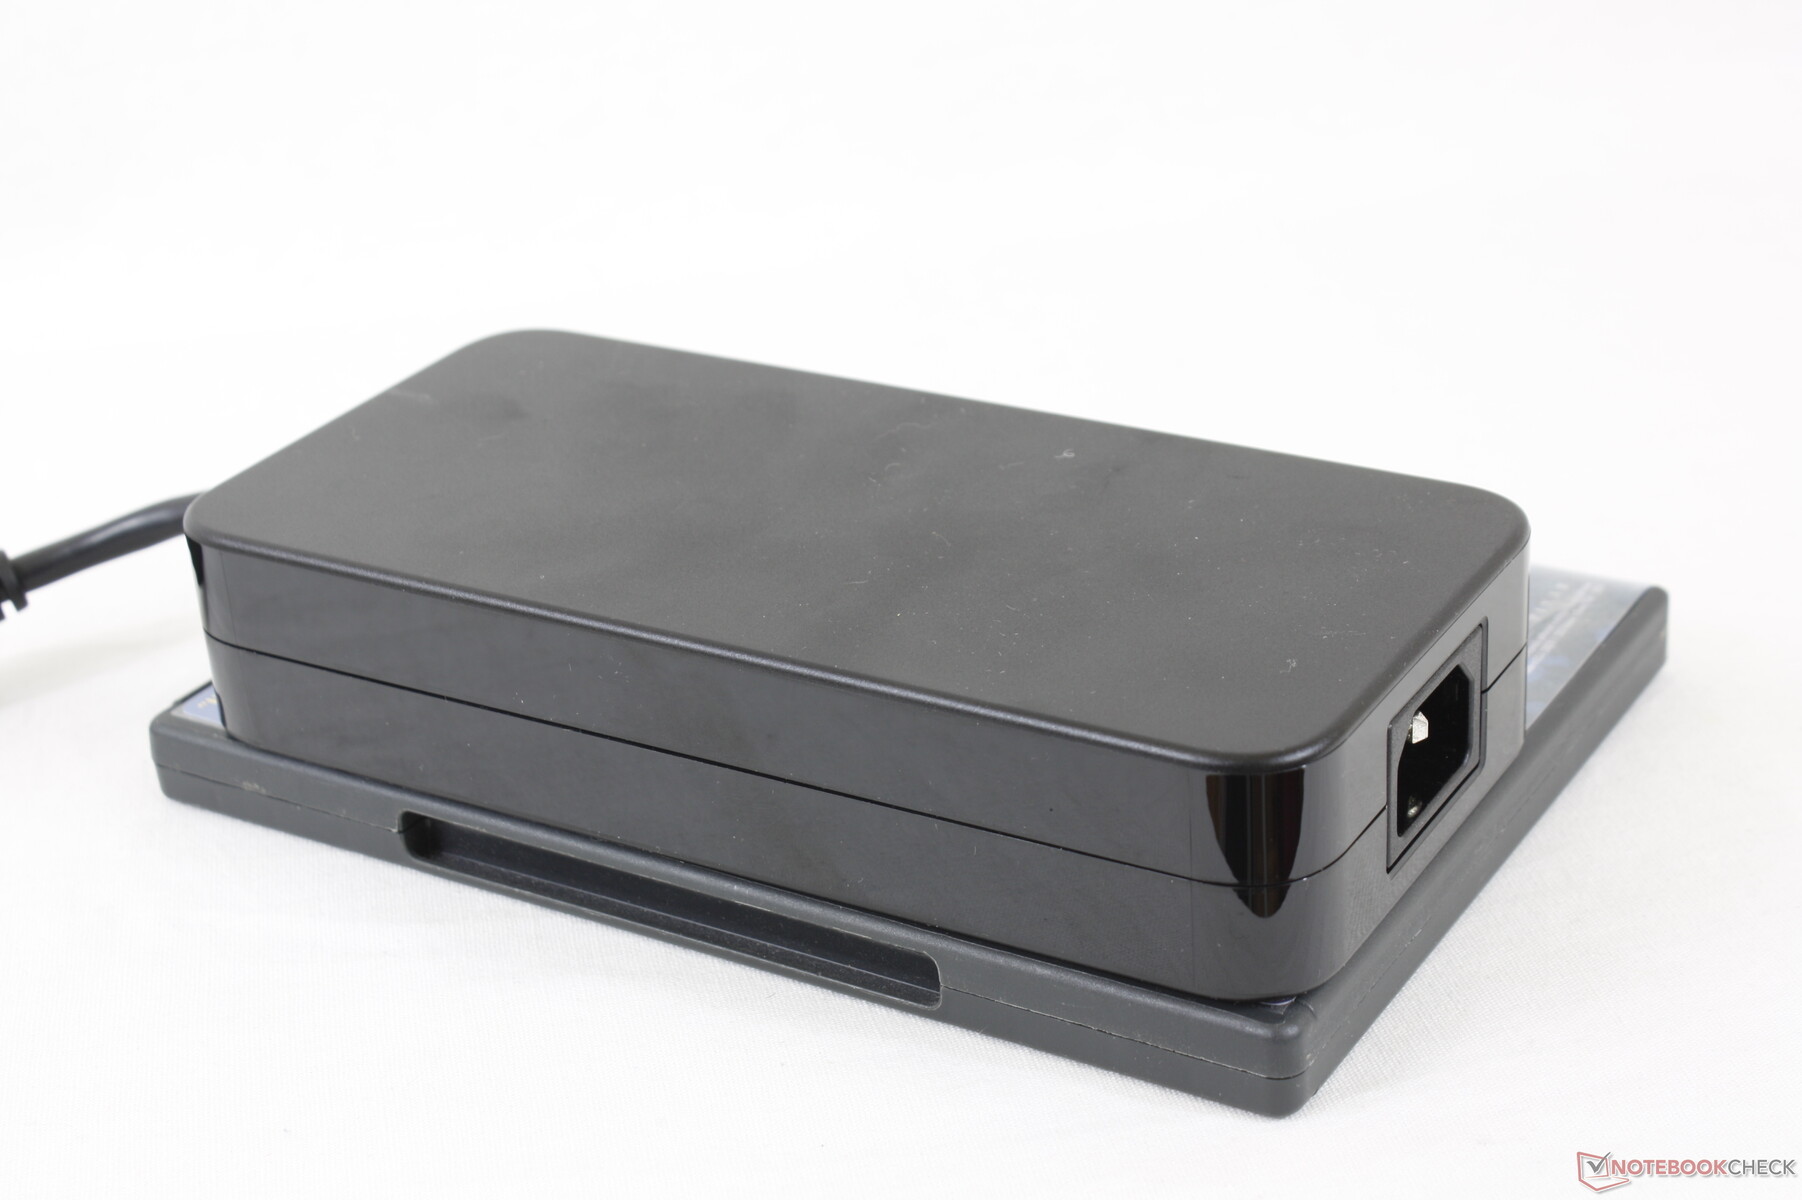
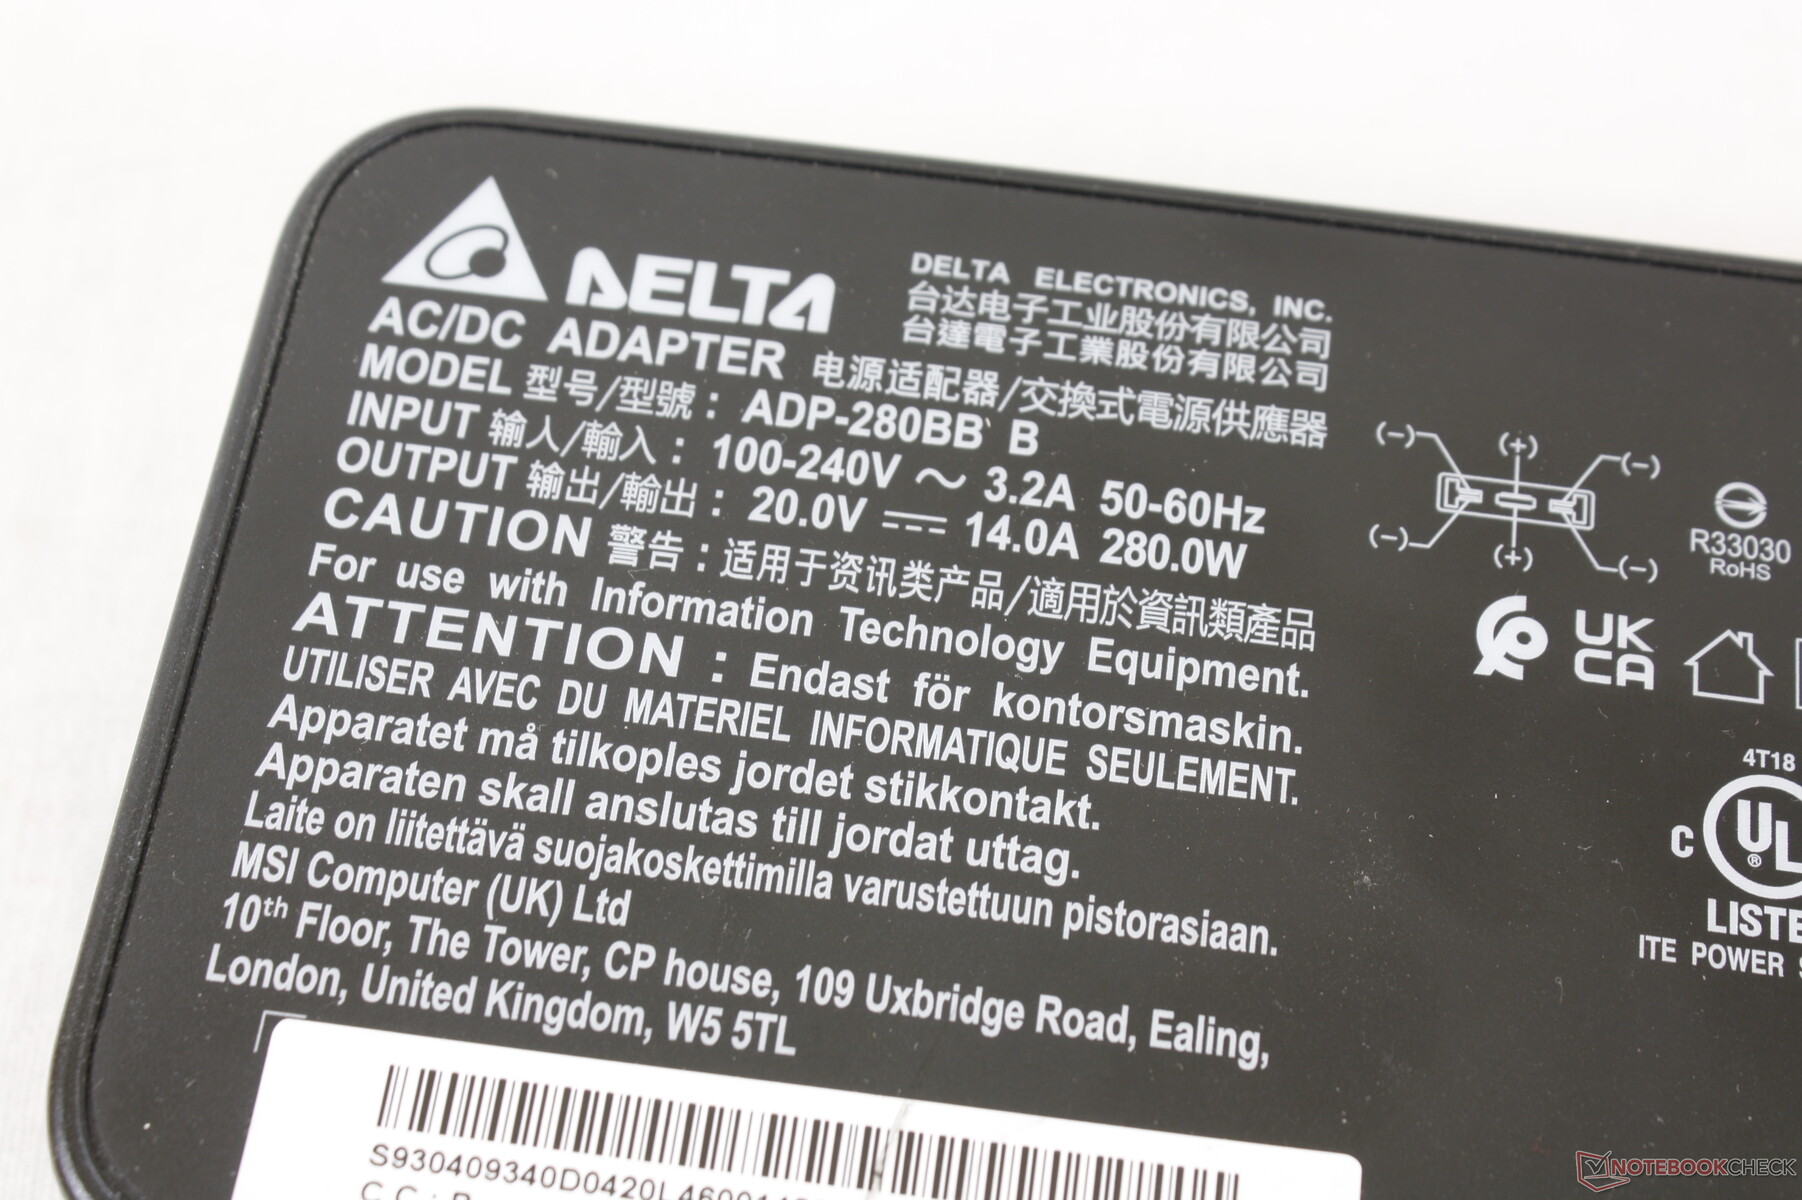
Nous avons pu enregistrer une consommation maximale temporaire de 278 W sur le grand adaptateur secteur de 280 W (~18 x 8,5 x 3,5 cm) en utilisant simultanément Prime95 et FurMark. La batterie se recharge toujours à un rythme décent pendant le jeu.
| Éteint/en veille | |
| Au repos | |
| Fortement sollicité |
|
Légende:
min: | |
| MSI Vector GP66 12UGS i9-12900H, GeForce RTX 3070 Ti Laptop GPU, , IPS, 1920x1080, 15.6" | MSI GP66 Leopard 11UH-028 i7-11800H, GeForce RTX 3080 Laptop GPU, Samsung PM9A1 MZVL21T0HCLR, IPS, 1920x1080, 15.6" | MSI Katana GF66 11UG-220 i7-11800H, GeForce RTX 3070 Laptop GPU, Kingston OM8PDP3512B-AI1, IPS, 1920x1080, 15.6" | Asus TUF Gaming F15 FX506HM i7-11800H, GeForce RTX 3060 Laptop GPU, SK Hynix HFM001TD3JX013N, IPS, 1920x1080, 15.6" | Razer Blade 15 Base Edition 2021, i7-10750H RTX 3060 i7-10750H, GeForce RTX 3060 Laptop GPU, Samsung SSD PM981a MZVLB512HBJQ, IPS, 1920x1080, 15.6" | Alienware m15 R5 Ryzen Edition R7 5800H, GeForce RTX 3060 Laptop GPU, Toshiba KBG40ZNS512G NVMe, IPS, 1920x1080, 15.6" | |
|---|---|---|---|---|---|---|
| Power Consumption | 24% | 38% | 36% | 28% | 23% | |
| Idle Minimum * (Watt) | 17.5 | 13 26% | 8 54% | 9.5 46% | 11.7 33% | 11 37% |
| Idle Average * (Watt) | 20.1 | 17 15% | 12 40% | 12.1 40% | 16 20% | 14 30% |
| Idle Maximum * (Watt) | 47.3 | 18 62% | 22 53% | 22.5 52% | 29.3 38% | 25 47% |
| Load Average * (Watt) | 107.3 | 96 11% | 98 9% | 99.5 7% | 95.6 11% | 123 -15% |
| Witcher 3 ultra * (Watt) | 225 | 207 8% | 152 32% | 157 30% | 141.3 37% | 176 22% |
| Load Maximum * (Watt) | 277.7 | 223 20% | 162 42% | 173.5 38% | 197 29% | 226 19% |
* ... Moindre est la valeur, meilleures sont les performances
Power Consumption Witcher 3 / Stresstest
Power Consumption external Monitor
Autonomie de la batterie
La capacité de la batterie est la même entre le GP66 Vector et le GP66 Leopard de l'année dernière, soit 65 Wh. Néanmoins, nous avons pu enregistrer des durées d'exécution WLAN plus longues sur le modèle le plus récent, soit un peu plus de deux heures supplémentaires. Nous recommandons de faire fonctionner le système en mode MSHybrid pour prolonger l'autonomie de la batterie si le mode dGPU n'est pas une priorité.
Le chargement d'une batterie vide à pleine capacité avec l'adaptateur secteur inclus prend environ 2,5 heures, contre 2 heures ou plus sur la plupart des autres ordinateurs portables. La charge avec des adaptateurs USB-C n'est pas prise en charge, contrairement à de nombreuses alternatives d'Asus ou de Razer.
| MSI Vector GP66 12UGS i9-12900H, GeForce RTX 3070 Ti Laptop GPU, 65 Wh | MSI GP66 Leopard 11UH-028 i7-11800H, GeForce RTX 3080 Laptop GPU, 65 Wh | MSI Katana GF66 11UG-220 i7-11800H, GeForce RTX 3070 Laptop GPU, 90 Wh | Asus TUF Gaming F15 FX506HM i7-11800H, GeForce RTX 3060 Laptop GPU, 90 Wh | Razer Blade 15 Base Edition 2021, i7-10750H RTX 3060 i7-10750H, GeForce RTX 3060 Laptop GPU, 65 Wh | Alienware m15 R5 Ryzen Edition R7 5800H, GeForce RTX 3060 Laptop GPU, 86 Wh | |
|---|---|---|---|---|---|---|
| Autonomie de la batterie | -9% | 9% | 59% | 11% | 22% | |
| Reader / Idle (h) | 7.9 | 9.1 15% | 11 39% | 7.8 -1% | 14.7 86% | |
| WiFi v1.3 (h) | 5.7 | 3.6 -37% | 5.3 -7% | 7.9 39% | 4.8 -16% | 5.1 -11% |
| Load (h) | 1 | 1.2 20% | 1.2 20% | 2 100% | 1.5 50% | 0.9 -10% |
| H.264 (h) | 3.5 | 8.8 | ||||
| Witcher 3 ultra (h) | 0.8 | 1.6 |
Points positifs
Points négatifs
Verdict
L'amélioration des conditions thermiques du GP66 par rapport au GP65 lui ont permis de supporter des graphiques TGP plus puissants de 150 W, contre seulement ~100 W sur le Razer Blade 15 ou MSI GS66 de MSI. En d'autres termes, vous obtenez l'une des meilleures versions de la mobile GeForce RTX 3070 Ti sur n'importe quel ordinateur portable de 15,6 pouces à l'heure actuelle, grâce au plafond TGP plus élevé du GP66. Le GS66 est peut-être plus fin et plus portable, mais sa GeForce RTX 3070 Ti est aussi nettement plus lente, ce qui est une conséquence directe. Pour une expérience plus équilibrée, le GP66 serait la meilleure option.
Le mode Performance Extrême est nécessaire si vous voulez tirer le maximum de performances du GPU. Ce mode est également le plus bruyant en termes de bruit de ventilateur, ce qui signifie que les ventilateurs plus bruyants que la moyenne sont inévitables si vous souhaitez obtenir des performances maximales. En jouant en mode équilibré, le bruit des ventilateurs sera considérablement réduit pour seulement une petite baisse de 5 % des performances graphiques. Nous trouvons que ce mode est idéal pour les joueurs qui n'aiment pas utiliser des écouteurs ou qui sont gênés par les ordinateurs portables de jeu très bruyants.
Le Vector GP66 équilibre la portabilité et les performances mieux que la plupart des autres ordinateurs portables de jeu ultra-minces avec ses options GPU 150 W plus puissantes.
Pour les futures révisions, nous aimerions voir des améliorations à la fois du clickpad spongieux et de la durabilité des performances du SSD PCIe4 x4. Le pavé tactile est une régression par rapport à l'ancien GP65, tandis que l'absence de dissipateur thermique pour le SSD NVMe signifie que les taux de transfert vont s'essouffler après une courte période d'utilisation intensive.
Prix et disponibilité
Notre configuration exacte telle qu'elle a été examinée est actuellement disponible sur Best Buy pour $2400 USD.
MSI Vector GP66 12UGS
- 03/03/2022 v7 (old)
Allen Ngo
Price comparison

