Test du Lenovo Legion 5i Pro 16 G7 : le PC portable de jeu avec Alder Lake et RTX 3070 Ti
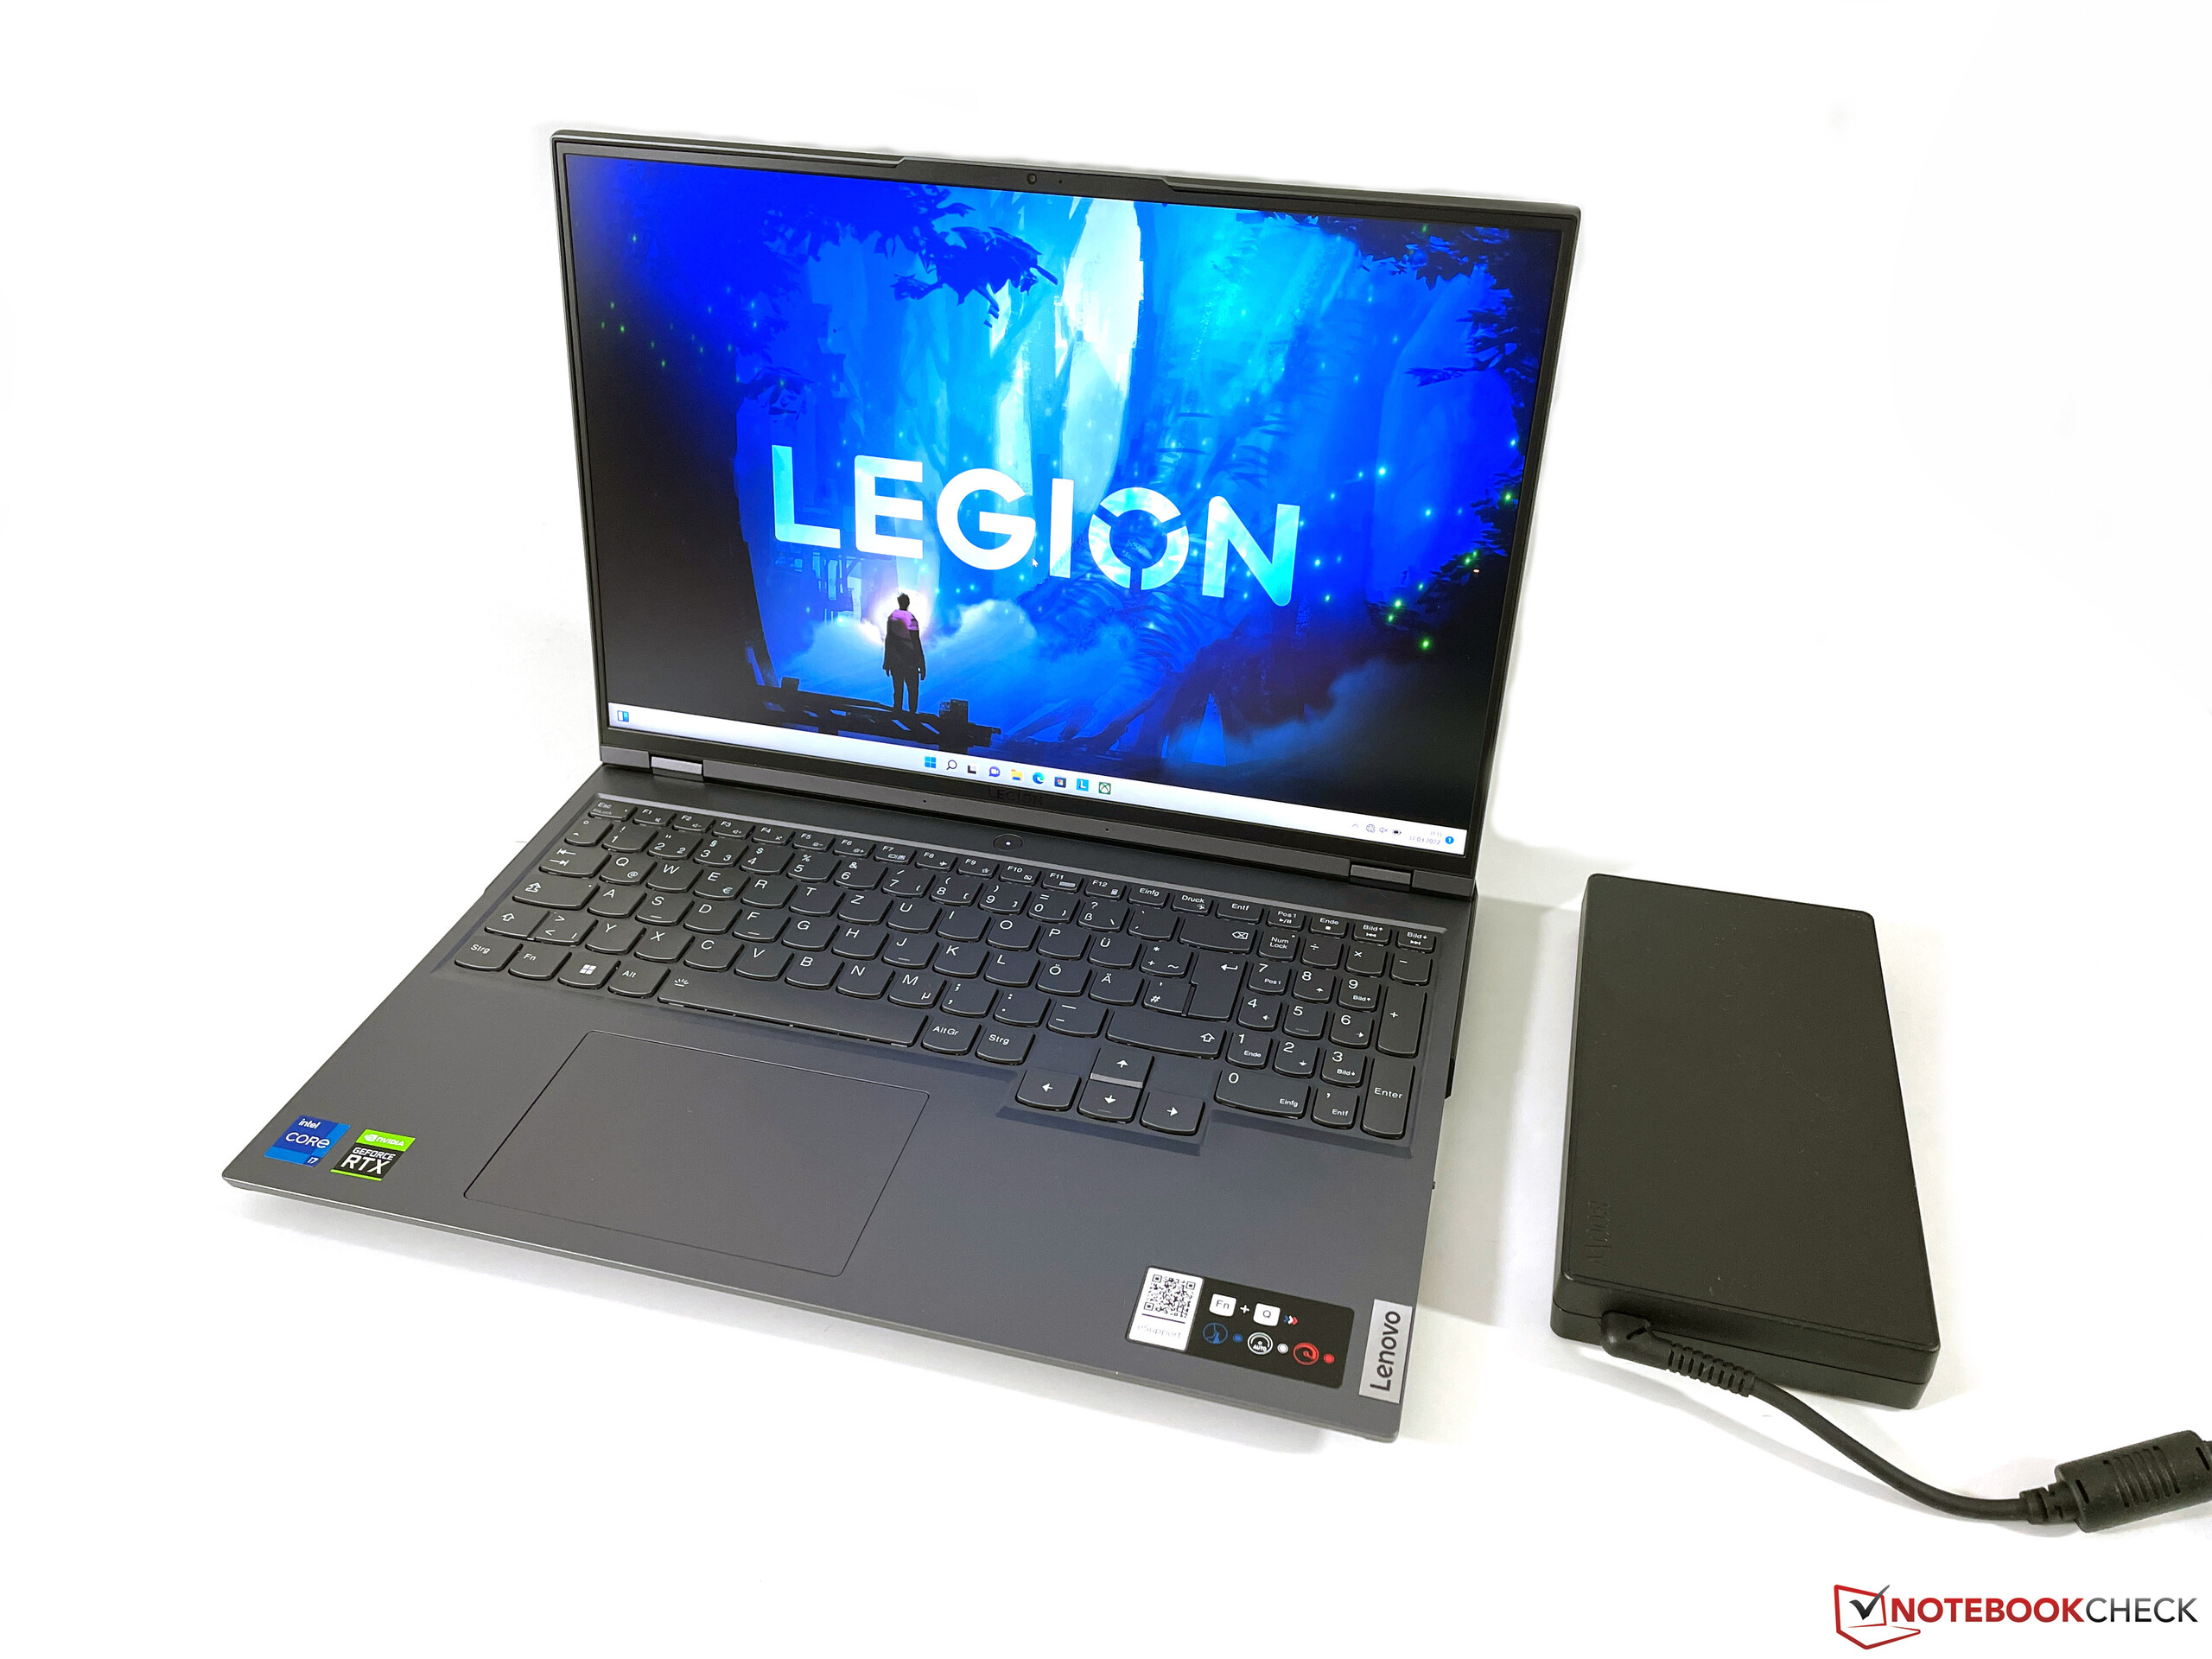
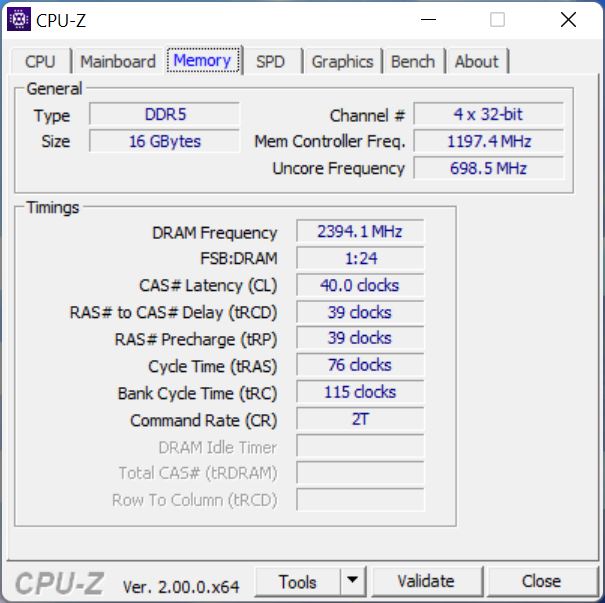
Nous avons déjà examiné le Legion 5 Pro 16 l'année dernière et Lenovo propose aujourd'hui une version actualisée de son ordinateur portable de jeu de 16 pouces. Les mises à jour sont axées sur les performances, car en plus des nouveaux processeurs Alder Lake d'Intel, vous obtenez également la technologieGeForce RTX 3070 Tide Nvidia, y compris Advanced Optimus (MUX dynamique). Vous obtenez également des supports Thunderbolt 4 ainsi que des SSD PCIe 4.0 rapides. Aujourd'hui, nous jetons un coup d'œil au modèle 82RF000VGE pour 2100 euros, qui est équipé de 16 Go de DDR5-RAM, d'un stockage PCIe 4.0 de 1 To, et d'un écran rapide de 165 Hz avec une résolution WQHD. Cet ordinateur portable est également disponible dans le programme campus de Lenovo pour 1900 euros.
Comparaison avec les concurrents potentiels
Note | Date | Modèle | Poids | Épaisseur | Taille | Résolution | Prix |
|---|---|---|---|---|---|---|---|
| 88 % v7 (old) | 03/22 | Lenovo Legion 5 Pro 16 G7 i7 RTX 3070Ti i7-12700H, GeForce RTX 3070 Ti Laptop GPU | 2.6 kg | 26.6 mm | 16.00" | 2560x1600 | |
| 86.9 % v7 (old) | 03/22 | MSI Vector GP66 12UGS i9-12900H, GeForce RTX 3070 Ti Laptop GPU | 2.3 kg | 23.4 mm | 15.60" | 1920x1080 | |
| 86.6 % v7 (old) | 10/21 | HP Omen 16-b0085ng i7-11800H, GeForce RTX 3070 Laptop GPU | 2.4 kg | 23 mm | 16.10" | 1920x1080 | |
| 82.2 % v7 (old) | 08/21 | Acer Nitro 5 AN515-45-R1JH R7 5800H, GeForce RTX 3070 Laptop GPU | 2.3 kg | 23.9 mm | 15.60" | 2560x1440 | |
| 85 % v7 (old) | 07/21 | Asus TUF Gaming A15 FA506QR-AZ061T R7 5800H, GeForce RTX 3070 Laptop GPU | 2.3 kg | 24 mm | 15.60" | 1920x1080 |
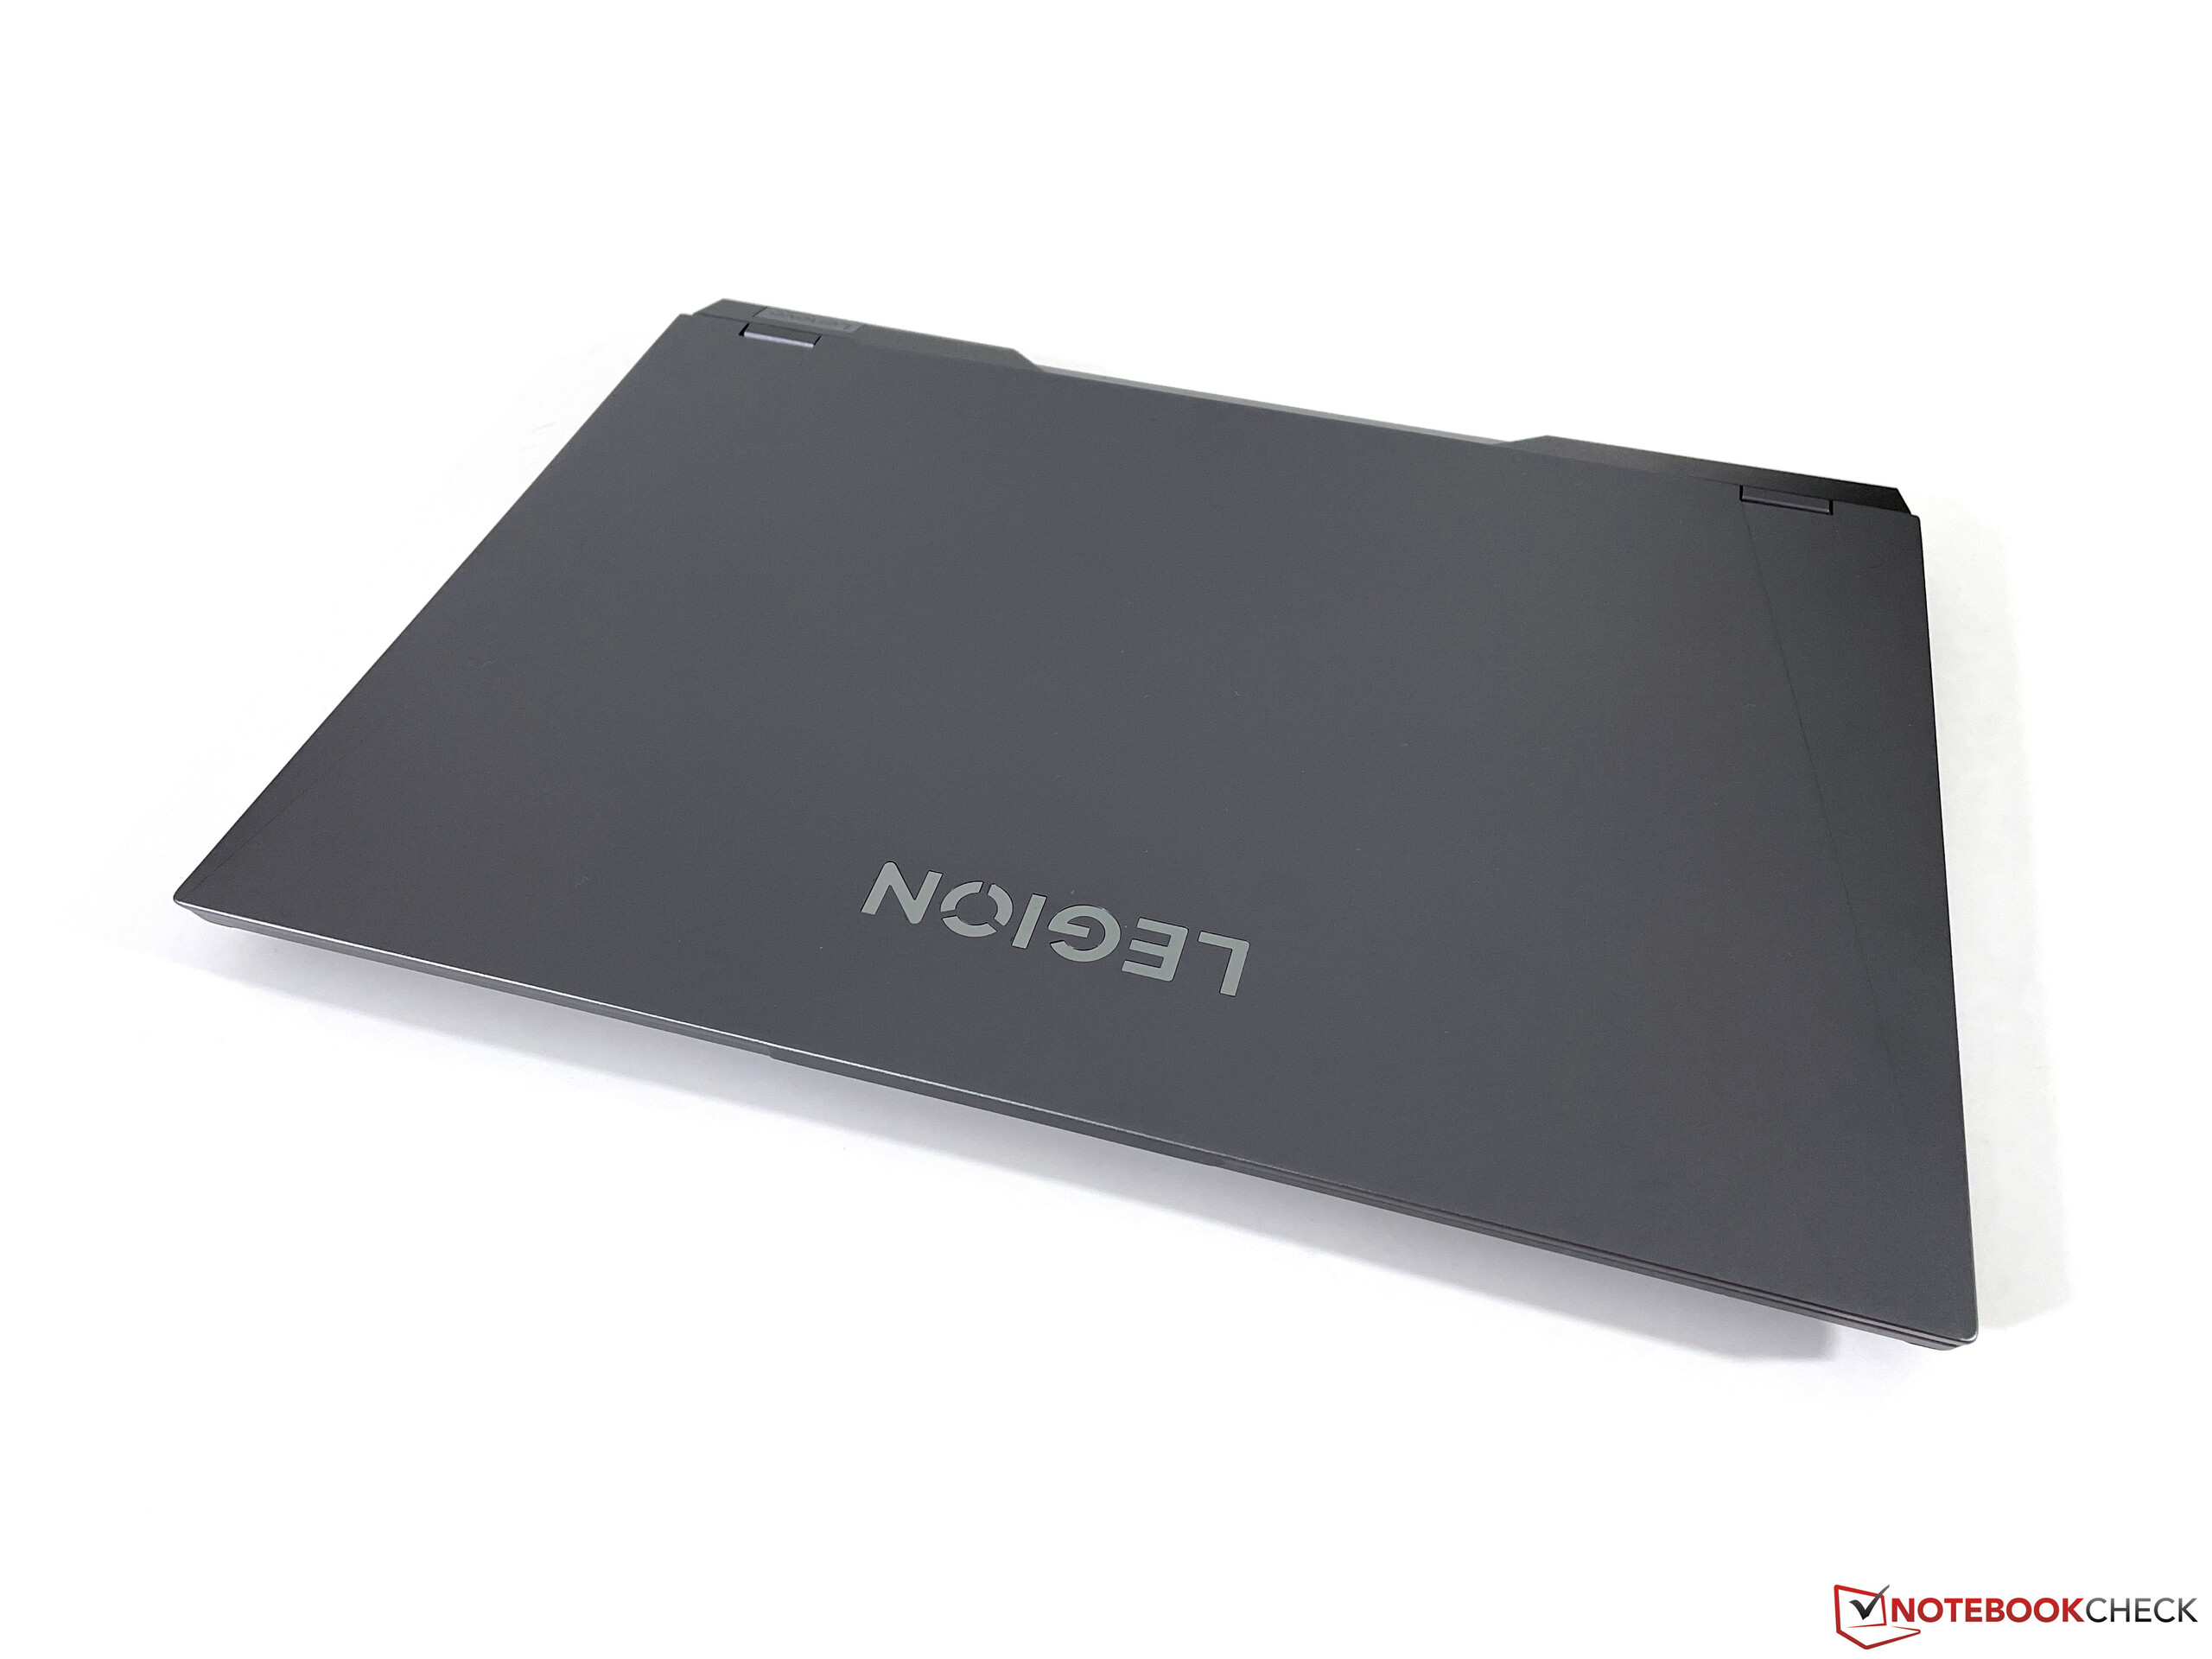
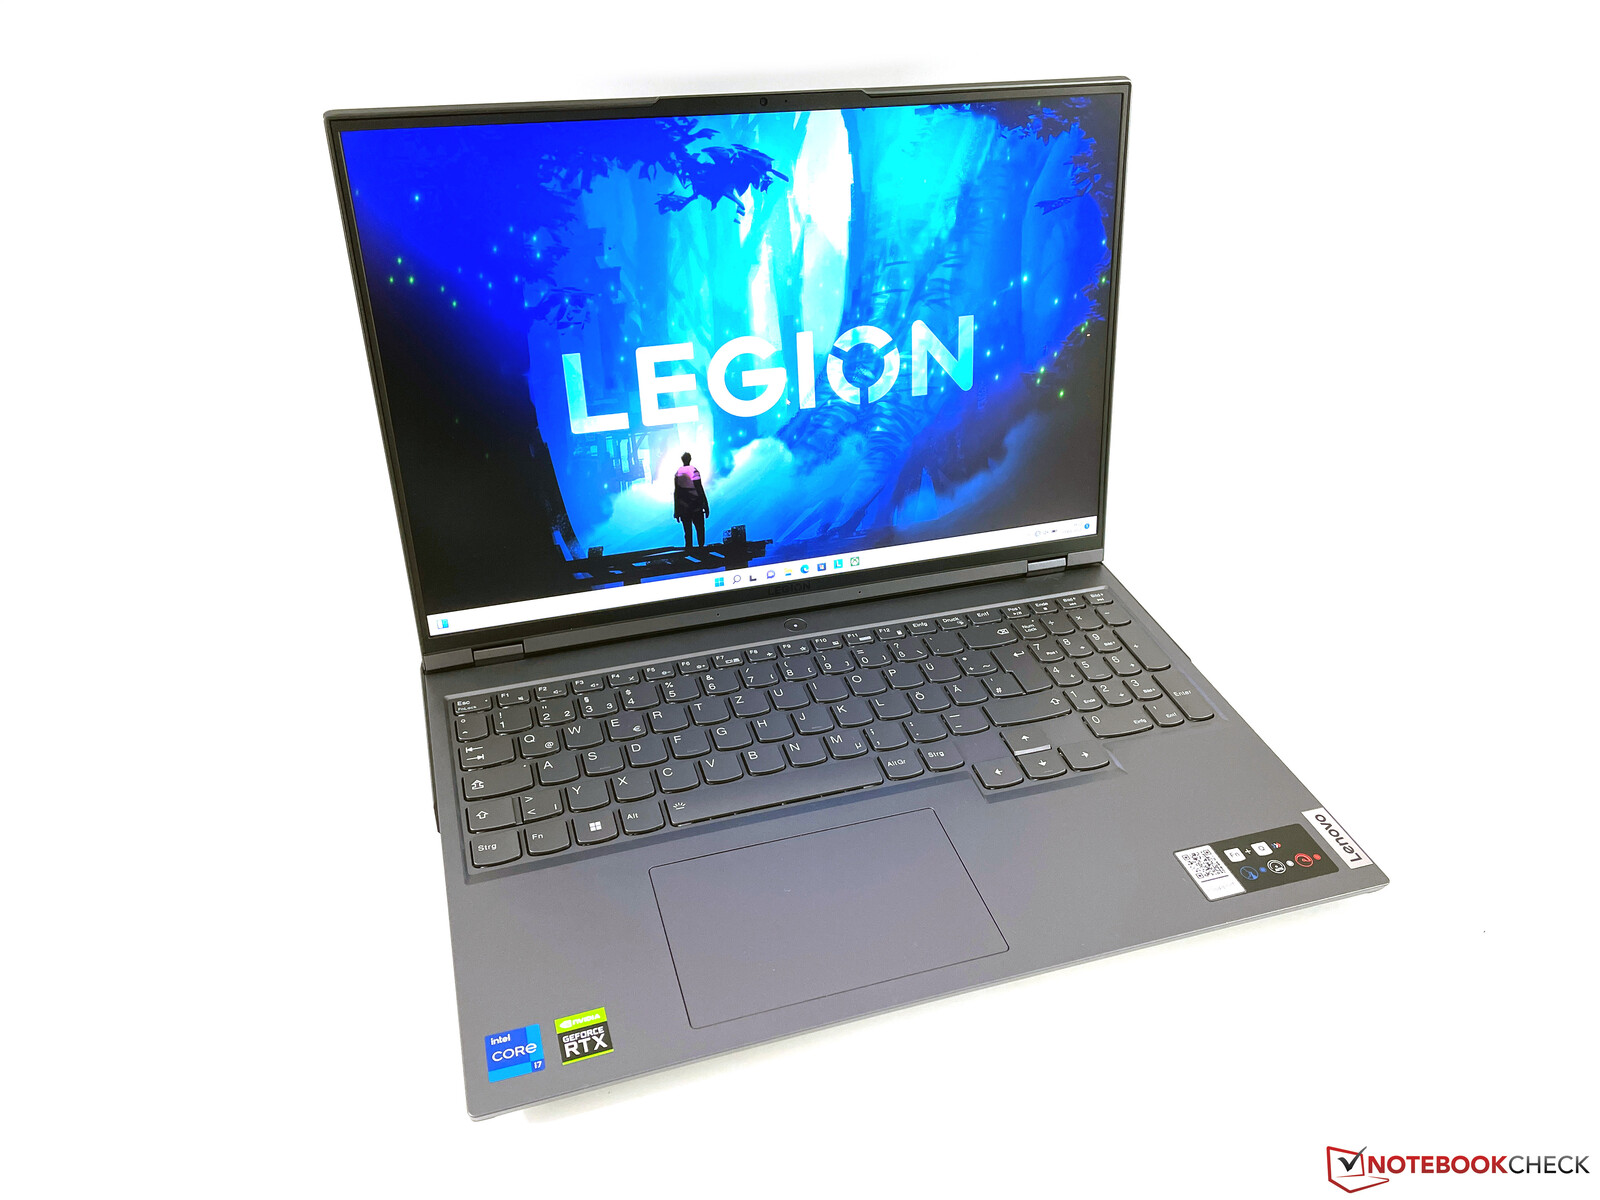
Cas - Legion avec des changements visuels mineurs
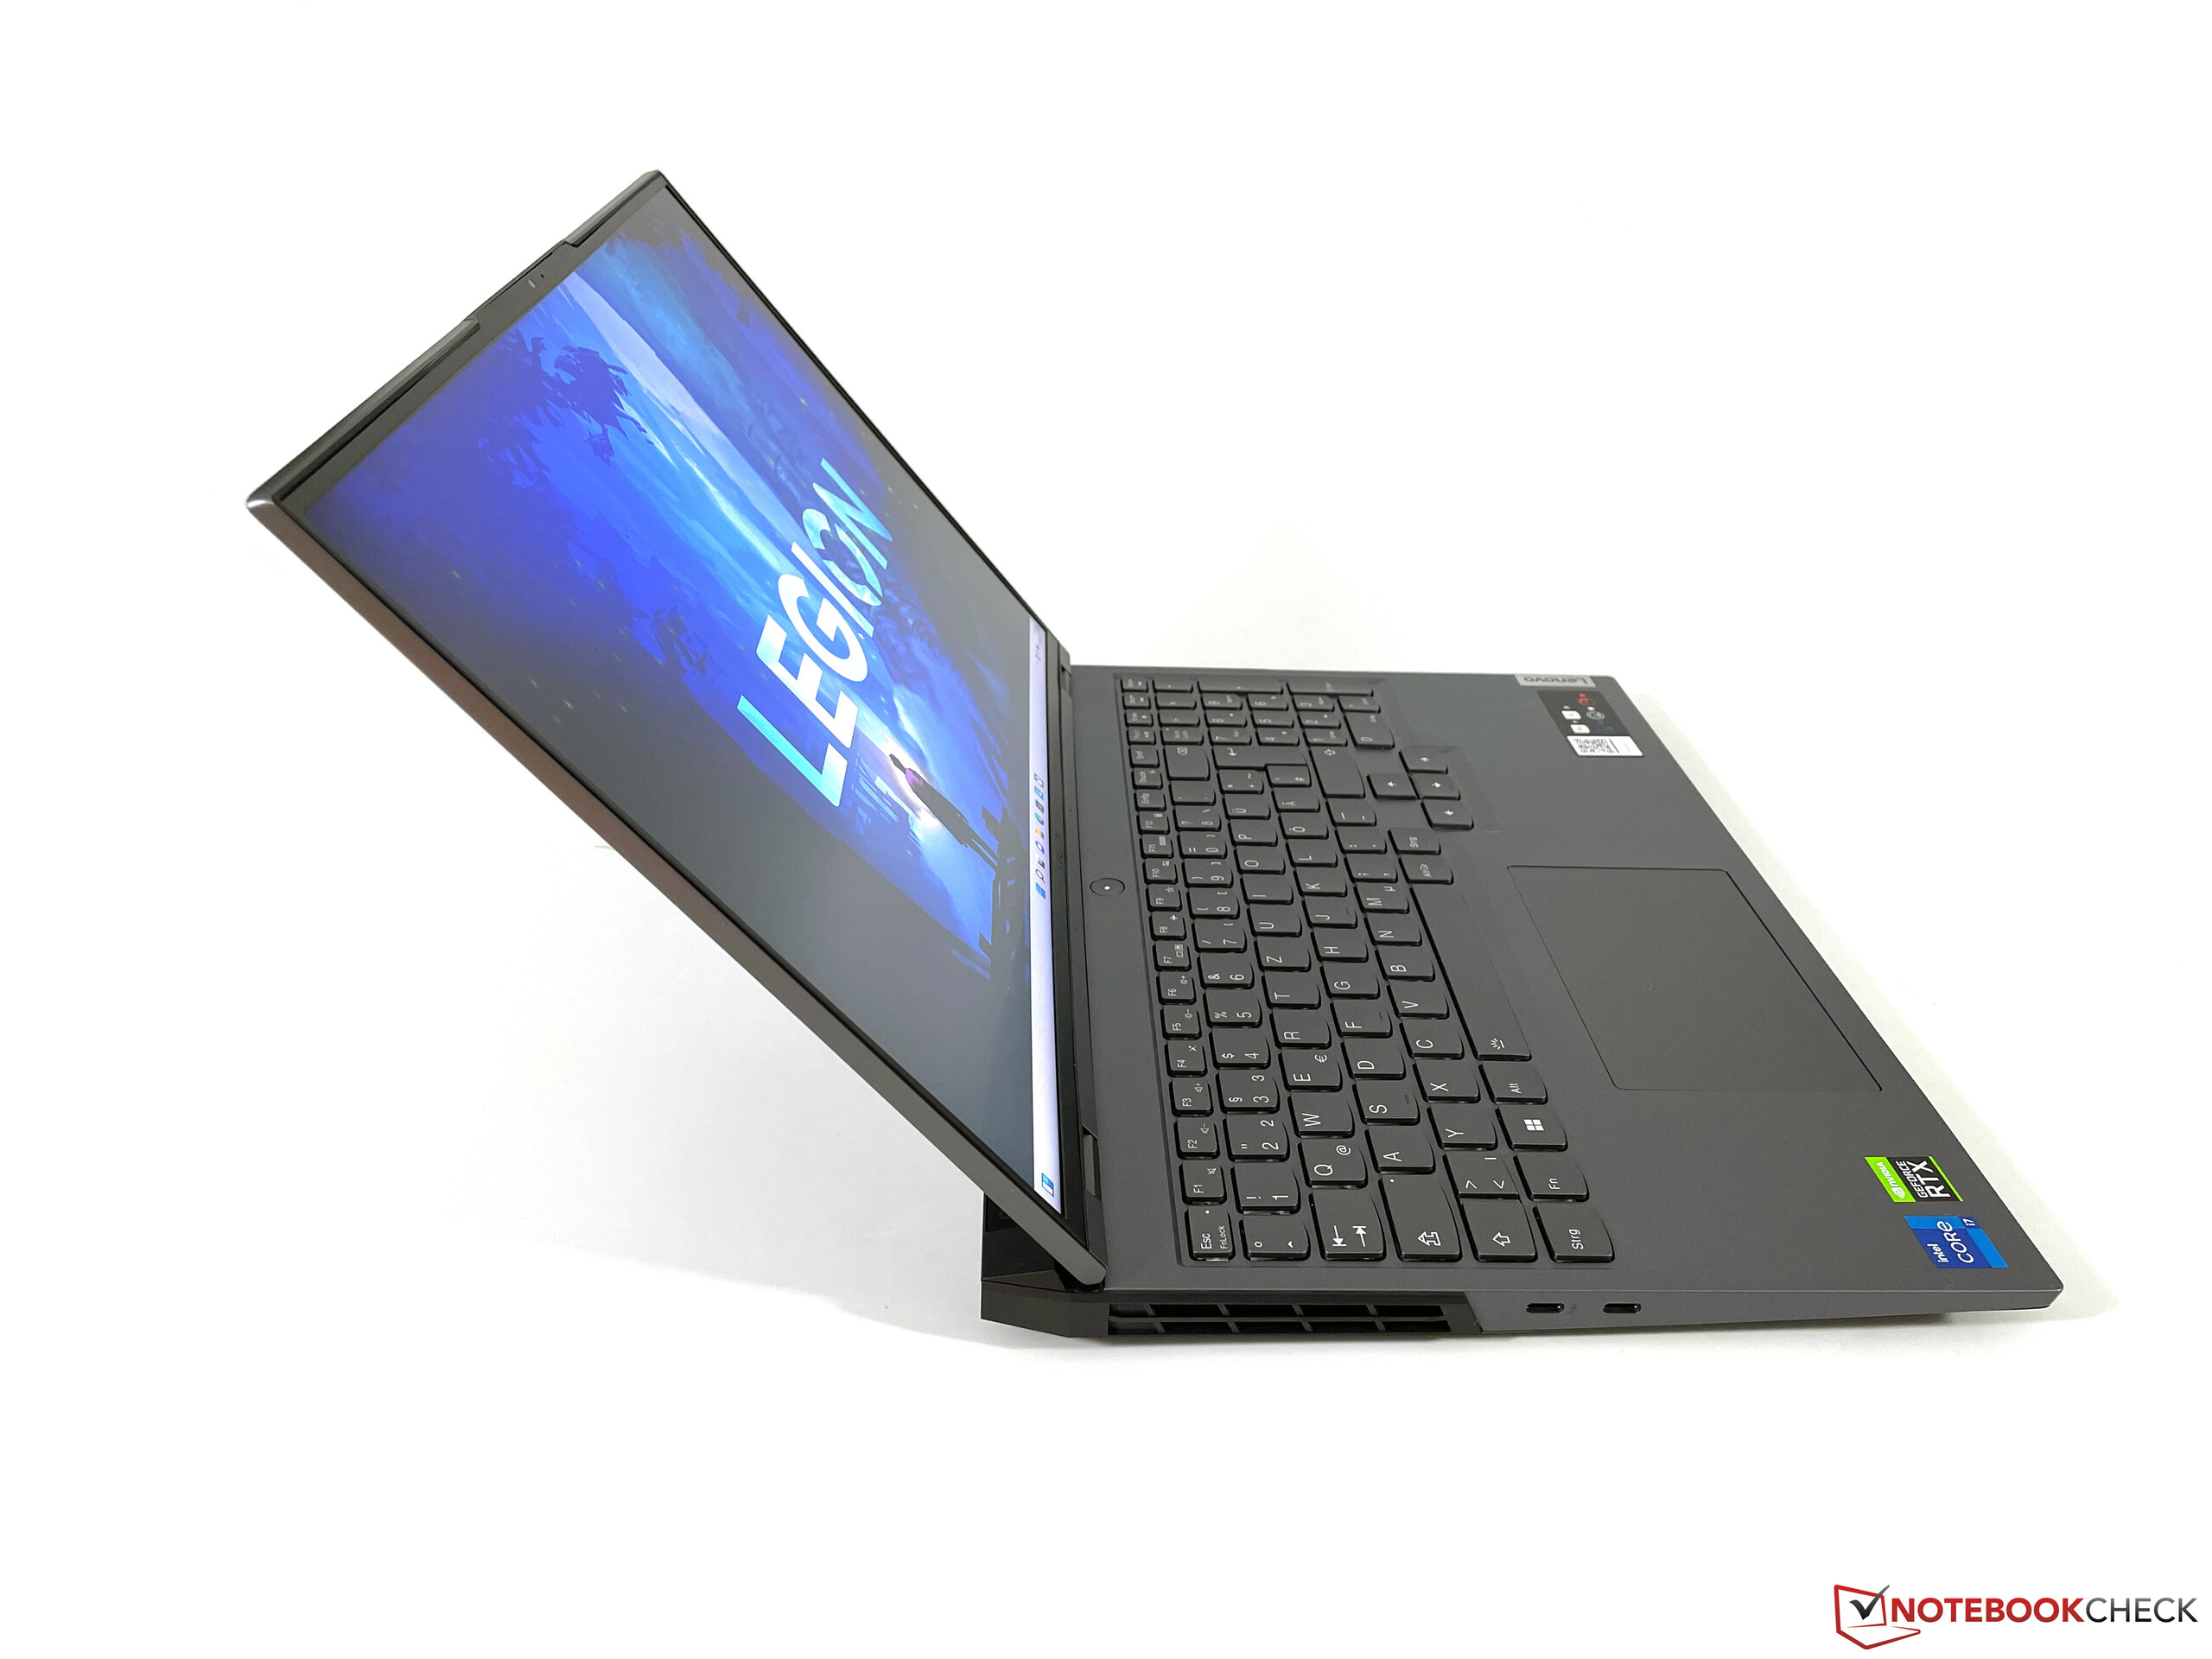
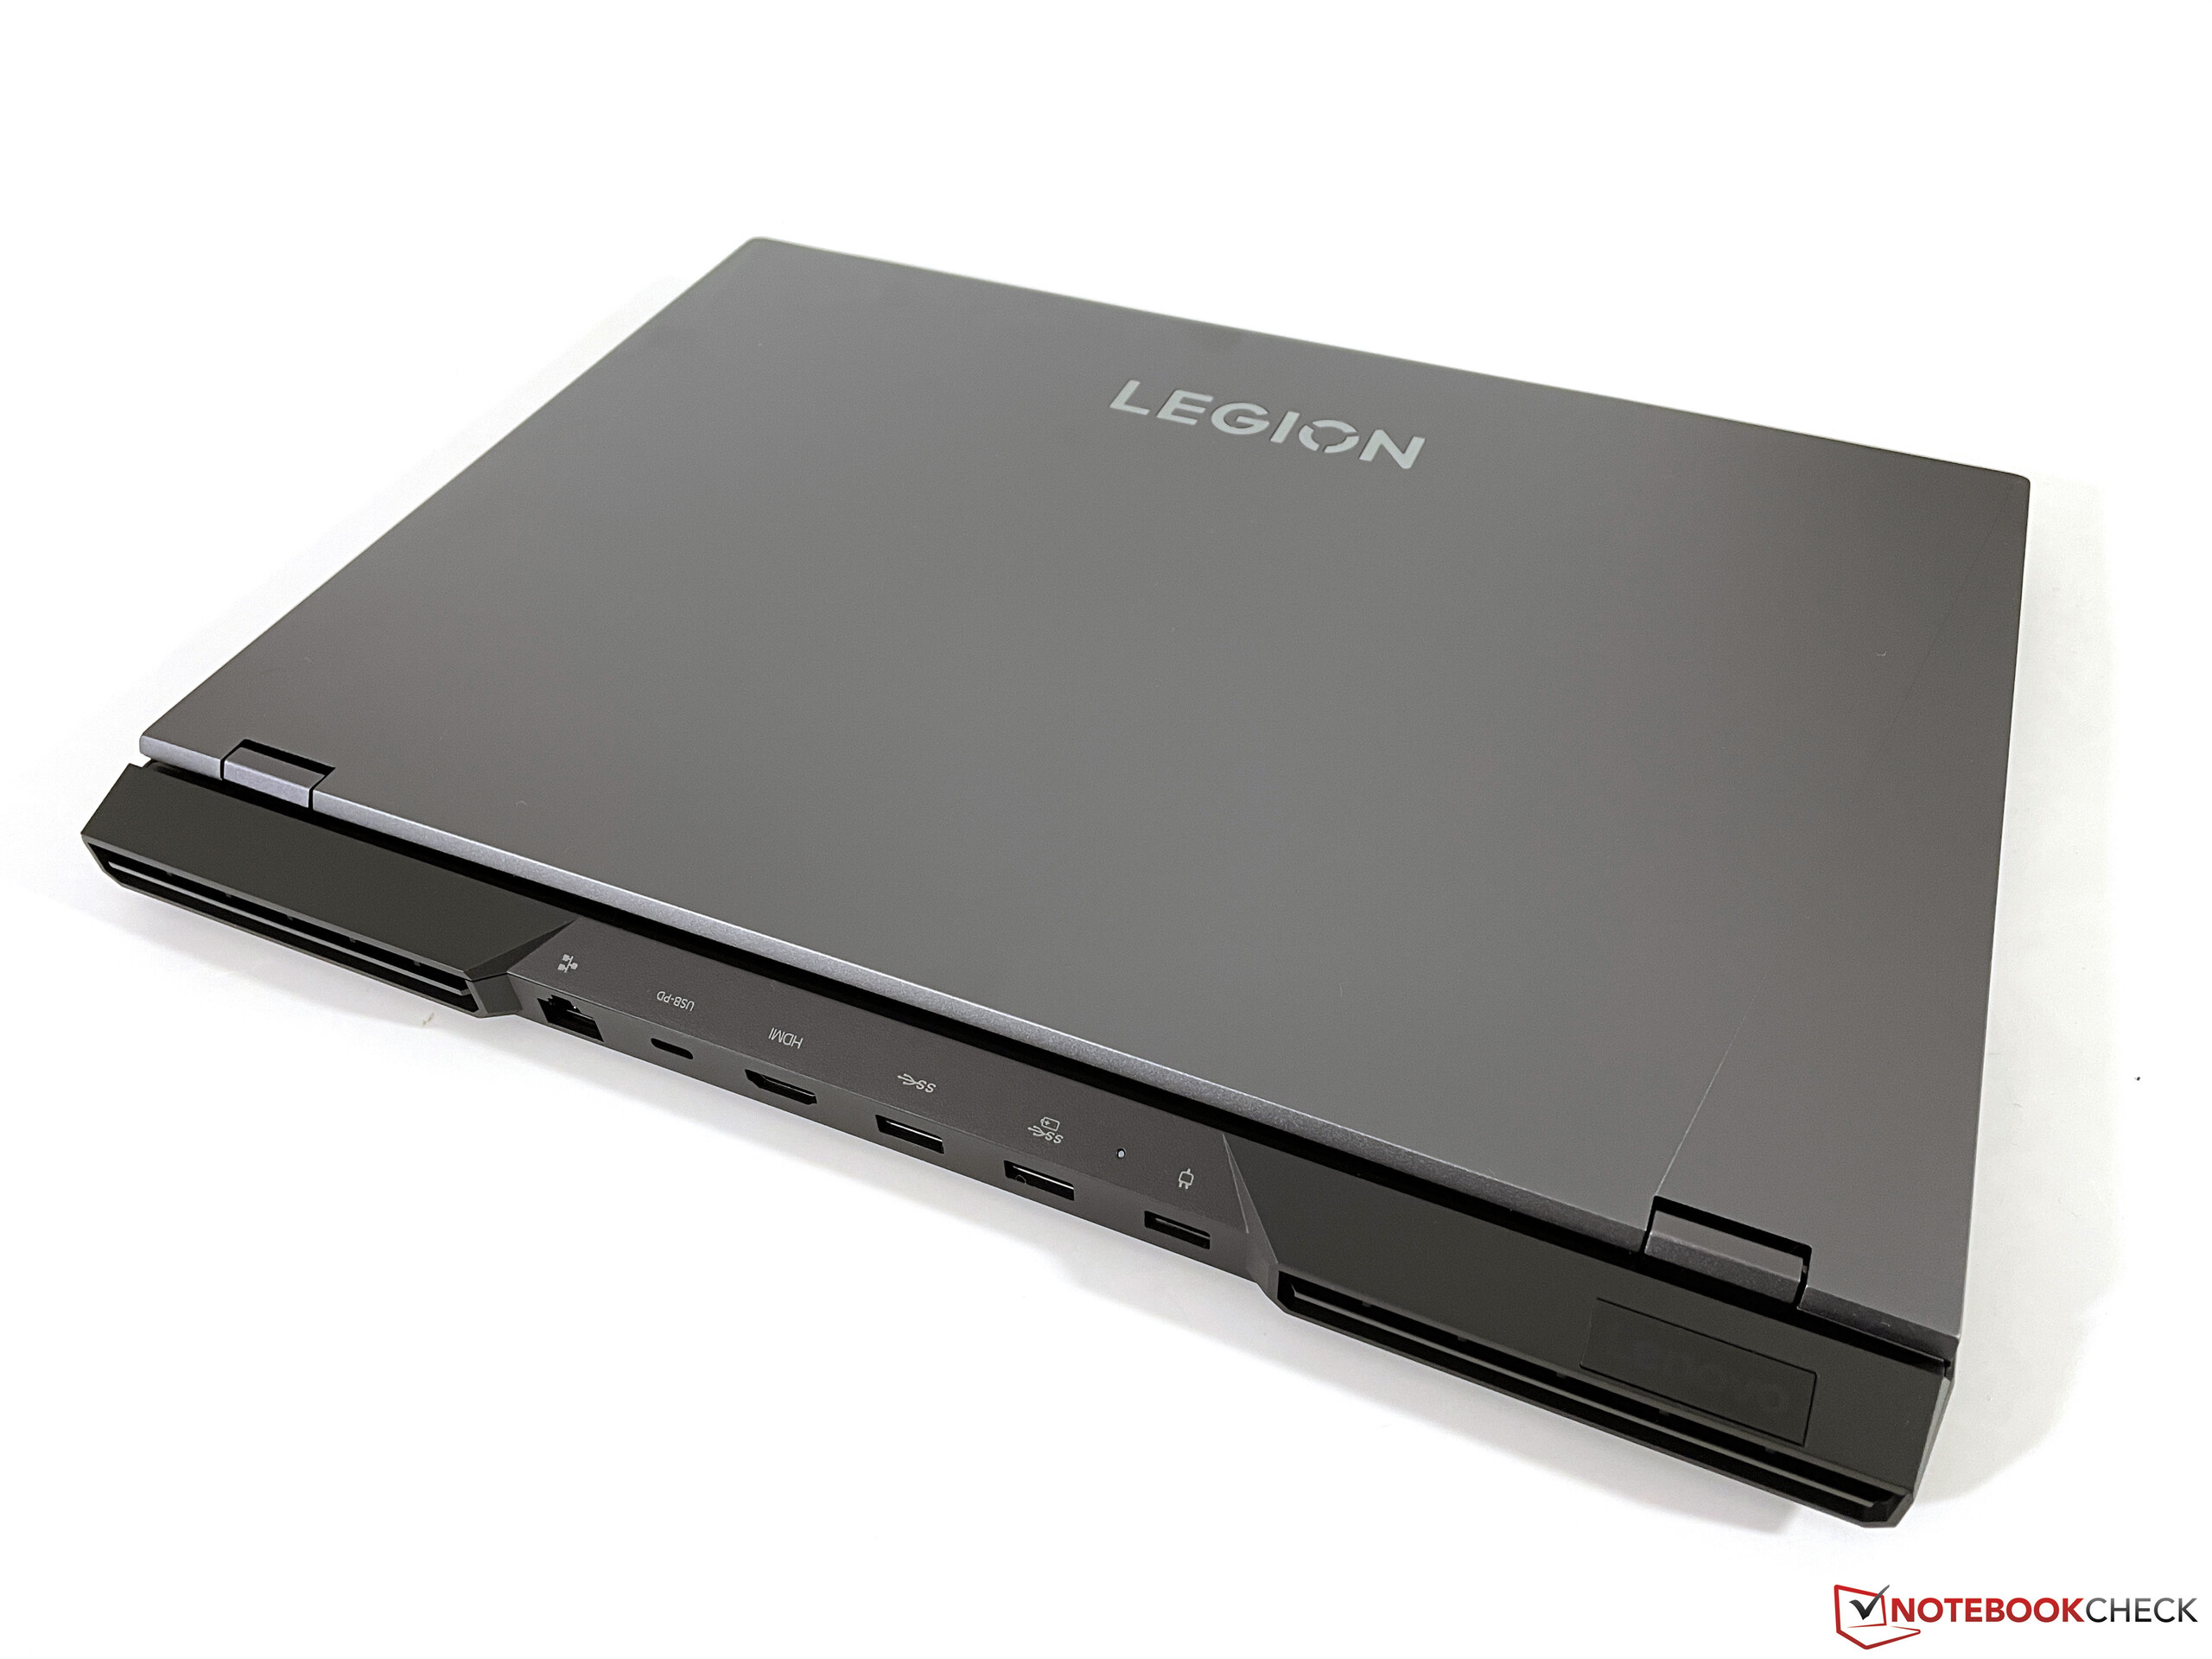
Comparé au Legion 5 Pro 16 avec le CPU AMD Ryzen 7 que nous avons examiné l'année dernière, le châssis est fondamentalement toujours le même, mais le design du couvercle a changé un peu. Au lieu du grand logo illuminé Legion, qui était également imprimé sur le côté du couvercle, il n'y a maintenant qu'un subtil lettrage Legion dans la partie supérieure du couvercle. Le châssis bicolore (gris foncé et gris clair), qui ne comporte aucun élément d'éclairage du châssis, semble donc encore plus sobre qu'auparavant. Les bords sont très fins grâce à l'écran au format 16:10 et le design semble très moderne. La stabilité n'est toujours pas critiquée non plus.
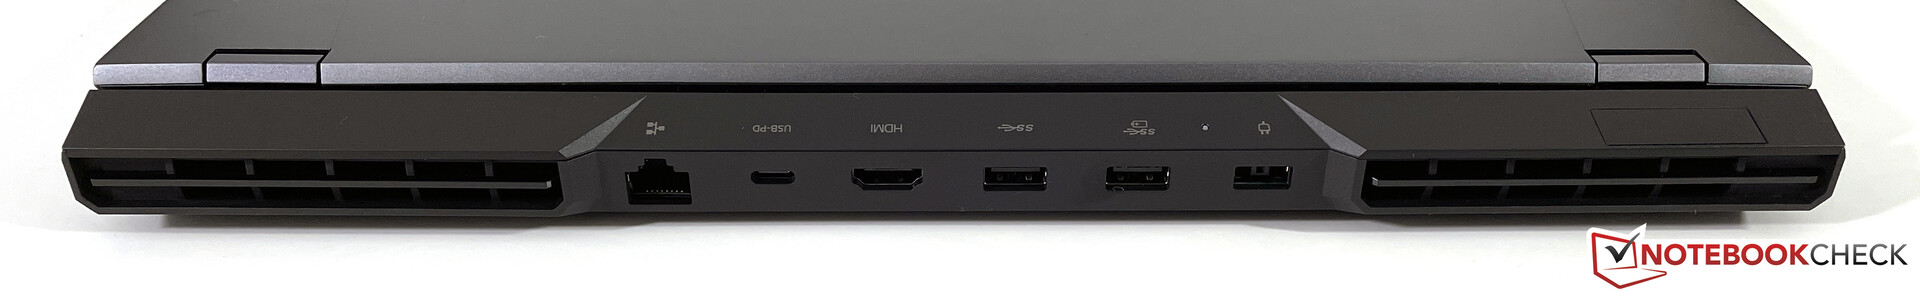
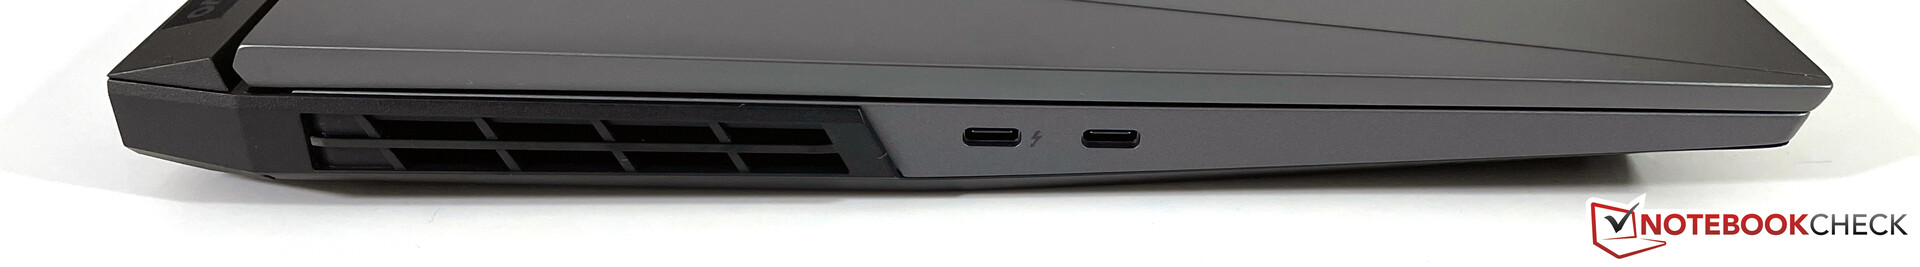
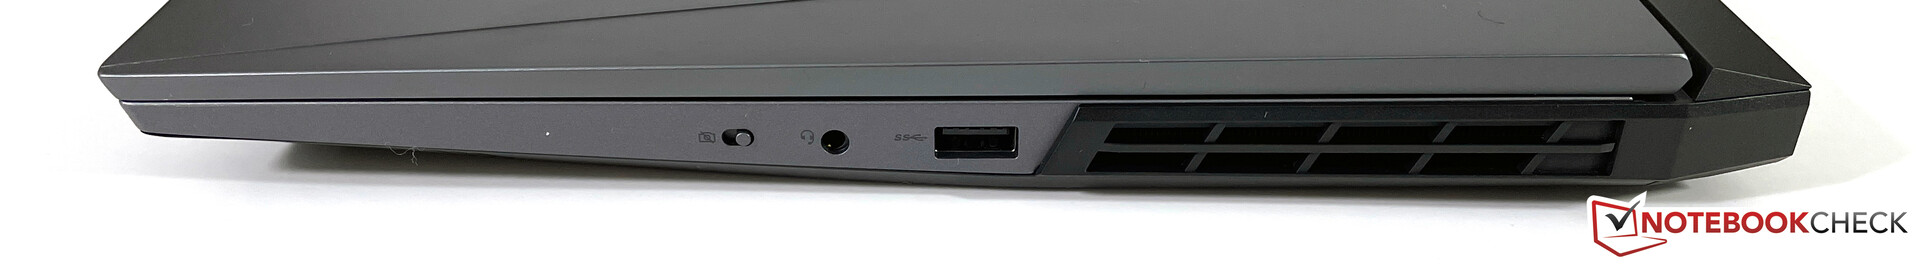
Connectivité - Legion maintenant avec Thunderbolt 4
Les ports, répartis sur les deux côtés ainsi qu'à l'arrière, sont très similaires à ceux du modèle précédent modèle précédent. Notre unité de test Intel offre également la prise en charge de Thunderbolt 4 (40 Gbps) pour le port USB-C situé sur le côté gauche. Grâce aux petites icônes situées en haut du bord arrière, il est très facile de fixer des câbles sans tourner l'ensemble de l'appareil. L'un des ports USB-C prend en charge Power Delivery (jusqu'à 135W), ce qui vous permet de charger le Legion via USB-C si nécessaire. Nous l'avons testé avec un PSU de 65W de Lenovo et cela a fonctionné, mais les performances seront évidemment limitées dans ce cas.
Communication
En plus du port Gigabit-Ethernet pour les réseaux filaires, Lenovo implémente un module Wi-Fi AX201 d'Intel. Il prend en charge la norme Wi-Fi 6 (802.11ax) ainsi que le Bluetooth 5.1, mais pas la dernière norme Wi-Fi 6E (6 GHz). Notre test avec le routeur de référence Netgear Nighthawk AX12 détermine d'excellents taux de transfert et nous n'avons pas rencontré d'autres problèmes avec la qualité du signal, non plus.
Webcam
La webcam utilise toujours un capteur 720p et la qualité d'image n'est pas très bonne, même dans de bonnes conditions d'éclairage. Il n'y a pas d'obturateur mécanique, mais un E-Shutter avec un bouton sur le côté droit.


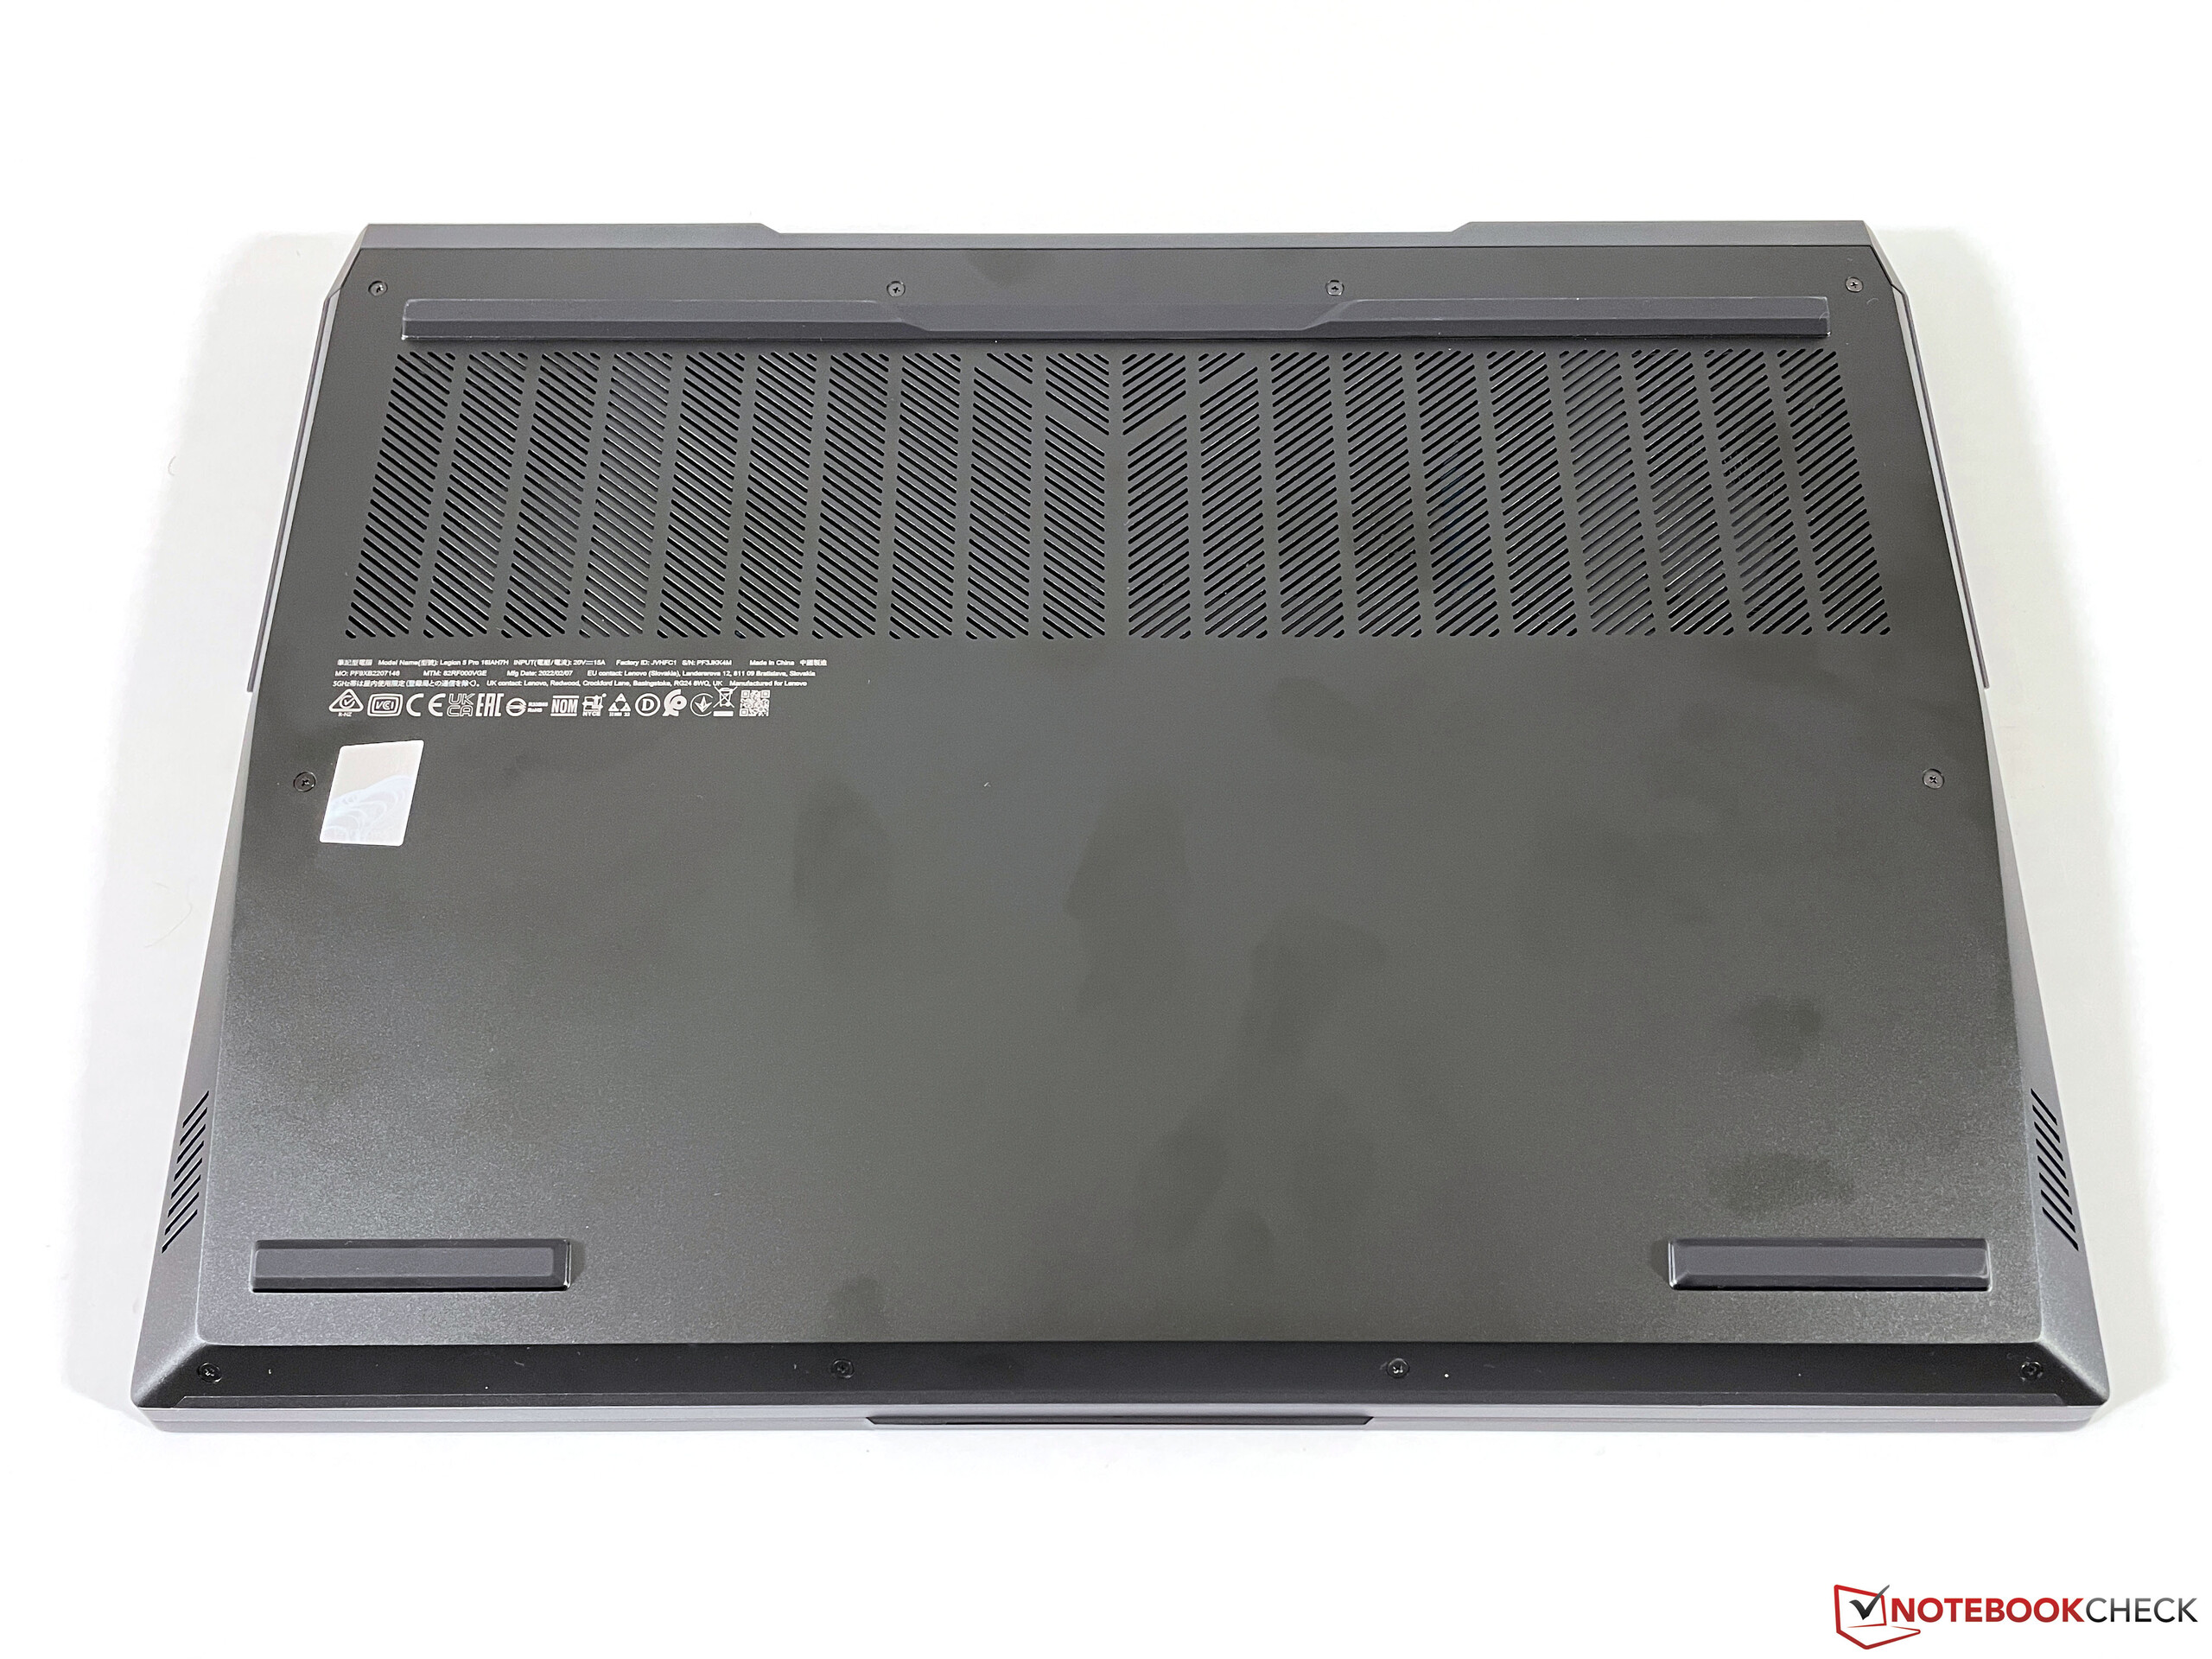
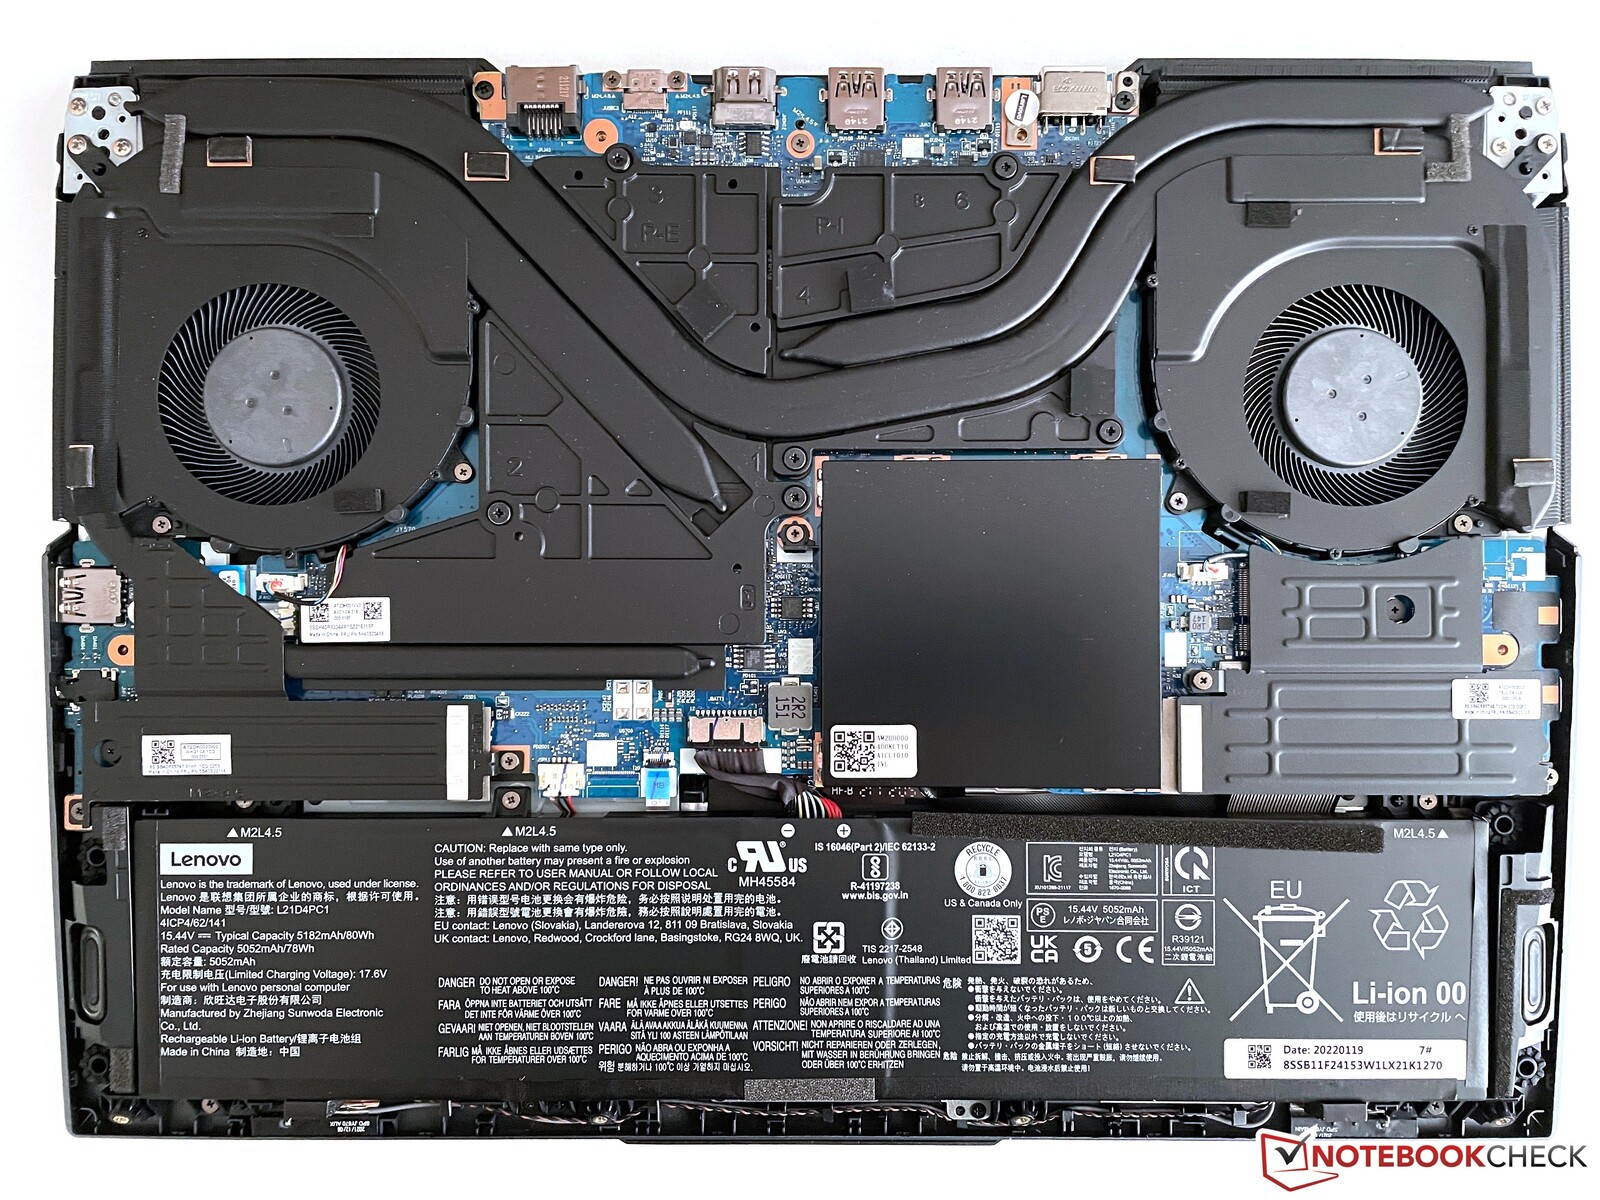
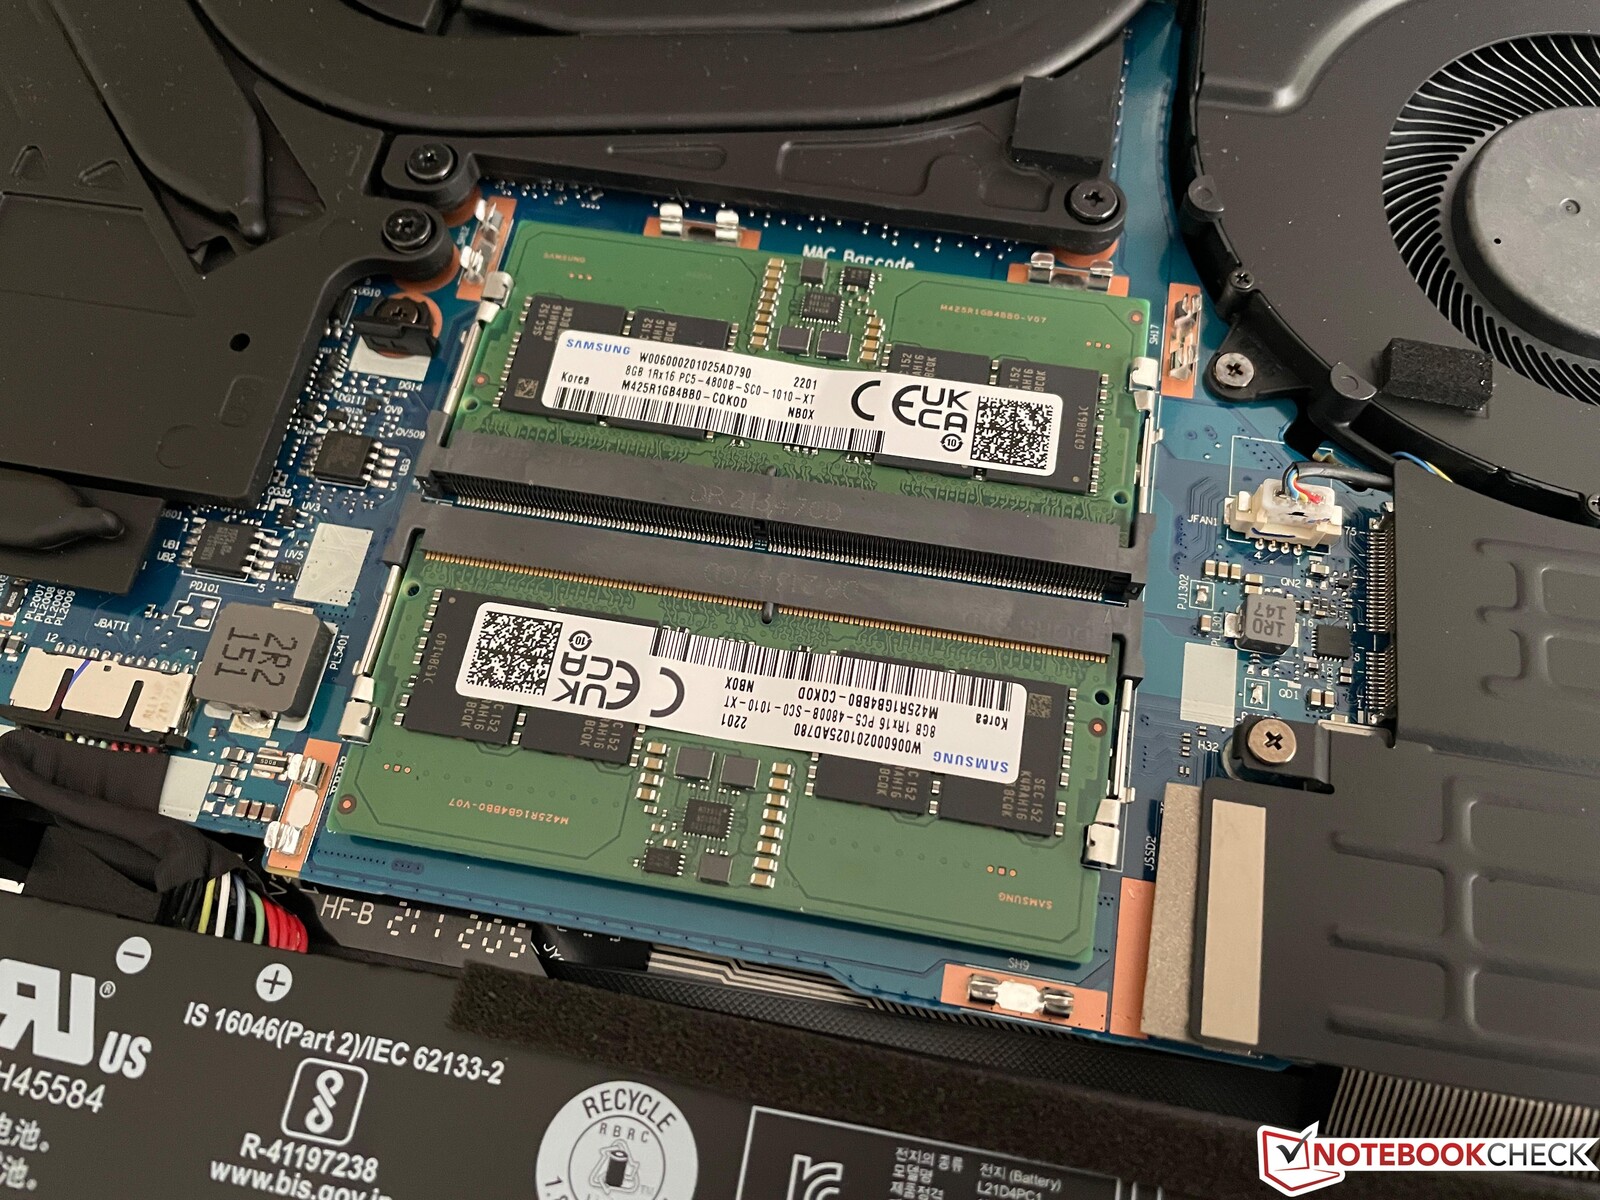
Maintenance
Vous pouvez retirer toute la partie inférieure de l'unité de base, qui est fixée par 10 vis Philips. Il y a des couvercles supplémentaires (certains avec des vis supplémentaires) pour les deux emplacements de RAM, les deux emplacements M.2 ainsi que le module Wi-Fi. Vous pouvez également nettoyer les ventilateurs.
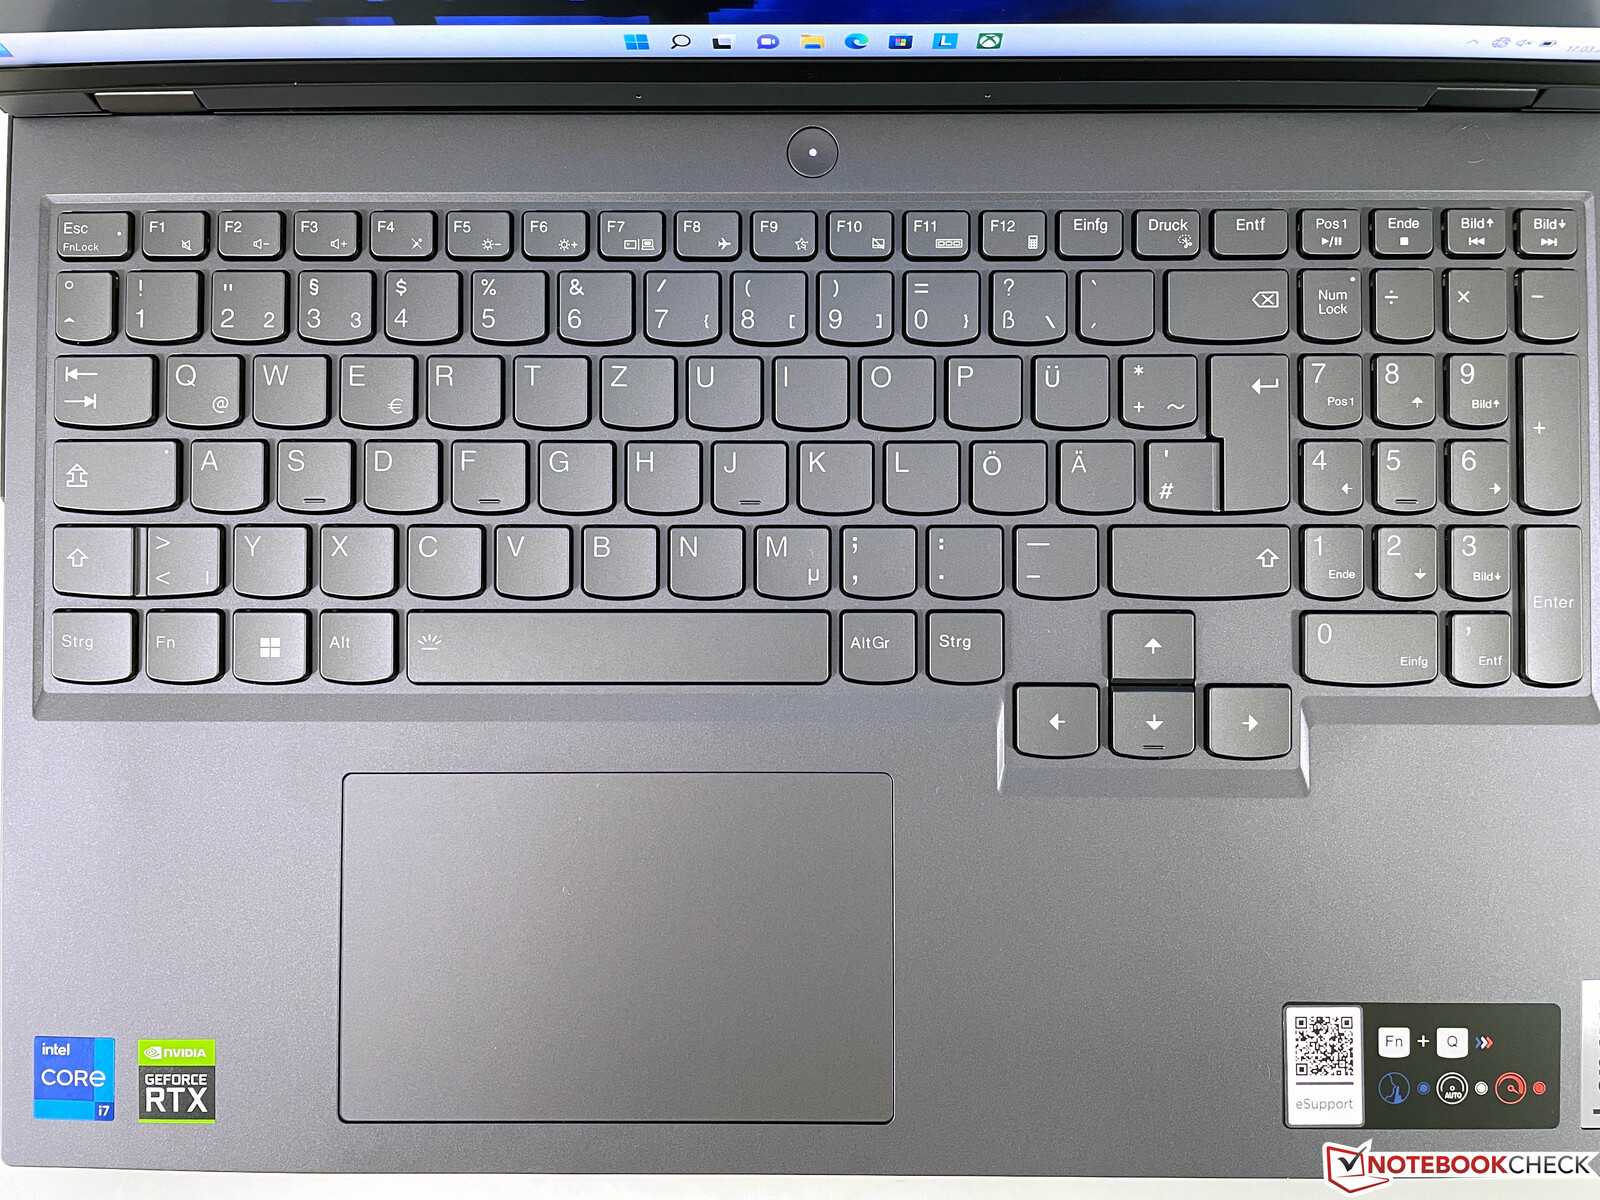
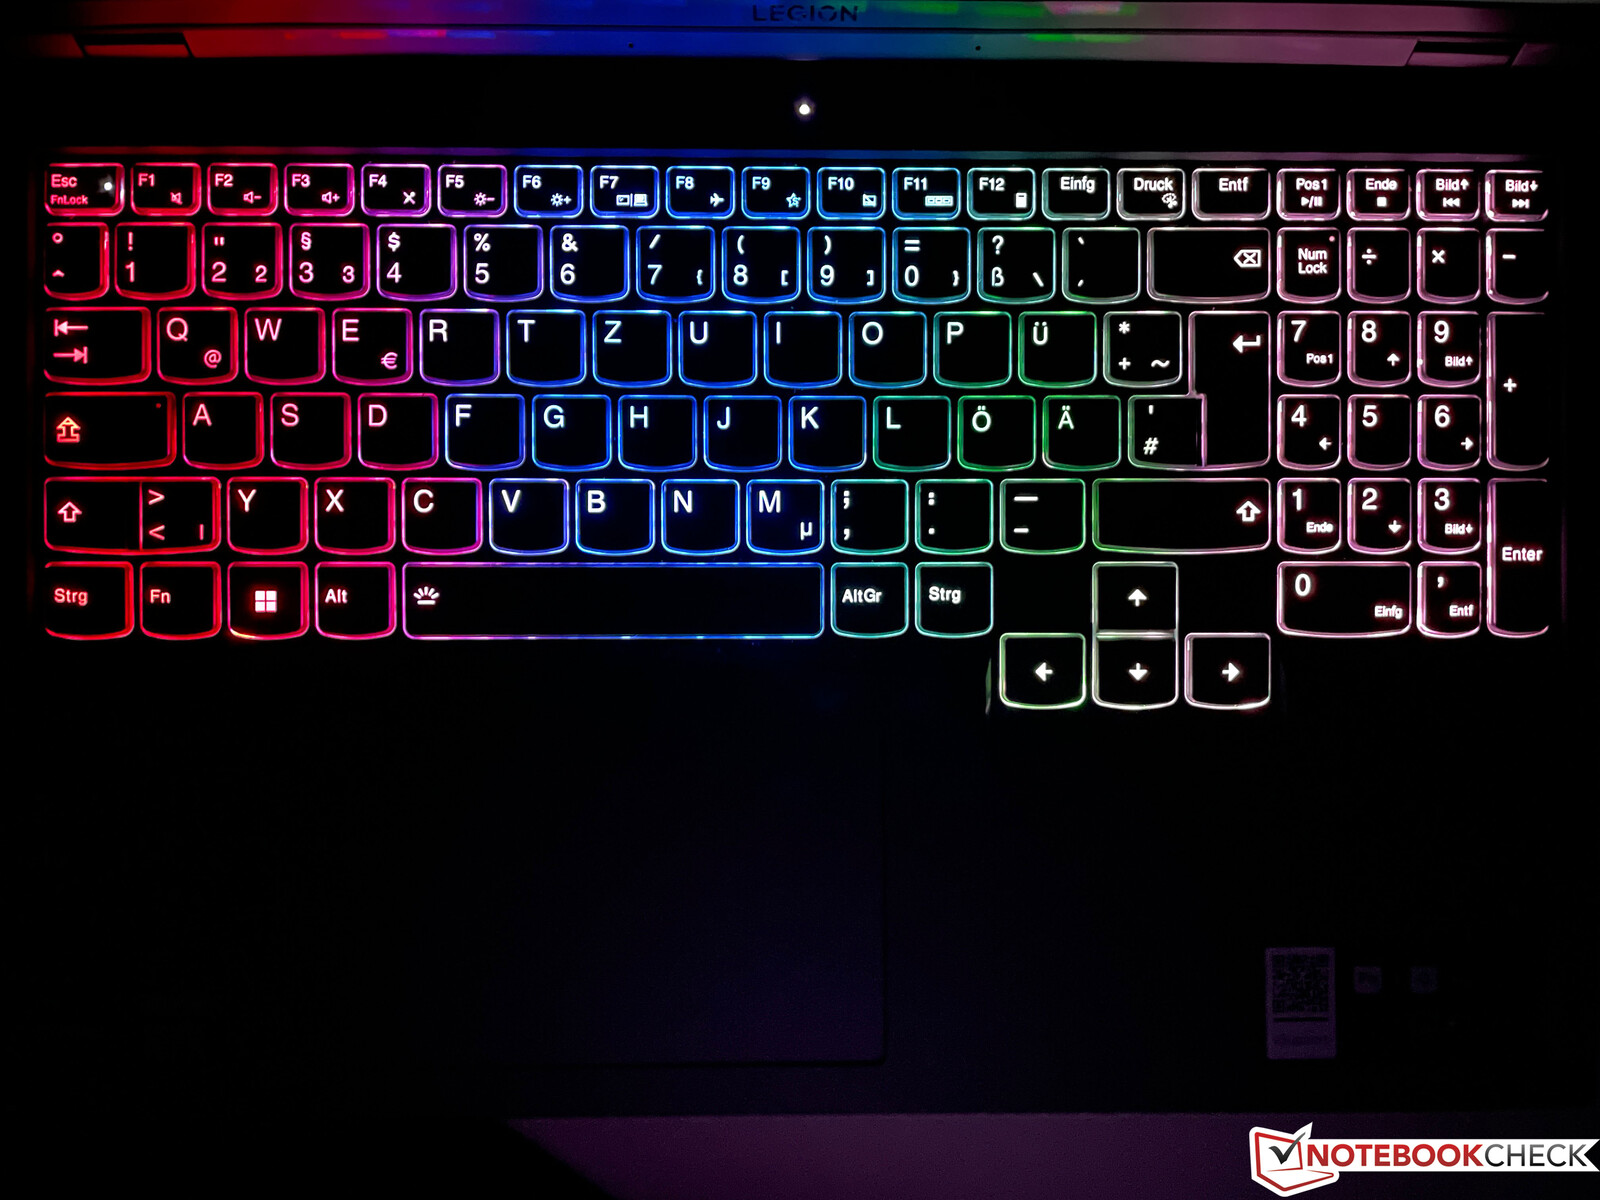
Périphériques d'entrée - Lenovo utilise avec un bon clavier
Le clavier offre toujours une course généreuse de 1,5 mm et une expérience de frappe très confortable, de sorte que vous pouvez facilement utiliser le Legion pour des textes plus longs. Les touches fléchées sont larges et légèrement isolées et il y a également un pavé numérique dédié, même si les touches sont un peu plus étroites. L'unité que nous avons testée est dotée d'un éclairage à 4 zones et vous pouvez configurer trois profils différents (un éclairage uniforme est également possible).
Le grand pavé tactile fonctionne bien dans les situations de tous les jours et les gestes avec jusqu'à quatre doigts sont très bien exécutés, mais le bruit des clics est assez fort. La plupart des joueurs utiliseront probablement une souris externe de toute façon, donc cela ne devrait pas être un gros problème.
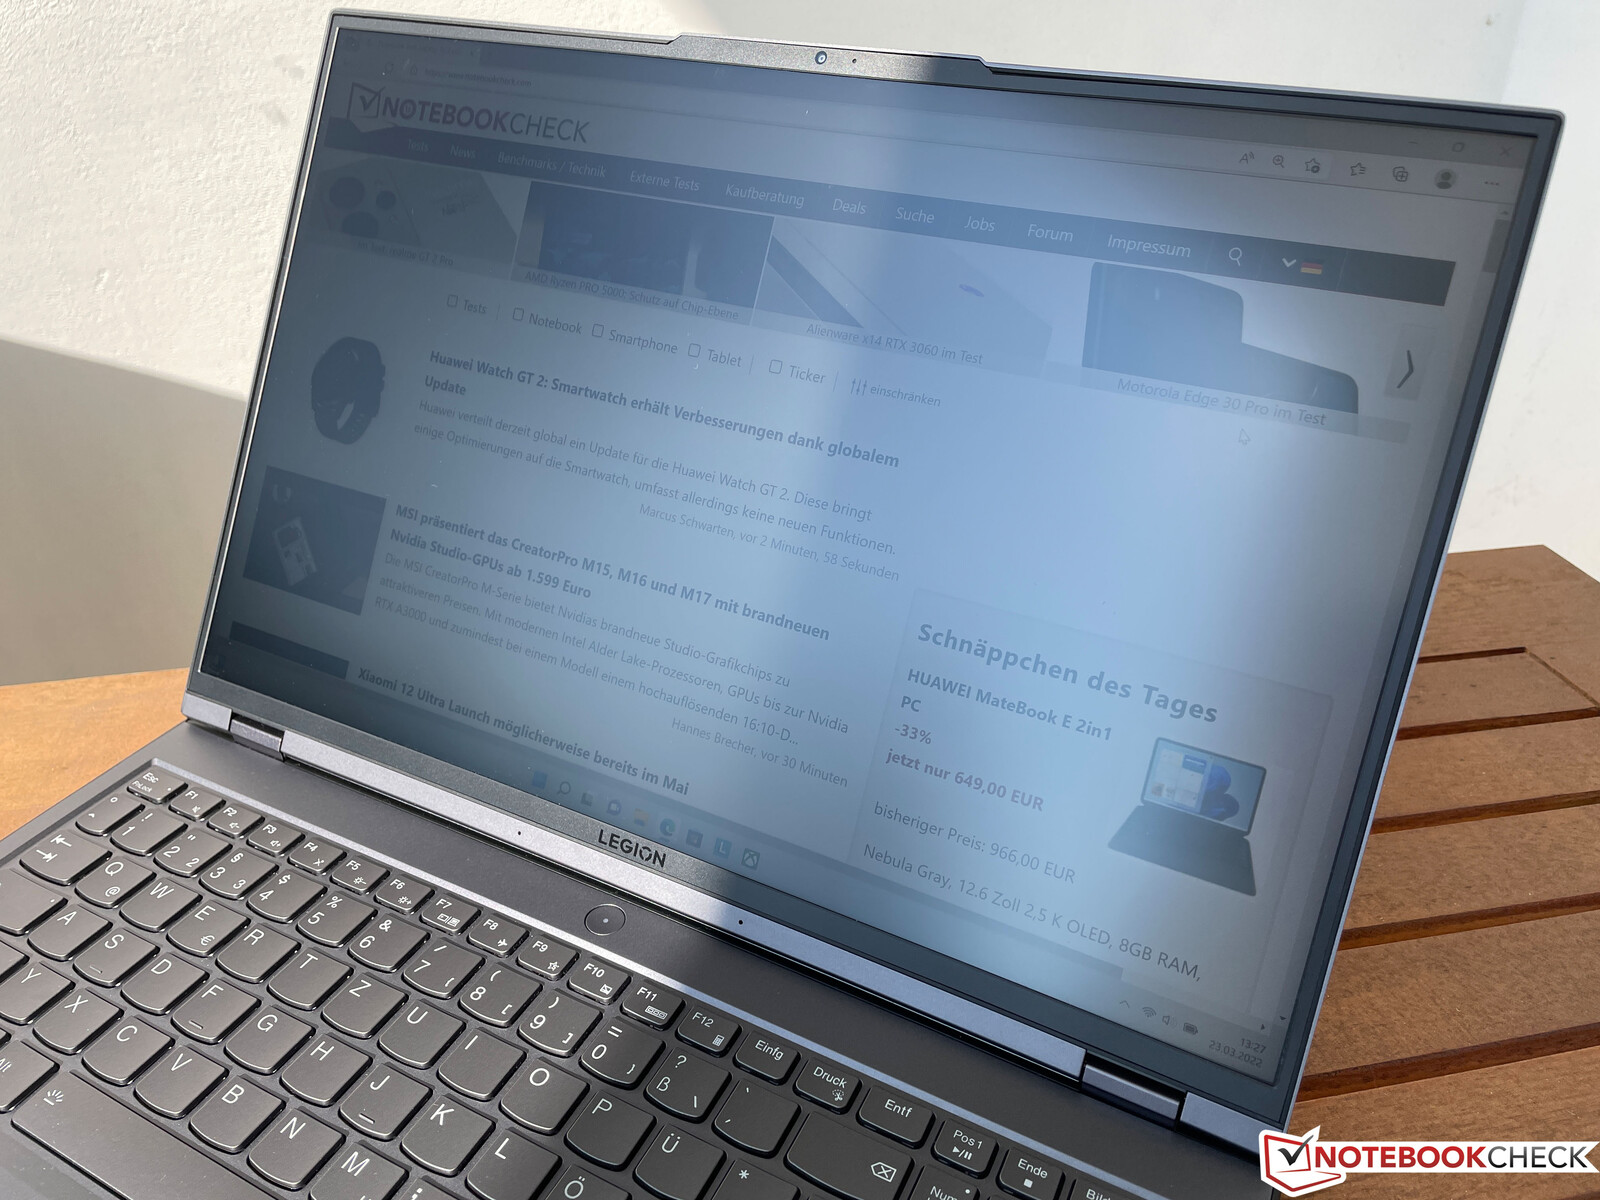
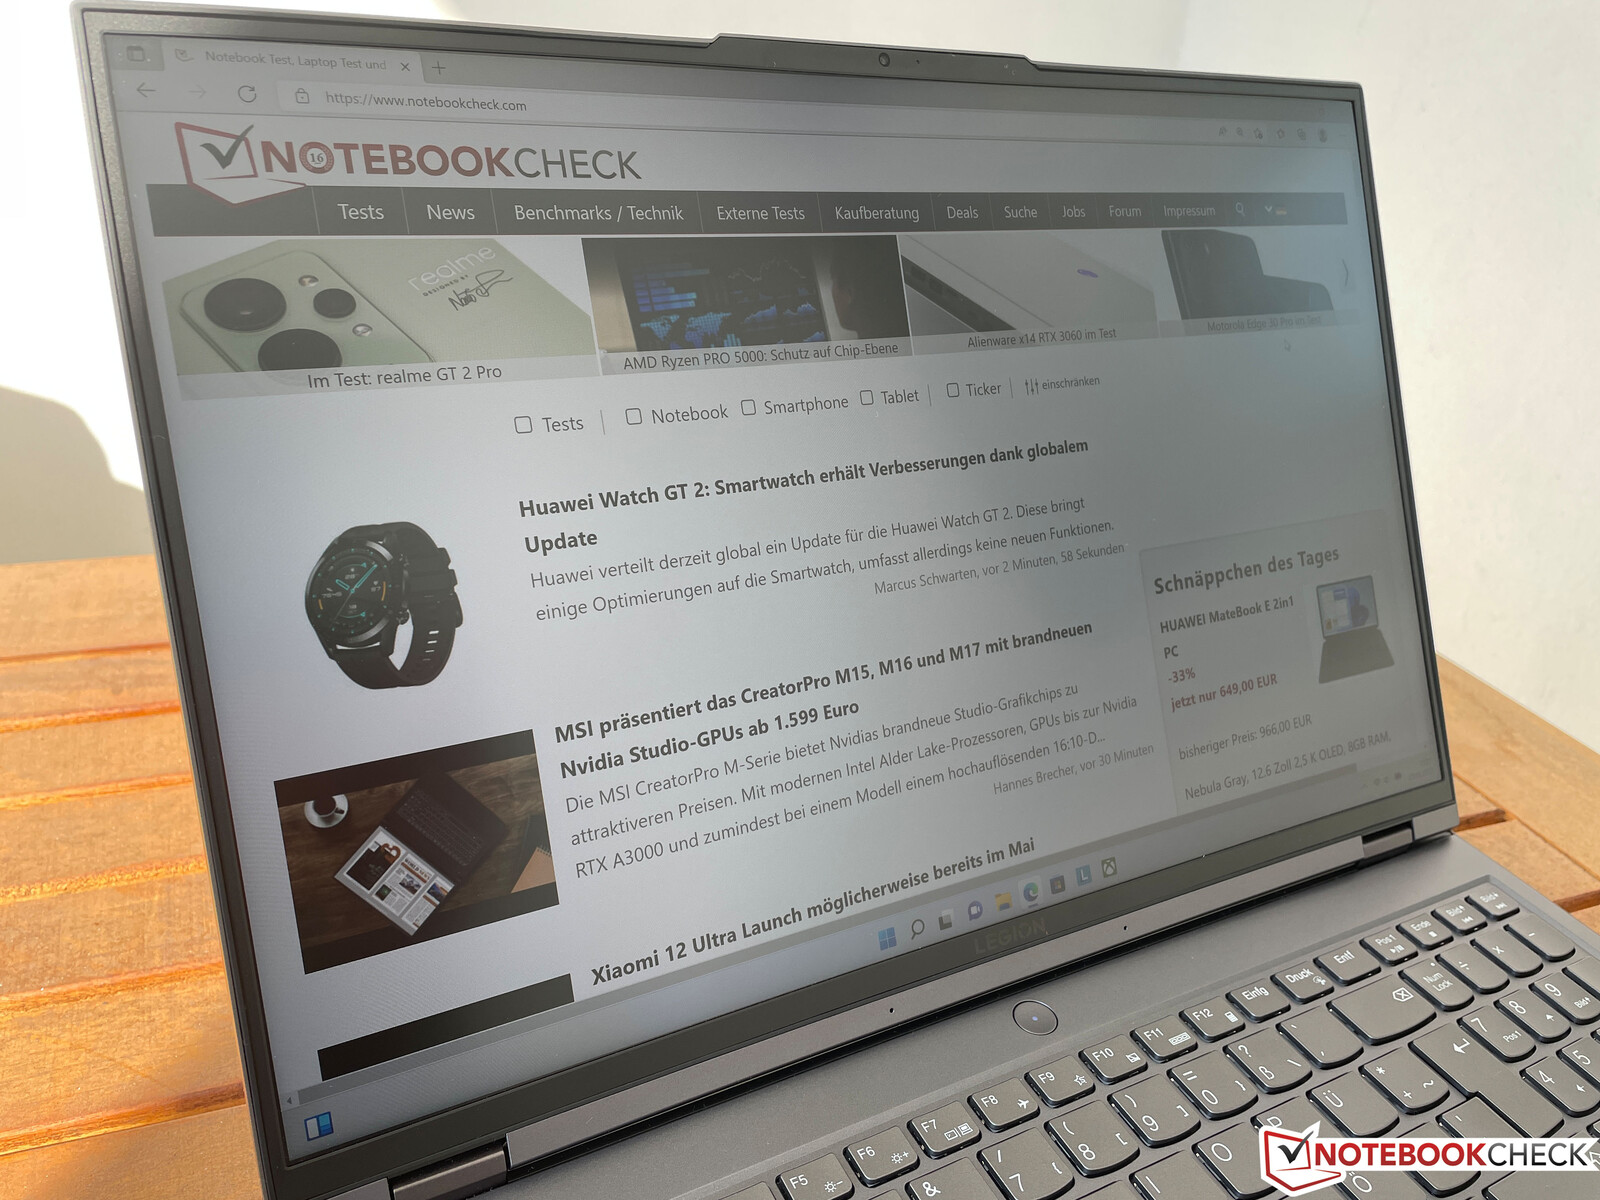
Écran - Panneau 165 Hz avec résolution WQHD et G-Sync

Les caractéristiques de base de l'écran de 16 pouces sont similaires à celles de notre unité de test précédente2560 x 1600 pixels, 16:10, IPS, HDR 400, et un taux de rafraîchissement élevé de 165 Hz. Grâce à Advanced Optimus, le système prend désormais en charge les graphiques commutables et G-Sync en même temps. Notre appareil utilise toutefois une dalle d'un autre fournisseur (BOE). L'impression subjective de l'image reste excellente avec des couleurs nettes, un bon contraste, et l'image ne semble pas granuleuse malgré la surface mate. La fréquence de rafraîchissement élevée permet d'obtenir des images plus fluides et vous pouvez clairement en voir l'effet lorsque vous faites défiler des sites Web ou des documents.
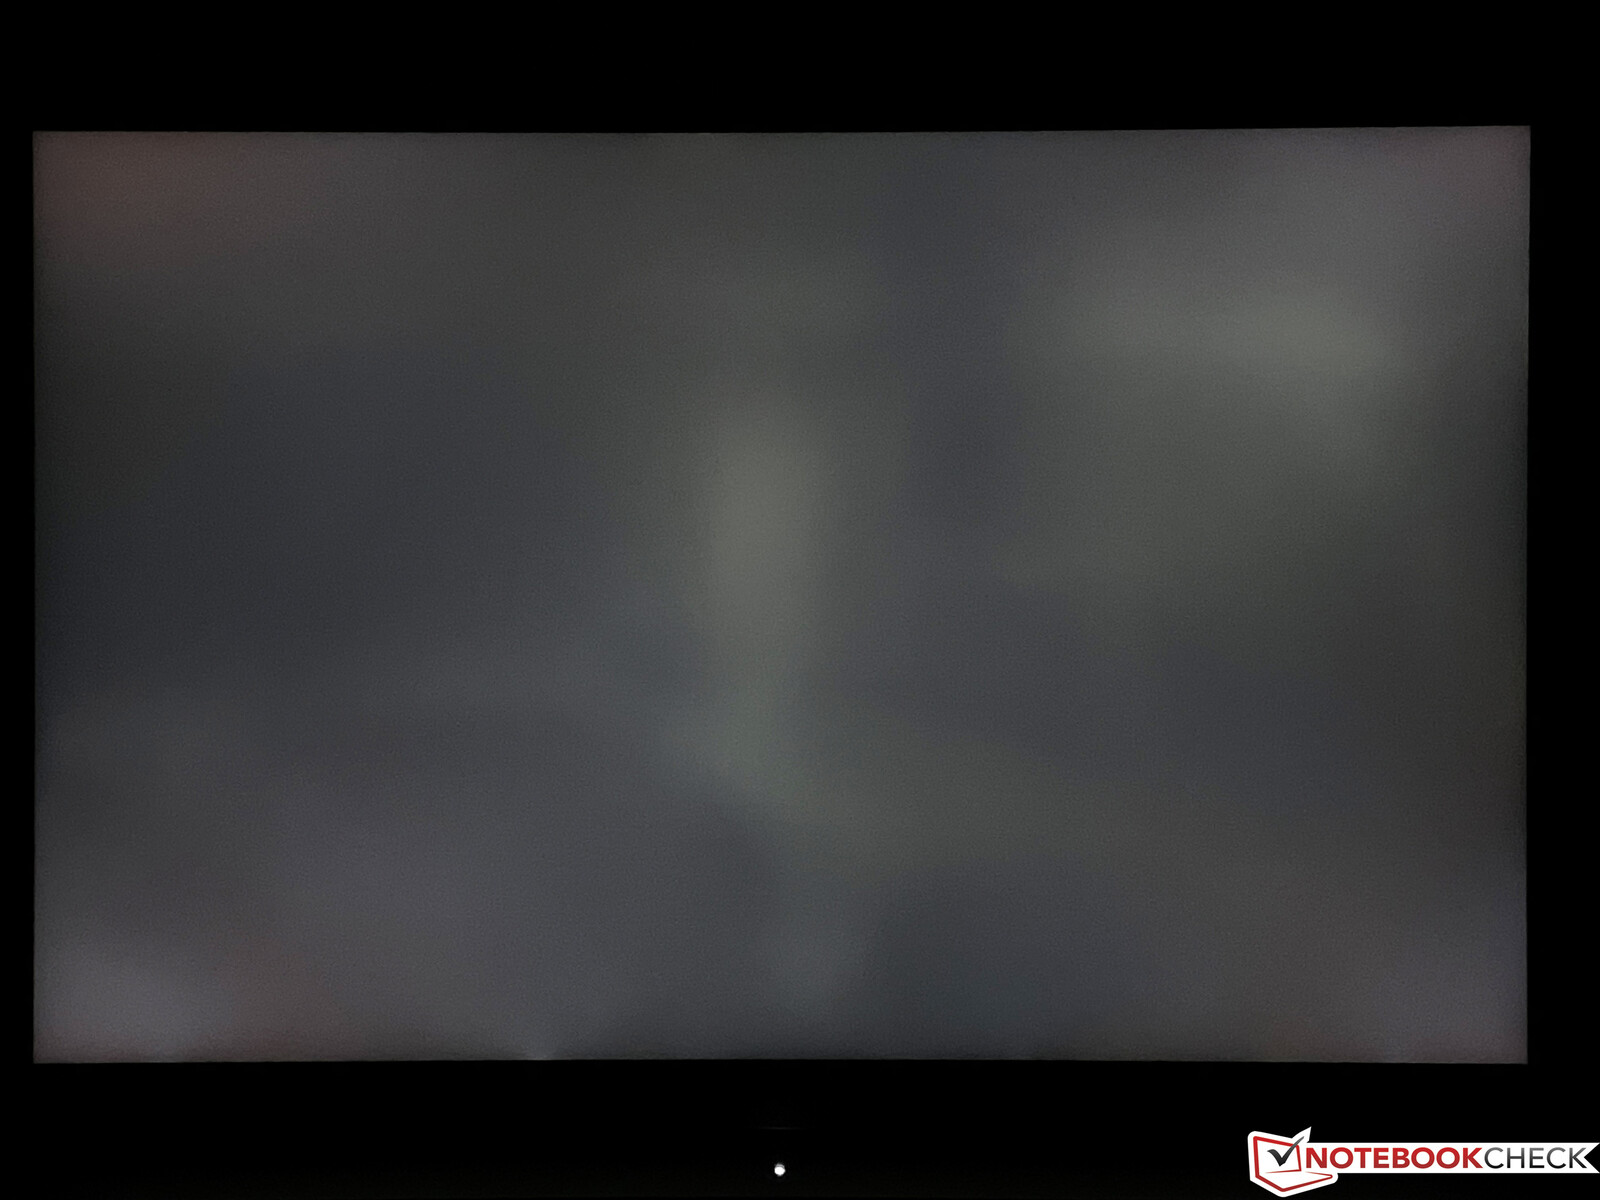
La luminosité moyenne est légèrement inférieure à 500 nits, mais la valeur du noir est meilleure par rapport à notre premier appareil de test, ce qui se traduit par un bon rapport de contraste de plus de 1300:1. Les temps de réponse sont rapides et nous n'avons pas non plus détecté de scintillement PWM. Il y a un saignement visible du rétroéclairage sur les fonds sombres et les niveaux de luminosité élevés, mais ils ne sont heureusement pas visibles en pratique.
| |||||||||||||||||||||||||
Homogénéité de la luminosité: 91 %
Valeur mesurée au centre, sur batterie: 503 cd/m²
Contraste: 1357:1 (Valeurs des noirs: 0.37 cd/m²)
ΔE ColorChecker Calman: 2.7 | ∀{0.5-29.43 Ø4.73}
calibrated: 1.4
ΔE Greyscale Calman: 2.7 | ∀{0.09-98 Ø4.97}
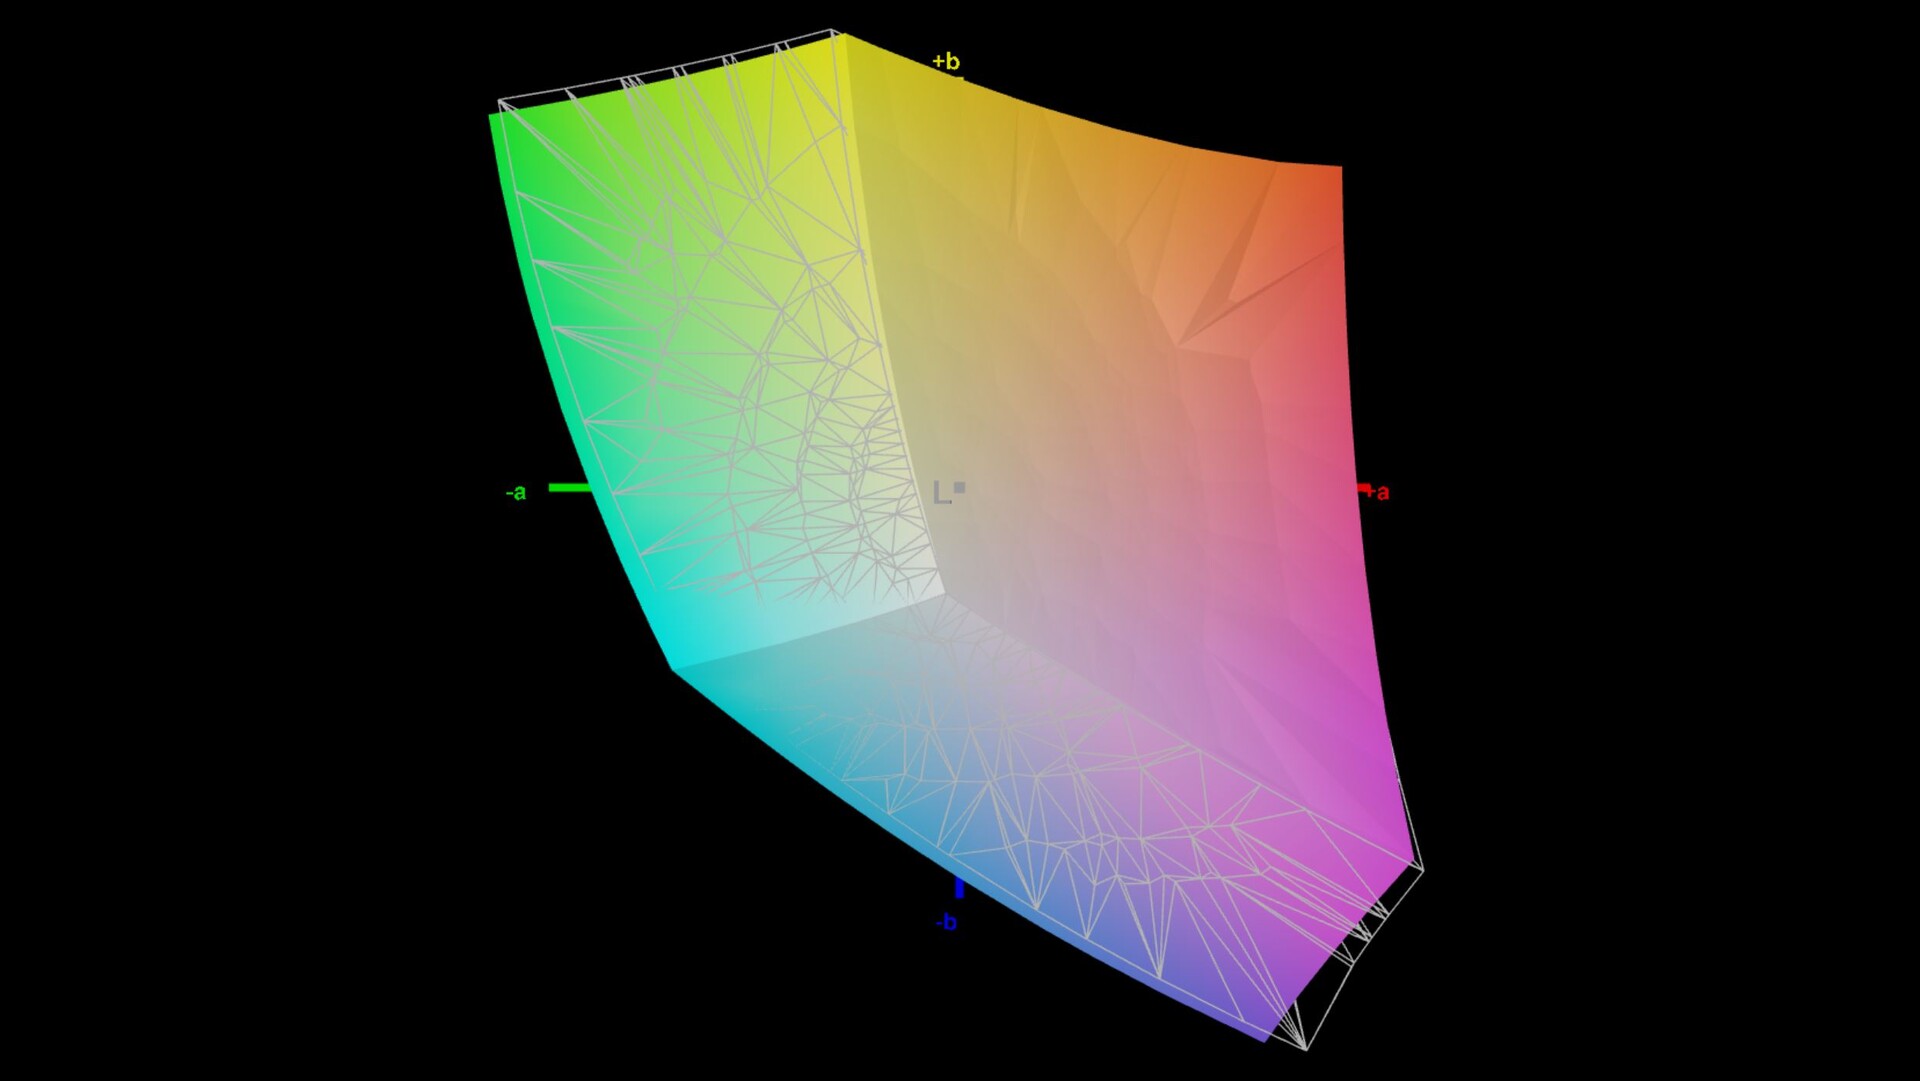
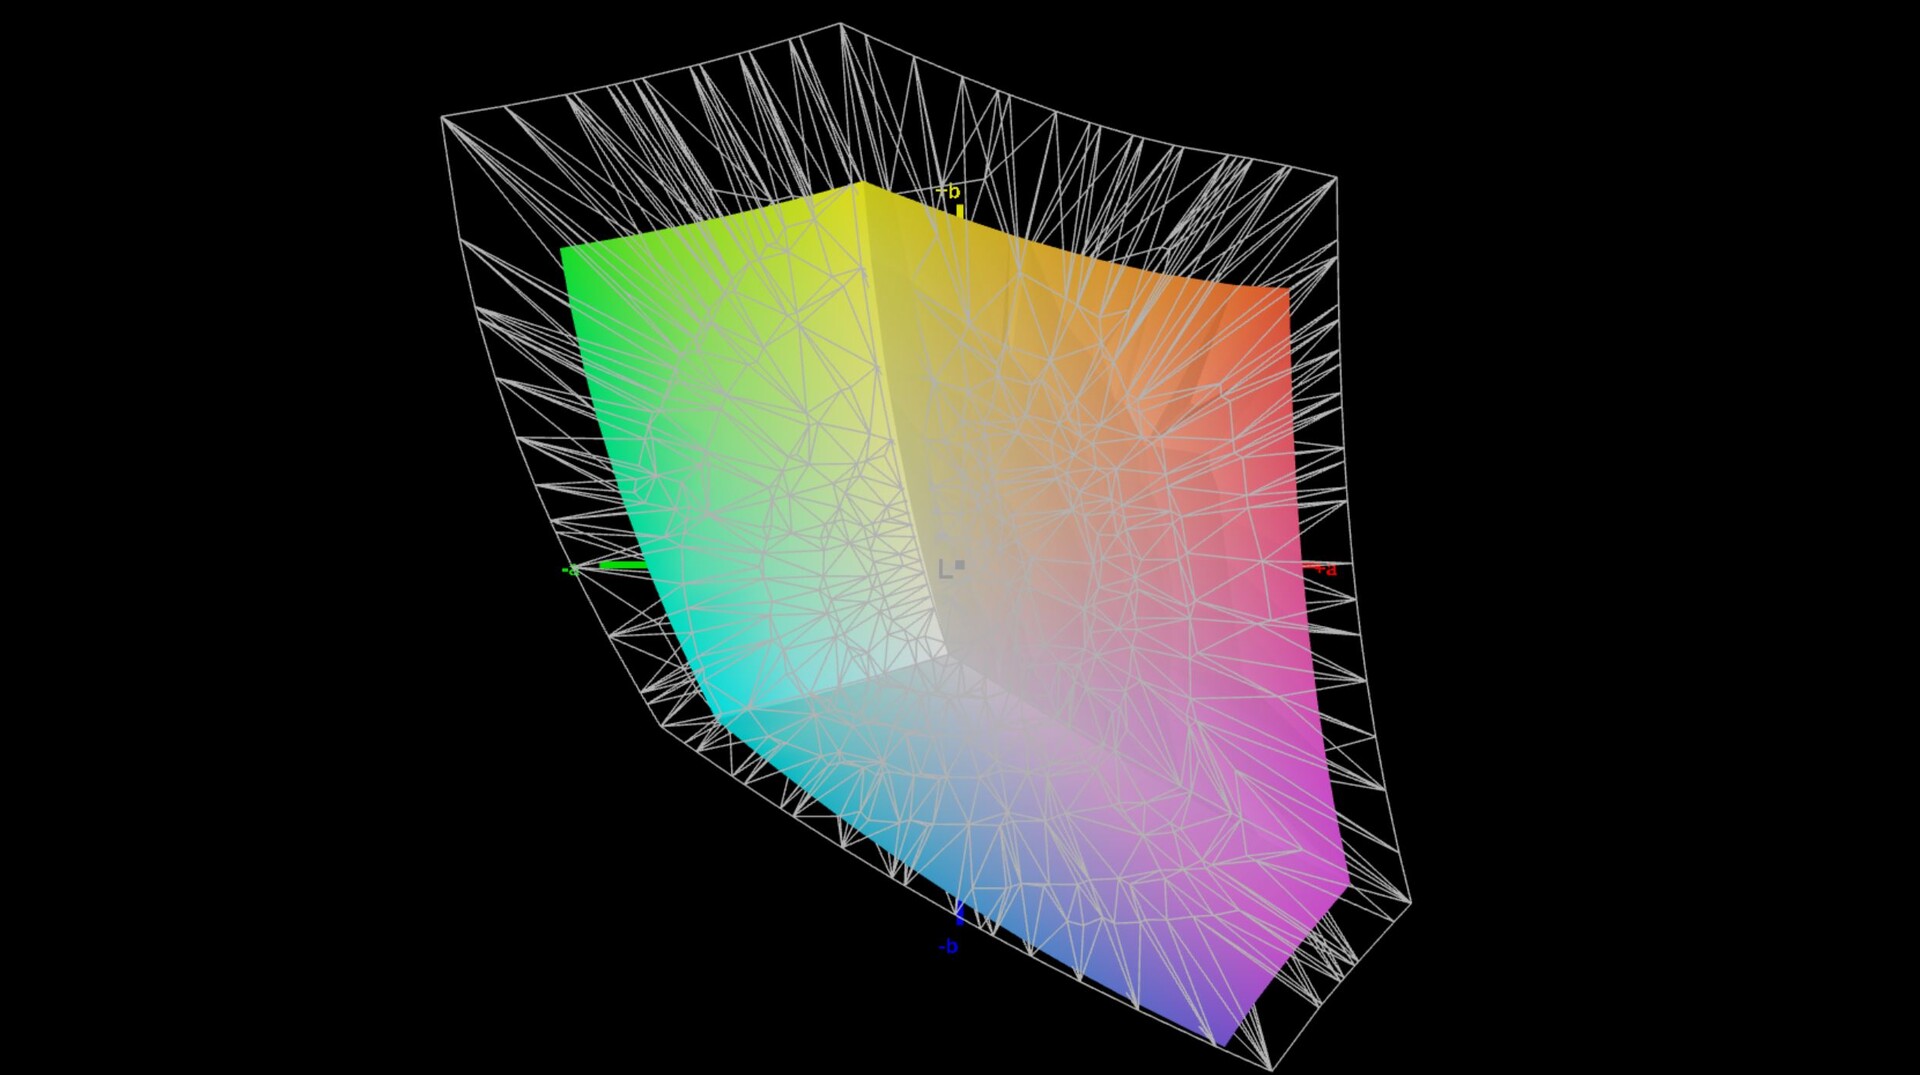
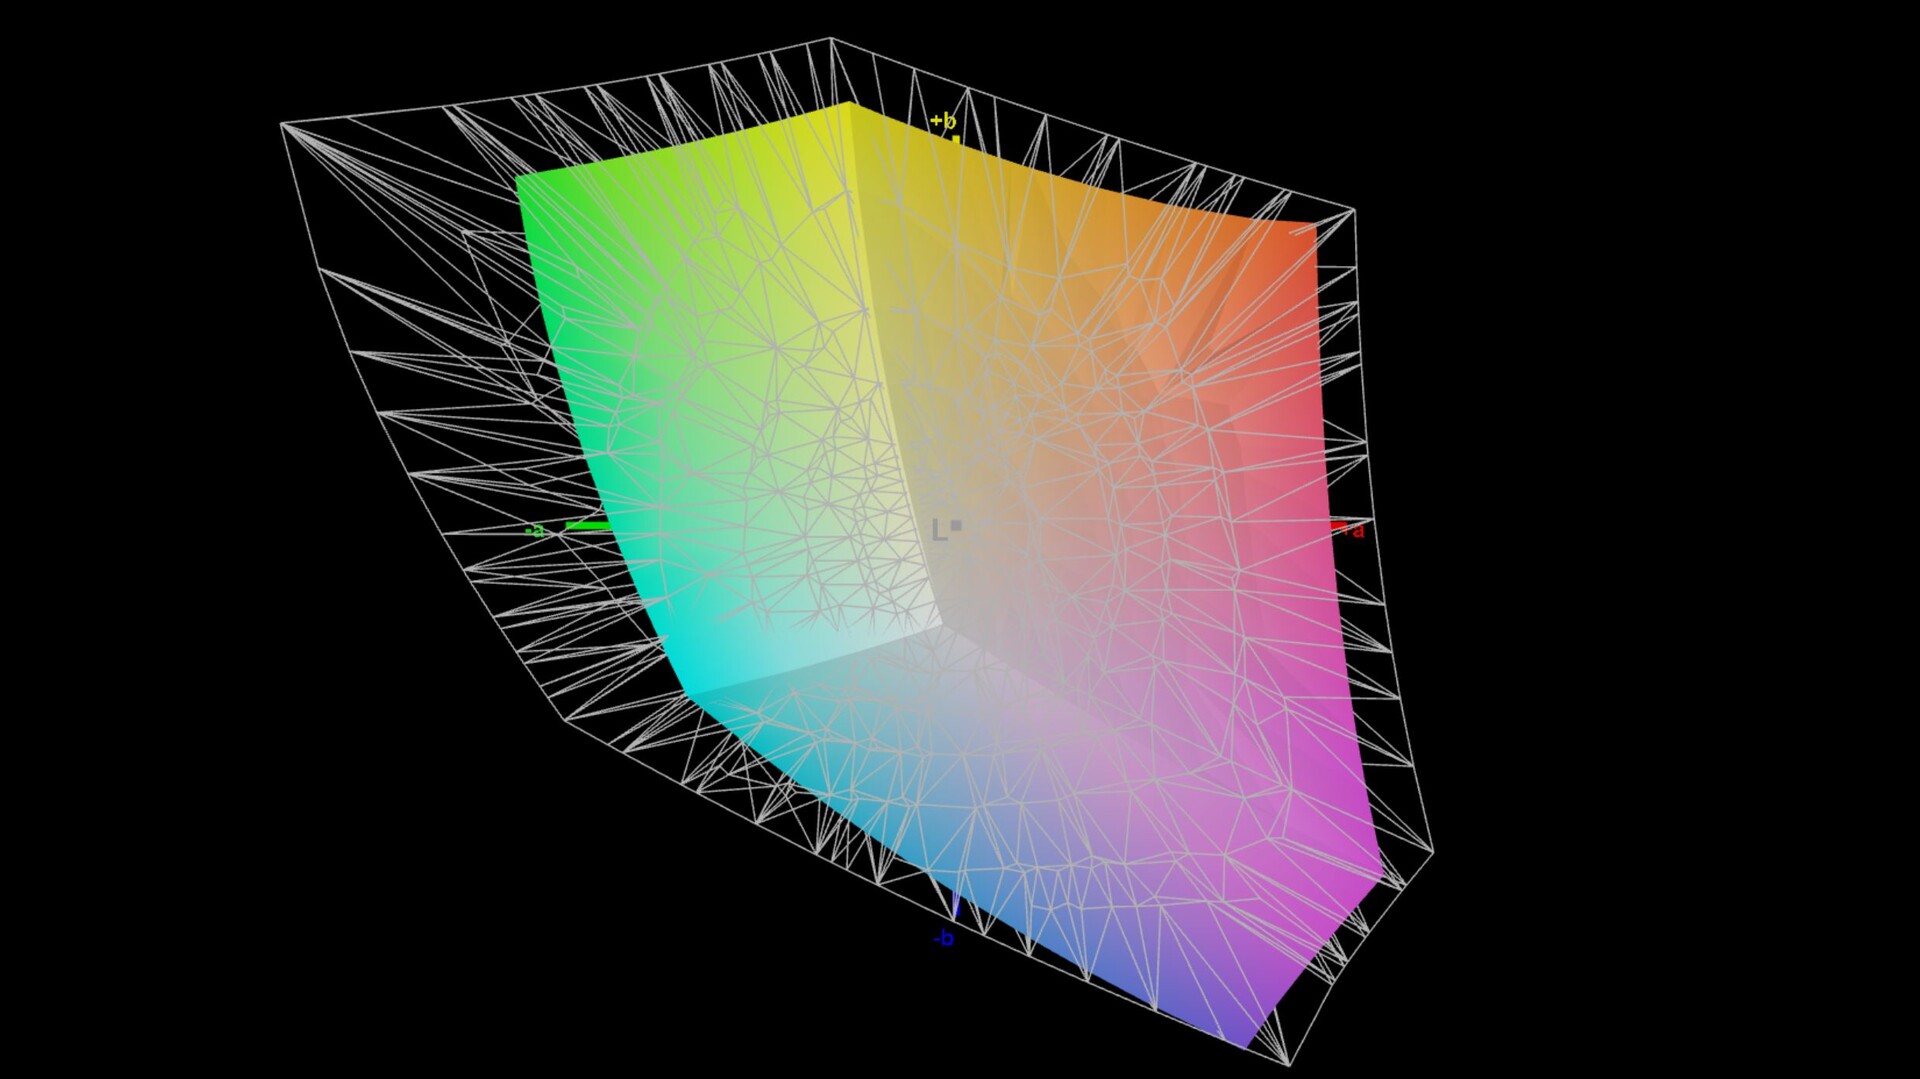
70.9% AdobeRGB 1998 (Argyll 3D)
97.6% sRGB (Argyll 3D)
68.7% Display P3 (Argyll 3D)
Gamma: 2.44
CCT: 6326 K
| Lenovo Legion 5 Pro 16 G7 i7 RTX 3070Ti NE160QDM-NY1, IPS, 2560x1600, 16" | MSI Vector GP66 12UGS BOE NE156FHM-NZ3, IPS, 1920x1080, 15.6" | HP Omen 16-b0085ng BOE09BE, IPS, 1920x1080, 16.1" | Acer Nitro 5 AN515-45-R1JH BOE BOE09B8, IPS, 2560x1440, 15.6" | Asus TUF Gaming A15 FA506QR-AZ061T Sharp SHP1532, IPS, 1920x1080, 15.6" | Lenovo Legion 5 Pro 16ACH6H (82JQ001PGE) CSOT T3 MNG007DA1-1, IPS, 2560x1600, 16" | |
|---|---|---|---|---|---|---|
| Display | 2% | 4% | -3% | 2% | ||
| Display P3 Coverage (%) | 68.7 | 70.1 2% | 72.3 5% | 66.2 -4% | ||
| sRGB Coverage (%) | 97.6 | 99.5 2% | 99.5 2% | 96.3 -1% | 99 1% | |
| AdobeRGB 1998 Coverage (%) | 70.9 | 72.1 2% | 73.8 4% | 67.1 -5% | 73 3% | |
| Response Times | 21% | -4% | 8% | 14% | 43% | |
| Response Time Grey 50% / Grey 80% * (ms) | 17.6 ? | 5.8 ? 67% | 8 ? 55% | 14 ? 20% | 12 ? 32% | 9.2 ? 48% |
| Response Time Black / White * (ms) | 7.6 ? | 9.6 ? -26% | 12.4 ? -63% | 8 ? -5% | 8 ? -5% | 4.8 37% |
| PWM Frequency (Hz) | 1250 ? | |||||
| Screen | -13% | -47% | -49% | 5% | 4% | |
| Brightness middle (cd/m²) | 502 | 353.1 -30% | 405 -19% | 349 -30% | 297 -41% | 551 10% |
| Brightness (cd/m²) | 491 | 325 -34% | 378 -23% | 304 -38% | 268 -45% | 523 7% |
| Brightness Distribution (%) | 91 | 85 -7% | 87 -4% | 79 -13% | 84 -8% | 88 -3% |
| Black Level * (cd/m²) | 0.37 | 0.38 -3% | 0.34 8% | 0.535 -45% | 0.22 41% | 0.54 -46% |
| Contrast (:1) | 1357 | 929 -32% | 1191 -12% | 652 -52% | 1350 -1% | 1020 -25% |
| Colorchecker dE 2000 * | 2.7 | 2.24 17% | 3.7 -37% | 3.11 -15% | 1.36 50% | 1.8 33% |
| Colorchecker dE 2000 max. * | 4.5 | 5 -11% | 7.77 -73% | 9.57 -113% | 3.82 15% | 2.53 44% |
| Colorchecker dE 2000 calibrated * | 1.4 | 1.02 27% | 3.49 -149% | 1.66 -19% | ||
| Greyscale dE 2000 * | 2.7 | 4 -48% | 5.88 -118% | 5 -85% | 1.88 30% | 1.85 31% |
| Gamma | 2.44 90% | 2.24 98% | 2.57 86% | 2.36 93% | 2.48 89% | 2.3 96% |
| CCT | 6326 103% | 6864 95% | 6342 102% | 6976 93% | 6768 96% | 6338 103% |
| Color Space (Percent of AdobeRGB 1998) (%) | 73.76 | 63 | 72.81 | |||
| Color Space (Percent of sRGB) (%) | 99.47 | 99 | 99.41 | |||
| Moyenne finale (programmes/paramètres) | 3% /
-5% | -16% /
-30% | -15% /
-30% | 10% /
7% | 16% /
9% |
* ... Moindre est la valeur, meilleures sont les performances

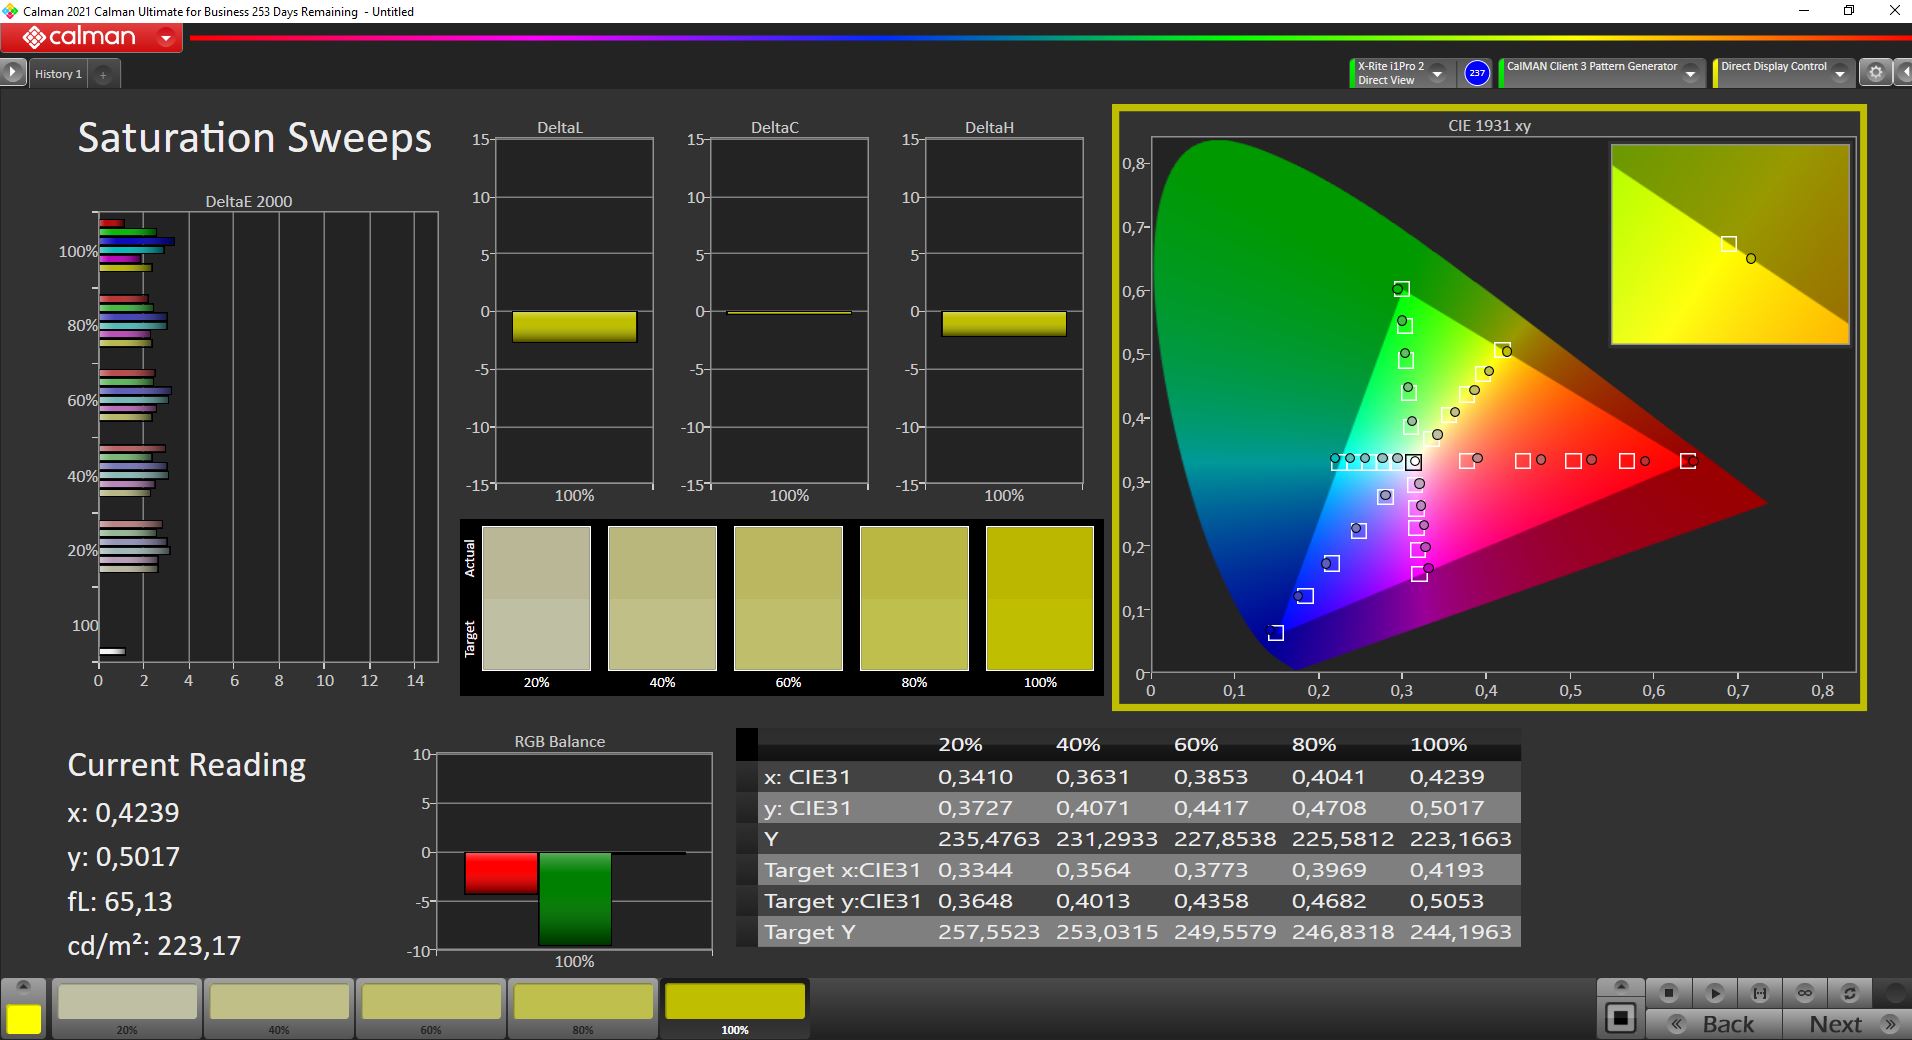
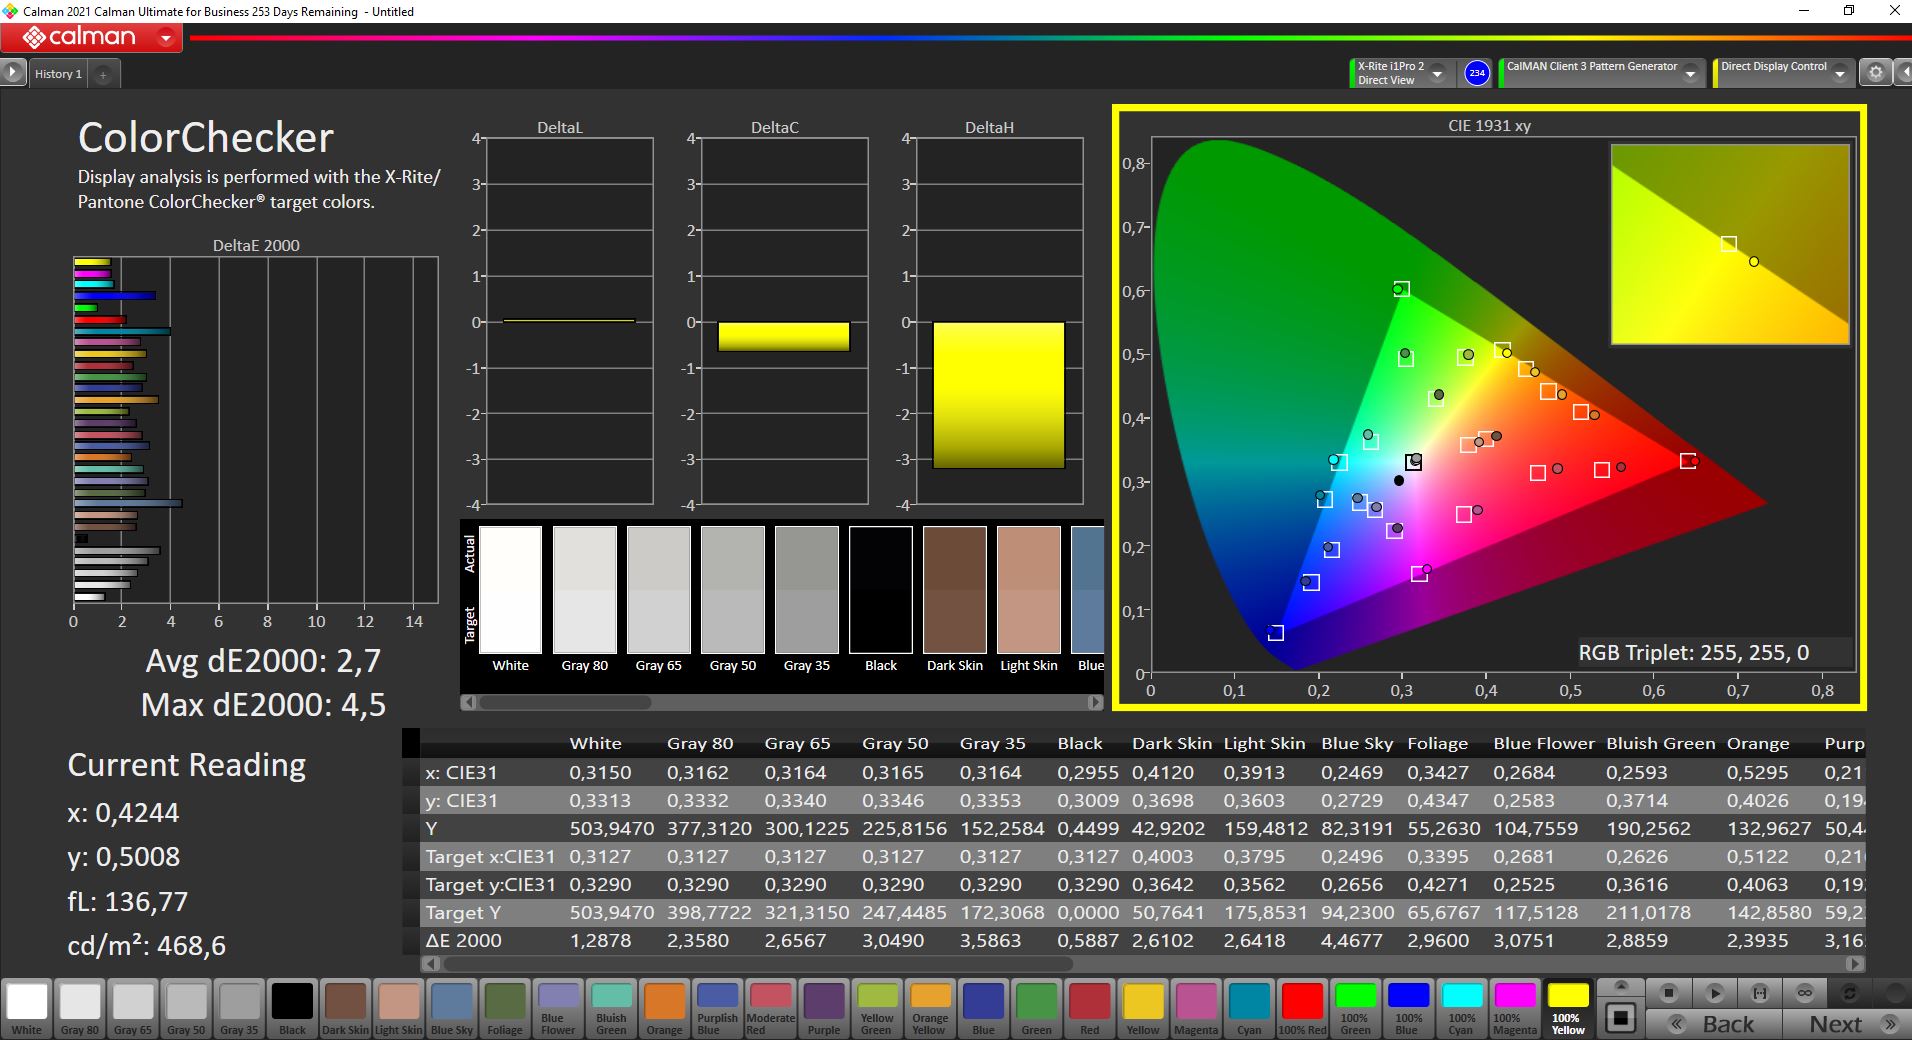
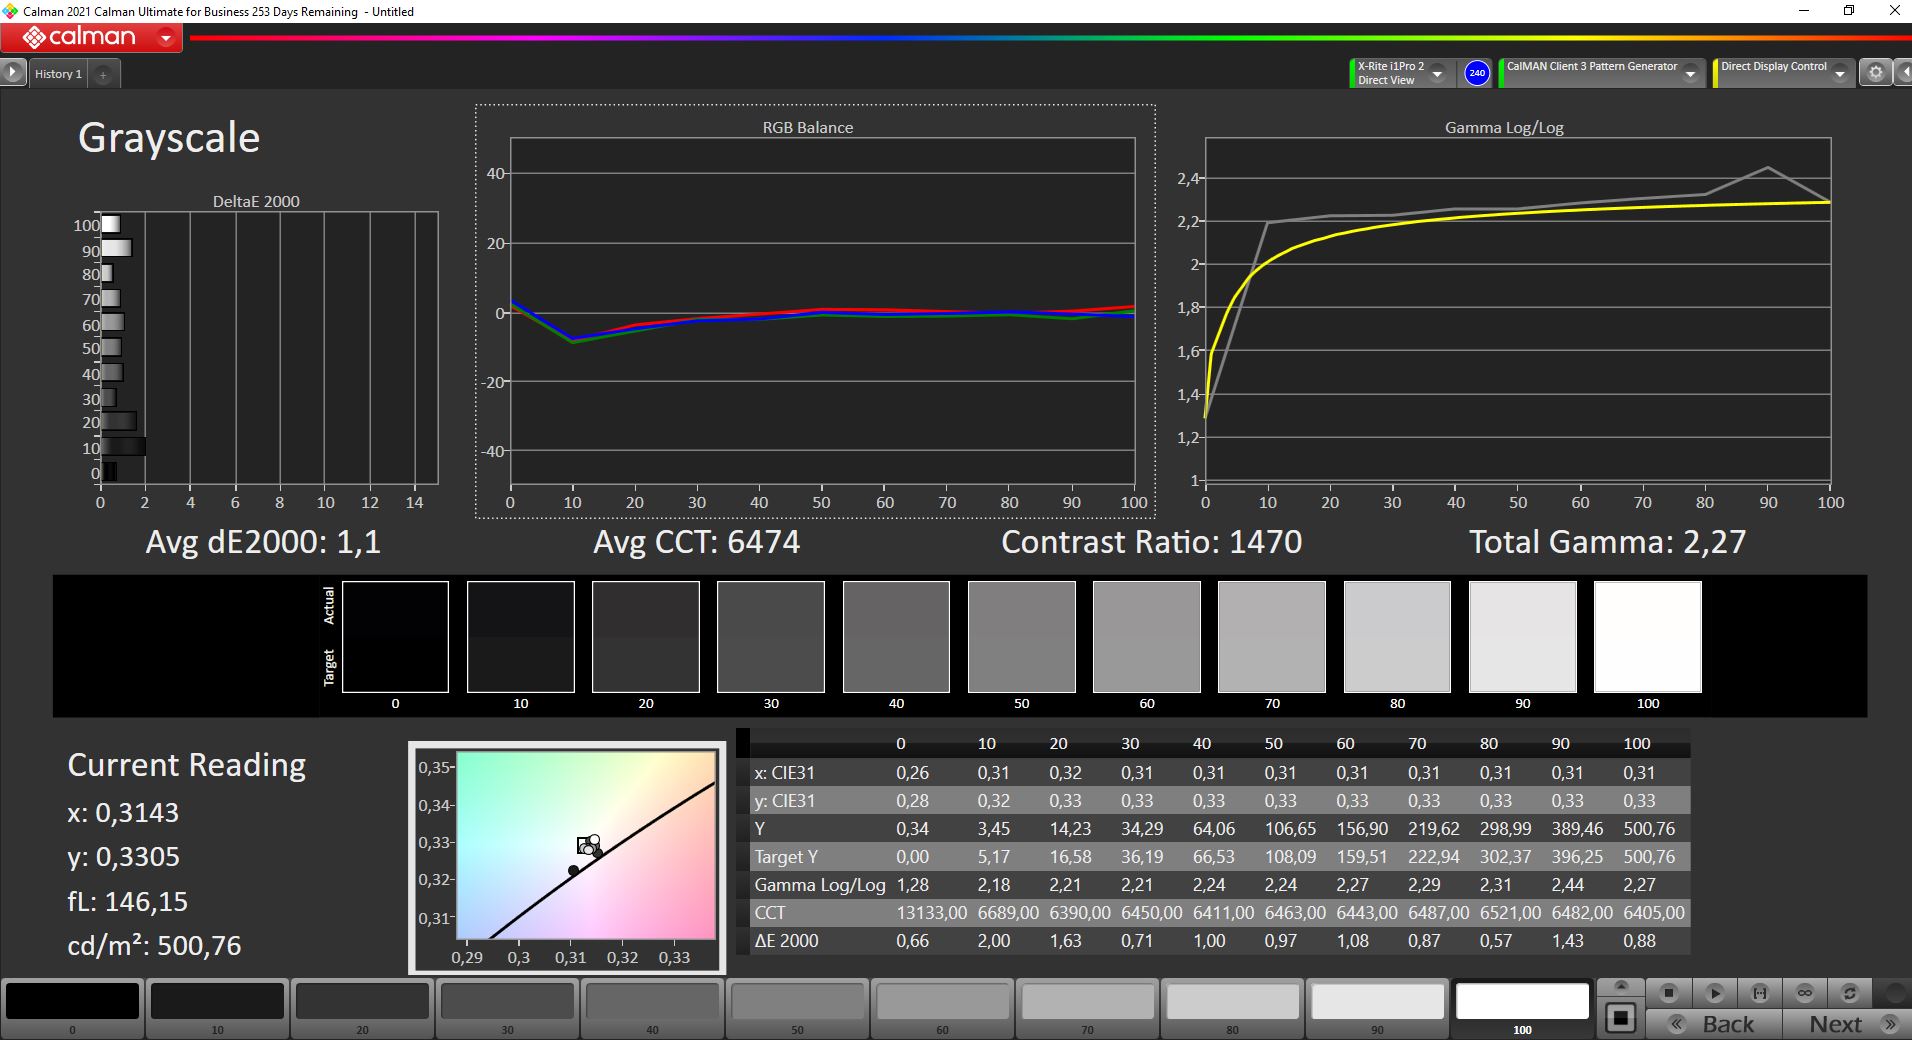
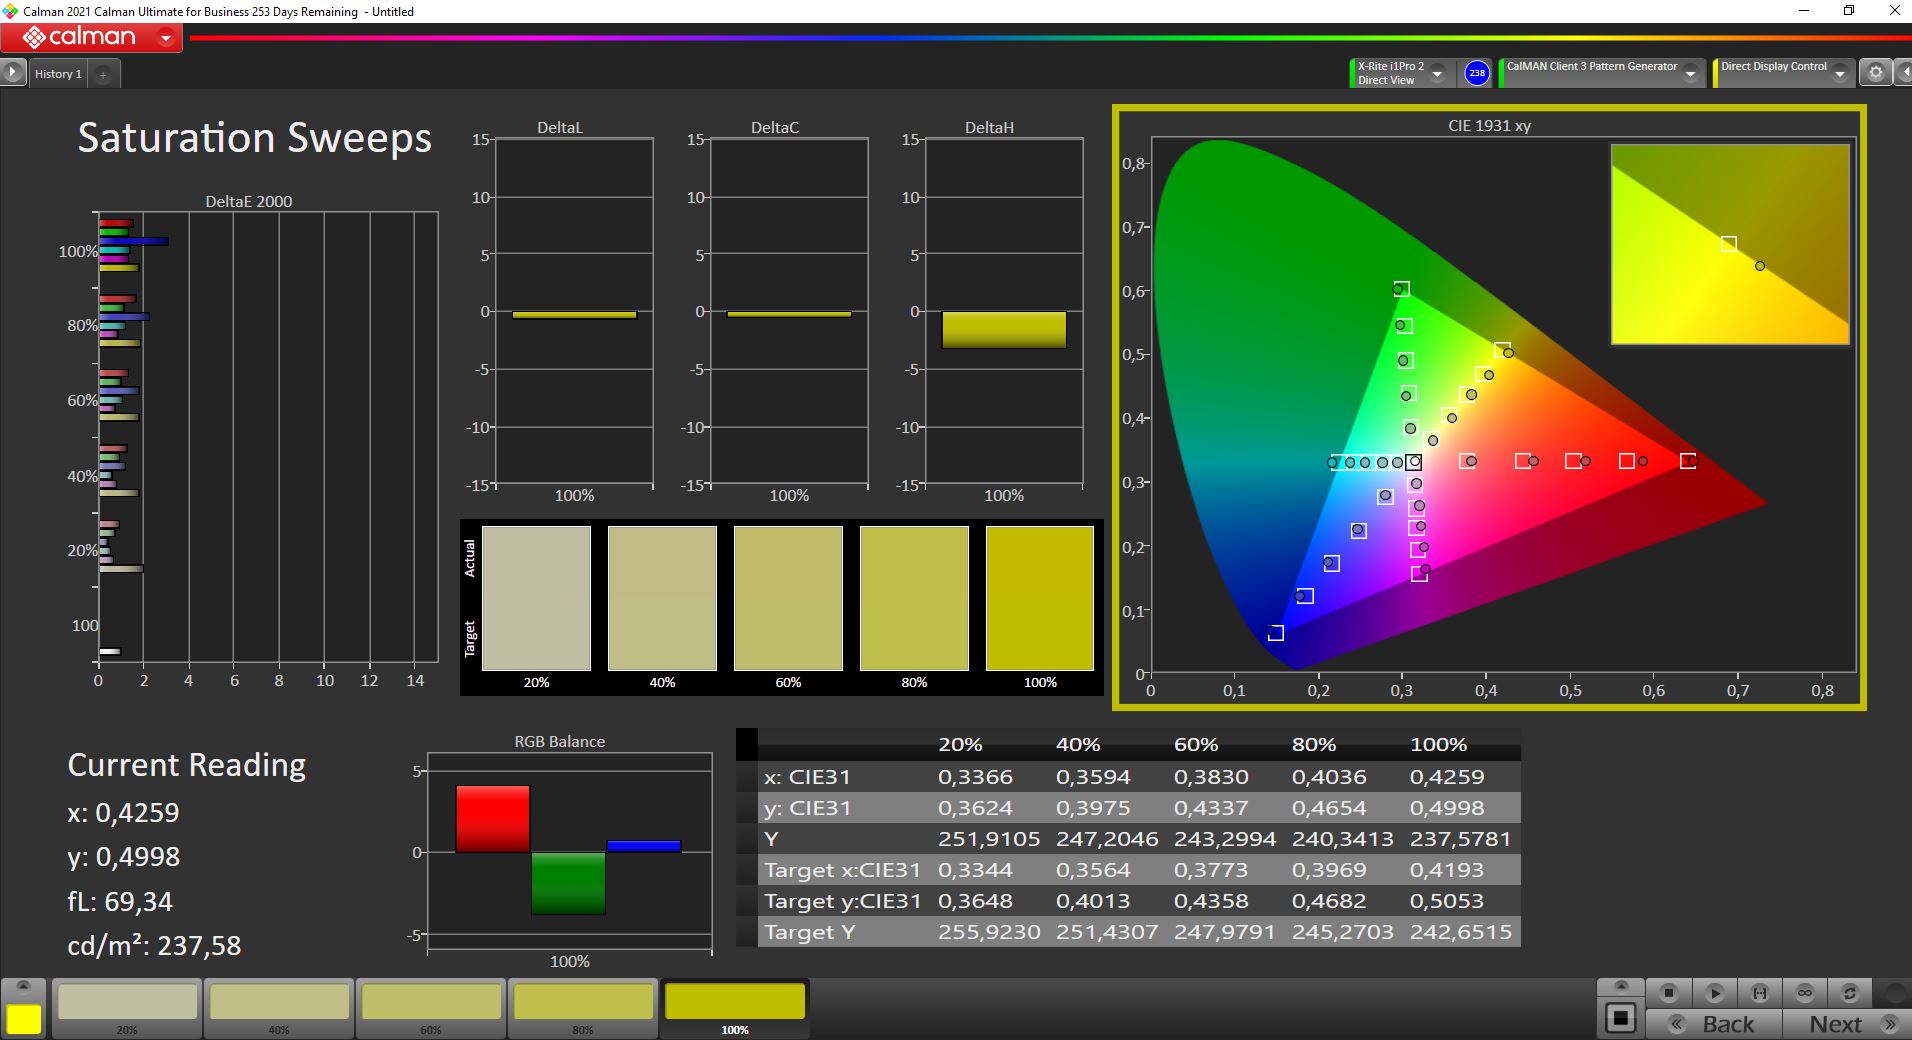
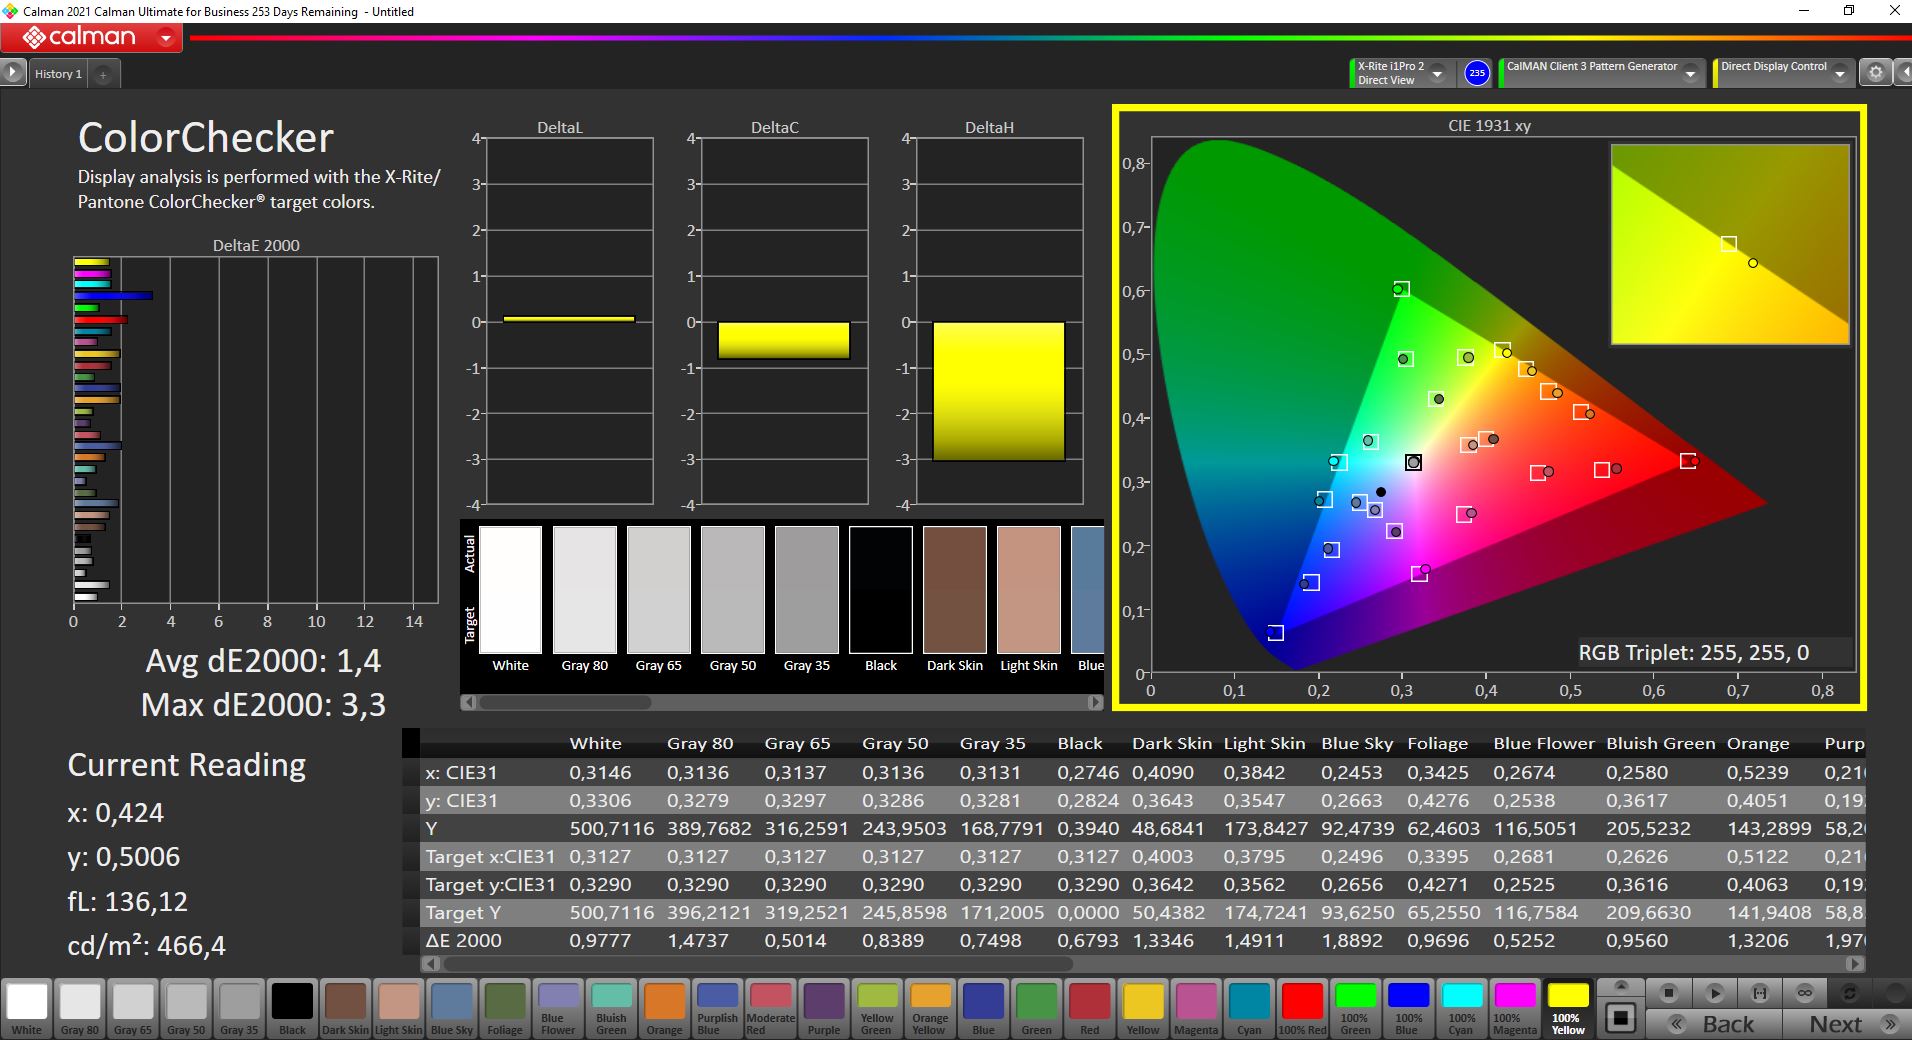
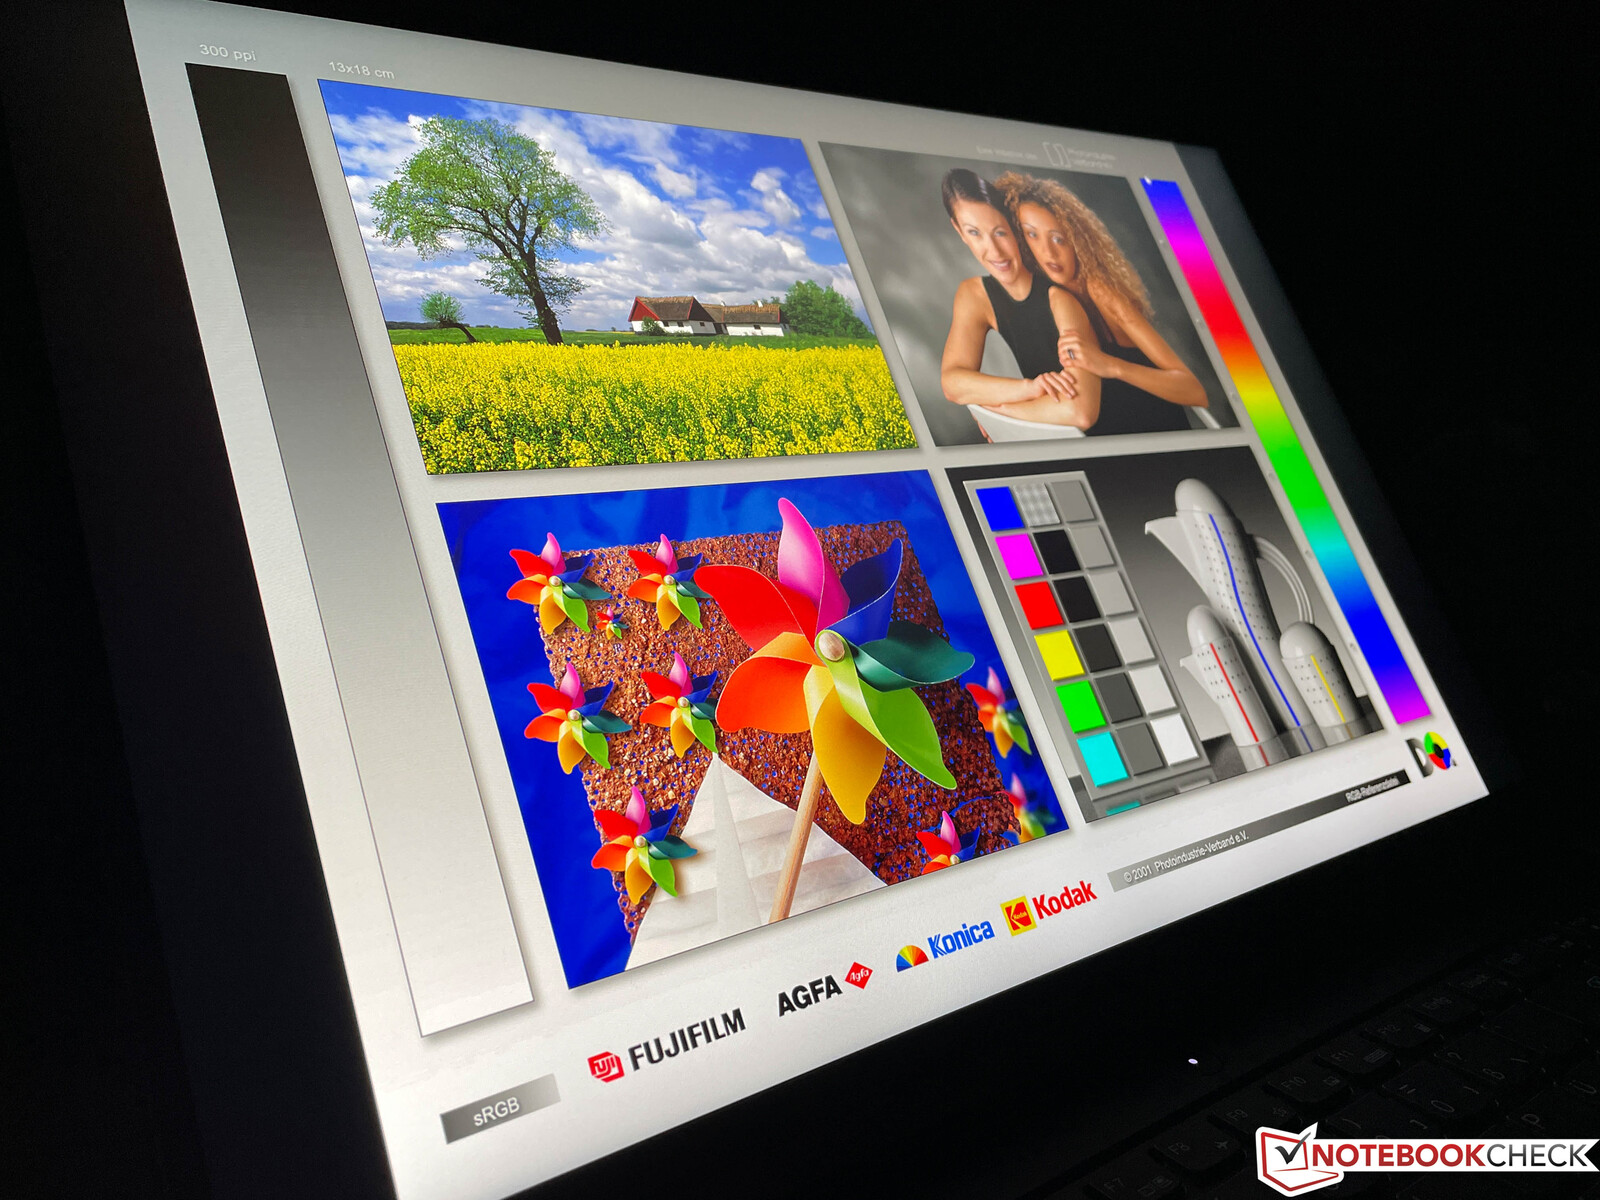
Nous avons analysé le panneau avec le logiciel professionnel CalMAN et l'image est déjà décente. Il n'y a aucune dominante de couleur visible et presque toutes les couleurs sont déjà dans l'écart cible. Notre propre calibration (le profil peut être téléchargé gratuitement dans la boîte ci-dessus) améliore un peu les performances. Le panneau couvre presque entièrement la petite gamme de couleurs sRGB, ce qui est tout à fait correct pour les jeux. Grâce aux faibles écarts de couleurs, vous pouvez également éditer des photos/vidéos.
Temps de réponse de l'écran
| ↔ Temps de réponse noir à blanc | ||
|---|---|---|
| 7.6 ms ... hausse ↗ et chute ↘ combinées | ↗ 2.4 ms hausse | 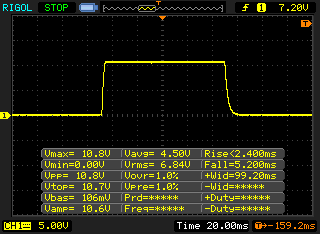 |
| ↘ 5.2 ms chute | ||
| L'écran montre de très faibles temps de réponse, parfait pour le jeu. En comparaison, tous les appareils testés affichent entre 0.1 (minimum) et 240 (maximum) ms. » 22 % des appareils testés affichent de meilleures performances. Cela signifie que les latences relevées sont meilleures que la moyenne (19.9 ms) de tous les appareils testés. | ||
| ↔ Temps de réponse gris 50% à gris 80% | ||
| 17.6 ms ... hausse ↗ et chute ↘ combinées | ↗ 9.2 ms hausse | 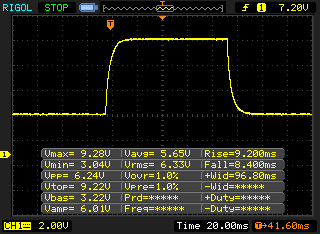 |
| ↘ 8.4 ms chute | ||
| L'écran montre de bons temps de réponse, mais insuffisant pour du jeu compétitif. En comparaison, tous les appareils testés affichent entre 0.165 (minimum) et 636 (maximum) ms. » 31 % des appareils testés affichent de meilleures performances. Cela signifie que les latences relevées sont meilleures que la moyenne (31.1 ms) de tous les appareils testés. | ||
Scintillement / MLI (Modulation de largeur d'impulsion)
| Scintillement / MLI (Modulation de largeur d'impulsion) non décelé | 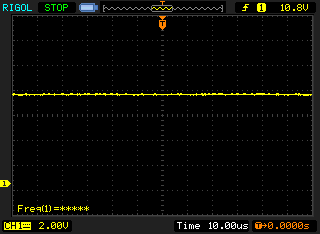 | ||
En comparaison, 52 % des appareils testés n'emploient pas MDI pour assombrir leur écran. Nous avons relevé une moyenne à 7784 (minimum : 5 - maximum : 343500) Hz dans le cas où une MDI était active. | |||
La stabilité de l'angle de vision de la dalle IPS est très bonne. Grâce à la surface mate et à la bonne luminosité, il est également possible d'utiliser le Legion 5 Pro 16 en extérieur dans des environnements plus lumineux.
Performance - Alder Lake sans limites
Paramètres de révision
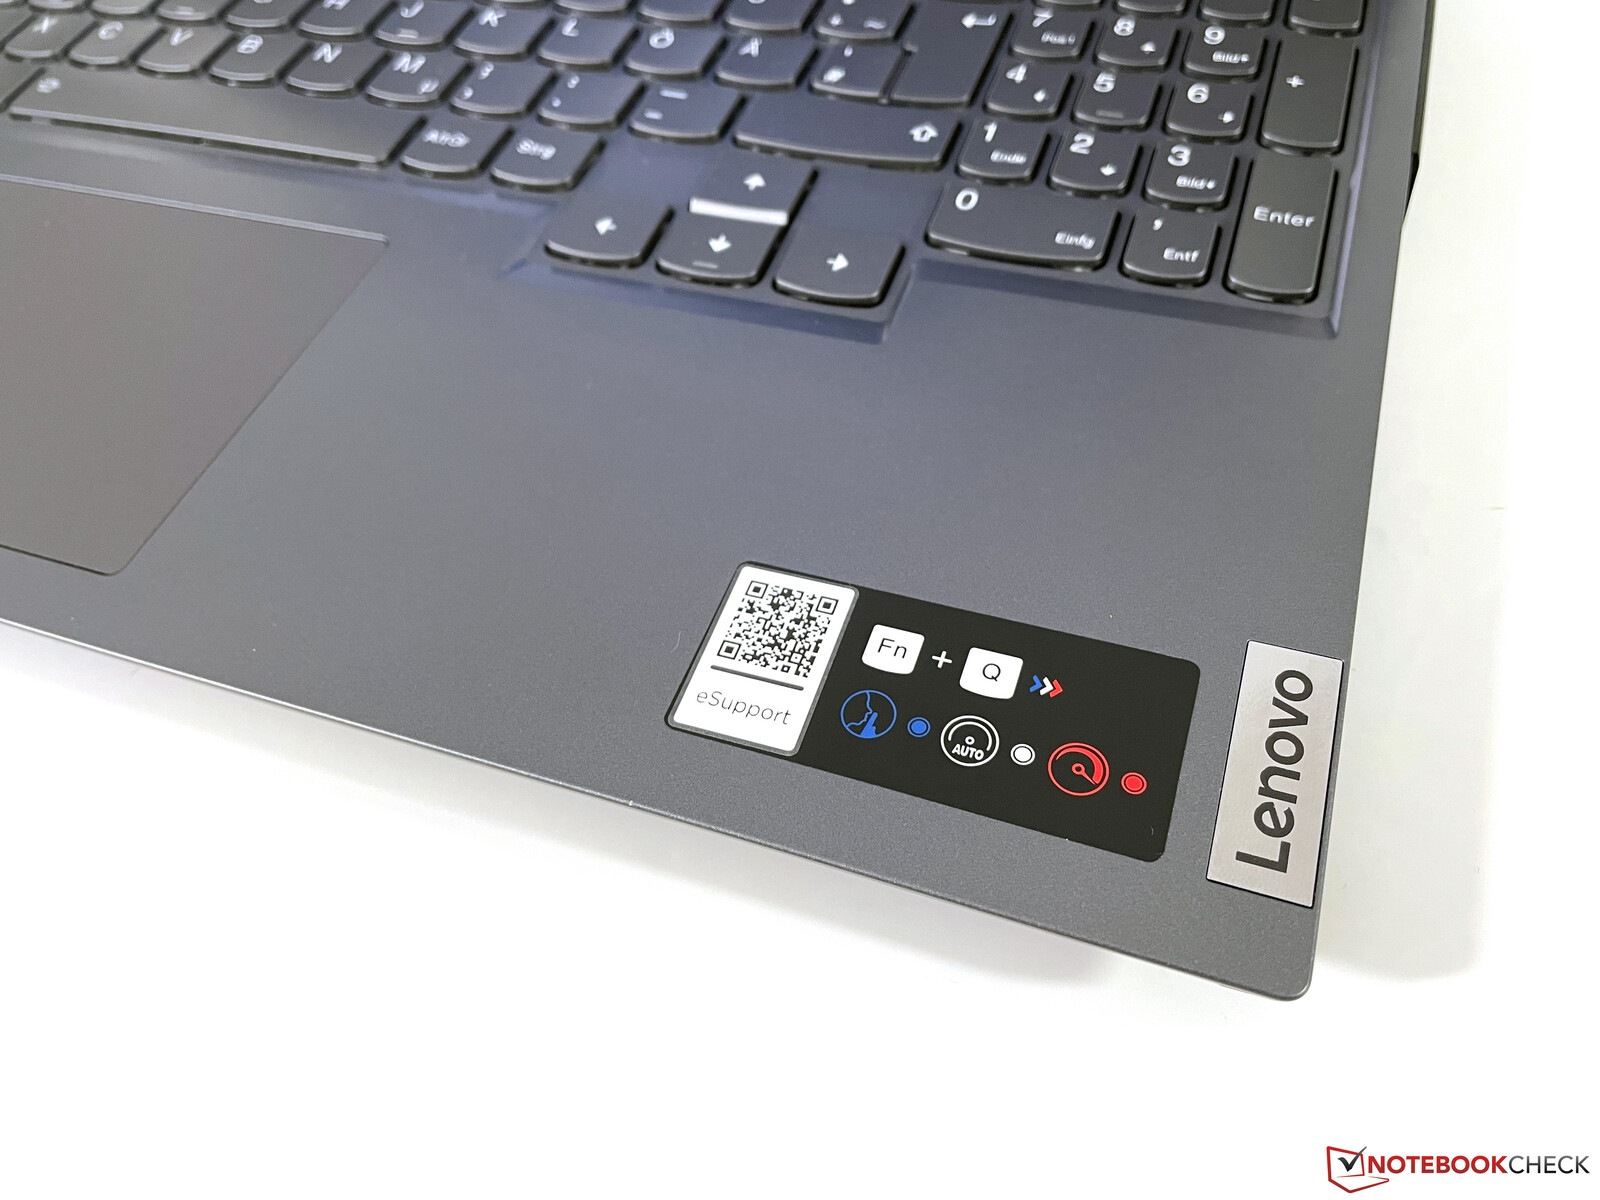
Comme d'habitude, Lenovo propose trois profils énergétiques différents dans l'application Vantage préchargée, qui peuvent être sélectionnés via le logiciel ou basculés via la combinaison de touches Fn+Q. La couleur de la LED du bouton d'alimentation indique le profil actuel : Bleu = mode silencieux, blanc = automatique, rouge = performance. Le profil Performance n'est disponible que sur le secteur. Nous avons répertorié les différents profils et leurs effets sur les performances du CPU et du GPU dans le tableau suivant.
| Scénario | Silencieux | Auto | Performance |
|---|---|---|---|
| Charge du CPU | 124/80W | 124/100W | 124/108W |
| Charge GPU | 115W | 120W | 150W |
| Test de stress | CPU : 62WGPU : 40W |
CPU : 62WGPU : 100W |
CPU : 62WGPU : 125W |
Comme pour le test précédent du Legion 5 Pro 16, il est à nouveau possible de désactiver le GPU intégré via l'application Vantage. Le nouveau modèle prend toutefois en charge Advanced Optimus, ce qui n'est pas vraiment nécessaire. Nous avons effectué les benchmarks et mesures suivants avec les paramètres suivants : Graphiques hybrides et mode Performance. Si vous ne jouez pas, vous pouvez tout à fait sélectionner le mode Silencieux où les performances du CPU sont encore très bonnes.
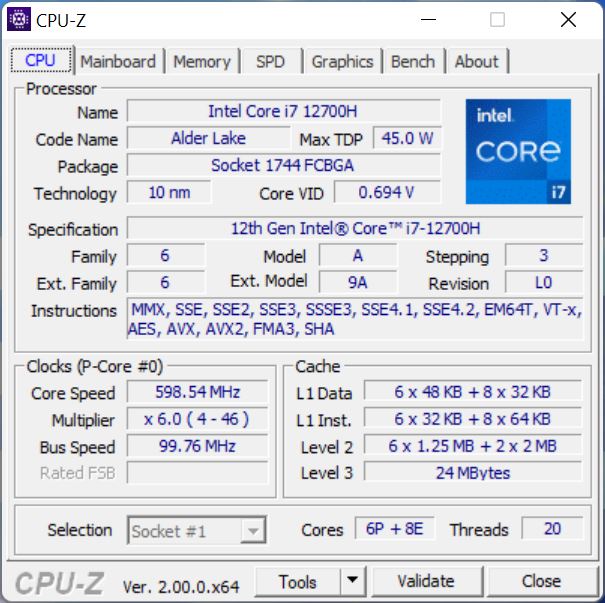
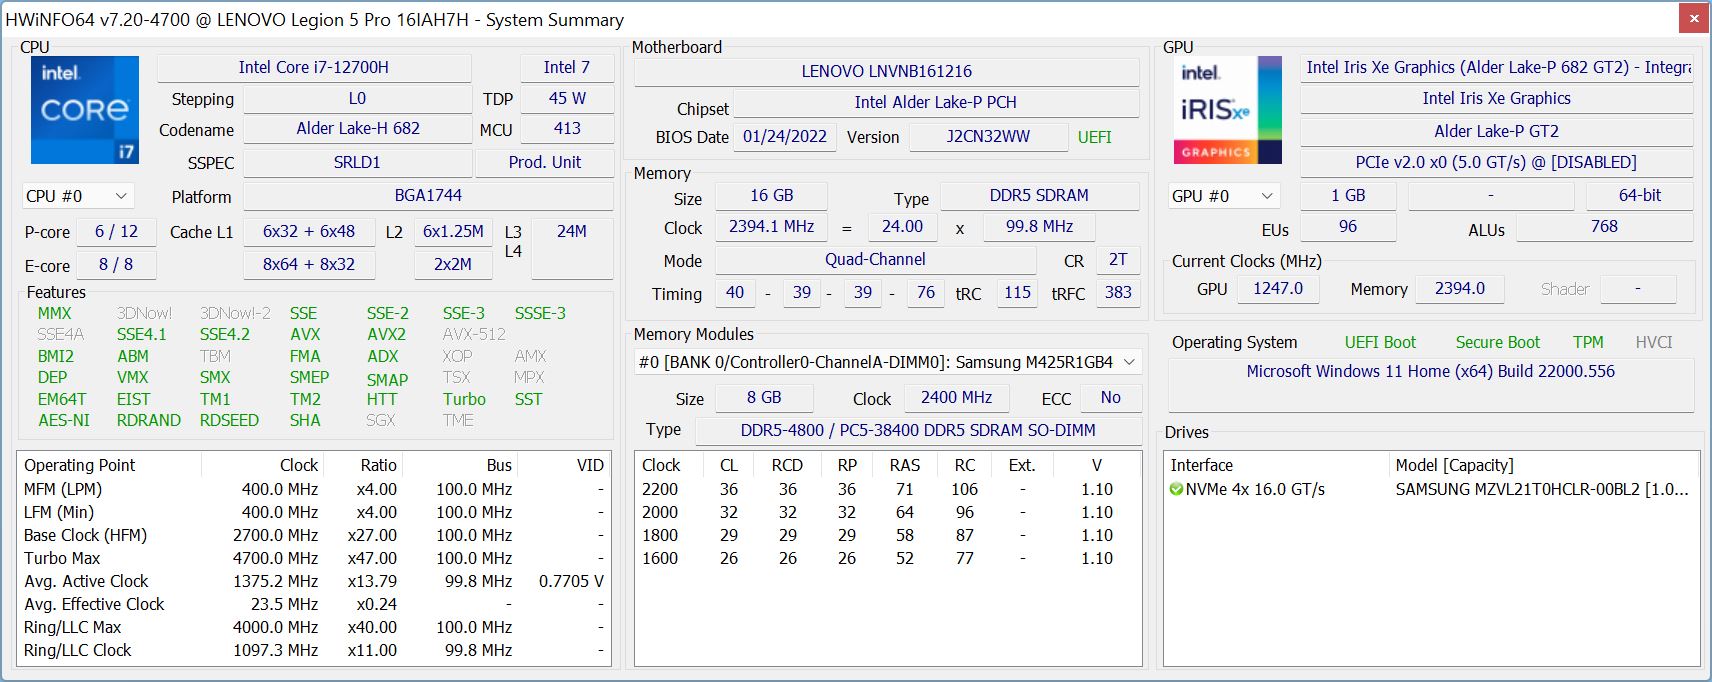
Processeur - Core i7-12700H
Lenovo utilise le tout nouveauIntel Core i7-12700Hde la génération Alder Lake, qui utilise une structure hybride avec 6 cœurs de performance (jusqu'à 4,8 GHz, y compris l'hyper threading) ainsi que 8 cœurs d'efficacité (jusqu'à 3,7 GHz). Le processeur peut donc exécuter jusqu'à 20 threads simultanément. Il s'agit d'un CPU de 45W, du moins en théorie, mais Lenovo ne limite pas la consommation. La pleine charge pour tous les cœurs entraîne une consommation de 124W et nous pouvons encore voir environ 25W (IA core) dans les tests single-core. L'efficacité n'est pas vraiment importante ici, mais les performances du Legion 5 Pro sont excellentes et il peut facilement prendre la première place dans notre groupe de comparaison et même battre leCore i9-12900Hdans leVecteur MSI. C'est le cas pour les tests multi-core, mais le i9 bénéficie de son horloge Turbo plus élevée pendant les charges de travail single-core.
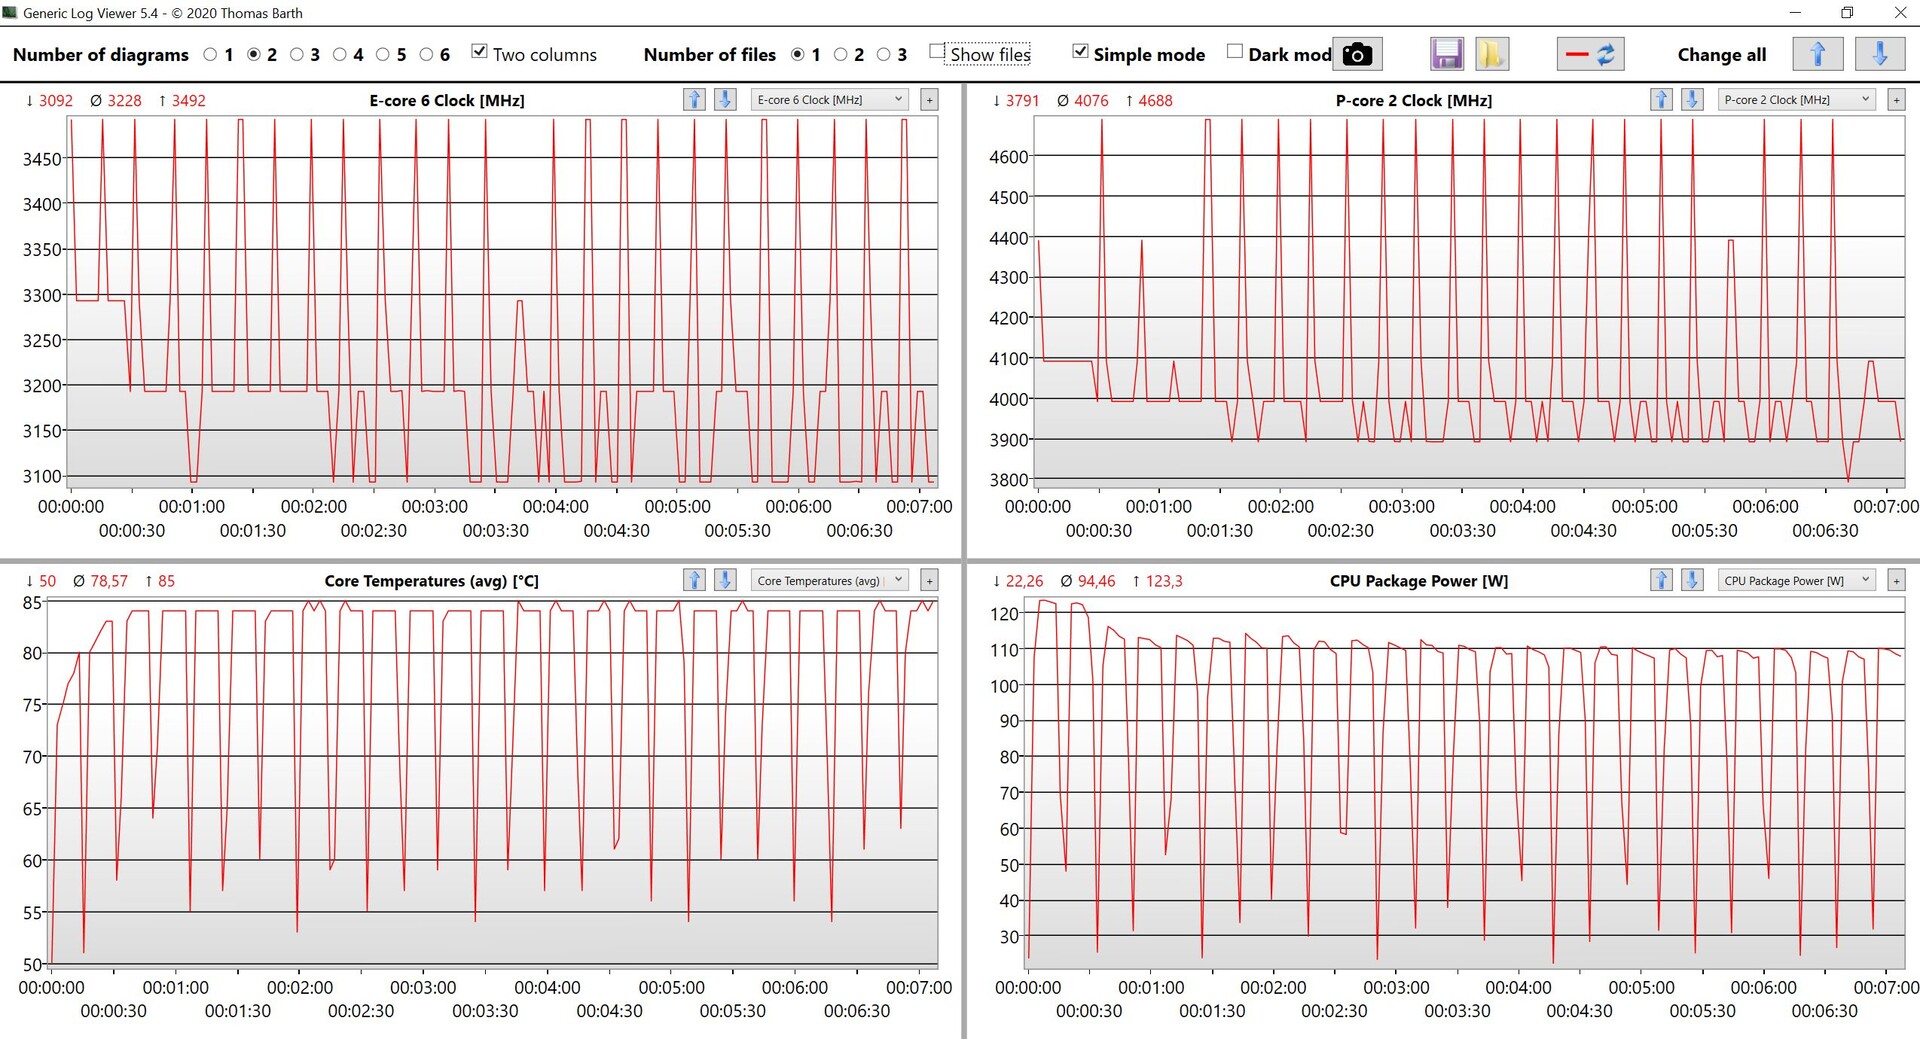
Cinebench R15 Multi Loop
Le système ne peut pas maintenir la pleine puissance de 124W pendant des périodes prolongées et le processeur finit par se stabiliser à 108W. Le score du CB R15 Multi tombe à environ 2700 points en mode Auto et toujours autour de 2450 euros à 80W (mode Silencieux). Dans l'ensemble, les performances du processeur sont excellentes, mais elles se traduisent également par une consommation d'énergie élevée.
Les performances en mode monocœur sur batterie sont identiques et le processeur peut encore consommer un peu plus de 110W dans les tests multicœurs, ce qui tombe à "juste" environ 90W sous des charges de travail soutenues. Les benchmarks du processeur Mire sont disponibles ici.
Cinebench R23: Multi Core | Single Core
Cinebench R20: CPU (Multi Core) | CPU (Single Core)
Cinebench R15: CPU Multi 64Bit | CPU Single 64Bit
Blender: v2.79 BMW27 CPU
7-Zip 18.03: 7z b 4 | 7z b 4 -mmt1
Geekbench 5.5: Multi-Core | Single-Core
HWBOT x265 Benchmark v2.2: 4k Preset
LibreOffice : 20 Documents To PDF
R Benchmark 2.5: Overall mean
| CPU Performance rating | |
| Moyenne de la classe Gaming | |
| Lenovo Legion 5 Pro 16 G7 i7 RTX 3070Ti | |
| MSI Vector GP66 12UGS | |
| Moyenne Intel Core i7-12700H | |
| HP Omen 16-b0085ng | |
| Asus TUF Gaming A15 FA506QR-AZ061T -2! | |
| Acer Nitro 5 AN515-45-R1JH | |
| Lenovo Legion 5 Pro 16ACH6H (82JQ001PGE) | |
| Cinebench R23 / Multi Core | |
| Moyenne de la classe Gaming (10488 - 40970, n=110, 2 dernières années) | |
| Lenovo Legion 5 Pro 16 G7 i7 RTX 3070Ti | |
| MSI Vector GP66 12UGS | |
| Moyenne Intel Core i7-12700H (4032 - 19330, n=64) | |
| Lenovo Legion 5 Pro 16ACH6H (82JQ001PGE) | |
| Lenovo Legion 5 Pro 16ACH6H (82JQ001PGE) | |
| HP Omen 16-b0085ng | |
| Acer Nitro 5 AN515-45-R1JH | |
| Cinebench R23 / Single Core | |
| Moyenne de la classe Gaming (1166 - 2356, n=110, 2 dernières années) | |
| MSI Vector GP66 12UGS | |
| Lenovo Legion 5 Pro 16 G7 i7 RTX 3070Ti | |
| Moyenne Intel Core i7-12700H (778 - 1826, n=63) | |
| HP Omen 16-b0085ng | |
| Acer Nitro 5 AN515-45-R1JH | |
| Lenovo Legion 5 Pro 16ACH6H (82JQ001PGE) | |
| Lenovo Legion 5 Pro 16ACH6H (82JQ001PGE) | |
| Cinebench R20 / CPU (Multi Core) | |
| Moyenne de la classe Gaming (4029 - 16108, n=109, 2 dernières années) | |
| Lenovo Legion 5 Pro 16 G7 i7 RTX 3070Ti | |
| MSI Vector GP66 12UGS | |
| Moyenne Intel Core i7-12700H (1576 - 7407, n=64) | |
| Lenovo Legion 5 Pro 16ACH6H (82JQ001PGE) | |
| Lenovo Legion 5 Pro 16ACH6H (82JQ001PGE) | |
| HP Omen 16-b0085ng | |
| Acer Nitro 5 AN515-45-R1JH | |
| Asus TUF Gaming A15 FA506QR-AZ061T | |
| Cinebench R20 / CPU (Single Core) | |
| Moyenne de la classe Gaming (442 - 895, n=109, 2 dernières années) | |
| MSI Vector GP66 12UGS | |
| Lenovo Legion 5 Pro 16 G7 i7 RTX 3070Ti | |
| Moyenne Intel Core i7-12700H (300 - 704, n=64) | |
| HP Omen 16-b0085ng | |
| Asus TUF Gaming A15 FA506QR-AZ061T | |
| Acer Nitro 5 AN515-45-R1JH | |
| Lenovo Legion 5 Pro 16ACH6H (82JQ001PGE) | |
| Lenovo Legion 5 Pro 16ACH6H (82JQ001PGE) | |
| Cinebench R15 / CPU Multi 64Bit | |
| Moyenne de la classe Gaming (1578 - 6271, n=109, 2 dernières années) | |
| Lenovo Legion 5 Pro 16 G7 i7 RTX 3070Ti | |
| Moyenne Intel Core i7-12700H (1379 - 2916, n=70) | |
| MSI Vector GP66 12UGS | |
| HP Omen 16-b0085ng | |
| Lenovo Legion 5 Pro 16ACH6H (82JQ001PGE) | |
| Asus TUF Gaming A15 FA506QR-AZ061T | |
| Acer Nitro 5 AN515-45-R1JH | |
| Cinebench R15 / CPU Single 64Bit | |
| Moyenne de la classe Gaming (188.8 - 343, n=109, 2 dernières années) | |
| MSI Vector GP66 12UGS | |
| Lenovo Legion 5 Pro 16 G7 i7 RTX 3070Ti | |
| Moyenne Intel Core i7-12700H (113 - 263, n=65) | |
| Asus TUF Gaming A15 FA506QR-AZ061T | |
| Acer Nitro 5 AN515-45-R1JH | |
| Lenovo Legion 5 Pro 16ACH6H (82JQ001PGE) | |
| Lenovo Legion 5 Pro 16ACH6H (82JQ001PGE) | |
| HP Omen 16-b0085ng | |
| Blender / v2.79 BMW27 CPU | |
| Asus TUF Gaming A15 FA506QR-AZ061T | |
| Acer Nitro 5 AN515-45-R1JH | |
| Lenovo Legion 5 Pro 16ACH6H (82JQ001PGE) | |
| Lenovo Legion 5 Pro 16ACH6H (82JQ001PGE) | |
| HP Omen 16-b0085ng | |
| Moyenne Intel Core i7-12700H (168 - 732, n=63) | |
| MSI Vector GP66 12UGS | |
| Lenovo Legion 5 Pro 16 G7 i7 RTX 3070Ti | |
| Moyenne de la classe Gaming (80 - 330, n=107, 2 dernières années) | |
| 7-Zip 18.03 / 7z b 4 | |
| Moyenne de la classe Gaming (33491 - 148086, n=108, 2 dernières années) | |
| Lenovo Legion 5 Pro 16 G7 i7 RTX 3070Ti | |
| MSI Vector GP66 12UGS | |
| Moyenne Intel Core i7-12700H (22844 - 73067, n=63) | |
| Lenovo Legion 5 Pro 16ACH6H (82JQ001PGE) | |
| Lenovo Legion 5 Pro 16ACH6H (82JQ001PGE) | |
| HP Omen 16-b0085ng | |
| Acer Nitro 5 AN515-45-R1JH | |
| Asus TUF Gaming A15 FA506QR-AZ061T | |
| 7-Zip 18.03 / 7z b 4 -mmt1 | |
| Moyenne de la classe Gaming (4199 - 7436, n=108, 2 dernières années) | |
| MSI Vector GP66 12UGS | |
| Lenovo Legion 5 Pro 16 G7 i7 RTX 3070Ti | |
| HP Omen 16-b0085ng | |
| Moyenne Intel Core i7-12700H (2743 - 5972, n=63) | |
| Asus TUF Gaming A15 FA506QR-AZ061T | |
| Acer Nitro 5 AN515-45-R1JH | |
| Lenovo Legion 5 Pro 16ACH6H (82JQ001PGE) | |
| Lenovo Legion 5 Pro 16ACH6H (82JQ001PGE) | |
| Geekbench 5.5 / Multi-Core | |
| Moyenne de la classe Gaming (6460 - 27010, n=108, 2 dernières années) | |
| Lenovo Legion 5 Pro 16 G7 i7 RTX 3070Ti | |
| MSI Vector GP66 12UGS | |
| Moyenne Intel Core i7-12700H (5144 - 13745, n=64) | |
| HP Omen 16-b0085ng | |
| Lenovo Legion 5 Pro 16ACH6H (82JQ001PGE) | |
| Lenovo Legion 5 Pro 16ACH6H (82JQ001PGE) | |
| Asus TUF Gaming A15 FA506QR-AZ061T | |
| Acer Nitro 5 AN515-45-R1JH | |
| Geekbench 5.5 / Single-Core | |
| Moyenne de la classe Gaming (986 - 2474, n=108, 2 dernières années) | |
| MSI Vector GP66 12UGS | |
| Lenovo Legion 5 Pro 16 G7 i7 RTX 3070Ti | |
| Moyenne Intel Core i7-12700H (803 - 1851, n=64) | |
| HP Omen 16-b0085ng | |
| Acer Nitro 5 AN515-45-R1JH | |
| Asus TUF Gaming A15 FA506QR-AZ061T | |
| Lenovo Legion 5 Pro 16ACH6H (82JQ001PGE) | |
| Lenovo Legion 5 Pro 16ACH6H (82JQ001PGE) | |
| HWBOT x265 Benchmark v2.2 / 4k Preset | |
| Moyenne de la classe Gaming (11.5 - 44.3, n=108, 2 dernières années) | |
| Lenovo Legion 5 Pro 16 G7 i7 RTX 3070Ti | |
| MSI Vector GP66 12UGS | |
| HP Omen 16-b0085ng | |
| Moyenne Intel Core i7-12700H (4.67 - 21.8, n=64) | |
| Lenovo Legion 5 Pro 16ACH6H (82JQ001PGE) | |
| Lenovo Legion 5 Pro 16ACH6H (82JQ001PGE) | |
| Acer Nitro 5 AN515-45-R1JH | |
| Asus TUF Gaming A15 FA506QR-AZ061T | |
| LibreOffice / 20 Documents To PDF | |
| Lenovo Legion 5 Pro 16ACH6H (82JQ001PGE) | |
| Lenovo Legion 5 Pro 16ACH6H (82JQ001PGE) | |
| Acer Nitro 5 AN515-45-R1JH | |
| Moyenne de la classe Gaming (19 - 88.8, n=108, 2 dernières années) | |
| Asus TUF Gaming A15 FA506QR-AZ061T | |
| HP Omen 16-b0085ng | |
| Moyenne Intel Core i7-12700H (34.2 - 95.3, n=63) | |
| Lenovo Legion 5 Pro 16 G7 i7 RTX 3070Ti | |
| MSI Vector GP66 12UGS | |
| R Benchmark 2.5 / Overall mean | |
| Lenovo Legion 5 Pro 16ACH6H (82JQ001PGE) | |
| Lenovo Legion 5 Pro 16ACH6H (82JQ001PGE) | |
| HP Omen 16-b0085ng | |
| Acer Nitro 5 AN515-45-R1JH | |
| Asus TUF Gaming A15 FA506QR-AZ061T | |
| Moyenne Intel Core i7-12700H (0.4441 - 1.052, n=63) | |
| Lenovo Legion 5 Pro 16 G7 i7 RTX 3070Ti | |
| Moyenne de la classe Gaming (0.3439 - 0.759, n=109, 2 dernières années) | |
| MSI Vector GP66 12UGS | |
* ... Moindre est la valeur, meilleures sont les performances
AIDA64: FP32 Ray-Trace | FPU Julia | CPU SHA3 | CPU Queen | FPU SinJulia | FPU Mandel | CPU AES | CPU ZLib | FP64 Ray-Trace | CPU PhotoWorxx
| Performance rating | |
| Moyenne de la classe Gaming | |
| Lenovo Legion 5 Pro 16ACH6H (82JQ001PGE) | |
| Acer Nitro 5 AN515-45-R1JH | |
| Lenovo Legion 5 Pro 16 G7 i7 RTX 3070Ti | |
| Moyenne Intel Core i7-12700H | |
| MSI Vector GP66 12UGS | |
| Asus TUF Gaming A15 FA506QR-AZ061T | |
| HP Omen 16-b0085ng -9! | |
| AIDA64 / FP32 Ray-Trace | |
| Moyenne de la classe Gaming (10227 - 85542, n=107, 2 dernières années) | |
| Lenovo Legion 5 Pro 16ACH6H (82JQ001PGE) | |
| Lenovo Legion 5 Pro 16ACH6H (82JQ001PGE) | |
| Asus TUF Gaming A15 FA506QR-AZ061T | |
| Acer Nitro 5 AN515-45-R1JH | |
| Moyenne Intel Core i7-12700H (2585 - 17957, n=64) | |
| Lenovo Legion 5 Pro 16 G7 i7 RTX 3070Ti | |
| MSI Vector GP66 12UGS | |
| AIDA64 / FPU Julia | |
| Moyenne de la classe Gaming (51376 - 238426, n=107, 2 dernières années) | |
| Lenovo Legion 5 Pro 16ACH6H (82JQ001PGE) | |
| Lenovo Legion 5 Pro 16ACH6H (82JQ001PGE) | |
| Acer Nitro 5 AN515-45-R1JH | |
| Asus TUF Gaming A15 FA506QR-AZ061T | |
| Moyenne Intel Core i7-12700H (12439 - 90760, n=64) | |
| Lenovo Legion 5 Pro 16 G7 i7 RTX 3070Ti | |
| MSI Vector GP66 12UGS | |
| AIDA64 / CPU SHA3 | |
| Moyenne de la classe Gaming (2180 - 9817, n=107, 2 dernières années) | |
| Lenovo Legion 5 Pro 16 G7 i7 RTX 3070Ti | |
| Lenovo Legion 5 Pro 16ACH6H (82JQ001PGE) | |
| Lenovo Legion 5 Pro 16ACH6H (82JQ001PGE) | |
| Moyenne Intel Core i7-12700H (833 - 4242, n=64) | |
| MSI Vector GP66 12UGS | |
| Acer Nitro 5 AN515-45-R1JH | |
| Asus TUF Gaming A15 FA506QR-AZ061T | |
| AIDA64 / CPU Queen | |
| Moyenne de la classe Gaming (49785 - 173351, n=98, 2 dernières années) | |
| MSI Vector GP66 12UGS | |
| Lenovo Legion 5 Pro 16 G7 i7 RTX 3070Ti | |
| Moyenne Intel Core i7-12700H (57923 - 103202, n=63) | |
| Acer Nitro 5 AN515-45-R1JH | |
| Asus TUF Gaming A15 FA506QR-AZ061T | |
| Lenovo Legion 5 Pro 16ACH6H (82JQ001PGE) | |
| Lenovo Legion 5 Pro 16ACH6H (82JQ001PGE) | |
| AIDA64 / FPU SinJulia | |
| Moyenne de la classe Gaming (4424 - 33636, n=107, 2 dernières années) | |
| Acer Nitro 5 AN515-45-R1JH | |
| Asus TUF Gaming A15 FA506QR-AZ061T | |
| Lenovo Legion 5 Pro 16ACH6H (82JQ001PGE) | |
| Lenovo Legion 5 Pro 16ACH6H (82JQ001PGE) | |
| Lenovo Legion 5 Pro 16 G7 i7 RTX 3070Ti | |
| MSI Vector GP66 12UGS | |
| Moyenne Intel Core i7-12700H (3249 - 9939, n=64) | |
| AIDA64 / FPU Mandel | |
| Moyenne de la classe Gaming (25115 - 128721, n=107, 2 dernières années) | |
| Lenovo Legion 5 Pro 16ACH6H (82JQ001PGE) | |
| Lenovo Legion 5 Pro 16ACH6H (82JQ001PGE) | |
| Acer Nitro 5 AN515-45-R1JH | |
| Asus TUF Gaming A15 FA506QR-AZ061T | |
| Moyenne Intel Core i7-12700H (7135 - 44760, n=64) | |
| Lenovo Legion 5 Pro 16 G7 i7 RTX 3070Ti | |
| MSI Vector GP66 12UGS | |
| AIDA64 / CPU AES | |
| Lenovo Legion 5 Pro 16ACH6H (82JQ001PGE) | |
| Lenovo Legion 5 Pro 16ACH6H (82JQ001PGE) | |
| Acer Nitro 5 AN515-45-R1JH | |
| Moyenne de la classe Gaming (39258 - 247074, n=107, 2 dernières années) | |
| Lenovo Legion 5 Pro 16 G7 i7 RTX 3070Ti | |
| MSI Vector GP66 12UGS | |
| Moyenne Intel Core i7-12700H (31839 - 144360, n=64) | |
| Asus TUF Gaming A15 FA506QR-AZ061T | |
| AIDA64 / CPU ZLib | |
| Moyenne de la classe Gaming (574 - 2531, n=107, 2 dernières années) | |
| Lenovo Legion 5 Pro 16 G7 i7 RTX 3070Ti | |
| MSI Vector GP66 12UGS | |
| Moyenne Intel Core i7-12700H (305 - 1171, n=64) | |
| Lenovo Legion 5 Pro 16ACH6H (82JQ001PGE) | |
| Lenovo Legion 5 Pro 16ACH6H (82JQ001PGE) | |
| Asus TUF Gaming A15 FA506QR-AZ061T | |
| Acer Nitro 5 AN515-45-R1JH | |
| HP Omen 16-b0085ng | |
| AIDA64 / FP64 Ray-Trace | |
| Moyenne de la classe Gaming (5509 - 45446, n=107, 2 dernières années) | |
| Asus TUF Gaming A15 FA506QR-AZ061T | |
| Lenovo Legion 5 Pro 16ACH6H (82JQ001PGE) | |
| Lenovo Legion 5 Pro 16ACH6H (82JQ001PGE) | |
| Acer Nitro 5 AN515-45-R1JH | |
| Moyenne Intel Core i7-12700H (1437 - 9692, n=64) | |
| Lenovo Legion 5 Pro 16 G7 i7 RTX 3070Ti | |
| MSI Vector GP66 12UGS | |
| AIDA64 / CPU PhotoWorxx | |
| Moyenne de la classe Gaming (12271 - 89891, n=107, 2 dernières années) | |
| Lenovo Legion 5 Pro 16 G7 i7 RTX 3070Ti | |
| Moyenne Intel Core i7-12700H (12863 - 52207, n=64) | |
| MSI Vector GP66 12UGS | |
| Lenovo Legion 5 Pro 16ACH6H (82JQ001PGE) | |
| Lenovo Legion 5 Pro 16ACH6H (82JQ001PGE) | |
| Asus TUF Gaming A15 FA506QR-AZ061T | |
| Acer Nitro 5 AN515-45-R1JH | |
Performance du système
L'impression subjective de performance est très bonne et les résultats des tests de référence sont excellents. Compte tenu du matériel, ce n'est pas vraiment surprenant. L'ordinateur portable est livré avec Windows 11 et nous n'avons pas rencontré de freezes ou de lags.
CrossMark: Overall | Productivity | Creativity | Responsiveness
| PCMark 10 / Score | |
| Moyenne de la classe Gaming (5828 - 11574, n=94, 2 dernières années) | |
| MSI Vector GP66 12UGS | |
| Lenovo Legion 5 Pro 16 G7 i7 RTX 3070Ti | |
| Moyenne Intel Core i7-12700H, NVIDIA GeForce RTX 3070 Ti Laptop GPU (6941 - 7947, n=11) | |
| HP Omen 16-b0085ng | |
| Asus TUF Gaming A15 FA506QR-AZ061T | |
| Acer Nitro 5 AN515-45-R1JH | |
| Lenovo Legion 5 Pro 16ACH6H (82JQ001PGE) | |
| PCMark 10 / Essentials | |
| MSI Vector GP66 12UGS | |
| HP Omen 16-b0085ng | |
| Moyenne de la classe Gaming (8810 - 12600, n=98, 2 dernières années) | |
| Moyenne Intel Core i7-12700H, NVIDIA GeForce RTX 3070 Ti Laptop GPU (9892 - 10935, n=11) | |
| Asus TUF Gaming A15 FA506QR-AZ061T | |
| Acer Nitro 5 AN515-45-R1JH | |
| Lenovo Legion 5 Pro 16 G7 i7 RTX 3070Ti | |
| Lenovo Legion 5 Pro 16ACH6H (82JQ001PGE) | |
| PCMark 10 / Productivity | |
| Moyenne de la classe Gaming (6845 - 18766, n=96, 2 dernières années) | |
| MSI Vector GP66 12UGS | |
| Lenovo Legion 5 Pro 16 G7 i7 RTX 3070Ti | |
| Moyenne Intel Core i7-12700H, NVIDIA GeForce RTX 3070 Ti Laptop GPU (9024 - 10638, n=11) | |
| Asus TUF Gaming A15 FA506QR-AZ061T | |
| Acer Nitro 5 AN515-45-R1JH | |
| HP Omen 16-b0085ng | |
| Lenovo Legion 5 Pro 16ACH6H (82JQ001PGE) | |
| PCMark 10 / Digital Content Creation | |
| Moyenne de la classe Gaming (7602 - 19657, n=96, 2 dernières années) | |
| MSI Vector GP66 12UGS | |
| Lenovo Legion 5 Pro 16 G7 i7 RTX 3070Ti | |
| Moyenne Intel Core i7-12700H, NVIDIA GeForce RTX 3070 Ti Laptop GPU (10165 - 12546, n=11) | |
| HP Omen 16-b0085ng | |
| Lenovo Legion 5 Pro 16ACH6H (82JQ001PGE) | |
| Asus TUF Gaming A15 FA506QR-AZ061T | |
| Acer Nitro 5 AN515-45-R1JH | |
| CrossMark / Overall | |
| Moyenne de la classe Gaming (1366 - 2409, n=96, 2 dernières années) | |
| Lenovo Legion 5 Pro 16 G7 i7 RTX 3070Ti | |
| Moyenne Intel Core i7-12700H, NVIDIA GeForce RTX 3070 Ti Laptop GPU (974 - 2000, n=12) | |
| CrossMark / Productivity | |
| Lenovo Legion 5 Pro 16 G7 i7 RTX 3070Ti | |
| Moyenne de la classe Gaming (1386 - 2254, n=96, 2 dernières années) | |
| Moyenne Intel Core i7-12700H, NVIDIA GeForce RTX 3070 Ti Laptop GPU (907 - 1962, n=12) | |
| CrossMark / Creativity | |
| Moyenne de la classe Gaming (1343 - 2729, n=96, 2 dernières années) | |
| Lenovo Legion 5 Pro 16 G7 i7 RTX 3070Ti | |
| Moyenne Intel Core i7-12700H, NVIDIA GeForce RTX 3070 Ti Laptop GPU (1027 - 2057, n=12) | |
| CrossMark / Responsiveness | |
| Lenovo Legion 5 Pro 16 G7 i7 RTX 3070Ti | |
| Moyenne Intel Core i7-12700H, NVIDIA GeForce RTX 3070 Ti Laptop GPU (1029 - 2142, n=12) | |
| Moyenne de la classe Gaming (1226 - 2334, n=96, 2 dernières années) | |
| PCMark 10 Score | 7555 points | |
Aide | ||
| AIDA64 / Memory Copy | |
| Moyenne de la classe Gaming (21750 - 129946, n=107, 2 dernières années) | |
| Moyenne Intel Core i7-12700H (25615 - 80511, n=64) | |
| Lenovo Legion 5 Pro 16 G7 i7 RTX 3070Ti | |
| MSI Vector GP66 12UGS | |
| Lenovo Legion 5 Pro 16ACH6H (82JQ001PGE) | |
| Lenovo Legion 5 Pro 16ACH6H (82JQ001PGE) | |
| Asus TUF Gaming A15 FA506QR-AZ061T | |
| Acer Nitro 5 AN515-45-R1JH | |
| AIDA64 / Memory Read | |
| Moyenne de la classe Gaming (22956 - 118858, n=107, 2 dernières années) | |
| Lenovo Legion 5 Pro 16 G7 i7 RTX 3070Ti | |
| Moyenne Intel Core i7-12700H (25586 - 79442, n=64) | |
| MSI Vector GP66 12UGS | |
| Lenovo Legion 5 Pro 16ACH6H (82JQ001PGE) | |
| Lenovo Legion 5 Pro 16ACH6H (82JQ001PGE) | |
| Asus TUF Gaming A15 FA506QR-AZ061T | |
| Acer Nitro 5 AN515-45-R1JH | |
| AIDA64 / Memory Write | |
| Moyenne de la classe Gaming (22297 - 135096, n=107, 2 dernières années) | |
| Lenovo Legion 5 Pro 16 G7 i7 RTX 3070Ti | |
| Moyenne Intel Core i7-12700H (23679 - 88660, n=64) | |
| MSI Vector GP66 12UGS | |
| Lenovo Legion 5 Pro 16ACH6H (82JQ001PGE) | |
| Lenovo Legion 5 Pro 16ACH6H (82JQ001PGE) | |
| Acer Nitro 5 AN515-45-R1JH | |
| Asus TUF Gaming A15 FA506QR-AZ061T | |
| AIDA64 / Memory Latency | |
| Moyenne de la classe Gaming (75.3 - 259, n=107, 2 dernières années) | |
| Lenovo Legion 5 Pro 16 G7 i7 RTX 3070Ti | |
| MSI Vector GP66 12UGS | |
| Lenovo Legion 5 Pro 16ACH6H (82JQ001PGE) | |
| Lenovo Legion 5 Pro 16ACH6H (82JQ001PGE) | |
| Asus TUF Gaming A15 FA506QR-AZ061T | |
| Moyenne Intel Core i7-12700H (76.2 - 133.9, n=62) | |
| Acer Nitro 5 AN515-45-R1JH | |
| HP Omen 16-b0085ng | |
* ... Moindre est la valeur, meilleures sont les performances
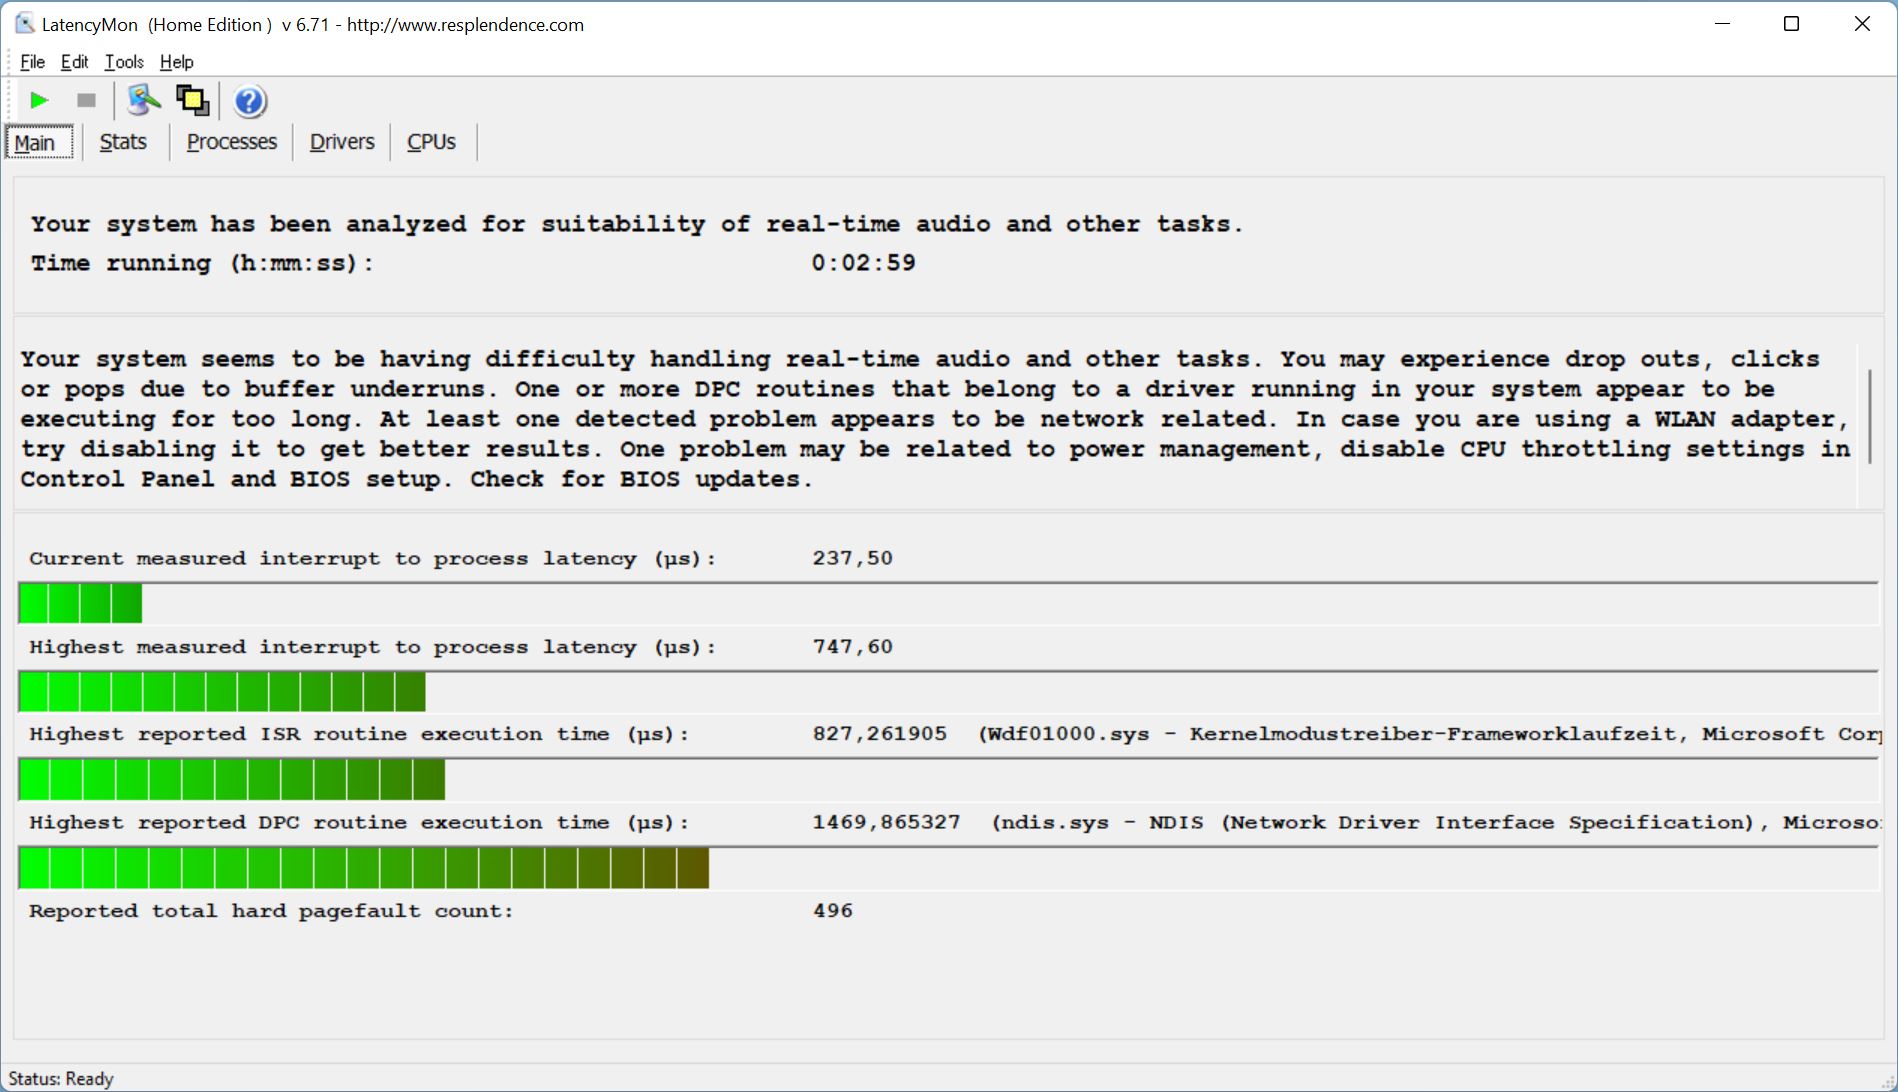
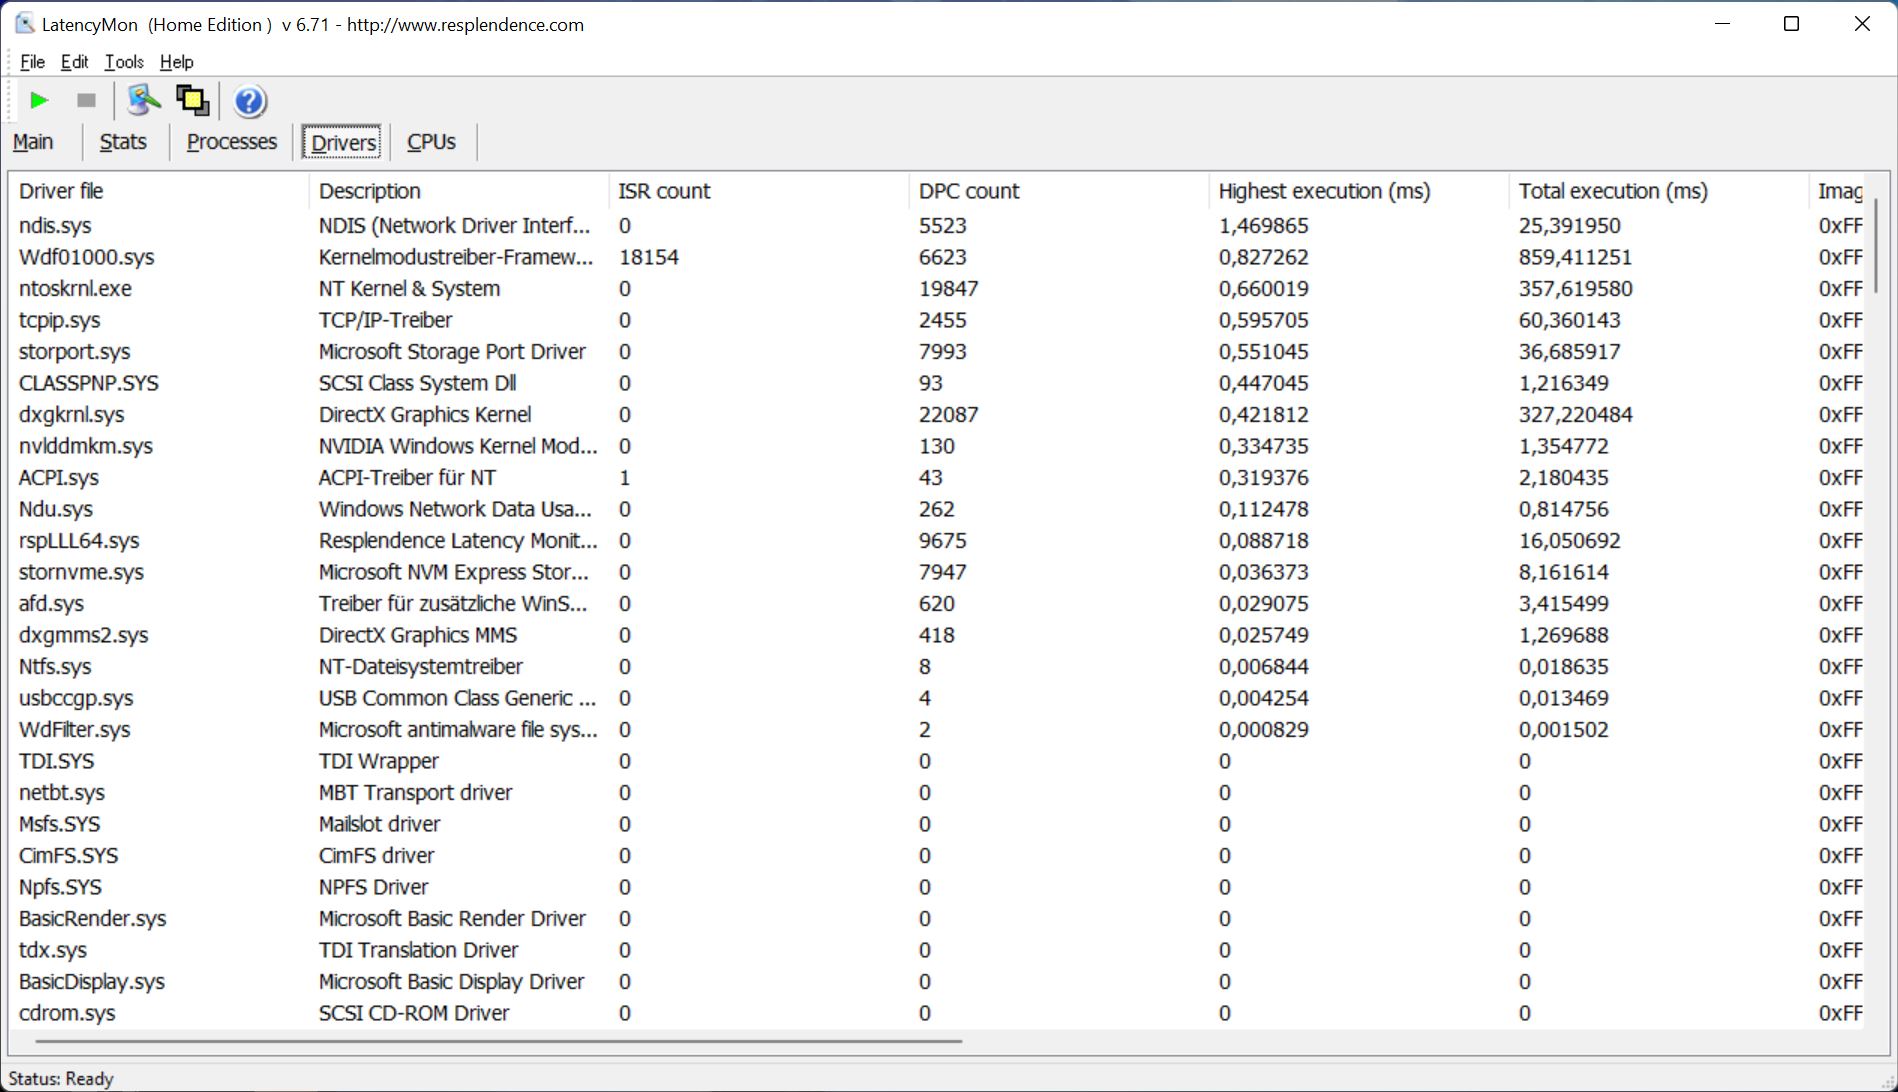
Latence DPC
Notre test de latence normalisé révèle quelques problèmes de pilote avec la version actuelle du BIOS, mais la latence elle-même est bonne. Il n'y a eu aucune perte d'images pendant la lecture d'une vidéo YouTube 4K.
| DPC Latencies / LatencyMon - interrupt to process latency (max), Web, Youtube, Prime95 | |
| MSI Vector GP66 12UGS | |
| Lenovo Legion 5 Pro 16ACH6H (82JQ001PGE) | |
| Asus TUF Gaming A15 FA506QR-AZ061T | |
| Lenovo Legion 5 Pro 16 G7 i7 RTX 3070Ti | |
| HP Omen 16-b0085ng | |
| Acer Nitro 5 AN515-45-R1JH | |
* ... Moindre est la valeur, meilleures sont les performances
Périphériques de stockage
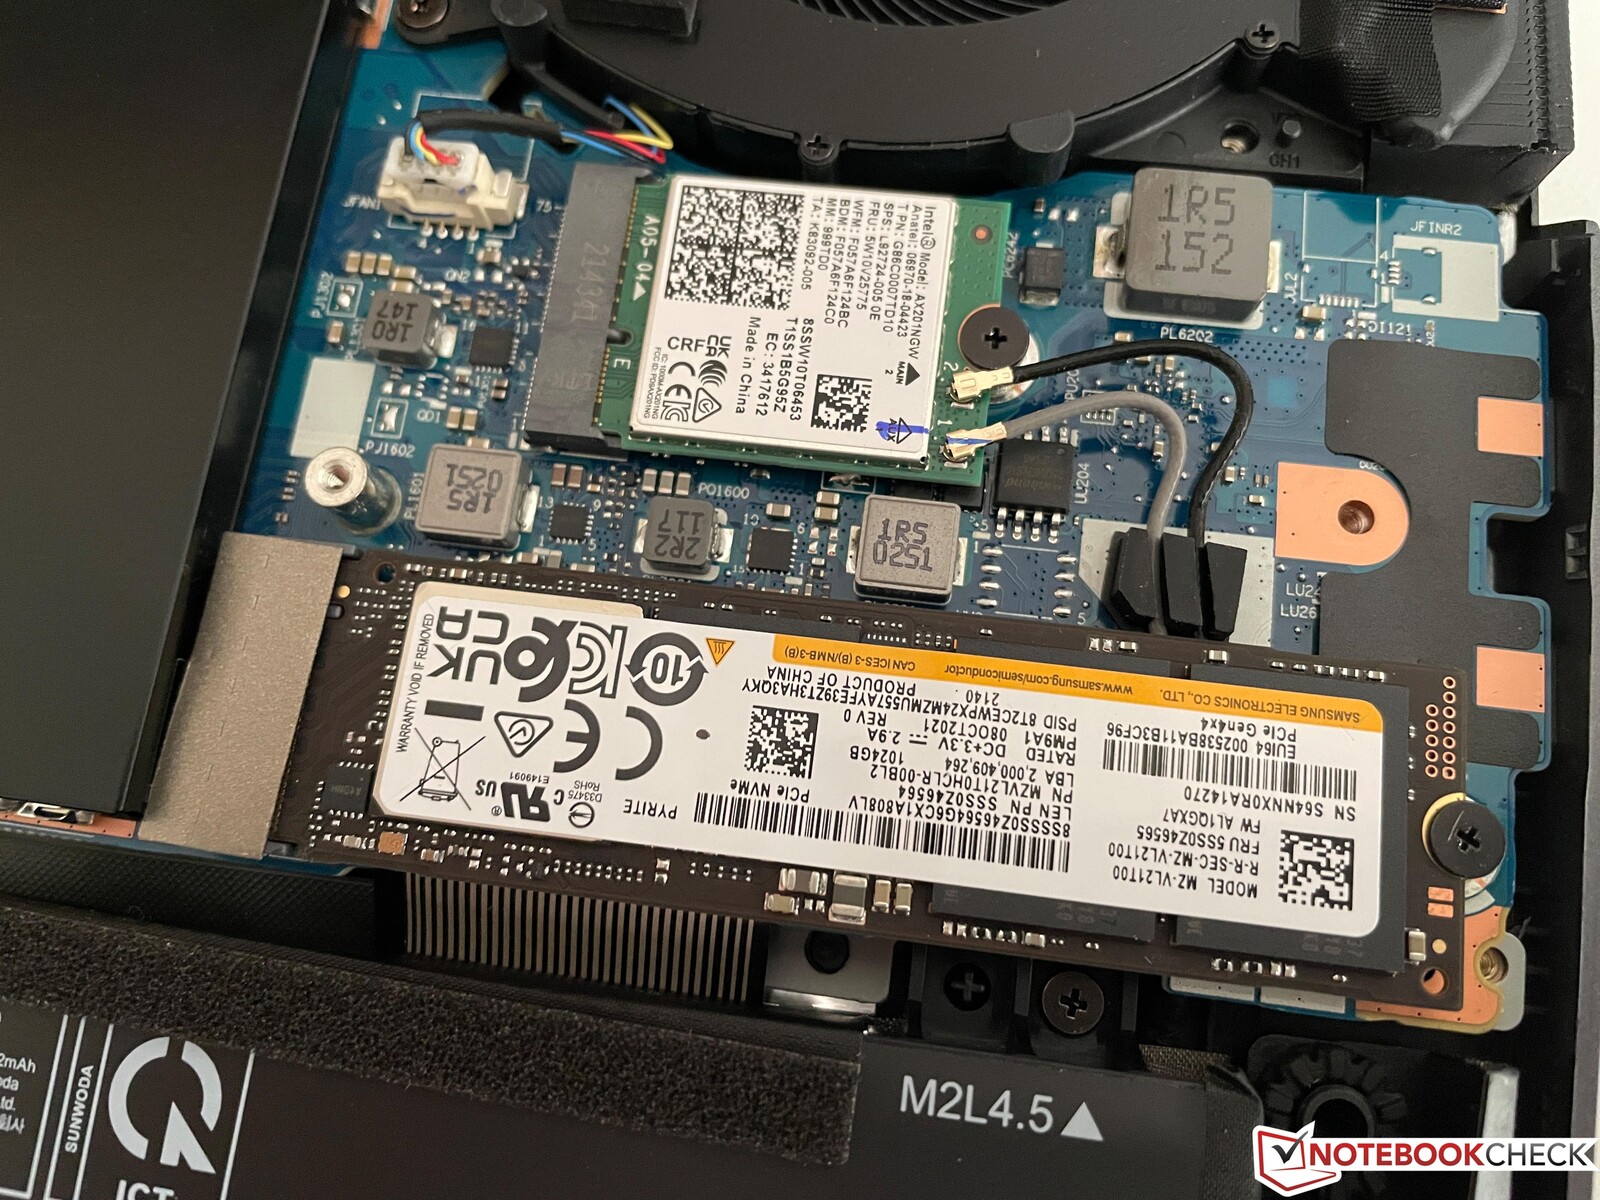
Le site Legion propose deux emplacements M.2-2280, qui sont cachés sous des caches supplémentaires. Il n'y a donc aucun problème pour étendre la capacité de stockage. Notre unité de test est équipée d'un seul SSD PCIe 4.0 de Samsung (PM91A) d'une capacité de stockage de 1 To. Vous pouvez utiliser 895 Go pour vos propres fichiers/applications après la configuration initiale. L'OM91A gère des taux de transfert très élevés de plus de 6 Go/s et c'est l'un des disques les plus rapides du marché. Le Legion s'assure également la première place au sein de notre groupe de comparaison. Plus de benchmarks SSD sont disponibles ici.

* ... Moindre est la valeur, meilleures sont les performances
Disk Throttling: DiskSpd Read Loop, Queue Depth 8
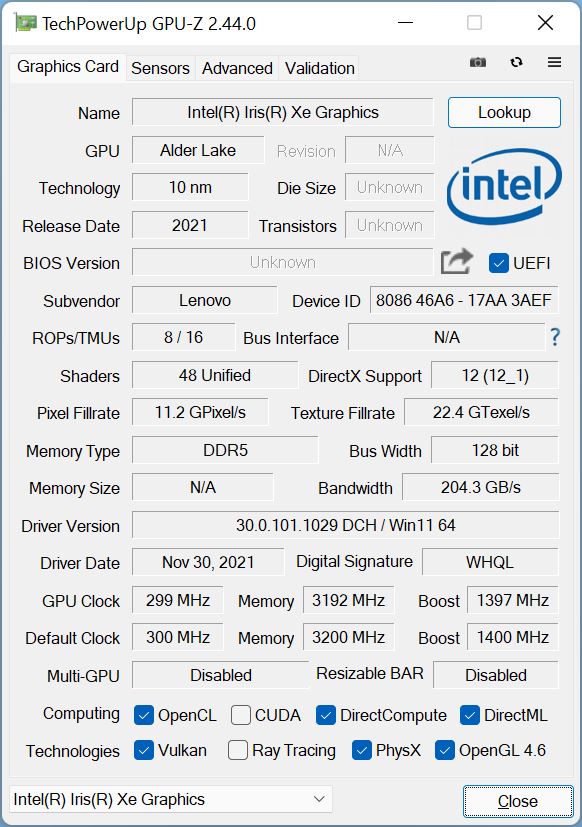
Performances du GPU - GeForce RTX 3070 Ti
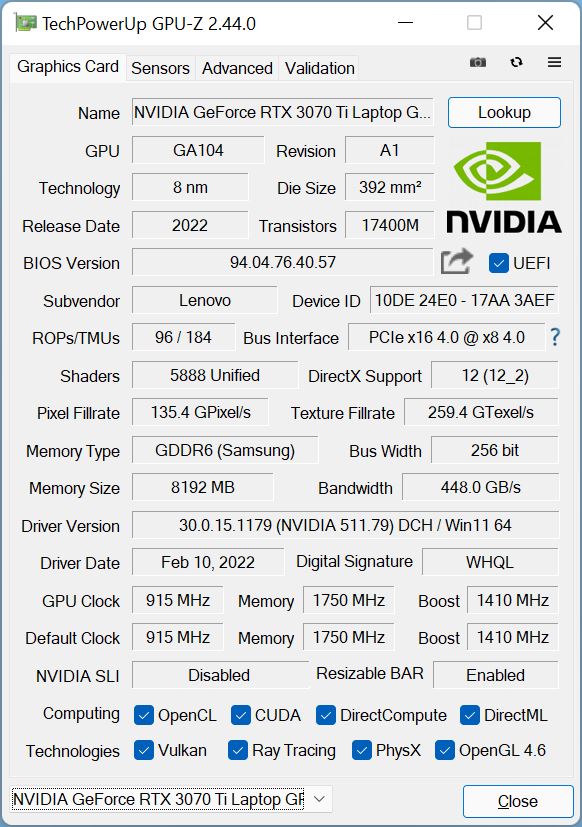
Nous avons déjà mentionné que le site Legion prend désormais en charge la technologie Advanced Optimus de Nvidia, qui utilise un MUX dynamique. Cela signifie que l'iGPU peut être désactivé lorsque vous pilotez l'écran interne, ce qui n'était pas possible auparavant sans un redémarrage. La nouvelleGeForce RTX 3070 Tiintervient automatiquement lorsque vous avez besoin de plus de performances. Lenovo utilise la version 125W de la 3070 Ti avec 8 GB GDDR6-VRAM et une horloge maximale de 1702 MHz, mais le GPU peut également utiliser 25W de boost dynamique du processeur.
Les résultats du benchmark sont très bons et au niveau attendu, mais leMSI Vector GP66est généralement légèrement plus rapide dans les benchmarks. Par rapport à l'ancienLegion 5 Pro 16avec laRTX 3070l'avantage est d'environ 20 %. Nous avons répertorié les résultats des trois modes d'énergie dans le tableau suivant.
| Scénario | Silencieux | Auto | Performance |
|---|---|---|---|
| Time Spy Graphiques | 9280 Points | 10424 Points | 11577 Points |
| Time Spy Stress test | 71.4 % (non réussi) | 96.8 % (non réussi) | 98 % (réussi) |
La RTX 3070 Ti est limitée à seulement 40W sur batterie, la baisse de performance est donc beaucoup plus importante par rapport au processeur. Le score graphique de Time Spy tombe à seulement 2670 points (-78 %). Veuillez consulter notre section technique pour plus de benchmarks GPU.
| 3DMark Fire Strike Score | 26098 points | |
| 3DMark Time Spy Score | 11752 points | |
Aide | ||
Performances en matière de jeux
Les performances de jeu du Legion 5i Pro 16 sont, comme prévu, très bonnes et l'ordinateur portable de jeu peut facilement gérer tous les jeux modernes dans la résolution native QHD. Cyberpunk 2077 tourne également à un peu plus de 60 fps, même avec le Ray Tracing. La nouvelleRTX 3070 Tiest environ 15 à 20 % plus rapide en moyenne par rapport à laRTX 3070. Certains titres fonctionneront toujours sans problème en mode silencieux (il y a un déficit de performance de 30-40 %) et vous bénéficiez du bruit plus faible du ventilateur.
| F1 2021 | |
| 1920x1080 High Preset AA:T AF:16x | |
| Lenovo Legion 5 Pro 16ACH6H (82JQ001PGE) | |
| Lenovo Legion 5 Pro 16 G7 i7 RTX 3070Ti | |
| Moyenne NVIDIA GeForce RTX 3070 Ti Laptop GPU (139.2 - 238, n=8) | |
| 1920x1080 Ultra High Preset + Raytracing AA:T AF:16x | |
| Lenovo Legion 5 Pro 16 G7 i7 RTX 3070Ti | |
| Lenovo Legion 5 Pro 16ACH6H (82JQ001PGE) | |
| Moyenne NVIDIA GeForce RTX 3070 Ti Laptop GPU (67.3 - 134.2, n=13) | |
| 2560x1440 Ultra High Preset + Raytracing AA:T AF:16x | |
| Lenovo Legion 5 Pro 16 G7 i7 RTX 3070Ti | |
| Lenovo Legion 5 Pro 16ACH6H (82JQ001PGE) | |
| Moyenne NVIDIA GeForce RTX 3070 Ti Laptop GPU (47.5 - 99.2, n=11) | |
| GRID Legends | |
| 1920x1080 High Preset | |
| Moyenne NVIDIA GeForce RTX 3070 Ti Laptop GPU (148 - 149.1, n=2) | |
| Lenovo Legion 5 Pro 16 G7 i7 RTX 3070Ti | |
| 1920x1080 Ultra Preset | |
| Lenovo Legion 5 Pro 16 G7 i7 RTX 3070Ti | |
| Moyenne NVIDIA GeForce RTX 3070 Ti Laptop GPU (111.2 - 114, n=2) | |
| 2560x1440 Ultra Preset | |
| Lenovo Legion 5 Pro 16 G7 i7 RTX 3070Ti | |
| Moyenne NVIDIA GeForce RTX 3070 Ti Laptop GPU (n=1) | |
| Cyberpunk 2077 1.6 | |
| 1920x1080 Ultra Preset | |
| Lenovo Legion 5 Pro 16 G7 i7 RTX 3070Ti | |
| Moyenne NVIDIA GeForce RTX 3070 Ti Laptop GPU (48.5 - 104, n=13) | |
| 2560x1440 Ultra Preset | |
| Lenovo Legion 5 Pro 16 G7 i7 RTX 3070Ti | |
| Moyenne NVIDIA GeForce RTX 3070 Ti Laptop GPU (40 - 62, n=10) | |
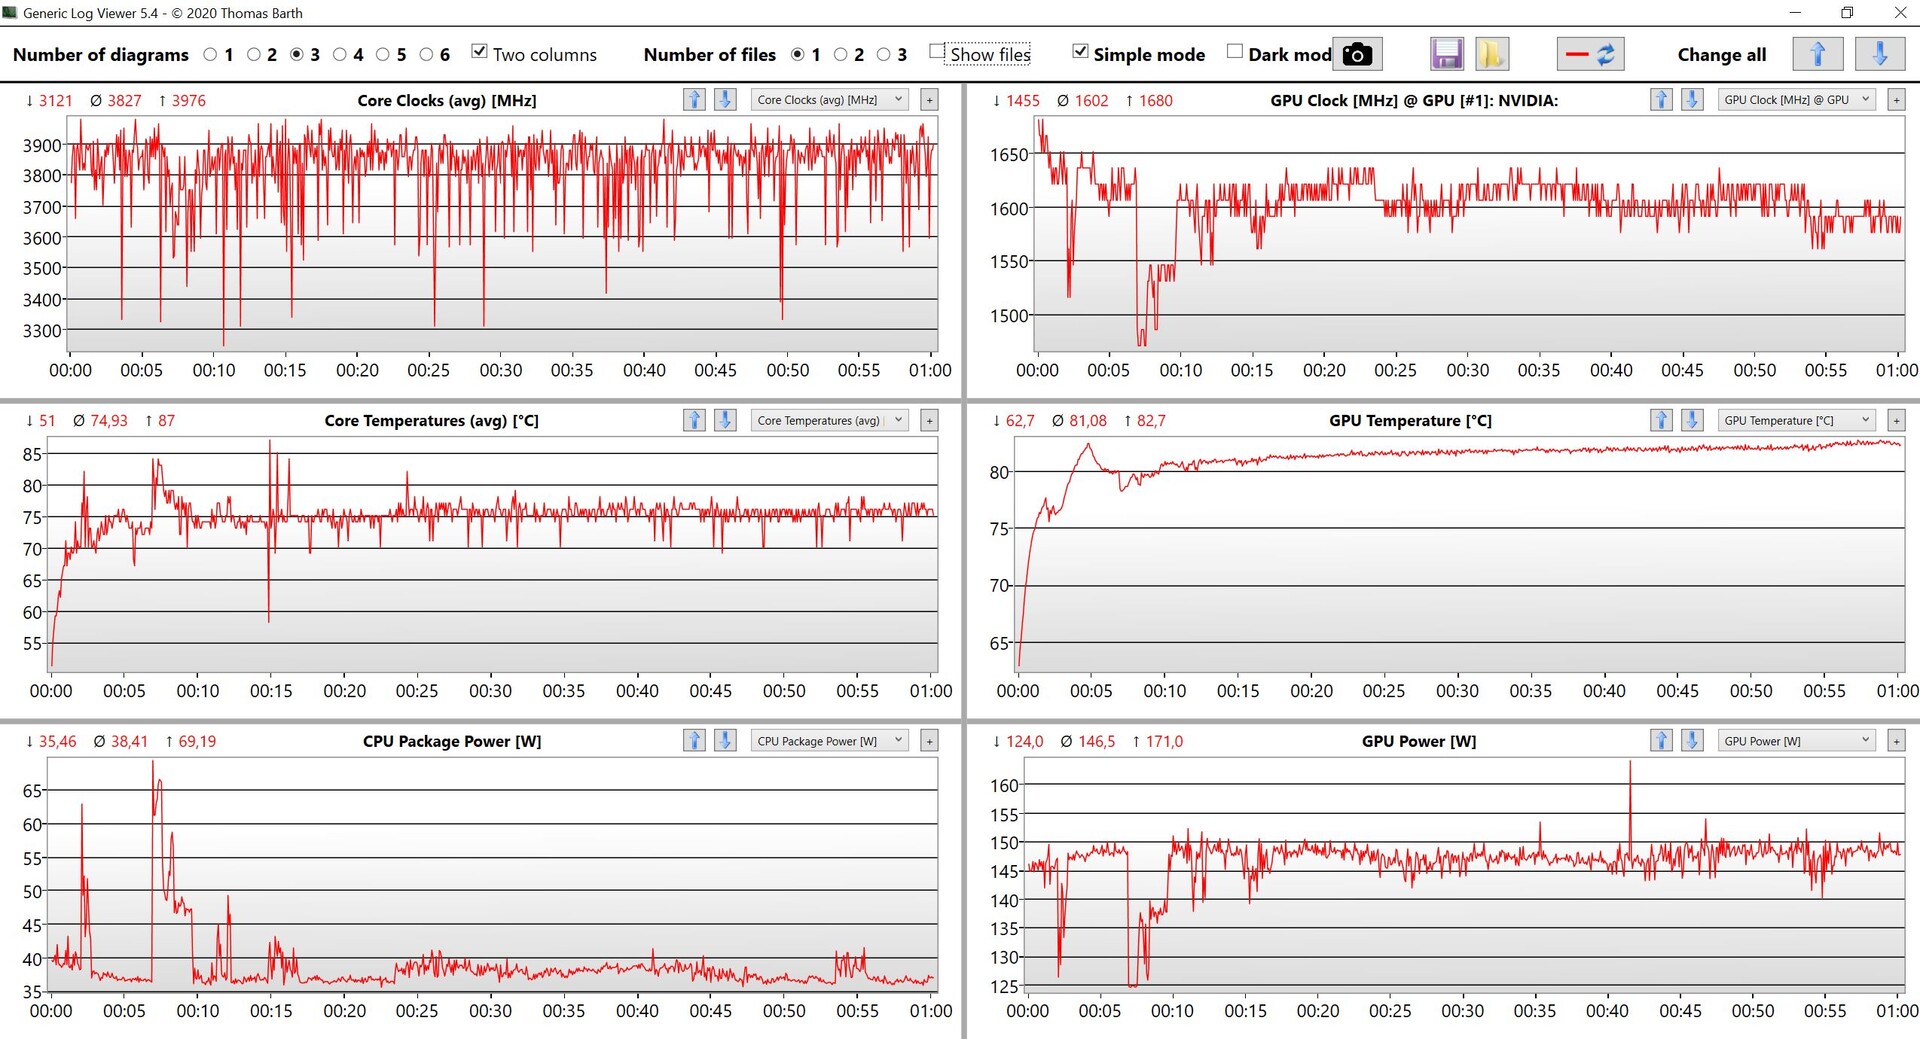
Le GPU peut également consommer 150W pendant le jeu, du moins en fonction de la charge du CPU (voir le graphique ci-dessous). Le jeu sur batterie est un peu problématique car les performances en prennent un coup. Witcher 3 (Préréglage Ultra), par exemple, tombe en dessous de 30 fps sans l'adaptateur d'alimentation. D'autres benchmarks de jeu sont listés ici.
Witcher 3 FPS-Diagramm
| Bas | Moyen | Élevé | Ultra | QHD | |
|---|---|---|---|---|---|
| GTA V (2015) | 185 | 182 | 171 | 117 | 100 |
| The Witcher 3 (2015) | 417 | 324 | 219 | 103 | |
| Dota 2 Reborn (2015) | 178 | 161 | 152 | 145 | |
| Final Fantasy XV Benchmark (2018) | 205 | 142 | 107 | 82.3 | |
| X-Plane 11.11 (2018) | 144 | 123 | 100 | ||
| Far Cry 5 (2018) | 172 | 137 | 129 | 122 | 108 |
| Strange Brigade (2018) | 453 | 270 | 224 | 199 | 150 |
| F1 2021 (2021) | 365 | 255 | 210 | 130 | 99.2 |
| GRID Legends (2022) | 209 | 169 | 148 | 114 | 99 |
| Cyberpunk 2077 1.6 (2022) | 145 | 123 | 96 | 94 | 62 |
Emissions - Legion 5i est bruyant et chaleureux
Bruit du système
Nous recommandons le mode Silencieux pour les tâches quotidiennes, car les ventilateurs seront désactivés la plupart du temps et il n'y a pas d'autres sons électroniques comme le ronronnement de la bobine. Dans les deux autres modes, les ventilateurs fonctionnent presque toujours, même au ralenti. Nous mesurons environ 40 dB(A) lorsque vous jouez en mode Silencieux, et cela dépend de la charge du CPU pour les deux autres modes. Witcher 3 avec une faible utilisation du CPU donne jusqu'à 49 dB(A), tandis que Cyberpunk 2077 donne jusqu'à 54 dB(A), ce qui est évidemment clairement audible.
| Scénario | Silencieux | Auto | Performance |
|---|---|---|---|
| Witcher 3 Ultra | 39,1 dB(A) (64 ips) | 49,4 dB(A) (100 ips) | 49,4 dB(A) (103 ips) |
| Cyberpunk 2077 1.5 Ultra QHD | 39.1 dB(A) (35 fps) | 49.4 dB(A) (57 fps) | 54.7 dB(A) (62 fps) |
| Test de stress | 39.1 dB(A) | 49.4 dB(A) | 54.7 dB(A) |
Degré de la nuisance sonore
| Au repos |
| 28.4 / 28.4 / 28.4 dB(A) |
| Fortement sollicité |
| 49.4 / 54.7 dB(A) |
 | ||
30 dB silencieux 40 dB(A) audible 50 dB(A) bruyant |
||
min: | ||
| Lenovo Legion 5 Pro 16 G7 i7 RTX 3070Ti GeForce RTX 3070 Ti Laptop GPU, i7-12700H, Samsung PM9A1 MZVL21T0HCLR | MSI Vector GP66 12UGS GeForce RTX 3070 Ti Laptop GPU, i9-12900H | HP Omen 16-b0085ng GeForce RTX 3070 Laptop GPU, i7-11800H, Intel Optane Memory H10 with Solid State Storage 32GB + 512GB HBRPEKNX0202A(L/H) | Acer Nitro 5 AN515-45-R1JH GeForce RTX 3070 Laptop GPU, R7 5800H, WDC PC SN530 SDBPNPZ-1T00 | Asus TUF Gaming A15 FA506QR-AZ061T GeForce RTX 3070 Laptop GPU, R7 5800H, SK Hynix HFM001TD3JX013N | Lenovo Legion 5 Pro 16ACH6H (82JQ001PGE) GeForce RTX 3070 Laptop GPU, R7 5800H, WDC PC SN730 SDBPNTY-1T00 | |
|---|---|---|---|---|---|---|
| Noise | 7% | 6% | 4% | 5% | 12% | |
| arrêt / environnement * (dB) | 24.6 | 22.9 7% | 23 7% | 25 -2% | 26 -6% | 23 7% |
| Idle Minimum * (dB) | 28.4 | 23.4 18% | 23 19% | 25 12% | 26 8% | 25 12% |
| Idle Average * (dB) | 28.4 | 23.4 18% | 23 19% | 25 12% | 26 8% | 25 12% |
| Idle Maximum * (dB) | 28.4 | 27.4 4% | 34.81 -23% | 32.2 -13% | 27.4 4% | 25 12% |
| Load Average * (dB) | 49.4 | 36 27% | 35.02 29% | 45.8 7% | 46.6 6% | 35.5 28% |
| Witcher 3 ultra * (dB) | 49.4 | 58.2 -18% | 52 -5% | 46.67 6% | ||
| Load Maximum * (dB) | 54.7 | 58 -6% | 56 -2% | 49.1 10% | 49.3 10% | 50.35 8% |
* ... Moindre est la valeur, meilleures sont les performances
Température
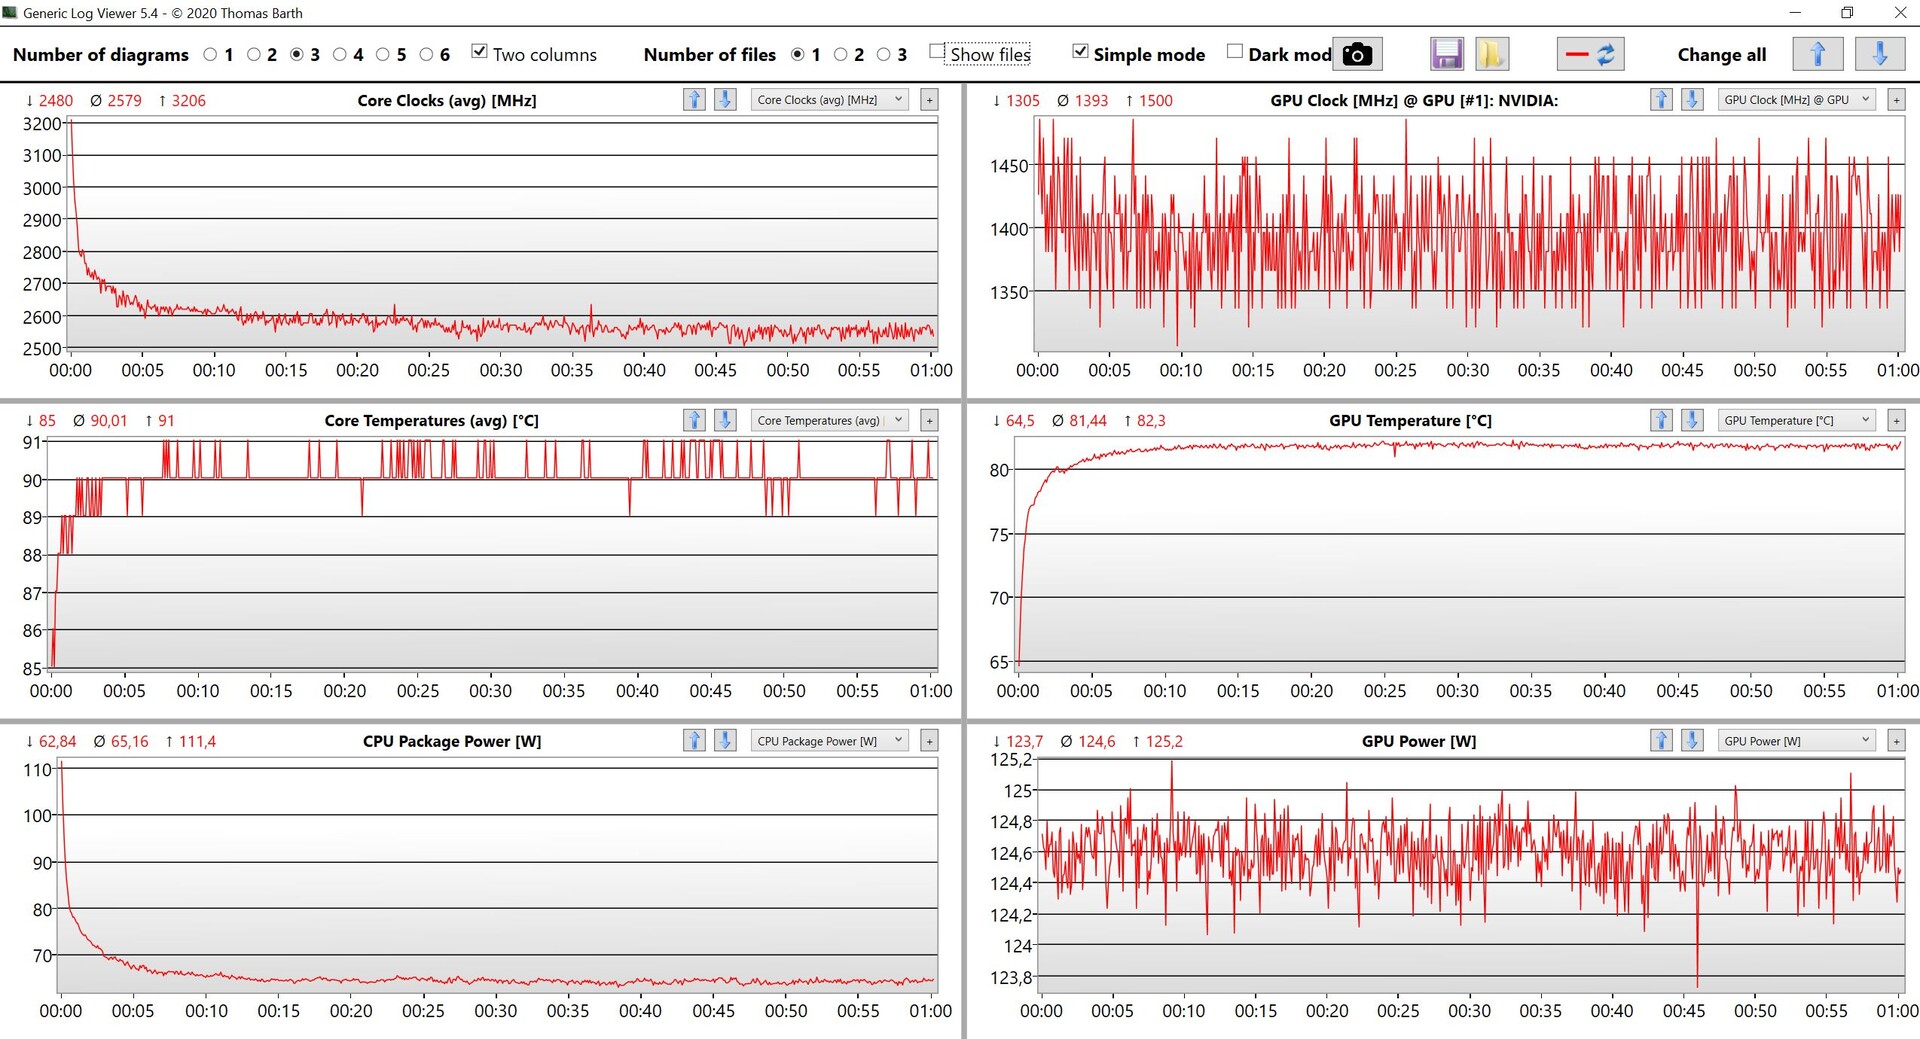
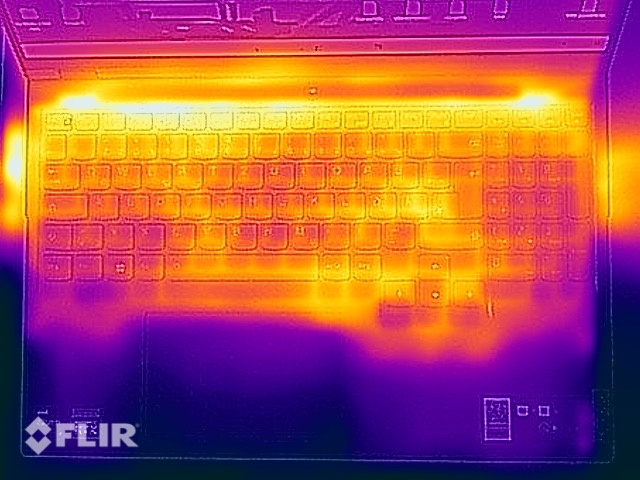
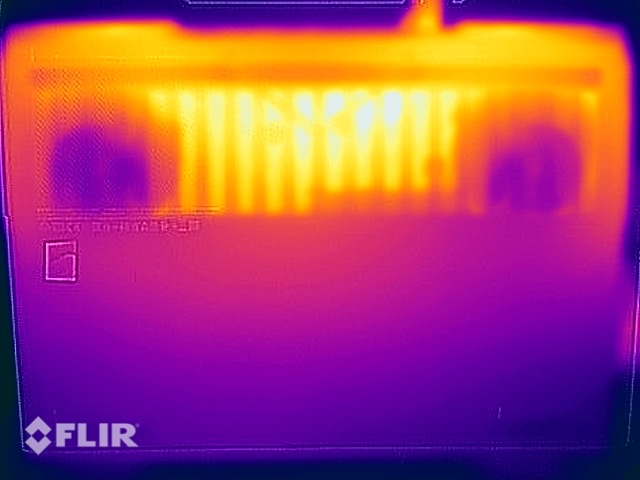
Certains endroits atteignent déjà plus de 30 °C au ralenti, mais cela ne signifie pas qu'il y a des limitations dans les charges de travail légères. Nous pouvons cependant mesurer près de 60 °C sur le bas de l'unité de base pendant le jeu, vous ne devriez donc pas l'utiliser sur vos genoux dans ce cas. Le clavier se réchauffe également de manière significative et vous aurez les doigts chauds pendant le jeu. Le GPU fonctionne à 125W pendant le test de stress et le processeur se stabilise rapidement à 62W.
(-) La température maximale du côté supérieur est de 45.3 °C / 114 F, par rapport à la moyenne de 40.4 °C / 105 F, allant de 21.2 à 68.8 °C pour la classe Gaming.
(-) Le fond chauffe jusqu'à un maximum de 61.2 °C / 142 F, contre une moyenne de 43.2 °C / 110 F
(+) En utilisation inactive, la température moyenne du côté supérieur est de 26.8 °C / 80 F, par rapport à la moyenne du dispositif de 33.9 °C / 93 F.
(±) En jouant à The Witcher 3, la température moyenne du côté supérieur est de 37.7 °C / 100 F, alors que la moyenne de l'appareil est de 33.9 °C / 93 F.
(±) Les repose-poignets et le pavé tactile peuvent devenir très chauds au toucher, avec un maximum de 37.5 °C / 99.5# F.
(-) La température moyenne de la zone de l'appui-paume de dispositifs similaires était de 28.8 °C / 83.8 F (-8.7 °C / #-15.7 F).
| Lenovo Legion 5 Pro 16 G7 i7 RTX 3070Ti Intel Core i7-12700H, NVIDIA GeForce RTX 3070 Ti Laptop GPU | MSI Vector GP66 12UGS Intel Core i9-12900H, NVIDIA GeForce RTX 3070 Ti Laptop GPU | HP Omen 16-b0085ng Intel Core i7-11800H, NVIDIA GeForce RTX 3070 Laptop GPU | Acer Nitro 5 AN515-45-R1JH AMD Ryzen 7 5800H, NVIDIA GeForce RTX 3070 Laptop GPU | Asus TUF Gaming A15 FA506QR-AZ061T AMD Ryzen 7 5800H, NVIDIA GeForce RTX 3070 Laptop GPU | Lenovo Legion 5 Pro 16ACH6H (82JQ001PGE) AMD Ryzen 7 5800H, NVIDIA GeForce RTX 3070 Laptop GPU | |
|---|---|---|---|---|---|---|
| Heat | -0% | -9% | -4% | -11% | -9% | |
| Maximum Upper Side * (°C) | 45.3 | 40.2 11% | 48 -6% | 53.2 -17% | 46.7 -3% | 50 -10% |
| Maximum Bottom * (°C) | 61.2 | 43.8 28% | 55 10% | 58.2 5% | 55.9 9% | 55 10% |
| Idle Upper Side * (°C) | 28.6 | 34.8 -22% | 33 -15% | 29.5 -3% | 37.1 -30% | 34 -19% |
| Idle Bottom * (°C) | 31.4 | 37 -18% | 39 -24% | 31.2 1% | 38.1 -21% | 37 -18% |
* ... Moindre est la valeur, meilleures sont les performances
Haut-parleurs
Les deux haut-parleurs stéréo (2W chacun) sont situés dans la zone avant de l'unité de base et dirigent le son vers le bas. Lenovo installe l'application Nahimic, qui propose de multiples profils et améliore nettement le son, qui est assez ténu sans le support logiciel. Cependant, les performances des basses pourraient être meilleures. Le système de haut-parleurs convient pour la musique de fond ou la lecture de vidéos, mais il est préférable d'utiliser un casque pendant les jeux, car les ventilateurs sont trop bruyants.
Lenovo Legion 5 Pro 16 G7 i7 RTX 3070Ti analyse audio
(±) | le niveau sonore du haut-parleur est moyen mais bon (79.1# dB)
Basses 100 - 315 Hz
(-) | presque aucune basse - en moyenne 17.8% plus bas que la médiane
(±) | la linéarité des basses est moyenne (9.9% delta à la fréquence précédente)
Médiums 400 - 2000 Hz
(+) | médiane équilibrée - seulement 3.7% de la médiane
(+) | les médiums sont linéaires (3.3% delta à la fréquence précédente)
Aiguës 2 - 16 kHz
(+) | des sommets équilibrés - à seulement 2.1% de la médiane
(+) | les aigus sont linéaires (5.8% delta à la fréquence précédente)
Globalement 100 - 16 000 Hz
(+) | le son global est linéaire (14.7% différence à la médiane)
Par rapport à la même classe
» 28% de tous les appareils testés de cette catégorie étaient meilleurs, 7% similaires, 64% pires
» Le meilleur avait un delta de 6%, la moyenne était de 18%, le pire était de 132%.
Par rapport à tous les appareils testés
» 19% de tous les appareils testés étaient meilleurs, 4% similaires, 77% pires
» Le meilleur avait un delta de 4%, la moyenne était de 24%, le pire était de 134%.
HP Omen 16-b0085ng analyse audio
(+) | les haut-parleurs peuvent jouer relativement fort (84.4# dB)
Basses 100 - 315 Hz
(-) | presque aucune basse - en moyenne 17.4% plus bas que la médiane
(±) | la linéarité des basses est moyenne (13.9% delta à la fréquence précédente)
Médiums 400 - 2000 Hz
(+) | médiane équilibrée - seulement 3.2% de la médiane
(+) | les médiums sont linéaires (2.9% delta à la fréquence précédente)
Aiguës 2 - 16 kHz
(+) | des sommets équilibrés - à seulement 1.5% de la médiane
(+) | les aigus sont linéaires (3.9% delta à la fréquence précédente)
Globalement 100 - 16 000 Hz
(+) | le son global est linéaire (12.1% différence à la médiane)
Par rapport à la même classe
» 12% de tous les appareils testés de cette catégorie étaient meilleurs, 4% similaires, 84% pires
» Le meilleur avait un delta de 6%, la moyenne était de 18%, le pire était de 132%.
Par rapport à tous les appareils testés
» 9% de tous les appareils testés étaient meilleurs, 2% similaires, 88% pires
» Le meilleur avait un delta de 4%, la moyenne était de 24%, le pire était de 134%.
Gestion de l'énergie - Legion 5i Pro avec Rapid Charge Pro
Consommation d'énergie
Nous mesurons une consommation maximale en veille jusqu'à 18W, ce qui reste correct compte tenu de la forte luminosité. La consommation maximale pendant le test de stress est de 294W, mais la valeur se stabilise à environ 240W après quelques minutes et vous pouvez également vous attendre à 230-240W pendant les jeux. L'adaptateur secteur de 300 W (1,056 kg) fourni est donc suffisant.
| Éteint/en veille | |
| Au repos | |
| Fortement sollicité |
|
Légende:
min: | |
| Lenovo Legion 5 Pro 16 G7 i7 RTX 3070Ti i7-12700H, GeForce RTX 3070 Ti Laptop GPU, Samsung PM9A1 MZVL21T0HCLR, IPS, 2560x1600, 16" | MSI Vector GP66 12UGS i9-12900H, GeForce RTX 3070 Ti Laptop GPU, , IPS, 1920x1080, 15.6" | HP Omen 16-b0085ng i7-11800H, GeForce RTX 3070 Laptop GPU, Intel Optane Memory H10 with Solid State Storage 32GB + 512GB HBRPEKNX0202A(L/H), IPS, 1920x1080, 16.1" | Acer Nitro 5 AN515-45-R1JH R7 5800H, GeForce RTX 3070 Laptop GPU, WDC PC SN530 SDBPNPZ-1T00, IPS, 2560x1440, 15.6" | Asus TUF Gaming A15 FA506QR-AZ061T R7 5800H, GeForce RTX 3070 Laptop GPU, SK Hynix HFM001TD3JX013N, IPS, 1920x1080, 15.6" | Lenovo Legion 5 Pro 16ACH6H (82JQ001PGE) R7 5800H, GeForce RTX 3070 Laptop GPU, WDC PC SN730 SDBPNTY-1T00, IPS, 2560x1600, 16" | Moyenne NVIDIA GeForce RTX 3070 Ti Laptop GPU | Moyenne de la classe Gaming | |
|---|---|---|---|---|---|---|---|---|
| Power Consumption | -44% | 4% | 18% | 15% | 9% | -24% | -15% | |
| Idle Minimum * (Watt) | 8.6 | 17.5 -103% | 12 -40% | 8.8 -2% | 10.2 -19% | 10.45 -22% | 14.2 ? -65% | 13.2 ? -53% |
| Idle Average * (Watt) | 17.6 | 20.1 -14% | 18 -2% | 13 26% | 12.8 27% | 14.92 15% | 19.9 ? -13% | 18.9 ? -7% |
| Idle Maximum * (Watt) | 18.5 | 47.3 -156% | 21 -14% | 14.6 21% | 15 19% | 16.02 13% | 26.2 ? -42% | 24.3 ? -31% |
| Load Average * (Watt) | 110 | 107.3 2% | 94 15% | 133 -21% | 130 -18% | 119.65 -9% | 125.8 ? -14% | 108.3 ? 2% |
| Witcher 3 ultra * (Watt) | 227 | 225 1% | 147 35% | 134 41% | 137 40% | 174.9 23% | ||
| Load Maximum * (Watt) | 294.6 | 277.7 6% | 199 32% | 164 44% | 184 38% | 187.26 36% | 248 ? 16% | 254 ? 14% |
* ... Moindre est la valeur, meilleures sont les performances
Power Consumption Witcher 3 / Stress test
Power Consumption external screen
Durée de vie de la batterie
La batterie de 80Wh ne permet pas d'obtenir une autonomie très longue. À 150 nits (soit 67 % de la luminosité maximale de notre appareil), notre test vidéo dure un peu plus de 6 heures et le test Wi-Fi 4,5 à 5,5 heures selon la luminosité. Si vous sollicitez vraiment l'ordinateur portable, la batterie se vide au bout de 37 minutes.
L'appareil prend en charge Rapid Charge Pro pour des temps de charge plus rapides. Vous pouvez activer cette fonction via le logiciel Vantage et elle raccourcit vraiment le temps de charge de façon notable. Le mode normal a une courbe de charge très linéaire et une charge complète prend 102 minutes. La charge rapide raccourcit ce temps d'environ 40 minutes et 80 % de la capacité sont déjà disponibles après seulement 22 minutes.
| Lenovo Legion 5 Pro 16 G7 i7 RTX 3070Ti i7-12700H, GeForce RTX 3070 Ti Laptop GPU, 80 Wh | MSI Vector GP66 12UGS i9-12900H, GeForce RTX 3070 Ti Laptop GPU, 65 Wh | HP Omen 16-b0085ng i7-11800H, GeForce RTX 3070 Laptop GPU, 83 Wh | Acer Nitro 5 AN515-45-R1JH R7 5800H, GeForce RTX 3070 Laptop GPU, 57.5 Wh | Asus TUF Gaming A15 FA506QR-AZ061T R7 5800H, GeForce RTX 3070 Laptop GPU, 90 Wh | Lenovo Legion 5 Pro 16ACH6H (82JQ001PGE) R7 5800H, GeForce RTX 3070 Laptop GPU, 80 Wh | Moyenne de la classe Gaming | |
|---|---|---|---|---|---|---|---|
| Autonomie de la batterie | 37% | 53% | 28% | 206% | 24% | 69% | |
| H.264 (h) | 6.3 | 5.4 -14% | 6.9 10% | 8.26 ? 31% | |||
| WiFi v1.3 (h) | 5.4 | 5.7 6% | 7.6 41% | 5.7 6% | 11.4 111% | 7 30% | 7.04 ? 30% |
| Load (h) | 0.6 | 1 67% | 1.4 133% | 1 67% | 2.4 300% | 0.7 17% | 1.47 ? 145% |
| Reader / Idle (h) | 7.9 | 9.2 | 17.4 | 9.1 | 8.71 ? |
Points positifs
Points négatifs
Verdict - L'ordinateur portable de jeu de Lenovo offre des performances élevées pour un prix raisonnable
La septième génération du Legion 5i Pro 16 bénéficie d'une augmentation sensible de ses performances. Lenovo utilise toujours le même châssis, qui n'utilise pas d'éléments d'éclairage ou d'autres caractéristiques spéciales. Il offre de bonnes capacités de refroidissement, de nombreux ports et des options de maintenance décentes avec deux emplacements RAM et deux emplacements M.2-SSD à la place. La dalle 165 Hz laisse également une bonne impression et est définitivement un bon choix pour un ordinateur portable de jeu
Les performances avec le nouveau Alder LakeCore i7-12700Het laGeForce RTX 3070 Tiavec des valeurs TDP/TGP élevées sont également impressionnantes. Même des titres très exigeants comme Cyberpunk 2077 fonctionnent sans problème en QHD avec Ray Tracing. Vous disposez également d'un SSD PCIe 4.0 rapide ainsi que de Thunderbolt 4, mais pas de la dernière norme Wi-Fi 6E (6 GHz) ni d'un port Ethernet 2,5 Gbps. Cela ne devrait pas être un gros problème
Le Lenovo Legion 5i Pro 16 se concentre sur les performances de jeu et combine des composants puissants avec un bon écran. Il est difficile d'obtenir plus de performances pour environ 2000 euros et le Legion 5i Pro 16 est tout simplement un très bon ordinateur portable de jeu
Le système n'est pas sans défaut, car toutes les performances se traduisent par des ventilateurs bruyants ainsi que des températures de surface élevées. Nous recommandons le mode silencieux si vous ne jouez pas à des jeux, et il peut être facilement activé par une combinaison de touches. Il peut également être utile pendant les jeux grâce au bruit nettement plus faible des ventilateurs, mais les performances diminuent de 30 à 40 %
MSIVector GP66 de MSIde MSI utilise également la nouvelle RTX 3070 Ti et est généralement un peu plus rapide pendant les jeux, mais il utilise également un écran 1080p de qualité inférieure avec une luminosité plus faible. Tous les autres concurrents, comme leAcer Nitro 5,Asus TUF Gaming A15ouHP Omen 16utilisent toujours la vieille RTX 3070 et sont 15-20 % plus lents lorsque vous jouez à des jeux.
Prix et disponibilité
La boutique en ligne de Lenovo aux États-Unis ne propose actuellement qu'une version moins puissante du Legion 5i Pro 16 Gen7 avec le même Core i7-12700H, mais une GeForce RTX 3050 Ti plus lente pour 1779 $.
Lenovo Legion 5 Pro 16 G7 i7 RTX 3070Ti
- 03/28/2022 v7 (old)
Andreas Osthoff
Price comparison

