Test du Lenovo Legion 5 Pro Gen 7 : Ryzen 7 6800H ou Ryzen 9 6900HX ?
Le Legion 5 Pro Gen 7 est un ordinateur portable de jeu de milieu de gamme, situé juste en dessous de la série 7 16, encore plus chère Legion série 7 16, encore plus chère. Il rejoint la gamme de plus en plus courante d'ordinateurs portables de jeu de 16 pouces comme le HP Omen 16, Asus ROG Zephyrus M16, Dell G16ou le Gigabyte Aero 16 qui sont tous des alternatives au modèle Lenovo examiné.
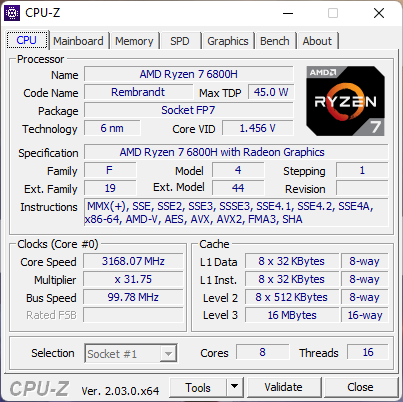
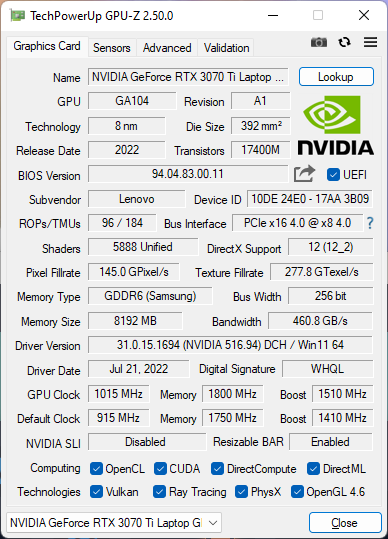
Notre unité de test est livrée avec le processeur AMD Zen 3+ Ryzen 7 6800H avec 150 W TGP GeForce RTX 3070 Ti graphics pour environ $1900 USD. D'autres SKU sont disponibles avec le Ryzen 9 6900HX, RTX 3070, RTX 3060, ou RTX 3050 Ti, mais toutes les options sont livrées avec le même écran IPS 16:10 2560 x 1600 avec support G-Sync.
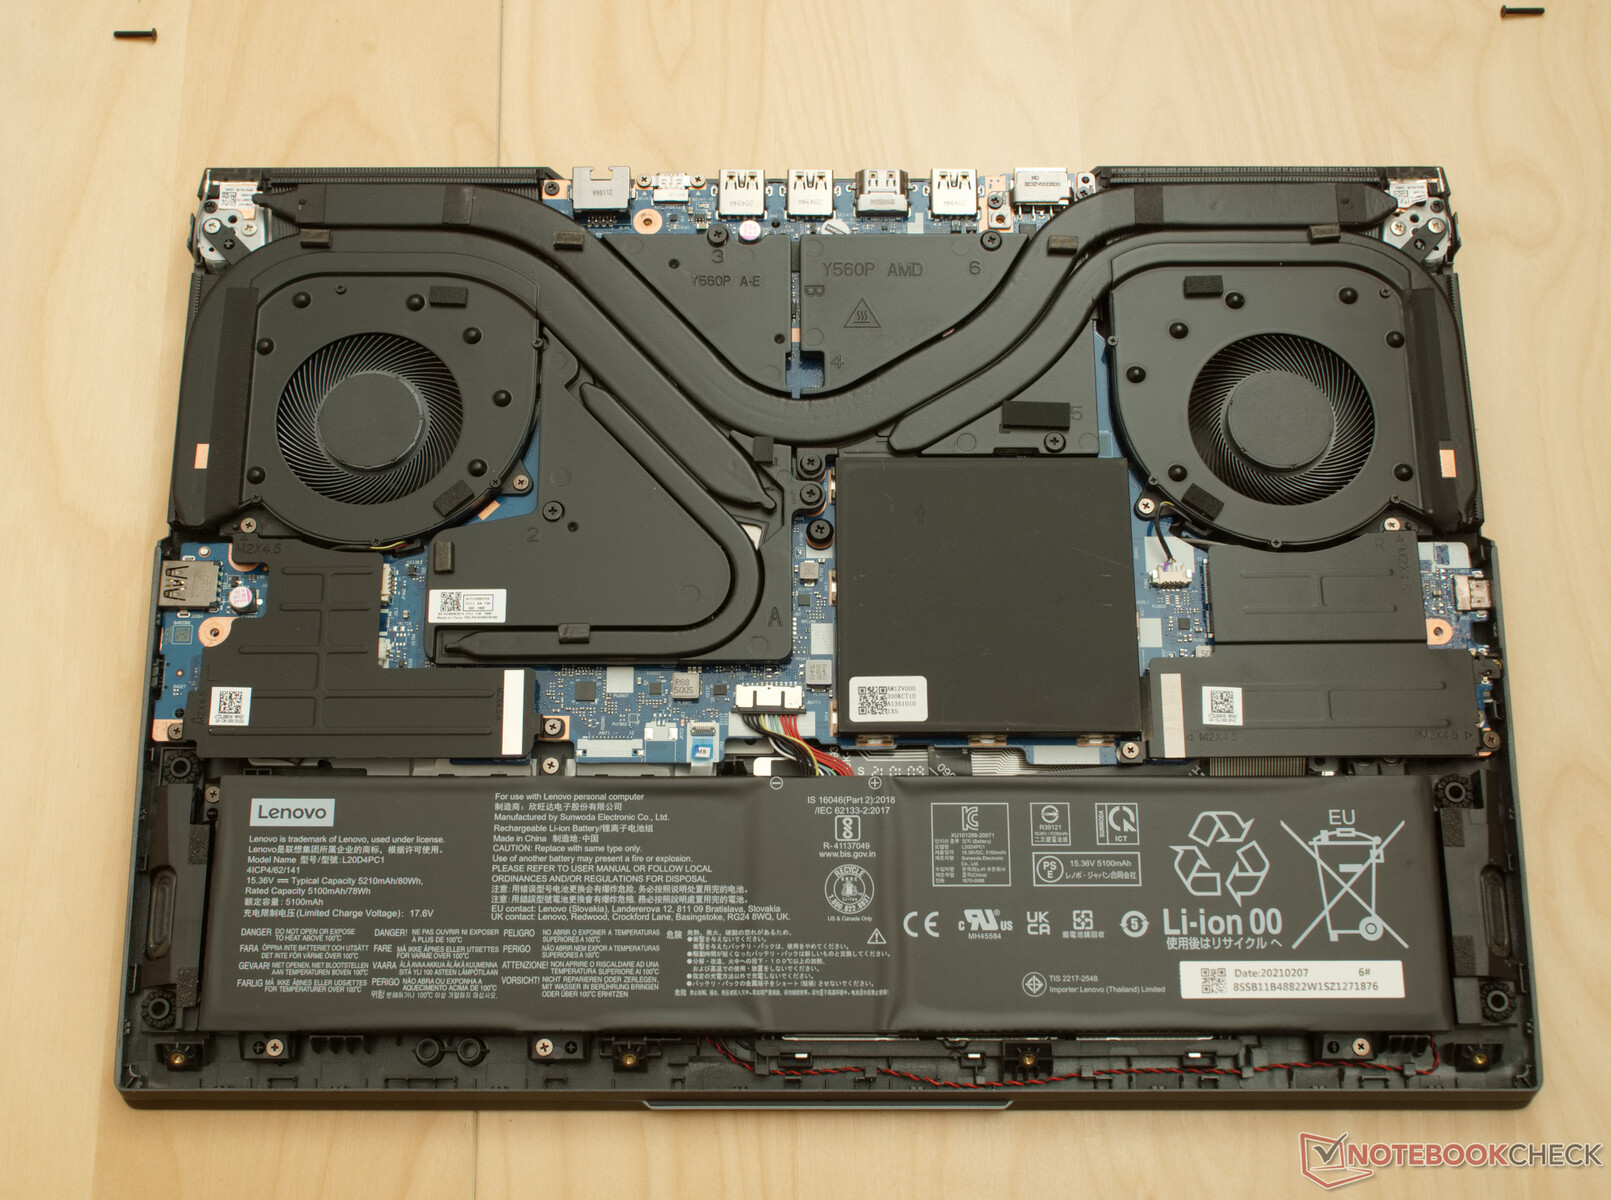
Le 2022 Legion 5 Pro Gen 7 partage le même design de châssis que le modèle de l'année dernière et nous vous recommandons donc de consulter notre critique du modèle 2021 pour plus d'informations sur les caractéristiques physiques de l'appareil. L'ancienne version utilise des processeurs Zen 3 Ryzen 7 5800H et TGP 140 W GeForce RTX 3070 plus lents en comparaison
Plus de commentaires sur Lenovo :
Comparaison avec les concurrents potentiels
Note | Date | Modèle | Poids | Épaisseur | Taille | Résolution | Prix |
|---|---|---|---|---|---|---|---|
| 87.7 % v7 (old) | 10/22 | Lenovo Legion 5 Pro 16ARH7H RTX 3070 Ti R7 6800H, GeForce RTX 3070 Ti Laptop GPU | 2.6 kg | 26.6 mm | 16.00" | 2560x1600 | |
| 86.6 % v7 (old) | 07/22 | Lenovo Legion 5 Pro 16IAH7H i7-12700H, GeForce RTX 3060 Laptop GPU | 2.6 kg | 27 mm | 16.00" | 2560x1600 | |
| 85.6 % v7 (old) | 07/21 | Asus ROG Zephyrus M16 GU603H i9-11900H, GeForce RTX 3070 Laptop GPU | 2 kg | 20 mm | 16.00" | 2560x1600 | |
| 90.8 % v7 (old) | 09/22 | Lenovo Legion 7 16ARHA7 R9 6900HX, Radeon RX 6850M XT | 2.6 kg | 19.4 mm | 16.00" | 2560x1600 | |
| 82.3 % v7 (old) | 05/22 | HP Victus 16-e0145ng R5 5600H, GeForce RTX 3050 Ti Laptop GPU | 2.4 kg | 23.5 mm | 16.10" | 1920x1080 | |
| 86.1 % v7 (old) | 10/22 | Dell G16 7620 i7-12700H, GeForce RTX 3060 Laptop GPU | 2.6 kg | 26.9 mm | 16.00" | 2560x1600 |
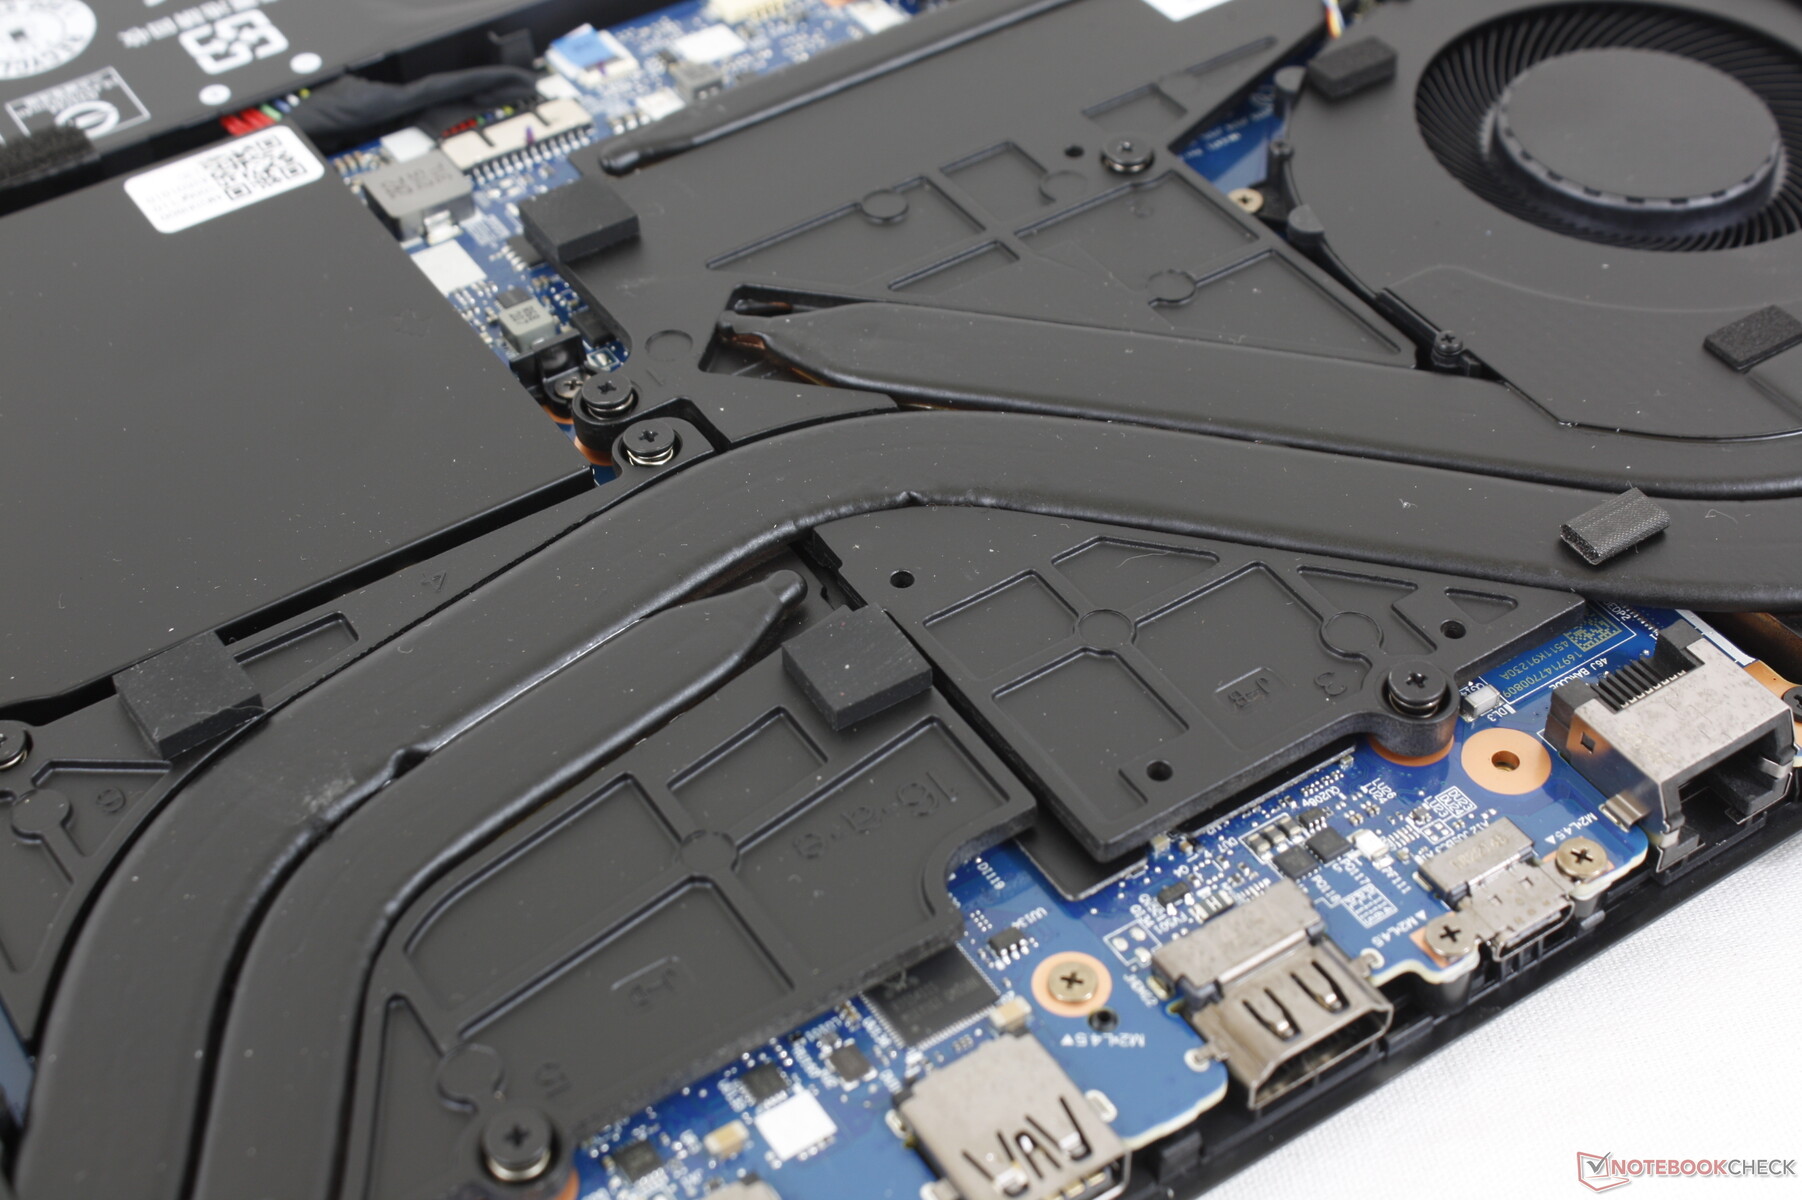
Mallette - Couvercle extérieur et base inférieure en aluminium
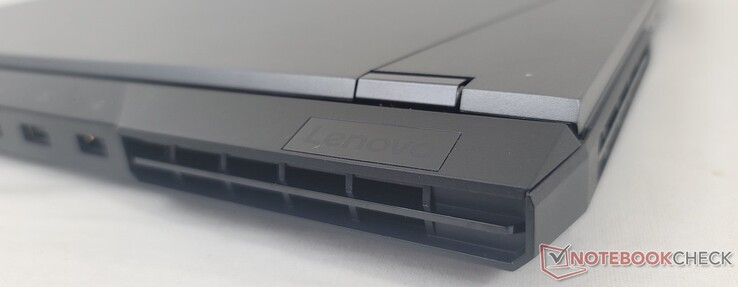
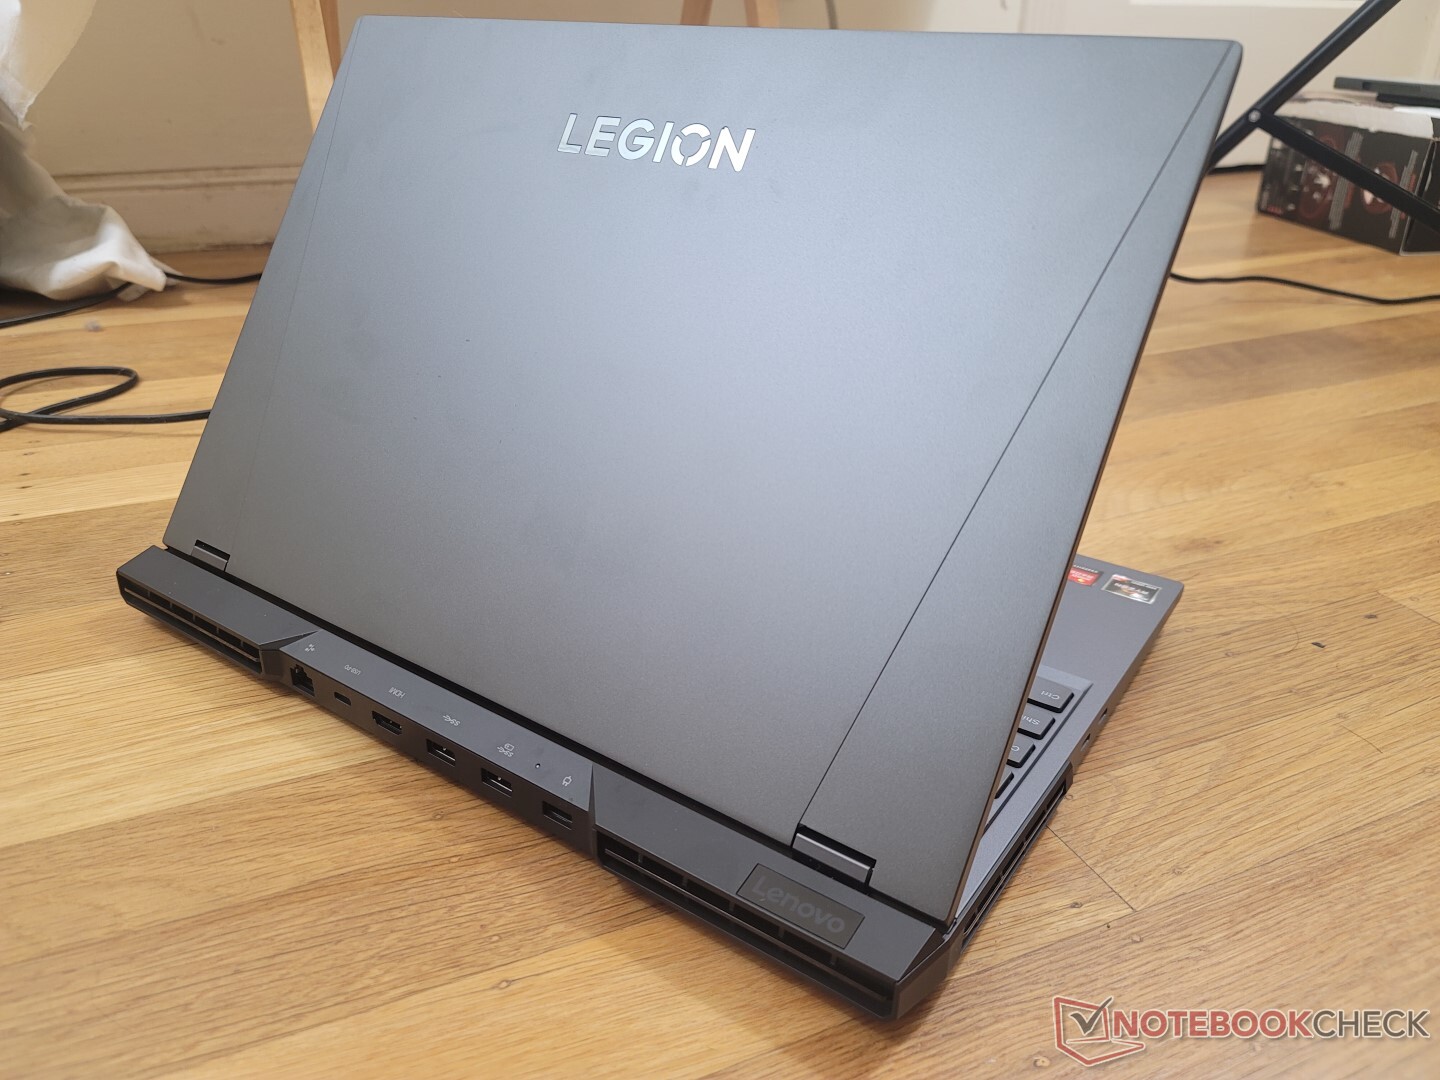
Il existe un moyen facile de distinguer le modèle 2022 Legion 5 Pro 16 du modèle 2021 Legion 5 Pro 16. Le modèle 2022 possède un port USB-C supplémentaire le long du bord gauche, soit trois au total, alors que le modèle 2021 n'en possède que deux. Parallèlement, le nombre de ports USB-A est passé de quatre à trois. Les deux modèles sont sinon visuellement identiques.
Communication
| Networking | |
| iperf3 transmit AX12 | |
| Asus ROG Zephyrus M16 GU603H | |
| iperf3 receive AX12 | |
| Asus ROG Zephyrus M16 GU603H | |
| iperf3 receive AXE11000 6GHz | |
| Lenovo Legion 5 Pro 16ARH7H RTX 3070 Ti | |
| Lenovo Legion 7 16ARHA7 | |
| iperf3 receive AXE11000 | |
| Dell G16 7620 | |
| HP Victus 16-e0145ng | |
| iperf3 transmit AXE11000 6GHz | |
| Lenovo Legion 7 16ARHA7 | |
| Lenovo Legion 5 Pro 16ARH7H RTX 3070 Ti | |
| iperf3 transmit AXE11000 | |
| Dell G16 7620 | |
| HP Victus 16-e0145ng | |
Webcam
La webcam continue à être seulement 720p sans IR.


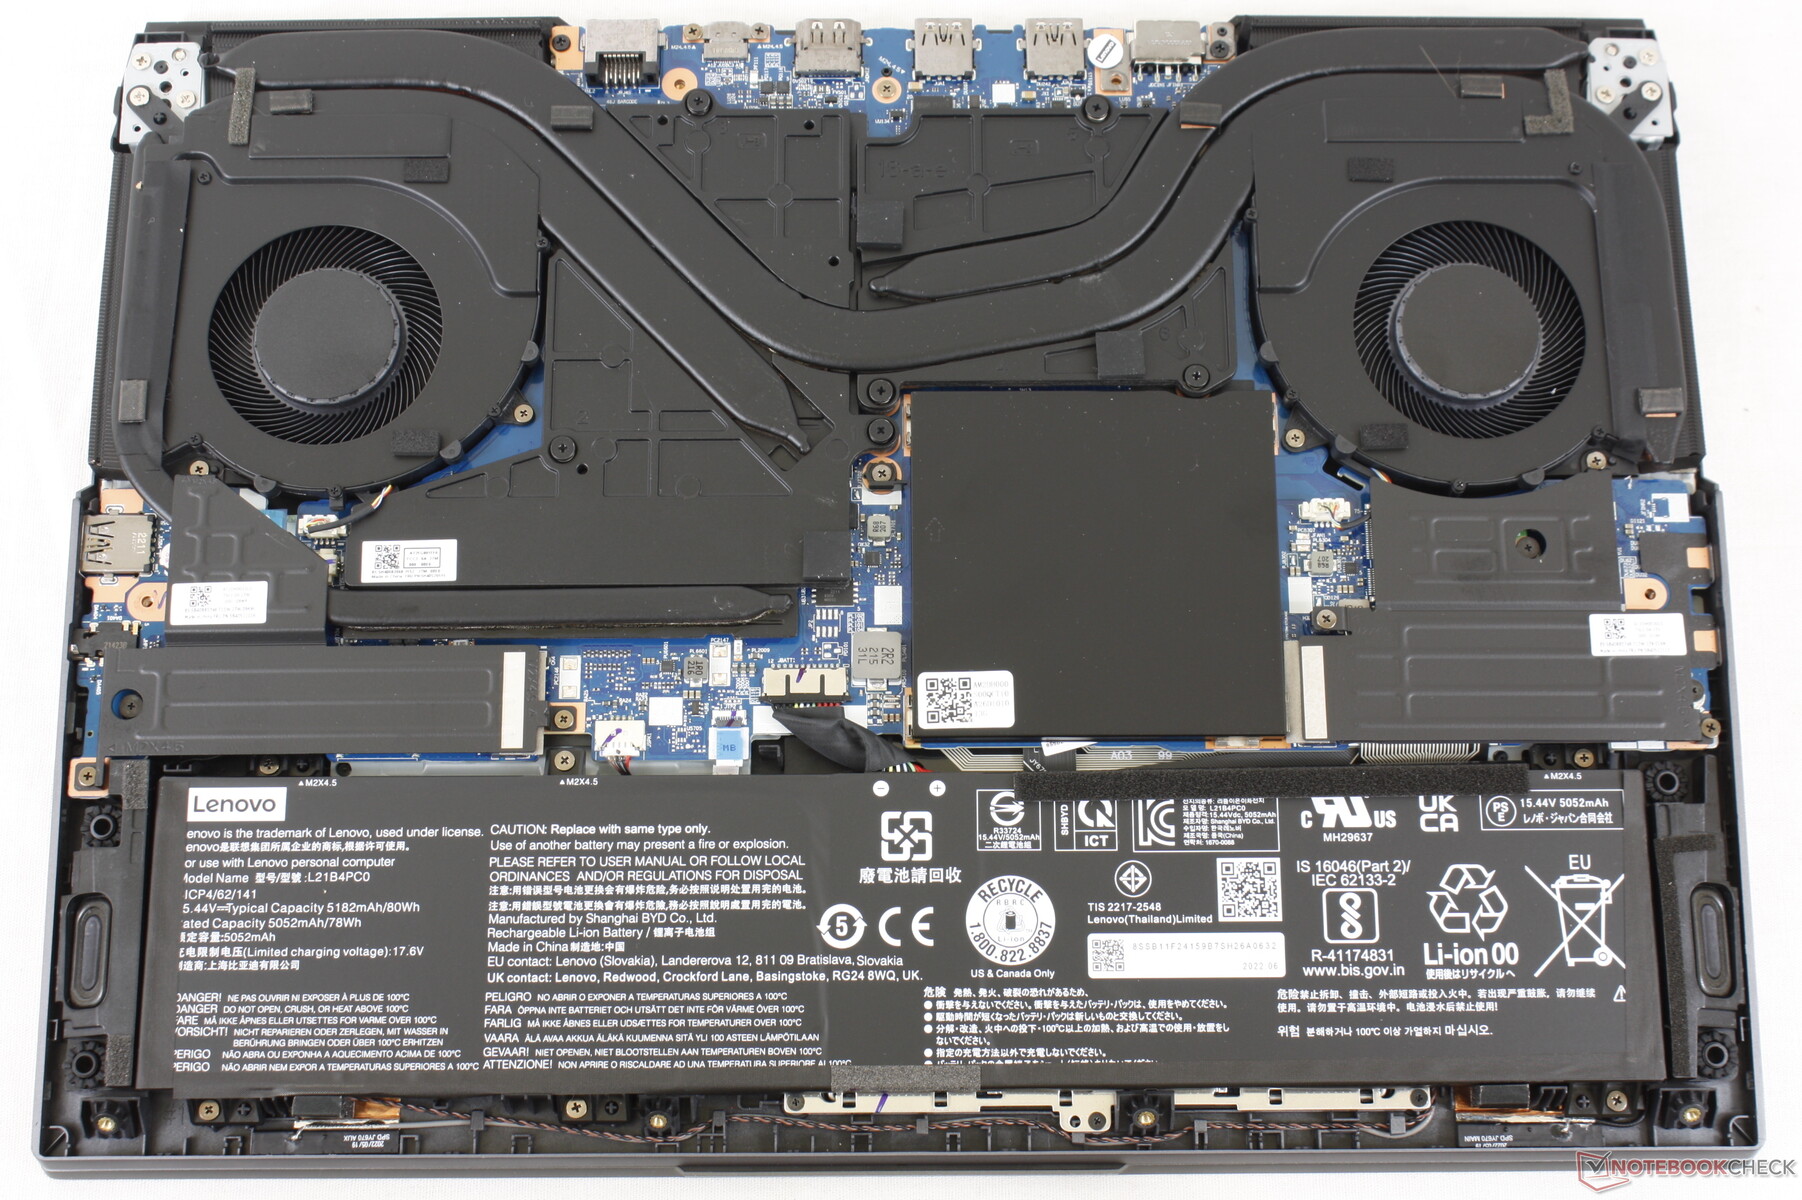
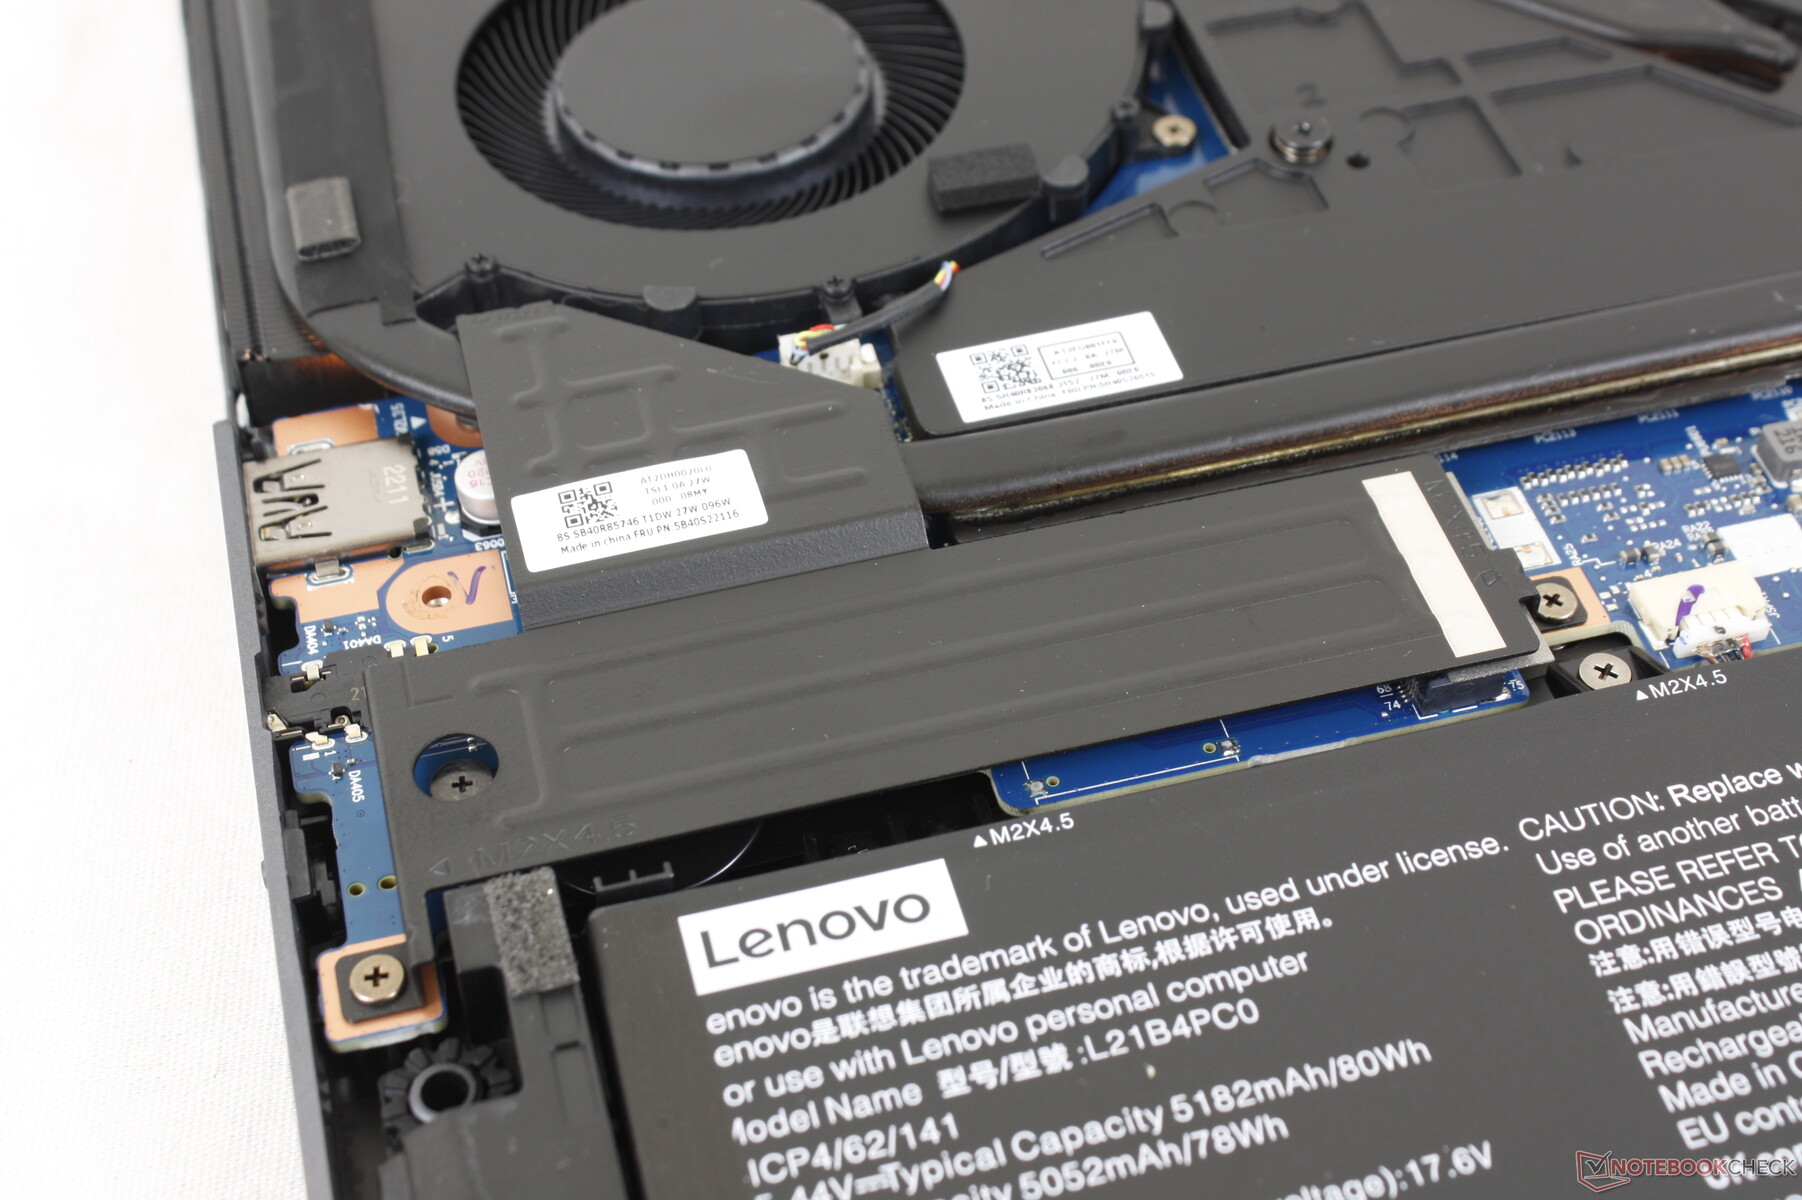
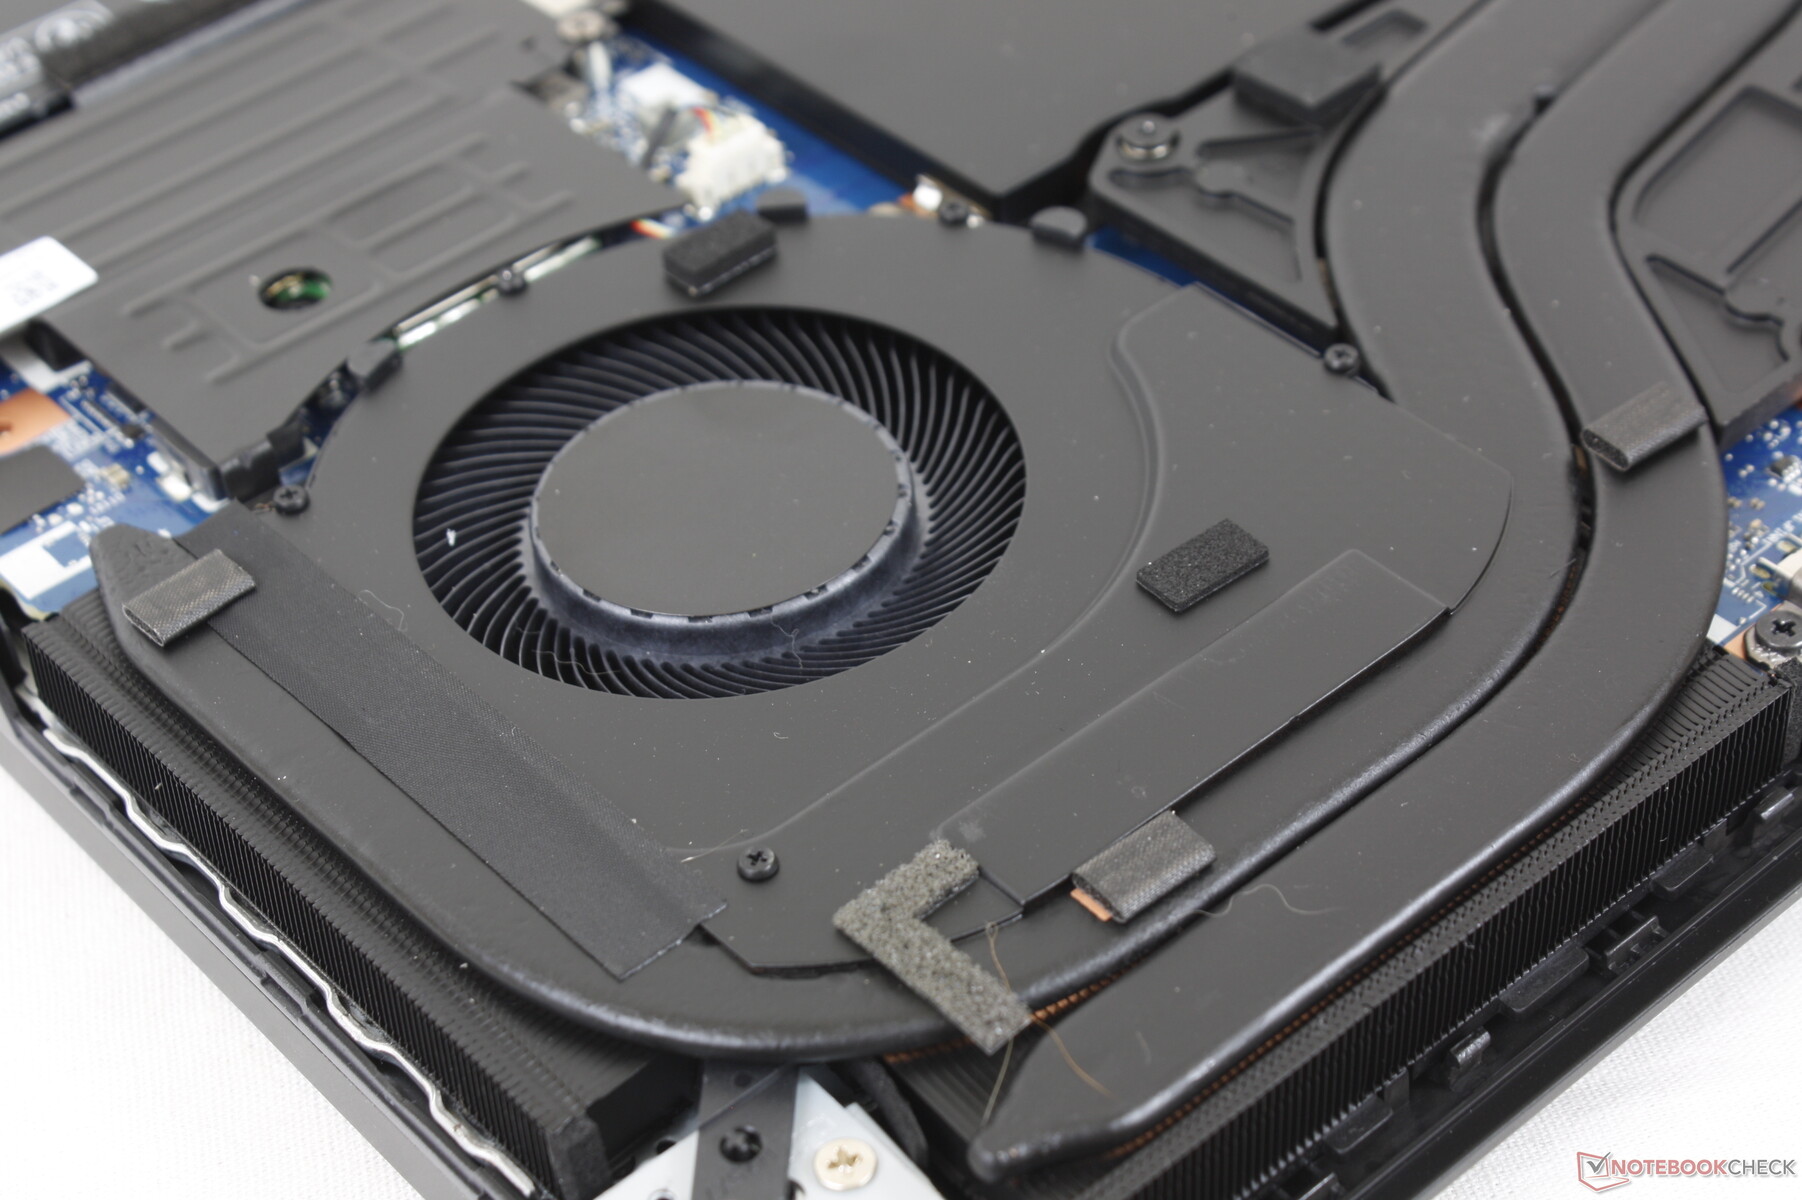
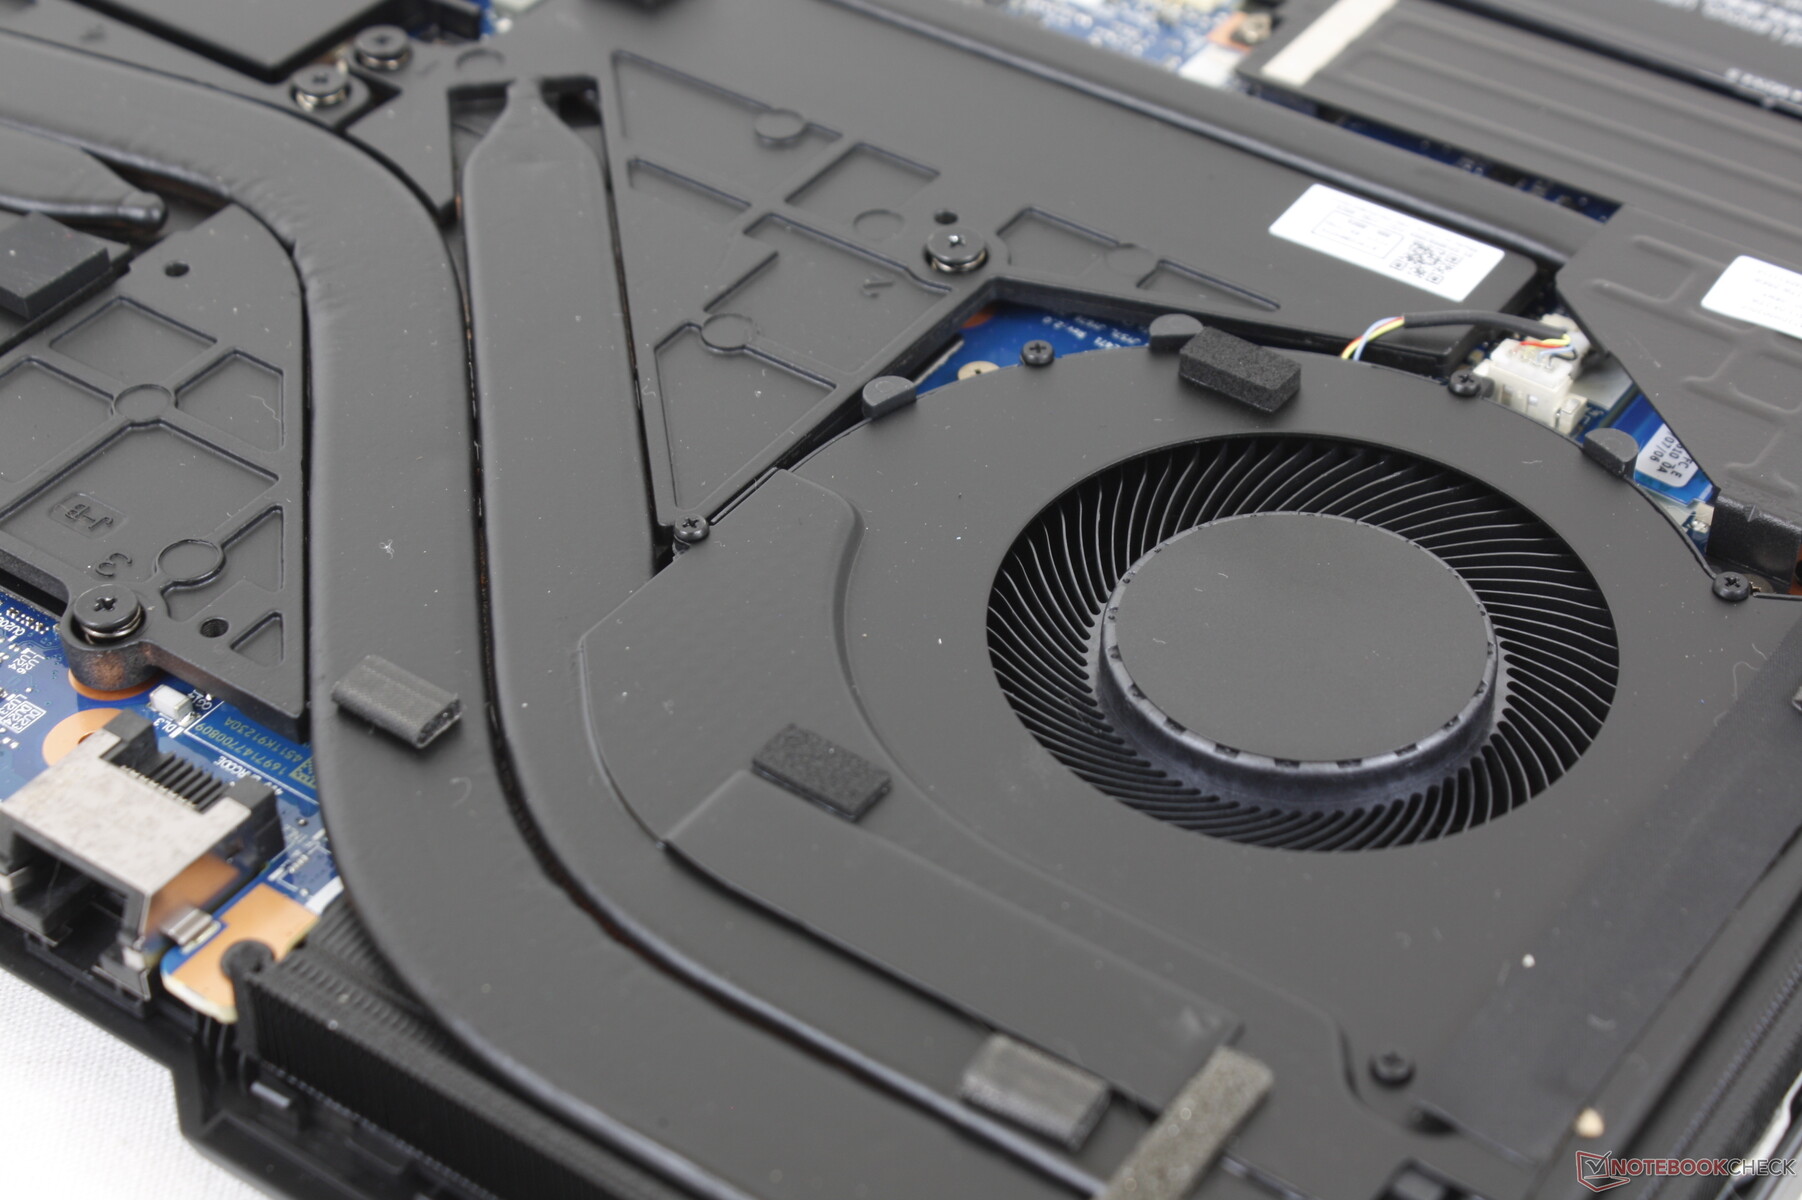
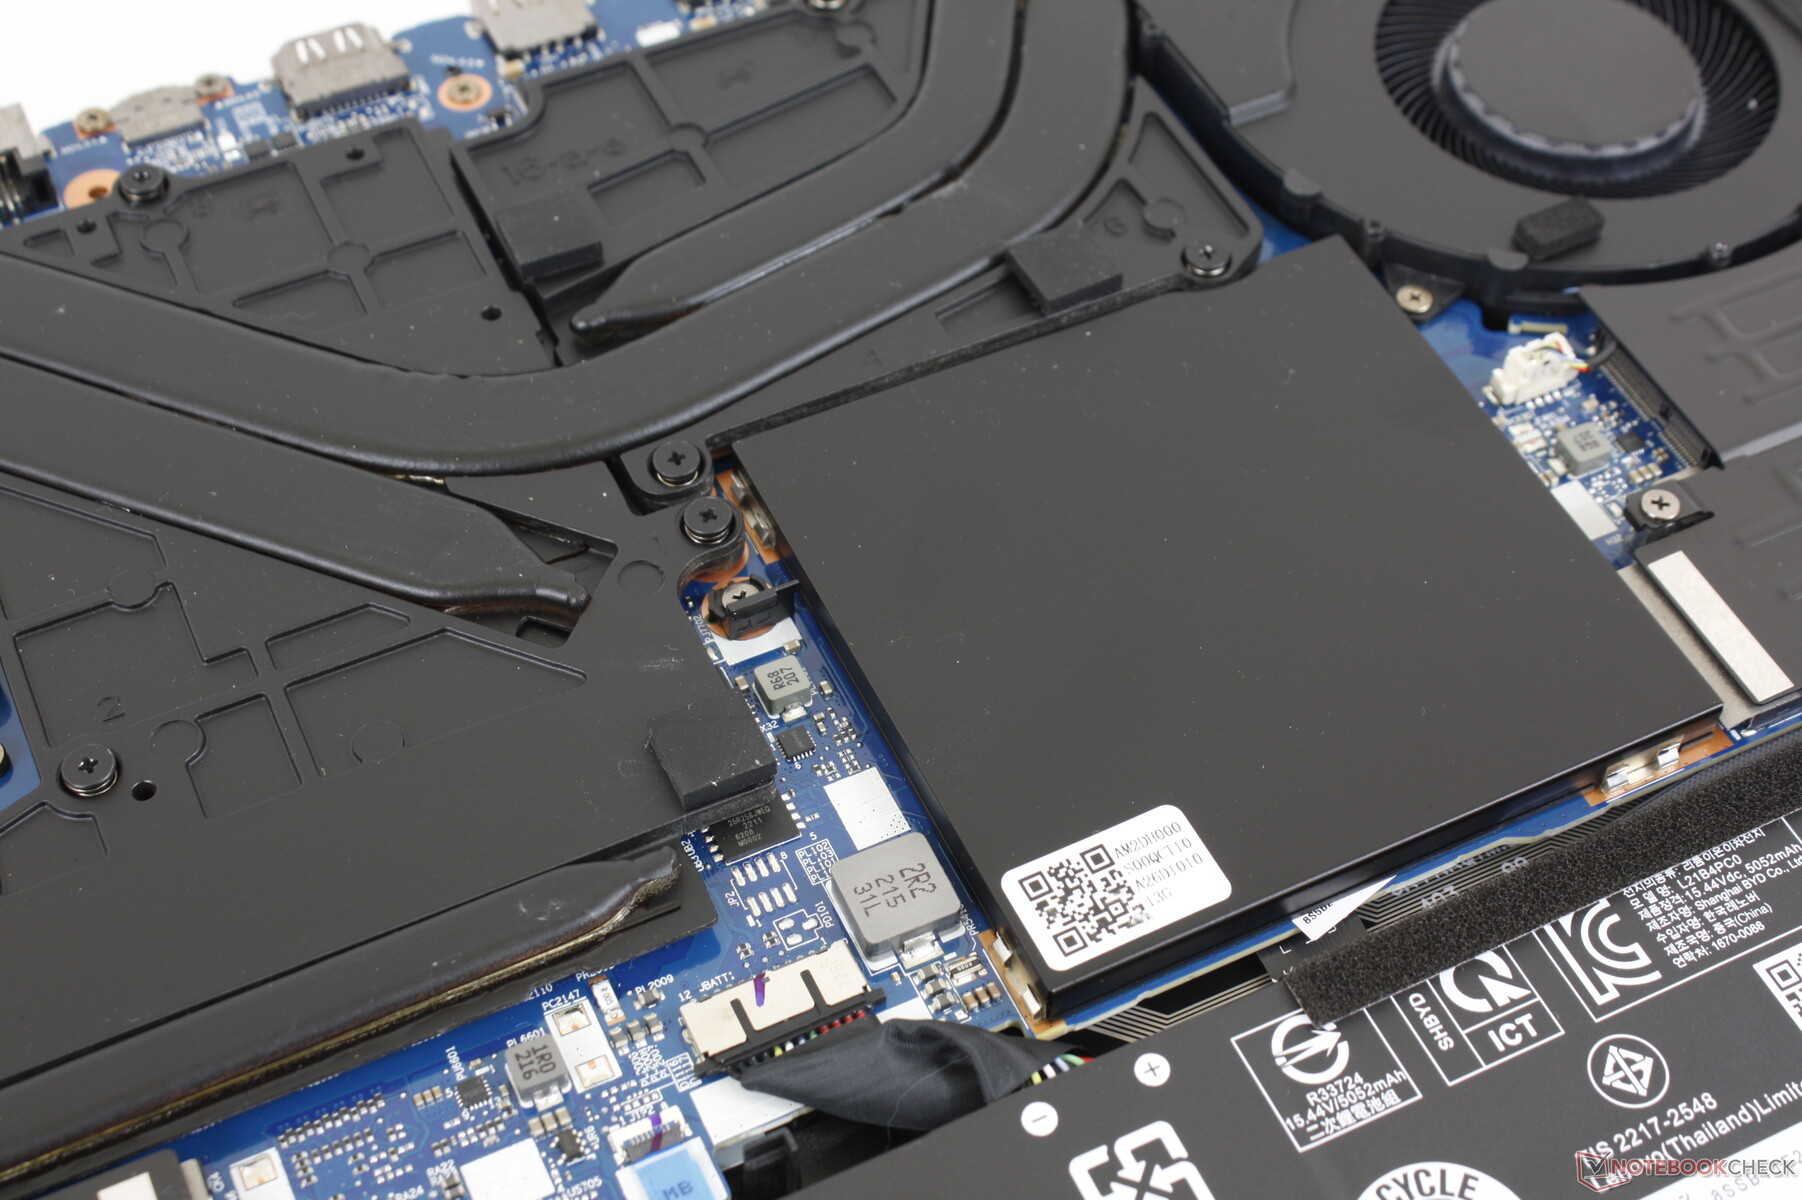
Maintenance
Accessoires et garantie
Il n'y a pas d'autres éléments dans la boîte que l'adaptateur secteur et les documents. La garantie standard limitée d'un an du fabricant s'applique si l'appareil est acheté aux États-Unis.
Affichage - Une seule option
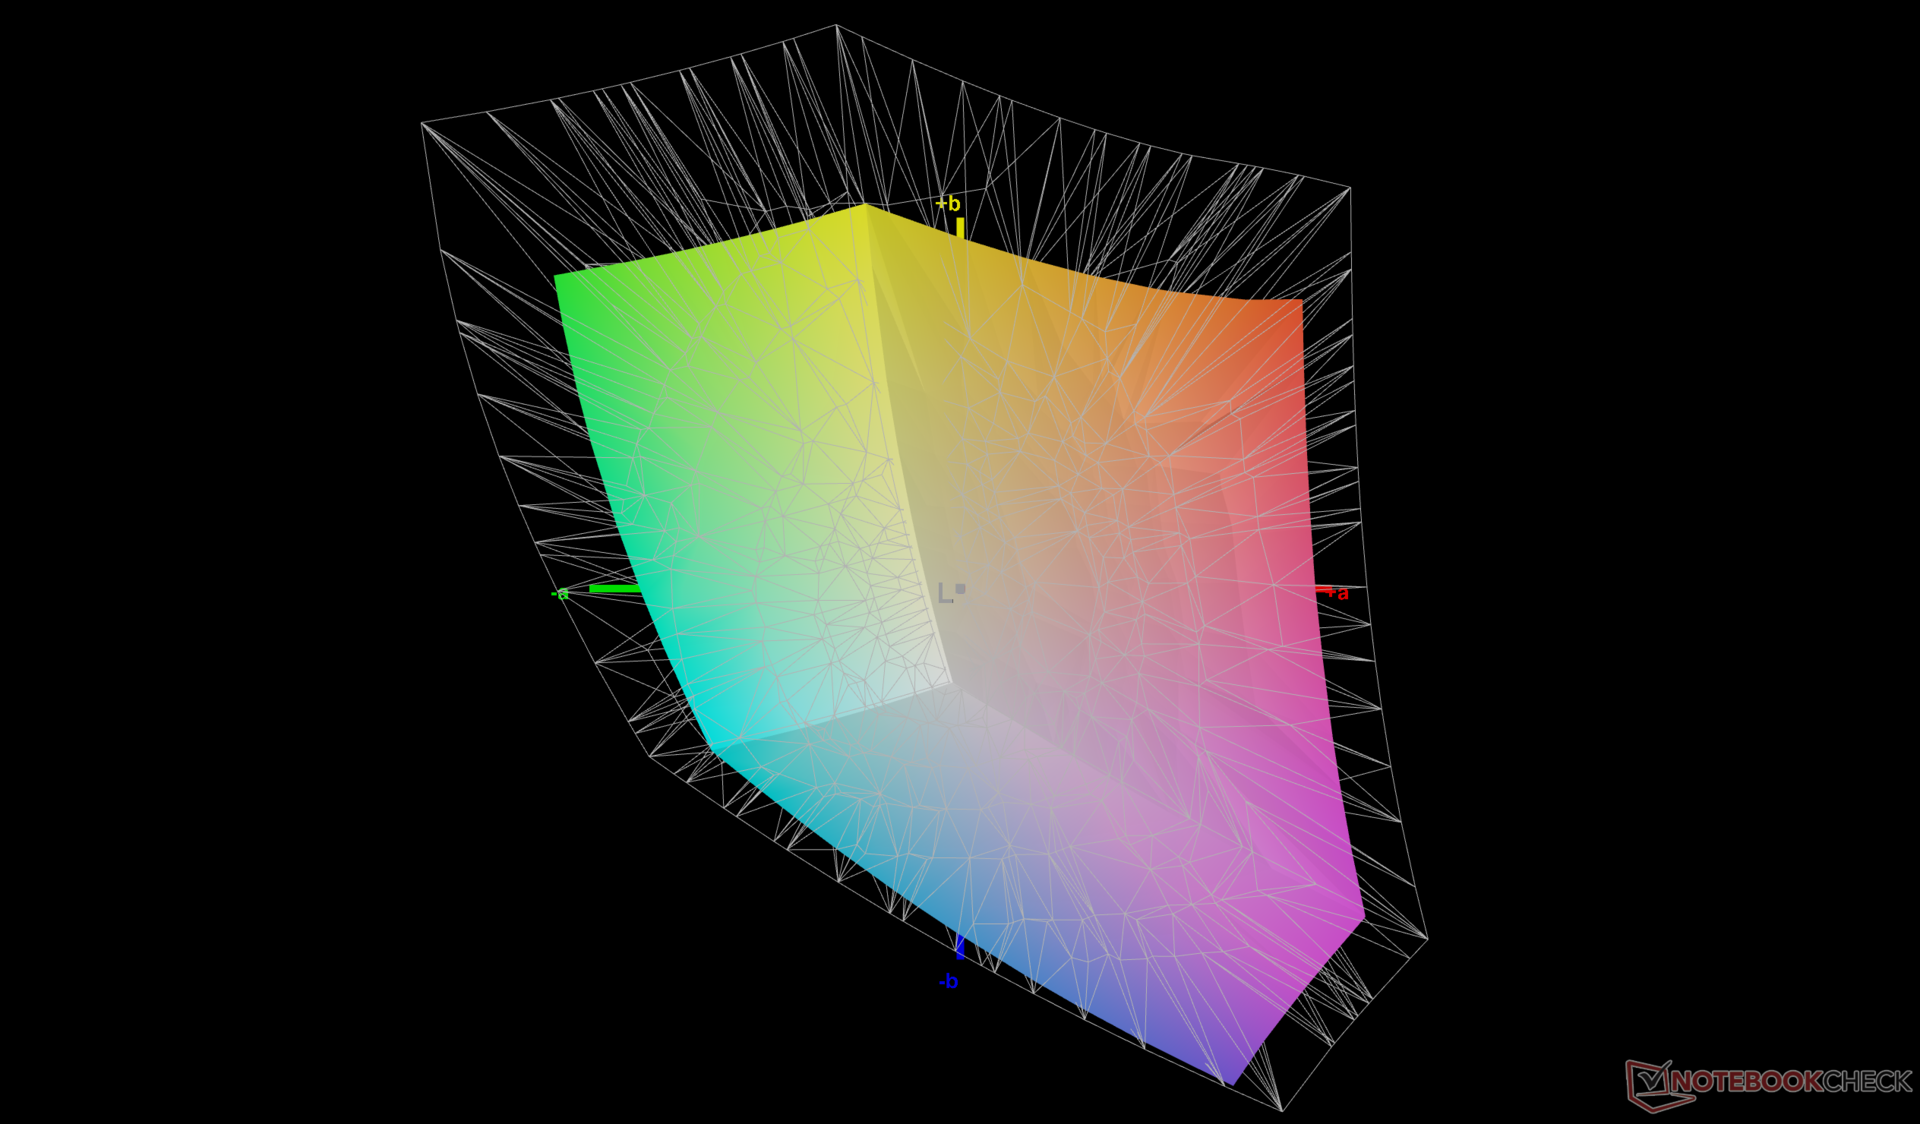
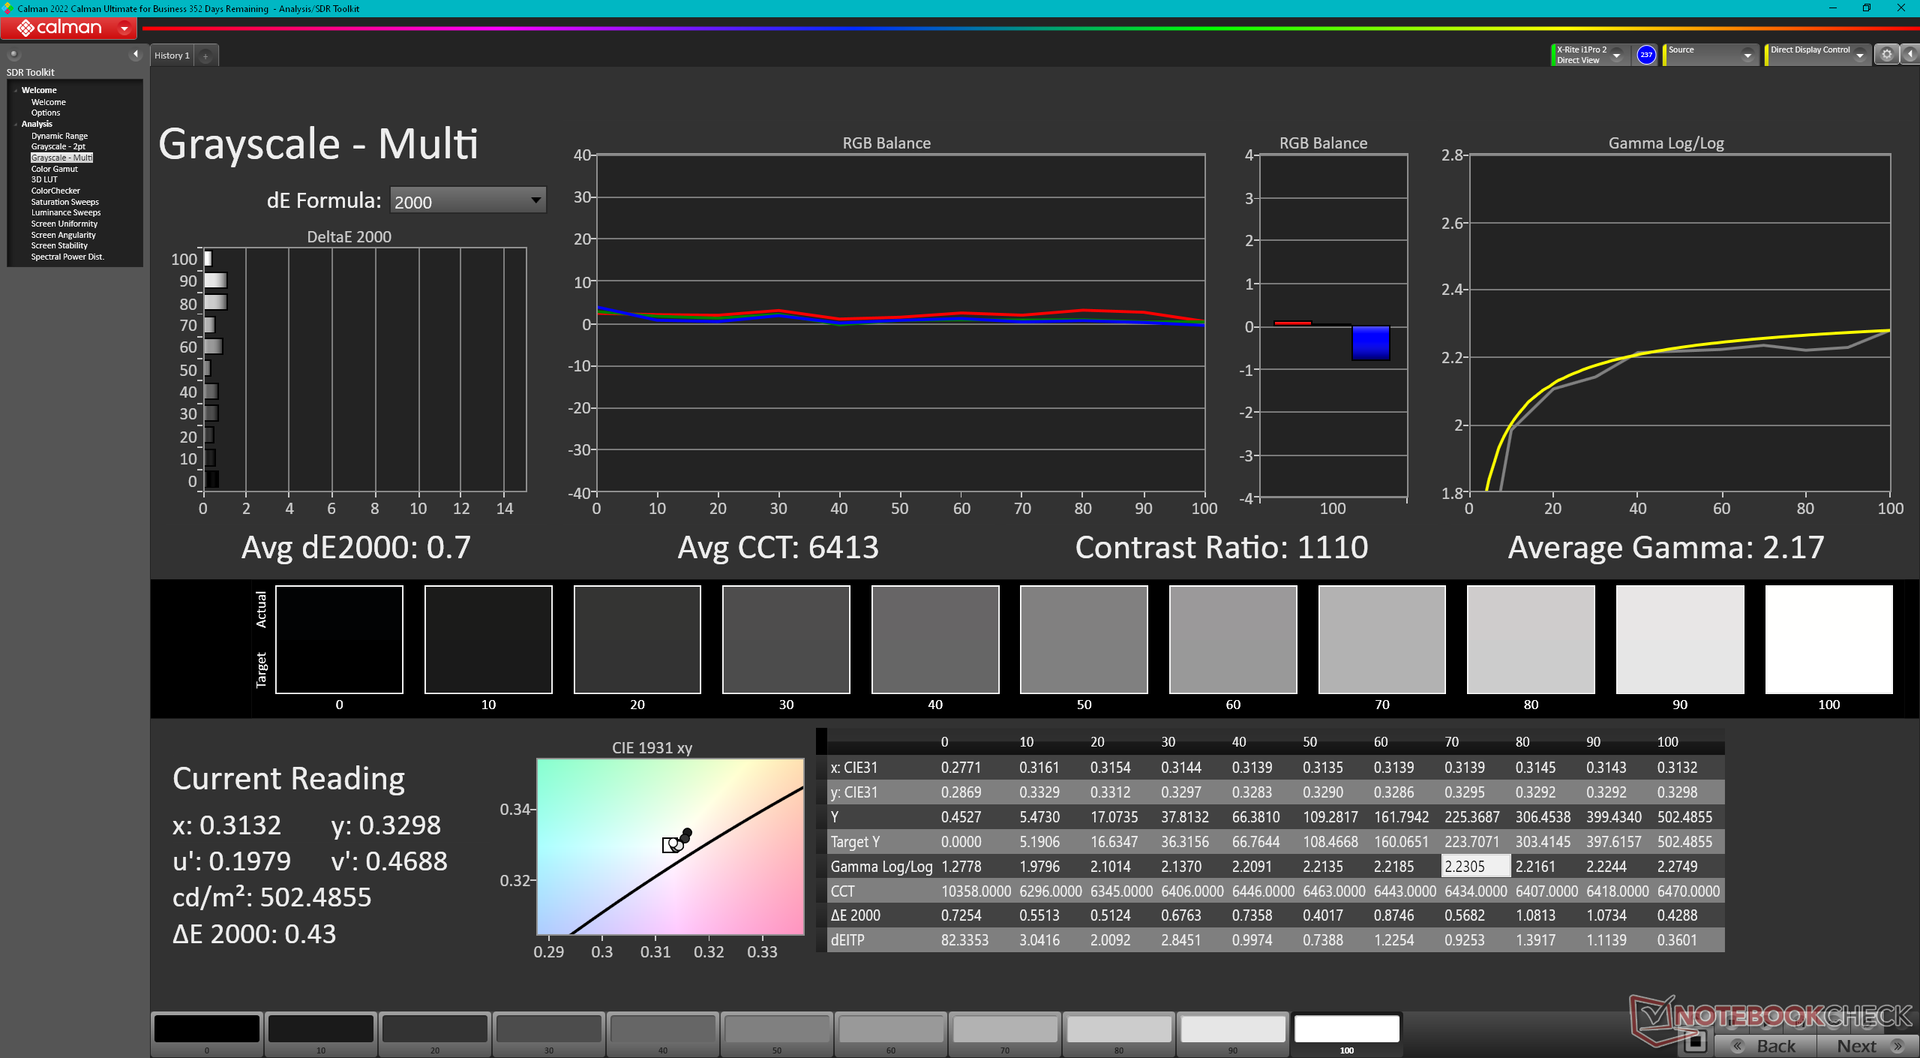
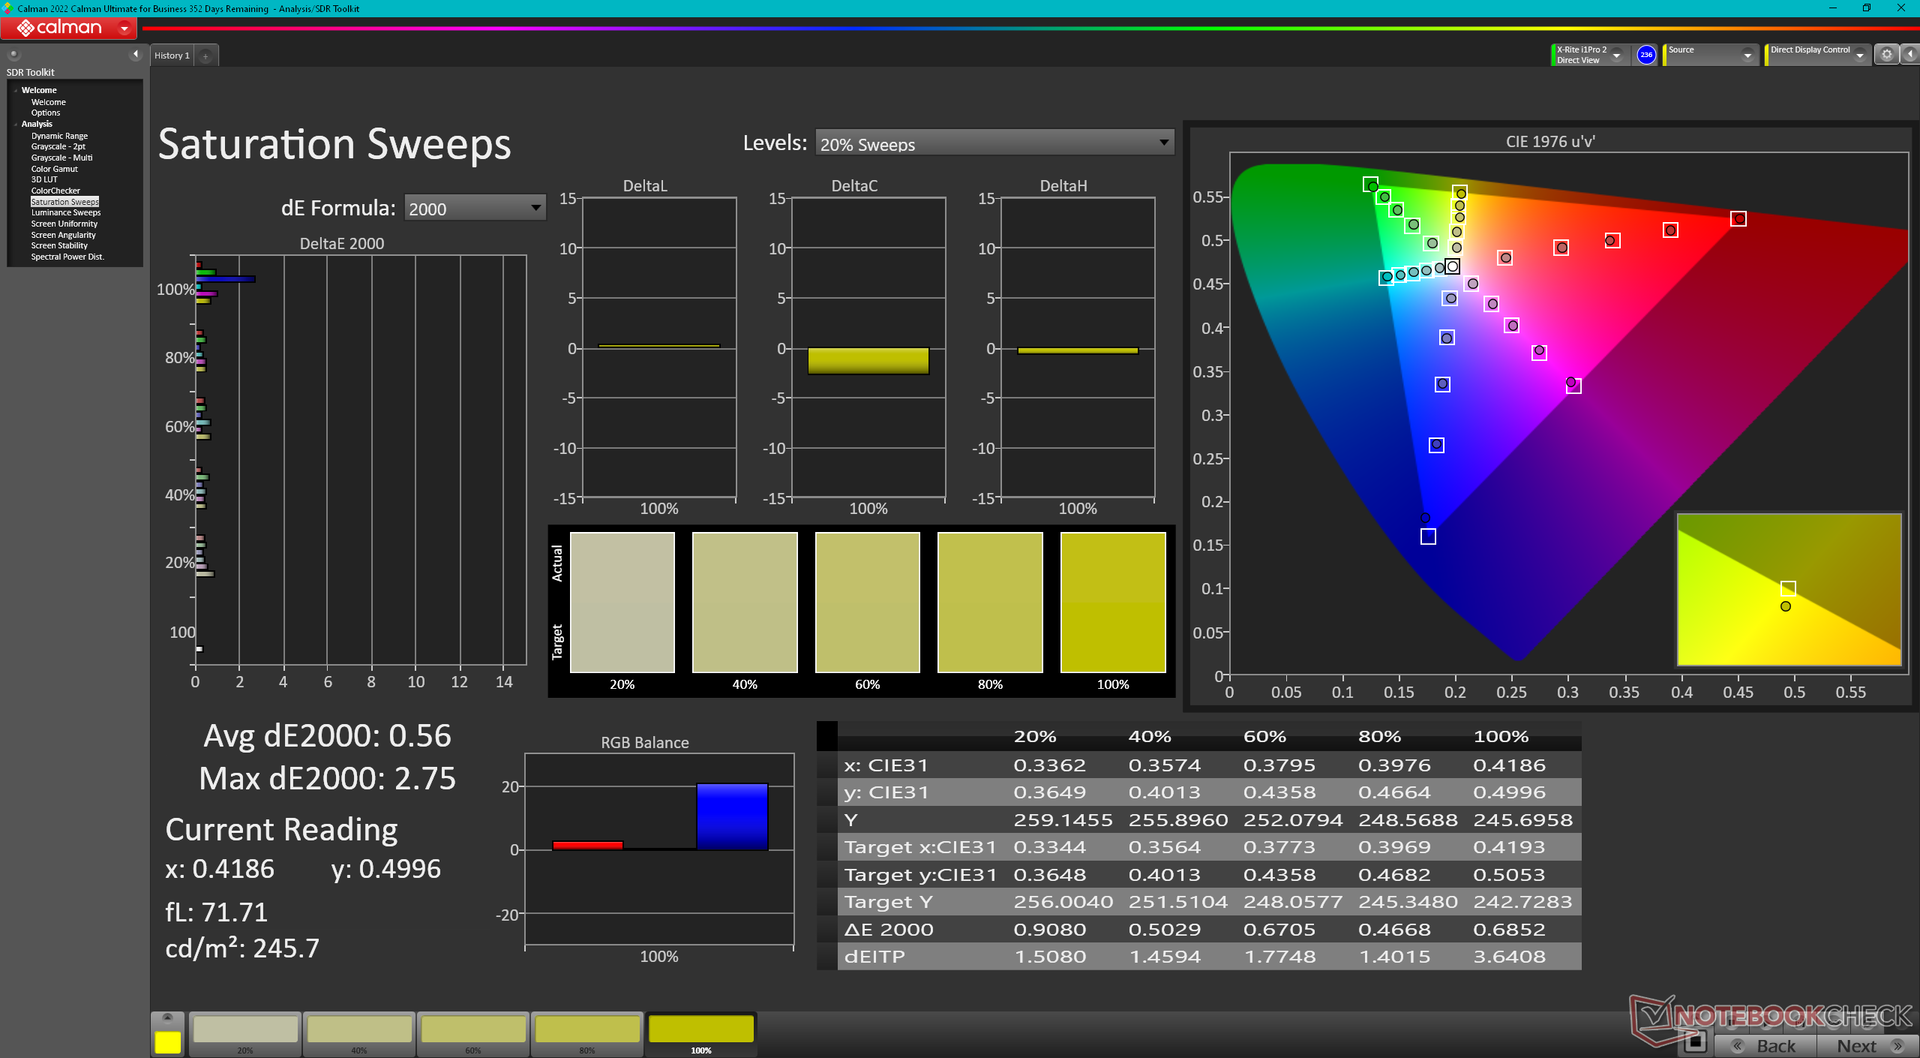
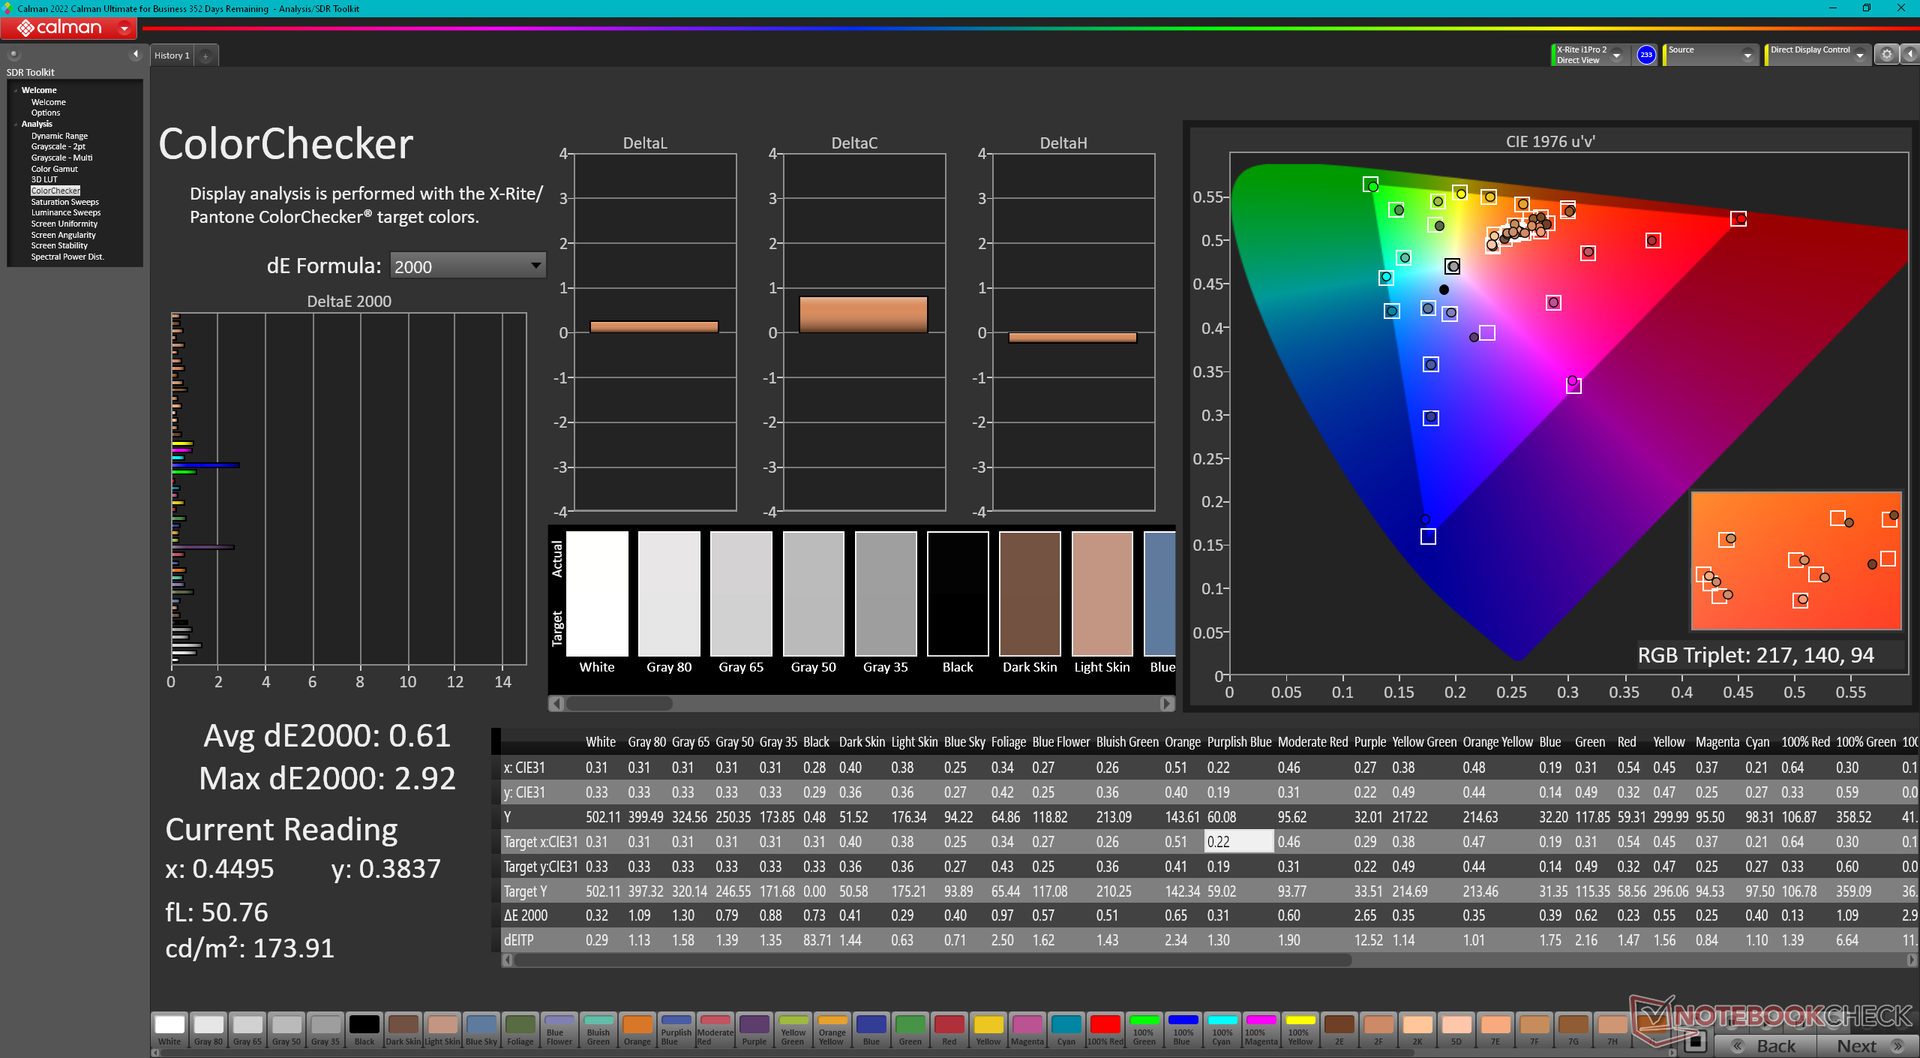
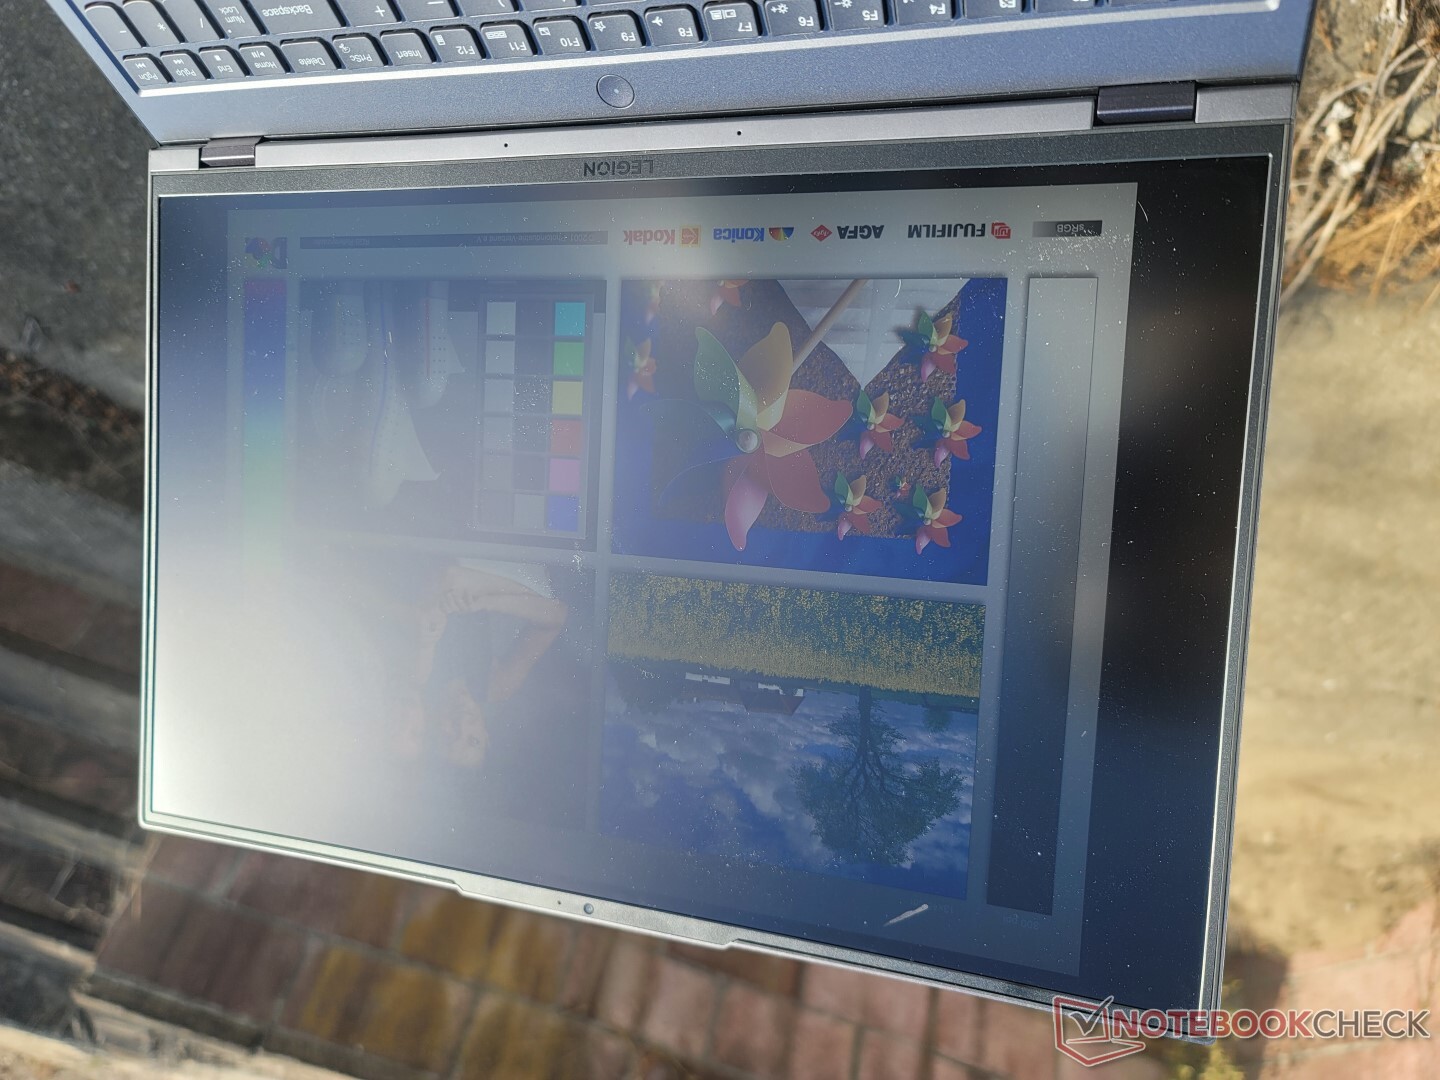
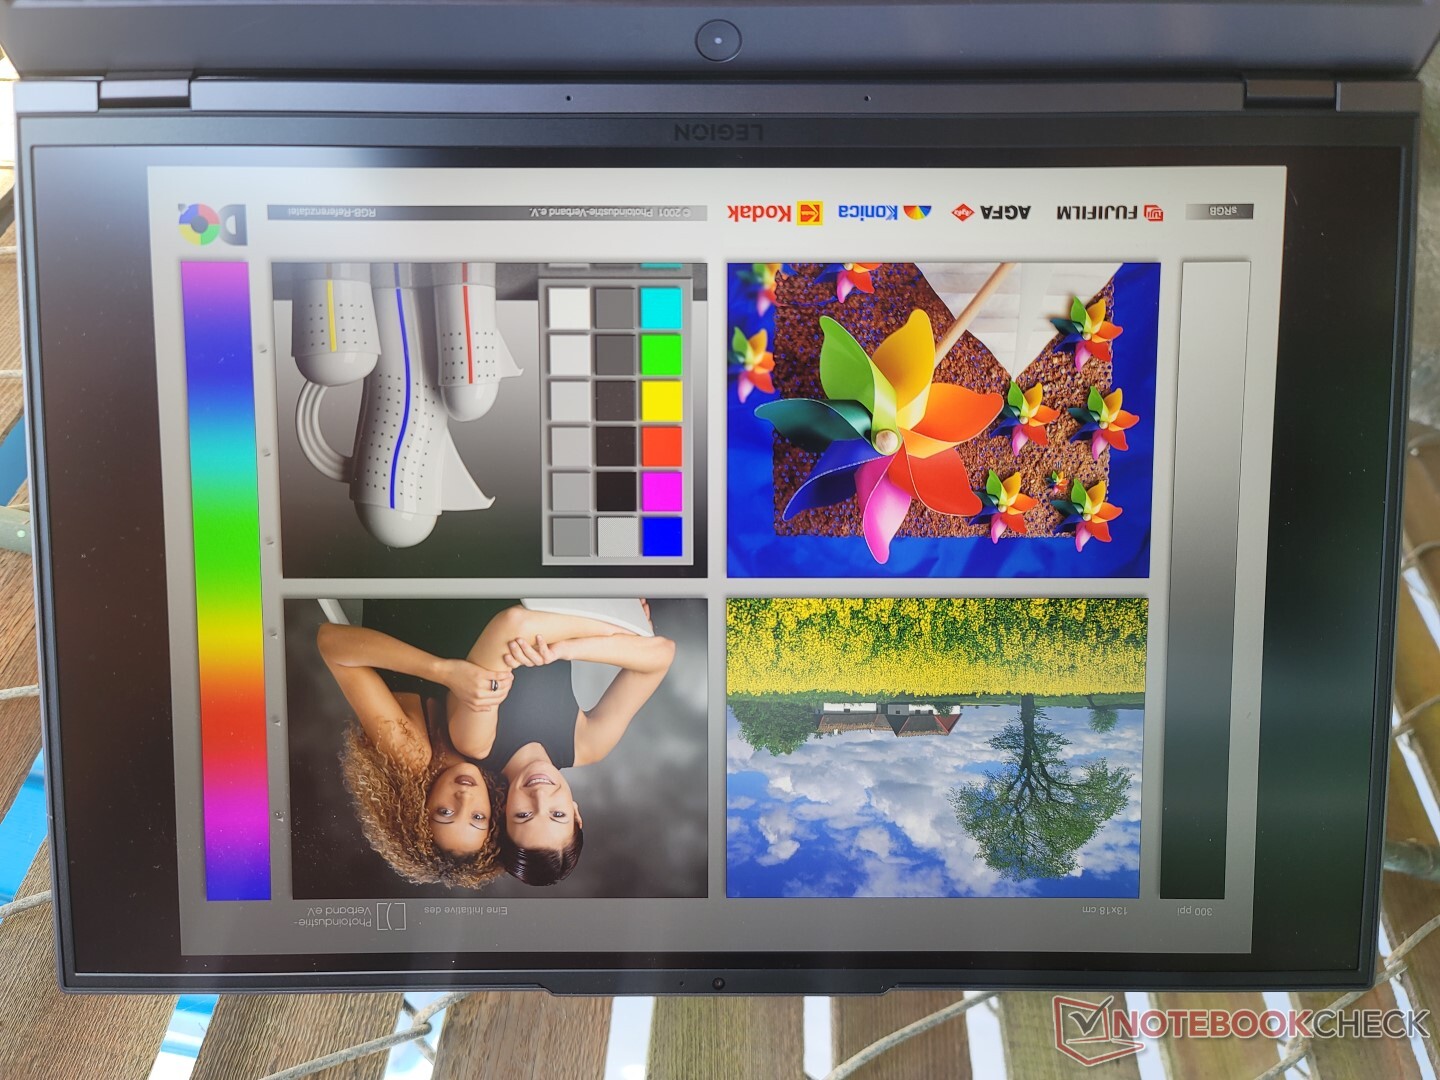
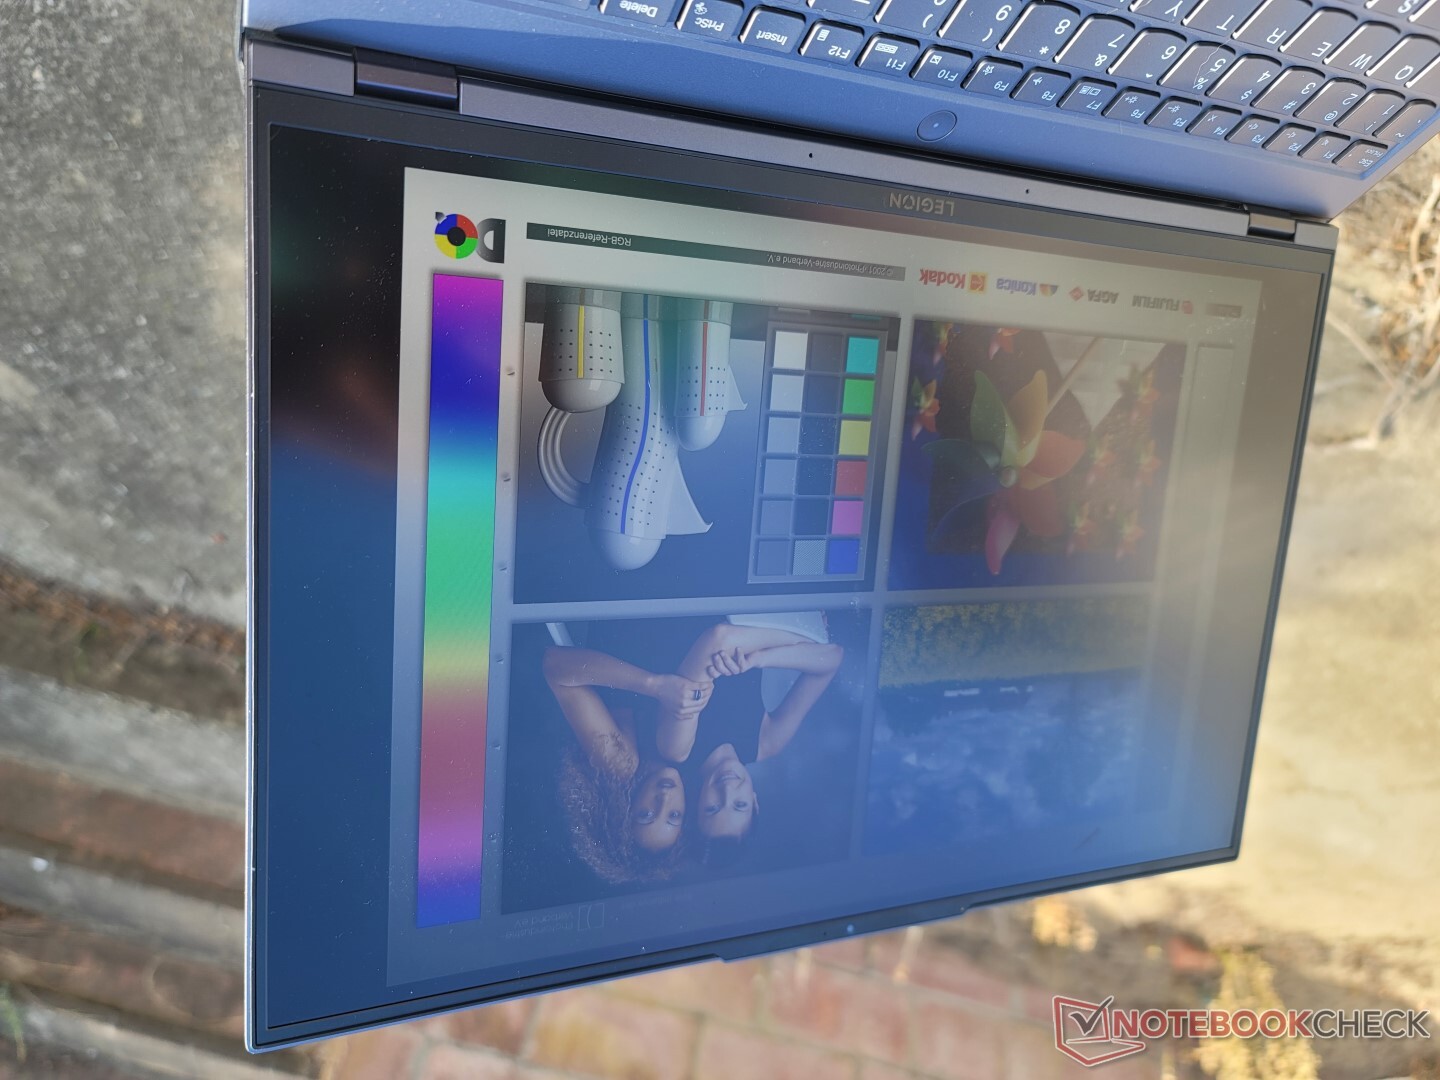
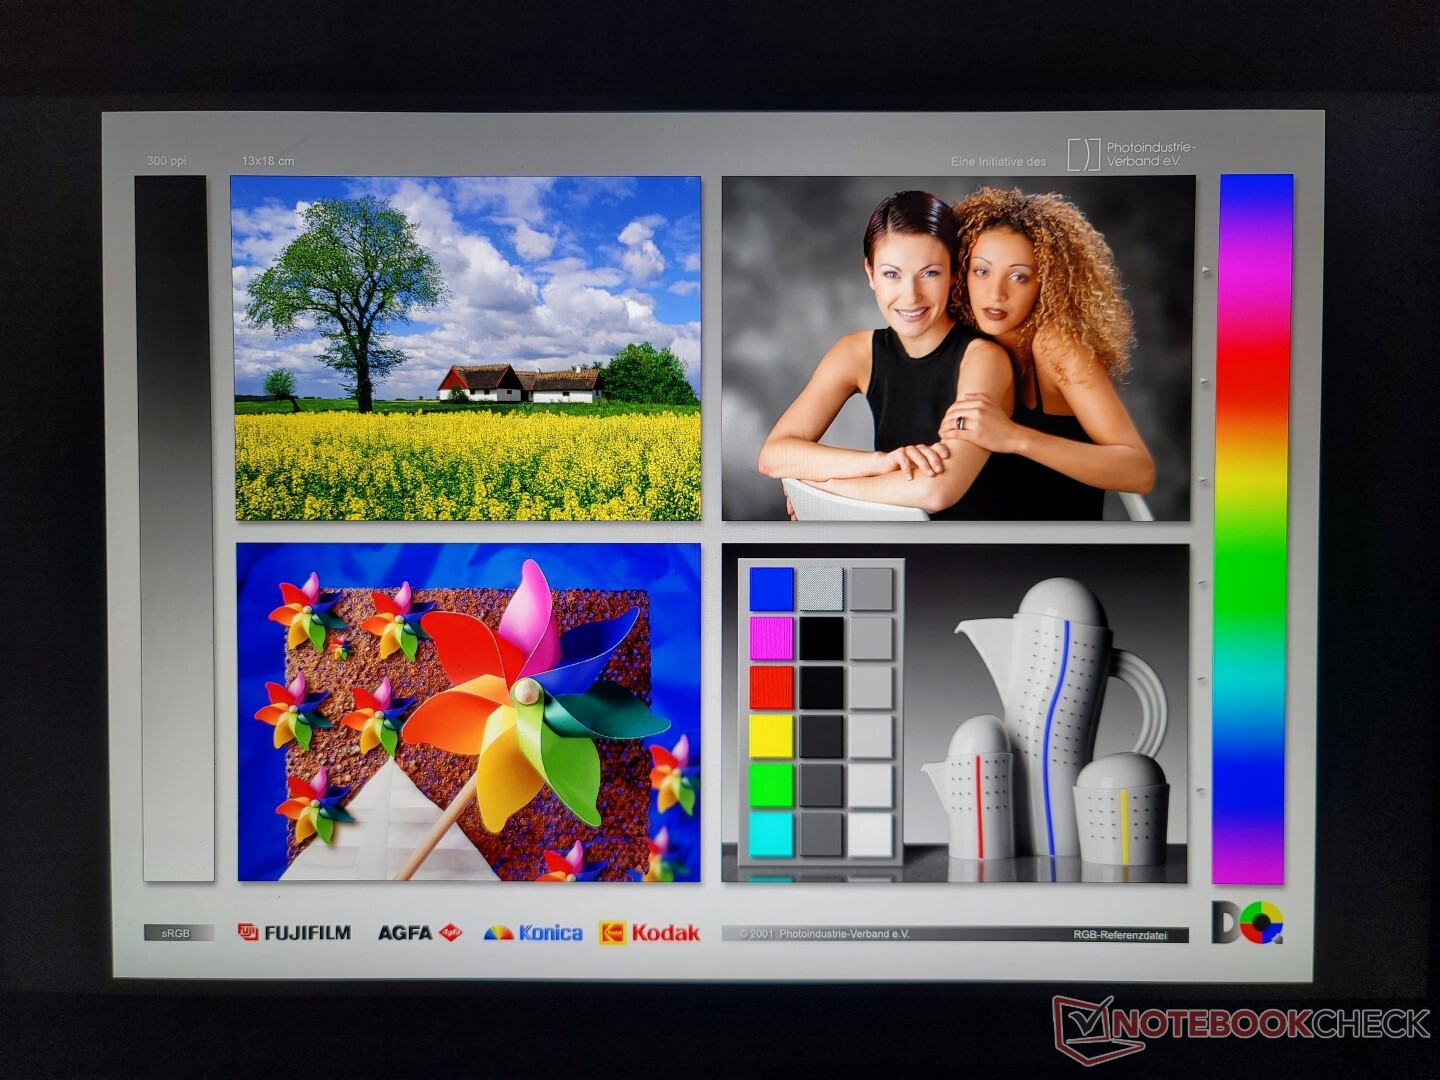
Lenovo n'a rien changé à la dalle IPS BOE CQ NE160QDM-NY1 par rapport au modèle Legion 5 Pro 16 de l'année dernière. Nos mesures ci-dessous montrent des attributs similaires sur toute la ligne, notamment la couverture sRGB complète, les temps de réponse noir-blanc rapides, le rapport de contraste de ~1000:1 et le rétroéclairage brillant de 500 nits.
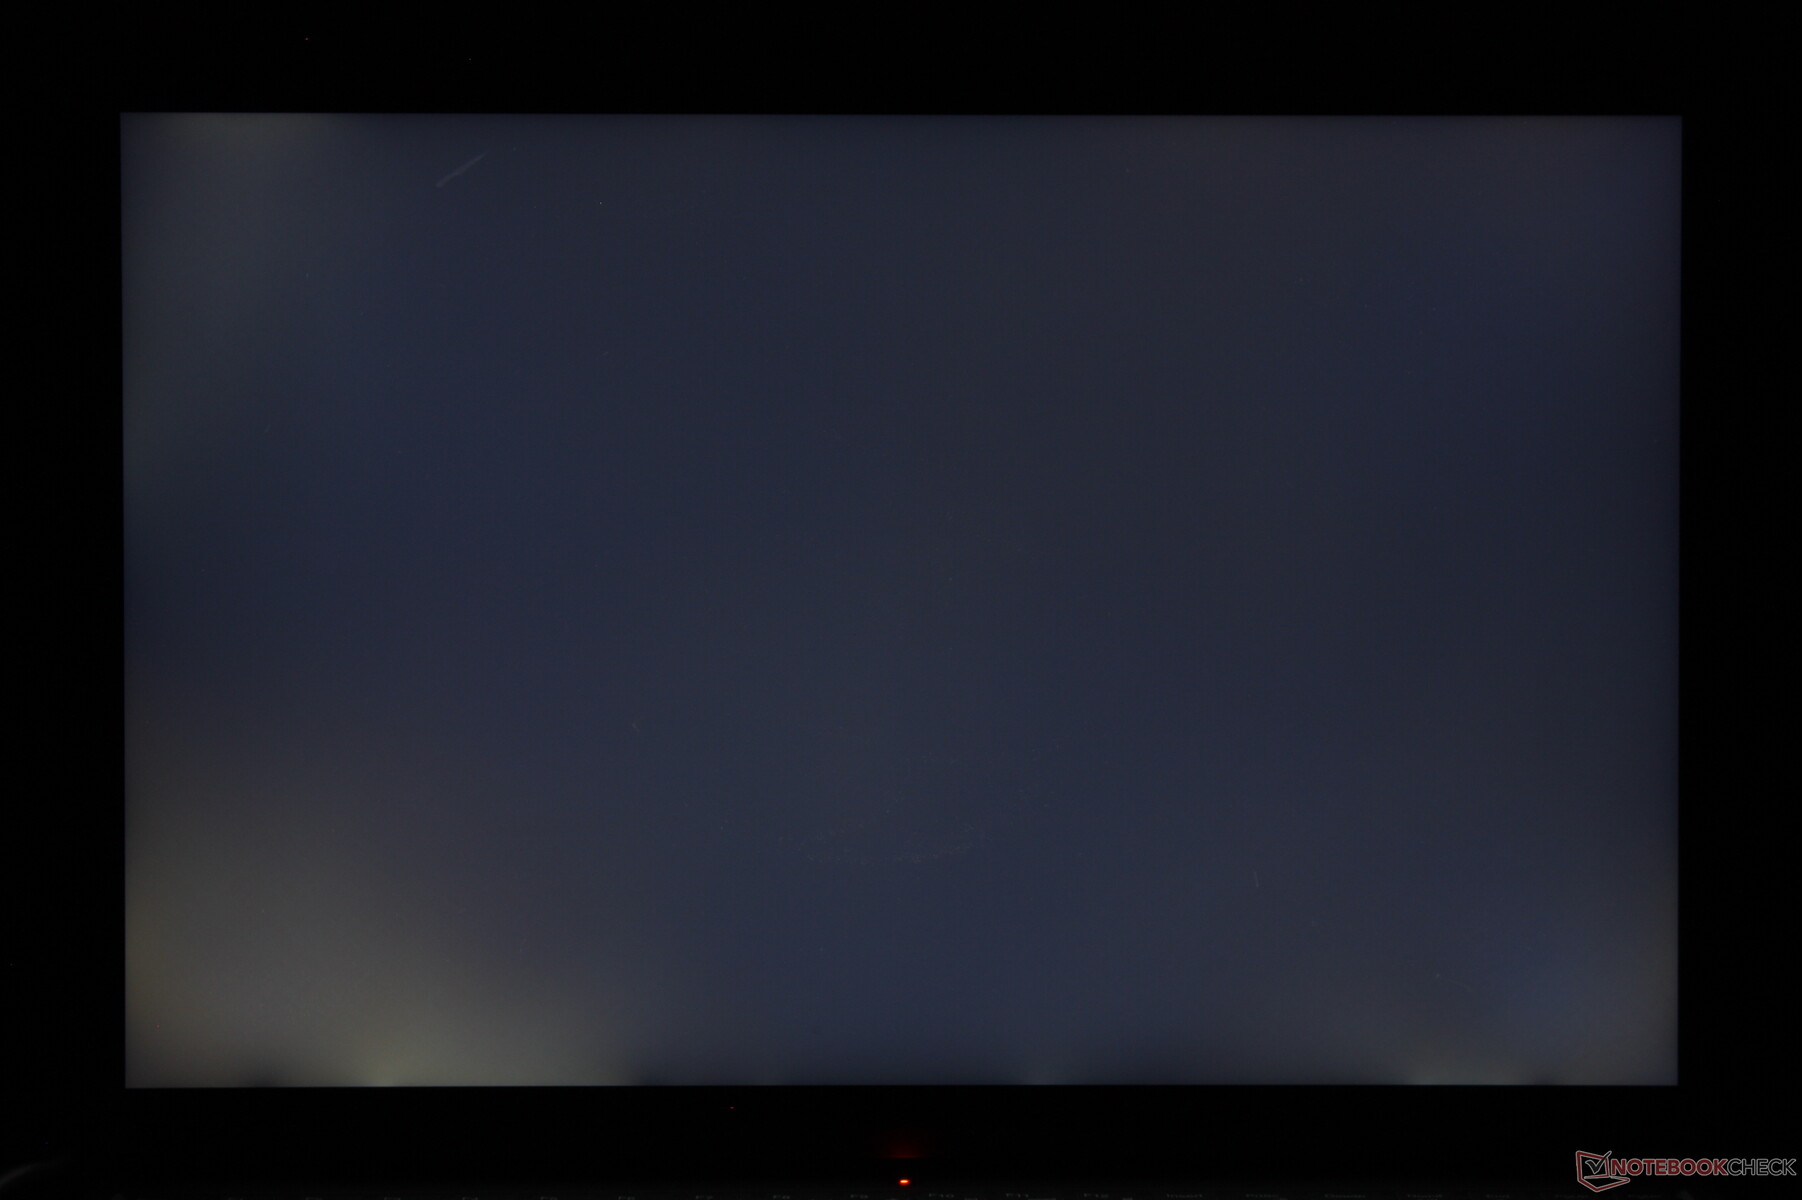
Néanmoins, notre unité spécifique souffre d'un saignement du rétroéclairage modéré ou important, comme le montre l'image ci-dessous. On peut s'attendre à ce que la plupart des écrans IPS présentent un saignement irrégulier de la lumière, mais cette intensité est particulièrement pénible à voir sur une machine de jeu haut de gamme comme le Legion 5 Pro 16.

| |||||||||||||||||||||||||
Homogénéité de la luminosité: 84 %
Valeur mesurée au centre, sur batterie: 522.8 cd/m²
Contraste: 1275:1 (Valeurs des noirs: 0.41 cd/m²)
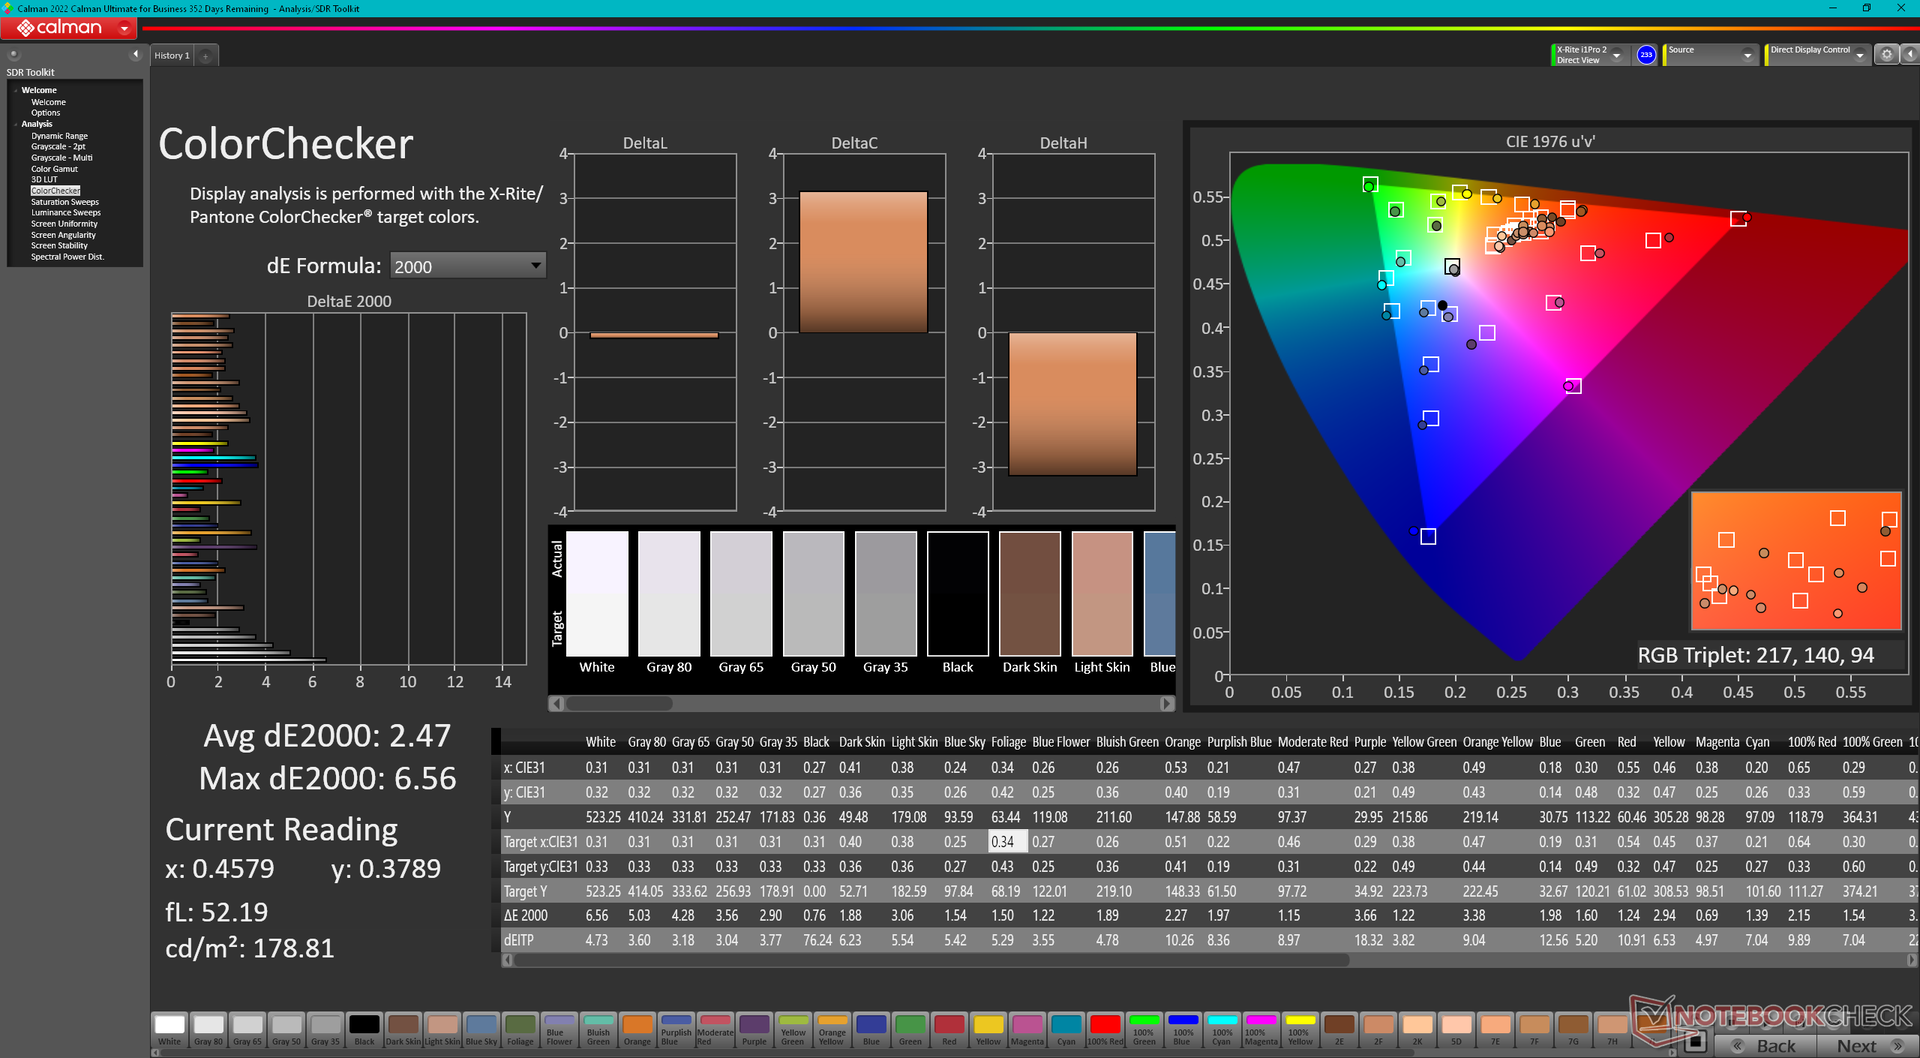
ΔE ColorChecker Calman: 2.47 | ∀{0.5-29.43 Ø4.73}
calibrated: 0.61
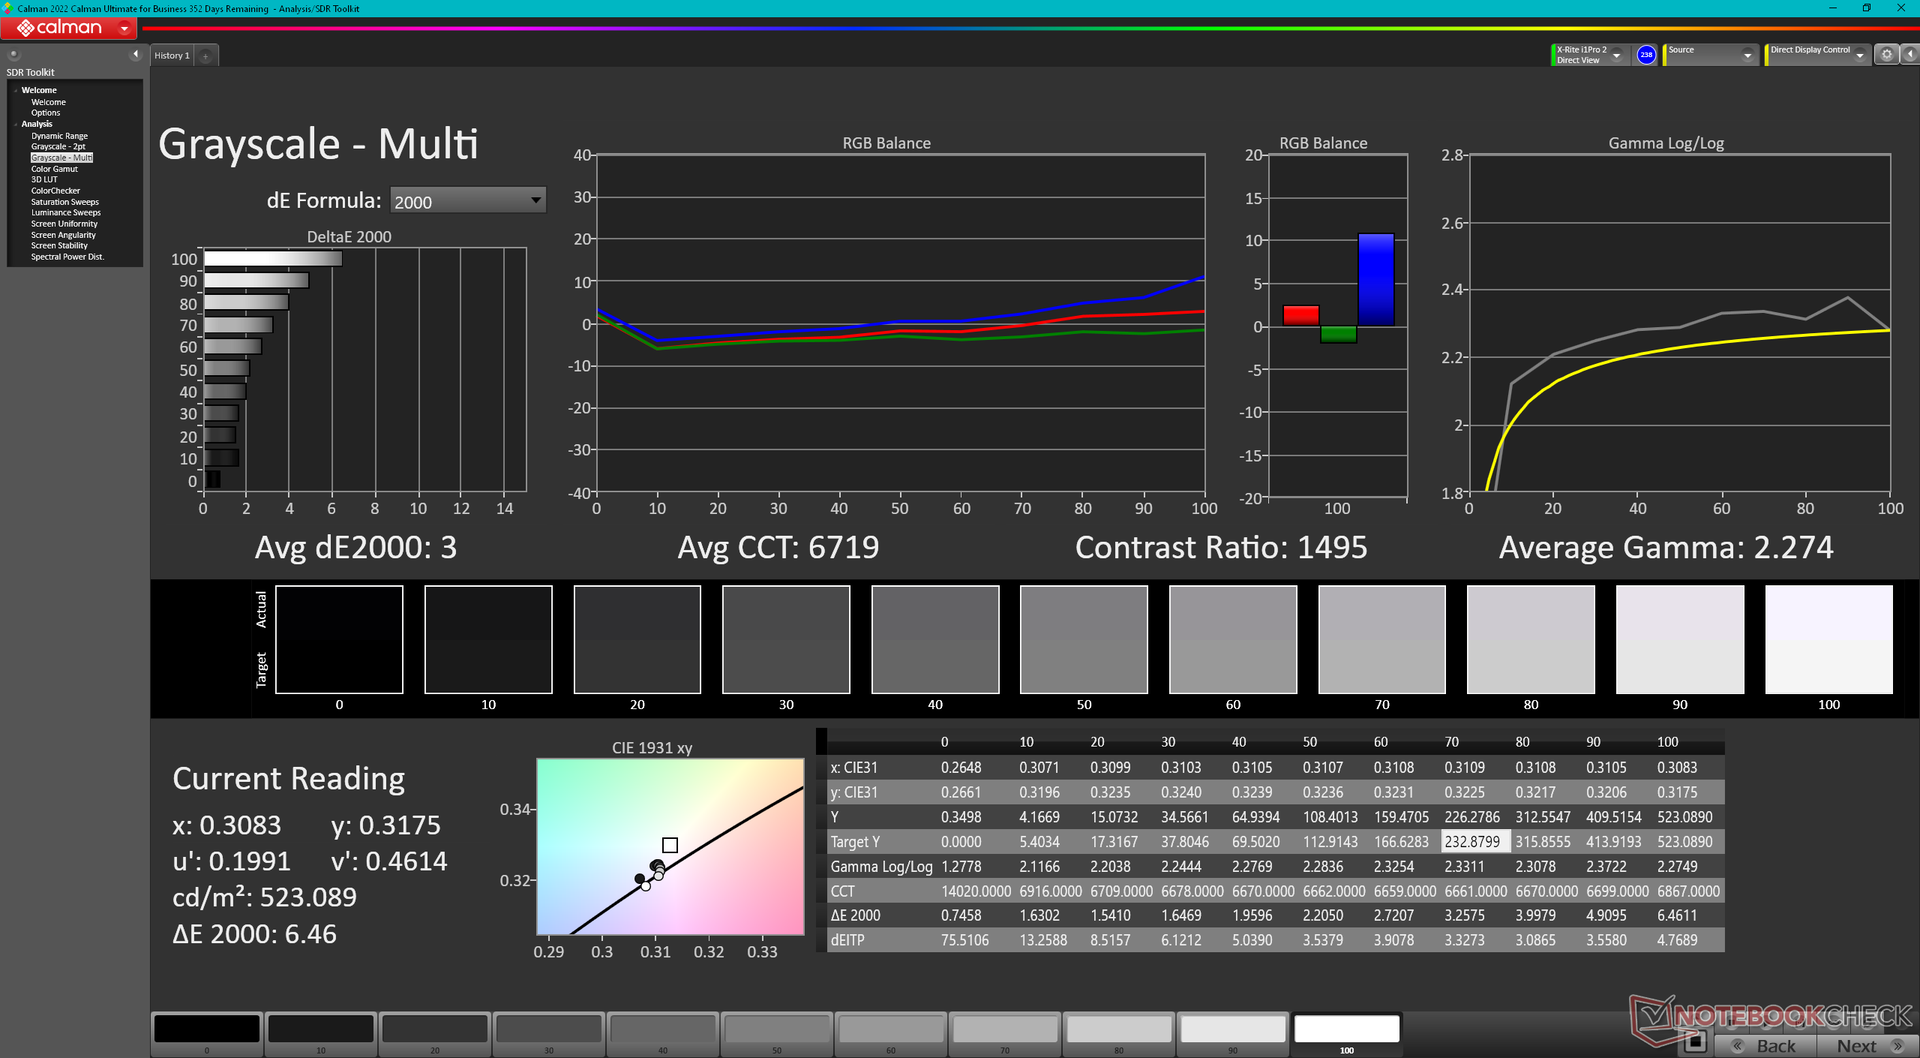
ΔE Greyscale Calman: 3 | ∀{0.09-98 Ø4.97}
69.5% AdobeRGB 1998 (Argyll 3D)
96.1% sRGB (Argyll 3D)
67.3% Display P3 (Argyll 3D)
Gamma: 2.27
CCT: 6719 K
| Lenovo Legion 5 Pro 16ARH7H RTX 3070 Ti BOE CQ NE160QDM-NY1, IPS, 2560x1600, 16" | Lenovo Legion 5 Pro 16IAH7H BOE CCQ_NE160QDM_NY1, IPS, 2560x1600, 16" | Asus ROG Zephyrus M16 GU603H AU Optronics AUOC199, IPS, 2560x1600, 16" | Lenovo Legion 7 16ARHA7 BOE CQ NE160QDM-NY1, IPS, 2560x1600, 16" | HP Victus 16-e0145ng CMN1609, IPS, 1920x1080, 16.1" | Dell G16 7620 BOE NE16QDM, IPS, 2560x1600, 16" | |
|---|---|---|---|---|---|---|
| Display | 2% | -4% | -37% | 1% | ||
| Display P3 Coverage (%) | 67.3 | 68.53 2% | 63.7 -5% | 41.6 -38% | 68.3 1% | |
| sRGB Coverage (%) | 96.1 | 98.38 2% | 95.3 -1% | 61.9 -36% | 98 2% | |
| AdobeRGB 1998 Coverage (%) | 69.5 | 70.45 1% | 65.7 -5% | 43 -38% | 70.5 1% | |
| Response Times | 25% | 57% | 25% | -90% | 24% | |
| Response Time Grey 50% / Grey 80% * (ms) | 14.4 ? | 14 ? 3% | 4.8 ? 67% | 9.2 ? 36% | 29.6 ? -106% | 8.6 ? 40% |
| Response Time Black / White * (ms) | 11.2 ? | 6 ? 46% | 6 ? 46% | 9.6 ? 14% | 19.4 ? -73% | 10.4 ? 7% |
| PWM Frequency (Hz) | ||||||
| Screen | -7% | -51% | -19% | -127% | -10% | |
| Brightness middle (cd/m²) | 522.8 | 515 -1% | 448 -14% | 478.8 -8% | 257 -51% | 369.4 -29% |
| Brightness (cd/m²) | 503 | 475 -6% | 446 -11% | 477 -5% | 239 -52% | 348 -31% |
| Brightness Distribution (%) | 84 | 85 1% | 86 2% | 90 7% | 88 5% | 83 -1% |
| Black Level * (cd/m²) | 0.41 | 0.45 -10% | 0.48 -17% | 0.43 -5% | 0.25 39% | 0.32 22% |
| Contrast (:1) | 1275 | 1144 -10% | 933 -27% | 1113 -13% | 1028 -19% | 1154 -9% |
| Colorchecker dE 2000 * | 2.47 | 2.38 4% | 2.76 -12% | 2.24 9% | 6.91 -180% | 1.78 28% |
| Colorchecker dE 2000 max. * | 6.56 | 4.37 33% | 7.09 -8% | 4.49 32% | 22.27 -239% | 4.41 33% |
| Colorchecker dE 2000 calibrated * | 0.61 | 1.1 -80% | 2.86 -369% | 1.89 -210% | 3.61 -492% | 1.22 -100% |
| Greyscale dE 2000 * | 3 | 2.71 10% | 3.1 -3% | 2.3 23% | 7.5 -150% | 3.2 -7% |
| Gamma | 2.27 97% | 2.49 88% | 2.153 102% | 2.25 98% | 2.125 104% | 2.2 100% |
| CCT | 6719 97% | 6117 106% | 6826 95% | 6955 93% | 6025 108% | 6750 96% |
| Color Space (Percent of AdobeRGB 1998) (%) | 87 | |||||
| Color Space (Percent of sRGB) (%) | 100 | |||||
| Moyenne finale (programmes/paramètres) | 7% /
-0% | 3% /
-31% | 1% /
-9% | -85% /
-102% | 5% /
-3% |
* ... Moindre est la valeur, meilleures sont les performances
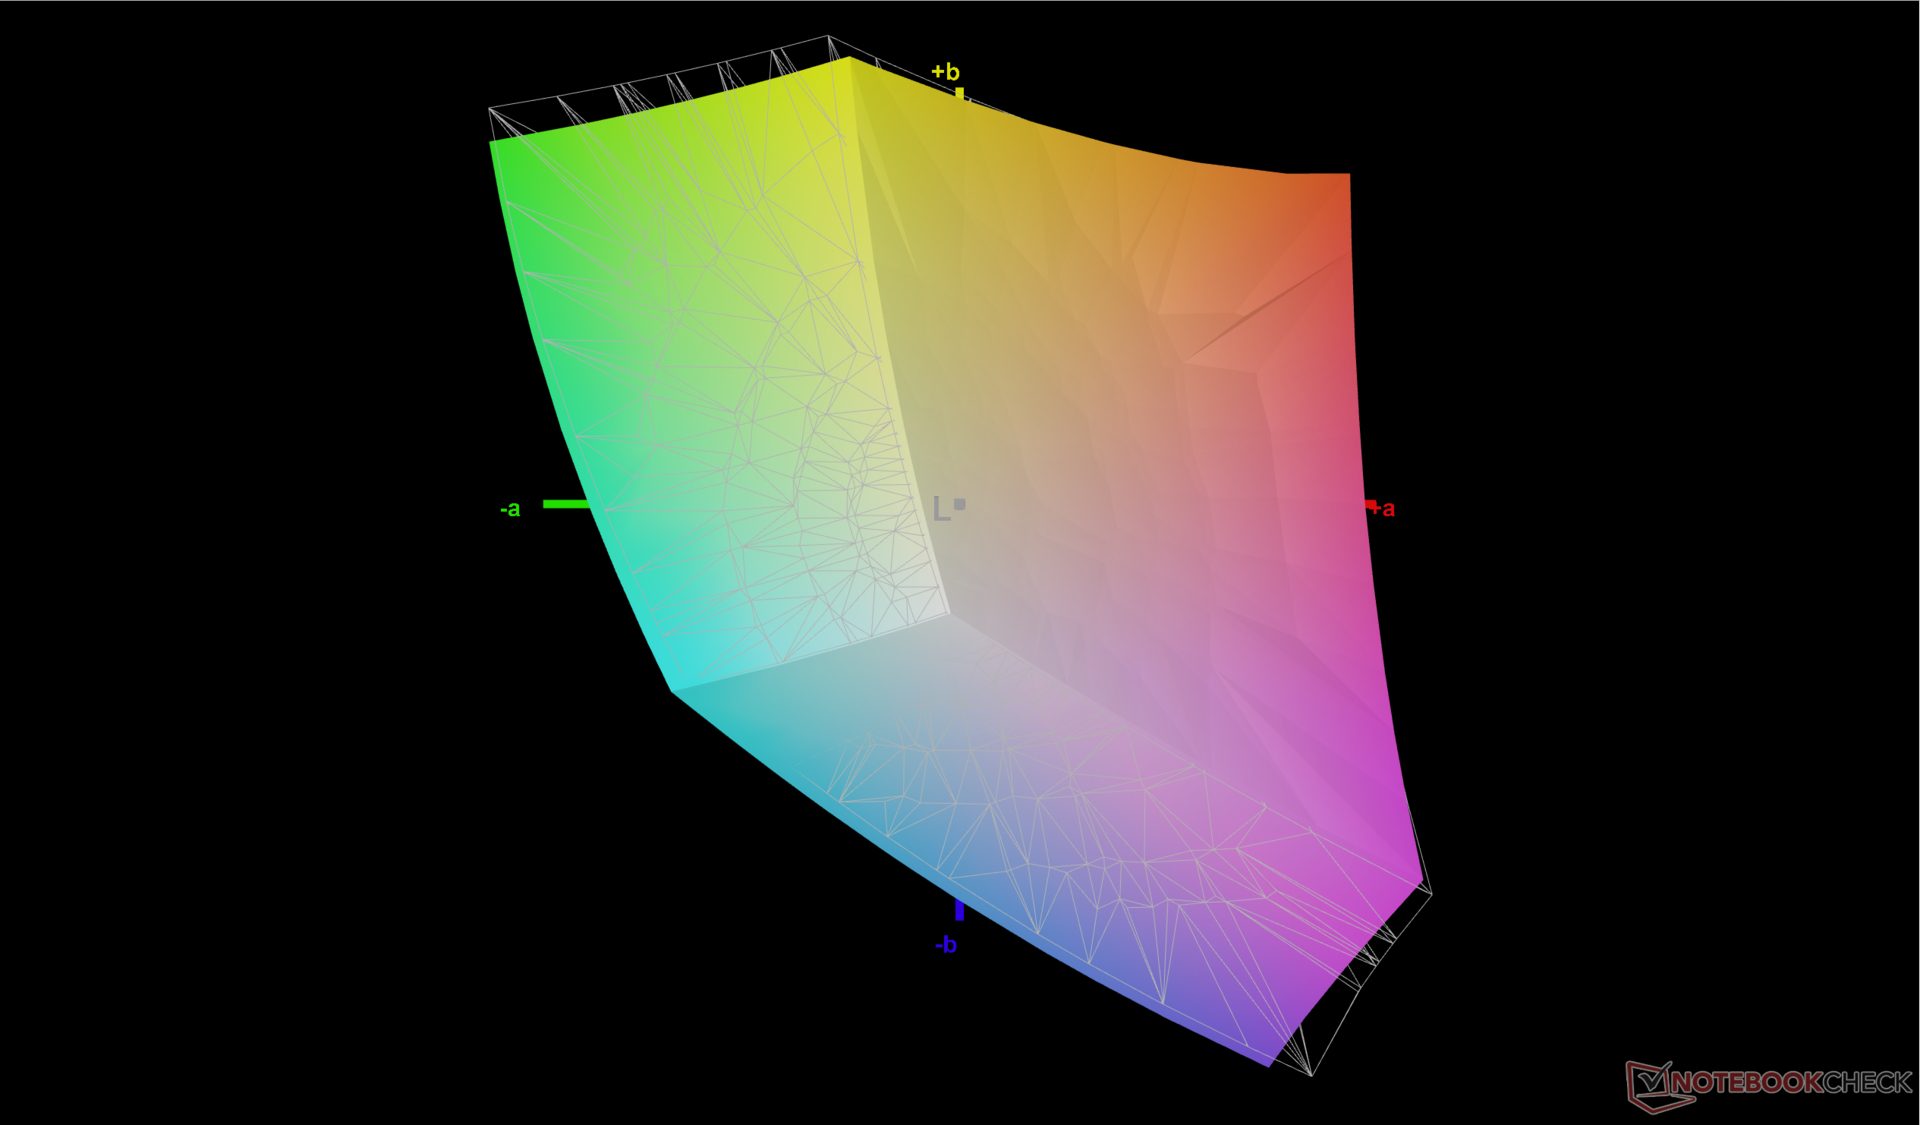
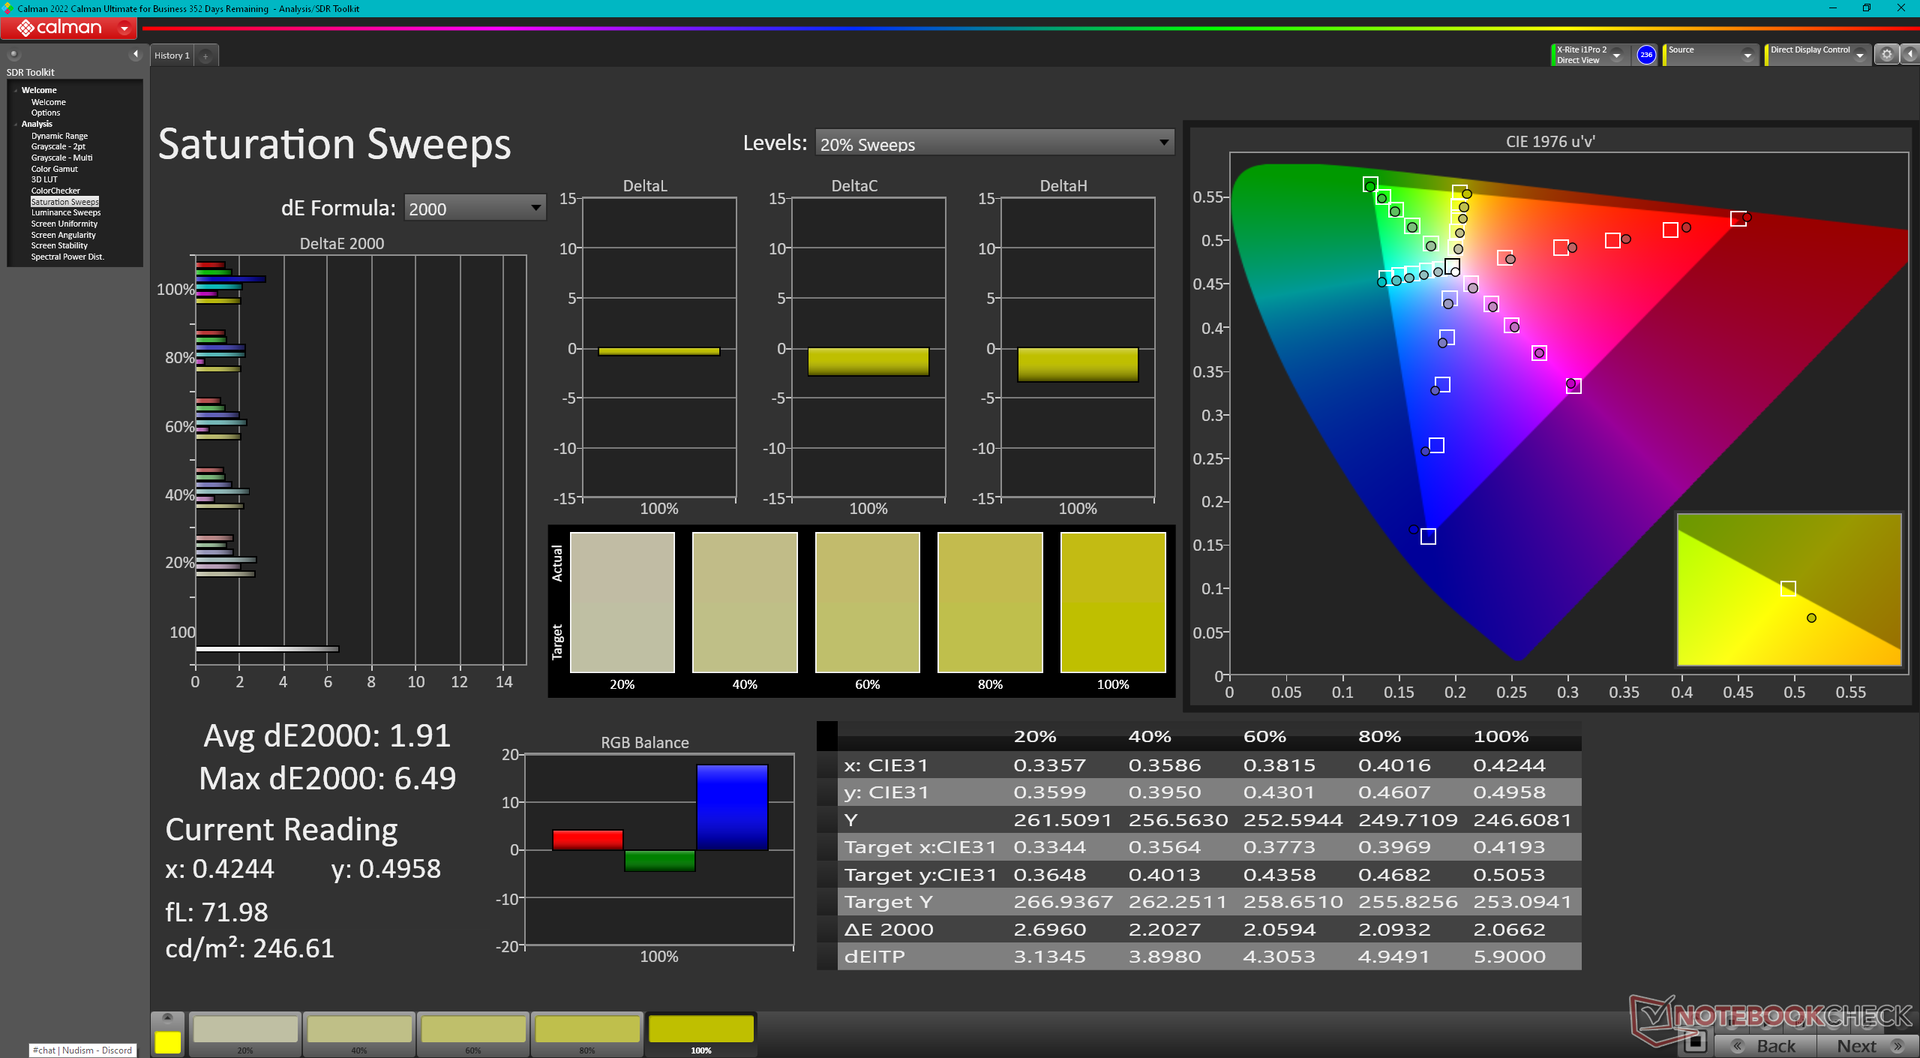
L'écran est livré pré-calibré avec des valeurs moyennes de deltaE en niveaux de gris et en couleurs de seulement 3 et 2,47, respectivement, sur notre appareil spécifique. Si nous étalonnions nous-mêmes l'écran avec un colorimètre X-Rite, les valeurs deltaE seraient encore plus élevées, à seulement 0,7 et 0,6. Nous recommandons d'appliquer notre profil ICM calibré ci-dessus pour mieux exploiter la couverture sRGB complète de l'écran.
Temps de réponse de l'écran
| ↔ Temps de réponse noir à blanc | ||
|---|---|---|
| 11.2 ms ... hausse ↗ et chute ↘ combinées | ↗ 6 ms hausse | 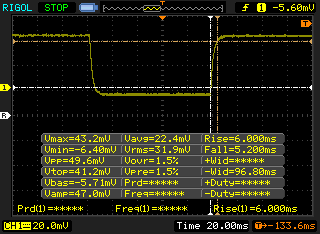 |
| ↘ 5.2 ms chute | ||
| L'écran montre de bons temps de réponse, mais insuffisant pour du jeu compétitif. En comparaison, tous les appareils testés affichent entre 0.1 (minimum) et 240 (maximum) ms. » 30 % des appareils testés affichent de meilleures performances. Cela signifie que les latences relevées sont meilleures que la moyenne (19.9 ms) de tous les appareils testés. | ||
| ↔ Temps de réponse gris 50% à gris 80% | ||
| 14.4 ms ... hausse ↗ et chute ↘ combinées | ↗ 7.6 ms hausse |  |
| ↘ 6.8 ms chute | ||
| L'écran montre de bons temps de réponse, mais insuffisant pour du jeu compétitif. En comparaison, tous les appareils testés affichent entre 0.165 (minimum) et 636 (maximum) ms. » 28 % des appareils testés affichent de meilleures performances. Cela signifie que les latences relevées sont meilleures que la moyenne (31.1 ms) de tous les appareils testés. | ||
Scintillement / MLI (Modulation de largeur d'impulsion)
| Scintillement / MLI (Modulation de largeur d'impulsion) non décelé |  | ||
En comparaison, 52 % des appareils testés n'emploient pas MDI pour assombrir leur écran. Nous avons relevé une moyenne à 7791 (minimum : 5 - maximum : 343500) Hz dans le cas où une MDI était active. | |||
Performance - Juste un peu plus rapide
Conditions d'essai
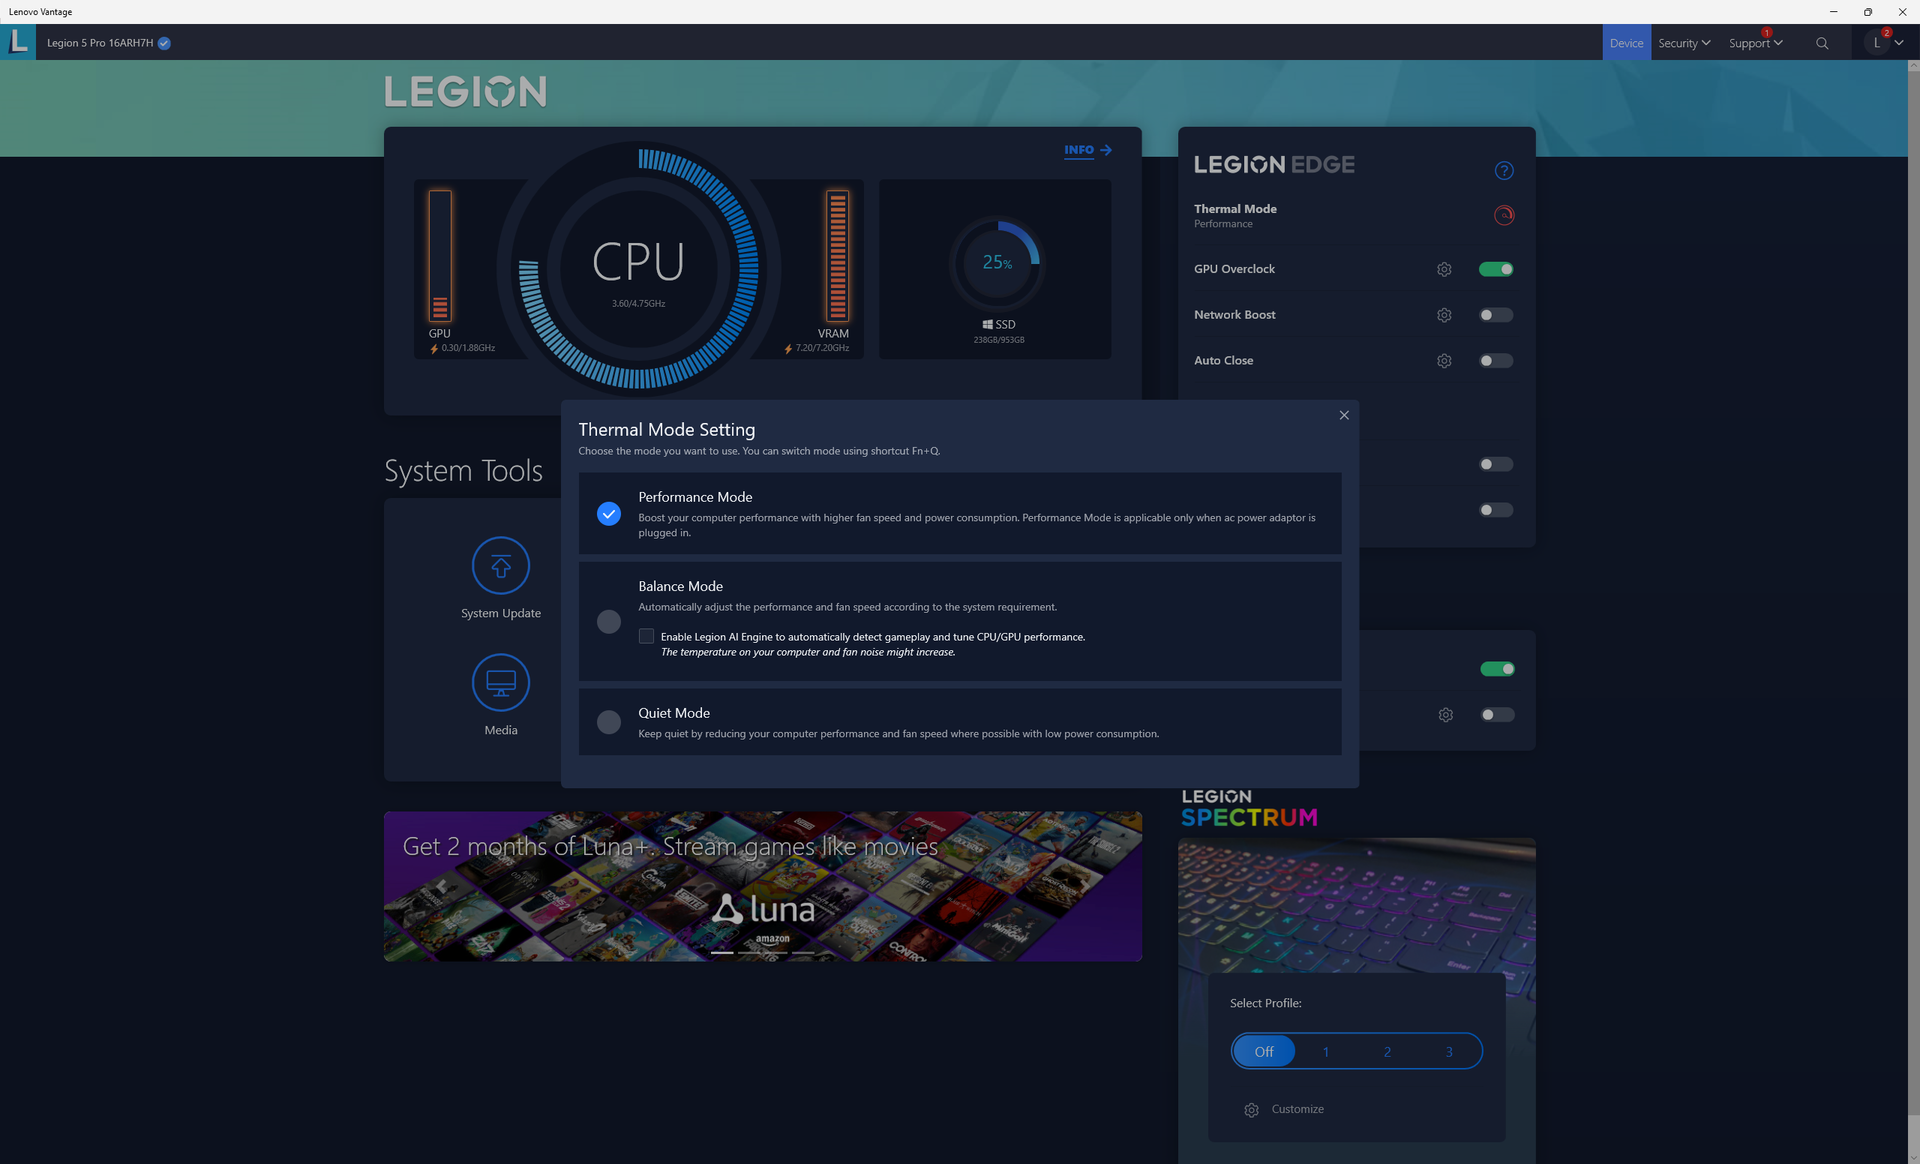
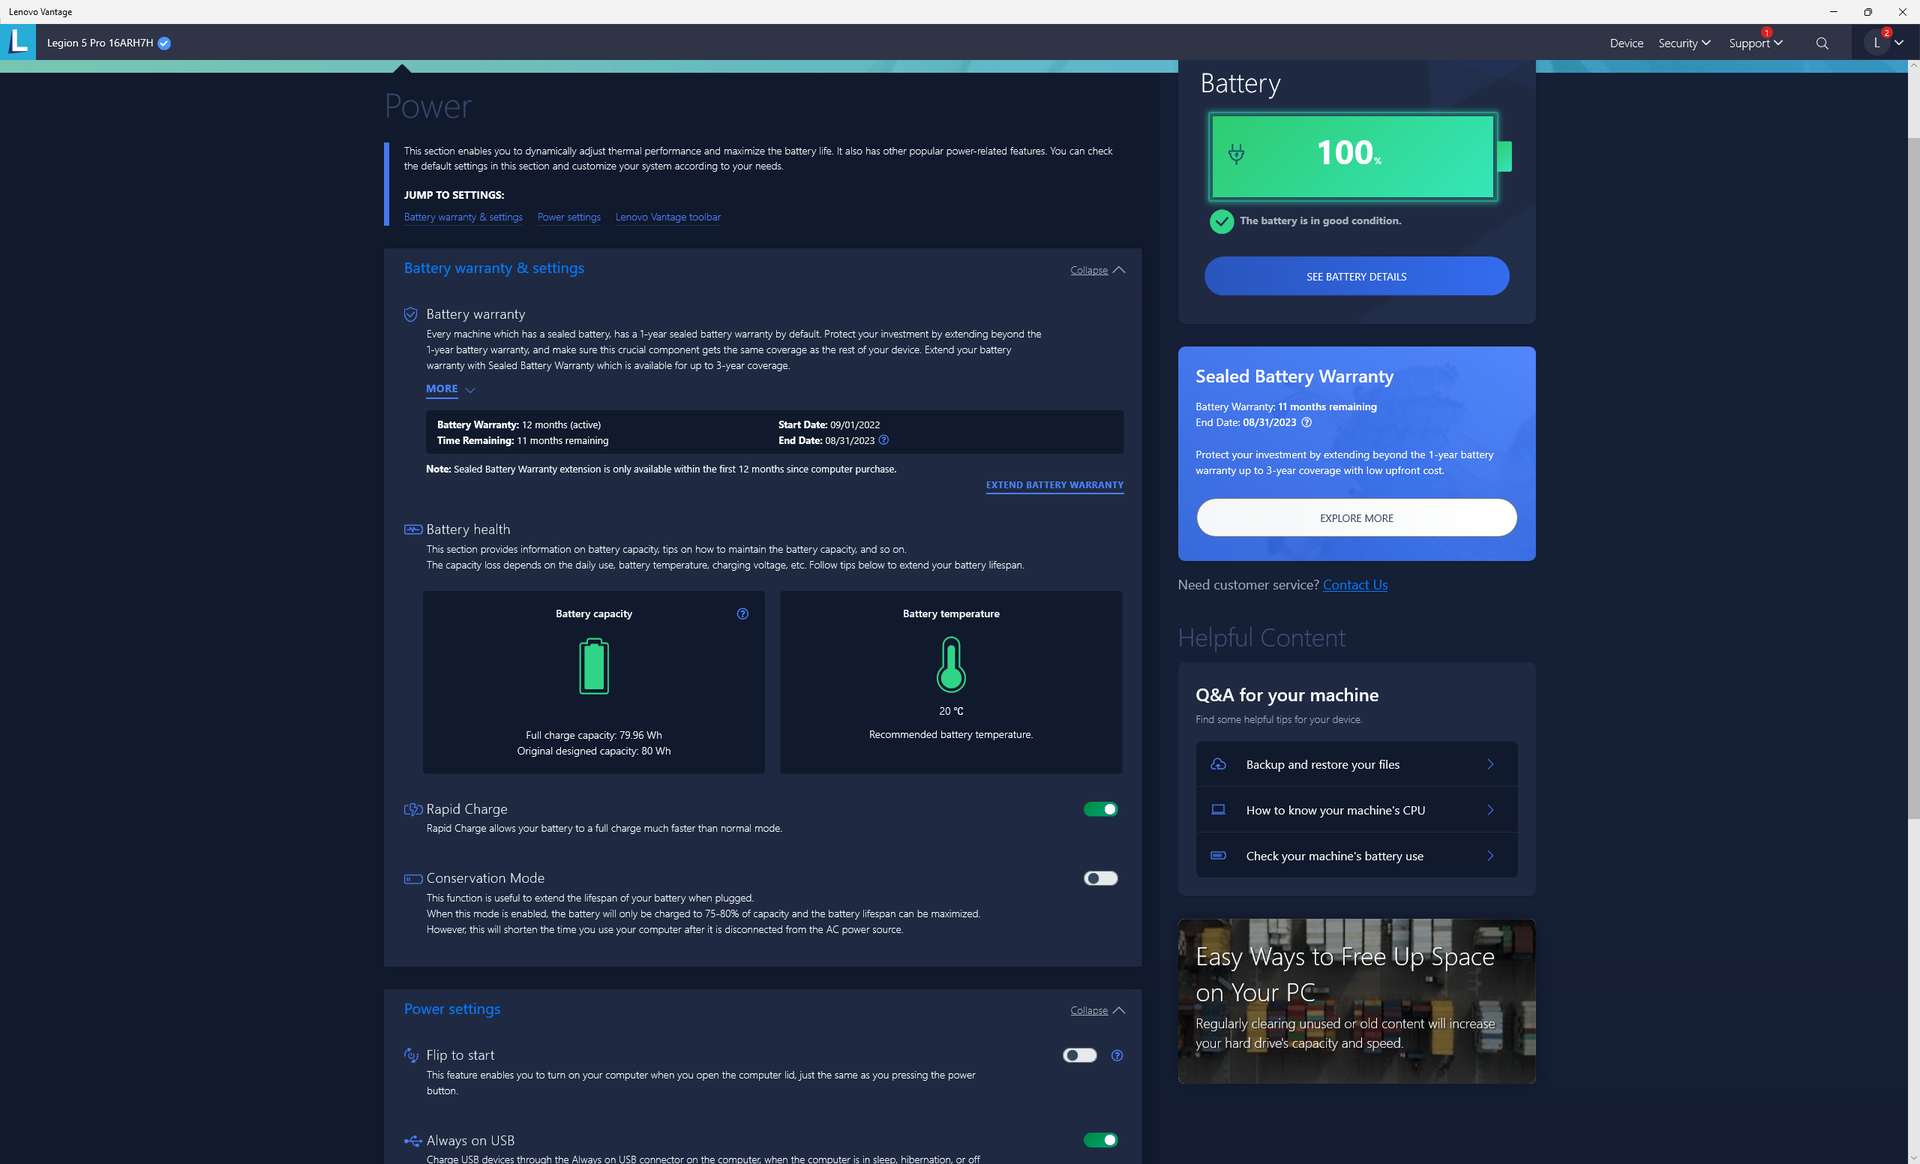
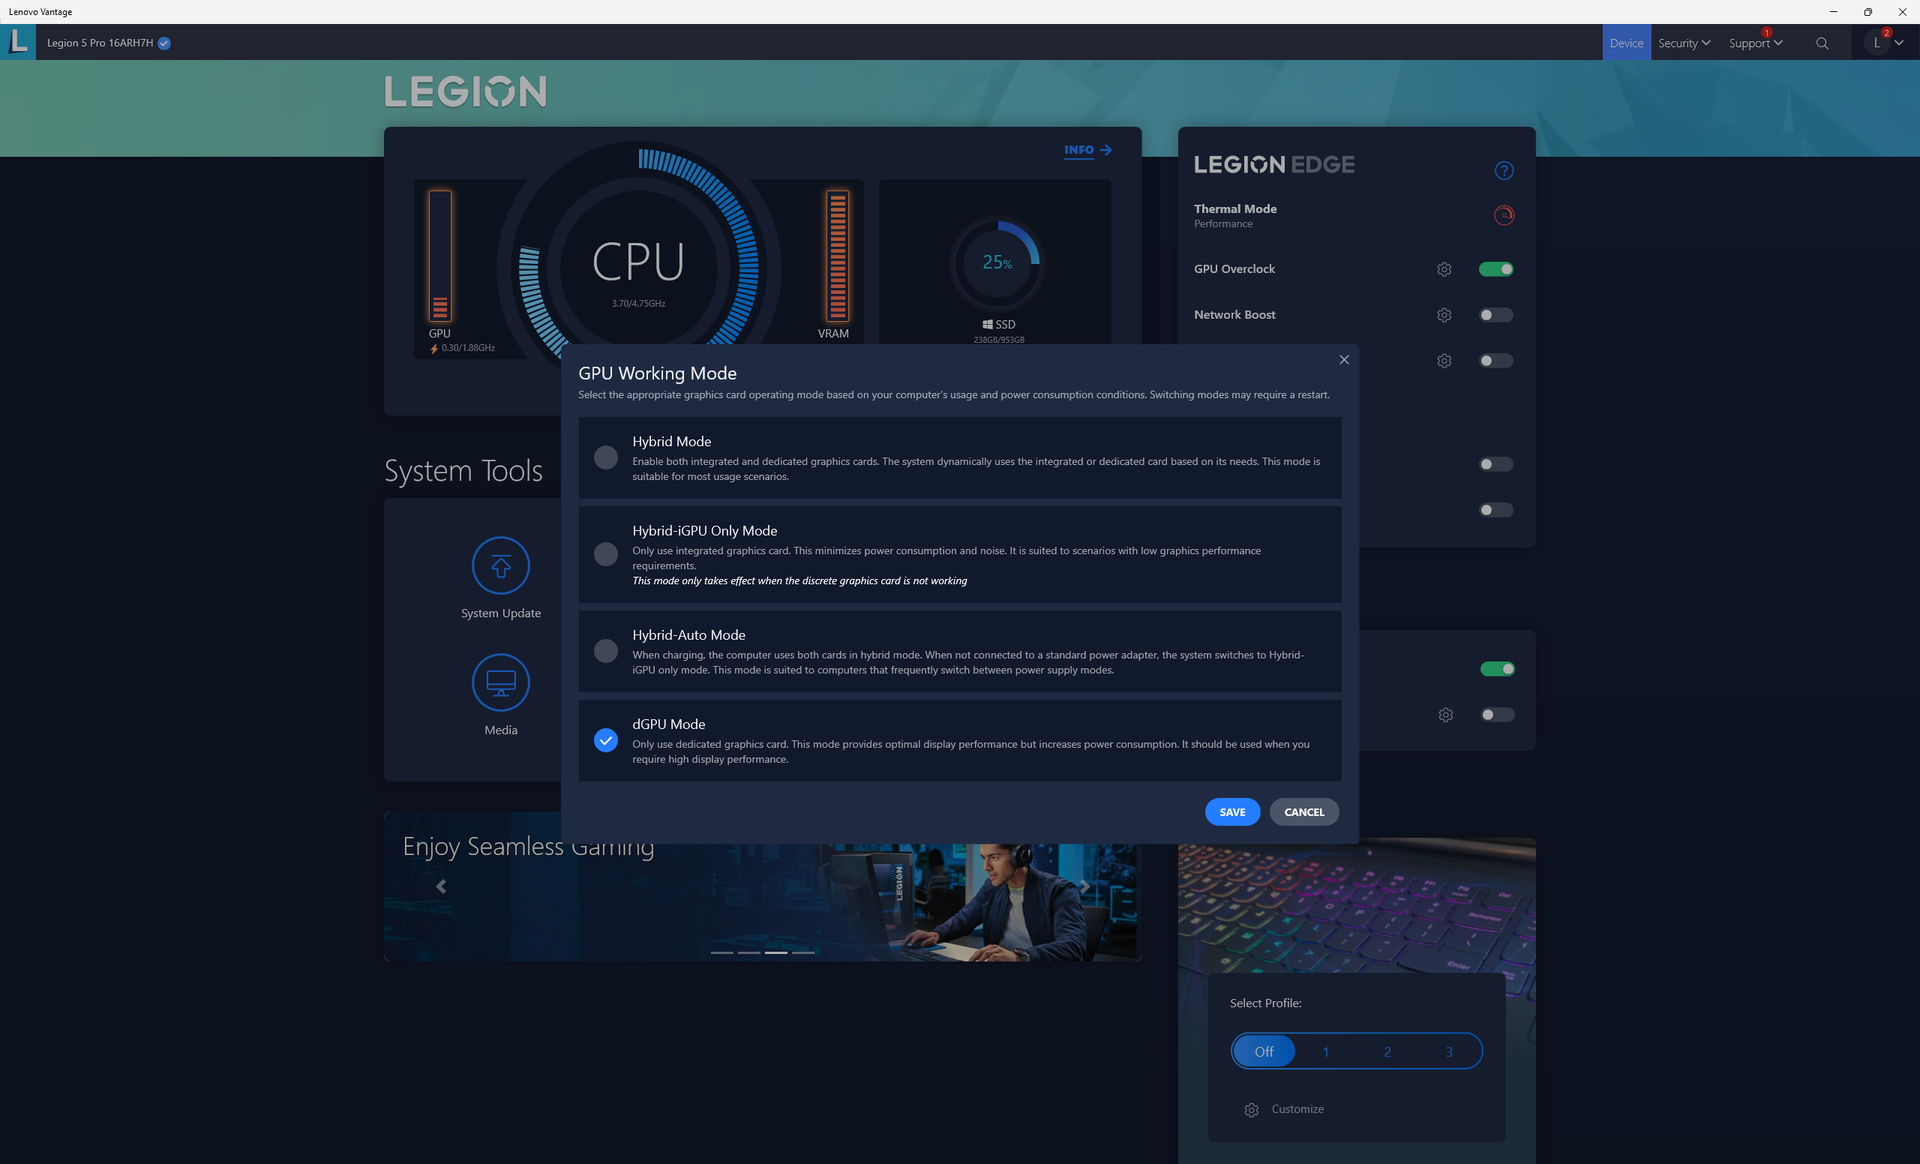
Nous avons réglé notre unité en mode Performance via Windows et le logiciel Lenovo Vantage avant d'exécuter les benchmarks ci-dessous. Nous nous sommes également assurés d'activer l'overclock du GPU et le mode de travail du GPU sur "dGPU only" pour des performances maximales. Les propriétaires doivent absolument se familiariser avec le logiciel Vantage et ses différents paramètres, comme en témoignent les captures d'écran ci-dessous.

Processeur
Les performances mono et multi-thread sont environ 10 % et 20 % plus rapides que sur la dernière génération de processeurs Ryzen 7 5800Hde dernière génération, respectivement, d'après notre expérience avec le HP Omen 16 et le Lenovo Legion 5 Pro 16 de 2021. Bien que non négligeable, l'augmentation des performances d'une année sur l'autre est loin d'être aussi importante que le passage de la 11e à la 12e génération d'Intel. Le Core i7-12700Hpar exemple, est toujours environ 15 à 30 % plus rapide que notre Ryzen 7 6800H
La mise à niveau vers le Ryzen 9 6900HX à partir de notre Ryzen 7 6800H ne devrait apporter que des gains marginaux au mieux, comme le montrent nos tableaux de comparaison ci-dessous. Ainsi, les acheteurs soucieux de leur budget peuvent vouloir considérer un Ryzen 7 6800H moins cher à la place.
Cinebench R15 Multi Loop
Cinebench R23: Multi Core | Single Core
Cinebench R15: CPU Multi 64Bit | CPU Single 64Bit
Blender: v2.79 BMW27 CPU
7-Zip 18.03: 7z b 4 | 7z b 4 -mmt1
Geekbench 5.5: Multi-Core | Single-Core
HWBOT x265 Benchmark v2.2: 4k Preset
LibreOffice : 20 Documents To PDF
R Benchmark 2.5: Overall mean
| HWBOT x265 Benchmark v2.2 / 4k Preset | |
| Lenovo Legion 5 Pro 16IAH7H | |
| Alienware x15 R2 P111F | |
| Dell G16 7620 | |
| Lenovo Legion 5 Pro 16ARH7H RTX 3070 Ti | |
| Lenovo Legion 7 16ARHA7 | |
| Gigabyte A5 X1 | |
| Moyenne AMD Ryzen 7 6800H (14.9 - 18.5, n=9) | |
| HP Omen 16-c0077ng | |
| Asus ROG Zephyrus M16 GU603H | |
| HP Victus 16-e0145ng | |
| Lenovo Legion C7 15IMH05 82EH0030GE | |
* ... Moindre est la valeur, meilleures sont les performances
AIDA64: FP32 Ray-Trace | FPU Julia | CPU SHA3 | CPU Queen | FPU SinJulia | FPU Mandel | CPU AES | CPU ZLib | FP64 Ray-Trace | CPU PhotoWorxx
| Performance rating | |
| Lenovo Legion 7 16ARHA7 | |
| Lenovo Legion 5 Pro 16ARH7H RTX 3070 Ti | |
| Moyenne AMD Ryzen 7 6800H | |
| Dell G16 7620 | |
| Lenovo Legion 5 Pro 16IAH7H | |
| HP Victus 16-e0145ng | |
| Asus ROG Zephyrus M16 GU603H -9! | |
| AIDA64 / FP32 Ray-Trace | |
| Lenovo Legion 7 16ARHA7 | |
| Lenovo Legion 5 Pro 16ARH7H RTX 3070 Ti | |
| Moyenne AMD Ryzen 7 6800H (12876 - 17031, n=8) | |
| Dell G16 7620 | |
| Lenovo Legion 5 Pro 16IAH7H | |
| Lenovo Legion 5 Pro 16IAH7H | |
| HP Victus 16-e0145ng | |
| AIDA64 / FPU Julia | |
| Lenovo Legion 7 16ARHA7 | |
| Lenovo Legion 5 Pro 16ARH7H RTX 3070 Ti | |
| Moyenne AMD Ryzen 7 6800H (82673 - 105987, n=8) | |
| Dell G16 7620 | |
| Lenovo Legion 5 Pro 16IAH7H | |
| Lenovo Legion 5 Pro 16IAH7H | |
| HP Victus 16-e0145ng | |
| AIDA64 / CPU SHA3 | |
| Dell G16 7620 | |
| Lenovo Legion 7 16ARHA7 | |
| Lenovo Legion 5 Pro 16ARH7H RTX 3070 Ti | |
| Lenovo Legion 5 Pro 16IAH7H | |
| Lenovo Legion 5 Pro 16IAH7H | |
| Moyenne AMD Ryzen 7 6800H (2886 - 3634, n=8) | |
| HP Victus 16-e0145ng | |
| AIDA64 / CPU Queen | |
| Lenovo Legion 5 Pro 16ARH7H RTX 3070 Ti | |
| Lenovo Legion 7 16ARHA7 | |
| Dell G16 7620 | |
| Lenovo Legion 5 Pro 16IAH7H | |
| Moyenne AMD Ryzen 7 6800H (75117 - 106322, n=8) | |
| HP Victus 16-e0145ng | |
| AIDA64 / FPU SinJulia | |
| Lenovo Legion 7 16ARHA7 | |
| Lenovo Legion 5 Pro 16ARH7H RTX 3070 Ti | |
| Moyenne AMD Ryzen 7 6800H (11771 - 13120, n=8) | |
| Lenovo Legion 5 Pro 16IAH7H | |
| Lenovo Legion 5 Pro 16IAH7H | |
| Dell G16 7620 | |
| HP Victus 16-e0145ng | |
| AIDA64 / FPU Mandel | |
| Lenovo Legion 7 16ARHA7 | |
| Lenovo Legion 5 Pro 16ARH7H RTX 3070 Ti | |
| Moyenne AMD Ryzen 7 6800H (45287 - 58327, n=8) | |
| HP Victus 16-e0145ng | |
| Lenovo Legion 5 Pro 16IAH7H | |
| Lenovo Legion 5 Pro 16IAH7H | |
| Dell G16 7620 | |
| AIDA64 / CPU AES | |
| Lenovo Legion 7 16ARHA7 | |
| Lenovo Legion 5 Pro 16ARH7H RTX 3070 Ti | |
| Lenovo Legion 5 Pro 16IAH7H | |
| Lenovo Legion 5 Pro 16IAH7H | |
| Moyenne AMD Ryzen 7 6800H (67816 - 137383, n=8) | |
| Dell G16 7620 | |
| HP Victus 16-e0145ng | |
| AIDA64 / FP64 Ray-Trace | |
| Lenovo Legion 7 16ARHA7 | |
| Lenovo Legion 5 Pro 16ARH7H RTX 3070 Ti | |
| Moyenne AMD Ryzen 7 6800H (6917 - 8980, n=8) | |
| Dell G16 7620 | |
| Lenovo Legion 5 Pro 16IAH7H | |
| Lenovo Legion 5 Pro 16IAH7H | |
| HP Victus 16-e0145ng | |
| AIDA64 / CPU PhotoWorxx | |
| Dell G16 7620 | |
| Lenovo Legion 5 Pro 16IAH7H | |
| Lenovo Legion 5 Pro 16IAH7H | |
| Lenovo Legion 7 16ARHA7 | |
| Lenovo Legion 5 Pro 16ARH7H RTX 3070 Ti | |
| Moyenne AMD Ryzen 7 6800H (26496 - 30360, n=8) | |
| HP Victus 16-e0145ng | |
Performance du système
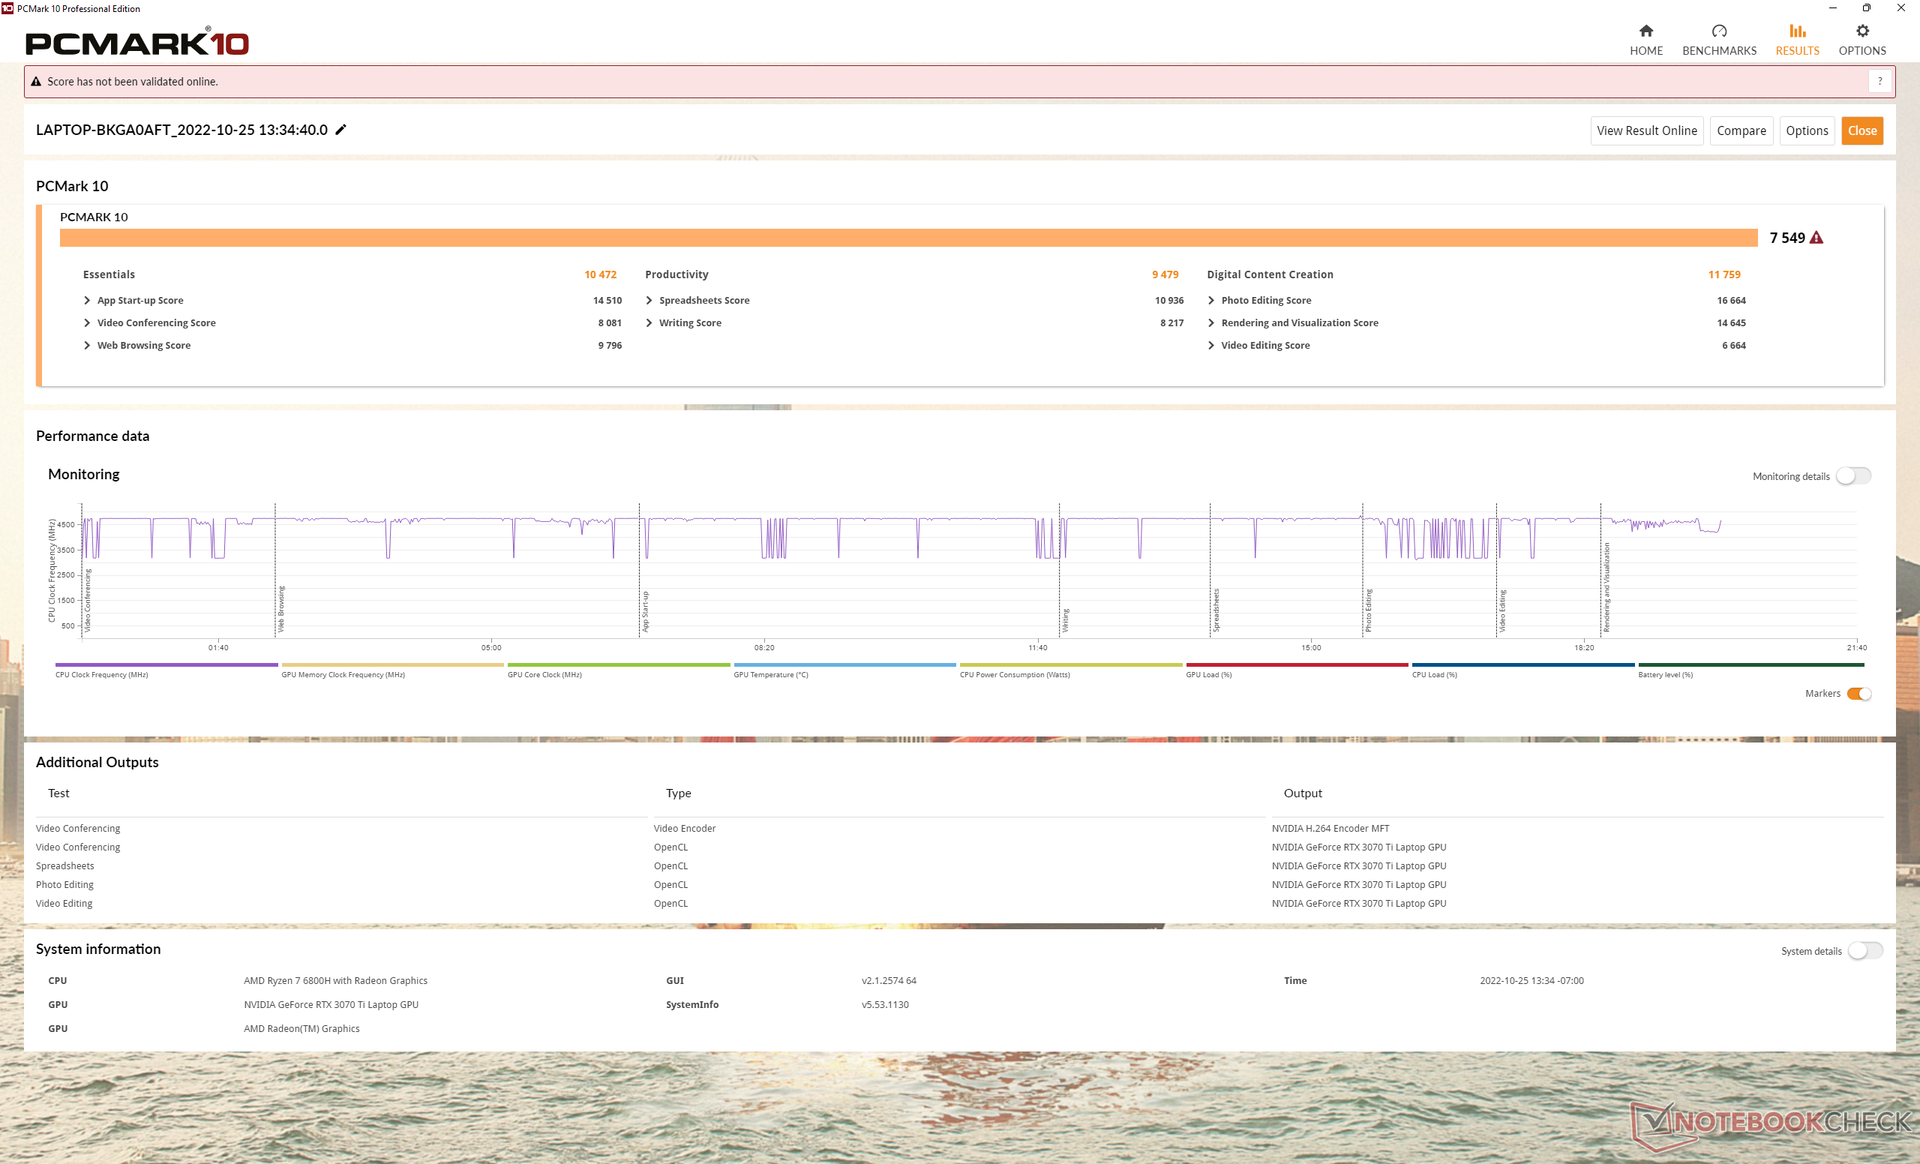
Les résultats de PCMark se situent dans une fourchette de pourcentage à un chiffre par rapport à d'autres ordinateurs portables de jeu haut de gamme équipés d'un processeur Intel comme leDell G16 7620 même si le Ryzen 7 6800H ne peut pas rivaliser avec les derniers CPU Core de 12e génération.
CrossMark: Overall | Productivity | Creativity | Responsiveness
| PCMark 10 / Score | |
| Lenovo Legion 5 Pro 16ARH7H RTX 3070 Ti | |
| Lenovo Legion 5 Pro 16IAH7H | |
| Lenovo Legion 7 16ARHA7 | |
| Dell G16 7620 | |
| Moyenne AMD Ryzen 7 6800H, NVIDIA GeForce RTX 3070 Ti Laptop GPU (6783 - 7549, n=2) | |
| Asus ROG Zephyrus M16 GU603H | |
| HP Victus 16-e0145ng | |
| PCMark 10 / Essentials | |
| Lenovo Legion 5 Pro 16IAH7H | |
| Asus ROG Zephyrus M16 GU603H | |
| Lenovo Legion 7 16ARHA7 | |
| Lenovo Legion 5 Pro 16ARH7H RTX 3070 Ti | |
| Moyenne AMD Ryzen 7 6800H, NVIDIA GeForce RTX 3070 Ti Laptop GPU (10343 - 10472, n=2) | |
| Dell G16 7620 | |
| HP Victus 16-e0145ng | |
| PCMark 10 / Productivity | |
| Lenovo Legion 5 Pro 16ARH7H RTX 3070 Ti | |
| Lenovo Legion 5 Pro 16IAH7H | |
| Moyenne AMD Ryzen 7 6800H, NVIDIA GeForce RTX 3070 Ti Laptop GPU (8991 - 9479, n=2) | |
| Asus ROG Zephyrus M16 GU603H | |
| Lenovo Legion 7 16ARHA7 | |
| Dell G16 7620 | |
| HP Victus 16-e0145ng | |
| PCMark 10 / Digital Content Creation | |
| Lenovo Legion 5 Pro 16ARH7H RTX 3070 Ti | |
| Lenovo Legion 7 16ARHA7 | |
| Lenovo Legion 5 Pro 16IAH7H | |
| Dell G16 7620 | |
| Moyenne AMD Ryzen 7 6800H, NVIDIA GeForce RTX 3070 Ti Laptop GPU (9108 - 11759, n=2) | |
| Asus ROG Zephyrus M16 GU603H | |
| HP Victus 16-e0145ng | |
| CrossMark / Overall | |
| Dell G16 7620 | |
| Lenovo Legion 5 Pro 16IAH7H | |
| Lenovo Legion 5 Pro 16ARH7H RTX 3070 Ti | |
| Lenovo Legion 7 16ARHA7 | |
| Moyenne AMD Ryzen 7 6800H, NVIDIA GeForce RTX 3070 Ti Laptop GPU (1522 - 1643, n=2) | |
| CrossMark / Productivity | |
| Lenovo Legion 5 Pro 16IAH7H | |
| Dell G16 7620 | |
| Lenovo Legion 5 Pro 16ARH7H RTX 3070 Ti | |
| Moyenne AMD Ryzen 7 6800H, NVIDIA GeForce RTX 3070 Ti Laptop GPU (1530 - 1600, n=2) | |
| Lenovo Legion 7 16ARHA7 | |
| CrossMark / Creativity | |
| Dell G16 7620 | |
| Lenovo Legion 5 Pro 16IAH7H | |
| Lenovo Legion 7 16ARHA7 | |
| Lenovo Legion 5 Pro 16ARH7H RTX 3070 Ti | |
| Moyenne AMD Ryzen 7 6800H, NVIDIA GeForce RTX 3070 Ti Laptop GPU (1589 - 1746, n=2) | |
| CrossMark / Responsiveness | |
| Lenovo Legion 5 Pro 16IAH7H | |
| Dell G16 7620 | |
| Lenovo Legion 5 Pro 16ARH7H RTX 3070 Ti | |
| Moyenne AMD Ryzen 7 6800H, NVIDIA GeForce RTX 3070 Ti Laptop GPU (1316 - 1481, n=2) | |
| Lenovo Legion 7 16ARHA7 | |
| PCMark 10 Score | 7549 points | |
Aide | ||
| AIDA64 / Memory Copy | |
| Lenovo Legion 5 Pro 16IAH7H | |
| Lenovo Legion 5 Pro 16IAH7H | |
| Dell G16 7620 | |
| Lenovo Legion 5 Pro 16ARH7H RTX 3070 Ti | |
| Lenovo Legion 7 16ARHA7 | |
| Moyenne AMD Ryzen 7 6800H (48209 - 51186, n=8) | |
| HP Victus 16-e0145ng | |
| AIDA64 / Memory Read | |
| Dell G16 7620 | |
| Lenovo Legion 5 Pro 16IAH7H | |
| Lenovo Legion 5 Pro 16IAH7H | |
| Lenovo Legion 7 16ARHA7 | |
| Lenovo Legion 5 Pro 16ARH7H RTX 3070 Ti | |
| Moyenne AMD Ryzen 7 6800H (43828 - 51778, n=8) | |
| HP Victus 16-e0145ng | |
| AIDA64 / Memory Write | |
| Lenovo Legion 5 Pro 16IAH7H | |
| Lenovo Legion 5 Pro 16IAH7H | |
| Dell G16 7620 | |
| Lenovo Legion 5 Pro 16ARH7H RTX 3070 Ti | |
| Lenovo Legion 7 16ARHA7 | |
| Moyenne AMD Ryzen 7 6800H (51116 - 55307, n=8) | |
| HP Victus 16-e0145ng | |
| AIDA64 / Memory Latency | |
| Lenovo Legion 5 Pro 16IAH7H | |
| Lenovo Legion 5 Pro 16IAH7H | |
| Dell G16 7620 | |
| Moyenne AMD Ryzen 7 6800H (83.1 - 104.1, n=8) | |
| Lenovo Legion 5 Pro 16ARH7H RTX 3070 Ti | |
| Lenovo Legion 7 16ARHA7 | |
| HP Victus 16-e0145ng | |
| Asus ROG Zephyrus M16 GU603H | |
* ... Moindre est la valeur, meilleures sont les performances
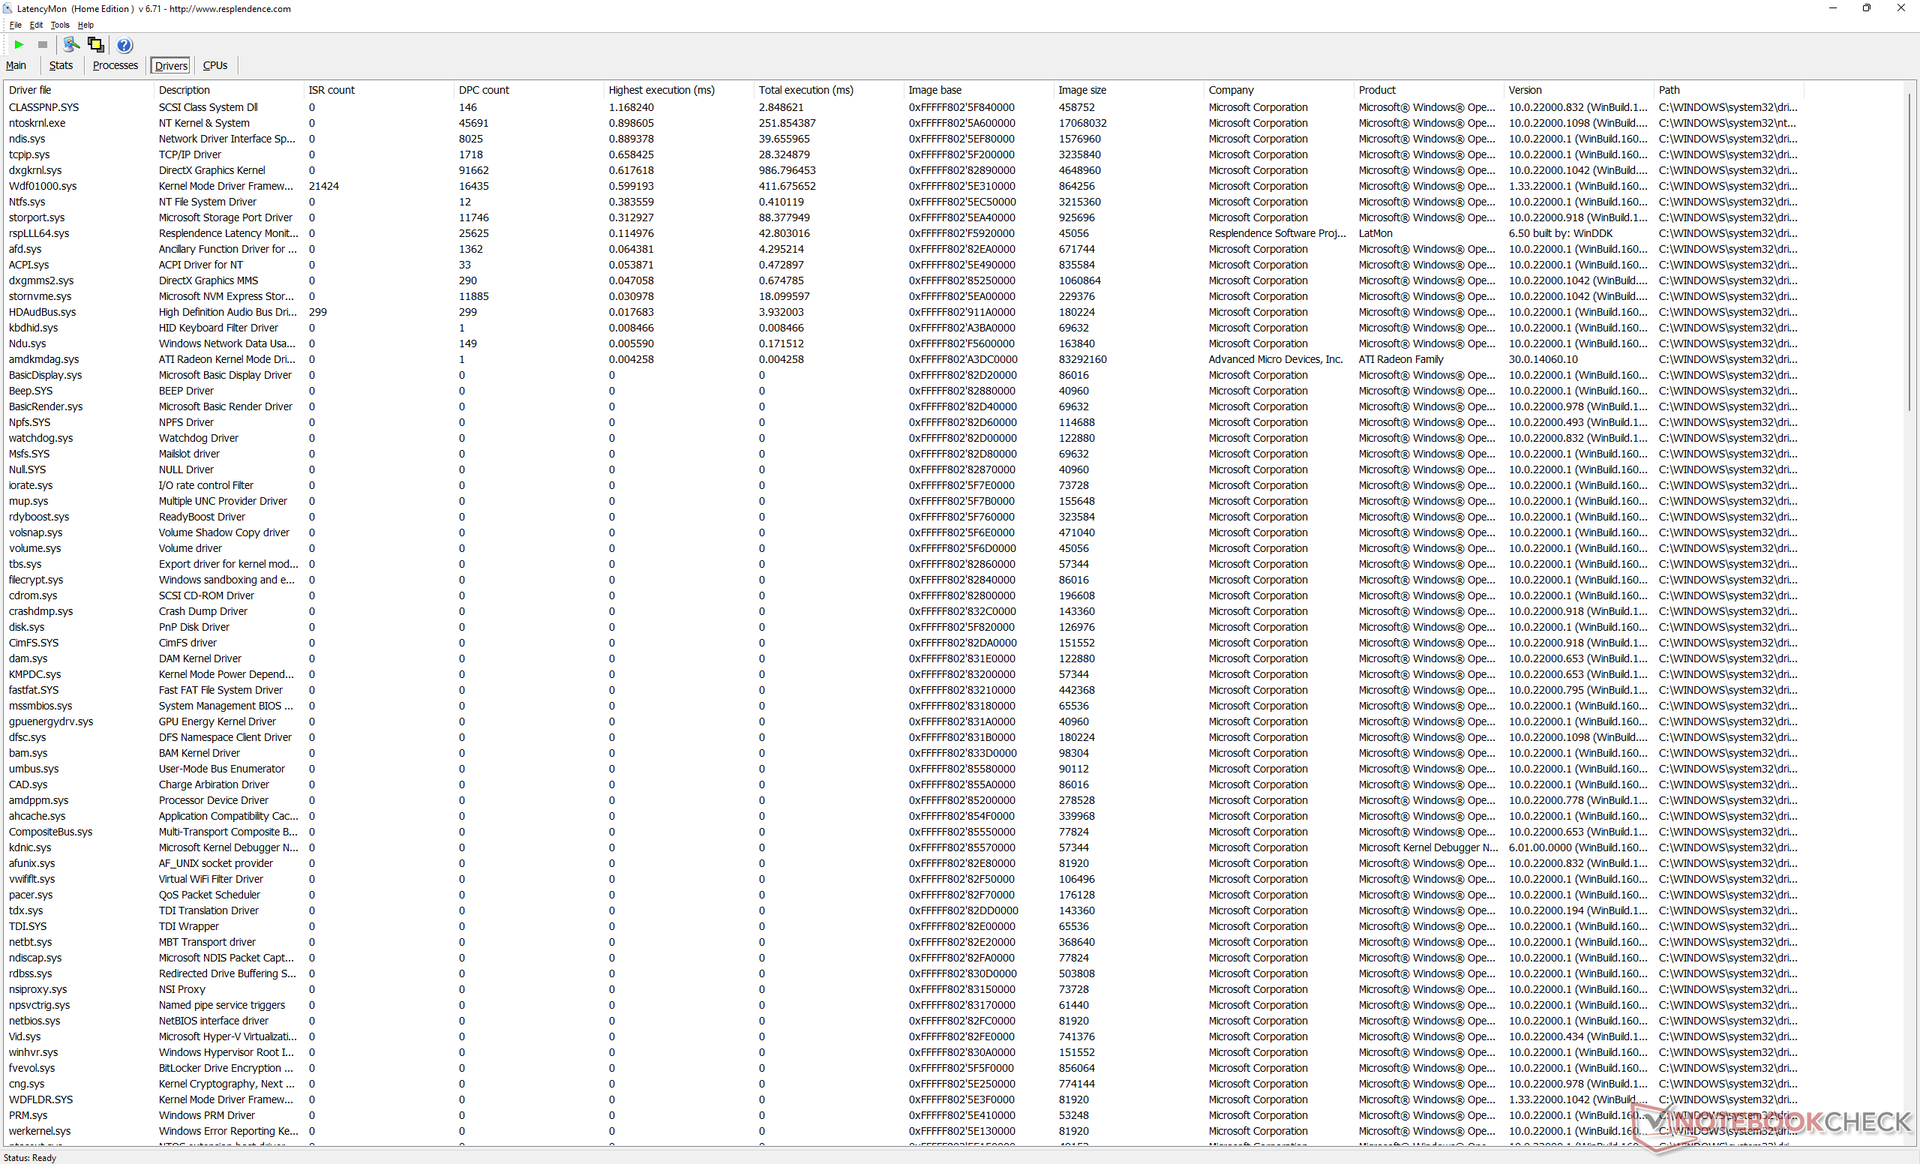
Latence DPC
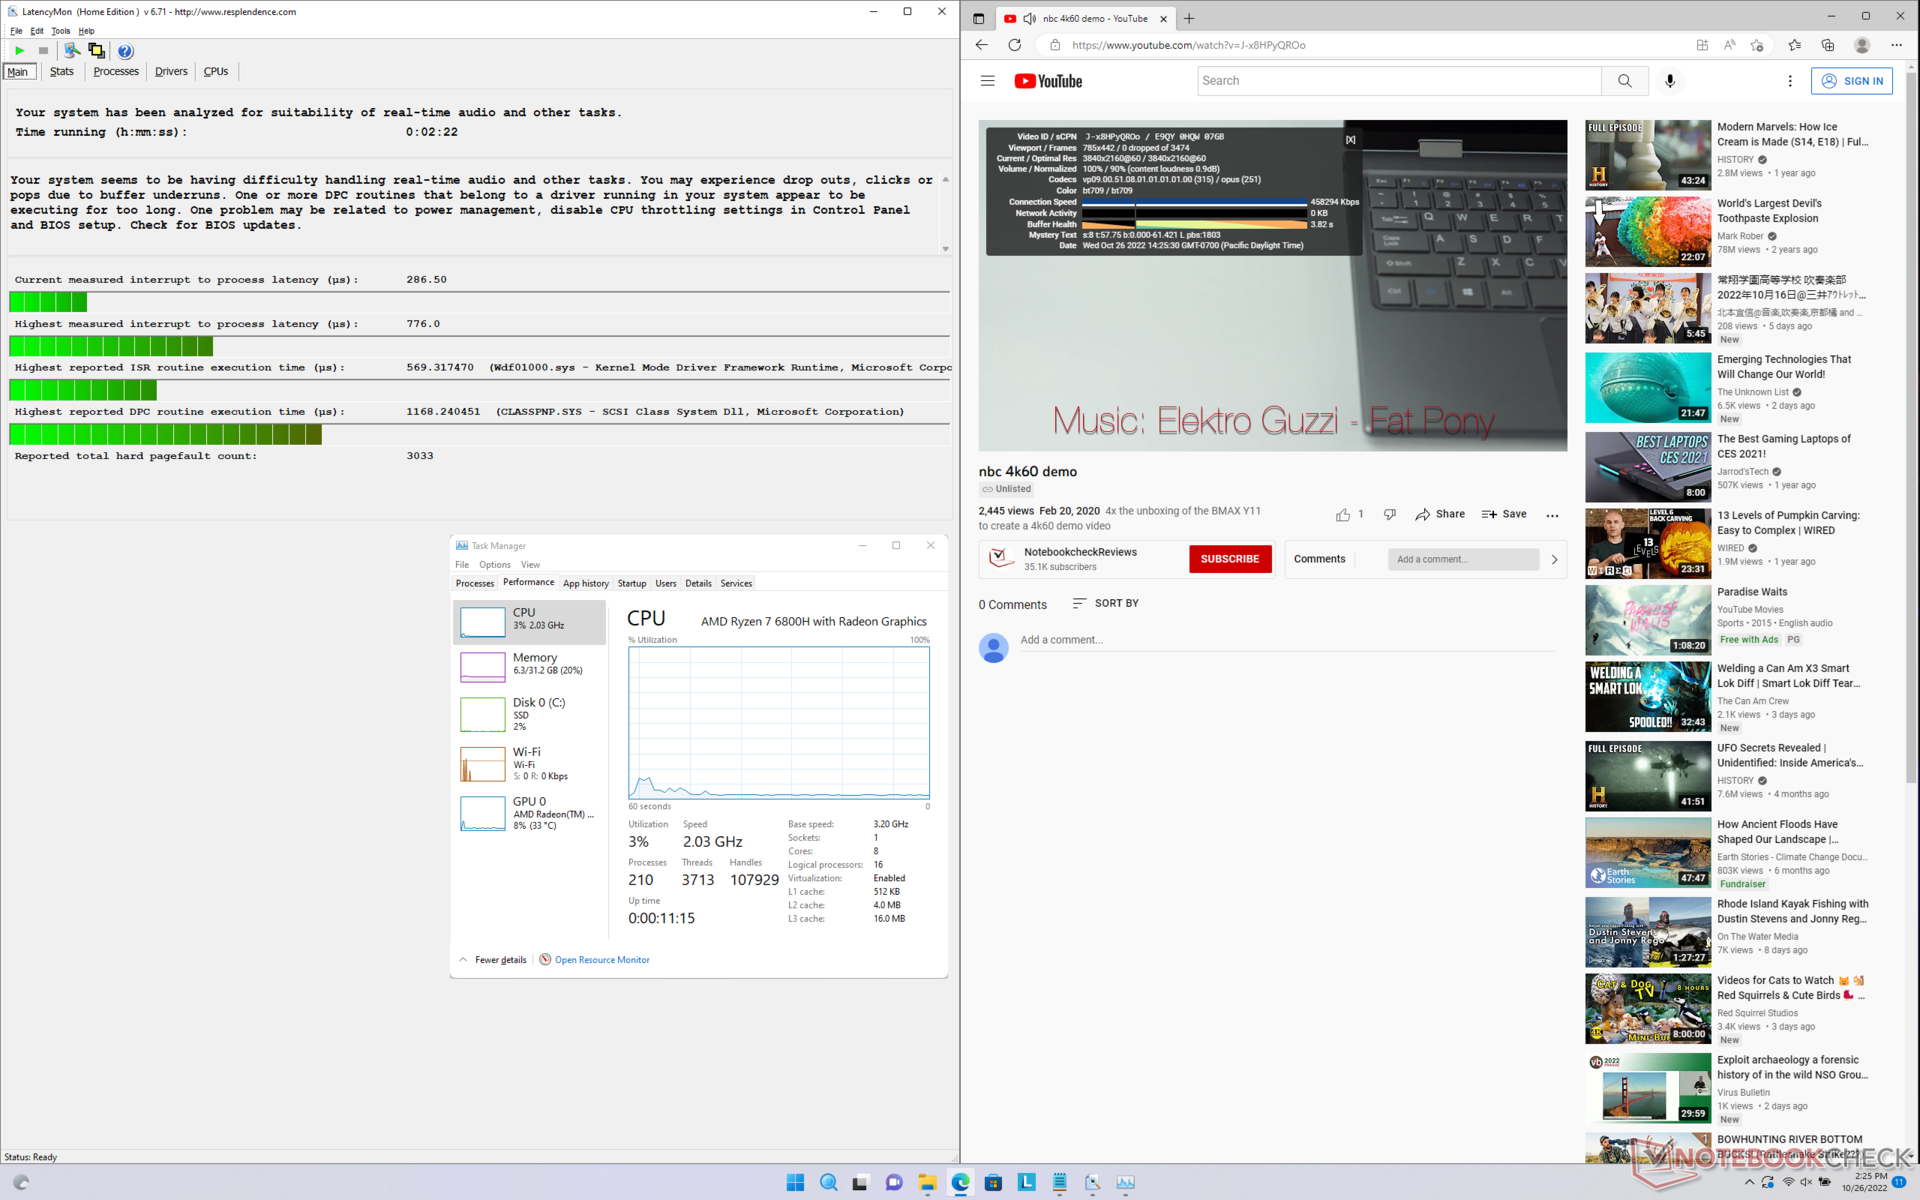
LatencyMon révèle des problèmes mineurs de CPD lors de l'ouverture de plusieurs onglets de navigateur de notre page d'accueil. la lecture de vidéos 4K à 60 FPS est par ailleurs parfaite et ne présente aucune perte d'images.
| DPC Latencies / LatencyMon - interrupt to process latency (max), Web, Youtube, Prime95 | |
| Lenovo Legion 7 16ARHA7 | |
| Asus ROG Zephyrus M16 GU603H | |
| Dell G16 7620 | |
| HP Victus 16-e0145ng | |
| Lenovo Legion 5 Pro 16ARH7H RTX 3070 Ti | |
| Lenovo Legion 5 Pro 16IAH7H | |
* ... Moindre est la valeur, meilleures sont les performances
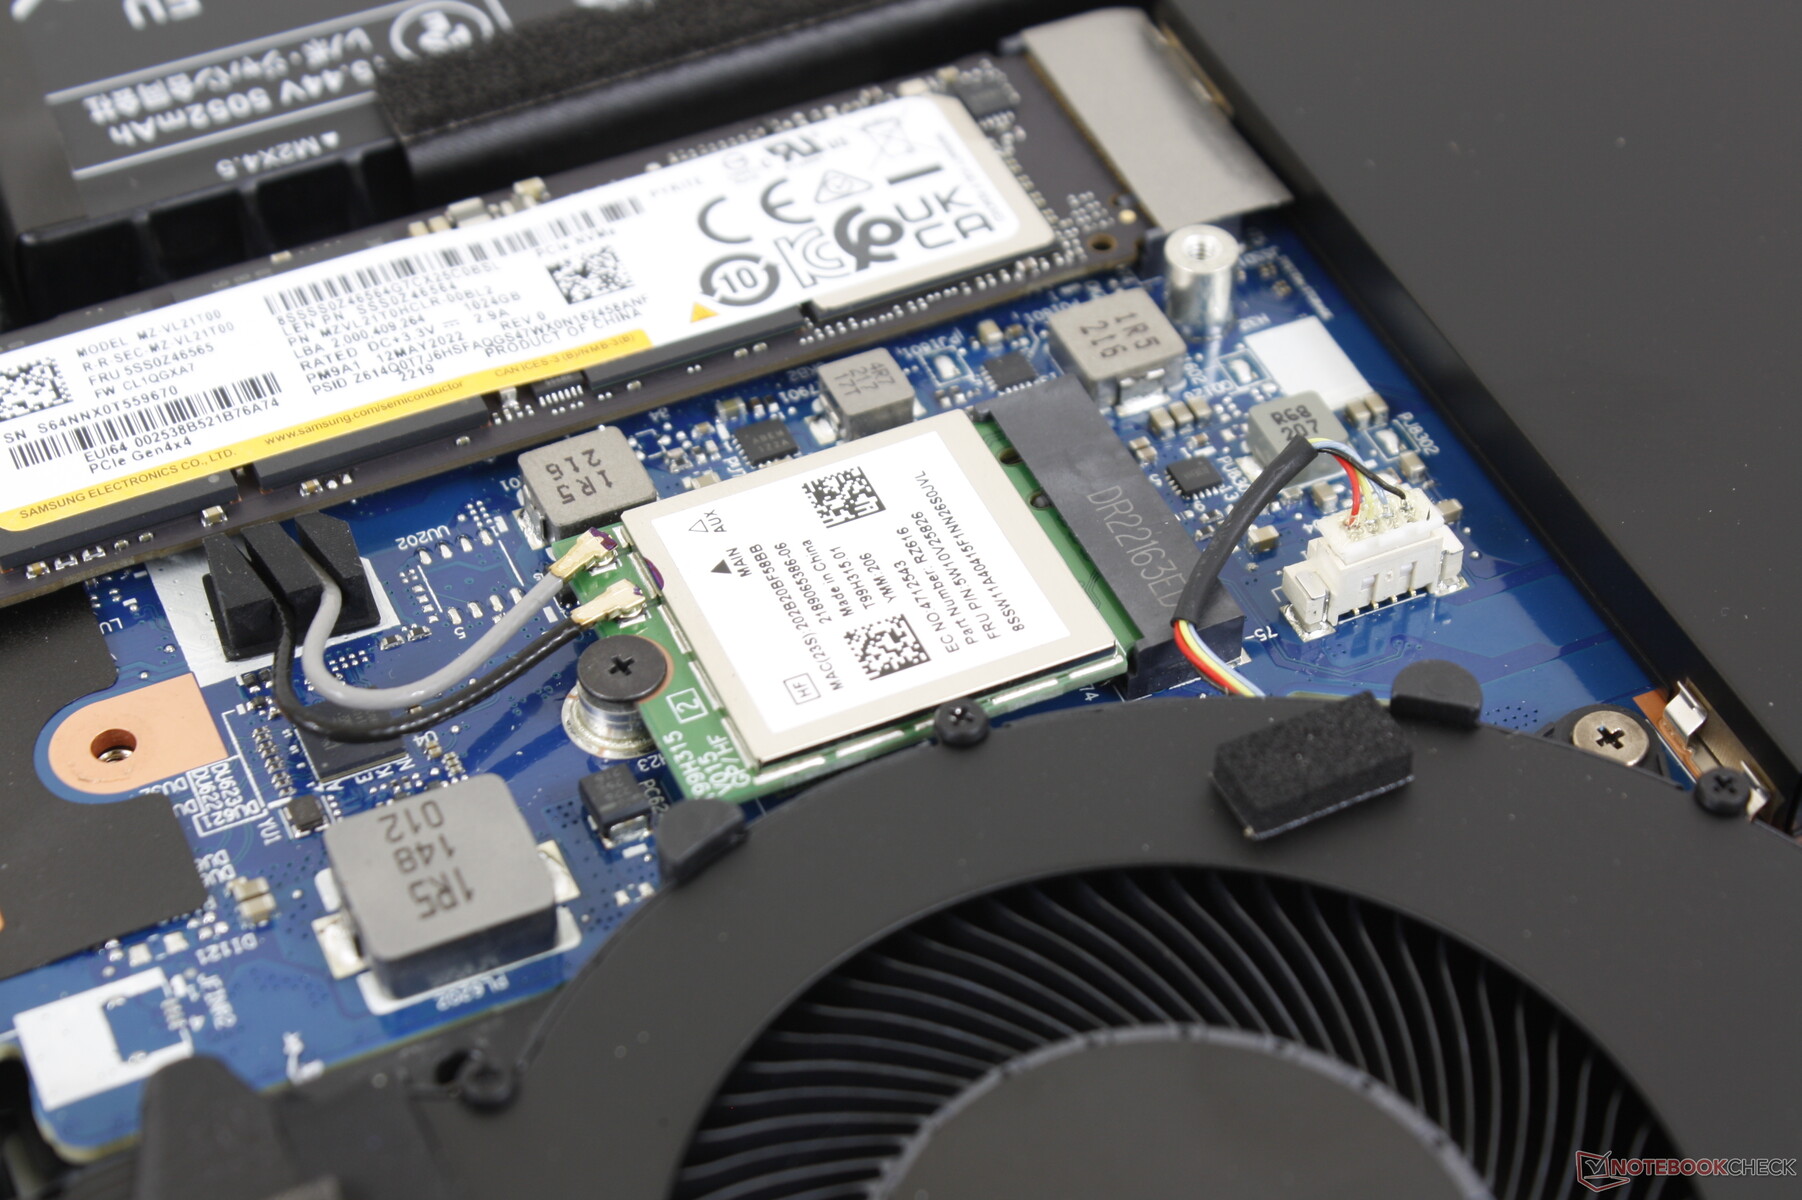
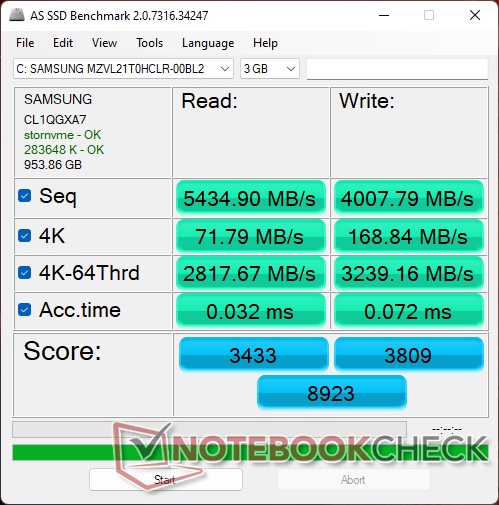
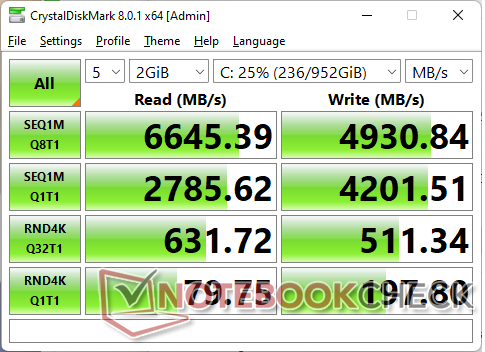
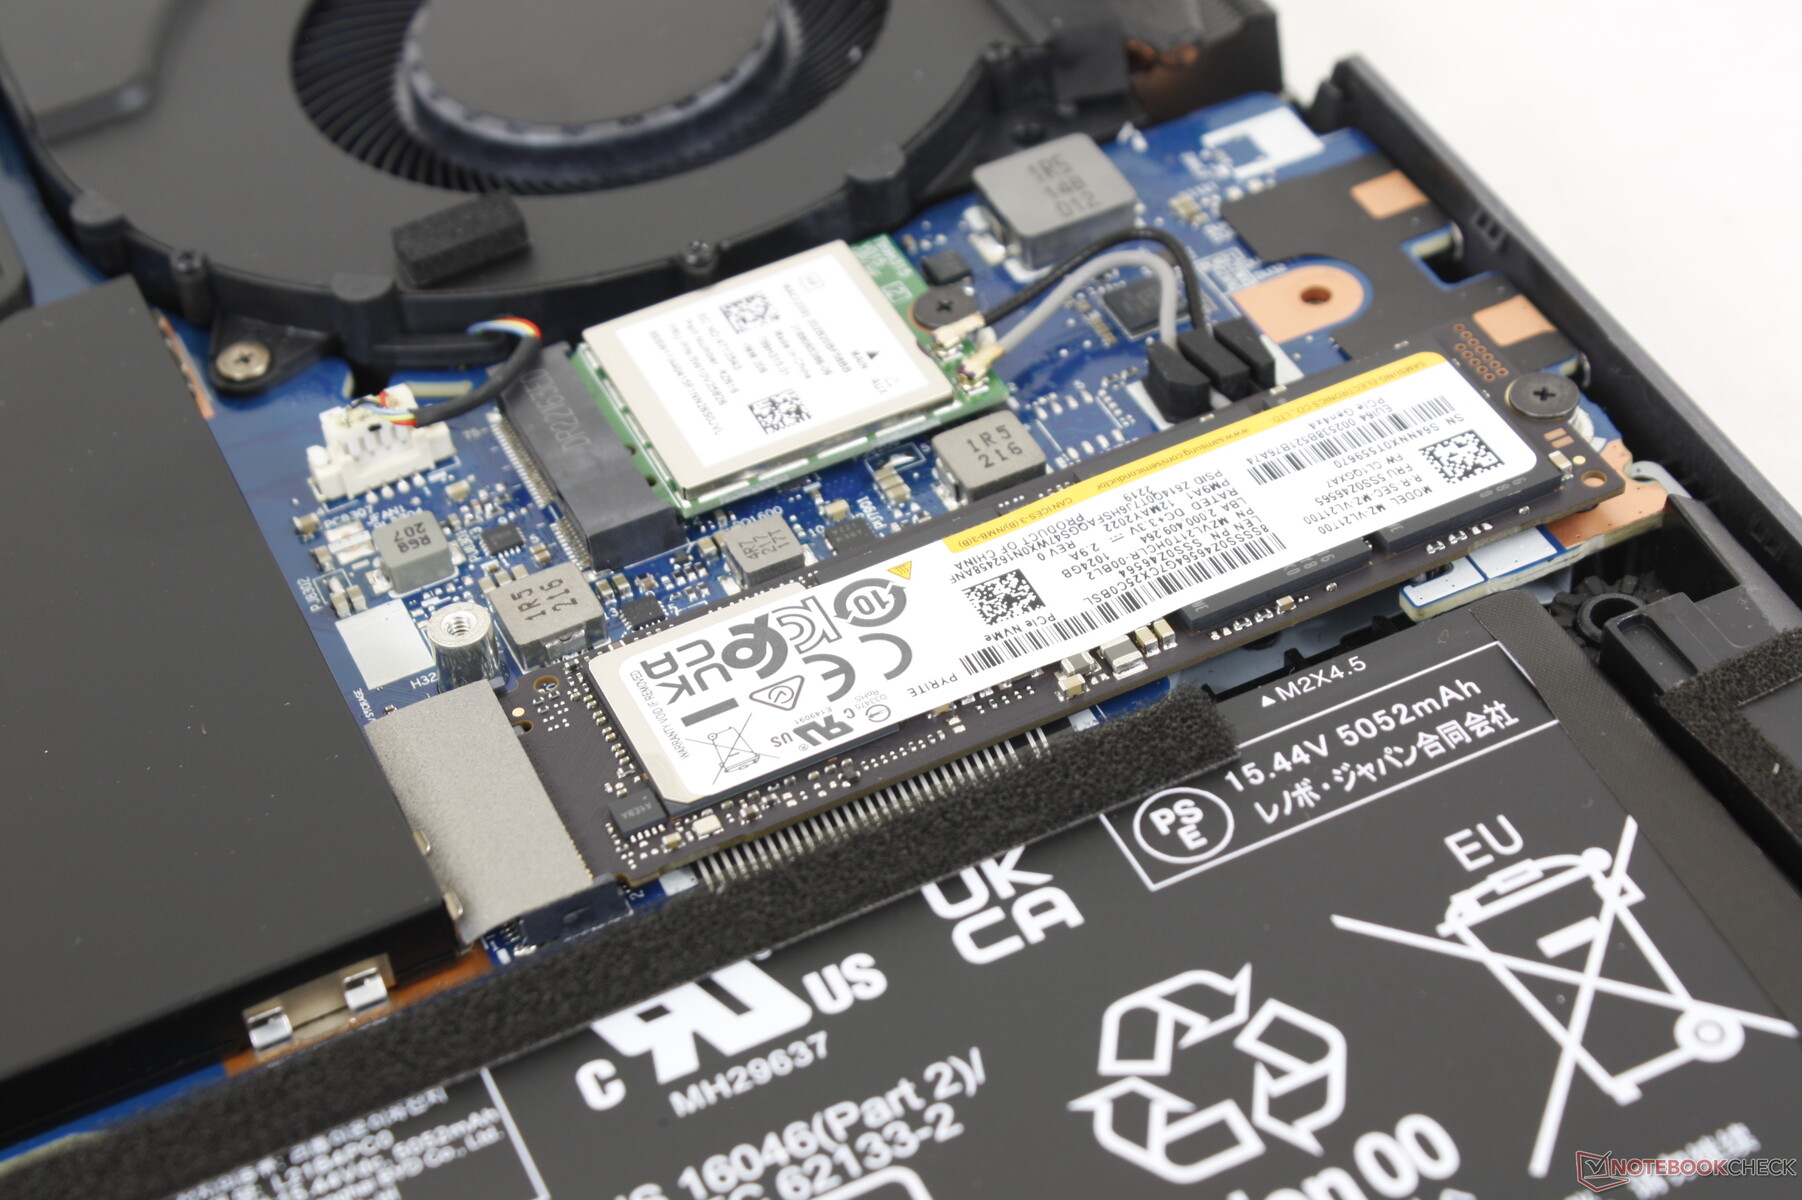
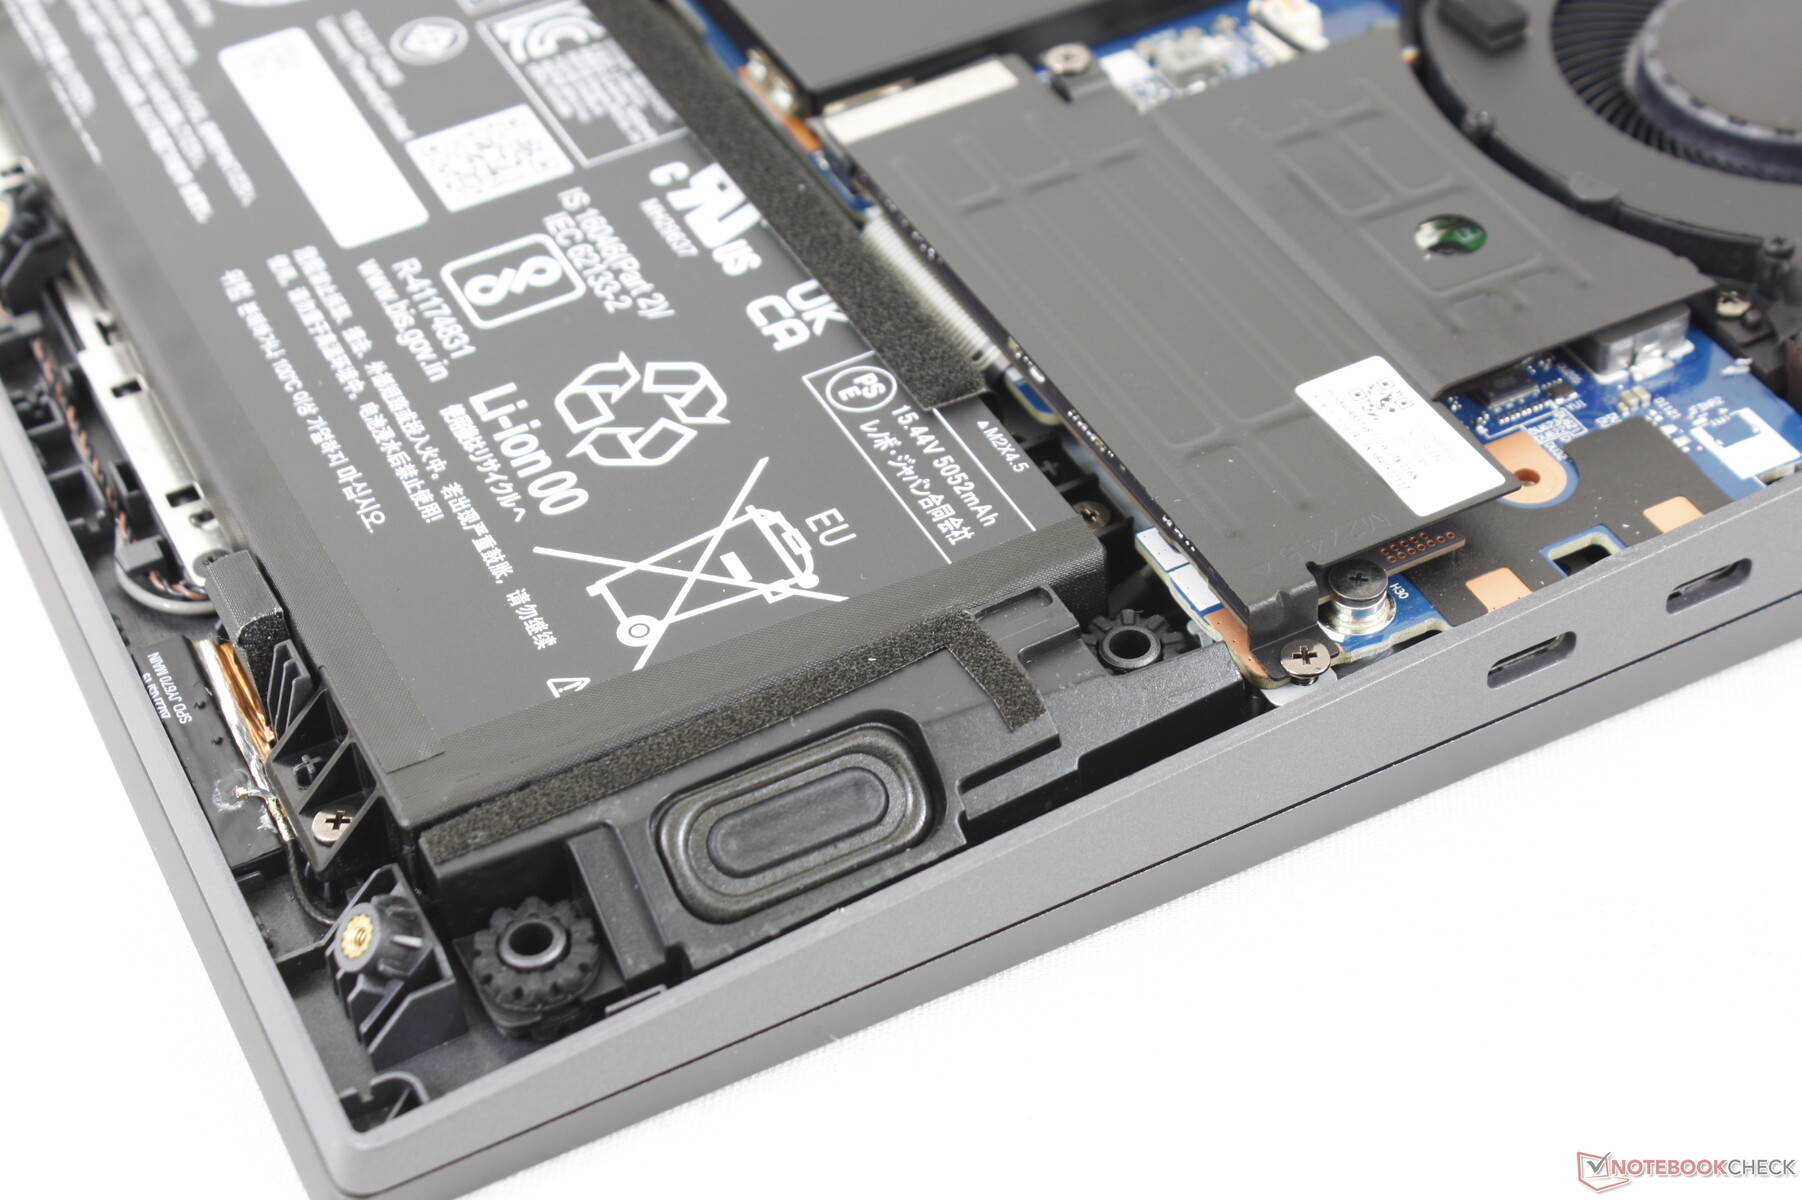
Périphériques de stockage - Jusqu'à deux SSD NVMe PCIe4

| Drive Performance rating - Percent | |
| Lenovo Legion 5 Pro 16IAH7H | |
| Lenovo Legion 5 Pro 16ARH7H RTX 3070 Ti | |
| Asus ROG Zephyrus M16 GU603H | |
| Dell G16 7620 | |
| Lenovo Legion 7 16ARHA7 | |
| HP Victus 16-e0145ng | |
* ... Moindre est la valeur, meilleures sont les performances
Disk Throttling: DiskSpd Read Loop, Queue Depth 8
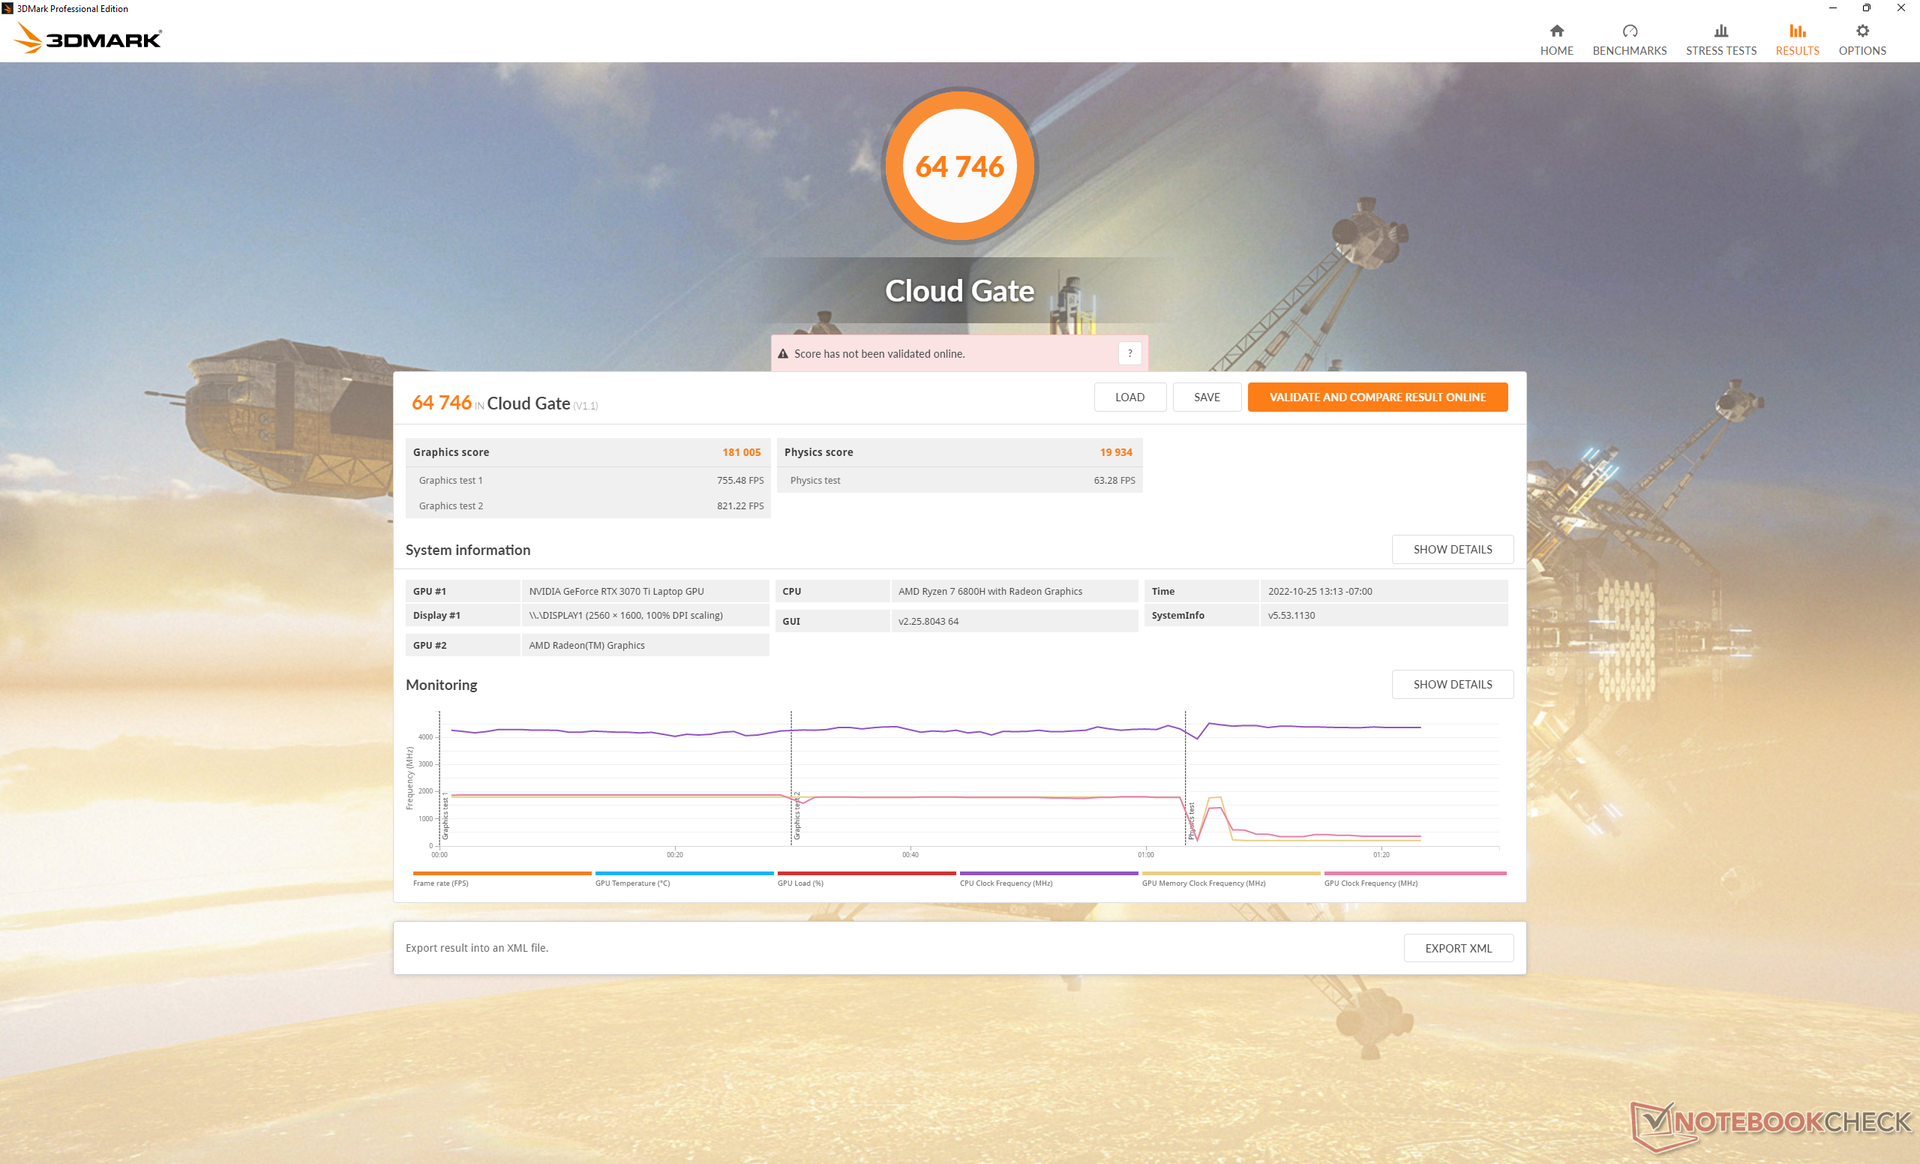
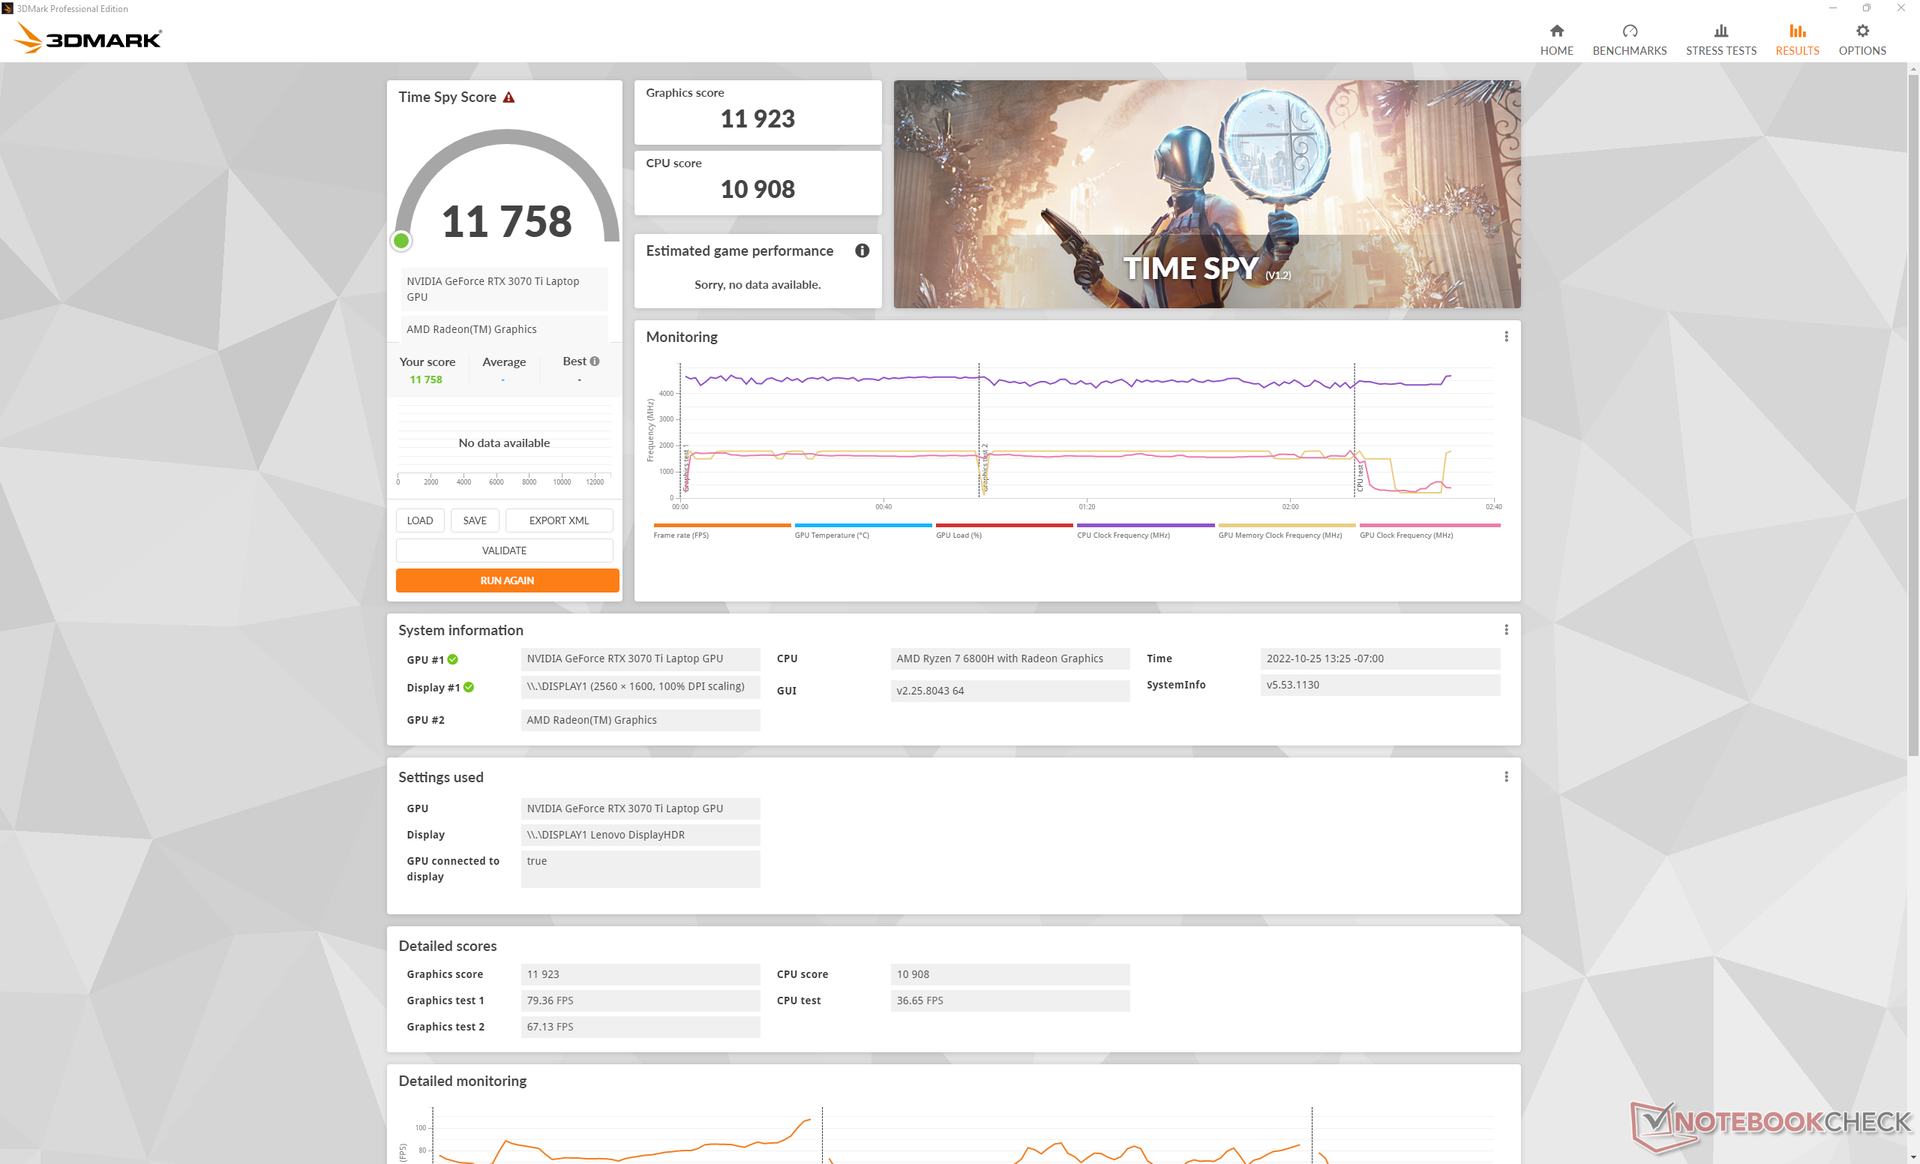
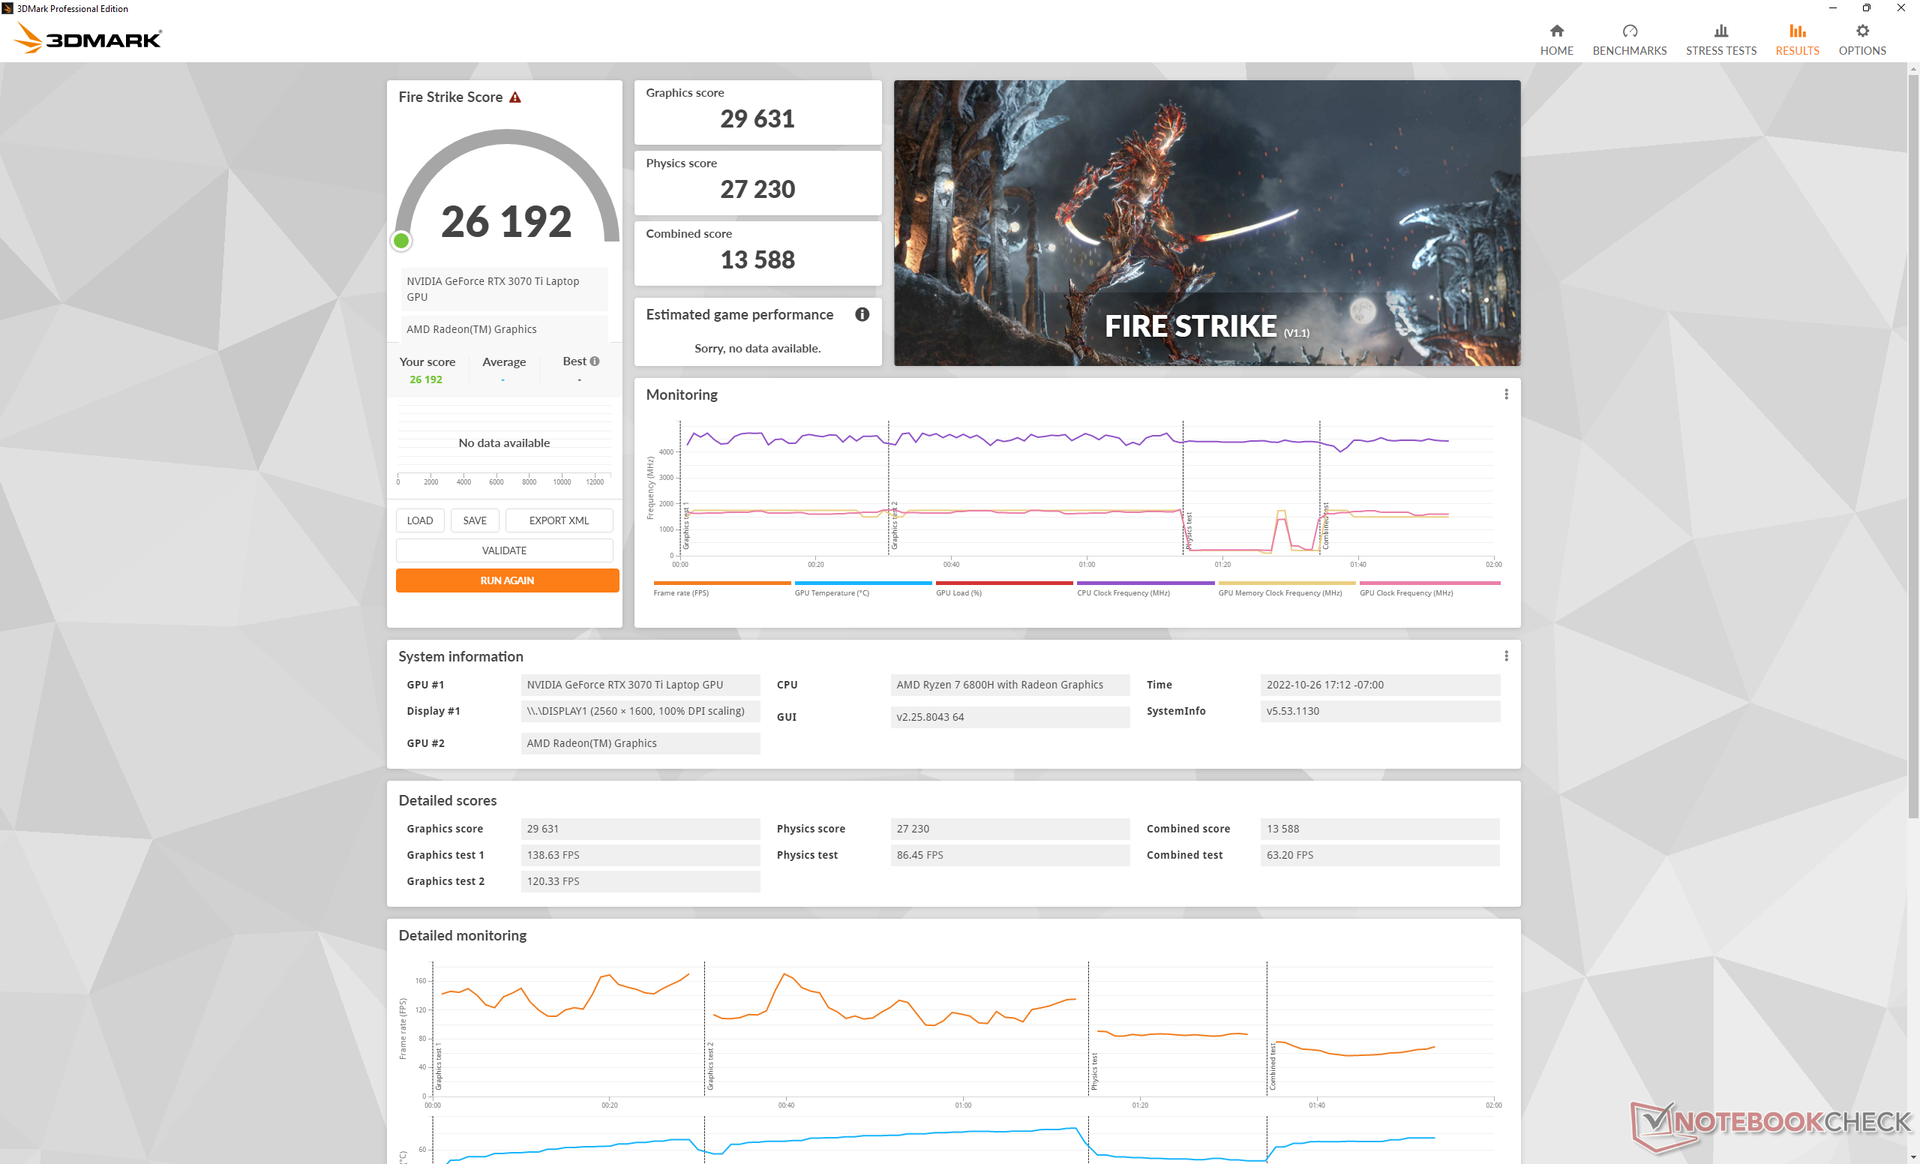
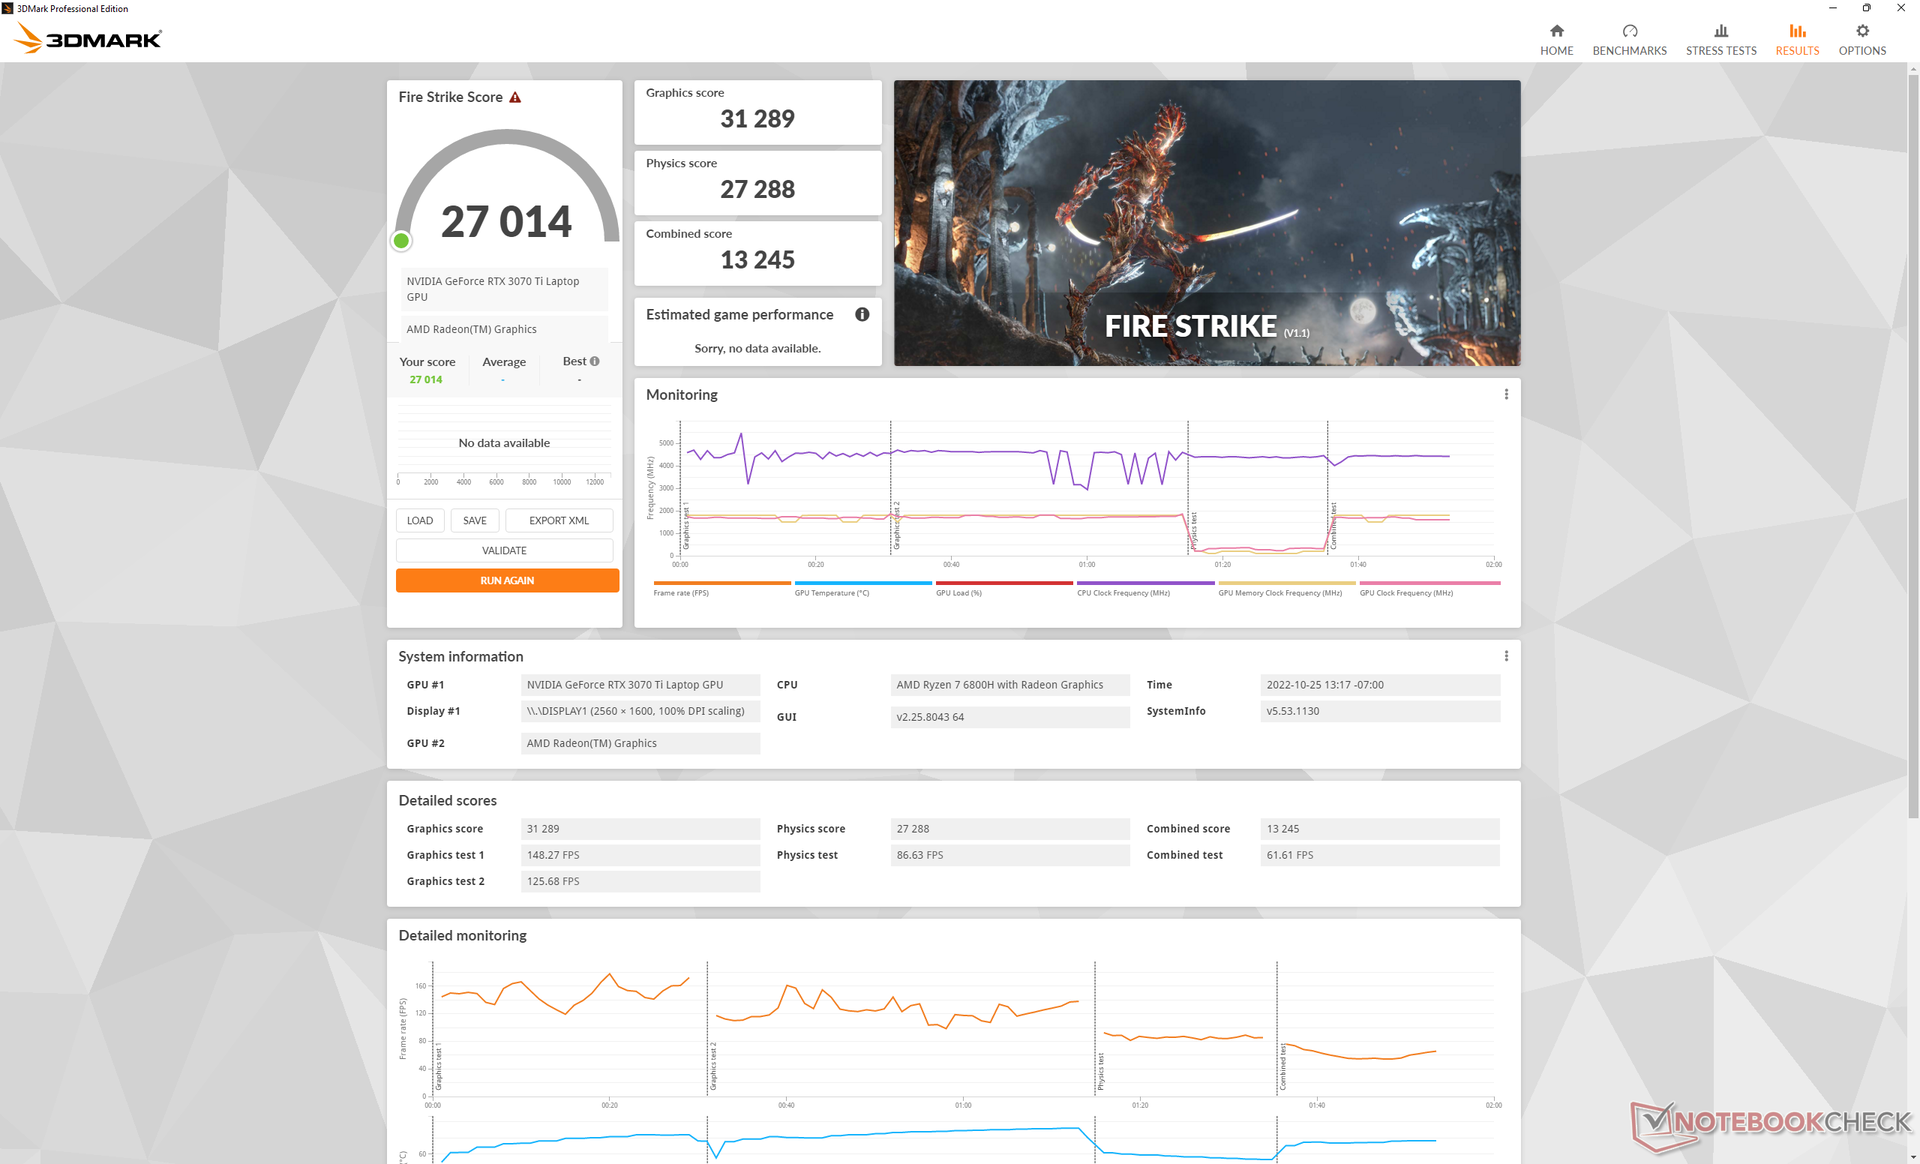
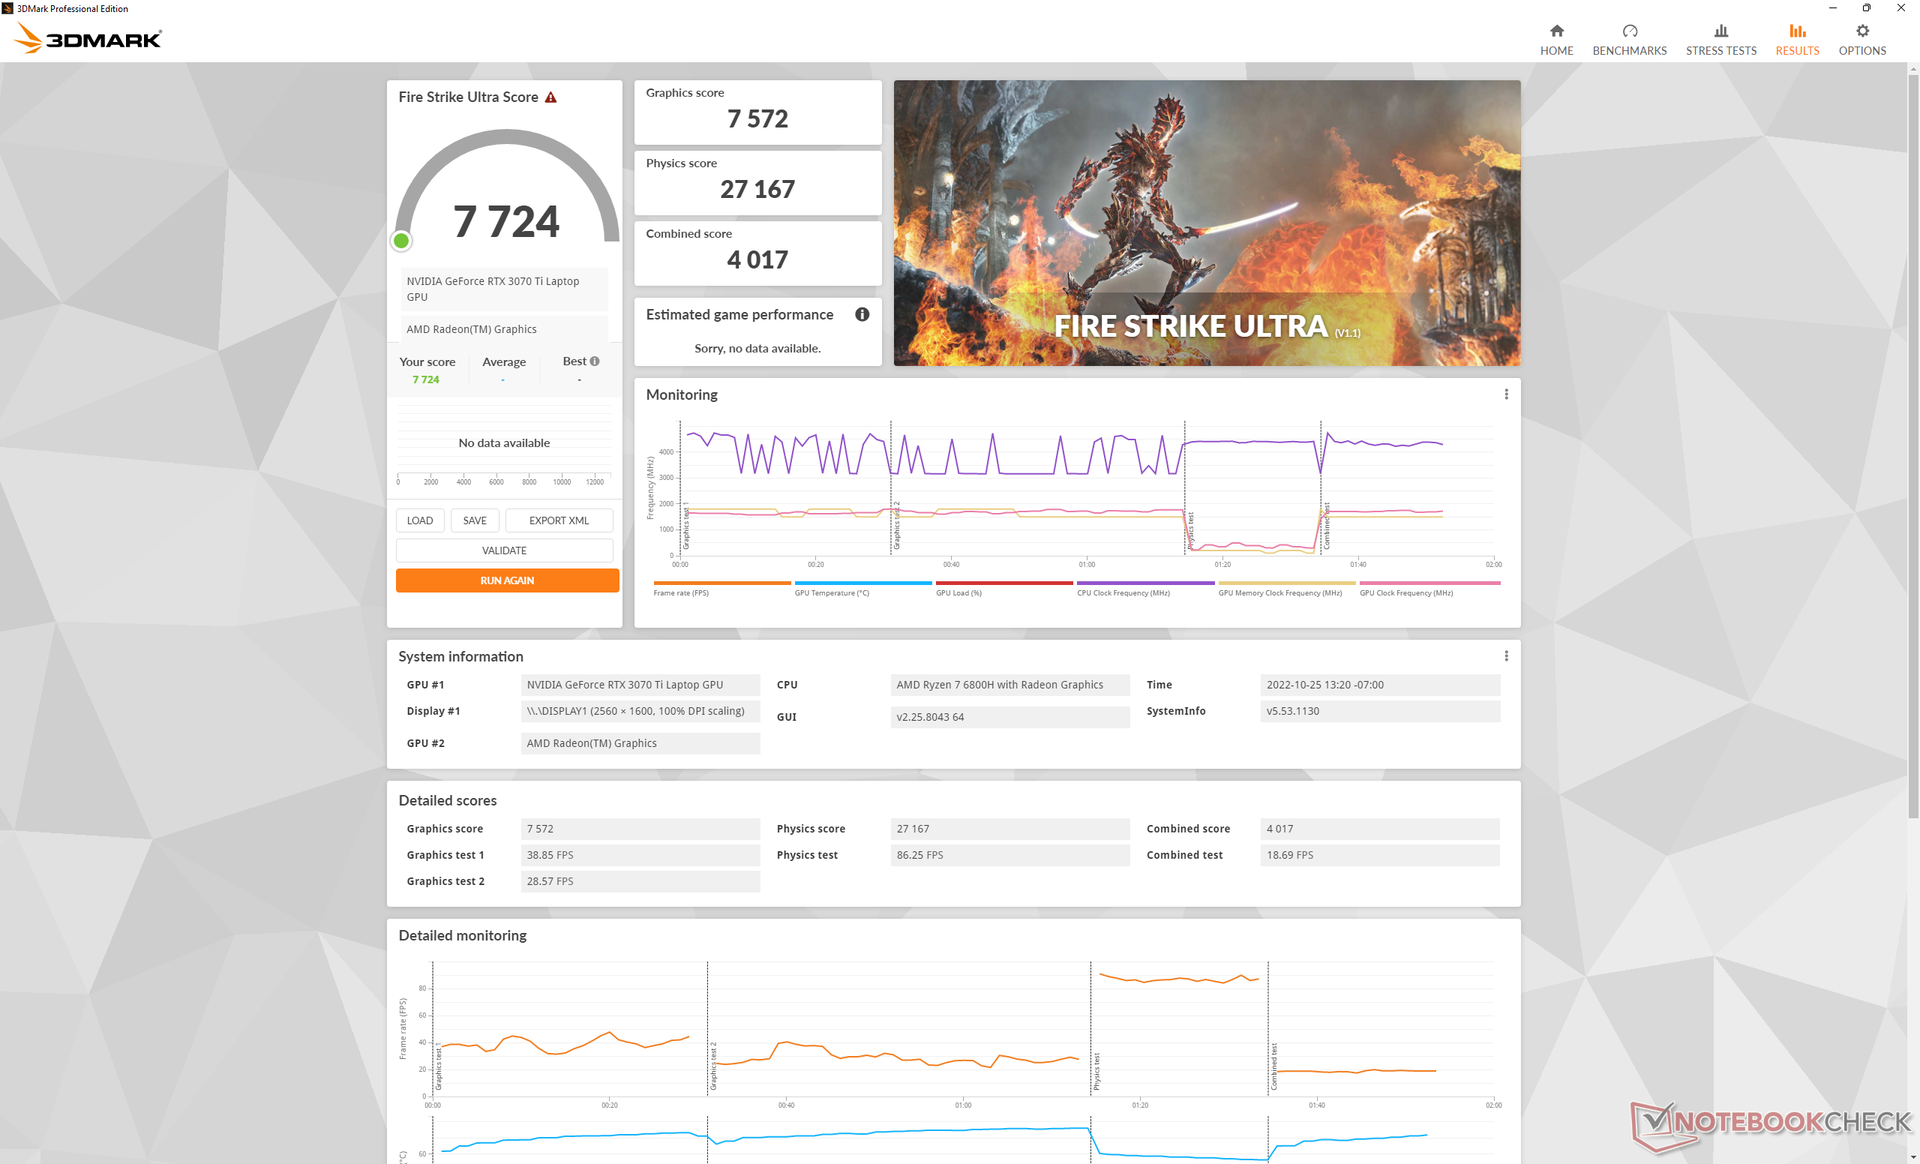
Performances du GPU - Graphique 150 W
Les performances graphiques sont excellentes avec des résultats 3DMark qui sont presque 15 % plus rapides que ceux de l'ordinateur portable moyen de notre base de données avec la même technologie GeForce RTX 3070 Ti GPU. En fait, il devance même le RTX 3080 Ti dans l'ordinateur Alienware x15 R2.
Les performances ne baissent que d'environ 5 % si le mode Turbo est désactivé. Les utilisateurs ne doivent donc pas oublier d'activer le mode Turbo via Lenovo Vantage s'ils veulent que leur ordinateur portable fonctionne au maximum de ses capacités.
En passant à la version inférieure RTX 3070 ou RTX 3060 Entraînera une baisse des performances d'environ 10 % et 30 %, respectivement, d'après notre expérience avec plusieurs ordinateurs portables RTX 3070 ou 3060.
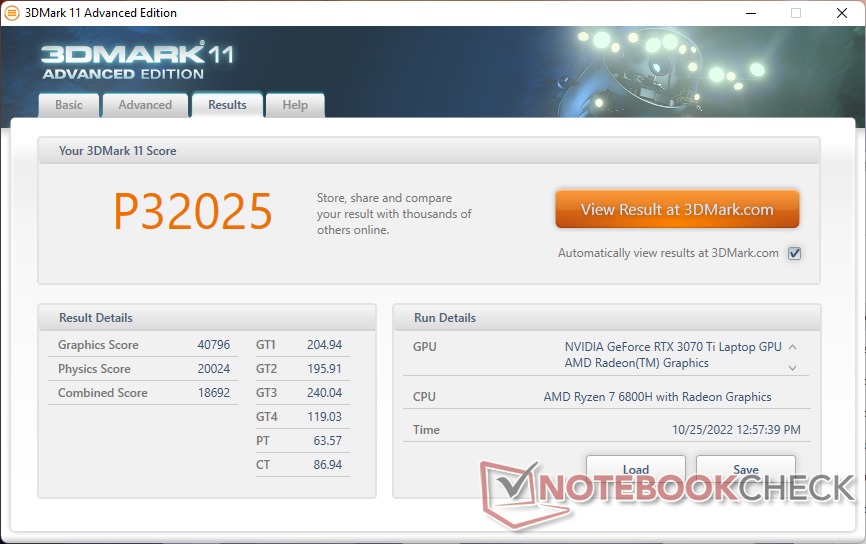
| 3DMark 11 Performance | 32025 points | |
| 3DMark Cloud Gate Standard Score | 64746 points | |
| 3DMark Fire Strike Score | 27014 points | |
| 3DMark Time Spy Score | 11758 points | |
Aide | ||
* ... Moindre est la valeur, meilleures sont les performances
Witcher 3 FPS Chart
| Bas | Moyen | Élevé | Ultra | QHD | |
|---|---|---|---|---|---|
| GTA V (2015) | 181.5 | 176.5 | 167.6 | 104 | 98.8 |
| The Witcher 3 (2015) | 370.5 | 308.8 | 226 | 117 | |
| Dota 2 Reborn (2015) | 150.4 | 138 | 132.2 | 126.6 | |
| Final Fantasy XV Benchmark (2018) | 187.2 | 156 | 115.6 | 90.4 | |
| X-Plane 11.11 (2018) | 119.6 | 103.6 | 83.9 | ||
| Strange Brigade (2018) | 383 | 298 | 248 | 217 | 160.5 |
| Cyberpunk 2077 1.6 (2022) | 148.9 | 130.2 | 102.1 | 86 | 54.4 |
Emissions - Assez bruyantes
Bruit du système
Le comportement du bruit du ventilateur est lié au réglage du profil d'alimentation. En mode économie d'énergie avec le GPU discret désactivé, par exemple, le système reste silencieux à 23,7 dB(A) contre un fond silencieux de 23,5 dB(A). Malheureusement, le multitâche léger ou le streaming vidéo suffisent à faire monter le bruit à 32 dB(A) plus audible, comme ce que nous avons observé sur le modèle de l'année dernière
Le jeu induit un bruit de ventilateur de près de 55 dB(A) même si le mode Turbo est désactivé. Ainsi, vous pouvez tout aussi bien activer le mode Turbo lorsque vous jouez car il ne semble pas rendre le système plus bruyant ou plus silencieux. Le milieu de la gamme des 50 dB(A) est plus bruyant que ce que nous avons enregistré sur le HP Victus 16 ou Dell G16 dans des conditions similaires.
Degré de la nuisance sonore
| Au repos |
| 23.7 / 31.1 / 32.2 dB(A) |
| Fortement sollicité |
| 38.4 / 54.8 dB(A) |
 | ||
30 dB silencieux 40 dB(A) audible 50 dB(A) bruyant |
||
min: | ||
| Lenovo Legion 5 Pro 16ARH7H RTX 3070 Ti GeForce RTX 3070 Ti Laptop GPU, R7 6800H, Samsung PM9A1 MZVL21T0HCLR | Lenovo Legion 5 Pro 16IAH7H GeForce RTX 3060 Laptop GPU, i7-12700H, 2x Samsung PM9A1 MZVL21T0HCLR (RAID 0) | Asus ROG Zephyrus M16 GU603H GeForce RTX 3070 Laptop GPU, i9-11900H, Samsung PM9A1 MZVL22T0HBLB | Lenovo Legion 7 16ARHA7 Radeon RX 6850M XT, R9 6900HX, Samsung PM9A1 MZVL22T0HBLB | HP Victus 16-e0145ng GeForce RTX 3050 Ti Laptop GPU, R5 5600H, Samsung SSD PM981a MZVLB512HBJQ | Dell G16 7620 GeForce RTX 3060 Laptop GPU, i7-12700H, WDC PC SN810 512GB | |
|---|---|---|---|---|---|---|
| Noise | -8% | -9% | 13% | -2% | 6% | |
| arrêt / environnement * (dB) | 23.5 | 24.6 -5% | 25 -6% | 22.8 3% | 26 -11% | 23.2 1% |
| Idle Minimum * (dB) | 23.7 | 28.7 -21% | 25 -5% | 23 3% | 26 -10% | 28.3 -19% |
| Idle Average * (dB) | 31.1 | 32 -3% | 31 -0% | 23 26% | 28 10% | 28.8 7% |
| Idle Maximum * (dB) | 32.2 | 32 1% | 42 -30% | 23 29% | 34 -6% | 28.9 10% |
| Load Average * (dB) | 38.4 | 45.2 -18% | 48 -25% | 26.8 30% | 44 -15% | 32.4 16% |
| Witcher 3 ultra * (dB) | 54.8 | 52 5% | 54.3 1% | 48 12% | 48.3 12% | |
| Load Maximum * (dB) | 54.8 | 54.4 1% | 56 -2% | 54.2 1% | 53 3% | 48.1 12% |
* ... Moindre est la valeur, meilleures sont les performances
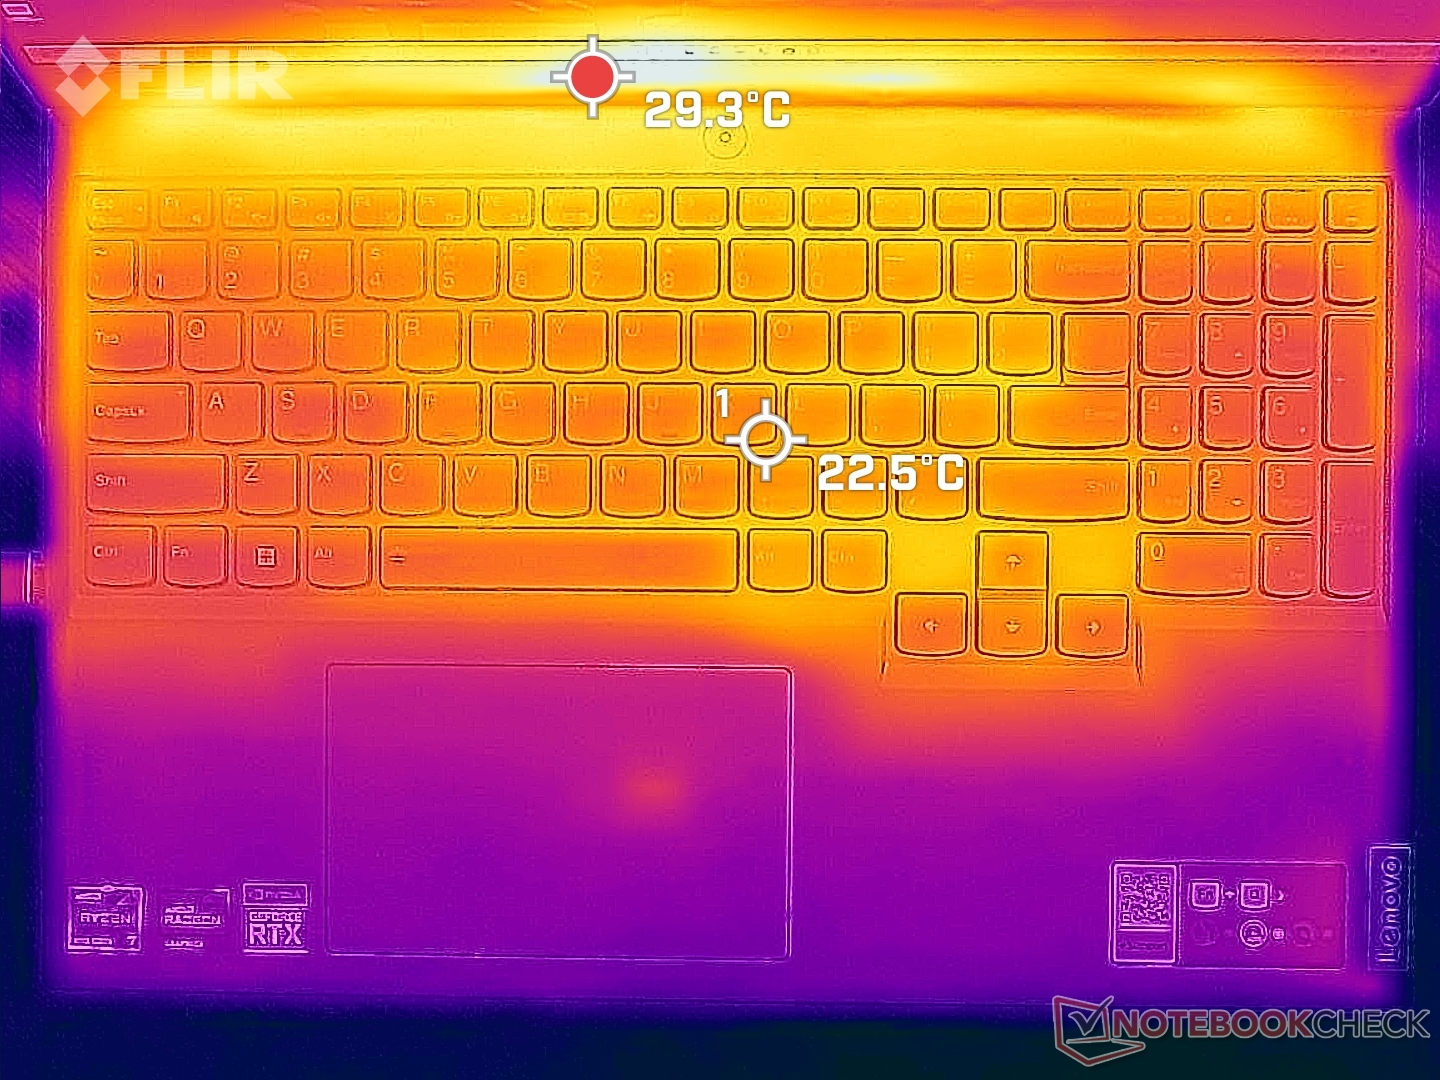
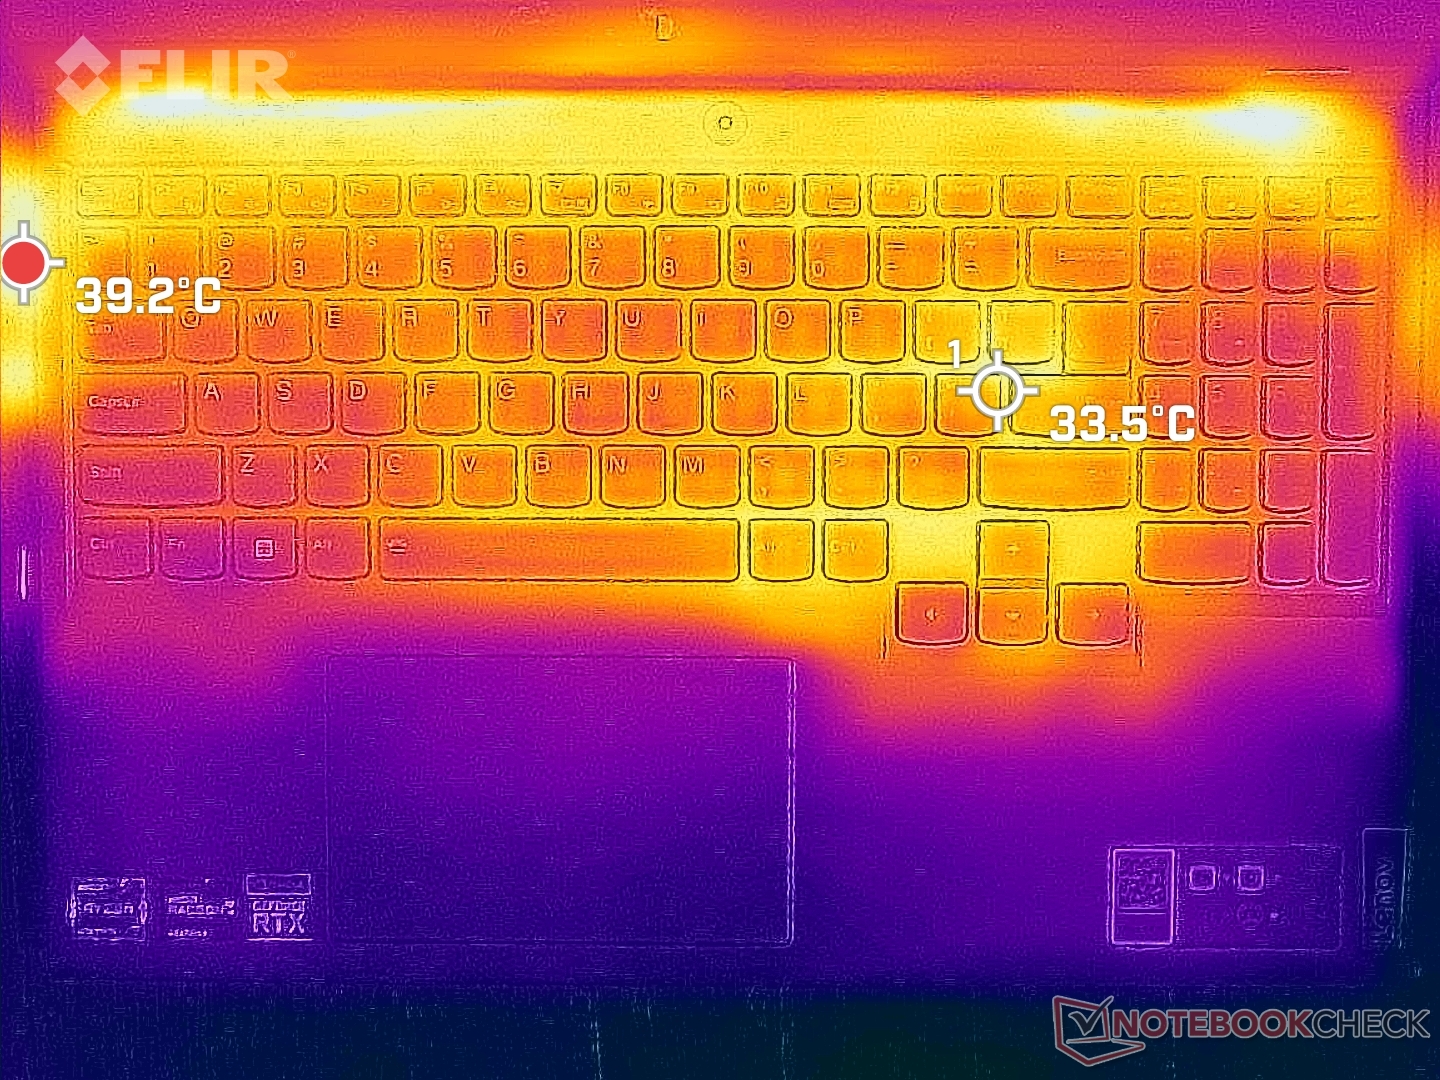
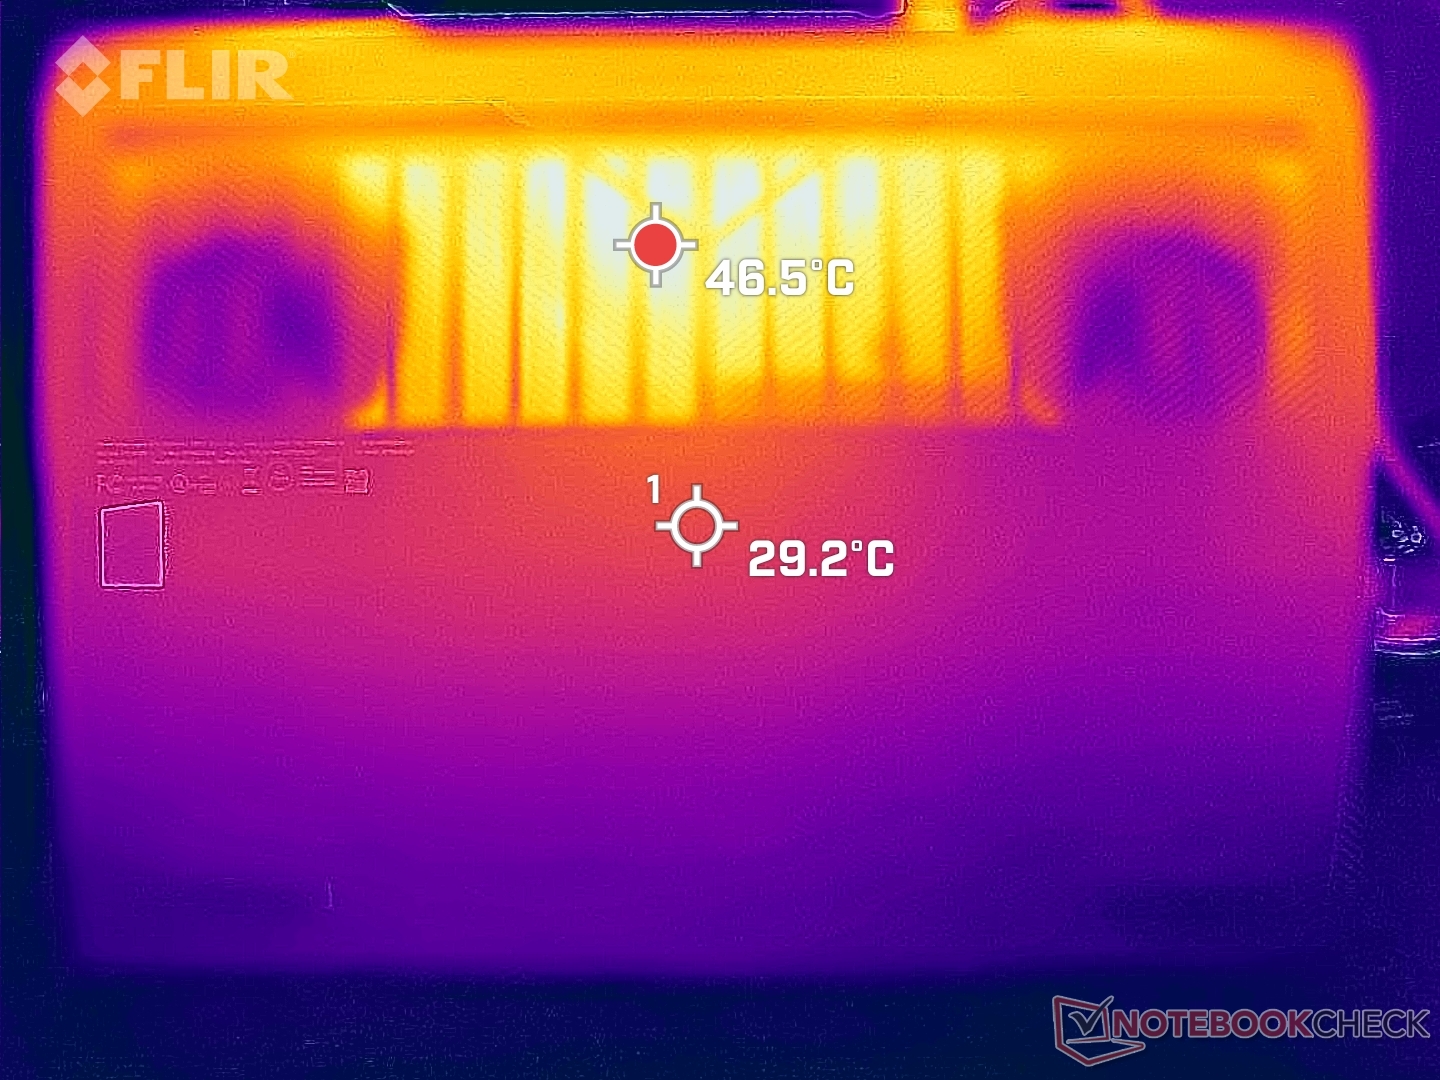
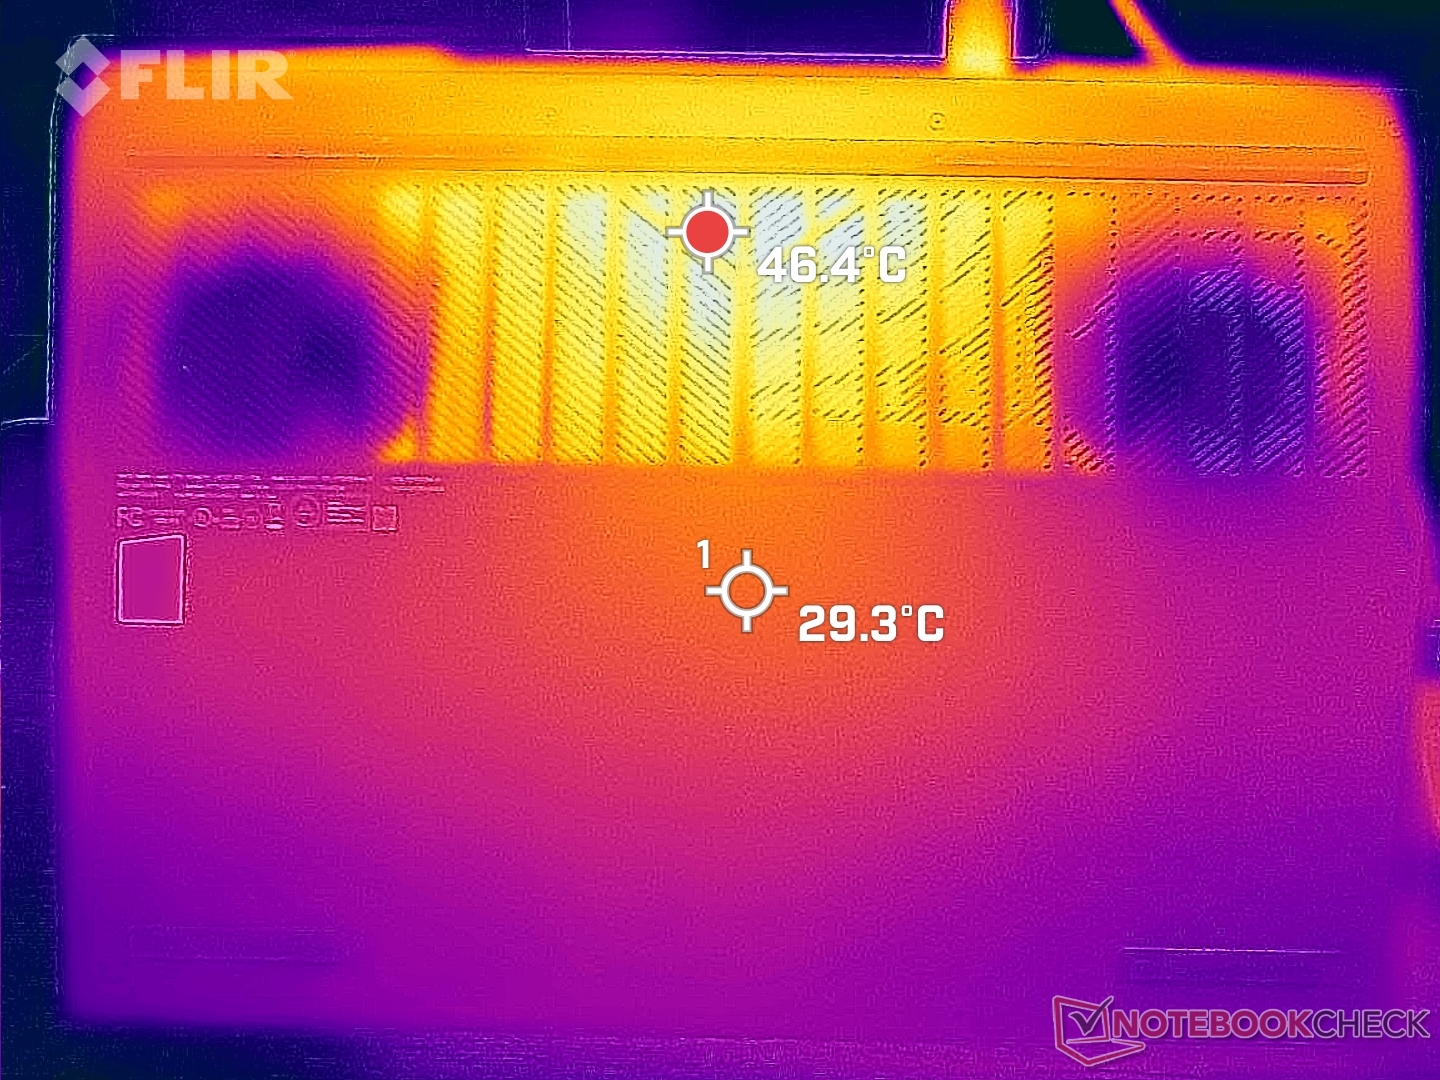
Température
Les températures de surface moyennes sont beaucoup plus fraîches que sur le ROG Zephyrus M16 d'Asus, même si leurs points chauds sont similaires. Par exemple, les points les plus chauds du Lenovo et de l'Asus peuvent atteindre jusqu'à 53 °C chacun, mais les repose-poignets et les zones du clavier du Lenovo restent sensiblement plus frais et donc plus confortables pour jouer.
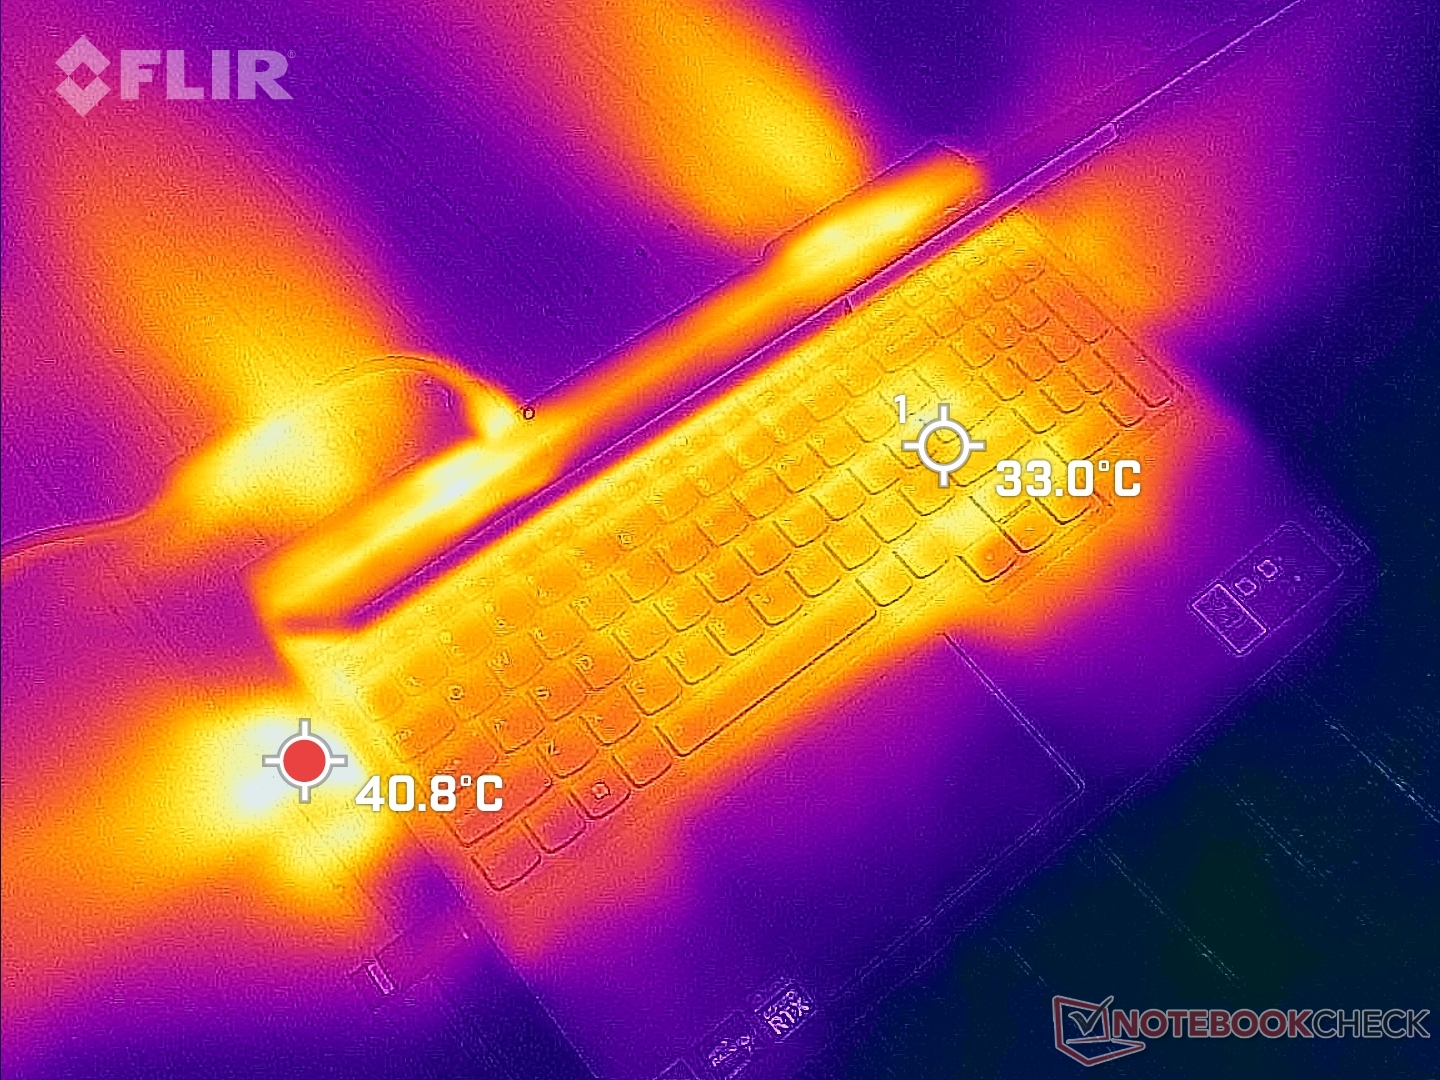
(±) La température maximale du côté supérieur est de 43.8 °C / 111 F, par rapport à la moyenne de 40.4 °C / 105 F, allant de 21.2 à 68.8 °C pour la classe Gaming.
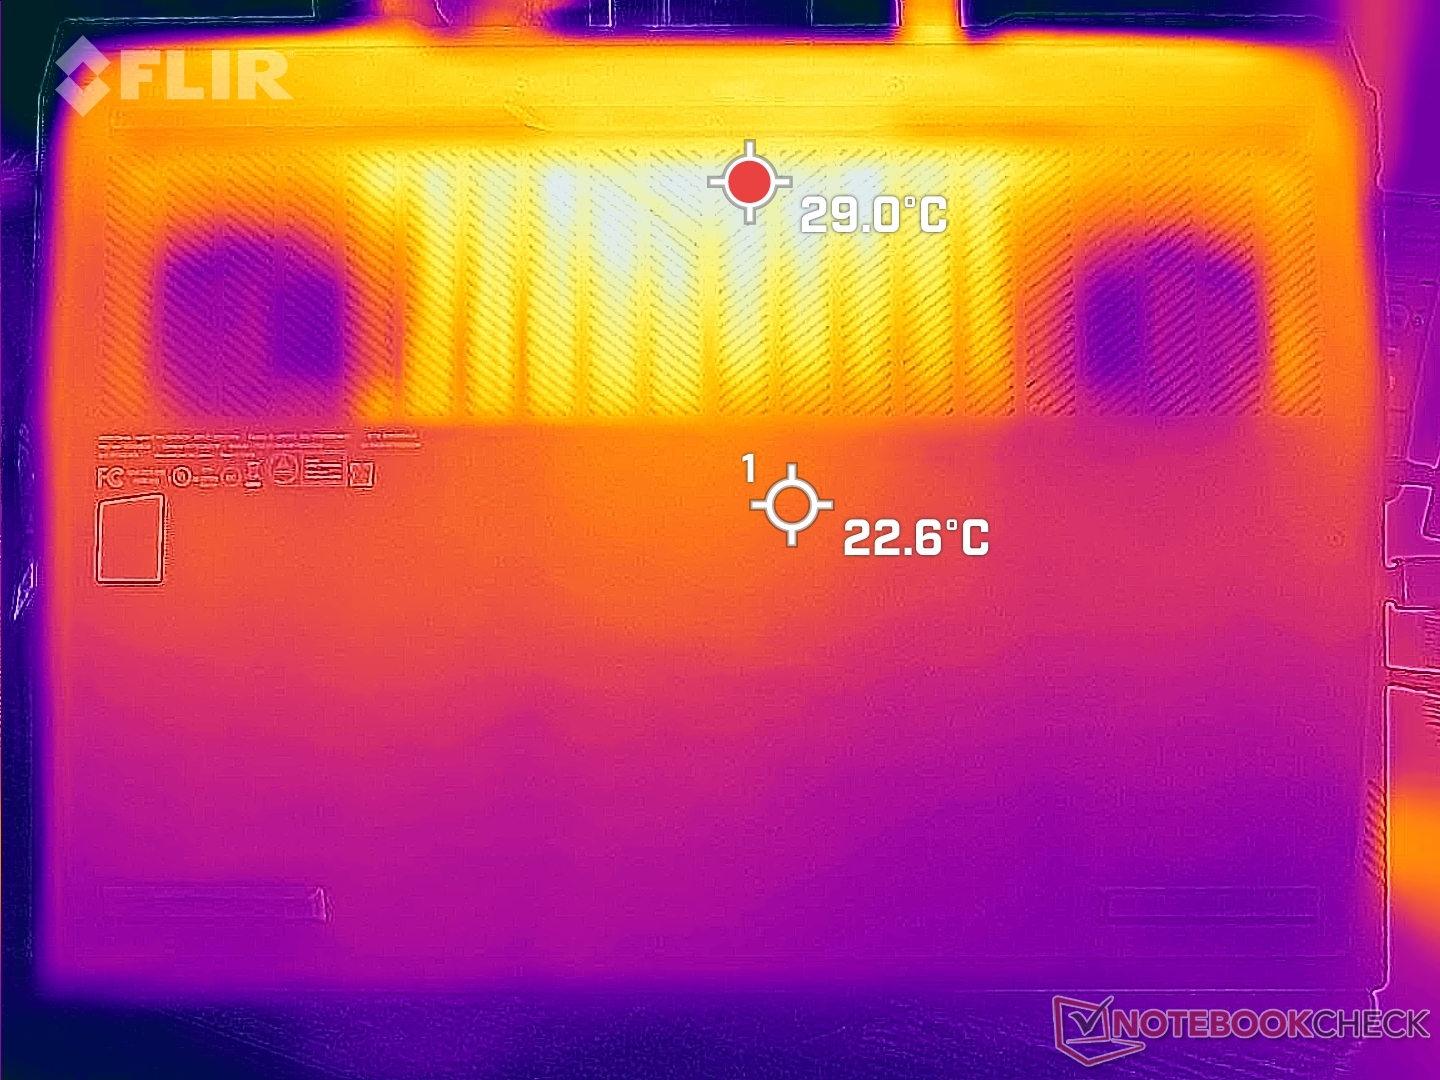
(-) Le fond chauffe jusqu'à un maximum de 53 °C / 127 F, contre une moyenne de 43.2 °C / 110 F
(+) En utilisation inactive, la température moyenne du côté supérieur est de 27.4 °C / 81 F, par rapport à la moyenne du dispositif de 33.9 °C / 93 F.
(±) En jouant à The Witcher 3, la température moyenne du côté supérieur est de 33.5 °C / 92 F, alors que la moyenne de l'appareil est de 33.9 °C / 93 F.
(+) Les repose-poignets et le pavé tactile sont plus froids que la température de la peau avec un maximum de 29.4 °C / 84.9 F et sont donc froids au toucher.
(±) La température moyenne de la zone de l'appui-paume de dispositifs similaires était de 28.8 °C / 83.8 F (-0.6 °C / #-1.1 F).

| Lenovo Legion 5 Pro 16ARH7H RTX 3070 Ti AMD Ryzen 7 6800H, NVIDIA GeForce RTX 3070 Ti Laptop GPU | Lenovo Legion 5 Pro 16IAH7H Intel Core i7-12700H, NVIDIA GeForce RTX 3060 Laptop GPU | Asus ROG Zephyrus M16 GU603H Intel Core i9-11900H, NVIDIA GeForce RTX 3070 Laptop GPU | Lenovo Legion 7 16ARHA7 AMD Ryzen 9 6900HX, AMD Radeon RX 6850M XT | HP Victus 16-e0145ng AMD Ryzen 5 5600H, NVIDIA GeForce RTX 3050 Ti Laptop GPU | Dell G16 7620 Intel Core i7-12700H, NVIDIA GeForce RTX 3060 Laptop GPU | |
|---|---|---|---|---|---|---|
| Heat | -7% | -19% | 5% | -12% | 9% | |
| Maximum Upper Side * (°C) | 43.8 | 45.8 -5% | 52 -19% | 37.2 15% | 54 -23% | 47.6 -9% |
| Maximum Bottom * (°C) | 53 | 66.3 -25% | 53 -0% | 43 19% | 47 11% | 54 -2% |
| Idle Upper Side * (°C) | 30 | 30.4 -1% | 38 -27% | 34 -13% | 41 -37% | 23 23% |
| Idle Bottom * (°C) | 31.8 | 30.4 4% | 41 -29% | 32.8 -3% | 31 3% | 24.6 23% |
* ... Moindre est la valeur, meilleures sont les performances
Test de stress
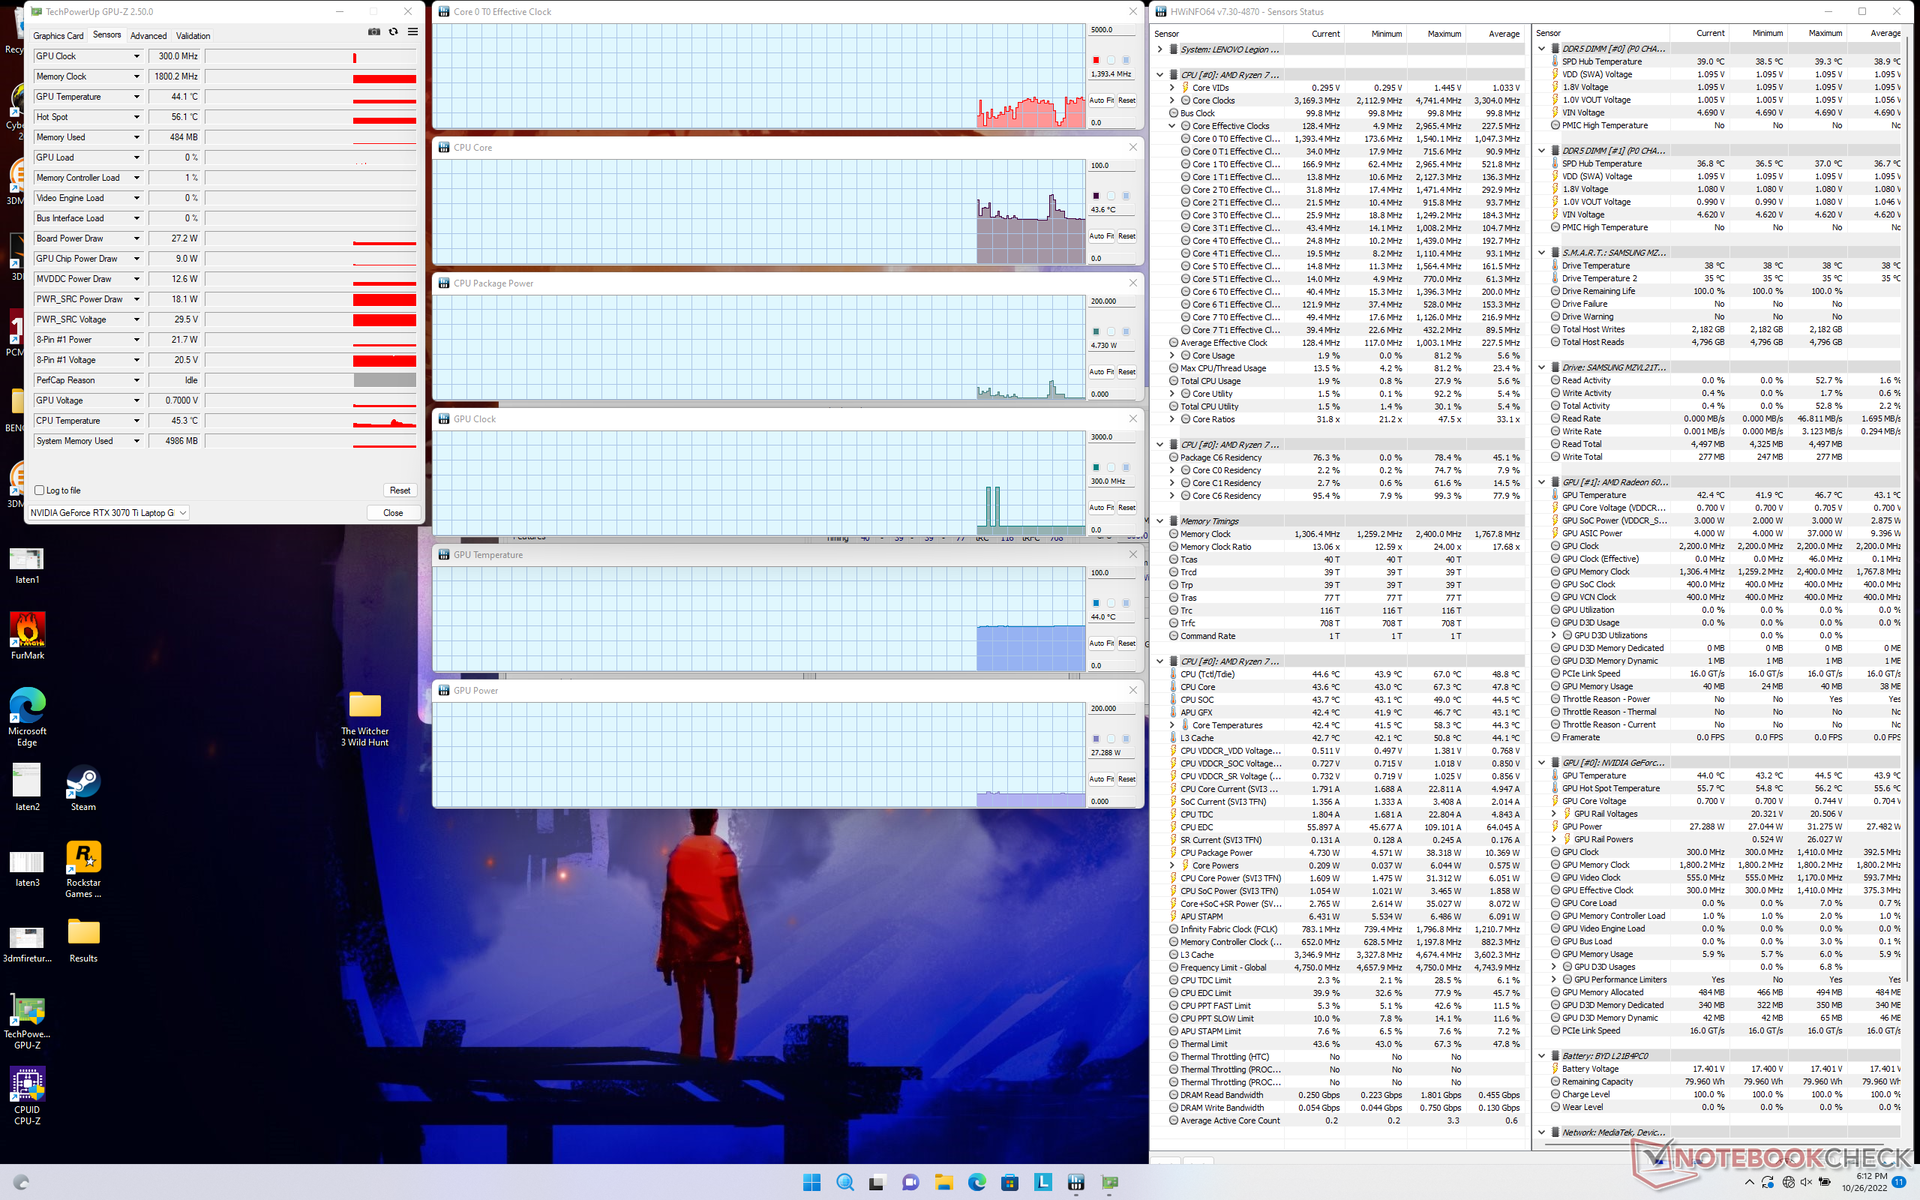
Sous le stress de Prime95, le processeur passe à 4,2 GHz et 90 W indéfiniment sans avoir besoin d'accélérer. Malheureusement, la température du cœur devient très élevée, à un peu moins de 95 °C, ce qui est plus chaud que sur la plupart des autres ordinateurs portables de jeu.
En fonctionnement Witcher 3 avec le mode Turbo actif, le GPU Nvidia se stabilise à 1620 MHz pour le cœur, 1800 MHz pour la mémoire et 136 W pour la consommation. Il est intéressant de noter qu'en répétant ce test avec le mode Turbo désactivé, les horloges du cœur et de la mémoire sont plus lentes, respectivement à 1605 MHz et 1750 MHz, mais la consommation d'énergie de la carte est plus élevée, à 149 W. Vous voudrez de toute façon activer le mode Turbo car les performances graphiques sont toujours légèrement plus rapides qu'avec le mode Turbo désactivé.
Le fonctionnement sur batterie limite les performances. Un test de Fire Strike sur batteries donnerait des scores de physique et de graphisme de 20957 et 13153 points, respectivement, contre 27288 et 31289 points sur secteur.
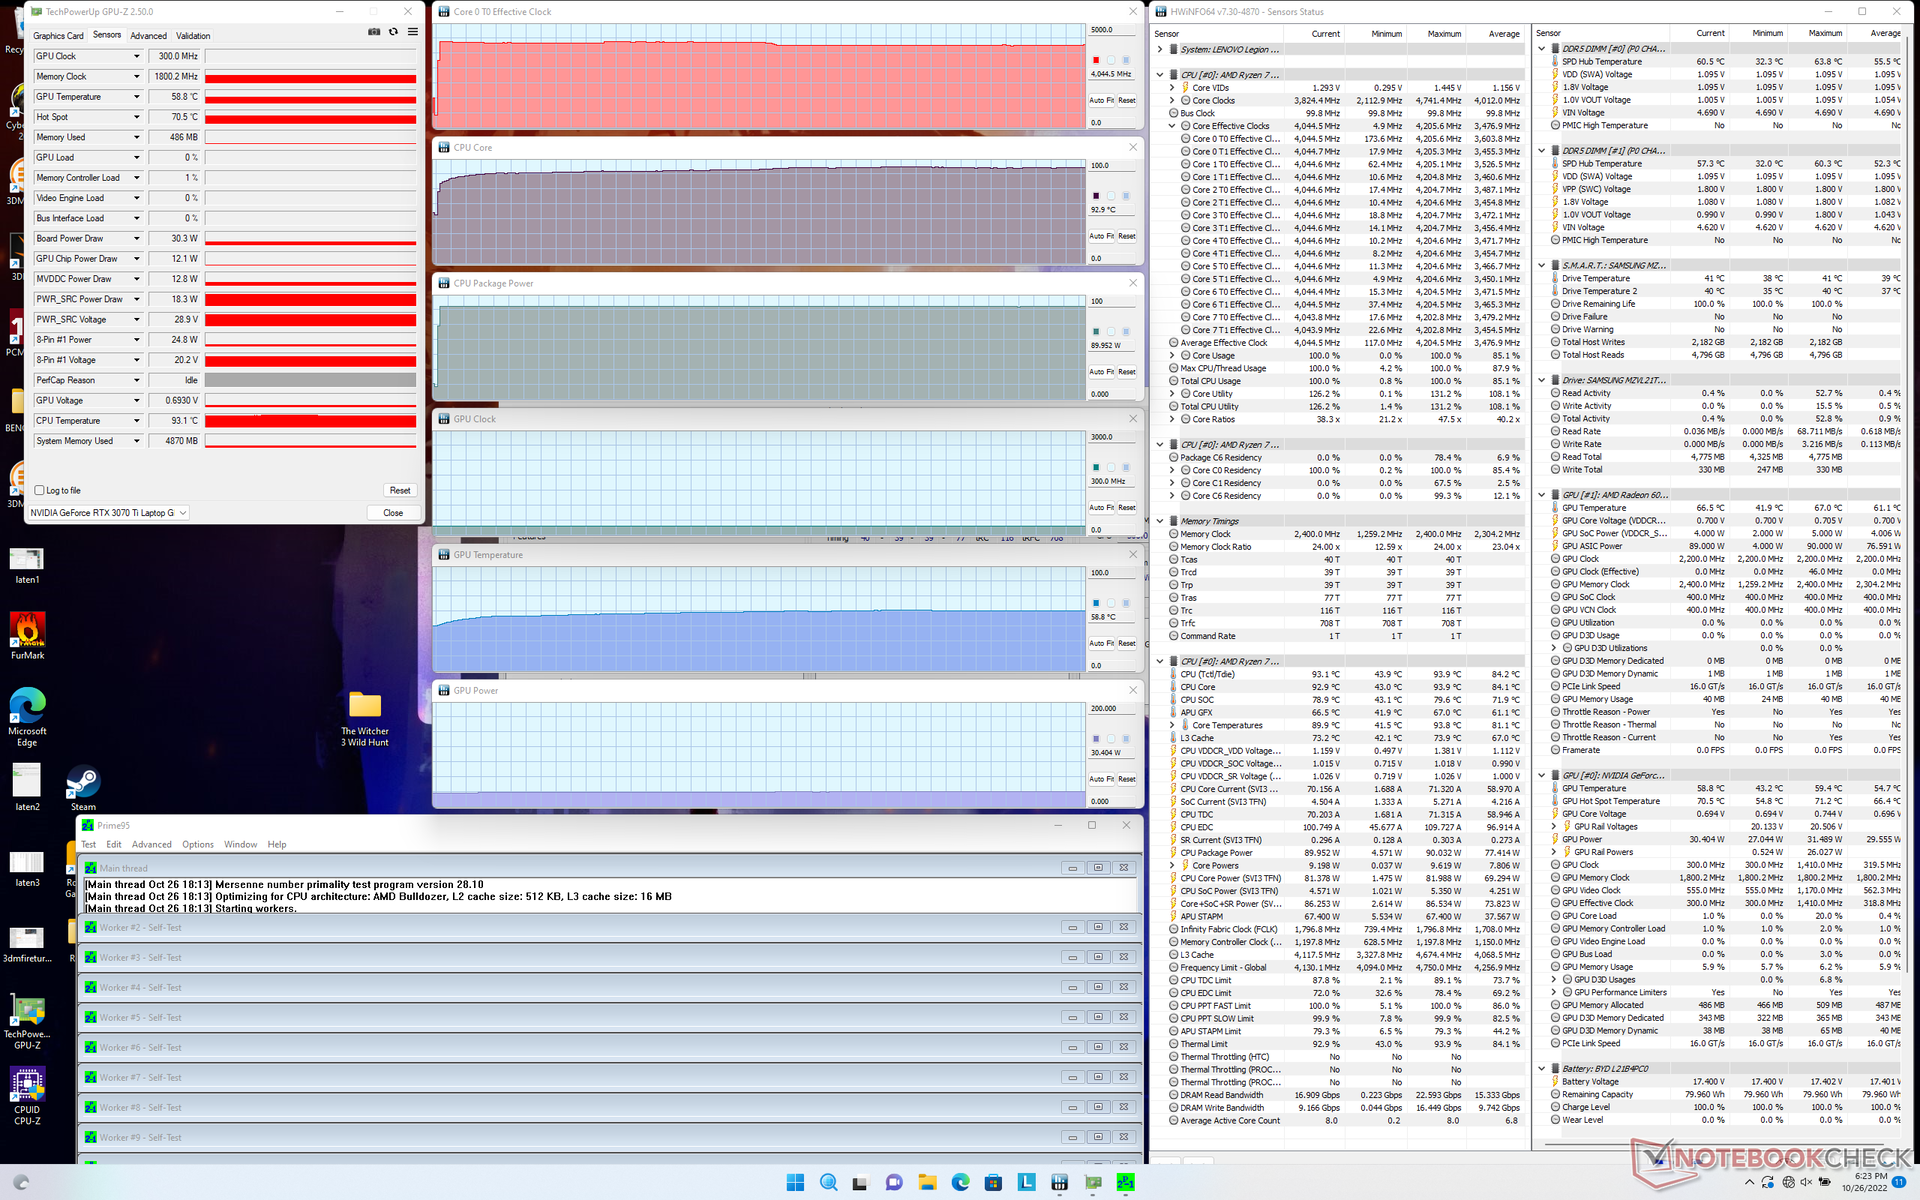
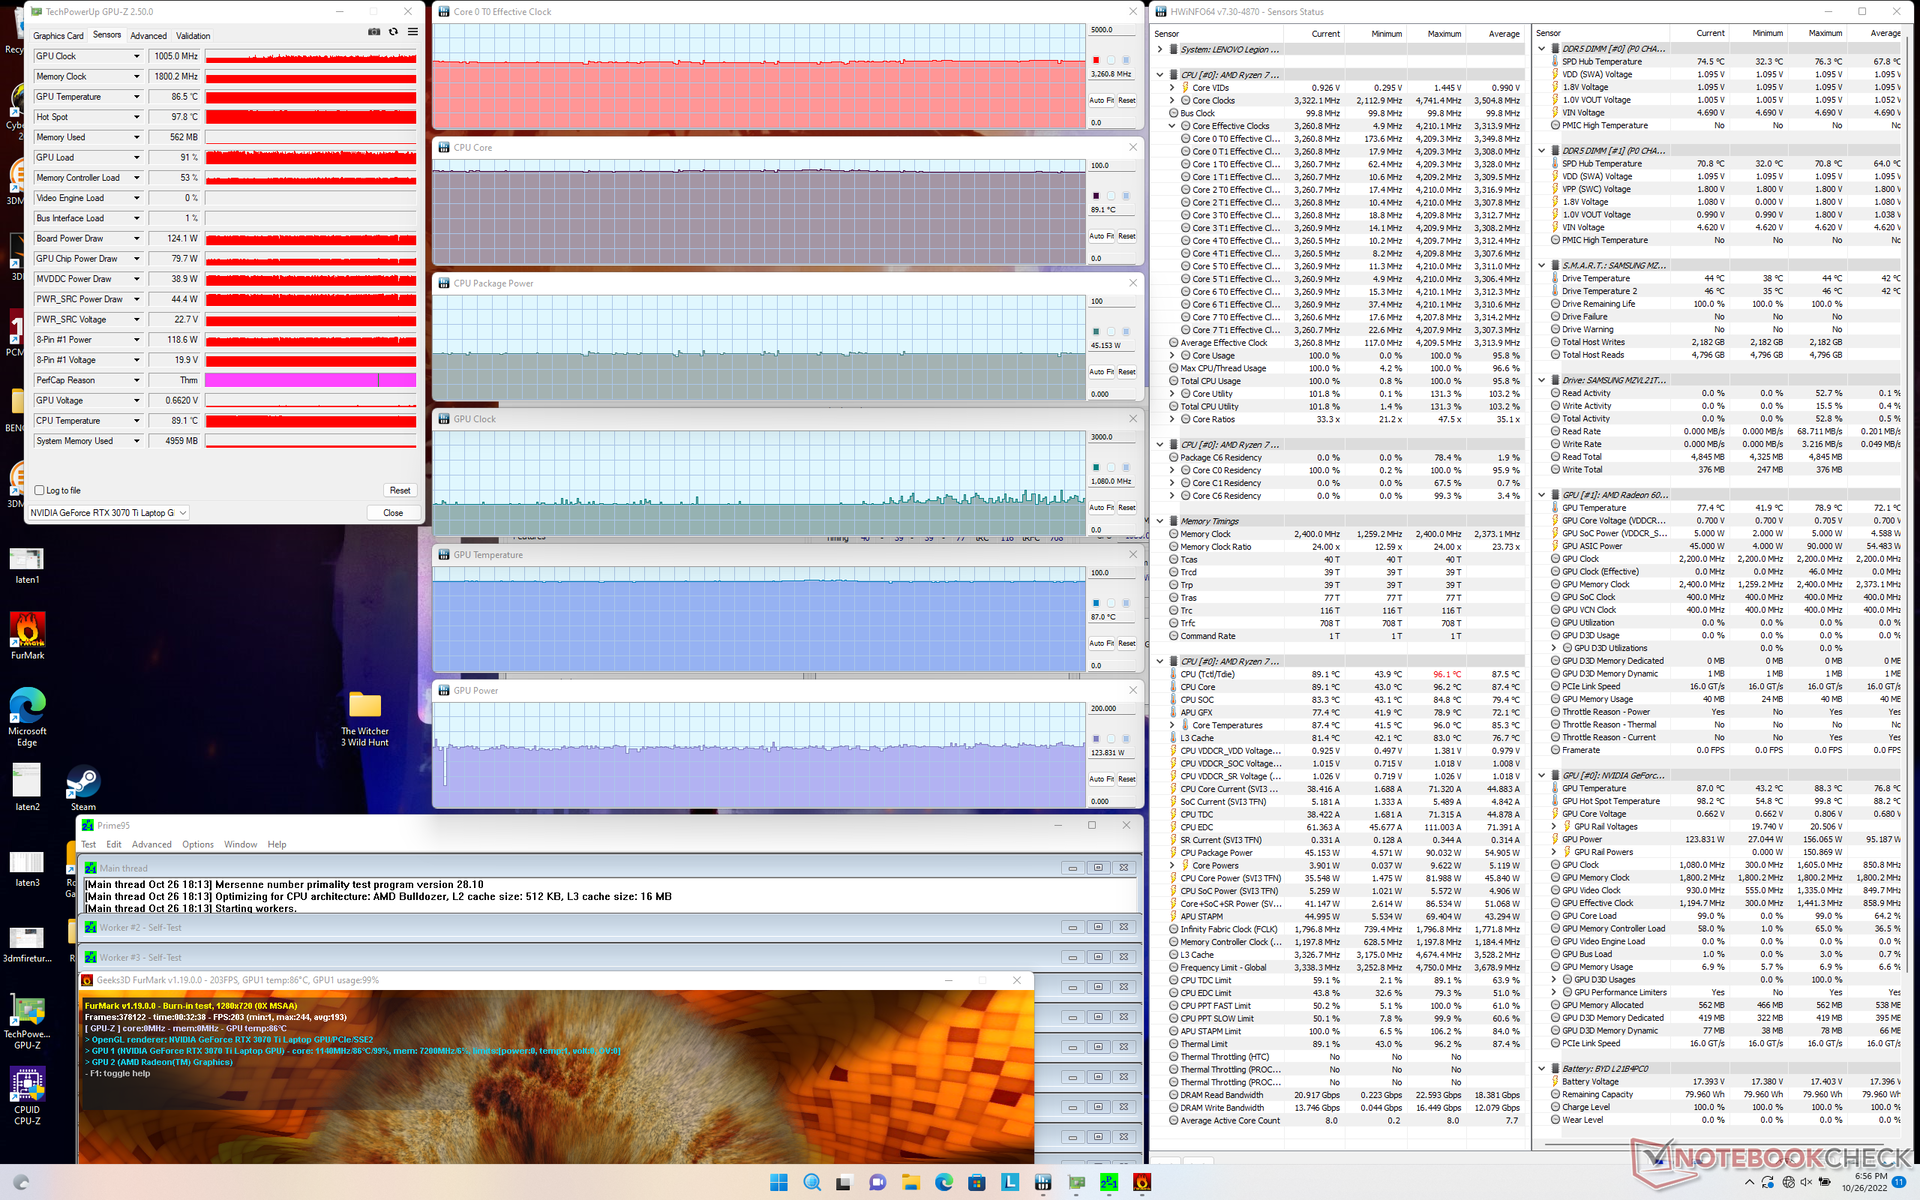
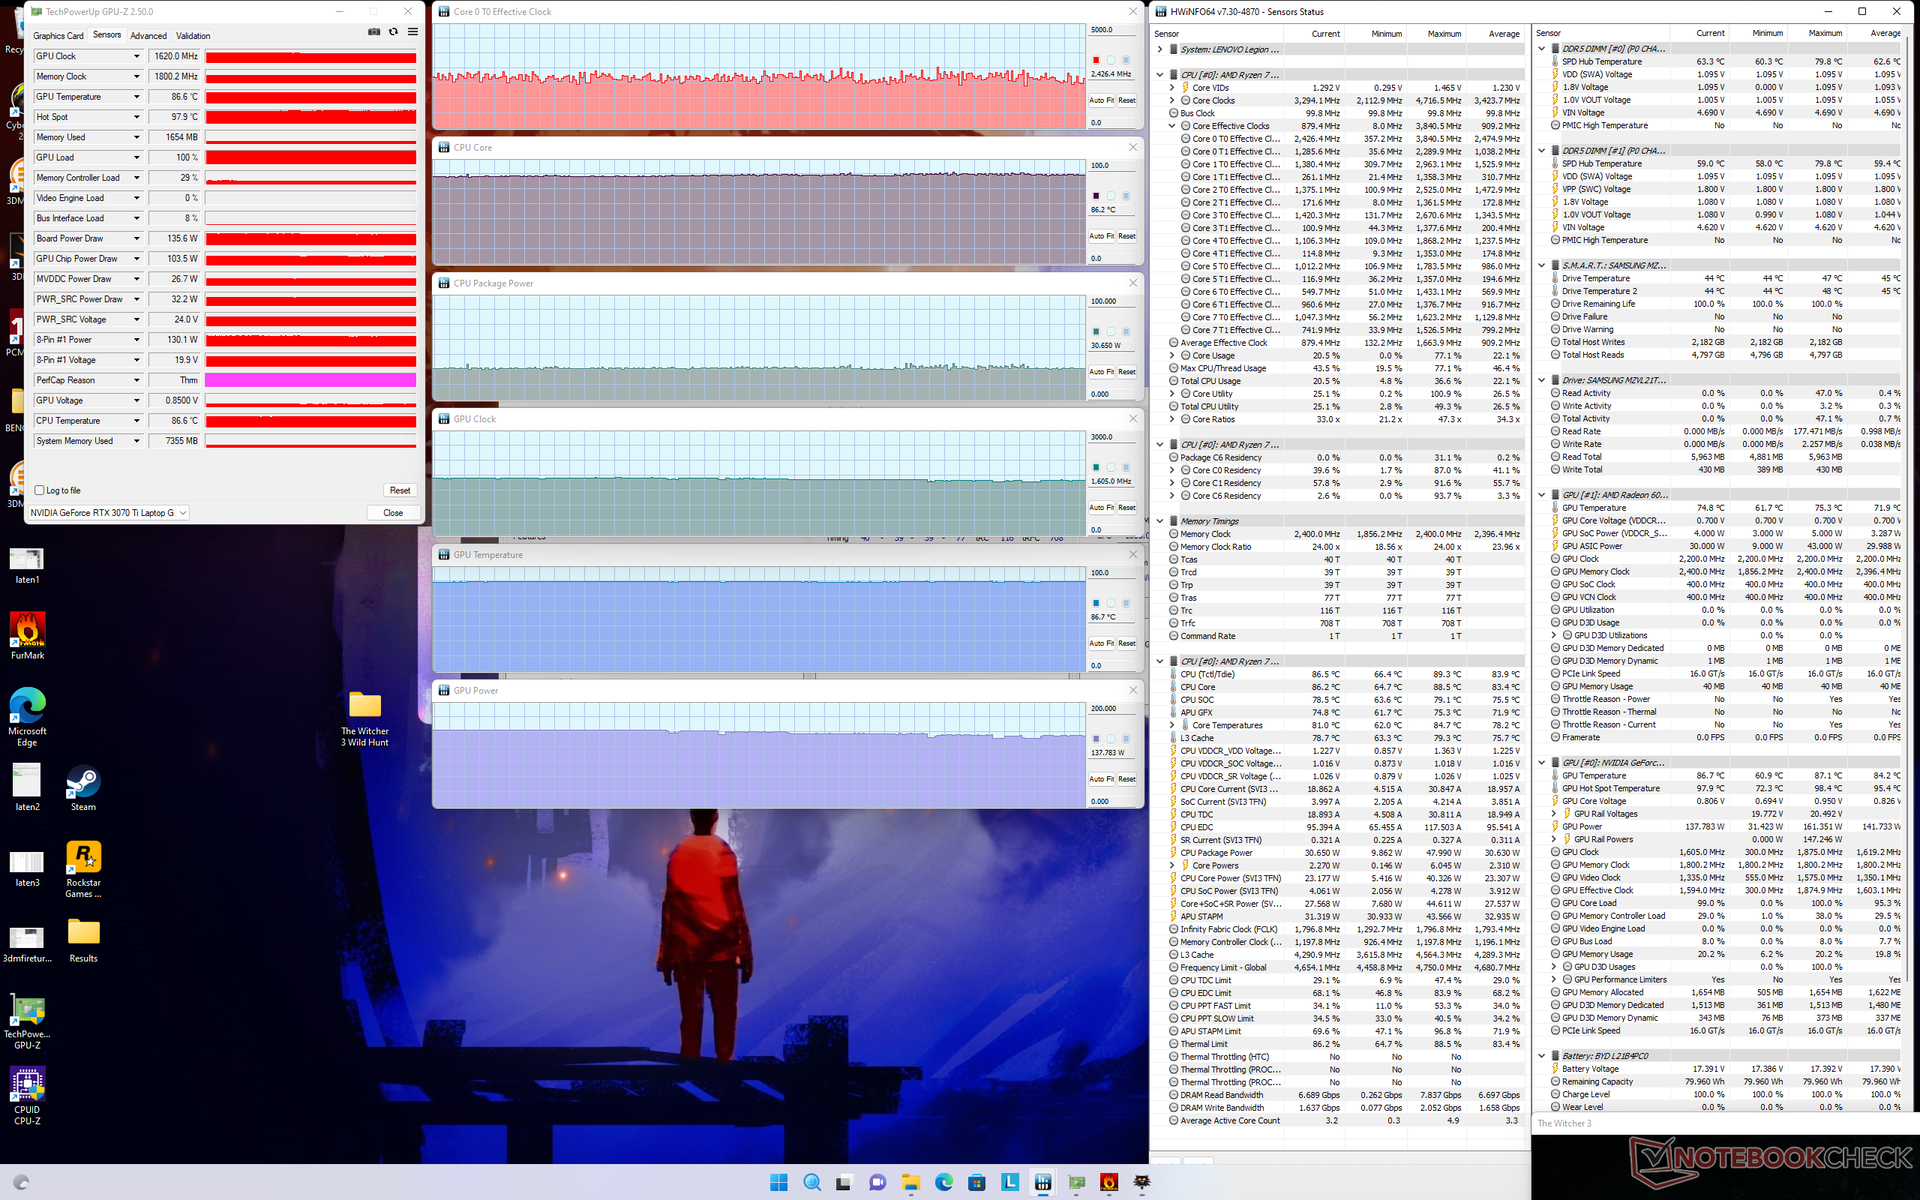
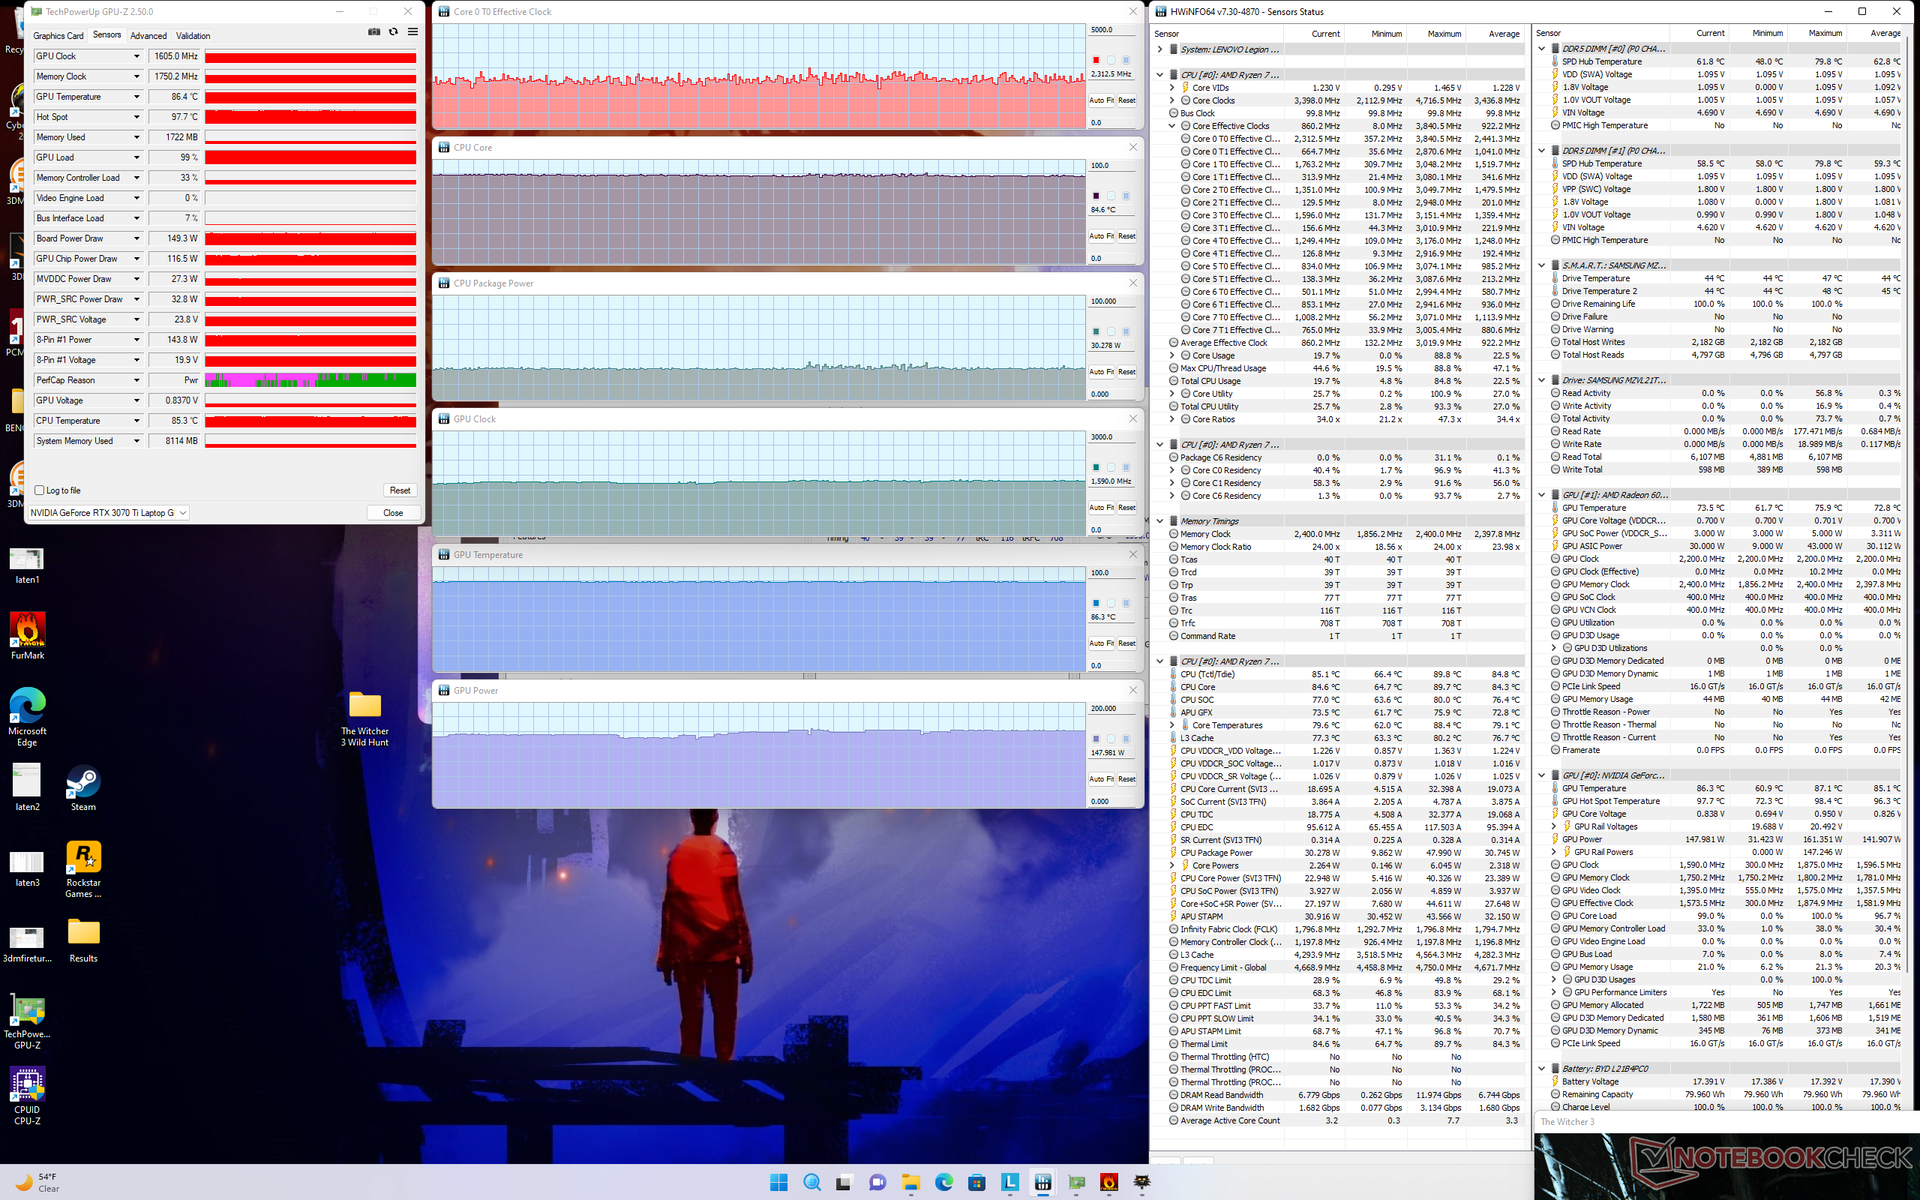
| Fréquence du CPU (GHz) | Fréquence du GPU (MHz) | Température moyenne du CPU (°C) | Température moyenne du GPU (°C) | |
| Système au repos | -- | -- | 44 | 44 |
| Prime95 Stress | 4.1 | -- | 93 | 59 |
| Prime95+ FurMark Stress | 3.3 | 1005 | 89 | 87 |
| Witcher 3 Stress (Turbo on) | ~2.3 | 1620 | 86 | 87 |
| Witcher 3 Stress (Turbo off) | ~2.3 | 1605 | 85 | 86 |
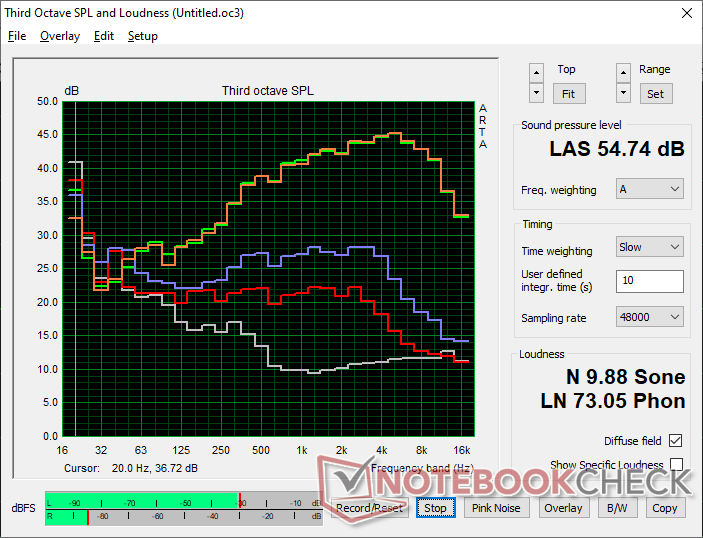
Haut-parleurs
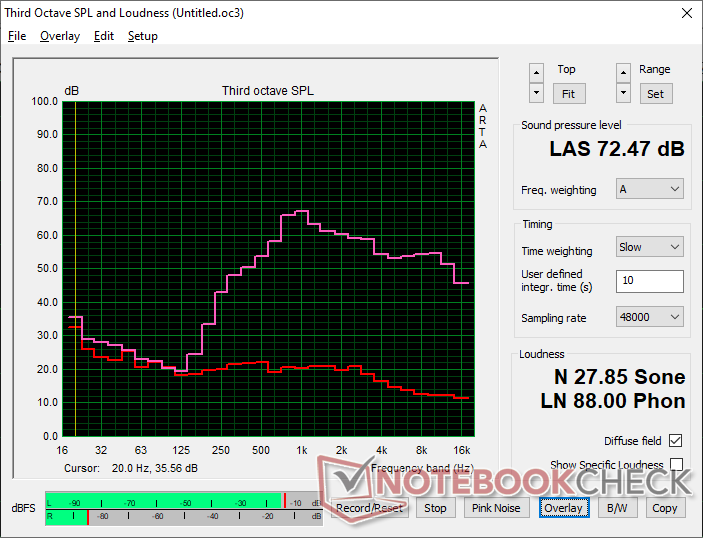
Lenovo Legion 5 Pro 16ARH7H RTX 3070 Ti analyse audio
(±) | le niveau sonore du haut-parleur est moyen mais bon (72.5# dB)
Basses 100 - 315 Hz
(-) | presque aucune basse - en moyenne 22.3% plus bas que la médiane
(-) | les basses ne sont pas linéaires (15.4% delta à la fréquence précédente)
Médiums 400 - 2000 Hz
(±) | médiane supérieure - en moyenne 7.1% supérieure à la médiane
(±) | la linéarité des médiums est moyenne (9.5% delta à la fréquence précédente)
Aiguës 2 - 16 kHz
(+) | des sommets équilibrés - à seulement 1.9% de la médiane
(+) | les aigus sont linéaires (3.6% delta à la fréquence précédente)
Globalement 100 - 16 000 Hz
(-) | le son global n'est pas linéaire (30.3% de différence à la médiane)
Par rapport à la même classe
» 96% de tous les appareils testés de cette catégorie étaient meilleurs, 2% similaires, 3% pires
» Le meilleur avait un delta de 6%, la moyenne était de 18%, le pire était de 132%.
Par rapport à tous les appareils testés
» 89% de tous les appareils testés étaient meilleurs, 3% similaires, 9% pires
» Le meilleur avait un delta de 4%, la moyenne était de 24%, le pire était de 134%.
Asus ROG Zephyrus M16 GU603H analyse audio
(±) | le niveau sonore du haut-parleur est moyen mais bon (80# dB)
Basses 100 - 315 Hz
(±) | basse réduite - en moyenne 7.4% inférieure à la médiane
(±) | la linéarité des basses est moyenne (9.2% delta à la fréquence précédente)
Médiums 400 - 2000 Hz
(±) | médiane supérieure - en moyenne 5.6% supérieure à la médiane
(+) | les médiums sont linéaires (4% delta à la fréquence précédente)
Aiguës 2 - 16 kHz
(+) | des sommets équilibrés - à seulement 2.6% de la médiane
(+) | les aigus sont linéaires (6.7% delta à la fréquence précédente)
Globalement 100 - 16 000 Hz
(+) | le son global est linéaire (12.1% différence à la médiane)
Par rapport à la même classe
» 12% de tous les appareils testés de cette catégorie étaient meilleurs, 4% similaires, 84% pires
» Le meilleur avait un delta de 6%, la moyenne était de 18%, le pire était de 132%.
Par rapport à tous les appareils testés
» 9% de tous les appareils testés étaient meilleurs, 2% similaires, 88% pires
» Le meilleur avait un delta de 4%, la moyenne était de 24%, le pire était de 134%.
Gestion de l'énergie - Machine exigeante
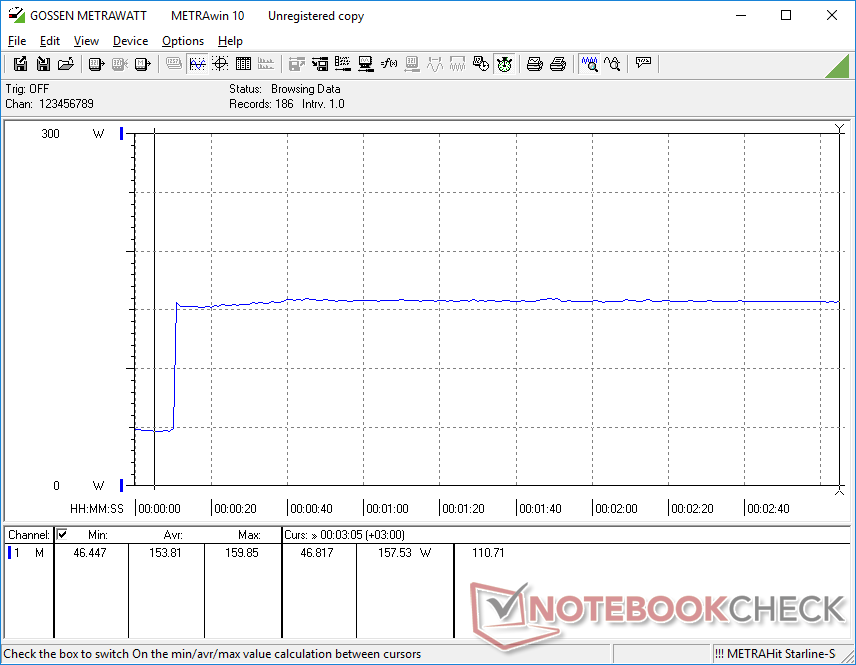
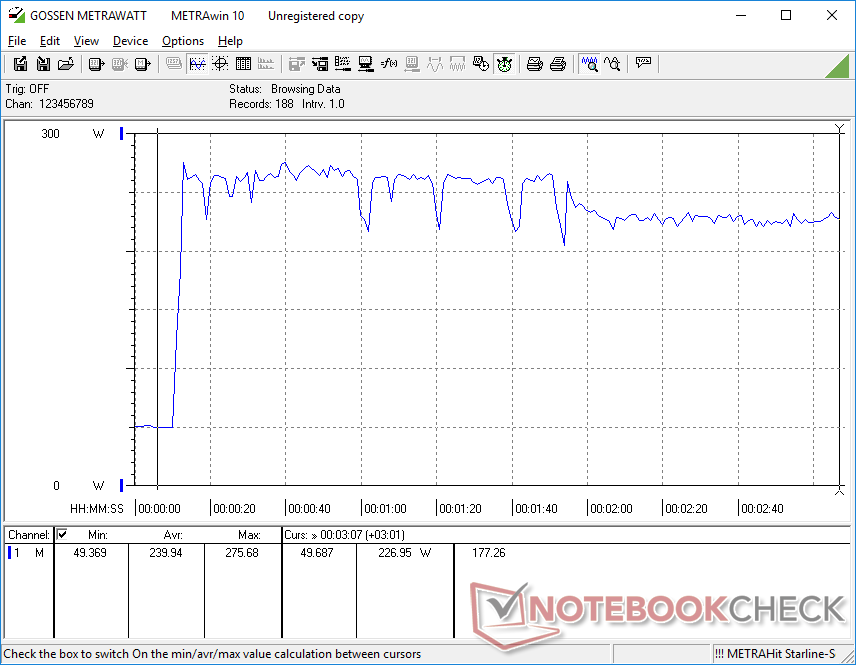
Consommation d'énergie
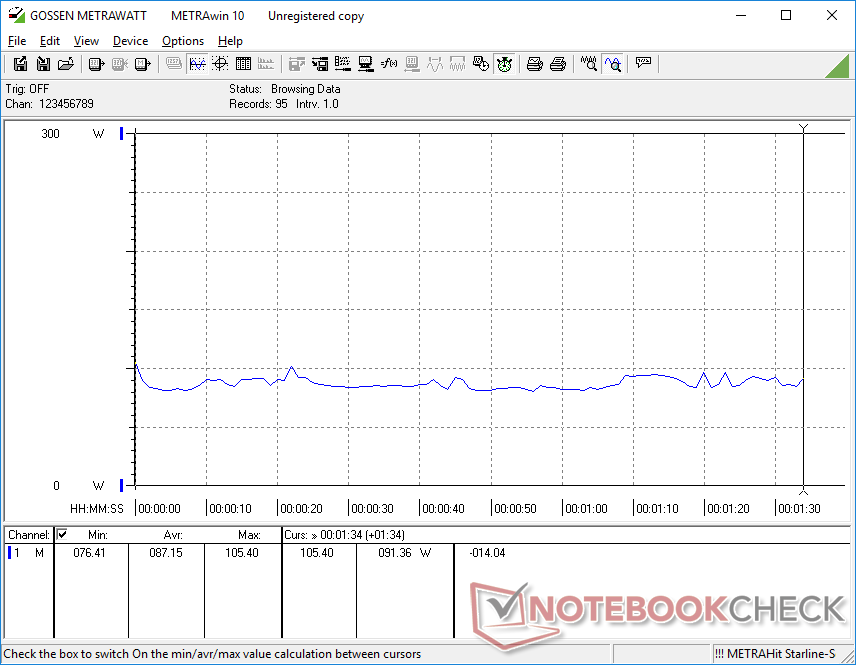
Bien que le Ryzen 7 6800H soit environ 25 % plus lent que le Core i7-12700H, il n'est pas nécessairement 25 % plus économe en énergie. En fait, la consommation d'énergie entre les versions AMD et Intel de Legion 5 Pro 16 est d'environ 160 W sur chaque système lors de l'exécution de Prime95. La consommation d'énergie reste également assez similaire entre les deux systèmes lors de l'exécution de Prime95 Witcher 3
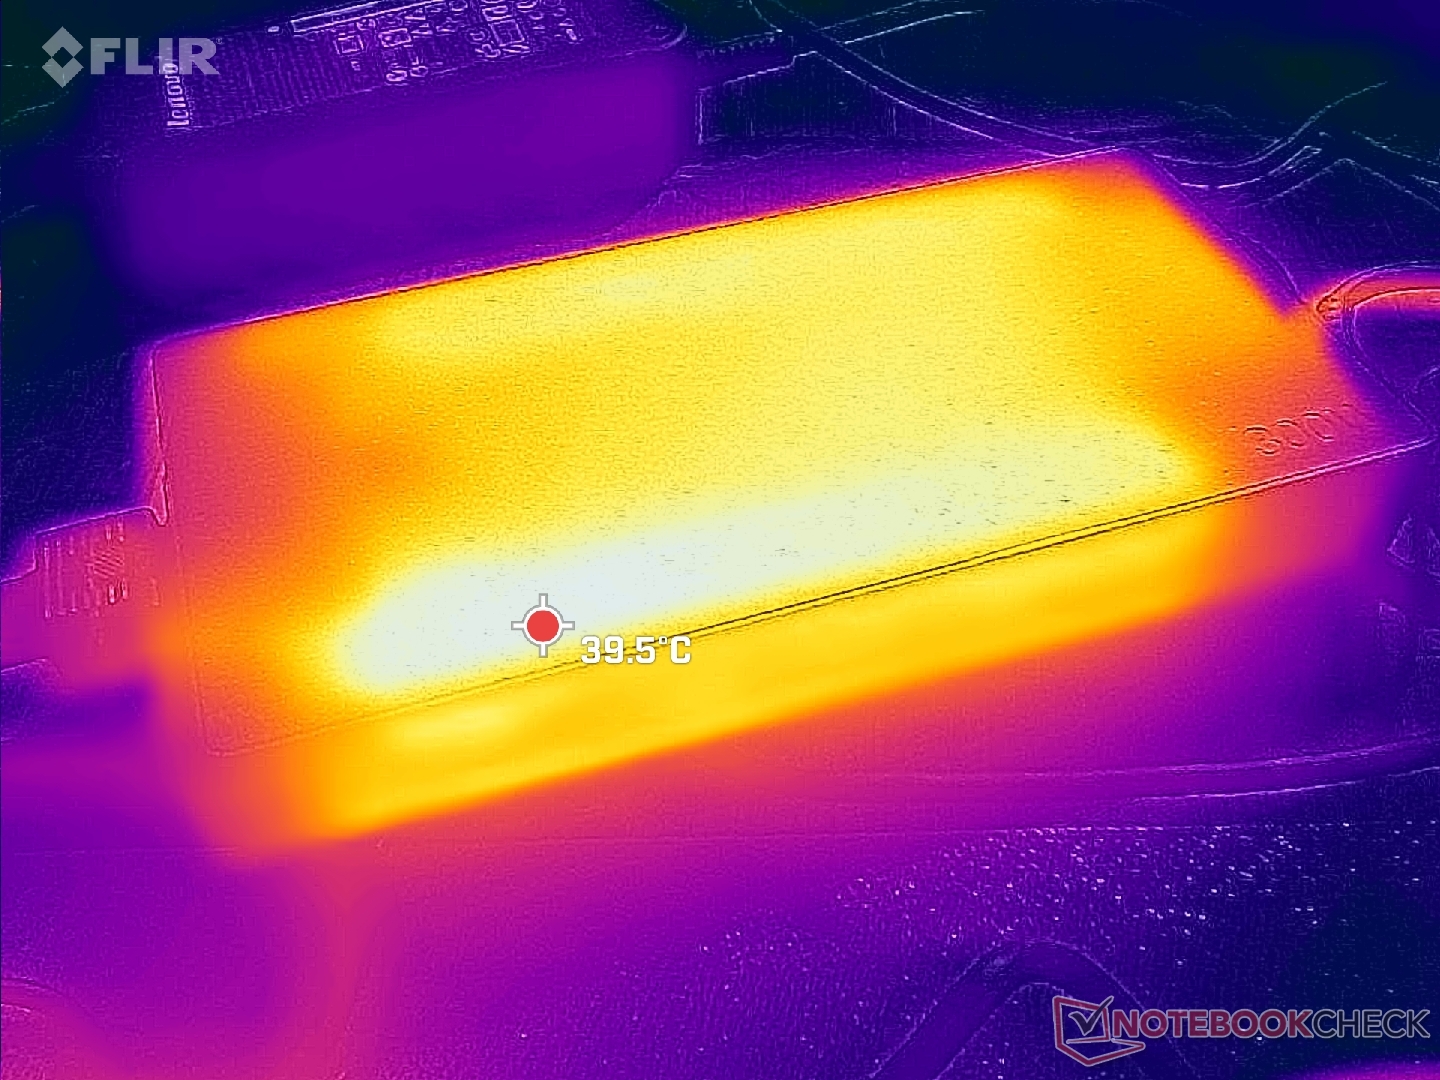
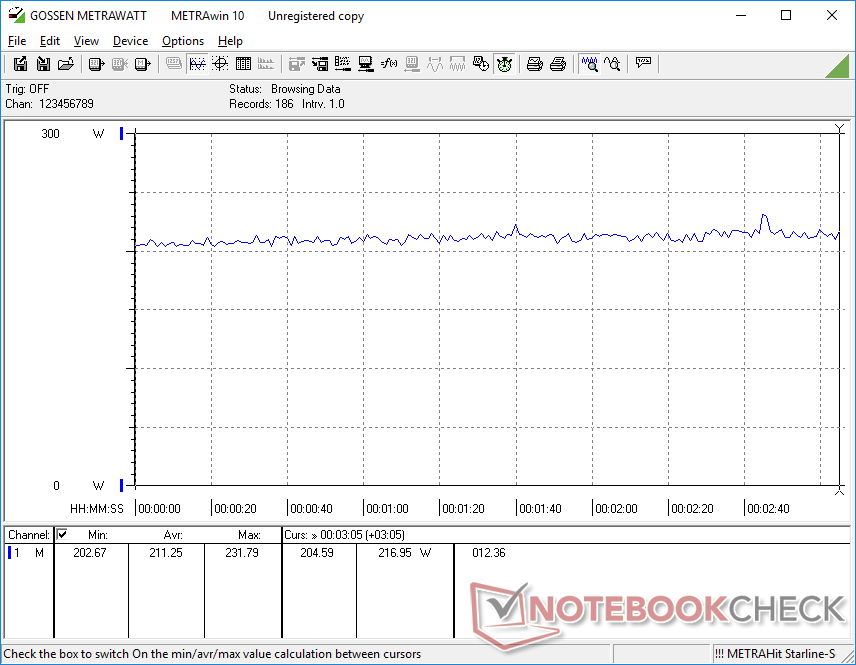
Nous avons pu enregistrer une consommation maximale temporaire de 275 W sur le grand adaptateur secteur de 300 W (~19,9 x 9,8 x 2,6 cm) lorsque le CPU et le GPU sont utilisés à 100 %. Le système peut se charger à un taux raisonnable et exécuter des charges exigeantes simultanément.
| Éteint/en veille | |
| Au repos | |
| Fortement sollicité |
|
Légende:
min: | |
| Lenovo Legion 5 Pro 16ARH7H RTX 3070 Ti R7 6800H, GeForce RTX 3070 Ti Laptop GPU, Samsung PM9A1 MZVL21T0HCLR, IPS, 2560x1600, 16" | Lenovo Legion 5 Pro 16IAH7H i7-12700H, GeForce RTX 3060 Laptop GPU, 2x Samsung PM9A1 MZVL21T0HCLR (RAID 0), IPS, 2560x1600, 16" | Asus ROG Zephyrus M16 GU603H i9-11900H, GeForce RTX 3070 Laptop GPU, Samsung PM9A1 MZVL22T0HBLB, IPS, 2560x1600, 16" | Lenovo Legion 7 16ARHA7 R9 6900HX, Radeon RX 6850M XT, Samsung PM9A1 MZVL22T0HBLB, IPS, 2560x1600, 16" | HP Victus 16-e0145ng R5 5600H, GeForce RTX 3050 Ti Laptop GPU, Samsung SSD PM981a MZVLB512HBJQ, IPS, 1920x1080, 16.1" | Dell G16 7620 i7-12700H, GeForce RTX 3060 Laptop GPU, WDC PC SN810 512GB, IPS, 2560x1600, 16" | |
|---|---|---|---|---|---|---|
| Power Consumption | -50% | 2% | -5% | 33% | -4% | |
| Idle Minimum * (Watt) | 9.7 | 22.8 -135% | 11 -13% | 9.9 -2% | 7 28% | 14.4 -48% |
| Idle Average * (Watt) | 14.8 | 26.5 -79% | 20 -35% | 22 -49% | 9 39% | 17.8 -20% |
| Idle Maximum * (Watt) | 45.8 | 41 10% | 30 34% | 23.1 50% | 15 67% | 31.5 31% |
| Load Average * (Watt) | 87.2 | 191 -119% | 111 -27% | 94.4 -8% | 93 -7% | 101.2 -16% |
| Witcher 3 ultra * (Watt) | 209 | 194.7 7% | 156 25% | 249 -19% | 134.5 36% | 176.9 15% |
| Load Maximum * (Watt) | 275.3 | 238 14% | 197 28% | 276 -0% | 185 33% | 242.9 12% |
* ... Moindre est la valeur, meilleures sont les performances
Power Consumption Witcher 3 / Stresstest
Power Consumption external Monitor
Autonomie de la batterie - pas trop mauvaise
Le temps d'exécution du WLAN est presque une heure plus long que sur la version Intel du Legion 5 Pro 16 lorsqu'il est réglé sur le profil d'alimentation équilibré avec l'iGPU actif. L'amélioration de l'autonomie de la batterie est probablement due au fait que le CPU AMD est plus efficace lorsqu'il est moins sollicité, comme le montre notre section Consommation d'énergie ci-dessus. Néanmoins, elle reste relativement courte, avec un peu moins de 4,5 heures, contre près de 8 heures pour le Asus ROG Zephyrus M16.
Le chargement d'un ordinateur vide à sa pleine capacité prend un peu moins d'une heure lorsque la fonction de charge rapide est activée. La plupart des autres ordinateurs portables mettent entre 1,5 et 2 heures.
| Lenovo Legion 5 Pro 16ARH7H RTX 3070 Ti R7 6800H, GeForce RTX 3070 Ti Laptop GPU, 80 Wh | Lenovo Legion 5 Pro 16IAH7H i7-12700H, GeForce RTX 3060 Laptop GPU, 80 Wh | Asus ROG Zephyrus M16 GU603H i9-11900H, GeForce RTX 3070 Laptop GPU, 90 Wh | Lenovo Legion 7 16ARHA7 R9 6900HX, Radeon RX 6850M XT, 99 Wh | HP Victus 16-e0145ng R5 5600H, GeForce RTX 3050 Ti Laptop GPU, 70 Wh | Dell G16 7620 i7-12700H, GeForce RTX 3060 Laptop GPU, 84 Wh | |
|---|---|---|---|---|---|---|
| Autonomie de la batterie | -18% | 75% | 66% | 61% | 14% | |
| WiFi v1.3 (h) | 4.4 | 3.6 -18% | 7.7 75% | 7.3 66% | 7.1 61% | 5 14% |
| H.264 (h) | 4.1 | |||||
| Witcher 3 ultra (h) | 2.1 | |||||
| Load (h) | 0.6 | 1.6 | 1.8 | 0.7 | ||
| Reader / Idle (h) | 13.3 | 4.9 | 7.1 |
Points positifs
Points négatifs
Verdict - Juste un peu plus rapide
Les Ryzen 7 6800H et 150 W GeForce RTX 3070 Ti sont chacun environ 10 % plus rapides que les Ryzen 7 5800H et 140 W GeForce RTX 3070 sur le Legion 5 Pro de l'année dernière. Le rafraîchissement de 2022 n'est donc qu'une simple mise à niveau mineure par rapport au modèle 2021, sans grands changements externes ou internes.
Si vous possédez déjà le Lenovo Legion 5 Pro 16 de 2021, vous ne manquerez pas grand-chose en sautant la version 2022. Lenovo va probablement rafraîchir complètement la série d'ici un à deux ans pour des améliorations plus importantes.
Les alternatives les plus proches du Legion 5 Pro 16 pour le moment sont les suivantes Dell G16 et le Asus ROG Zephyrus M16 chacun avec un taux de rafraîchissement similaire de 165 Hz et des options de CPU de la série H. Le modèle Asus est nettement plus petit et plus léger, mais il est encore plus chaud et tout aussi bruyant. Quant au modèle Dell, il est plus silencieux, mais sa taille et la température de son cœur sont légèrement plus élevées et plus lourdes que celles du modèle Lenovo, déjà chaud et lourd.
Pour les futures révisions, nous aimerions voir des températures centrales plus basses et un logiciel plus simple pour contrôler les performances. Dans la version actuelle de Vantage, les utilisateurs doivent activer individuellement quatre paramètres distincts (modes MUX, GPU Overclock, Vantage Performance et Windows Performance) afin d'exploiter pleinement la puissance de l'ordinateur portable, ce qui peut devenir ennuyeux lorsqu'on passe d'un mode d'alimentation à un autre.
Prix et disponibilité
Le Lenovo Legion 5 Pro 16 est maintenant largement disponible sur Best Buy Newegget Amazon pour un prix compris entre 1200 et 1900 dollars US, selon la configuration. Notre configuration spécifique est vendue au détail pour $1800 USD. Les utilisateurs peuvent également acheter directement auprès de Lenovo.
Lenovo Legion 5 Pro 16ARH7H RTX 3070 Ti
- 10/29/2022 v7 (old)
Allen Ngo
Price comparison

