Test du Lenovo Legion Slim 7 16 : Convaincant même avec AMD Ryzen

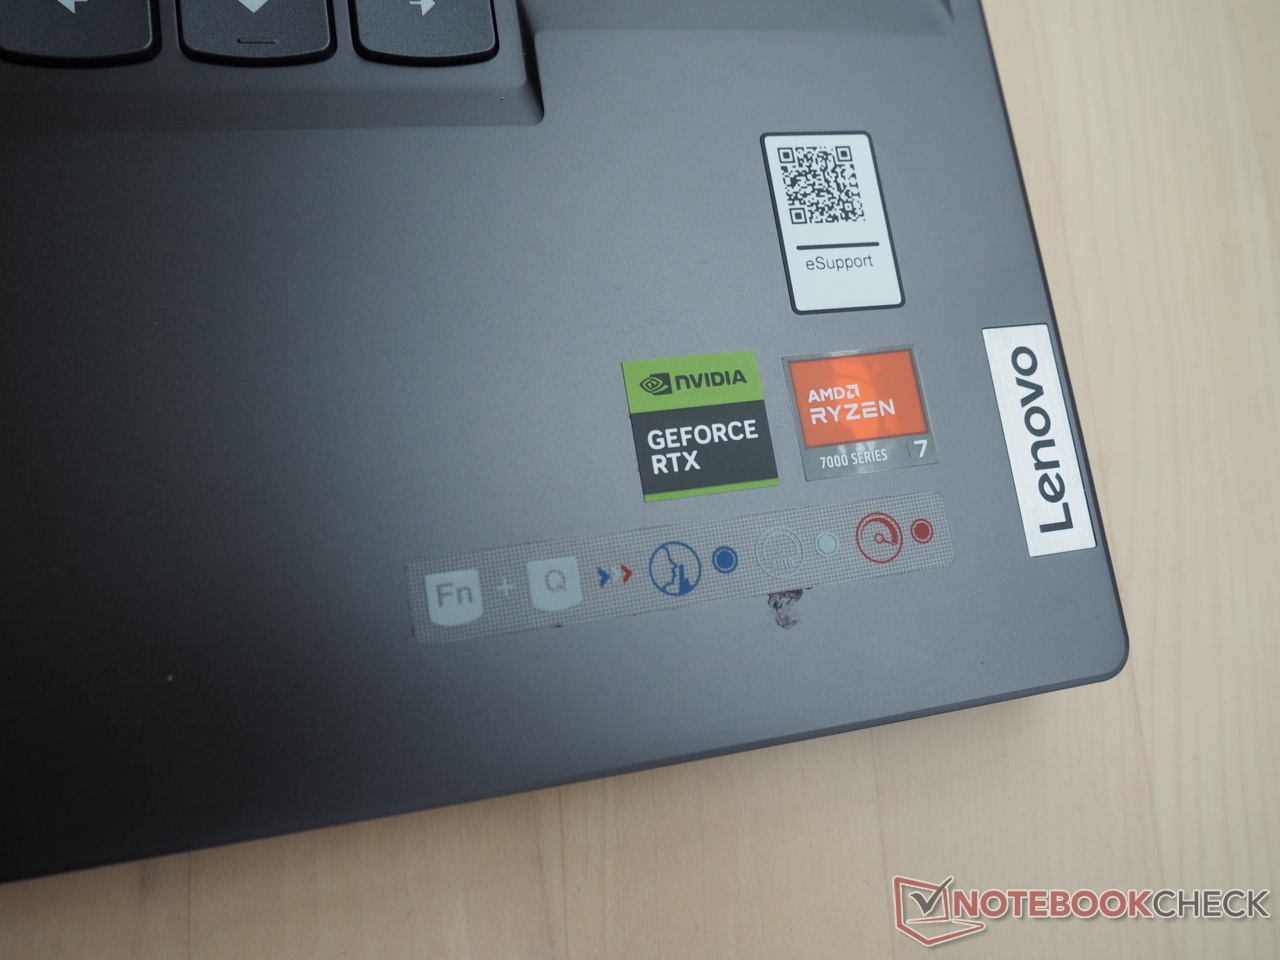
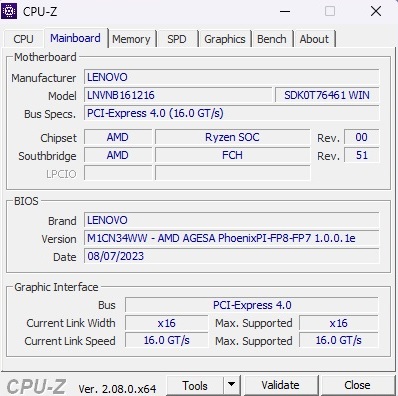
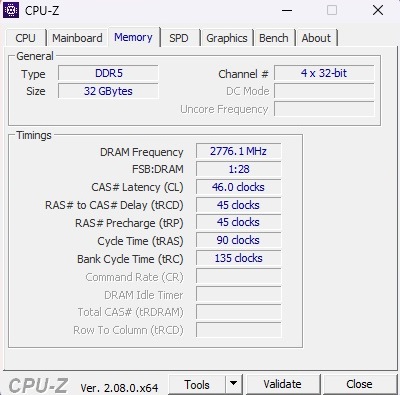
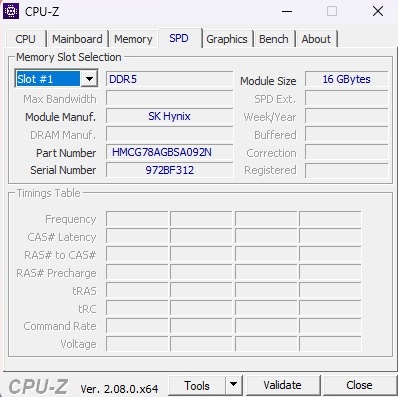
Outre les processeurs Intel, Lenovo propose des processeurs AMD pour la série Legion Slim 7. Le modèle que nous avons testé, le 16APH8, est équipé d'un processeur Ryzen 7 7840HS associé à un processeur GeForce RTX 4060 32 Go de mémoire vive DDR5-5600-RAM et un spacieux disque dur SSD M.2 de 1 To. L'ordinateur portable dispose d'un écran WQXGA vibrant avec une résolution de 2 560 x 1 600 pixels, un taux de rafraîchissement élevé de 240 Hz, un calibrage d'usine et un support HDR, Windows 11 Home complète le produit. Malgré ses spécifications impressionnantes, le 16APH8 est vendu à environ 1750 USD, ce qui le rend relativement cher pour un ordinateur portable équipé d'une carte graphique RTX 4060.
Le Slim 7 doit faire face à la concurrence d'autres ordinateurs portables de jeu de 16 pouces équipés de la RTX 4060, notamment des modèles comme le Asus ROG Flow X16 GV601V, Alienware m16 R1, Acer Predator Helios 16 PH16-71-731Qainsi que le Pro 5 16IRX8 de Lenovo Legion Pro 5 16IRX8 et Lenovo LOQ 16IRH8 de Lenovo.
Comparaison avec les concurrents potentiels
Note | Date | Modèle | Poids | Épaisseur | Taille | Résolution | Prix |
|---|---|---|---|---|---|---|---|
| 90.4 % v7 (old) | 11/23 | Lenovo Legion Slim 7 16APH8 R7 7840HS, GeForce RTX 4060 Laptop GPU | 2.1 kg | 20 mm | 16.00" | 2560x1600 | |
| 89.7 % v7 (old) | 06/23 | Asus ROG Flow X16 GV601V i9-13900H, GeForce RTX 4060 Laptop GPU | 2.1 kg | 19.4 mm | 16.00" | 2560x1600 | |
| 88.3 % v7 (old) | 09/23 | Alienware m16 R1 Intel i7-13700HX, GeForce RTX 4060 Laptop GPU | 3 kg | 25.4 mm | 16.00" | 2560x1600 | |
| 89.5 % v7 (old) | 07/23 | Acer Predator Helios 16 PH16-71-731Q i7-13700HX, GeForce RTX 4060 Laptop GPU | 2.6 kg | 26.9 mm | 16.00" | 2560x1600 | |
| 87.9 % v7 (old) | 05/23 | Lenovo Legion Pro 5 16IRX8 i7-13700HX, GeForce RTX 4060 Laptop GPU | 2.5 kg | 26.8 mm | 16.00" | 2560x1600 | |
| 87.3 % v7 (old) | 09/23 | Lenovo LOQ 16IRH8 i7-13620H, GeForce RTX 4060 Laptop GPU | 2.7 kg | 25.9 mm | 16.00" | 2560x1600 |
A l'exception de quelques différences mineures, le boîtier est le même que celui de la version Intel Version Intel avec le Core i9-13900H et la GeForce RTX 4070 que nous avons déjà examinée. Nous nous contenterons donc de passer brièvement en revue le boîtier, les caractéristiques et les périphériques d'entrée dans cet article.
Cas
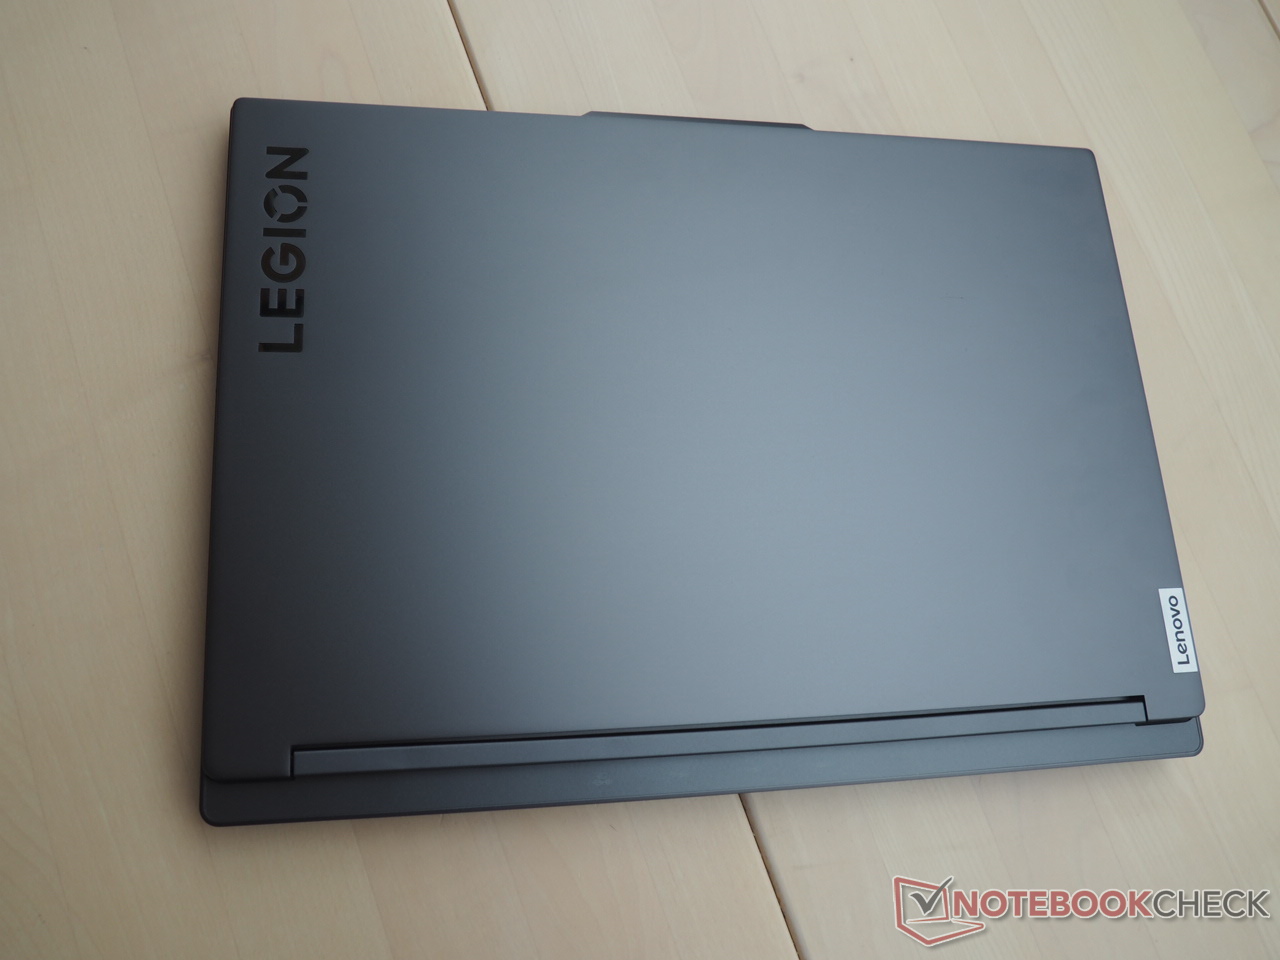
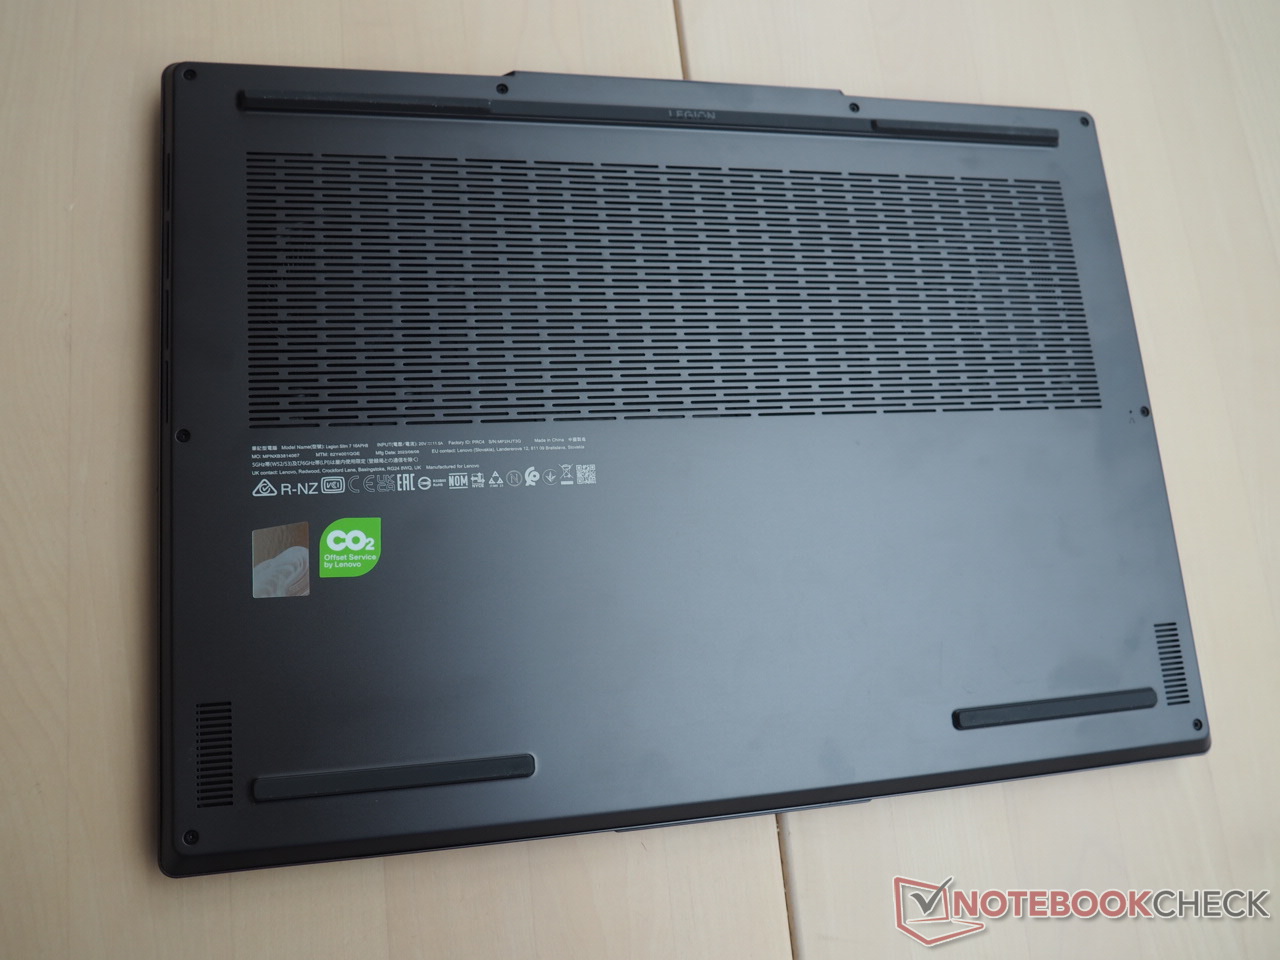
L'une des caractéristiques les plus remarquables est l'élégance du boîtier. L'appareil de 16 pouces présente un design élégant, des matériaux de qualité supérieure et une excellente stabilité. Avec un poids de 4,6 livres, il se situe dans la partie la plus légère de l'échelle par rapport à ses concurrents.

Connectivité
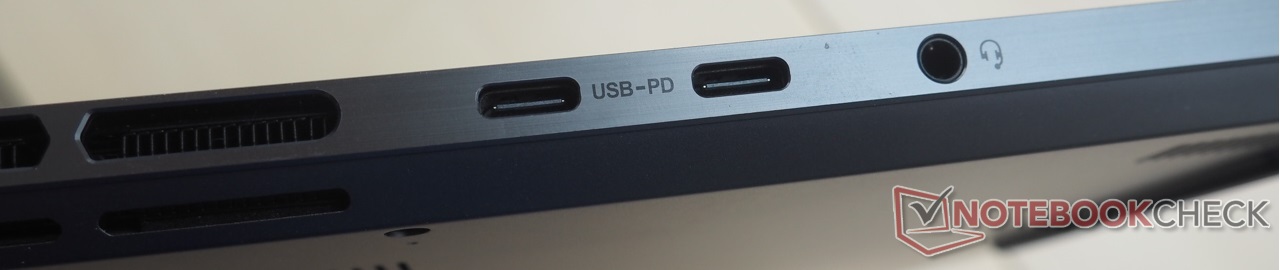
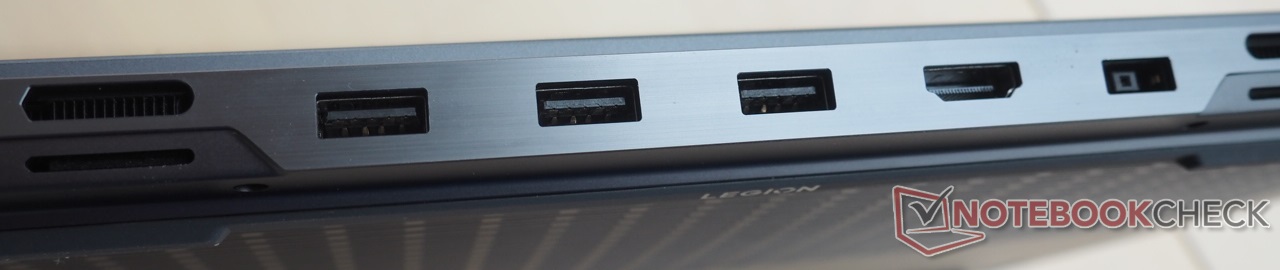
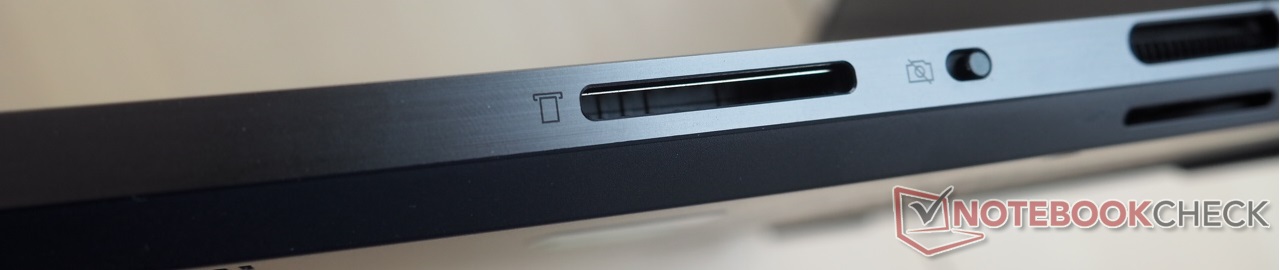
Malgré l'absence d'un port RJ45, le Slim 7 offre un large éventail de connexions. Sur le côté droit, vous trouverez un lecteur de cartes à vitesse moyenne et un obturateur de confidentialité pour une webcam décente. Le côté gauche comporte une prise audio et deux ports USB (1x USB 4, 1x USB 3.2 Gen2), tous deux compatibles avec DisplayPort 1.4 et une alimentation de 140 watts. En outre, un port HDMI 2.1 permet de connecter jusqu'à trois moniteurs externes. À l'arrière, vous trouverez trois ports USB 3.2 Gen2 et une connexion pour le bloc d'alimentation de 230 watts inclus.
Pour la connectivité sans fil, l'ordinateur portable utilise une puce Wi-Fi 6E (MediaTek RZ616), dont les performances sont légèrement inférieures à la moyenne lors de l'émission, mais supérieures à la moyenne lors de la réception.
Lecteur de carte SD
| SD Card Reader | |
| average JPG Copy Test (av. of 3 runs) | |
| Alienware m16 R1 Intel (AV PRO microSD 128 GB V60) | |
| Moyenne de la classe Gaming (20.9 - 210, n=54, 2 dernières années) | |
| Asus ROG Flow X16 GV601V | |
| Lenovo Legion Slim 7 16APH8 (AV PRO microSD 128 GB V60) | |
| Acer Predator Helios 16 PH16-71-731Q | |
| maximum AS SSD Seq Read Test (1GB) | |
| Asus ROG Flow X16 GV601V | |
| Alienware m16 R1 Intel (AV PRO microSD 128 GB V60) | |
| Moyenne de la classe Gaming (25.5 - 261, n=51, 2 dernières années) | |
| Acer Predator Helios 16 PH16-71-731Q | |
| Lenovo Legion Slim 7 16APH8 (AV PRO microSD 128 GB V60) | |
Communication
Webcam


Périphériques d'entrée
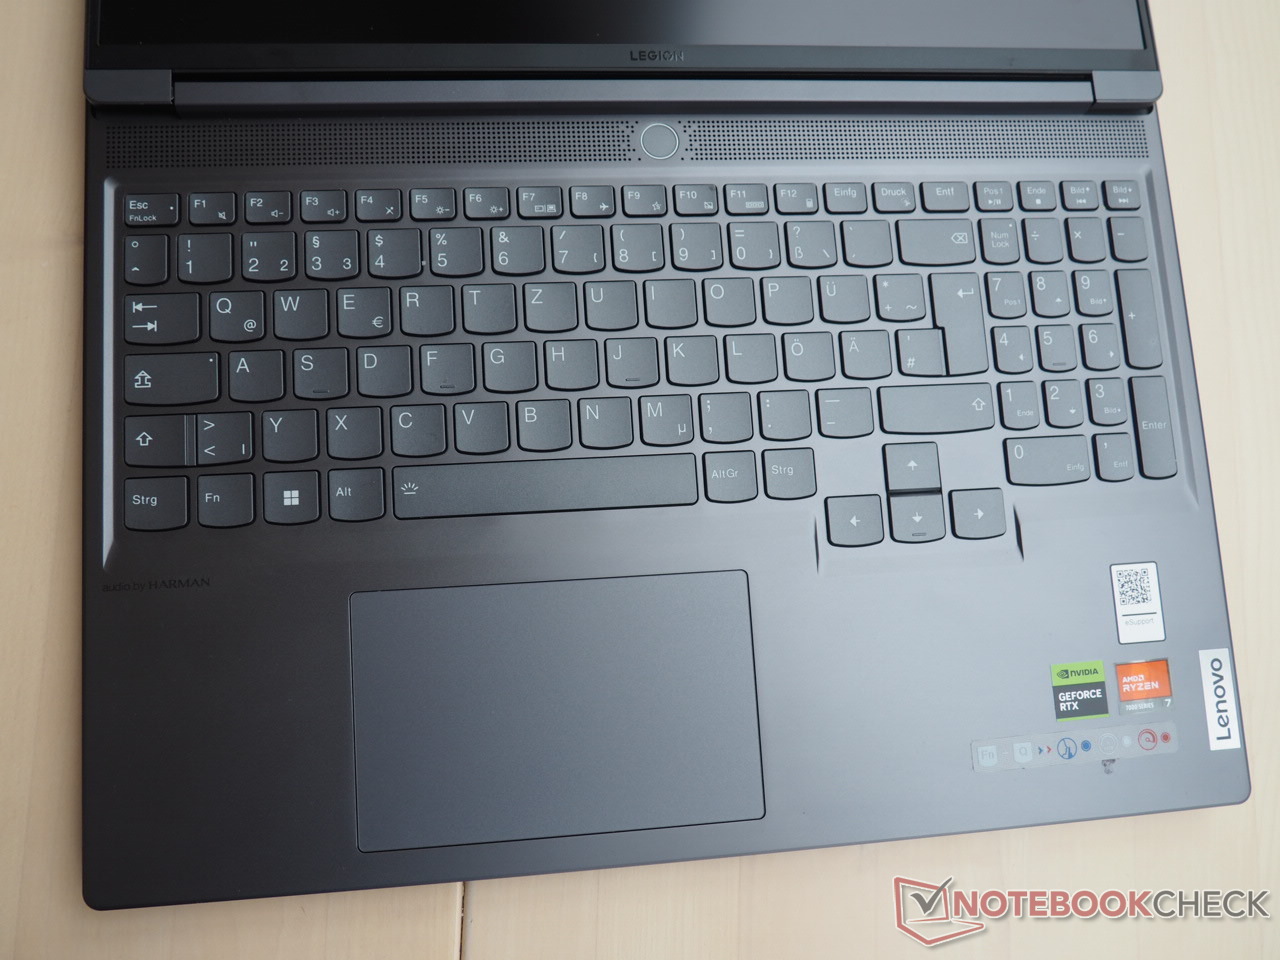
Le clavier offre non seulement des touches de bonne taille, mais aussi une disposition agréable, une forme de touche plaisante et un pavé numérique dédié. Il offre également une bonne sensation de frappe. Un pavé sensitif d'environ 4,72 x 2,95 pouces remplace la souris et fait également bonne impression.
Affichage
Bien que le modèle d'Intel et l'écran de notre appareil de test partagent des caractéristiques fondamentales comparables, ils ne sont pas identiques. Notre modèle était équipé d'un panneau BOE étiqueté NE160QDM-NZ3.
| |||||||||||||||||||||||||
Homogénéité de la luminosité: 82 %
Valeur mesurée au centre, sur batterie: 545 cd/m²
Contraste: 1135:1 (Valeurs des noirs: 0.48 cd/m²)
ΔE ColorChecker Calman: 1.36 | ∀{0.5-29.43 Ø4.73}
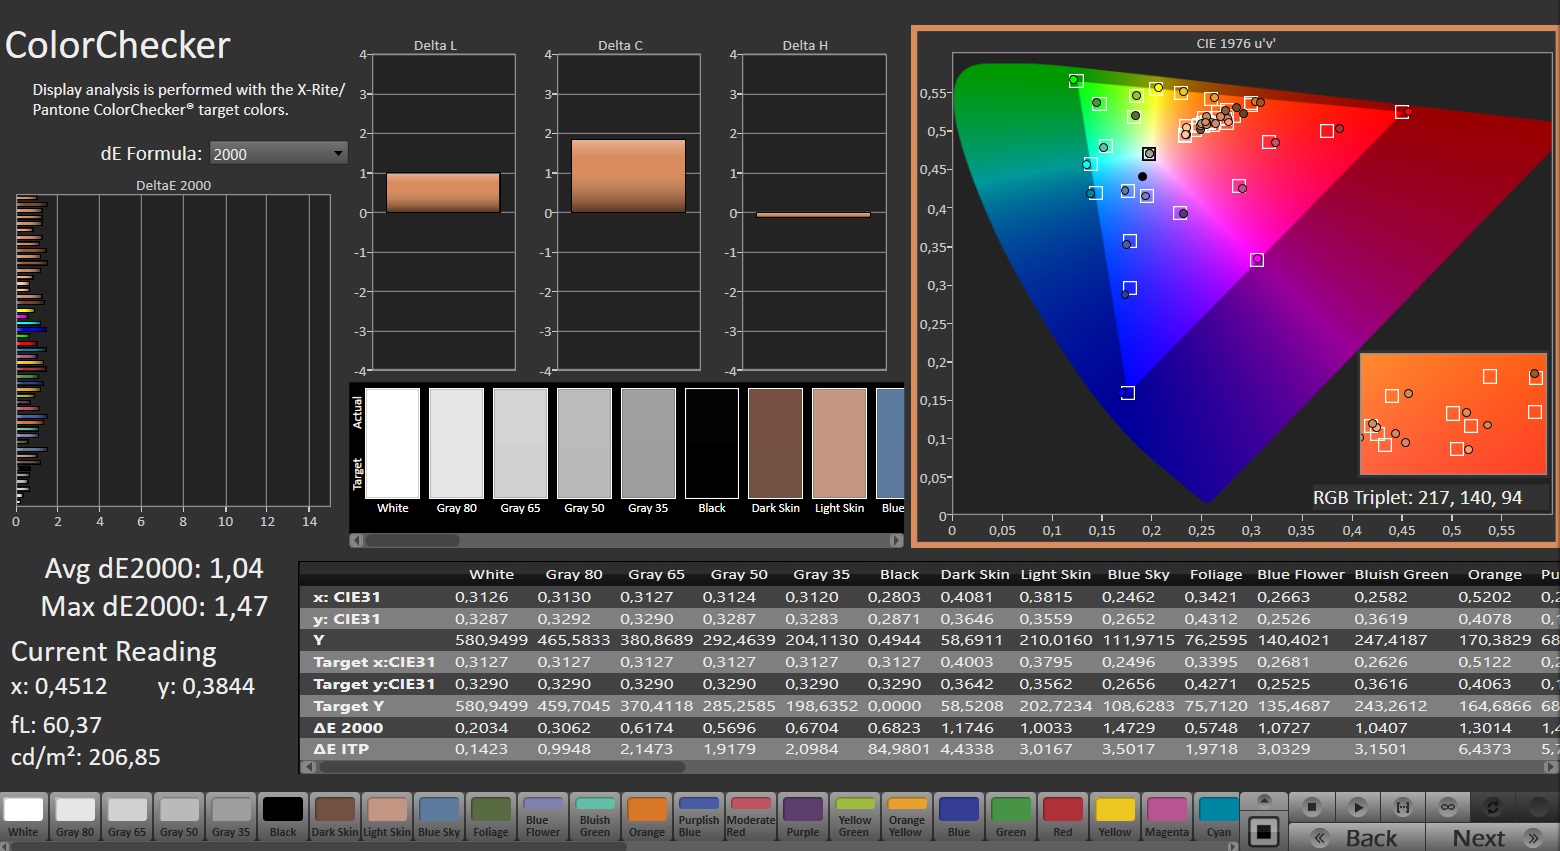
calibrated: 1.04
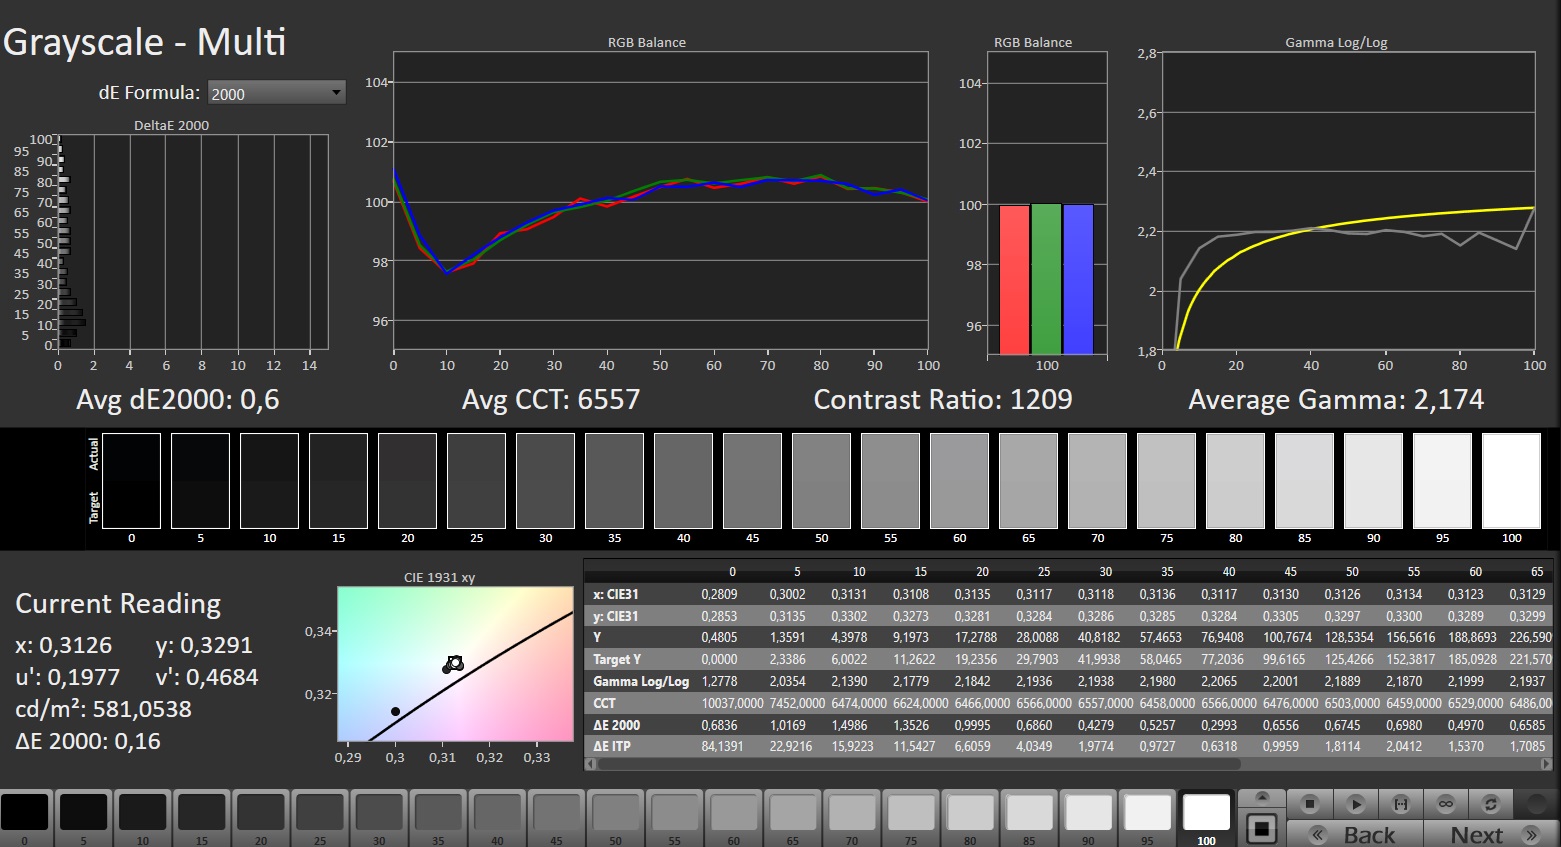
ΔE Greyscale Calman: 1.4 | ∀{0.09-98 Ø4.97}
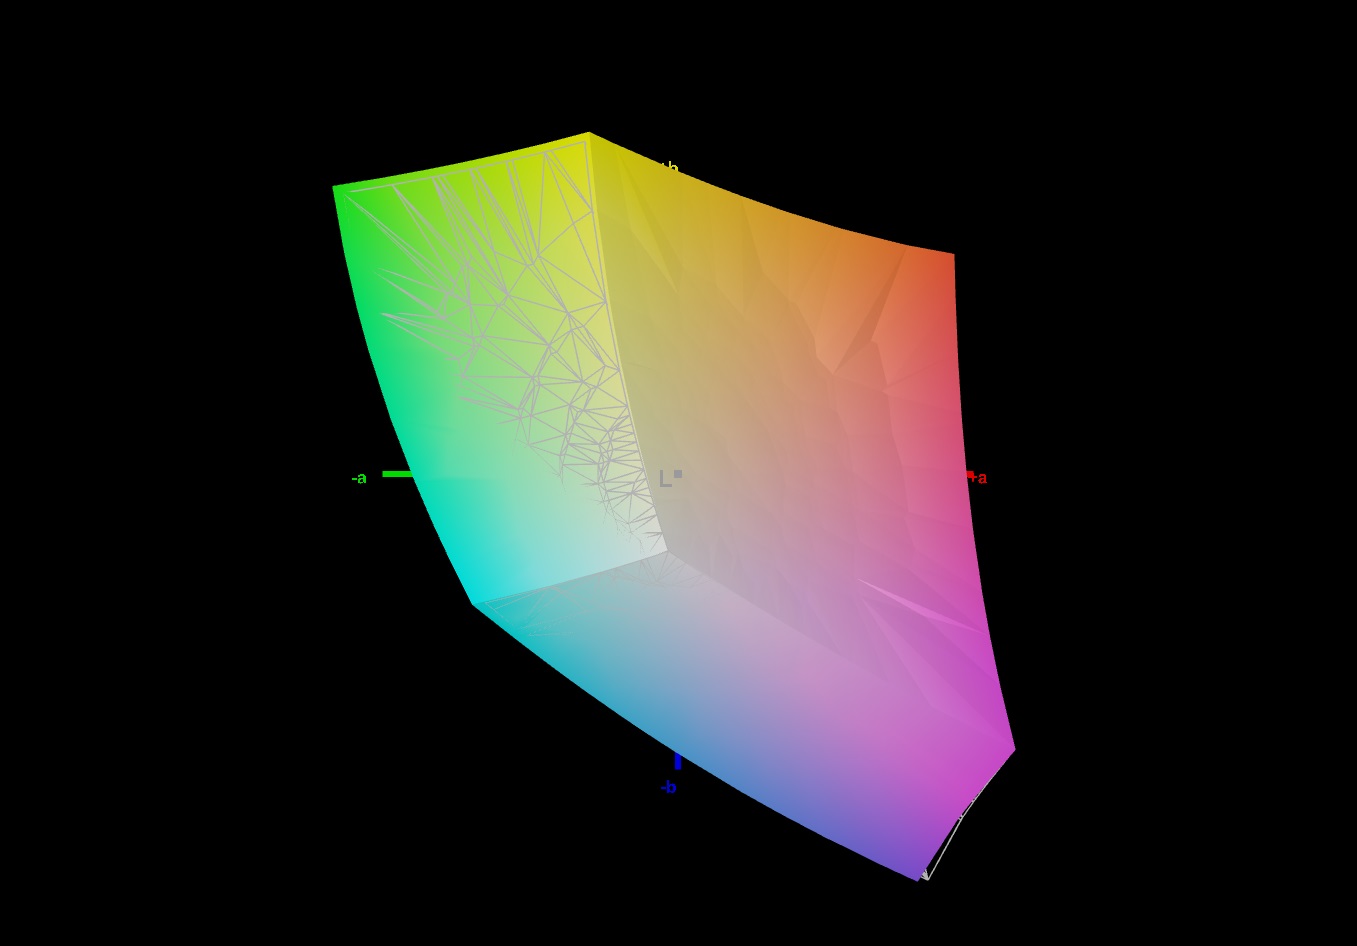
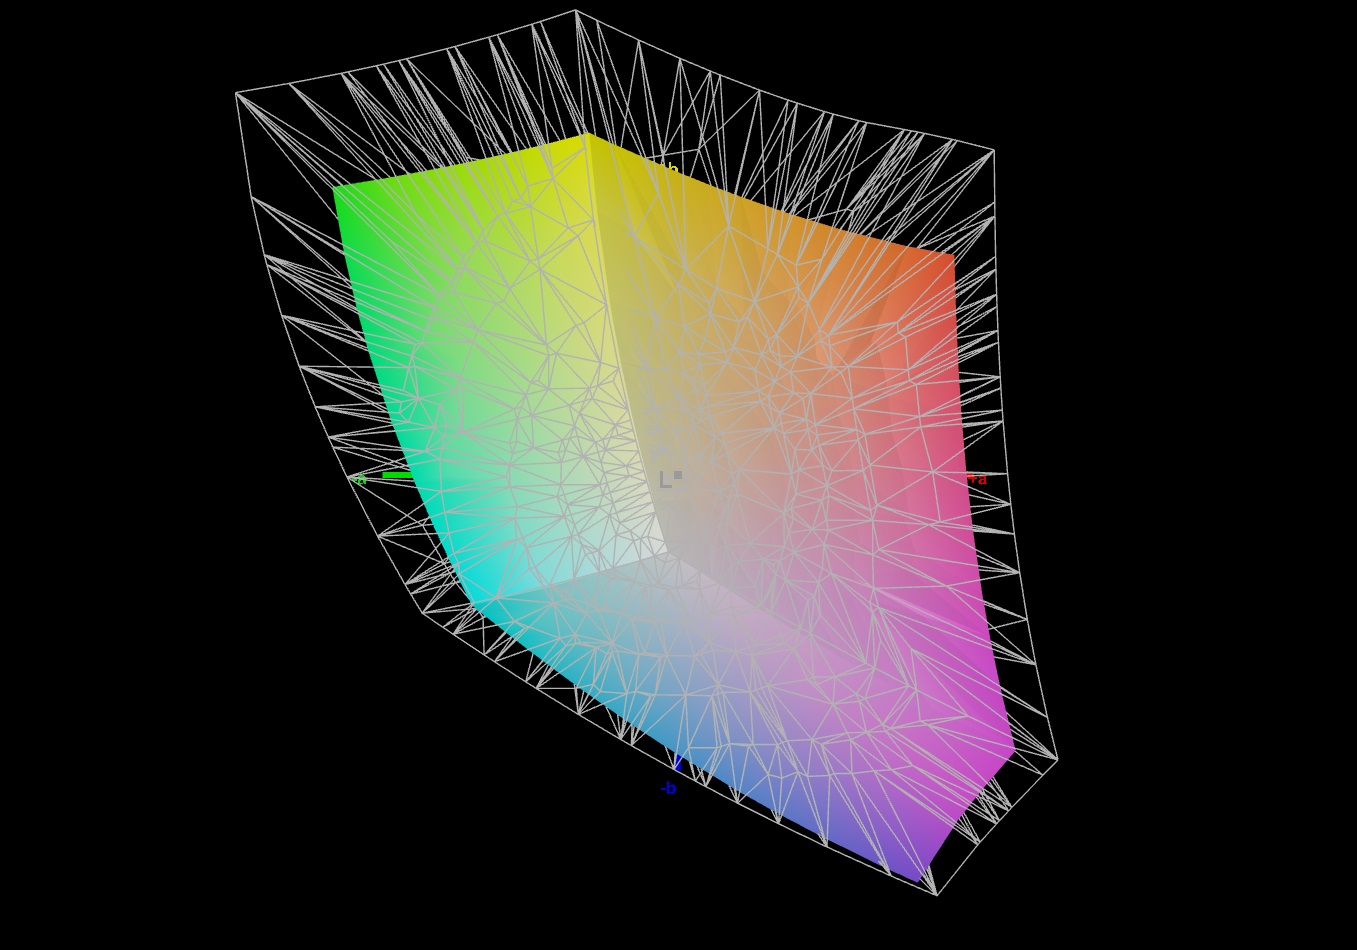
72.4% AdobeRGB 1998 (Argyll 3D)
99.6% sRGB (Argyll 3D)
70.3% Display P3 (Argyll 3D)
Gamma: 2.253
CCT: 6631 K
| Lenovo Legion Slim 7 16APH8 BOE NE160QDM-NZ3, IPS, 2560x1600, 16" | Asus ROG Flow X16 GV601V TMX1603 (TL160ADMP03-0), IPS, 2560x1600, 16" | Alienware m16 R1 Intel BOE NE16NYB, IPS, 2560x1600, 16" | Acer Predator Helios 16 PH16-71-731Q BOE NE160QDM-NZ2, IPS-LED, 2560x1600, 16" | Lenovo Legion Pro 5 16IRX8 AU Optronics B160QAN03.1, IPS, 2560x1600, 16" | Lenovo LOQ 16IRH8 AUOC1A5 (B160QAN03.L), IPS, 2560x1600, 16" | |
|---|---|---|---|---|---|---|
| Display | 18% | -3% | 18% | 0% | -0% | |
| Display P3 Coverage (%) | 70.3 | 96.61 37% | 67.7 -4% | 97.1 38% | 71.2 1% | 70.5 0% |
| sRGB Coverage (%) | 99.6 | 99.92 0% | 97.2 -2% | 100 0% | 98.8 -1% | 98.9 -1% |
| AdobeRGB 1998 Coverage (%) | 72.4 | 84.63 17% | 70 -3% | 84.7 17% | 73.3 1% | 72.6 0% |
| Response Times | 21% | 22% | -8% | -46% | 9% | |
| Response Time Grey 50% / Grey 80% * (ms) | 12.6 ? | 3.8 ? 70% | 4 ? 68% | 13.6 ? -8% | 14.5 ? -15% | 7.2 ? 43% |
| Response Time Black / White * (ms) | 5.9 ? | 7.6 ? -29% | 7.3 ? -24% | 6.4 ? -8% | 10.4 ? -76% | 7.4 ? -25% |
| PWM Frequency (Hz) | ||||||
| Screen | -25% | -32% | -17% | -3% | -7% | |
| Brightness middle (cd/m²) | 545 | 486 -11% | 306 -44% | 511 -6% | 405.7 -26% | 407 -25% |
| Brightness (cd/m²) | 502 | 469 -7% | 302 -40% | 498 -1% | 368 -27% | 369 -26% |
| Brightness Distribution (%) | 82 | 91 11% | 89 9% | 94 15% | 87 6% | 85 4% |
| Black Level * (cd/m²) | 0.48 | 0.39 19% | 0.3 37% | 0.36 25% | 0.38 21% | 0.45 6% |
| Contrast (:1) | 1135 | 1246 10% | 1020 -10% | 1419 25% | 1068 -6% | 904 -20% |
| Colorchecker dE 2000 * | 1.36 | 2.27 -67% | 2.57 -89% | 1.76 -29% | 1.65 -21% | 1.43 -5% |
| Colorchecker dE 2000 max. * | 3.11 | 5.73 -84% | 4.26 -37% | 3.7 -19% | 4.2 -35% | 3.58 -15% |
| Colorchecker dE 2000 calibrated * | 1.04 | 0.6 42% | 0.85 18% | 1.56 -50% | 0.53 49% | 1.07 -3% |
| Greyscale dE 2000 * | 1.4 | 3.36 -140% | 3.3 -136% | 3 -114% | 1.2 14% | 1.13 19% |
| Gamma | 2.253 98% | 2.46 89% | 1.997 110% | 2.33 94% | 2.3 96% | 2.5 88% |
| CCT | 6631 98% | 6625 98% | 6895 94% | 6341 103% | 6453 101% | 6526 100% |
| Moyenne finale (programmes/paramètres) | 5% /
-9% | -4% /
-18% | -2% /
-8% | -16% /
-8% | 1% /
-3% |
* ... Moindre est la valeur, meilleures sont les performances
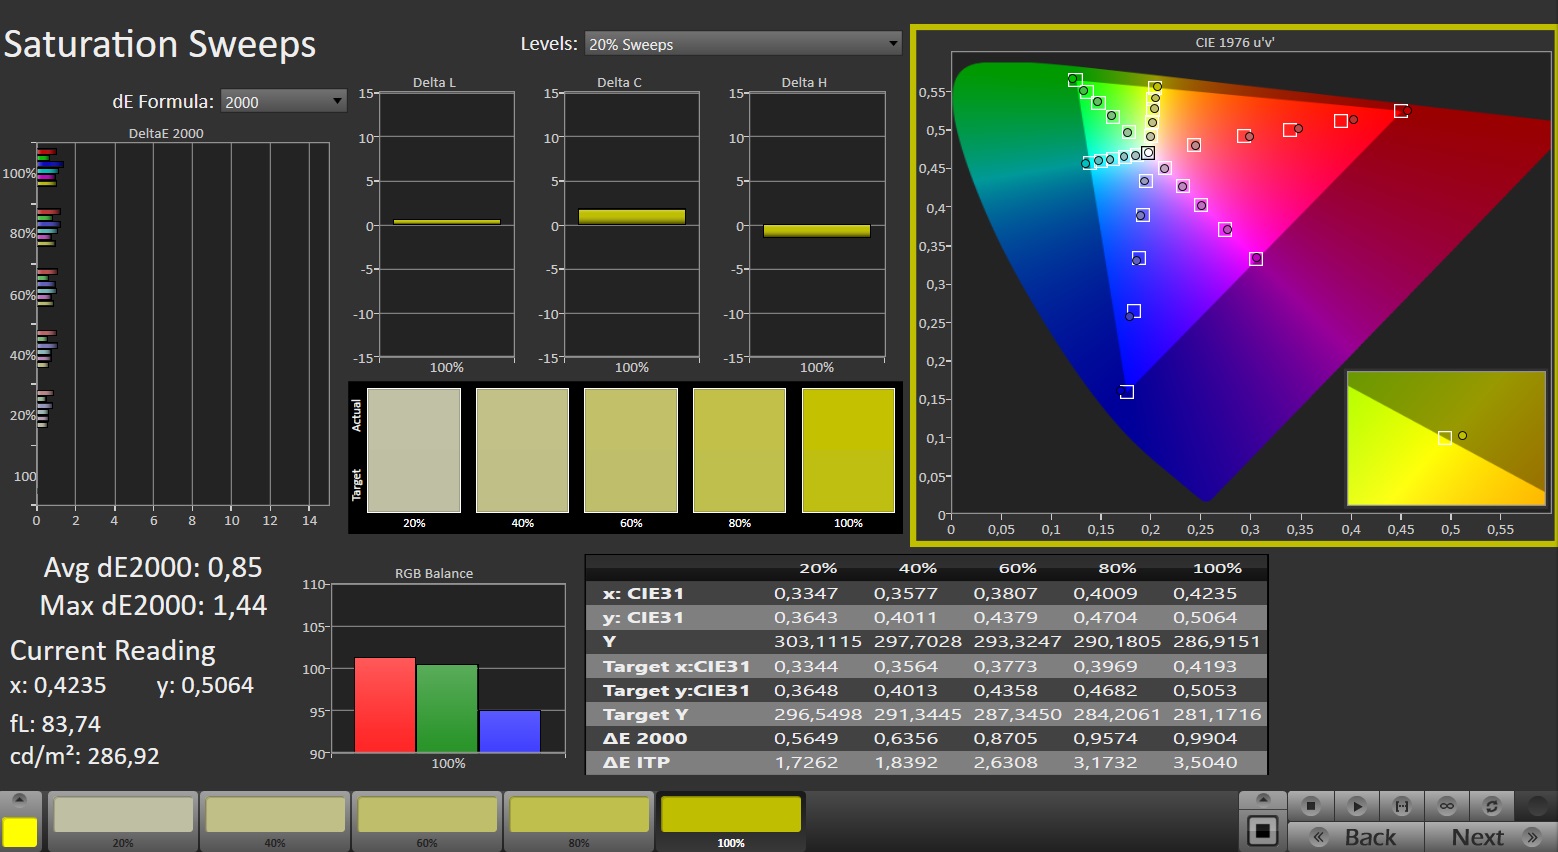
En dehors de l'espace colorimétrique, qui pourrait être un peu plus grand compte tenu de la couverture de 70% DCI-P3 et 72% AdobeRGB (en comparaison avec l'Alienware m16 et l'Acer Predator Helios 16), l'écran WQXGA fonctionne très bien dans presque tous les aspects. Grâce au calibrage en usine, la précision des couleurs est exceptionnelle dès le départ. De plus, les temps de réponse de l'écran 240 Hz sont corrects, avec un peu moins de 6 ms pour les transitions noir-blanc et 12 ms pour les transitions gris-gris.
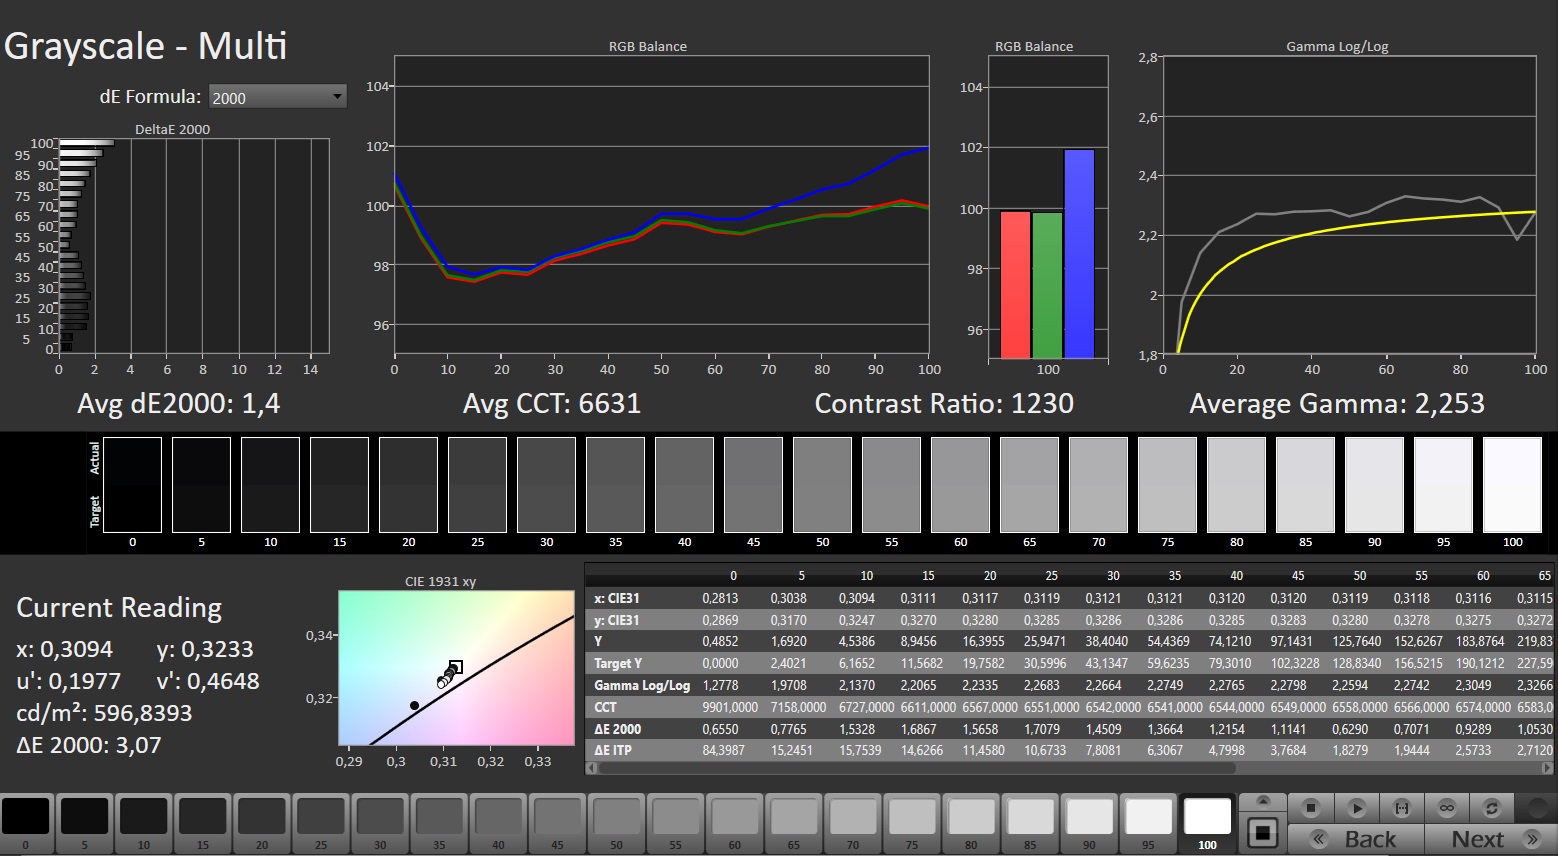

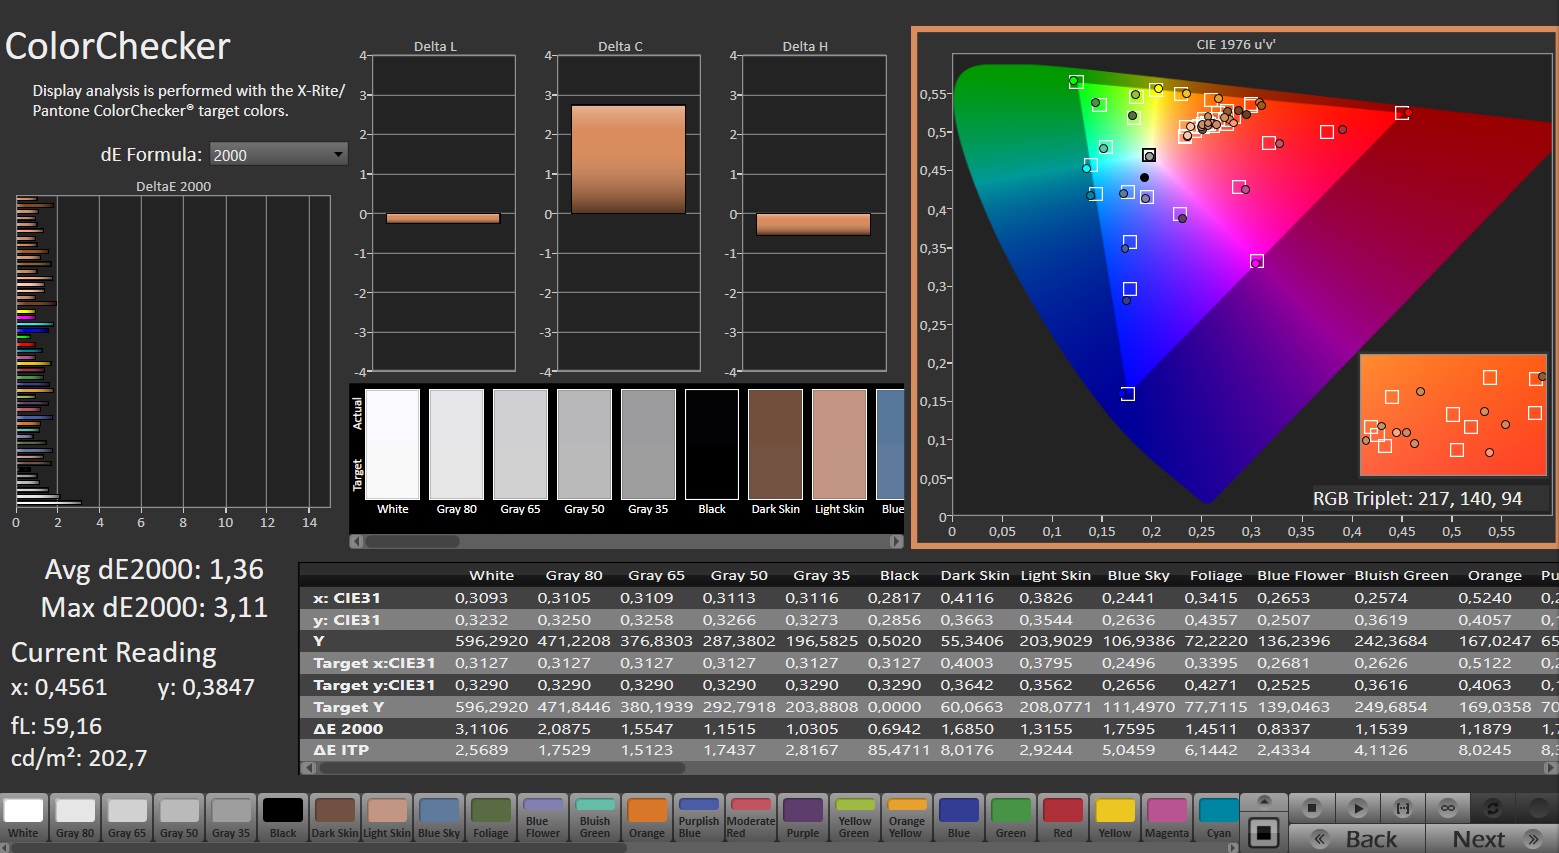
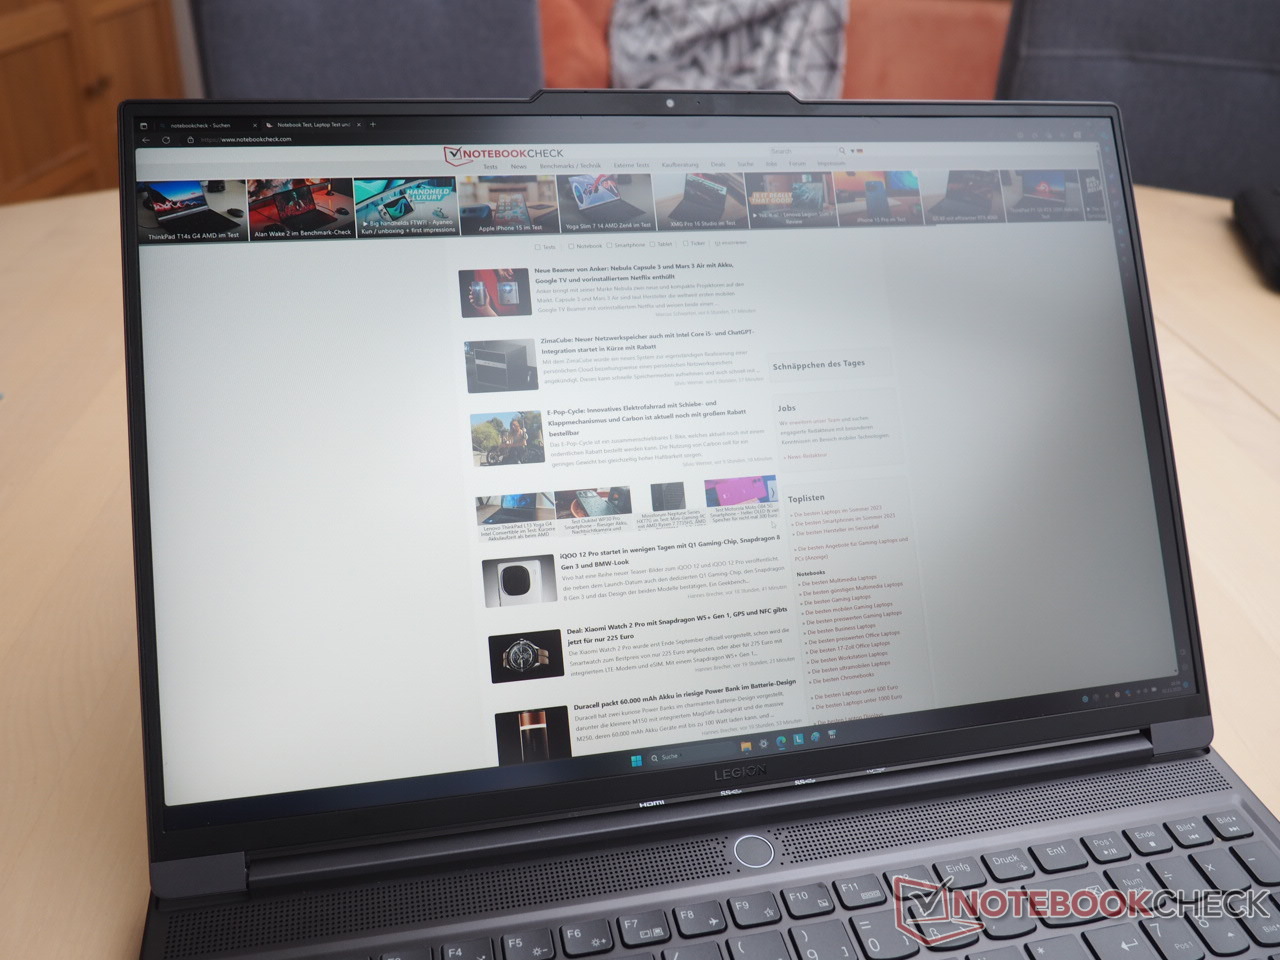
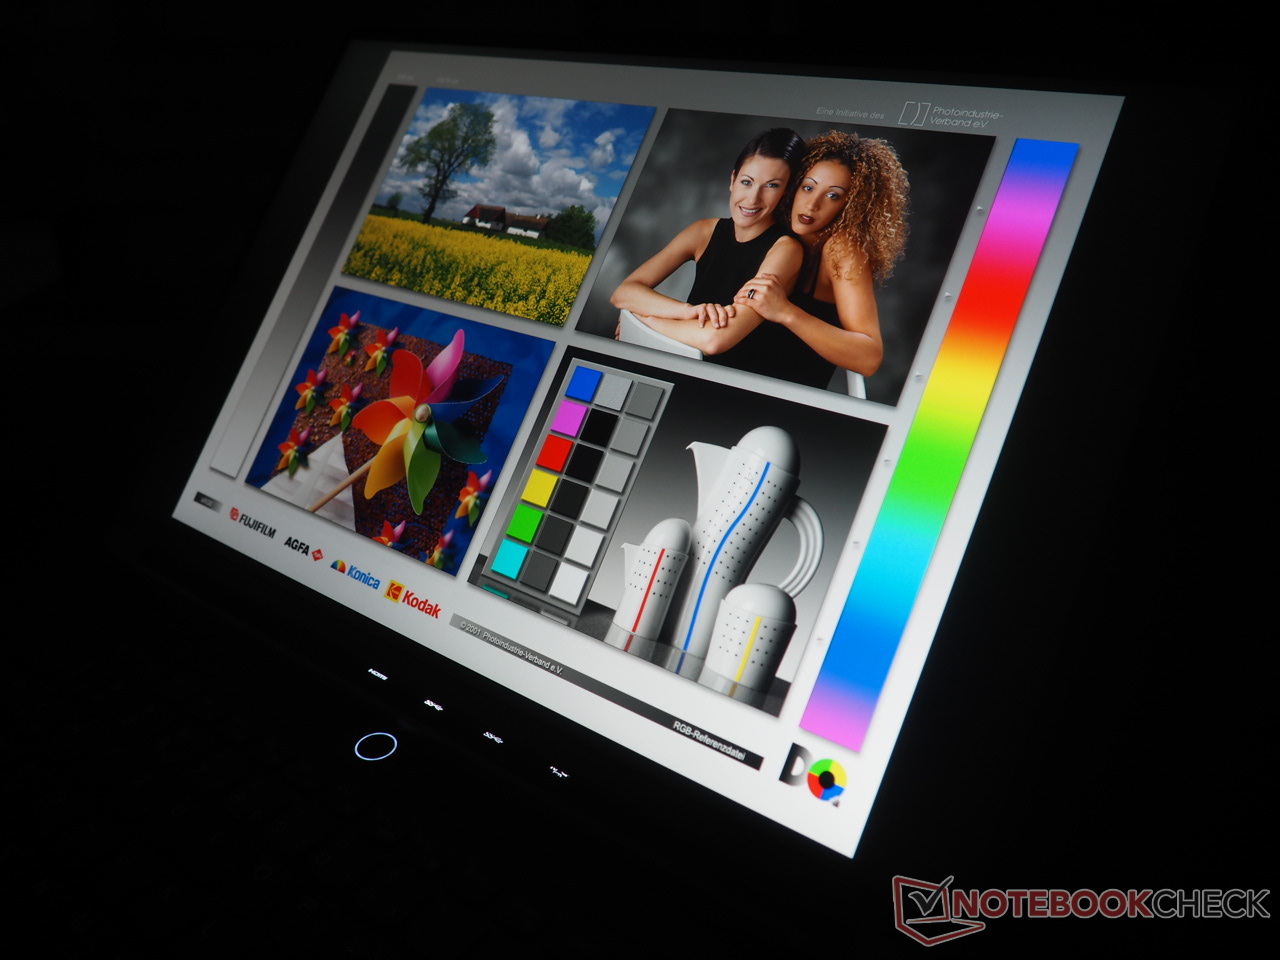
La luminosité est particulièrement remarquable : une valeur moyenne de 502 cd/m2 est assez élevée pour un écran IPS et dépasse même les normes de l'entreprise pour la luminosité de la salle SDR (400 cd/m2). Les joueurs apprécieront la prise en charge des technologies FreeSync et GSync. Malgré une luminosité maximale dans le champ de test, le contraste ne se démarque pas de la concurrence. Cela est dû à la valeur noire insatisfaisante de 0,48 cd/m².

Les angles de vision sont conformes à la norme IPS, comme le montre notre photo. Il n'y a pas eu de problèmes de scintillement de l'écran.
Temps de réponse de l'écran
| ↔ Temps de réponse noir à blanc | ||
|---|---|---|
| 5.9 ms ... hausse ↗ et chute ↘ combinées | ↗ 1.9 ms hausse | 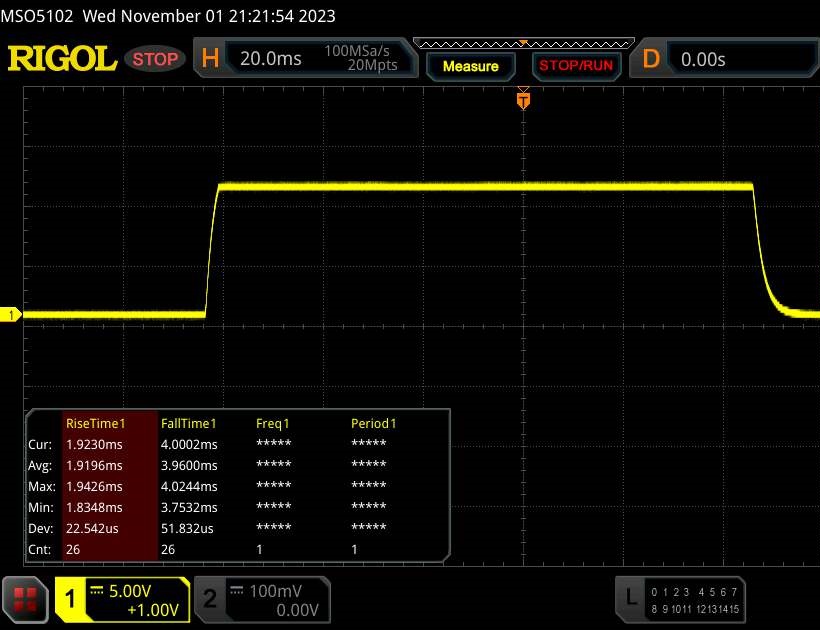 |
| ↘ 4 ms chute | ||
| L'écran montre de très faibles temps de réponse, parfait pour le jeu. En comparaison, tous les appareils testés affichent entre 0.1 (minimum) et 240 (maximum) ms. » 18 % des appareils testés affichent de meilleures performances. Cela signifie que les latences relevées sont meilleures que la moyenne (19.9 ms) de tous les appareils testés. | ||
| ↔ Temps de réponse gris 50% à gris 80% | ||
| 12.6 ms ... hausse ↗ et chute ↘ combinées | ↗ 6.1 ms hausse | 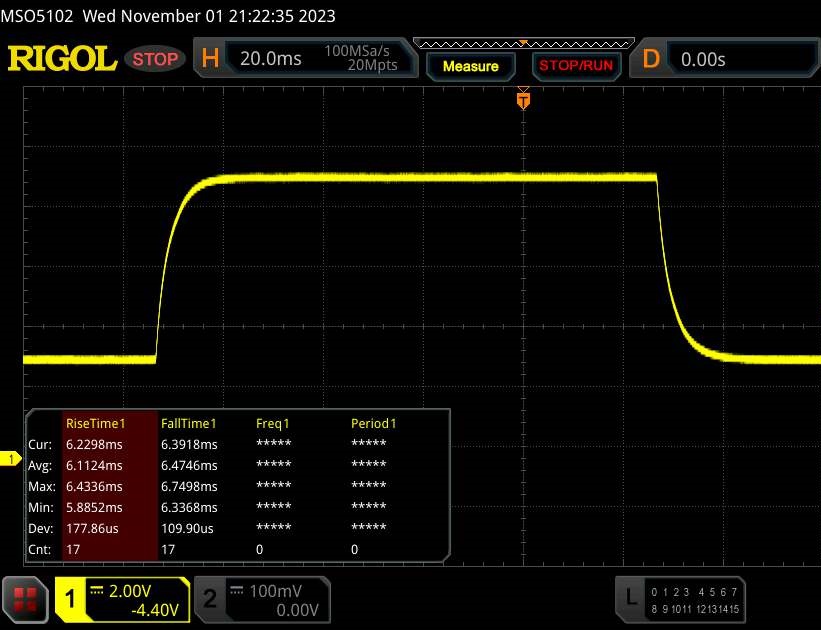 |
| ↘ 6.5 ms chute | ||
| L'écran montre de bons temps de réponse, mais insuffisant pour du jeu compétitif. En comparaison, tous les appareils testés affichent entre 0.165 (minimum) et 636 (maximum) ms. » 26 % des appareils testés affichent de meilleures performances. Cela signifie que les latences relevées sont meilleures que la moyenne (31.1 ms) de tous les appareils testés. | ||
Scintillement / MLI (Modulation de largeur d'impulsion)
| Scintillement / MLI (Modulation de largeur d'impulsion) non décelé | 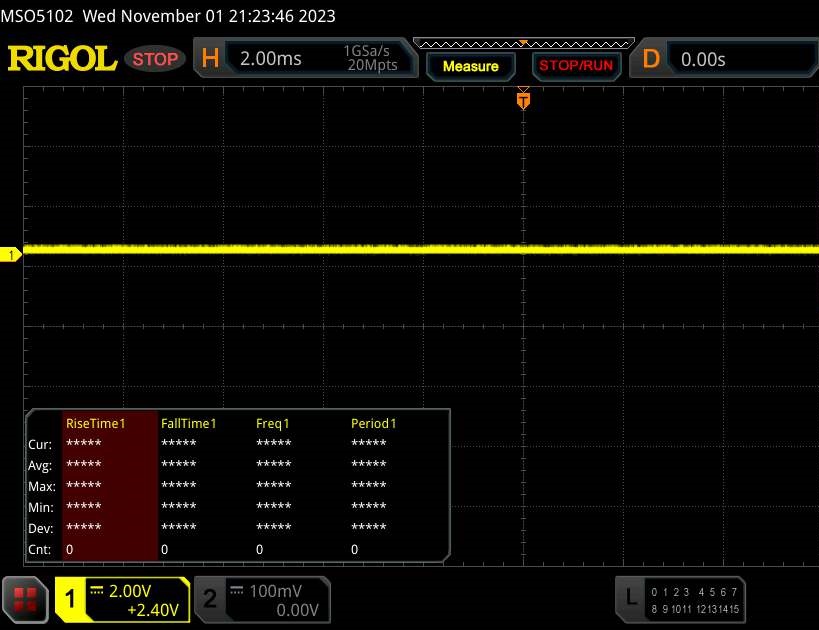 | ||
En comparaison, 52 % des appareils testés n'emploient pas MDI pour assombrir leur écran. Nous avons relevé une moyenne à 7788 (minimum : 5 - maximum : 343500) Hz dans le cas où une MDI était active. | |||
Performance
Le GeForce RTX 4060 positionne le Legion dans la catégorie moyenne des ordinateurs portables de jeu. Avec 32 Go de RAM et un SSD de 1 To, il devrait suffire à la majorité des acheteurs pour le moment. Ceux qui recherchent des performances plus élevées peuvent opter pour la version RTX 4070. Mais Lenovo ne propose pas de version RTX 4080 ou RTX 4090 pour le Slim 7.
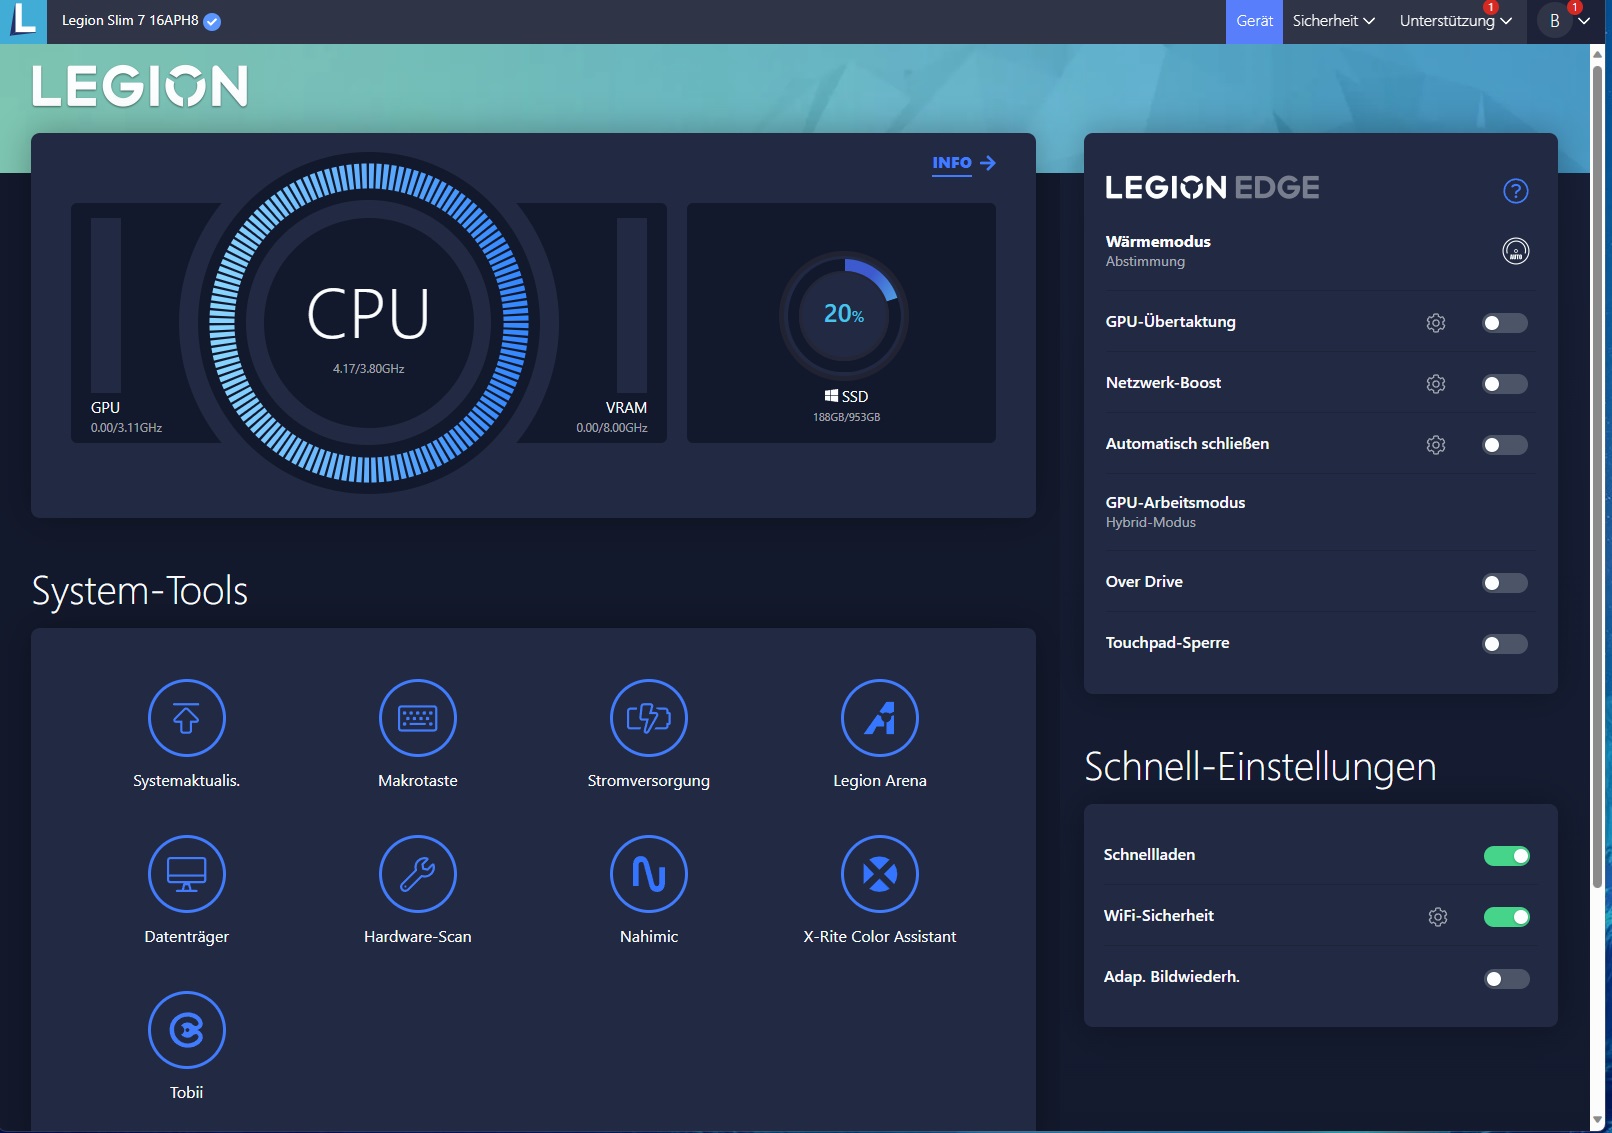
Conditions d'essai
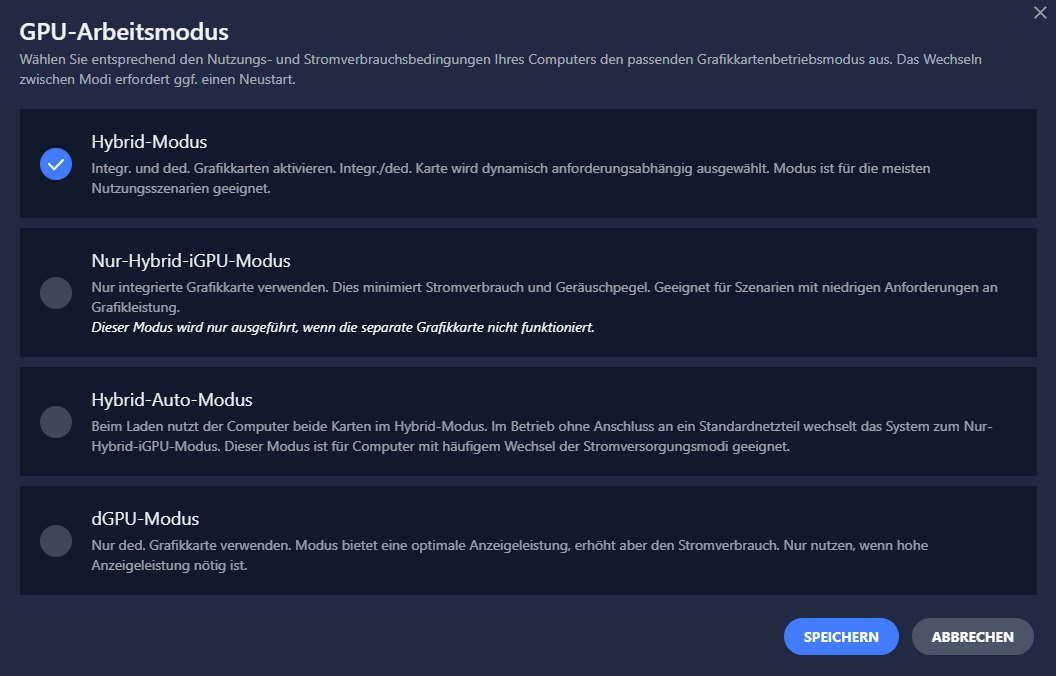
Le logiciel Lenovo Vantage préinstallé se distingue par ses capacités de personnalisation étendues. Outre le mode thermique, les utilisateurs peuvent également choisir le mode de travail du GPU. Comme l'augmentation du nombre de FPS dans le profil Performance n'est pas proportionnelle à l'augmentation du volume (comme le montre le tableau), nous avons effectué toutes les mesures dans le profil Équilibré. La commutation graphique par défaut (mode hybride) était toujours activée.
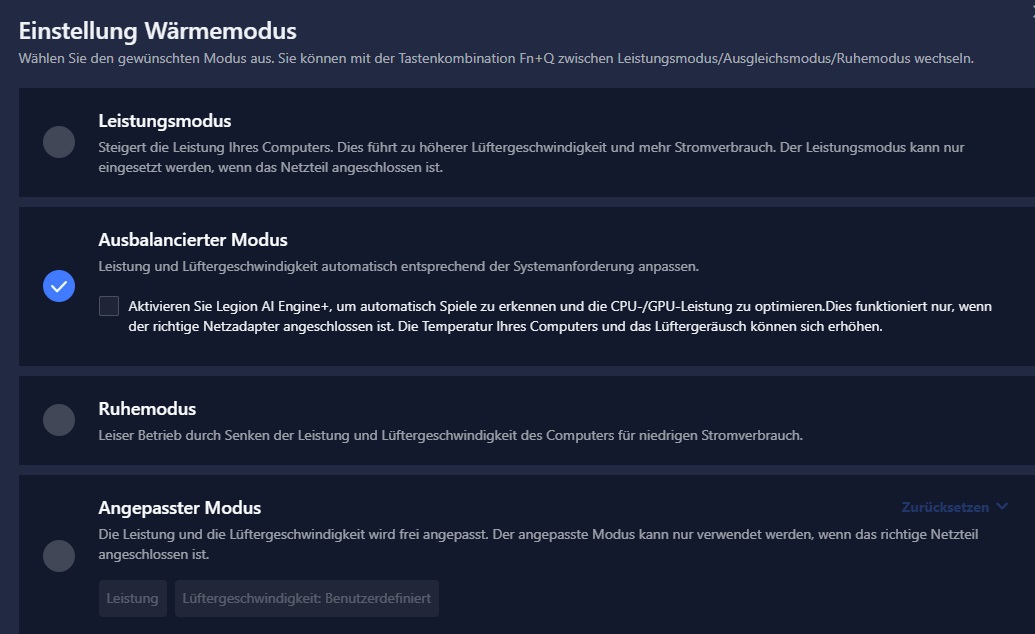
| Silencieux | Équilibré | Performance | |
|---|---|---|---|
| Bruit (Witcher 3, FHD/Ultra) | 36 dB(A) | 47 dB(A) | 52 dB(A) |
| Performances (Witcher 3, FHD/Ultra) | ~86 fps | ~98 fps | ~100 fps |
| Limite de puissance 1 (HWInfo) | 50 w | 54 w | 100 w |
| Limite de puissance 2 (HWInfo) | 60 w | 65 w | 125 w |
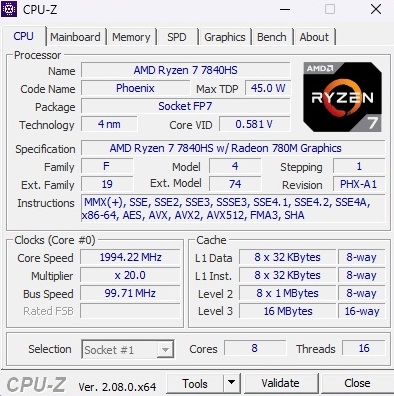
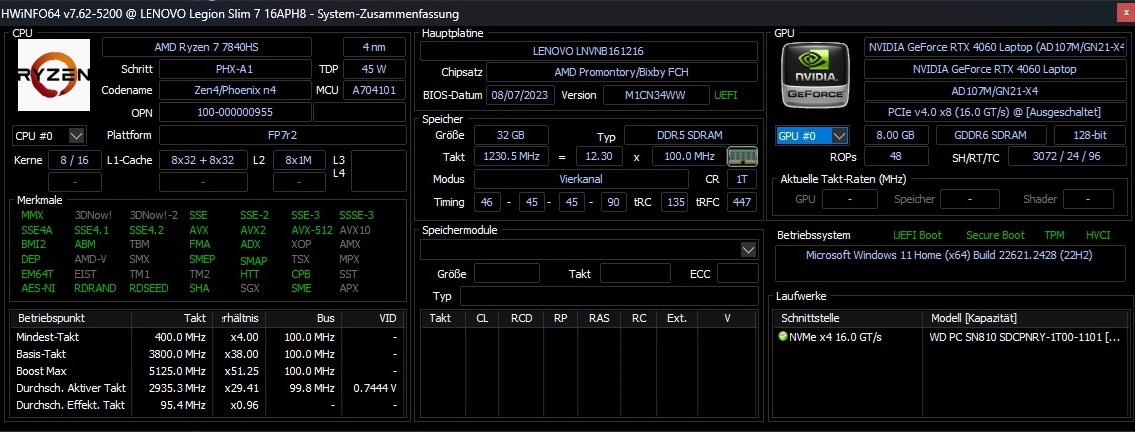
Processeur
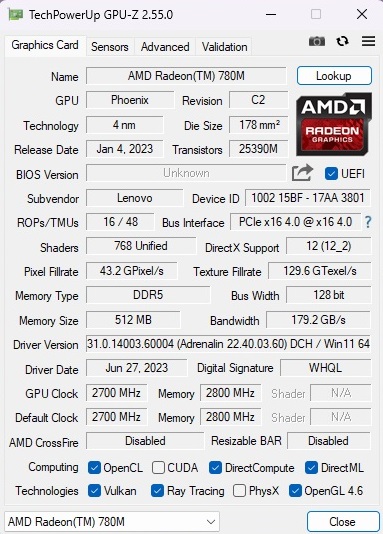
Le Ryzen 7 7840HS est un processeur à huit cœurs équipé de 16 Mo de cache L3 et capable de gérer jusqu'à 16 threads simultanément, grâce à la technologie SMT. En outre, cette puce de 4 nm est dotée d'un GPU intégré relativement rapide, le Radeon 780Mresponsable des calculs et de l'affichage des images, pour les tâches moins exigeantes comme la bureautique, le streaming vidéo et la navigation sur le web. Lors des tests de référence, les performances du processeur se situent entre celles du Core i7-13620H et le Core i7-13700HX. L'un des avantages notables du processeur AMD réside dans l'amélioration constante de ses performances, une caractéristique qui ne s'applique pas entièrement ou seulement partiellement à de nombreux homologues Intel, comme le montrent des tests de référence tels que la boucle Cinebench.
Cinebench R15 Multi Loop
* ... Moindre est la valeur, meilleures sont les performances
AIDA64: FP32 Ray-Trace | FPU Julia | CPU SHA3 | CPU Queen | FPU SinJulia | FPU Mandel | CPU AES | CPU ZLib | FP64 Ray-Trace | CPU PhotoWorxx
| Performance rating | |
| Moyenne de la classe Gaming | |
| Moyenne AMD Ryzen 7 7840HS | |
| Alienware m16 R1 Intel | |
| Lenovo Legion Slim 7 16APH8 | |
| Acer Predator Helios 16 PH16-71-731Q | |
| Lenovo Legion Pro 5 16IRX8 | |
| Asus ROG Flow X16 GV601V | |
| Lenovo LOQ 16IRH8 | |
| AIDA64 / FP32 Ray-Trace | |
| Moyenne de la classe Gaming (10227 - 85542, n=107, 2 dernières années) | |
| Moyenne AMD Ryzen 7 7840HS (22845 - 28921, n=21) | |
| Lenovo Legion Slim 7 16APH8 | |
| Lenovo Legion Pro 5 16IRX8 | |
| Alienware m16 R1 Intel | |
| Acer Predator Helios 16 PH16-71-731Q | |
| Asus ROG Flow X16 GV601V | |
| Lenovo LOQ 16IRH8 | |
| AIDA64 / FPU Julia | |
| Moyenne de la classe Gaming (51376 - 238426, n=107, 2 dernières années) | |
| Lenovo Legion Slim 7 16APH8 | |
| Moyenne AMD Ryzen 7 7840HS (97164 - 123167, n=21) | |
| Lenovo Legion Pro 5 16IRX8 | |
| Alienware m16 R1 Intel | |
| Acer Predator Helios 16 PH16-71-731Q | |
| Asus ROG Flow X16 GV601V | |
| Lenovo LOQ 16IRH8 | |
| AIDA64 / CPU SHA3 | |
| Moyenne de la classe Gaming (2180 - 9817, n=107, 2 dernières années) | |
| Alienware m16 R1 Intel | |
| Moyenne AMD Ryzen 7 7840HS (4293 - 5155, n=21) | |
| Lenovo Legion Slim 7 16APH8 | |
| Lenovo Legion Pro 5 16IRX8 | |
| Acer Predator Helios 16 PH16-71-731Q | |
| Asus ROG Flow X16 GV601V | |
| Lenovo LOQ 16IRH8 | |
| AIDA64 / CPU Queen | |
| Moyenne de la classe Gaming (49785 - 173351, n=98, 2 dernières années) | |
| Lenovo Legion Slim 7 16APH8 | |
| Moyenne AMD Ryzen 7 7840HS (102271 - 125820, n=21) | |
| Alienware m16 R1 Intel | |
| Acer Predator Helios 16 PH16-71-731Q | |
| Lenovo Legion Pro 5 16IRX8 | |
| Asus ROG Flow X16 GV601V | |
| Lenovo LOQ 16IRH8 | |
| AIDA64 / FPU SinJulia | |
| Lenovo Legion Slim 7 16APH8 | |
| Moyenne AMD Ryzen 7 7840HS (13767 - 15525, n=21) | |
| Moyenne de la classe Gaming (4424 - 33636, n=107, 2 dernières années) | |
| Alienware m16 R1 Intel | |
| Lenovo Legion Pro 5 16IRX8 | |
| Acer Predator Helios 16 PH16-71-731Q | |
| Asus ROG Flow X16 GV601V | |
| Lenovo LOQ 16IRH8 | |
| AIDA64 / FPU Mandel | |
| Moyenne de la classe Gaming (25115 - 128721, n=107, 2 dernières années) | |
| Lenovo Legion Slim 7 16APH8 | |
| Moyenne AMD Ryzen 7 7840HS (52084 - 65812, n=21) | |
| Lenovo Legion Pro 5 16IRX8 | |
| Alienware m16 R1 Intel | |
| Acer Predator Helios 16 PH16-71-731Q | |
| Asus ROG Flow X16 GV601V | |
| Lenovo LOQ 16IRH8 | |
| AIDA64 / CPU AES | |
| Alienware m16 R1 Intel | |
| Acer Predator Helios 16 PH16-71-731Q | |
| Moyenne AMD Ryzen 7 7840HS (67389 - 177158, n=21) | |
| Moyenne de la classe Gaming (39258 - 247074, n=107, 2 dernières années) | |
| Lenovo Legion Pro 5 16IRX8 | |
| Asus ROG Flow X16 GV601V | |
| Lenovo Legion Slim 7 16APH8 | |
| Lenovo LOQ 16IRH8 | |
| AIDA64 / CPU ZLib | |
| Moyenne de la classe Gaming (574 - 2531, n=107, 2 dernières années) | |
| Acer Predator Helios 16 PH16-71-731Q | |
| Alienware m16 R1 Intel | |
| Lenovo Legion Pro 5 16IRX8 | |
| Asus ROG Flow X16 GV601V | |
| Lenovo Legion Slim 7 16APH8 | |
| Moyenne AMD Ryzen 7 7840HS (944 - 1123, n=21) | |
| Lenovo LOQ 16IRH8 | |
| AIDA64 / FP64 Ray-Trace | |
| Moyenne de la classe Gaming (5509 - 45446, n=107, 2 dernières années) | |
| Moyenne AMD Ryzen 7 7840HS (12248 - 15599, n=21) | |
| Lenovo Legion Slim 7 16APH8 | |
| Lenovo Legion Pro 5 16IRX8 | |
| Alienware m16 R1 Intel | |
| Acer Predator Helios 16 PH16-71-731Q | |
| Asus ROG Flow X16 GV601V | |
| Lenovo LOQ 16IRH8 | |
| AIDA64 / CPU PhotoWorxx | |
| Moyenne de la classe Gaming (12271 - 89891, n=107, 2 dernières années) | |
| Lenovo Legion Slim 7 16APH8 | |
| Asus ROG Flow X16 GV601V | |
| Moyenne AMD Ryzen 7 7840HS (17615 - 41516, n=21) | |
| Lenovo Legion Pro 5 16IRX8 | |
| Alienware m16 R1 Intel | |
| Acer Predator Helios 16 PH16-71-731Q | |
| Lenovo LOQ 16IRH8 | |
Performance du système
En termes de performances système, le Slim 7 rivalise aisément avec ses concurrents, obtenant un score de 7 502 points dans PCMark 10. La mémoire DDR5, connue pour sa vitesse exceptionnelle, dépasse la moyenne. En outre, l'ordinateur réagit de manière agréable et rapide dans les scénarios d'utilisation pratiques.
CrossMark: Overall | Productivity | Creativity | Responsiveness
| PCMark 10 / Score | |
| Moyenne de la classe Gaming (5828 - 11574, n=94, 2 dernières années) | |
| Asus ROG Flow X16 GV601V | |
| Moyenne AMD Ryzen 7 7840HS, NVIDIA GeForce RTX 4060 Laptop GPU (7502 - 7946, n=4) | |
| Acer Predator Helios 16 PH16-71-731Q | |
| Lenovo Legion Pro 5 16IRX8 | |
| Lenovo Legion Slim 7 16APH8 | |
| Alienware m16 R1 Intel | |
| Lenovo LOQ 16IRH8 | |
| PCMark 10 / Essentials | |
| Asus ROG Flow X16 GV601V | |
| Acer Predator Helios 16 PH16-71-731Q | |
| Lenovo Legion Pro 5 16IRX8 | |
| Moyenne AMD Ryzen 7 7840HS, NVIDIA GeForce RTX 4060 Laptop GPU (10441 - 11169, n=4) | |
| Alienware m16 R1 Intel | |
| Moyenne de la classe Gaming (8810 - 12600, n=98, 2 dernières années) | |
| Lenovo Legion Slim 7 16APH8 | |
| Lenovo LOQ 16IRH8 | |
| PCMark 10 / Productivity | |
| Acer Predator Helios 16 PH16-71-731Q | |
| Moyenne de la classe Gaming (6845 - 18766, n=96, 2 dernières années) | |
| Asus ROG Flow X16 GV601V | |
| Moyenne AMD Ryzen 7 7840HS, NVIDIA GeForce RTX 4060 Laptop GPU (9575 - 10273, n=4) | |
| Lenovo Legion Slim 7 16APH8 | |
| Alienware m16 R1 Intel | |
| Lenovo Legion Pro 5 16IRX8 | |
| Lenovo LOQ 16IRH8 | |
| PCMark 10 / Digital Content Creation | |
| Moyenne de la classe Gaming (7602 - 19657, n=96, 2 dernières années) | |
| Lenovo Legion Pro 5 16IRX8 | |
| Moyenne AMD Ryzen 7 7840HS, NVIDIA GeForce RTX 4060 Laptop GPU (11464 - 12418, n=4) | |
| Lenovo Legion Slim 7 16APH8 | |
| Asus ROG Flow X16 GV601V | |
| Acer Predator Helios 16 PH16-71-731Q | |
| Alienware m16 R1 Intel | |
| Lenovo LOQ 16IRH8 | |
| CrossMark / Overall | |
| Acer Predator Helios 16 PH16-71-731Q | |
| Alienware m16 R1 Intel | |
| Moyenne de la classe Gaming (1366 - 2409, n=96, 2 dernières années) | |
| Asus ROG Flow X16 GV601V | |
| Lenovo LOQ 16IRH8 | |
| Moyenne AMD Ryzen 7 7840HS, NVIDIA GeForce RTX 4060 Laptop GPU (1800 - 1866, n=3) | |
| Lenovo Legion Pro 5 16IRX8 | |
| CrossMark / Productivity | |
| Acer Predator Helios 16 PH16-71-731Q | |
| Alienware m16 R1 Intel | |
| Lenovo LOQ 16IRH8 | |
| Asus ROG Flow X16 GV601V | |
| Moyenne de la classe Gaming (1386 - 2254, n=96, 2 dernières années) | |
| Moyenne AMD Ryzen 7 7840HS, NVIDIA GeForce RTX 4060 Laptop GPU (1743 - 1821, n=3) | |
| Lenovo Legion Pro 5 16IRX8 | |
| CrossMark / Creativity | |
| Acer Predator Helios 16 PH16-71-731Q | |
| Alienware m16 R1 Intel | |
| Moyenne de la classe Gaming (1343 - 2729, n=96, 2 dernières années) | |
| Asus ROG Flow X16 GV601V | |
| Lenovo LOQ 16IRH8 | |
| Moyenne AMD Ryzen 7 7840HS, NVIDIA GeForce RTX 4060 Laptop GPU (1908 - 1966, n=3) | |
| Lenovo Legion Pro 5 16IRX8 | |
| CrossMark / Responsiveness | |
| Acer Predator Helios 16 PH16-71-731Q | |
| Alienware m16 R1 Intel | |
| Lenovo LOQ 16IRH8 | |
| Moyenne de la classe Gaming (1226 - 2334, n=96, 2 dernières années) | |
| Asus ROG Flow X16 GV601V | |
| Lenovo Legion Pro 5 16IRX8 | |
| Moyenne AMD Ryzen 7 7840HS, NVIDIA GeForce RTX 4060 Laptop GPU (1522 - 1776, n=3) | |
| PCMark 10 Score | 7502 points | |
Aide | ||
| AIDA64 / Memory Copy | |
| Moyenne de la classe Gaming (21750 - 129946, n=107, 2 dernières années) | |
| Lenovo Legion Slim 7 16APH8 | |
| Moyenne AMD Ryzen 7 7840HS (30937 - 72158, n=21) | |
| Asus ROG Flow X16 GV601V | |
| Lenovo Legion Pro 5 16IRX8 | |
| Alienware m16 R1 Intel | |
| Acer Predator Helios 16 PH16-71-731Q | |
| Lenovo LOQ 16IRH8 | |
| AIDA64 / Memory Read | |
| Moyenne de la classe Gaming (22956 - 118858, n=107, 2 dernières années) | |
| Asus ROG Flow X16 GV601V | |
| Lenovo Legion Pro 5 16IRX8 | |
| Alienware m16 R1 Intel | |
| Acer Predator Helios 16 PH16-71-731Q | |
| Lenovo LOQ 16IRH8 | |
| Lenovo Legion Slim 7 16APH8 | |
| Moyenne AMD Ryzen 7 7840HS (30497 - 62147, n=21) | |
| AIDA64 / Memory Write | |
| Lenovo Legion Slim 7 16APH8 | |
| Acer Predator Helios 16 PH16-71-731Q | |
| Moyenne AMD Ryzen 7 7840HS (34590 - 93323, n=21) | |
| Moyenne de la classe Gaming (22297 - 135096, n=107, 2 dernières années) | |
| Lenovo Legion Pro 5 16IRX8 | |
| Asus ROG Flow X16 GV601V | |
| Alienware m16 R1 Intel | |
| Lenovo LOQ 16IRH8 | |
| AIDA64 / Memory Latency | |
| Lenovo LOQ 16IRH8 | |
| Moyenne de la classe Gaming (75.3 - 259, n=107, 2 dernières années) | |
| Moyenne AMD Ryzen 7 7840HS (85.1 - 112, n=21) | |
| Asus ROG Flow X16 GV601V | |
| Lenovo Legion Slim 7 16APH8 | |
| Alienware m16 R1 Intel | |
| Acer Predator Helios 16 PH16-71-731Q | |
| Lenovo Legion Pro 5 16IRX8 | |
* ... Moindre est la valeur, meilleures sont les performances
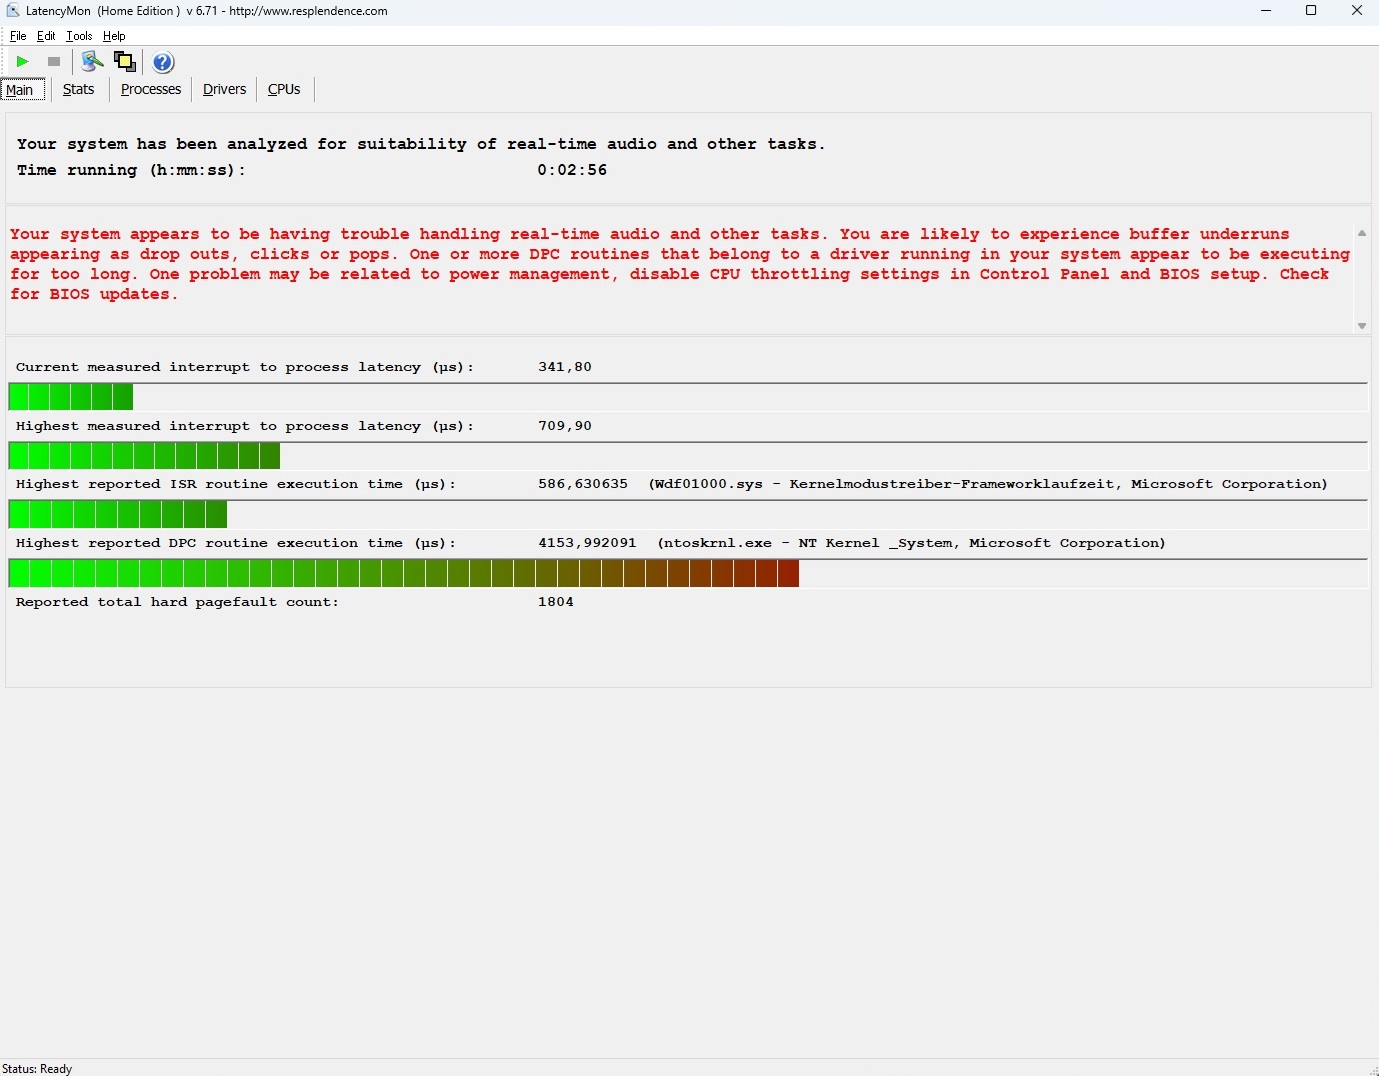
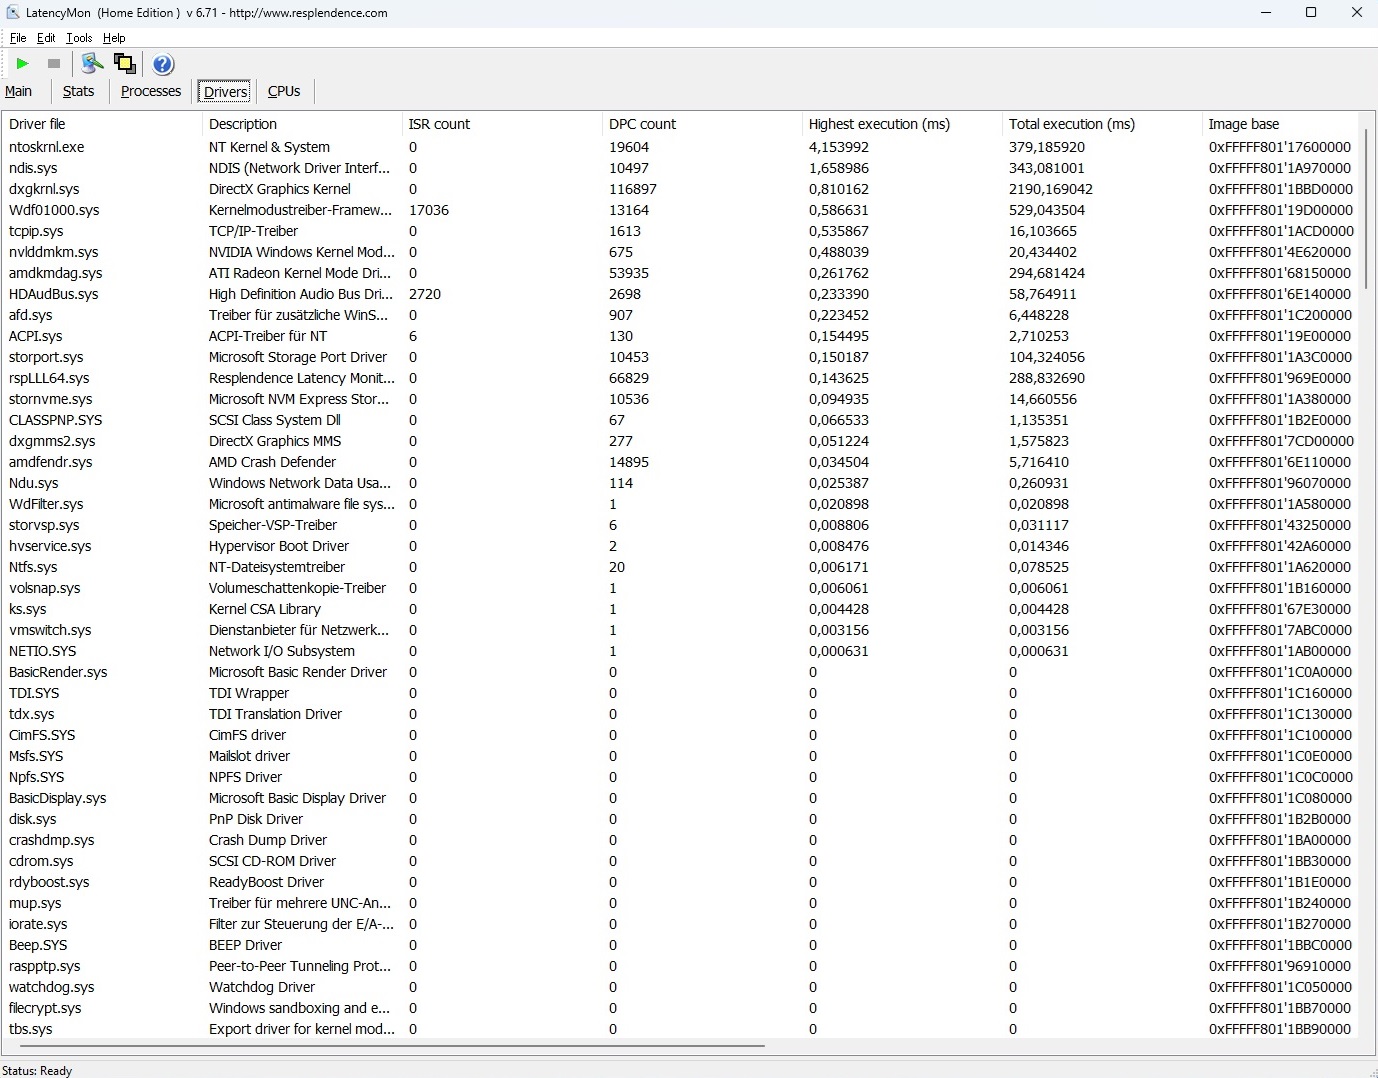
Latence DPC
Bien qu'il présente les latences les plus faibles parmi les appareils de 16 pouces testés, l'outil LatencyMon révèle des problèmes possibles avec l'édition audio et vidéo en temps réel.
| DPC Latencies / LatencyMon - interrupt to process latency (max), Web, Youtube, Prime95 | |
| Alienware m16 R1 Intel | |
| Acer Predator Helios 16 PH16-71-731Q | |
| Lenovo LOQ 16IRH8 | |
| Asus ROG Flow X16 GV601V | |
| Lenovo Legion Pro 5 16IRX8 | |
| Lenovo Legion Slim 7 16APH8 | |
* ... Moindre est la valeur, meilleures sont les performances
Dispositifs de stockage
Le SSD intégré de 1 To de WDC (modèle SN810) offre généralement une excellente vitesse, mais il est parfois confronté à des problèmes d'étranglement en cas de charge prolongée. Toutefois, ces problèmes ne sont pas aussi graves que ceux observés sur l'Acer Predator Helios 16.

* ... Moindre est la valeur, meilleures sont les performances
Continuous power read: DiskSpd Read Loop, Queue Depth 8
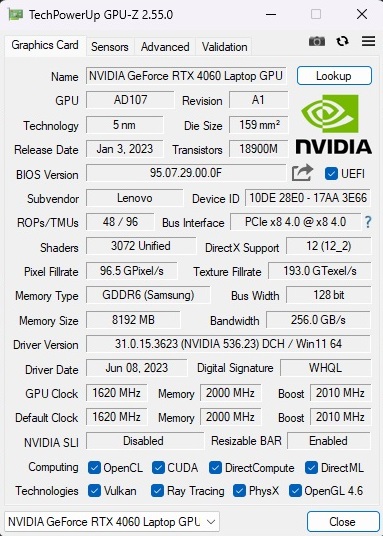
Carte graphique
La RTX 4060 ( GeForce ) est l'un des GPU pour ordinateur portable les plus populaires et les plus performants du moment. Bien que ce modèle de milieu de gamme ne soit pas adapté aux écrans UHD et que sa capacité d'évolution soit limitée en raison de sa faible architecture VRAM GDDR6 de 8 Go, ses performances pour les résolutions Full HD (FHD) ou Quad HD (QHD) sont néanmoins remarquables.
Dans les benchmarks graphiques synthétiques, les performances 3D en mode Balanced sont comparables aux performances moyennes de la RTX 4060 jusqu'à présent, bien qu'elles soient légèrement inférieures à celles des appareils de comparaison. Notamment, le Slim 7 est loin d'atteindre le TGP maximal de 140 watts, Dynamic Boost inclus.
| 3DMark 11 Performance | 30859 points | |
| 3DMark Ice Storm Standard Score | 123335 points | |
| 3DMark Cloud Gate Standard Score | 60481 points | |
| 3DMark Fire Strike Score | 23735 points | |
| 3DMark Time Spy Score | 10032 points | |
Aide | ||
* ... Moindre est la valeur, meilleures sont les performances
Performances des jeux
Les benchmarks de jeux montrent une tendance similaire. À l'exception de quelques jeux très exigeants comme Lords of the Fallen ou Alan Wake 2la plupart d'entre eux peuvent être joués en résolution native avec des paramètres élevés à maximaux sans aucun problème, bien qu'il ne soit pas toujours possible d'atteindre la barre des 60 FPS.
| The Witcher 3 - 1920x1080 Ultra Graphics & Postprocessing (HBAO+) | |
| Moyenne de la classe Gaming (95 - 240, n=8, 2 dernières années) | |
| Lenovo Legion Pro 5 16IRX8 | |
| Asus ROG Flow X16 GV601V | |
| Alienware m16 R1 Intel | |
| Lenovo LOQ 16IRH8 | |
| Acer Predator Helios 16 PH16-71-731Q | |
| Moyenne NVIDIA GeForce RTX 4060 Laptop GPU (77 - 159.7, n=42) | |
| Lenovo Legion Slim 7 16APH8 | |
| Alan Wake 2 | |
| 1920x1080 High Preset | |
| Moyenne de la classe Gaming (54.6 - 133.2, n=31, 2 dernières années) | |
| Moyenne NVIDIA GeForce RTX 4060 Laptop GPU (53.8 - 64.3, n=3) | |
| XMG Pro 15 E23 | |
| Lenovo Legion Slim 7 16APH8 | |
| 2560x1440 High Preset | |
| Moyenne de la classe Gaming (31.2 - 93.1, n=33, 2 dernières années) | |
| XMG Pro 15 E23 | |
| Moyenne NVIDIA GeForce RTX 4060 Laptop GPU (33 - 36.7, n=3) | |
| Lenovo Legion Slim 7 16APH8 | |
| Lords of the Fallen | |
| 1920x1080 High Preset | |
| XMG Pro 15 E23 | |
| Moyenne NVIDIA GeForce RTX 4060 Laptop GPU (46.7 - 53.9, n=3) | |
| Lenovo Legion Slim 7 16APH8 | |
| 1920x1080 Ultra Preset | |
| XMG Pro 15 E23 | |
| Moyenne NVIDIA GeForce RTX 4060 Laptop GPU (32.8 - 38.1, n=3) | |
| Lenovo Legion Slim 7 16APH8 | |
| 2560x1440 Ultra Preset | |
| XMG Pro 15 E23 | |
| Moyenne NVIDIA GeForce RTX 4060 Laptop GPU (24.2 - 25.7, n=2) | |
| Lenovo Legion Slim 7 16APH8 | |
| Total War Pharaoh | |
| 1920x1080 High Preset | |
| XMG Pro 15 E23 | |
| Moyenne NVIDIA GeForce RTX 4060 Laptop GPU (128 - 149, n=2) | |
| Lenovo Legion Slim 7 16APH8 | |
| Moyenne de la classe Gaming (47.4 - 200, n=2, 2 dernières années) | |
| 1920x1080 Ultra Preset | |
| XMG Pro 15 E23 | |
| Moyenne NVIDIA GeForce RTX 4060 Laptop GPU (104 - 116, n=2) | |
| Lenovo Legion Slim 7 16APH8 | |
| Moyenne de la classe Gaming (42.9 - 161.4, n=2, 2 dernières années) | |
| 2560x1440 Ultra Preset | |
| XMG Pro 15 E23 | |
| Moyenne NVIDIA GeForce RTX 4060 Laptop GPU (76 - 81.6, n=2) | |
| Lenovo Legion Slim 7 16APH8 | |
| Moyenne de la classe Gaming (24.1 - 127.4, n=2, 2 dernières années) | |
| Assassin's Creed Mirage | |
| 1920x1080 High Preset (Adaptive Quality Off) | |
| XMG Pro 15 E23 | |
| Moyenne NVIDIA GeForce RTX 4060 Laptop GPU (76 - 118, n=4) | |
| Lenovo Legion Slim 7 16APH8 | |
| 1920x1080 Ultra High Preset (Adaptive Quality Off) | |
| XMG Pro 15 E23 | |
| Moyenne NVIDIA GeForce RTX 4060 Laptop GPU (65 - 93, n=6) | |
| Lenovo Legion Slim 7 16APH8 | |
| 2560x1440 Ultra High Preset (Adaptive Quality Off) | |
| XMG Pro 15 E23 | |
| Moyenne NVIDIA GeForce RTX 4060 Laptop GPU (64 - 72, n=5) | |
| Lenovo Legion Slim 7 16APH8 | |
| EA Sports FC 24 | |
| 1920x1080 High Preset | |
| Lenovo Legion Slim 7 16APH8 | |
| XMG Pro 15 E23 | |
| Moyenne NVIDIA GeForce RTX 4060 Laptop GPU (142.9 - 155.2, n=3) | |
| 1920x1080 Ultra Preset | |
| XMG Pro 15 E23 | |
| Moyenne NVIDIA GeForce RTX 4060 Laptop GPU (136.9 - 138, n=3) | |
| Lenovo Legion Slim 7 16APH8 | |
| Moyenne de la classe Gaming (n=12 dernières années) | |
| 2560x1440 Ultra Preset | |
| XMG Pro 15 E23 | |
| Moyenne NVIDIA GeForce RTX 4060 Laptop GPU (117.5 - 121, n=2) | |
| Lenovo Legion Slim 7 16APH8 | |
Pendant le test de 60 minutes avec Le Witcher 3aucune anomalie n'a été observée. Le taux de rafraîchissement est resté relativement stable pendant toute la durée du test.
Witcher 3 FPS chart
| Bas | Moyen | Élevé | Ultra | QHD | |
|---|---|---|---|---|---|
| GTA V (2015) | 172.9 | 166 | 103.2 | ||
| The Witcher 3 (2015) | 98 | ||||
| Dota 2 Reborn (2015) | 161.6 | 159.2 | 140.6 | 134.7 | |
| X-Plane 11.11 (2018) | 116 | 103.5 | 81.6 | ||
| Strange Brigade (2018) | 258 | 208 | 180.8 | ||
| Atomic Heart (2023) | 122.1 | 82.7 | 64.9 | 50.7 | |
| Company of Heroes 3 (2023) | 156 | 122 | 120 | 92 | |
| Sons of the Forest (2023) | 83.8 | 80.2 | 78.8 | 64.2 | |
| Resident Evil 4 Remake (2023) | 98.4 | 92.1 | 64.4 | 55.1 | |
| Armored Core 6 (2023) | 104.5 | 103.1 | 95.6 | 73.2 | |
| Baldur's Gate 3 (2023) | 98.7 | 84.8 | 82.6 | 55.8 | |
| EA Sports FC 24 (2023) | 187.9 | 155.2 | 136.9 | 117.5 | |
| Assassin's Creed Mirage (2023) | 80 | 76 | 65 | 64 | |
| Total War Pharaoh (2023) | 193 | 128 | 104 | 76 | |
| Lords of the Fallen (2023) | 66.4 | 48.2 | 33.2 | 24.2 | |
| Alan Wake 2 (2023) | 58.5 | 53.8 | 33.8 |
Émissions
Bruit du système
Il présente les niveaux de bruit les plus bas du champ de test, avec des niveaux de bruit allant de 33 à 49 dB(A) en mode 3D. Pour les joueurs sensibles au bruit, nous recommandons de choisir le mode silencieux, qui entraîne une perte de performances minimale tout en réduisant considérablement le bruit de fonctionnement (reportez-vous au tableau pour connaître les conditions de test spécifiques). Les ventilateurs sont parfois totalement silencieux lorsqu'ils sont en veille, et même lorsqu'ils sont actifs, le bruit généré est réduit au minimum. Il convient de mentionner que notre unité de test n'a montré aucun signe de gémissement de la bobine.
Degré de la nuisance sonore
| Au repos |
| 25 / 28 / 31 dB(A) |
| Fortement sollicité |
| 33 / 49 dB(A) |
 | ||
30 dB silencieux 40 dB(A) audible 50 dB(A) bruyant |
||
min: | ||
| Lenovo Legion Slim 7 16APH8 R7 7840HS, GeForce RTX 4060 Laptop GPU | Asus ROG Flow X16 GV601V i9-13900H, GeForce RTX 4060 Laptop GPU | Alienware m16 R1 Intel i7-13700HX, GeForce RTX 4060 Laptop GPU | Acer Predator Helios 16 PH16-71-731Q i7-13700HX, GeForce RTX 4060 Laptop GPU | Lenovo Legion Pro 5 16IRX8 i7-13700HX, GeForce RTX 4060 Laptop GPU | Lenovo LOQ 16IRH8 i7-13620H, GeForce RTX 4060 Laptop GPU | |
|---|---|---|---|---|---|---|
| Noise | 3% | -8% | -0% | 4% | -6% | |
| arrêt / environnement * (dB) | 24 | 24 -0% | 25 -4% | 24 -0% | 23 4% | 23 4% |
| Idle Minimum * (dB) | 25 | 24 4% | 25 -0% | 24 4% | 23.1 8% | 23 8% |
| Idle Average * (dB) | 28 | 24 14% | 26 7% | 24 14% | 23.1 17% | 23 18% |
| Idle Maximum * (dB) | 31 | 24 23% | 27 13% | 32.32 -4% | 26.6 14% | 27.66 11% |
| Load Average * (dB) | 33 | 36.71 -11% | 52 -58% | 36.66 -11% | 34.7 -5% | 53.62 -62% |
| Witcher 3 ultra * (dB) | 47 | 50.92 -8% | 51 -9% | 49.06 -4% | 47.6 -1% | 53.5 -14% |
| Load Maximum * (dB) | 49 | 50.92 -4% | 53 -8% | 49.49 -1% | 54.8 -12% | 53.5 -9% |
* ... Moindre est la valeur, meilleures sont les performances
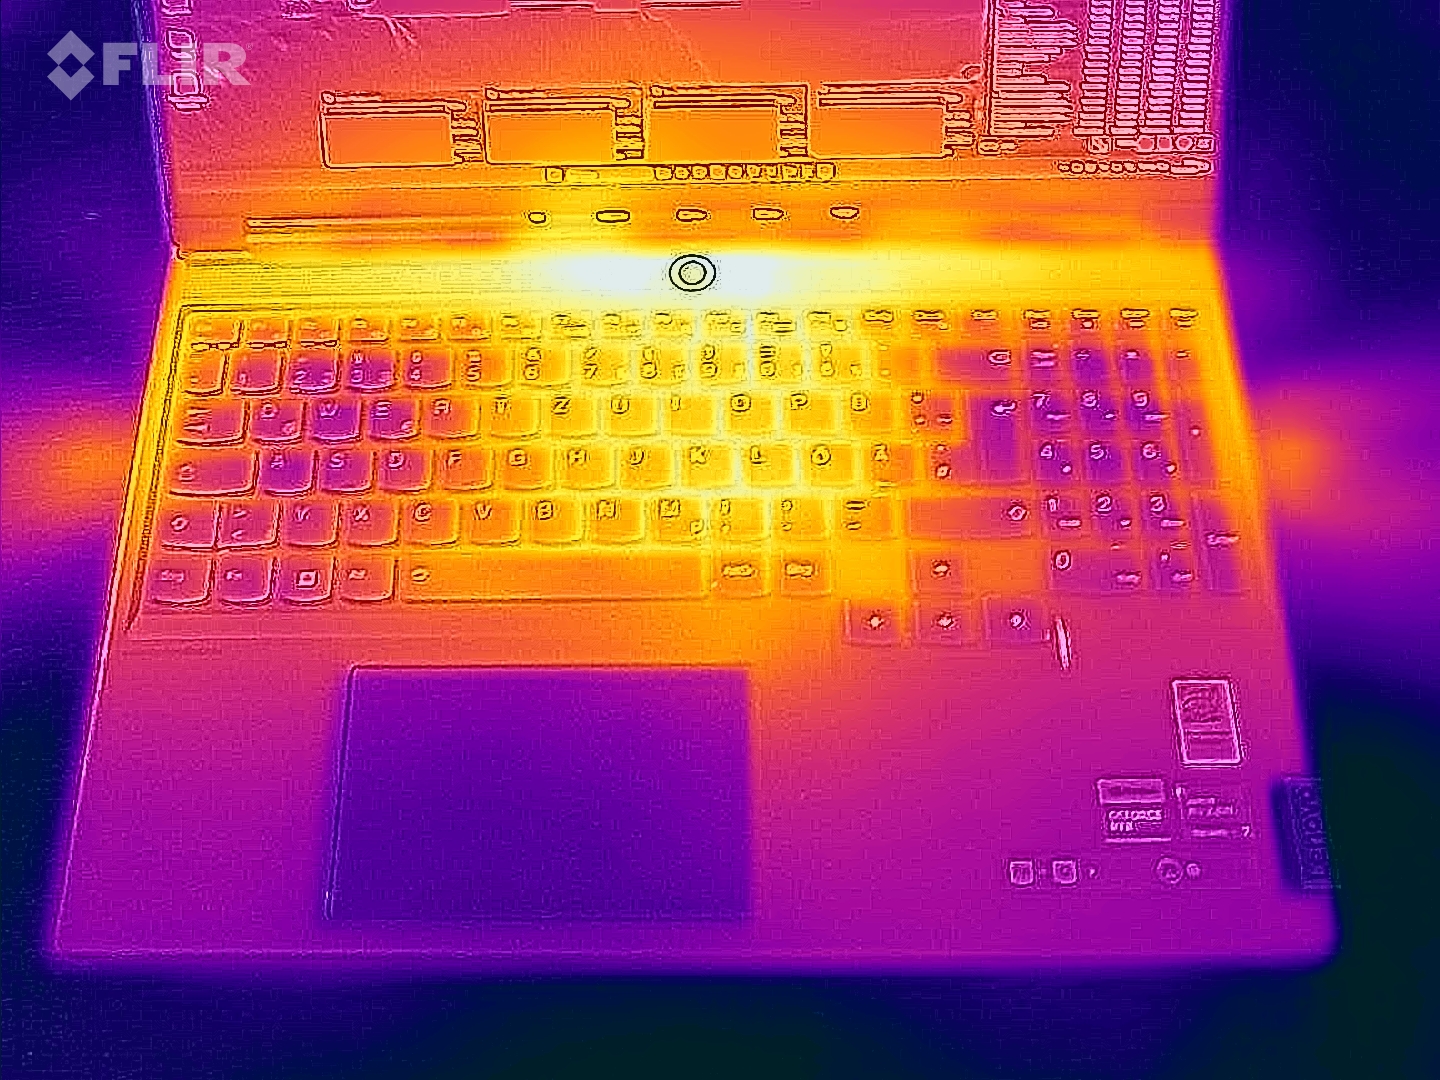
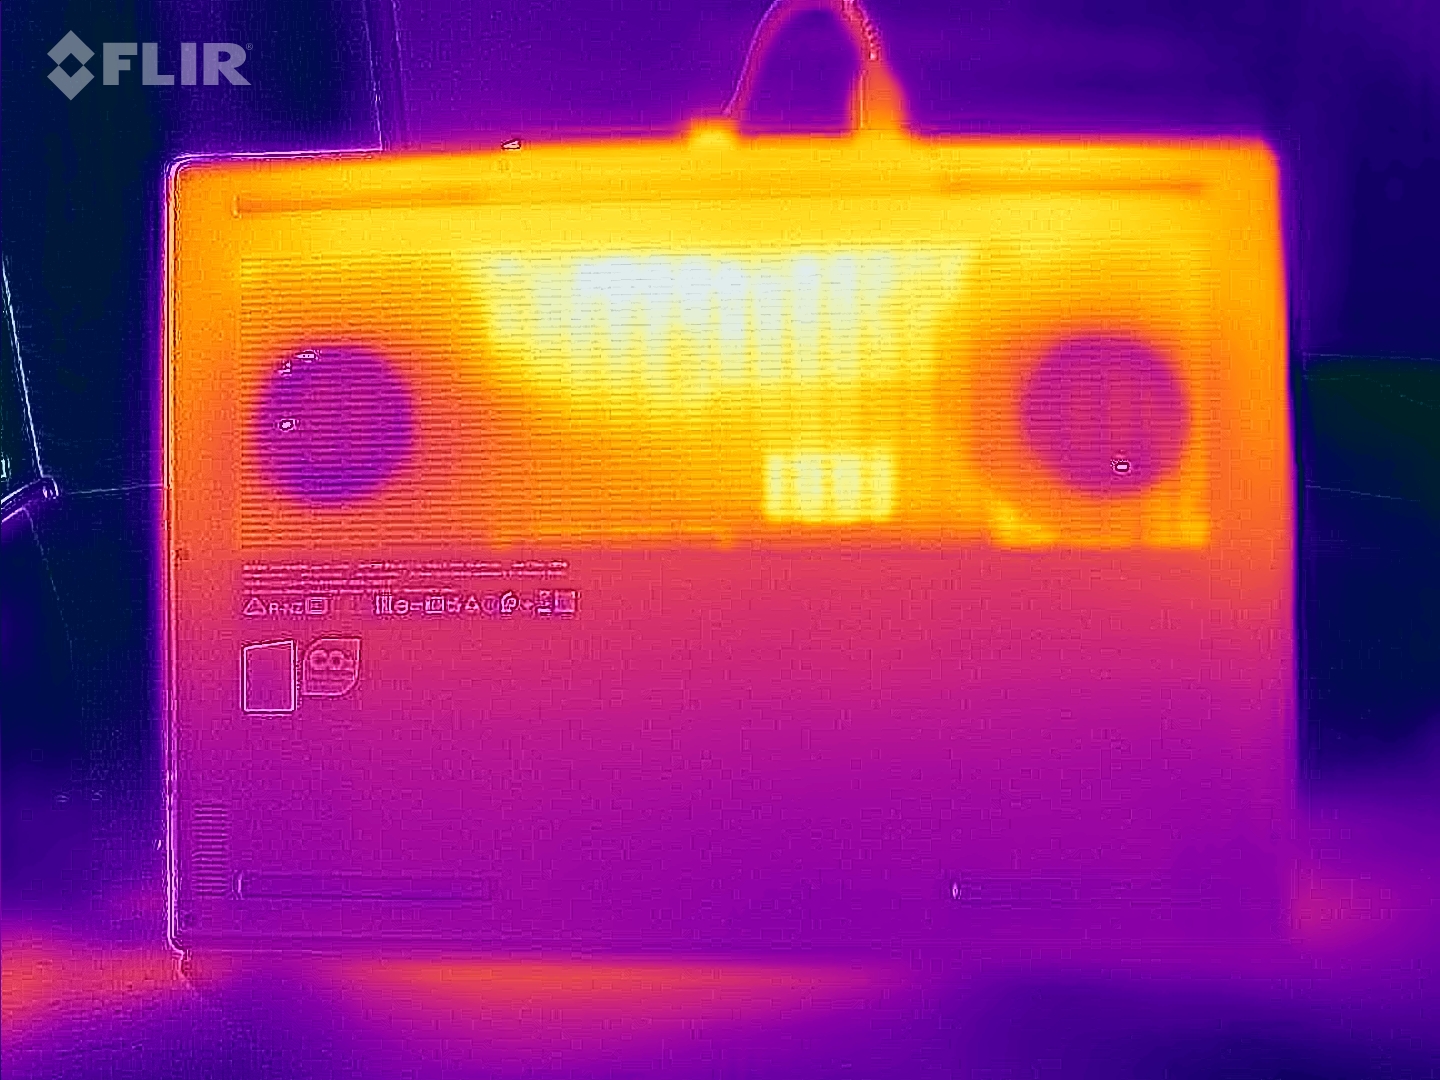
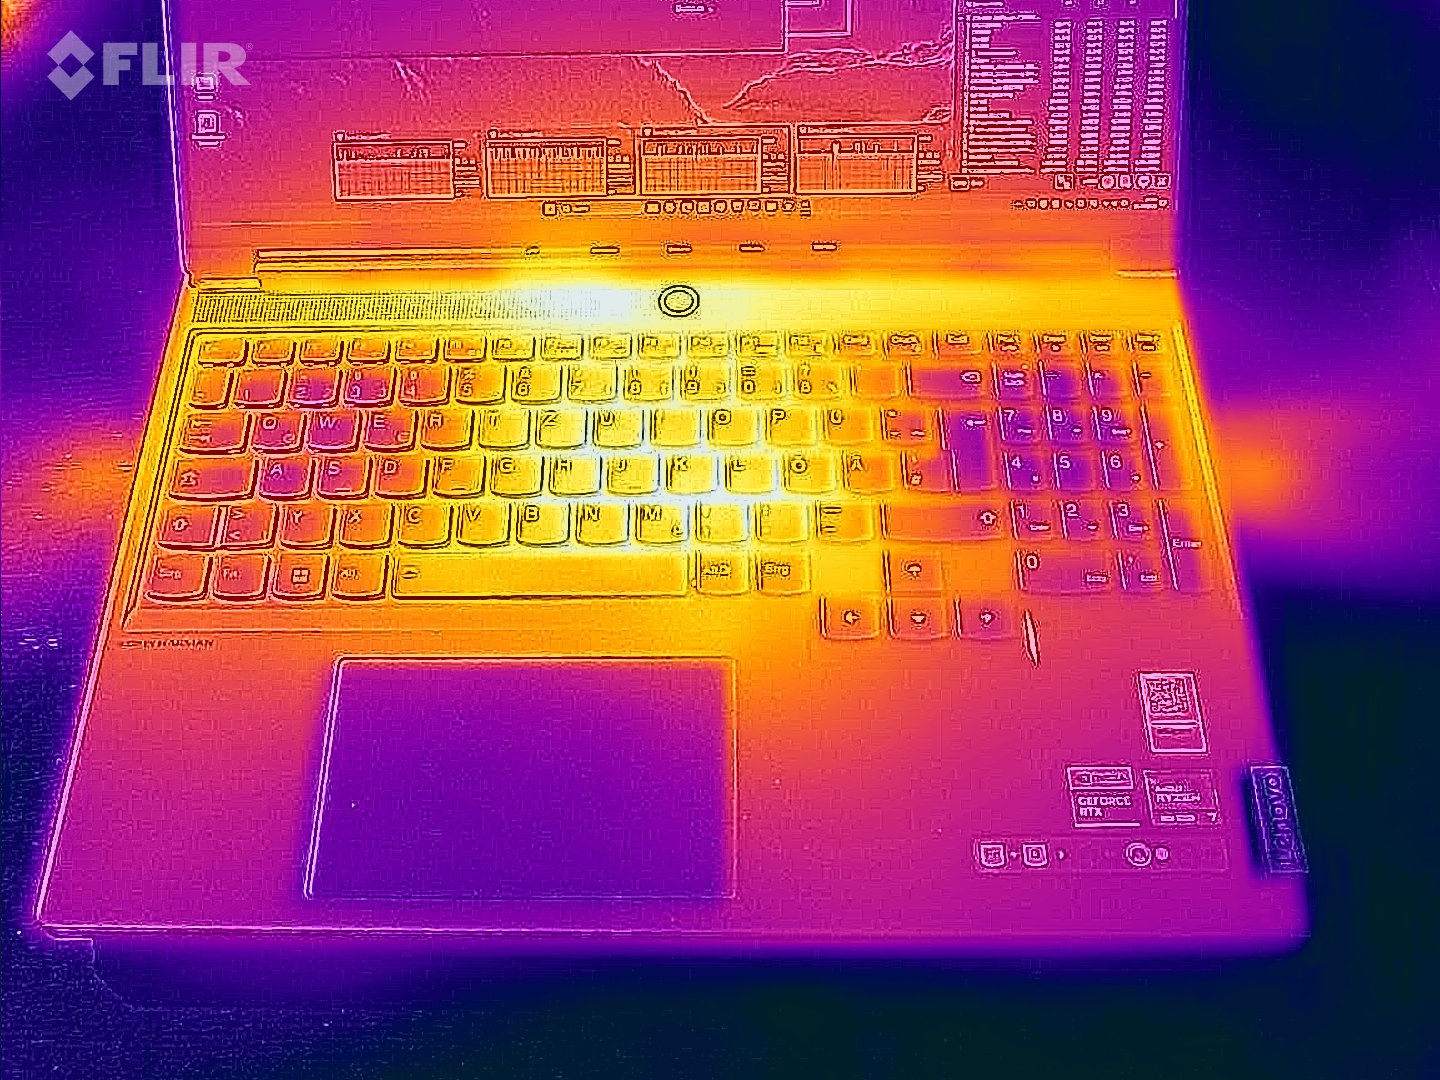
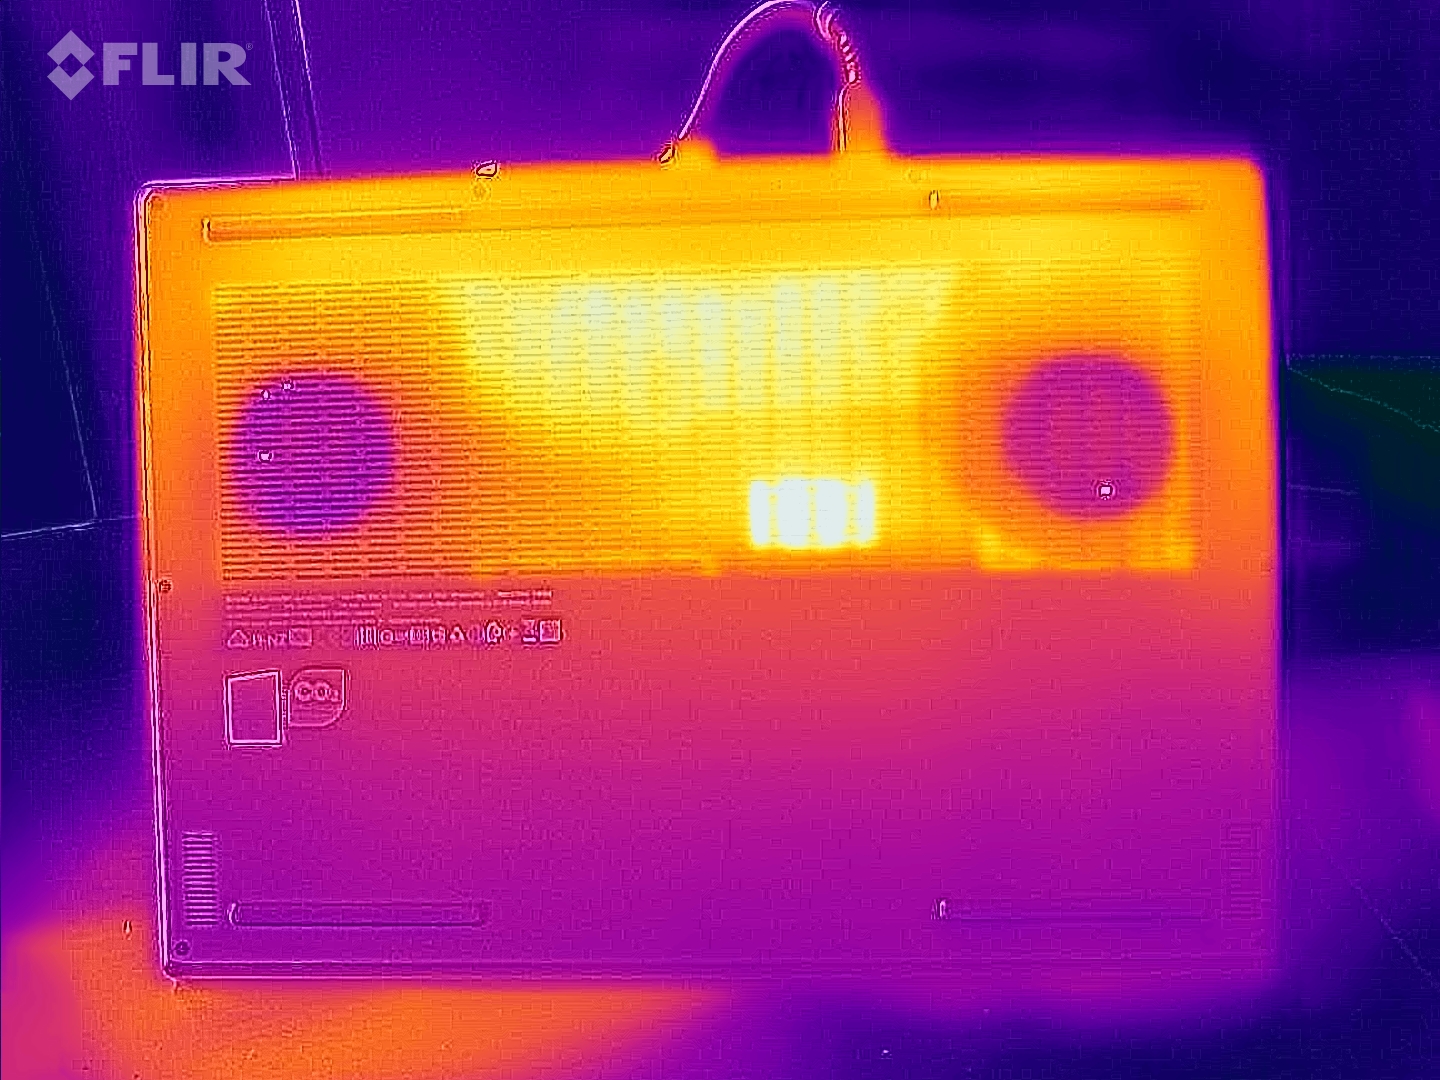
Température
La température à l'intérieur du boîtier se situe dans la moyenne et n'atteint pas des niveaux exceptionnellement bas ou élevés. Lors des tests de stress avec les outils Furmark et Prime95, la carte graphique s'est emballée, provoquant les températures les plus élevées en mode jeu. Après 60 minutes d'utilisation de The Witcher 3, le châssis a atteint une température maximale de 49°C sur le dessus et de 52°C sur le dessous, des valeurs typiques pour un ordinateur portable de jeu. En mode veille, les températures de surface oscillent autour d'une moyenne de 30°C, ce qui indique un niveau de chaleur modéré.
(-) La température maximale du côté supérieur est de 46 °C / 115 F, par rapport à la moyenne de 40.4 °C / 105 F, allant de 21.2 à 68.8 °C pour la classe Gaming.
(-) Le fond chauffe jusqu'à un maximum de 46 °C / 115 F, contre une moyenne de 43.2 °C / 110 F
(+) En utilisation inactive, la température moyenne du côté supérieur est de 30.3 °C / 87 F, par rapport à la moyenne du dispositif de 33.9 °C / 93 F.
(-) En jouant à The Witcher 3, la température moyenne du côté supérieur est de 41.6 °C / 107 F, alors que la moyenne de l'appareil est de 33.9 °C / 93 F.
(+) Les repose-poignets et le pavé tactile atteignent la température maximale de la peau (35 °C / 95 F) et ne sont donc pas chauds.
(-) La température moyenne de la zone de l'appui-paume de dispositifs similaires était de 28.8 °C / 83.8 F (-6.2 °C / #-11.2 F).
| Lenovo Legion Slim 7 16APH8 R7 7840HS, GeForce RTX 4060 Laptop GPU | Asus ROG Flow X16 GV601V i9-13900H, GeForce RTX 4060 Laptop GPU | Alienware m16 R1 Intel i7-13700HX, GeForce RTX 4060 Laptop GPU | Acer Predator Helios 16 PH16-71-731Q i7-13700HX, GeForce RTX 4060 Laptop GPU | Lenovo Legion Pro 5 16IRX8 i7-13700HX, GeForce RTX 4060 Laptop GPU | Lenovo LOQ 16IRH8 i7-13620H, GeForce RTX 4060 Laptop GPU | |
|---|---|---|---|---|---|---|
| Heat | 1% | -12% | -13% | 2% | 0% | |
| Maximum Upper Side * (°C) | 46 | 46 -0% | 49 -7% | 41 11% | 42.8 7% | 48 -4% |
| Maximum Bottom * (°C) | 46 | 41 11% | 48 -4% | 66 -43% | 50 -9% | 59 -28% |
| Idle Upper Side * (°C) | 33 | 36 -9% | 40 -21% | 36 -9% | 29.6 10% | 28 15% |
| Idle Bottom * (°C) | 34 | 33 3% | 39 -15% | 37 -9% | 34 -0% | 28 18% |
* ... Moindre est la valeur, meilleures sont les performances
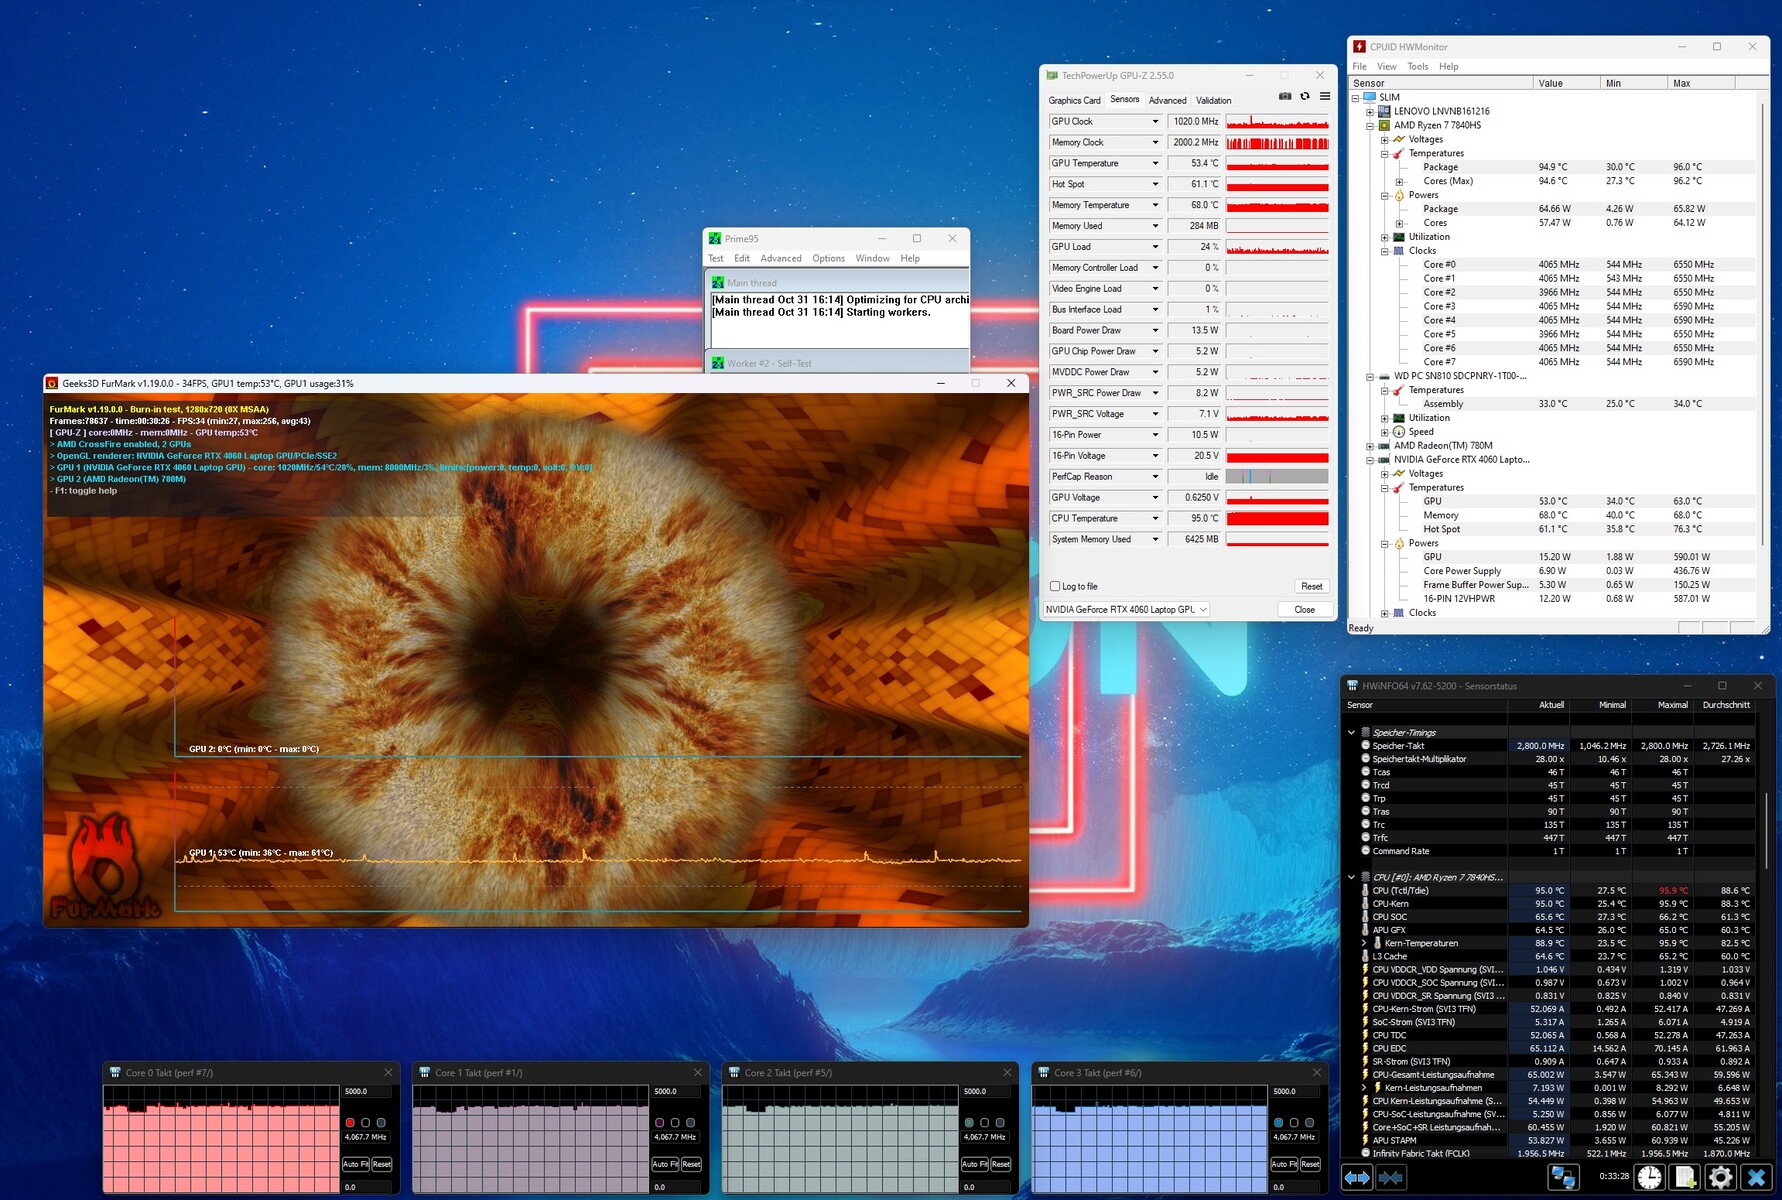
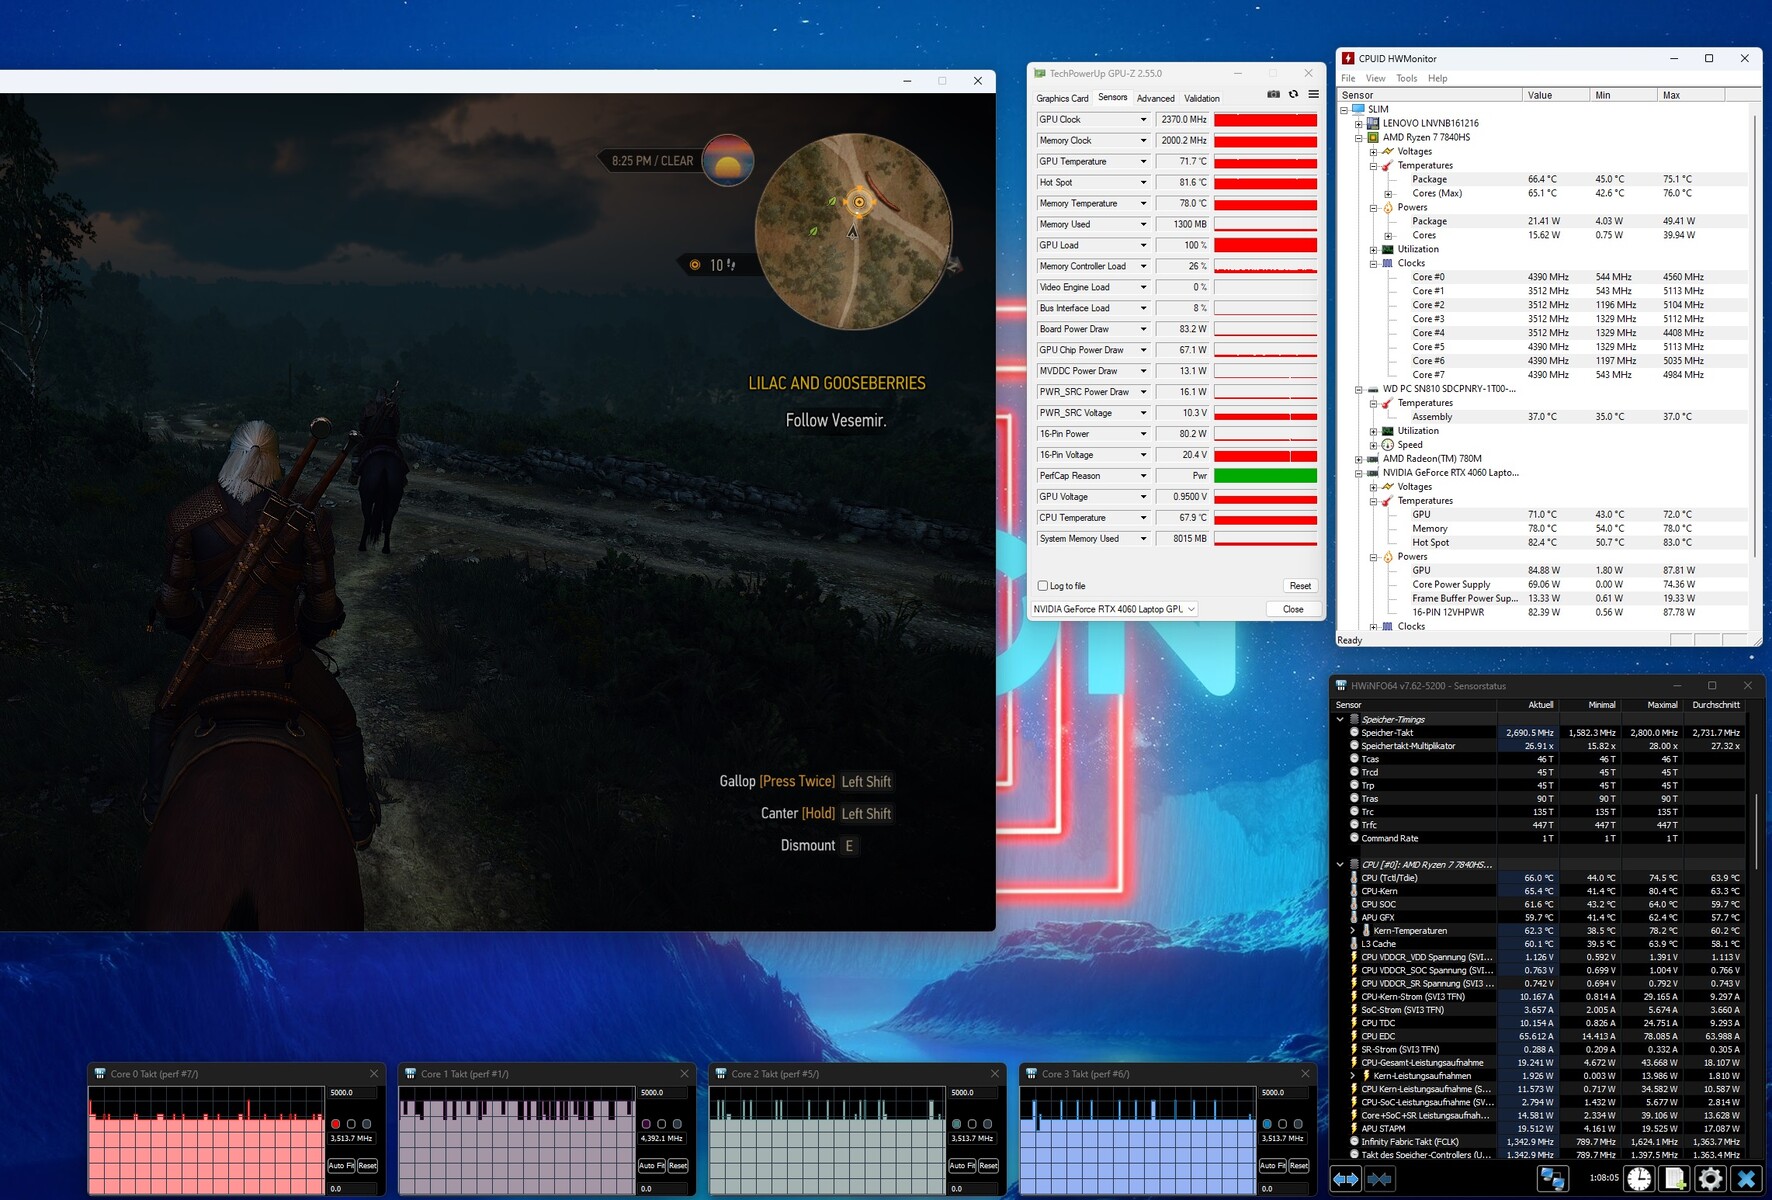
Test de stress
Le processeur a chauffé pendant notre test de stress de 60 minutes. Bien que le Ryzen 7 7840HS ait atteint 95°C, il a maintenu une fréquence constante de 4,1 GHz. En mode jeu, la situation est nettement plus détendue. En jouant à The Witcher 3, la température du CPU a oscillé autour de 66°C, tandis que la température de la carte graphique est restée dans le vert, à un peu moins de 72°C.
Intervenants
La qualité du son dépasse celle de la plupart des concurrents. Le système 2.0 (Harman) produit un son robuste qui peut être agréablement fort si nécessaire. Cependant, comme pour la plupart des ordinateurs portables, les basses manquent quelque peu.
Lenovo Legion Slim 7 16APH8 analyse audio
(+) | les haut-parleurs peuvent jouer relativement fort (87# dB)
Basses 100 - 315 Hz
(±) | basse réduite - en moyenne 13.8% inférieure à la médiane
(±) | la linéarité des basses est moyenne (8.5% delta à la fréquence précédente)
Médiums 400 - 2000 Hz
(+) | médiane équilibrée - seulement 1.1% de la médiane
(+) | les médiums sont linéaires (2.5% delta à la fréquence précédente)
Aiguës 2 - 16 kHz
(+) | des sommets équilibrés - à seulement 4.1% de la médiane
(+) | les aigus sont linéaires (4.8% delta à la fréquence précédente)
Globalement 100 - 16 000 Hz
(+) | le son global est linéaire (9.9% différence à la médiane)
Par rapport à la même classe
» 5% de tous les appareils testés de cette catégorie étaient meilleurs, 2% similaires, 94% pires
» Le meilleur avait un delta de 6%, la moyenne était de 18%, le pire était de 132%.
Par rapport à tous les appareils testés
» 4% de tous les appareils testés étaient meilleurs, 1% similaires, 95% pires
» Le meilleur avait un delta de 4%, la moyenne était de 24%, le pire était de 134%.
Asus ROG Flow X16 GV601V analyse audio
(±) | le niveau sonore du haut-parleur est moyen mais bon (77.38# dB)
Basses 100 - 315 Hz
(±) | basse réduite - en moyenne 9.6% inférieure à la médiane
(±) | la linéarité des basses est moyenne (9.2% delta à la fréquence précédente)
Médiums 400 - 2000 Hz
(+) | médiane équilibrée - seulement 4.7% de la médiane
(±) | la linéarité des médiums est moyenne (7.5% delta à la fréquence précédente)
Aiguës 2 - 16 kHz
(+) | des sommets équilibrés - à seulement 2.2% de la médiane
(+) | les aigus sont linéaires (6.1% delta à la fréquence précédente)
Globalement 100 - 16 000 Hz
(+) | le son global est linéaire (12% différence à la médiane)
Par rapport à la même classe
» 12% de tous les appareils testés de cette catégorie étaient meilleurs, 4% similaires, 84% pires
» Le meilleur avait un delta de 6%, la moyenne était de 18%, le pire était de 132%.
Par rapport à tous les appareils testés
» 9% de tous les appareils testés étaient meilleurs, 2% similaires, 88% pires
» Le meilleur avait un delta de 4%, la moyenne était de 24%, le pire était de 134%.
Gestion de l'énergie
Consommation électrique
La consommation d'énergie semble parfois incohérente. Malgré une commutation graphique active, la consommation au repos de 33 à 45 watts est supérieure à la moyenne. En revanche, la consommation d'énergie de 3DMark 06, qui est d'environ 59 watts, est très faible. De plus, les résultats obtenus pendant The Witcher 3 (131 watts) et le test de stress (maximum 177 watts) sont inférieurs à ceux de la concurrence, ce qui montre l'efficacité énergétique du CPU Zen 4, du moins sous charge.
| Éteint/en veille | |
| Au repos | |
| Fortement sollicité |
|
Légende:
min: | |
| Lenovo Legion Slim 7 16APH8 R7 7840HS, GeForce RTX 4060 Laptop GPU | Asus ROG Flow X16 GV601V i9-13900H, GeForce RTX 4060 Laptop GPU | Alienware m16 R1 Intel i7-13700HX, GeForce RTX 4060 Laptop GPU | Acer Predator Helios 16 PH16-71-731Q i7-13700HX, GeForce RTX 4060 Laptop GPU | Lenovo Legion Pro 5 16IRX8 i7-13700HX, GeForce RTX 4060 Laptop GPU | Lenovo LOQ 16IRH8 i7-13620H, GeForce RTX 4060 Laptop GPU | Moyenne de la classe Gaming | |
|---|---|---|---|---|---|---|---|
| Power Consumption | 14% | -7% | -4% | -13% | 8% | 5% | |
| Idle Minimum * (Watt) | 33 | 9.6 71% | 10 70% | 15.9 52% | 24.5 26% | 17.2 48% | 13.2 ? 60% |
| Idle Average * (Watt) | 35 | 16 54% | 14 60% | 20.5 41% | 29.2 17% | 19.3 45% | 18.9 ? 46% |
| Idle Maximum * (Watt) | 45 | 16.9 62% | 21 53% | 20.9 54% | 34.3 24% | 21.2 53% | 24.3 ? 46% |
| Load Average * (Watt) | 59 | 104 -76% | 119 -102% | 106 -80% | 98.7 -67% | 90 -53% | 108.3 ? -84% |
| Witcher 3 ultra * (Watt) | 131 | 142 -8% | 186.7 -43% | 175 -34% | 178.6 -36% | 168 -28% | |
| Load Maximum * (Watt) | 177 | 214 -21% | 323 -82% | 276 -56% | 249.6 -41% | 211 -19% | 254 ? -44% |
* ... Moindre est la valeur, meilleures sont les performances
Power consumption Witcher 3 / stress test
Power consumption with external monitor
Autonomie de la batterie
Compte tenu de la grande batterie de 99,9 Wh, l'autonomie ne bat pas de records. Environ 7 heures de navigation sur Internet avec une luminosité réduite à 150 cd/m2, c'est bien, mais compte tenu de la taille de la batterie, cela pourrait être nettement mieux. Néanmoins, il occupe la deuxième place du test, juste derrière l'Asus ROG Flow X16.
| Lenovo Legion Slim 7 16APH8 R7 7840HS, GeForce RTX 4060 Laptop GPU, 99.9 Wh | Asus ROG Flow X16 GV601V i9-13900H, GeForce RTX 4060 Laptop GPU, 90 Wh | Alienware m16 R1 Intel i7-13700HX, GeForce RTX 4060 Laptop GPU, 86 Wh | Acer Predator Helios 16 PH16-71-731Q i7-13700HX, GeForce RTX 4060 Laptop GPU, 90 Wh | Lenovo Legion Pro 5 16IRX8 i7-13700HX, GeForce RTX 4060 Laptop GPU, 80 Wh | Lenovo LOQ 16IRH8 i7-13620H, GeForce RTX 4060 Laptop GPU, 80 Wh | Moyenne de la classe Gaming | |
|---|---|---|---|---|---|---|---|
| Autonomie de la batterie | 11% | -32% | -21% | -52% | -11% | -1% | |
| WiFi v1.3 (h) | 7.1 | 7.9 11% | 4.8 -32% | 5.6 -21% | 3.4 -52% | 6.3 -11% | 7.04 ? -1% |
| H.264 (h) | 8.9 | 5.6 | 4.8 | 6.4 | 8.26 ? | ||
| Load (h) | 1.5 | 1 | 1.5 | 0.7 | 1.5 | 1.47 ? | |
| Reader / Idle (h) | 6.4 | 6.7 | 8.71 ? | ||||
| Witcher 3 ultra (h) | 1.5 |
Points positifs
Points négatifs
Verdict

La version AMD de l'ordinateur portable, tout comme son homologue Intel, est fortement recommandée.
La synergie entre le Ryzen 7 7840HS et le GeForce RTX 4060 permet des performances fluides, permettant des réglages élevés à maximaux avec une résolution de 2 560 x 1 600 pixels.
L'écran 240 Hz est remarquable non seulement pour sa luminosité élevée, mais aussi pour sa visibilité dans les environnements extérieurs. Le boîtier de l'ordinateur portable excelle dans divers aspects, notamment les connexions, la stabilité, le design et la qualité des matériaux. Malgré sa taille de 16 pouces, il est plutôt léger (4,6 livres). Il dispose également de périphériques d'entrée bien pensés et d'une excellente qualité sonore.
Bien qu'il y ait de petits défauts, tels qu'une consommation d'énergie légèrement supérieure en mode veille et un ralentissement occasionnel du SSD au fil du temps, ces défauts ne nuisent pas de manière significative à l'excellente expérience globale. Par conséquent, l'ordinateur portable reçoit une très bonne note globale.
Il convient de mentionner que la concurrence, telle que le Asus ROG Flow X16offre également d'excellentes performances, mais à un prix plus élevé, ce qui rend notre proposition encore plus tentante.
Prix et disponibilité
Le Lenovo Legion Slim 7 16APH8 testé est disponible pour environ $1750 USD sur Amazon.
Lenovo Legion Slim 7 16APH8
- 11/03/2023 v7 (old)
Florian Glaser
Transparency
La sélection des appareils à examiner est effectuée par notre équipe éditoriale. L'échantillon de test a été prêté à l'auteur par le fabricant ou le détaillant pour les besoins de cet examen. Le prêteur n'a pas eu d'influence sur cette évaluation et le fabricant n'a pas reçu de copie de cette évaluation avant sa publication. Il n'y avait aucune obligation de publier cet article. En tant que média indépendant, Notebookcheck n'est pas soumis à l'autorité des fabricants, des détaillants ou des éditeurs.
Voici comment Notebookcheck teste
Chaque année, Notebookcheck examine de manière indépendante des centaines d'ordinateurs portables et de smartphones en utilisant des procédures standardisées afin de garantir que tous les résultats sont comparables. Nous avons continuellement développé nos méthodes de test depuis environ 20 ans et avons établi des normes industrielles dans le processus. Dans nos laboratoires de test, des équipements de mesure de haute qualité sont utilisés par des techniciens et des rédacteurs expérimentés. Ces tests impliquent un processus de validation en plusieurs étapes. Notre système d'évaluation complexe repose sur des centaines de mesures et de points de référence bien fondés, ce qui garantit l'objectivité.Price comparison

