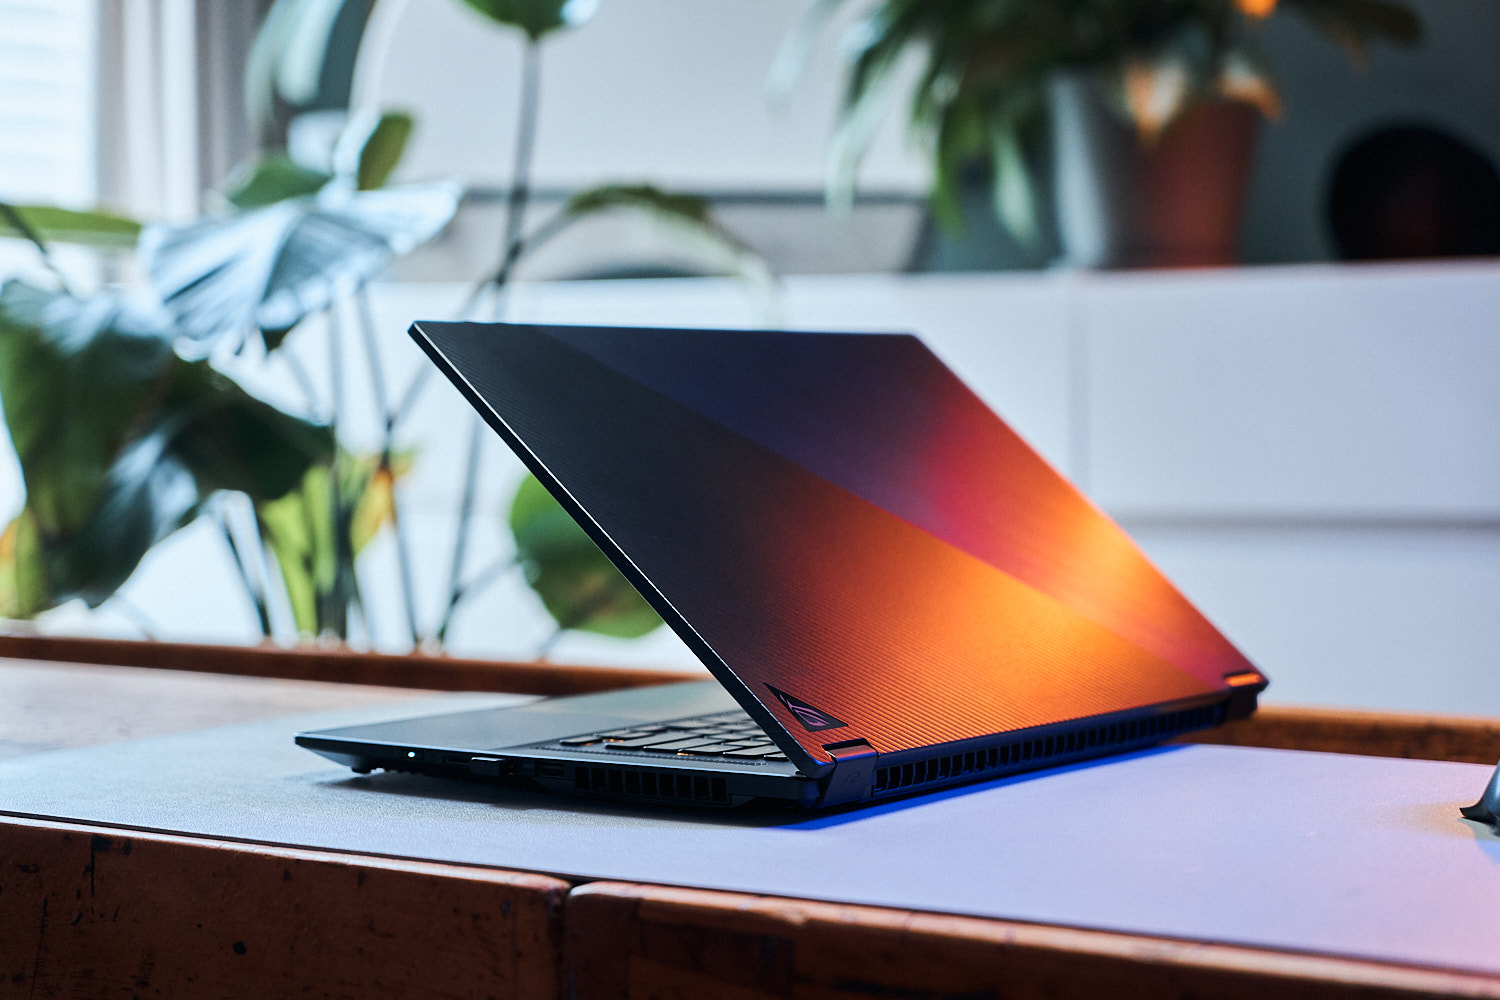
Test de l'Asus ROG Flow X16 : puissante station de travail 2-en-1 de 16 pouces pour le jeu

L'année dernière, le ROG Flow X16était notre premier ordinateur portable de jeu équipé d'un écran mini-LED. À l'époque, l'ordinateur portable était en avance sur son temps et, pour cette raison, Asus ne semble pas avoir eu de raison de donner à ce modèle une révision complète. Cependant, la version que nous examinons ici est dépourvue d'un écran mini-LED. Néanmoins, de nombreuses caractéristiques restent les mêmes, comme le boîtier et les ports, Asus se contentant de changer de génération de CPU/GPU.
De même, Asus est actuellement en avance dans la réalisation de nouveaux concepts, comme le prouve le nouveau Asus ROG Ally ainsi que leAsus ROG Flow Z13la tablette de jeu. Le X16 n'est pas exactement l'appareil de tous les jours : Il s'agit d'un ordinateur portable de jeu ultra-mince qui est en même temps un 2-en-1. L'écran peut être tourné à 360 degrés, ce qui permet d'utiliser l'ordinateur portable comme une tablette grâce à l'écran tactile. Il est difficile de trouver un concurrent direct, c'est pourquoi nous le comparons à des machines de jeu normales. En plus de son prédécesseur, nous utilisons également leSamsung Galaxy Book3 Ultra 16et leLenovo Legion Pro 5, leLenovo Yoga Pro 7 14 G8et leMSI Katana 17 B13V à titre de comparaison.
Étant donné que certaines caractéristiques du modèle de l'année dernière restent inchangées, nous n'accordons pas d'attention particulière à l'étui, aux accessoires, à l'entretien et aux périphériques d'entrée, mais nous préférons vous orienter vers notre examen du modèle de l'année dernière, le Asus ROG Flow X16 GV601RWde l'année dernière, pour plus d'informations.
Comparaison avec les concurrents potentiels
Note | Date | Modèle | Poids | Épaisseur | Taille | Résolution | Prix |
|---|---|---|---|---|---|---|---|
| 89.7 % v7 (old) | 06/23 | Asus ROG Flow X16 GV601V i9-13900H, GeForce RTX 4060 Laptop GPU | 2.1 kg | 19.4 mm | 16.00" | 2560x1600 | |
| 89.5 % v7 (old) | 08/22 | Asus ROG Flow X16 GV601RW-M5082W R9 6900HS, GeForce RTX 3070 Ti Laptop GPU | 2.1 kg | 19.4 mm | 16.10" | 2560x1600 | |
| 88.8 % v7 (old) | 05/23 | Samsung Galaxy Book3 Ultra 16, i9-13900H RTX 4070 i9-13900H, GeForce RTX 4070 Laptop GPU | 1.8 kg | 16.8 mm | 16.00" | 2880x1800 | |
| 87.9 % v7 (old) | 05/23 | Lenovo Legion Pro 5 16IRX8 i7-13700HX, GeForce RTX 4060 Laptop GPU | 2.5 kg | 26.8 mm | 16.00" | 2560x1600 | |
| 90.2 % v7 (old) | 05/23 | Lenovo Yoga Pro 7 14IRH G8 i7-13700H, GeForce RTX 4050 Laptop GPU | 1.5 kg | 15.6 mm | 14.50" | 3072x1920 | |
| 82.1 % v7 (old) | 02/23 | MSI Katana 17 B13VFK i7-13620H, GeForce RTX 4060 Laptop GPU | 2.8 kg | 25.2 mm | 17.30" | 1920x1080 |
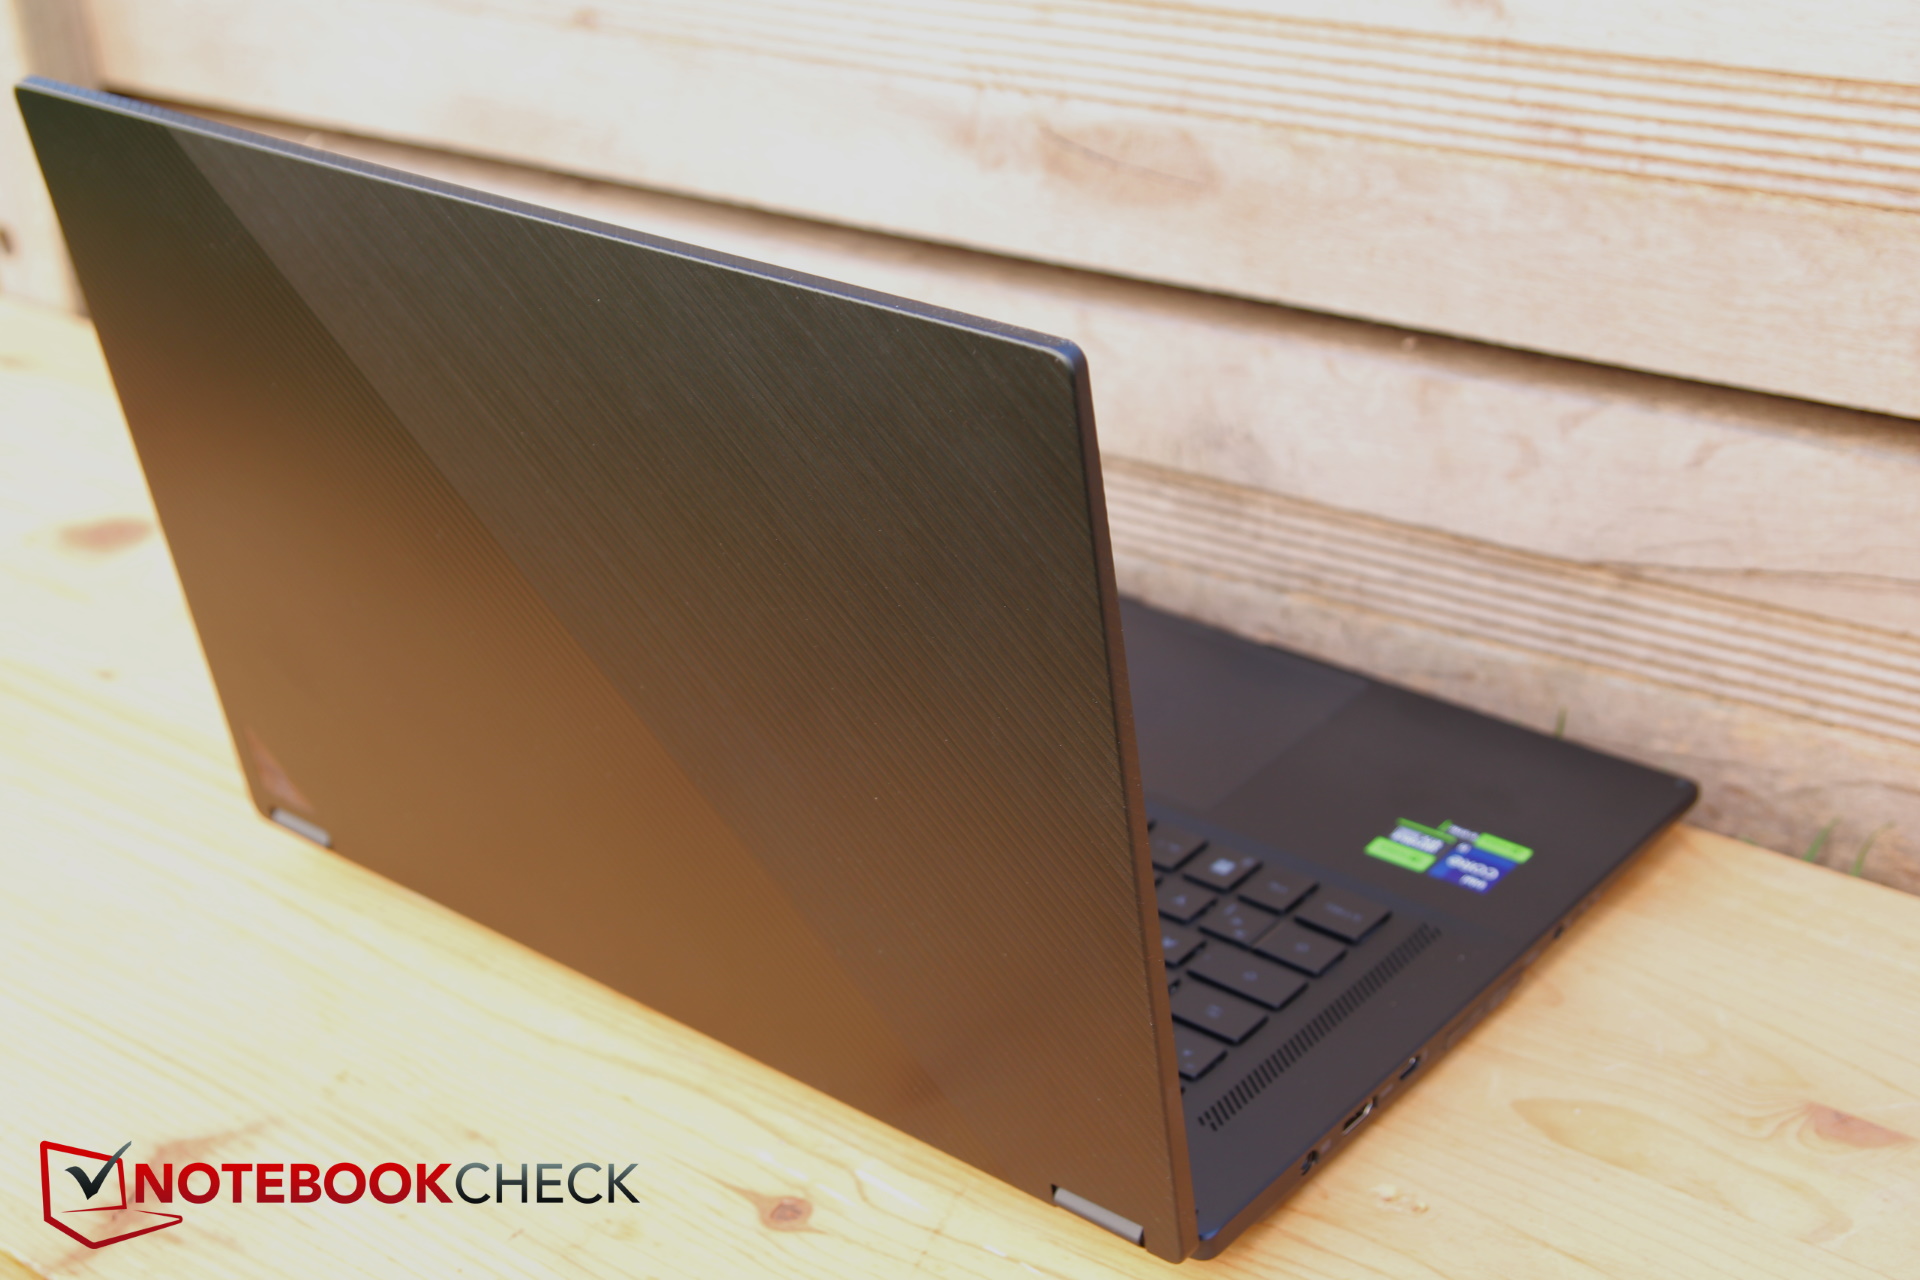
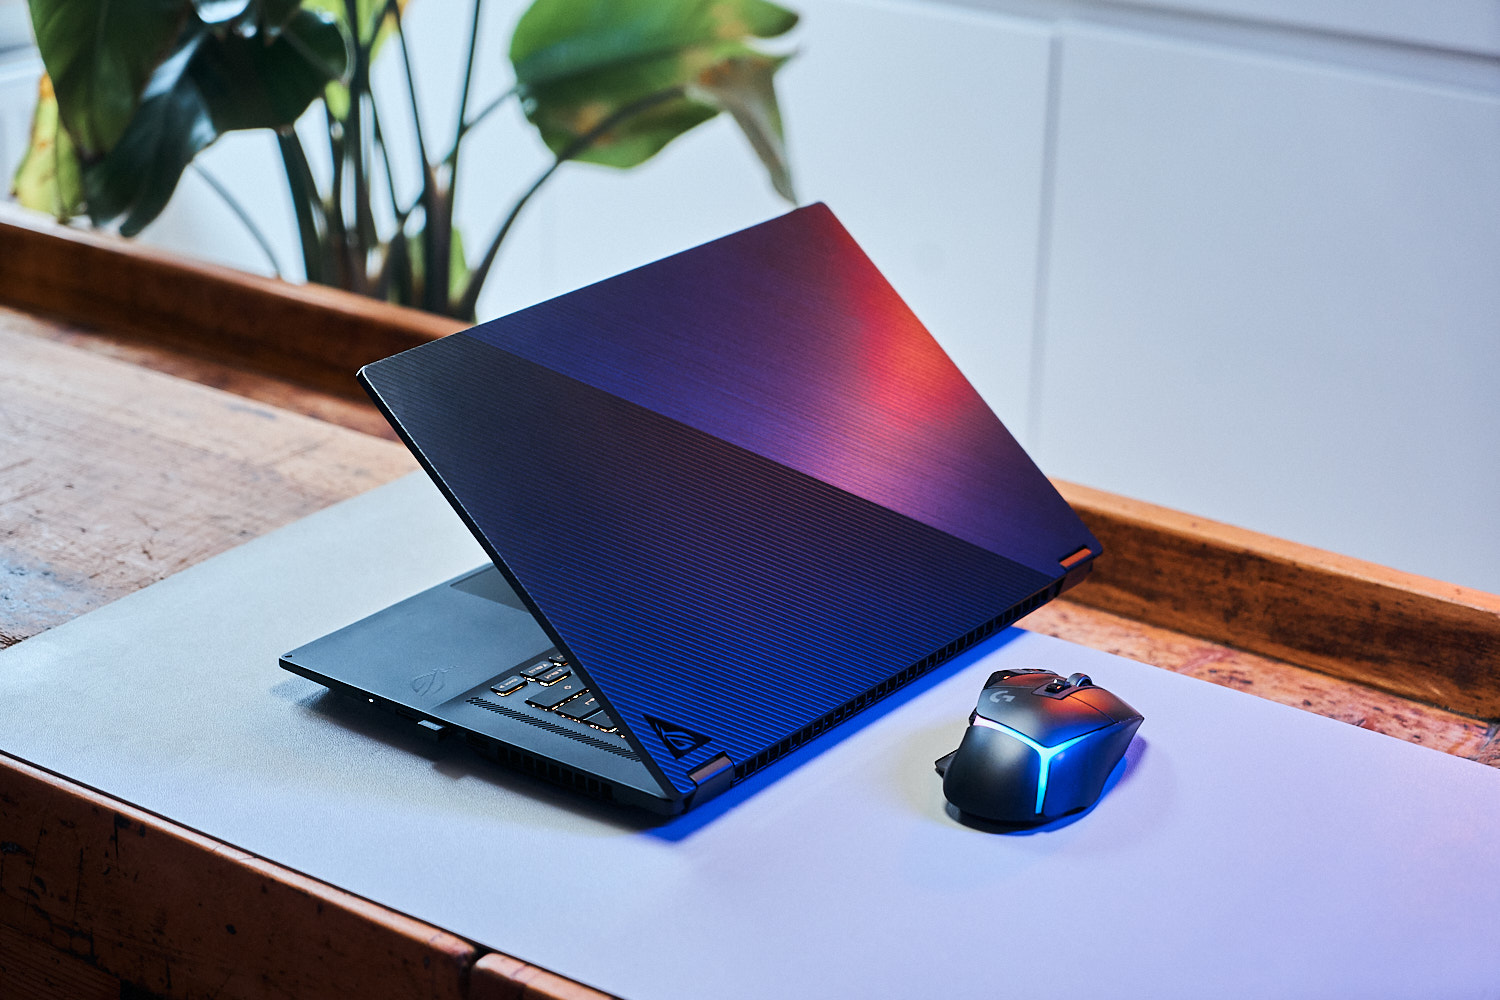
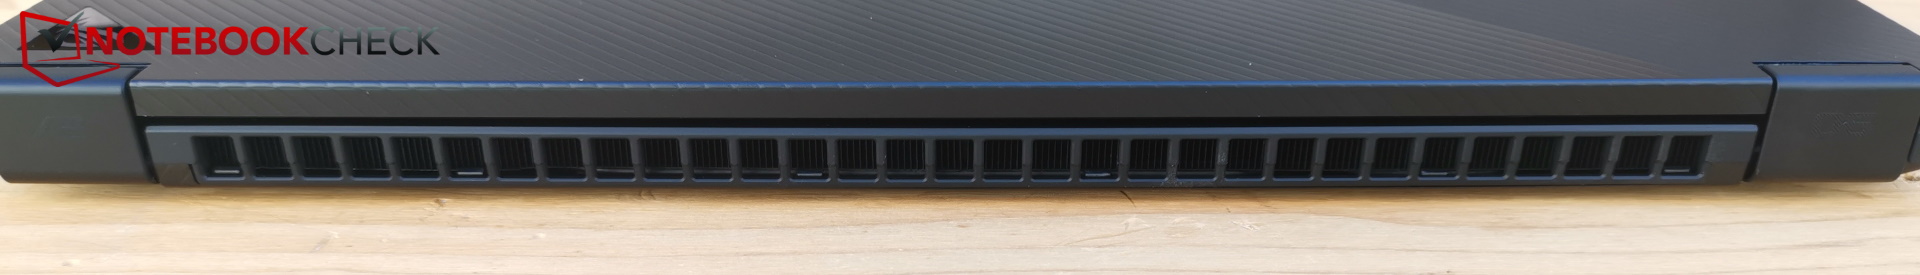
Cas - Aussi mince et bon que l'année dernière
Le logo sur le couvercle du boîtier est légèrement différent, mais à part cela, tout est pratiquement inchangé.

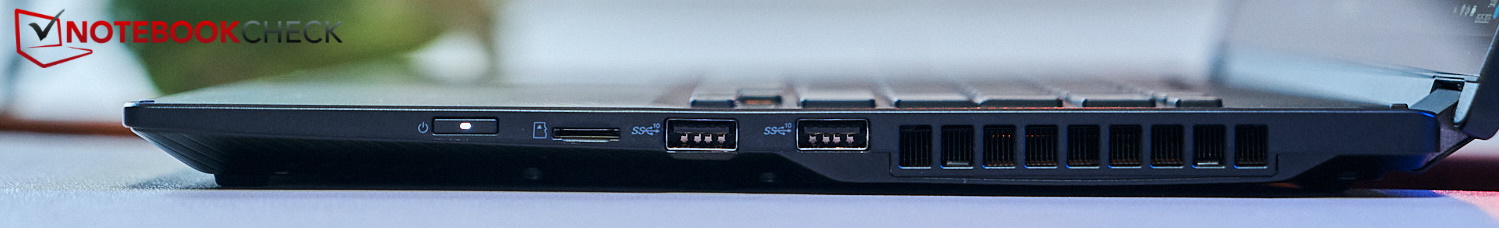
Caractéristiques - Interface mobile TB4 et XG
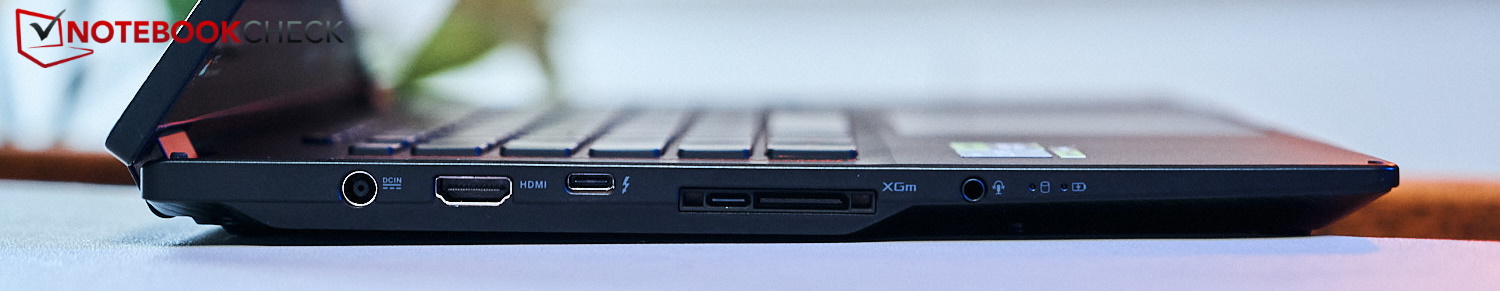
Lecteur de carte SD
| SD Card Reader | |
| average JPG Copy Test (av. of 3 runs) | |
| Asus ROG Flow X16 GV601RW-M5082W (AV Pro SD microSD 128 GB V60) | |
| Moyenne de la classe Gaming (20.9 - 210, n=54, 2 dernières années) | |
| Asus ROG Flow X16 GV601V | |
| Samsung Galaxy Book3 Ultra 16, i9-13900H RTX 4070 (AV Pro SD microSD 128 GB V60) | |
| maximum AS SSD Seq Read Test (1GB) | |
| Asus ROG Flow X16 GV601V | |
| Asus ROG Flow X16 GV601RW-M5082W (AV Pro SD microSD 128 GB V60) | |
| Moyenne de la classe Gaming (25.5 - 261, n=51, 2 dernières années) | |
| Samsung Galaxy Book3 Ultra 16, i9-13900H RTX 4070 (AV Pro SD microSD 128 GB V60) | |
Communication
Les taux de transfert avec l'AX211 d'Intel dans un réseau de 6 GHz sont très élevés et stables (environ 1,6 MBit/s) et dans un réseau de 5 GHz, des taux de transfert faibles d'environ 1 MBit/s seulement sont possibles.
Webcam
Dans ce domaine, Asus a remplacé la caméra 720p du modèle de l'année dernière par une caméra Full HD. Les images sont correctes, mais la déviation des couleurs est un peu élevée.


Sécurité
Le TPM est disponible grâce à la puce Intel, mais il manque un capteur d'empreintes digitales et même un verrou Kensington. La caméra est compatible avec Windows Hello.
Accessoires
Malheureusement, le stylet n'est pas inclus cette année et théoriquement, vous recevez un ordinateur portable sans aucun accessoire supplémentaire. Cependant, selon le pack, un sac à dos pour ordinateur portable de la marque ROG, le casque ROG Fusion II 300 ainsi que la souris ROG Gladius III sont inclus.
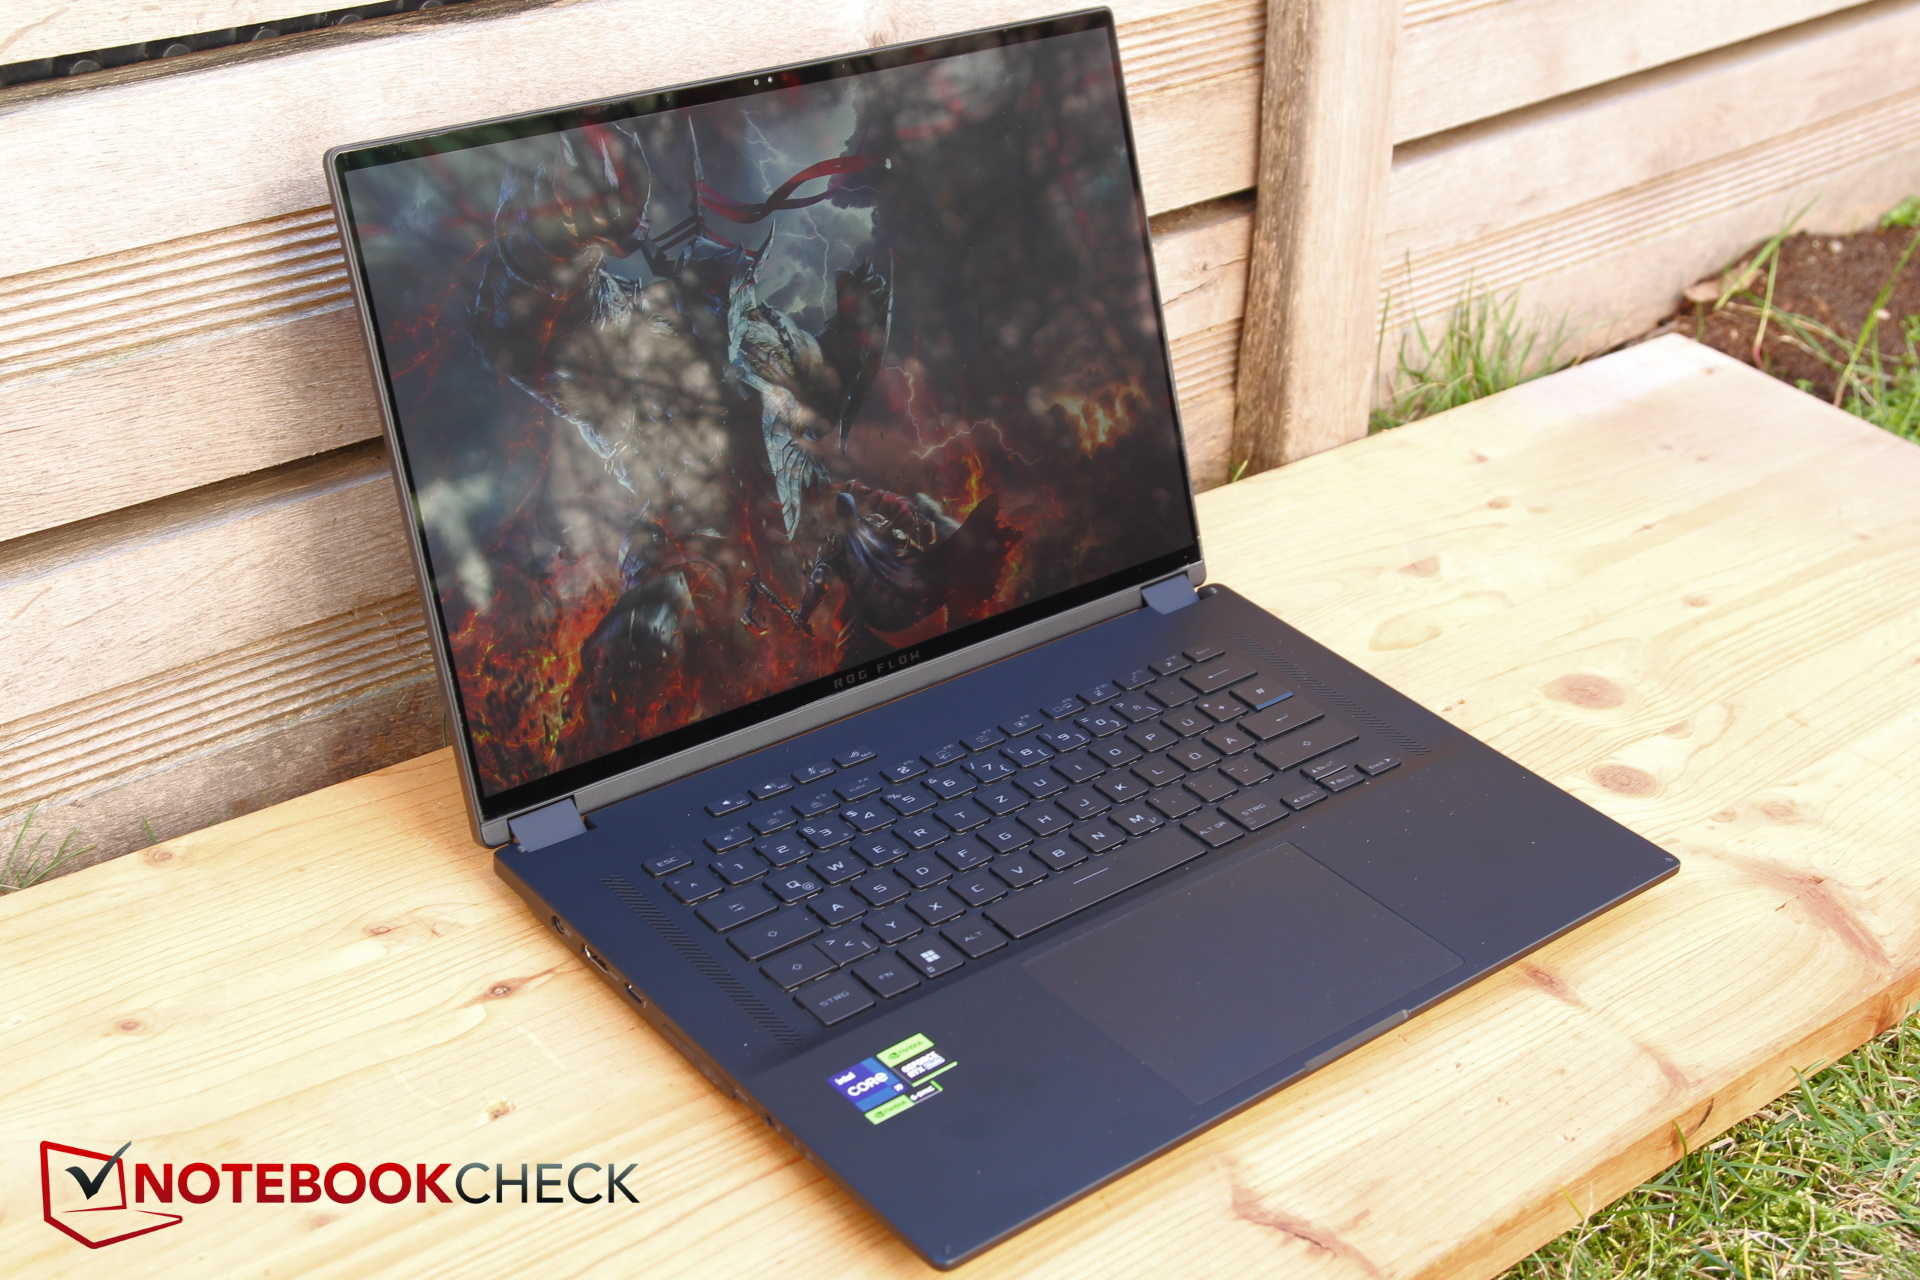
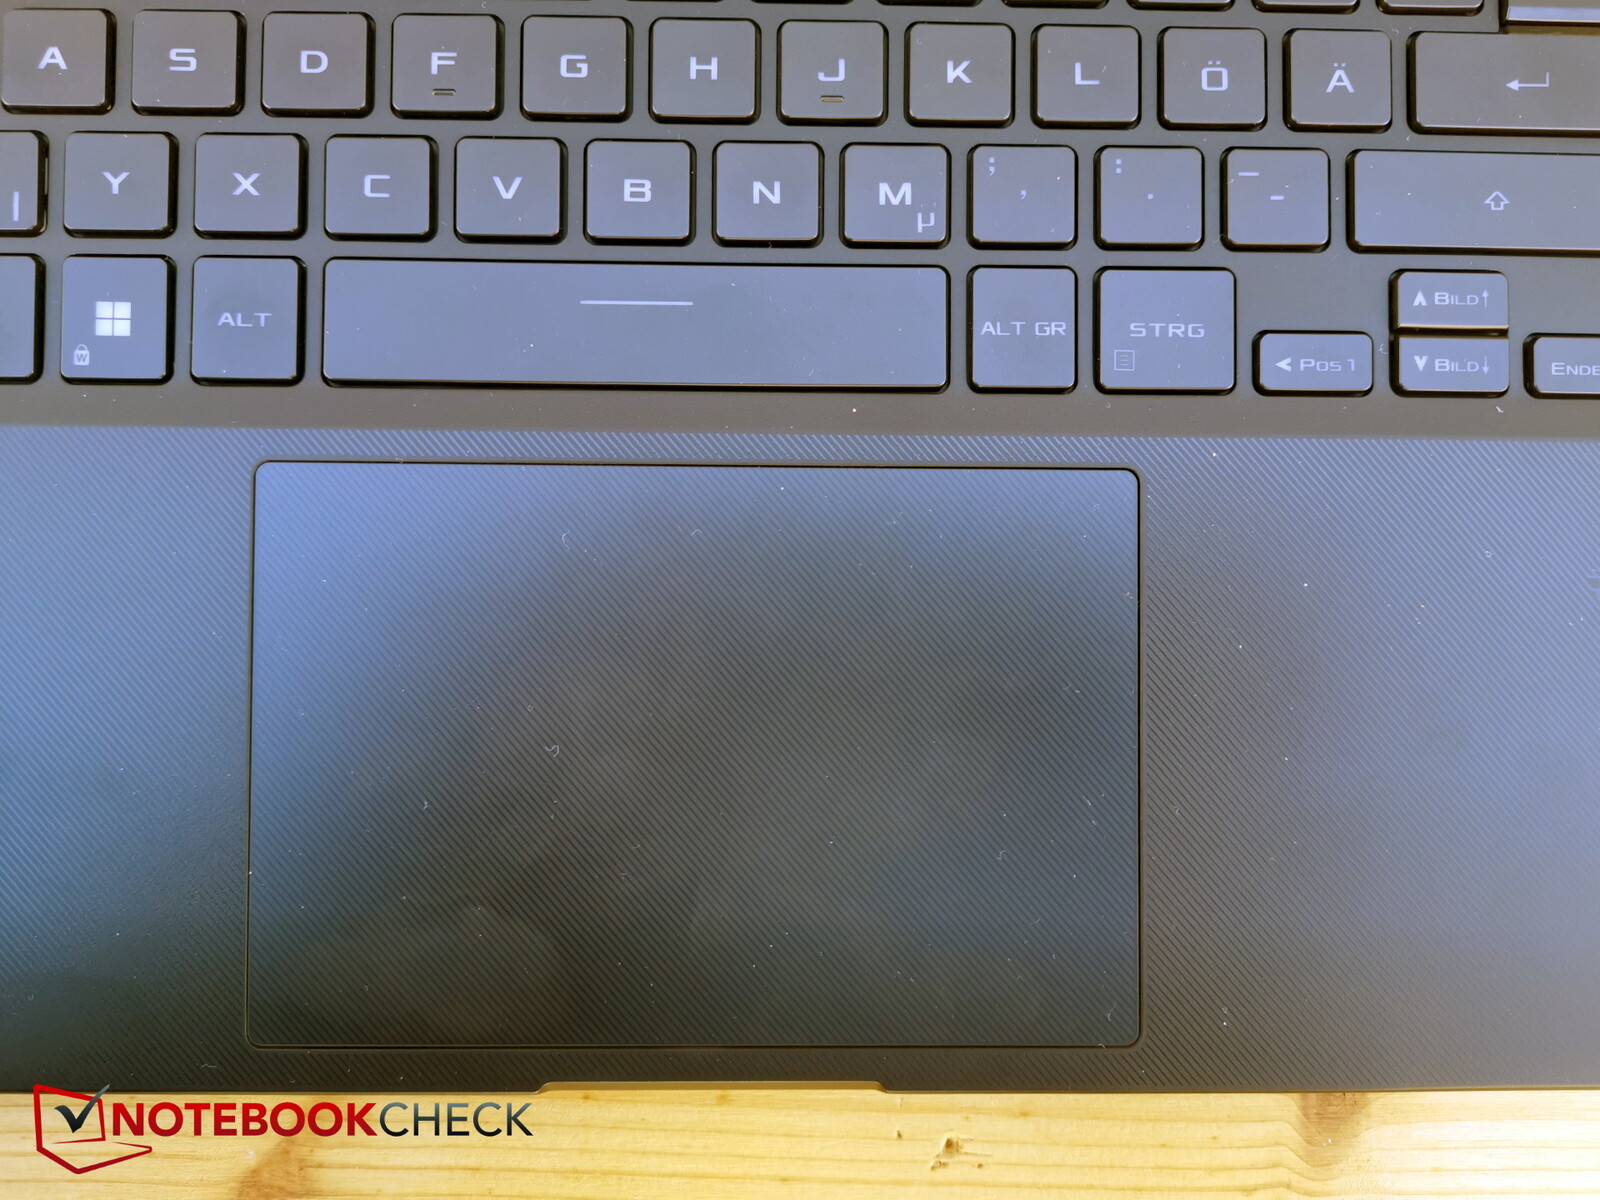
Périphériques d'entrée - Le X16 est doté d'un grand pavé tactile
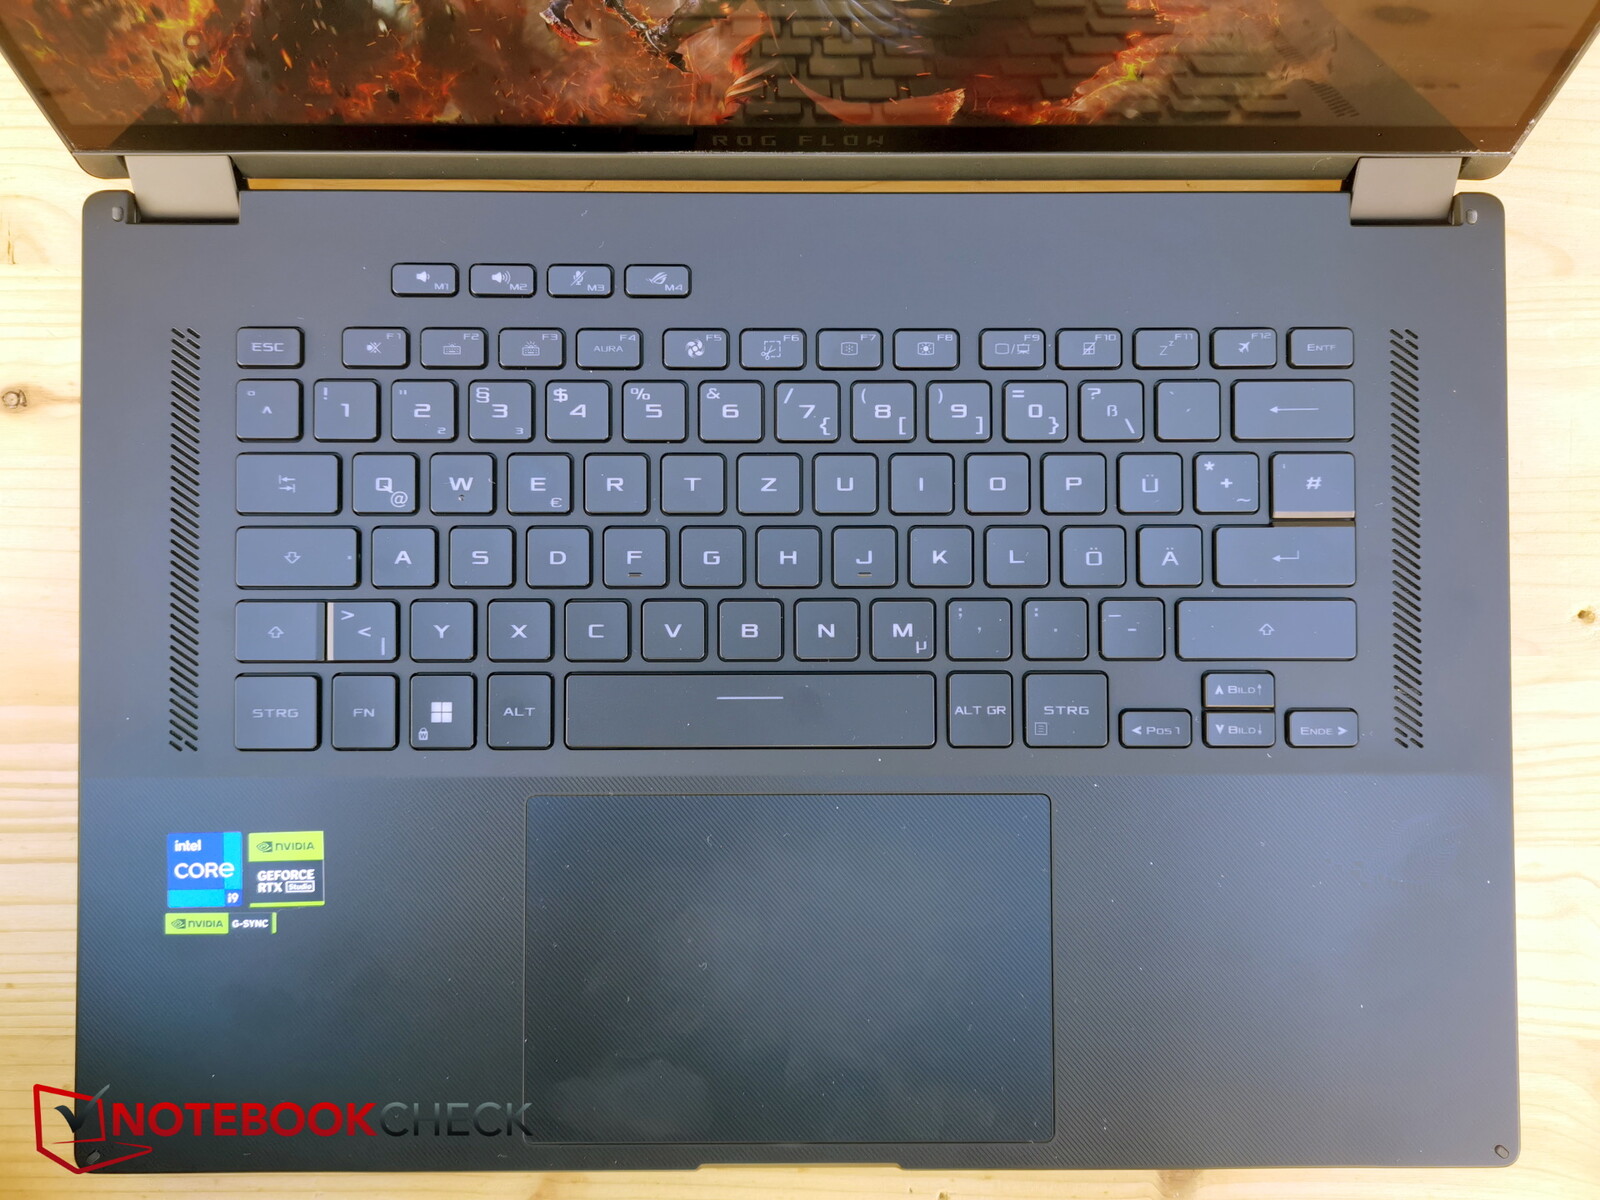

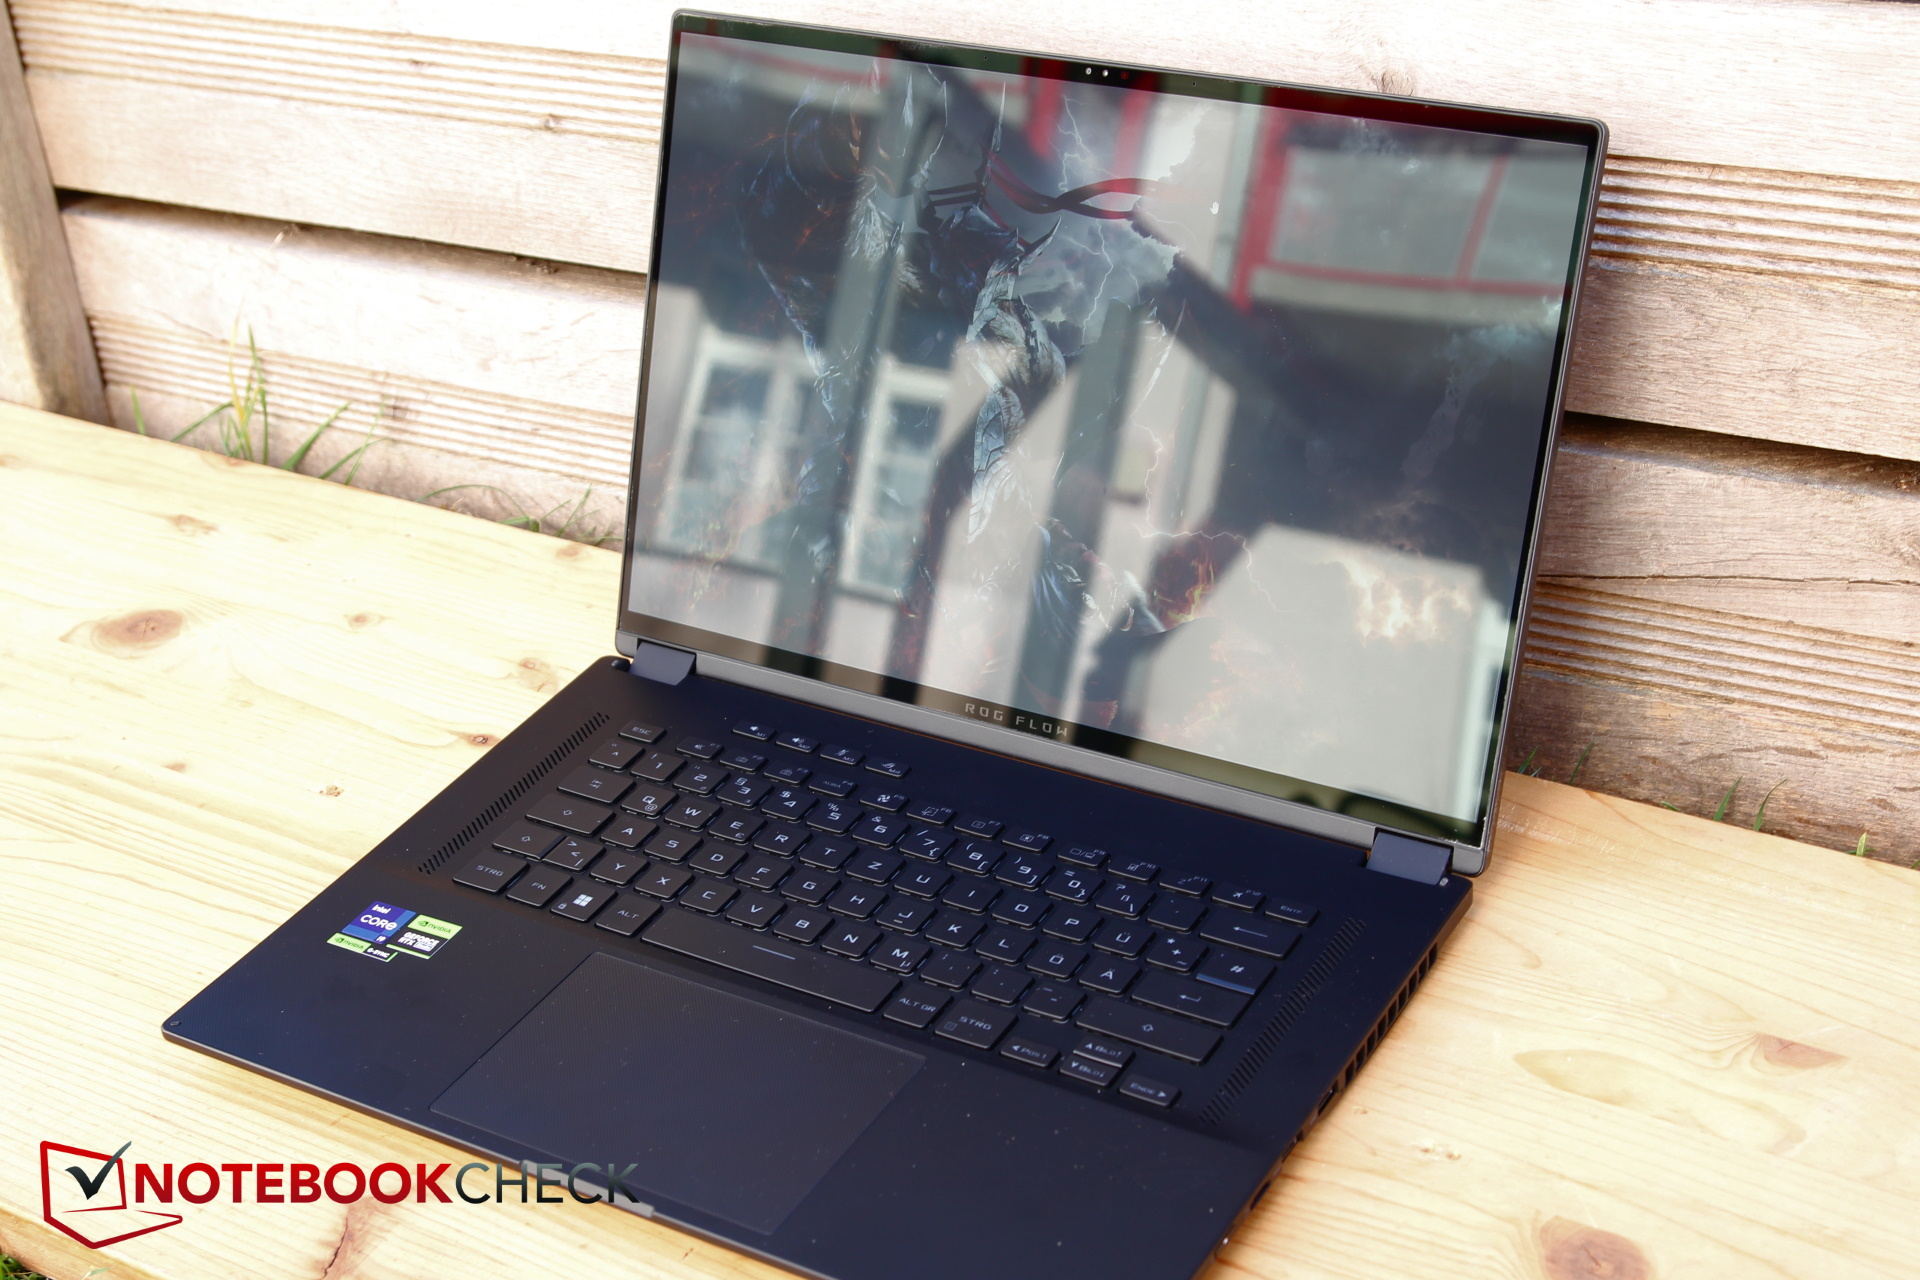
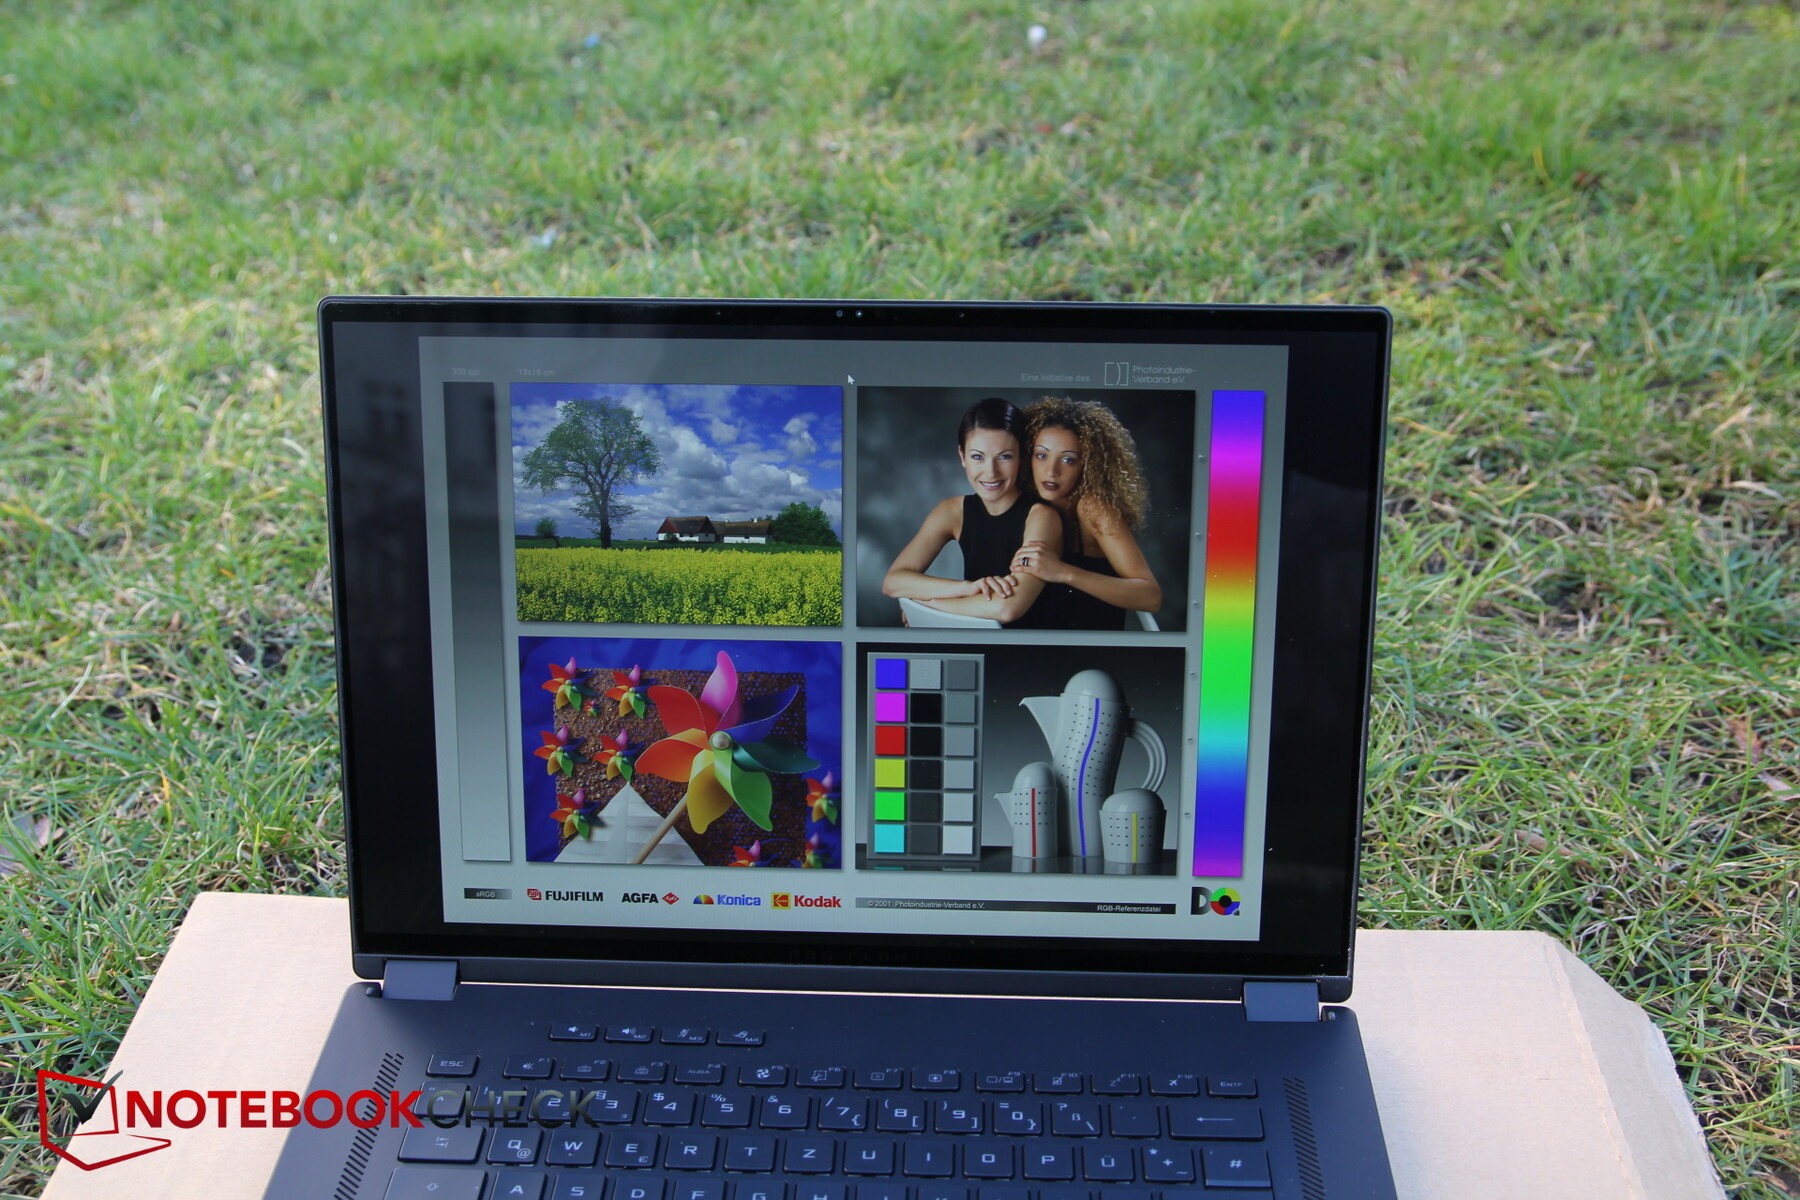
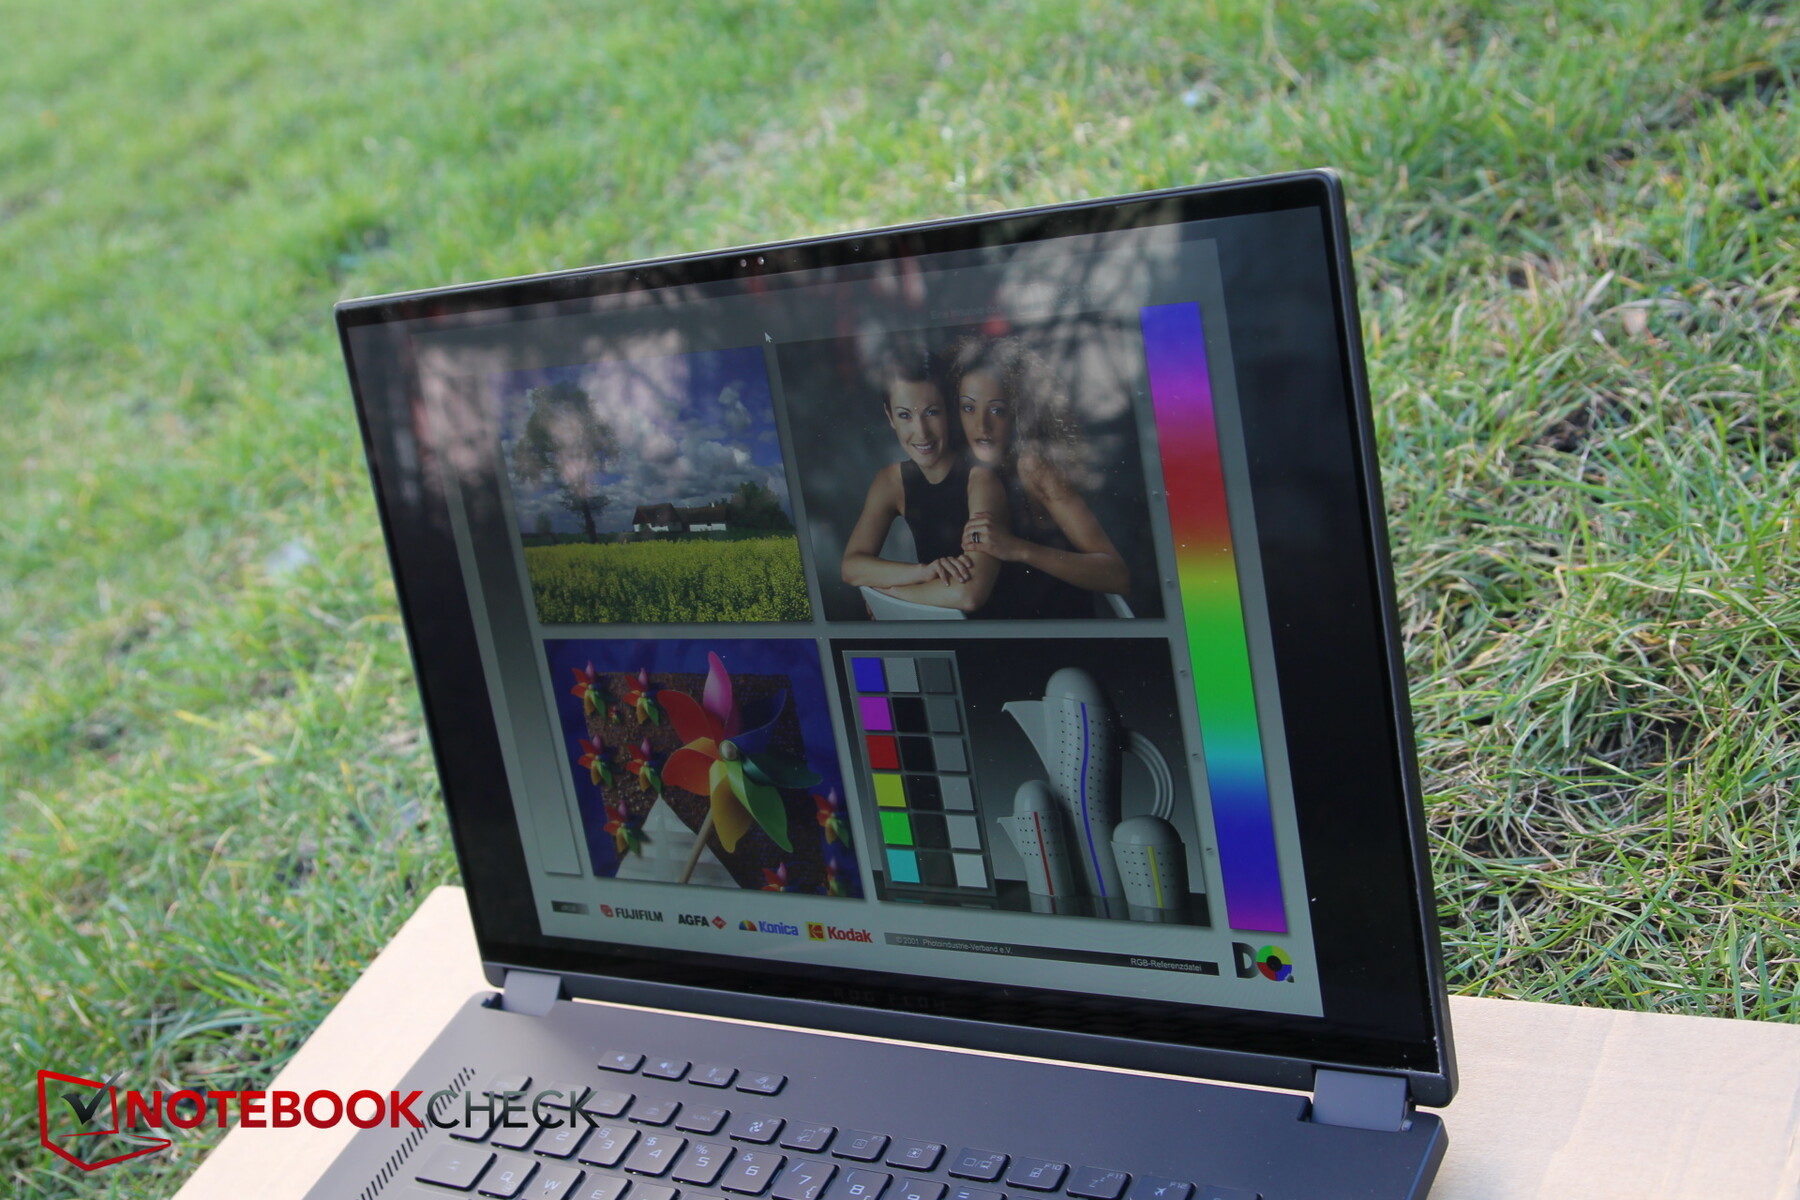
Affichage - Avec ou sans mini-LED ?
Le X16 est équipé d'un écran IPS Asus TMX1603 ou TL160ADMP03-0 de 16 pouces avec fonctionnalité tactile mais sans mini-LED. Le même panneau, bien que dans la variante non tactile, peut également être trouvé dans le Asus ROG Strix G16. Il s'agit d'un écran au format 16:10 de 2560 x 1600 pixels qui prend en charge la saisie au stylet. Malheureusement, contrairement à l'année dernière où le stylet était inclus, cette année il faut l'acheter séparément.
Comme l'année dernière, il est également possible d'opter pour un écran doté d'un rétroéclairage mini-LED, qui a été amélioré une fois de plus : Le nombre de zones de gradation a été doublé pour atteindre 1 024, le taux de rafraîchissement est passé de 165 à 240 Hz et la luminosité maximale a légèrement augmenté pour atteindre 1 100 nits (HDR). Malheureusement, la dalle mini-LED (revue ici) n'est disponible qu'à partir de la RTX 4070ou plus et n'est donc pas présent dans notre modèle de test.
Cependant, le site web d'Asus donne l'impression que tous les modèles sont équipés d'un écran mini-LED, même ceux équipés d'une RTX 4050 ou d'une RTX 4060. Faites donc bien attention lors de l'achat !
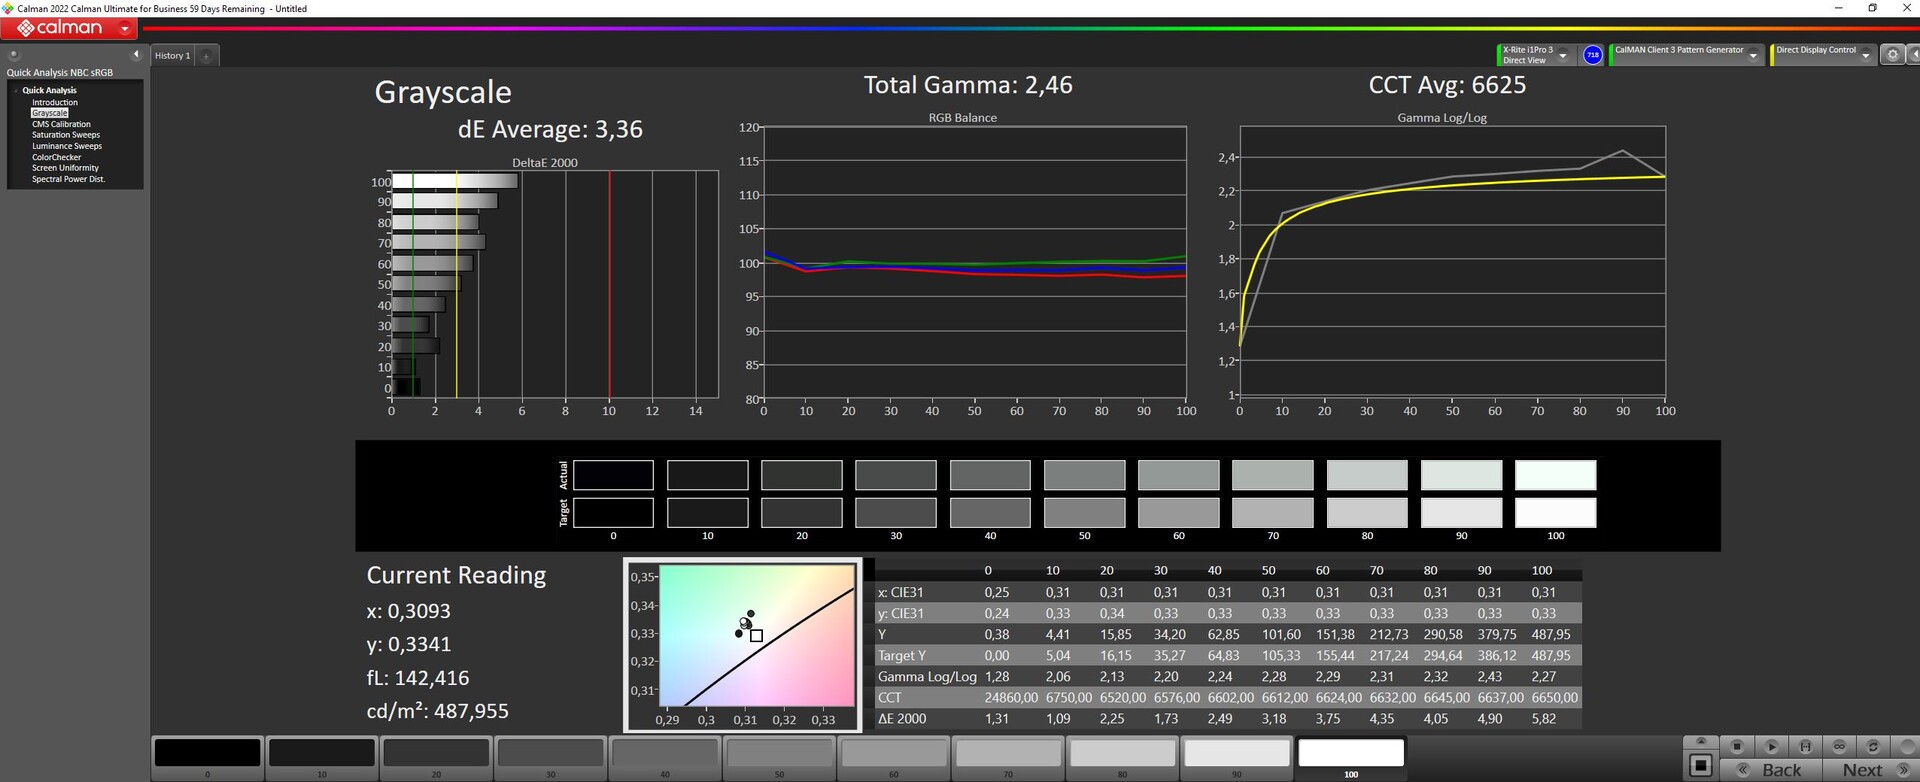
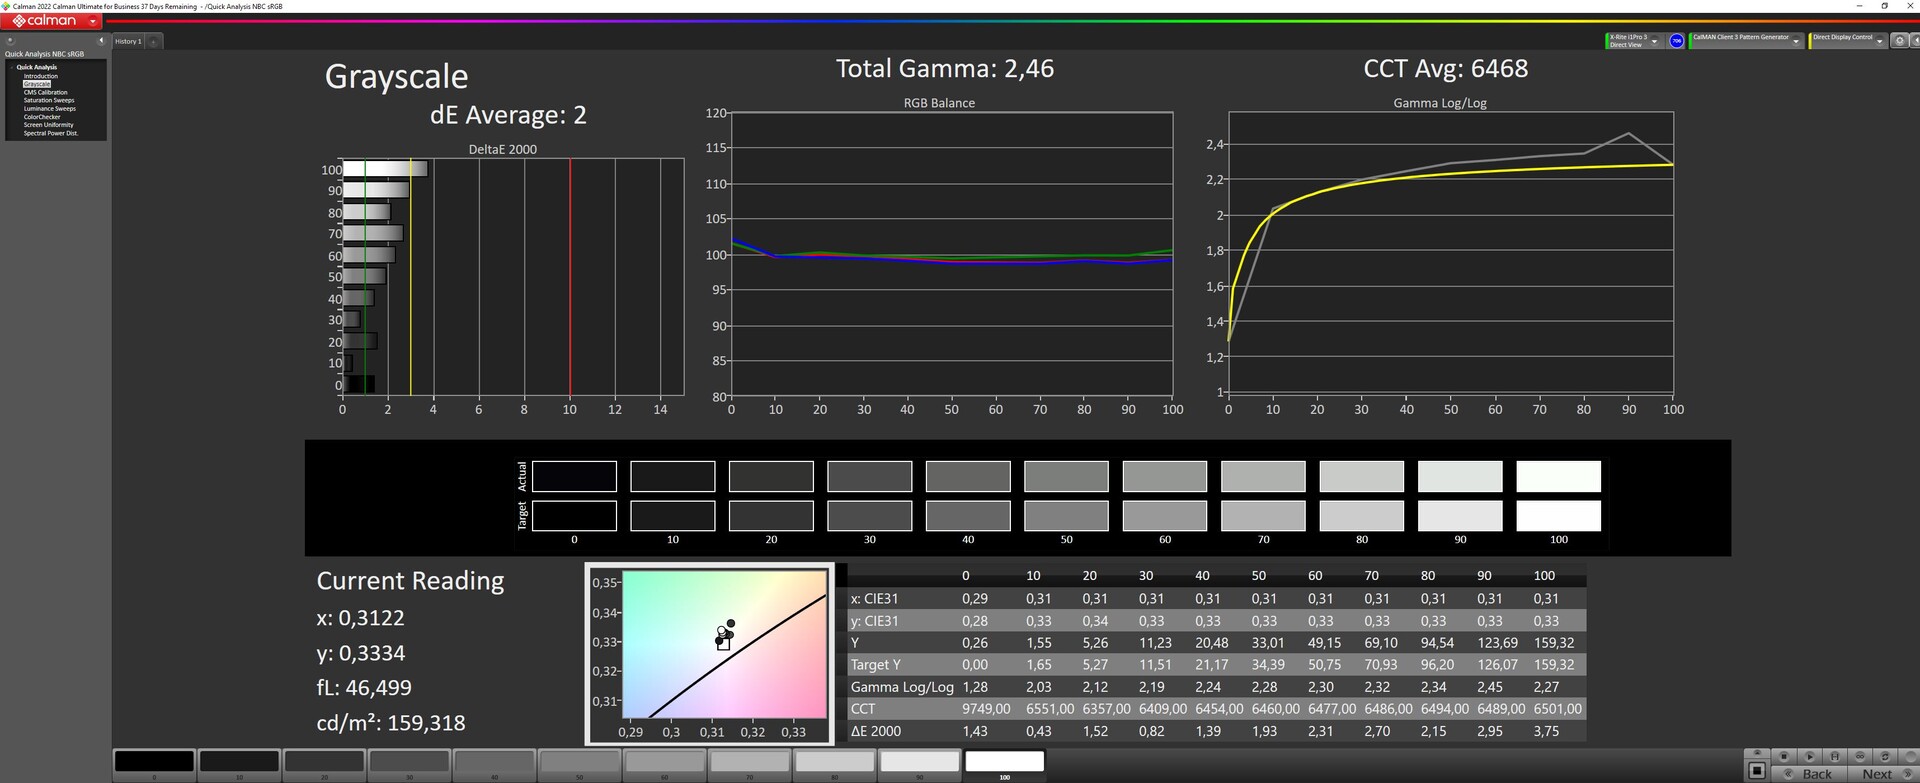
Mais, même sans mini-LED, notre modèle standard a mesuré une luminosité moyenne d'environ 469 nits, avec un très bon taux d'éclairage de 91 %. Les niveaux de noir sont acceptables (0,39), ce qui donne un rapport de contraste de 1 246:1.
Les temps de réponse sont très rapides, il n'y a pas besoin de se préoccuper du PWM et le saignement du rétroéclairage est très minime, il n'est visible que sur le bord supérieur.
| |||||||||||||||||||||||||
Homogénéité de la luminosité: 91 %
Valeur mesurée au centre, sur batterie: 487 cd/m²
Contraste: 1246:1 (Valeurs des noirs: 0.39 cd/m²)
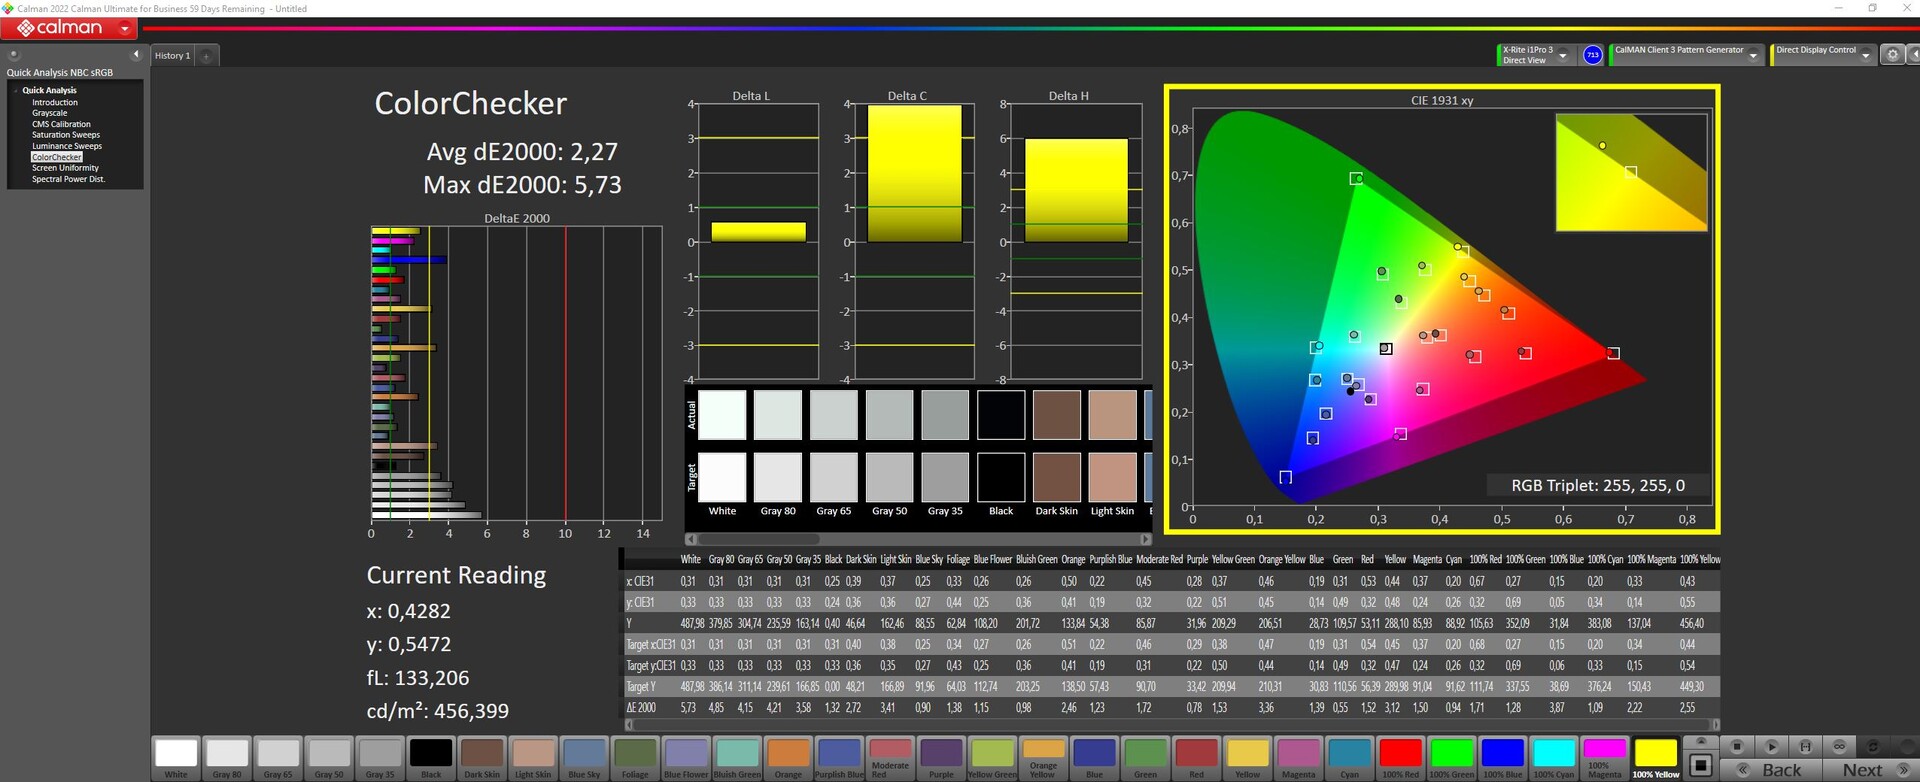
ΔE ColorChecker Calman: 2.27 | ∀{0.5-29.43 Ø4.71}
calibrated: 0.6
ΔE Greyscale Calman: 3.36 | ∀{0.09-98 Ø4.96}
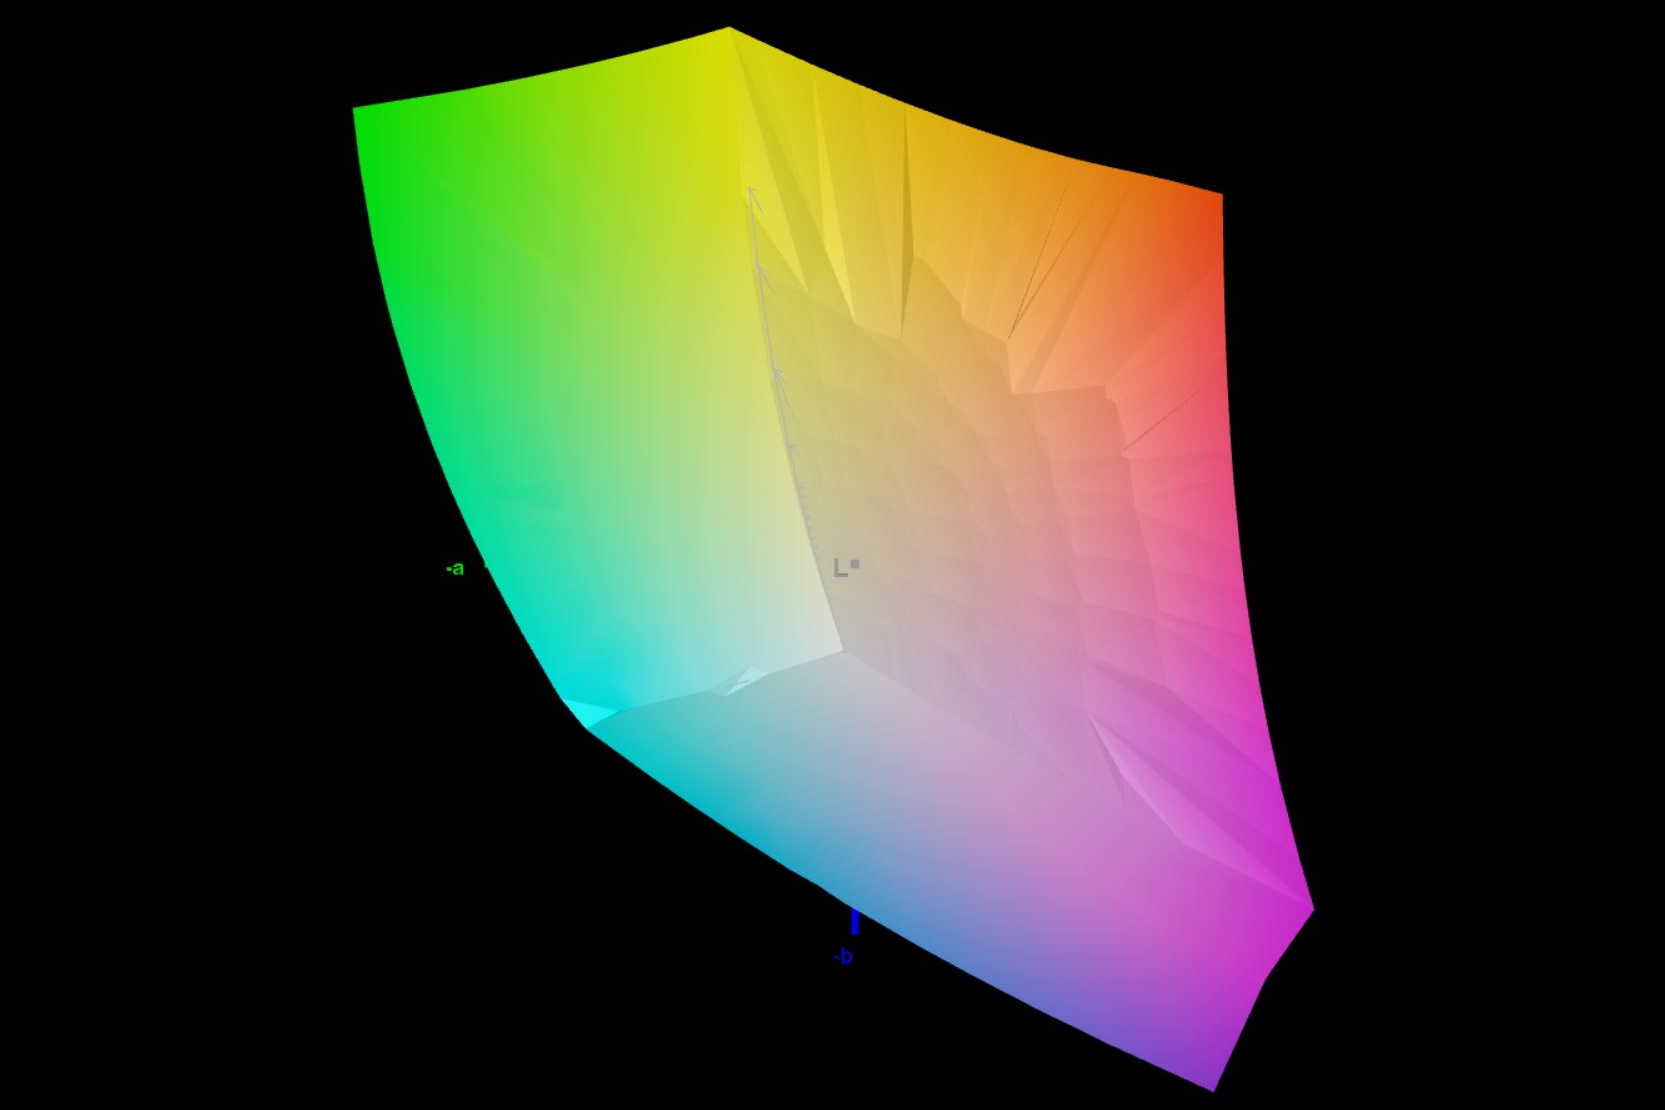
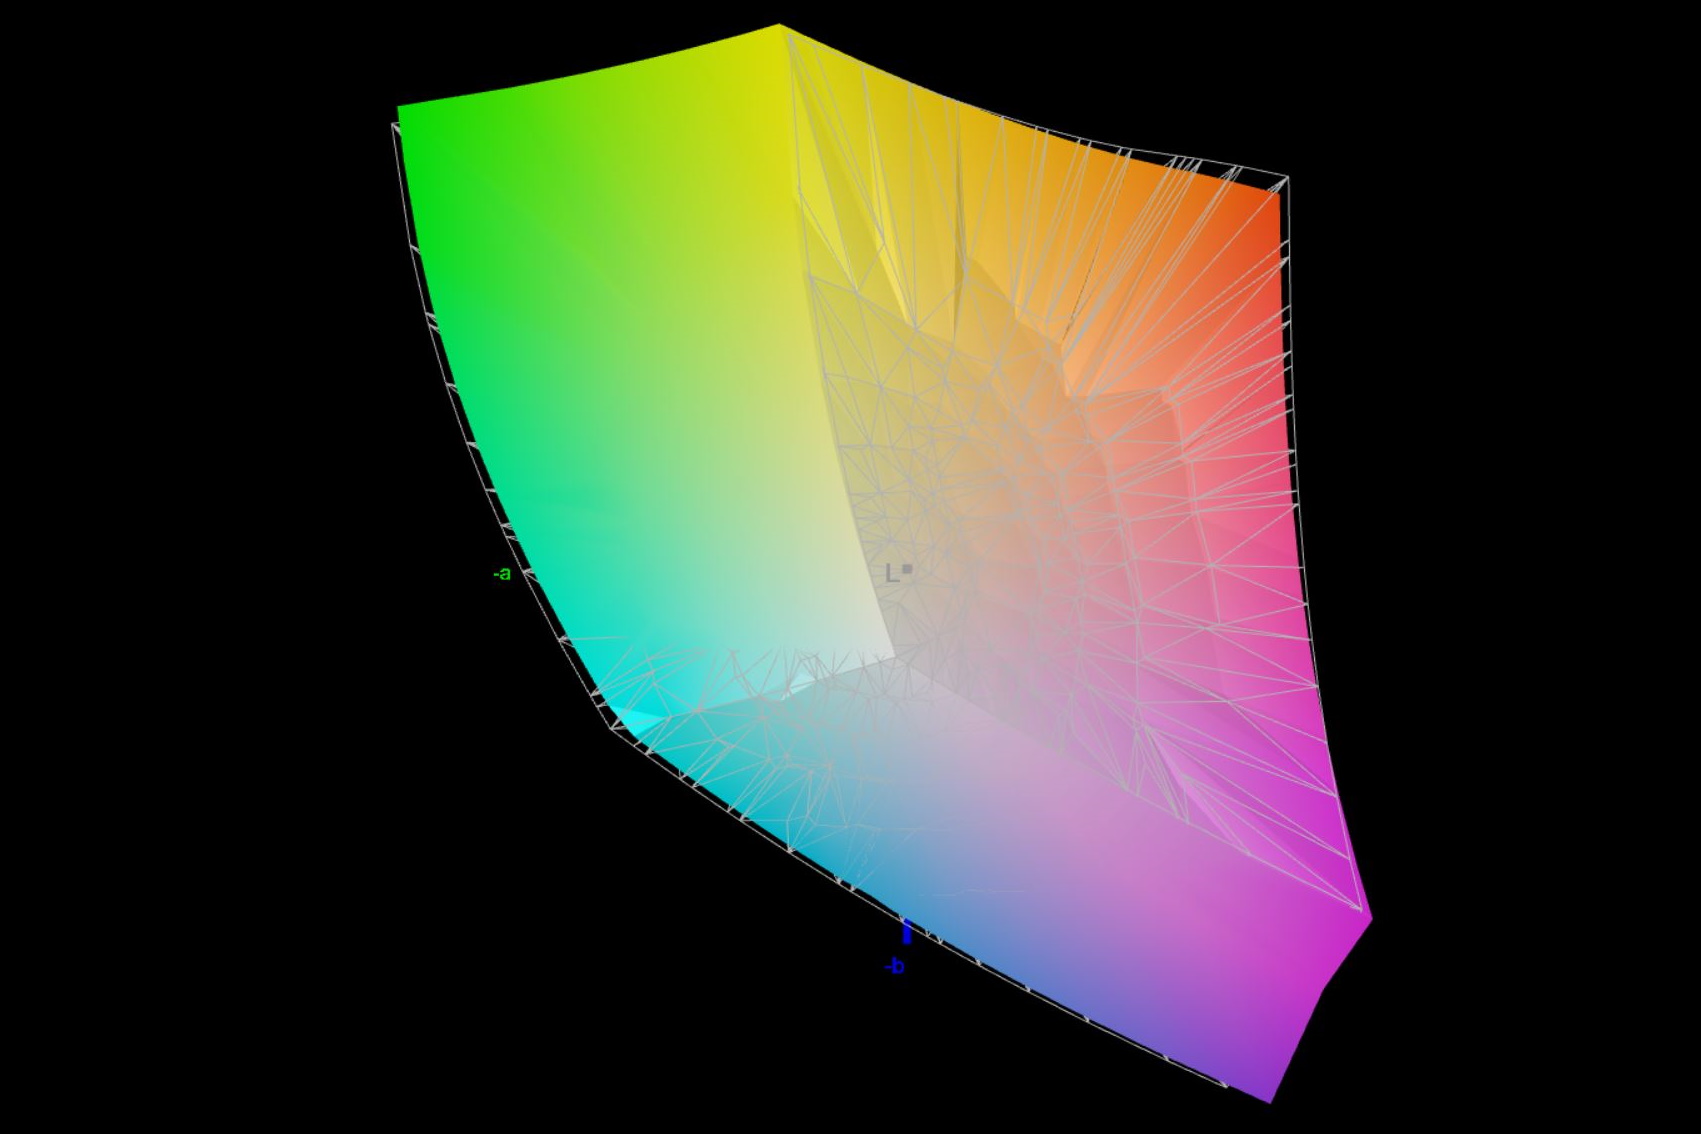
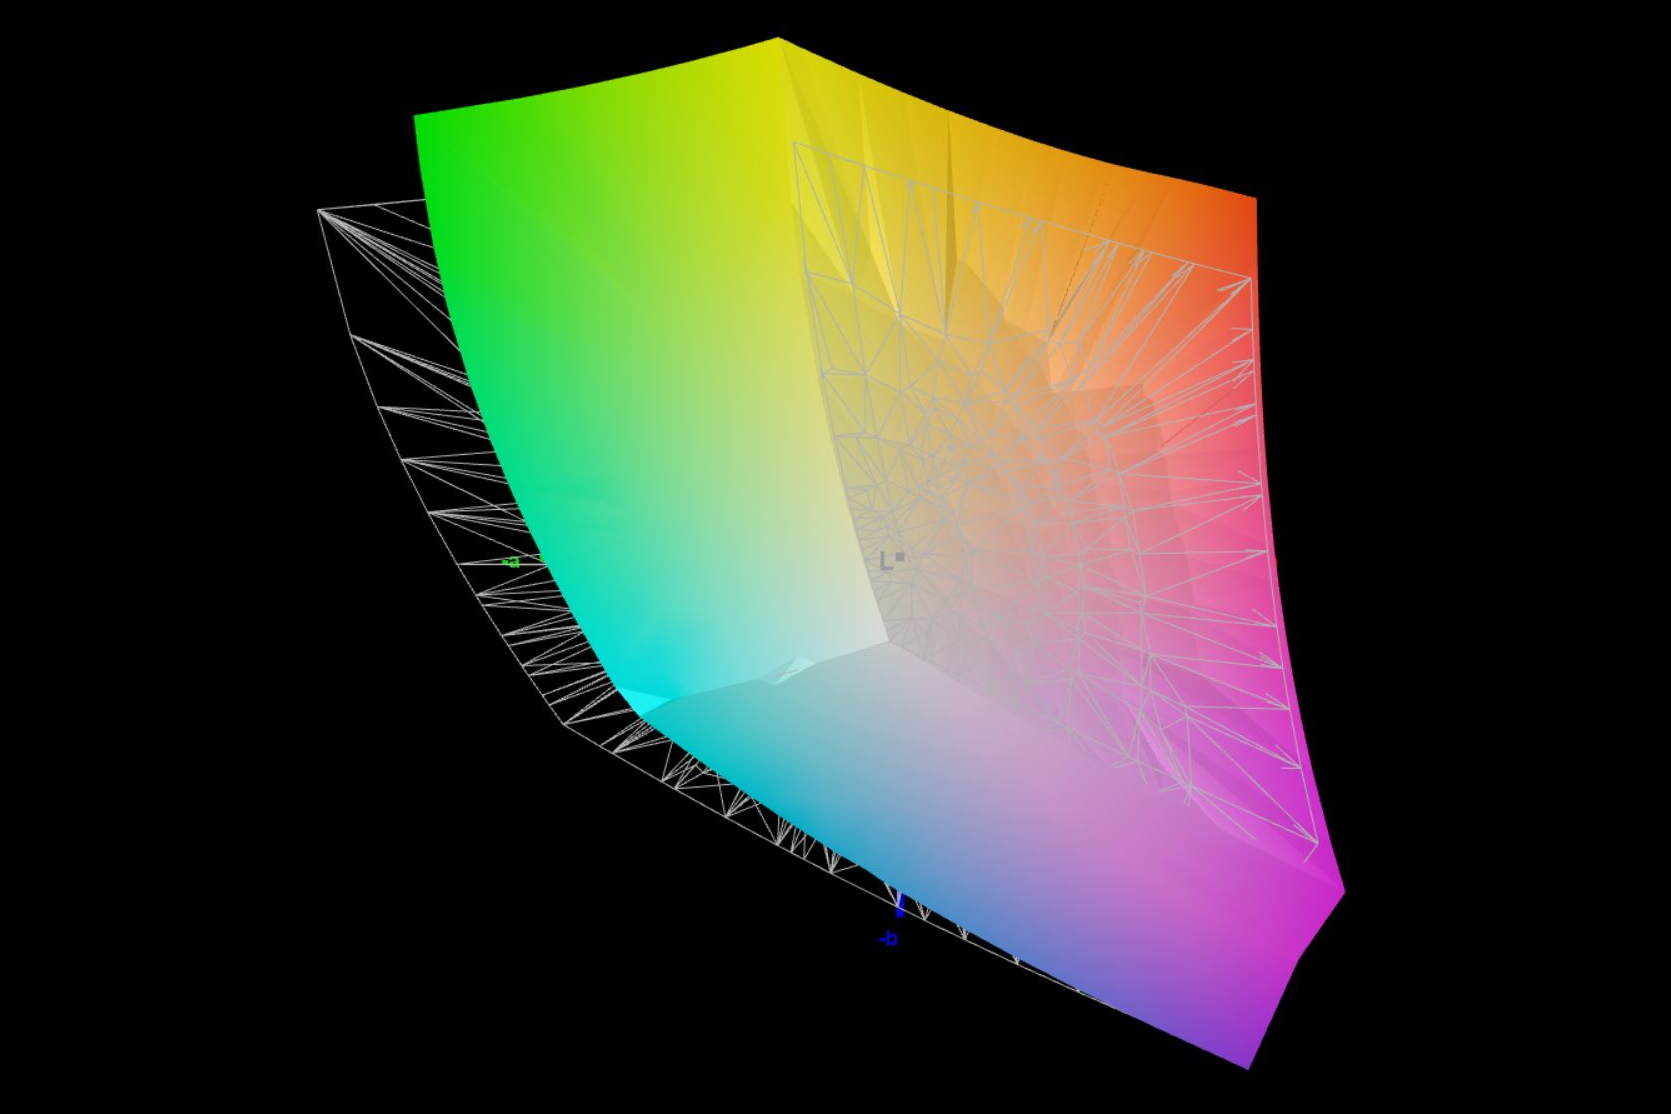
84.63% AdobeRGB 1998 (Argyll 3D)
99.92% sRGB (Argyll 3D)
96.61% Display P3 (Argyll 3D)
Gamma: 2.46
CCT: 6625 K
| Asus ROG Flow X16 GV601V TMX1603 (TL160ADMP03-0), IPS, 2560x1600, 16" | Asus ROG Flow X16 GV601RW-M5082W AUO B160QAN02.S, Mini LED, 2560x1600, 16.1" | Samsung Galaxy Book3 Ultra 16, i9-13900H RTX 4070 Samsung SDC4185 ATNA60CL03-0, OLED / AMOLED, 2880x1800, 16" | Lenovo Legion Pro 5 16IRX8 AU Optronics B160QAN03.1, IPS, 2560x1600, 16" | Lenovo Yoga Pro 7 14IRH G8 LEN145-3K, IPS, 3072x1920, 14.5" | MSI Katana 17 B13VFK B173HAN04.9, IPS LED, 1920x1080, 17.3" | |
|---|---|---|---|---|---|---|
| Display | 3% | 4% | -13% | 2% | -49% | |
| Display P3 Coverage (%) | 96.61 | 99.82 3% | 95.3 -1% | 71.2 -26% | 98.7 2% | 40.8 -58% |
| sRGB Coverage (%) | 99.92 | 99.99 0% | 99.1 -1% | 98.8 -1% | 100 0% | 61 -39% |
| AdobeRGB 1998 Coverage (%) | 84.63 | 90.21 7% | 97.4 15% | 73.3 -13% | 87.6 4% | 42.2 -50% |
| Response Times | -117% | 61% | -160% | -419% | -505% | |
| Response Time Grey 50% / Grey 80% * (ms) | 3.8 ? | 11 ? -189% | 2 ? 47% | 14.5 ? -282% | 31.5 ? -729% | 33 ? -768% |
| Response Time Black / White * (ms) | 7.6 ? | 11 ? -45% | 2 ? 74% | 10.4 ? -37% | 15.8 ? -108% | 26 ? -242% |
| PWM Frequency (Hz) | 7400 ? | 250 ? | ||||
| Screen | 16% | 2% | 8% | 26% | -111% | |
| Brightness middle (cd/m²) | 486 | 498 2% | 403 -17% | 405.7 -17% | 441 -9% | 267 -45% |
| Brightness (cd/m²) | 469 | 502 7% | 408 -13% | 368 -22% | 453 -3% | 256 -45% |
| Brightness Distribution (%) | 91 | 94 3% | 98 8% | 87 -4% | 92 1% | 93 2% |
| Black Level * (cd/m²) | 0.39 | 0.11 72% | 0.38 3% | 0.34 13% | 0.21 46% | |
| Contrast (:1) | 1246 | 4527 263% | 1068 -14% | 1297 4% | 1271 2% | |
| Colorchecker dE 2000 * | 2.27 | 1.87 18% | 2.63 -16% | 1.65 27% | 0.6 74% | 4.7 -107% |
| Colorchecker dE 2000 max. * | 5.73 | 6.15 -7% | 4.07 29% | 4.2 27% | 1.3 77% | 20.4 -256% |
| Colorchecker dE 2000 calibrated * | 0.6 | 1.94 -223% | 0.53 12% | 0.6 -0% | 4.5 -650% | |
| Greyscale dE 2000 * | 3.36 | 3.15 6% | 2.69 20% | 1.2 64% | 0.8 76% | 1.5 55% |
| Gamma | 2.46 89% | 330.95 1% | 2.48 89% | 2.3 96% | 2.2 100% | 2.12 104% |
| CCT | 6625 98% | 7294 89% | 6907 94% | 6453 101% | 6597 99% | 6552 99% |
| Moyenne finale (programmes/paramètres) | -33% /
-6% | 22% /
13% | -55% /
-20% | -130% /
-43% | -222% /
-154% |
* ... Moindre est la valeur, meilleures sont les performances
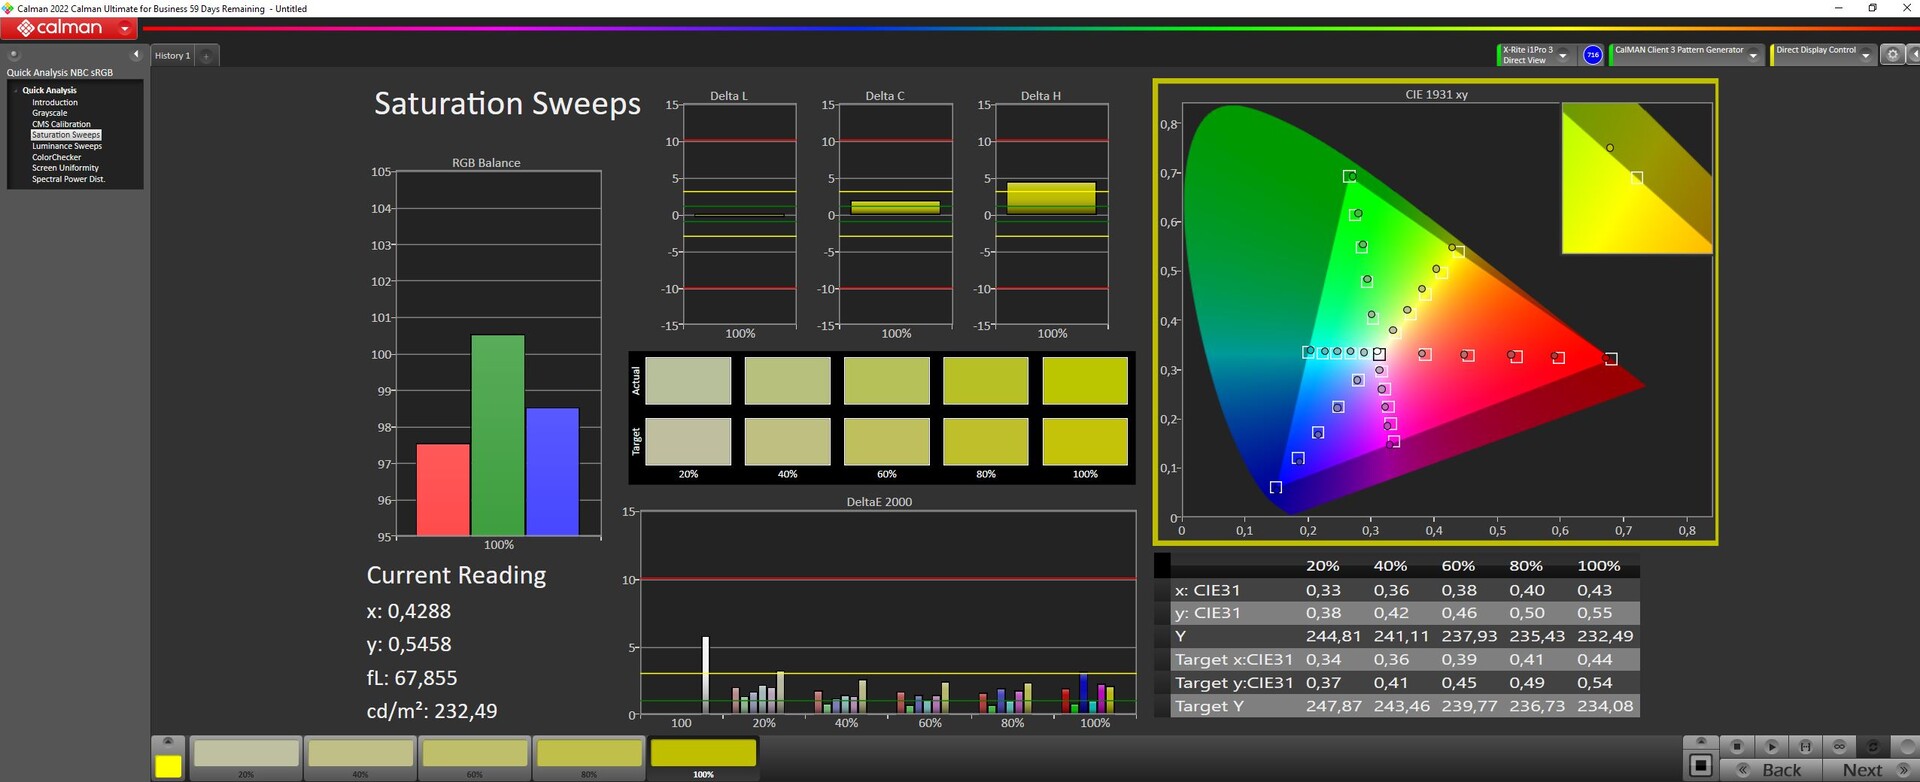
Asus annonce que l'appareil offre 100 % de DCI P3 et nous avons mesuré environ 97 %. AdobeRGB est couvert à environ 85% et sRGB complètement.
Pour une meilleure précision des couleurs, il est utile de réduire la luminosité de la X16 à environ 50 %. Par la suite, le DeltaE en niveaux de gris passe de 3,36 à seulement 2. En outre, le DeltaE de ColorChecker diminue encore. Un nouvel étalonnage à l'aide de i1Profiler n'a pas vraiment de sens.
Temps de réponse de l'écran
| ↔ Temps de réponse noir à blanc | ||
|---|---|---|
| 7.6 ms ... hausse ↗ et chute ↘ combinées | ↗ 4 ms hausse | 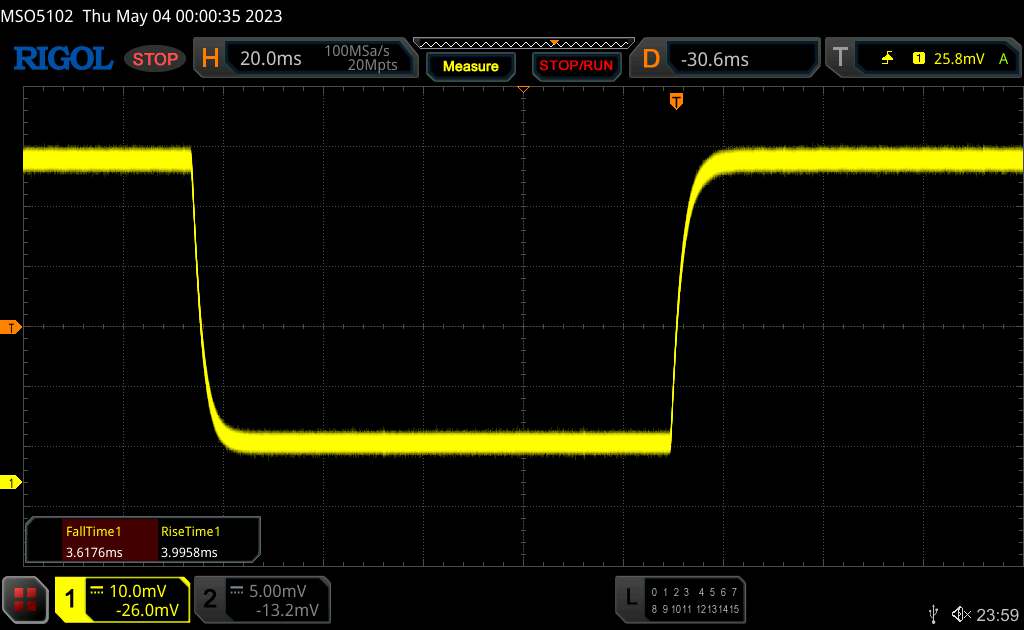 |
| ↘ 3.6 ms chute | ||
| L'écran montre de très faibles temps de réponse, parfait pour le jeu. En comparaison, tous les appareils testés affichent entre 0.1 (minimum) et 240 (maximum) ms. » 22 % des appareils testés affichent de meilleures performances. Cela signifie que les latences relevées sont meilleures que la moyenne (19.8 ms) de tous les appareils testés. | ||
| ↔ Temps de réponse gris 50% à gris 80% | ||
| 3.8 ms ... hausse ↗ et chute ↘ combinées | ↗ 1.8 ms hausse |  |
| ↘ 2 ms chute | ||
| L'écran montre de très faibles temps de réponse, parfait pour le jeu. En comparaison, tous les appareils testés affichent entre 0.165 (minimum) et 636 (maximum) ms. » 15 % des appareils testés affichent de meilleures performances. Cela signifie que les latences relevées sont meilleures que la moyenne (31 ms) de tous les appareils testés. | ||
Scintillement / MLI (Modulation de largeur d'impulsion)
| Scintillement / MLI (Modulation de largeur d'impulsion) non décelé |  | ||
En comparaison, 52 % des appareils testés n'emploient pas MDI pour assombrir leur écran. Nous avons relevé une moyenne à 7754 (minimum : 5 - maximum : 343500) Hz dans le cas où une MDI était active. | |||
À l'extérieur, la très grande luminosité est utile aussi bien en plein soleil qu'à l'ombre. Vu sous de grands angles, l'écran tactile brillant gêne l'expérience visuelle.

Performance - Une ardoise Asus puissante
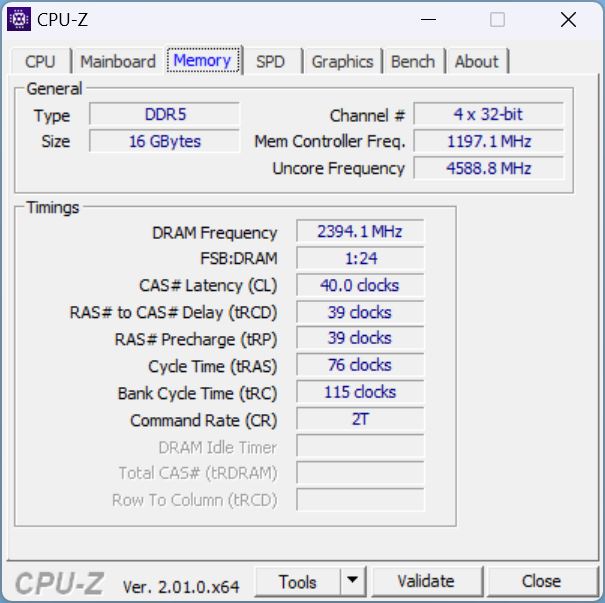
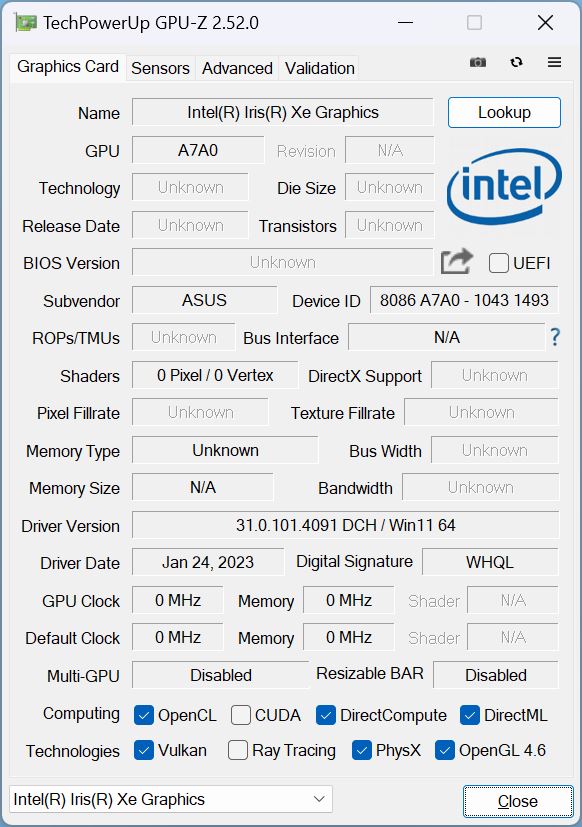
Toutes les configurations ont en commun le Core i9-13900H. Il est combiné en option avec uneRTX 4050, RTX 4060 ou RTX 4070. Selon le site web, les SKUs avec les deux cartes graphiques les plus faibles ne sont équipées que de 8 Go de RAM, la configuration RTX 4070 étant équipée de 16 Go. Cependant, notre modèle est équipé d'une RTX 4060 et de 16 Go de RAM. Il semblerait qu'Asus ait mis à jour notre modèle de test. Par ailleurs, l'appareil peut être équipé d'une mémoire vive allant jusqu'à 64 Go.
Conditions d'essai
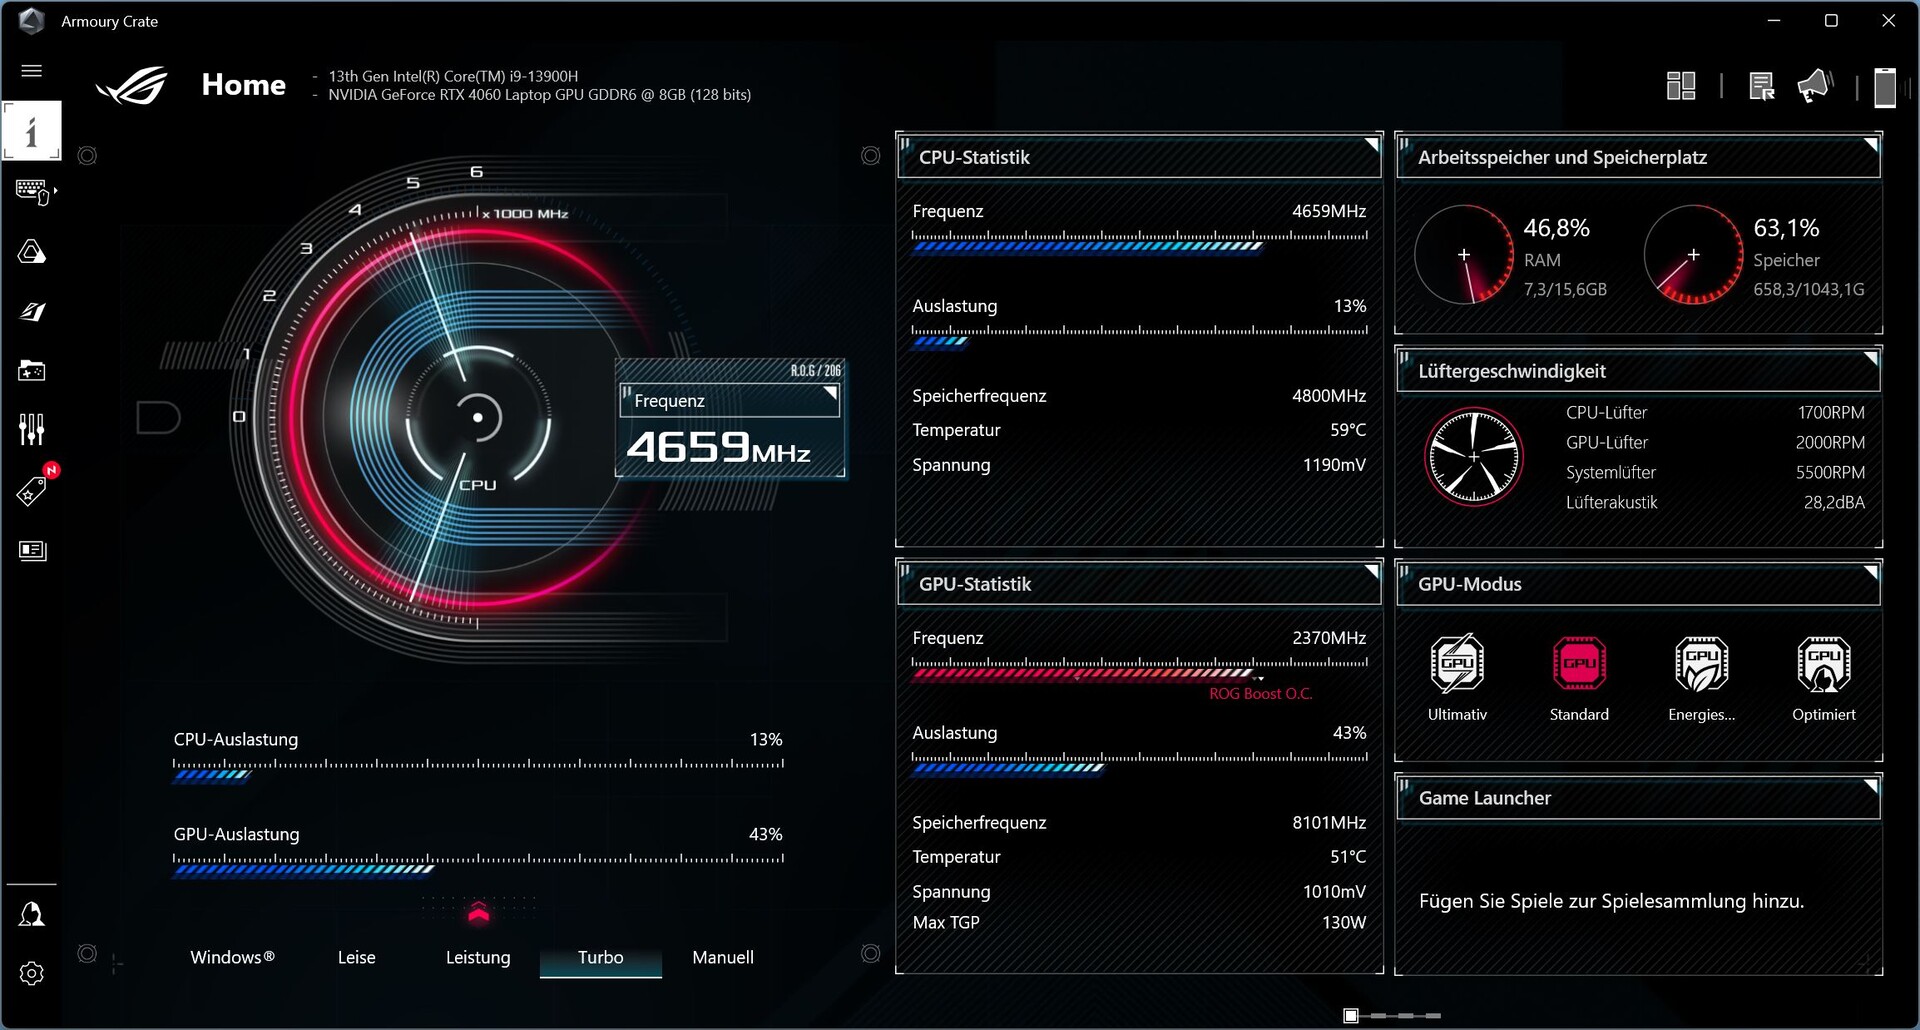
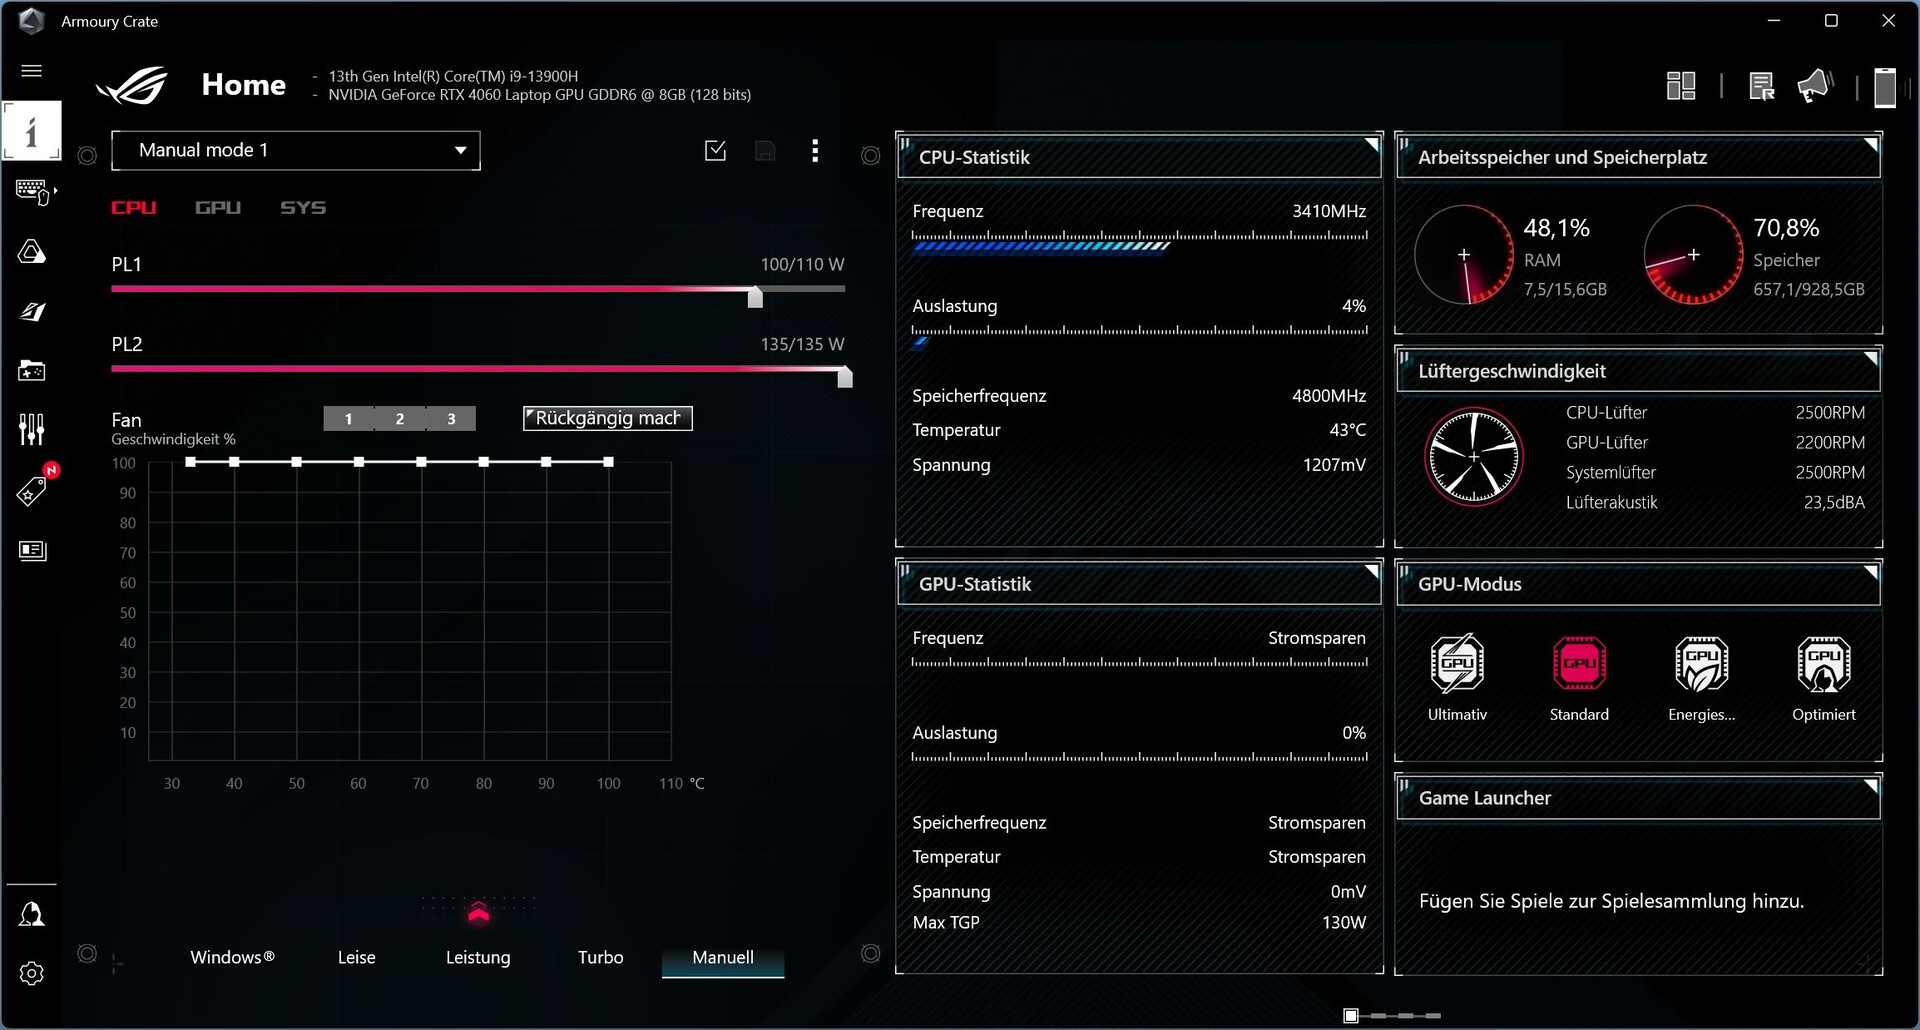
Les ordinateurs portables de jeu Asus sont toujours équipés de deux applications préinstallées par le fabricant, qui font presque penser à des bloatwares. MyAsus est responsable des questions d'assistance, tandis qu'Armory Crate fait office de centre de contrôle et, comme c'est malheureusement la coutume de nos jours, de collecte de données. L'application n'est pas encore très mûre, surtout en ce qui concerne la traduction. Il y a continuellement des parties manquantes ou coupées. En outre, l'application se met parfois à jour volontairement au démarrage, ce qui signifie que l'utilisateur doit attendre longtemps avant d'avoir accès à des éléments tels que les modes de performance - c'est ennuyeux !
Il existe au total quatre modes de performance (Windows, Silence, Performance, Turbo, Manuel). Afin d'obtenir les meilleurs résultats de benchmarking, nous avons opté pour le mode turbo. Nous présentons néanmoins tous les résultats obtenus en utilisant les autres modes. Vous trouverez également ici le commutateur MUX, c'est-à-dire la commutation entre l'iGPU et le dGPU.
Processeur
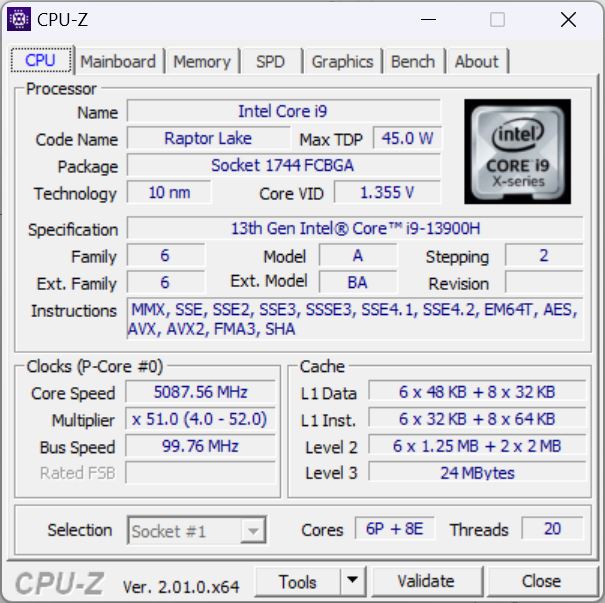
Malgré son boîtier mince, le X16 abrite un Intel Core i9-13900Hun processeur Raptor Lake haut de gamme avec 6 cœurs P et 8 cœurs E qui peuvent fonctionner de 1,9 GHz (vitesse d'horloge de base du cœur E) à 5,4 GHz (turbo à cœur unique).
Comme la nouvelle série H n'a pratiquement pas changé par rapport à la série Alder Lake, il n'est pas surprenant que le X16 ne puisse pas se démarquer de la concurrence de l'année dernière. Le Lenovo Legion Pro 7avec son processeur HX, est dans une autre catégorie. Cependant, il est impressionnant que le score soit supérieur de 10 % à la moyenne de notre base de données pour le i9-13900H, malgré la minceur de l'appareil.
Après les deux ou trois premières exécutions, la valeur a quelque peu baissé. Ci-dessous, vous trouverez le TDP du processeur en fonction du mode de performance sélectionné, bien que ces valeurs soient plus théoriques (HWinfo). En conséquence, le CPU ne consomme guère plus de 100 watts, même en mode turbo dans CinebenchR15, et lors d'une exécution en mode silencieux, le TDP est descendu en dessous de 60 watts.
En mode batterie, le mode silencieux est automatiquement sélectionné. Le mode turbo est bloqué, mais il est théoriquement possible d'activer la puissance.
| Leistungsmodus/TDP der CPU | PL1 | PL2 | Score |
|---|---|---|---|
| Turbo | 110 | 135 | 3.100 |
| Résistance | 100 | 120 | 2.882 |
| Autonomie | 80 | 100 | 2.342 |
| Akku Leistung | 38 | 60 | 2.199 |
| Leçon Akku | 30 | 30 | 1.604 |
Cinebench R15 Multi Continuous Test
Cinebench R23: Multi Core | Single Core
Cinebench R20: CPU (Multi Core) | CPU (Single Core)
Cinebench R15: CPU Multi 64Bit | CPU Single 64Bit
Blender: v2.79 BMW27 CPU
7-Zip 18.03: 7z b 4 | 7z b 4 -mmt1
Geekbench 5.5: Multi-Core | Single-Core
HWBOT x265 Benchmark v2.2: 4k Preset
LibreOffice : 20 Documents To PDF
R Benchmark 2.5: Overall mean
| CPU Performance rating | |
| Lenovo Legion Pro 7 16IRX8H | |
| Moyenne de la classe Gaming | |
| Asus ROG Flow X16 GV601V | |
| Asus ROG Zephyrus M16 GU604VY-NM042X | |
| Apple MacBook Pro 16 2023 M2 Max -6! | |
| MSI Creator Z16P B12UHST | |
| Moyenne Intel Core i9-13900H | |
| Lenovo Legion Slim 7-16IAH 82TF004YGE | |
| MSI Katana 17 B13VFK | |
| Razer Blade 15 OLED (Early 2022) | |
| Lenovo Legion S7 16ARHA7 | |
| Asus ROG Flow X16 GV601RW-M5082W | |
| Corsair Voyager a1600 | |
| Cinebench R20 / CPU (Multi Core) | |
| Lenovo Legion Pro 7 16IRX8H | |
| Moyenne de la classe Gaming (4029 - 16433, n=106, 2 dernières années) | |
| Asus ROG Flow X16 GV601V | |
| Asus ROG Zephyrus M16 GU604VY-NM042X | |
| MSI Creator Z16P B12UHST | |
| Lenovo Legion Slim 7-16IAH 82TF004YGE | |
| Moyenne Intel Core i9-13900H (4935 - 7716, n=25) | |
| Razer Blade 15 OLED (Early 2022) | |
| MSI Katana 17 B13VFK | |
| Lenovo Legion S7 16ARHA7 | |
| Asus ROG Flow X16 GV601RW-M5082W | |
| Corsair Voyager a1600 | |
| Apple MacBook Pro 16 2023 M2 Max | |
| Cinebench R20 / CPU (Single Core) | |
| Lenovo Legion Pro 7 16IRX8H | |
| Moyenne de la classe Gaming (442 - 913, n=106, 2 dernières années) | |
| Asus ROG Flow X16 GV601V | |
| Asus ROG Zephyrus M16 GU604VY-NM042X | |
| MSI Creator Z16P B12UHST | |
| Moyenne Intel Core i9-13900H (428 - 792, n=25) | |
| MSI Katana 17 B13VFK | |
| Lenovo Legion Slim 7-16IAH 82TF004YGE | |
| Razer Blade 15 OLED (Early 2022) | |
| Lenovo Legion S7 16ARHA7 | |
| Asus ROG Flow X16 GV601RW-M5082W | |
| Corsair Voyager a1600 | |
| Apple MacBook Pro 16 2023 M2 Max | |
| Cinebench R15 / CPU Multi 64Bit | |
| Lenovo Legion Pro 7 16IRX8H | |
| Moyenne de la classe Gaming (1578 - 6330, n=105, 2 dernières années) | |
| Asus ROG Flow X16 GV601V | |
| Asus ROG Zephyrus M16 GU604VY-NM042X | |
| MSI Creator Z16P B12UHST | |
| Lenovo Legion Slim 7-16IAH 82TF004YGE | |
| Moyenne Intel Core i9-13900H (2061 - 3100, n=26) | |
| Razer Blade 15 OLED (Early 2022) | |
| Lenovo Legion S7 16ARHA7 | |
| MSI Katana 17 B13VFK | |
| Asus ROG Flow X16 GV601RW-M5082W | |
| Corsair Voyager a1600 | |
| Apple MacBook Pro 16 2023 M2 Max | |
| Cinebench R15 / CPU Single 64Bit | |
| Lenovo Legion Pro 7 16IRX8H | |
| Moyenne de la classe Gaming (188.8 - 350, n=106, 2 dernières années) | |
| Asus ROG Zephyrus M16 GU604VY-NM042X | |
| Asus ROG Flow X16 GV601V | |
| MSI Creator Z16P B12UHST | |
| Moyenne Intel Core i9-13900H (211 - 297, n=26) | |
| MSI Katana 17 B13VFK | |
| Lenovo Legion S7 16ARHA7 | |
| Lenovo Legion Slim 7-16IAH 82TF004YGE | |
| Razer Blade 15 OLED (Early 2022) | |
| Corsair Voyager a1600 | |
| Asus ROG Flow X16 GV601RW-M5082W | |
| Apple MacBook Pro 16 2023 M2 Max | |
| Blender / v2.79 BMW27 CPU | |
| Corsair Voyager a1600 | |
| Asus ROG Flow X16 GV601RW-M5082W | |
| Razer Blade 15 OLED (Early 2022) | |
| MSI Katana 17 B13VFK | |
| Lenovo Legion S7 16ARHA7 | |
| Moyenne Intel Core i9-13900H (166 - 268, n=24) | |
| MSI Creator Z16P B12UHST | |
| Lenovo Legion Slim 7-16IAH 82TF004YGE | |
| Asus ROG Flow X16 GV601V | |
| Asus ROG Zephyrus M16 GU604VY-NM042X | |
| Moyenne de la classe Gaming (79 - 330, n=104, 2 dernières années) | |
| Lenovo Legion Pro 7 16IRX8H | |
| 7-Zip 18.03 / 7z b 4 -mmt1 | |
| Lenovo Legion Pro 7 16IRX8H | |
| Moyenne de la classe Gaming (4199 - 7436, n=105, 2 dernières années) | |
| Asus ROG Flow X16 GV601V | |
| Asus ROG Zephyrus M16 GU604VY-NM042X | |
| MSI Creator Z16P B12UHST | |
| Lenovo Legion S7 16ARHA7 | |
| Moyenne Intel Core i9-13900H (3665 - 6600, n=25) | |
| Corsair Voyager a1600 | |
| MSI Katana 17 B13VFK | |
| Asus ROG Flow X16 GV601RW-M5082W | |
| Lenovo Legion Slim 7-16IAH 82TF004YGE | |
| Razer Blade 15 OLED (Early 2022) | |
| HWBOT x265 Benchmark v2.2 / 4k Preset | |
| Lenovo Legion Pro 7 16IRX8H | |
| Moyenne de la classe Gaming (11.5 - 44.4, n=105, 2 dernières années) | |
| Asus ROG Zephyrus M16 GU604VY-NM042X | |
| Asus ROG Flow X16 GV601V | |
| MSI Creator Z16P B12UHST | |
| Lenovo Legion Slim 7-16IAH 82TF004YGE | |
| Moyenne Intel Core i9-13900H (14.1 - 22.3, n=25) | |
| Lenovo Legion S7 16ARHA7 | |
| Razer Blade 15 OLED (Early 2022) | |
| MSI Katana 17 B13VFK | |
| Corsair Voyager a1600 | |
| Asus ROG Flow X16 GV601RW-M5082W | |
| LibreOffice / 20 Documents To PDF | |
| Corsair Voyager a1600 | |
| MSI Katana 17 B13VFK | |
| Asus ROG Flow X16 GV601RW-M5082W | |
| Razer Blade 15 OLED (Early 2022) | |
| Asus ROG Zephyrus M16 GU604VY-NM042X | |
| Moyenne de la classe Gaming (33.2 - 88.8, n=105, 2 dernières années) | |
| Lenovo Legion S7 16ARHA7 | |
| Moyenne Intel Core i9-13900H (34.4 - 82.8, n=25) | |
| Lenovo Legion Pro 7 16IRX8H | |
| Lenovo Legion Slim 7-16IAH 82TF004YGE | |
| MSI Creator Z16P B12UHST | |
| Asus ROG Flow X16 GV601V | |
| R Benchmark 2.5 / Overall mean | |
| Razer Blade 15 OLED (Early 2022) | |
| Asus ROG Flow X16 GV601RW-M5082W | |
| Corsair Voyager a1600 | |
| Lenovo Legion Slim 7-16IAH 82TF004YGE | |
| Lenovo Legion S7 16ARHA7 | |
| Moyenne Intel Core i9-13900H (0.4052 - 0.723, n=25) | |
| MSI Katana 17 B13VFK | |
| MSI Creator Z16P B12UHST | |
| Moyenne de la classe Gaming (0.3439 - 0.759, n=106, 2 dernières années) | |
| Asus ROG Flow X16 GV601V | |
| Asus ROG Zephyrus M16 GU604VY-NM042X | |
| Lenovo Legion Pro 7 16IRX8H | |
* ... Moindre est la valeur, meilleures sont les performances
AIDA64: FP32 Ray-Trace | FPU Julia | CPU SHA3 | CPU Queen | FPU SinJulia | FPU Mandel | CPU AES | CPU ZLib | FP64 Ray-Trace | CPU PhotoWorxx
| Performance rating | |
| Moyenne de la classe Gaming | |
| Asus ROG Flow X16 GV601RW-M5082W | |
| Lenovo Legion S7 16ARHA7 | |
| Corsair Voyager a1600 | |
| Asus ROG Flow X16 GV601V | |
| Lenovo Legion Slim 7-16IAH 82TF004YGE | |
| Moyenne Intel Core i9-13900H | |
| Razer Blade 15 OLED (Early 2022) | |
| MSI Creator Z16P B12UHST | |
| MSI Katana 17 B13VFK | |
| AIDA64 / FP32 Ray-Trace | |
| Moyenne de la classe Gaming (10227 - 85542, n=105, 2 dernières années) | |
| Lenovo Legion Slim 7-16IAH 82TF004YGE | |
| Asus ROG Flow X16 GV601RW-M5082W | |
| Lenovo Legion S7 16ARHA7 | |
| Corsair Voyager a1600 | |
| Moyenne Intel Core i9-13900H (6788 - 19557, n=25) | |
| MSI Katana 17 B13VFK | |
| Razer Blade 15 OLED (Early 2022) | |
| Asus ROG Flow X16 GV601V | |
| MSI Creator Z16P B12UHST | |
| AIDA64 / FPU Julia | |
| Moyenne de la classe Gaming (51376 - 238426, n=105, 2 dernières années) | |
| Lenovo Legion S7 16ARHA7 | |
| Asus ROG Flow X16 GV601RW-M5082W | |
| Corsair Voyager a1600 | |
| Asus ROG Flow X16 GV601V | |
| Lenovo Legion Slim 7-16IAH 82TF004YGE | |
| Moyenne Intel Core i9-13900H (22551 - 95579, n=25) | |
| Razer Blade 15 OLED (Early 2022) | |
| MSI Katana 17 B13VFK | |
| MSI Creator Z16P B12UHST | |
| AIDA64 / CPU SHA3 | |
| Moyenne de la classe Gaming (2180 - 10115, n=105, 2 dernières années) | |
| Asus ROG Flow X16 GV601V | |
| Lenovo Legion Slim 7-16IAH 82TF004YGE | |
| Asus ROG Flow X16 GV601RW-M5082W | |
| Lenovo Legion S7 16ARHA7 | |
| Moyenne Intel Core i9-13900H (2491 - 4270, n=25) | |
| Corsair Voyager a1600 | |
| Razer Blade 15 OLED (Early 2022) | |
| MSI Creator Z16P B12UHST | |
| MSI Katana 17 B13VFK | |
| AIDA64 / CPU Queen | |
| Moyenne de la classe Gaming (49785 - 173351, n=90, 2 dernières années) | |
| Asus ROG Flow X16 GV601V | |
| Lenovo Legion S7 16ARHA7 | |
| MSI Creator Z16P B12UHST | |
| Razer Blade 15 OLED (Early 2022) | |
| Corsair Voyager a1600 | |
| Moyenne Intel Core i9-13900H (65121 - 120936, n=25) | |
| Asus ROG Flow X16 GV601RW-M5082W | |
| Lenovo Legion Slim 7-16IAH 82TF004YGE | |
| MSI Katana 17 B13VFK | |
| AIDA64 / FPU SinJulia | |
| Moyenne de la classe Gaming (4424 - 33636, n=105, 2 dernières années) | |
| Corsair Voyager a1600 | |
| Lenovo Legion S7 16ARHA7 | |
| Asus ROG Flow X16 GV601RW-M5082W | |
| Asus ROG Flow X16 GV601V | |
| MSI Creator Z16P B12UHST | |
| Lenovo Legion Slim 7-16IAH 82TF004YGE | |
| Razer Blade 15 OLED (Early 2022) | |
| Moyenne Intel Core i9-13900H (6108 - 11631, n=25) | |
| MSI Katana 17 B13VFK | |
| AIDA64 / FPU Mandel | |
| Moyenne de la classe Gaming (25115 - 128721, n=105, 2 dernières années) | |
| Lenovo Legion S7 16ARHA7 | |
| Asus ROG Flow X16 GV601RW-M5082W | |
| Corsair Voyager a1600 | |
| Asus ROG Flow X16 GV601V | |
| Lenovo Legion Slim 7-16IAH 82TF004YGE | |
| Moyenne Intel Core i9-13900H (11283 - 48474, n=25) | |
| Razer Blade 15 OLED (Early 2022) | |
| MSI Katana 17 B13VFK | |
| MSI Creator Z16P B12UHST | |
| AIDA64 / CPU AES | |
| Asus ROG Flow X16 GV601RW-M5082W | |
| Lenovo Legion Slim 7-16IAH 82TF004YGE | |
| Lenovo Legion S7 16ARHA7 | |
| Corsair Voyager a1600 | |
| Moyenne de la classe Gaming (39258 - 247074, n=105, 2 dernières années) | |
| MSI Creator Z16P B12UHST | |
| Razer Blade 15 OLED (Early 2022) | |
| Moyenne Intel Core i9-13900H (3691 - 149377, n=25) | |
| Asus ROG Flow X16 GV601V | |
| MSI Katana 17 B13VFK | |
| AIDA64 / CPU ZLib | |
| Moyenne de la classe Gaming (574 - 2531, n=105, 2 dernières années) | |
| Asus ROG Flow X16 GV601V | |
| MSI Creator Z16P B12UHST | |
| Razer Blade 15 OLED (Early 2022) | |
| Moyenne Intel Core i9-13900H (789 - 1254, n=25) | |
| Lenovo Legion Slim 7-16IAH 82TF004YGE | |
| Asus ROG Flow X16 GV601RW-M5082W | |
| Lenovo Legion S7 16ARHA7 | |
| Corsair Voyager a1600 | |
| MSI Katana 17 B13VFK | |
| AIDA64 / FP64 Ray-Trace | |
| Moyenne de la classe Gaming (5509 - 45446, n=105, 2 dernières années) | |
| Asus ROG Flow X16 GV601V | |
| Asus ROG Flow X16 GV601RW-M5082W | |
| Lenovo Legion S7 16ARHA7 | |
| Lenovo Legion Slim 7-16IAH 82TF004YGE | |
| Corsair Voyager a1600 | |
| Moyenne Intel Core i9-13900H (3655 - 10716, n=25) | |
| MSI Katana 17 B13VFK | |
| Razer Blade 15 OLED (Early 2022) | |
| MSI Creator Z16P B12UHST | |
| AIDA64 / CPU PhotoWorxx | |
| Moyenne de la classe Gaming (12271 - 89891, n=105, 2 dernières années) | |
| MSI Creator Z16P B12UHST | |
| Moyenne Intel Core i9-13900H (10871 - 50488, n=25) | |
| Asus ROG Flow X16 GV601V | |
| Lenovo Legion Slim 7-16IAH 82TF004YGE | |
| Razer Blade 15 OLED (Early 2022) | |
| Razer Blade 15 OLED (Early 2022) | |
| MSI Katana 17 B13VFK | |
| Corsair Voyager a1600 | |
| Asus ROG Flow X16 GV601RW-M5082W | |
| Lenovo Legion S7 16ARHA7 | |
Performance du système
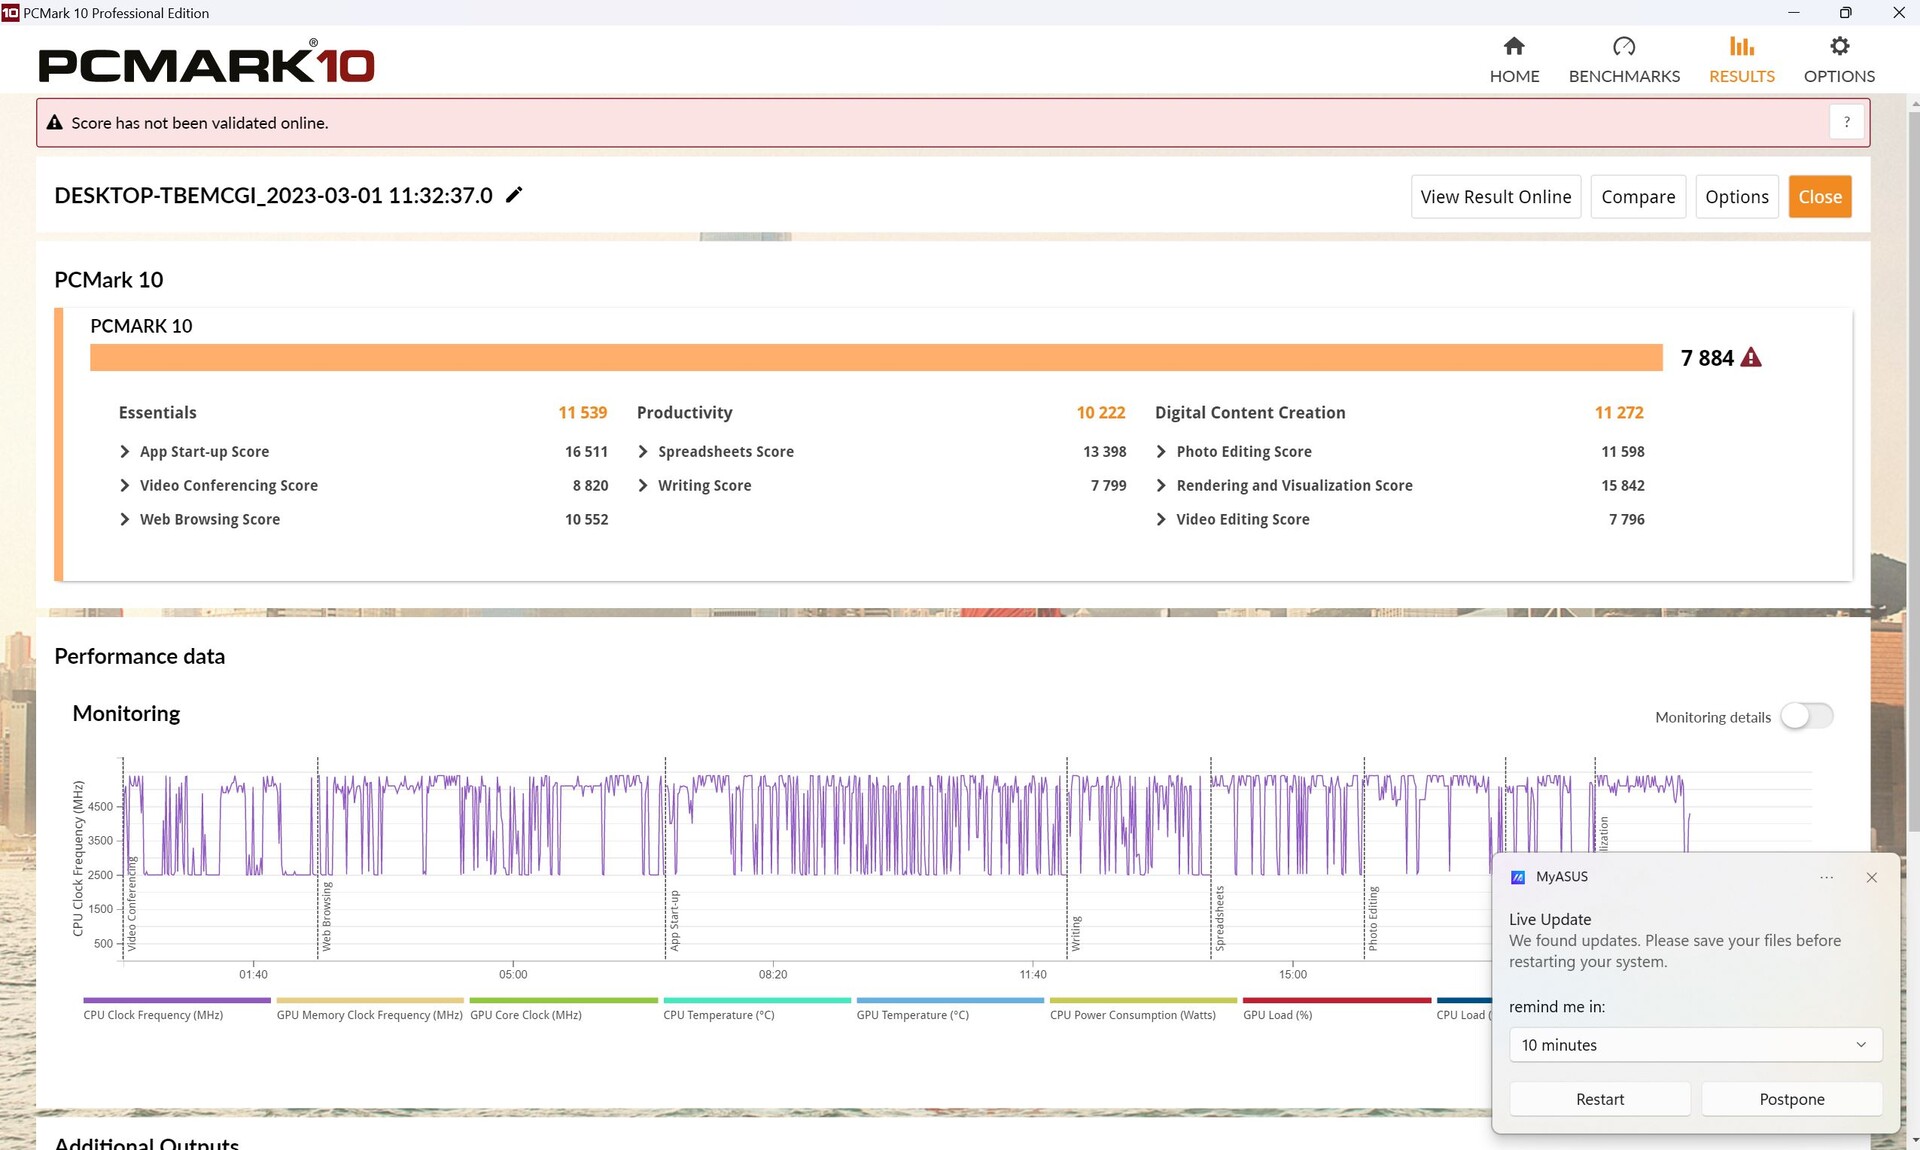
Lors des tests PCMark10, la X16 a obtenu les résultats escomptés, si ce n'est un peu plus. Il n'y a pas eu de valeurs aberrantes ou de creux dans aucun de nos sous-tests.
CrossMark: Overall | Productivity | Creativity | Responsiveness
| PCMark 10 / Score | |
| Moyenne de la classe Gaming (5828 - 12414, n=93, 2 dernières années) | |
| Asus ROG Zephyrus M16 GU604VY-NM042X | |
| MSI Creator Z16P B12UHST | |
| Asus ROG Flow X16 GV601V | |
| Lenovo Legion Pro 7 16IRX8H | |
| Moyenne Intel Core i9-13900H, NVIDIA GeForce RTX 4060 Laptop GPU (7578 - 7884, n=3) | |
| Lenovo Legion S7 16ARHA7 | |
| Lenovo Legion Slim 7-16IAH 82TF004YGE | |
| Razer Blade 15 OLED (Early 2022) | |
| Corsair Voyager a1600 | |
| MSI Katana 17 B13VFK | |
| Asus ROG Flow X16 GV601RW-M5082W | |
| PCMark 10 / Essentials | |
| Lenovo Legion Pro 7 16IRX8H | |
| Asus ROG Zephyrus M16 GU604VY-NM042X | |
| Asus ROG Flow X16 GV601V | |
| Moyenne Intel Core i9-13900H, NVIDIA GeForce RTX 4060 Laptop GPU (11235 - 11539, n=3) | |
| MSI Creator Z16P B12UHST | |
| Lenovo Legion Slim 7-16IAH 82TF004YGE | |
| MSI Katana 17 B13VFK | |
| Lenovo Legion S7 16ARHA7 | |
| Moyenne de la classe Gaming (8810 - 11935, n=97, 2 dernières années) | |
| Razer Blade 15 OLED (Early 2022) | |
| Corsair Voyager a1600 | |
| Asus ROG Flow X16 GV601RW-M5082W | |
| PCMark 10 / Productivity | |
| Moyenne de la classe Gaming (6845 - 25323, n=95, 2 dernières années) | |
| MSI Creator Z16P B12UHST | |
| Asus ROG Zephyrus M16 GU604VY-NM042X | |
| Lenovo Legion Pro 7 16IRX8H | |
| Asus ROG Flow X16 GV601V | |
| Moyenne Intel Core i9-13900H, NVIDIA GeForce RTX 4060 Laptop GPU (9888 - 10222, n=3) | |
| Razer Blade 15 OLED (Early 2022) | |
| Lenovo Legion S7 16ARHA7 | |
| Asus ROG Flow X16 GV601RW-M5082W | |
| Lenovo Legion Slim 7-16IAH 82TF004YGE | |
| MSI Katana 17 B13VFK | |
| Corsair Voyager a1600 | |
| PCMark 10 / Digital Content Creation | |
| Moyenne de la classe Gaming (7602 - 19954, n=95, 2 dernières années) | |
| Asus ROG Zephyrus M16 GU604VY-NM042X | |
| MSI Creator Z16P B12UHST | |
| Lenovo Legion S7 16ARHA7 | |
| Corsair Voyager a1600 | |
| Asus ROG Flow X16 GV601V | |
| Moyenne Intel Core i9-13900H, NVIDIA GeForce RTX 4060 Laptop GPU (10418 - 11272, n=3) | |
| Lenovo Legion Slim 7-16IAH 82TF004YGE | |
| Razer Blade 15 OLED (Early 2022) | |
| Lenovo Legion Pro 7 16IRX8H | |
| MSI Katana 17 B13VFK | |
| Asus ROG Flow X16 GV601RW-M5082W | |
| CrossMark / Overall | |
| Moyenne de la classe Gaming (1366 - 2409, n=94, 2 dernières années) | |
| Asus ROG Zephyrus M16 GU604VY-NM042X | |
| Asus ROG Flow X16 GV601V | |
| Moyenne Intel Core i9-13900H, NVIDIA GeForce RTX 4060 Laptop GPU (1874 - 1983, n=3) | |
| Apple MacBook Pro 16 2023 M2 Max | |
| Lenovo Legion Slim 7-16IAH 82TF004YGE | |
| MSI Katana 17 B13VFK | |
| Razer Blade 15 OLED (Early 2022) | |
| Lenovo Legion S7 16ARHA7 | |
| Asus ROG Flow X16 GV601RW-M5082W | |
| Corsair Voyager a1600 | |
| CrossMark / Productivity | |
| Asus ROG Flow X16 GV601V | |
| Moyenne de la classe Gaming (1386 - 2254, n=94, 2 dernières années) | |
| Asus ROG Zephyrus M16 GU604VY-NM042X | |
| Moyenne Intel Core i9-13900H, NVIDIA GeForce RTX 4060 Laptop GPU (1779 - 1889, n=3) | |
| Lenovo Legion Slim 7-16IAH 82TF004YGE | |
| MSI Katana 17 B13VFK | |
| Lenovo Legion S7 16ARHA7 | |
| Razer Blade 15 OLED (Early 2022) | |
| Apple MacBook Pro 16 2023 M2 Max | |
| Asus ROG Flow X16 GV601RW-M5082W | |
| Corsair Voyager a1600 | |
| CrossMark / Creativity | |
| Apple MacBook Pro 16 2023 M2 Max | |
| Moyenne de la classe Gaming (1343 - 2786, n=94, 2 dernières années) | |
| Asus ROG Zephyrus M16 GU604VY-NM042X | |
| Asus ROG Flow X16 GV601V | |
| Moyenne Intel Core i9-13900H, NVIDIA GeForce RTX 4060 Laptop GPU (2104 - 2195, n=3) | |
| MSI Katana 17 B13VFK | |
| Lenovo Legion Slim 7-16IAH 82TF004YGE | |
| Razer Blade 15 OLED (Early 2022) | |
| Lenovo Legion S7 16ARHA7 | |
| Asus ROG Flow X16 GV601RW-M5082W | |
| Corsair Voyager a1600 | |
| CrossMark / Responsiveness | |
| Lenovo Legion Slim 7-16IAH 82TF004YGE | |
| MSI Katana 17 B13VFK | |
| Moyenne de la classe Gaming (1226 - 2334, n=94, 2 dernières années) | |
| Asus ROG Flow X16 GV601V | |
| Asus ROG Zephyrus M16 GU604VY-NM042X | |
| Moyenne Intel Core i9-13900H, NVIDIA GeForce RTX 4060 Laptop GPU (1548 - 1698, n=3) | |
| Razer Blade 15 OLED (Early 2022) | |
| Lenovo Legion S7 16ARHA7 | |
| Asus ROG Flow X16 GV601RW-M5082W | |
| Apple MacBook Pro 16 2023 M2 Max | |
| Corsair Voyager a1600 | |
| PCMark 10 Score | 7884 points | |
Aide | ||
| AIDA64 / Memory Copy | |
| Moyenne de la classe Gaming (21750 - 129946, n=105, 2 dernières années) | |
| Samsung Galaxy Book3 Ultra 16, i9-13900H RTX 4070 | |
| Lenovo Yoga Pro 7 14IRH G8 | |
| Moyenne Intel Core i9-13900H (37448 - 74486, n=25) | |
| Asus ROG Flow X16 GV601V | |
| Lenovo Legion Pro 5 16IRX8 | |
| MSI Katana 17 B13VFK | |
| Asus ROG Flow X16 GV601RW-M5082W | |
| AIDA64 / Memory Read | |
| Moyenne de la classe Gaming (22956 - 118858, n=105, 2 dernières années) | |
| Samsung Galaxy Book3 Ultra 16, i9-13900H RTX 4070 | |
| Lenovo Yoga Pro 7 14IRH G8 | |
| Asus ROG Flow X16 GV601V | |
| Lenovo Legion Pro 5 16IRX8 | |
| Moyenne Intel Core i9-13900H (41599 - 75433, n=25) | |
| MSI Katana 17 B13VFK | |
| Asus ROG Flow X16 GV601RW-M5082W | |
| AIDA64 / Memory Write | |
| Samsung Galaxy Book3 Ultra 16, i9-13900H RTX 4070 | |
| Moyenne de la classe Gaming (22297 - 135096, n=105, 2 dernières années) | |
| Lenovo Yoga Pro 7 14IRH G8 | |
| Lenovo Legion Pro 5 16IRX8 | |
| Moyenne Intel Core i9-13900H (36152 - 88505, n=25) | |
| Asus ROG Flow X16 GV601V | |
| Asus ROG Flow X16 GV601RW-M5082W | |
| MSI Katana 17 B13VFK | |
| AIDA64 / Memory Latency | |
| Moyenne de la classe Gaming (75.3 - 259, n=105, 2 dernières années) | |
| Lenovo Yoga Pro 7 14IRH G8 | |
| Samsung Galaxy Book3 Ultra 16, i9-13900H RTX 4070 | |
| MSI Katana 17 B13VFK | |
| Asus ROG Flow X16 GV601RW-M5082W | |
| Asus ROG Flow X16 GV601V | |
| Moyenne Intel Core i9-13900H (75.8 - 102.3, n=25) | |
| Lenovo Legion Pro 5 16IRX8 | |
* ... Moindre est la valeur, meilleures sont les performances
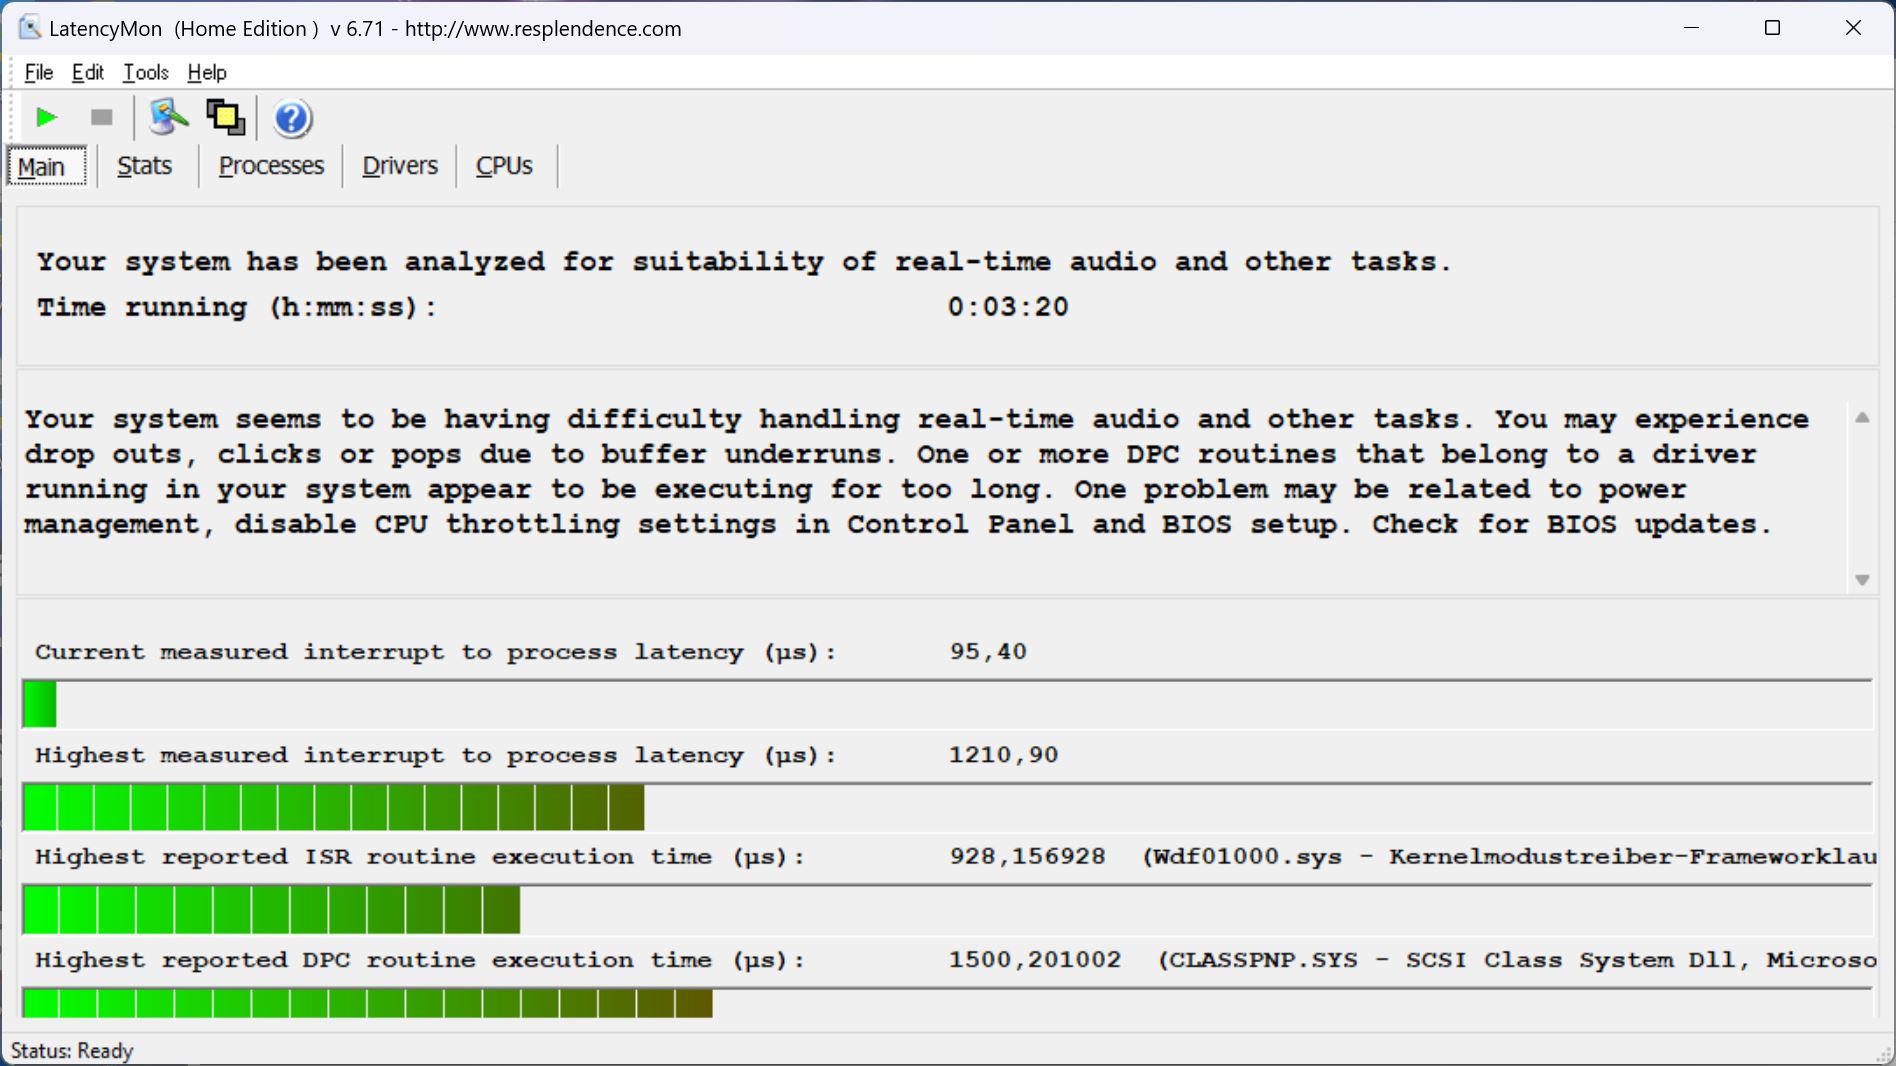
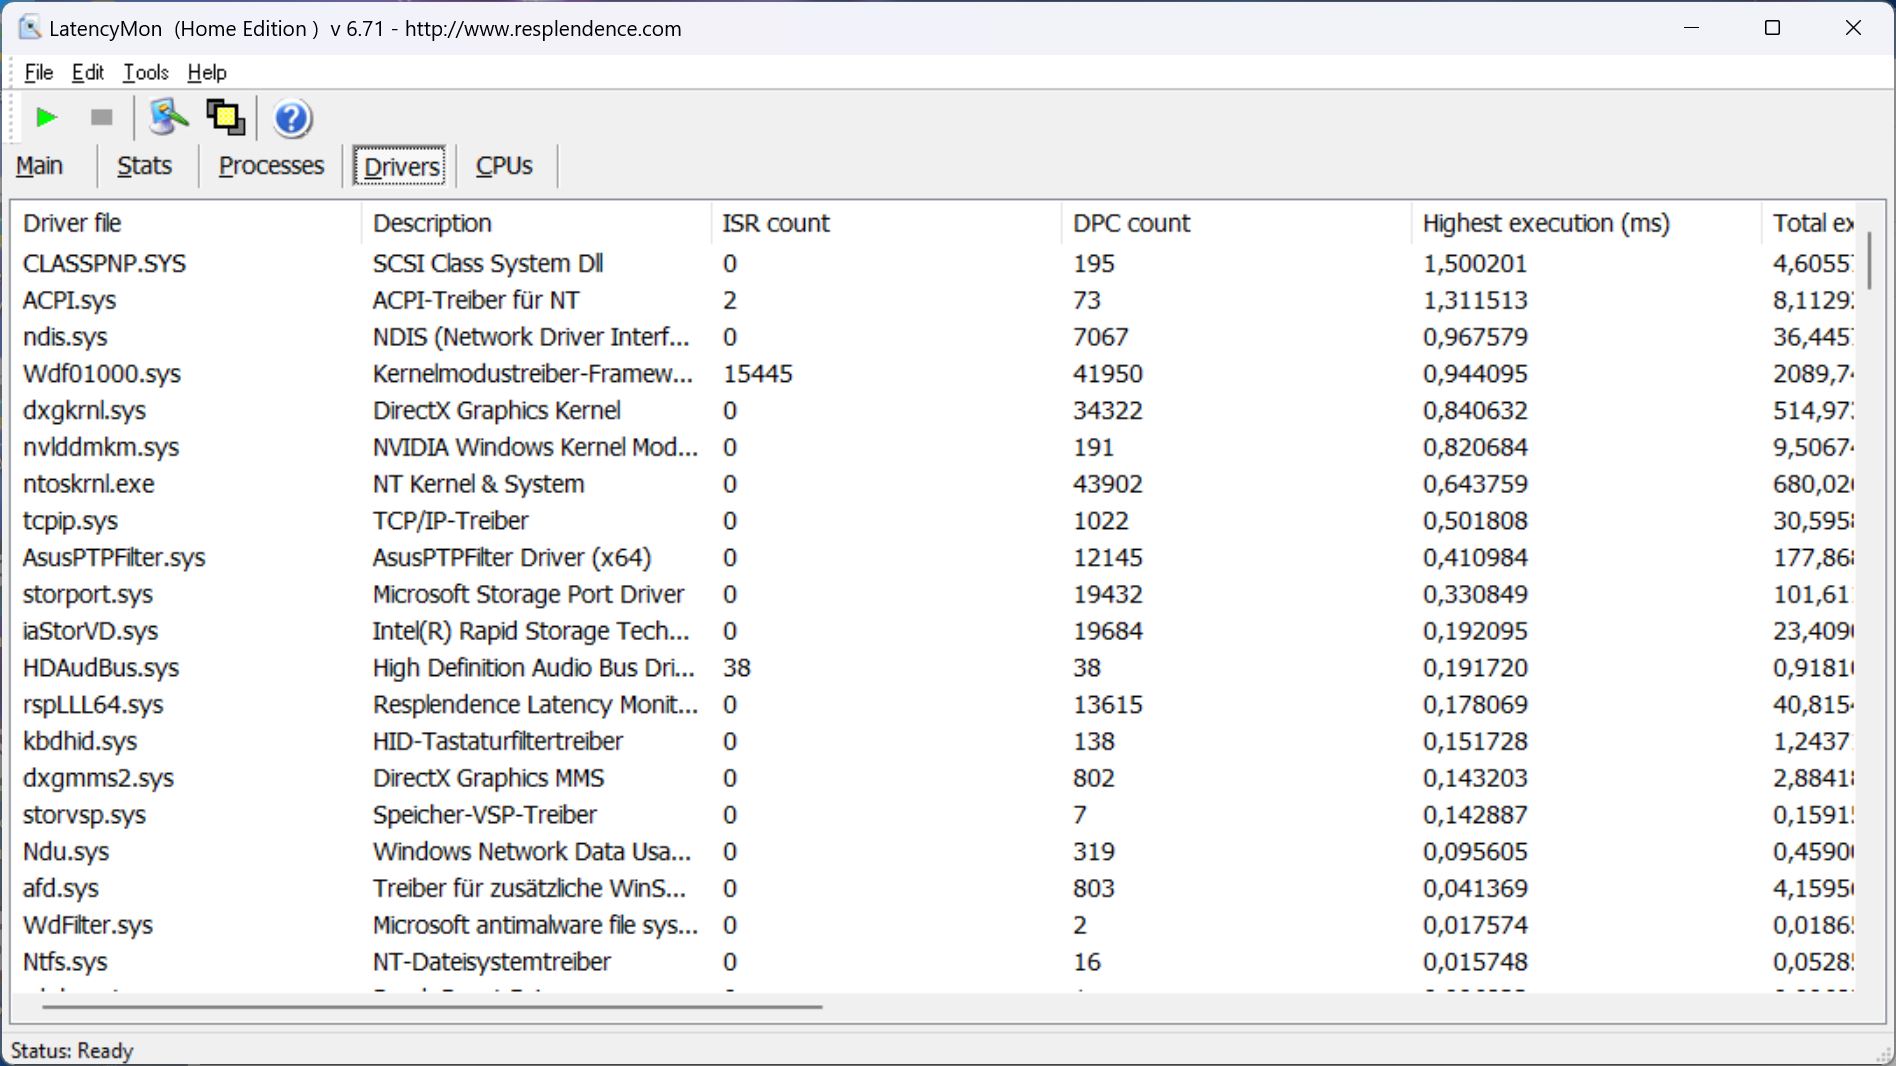
Latences DPC
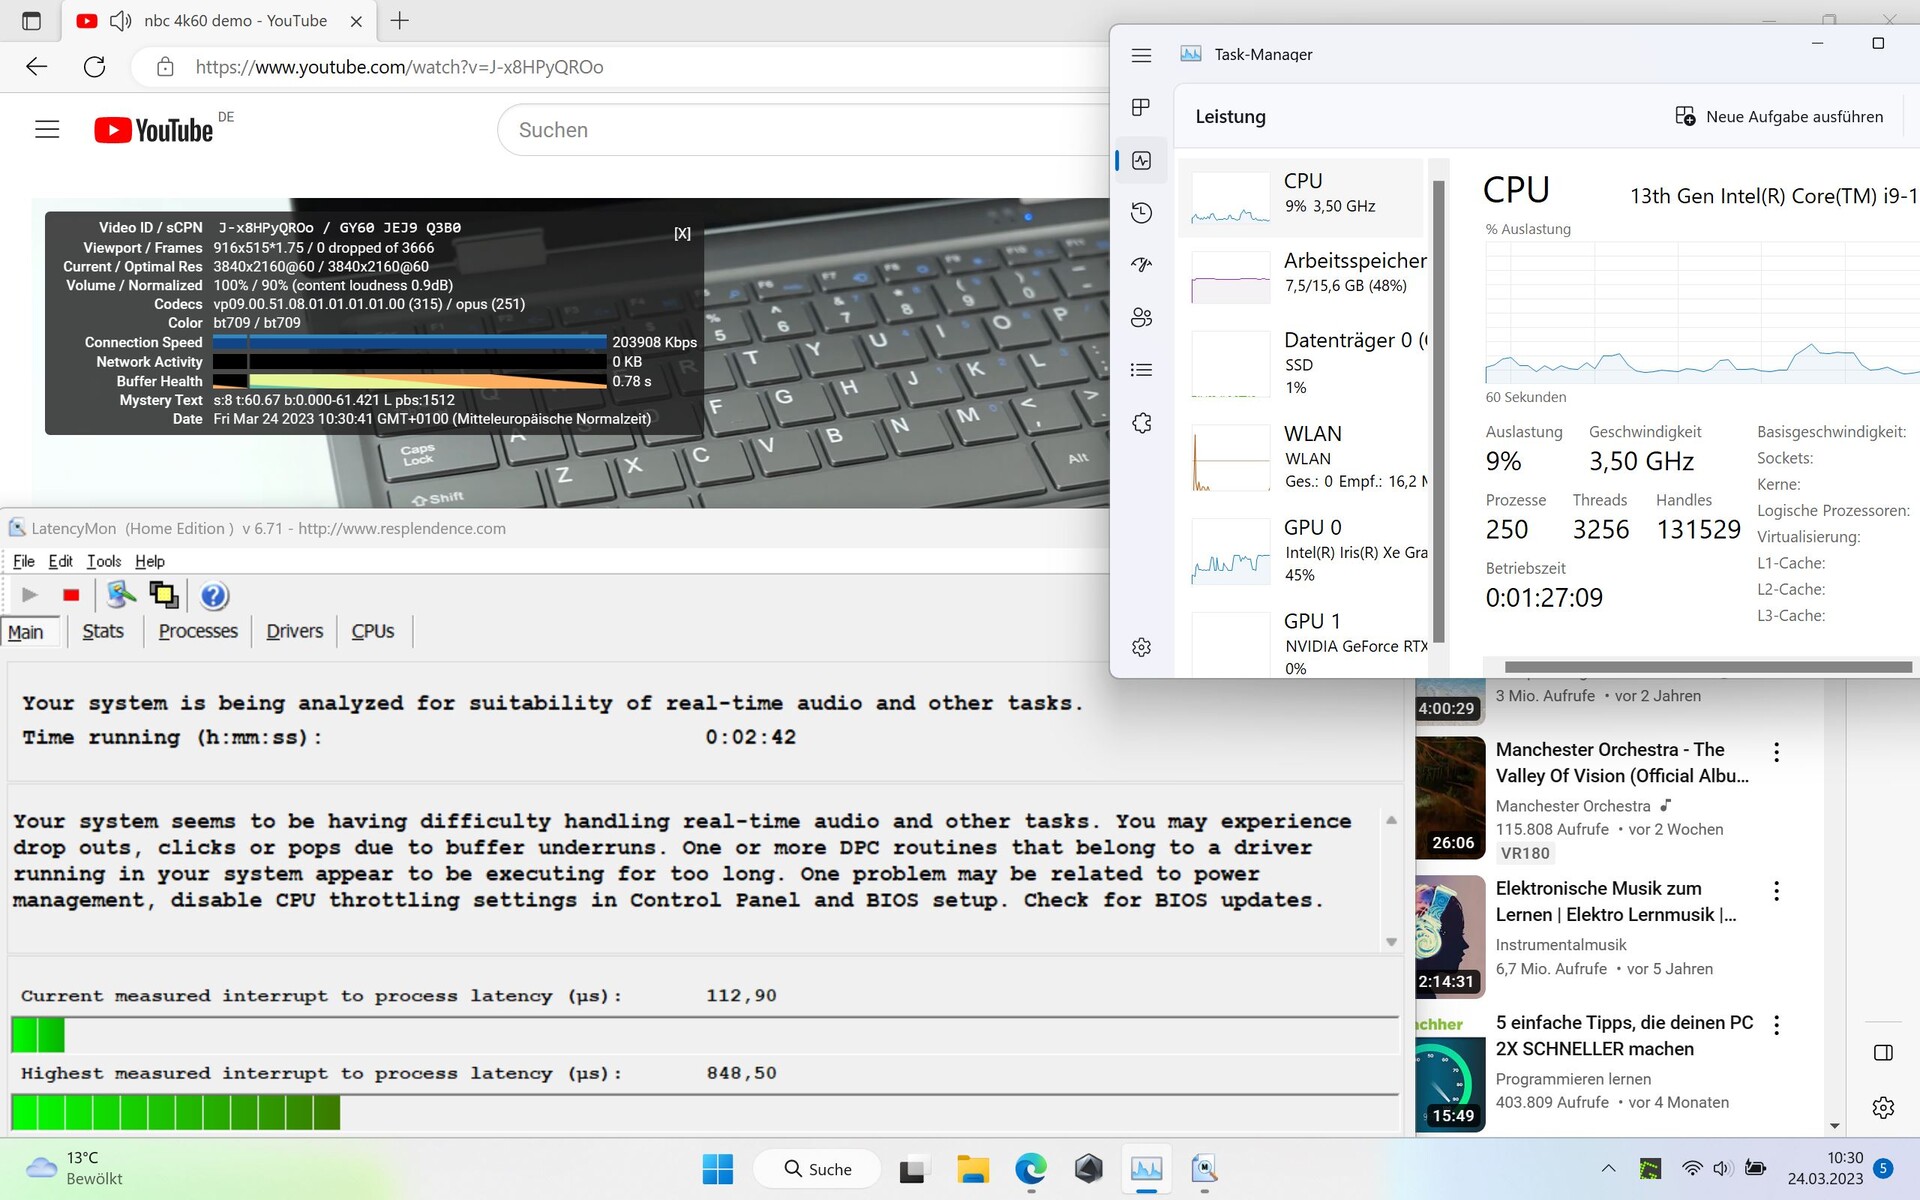
Lors de l'ouverture de plusieurs onglets de navigateur, le logiciel a affiché des latences LatencyMon. Cependant, notre vidéo YouTube 4K/60fps s'est déroulée sans problème et sans perte d'images. Néanmoins, les scores pourraient être un peu moins élevés, en particulier pour le groupe de créateurs de contenu ciblé.
| DPC Latencies / LatencyMon - interrupt to process latency (max), Web, Youtube, Prime95 | |
| Samsung Galaxy Book3 Ultra 16, i9-13900H RTX 4070 | |
| MSI Katana 17 B13VFK | |
| Asus ROG Flow X16 GV601V | |
| Asus ROG Flow X16 GV601RW-M5082W | |
| Lenovo Yoga Pro 7 14IRH G8 | |
| Lenovo Legion Pro 5 16IRX8 | |
* ... Moindre est la valeur, meilleures sont les performances
Mémoire de masse
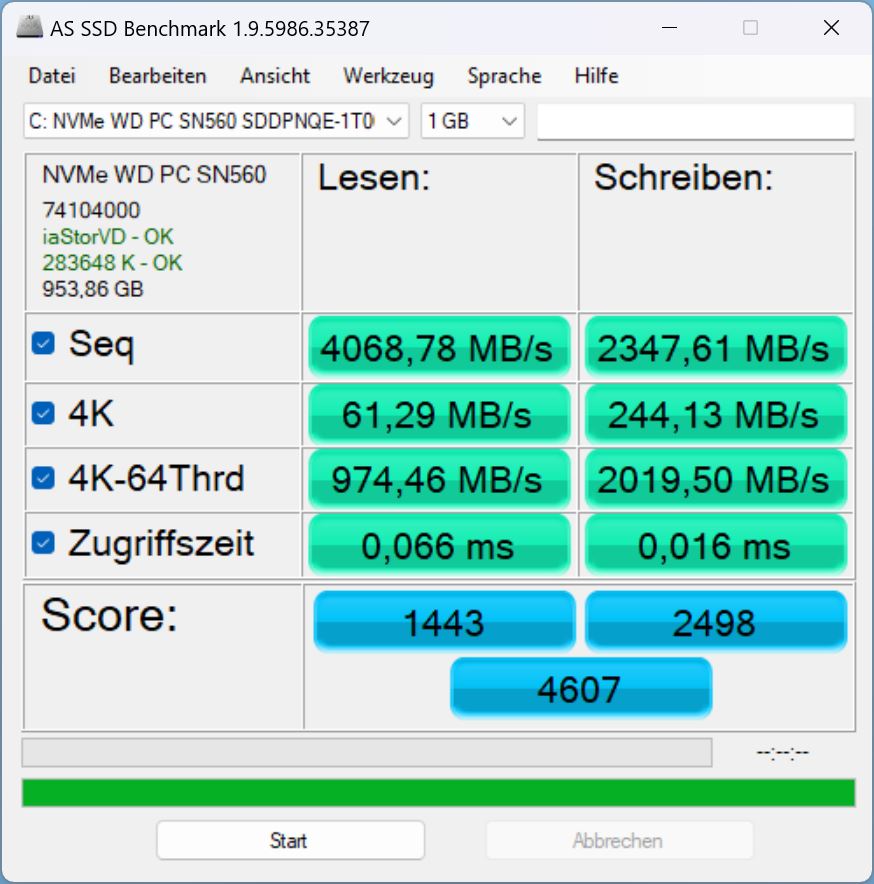
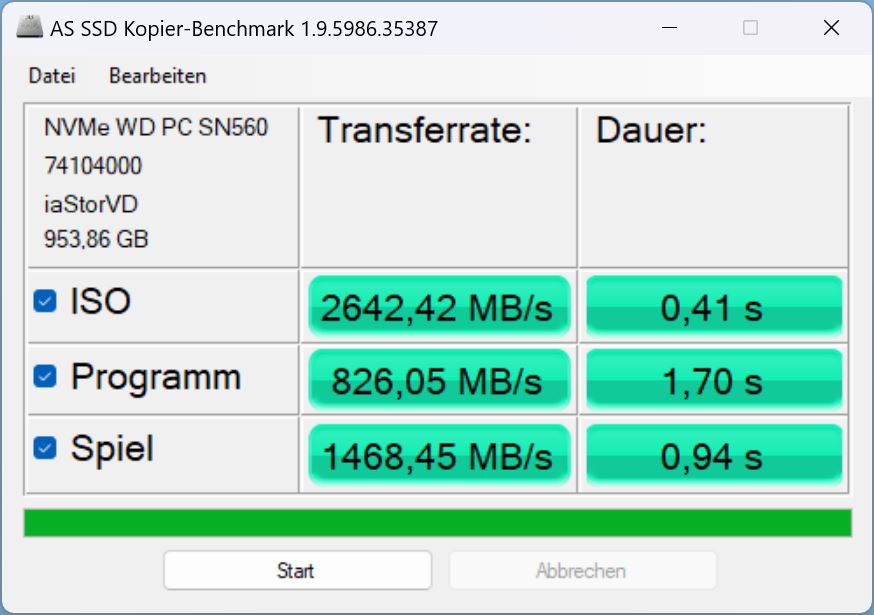
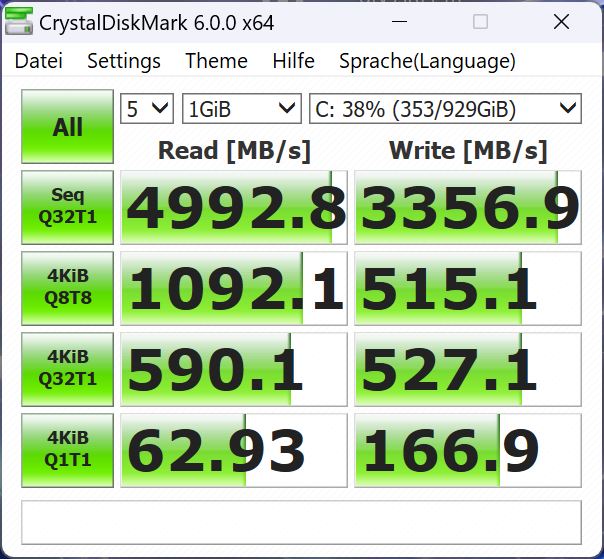
Asus a installé un SSD Western Digital PCIe-4.0-x4-NVMe de 1 To. Une fois de plus, le disque dur se retrouve en queue de peloton dans notreListe des meilleurs disques SSD. Le SSD Micron du modèle précédent était nettement plus rapide, d'environ 42 % en moyenne !
Bien sûr, pour une utilisation domestique, le SSD est suffisamment rapide, mais pour les utilisateurs professionnels - la catégorie à laquelle le X16 est destiné - ce recul des performances est quelque peu regrettable.

* ... Moindre est la valeur, meilleures sont les performances
Continuous performance Read: DiskSpd Read Loop, Queue Depth 8
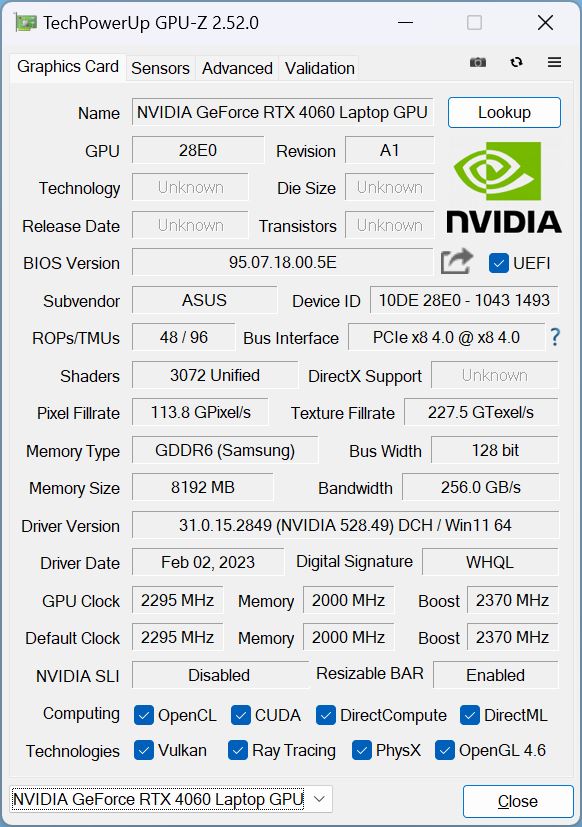
Carte graphique
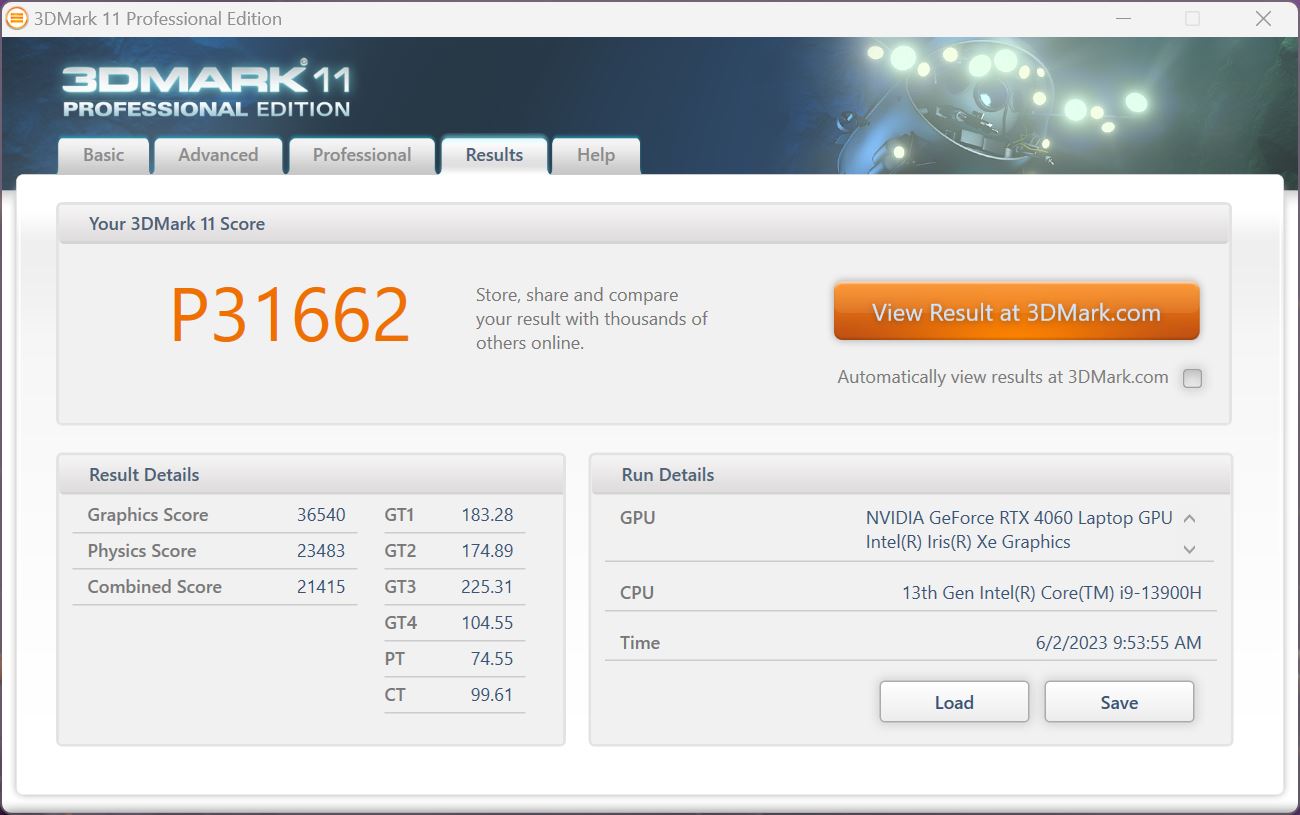
Notre modèle d'évaluation est équipé d'uneNvidia Geforce RTX 4060. UneRTX 4050ou uneRTX 4070sont également disponibles. La carte peut tirer un maximum de 120 watts, y compris un boost dynamique de 20 watts.
Dans les benchmarks 3DMark, ses performances ont été supérieures d'environ 10 % (turbo) à celles de la moyenne des ordinateurs portables RTX 4060 de notre base de données.
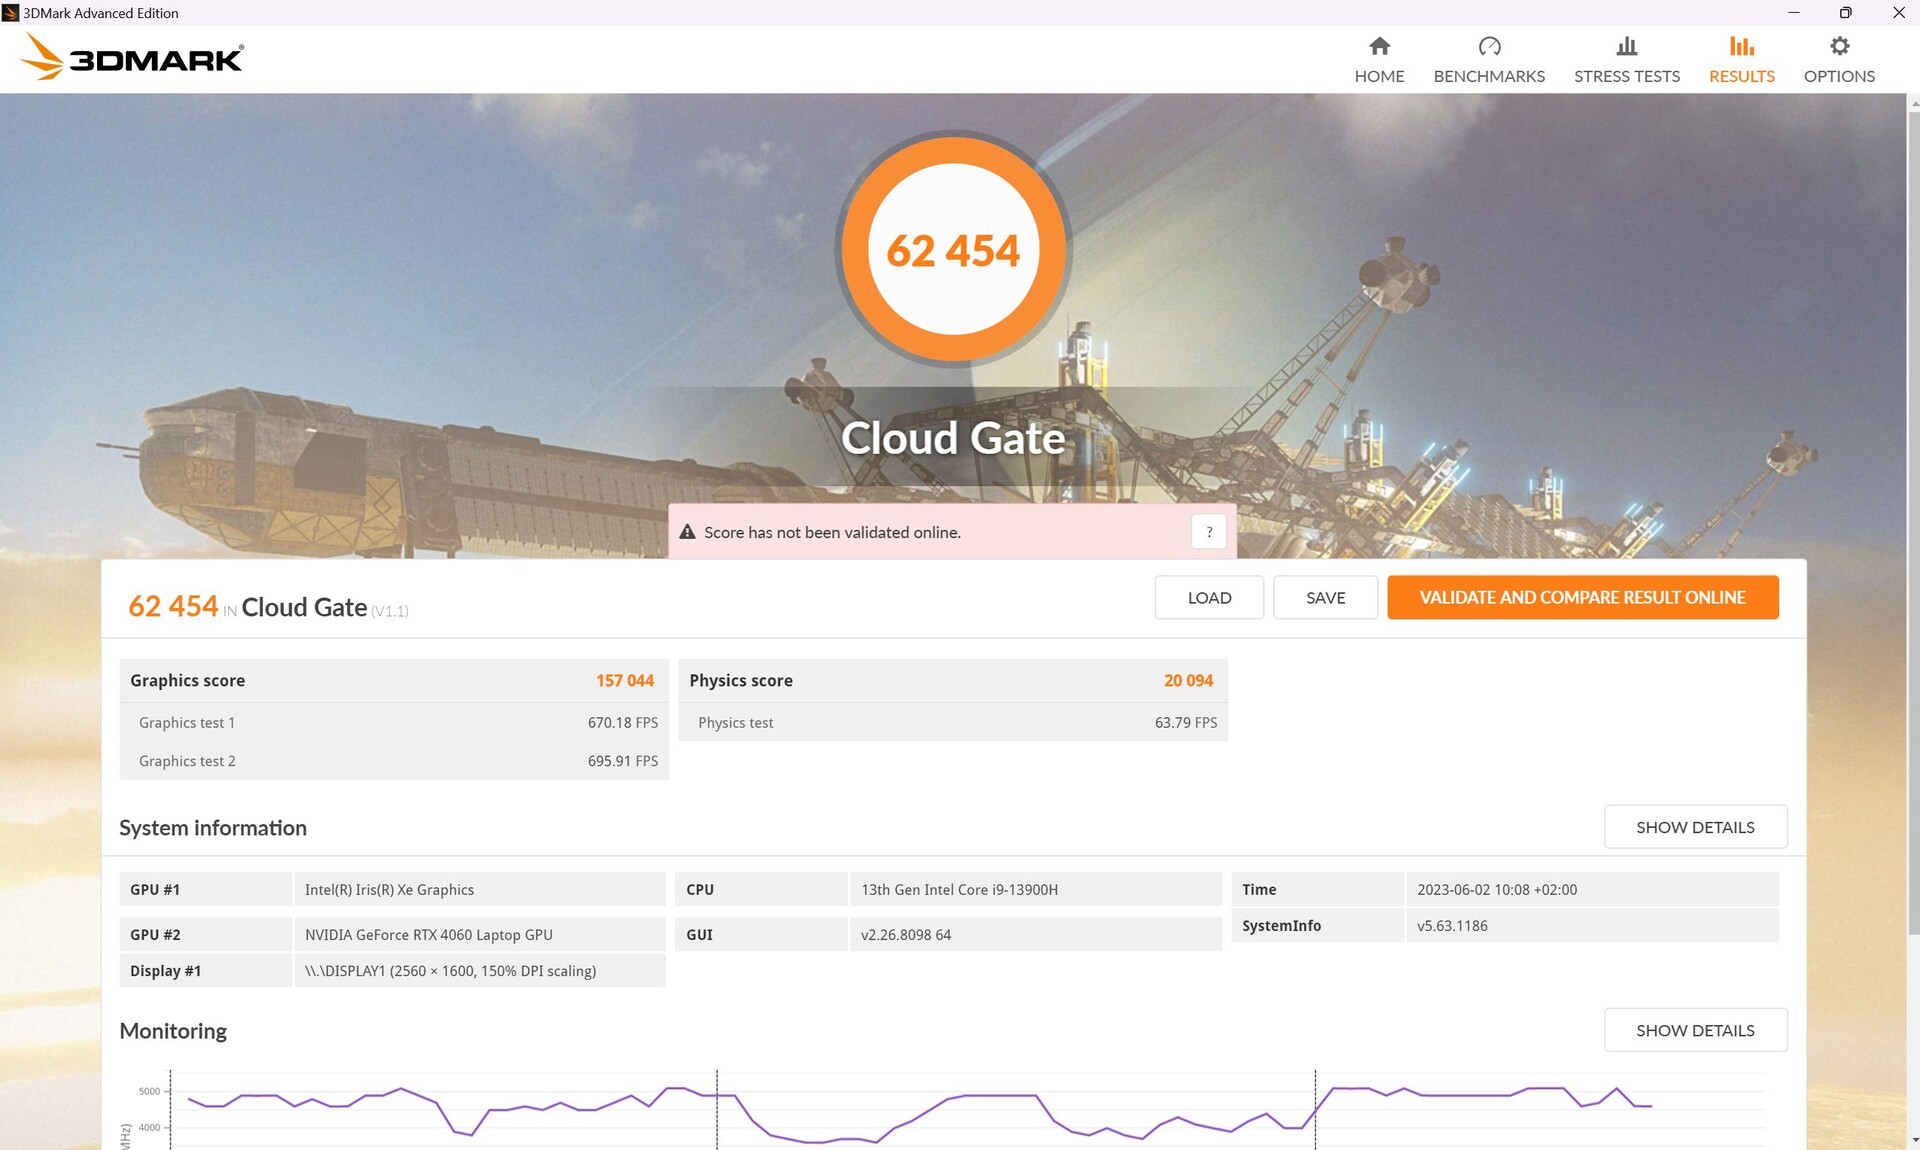
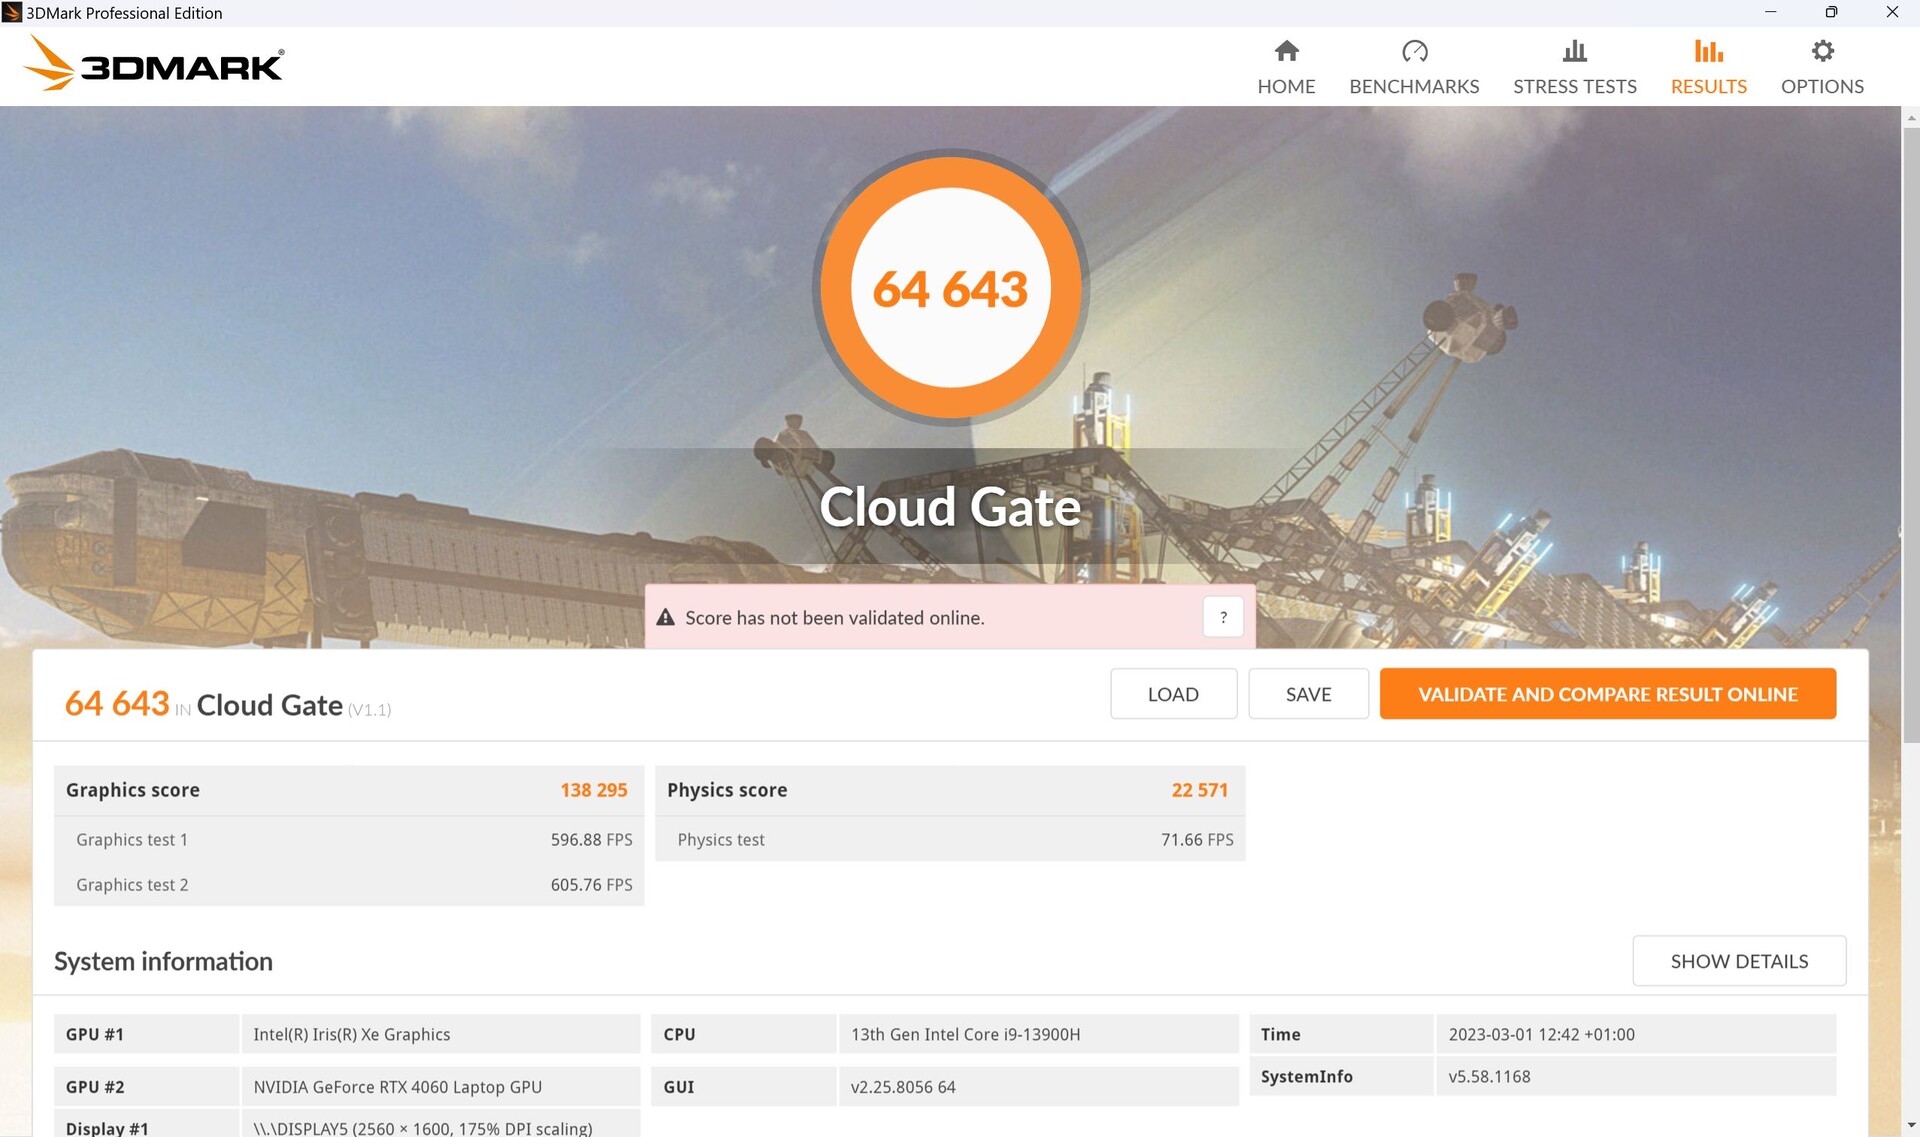
Lorsque nous comparons les résultats entre le mode turbo et le mode performance, il est particulièrement évident que les performances graphiques augmentent, mais que les performances du CPU et de la physique ont tendance à baisser (voir Cloud Gate ou Fire Strike).
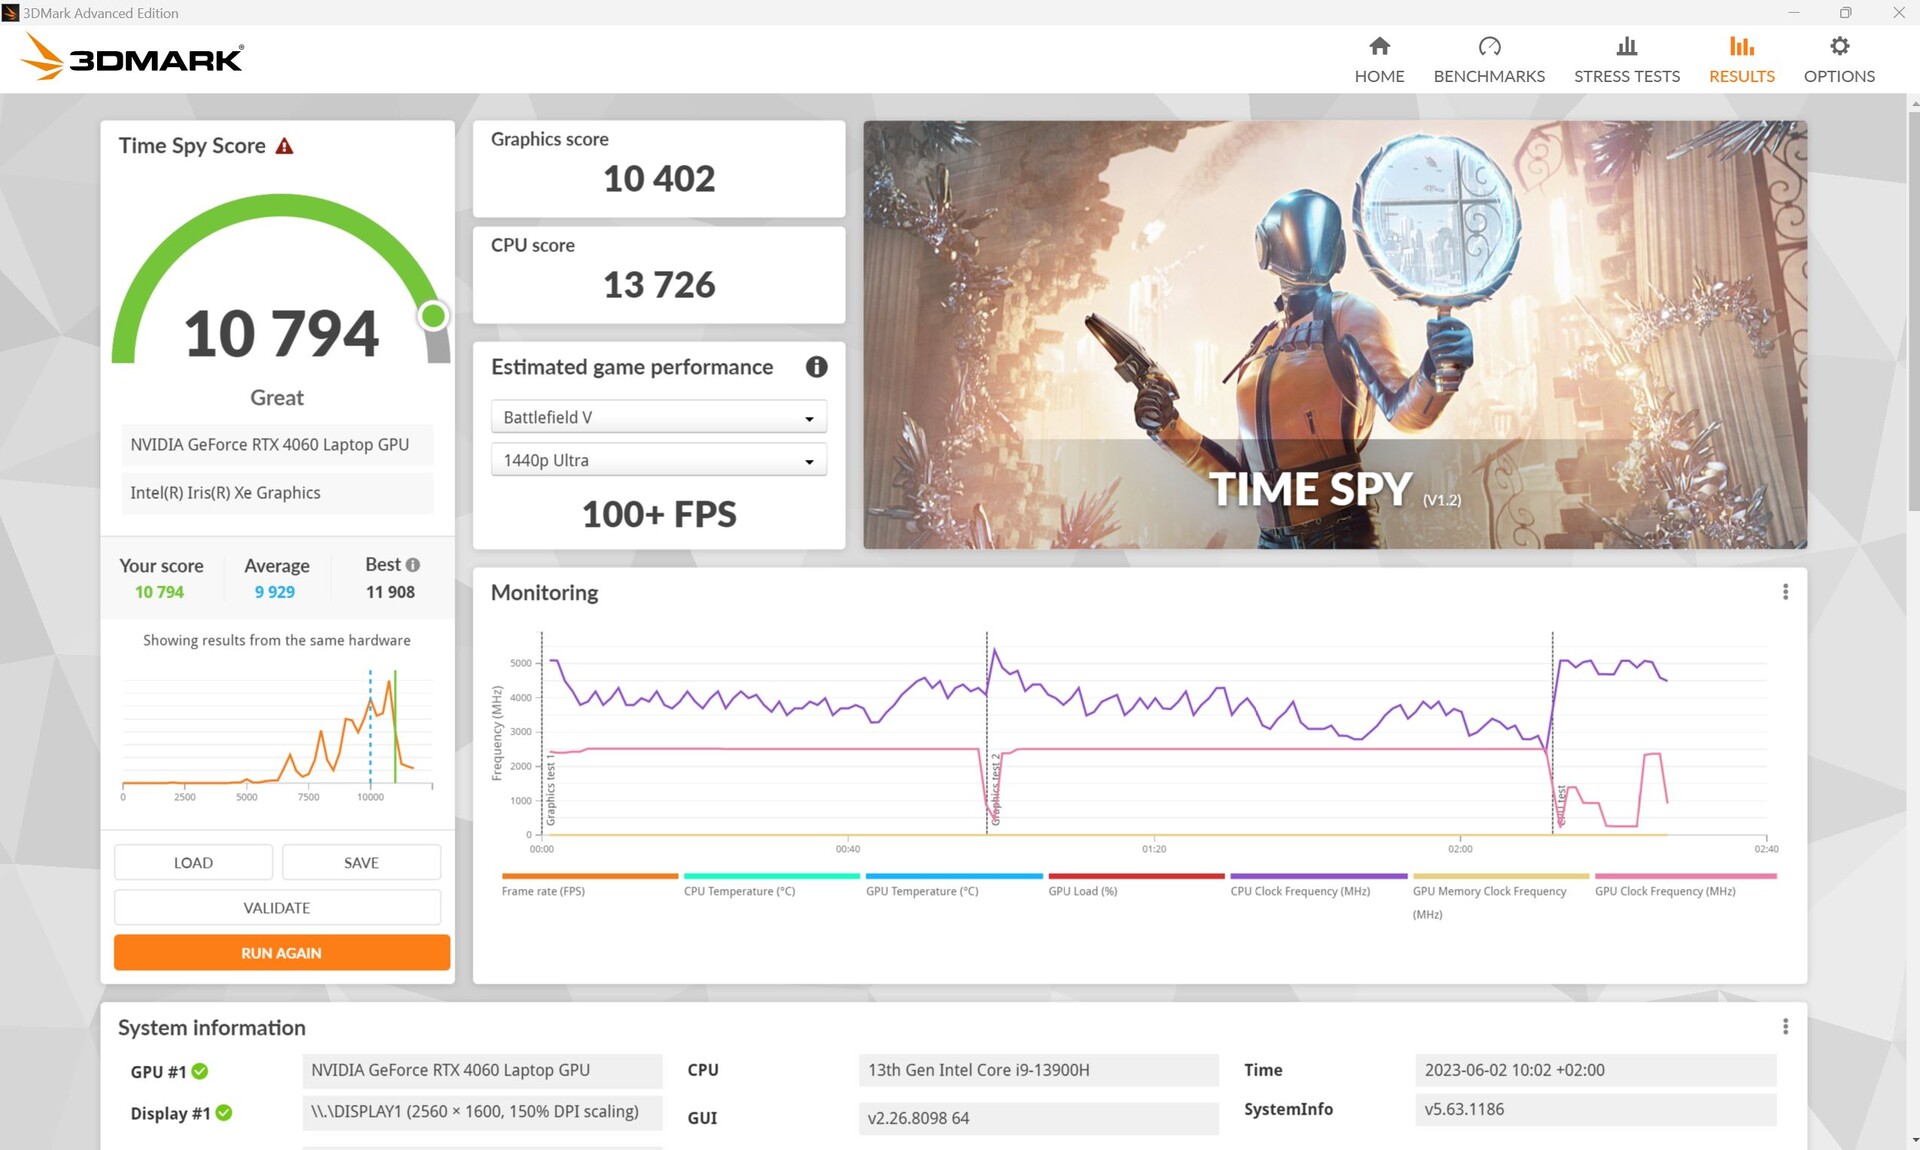
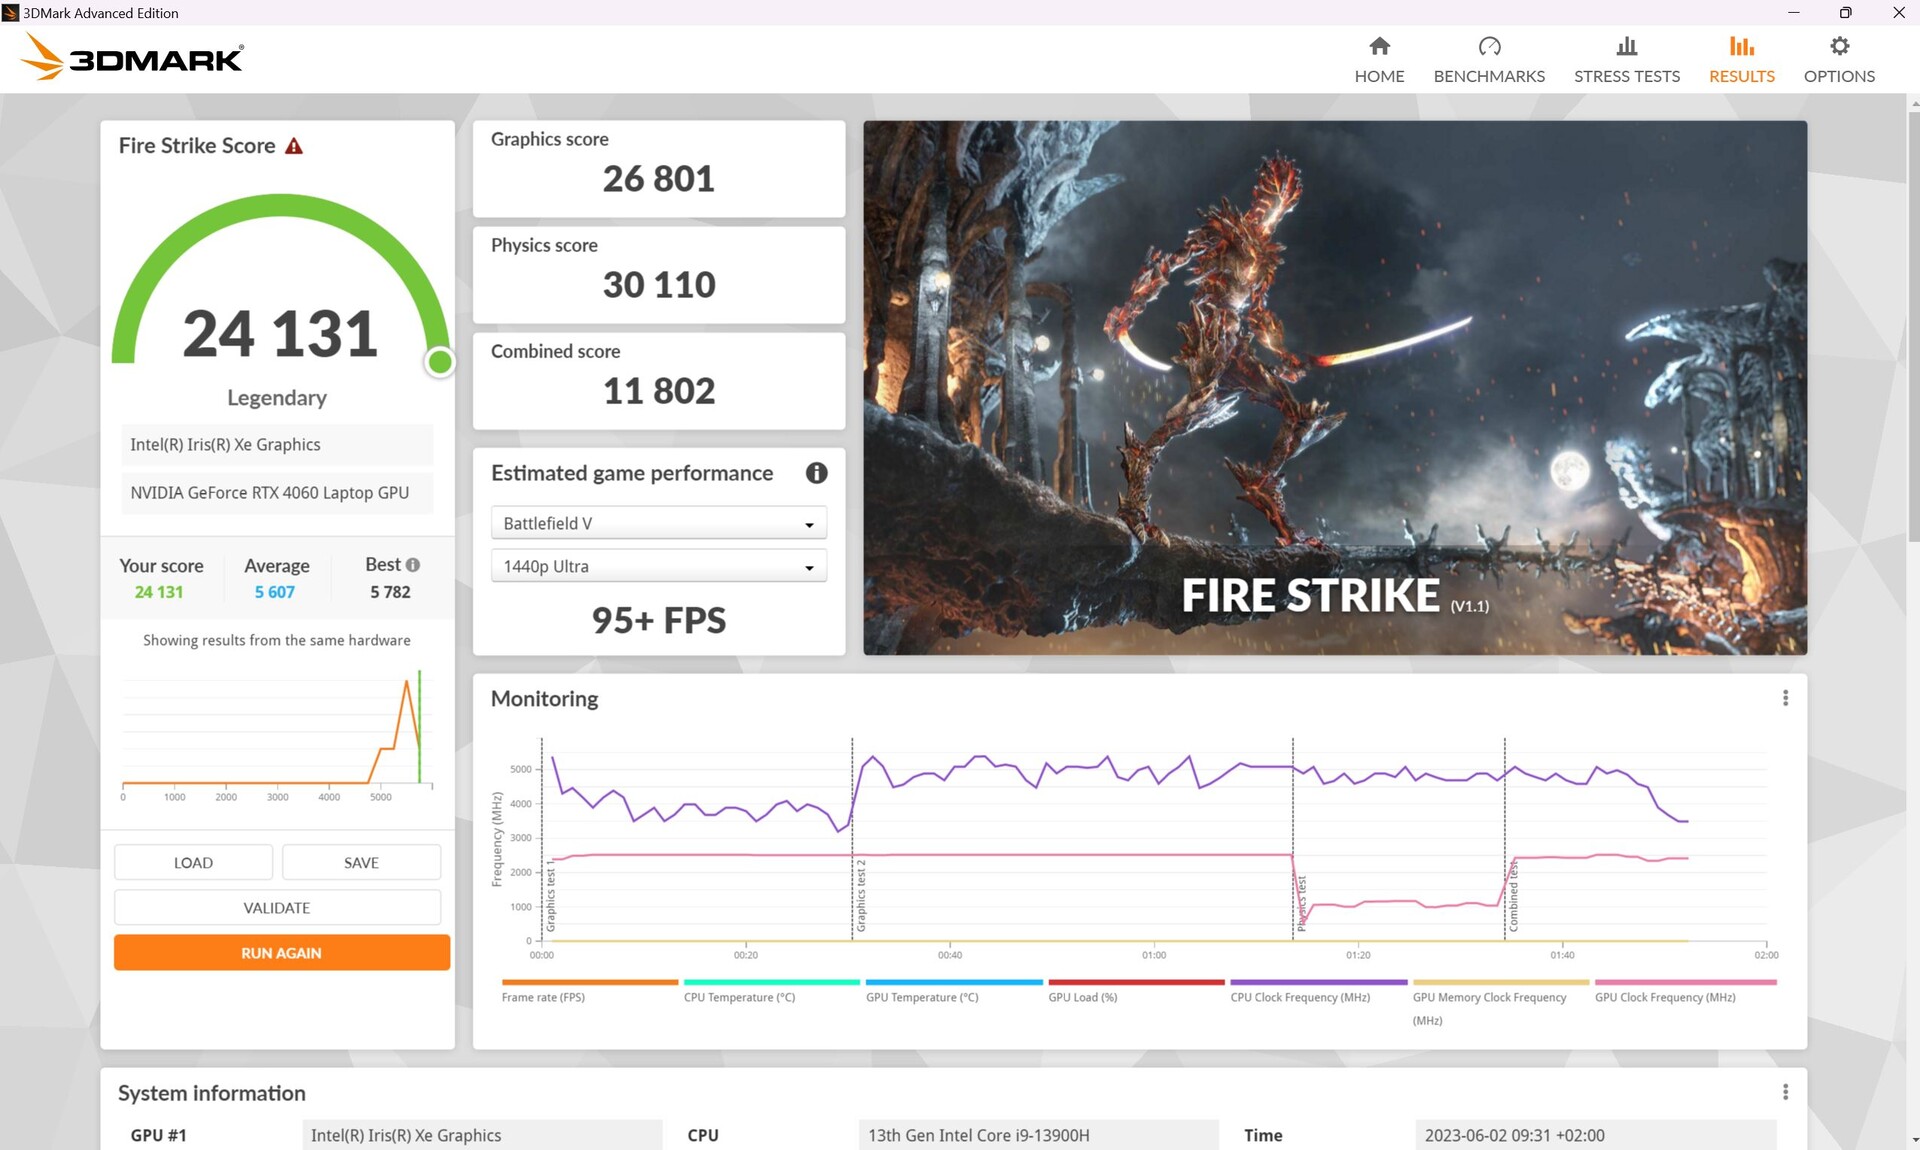
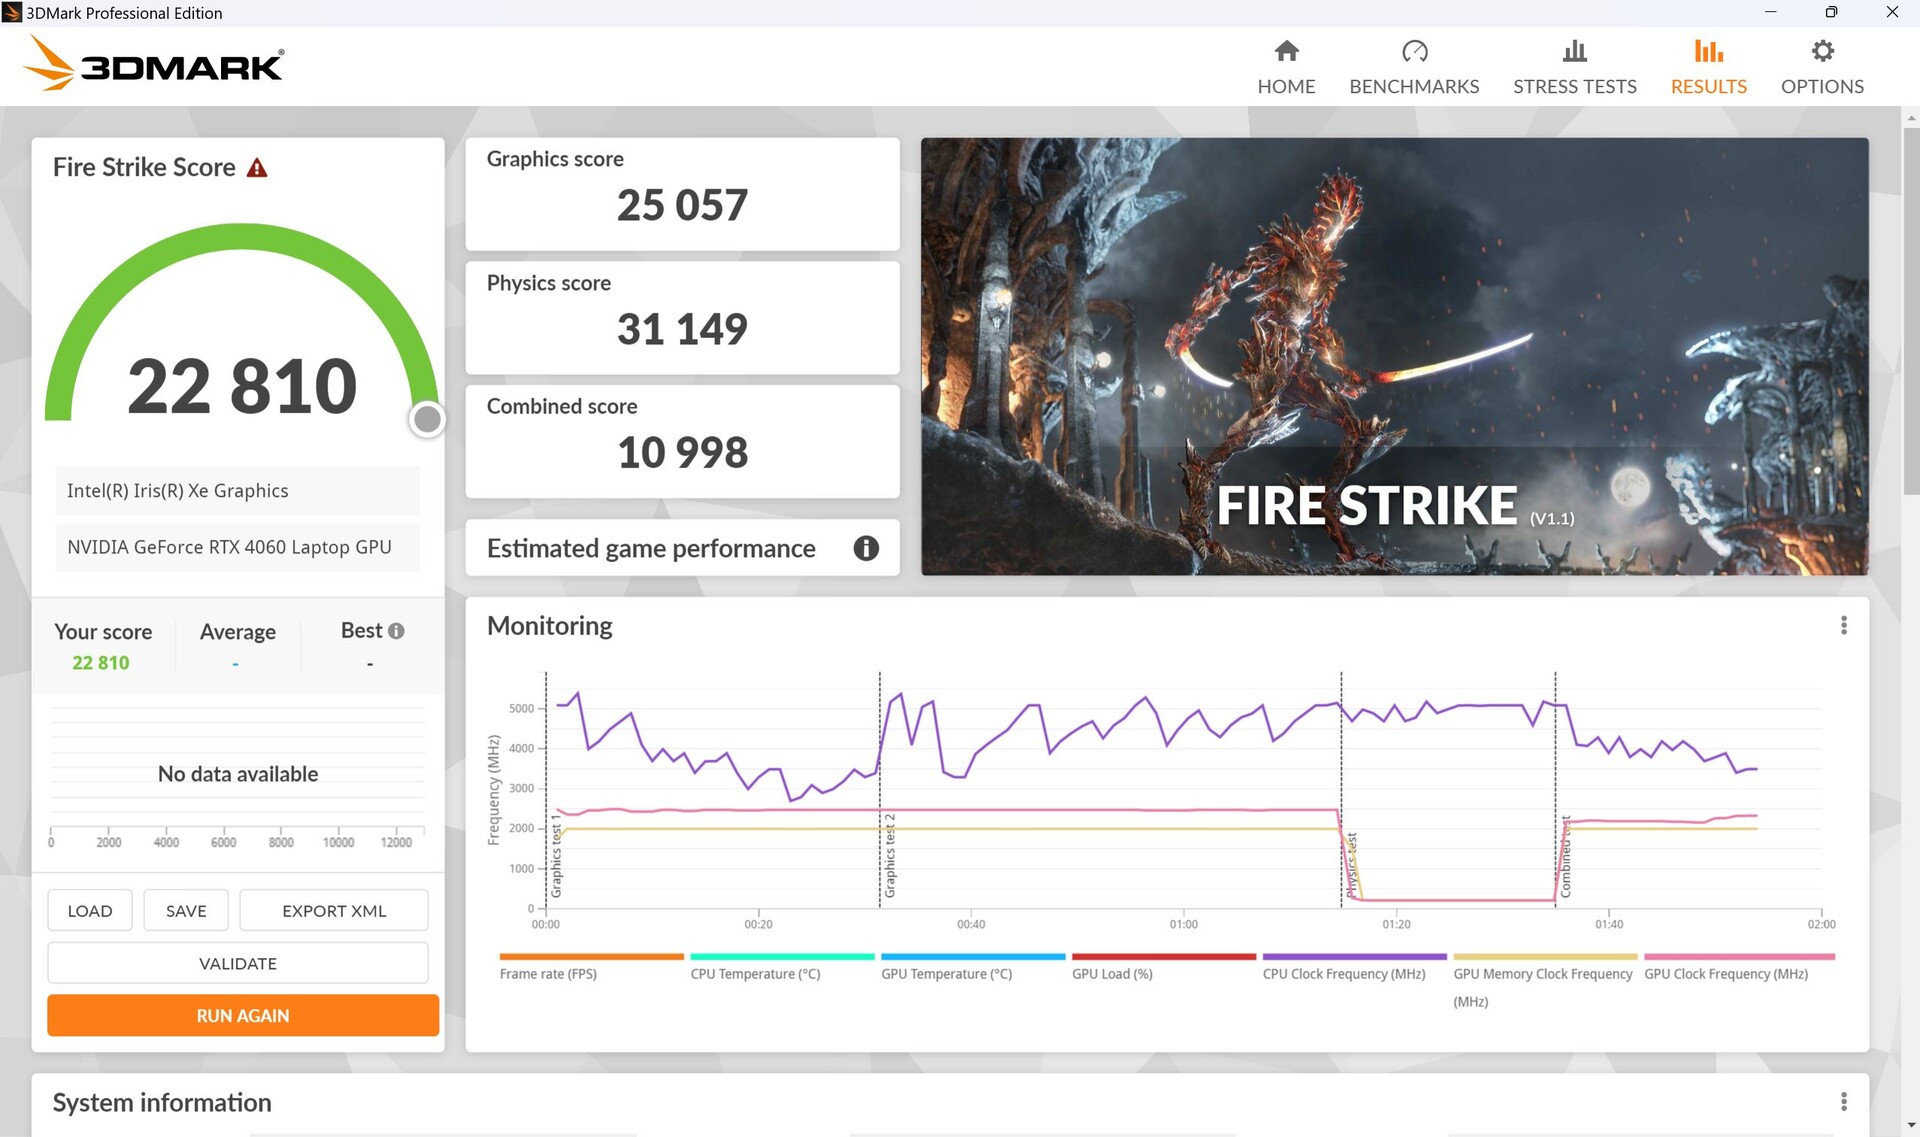
Loin du mur, les performances graphiques chutent. En mode performance, le score graphique de Fire Strike a chuté d'environ 17 % et en mode silencieux, de 42 %.


| 3DMark 11 Performance | 31662 points | |
| 3DMark Cloud Gate Standard Score | 62454 points | |
| 3DMark Fire Strike Score | 24131 points | |
| 3DMark Time Spy Score | 10794 points | |
Aide | ||
* ... Moindre est la valeur, meilleures sont les performances
| Premiere Pro PugetBench - Overall Score 0.9 | |
| MSI Stealth 17 Studio A13VH-014 | |
| Asus ROG Flow X16 GV601V | |
| Asus Zephyrus Duo 16 GX650PY-NM006W | |
| MSI Titan GT77 HX 13VI | |
| Apple MacBook Pro 14 2023 M2 Pro | |
| Asus ROG Zephyrus G14 GA402XY | |
Performances de jeu
En Full HD, presque tous les jeux que nous avons testés ont fonctionné sans problème avec un maximum de détails. Les ressources disponibles sont même suffisantes pour la QHD, seuls les titres très exigeants comme The Last of Us s'essoufflant.
Dans notre comparaison, le Flow X16 est au même niveau que le Katana 17 dont le RTX 4060 n'a qu'un TGP maximum de 105 watts. En revanche, 5 % seulement la séparent de la Legion 5 dont la RTX 4060 a un TGP de 140 watts. Cela montre une fois de plus que le GPU ne parvient guère à tirer parti de TGP plus élevés, comme l'a souligné notre collègue dans son analyse des nouvelles cartes Nvidia Geforce RTX 4000. Le prédécesseur, avec sa RTX 3070 Ti, la dépasse de 21 %.
| The Witcher 3 - 1920x1080 Ultra Graphics & Postprocessing (HBAO+) | |
| Moyenne de la classe Gaming (104.7 - 240, n=7, 2 dernières années) | |
| Lenovo Legion Pro 5 16IRX8 | |
| Asus ROG Flow X16 GV601V | |
| MSI Katana 17 B13VFK | |
| Asus ROG Flow X16 GV601RW-M5082W | |
| Samsung Galaxy Book3 Ultra 16, i9-13900H RTX 4070 | |
| Lenovo Yoga Pro 7 14IRH G8 | |
| Strange Brigade - 1920x1080 ultra AA:ultra AF:16 | |
| Moyenne de la classe Gaming (76.3 - 458, n=87, 2 dernières années) | |
| Asus ROG Flow X16 GV601V | |
| MSI Katana 17 B13VFK | |
| Asus ROG Flow X16 GV601RW-M5082W | |
| Samsung Galaxy Book3 Ultra 16, i9-13900H RTX 4070 | |
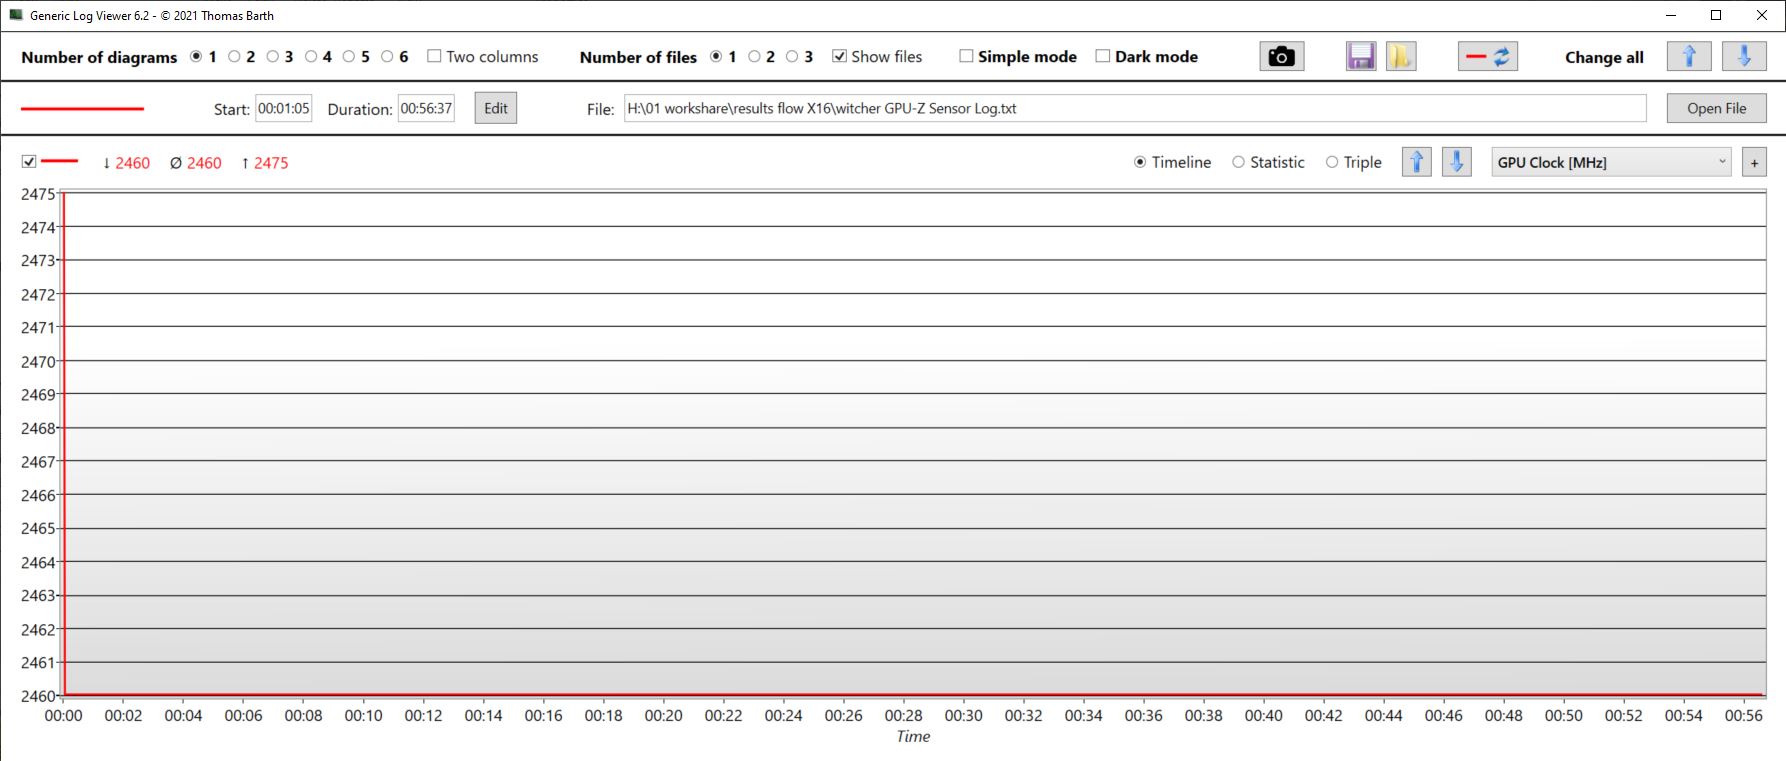
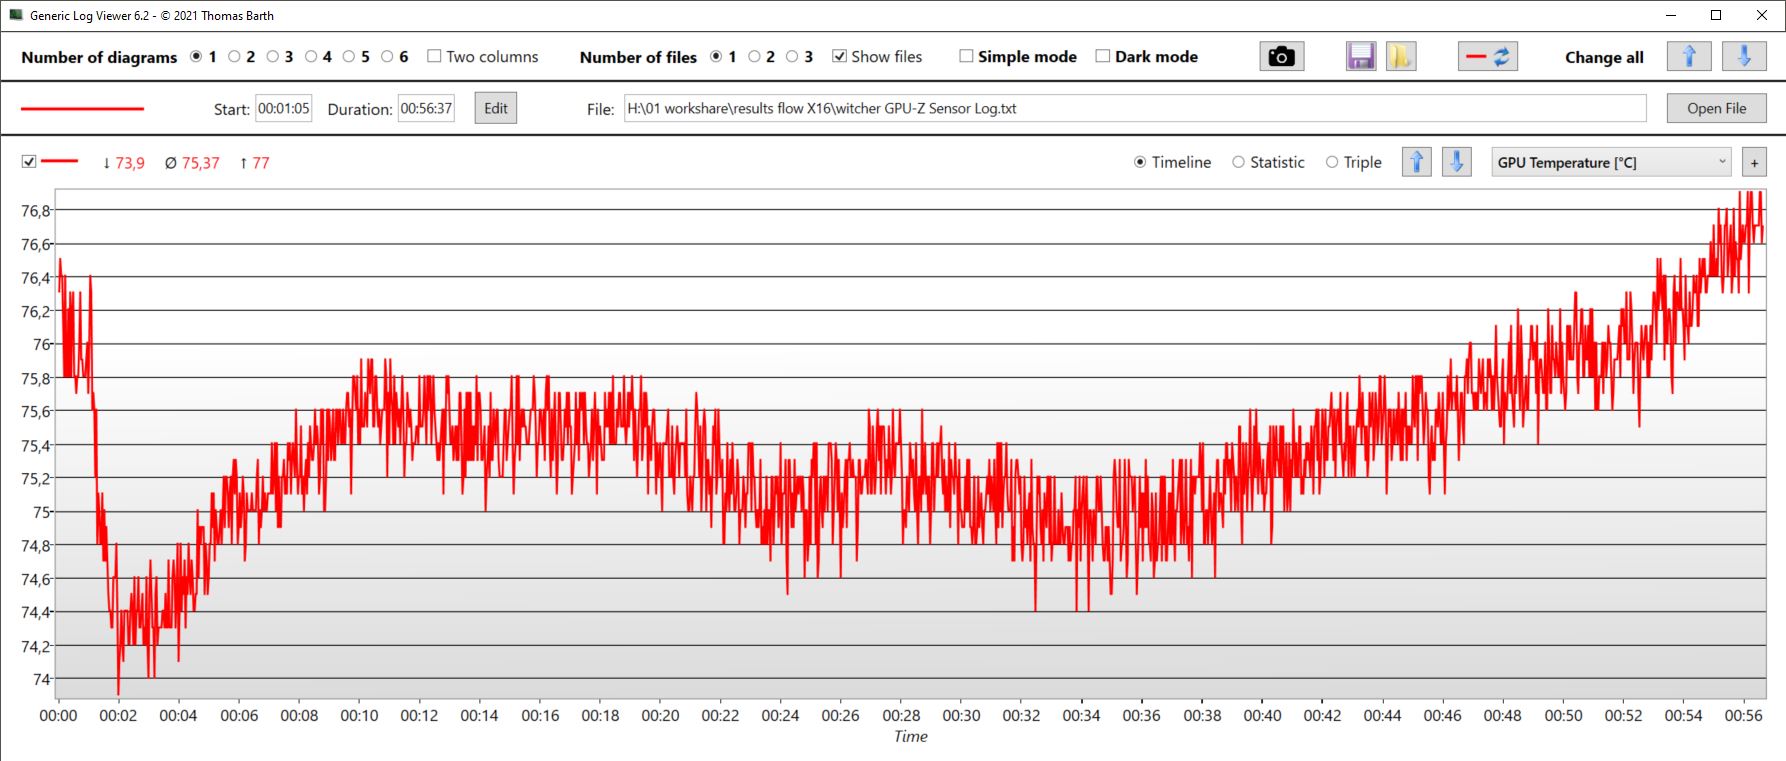
Le framerate de Witcher 3 affiche la courbe jour/nuit habituelle, mais est par ailleurs très stable. D'après le journal GPU-Z, la vitesse d'horloge du cœur est presque constante à 2 460 MHz et la vitesse d'horloge de la mémoire est également stable (2 GHz).
La température du GPU a fluctué quelque peu avec une moyenne d'environ 75 °C, mais a augmenté de façon continue vers la fin de l'heure, ce qui signifie que la vitesse d'horloge pourrait être limitée pendant les périodes d'utilisation plus longues.
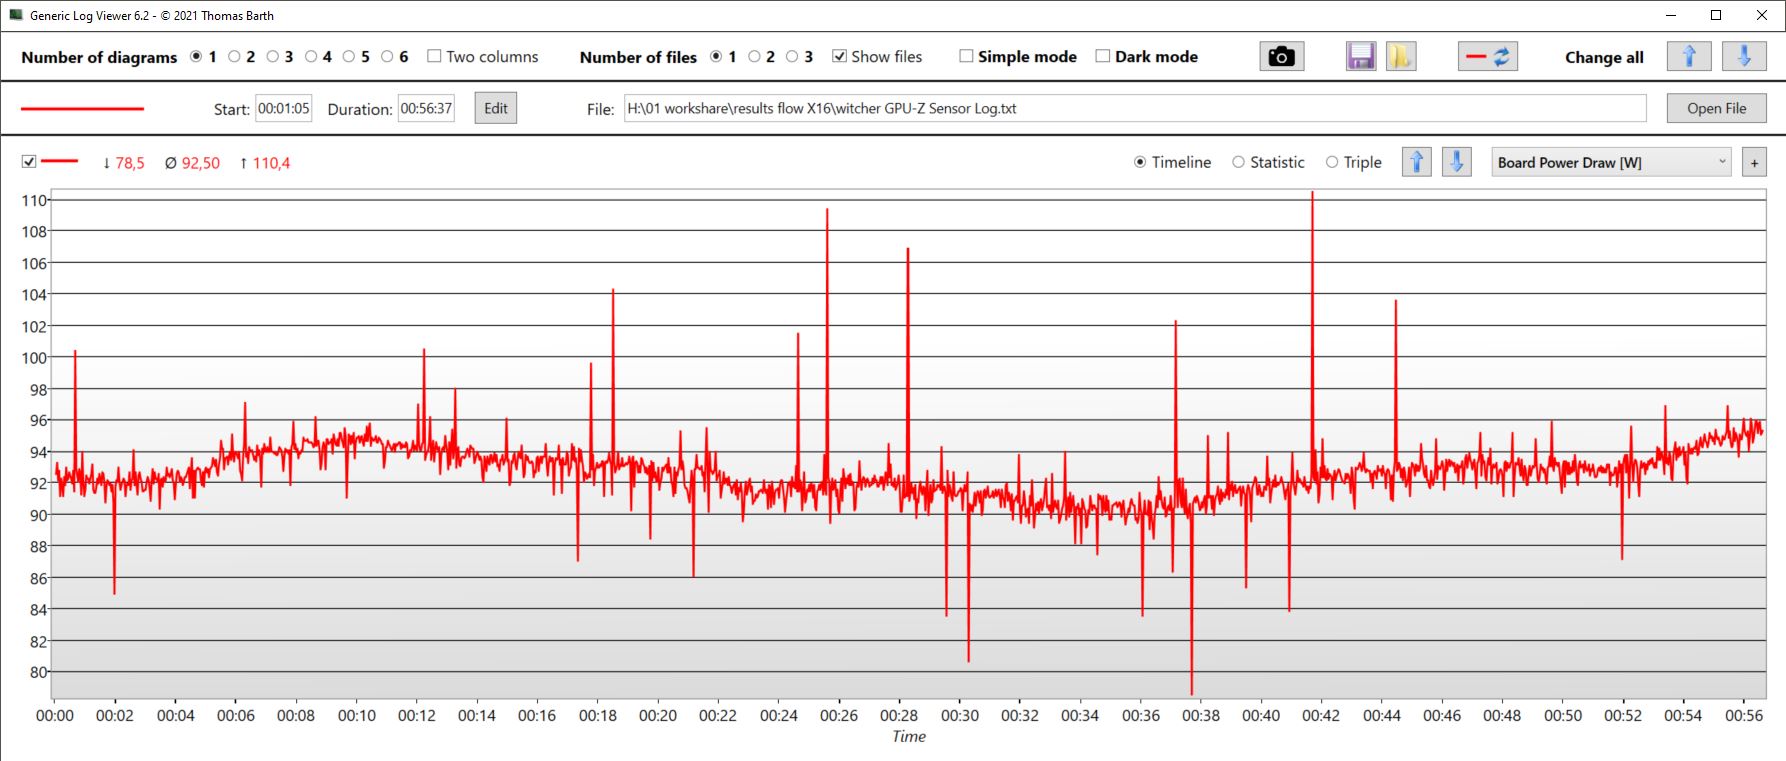
La carte ne consomme que 92,5 watts en moyenne, avec des pointes de 110 watts, mais sans jamais atteindre les 120 watts possibles.
Avec saRTX 4070leGalaxy Book3 n'a aucune chance face à notre X16 qui, d'un point de vue technique, parvient même à s'approcher de la X16 Legion 5.
Witcher 3 FPS diagram
| Bas | Moyen | Élevé | Ultra | QHD | 4K | |
|---|---|---|---|---|---|---|
| GTA V (2015) | 184.4 | 179.8 | 173.9 | 110.3 | 79.4 | |
| The Witcher 3 (2015) | 214.8 | 106.5 | ||||
| Dota 2 Reborn (2015) | 188.3 | 166 | 162.8 | 149.2 | 115.5 | |
| Final Fantasy XV Benchmark (2018) | 100.8 | |||||
| X-Plane 11.11 (2018) | 174 | 145.4 | 116.4 | 105.6 | ||
| Far Cry 5 (2018) | 140 | 130 | 99 | |||
| Strange Brigade (2018) | 419 | 266 | 225 | 192.5 | 129.2 | |
| Shadow of the Tomb Raider (2018) | 150 | 137 | 93 | |||
| Assassin´s Creed Valhalla (2020) | 114 | 98 | 71 | |||
| Far Cry 6 (2021) | 120 | 108 | 79 | |||
| Cyberpunk 2077 1.6 (2022) | 84.25 | 76.64 | 48.71 | |||
| F1 22 (2022) | 257 | 218 | 183.9 | 64.8 | 42.3 | |
| Call of Duty Modern Warfare 2 2022 (2022) | 91 | 86 | 61 | |||
| Hogwarts Legacy (2023) | 106.9 | 91.9 | 42.8 | |||
| The Last of Us (2023) | 71.2 | 53.1 | 32.7 |
Émissions - Le silence est également possible avec le Flow X16
Émissions sonores
Au ralenti, les ventilateurs sont restés le plus souvent immobiles. En charge, le bruit dépend clairement du mode de performance sélectionné. Par exemple, en mode turbo, les ventilateurs atteignent plus de 50 dB, alors qu'en mode performance, ils tournent à 44 dB, ce qui est beaucoup plus tolérable. Cette différence relativement importante devrait à elle seule rendre plus supportable la légère baisse de performance en mode performance. En mode silencieux, le niveau de décibels est tombé à seulement 37 dB.
En mode turbo, les ventilateurs ont fonctionné pendant un certain temps après l'exécution de tâches exigeantes telles que les jeux, même s'ils n'ont pas tourné à plein régime. Cependant, même au ralenti, le X16 reste bruyant pendant quelques minutes, si une session de jeu vient d'avoir lieu.
Pour les créateurs de contenu, nous recommandons donc d'utiliser le mode performance (ou même le mode silencieux) car ils sont beaucoup plus silencieux avec une baisse tolérable de la puissance disponible.
Au ralenti, Windows ou les processus d'arrière-plan d'Asus perturbent les ventilateurs silencieux. Ces derniers se mettent alors en marche, surtout en mode turbo.
| Modus/Witcher 3 Ultra | FPS | Lautstärke in dB | Durchschnittsverbrauch in W |
|---|---|---|---|
| Turbo | 102 | 50.92 | 142 |
| Leistung | 92 | 44 | |
| Leise | 80 | 37.53 | 106 |
Degré de la nuisance sonore
| Au repos |
| 24 / 24 / 24 dB(A) |
| Fortement sollicité |
| 36.71 / 50.92 dB(A) |
 | ||
30 dB silencieux 40 dB(A) audible 50 dB(A) bruyant |
||
min: | ||
| Asus ROG Flow X16 GV601V GeForce RTX 4060 Laptop GPU, i9-13900H, WD PC SN560 SDDPNQE-1T00 | Asus ROG Flow X16 GV601RW-M5082W GeForce RTX 3070 Ti Laptop GPU, R9 6900HS, Micron 3400 1TB MTFDKBA1T0TFH | Samsung Galaxy Book3 Ultra 16, i9-13900H RTX 4070 GeForce RTX 4070 Laptop GPU, i9-13900H, Samsung PM9A1 MZVL21T0HCLR | Lenovo Legion Pro 5 16IRX8 GeForce RTX 4060 Laptop GPU, i7-13700HX, SK hynix PC801 HFS512GEJ9X115N | Lenovo Yoga Pro 7 14IRH G8 GeForce RTX 4050 Laptop GPU, i7-13700H, Samsung PM9A1 MZVL21T0HCLR | MSI Katana 17 B13VFK GeForce RTX 4060 Laptop GPU, i7-13620H, Micron 2400 MTFDKBA1T0QFM | |
|---|---|---|---|---|---|---|
| Noise | -13% | -9% | 1% | -6% | -19% | |
| arrêt / environnement * (dB) | 24 | 25.5 -6% | 25.2 -5% | 23 4% | 22.9 5% | 24.5 -2% |
| Idle Minimum * (dB) | 24 | 25.5 -6% | 25.2 -5% | 23.1 4% | 22.9 5% | 24.5 -2% |
| Idle Average * (dB) | 24 | 25.5 -6% | 25.2 -5% | 23.1 4% | 22.9 5% | 24.5 -2% |
| Idle Maximum * (dB) | 24 | 27.4 -14% | 31.3 -30% | 26.6 -11% | 36.8 -53% | 40 -67% |
| Load Average * (dB) | 36.71 | 49.9 -36% | 38.8 -6% | 34.7 5% | 43.7 -19% | 48.3 -32% |
| Witcher 3 ultra * (dB) | 50.92 | 47.6 7% | 46.2 9% | 56 -10% | ||
| Load Maximum * (dB) | 50.92 | 55 -8% | 51.2 -1% | 54.8 -8% | 46.2 9% | 59.1 -16% |
* ... Moindre est la valeur, meilleures sont les performances
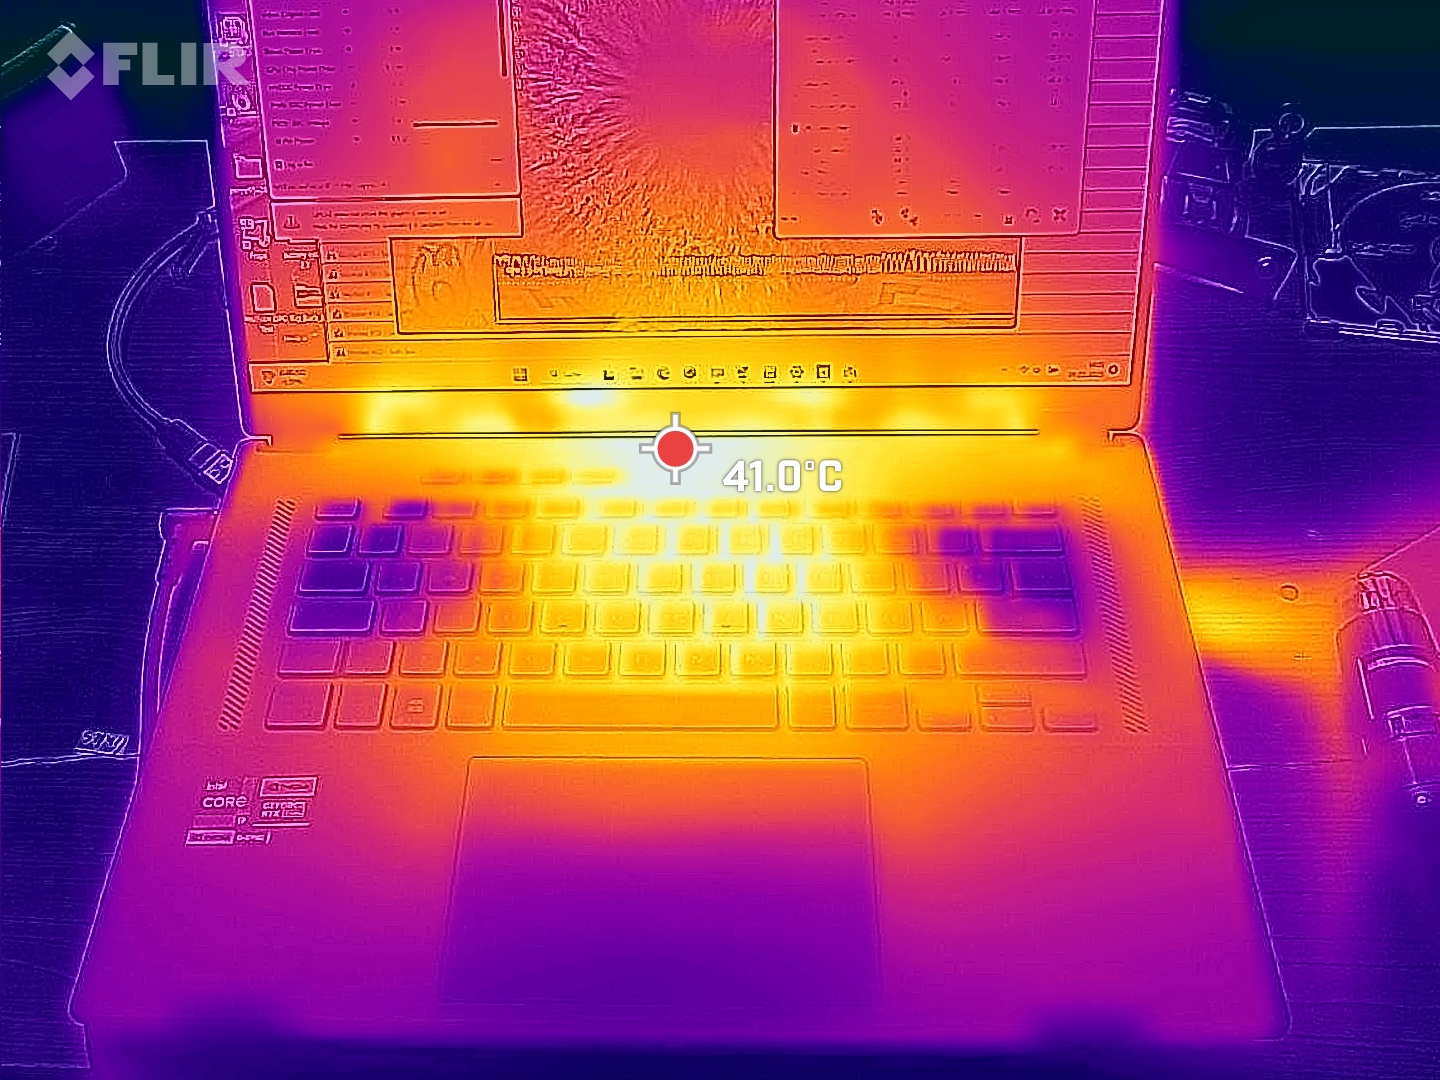
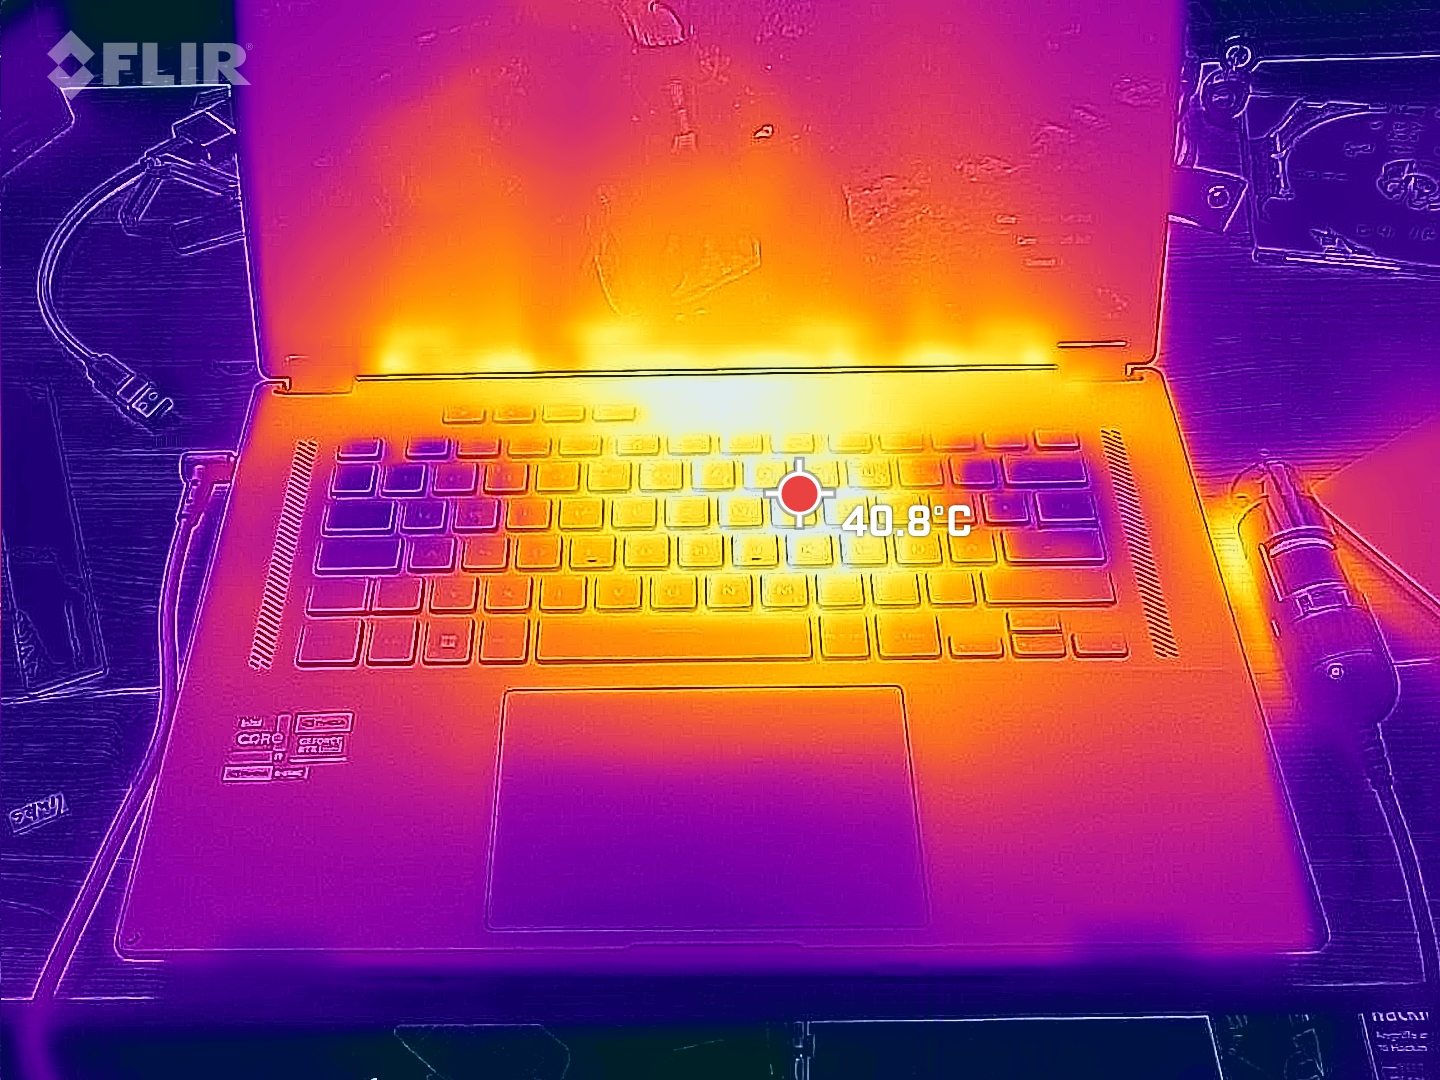
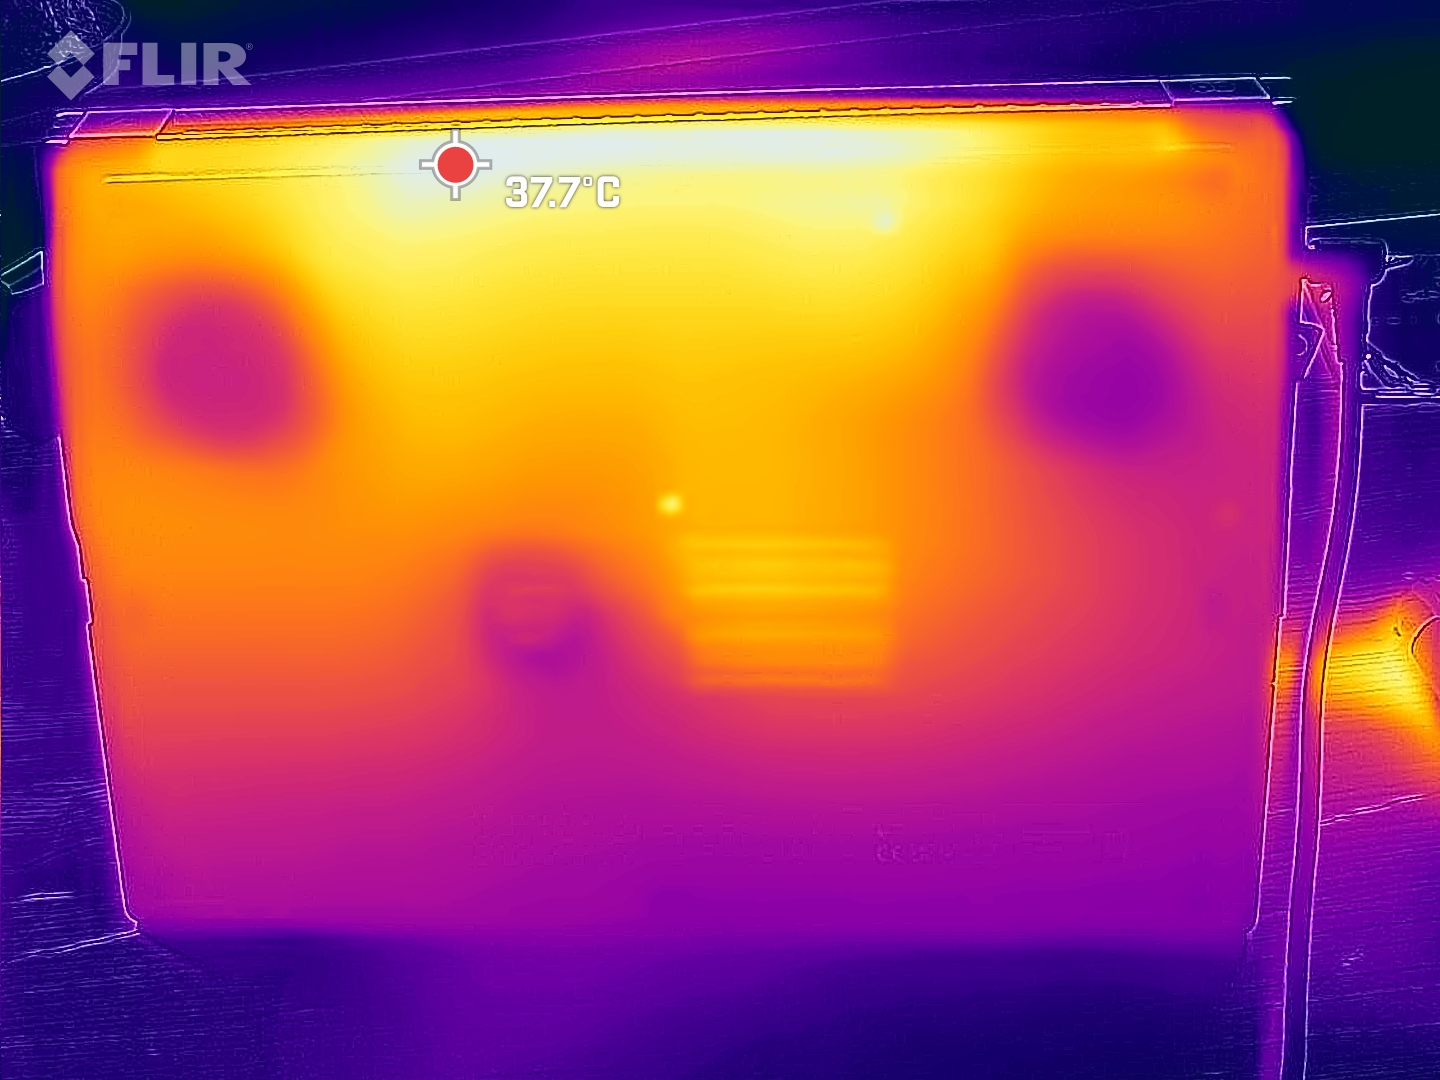
Température
Pendant le jeu, des points chauds d'environ 50 °C apparaissent au milieu, sur la partie supérieure de l'appareil et vers l'arrière, le repose-paume et les touches WASD restant relativement froids. La partie inférieure de l'ordinateur portable ne chauffe pas trop.
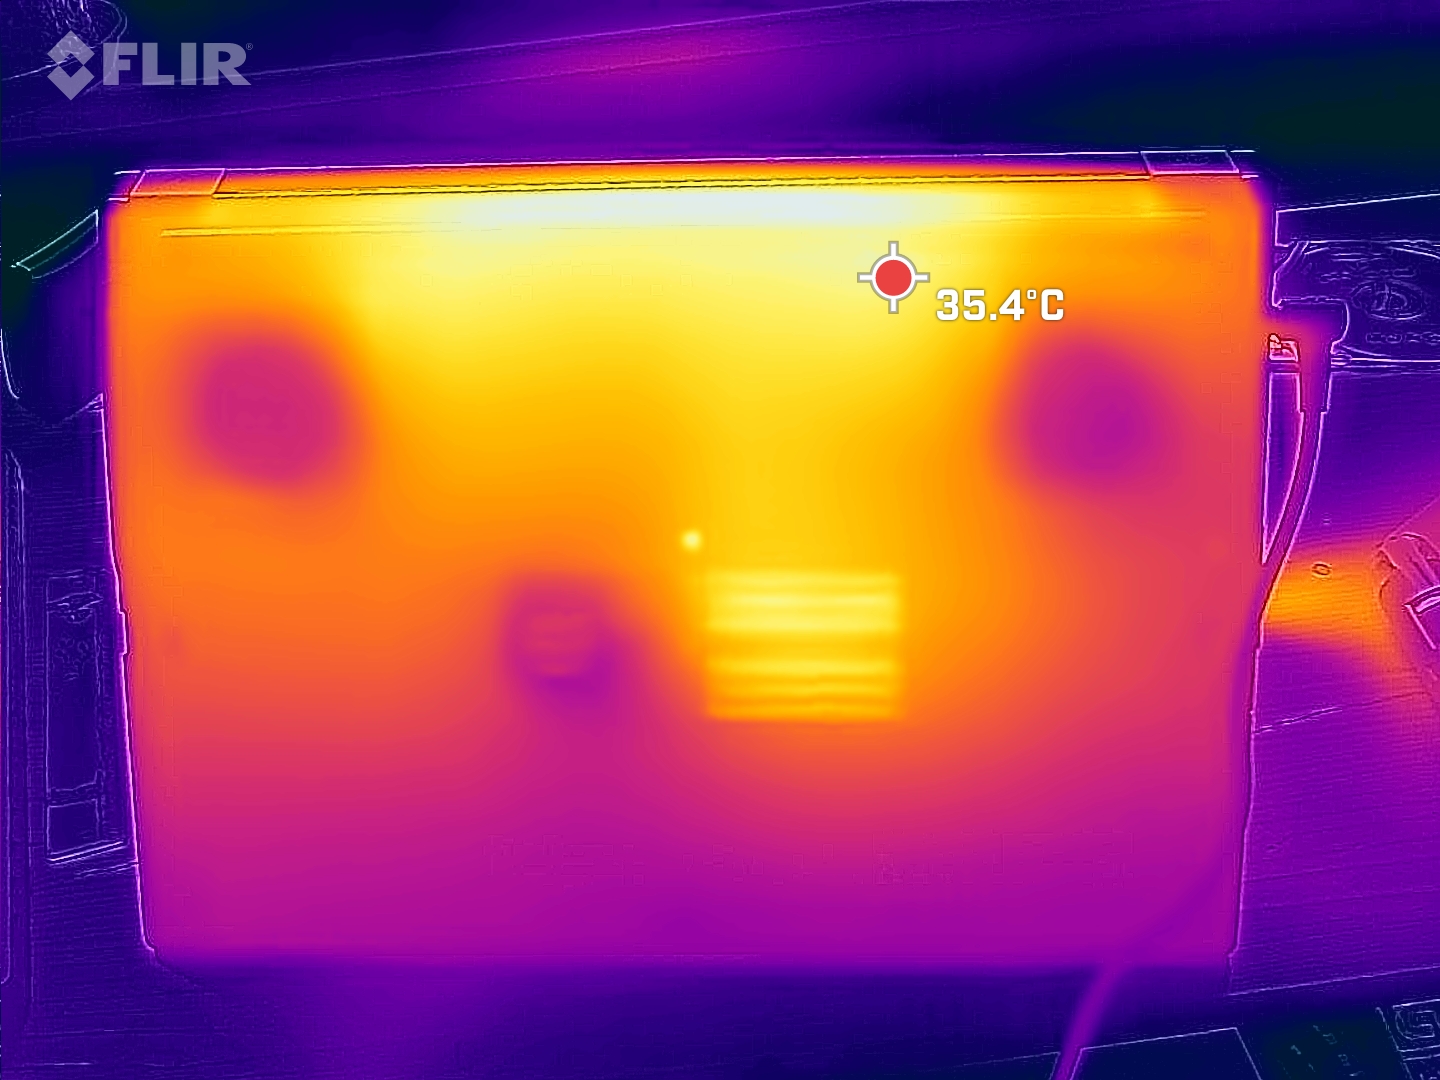
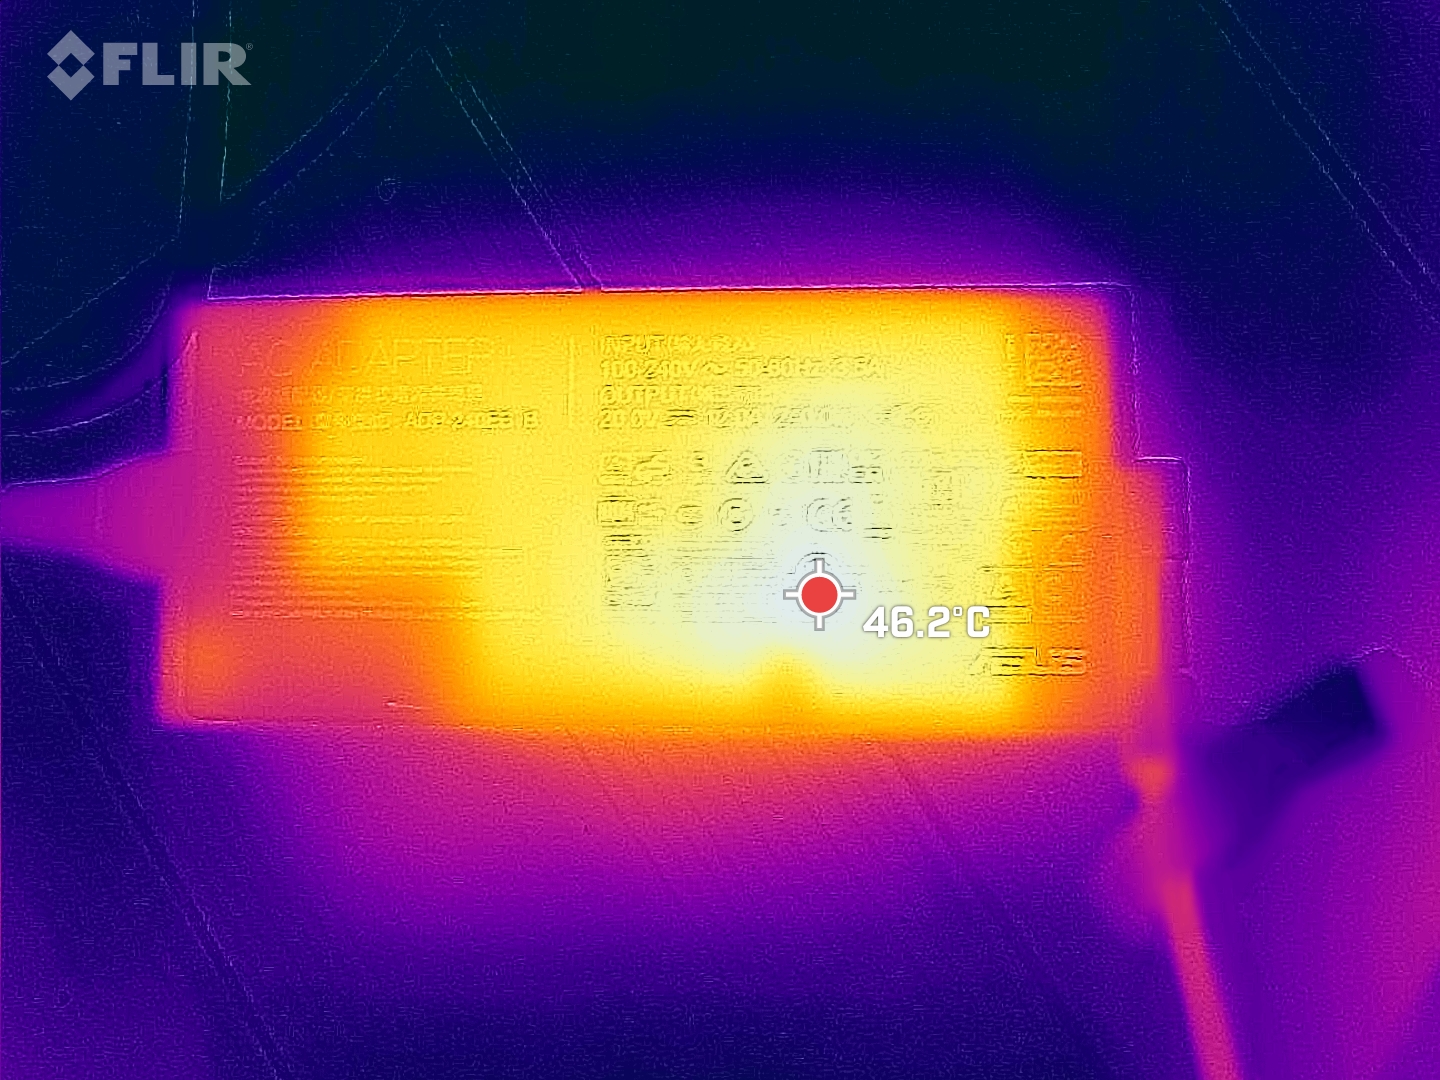
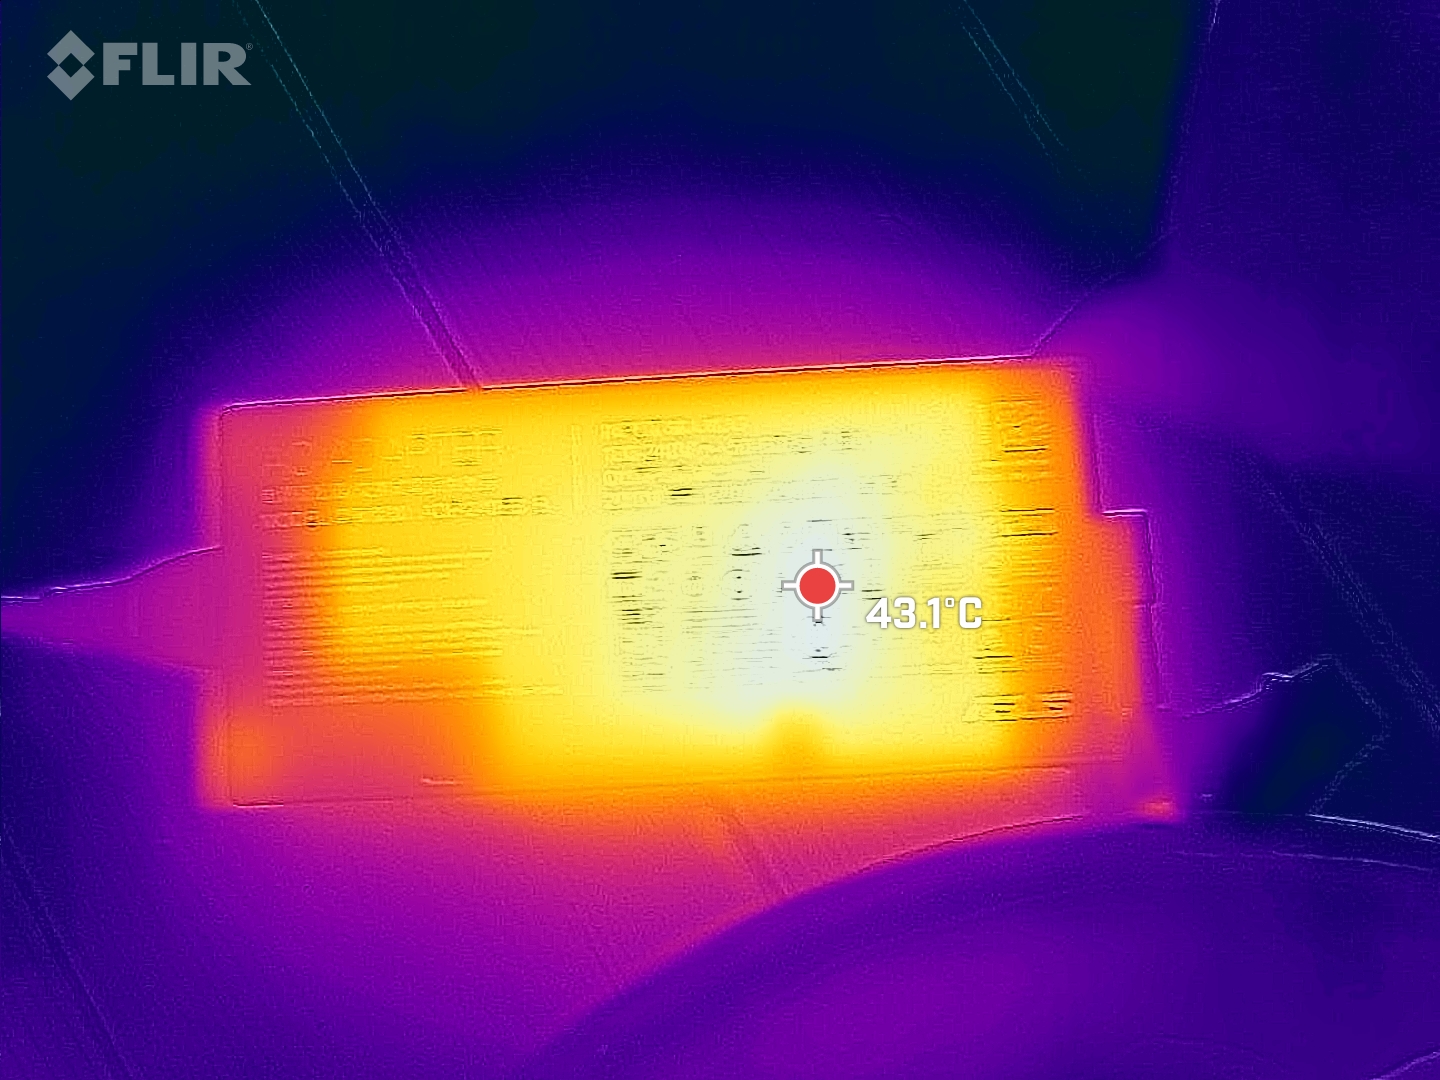
Cependant, même en mode veille, l'adaptateur d'alimentation peut devenir très chaud. Il suffit de quelques processus en arrière-plan pour que le bloc d'alimentation atteigne une température de 45 °C !
(-) La température maximale du côté supérieur est de 46 °C / 115 F, par rapport à la moyenne de 40.4 °C / 105 F, allant de 21.2 à 68.8 °C pour la classe Gaming.
(±) Le fond chauffe jusqu'à un maximum de 41 °C / 106 F, contre une moyenne de 43.2 °C / 110 F
(+) En utilisation inactive, la température moyenne du côté supérieur est de 31.9 °C / 89 F, par rapport à la moyenne du dispositif de 33.9 °C / 93 F.
(±) En jouant à The Witcher 3, la température moyenne du côté supérieur est de 37.4 °C / 99 F, alors que la moyenne de l'appareil est de 33.9 °C / 93 F.
(+) Les repose-poignets et le pavé tactile sont plus froids que la température de la peau avec un maximum de 31 °C / 87.8 F et sont donc froids au toucher.
(-) La température moyenne de la zone de l'appui-paume de dispositifs similaires était de 28.8 °C / 83.8 F (-2.2 °C / #-4 F).
| Asus ROG Flow X16 GV601V Intel Core i9-13900H, NVIDIA GeForce RTX 4060 Laptop GPU | Asus ROG Flow X16 GV601RW-M5082W AMD Ryzen 9 6900HS, NVIDIA GeForce RTX 3070 Ti Laptop GPU | Samsung Galaxy Book3 Ultra 16, i9-13900H RTX 4070 Intel Core i9-13900H, NVIDIA GeForce RTX 4070 Laptop GPU | Lenovo Legion Pro 5 16IRX8 Intel Core i7-13700HX, NVIDIA GeForce RTX 4060 Laptop GPU | Lenovo Yoga Pro 7 14IRH G8 Intel Core i7-13700H, NVIDIA GeForce RTX 4050 Laptop GPU | MSI Katana 17 B13VFK Intel Core i7-13620H, NVIDIA GeForce RTX 4060 Laptop GPU | |
|---|---|---|---|---|---|---|
| Heat | -13% | -4% | 0% | 4% | 2% | |
| Maximum Upper Side * (°C) | 46 | 55.1 -20% | 45.9 -0% | 42.8 7% | 41.6 10% | 41.6 10% |
| Maximum Bottom * (°C) | 41 | 50.3 -23% | 50.9 -24% | 50 -22% | 55.7 -36% | 43.1 -5% |
| Idle Upper Side * (°C) | 36 | 35.5 1% | 31.6 12% | 29.6 18% | 25.9 28% | 32 11% |
| Idle Bottom * (°C) | 33 | 36.1 -9% | 34.2 -4% | 34 -3% | 28 15% | 35.8 -8% |
* ... Moindre est la valeur, meilleures sont les performances
Épreuve d'effort
Au début, les cœurs atteignaient presque 4 GHz et le processeur consommait 85 watts. Cependant, après environ une minute, la température des cœurs a atteint 96 °C et les performances ont été considérablement réduites. La vitesse d'horloge des cœurs a chuté à 2,4 GHz pendant quelques minutes et le TDP n'était plus que de 35 watts. Cela a entraîné une nouvelle baisse de la température. Après quelques minutes, la vitesse a augmenté et a fluctué considérablement, pour se stabiliser à une moyenne d'environ 2,6 GHz. La réduction du TDP à 35 watts pendant plusieurs minutes était un phénomène régulier, après quoi il fluctuait à nouveau périodiquement. La température chutant aussi rapidement, ce n'est pas la seule raison de ce comportement.
Dans une moindre mesure, le GPU était similaire. Les phases relativement stables étaient nettement plus courtes et les valeurs globales fluctuaient davantage. La fréquence d'horloge a oscillé à plusieurs reprises de 2,4 GHz à 2,4 GHz jusqu'à seulement 500 MHz et moins, la vitesse d'horloge de la mémoire affichant des fluctuations extrêmes similaires. La température moyenne était de 65 °C et a atteint un maximum de 82 °C. La consommation d'énergie s'est établie à 46 watts en moyenne, mais a grimpé à plusieurs reprises jusqu'à 90 watts ou plus de 100 watts.
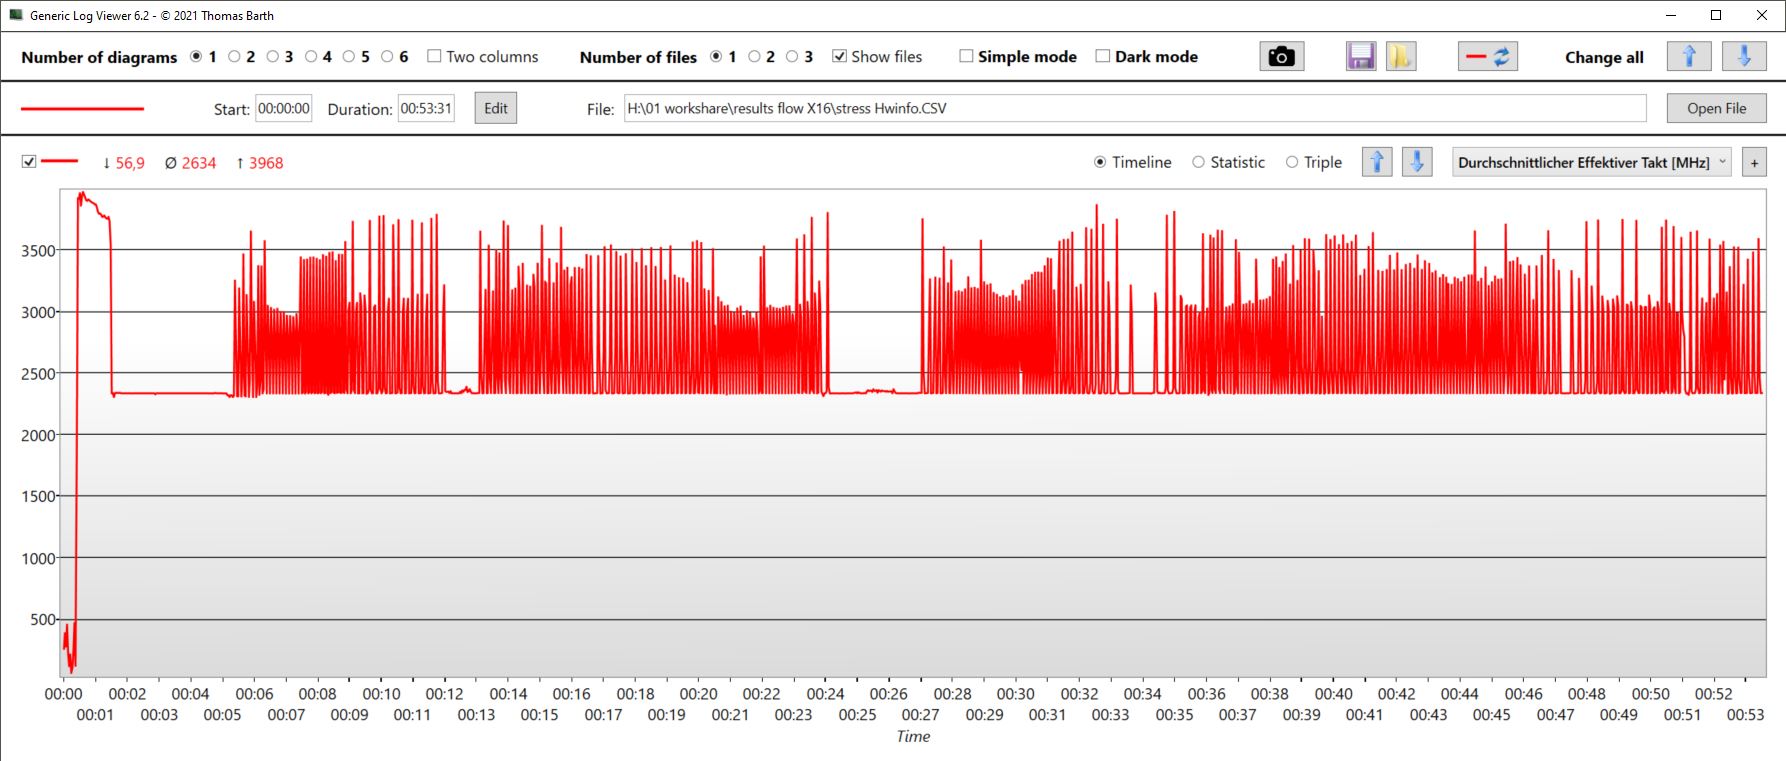
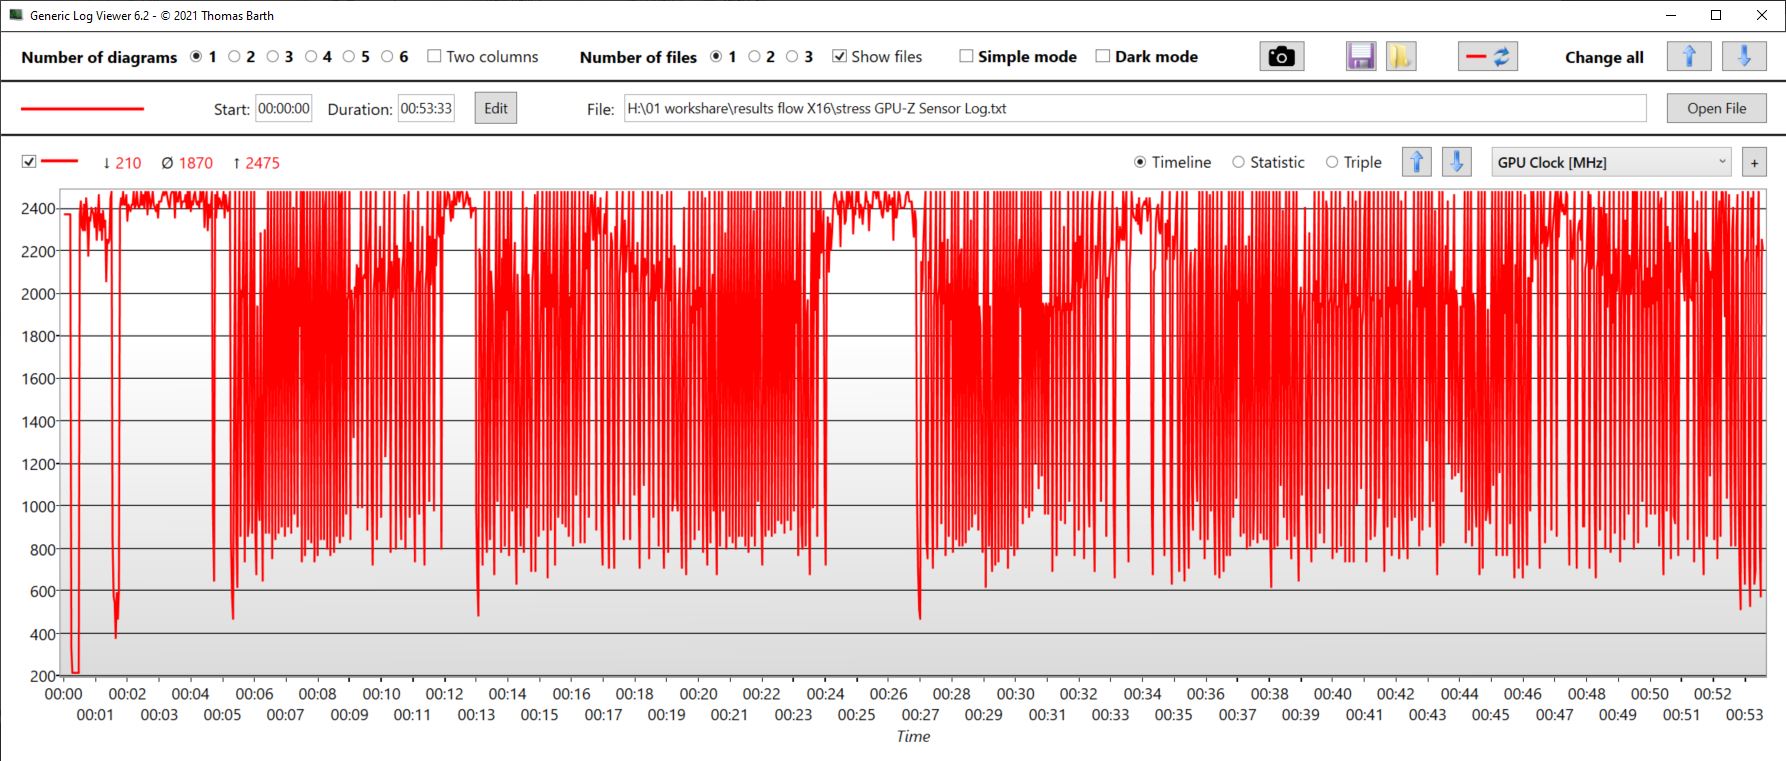
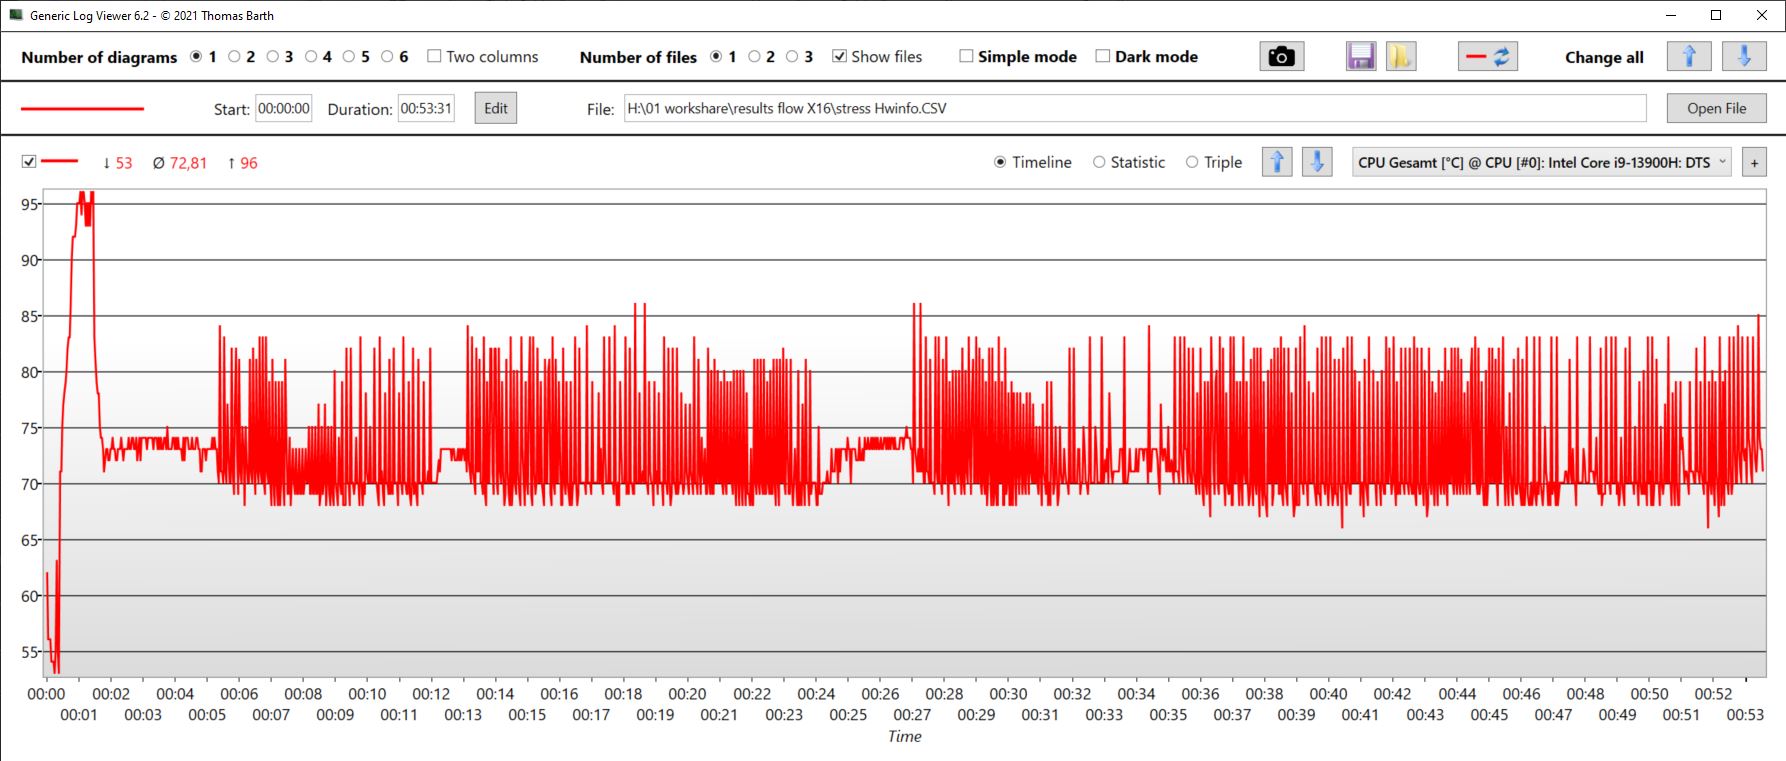
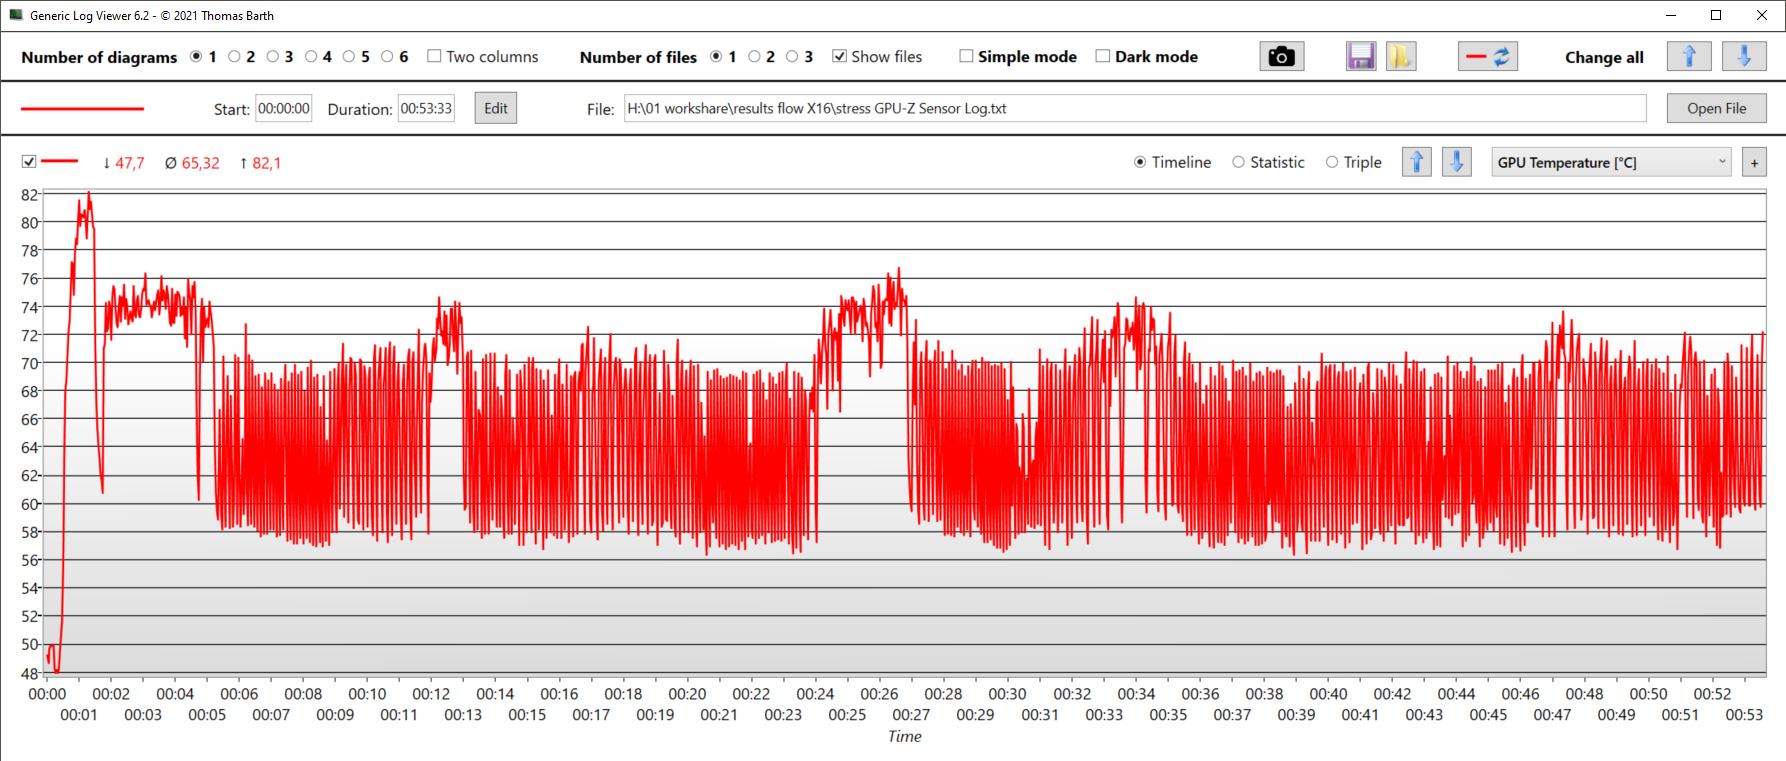
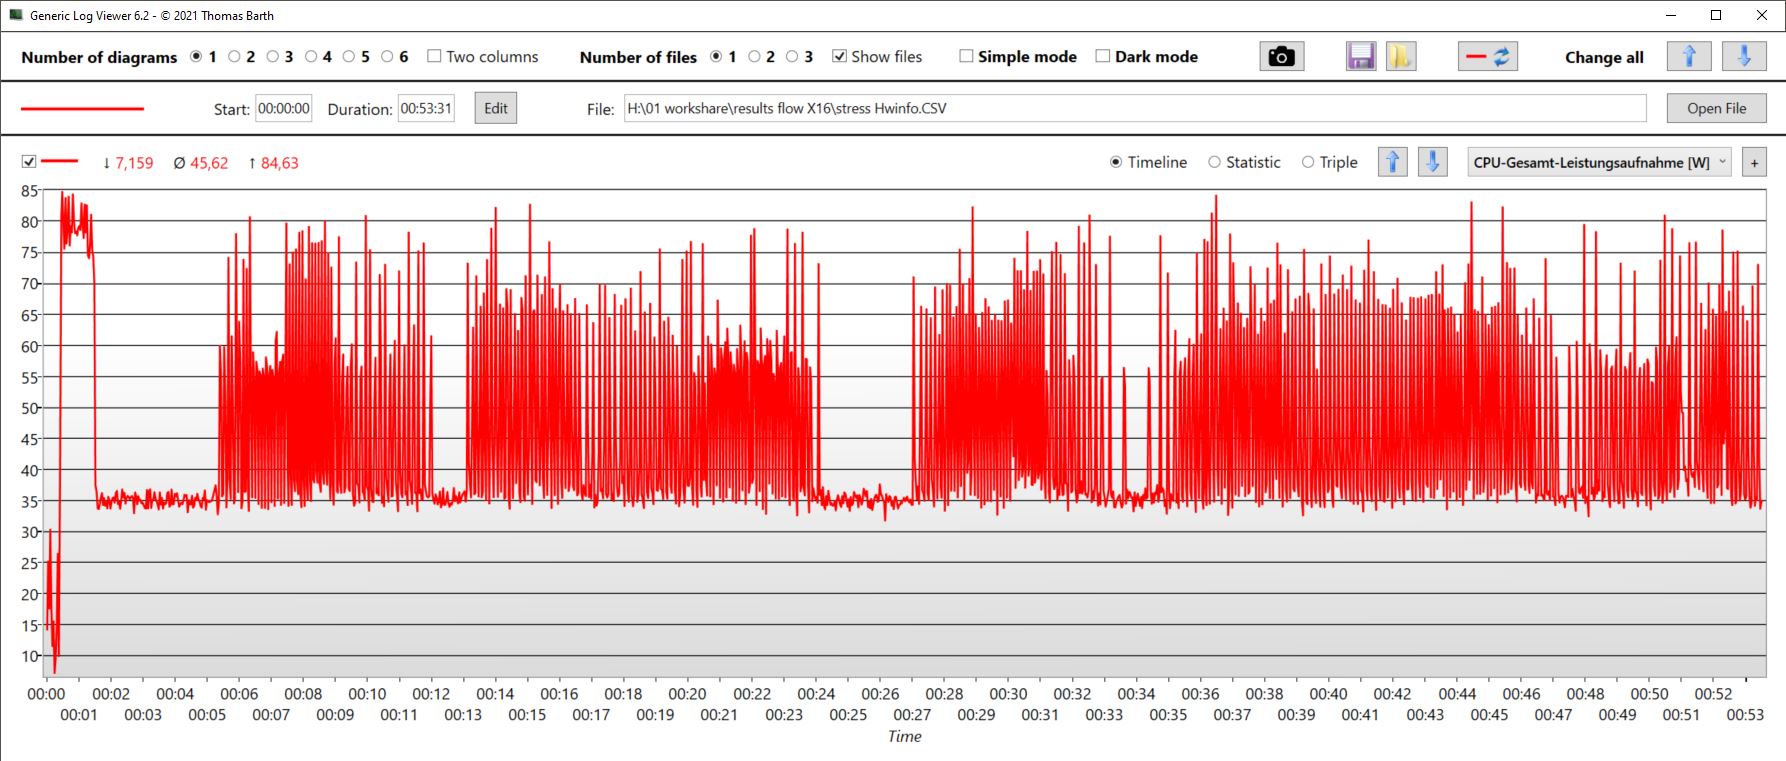
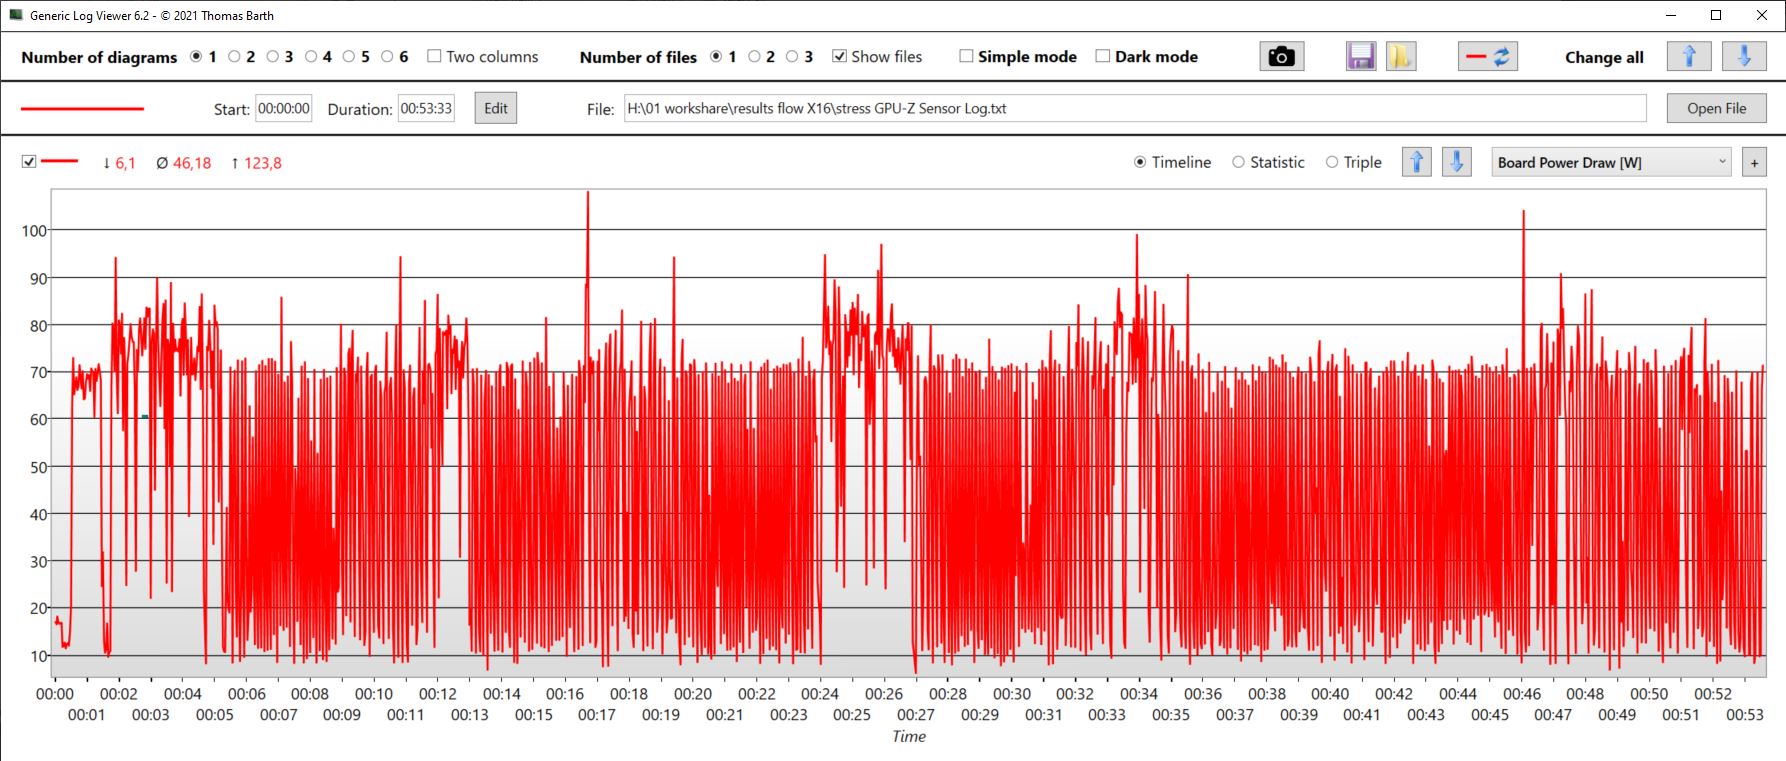
| Horloge CPU (GHz) | Horloge GPU (MHz) | Température moyenne du CPU (°C) | Température moyenne du GPU (°C) | |
| Prime95 + FurMark Stress | 2,6 | 1.870 | 73 | 65 |
| Witcher 3 StressAllerdings könnten die Boxen etwas lauter | 505 | 2.460 | 67,6 | 75 |
Intervenants
Les haut-parleurs offrent des médiums et des aigus équilibrés et les basses sont, bien sûr, plus basses, mais moins que dans d'autres modèles. Toutefois, les haut-parleurs pourraient être un peu plus puissants, dans l'ensemble.
La prise casque de 3,5 mm permet de connecter des appareils analogiques.
Asus ROG Flow X16 GV601V analyse audio
(±) | le niveau sonore du haut-parleur est moyen mais bon (77.38# dB)
Basses 100 - 315 Hz
(±) | basse réduite - en moyenne 9.6% inférieure à la médiane
(±) | la linéarité des basses est moyenne (9.2% delta à la fréquence précédente)
Médiums 400 - 2000 Hz
(+) | médiane équilibrée - seulement 4.7% de la médiane
(±) | la linéarité des médiums est moyenne (7.5% delta à la fréquence précédente)
Aiguës 2 - 16 kHz
(+) | des sommets équilibrés - à seulement 2.2% de la médiane
(+) | les aigus sont linéaires (6.1% delta à la fréquence précédente)
Globalement 100 - 16 000 Hz
(+) | le son global est linéaire (12% différence à la médiane)
Par rapport à la même classe
» 12% de tous les appareils testés de cette catégorie étaient meilleurs, 4% similaires, 84% pires
» Le meilleur avait un delta de 6%, la moyenne était de 18%, le pire était de 132%.
Par rapport à tous les appareils testés
» 9% de tous les appareils testés étaient meilleurs, 2% similaires, 88% pires
» Le meilleur avait un delta de 4%, la moyenne était de 23%, le pire était de 134%.
Lenovo Legion Pro 5 16IRX8 analyse audio
(±) | le niveau sonore du haut-parleur est moyen mais bon (72.7# dB)
Basses 100 - 315 Hz
(-) | presque aucune basse - en moyenne 23.7% plus bas que la médiane
(±) | la linéarité des basses est moyenne (10.7% delta à la fréquence précédente)
Médiums 400 - 2000 Hz
(+) | médiane équilibrée - seulement 3.8% de la médiane
(±) | la linéarité des médiums est moyenne (7.1% delta à la fréquence précédente)
Aiguës 2 - 16 kHz
(+) | des sommets équilibrés - à seulement 3.7% de la médiane
(+) | les aigus sont linéaires (6.7% delta à la fréquence précédente)
Globalement 100 - 16 000 Hz
(±) | la linéarité du son global est moyenne (21.9% de différence avec la médiane)
Par rapport à la même classe
» 79% de tous les appareils testés de cette catégorie étaient meilleurs, 6% similaires, 16% pires
» Le meilleur avait un delta de 6%, la moyenne était de 18%, le pire était de 132%.
Par rapport à tous les appareils testés
» 63% de tous les appareils testés étaient meilleurs, 7% similaires, 30% pires
» Le meilleur avait un delta de 4%, la moyenne était de 23%, le pire était de 134%.
Gestion de l'énergie - Bien mais pas génial
Gestion de l'énergie
En mode veille, notre X16 n'est pas aussi économique que le Galaxy Book3, notamment en raison de la luminosité de l'écran tactile. Malgré cela, en mode veille, l'appareil est à mille lieues du Legion 5. Mais en jetant un coup d'œil au Katana 17 pouces, il est clair que le Flow X16 pourrait être un peu plus économe en énergie lorsqu'il est en veille.
En jeu, la consommation est comparable à celle duKatana 17avec des performances légèrement supérieures. Dans le même temps, leLegion 5consomme beaucoup plus d'énergie. Cette remarque s'applique également à ses prédécesseurr, le nouvel Asus étant devenu nettement plus efficace.
| Éteint/en veille | |
| Au repos | |
| Fortement sollicité |
|
Légende:
min: | |
| Asus ROG Flow X16 GV601V i9-13900H, GeForce RTX 4060 Laptop GPU, WD PC SN560 SDDPNQE-1T00, IPS, 2560x1600, 16" | Asus ROG Flow X16 GV601RW-M5082W R9 6900HS, GeForce RTX 3070 Ti Laptop GPU, Micron 3400 1TB MTFDKBA1T0TFH, Mini LED, 2560x1600, 16.1" | Samsung Galaxy Book3 Ultra 16, i9-13900H RTX 4070 i9-13900H, GeForce RTX 4070 Laptop GPU, Samsung PM9A1 MZVL21T0HCLR, OLED / AMOLED, 2880x1800, 16" | Lenovo Legion Pro 5 16IRX8 i7-13700HX, GeForce RTX 4060 Laptop GPU, SK hynix PC801 HFS512GEJ9X115N, IPS, 2560x1600, 16" | Lenovo Yoga Pro 7 14IRH G8 i7-13700H, GeForce RTX 4050 Laptop GPU, Samsung PM9A1 MZVL21T0HCLR, IPS, 3072x1920, 14.5" | MSI Katana 17 B13VFK i7-13620H, GeForce RTX 4060 Laptop GPU, Micron 2400 MTFDKBA1T0QFM, IPS LED, 1920x1080, 17.3" | Moyenne NVIDIA GeForce RTX 4060 Laptop GPU | Moyenne de la classe Gaming | |
|---|---|---|---|---|---|---|---|---|
| Power Consumption | -48% | 41% | -63% | 23% | 0% | -5% | -25% | |
| Idle Minimum * (Watt) | 9.6 | 12.2 -27% | 4.3 55% | 24.5 -155% | 7.6 21% | 12.2 -27% | 11.5 ? -20% | 13 ? -35% |
| Idle Average * (Watt) | 16 | 25.5 -59% | 4.6 71% | 29.2 -83% | 13.3 17% | 14.9 7% | 16 ? -0% | 19 ? -19% |
| Idle Maximum * (Watt) | 16.9 | 29.8 -76% | 11.4 33% | 34.3 -103% | 13.7 19% | 15.8 7% | 20.3 ? -20% | 24.6 ? -46% |
| Load Average * (Watt) | 104 | 183 -76% | 97 7% | 98.7 5% | 88.2 15% | 85.22 18% | 92.9 ? 11% | 110.7 ? -6% |
| Witcher 3 ultra * (Watt) | 142 | 183.6 -29% | 100.9 29% | 178.6 -26% | 94.2 34% | 151.1 -6% | ||
| Load Maximum * (Watt) | 214 | 253 -18% | 107 50% | 249.6 -17% | 143 33% | 212.8 1% | 210 ? 2% | 259 ? -21% |
* ... Moindre est la valeur, meilleures sont les performances
Power consumption Witcher 3 / Stress test
Power consumption with an external monitor
Durée de vie de la batterie
Notre modèle d'évaluation a conservé la même taille de batterie (90 Wh) que son prédécesseur prédécesseur. La batterie de la X16 est donc plus grande que celle que l'on trouve dans les machines de jeu de taille normale et de milieu de gamme, telles que le Legion 5.
On peut donc s'attendre à une longue durée de vie de la batterie. Notre test Wi-Fi n'en a été que plus surprenant. Les concurrents dotés de batteries plus petites, comme le Galaxy Book3 (76 Wh) ou le Yoga Pro 7 (73 Wh), sont tout aussi endurants. C'est un domaine dans lequel le X16 pourrait améliorer sa consommation d'énergie au repos.
Néanmoins, l'autonomie de la batterie est bonne, mais, compte tenu de la grande taille de la batterie, on aurait pu s'attendre à de meilleures durées de fonctionnement - au moins lorsqu'il s'agit de tâches peu exigeantes telles que la navigation sur Internet. En outre, lorsque vous naviguez sur le web en mode batterie, assurez-vous que le mode silencieux est sélectionné et non le mode performance.
| Asus ROG Flow X16 GV601V i9-13900H, GeForce RTX 4060 Laptop GPU, 90 Wh | Asus ROG Flow X16 GV601RW-M5082W R9 6900HS, GeForce RTX 3070 Ti Laptop GPU, 90 Wh | Samsung Galaxy Book3 Ultra 16, i9-13900H RTX 4070 i9-13900H, GeForce RTX 4070 Laptop GPU, 76 Wh | Lenovo Legion Pro 5 16IRX8 i7-13700HX, GeForce RTX 4060 Laptop GPU, 80 Wh | Lenovo Yoga Pro 7 14IRH G8 i7-13700H, GeForce RTX 4050 Laptop GPU, 73 Wh | MSI Katana 17 B13VFK i7-13620H, GeForce RTX 4060 Laptop GPU, 53.5 Wh | Moyenne de la classe Gaming | |
|---|---|---|---|---|---|---|---|
| Autonomie de la batterie | -34% | -13% | -55% | 6% | -48% | -6% | |
| H.264 (h) | 8.9 | 9 1% | 12.4 39% | 8.32 ? -7% | |||
| WiFi v1.3 (h) | 7.9 | 5.7 -28% | 8 1% | 3.4 -57% | 9.9 25% | 2.9 -63% | 7.11 ? -10% |
| Load (h) | 1.5 | 0.9 -40% | 0.9 -40% | 0.7 -53% | 0.8 -47% | 1 -33% | 1.502 ? 0% |
| Witcher 3 ultra (h) | 0.9 | ||||||
| Reader / Idle (h) | 6.7 | 8.27 ? |
Points positifs
Points négatifs
Verdict - Un appareil merveilleux et très polyvalent
L'Asus ROG Flow X16 est avant tout polyvalent ! C'est un appareil de travail fin et mobile, c'est un 2-en-1, une tablette, une station de travail puissante et même un PC de jeu. Mais ce qui est encore plus surprenant, c'est qu'il fait tout cela très bien : Il fait tout cela très bien, sans commettre de grosses erreurs. C'est tout sauf un compromis paresseux.
En effet, malgré ses dimensions compactes et sa fonctionnalité 2-en-1, le matériel n'est pas bridé et affiche, du moins en mode turbo, des performances supérieures à la moyenne. Même si le bruit devient un peu fort, il n'est pas plus fort que celui de la concurrence purement axée sur le jeu. Cependant, même après une période de forte charge, les ventilateurs continuent à fonctionner pendant un certain temps.
Nous changeons la catégorie de produit en "Gaming" car le score est ici supérieur d'environ 2,4 points de pourcentage à celui de la catégorie "Convertible".
L'Asus ROG Flow X16 est une station de travail gaming 2-en-1 extrêmement polyvalente et puissante, dotée d'un bon écran tactile.
Jusqu'à présent, les alternatives de ce type sont rares. Pour l'instant, Asus semble vouloir tenter l'expérience. Les acheteurs potentiels peuvent jeter un coup d'œil à un appareil que nous avons mentionné au début de l'article, la tablette de jeu Asus ROG Flow Z13. LeSamsung Galaxy Book3 Ultra 16(89 %) est tout aussi performante, mais un peu lente malgré un GPU plus puissant. La moins bien équipéeLenovo Yoga Pro 7 14 G8(90 %) mérite également d'être pris en considération.
Prix et disponibilité
Actuellement, notre configuration de la Flow X16 avec une RTX 4060 n'est pas disponible sur Amazon ou BestBuy. En revanche, sur ce dernier site, le modèle RTX 4070 est disponible au prix de 2699,99 $.
Asus ROG Flow X16 GV601V
- 06/08/2023 v7 (old)
Christian Hintze
Transparency
La sélection des appareils à examiner est effectuée par notre équipe éditoriale. L'échantillon de test a été prêté à l'auteur par le fabricant ou le détaillant pour les besoins de cet examen. Le prêteur n'a pas eu d'influence sur cette évaluation et le fabricant n'a pas reçu de copie de cette évaluation avant sa publication. Il n'y avait aucune obligation de publier cet article. En tant que média indépendant, Notebookcheck n'est pas soumis à l'autorité des fabricants, des détaillants ou des éditeurs.
Voici comment Notebookcheck teste
Chaque année, Notebookcheck examine de manière indépendante des centaines d'ordinateurs portables et de smartphones en utilisant des procédures standardisées afin de garantir que tous les résultats sont comparables. Nous avons continuellement développé nos méthodes de test depuis environ 20 ans et avons établi des normes industrielles dans le processus. Dans nos laboratoires de test, des équipements de mesure de haute qualité sont utilisés par des techniciens et des rédacteurs expérimentés. Ces tests impliquent un processus de validation en plusieurs étapes. Notre système d'évaluation complexe repose sur des centaines de mesures et de points de référence bien fondés, ce qui garantit l'objectivité.Price comparison

