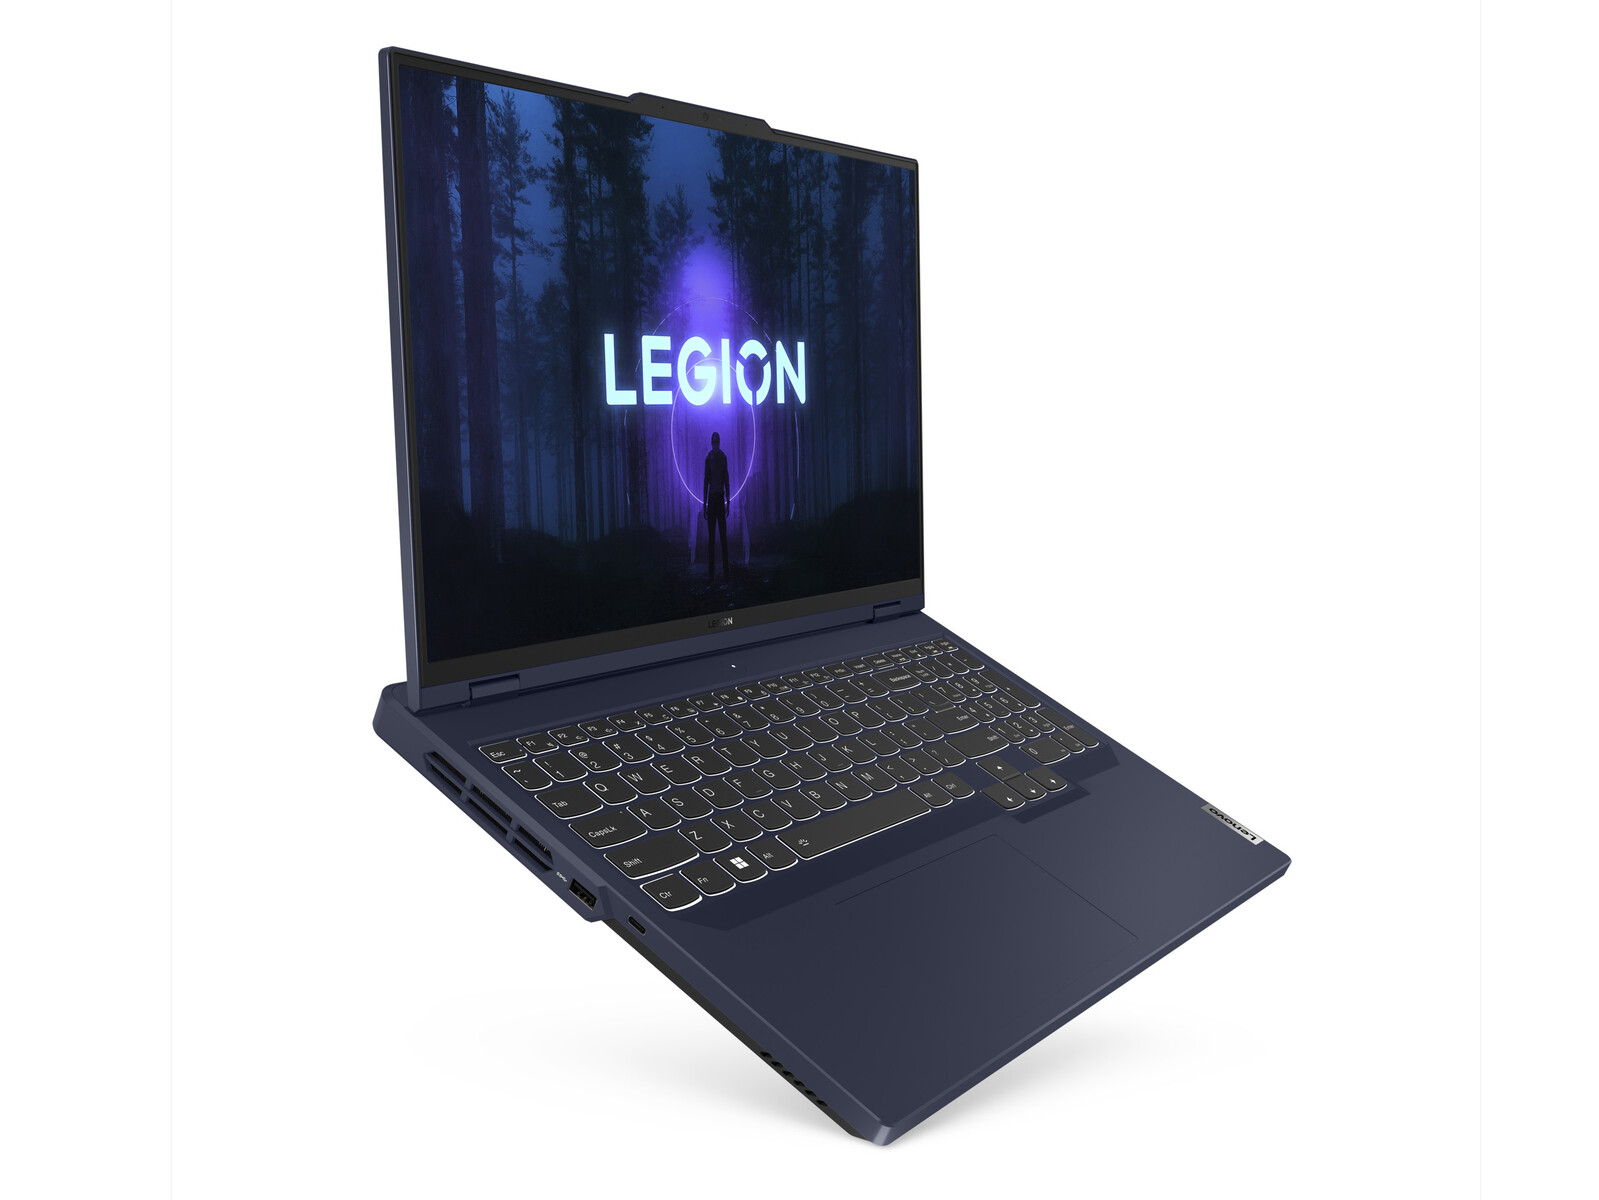
Test du Lenovo Legion Pro 5 16IRX8 : un prix élevé pour la GeForce RTX 4060
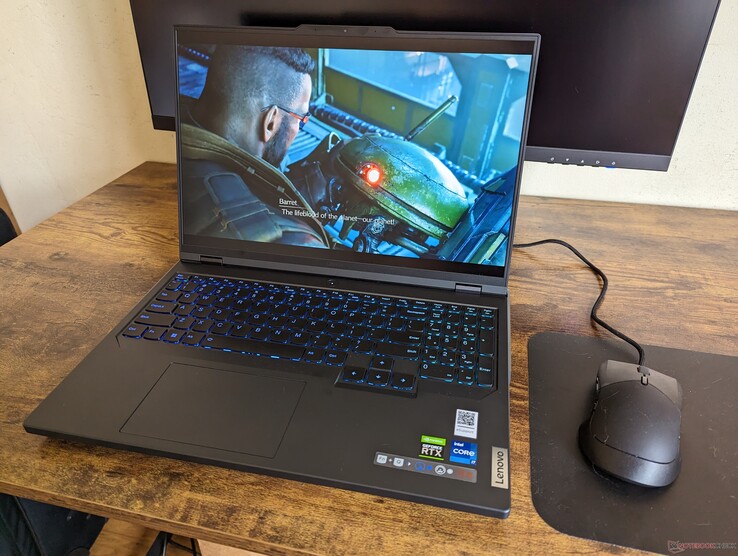
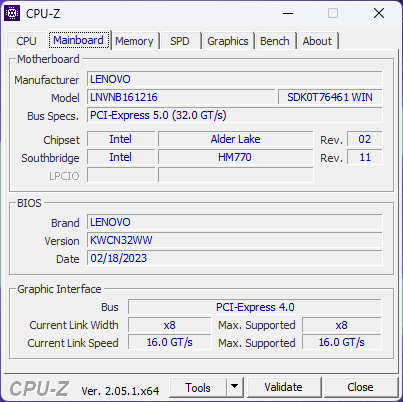
Le Legion Pro 5 16 IRX8 (ou Legion Pro 5i 16 Gen 8) est le successeur du Pro 5i 16 Gen 8 2022 Legion Pro 5i 16 Gen 7. Il introduit plusieurs changements, notamment une refonte du châssis, ainsi que des options de CPU Intel Raptor Lake-H de 13e génération et de GPU Nvidia Ada Lovelace pour remplacer les options Alder Lake-H et Ampere de 12e génération, respectivement. Il s'agit d'un modèle de jeu de milieu de gamme supérieur, situé entre la série IdeaPad gaming d'entrée de gamme et la série phare Legion Série Pro 7.
Notre unité de test spécifique est une configuration intermédiaire avec le Core i7-13700HX, GeForce RTX 4060, et un écran IPS 165 Hz pour environ 1400 à 1700 USD. Des SKUs bas de gamme et haut de gamme sont disponibles avec le Core i5-12500HrTX 4050, RTX 4070, ou un écran IPS 240 Hz, mais toutes les options d'affichage ont G-Sync et une résolution native de 2560 x 1600.
Les concurrents du Legion Pro 5 16 comprennent d'autres ordinateurs portables de jeu de 16 pouces comme le Razer Blade 16,Asus ROG Zephyrus M16,Dell G16 7620ou Gigabyte Aero 16.
Plus de commentaires sur Lenovo :
Comparaison avec les concurrents potentiels
Note | Date | Modèle | Poids | Épaisseur | Taille | Résolution | Prix |
|---|---|---|---|---|---|---|---|
| 87.9 % v7 (old) | 05/23 | Lenovo Legion Pro 5 16IRX8 i7-13700HX, GeForce RTX 4060 Laptop GPU | 2.5 kg | 26.8 mm | 16.00" | 2560x1600 | |
| 87.8 % v7 (old) | 02/23 | Asus ROG Zephyrus M16 GU603Z i9-12900H, GeForce RTX 3070 Ti Laptop GPU | 2.1 kg | 19.9 mm | 16.00" | 2560x1600 | |
| 91.2 % v7 (old) | 02/23 | Razer Blade 16 Early 2023 i9-13950HX, GeForce RTX 4080 Laptop GPU | 2.4 kg | 21.99 mm | 16.00" | 2560x1600 | |
| 89.4 % v7 (old) | 02/23 | Lenovo Legion Pro 7 16IRX8H i9-13900HX, GeForce RTX 4080 Laptop GPU | 2.7 kg | 26 mm | 16.00" | 2560x1600 | |
| 87.7 % v7 (old) | 10/22 | Lenovo Legion 5 Pro 16ARH7H RTX 3070 Ti R7 6800H, GeForce RTX 3070 Ti Laptop GPU | 2.6 kg | 26.6 mm | 16.00" | 2560x1600 | |
| 89.3 % v7 (old) | 01/23 | Lenovo Legion S7 16ARHA7 R9 6900HX, Radeon RX 6800S | 2.2 kg | 16.9 mm | 16.00" | 2560x1600 |
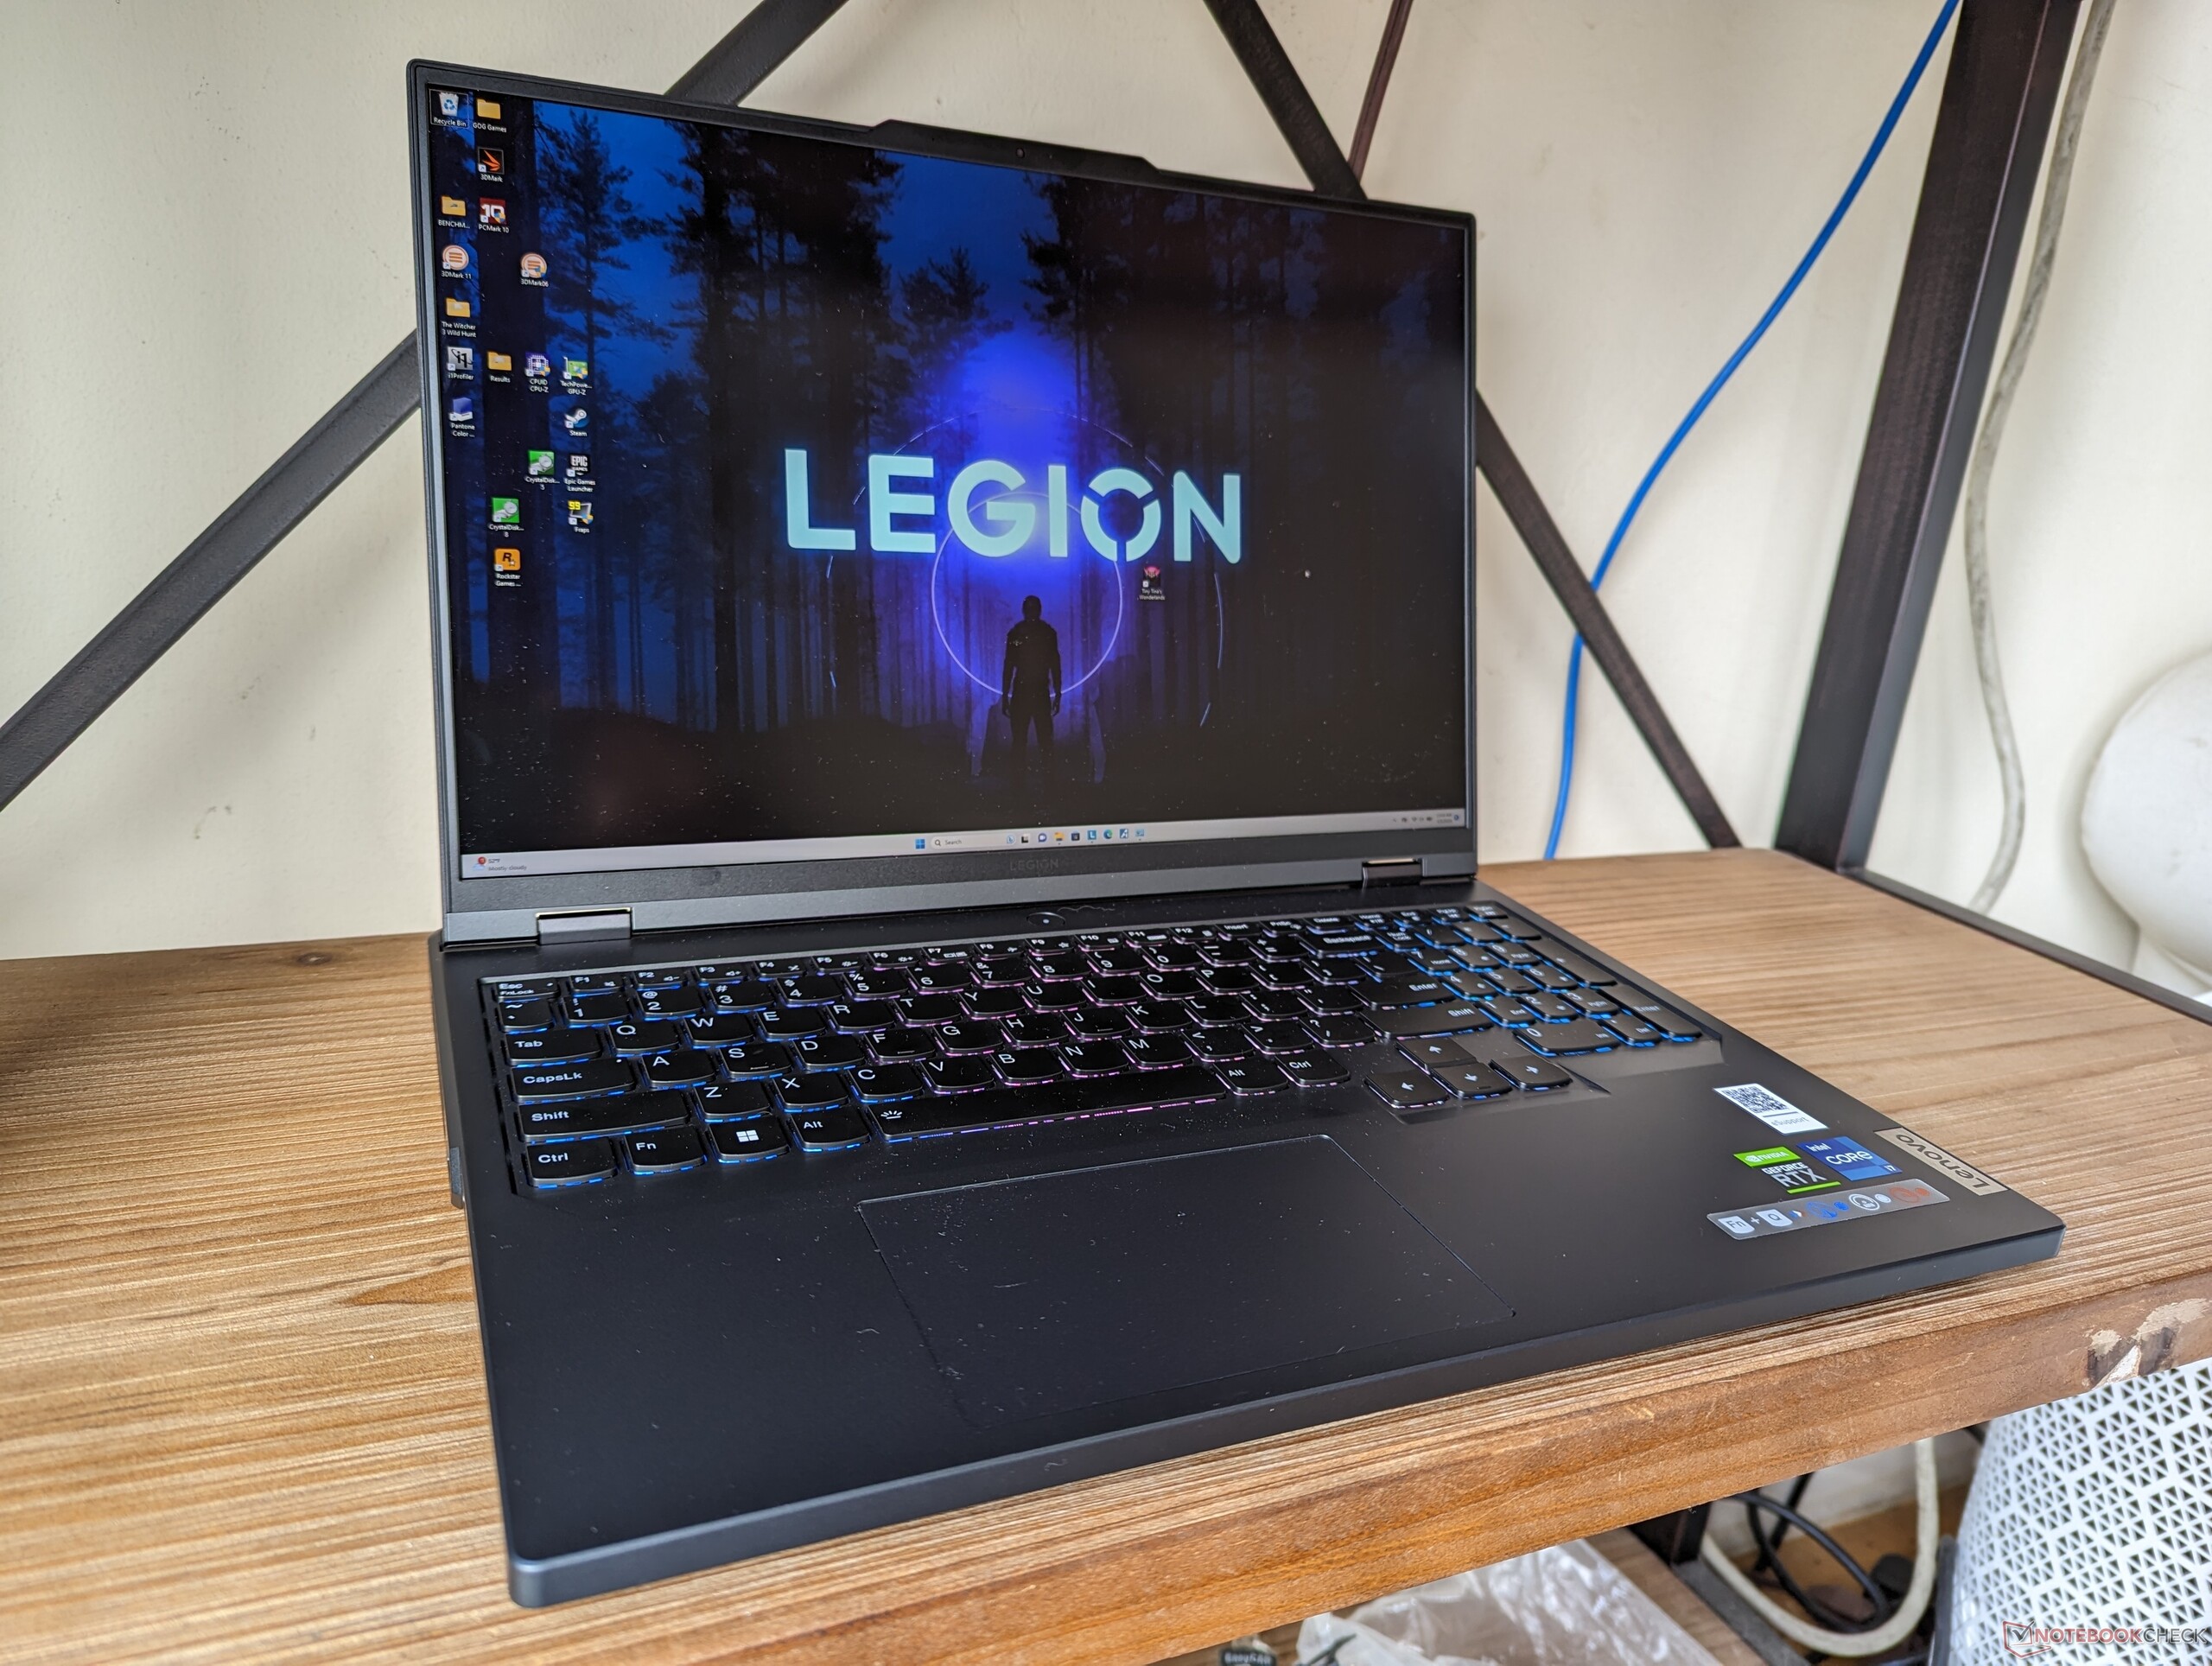
Cas - Un plus léger Legion
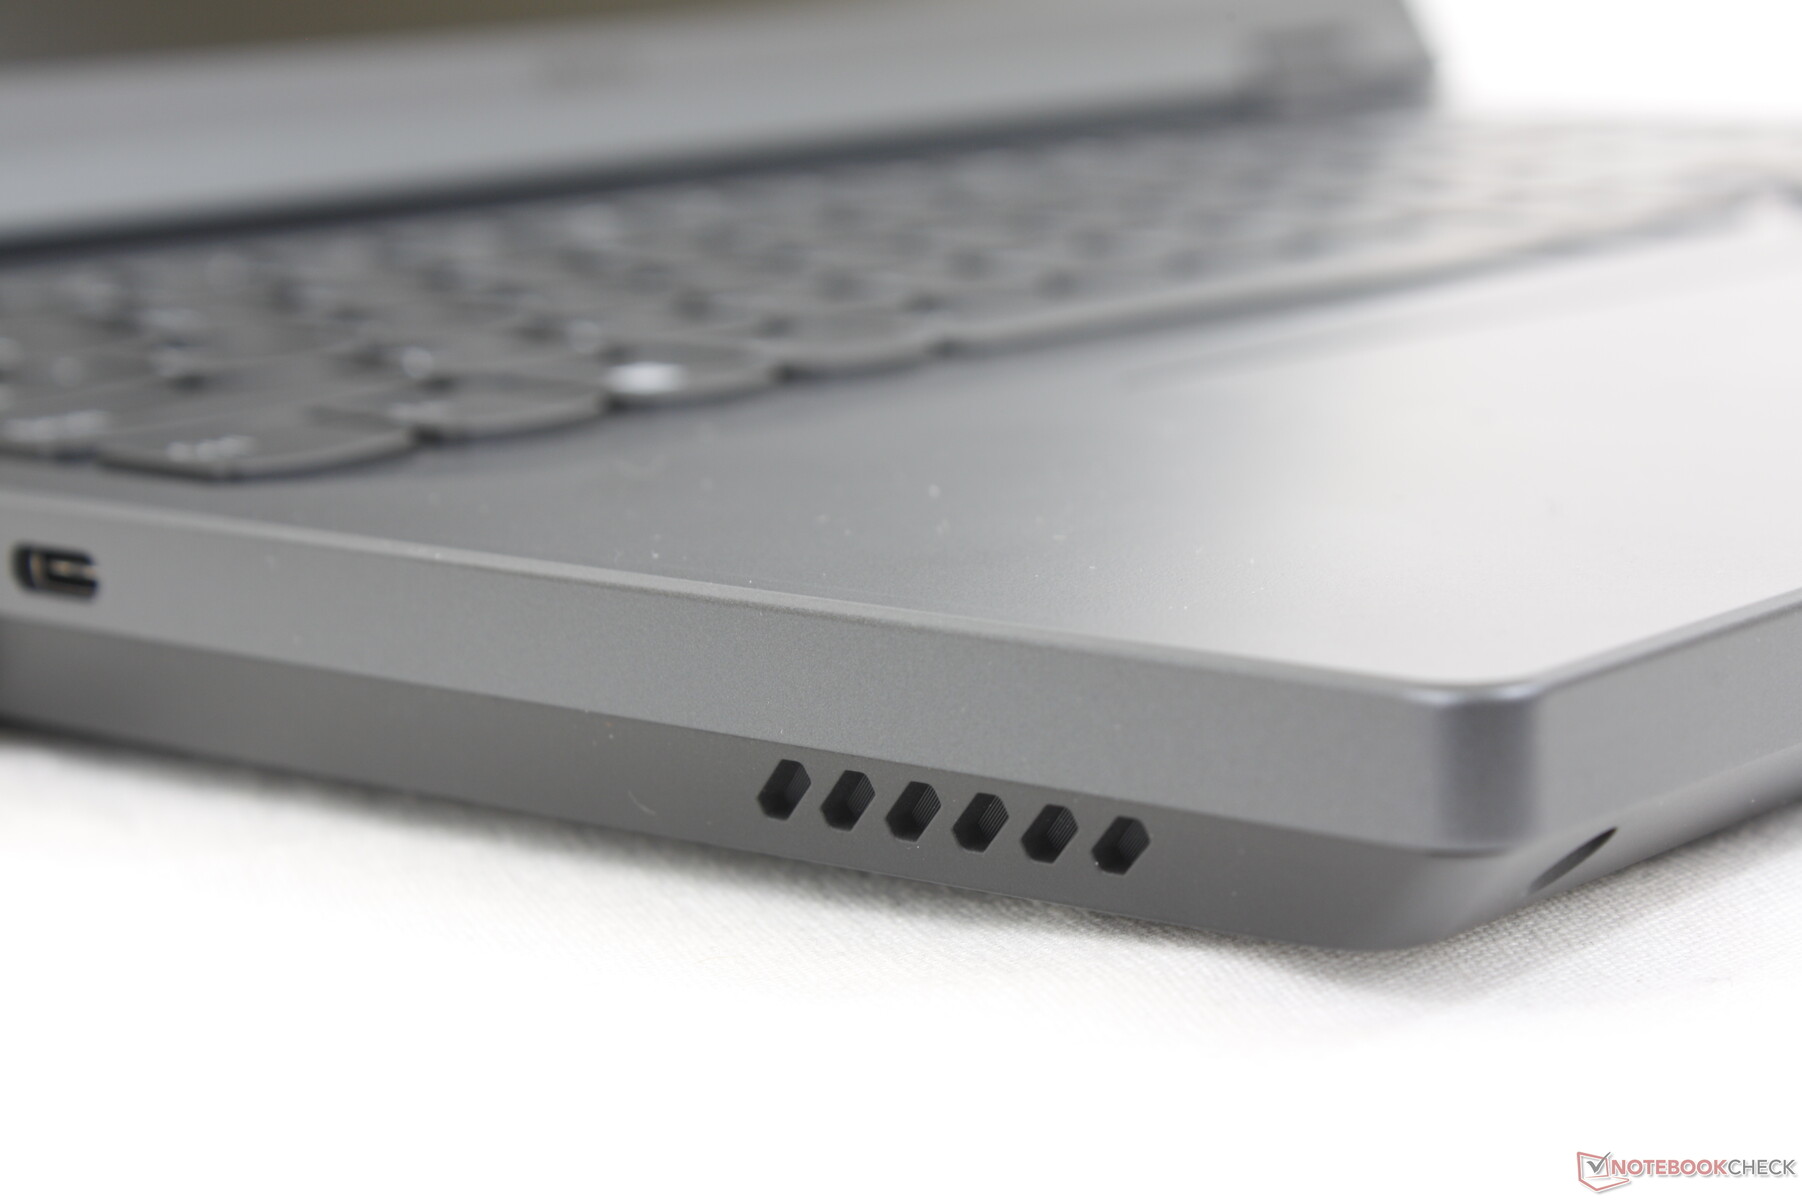
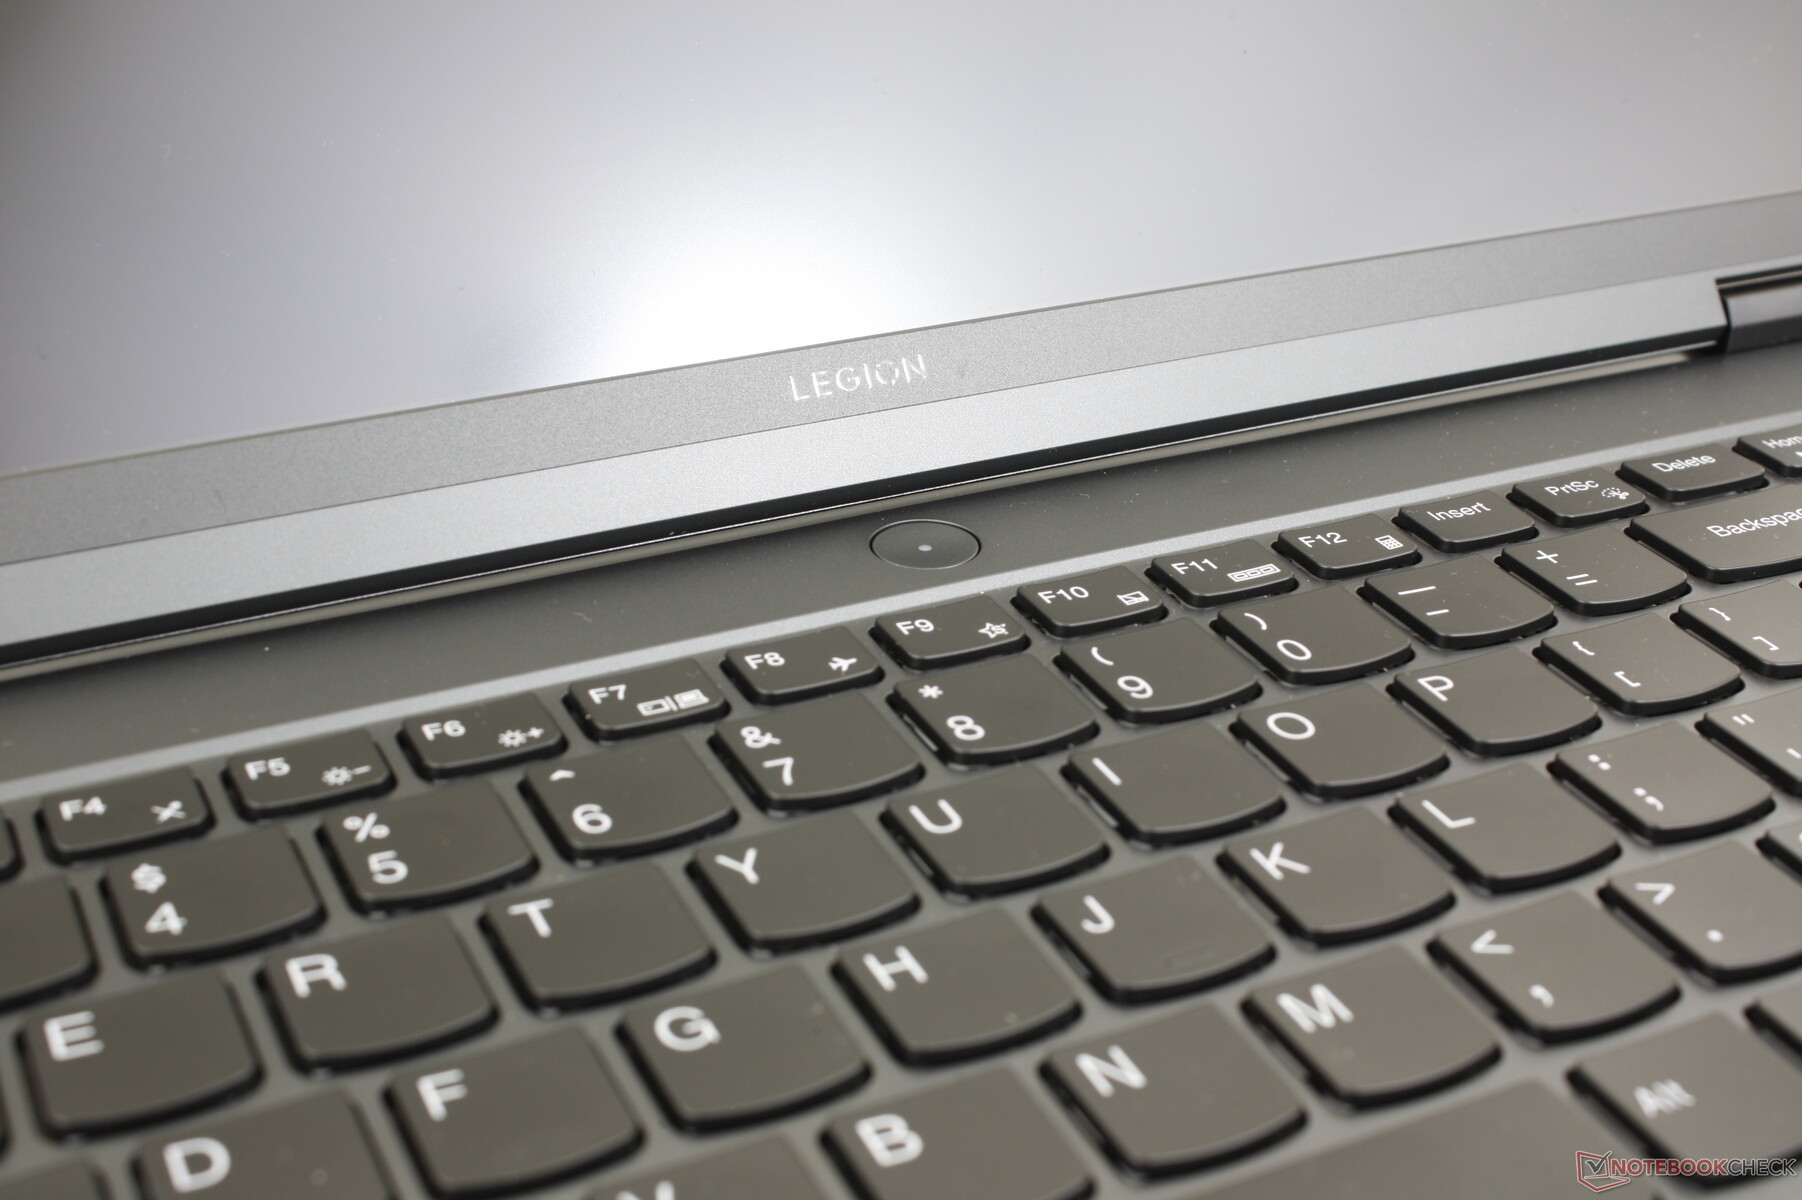
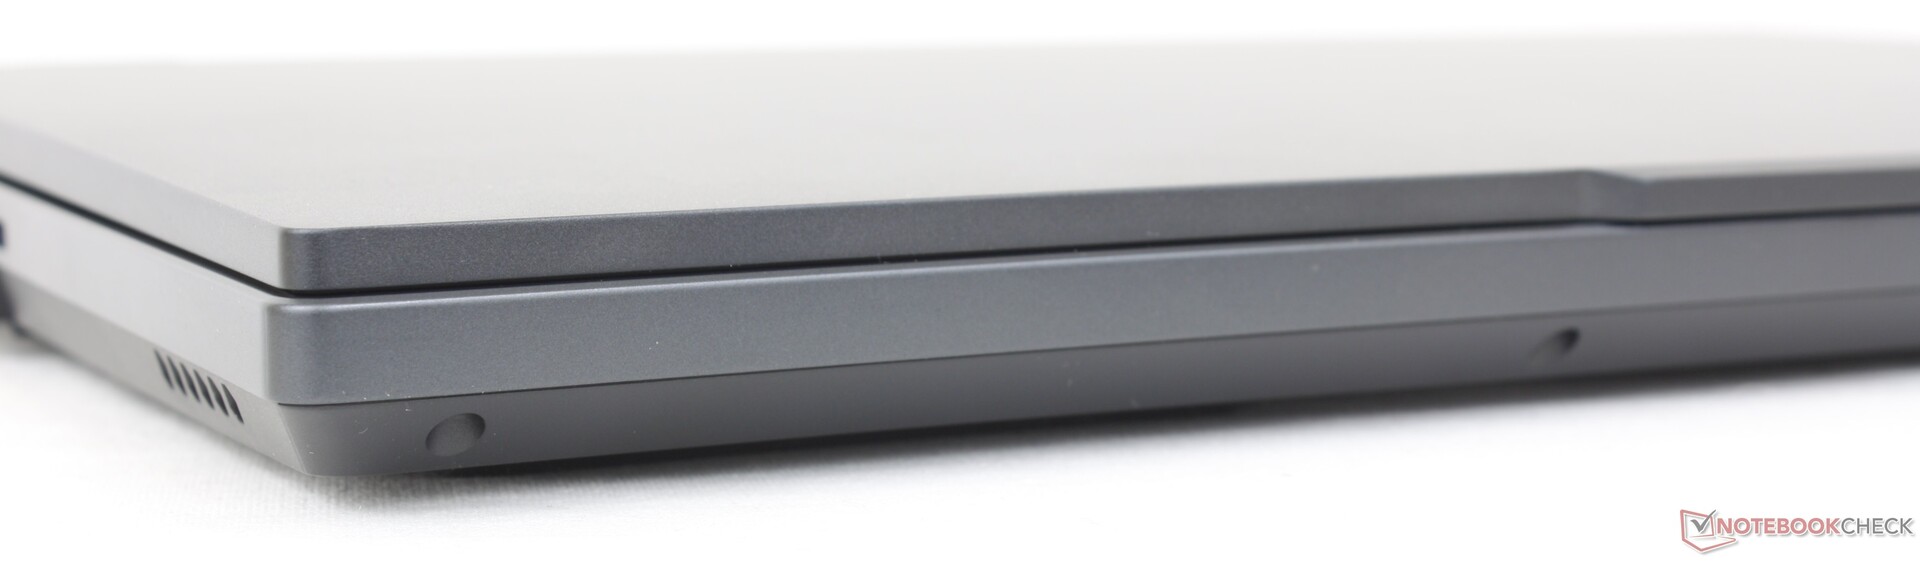
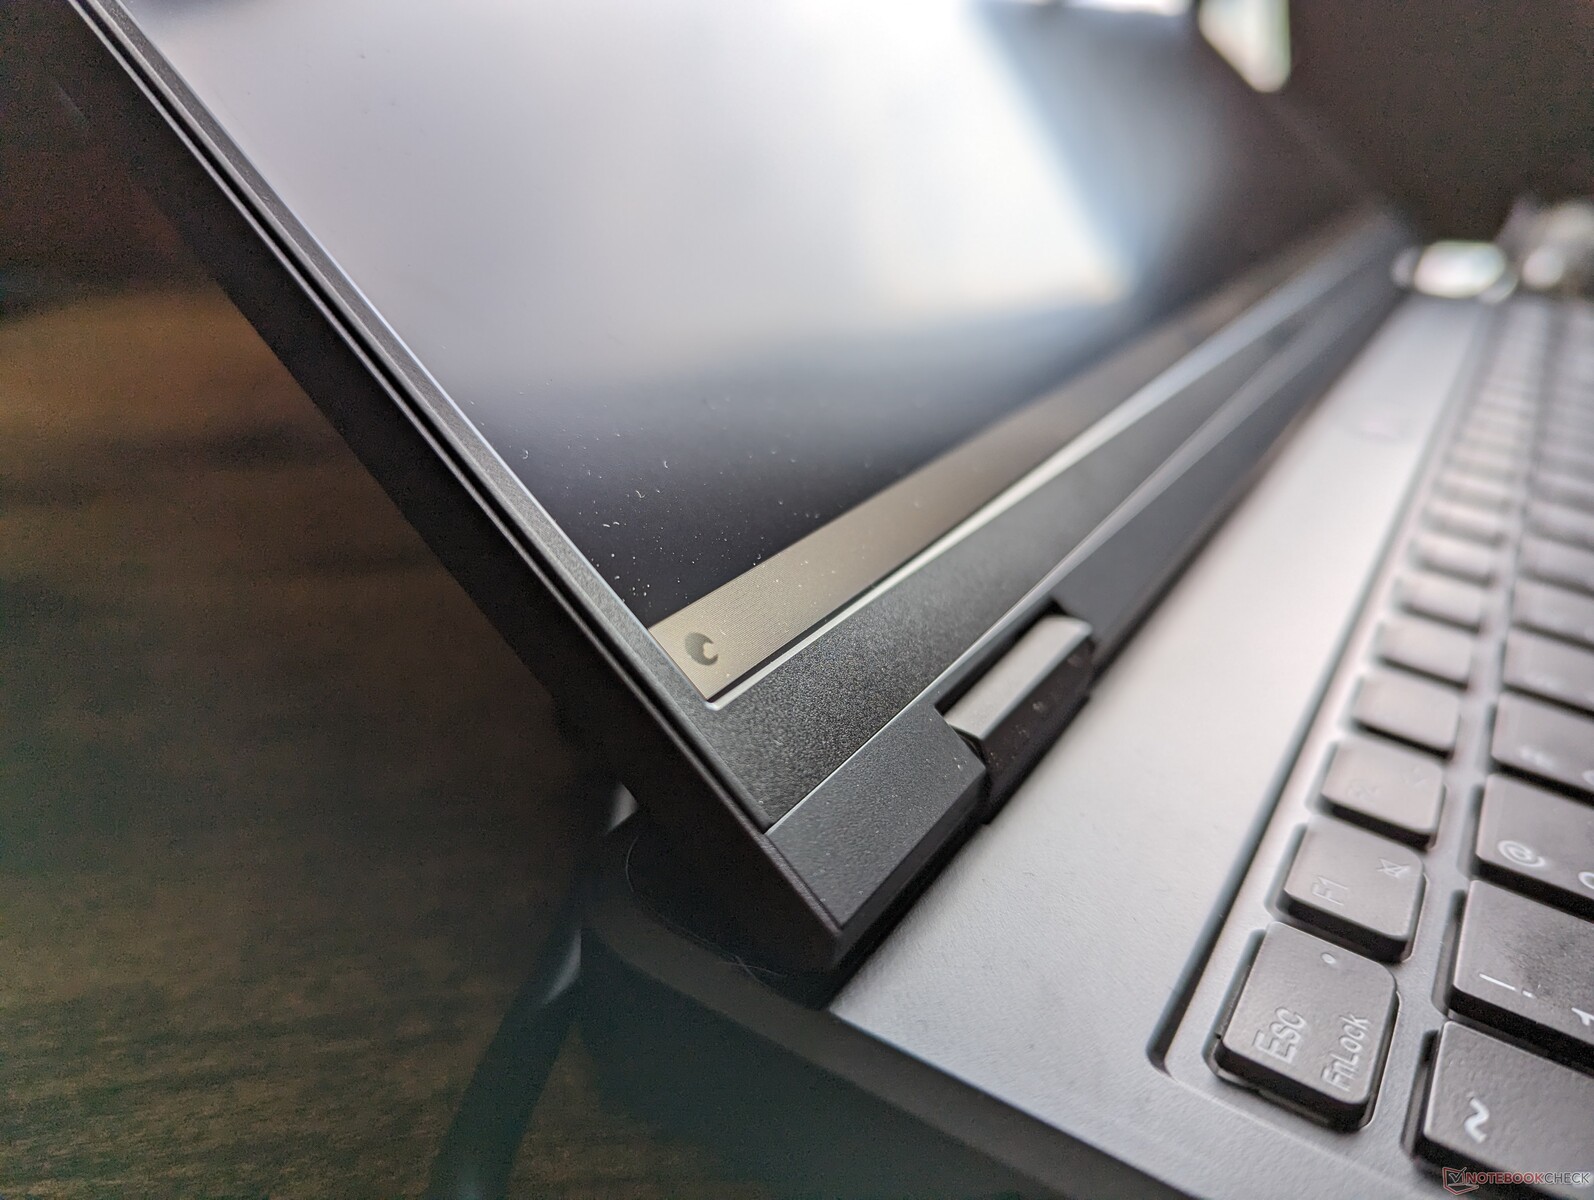
Visuellement, le châssis révisé présente moins d'accents et d'angles pour un aspect plus plat et plus professionnel que le modèle de l'année dernière, en particulier à l'arrière. Les deux tons de gris et d'argent ont disparu au profit d'une apparence plus uniforme. Nous préférons le nouveau design qui tend vers le minimalisme tout en conservant de nombreuses caractéristiques propres à Legion.
La rigidité du châssis est excellente sur notre appareil, sans craquement audible ni point faible notable. La base et le couvercle présentent plus de torsion que les modèles plus rigides du Blade 16plus rigide, mais pas suffisamment pour être inquiétant.
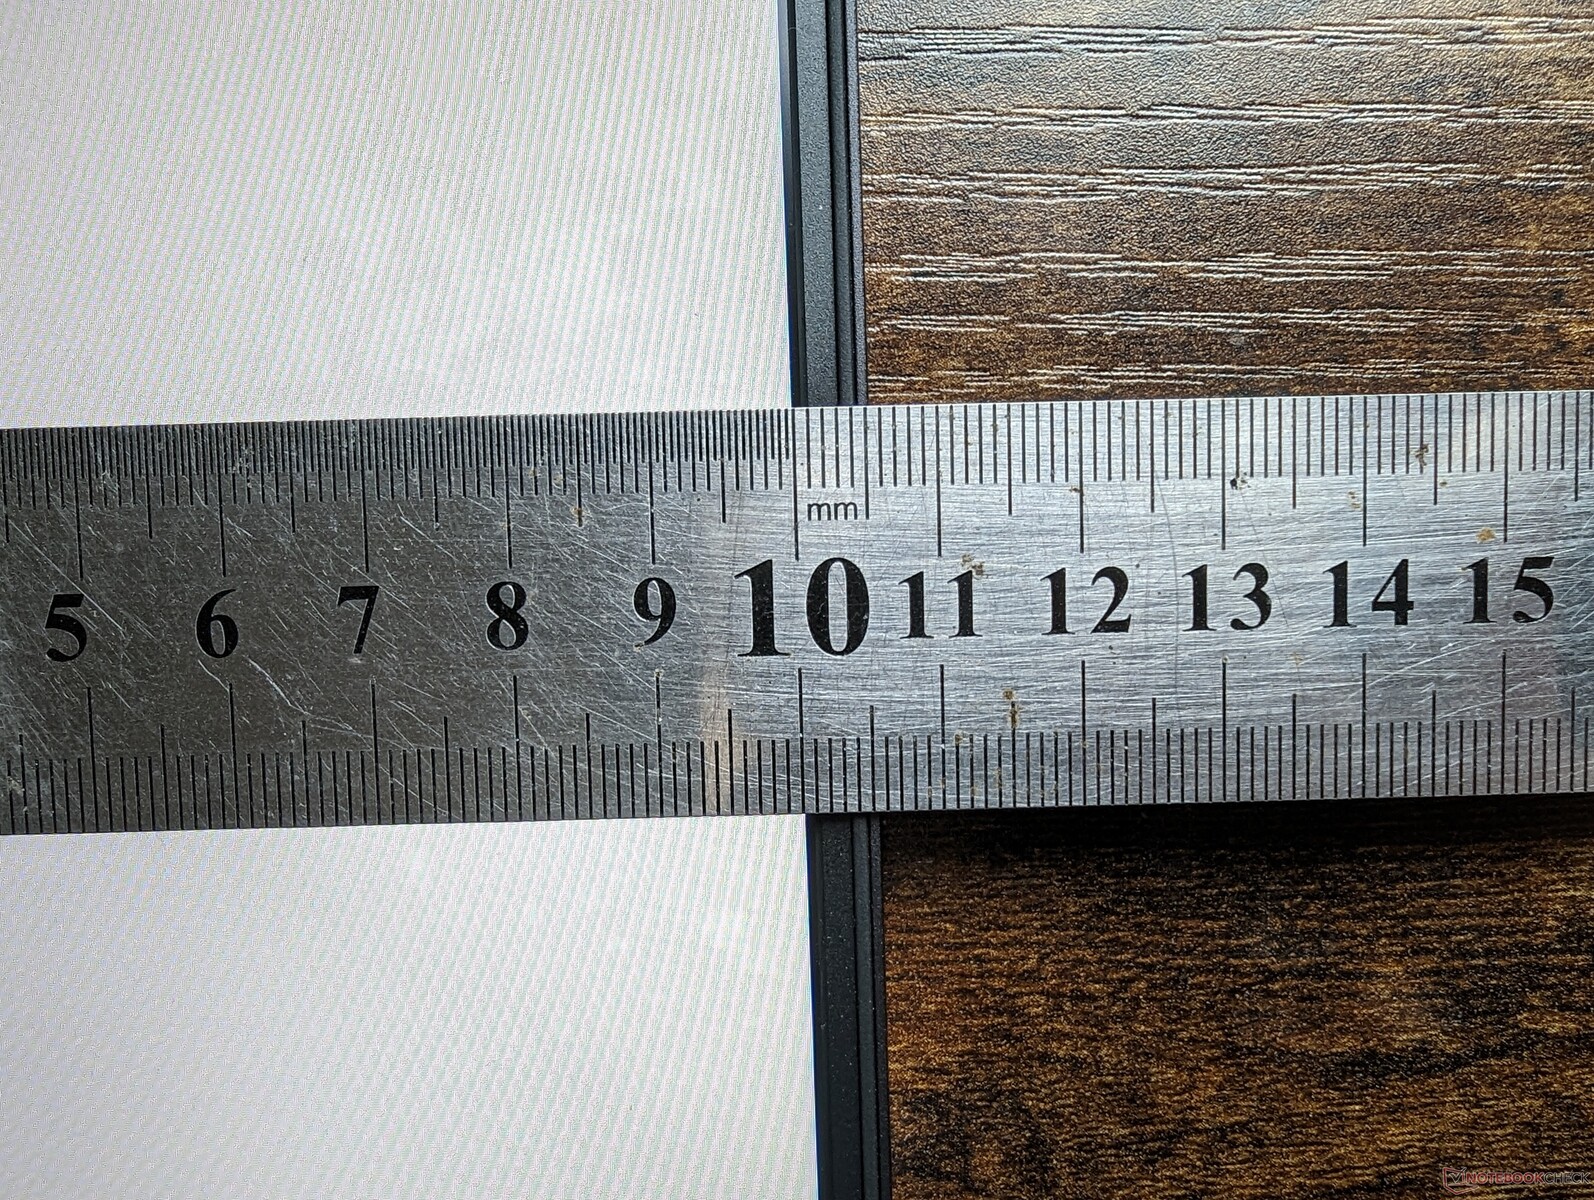
Le Legion Pro 5 16 est sensiblement plus grand et plus lourd que la plupart de ses homologues. L'Aero 16, le Blade 16 et le Zephyrus M16 sont tous plus fins et plus légers que le Lenovo de 8 mm ou 400 grammes, ce qui n'est pas négligeable. Bien qu'il soit loin d'être aussi encombrant que de nombreux ordinateurs portables de jeu de 17,3 pouces, le Legion Pro 5 16 n'est pas non plus l'option la plus facile à transporter dans sa catégorie de taille de 16 pouces.
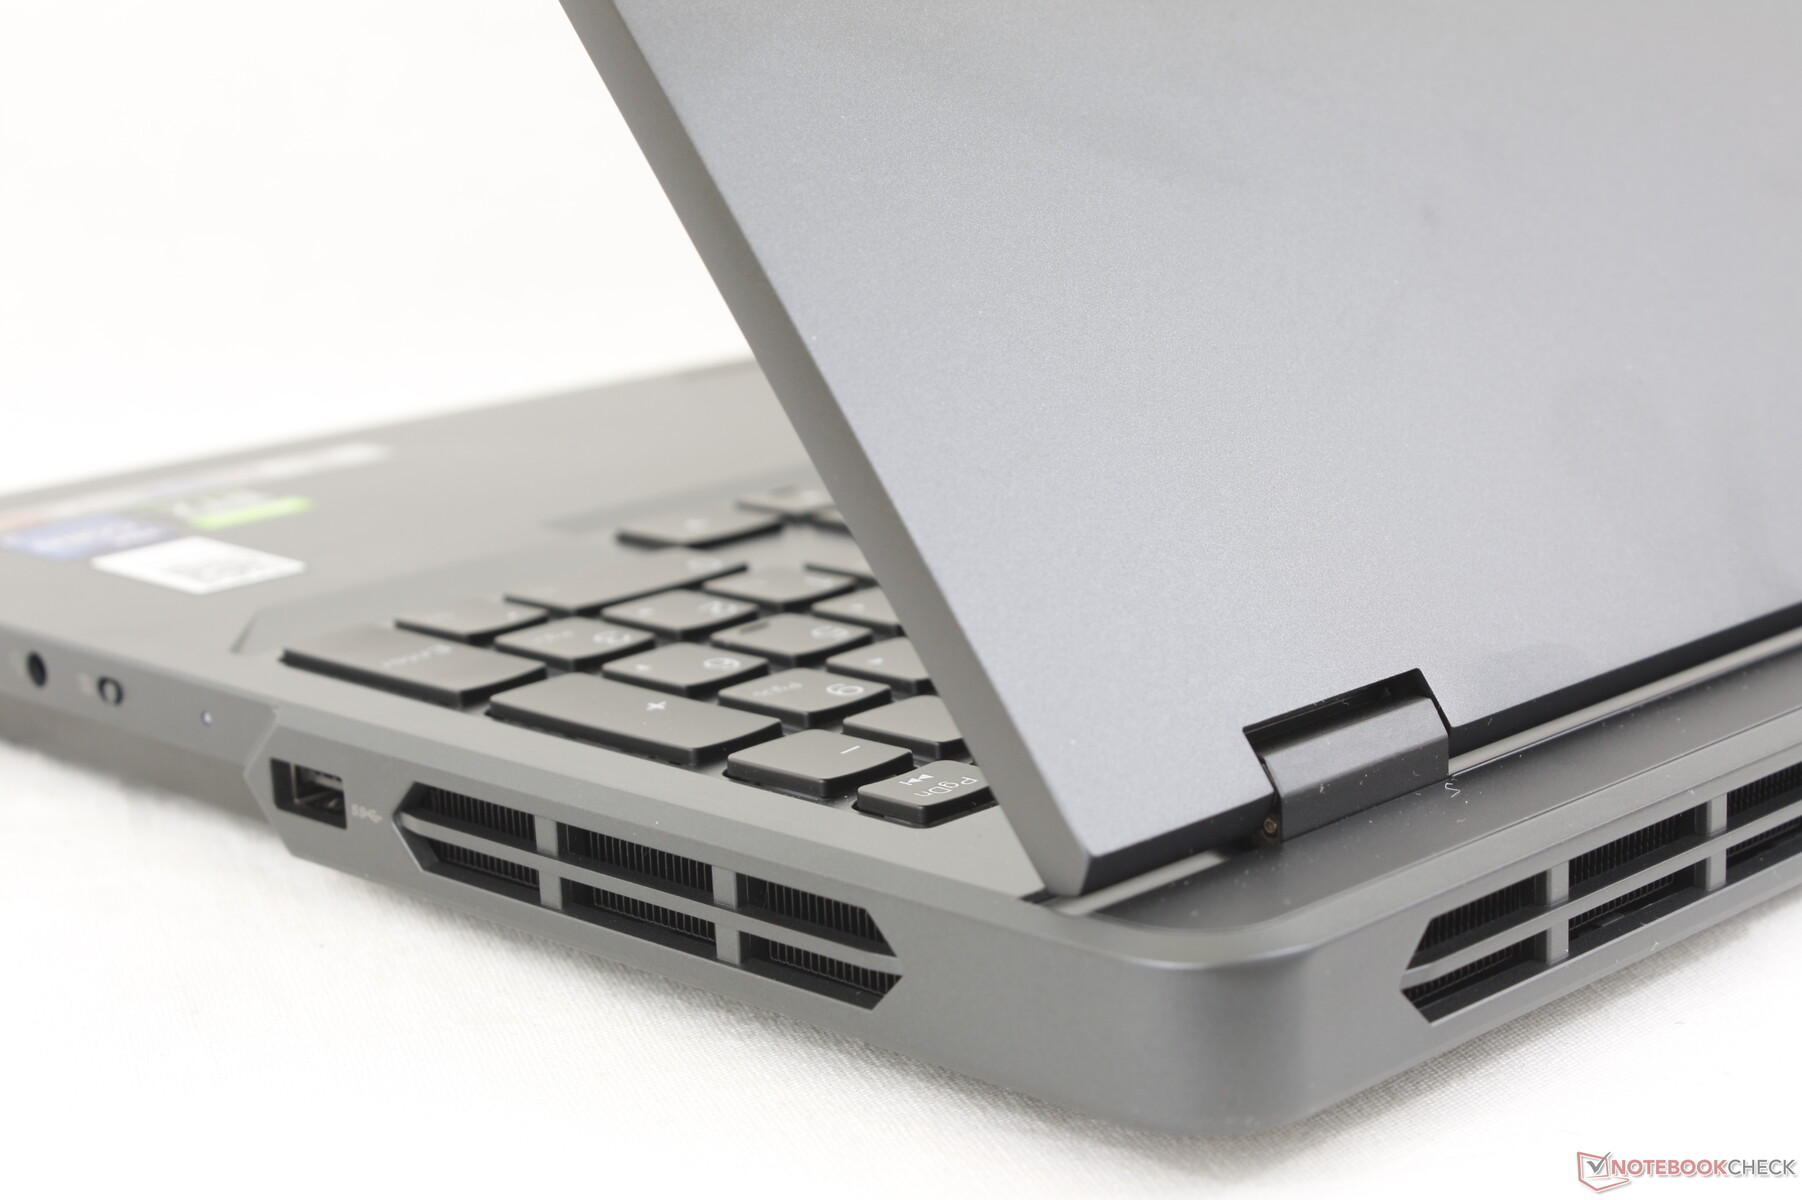
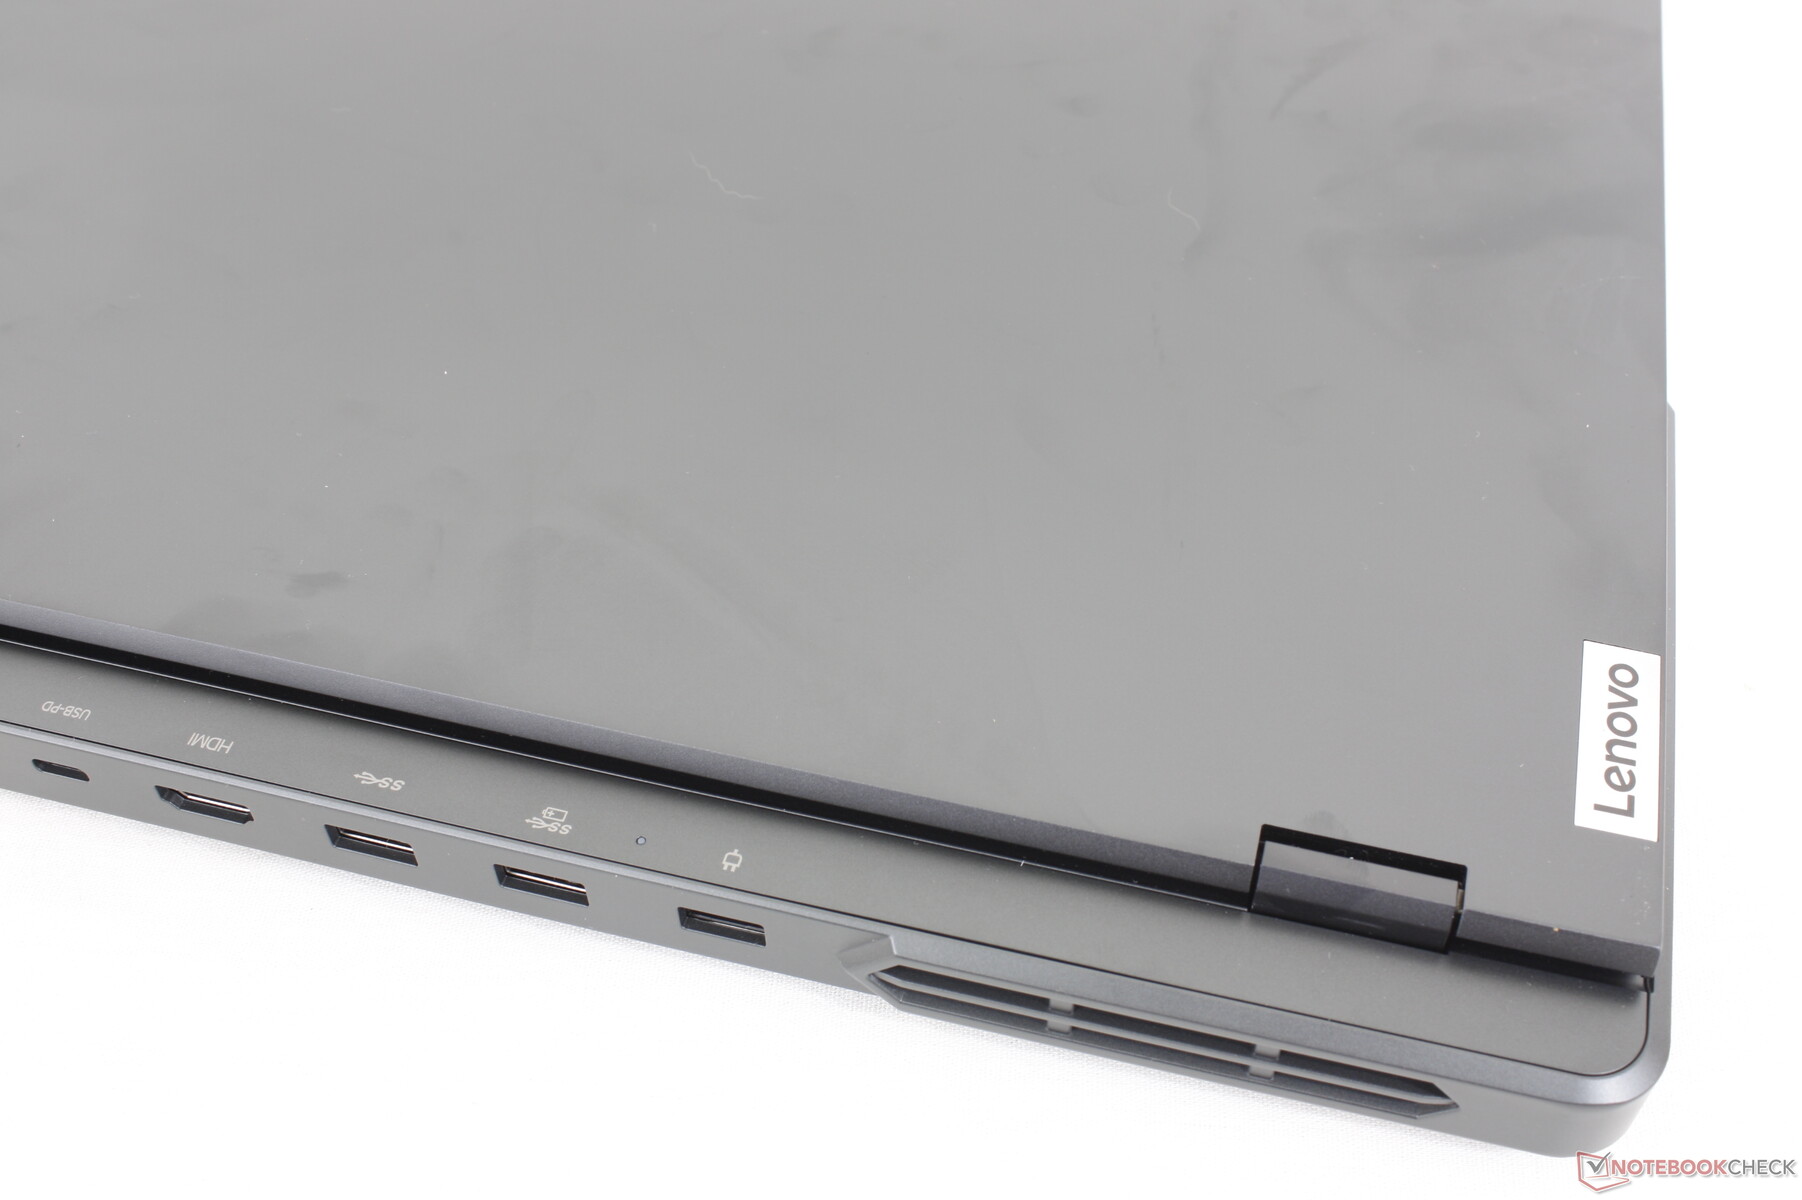
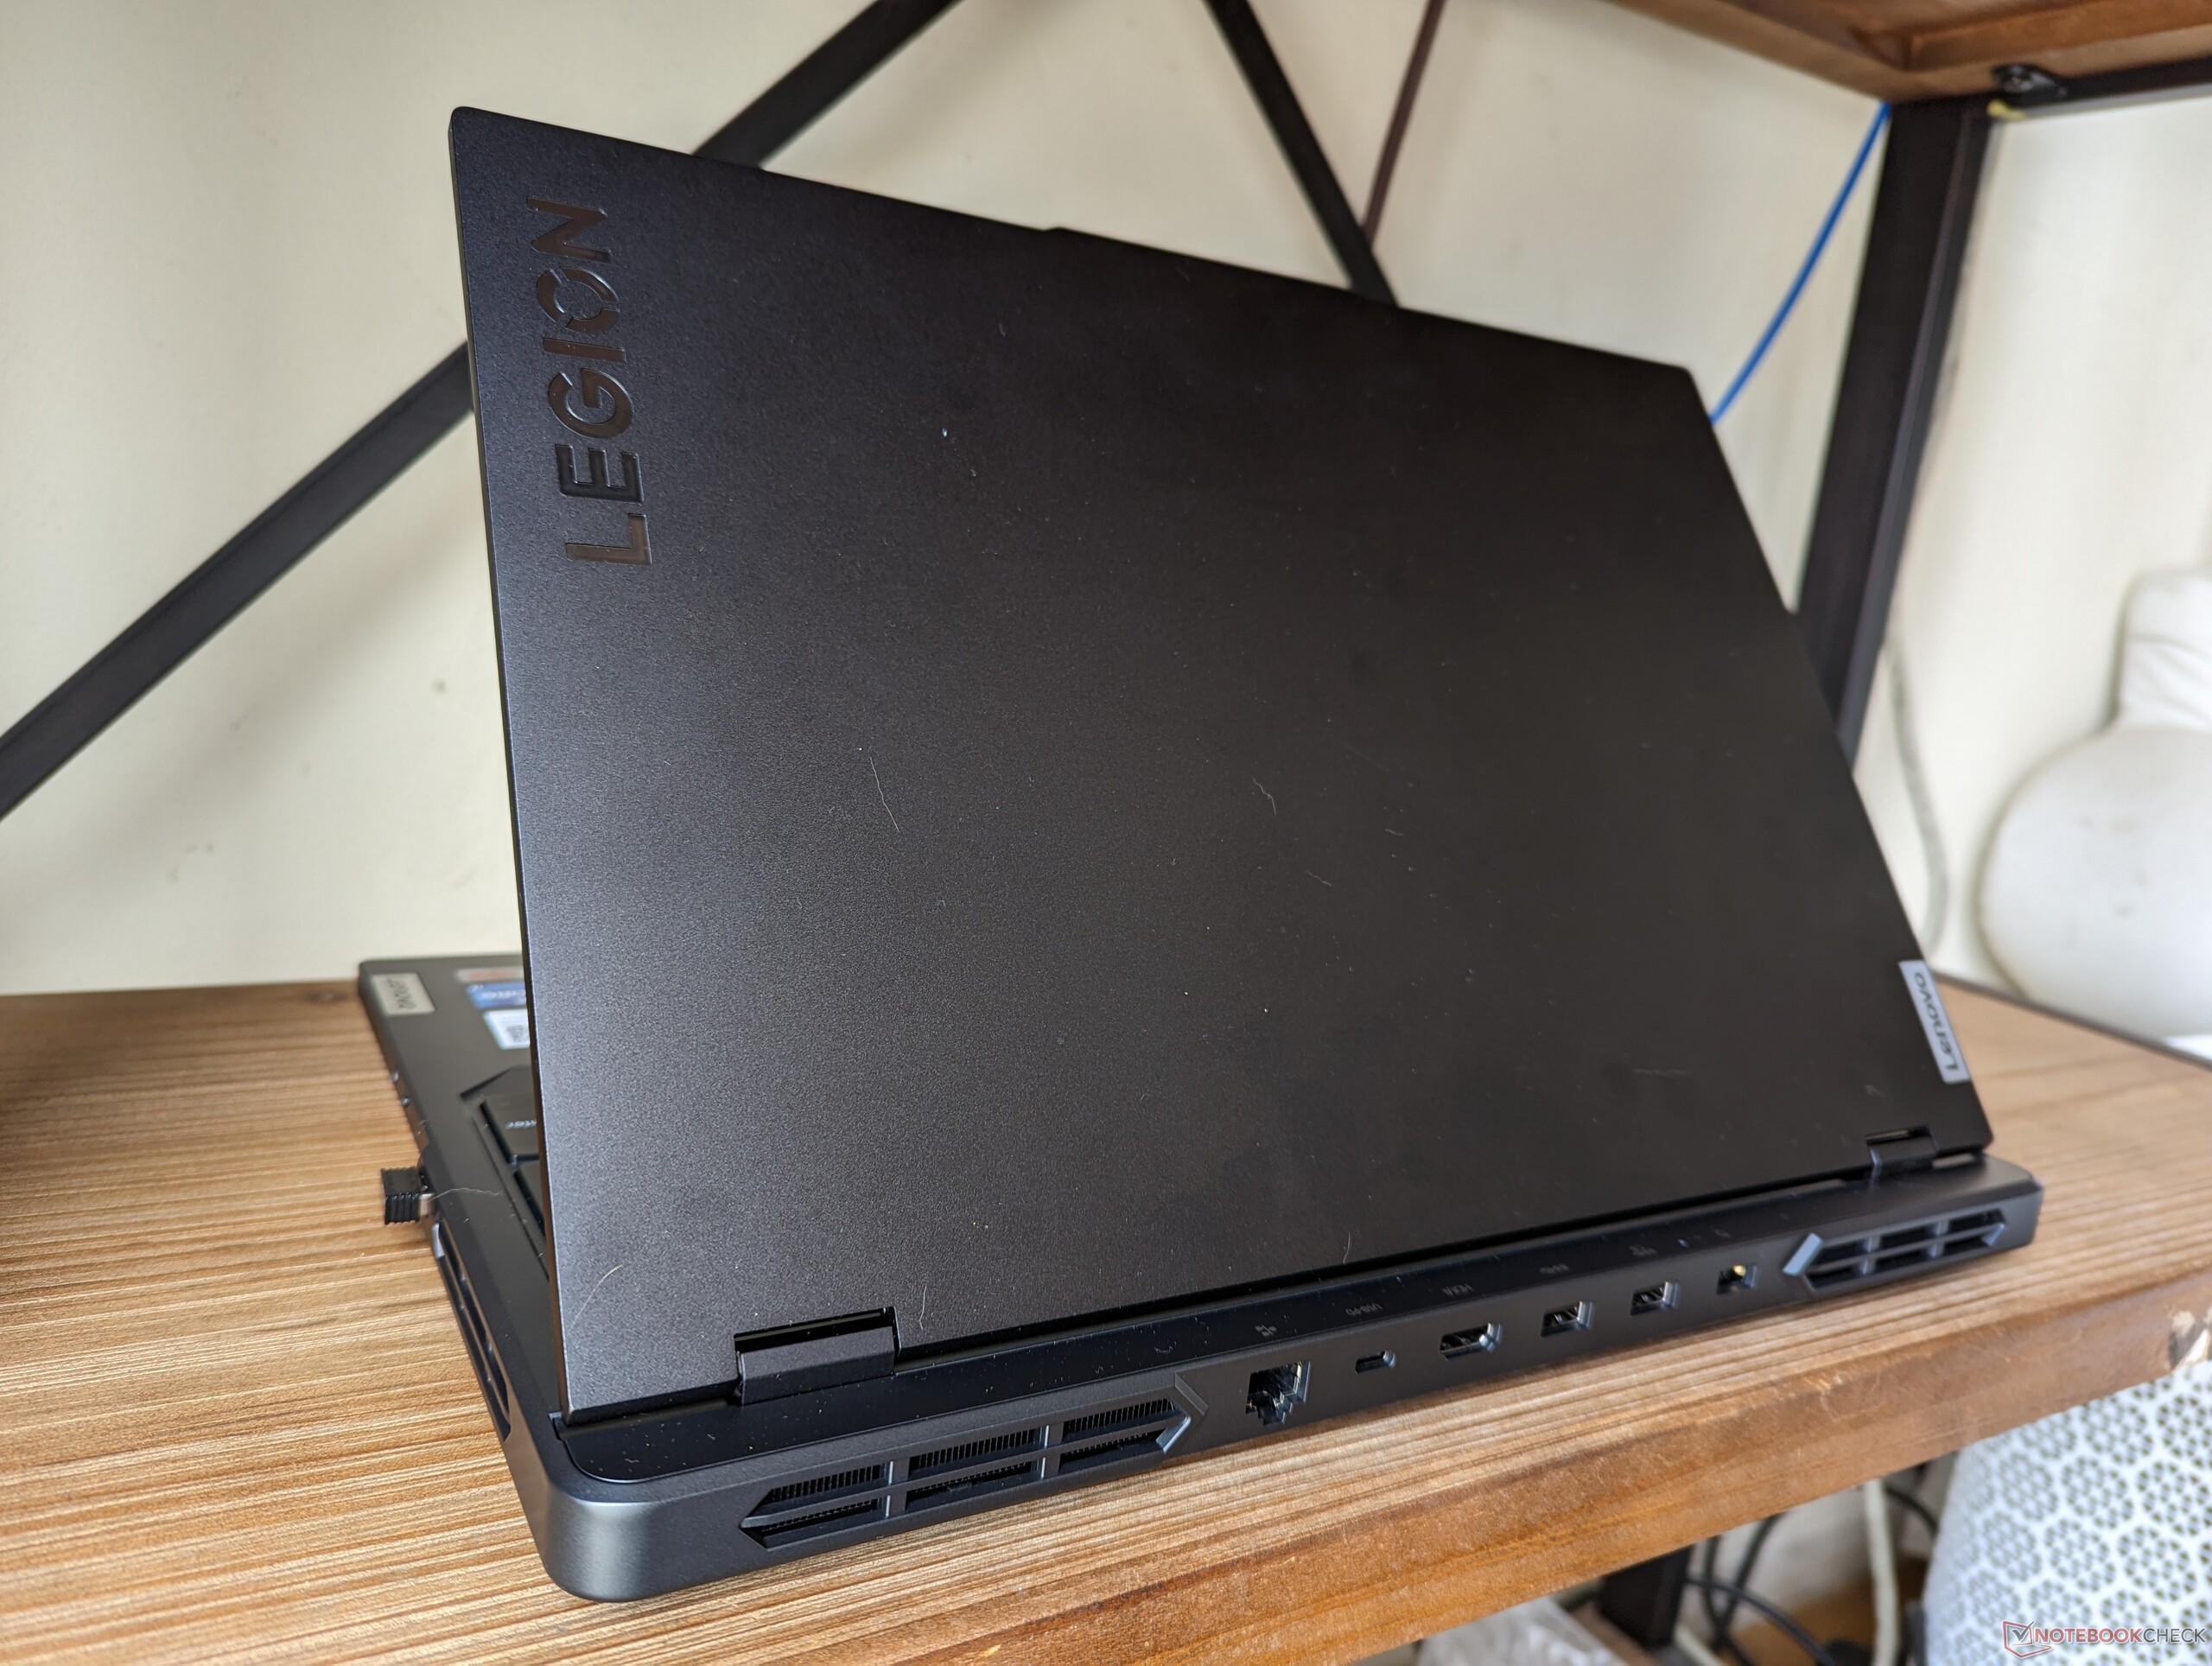
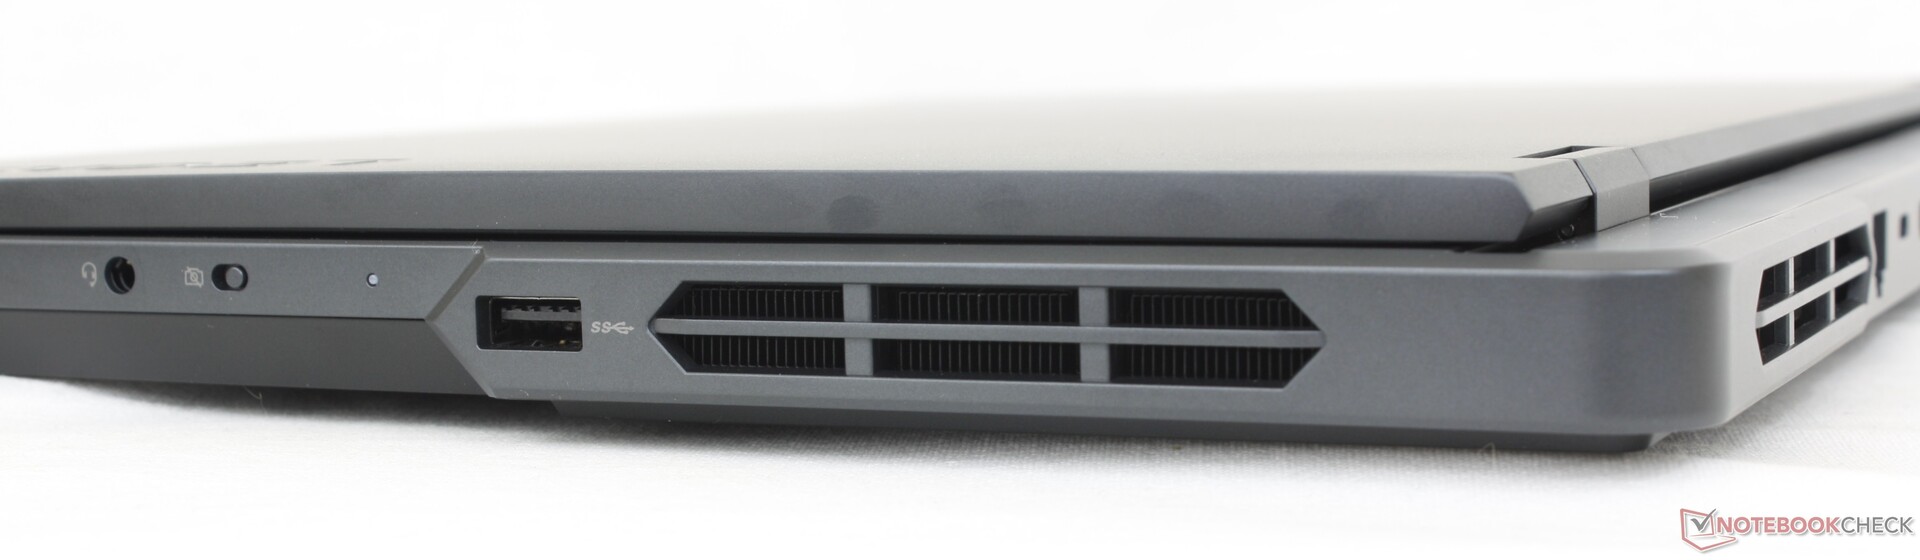
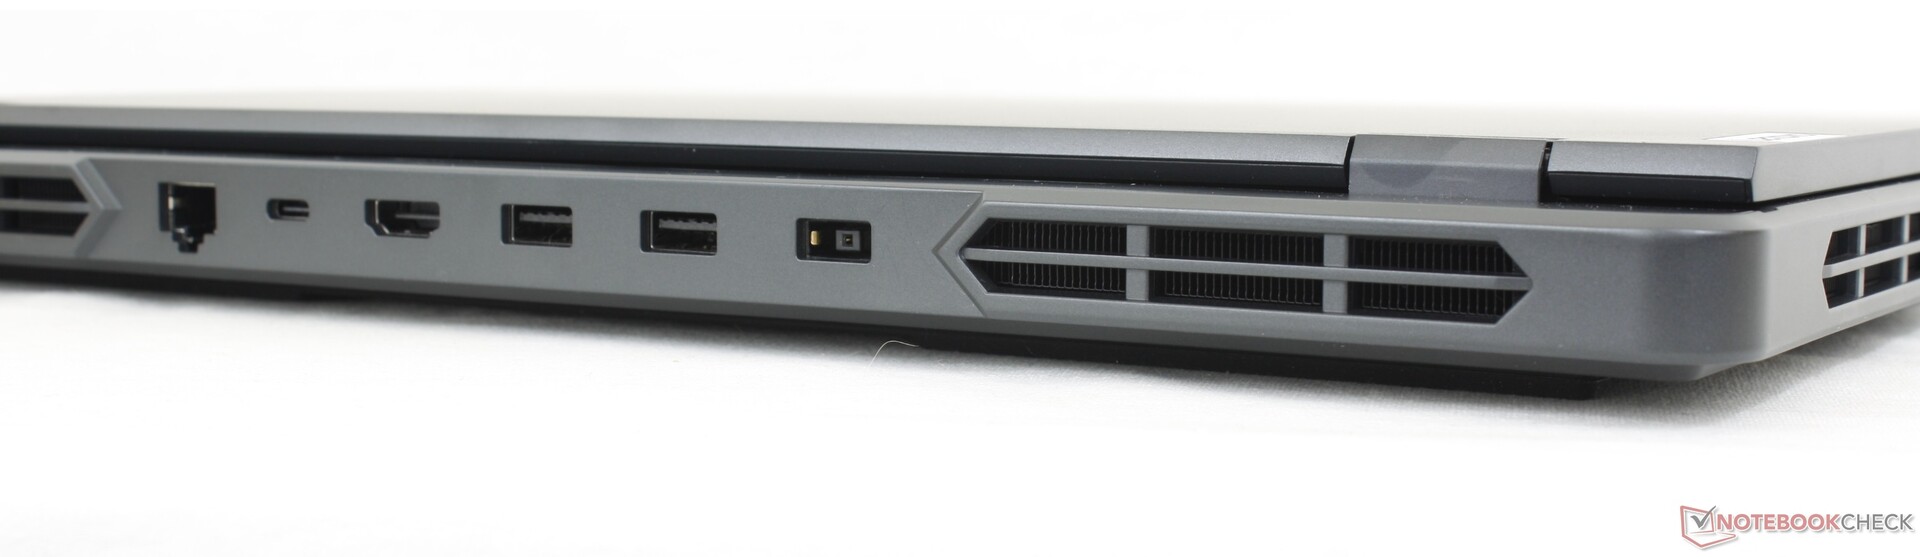
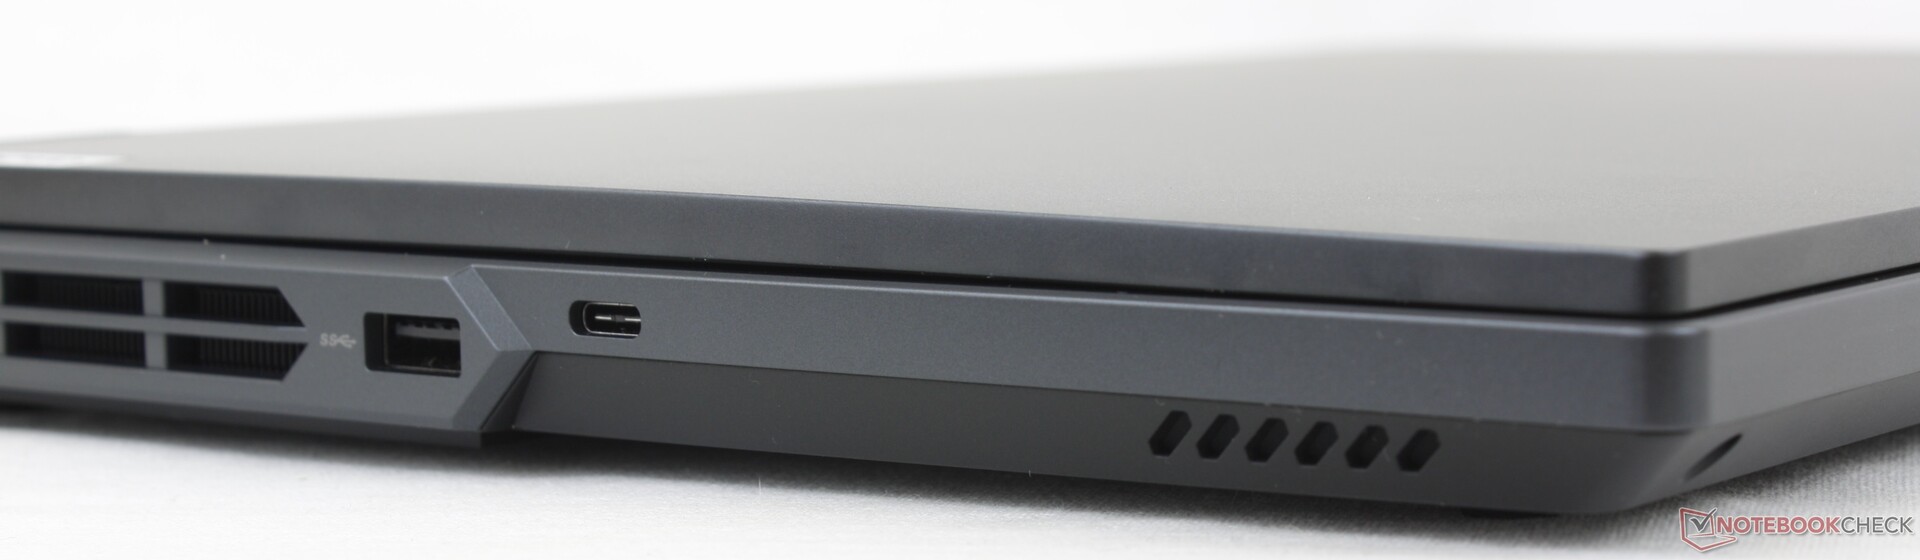
Connectivité - Beaucoup de ports mais pas de Thunderbolt
Il y a une bonne sélection de ports, la plupart d'entre eux étant placés à l'arrière. En fait, le modèle partage exactement les mêmes ports et le même positionnement que sur les modèles plus haut de gamme de la gammeLegion Pro 7 16IRX8H même si les deux modèles sont visuellement différents.
Notez que le modèle ne prend pas en charge Thunderbolt. Il est au moins équipé d'un port RJ-45, contrairement au Blade 16.
Les ports arrière sont étiquetés avec des icônes visibles depuis le haut du châssis comme le montre l'image ci-dessus. Les icônes facilitent la connexion des câbles, contrairement aux ports arrière de l'Alienware m18, mais elles ne s'allument malheureusement pas.
Communication
Un Intel AX211 est fourni en standard pour la connectivité Wi-Fi 6E et Bluetooth 5.2. Nous avons constaté des taux de transfert stables et n'avons rencontré aucun problème lorsque nous l'avons couplé à notre réseau Asus AXE11000 6 GHz.
Webcam
La webcam 1080p ou 2 MP est devenue la norme sur les ordinateurs portables de jeu. Sur notre Lenovo, cependant, les ajustements automatiques de la luminosité se faisaient plus lentement que d'habitude, ce qui donnait une image plus sombre.
La webcam est équipée d'un obturateur électronique pour le contrôle de la confidentialité, mais pas de capteur IR.


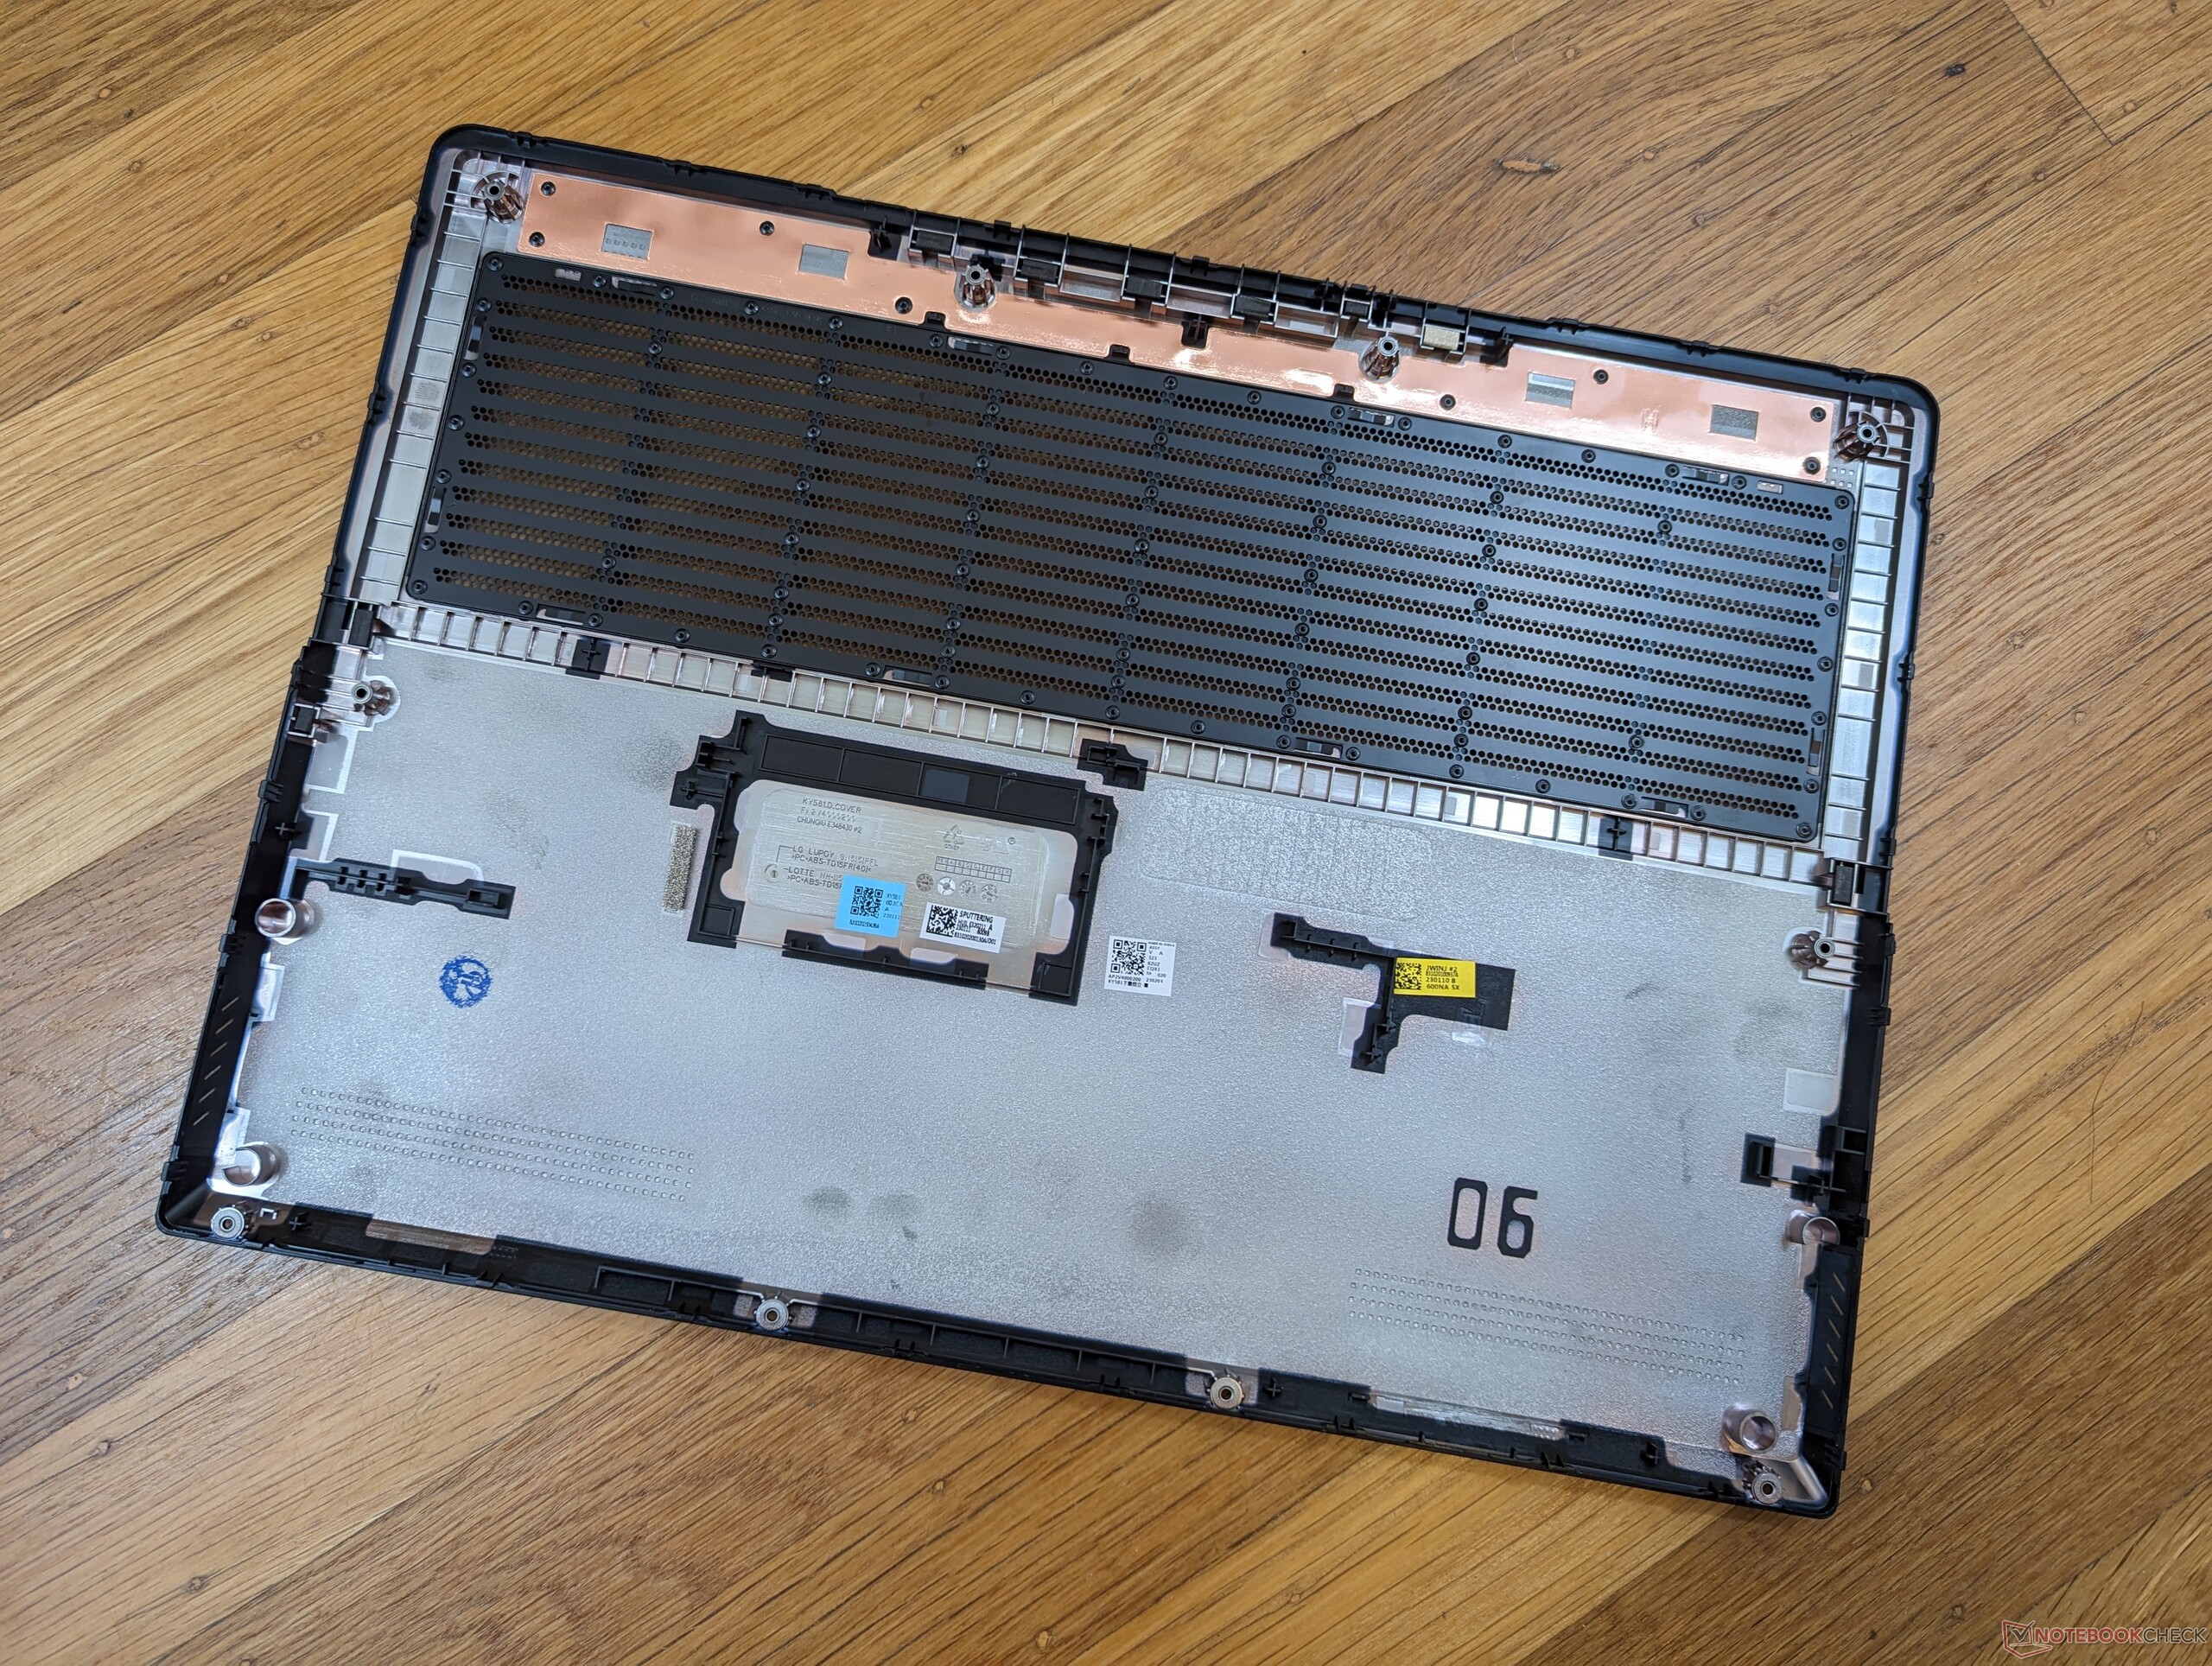
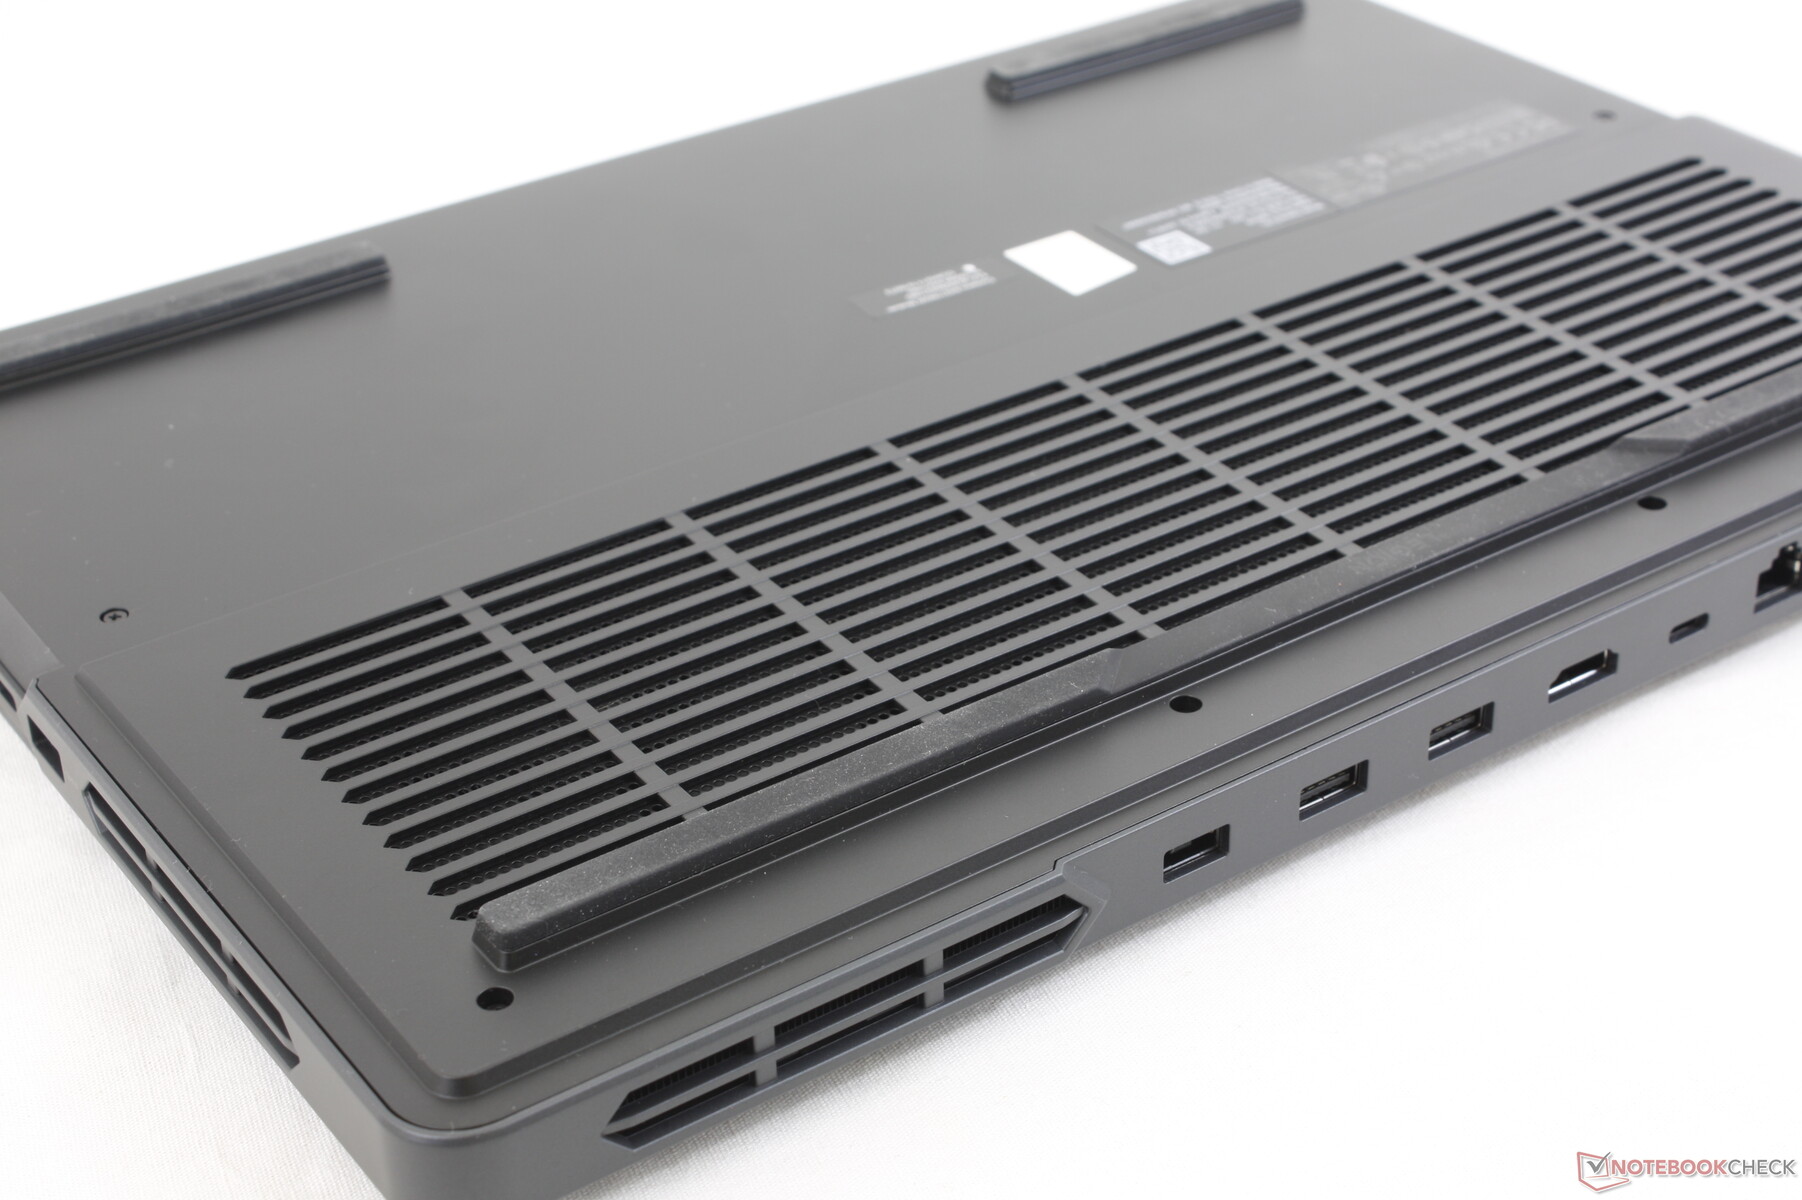
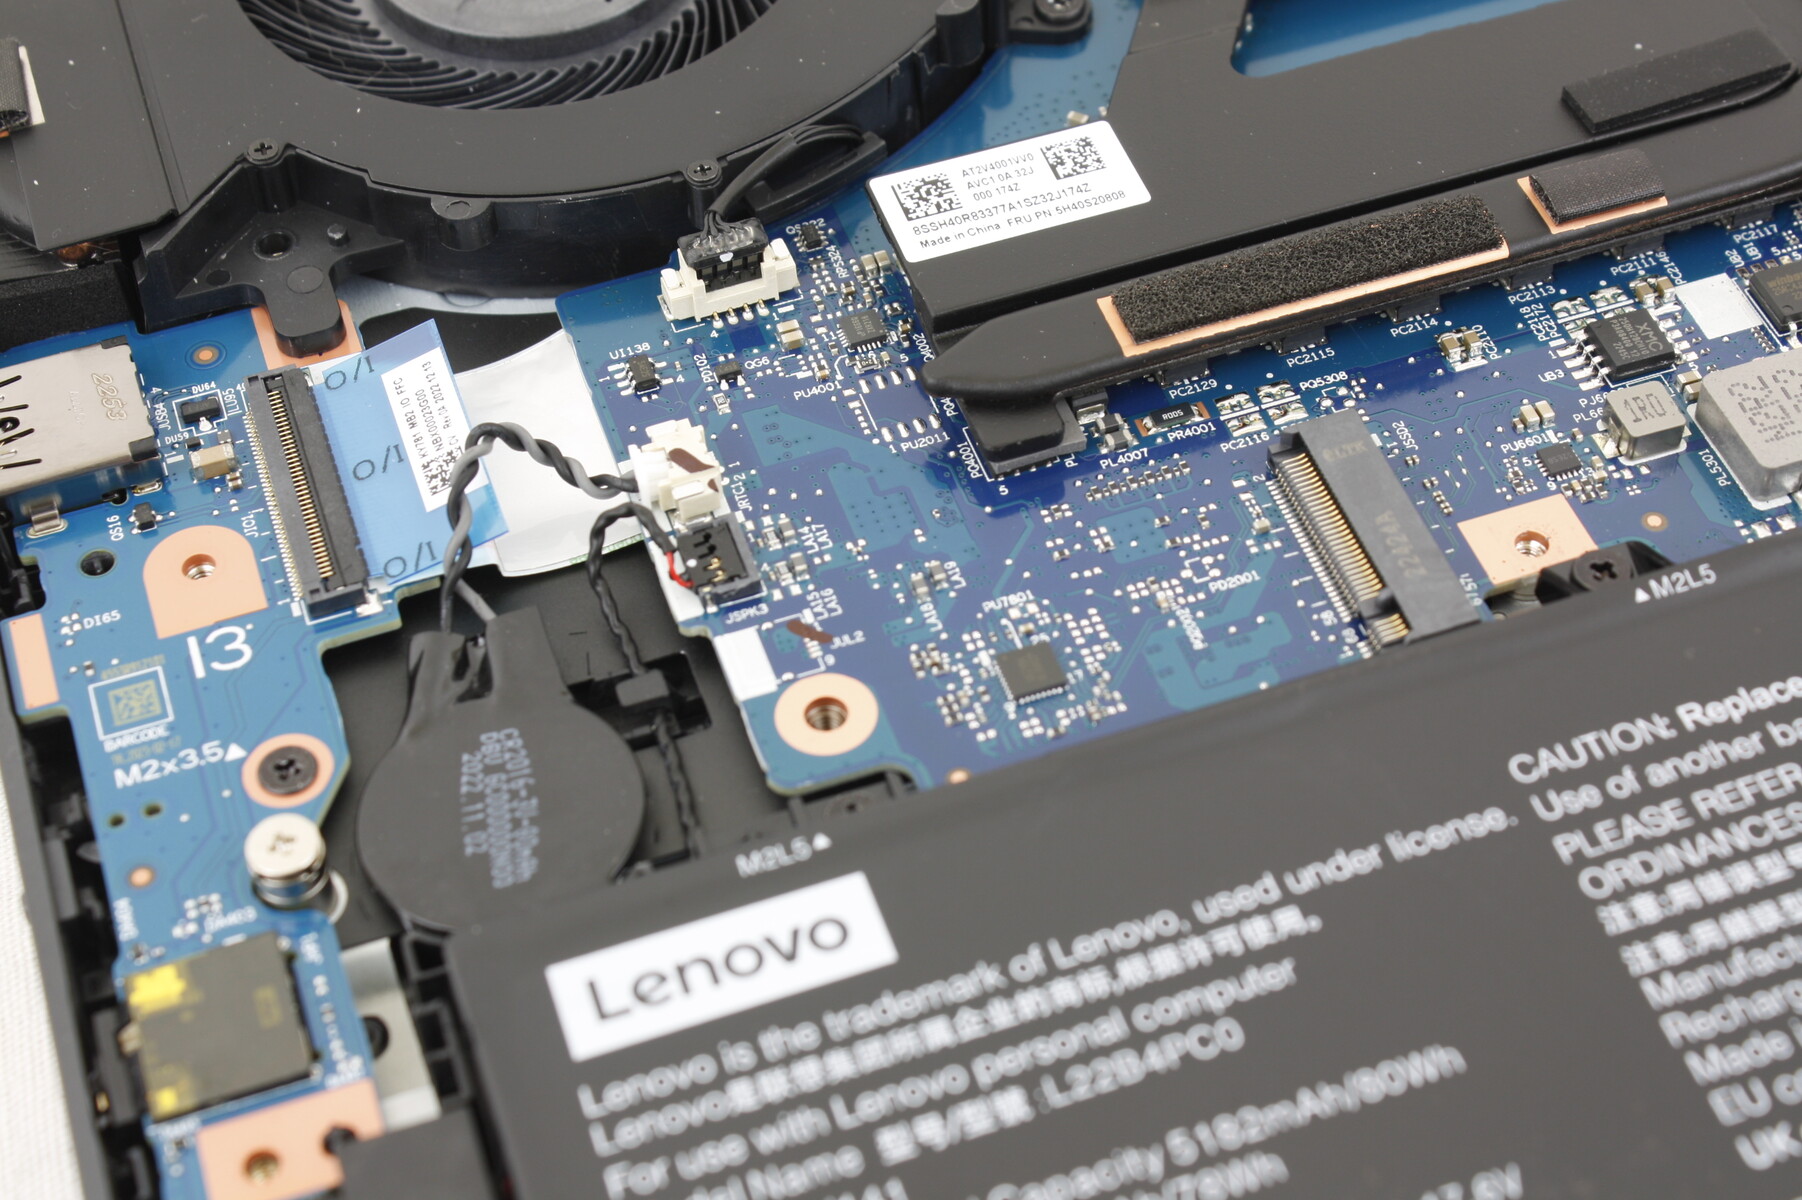
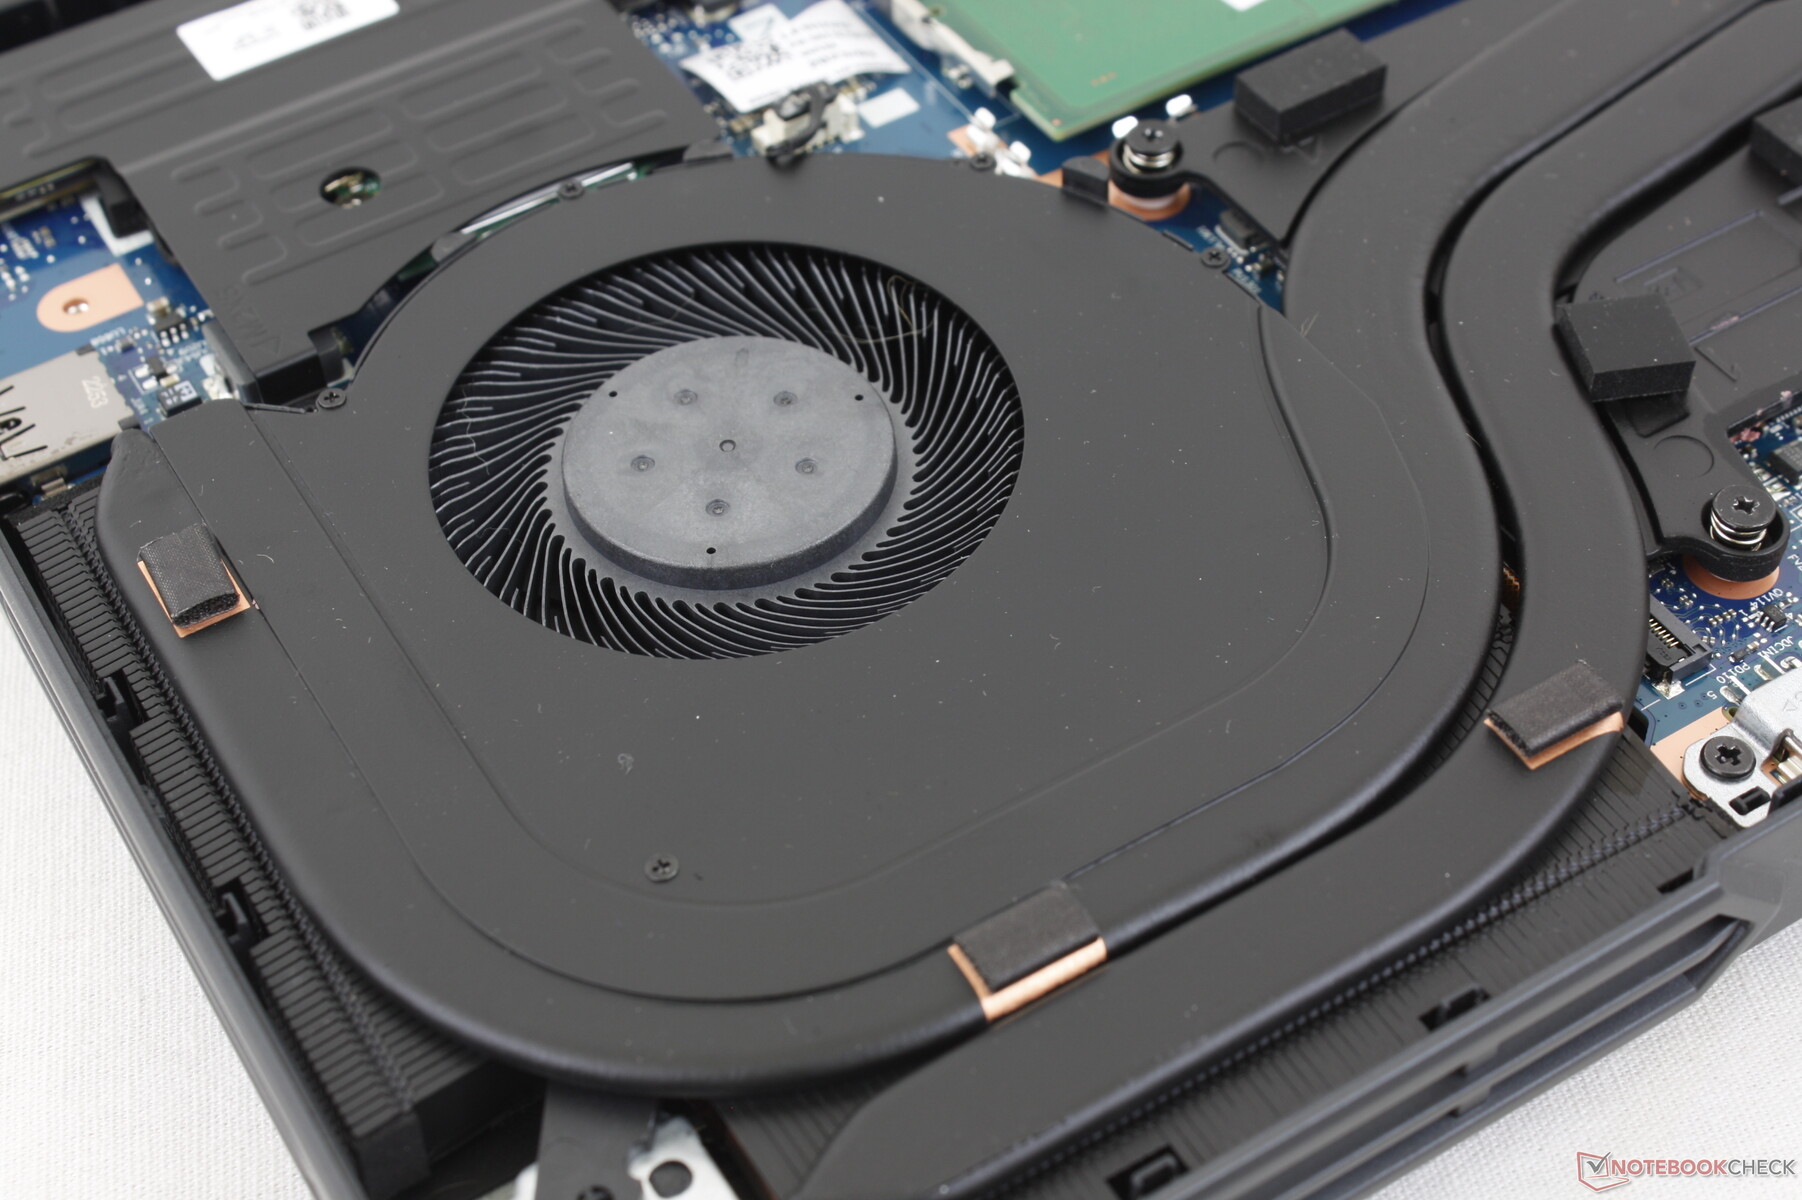
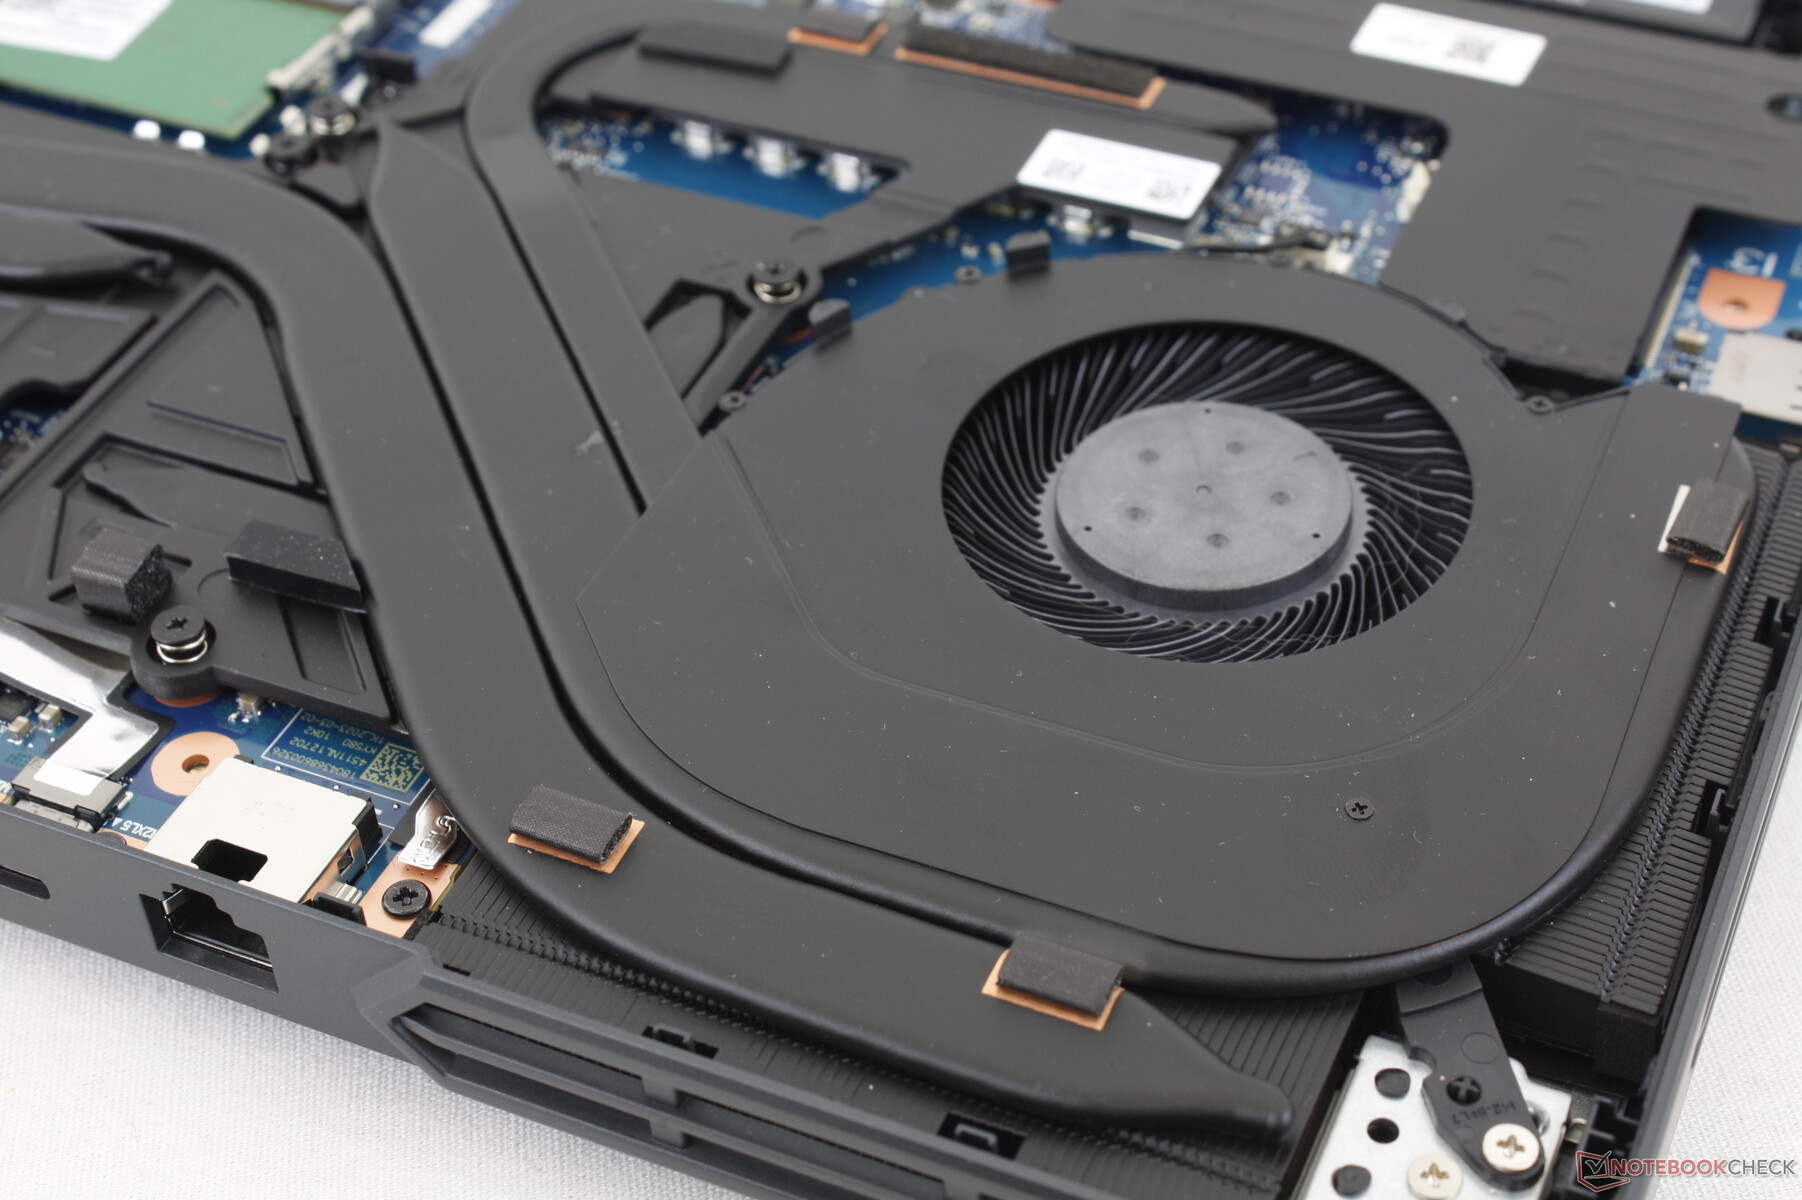
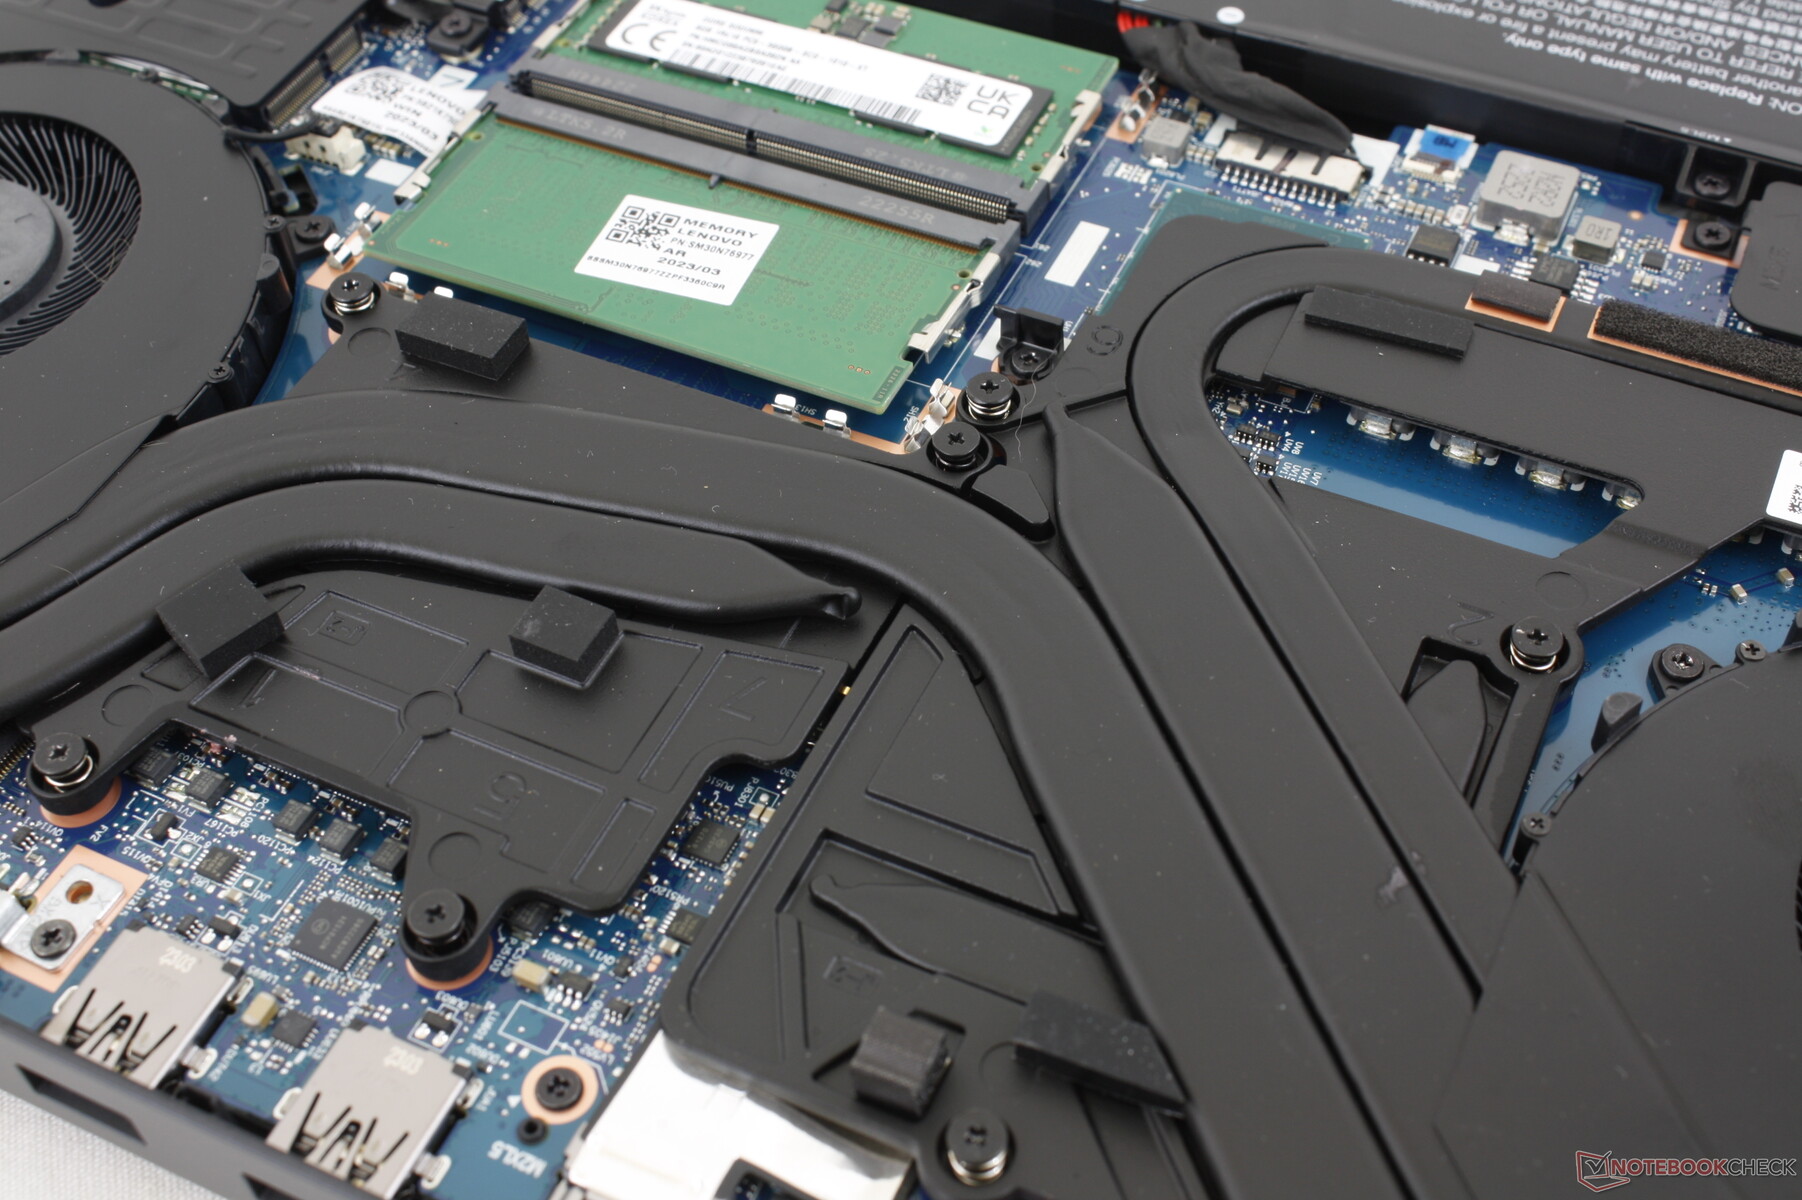
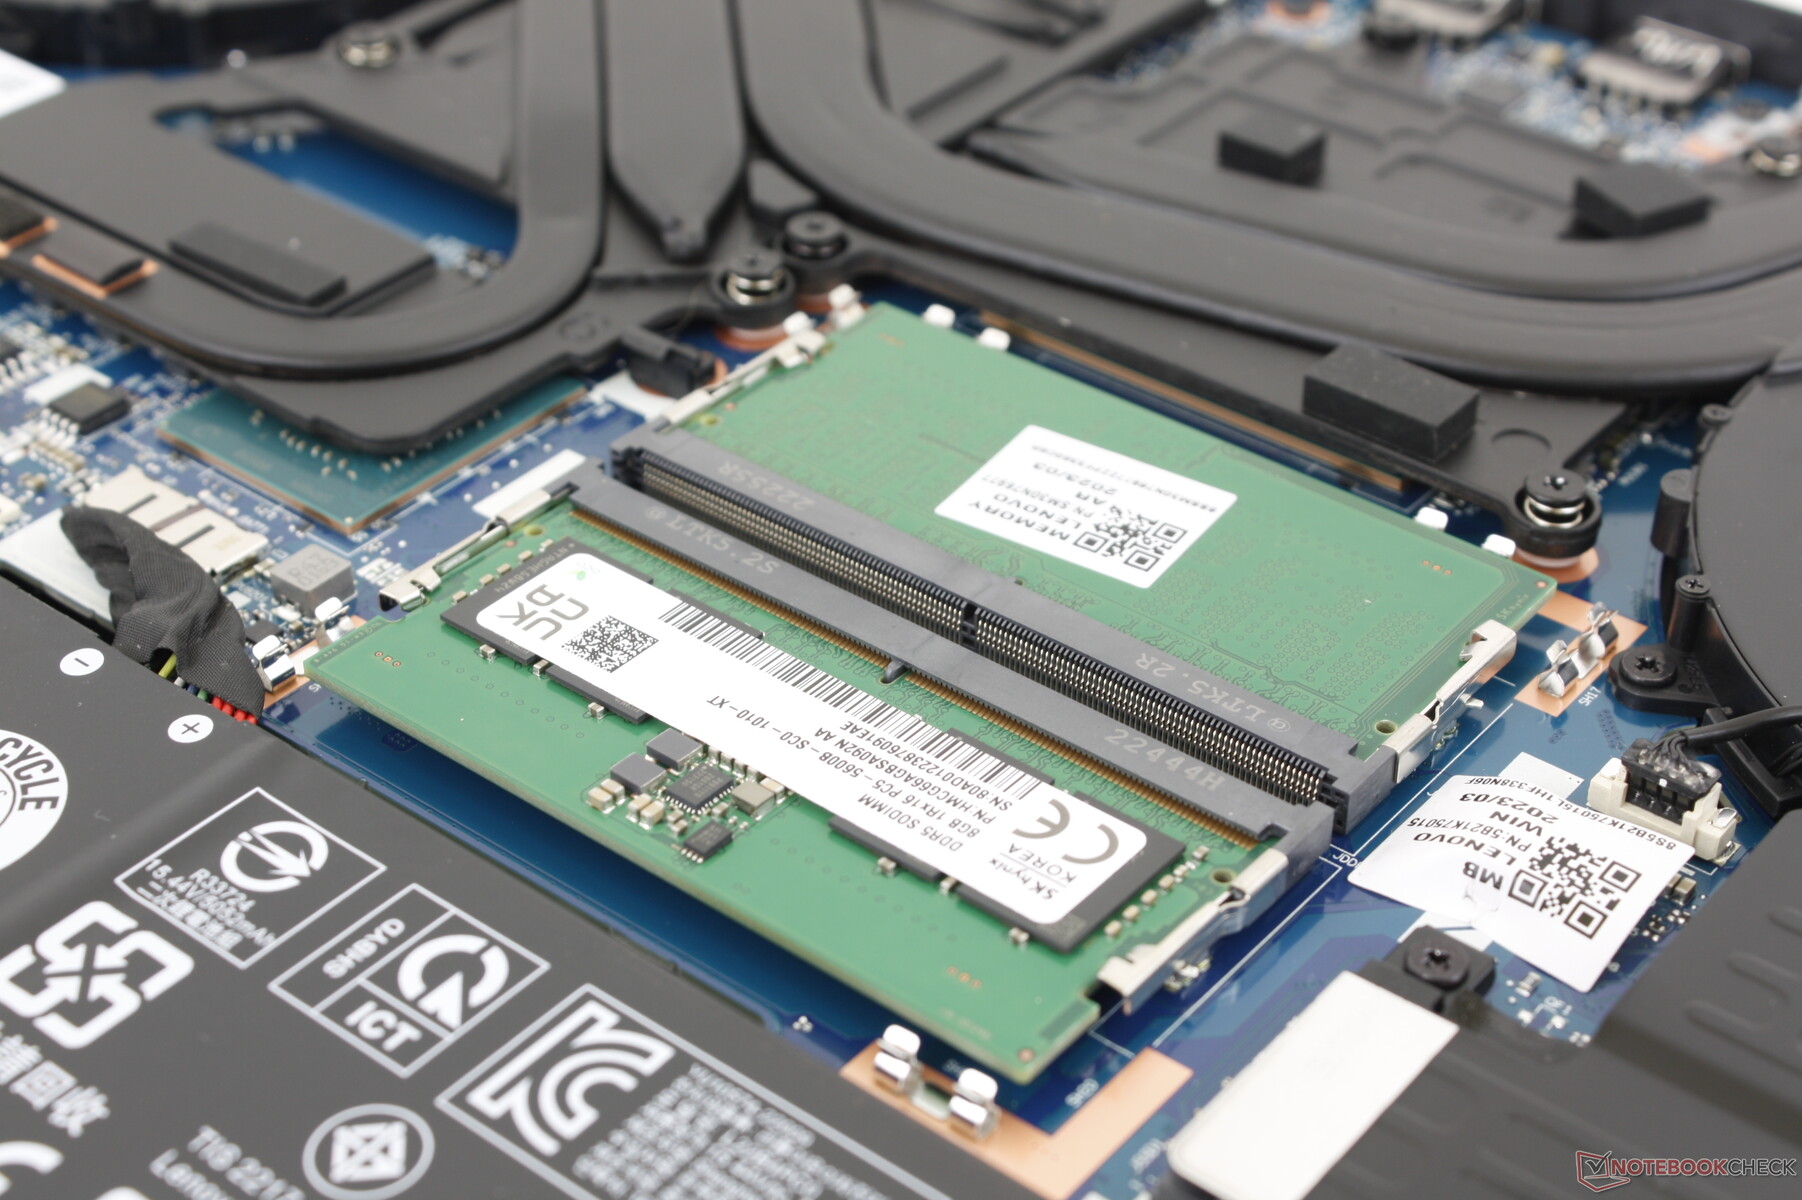
Maintenance
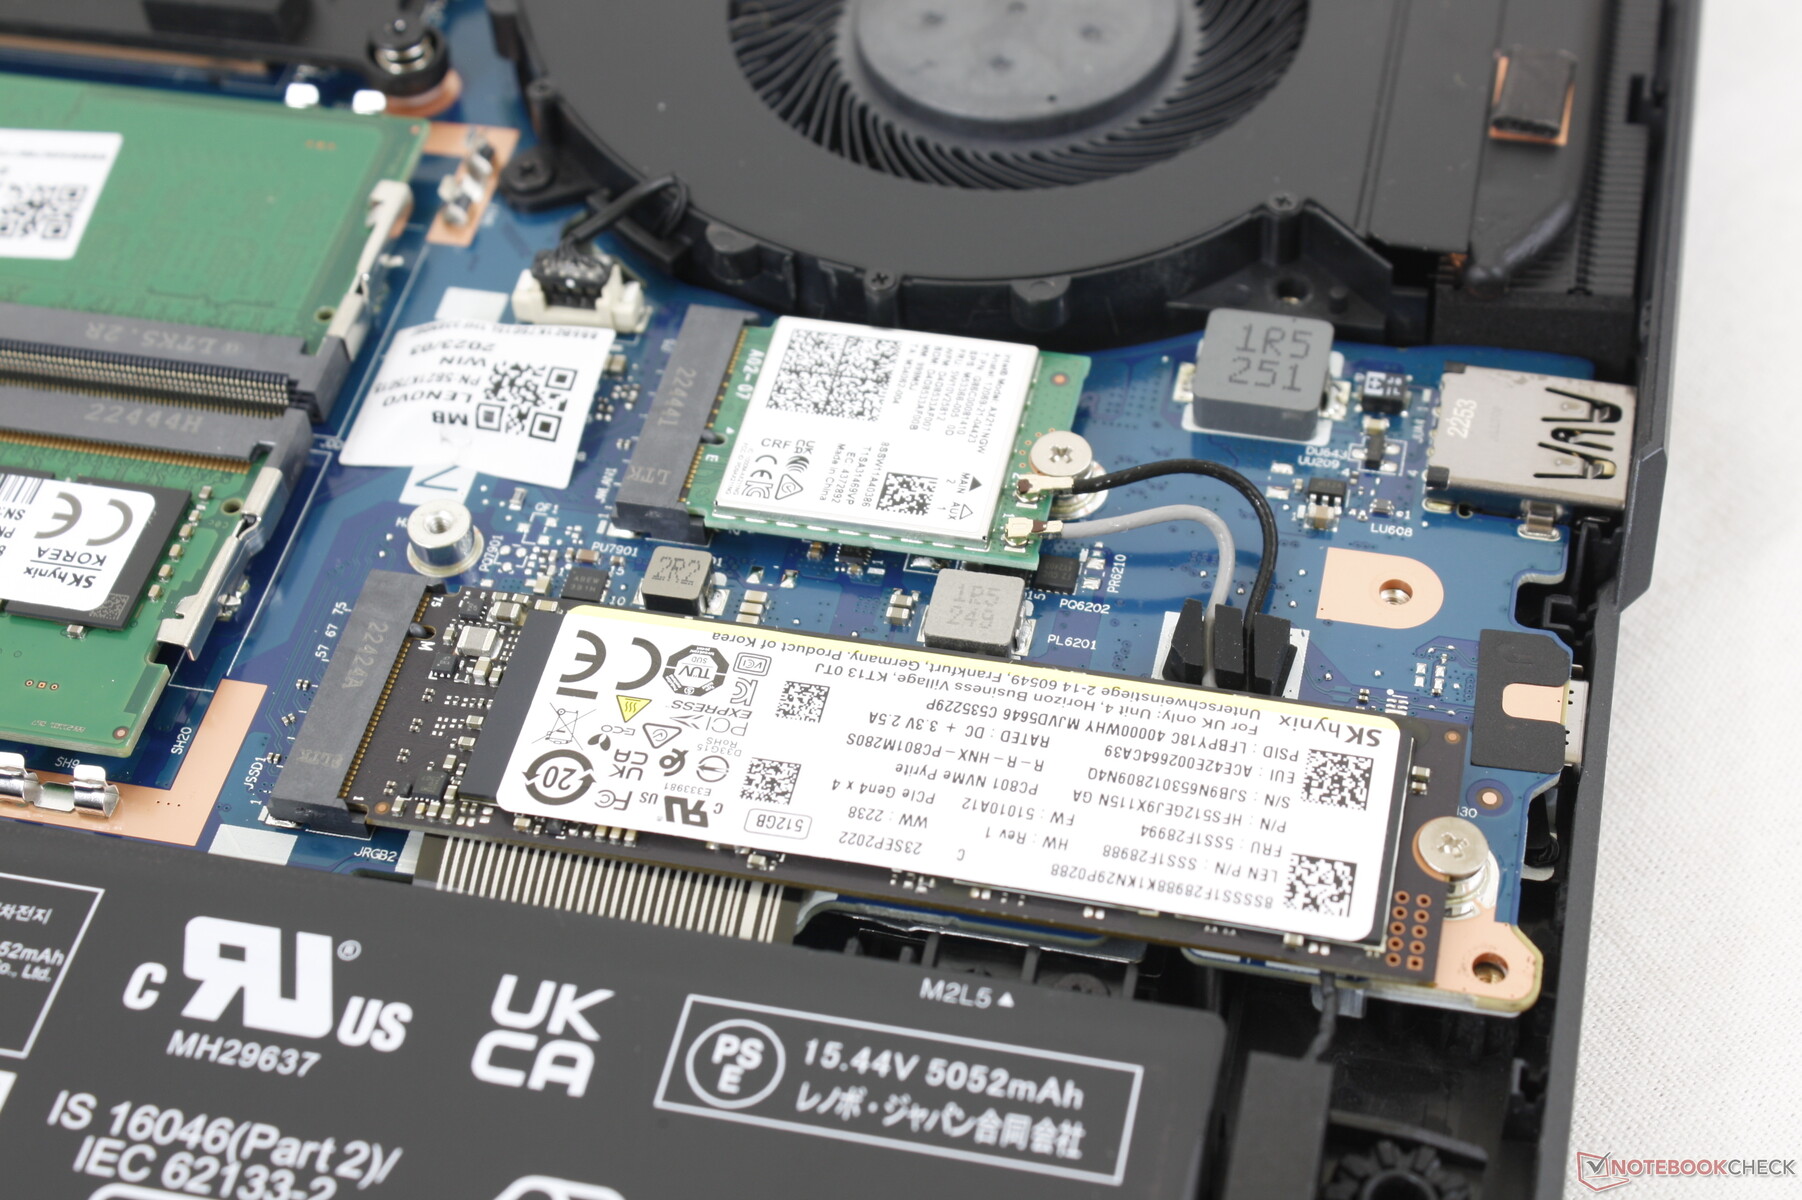
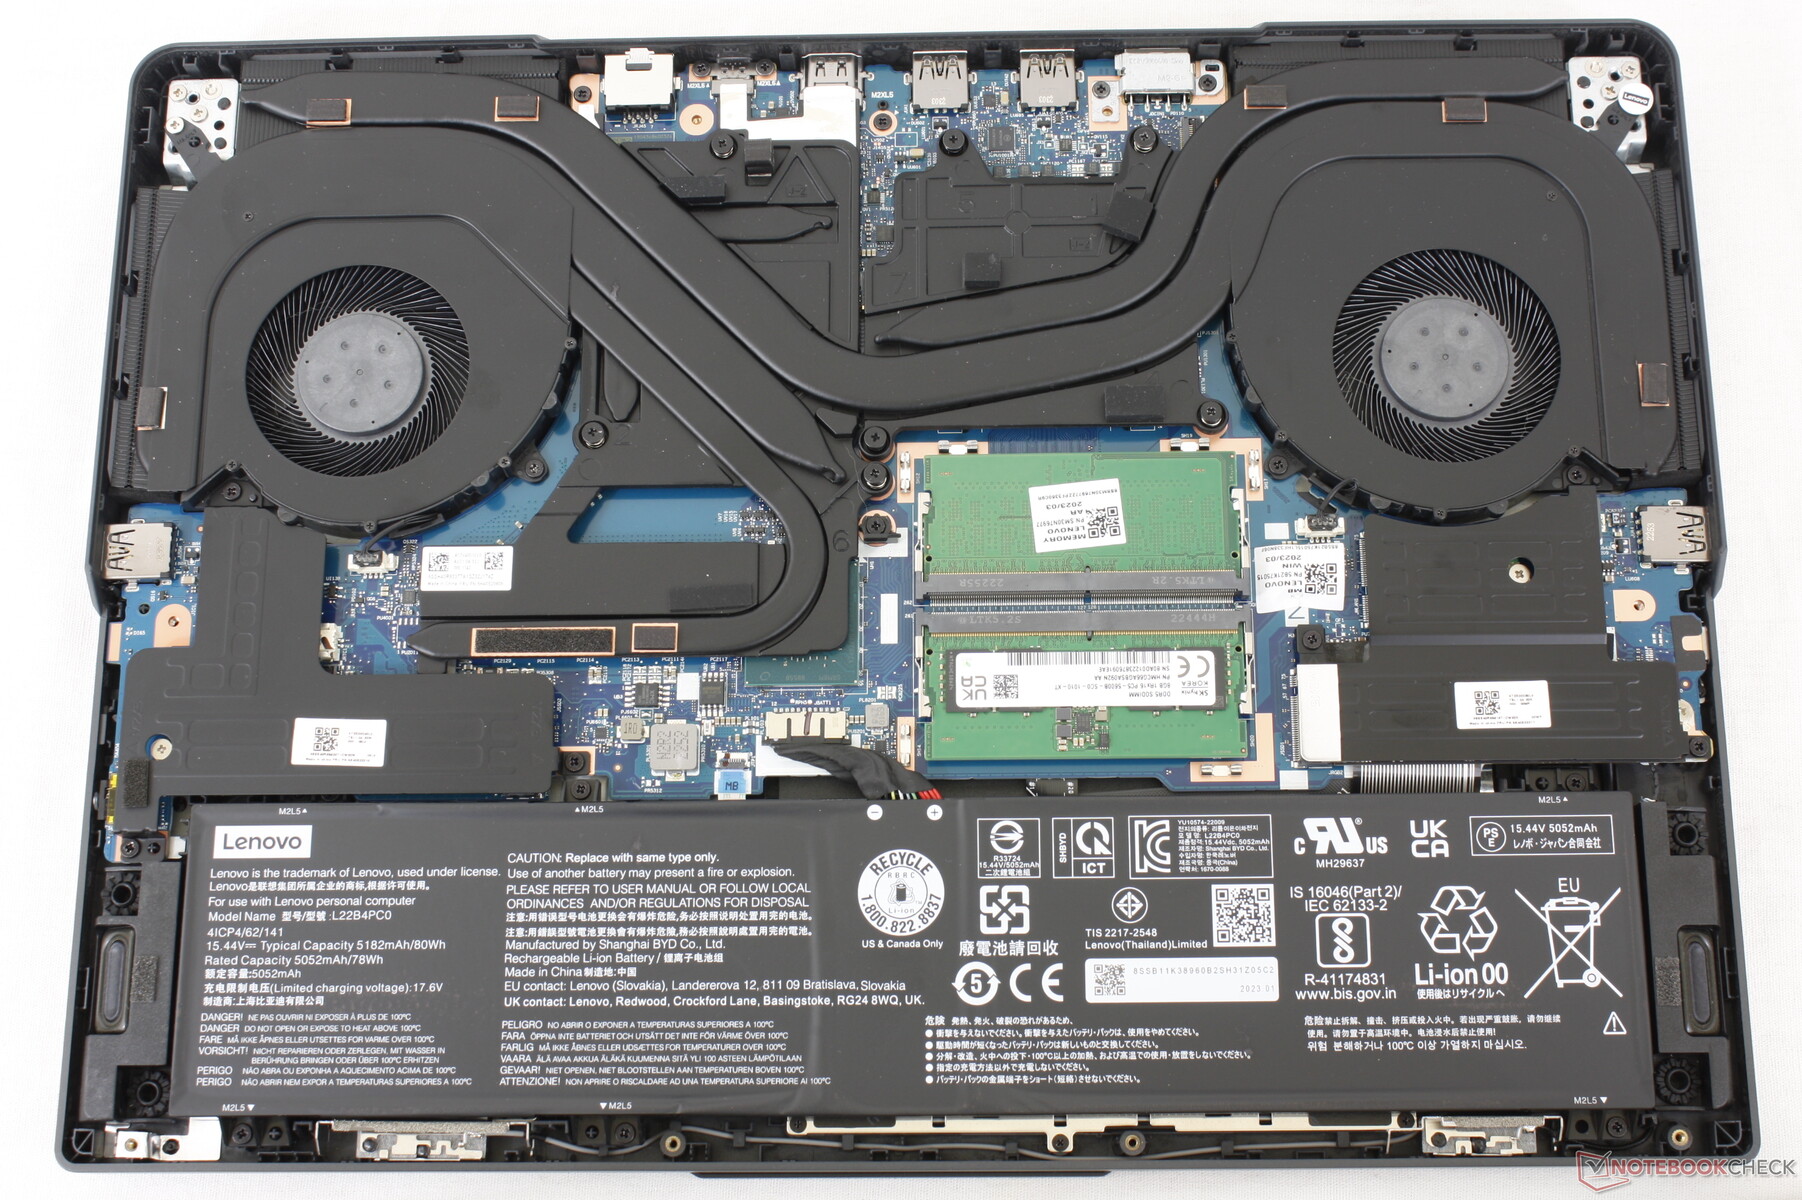
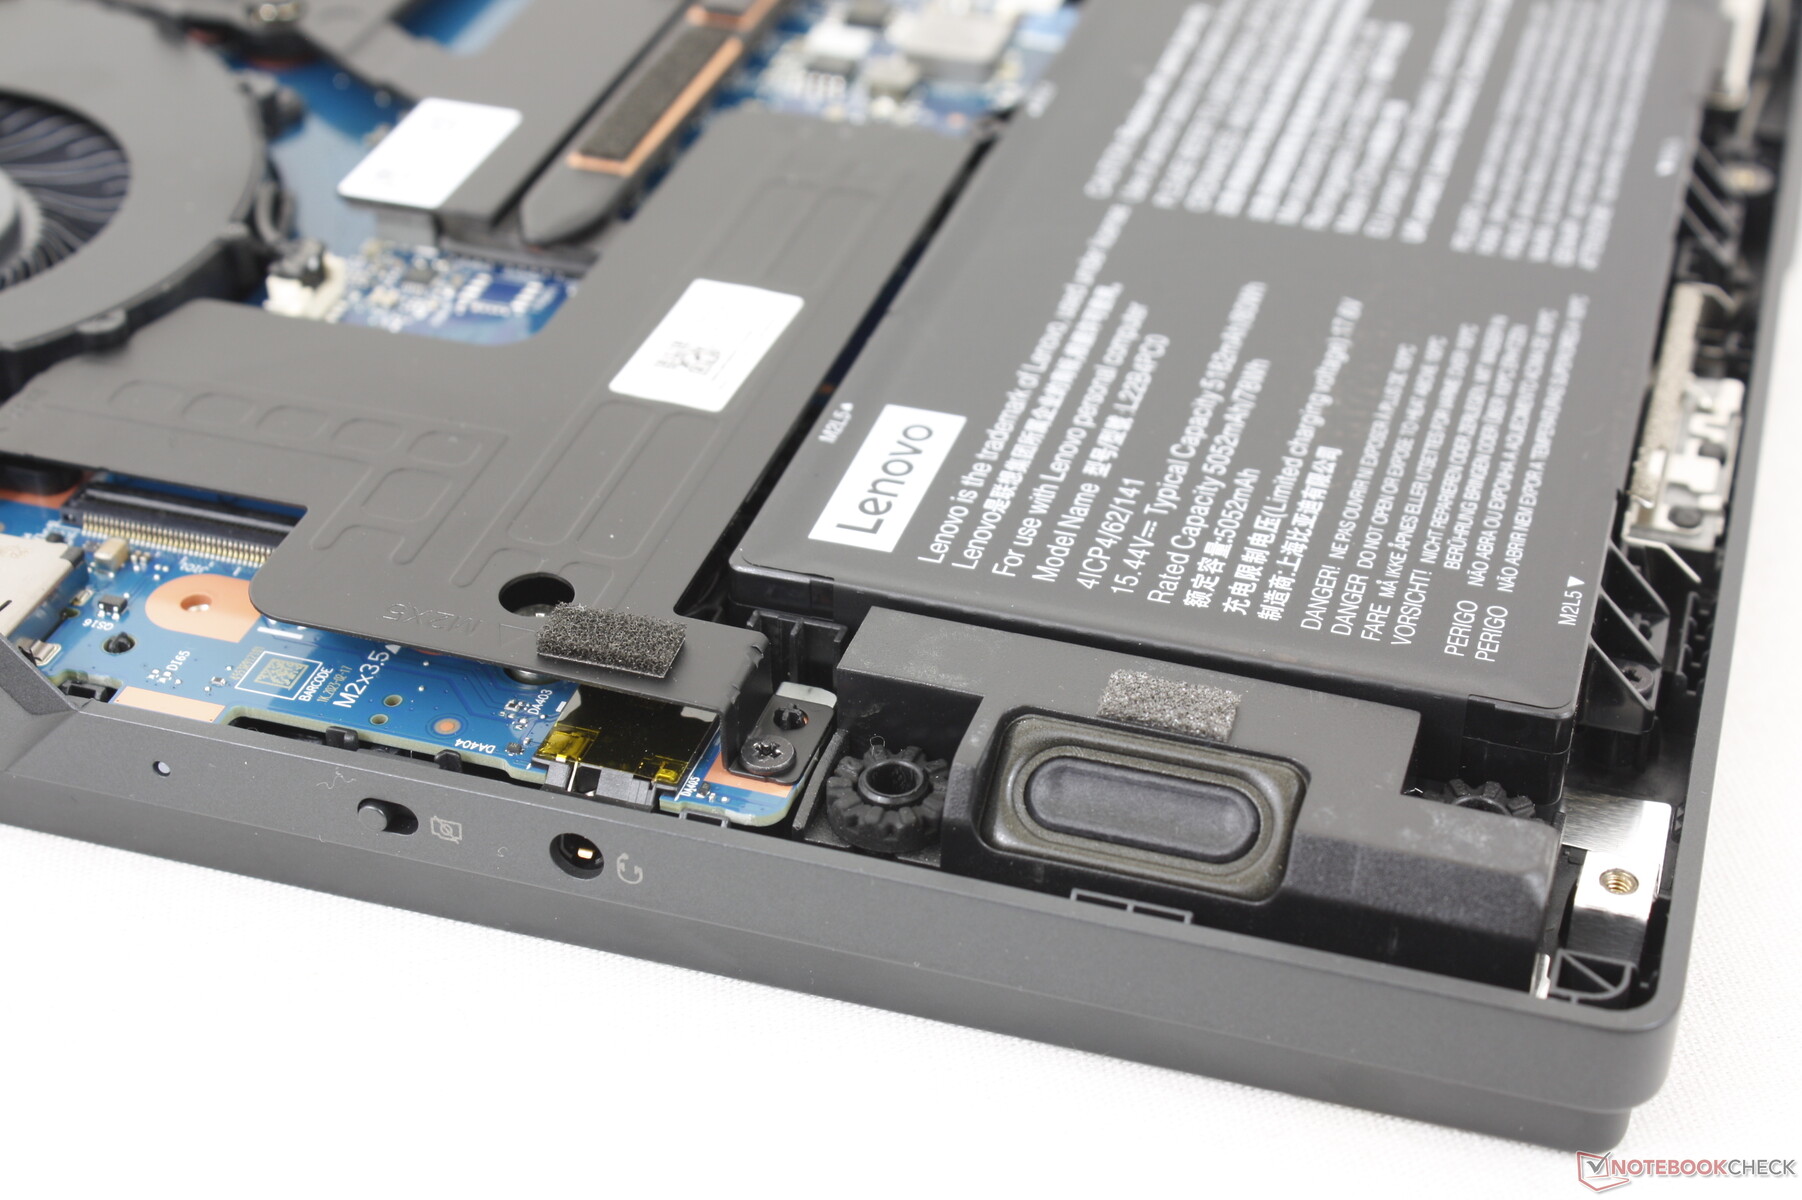
Le panneau inférieur se détache facilement à l'aide d'un tournevis Philips pour révéler deux baies PCIe4 x4 M.2 2280, deux emplacements SODIMM et le module WLAN amovible. Notez que les baies et l'emplacement WLAN sont couverts par des dissipateurs de chaleur en aluminium.
Accessoires et garantie
La boîte ne contient pas d'autres éléments que l'adaptateur secteur et la documentation. La garantie habituelle d'un an du fabricant s'applique si l'appareil est acheté aux États-Unis.
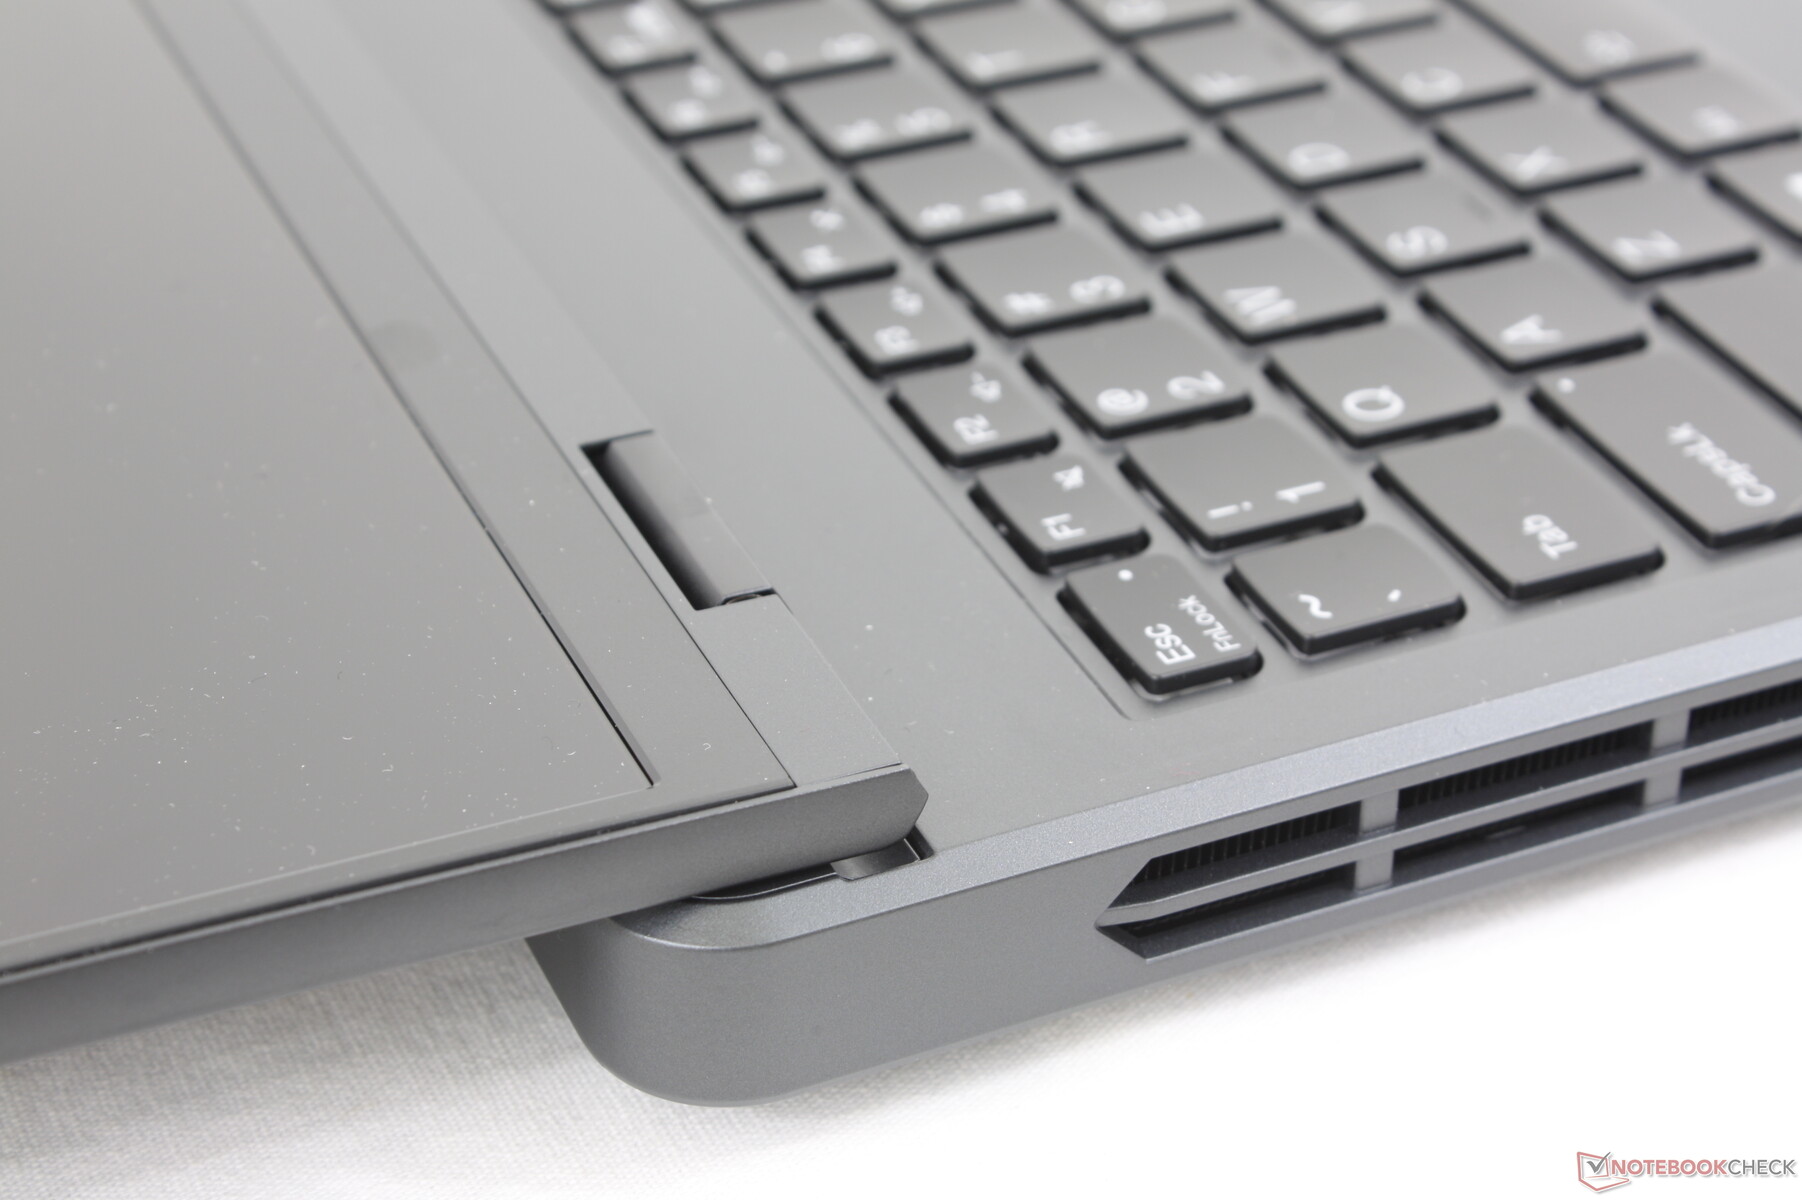
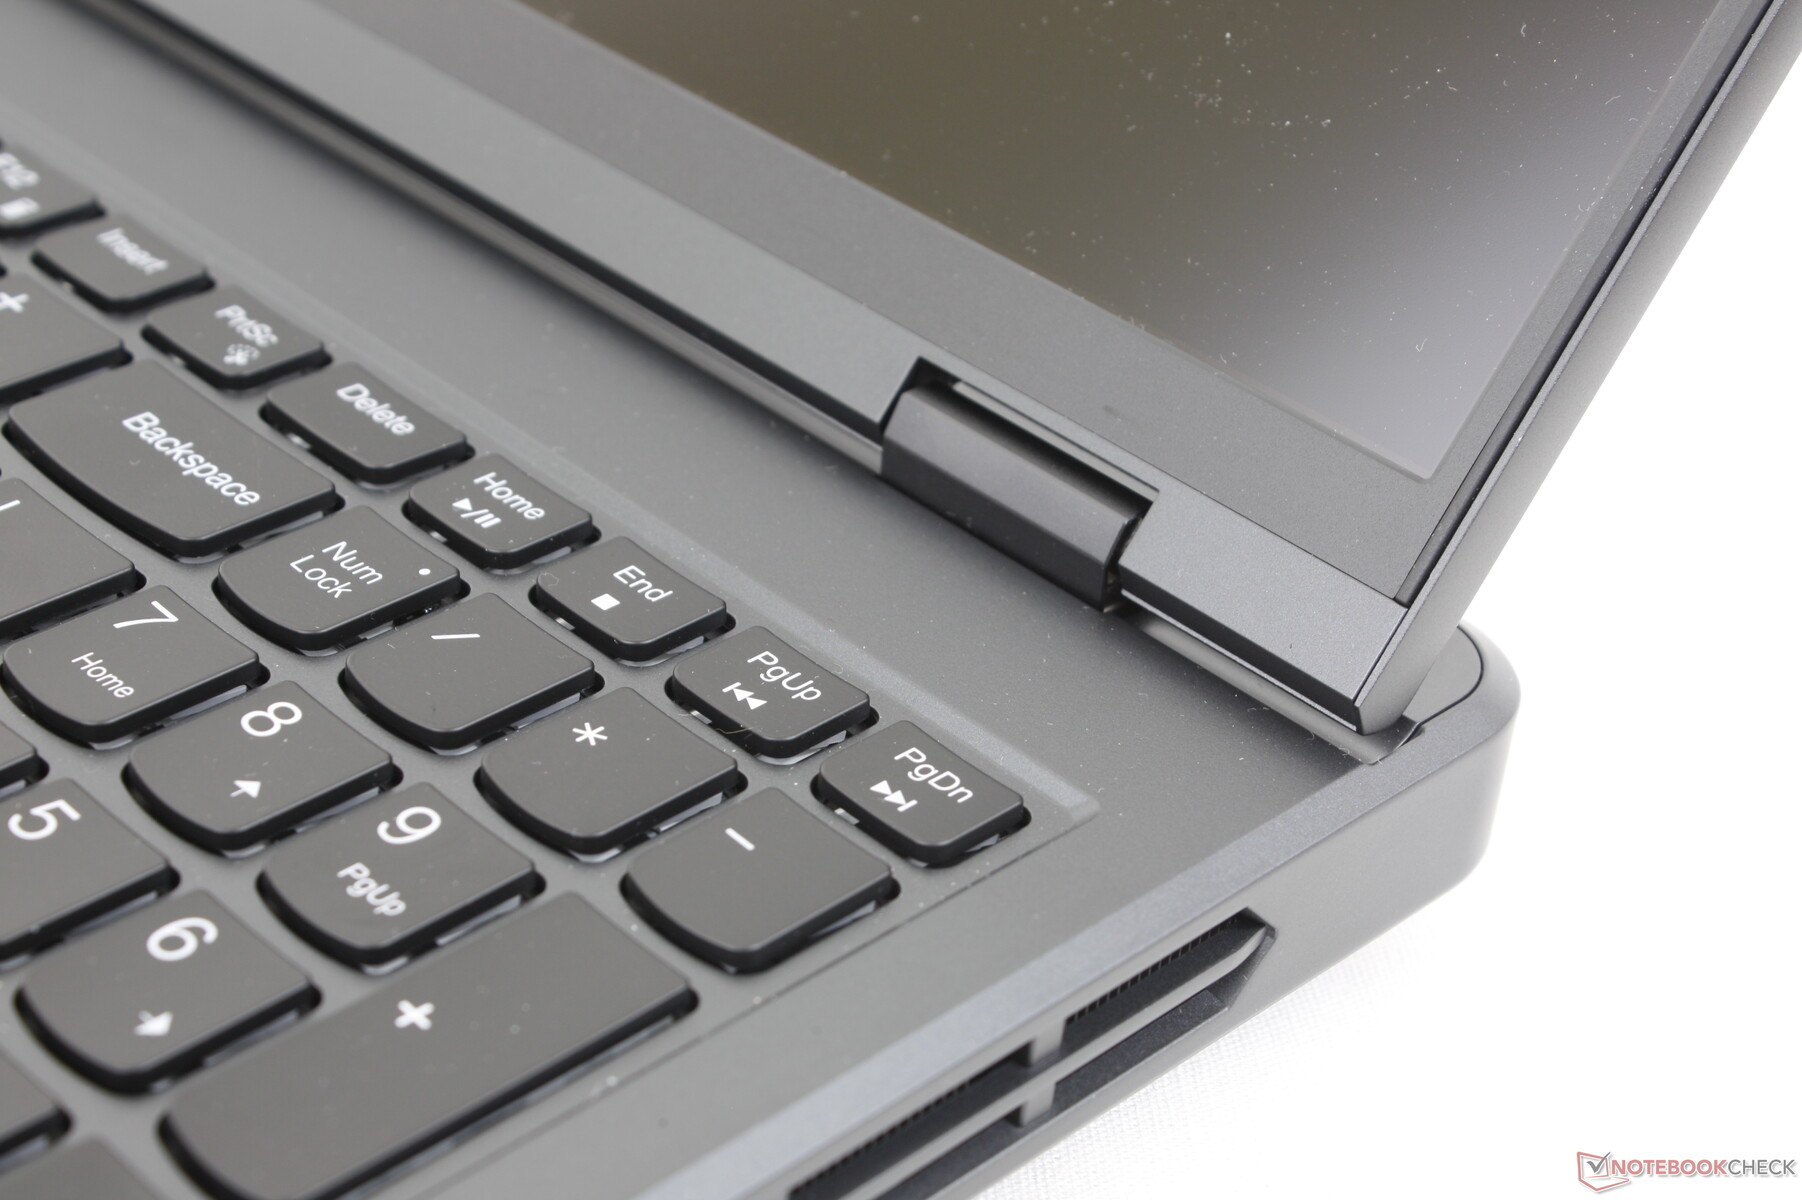
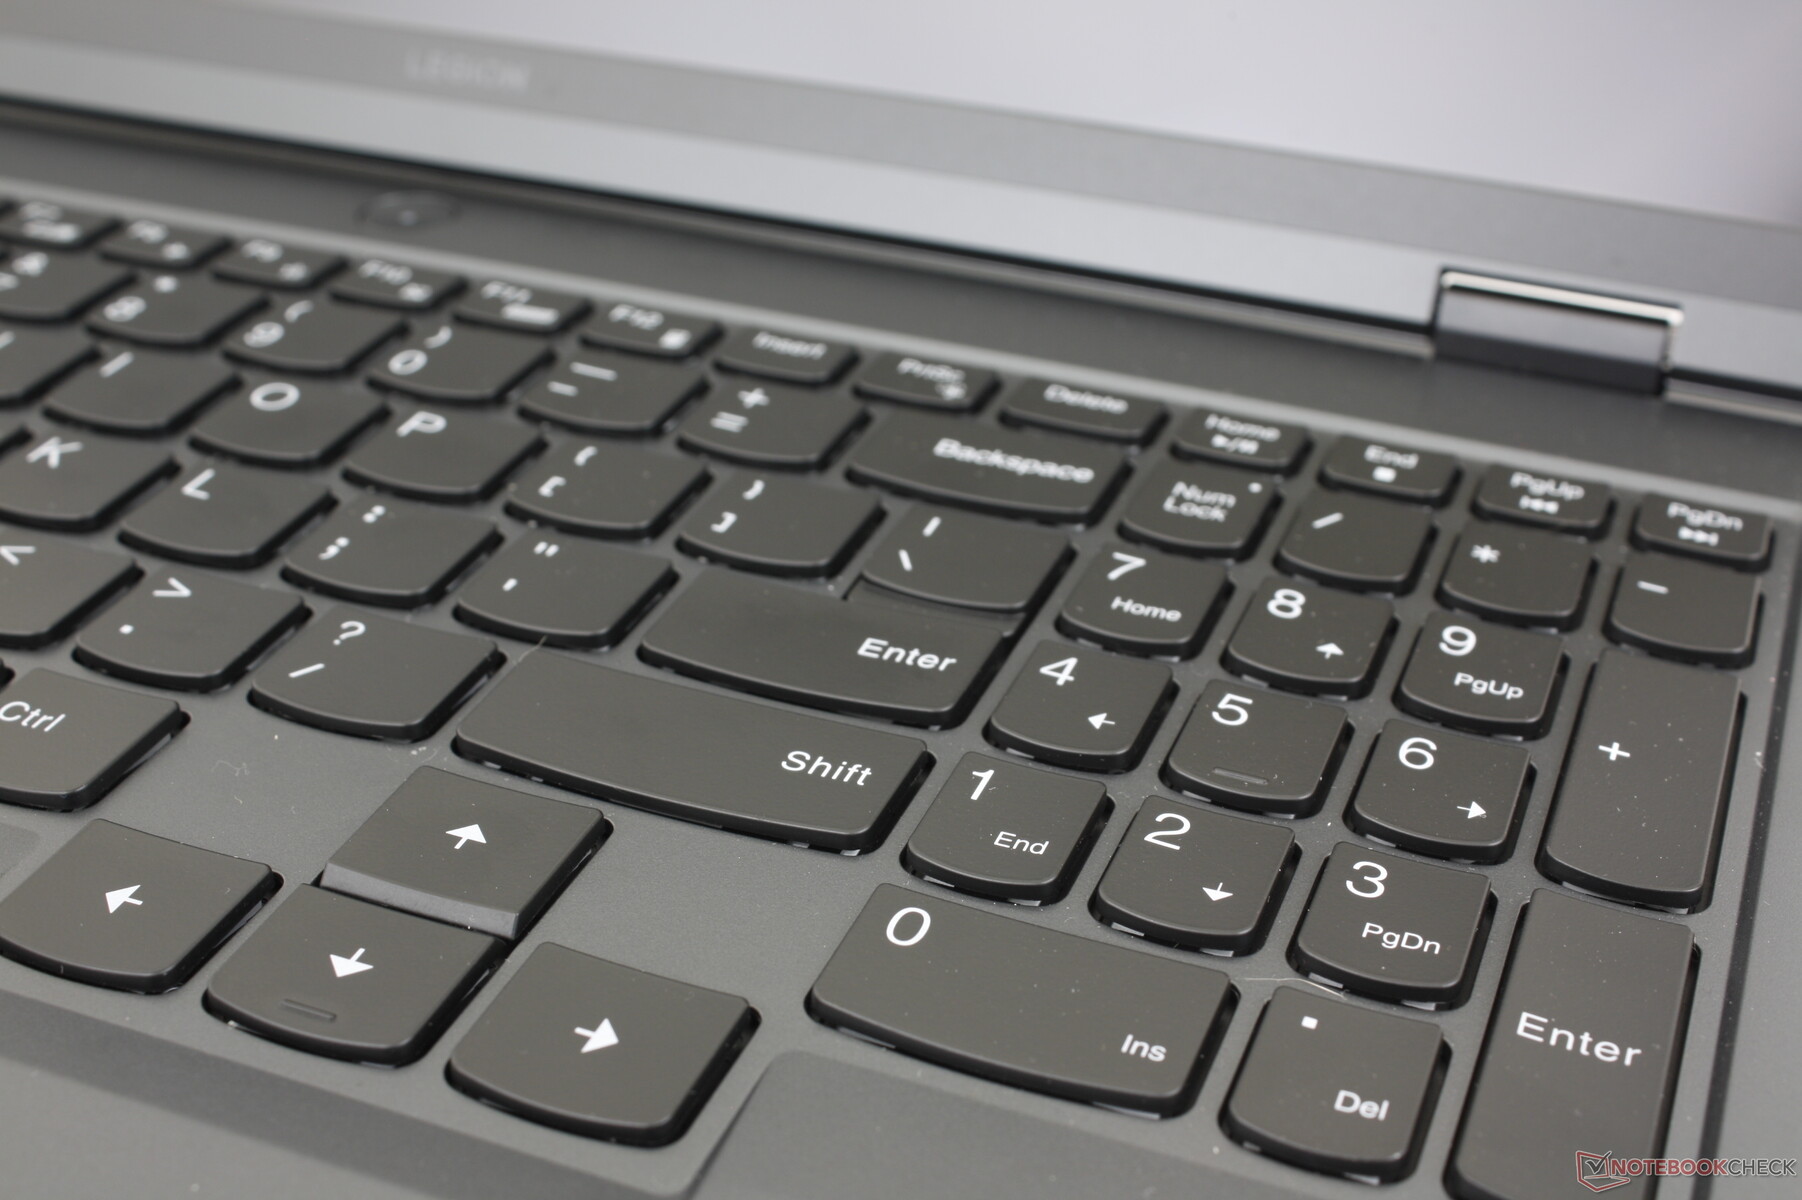
Périphériques d'entrée - Clavier confortable et spacieux
Clavier
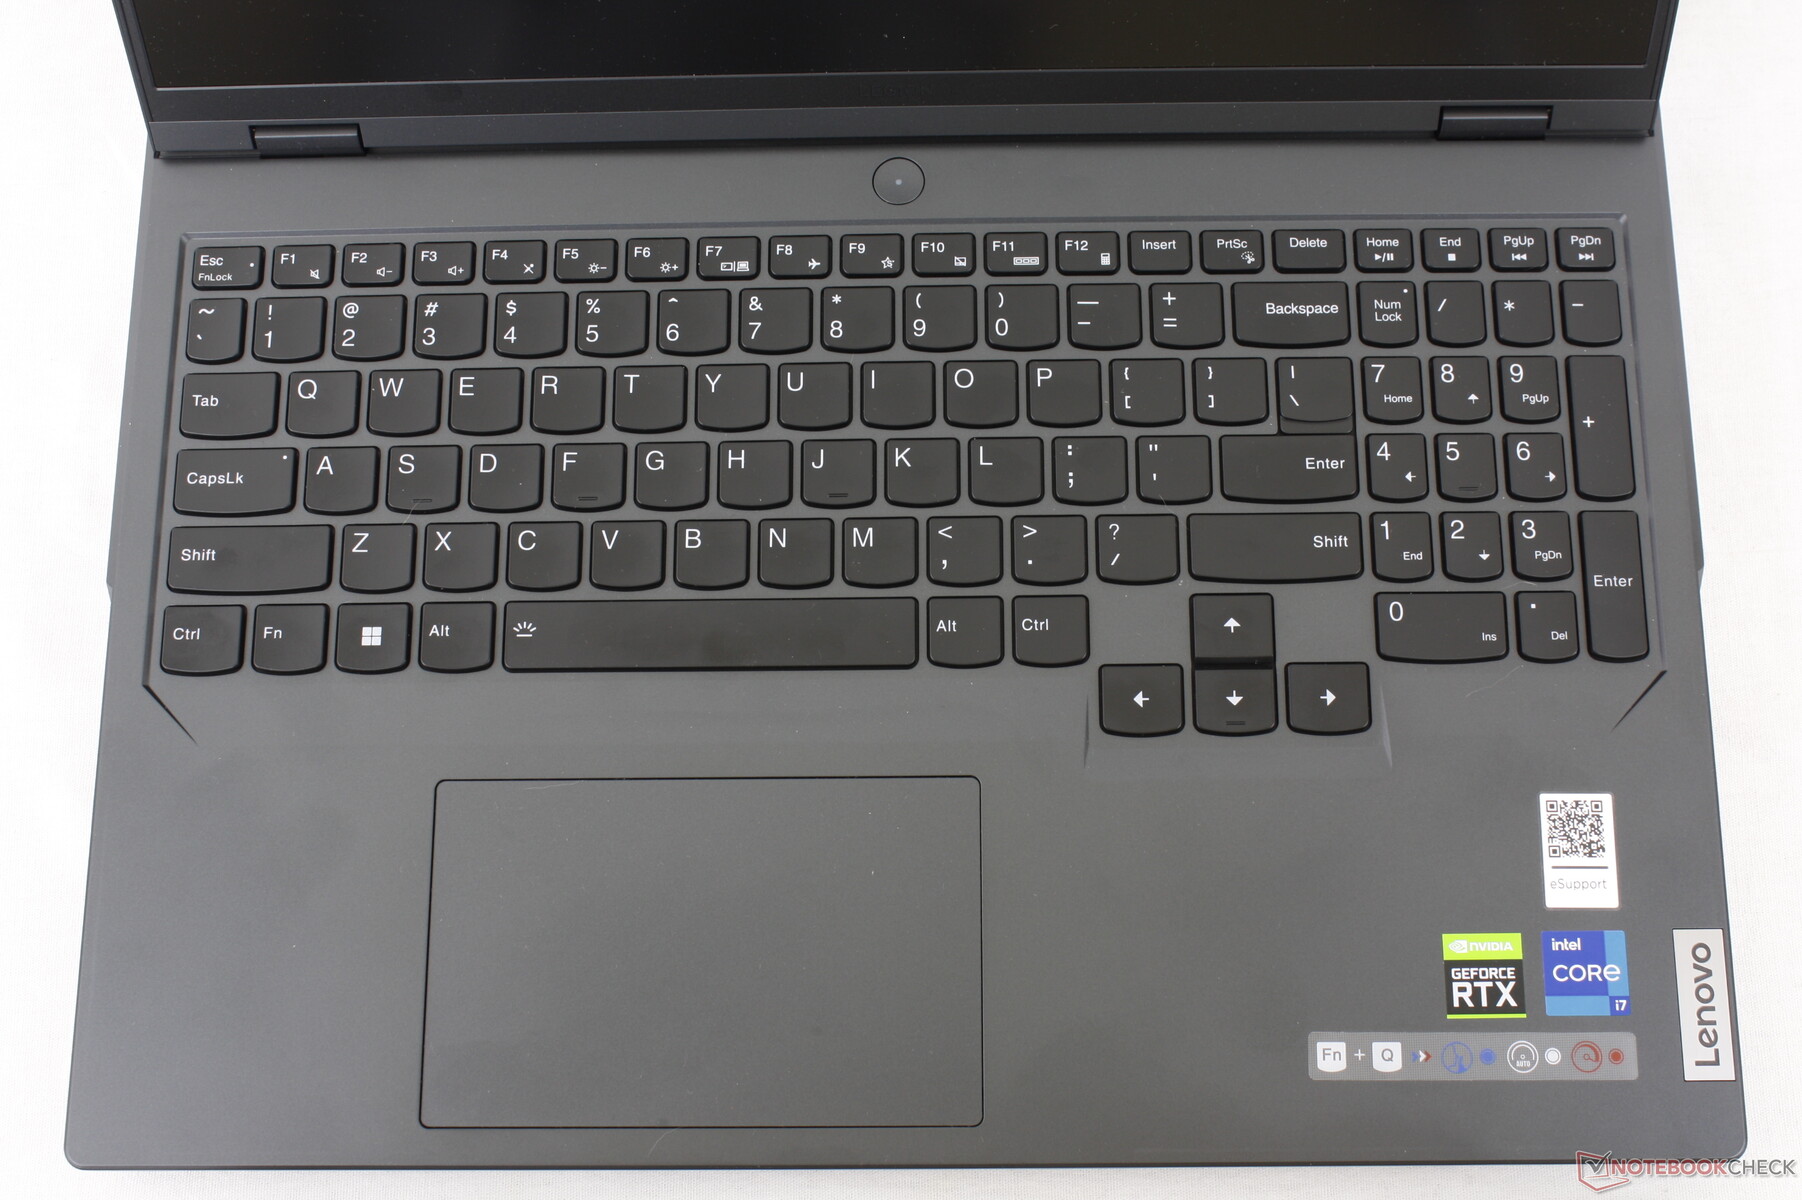
Le clavier offre une course de 1,5 mm, un pas de 0,2 mm et un anti-ghosting à 100 % pour les jeux. La course et le retour d'information sont déjà plus profonds et plus forts, respectivement, que les claviers du Razer Blade 16 ou de l'Asus Zephyrus M16, pour une expérience de frappe plus satisfaisante que celle de ces deux concurrents.
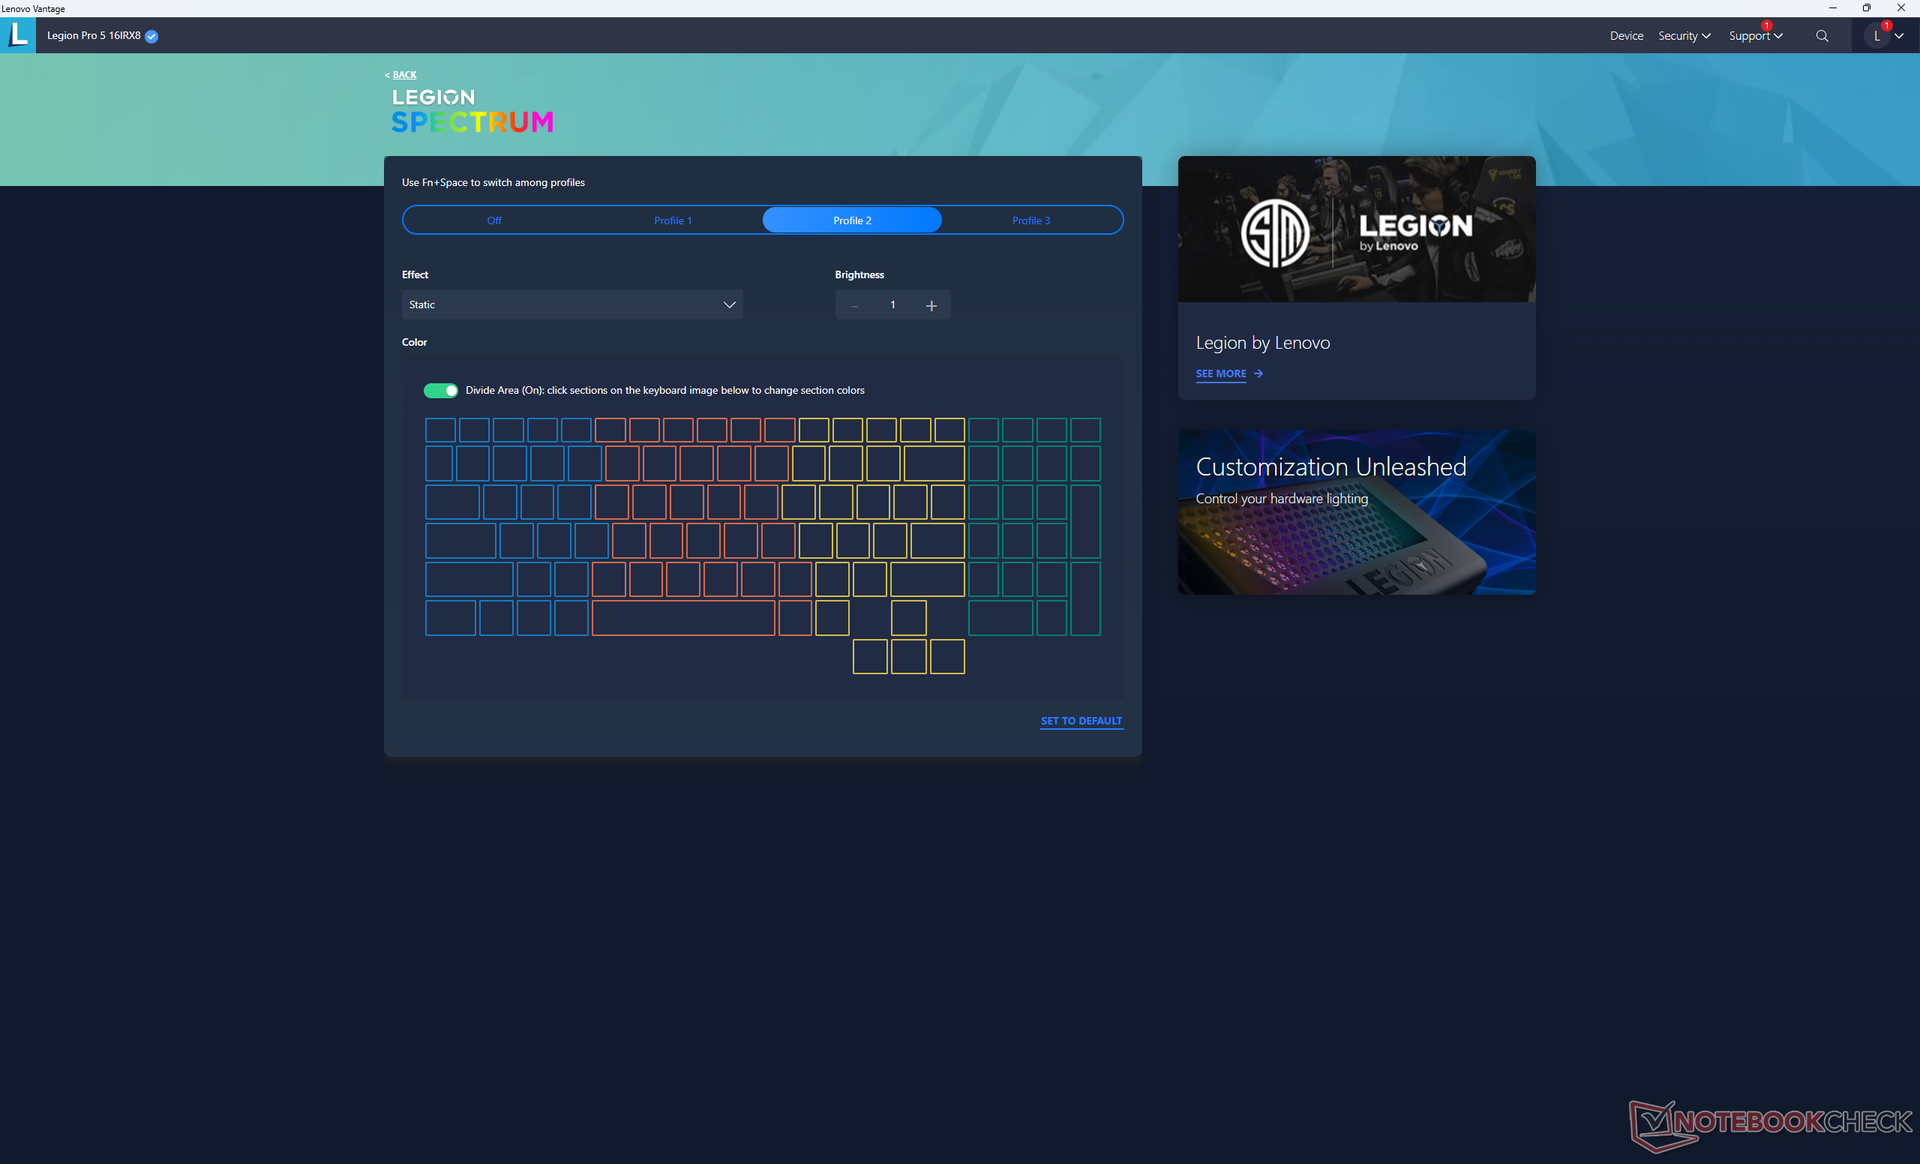
Certaines caractéristiques restent exclusives à la série haut de gamme Legion 7 Pro, comme le clavier mécanique et l'éclairage RGB par touche. La première est compréhensible, mais nous trouvons ridicule que Lenovo n'offre pas la seconde pour notre configuration à plus de 1500 $. Les propriétaires doivent se contenter d'un éclairage RVB quadri-zone.
Pavé tactile
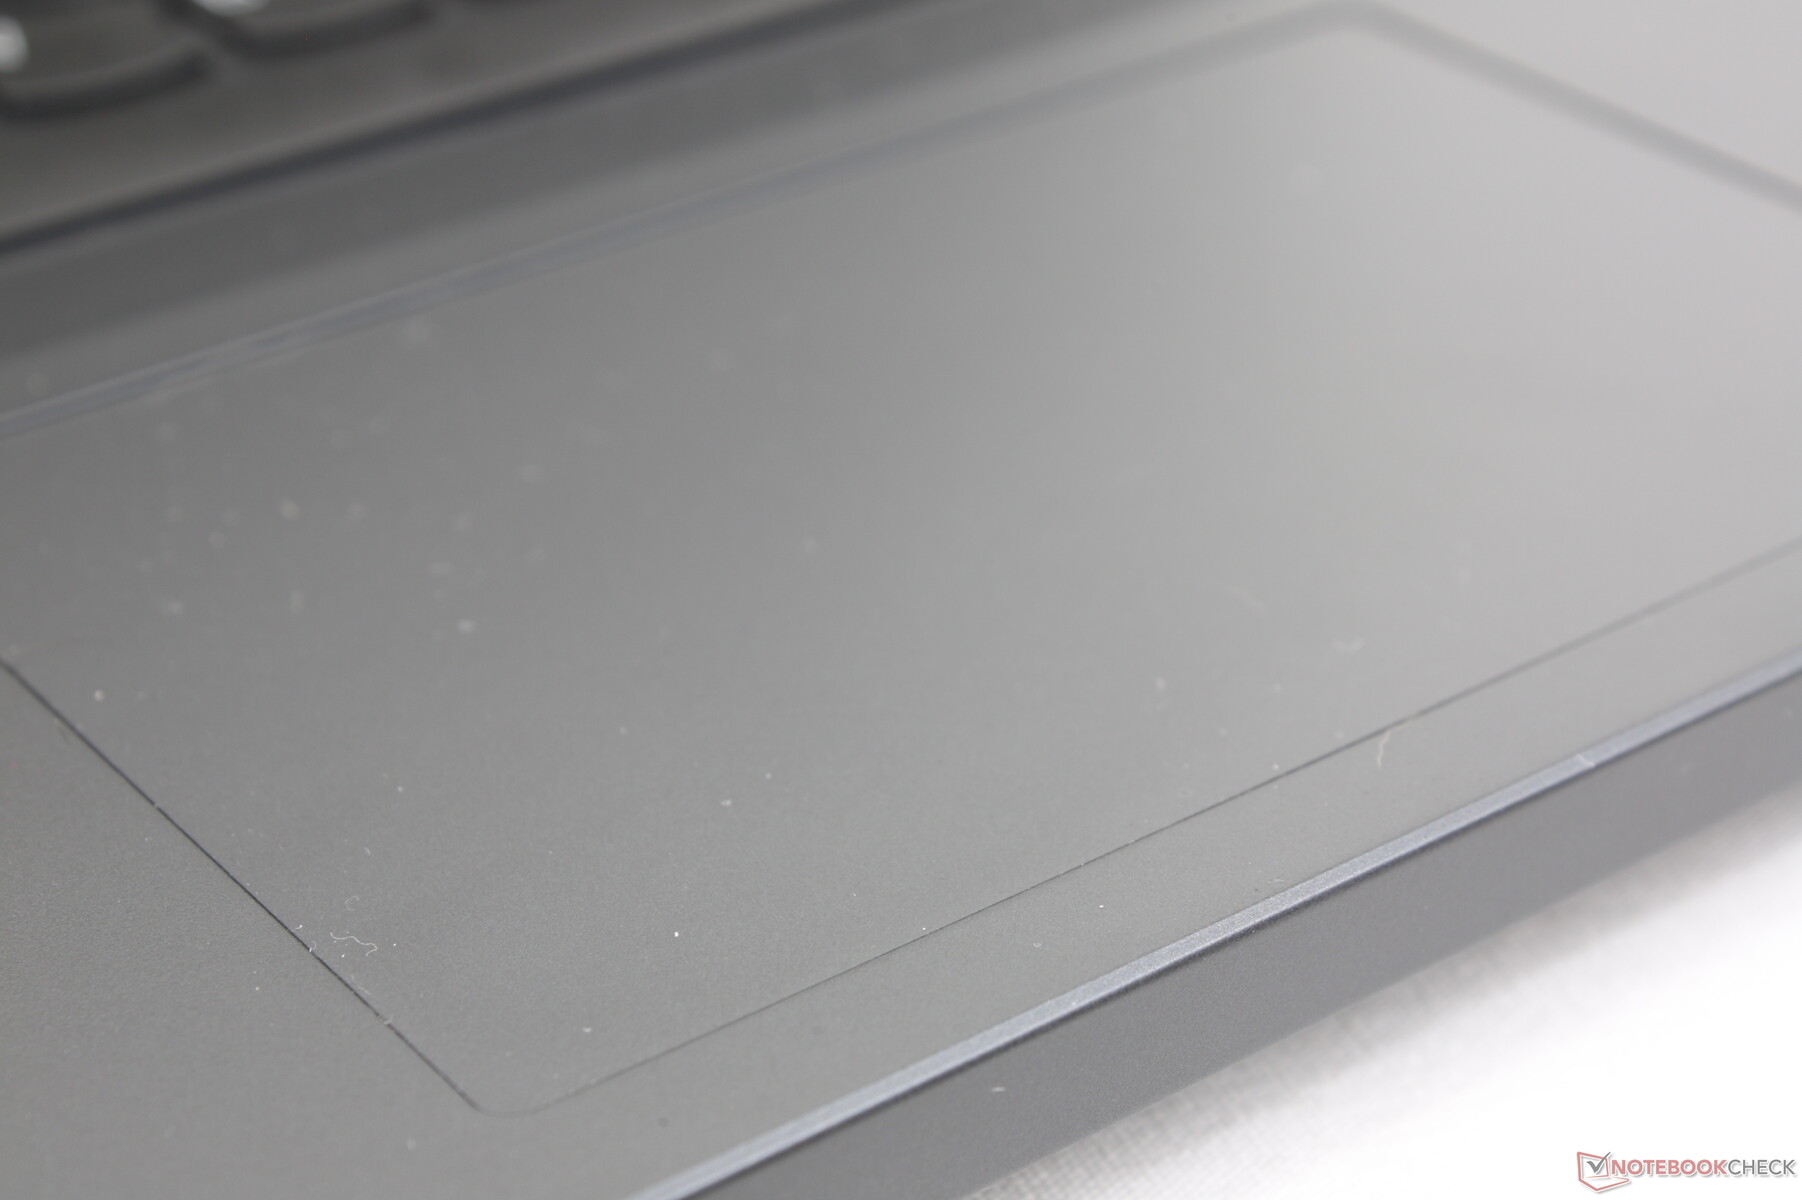
Le pavé tactile (12 x 7,5 cm) est à peu près de la même taille que celui de l'Inspiron 16 Plus 7620.Inspiron 16 Plus 7620 (11,5 x 8 cm). La glisse est fluide et réactive, avec une légère adhérence à faible vitesse pour des clics plus précis. Cependant, la course est très faible lors des clics et le retour d'information n'est pas très fort. Néanmoins, le pavé tactile fonctionne de manière suffisamment fiable pour les tâches simples lorsque l'on ne dispose pas d'une souris.

Affichage - 165 Hz minimum
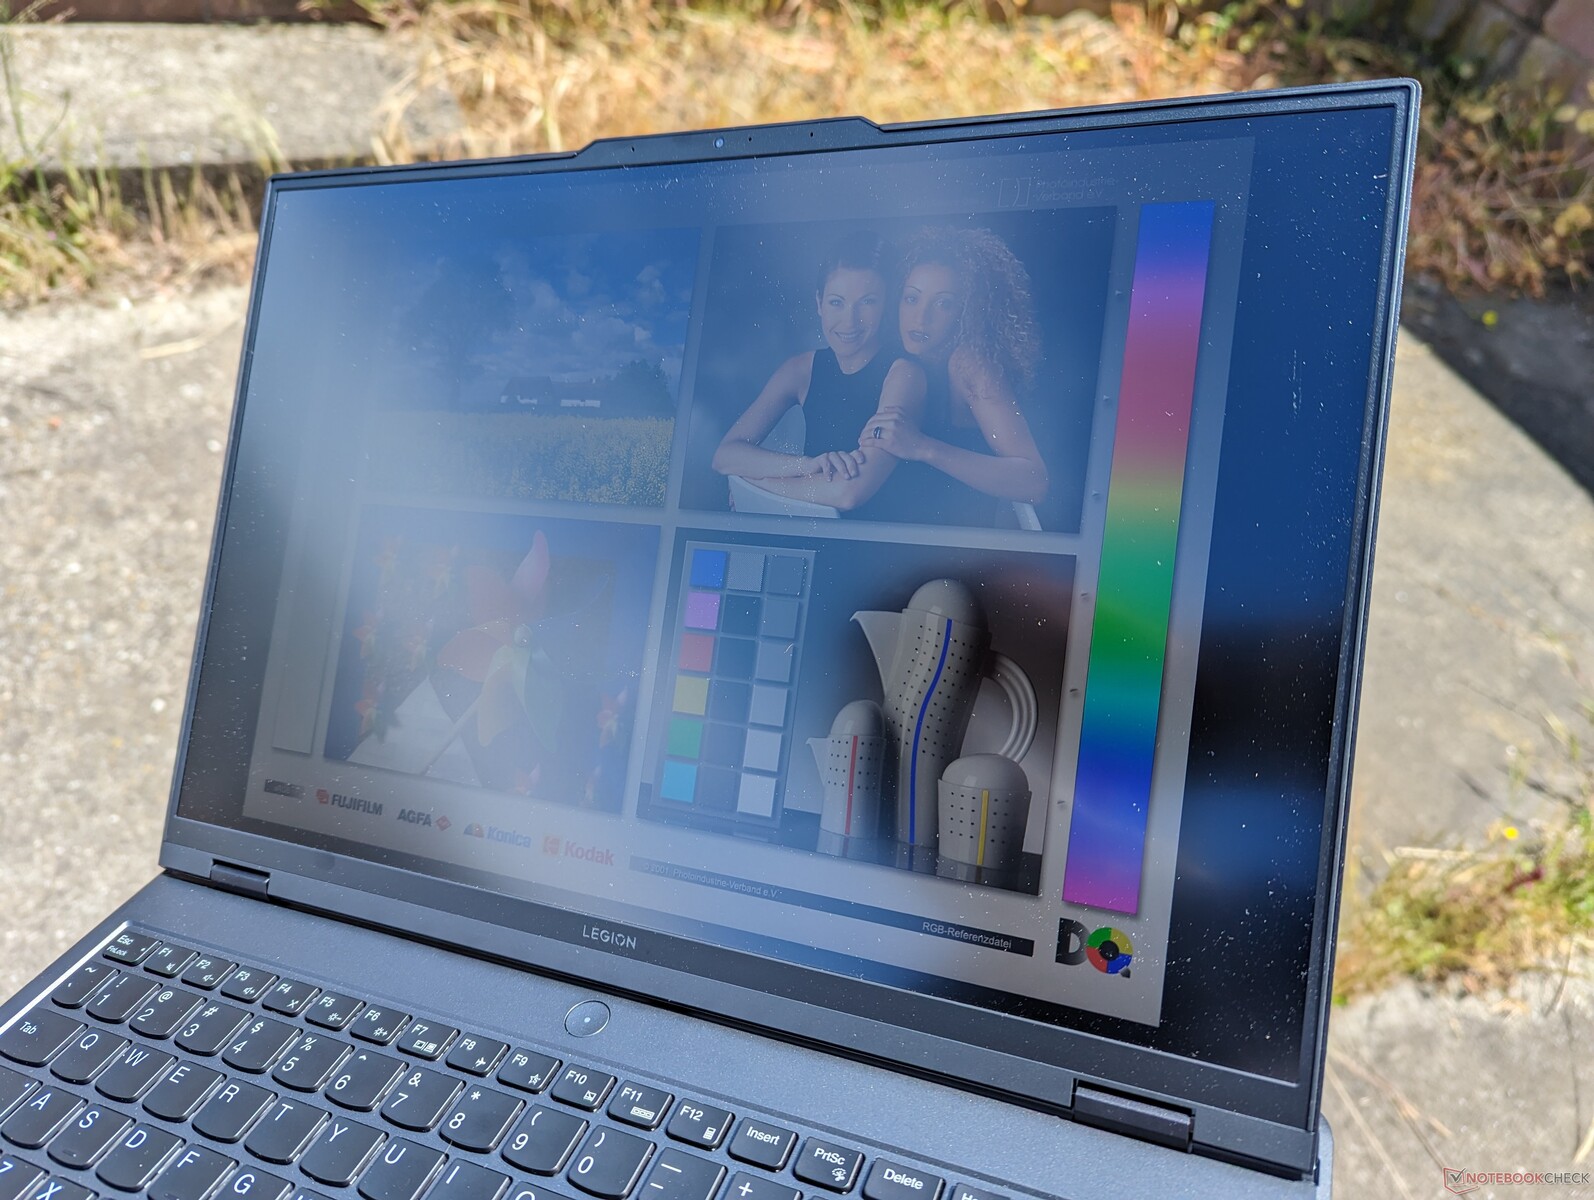
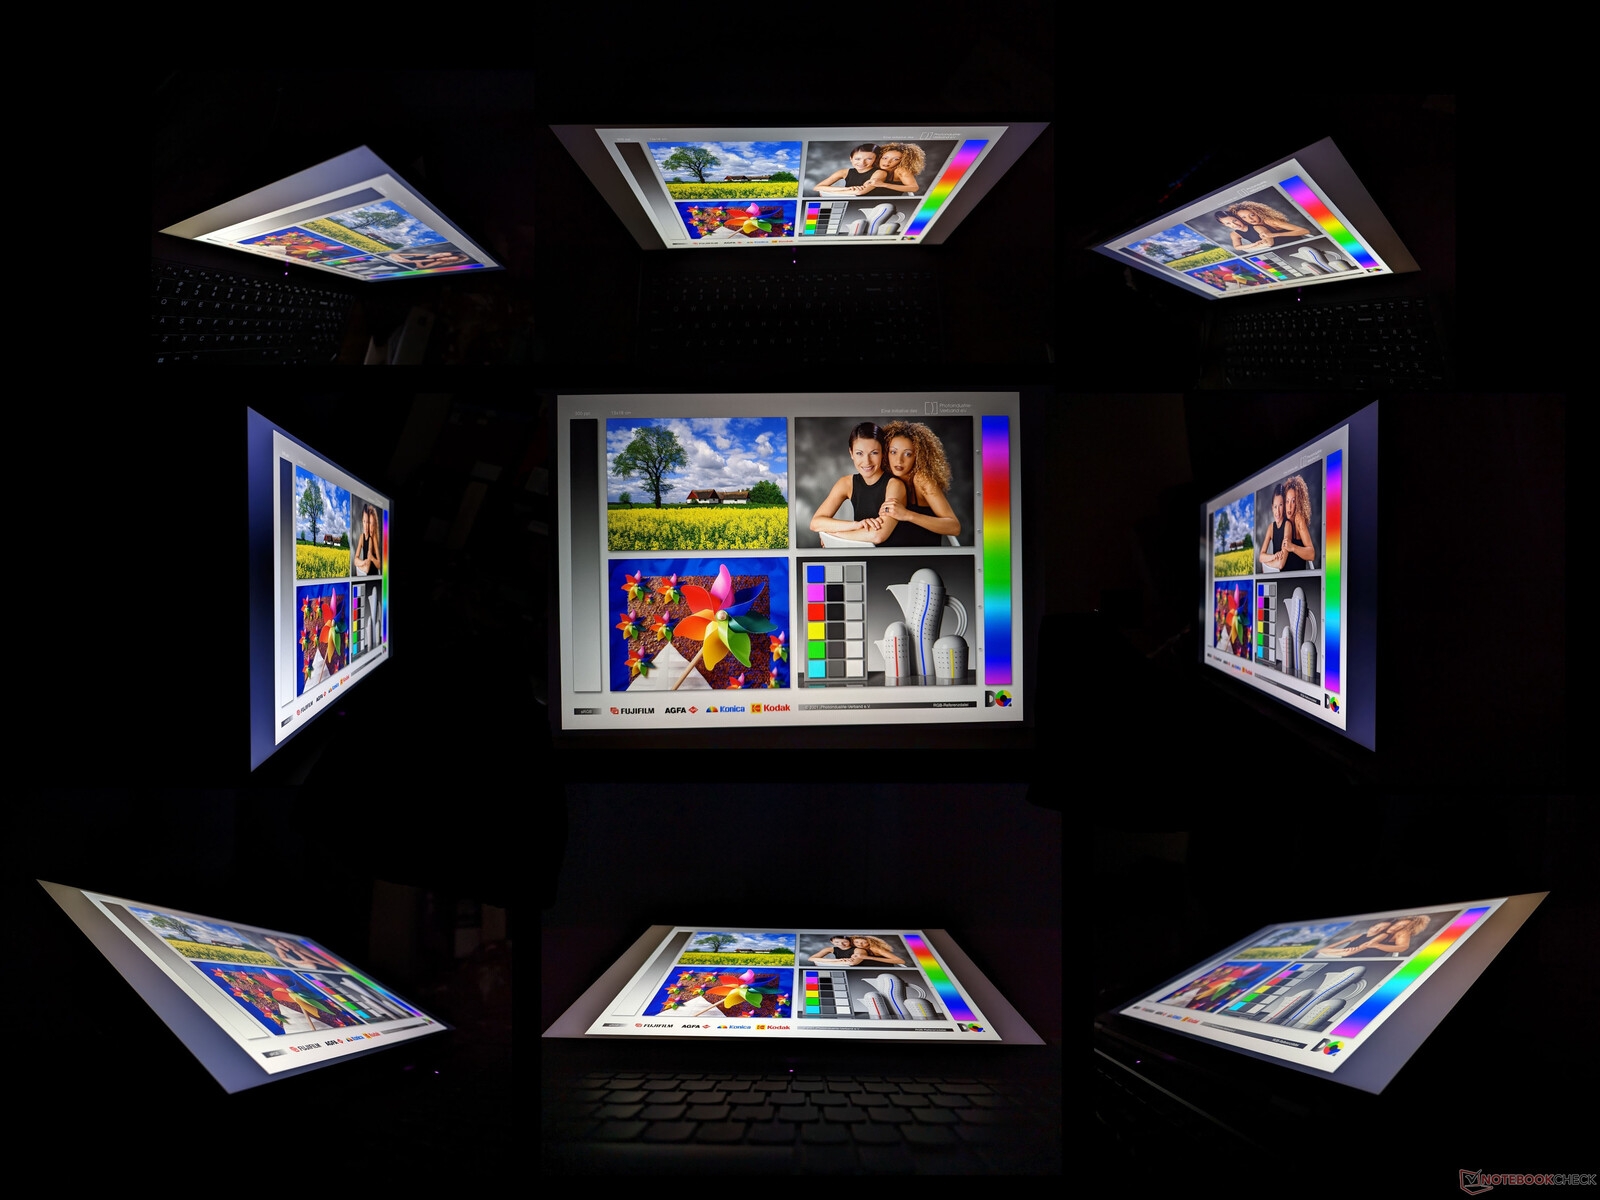
Il existe deux options d'affichage pour le 2023 Legion Pro 5 16 : 165 Hz et 240 Hz. Les deux prennent en charge G-Sync, une résolution native de 2560 x 1600 et une couverture sRGB complète, tandis que seul le panneau de 240 Hz prend en charge HDR400. L'option de base de 165 Hz devrait être plus que suffisante pour les joueurs de milieu de gamme. La qualité de l'image est excellente, avec une granulation étonnamment faible pour un écran mat.
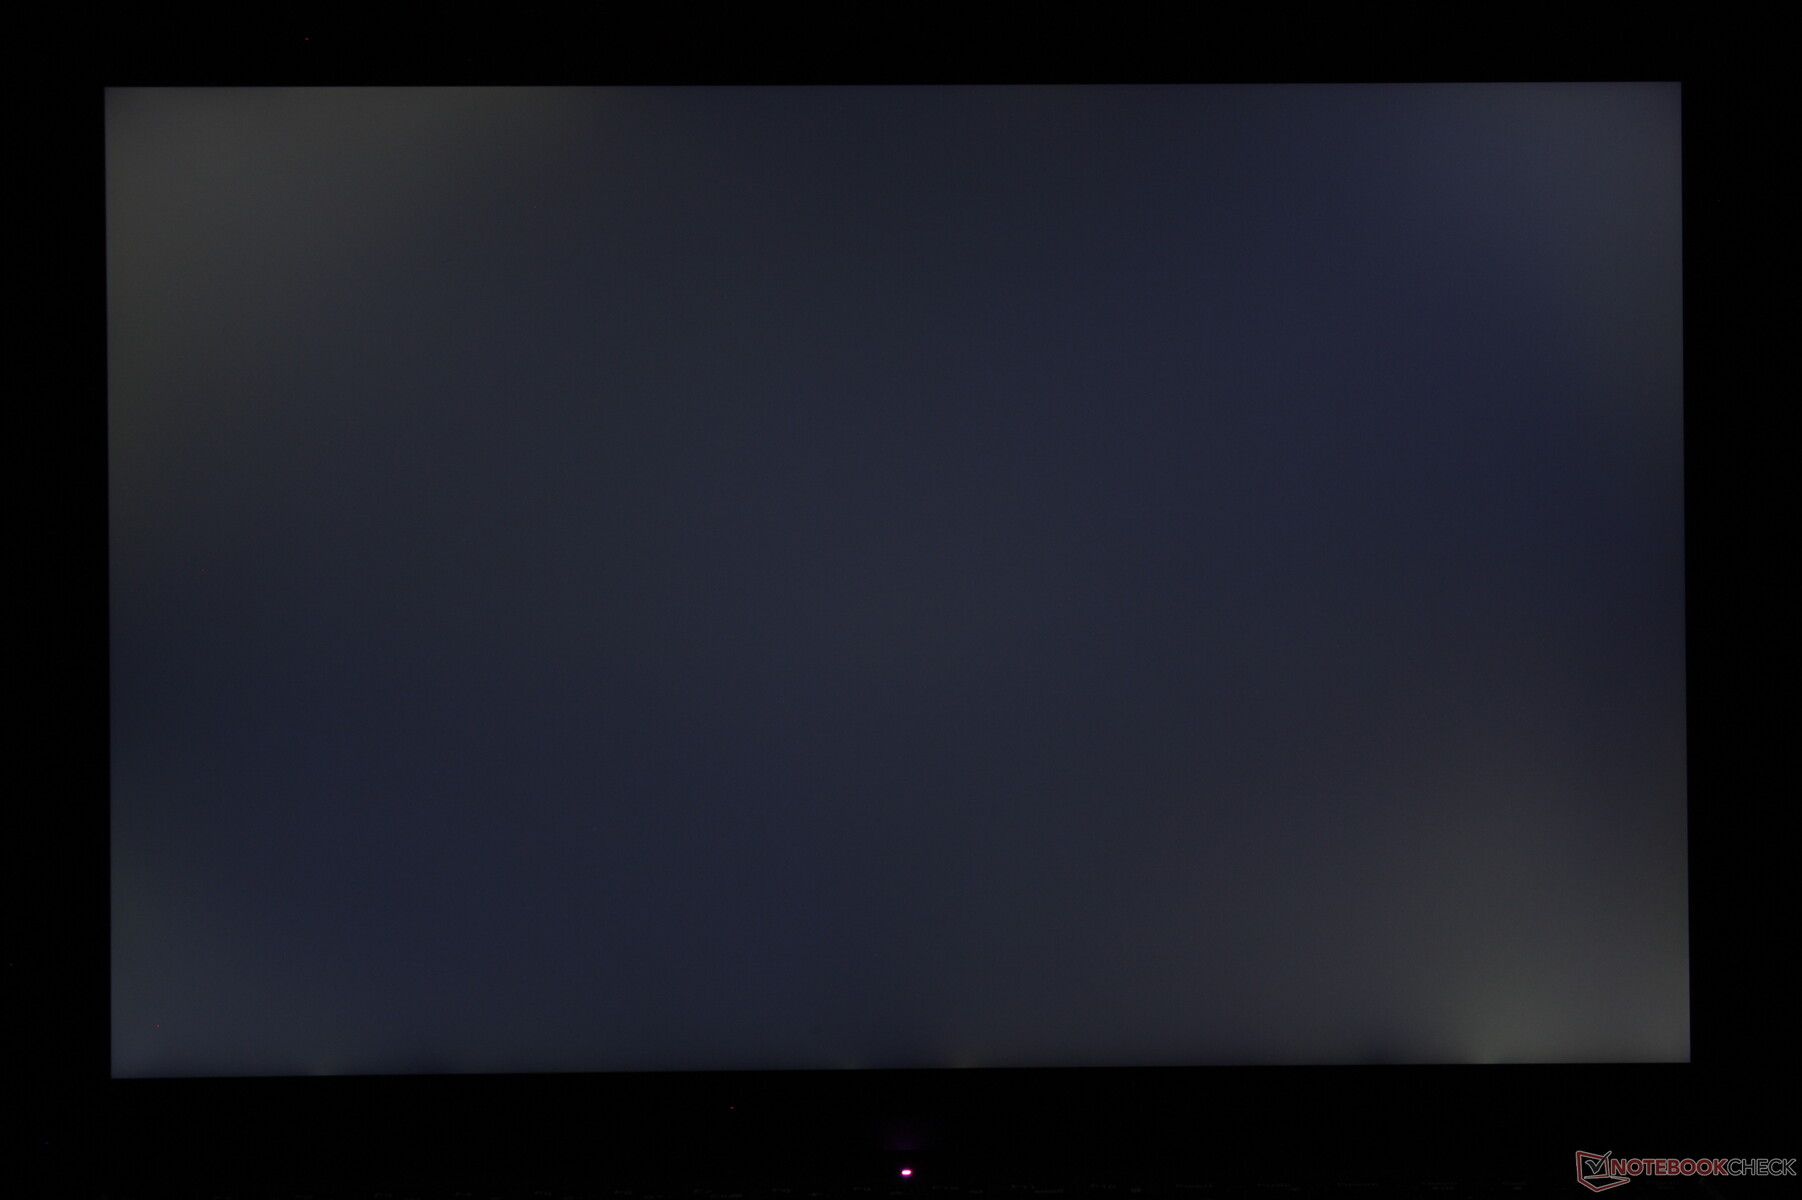
L'affaiblissement du rétroéclairage pourrait certainement être amélioré. Notre unité présentait une certaine quantité de saignement de lumière que nous trouvons à la limite de l'inacceptable sur un ordinateur portable de jeu de cette gamme de prix.
Les utilisateurs intéressés par l'OLED ou les couleurs AdobeRGB plus larges devront regarder au-delà de la série de milieu de gamme Legion Pro 5.

| |||||||||||||||||||||||||
Homogénéité de la luminosité: 87 %
Valeur mesurée au centre, sur batterie: 405.7 cd/m²
Contraste: 1068:1 (Valeurs des noirs: 0.38 cd/m²)
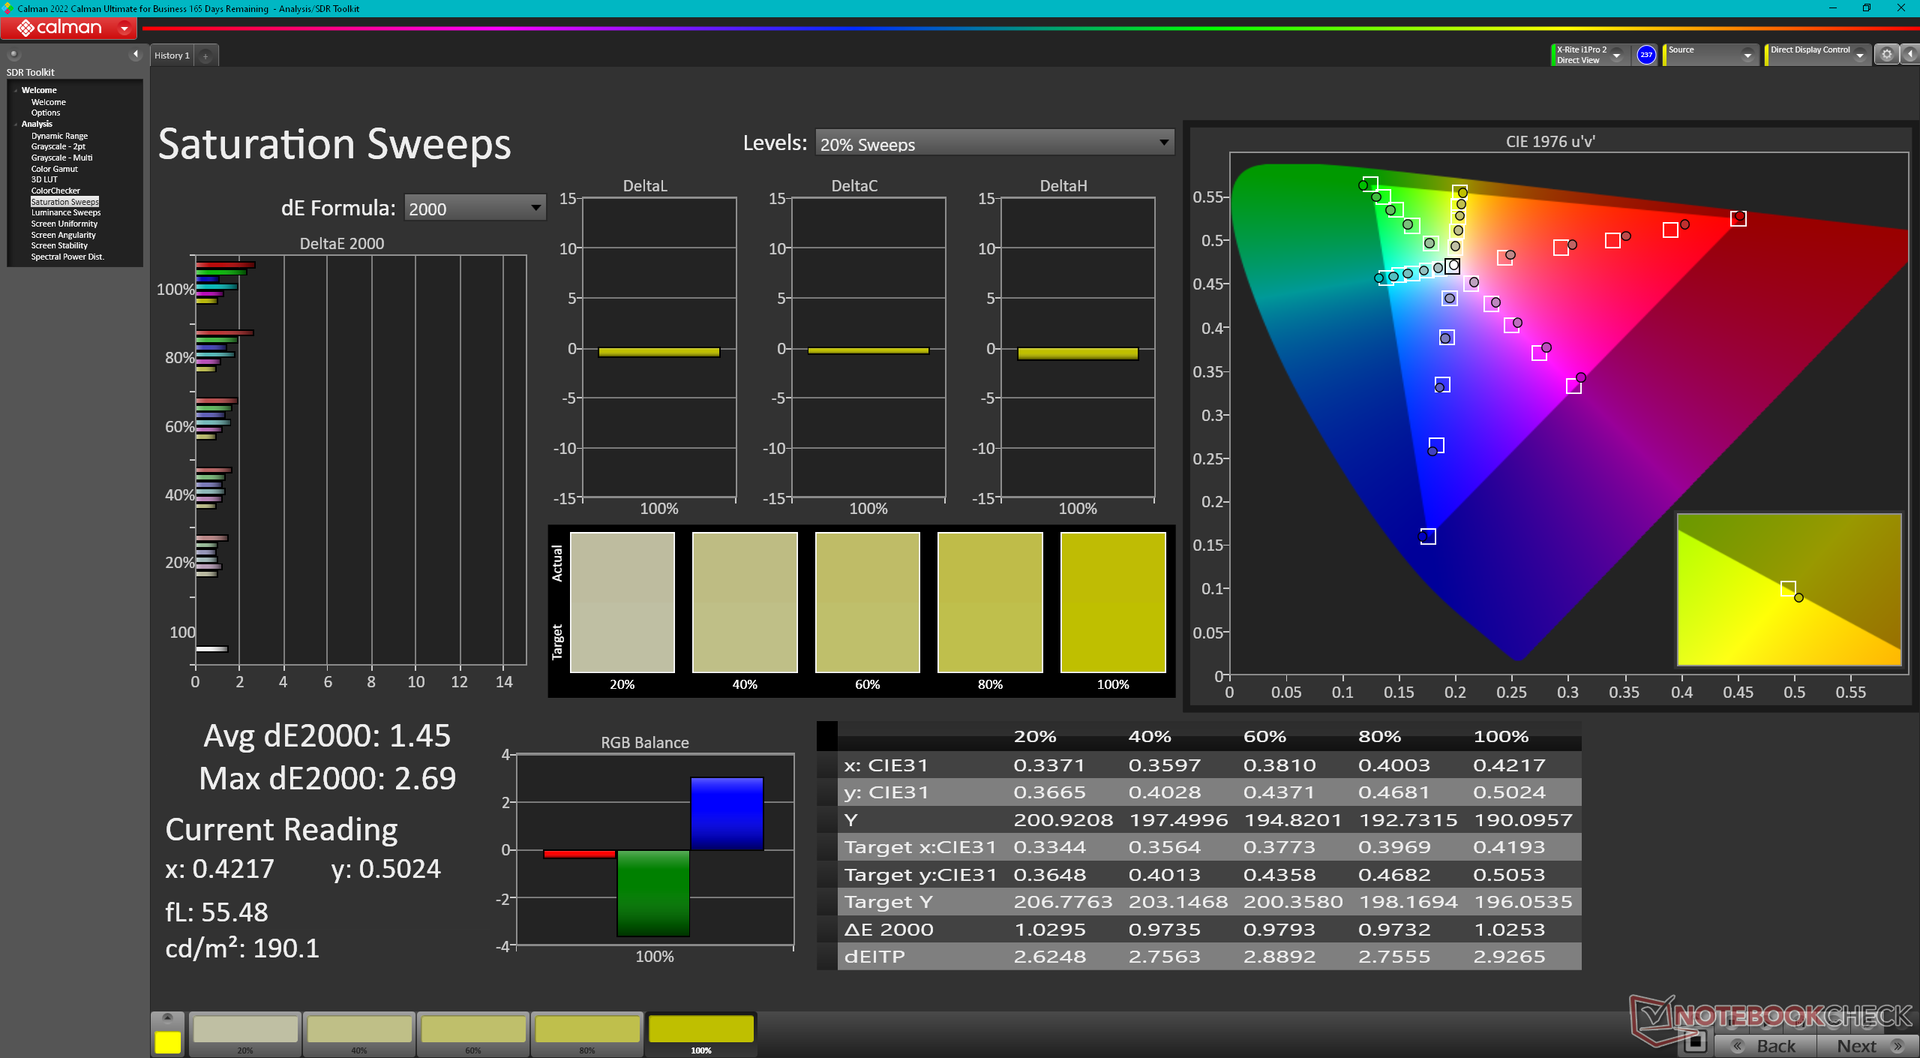
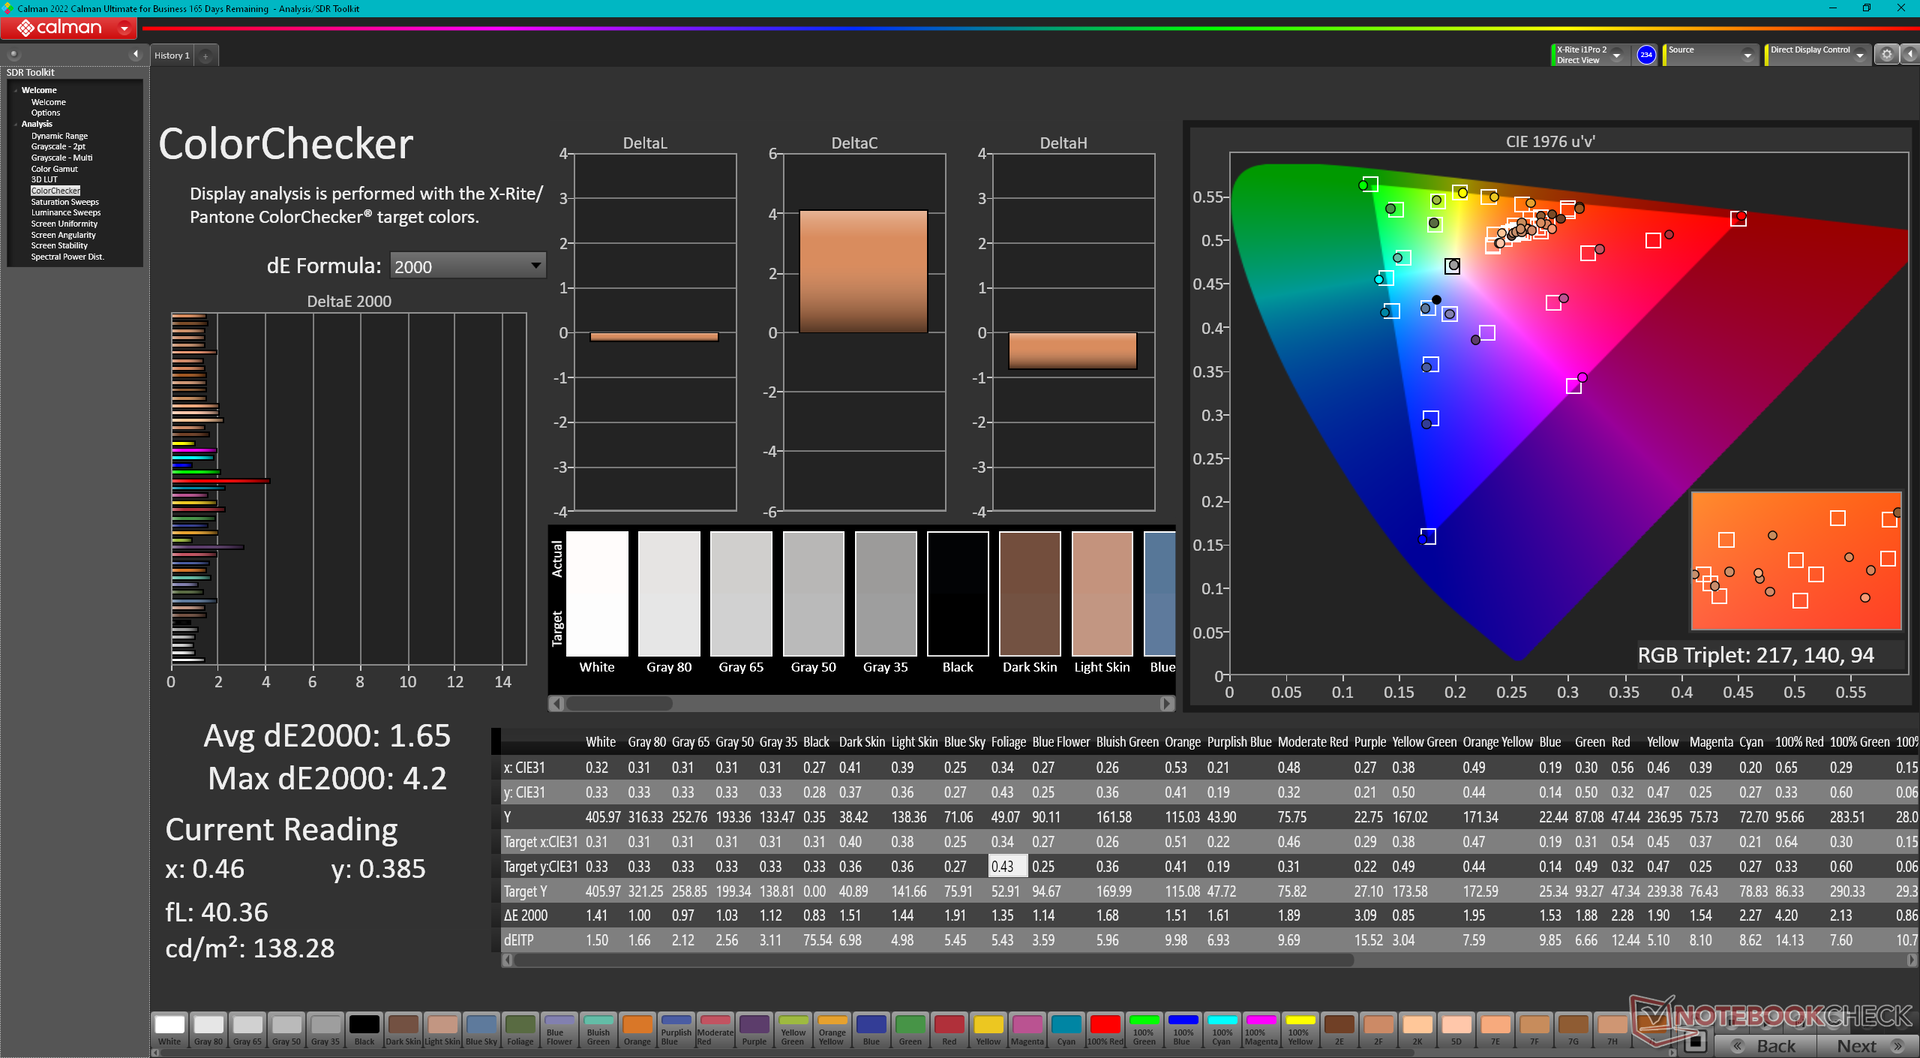
ΔE ColorChecker Calman: 1.65 | ∀{0.5-29.43 Ø4.71}
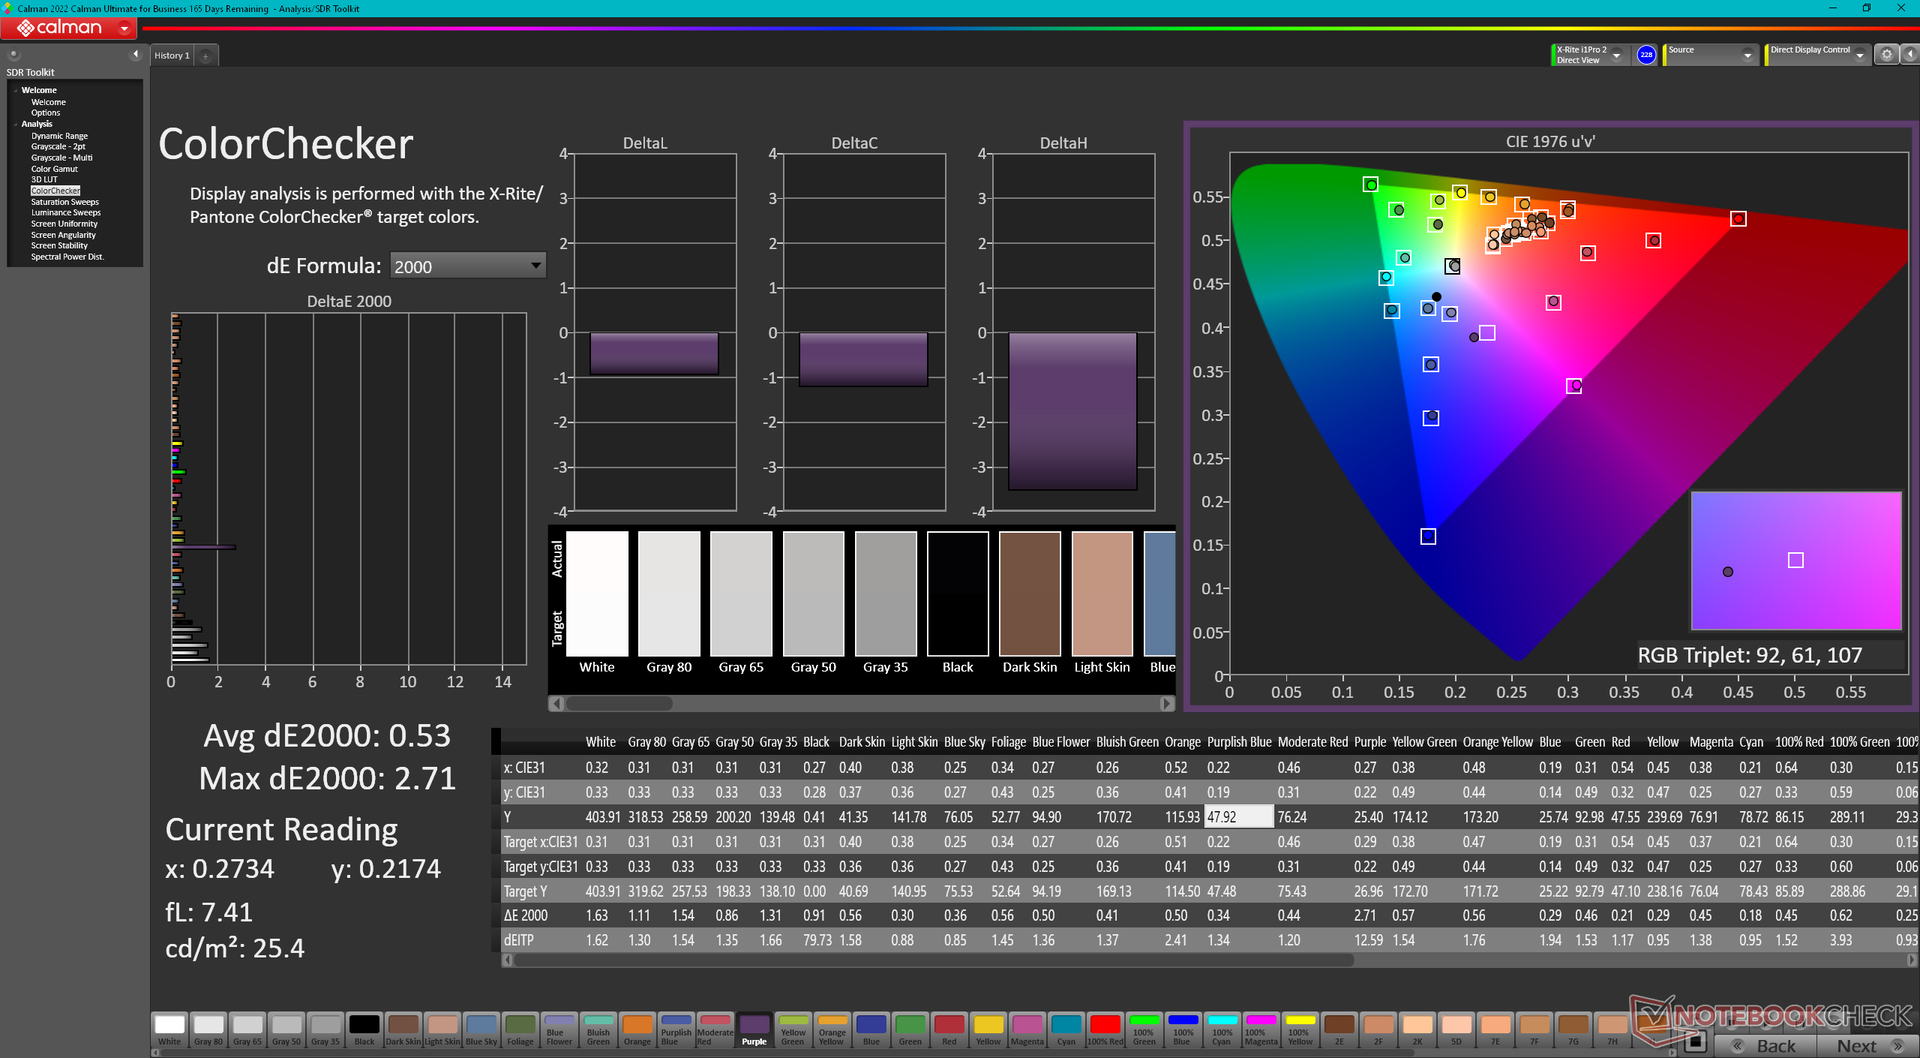
calibrated: 0.53
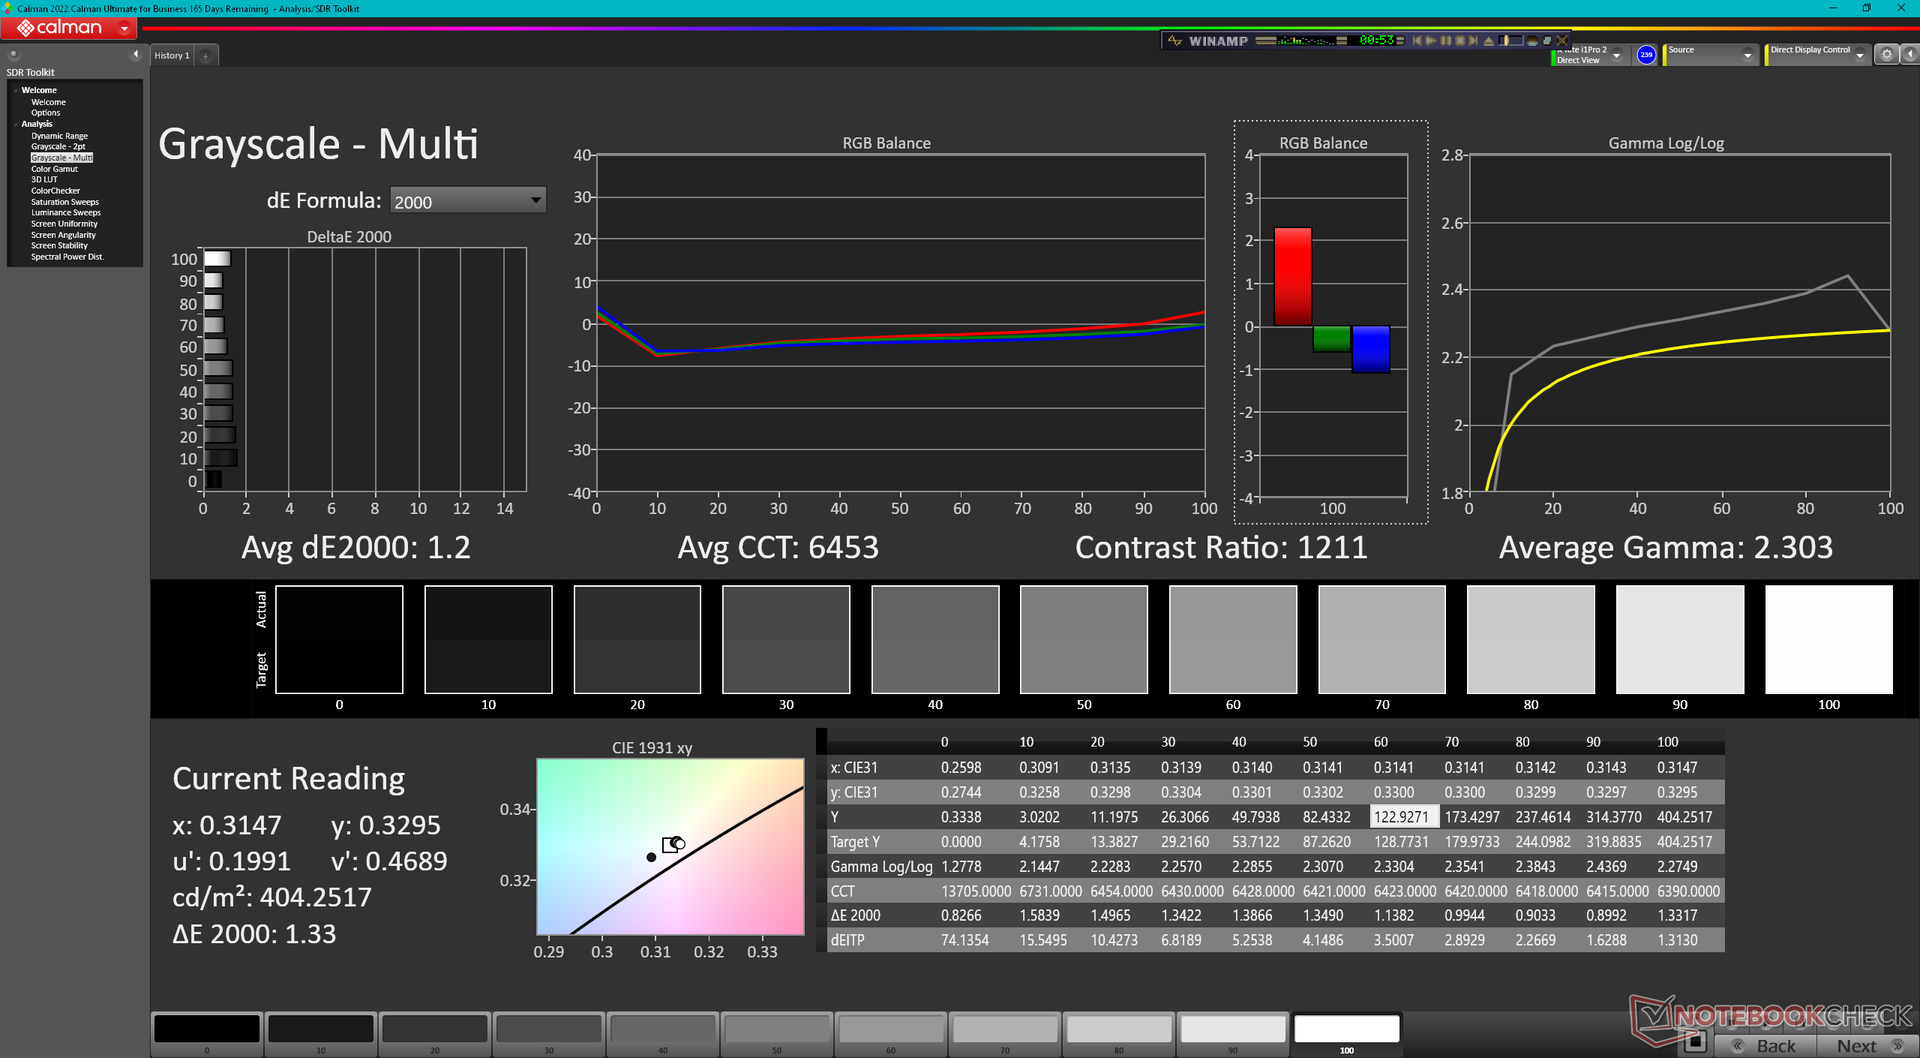
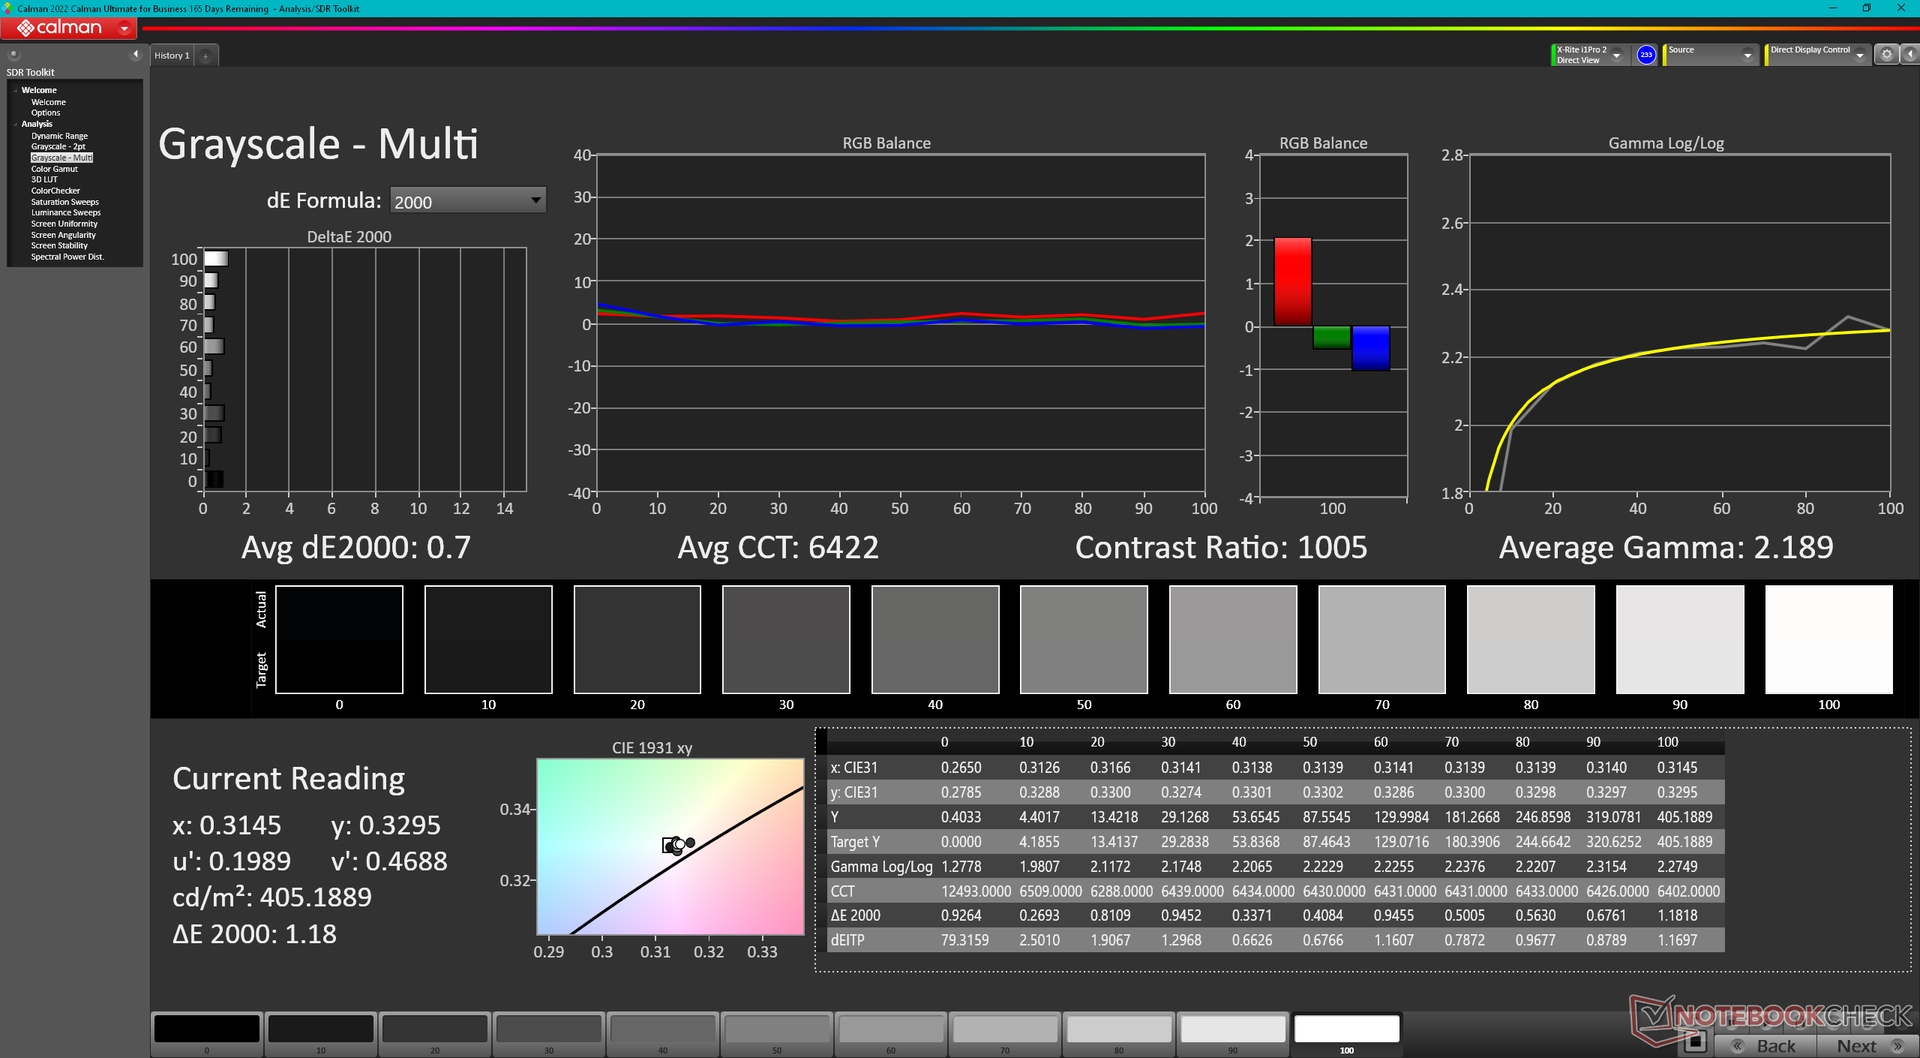
ΔE Greyscale Calman: 1.2 | ∀{0.09-98 Ø4.96}
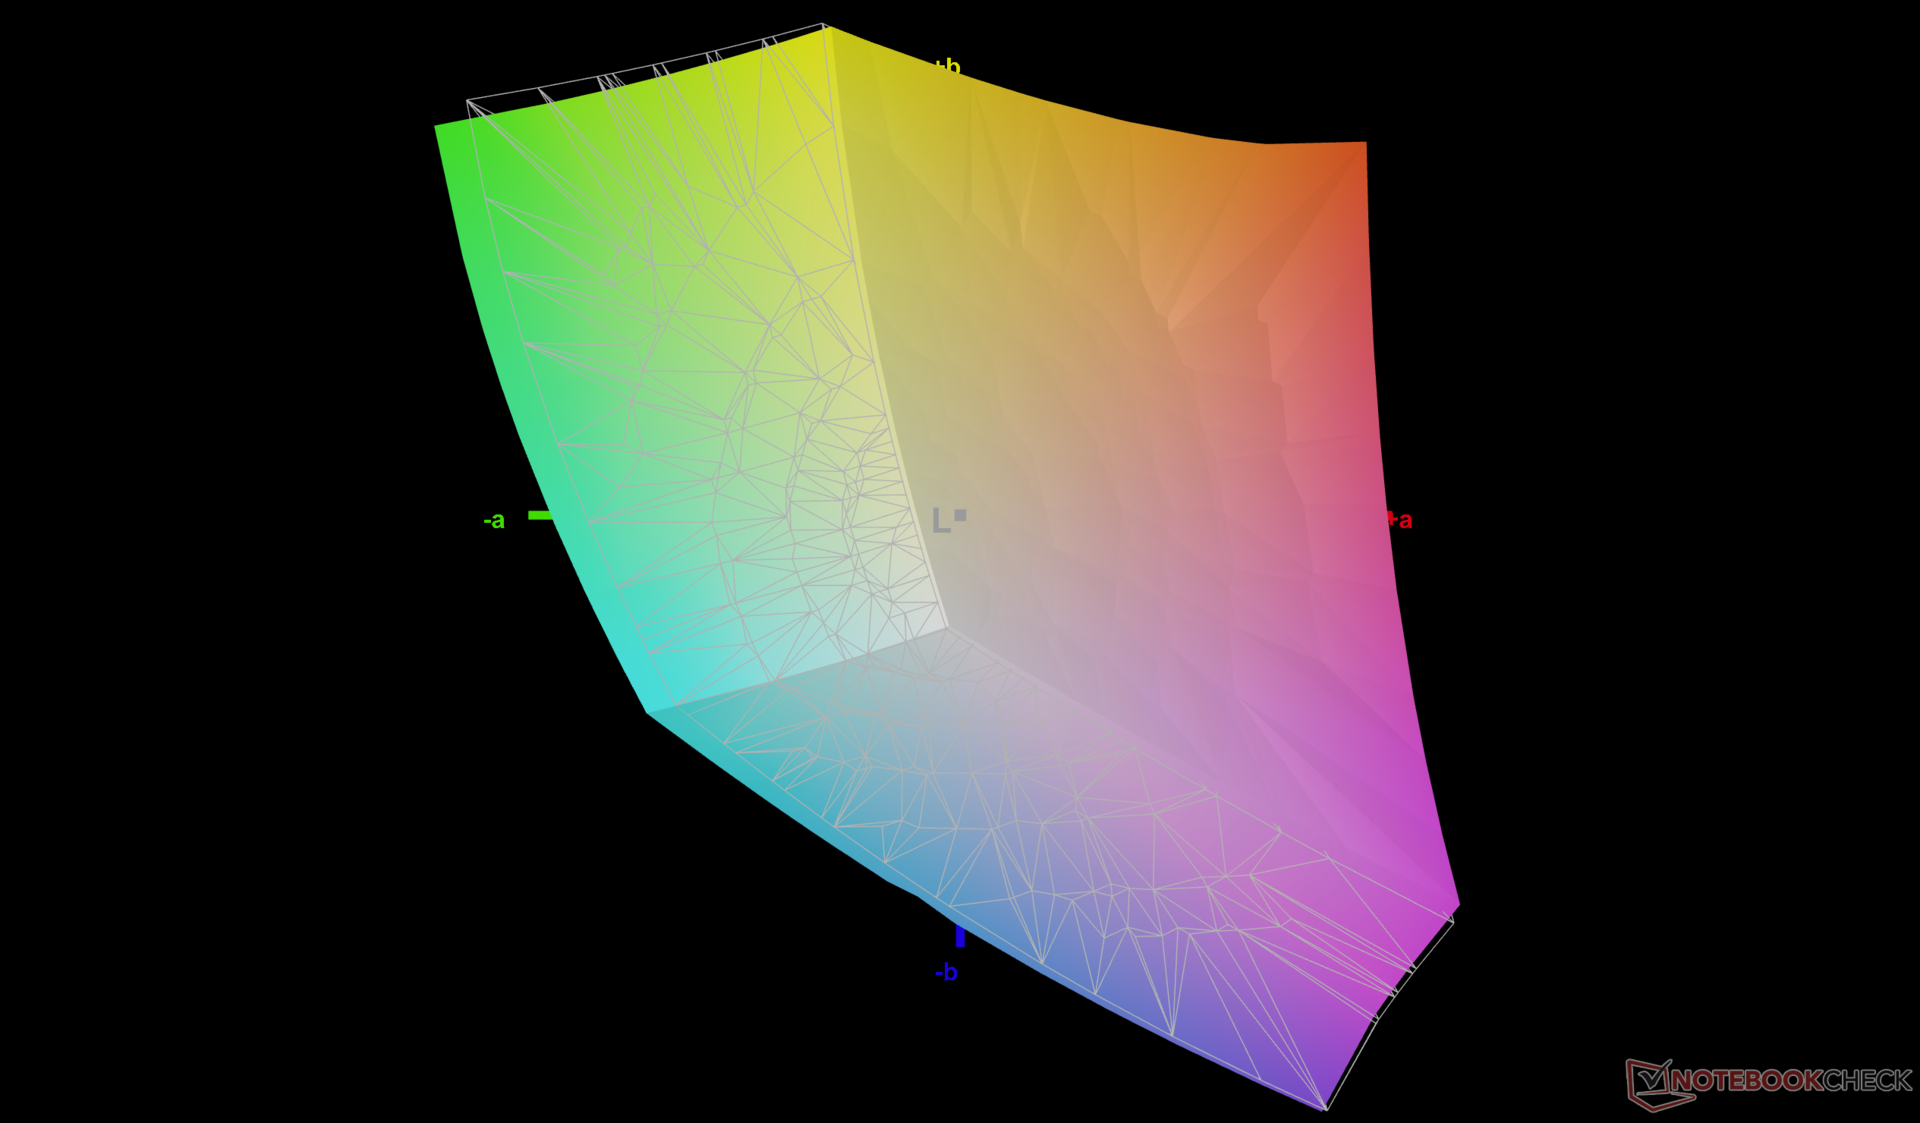
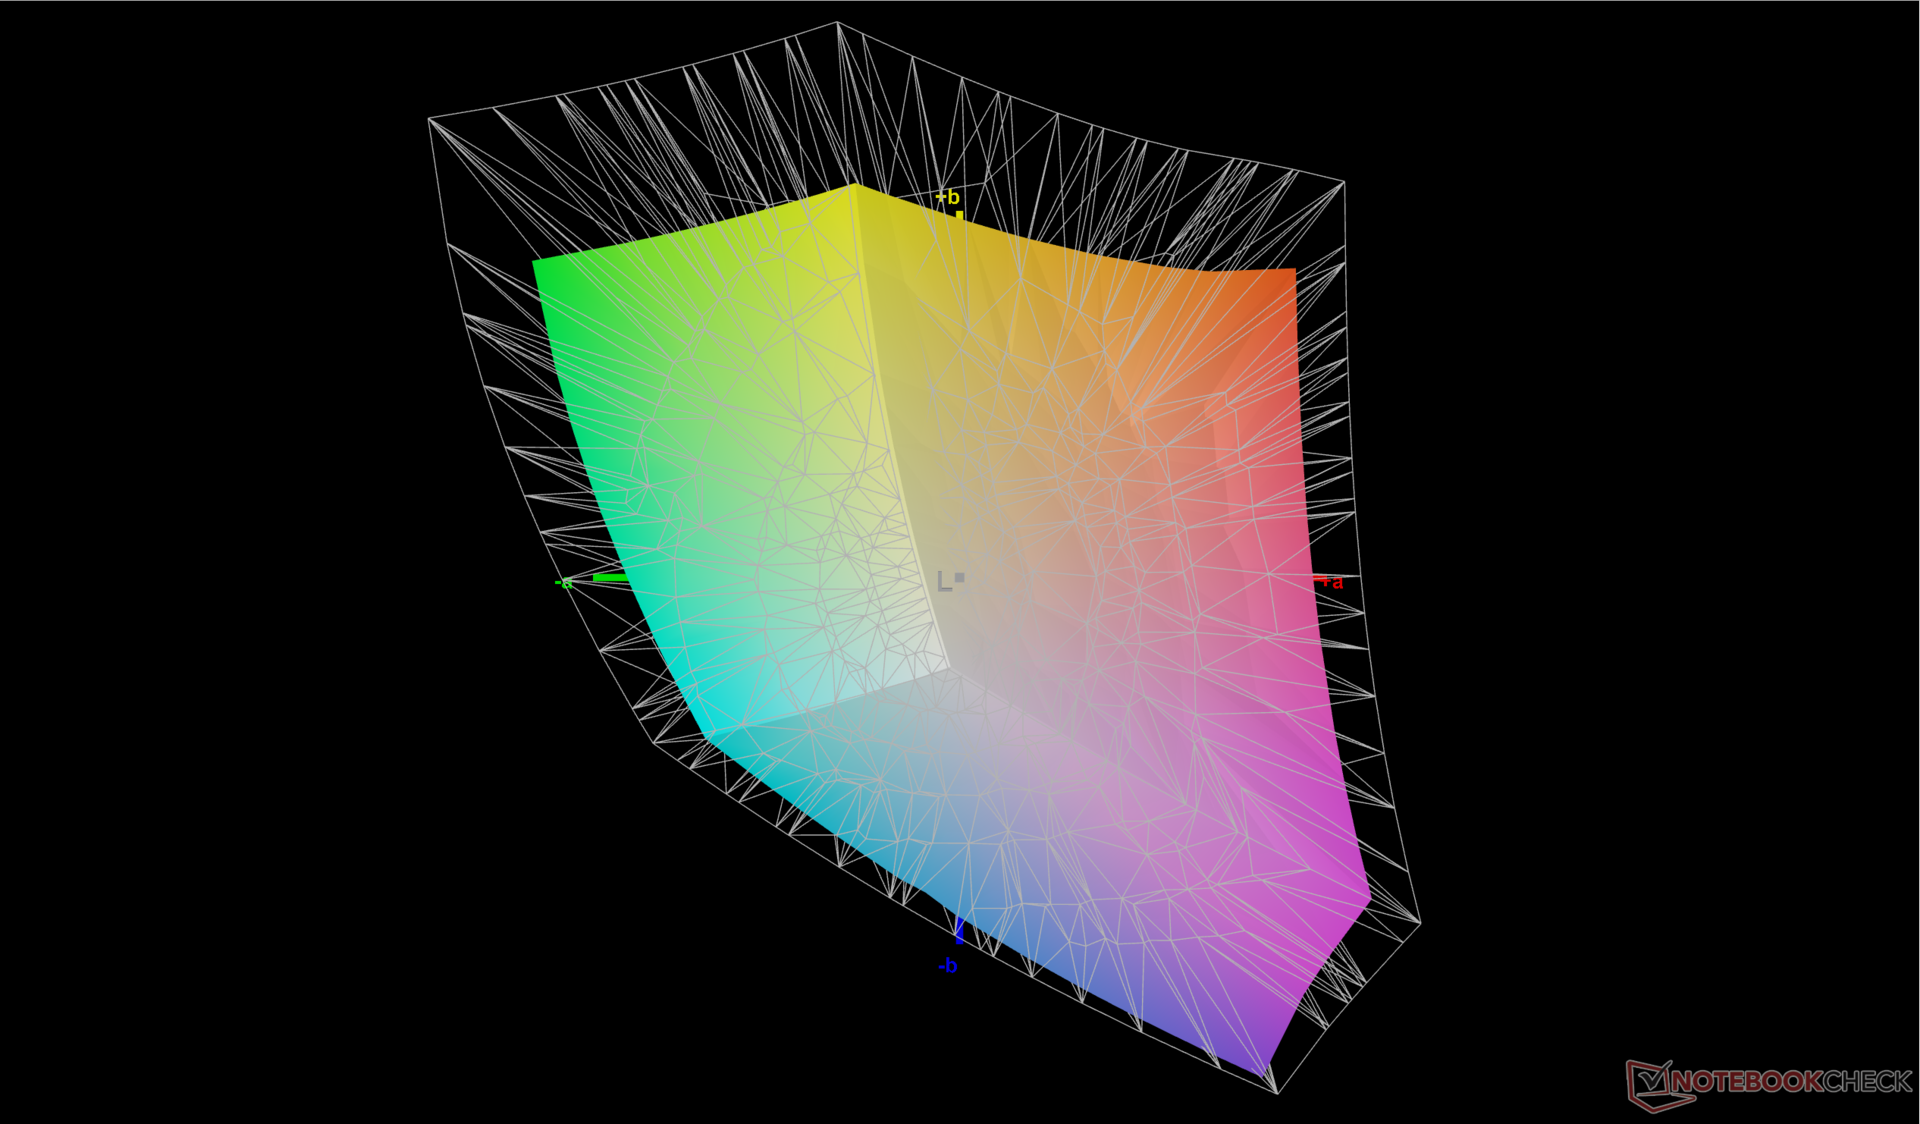
73.3% AdobeRGB 1998 (Argyll 3D)
98.8% sRGB (Argyll 3D)
71.2% Display P3 (Argyll 3D)
Gamma: 2.3
CCT: 6453 K
| Lenovo Legion Pro 5 16IRX8 AU Optronics B160QAN03.1, IPS, 2560x1600, 16" | Asus ROG Zephyrus M16 GU603Z BOE0A0B (BOE CQ NE160QDM-NY3), IPS, 2560x1600, 16" | Razer Blade 16 Early 2023 CSOT T3 MNG007DA4-1, IPS, 2560x1600, 16" | Lenovo Legion Pro 7 16IRX8H MNG007DA2-3 (CSO1628), IPS, 2560x1600, 16" | Lenovo Legion 5 Pro 16ARH7H RTX 3070 Ti BOE CQ NE160QDM-NY1, IPS, 2560x1600, 16" | Lenovo Legion S7 16ARHA7 BOE CQ NE160QDM-NY1, IPS, 2560x1600, 16" | |
|---|---|---|---|---|---|---|
| Display | 14% | 20% | -2% | -4% | -2% | |
| Display P3 Coverage (%) | 71.2 | 92.8 30% | 98.5 38% | 69.1 -3% | 67.3 -5% | 69.8 -2% |
| sRGB Coverage (%) | 98.8 | 98.5 0% | 100 1% | 99.7 1% | 96.1 -3% | 98.1 -1% |
| AdobeRGB 1998 Coverage (%) | 73.3 | 83.1 13% | 89.7 22% | 71.2 -3% | 69.5 -5% | 71.9 -2% |
| Response Times | 26% | 20% | 29% | -4% | 4% | |
| Response Time Grey 50% / Grey 80% * (ms) | 14.5 ? | 7.6 ? 48% | 6.6 ? 54% | 12.3 ? 15% | 14.4 ? 1% | 10 ? 31% |
| Response Time Black / White * (ms) | 10.4 ? | 10 ? 4% | 12 ? -15% | 5.9 ? 43% | 11.2 ? -8% | 12.8 ? -23% |
| PWM Frequency (Hz) | ||||||
| Screen | -62% | -29% | 15% | -22% | -8% | |
| Brightness middle (cd/m²) | 405.7 | 497 23% | 456.8 13% | 511 26% | 522.8 29% | 492.4 21% |
| Brightness (cd/m²) | 368 | 481 31% | 437 19% | 469 27% | 503 37% | 471 28% |
| Brightness Distribution (%) | 87 | 82 -6% | 83 -5% | 86 -1% | 84 -3% | 90 3% |
| Black Level * (cd/m²) | 0.38 | 0.21 45% | 0.35 8% | 0.4 -5% | 0.41 -8% | 0.4 -5% |
| Contrast (:1) | 1068 | 2367 122% | 1305 22% | 1278 20% | 1275 19% | 1231 15% |
| Colorchecker dE 2000 * | 1.65 | 3.53 -114% | 3.7 -124% | 0.95 42% | 2.47 -50% | 1.9 -15% |
| Colorchecker dE 2000 max. * | 4.2 | 6.15 -46% | 6.42 -53% | 2.07 51% | 6.56 -56% | 3.81 9% |
| Colorchecker dE 2000 calibrated * | 0.53 | 3.53 -566% | 0.66 -25% | 0.91 -72% | 0.61 -15% | 0.99 -87% |
| Greyscale dE 2000 * | 1.2 | 1.74 -45% | 2.6 -117% | 0.6 50% | 3 -150% | 1.7 -42% |
| Gamma | 2.3 96% | 2.2 100% | 2.3 96% | 2.176 101% | 2.27 97% | 2.36 93% |
| CCT | 6453 101% | 6418 101% | 6108 106% | 6545 99% | 6719 97% | 6497 100% |
| Moyenne finale (programmes/paramètres) | -7% /
-33% | 4% /
-12% | 14% /
14% | -10% /
-16% | -2% /
-5% |
* ... Moindre est la valeur, meilleures sont les performances
L'écran est bien calibré dès sa sortie de l'emballage, avec des valeurs moyennes de deltaE en niveaux de gris et en couleurs de seulement 1,2 et 1,65, respectivement. Ces valeurs sont suffisamment basses pour qu'un étalonnage par l'utilisateur final ne soit pas nécessaire. L'étalonnage de la dalle améliorerait encore la précision des couleurs à <1, comme le montrent les captures d'écran ci-dessous. Si nous devons pinailler, le violet semble être représenté avec le moins de précision de toutes les couleurs testées, avec un deltaE de 2,71.

Temps de réponse de l'écran
| ↔ Temps de réponse noir à blanc | ||
|---|---|---|
| 10.4 ms ... hausse ↗ et chute ↘ combinées | ↗ 5.7 ms hausse | 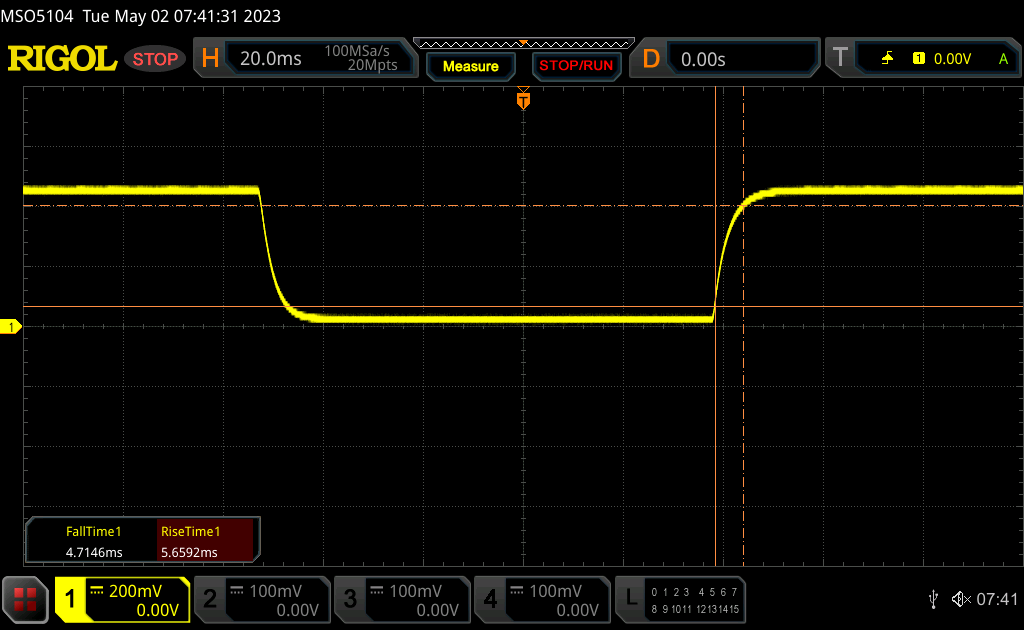 |
| ↘ 4.7 ms chute | ||
| L'écran montre de bons temps de réponse, mais insuffisant pour du jeu compétitif. En comparaison, tous les appareils testés affichent entre 0.1 (minimum) et 240 (maximum) ms. » 28 % des appareils testés affichent de meilleures performances. Cela signifie que les latences relevées sont meilleures que la moyenne (19.8 ms) de tous les appareils testés. | ||
| ↔ Temps de réponse gris 50% à gris 80% | ||
| 14.5 ms ... hausse ↗ et chute ↘ combinées | ↗ 7 ms hausse | 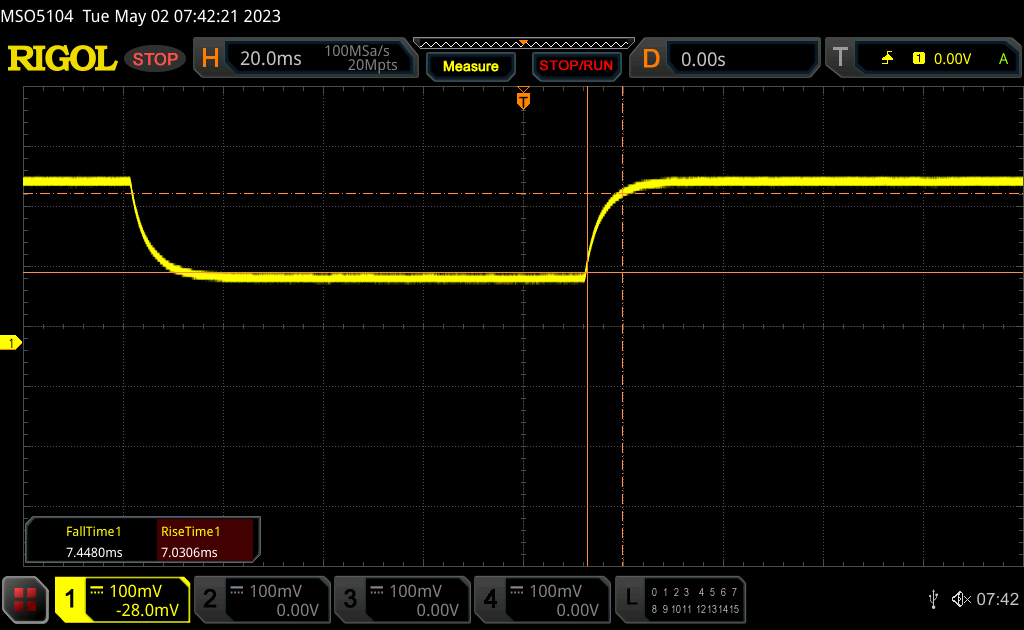 |
| ↘ 7.5 ms chute | ||
| L'écran montre de bons temps de réponse, mais insuffisant pour du jeu compétitif. En comparaison, tous les appareils testés affichent entre 0.165 (minimum) et 636 (maximum) ms. » 29 % des appareils testés affichent de meilleures performances. Cela signifie que les latences relevées sont meilleures que la moyenne (31 ms) de tous les appareils testés. | ||
Scintillement / MLI (Modulation de largeur d'impulsion)
| Scintillement / MLI (Modulation de largeur d'impulsion) non décelé | 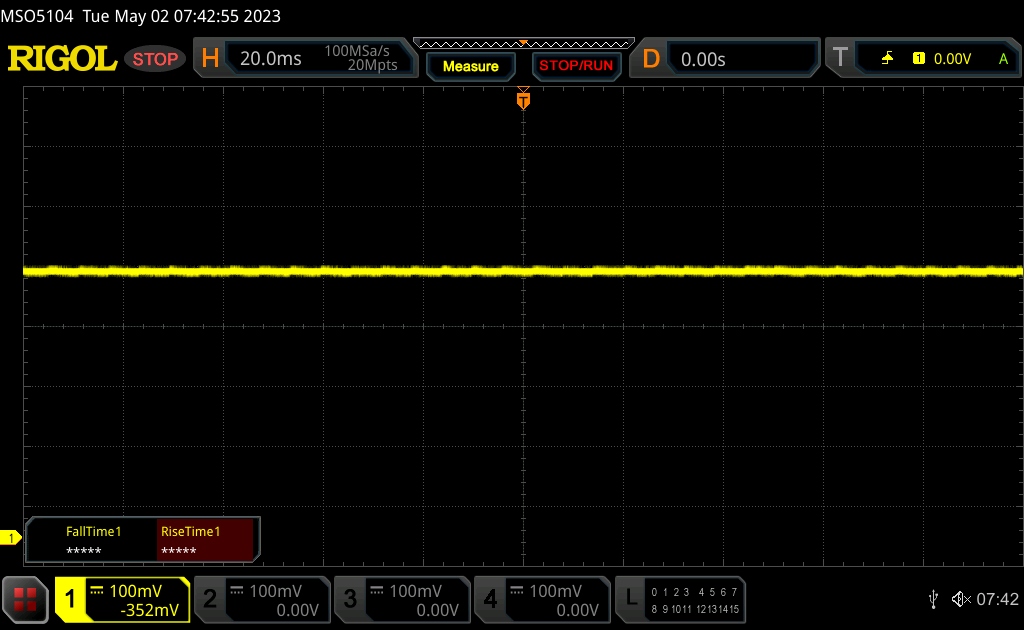 | ||
En comparaison, 52 % des appareils testés n'emploient pas MDI pour assombrir leur écran. Nous avons relevé une moyenne à 7757 (minimum : 5 - maximum : 343500) Hz dans le cas où une MDI était active. | |||
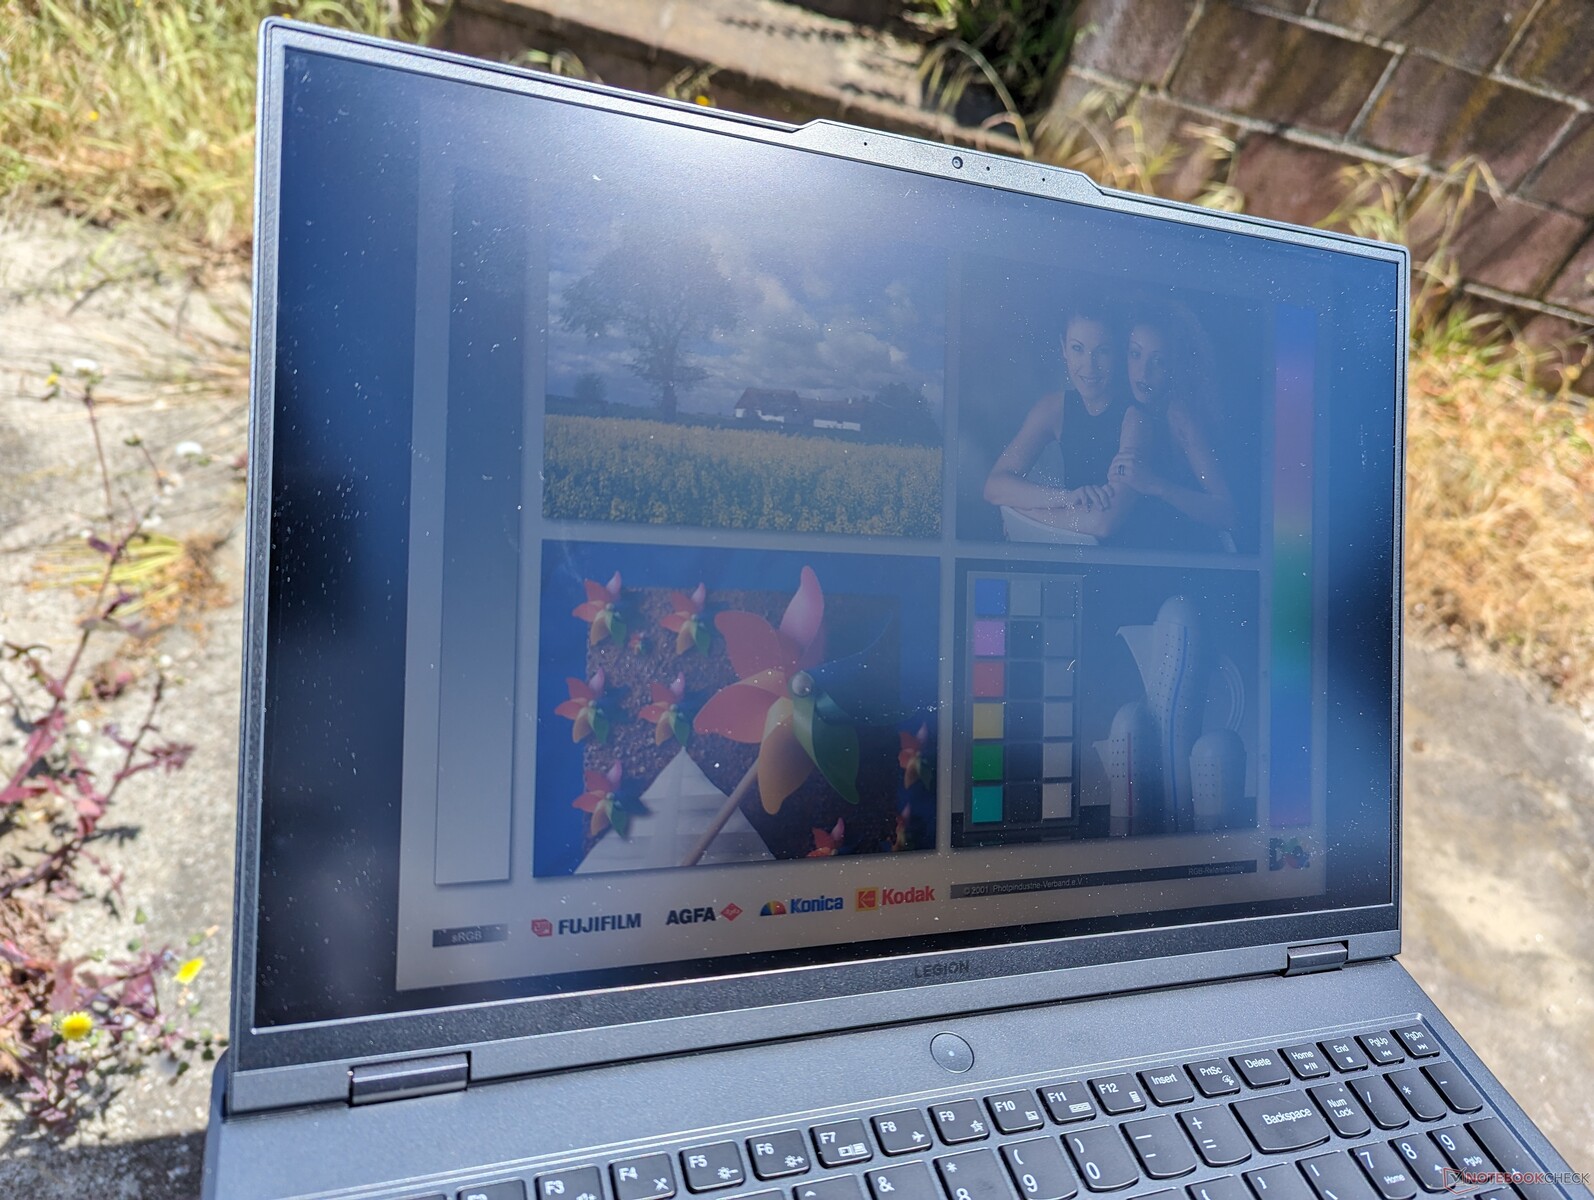
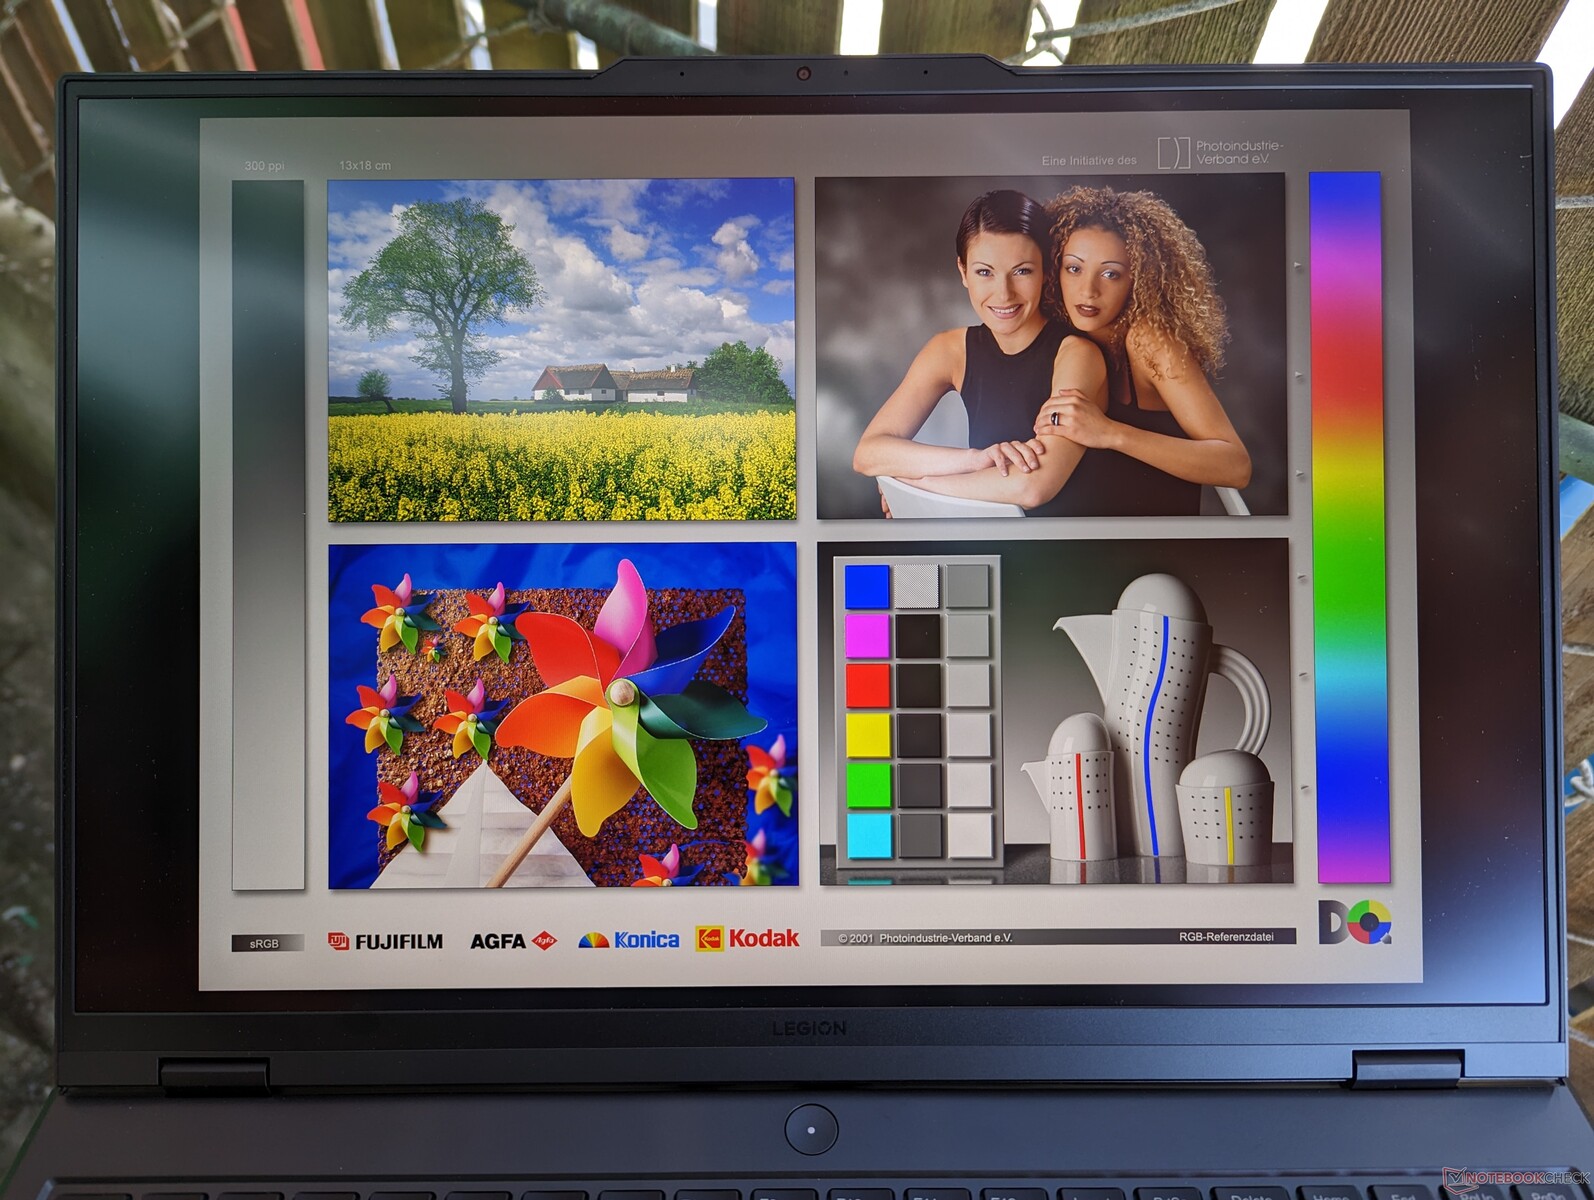
À 400 nits, l'écran est généralement utilisable à l'ombre. L'option de panneau 240 Hz est légèrement plus lumineuse si la visibilité extérieure est un problème. Les écrans de la plupart des machines de jeu de 16 pouces sont déjà plus lumineux que ceux de nombreux ultrabooks de milieu de gamme, qui affichent couramment 300 nits.
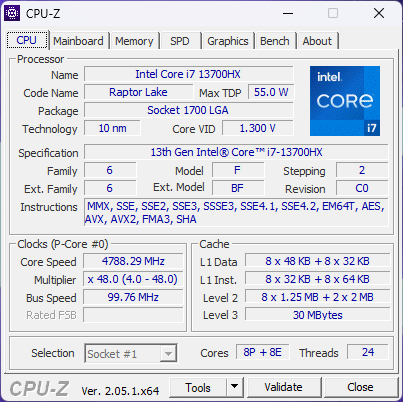
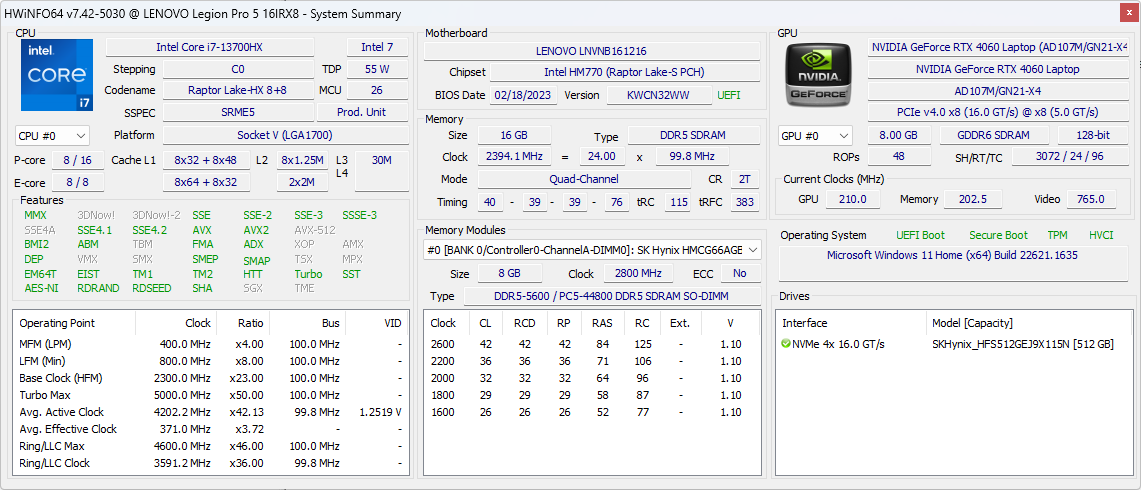
Performance - Raptor Lake 13e génération
Conditions d'essai
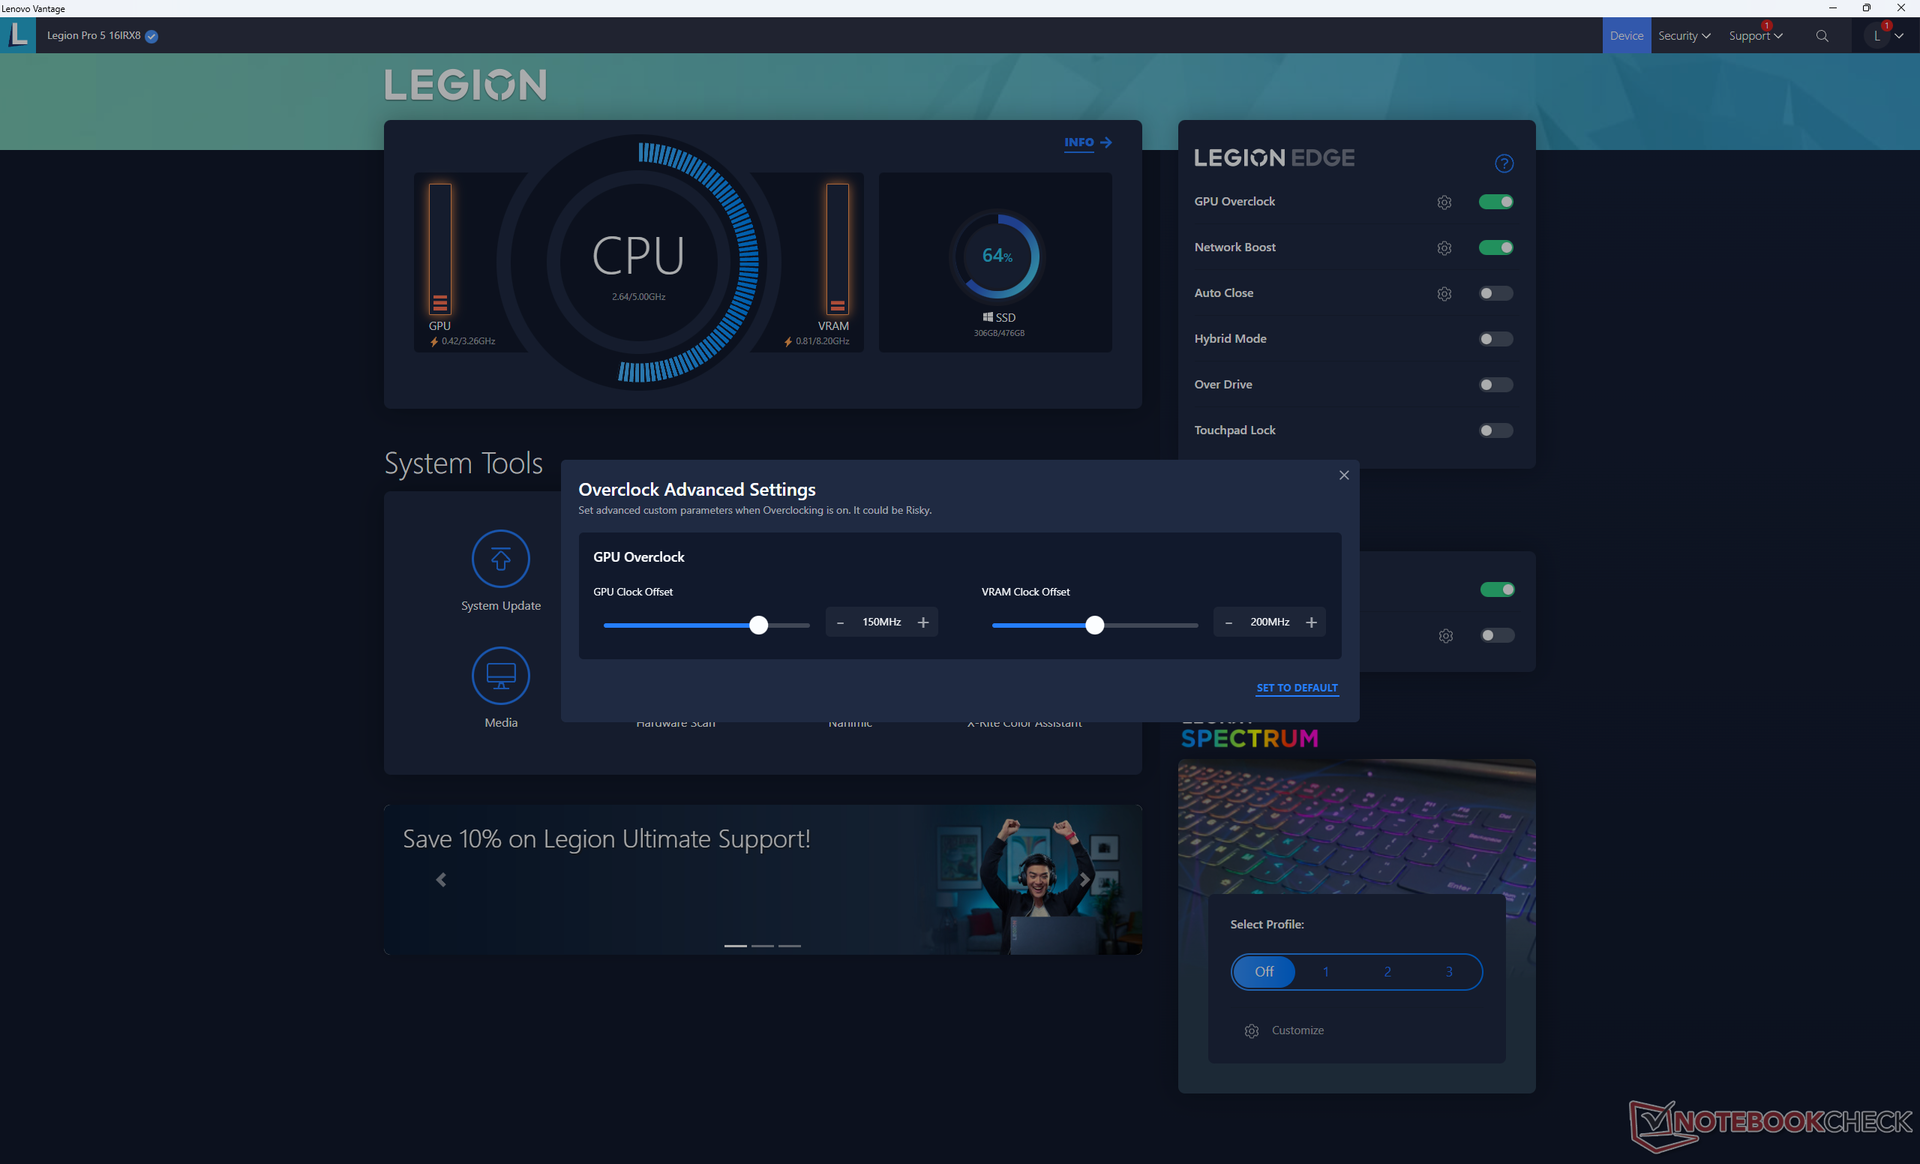
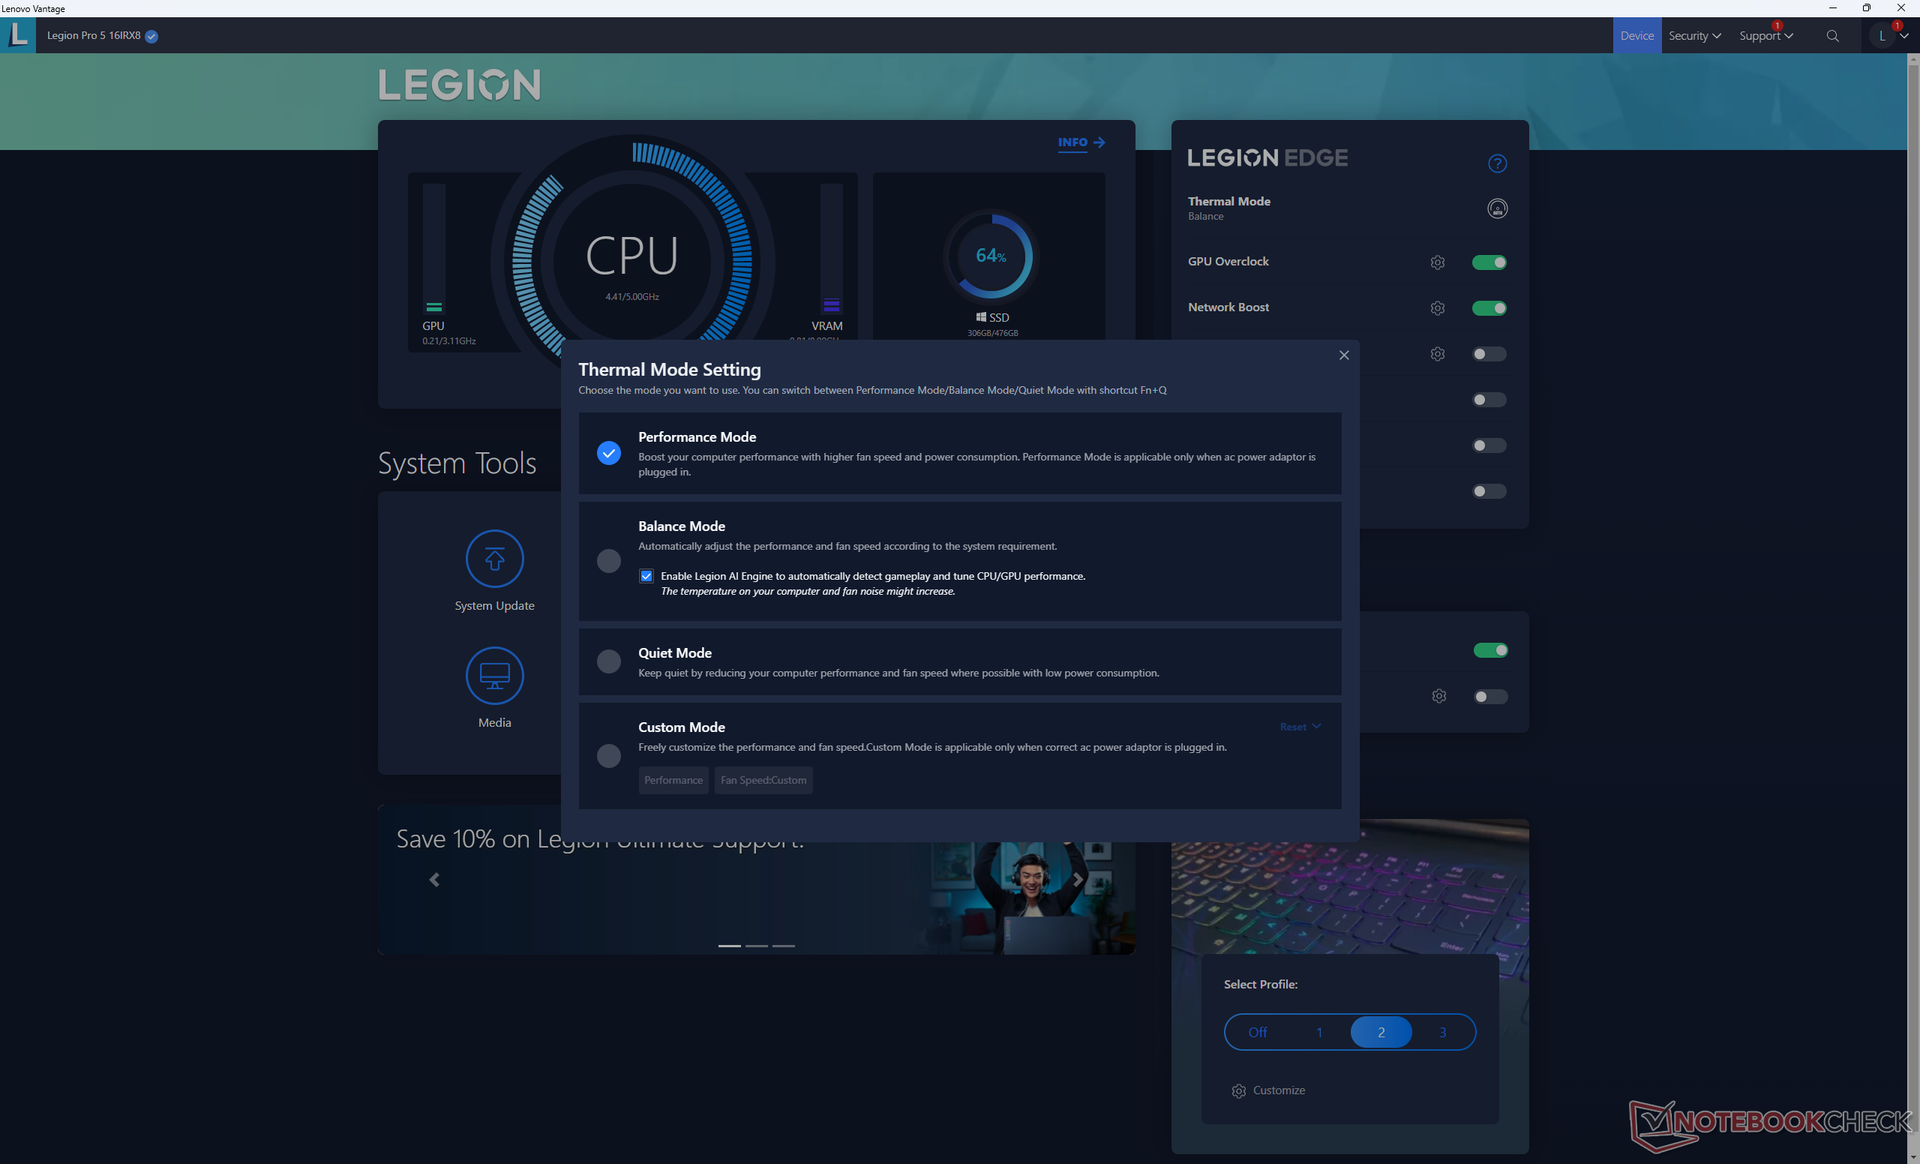
Nous avons réglé notre unité de test en mode Performance, avec l'Overclock du GPU actif et le mode Hybride désactivé, avant d'exécuter les tests de référence ci-dessous. Tous ces paramètres sont heureusement facilement accessibles via l'écran d'accueil du Lenovo Vantage.
Notez que si le MUX est pris en charge pour passer du mode Optimus au mode GPU discret uniquement, un redémarrage du système sera toujours nécessaire. Le mode Optimus avancé n'est donc pas pris en charge. G-Sync pour l'affichage interne ne fonctionne qu'en mode dGPU.
Processeur
Notre Core i7-13700HX n'est qu'environ 5 à 15 % plus rapide en charge multithread que l'ancien Core i7-12700H qu'il remplace. Les avantages sont mesurables, mais relativement mineurs. Les performances globales sont comparables à celles du Core i9-12900H.
La durabilité des performances est excellente et il n'y a pas de baisse notable dans le temps lors de l'exécution en boucle de CineBench R15 xT.
La mise à niveau vers le Core i9-13900HX Devrait augmenter les performances multithread de 50 à 70 % par rapport au Core i7-13700HX. Si vous accordez de l'importance aux performances du processeur, il peut être intéressant de ne pas choisir les Core i5-13500H et Core i7-13700HX au profit du Core i9.
Cinebench R15 Multi Loop
Cinebench R23: Multi Core | Single Core
Cinebench R20: CPU (Multi Core) | CPU (Single Core)
Cinebench R15: CPU Multi 64Bit | CPU Single 64Bit
Blender: v2.79 BMW27 CPU
7-Zip 18.03: 7z b 4 | 7z b 4 -mmt1
Geekbench 5.5: Multi-Core | Single-Core
HWBOT x265 Benchmark v2.2: 4k Preset
LibreOffice : 20 Documents To PDF
R Benchmark 2.5: Overall mean
* ... Moindre est la valeur, meilleures sont les performances
AIDA64: FP32 Ray-Trace | FPU Julia | CPU SHA3 | CPU Queen | FPU SinJulia | FPU Mandel | CPU AES | CPU ZLib | FP64 Ray-Trace | CPU PhotoWorxx
| Performance rating | |
| Lenovo Legion Pro 7 16IRX8H | |
| Razer Blade 16 Early 2023 | |
| Lenovo Legion Pro 5 16IRX8 | |
| Moyenne Intel Core i7-13700HX | |
| Lenovo Legion 5 Pro 16ARH7H RTX 3070 Ti | |
| Lenovo Legion S7 16ARHA7 | |
| Asus ROG Zephyrus M16 GU603Z | |
Performance du système
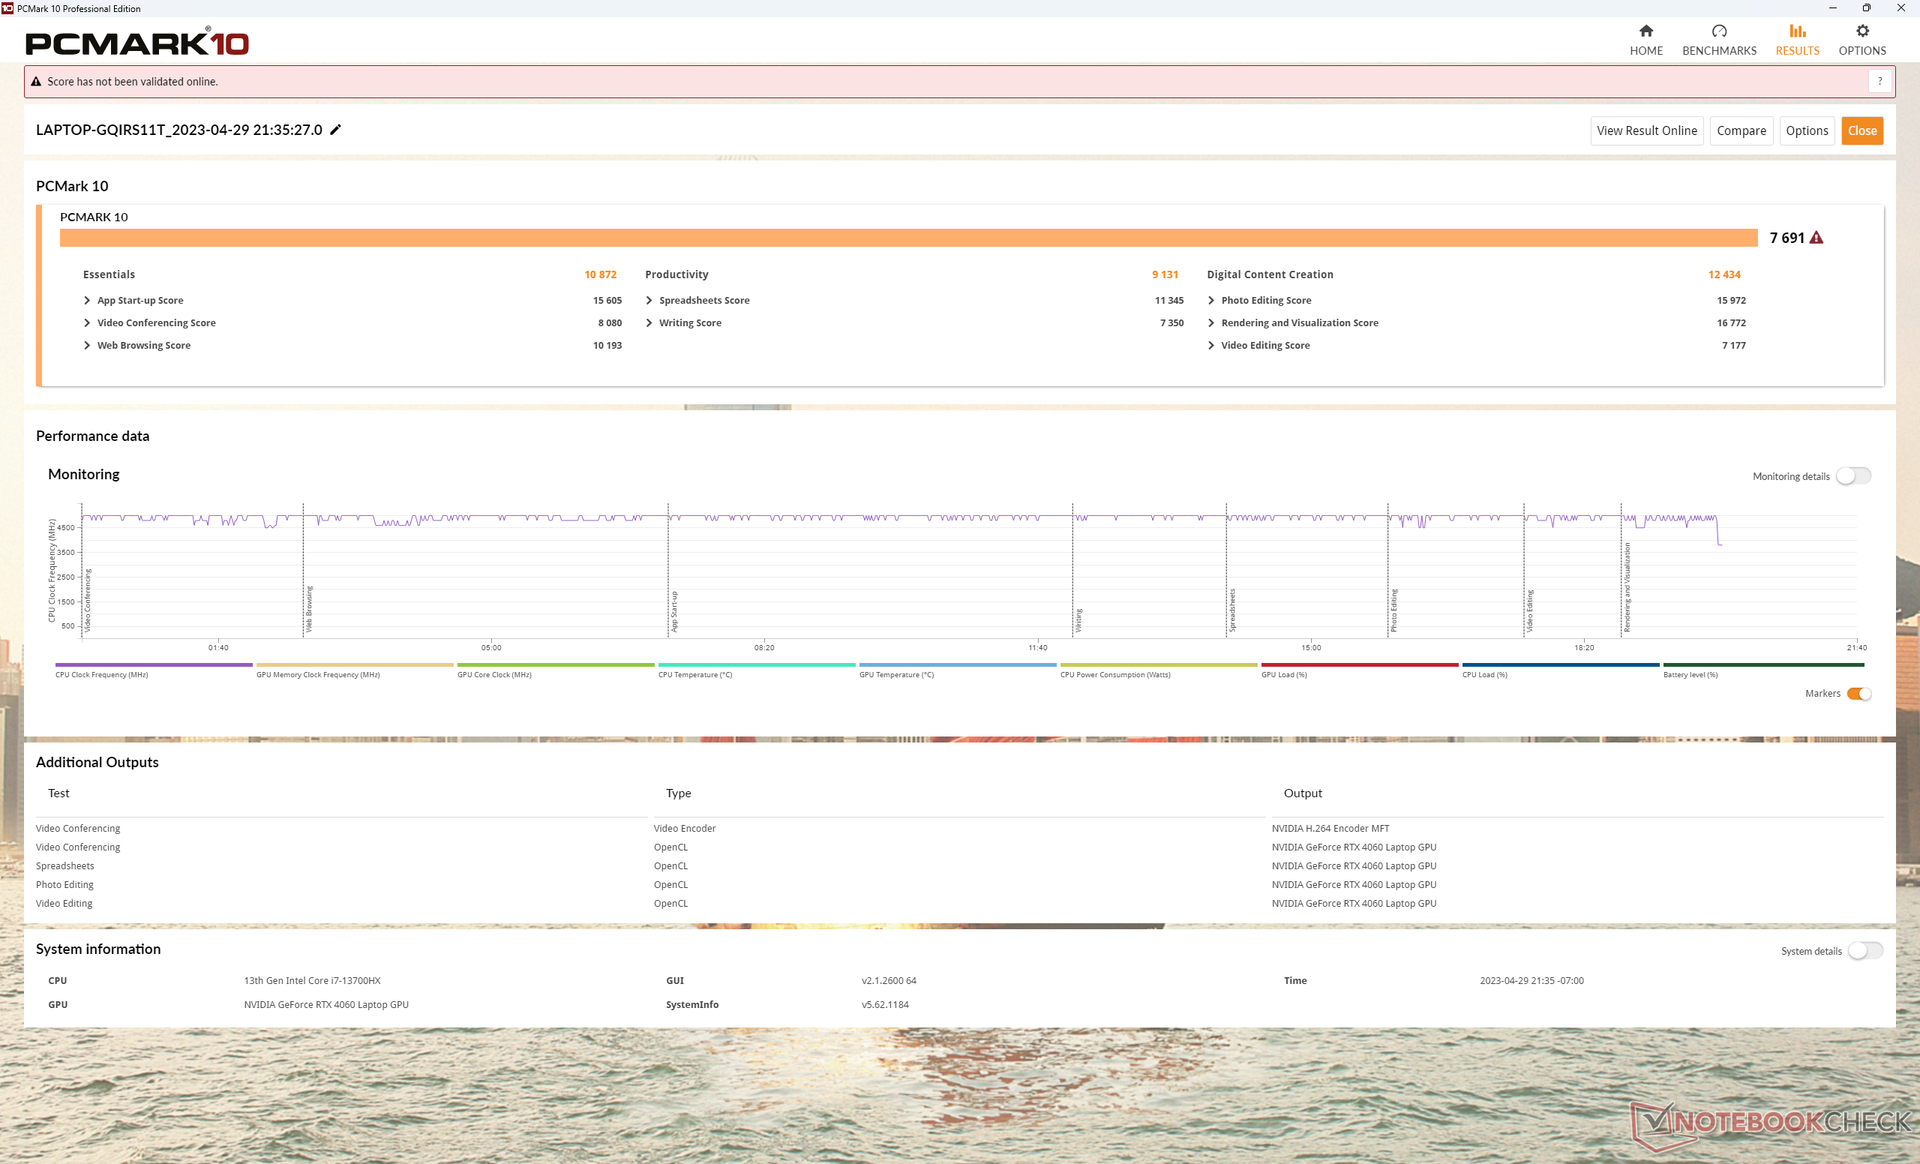
Les résultats de PCMark sont comparables à ceux d'autres modèles Legion, comme le Legion 5 Pro 16 de 2022, malgré les processeurs de nouvelle génération de notre modèle 2023. Cela suggère que même si le CPU et le GPU sont plus rapides cette fois-ci, ils n'exécuteront pas nécessairement les applications quotidiennes comme le travail de bureau ou les navigateurs sensiblement plus rapidement qu'un ordinateur portable de jeu d'antan.
CrossMark: Overall | Productivity | Creativity | Responsiveness
| PCMark 10 / Score | |
| Razer Blade 16 Early 2023 | |
| Asus ROG Zephyrus M16 GU603Z | |
| Lenovo Legion Pro 7 16IRX8H | |
| Lenovo Legion Pro 5 16IRX8 | |
| Lenovo Legion S7 16ARHA7 | |
| Lenovo Legion 5 Pro 16ARH7H RTX 3070 Ti | |
| Moyenne Intel Core i7-13700HX, NVIDIA GeForce RTX 4060 Laptop GPU (6909 - 7743, n=5) | |
| PCMark 10 / Essentials | |
| Lenovo Legion Pro 7 16IRX8H | |
| Razer Blade 16 Early 2023 | |
| Asus ROG Zephyrus M16 GU603Z | |
| Lenovo Legion Pro 5 16IRX8 | |
| Lenovo Legion S7 16ARHA7 | |
| Moyenne Intel Core i7-13700HX, NVIDIA GeForce RTX 4060 Laptop GPU (9760 - 11313, n=5) | |
| Lenovo Legion 5 Pro 16ARH7H RTX 3070 Ti | |
| PCMark 10 / Productivity | |
| Lenovo Legion Pro 7 16IRX8H | |
| Asus ROG Zephyrus M16 GU603Z | |
| Lenovo Legion S7 16ARHA7 | |
| Moyenne Intel Core i7-13700HX, NVIDIA GeForce RTX 4060 Laptop GPU (9131 - 11018, n=5) | |
| Lenovo Legion 5 Pro 16ARH7H RTX 3070 Ti | |
| Lenovo Legion Pro 5 16IRX8 | |
| Razer Blade 16 Early 2023 | |
| PCMark 10 / Digital Content Creation | |
| Razer Blade 16 Early 2023 | |
| Lenovo Legion Pro 5 16IRX8 | |
| Asus ROG Zephyrus M16 GU603Z | |
| Lenovo Legion 5 Pro 16ARH7H RTX 3070 Ti | |
| Lenovo Legion S7 16ARHA7 | |
| Moyenne Intel Core i7-13700HX, NVIDIA GeForce RTX 4060 Laptop GPU (9393 - 12434, n=5) | |
| Lenovo Legion Pro 7 16IRX8H | |
| CrossMark / Overall | |
| Asus ROG Zephyrus M16 GU603Z | |
| Moyenne Intel Core i7-13700HX, NVIDIA GeForce RTX 4060 Laptop GPU (1663 - 2105, n=5) | |
| Lenovo Legion S7 16ARHA7 | |
| Lenovo Legion Pro 5 16IRX8 | |
| Lenovo Legion 5 Pro 16ARH7H RTX 3070 Ti | |
| Razer Blade 16 Early 2023 | |
| CrossMark / Productivity | |
| Asus ROG Zephyrus M16 GU603Z | |
| Moyenne Intel Core i7-13700HX, NVIDIA GeForce RTX 4060 Laptop GPU (1618 - 1989, n=5) | |
| Lenovo Legion S7 16ARHA7 | |
| Lenovo Legion Pro 5 16IRX8 | |
| Lenovo Legion 5 Pro 16ARH7H RTX 3070 Ti | |
| Razer Blade 16 Early 2023 | |
| CrossMark / Creativity | |
| Moyenne Intel Core i7-13700HX, NVIDIA GeForce RTX 4060 Laptop GPU (1710 - 2274, n=5) | |
| Asus ROG Zephyrus M16 GU603Z | |
| Lenovo Legion S7 16ARHA7 | |
| Razer Blade 16 Early 2023 | |
| Lenovo Legion 5 Pro 16ARH7H RTX 3070 Ti | |
| Lenovo Legion Pro 5 16IRX8 | |
| CrossMark / Responsiveness | |
| Asus ROG Zephyrus M16 GU603Z | |
| Moyenne Intel Core i7-13700HX, NVIDIA GeForce RTX 4060 Laptop GPU (1269 - 1983, n=5) | |
| Lenovo Legion Pro 5 16IRX8 | |
| Lenovo Legion S7 16ARHA7 | |
| Lenovo Legion 5 Pro 16ARH7H RTX 3070 Ti | |
| Razer Blade 16 Early 2023 | |
| PCMark 10 Score | 7691 points | |
Aide | ||
* ... Moindre est la valeur, meilleures sont les performances
Latence DPC
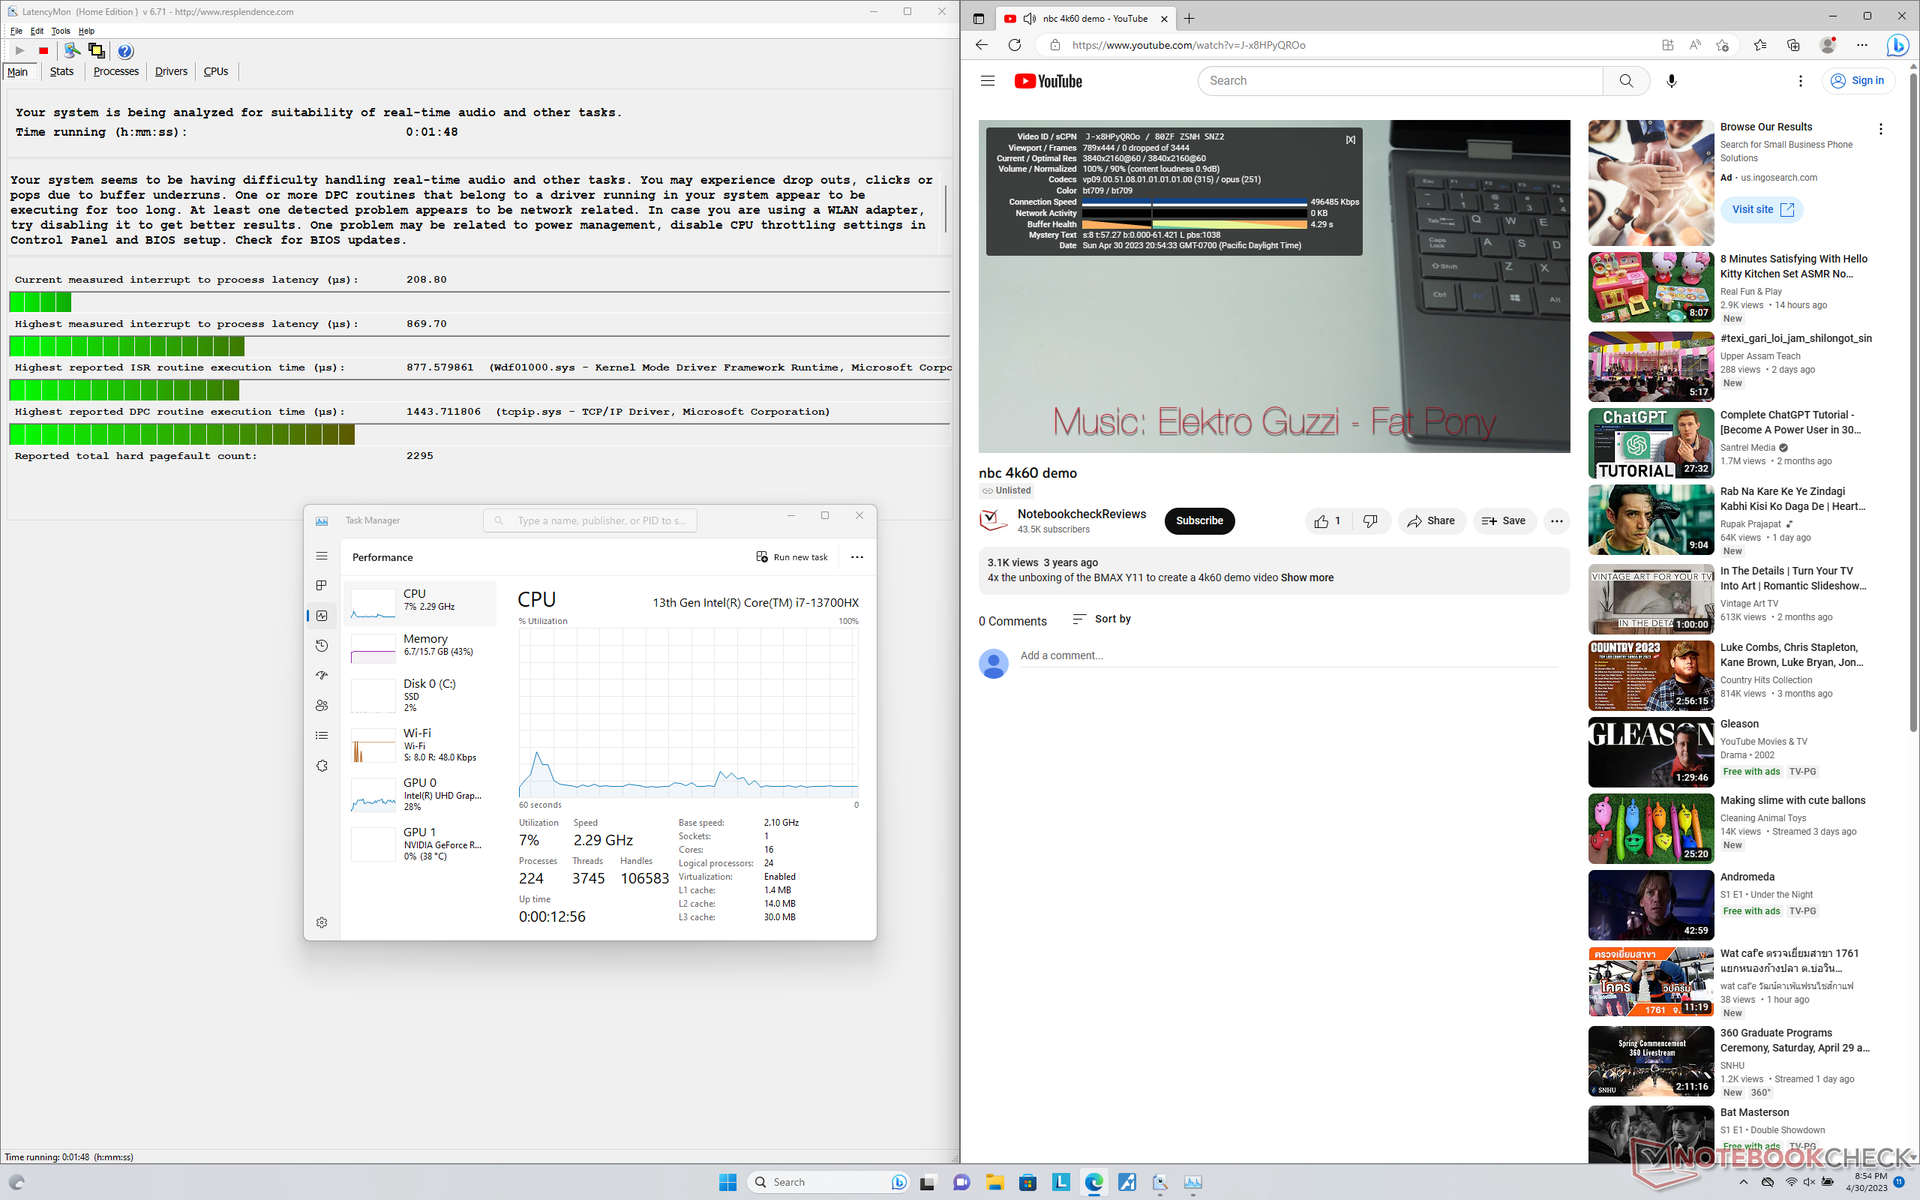
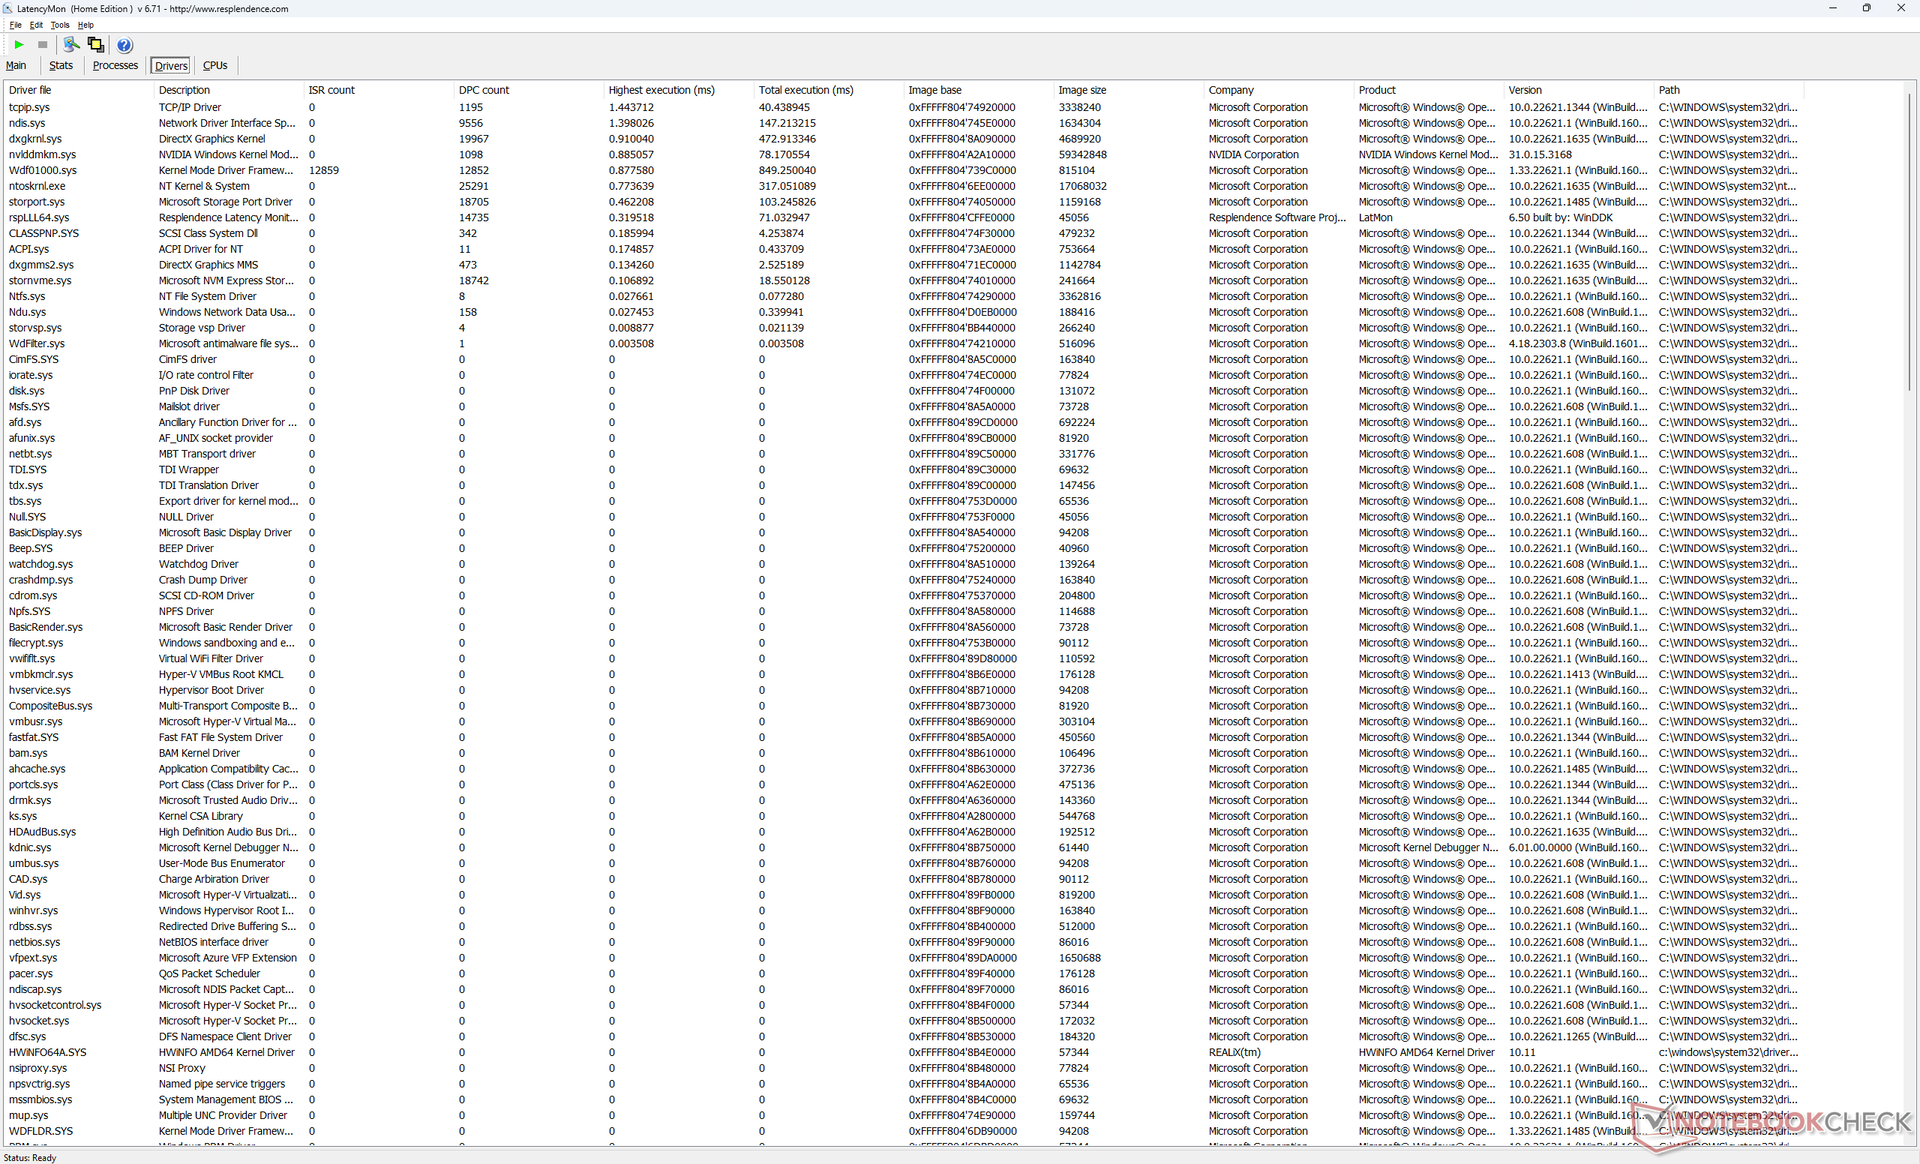
LatencyMon révèle des problèmes mineurs de DPC lors de l'ouverture de plusieurs onglets de notre page d'accueil, même en mode iGPU. la lecture de vidéos 4K à 60 FPS est par ailleurs parfaite, sans aucune perte d'images.
| DPC Latencies / LatencyMon - interrupt to process latency (max), Web, Youtube, Prime95 | |
| Razer Blade 16 Early 2023 | |
| Asus ROG Zephyrus M16 GU603Z | |
| Lenovo Legion S7 16ARHA7 | |
| Lenovo Legion Pro 5 16IRX8 | |
| Lenovo Legion 5 Pro 16ARH7H RTX 3070 Ti | |
| Lenovo Legion Pro 7 16IRX8H | |
* ... Moindre est la valeur, meilleures sont les performances
Périphériques de stockage - Jusqu'à deux lecteurs PCIe4 x4
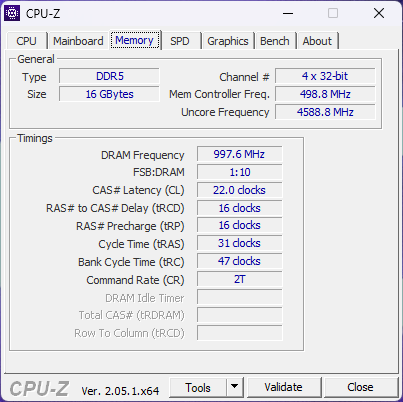
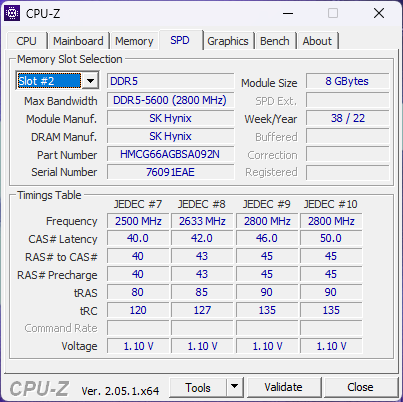
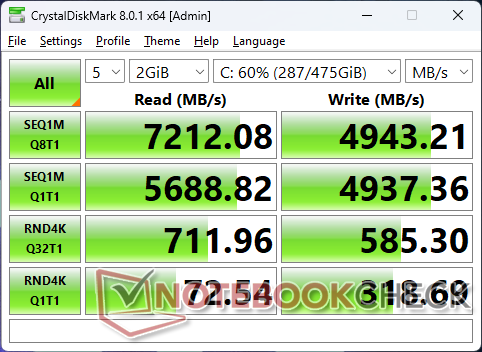
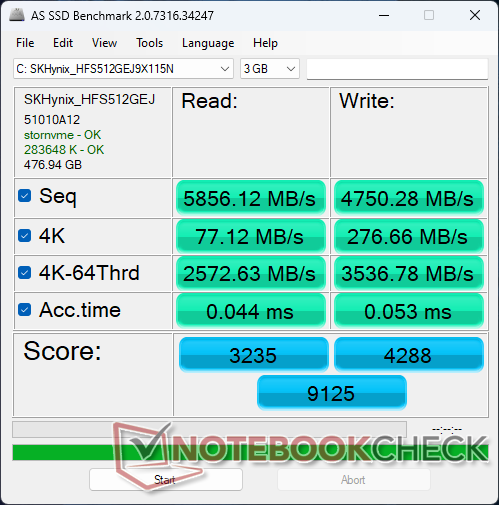
Notre unité utilise le même disque PCIe4 x4 de 512 GB SK Hynix de 512 Go que l'on trouve sur le Lenovo Legion S7 16. Les performances sont excellentes avec des taux de lecture séquentielle et d'écriture approchant respectivement 7200 Mo/s et 5000 Mo/s, rivalisant avec le populaire Samsung PM9A1. Malgré cela, il y a encore de la place pour l'amélioration car les taux de transfert peuvent périodiquement atteindre 6300 Mo/s au lieu de maintenir un maximum constant de 7200 Mo/s.

* ... Moindre est la valeur, meilleures sont les performances
Disk Throttling: DiskSpd Read Loop, Queue Depth 8
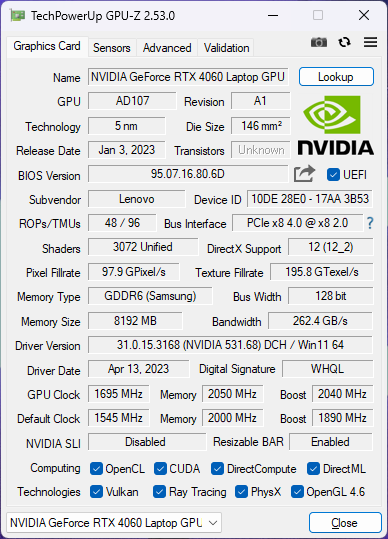
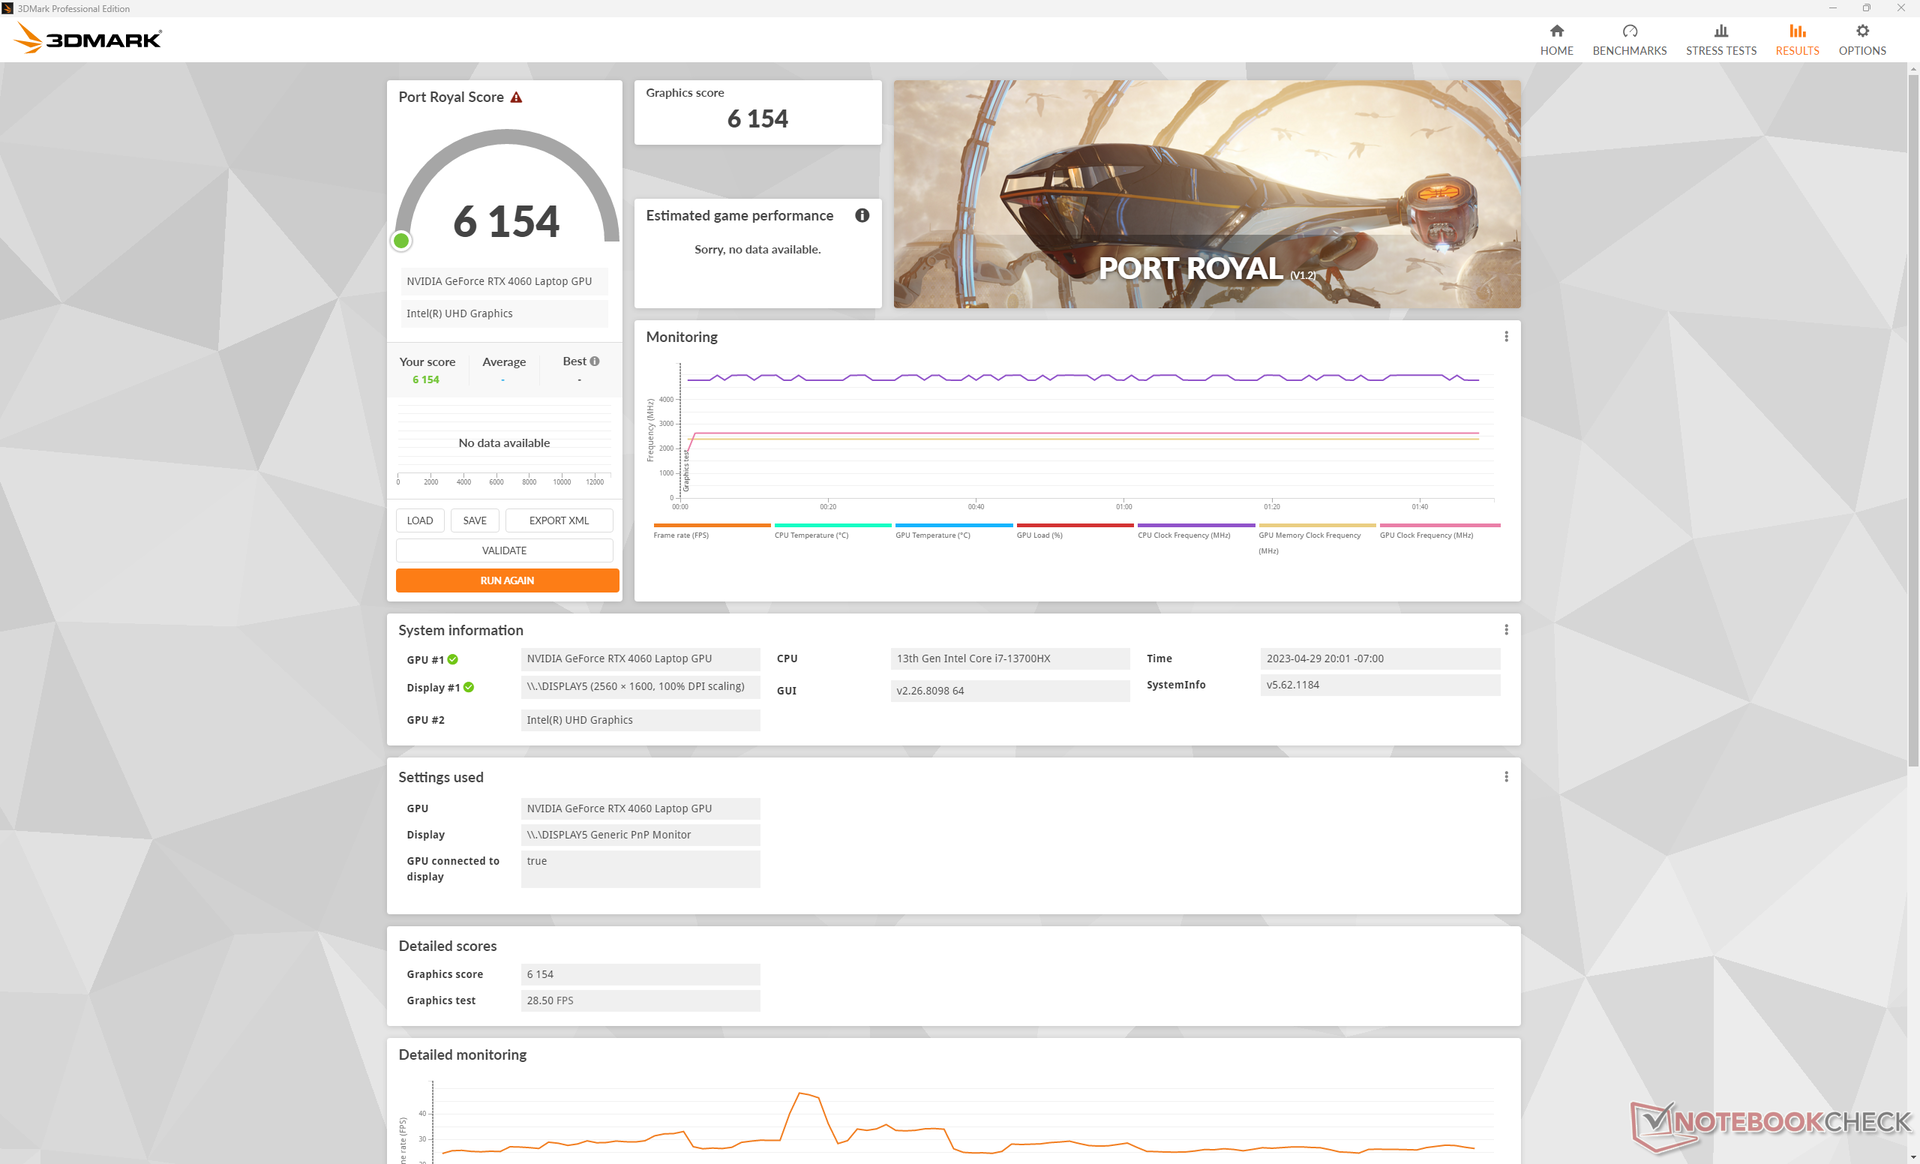
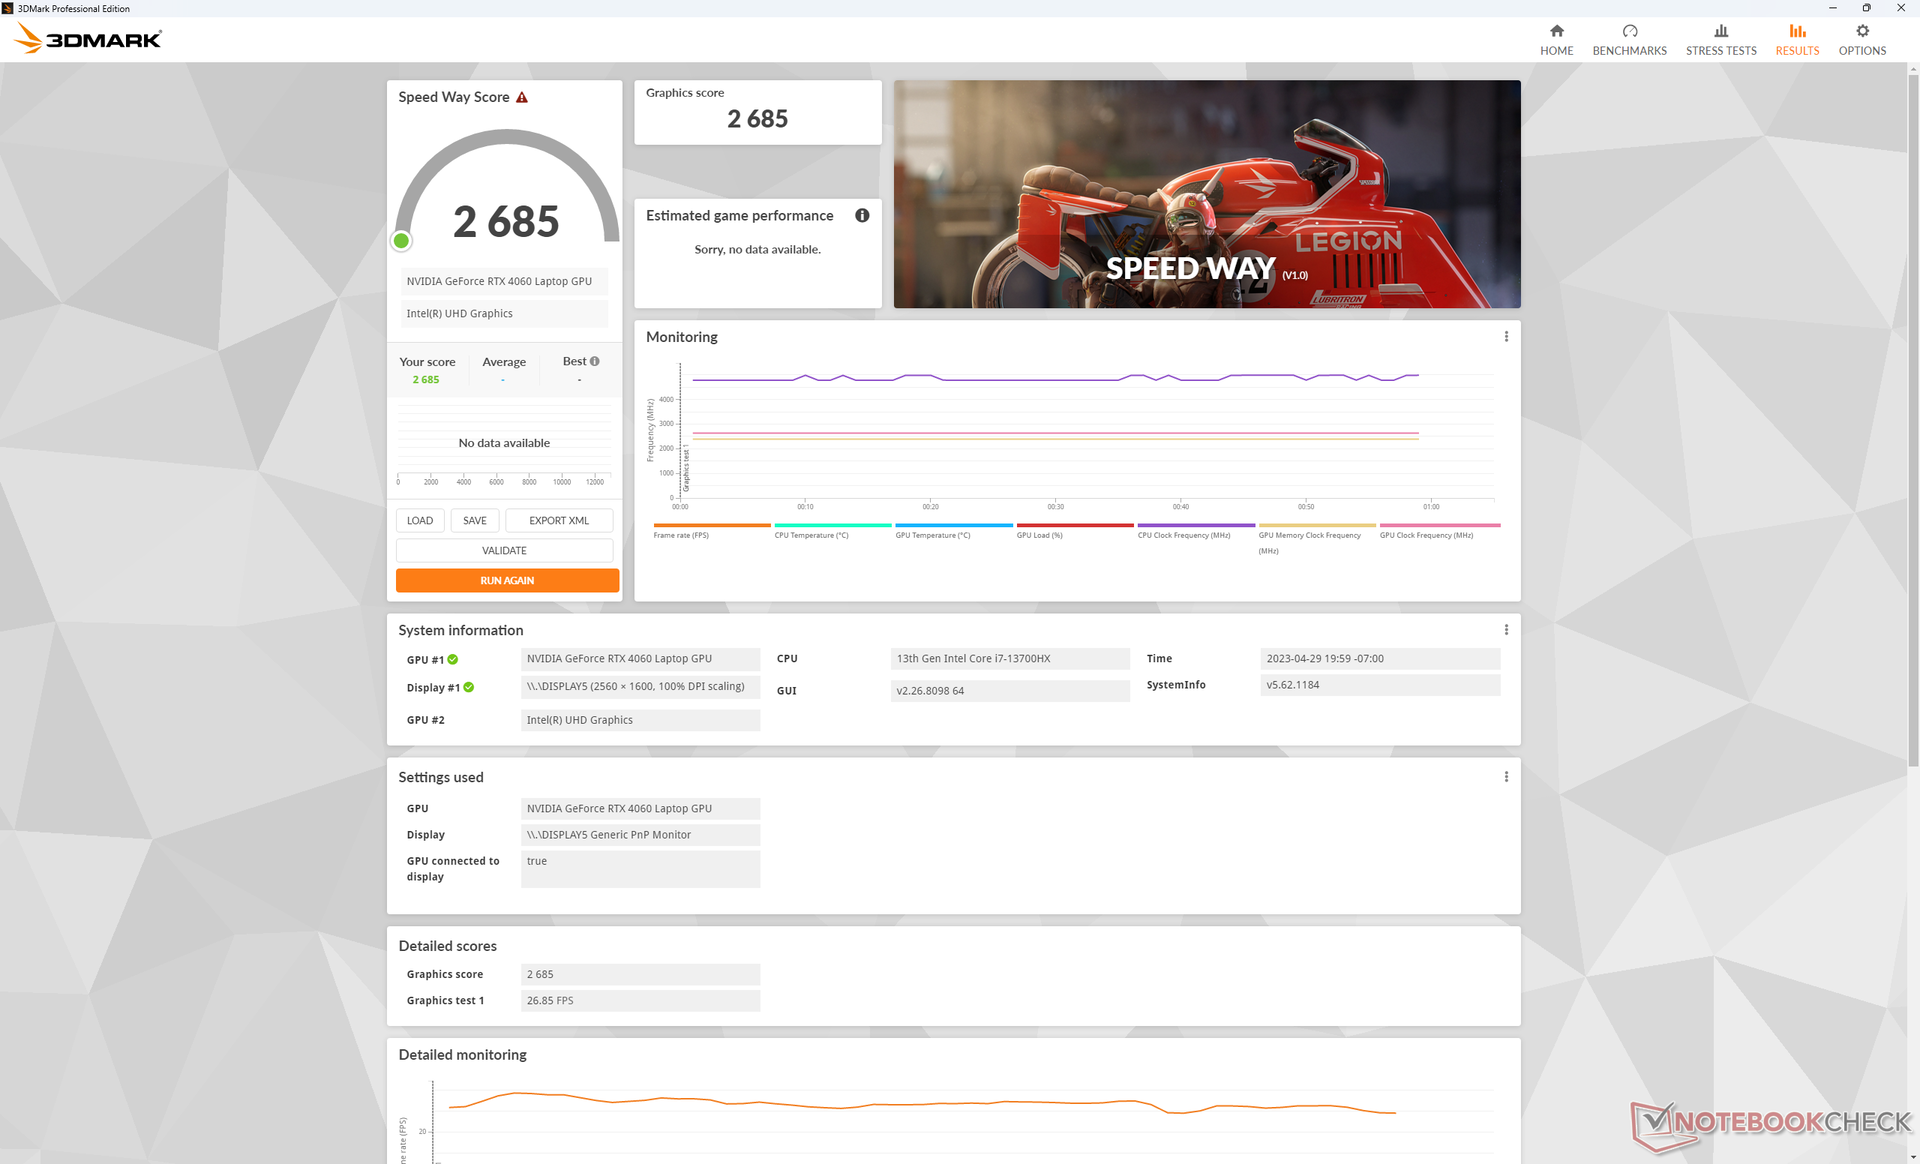
Performances du GPU - GeForce RTX 4060
Les performances graphiques sont 10 à 15 % plus rapides que celles d'un ordinateur portable moyen de notre base de données avec la même technologie mobile mobile GeForce RTX 4060 MOBILE. Ainsi, le Legion Pro 5 16 peut être une bonne option pour ceux qui veulent maximiser les performances graphiques. Le MSI Cyborg 15par exemple, est équipé du même GPU, mais il vise un TGP de 45 W beaucoup plus bas, ce qui se traduit par des performances plus lentes dans l'ensemble.
La rTX 3070 Ti de l'année dernière est légèrement plus rapide que notre RTX 4060 mobile d'environ 15 %. Passer d'un ordinateur portable RTX 3060 vers notre RTX 4060 vers notre RTX 4060 améliorera les performances d'environ 20 à 25 %, ce qui n'est pas mal pour une carte de milieu de gamme. Vous devrez jouer à des titres qui prennent en charge DLSS3 pour mieux exploiter la RTX 4060, car cette fonctionnalité n'est pas disponible sur les GPU GeForce 30.
La mise à niveau vers la RTX 4070 Améliorera les performances graphiques de 15 à 20 % par rapport à la RTX 4060. Pour les options RTX 4080 ou RTX 4090, cependant, vous devrez considérer la série haut de gamme Legion 7 Pro.
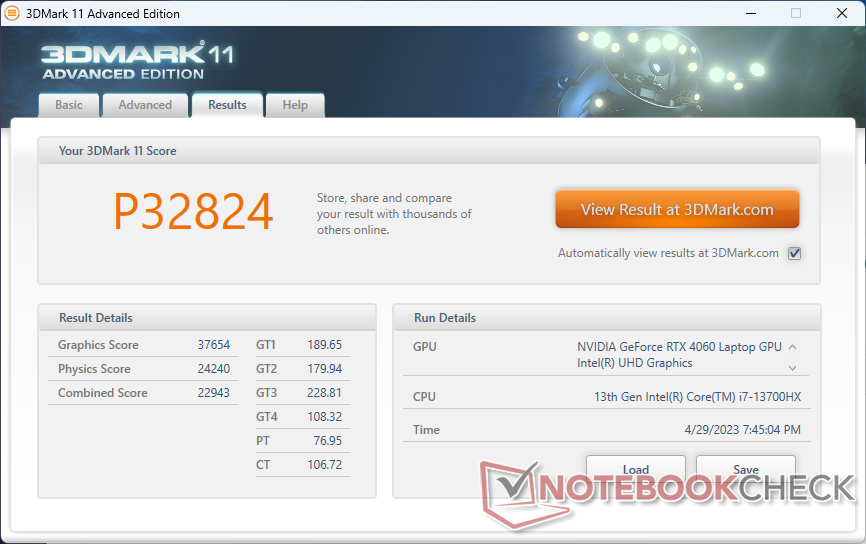
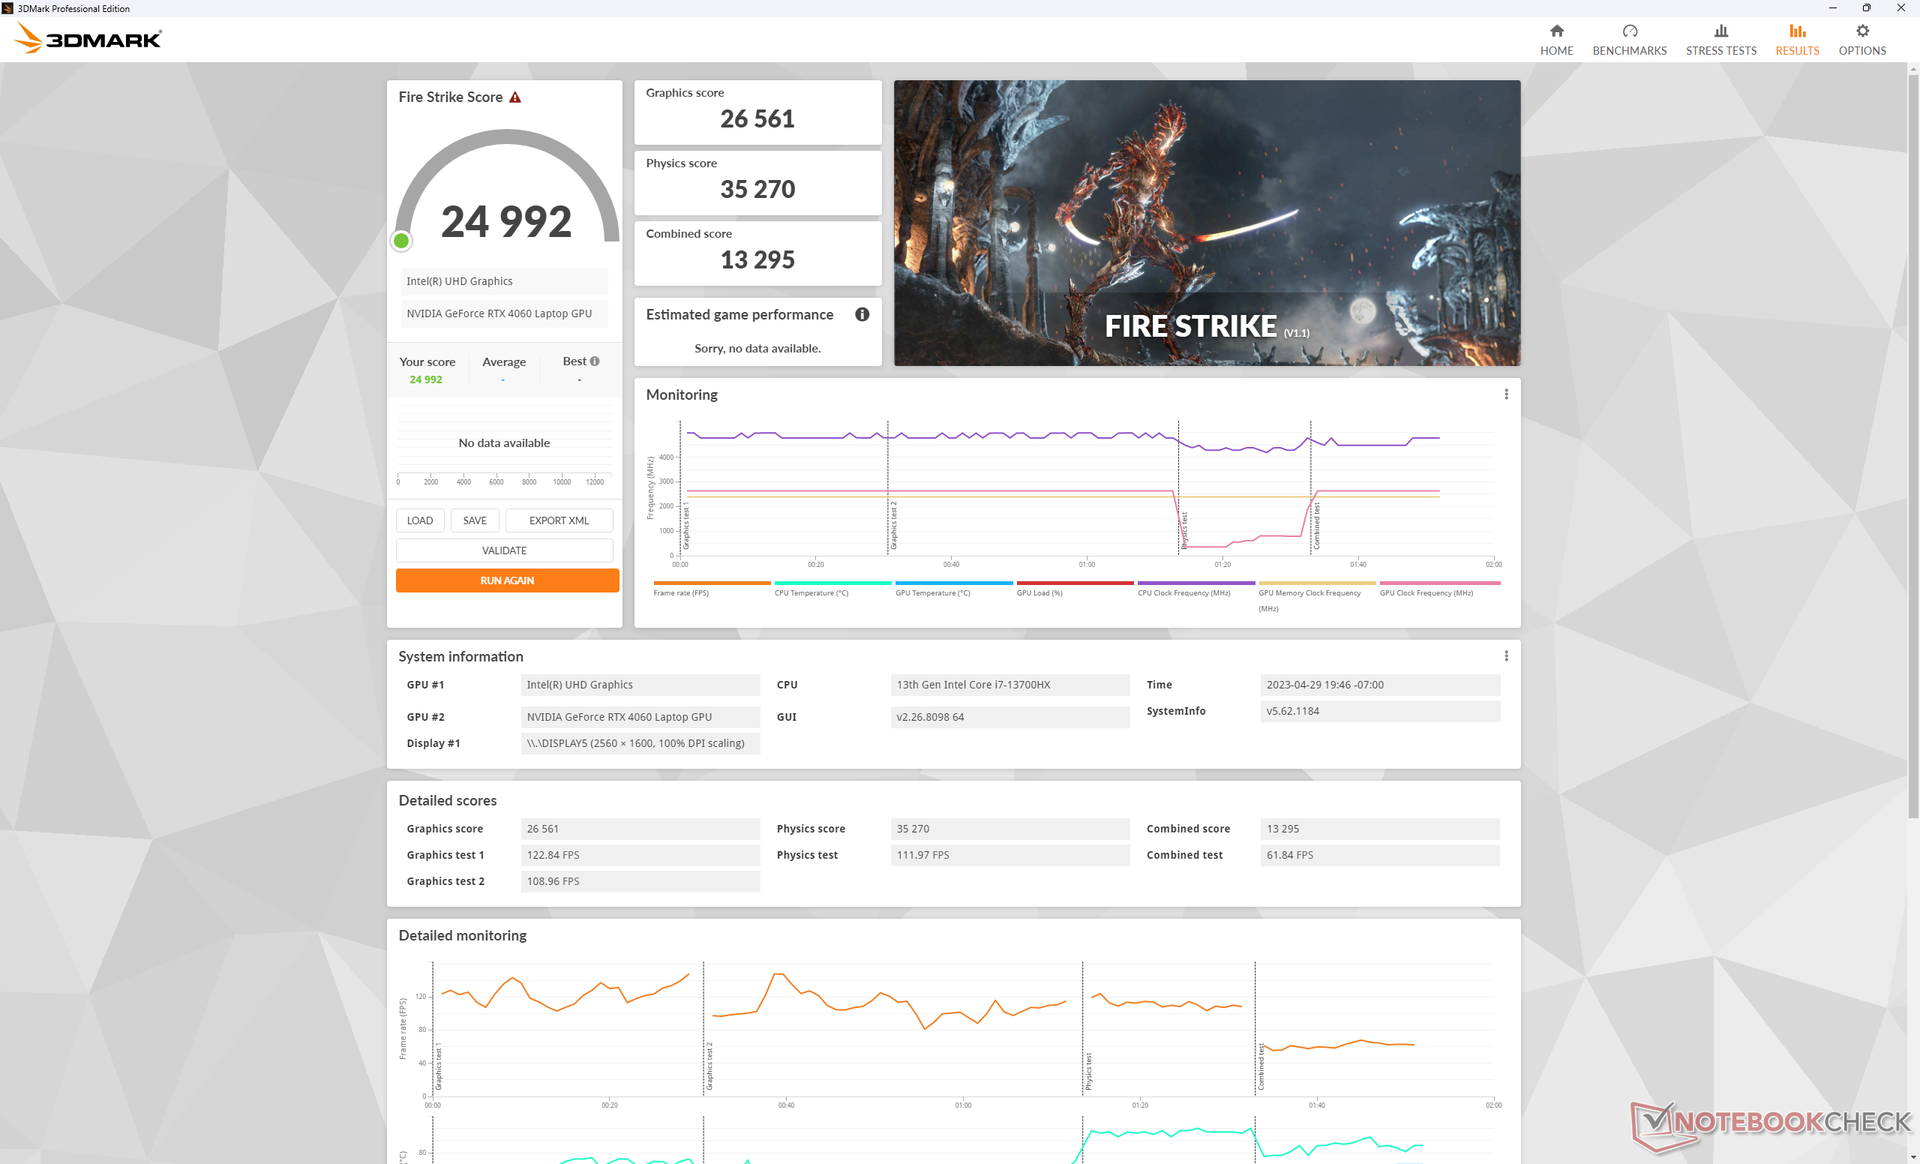
| 3DMark 11 Performance | 32824 points | |
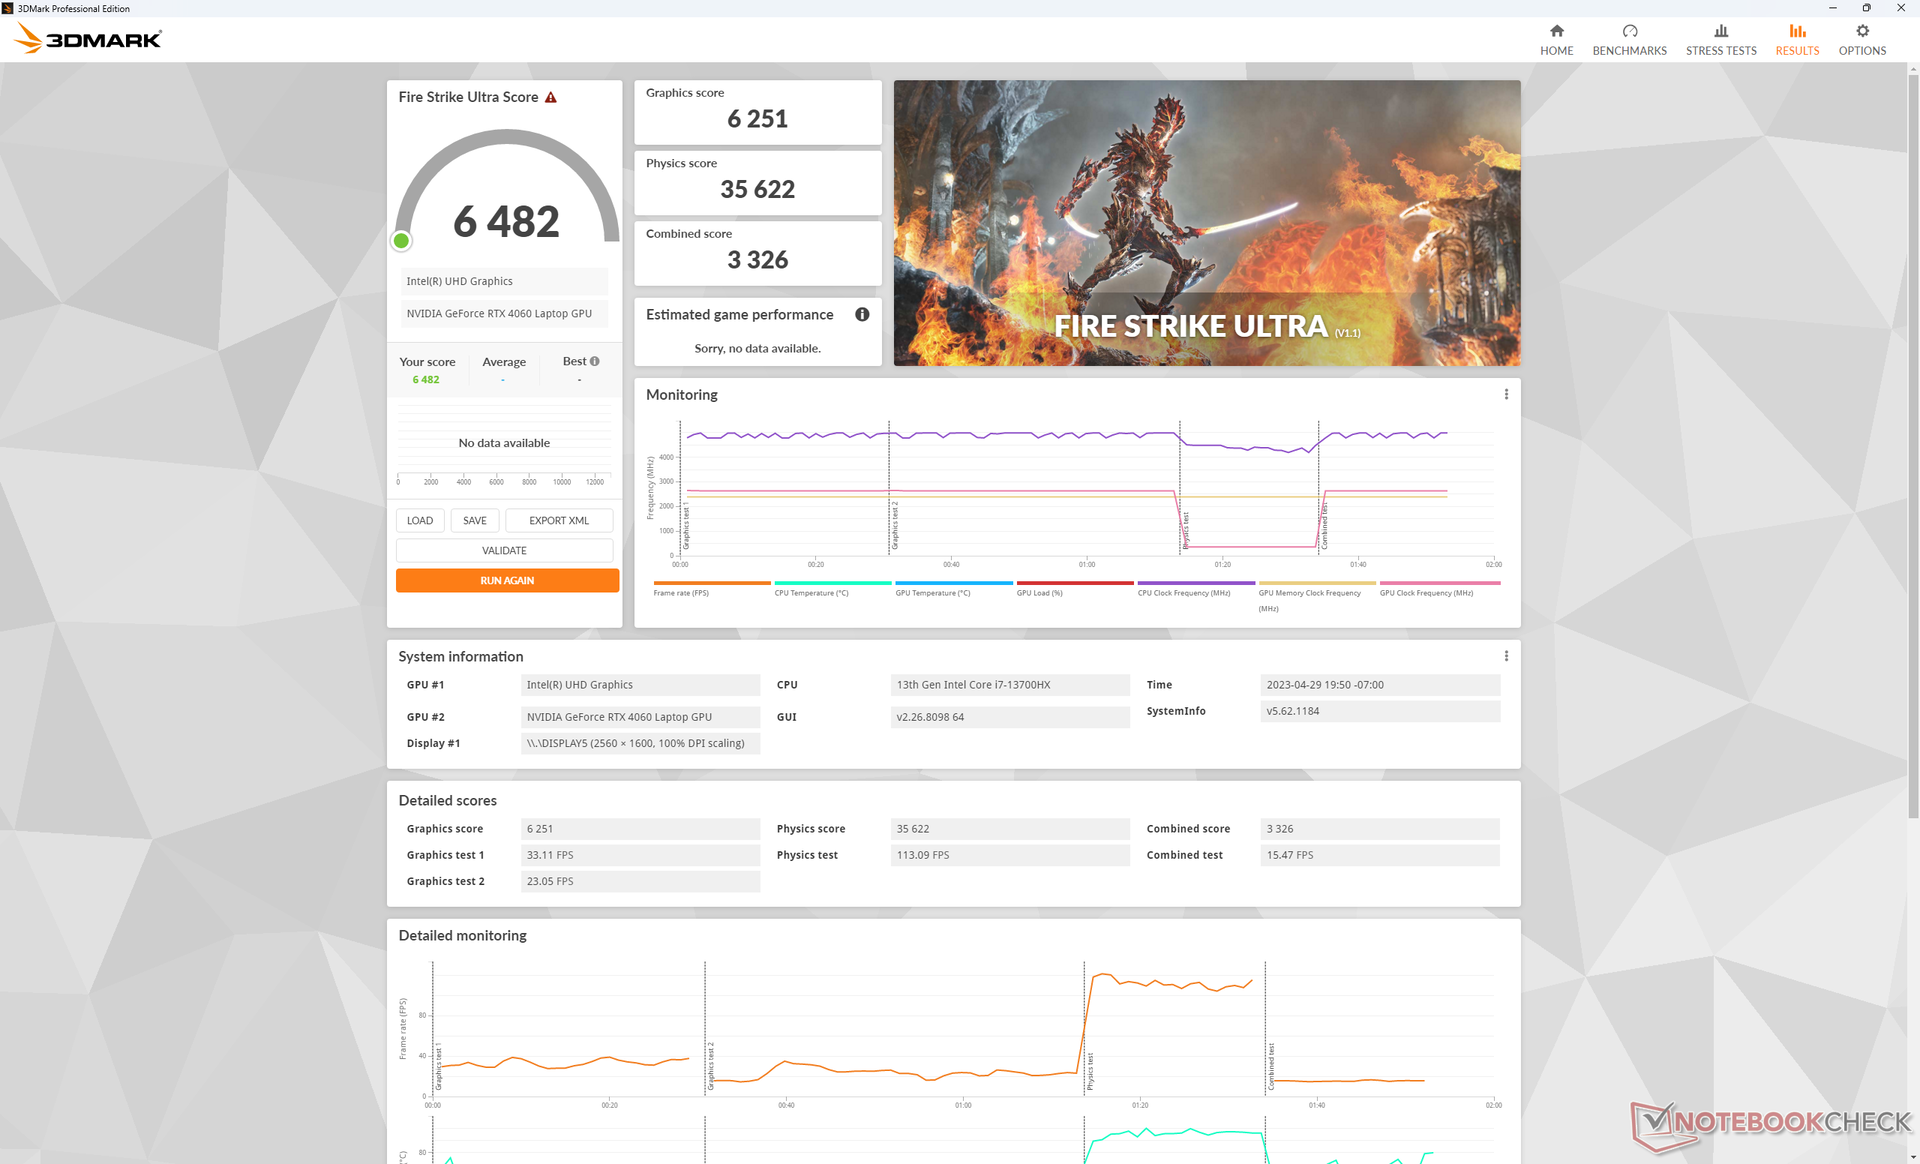
| 3DMark Fire Strike Score | 24992 points | |
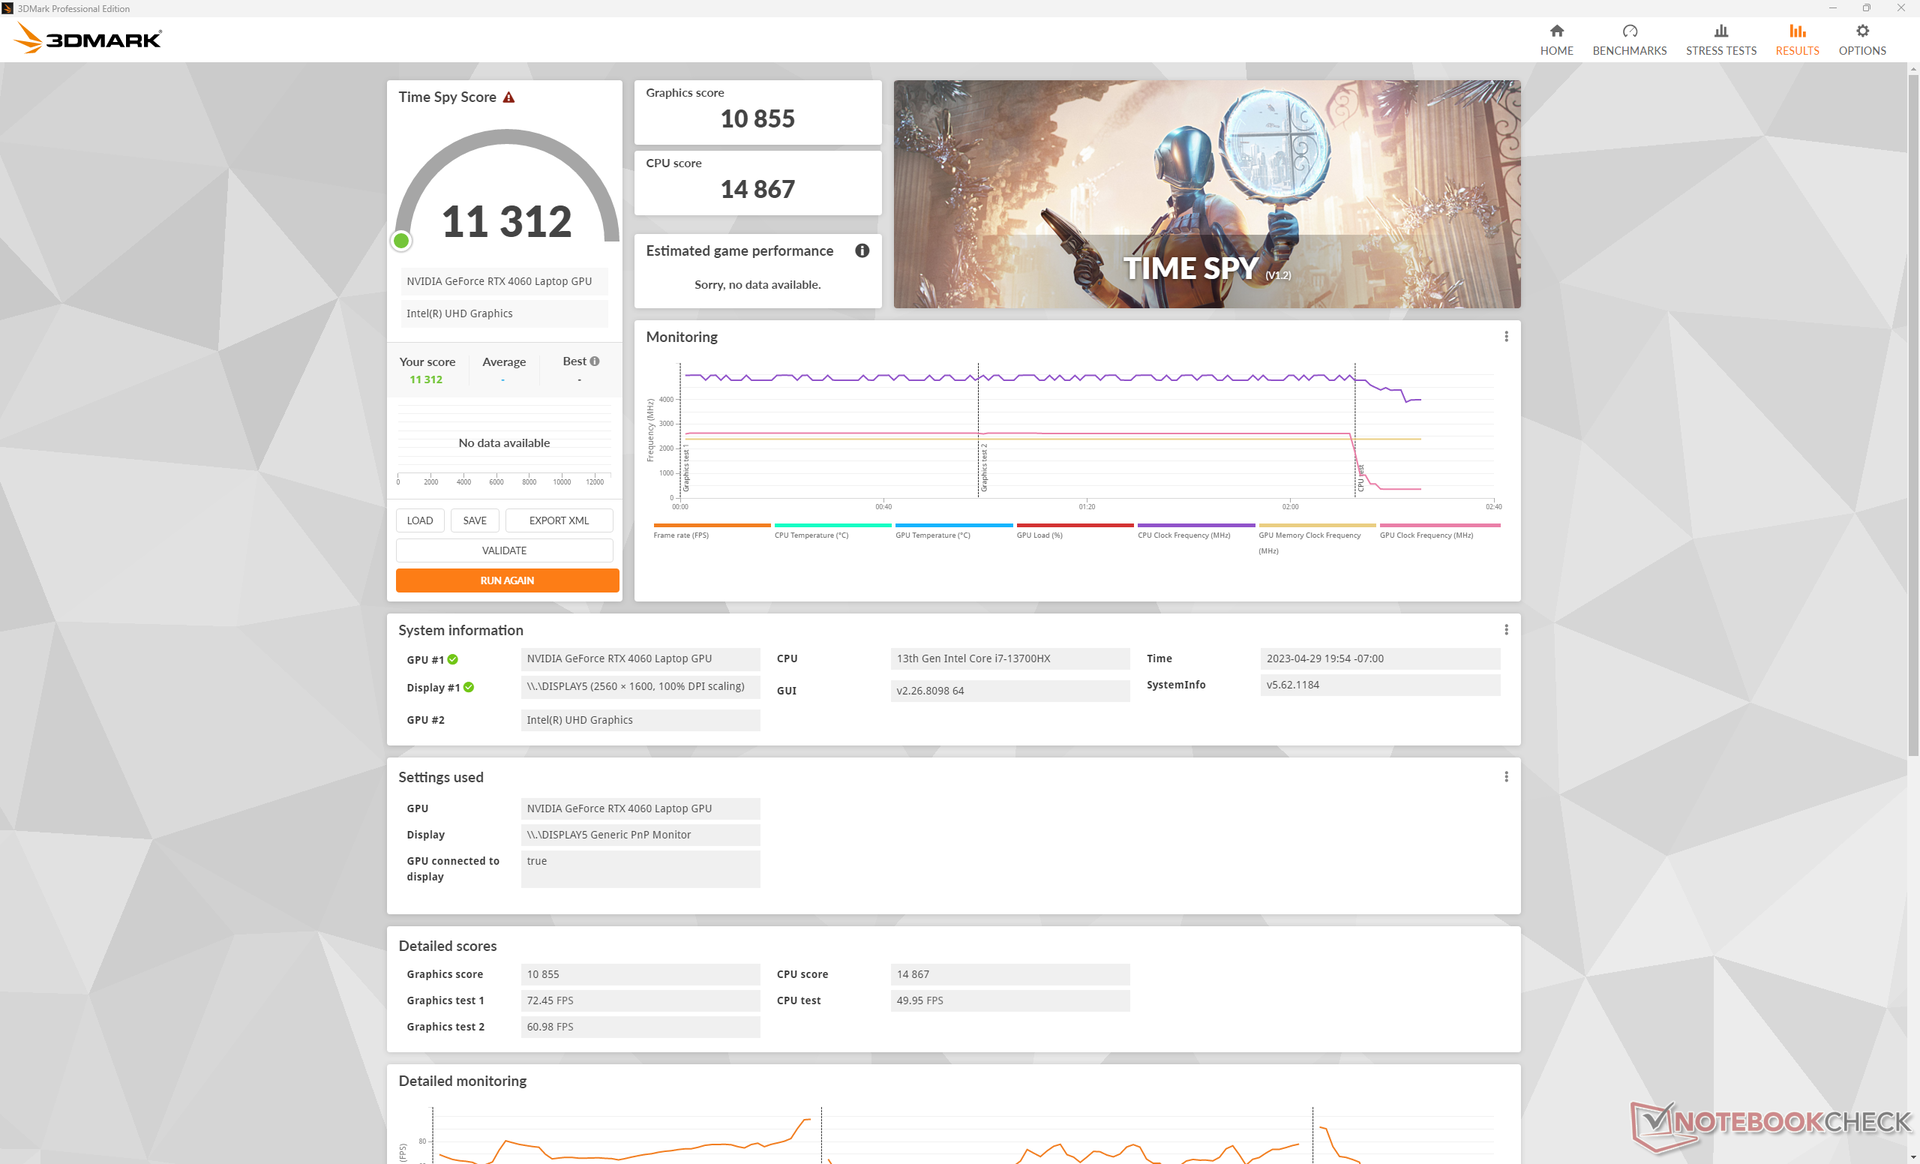
| 3DMark Time Spy Score | 11312 points | |
Aide | ||
* ... Moindre est la valeur, meilleures sont les performances
Performance des jeux
N'importe quel titre actuel peut tourner à plus de 60 FPS avec des paramètres ultra 1080p. L'exécution à la résolution native QHD+, cependant, nécessite d'ajuster certains paramètres, en particulier pour les titres exigeants comme Returnal ou F1 2022. Atteindre un taux de rafraîchissement stable de 165 FPS pour correspondre au taux de rafraîchissement de 165 Hz est difficile pour la plupart des titres avec la RTX 3060 de milieu de gamme. Nous recommandons plutôt de viser 50 à 100 FPS avec G-Sync activé pour réduire le déchirement de l'écran.
| Returnal | |
| 1920x1080 Low Preset | |
| Moyenne NVIDIA GeForce RTX 4060 Laptop GPU (71 - 99, n=5) | |
| Lenovo Legion Pro 5 16IRX8 | |
| 1920x1080 Medium Preset | |
| Moyenne NVIDIA GeForce RTX 4060 Laptop GPU (68 - 93, n=5) | |
| Lenovo Legion Pro 5 16IRX8 | |
| 1920x1080 High Preset | |
| Lenovo Legion Pro 5 16IRX8 | |
| Moyenne NVIDIA GeForce RTX 4060 Laptop GPU (63 - 87, n=6) | |
| 1920x1080 Epic Preset | |
| Lenovo Legion Pro 5 16IRX8 | |
| Moyenne NVIDIA GeForce RTX 4060 Laptop GPU (57 - 75, n=6) | |
| 2560x1440 Epic Preset | |
| Moyenne NVIDIA GeForce RTX 4060 Laptop GPU (39 - 59.4, n=5) | |
| Lenovo Legion Pro 5 16IRX8 | |
| 3840x2160 Epic Preset | |
| Moyenne NVIDIA GeForce RTX 4060 Laptop GPU (25 - 29, n=2) | |
| Lenovo Legion Pro 5 16IRX8 | |
Witcher 3 FPS Chart
| Bas | Moyen | Élevé | Ultra | QHD | 4K | |
|---|---|---|---|---|---|---|
| GTA V (2015) | 186.7 | 184 | 178.9 | 119.6 | 88.9 | 85.5 |
| The Witcher 3 (2015) | 521.8 | 369.3 | 215.8 | 107.6 | 67.2 | |
| Dota 2 Reborn (2015) | 196.6 | 176.5 | 170.3 | 161.8 | 142.9 | |
| Final Fantasy XV Benchmark (2018) | 222 | 161.2 | 109.8 | 79.4 | 45.4 | |
| X-Plane 11.11 (2018) | 177.4 | 156.3 | 121.9 | 104.4 | ||
| Cyberpunk 2077 1.6 (2022) | 150.7 | 136.6 | 106 | 87.4 | 51.7 | 22.9 |
| Tiny Tina's Wonderlands (2022) | 234.6 | 192.3 | 121.2 | 92.7 | 64.2 | 33.6 |
| F1 22 (2022) | 276 | 274 | 208 | 70.1 | 44.8 | 21.5 |
| Returnal (2023) | 81 | 79 | 75 | 70 | 48 | 25 |
Émissions
Bruit du système - Comportement stable du régime du ventilateur
Le bruit du ventilateur lors de faibles charges comme la navigation ou le streaming vidéo tend à se stabiliser à 26,6 dB(A) sur un fond silencieux de 23 dB(A). C'est suffisamment fort pour être audible, mais pas gênant. Les ventilateurs sont heureusement stables en RPM et ne pulsent pas fréquemment dans cet état, même en mode Performance.
Le bruit des ventilateurs en mode Witcher 3 en mode Performance se stabilise à 47.6 dB(A) comparé à 55 dB(A) sur le Legion Pro 5 16 avec RTX 3070 Ti de l'année dernière et sur le Legion Pro 7. Si le CPU et le GPU sont plus sollicités, par exemple avec des benchmarks ou des jeux très exigeants, notre Legion Pro 5 16 peut atteindre le même maximum de 55 dB(A).
Le jeu en mode équilibré est légèrement plus silencieux à 46 dB(A) contre les 47,6 dB(A) mentionnés ci-dessus. La différence est si minime qu'il n'y a guère de raison d'utiliser le mode équilibré dans la plupart des scénarios de jeu...
Degré de la nuisance sonore
| Au repos |
| 23.1 / 23.1 / 26.6 dB(A) |
| Fortement sollicité |
| 34.7 / 54.8 dB(A) |
 | ||
30 dB silencieux 40 dB(A) audible 50 dB(A) bruyant |
||
min: | ||
| Lenovo Legion Pro 5 16IRX8 GeForce RTX 4060 Laptop GPU, i7-13700HX, SK hynix PC801 HFS512GEJ9X115N | Asus ROG Zephyrus M16 GU603Z GeForce RTX 3070 Ti Laptop GPU, i9-12900H, Micron 3400 1TB MTFDKBA1T0TFH | Razer Blade 16 Early 2023 GeForce RTX 4080 Laptop GPU, i9-13950HX, SSSTC CA6-8D1024 | Lenovo Legion Pro 7 16IRX8H GeForce RTX 4080 Laptop GPU, i9-13900HX, Samsung PM9A1 MZVL21T0HCLR | Lenovo Legion 5 Pro 16ARH7H RTX 3070 Ti GeForce RTX 3070 Ti Laptop GPU, R7 6800H, Samsung PM9A1 MZVL21T0HCLR | Lenovo Legion S7 16ARHA7 Radeon RX 6800S, R9 6900HX, SK Hynix HFS001TEJ9X115N | |
|---|---|---|---|---|---|---|
| Noise | -16% | -0% | -17% | -12% | 3% | |
| arrêt / environnement * (dB) | 23 | 23 -0% | 23 -0% | 24 -4% | 23.5 -2% | 23.1 -0% |
| Idle Minimum * (dB) | 23.1 | 23 -0% | 23 -0% | 26 -13% | 23.7 -3% | 23.1 -0% |
| Idle Average * (dB) | 23.1 | 24 -4% | 23 -0% | 28 -21% | 31.1 -35% | 23.1 -0% |
| Idle Maximum * (dB) | 26.6 | 47 -77% | 23.6 11% | 34 -28% | 32.2 -21% | 23.1 13% |
| Load Average * (dB) | 34.7 | 47.91 -38% | 39 -12% | 47 -35% | 38.4 -11% | 31.4 10% |
| Witcher 3 ultra * (dB) | 47.6 | 48.91 -3% | 51.6 -8% | 55 -16% | 54.8 -15% | 51.4 -8% |
| Load Maximum * (dB) | 54.8 | 50.25 8% | 51.3 6% | 56 -2% | 54.8 -0% | 51.2 7% |
* ... Moindre est la valeur, meilleures sont les performances
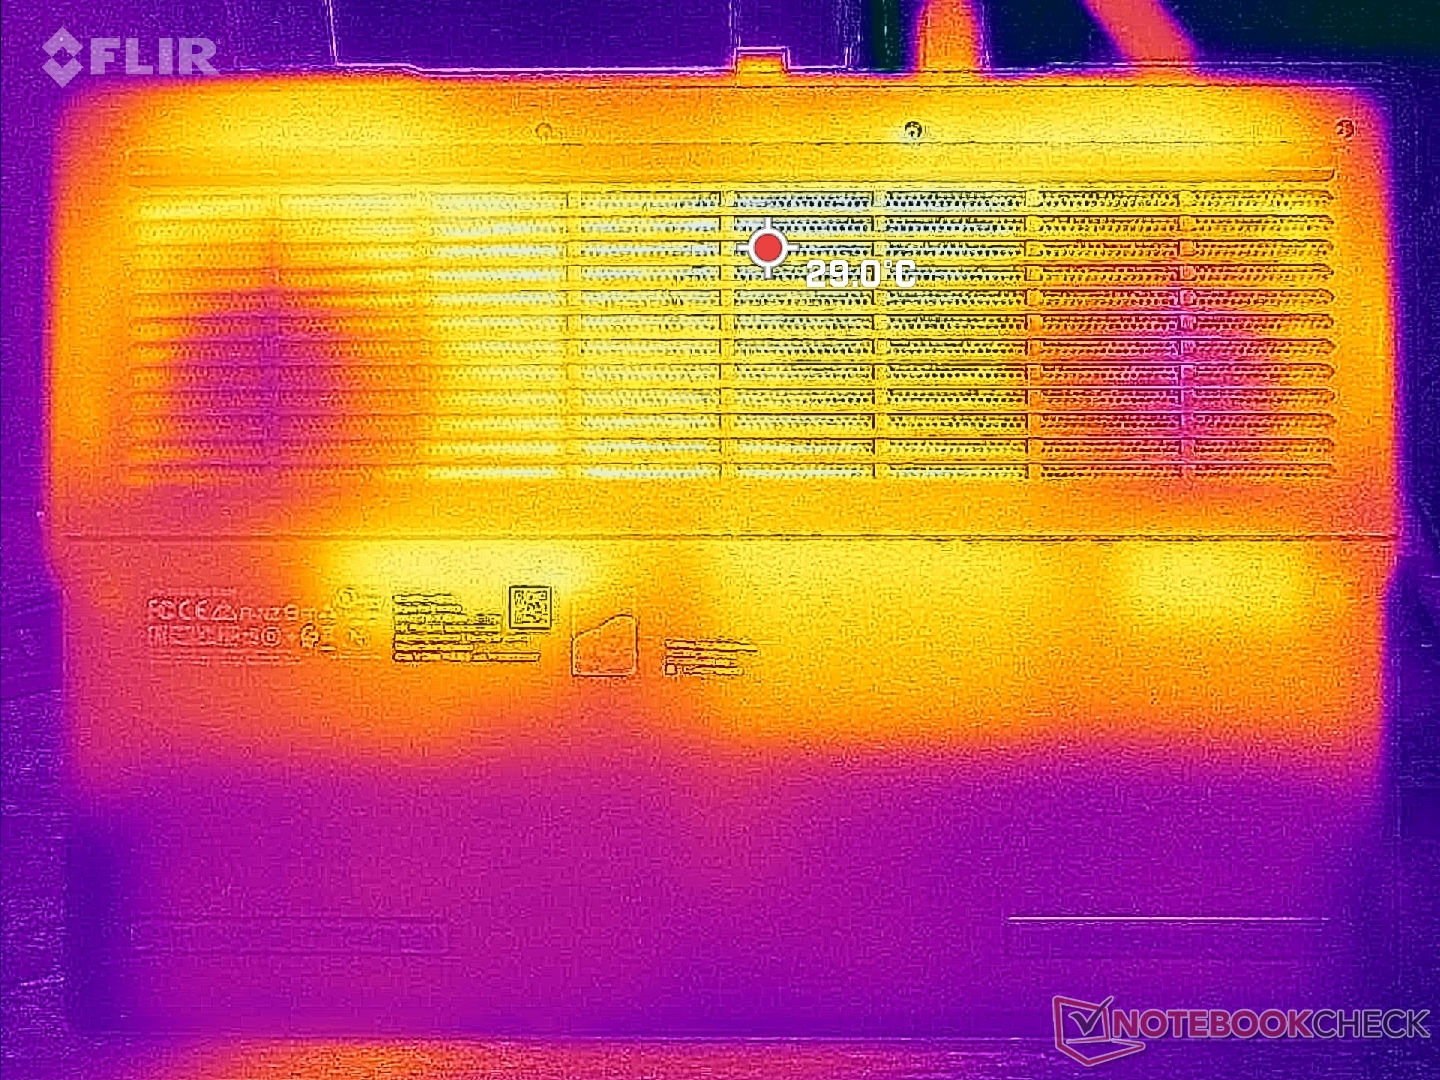
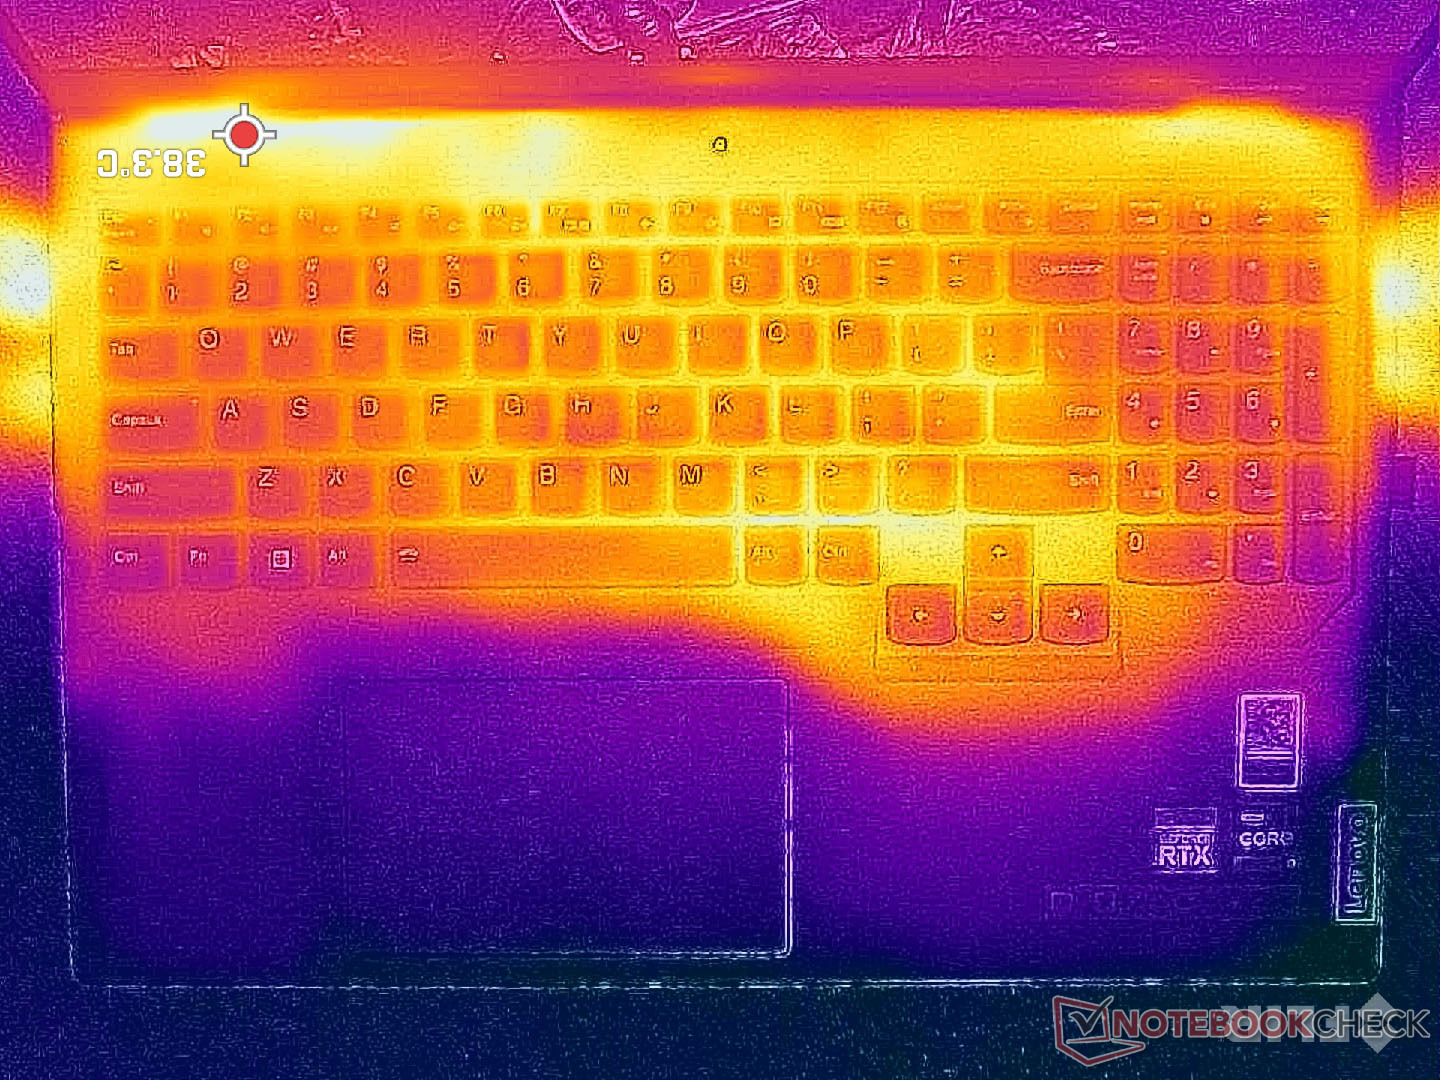
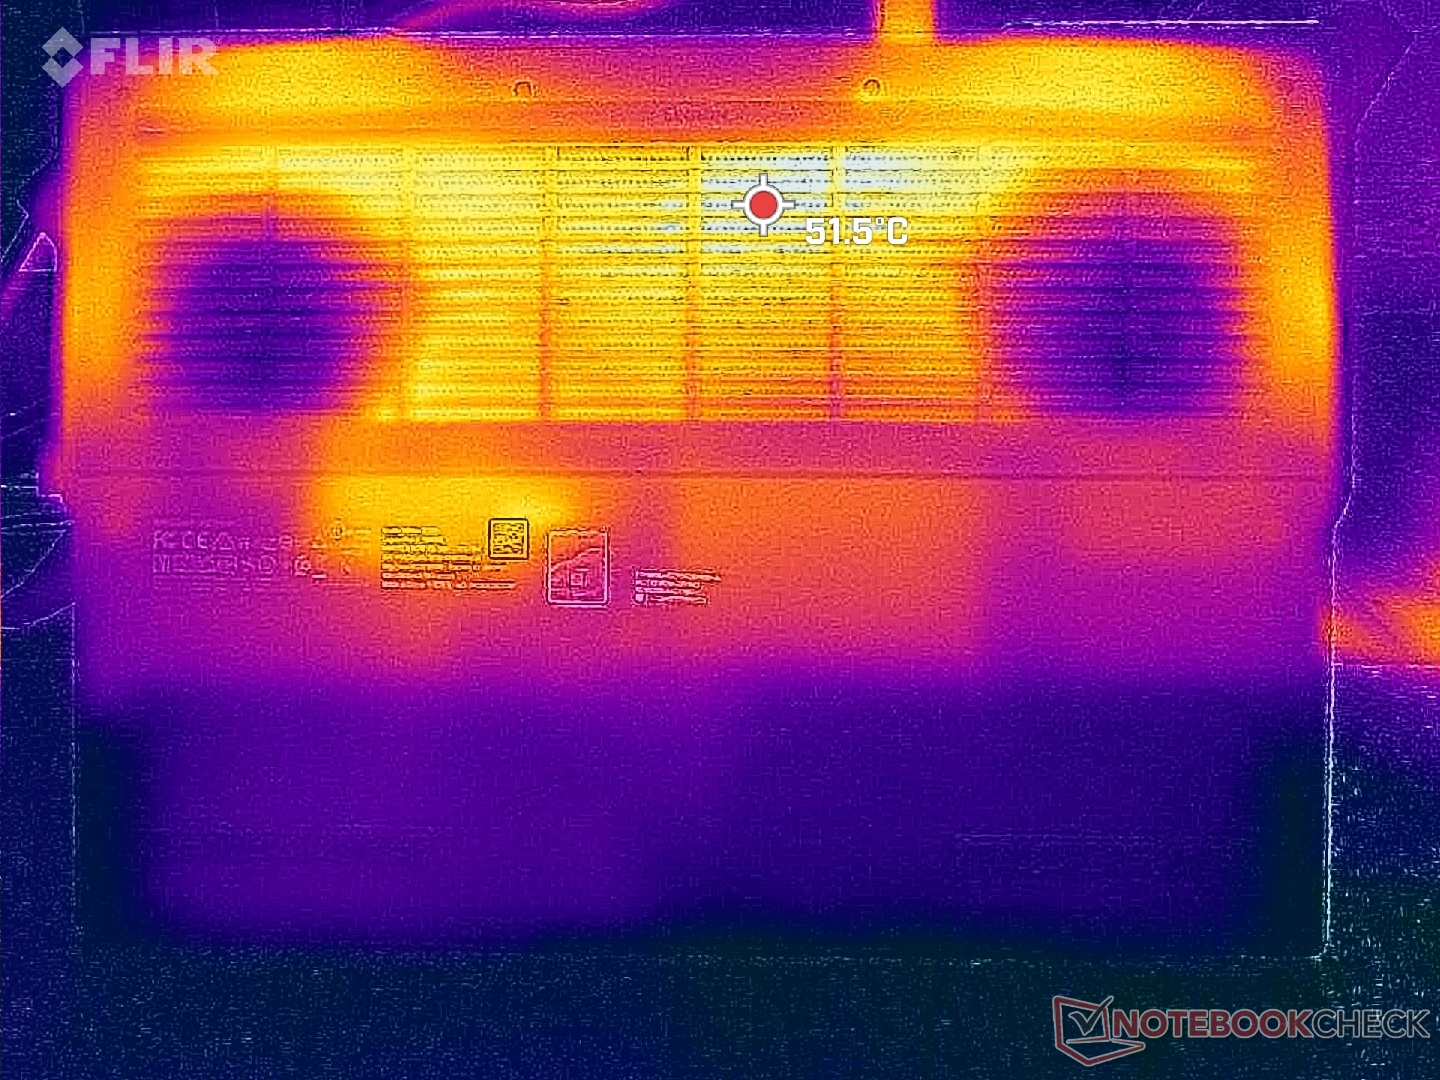
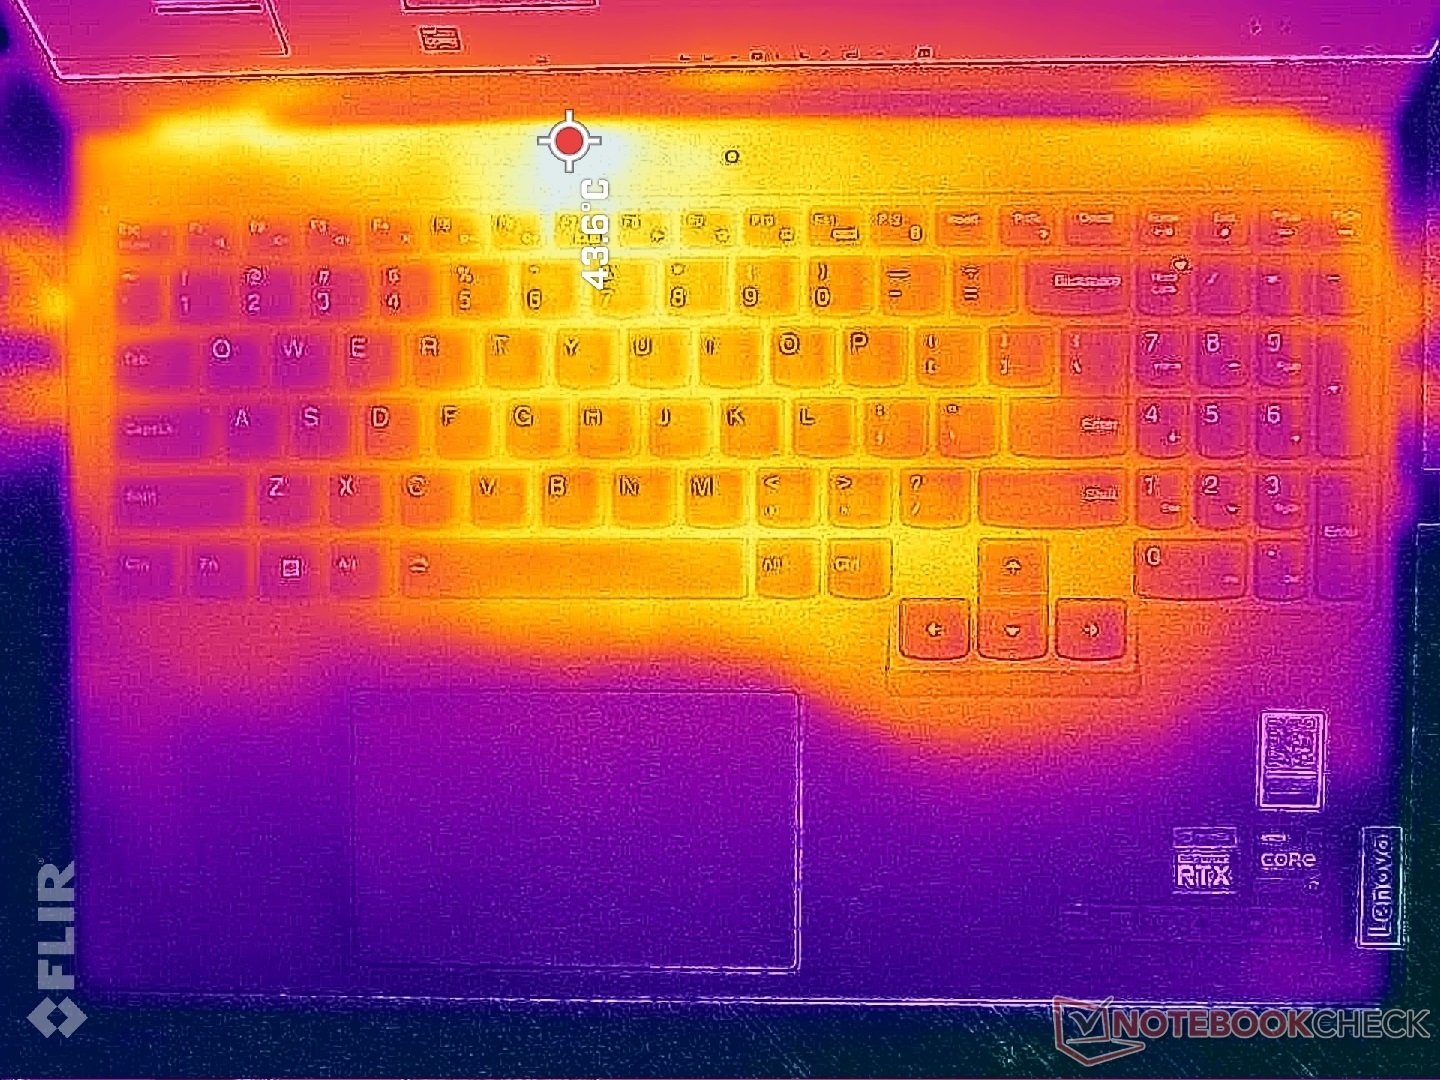
Température - Repose-poignets froids
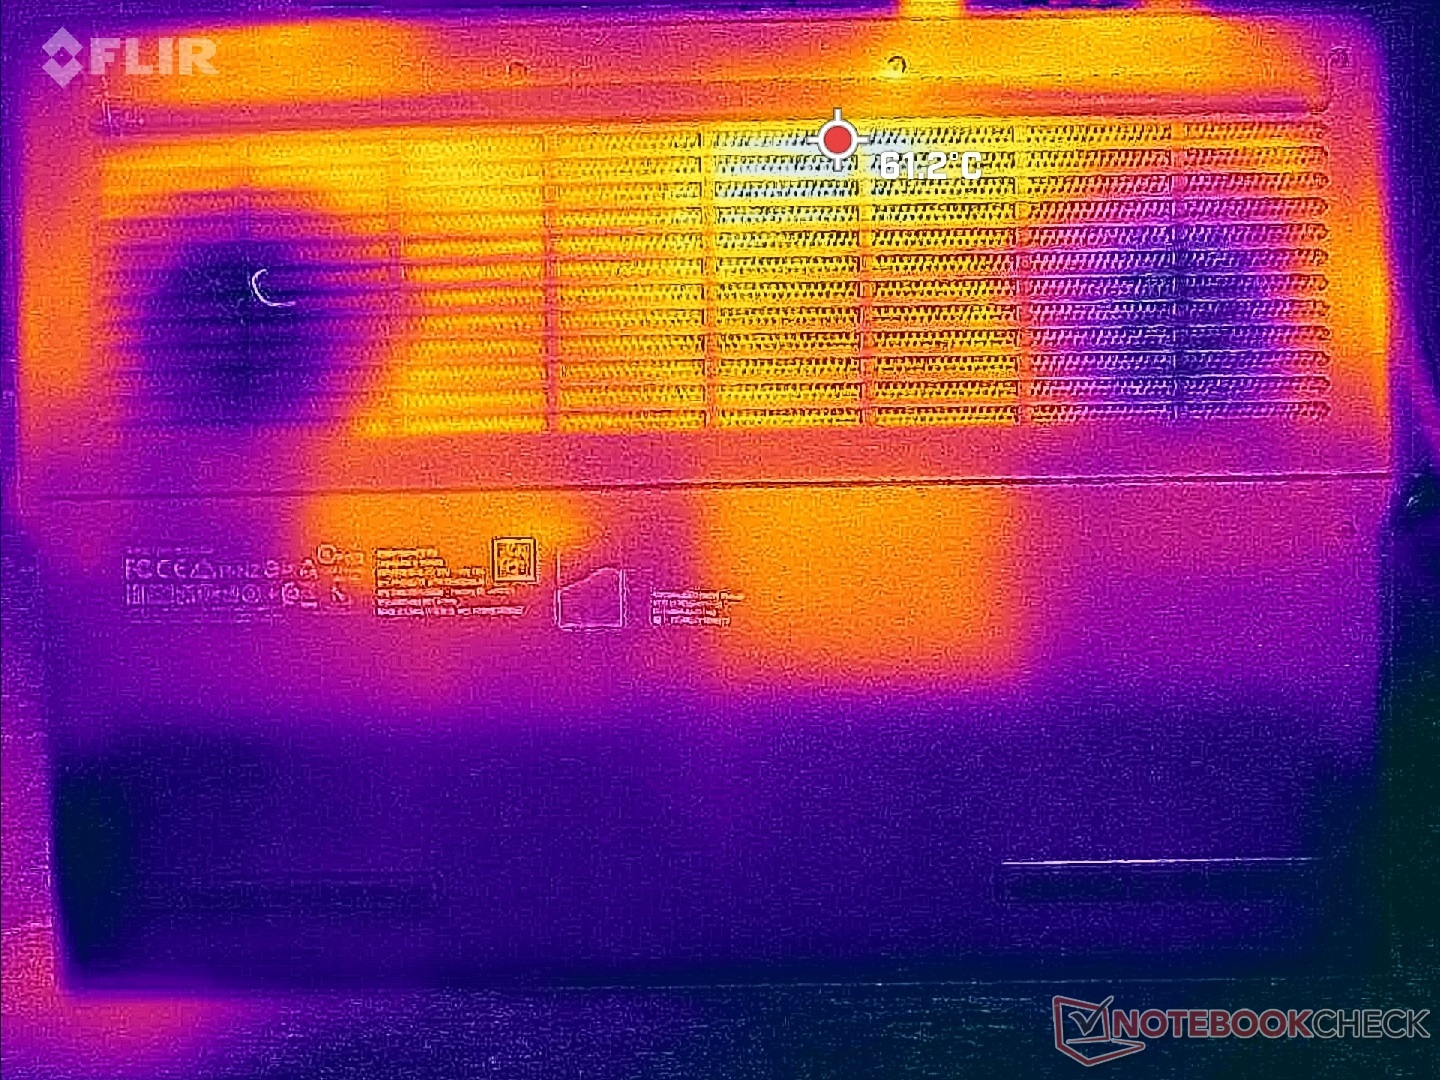
Les températures de surface lors de l'utilisation de jeux peuvent atteindre 43°C à 50°C sur le dessus et le dessous, respectivement. Ces points chauds sont heureusement concentrés à l'arrière, là où la peau ne risque pas d'entrer en contact avec l'appareil. Le ROG Zephyrus M16 ROG Zephyrus M16 plus fin, peut être encore plus chaud en moyenne et présenter des points chauds plus importants.
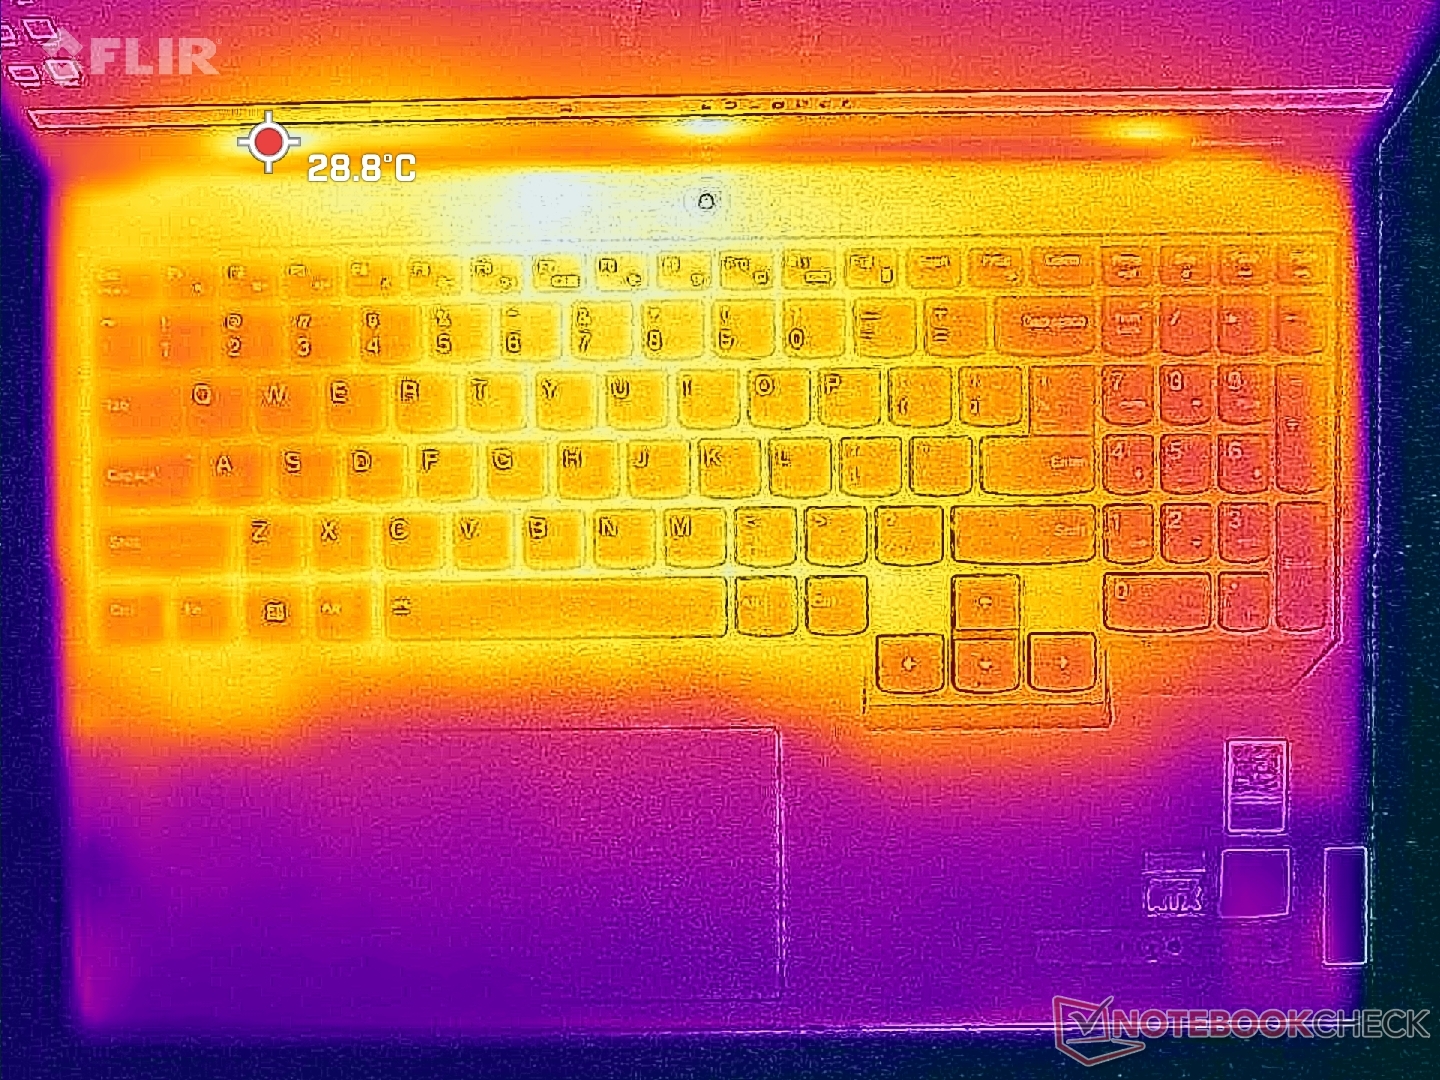
Les côtés du clavier sont généralement plus frais que le centre de quelques degrés C car les ventilateurs sont positionnés directement en dessous, comme le montrent les cartes de température ci-dessous. Les paumes et les doigts sont donc moins susceptibles d'être inconfortables pendant le jeu.
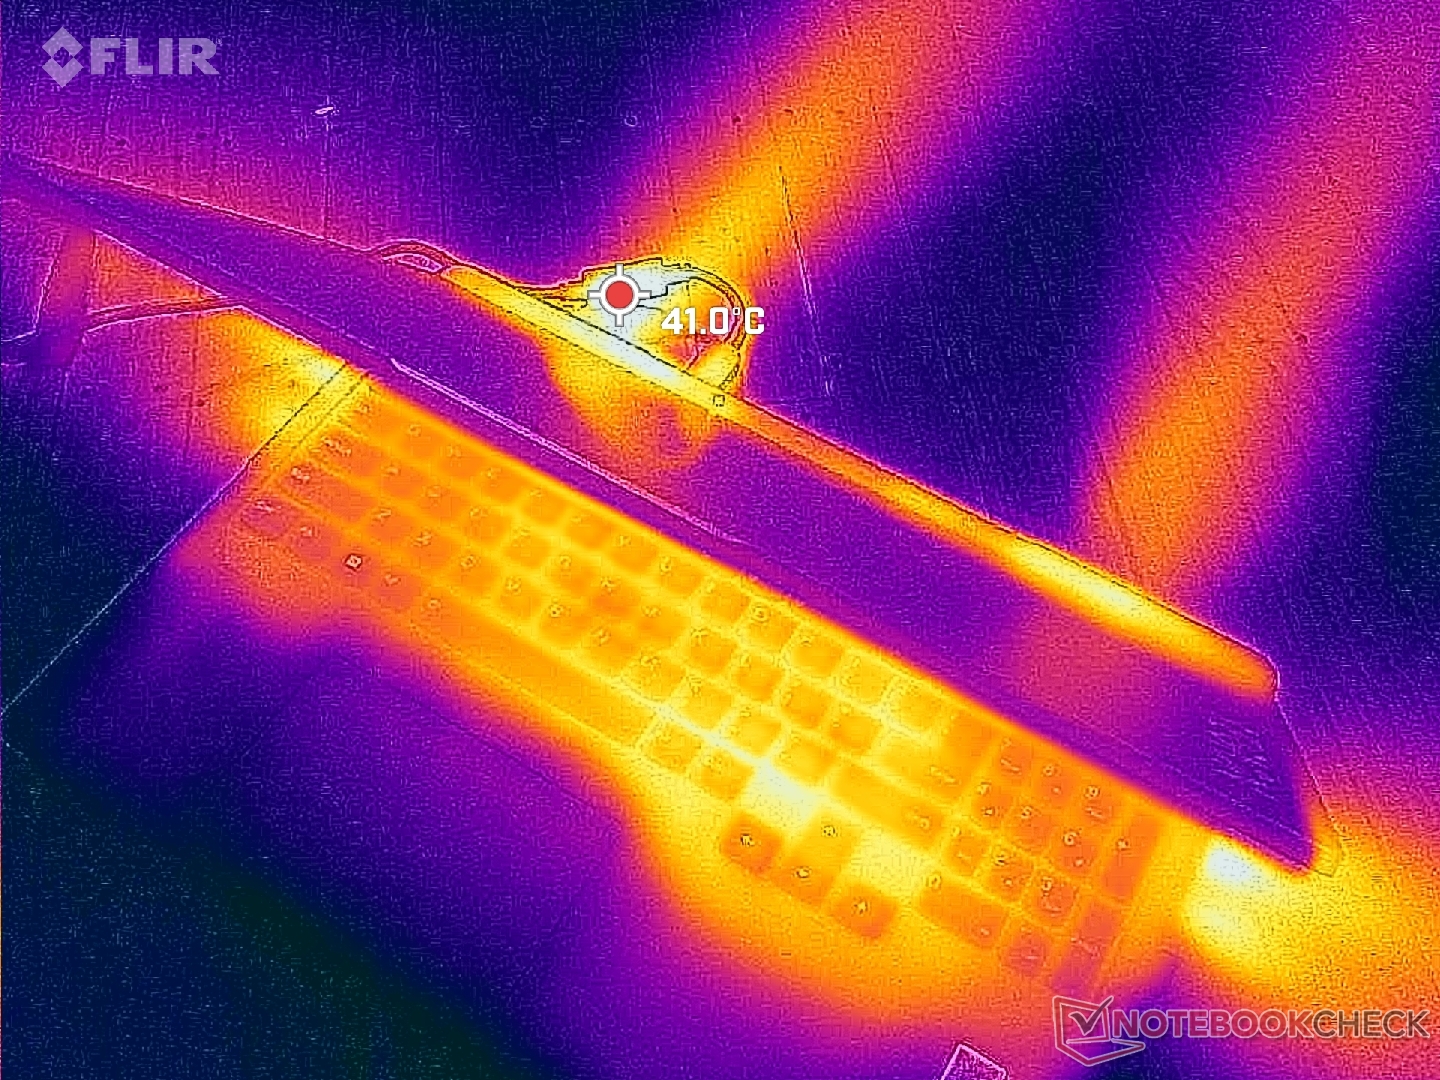
(±) La température maximale du côté supérieur est de 42.8 °C / 109 F, par rapport à la moyenne de 40.4 °C / 105 F, allant de 21.2 à 68.8 °C pour la classe Gaming.
(-) Le fond chauffe jusqu'à un maximum de 50 °C / 122 F, contre une moyenne de 43.2 °C / 110 F
(+) En utilisation inactive, la température moyenne du côté supérieur est de 27.2 °C / 81 F, par rapport à la moyenne du dispositif de 33.9 °C / 93 F.
(±) En jouant à The Witcher 3, la température moyenne du côté supérieur est de 32.4 °C / 90 F, alors que la moyenne de l'appareil est de 33.9 °C / 93 F.
(+) Les repose-poignets et le pavé tactile sont plus froids que la température de la peau avec un maximum de 26.2 °C / 79.2 F et sont donc froids au toucher.
(+) La température moyenne de la zone de l'appui-paume de dispositifs similaires était de 28.8 °C / 83.8 F (+2.6 °C / #4.6 F).
| Lenovo Legion Pro 5 16IRX8 Intel Core i7-13700HX, NVIDIA GeForce RTX 4060 Laptop GPU | Asus ROG Zephyrus M16 GU603Z Intel Core i9-12900H, NVIDIA GeForce RTX 3070 Ti Laptop GPU | Razer Blade 16 Early 2023 Intel Core i9-13950HX, NVIDIA GeForce RTX 4080 Laptop GPU | Lenovo Legion Pro 7 16IRX8H Intel Core i9-13900HX, NVIDIA GeForce RTX 4080 Laptop GPU | Lenovo Legion 5 Pro 16ARH7H RTX 3070 Ti AMD Ryzen 7 6800H, NVIDIA GeForce RTX 3070 Ti Laptop GPU | Lenovo Legion S7 16ARHA7 AMD Ryzen 9 6900HX, AMD Radeon RX 6800S | |
|---|---|---|---|---|---|---|
| Heat | -5% | 8% | -11% | -1% | 5% | |
| Maximum Upper Side * (°C) | 42.8 | 52 -21% | 40 7% | 48 -12% | 43.8 -2% | 46.6 -9% |
| Maximum Bottom * (°C) | 50 | 51 -2% | 37.6 25% | 49 2% | 53 -6% | 50.8 -2% |
| Idle Upper Side * (°C) | 29.6 | 29 2% | 32.4 -9% | 40 -35% | 30 -1% | 26.4 11% |
| Idle Bottom * (°C) | 34 | 33 3% | 31.4 8% | 33 3% | 31.8 6% | 27.2 20% |
* ... Moindre est la valeur, meilleures sont les performances
Test de stress
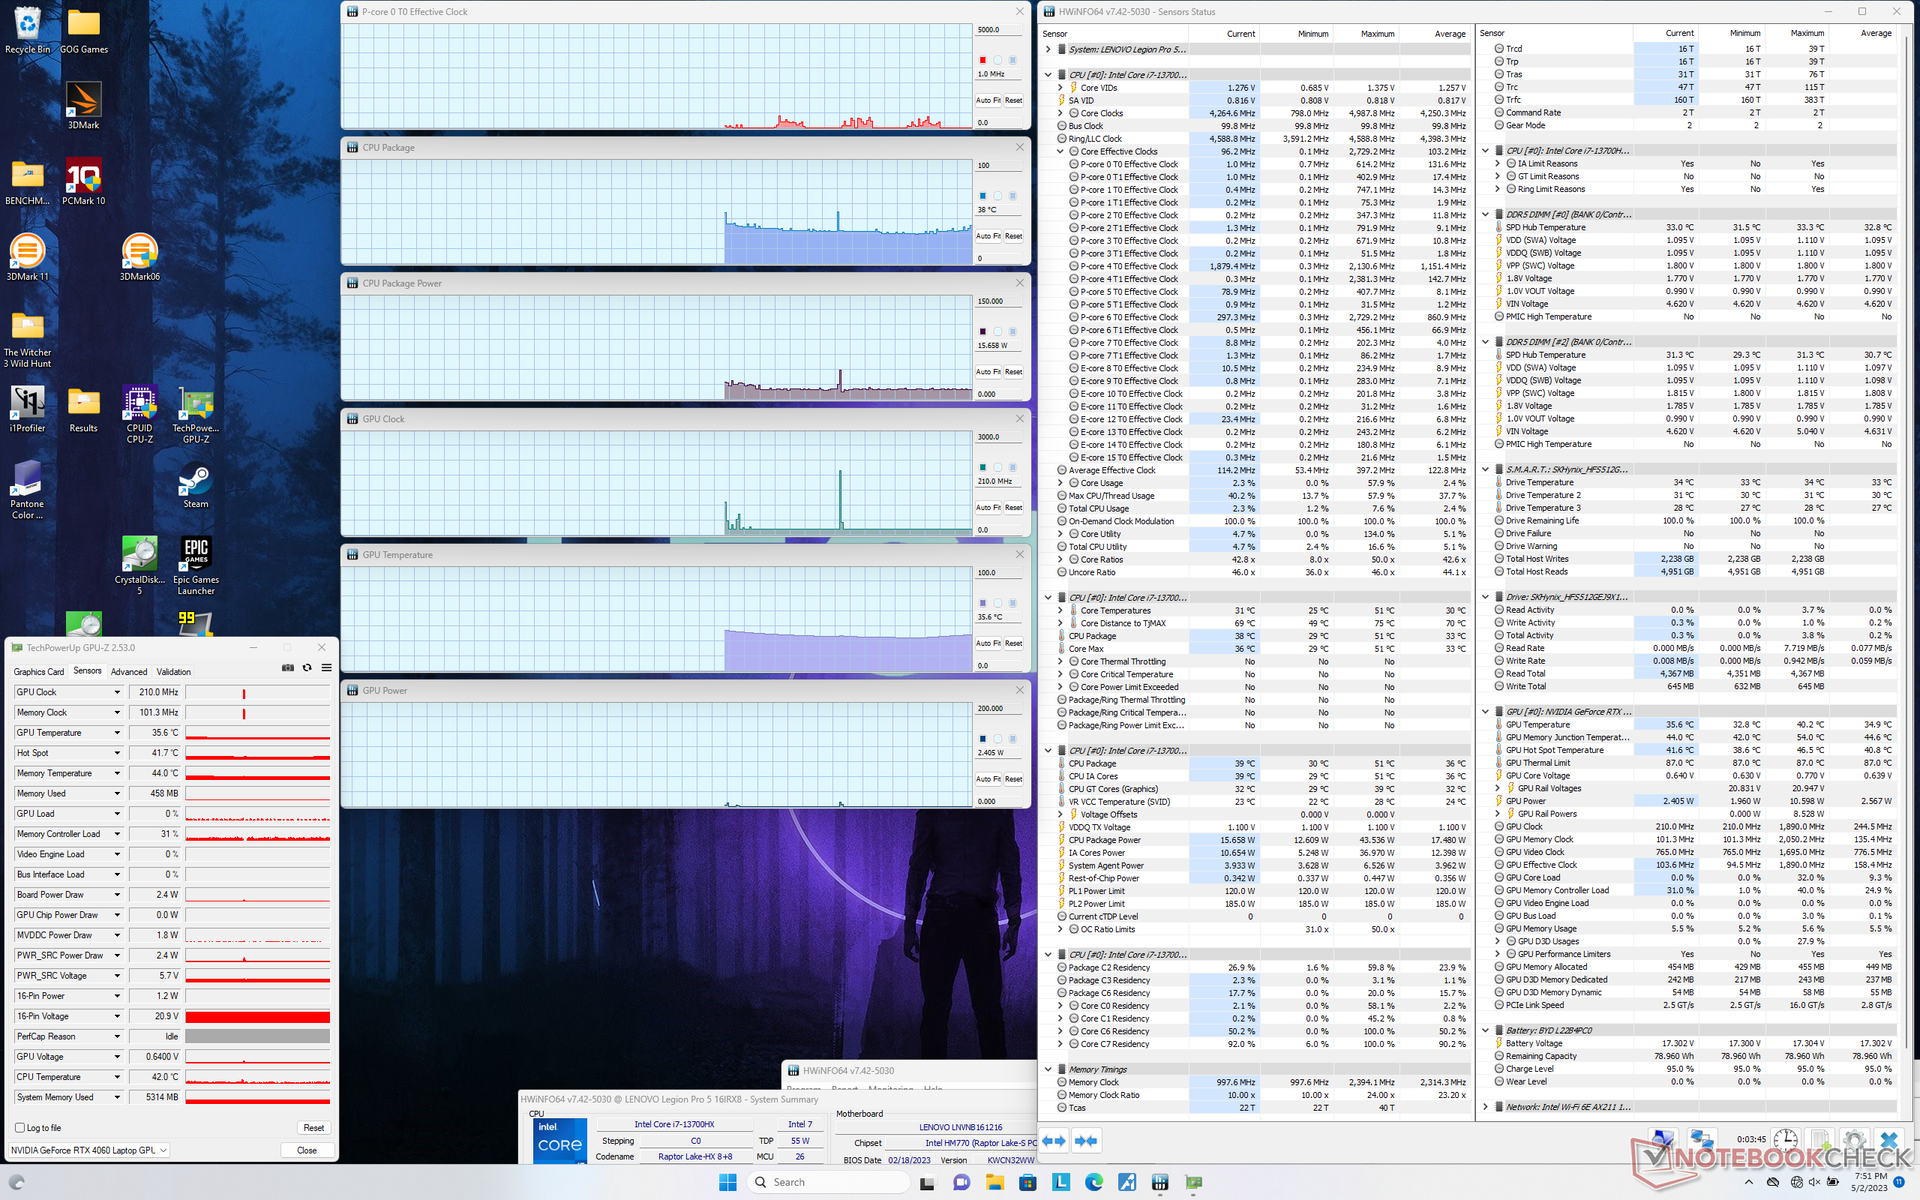
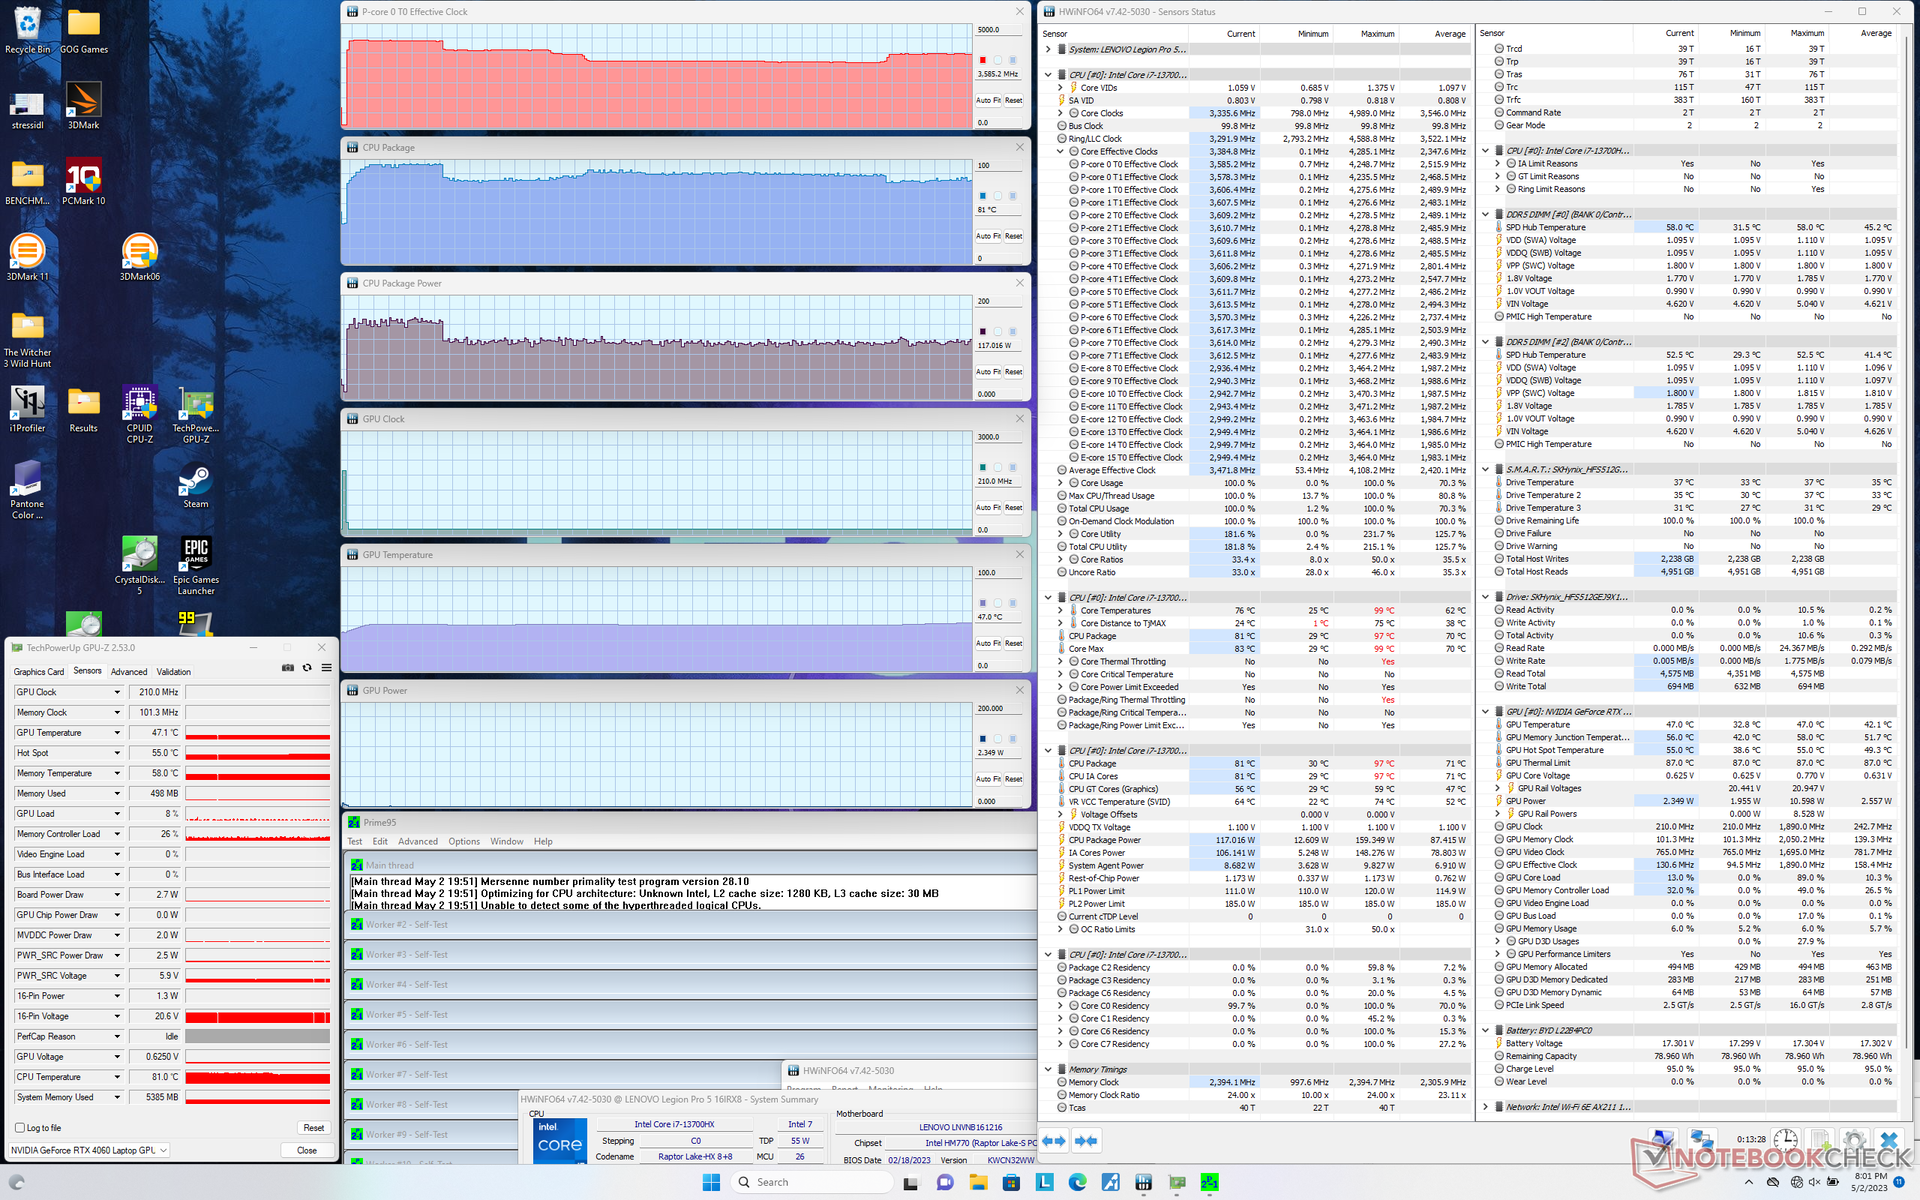
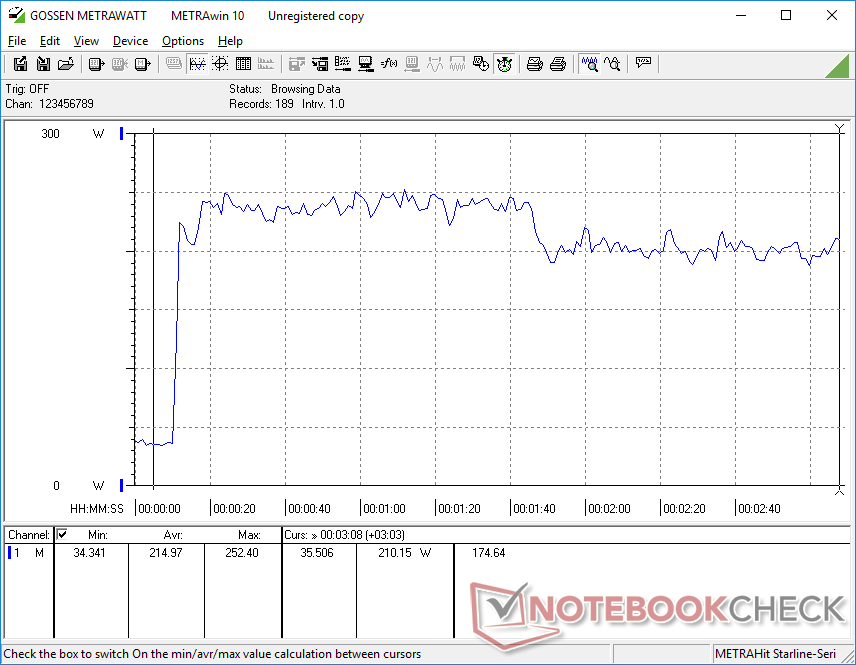
Lorsqu'il est soumis à Prime95, le processeur atteint 4,3 GHz, 157 W et 97 C pendant environ une minute. Ensuite, les fréquences d'horloge et la consommation d'énergie de la carte tombent respectivement entre 3,3 et 3,6 GHz et à 117 W, afin de maintenir la température du cœur à 81 C. Le Turbo Boost maximum n'est donc pas viable pendant de longues périodes. En répétant ce même test sur le modèle AMD plus lent de l'année dernière, le Legion Pro 5 16 de l'année dernière, plus lent et alimenté par AMD, aurait abouti à une température plus élevée du processeur, de 93 °C.
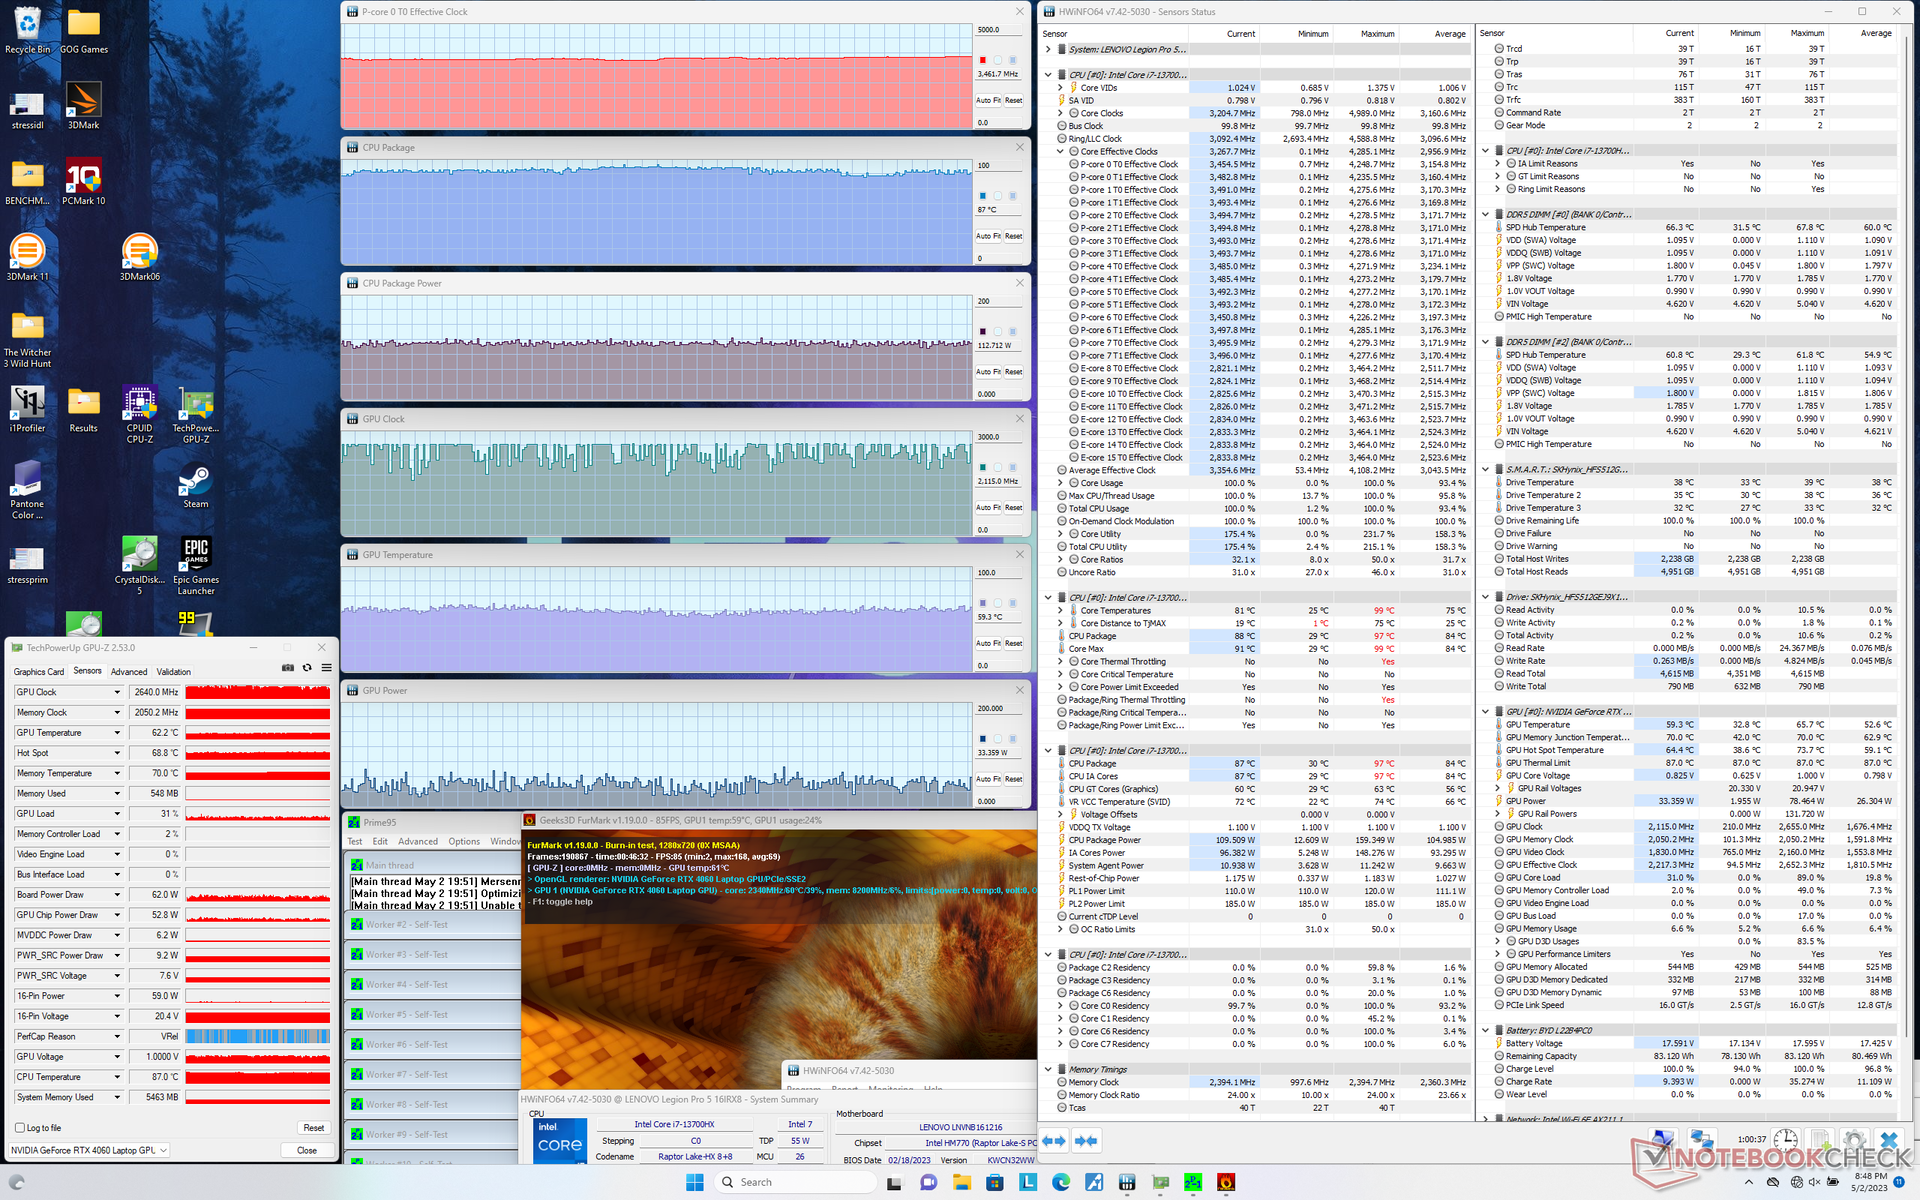
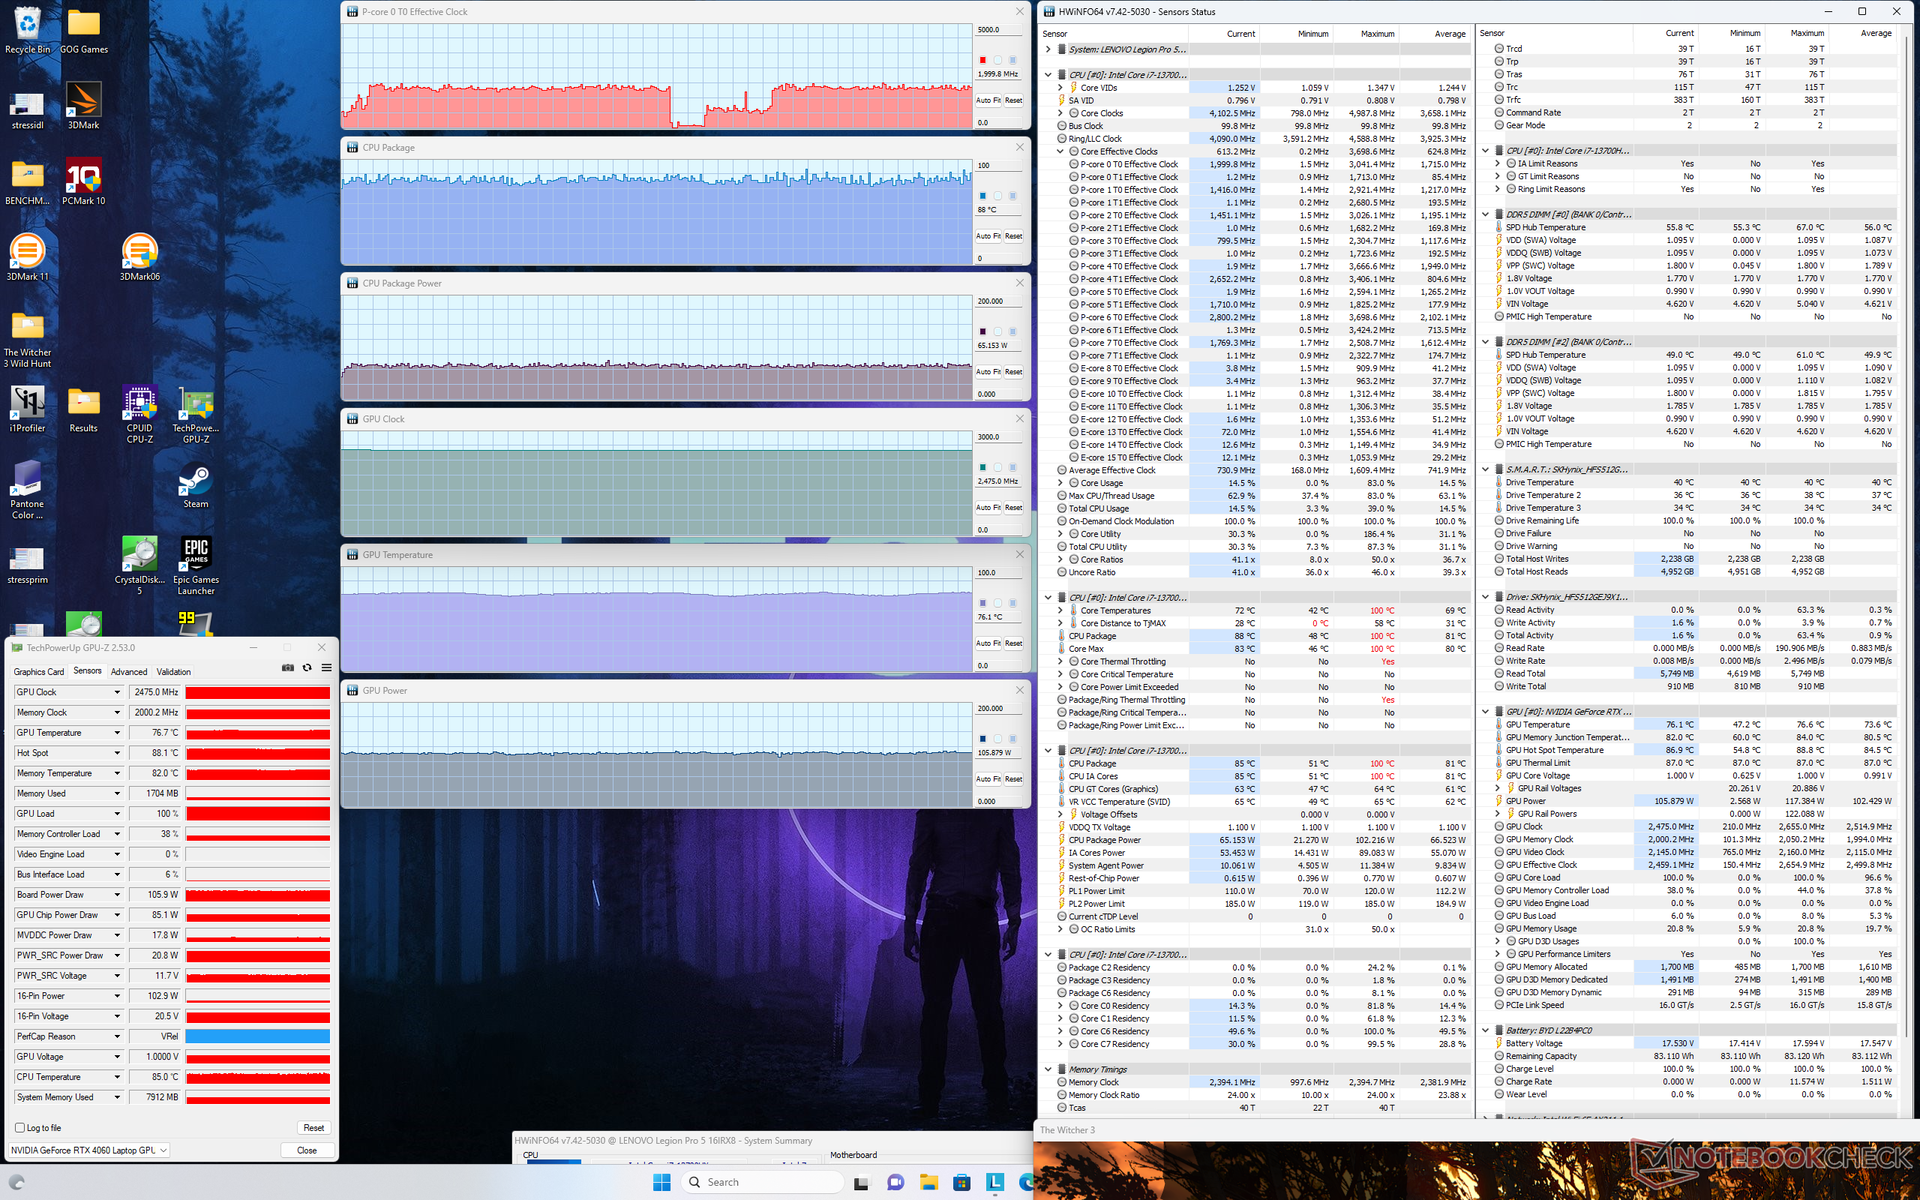
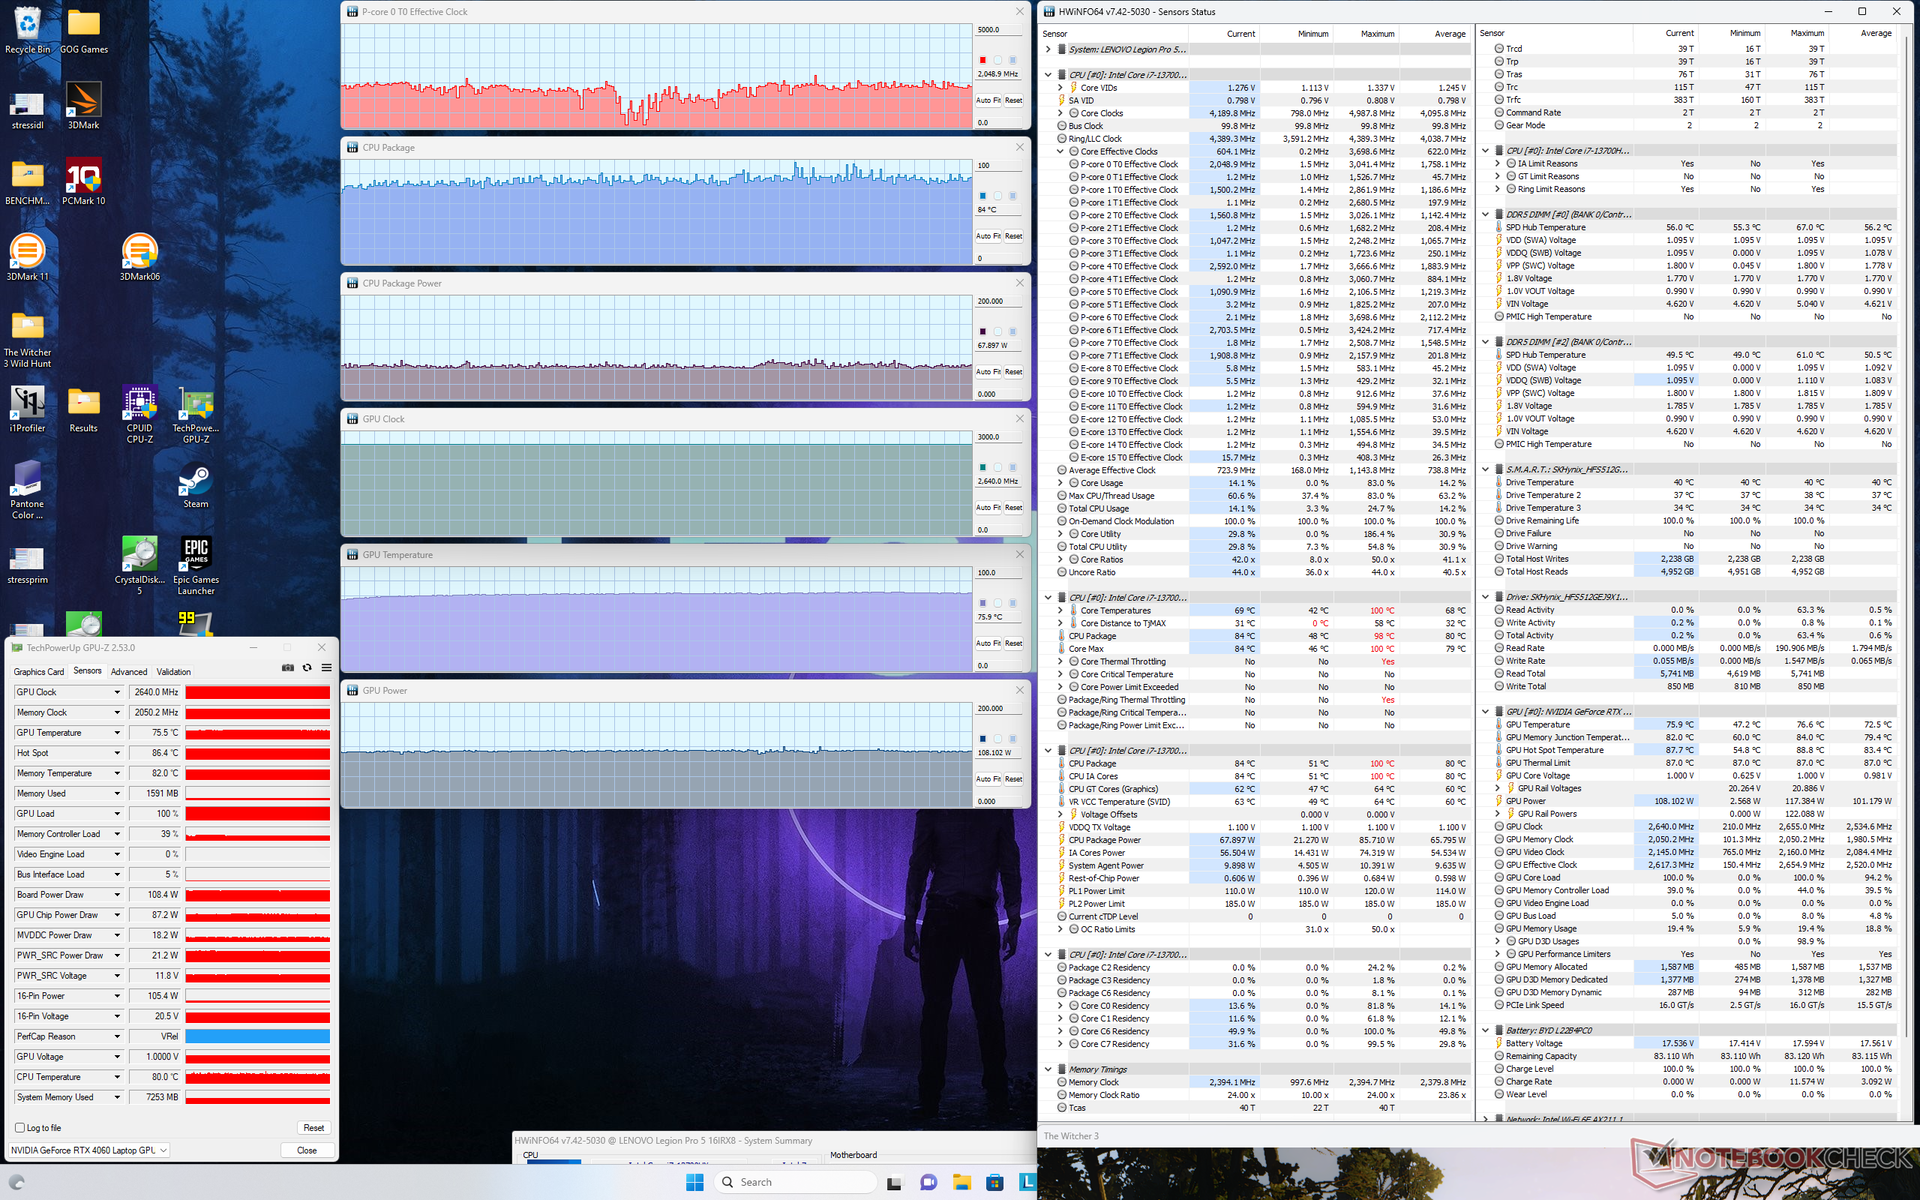
En mode Witcher 3en mode Performance pour représenter des charges de jeu typiques, notre GPU RTX 4060 se stabiliserait à 2640 MHz d'horloge, 2050 MHz de RAM, 76 C, et 109 W, ce qui est nettement inférieur aux 140 W indiqués sur le panneau de contrôle Nvidia. En mode équilibré, le GPU descendrait légèrement à 2475 MHz, 2000 MHz de RAM, et 105 W de consommation d'énergie alors que la température du cœur resterait la même. Il est donc préférable de mettre le système en mode Performance afin d'exploiter pleinement le GPU. La température du cœur est inférieure d'environ 10°C à celle du modèle de l'année dernière avec la RTX 3070 Ti, car cette dernière consomme 149 W de plus.
L'utilisation de la batterie limite les performances, comme on pouvait s'y attendre. Un test Fire Strike sur batterie donnerait des scores en physique et en graphique de 21363 et 12851 points, respectivement, contre 35270 et 26561 points sur secteur.
| Horloge du CPU (GHz) | Horloge du GPU (MHz) | Température moyenne du CPU (°C) | Température moyenne du GPU (°C) | |
| Système au repos | -- | -- | 37 | 36 |
| Prime95 Stress | 3.3 - 3.6 | -- | 81 - 86 | 47 |
| Prime95 + FurMark Stress | 3.5 | 1714 - 2640 | 87 | 59 |
| Witcher 3 Stress(mode équilibré) | ~2.0 | 2475 | 88 | 76 |
| Witcher 3 Stress (mode Performance) | ~2.0 | 2640 | 84 | 76 |
Intervenants
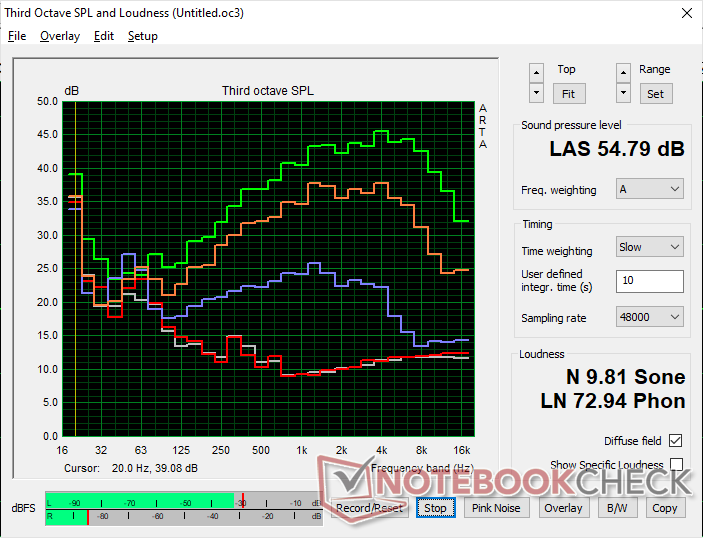
Lenovo Legion Pro 5 16IRX8 analyse audio
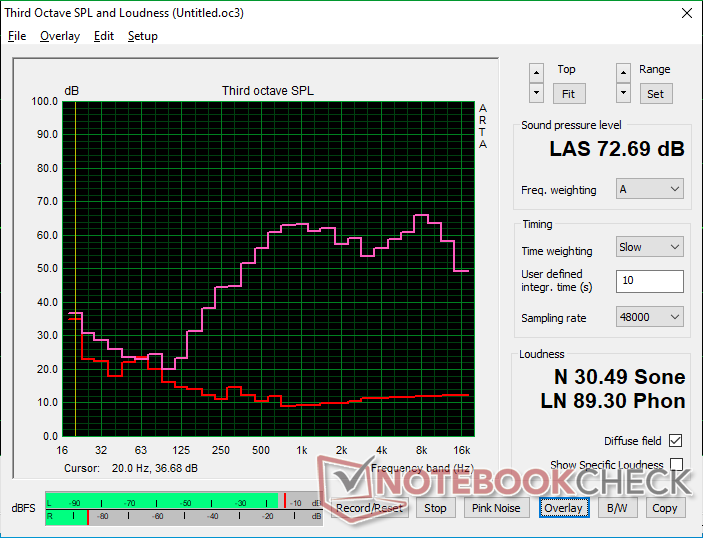
(±) | le niveau sonore du haut-parleur est moyen mais bon (72.7# dB)
Basses 100 - 315 Hz
(-) | presque aucune basse - en moyenne 23.7% plus bas que la médiane
(±) | la linéarité des basses est moyenne (10.7% delta à la fréquence précédente)
Médiums 400 - 2000 Hz
(+) | médiane équilibrée - seulement 3.8% de la médiane
(±) | la linéarité des médiums est moyenne (7.1% delta à la fréquence précédente)
Aiguës 2 - 16 kHz
(+) | des sommets équilibrés - à seulement 3.7% de la médiane
(+) | les aigus sont linéaires (6.7% delta à la fréquence précédente)
Globalement 100 - 16 000 Hz
(±) | la linéarité du son global est moyenne (21.9% de différence avec la médiane)
Par rapport à la même classe
» 79% de tous les appareils testés de cette catégorie étaient meilleurs, 6% similaires, 16% pires
» Le meilleur avait un delta de 6%, la moyenne était de 18%, le pire était de 132%.
Par rapport à tous les appareils testés
» 63% de tous les appareils testés étaient meilleurs, 7% similaires, 30% pires
» Le meilleur avait un delta de 4%, la moyenne était de 23%, le pire était de 134%.
Apple MacBook Pro 16 2021 M1 Pro analyse audio
(+) | les haut-parleurs peuvent jouer relativement fort (84.7# dB)
Basses 100 - 315 Hz
(+) | bonne basse - seulement 3.8% loin de la médiane
(+) | les basses sont linéaires (5.2% delta à la fréquence précédente)
Médiums 400 - 2000 Hz
(+) | médiane équilibrée - seulement 1.3% de la médiane
(+) | les médiums sont linéaires (2.1% delta à la fréquence précédente)
Aiguës 2 - 16 kHz
(+) | des sommets équilibrés - à seulement 1.9% de la médiane
(+) | les aigus sont linéaires (2.7% delta à la fréquence précédente)
Globalement 100 - 16 000 Hz
(+) | le son global est linéaire (4.6% différence à la médiane)
Par rapport à la même classe
» 0% de tous les appareils testés de cette catégorie étaient meilleurs, 0% similaires, 100% pires
» Le meilleur avait un delta de 5%, la moyenne était de 17%, le pire était de 45%.
Par rapport à tous les appareils testés
» 0% de tous les appareils testés étaient meilleurs, 0% similaires, 100% pires
» Le meilleur avait un delta de 4%, la moyenne était de 23%, le pire était de 134%.
Gestion de l'énergie
Consommation d'énergie - aussi exigeante qu'avant
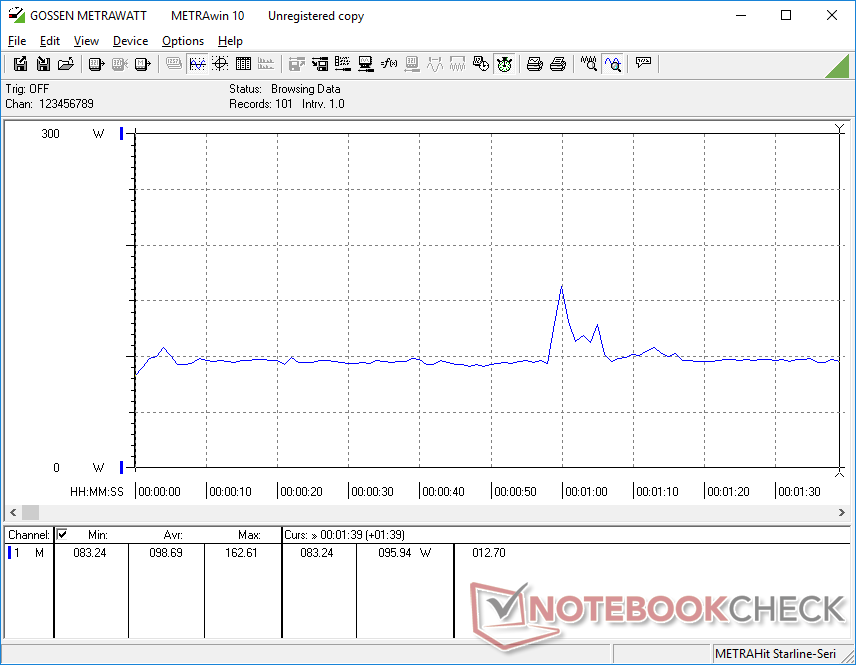
Le système est exceptionnellement exigeant lorsqu'il tourne au ralenti sur l'ordinateur de bureau, où nous avons pu mesurer un minimum de 24 W, contre seulement 10 W à 15 W sur des alternatives comme le ROG Zephyrus M16 ou le Blade 16. Nous avons même pris soin de mettre le système en mode économie d'énergie avec l'iGPU actif et la luminosité minimale, mais les résultats ne se sont pas améliorés. La consommation relativement élevée peut être en partie responsable de la durée de vie de la batterie plus courte que prévu, comme nous le verrons dans la section suivante.
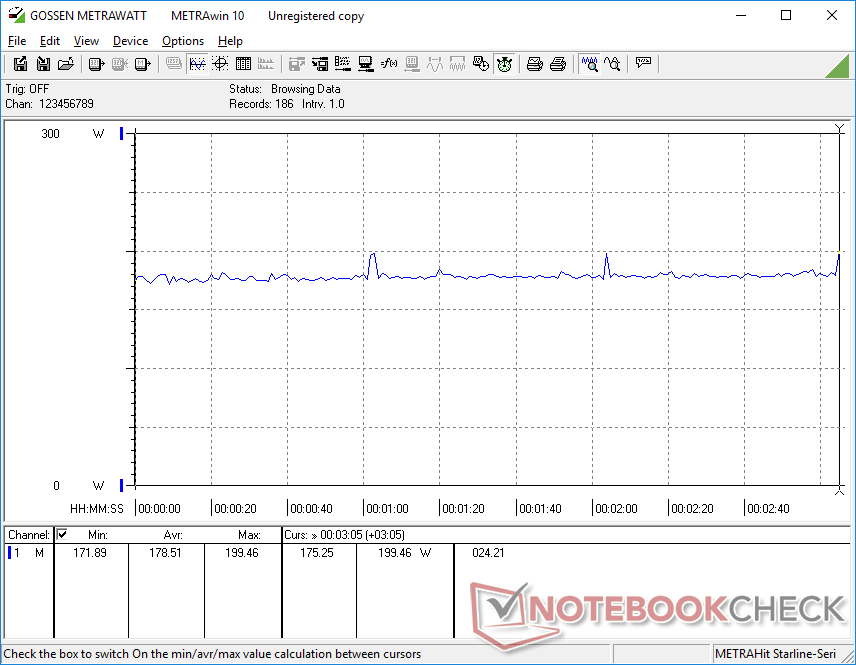
L'utilisation de Witcher 3 consommerait 179 W, contre 209 W sur le Legion 5 Pro 16 de l'année dernière avec la RTX 3070 Ti. Ce GPU est environ 15 à 20 % plus rapide que notre RTX 4060 et avec un objectif TGP plus élevé comme indiqué précédemment, ce qui correspond à une consommation d'énergie 15 % plus élevée. Les performances par watt restent donc relativement linéaires d'une année sur l'autre.
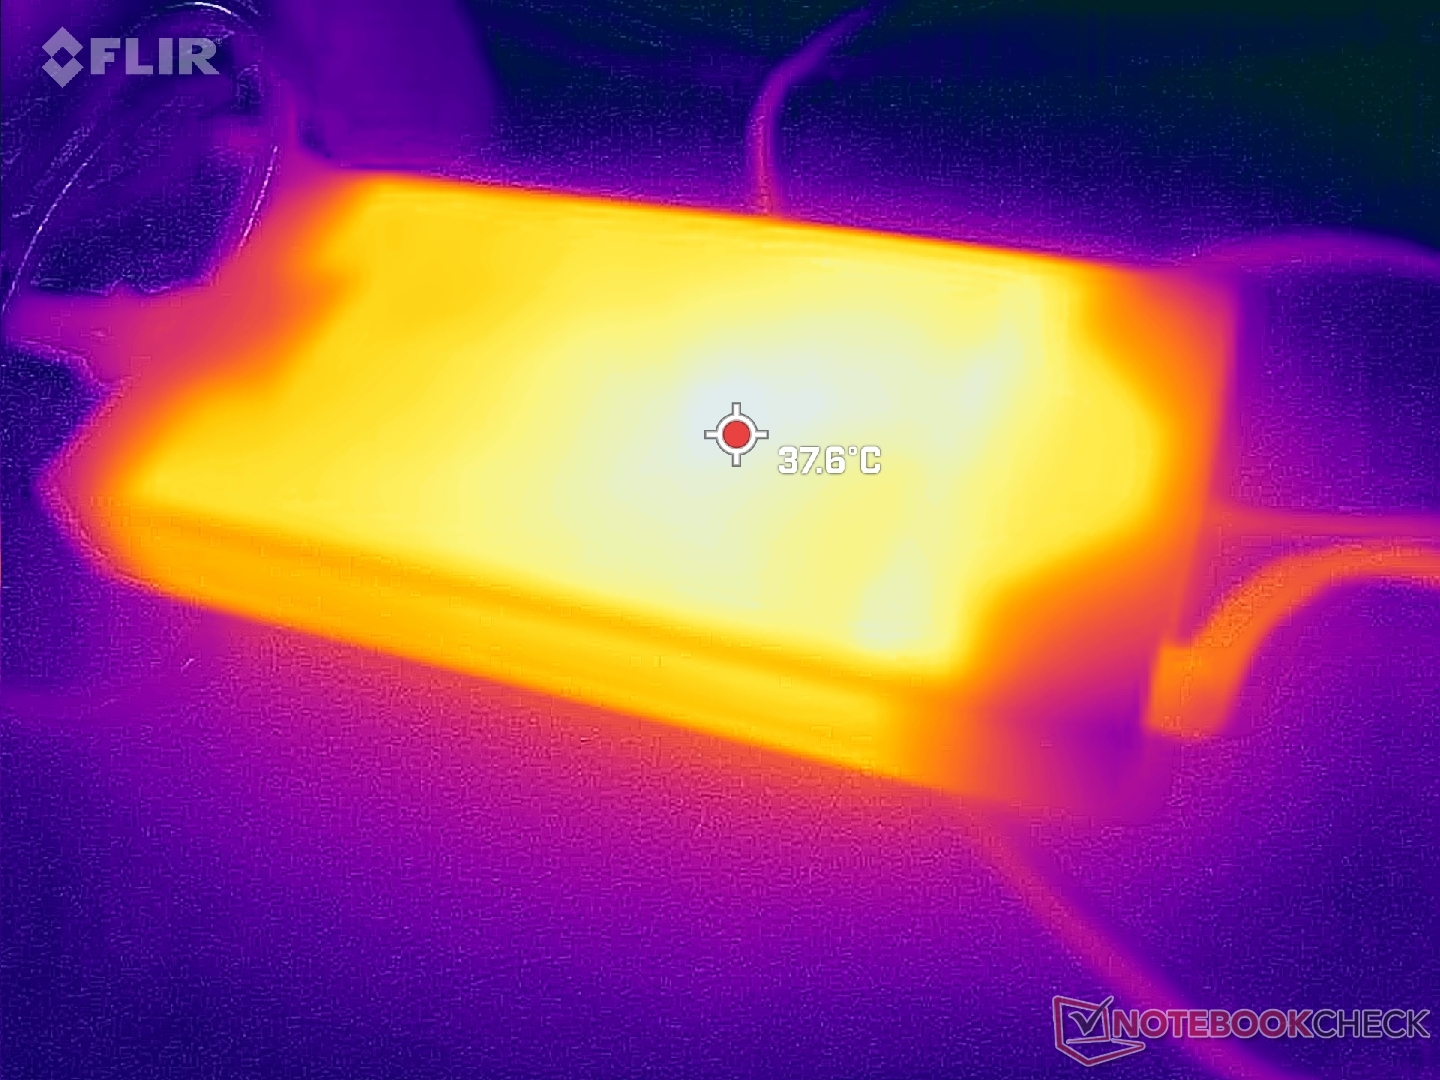
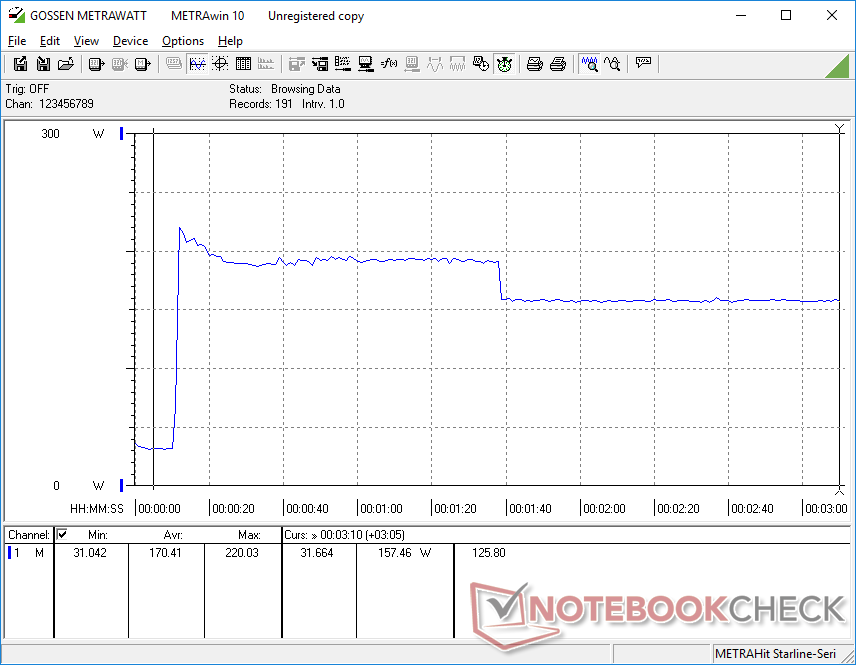
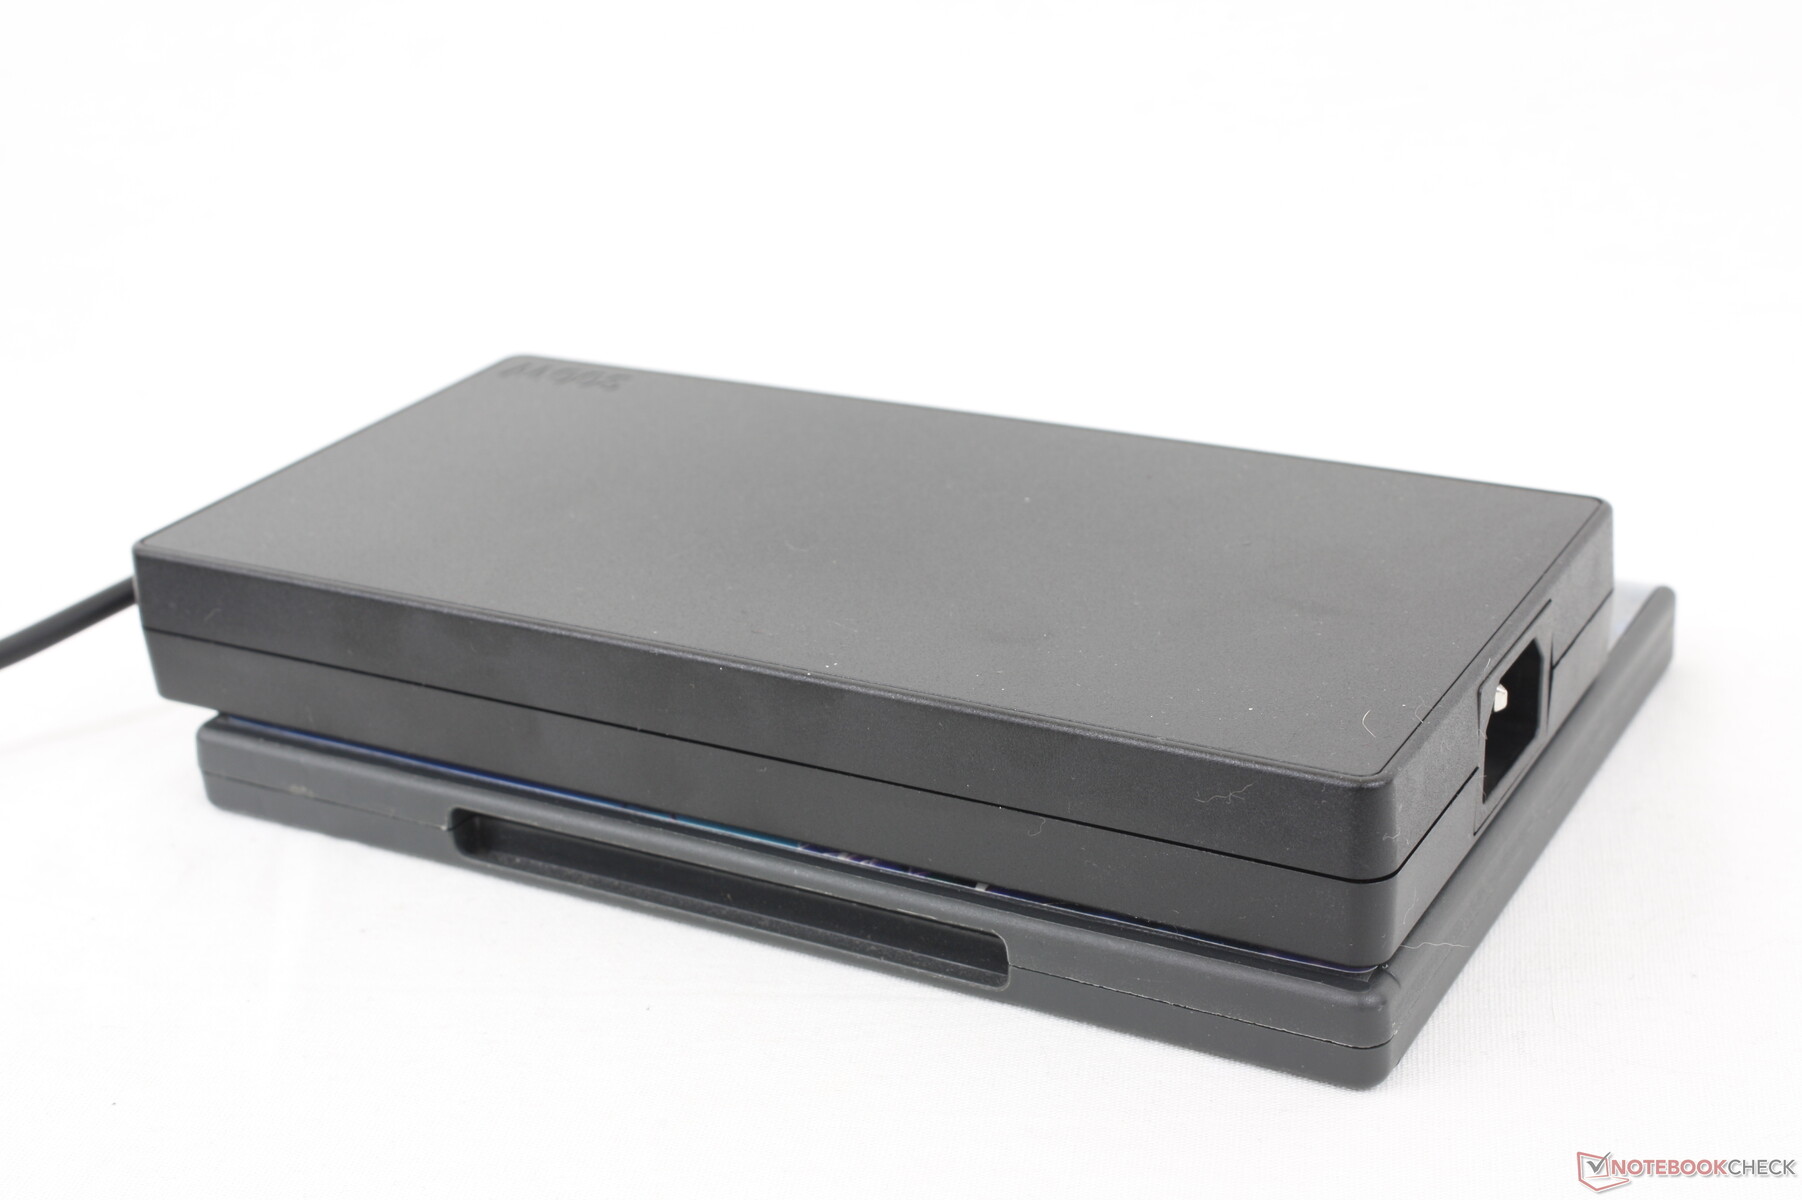
Nous avons pu mesurer une consommation maximale de 250 W sur le grand adaptateur CA de 300 W (~19,9 x 9,9 x 2,6 cm) lorsque le CPU et le GPU sont utilisés à 100 %. Lenovo utilise ce même adaptateur de 300 W pour la plupart de ses autres modèles Legion.
| Éteint/en veille | |
| Au repos | |
| Fortement sollicité |
|
Légende:
min: | |
| Lenovo Legion Pro 5 16IRX8 i7-13700HX, GeForce RTX 4060 Laptop GPU, SK hynix PC801 HFS512GEJ9X115N, IPS, 2560x1600, 16" | Asus ROG Zephyrus M16 GU603Z i9-12900H, GeForce RTX 3070 Ti Laptop GPU, Micron 3400 1TB MTFDKBA1T0TFH, IPS, 2560x1600, 16" | Razer Blade 16 Early 2023 i9-13950HX, GeForce RTX 4080 Laptop GPU, SSSTC CA6-8D1024, IPS, 2560x1600, 16" | Lenovo Legion Pro 7 16IRX8H i9-13900HX, GeForce RTX 4080 Laptop GPU, Samsung PM9A1 MZVL21T0HCLR, IPS, 2560x1600, 16" | Lenovo Legion 5 Pro 16ARH7H RTX 3070 Ti R7 6800H, GeForce RTX 3070 Ti Laptop GPU, Samsung PM9A1 MZVL21T0HCLR, IPS, 2560x1600, 16" | Lenovo Legion S7 16ARHA7 R9 6900HX, Radeon RX 6800S, SK Hynix HFS001TEJ9X115N, IPS, 2560x1600, 16" | |
|---|---|---|---|---|---|---|
| Power Consumption | 27% | -9% | -9% | 10% | 31% | |
| Idle Minimum * (Watt) | 24.5 | 10.8 56% | 15.2 38% | 18 27% | 9.7 60% | 8.8 64% |
| Idle Average * (Watt) | 29.2 | 17 42% | 22.8 22% | 24 18% | 14.8 49% | 14.7 50% |
| Idle Maximum * (Watt) | 34.3 | 17.8 48% | 49.8 -45% | 32 7% | 45.8 -34% | 19.8 42% |
| Load Average * (Watt) | 98.7 | 116 -18% | 121.2 -23% | 130 -32% | 87.2 12% | 85.3 14% |
| Witcher 3 ultra * (Watt) | 178.6 | 144 19% | 242 -35% | 260 -46% | 209 -17% | 167.5 6% |
| Load Maximum * (Watt) | 249.6 | 220 12% | 273.7 -10% | 320 -28% | 275.3 -10% | 230.7 8% |
* ... Moindre est la valeur, meilleures sont les performances
Power Consumption Witcher 3 / Stresstest
Power Consumption external Monitor
Autonomie de la batterie - plus courte que les autres ordinateurs portables de jeu
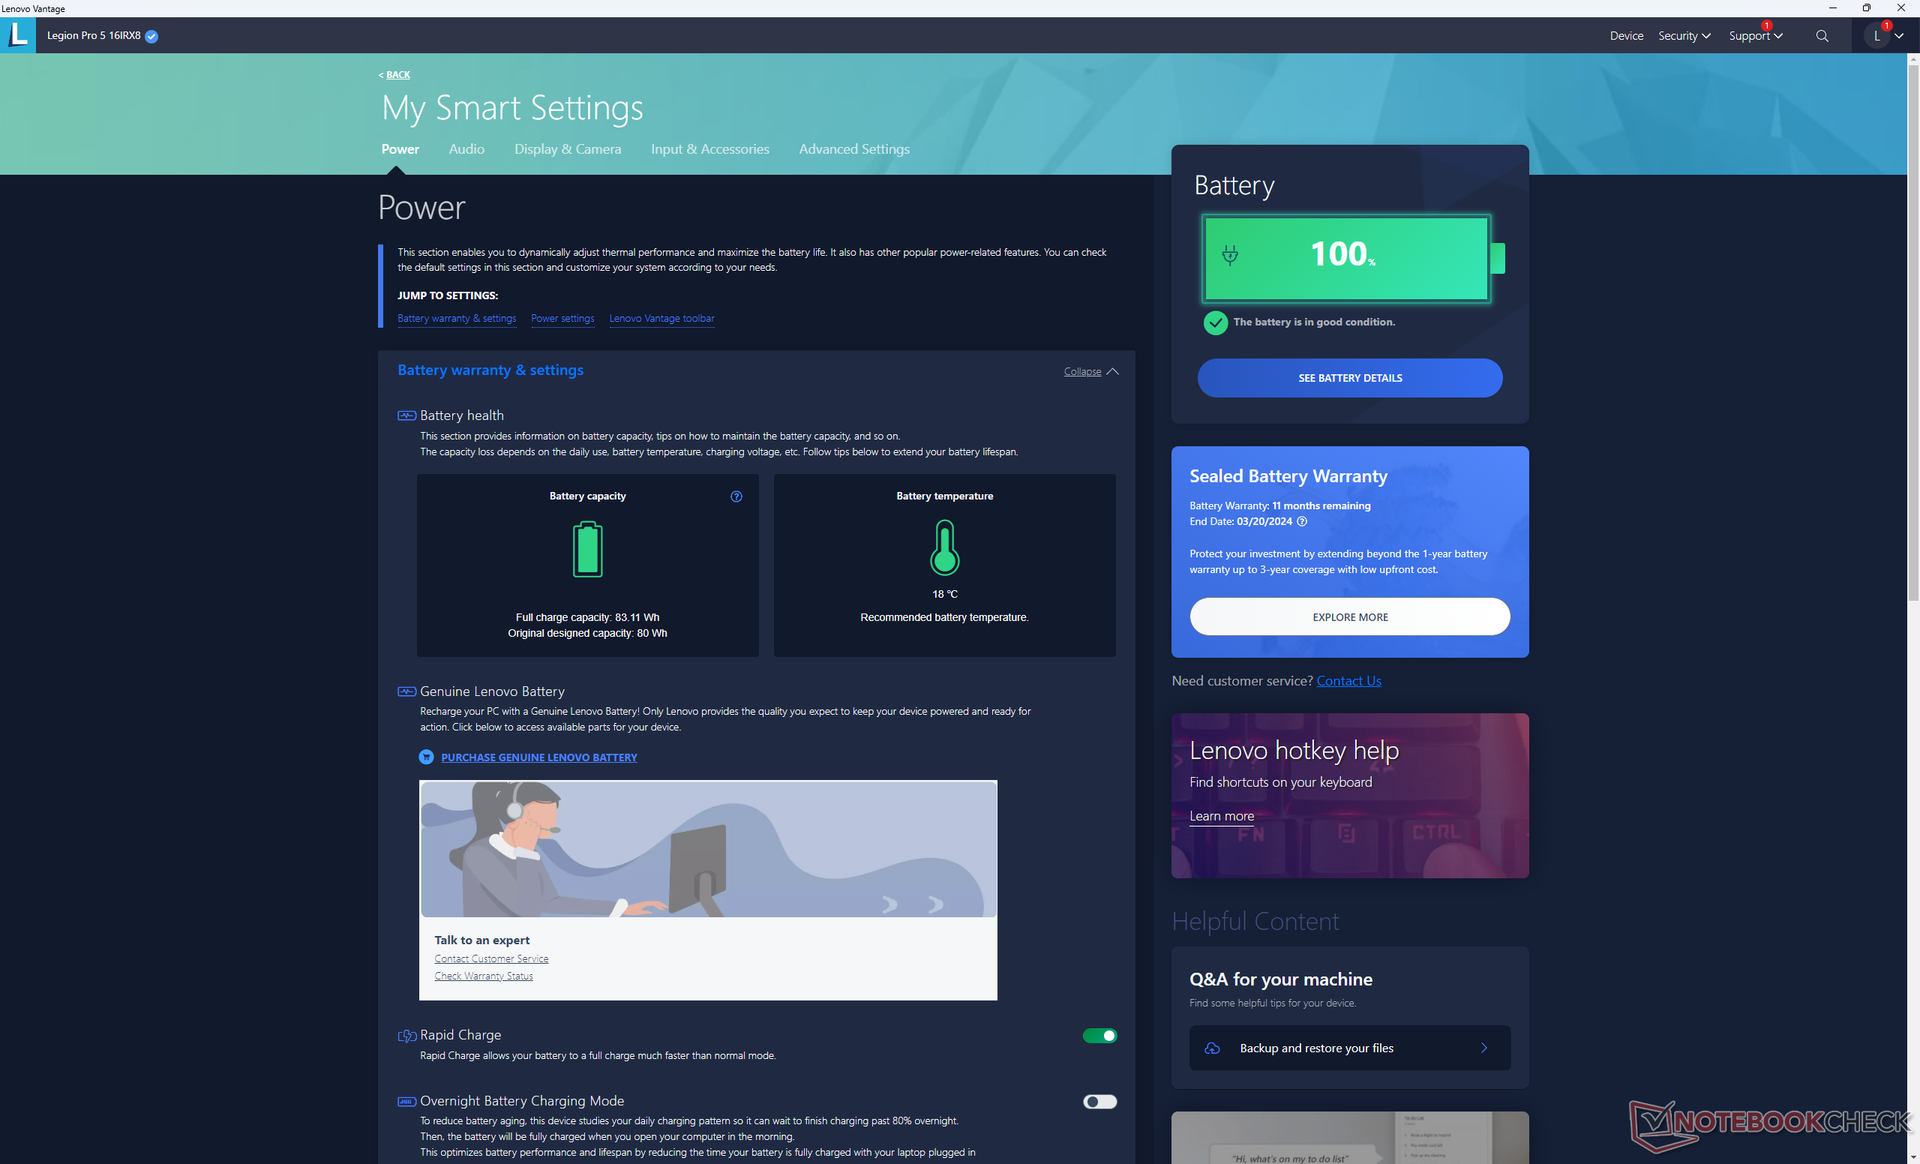
La capacité de la batterie reste de 80 Wh, contre 99 Wh pour le modèle plus coûteux Legion 7 Pro plus onéreux. Les durées d'utilisation sont courtes, ce qui semble être une tendance parmi les modèles Legion; nous n'avons pu enregistrer qu'une durée d'utilisation WLAN de moins de 3,5 heures, même en mode iGPU et profil équilibré. Le Razer Blade 16 et l'Asus ROG Zephyrus M16 ont chacun une autonomie supérieure de plusieurs heures.
Le chargement de la batterie vide à la batterie pleine est relativement rapide (moins de 90 minutes) grâce à l'adaptateur secteur fourni. Le système peut également être rechargé via des adaptateurs USB-C plus petits, bien qu'à un rythme plus lent et avec des performances limitées.
| Lenovo Legion Pro 5 16IRX8 i7-13700HX, GeForce RTX 4060 Laptop GPU, 80 Wh | Asus ROG Zephyrus M16 GU603Z i9-12900H, GeForce RTX 3070 Ti Laptop GPU, 90 Wh | Razer Blade 16 Early 2023 i9-13950HX, GeForce RTX 4080 Laptop GPU, 95.2 Wh | Lenovo Legion Pro 7 16IRX8H i9-13900HX, GeForce RTX 4080 Laptop GPU, 99.9 Wh | Lenovo Legion 5 Pro 16ARH7H RTX 3070 Ti R7 6800H, GeForce RTX 3070 Ti Laptop GPU, 80 Wh | Lenovo Legion S7 16ARHA7 R9 6900HX, Radeon RX 6800S, 71 Wh | |
|---|---|---|---|---|---|---|
| Autonomie de la batterie | 109% | 71% | 82% | 29% | 82% | |
| Reader / Idle (h) | 6.7 | 8.9 33% | 6.4 -4% | |||
| WiFi v1.3 (h) | 3.4 | 7.4 118% | 6.1 79% | 5.1 50% | 4.4 29% | 6.2 82% |
| Load (h) | 0.7 | 1.4 100% | 1.4 100% | 2.1 200% | ||
| H.264 (h) | 7.3 |
Points positifs
Points négatifs
Verdict - Quelques fonctionnalités manquantes pour le prix
Le 2023 Legion Pro 5 16 configuré avec la carte graphique GeForce RTX 4060 n'est pas un ordinateur portable de jeu bon marché à 1600 USD. Ce n'est pas un problème, bien sûr, tant qu'il est équipé des fonctions que les joueurs recherchent. G-Sync, QHD+ 165 Hz, couleurs sRGB, facilité d'entretien et grandes touches fléchées sont autant d'éléments qui font de ce modèle un ordinateur portable de jeu bien équilibré.
Néanmoins, nous pouvons remarquer quelques coupes sombres, même dans cette gamme de prix. Le modèle omet quelques fonctionnalités clés comme l'éclairage RGB par touche, le support Thunderbolt, Advanced Optimus, et les options de panneau AdobeRGB. Ce dernier point en particulier signifie que le Legion Pro 5 16 n'est peut-être pas la meilleure solution pour les utilisateurs qui sont à la fois des créateurs de contenu, des artistes numériques et des joueurs. Des modèles concurrents comme leRazer Blade 16, Aero 16ou Asus ROG Zephyrus M16 sont non seulement plus légers et plus minces, mais ils offrent également des options d'affichage plus larges ainsi que certaines des fonctionnalités manquantes mentionnées plus haut.
Le nouveau Legion Pro 5 16 couvre presque tout ce que l'on peut attendre d'un ordinateur portable de jeu de milieu de gamme. Cependant, certaines caractéristiques souhaitables comme AdobeRGB, Thunderbolt et Advanced Optimus sont malheureusement absentes.
Du côté des performances, les utilisateurs de systèmes équipés de CPU Intel de 12e génération et de GPU GeForce RTX 3070 ou plus ne verront pas beaucoup d'avantages à passer à la 13e génération Intel avec des graphiques GeForce RTX 4060 ou 4070. Les machines plus anciennes équipées de GPU GeForce RTX 20 et de CPU Intel ou AMD Zen 3 de la 11ème génération peuvent envisager de passer à la vitesse supérieure.
Prix et disponibilité
Lenovo commercialise actuellement le Legion Pro 5 16IRX8 dans notre configuration d'évaluation au prix de 1600 USD.
Lenovo Legion Pro 5 16IRX8
- 05/05/2023 v7 (old)
Allen Ngo
Transparency
La sélection des appareils à examiner est effectuée par notre équipe éditoriale. L'échantillon de test a été prêté à l'auteur par le fabricant ou le détaillant pour les besoins de cet examen. Le prêteur n'a pas eu d'influence sur cette évaluation et le fabricant n'a pas reçu de copie de cette évaluation avant sa publication. Il n'y avait aucune obligation de publier cet article. En tant que média indépendant, Notebookcheck n'est pas soumis à l'autorité des fabricants, des détaillants ou des éditeurs.
Voici comment Notebookcheck teste
Chaque année, Notebookcheck examine de manière indépendante des centaines d'ordinateurs portables et de smartphones en utilisant des procédures standardisées afin de garantir que tous les résultats sont comparables. Nous avons continuellement développé nos méthodes de test depuis environ 20 ans et avons établi des normes industrielles dans le processus. Dans nos laboratoires de test, des équipements de mesure de haute qualité sont utilisés par des techniciens et des rédacteurs expérimentés. Ces tests impliquent un processus de validation en plusieurs étapes. Notre système d'évaluation complexe repose sur des centaines de mesures et de points de référence bien fondés, ce qui garantit l'objectivité.Price comparison

