Critiques du AMD Ryzen 7 7840HS processeur
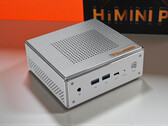
Test du Peladn HA-4 (Ryzen 7 7840HS) : puissant pour son prix, il défie Geekom, Minisforum et consorts
Le Peladn HA-4 est un mini PC puissant mais compact avec le processeur AMD Ryzen 7 7840HS, 8 cœurs Zen4 et une carte graphique Radeon 780M intégrée. Grâce à une RAM DDR5 rapide et un SSD PCIe rapide, il offre des performances puissantes dans un boîtier peu encombrant. Avec un prix d'environ 505 $, le Peladn HA-4 est l'un des mini PC les plus efficaces dans sa catégorie de prix.
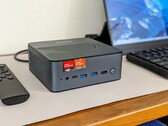
AMD Ryzen 7 7840HS, Radeon 780M, 965 gTest du Bosgame M4 Neo - une alternative abordable aux mini PC coûteux
Petit, puissant et flexible - avec l'AMD Ryzen 7 7840HS, la Radeon 780M iGPU et la connexion OCuLink, le Bosgame M4 Neo offre de nombreuses performances dans un format miniature. Mais comment ce PC compact se comporte-t-il au quotidien ? Nous avons testé en détail ce concentré de puissance bon marché.
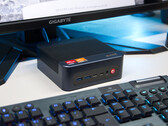
AMD Ryzen 7 7840HS, Radeon 780M, 560 gTest du M1 de BOSGAME : le Ryzen 7 7840HS est encore une bête pour mini-PC
Si vous ne vous souciez pas de l'accélération de l'IA, le Bosgame M1 est l'un des mini-PC les plus rapides pour sa taille. Il intègre même des haut-parleurs stéréo, contrairement à la plupart des autres produits de cette catégorie.
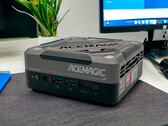
AMD Ryzen 7 7840HS, Radeon 780M, 766 gTest de l'Acemagic AM18 : mini-PC de jeu au look cyberpunk avec Ryzen 7 7840HS et 32 Go de RAM
L'Acemagic AM18 est présenté comme un PC de jeu compact. Avec l'AMD Ryzen 780HS et l'AMD Radeon 780M, il contient du matériel intéressant que l'on retrouve dans de nombreux appareils portables. Nous avons analysé le fonctionnement du matériel intégré de l'Acemagic AM18 en nous basant sur de nombreuses mesures et benchmarks.
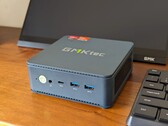
AMD Ryzen 7 7840HS, Radeon 780M, 600 gTest du GMK NucBox K6 : mini-PC aussi puissant que les derniers PC portables Intel Core Ultra
Le mini PC est livré avec 16 Go de RAM, 1 To de stockage et un puissant Ryzen 7 7840HS, le tout pour moins de 500 $, ce qui en fait une alternative attrayante au NUC d'Intel. Il y a bien quelques inconvénients, mais ils sont bien pâles en comparaison de la longue liste de points forts.
AMD Ryzen 7 7840HS, Radeon 780M, 514 gGigabyte Aorus RTX 4090 Gaming Box (eGPU): , 0.00"
Critique » Test du Gigabyte Aorus RTX 4090 Gaming Box : le GPU Nvidia le plus puissant bridé par Thunderbolt
Tuxedo Pulse 14 Gen3: AMD Radeon 780M, 14.00", 1.4 kg
Critique » Test du Tuxedo Pulse 14 Gen3 : l'ultrabook Linux avec AMD Zen4 et un écran 120 Hz
Lenovo Yoga Pro 7 14APH G8: AMD Radeon 780M, 14.50", 1.5 kg
Critique » Test du Lenovo Yoga Pro 7 14 G8 : le Zen4 d'AMD n'est pas toujours le meilleur
Minisforum EliteMini UM780 XTX: AMD Radeon 780M, 0.8 kg
Critique » Test du Minisforum EliteMini UM780 XTX : mini PC Ryzen 7 7840HS, Radeon 780M, OCuLink et USB 4
Lenovo Legion Slim 7 16APH8: NVIDIA GeForce RTX 4060 Laptop GPU, 16.00", 2.1 kg
Critique » Test du Lenovo Legion Slim 7 16 : Convaincant même avec AMD Ryzen
Schenker XMG Apex 15 (Late 23): NVIDIA GeForce RTX 4050 Laptop GPU, 15.60", 2.2 kg
Critique » Test du XMG Apex 15 (fin 2023) : PC portable de jeu avec RTX 4050 et une bonne autonomie
Schenker XMG CORE 16 (L23): NVIDIA GeForce RTX 4070 Laptop GPU, 16.00", 2.4 kg
Critique » Test du Schenker XMG Core 16 : un vrai concurrent au Lenovo Legion Pro 5 16
Schenker XMG Apex 17 (Late 23): NVIDIA GeForce RTX 4060 Laptop GPU, 17.30", 2.5 kg
Critique » Test du XMG Apex 17 : un ordinateur portable de jeu QHD avec une RTX 4060
Lenovo Legion Slim 5 14APH8: NVIDIA GeForce RTX 4060 Laptop GPU, 14.50", 1.7 kg
Critique » Test du Lenovo Legion Slim 5 14APH8 : son point fort, l'OLED 2,8K à 120 Hz
HP Omen 16-xf0376ng: NVIDIA GeForce RTX 4070 Laptop GPU, 16.10", 2.4 kg
Critique » Test du HP Omen 16 : un bon choix pour les joueurs, même avec le Zen 4
Beelink SER7: AMD Radeon 780M, 0.6 kg
Critique » Test du Beelink SER7 : mini PC Ryzen 7 7840HS avec refroidissement par chambre à vapeur
Lenovo Legion Slim 5 16APH8: NVIDIA GeForce RTX 4060 Laptop GPU, 16.00", 2.4 kg
Critique » Test du Lenovo Legion Slim 5 16APH8 : design décevant et GPU peu performant
Lenovo LOQ 15APH8: NVIDIA GeForce RTX 4050 Laptop GPU, 15.60", 2.5 kg
Critique » Test du Lenovo LOQ 15 Ryzen 7 7840HS : ordinateur portable Legion qui a de l'allure
Beelink GTR7 7840HS: AMD Radeon 780M, 0.9 kg
Critique » Test du Beelink GTR7 : première évaluation de l'AMD Ryzen 7 7840HS dans ce mini-PC
Acer Nitro 16 AN16-41, R7 7840HS RTX 4060: NVIDIA GeForce RTX 4060 Laptop GPU, 16.00", 2.7 kg
Autres tests » Acer Nitro 16 AN16-41, R7 7840HS RTX 4060
HP ZBook Firefly 14 G10, R7 7840HS: AMD Radeon 780M, 14.00", 1.5 kg
Autres tests » HP ZBook Firefly 14 G10, R7 7840HS
Acer Nitro 16 AN16-41-R6KQ: NVIDIA GeForce RTX 4070 Laptop GPU, 16.00", 2.7 kg
Autres tests » Acer Nitro 16 AN16-41-R6KQ
HP Omen 16-xf0079ng: NVIDIA GeForce RTX 4070 Laptop GPU, 16.10", 2.4 kg
Autres tests » HP Omen 16-xf0079ng
Lenovo IdeaPad Pro 5 16APH8: AMD Radeon 780M, 16.00", 1.9 kg
Autres tests » Lenovo IdeaPad Pro 5 16APH8
Acer Swift X SFX16-61G-R0SU: NVIDIA GeForce RTX 4050 Laptop GPU, 16.00", 2 kg
Autres tests » Acer Swift X SFX16-61G-R0SU
HP Victus 16-s0475ng: NVIDIA GeForce RTX 4060 Laptop GPU, 16.10", 2.3 kg
Autres tests » HP Victus 16-s0475ng
Acer Nitro 17 AN17-41-R182: NVIDIA GeForce RTX 4060 Laptop GPU, 17.30", 3 kg
Autres tests » Acer Nitro 17 AN17-41-R182
Acer Nitro 17 AN17-41: NVIDIA GeForce RTX 4070 Laptop GPU, 17.30", 3 kg
Autres tests » Acer Nitro 17 AN17-41
Schenker XMG CORE 16 (L23): NVIDIA GeForce RTX 4070 Laptop GPU, 16.00", 2.4 kg
Autres tests » SCHENKER XMG CORE 16 (L23)
HP Omen 16-xf0000: NVIDIA GeForce RTX 4060 Laptop GPU, 16.10", 2.4 kg
Autres tests » HP Omen 16-xf0000
Lenovo LOQ 15, R7 7840HS RTX 4060: NVIDIA GeForce RTX 4060 Laptop GPU, 15.60", 2.4 kg
Autres tests » Lenovo LOQ 15, R7 7840HS RTX 4060
Lenovo Yoga Pro 7 14APH G8: AMD Radeon 780M, 14.50", 1.5 kg
Autres tests » Lenovo Yoga Pro 7 14APH8
HP Victus 16-s0000ng: NVIDIA GeForce RTX 4050 Laptop GPU, 16.10", 2.3 kg
Autres tests » HP Victus 16-s0000ng
Lenovo IdeaPad 5 Pro 16APH8: AMD Radeon 780M, 16.00", 1.9 kg
Autres tests » Lenovo IdeaPad 5 Pro 16APH8
HP Victus 16-s0000: NVIDIA GeForce RTX 4070 Laptop GPU, 16.10", 2.3 kg
Autres tests » HP Victus 16-s0000
Lenovo Legion Slim 5 14APH8: NVIDIA GeForce RTX 4060 Laptop GPU, 14.50", 1.7 kg
Autres tests » Lenovo Legion Slim 5 14APH8
Xiaomi RedmiBook Pro 15 2023: AMD Radeon 780M, 15.60", 1.8 kg
Autres tests » Xiaomi RedmiBook Pro 15 2023
Lenovo LOQ 15APH8: NVIDIA GeForce RTX 4050 Laptop GPU, 15.60", 2.5 kg
Autres tests » Lenovo LOQ 15APH8
Acer Nitro 17 AN17-41-R6L9: NVIDIA GeForce RTX 4050 Laptop GPU, 17.30", 3 kg
Autres tests » Acer Nitro 17 AN17-41-R6L9
Lenovo Legion Slim 5 16APH8: NVIDIA GeForce RTX 4060 Laptop GPU, 16.00", 2.4 kg
Autres tests » Lenovo Legion Slim 5 16APH8
Acemagic AM18: AMD Radeon 780M, 0.6 kg
» Anniversaire d'Acemagic 2026 : Grande campagne de réduction sur les mini-PC, les ordinateurs portables et les systèmes NAS
Peladn HA-4, R7 7840HS: AMD Radeon 780M, 1 kg
» Test d'un mini PC Ryzen 7 élégant - Peladn HA-4 avec une efficacité maximale et un éclairage RGB