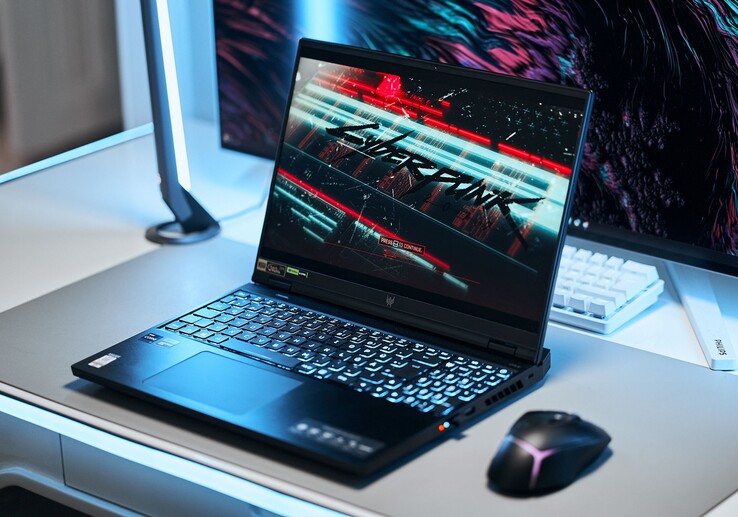
Test de l'Acer Predator Helios 16 : PC portable de jeu silencieux avec de nombreux atouts
En tant que successeur du Predator Helios 300le Predator Helios 16 est le dernier ordinateur portable de jeu haut de gamme d'Acer avec des éléments de milieu de gamme. Notre modèle d'évaluation a opté pour uneRTX 4060un GPU de milieu de gamme, et coûte environ 1700$, avec des SKUs allant jusqu'à uneRTX 4080sont également disponibles. Le milieu de gamme pur d'Acer est représenté par leHelios Neo 16et la sérieSérie Nitrocette dernière servant à couvrir le segment d'entrée de gamme. En revanche, leTriton 16est l'ordinateur portable de jeu ultrafin d'Acer.
En outre, un processeur Intel Core i7-13700HX (TDP de 55 watts), 16 Go de RAM DDR5 (deux banques de RAM) et un SSD de 1 To (PCIe 4.0) sont également mis en œuvre. Bien qu'un écran mini-LED soit également disponible, notre modèle est équipé d'une dalle IPS rétroéclairée par LED qui, contre toute attente, a opté pour un ensemble de fonctionnalités haut de gamme, comme le montre notre évaluation.
La concurrence se présente principalement sous la forme du Lenovo Legion Pro 5 de Lenovo, mais le Asus TUF Gaming A16de Gigabyte Aorus 15Xde Gigabyte et le G15 se disputent également le titre de meilleur ordinateur portable de jeu de milieu de gamme.
Comparaison avec les concurrents potentiels
Note | Date | Modèle | Poids | Épaisseur | Taille | Résolution | Prix |
|---|---|---|---|---|---|---|---|
| 89.5 % v7 (old) | 07/23 | Acer Predator Helios 16 PH16-71-731Q i7-13700HX, GeForce RTX 4060 Laptop GPU | 2.6 kg | 26.9 mm | 16.00" | 2560x1600 | |
| 88.1 % v7 (old) | 06/23 | Acer Nitro 16 AN16-41 R7 7735HS, GeForce RTX 4070 Laptop GPU | 2.7 kg | 27.9 mm | 16.00" | 2560x1600 | |
| 87.9 % v7 (old) | 05/23 | Lenovo Legion Pro 5 16IRX8 i7-13700HX, GeForce RTX 4060 Laptop GPU | 2.5 kg | 26.8 mm | 16.00" | 2560x1600 | |
| 86.2 % v7 (old) | 04/23 | Aorus 15X ASF i7-13700HX, GeForce RTX 4070 Laptop GPU | 2.3 kg | 19.7 mm | 15.60" | 2560x1440 | |
| 86.2 % v7 (old) | 02/23 | Asus TUF Gaming A16 FA617 R7 7735HS, Radeon RX 7600S | 2.2 kg | 27 mm | 16.00" | 1920x1200 | |
| 84.2 % v7 (old) | 06/23 | Dell G15 5530 i7-13650HX, GeForce RTX 4060 Laptop GPU | 3 kg | 26.95 mm | 15.60" | 1920x1080 |
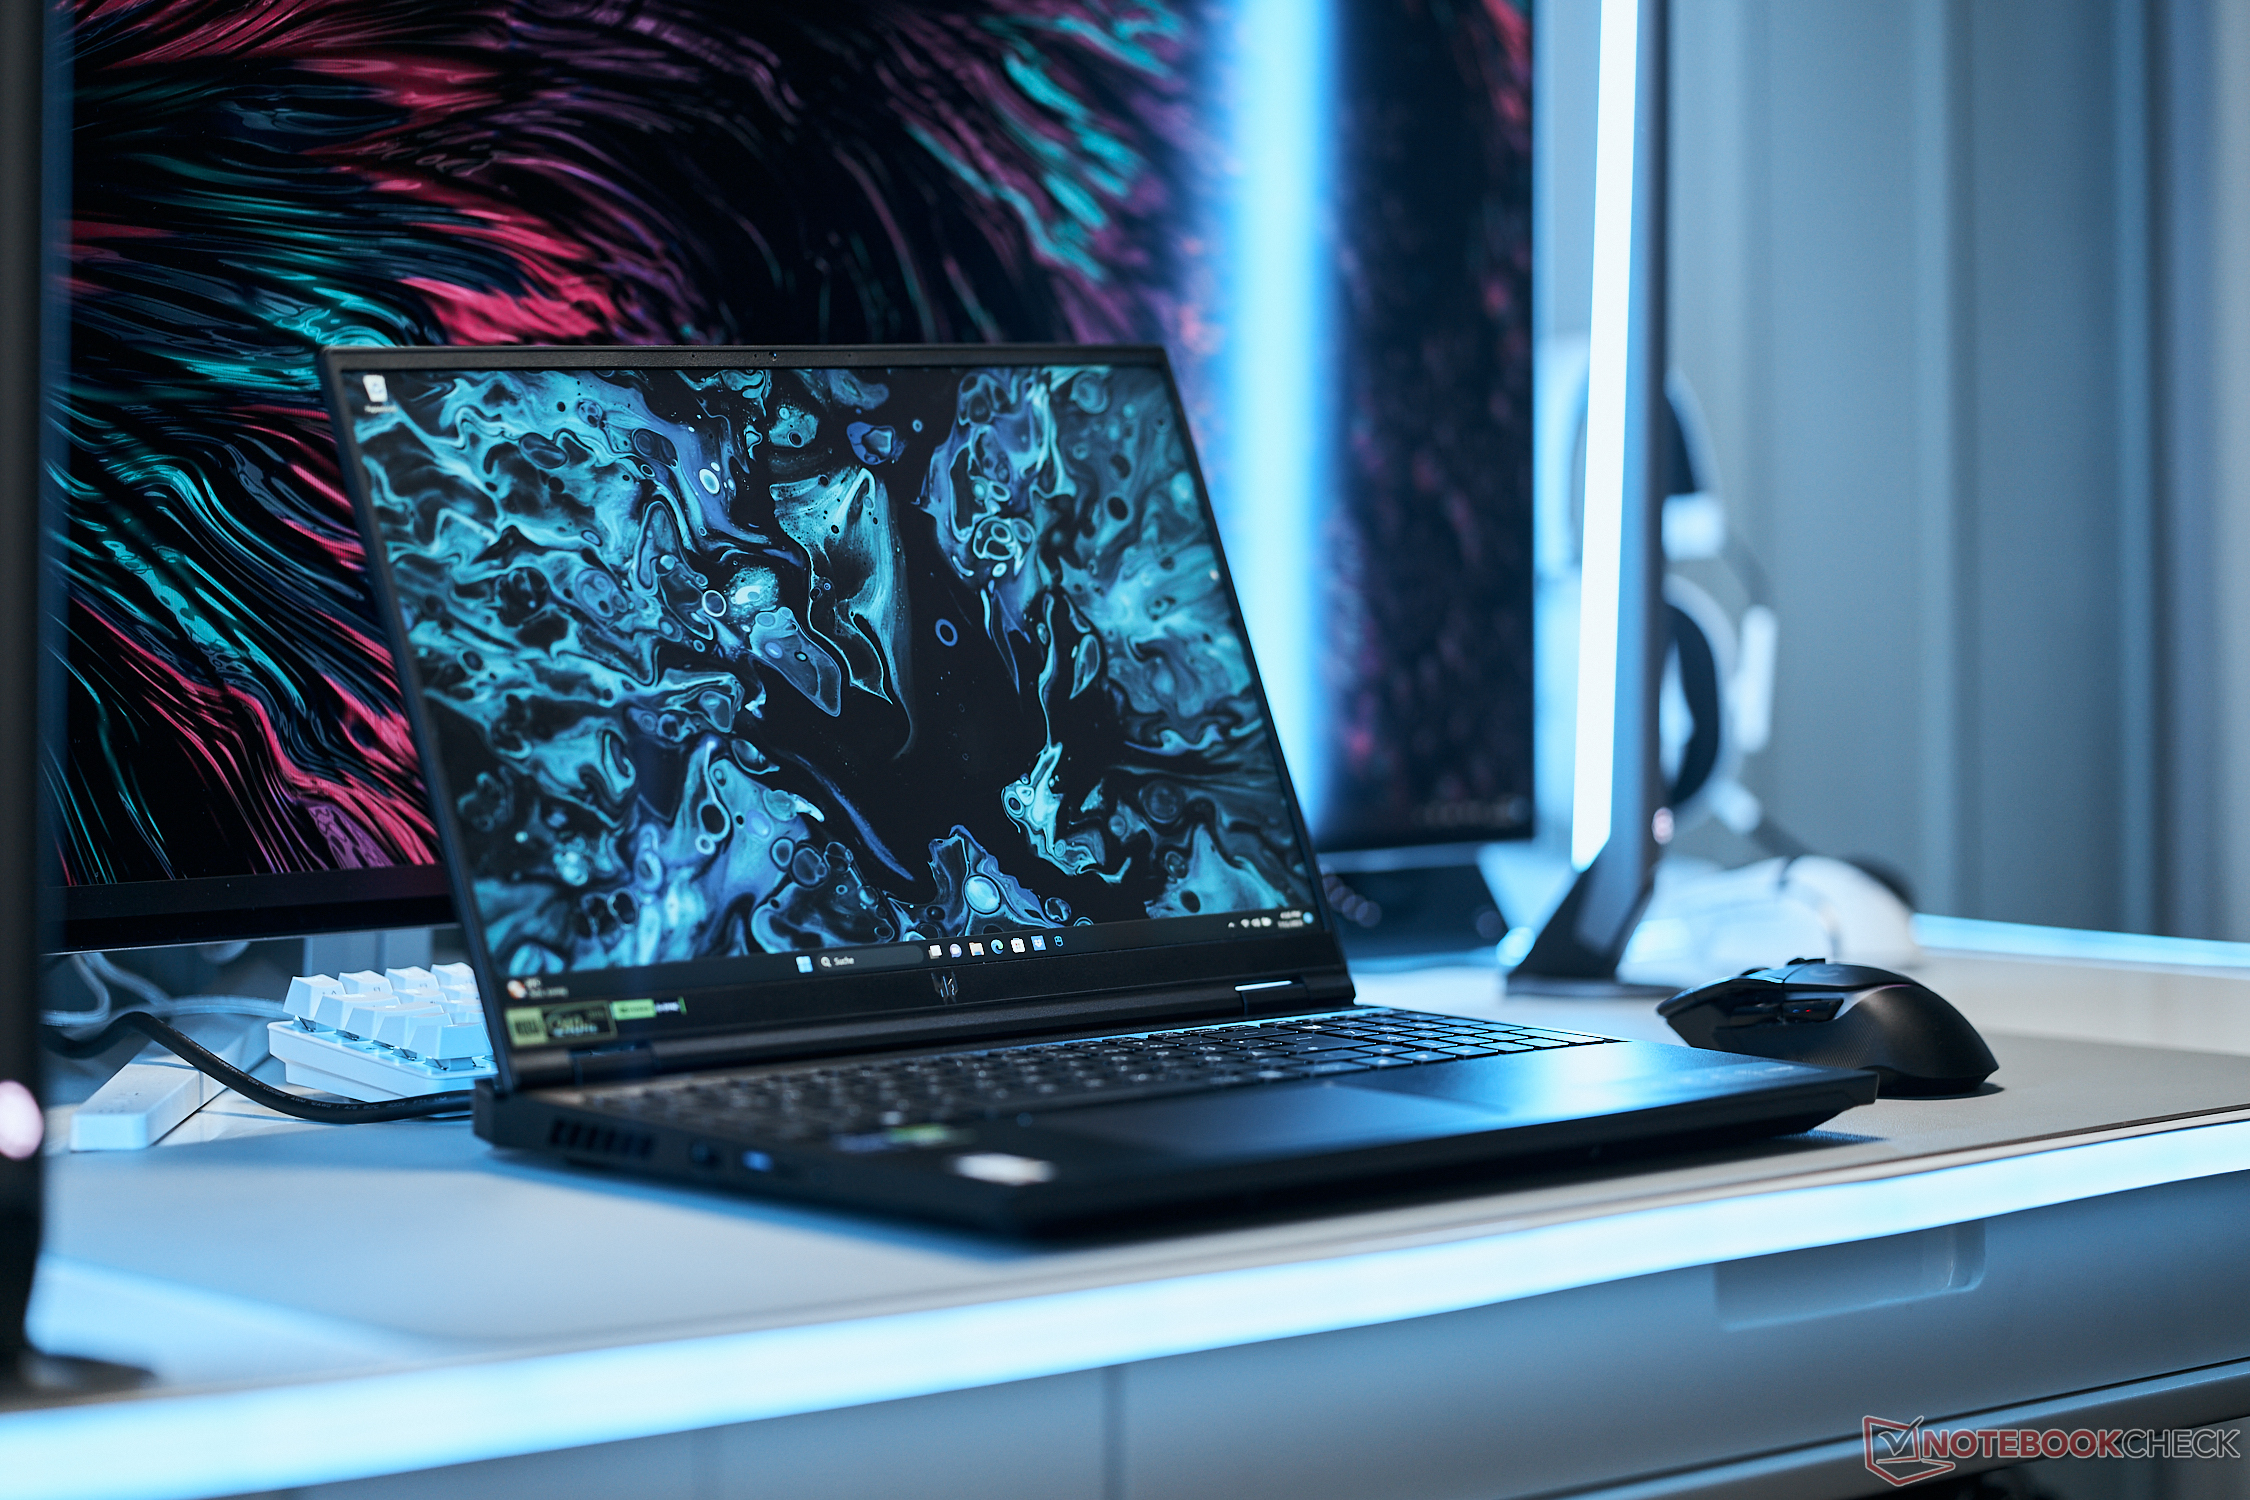
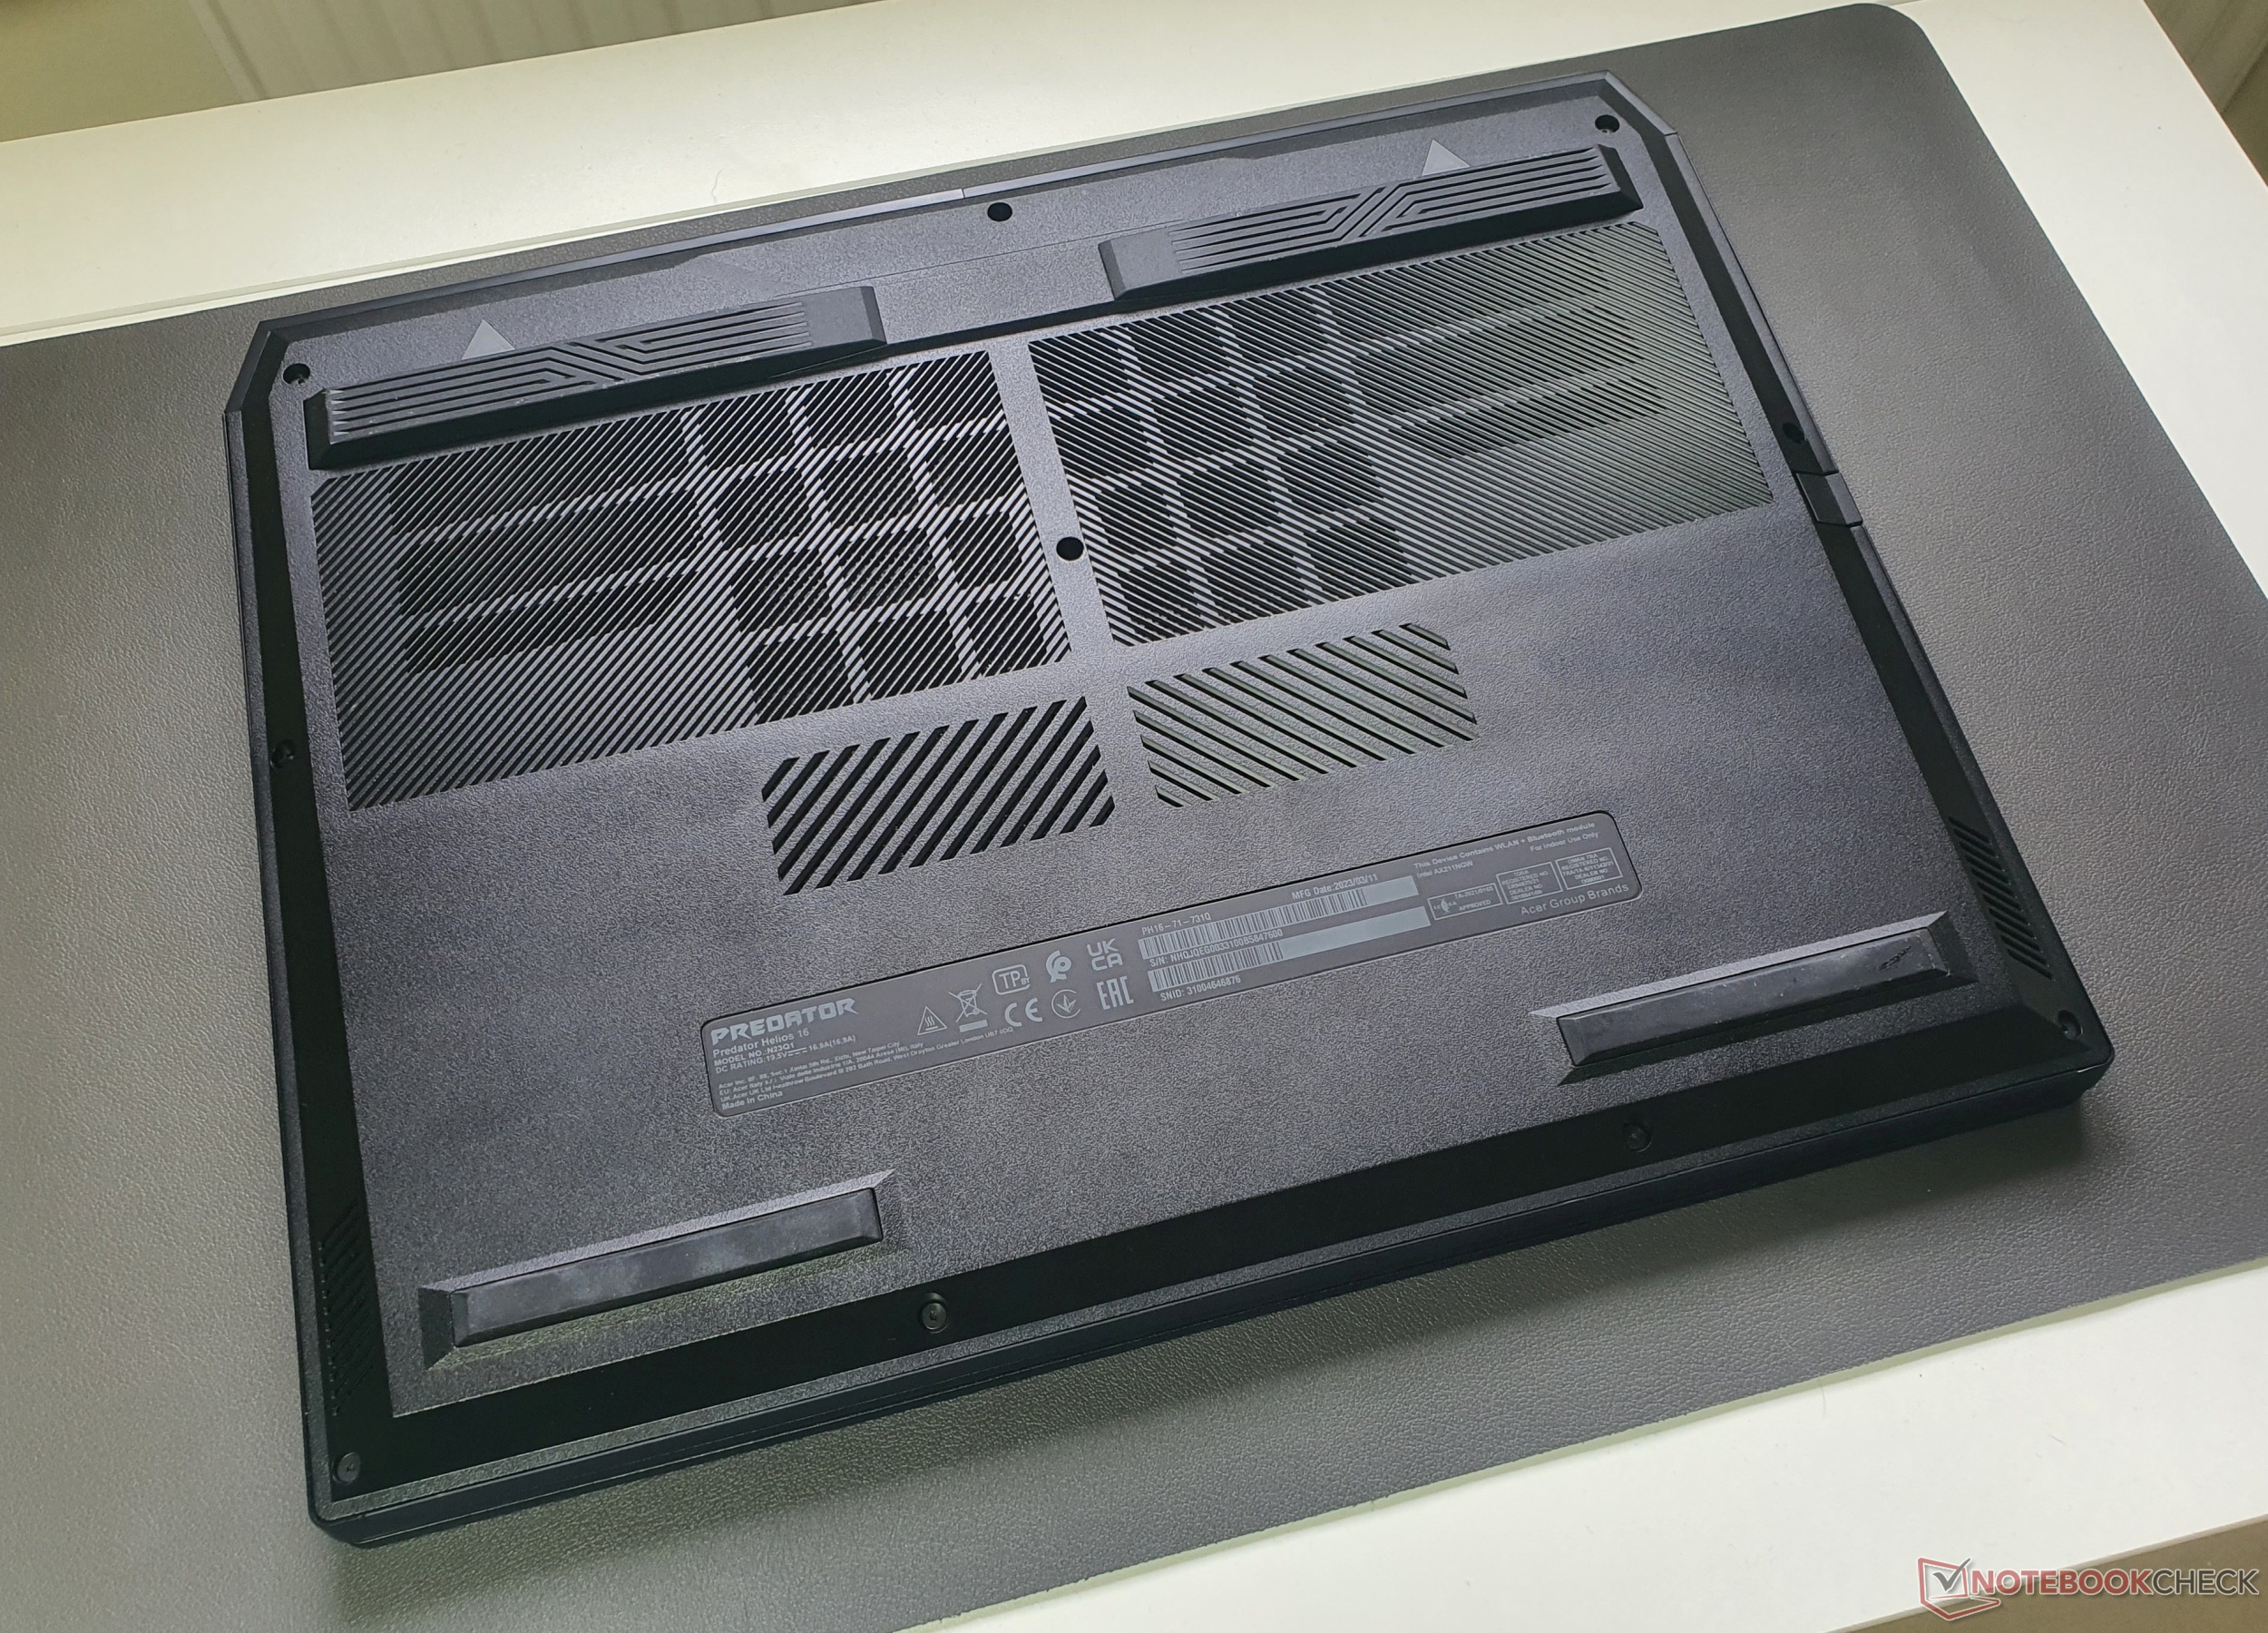
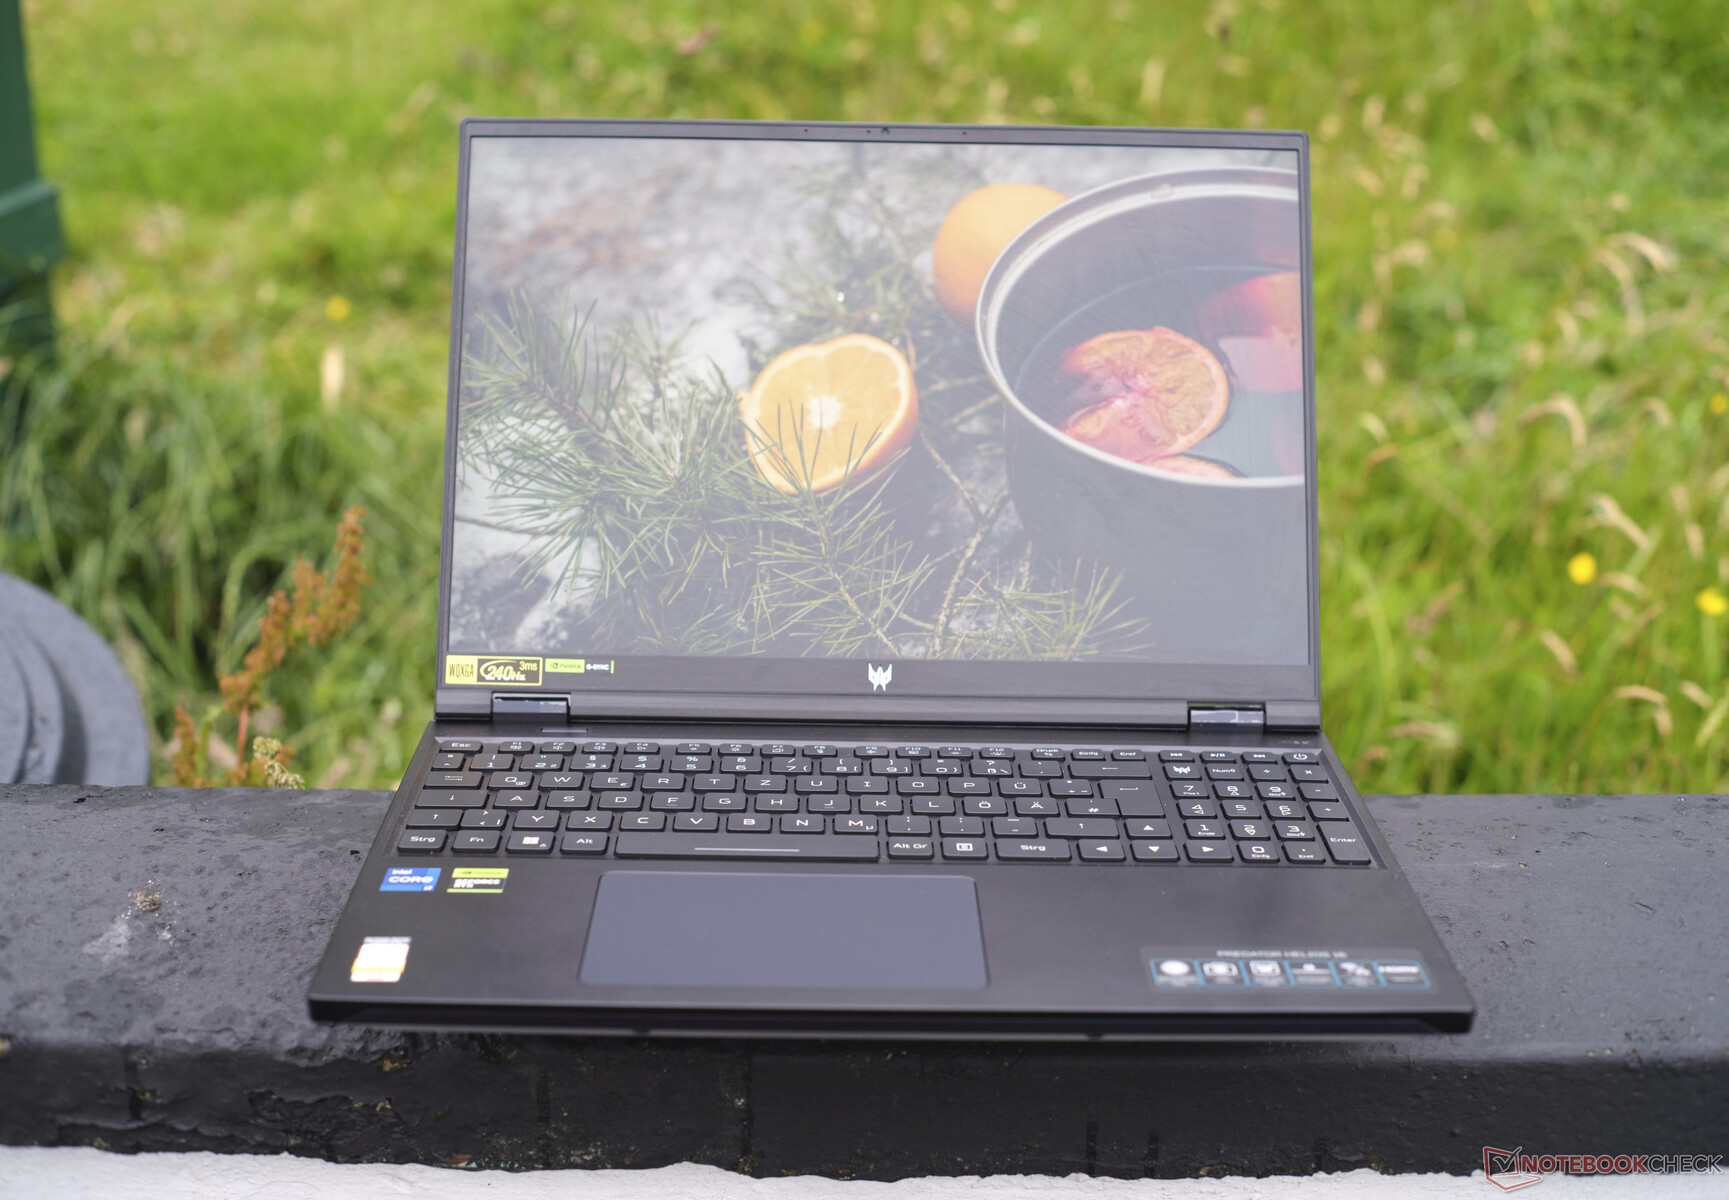
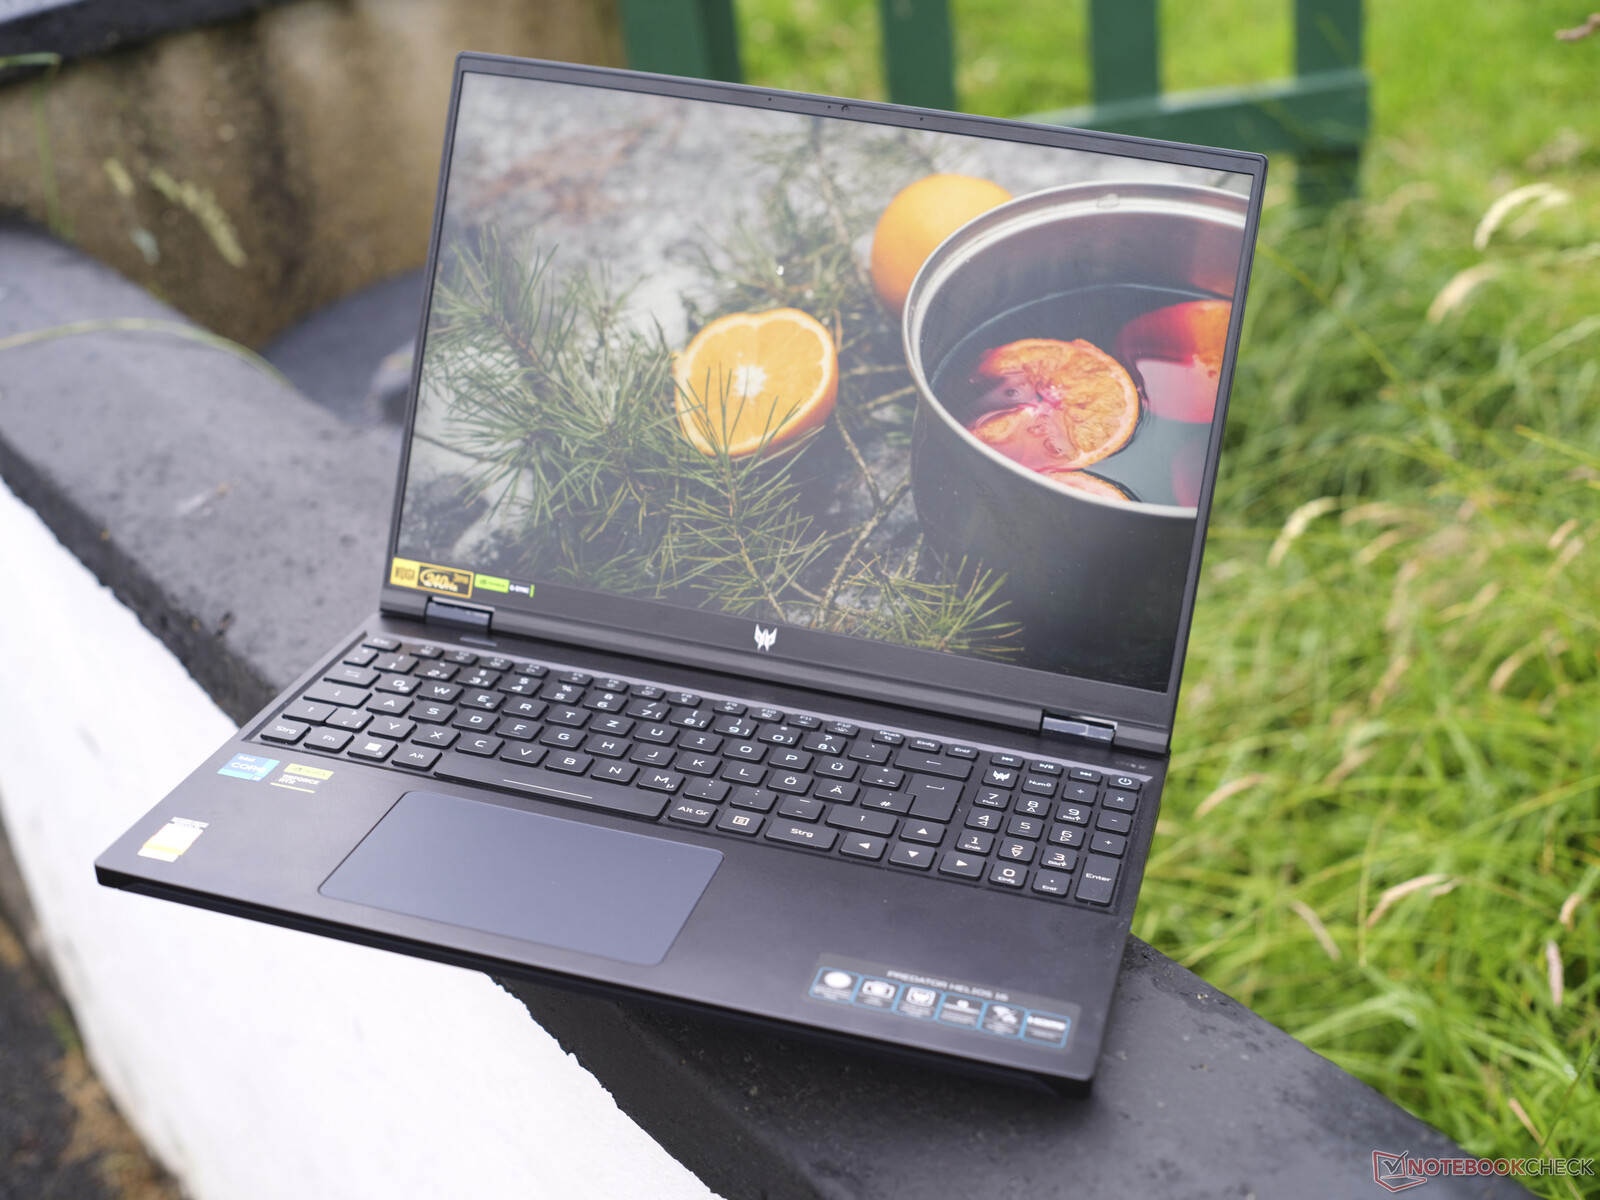
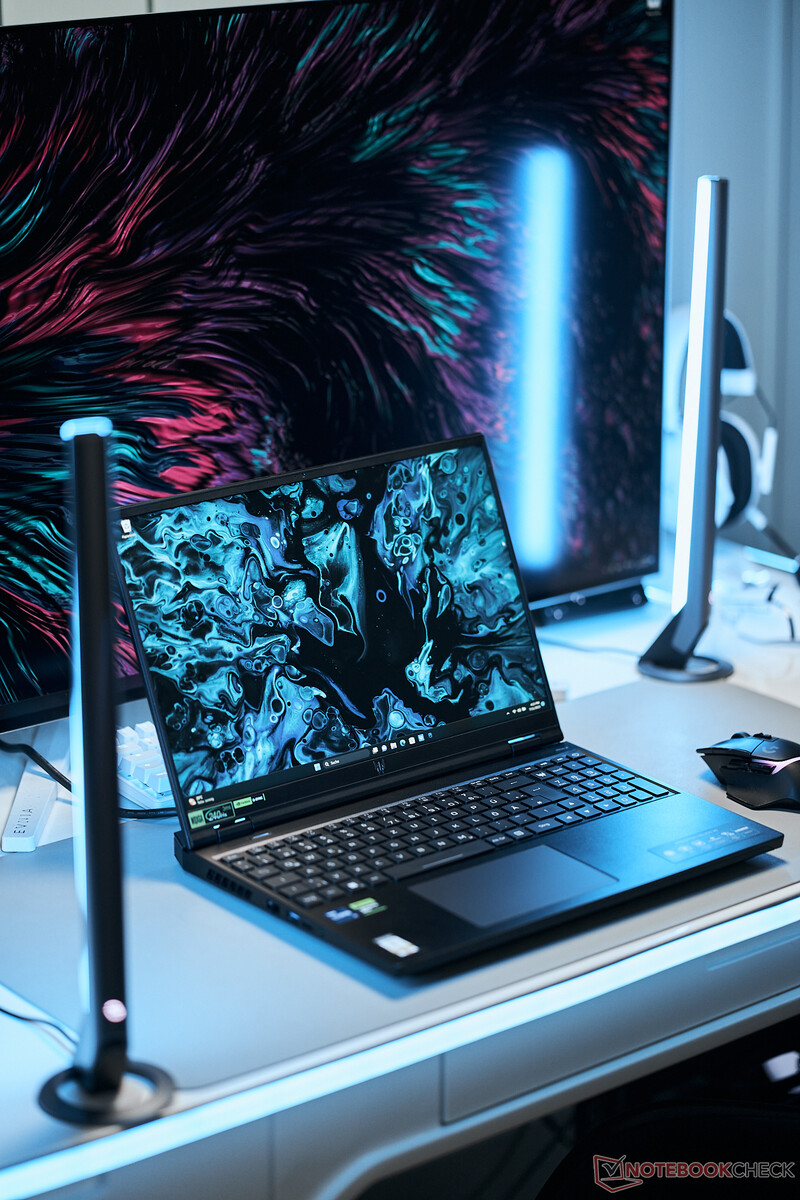
Boîtier : Un ordinateur portable de jeu Acer robuste et presque discret
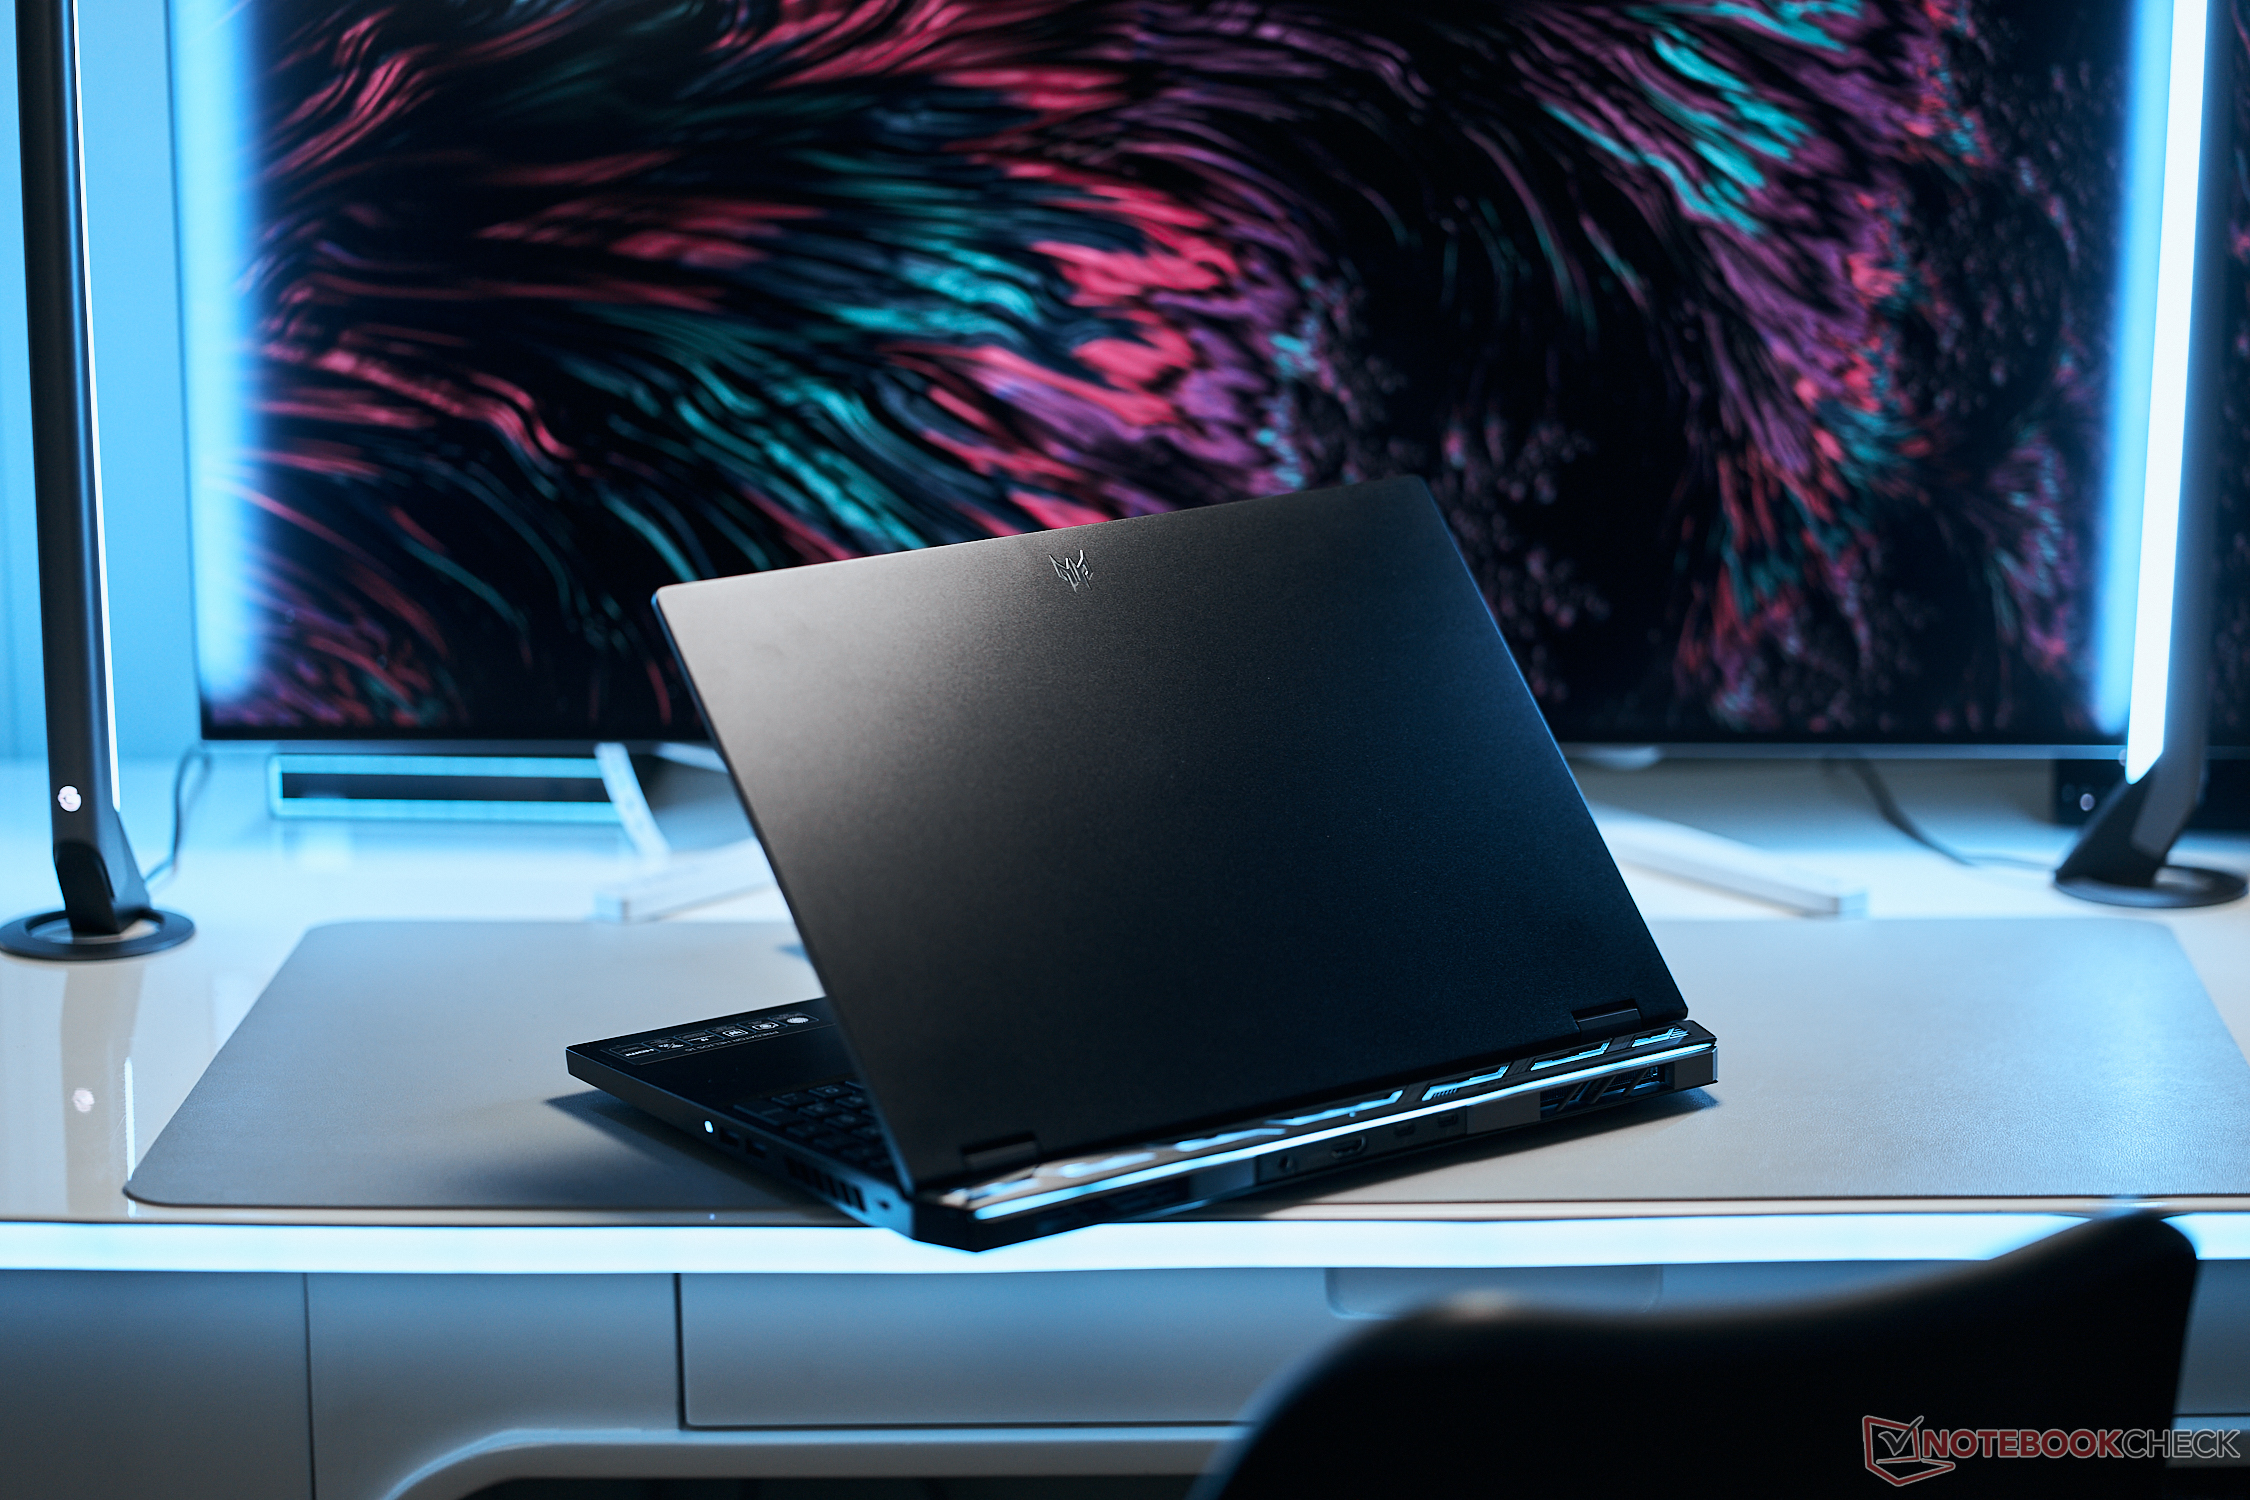
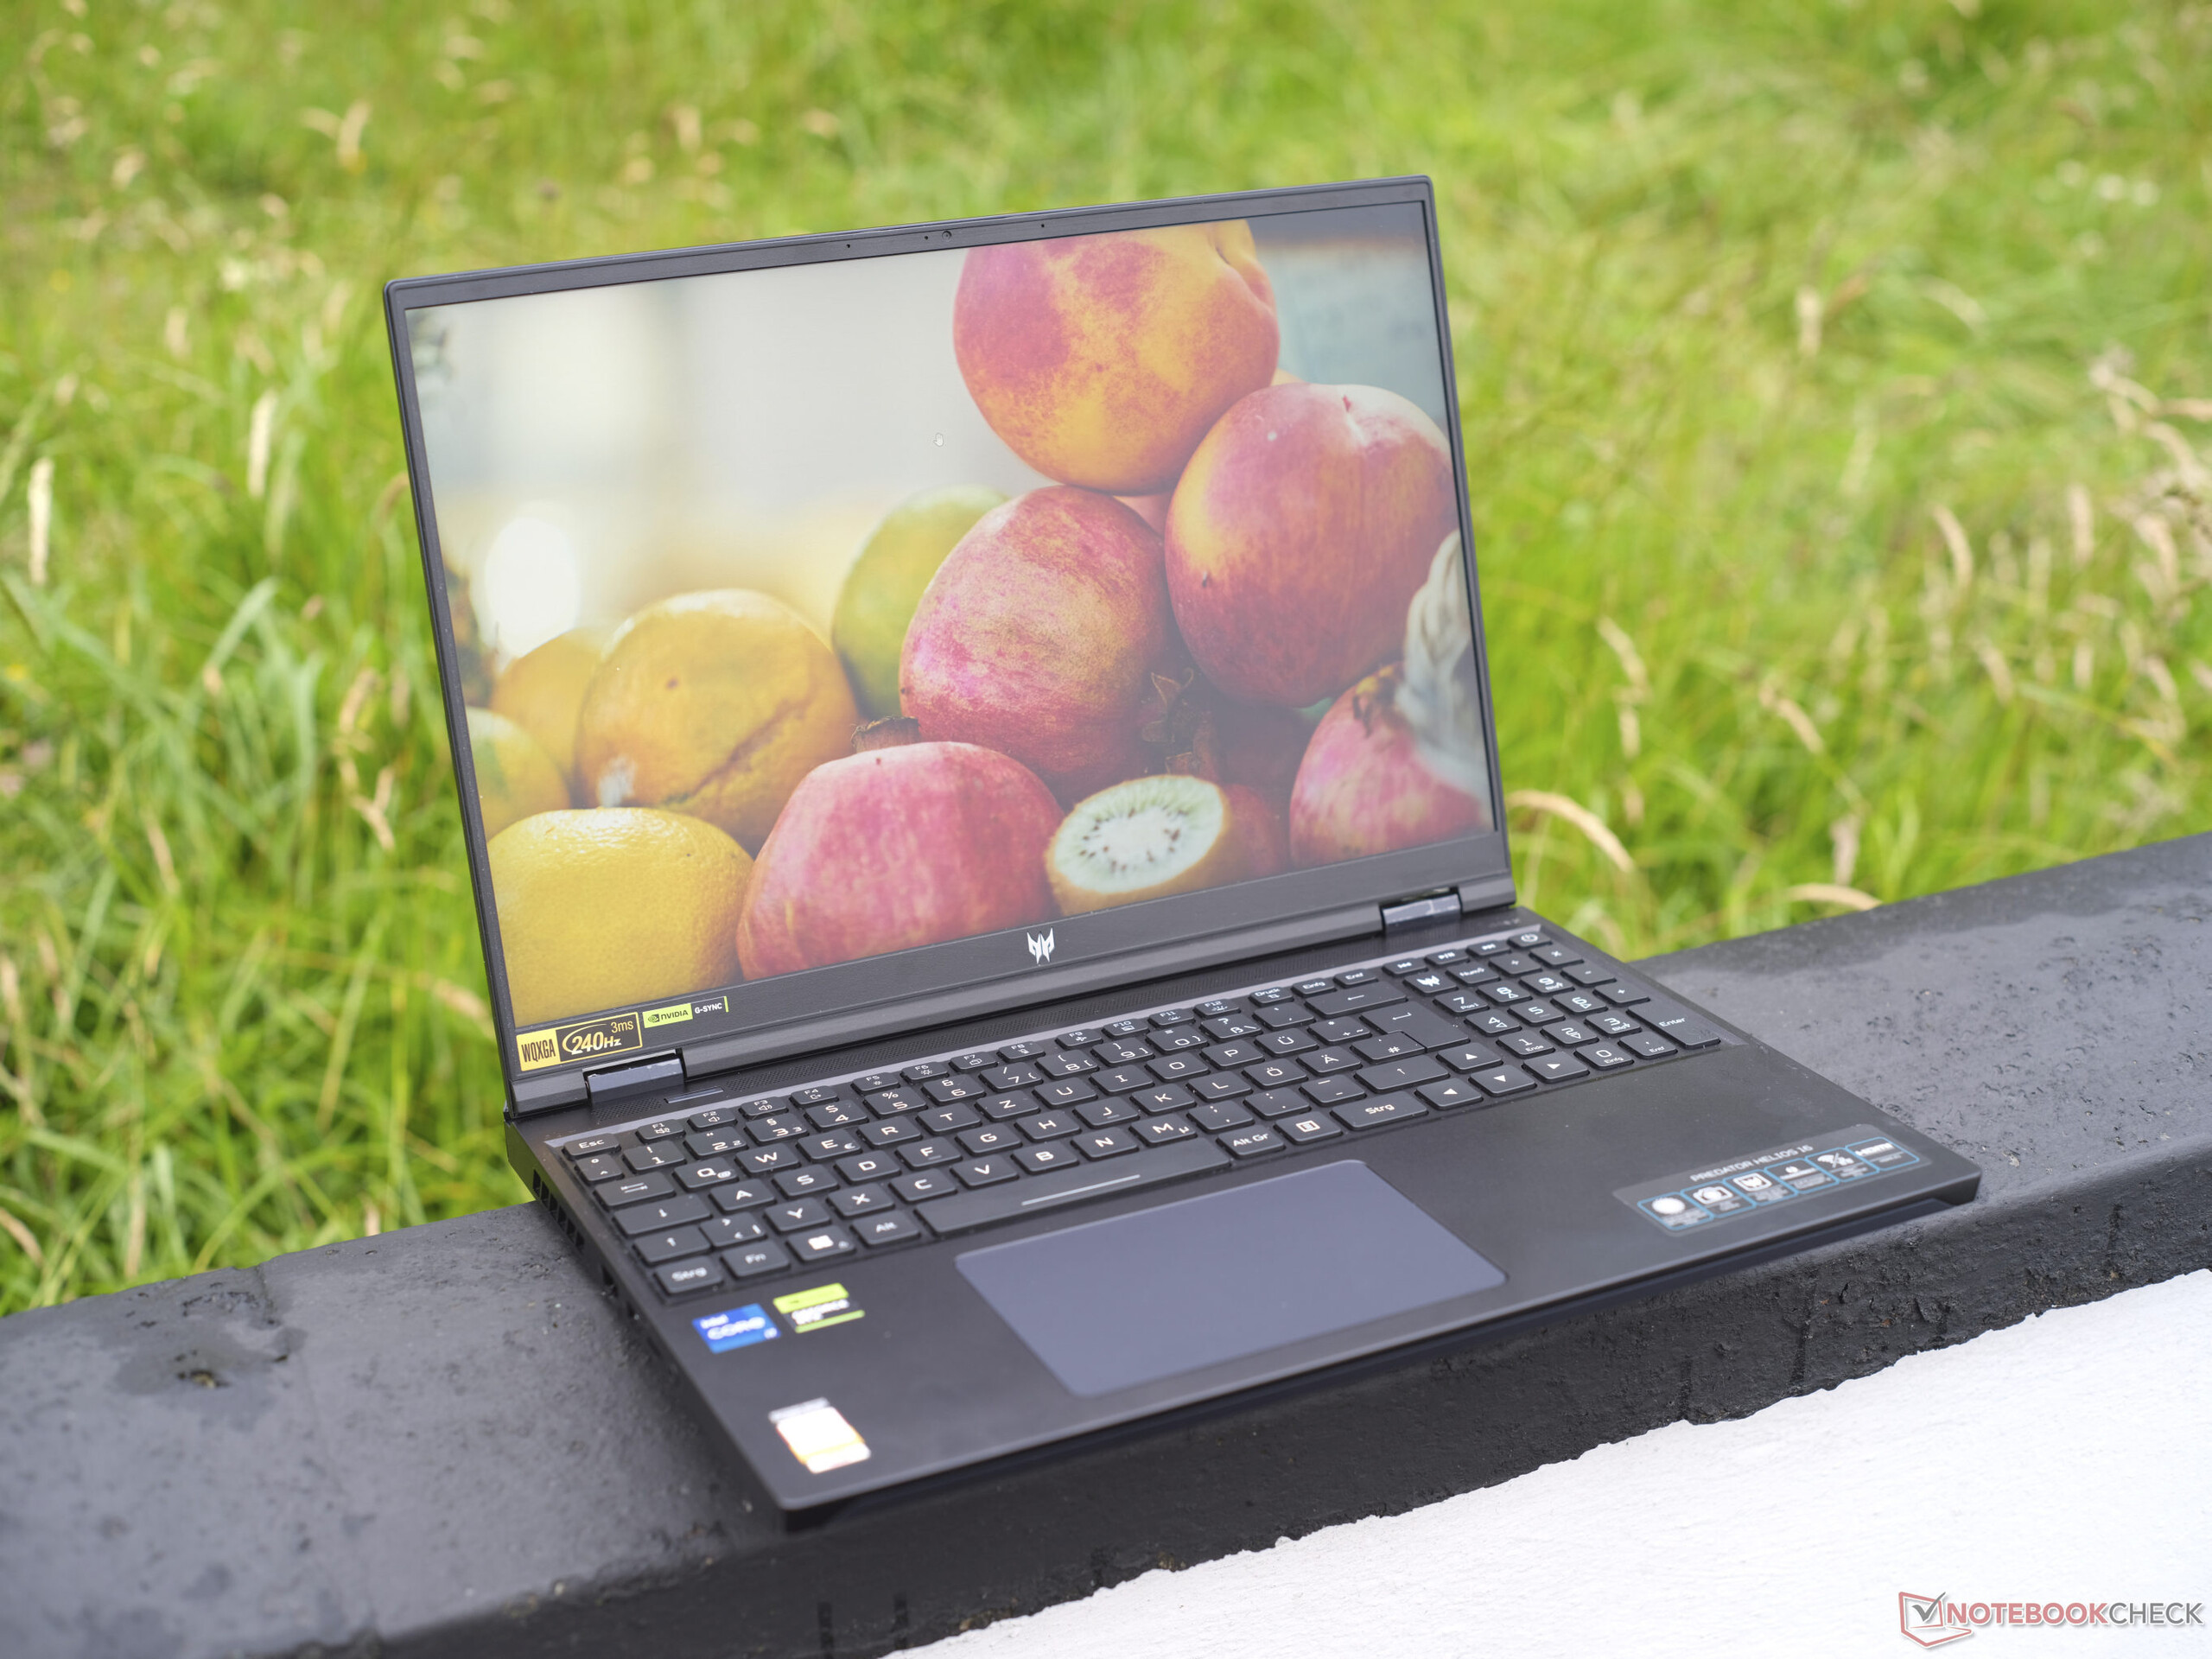
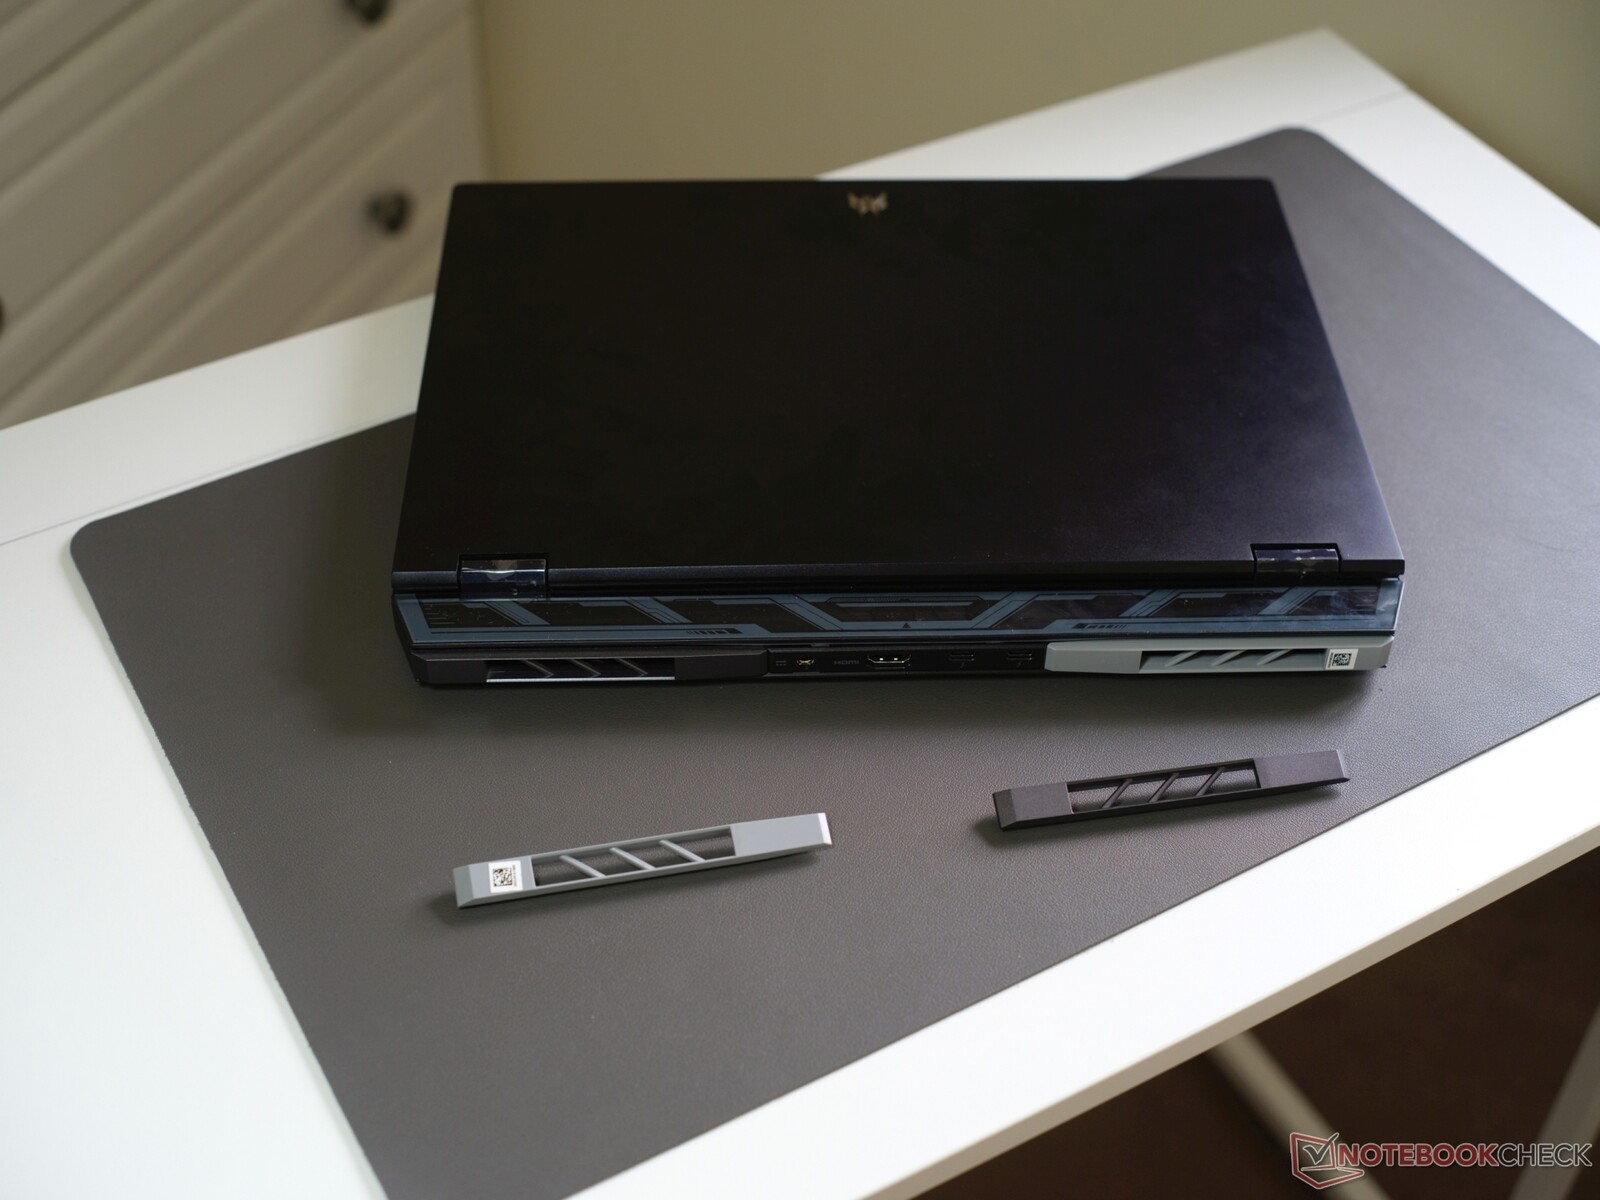
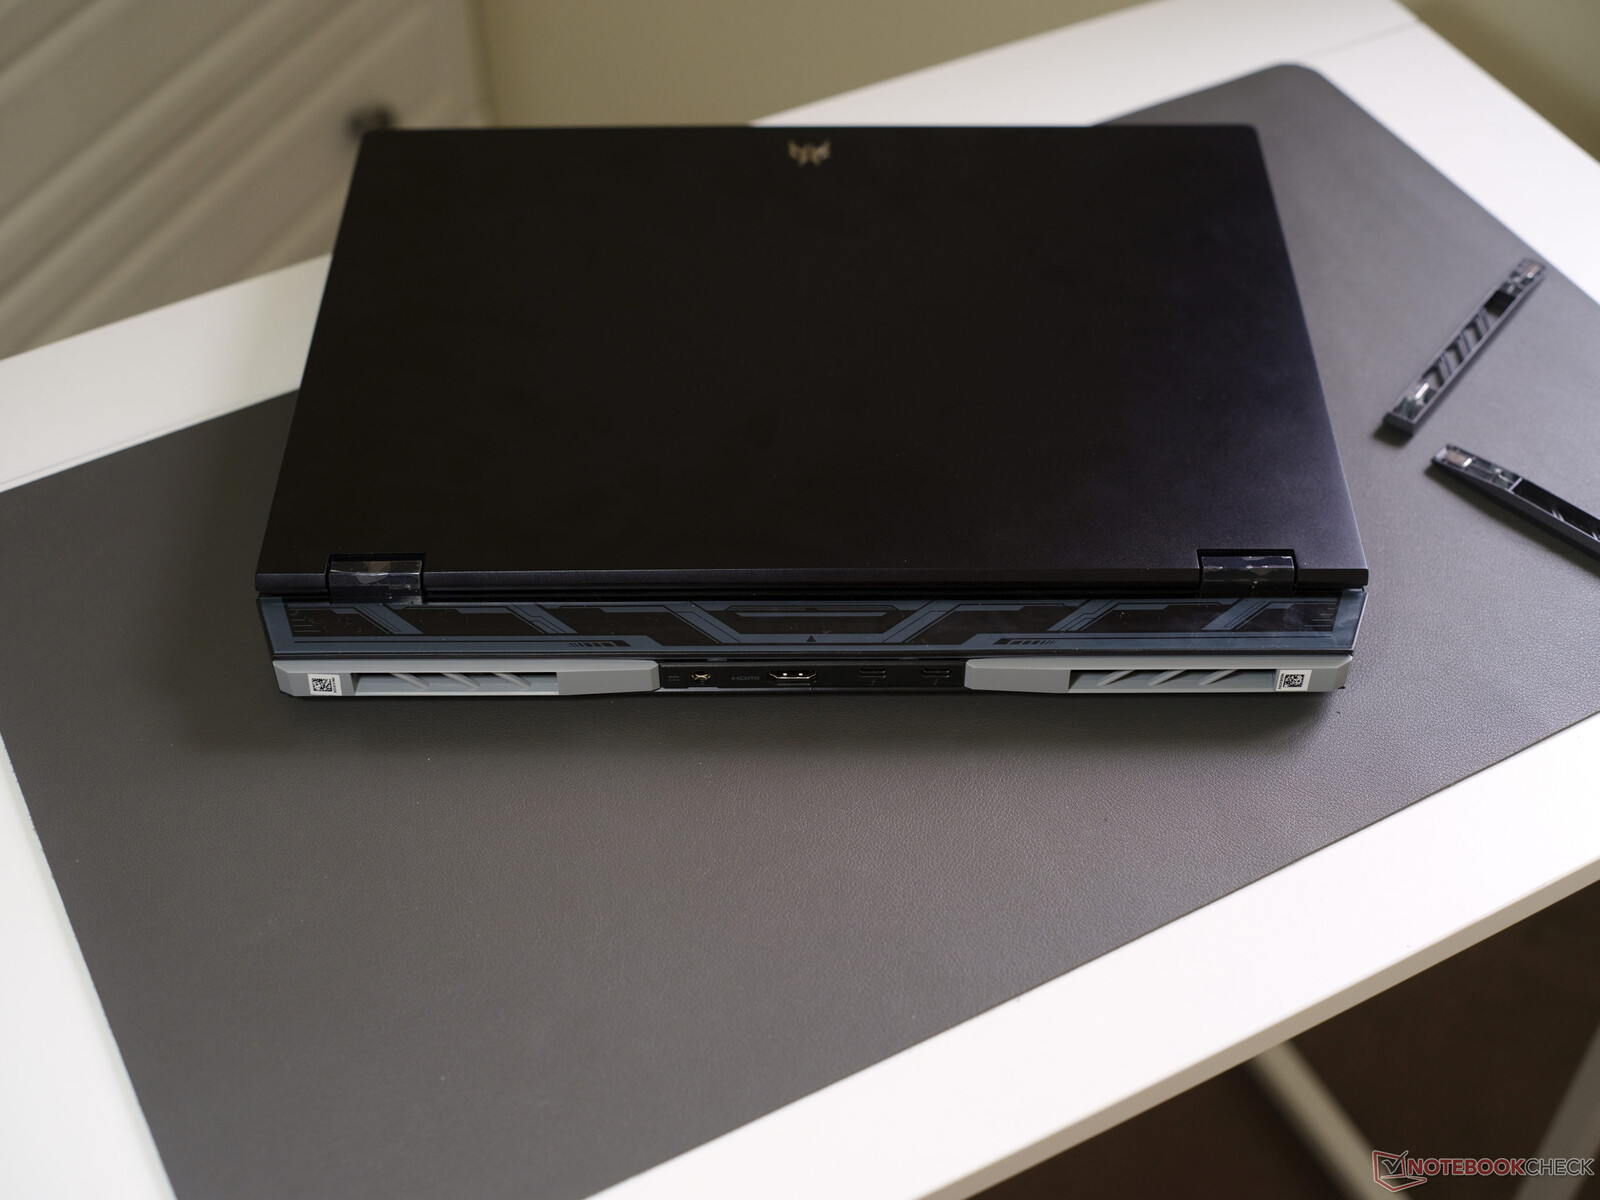
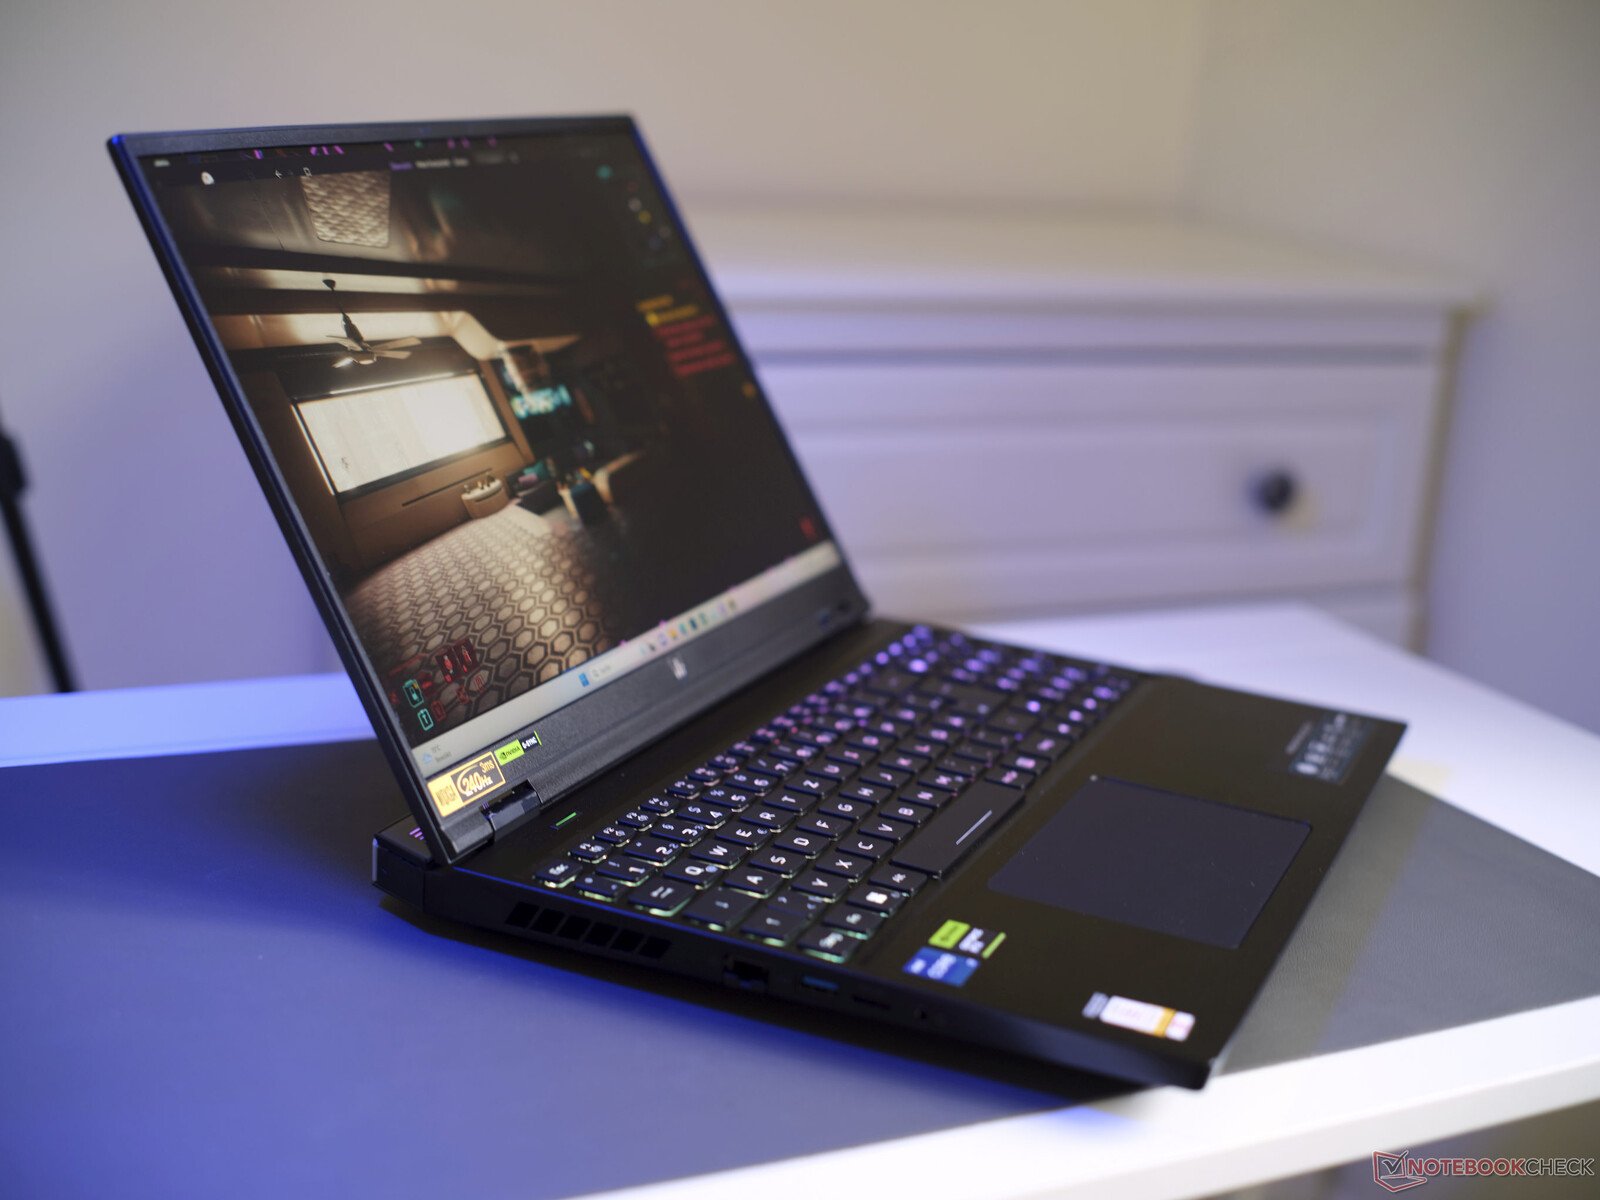
Comme son prédécesseurl'Helios 16 est disponible en noir mat et est principalement constitué d'un alliage d'aluminium brossé. Seules la base et la bordure de l'écran sont en plastique afin d'éviter les inconvénients liés aux matériaux conducteurs de chaleur.
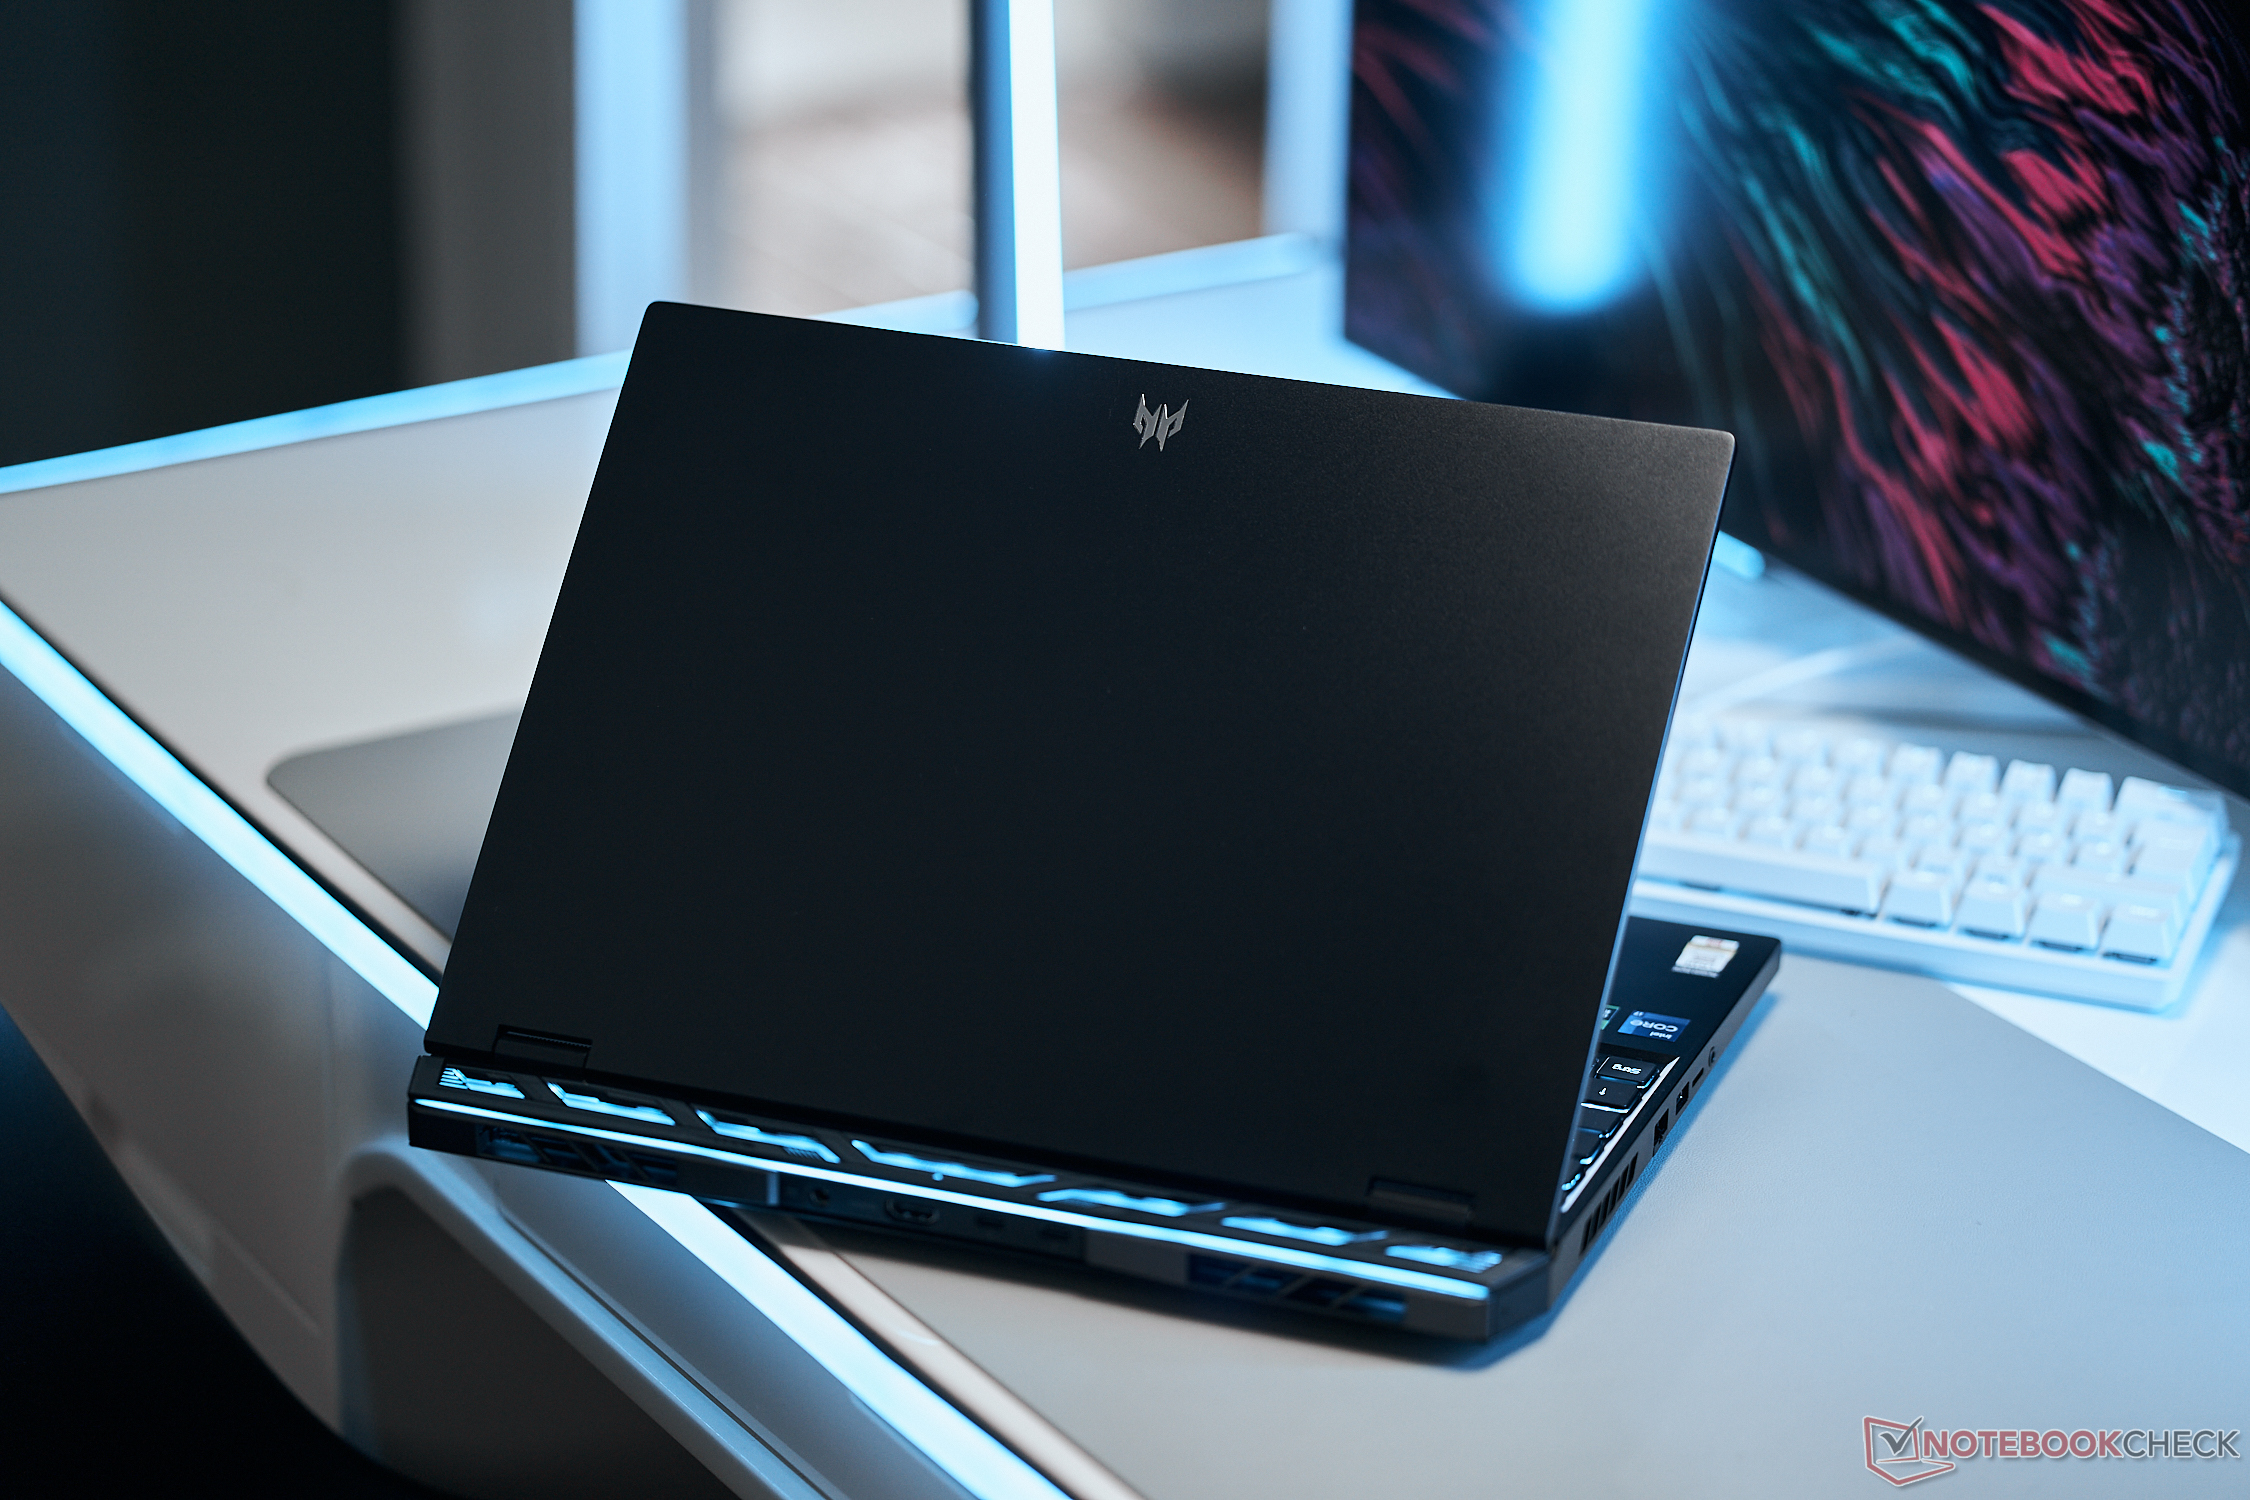
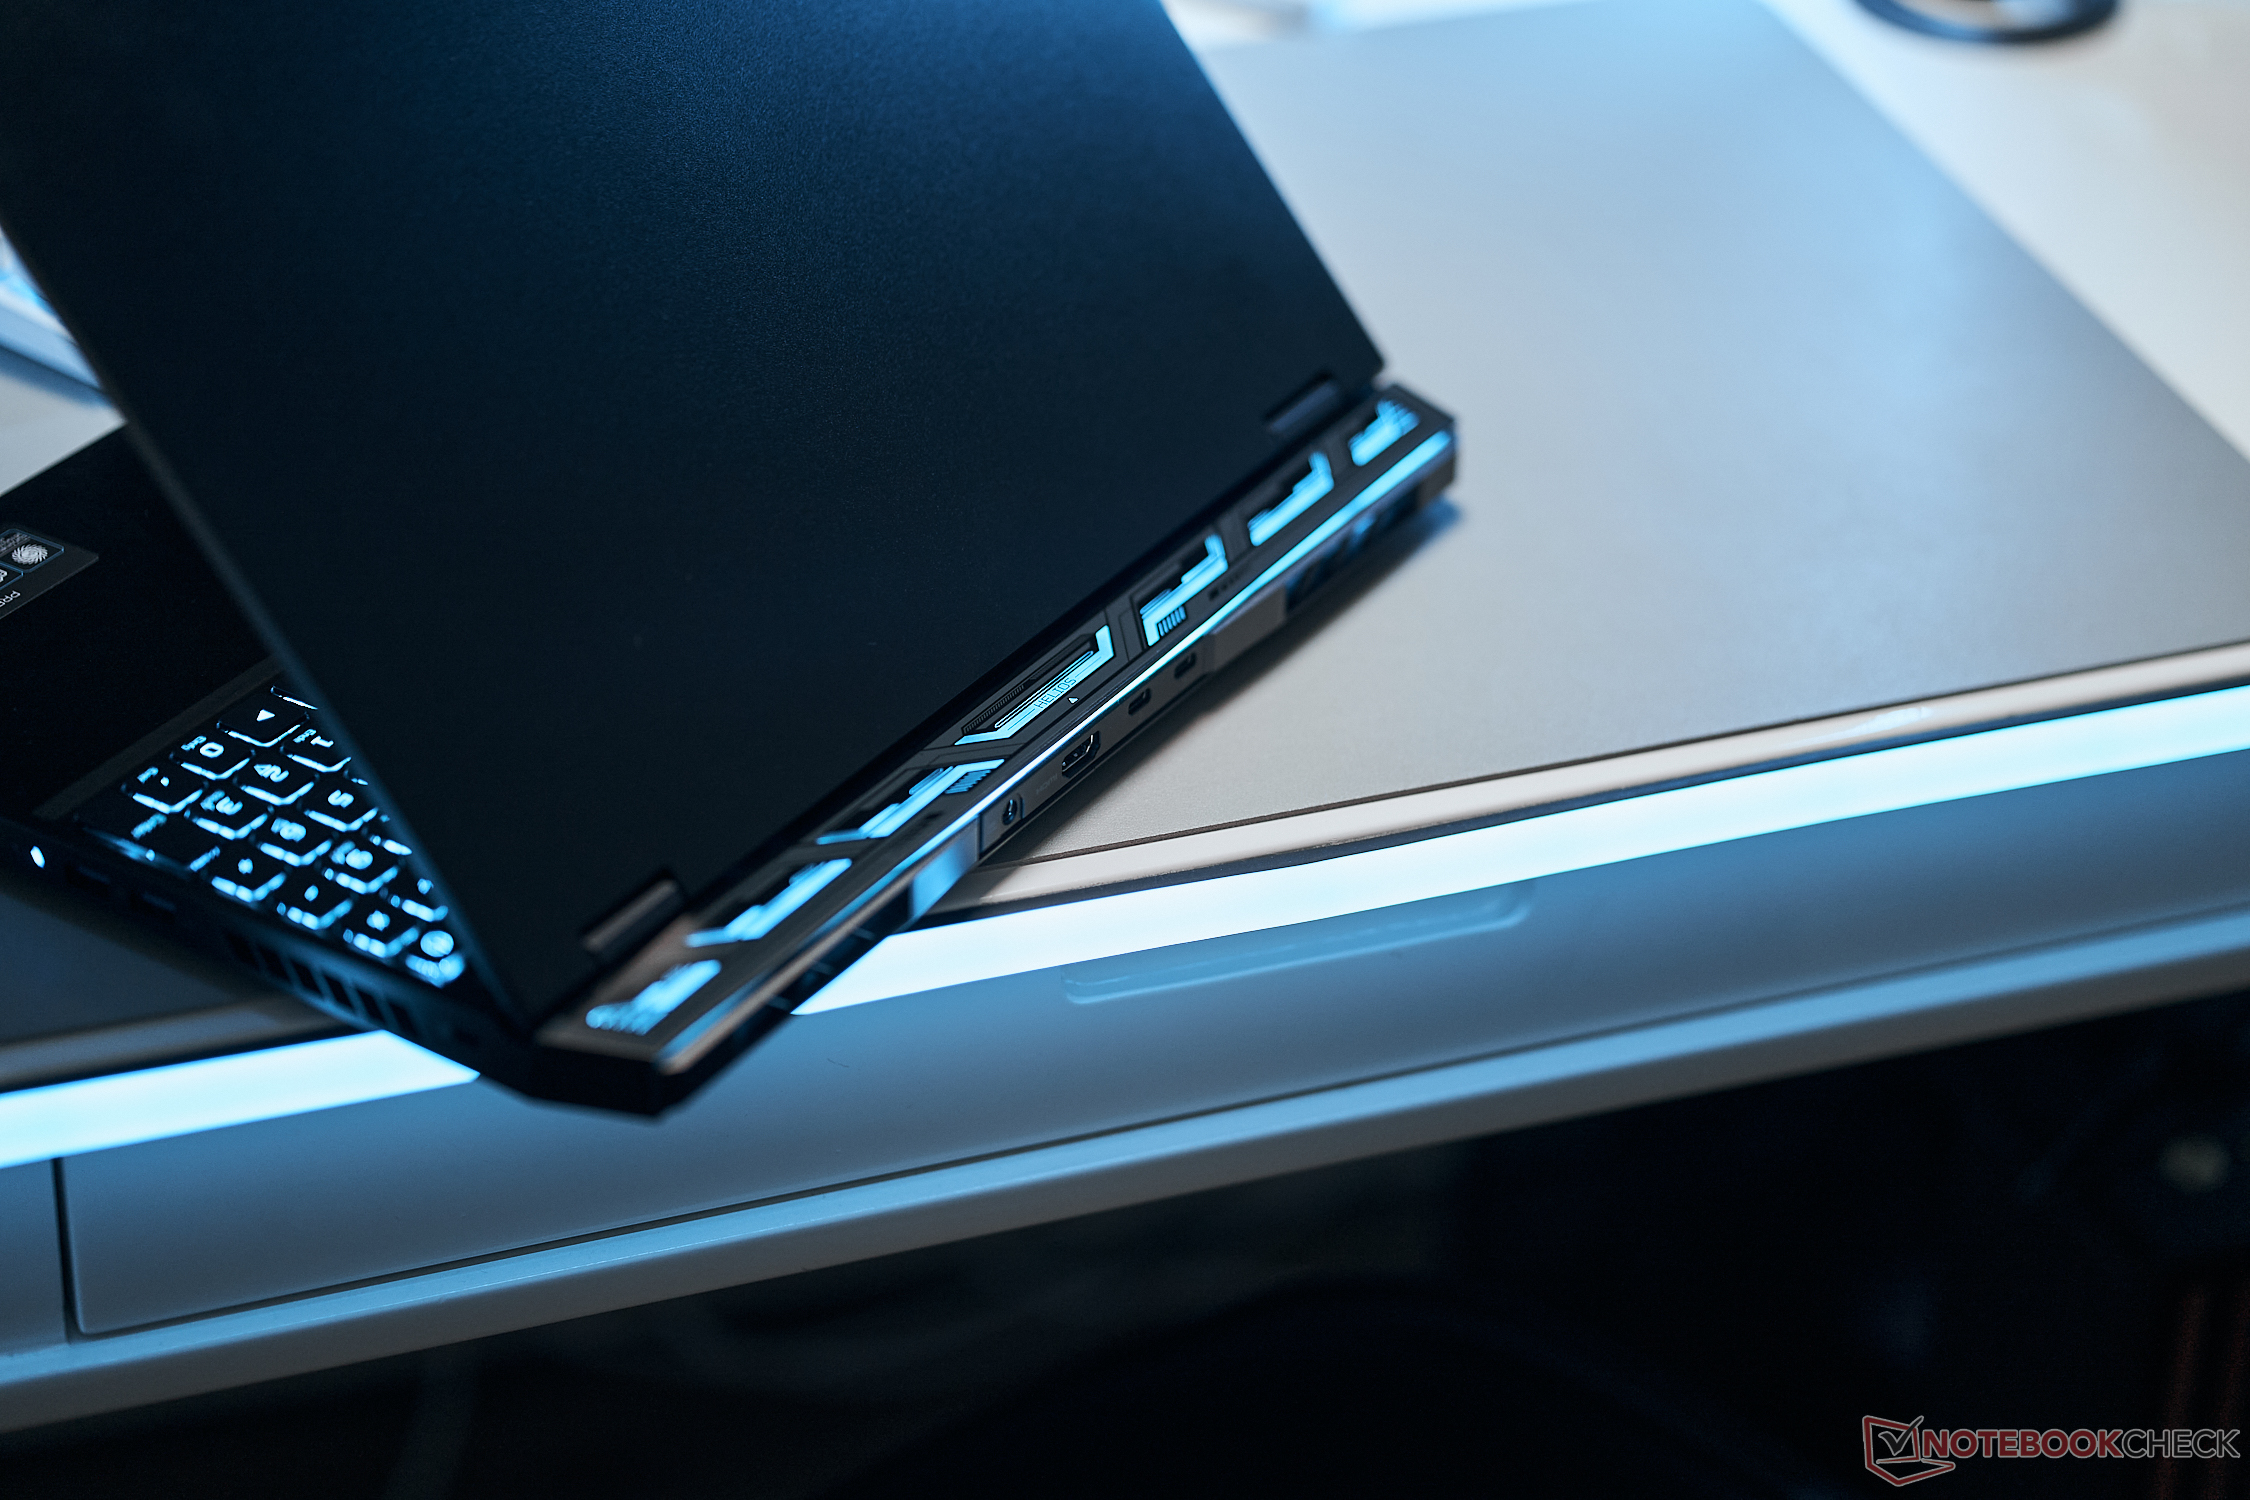
Le logo Predator est présent sur le couvercle de l'écran et le cadre inférieur, ainsi qu'un système de refroidissement éclairé par LED et orienté vers l'arrière. Les surfaces lisses attirent bien les traces de doigts, tandis que l'ajustement et la finition sont impeccables - pas de craquements.
L'unité de base est très stable, tandis que le couvercle peut être légèrement tordu, mais nous n'avons pas réussi à produire des distorsions d'image, même en appliquant une pression ciblée. Les charnières sont solidement fixées, le couvercle n'oscille pratiquement pas et peut être ouvert d'une seule main jusqu'à un angle de 145°. Dans l'ensemble, le Predator Helios fait une très bonne impression.


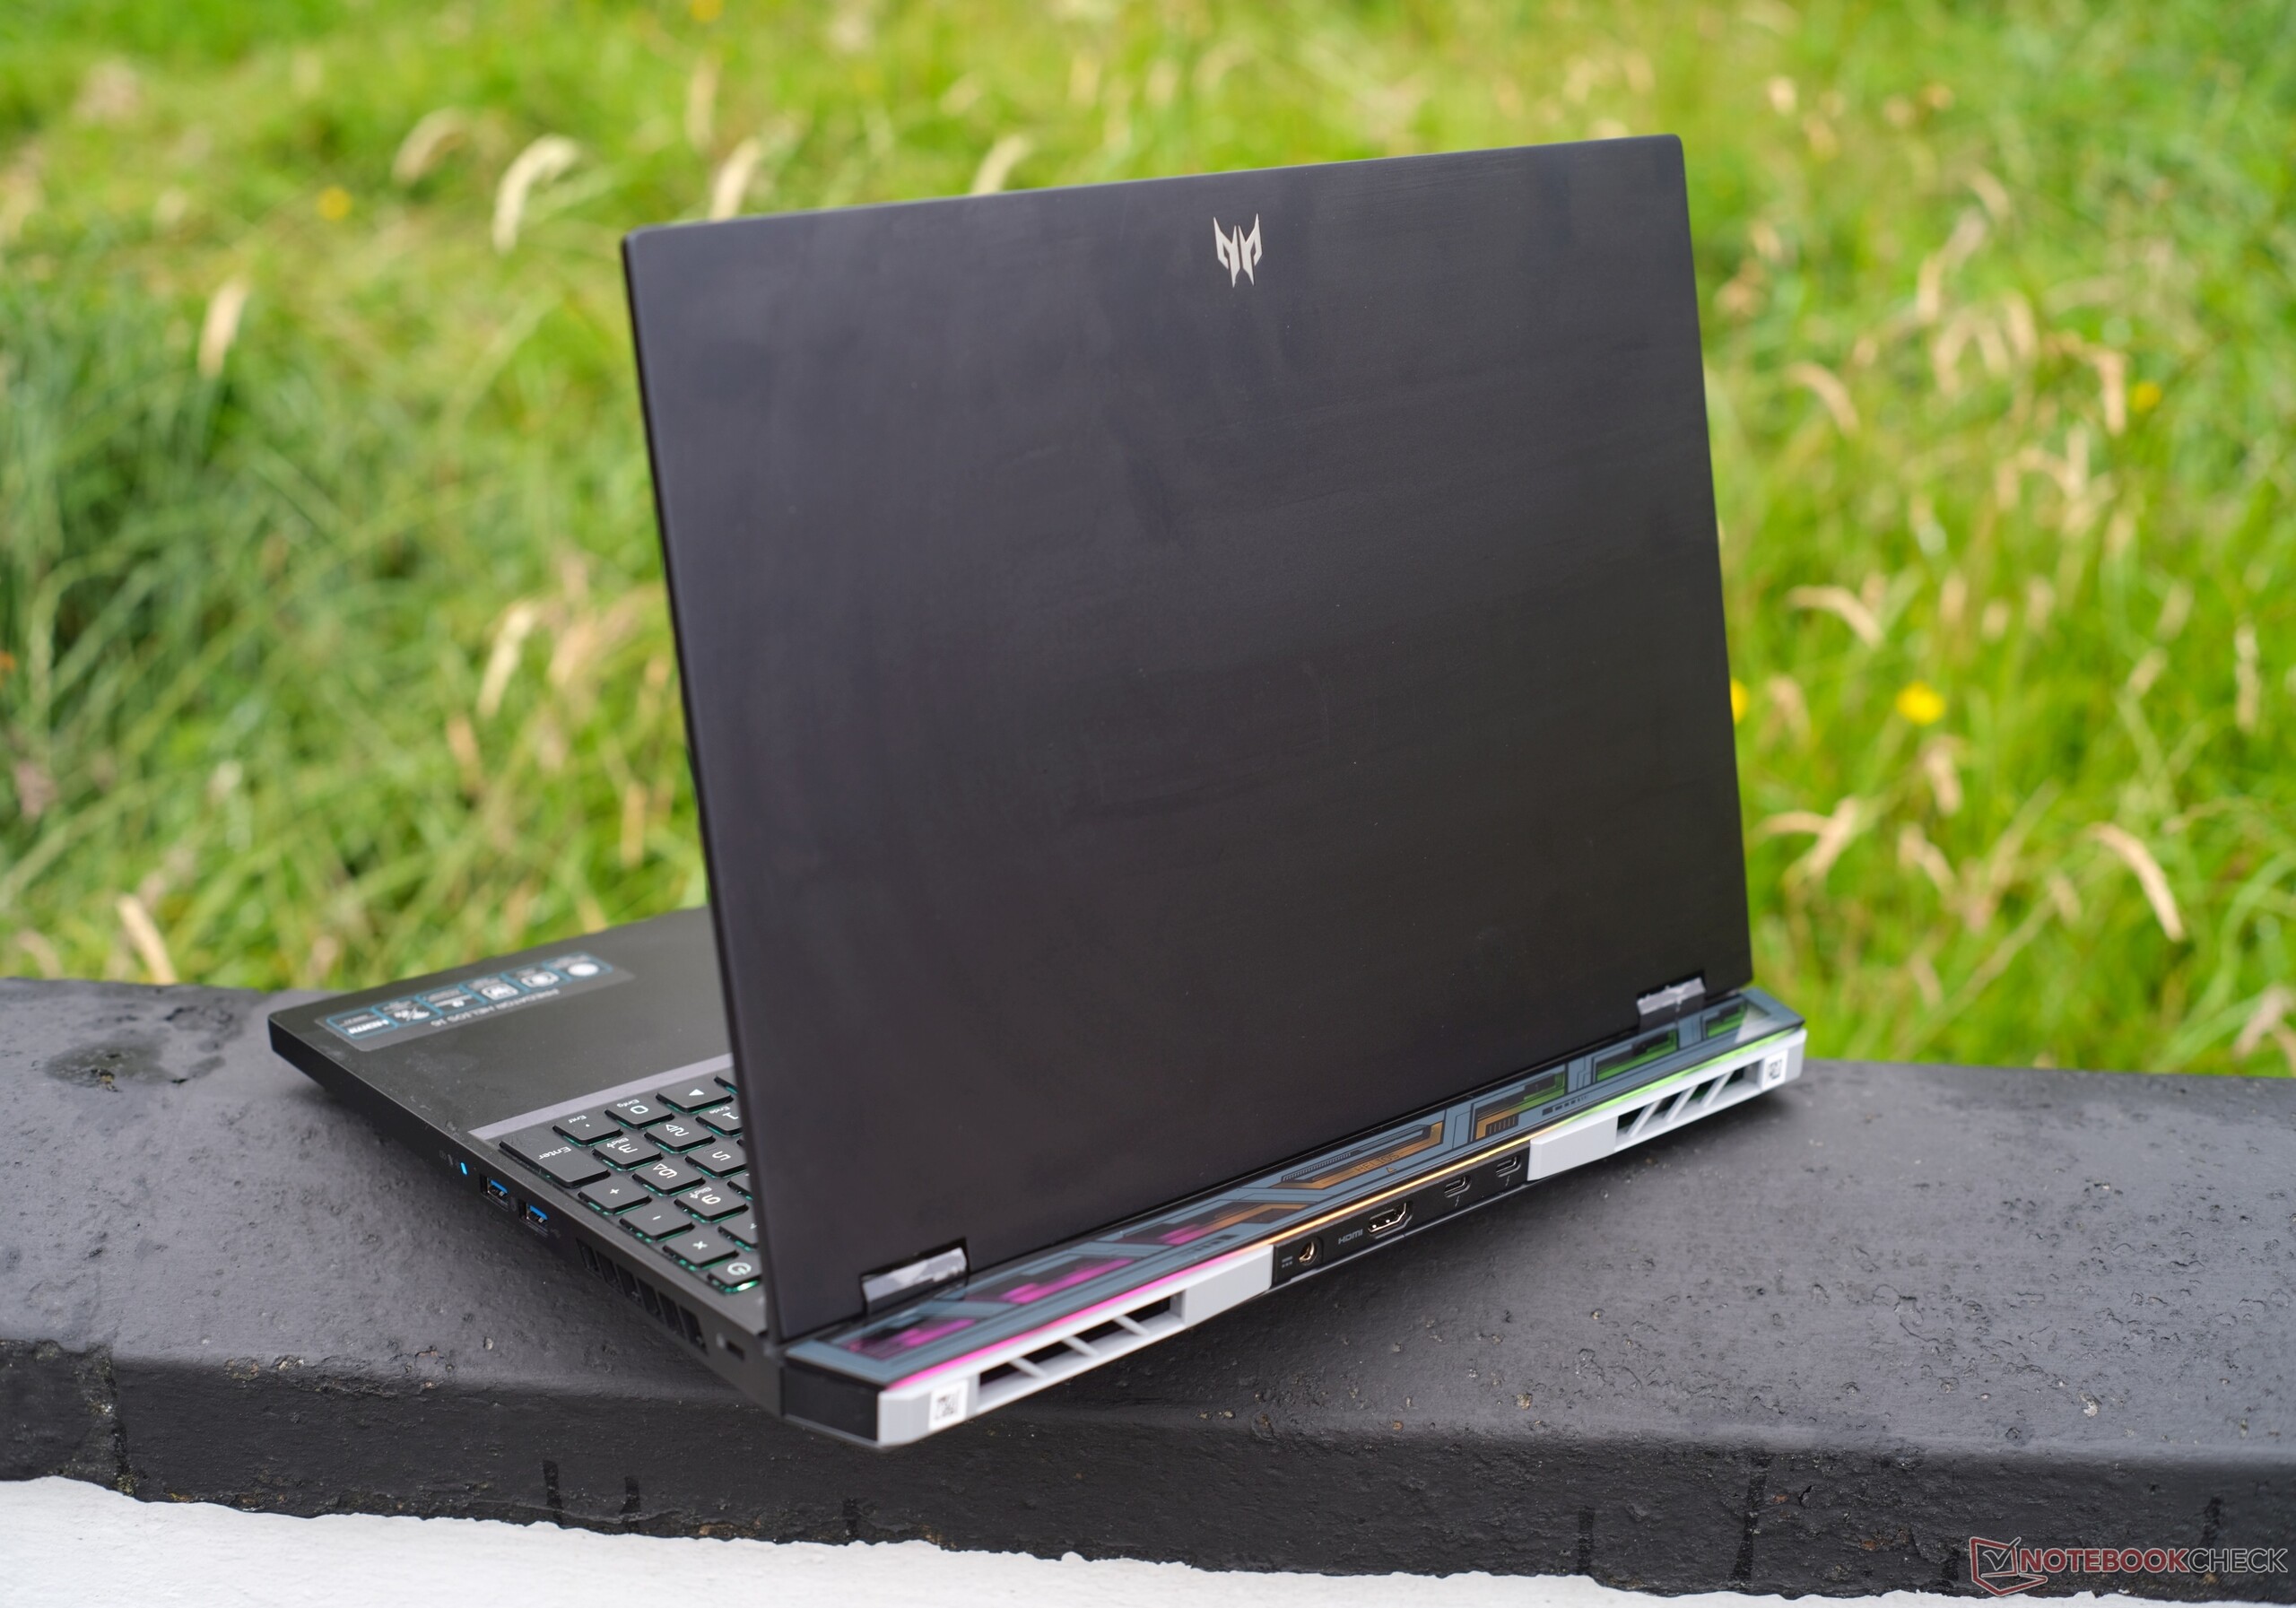
L'Acer Predator Helios mesure environ 27 mm d'épaisseur et pèse à peine 2,6 kg. Ces statistiques essentielles peuvent être considérées comme moyennes pour une machine de jeu dotée d'un système de refroidissement aussi puissant. Cependant, bien qu'il soit de la même taille et pèse 2,2 kg, l'Asus TUF Gaming A16 est plus léger.Asus TUF Gaming A16est nettement plus léger, tandis que le Gigabyte Aorus 15XX, d'une épaisseur de 19,7 mm, est plus léger.Gigabyte Aorus 15Xest nettement plus fin, bien qu'il ait le même TGP.
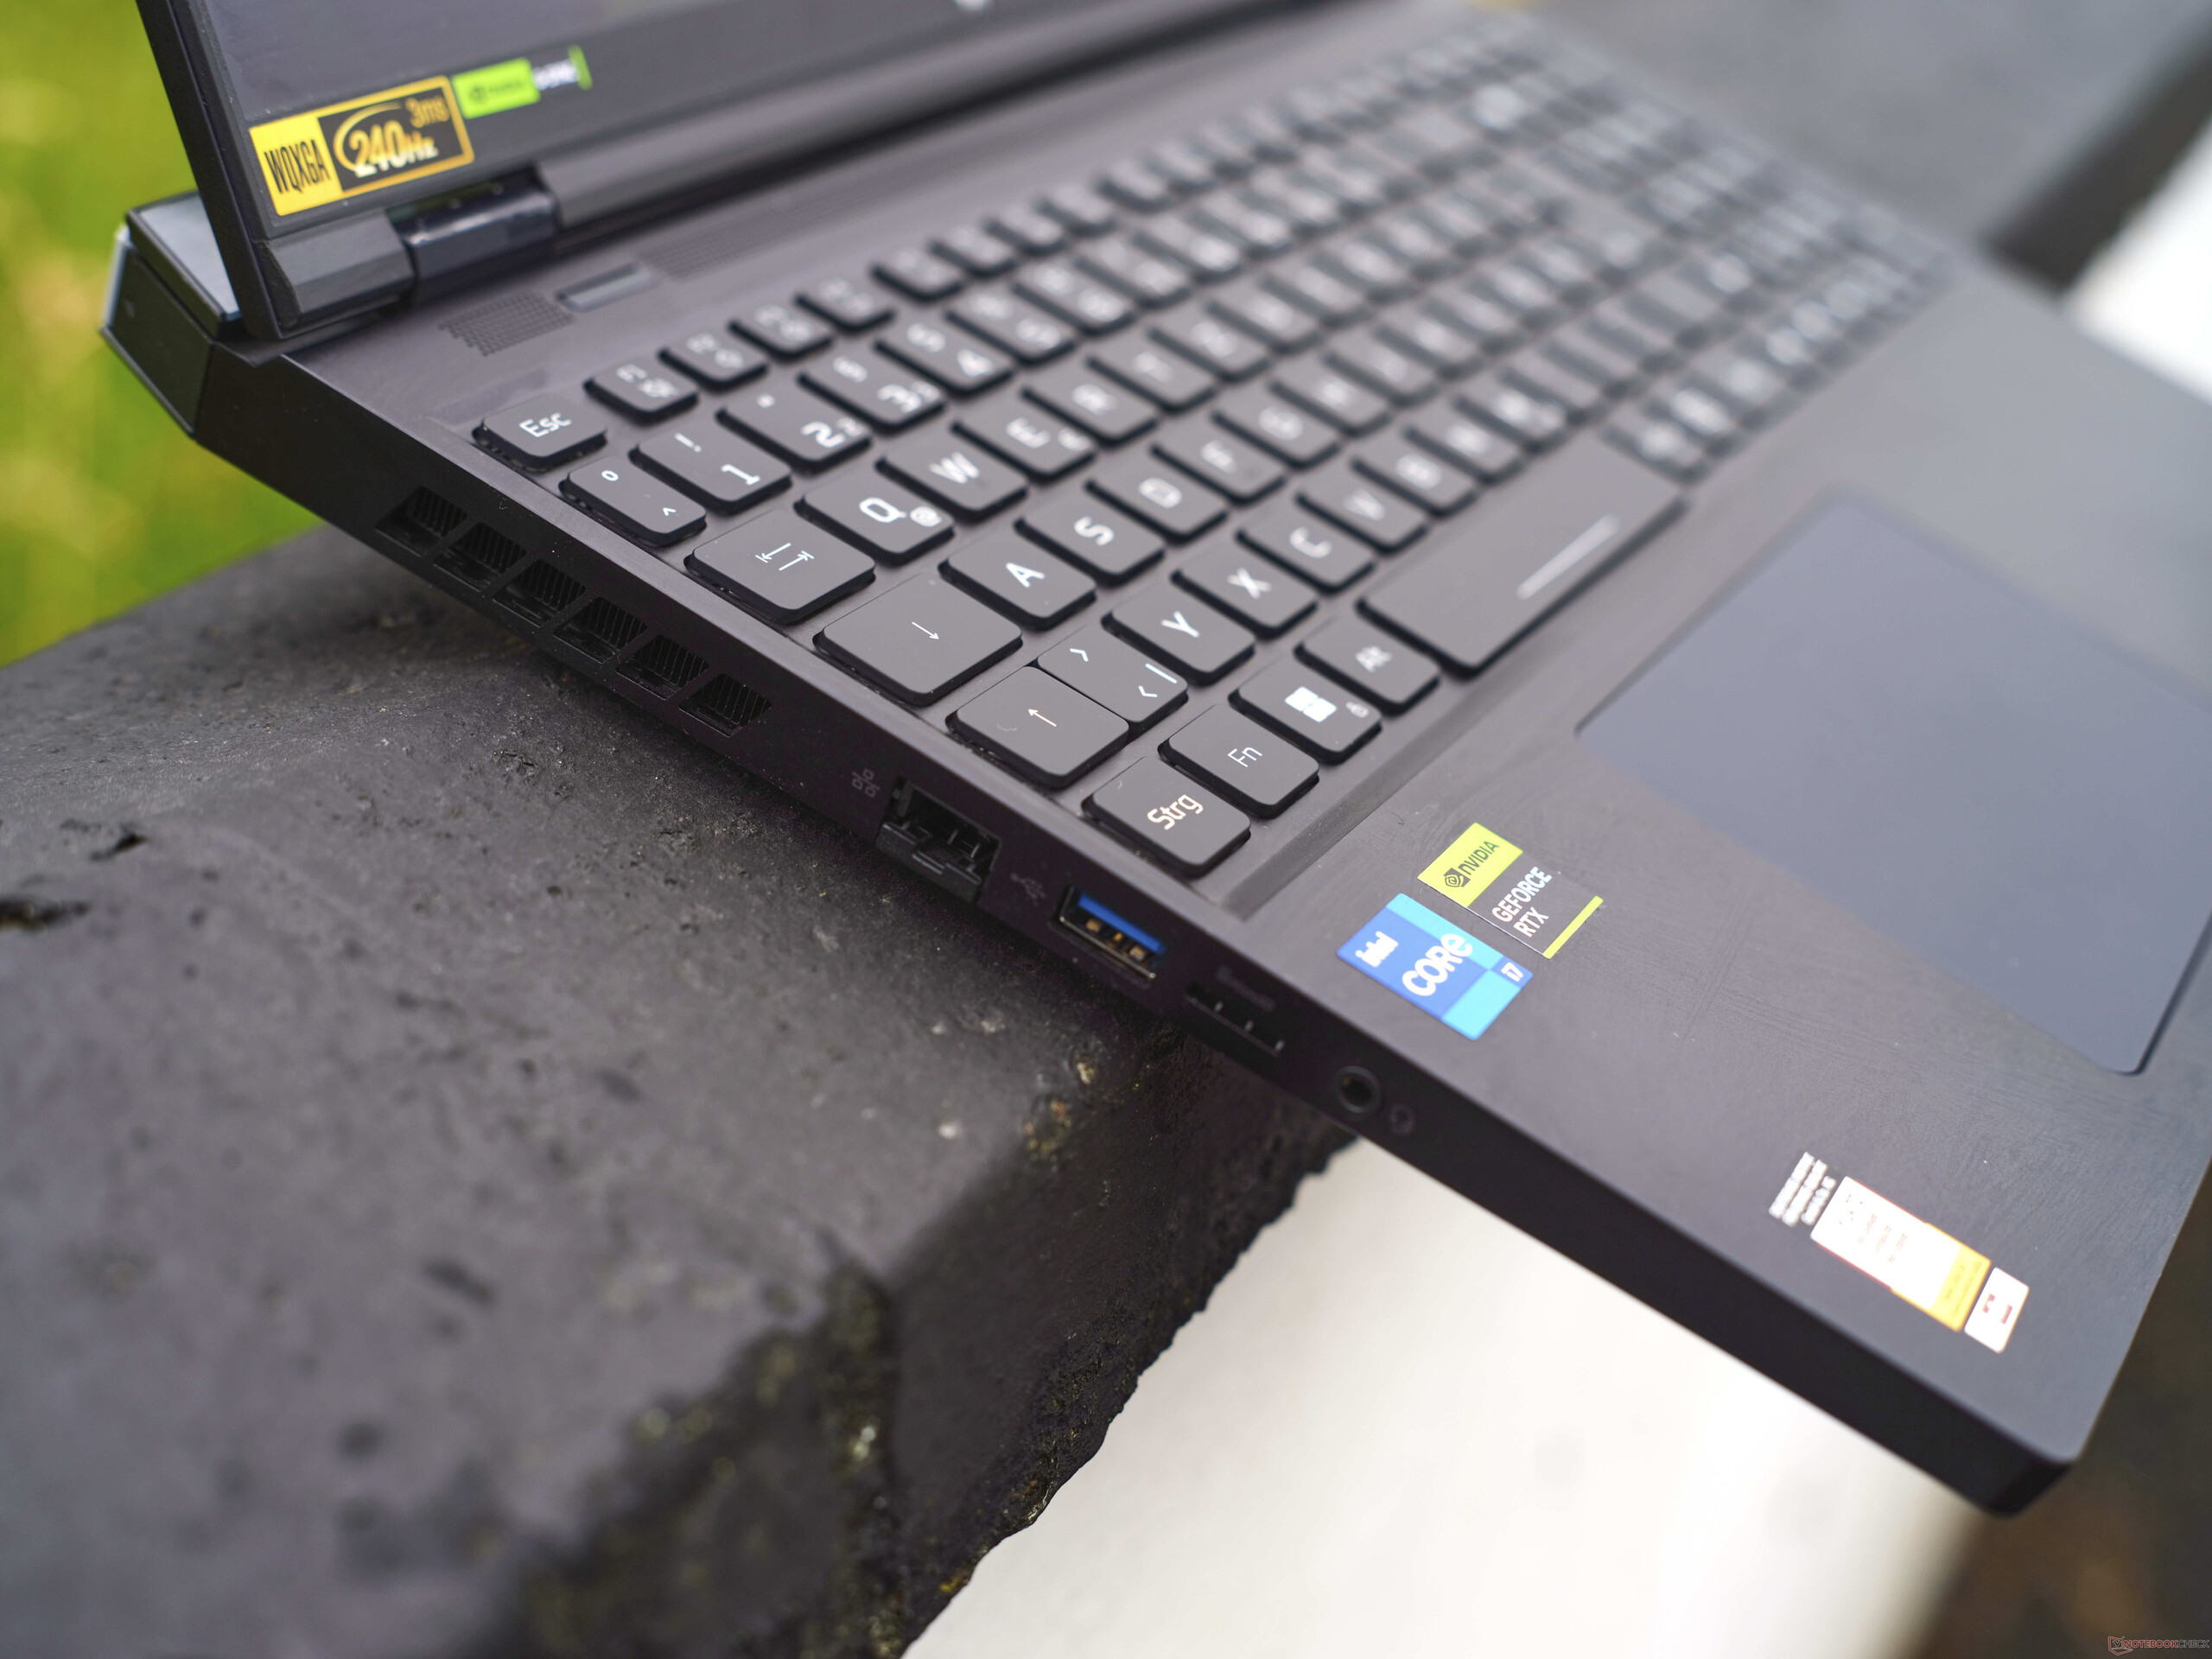
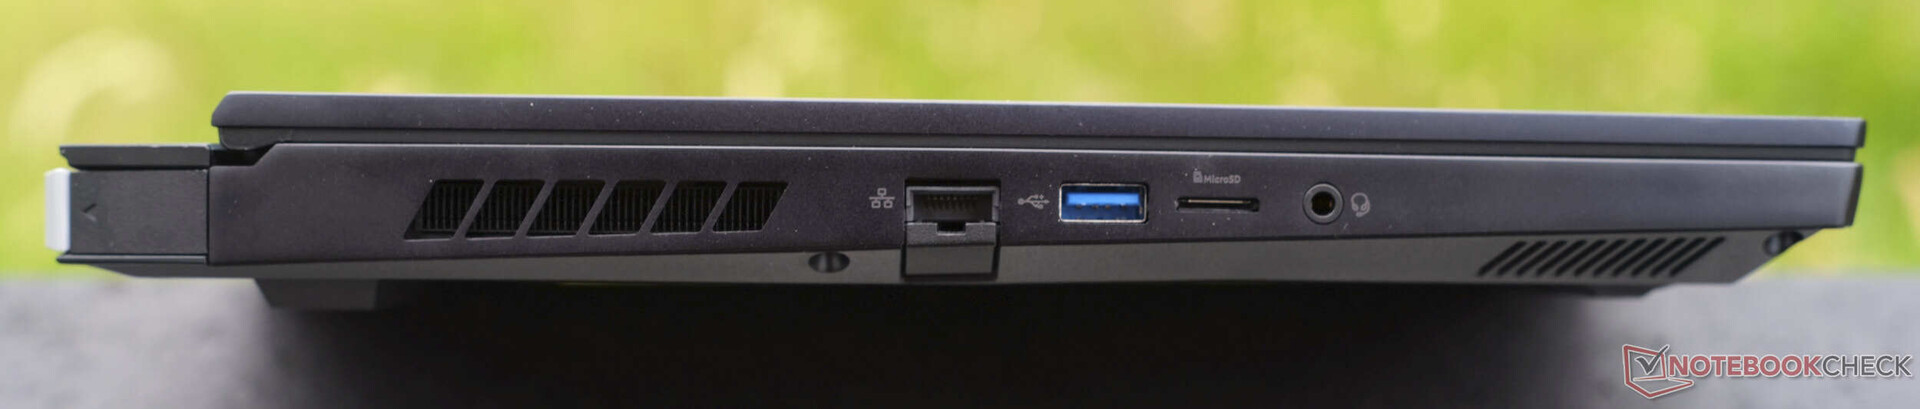
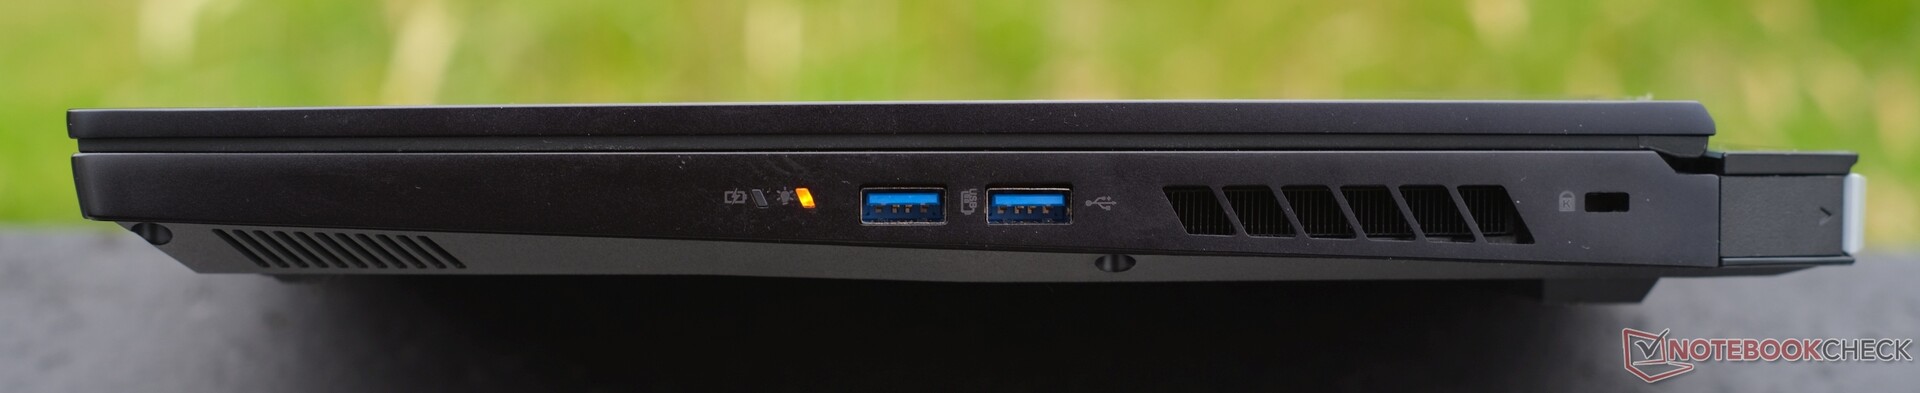
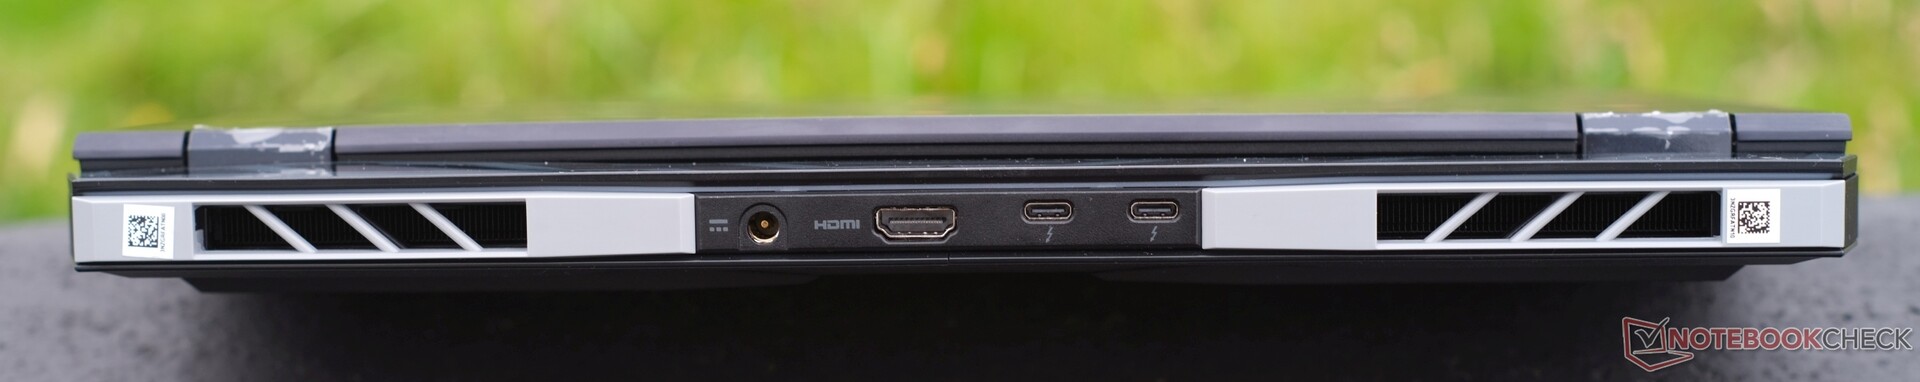
Caractéristiques : L'Helios 16 offre une sélection généreuse de ports et une connexion Wi-Fi Killer rapide
L'ordinateur portable de jeu Acer dispose de nombreux ports, dont 5x USB. À gauche, il y a 1x USB-A 3.1 (5 GBit/s), à droite, 2x USB-A 3.2 (10 GBit/s) ainsi que 2x Thunderbolt 4 à l'arrière qui inclut DisplayPort 1.4 et Power Delivery (100 watts). L'ordinateur portable est également équipé d'un réseau Ethernet Gigabit, d'un lecteur de carte microSD, d'une prise audio de 3,5 mm, d'un verrou Kensington, d'une interface HDMI 2.1 et d'un connecteur de charge.
Lecteur de carte SD
Associé à notre carte de référence AV PRO microSD 128 GB V60, le lecteur de carte microSD n'est pas forcément lent mais il n'est pas non plus très rapide et c'est dommage compte tenu du prix de l'Helios 16. Cependant, les appareils de notre panel de concurrents (du moins ceux équipés d'un lecteur de carte), lisent et copient les données avec une rapidité similaire.
| SD Card Reader | |
| average JPG Copy Test (av. of 3 runs) | |
| Moyenne de la classe Gaming (20.9 - 210, n=55, 2 dernières années) | |
| Lenovo Legion S7 16ARHA7 (AV PRO microSD 128 GB V60) | |
| Medion Erazer Defender P40 (AV PRO microSD 128 GB V60) | |
| Acer Nitro 16 AN16-41 (AV Pro SD microSD 128 GB V60) | |
| HP Omen 17-ck2097ng (AV PRO microSD 128 GB V60) | |
| Acer Predator Helios 16 PH16-71-731Q | |
| maximum AS SSD Seq Read Test (1GB) | |
| Moyenne de la classe Gaming (25.5 - 261, n=52, 2 dernières années) | |
| Medion Erazer Defender P40 (AV PRO microSD 128 GB V60) | |
| Lenovo Legion S7 16ARHA7 (AV PRO microSD 128 GB V60) | |
| Acer Predator Helios 16 PH16-71-731Q | |
| Acer Nitro 16 AN16-41 (AV Pro SD microSD 128 GB V60) | |
| HP Omen 17-ck2097ng (AV PRO microSD 128 GB V60) | |
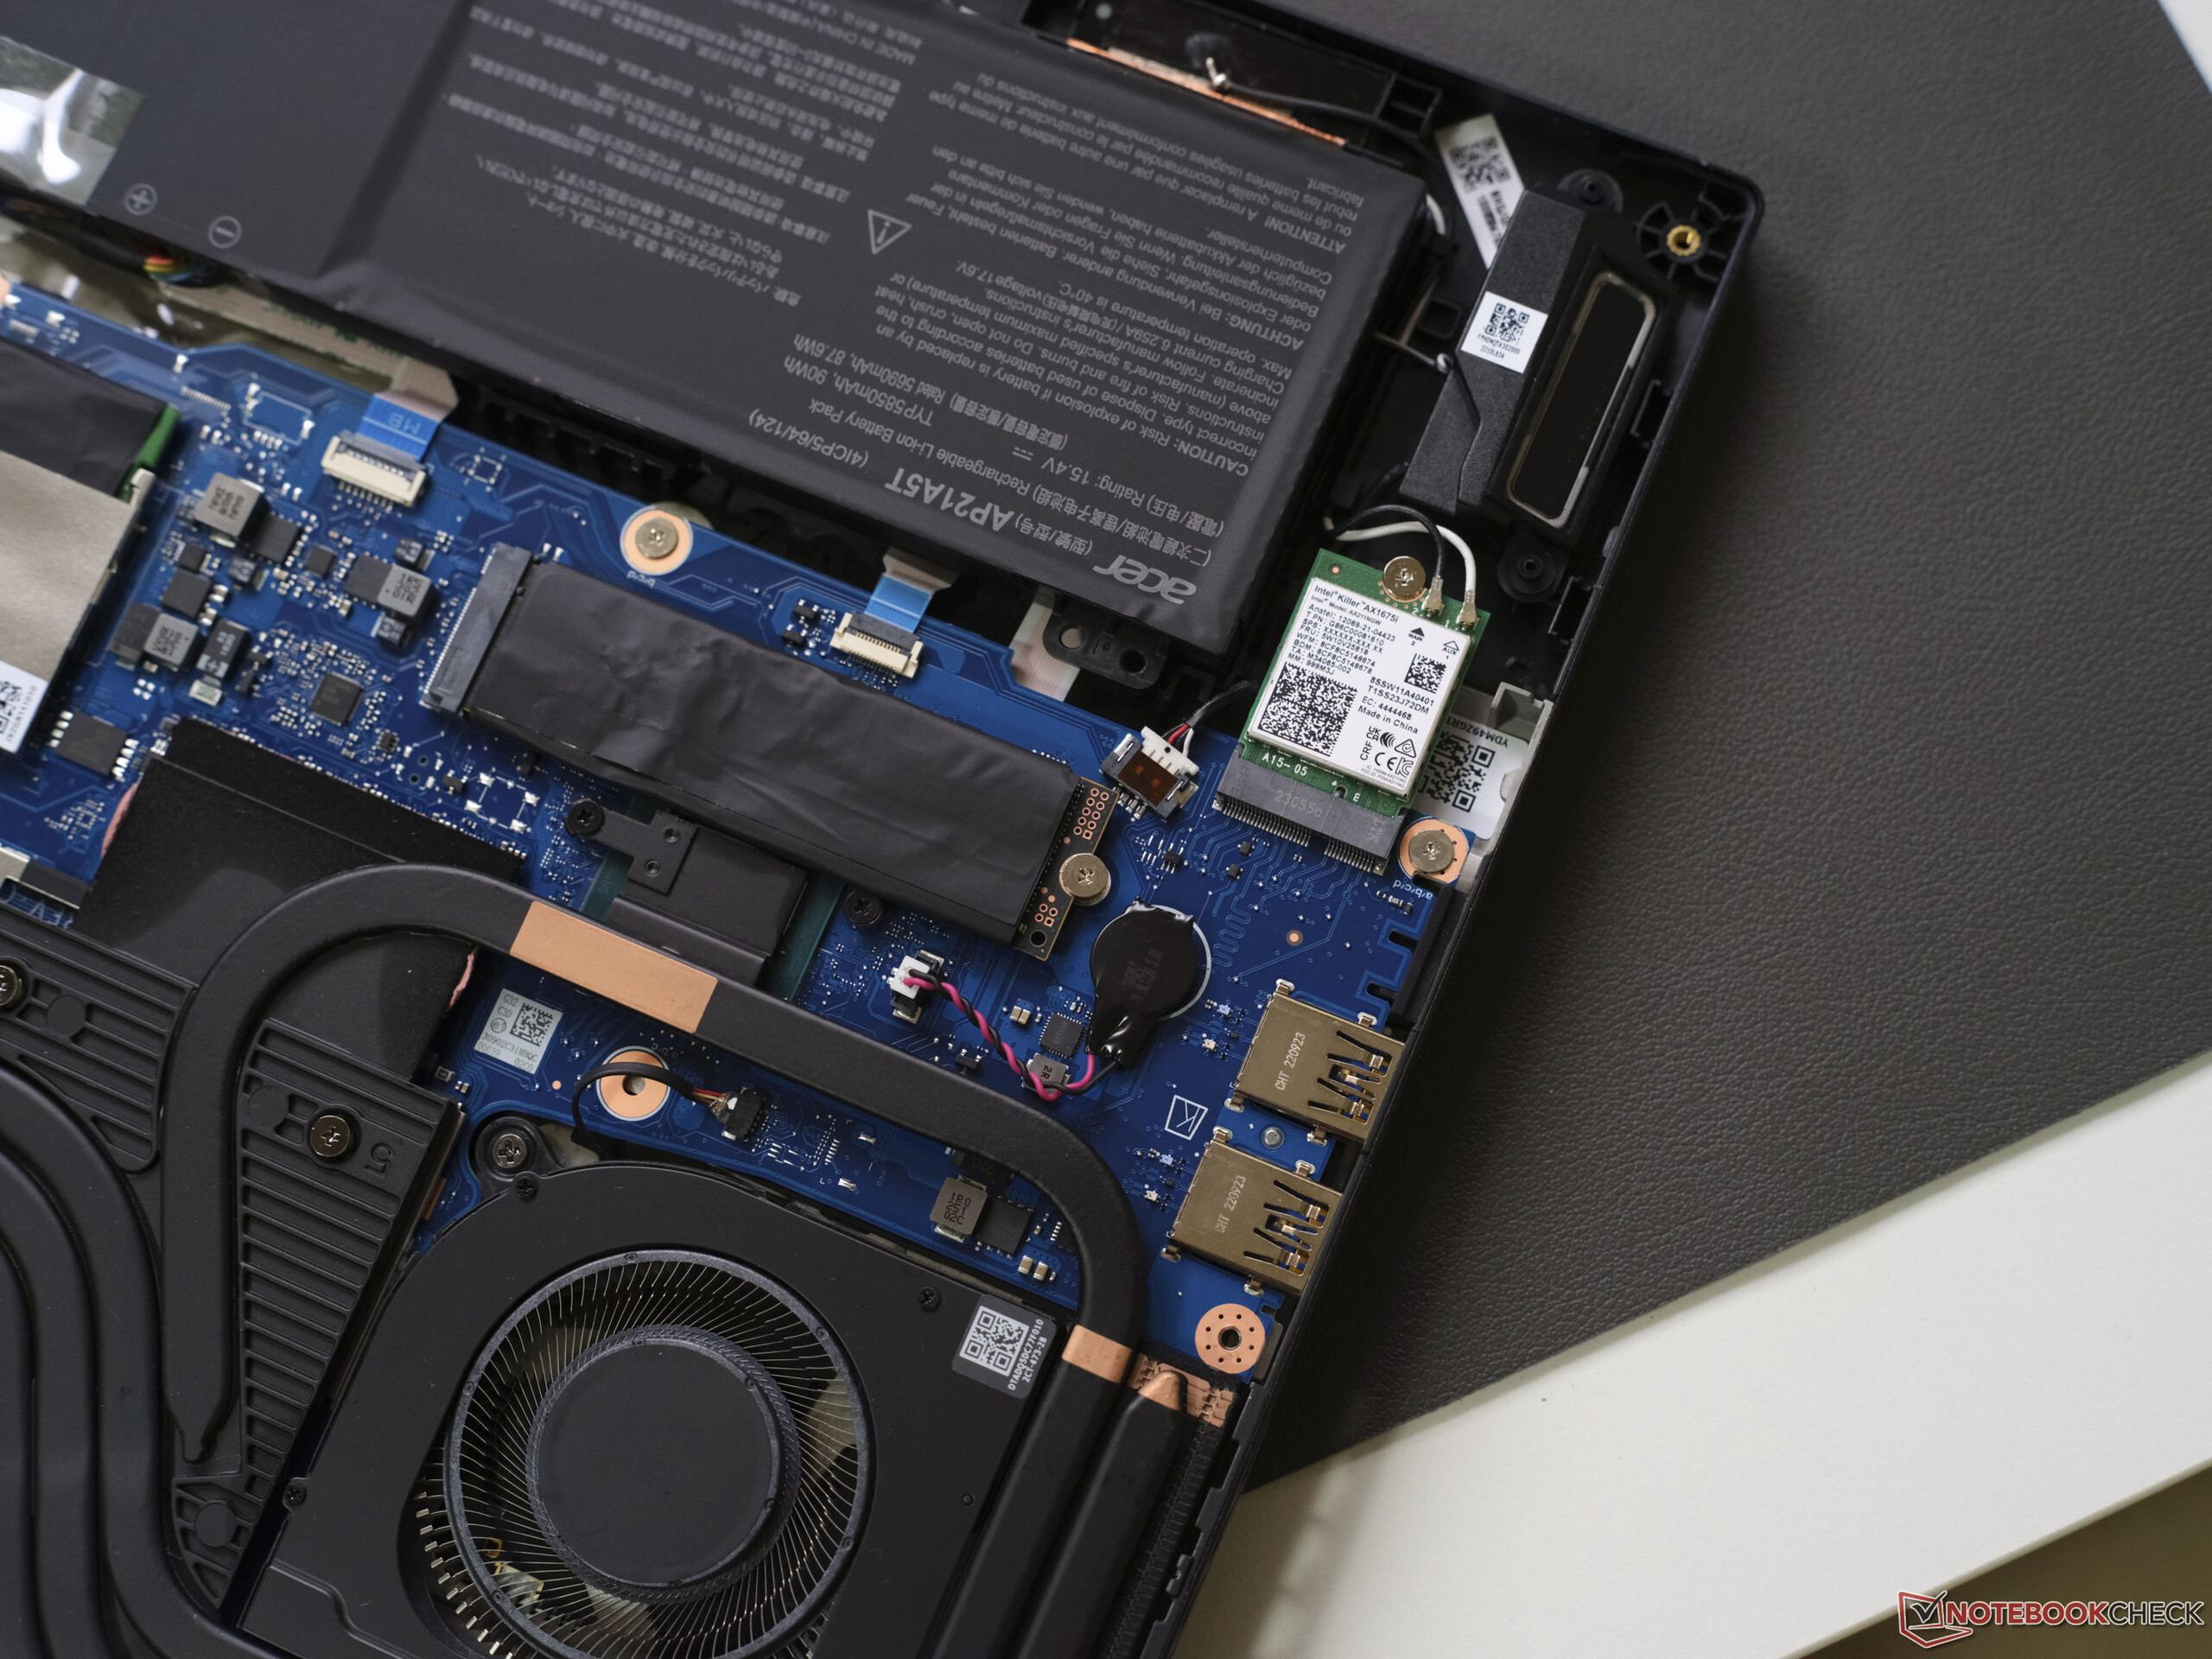
Communication
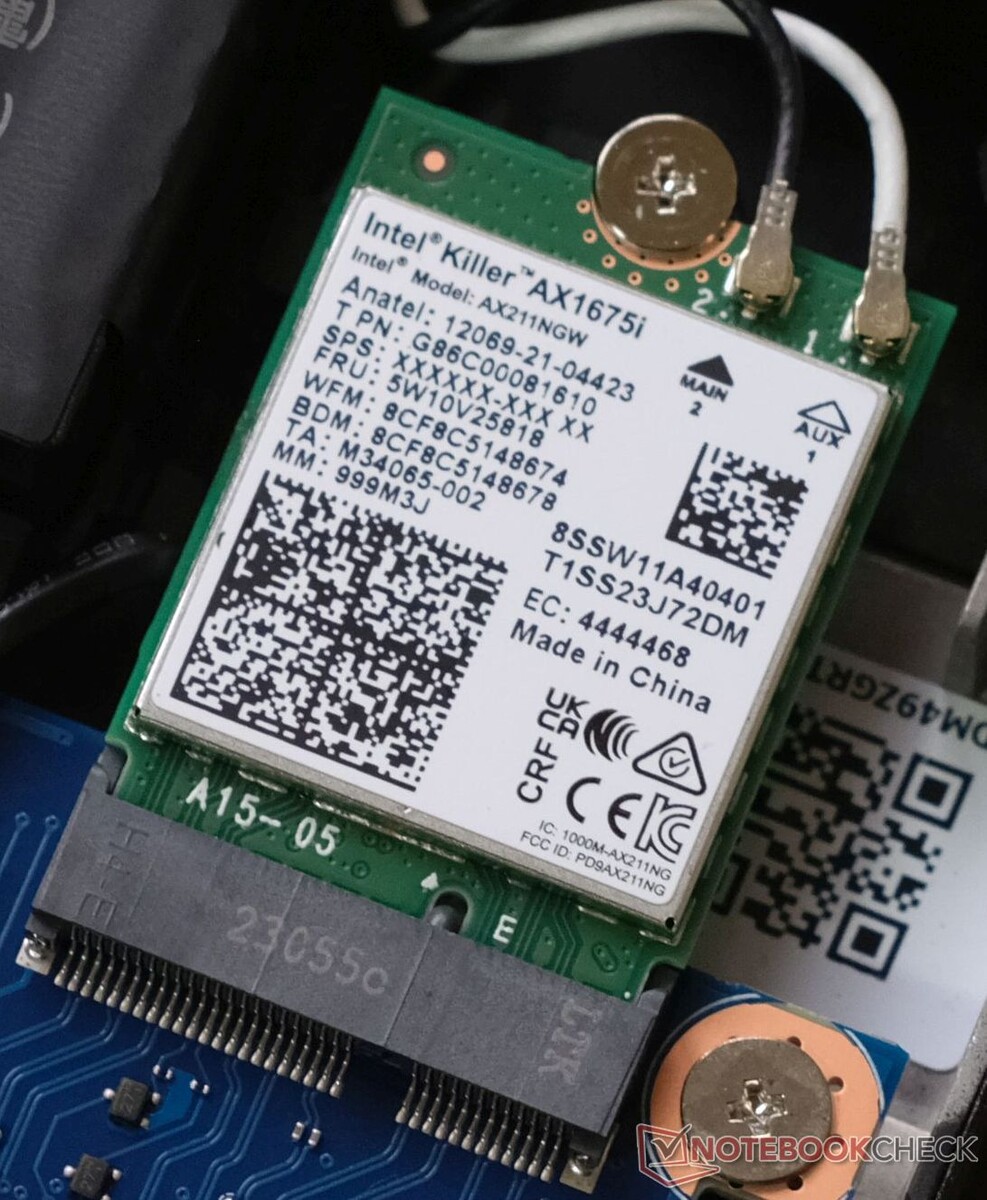
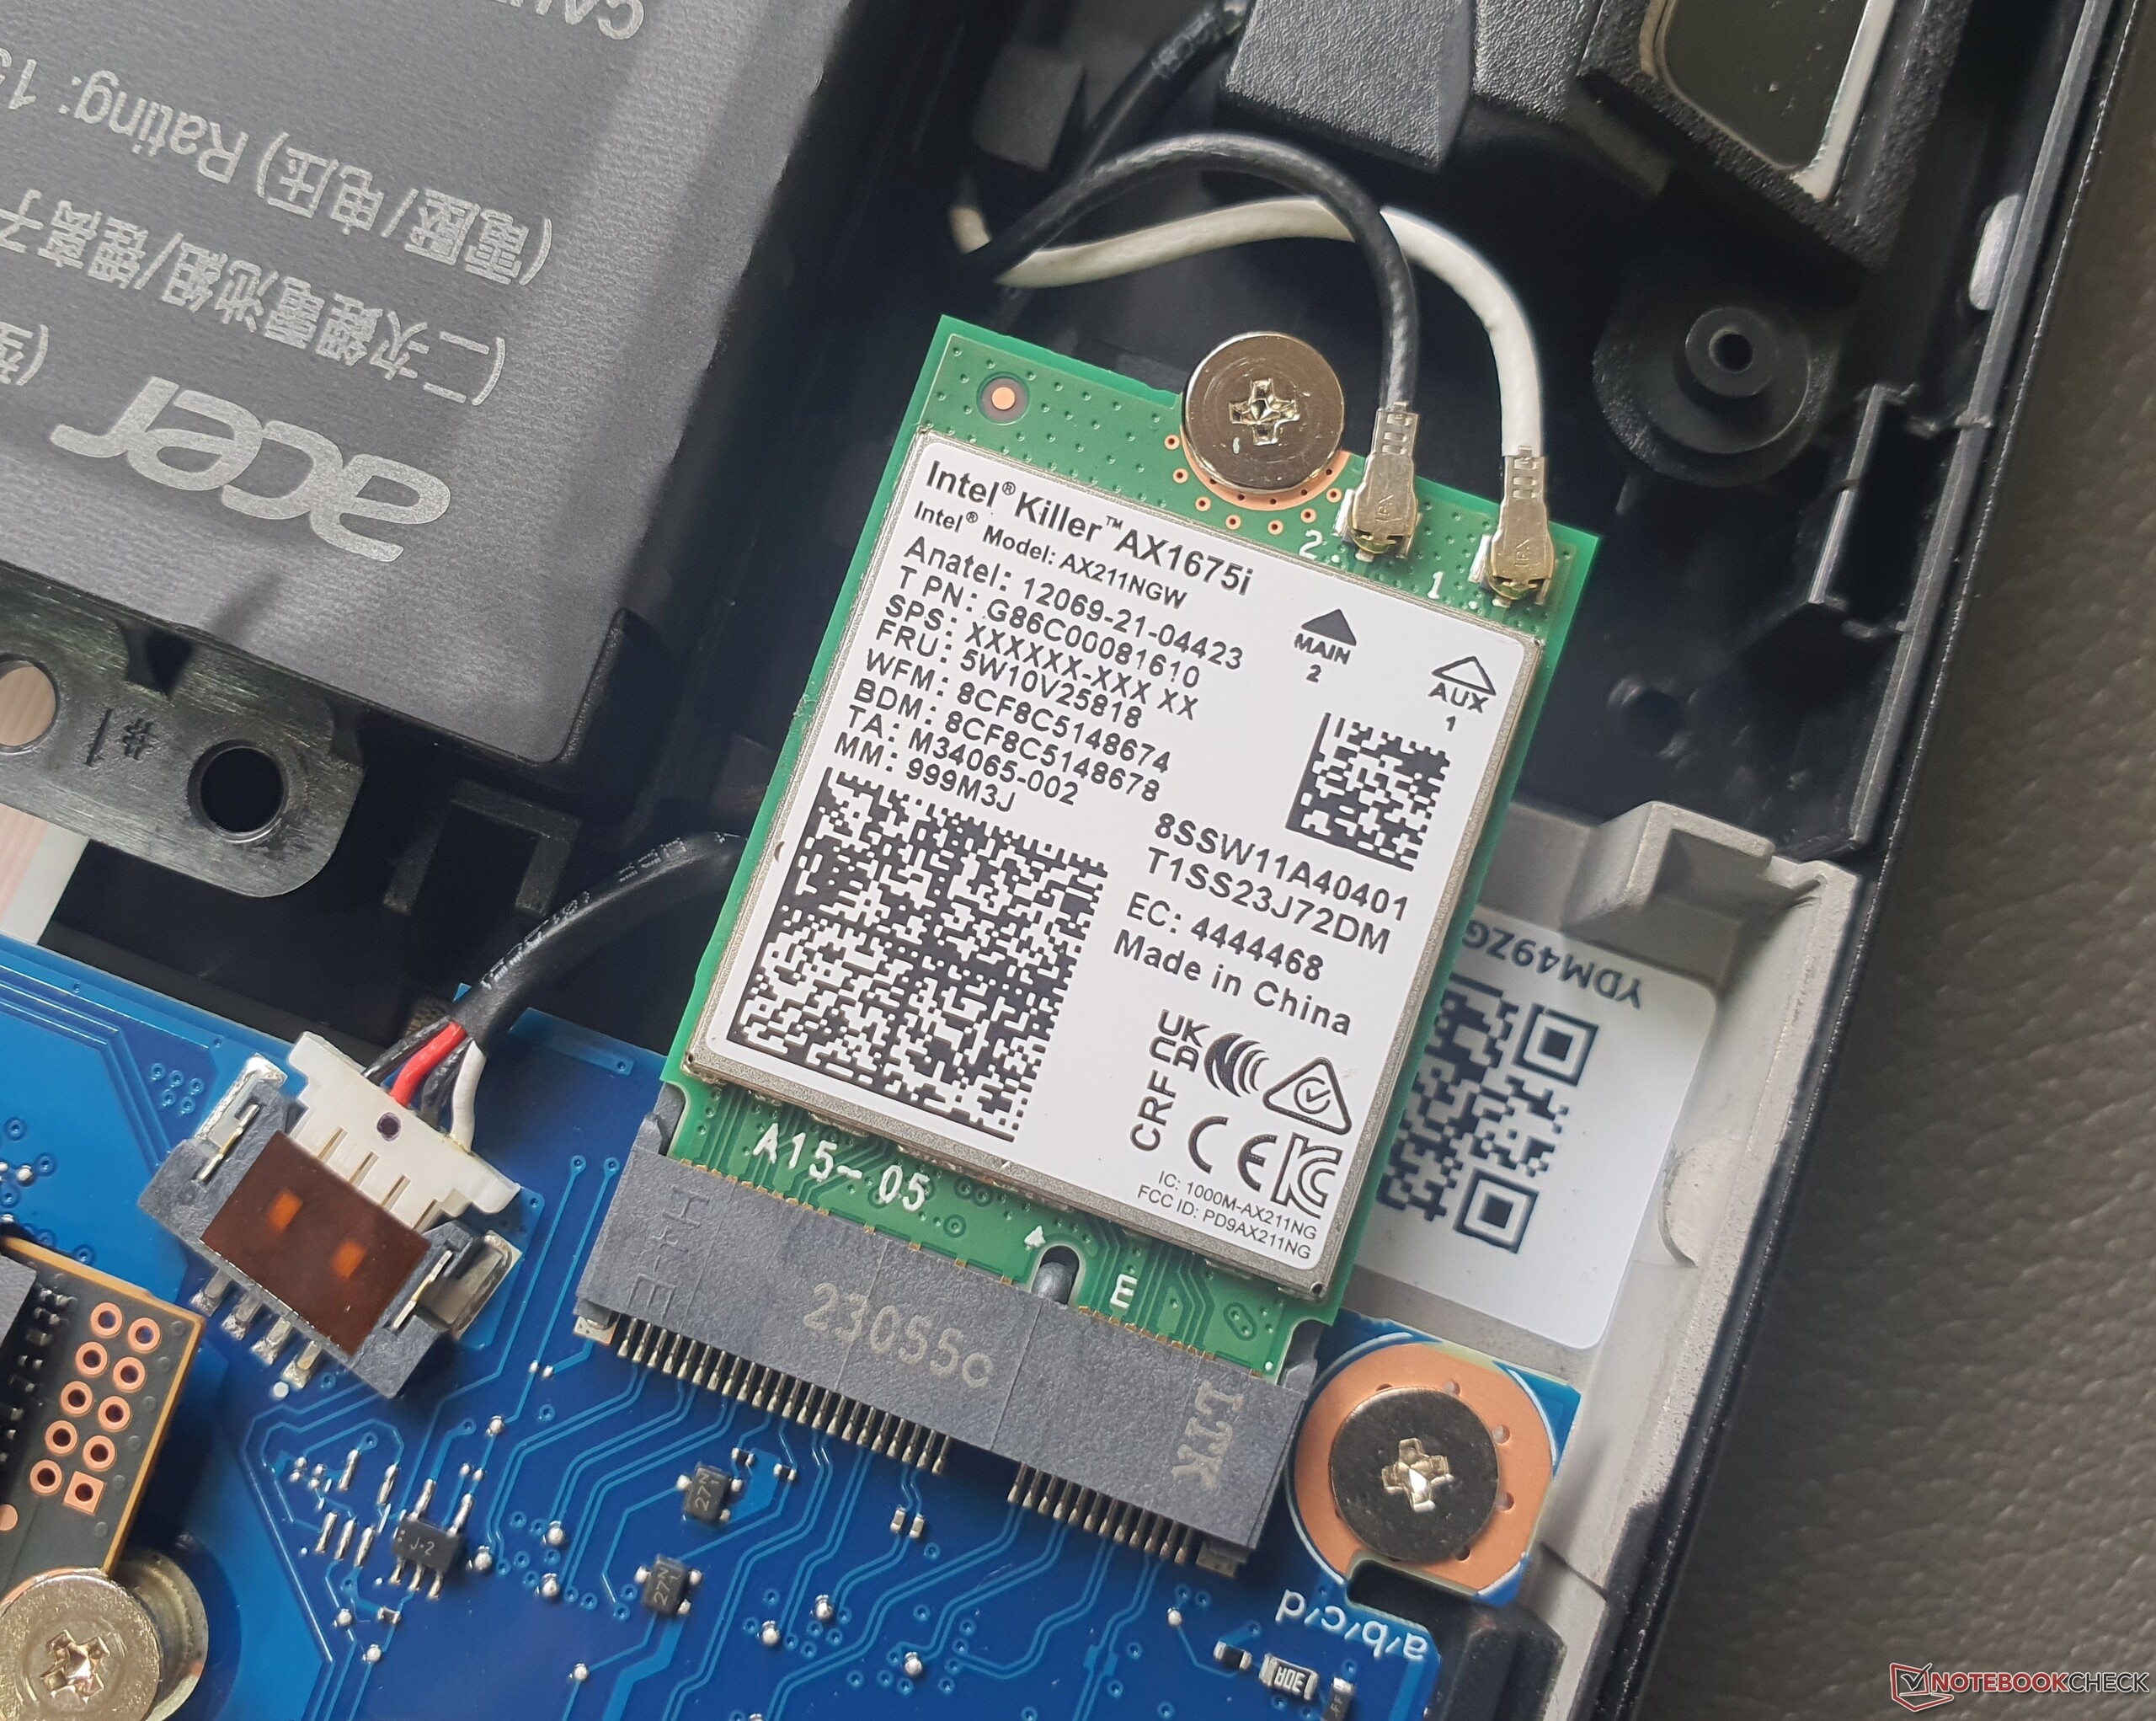
La puce Intel Killer AX1675i Wi-Fi 6E est responsable de la transmission du réseau sans fil, fonctionnant à une vitesse de pointe allant jusqu'à 1,6 GBit/s, plus rapide que le port Gigabit RJ45 installé (Killer 2600), qui ne supporte pas 2,5 GBit/s. En particulier, la puce Intel Killer AX1675i Wi-Fi 6E est responsable de la transmission du réseau sans fil, fonctionnant à une vitesse de pointe allant jusqu'à 1,6 GBit/s.Legion Pro 5 16et leTUF Gaming A16sont à la traîne par rapport à l'Helios 16. Le Bluetooth 5.2 est de la partie.
Webcam
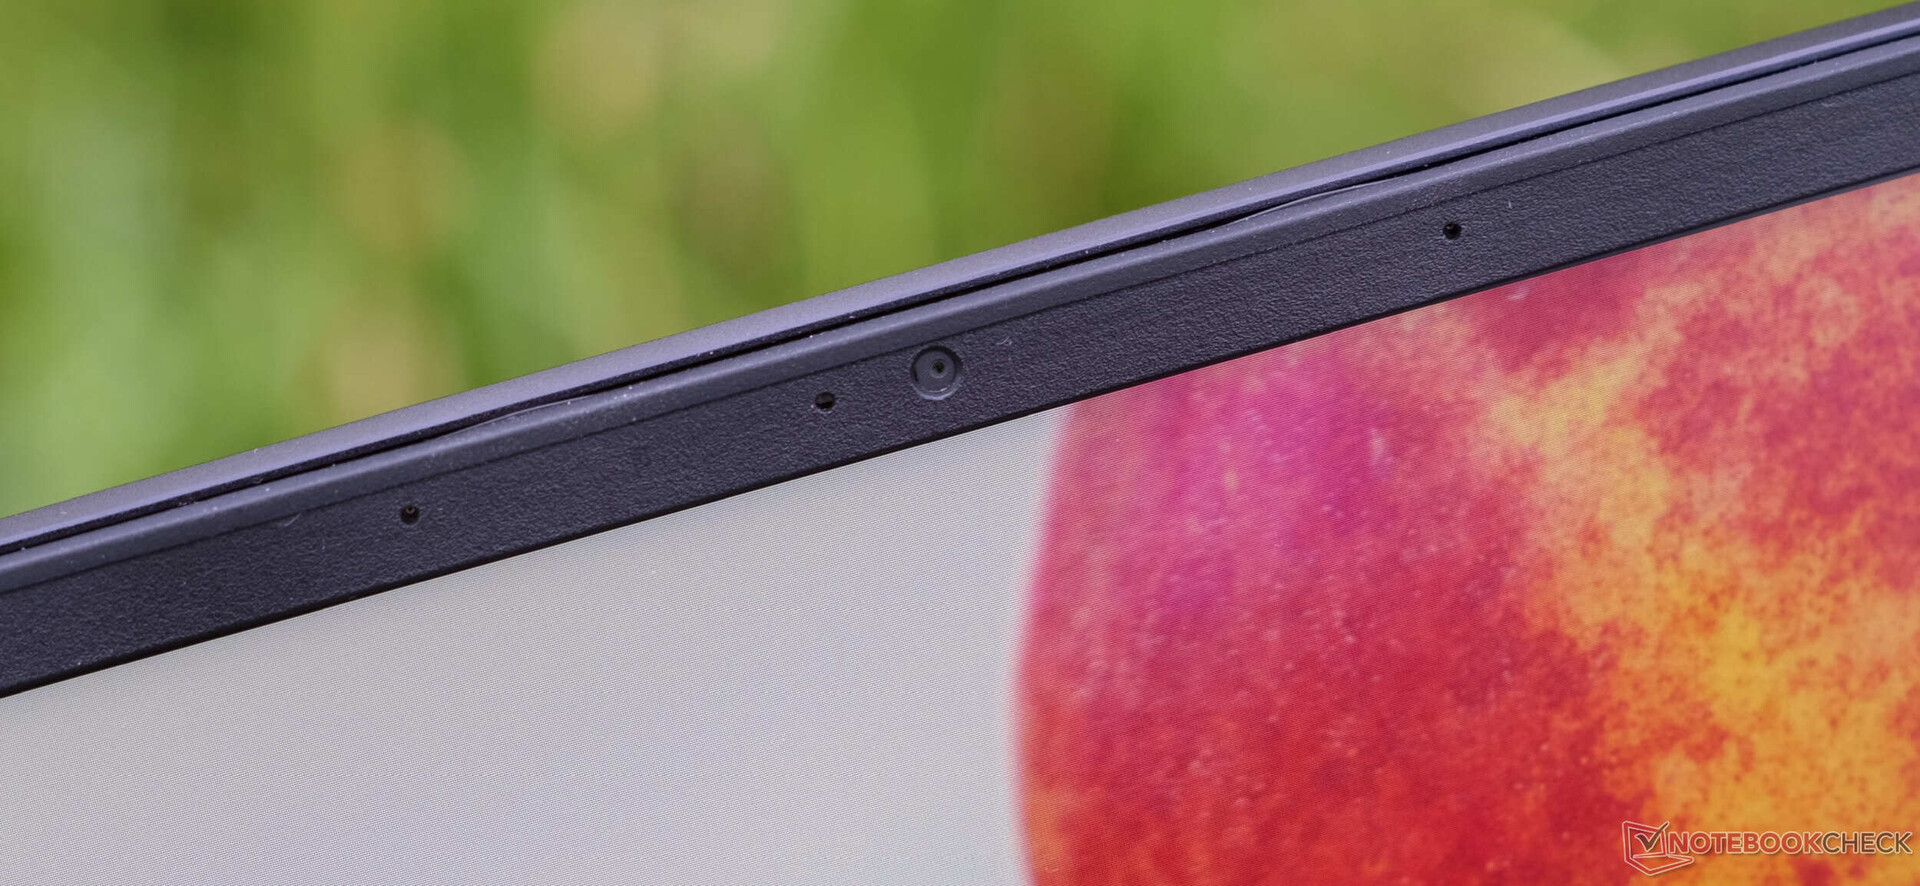
Dans de bonnes conditions d'éclairage, la webcam 1080p fournit de très bonnes images. En présence d'un contre-jour (dans ce cas, provenant d'une fenêtre latérale sans autre source de lumière), la qualité diminue considérablement. Windows Hello est pris en charge, mais il n'y a pas d'obturateur physique.


Accessoires

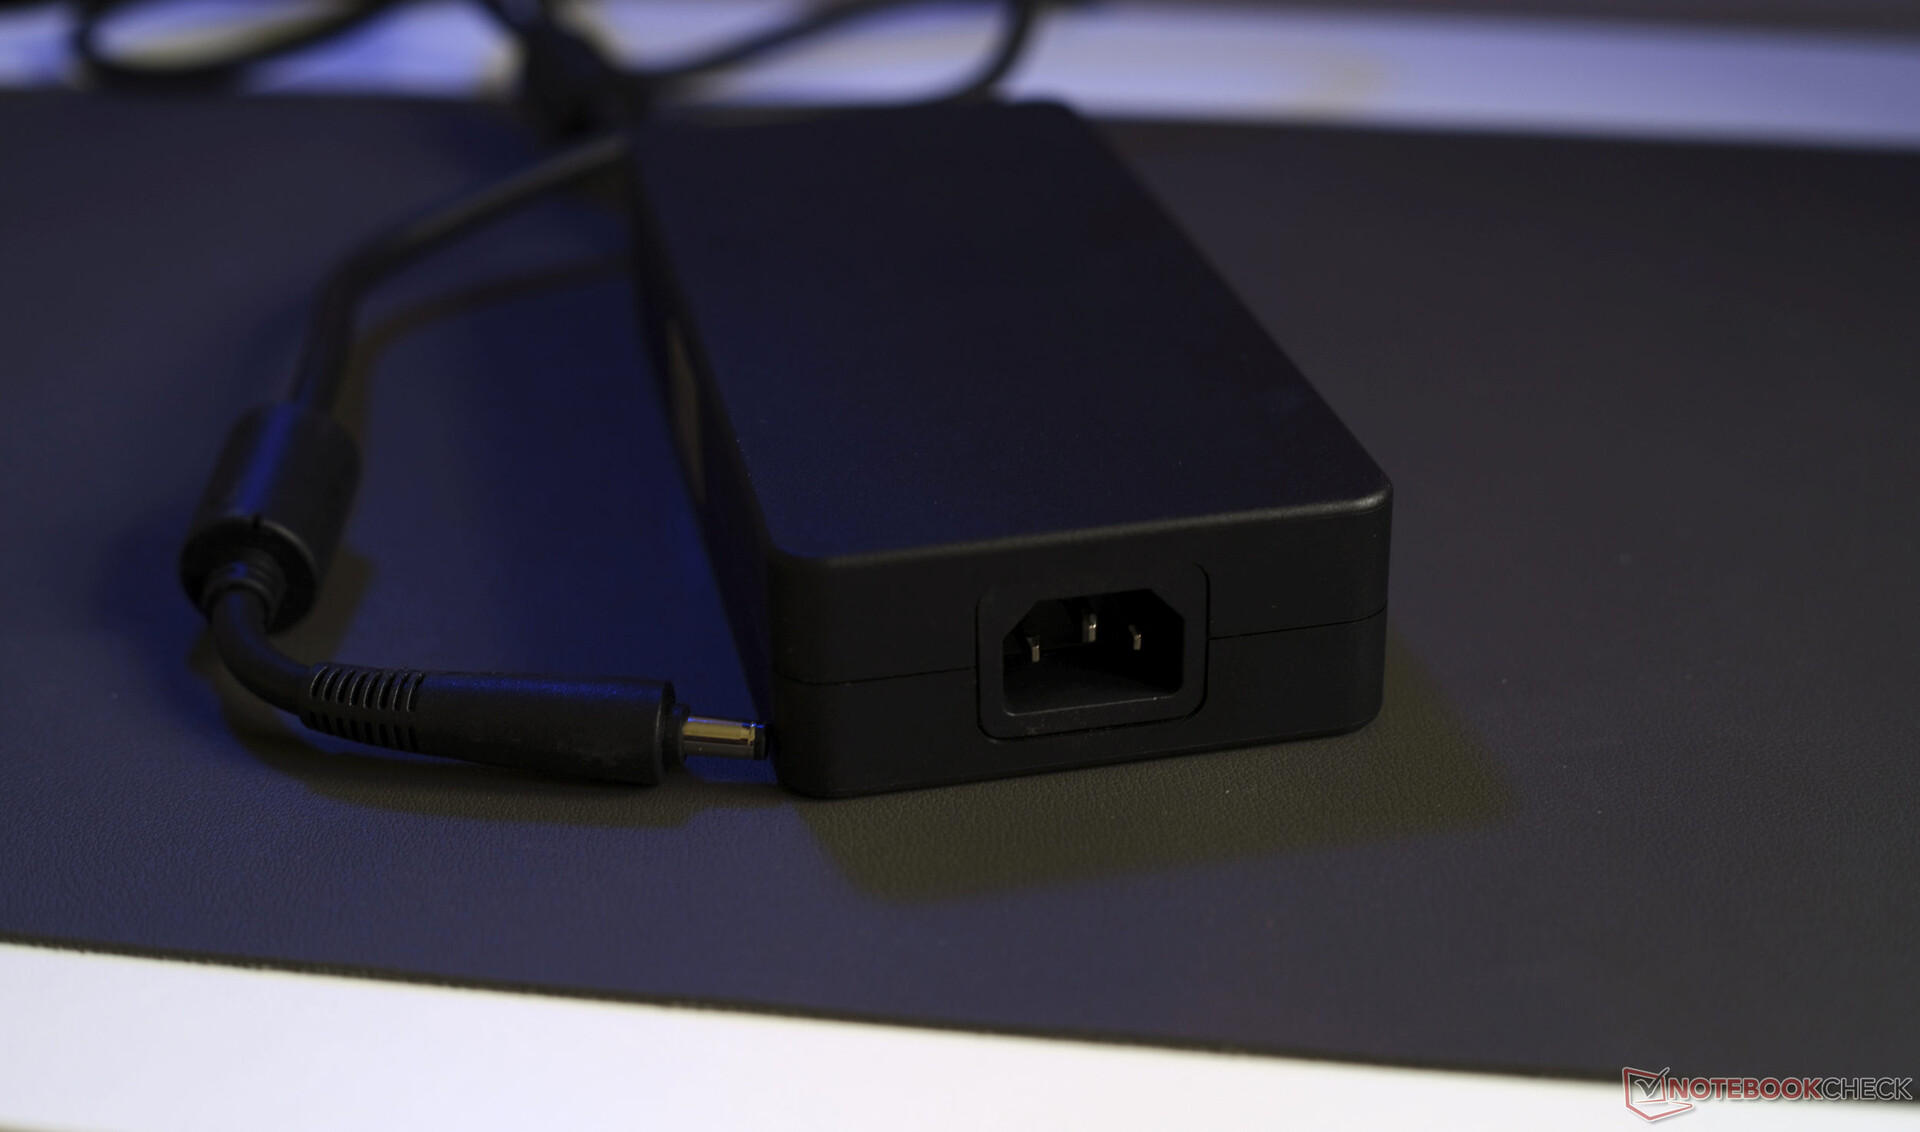
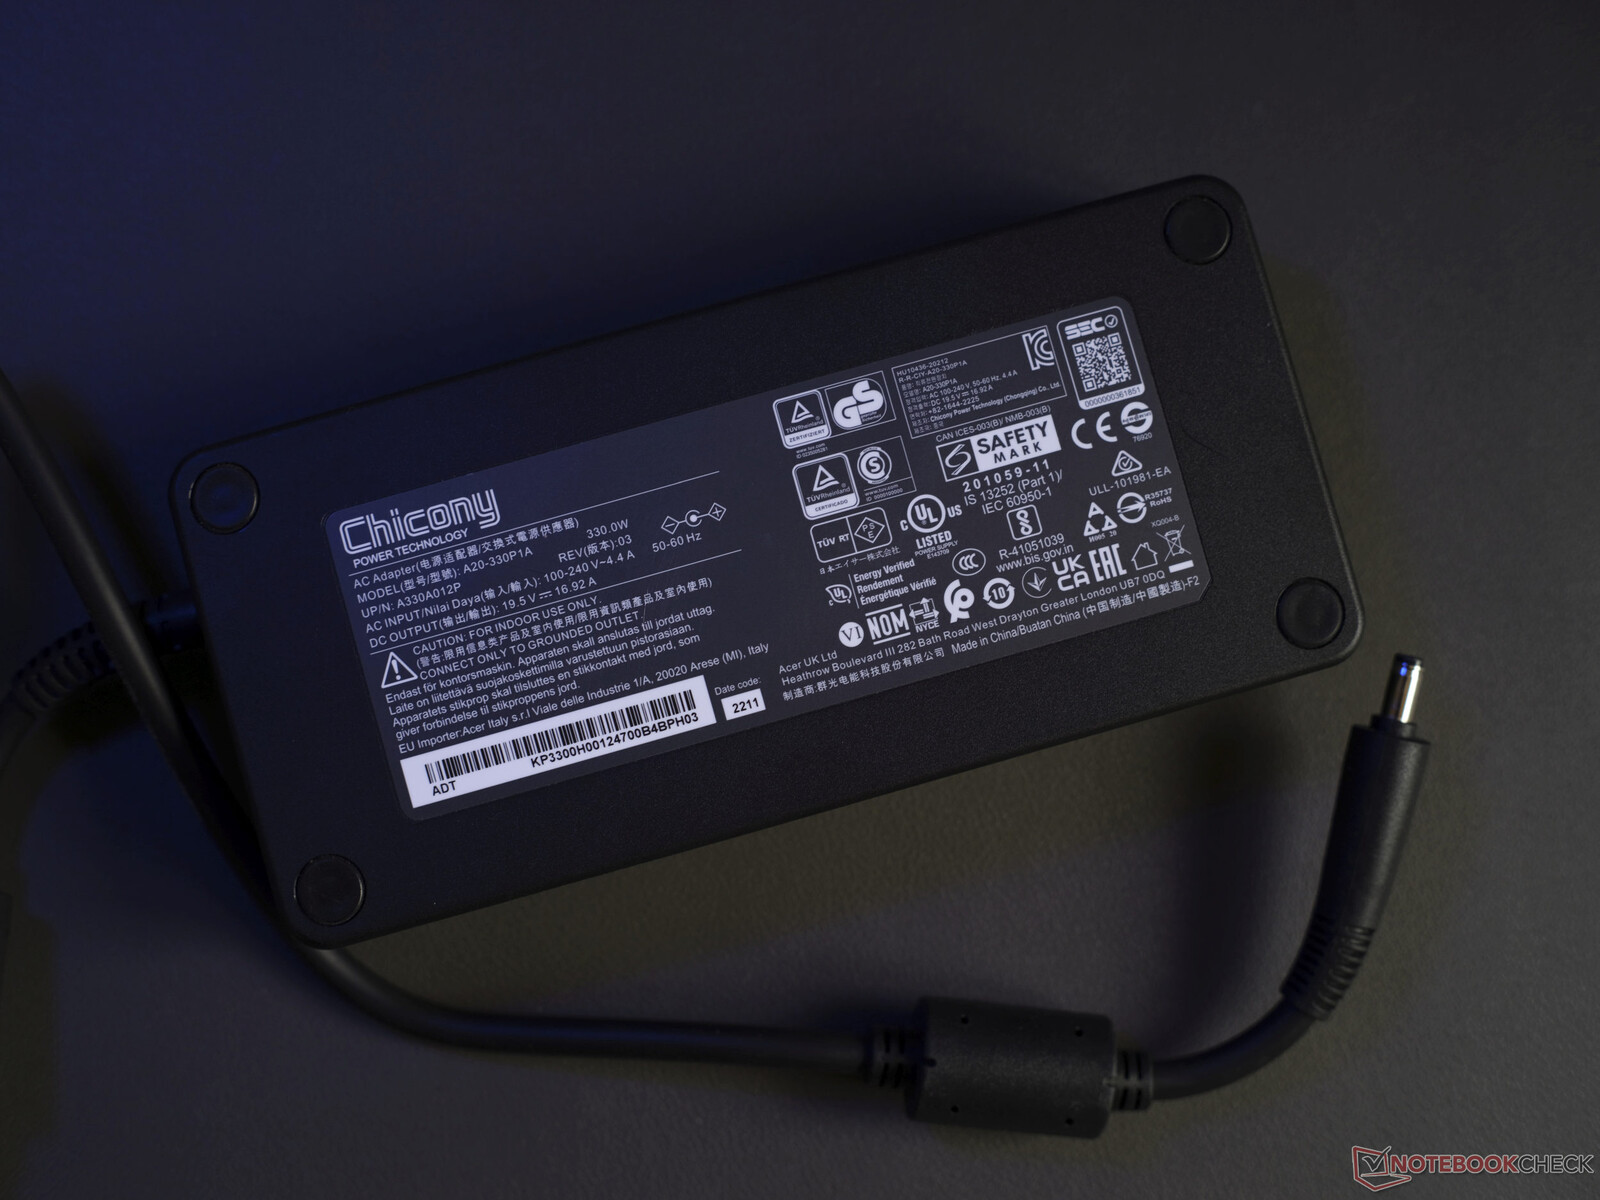
Acer a inclus deux grilles de ventilateur magnétiques gris clair supplémentaires afin de remplacer les grilles gris foncé préinstallées. Des couleurs plus audacieuses auraient été les bienvenues. A part cela, il n'y a que l'alimentation de 330 watts. Le fabricant n'a pas opté pour un emballage respectueux de l'environnement.
Les photos de droite concernent le pack Predator gaming actuellement disponible sur la boutique allemande d'Acer.
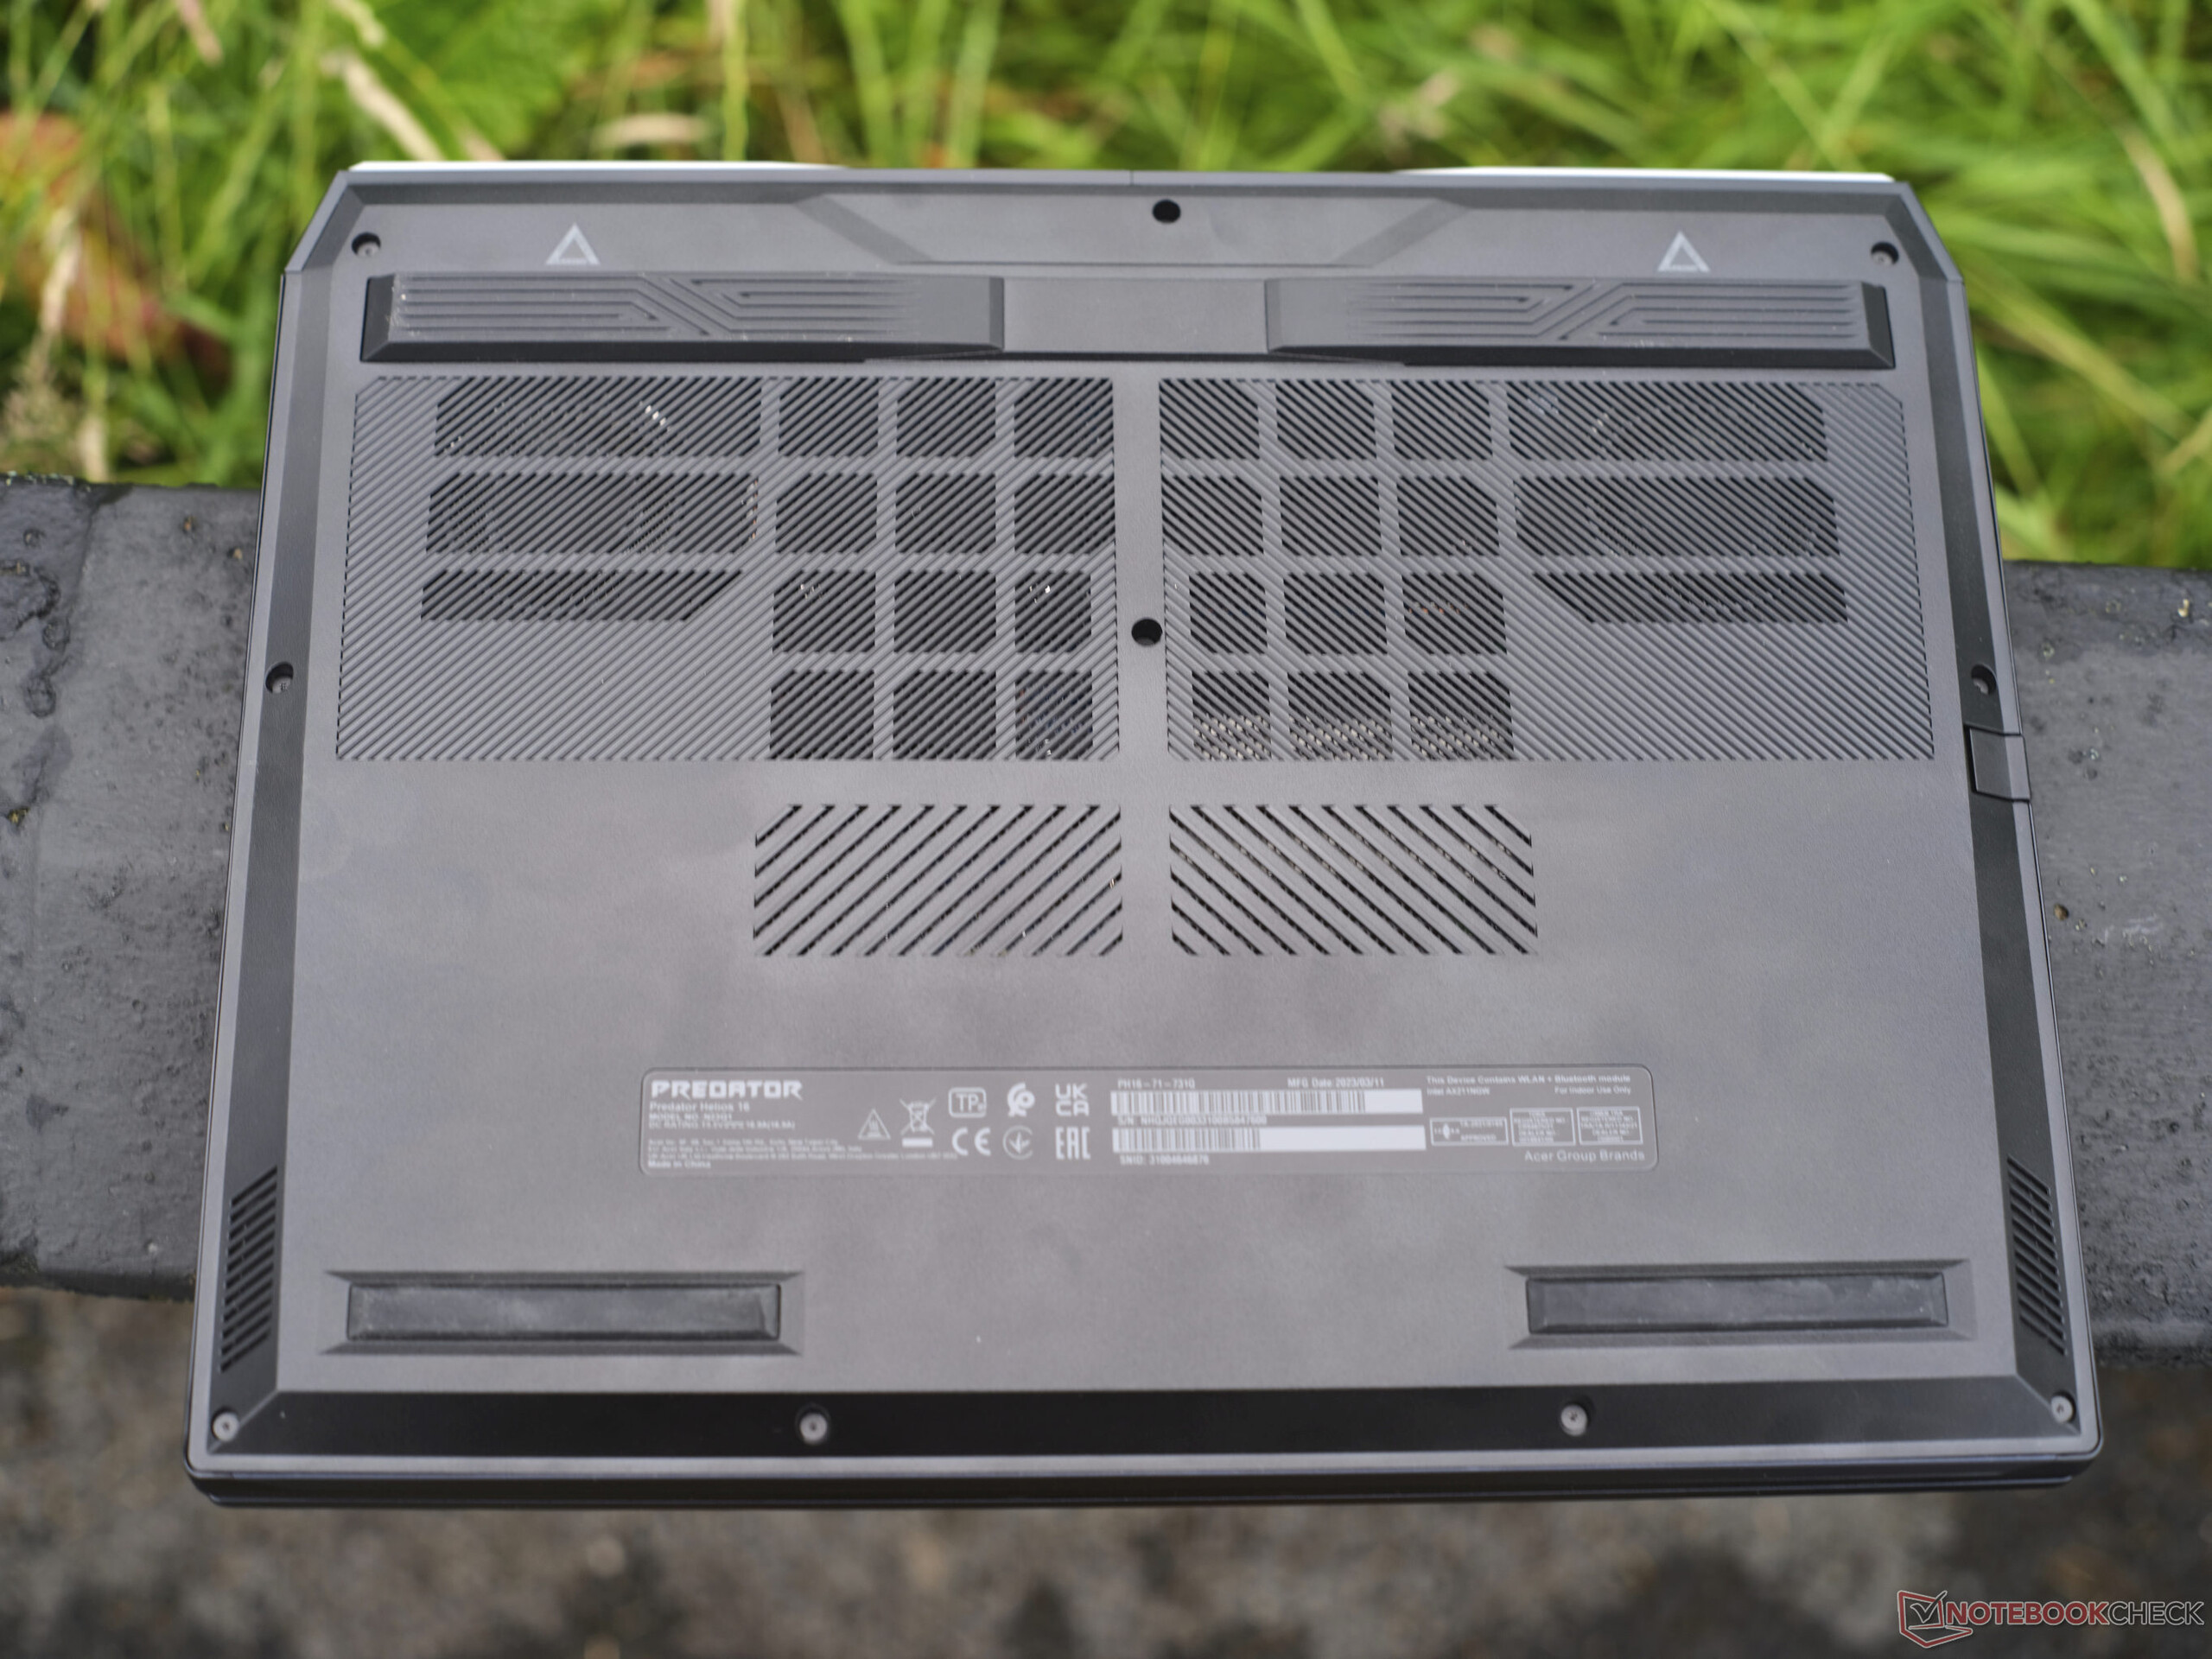
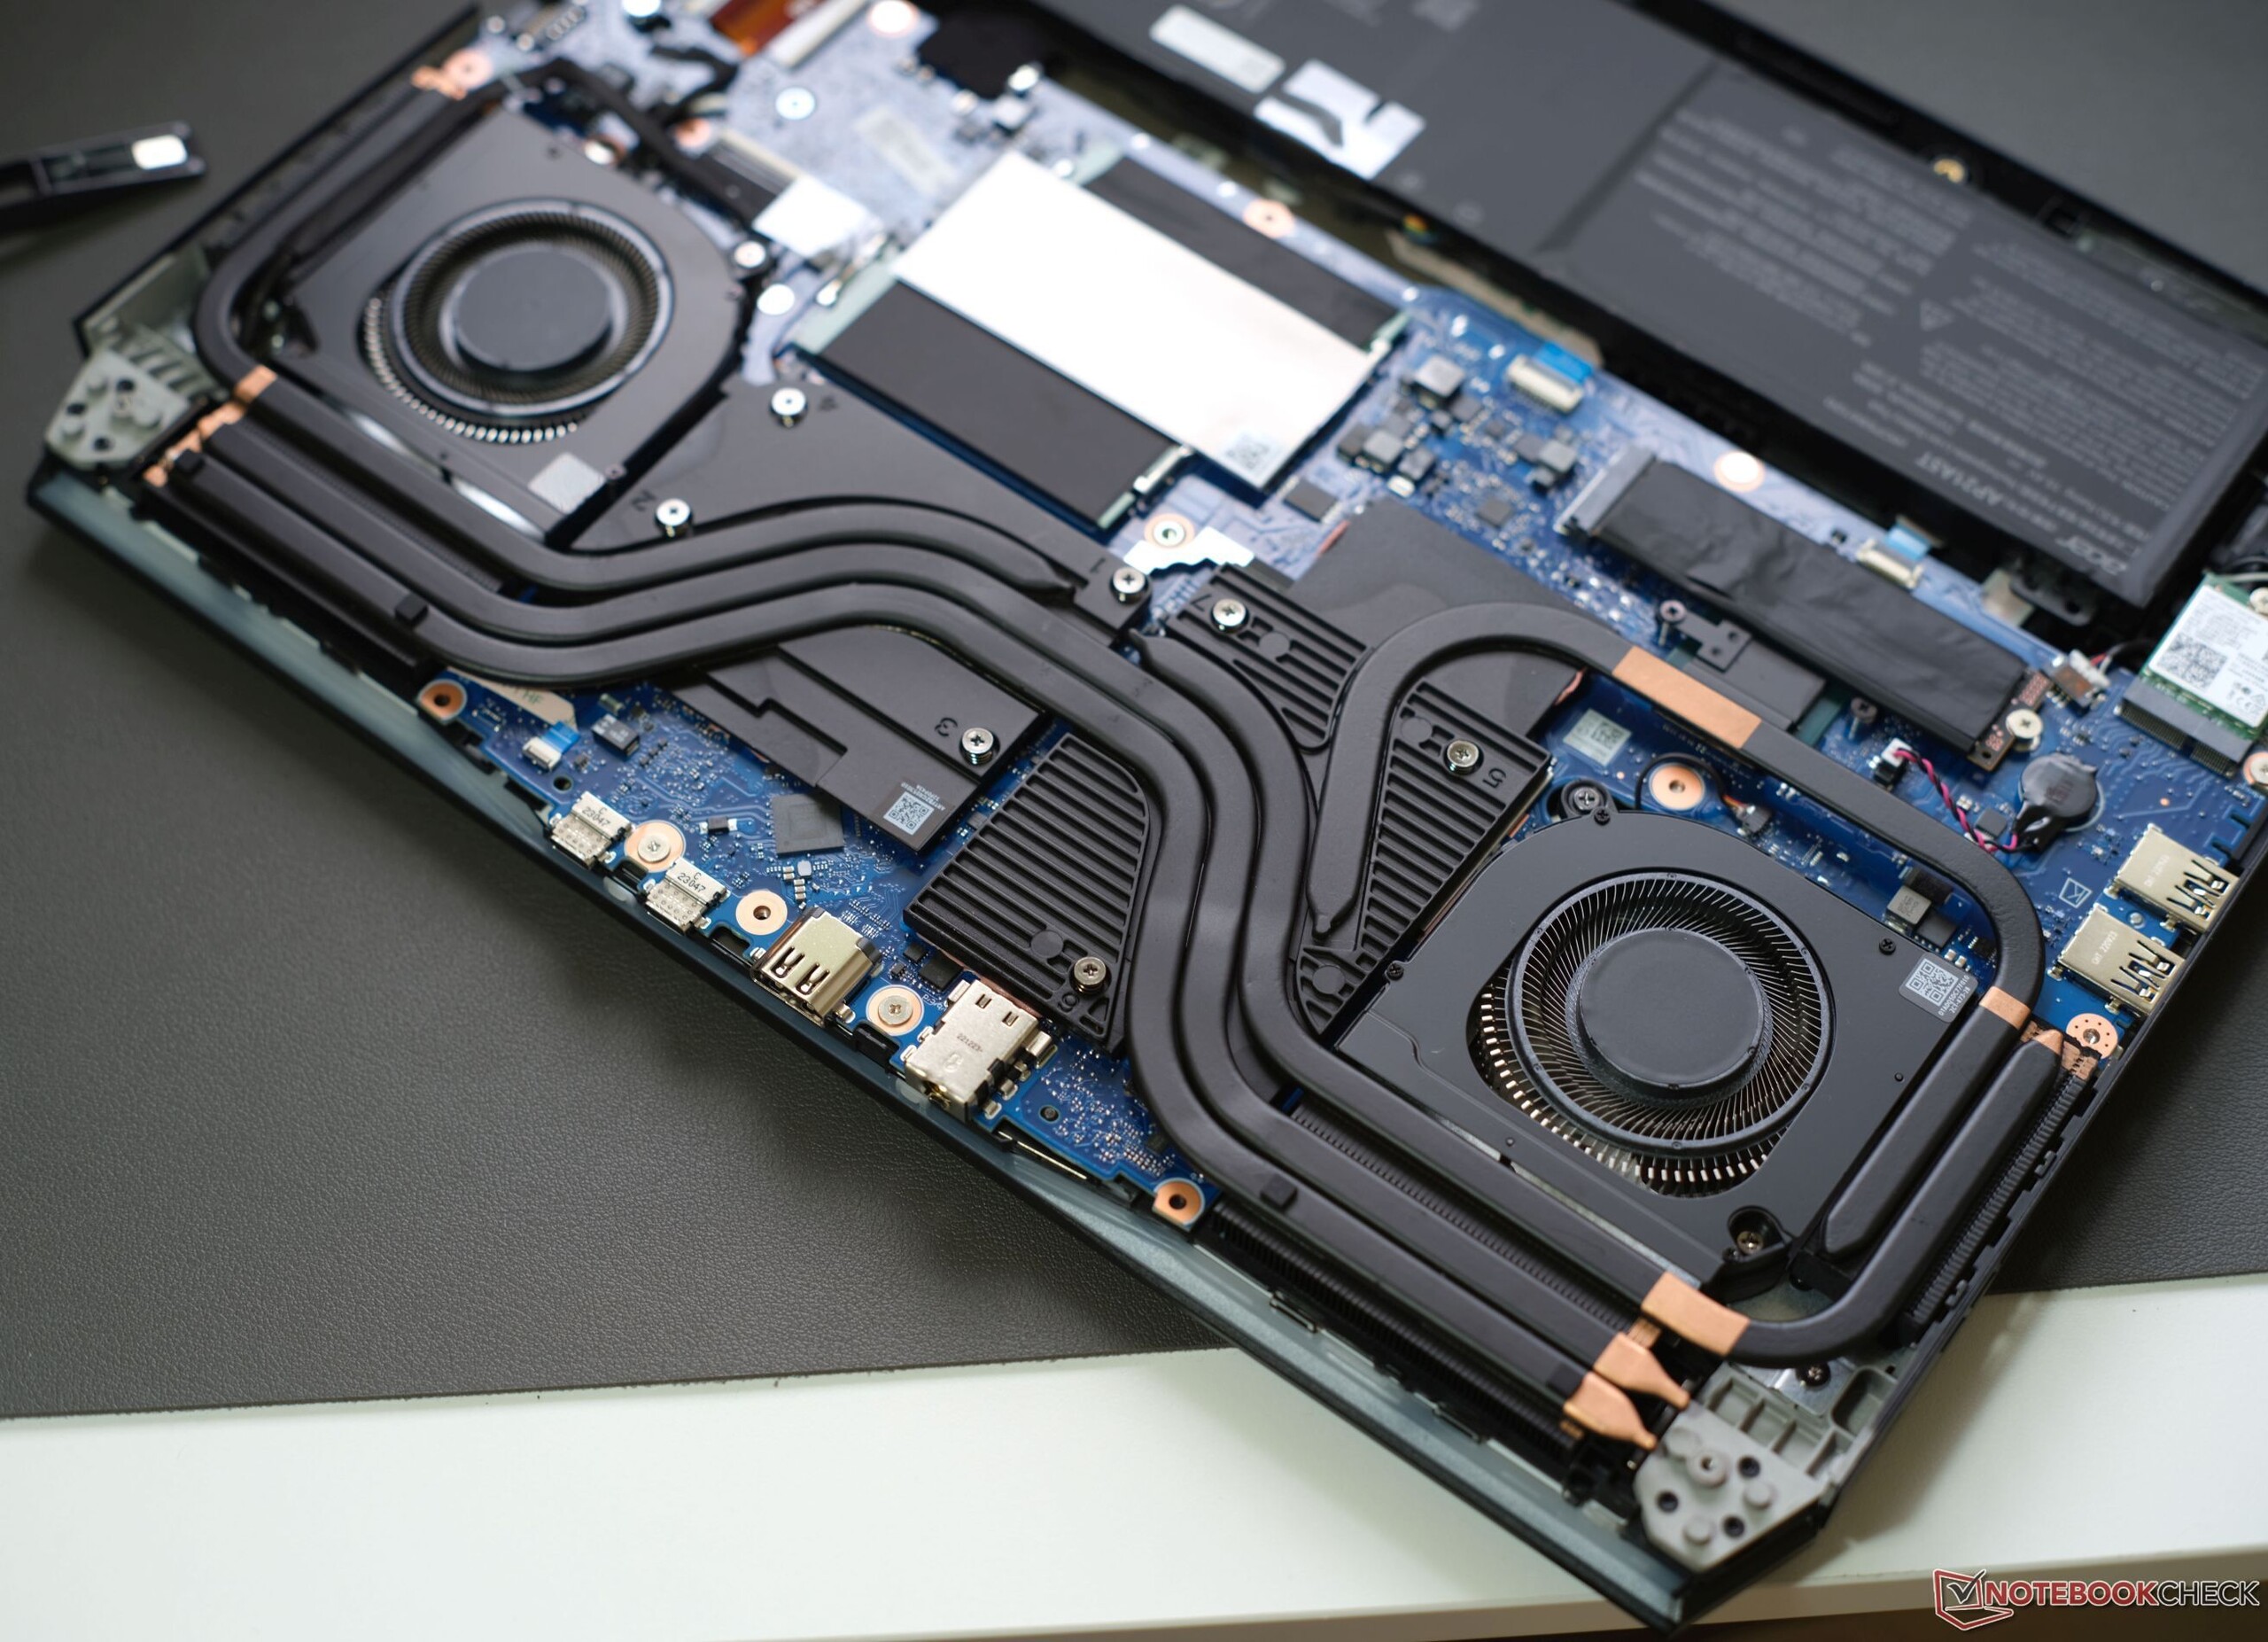
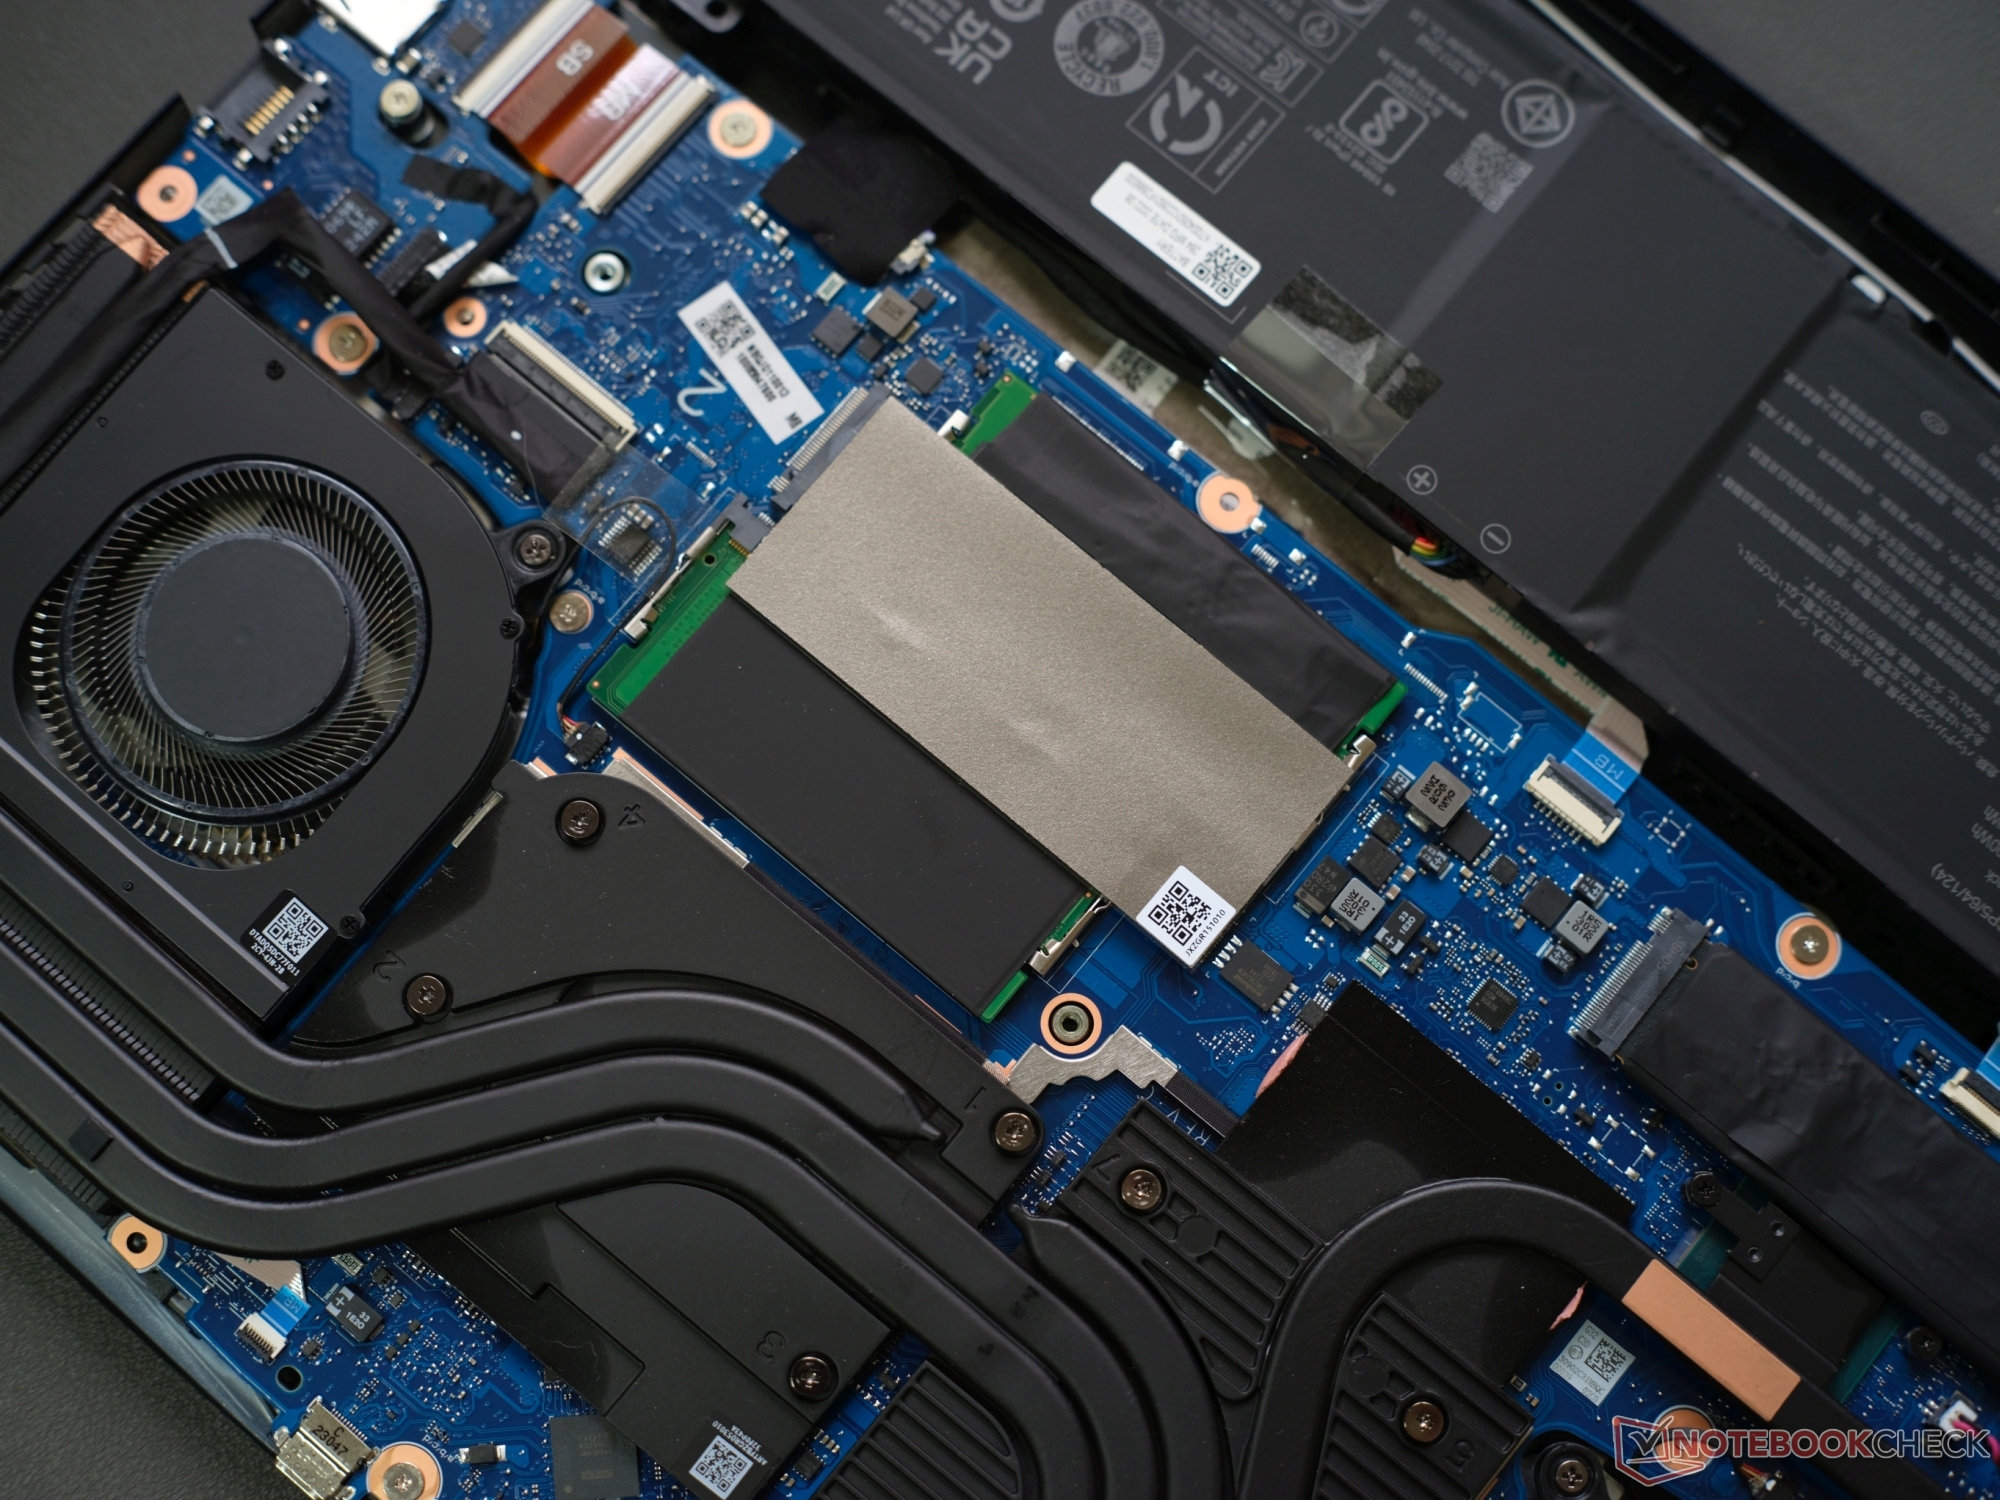
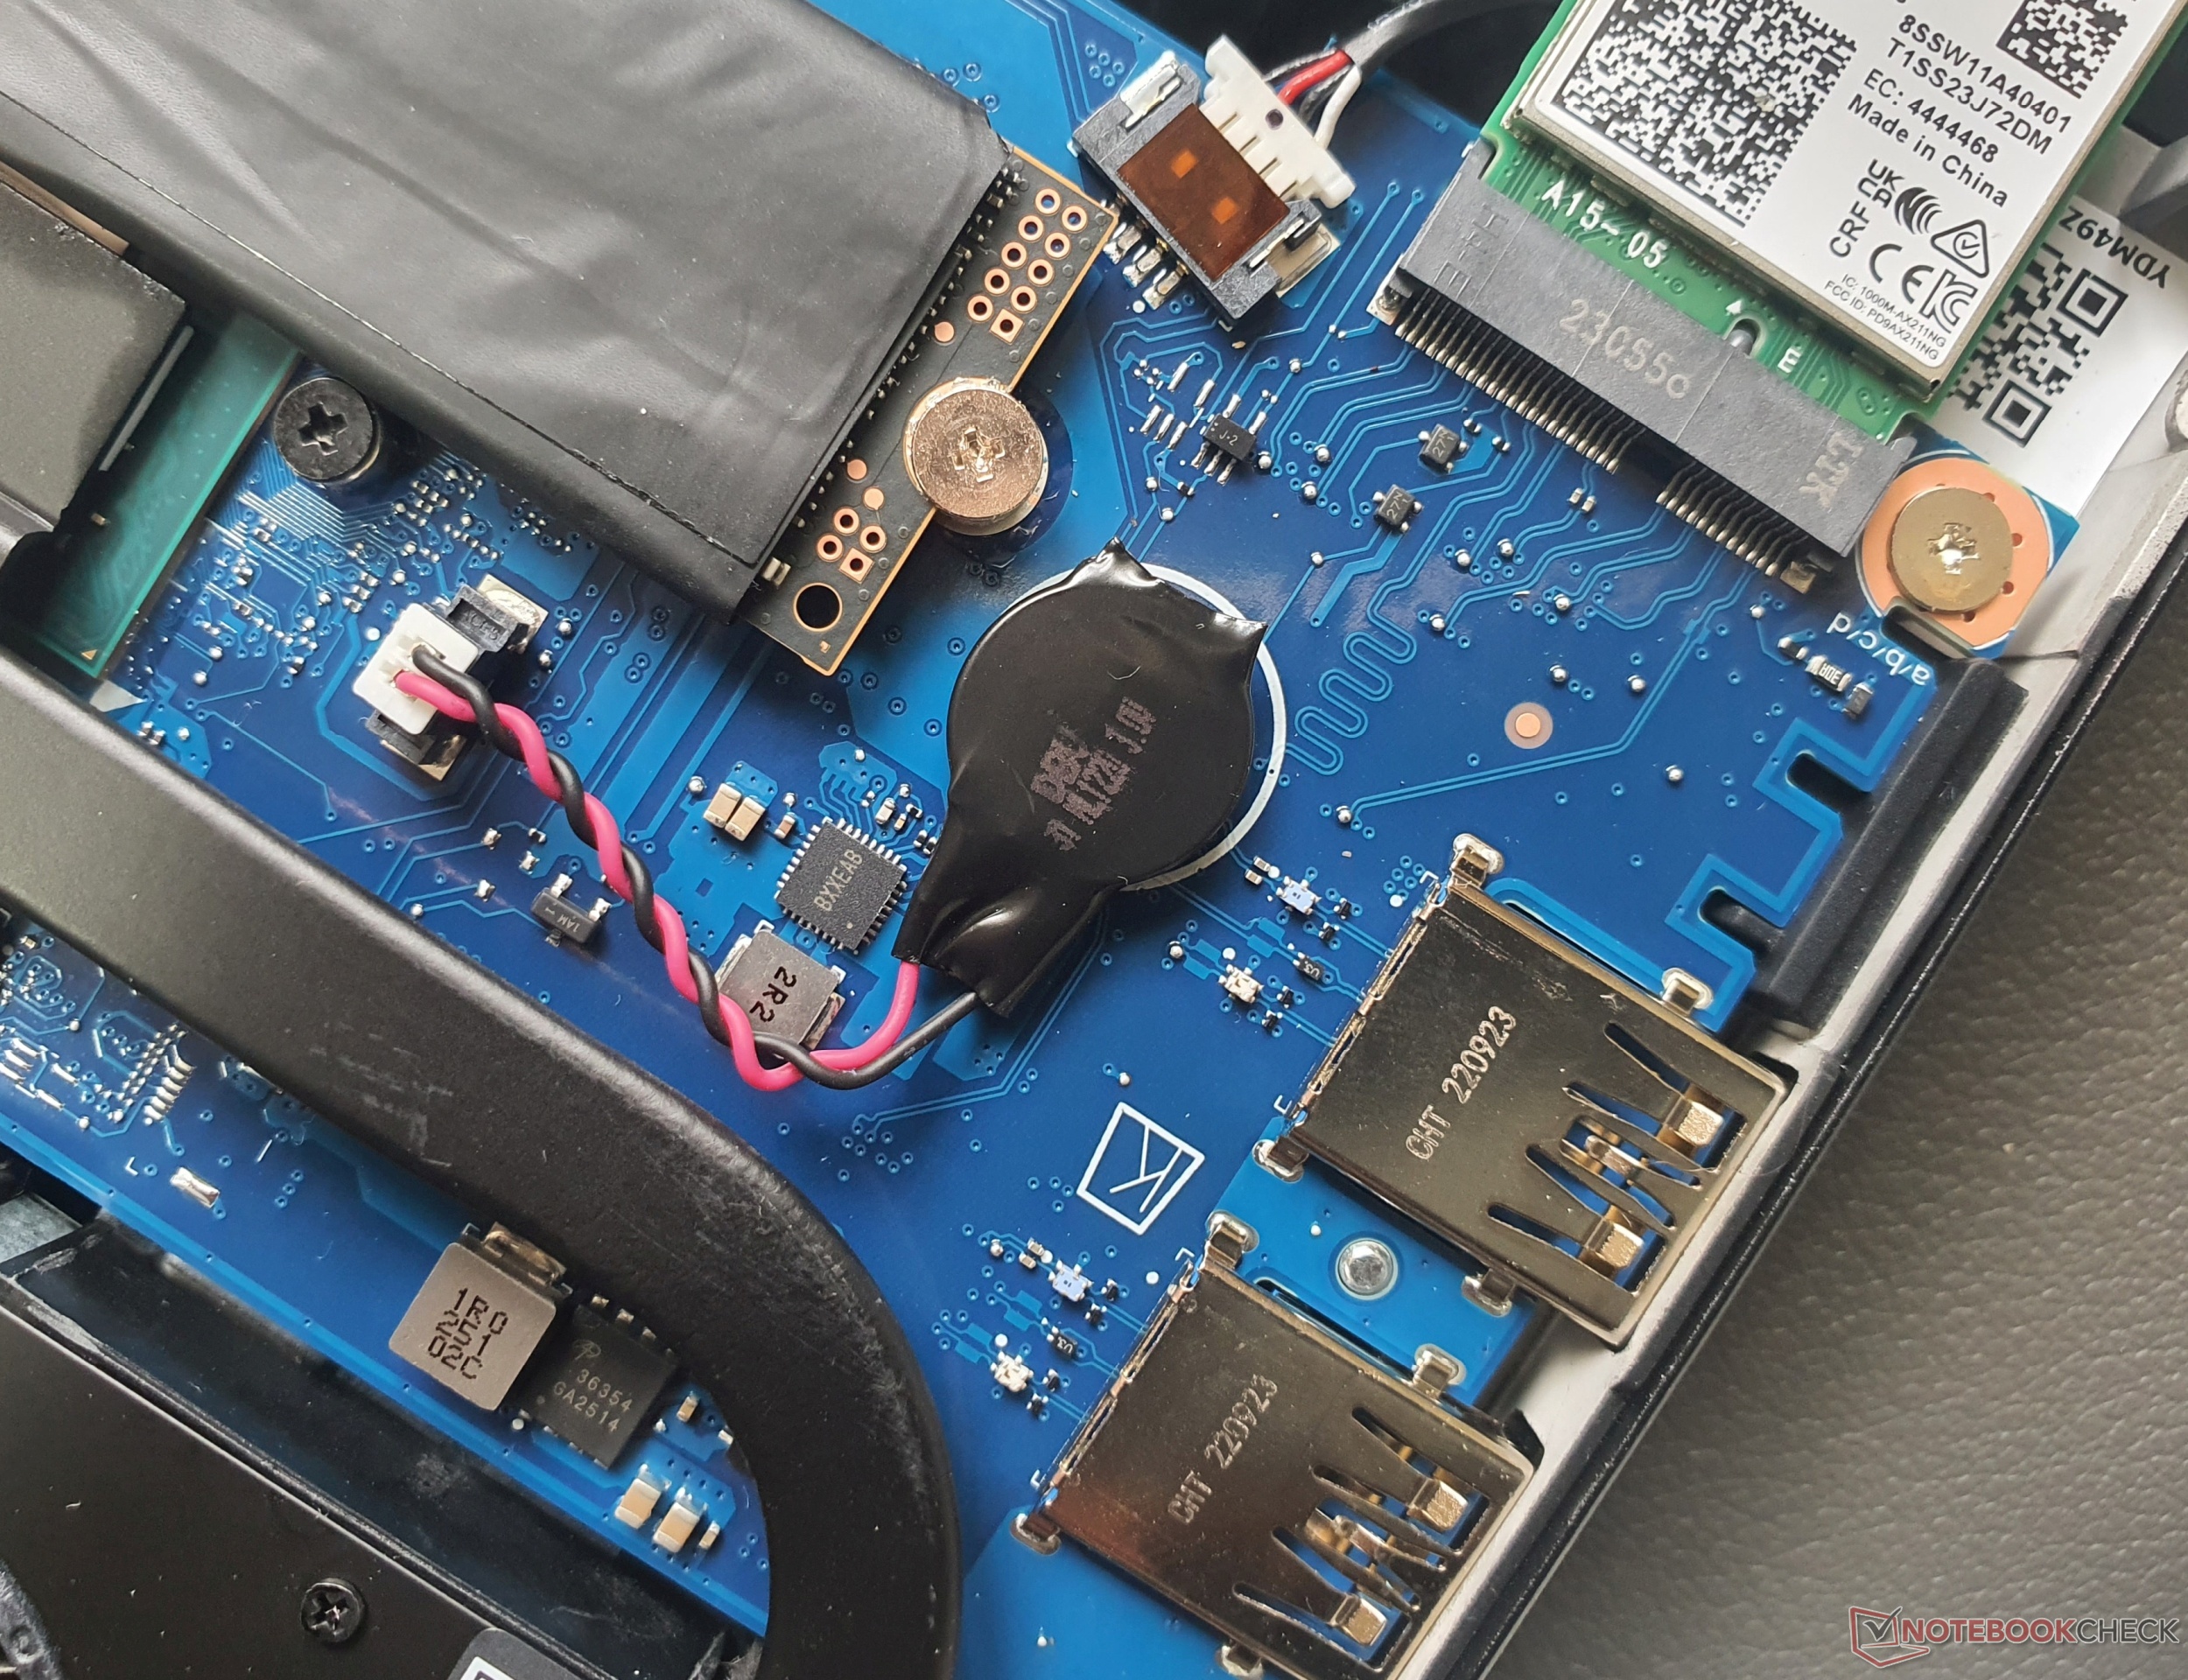
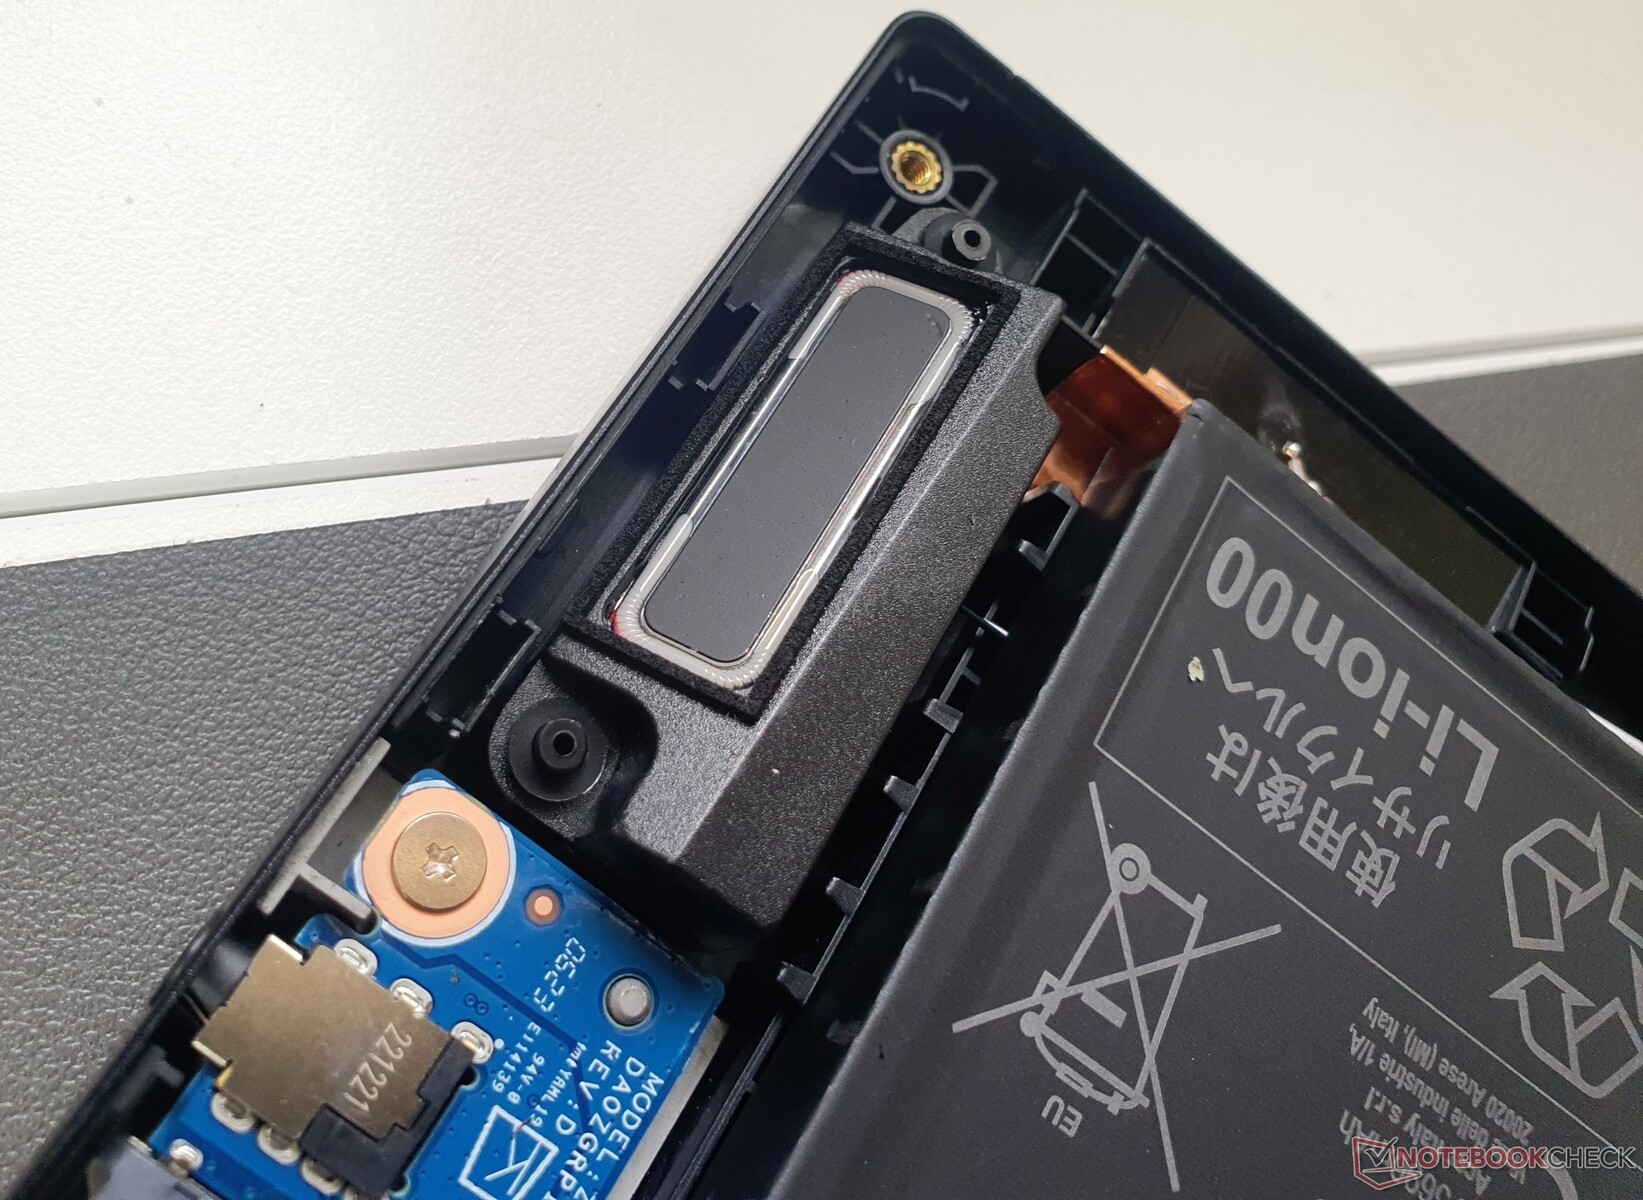
Maintenance
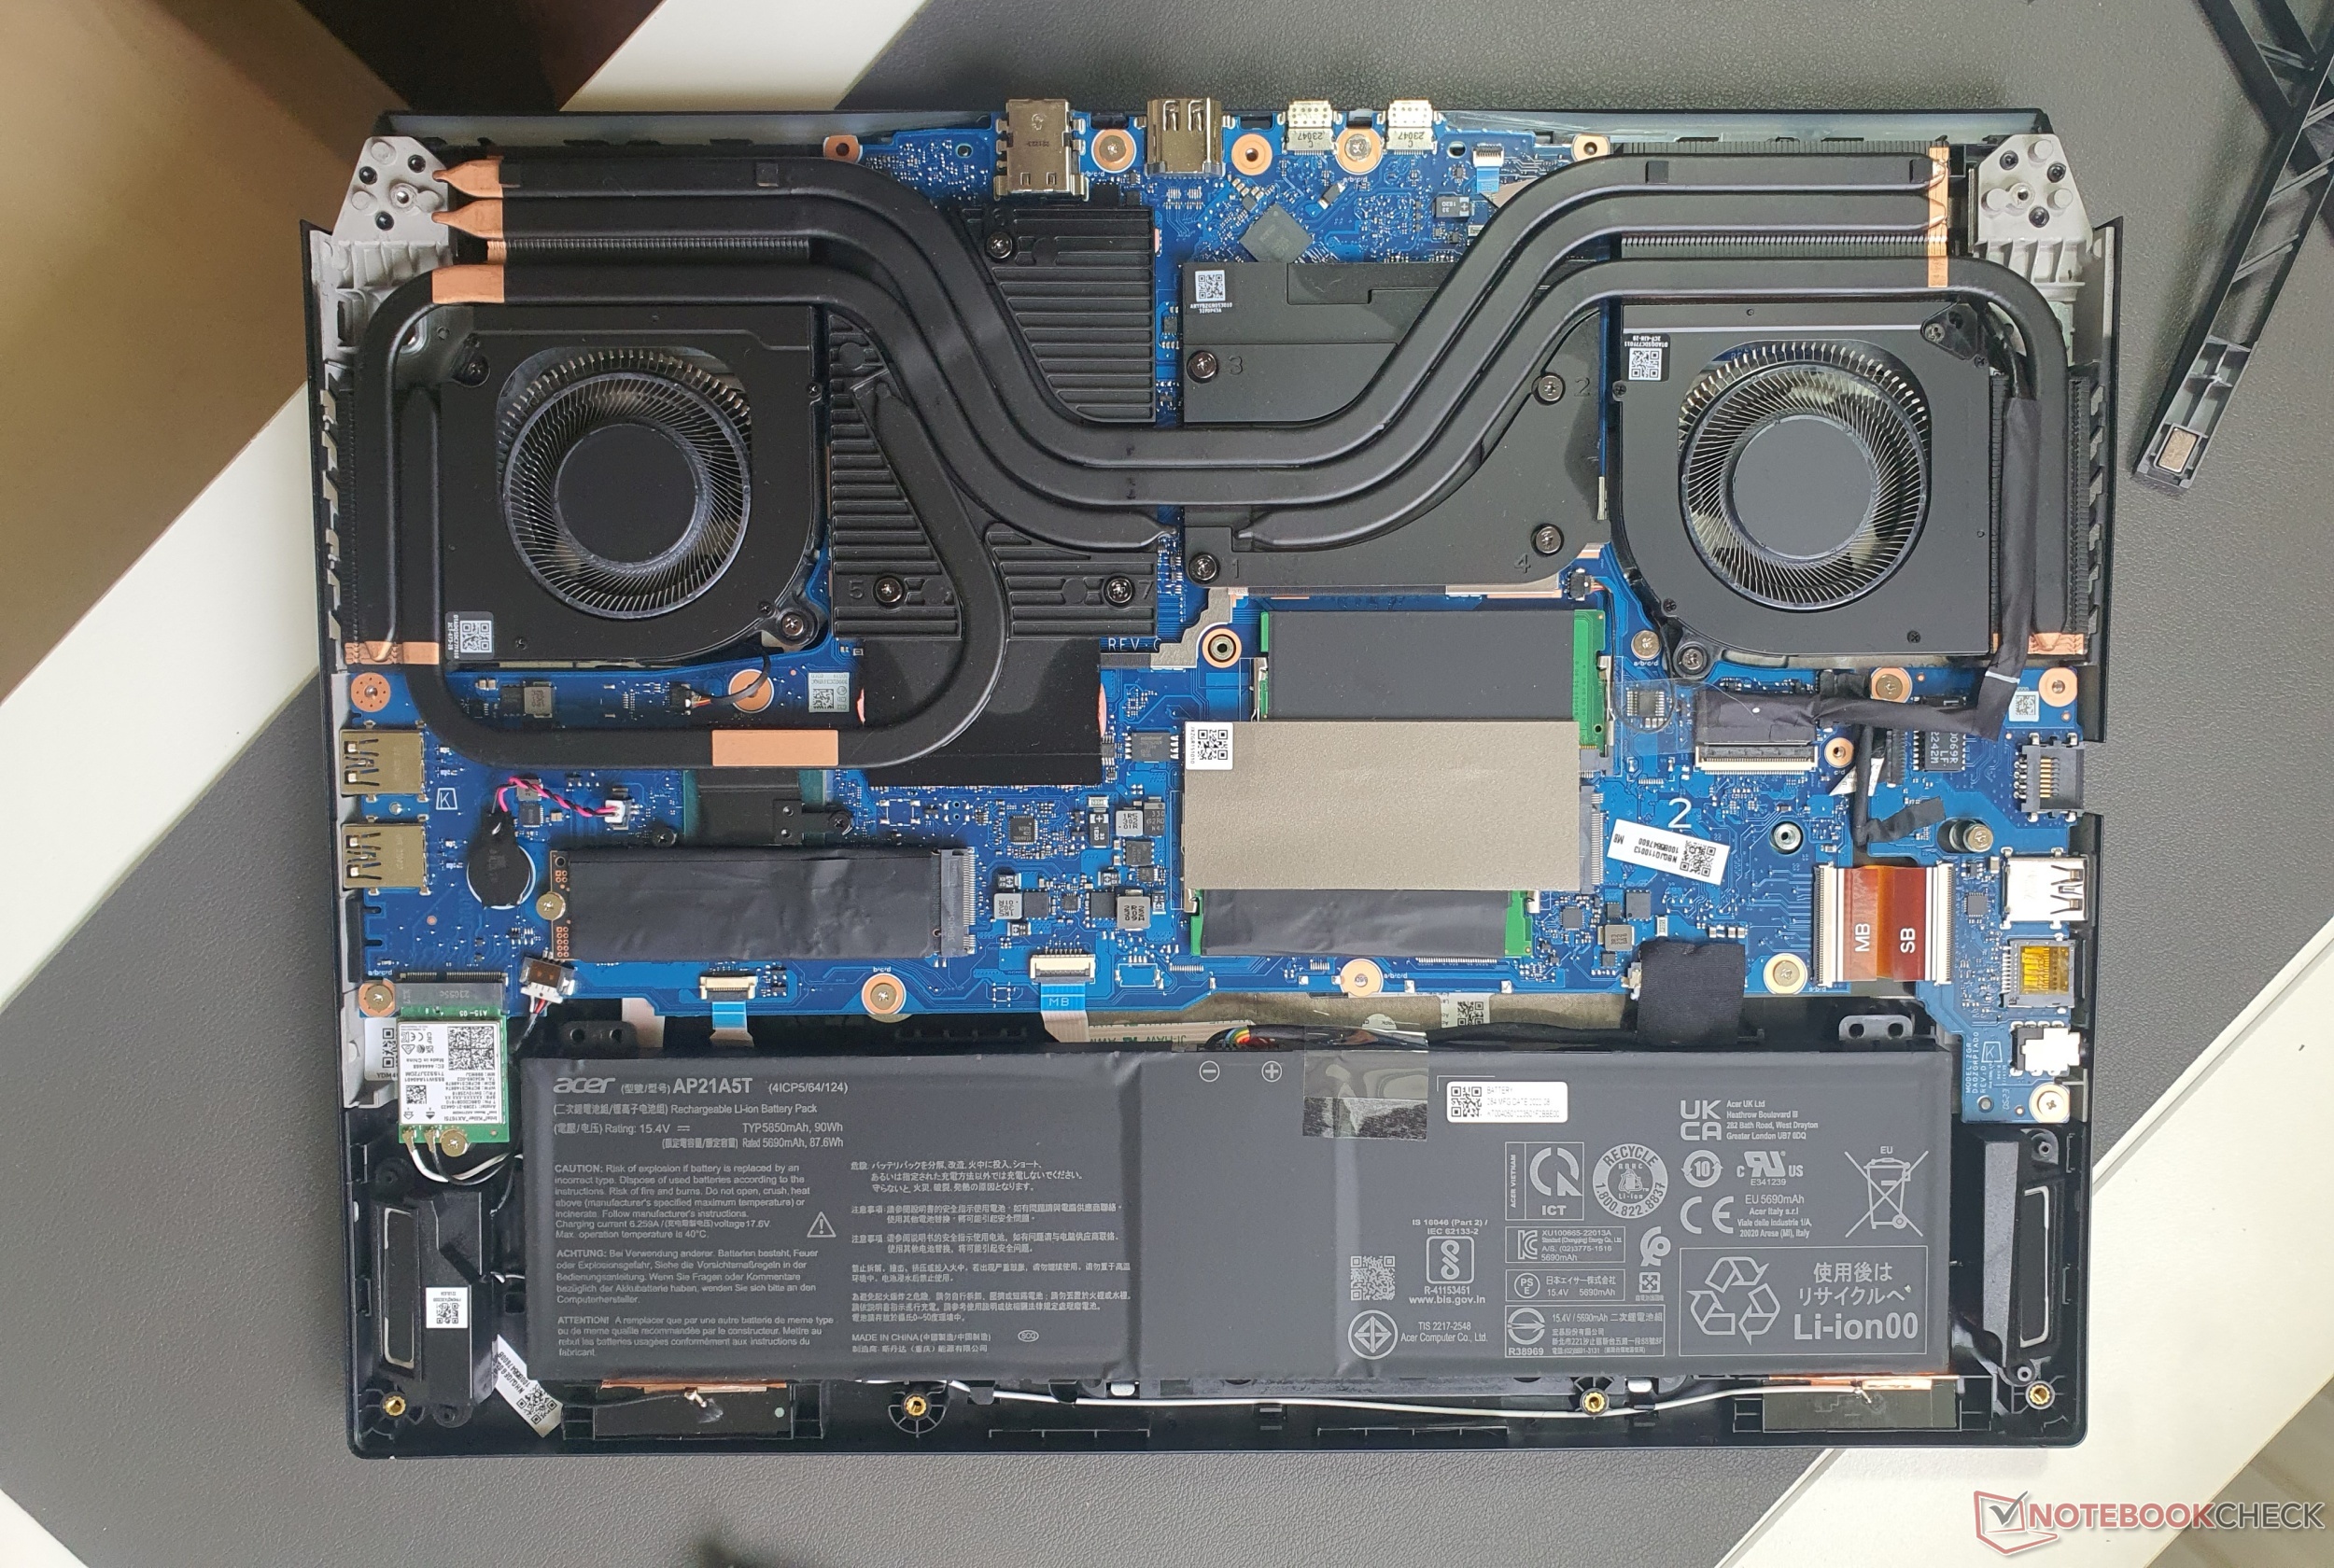
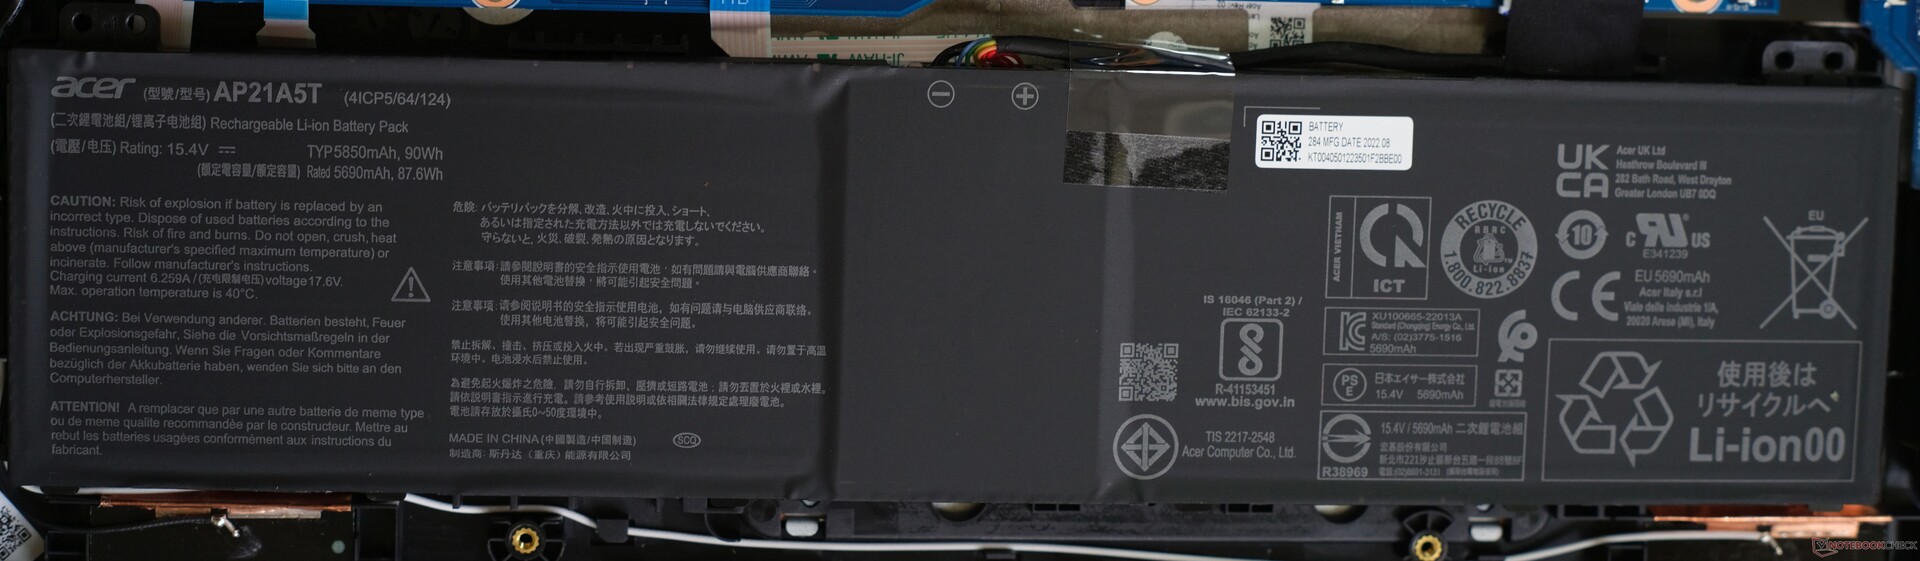
Il est assez facile d'accéder aux composants internes du boîtier après avoir desserré dix vis Torx T5. Les éléments interchangeables sont la RAM (deux banques), le SSD M.2 2280 et la puce Wi-Fi. Cependant, la batterie vissée et la batterie du BIOS peuvent également être facilement remplacées.
Garantie
En Allemagne, Acer offre une garantie de 24 mois. Avec Acer Care Plus, cette garantie peut être prolongée jusqu'à cinq ans.
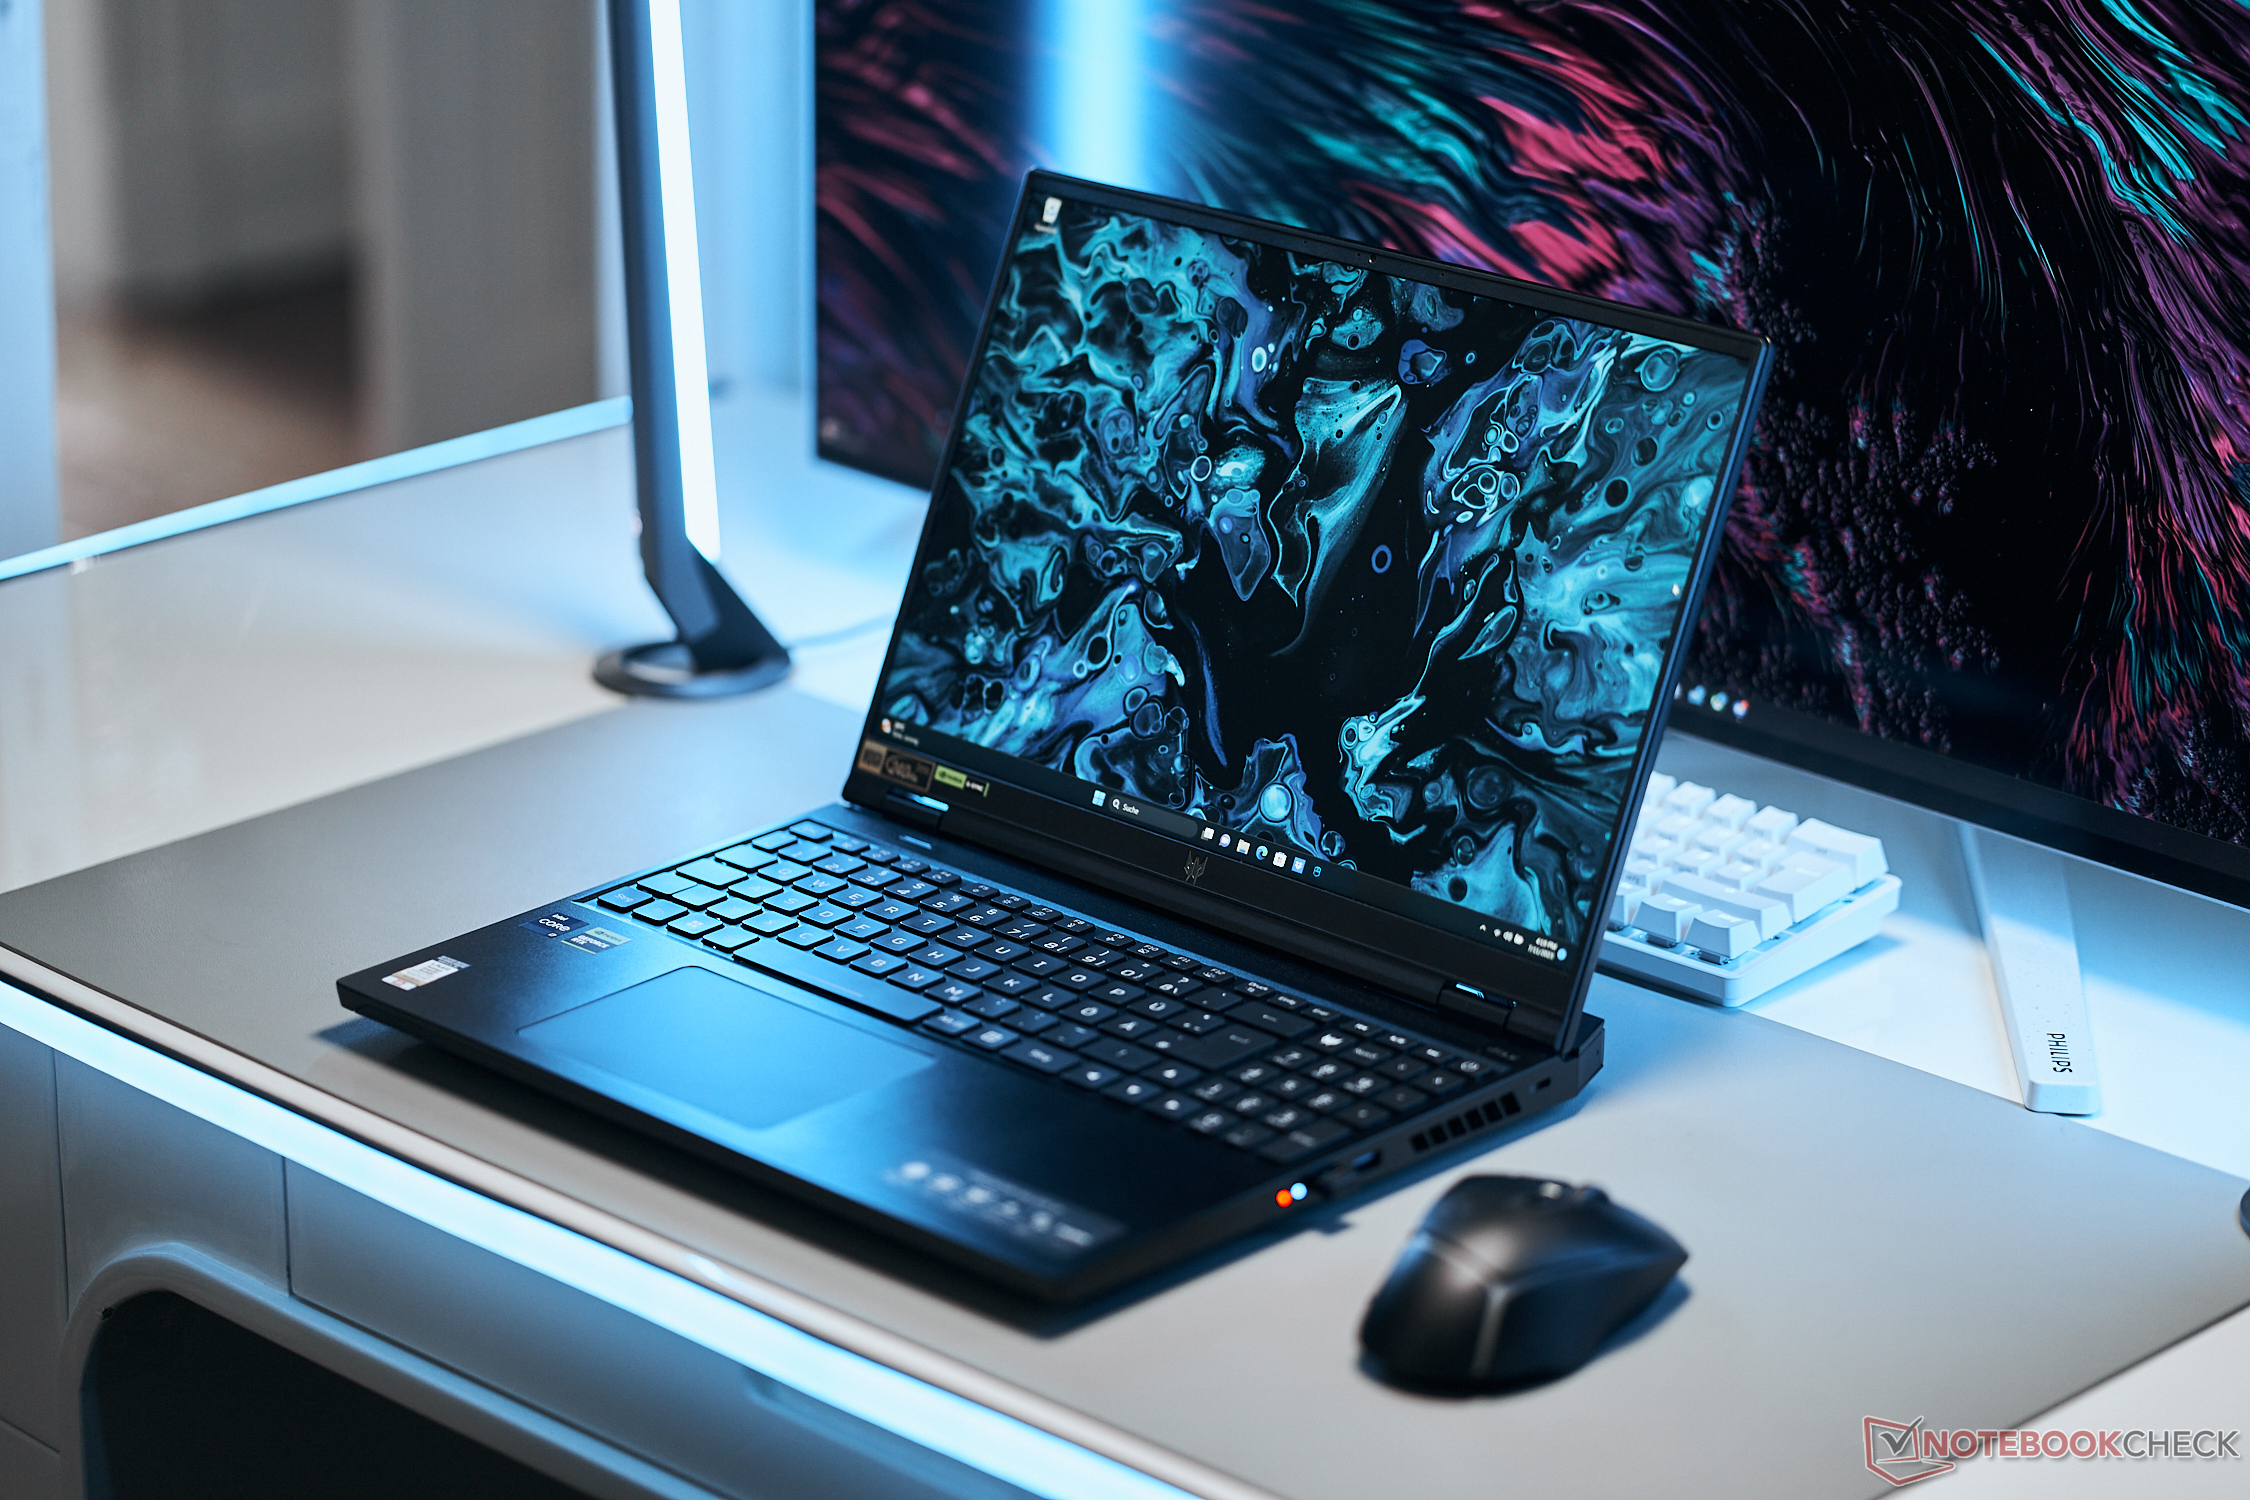
Dispositifs d'entrée : Le Predator Helios est doté d'un éclairage mini-LED
Clavier
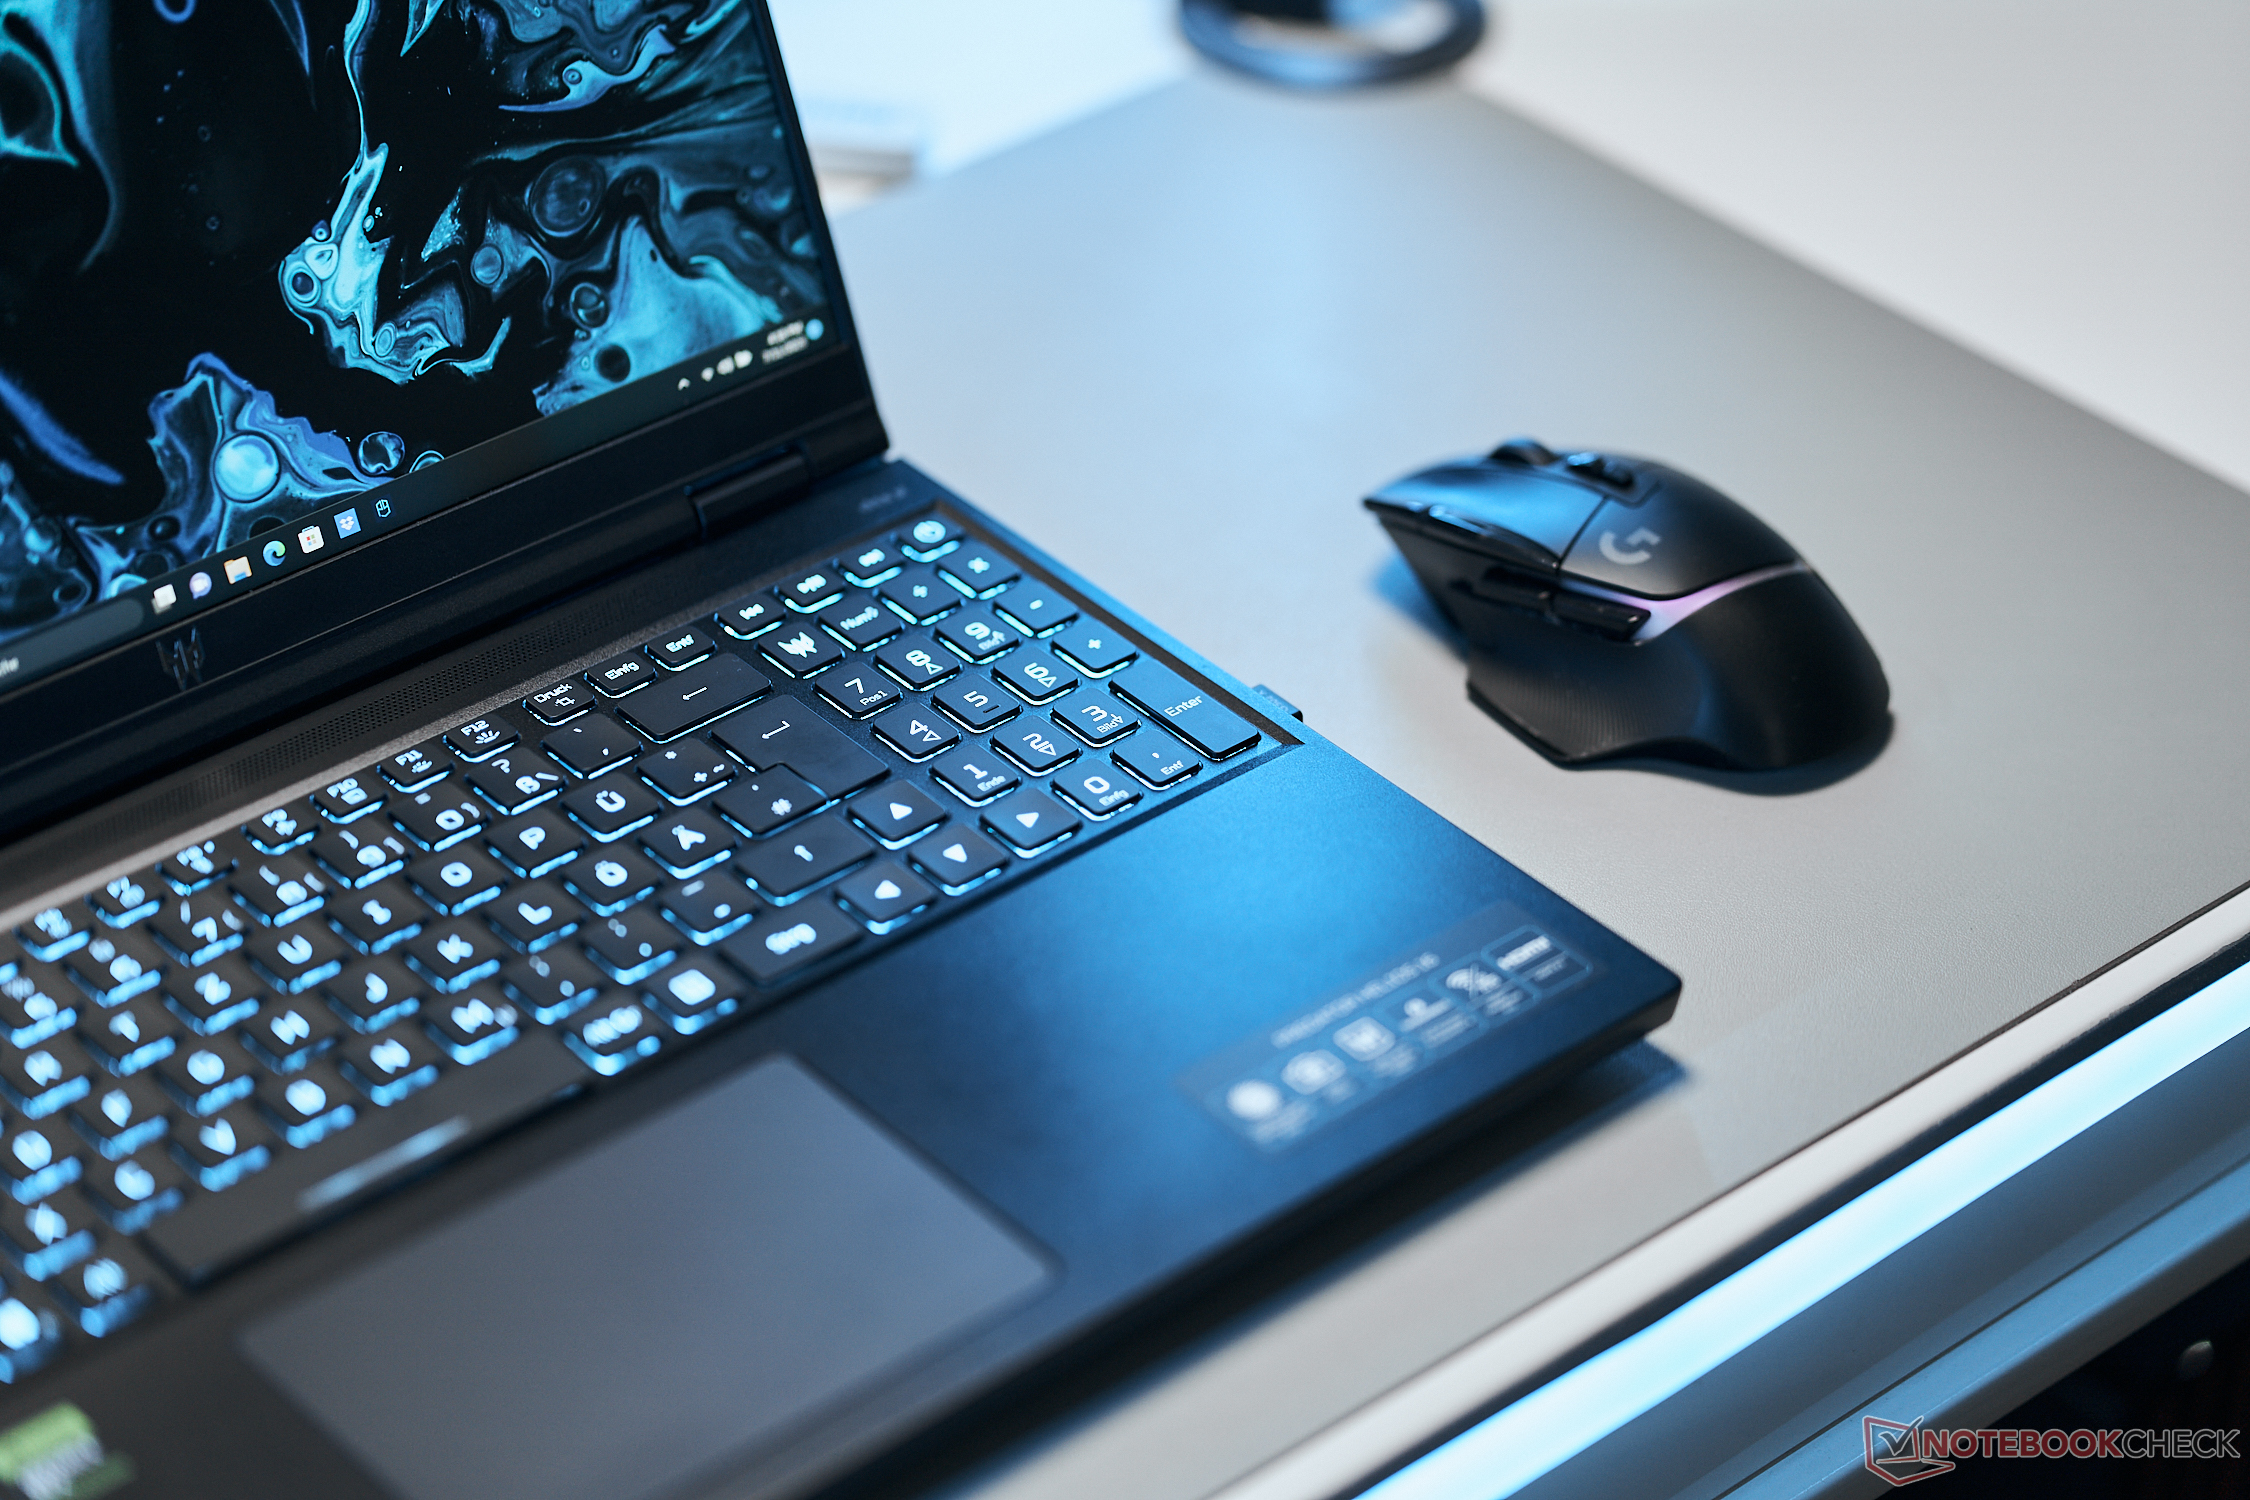
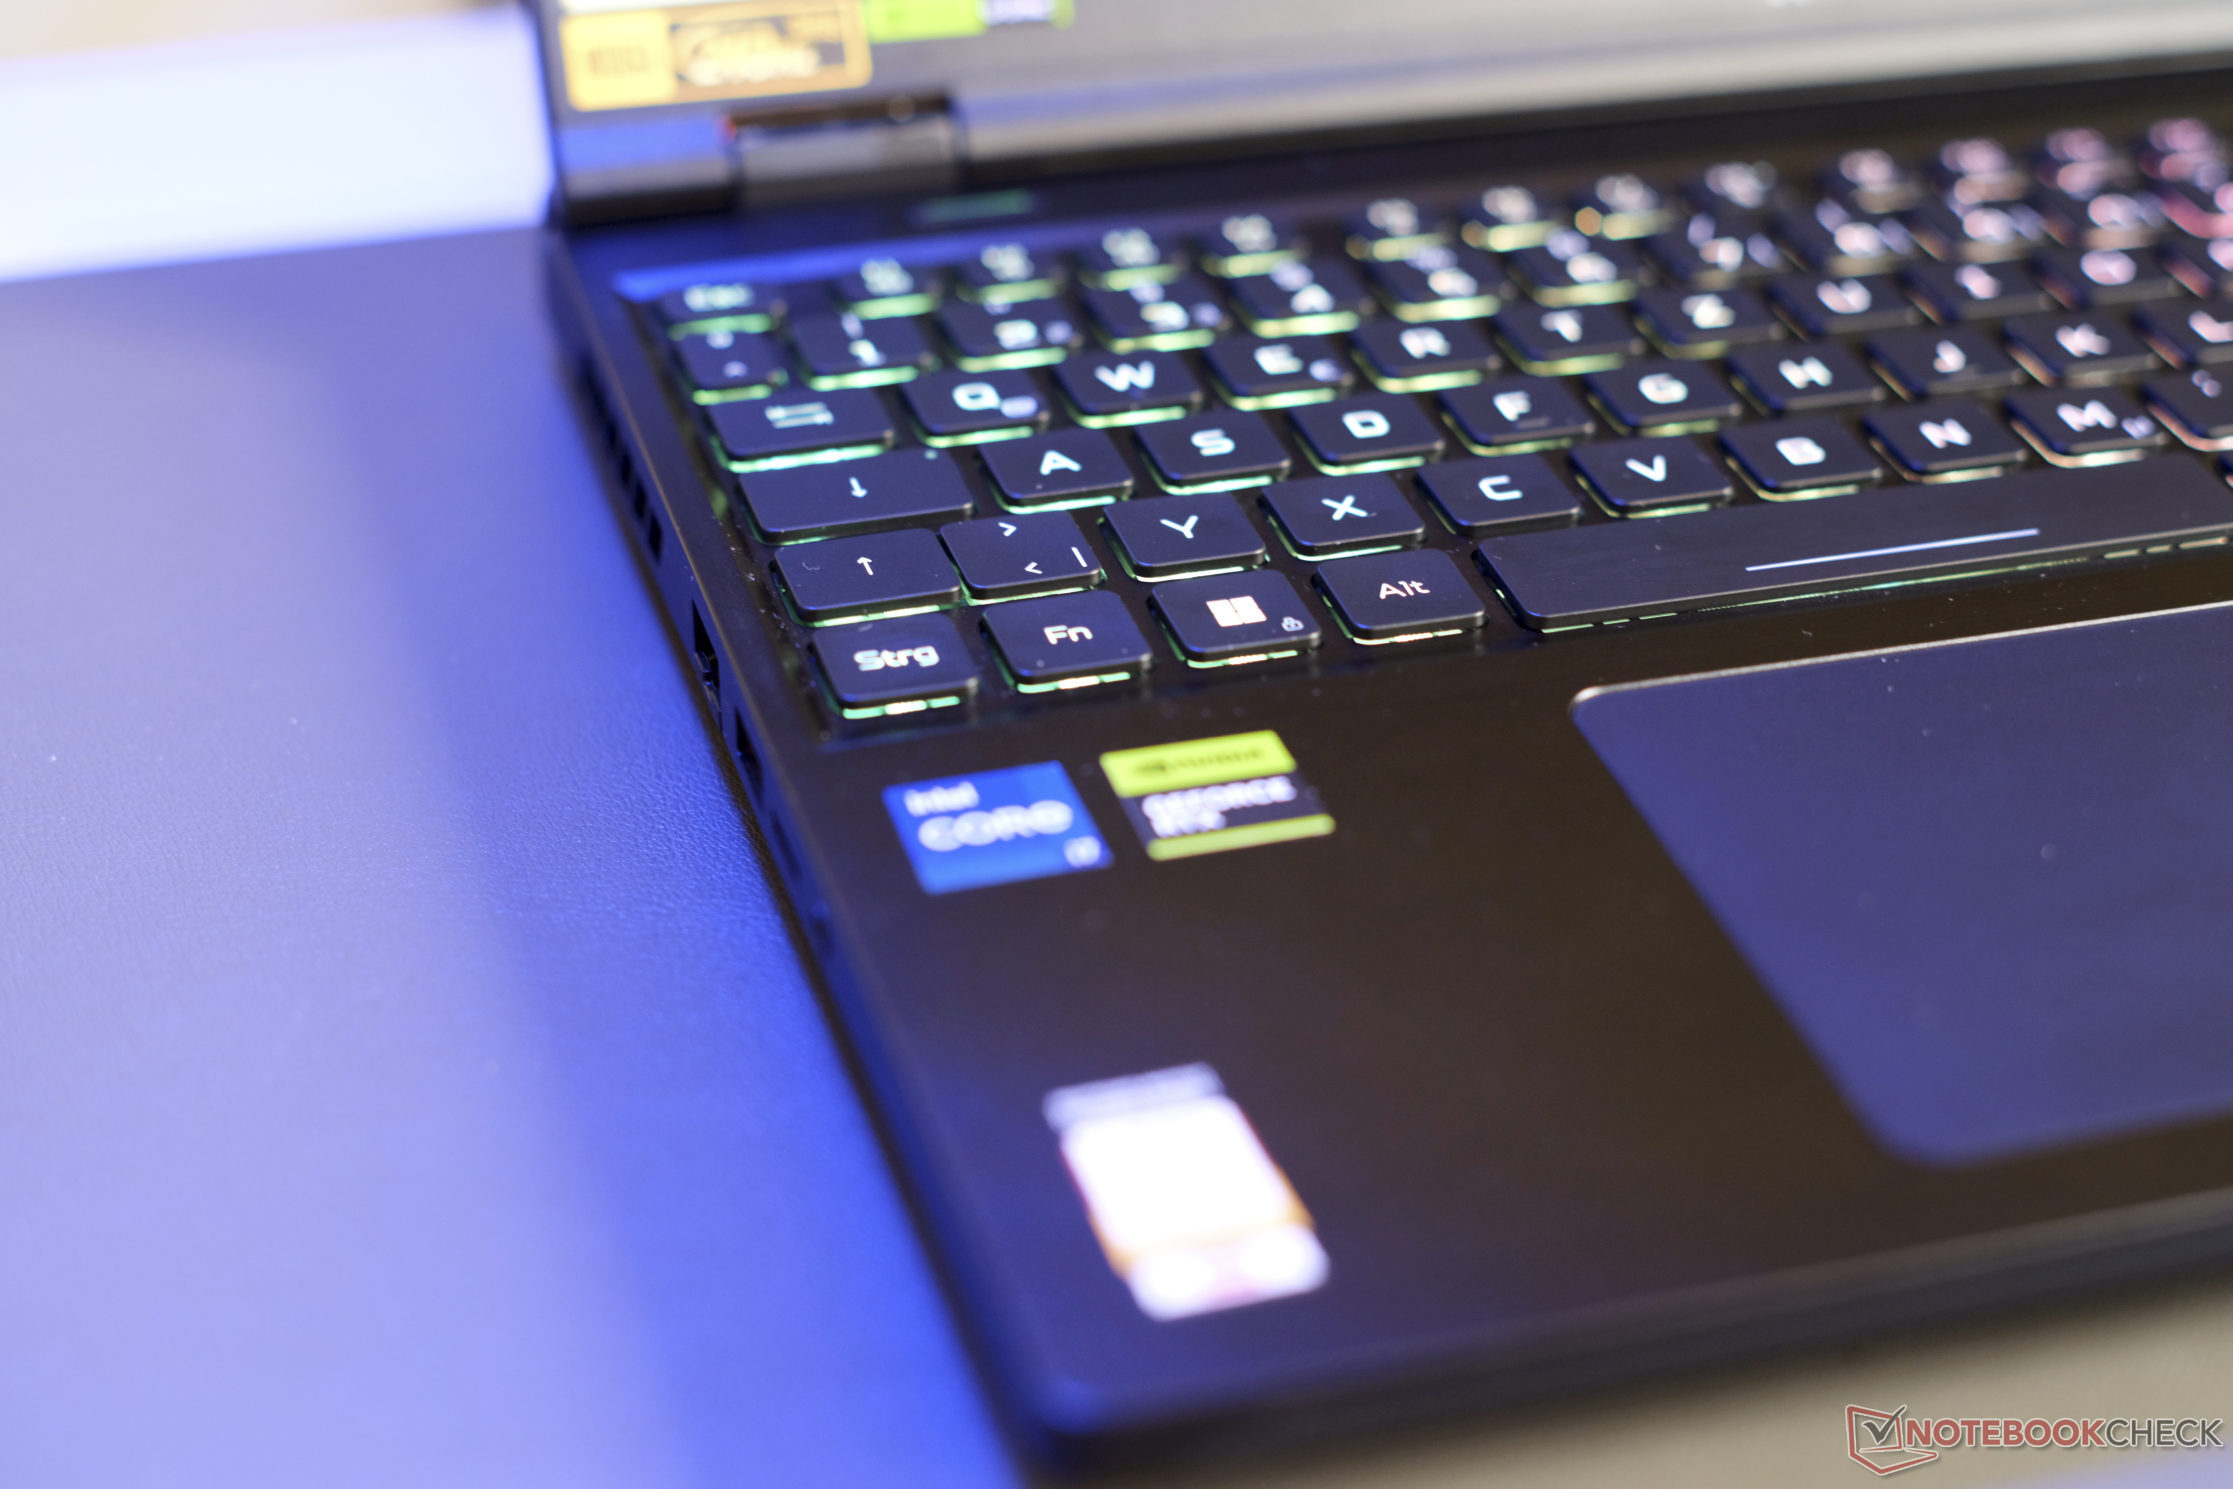
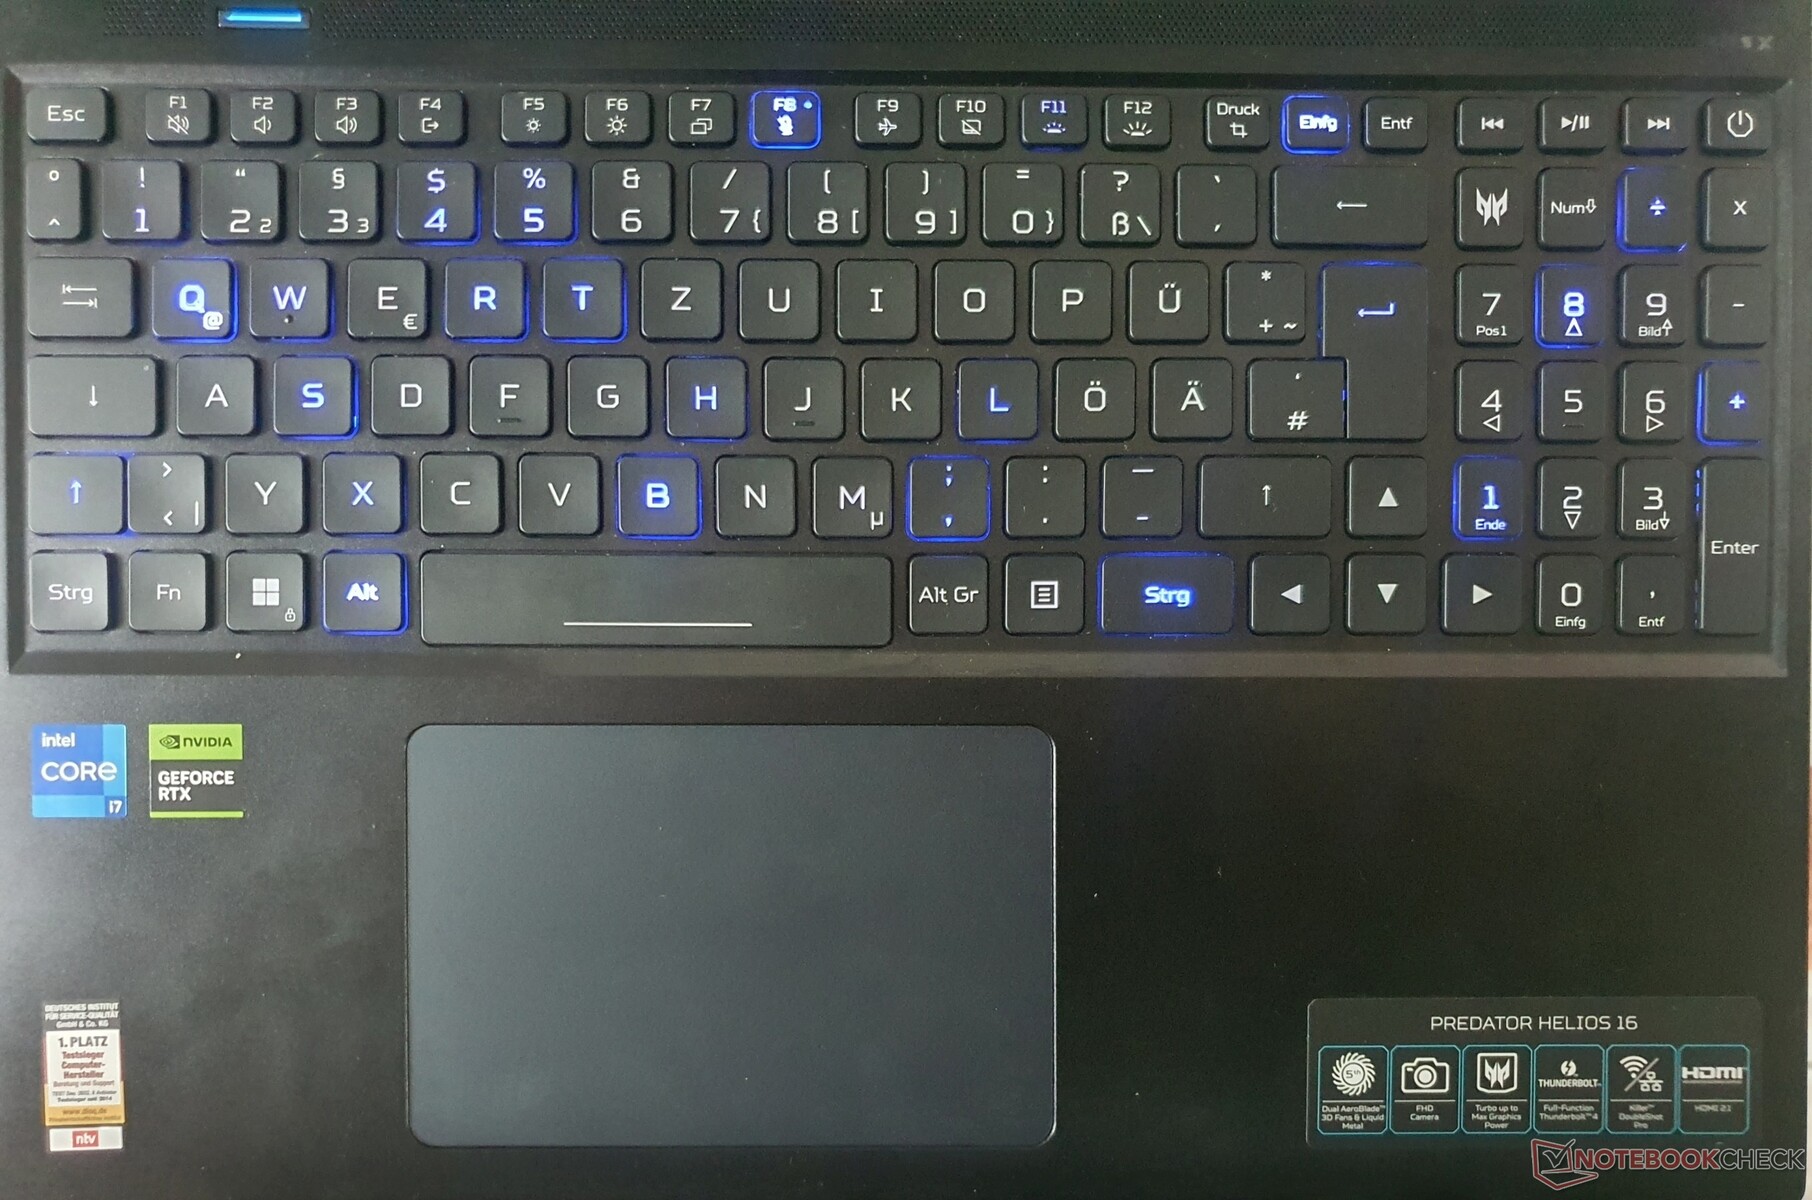
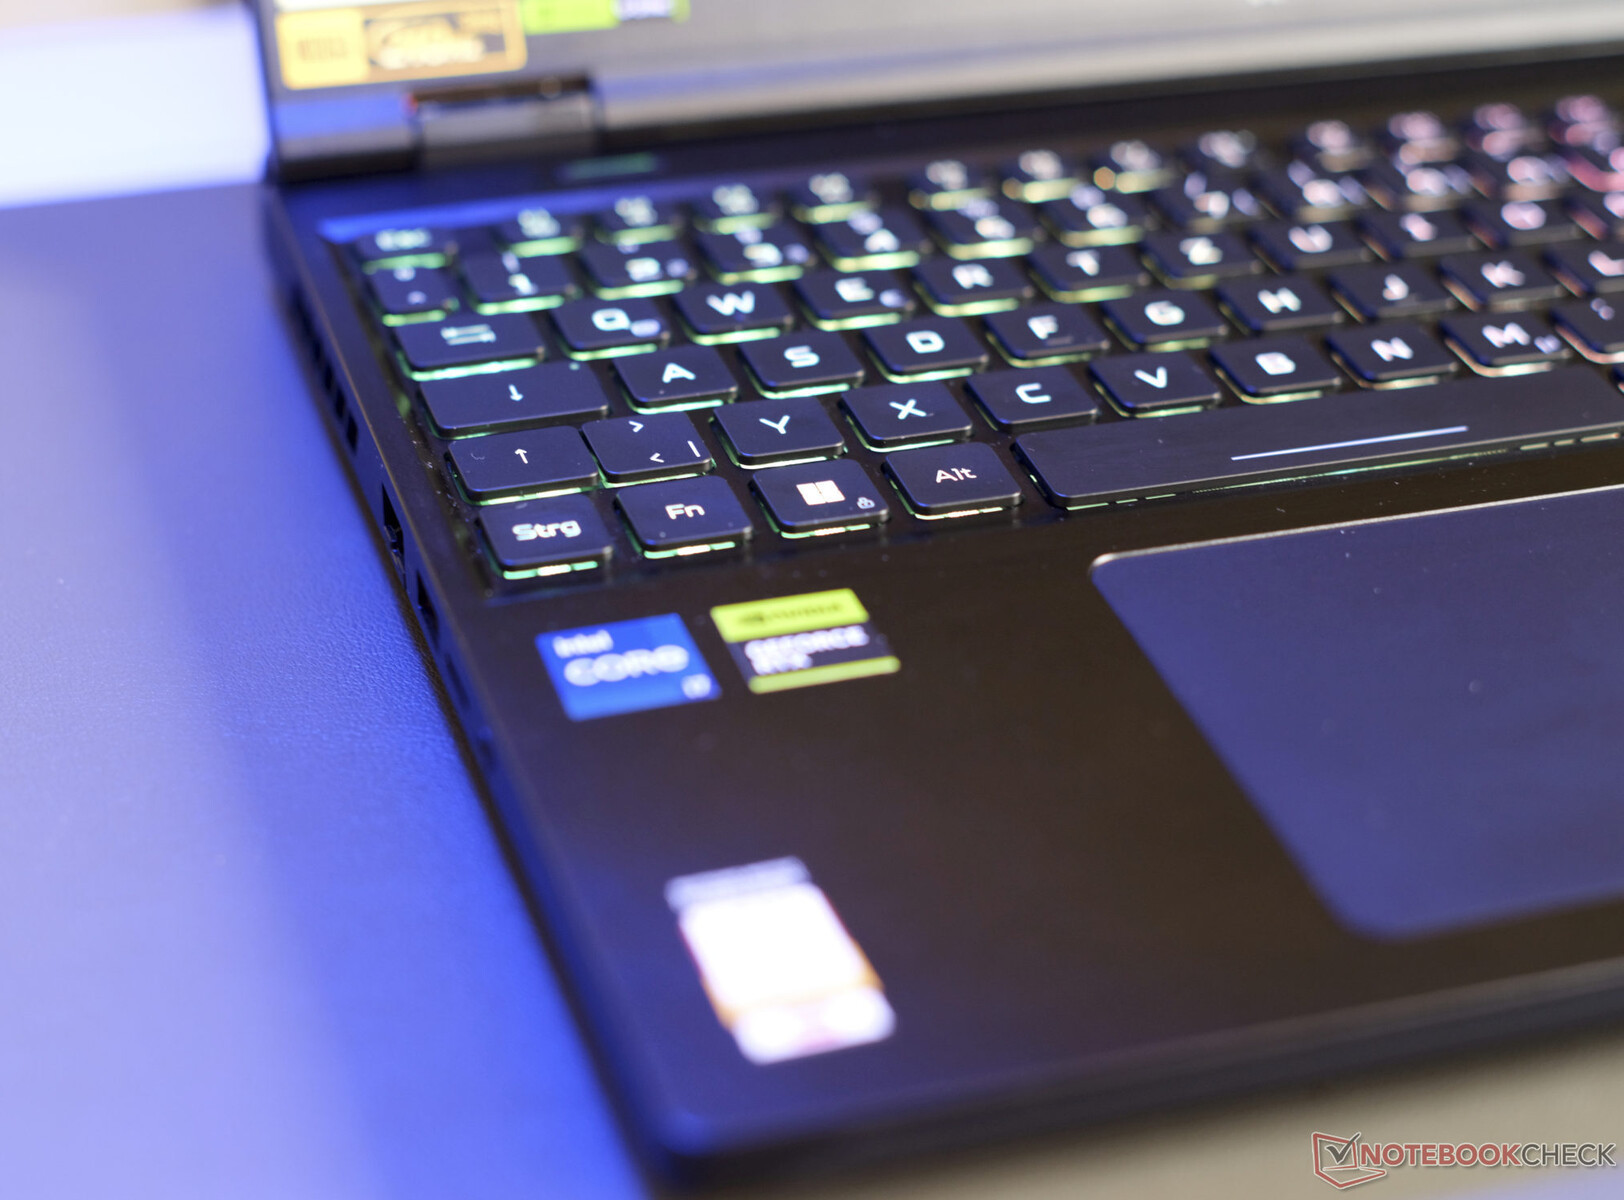
Acer utilise le même clavier chiclet à 6 rangées de touches de 15 x 15 mm depuis lemodèle 2020. Malgré la course généreuse des touches, le retour d'information n'atteint pas tout à fait son potentiel : Le point de pression est tangible et pourrait être un peu plus défini, mais le bruit de frappe est discret. Au milieu et sur le côté droit, le clavier fléchit sensiblement mais n'est pas gênant lors de la frappe, à condition de ne pas marteler les touches.
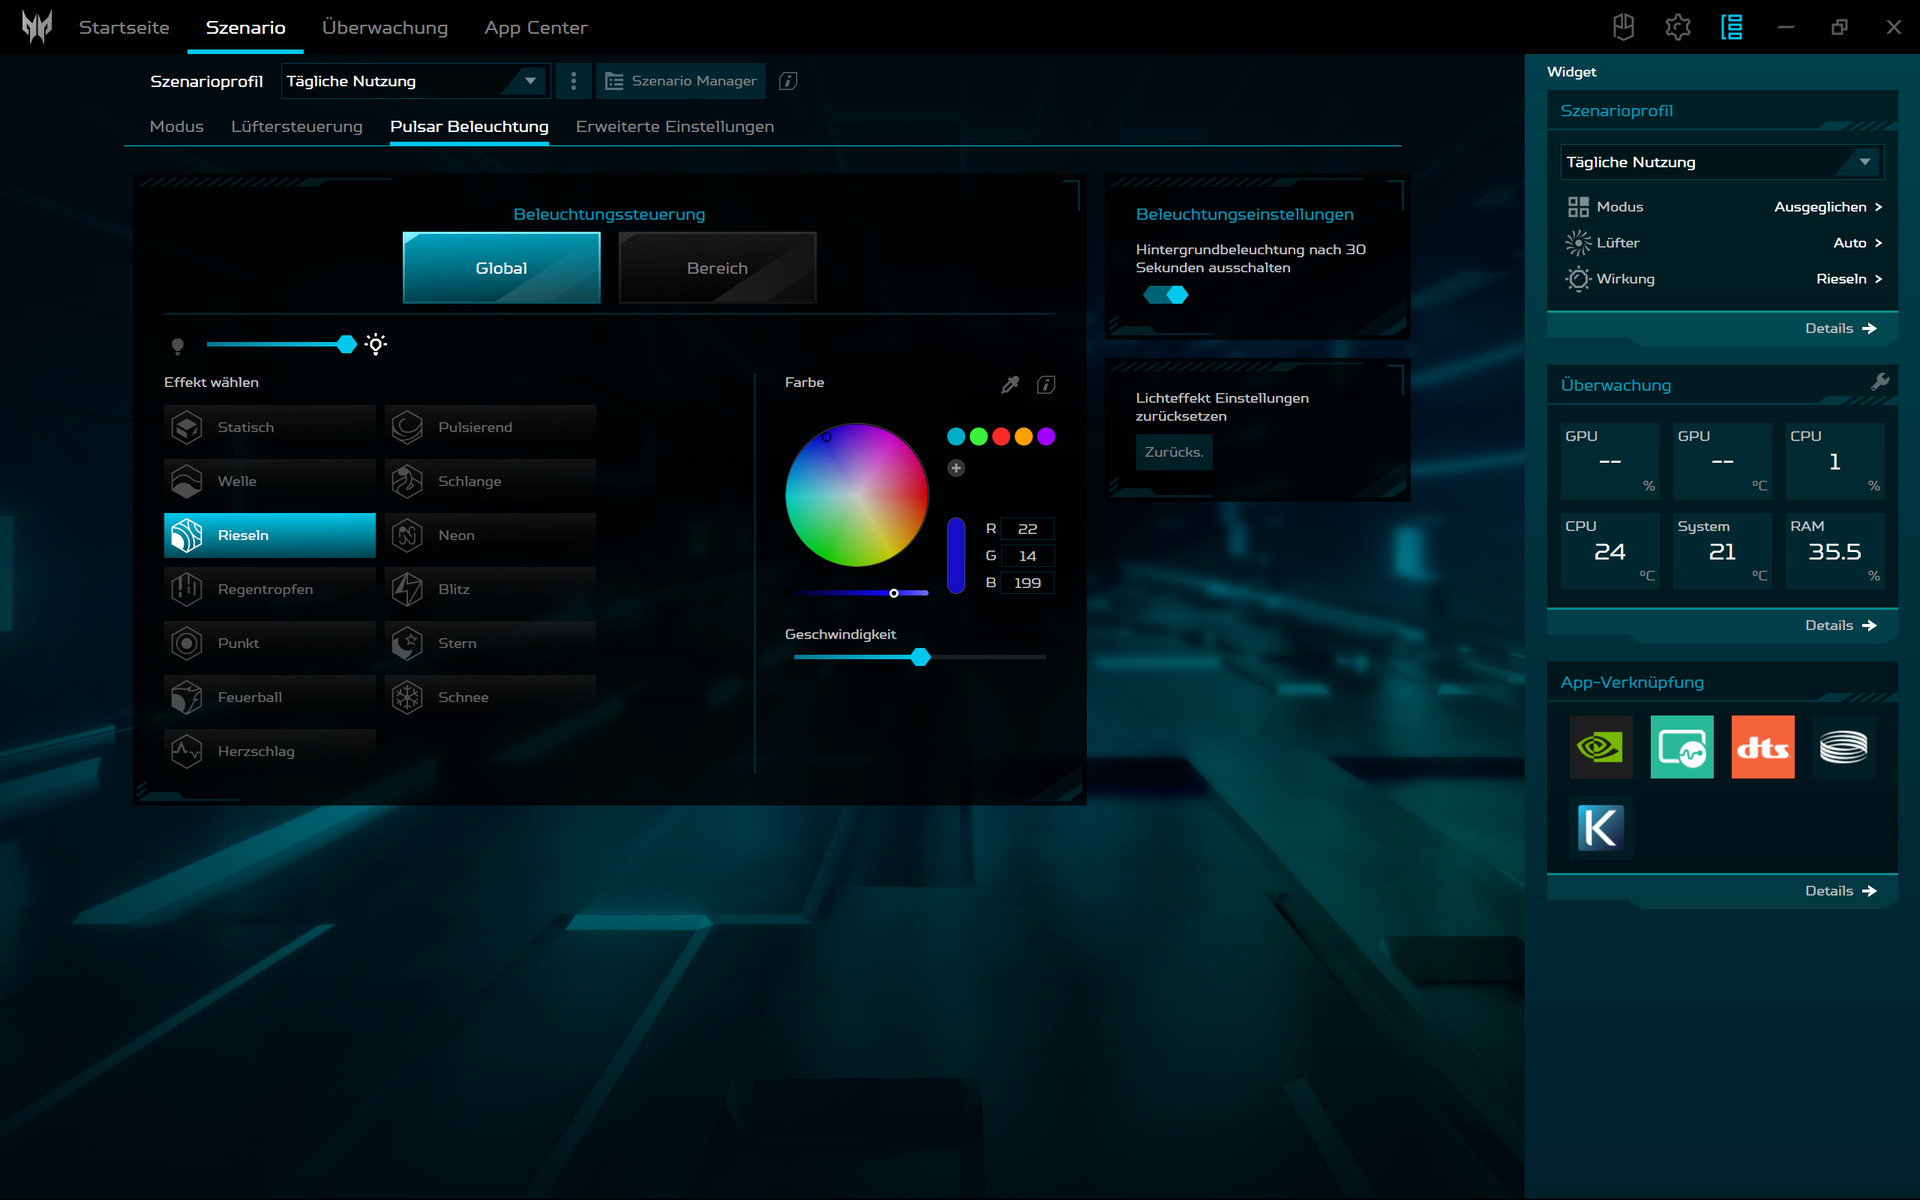
Le rétroéclairage par mini-LED est nouveau et offre plusieurs réglages différents. Le RGB des touches individuelles dispose de quatre réglages et peut devenir très lumineux. Les transitions sont particulièrement fluides et nettes, et les mini-LED sont également plus économes en énergie.
Nous apprécions la disposition et, en particulier, les touches fléchées de taille normale au prix d'un décalage plus petit. Alors que le bouton logo démarre l'application Predator Sense, il est possible de basculer entre les modes de performance en utilisant le bouton situé sur le côté gauche au-dessus du clavier.
Pavé tactile
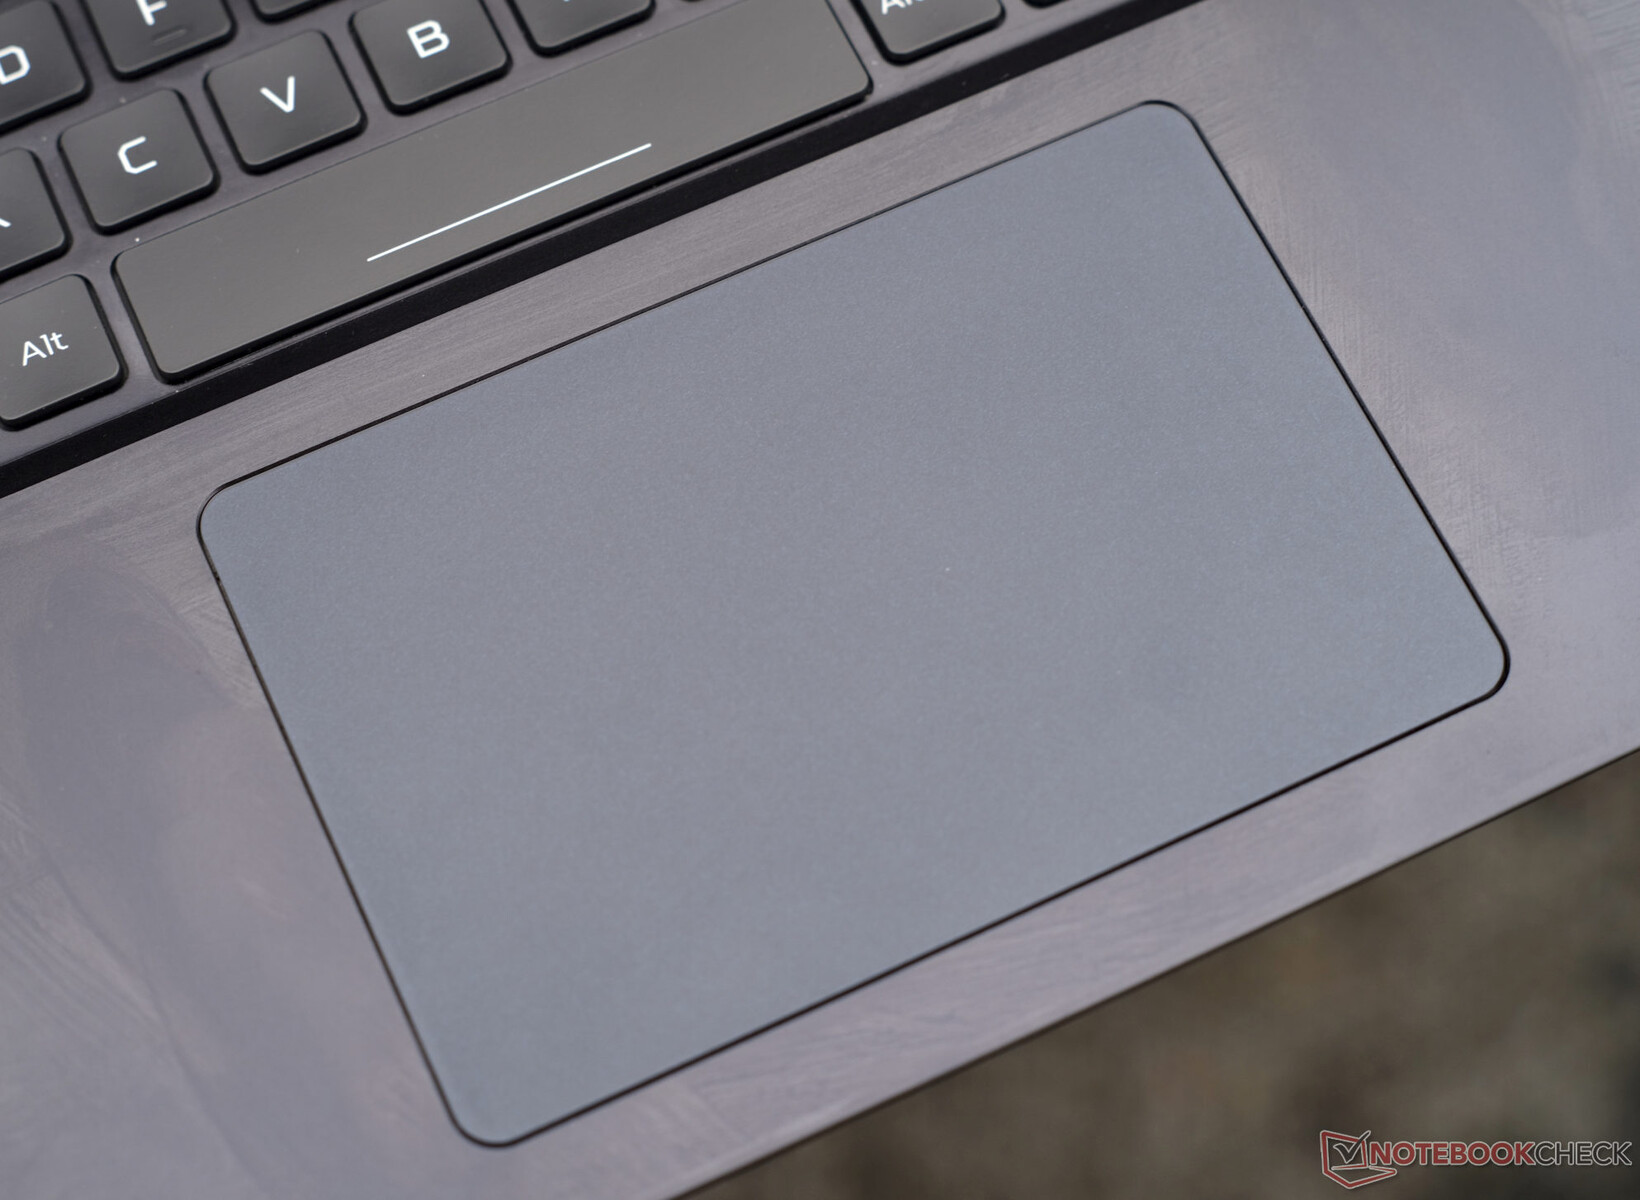
Grâce à son revêtement en verre Gorilla, le pavé tactile de 12,6 x 8,3 mm permet aux doigts de glisser avec une grande précision. Les gestes multi-touch et le défilement s'effectuent donc sans effort. Les boutons cliquables intégrés ont une course moyenne et un retour d'information satisfaisant.
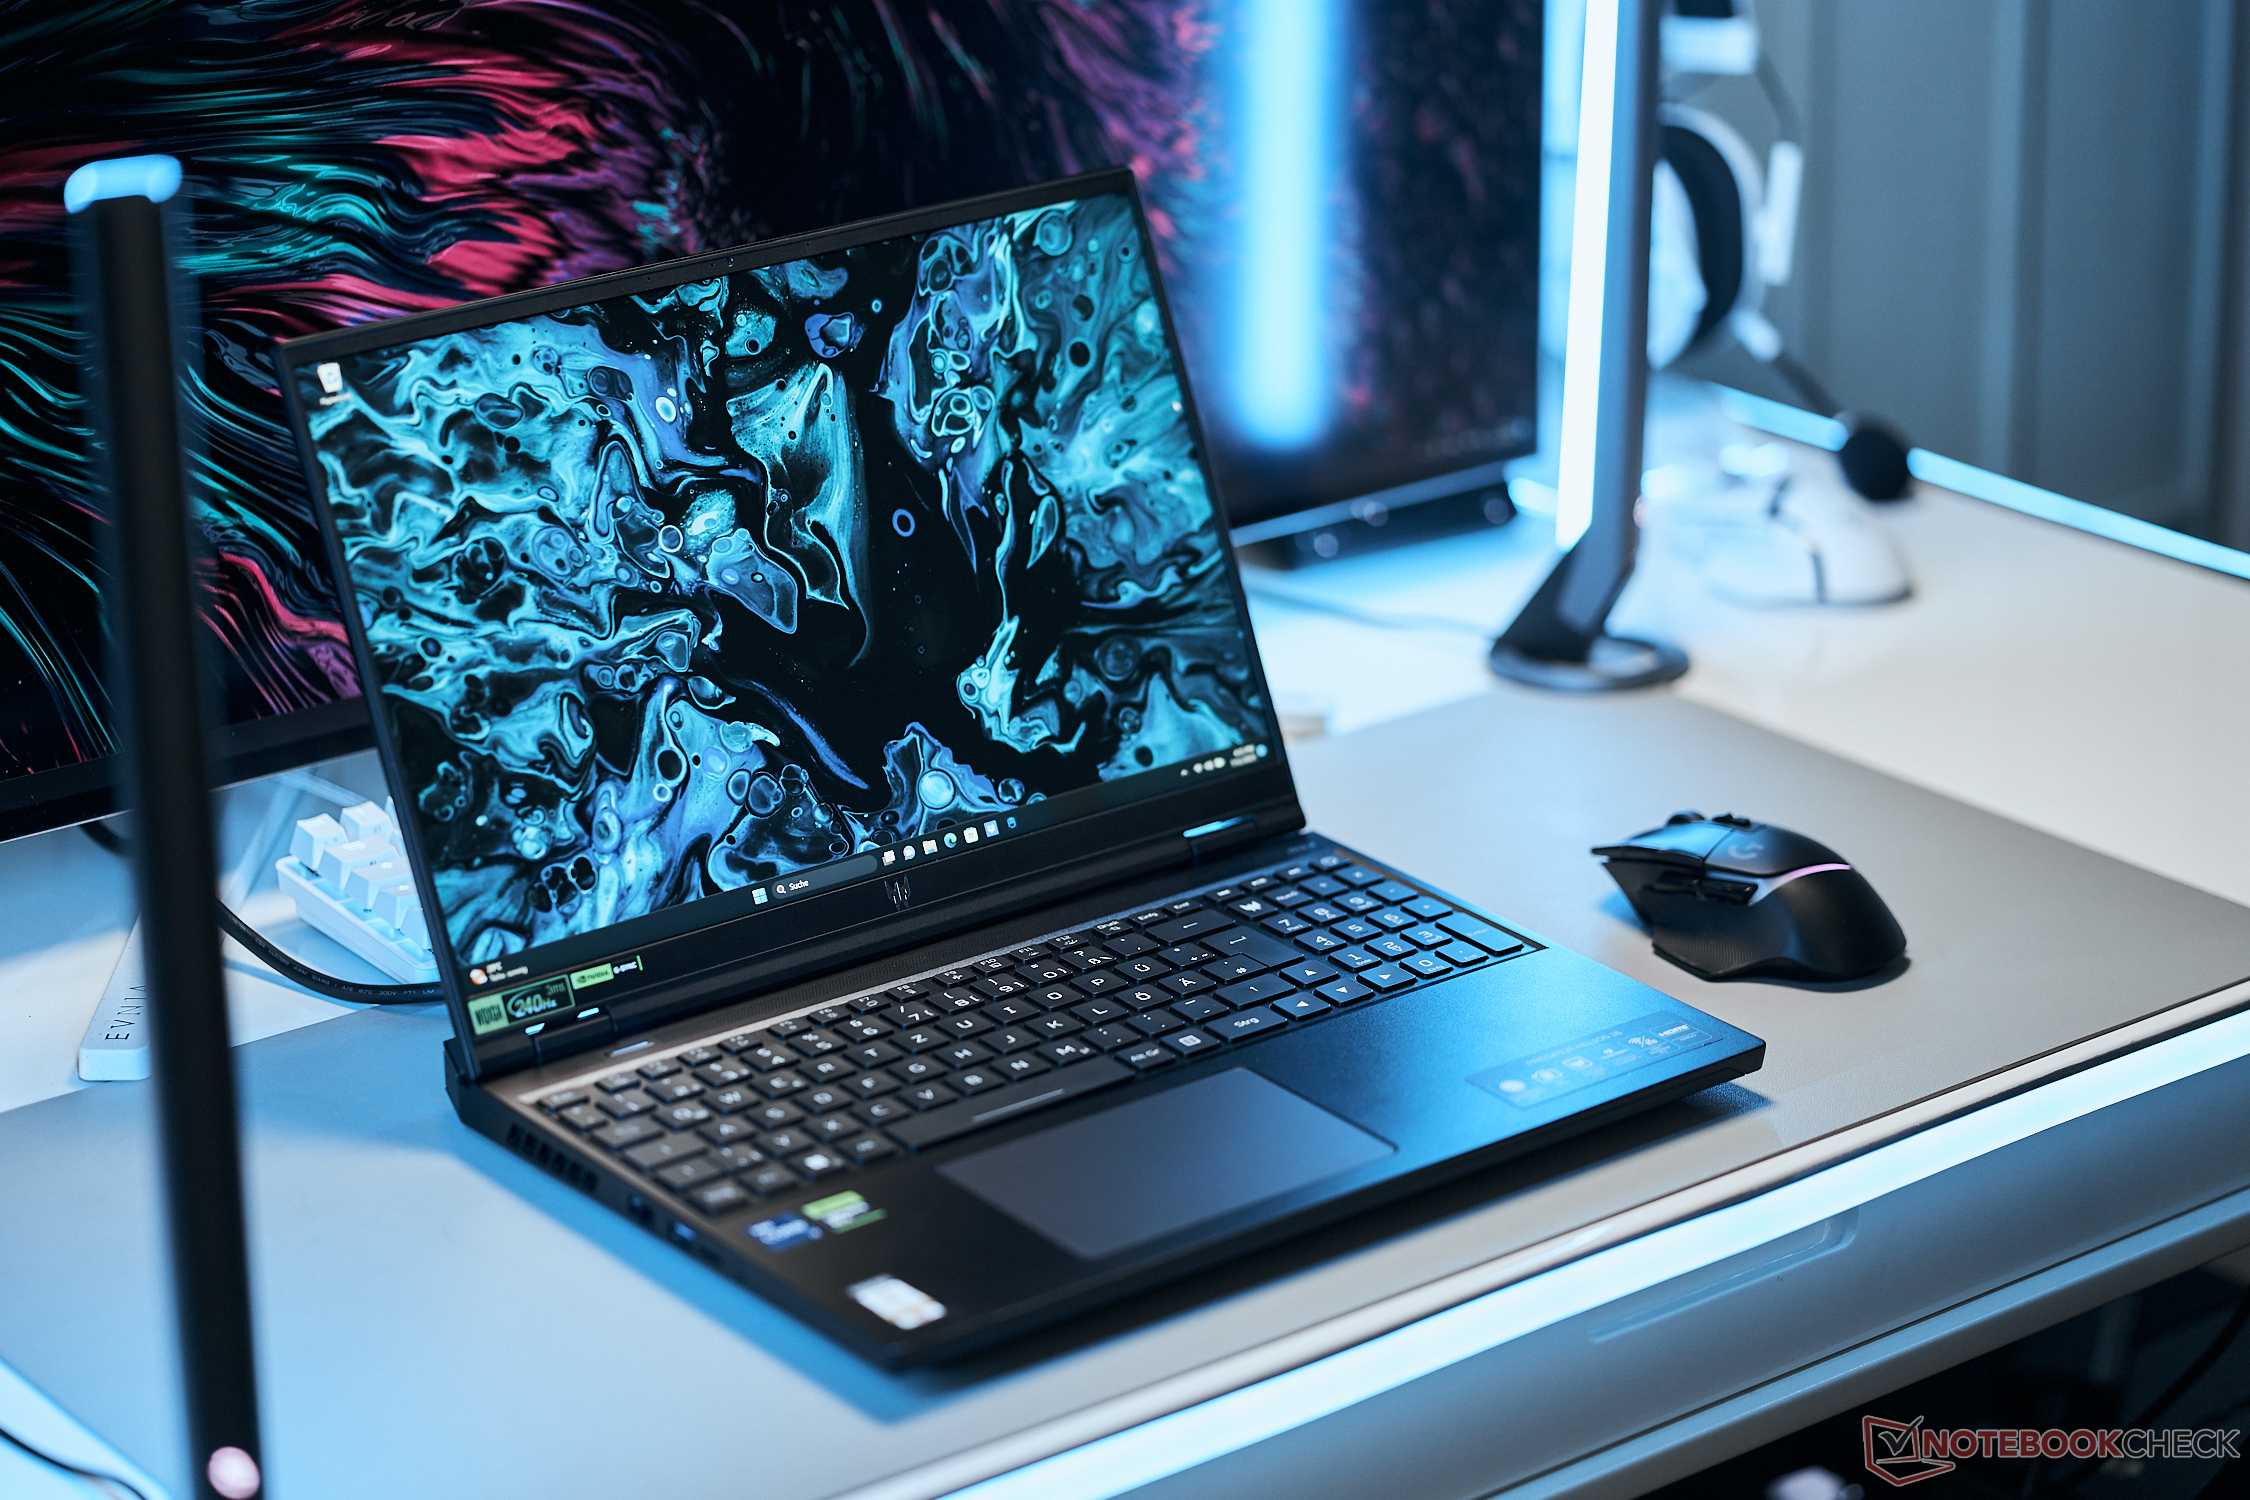
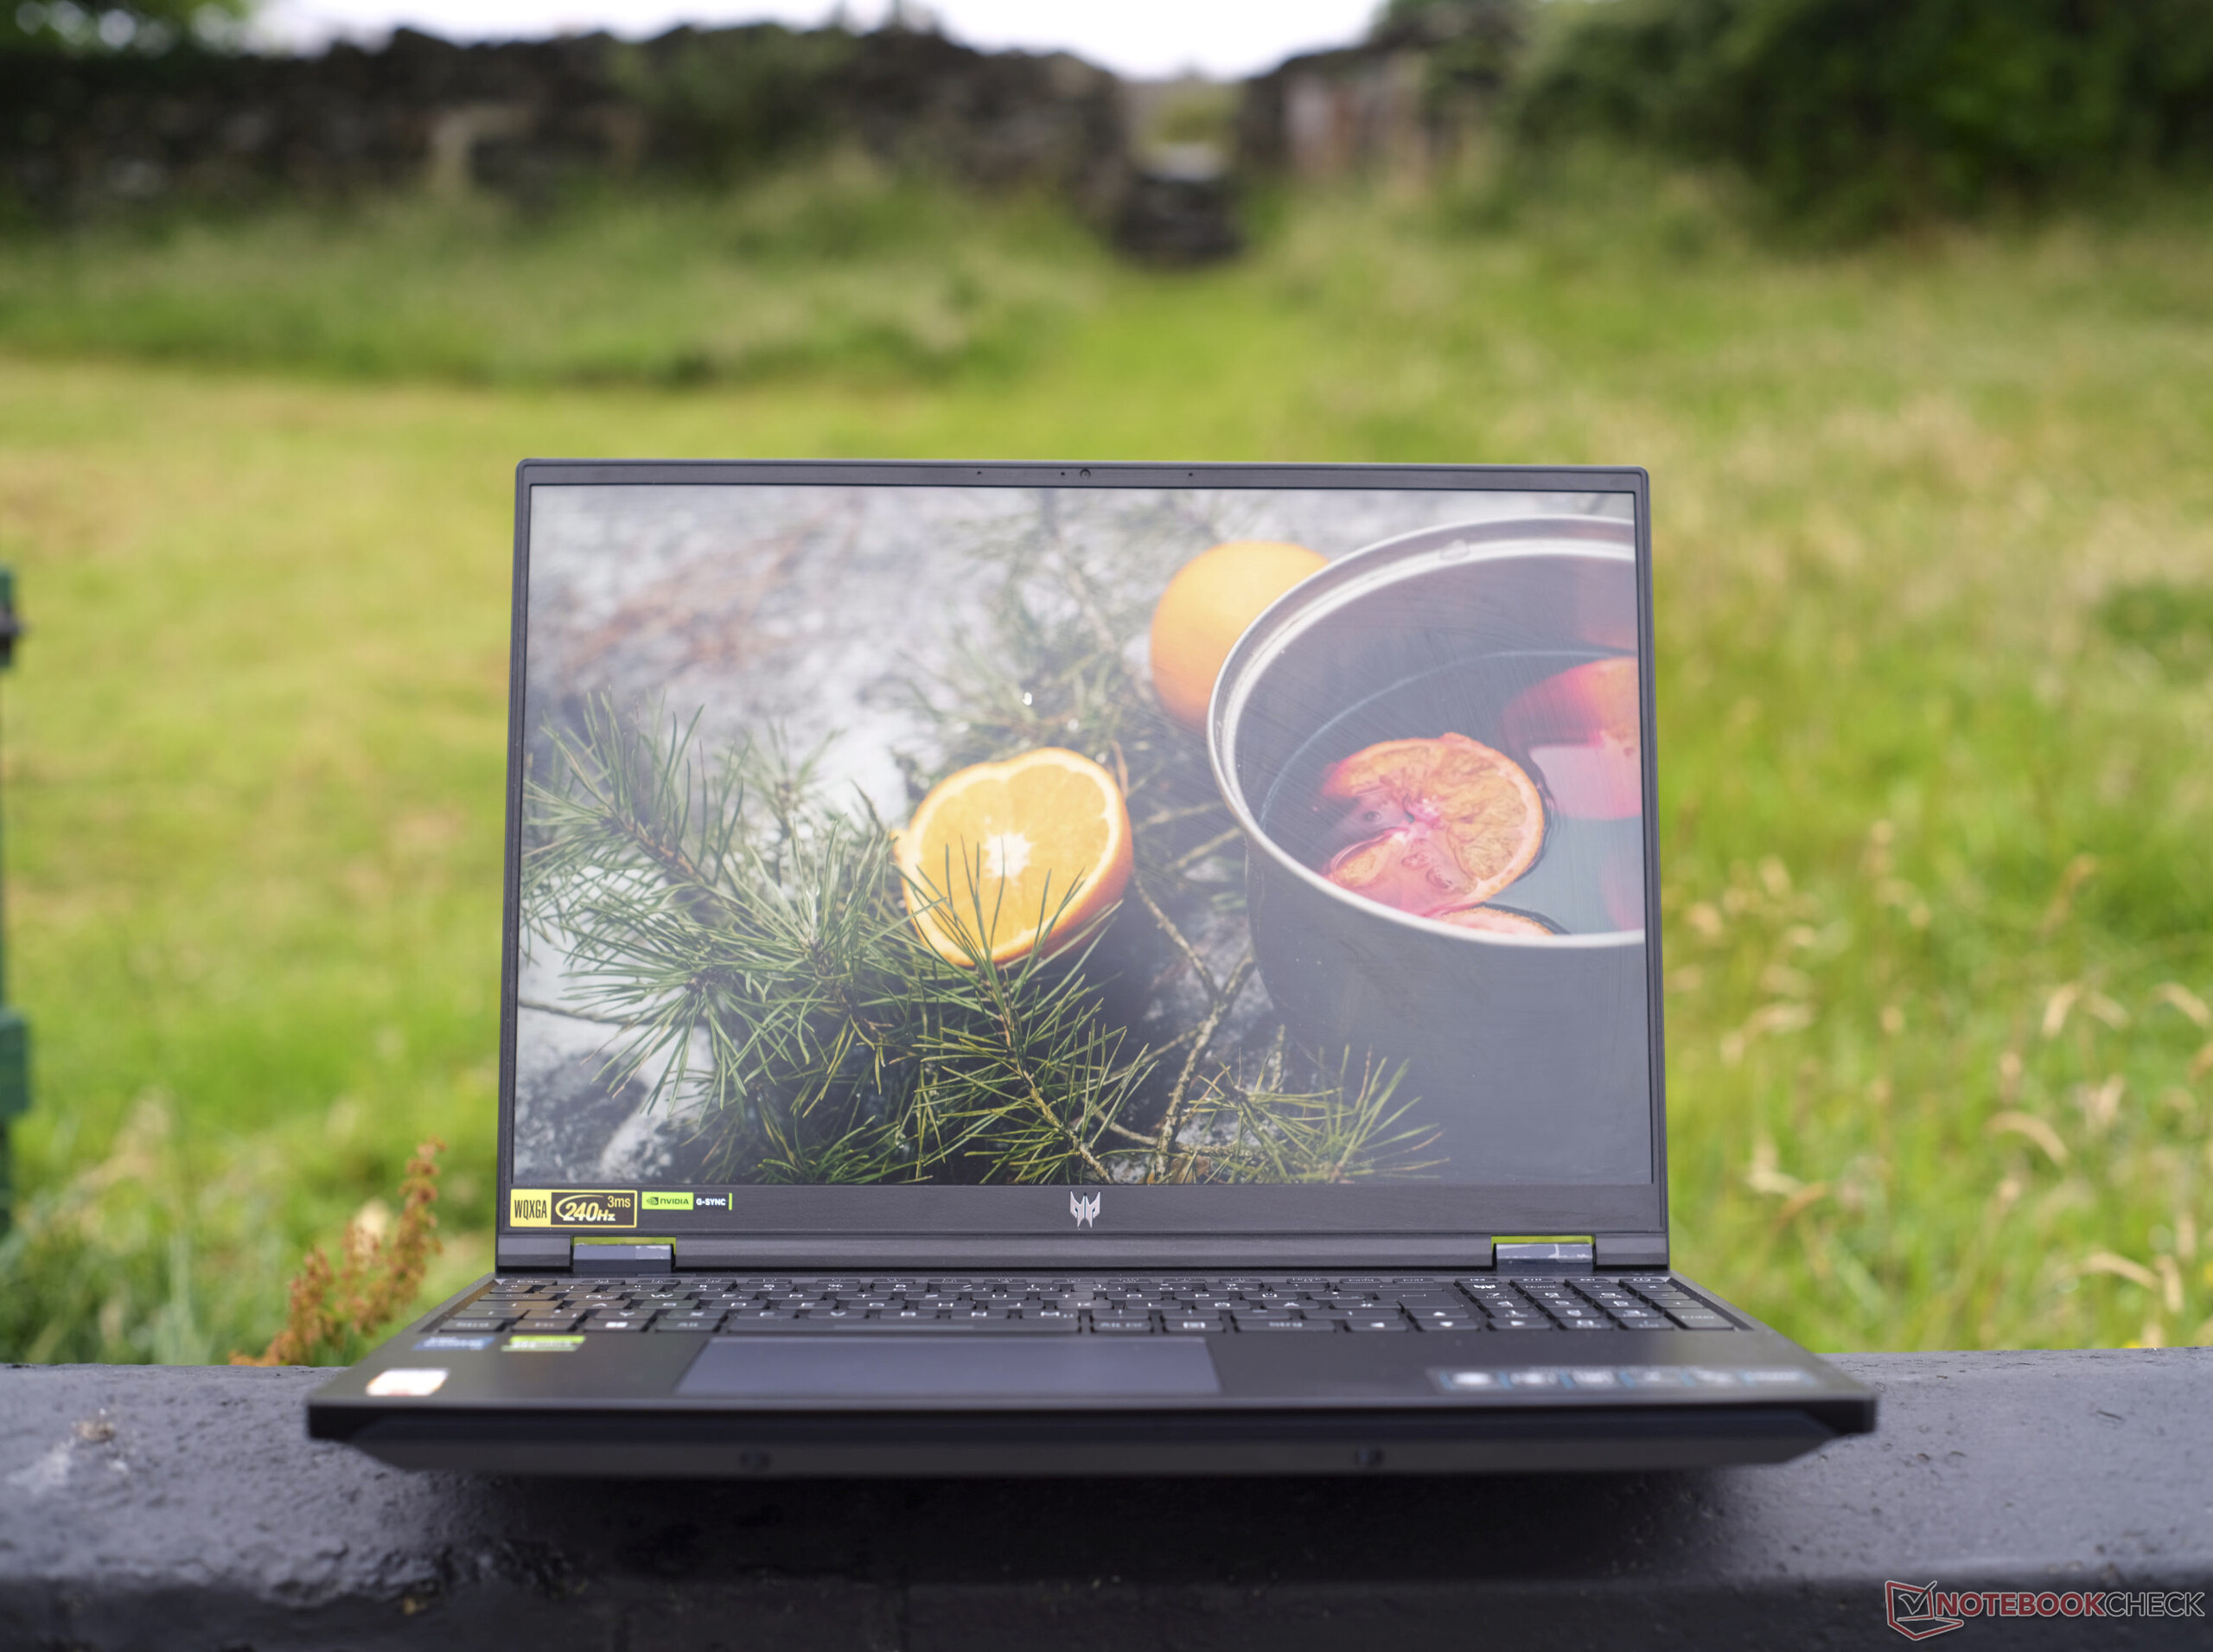
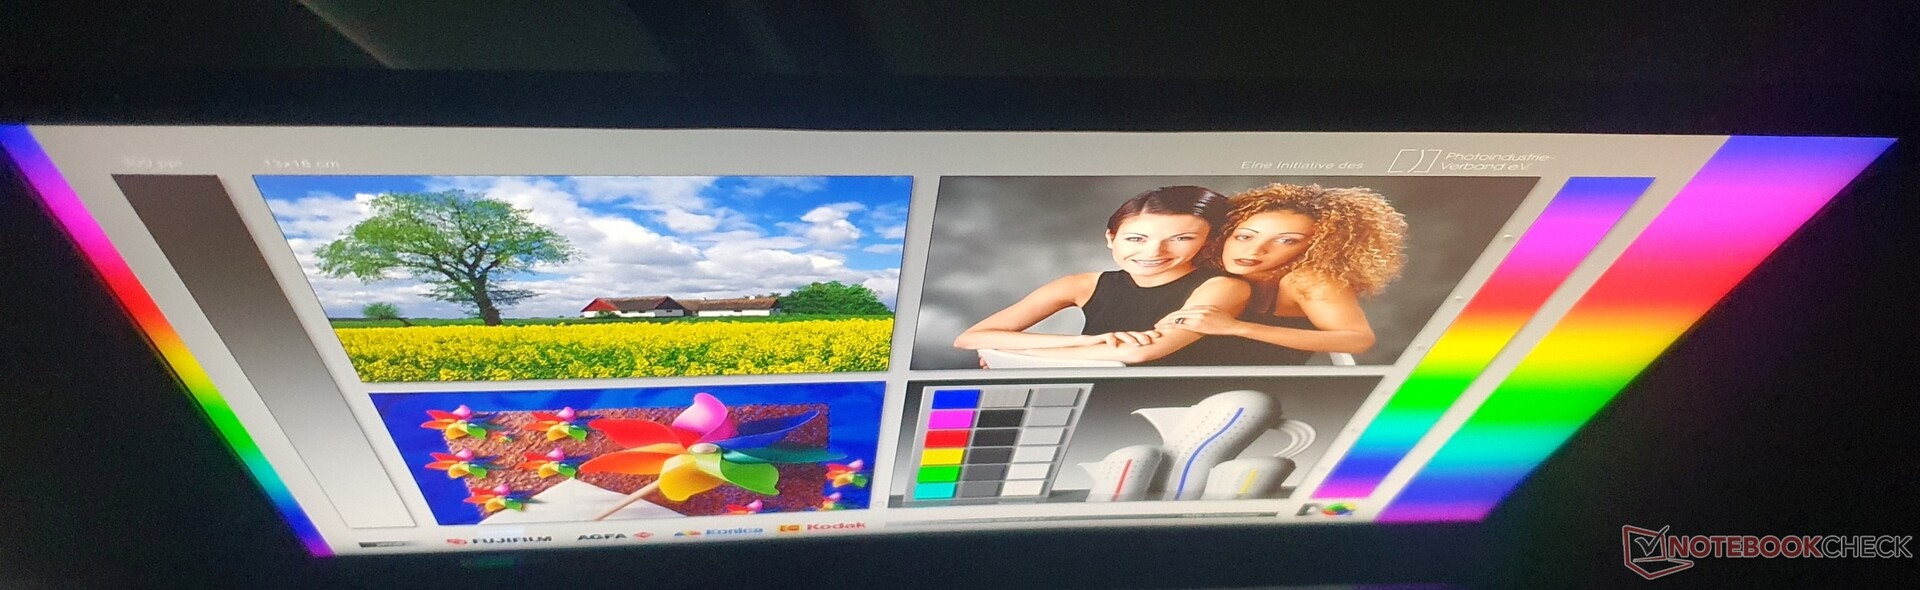
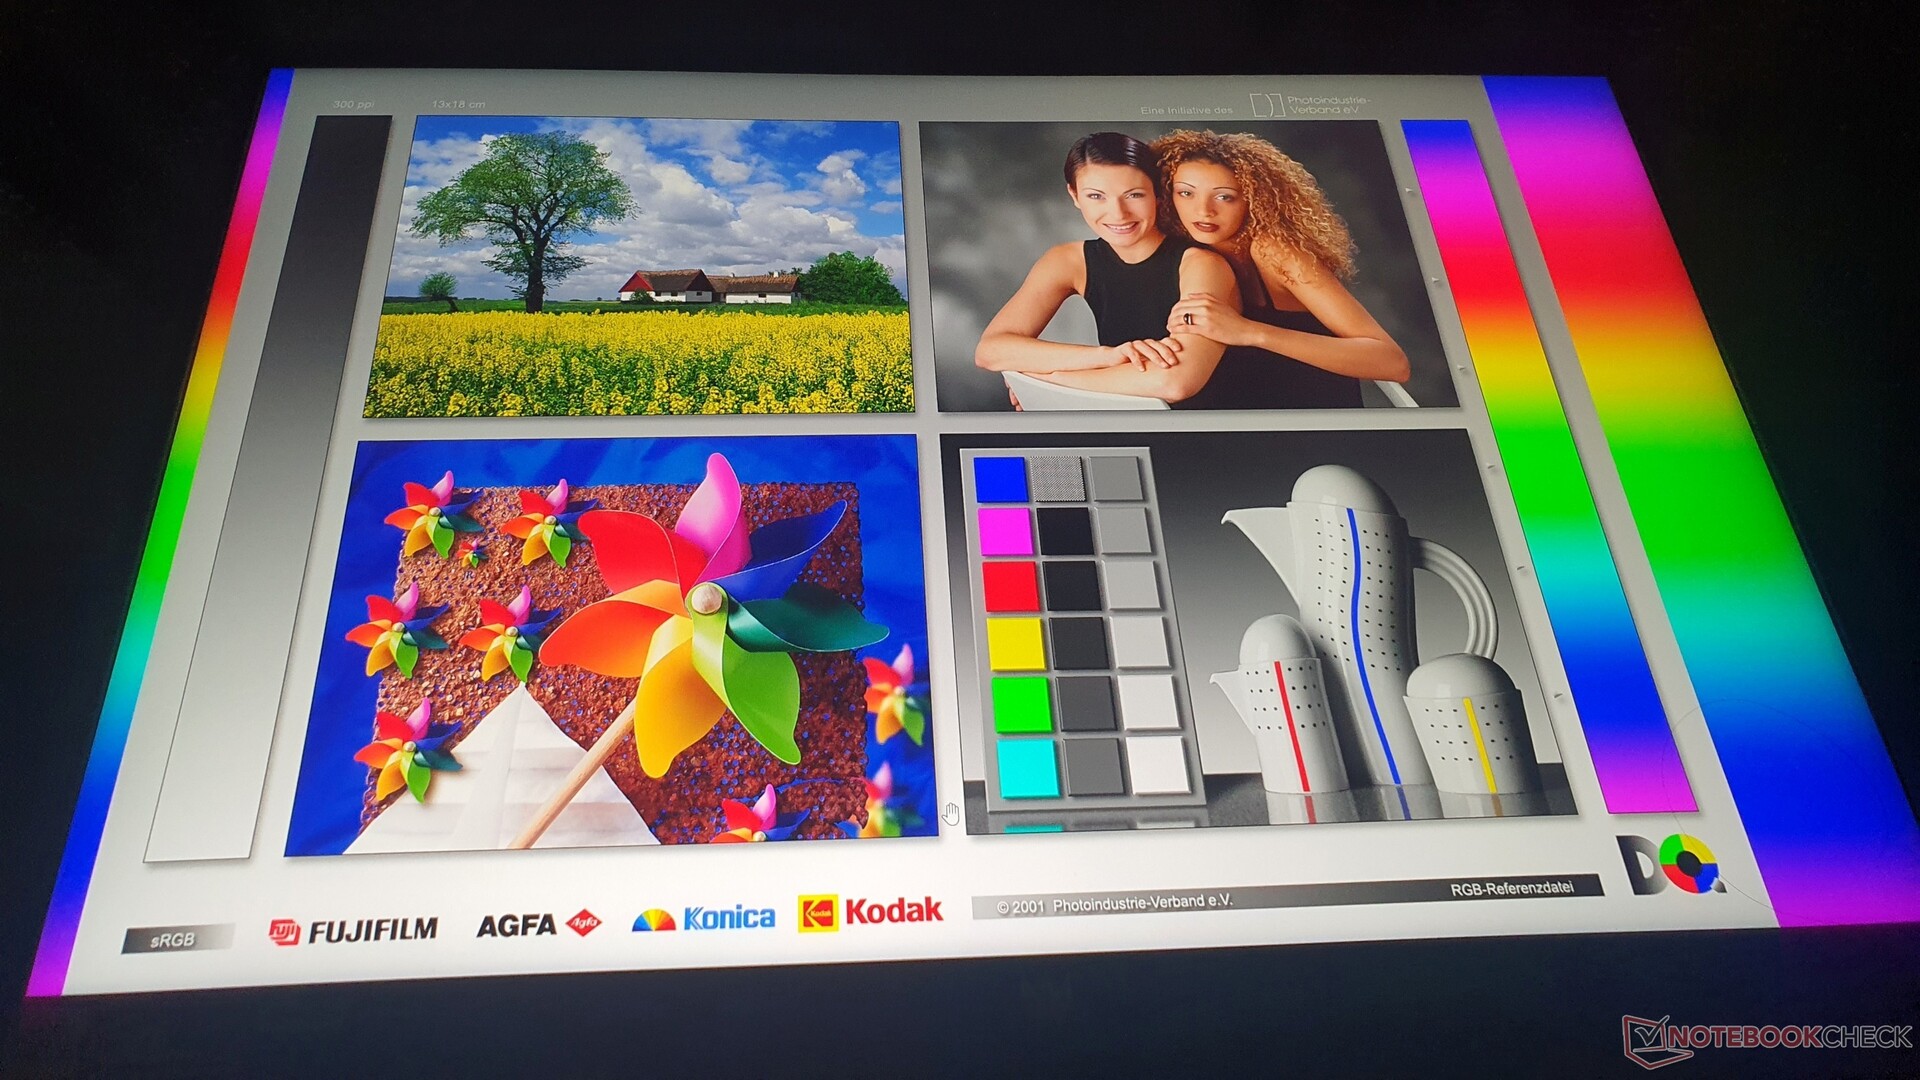
Écran : Une machine de jeu avec 97 % DCI P3, 500 cd/m² et 240 Hz
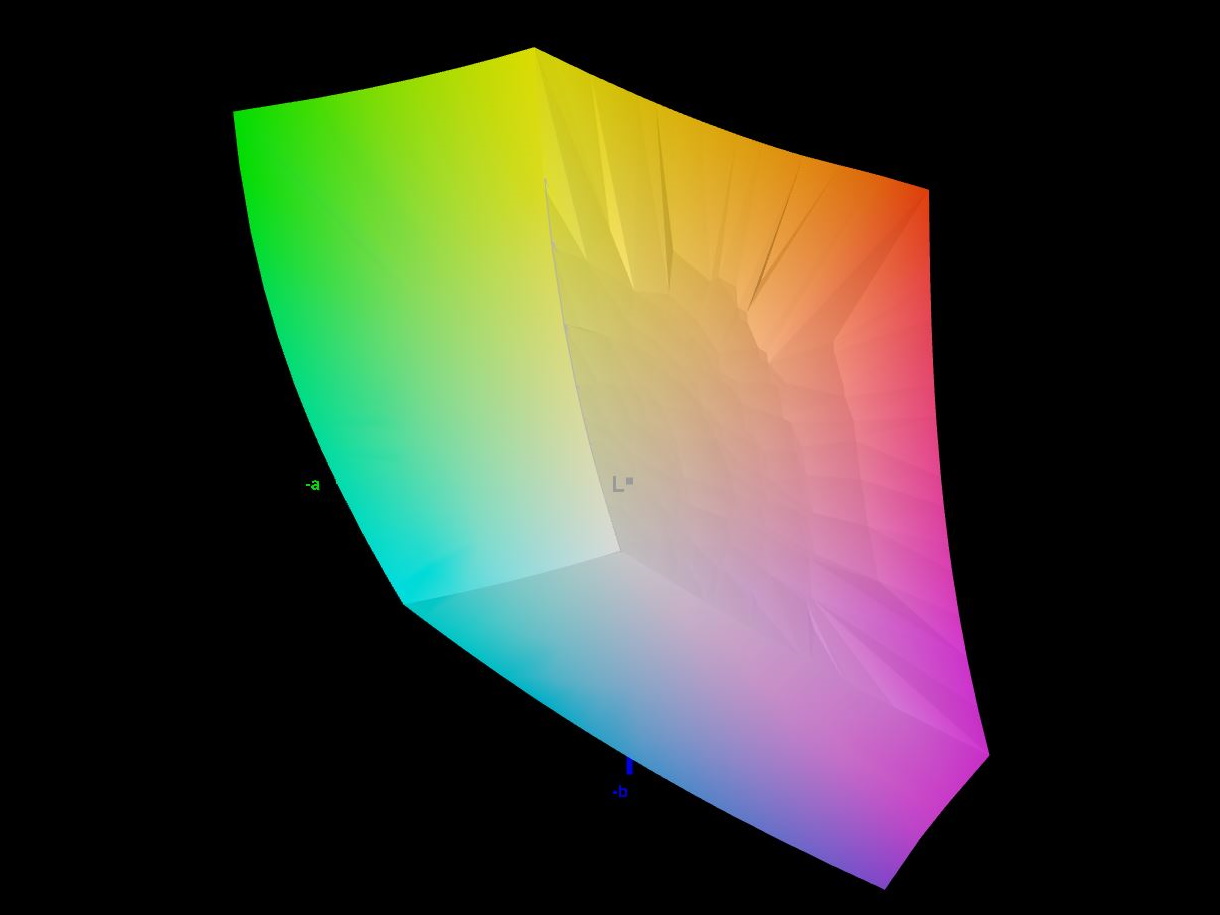
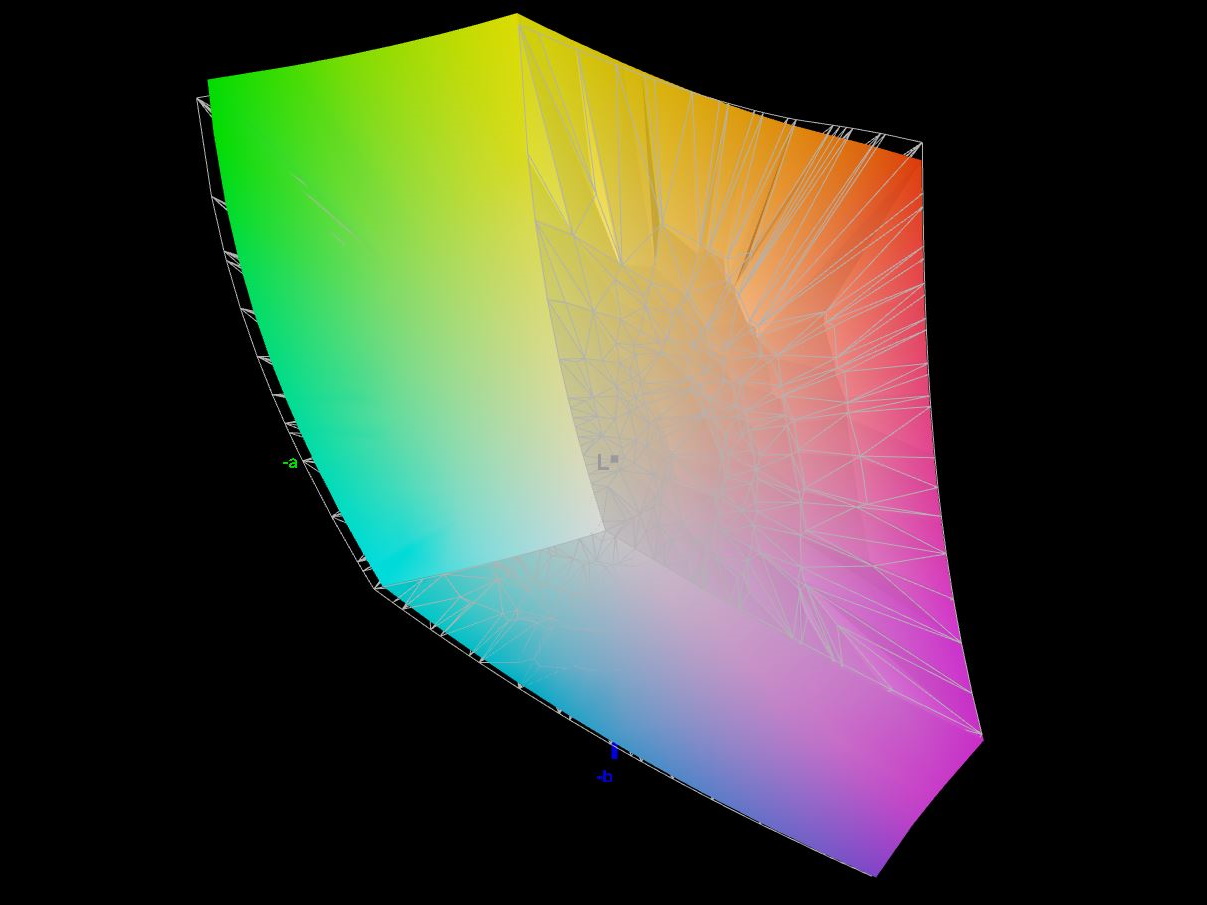
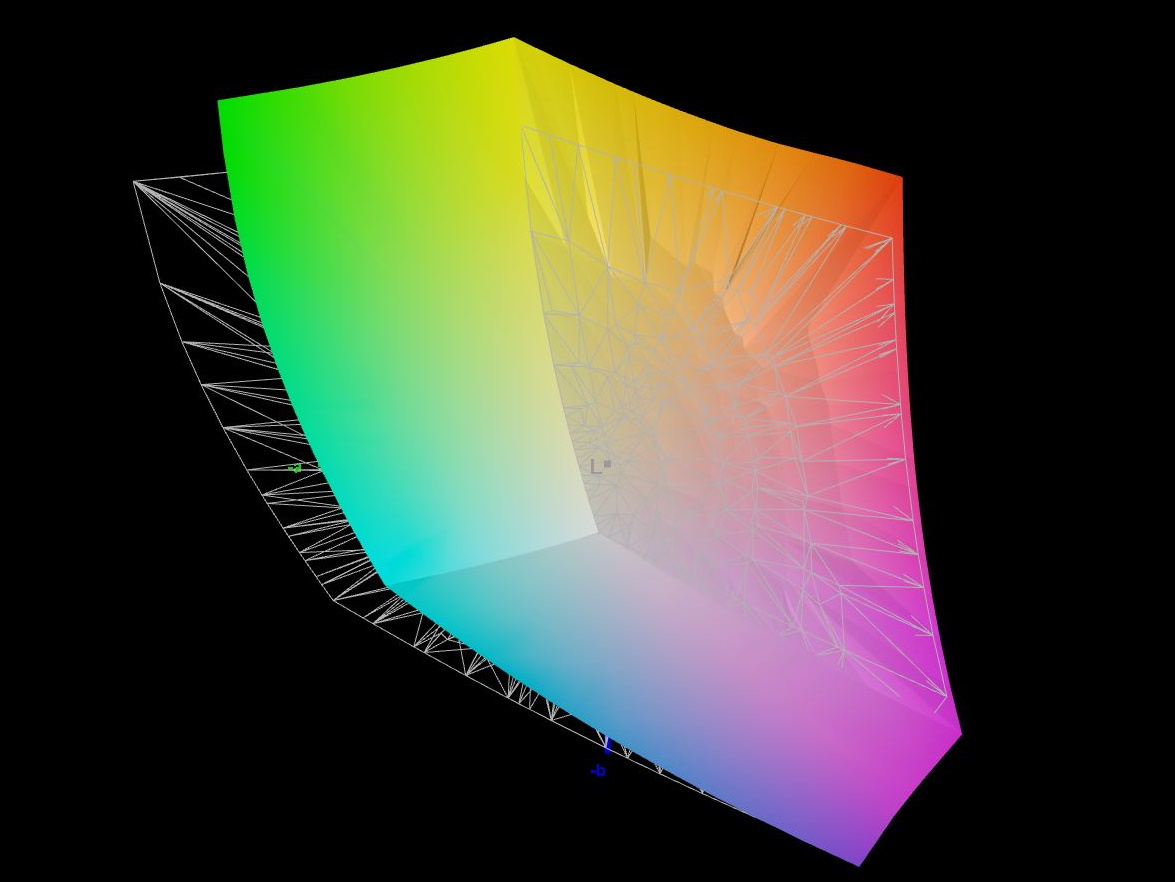
L'appareil examiné, portant le numéro de modèle PH16-71-731Q, n'est pas équipé de l'écran mini-LED disponible en option et de ses 1 024 zones de gradation. Néanmoins, nous avons été surpris de constater que l'écran IPS mat, rapide, 240 Hz, d'une résolution de 2 560 x 1 600 pixels (16:10) couvre fièrement 97 % de l'espace colorimétrique DCI P3. Cela signifie que les images, dans les jeux entre autres, apparaissent encore plus vives.
Toutes les autres données clés sont également bonnes : Luminosité de près de 500 cd/m², contraste élevé de 1:419:1 et éclairage homogène de 94 %. Le Acer Nitro 16 est le seul concurrent dans notre liste d'appareils concurrents qui parvient à une luminosité nettement supérieure à ~300 cd/m².
Les bons temps de réponse gris à gris de 13,6 ms et noir à blanc de 6,4 ms sont similaires à ceux de ses pairs, tandis que le Dell G15 5530 a le nez devant avec un temps de réponse gris à gris de seulement 3,4 ms. En outre, Nvidia G-Sync et Dolby Vision sont également pris en charge.
| |||||||||||||||||||||||||
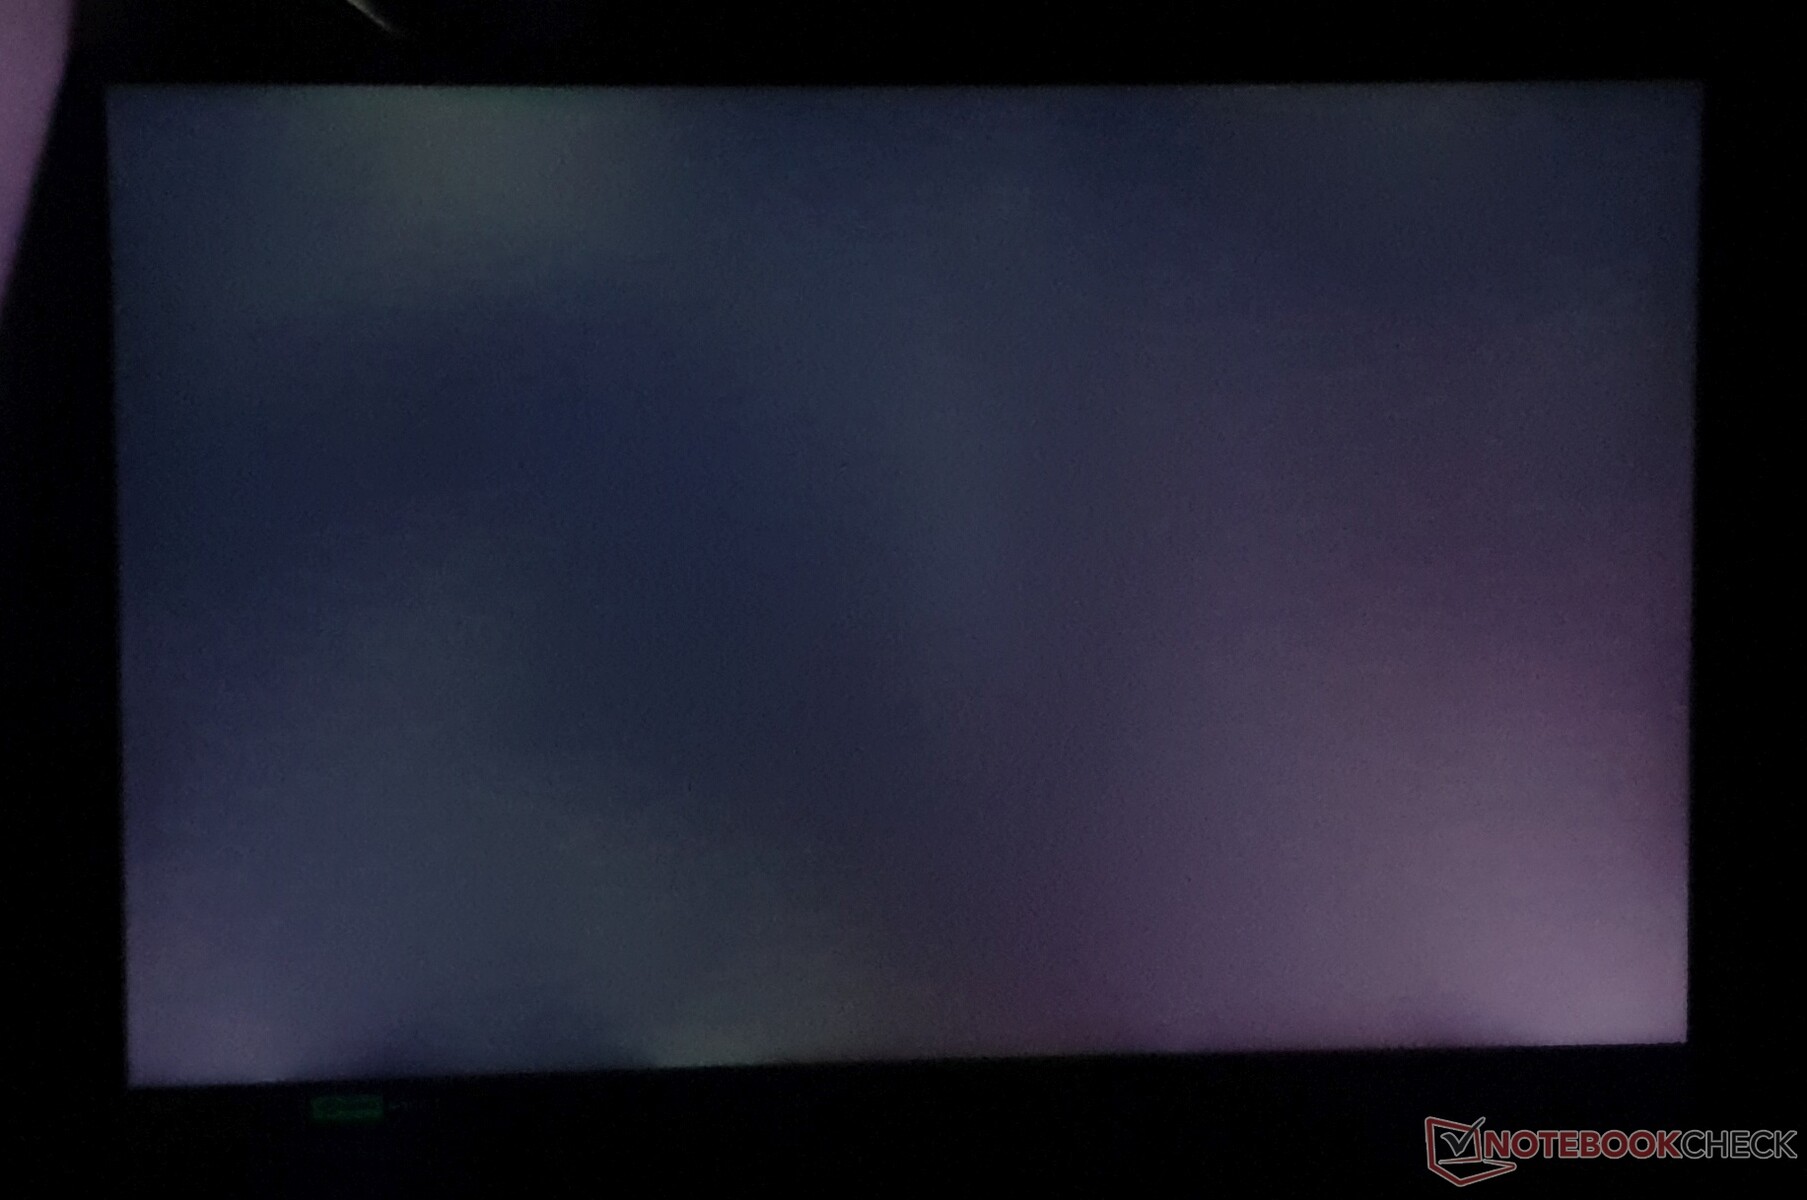
Homogénéité de la luminosité: 94 %
Valeur mesurée au centre, sur batterie: 511 cd/m²
Contraste: 1419:1 (Valeurs des noirs: 0.36 cd/m²)
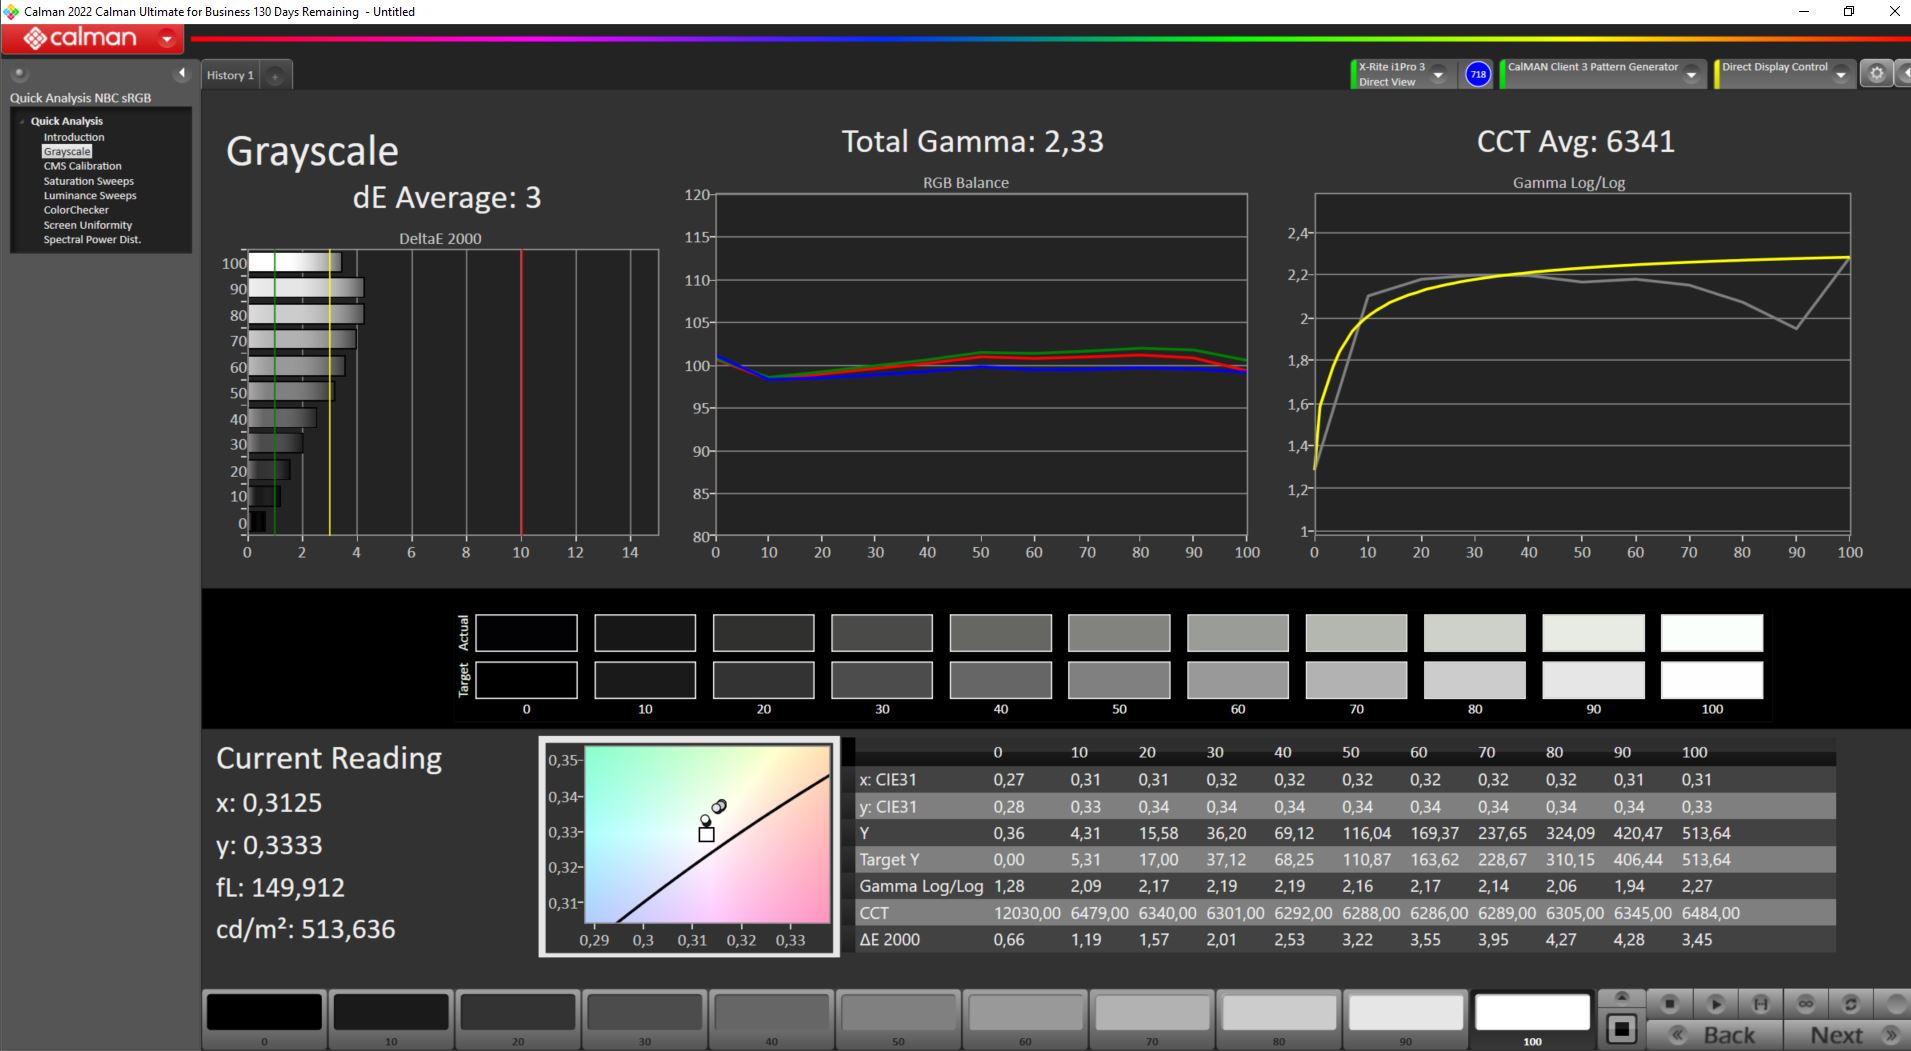
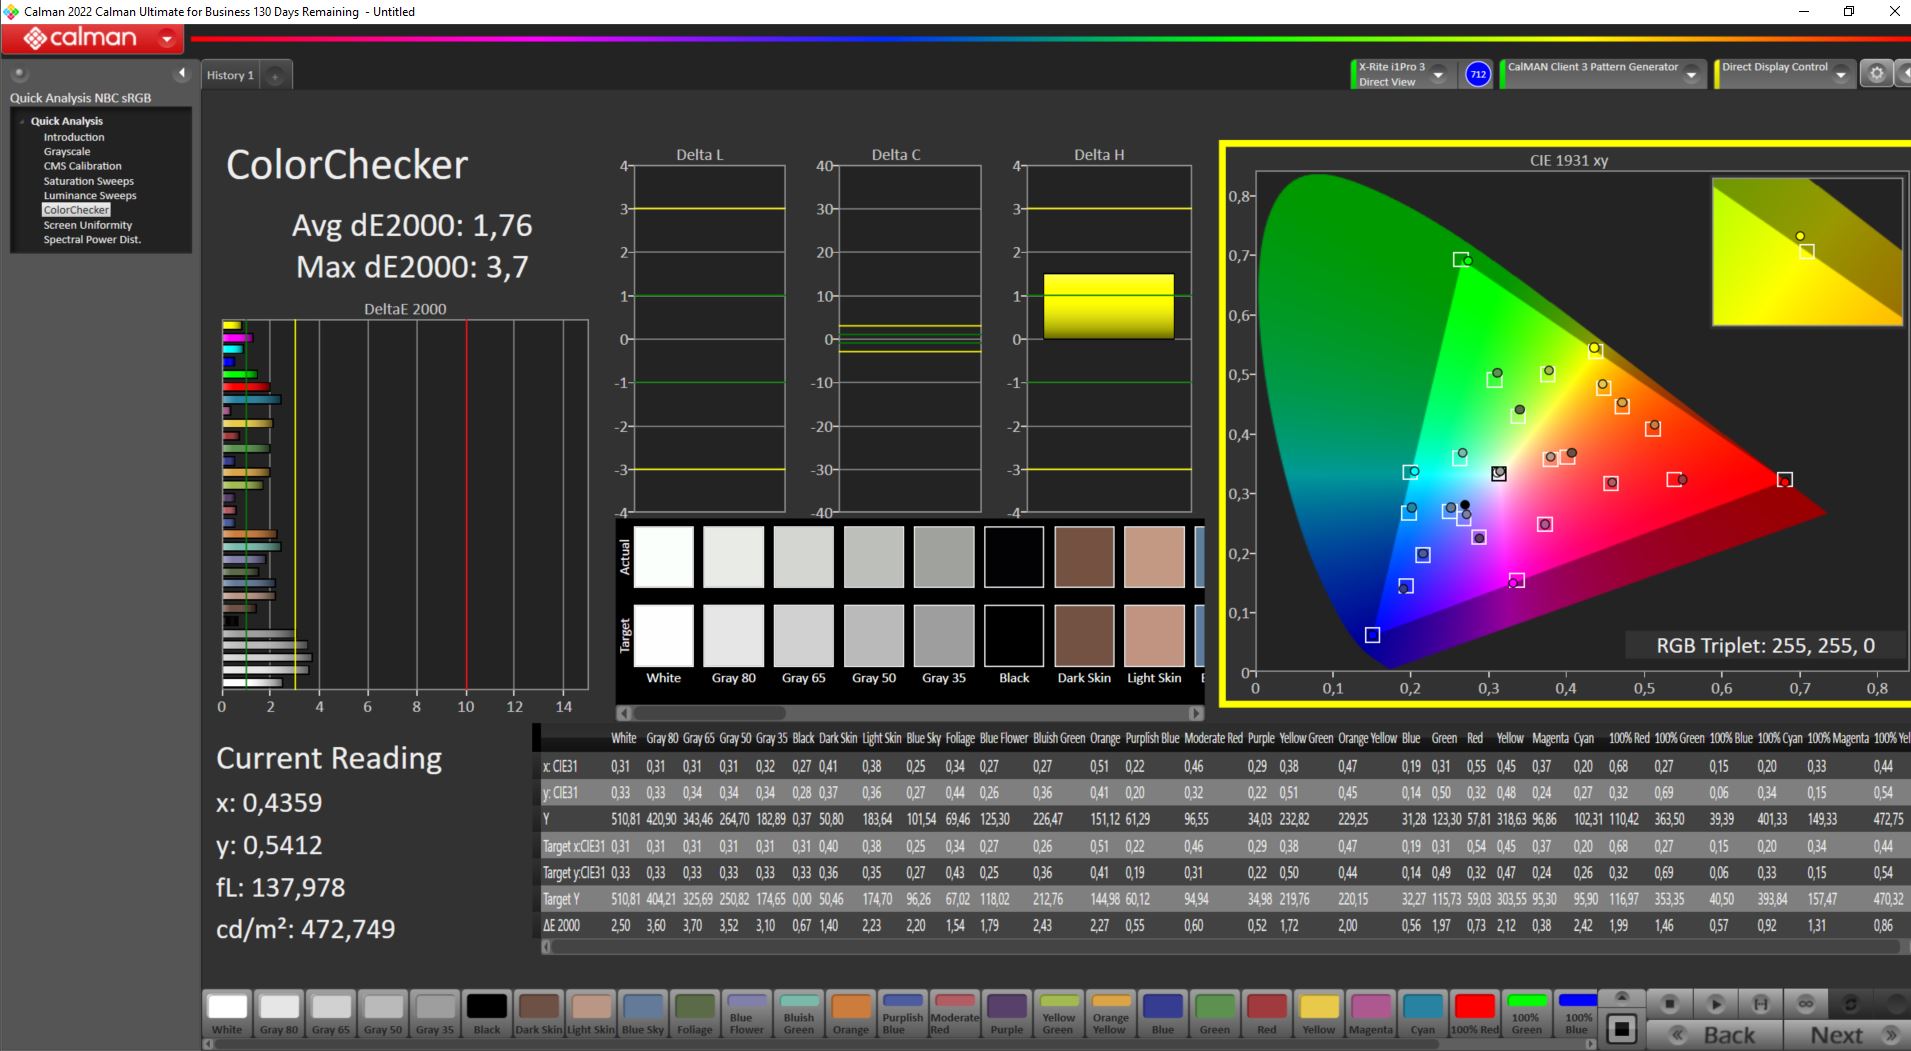
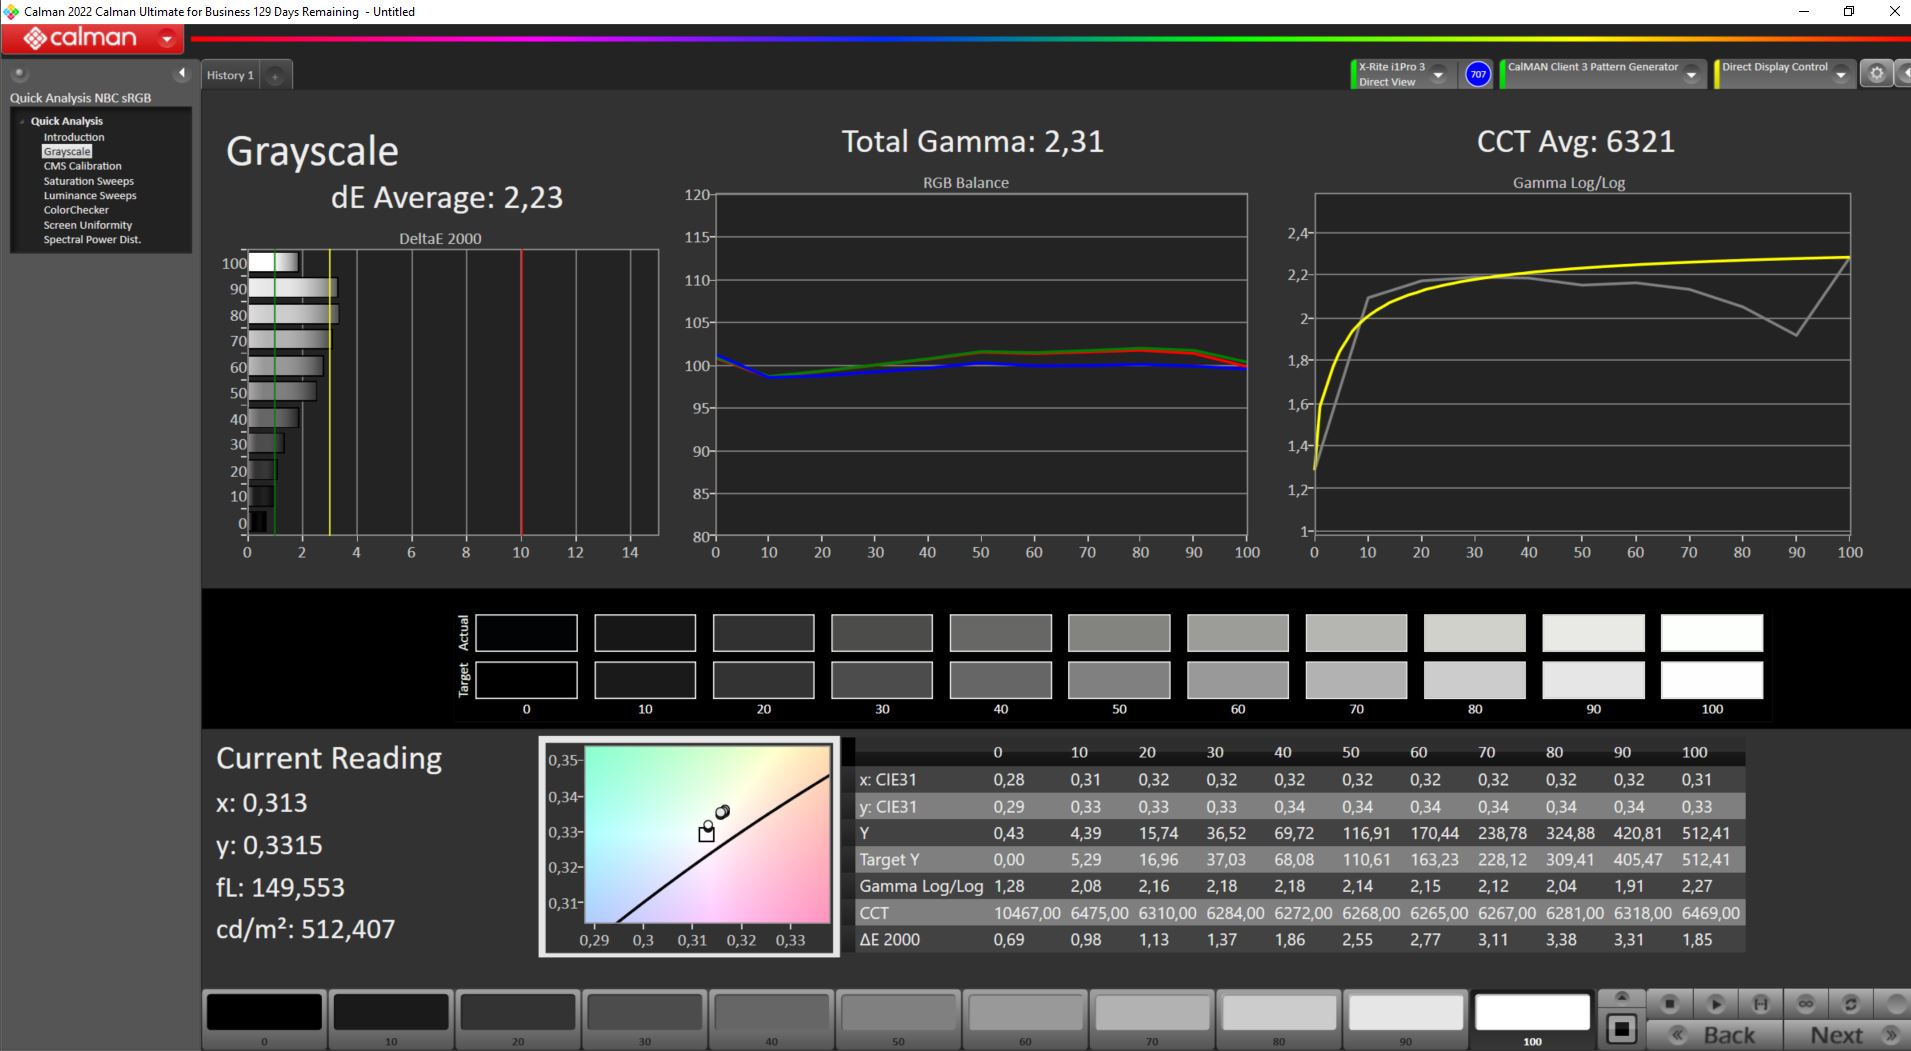
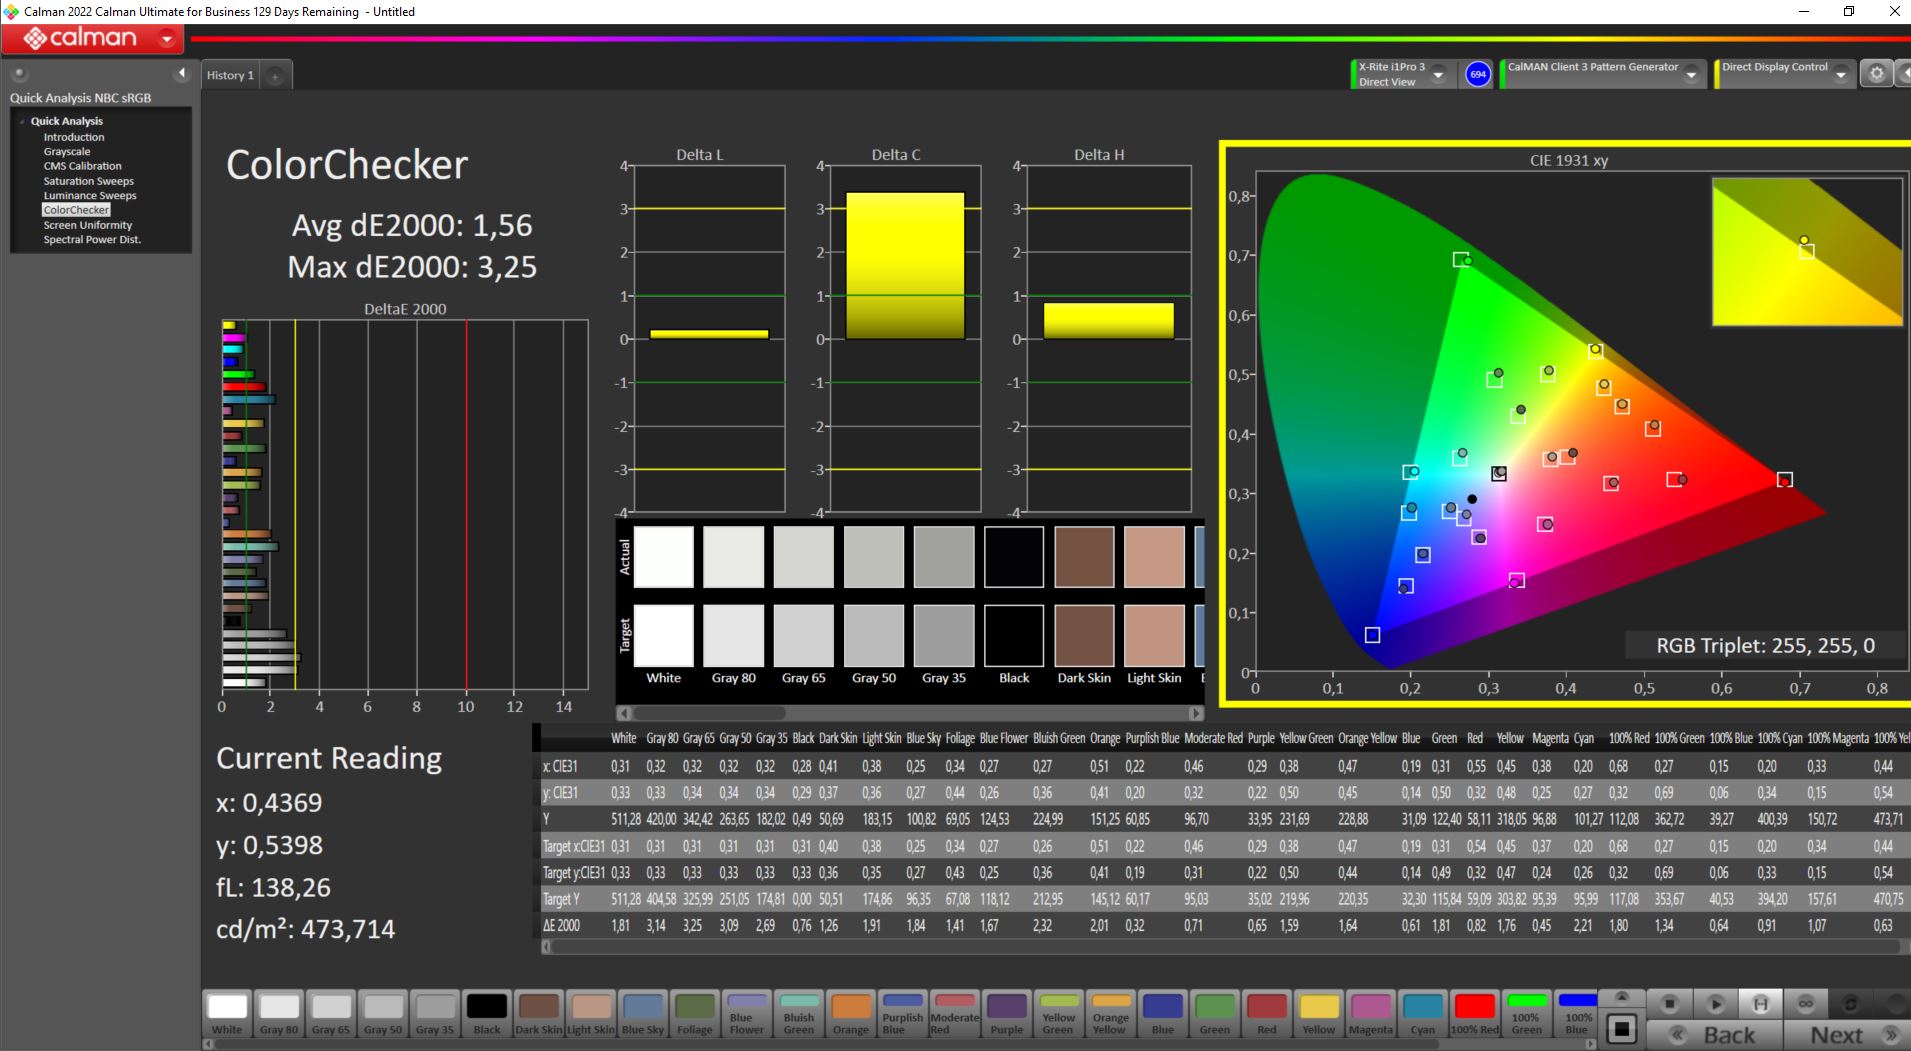
ΔE ColorChecker Calman: 1.76 | ∀{0.5-29.43 Ø4.73}
calibrated: 1.56
ΔE Greyscale Calman: 3 | ∀{0.09-98 Ø4.97}
84.7% AdobeRGB 1998 (Argyll 3D)
100% sRGB (Argyll 3D)
97.1% Display P3 (Argyll 3D)
Gamma: 2.33
CCT: 6341 K
| Acer Predator Helios 16 PH16-71-731Q BOE NE160QDM-NZ2, IPS-LED, 2560x1600, 16" | Acer Nitro 16 AN16-41 BOE CQ NE16QDM-NY1, IPS, 2560x1600, 16" | Lenovo Legion Pro 5 16IRX8 AU Optronics B160QAN03.1, IPS, 2560x1600, 16" | Aorus 15X ASF BOE CQ NE156QHM-NZ1, IPS, 2560x1440, 15.6" | Asus TUF Gaming A16 FA617 NE160WUM-NX2 (BOE0B33), IPS-Level, 1920x1200, 16" | Dell G15 5530 AUO B156HAN, IPS, 1920x1080, 15.6" | |
|---|---|---|---|---|---|---|
| Display | -16% | -14% | -16% | -16% | -13% | |
| Display P3 Coverage (%) | 97.1 | 67.9 -30% | 71.2 -27% | 69.3 -29% | 69.4 -29% | 73.1 -25% |
| sRGB Coverage (%) | 100 | 99.1 -1% | 98.8 -1% | 98.2 -2% | 97.8 -2% | 98.4 -2% |
| AdobeRGB 1998 Coverage (%) | 84.7 | 69.9 -17% | 73.3 -13% | 70.5 -17% | 70.9 -16% | 74.4 -12% |
| Response Times | 21% | -35% | -19% | -42% | 46% | |
| Response Time Grey 50% / Grey 80% * (ms) | 13.6 ? | 11 ? 19% | 14.5 ? -7% | 12.4 ? 9% | 17 ? -25% | 3.39 ? 75% |
| Response Time Black / White * (ms) | 6.4 ? | 5 ? 22% | 10.4 ? -63% | 9.4 ? -47% | 10.1 ? -58% | 5.35 ? 16% |
| PWM Frequency (Hz) | 21620 ? | |||||
| Screen | -3% | 4% | 5% | 5% | -50% | |
| Brightness middle (cd/m²) | 511 | 520 2% | 405.7 -21% | 316 -38% | 308 -40% | 320 -37% |
| Brightness (cd/m²) | 498 | 494 -1% | 368 -26% | 301 -40% | 293 -41% | 316 -37% |
| Brightness Distribution (%) | 94 | 91 -3% | 87 -7% | 90 -4% | 90 -4% | 94 0% |
| Black Level * (cd/m²) | 0.36 | 0.39 -8% | 0.38 -6% | 0.28 22% | 0.23 36% | 0.21 42% |
| Contrast (:1) | 1419 | 1333 -6% | 1068 -25% | 1129 -20% | 1339 -6% | 1524 7% |
| Colorchecker dE 2000 * | 1.76 | 1.94 -10% | 1.65 6% | 1.54 12% | 1.47 16% | 4.55 -159% |
| Colorchecker dE 2000 max. * | 3.7 | 5.62 -52% | 4.2 -14% | 2.46 34% | 2.98 19% | 9.83 -166% |
| Colorchecker dE 2000 calibrated * | 1.56 | 0.74 53% | 0.53 66% | 1.21 22% | 1.02 35% | 1.51 3% |
| Greyscale dE 2000 * | 3 | 2.94 2% | 1.2 60% | 1.3 57% | 2.2 27% | 6.2 -107% |
| Gamma | 2.33 94% | 2.37 93% | 2.3 96% | 2.307 95% | 2.228 99% | 2.07 106% |
| CCT | 6341 103% | 6443 101% | 6453 101% | 6456 101% | 6228 104% | 6479 100% |
| Moyenne finale (programmes/paramètres) | 1% /
-2% | -15% /
-6% | -10% /
-3% | -18% /
-6% | -6% /
-29% |
* ... Moindre est la valeur, meilleures sont les performances
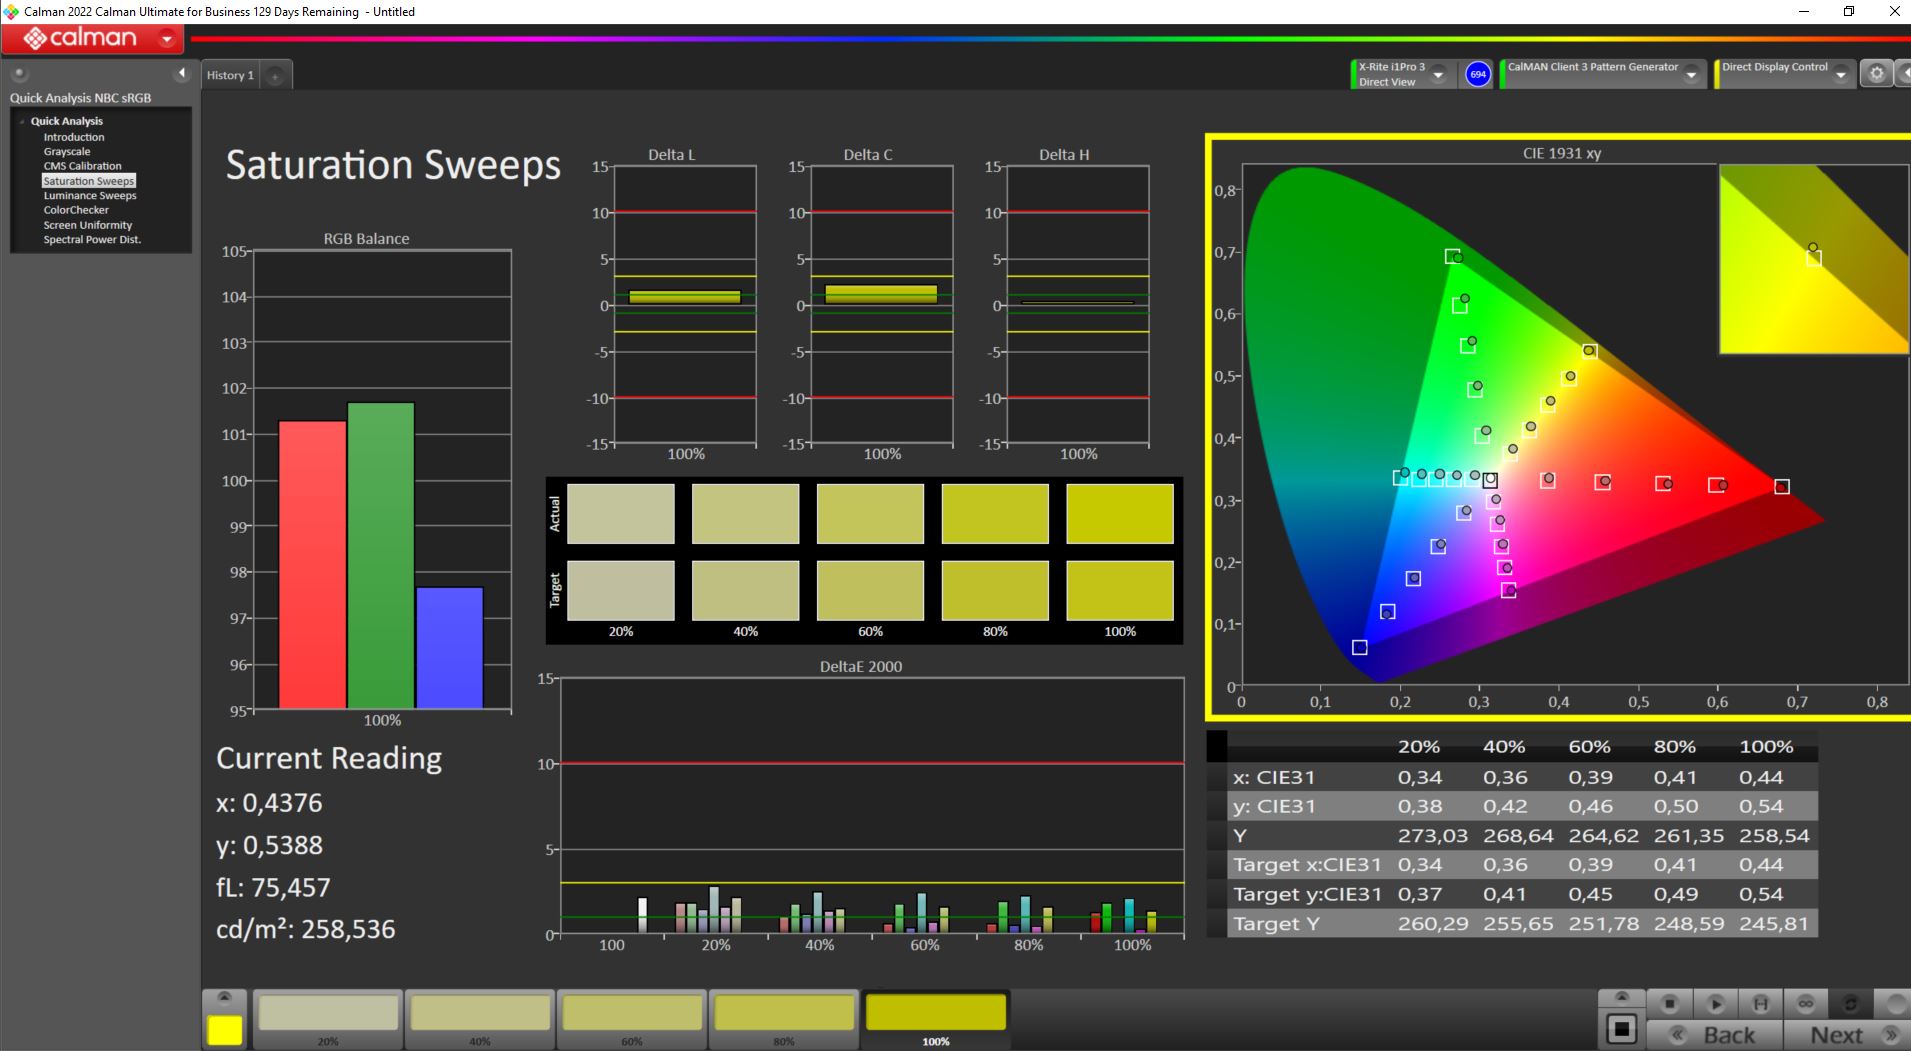
Comme il couvre 100 % de l'espace sRGB, 97,1 % de l'espace DCI P3 et 84,7 % de l'espace AdobeRGB, rien ne s'oppose à l'édition de photos et de vidéos, qui dépendent toutes deux de la précision des couleurs. Aucun ordinateur portable de jeu de notre comparatif ne peut s'approcher de ces chiffres, à l'exception de l'espace colorimétrique sRGB.
Les couleurs et les échelles de gris sont déjà calibrées et ne dépassent donc pas la limite DeltaE 3, jusqu'à laquelle l'œil humain peut détecter les écarts de couleur. Notre étalonnage a permis d'améliorer encore ces valeurs sans aucune dominante de couleur visible. Notre profil de couleurs calibré peut être téléchargé à l'adresse https://notebookcheck.com/uploads/tx_nbc2/helios16_kal.icm.

Temps de réponse de l'écran
| ↔ Temps de réponse noir à blanc | ||
|---|---|---|
| 6.4 ms ... hausse ↗ et chute ↘ combinées | ↗ 2.2 ms hausse | 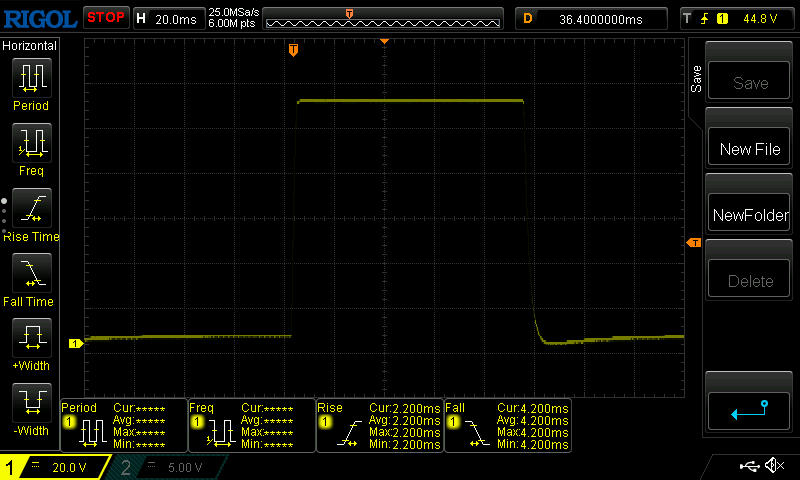 |
| ↘ 4.2 ms chute | ||
| L'écran montre de très faibles temps de réponse, parfait pour le jeu. En comparaison, tous les appareils testés affichent entre 0.1 (minimum) et 240 (maximum) ms. » 20 % des appareils testés affichent de meilleures performances. Cela signifie que les latences relevées sont meilleures que la moyenne (19.9 ms) de tous les appareils testés. | ||
| ↔ Temps de réponse gris 50% à gris 80% | ||
| 13.6 ms ... hausse ↗ et chute ↘ combinées | ↗ 6.2 ms hausse | 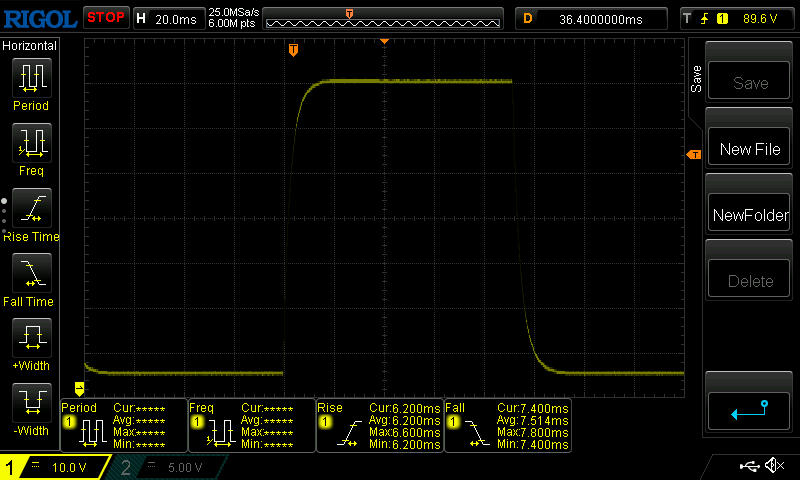 |
| ↘ 7.4 ms chute | ||
| L'écran montre de bons temps de réponse, mais insuffisant pour du jeu compétitif. En comparaison, tous les appareils testés affichent entre 0.165 (minimum) et 636 (maximum) ms. » 27 % des appareils testés affichent de meilleures performances. Cela signifie que les latences relevées sont meilleures que la moyenne (31.1 ms) de tous les appareils testés. | ||
Scintillement / MLI (Modulation de largeur d'impulsion)
| Scintillement / MLI (Modulation de largeur d'impulsion) non décelé | 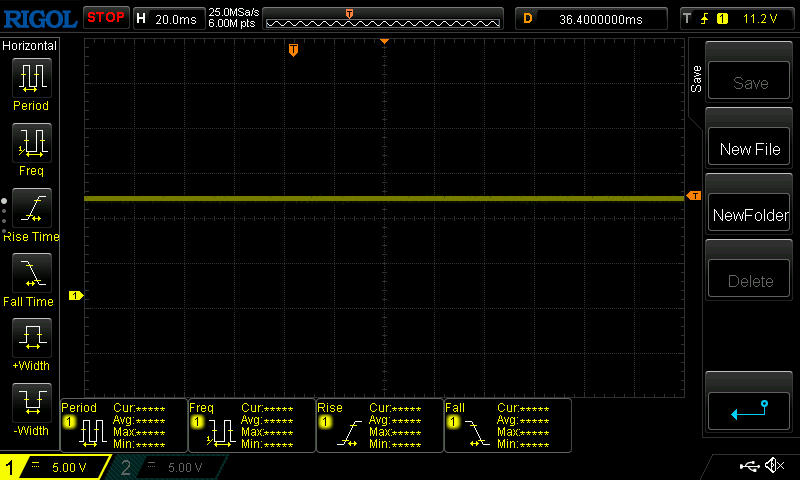 | ||
En comparaison, 52 % des appareils testés n'emploient pas MDI pour assombrir leur écran. Nous avons relevé une moyenne à 7798 (minimum : 5 - maximum : 343500) Hz dans le cas où une MDI était active. | |||
À l'extérieur, l'écran est lisible à l'ombre et dans les zones semi-ombragées. En plein soleil, même un écran mat et 500 cd/m² ne suffisent pas toujours.

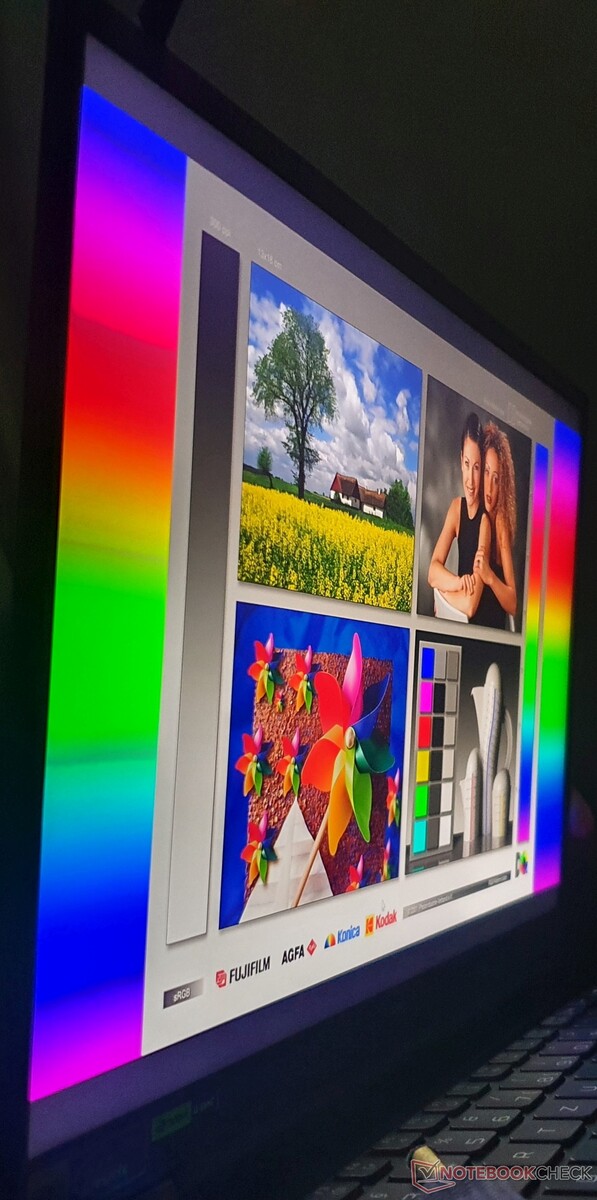
Les angles de vision sont stables, que ce soit en haut, en bas ou sur les côtés, ce qui est typique d'une dalle IPS.
Performance : La RTX 4060 atteint déjà sa vitesse d'horloge maximale à 100 watts
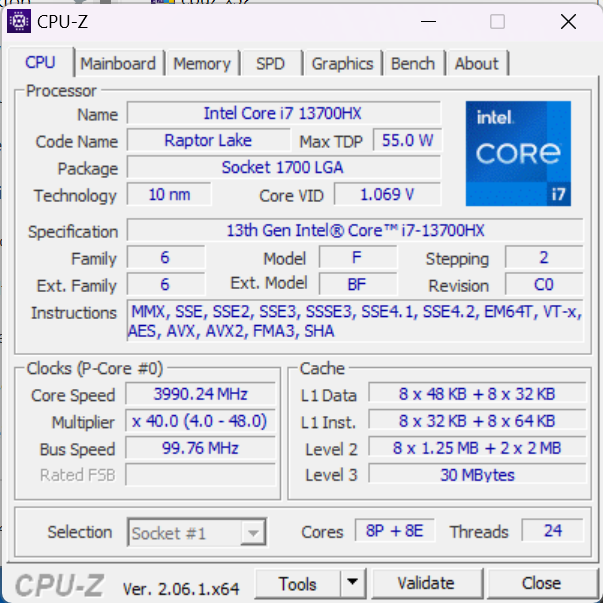
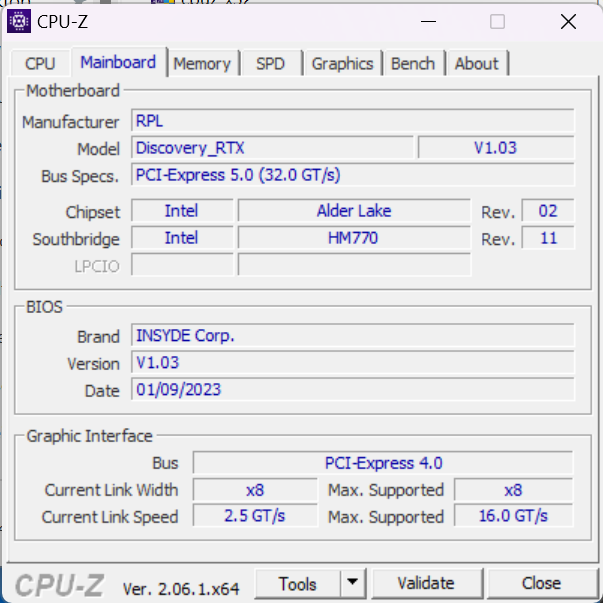
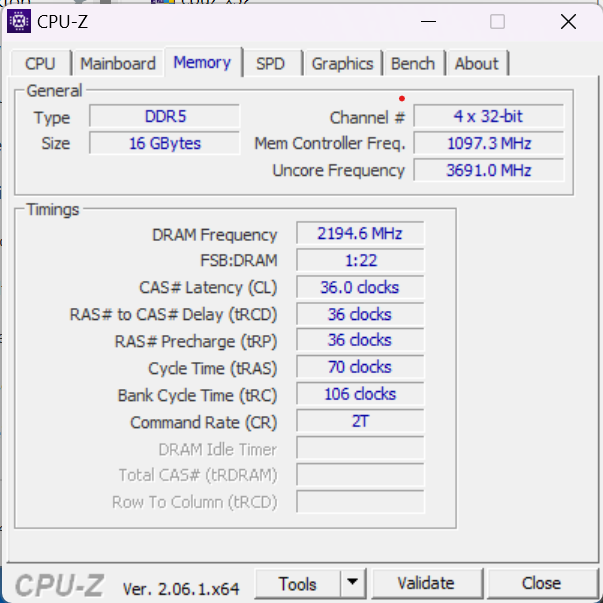
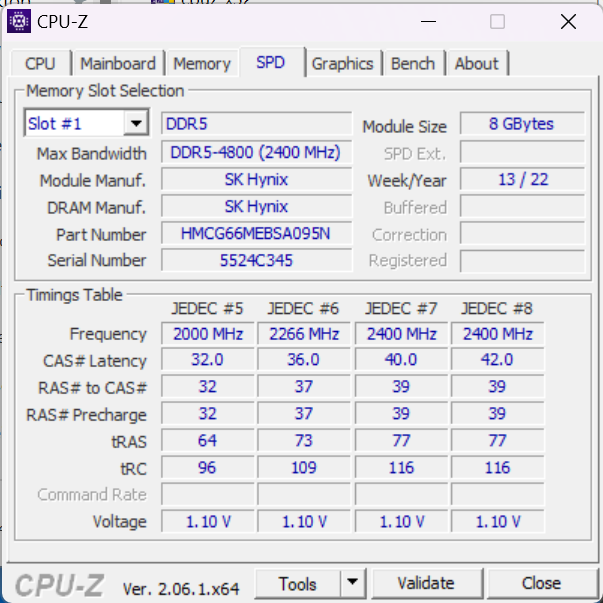
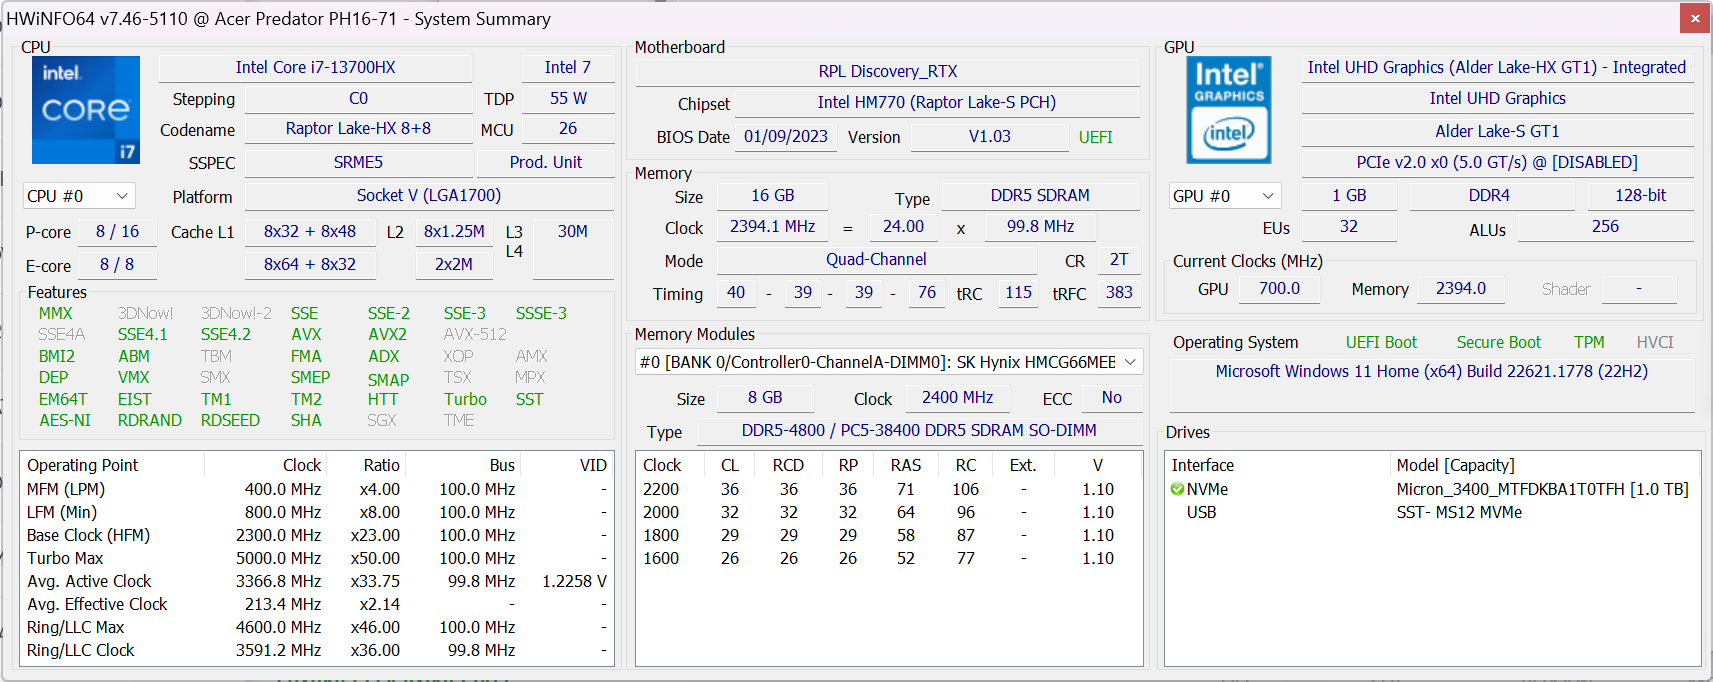
Notre configuration d'évaluation Acer Predator Helios 16 est équipée d'un processeur Intel Core i7-13700HX(8 cœurs P + 8 cœurs E), 16 Go de RAM DDR5 4800, un disque SSD de 1 To (PCIe 4.0) et une carte Nvidia GeForce RTX 4060avec Max TGP (140 watts). D'autres SKU sont disponibles avec un Core i9-13900HX(8 P-cores + 16 E-cores), uneRTX 4070 ou RTX 4080.
Le marché cible de ce modèle est celui des joueurs qui n'ont pas besoin de jouer aux jeux actuels aux taux d'images les plus élevés ou à la résolution native QHD de l'appareil. D'autres applications graphiques telles que l'édition vidéo 4K ou le rendu 3D sont facilement réalisables avec ce modèle.
Conditions d'essai
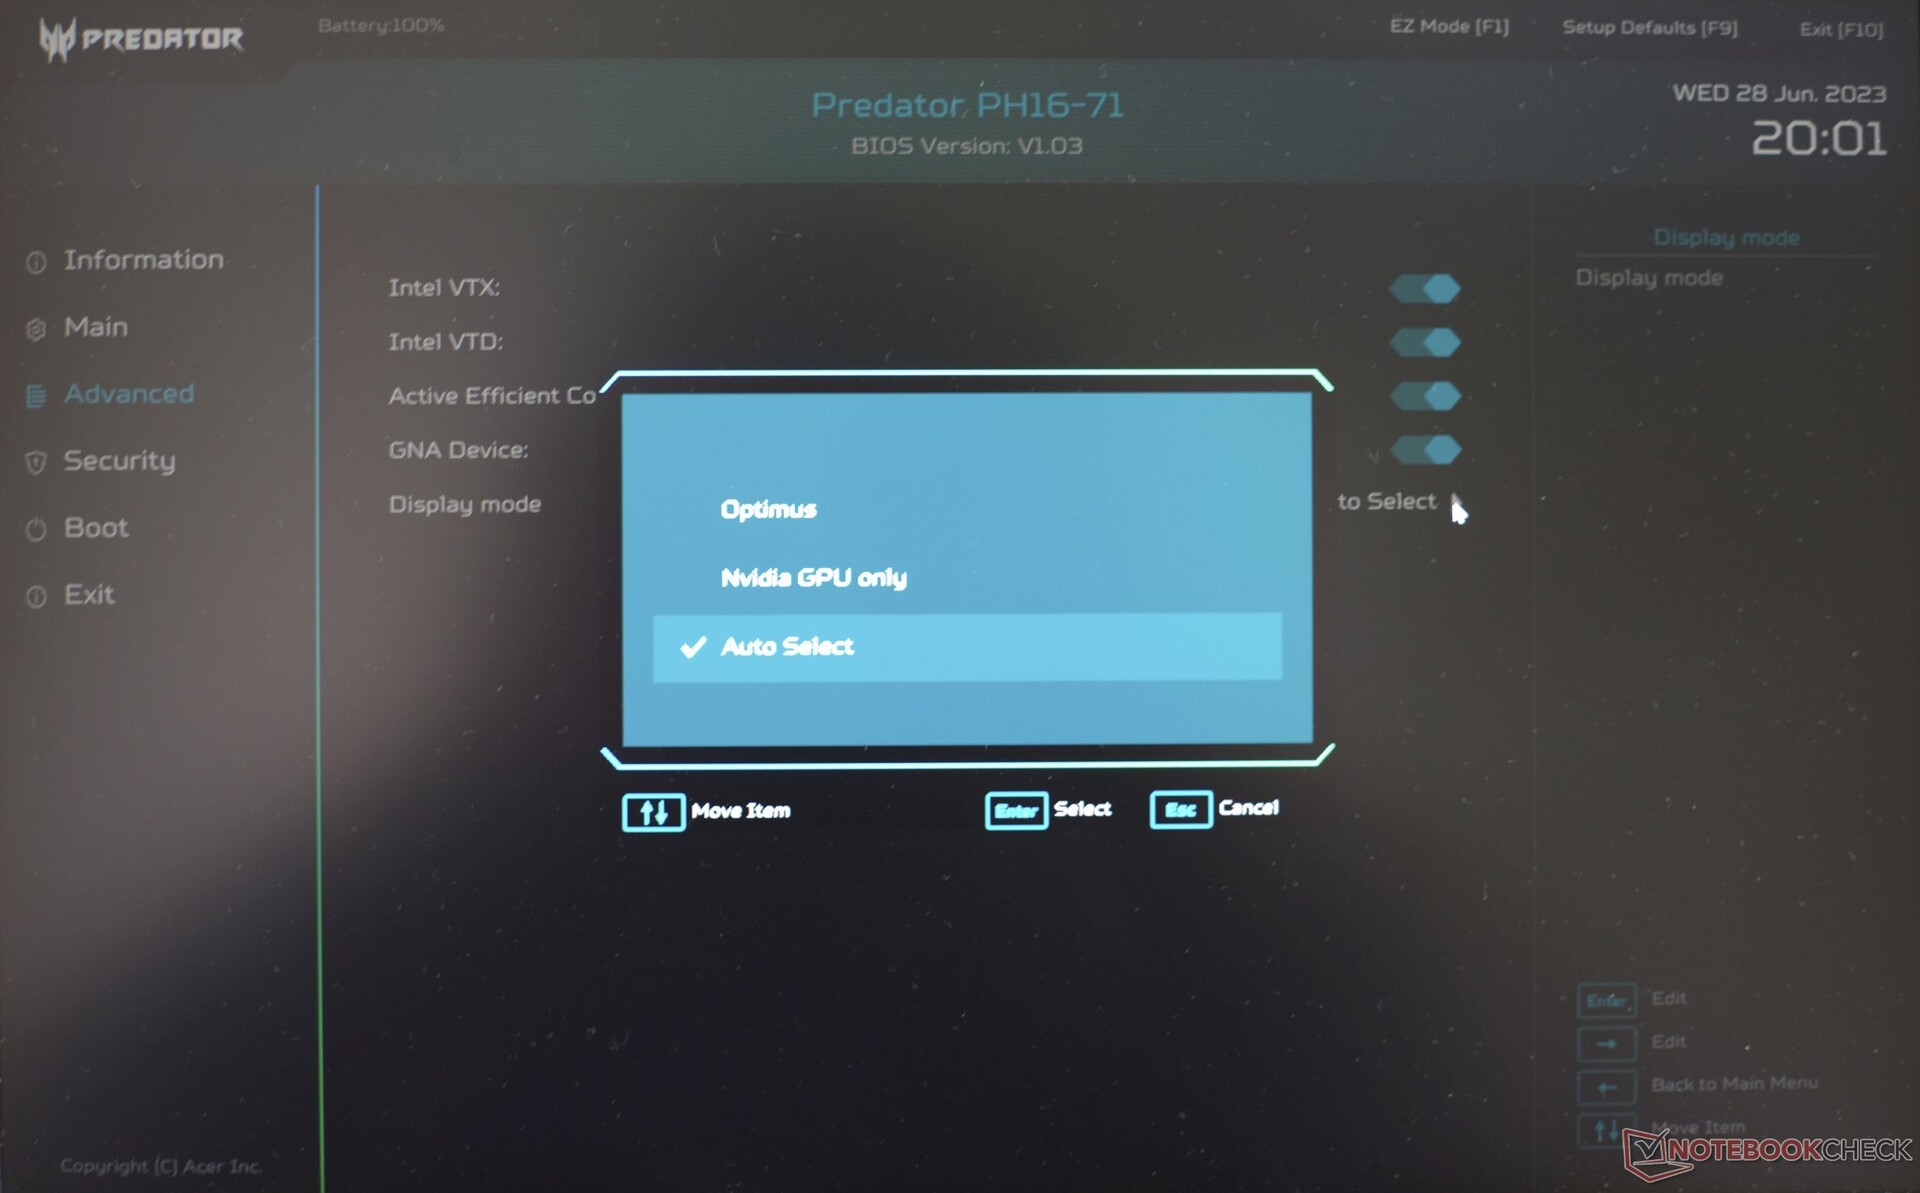
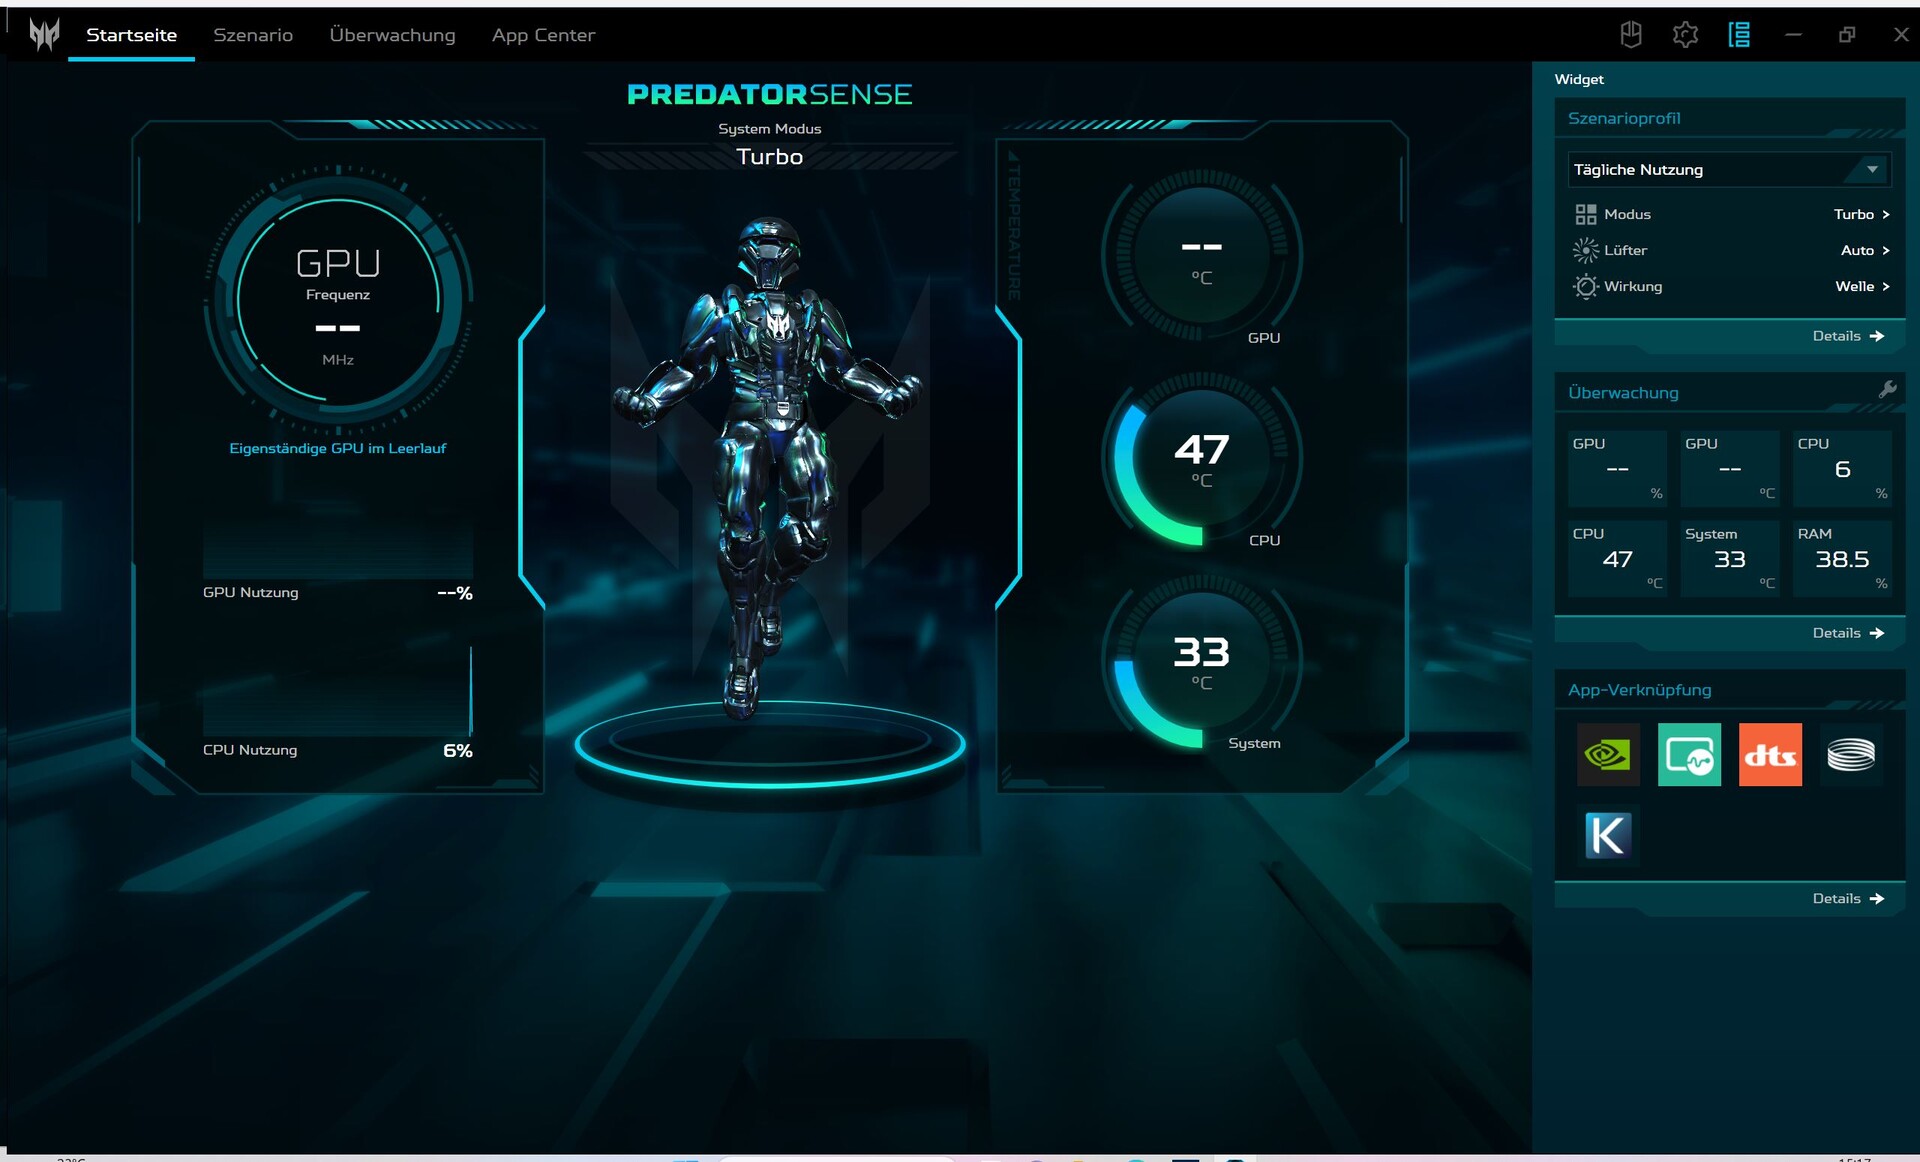
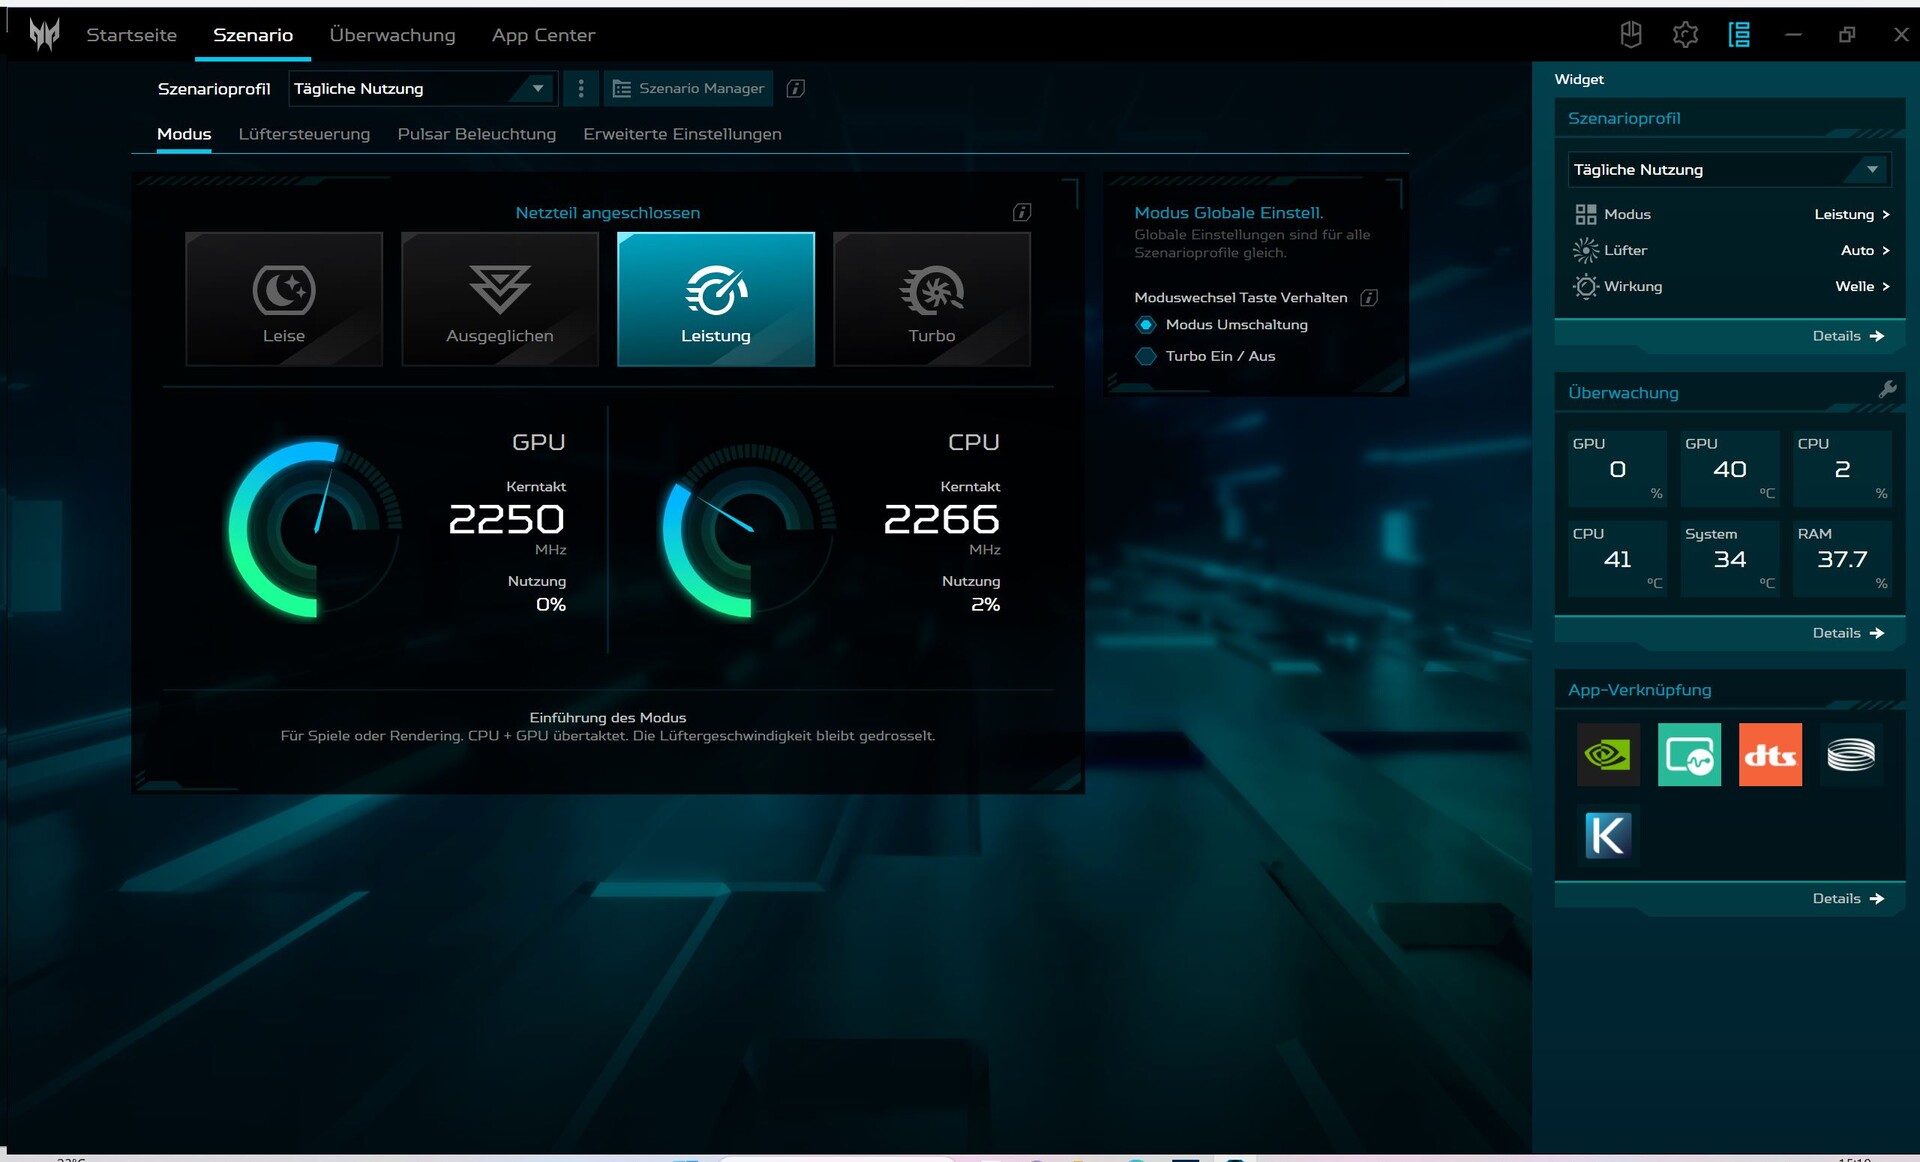
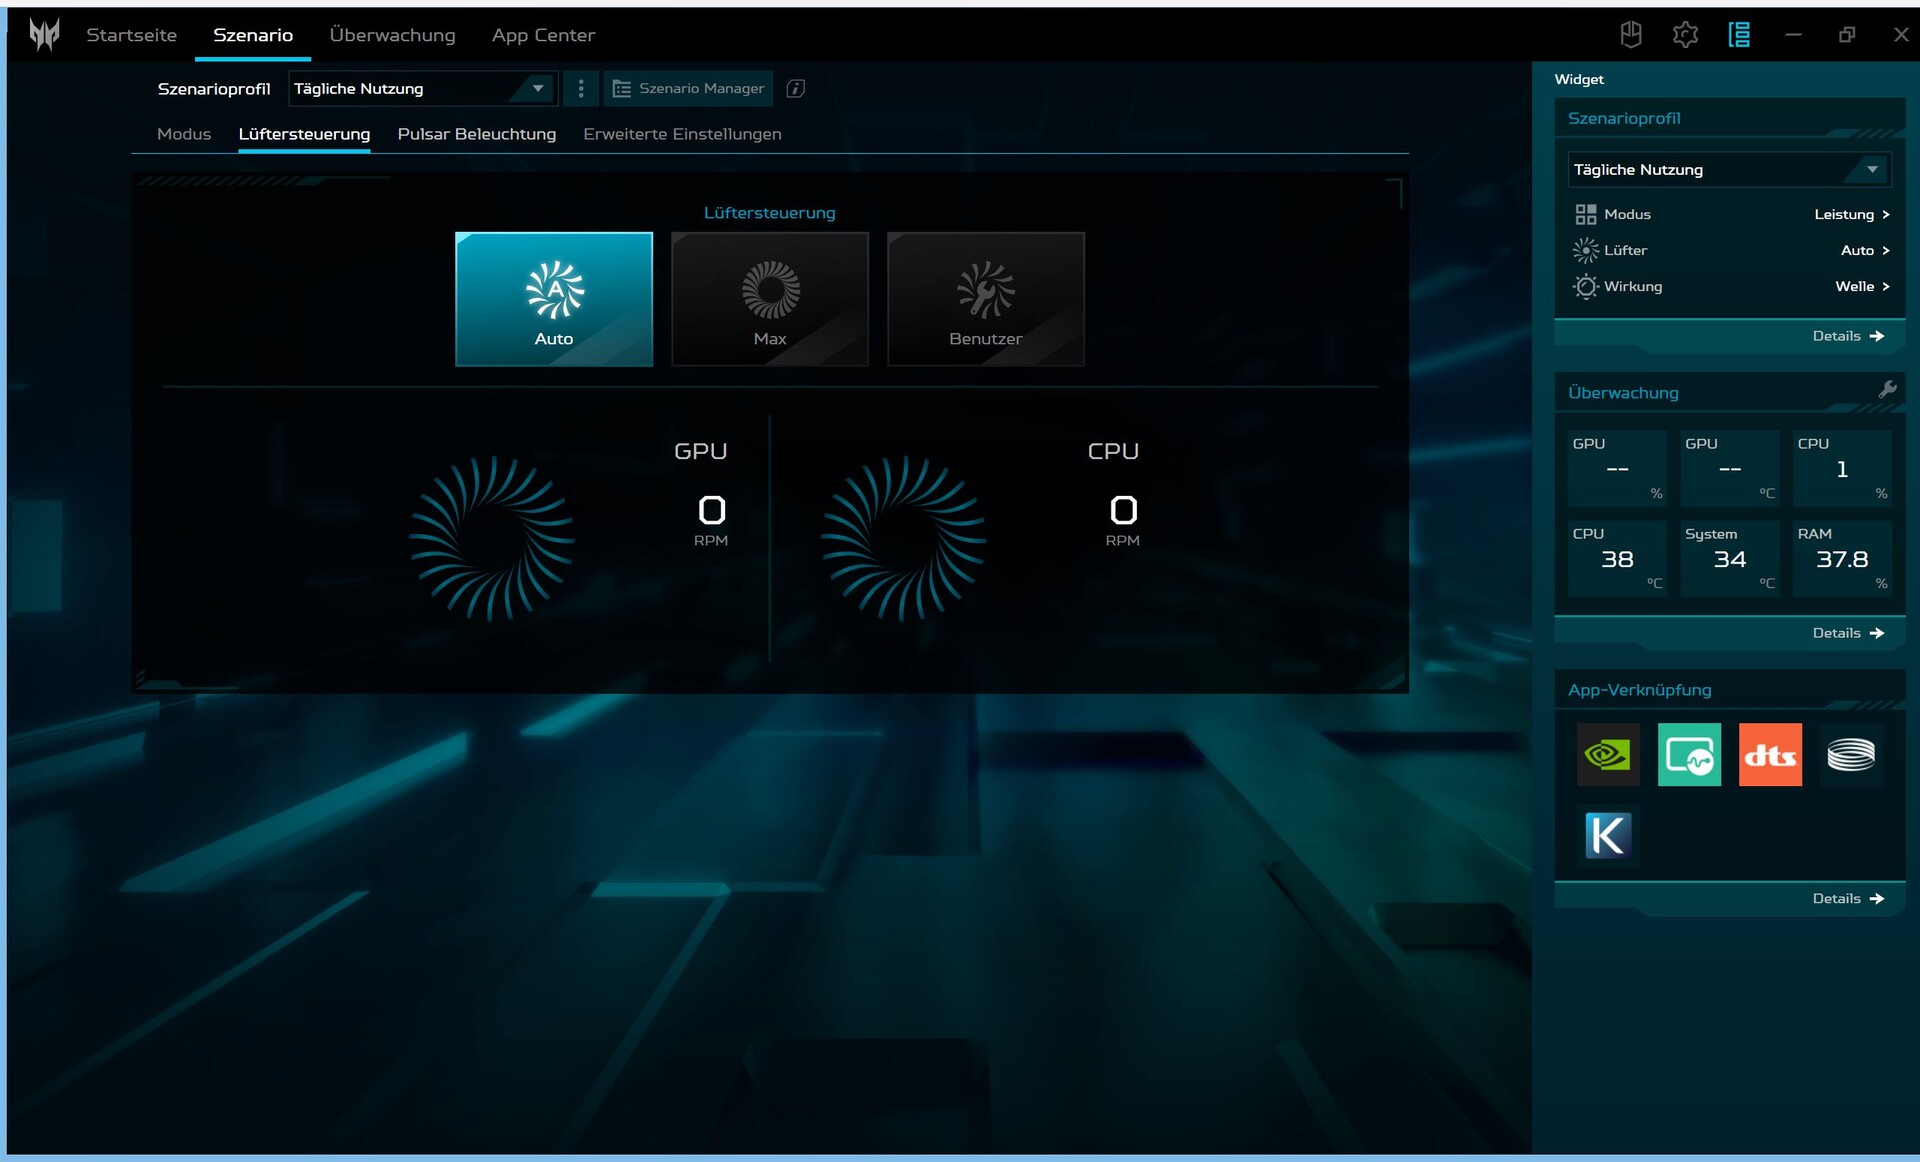
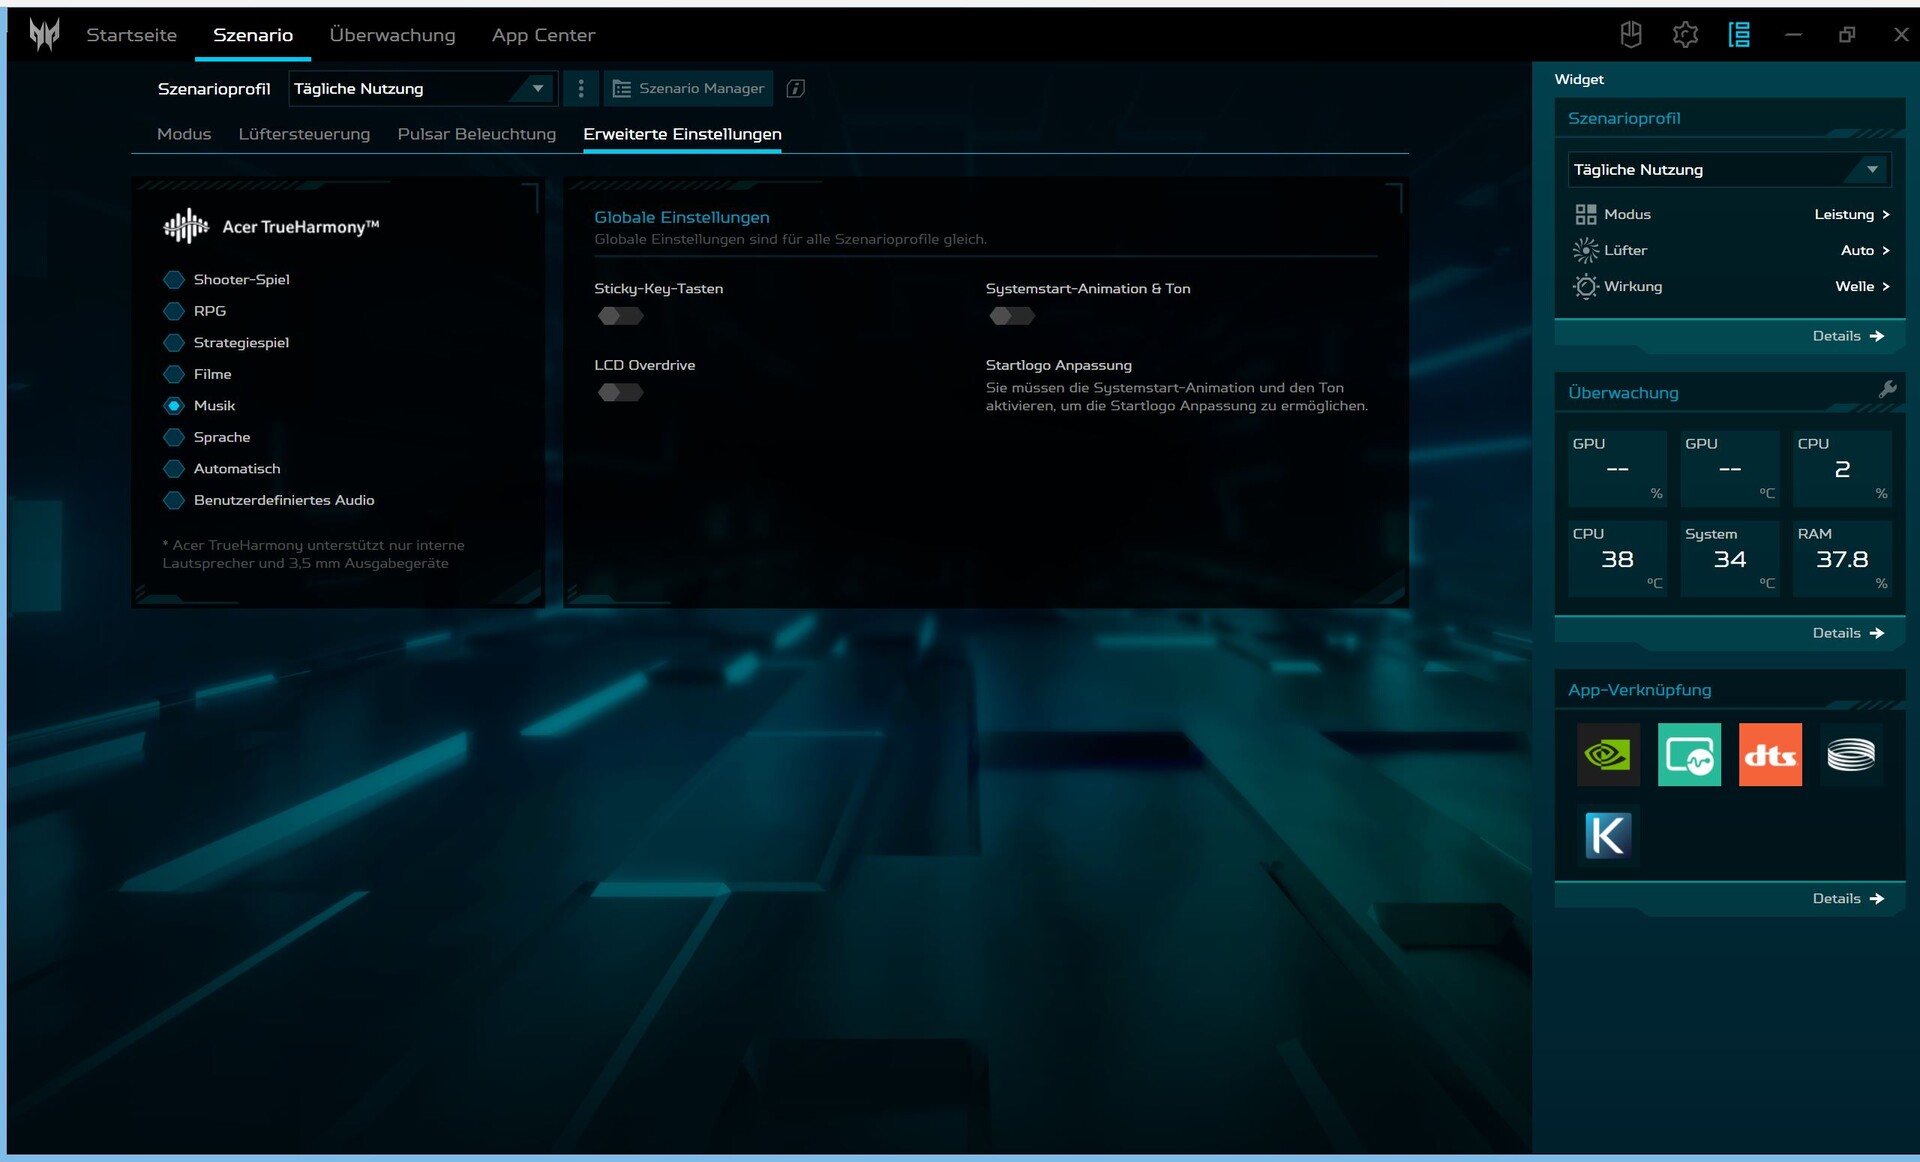
Dans le logiciel Control Center d'Acer, "PredatorSense", quatre modes de performance sont disponibles et peuvent être sélectionnés via le bouton situé sur le côté gauche au-dessus du clavier. Nous avons effectué nos tests de performance en utilisant le mode "Performance". Lorsque l'appareil est débranché du secteur, il passe automatiquement en mode "Équilibre". Le mode "Eco", également disponible ici, réduit la luminosité de l'écran et toutes les formes d'éclairage LED sont désactivées. L'Helios 16 doit être chargé à au moins 40 % pour que les modes de performance puissent être activés.
Le tableau ci-dessous montre que le mode "Balanced" n'entraîne qu'une très faible perte de puissance et que les ventilateurs sont nettement plus silencieux, presque agréablement silencieux. En revanche, le mode "Turbo" est insupportablement bruyant et n'est donc utile que pour un long rendu vidéo ou quelque chose de similaire.
| Scénario | Turbo + Max fans | Turbo | Performance | Balanced | Quiet | Battery |
|---|---|---|---|---|---|---|
| CPU PL2 | 157 W (1:05 min) | 157 W > 150 W (1 min) | 157 W > 140 W (~55 sec) | 157 W > 135 W (~55 sec) | 157 W > 120 W (~40 sec) | 25 W |
| CPU PL1 | 118 W | 115 W | 95 W | 85 W | 55 W | 25 W |
| GPU @Cyberpunk 2077 1.6 | 103 W | 100 W | 100 W | 90 W | 55 W | 37 W |
| GPU @FurMark | 138 W | 137 W | 130 W | 100 W | 60 W | 40 W |
| Performance (Cyperpunk 2077 1.6 @FHD/Ultra) | 96.2fps | 95.5fps | 93.2fps | 87.4fps | 65.8fps | 30fps |
Processeur
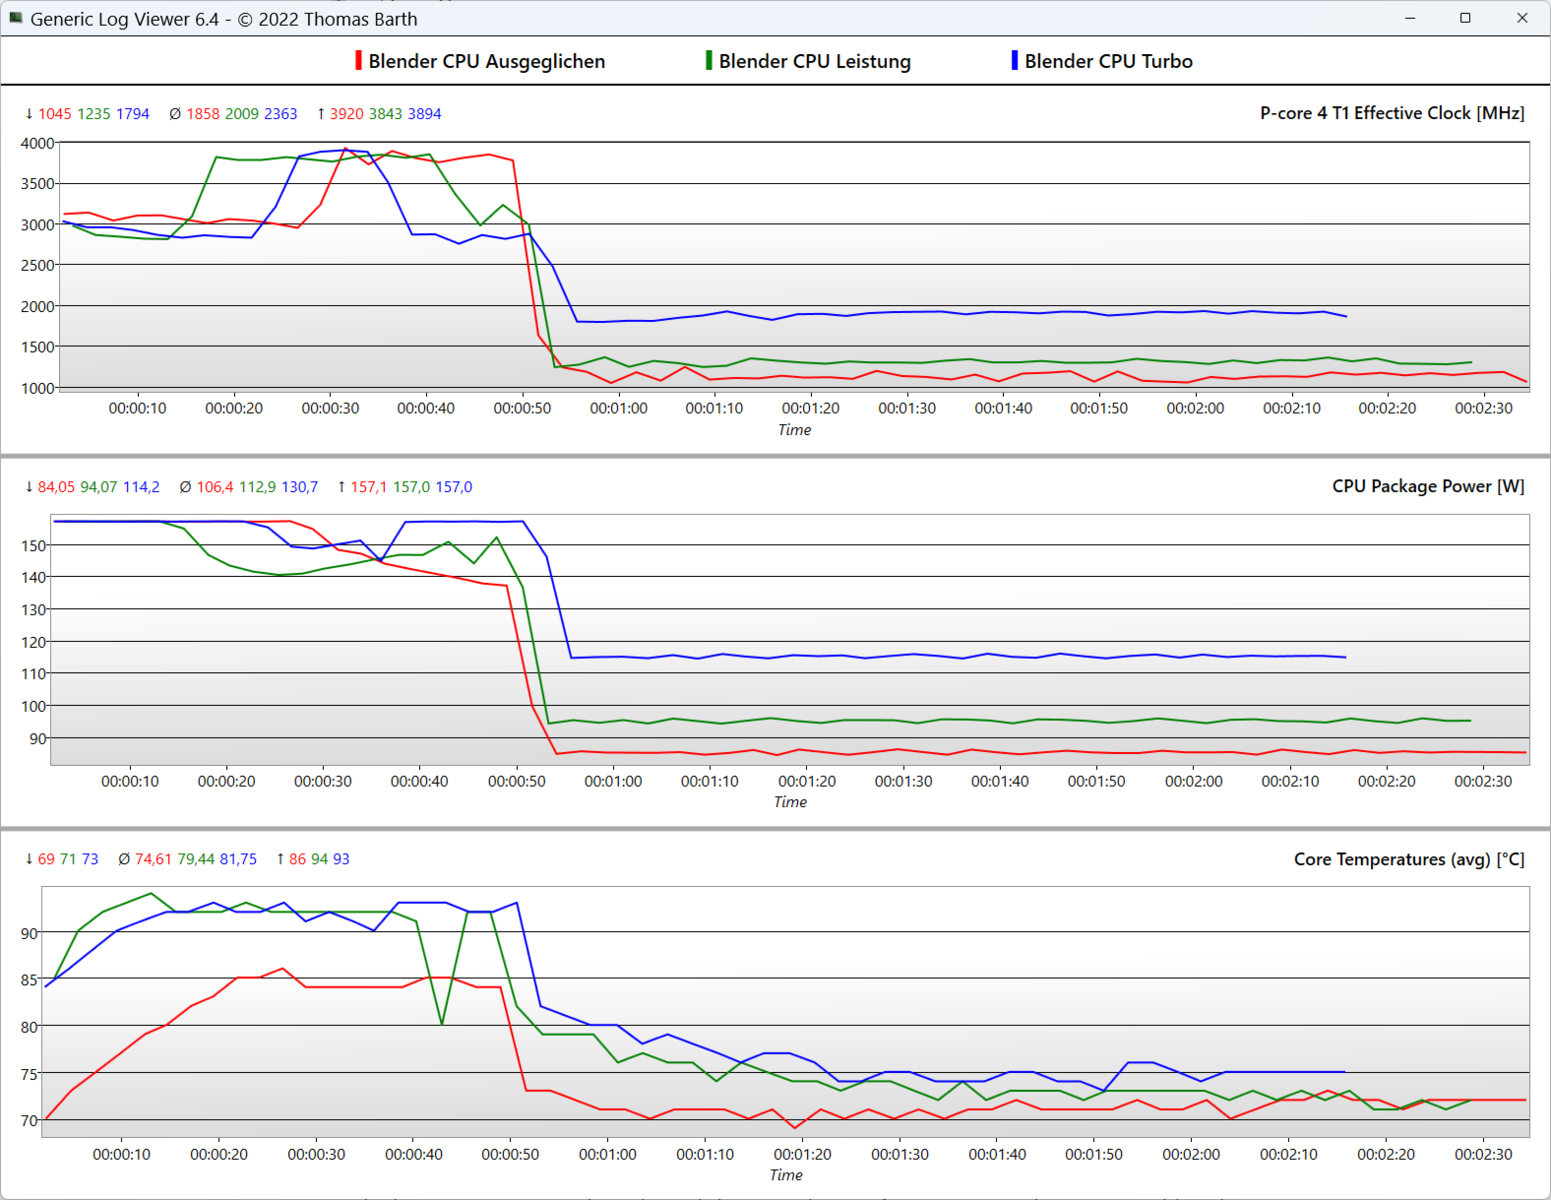
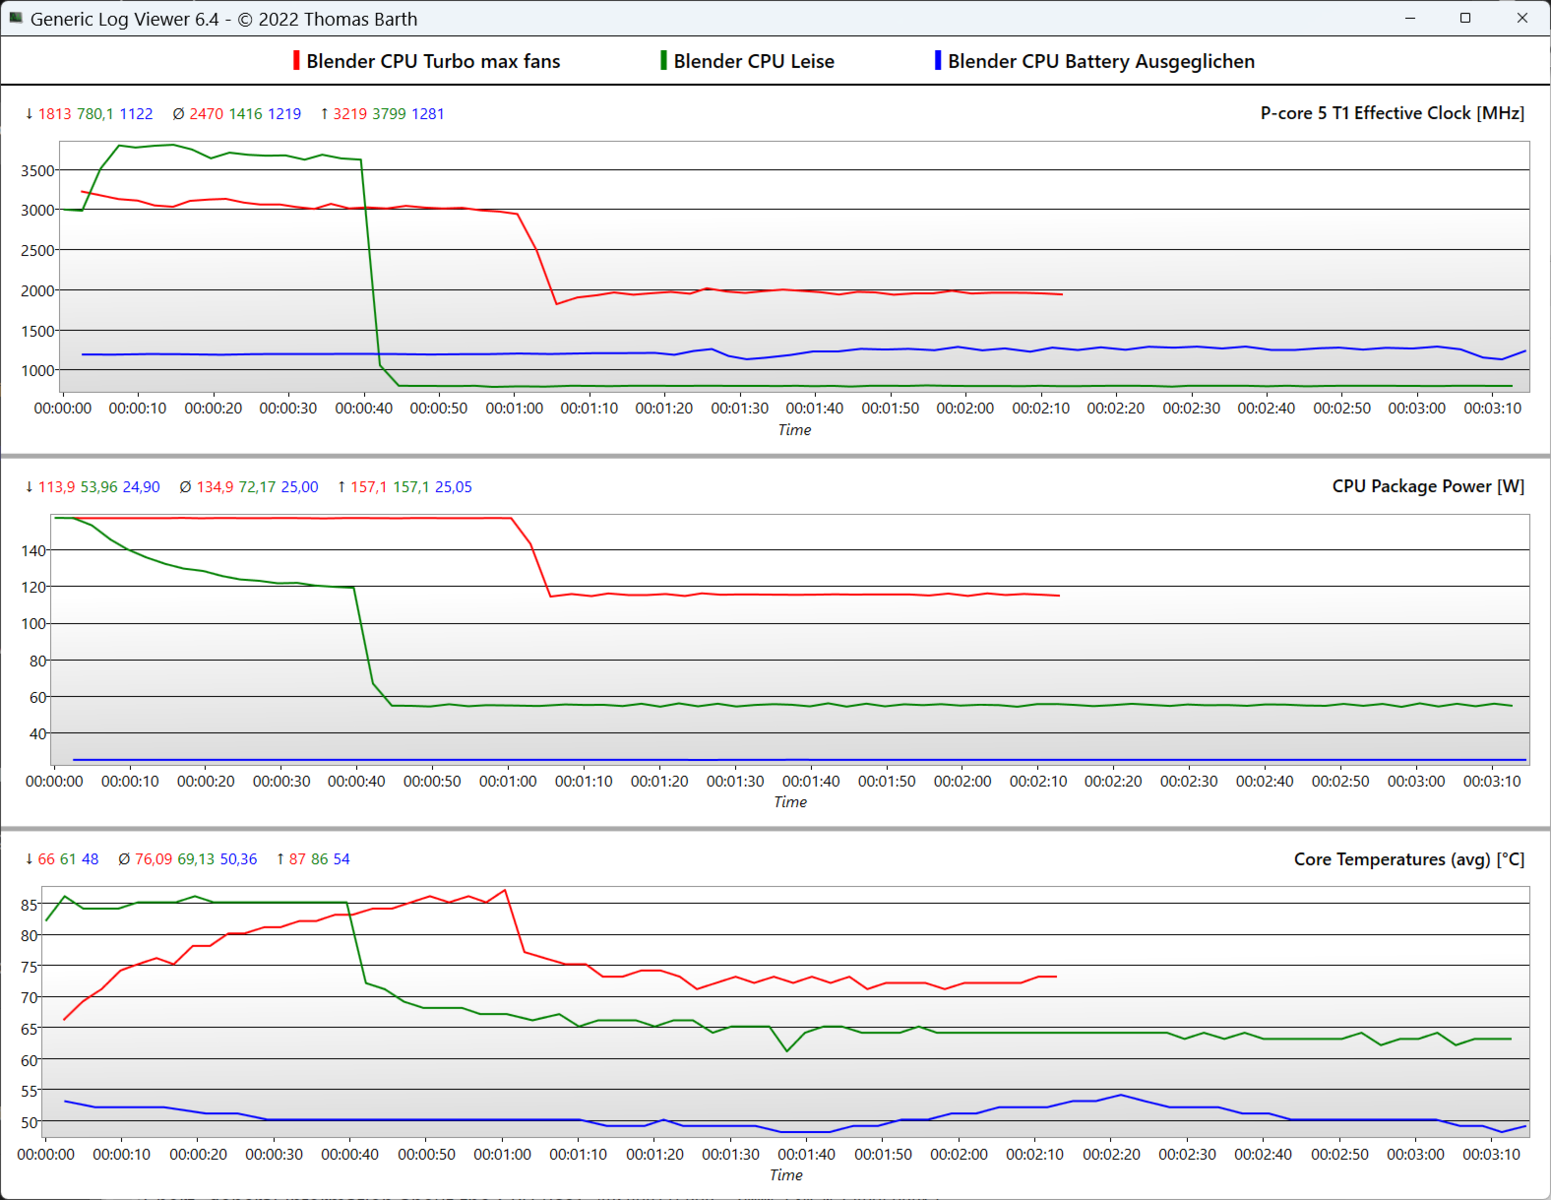
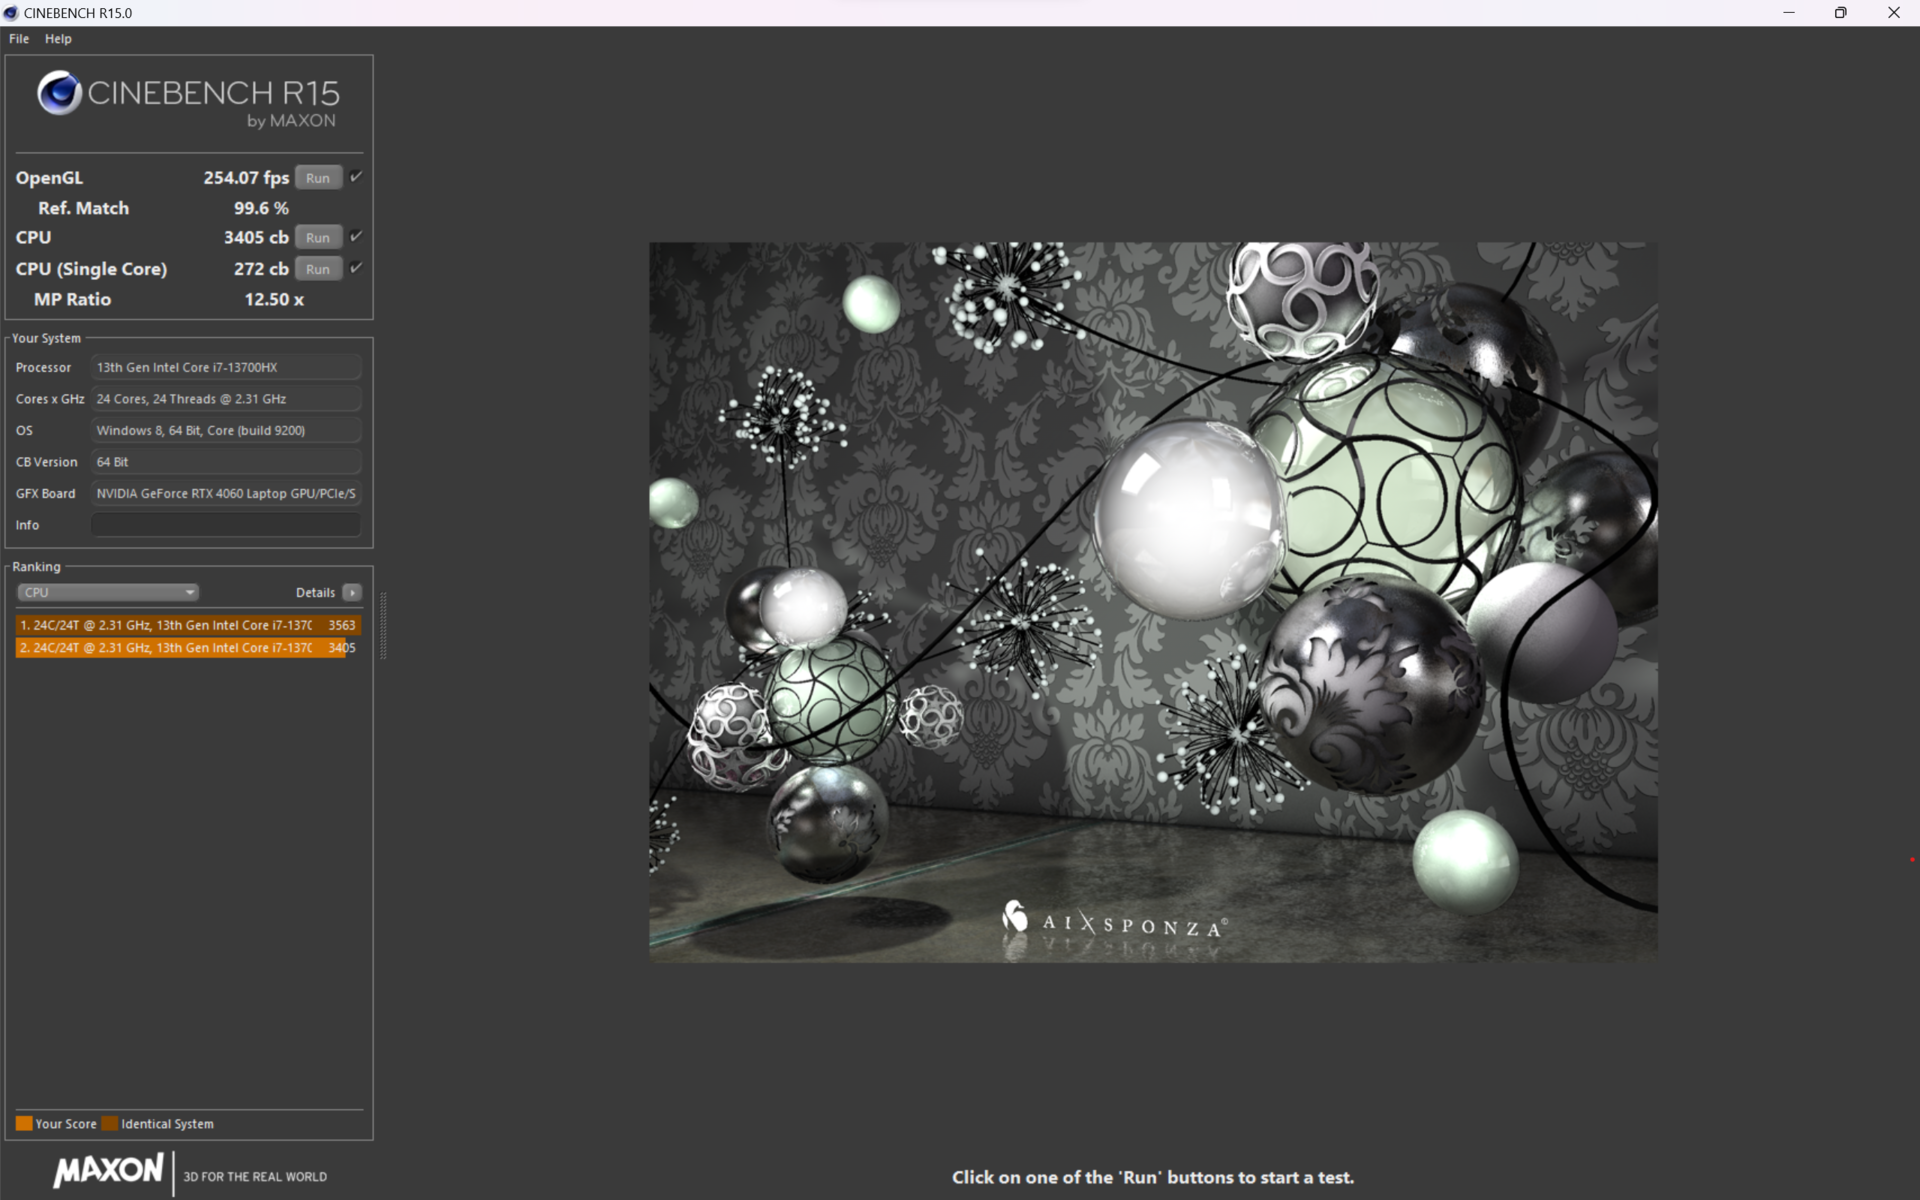
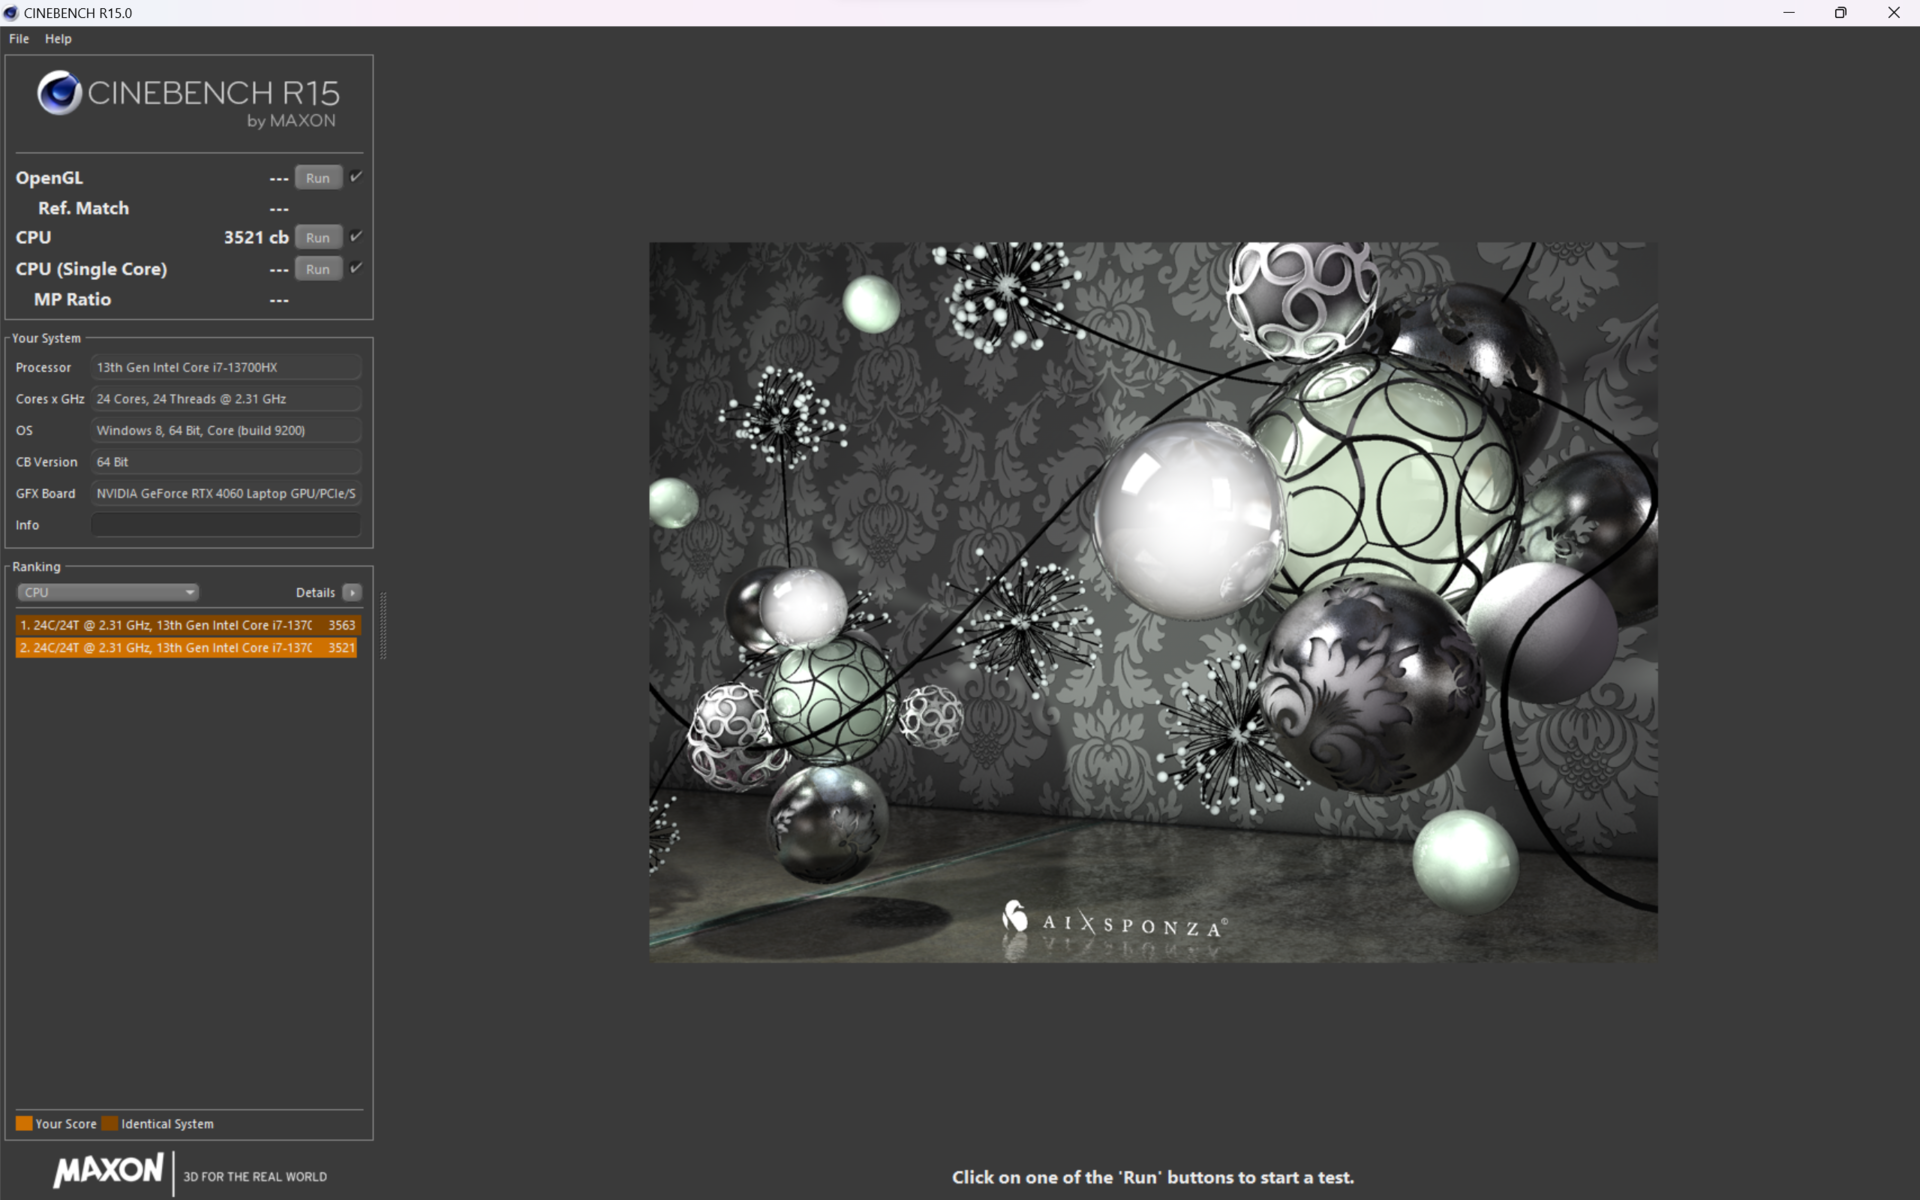
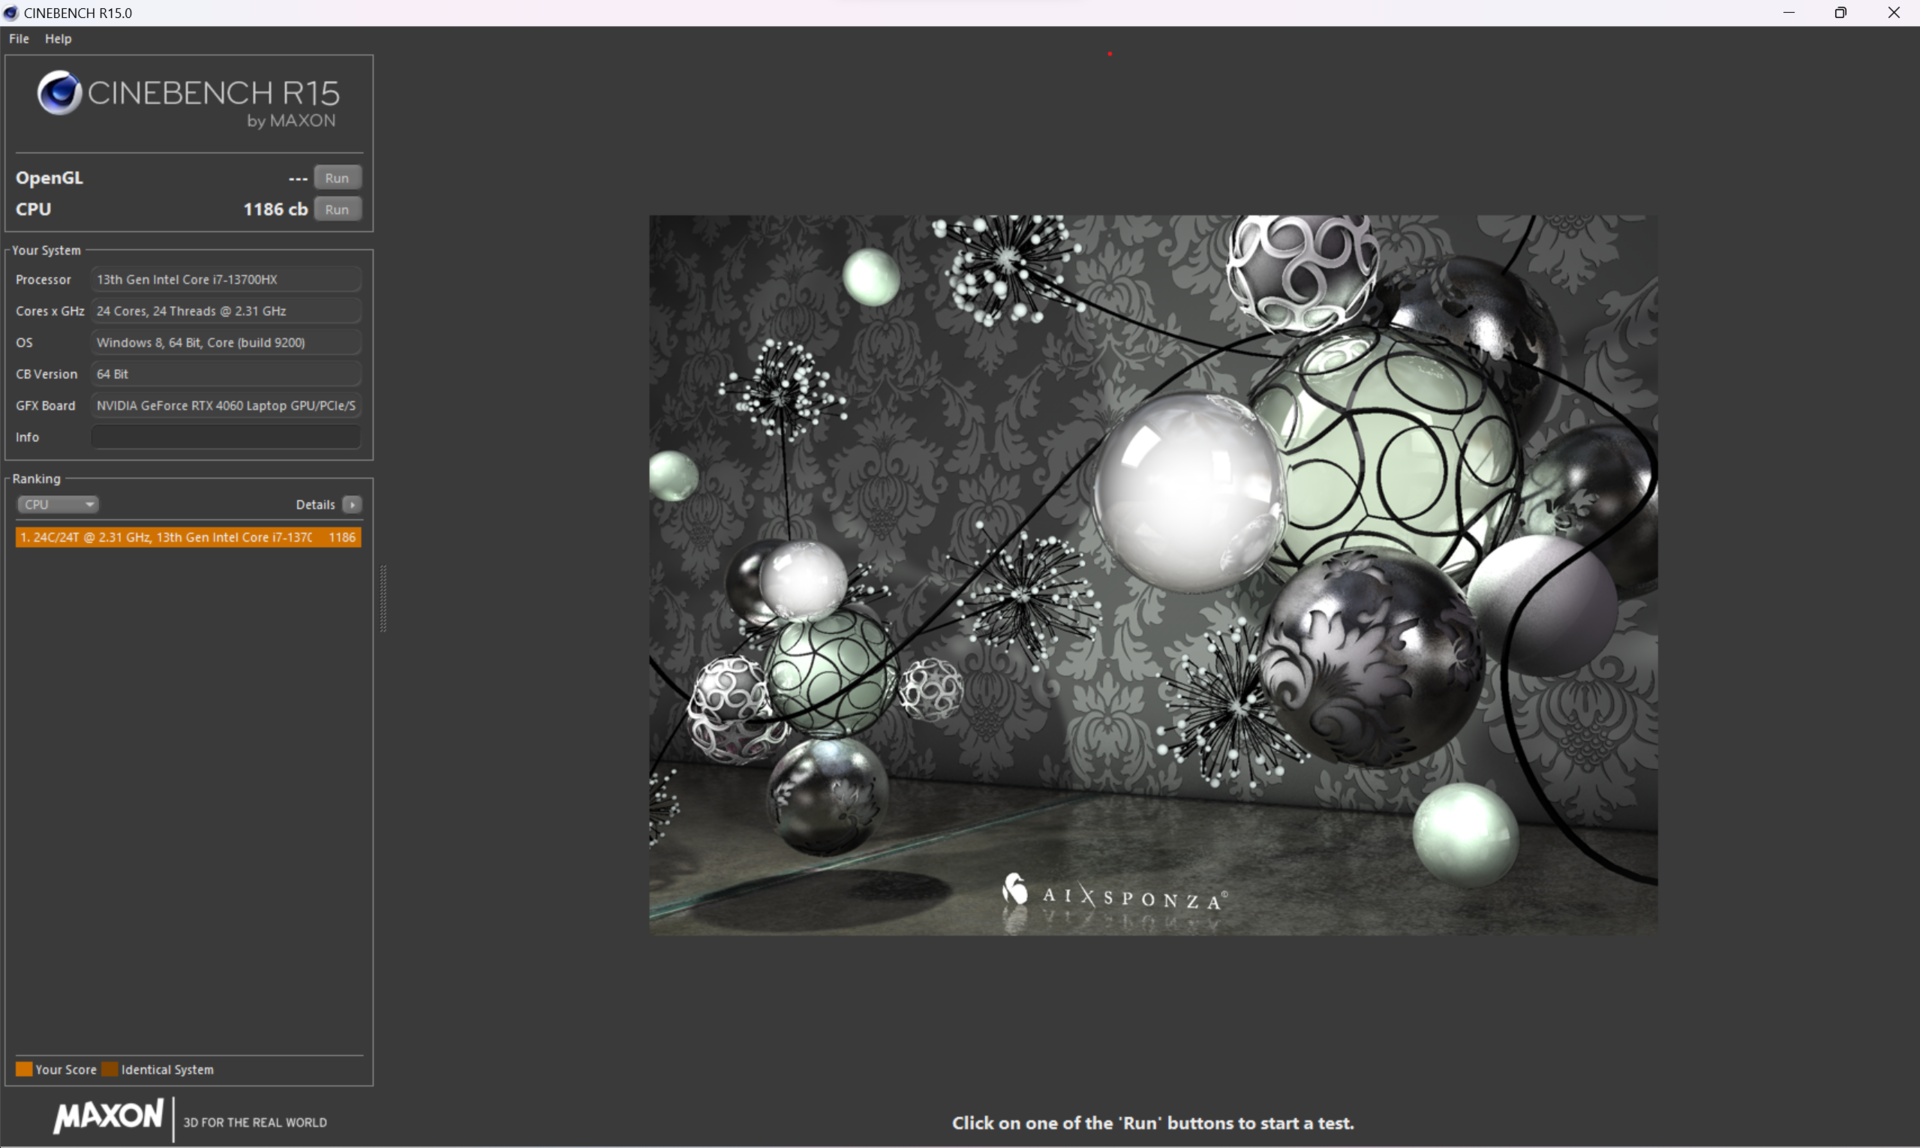
Le processeur Intel Core i7-13700HXpossède 16 cœurs et 24 threads (8 cœurs P + 8 cœurs E) ainsi qu'un TDP de 55 watts. Le turbo de 4,5 GHz n'est pas pleinement utilisé et, dans la première minute, les cœurs P se situent entre 3 GHz et 3,9 GHz, puis tombent à 1,9 GHz (mode Turbo) et 1,3 GHz (mode Performance), respectivement.
Les performances multicœurs correspondent à celles de ses concurrents dotés du même processeur. Le processeur AMD Ryzen 7 7735HS à 8 cœurs que l'on trouve dans le Acer Nitro 16 et le Asus TUF Gaming A16 est clairement surpassé. A partir de la cinquième exécution de Cinebench R15, l'étranglement se situait à ~15 % et pouvait être presque complètement évité en activant le mode "Turbo" bruyant. Le Core i9-13900HX
disponible en option possède deux fois plus de cœurs E et est généralement ~33 % plus rapide dans les tâches multicœurs. En mode batterie, les choses semblent sombres puisque la limite de 25 watts du TDP signifie une baisse de performance de près de 65 %. <br>


Cinebench R15 Multi Continuous Test
Cinebench R23: Multi Core | Single Core
Cinebench R20: CPU (Multi Core) | CPU (Single Core)
Cinebench R15: CPU Multi 64Bit | CPU Single 64Bit
Blender: v2.79 BMW27 CPU
7-Zip 18.03: 7z b 4 | 7z b 4 -mmt1
Geekbench 5.5: Multi-Core | Single-Core
HWBOT x265 Benchmark v2.2: 4k Preset
LibreOffice : 20 Documents To PDF
R Benchmark 2.5: Overall mean
| CPU Performance rating | |
| Moyenne de la classe Gaming | |
| Acer Predator Helios 16 PH16-71-731Q | |
| Asus ROG Zephyrus M16 GU604VY-NM042X | |
| Aorus 15X ASF | |
| Dell G15 5530 | |
| Moyenne Intel Core i7-13700HX | |
| Lenovo Legion Pro 5 16IRX8 | |
| Acer Predator Helios 300 (i7-12700H, RTX 3070 Ti) | |
| Acer Nitro 16 AN16-41 | |
| Asus TUF Gaming A16 FA617 | |
| Cinebench R23 / Multi Core | |
| Moyenne de la classe Gaming (10488 - 40970, n=113, 2 dernières années) | |
| Acer Predator Helios 16 PH16-71-731Q | |
| Dell G15 5530 | |
| Moyenne Intel Core i7-13700HX (15558 - 22598, n=11) | |
| Aorus 15X ASF | |
| Lenovo Legion Pro 5 16IRX8 | |
| Asus ROG Zephyrus M16 GU604VY-NM042X | |
| Acer Predator Helios 300 (i7-12700H, RTX 3070 Ti) | |
| Acer Nitro 16 AN16-41 | |
| Asus TUF Gaming A16 FA617 | |
| Cinebench R23 / Single Core | |
| Moyenne de la classe Gaming (1166 - 2356, n=113, 2 dernières années) | |
| Asus ROG Zephyrus M16 GU604VY-NM042X | |
| Acer Predator Helios 16 PH16-71-731Q | |
| Aorus 15X ASF | |
| Dell G15 5530 | |
| Moyenne Intel Core i7-13700HX (1666 - 1933, n=11) | |
| Acer Predator Helios 300 (i7-12700H, RTX 3070 Ti) | |
| Lenovo Legion Pro 5 16IRX8 | |
| Asus TUF Gaming A16 FA617 | |
| Acer Nitro 16 AN16-41 | |
| Cinebench R20 / CPU (Multi Core) | |
| Moyenne de la classe Gaming (4029 - 16108, n=112, 2 dernières années) | |
| Acer Predator Helios 16 PH16-71-731Q | |
| Dell G15 5530 | |
| Aorus 15X ASF | |
| Moyenne Intel Core i7-13700HX (6160 - 8610, n=11) | |
| Asus ROG Zephyrus M16 GU604VY-NM042X | |
| Lenovo Legion Pro 5 16IRX8 | |
| Acer Predator Helios 300 (i7-12700H, RTX 3070 Ti) | |
| Acer Nitro 16 AN16-41 | |
| Asus TUF Gaming A16 FA617 | |
| Cinebench R20 / CPU (Single Core) | |
| Moyenne de la classe Gaming (442 - 895, n=112, 2 dernières années) | |
| Asus ROG Zephyrus M16 GU604VY-NM042X | |
| Acer Predator Helios 16 PH16-71-731Q | |
| Aorus 15X ASF | |
| Dell G15 5530 | |
| Moyenne Intel Core i7-13700HX (644 - 740, n=11) | |
| Acer Predator Helios 300 (i7-12700H, RTX 3070 Ti) | |
| Lenovo Legion Pro 5 16IRX8 | |
| Asus TUF Gaming A16 FA617 | |
| Acer Nitro 16 AN16-41 | |
| Cinebench R15 / CPU Multi 64Bit | |
| Moyenne de la classe Gaming (1578 - 6271, n=113, 2 dernières années) | |
| Aorus 15X ASF | |
| Acer Predator Helios 16 PH16-71-731Q | |
| Acer Predator Helios 16 PH16-71-731Q | |
| Lenovo Legion Pro 5 16IRX8 | |
| Moyenne Intel Core i7-13700HX (2548 - 3482, n=12) | |
| Dell G15 5530 | |
| Asus ROG Zephyrus M16 GU604VY-NM042X | |
| Acer Predator Helios 300 (i7-12700H, RTX 3070 Ti) | |
| Acer Nitro 16 AN16-41 | |
| Asus TUF Gaming A16 FA617 | |
| Cinebench R15 / CPU Single 64Bit | |
| Moyenne de la classe Gaming (188.8 - 343, n=112, 2 dernières années) | |
| Asus ROG Zephyrus M16 GU604VY-NM042X | |
| Aorus 15X ASF | |
| Dell G15 5530 | |
| Acer Predator Helios 16 PH16-71-731Q | |
| Moyenne Intel Core i7-13700HX (243 - 279, n=11) | |
| Lenovo Legion Pro 5 16IRX8 | |
| Acer Predator Helios 300 (i7-12700H, RTX 3070 Ti) | |
| Asus TUF Gaming A16 FA617 | |
| Acer Nitro 16 AN16-41 | |
| Blender / v2.79 BMW27 CPU | |
| Asus TUF Gaming A16 FA617 | |
| Acer Nitro 16 AN16-41 | |
| Acer Predator Helios 300 (i7-12700H, RTX 3070 Ti) | |
| Aorus 15X ASF | |
| Asus ROG Zephyrus M16 GU604VY-NM042X | |
| Moyenne Intel Core i7-13700HX (138 - 207, n=10) | |
| Dell G15 5530 | |
| Acer Predator Helios 16 PH16-71-731Q | |
| Moyenne de la classe Gaming (80 - 330, n=110, 2 dernières années) | |
| Lenovo Legion Pro 5 16IRX8 | |
| 7-Zip 18.03 / 7z b 4 | |
| Moyenne de la classe Gaming (33491 - 148086, n=111, 2 dernières années) | |
| Acer Predator Helios 16 PH16-71-731Q | |
| Asus ROG Zephyrus M16 GU604VY-NM042X | |
| Lenovo Legion Pro 5 16IRX8 | |
| Dell G15 5530 | |
| Moyenne Intel Core i7-13700HX (58912 - 89294, n=11) | |
| Aorus 15X ASF | |
| Acer Predator Helios 300 (i7-12700H, RTX 3070 Ti) | |
| Asus TUF Gaming A16 FA617 | |
| Acer Nitro 16 AN16-41 | |
| 7-Zip 18.03 / 7z b 4 -mmt1 | |
| Aorus 15X ASF | |
| Moyenne de la classe Gaming (4199 - 7436, n=111, 2 dernières années) | |
| Asus ROG Zephyrus M16 GU604VY-NM042X | |
| Acer Predator Helios 16 PH16-71-731Q | |
| Moyenne Intel Core i7-13700HX (5552 - 6409, n=11) | |
| Dell G15 5530 | |
| Asus TUF Gaming A16 FA617 | |
| Acer Predator Helios 300 (i7-12700H, RTX 3070 Ti) | |
| Lenovo Legion Pro 5 16IRX8 | |
| Acer Nitro 16 AN16-41 | |
| Geekbench 5.5 / Multi-Core | |
| Moyenne de la classe Gaming (6460 - 27010, n=111, 2 dernières années) | |
| Acer Predator Helios 16 PH16-71-731Q | |
| Asus ROG Zephyrus M16 GU604VY-NM042X | |
| Aorus 15X ASF | |
| Lenovo Legion Pro 5 16IRX8 | |
| Dell G15 5530 | |
| Moyenne Intel Core i7-13700HX (10156 - 15850, n=12) | |
| Acer Predator Helios 300 (i7-12700H, RTX 3070 Ti) | |
| Asus TUF Gaming A16 FA617 | |
| Acer Nitro 16 AN16-41 | |
| Geekbench 5.5 / Single-Core | |
| Moyenne de la classe Gaming (986 - 2474, n=111, 2 dernières années) | |
| Asus ROG Zephyrus M16 GU604VY-NM042X | |
| Acer Predator Helios 16 PH16-71-731Q | |
| Aorus 15X ASF | |
| Dell G15 5530 | |
| Moyenne Intel Core i7-13700HX (1666 - 1899, n=12) | |
| Lenovo Legion Pro 5 16IRX8 | |
| Acer Predator Helios 300 (i7-12700H, RTX 3070 Ti) | |
| Asus TUF Gaming A16 FA617 | |
| Acer Nitro 16 AN16-41 | |
| HWBOT x265 Benchmark v2.2 / 4k Preset | |
| Moyenne de la classe Gaming (11.5 - 44.3, n=111, 2 dernières années) | |
| Lenovo Legion Pro 5 16IRX8 | |
| Acer Predator Helios 16 PH16-71-731Q | |
| Dell G15 5530 | |
| Moyenne Intel Core i7-13700HX (17.1 - 25.5, n=11) | |
| Asus ROG Zephyrus M16 GU604VY-NM042X | |
| Aorus 15X ASF | |
| Asus TUF Gaming A16 FA617 | |
| Acer Nitro 16 AN16-41 | |
| Acer Predator Helios 300 (i7-12700H, RTX 3070 Ti) | |
| LibreOffice / 20 Documents To PDF | |
| Acer Predator Helios 300 (i7-12700H, RTX 3070 Ti) | |
| Asus TUF Gaming A16 FA617 | |
| Acer Nitro 16 AN16-41 | |
| Asus ROG Zephyrus M16 GU604VY-NM042X | |
| Moyenne de la classe Gaming (19 - 88.8, n=111, 2 dernières années) | |
| Dell G15 5530 | |
| Moyenne Intel Core i7-13700HX (36.5 - 52.9, n=11) | |
| Aorus 15X ASF | |
| Acer Predator Helios 16 PH16-71-731Q | |
| Lenovo Legion Pro 5 16IRX8 | |
| R Benchmark 2.5 / Overall mean | |
| Asus TUF Gaming A16 FA617 | |
| Acer Nitro 16 AN16-41 | |
| Lenovo Legion Pro 5 16IRX8 | |
| Moyenne Intel Core i7-13700HX (0.4274 - 0.513, n=11) | |
| Acer Predator Helios 300 (i7-12700H, RTX 3070 Ti) | |
| Aorus 15X ASF | |
| Moyenne de la classe Gaming (0.3439 - 0.759, n=112, 2 dernières années) | |
| Acer Predator Helios 16 PH16-71-731Q | |
| Dell G15 5530 | |
| Asus ROG Zephyrus M16 GU604VY-NM042X | |
* ... Moindre est la valeur, meilleures sont les performances
AIDA64: FP32 Ray-Trace | FPU Julia | CPU SHA3 | CPU Queen | FPU SinJulia | FPU Mandel | CPU AES | CPU ZLib | FP64 Ray-Trace | CPU PhotoWorxx
| Performance rating | |
| Moyenne de la classe Gaming | |
| Acer Predator Helios 16 PH16-71-731Q | |
| Lenovo Legion Pro 5 16IRX8 | |
| Moyenne Intel Core i7-13700HX | |
| Aorus 15X ASF | |
| Dell G15 5530 | |
| Acer Nitro 16 AN16-41 | |
| Asus TUF Gaming A16 FA617 | |
| AIDA64 / FP32 Ray-Trace | |
| Moyenne de la classe Gaming (10227 - 85542, n=110, 2 dernières années) | |
| Lenovo Legion Pro 5 16IRX8 | |
| Acer Predator Helios 16 PH16-71-731Q | |
| Moyenne Intel Core i7-13700HX (14261 - 21999, n=11) | |
| Dell G15 5530 | |
| Aorus 15X ASF | |
| Acer Nitro 16 AN16-41 | |
| Asus TUF Gaming A16 FA617 | |
| AIDA64 / FPU Julia | |
| Moyenne de la classe Gaming (51376 - 238426, n=110, 2 dernières années) | |
| Acer Nitro 16 AN16-41 | |
| Lenovo Legion Pro 5 16IRX8 | |
| Asus TUF Gaming A16 FA617 | |
| Acer Predator Helios 16 PH16-71-731Q | |
| Moyenne Intel Core i7-13700HX (74636 - 109364, n=11) | |
| Dell G15 5530 | |
| Aorus 15X ASF | |
| AIDA64 / CPU SHA3 | |
| Moyenne de la classe Gaming (2180 - 9817, n=110, 2 dernières années) | |
| Lenovo Legion Pro 5 16IRX8 | |
| Acer Predator Helios 16 PH16-71-731Q | |
| Dell G15 5530 | |
| Moyenne Intel Core i7-13700HX (3359 - 5053, n=11) | |
| Aorus 15X ASF | |
| Asus TUF Gaming A16 FA617 | |
| Acer Nitro 16 AN16-41 | |
| AIDA64 / CPU Queen | |
| Moyenne de la classe Gaming (49785 - 173351, n=101, 2 dernières années) | |
| Acer Predator Helios 16 PH16-71-731Q | |
| Lenovo Legion Pro 5 16IRX8 | |
| Aorus 15X ASF | |
| Moyenne Intel Core i7-13700HX (86532 - 114717, n=11) | |
| Acer Nitro 16 AN16-41 | |
| Dell G15 5530 | |
| Asus TUF Gaming A16 FA617 | |
| AIDA64 / FPU SinJulia | |
| Moyenne de la classe Gaming (4424 - 33636, n=110, 2 dernières années) | |
| Lenovo Legion Pro 5 16IRX8 | |
| Acer Nitro 16 AN16-41 | |
| Acer Predator Helios 16 PH16-71-731Q | |
| Asus TUF Gaming A16 FA617 | |
| Moyenne Intel Core i7-13700HX (9290 - 13519, n=11) | |
| Aorus 15X ASF | |
| Dell G15 5530 | |
| AIDA64 / FPU Mandel | |
| Moyenne de la classe Gaming (25115 - 128721, n=110, 2 dernières années) | |
| Acer Nitro 16 AN16-41 | |
| Asus TUF Gaming A16 FA617 | |
| Lenovo Legion Pro 5 16IRX8 | |
| Acer Predator Helios 16 PH16-71-731Q | |
| Moyenne Intel Core i7-13700HX (35751 - 53484, n=11) | |
| Dell G15 5530 | |
| Aorus 15X ASF | |
| AIDA64 / CPU AES | |
| Acer Predator Helios 16 PH16-71-731Q | |
| Aorus 15X ASF | |
| Moyenne Intel Core i7-13700HX (67846 - 182575, n=11) | |
| Moyenne de la classe Gaming (39258 - 247074, n=110, 2 dernières années) | |
| Lenovo Legion Pro 5 16IRX8 | |
| Dell G15 5530 | |
| Asus TUF Gaming A16 FA617 | |
| Acer Nitro 16 AN16-41 | |
| AIDA64 / CPU ZLib | |
| Moyenne de la classe Gaming (574 - 2531, n=110, 2 dernières années) | |
| Acer Predator Helios 16 PH16-71-731Q | |
| Lenovo Legion Pro 5 16IRX8 | |
| Dell G15 5530 | |
| Moyenne Intel Core i7-13700HX (981 - 1451, n=11) | |
| Aorus 15X ASF | |
| Acer Nitro 16 AN16-41 | |
| Asus TUF Gaming A16 FA617 | |
| AIDA64 / FP64 Ray-Trace | |
| Moyenne de la classe Gaming (5509 - 45446, n=110, 2 dernières années) | |
| Lenovo Legion Pro 5 16IRX8 | |
| Acer Predator Helios 16 PH16-71-731Q | |
| Moyenne Intel Core i7-13700HX (7728 - 11837, n=11) | |
| Dell G15 5530 | |
| Aorus 15X ASF | |
| Acer Nitro 16 AN16-41 | |
| Asus TUF Gaming A16 FA617 | |
| AIDA64 / CPU PhotoWorxx | |
| Moyenne de la classe Gaming (12271 - 89891, n=110, 2 dernières années) | |
| Dell G15 5530 | |
| Lenovo Legion Pro 5 16IRX8 | |
| Acer Predator Helios 16 PH16-71-731Q | |
| Aorus 15X ASF | |
| Moyenne Intel Core i7-13700HX (19678 - 42415, n=11) | |
| Asus TUF Gaming A16 FA617 | |
| Acer Nitro 16 AN16-41 | |
Performance du système
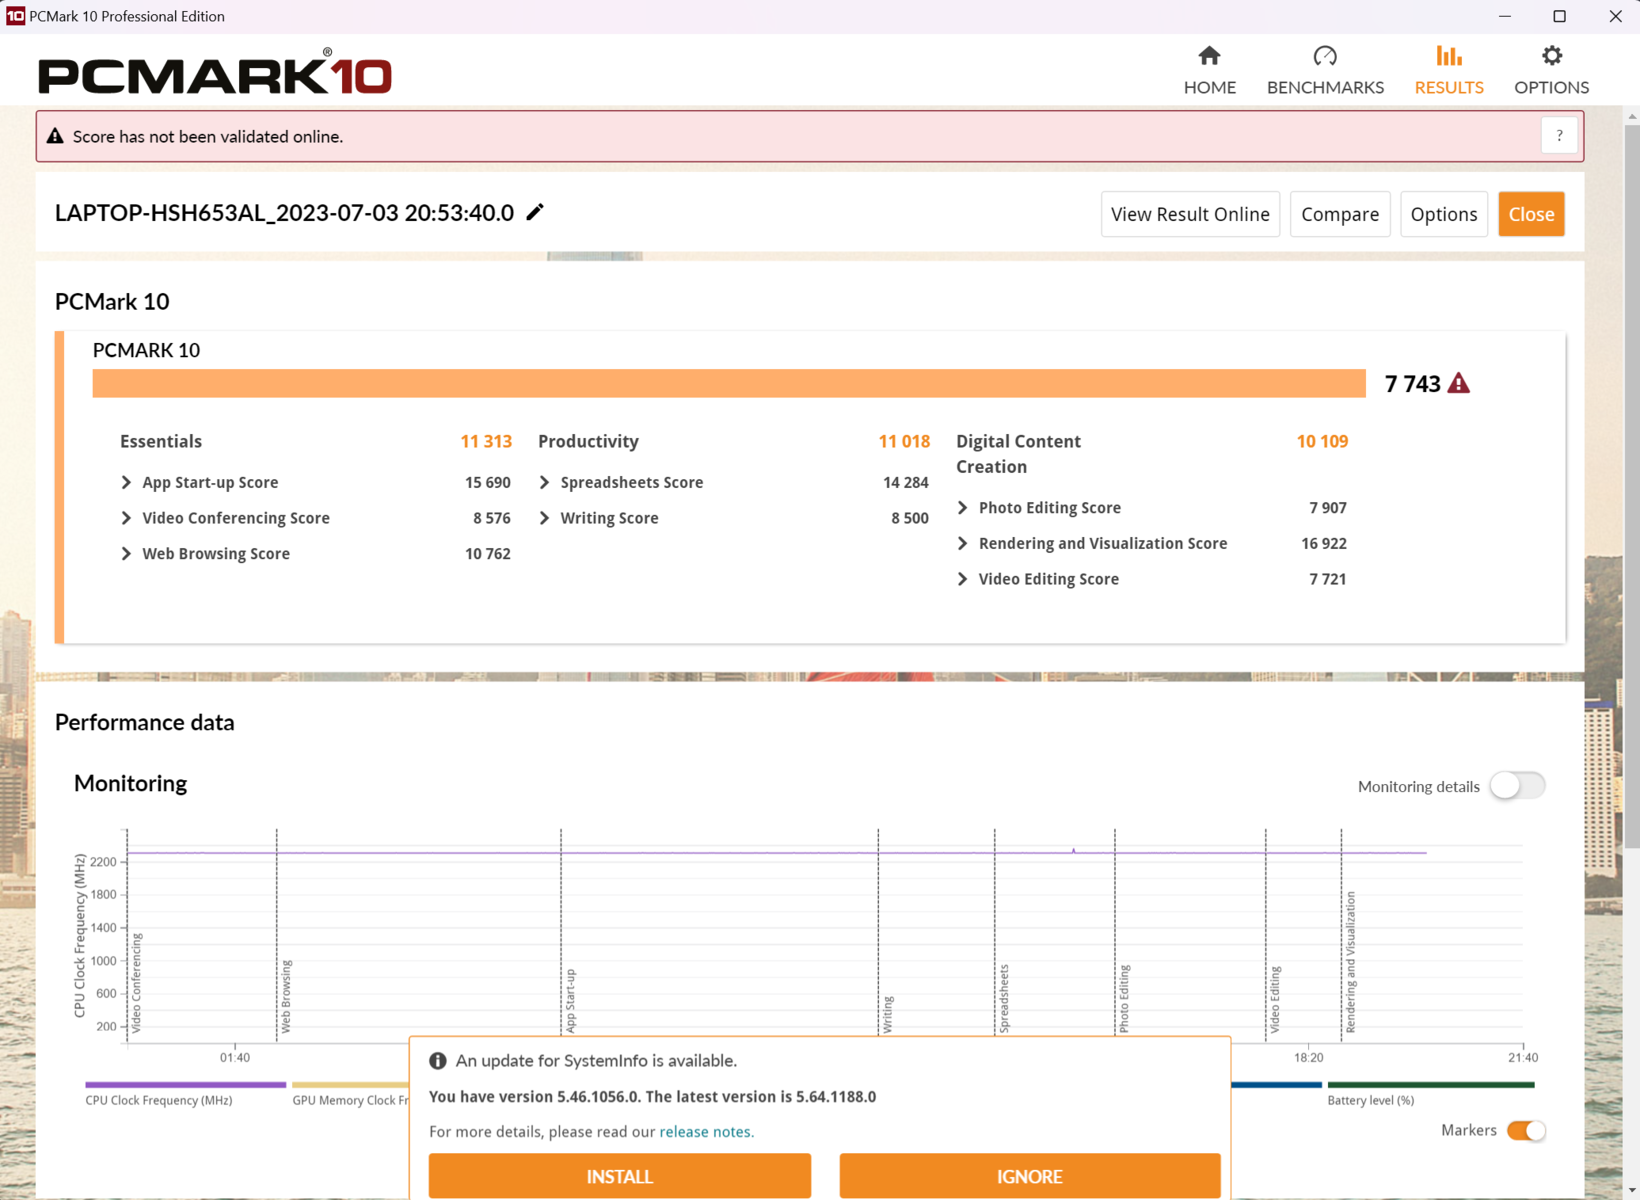
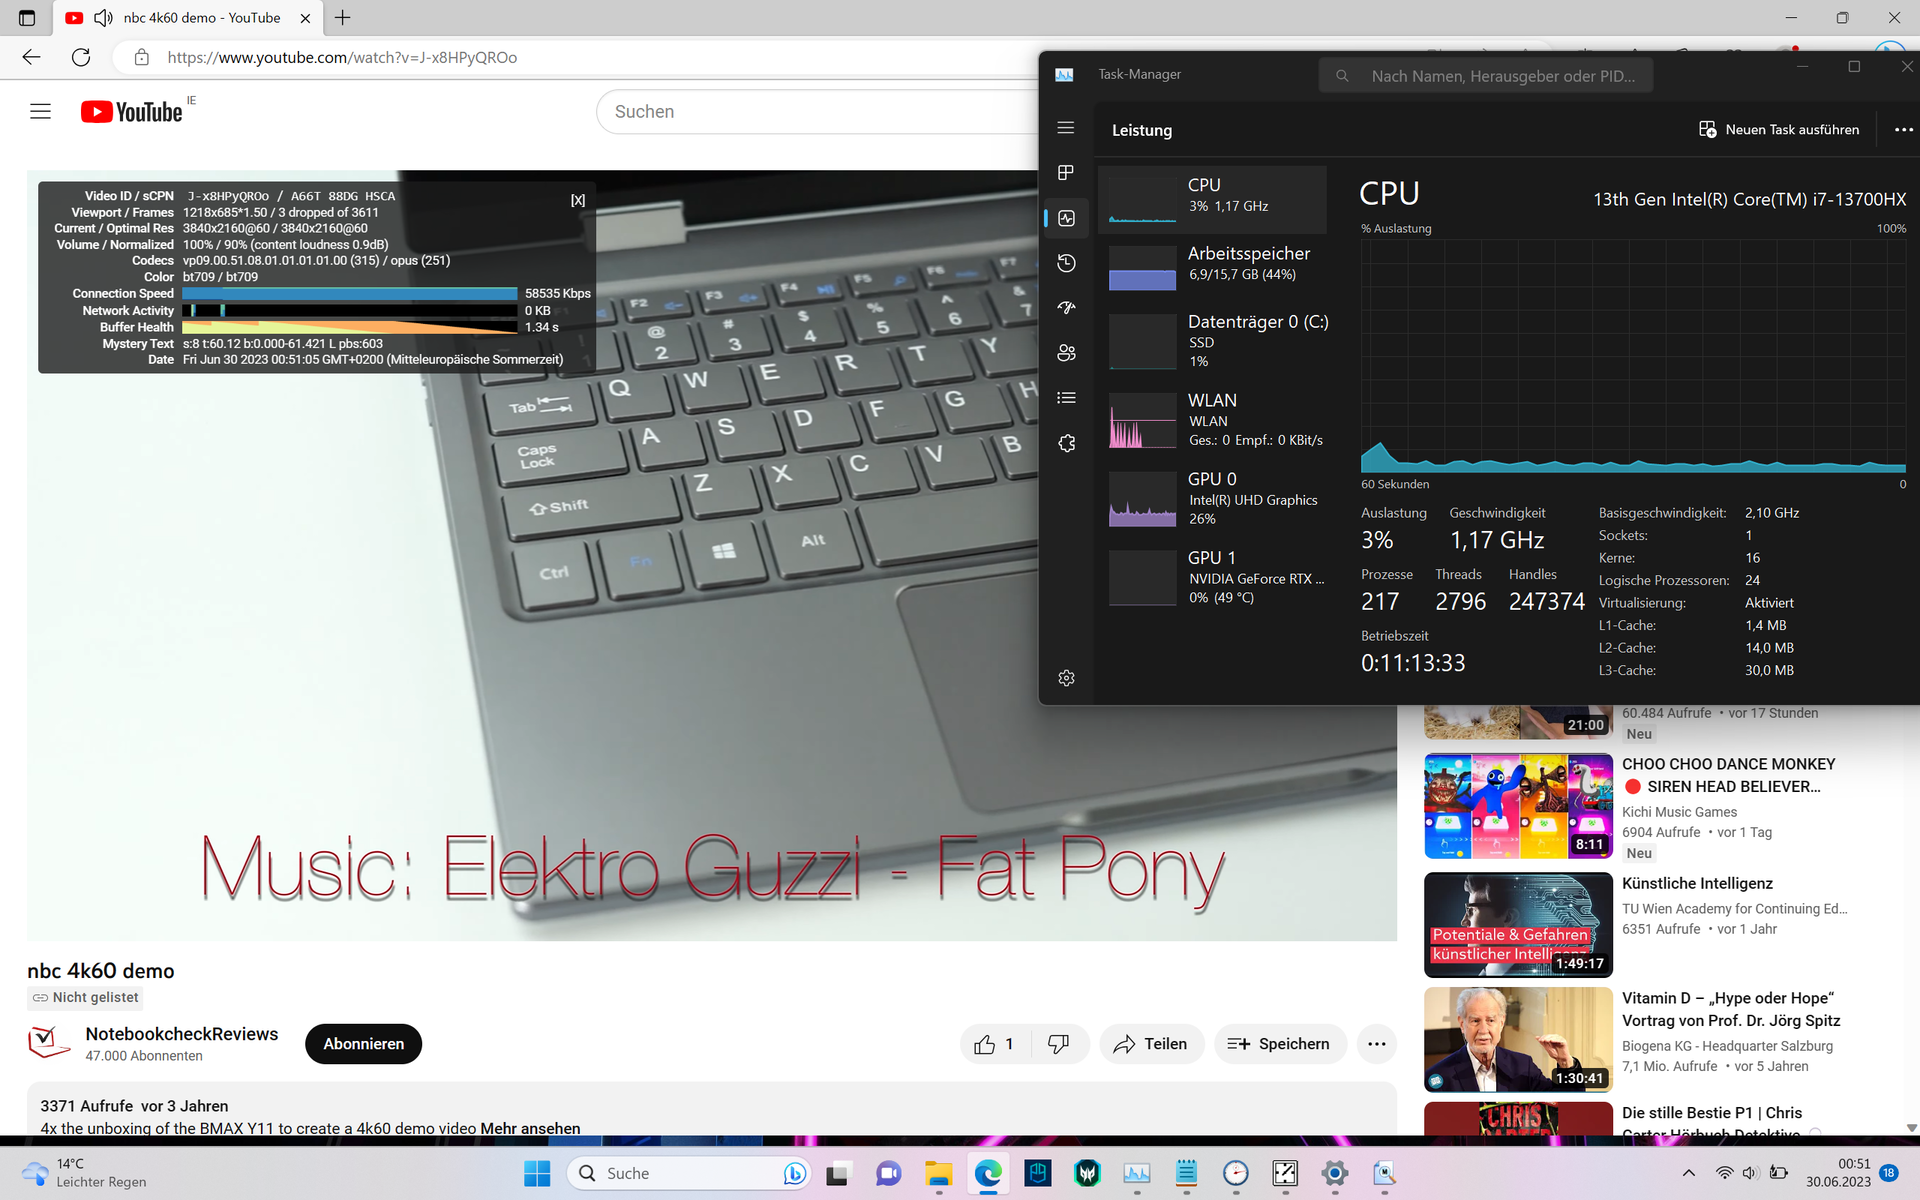
Dans les tâches quotidiennes, l'ordinateur portable Acer est exceptionnellement réactif. Surfer sur Internet tout en lisant une vidéo YouTube 4K ne fait même pas transpirer le système Intel-HX. Ainsi, dans le benchmark PCMark 10, le Predator Helios occupe la première place, suivi de près par le Predator HX.Lenovo Legion Pro 5 16.
De même, les performances de navigation sur le web, illustrées par Mozilla Kraken 1.1 et WebXPRT, se situent également à un niveau très élevé grâce à la forte performance du cœur unique.
CrossMark: Overall | Productivity | Creativity | Responsiveness
Mozilla Kraken 1.1: Total
Speedometer 2.0: Result 2.0
Octane V2: Total Score
Jetstream 2: 2.0 Total
WebXPRT 3: Overall
WebXPRT 4: Overall
| PCMark 10 / Score | |
| Moyenne de la classe Gaming (5828 - 11574, n=96, 2 dernières années) | |
| Acer Predator Helios 16 PH16-71-731Q | |
| Lenovo Legion Pro 5 16IRX8 | |
| Moyenne Intel Core i7-13700HX, NVIDIA GeForce RTX 4060 Laptop GPU (6909 - 7743, n=5) | |
| Asus TUF Gaming A16 FA617 | |
| Acer Nitro 16 AN16-41 | |
| Aorus 15X ASF | |
| Dell G15 5530 | |
| PCMark 10 / Essentials | |
| Acer Predator Helios 16 PH16-71-731Q | |
| Dell G15 5530 | |
| Lenovo Legion Pro 5 16IRX8 | |
| Aorus 15X ASF | |
| Moyenne Intel Core i7-13700HX, NVIDIA GeForce RTX 4060 Laptop GPU (9760 - 11313, n=5) | |
| Moyenne de la classe Gaming (8810 - 12600, n=100, 2 dernières années) | |
| Asus TUF Gaming A16 FA617 | |
| Acer Nitro 16 AN16-41 | |
| PCMark 10 / Productivity | |
| Acer Predator Helios 16 PH16-71-731Q | |
| Moyenne de la classe Gaming (6845 - 18766, n=98, 2 dernières années) | |
| Dell G15 5530 | |
| Moyenne Intel Core i7-13700HX, NVIDIA GeForce RTX 4060 Laptop GPU (9131 - 11018, n=5) | |
| Aorus 15X ASF | |
| Asus TUF Gaming A16 FA617 | |
| Acer Nitro 16 AN16-41 | |
| Lenovo Legion Pro 5 16IRX8 | |
| PCMark 10 / Digital Content Creation | |
| Moyenne de la classe Gaming (7602 - 19657, n=98, 2 dernières années) | |
| Lenovo Legion Pro 5 16IRX8 | |
| Moyenne Intel Core i7-13700HX, NVIDIA GeForce RTX 4060 Laptop GPU (9393 - 12434, n=5) | |
| Asus TUF Gaming A16 FA617 | |
| Acer Nitro 16 AN16-41 | |
| Acer Predator Helios 16 PH16-71-731Q | |
| Aorus 15X ASF | |
| Dell G15 5530 | |
| CrossMark / Overall | |
| Acer Predator Helios 16 PH16-71-731Q | |
| Aorus 15X ASF | |
| Moyenne de la classe Gaming (1366 - 2409, n=98, 2 dernières années) | |
| Moyenne Intel Core i7-13700HX, NVIDIA GeForce RTX 4060 Laptop GPU (1663 - 2105, n=5) | |
| Dell G15 5530 | |
| Lenovo Legion Pro 5 16IRX8 | |
| Acer Nitro 16 AN16-41 | |
| CrossMark / Productivity | |
| Acer Predator Helios 16 PH16-71-731Q | |
| Aorus 15X ASF | |
| Moyenne de la classe Gaming (1386 - 2254, n=98, 2 dernières années) | |
| Moyenne Intel Core i7-13700HX, NVIDIA GeForce RTX 4060 Laptop GPU (1618 - 1989, n=5) | |
| Dell G15 5530 | |
| Lenovo Legion Pro 5 16IRX8 | |
| Acer Nitro 16 AN16-41 | |
| CrossMark / Creativity | |
| Acer Predator Helios 16 PH16-71-731Q | |
| Moyenne de la classe Gaming (1343 - 2729, n=98, 2 dernières années) | |
| Aorus 15X ASF | |
| Dell G15 5530 | |
| Moyenne Intel Core i7-13700HX, NVIDIA GeForce RTX 4060 Laptop GPU (1710 - 2274, n=5) | |
| Lenovo Legion Pro 5 16IRX8 | |
| Acer Nitro 16 AN16-41 | |
| CrossMark / Responsiveness | |
| Aorus 15X ASF | |
| Acer Predator Helios 16 PH16-71-731Q | |
| Moyenne de la classe Gaming (1226 - 2334, n=98, 2 dernières années) | |
| Moyenne Intel Core i7-13700HX, NVIDIA GeForce RTX 4060 Laptop GPU (1269 - 1983, n=5) | |
| Lenovo Legion Pro 5 16IRX8 | |
| Dell G15 5530 | |
| Acer Nitro 16 AN16-41 | |
| Mozilla Kraken 1.1 / Total | |
| Asus TUF Gaming A16 FA617 | |
| Asus TUF Gaming A16 FA617 | |
| Acer Nitro 16 AN16-41 | |
| Lenovo Legion Pro 5 16IRX8 | |
| Moyenne Intel Core i7-13700HX, NVIDIA GeForce RTX 4060 Laptop GPU (495 - 538, n=5) | |
| Dell G15 5530 | |
| Acer Predator Helios 16 PH16-71-731Q | |
| Aorus 15X ASF | |
| Moyenne de la classe Gaming (391 - 590, n=106, 2 dernières années) | |
| Speedometer 2.0 / Result 2.0 | |
| Moyenne de la classe Gaming (29 - 686, n=30, 2 dernières années) | |
| Acer Predator Helios 16 PH16-71-731Q | |
| Moyenne Intel Core i7-13700HX, NVIDIA GeForce RTX 4060 Laptop GPU (300 - 343, n=3) | |
| Aorus 15X ASF | |
| Acer Nitro 16 AN16-41 | |
| Octane V2 / Total Score | |
| Moyenne de la classe Gaming (87588 - 139447, n=31, 2 dernières années) | |
| Aorus 15X ASF | |
| Acer Predator Helios 16 PH16-71-731Q | |
| Moyenne Intel Core i7-13700HX, NVIDIA GeForce RTX 4060 Laptop GPU (86875 - 96413, n=3) | |
| Acer Nitro 16 AN16-41 | |
| Jetstream 2 / 2.0 Total | |
| Moyenne de la classe Gaming (291 - 516, n=32, 2 dernières années) | |
| Lenovo Legion Pro 5 16IRX8 | |
| Acer Predator Helios 16 PH16-71-731Q | |
| Aorus 15X ASF | |
| Moyenne Intel Core i7-13700HX, NVIDIA GeForce RTX 4060 Laptop GPU (263 - 305, n=4) | |
| Acer Nitro 16 AN16-41 | |
| WebXPRT 3 / Overall | |
| Acer Predator Helios 16 PH16-71-731Q | |
| Aorus 15X ASF | |
| Moyenne de la classe Gaming (242 - 532, n=101, 2 dernières années) | |
| Asus TUF Gaming A16 FA617 | |
| Asus TUF Gaming A16 FA617 | |
| Dell G15 5530 | |
| Moyenne Intel Core i7-13700HX, NVIDIA GeForce RTX 4060 Laptop GPU (238 - 336, n=4) | |
| Acer Nitro 16 AN16-41 | |
| Lenovo Legion Pro 5 16IRX8 | |
| WebXPRT 4 / Overall | |
| Moyenne de la classe Gaming (176.4 - 354, n=101, 2 dernières années) | |
| Acer Predator Helios 16 PH16-71-731Q | |
| Dell G15 5530 | |
| Aorus 15X ASF | |
| Moyenne Intel Core i7-13700HX, NVIDIA GeForce RTX 4060 Laptop GPU (247 - 283, n=5) | |
| Lenovo Legion Pro 5 16IRX8 | |
| Asus TUF Gaming A16 FA617 | |
| Asus TUF Gaming A16 FA617 | |
| Acer Nitro 16 AN16-41 | |
* ... Moindre est la valeur, meilleures sont les performances
| PCMark 10 Score | 7743 points | |
Aide | ||
| AIDA64 / Memory Copy | |
| Moyenne de la classe Gaming (21750 - 129946, n=110, 2 dernières années) | |
| Dell G15 5530 | |
| Lenovo Legion Pro 5 16IRX8 | |
| Aorus 15X ASF | |
| Acer Predator Helios 16 PH16-71-731Q | |
| Moyenne Intel Core i7-13700HX (36125 - 63990, n=11) | |
| Asus TUF Gaming A16 FA617 | |
| Acer Nitro 16 AN16-41 | |
| AIDA64 / Memory Read | |
| Moyenne de la classe Gaming (22956 - 118858, n=110, 2 dernières années) | |
| Dell G15 5530 | |
| Lenovo Legion Pro 5 16IRX8 | |
| Acer Predator Helios 16 PH16-71-731Q | |
| Aorus 15X ASF | |
| Moyenne Intel Core i7-13700HX (36510 - 69729, n=11) | |
| Asus TUF Gaming A16 FA617 | |
| Acer Nitro 16 AN16-41 | |
| AIDA64 / Memory Write | |
| Acer Predator Helios 16 PH16-71-731Q | |
| Moyenne de la classe Gaming (22297 - 135096, n=110, 2 dernières années) | |
| Lenovo Legion Pro 5 16IRX8 | |
| Dell G15 5530 | |
| Moyenne Intel Core i7-13700HX (33598 - 85675, n=11) | |
| Aorus 15X ASF | |
| Asus TUF Gaming A16 FA617 | |
| Acer Nitro 16 AN16-41 | |
| AIDA64 / Memory Latency | |
| Moyenne de la classe Gaming (75.3 - 259, n=110, 2 dernières années) | |
| Acer Nitro 16 AN16-41 | |
| Dell G15 5530 | |
| Moyenne Intel Core i7-13700HX (81.5 - 97.9, n=11) | |
| Aorus 15X ASF | |
| Acer Predator Helios 16 PH16-71-731Q | |
| Asus TUF Gaming A16 FA617 | |
| Lenovo Legion Pro 5 16IRX8 | |
* ... Moindre est la valeur, meilleures sont les performances
Latences DPC
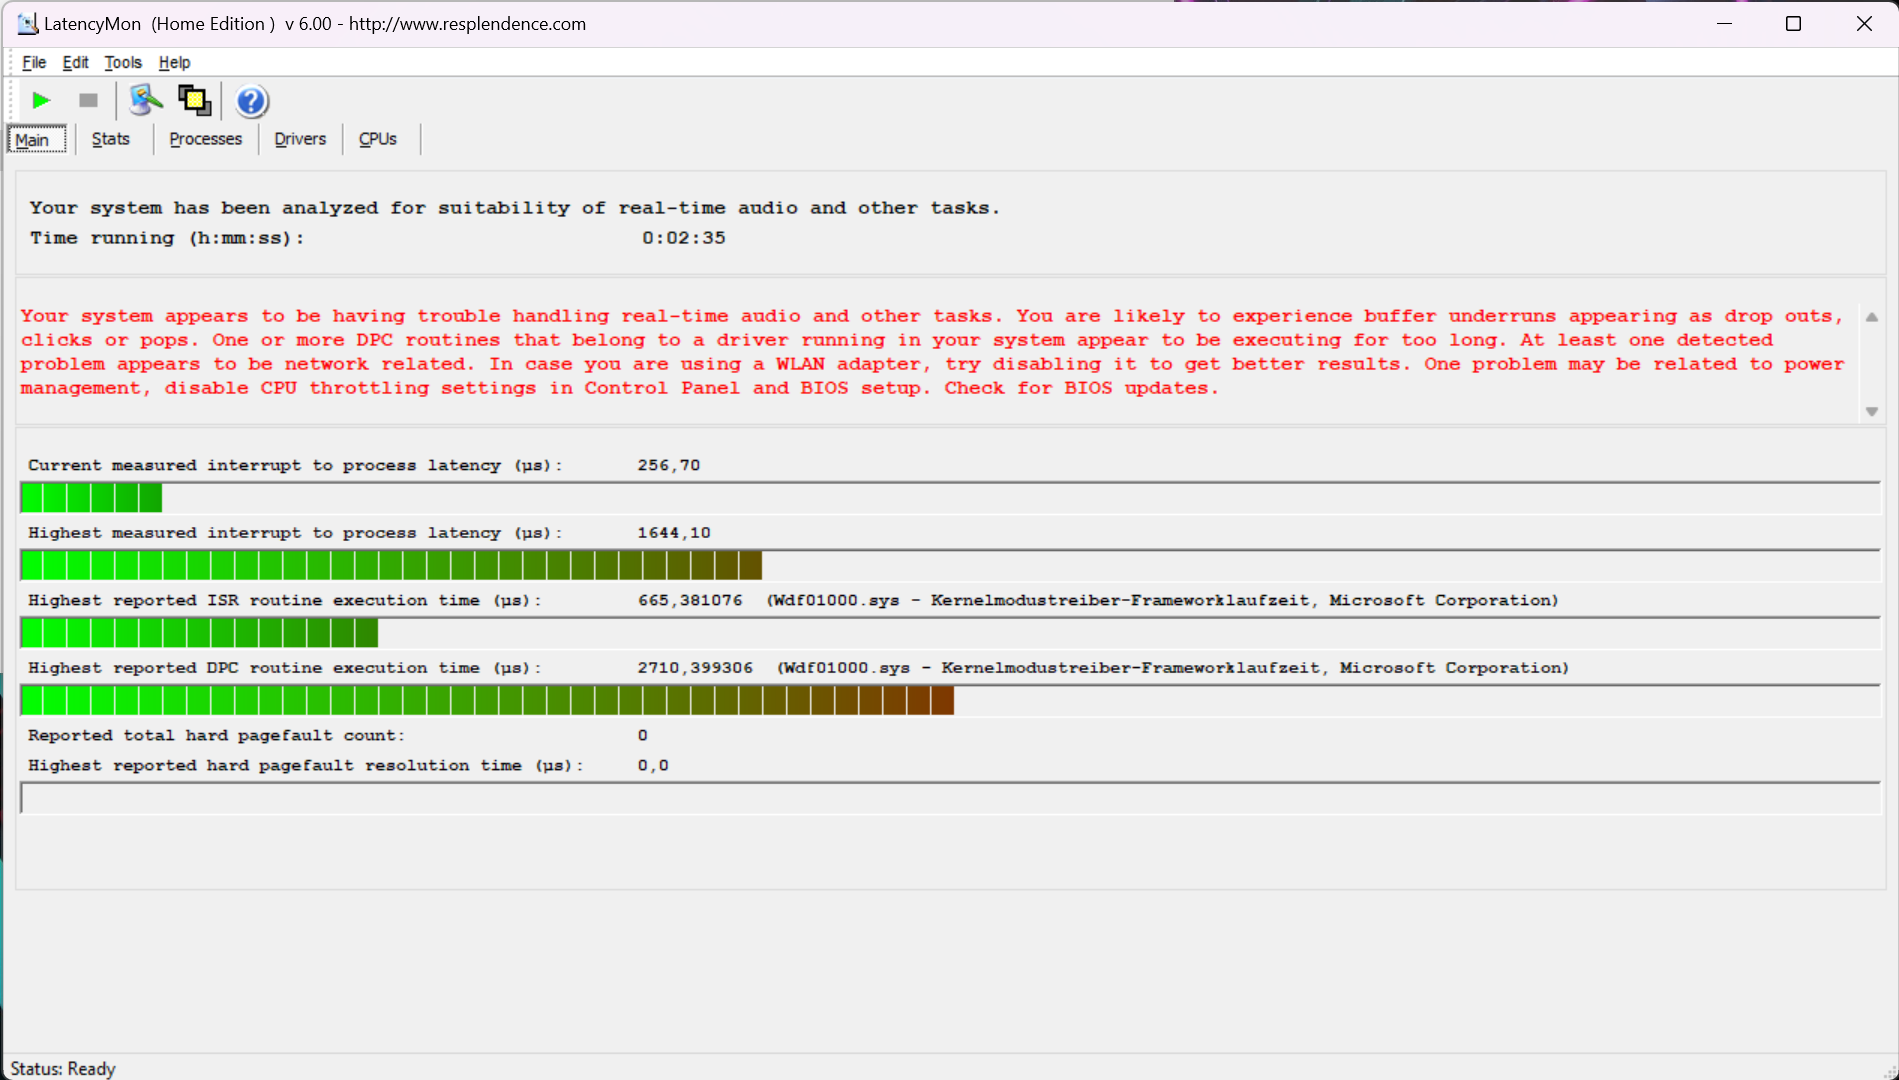
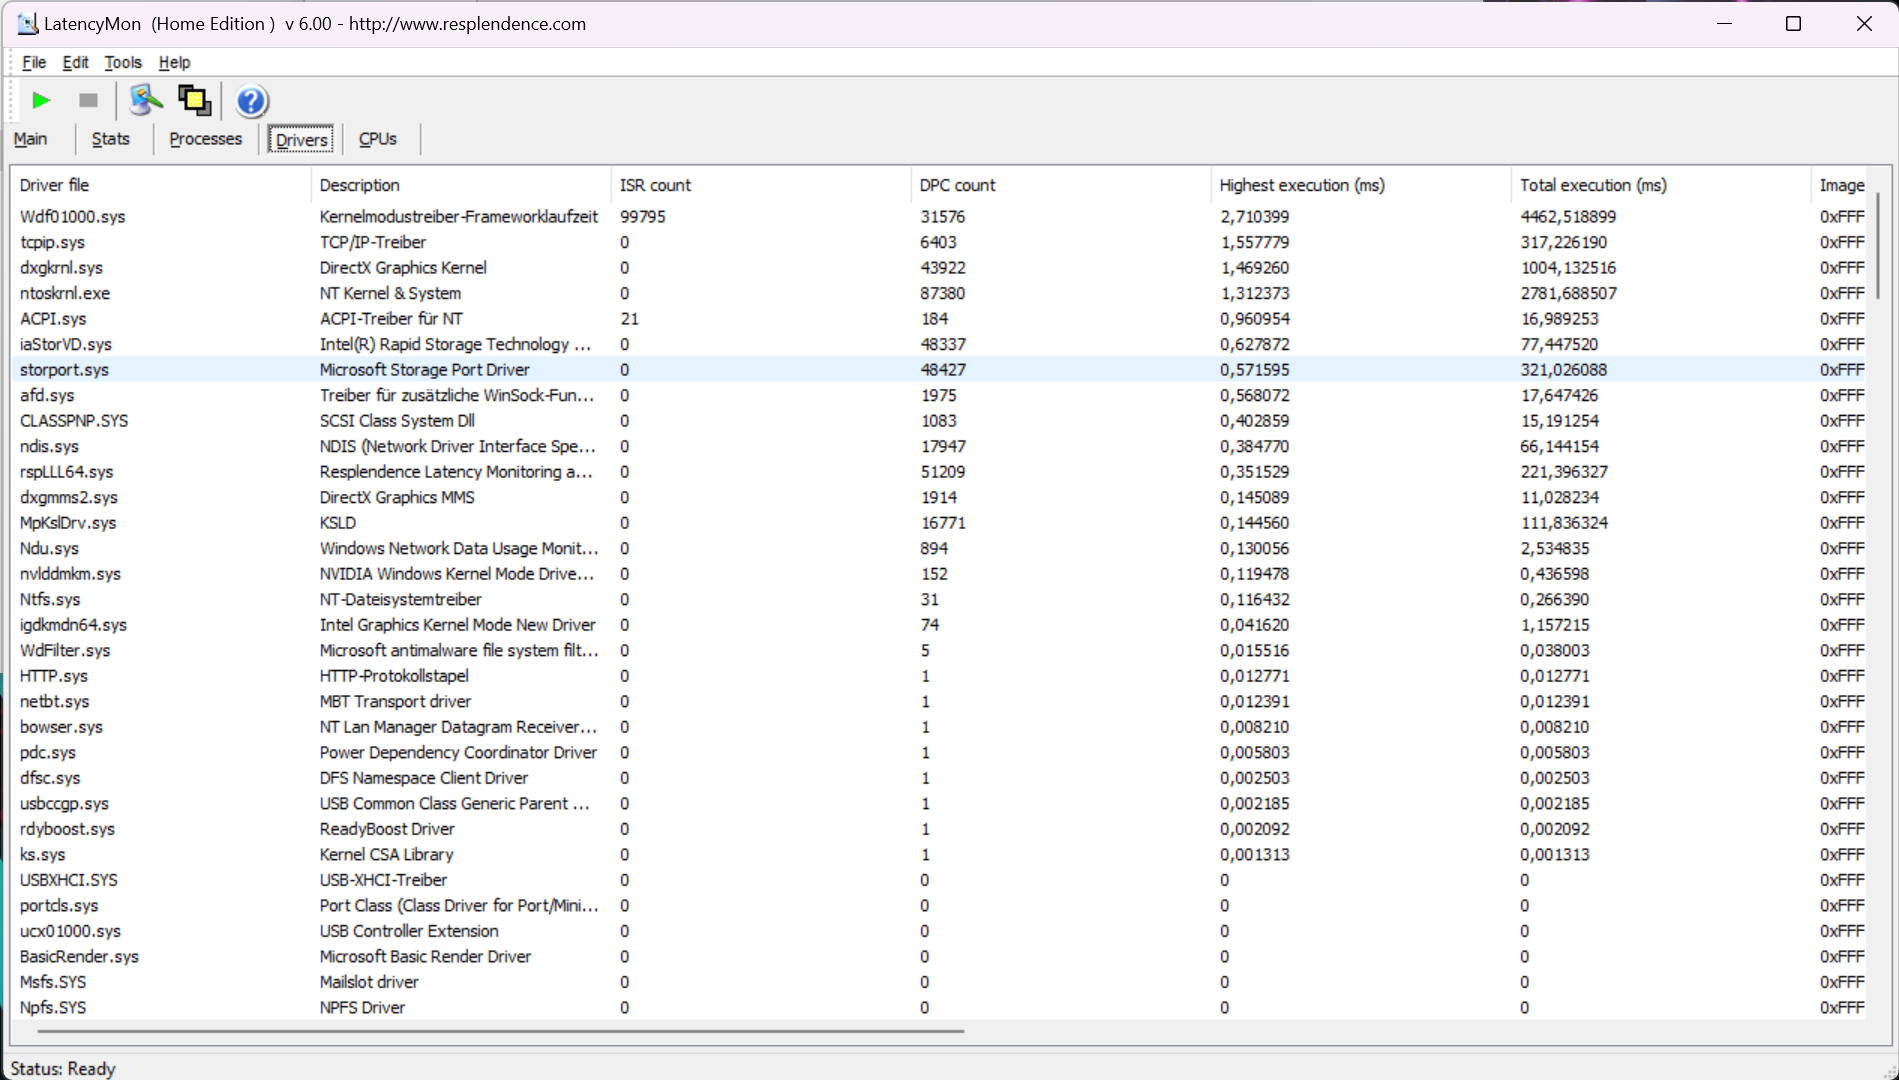
| DPC Latencies / LatencyMon - interrupt to process latency (max), Web, Youtube, Prime95 | |
| Dell G15 5530 | |
| Aorus 15X ASF | |
| Acer Predator Helios 16 PH16-71-731Q | |
| Acer Nitro 16 AN16-41 | |
| Lenovo Legion Pro 5 16IRX8 | |
| Asus TUF Gaming A16 FA617 | |
* ... Moindre est la valeur, meilleures sont les performances
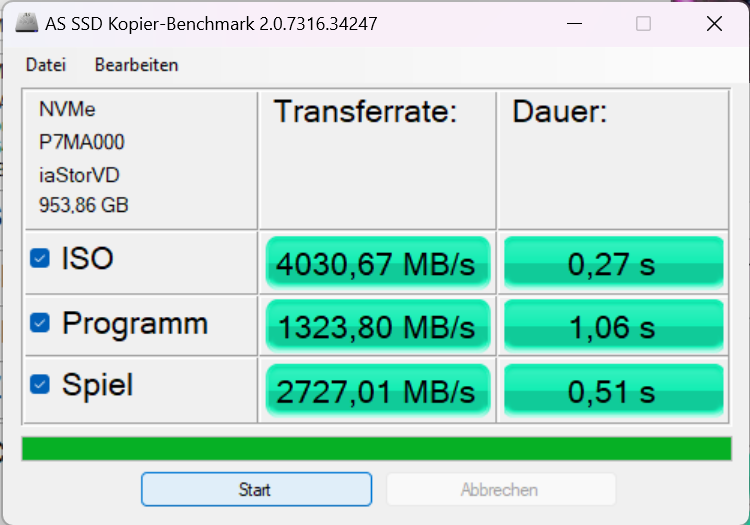
Mémoire de masse
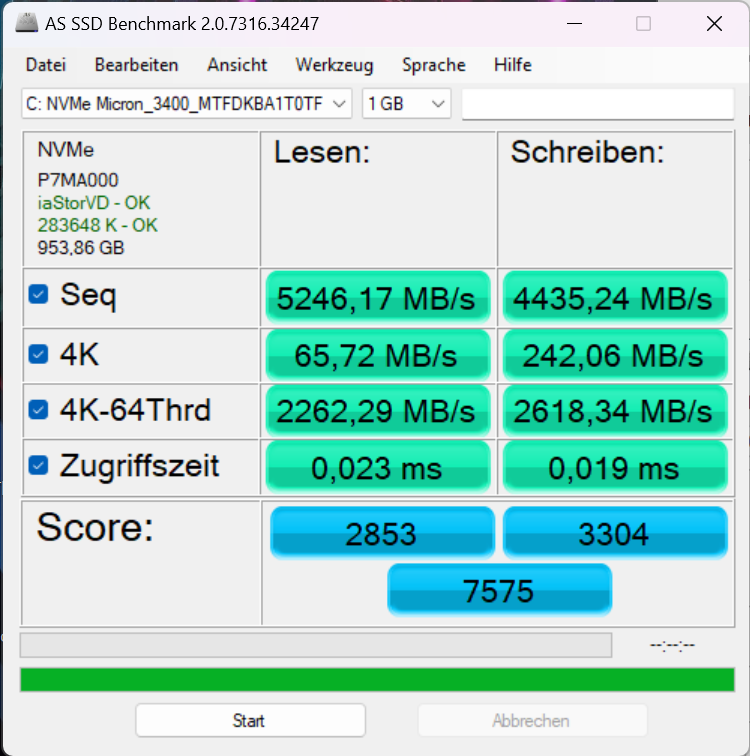
Le disque SSD Micron 3400 PCIe 4.0 installé peut contenir 1 To. Les taux de transfert en lecture séquentielle, qui atteignent 6 100 Mo/s, sont supérieurs à la moyenne. Cependant, après un court laps de temps, un étranglement thermique drastique se produit, réduisant la vitesse à un tiers de sa capacité. Ce ralentissement n'est pas présent dans le Micron 3400 que l'on trouve dans l'Asus ROG Flow X16, ni dans l'Asus ROG Flow X16.Asus ROG Flow X16ni dans leLenovo Legion 7mais le même problème a été signalé dans le HP ZBook Fury 16et ZBook Firefly 14.
Le SK Hynix PC801 dans leLegion Pro 5 16peut également supporter des transferts allant jusqu'à ~6000 Mo/s, tandis que le petit SSD M.2 2242 présent dans les modèles Dell G15 5530 et ZBook Firefly 14 peut supporter des transferts allant jusqu'à ~6000 Mo/s.Dell G15 5530est clairement en queue de peloton.
| Acer Predator Helios 16 PH16-71-731Q Micron 3400 1TB MTFDKBA1T0TFH | Acer Nitro 16 AN16-41 Samsung PM9A1 MZVL21T0HCLR | Lenovo Legion Pro 5 16IRX8 SK hynix PC801 HFS512GEJ9X115N | Aorus 15X ASF Gigabyte AG470S1TB-SI B10 | Asus TUF Gaming A16 FA617 Micron 2400 MTFDKBA1T0QFM | Dell G15 5530 SSTC CL4-3D512-Q11 | |
|---|---|---|---|---|---|---|
| AS SSD | -25% | -15% | -15% | -72% | -144% | |
| Seq Read (MB/s) | 5246.2 | 5185.49 -1% | 5856.12 12% | 4649.46 -11% | 3976.53 -24% | 2603.73 -50% |
| Seq Write (MB/s) | 4435.2 | 3900.46 -12% | 4750.28 7% | 3810.26 -14% | 3020.8 -32% | 494.63 -89% |
| 4K Read (MB/s) | 65.7 | 62.76 -4% | 77.12 17% | 100.75 53% | 49.25 -25% | 36.37 -45% |
| 4K Write (MB/s) | 242.1 | 137.9 -43% | 276.66 14% | 308.92 28% | 152.75 -37% | 188.64 -22% |
| 4K-64 Read (MB/s) | 2262.3 | 2593.07 15% | 2572.63 14% | 2964.13 31% | 1901.41 -16% | 932.26 -59% |
| 4K-64 Write (MB/s) | 2618.3 | 3195.33 22% | 3536.78 35% | 3103.89 19% | 1949.13 -26% | 276.64 -89% |
| Access Time Read * (ms) | 0.023 | 0.079 -243% | 0.044 -91% | 0.068 -196% | 0.05 -117% | 0.103 -348% |
| Access Time Write * (ms) | 0.019 | 0.029 -53% | 0.053 -179% | 0.012 37% | 0.105 -453% | 0.182 -858% |
| Score Read (Points) | 2853 | 3174 11% | 3235 13% | 3530 24% | 2348 -18% | 1229 -57% |
| Score Write (Points) | 3304 | 3723 13% | 4288 30% | 3794 15% | 2404 -27% | 515 -84% |
| Score Total (Points) | 7575 | 8452 12% | 9125 20% | 9097 20% | 5903 -22% | 2271 -70% |
| Copy ISO MB/s (MB/s) | 4030.7 | 3037.59 -25% | 566.62 -86% | 1039.04 -74% | 488.98 -88% | |
| Copy Program MB/s (MB/s) | 1323.8 | 968.9 -27% | 1098.38 -17% | 439.84 -67% | 296.26 -78% | |
| Copy Game MB/s (MB/s) | 2727 | 2239.37 -18% | 2670.4 -2% | 721.09 -74% | 452.22 -83% | |
| DiskSpd | -22% | -3% | 9% | -31% | -57% | |
| seq read (MB/s) | 3587 | 3520 -2% | 5346 49% | 3419 -5% | 2460 -31% | 2726 -24% |
| seq write (MB/s) | 4634 | 2220 -52% | 1495 -68% | 3270 -29% | 2991 -35% | 535 -88% |
| seq q8 t1 read (MB/s) | 6521 | 6661 2% | 7127 9% | 7018 8% | 4633 -29% | 2985 -54% |
| seq q8 t1 write (MB/s) | 4962 | 2216 -55% | 4903 -1% | 4398 -11% | 3415 -31% | 539 -89% |
| 4k q1 t1 read (MB/s) | 68.3 | 48.4 -29% | 65.9 -4% | 73.5 8% | 35.5 -48% | 34 -50% |
| 4k q1 t1 write (MB/s) | 249 | 159.6 -36% | 328 32% | 346 39% | 181.3 -27% | 224 -10% |
| 4k q32 t16 read (MB/s) | 2848 | 3311 16% | 2889 1% | 3552 25% | 2025 -29% | 1054 -63% |
| 4k q32 t16 write (MB/s) | 2670 | 2193 -18% | 1457 -45% | 3610 35% | 2291 -14% | 507 -81% |
| Moyenne finale (programmes/paramètres) | -24% /
-24% | -9% /
-11% | -3% /
-6% | -52% /
-55% | -101% /
-113% |
* ... Moindre est la valeur, meilleures sont les performances
* ... Moindre est la valeur, meilleures sont les performances
Continuous Performance Read: DiskSpd Read Loop, Queue Depth 8
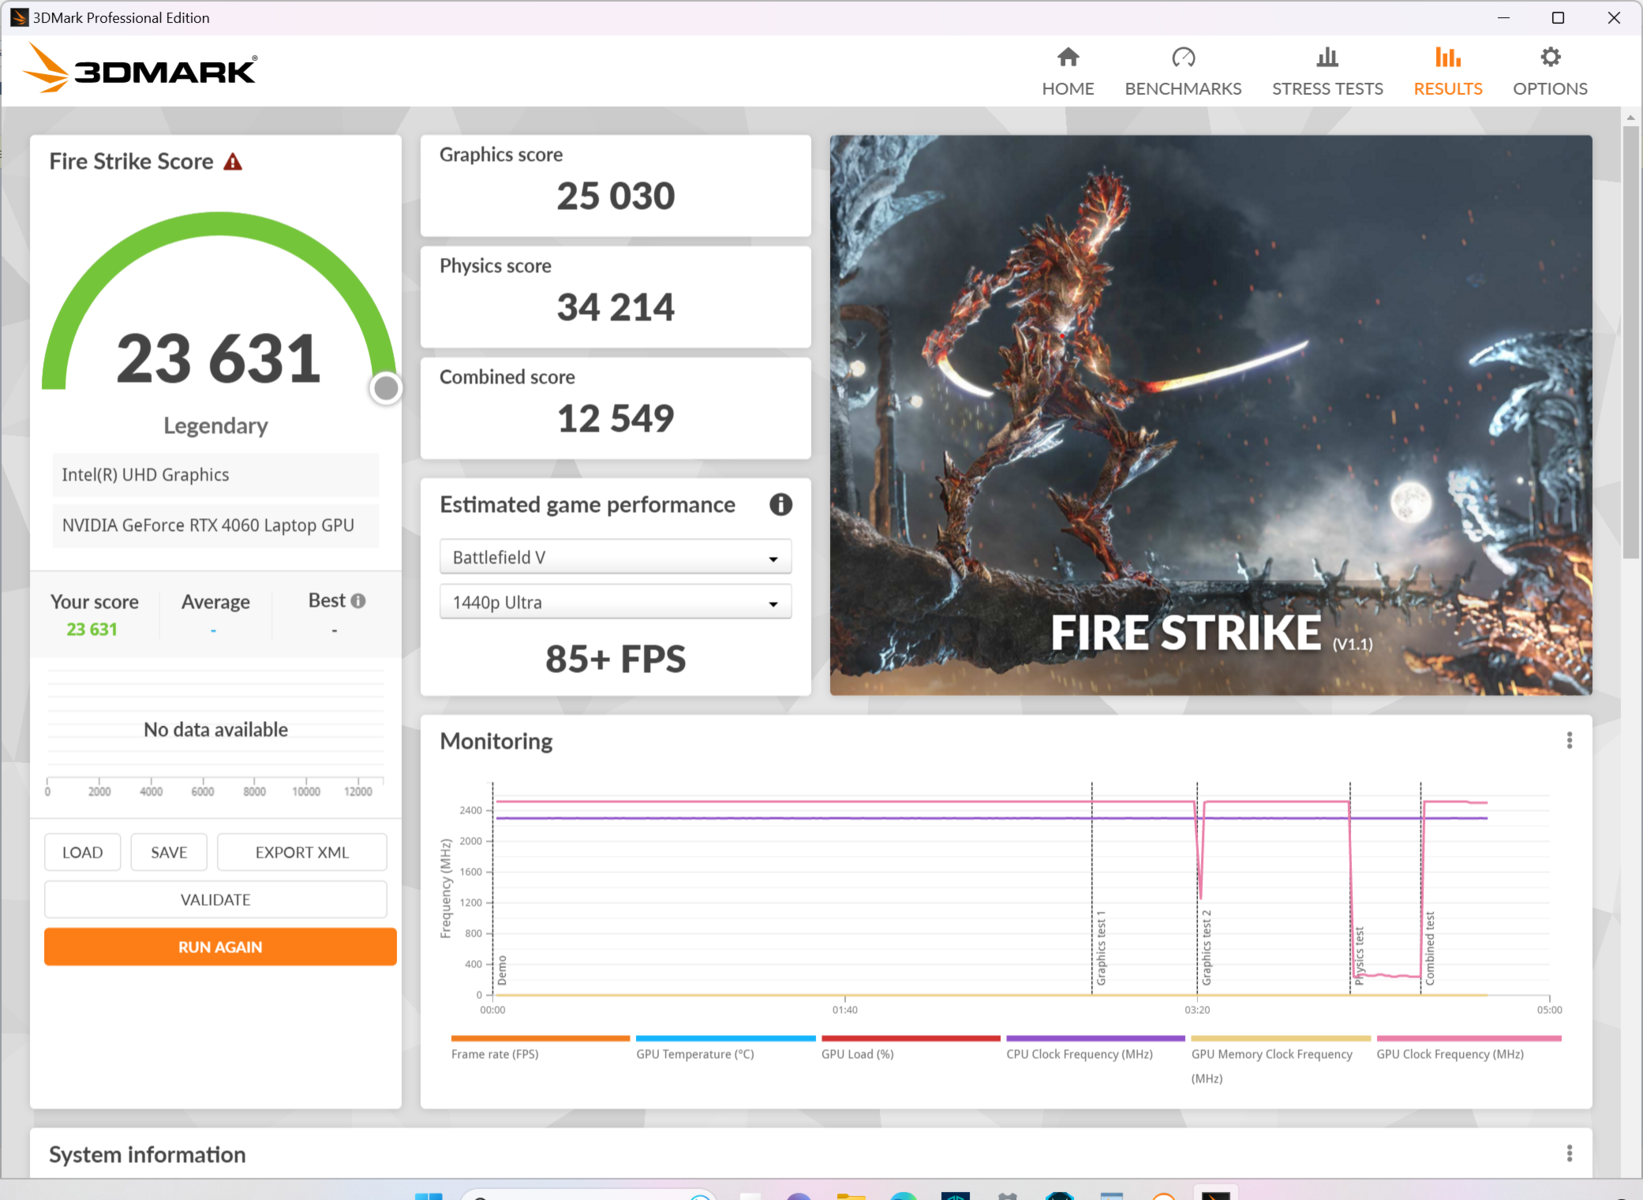
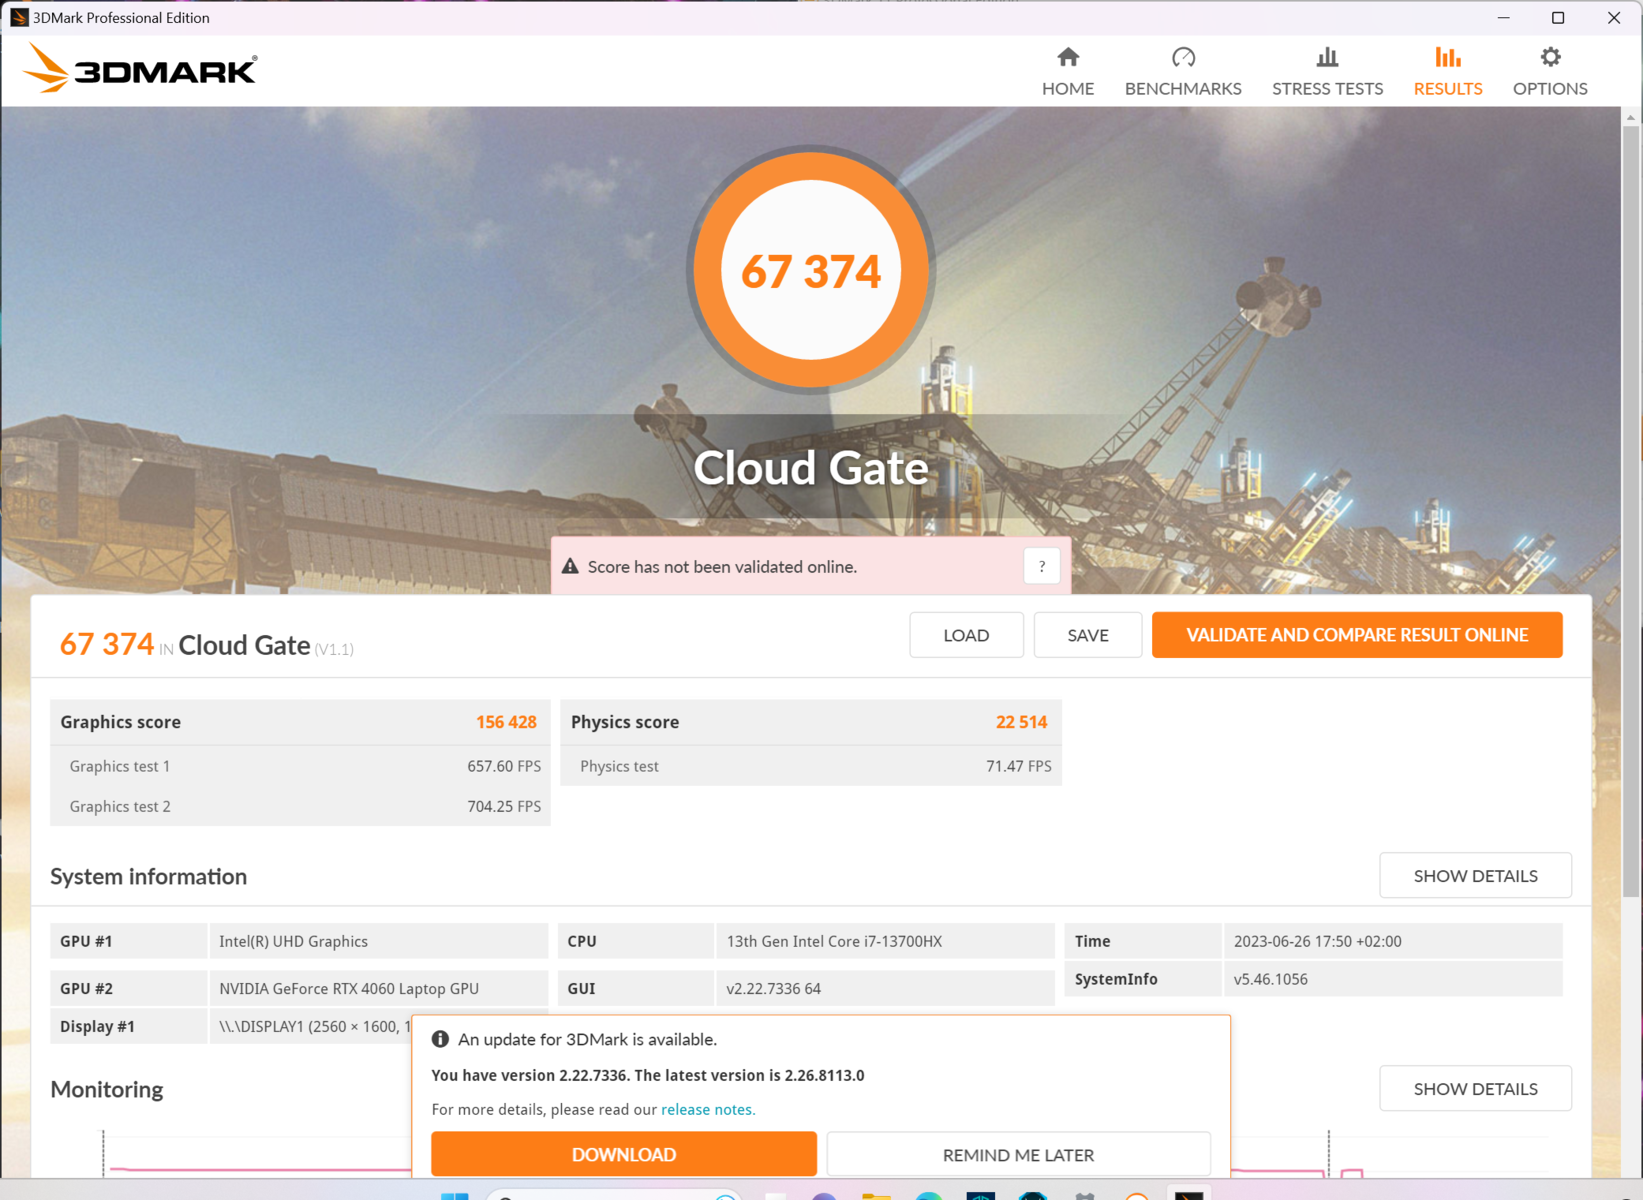
Carte graphique
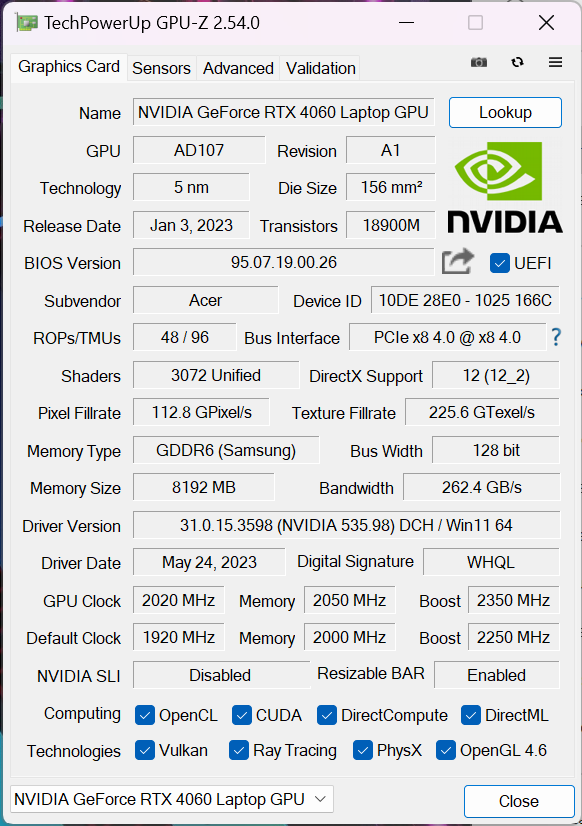
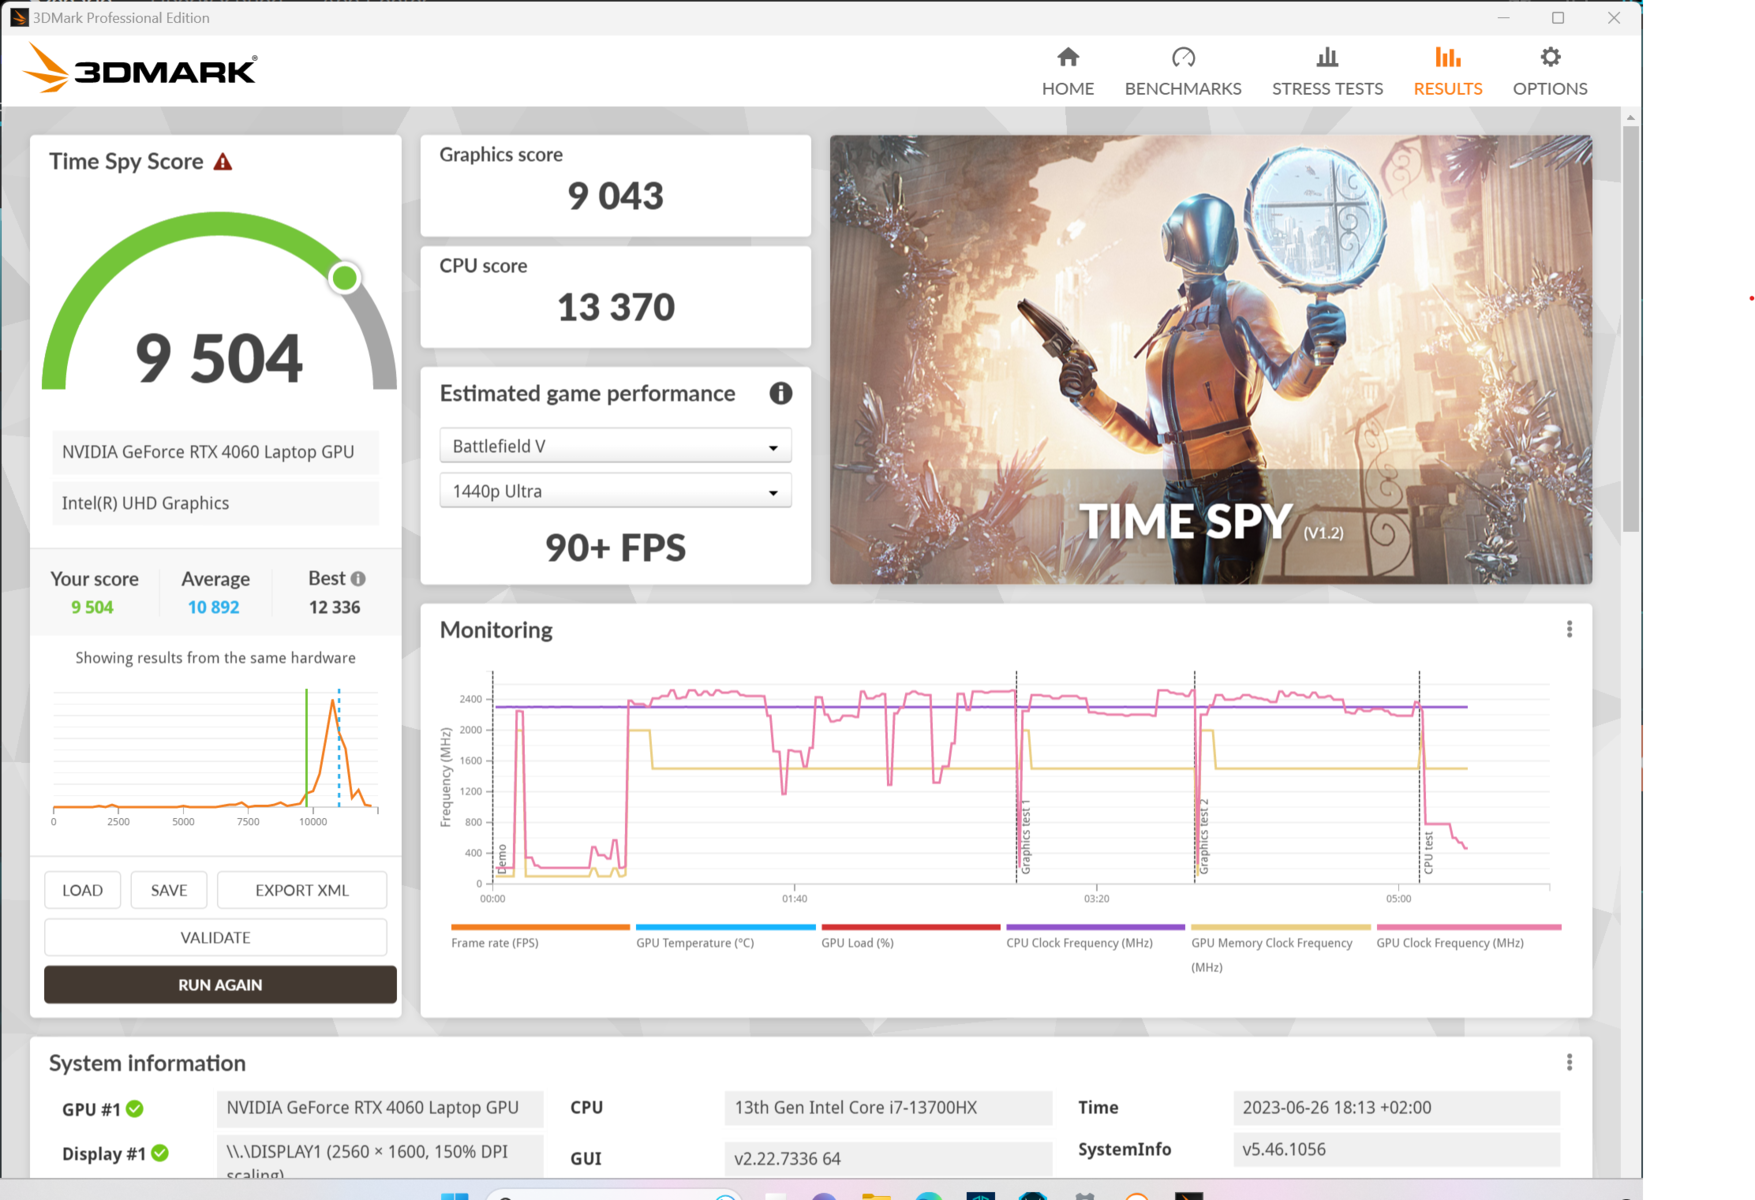
La Nvidia GeForce RTX 4060 est une puce de milieu de gamme avec 8 Go de VRAM qui a un TGP maximum de 140 watts (115 watts + 25 watts Dynamic Boost). Cependant, la vitesse d'horloge maximale de 2.570 MHz est déjà atteinte à 100 watts. Seul le test de stress FurMark a permis de tirer ~140 watts du GPU. En revanche, dans les jeux, un GPU RTX 4060 pour ordinateur portable ne consomme jamais plus de 100 watts.
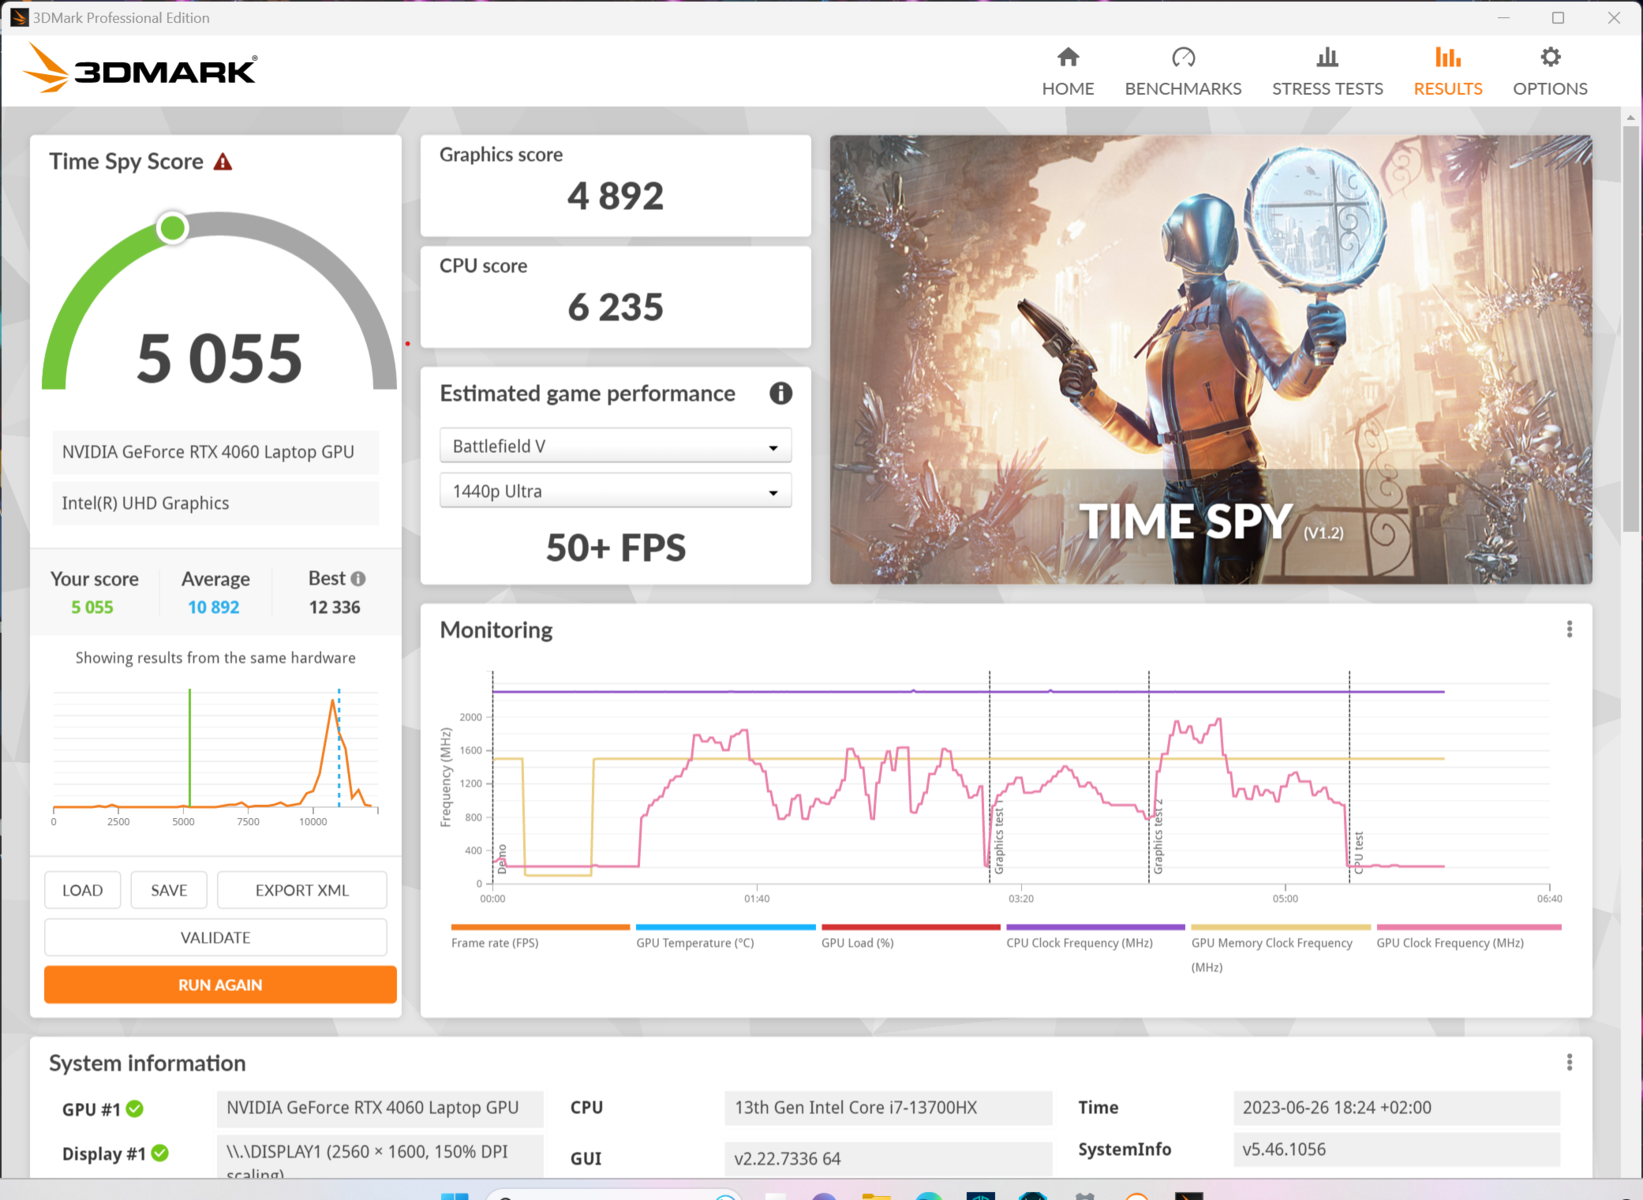
Les performances sont donc similaires à celles d'autres ordinateurs portables de jeu équipés d'une RTX 4060, tels que leLegion Pro 5 16et le Dell G15 5530. La RTX 4070dans l'AorusAorus 15X n'est pas loin non plus. Les résultats des tests synthétiques sont divisés par deux en mode batterie.
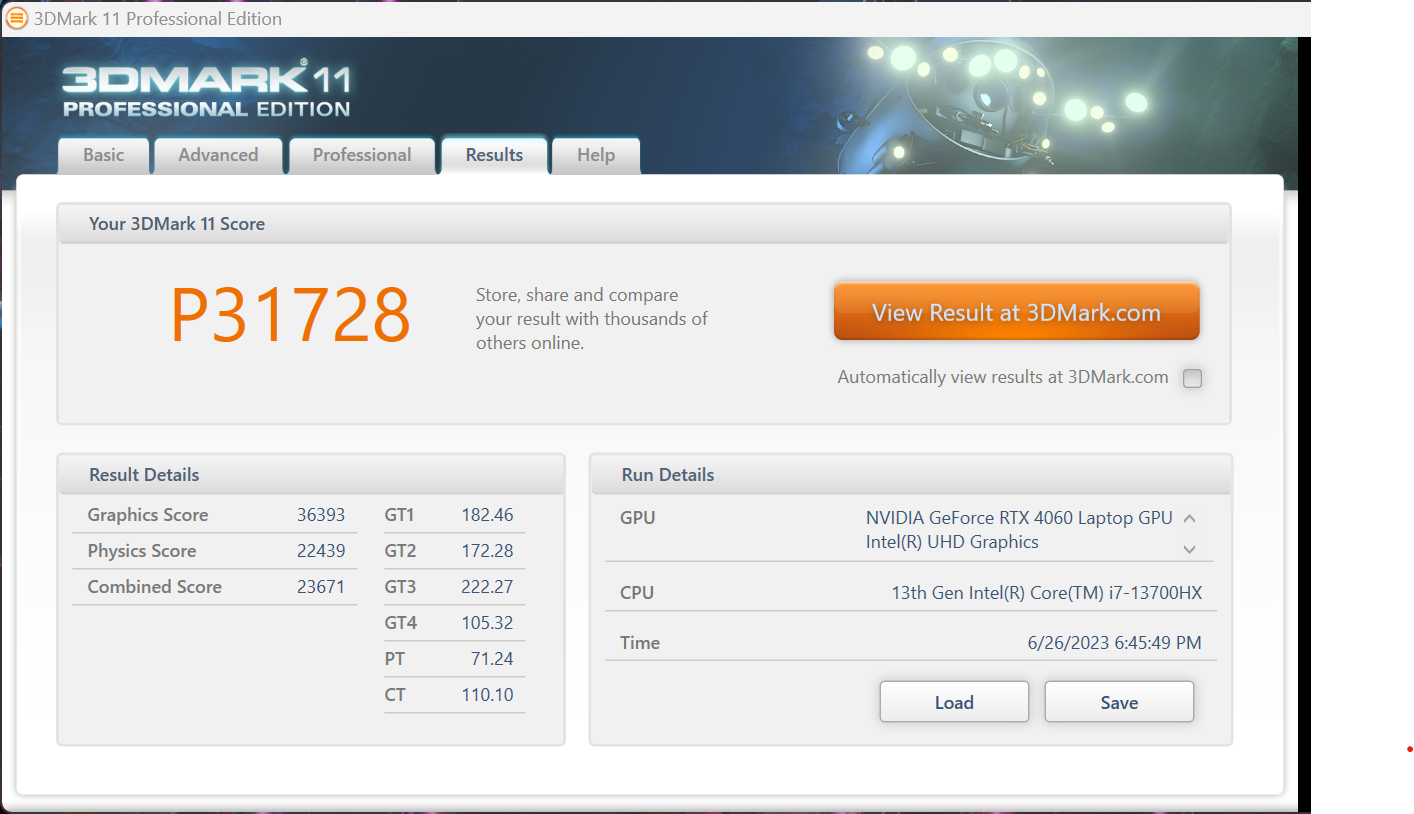
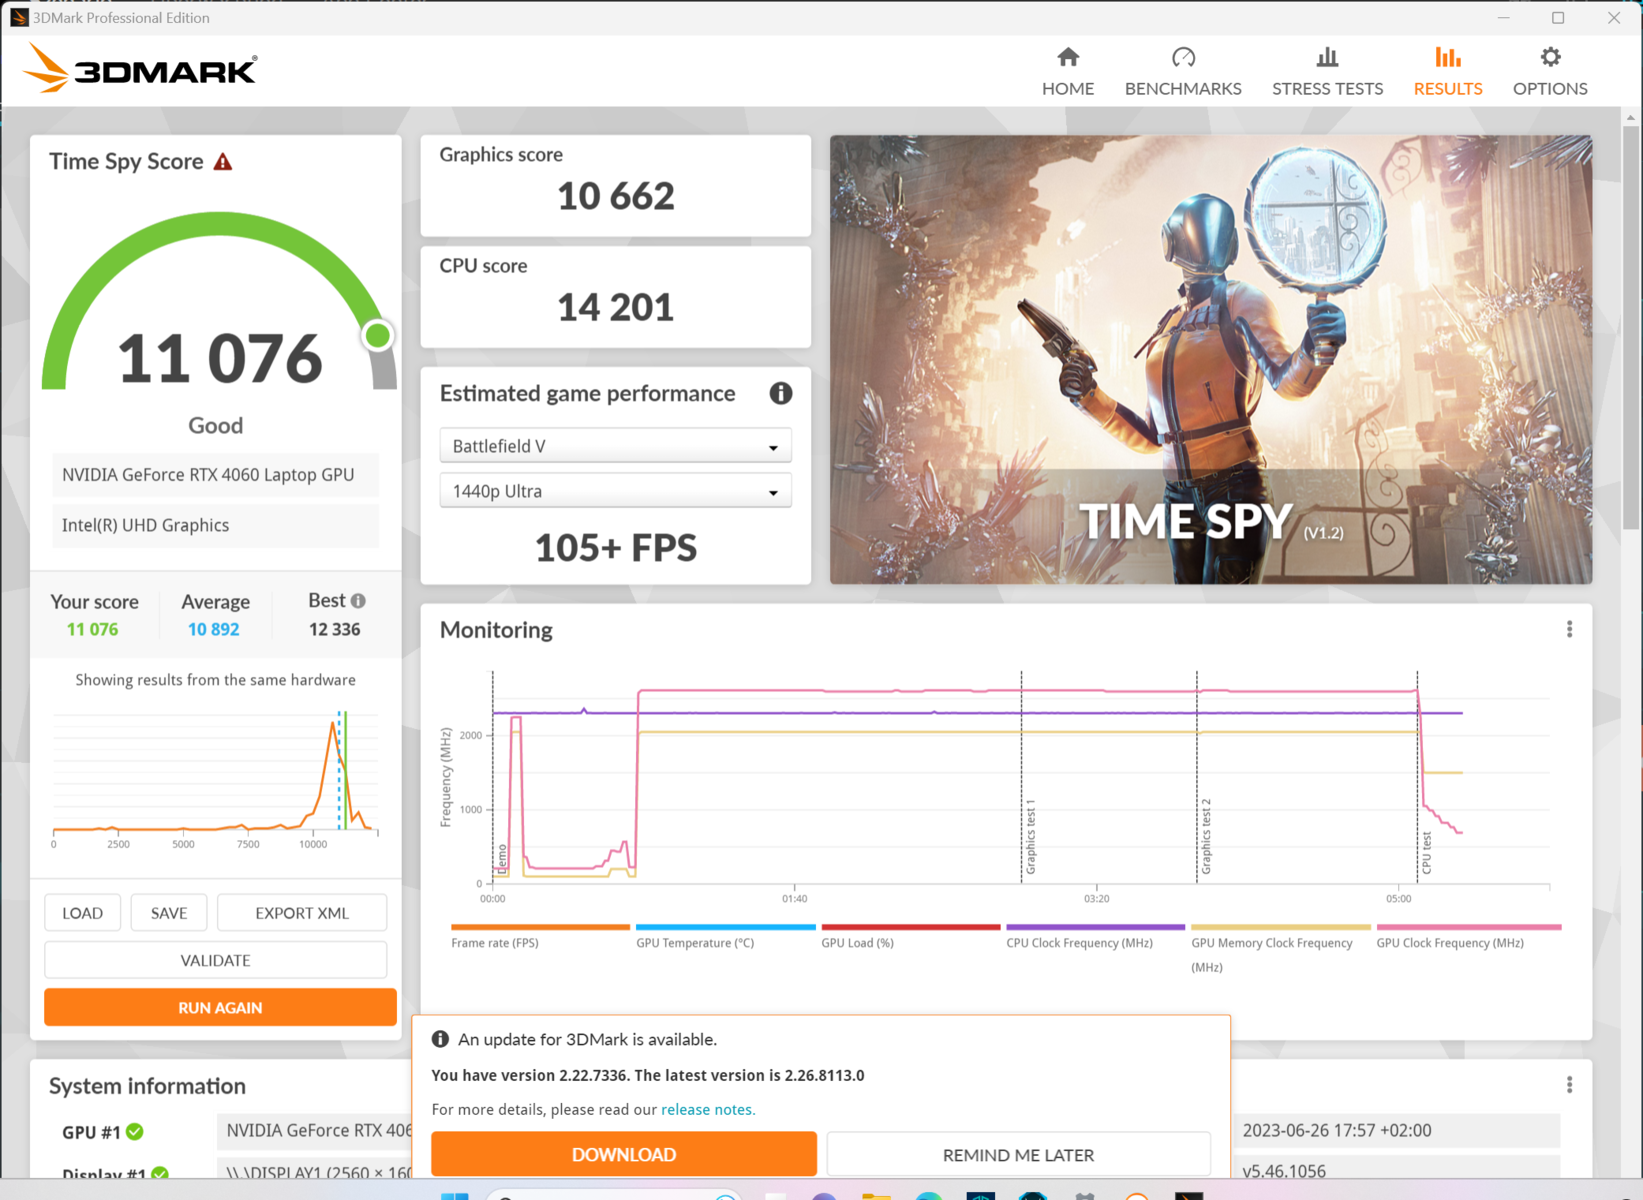
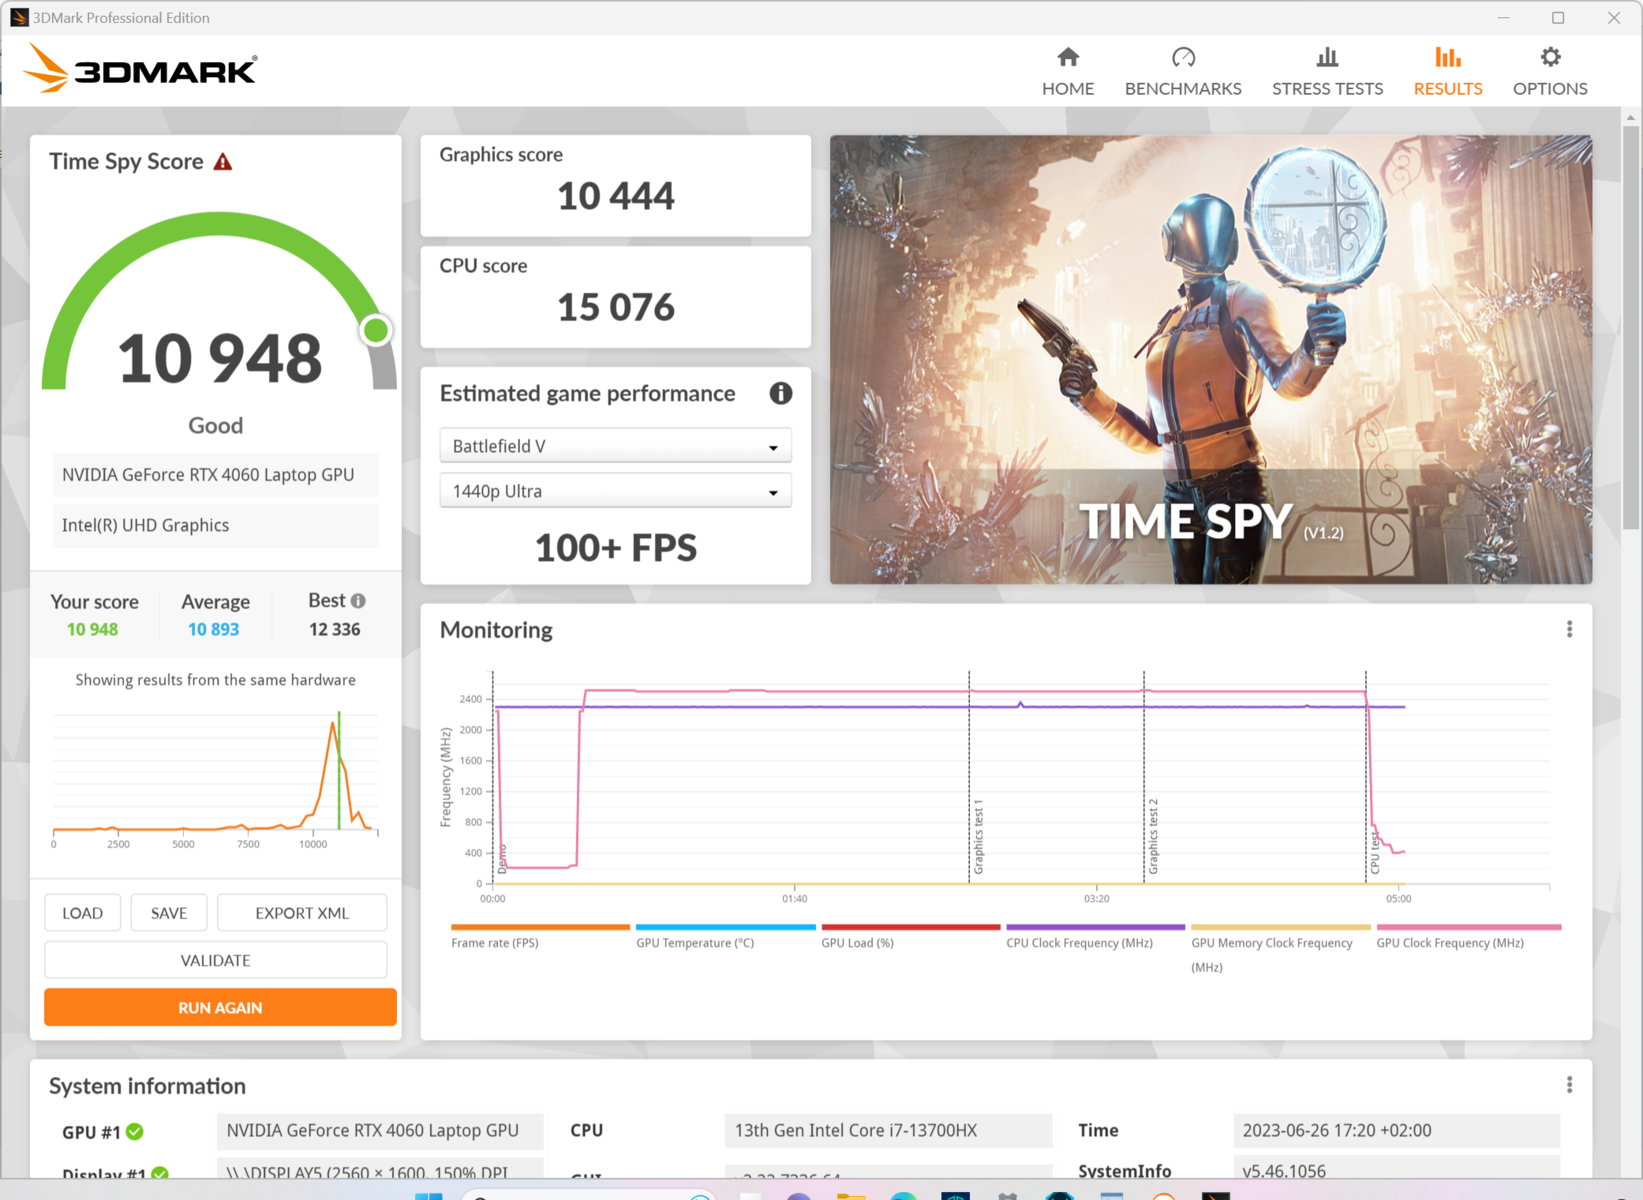

| 3DMark 11 Performance | 31728 points | |
| 3DMark Cloud Gate Standard Score | 67374 points | |
| 3DMark Fire Strike Score | 23631 points | |
| 3DMark Time Spy Score | 10948 points | |
Aide | ||
| Geekbench 6.0 - GPU OpenCL 6.0 | |
| Aorus 15X ASF | |
| Acer Nitro 16 AN16-41 | |
| Acer Predator Helios 16 PH16-71-731Q | |
| Dell G15 5530 | |
* ... Moindre est la valeur, meilleures sont les performances
Performances de jeu
Dans Cyberpunk 2077 @QHD/Ultra, l'Acer Predator Helios 16 a pu faire la course en tête parmi nos concurrents, devançant même légèrement le Legion Pro 5 16'sRTX 4070. Cependant, dans notre évaluation des performances, les appareils concurrents sont tous regroupés avec la RadeonRX 7600Sque l'on trouve dans le TUF Gaming A16s'affaiblissant légèrement.
Le passage au mode dGPU seul se traduit par un maigre gain de performance de 3 %. Si l'on combine ce mode avec le mode turbo, ce gain passe à 6 %. Avec le ray tracing activé, vous obtenez encore 60fps dans Cyberpunk 2077 1.6 Ultra/FHD au lieu de 93.2fps. Avec DLSS activé (équilibré) - dans ce cas sans ray tracing - c'est 134,2fps.
Le mode performance équilibré fait chuter le taux de rafraîchissement à 87,4, ce qui est plus qu'acceptable compte tenu des ventilateurs nettement plus silencieux. En mode batterie, le taux de rafraîchissement chute de près de 70 % pour atteindre 30 images par seconde. Avec "DLSS Max Performance", il est possible de doubler à nouveau le taux de rafraîchissement, de sorte que certains nouveaux jeux fonctionnent (et restent) relativement bien en mode batterie.
Witcher 3 FPS diagram
| Bas | Moyen | Élevé | Ultra | QHD | |
|---|---|---|---|---|---|
| GTA V (2015) | 182.8 | 181.3 | 172.5 | 112.8 | 88.3 |
| The Witcher 3 (2015) | 466 | 331 | 181.3 | 102.1 | |
| Dota 2 Reborn (2015) | 189.6 | 171.8 | 159.2 | 153 | |
| Final Fantasy XV Benchmark (2018) | 226 | 150.3 | 100.1 | 72.4 | |
| X-Plane 11.11 (2018) | 136.2 | 123.2 | 95.4 | ||
| Strange Brigade (2018) | 434 | 272 | 215 | 185.2 | 123.5 |
| Shadow of the Tomb Raider (2018) | 141 | 93 | |||
| God of War (2022) | 134.4 | 112.3 | 89.4 | 64.6 | 53.3 |
| Cyberpunk 2077 1.6 (2022) | 132.5 | 126 | 114.9 | 93.2 | 58.6 |
| Tiny Tina's Wonderlands (2022) | 219 | 175.1 | 114.7 | 87.9 | 60 |
| F1 22 (2022) | 256 | 244 | 196.5 | 65.2 | 38 |
| Call of Duty Modern Warfare 2 2022 (2022) | 88 | 60 | |||
| Returnal (2023) | 84.4 | 77.9 | 72.6 | 67 | 59.4 |
Émissions : L'Acer Predator Helios 16 est doté d'un puissant système de refroidissement

Émissions sonores
En mode veille, lorsqu'il surfe sur Internet ou effectue des tâches bureautiques simples, le Predator Helios 16 est presque toujours agréablement silencieux et, cela va sans dire, en mode silencieux ou en fonctionnement sur batterie.
En ce qui concerne la charge pure du processeur, 36,6 dB(A) ont été atteints, mais ils ne sont pas non plus très gênants. Dans les jeux, le mode performance devient très bruyant avec 49 dB(A), ce qui est la moyenne des ordinateurs portables de jeux. En mode turbo, il devient insupportable sans réelle valeur ajoutée. En revanche, le mode équilibré permet d'obtenir un bruit de fond presque agréable tout en ne perdant que très peu de performances. Enfin, le mode silencieux est agréable à l'oreille avec des baisses d'environ 30 % dans les applications 3D.
Cependant, le chargement de notre modèle d'évaluation a donné lieu à un bruit de gémissement clairement audible.
Degré de la nuisance sonore
| Au repos |
| 24 / 24 / 32.32 dB(A) |
| Fortement sollicité |
| 36.66 / 49.49 dB(A) |
 | ||
30 dB silencieux 40 dB(A) audible 50 dB(A) bruyant |
||
min: | ||
| Acer Predator Helios 16 PH16-71-731Q GeForce RTX 4060 Laptop GPU, i7-13700HX, Micron 3400 1TB MTFDKBA1T0TFH | Acer Nitro 16 AN16-41 GeForce RTX 4070 Laptop GPU, R7 7735HS, Samsung PM9A1 MZVL21T0HCLR | Lenovo Legion Pro 5 16IRX8 GeForce RTX 4060 Laptop GPU, i7-13700HX, SK hynix PC801 HFS512GEJ9X115N | Aorus 15X ASF GeForce RTX 4070 Laptop GPU, i7-13700HX, Gigabyte AG470S1TB-SI B10 | Asus TUF Gaming A16 FA617 Radeon RX 7600S, R7 7735HS, Micron 2400 MTFDKBA1T0QFM | Dell G15 5530 GeForce RTX 4060 Laptop GPU, i7-13650HX, SSTC CL4-3D512-Q11 | |
|---|---|---|---|---|---|---|
| Noise | -3% | 4% | -17% | -1% | 5% | |
| arrêt / environnement * (dB) | 24 | 25.7 -7% | 23 4% | 25 -4% | 24 -0% | 20.41 15% |
| Idle Minimum * (dB) | 24 | 25.7 -7% | 23.1 4% | 28 -17% | 24 -0% | 26.85 -12% |
| Idle Average * (dB) | 24 | 25.7 -7% | 23.1 4% | 29 -21% | 25 -4% | 26.85 -12% |
| Idle Maximum * (dB) | 32.32 | 26.3 19% | 26.6 18% | 36 -11% | 28 13% | 26.85 17% |
| Load Average * (dB) | 36.66 | 33.9 8% | 34.7 5% | 50 -36% | 42 -15% | 27.65 25% |
| Witcher 3 ultra * (dB) | 49.06 | 47.6 3% | 54 -10% | 50 -2% | 47.9 2% | |
| Load Maximum * (dB) | 49.49 | 62 -25% | 54.8 -11% | 58 -17% | 50 -1% | 47.86 3% |
* ... Moindre est la valeur, meilleures sont les performances
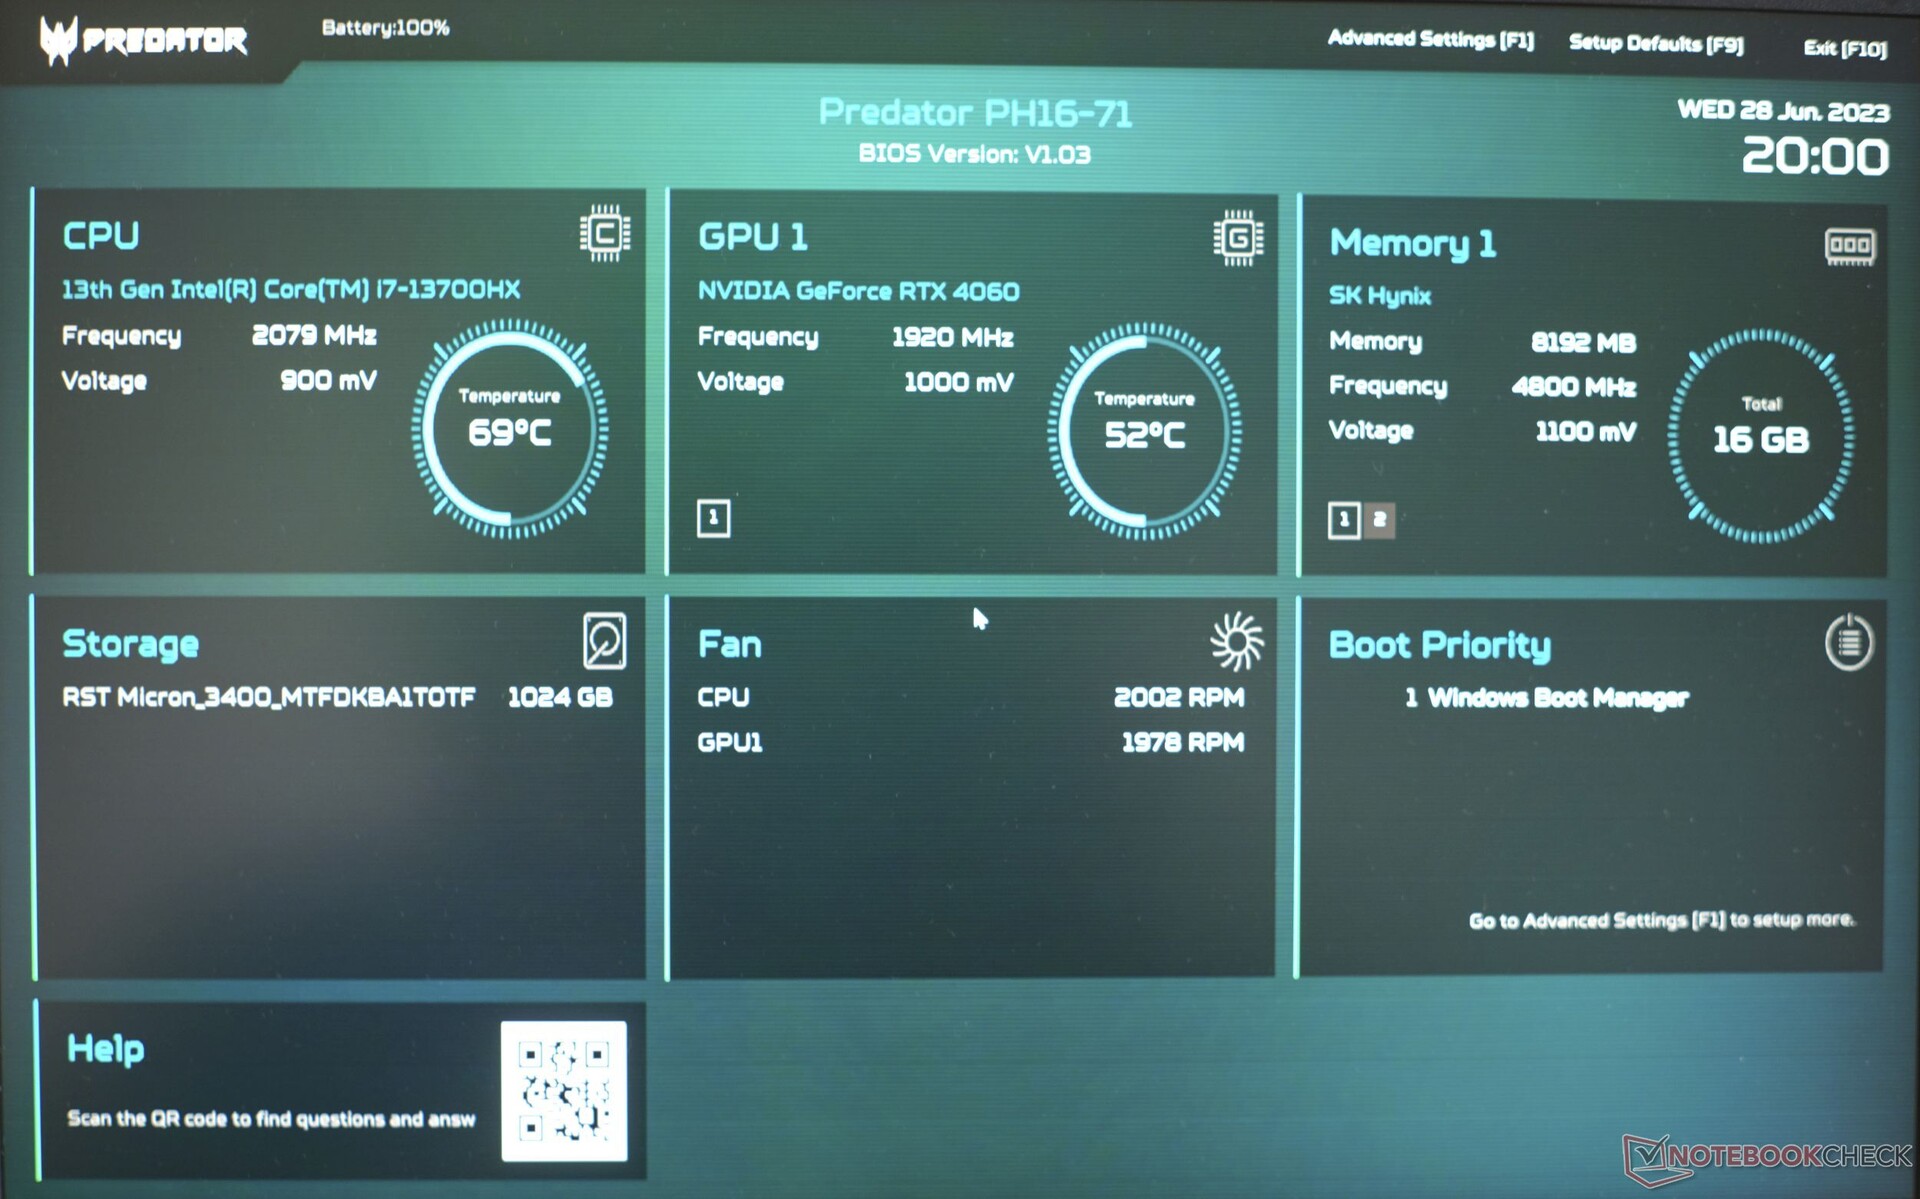
Température
L'ordinateur portable de jeu d'Acer reste étonnamment froid et, pendant les sessions de jeu, la plupart des surfaces n'atteignent même pas 40 °C. La chaleur se concentre uniquement sur le système de refroidissement en saillie à l'arrière, où les points chauds peuvent atteindre 55 °C pendant les sessions de jeu. Ce n'est que lors du test de stress combiné que nous avons mesuré un point chaud de 66 °C, bien que cela ne se produise pas dans le cadre d'une utilisation quotidienne. Les utilisateurs n'entreront généralement jamais en contact avec la barre arrière mais, lorsqu'ils sont placés sur leurs genoux, un contact occasionnel avec l'appareil sera désagréable lors des jeux.
(±) La température maximale du côté supérieur est de 41 °C / 106 F, par rapport à la moyenne de 40.4 °C / 105 F, allant de 21.2 à 68.8 °C pour la classe Gaming.
(-) Le fond chauffe jusqu'à un maximum de 66 °C / 151 F, contre une moyenne de 43.2 °C / 110 F
(±) En utilisation inactive, la température moyenne du côté supérieur est de 32.4 °C / 90 F, par rapport à la moyenne du dispositif de 33.9 °C / 93 F.
(±) En jouant à The Witcher 3, la température moyenne du côté supérieur est de 33.1 °C / 92 F, alors que la moyenne de l'appareil est de 33.9 °C / 93 F.
(+) Les repose-poignets et le pavé tactile atteignent la température maximale de la peau (32 °C / 89.6 F) et ne sont donc pas chauds.
(-) La température moyenne de la zone de l'appui-paume de dispositifs similaires était de 28.8 °C / 83.8 F (-3.2 °C / #-5.8 F).
| Acer Predator Helios 16 PH16-71-731Q Intel Core i7-13700HX, NVIDIA GeForce RTX 4060 Laptop GPU | Acer Nitro 16 AN16-41 AMD Ryzen 7 7735HS, NVIDIA GeForce RTX 4070 Laptop GPU | Lenovo Legion Pro 5 16IRX8 Intel Core i7-13700HX, NVIDIA GeForce RTX 4060 Laptop GPU | Aorus 15X ASF Intel Core i7-13700HX, NVIDIA GeForce RTX 4070 Laptop GPU | Asus TUF Gaming A16 FA617 AMD Ryzen 7 7735HS, AMD Radeon RX 7600S | Dell G15 5530 Intel Core i7-13650HX, NVIDIA GeForce RTX 4060 Laptop GPU | |
|---|---|---|---|---|---|---|
| Heat | 10% | 12% | 19% | -6% | -2% | |
| Maximum Upper Side * (°C) | 41 | 41.5 -1% | 42.8 -4% | 42 -2% | 54 -32% | 54 -32% |
| Maximum Bottom * (°C) | 66 | 51.8 22% | 50 24% | 51 23% | 47 29% | 62.2 6% |
| Idle Upper Side * (°C) | 36 | 31.6 12% | 29.6 18% | 27 25% | 40 -11% | 33.4 7% |
| Idle Bottom * (°C) | 37 | 34.5 7% | 34 8% | 26 30% | 40 -8% | 33.4 10% |
* ... Moindre est la valeur, meilleures sont les performances
Épreuve d'effort
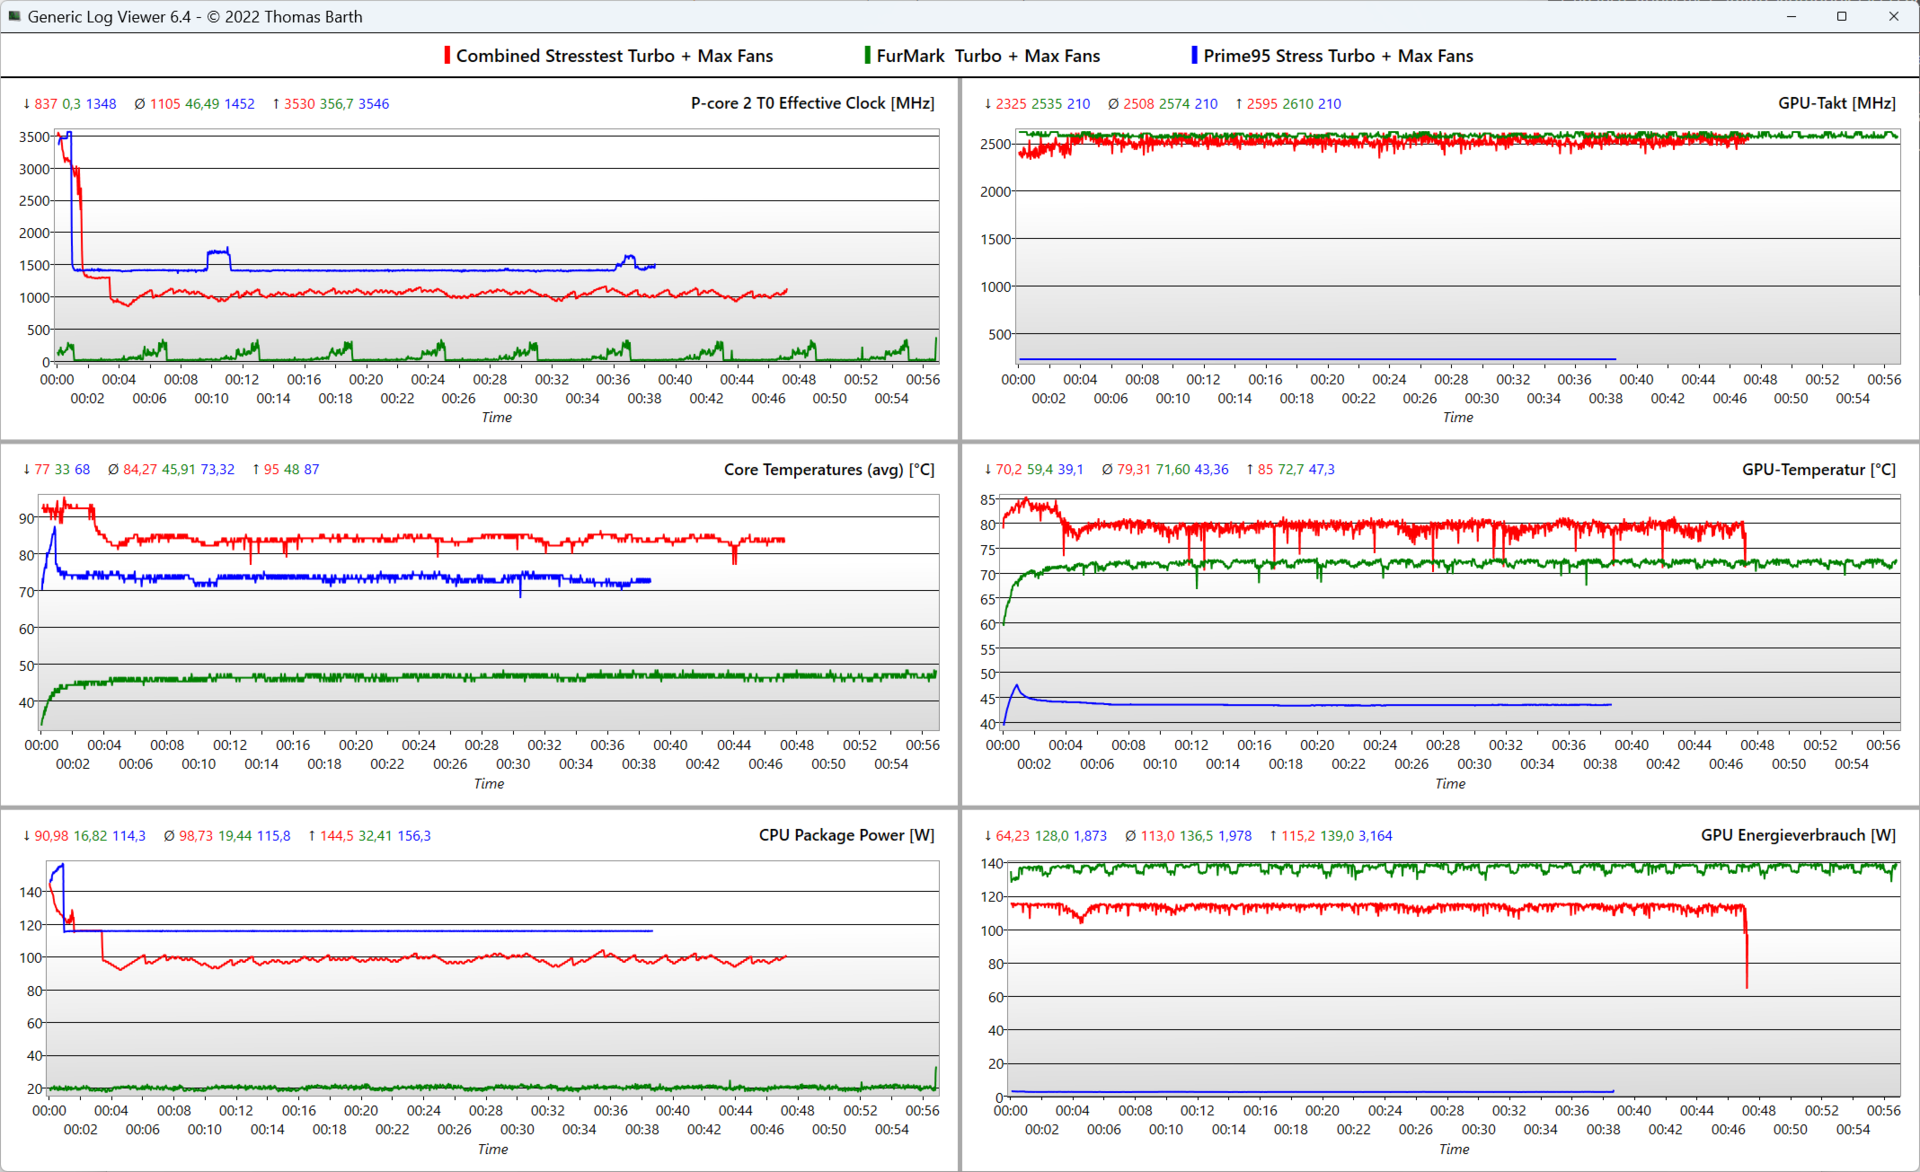
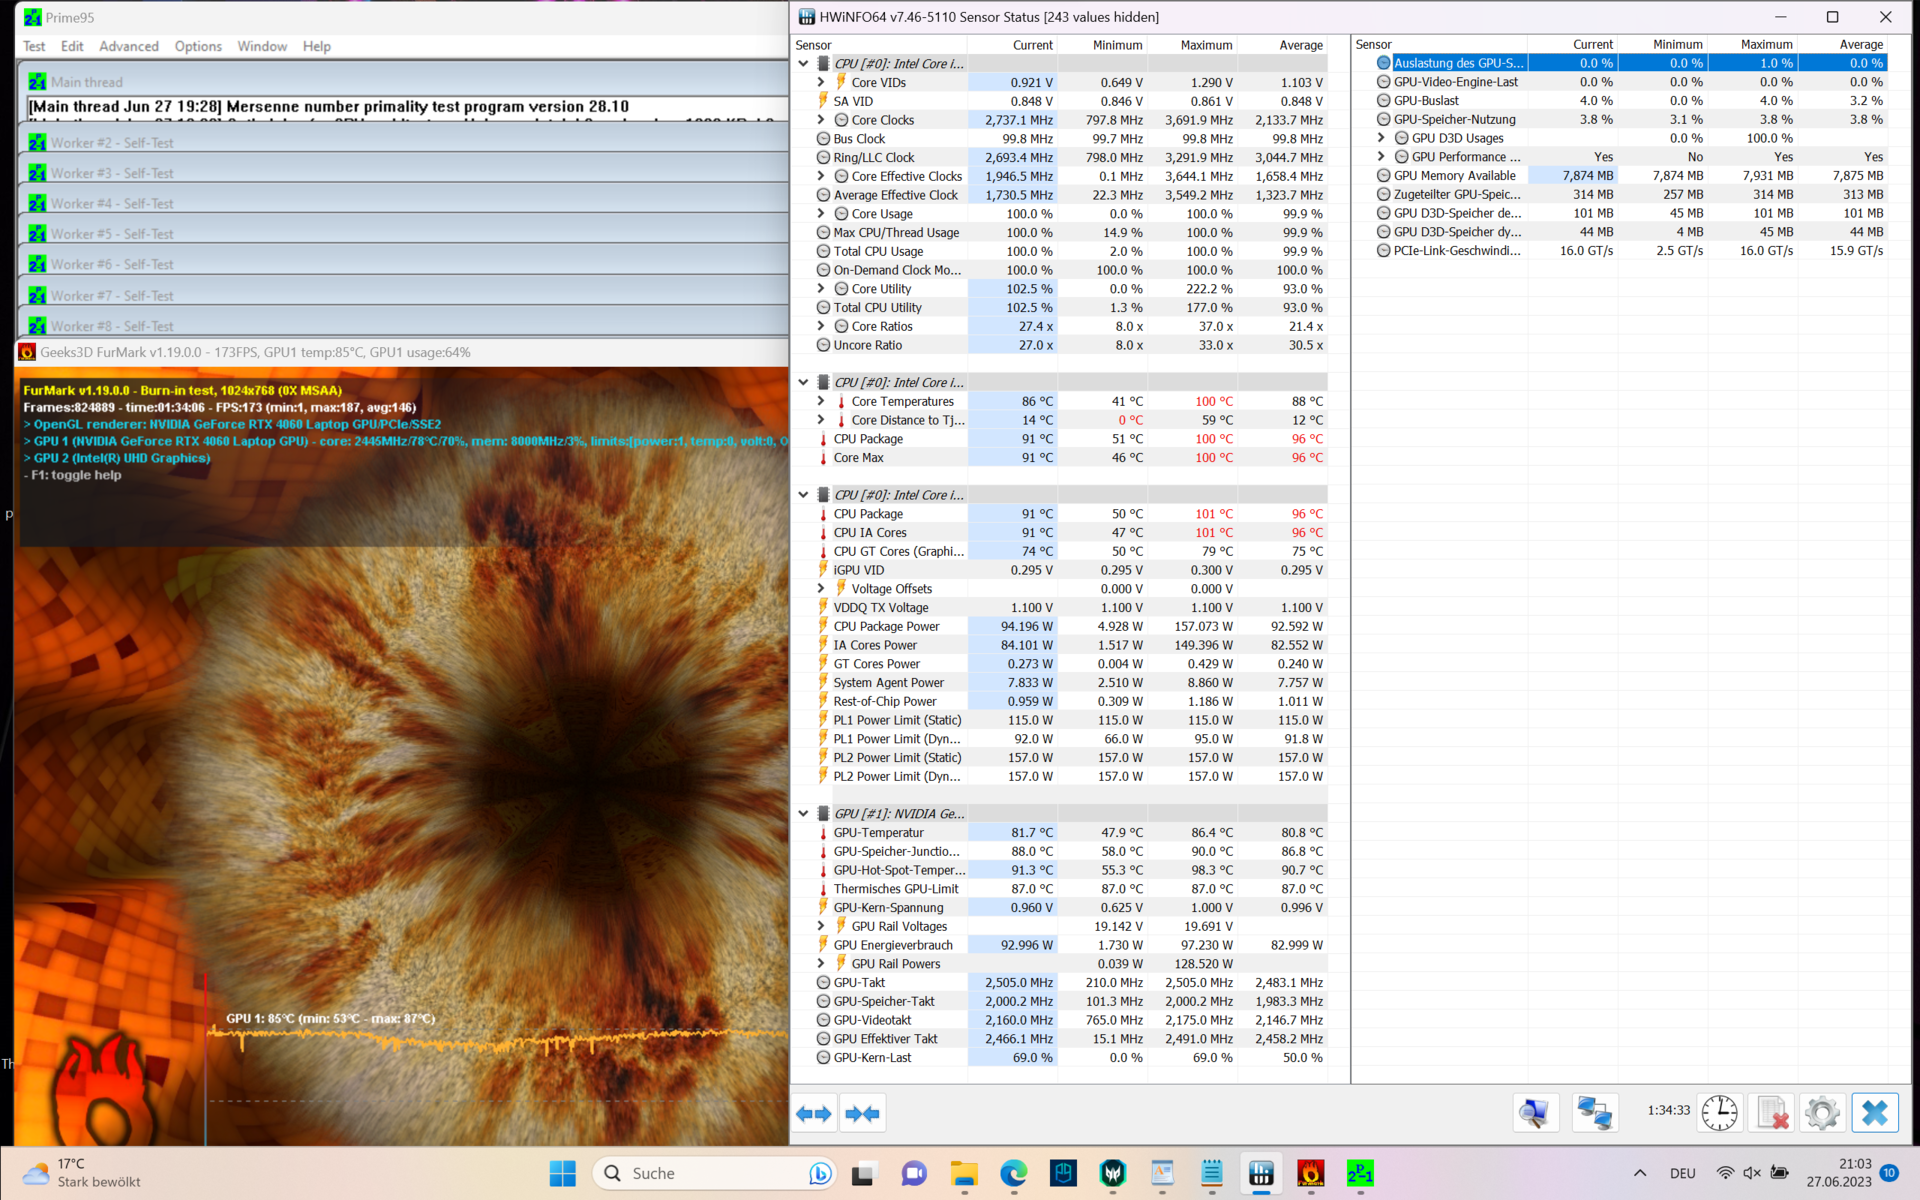
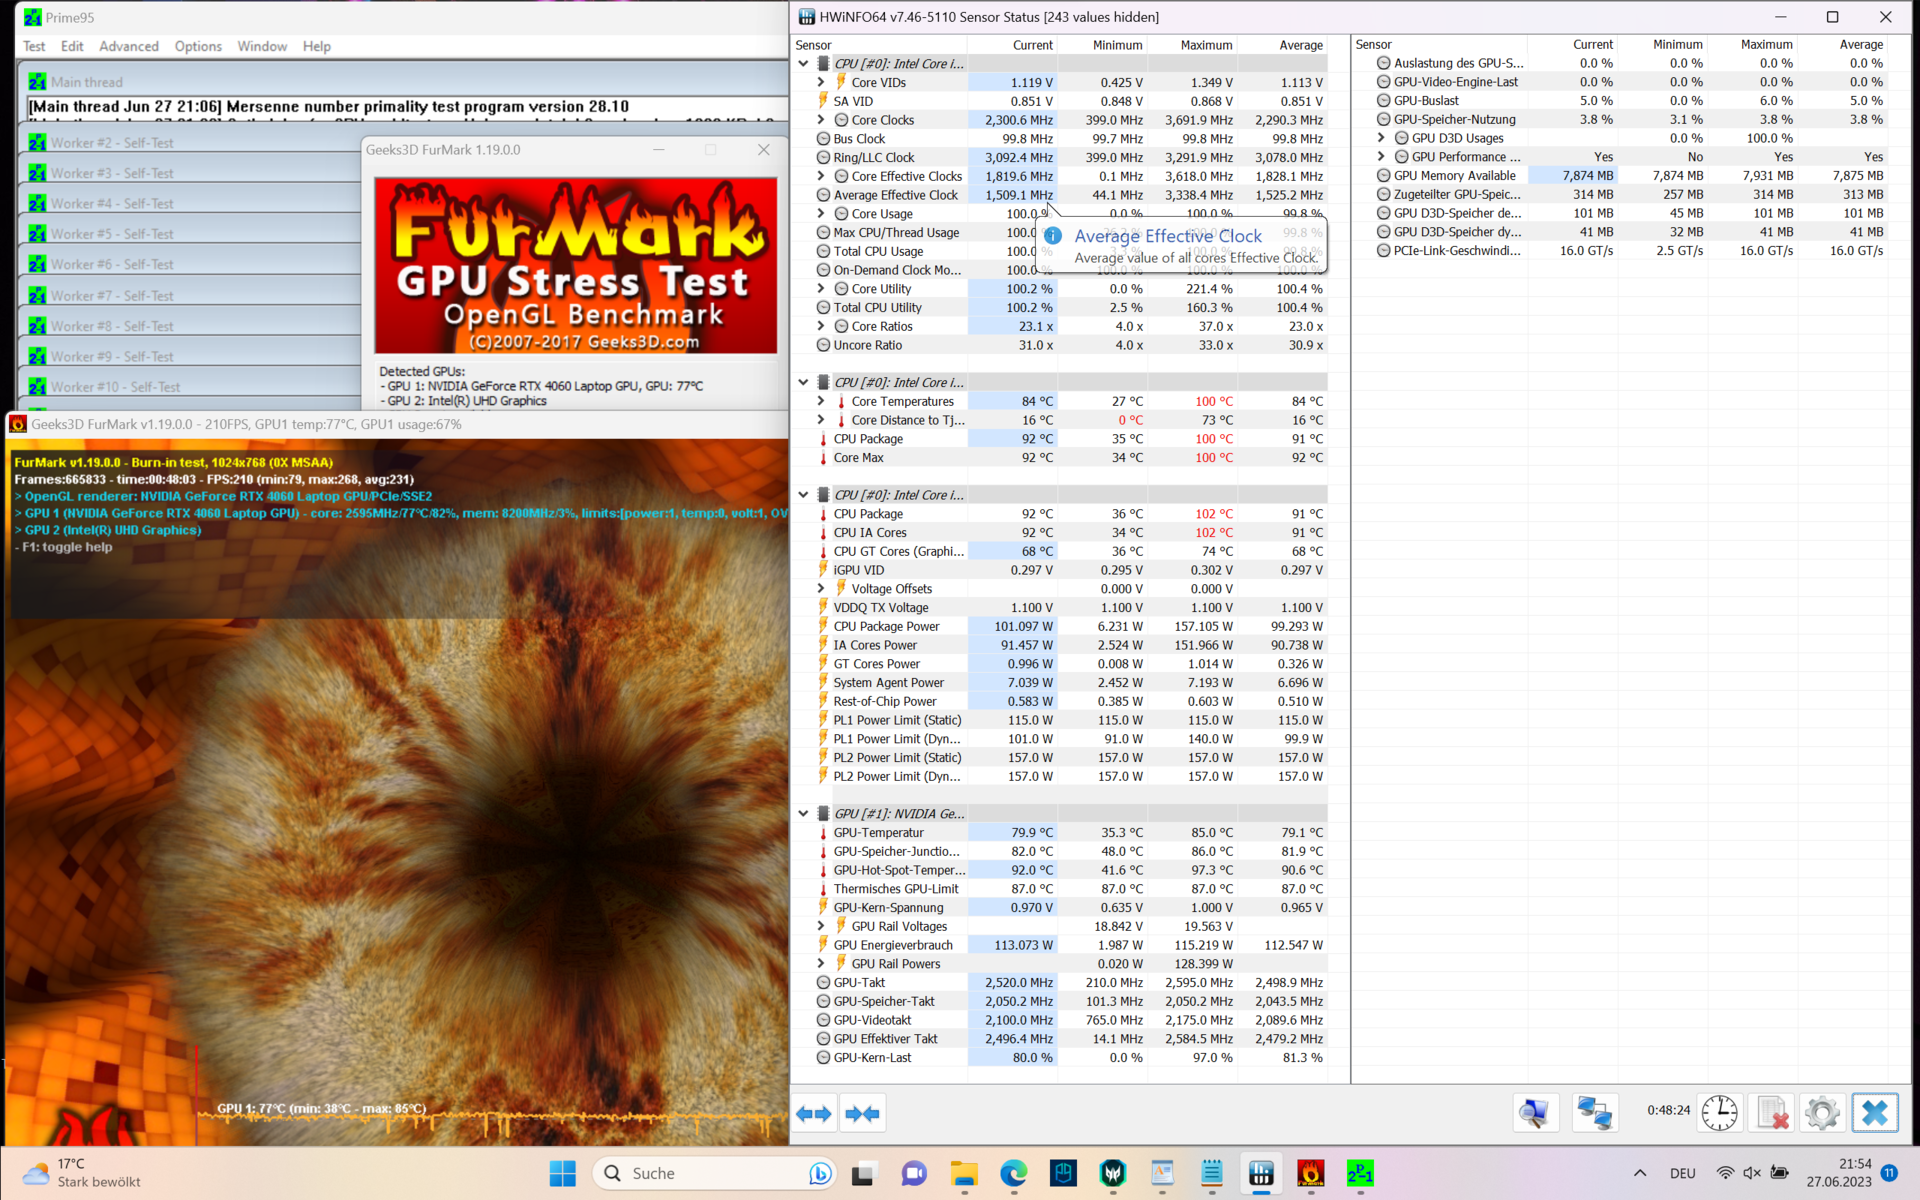
Dans le test de stress (FurMark + Prime95), après une minute, la fréquence d'horloge des P-cores est passée de 3,6 GHz à seulement 0,85 GHz, ce qui est nettement inférieur à la fréquence d'horloge de base de 2,1 GHz. En activant le mode turbo et les "ventilateurs max", la fréquence d'horloge n'a chuté qu'après 3 minutes (à ~1,1 GHz). Le CPU chauffe jusqu'à 86 °C (et 83 °C, respectivement) et consomme 100 watts en continu.
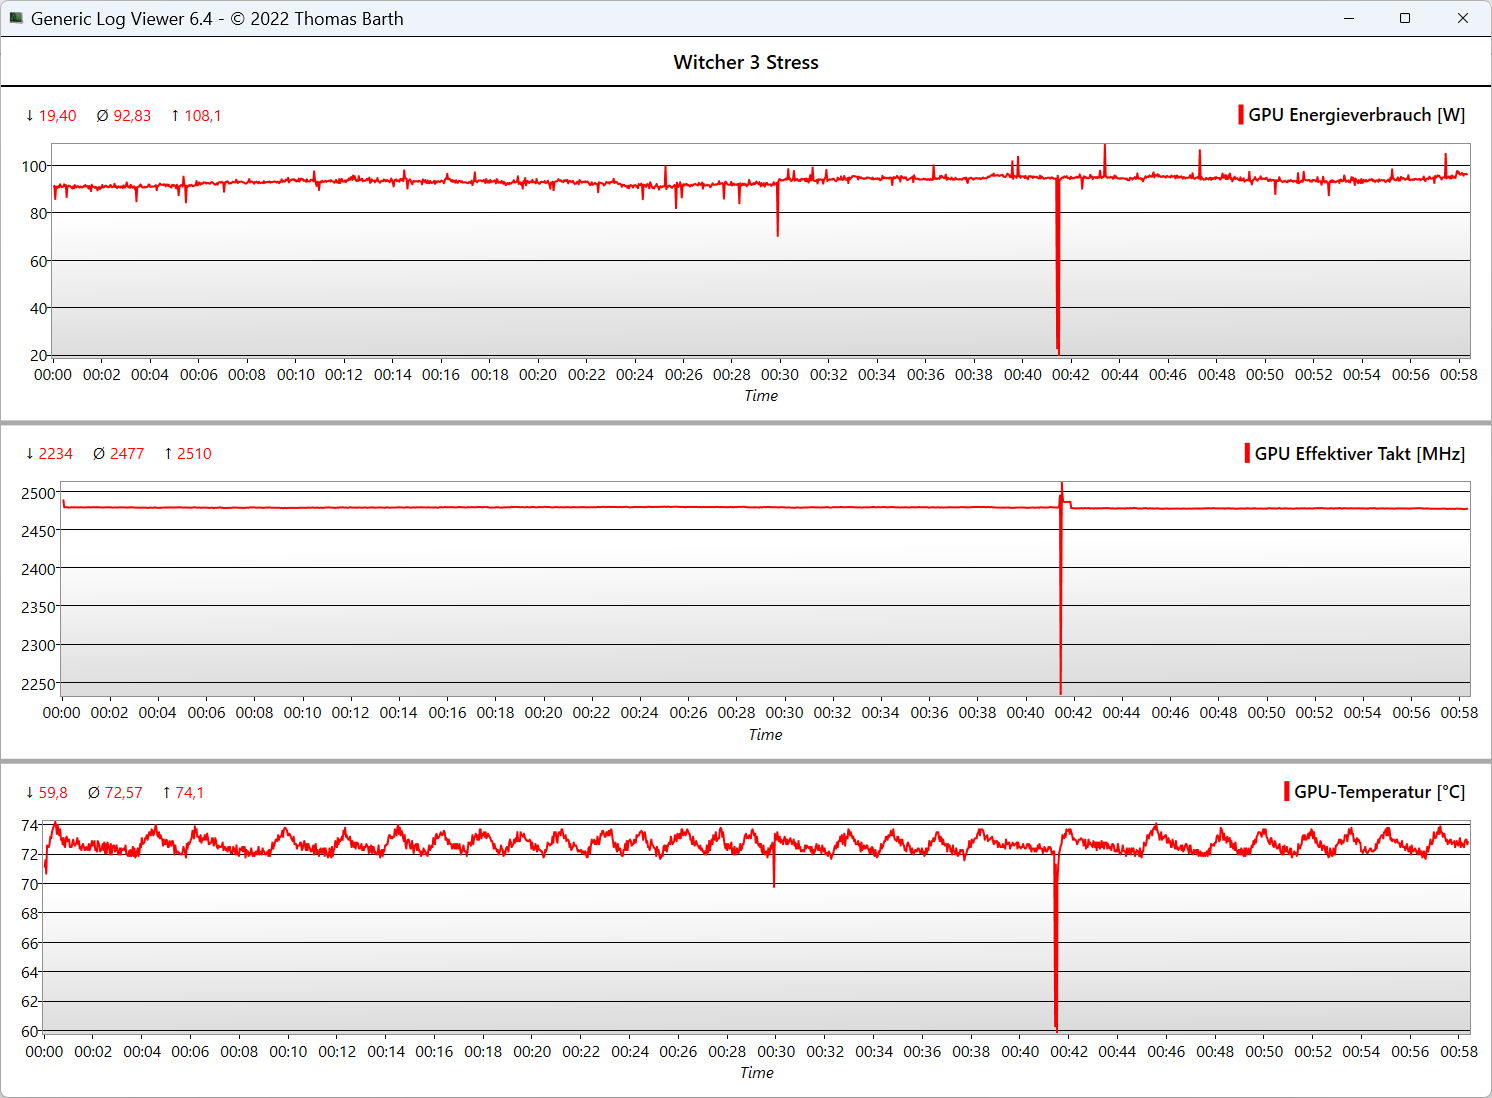
Le GPU maintient plus ou moins sa vitesse d'horloge entre 2 500 et 2 600 MHz, ne chauffe pas trop (81 °C) et consomme 115 watts. Dans le test de stress Witcher 3 et dans presque tous les jeux, laRTX 4060 n'a besoin que de 100 watts pour atteindre sa vitesse d'horloge maximale. En revanche, dans les modèles équipés d'uneRTX 4080cela devrait être différent.
Dans le test de stress GPU pur (FurMark), le GPU a continué à atteindre presque la vitesse d'horloge maximale d'environ 2.430 MHz, consommant 129 watts et chauffant jusqu'à 76 °C. En mode turbo + ventilateurs max, on atteint 2.625 MHz (léger overclocking), avec une consommation de 136 watts (pic à 139 watts), alors que le GPU reste relativement froid à 71,5 °C.
Même pendant le stress CPU pur, après une minute, les cœurs P ne tournent qu'à 0,92 GHz car ils sont limités à 100 watts, bien que le CPU n'atteigne que 70 °C. Le système de refroidissement pourrait clairement gérer plus. Si le mode turbo et les ventilateurs max sont activés, le processeur atteint encore 1,45 GHz à 115 watts et 73 °C. La possibilité de sélectionner les limites du PL aurait été judicieuse, en particulier lorsque l'on choisit un SKU avec un Core i9-13900HX.
| @Performance Mode | Horloge P-Cores/ E-Cores (GHz) | Horloge GPU (MHz) | Température moyenne du CPU (°C) | Température moyenne du GPU (°C) |
| Système au repos | 0,07 / 0,07 | - | 33 | 37 |
| Prime95 Stress | 0,95 / 3,5 | 10 | 71 | 49 |
| Prime95 + FurMark | 0,85 / 3,4 | 2.500 | 86 | 81 |
| FurMark Stress | 0,55 / 0,02 | 2.450 | 54 | 76 |
| Witcher 3 Stress | 1,6 / 0,02 | 2.475 | 61 | 73 |
Intervenants
Les haut-parleurs stéréo de 2 watts orientés vers le bas produisent des médiums et des aigus équilibrés, mais les basses sont presque totalement absentes, tandis que le volume maximal de 76,1 dB(A) est plutôt moyen. Les ordinateurs portables de jeu de notre comparatif ne font pas mieux.
Les ordinateurs portables de jeu de notre comparatif ne font pas mieux.Asus ROG Strix G16d'Asus, le Legion Pro 7de Lenovo offre un meilleur son ou vous pouvez utiliser un casque ou un système audio via la prise audio ou Bluetooth.
Acer Predator Helios 16 PH16-71-731Q analyse audio
(±) | le niveau sonore du haut-parleur est moyen mais bon (76.12# dB)
Basses 100 - 315 Hz
(-) | presque aucune basse - en moyenne 15% plus bas que la médiane
(-) | les basses ne sont pas linéaires (15% delta à la fréquence précédente)
Médiums 400 - 2000 Hz
(+) | médiane équilibrée - seulement 2.5% de la médiane
(+) | les médiums sont linéaires (5.9% delta à la fréquence précédente)
Aiguës 2 - 16 kHz
(+) | des sommets équilibrés - à seulement 2.9% de la médiane
(±) | la linéarité des aigus est moyenne (8.4% delta à la fréquence précédente)
Globalement 100 - 16 000 Hz
(+) | le son global est linéaire (13.6% différence à la médiane)
Par rapport à la même classe
» 20% de tous les appareils testés de cette catégorie étaient meilleurs, 7% similaires, 73% pires
» Le meilleur avait un delta de 6%, la moyenne était de 18%, le pire était de 132%.
Par rapport à tous les appareils testés
» 15% de tous les appareils testés étaient meilleurs, 4% similaires, 82% pires
» Le meilleur avait un delta de 4%, la moyenne était de 24%, le pire était de 134%.
Lenovo Legion Pro 5 16IRX8 analyse audio
(±) | le niveau sonore du haut-parleur est moyen mais bon (72.7# dB)
Basses 100 - 315 Hz
(-) | presque aucune basse - en moyenne 23.7% plus bas que la médiane
(±) | la linéarité des basses est moyenne (10.7% delta à la fréquence précédente)
Médiums 400 - 2000 Hz
(+) | médiane équilibrée - seulement 3.8% de la médiane
(±) | la linéarité des médiums est moyenne (7.1% delta à la fréquence précédente)
Aiguës 2 - 16 kHz
(+) | des sommets équilibrés - à seulement 3.7% de la médiane
(+) | les aigus sont linéaires (6.7% delta à la fréquence précédente)
Globalement 100 - 16 000 Hz
(±) | la linéarité du son global est moyenne (21.9% de différence avec la médiane)
Par rapport à la même classe
» 79% de tous les appareils testés de cette catégorie étaient meilleurs, 6% similaires, 16% pires
» Le meilleur avait un delta de 6%, la moyenne était de 18%, le pire était de 132%.
Par rapport à tous les appareils testés
» 63% de tous les appareils testés étaient meilleurs, 7% similaires, 31% pires
» Le meilleur avait un delta de 4%, la moyenne était de 24%, le pire était de 134%.
Gestion de l'énergie : Consommation élevée en mode veille, réduction de la durée de vie de la batterie
Consommation électrique
Avec 20 watts, la consommation au repos est très élevée, même pour un système Intel HX, tandis que les systèmes AMD HS offrent les meilleurs résultats parmi les concurrents d'Acer.
la consommation de 175 watts en jeu est relativement faible, cependant, presque tous les ordinateurs portables RTX 4060 enregistrent cette valeur puisque le GPU atteint sa vitesse d'horloge maximale à 100 watts. 240 watts à 276 watts ne sont atteints que dans le test de stress quotidien (et non typique), ce qui est facilement absorbé par le bloc d'alimentation de 330 watts.
| Éteint/en veille | |
| Au repos | |
| Fortement sollicité |
|
Légende:
min: | |
| Acer Predator Helios 16 PH16-71-731Q i7-13700HX, GeForce RTX 4060 Laptop GPU, Micron 3400 1TB MTFDKBA1T0TFH, IPS-LED, 2560x1600, 16" | Acer Nitro 16 AN16-41 R7 7735HS, GeForce RTX 4070 Laptop GPU, Samsung PM9A1 MZVL21T0HCLR, IPS, 2560x1600, 16" | Lenovo Legion Pro 5 16IRX8 i7-13700HX, GeForce RTX 4060 Laptop GPU, SK hynix PC801 HFS512GEJ9X115N, IPS, 2560x1600, 16" | Aorus 15X ASF i7-13700HX, GeForce RTX 4070 Laptop GPU, Gigabyte AG470S1TB-SI B10, IPS, 2560x1440, 15.6" | Asus TUF Gaming A16 FA617 R7 7735HS, Radeon RX 7600S, Micron 2400 MTFDKBA1T0QFM, IPS-Level, 1920x1200, 16" | Dell G15 5530 i7-13650HX, GeForce RTX 4060 Laptop GPU, SSTC CL4-3D512-Q11, IPS, 1920x1080, 15.6" | Moyenne NVIDIA GeForce RTX 4060 Laptop GPU | Moyenne de la classe Gaming | |
|---|---|---|---|---|---|---|---|---|
| Power Consumption | 11% | -24% | 6% | 29% | 18% | 18% | 2% | |
| Idle Minimum * (Watt) | 15.9 | 11.6 27% | 24.5 -54% | 11 31% | 8 50% | 8.4 47% | 11.5 ? 28% | 13.3 ? 16% |
| Idle Average * (Watt) | 20.5 | 15.6 24% | 29.2 -42% | 16 22% | 11 46% | 14.98 27% | 16 ? 22% | 19 ? 7% |
| Idle Maximum * (Watt) | 20.9 | 16.5 21% | 34.3 -64% | 24 -15% | 16 23% | 15.56 26% | 20.3 ? 3% | 24.5 ? -17% |
| Load Average * (Watt) | 106 | 155 -46% | 98.7 7% | 104 2% | 97 8% | 96.8 9% | 92.9 ? 12% | 108.1 ? -2% |
| Witcher 3 ultra * (Watt) | 175 | 154.8 12% | 178.6 -2% | 185.4 -6% | 161.5 8% | 186 -6% | ||
| Load Maximum * (Watt) | 276 | 205 26% | 249.6 10% | 272 1% | 168 39% | 271.42 2% | 210 ? 24% | 254 ? 8% |
* ... Moindre est la valeur, meilleures sont les performances
Power consumption Witcher 3 / stress test
Power consumption with an external monitor
Durée de vie de la batterie
Avec une luminosité de 150 cd/m² lors de la navigation sur Internet et un taux de rafraîchissement variable de 120 à 240 Hz, l'autonomie de l'Helios 16 est d'un peu plus de 5,5 heures, ce qui correspond à peu près à la moyenne des ordinateurs portables de jeu. Les systèmes AMD, leAcer Nitro 16et leAsus TUF Gaming A16ont une autonomie beaucoup plus longue, respectivement de 9 et 12 heures. Avec seulement 3,5 heures, leLegion Pro 5 16 est à la traîne.
Après une demi-heure, la batterie est rechargée à 50 % et à 100 % en 1 h 15 environ. Il est également possible de recharger l'ordinateur portable via l'USB-C, mais cette opération est plus lente.
| Acer Predator Helios 16 PH16-71-731Q i7-13700HX, GeForce RTX 4060 Laptop GPU, 90 Wh | Acer Nitro 16 AN16-41 R7 7735HS, GeForce RTX 4070 Laptop GPU, 90 Wh | Lenovo Legion Pro 5 16IRX8 i7-13700HX, GeForce RTX 4060 Laptop GPU, 80 Wh | Aorus 15X ASF i7-13700HX, GeForce RTX 4070 Laptop GPU, 99 Wh | Asus TUF Gaming A16 FA617 R7 7735HS, Radeon RX 7600S, 90 Wh | Dell G15 5530 i7-13650HX, GeForce RTX 4060 Laptop GPU, 86 Wh | Moyenne de la classe Gaming | |
|---|---|---|---|---|---|---|---|
| Autonomie de la batterie | 65% | -46% | 48% | 58% | -9% | 32% | |
| H.264 (h) | 4.8 | 10.2 113% | 7.9 65% | 6.8 42% | 8.26 ? 72% | ||
| WiFi v1.3 (h) | 5.6 | 9 61% | 3.4 -39% | 8.2 46% | 12.1 116% | 6.5 16% | 7.01 ? 25% |
| Witcher 3 ultra (h) | 1.5 | 0.8 -47% | |||||
| Load (h) | 1.5 | 1.8 20% | 0.7 -53% | 2 33% | 1.5 0% | 0.8 -47% | 1.47 ? -2% |
| Reader / Idle (h) | 12.2 | 6.7 | 11.3 | 20.2 | 8.71 ? |
Points positifs
Points négatifs
Verdict : Le solide ordinateur portable de jeu RTX 4060 peut aussi être silencieux
L'ordinateur portable de jeu Acer Predator Helios 16 a de nombreux points forts, mais aussi quelques petits compromis. Nous avons été positivement surpris par l'écran QHD rapide, aux couleurs vives et à 240 Hz, avec 97 % de DCI P3 et Dolby Vision, ce qui signifie que rien ne vient entraver le travail créatif.
Associé à la puissance du processeur Intel HX et à la très puissanteRTX 4060vous obtenez un ordinateur portable de jeu de milieu de gamme avec de nombreux éléments haut de gamme.
Nous avons également été impressionnés par le boîtier métallique, même si le clavier fléchit un peu. Les touches elles-mêmes pourraient avoir plus de retour, mais, à l'inverse, nous avons apprécié l'éclairage des touches par mini-LED aux couleurs particulièrement vives et peu gourmandes en énergie. Néanmoins, l'autonomie de la batterie est médiocre et sera probablement encore plus courte si l'on utilise l'écran mini-LED disponible en option - surtout lorsqu'il est combiné avec le SKU le plus puissant (Core i9-13900HX + RTX 4080).
Des performances de haut niveau, un écran QHD de 240 Hz et le calme et la tranquillité dans les jeux : voilà la recette idéale pour un ordinateur portable de jeu et une station de travail créative. Cependant, nous devons accepter certains compromis.
Le puissant système de refroidissement permet de maintenir les températures internes à un niveau bas, ce qui garantit des performances stables et silencieuses, en particulier en mode équilibré ou silencieux. Ce qui nous a manqué, c'est la possibilité de personnaliser les limites de puissance afin de pousser le système de refroidissement à ses limites. L'étranglement du SSD lié à la température semble être une tache sur une image générale positive avec une limitation du CPU de 25 watts en mode batterie qui semble excessive.
Avec sa variante SKU, l'ordinateur portable coûte actuellement 1 900 $ et 1 750 $, respectivement, mais il est parfois possible d'acheter un modèle moins cher pour environ 1 450 $ avec un écran 165 Hz un peu moins coloré. Cependant, il est souvent possible de trouver son principal concurrent, le Lenovo Legion Pro 5 16 pour environ 1 400 $ avec l'appareil offrant presque les mêmes avantages. Les différences ne sont visibles que dans les détails, comme l'absence d'Advanced Optimus, un meilleur clavier et un écran QHD 165 Hz sans couverture DCI P3.
En outre, l'Asus ROG Strix G16 est une option intéressante, il est livré avec une RTX 4060 et coûte également environ 1 800 $. Cet investissement vous permettra également de bénéficier de meilleurs haut-parleurs, d'une plus grande autonomie, d'un clavier avec un retour d'information plus prononcé et de temps de réponse plus rapides pour l'écran.
Prix et disponibilité
L'Acer Predator Helios 16 portant le numéro de modèle PH16-71-74UU (Core i7-13700HX, RTX 4060 et écran 165 Hz) coûte actuellement 1 650 dollars sur Amazon. Le modèle mini-LED, associé à un Core i9-13900HX et à la RTX 4080, est actuellement en rupture de stock.
Acer Predator Helios 16 PH16-71-731Q
- 07/05/2023 v7 (old)
Marvin Gollor
Transparency
La sélection des appareils à examiner est effectuée par notre équipe éditoriale. L'échantillon de test a été prêté à l'auteur par le fabricant ou le détaillant pour les besoins de cet examen. Le prêteur n'a pas eu d'influence sur cette évaluation et le fabricant n'a pas reçu de copie de cette évaluation avant sa publication. Il n'y avait aucune obligation de publier cet article. En tant que média indépendant, Notebookcheck n'est pas soumis à l'autorité des fabricants, des détaillants ou des éditeurs.
Voici comment Notebookcheck teste
Chaque année, Notebookcheck examine de manière indépendante des centaines d'ordinateurs portables et de smartphones en utilisant des procédures standardisées afin de garantir que tous les résultats sont comparables. Nous avons continuellement développé nos méthodes de test depuis environ 20 ans et avons établi des normes industrielles dans le processus. Dans nos laboratoires de test, des équipements de mesure de haute qualité sont utilisés par des techniciens et des rédacteurs expérimentés. Ces tests impliquent un processus de validation en plusieurs étapes. Notre système d'évaluation complexe repose sur des centaines de mesures et de points de référence bien fondés, ce qui garantit l'objectivité.Price comparison

