Test de l'Alienware m16 R1 : une machine de jeu QHD avec RTX 4060 et Thunderbolt 4
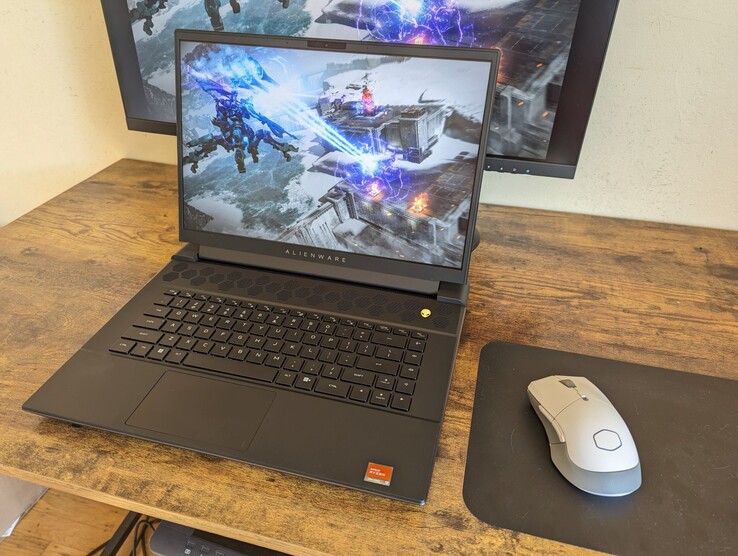
Les jeux, le rendu et la création de contenu seront probablement les principaux domaines d'application de l'Alienware m16 R1. Raptor Lake et Ada Lovelace fournissent la puissance de calcul nécessaire. Notre variante est un modèle d'entrée de gamme de la série m16-R1.modèle apparenté de l'extrémité supérieure de l'échelle de performance. Parmi les appareils concurrents, citons Acer Predator Helios 16 PH16-71le Medion Erazer Defender P40medion Erazer Defender P40, le Lenovo Legion Pro 5 16IRX8lenovo Pro 5 16IRX8 XMG Pro 15 (E23) et leAorus 15 BSF.
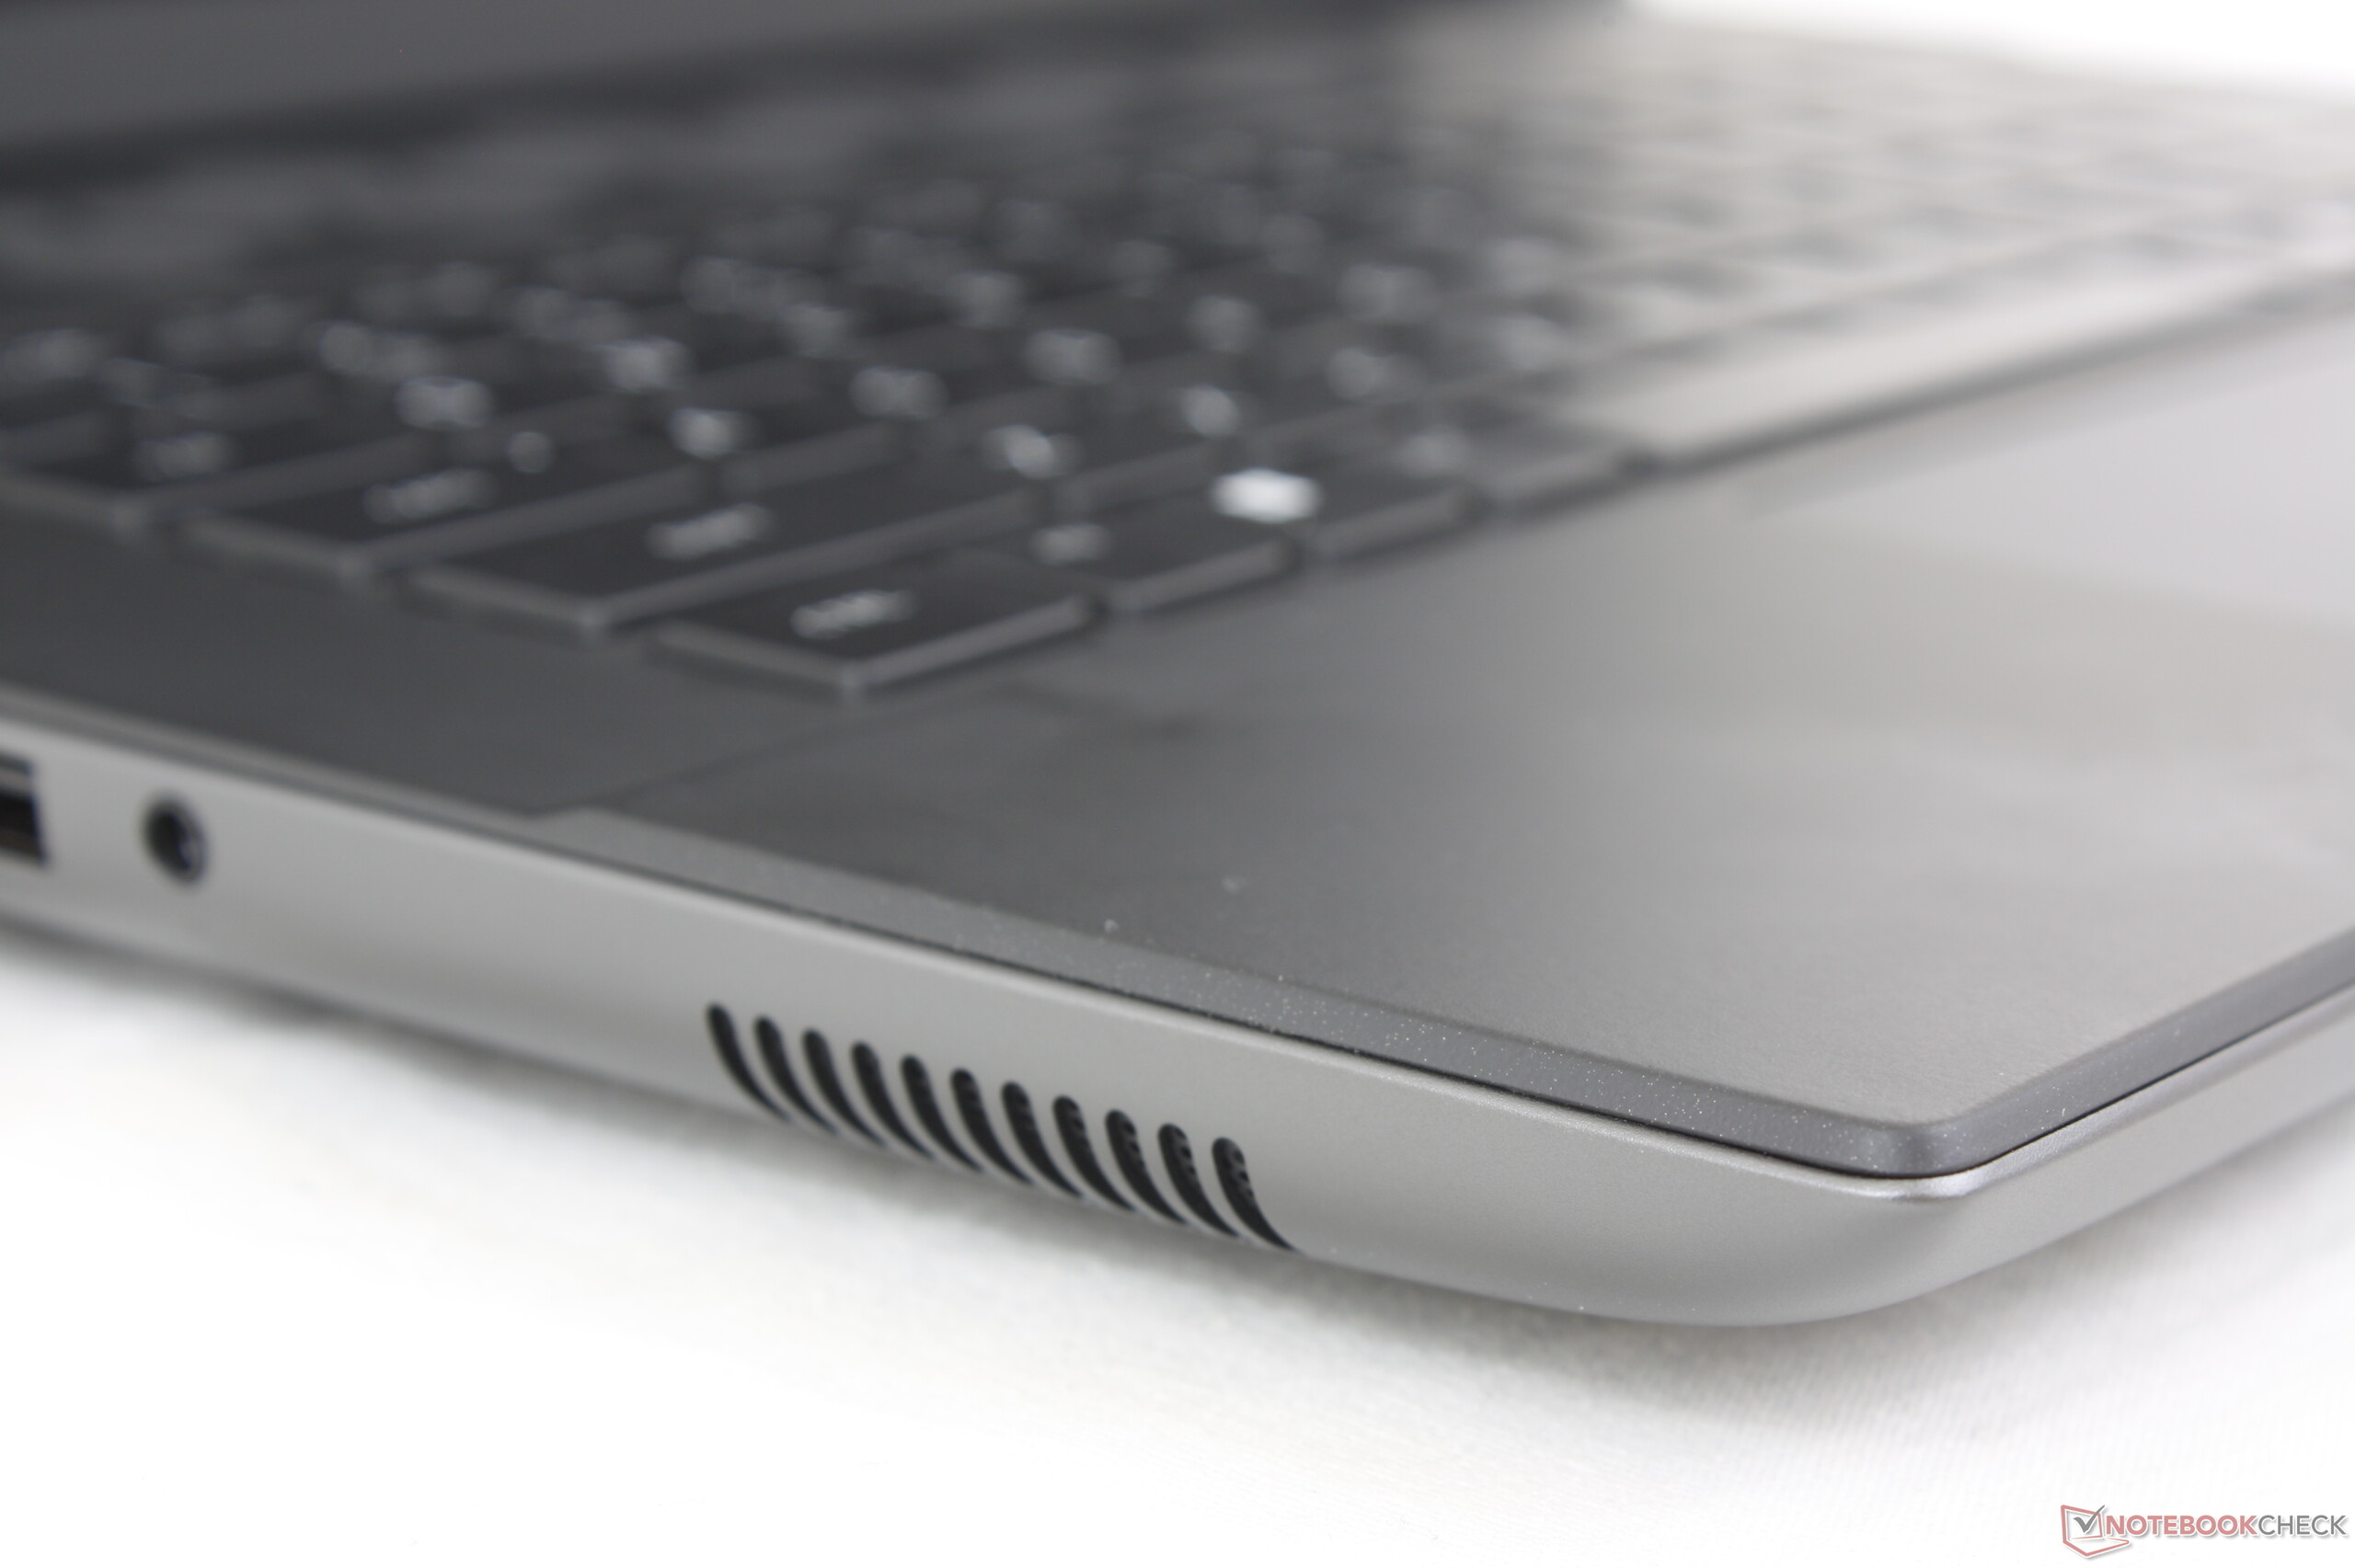
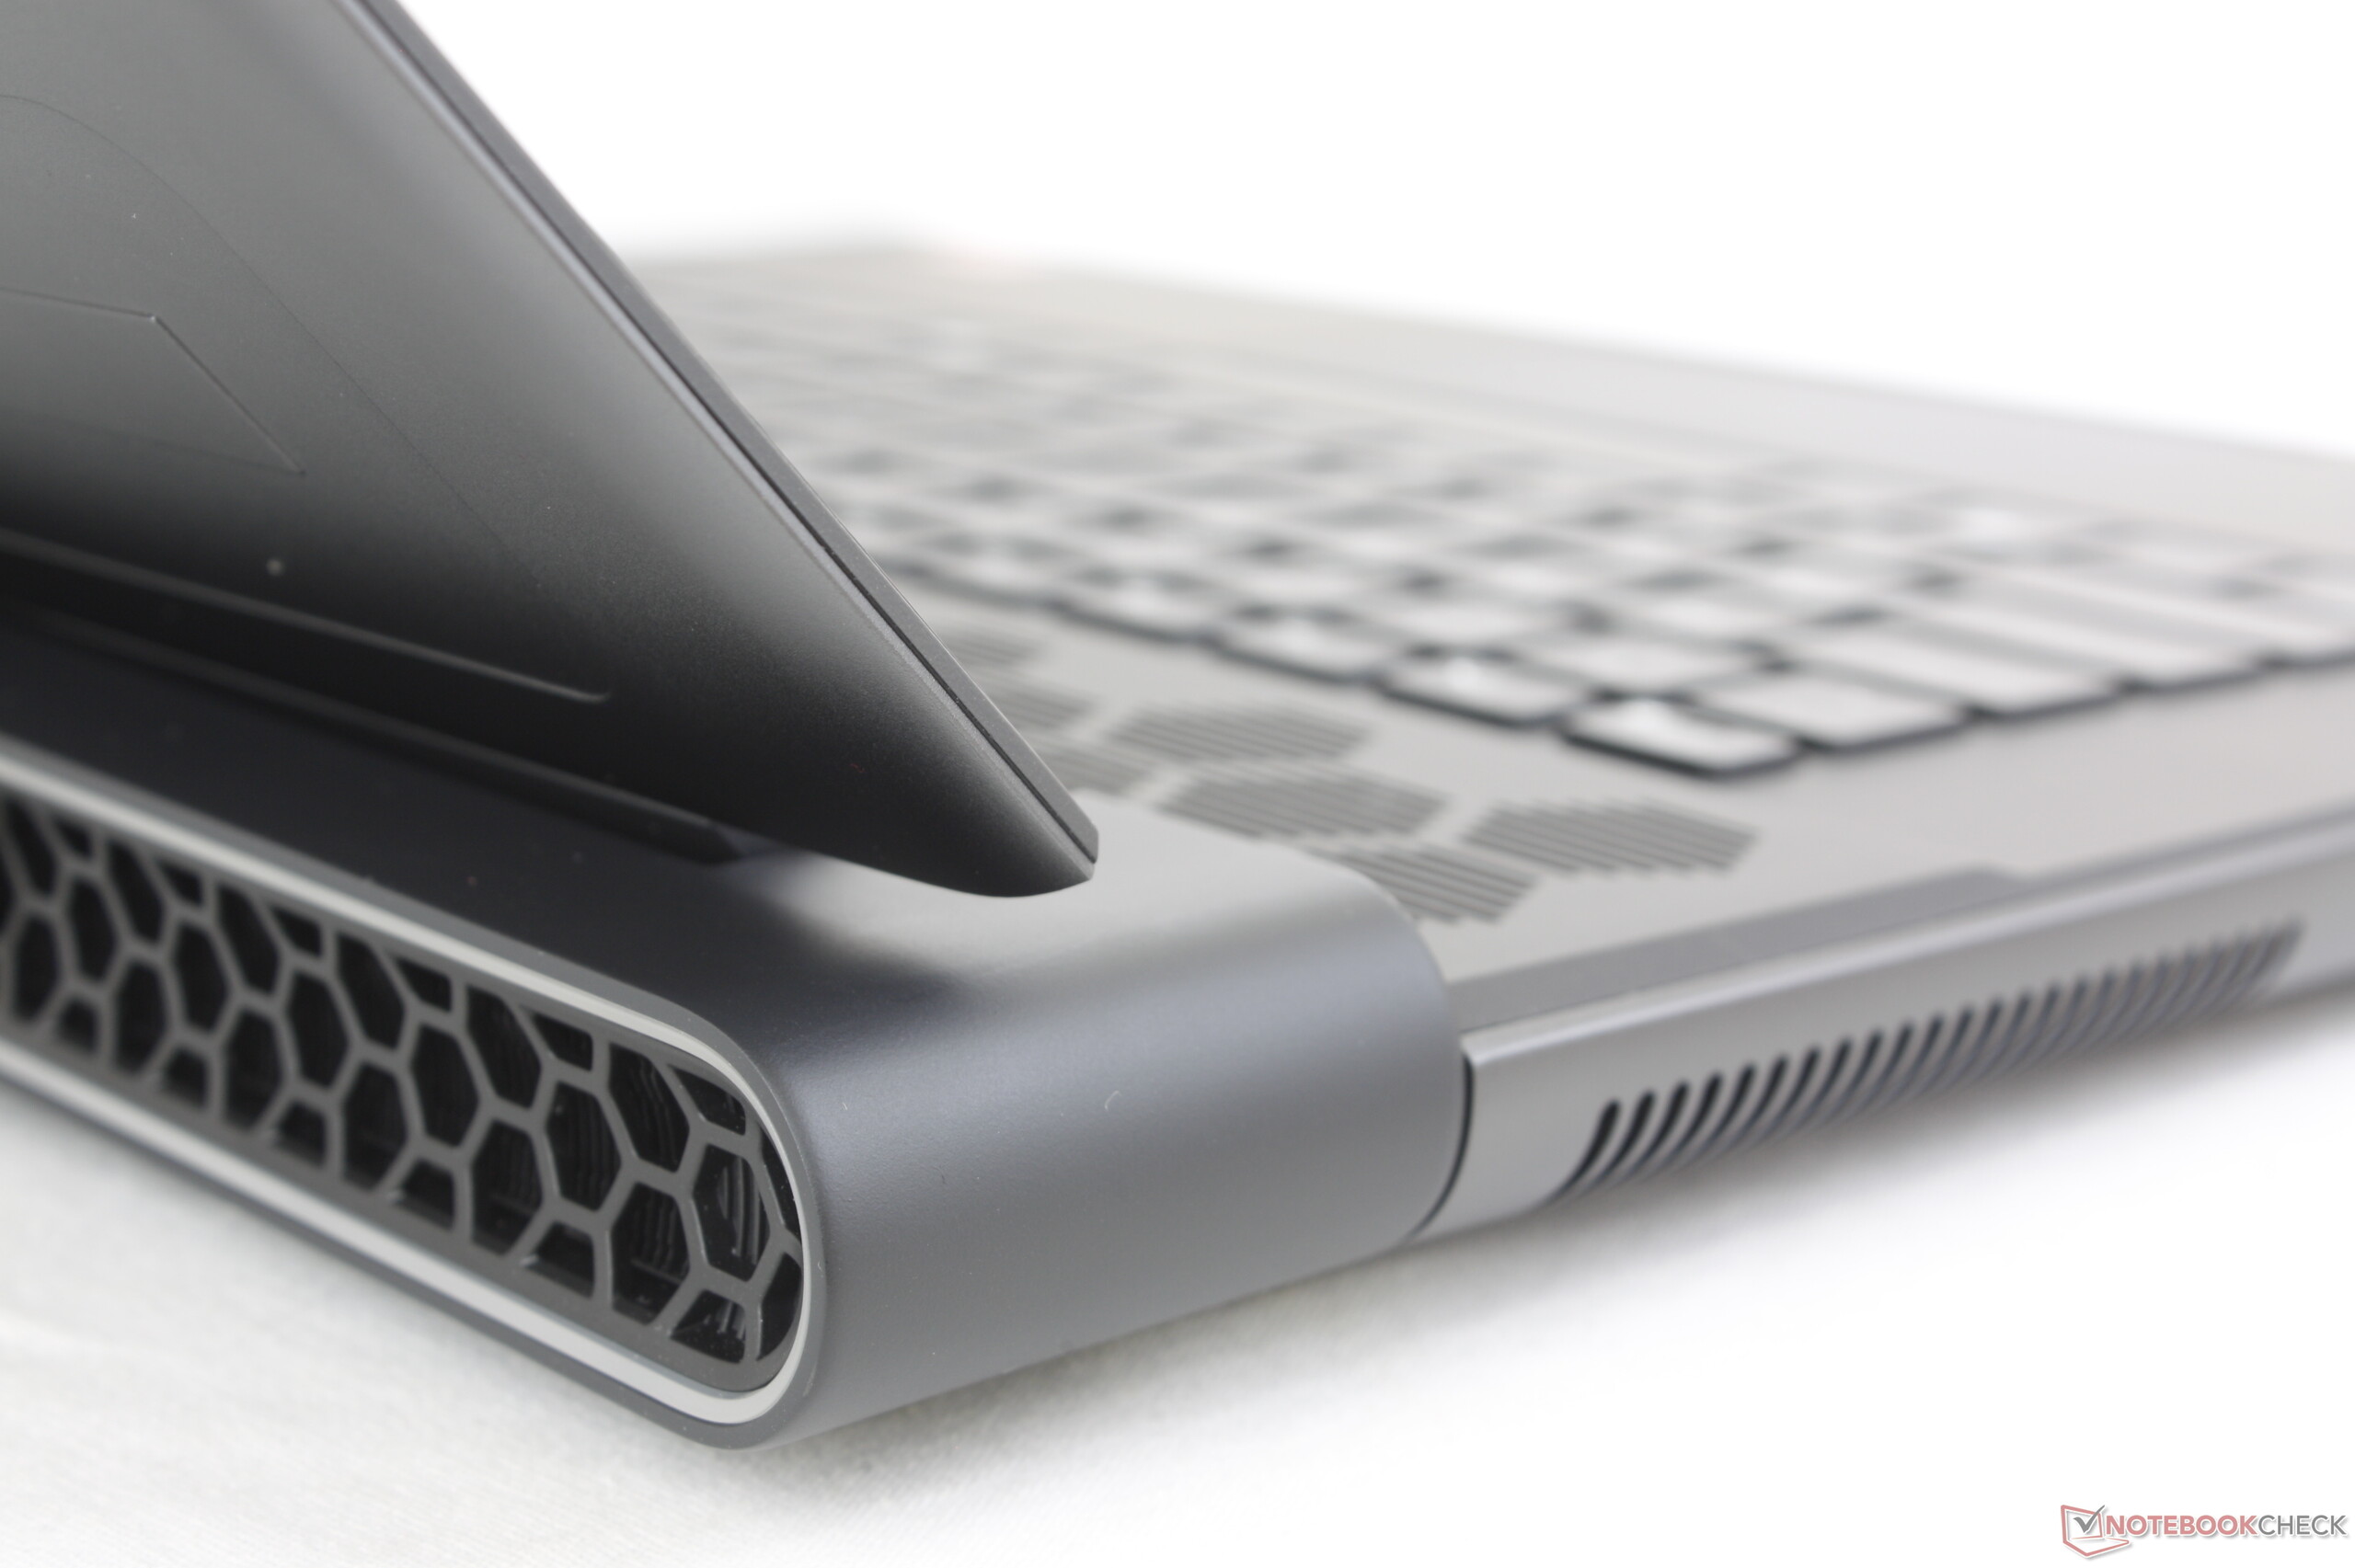
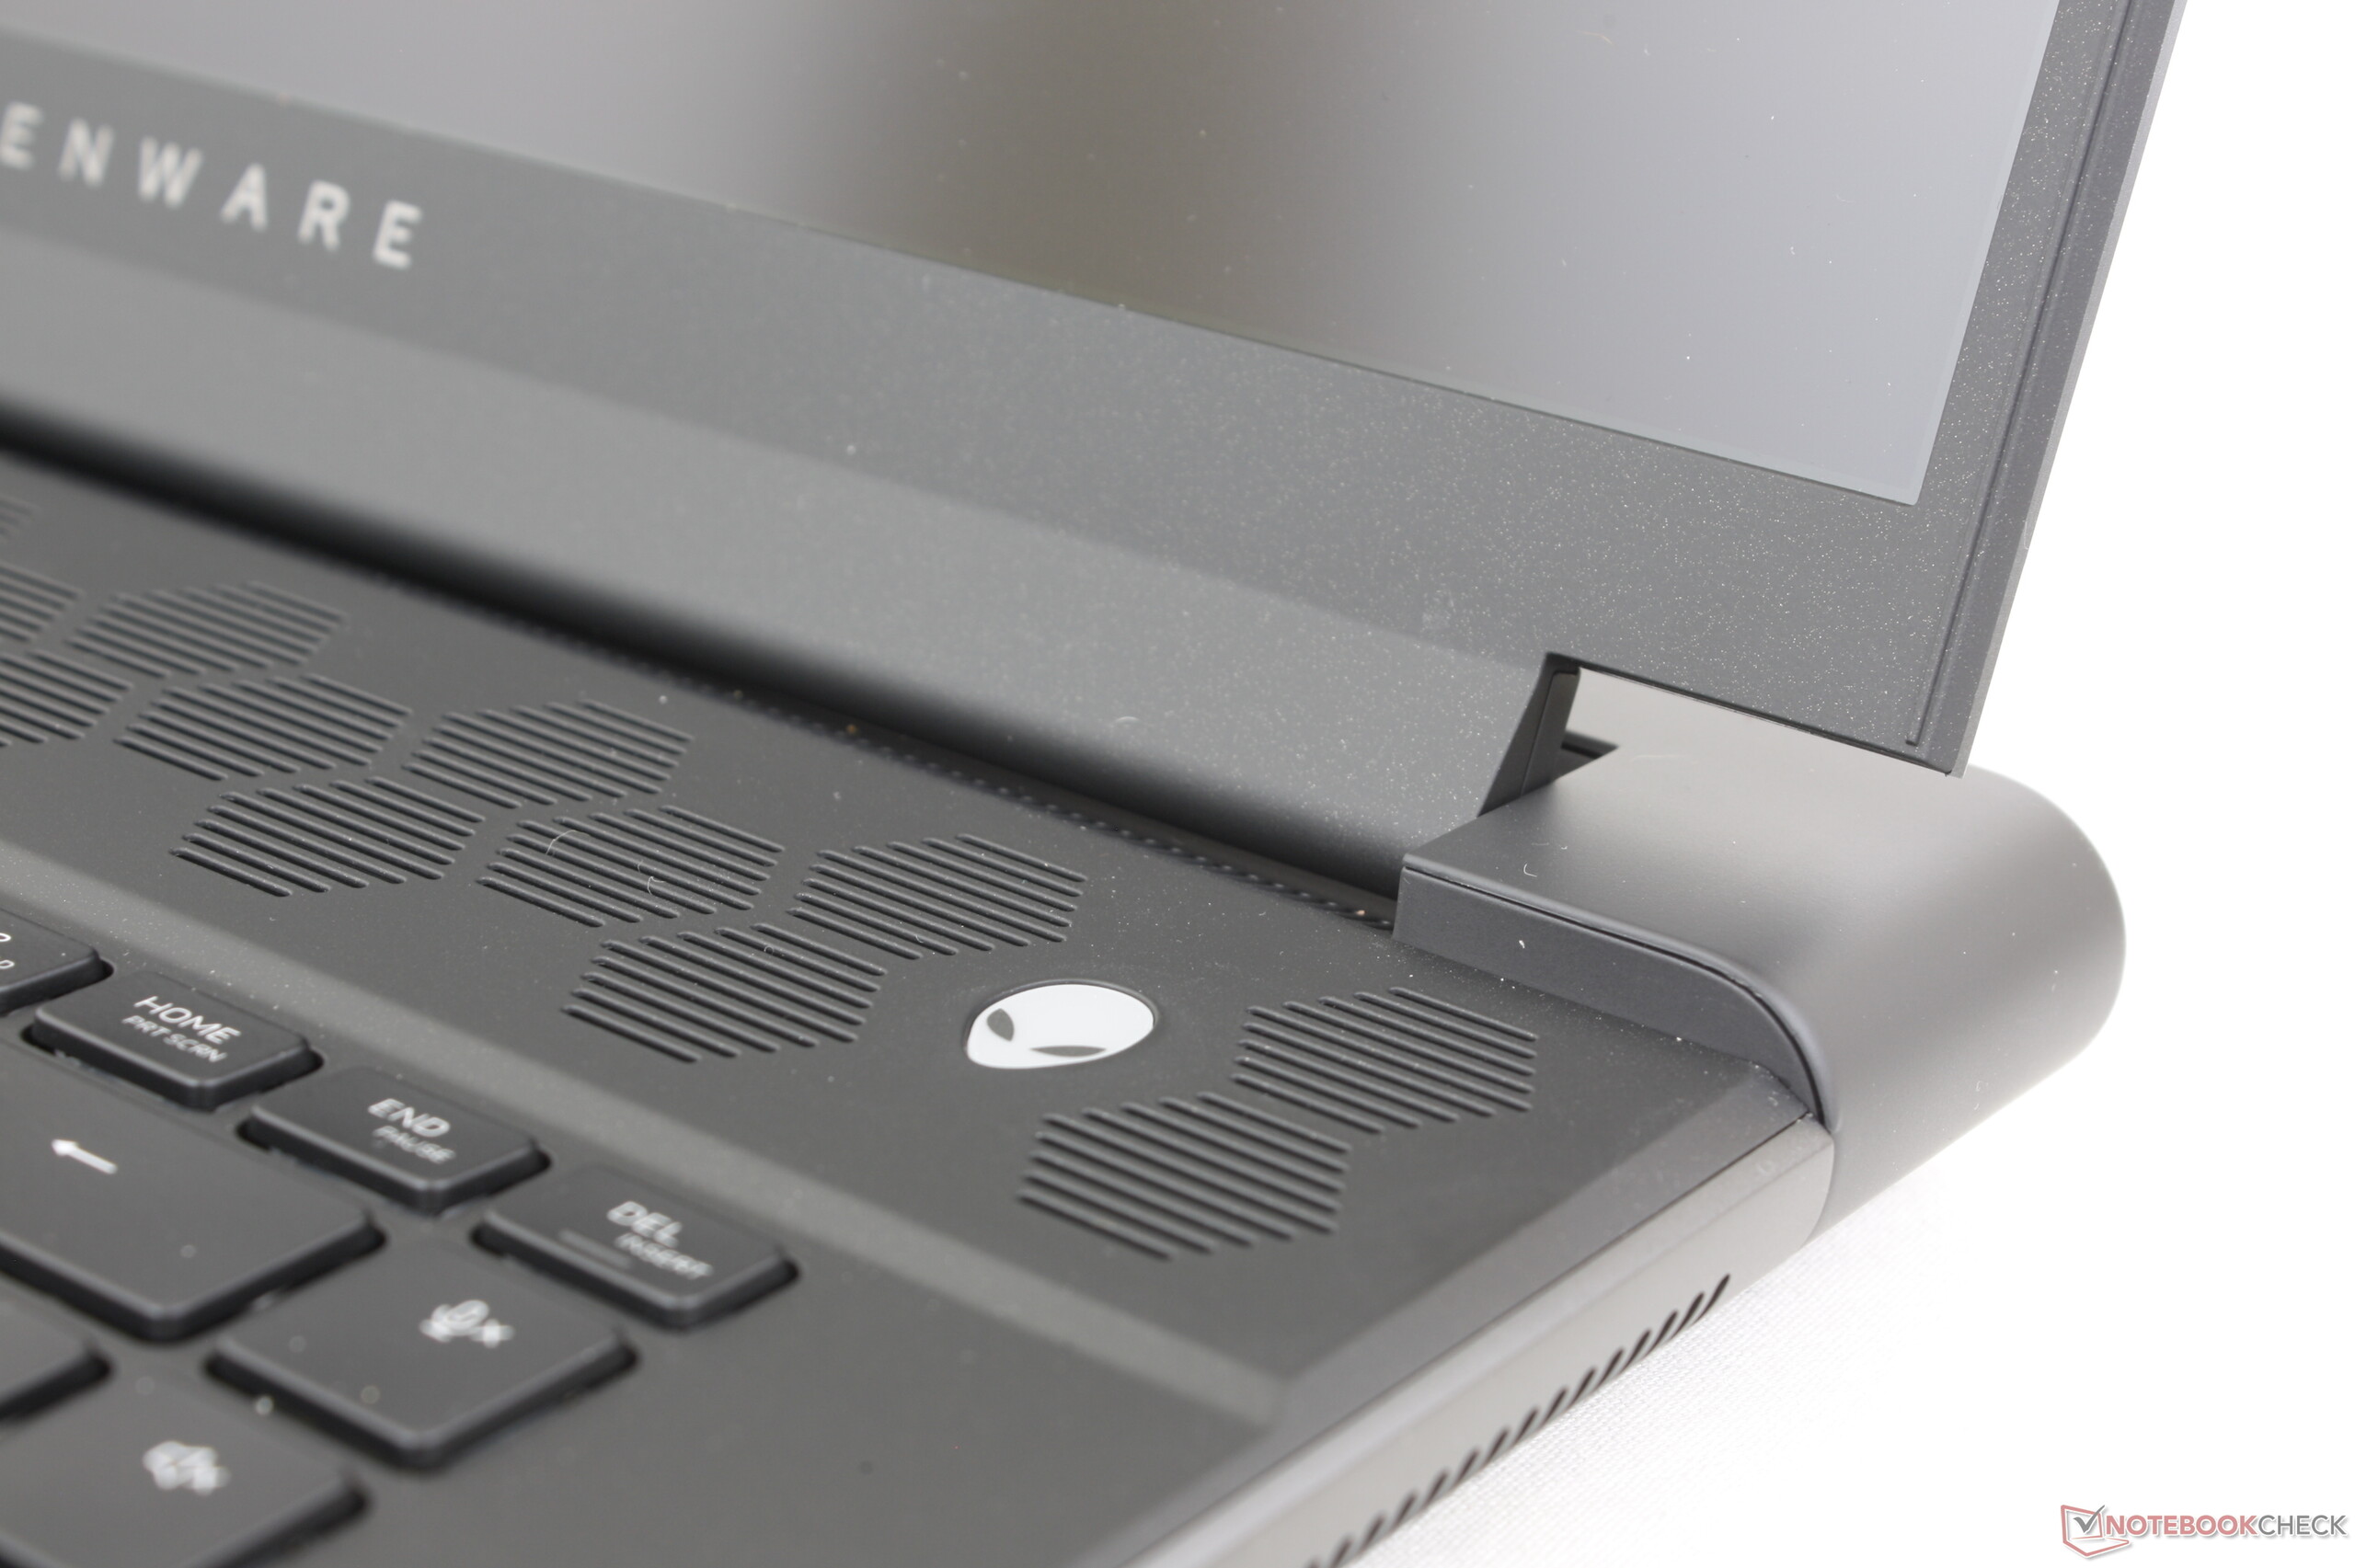
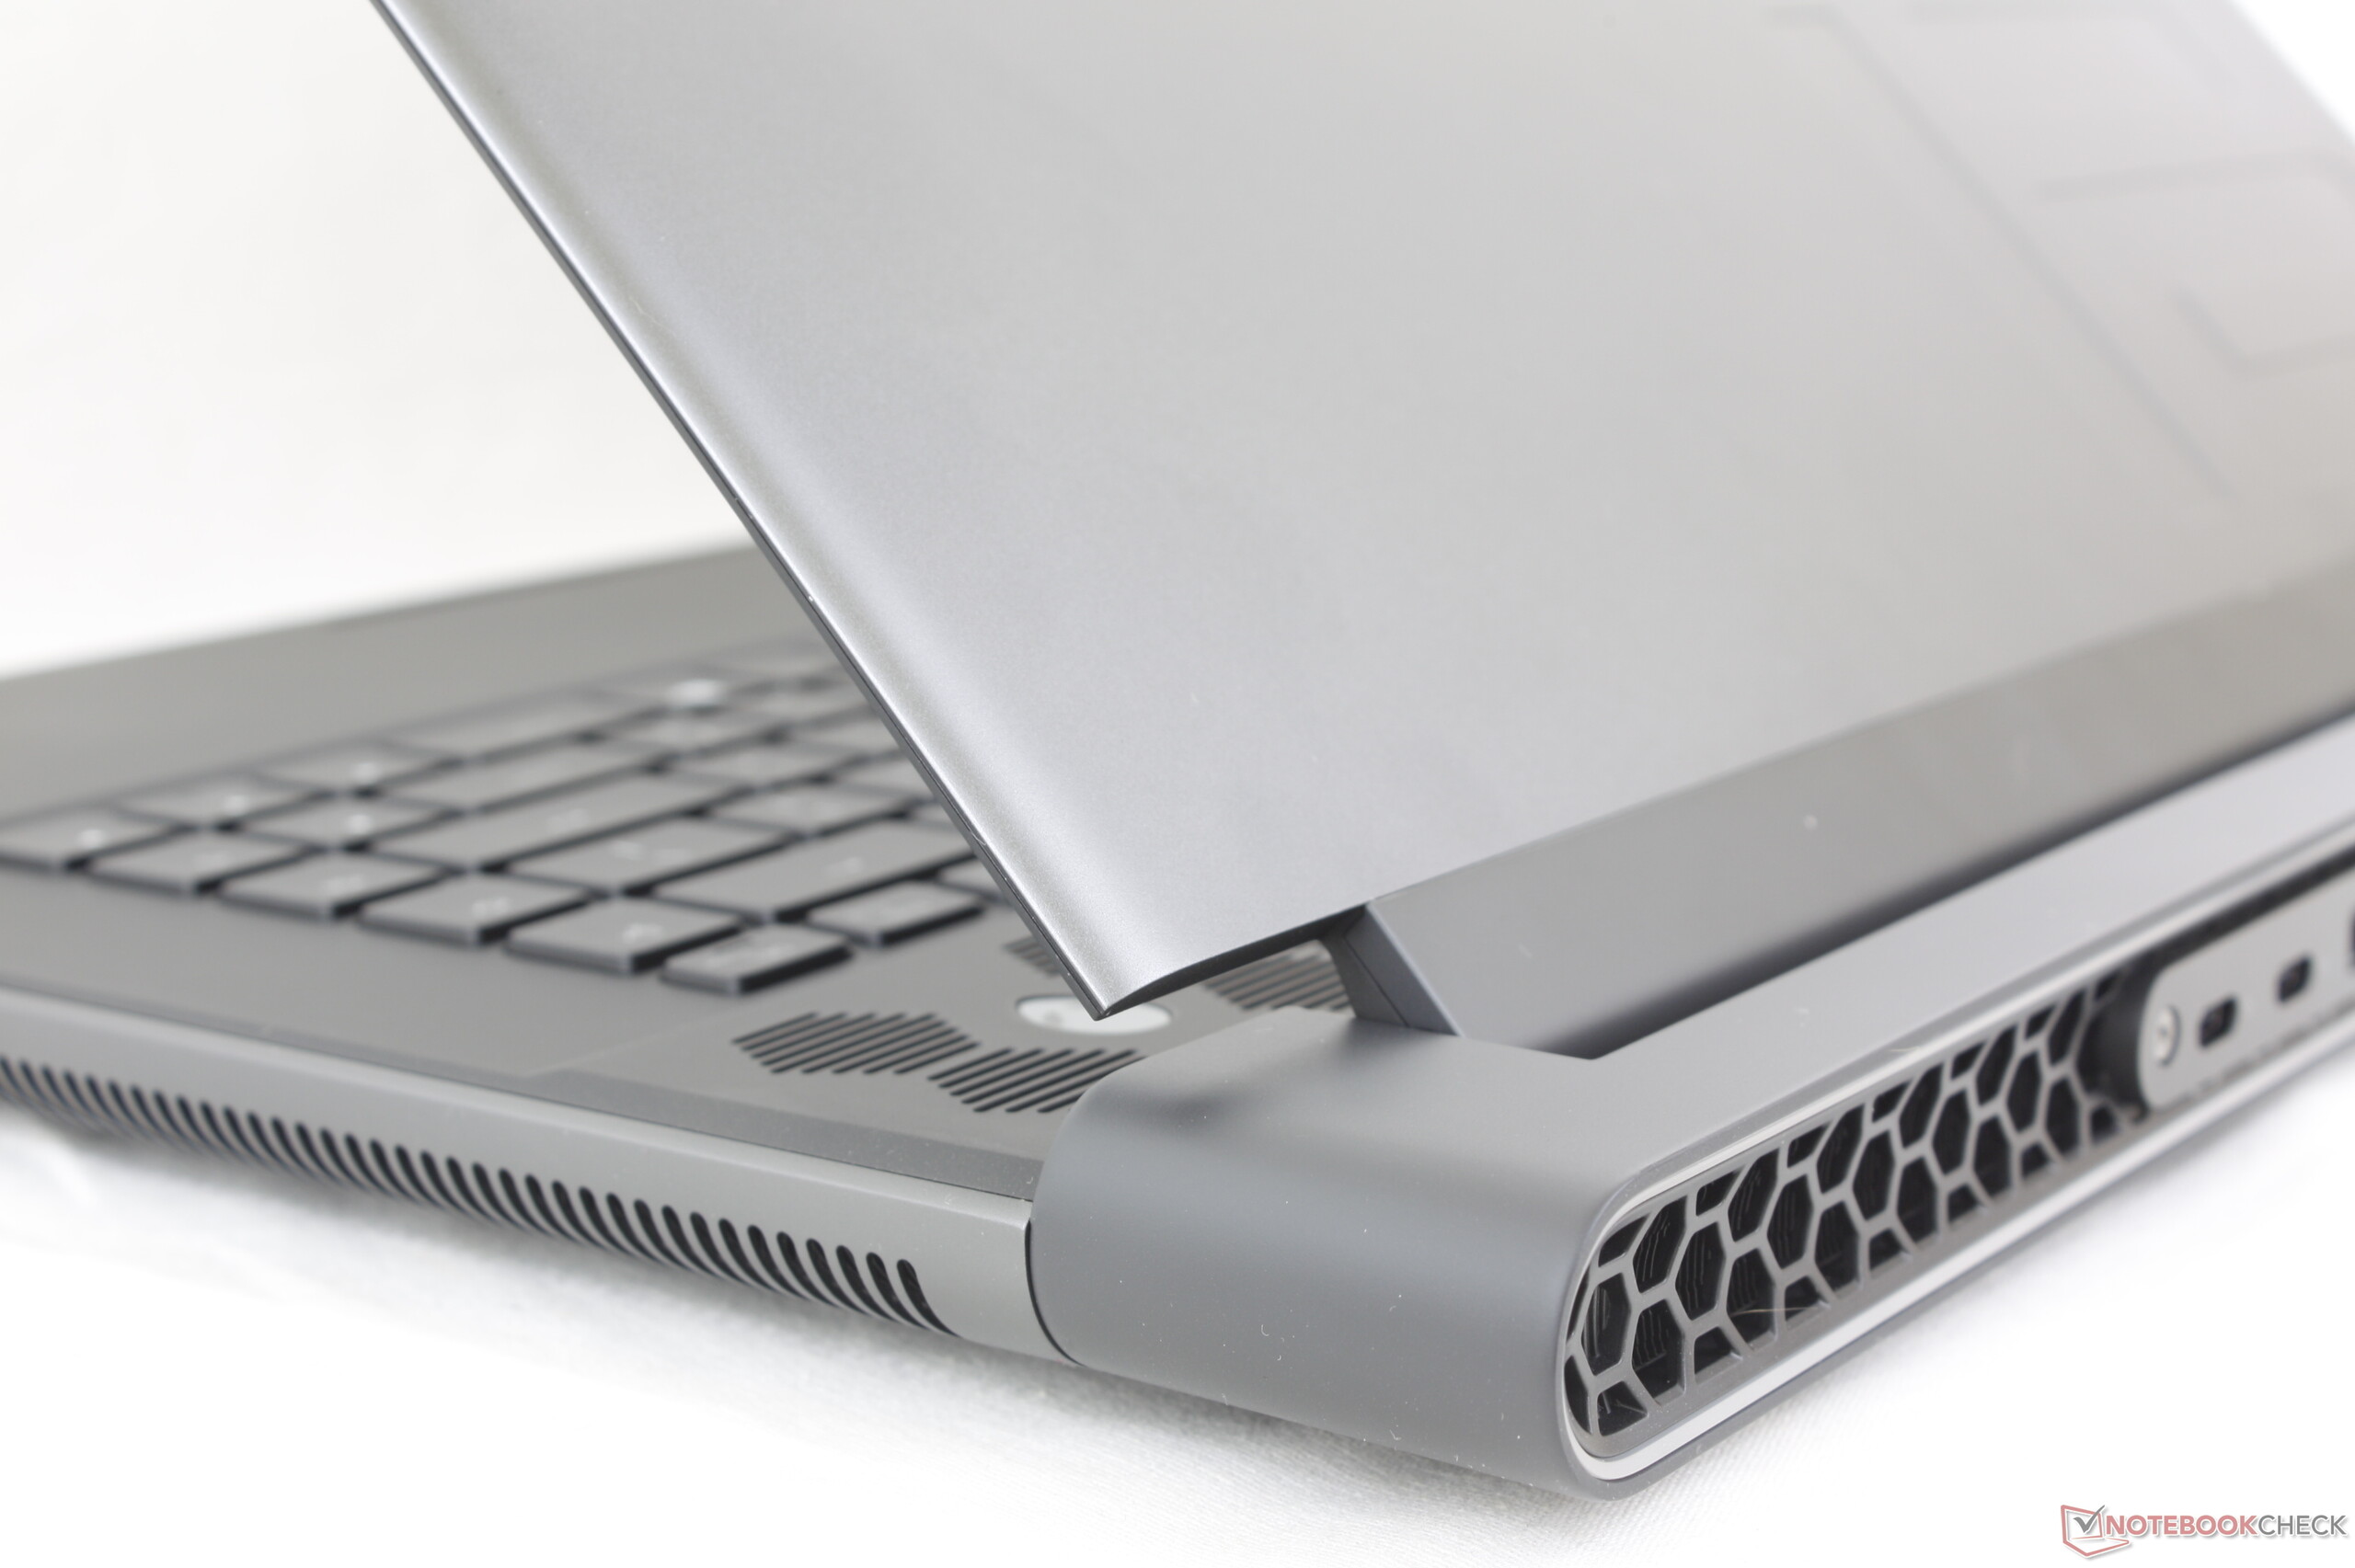
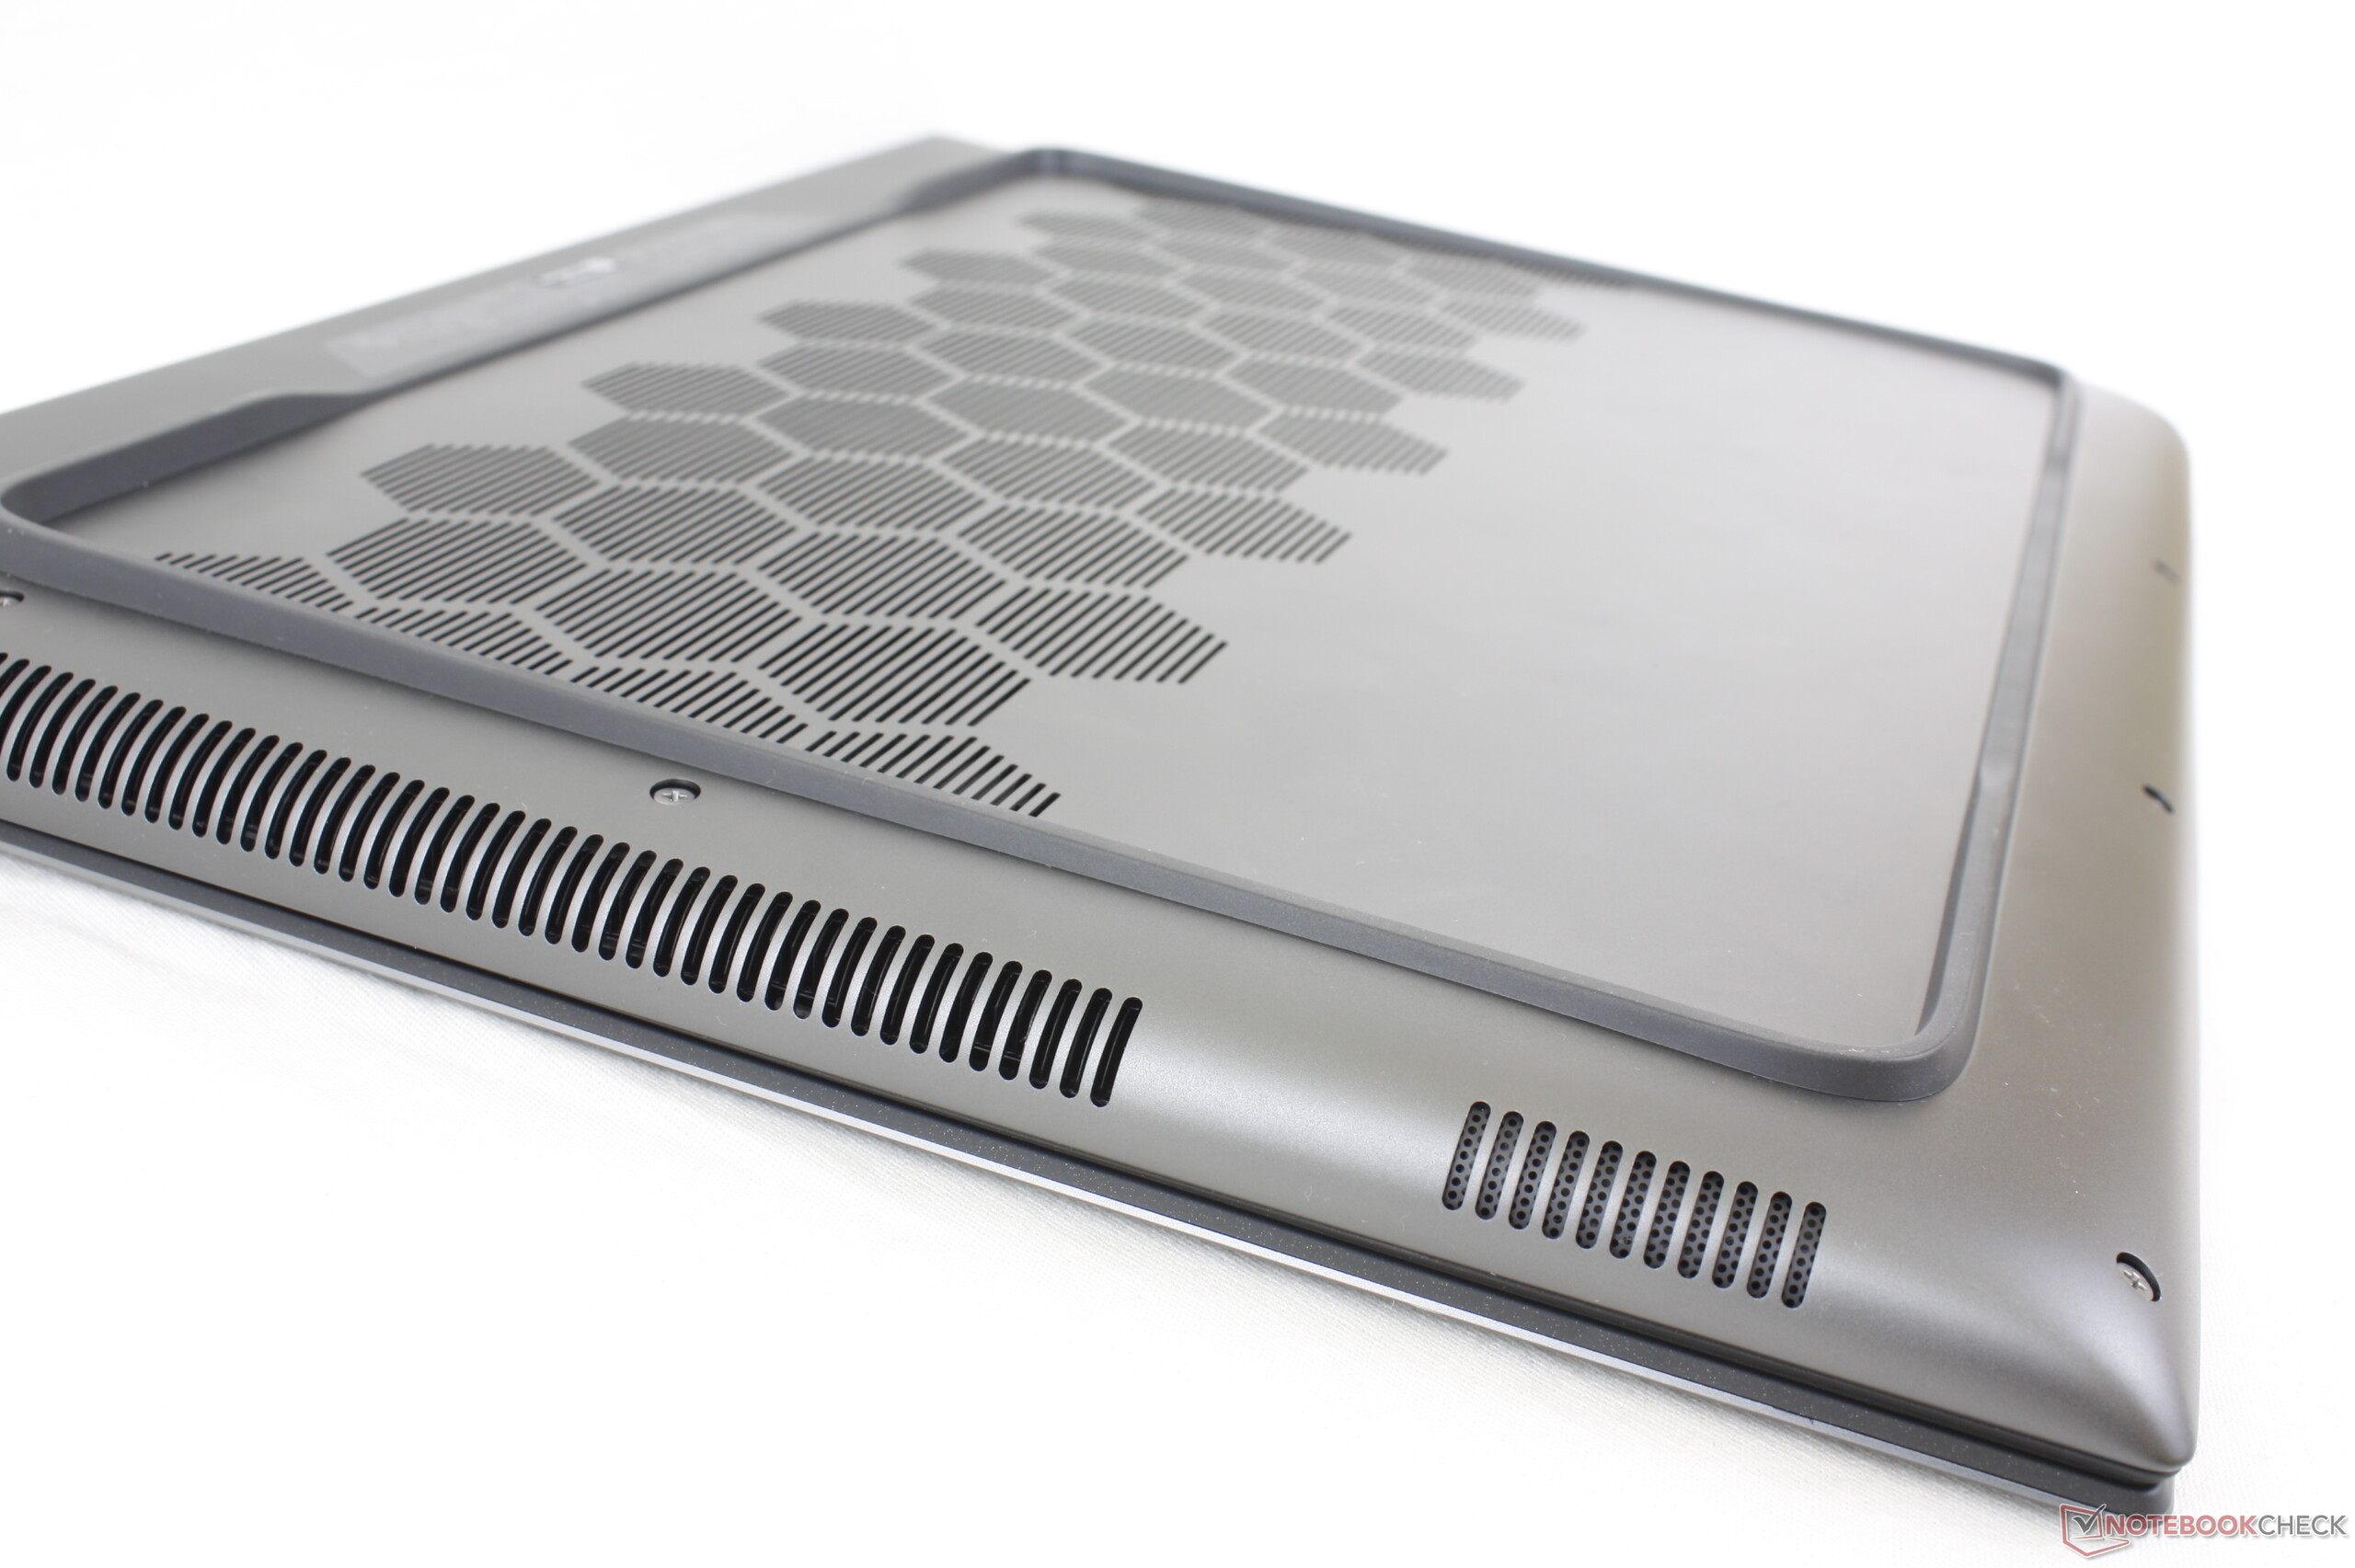
Des informations sur le boîtier, l'équipement et les périphériques d'entrée peuvent être trouvées dansnotre examen du modèle frère presque identique.
Comparaison avec les concurrents potentiels
Note | Date | Modèle | Poids | Épaisseur | Taille | Résolution | Prix |
|---|---|---|---|---|---|---|---|
| 88.3 % v7 (old) | 09/23 | Alienware m16 R1 Intel i7-13700HX, GeForce RTX 4060 Laptop GPU | 3 kg | 25.4 mm | 16.00" | 2560x1600 | |
| 89.5 % v7 (old) | 07/23 | Acer Predator Helios 16 PH16-71-731Q i7-13700HX, GeForce RTX 4060 Laptop GPU | 2.6 kg | 26.9 mm | 16.00" | 2560x1600 | |
| 84.6 % v7 (old) | 05/23 | Medion Erazer Defender P40 i7-13700HX, GeForce RTX 4060 Laptop GPU | 2.9 kg | 33 mm | 17.30" | 2560x1440 | |
| 87.9 % v7 (old) | 05/23 | Lenovo Legion Pro 5 16IRX8 i7-13700HX, GeForce RTX 4060 Laptop GPU | 2.5 kg | 26.8 mm | 16.00" | 2560x1600 | |
| 86.2 % v7 (old) | 07/23 | Schenker XMG Pro 15 (E23) i9-13900HX, GeForce RTX 4060 Laptop GPU | 2.4 kg | 24.9 mm | 15.60" | 2560x1440 | |
| 85.7 % v7 (old) | 08/23 | Aorus 15 BSF i7-13700H, GeForce RTX 4070 Laptop GPU | 2.4 kg | 20.9 mm | 15.60" | 2560x1440 |
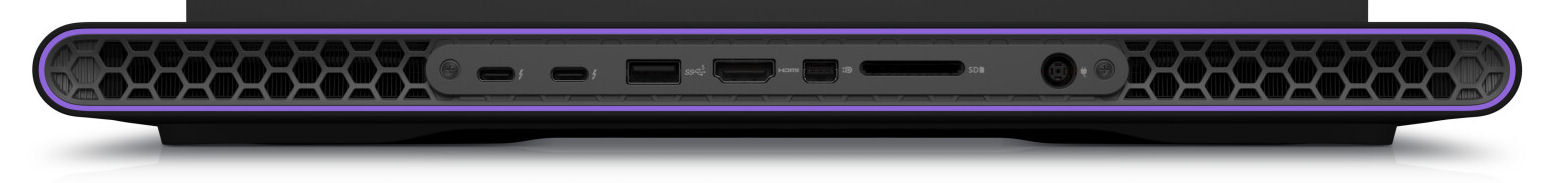
Équipement et périphériques d'entrée - Différences par rapport au modèle AMD
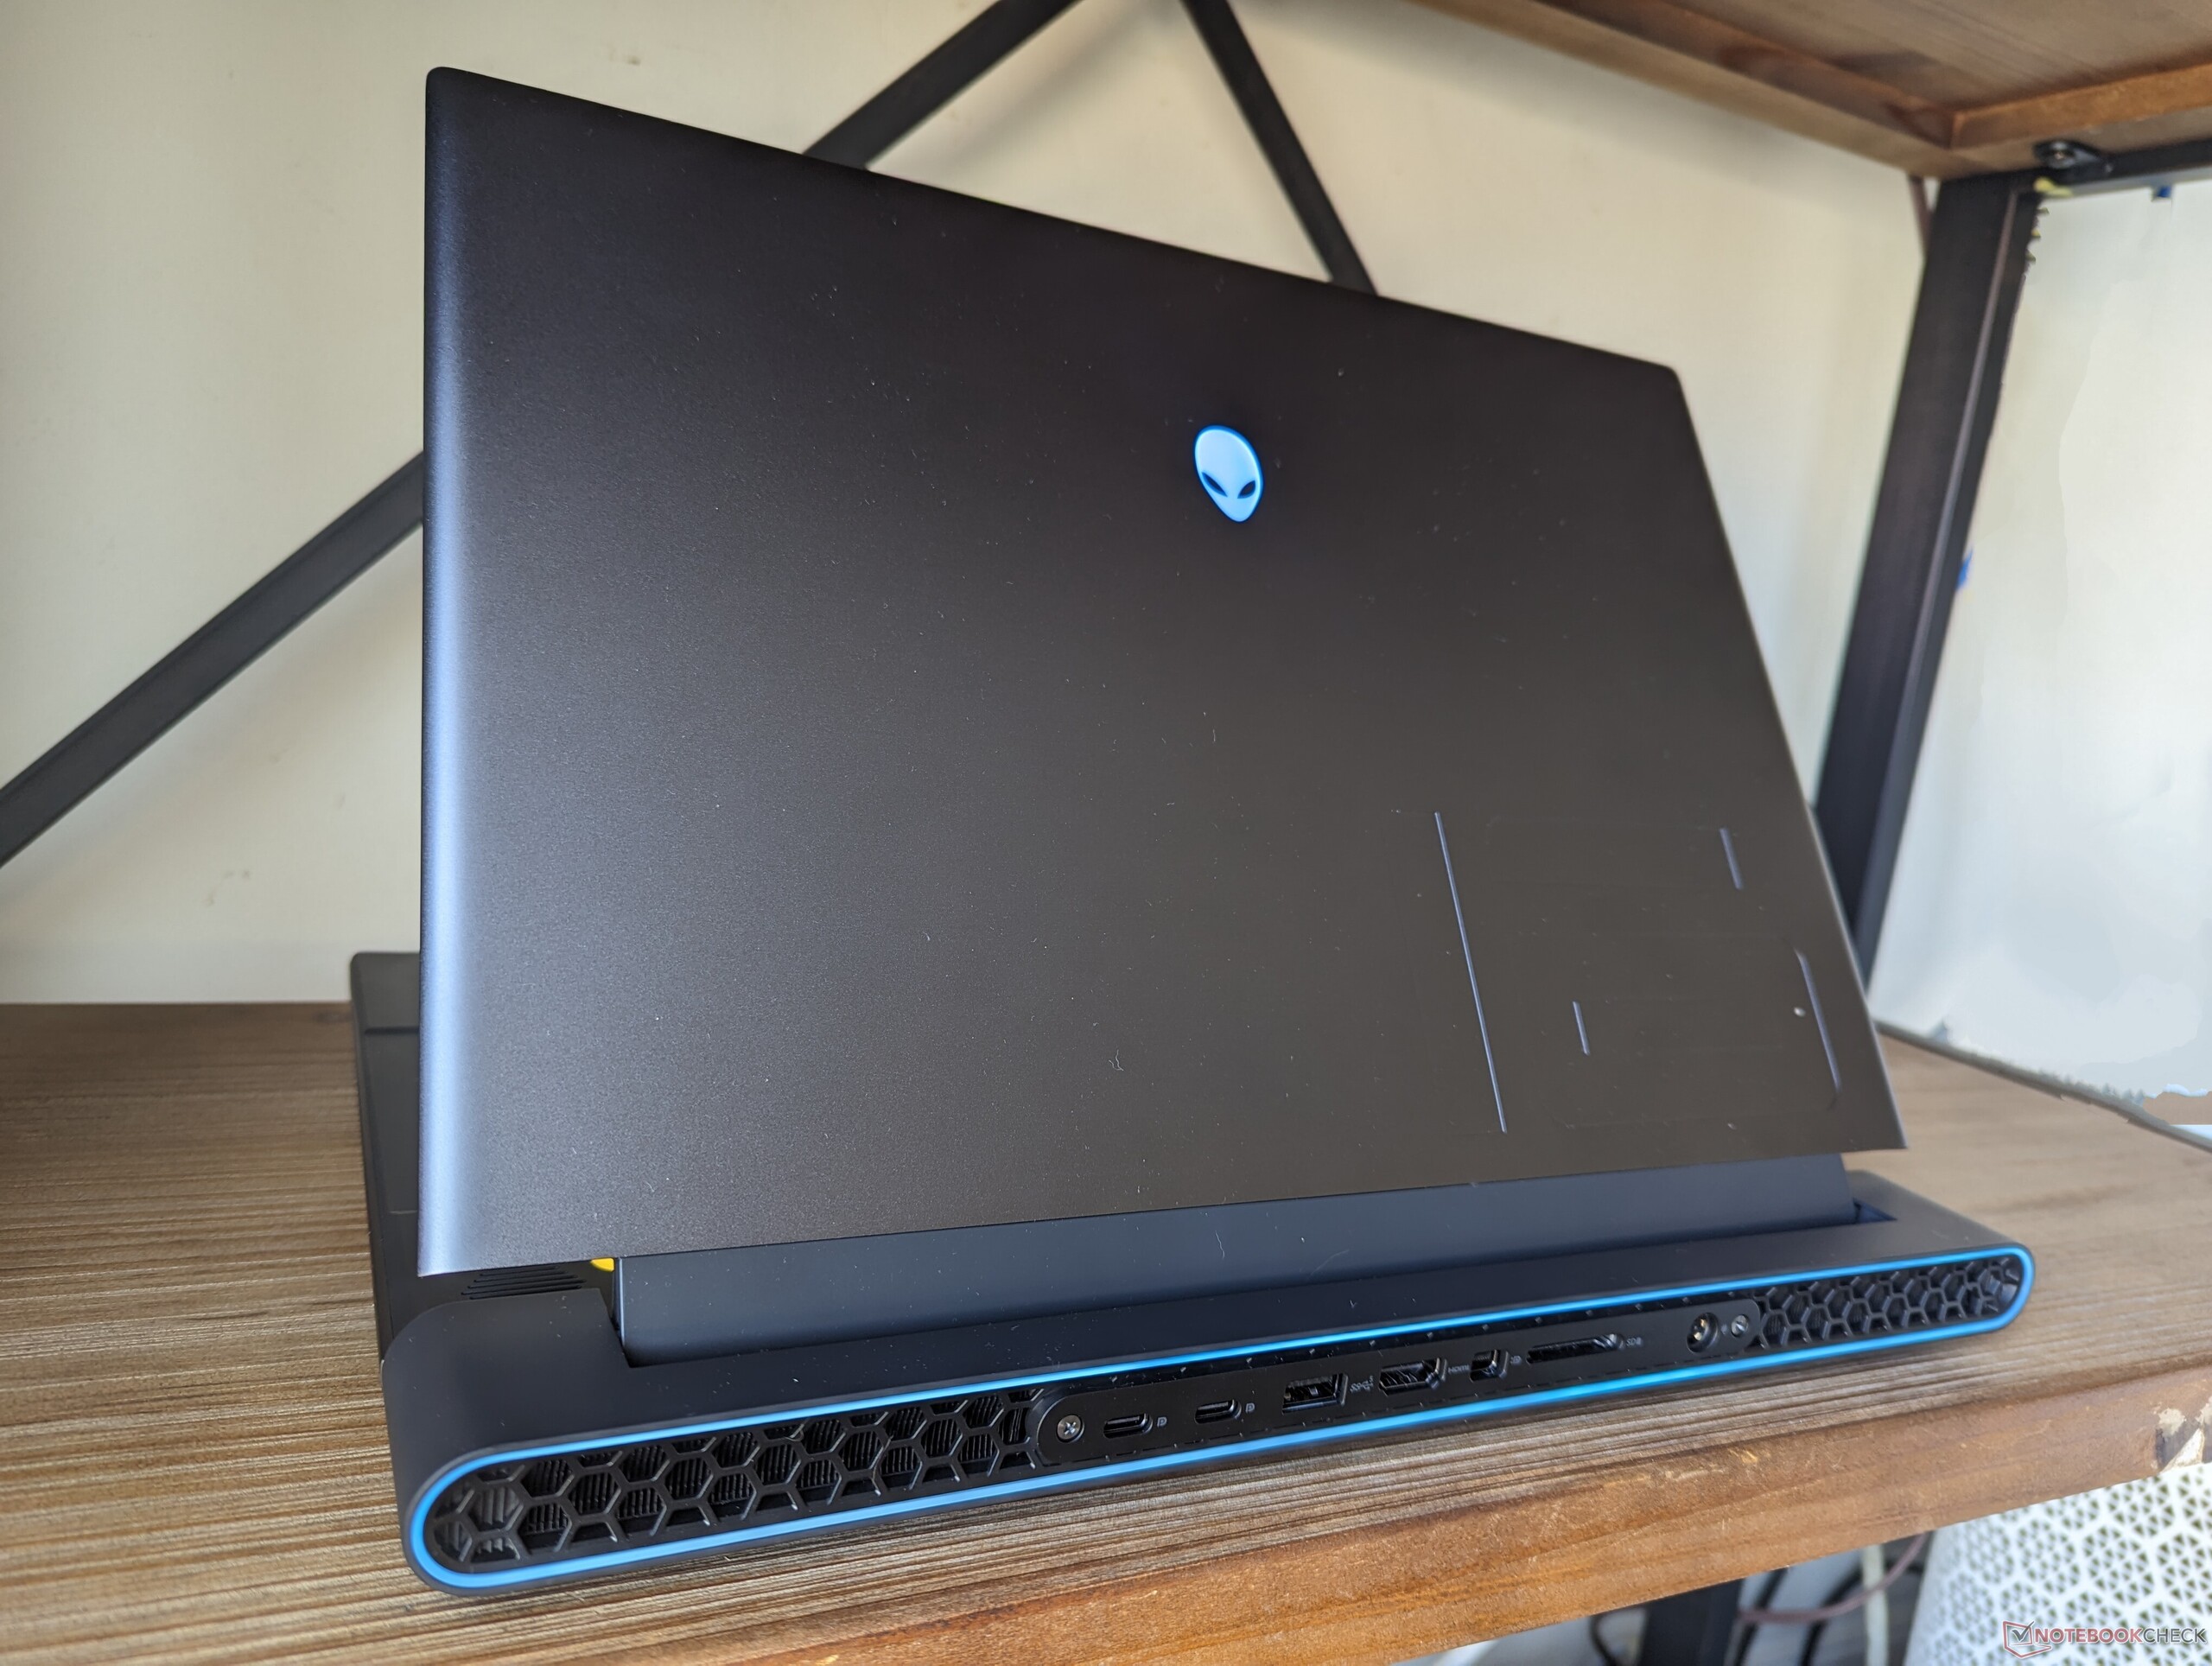
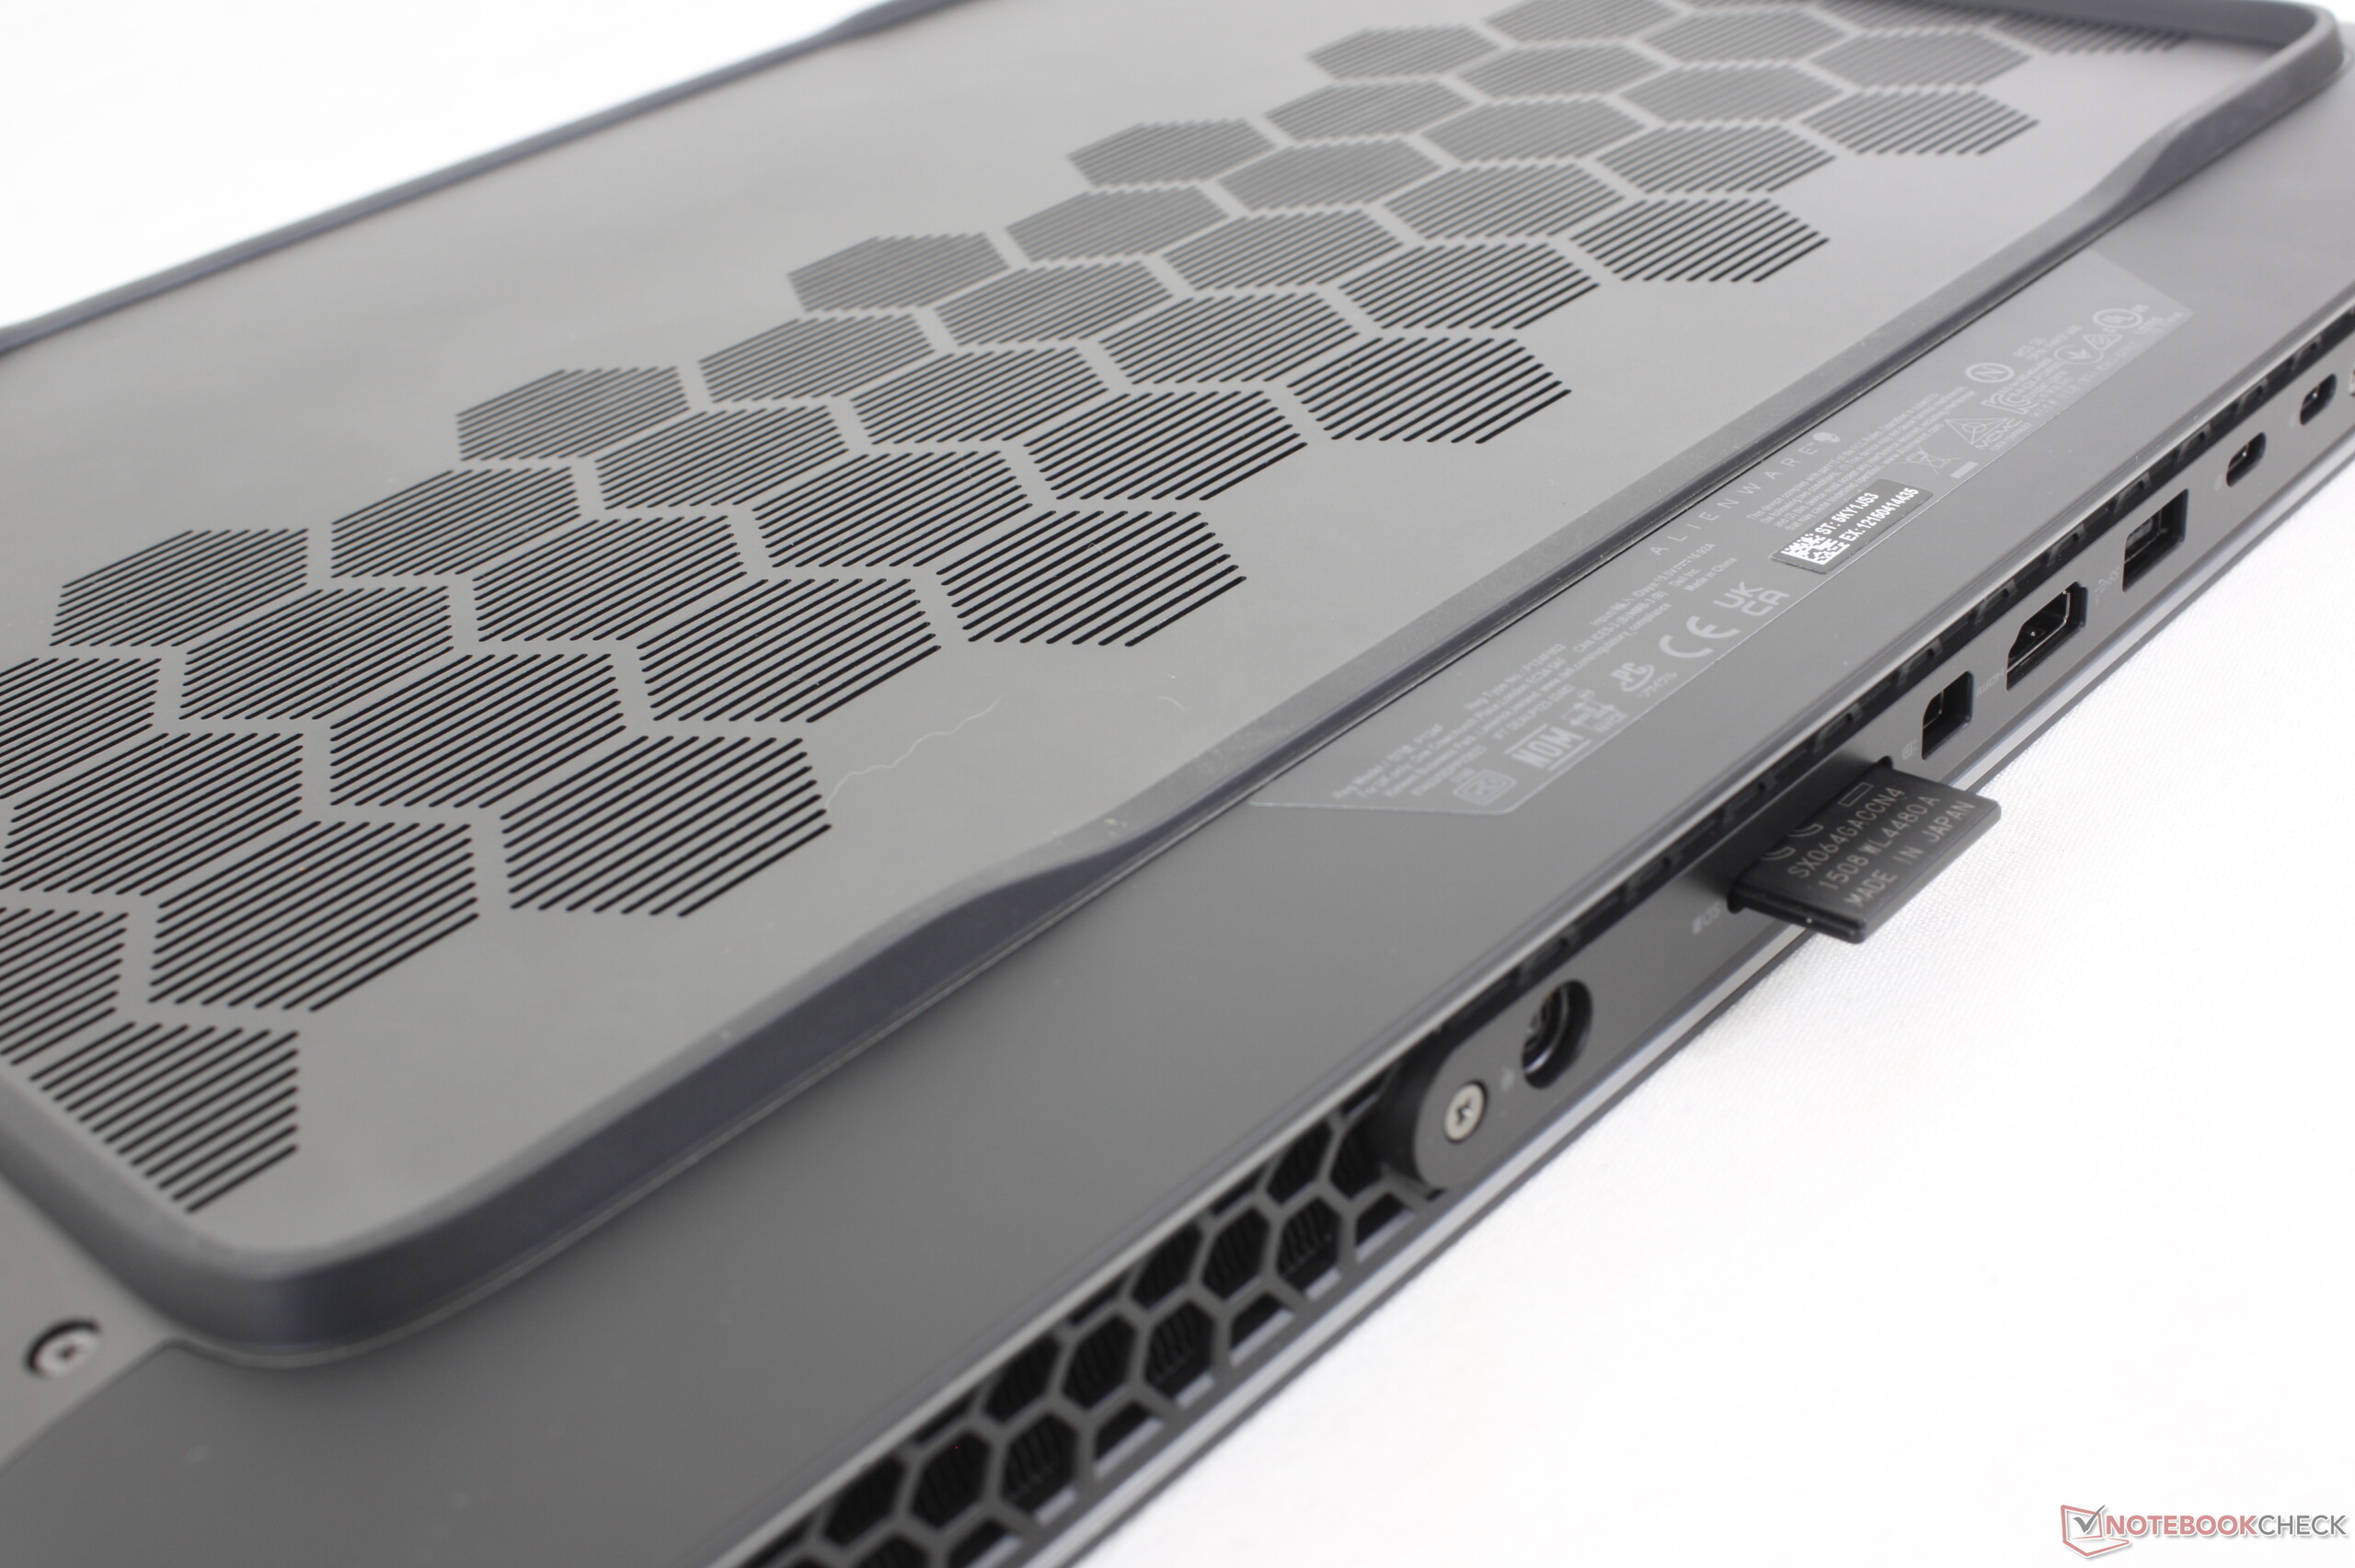
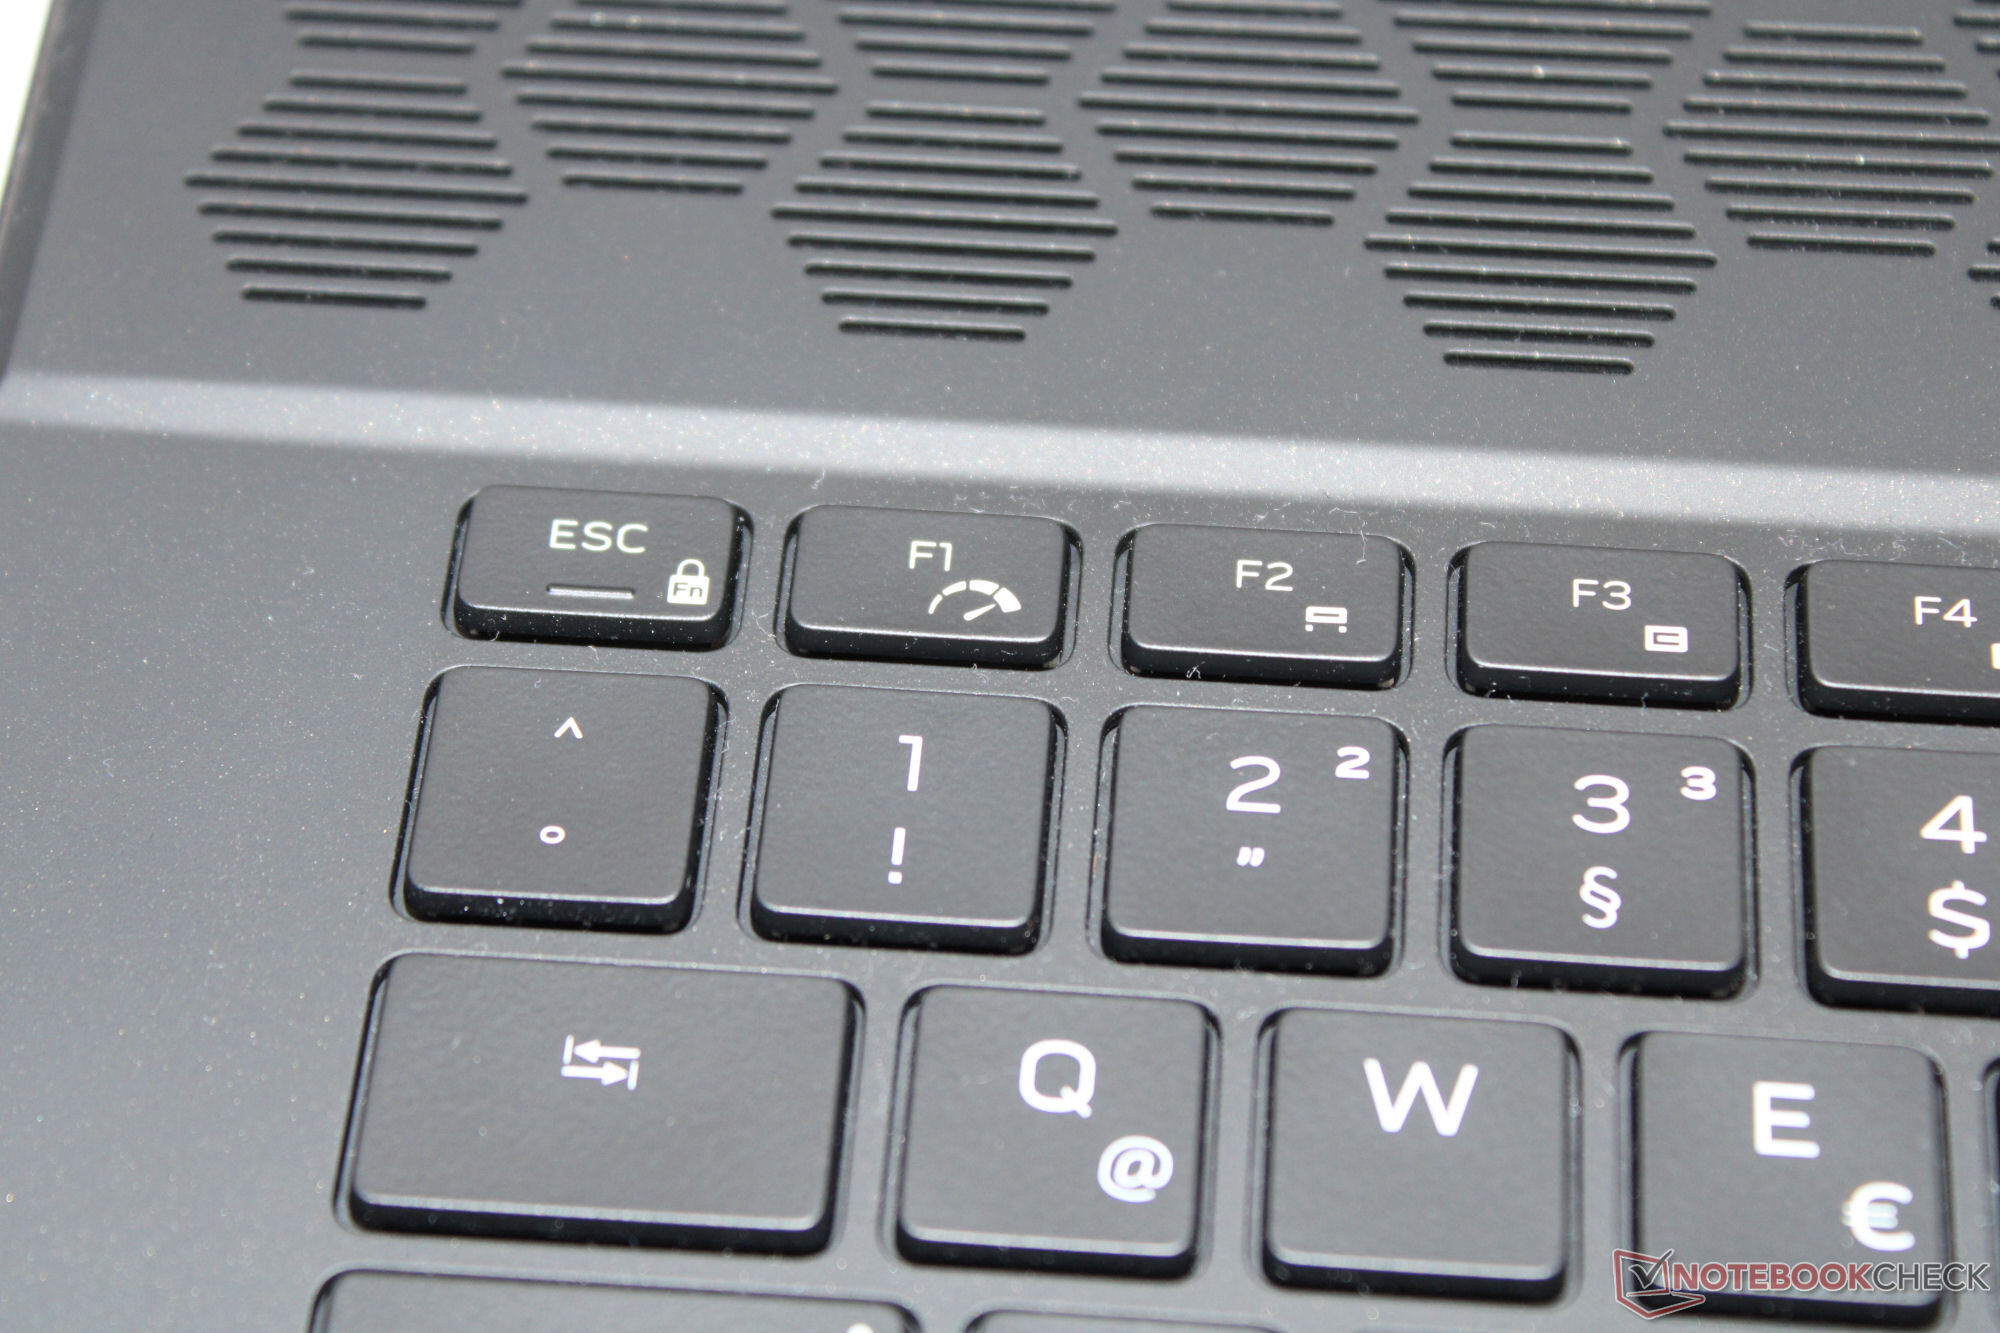
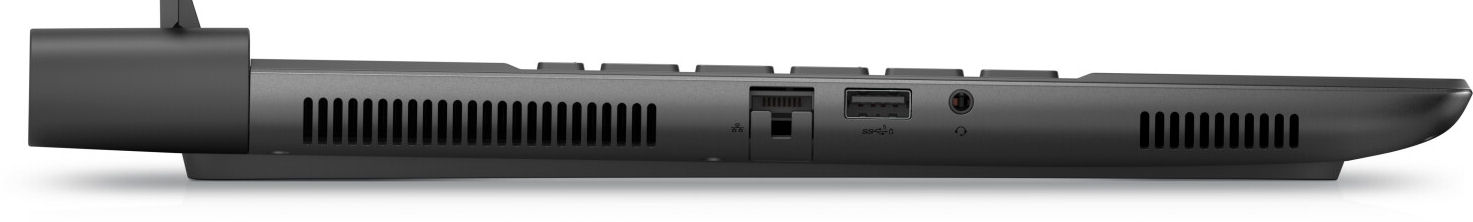
- Les deux ports USB-C des modèles m16 basés sur Intel prennent en charge Thunderbolt 4 (AMD : seulement USB 3.2 Gen 2), y compris DisplayPort et Power Delivery. Mais attention : il n'est pas possible d'alimenter l'ordinateur portable ou de charger la batterie via l'USB-C. Les ports USB-C ne peuvent fournir que de l'énergie.
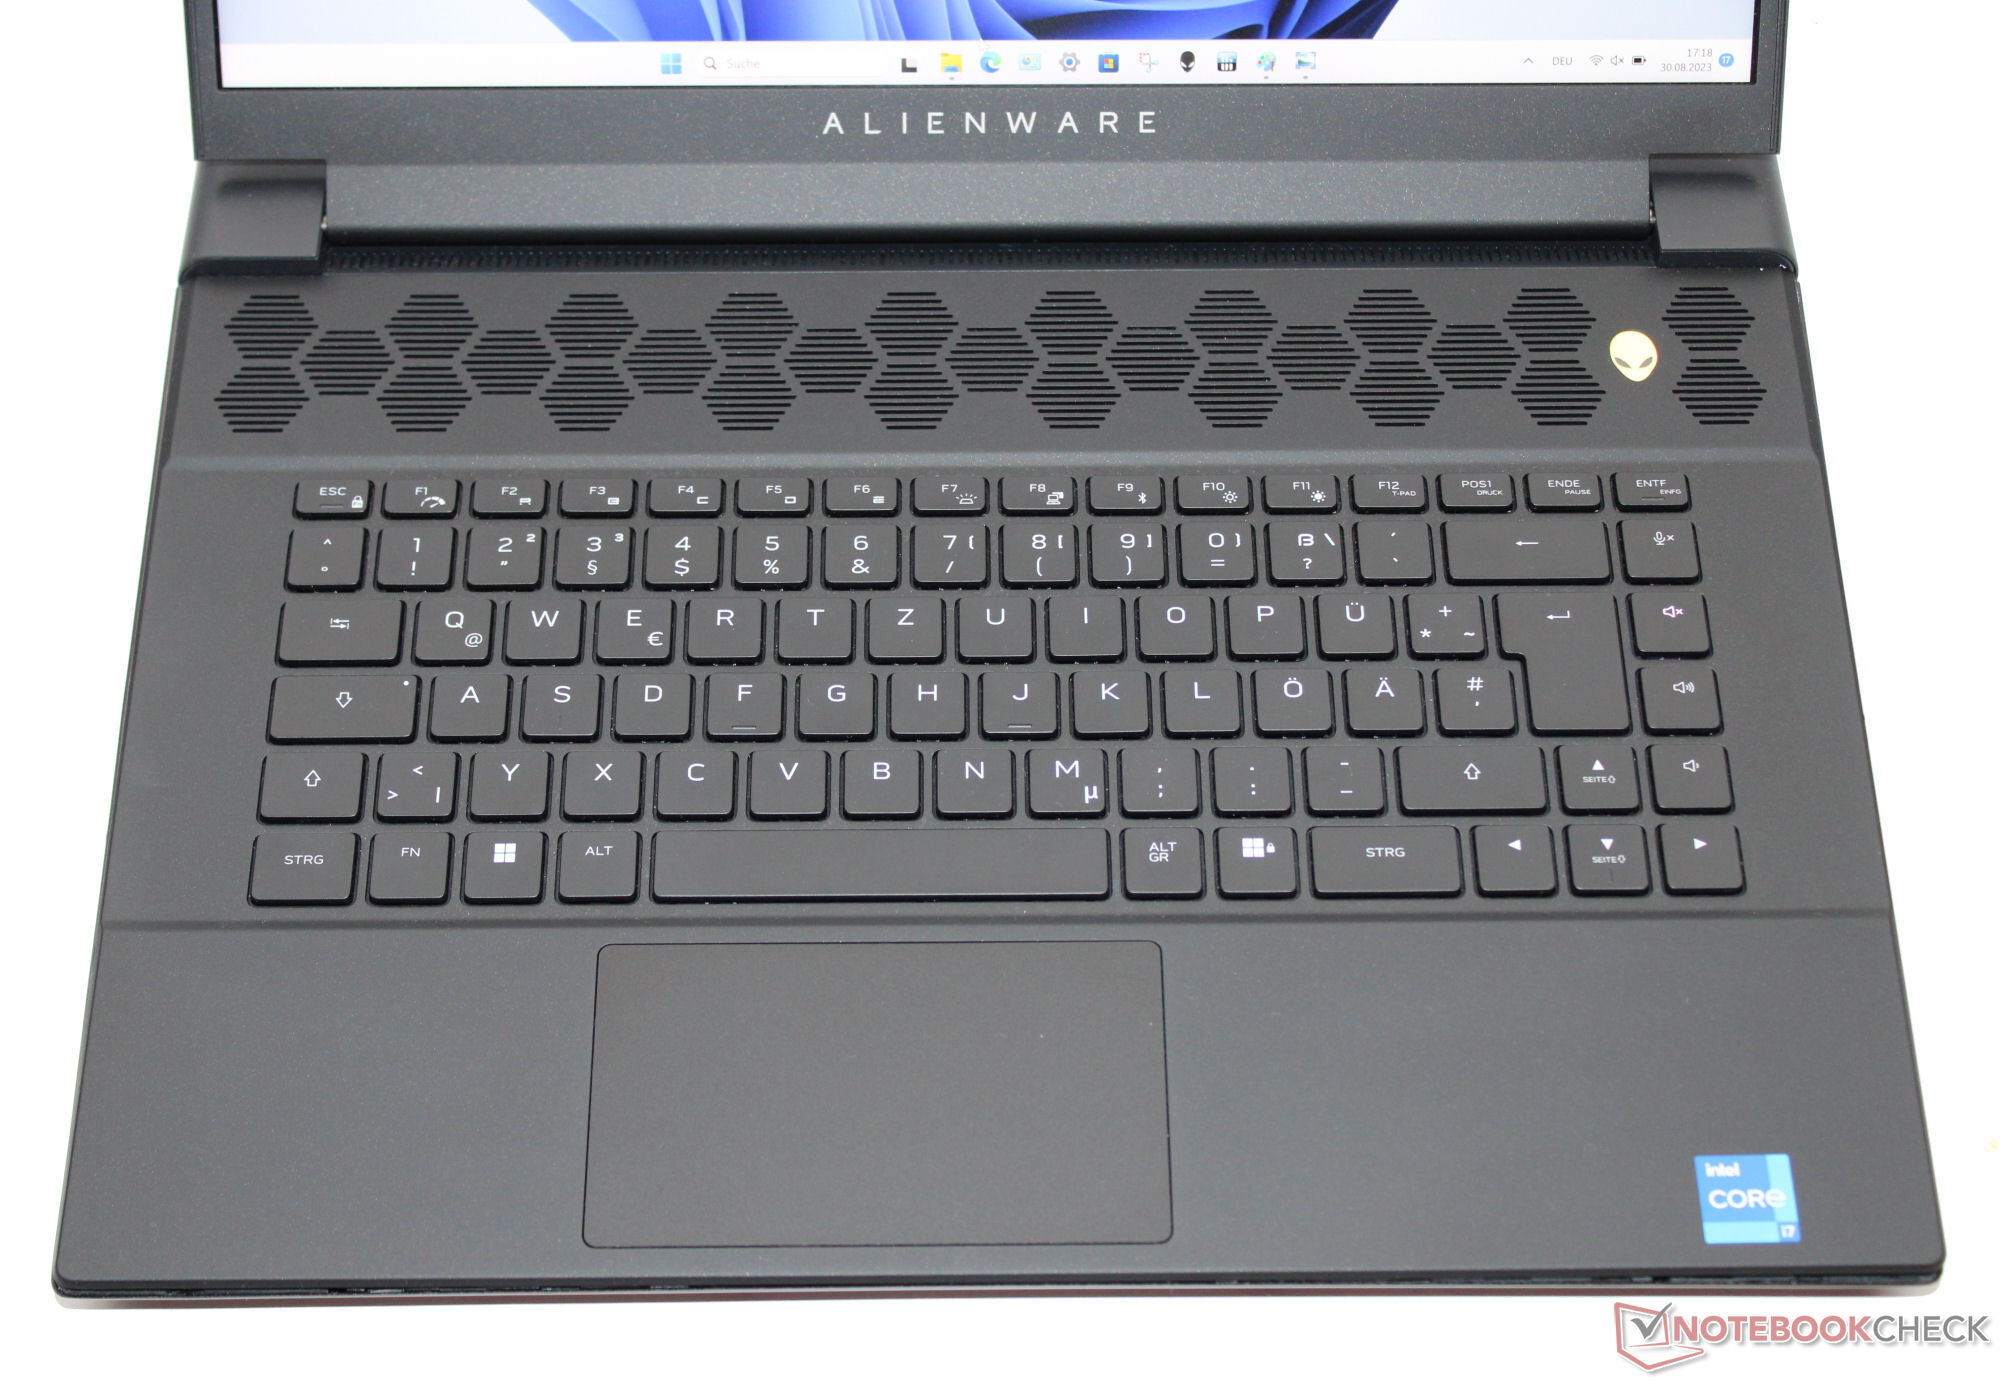
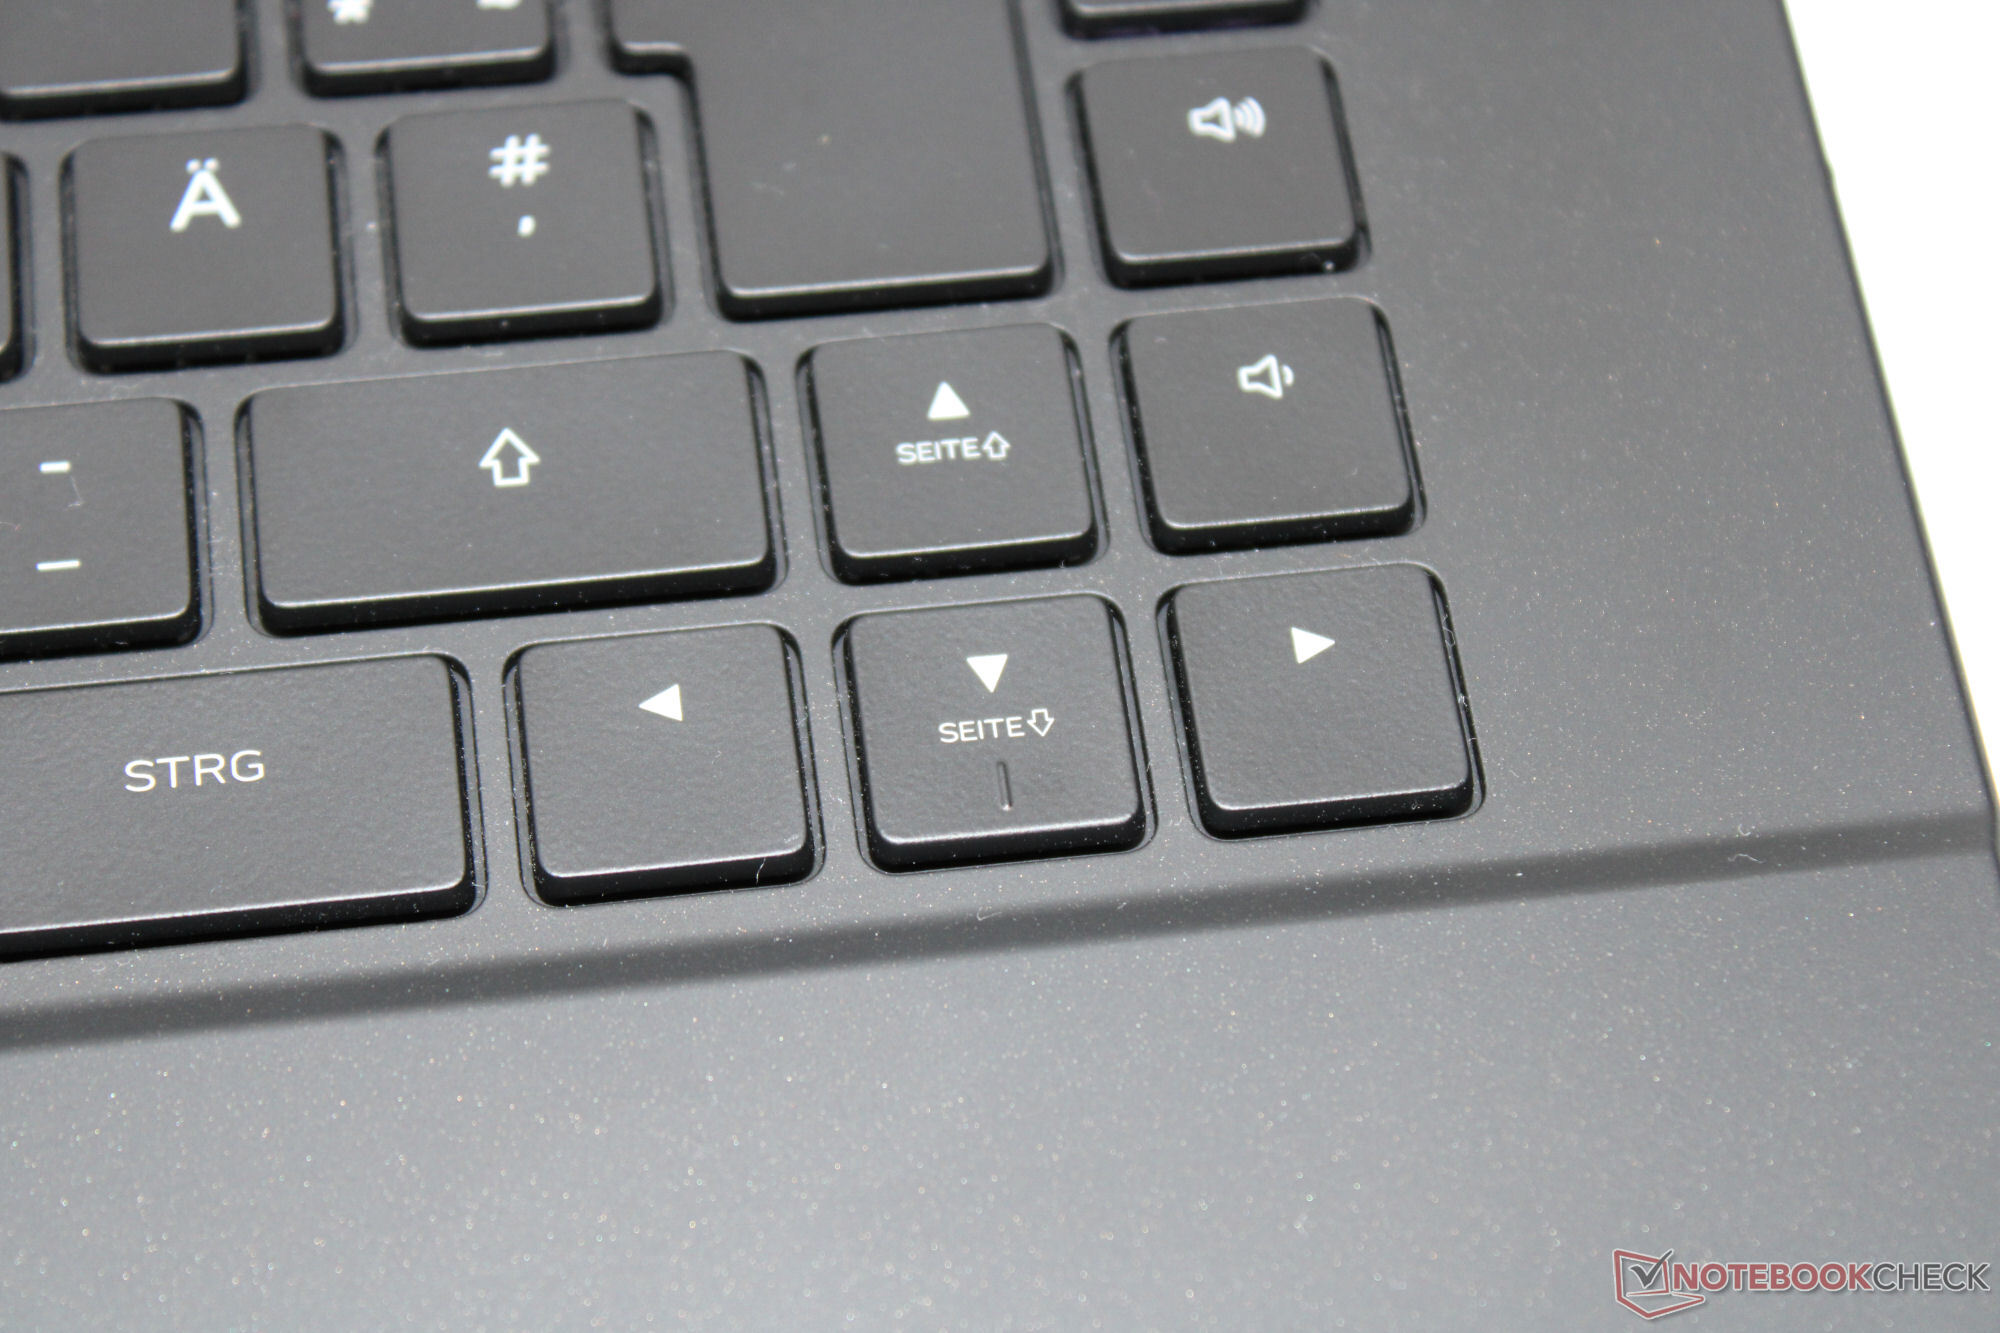
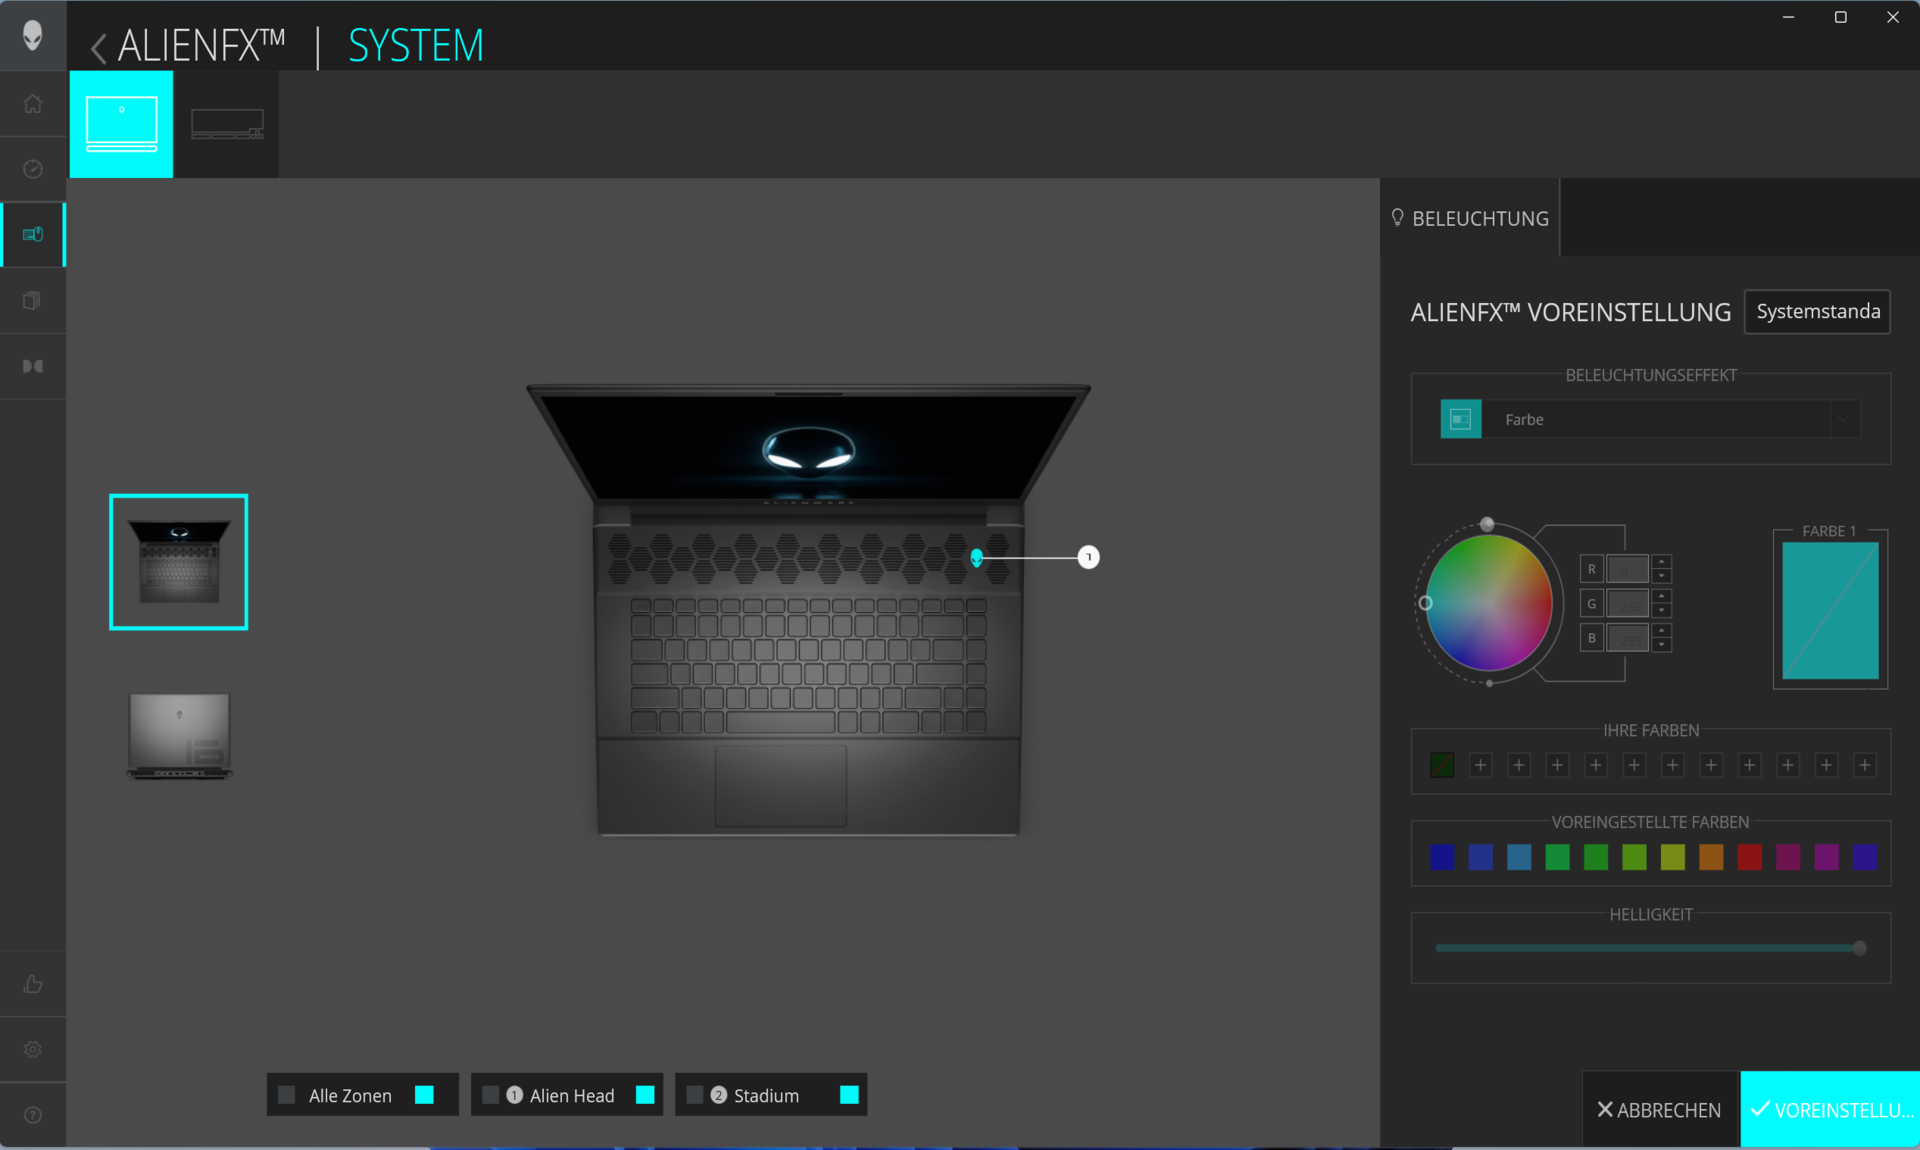
- Au lieu du clavier mécanique (CherryMX) dumodèle jumeaunotre appareil de test est équipé d'un clavier à membrane. Ses touches offrent une course moyenne, un point de pression très clair et une résistance très ferme. Un éclairage individuel des touches (RGB) est également possible.
| SD Card Reader | |
| average JPG Copy Test (av. of 3 runs) | |
| Alienware m16 R1 AMD (Toshiba Exceria Pro SDXC 64 GB UHS-II) | |
| Alienware m16 R1 Intel (AV PRO microSD 128 GB V60) | |
| Moyenne de la classe Gaming (20.9 - 210, n=54, 2 dernières années) | |
| Medion Erazer Defender P40 (AV PRO microSD 128 GB V60) | |
| Schenker XMG Pro 15 (E23) | |
| Acer Predator Helios 16 PH16-71-731Q | |
| maximum AS SSD Seq Read Test (1GB) | |
| Alienware m16 R1 AMD (Toshiba Exceria Pro SDXC 64 GB UHS-II) | |
| Alienware m16 R1 Intel (AV PRO microSD 128 GB V60) | |
| Moyenne de la classe Gaming (25.5 - 261, n=51, 2 dernières années) | |
| Medion Erazer Defender P40 (AV PRO microSD 128 GB V60) | |
| Schenker XMG Pro 15 (E23) | |
| Acer Predator Helios 16 PH16-71-731Q | |


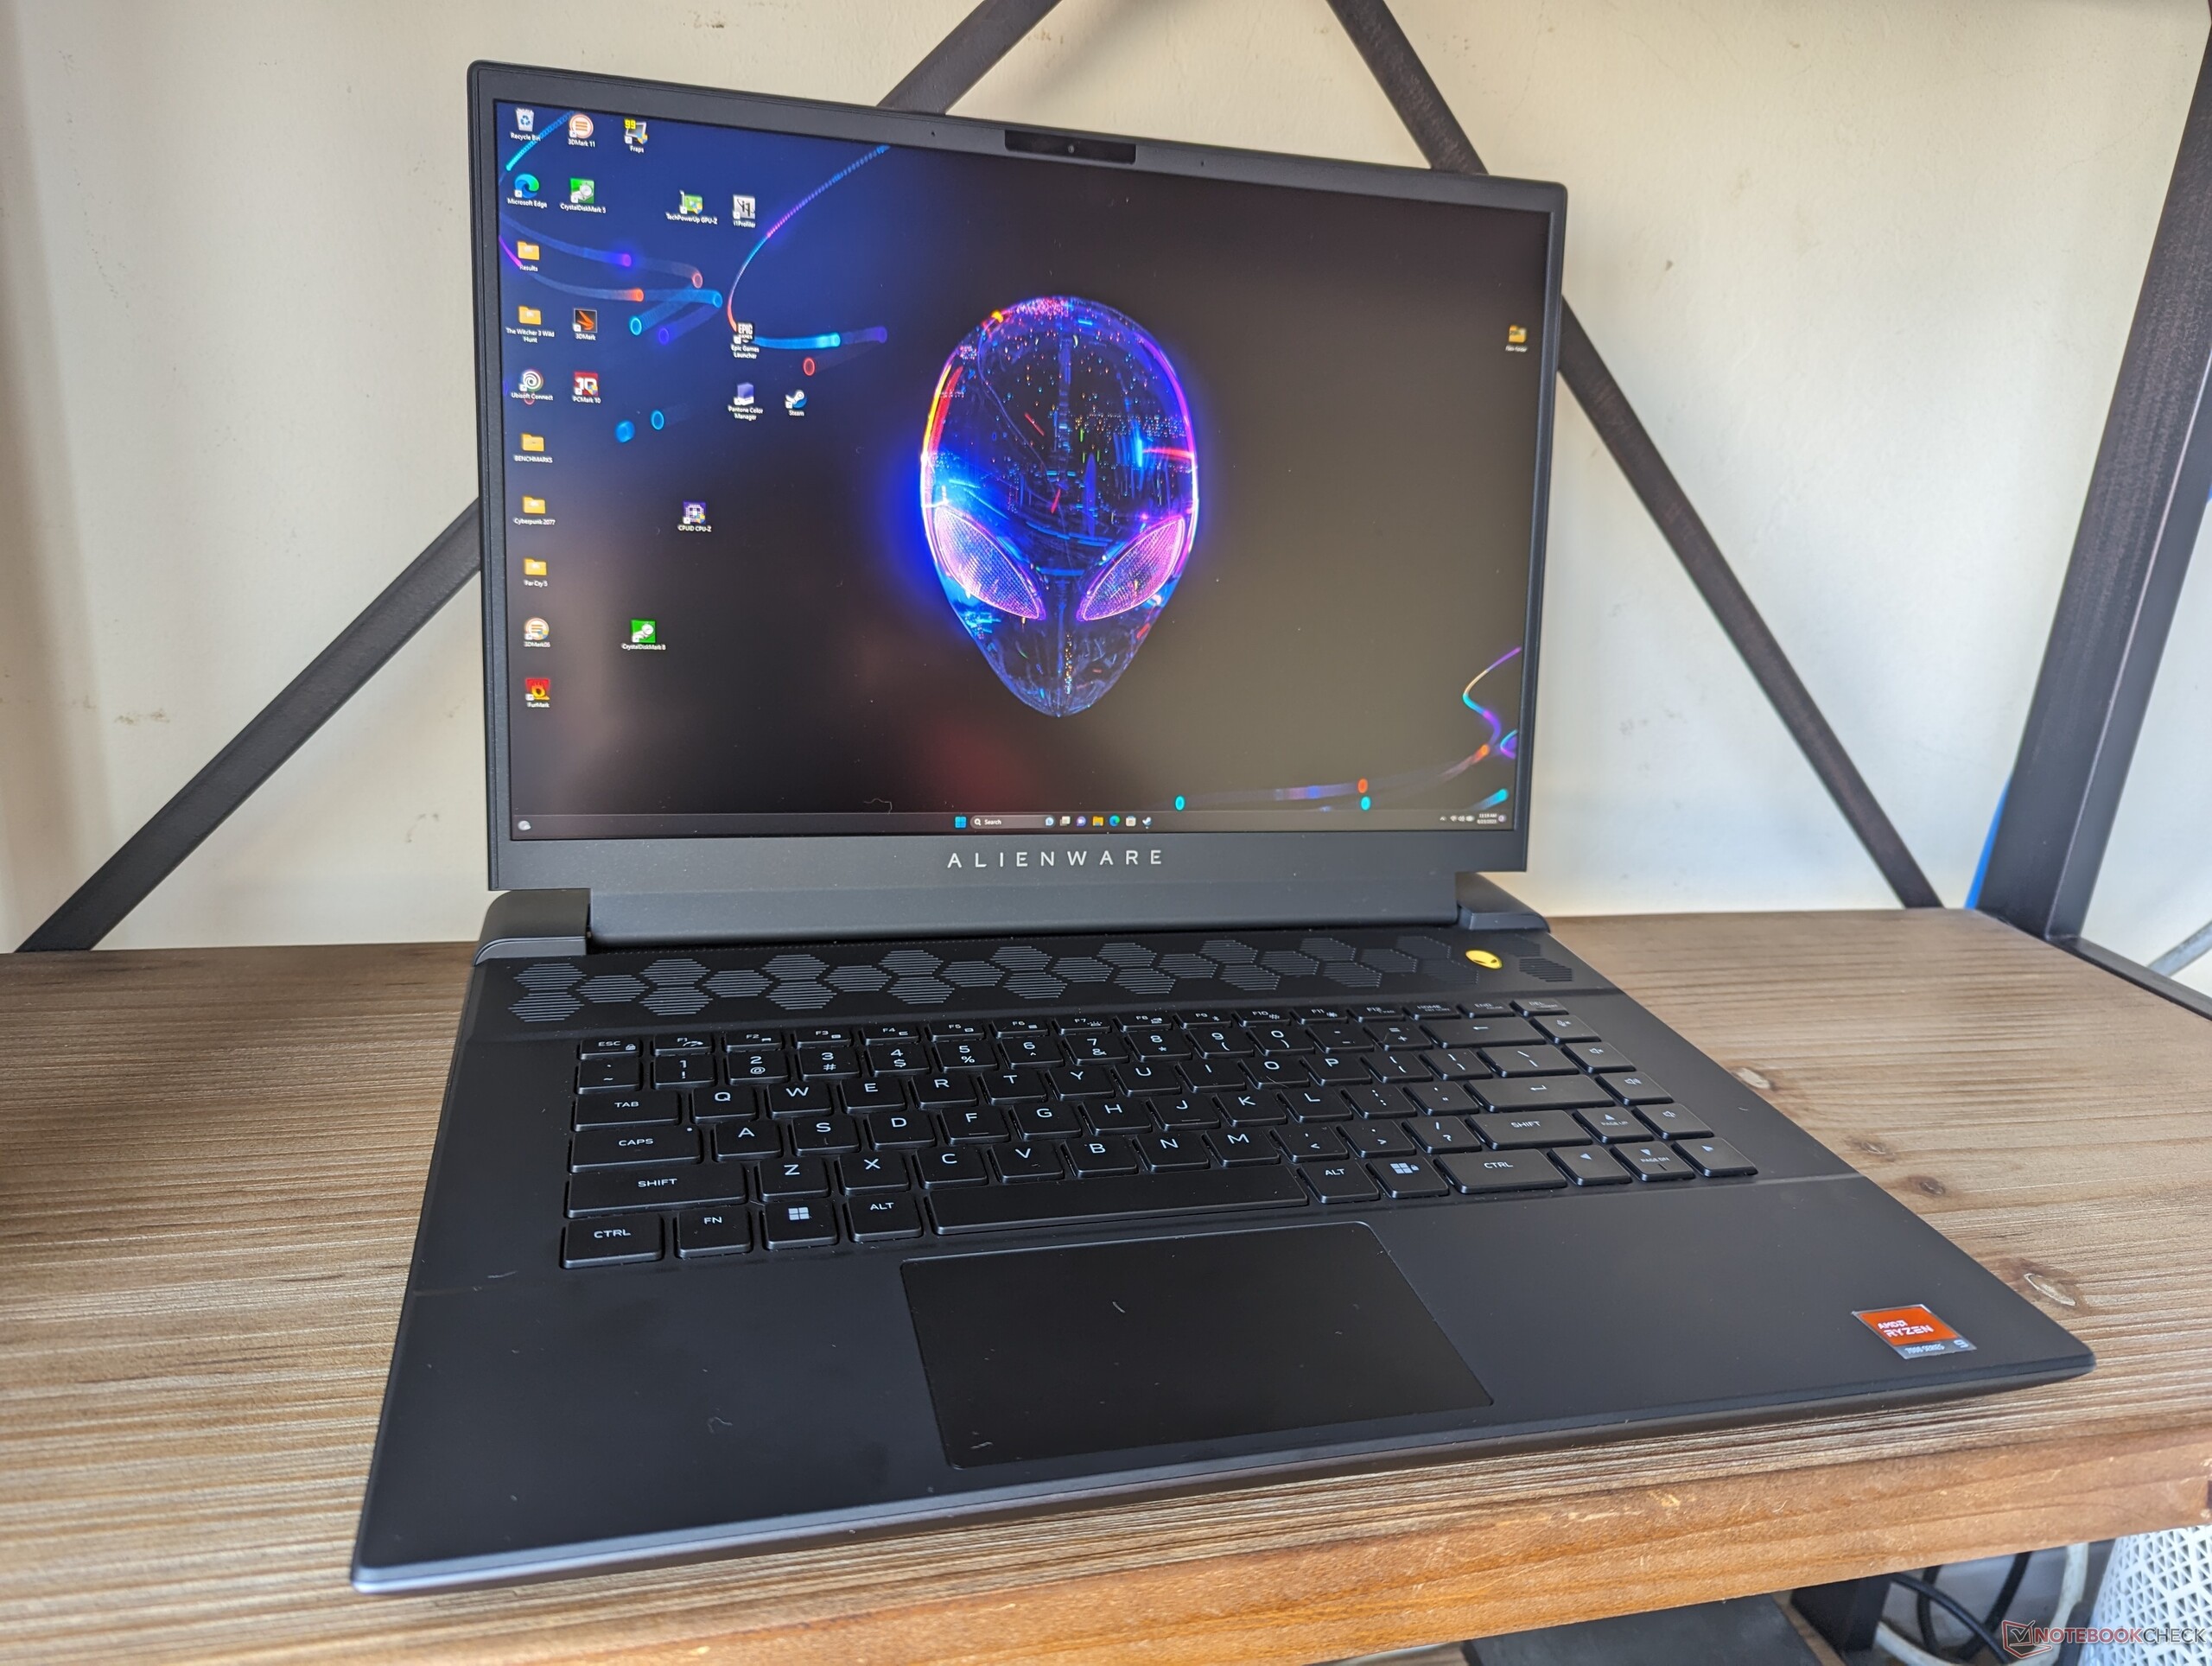
Écran - QHD+ avec couverture sRGB
Le côté positif de l'écran mat de 16 pouces (2560x1600, IPS) au format 16:10 est l'absence de scintillement PWM, la prise en charge de G-Sync (uniquement pour les modèles Intel m16) et les temps de réponse courts. La luminosité et le contraste de l'écran 165 Hz atteignent les objectifs respectifs (> 300 cd/m² ou 1000:1).
Il existe également deux autres écrans (1x QHD+, 1x FHD+) qui offrent des taux de rafraîchissement plus élevés et une plus grande couverture de l'espace colorimétrique. les options 4k, OLED ou mini-LED ne sont pas disponibles.
| |||||||||||||||||||||||||
Homogénéité de la luminosité: 89 %
Valeur mesurée au centre, sur batterie: 306 cd/m²
Contraste: 1020:1 (Valeurs des noirs: 0.3 cd/m²)
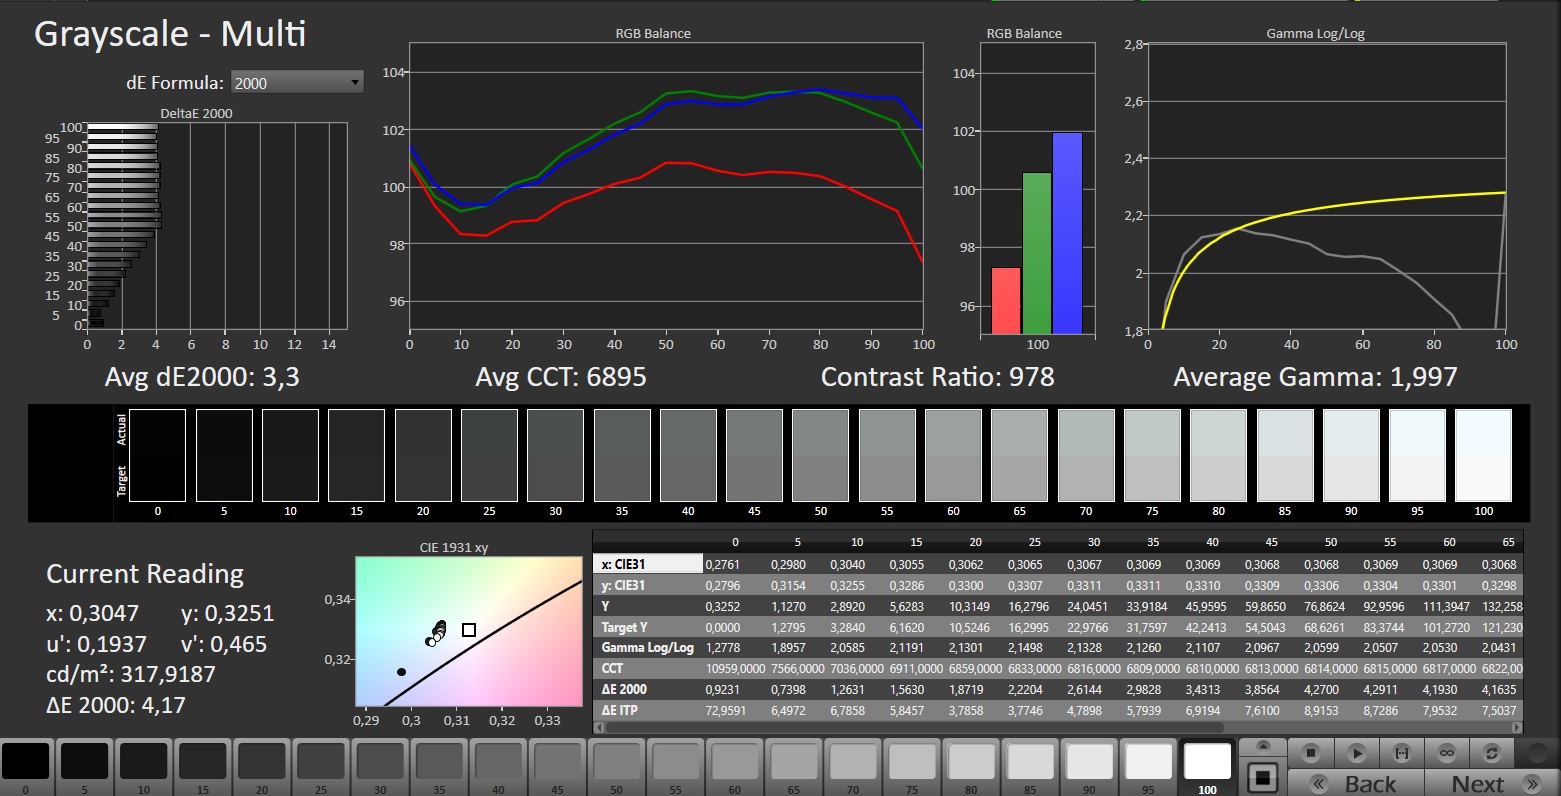
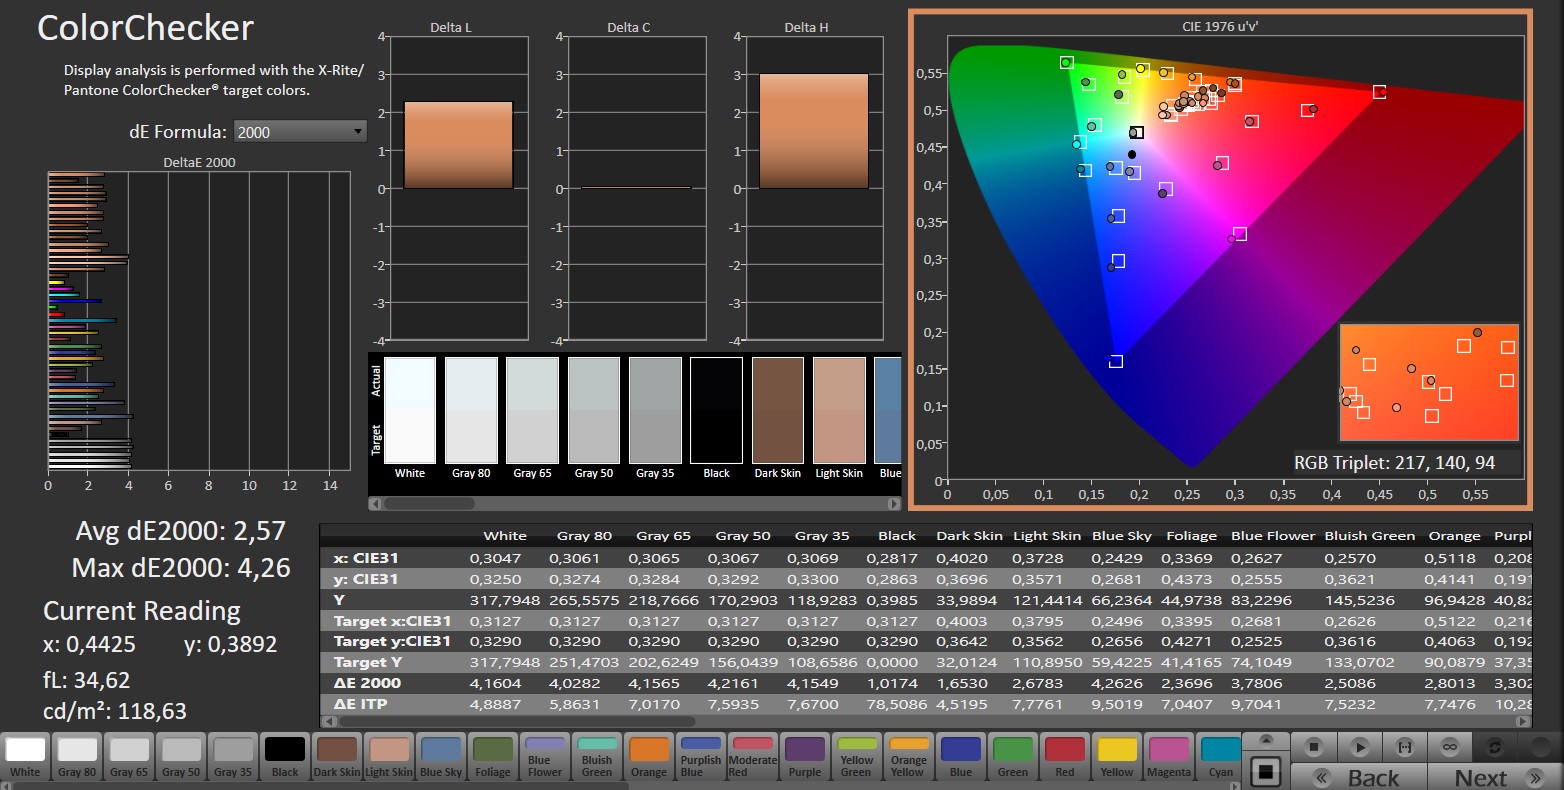
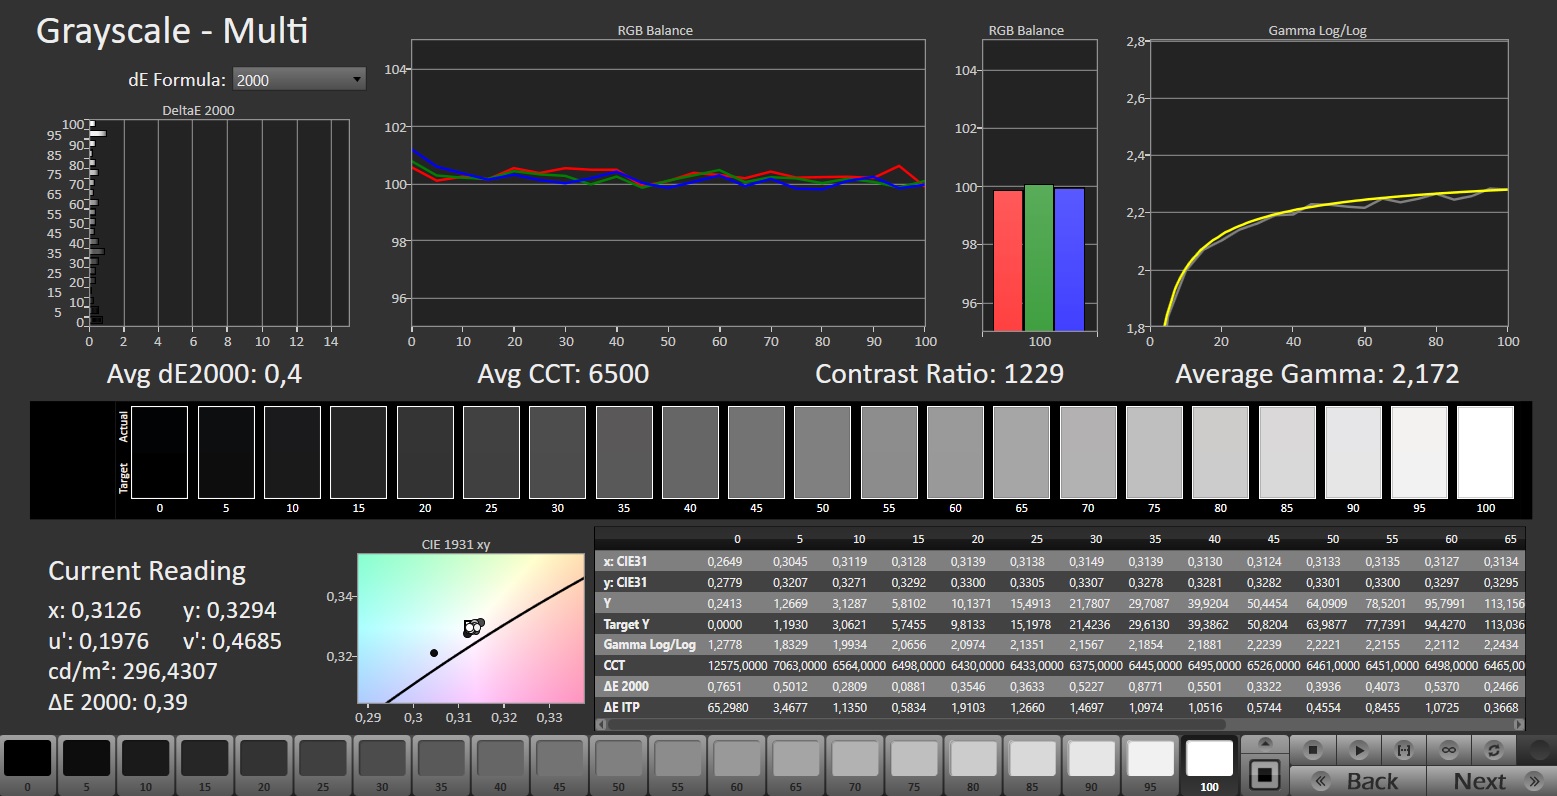
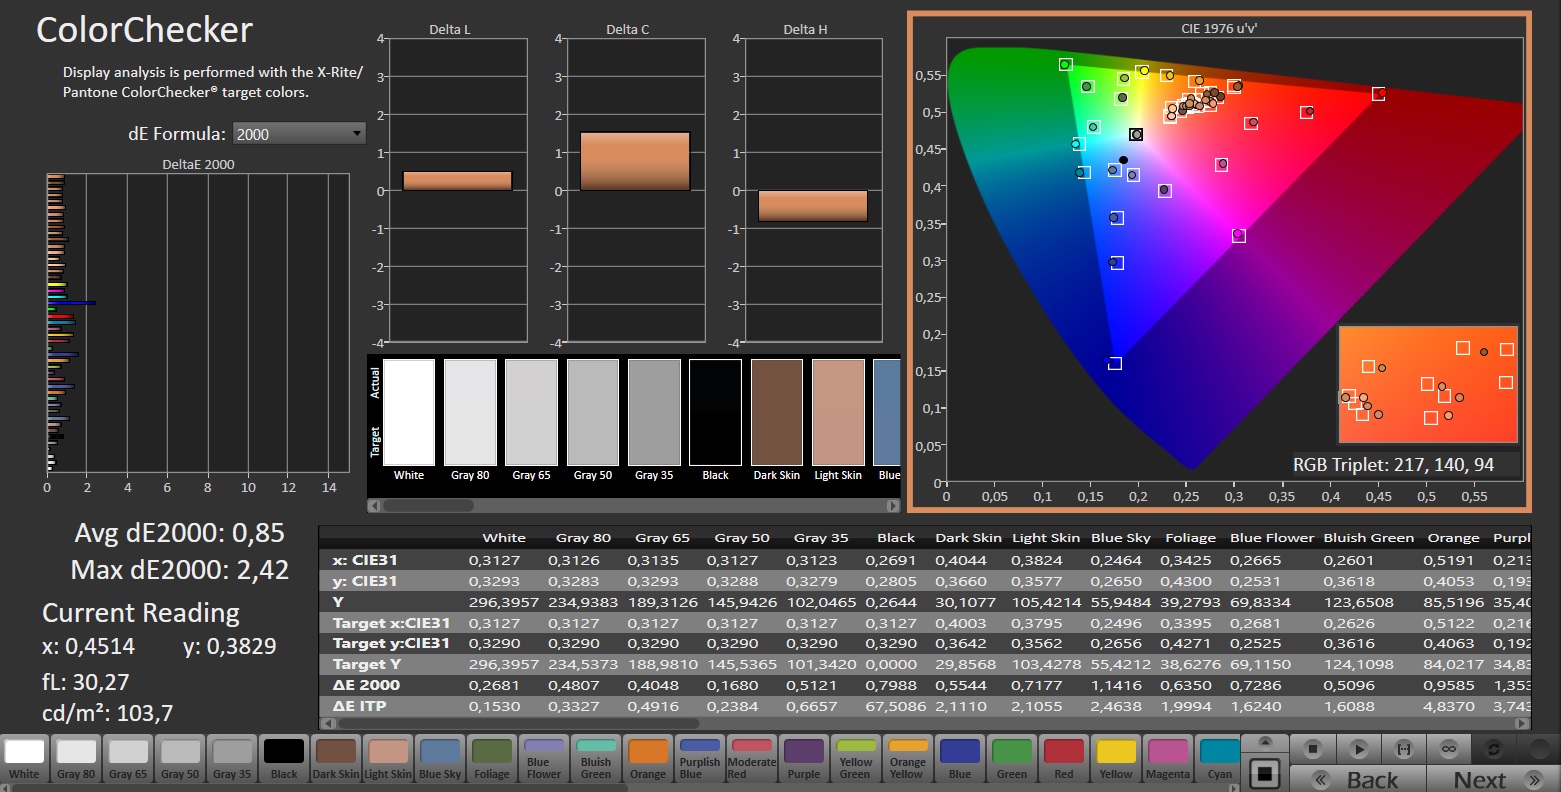
ΔE ColorChecker Calman: 2.57 | ∀{0.5-29.43 Ø4.71}
calibrated: 0.85
ΔE Greyscale Calman: 3.3 | ∀{0.09-98 Ø4.96}
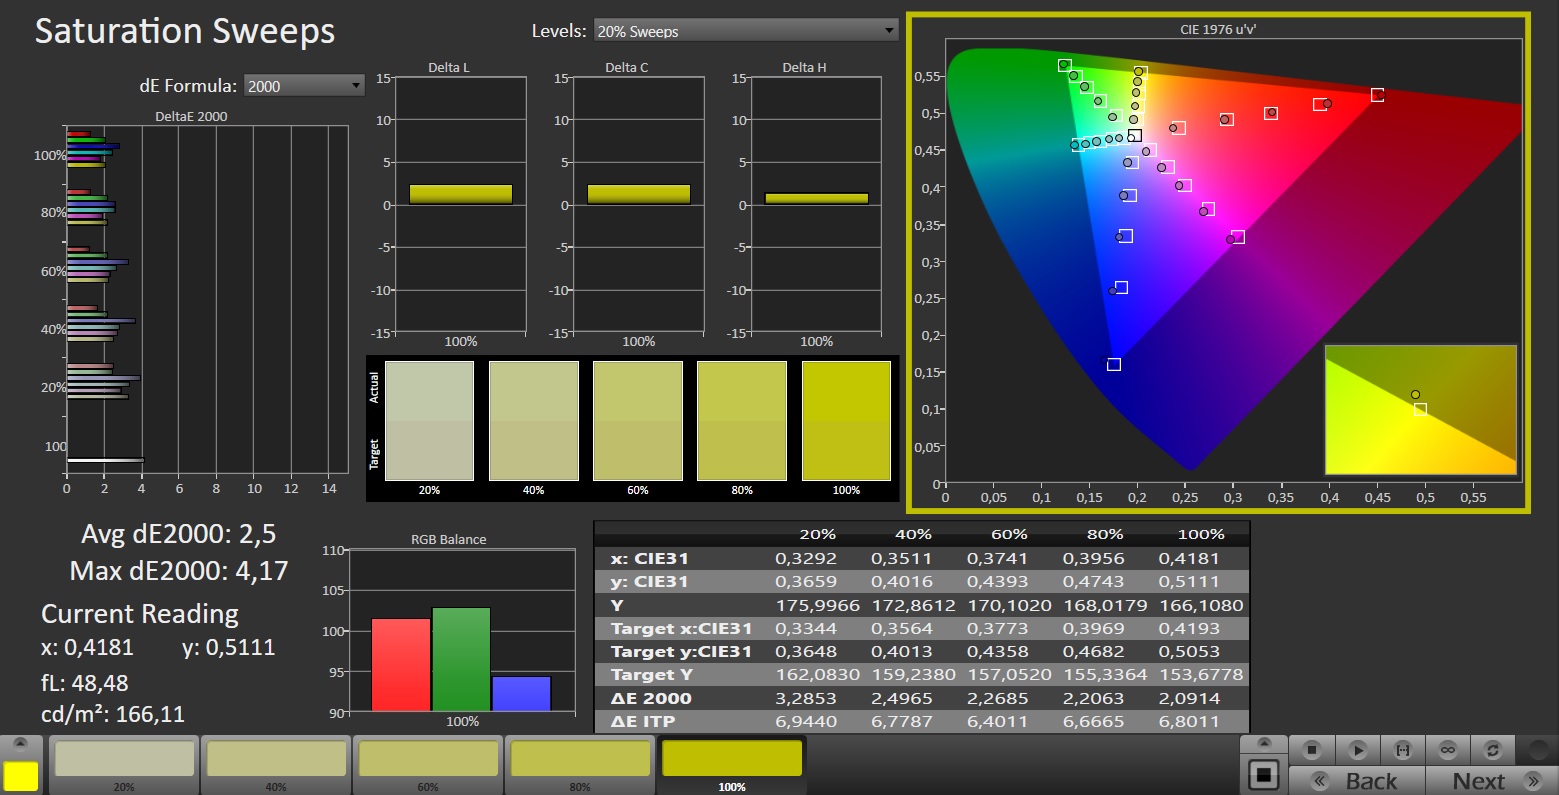
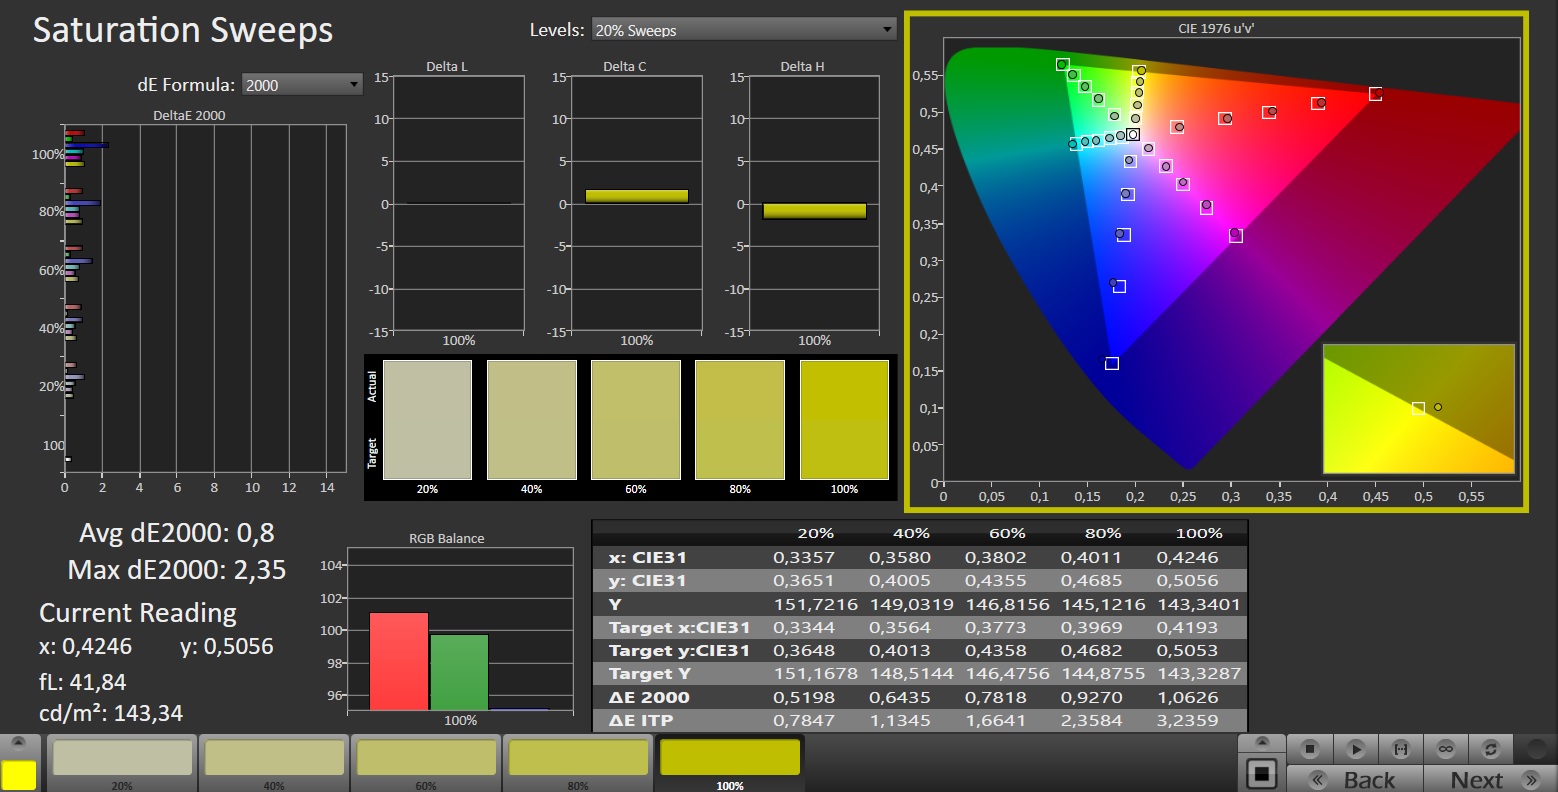
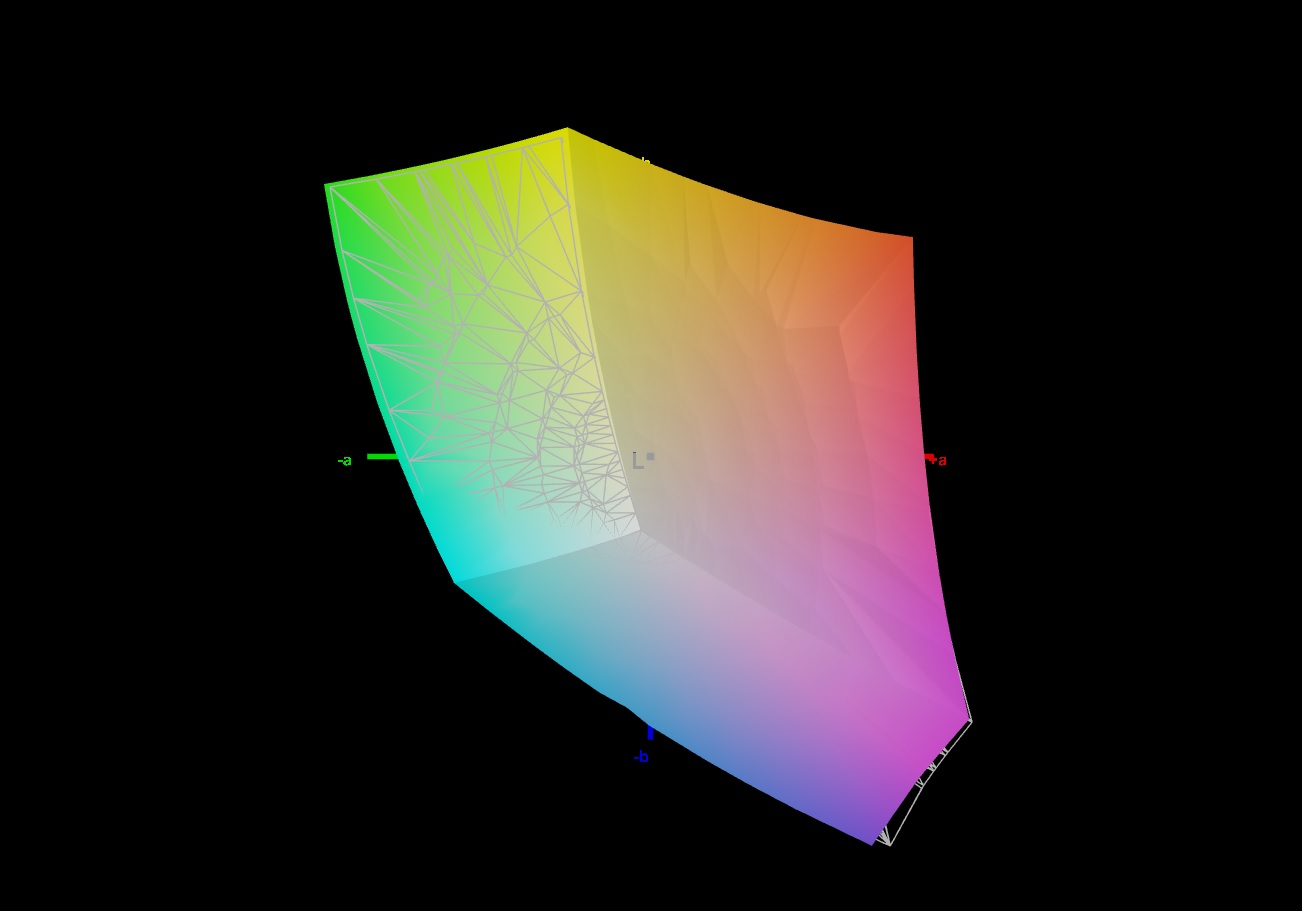
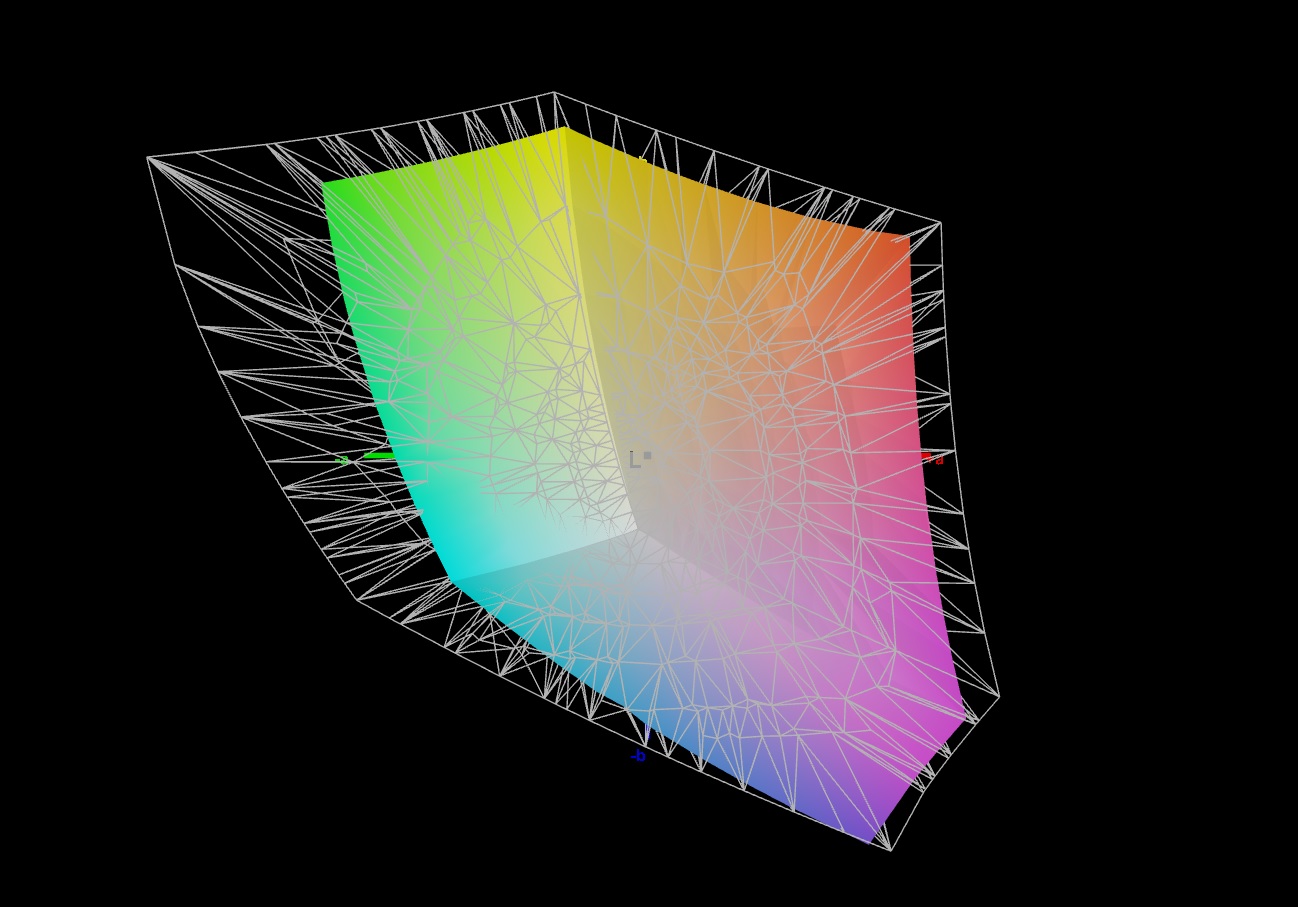
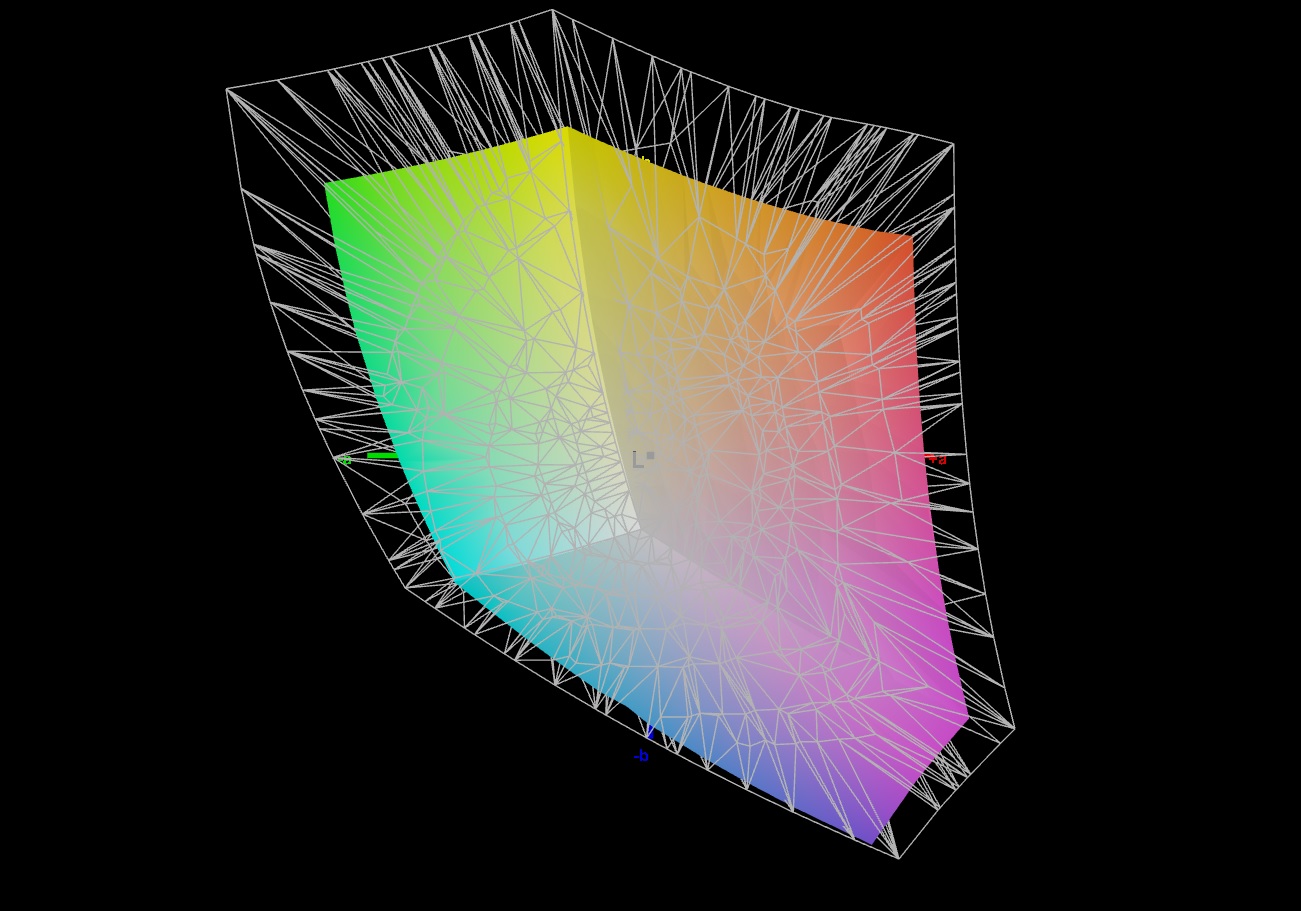
70% AdobeRGB 1998 (Argyll 3D)
97.2% sRGB (Argyll 3D)
67.7% Display P3 (Argyll 3D)
Gamma: 1.997
CCT: 6895 K
| Alienware m16 R1 Intel BOE NE16NYB, IPS, 2560x1600, 16" | Acer Predator Helios 16 PH16-71-731Q BOE NE160QDM-NZ2, IPS-LED, 2560x1600, 16" | Medion Erazer Defender P40 BOE CQ NE173QHM-NZ3, IPS, 2560x1440, 17.3" | Lenovo Legion Pro 5 16IRX8 AU Optronics B160QAN03.1, IPS, 2560x1600, 16" | Schenker XMG Pro 15 (E23) BOE0AD1, IPS, 2560x1440, 15.6" | Aorus 15 BSF Sharp LQ156T1JW05, IPS, 2560x1440, 15.6" | Alienware m16 R1 AMD BOE NE16NZ4, IPS, 2560x1600, 16" | |
|---|---|---|---|---|---|---|---|
| Display | 22% | 1% | 4% | 23% | 23% | 25% | |
| Display P3 Coverage (%) | 67.7 | 97.1 43% | 68.3 1% | 71.2 5% | 97.8 44% | 98.2 45% | 98.6 46% |
| sRGB Coverage (%) | 97.2 | 100 3% | 98.1 1% | 98.8 2% | 99.9 3% | 99.9 3% | 99.9 3% |
| AdobeRGB 1998 Coverage (%) | 70 | 84.7 21% | 69.8 0% | 73.3 5% | 85.4 22% | 85.7 22% | 88.9 27% |
| Response Times | -114% | -142% | -153% | -141% | -90% | -25% | |
| Response Time Grey 50% / Grey 80% * (ms) | 4 ? | 13.6 ? -240% | 14.6 ? -265% | 14.5 ? -263% | 14 ? -250% | 11.3 ? -183% | 5.1 ? -27% |
| Response Time Black / White * (ms) | 7.3 ? | 6.4 ? 12% | 8.7 ? -19% | 10.4 ? -42% | 9.6 ? -32% | 7 ? 4% | 9 ? -23% |
| PWM Frequency (Hz) | |||||||
| Screen | 14% | 18% | 19% | -15% | -24% | -34% | |
| Brightness middle (cd/m²) | 306 | 511 67% | 364 19% | 405.7 33% | 322 5% | 299 -2% | 329 8% |
| Brightness (cd/m²) | 302 | 498 65% | 343 14% | 368 22% | 301 0% | 282 -7% | 317 5% |
| Brightness Distribution (%) | 89 | 94 6% | 86 -3% | 87 -2% | 85 -4% | 82 -8% | 89 0% |
| Black Level * (cd/m²) | 0.3 | 0.36 -20% | 0.28 7% | 0.38 -27% | 0.36 -20% | 0.31 -3% | 0.32 -7% |
| Contrast (:1) | 1020 | 1419 39% | 1300 27% | 1068 5% | 894 -12% | 965 -5% | 1028 1% |
| Colorchecker dE 2000 * | 2.57 | 1.76 32% | 1.67 35% | 1.65 36% | 1.98 23% | 2.24 13% | 3.71 -44% |
| Colorchecker dE 2000 max. * | 4.26 | 3.7 13% | 2.78 35% | 4.2 1% | 5.24 -23% | 4.29 -1% | 7.23 -70% |
| Colorchecker dE 2000 calibrated * | 0.85 | 1.56 -84% | 1.14 -34% | 0.53 38% | 1.98 -133% | 2.62 -208% | 2.82 -232% |
| Greyscale dE 2000 * | 3.3 | 3 9% | 1.4 58% | 1.2 64% | 2.44 26% | 3 9% | 2.2 33% |
| Gamma | 1.997 110% | 2.33 94% | 2.091 105% | 2.3 96% | 2.42 91% | 2.086 105% | 2.3 96% |
| CCT | 6895 94% | 6341 103% | 6568 99% | 6453 101% | 6984 93% | 6289 103% | 6270 104% |
| Moyenne finale (programmes/paramètres) | -26% /
-2% | -41% /
-9% | -43% /
-9% | -44% /
-25% | -30% /
-23% | -11% /
-20% |
* ... Moindre est la valeur, meilleures sont les performances
L'écran montre une bonne représentation des couleurs départ usine : l'objectif (DeltaE < 3) est atteint avec une déviation d'environ 2,6. L'étalonnage réduit encore cet écart à 0,85 et garantit des niveaux de gris plus équilibrés. L'écran est capable de reproduire entièrement l'espace colorimétrique sRGB, mais pas les espaces colorimétriques AdobeRGB et DCI P3. En revanche, l'espace P3 peut être reproduit sur les écrans alternatifs.
Temps de réponse de l'écran
| ↔ Temps de réponse noir à blanc | ||
|---|---|---|
| 7.3 ms ... hausse ↗ et chute ↘ combinées | ↗ 3.6 ms hausse | 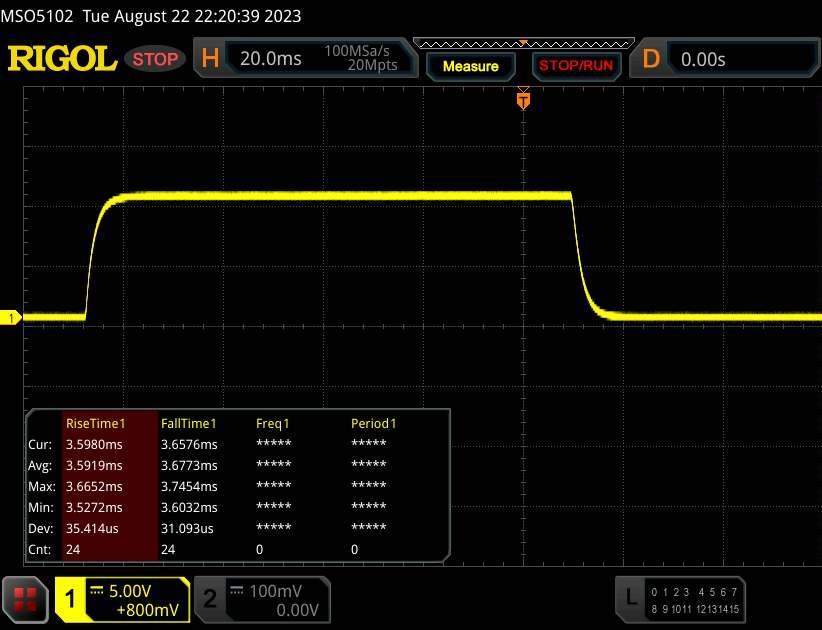 |
| ↘ 3.7 ms chute | ||
| L'écran montre de très faibles temps de réponse, parfait pour le jeu. En comparaison, tous les appareils testés affichent entre 0.1 (minimum) et 240 (maximum) ms. » 22 % des appareils testés affichent de meilleures performances. Cela signifie que les latences relevées sont meilleures que la moyenne (19.8 ms) de tous les appareils testés. | ||
| ↔ Temps de réponse gris 50% à gris 80% | ||
| 4 ms ... hausse ↗ et chute ↘ combinées | ↗ 1.7 ms hausse | 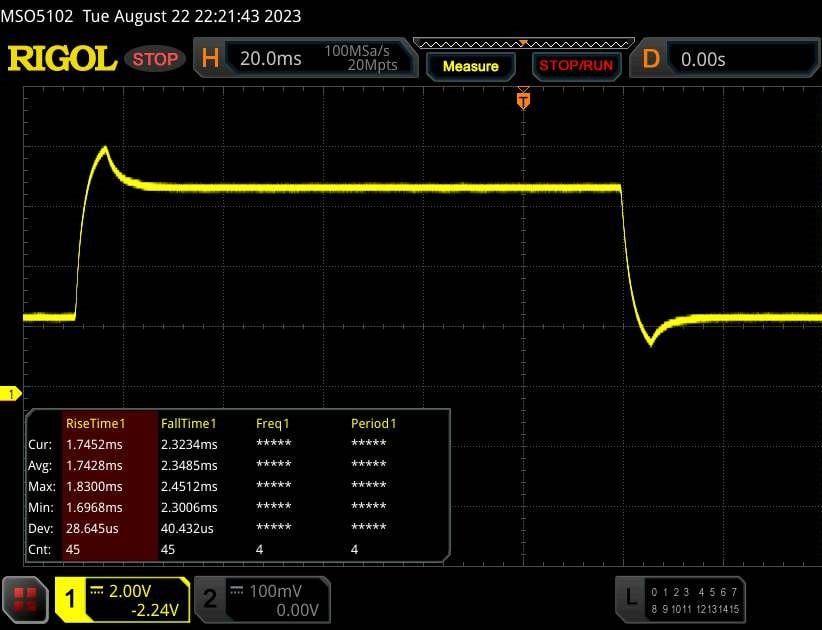 |
| ↘ 2.3 ms chute | ||
| L'écran montre de très faibles temps de réponse, parfait pour le jeu. En comparaison, tous les appareils testés affichent entre 0.165 (minimum) et 636 (maximum) ms. » 15 % des appareils testés affichent de meilleures performances. Cela signifie que les latences relevées sont meilleures que la moyenne (31 ms) de tous les appareils testés. | ||
Scintillement / MLI (Modulation de largeur d'impulsion)
| Scintillement / MLI (Modulation de largeur d'impulsion) non décelé | 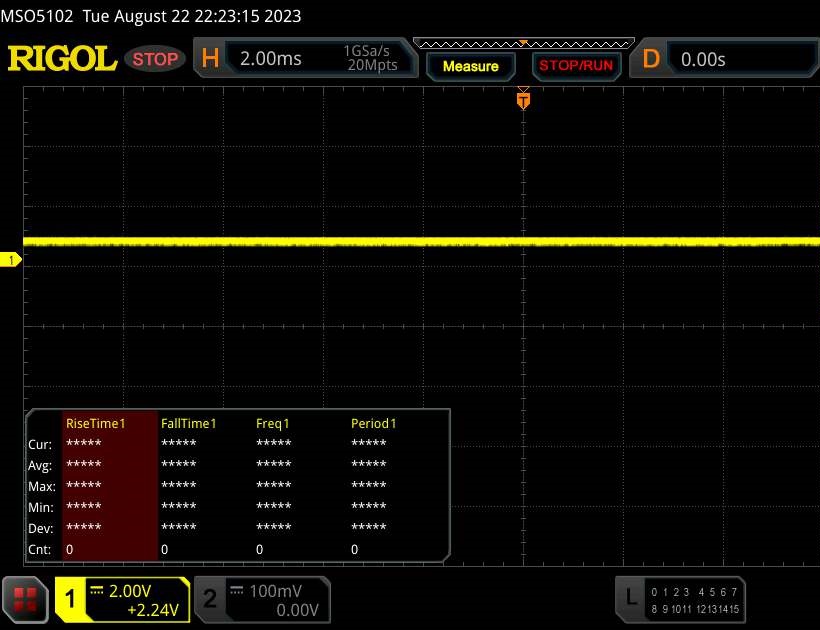 | ||
En comparaison, 52 % des appareils testés n'emploient pas MDI pour assombrir leur écran. Nous avons relevé une moyenne à 7754 (minimum : 5 - maximum : 343500) Hz dans le cas où une MDI était active. | |||
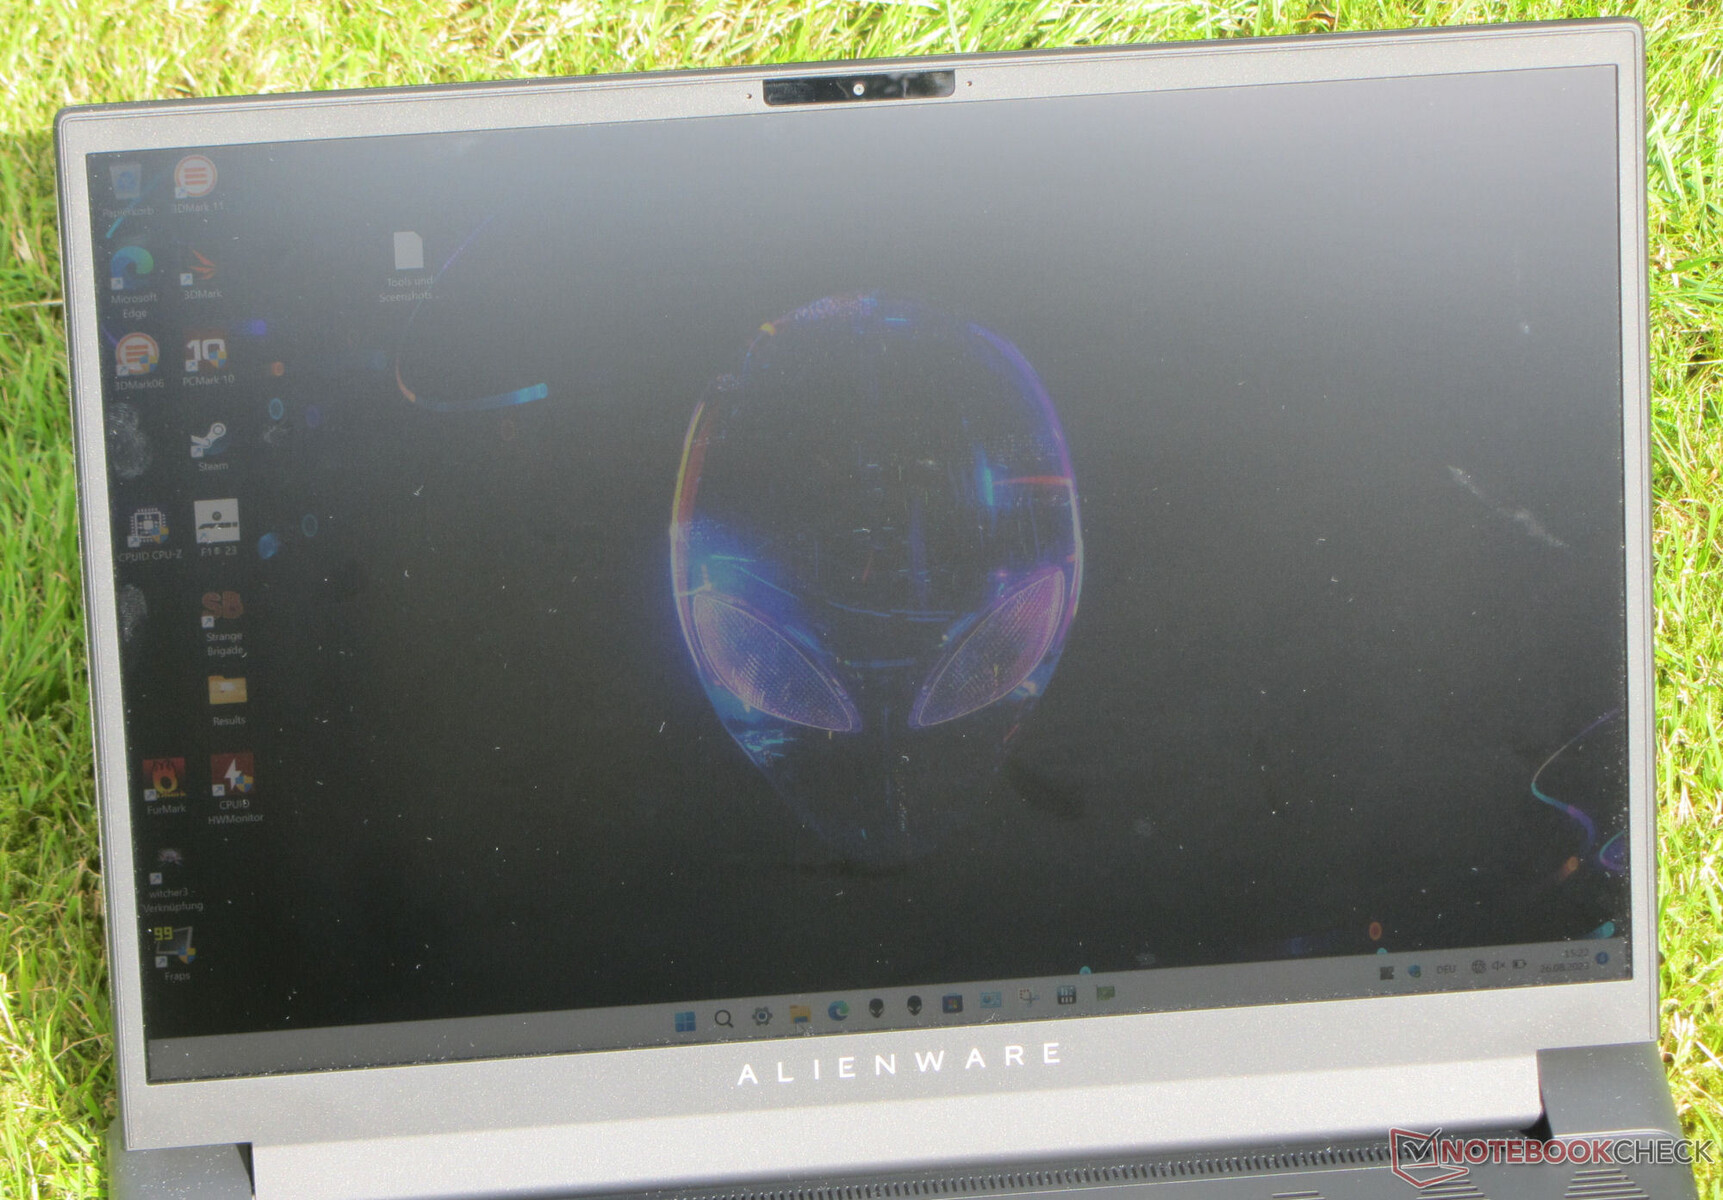
L'écran IPS, dont l'angle de vision est stable, peut être lu dans n'importe quelle position. En extérieur, la lecture de l'écran est tout à fait possible tant que le soleil ne brille pas trop fort.

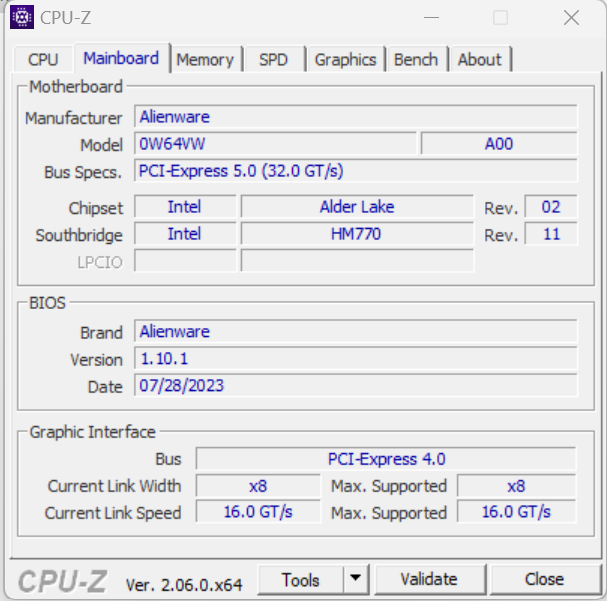
Performances - L'ordinateur portable Alienware offre des performances système élevées
Dans la gamme Alienware m16 R1, les GPU Ada Lovelace (RTX 4060, 4070, 4080) sont combinés avec des unités centrales d'Intel ou d'AMD. Il existe deux exceptions : certains modèles AMD ne peuvent être commandés qu'avec une Radeon RX 7600M XT et certains modèles Intel avec une GeForce RTX 4090. Notre m16 basé sur Intel est disponible pour environ 1 900 euros, ce qui en fait l'un des représentants les moins chers de la série.
Conditions d'essai
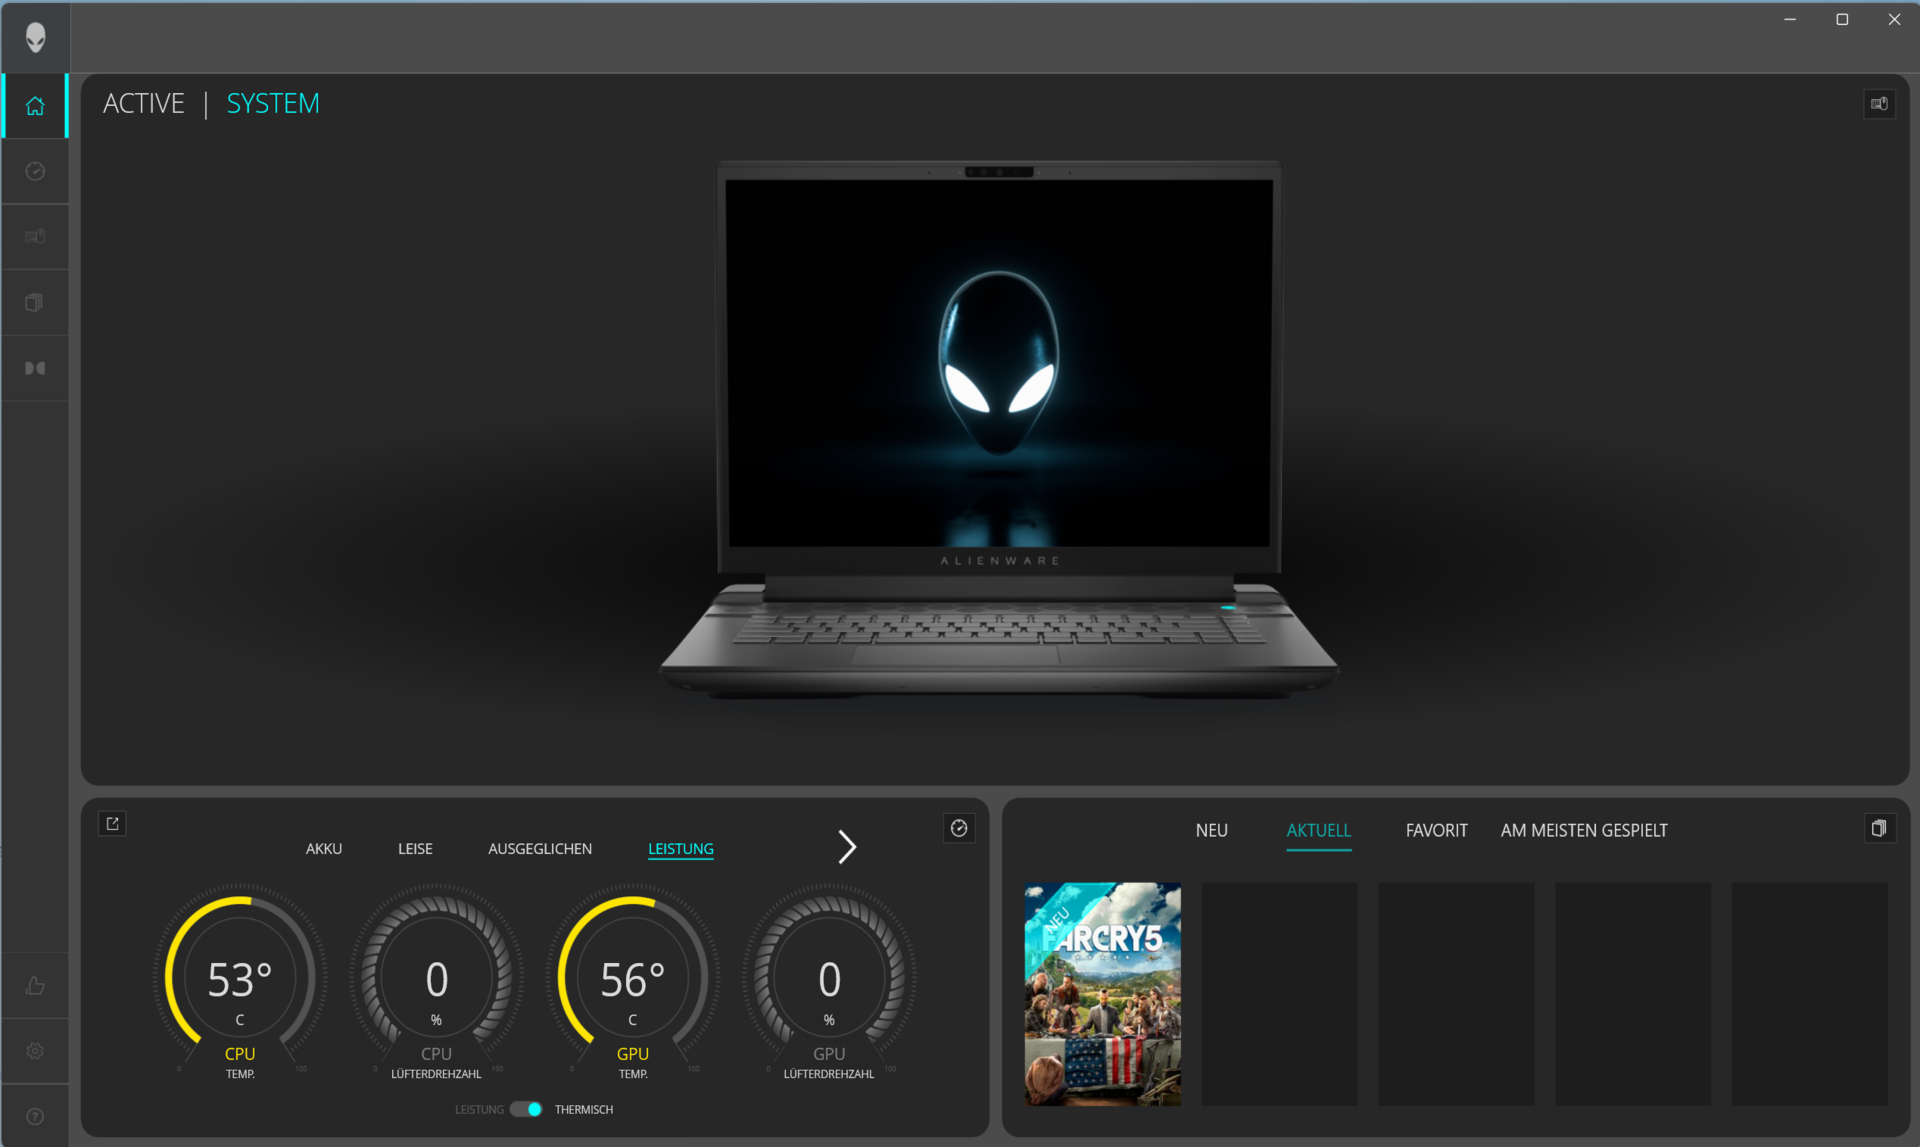
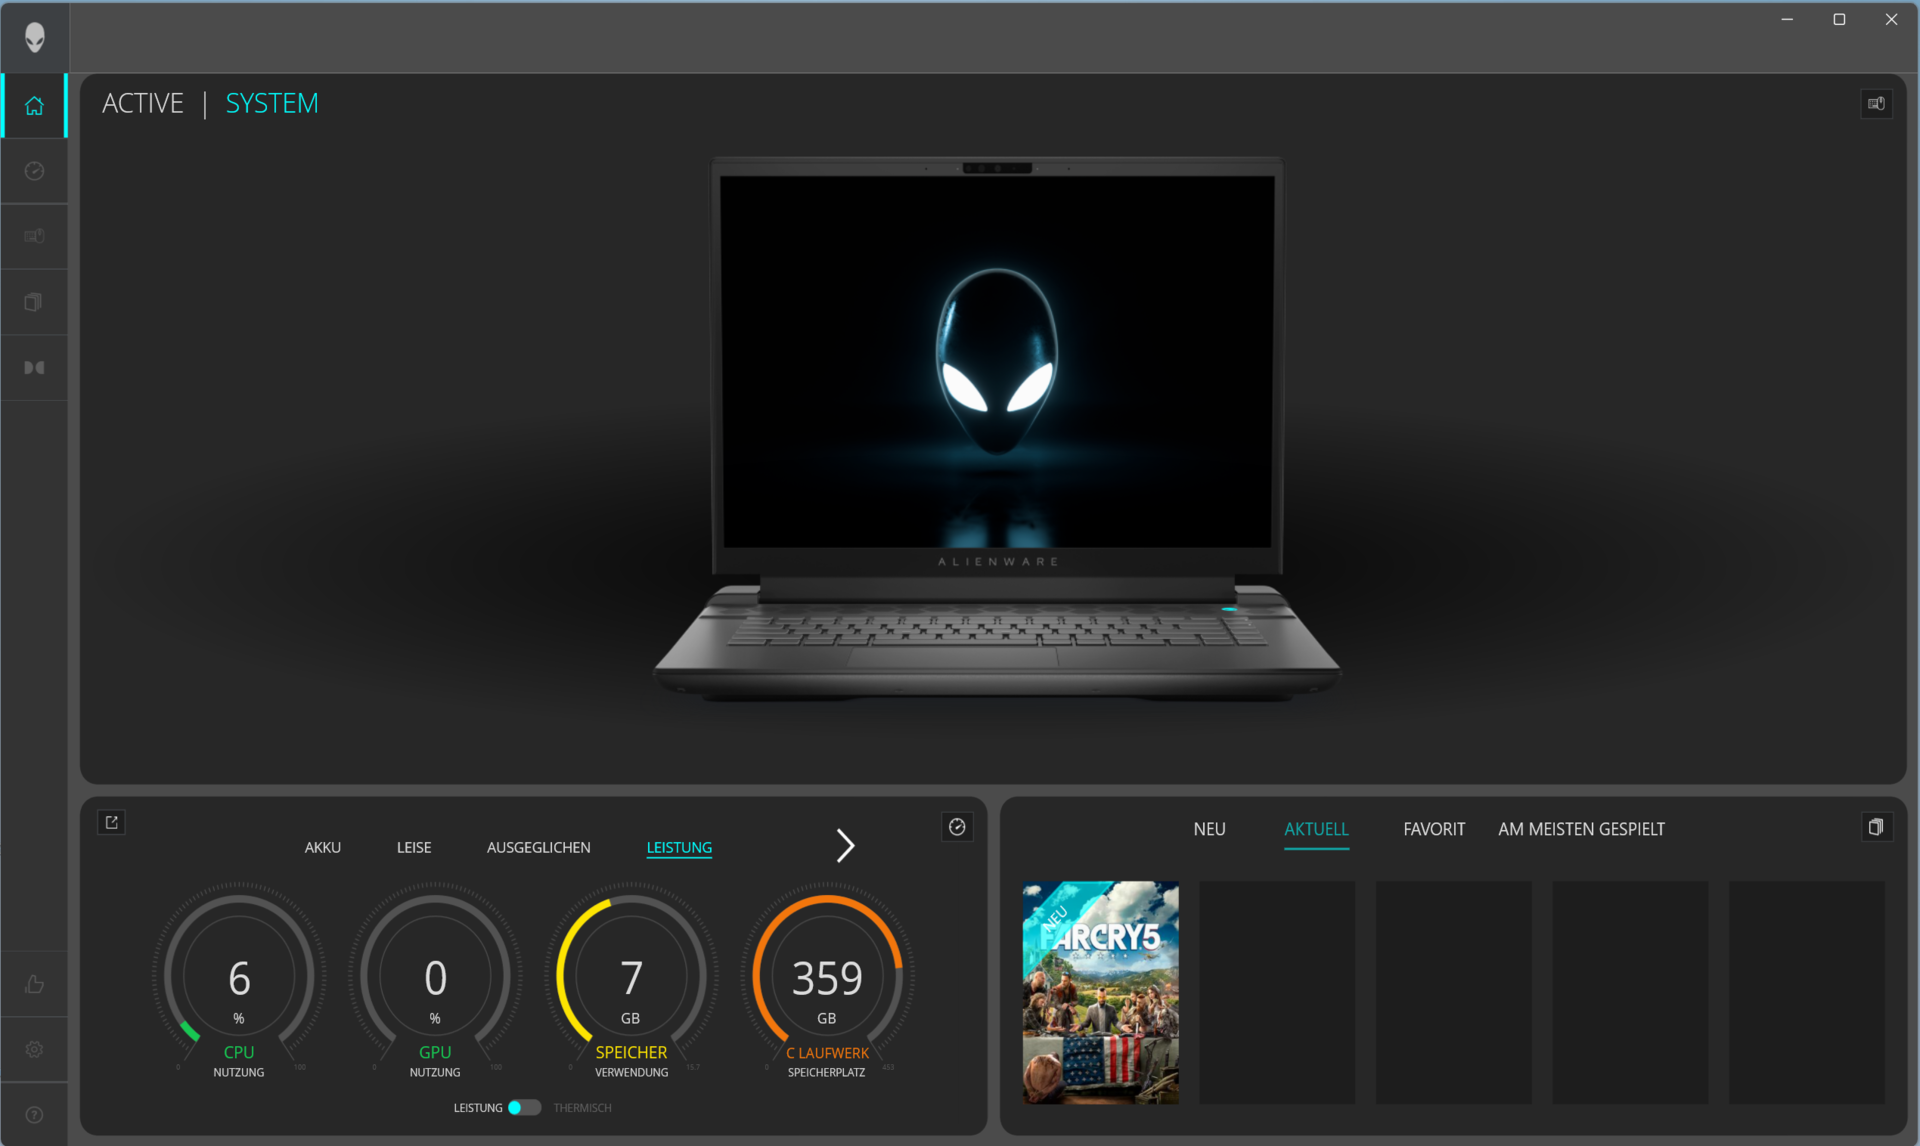
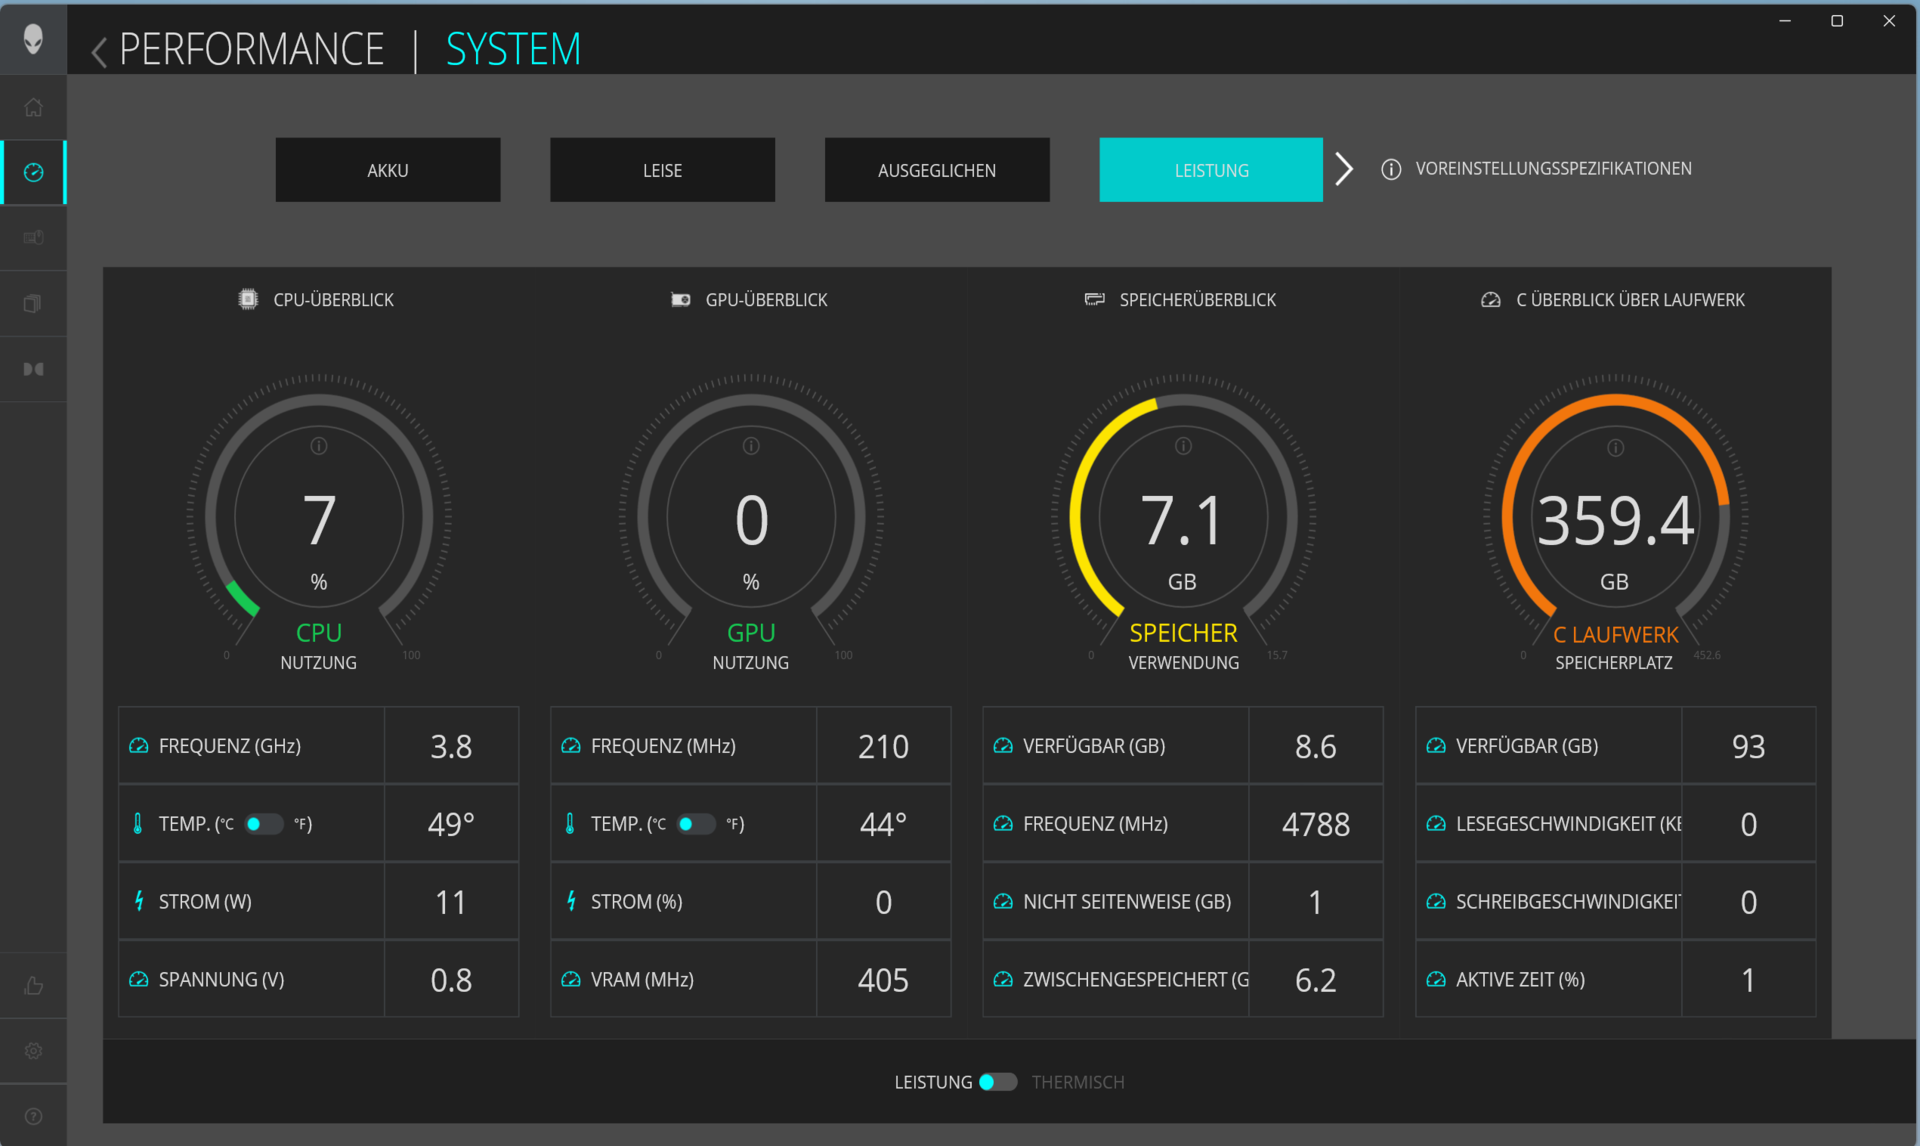
Les utilisateurs peuvent basculer entre cinq modes de performance spécifiques au fabricant via l'Alienware Command Center (centre de contrôle de l'ordinateur portable). Un mode haute performance (performances maximales, ventilateurs à plein régime) peut être activé via la touche "F1". Dans nos tests, nous avons utilisé les modes "Performance" (benchmarks) et "Balanced" (tests de batterie).
Remarque : le modèle jumeau Test de l'Alienware m16 R1 : les débuts de l'AMD Ryzen 9 7845HX a été testé avec le profil "Overdrive" et le mode dGPU actif. Les résultats des tests de référence ne sont donc pas toujours directement comparables.
| Performance | Overdrive | Balanced | Silent | Battery | |
|---|---|---|---|---|---|
| Limite de puissance 1 (HWInfo) | 157 watts | 165 watts | 157 watts | 50 watts | 55 watts |
| Limite de puissance 2 (HWInfo) | 157 watts | 165 watts | 157 watts | 157 watts | 157 watts |
| Performance (Witcher 3) | 104fps | 104fps | 103fps | 102fps | 103fps |
| Bruit (Witcher 3) | 51dB(A) | 58dB(A) | 49dB(A) | 43dB(A) | 47dB(A) |

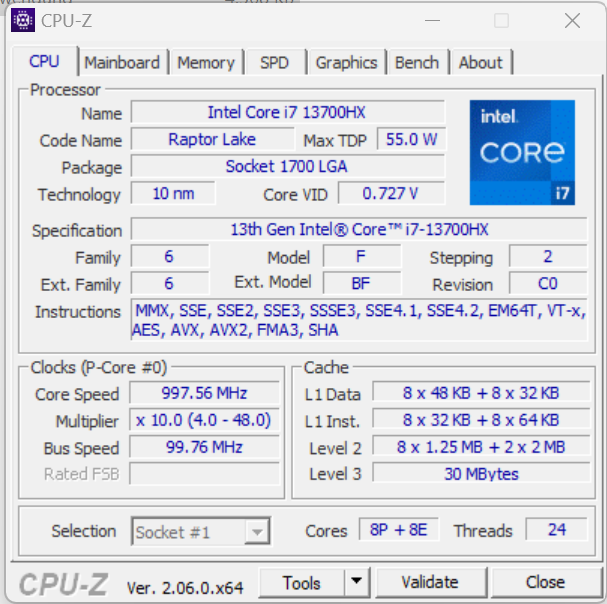
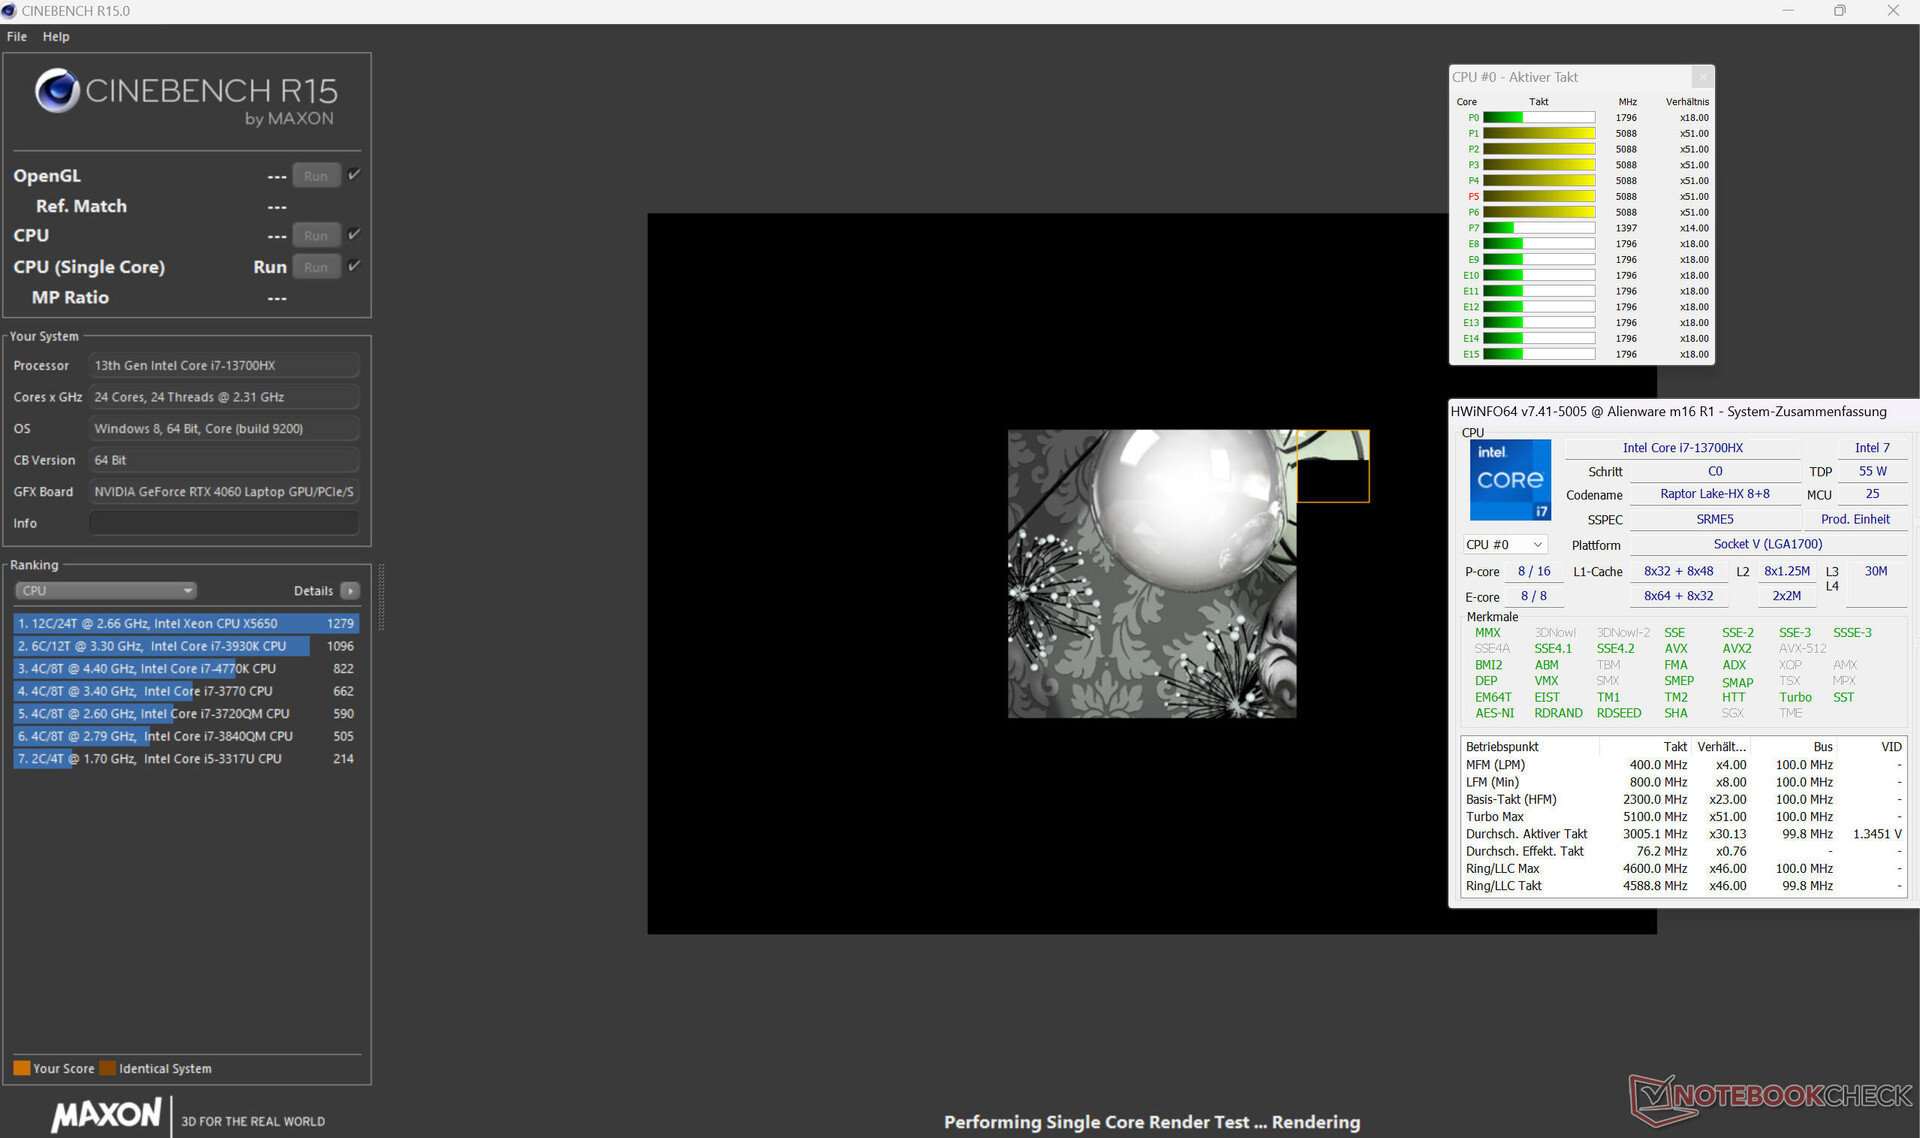
Processeur
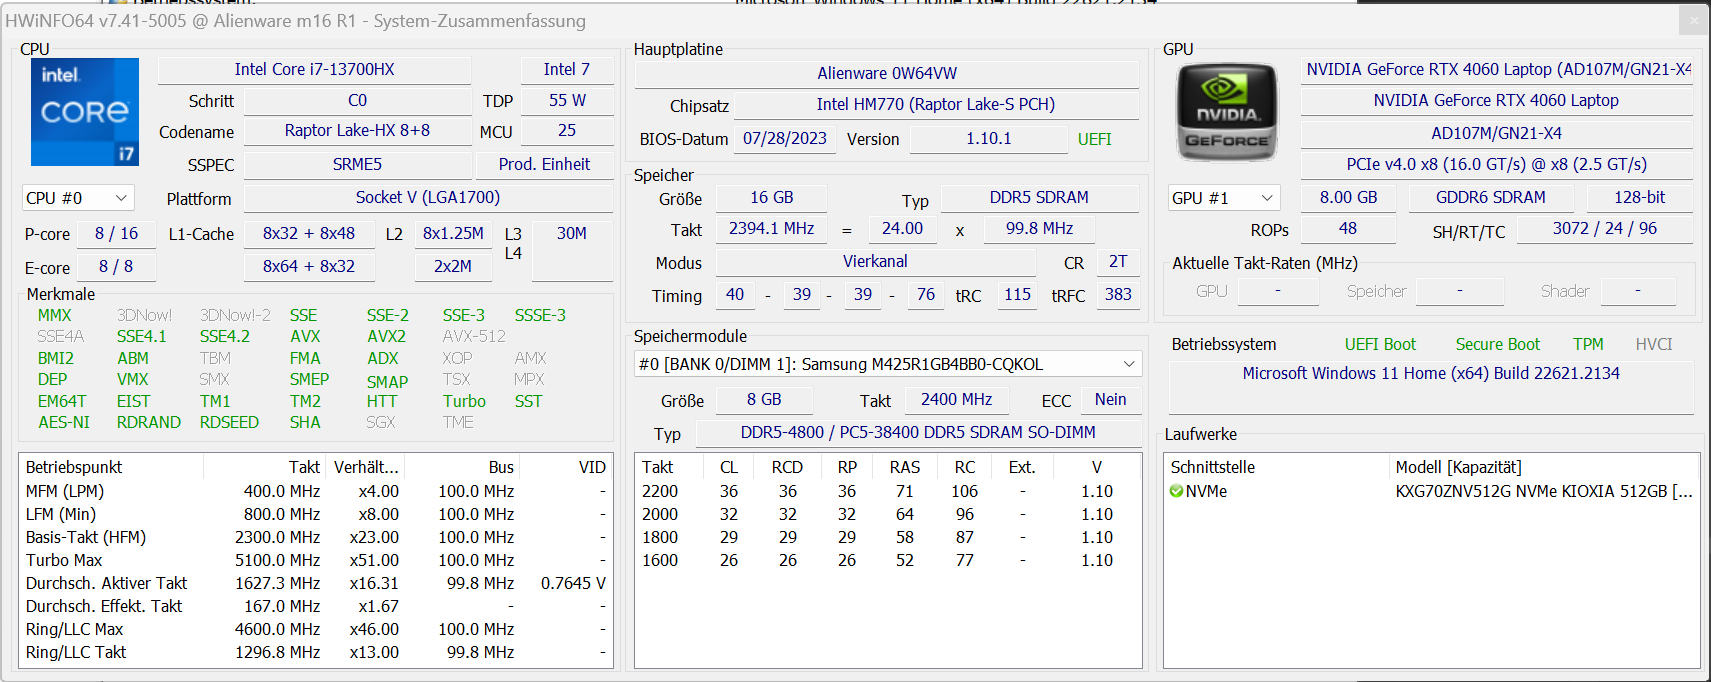
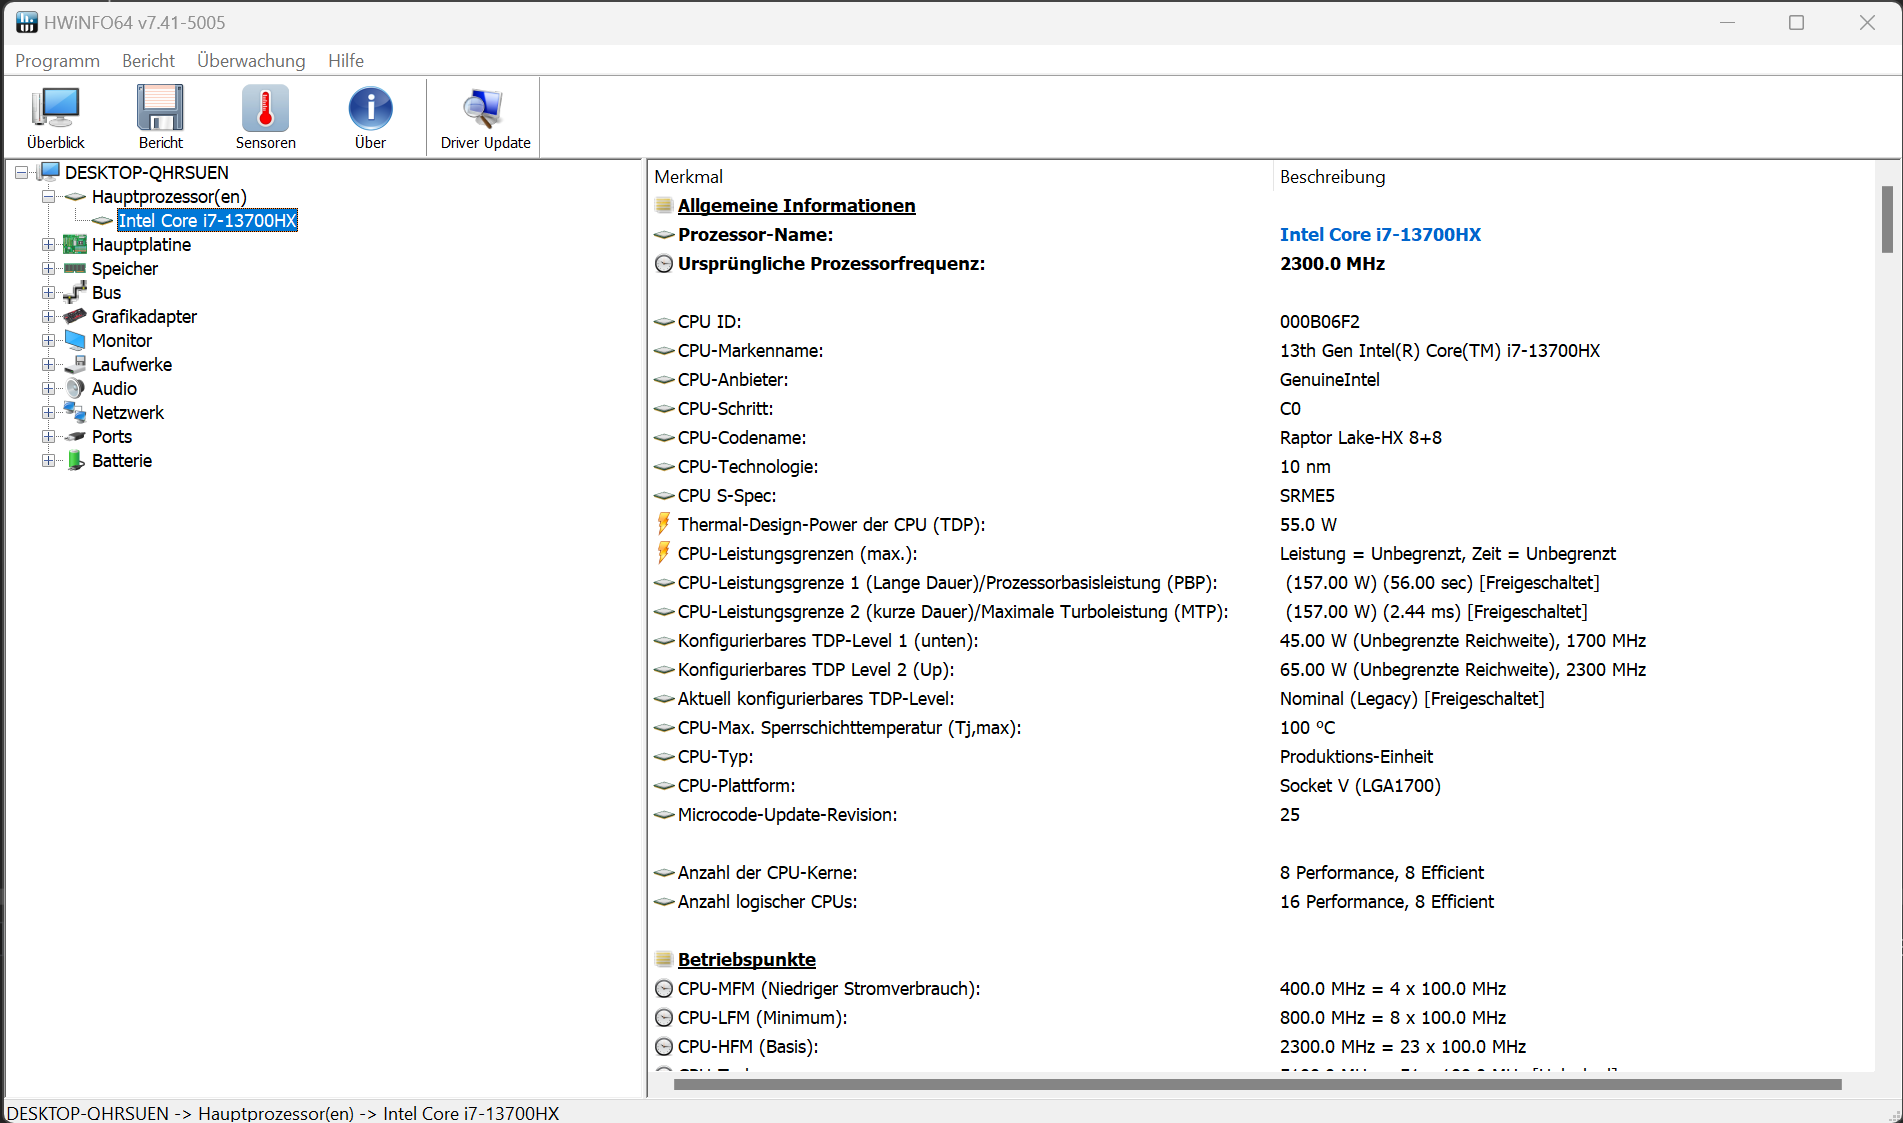
Le Core-i7-13700HX (Raptor Lake) se compose de huit cœurs d'efficacité (sans hyperthreading, 1,5 à 3,7 GHz) et de huit cœurs de performance (hyperthreading, 2,1 à 5 GHz). Au total, il y a 24 cœurs logiques de CPU.
Les résultats du benchmark sont supérieurs à la moyenne de l'unité centrale en fonctionnement sur secteur. En mode batterie, les performances les plus pertinentes (160 points) chutent de la même manière que les performances multithread (2 134 points).
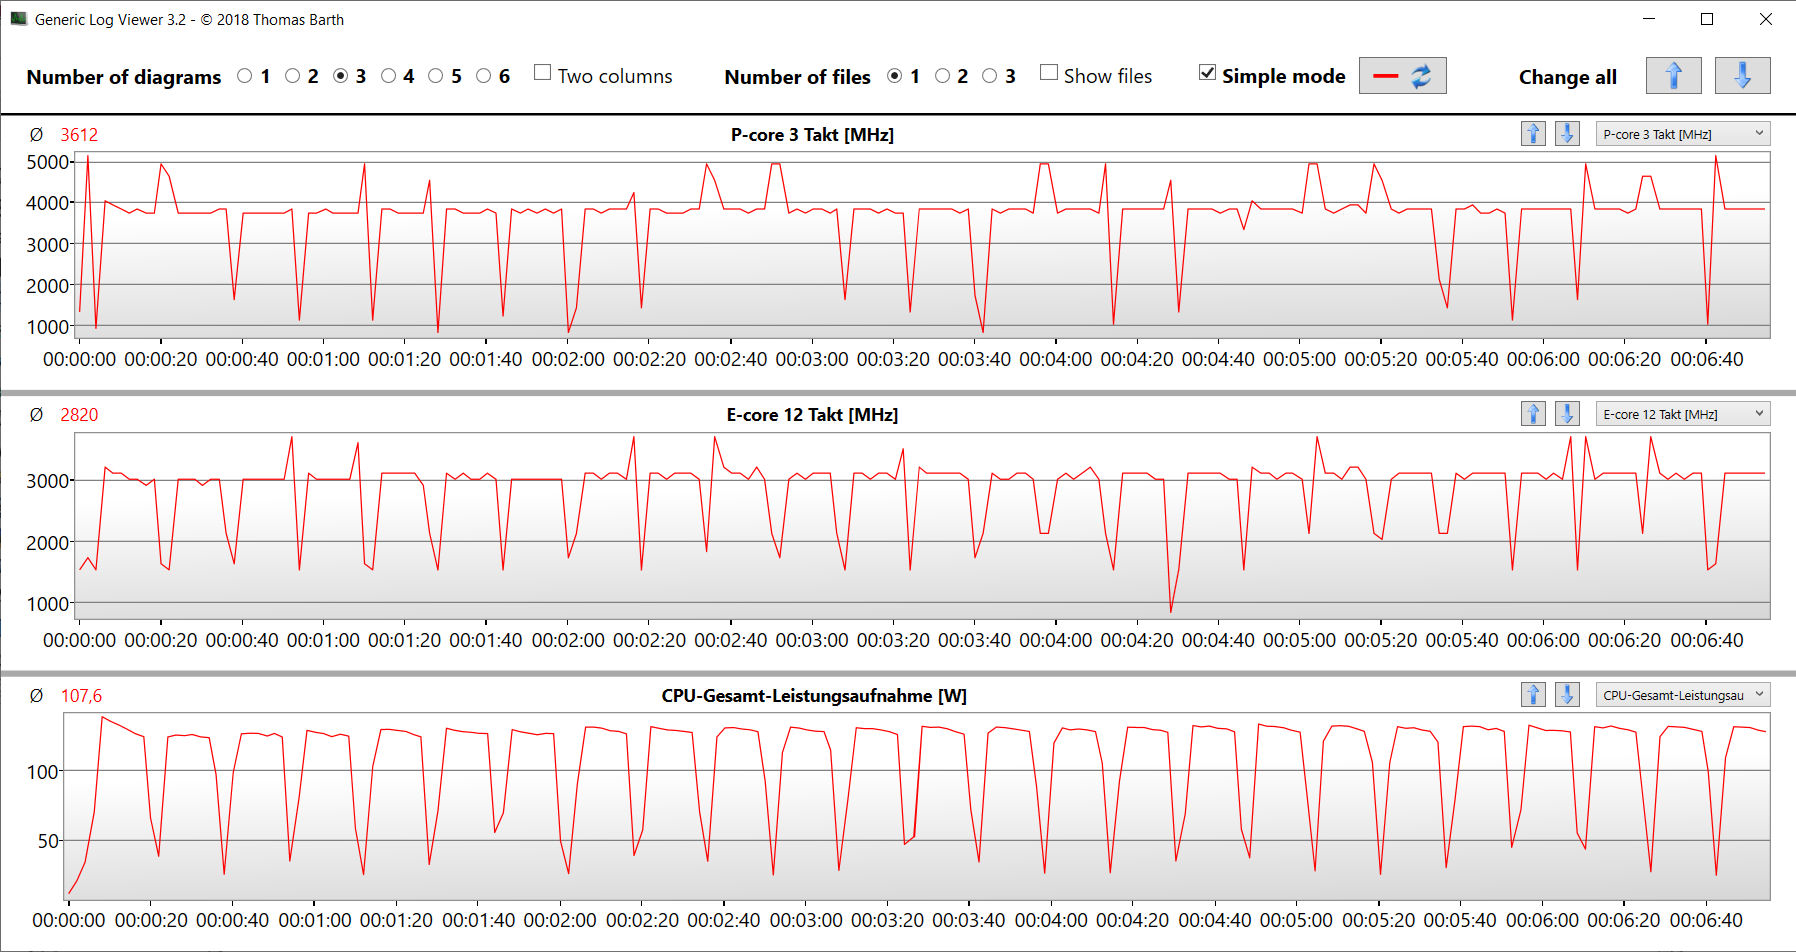
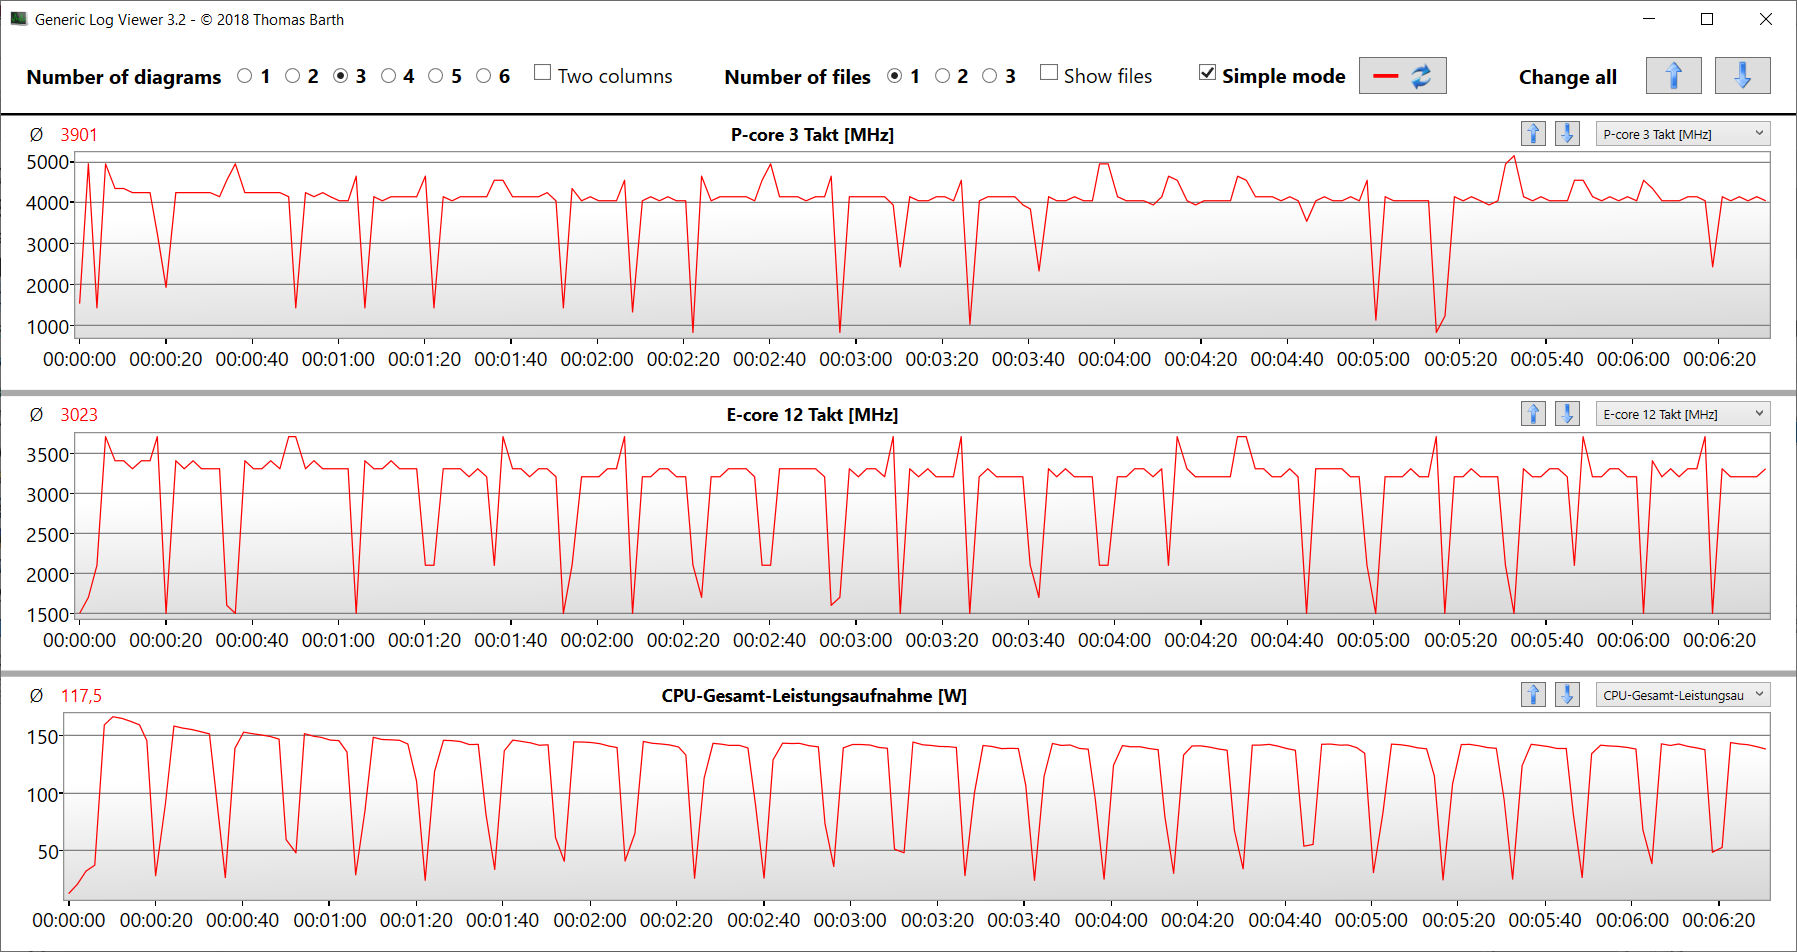
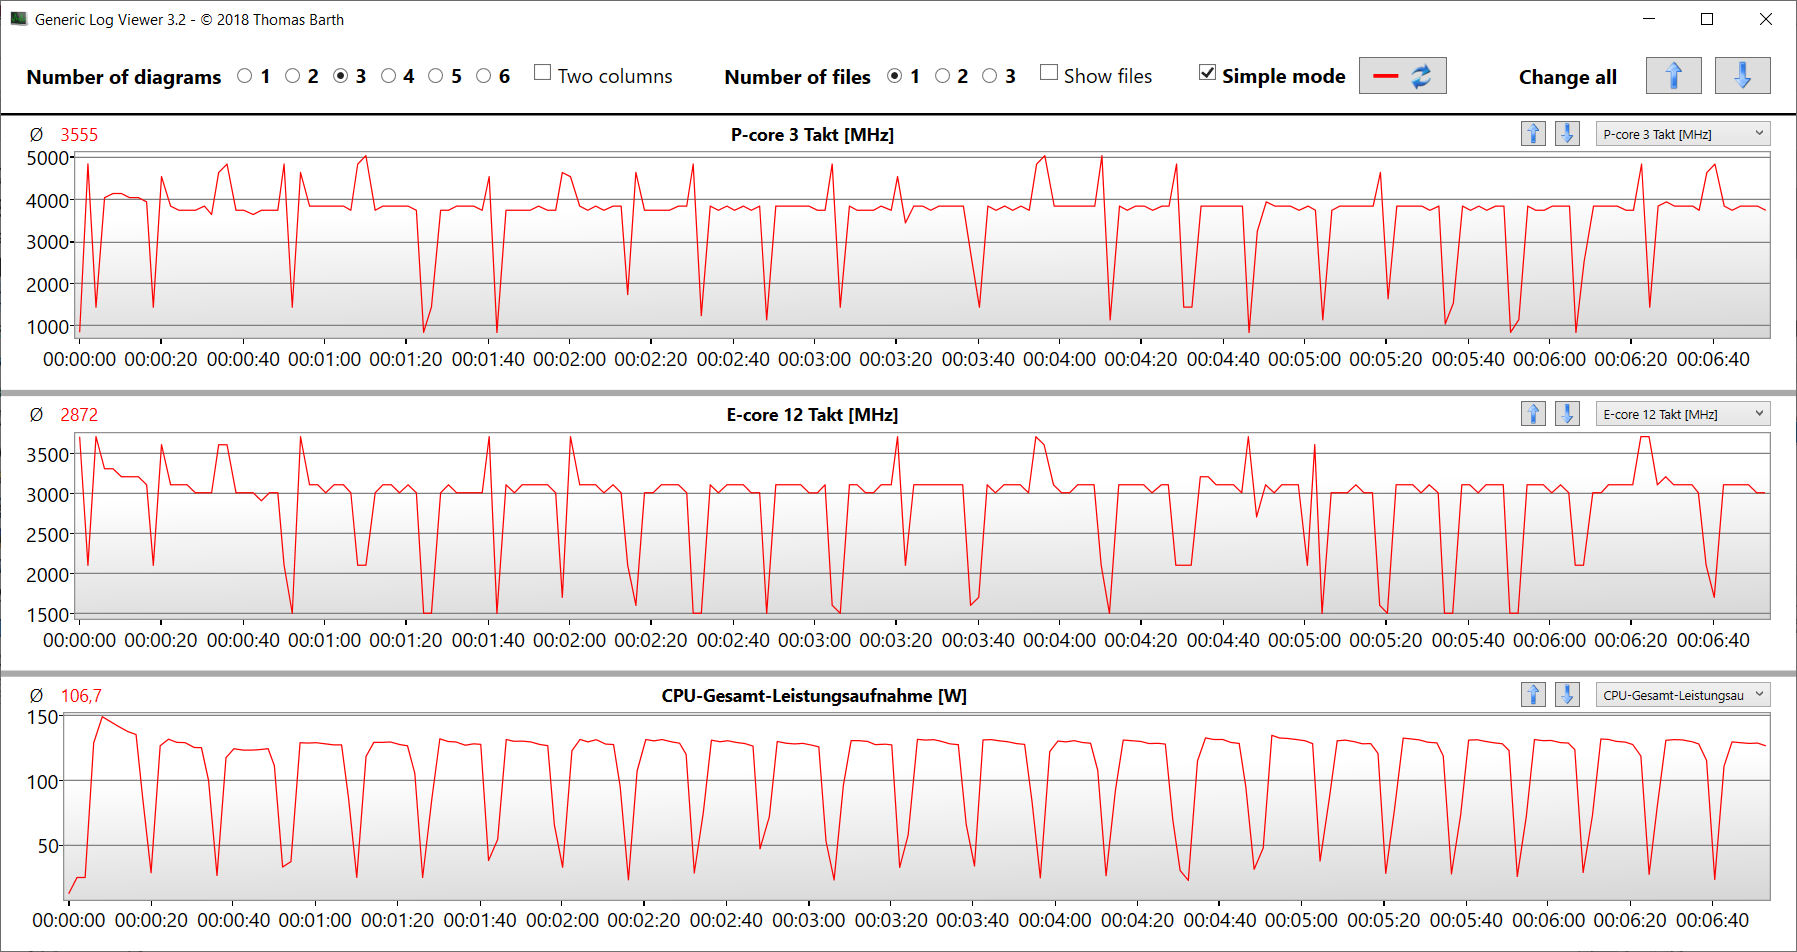
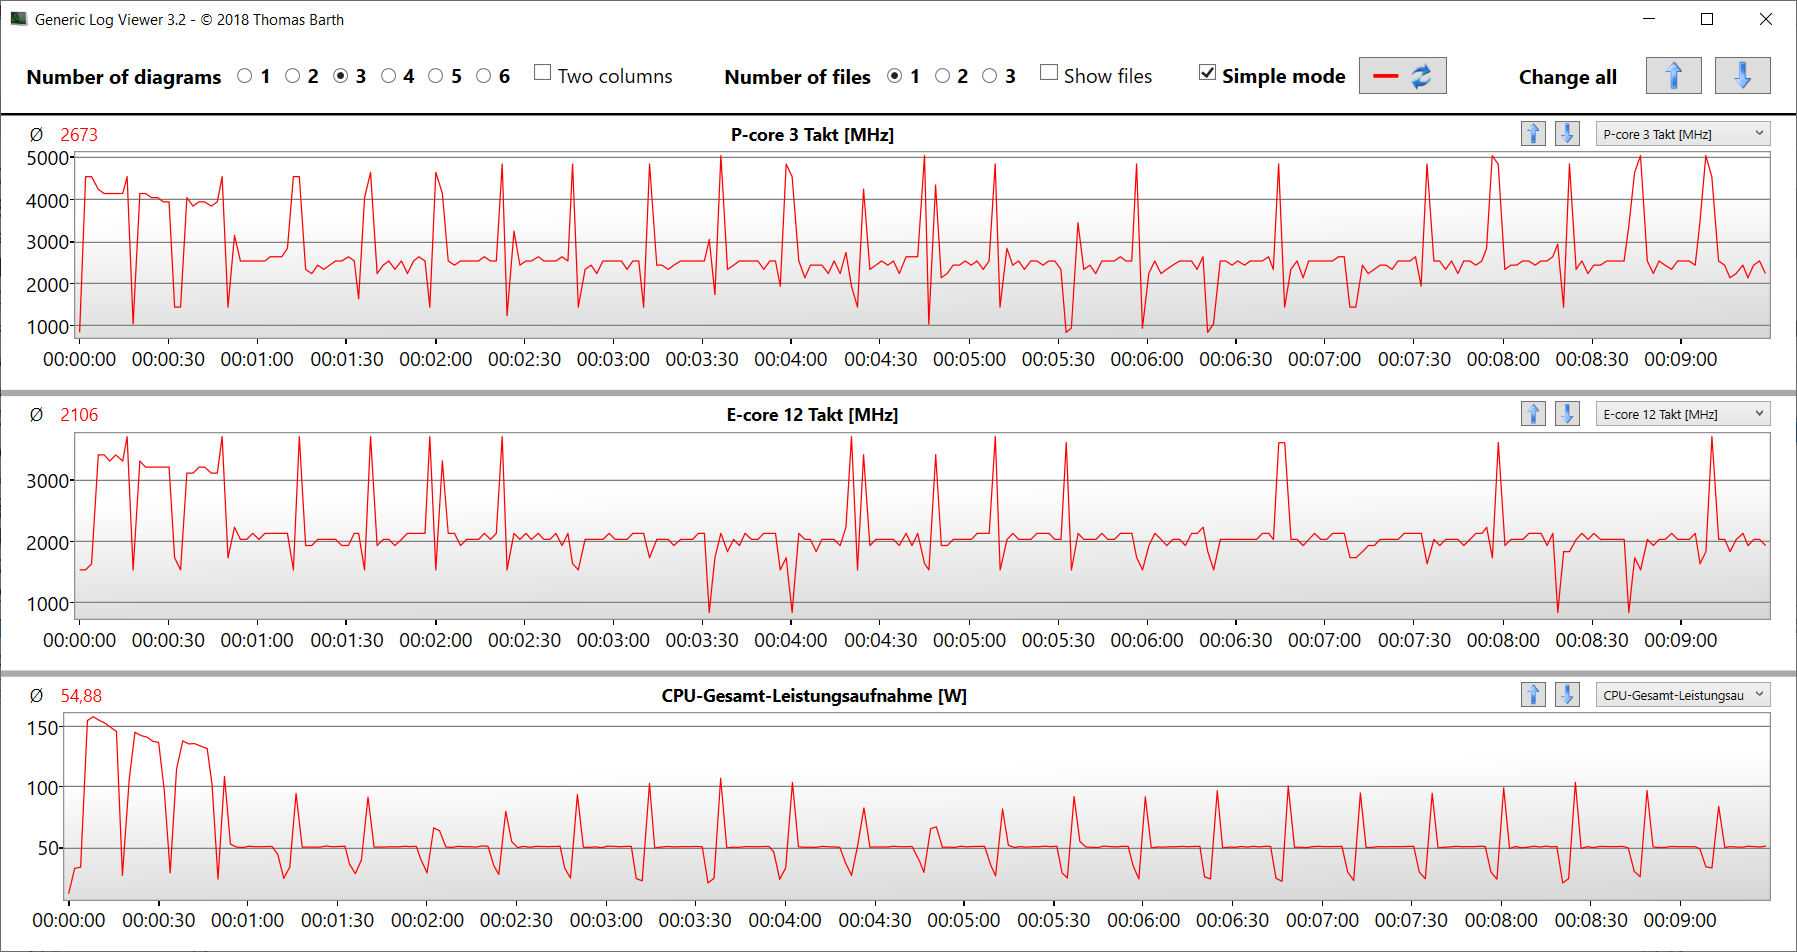
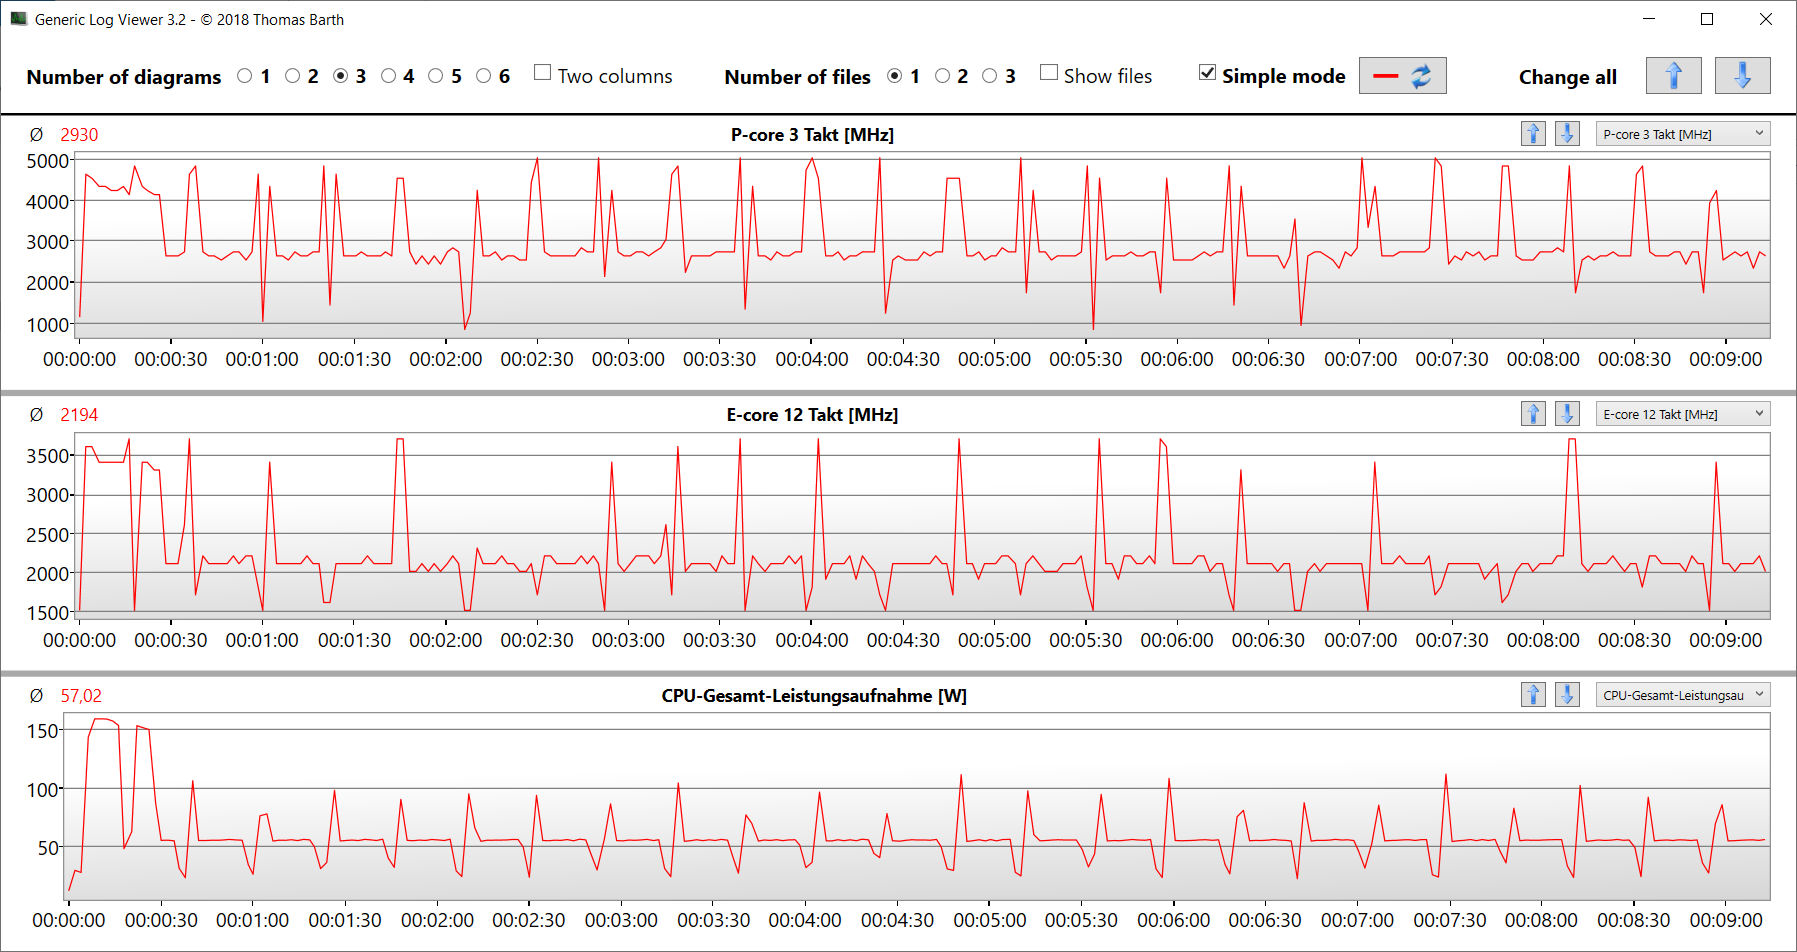
Le test en boucle CB15 confirme que le turbo du CPU peut être maintenu en permanence. Cependant, la fréquence d'horloge diminue légèrement après la première exécution, quel que soit le profil utilisé. le profil "Overdrive" garantit le niveau de performance global le plus élevé.
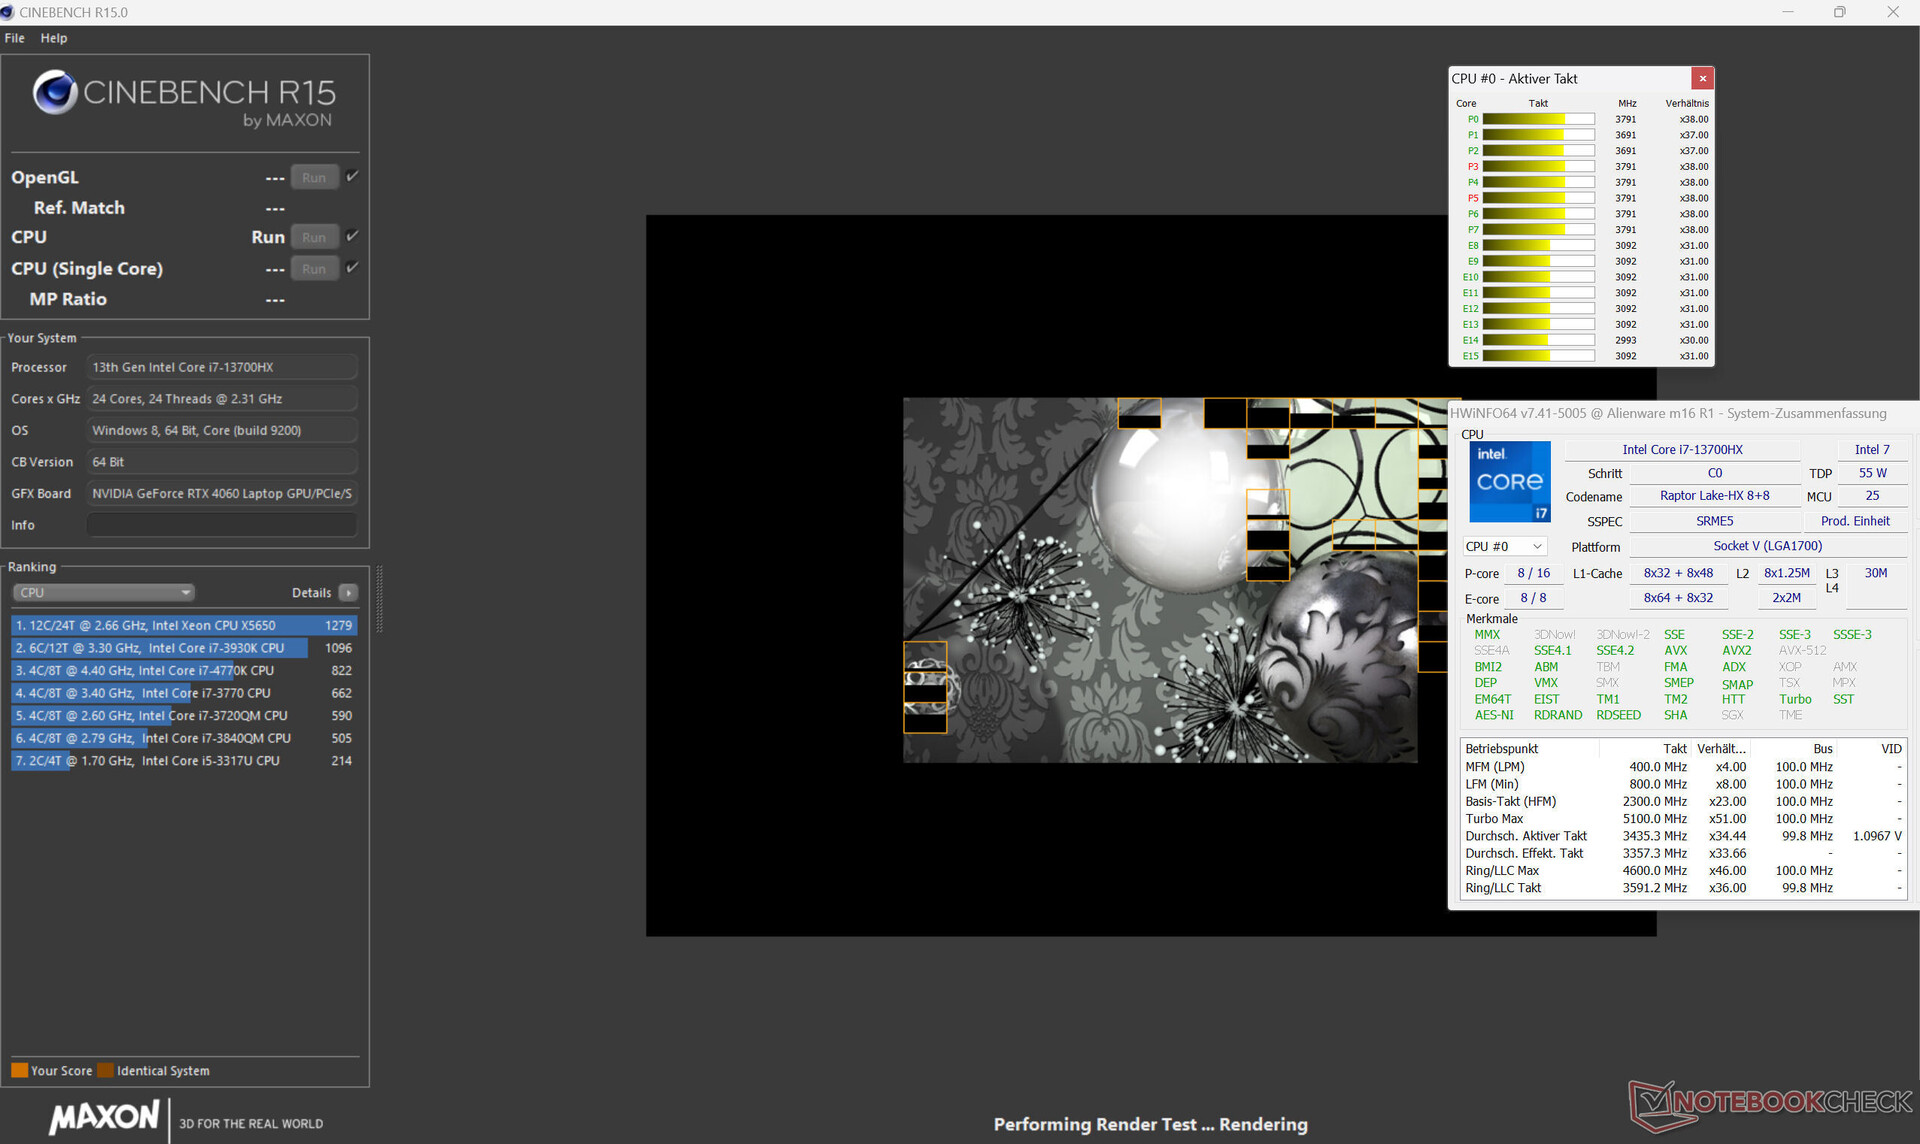
Cinebench R15 Multi Sustained Load
* ... Moindre est la valeur, meilleures sont les performances
AIDA64: FP32 Ray-Trace | FPU Julia | CPU SHA3 | CPU Queen | FPU SinJulia | FPU Mandel | CPU AES | CPU ZLib | FP64 Ray-Trace | CPU PhotoWorxx
| Performance rating | |
| Alienware m16 R1 AMD | |
| Moyenne de la classe Gaming | |
| Alienware m16 R1 Intel | |
| Acer Predator Helios 16 PH16-71-731Q | |
| Schenker XMG Pro 15 (E23) | |
| Lenovo Legion Pro 5 16IRX8 | |
| Moyenne Intel Core i7-13700HX | |
| Medion Erazer Defender P40 | |
| Aorus 15 BSF | |
| AIDA64 / FP32 Ray-Trace | |
| Alienware m16 R1 AMD | |
| Moyenne de la classe Gaming (10227 - 85542, n=105, 2 dernières années) | |
| Lenovo Legion Pro 5 16IRX8 | |
| Alienware m16 R1 Intel | |
| Acer Predator Helios 16 PH16-71-731Q | |
| Moyenne Intel Core i7-13700HX (14261 - 21999, n=11) | |
| Schenker XMG Pro 15 (E23) | |
| Medion Erazer Defender P40 | |
| Aorus 15 BSF | |
| AIDA64 / FPU Julia | |
| Alienware m16 R1 AMD | |
| Moyenne de la classe Gaming (51376 - 238426, n=105, 2 dernières années) | |
| Lenovo Legion Pro 5 16IRX8 | |
| Alienware m16 R1 Intel | |
| Acer Predator Helios 16 PH16-71-731Q | |
| Moyenne Intel Core i7-13700HX (74636 - 109364, n=11) | |
| Schenker XMG Pro 15 (E23) | |
| Medion Erazer Defender P40 | |
| Aorus 15 BSF | |
| AIDA64 / CPU SHA3 | |
| Alienware m16 R1 AMD | |
| Moyenne de la classe Gaming (2180 - 10115, n=105, 2 dernières années) | |
| Alienware m16 R1 Intel | |
| Schenker XMG Pro 15 (E23) | |
| Lenovo Legion Pro 5 16IRX8 | |
| Acer Predator Helios 16 PH16-71-731Q | |
| Moyenne Intel Core i7-13700HX (3359 - 5053, n=11) | |
| Medion Erazer Defender P40 | |
| Aorus 15 BSF | |
| AIDA64 / CPU Queen | |
| Alienware m16 R1 AMD | |
| Schenker XMG Pro 15 (E23) | |
| Moyenne de la classe Gaming (49785 - 173351, n=90, 2 dernières années) | |
| Alienware m16 R1 Intel | |
| Acer Predator Helios 16 PH16-71-731Q | |
| Lenovo Legion Pro 5 16IRX8 | |
| Medion Erazer Defender P40 | |
| Moyenne Intel Core i7-13700HX (86532 - 114717, n=11) | |
| Aorus 15 BSF | |
| AIDA64 / FPU SinJulia | |
| Alienware m16 R1 AMD | |
| Moyenne de la classe Gaming (4424 - 33636, n=105, 2 dernières années) | |
| Alienware m16 R1 Intel | |
| Lenovo Legion Pro 5 16IRX8 | |
| Acer Predator Helios 16 PH16-71-731Q | |
| Schenker XMG Pro 15 (E23) | |
| Moyenne Intel Core i7-13700HX (9290 - 13519, n=11) | |
| Medion Erazer Defender P40 | |
| Aorus 15 BSF | |
| AIDA64 / FPU Mandel | |
| Alienware m16 R1 AMD | |
| Moyenne de la classe Gaming (25115 - 128721, n=105, 2 dernières années) | |
| Lenovo Legion Pro 5 16IRX8 | |
| Alienware m16 R1 Intel | |
| Acer Predator Helios 16 PH16-71-731Q | |
| Moyenne Intel Core i7-13700HX (35751 - 53484, n=11) | |
| Schenker XMG Pro 15 (E23) | |
| Medion Erazer Defender P40 | |
| Aorus 15 BSF | |
| AIDA64 / CPU AES | |
| Alienware m16 R1 Intel | |
| Acer Predator Helios 16 PH16-71-731Q | |
| Aorus 15 BSF | |
| Moyenne Intel Core i7-13700HX (67846 - 182575, n=11) | |
| Alienware m16 R1 AMD | |
| Moyenne de la classe Gaming (39258 - 247074, n=105, 2 dernières années) | |
| Lenovo Legion Pro 5 16IRX8 | |
| Schenker XMG Pro 15 (E23) | |
| Medion Erazer Defender P40 | |
| AIDA64 / CPU ZLib | |
| Alienware m16 R1 AMD | |
| Moyenne de la classe Gaming (574 - 2531, n=105, 2 dernières années) | |
| Acer Predator Helios 16 PH16-71-731Q | |
| Schenker XMG Pro 15 (E23) | |
| Alienware m16 R1 Intel | |
| Lenovo Legion Pro 5 16IRX8 | |
| Moyenne Intel Core i7-13700HX (981 - 1451, n=11) | |
| Medion Erazer Defender P40 | |
| Aorus 15 BSF | |
| AIDA64 / FP64 Ray-Trace | |
| Alienware m16 R1 AMD | |
| Moyenne de la classe Gaming (5509 - 45446, n=105, 2 dernières années) | |
| Lenovo Legion Pro 5 16IRX8 | |
| Alienware m16 R1 Intel | |
| Acer Predator Helios 16 PH16-71-731Q | |
| Moyenne Intel Core i7-13700HX (7728 - 11837, n=11) | |
| Schenker XMG Pro 15 (E23) | |
| Medion Erazer Defender P40 | |
| Aorus 15 BSF | |
| AIDA64 / CPU PhotoWorxx | |
| Schenker XMG Pro 15 (E23) | |
| Moyenne de la classe Gaming (12271 - 89891, n=105, 2 dernières années) | |
| Aorus 15 BSF | |
| Lenovo Legion Pro 5 16IRX8 | |
| Medion Erazer Defender P40 | |
| Alienware m16 R1 Intel | |
| Acer Predator Helios 16 PH16-71-731Q | |
| Moyenne Intel Core i7-13700HX (19678 - 42415, n=11) | |
| Alienware m16 R1 AMD | |
Performance du système
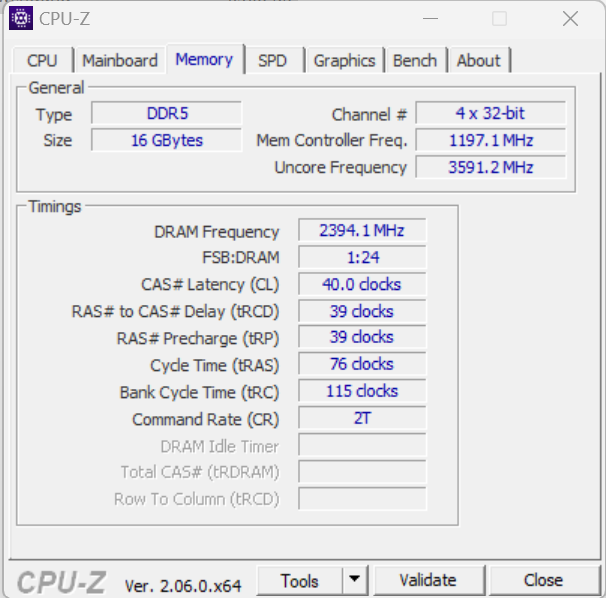
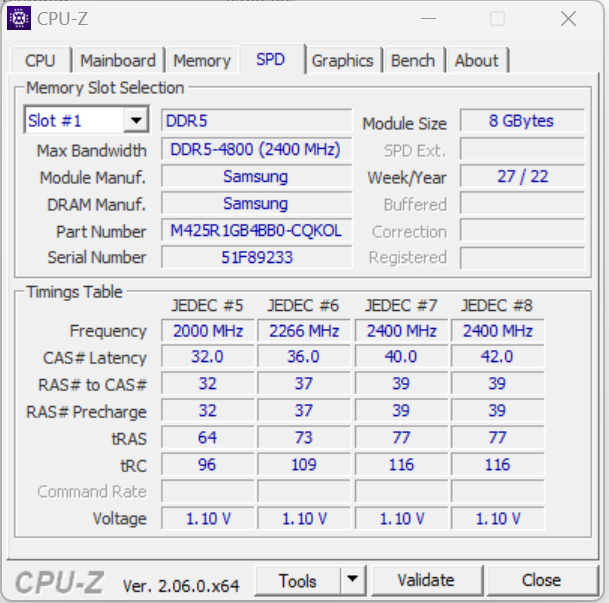
Le système, qui fonctionne en douceur, ne manque pas de puissance de calcul. L'ordinateur portable prend en charge le rendu, l'édition vidéo et les jeux sans problème. Les taux de transfert de la mémoire vive sont normaux pour une mémoire DDR5-4800.
CrossMark: Overall | Productivity | Creativity | Responsiveness
| PCMark 10 / Score | |
| Alienware m16 R1 AMD | |
| Moyenne de la classe Gaming (5828 - 12414, n=93, 2 dernières années) | |
| Acer Predator Helios 16 PH16-71-731Q | |
| Lenovo Legion Pro 5 16IRX8 | |
| Schenker XMG Pro 15 (E23) | |
| Moyenne Intel Core i7-13700HX, NVIDIA GeForce RTX 4060 Laptop GPU (6909 - 7743, n=5) | |
| Aorus 15 BSF | |
| Alienware m16 R1 Intel | |
| Medion Erazer Defender P40 | |
| PCMark 10 / Essentials | |
| Alienware m16 R1 AMD | |
| Schenker XMG Pro 15 (E23) | |
| Acer Predator Helios 16 PH16-71-731Q | |
| Lenovo Legion Pro 5 16IRX8 | |
| Aorus 15 BSF | |
| Alienware m16 R1 Intel | |
| Moyenne de la classe Gaming (8810 - 11935, n=97, 2 dernières années) | |
| Moyenne Intel Core i7-13700HX, NVIDIA GeForce RTX 4060 Laptop GPU (9760 - 11313, n=5) | |
| Medion Erazer Defender P40 | |
| PCMark 10 / Productivity | |
| Moyenne de la classe Gaming (6845 - 25323, n=95, 2 dernières années) | |
| Acer Predator Helios 16 PH16-71-731Q | |
| Schenker XMG Pro 15 (E23) | |
| Alienware m16 R1 AMD | |
| Medion Erazer Defender P40 | |
| Moyenne Intel Core i7-13700HX, NVIDIA GeForce RTX 4060 Laptop GPU (9131 - 11018, n=5) | |
| Alienware m16 R1 Intel | |
| Lenovo Legion Pro 5 16IRX8 | |
| Aorus 15 BSF | |
| PCMark 10 / Digital Content Creation | |
| Alienware m16 R1 AMD | |
| Moyenne de la classe Gaming (7602 - 19954, n=95, 2 dernières années) | |
| Lenovo Legion Pro 5 16IRX8 | |
| Moyenne Intel Core i7-13700HX, NVIDIA GeForce RTX 4060 Laptop GPU (9393 - 12434, n=5) | |
| Aorus 15 BSF | |
| Acer Predator Helios 16 PH16-71-731Q | |
| Alienware m16 R1 Intel | |
| Schenker XMG Pro 15 (E23) | |
| Medion Erazer Defender P40 | |
| CrossMark / Overall | |
| Acer Predator Helios 16 PH16-71-731Q | |
| Aorus 15 BSF | |
| Alienware m16 R1 Intel | |
| Alienware m16 R1 AMD | |
| Moyenne de la classe Gaming (1366 - 2409, n=94, 2 dernières années) | |
| Schenker XMG Pro 15 (E23) | |
| Moyenne Intel Core i7-13700HX, NVIDIA GeForce RTX 4060 Laptop GPU (1663 - 2105, n=5) | |
| Medion Erazer Defender P40 | |
| Lenovo Legion Pro 5 16IRX8 | |
| CrossMark / Productivity | |
| Aorus 15 BSF | |
| Acer Predator Helios 16 PH16-71-731Q | |
| Alienware m16 R1 Intel | |
| Alienware m16 R1 AMD | |
| Moyenne de la classe Gaming (1386 - 2254, n=94, 2 dernières années) | |
| Schenker XMG Pro 15 (E23) | |
| Moyenne Intel Core i7-13700HX, NVIDIA GeForce RTX 4060 Laptop GPU (1618 - 1989, n=5) | |
| Medion Erazer Defender P40 | |
| Lenovo Legion Pro 5 16IRX8 | |
| CrossMark / Creativity | |
| Acer Predator Helios 16 PH16-71-731Q | |
| Moyenne de la classe Gaming (1343 - 2786, n=94, 2 dernières années) | |
| Alienware m16 R1 Intel | |
| Schenker XMG Pro 15 (E23) | |
| Alienware m16 R1 AMD | |
| Aorus 15 BSF | |
| Moyenne Intel Core i7-13700HX, NVIDIA GeForce RTX 4060 Laptop GPU (1710 - 2274, n=5) | |
| Medion Erazer Defender P40 | |
| Lenovo Legion Pro 5 16IRX8 | |
| CrossMark / Responsiveness | |
| Aorus 15 BSF | |
| Acer Predator Helios 16 PH16-71-731Q | |
| Alienware m16 R1 Intel | |
| Schenker XMG Pro 15 (E23) | |
| Alienware m16 R1 AMD | |
| Moyenne de la classe Gaming (1226 - 2334, n=94, 2 dernières années) | |
| Moyenne Intel Core i7-13700HX, NVIDIA GeForce RTX 4060 Laptop GPU (1269 - 1983, n=5) | |
| Lenovo Legion Pro 5 16IRX8 | |
| Medion Erazer Defender P40 | |
| PCMark 10 Score | 7224 points | |
Aide | ||
| AIDA64 / Memory Copy | |
| Schenker XMG Pro 15 (E23) | |
| Moyenne de la classe Gaming (21750 - 129946, n=105, 2 dernières années) | |
| Aorus 15 BSF | |
| Lenovo Legion Pro 5 16IRX8 | |
| Medion Erazer Defender P40 | |
| Alienware m16 R1 Intel | |
| Acer Predator Helios 16 PH16-71-731Q | |
| Moyenne Intel Core i7-13700HX (36125 - 63990, n=11) | |
| Alienware m16 R1 AMD | |
| AIDA64 / Memory Read | |
| Schenker XMG Pro 15 (E23) | |
| Moyenne de la classe Gaming (22956 - 118858, n=105, 2 dernières années) | |
| Aorus 15 BSF | |
| Lenovo Legion Pro 5 16IRX8 | |
| Medion Erazer Defender P40 | |
| Alienware m16 R1 Intel | |
| Acer Predator Helios 16 PH16-71-731Q | |
| Moyenne Intel Core i7-13700HX (36510 - 69729, n=11) | |
| Alienware m16 R1 AMD | |
| AIDA64 / Memory Write | |
| Aorus 15 BSF | |
| Acer Predator Helios 16 PH16-71-731Q | |
| Moyenne de la classe Gaming (22297 - 135096, n=105, 2 dernières années) | |
| Schenker XMG Pro 15 (E23) | |
| Lenovo Legion Pro 5 16IRX8 | |
| Moyenne Intel Core i7-13700HX (33598 - 85675, n=11) | |
| Alienware m16 R1 Intel | |
| Medion Erazer Defender P40 | |
| Alienware m16 R1 AMD | |
| AIDA64 / Memory Latency | |
| Moyenne de la classe Gaming (75.3 - 259, n=105, 2 dernières années) | |
| Medion Erazer Defender P40 | |
| Aorus 15 BSF | |
| Alienware m16 R1 AMD | |
| Alienware m16 R1 Intel | |
| Moyenne Intel Core i7-13700HX (81.5 - 97.9, n=11) | |
| Acer Predator Helios 16 PH16-71-731Q | |
| Schenker XMG Pro 15 (E23) | |
| Lenovo Legion Pro 5 16IRX8 | |
* ... Moindre est la valeur, meilleures sont les performances
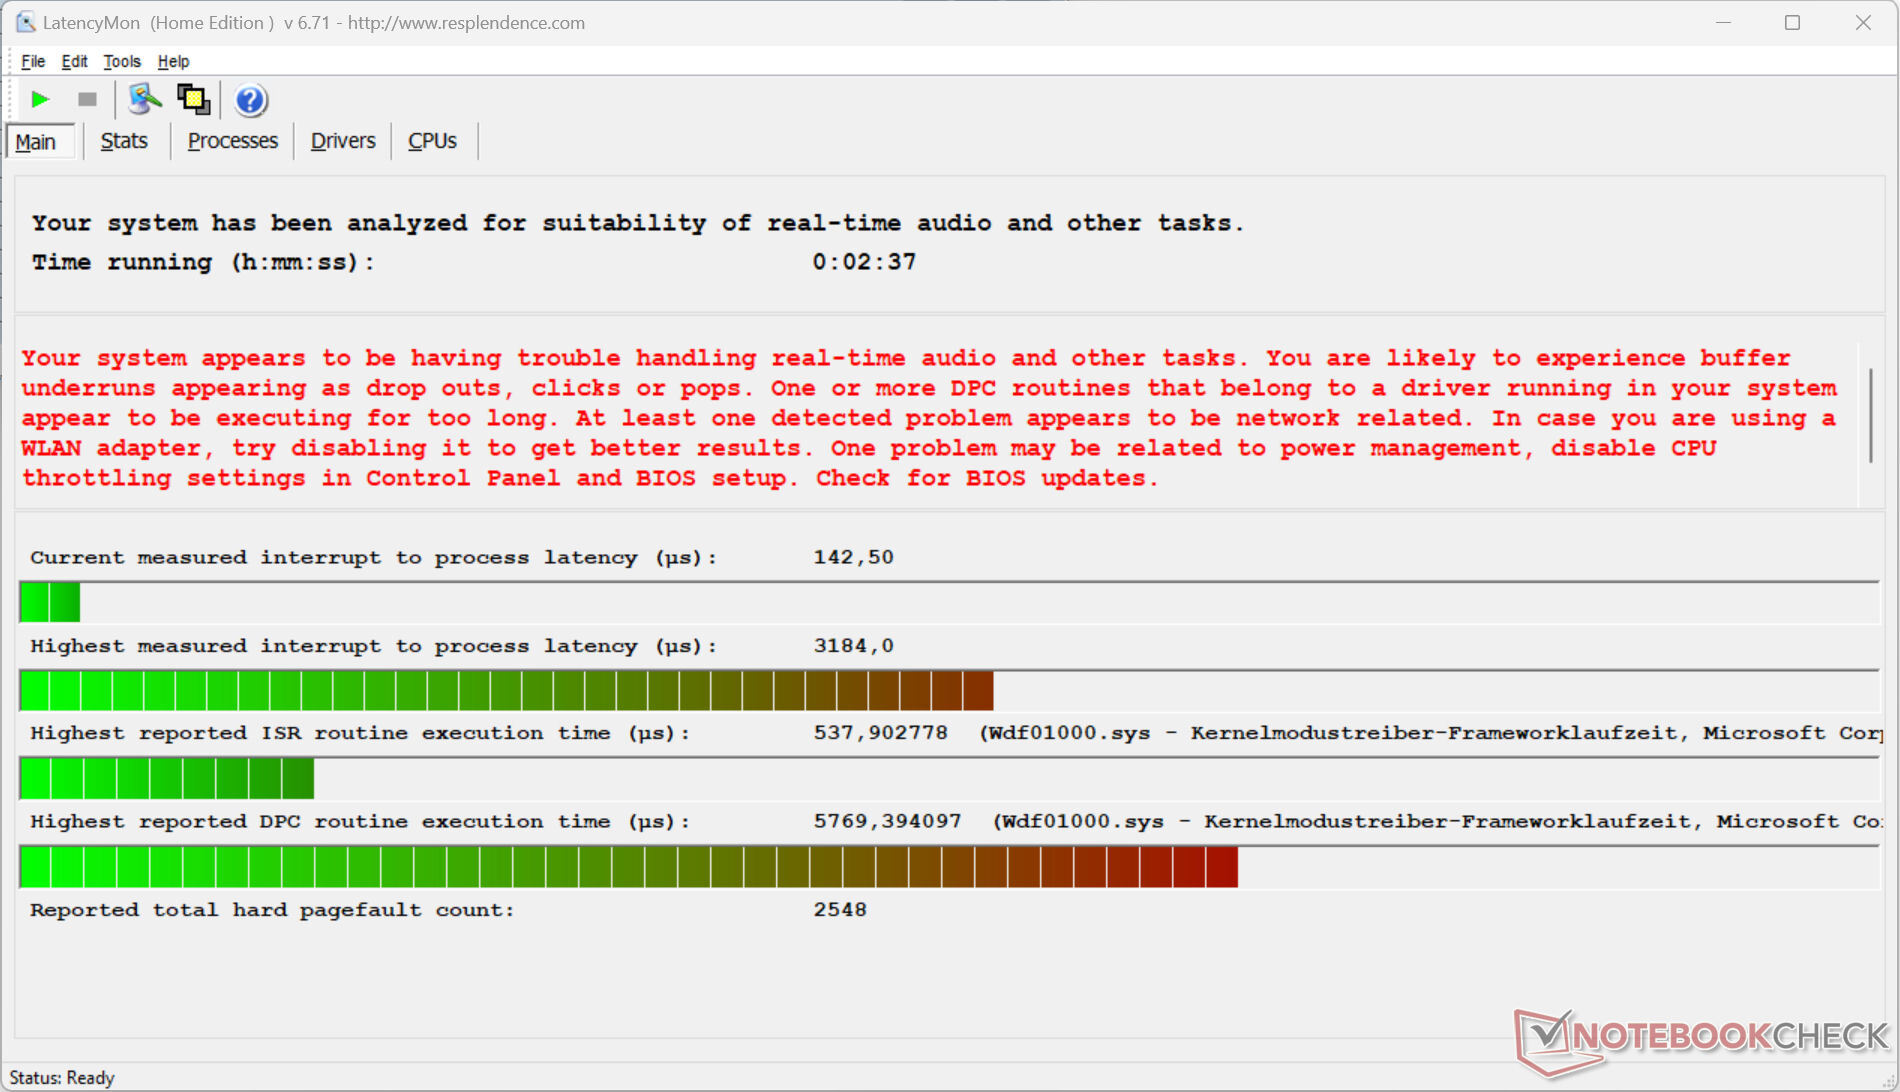
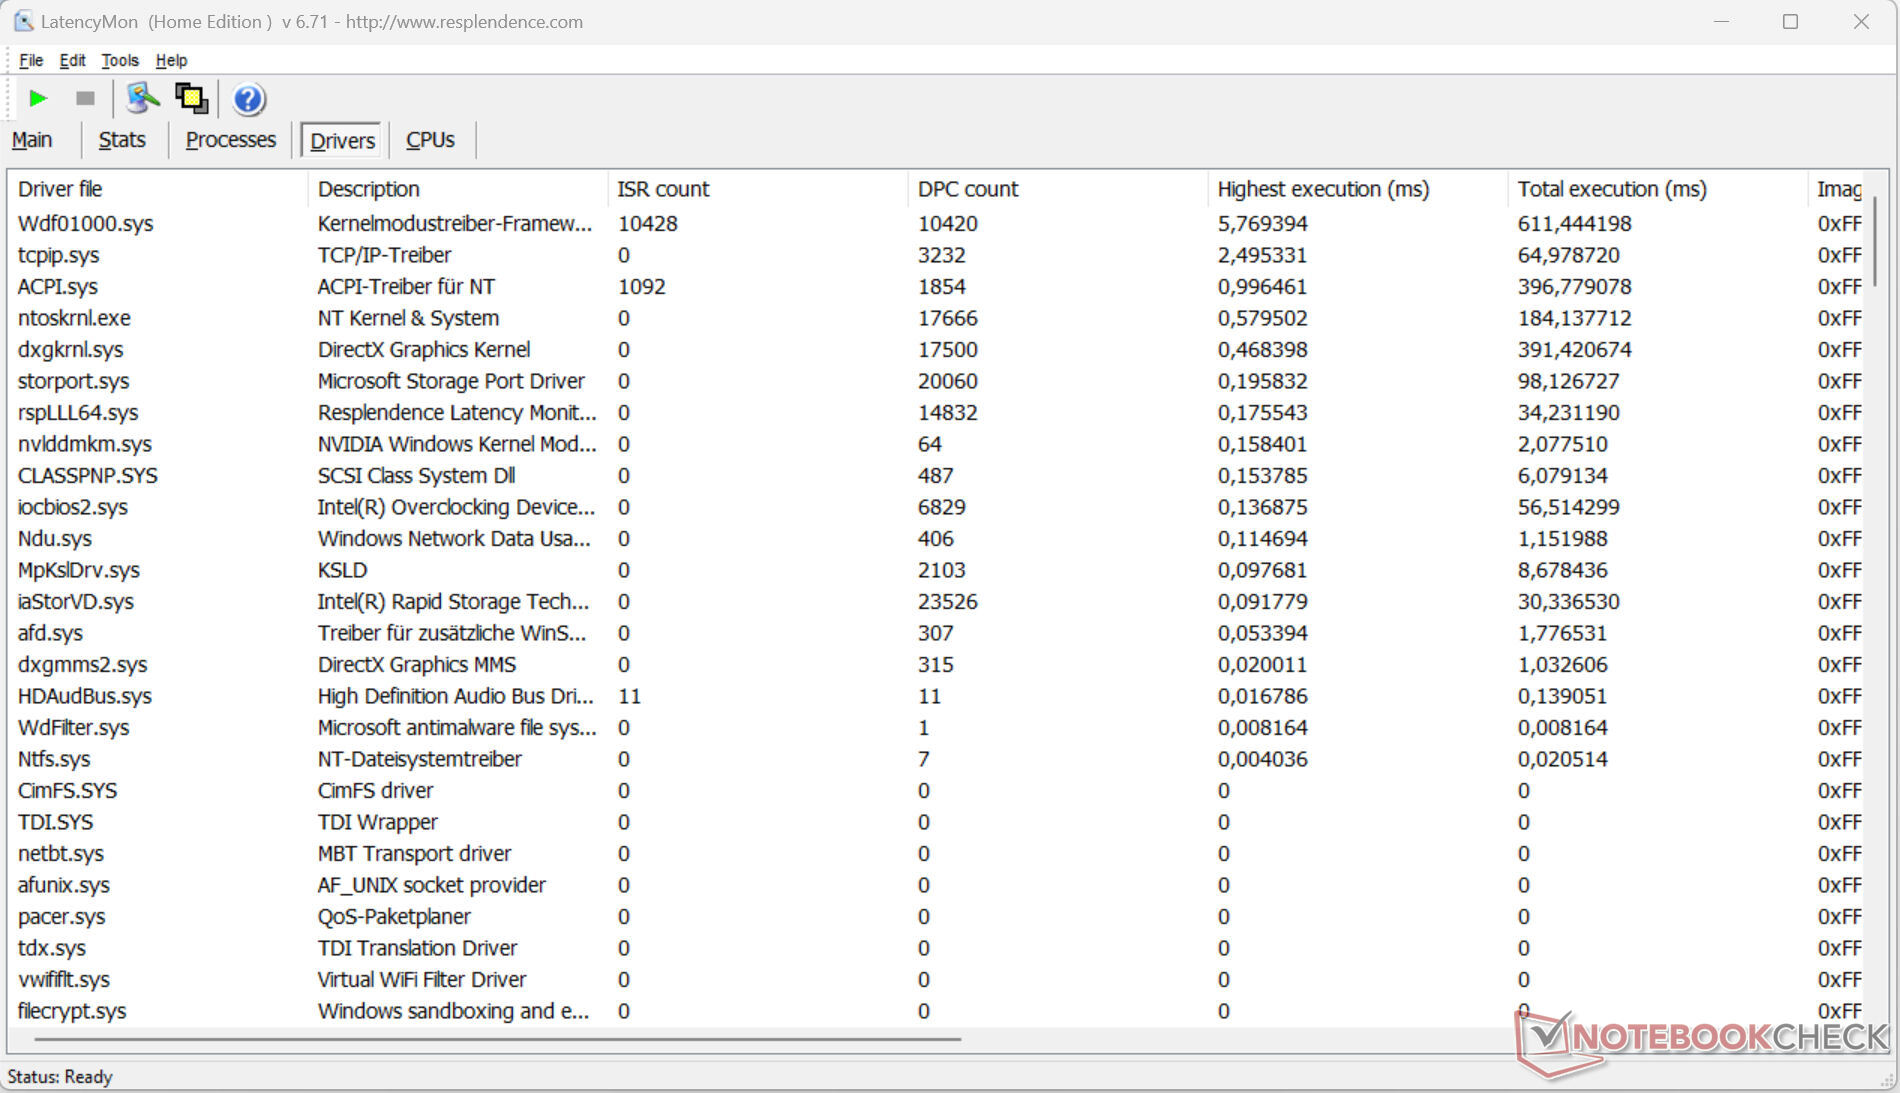
Latence DPC
Le test standardisé du moniteur de latence (surf sur le web, lecture vidéo 4k, charge élevée Prime95) a révélé des anomalies. Le système ne semble pas adapté à l'édition vidéo et audio en temps réel. Les futures mises à jour du logiciel peuvent entraîner une amélioration ou une dégradation supplémentaire.
| DPC Latencies / LatencyMon - interrupt to process latency (max), Web, Youtube, Prime95 | |
| Medion Erazer Defender P40 | |
| Alienware m16 R1 Intel | |
| Alienware m16 R1 AMD | |
| Aorus 15 BSF | |
| Acer Predator Helios 16 PH16-71-731Q | |
| Schenker XMG Pro 15 (E23) | |
| Lenovo Legion Pro 5 16IRX8 | |
* ... Moindre est la valeur, meilleures sont les performances
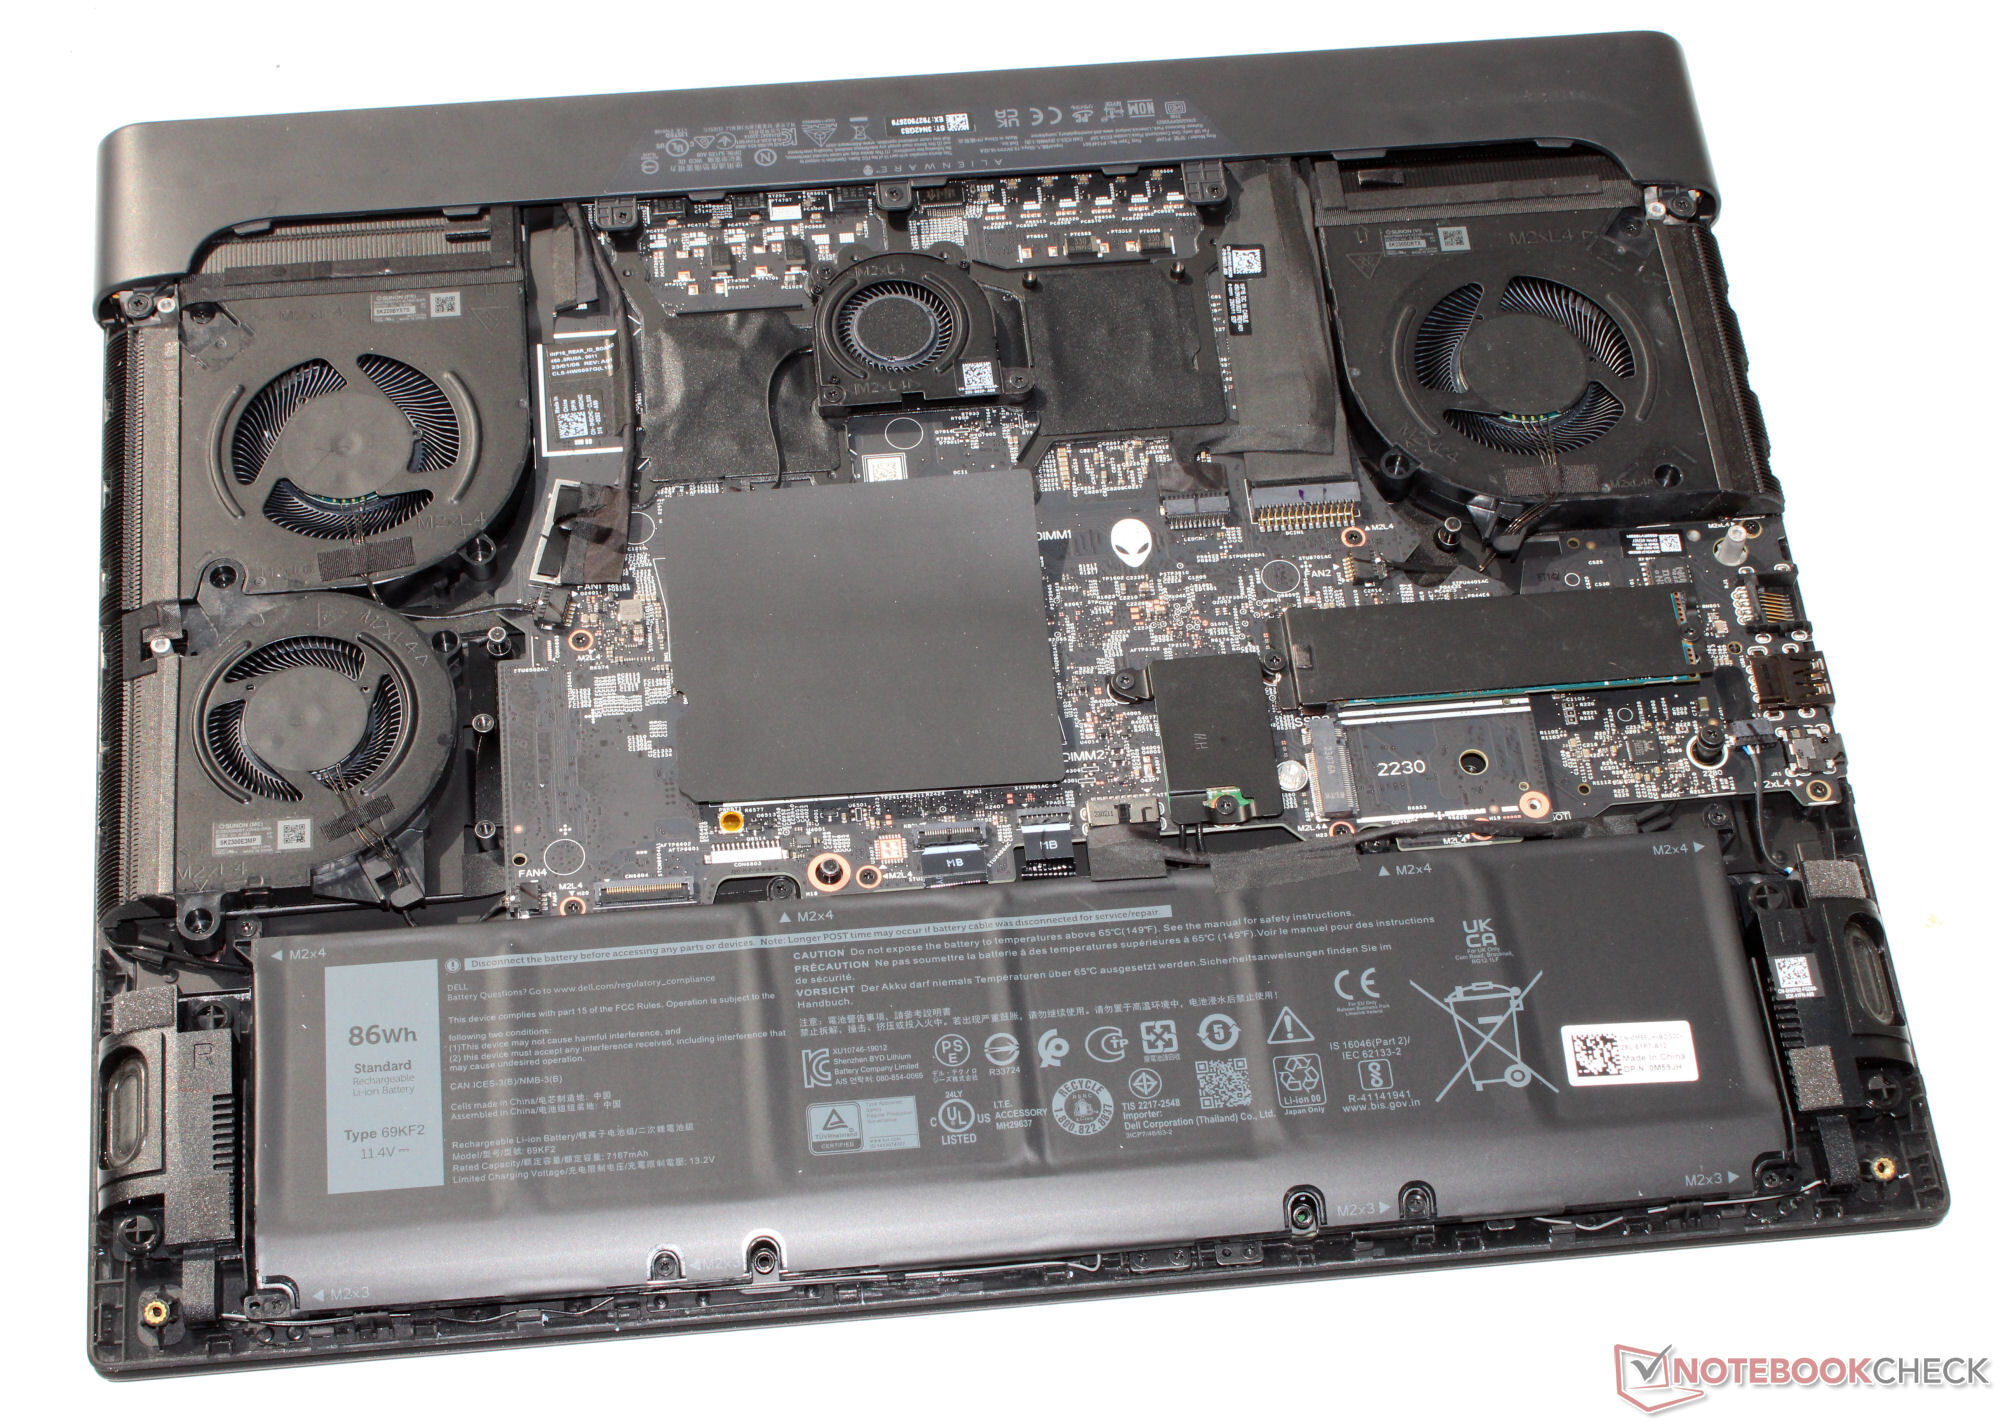
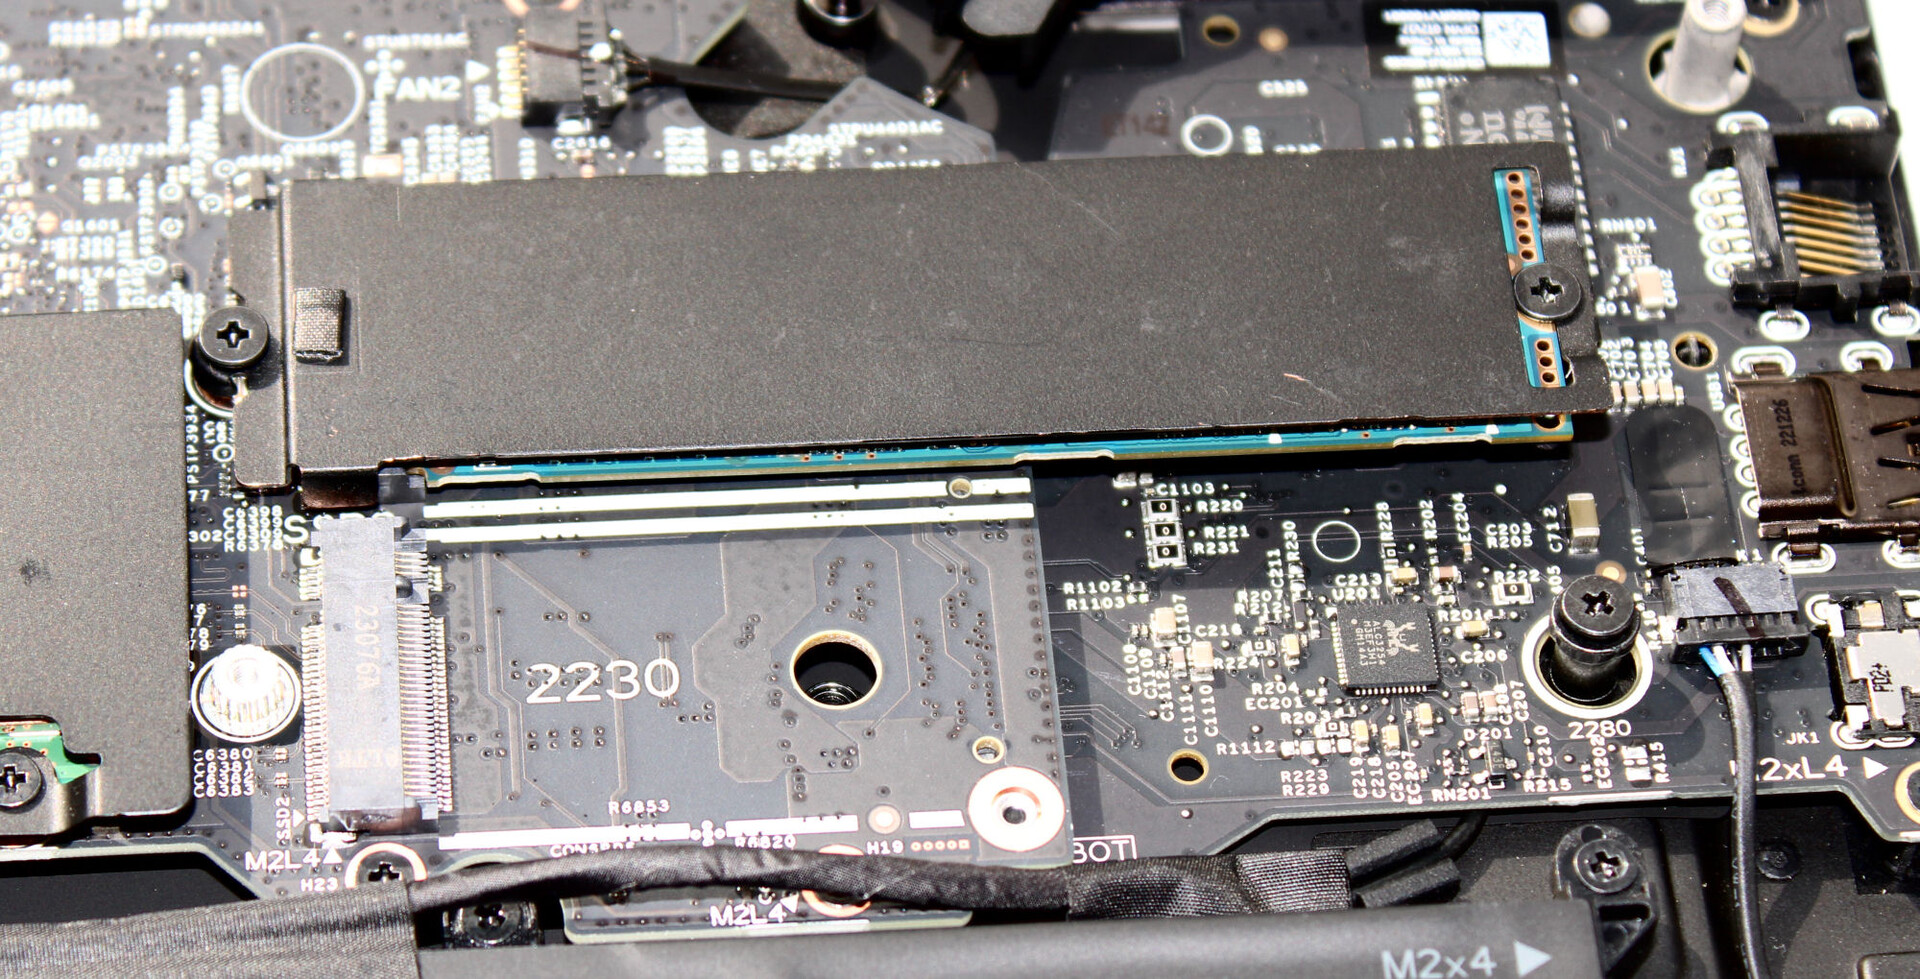
Dispositifs de stockage
Un disque SSD de 512 Go (PCIe 4, M.2 2280) de Kioxia sert de disque système. Il fournit de bons débits de données, mais n'est pas l'un des meilleurs modèles de SSD. Il n'y a pas eu d'étranglement d'origine thermique. L'ordinateur portable peut accueillir un autre PCIe-4-SSD (M.2 2230 ou M.2 2280). D'autres configurations du m16 peuvent même accueillir jusqu'à quatre SSD.

* ... Moindre est la valeur, meilleures sont les performances
Sustained Read Performance: DiskSpd Read Loop, Queue Depth 8
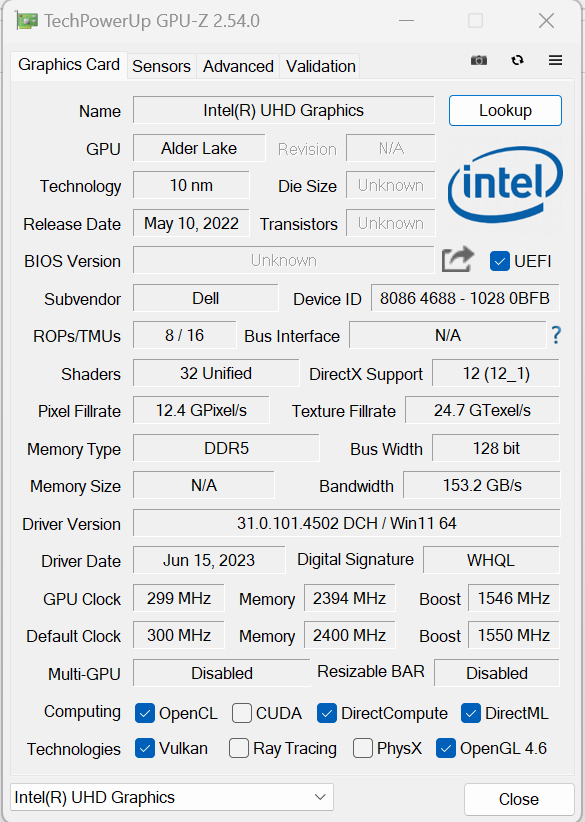
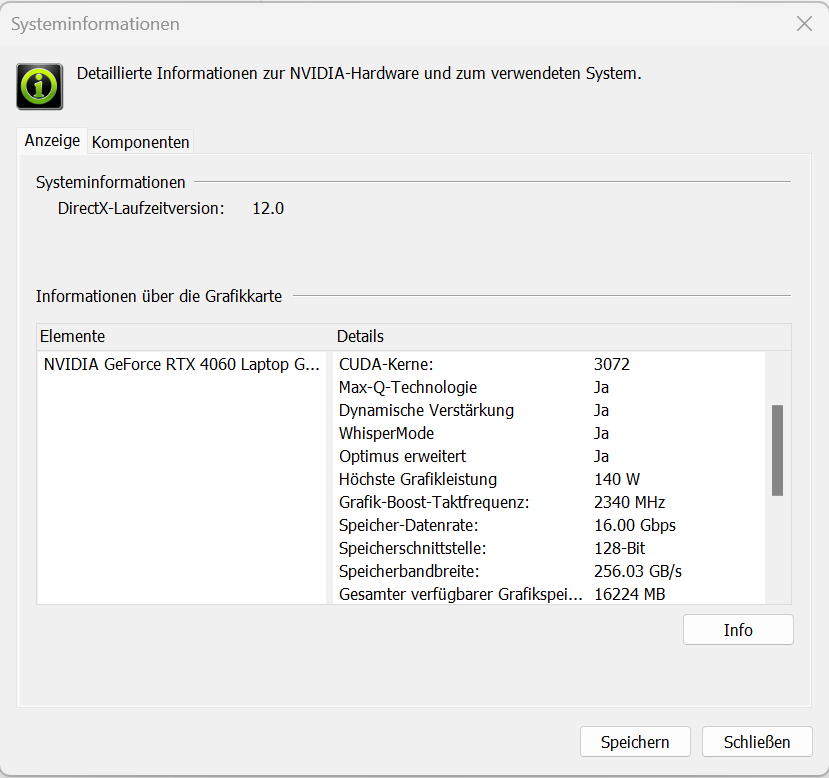
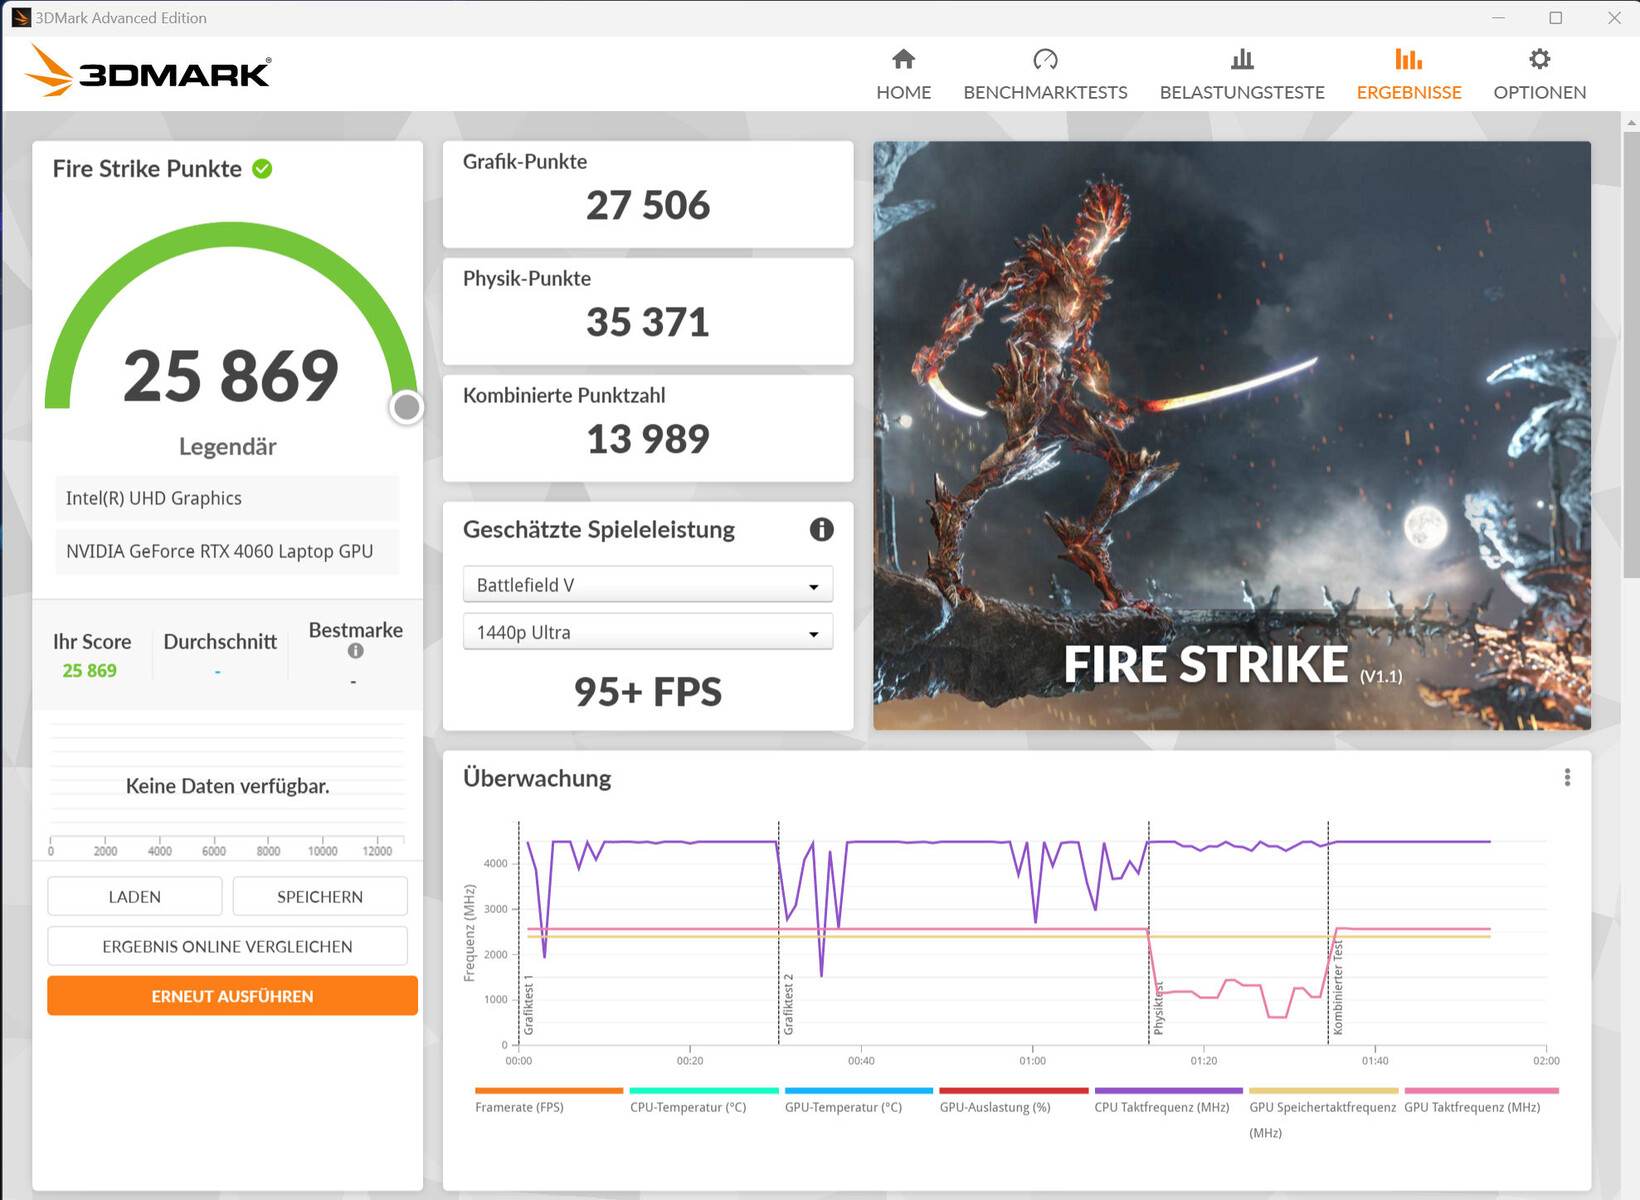
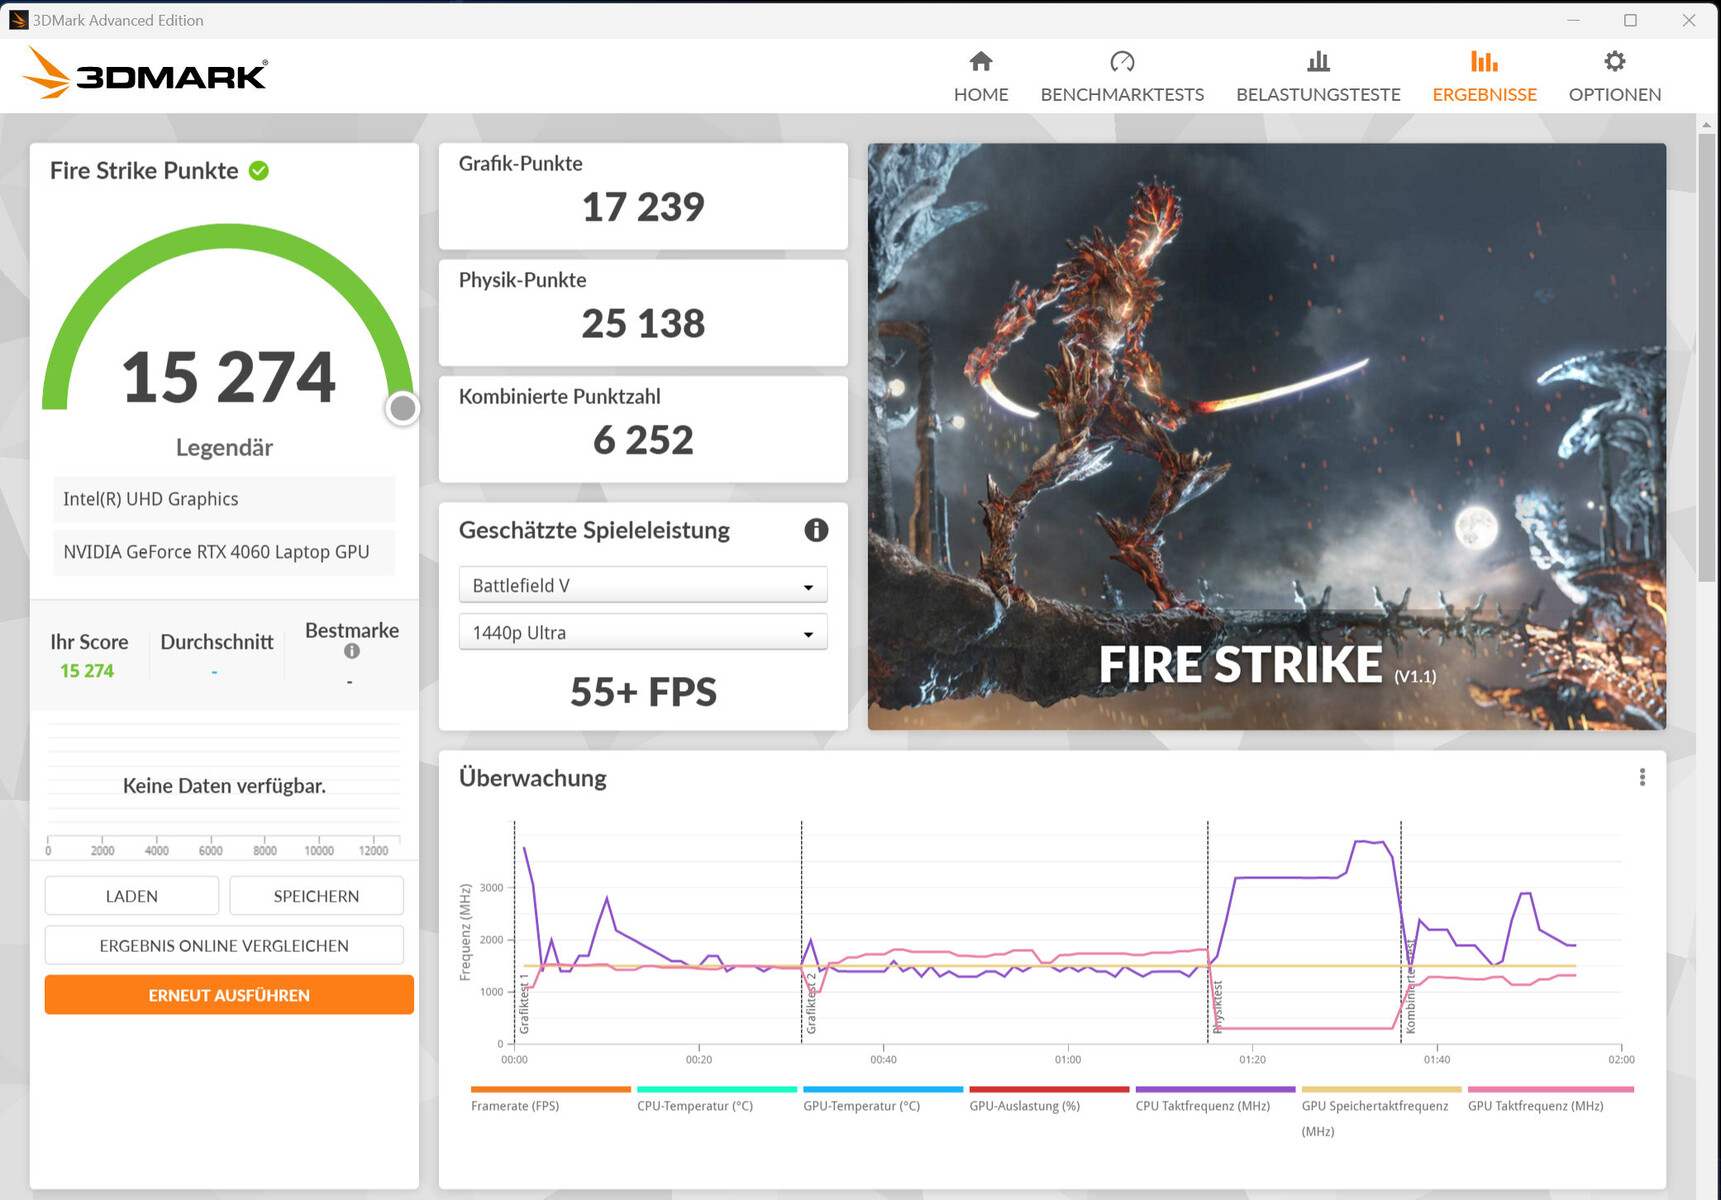
Carte graphique
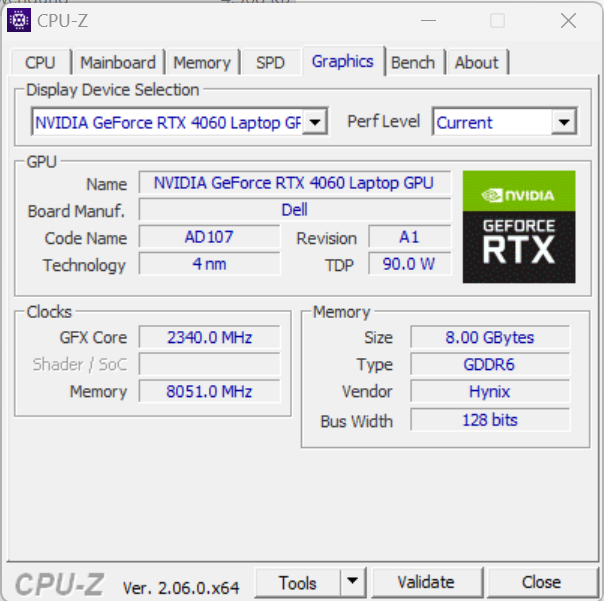
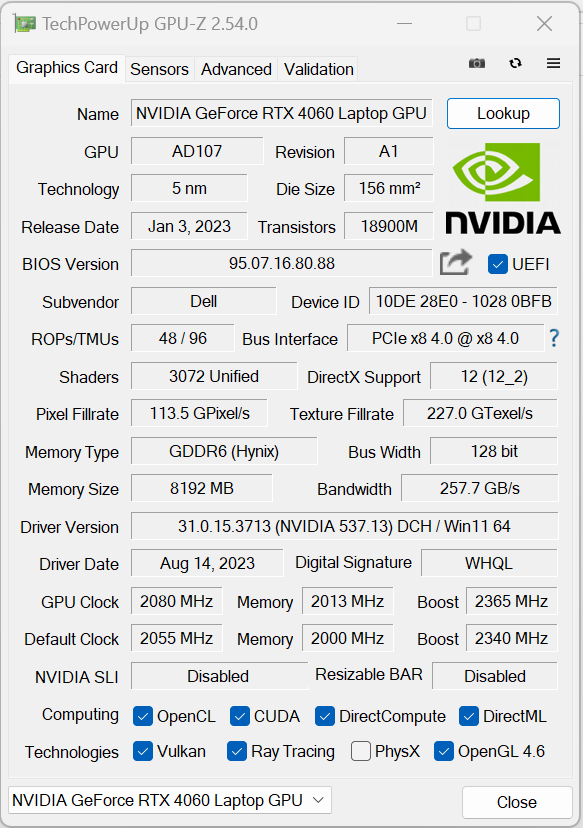
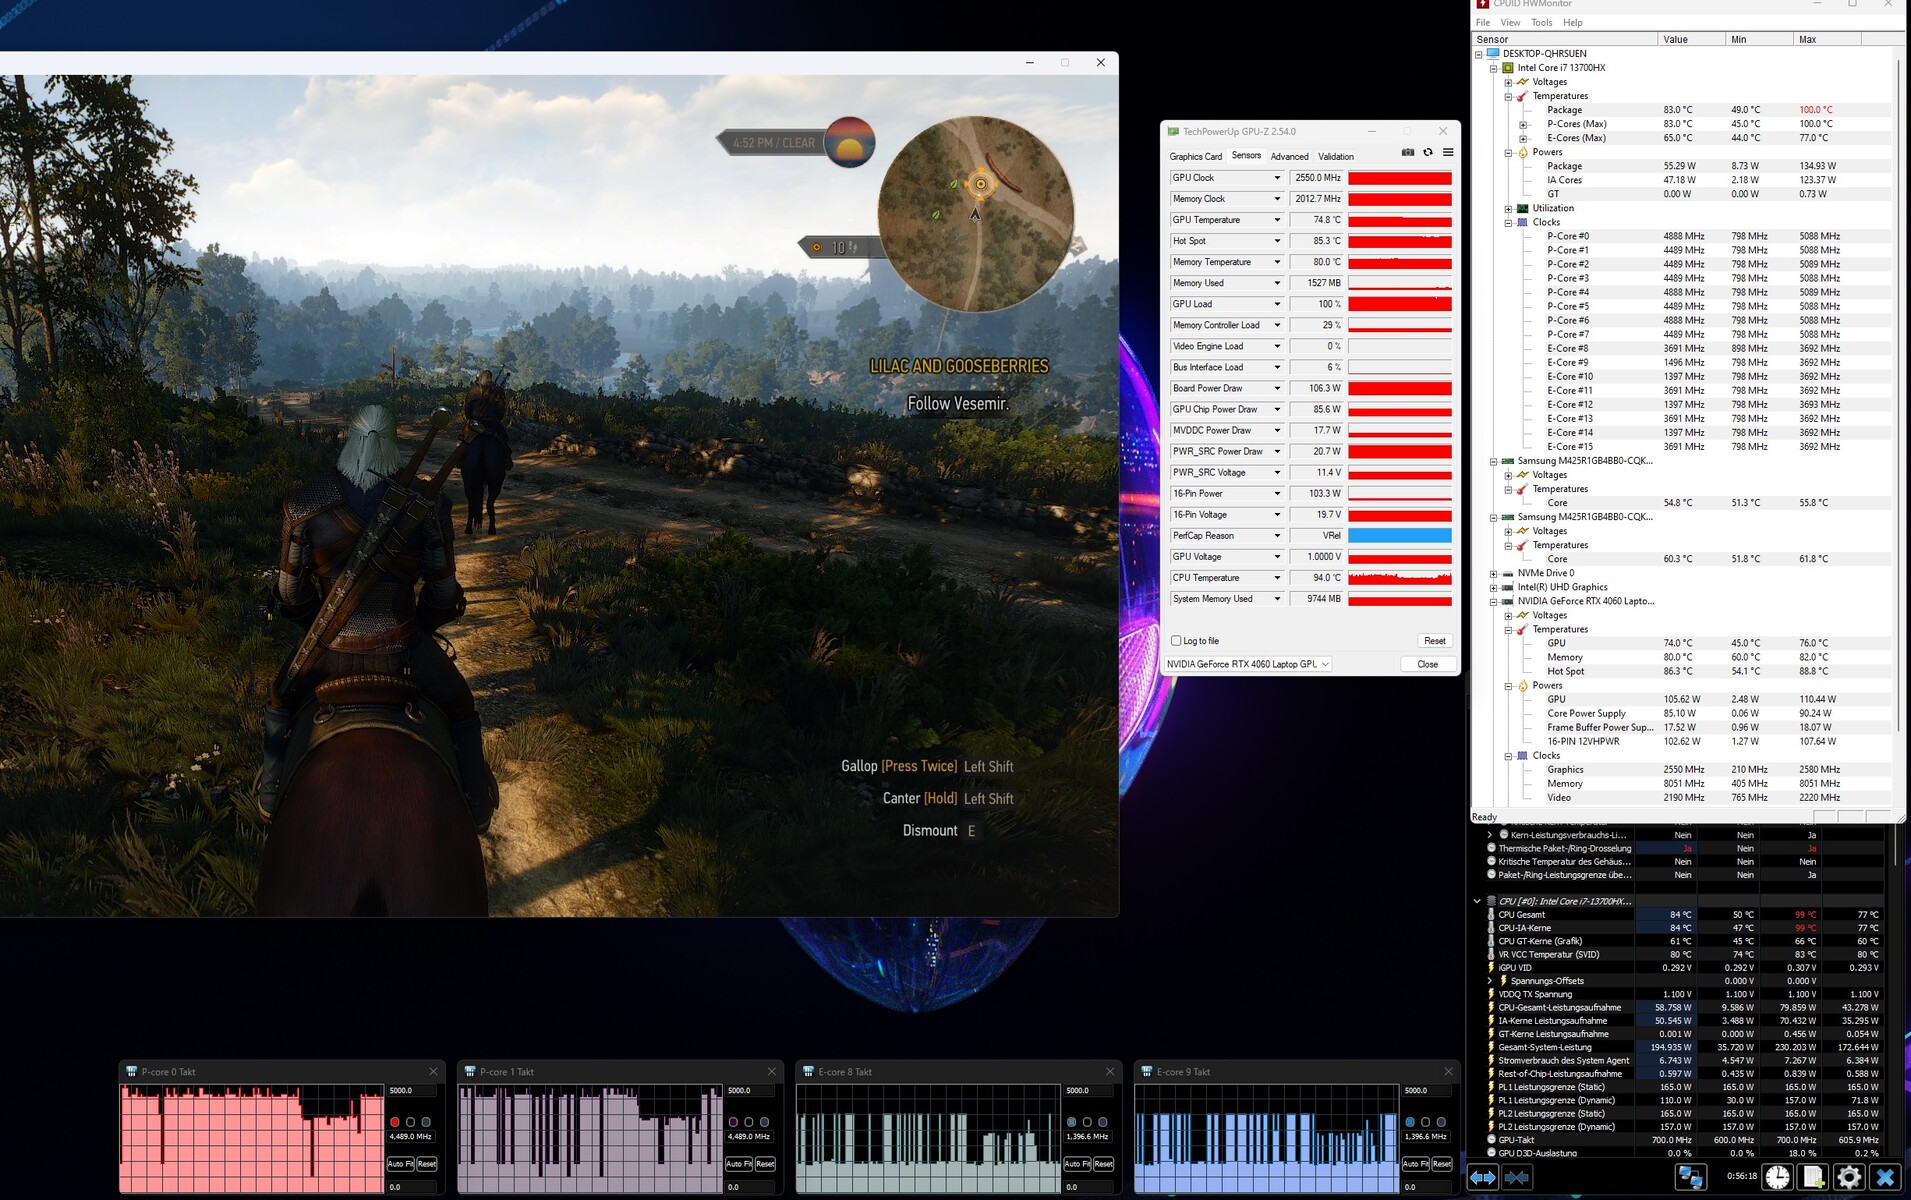
La GeForce RTX 4060offre 3072 shaders, un bus de 128 bits et une mémoire GDDR6 rapide (8 192 Mo). Dell autorise un TGP maximum de 140 watts (115 watts + 25 watts Dynamic Boost) - il n'est pas possible d'aller plus loin. D'après le test Witcher 3, le TGP n'est pas pleinement utilisé. Les résultats du benchmark sont supérieurs à la moyenne de la RTX 4060 et font partie des meilleures valeurs enregistrées avec ce GPU jusqu'à présent. Passer de dGPU à Optimus ne nécessite pas de redémarrage - Advanced Optimus est pris en charge.

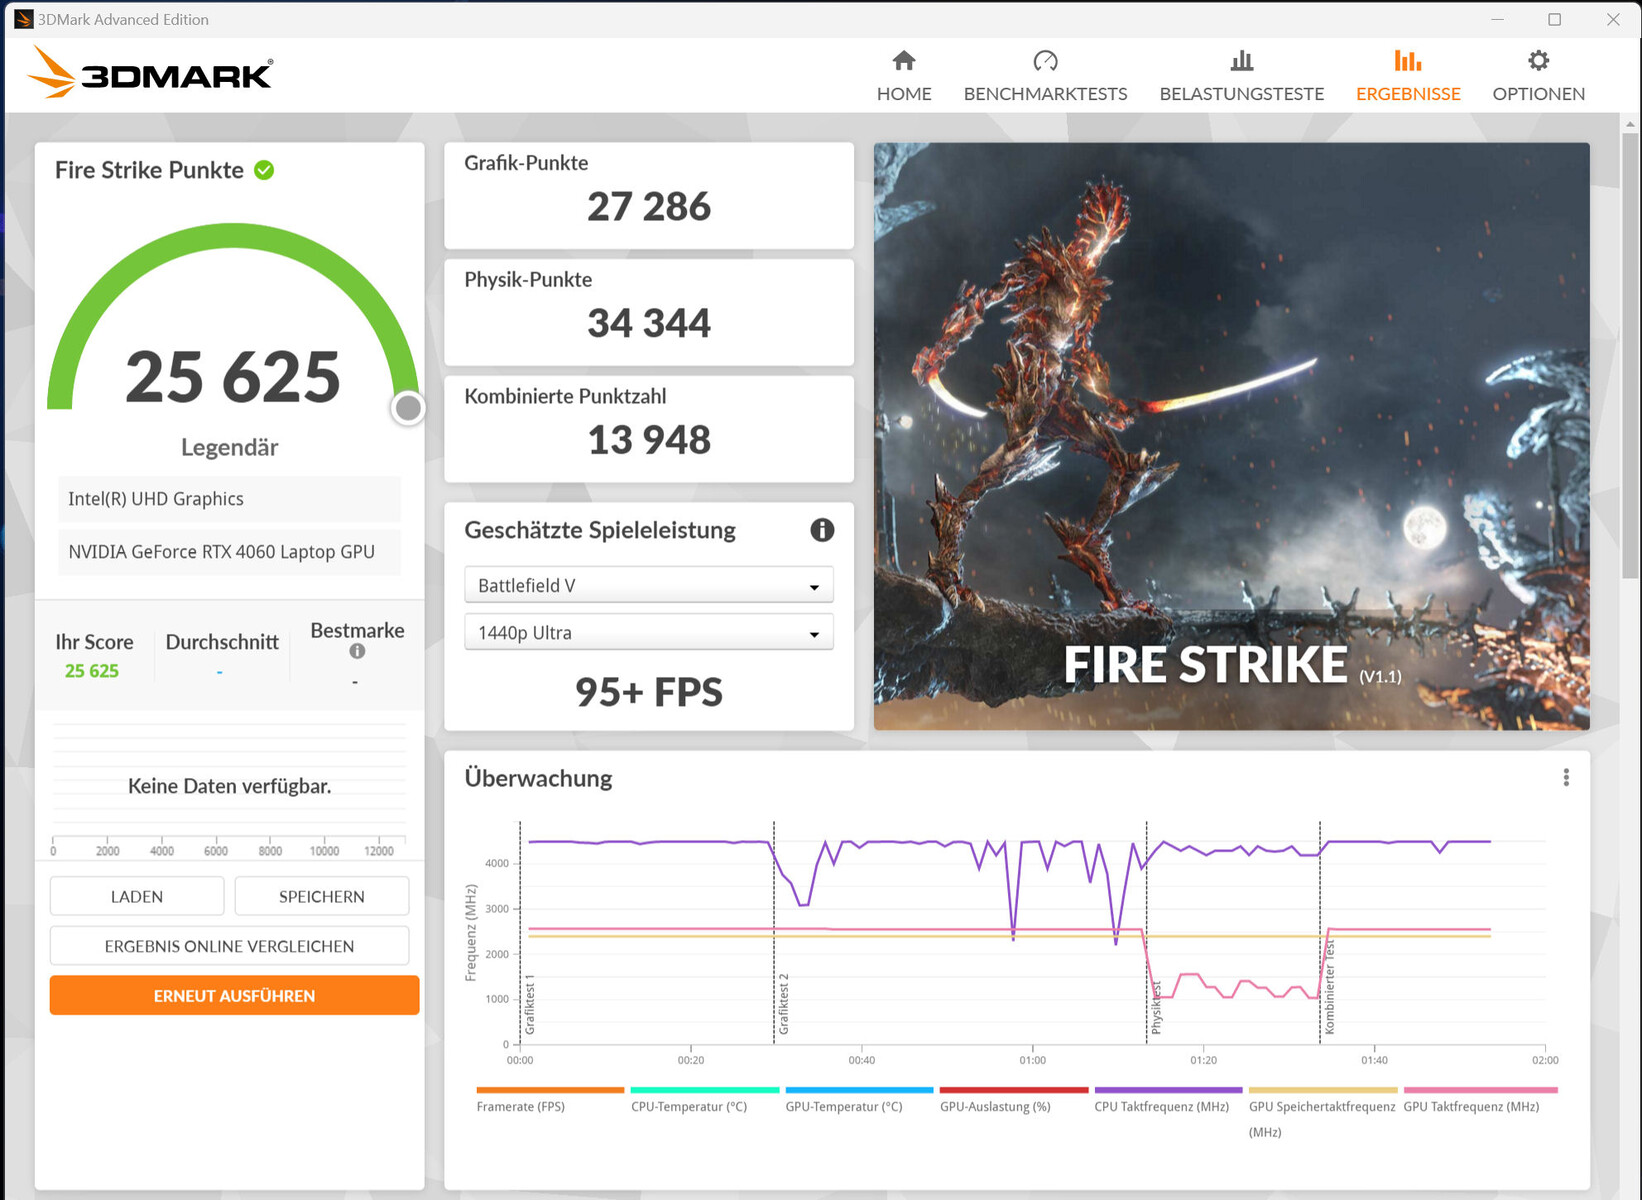
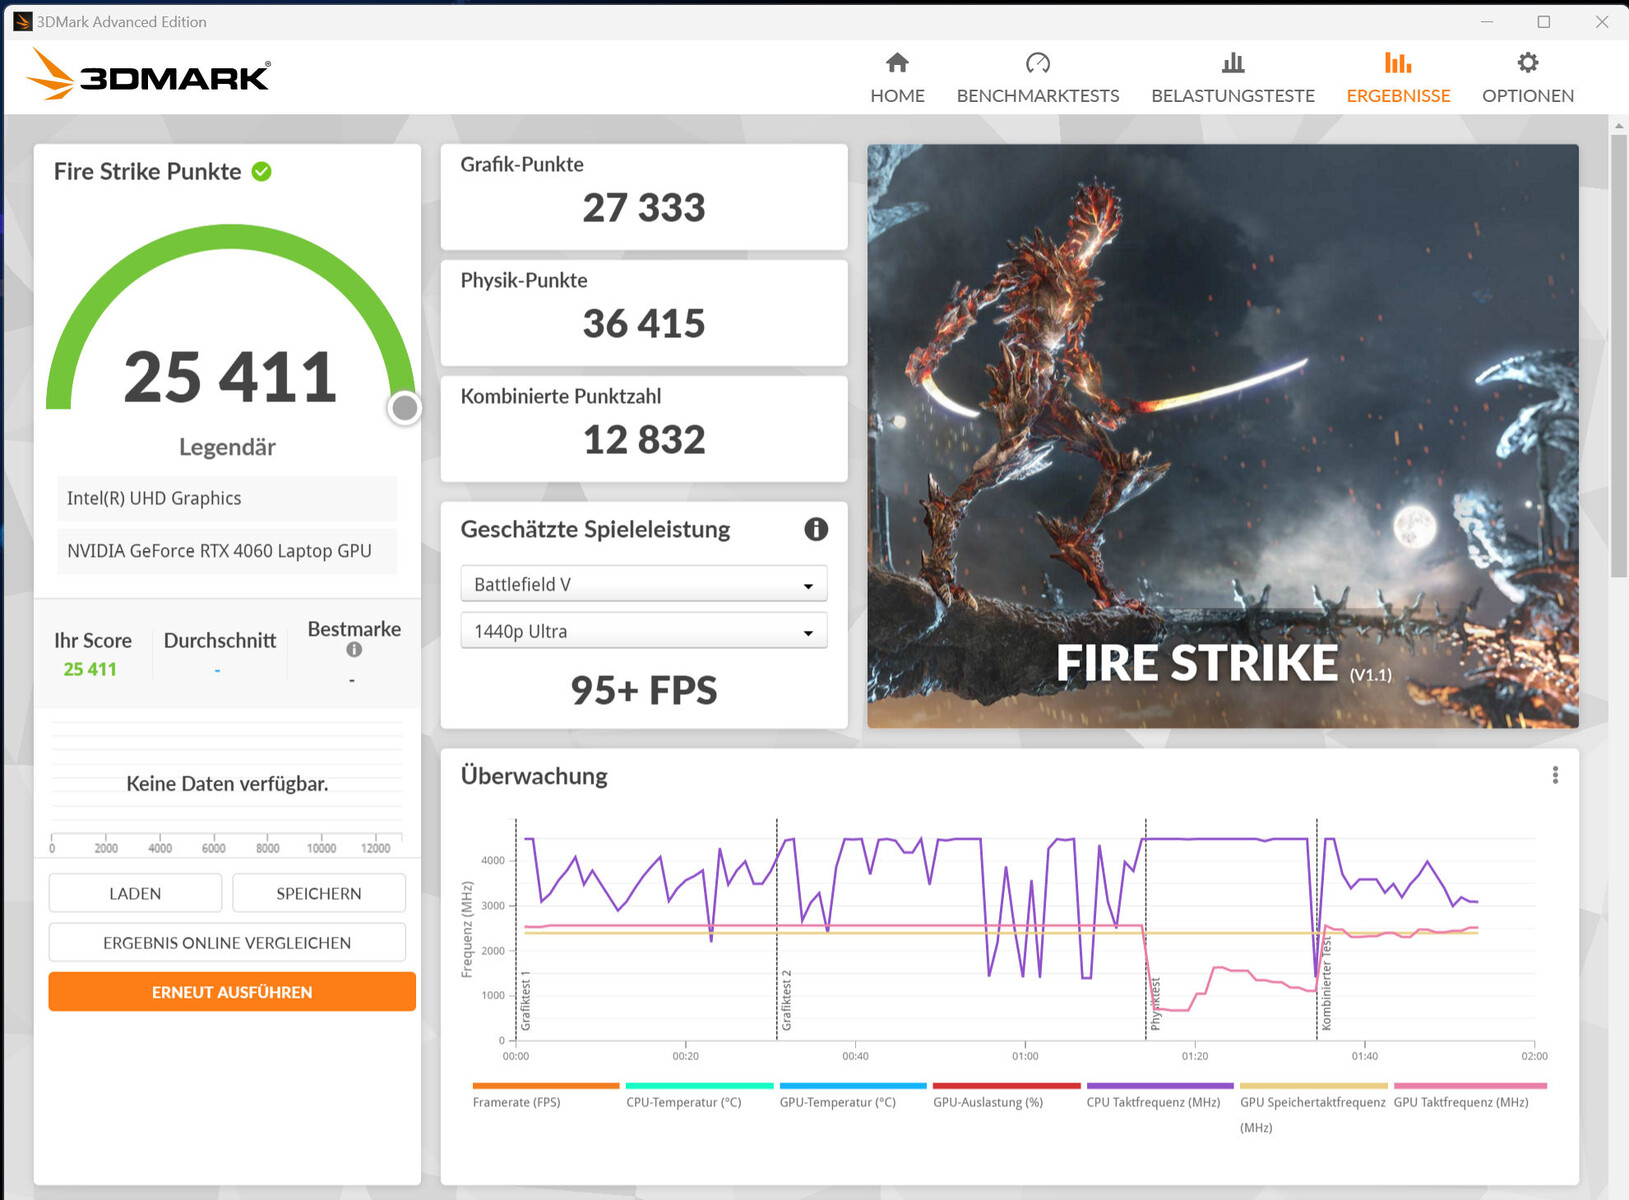
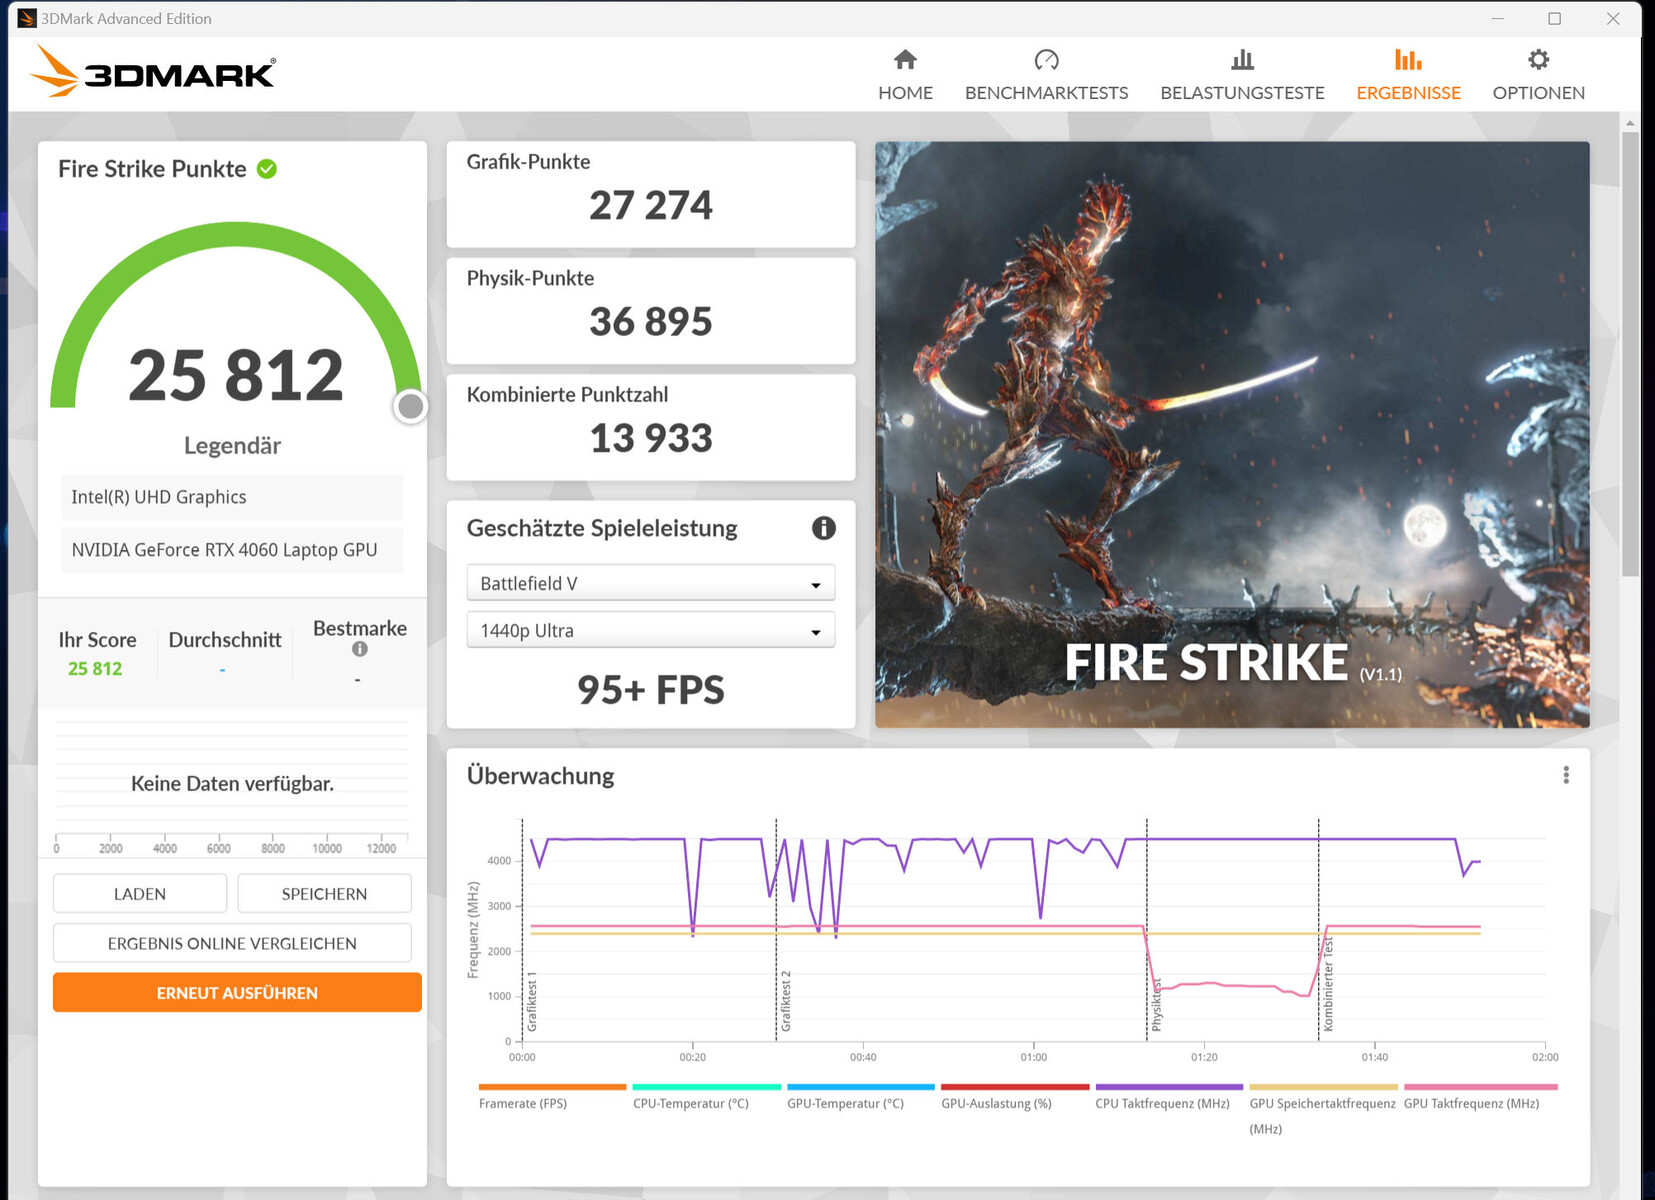
| 3DMark 06 Standard Score | 55811 points | |
| 3DMark 11 Performance | 33427 points | |
| 3DMark Cloud Gate Standard Score | 67224 points | |
| 3DMark Fire Strike Score | 25869 points | |
| 3DMark Time Spy Score | 11090 points | |
Aide | ||
* ... Moindre est la valeur, meilleures sont les performances
Performance des jeux
Le m16 est conçu pour les jeux en QHD+ avec des paramètres élevés à maximaux. Des résolutions plus élevées sont possibles si un écran correspondant est connecté - avec des paramètres partiellement réduits. Des taux de rafraîchissement supérieurs à la moyenne de la RTX 4060 sont atteints.
| The Witcher 3 - 1920x1080 Ultra Graphics & Postprocessing (HBAO+) | |
| Moyenne de la classe Gaming (104.7 - 240, n=7, 2 dernières années) | |
| Alienware m16 R1 AMD | |
| Schenker XMG Pro 15 (E23) | |
| Aorus 15 BSF | |
| Lenovo Legion Pro 5 16IRX8 | |
| Alienware m16 R1 Intel | |
| Medion Erazer Defender P40 | |
| Acer Predator Helios 16 PH16-71-731Q | |
| Moyenne NVIDIA GeForce RTX 4060 Laptop GPU (77 - 159.7, n=42) | |
| Atlas Fallen - 1920x1080 Very High Preset | |
| Alienware m16 R1 Intel | |
| Moyenne NVIDIA GeForce RTX 4060 Laptop GPU (88.2 - 114.4, n=3) | |
| Ratchet & Clank Rift Apart | |
| 1920x1080 Very High Preset AA:T | |
| Aorus 15 BSF | |
| Alienware m16 R1 Intel | |
| Moyenne NVIDIA GeForce RTX 4060 Laptop GPU (51.6 - 54.8, n=4) | |
| 1920x1080 Very High Preset + Very High Raytracing AA:T | |
| Aorus 15 BSF | |
| Alienware m16 R1 Intel | |
| Moyenne NVIDIA GeForce RTX 4060 Laptop GPU (39.1 - 44.5, n=3) | |
| Immortals of Aveum - 1920x1080 Ultra AF:16x | |
| Alienware m16 R1 Intel | |
| Moyenne NVIDIA GeForce RTX 4060 Laptop GPU (33 - 48.9, n=4) | |
| The Callisto Protocol | |
| 1920x1080 Ultra Preset (without FSR Upscaling) | |
| Aorus 15 BSF | |
| Alienware m16 R1 Intel | |
| Moyenne NVIDIA GeForce RTX 4060 Laptop GPU (54.4 - 81.1, n=3) | |
| 1920x1080 Ultra Preset (without FSR Upscaling) + Full Ray-Tracing | |
| Aorus 15 BSF | |
| Alienware m16 R1 Intel | |
| Moyenne NVIDIA GeForce RTX 4060 Laptop GPU (38.6 - 69.8, n=2) | |
| Star Wars Jedi Survivor | |
| 1920x1080 Epic Preset | |
| Alienware m16 R1 Intel | |
| Medion Erazer Defender P40 | |
| Moyenne NVIDIA GeForce RTX 4060 Laptop GPU (45.5 - 66.7, n=10) | |
| 1920x1080 Epic Preset + Ray Tracing | |
| Alienware m16 R1 Intel | |
| Moyenne NVIDIA GeForce RTX 4060 Laptop GPU (47 - 52.8, n=4) | |
| Medion Erazer Defender P40 | |
Pour vérifier si le taux de rafraîchissement reste constant sur de longues périodes, "The Witcher 3" est exécuté pendant environ 60 minutes en résolution Full HD et avec les paramètres de qualité maximum. Le personnage du jeu n'est pas déplacé. Aucune baisse de la fréquence d'images n'a été observée.
Witcher 3 FPS-Diagramm
| Bas | Moyen | Élevé | Ultra | QHD | |
|---|---|---|---|---|---|
| The Witcher 3 (2015) | 497 | 340.9 | 206.2 | 106.5 | 78.8 |
| Dota 2 Reborn (2015) | 189.5 | 169.6 | 165.8 | 153.2 | |
| Final Fantasy XV Benchmark (2018) | 232 | 150.8 | 104.7 | 77.1 | |
| X-Plane 11.11 (2018) | 170.4 | 156.7 | 120.4 | ||
| Far Cry 5 (2018) | 199 | 163 | 155 | 146 | 107 |
| Strange Brigade (2018) | 580 | 283 | 223 | 190.3 | 128.5 |
| Cyberpunk 2077 1.6 (2022) | 134.6 | 104.5 | 89.3 | 82.1 | 49.9 |
| The Callisto Protocol (2022) | 165.4 | 135.4 | 128 | 81.1 | 62.8 |
| Star Wars Jedi Survivor (2023) | 86 | 75.8 | 70.9 | 66.7 | 41.7 |
| F1 23 (2023) | 291 | 272 | 187.6 | 119.9 | 38.9 |
| Ratchet & Clank Rift Apart (2023) | 86 | 74.7 | 60.6 | 54.8 | 46.6 |
| Atlas Fallen (2023) | 145.9 | 137.5 | 132.1 | 114.4 | 79.2 |
| Immortals of Aveum (2023) | 61.6 | 54.6 | 48.9 | 32.8 |
Émissions - L'ordinateur portable Dell peut produire beaucoup de bruit
Bruit
Le niveau de pression sonore peut atteindre 58 dB(A) ("Overdrive") en mode jeu. le mode "Performance" est plus performant avec 51 dB(A). Le mode préféré est le profil "Silent" : un niveau de 43 dB(A) au prix d'une performance de jeu légèrement réduite.
Au repos et en utilisation quotidienne (bureau, internet), les quatre ventilateurs s'arrêtent souvent et le silence règne.
Degré de la nuisance sonore
| Au repos |
| 25 / 26 / 27 dB(A) |
| Fortement sollicité |
| 52 / 53 dB(A) |
 | ||
30 dB silencieux 40 dB(A) audible 50 dB(A) bruyant |
||
min: | ||
| Alienware m16 R1 Intel GeForce RTX 4060 Laptop GPU, i7-13700HX, Kioxia KXG70ZNV512G | Acer Predator Helios 16 PH16-71-731Q GeForce RTX 4060 Laptop GPU, i7-13700HX, Micron 3400 1TB MTFDKBA1T0TFH | Medion Erazer Defender P40 GeForce RTX 4060 Laptop GPU, i7-13700HX, Phison PS5021-E21 1TB | Lenovo Legion Pro 5 16IRX8 GeForce RTX 4060 Laptop GPU, i7-13700HX, SK hynix PC801 HFS512GEJ9X115N | Schenker XMG Pro 15 (E23) GeForce RTX 4060 Laptop GPU, i9-13900HX, Crucial P5 Plus 1TB CT1000P5PSSD8 | Aorus 15 BSF GeForce RTX 4070 Laptop GPU, i7-13700H, Gigabyte AG470S1TB-SI B10 | Alienware m16 R1 AMD GeForce RTX 4080 Laptop GPU, R9 7845HX, Kioxia XG8 KXG80ZNV1T02 | |
|---|---|---|---|---|---|---|---|
| Noise | 5% | -9% | 9% | 3% | -10% | 4% | |
| arrêt / environnement * (dB) | 25 | 24 4% | 25 -0% | 23 8% | 24 4% | 24 4% | 22.9 8% |
| Idle Minimum * (dB) | 25 | 24 4% | 26 -4% | 23.1 8% | 24 4% | 25 -0% | 22.9 8% |
| Idle Average * (dB) | 26 | 24 8% | 27 -4% | 23.1 11% | 24 8% | 31 -19% | 29.7 -14% |
| Idle Maximum * (dB) | 27 | 32.32 -20% | 32 -19% | 26.6 1% | 24 11% | 37 -37% | 29.7 -10% |
| Load Average * (dB) | 52 | 36.66 29% | 53 -2% | 34.7 33% | 53.65 -3% | 51 2% | 29.8 43% |
| Witcher 3 ultra * (dB) | 51 | 49.06 4% | 56 -10% | 47.6 7% | 53.53 -5% | 54.7 -7% | |
| Load Maximum * (dB) | 53 | 49.49 7% | 64 -21% | 54.8 -3% | 53.65 -1% | 57 -8% | 54.7 -3% |
* ... Moindre est la valeur, meilleures sont les performances
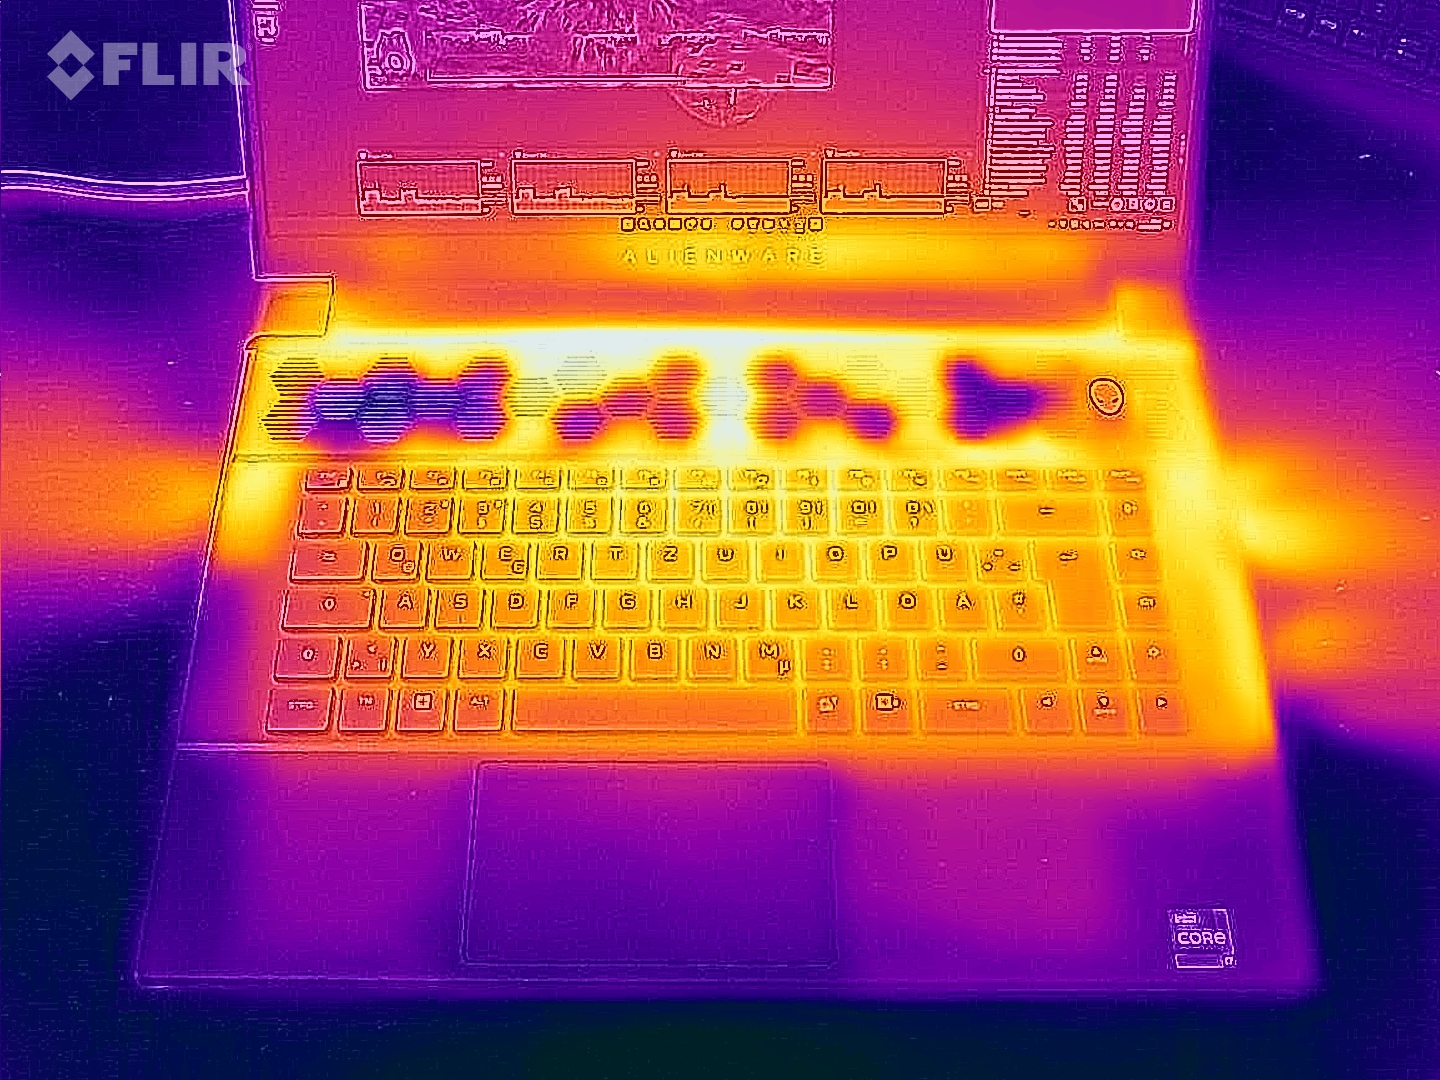
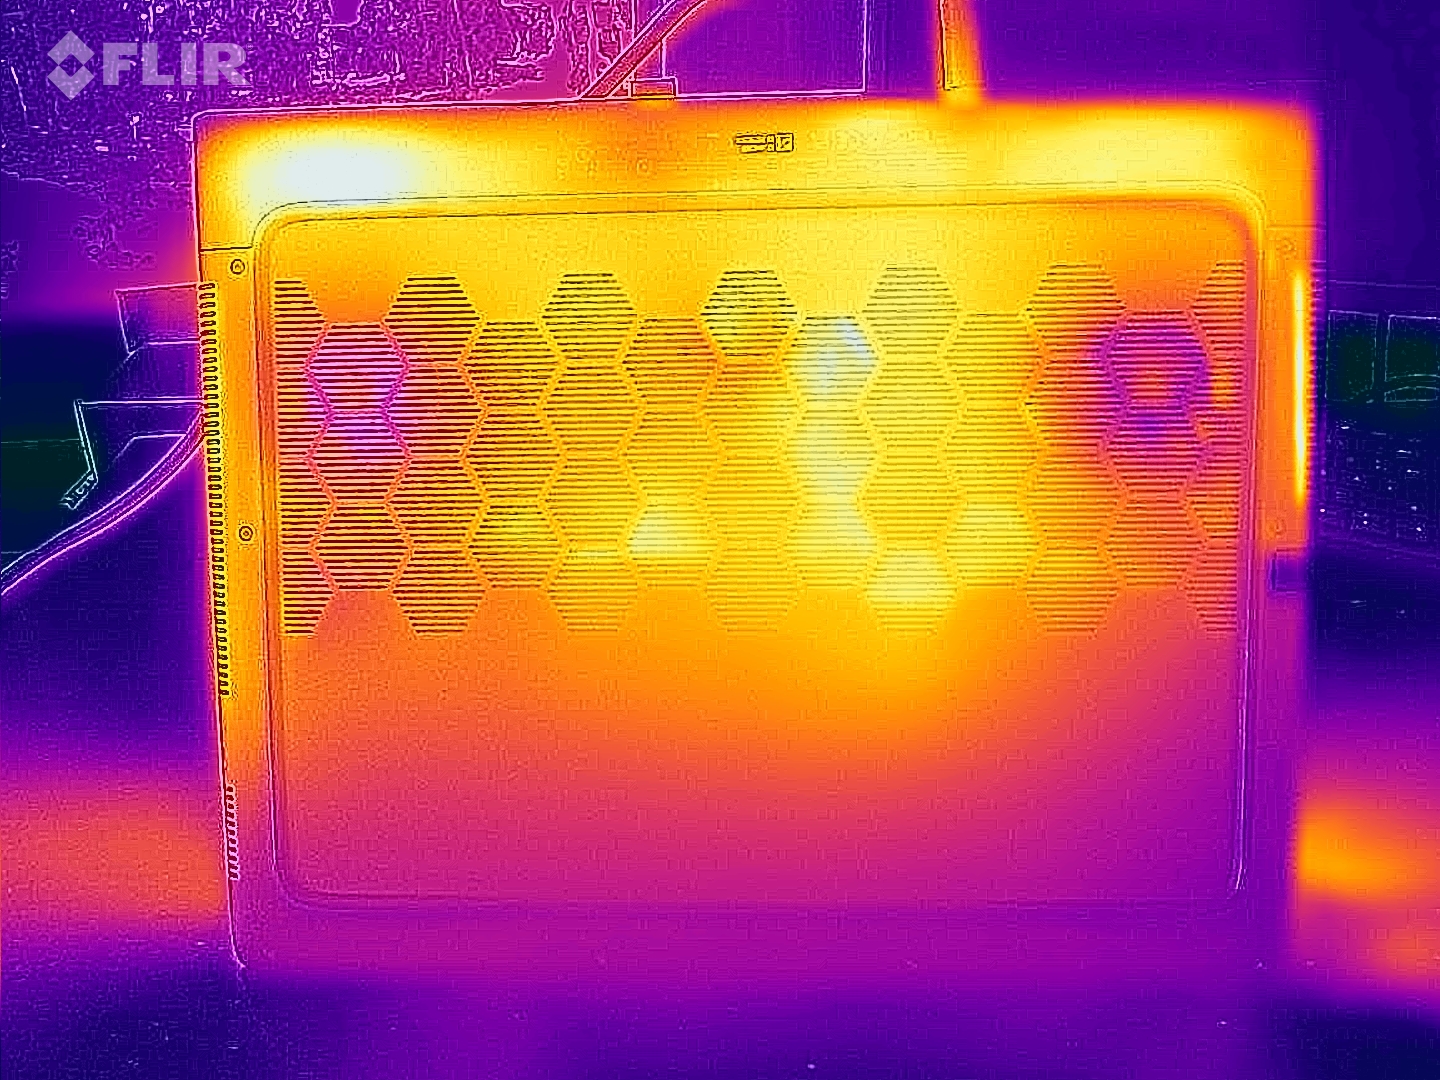
Température
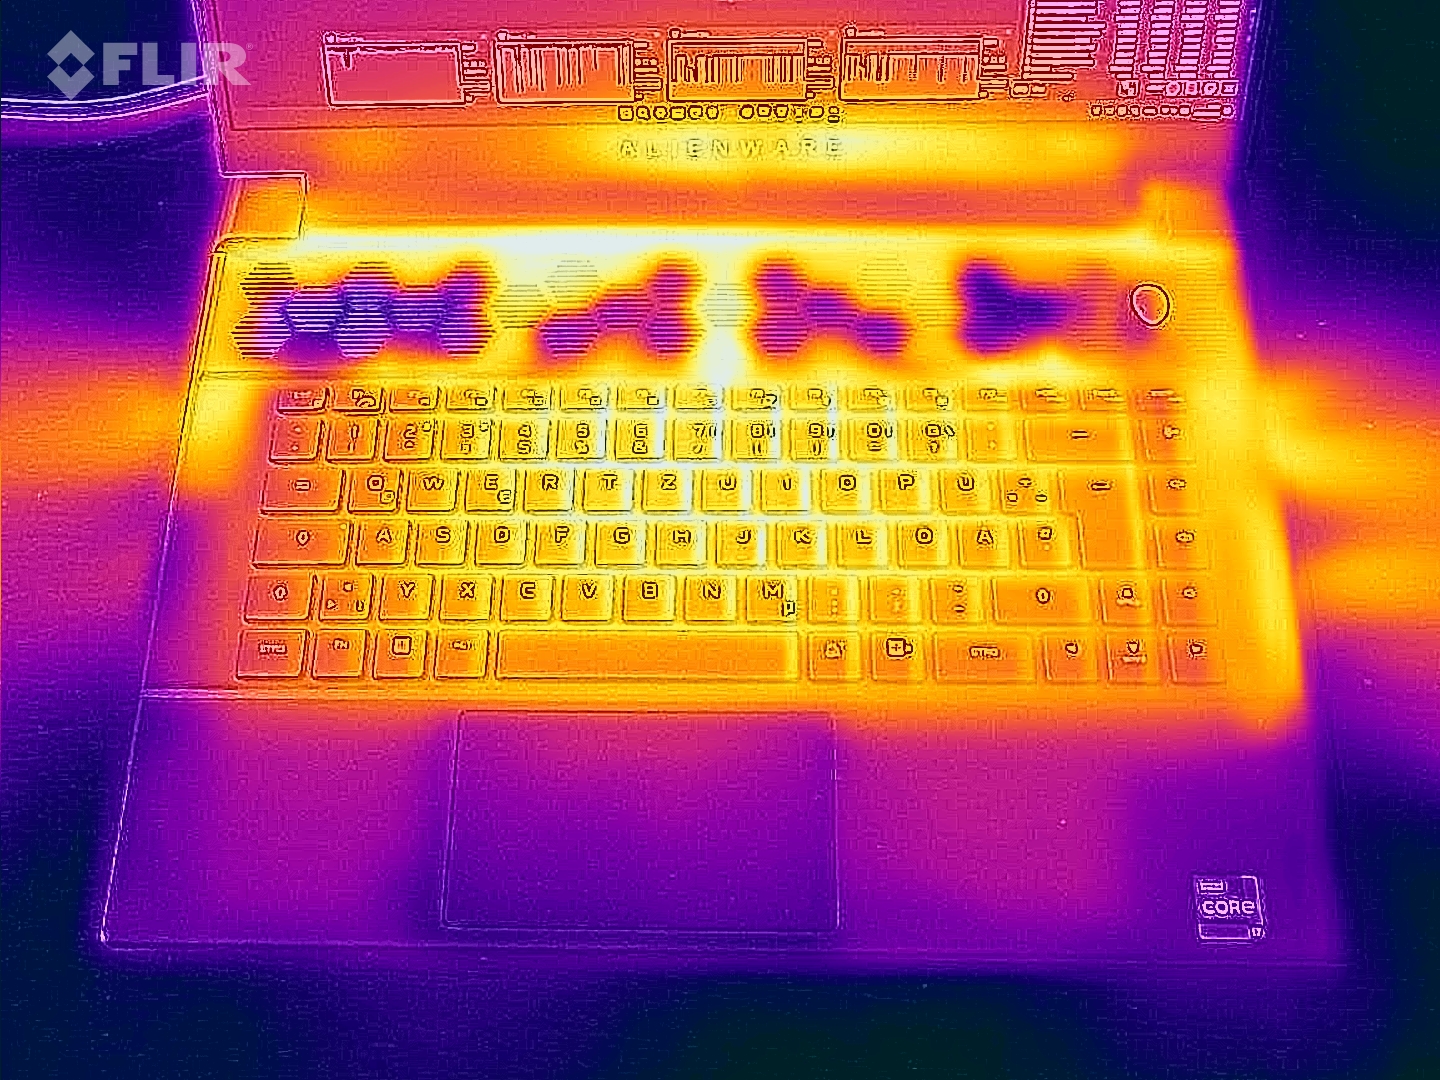
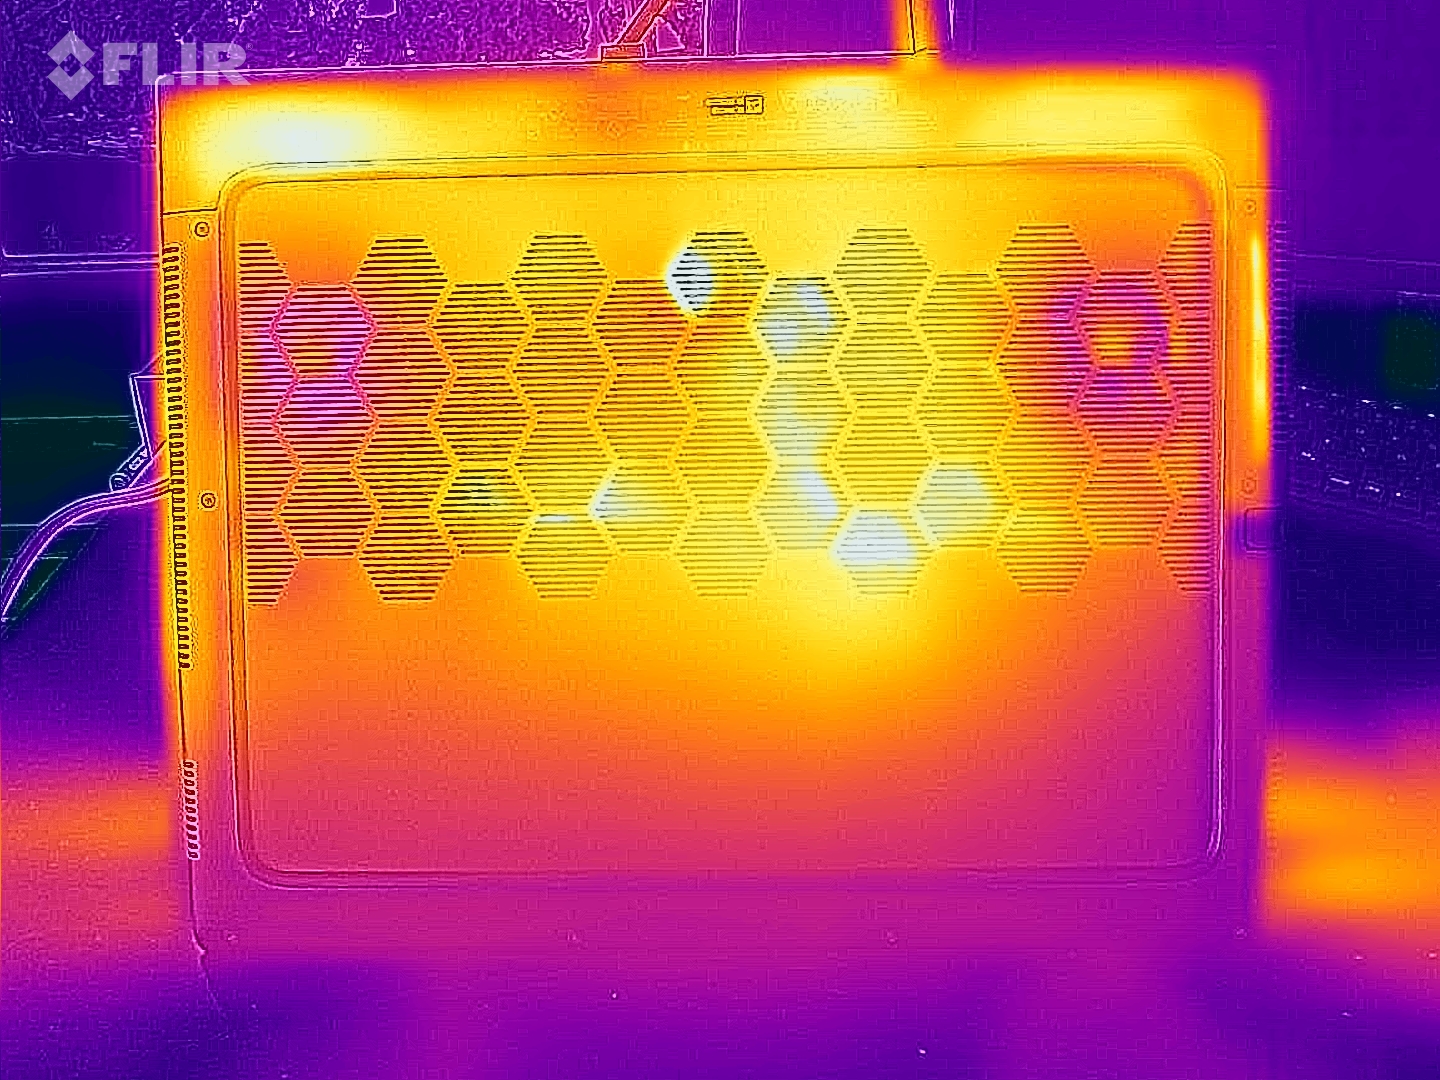
Les tests de stress et le site Witcher 3 provoquent un réchauffement notable de l'ordinateur portable, mais tout reste dans des limites acceptables. En utilisation quotidienne (bureau, internet), les températures du boîtier restent dans la zone verte, mais sont trop élevées par rapport à des ordinateurs portables comparables.
L'ordinateur portable chauffe plus sous charge que son homologue AMD Test de l'Alienware m16 R1 : les débuts de l'AMD Ryzen 9 7845HX équipé d'un matériel plus puissant. Ce dernier bénéficie de l'APU plus économe.
(-) La température maximale du côté supérieur est de 49 °C / 120 F, par rapport à la moyenne de 40.4 °C / 105 F, allant de 21.2 à 68.8 °C pour la classe Gaming.
(-) Le fond chauffe jusqu'à un maximum de 48 °C / 118 F, contre une moyenne de 43.2 °C / 110 F
(±) En utilisation inactive, la température moyenne du côté supérieur est de 37 °C / 99 F, par rapport à la moyenne du dispositif de 33.9 °C / 93 F.
(-) En jouant à The Witcher 3, la température moyenne du côté supérieur est de 46 °C / 115 F, alors que la moyenne de l'appareil est de 33.9 °C / 93 F.
(-) Les repose-poignets et le pavé tactile peuvent devenir très chauds au toucher, avec un maximum de 44 °C / 111.2# F.
(-) La température moyenne de la zone de l'appui-paume de dispositifs similaires était de 28.8 °C / 83.8 F (-15.2 °C / #-27.4 F).
| Alienware m16 R1 Intel Intel Core i7-13700HX, NVIDIA GeForce RTX 4060 Laptop GPU | Acer Predator Helios 16 PH16-71-731Q Intel Core i7-13700HX, NVIDIA GeForce RTX 4060 Laptop GPU | Medion Erazer Defender P40 Intel Core i7-13700HX, NVIDIA GeForce RTX 4060 Laptop GPU | Lenovo Legion Pro 5 16IRX8 Intel Core i7-13700HX, NVIDIA GeForce RTX 4060 Laptop GPU | Schenker XMG Pro 15 (E23) Intel Core i9-13900HX, NVIDIA GeForce RTX 4060 Laptop GPU | Aorus 15 BSF Intel Core i7-13700H, NVIDIA GeForce RTX 4070 Laptop GPU | Alienware m16 R1 AMD AMD Ryzen 9 7845HX, NVIDIA GeForce RTX 4080 Laptop GPU | |
|---|---|---|---|---|---|---|---|
| Heat | -2% | 18% | 12% | 7% | 4% | 9% | |
| Maximum Upper Side * (°C) | 49 | 41 16% | 42 14% | 42.8 13% | 50 -2% | 48 2% | 48 2% |
| Maximum Bottom * (°C) | 48 | 66 -38% | 45 6% | 50 -4% | 50 -4% | 47 2% | 39 19% |
| Idle Upper Side * (°C) | 40 | 36 10% | 28 30% | 29.6 26% | 33 17% | 39 2% | 37 7% |
| Idle Bottom * (°C) | 39 | 37 5% | 30 23% | 34 13% | 32 18% | 35 10% | 36.2 7% |
* ... Moindre est la valeur, meilleures sont les performances
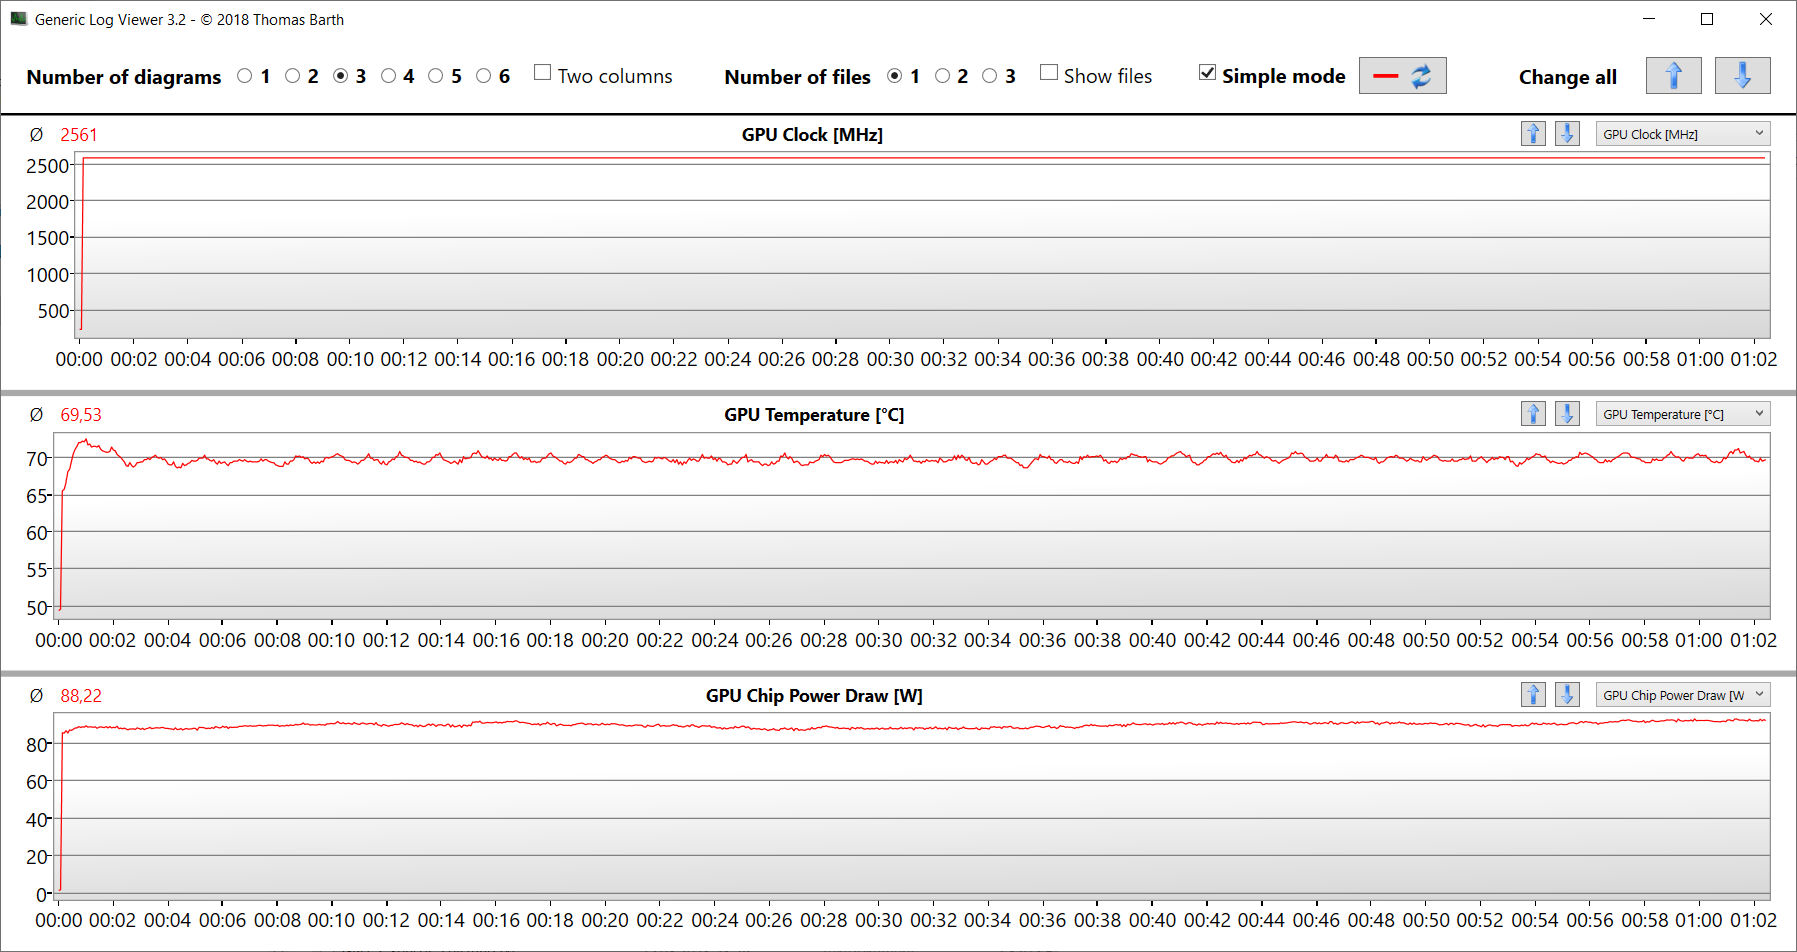
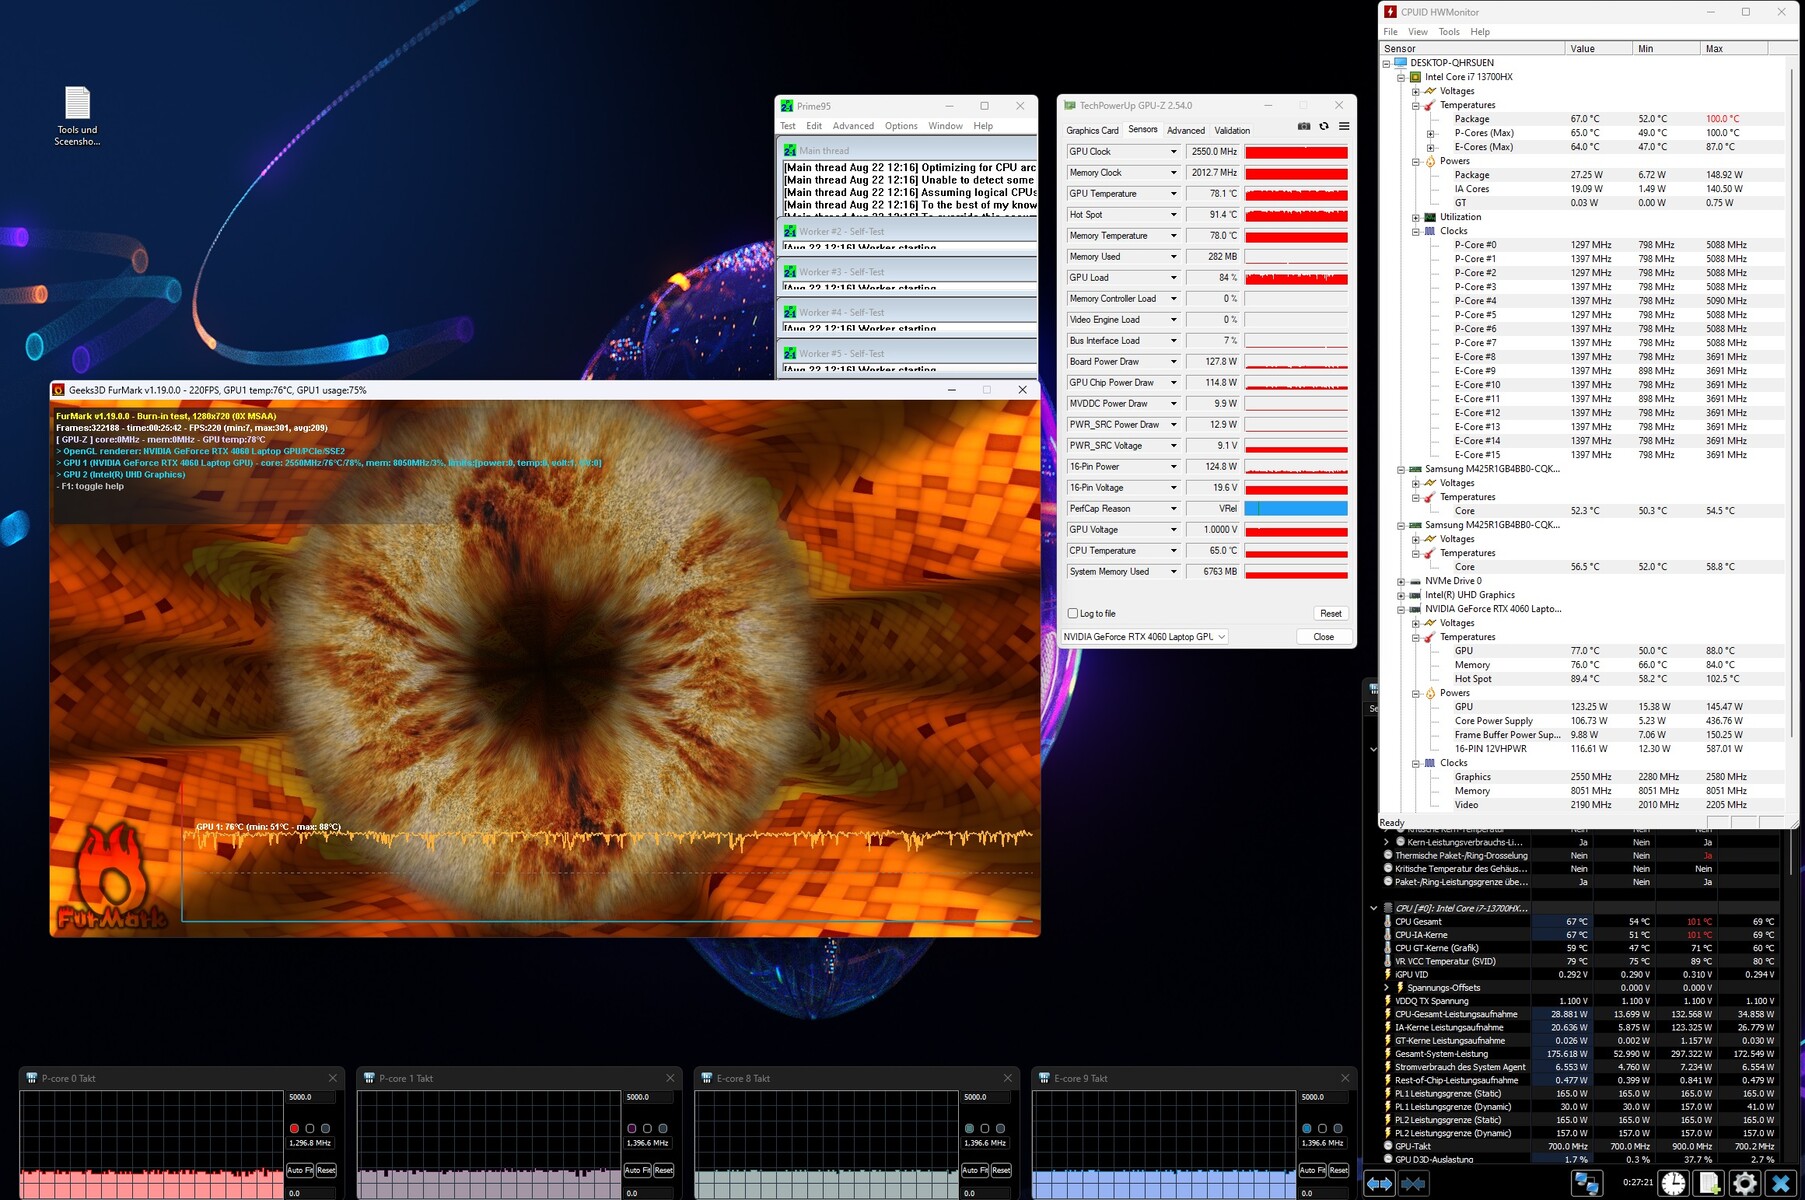
Tests de résistance
Le test de stress (Prime95 et Furmark en fonctionnement continu) représente un scénario extrême pour vérifier la stabilité du système à pleine charge. L'unité centrale (P : 4,2 GHz, E : 3,4 GHz) commence le test avec une fréquence d'horloge élevée. Au fur et à mesure que le test progresse, l'horloge diminue légèrement jusqu'à ce qu'elle tombe soudainement à des valeurs inférieures à l'horloge de base après environ 30 minutes. Le GPU fonctionne en permanence à pleine puissance.
Intervenants
Les haut-parleurs stéréo produisent un son décent, mais il n'y a pratiquement pas de basses. Un casque ou des haut-parleurs externes sont recommandés pour une meilleure expérience sonore.
Alienware m16 R1 Intel analyse audio
(+) | les haut-parleurs peuvent jouer relativement fort (87# dB)
Basses 100 - 315 Hz
(-) | presque aucune basse - en moyenne 24% plus bas que la médiane
(±) | la linéarité des basses est moyenne (13.5% delta à la fréquence précédente)
Médiums 400 - 2000 Hz
(+) | médiane équilibrée - seulement 1.4% de la médiane
(+) | les médiums sont linéaires (3.3% delta à la fréquence précédente)
Aiguës 2 - 16 kHz
(+) | des sommets équilibrés - à seulement 3.5% de la médiane
(+) | les aigus sont linéaires (4.6% delta à la fréquence précédente)
Globalement 100 - 16 000 Hz
(+) | le son global est linéaire (13.4% différence à la médiane)
Par rapport à la même classe
» 19% de tous les appareils testés de cette catégorie étaient meilleurs, 7% similaires, 74% pires
» Le meilleur avait un delta de 6%, la moyenne était de 18%, le pire était de 132%.
Par rapport à tous les appareils testés
» 14% de tous les appareils testés étaient meilleurs, 4% similaires, 82% pires
» Le meilleur avait un delta de 4%, la moyenne était de 23%, le pire était de 134%.
Acer Predator Helios 16 PH16-71-731Q analyse audio
(±) | le niveau sonore du haut-parleur est moyen mais bon (76.12# dB)
Basses 100 - 315 Hz
(-) | presque aucune basse - en moyenne 15% plus bas que la médiane
(-) | les basses ne sont pas linéaires (15% delta à la fréquence précédente)
Médiums 400 - 2000 Hz
(+) | médiane équilibrée - seulement 2.5% de la médiane
(+) | les médiums sont linéaires (5.9% delta à la fréquence précédente)
Aiguës 2 - 16 kHz
(+) | des sommets équilibrés - à seulement 2.9% de la médiane
(±) | la linéarité des aigus est moyenne (8.4% delta à la fréquence précédente)
Globalement 100 - 16 000 Hz
(+) | le son global est linéaire (13.6% différence à la médiane)
Par rapport à la même classe
» 20% de tous les appareils testés de cette catégorie étaient meilleurs, 7% similaires, 73% pires
» Le meilleur avait un delta de 6%, la moyenne était de 18%, le pire était de 132%.
Par rapport à tous les appareils testés
» 15% de tous les appareils testés étaient meilleurs, 4% similaires, 82% pires
» Le meilleur avait un delta de 4%, la moyenne était de 23%, le pire était de 134%.
Gestion de l'énergie - Le m16 offre de maigres durées d'utilisation
Consommation électrique
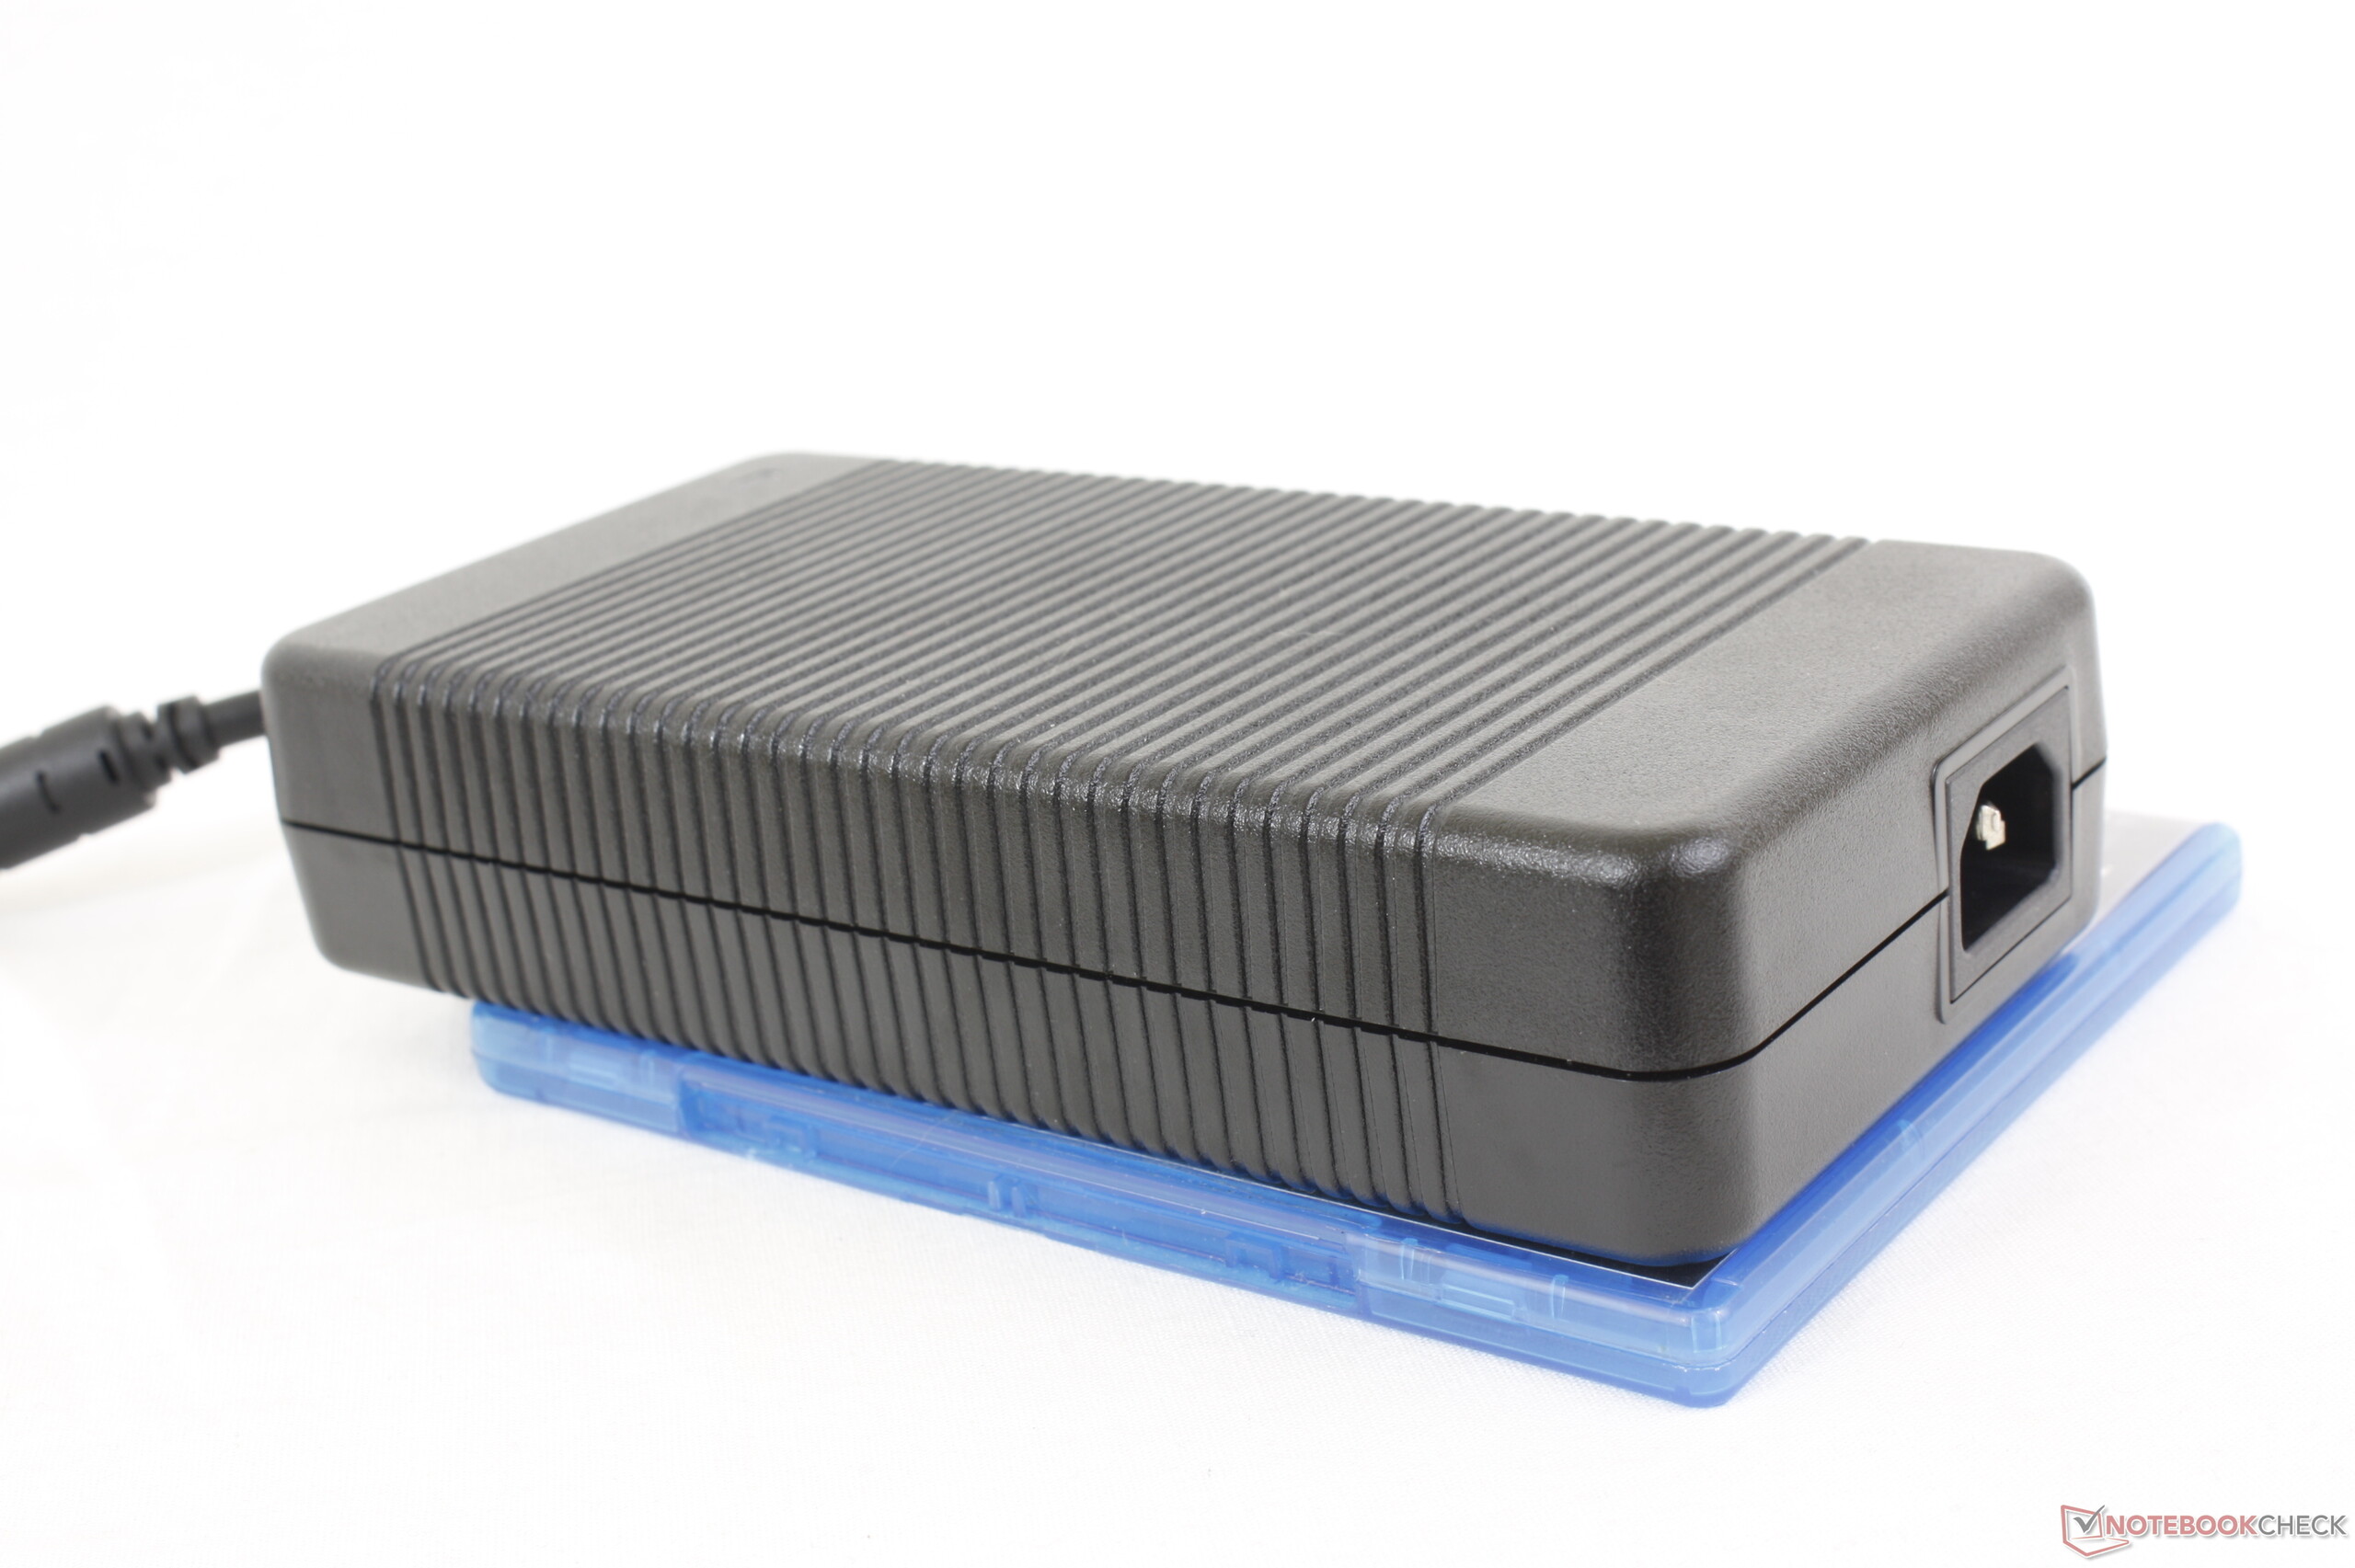
Le m16 ne présente aucune anomalie en termes de consommation d'énergie : les valeurs sont normales pour le matériel installé. Le test Witcher 3 est effectué avec une consommation d'énergie constante. Pendant le test de stress, la demande diminue de manière significative au fil du temps. L'alimentation (330 watts) est donc suffisamment dimensionnée.
| Éteint/en veille | |
| Au repos | |
| Fortement sollicité |
|
Légende:
min: | |
| Alienware m16 R1 Intel i7-13700HX, GeForce RTX 4060 Laptop GPU | Acer Predator Helios 16 PH16-71-731Q i7-13700HX, GeForce RTX 4060 Laptop GPU | Medion Erazer Defender P40 i7-13700HX, GeForce RTX 4060 Laptop GPU | Lenovo Legion Pro 5 16IRX8 i7-13700HX, GeForce RTX 4060 Laptop GPU | Schenker XMG Pro 15 (E23) i9-13900HX, GeForce RTX 4060 Laptop GPU | Aorus 15 BSF i7-13700H, GeForce RTX 4070 Laptop GPU | Alienware m16 R1 AMD R9 7845HX, GeForce RTX 4080 Laptop GPU | Moyenne NVIDIA GeForce RTX 4060 Laptop GPU | Moyenne de la classe Gaming | |
|---|---|---|---|---|---|---|---|---|---|
| Power Consumption | -12% | 13% | -46% | -62% | 17% | -133% | 6% | -11% | |
| Idle Minimum * (Watt) | 10 | 15.9 -59% | 8 20% | 24.5 -145% | 21.6 -116% | 7 30% | 39 -290% | 11.5 ? -15% | 13 ? -30% |
| Idle Average * (Watt) | 14 | 20.5 -46% | 12 14% | 29.2 -109% | 29 -107% | 12 14% | 44.6 -219% | 16 ? -14% | 19 ? -36% |
| Idle Maximum * (Watt) | 21 | 20.9 -0% | 18 14% | 34.3 -63% | 42.7 -103% | 20 5% | 68.1 -224% | 20.3 ? 3% | 24.6 ? -17% |
| Load Average * (Watt) | 119 | 106 11% | 101 15% | 98.7 17% | 190 -60% | 94 21% | 129.8 -9% | 92.9 ? 22% | 110.7 ? 7% |
| Witcher 3 ultra * (Watt) | 186.7 | 175 6% | 180.8 3% | 178.6 4% | 189 -1% | 175.8 6% | 285 -53% | ||
| Load Maximum * (Watt) | 323 | 276 15% | 284 12% | 249.6 23% | 269 17% | 247 24% | 327.3 -1% | 210 ? 35% | 259 ? 20% |
* ... Moindre est la valeur, meilleures sont les performances
Power consumption Witcher 3 / Stress test
Power consumption with an external monitor
Autonomie de la batterie
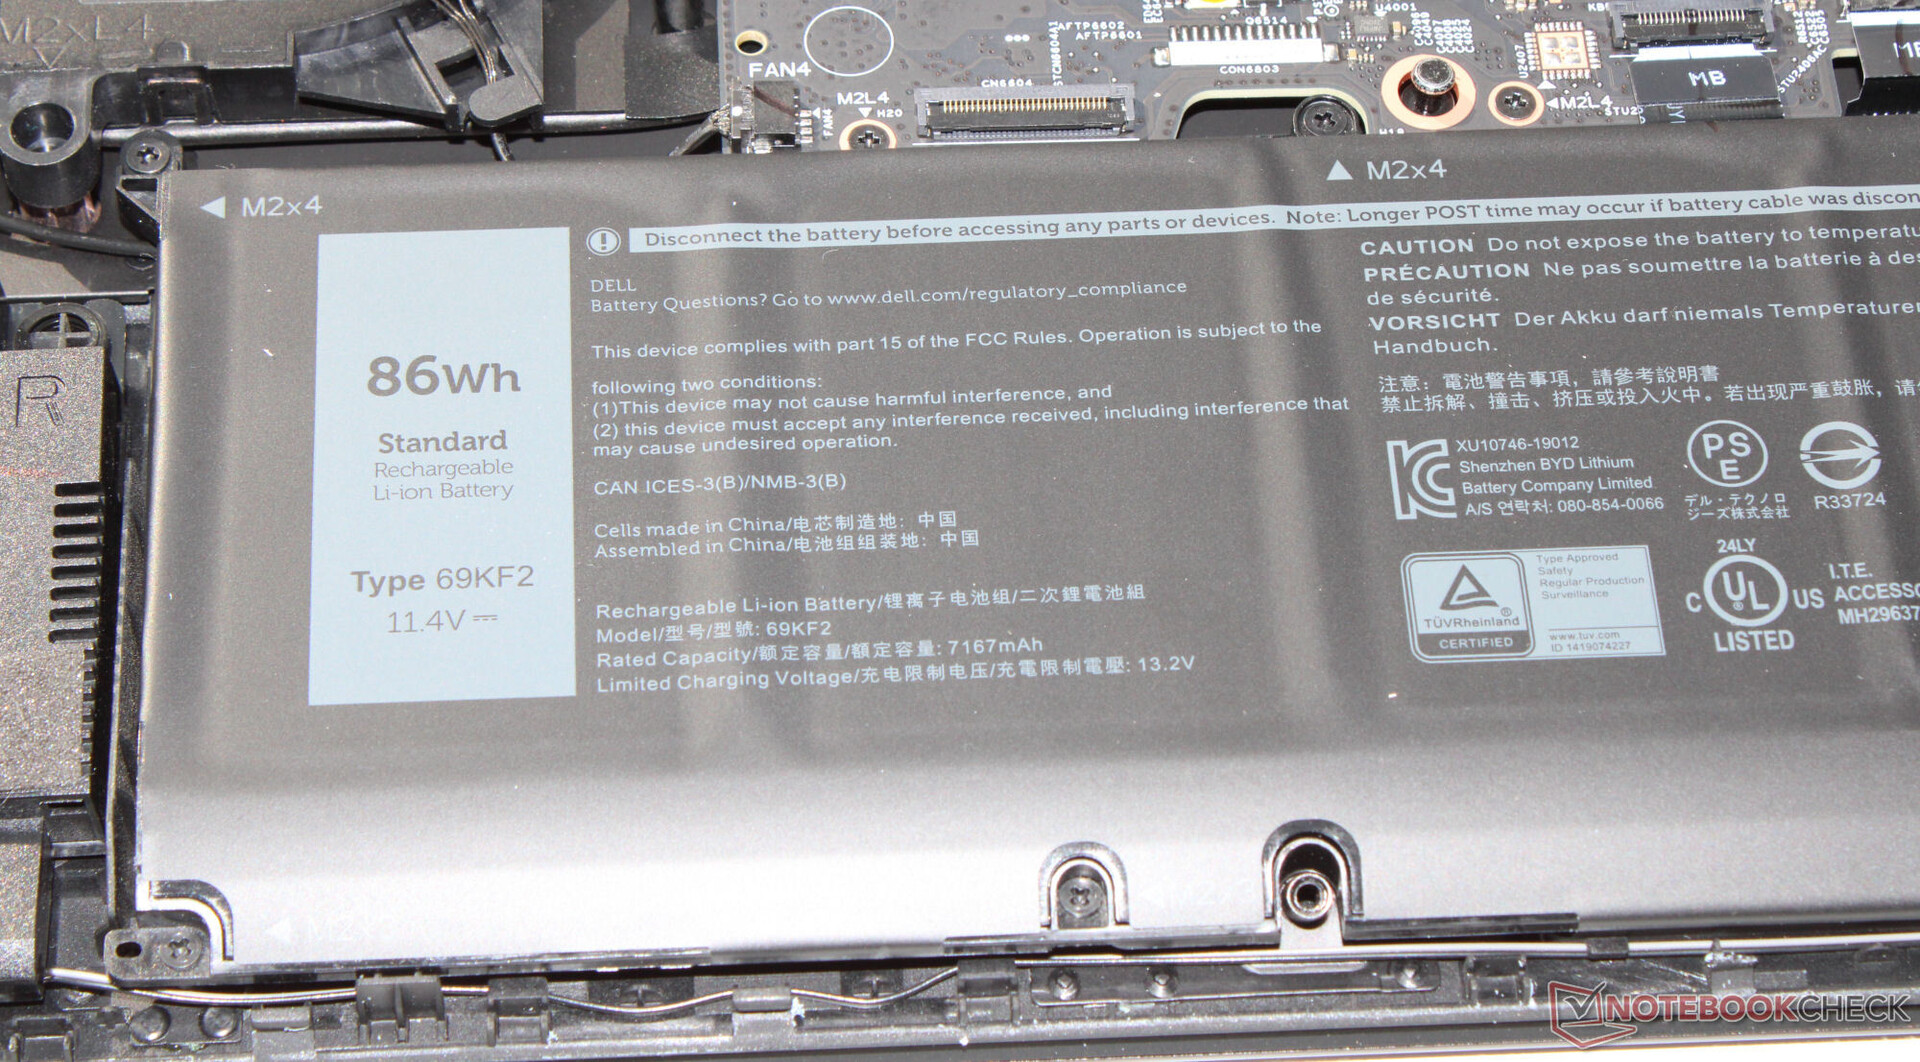
Le 16 pouces a atteint des durées d'exécution de 4:46 h et 5:36 h dans le test WLAN (chargement de sites web via un script) et le test vidéo (court métrage Big Buck Bunny, codage H.264, FHD, en boucle), respectivement. Pendant les deux tests, les fonctions d'économie d'énergie de l'ordinateur portable ont été désactivées et la luminosité de l'écran a été réglée à environ 150 cd/m². Les modules sans fil ont également été désactivés pour le test vidéo.
Dans l'ensemble, le m16 n'offre qu'une faible autonomie. Certains concurrents offrent de bien meilleurs résultats. L'avantage par rapport auModèle sœur d'AMDd'AMD est probablement dû au mode dGPU actif de ce dernier.
| Alienware m16 R1 Intel i7-13700HX, GeForce RTX 4060 Laptop GPU, 86 Wh | Acer Predator Helios 16 PH16-71-731Q i7-13700HX, GeForce RTX 4060 Laptop GPU, 90 Wh | Medion Erazer Defender P40 i7-13700HX, GeForce RTX 4060 Laptop GPU, 73 Wh | Lenovo Legion Pro 5 16IRX8 i7-13700HX, GeForce RTX 4060 Laptop GPU, 80 Wh | Schenker XMG Pro 15 (E23) i9-13900HX, GeForce RTX 4060 Laptop GPU, 80 Wh | Aorus 15 BSF i7-13700H, GeForce RTX 4070 Laptop GPU, 99 Wh | Alienware m16 R1 AMD R9 7845HX, GeForce RTX 4080 Laptop GPU, 86 Wh | Moyenne de la classe Gaming | |
|---|---|---|---|---|---|---|---|---|
| Autonomie de la batterie | 18% | 25% | -18% | 55% | 92% | -27% | 44% | |
| Reader / Idle (h) | 6.4 | 8.8 38% | 6.7 5% | 10.9 70% | 4 -37% | 8.27 ? 29% | ||
| H.264 (h) | 5.6 | 4.8 -14% | 5.7 2% | 9 61% | 8.32 ? 49% | |||
| WiFi v1.3 (h) | 4.8 | 5.6 17% | 6.2 29% | 3.4 -29% | 5.7 19% | 10.3 115% | 3.7 -23% | 7.11 ? 48% |
| Load (h) | 1 | 1.5 50% | 1.3 30% | 0.7 -30% | 1.9 90% | 2.2 120% | 0.8 -20% | 1.502 ? 50% |
| Witcher 3 ultra (h) | 1.5 |
Points positifs
Points négatifs
Verdict - Une machine de jeu puissante
Notre variante de l'Alienware m16 R1 - le modèle d'entrée de gamme de la série - est conçue pour les jeux et le rendu QHD+. Le Core i7-13700HX et la GeForce RTX 4060 fournissent la puissance nécessaire. Les deux composants fonctionnent à des vitesses d'horloge généralement élevées et il est possible d'obtenir un compromis acceptable entre les performances et le bruit.
Dell propose un ordinateur portable de jeu QHD+ puissant avec l'Alienware m16 R1. Seules les caractéristiques secondaires méritent d'être critiquées.
L'écran IPS (16 pouces, 2560x1600, sRGB, G-Sync) fait bonne impression. Il est possible d'opter pour deux autres dalles avec des taux de rafraîchissement plus élevés et une plus grande couverture de l'espace colorimétrique (DCI-P3). L'offre de disque dur (512 GB) est plutôt mince ; 1 TB ou 2 TB seraient plus appropriés pour le prix de 1900 EUR. L'autonomie de la batterie est également médiocre.
Deux ports Thunderbolt 4 (Power Delivery, Displayport) garantissent de nombreuses possibilités d'extension (GPU externe, docking). L'alimentation électrique de l'ordinateur portable via l'USB C n'est pas possible ; les ports USB C ne font que fournir de l'énergie.
Une alternative est le port USB C Acer Predator Helios 16 PH16-71. Il offre pratiquement la même configuration matérielle, mais plus d'espace sur le disque dur (1 To). En outre, il dispose d'un écran plus lumineux.
Prix et disponibilité
Une configuration similaire à notre variante de l'Alienware m16 R1, mais avec un disque dur de 1 To, est disponible aux États-Unis via Best Buy au prix de 1 999,99 $.
Les prix sont en date du 05.09.2023 et sont susceptibles d'être modifiés.
Alienware m16 R1 Intel
- 09/04/2023 v7 (old)
Sascha Mölck
Transparency
La sélection des appareils à examiner est effectuée par notre équipe éditoriale. L'échantillon de test a été prêté à l'auteur par le fabricant ou le détaillant pour les besoins de cet examen. Le prêteur n'a pas eu d'influence sur cette évaluation et le fabricant n'a pas reçu de copie de cette évaluation avant sa publication. Il n'y avait aucune obligation de publier cet article. En tant que média indépendant, Notebookcheck n'est pas soumis à l'autorité des fabricants, des détaillants ou des éditeurs.
Voici comment Notebookcheck teste
Chaque année, Notebookcheck examine de manière indépendante des centaines d'ordinateurs portables et de smartphones en utilisant des procédures standardisées afin de garantir que tous les résultats sont comparables. Nous avons continuellement développé nos méthodes de test depuis environ 20 ans et avons établi des normes industrielles dans le processus. Dans nos laboratoires de test, des équipements de mesure de haute qualité sont utilisés par des techniciens et des rédacteurs expérimentés. Ces tests impliquent un processus de validation en plusieurs étapes. Notre système d'évaluation complexe repose sur des centaines de mesures et de points de référence bien fondés, ce qui garantit l'objectivité.Price comparison

