Test du Lenovo ThinkPad P14s G5 : station de travail mobile avec RTX 500 Ada et écran IPS 3K
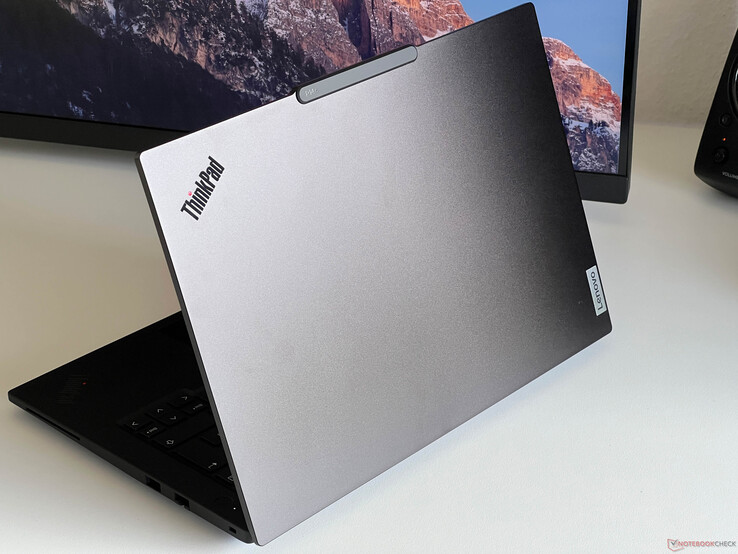
Lenovo a emprunté une nouvelle voie avec sa station de travail mobile ThinkPad P14s G5. Alors que les modèles précédents étaient toujours basés sur les modèles respectifs de la série T, le nouveau P14s G5 équipé de processeurs Intel a reçu son propre design, y compris un nouvel écran de 14,5 pouces (contre 14 pouces auparavant). Le P14s G5 avec les processeurs AMD, quant à lui, utilise toujours l'ancien boîtier avec son écran de 14 pouces.
Notre appareil de test est la version Campus 21G3S00A00 pour environ 2100 dollars sans système d'exploitation mais avec une très bonne configuration. Outre son nouvel écran 3K, il est équipé du Core Ultra 7 155H associé à 64 Go de RAM, un SSD de 1 To ainsi qu'un processeur dédié, le Nvidia RTX 500 Adrian Nvidia RTX 500 Ada. Il n'existe actuellement pas de modèle correspondant le plus vendu pour les particuliers ; si vous configurez l'appareil via le site web de Lenovo, vous en aurez pour un peu plus de 2 700 dollars US, Windows 11 Home inclus.
Comparaison avec les concurrents potentiels
Note | Version | Date | Modèle | Poids | Épaisseur | Taille | Résolution | Prix |
|---|---|---|---|---|---|---|---|---|
| 82.5 % | v8 | 07/24 | Lenovo ThinkPad P14s G5 21G3S00A00 Ultra 7 155H, RTX 500 Ada Generation Laptop | 1.7 kg | 22 mm | 14.50" | 3072x1920 | |
| 80.3 % | v8 | 07/24 | HP ZBook Firefly 14 G11 Ultra 7 165H, RTX A500 Laptop GPU | 1.5 kg | 19.2 mm | 14.00" | 2560x1600 | |
| 81 % | v8 | 07/24 | Lenovo ThinkPad P14s G4 21HF0017GE i7-1370P, RTX A500 Laptop GPU | 1.5 kg | 22.7 mm | 14.00" | 2880x1800 | |
| 89.3 % v7 (old) | v7 (old) | 04/24 | Dell Precision 5000 5490 Ultra 9 185H, RTX 3000 Ada Generation Laptop | 1.6 kg | 18.95 mm | 14.00" | 2560x1600 | |
| 85.5 % v7 (old) | v7 (old) | 10/23 | Microsoft Surface Laptop Studio 2 RTX 4060 i7-13700H, GeForce RTX 4060 Laptop GPU | 2 kg | 22 mm | 14.40" | 2400x1600 | |
| 89.8 % v7 (old) | v7 (old) | 07/23 | Lenovo Yoga Pro 9-14IRP G8 i7-13705H, GeForce RTX 4050 Laptop GPU | 1.7 kg | 17.6 mm | 14.50" | 3072x1920 |
Top 10
» Le Top 10 des PC portables multimédia
» Le Top 10 des PC portables de jeu
» Le Top 10 des PC portables de jeu légers
» Le Top 10 des ordinateurs portables bureautiques
» Le Top 10 des PC portables bureautiques premium/professionnels
» Le Top 10 des Stations de travail mobiles
» Le Top 10 des Ultraportables
» Le Top 10 des Ultrabooks
» Le Top 10 des Convertibles
» Le Top 10 des Tablettes
» Le Top 10 des Tablettes Windows
» Le Top 10 des Smartphones
» Le Top 10 des PC Portables á moins de 300 euros
» Le Top 10 des PC Portables á moins de 500 euros
» Le Top 25 des meilleurs écrans d'ordinateurs
Veuillez noter que nous avons récemment mis à jour notre système d'évaluation et que les résultats de la version 8 ne sont pas comparables à ceux de la version 7. Vous trouverez de plus amples informations ici .
Boîtier - Lenovo a triché avec ses dimensions
Le ThinkPad P14s est une station de travail mobile et lorsque vous le prenez en main pour la première fois, vous remarquez immédiatement qu'il ne s'agit pas d'un appareil particulièrement fin ou léger. Cependant, lorsque nous avons consulté sa fiche technique, nous avons été surpris car Lenovo indique une hauteur de 18,5 mm, ce qui n'est tout simplement pas correct. Nous avons mesuré environ 22 mm sans les pieds, ce qui fait une autre différence significative.
De l'extérieur, le ThinkPad P14s G5 présente le même design que les modèles actuels du fabricant, ce qui inclut malheureusement la bosse de l'appareil photo, peu attrayante et proéminente. À part cela, son design est resté simple et, pour certains, peut-être un peu ennuyeux. Les surfaces lisses du couvercle et du dessous (tous deux en aluminium) sont très sensibles aux traces de doigts, tandis que le dessus de l'unité de base (alliage de magnésium et d'aluminium) est légèrement caoutchouté et ne pose pas ce problème. Les bords de l'écran sont légèrement plus étroits que sur le modèle précédent, ce qui explique qu'il y ait de la place pour la grande dalle de 14,5 pouces.
La stabilité de l'unité de base est remarquable et rien ne peut être enfoncé ou tordu, mais une pression sur la zone à droite du clavier produit de légers grincements sur notre appareil de test. Le couvercle de l'écran est également très stable et nous n'avons pu provoquer aucune erreur d'image pendant notre test. Les charnières sont assez serrées dans l'ensemble, mais vous pouvez toujours ouvrir l'appareil d'une seule main. Cependant, il n'est pas possible d'empêcher complètement l'appareil de basculer lorsque vous changez l'angle d'ouverture (max. 180 degrés).
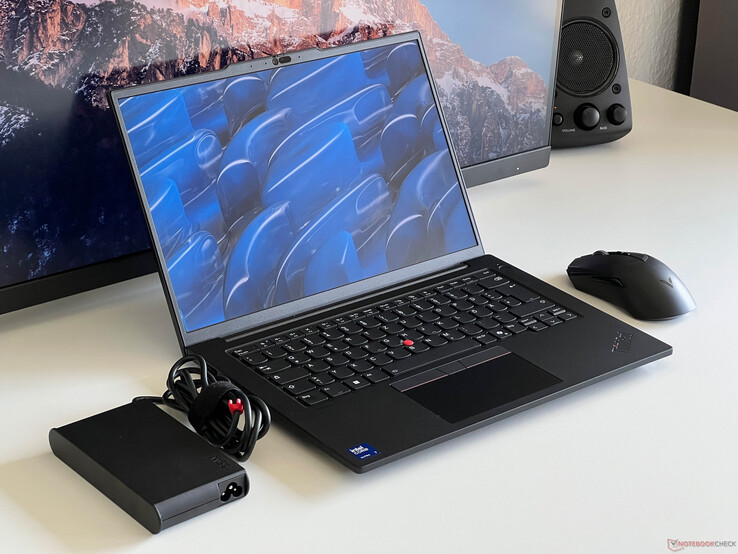
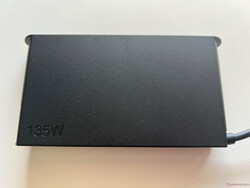
Nous avons déjà parlé de sa taille, mais le nouveau P14s G5 est également l'un des plus grands modèles de notre groupe de comparaison en ce qui concerne son encombrement. Son poids est de 1,72 kg et l'alimentation de 135 watts pèse 527 grammes.
Connectivité - Thunderbolt 4 et lecteur SmartCard
Les utilisateurs n'ont pas de surprise en ce qui concerne les connexions et, en plus des ports Thunderbolt 4 modernes, deux ports USB-A ordinaires sont également installés. Cela signifie que vous n'aurez pas besoin d'utiliser des adaptateurs au quotidien. Notre appareil de test est également équipé d'un lecteur de cartes à puce en option, mais pas d'un lecteur de cartes SD.
Communication
Lenovo a installé le module WLAN Intel AX211 qui prend également en charge les réseaux modernes de 6 GHz et Bluetooth 5.3. En revanche, il n'y a pas de module Wi-Fi 7 à bord. Lors de notre test avec notre routeur de référence Asus, les taux de transfert étaient excellents et très stables, ce qui ne devrait pas poser de problème à l'usage. Un port Gigabit Ethernet (Intel i219-V) est également disponible pour les réseaux câblés.
Le P14s G5 dispose en outre d'un emplacement M.2-2242 pour un module WWAN, mais aucune configuration correspondante n'est actuellement disponible en Allemagne (où ce test a été effectué) en raison d'un litige juridique. Les antennes nécessaires font également défaut (elles ne sont pas prêtes pour le WWAN), de sorte qu'un module ne peut pas être installé ultérieurement par les utilisateurs sans prendre d'autres mesures.
| Networking | |
| Lenovo ThinkPad P14s G5 21G3S00A00 | |
| iperf3 transmit AXE11000 | |
| iperf3 receive AXE11000 | |
| HP ZBook Firefly 14 G11 | |
| iperf3 transmit AXE11000 | |
| iperf3 receive AXE11000 | |
| iperf3 transmit AXE11000 6GHz | |
| iperf3 receive AXE11000 6GHz | |
| Dell Precision 5000 5490 | |
| iperf3 transmit AXE11000 | |
| iperf3 receive AXE11000 | |
| iperf3 transmit AXE11000 6GHz | |
| iperf3 receive AXE11000 6GHz | |
| Lenovo ThinkPad P14s G4 21HF0017GE | |
| iperf3 transmit AXE11000 | |
| iperf3 receive AXE11000 | |
| iperf3 transmit AXE11000 6GHz | |
| iperf3 receive AXE11000 6GHz | |
| Microsoft Surface Laptop Studio 2 RTX 4060 | |
| iperf3 transmit AXE11000 | |
| iperf3 receive AXE11000 | |
| Lenovo Yoga Pro 9-14IRP G8 | |
| iperf3 transmit AXE11000 | |
| iperf3 receive AXE11000 | |
Webcam
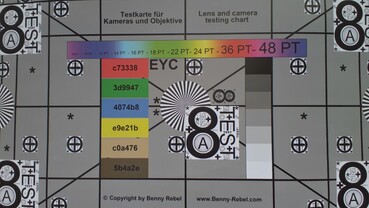
La webcam peut capturer des images jusqu'à 5 MP en 4:3 (2 592 x 1 944 pixels) ou 3,7 MP en 16:9 (2 560 x 1 440 pixels). La netteté de l'image est meilleure qu'avec les capteurs habituels de 2 MP et les effets supplémentaires de Windows Studio sont également pris en charge.

Maintenance
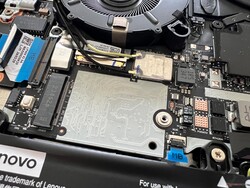
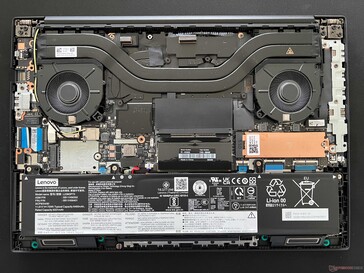
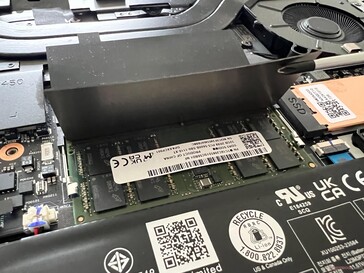
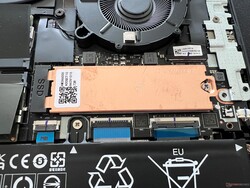
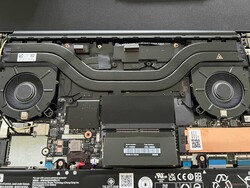
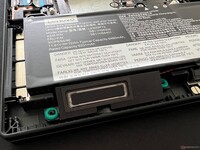
Le couvercle inférieur du boîtier est fixé par six vis Phillips et peut être retiré facilement. Le processeur, la carte graphique et le module WLAN sont tous soudés, mais le SSD M.2 2280 et la RAM peuvent être mis à niveau. Les deux emplacements DIMM peuvent accueillir des modules d'un maximum de 48 Go, ce qui signifie qu'un total de 96 Go de RAM peut être installé dans l'ordinateur portable.
Périphériques d'entrée - élévation de 1,5 mm et nouveau positionnement de la touche Fn
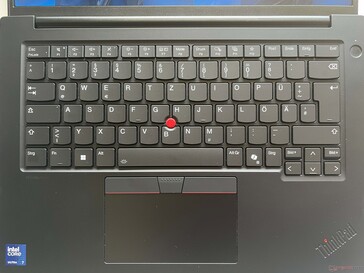
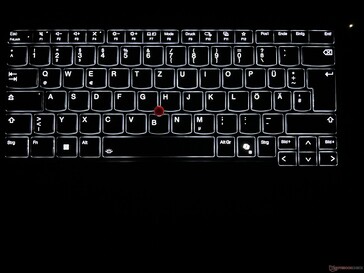
Le clavier est un modèle familier avec une levée de 1,5 mm. Il est agréable à utiliser, mais ce ThinkPad ne peut plus se démarquer des autres concurrents à cet égard. Nous avons encore un ThinkPad X1 Carbon avec une levée de touche de 1,8 mm en cours d'utilisation et vous pouvez clairement sentir la différence. La nouveauté de l'année 2024 est le remplacement des touches Fn et Ctrl, ce qui ne manquera pas de poser quelques problèmes aux vétérans du ThinkPad au début. Une touche Co-Pilote a également été installée. Le rétroéclairage blanc à deux niveaux du clavier ne peut pas être activé par un capteur. Le bouton d'alimentation est situé en haut à droite, à côté du clavier, et sert également de lecteur d'empreintes digitales.
Selon les normes actuelles, le pavé tactile de 11,5 x 6 cm de l'ordinateur portable n'est pas particulièrement grand, car il doit également faire de la place pour les boutons supplémentaires du TrackPoint. Cependant, il est agréable et fluide, seul le bruit du clic est un peu trop fort. Bien entendu, le TrackPoint est également disponible comme alternative et fonctionne très bien (une fois qu'on s'y est habitué). Les touches dédiées ont fait une très bonne impression sur notre appareil de test grâce à leurs clics étouffés de haute qualité, et nous n'avons constaté aucun relâchement.
Affichage - 3K IPS à 120 Hz
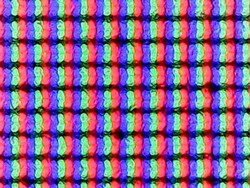
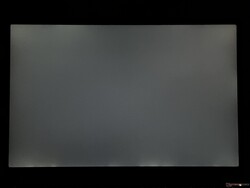
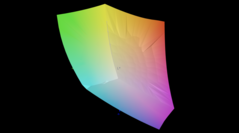
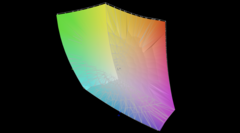
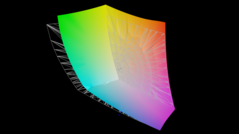
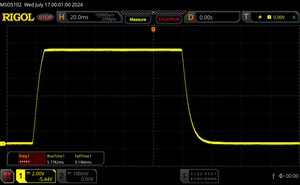
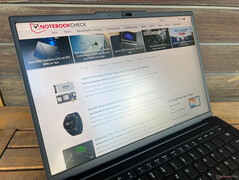
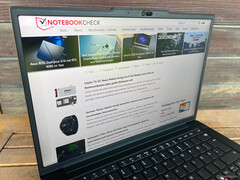
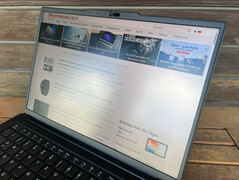
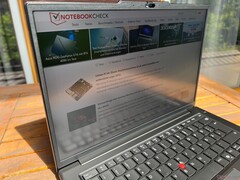
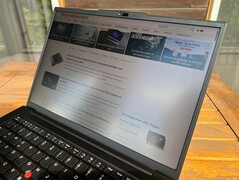
Lenovo ne propose plus l'écran OLED optionnel du P14s G4 sur ce modèle Intel mis à jour ; à la place, vous ne pouvez choisir que des panneaux IPS mats de 14,5 pouces. Le nouveau modèle 3K avec une résolution de 3 072 x 1 920 pixels, un taux de rafraîchissement de 120 Hz et une couverture de l'espace colorimétrique P3 est installé dans notre appareil de test. D'un point de vue subjectif, la qualité d'image est excellente, car même en y regardant de plus près, vous ne pouvez voir qu'une granulation minimale lors de la représentation de contenus clairs. Heureusement, cela n'est pas perceptible lorsque vous regardez l'écran à une distance normale. Tous les contenus sont représentés avec une grande netteté et les couleurs sont superbes. Bien sûr, les couleurs de cet écran ne sont pas aussi éclatantes que celles des écrans OLED, mais l'écran est au moins mat et n'utilise pas de PWM. Les mouvements sont fluides grâce à l'augmentation du taux de rafraîchissement et les temps de réponse sont corrects (pas d'images fantômes). Lorsque la luminosité est réglée à un niveau élevé et que l'on regarde une image sombre, on peut observer une légère perte de rétroéclairage sur les bords de l'écran. Ni la luminosité ni la température des couleurs ne peuvent être réglées automatiquement, et le contenu HDR n'est pas pris en charge.
Lenovo annonce une luminosité de 430 cd/m², mais nous n'avons pu le confirmer qu'au centre de l'écran. En moyenne, la luminosité est à peine supérieure à 400 cd/m². La valeur de noir de l'écran est de 0,32 cd/m², ce qui donne un rapport de contraste maximum d'un peu moins de 1 400,1. Ce sont des valeurs raisonnables dans l'ensemble, mais on ne peut pas dire qu'elles soient bonnes non plus. Cela se voit également dans la comparaison avec la concurrence, puisque le nouveau HP ZBook Firefly G11par exemple, atteint une luminosité d'environ 550 cd/m² avec son écran 120 Hz (même si sa résolution est légèrement inférieure). Lenovo propose également d'autres panneaux, comme le mini panneau LED supérieur à 165 Hz dans le Yoga Pro 9i 14 (également 14,5 pouces, 3 072 x 1 920 pixels).
| |||||||||||||||||||||||||
Homogénéité de la luminosité: 87 %
Valeur mesurée au centre, sur batterie: 439 cd/m²
Contraste: 1372:1 (Valeurs des noirs: 0.32 cd/m²)
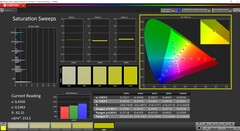
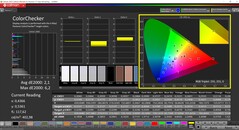
ΔE ColorChecker Calman: 2.1 | ∀{0.5-29.43 Ø4.77}
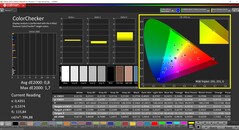
calibrated: 0.8
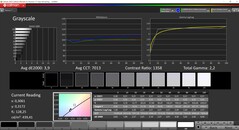
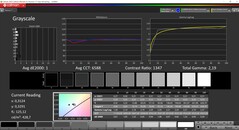
ΔE Greyscale Calman: 3.9 | ∀{0.09-98 Ø5}
87.4% AdobeRGB 1998 (Argyll 3D)
100% sRGB (Argyll 3D)
98.4% Display P3 (Argyll 3D)
Gamma: 2.2
CCT: 7013 K
| Lenovo ThinkPad P14s G5 21G3S00A00 LEN145-3K, IPS, 3072x1920, 14.5", 120 Hz | HP ZBook Firefly 14 G11 AUO6DA8, IPS, 2560x1600, 14", 120 Hz | Dell Precision 5000 5490 AU Optronics B140QAN, IPS, 2560x1600, 14", 60 Hz | Lenovo ThinkPad P14s G4 21HF0017GE ATNA40YK15-0, OLED, 2880x1800, 14", 60 Hz | Microsoft Surface Laptop Studio 2 RTX 4060 LQ144P1JX01, IPS, 2400x1600, 14.4", 120 Hz | Lenovo Yoga Pro 9-14IRP G8 CSOT T3 MNE507HZ2-1, Mini-LED, 3072x1920, 14.5", 165 Hz | |
|---|---|---|---|---|---|---|
| Display | 0% | -9% | 4% | -18% | 1% | |
| Display P3 Coverage (%) | 98.4 | 98.9 1% | 79.7 -19% | 99.9 2% | 66.7 -32% | 92 -7% |
| sRGB Coverage (%) | 100 | 99.9 0% | 100 0% | 100 0% | 99 -1% | 99.7 0% |
| AdobeRGB 1998 Coverage (%) | 87.4 | 86.6 -1% | 79.5 -9% | 97 11% | 68.9 -21% | 96.9 11% |
| Response Times | 52% | -98% | 88% | -143% | 41% | |
| Response Time Grey 50% / Grey 80% * (ms) | 30.2 ? | 12.3 ? 59% | 52.3 ? -73% | 3 ? 90% | 77.6 ? -157% | 12.7 ? 58% |
| Response Time Black / White * (ms) | 15 ? | 8.3 ? 45% | 33.3 ? -122% | 2.2 ? 85% | 34.3 ? -129% | 11.4 ? 24% |
| PWM Frequency (Hz) | 360 ? | 17600 ? | 6000 ? | |||
| PWM Amplitude * (%) | 25 | |||||
| Screen | 6% | 9% | -90% | 43% | 19% | |
| Brightness middle (cd/m²) | 439 | 554.1 26% | 485.1 11% | 432 -2% | 511 16% | 670 53% |
| Brightness (cd/m²) | 406 | 540 33% | 471 16% | 432 6% | 503 24% | 680 67% |
| Brightness Distribution (%) | 87 | 93 7% | 90 3% | 98 13% | 89 2% | 89 2% |
| Black Level * (cd/m²) | 0.32 | 0.58 -81% | 0.38 -19% | 0.26 19% | 0.19 41% | |
| Contrast (:1) | 1372 | 955 -30% | 1277 -7% | 1965 43% | 3526 157% | |
| Colorchecker dE 2000 * | 2.1 | 2.54 -21% | 2.15 -2% | 4.8 -129% | 0.5 76% | 4 -90% |
| Colorchecker dE 2000 max. * | 6.2 | 4.99 20% | 5.39 13% | 9.2 -48% | 1.1 82% | 4.5 27% |
| Colorchecker dE 2000 calibrated * | 0.8 | 0.56 30% | 0.67 16% | 4.9 -513% | 1.3 -63% | |
| Greyscale dE 2000 * | 3.9 | 1 74% | 2 49% | 2.3 41% | 0.8 79% | 4.9 -26% |
| Gamma | 2.2 100% | 2.3 96% | 2.3 96% | 2.23 99% | 2.19 100% | 2.22 99% |
| CCT | 7013 93% | 6556 99% | 6826 95% | 6391 102% | 6650 98% | 5735 113% |
| Moyenne finale (programmes/paramètres) | 19% /
12% | -33% /
-10% | 1% /
-37% | -39% /
0% | 20% /
18% |
* ... Moindre est la valeur, meilleures sont les performances
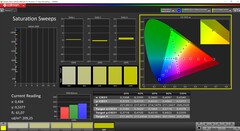
Nous avons analysé l'écran à l'aide du logiciel professionnel CalMAN (X-Rite i1 Pro 2), mais Lenovo ne fournit pas de profil sRGB. Dès sa sortie de l'emballage, l'écran présente une dominante bleue associée à une température de couleur trop froide, et certains écarts de couleur sont supérieurs à la valeur cible de 3. En effectuant notre propre étalonnage, nous avons amélioré de manière significative sa représentation et corrigé ses écarts de niveaux de gris et de couleur. Le profil correspondant peut être téléchargé gratuitement ci-dessus. Le panneau couvre entièrement les espaces colorimétriques P3 et sRGB.
Temps de réponse de l'écran
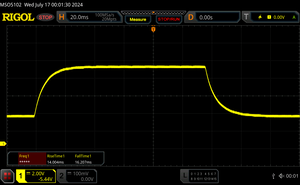
| ↔ Temps de réponse noir à blanc | ||
|---|---|---|
| 15 ms ... hausse ↗ et chute ↘ combinées | ↗ 5.8 ms hausse | |
| ↘ 9.2 ms chute | ||
| L'écran montre de bons temps de réponse, mais insuffisant pour du jeu compétitif. En comparaison, tous les appareils testés affichent entre 0.1 (minimum) et 240 (maximum) ms. » 35 % des appareils testés affichent de meilleures performances. Cela signifie que les latences relevées sont meilleures que la moyenne (20.2 ms) de tous les appareils testés. | ||
| ↔ Temps de réponse gris 50% à gris 80% | ||
| 30.2 ms ... hausse ↗ et chute ↘ combinées | ↗ 14 ms hausse | |
| ↘ 16.2 ms chute | ||
| L'écran souffre de latences très élevées, à éviter pour le jeu. En comparaison, tous les appareils testés affichent entre 0.165 (minimum) et 636 (maximum) ms. » 40 % des appareils testés affichent de meilleures performances. Cela signifie que les latences relevées sont similaires à la moyenne (31.6 ms) de tous les appareils testés. | ||
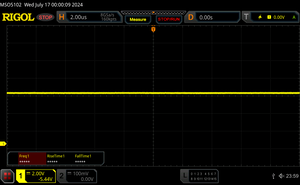
Scintillement / MLI (Modulation de largeur d'impulsion)
| Scintillement / MLI (Modulation de largeur d'impulsion) non décelé | |||
En comparaison, 53 % des appareils testés n'emploient pas MDI pour assombrir leur écran. Nous avons relevé une moyenne à 8084 (minimum : 5 - maximum : 343500) Hz dans le cas où une MDI était active. | |||
Performance - Meteor Lake & RTX 500 Ada
La version Intel du ThinkPad P14s G5 n'est disponible qu'avec les processeurs Meteor Lake. En ce qui concerne le GPU, vous avez le choix entre la carte graphique intégrée Intel Arc Graphics et la carte graphique dédiée Nvidia RTX 500 Ada. La version AMD du P14s G5 avec l'ancien design, en revanche, n'est disponible qu'avec un iGPU.
Conditions d'essai
Lenovo relie depuis longtemps ses propres profils énergétiques pour ThinkPad directement aux paramètres d'alimentation de Windows. Le tableau suivant résume les paramètres TDP/TGP correspondants. Nous avons effectué les tests et les mesures en utilisant les meilleures performances, qui sont définies par défaut.
| Mode performance | CPU TDP | CB R23 Multi | GPU TGP | Time Spy graphics | Stress test | max. fan noise emissions |
|---|---|---|---|---|---|---|
| Meilleure économie d'énergie | 80/30 watts | 12,089 points | 35 watts | 4,848 points | CPU : 15 watts GPU : 35 watts |
38,3 dB(A) |
| Équilibré | 80/40 watts | 17,620 points | 40 watts | 4,981 points | CPU : 17 watts GPU : 35 watts |
44,8 dB(A) |
| Meilleure performance | 80/50 watts | 17,612 points | 50 watts | 5,278 points | CPU : 25 watts GPU : 35 watts |
46,8 dB(A) |
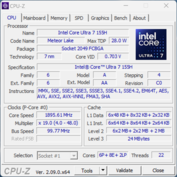
Processeur - Intel Core Ultra 7 155H
Le Core Ultra 7 155H fait partie de l'actuelle génération Meteor Lake d'Intel et est utilisé dans de nombreux ordinateurs portables. Grâce à ses limites de puissance élevées, le processeur a obtenu de très bons résultats aux tests de référence et a surpassé à la fois le Core i7-1370P et le AMD Ryzen 7 PRO 7840U dans les modèles P14s-G4. Même le Core Ultra 7 165H à l'intérieur du ZBook Firefly 14 G11 était nettement plus lent. Cependant, il convient également de mentionner que les anciennes puces Raptor Lake d'Intel (par exemple, le Core i7-13700H) offraient des performances à cœur unique plus élevées. En mode batterie, le processeur peut consommer un maximum de 55 watts, ce qui explique que ses performances multicœurs soient inférieures de 8 %. Vous trouverez d'autres tests de performance du processeur dans notre section technique.
Cinebench R15 Multi continuous test
Cinebench R23: Multi Core | Single Core
Cinebench R20: CPU (Multi Core) | CPU (Single Core)
Cinebench R15: CPU Multi 64Bit | CPU Single 64Bit
Blender: v2.79 BMW27 CPU
7-Zip 18.03: 7z b 4 | 7z b 4 -mmt1
Geekbench 6.5: Multi-Core | Single-Core
Geekbench 5.5: Multi-Core | Single-Core
HWBOT x265 Benchmark v2.2: 4k Preset
LibreOffice : 20 Documents To PDF
R Benchmark 2.5: Overall mean
| CPU Performance rating | |
| Moyenne de la classe Workstation | |
| Lenovo Yoga Pro 9-14IRP G8 | |
| Microsoft Surface Laptop Studio 2 RTX 4060 | |
| Lenovo ThinkPad P14s G5 21G3S00A00 | |
| Dell Precision 5000 5490 | |
| Lenovo ThinkPad P14s G4 21HF0017GE | |
| Moyenne Intel Core Ultra 7 155H | |
| HP ZBook Firefly 14 G11 | |
| Lenovo ThinkPad P14s G4 21K5000LGE | |
| Cinebench R23 / Multi Core | |
| Moyenne de la classe Workstation (14055 - 38520, n=25, 2 dernières années) | |
| Lenovo Yoga Pro 9-14IRP G8 | |
| Lenovo ThinkPad P14s G5 21G3S00A00 | |
| Dell Precision 5000 5490 | |
| Microsoft Surface Laptop Studio 2 RTX 4060 | |
| Moyenne Intel Core Ultra 7 155H (9769 - 19007, n=52) | |
| Lenovo ThinkPad P14s G4 21HF0017GE | |
| HP ZBook Firefly 14 G11 | |
| Lenovo ThinkPad P14s G4 21K5000LGE | |
| Cinebench R23 / Single Core | |
| Moyenne de la classe Workstation (1712 - 2206, n=25, 2 dernières années) | |
| Lenovo ThinkPad P14s G4 21HF0017GE | |
| Microsoft Surface Laptop Studio 2 RTX 4060 | |
| Lenovo Yoga Pro 9-14IRP G8 | |
| Lenovo ThinkPad P14s G5 21G3S00A00 | |
| Dell Precision 5000 5490 | |
| HP ZBook Firefly 14 G11 | |
| Moyenne Intel Core Ultra 7 155H (1496 - 1815, n=52) | |
| Lenovo ThinkPad P14s G4 21K5000LGE | |
| Cinebench R20 / CPU (Multi Core) | |
| Moyenne de la classe Workstation (5471 - 15043, n=25, 2 dernières années) | |
| Lenovo Yoga Pro 9-14IRP G8 | |
| Lenovo ThinkPad P14s G5 21G3S00A00 | |
| Dell Precision 5000 5490 | |
| Microsoft Surface Laptop Studio 2 RTX 4060 | |
| Moyenne Intel Core Ultra 7 155H (3798 - 7409, n=50) | |
| Lenovo ThinkPad P14s G4 21HF0017GE | |
| Lenovo ThinkPad P14s G4 21K5000LGE | |
| HP ZBook Firefly 14 G11 | |
| Cinebench R20 / CPU (Single Core) | |
| Moyenne de la classe Workstation (671 - 849, n=25, 2 dernières années) | |
| Microsoft Surface Laptop Studio 2 RTX 4060 | |
| Lenovo ThinkPad P14s G4 21HF0017GE | |
| Lenovo Yoga Pro 9-14IRP G8 | |
| Lenovo ThinkPad P14s G5 21G3S00A00 | |
| Dell Precision 5000 5490 | |
| HP ZBook Firefly 14 G11 | |
| Moyenne Intel Core Ultra 7 155H (601 - 696, n=50) | |
| Lenovo ThinkPad P14s G4 21K5000LGE | |
| Cinebench R15 / CPU Multi 64Bit | |
| Moyenne de la classe Workstation (2404 - 5810, n=25, 2 dernières années) | |
| Dell Precision 5000 5490 | |
| Lenovo Yoga Pro 9-14IRP G8 | |
| Lenovo ThinkPad P14s G5 21G3S00A00 | |
| Microsoft Surface Laptop Studio 2 RTX 4060 | |
| HP ZBook Firefly 14 G11 | |
| Moyenne Intel Core Ultra 7 155H (1932 - 2880, n=56) | |
| Lenovo ThinkPad P14s G4 21HF0017GE | |
| Lenovo ThinkPad P14s G4 21K5000LGE | |
| Cinebench R15 / CPU Single 64Bit | |
| Moyenne de la classe Workstation (191.4 - 328, n=25, 2 dernières années) | |
| Microsoft Surface Laptop Studio 2 RTX 4060 | |
| Lenovo Yoga Pro 9-14IRP G8 | |
| Lenovo ThinkPad P14s G4 21K5000LGE | |
| Lenovo ThinkPad P14s G5 21G3S00A00 | |
| Lenovo ThinkPad P14s G4 21HF0017GE | |
| HP ZBook Firefly 14 G11 | |
| Dell Precision 5000 5490 | |
| Moyenne Intel Core Ultra 7 155H (99.6 - 268, n=52) | |
| Blender / v2.79 BMW27 CPU | |
| HP ZBook Firefly 14 G11 | |
| Lenovo ThinkPad P14s G4 21HF0017GE | |
| Microsoft Surface Laptop Studio 2 RTX 4060 | |
| Lenovo ThinkPad P14s G4 21K5000LGE | |
| Moyenne Intel Core Ultra 7 155H (175 - 381, n=47) | |
| Dell Precision 5000 5490 | |
| Lenovo ThinkPad P14s G5 21G3S00A00 | |
| Lenovo Yoga Pro 9-14IRP G8 | |
| Moyenne de la classe Workstation (91 - 261, n=25, 2 dernières années) | |
| 7-Zip 18.03 / 7z b 4 | |
| Moyenne de la classe Workstation (53407 - 116969, n=25, 2 dernières années) | |
| Lenovo Yoga Pro 9-14IRP G8 | |
| Lenovo ThinkPad P14s G5 21G3S00A00 | |
| Dell Precision 5000 5490 | |
| Microsoft Surface Laptop Studio 2 RTX 4060 | |
| Moyenne Intel Core Ultra 7 155H (41739 - 70254, n=50) | |
| Lenovo ThinkPad P14s G4 21K5000LGE | |
| HP ZBook Firefly 14 G11 | |
| Lenovo ThinkPad P14s G4 21HF0017GE | |
| 7-Zip 18.03 / 7z b 4 -mmt1 | |
| Microsoft Surface Laptop Studio 2 RTX 4060 | |
| Lenovo ThinkPad P14s G4 21HF0017GE | |
| Lenovo Yoga Pro 9-14IRP G8 | |
| Moyenne de la classe Workstation (4981 - 6960, n=25, 2 dernières années) | |
| Lenovo ThinkPad P14s G4 21K5000LGE | |
| Lenovo ThinkPad P14s G5 21G3S00A00 | |
| Dell Precision 5000 5490 | |
| HP ZBook Firefly 14 G11 | |
| Moyenne Intel Core Ultra 7 155H (4594 - 5621, n=50) | |
| Geekbench 6.5 / Multi-Core | |
| Moyenne de la classe Workstation (12196 - 20887, n=25, 2 dernières années) | |
| Lenovo Yoga Pro 9-14IRP G8 | |
| Lenovo Yoga Pro 9-14IRP G8 | |
| Dell Precision 5000 5490 | |
| Microsoft Surface Laptop Studio 2 RTX 4060 | |
| Lenovo ThinkPad P14s G5 21G3S00A00 | |
| Lenovo ThinkPad P14s G4 21HF0017GE | |
| Moyenne Intel Core Ultra 7 155H (7732 - 13656, n=55) | |
| HP ZBook Firefly 14 G11 | |
| Lenovo ThinkPad P14s G4 21K5000LGE | |
| Geekbench 6.5 / Single-Core | |
| Moyenne de la classe Workstation (2384 - 3028, n=25, 2 dernières années) | |
| Lenovo ThinkPad P14s G4 21HF0017GE | |
| Microsoft Surface Laptop Studio 2 RTX 4060 | |
| Lenovo Yoga Pro 9-14IRP G8 | |
| Lenovo Yoga Pro 9-14IRP G8 | |
| Lenovo ThinkPad P14s G4 21K5000LGE | |
| Lenovo ThinkPad P14s G5 21G3S00A00 | |
| HP ZBook Firefly 14 G11 | |
| Dell Precision 5000 5490 | |
| Moyenne Intel Core Ultra 7 155H (1901 - 2473, n=52) | |
| Geekbench 5.5 / Multi-Core | |
| Moyenne de la classe Workstation (11542 - 25554, n=25, 2 dernières années) | |
| Lenovo Yoga Pro 9-14IRP G8 | |
| Lenovo ThinkPad P14s G5 21G3S00A00 | |
| Microsoft Surface Laptop Studio 2 RTX 4060 | |
| Dell Precision 5000 5490 | |
| HP ZBook Firefly 14 G11 | |
| Moyenne Intel Core Ultra 7 155H (10017 - 13556, n=52) | |
| Lenovo ThinkPad P14s G4 21HF0017GE | |
| Lenovo ThinkPad P14s G4 21K5000LGE | |
| Geekbench 5.5 / Single-Core | |
| Moyenne de la classe Workstation (1759 - 2183, n=25, 2 dernières années) | |
| Lenovo Yoga Pro 9-14IRP G8 | |
| Microsoft Surface Laptop Studio 2 RTX 4060 | |
| Lenovo ThinkPad P14s G4 21HF0017GE | |
| Lenovo ThinkPad P14s G5 21G3S00A00 | |
| HP ZBook Firefly 14 G11 | |
| Dell Precision 5000 5490 | |
| Moyenne Intel Core Ultra 7 155H (1462 - 1824, n=52) | |
| Lenovo ThinkPad P14s G4 21K5000LGE | |
| HWBOT x265 Benchmark v2.2 / 4k Preset | |
| Moyenne de la classe Workstation (14.4 - 40.5, n=25, 2 dernières années) | |
| Lenovo ThinkPad P14s G5 21G3S00A00 | |
| Lenovo Yoga Pro 9-14IRP G8 | |
| Microsoft Surface Laptop Studio 2 RTX 4060 | |
| Dell Precision 5000 5490 | |
| Lenovo ThinkPad P14s G4 21K5000LGE | |
| Moyenne Intel Core Ultra 7 155H (9.93 - 21.2, n=50) | |
| Lenovo ThinkPad P14s G4 21HF0017GE | |
| HP ZBook Firefly 14 G11 | |
| LibreOffice / 20 Documents To PDF | |
| Lenovo ThinkPad P14s G4 21K5000LGE | |
| HP ZBook Firefly 14 G11 | |
| Lenovo ThinkPad P14s G5 21G3S00A00 | |
| Moyenne Intel Core Ultra 7 155H (37.5 - 79.2, n=49) | |
| Moyenne de la classe Workstation (37.1 - 74.7, n=25, 2 dernières années) | |
| Lenovo Yoga Pro 9-14IRP G8 | |
| Microsoft Surface Laptop Studio 2 RTX 4060 | |
| Lenovo ThinkPad P14s G4 21HF0017GE | |
| Dell Precision 5000 5490 | |
| R Benchmark 2.5 / Overall mean | |
| Moyenne Intel Core Ultra 7 155H (0.4457 - 0.53, n=49) | |
| Lenovo ThinkPad P14s G4 21K5000LGE | |
| Dell Precision 5000 5490 | |
| Lenovo ThinkPad P14s G5 21G3S00A00 | |
| HP ZBook Firefly 14 G11 | |
| Moyenne de la classe Workstation (0.3825 - 0.603, n=25, 2 dernières années) | |
| Microsoft Surface Laptop Studio 2 RTX 4060 | |
| Lenovo ThinkPad P14s G4 21HF0017GE | |
| Lenovo Yoga Pro 9-14IRP G8 | |
* ... Moindre est la valeur, meilleures sont les performances
AIDA64: FP32 Ray-Trace | FPU Julia | CPU SHA3 | CPU Queen | FPU SinJulia | FPU Mandel | CPU AES | CPU ZLib | FP64 Ray-Trace | CPU PhotoWorxx
| Performance rating | |
| Moyenne de la classe Workstation | |
| Lenovo Yoga Pro 9-14IRP G8 | |
| Lenovo ThinkPad P14s G5 21G3S00A00 | |
| Dell Precision 5000 5490 | |
| Moyenne Intel Core Ultra 7 155H | |
| Microsoft Surface Laptop Studio 2 RTX 4060 | |
| Lenovo ThinkPad P14s G4 21HF0017GE | |
| HP ZBook Firefly 14 G11 | |
| AIDA64 / FP32 Ray-Trace | |
| Moyenne de la classe Workstation (10658 - 61611, n=25, 2 dernières années) | |
| Lenovo Yoga Pro 9-14IRP G8 | |
| Lenovo ThinkPad P14s G5 21G3S00A00 | |
| Dell Precision 5000 5490 | |
| Moyenne Intel Core Ultra 7 155H (6670 - 18470, n=50) | |
| Microsoft Surface Laptop Studio 2 RTX 4060 | |
| Lenovo ThinkPad P14s G4 21HF0017GE | |
| HP ZBook Firefly 14 G11 | |
| AIDA64 / FPU Julia | |
| Moyenne de la classe Workstation (56664 - 186971, n=25, 2 dernières années) | |
| Lenovo ThinkPad P14s G5 21G3S00A00 | |
| Lenovo Yoga Pro 9-14IRP G8 | |
| Dell Precision 5000 5490 | |
| Microsoft Surface Laptop Studio 2 RTX 4060 | |
| Moyenne Intel Core Ultra 7 155H (40905 - 93181, n=50) | |
| Lenovo ThinkPad P14s G4 21HF0017GE | |
| HP ZBook Firefly 14 G11 | |
| AIDA64 / CPU SHA3 | |
| Moyenne de la classe Workstation (2608 - 8975, n=25, 2 dernières années) | |
| Dell Precision 5000 5490 | |
| Lenovo ThinkPad P14s G5 21G3S00A00 | |
| Lenovo Yoga Pro 9-14IRP G8 | |
| Moyenne Intel Core Ultra 7 155H (1940 - 4436, n=50) | |
| Microsoft Surface Laptop Studio 2 RTX 4060 | |
| Lenovo ThinkPad P14s G4 21HF0017GE | |
| HP ZBook Firefly 14 G11 | |
| AIDA64 / CPU Queen | |
| Lenovo Yoga Pro 9-14IRP G8 | |
| Moyenne de la classe Workstation (60778 - 144411, n=25, 2 dernières années) | |
| Microsoft Surface Laptop Studio 2 RTX 4060 | |
| Lenovo ThinkPad P14s G4 21HF0017GE | |
| Dell Precision 5000 5490 | |
| HP ZBook Firefly 14 G11 | |
| Lenovo ThinkPad P14s G5 21G3S00A00 | |
| Moyenne Intel Core Ultra 7 155H (64698 - 94181, n=50) | |
| AIDA64 / FPU SinJulia | |
| Moyenne de la classe Workstation (7906 - 29343, n=25, 2 dernières années) | |
| Lenovo Yoga Pro 9-14IRP G8 | |
| Lenovo ThinkPad P14s G5 21G3S00A00 | |
| Dell Precision 5000 5490 | |
| Moyenne Intel Core Ultra 7 155H (5639 - 10647, n=50) | |
| Microsoft Surface Laptop Studio 2 RTX 4060 | |
| HP ZBook Firefly 14 G11 | |
| Lenovo ThinkPad P14s G4 21HF0017GE | |
| AIDA64 / FPU Mandel | |
| Moyenne de la classe Workstation (27301 - 98153, n=25, 2 dernières années) | |
| Lenovo Yoga Pro 9-14IRP G8 | |
| Lenovo ThinkPad P14s G5 21G3S00A00 | |
| Dell Precision 5000 5490 | |
| Moyenne Intel Core Ultra 7 155H (18236 - 47685, n=50) | |
| Microsoft Surface Laptop Studio 2 RTX 4060 | |
| Lenovo ThinkPad P14s G4 21HF0017GE | |
| HP ZBook Firefly 14 G11 | |
| AIDA64 / CPU AES | |
| Moyenne de la classe Workstation (56077 - 187841, n=25, 2 dernières années) | |
| Lenovo ThinkPad P14s G5 21G3S00A00 | |
| Moyenne Intel Core Ultra 7 155H (45713 - 152179, n=50) | |
| Dell Precision 5000 5490 | |
| Lenovo Yoga Pro 9-14IRP G8 | |
| Microsoft Surface Laptop Studio 2 RTX 4060 | |
| Lenovo ThinkPad P14s G4 21HF0017GE | |
| HP ZBook Firefly 14 G11 | |
| AIDA64 / CPU ZLib | |
| Moyenne de la classe Workstation (742 - 2148, n=25, 2 dernières années) | |
| Lenovo ThinkPad P14s G5 21G3S00A00 | |
| Lenovo Yoga Pro 9-14IRP G8 | |
| Dell Precision 5000 5490 | |
| Moyenne Intel Core Ultra 7 155H (557 - 1250, n=50) | |
| Microsoft Surface Laptop Studio 2 RTX 4060 | |
| Lenovo ThinkPad P14s G4 21HF0017GE | |
| HP ZBook Firefly 14 G11 | |
| AIDA64 / FP64 Ray-Trace | |
| Moyenne de la classe Workstation (5580 - 32891, n=25, 2 dernières années) | |
| Lenovo Yoga Pro 9-14IRP G8 | |
| Lenovo ThinkPad P14s G5 21G3S00A00 | |
| Dell Precision 5000 5490 | |
| Microsoft Surface Laptop Studio 2 RTX 4060 | |
| Moyenne Intel Core Ultra 7 155H (3569 - 9802, n=50) | |
| Lenovo ThinkPad P14s G4 21HF0017GE | |
| HP ZBook Firefly 14 G11 | |
| AIDA64 / CPU PhotoWorxx | |
| Lenovo Yoga Pro 9-14IRP G8 | |
| Moyenne de la classe Workstation (37151 - 93684, n=25, 2 dernières années) | |
| Dell Precision 5000 5490 | |
| Lenovo ThinkPad P14s G5 21G3S00A00 | |
| Moyenne Intel Core Ultra 7 155H (32719 - 54223, n=50) | |
| HP ZBook Firefly 14 G11 | |
| Microsoft Surface Laptop Studio 2 RTX 4060 | |
| Lenovo ThinkPad P14s G4 21HF0017GE | |
Performance du système
Le ThinkPad P14s G5 est un ordinateur portable très rapide, ce qui a également été confirmé lors des tests de référence synthétiques. Bien que d'autres appareils aient parfois été encore plus rapides pendant ce test, les différences globales sont faibles et toutes les entrées sont traitées rapidement par le système. De plus, nous n'avons eu aucun problème avec la stabilité du système pendant le test.
CrossMark: Overall | Productivity | Creativity | Responsiveness
WebXPRT 3: Overall
WebXPRT 4: Overall
Mozilla Kraken 1.1: Total
| PCMark 10 / Score | |
| Moyenne de la classe Workstation (6436 - 9625, n=21, 2 dernières années) | |
| Lenovo Yoga Pro 9-14IRP G8 | |
| Dell Precision 5000 5490 | |
| Microsoft Surface Laptop Studio 2 RTX 4060 | |
| Lenovo ThinkPad P14s G4 21HF0017GE | |
| Lenovo ThinkPad P14s G5 21G3S00A00 | |
| Moyenne Intel Core Ultra 7 155H, NVIDIA RTX 500 Ada Generation Laptop (n=1) | |
| HP ZBook Firefly 14 G11 | |
| PCMark 10 / Essentials | |
| Lenovo Yoga Pro 9-14IRP G8 | |
| Dell Precision 5000 5490 | |
| Lenovo ThinkPad P14s G5 21G3S00A00 | |
| Moyenne Intel Core Ultra 7 155H, NVIDIA RTX 500 Ada Generation Laptop (n=1) | |
| Microsoft Surface Laptop Studio 2 RTX 4060 | |
| Lenovo ThinkPad P14s G4 21HF0017GE | |
| Moyenne de la classe Workstation (9622 - 11157, n=21, 2 dernières années) | |
| HP ZBook Firefly 14 G11 | |
| PCMark 10 / Productivity | |
| Moyenne de la classe Workstation (8789 - 18261, n=21, 2 dernières années) | |
| Lenovo ThinkPad P14s G4 21HF0017GE | |
| HP ZBook Firefly 14 G11 | |
| Lenovo ThinkPad P14s G5 21G3S00A00 | |
| Moyenne Intel Core Ultra 7 155H, NVIDIA RTX 500 Ada Generation Laptop (n=1) | |
| Microsoft Surface Laptop Studio 2 RTX 4060 | |
| Dell Precision 5000 5490 | |
| Lenovo Yoga Pro 9-14IRP G8 | |
| PCMark 10 / Digital Content Creation | |
| Moyenne de la classe Workstation (7744 - 15631, n=21, 2 dernières années) | |
| Lenovo Yoga Pro 9-14IRP G8 | |
| Microsoft Surface Laptop Studio 2 RTX 4060 | |
| Dell Precision 5000 5490 | |
| Lenovo ThinkPad P14s G5 21G3S00A00 | |
| Moyenne Intel Core Ultra 7 155H, NVIDIA RTX 500 Ada Generation Laptop (n=1) | |
| Lenovo ThinkPad P14s G4 21HF0017GE | |
| HP ZBook Firefly 14 G11 | |
| CrossMark / Overall | |
| Lenovo Yoga Pro 9-14IRP G8 | |
| Moyenne de la classe Workstation (1307 - 2267, n=24, 2 dernières années) | |
| Lenovo ThinkPad P14s G4 21HF0017GE | |
| Dell Precision 5000 5490 | |
| Microsoft Surface Laptop Studio 2 RTX 4060 | |
| Lenovo ThinkPad P14s G5 21G3S00A00 | |
| Moyenne Intel Core Ultra 7 155H, NVIDIA RTX 500 Ada Generation Laptop (n=1) | |
| HP ZBook Firefly 14 G11 | |
| CrossMark / Productivity | |
| Lenovo Yoga Pro 9-14IRP G8 | |
| Moyenne de la classe Workstation (1130 - 2028, n=24, 2 dernières années) | |
| Lenovo ThinkPad P14s G4 21HF0017GE | |
| Dell Precision 5000 5490 | |
| Microsoft Surface Laptop Studio 2 RTX 4060 | |
| HP ZBook Firefly 14 G11 | |
| Lenovo ThinkPad P14s G5 21G3S00A00 | |
| Moyenne Intel Core Ultra 7 155H, NVIDIA RTX 500 Ada Generation Laptop (n=1) | |
| CrossMark / Creativity | |
| Moyenne de la classe Workstation (1657 - 2725, n=24, 2 dernières années) | |
| Lenovo Yoga Pro 9-14IRP G8 | |
| Lenovo ThinkPad P14s G4 21HF0017GE | |
| Microsoft Surface Laptop Studio 2 RTX 4060 | |
| Dell Precision 5000 5490 | |
| HP ZBook Firefly 14 G11 | |
| Lenovo ThinkPad P14s G5 21G3S00A00 | |
| Moyenne Intel Core Ultra 7 155H, NVIDIA RTX 500 Ada Generation Laptop (n=1) | |
| CrossMark / Responsiveness | |
| Lenovo ThinkPad P14s G4 21HF0017GE | |
| Lenovo Yoga Pro 9-14IRP G8 | |
| Moyenne de la classe Workstation (993 - 1908, n=24, 2 dernières années) | |
| Lenovo ThinkPad P14s G5 21G3S00A00 | |
| Moyenne Intel Core Ultra 7 155H, NVIDIA RTX 500 Ada Generation Laptop (n=1) | |
| Dell Precision 5000 5490 | |
| Microsoft Surface Laptop Studio 2 RTX 4060 | |
| HP ZBook Firefly 14 G11 | |
| WebXPRT 3 / Overall | |
| Moyenne de la classe Workstation (260 - 360, n=25, 2 dernières années) | |
| Lenovo Yoga Pro 9-14IRP G8 | |
| Microsoft Surface Laptop Studio 2 RTX 4060 | |
| Lenovo ThinkPad P14s G4 21HF0017GE | |
| HP ZBook Firefly 14 G11 | |
| Dell Precision 5000 5490 | |
| Lenovo ThinkPad P14s G5 21G3S00A00 | |
| Moyenne Intel Core Ultra 7 155H, NVIDIA RTX 500 Ada Generation Laptop (n=1) | |
| WebXPRT 4 / Overall | |
| Moyenne de la classe Workstation (189.2 - 323, n=26, 2 dernières années) | |
| Microsoft Surface Laptop Studio 2 RTX 4060 | |
| Lenovo Yoga Pro 9-14IRP G8 | |
| Lenovo ThinkPad P14s G4 21HF0017GE | |
| Lenovo ThinkPad P14s G4 21HF0017GE | |
| Dell Precision 5000 5490 | |
| HP ZBook Firefly 14 G11 | |
| Lenovo ThinkPad P14s G5 21G3S00A00 | |
| Moyenne Intel Core Ultra 7 155H, NVIDIA RTX 500 Ada Generation Laptop (n=1) | |
| Mozilla Kraken 1.1 / Total | |
| Lenovo ThinkPad P14s G5 21G3S00A00 | |
| Moyenne Intel Core Ultra 7 155H, NVIDIA RTX 500 Ada Generation Laptop (n=1) | |
| Dell Precision 5000 5490 | |
| HP ZBook Firefly 14 G11 | |
| Lenovo Yoga Pro 9-14IRP G8 | |
| Microsoft Surface Laptop Studio 2 RTX 4060 | |
| Lenovo ThinkPad P14s G4 21HF0017GE | |
| Moyenne de la classe Workstation (411 - 538, n=25, 2 dernières années) | |
* ... Moindre est la valeur, meilleures sont les performances
| PCMark 10 Score | 6974 points | |
Aide | ||
| AIDA64 / Memory Copy | |
| Dell Precision 5000 5490 | |
| Moyenne Intel Core Ultra 7 155H (62397 - 96791, n=50) | |
| Moyenne de la classe Workstation (56003 - 164795, n=25, 2 dernières années) | |
| Lenovo Yoga Pro 9-14IRP G8 | |
| Lenovo ThinkPad P14s G5 21G3S00A00 | |
| HP ZBook Firefly 14 G11 | |
| Microsoft Surface Laptop Studio 2 RTX 4060 | |
| Lenovo ThinkPad P14s G4 21HF0017GE | |
| AIDA64 / Memory Read | |
| Dell Precision 5000 5490 | |
| Moyenne Intel Core Ultra 7 155H (60544 - 90647, n=50) | |
| Moyenne de la classe Workstation (55795 - 121563, n=25, 2 dernières années) | |
| Lenovo ThinkPad P14s G5 21G3S00A00 | |
| HP ZBook Firefly 14 G11 | |
| Lenovo Yoga Pro 9-14IRP G8 | |
| Microsoft Surface Laptop Studio 2 RTX 4060 | |
| Lenovo ThinkPad P14s G4 21HF0017GE | |
| AIDA64 / Memory Write | |
| Dell Precision 5000 5490 | |
| Lenovo Yoga Pro 9-14IRP G8 | |
| Moyenne de la classe Workstation (55663 - 214520, n=25, 2 dernières années) | |
| Microsoft Surface Laptop Studio 2 RTX 4060 | |
| Lenovo ThinkPad P14s G5 21G3S00A00 | |
| Moyenne Intel Core Ultra 7 155H (58692 - 93451, n=50) | |
| HP ZBook Firefly 14 G11 | |
| Lenovo ThinkPad P14s G4 21HF0017GE | |
| AIDA64 / Memory Latency | |
| Moyenne Intel Core Ultra 7 155H (116.2 - 233, n=50) | |
| Dell Precision 5000 5490 | |
| Moyenne de la classe Workstation (84.5 - 165.2, n=25, 2 dernières années) | |
| HP ZBook Firefly 14 G11 | |
| Lenovo ThinkPad P14s G5 21G3S00A00 | |
| Lenovo ThinkPad P14s G4 21HF0017GE | |
| Lenovo Yoga Pro 9-14IRP G8 | |
| Microsoft Surface Laptop Studio 2 RTX 4060 | |
* ... Moindre est la valeur, meilleures sont les performances
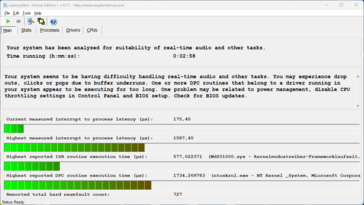
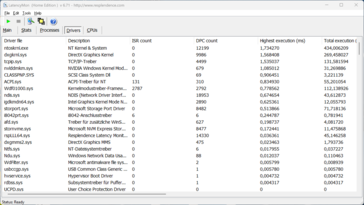
Latences DPC
| DPC Latencies / LatencyMon - interrupt to process latency (max), Web, Youtube, Prime95 | |
| Microsoft Surface Laptop Studio 2 RTX 4060 | |
| HP ZBook Firefly 14 G11 | |
| Dell Precision 5000 5490 | |
| Lenovo ThinkPad P14s G4 21HF0017GE | |
| Lenovo ThinkPad P14s G5 21G3S00A00 | |
| Lenovo Yoga Pro 9-14IRP G8 | |
* ... Moindre est la valeur, meilleures sont les performances
Dispositif de stockage
Le P14s G5 dispose d'un slot M.2 2280 qui est connecté via PCIe 4.0. La version 1 TB de l'UMIS AM630 est installée dans notre appareil de test. Après le premier démarrage de l'appareil, l'utilisateur dispose de 871 Go. Avec des taux de transfert allant jusqu'à 7 Go/s, la performance est très bonne, bien qu'elle ne puisse pas maintenir ces valeurs complètement constantes sous une charge continue. Toutefois, comme les valeurs sont toujours supérieures à 4 Go/s, les utilisateurs ne devraient pas être limités. Vous trouverez d'autres tests de performance des disques durs SSD ici.
* ... Moindre est la valeur, meilleures sont les performances
Reading continuous performance: DiskSpd Read Loop, Queue Depth 8
Carte graphique - Nvidia RTX 500 Ada
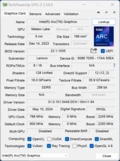
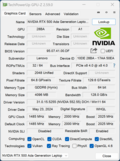
En option, vous pouvez obtenir le P14s G5 avec le logiciel Nvidia RTX 500 Adaqui est actuellement le plus petit GPU mobile professionnel de Nvidia. La RTX 500 Ada est basée sur la puce AD107GLM avec 2 048 cœurs CUDA et 4 Go de VRAM GDDR6. Il s'agit donc d'une version allégée du RTX 1000 Ada et, par conséquent, de la GeForce RTX 4050 Laptop-tous deux équipés de 2 560 cœurs CUDA et de 6 Go de VRAM. Dans le ThinkPad P14s G5, la RTX 500 Ada peut consommer un maximum de 50 watts et le système prend en charge la commutation graphique via la technologie Optimus de Nvidia. Par rapport aux modèles GeForce, les GPU professionnels offrent des certifications ISV qui garantissent une compatibilité maximale avec les applications professionnelles.
Par rapport à l'ancien ordinateur portable RTX A500 (qui est basé sur la GeForce RTX 3050 et qui est utilisé dans les modèles actuels du ZBook Firefly 14 G11par exemple), ses performances dans les tests 3DMark et SPECviewperf professionnels étaient nettement meilleures (50-80 %), mais l'ordinateur portable grand public GeForce RTX 4050 offre des performances 3D encore plus élevées. Il est dommage que Lenovo ne propose pas la RTX 1000 Ada dans le P14s G5.
Les performances du GPU restent stables en charge constante et en mode batterie. D'autres tests de performance du GPU sont disponibles ici.
| 3DMark 06 Standard Score | 50935 points | |
| 3DMark Vantage P Result | 66297 points | |
| 3DMark 11 Performance | 20426 points | |
| 3DMark Fire Strike Score | 12761 points | |
| 3DMark Time Spy Score | 5745 points | |
| 3DMark Steel Nomad Score | 981 points | |
| 3DMark Steel Nomad Light Score | 5441 points | |
Aide | ||
| Performance rating - Percent | |
| Dell Precision 5000 5490 -1! | |
| Lenovo ThinkPad P14s G5 21G3S00A00 | |
| Lenovo ThinkPad P14s G4 21HF0017GE -1! | |
| HP ZBook Firefly 14 G11 -1! | |
| Blender / v3.3 Classroom OPTIX/RTX | |
| HP ZBook Firefly 14 G11 | |
| Lenovo ThinkPad P14s G4 21HF0017GE | |
| Moyenne NVIDIA RTX 500 Ada Generation Laptop (39 - 43, n=2) | |
| Lenovo ThinkPad P14s G5 21G3S00A00 | |
| Moyenne de la classe Workstation (10 - 95, n=19, 2 dernières années) | |
| Lenovo Yoga Pro 9-14IRP G8 | |
| Dell Precision 5000 5490 | |
| Microsoft Surface Laptop Studio 2 RTX 4060 | |
| Blender / v3.3 Classroom CUDA | |
| Lenovo ThinkPad P14s G4 21HF0017GE | |
| HP ZBook Firefly 14 G11 | |
| Moyenne NVIDIA RTX 500 Ada Generation Laptop (71 - 72, n=2) | |
| Lenovo ThinkPad P14s G5 21G3S00A00 | |
| Lenovo Yoga Pro 9-14IRP G8 | |
| Moyenne de la classe Workstation (16 - 150, n=19, 2 dernières années) | |
| Dell Precision 5000 5490 | |
| Microsoft Surface Laptop Studio 2 RTX 4060 | |
| Blender / v3.3 Classroom CPU | |
| Lenovo ThinkPad P14s G4 21HF0017GE | |
| HP ZBook Firefly 14 G11 | |
| Microsoft Surface Laptop Studio 2 RTX 4060 | |
| Dell Precision 5000 5490 | |
| Lenovo ThinkPad P14s G5 21G3S00A00 | |
| Lenovo Yoga Pro 9-14IRP G8 | |
| Moyenne NVIDIA RTX 500 Ada Generation Laptop (280 - 343, n=2) | |
| Moyenne de la classe Workstation (148 - 472, n=25, 2 dernières années) | |
* ... Moindre est la valeur, meilleures sont les performances
Performances des jeux
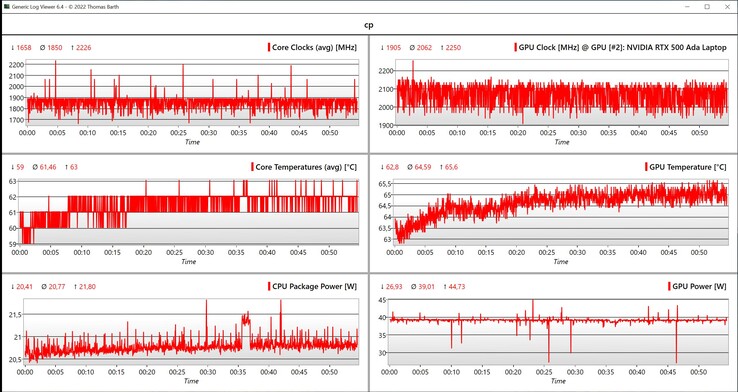
Vous pouvez également jouer sur le ThinkPad P14s G5 si vous souhaitez vous détendre après le travail, bien que ses performances soient une fois de plus nettement inférieures à celles des ordinateurs portables grand public GeForce Ordinateur portable RTX 4050. Cela signifie que vous êtes généralement limité à une résolution de 1080p et que les détails élevés ou maximaux ne sont possibles que lorsque vous jouez à des jeux plus anciens ou moins exigeants. En revanche, les jeux actuels tels que F1 24 ou Cyberpunk 2077 nécessitent une réduction supplémentaire des détails. Le suréchantillonnage DLSS peut également être utilisé pour les jeux pris en charge ; par exemple, nous avons pu augmenter les performances de l'ordinateur portable lors de l'exécution de Cyberpunk 2077 (1080p, Ultra) de 25fps à 45fps (DLSS Balanced). Ses performances de jeu restent parfaitement stables, même lors de sessions prolongées.
| F1 24 - 1920x1080 Ultra High Preset AA:T AF:16x | |
| Moyenne de la classe Workstation (11.7 - 147.7, n=11, 2 dernières années) | |
| Lenovo ThinkPad P14s G5 21G3S00A00 | |
| Moyenne NVIDIA RTX 500 Ada Generation Laptop (n=1) | |
| Lenovo ThinkPad P14s G4 21HF0017GE | |
Cyberpunk 2077 ultra FPS diagram
| Bas | Moyen | Élevé | Ultra | QHD | |
|---|---|---|---|---|---|
| GTA V (2015) | 182.7 | 177.4 | 138.2 | 64.6 | 45.1 |
| The Witcher 3 (2015) | 278 | 175 | 91 | 51 | 36 |
| Dota 2 Reborn (2015) | 176.2 | 156.1 | 148.1 | 137.4 | |
| Final Fantasy XV Benchmark (2018) | 130.5 | 71 | 50 | 36.1 | |
| X-Plane 11.11 (2018) | 128.3 | 103.5 | 81.5 | ||
| Far Cry 5 (2018) | 135 | 86 | 78 | 74 | 50 |
| Strange Brigade (2018) | 316 | 126 | 104 | 91 | 63 |
| Far Cry 6 (2021) | 126 | 80 | 68 | ||
| F1 22 (2022) | 150.4 | 134.4 | 99.6 | 32.9 | |
| F1 23 (2023) | 136.5 | 119.8 | 84.1 | 25 | 16 |
| Baldur's Gate 3 (2023) | 69.4 | 53.6 | 39 | 38.9 | 26.8 |
| Cyberpunk 2077 (2023) | 52.9 | 37.7 | 25.4 | 25 | 19.8 |
| Assassin's Creed Mirage (2023) | 78 | 69 | 55 | 40 | 32 |
| Total War Pharaoh (2023) | 199 | 129 | 73 | 56 | 39 |
| Call of Duty Modern Warfare 3 2023 (2023) | 88 | 78 | 58 | 49 | 33 |
| Avatar Frontiers of Pandora (2023) | 42 | 38 | 32 | 20 | |
| Ghost of Tsushima (2024) | 56.4 | 47.1 | 40.2 | 30.9 | 22 |
| F1 24 (2024) | 112.9 | 80.8 | 26.5 | 16 | 22 |
Émissions - Ventilateurs bruyants
Émissions sonores
Le système de refroidissement de l'ordinateur portable se compose de deux ventilateurs et démarre très rapidement, même lors de brefs pics de charge. Même en faisant des choses très simples comme regarder des vidéos sur YouTube, les ventilateurs étaient en fait toujours actifs à faible vitesse pendant notre test - cela ne pouvait être réduit que par l'utilisation d'un profil d'énergie plus faible. L'appareil est également devenu rapidement plus bruyant sous charge et nous avons mesuré 46,8 dB(A) à la fois dans les jeux et dans le test de stress. Le mode équilibré n'était pas beaucoup plus silencieux avec 44,8 dB(A) et même en utilisant le meilleur mode d'économie d'énergie, les ventilateurs étaient encore clairement audibles avec 38,3 dB(A). Aucun autre bruit électronique n'a été émis par notre appareil pendant la phase de test.
Degré de la nuisance sonore
| Au repos |
| 24.6 / 24.6 / 27.5 dB(A) |
| Fortement sollicité |
| 41.2 / 46.8 dB(A) |
 | ||
30 dB silencieux 40 dB(A) audible 50 dB(A) bruyant |
||
min: | ||
| Lenovo ThinkPad P14s G5 21G3S00A00 RTX 500 Ada Generation Laptop, Ultra 7 155H, Lenovo UMIS AM630 RPETJ1T24MGE2QDQ | HP ZBook Firefly 14 G11 RTX A500 Laptop GPU, Ultra 7 165H, Kioxia XG8 KXG80ZNV512G | Dell Precision 5000 5490 RTX 3000 Ada Generation Laptop, Ultra 9 185H, Kioxia XG8 KXG80ZNV1T02 | Lenovo ThinkPad P14s G4 21HF0017GE RTX A500 Laptop GPU, i7-1370P, SK Hynix HFS002TEJ9X162N | Microsoft Surface Laptop Studio 2 RTX 4060 GeForce RTX 4060 Laptop GPU, i7-13700H, Kioxia XG8 KXG80ZNV1T02 | Lenovo Yoga Pro 9-14IRP G8 GeForce RTX 4050 Laptop GPU, i7-13705H, Samsung PM9A1 MZVL21T0HCLR | |
|---|---|---|---|---|---|---|
| Noise | 3% | 3% | 2% | -3% | -4% | |
| arrêt / environnement * (dB) | 24.6 | 24.3 1% | 22.8 7% | 24.6 -0% | 23.9 3% | 24.8 -1% |
| Idle Minimum * (dB) | 24.6 | 24.6 -0% | 23.8 3% | 24.6 -0% | 23.9 3% | 24.8 -1% |
| Idle Average * (dB) | 24.6 | 25.2 -2% | 23.8 3% | 24.6 -0% | 24.4 1% | 24.8 -1% |
| Idle Maximum * (dB) | 27.5 | 26.8 3% | 24.7 10% | 25.9 6% | 26.9 2% | 24.8 10% |
| Load Average * (dB) | 41.2 | 38.9 6% | 38.9 6% | 41.3 -0% | 48.5 -18% | 47.4 -15% |
| Cyberpunk 2077 ultra * (dB) | 46.8 | 41.8 11% | 44.2 6% | |||
| Load Maximum * (dB) | 46.8 | 45.8 2% | 51.4 -10% | 46.2 1% | 51.8 -11% | 52.9 -13% |
| Witcher 3 ultra * (dB) | 49.9 | 46 | 51.8 | 52.9 |
* ... Moindre est la valeur, meilleures sont les performances
Température
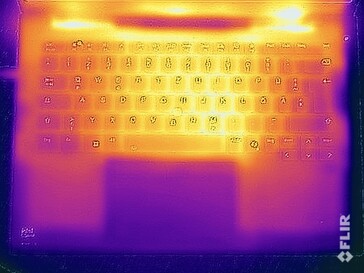
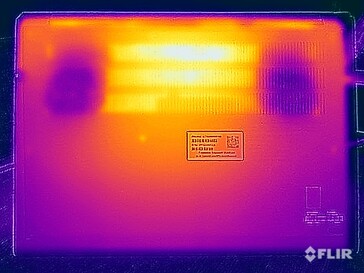
Certaines parties de la surface du ThinkPad P14s G5 ont déjà atteint des températures de 30 °C au ralenti, de sorte que les capacités de refroidissement passif de l'appareil ne semblent pas être les meilleures. Sous charge, nous avons noté un point chaud d'environ 47 °C dans la zone centrale arrière de la face inférieure, mais cette valeur n'est pas critique. Néanmoins, vous ne devriez probablement pas poser l'ordinateur portable sur vos cuisses. La zone du clavier est également très chaude - nous avons mesuré un pic de 41 °C, mais cela ne devrait pas poser de problème lors de l'utilisation.
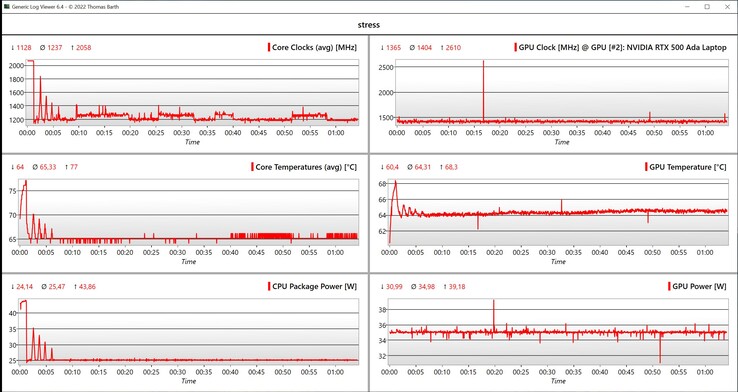
Lors du test de stress avec une charge combinée CPU/GPU, la carte graphique a été privilégiée par le système et a fonctionné en permanence à 35 watts, tandis que le processeur s'est rapidement stabilisé à seulement 25 watts. Au total, le système peut refroidir 60 watts en permanence.
(±) La température maximale du côté supérieur est de 41.3 °C / 106 F, par rapport à la moyenne de 38.2 °C / 101 F, allant de 22.2 à 69.8 °C pour la classe Workstation.
(-) Le fond chauffe jusqu'à un maximum de 47 °C / 117 F, contre une moyenne de 41.1 °C / 106 F
(+) En utilisation inactive, la température moyenne du côté supérieur est de 29.1 °C / 84 F, par rapport à la moyenne du dispositif de 32 °C / 90 F.
(±) 3: The average temperature for the upper side is 36.3 °C / 97 F, compared to the average of 32 °C / 90 F for the class Workstation.
(+) Les repose-poignets et le pavé tactile sont plus froids que la température de la peau avec un maximum de 30.2 °C / 86.4 F et sont donc froids au toucher.
(-) La température moyenne de la zone de l'appui-paume de dispositifs similaires était de 27.8 °C / 82 F (-2.4 °C / #-4.4 F).
| Lenovo ThinkPad P14s G5 21G3S00A00 Intel Core Ultra 7 155H, NVIDIA RTX 500 Ada Generation Laptop | HP ZBook Firefly 14 G11 Intel Core Ultra 7 165H, NVIDIA RTX A500 Laptop GPU | Dell Precision 5000 5490 Intel Core Ultra 9 185H, NVIDIA RTX 3000 Ada Generation Laptop | Lenovo ThinkPad P14s G4 21HF0017GE Intel Core i7-1370P, NVIDIA RTX A500 Laptop GPU | Microsoft Surface Laptop Studio 2 RTX 4060 Intel Core i7-13700H, NVIDIA GeForce RTX 4060 Laptop GPU | Lenovo Yoga Pro 9-14IRP G8 Intel Core i7-13705H, NVIDIA GeForce RTX 4050 Laptop GPU | |
|---|---|---|---|---|---|---|
| Heat | 2% | 4% | -8% | 11% | 0% | |
| Maximum Upper Side * (°C) | 41.3 | 42.8 -4% | 43.2 -5% | 55.3 -34% | 40.4 2% | 41 1% |
| Maximum Bottom * (°C) | 47 | 44 6% | 38.4 18% | 48.7 -4% | 42.2 10% | 56.7 -21% |
| Idle Upper Side * (°C) | 30.2 | 30.6 -1% | 31.6 -5% | 31 -3% | 26.6 12% | 27.4 9% |
| Idle Bottom * (°C) | 33.2 | 31.4 5% | 30.6 8% | 29.9 10% | 27 19% | 29.1 12% |
* ... Moindre est la valeur, meilleures sont les performances
Intervenants
Les deux haut-parleurs stéréo sont situés sous le bord avant de l'unité de base et émettent le son vers le bas, où il est idéalement réfléchi vers l'utilisateur par une surface dure. Lors de notre analyse, les modules se sont bien comportés, non seulement parce qu'ils étaient puissants, mais aussi parce que les aigus et les médiums étaient équilibrés. Cela profite également aux voix. Seules les basses étaient un peu faibles, ce qui explique que la musique ou les films ne soient pas aussi puissants qu'ils le pourraient.
Lenovo ThinkPad P14s G5 21G3S00A00 analyse audio
(+) | les haut-parleurs peuvent jouer relativement fort (87# dB)
Basses 100 - 315 Hz
(-) | presque aucune basse - en moyenne 18.8% plus bas que la médiane
(±) | la linéarité des basses est moyenne (8.3% delta à la fréquence précédente)
Médiums 400 - 2000 Hz
(+) | médiane équilibrée - seulement 2.7% de la médiane
(+) | les médiums sont linéaires (2.8% delta à la fréquence précédente)
Aiguës 2 - 16 kHz
(+) | des sommets équilibrés - à seulement 2.4% de la médiane
(+) | les aigus sont linéaires (3.5% delta à la fréquence précédente)
Globalement 100 - 16 000 Hz
(+) | le son global est linéaire (12.2% différence à la médiane)
Par rapport à la même classe
» 17% de tous les appareils testés de cette catégorie étaient meilleurs, 3% similaires, 80% pires
» Le meilleur avait un delta de 7%, la moyenne était de 17%, le pire était de 35%.
Par rapport à tous les appareils testés
» 9% de tous les appareils testés étaient meilleurs, 2% similaires, 88% pires
» Le meilleur avait un delta de 4%, la moyenne était de 24%, le pire était de 134%.
HP ZBook Firefly 14 G11 analyse audio
(+) | les haut-parleurs peuvent jouer relativement fort (83.7# dB)
Basses 100 - 315 Hz
(-) | presque aucune basse - en moyenne 21.6% plus bas que la médiane
(±) | la linéarité des basses est moyenne (10% delta à la fréquence précédente)
Médiums 400 - 2000 Hz
(+) | médiane équilibrée - seulement 4.5% de la médiane
(+) | les médiums sont linéaires (4.3% delta à la fréquence précédente)
Aiguës 2 - 16 kHz
(+) | des sommets équilibrés - à seulement 3.4% de la médiane
(+) | les aigus sont linéaires (3.2% delta à la fréquence précédente)
Globalement 100 - 16 000 Hz
(±) | la linéarité du son global est moyenne (16.2% de différence avec la médiane)
Par rapport à la même classe
» 42% de tous les appareils testés de cette catégorie étaient meilleurs, 7% similaires, 51% pires
» Le meilleur avait un delta de 7%, la moyenne était de 17%, le pire était de 35%.
Par rapport à tous les appareils testés
» 25% de tous les appareils testés étaient meilleurs, 5% similaires, 69% pires
» Le meilleur avait un delta de 4%, la moyenne était de 24%, le pire était de 134%.
Lenovo Yoga Pro 9-14IRP G8 analyse audio
(±) | le niveau sonore du haut-parleur est moyen mais bon (81.8# dB)
Basses 100 - 315 Hz
(±) | basse réduite - en moyenne 5.9% inférieure à la médiane
(±) | la linéarité des basses est moyenne (7.8% delta à la fréquence précédente)
Médiums 400 - 2000 Hz
(+) | médiane équilibrée - seulement 2.3% de la médiane
(+) | les médiums sont linéaires (3.2% delta à la fréquence précédente)
Aiguës 2 - 16 kHz
(+) | des sommets équilibrés - à seulement 2.5% de la médiane
(+) | les aigus sont linéaires (3.4% delta à la fréquence précédente)
Globalement 100 - 16 000 Hz
(+) | le son global est linéaire (7.3% différence à la médiane)
Par rapport à la même classe
» 5% de tous les appareils testés de cette catégorie étaient meilleurs, 1% similaires, 95% pires
» Le meilleur avait un delta de 5%, la moyenne était de 17%, le pire était de 45%.
Par rapport à tous les appareils testés
» 1% de tous les appareils testés étaient meilleurs, 0% similaires, 99% pires
» Le meilleur avait un delta de 4%, la moyenne était de 24%, le pire était de 134%.
Gestion de l'énergie - Le panneau 3K a besoin de beaucoup d'énergie
Consommation électrique
Nos mesures de consommation ont clairement montré que le nouvel écran 3K nécessite beaucoup d'énergie. Malgré une luminosité maximale plus faible, la consommation maximale en veille de l'ordinateur portable est supérieure à celle du ZBook Firefly 14 G11par exemple. En jeu, l'appareil nécessite entre 80-90 watts, alors que nous avons vu 137 watts pendant quelques secondes lors du test de stress. Cependant, cette valeur s'est ensuite rapidement stabilisée à 90 watts et est restée à ce niveau. L'alimentation de 135 watts est donc suffisante. Les configurations sans RTX 500 Ada sont livrées avec un bloc d'alimentation plus faible de 100 watts.
| Éteint/en veille | |
| Au repos | |
| Fortement sollicité |
|
Légende:
min: | |
| Lenovo ThinkPad P14s G5 21G3S00A00 Ultra 7 155H, RTX 500 Ada Generation Laptop, Lenovo UMIS AM630 RPETJ1T24MGE2QDQ, IPS, 3072x1920, 14.5" | HP ZBook Firefly 14 G11 Ultra 7 165H, RTX A500 Laptop GPU, Kioxia XG8 KXG80ZNV512G, IPS, 2560x1600, 14" | Dell Precision 5000 5490 Ultra 9 185H, RTX 3000 Ada Generation Laptop, Kioxia XG8 KXG80ZNV1T02, IPS, 2560x1600, 14" | Lenovo ThinkPad P14s G4 21HF0017GE i7-1370P, RTX A500 Laptop GPU, SK Hynix HFS002TEJ9X162N, OLED, 2880x1800, 14" | Microsoft Surface Laptop Studio 2 RTX 4060 i7-13700H, GeForce RTX 4060 Laptop GPU, Kioxia XG8 KXG80ZNV1T02, IPS, 2400x1600, 14.4" | Lenovo Yoga Pro 9-14IRP G8 i7-13705H, GeForce RTX 4050 Laptop GPU, Samsung PM9A1 MZVL21T0HCLR, Mini-LED, 3072x1920, 14.5" | Moyenne NVIDIA RTX 500 Ada Generation Laptop | Moyenne de la classe Workstation | |
|---|---|---|---|---|---|---|---|---|
| Power Consumption | 21% | -9% | 30% | 37% | -23% | 11% | -12% | |
| Idle Minimum * (Watt) | 7.5 | 6.6 12% | 11.1 -48% | 6.3 16% | 3 60% | 10.9 -45% | 6.5 ? 13% | 9.05 ? -21% |
| Idle Average * (Watt) | 13.5 | 12.7 6% | 14.8 -10% | 7 48% | 7.1 47% | 17.7 -31% | 11 ? 19% | 13.4 ? 1% |
| Idle Maximum * (Watt) | 14.2 | 13.3 6% | 16.5 -16% | 8.1 43% | 7.6 46% | 19.3 -36% | 11.5 ? 19% | 17.8 ? -25% |
| Load Average * (Watt) | 100.2 | 67 33% | 70.1 30% | 84.6 16% | 73.1 27% | 93.3 7% | 94.1 ? 6% | 91.8 ? 8% |
| Cyberpunk 2077 ultra * (Watt) | 86.7 | 63.4 27% | ||||||
| Cyberpunk 2077 ultra external monitor * (Watt) | 84.6 | 58.1 31% | ||||||
| Load Maximum * (Watt) | 137.4 | 94.9 31% | 137.5 -0% | 98.3 28% | 128.5 6% | 150.2 -9% | 137.2 ? -0% | 171.5 ? -25% |
| Witcher 3 ultra * (Watt) | 93.1 | 56.5 | 113.9 | 129.5 |
* ... Moindre est la valeur, meilleures sont les performances
Power consumption Cyberpunk / stress test
Power consumption with external monitor
Délais d'exécution
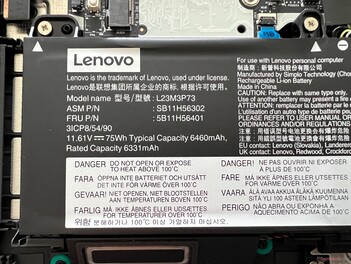
Le nouveau ThinkPad P14s G5 Intel est disponible avec deux tailles de batterie différentes (57 ou 75 Wh). Notre appareil de test est équipé de la plus grande batterie de 75 Wh, qui est nécessaire pour obtenir des durées d'exécution décentes puisqu'il est équipé d'un écran 3K. Par ailleurs, il n'est pas possible de modifier le taux de rafraîchissement, car le mode de signal actif reste toujours à 120 Hz ; Lenovo pourrait améliorer ce point dans une mise à jour. À 120 Hz, les résultats sont moyens. Lors du test WLAN à 150 cd/m² (ce qui correspond à 66 % de la luminosité maximale de notre appareil de test), nous avons constaté une autonomie d'un peu moins de 8 heures P14s G4 avec sa batterie de 52,5 Wh. À pleine luminosité, le test WLAN n'a duré que 5 heures 43. Dans le test vidéo, il a duré un peu moins de 9 heures et, sous charge, la batterie s'est vidée en 80 minutes environ.
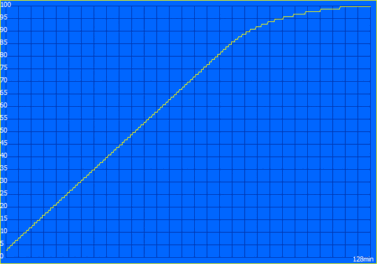
Il faut 128 minutes pour charger complètement l'appareil à l'aide de l'alimentation de 135 watts lorsqu'il est allumé, et 80 % de sa capacité est disponible après 75 minutes.
| Lenovo ThinkPad P14s G5 21G3S00A00 Ultra 7 155H, RTX 500 Ada Generation Laptop, 75 Wh | HP ZBook Firefly 14 G11 Ultra 7 165H, RTX A500 Laptop GPU, 56 Wh | Dell Precision 5000 5490 Ultra 9 185H, RTX 3000 Ada Generation Laptop, 72 Wh | Lenovo ThinkPad P14s G4 21HF0017GE i7-1370P, RTX A500 Laptop GPU, 52.5 Wh | Microsoft Surface Laptop Studio 2 RTX 4060 i7-13700H, GeForce RTX 4060 Laptop GPU, 58 Wh | Lenovo Yoga Pro 9-14IRP G8 i7-13705H, GeForce RTX 4050 Laptop GPU, 75 Wh | Moyenne de la classe Workstation | |
|---|---|---|---|---|---|---|---|
| Autonomie de la batterie | 9% | 39% | -23% | 34% | -2% | 5% | |
| H.264 (h) | 8.9 | 11.3 27% | 9.1 2% | 9.51 ? 7% | |||
| WiFi v1.3 (h) | 7.9 | 8.6 9% | 11 39% | 6.1 -23% | 8.3 5% | 8 1% | 8.17 ? 3% |
| Load (h) | 1.3 | 1 -23% | 2.2 69% | 1.2 -8% | 1.364 ? 5% |
Points positifs
Points négatifs
Verdict - Le ThinkPad P14s G5 avec un GPU plus rapide
Au début de ce test, nous avons posé la question de savoir si le développement de cet ordinateur portable allait à nouveau dans la bonne direction. Le nouveau ThinkPad P14s G5 (Intel) a beaucoup de potentiel - la décision de ne pas utiliser le boîtier le plus fin possible, l'abandon de l'écran OLED optionnel au profit d'un écran IPS mat sans PWM, ainsi que la mémoire vive extensible sont autant d'avantages pour une station de travail mobile. Cependant, ces mesures ne sont pas suffisantes à nos yeux. Même si les performances des composants sont généralement bonnes, vous devez simplement vous demander pourquoi le fabricant ne propose pas la RTX 1000 Ada plus rapide, par exemple, compte tenu du boîtier épais de l'ordinateur portable - ou pourquoi même l'écran IPS optionnel avec sa résolution 3K est toujours derrière la concurrence en termes de luminosité. En fin de compte, Lenovo a réussi à utiliser des composants plus puissants et un mini panneau LED beaucoup plus lumineux dans le Yoga Pro 9 14-le tout dans un boîtier plus fin.
Le nouvel écran IPS lui-même, avec sa résolution 3K et sa couverture P3, est un panneau plutôt décent, mais Lenovo devrait donner aux utilisateurs l'accès à un profil sRGB - de plus, vous ne pouvez actuellement pas réduire son taux de rafraîchissement à 60 Hz, ce qui améliorerait un peu plus la durée de vie de la batterie de l'appareil. L'écran RTX 500 Adales performances graphiques de la RTX 500 Ada sont bien meilleures que celles de l'ancienne RTX A500 Laptop et son processeur Meteor Lake ne déçoit pas non plus, alors que le refroidissement de l'ordinateur portable a atteint ses limites lors du test de stress. Au vu de son unité de base épaisse, une capacité de refroidissement maximale de 60 watts (CPU/GPU combinés) n'est pas terriblement impressionnante, surtout si on la compare à celle de puissants ordinateurs portables multimédias de 14 pouces. Quant au clavier, la nouvelle position de la touche Fn demandera certainement un temps d'adaptation aux vétérans du ThinkPad, mais la qualité du clavier en lui-même n'a pas changé. Le clavier est donc bon, mais il n'a rien d'exceptionnel. Encore une fois, on peut se demander pourquoi un clavier de 1,8 mm n'aurait pas pu être installé dans une unité de base aussi épaisse.
La version Intel du ThinkPad P14s G5 offre de bonnes options de maintenance ainsi qu'un nouvel écran de 14,5 pouces. Ses performances sont également un peu meilleures que celles de son prédécesseur, mais malgré son socle épais, la station de travail mobile ne peut être achetée qu'avec le GPU d'entrée de gamme de Nvidia, à savoir le RTX 500 Ada.
Le ThinkPad P14s offre d'autres avantages tels que de bonnes options de maintenance - y compris deux emplacements de RAM pour un maximum de 96 Go de RAM. Il y a suffisamment de ports et sa webcam de 5 MP fait un travail décent. En termes de performances, il est nettement supérieur à son concurrent direct, le HP ZBook Firefly 14 G11. Toutefois, si vous ne dépendez pas des certifications ISV, vous pouvez obtenir des performances nettement supérieures avec les appareils multimédias d'aujourd'hui, en particulier en ce qui concerne les cartes graphiques. La grande différence entre les modèles Intel et AMD n'est pas non plus une bonne chose pour les clients.
Prix et disponibilité
Le ThinkPad P14s G5 peut être configuré via la boutique en ligne de Lenovo, à partir de 2 439 dollars.
Veuillez noter que nous avons récemment mis à jour notre système d'évaluation et que les résultats de la version 8 ne sont pas comparables à ceux de la version 7. Vous trouverez de plus amples informations ici.
Lenovo ThinkPad P14s G5 21G3S00A00
- 07/18/2024 v8
Andreas Osthoff
Transparency
La sélection des appareils à examiner est effectuée par notre équipe éditoriale. L'échantillon de test a été prêté à l'auteur par le fabricant ou le détaillant pour les besoins de cet examen. Le prêteur n'a pas eu d'influence sur cette évaluation et le fabricant n'a pas reçu de copie de cette évaluation avant sa publication. Il n'y avait aucune obligation de publier cet article. En tant que média indépendant, Notebookcheck n'est pas soumis à l'autorité des fabricants, des détaillants ou des éditeurs.
Voici comment Notebookcheck teste
Chaque année, Notebookcheck examine de manière indépendante des centaines d'ordinateurs portables et de smartphones en utilisant des procédures standardisées afin de garantir que tous les résultats sont comparables. Nous avons continuellement développé nos méthodes de test depuis environ 20 ans et avons établi des normes industrielles dans le processus. Dans nos laboratoires de test, des équipements de mesure de haute qualité sont utilisés par des techniciens et des rédacteurs expérimentés. Ces tests impliquent un processus de validation en plusieurs étapes. Notre système d'évaluation complexe repose sur des centaines de mesures et de points de référence bien fondés, ce qui garantit l'objectivité.









 Total Sustainability Score:
