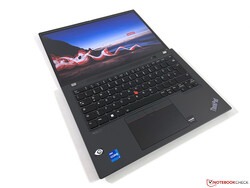
Test du Lenovo ThinkPad T14 G3 : le PC portable pro est moins bon avec Intel et Nvidia
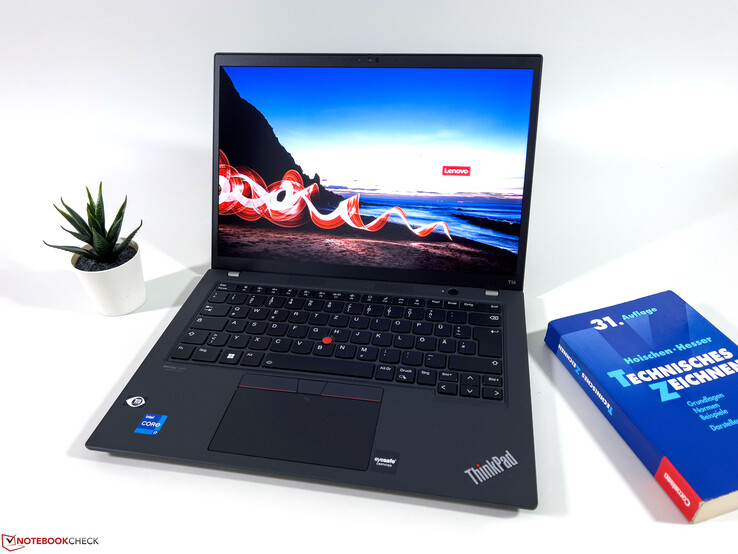
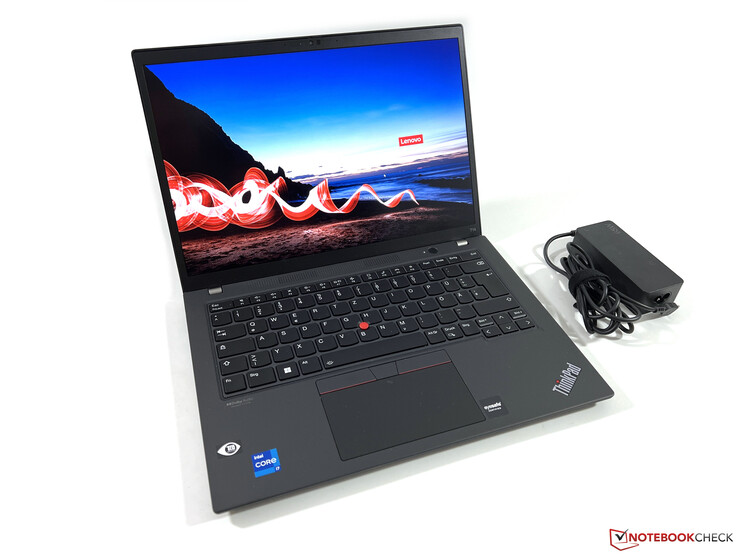
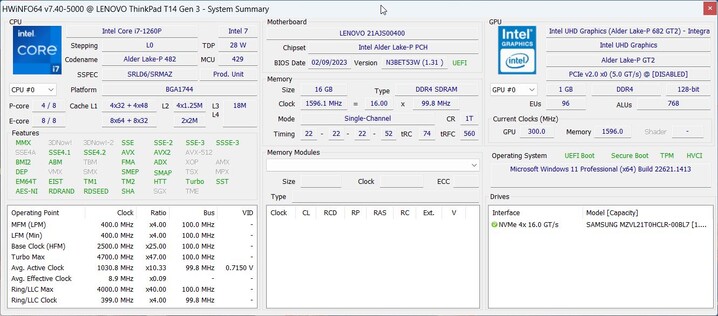
Nous avons déjà testé la versionThinkPad T14 G3 avec le processeur AMD Ryzen 7 Proincluant le rapide iGPU Radeon 680M, mais Lenovo continue également de proposer l'ordinateur portable professionnel de 14 pouces avec des processeurs Intel et le GPU Nvidia GeForce en option. Avec le modèle 21AJS00400, nous avons maintenant un tel représentant combinant le Alder Lake Core i7-1260Pavec le GeForce MX550 sur notre banc d'essai. Nous pouvons négliger le fait qu'un processeur Raptor Lake n'est pas encore utilisé ici, car l'augmentation des performances ne serait que faible, comme nous l'avons déjà vu déjà pu constater.
En principe, le modèle AMD et le modèle Intel partagent le même boîtier et les mêmes périphériques d'entrée, la même webcam et les mêmes haut-parleurs. Dans le test suivant, nous nous concentrerons donc principalement sur la question de savoir quelle version est la meilleure et si la carte graphique supplémentaire en vaut vraiment la peine.
Comparaison avec les concurrents potentiels
Note | Date | Modèle | Poids | Épaisseur | Taille | Résolution | Prix |
|---|---|---|---|---|---|---|---|
| 86.4 % v7 (old) | 03/23 | Lenovo ThinkPad T14 G3-21AJS00400 i7-1260P, GeForce MX550 | 1.5 kg | 17.9 mm | 14.00" | 1920x1200 | |
| 88.8 % v7 (old) | 09/22 | Lenovo ThinkPad T14 G3-21CF004NGE R7 PRO 6850U, Radeon 680M | 1.4 kg | 17.9 mm | 14.00" | 1920x1200 | |
| 88.7 % v7 (old) | 12/22 | HP EliteBook 840 G9 i7-1280P, Iris Xe G7 96EUs | 1.5 kg | 19 mm | 14.00" | 1920x1200 | |
| 88.8 % v7 (old) | 10/22 | Schenker Vision 14 2022 RTX 3050 Ti i7-12700H, GeForce RTX 3050 Ti Laptop GPU | 1.3 kg | 16.6 mm | 14.00" | 2880x1800 | |
| 90.3 % v7 (old) | 09/22 | Huawei MateBook X Pro 2022 i7-1260P, Iris Xe G7 96EUs | 1.3 kg | 15.6 mm | 14.20" | 3120x2080 |
Top 10
» Le Top 10 des PC portables multimédia
» Le Top 10 des PC portables de jeu
» Le Top 10 des PC portables de jeu légers
» Le Top 10 des ordinateurs portables bureautiques
» Le Top 10 des PC portables bureautiques premium/professionnels
» Le Top 10 des Stations de travail mobiles
» Le Top 10 des Ultraportables
» Le Top 10 des Ultrabooks
» Le Top 10 des Convertibles
» Le Top 10 des Tablettes
» Le Top 10 des Tablettes Windows
» Le Top 10 des Smartphones
» Le Top 10 des PC Portables á moins de 300 euros
» Le Top 10 des PC Portables á moins de 500 euros
» Le Top 25 des meilleurs écrans d'ordinateurs
Différences avec le ThinkPad T14 G3 AMD
Hormis les différents autocollants sur le repose-paume, les deux versions du ThinkPad T14 ne présentent aucune différence au niveau de l'aspect extérieur test complet du modèle AMDà ce sujet. Les connexions de base sont également les mêmes, mais alors que Lenovo renonce à l'USB 4.0 dans le modèle AMD, la version Intel est livrée avec deux connexions USB-C qui prennent en charge Thunderbolt 4.
Avec la carte WLAN AX211, le modèle Intel prend également en charge le réseau moderne à 6 GHz, mais nous n'avons pas pu nous connecter au réseau correspondant à l'aide de notre routeur réseau de référence pendant le test. Cependant, la performance dans le réseau 5G ordinaire était également très bonne. Notre unité de test est prête pour le WWAN, et l'emplacement Nano-SIM à l'arrière ainsi que les antennes nécessaires pour le module LTE sont déjà en place.
| Networking | |
| Lenovo ThinkPad T14 G3-21AJS00400 | |
| iperf3 receive AXE11000 | |
| iperf3 transmit AXE11000 | |
| Lenovo ThinkPad T14 G3-21CF004NGE | |
| iperf3 receive AXE11000 6GHz | |
| iperf3 transmit AXE11000 6GHz | |
| HP EliteBook 840 G9 | |
| iperf3 receive AXE11000 6GHz | |
| iperf3 receive AXE11000 | |
| iperf3 transmit AXE11000 6GHz | |
| iperf3 transmit AXE11000 | |
| Schenker Vision 14 2022 RTX 3050 Ti | |
| iperf3 receive AXE11000 | |
| iperf3 transmit AXE11000 | |
| Huawei MateBook X Pro 2022 | |
| iperf3 receive AXE11000 6GHz | |
| iperf3 transmit AXE11000 6GHz | |
Maintenance
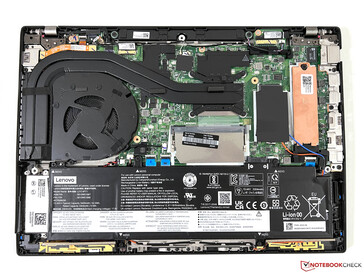
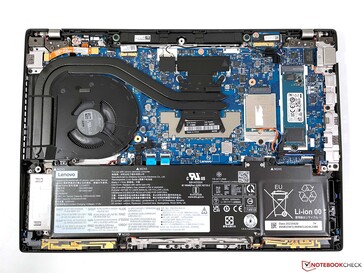
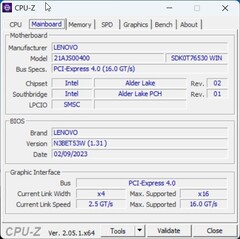
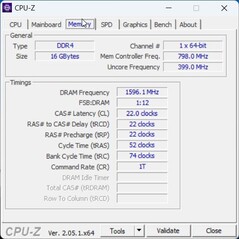
Il y a également une différence dans l'agencement interne. Alors que Lenovo livre le modèle Modèle AMDexclusivement avec de la RAM soudée sans offrir de possibilités d'extension à l'utilisateur, la situation est différente pour le modèle Intel. En plus d'un module soudé (16 Go dans notre cas), il y a également un emplacement SO-DIMM libre, ce qui porte la quantité totale de RAM possible à 48 Go.
Affichage - La loterie du panneau continue
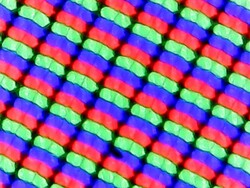
Comme pour les modèles ThinkPad précédents, Lenovo fait appel à différents fabricants de dalles pour les modèles actuels. Bien que nos deux unités de test soient équipées de l'écran 14 pouces LowPower Full-HD, il existe des différences, même si les spécifications techniques de base des deux versions (ou même plus, puisqu'il y a eu jusqu'à 4 versions dans le passé) sont conservées. Contrairement à la dalleLG de notre précédente unité de test AMDnotre unité de test Intel actuelle utilise une dalle AUO, qui subjectivement n'est pas complètement convaincante, car les zones lumineuses apparaissent légèrement granuleuses. Les temps de réponse sont également nettement plus lents et des effets de fantômes sont visibles, par exemple lorsque l'on déplace le pointeur de la souris. Cependant, le PWM n'est pas utilisé ici non plus.
Il en va de même pour la luminosité, qui est inférieure à celle du modèle LG. Elle atteint néanmoins les 400 cd/m² annoncés. Grâce à la faible valeur des noirs, le rapport de contraste n'est pas à plaindre. Notre appareil de test ne présente aucun problème d'opacité ou de saignement de l'écran, même au niveau de luminosité le plus élevé.
| |||||||||||||||||||||||||
Homogénéité de la luminosité: 91 %
Valeur mesurée au centre, sur batterie: 399 cd/m²
Contraste: 2105:1 (Valeurs des noirs: 0.19 cd/m²)
ΔE ColorChecker Calman: 3.5 | ∀{0.5-29.43 Ø4.76}
calibrated: 1.6
ΔE Greyscale Calman: 4.8 | ∀{0.09-98 Ø5}
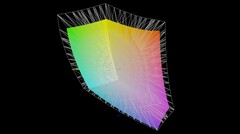
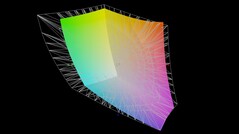
77.9% AdobeRGB 1998 (Argyll 3D)
100% sRGB (Argyll 3D)
76.3% Display P3 (Argyll 3D)
Gamma: 2.11
CCT: 6662 K
| Lenovo ThinkPad T14 G3-21AJS00400 B140UAN02.1, IPS, 1920x1200, 14" | Lenovo ThinkPad T14 G3-21CF004NGE LP140WU1-SPB2, IPS, 1920x1200, 14" | HP EliteBook 840 G9 Chi Mei CMN1435, IPS, 1920x1200, 14" | Schenker Vision 14 2022 RTX 3050 Ti MNE007ZA1-1, IPS, 2880x1800, 14" | Huawei MateBook X Pro 2022 TMX1422, IPS, 3120x2080, 14.2" | |
|---|---|---|---|---|---|
| Display | -7% | -8% | -3% | 12% | |
| Display P3 Coverage (%) | 76.3 | 69.2 -9% | 67.6 -11% | 74.1 -3% | 94.6 24% |
| sRGB Coverage (%) | 100 | 97.4 -3% | 98.7 -1% | 97.4 -3% | 99.5 0% |
| AdobeRGB 1998 Coverage (%) | 77.9 | 71.5 -8% | 69.7 -11% | 75.3 -3% | 86.5 11% |
| Response Times | 40% | -19% | 54% | 55% | |
| Response Time Grey 50% / Grey 80% * (ms) | 62.6 ? | 41.4 ? 34% | 66 ? -5% | 31.5 ? 50% | 25.4 ? 59% |
| Response Time Black / White * (ms) | 34.9 ? | 19.2 ? 45% | 46.4 ? -33% | 14.5 ? 58% | 17.1 ? 51% |
| PWM Frequency (Hz) | |||||
| Screen | 16% | 14% | -6% | 22% | |
| Brightness middle (cd/m²) | 400 | 451 13% | 391.3 -2% | 421 5% | 603 51% |
| Brightness (cd/m²) | 395 | 435 10% | 368 -7% | 416 5% | 586 48% |
| Brightness Distribution (%) | 91 | 94 3% | 86 -5% | 89 -2% | 91 0% |
| Black Level * (cd/m²) | 0.19 | 0.21 -11% | 0.32 -68% | 0.28 -47% | 0.39 -105% |
| Contrast (:1) | 2105 | 2148 2% | 1223 -42% | 1504 -29% | 1546 -27% |
| Colorchecker dE 2000 * | 3.5 | 2.4 31% | 1.49 57% | 3.2 9% | 1.1 69% |
| Colorchecker dE 2000 max. * | 7.2 | 4.1 43% | 3.29 54% | 5.5 24% | 2.2 69% |
| Colorchecker dE 2000 calibrated * | 1.6 | 1.3 19% | 0.44 73% | 2 -25% | 1.2 25% |
| Greyscale dE 2000 * | 4.8 | 3.3 31% | 1.7 65% | 4.4 8% | 1.5 69% |
| Gamma | 2.11 104% | 2.13 103% | 2.12 104% | 2.22 99% | 2.17 101% |
| CCT | 6662 98% | 6848 95% | 6488 100% | 6384 102% | 6549 99% |
| Moyenne finale (programmes/paramètres) | 16% /
14% | -4% /
5% | 15% /
3% | 30% /
25% |
* ... Moindre est la valeur, meilleures sont les performances
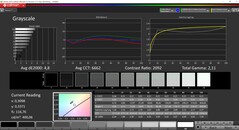
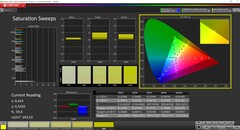
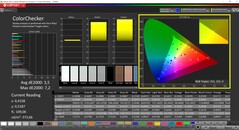
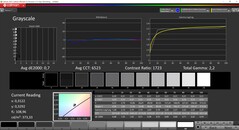
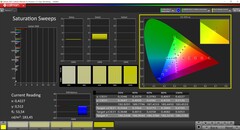
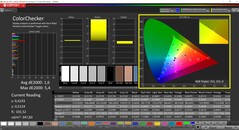
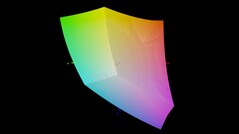
Nous avons mesuré l'écran avec le logiciel professionnel CalMAN (X-Rite i1 Pro 2). Bien qu'il y ait une légère teinte de couleur vers le vert/bleu dans l'état de livraison, ce n'est pas très apparent dans l'utilisation quotidienne, et les résultats sont déjà décents pour un ordinateur portable d'affaires. Avec notre propre étalonnage (profil de couleur disponible en téléchargement gratuit à partir du lien ci-dessus), nous sommes en mesure d'améliorer encore la reproduction des couleurs. En combinaison avec la couverture complète de l'espace colorimétrique sRGB, la dalle est tout à fait appropriée pour les tâches occasionnelles de traitement d'images ou de vidéos.
Temps de réponse de l'écran
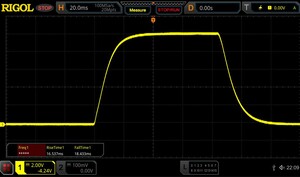
| ↔ Temps de réponse noir à blanc | ||
|---|---|---|
| 34.9 ms ... hausse ↗ et chute ↘ combinées | ↗ 16.5 ms hausse | |
| ↘ 18.4 ms chute | ||
| L'écran souffre de latences très élevées, à éviter pour le jeu. En comparaison, tous les appareils testés affichent entre 0.1 (minimum) et 240 (maximum) ms. » 92 % des appareils testés affichent de meilleures performances. Cela signifie que les latences relevées sont moins bonnes que la moyenne (20.1 ms) de tous les appareils testés. | ||
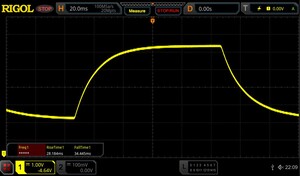
| ↔ Temps de réponse gris 50% à gris 80% | ||
| 62.6 ms ... hausse ↗ et chute ↘ combinées | ↗ 28.2 ms hausse | |
| ↘ 34.4 ms chute | ||
| L'écran souffre de latences très élevées, à éviter pour le jeu. En comparaison, tous les appareils testés affichent entre 0.165 (minimum) et 636 (maximum) ms. » 97 % des appareils testés affichent de meilleures performances. Cela signifie que les latences relevées sont moins bonnes que la moyenne (31.5 ms) de tous les appareils testés. | ||
Scintillement / MLI (Modulation de largeur d'impulsion)
| Scintillement / MLI (Modulation de largeur d'impulsion) non décelé | |||
En comparaison, 53 % des appareils testés n'emploient pas MDI pour assombrir leur écran. Nous avons relevé une moyenne à 8036 (minimum : 5 - maximum : 343500) Hz dans le cas où une MDI était active. | |||
Performance - Alder Lake et GeForce MX550
Conditions d'essai
L'application Lenovo Vantage propose un mode "Intelligent Cooling", mais lors de notre test, ce mode a eu un effet négatif sur les performances après un court laps de temps. Nous avons donc désactivé ce mode pour nos benchmarks et nos mesures (soit via l'application, soit en utilisant la combinaison de touches Fn+T).
Processeur - Core i7-1260P
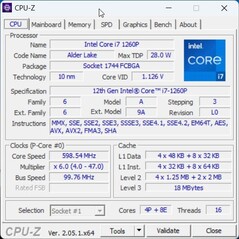
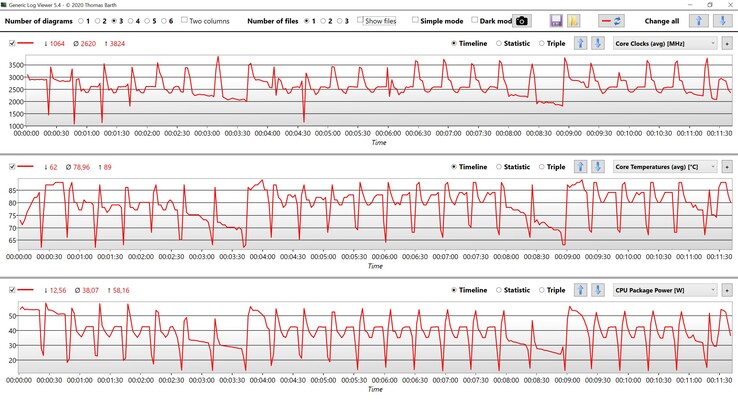
Nous connaissons déjà leCore i7-1260Pde la génération Alder Lake, et avec ses 4 cœurs de performance rapide et 8 cœurs d'efficacité, la performance est très bonne, mais le processeur Intel consomme également beaucoup d'énergie. Dans le ThinkPad T14 G3, le processeur peut consommer jusqu'à 58 watts au maximum et 42 watts en permanence. Les performances à un seul cœur sont meilleures que celles du modèle AMD, tandis que les performances à plusieurs cœurs sont comparables.
Cinebench R15 Multi Constant Load Test
Les performances globales restent relativement stables dans la boucle Cinebench. Ce qui est également intéressant ici, c'est la comparaison avec le nouveau Core i7-1360P de Raptor Lake Core i7-1360Pqui a un avantage lors de la première exécution, mais qui retombe ensuite au niveau des anciens processeurs Alder Lake. Seules les performances à cœur unique restent légèrement supérieures, mais dans l'ensemble, vous pouvez également choisir le Core i7-1260P sans crainte.
En fonctionnement sur batterie, le processeur est autorisé à consommer un maximum de 32 watts, ce qui entraîne une réduction des performances de ~30 % dans les tests multicœurs. Vous trouverez d'autres tests de performance dans notre section technique.
Cinebench R23: Multi Core | Single Core
Cinebench R20: CPU (Multi Core) | CPU (Single Core)
Cinebench R15: CPU Multi 64Bit | CPU Single 64Bit
Blender: v2.79 BMW27 CPU
7-Zip 18.03: 7z b 4 | 7z b 4 -mmt1
Geekbench 5.5: Multi-Core | Single-Core
HWBOT x265 Benchmark v2.2: 4k Preset
LibreOffice : 20 Documents To PDF
R Benchmark 2.5: Overall mean
| CPU Performance rating | |
| Schenker Vision 14 2022 RTX 3050 Ti | |
| Lenovo Yoga 9 14IRP G8 | |
| HP EliteBook 840 G9 | |
| Lenovo ThinkPad T14 G3-21AJS00400 | |
| Huawei MateBook X Pro 2022 | |
| Lenovo ThinkPad T14 G3-21CF004NGE | |
| Moyenne de la classe Office | |
| Moyenne Intel Core i7-1260P | |
| Cinebench R23 / Multi Core | |
| Schenker Vision 14 2022 RTX 3050 Ti | |
| Lenovo ThinkPad T14 G3-21AJS00400 | |
| Lenovo Yoga 9 14IRP G8 | |
| Moyenne de la classe Office (1577 - 22808, n=83, 2 dernières années) | |
| Lenovo ThinkPad T14 G3-21CF004NGE | |
| HP EliteBook 840 G9 | |
| Moyenne Intel Core i7-1260P (3173 - 12150, n=27) | |
| Huawei MateBook X Pro 2022 | |
| Cinebench R23 / Single Core | |
| Lenovo Yoga 9 14IRP G8 | |
| Lenovo ThinkPad T14 G3-21AJS00400 | |
| HP EliteBook 840 G9 | |
| Schenker Vision 14 2022 RTX 3050 Ti | |
| Moyenne Intel Core i7-1260P (1155 - 1812, n=25) | |
| Huawei MateBook X Pro 2022 | |
| Moyenne de la classe Office (708 - 2130, n=83, 2 dernières années) | |
| Lenovo ThinkPad T14 G3-21CF004NGE | |
| Cinebench R20 / CPU (Multi Core) | |
| Schenker Vision 14 2022 RTX 3050 Ti | |
| Lenovo ThinkPad T14 G3-21AJS00400 | |
| Lenovo Yoga 9 14IRP G8 | |
| HP EliteBook 840 G9 | |
| Moyenne de la classe Office (590 - 8840, n=81, 2 dernières années) | |
| Lenovo ThinkPad T14 G3-21CF004NGE | |
| Huawei MateBook X Pro 2022 | |
| Moyenne Intel Core i7-1260P (1234 - 4748, n=25) | |
| Cinebench R20 / CPU (Single Core) | |
| Lenovo Yoga 9 14IRP G8 | |
| Schenker Vision 14 2022 RTX 3050 Ti | |
| Lenovo ThinkPad T14 G3-21AJS00400 | |
| Huawei MateBook X Pro 2022 | |
| Moyenne Intel Core i7-1260P (448 - 698, n=25) | |
| Moyenne de la classe Office (285 - 816, n=81, 2 dernières années) | |
| HP EliteBook 840 G9 | |
| Lenovo ThinkPad T14 G3-21CF004NGE | |
| Cinebench R15 / CPU Multi 64Bit | |
| Schenker Vision 14 2022 RTX 3050 Ti | |
| Lenovo Yoga 9 14IRP G8 | |
| HP EliteBook 840 G9 | |
| Huawei MateBook X Pro 2022 | |
| Huawei MateBook X Pro 2022 | |
| Lenovo ThinkPad T14 G3-21AJS00400 | |
| Moyenne de la classe Office (246 - 3380, n=83, 2 dernières années) | |
| Lenovo ThinkPad T14 G3-21CF004NGE | |
| Moyenne Intel Core i7-1260P (549 - 2034, n=29) | |
| Cinebench R15 / CPU Single 64Bit | |
| Lenovo Yoga 9 14IRP G8 | |
| Schenker Vision 14 2022 RTX 3050 Ti | |
| HP EliteBook 840 G9 | |
| Huawei MateBook X Pro 2022 | |
| Lenovo ThinkPad T14 G3-21AJS00400 | |
| Moyenne de la classe Office (99.5 - 312, n=83, 2 dernières années) | |
| Lenovo ThinkPad T14 G3-21CF004NGE | |
| Moyenne Intel Core i7-1260P (165.4 - 260, n=27) | |
| Blender / v2.79 BMW27 CPU | |
| Moyenne de la classe Office (158 - 1956, n=84, 2 dernières années) | |
| Moyenne Intel Core i7-1260P (264 - 906, n=26) | |
| Huawei MateBook X Pro 2022 | |
| Lenovo ThinkPad T14 G3-21AJS00400 | |
| Lenovo ThinkPad T14 G3-21CF004NGE | |
| Lenovo Yoga 9 14IRP G8 | |
| HP EliteBook 840 G9 | |
| Schenker Vision 14 2022 RTX 3050 Ti | |
| 7-Zip 18.03 / 7z b 4 | |
| Schenker Vision 14 2022 RTX 3050 Ti | |
| Lenovo ThinkPad T14 G3-21CF004NGE | |
| HP EliteBook 840 G9 | |
| Lenovo Yoga 9 14IRP G8 | |
| Huawei MateBook X Pro 2022 | |
| Moyenne de la classe Office (7532 - 76886, n=84, 2 dernières années) | |
| Lenovo ThinkPad T14 G3-21AJS00400 | |
| Moyenne Intel Core i7-1260P (16146 - 47064, n=25) | |
| 7-Zip 18.03 / 7z b 4 -mmt1 | |
| HP EliteBook 840 G9 | |
| Lenovo Yoga 9 14IRP G8 | |
| Schenker Vision 14 2022 RTX 3050 Ti | |
| Lenovo ThinkPad T14 G3-21AJS00400 | |
| Huawei MateBook X Pro 2022 | |
| Lenovo ThinkPad T14 G3-21CF004NGE | |
| Moyenne de la classe Office (3046 - 6469, n=83, 2 dernières années) | |
| Moyenne Intel Core i7-1260P (4064 - 5791, n=25) | |
| Geekbench 5.5 / Multi-Core | |
| HP EliteBook 840 G9 | |
| Schenker Vision 14 2022 RTX 3050 Ti | |
| Lenovo Yoga 9 14IRP G8 | |
| Huawei MateBook X Pro 2022 | |
| Moyenne Intel Core i7-1260P (3866 - 10570, n=25) | |
| Moyenne de la classe Office (1719 - 16999, n=80, 2 dernières années) | |
| Lenovo ThinkPad T14 G3-21CF004NGE | |
| Lenovo ThinkPad T14 G3-21AJS00400 | |
| Geekbench 5.5 / Single-Core | |
| Lenovo Yoga 9 14IRP G8 | |
| Schenker Vision 14 2022 RTX 3050 Ti | |
| HP EliteBook 840 G9 | |
| Huawei MateBook X Pro 2022 | |
| Moyenne de la classe Office (811 - 2128, n=80, 2 dernières années) | |
| Moyenne Intel Core i7-1260P (1436 - 1786, n=25) | |
| Lenovo ThinkPad T14 G3-21AJS00400 | |
| Lenovo ThinkPad T14 G3-21CF004NGE | |
| HWBOT x265 Benchmark v2.2 / 4k Preset | |
| Schenker Vision 14 2022 RTX 3050 Ti | |
| Lenovo ThinkPad T14 G3-21AJS00400 | |
| Lenovo ThinkPad T14 G3-21CF004NGE | |
| Lenovo Yoga 9 14IRP G8 | |
| HP EliteBook 840 G9 | |
| Moyenne de la classe Office (1.72 - 26, n=82, 2 dernières années) | |
| Huawei MateBook X Pro 2022 | |
| Moyenne Intel Core i7-1260P (3.45 - 13.6, n=26) | |
| LibreOffice / 20 Documents To PDF | |
| Moyenne de la classe Office (41.5 - 129.6, n=82, 2 dernières années) | |
| Lenovo ThinkPad T14 G3-21CF004NGE | |
| Moyenne Intel Core i7-1260P (40.2 - 65.7, n=25) | |
| Lenovo Yoga 9 14IRP G8 | |
| HP EliteBook 840 G9 | |
| Schenker Vision 14 2022 RTX 3050 Ti | |
| Lenovo ThinkPad T14 G3-21AJS00400 | |
| Huawei MateBook X Pro 2022 | |
| R Benchmark 2.5 / Overall mean | |
| Moyenne de la classe Office (0.4098 - 1.06, n=82, 2 dernières années) | |
| Lenovo ThinkPad T14 G3-21CF004NGE | |
| Moyenne Intel Core i7-1260P (0.4559 - 0.727, n=25) | |
| Huawei MateBook X Pro 2022 | |
| Lenovo ThinkPad T14 G3-21AJS00400 | |
| HP EliteBook 840 G9 | |
| Lenovo Yoga 9 14IRP G8 | |
| Schenker Vision 14 2022 RTX 3050 Ti | |
* ... Moindre est la valeur, meilleures sont les performances
AIDA64: FP32 Ray-Trace | FPU Julia | CPU SHA3 | CPU Queen | FPU SinJulia | FPU Mandel | CPU AES | CPU ZLib | FP64 Ray-Trace | CPU PhotoWorxx
| Performance rating | |
| Schenker Vision 14 2022 RTX 3050 Ti | |
| Lenovo ThinkPad T14 G3-21CF004NGE | |
| Moyenne de la classe Office | |
| HP EliteBook 840 G9 | |
| Lenovo ThinkPad T14 G3-21AJS00400 | |
| Huawei MateBook X Pro 2022 | |
| Moyenne Intel Core i7-1260P | |
| AIDA64 / FP32 Ray-Trace | |
| Moyenne de la classe Office (1685 - 31245, n=87, 2 dernières années) | |
| Schenker Vision 14 2022 RTX 3050 Ti | |
| Lenovo ThinkPad T14 G3-21CF004NGE | |
| Lenovo ThinkPad T14 G3-21AJS00400 | |
| HP EliteBook 840 G9 | |
| Moyenne Intel Core i7-1260P (2176 - 10898, n=26) | |
| Huawei MateBook X Pro 2022 | |
| AIDA64 / FPU Julia | |
| Lenovo ThinkPad T14 G3-21CF004NGE | |
| Schenker Vision 14 2022 RTX 3050 Ti | |
| Lenovo ThinkPad T14 G3-21AJS00400 | |
| Moyenne de la classe Office (8977 - 125394, n=87, 2 dernières années) | |
| HP EliteBook 840 G9 | |
| Moyenne Intel Core i7-1260P (11015 - 56906, n=26) | |
| Huawei MateBook X Pro 2022 | |
| AIDA64 / CPU SHA3 | |
| Schenker Vision 14 2022 RTX 3050 Ti | |
| Moyenne de la classe Office (590 - 5755, n=87, 2 dernières années) | |
| Lenovo ThinkPad T14 G3-21AJS00400 | |
| Lenovo ThinkPad T14 G3-21CF004NGE | |
| HP EliteBook 840 G9 | |
| Moyenne Intel Core i7-1260P (669 - 2709, n=26) | |
| Huawei MateBook X Pro 2022 | |
| AIDA64 / CPU Queen | |
| HP EliteBook 840 G9 | |
| Schenker Vision 14 2022 RTX 3050 Ti | |
| Lenovo ThinkPad T14 G3-21CF004NGE | |
| Lenovo ThinkPad T14 G3-21AJS00400 | |
| Huawei MateBook X Pro 2022 | |
| Moyenne Intel Core i7-1260P (42571 - 82493, n=26) | |
| Moyenne de la classe Office (20636 - 115197, n=84, 2 dernières années) | |
| AIDA64 / FPU SinJulia | |
| Lenovo ThinkPad T14 G3-21CF004NGE | |
| Schenker Vision 14 2022 RTX 3050 Ti | |
| HP EliteBook 840 G9 | |
| Moyenne de la classe Office (1064 - 18321, n=87, 2 dernières années) | |
| Lenovo ThinkPad T14 G3-21AJS00400 | |
| Huawei MateBook X Pro 2022 | |
| Moyenne Intel Core i7-1260P (2901 - 6975, n=26) | |
| AIDA64 / FPU Mandel | |
| Lenovo ThinkPad T14 G3-21CF004NGE | |
| Schenker Vision 14 2022 RTX 3050 Ti | |
| Moyenne de la classe Office (4415 - 66922, n=87, 2 dernières années) | |
| Lenovo ThinkPad T14 G3-21AJS00400 | |
| HP EliteBook 840 G9 | |
| Moyenne Intel Core i7-1260P (5950 - 26376, n=26) | |
| Huawei MateBook X Pro 2022 | |
| AIDA64 / CPU AES | |
| Schenker Vision 14 2022 RTX 3050 Ti | |
| Huawei MateBook X Pro 2022 | |
| Lenovo ThinkPad T14 G3-21AJS00400 | |
| HP EliteBook 840 G9 | |
| Lenovo ThinkPad T14 G3-21CF004NGE | |
| Moyenne de la classe Office (5127 - 155900, n=87, 2 dernières années) | |
| Moyenne Intel Core i7-1260P (16041 - 92356, n=26) | |
| AIDA64 / CPU ZLib | |
| Schenker Vision 14 2022 RTX 3050 Ti | |
| Lenovo ThinkPad T14 G3-21AJS00400 | |
| HP EliteBook 840 G9 | |
| Moyenne de la classe Office (138.6 - 1366, n=87, 2 dernières années) | |
| Lenovo ThinkPad T14 G3-21CF004NGE | |
| Huawei MateBook X Pro 2022 | |
| Moyenne Intel Core i7-1260P (259 - 771, n=26) | |
| AIDA64 / FP64 Ray-Trace | |
| Moyenne de la classe Office (859 - 17834, n=87, 2 dernières années) | |
| Schenker Vision 14 2022 RTX 3050 Ti | |
| Lenovo ThinkPad T14 G3-21CF004NGE | |
| Lenovo ThinkPad T14 G3-21AJS00400 | |
| HP EliteBook 840 G9 | |
| Moyenne Intel Core i7-1260P (1237 - 5858, n=26) | |
| Huawei MateBook X Pro 2022 | |
| AIDA64 / CPU PhotoWorxx | |
| Huawei MateBook X Pro 2022 | |
| HP EliteBook 840 G9 | |
| Moyenne de la classe Office (11090 - 65229, n=87, 2 dernières années) | |
| Moyenne Intel Core i7-1260P (13261 - 43652, n=26) | |
| Schenker Vision 14 2022 RTX 3050 Ti | |
| Lenovo ThinkPad T14 G3-21CF004NGE | |
| Lenovo ThinkPad T14 G3-21AJS00400 | |
Performance du système
En pratique, la version Intel du ThinkPad T14 G3 est également un ordinateur portable très réactif, et nous n'avons remarqué aucun problème. Cependant, notre unité de test n'affiche que des performances moyennes dans les benchmarks synthétiques. Ceci est principalement dû à la mauvaise performance du stockage, puisque la mémoire de travail ne fonctionne qu'en configuration monocanal.
CrossMark: Overall | Productivity | Creativity | Responsiveness
| PCMark 10 / Score | |
| Schenker Vision 14 2022 RTX 3050 Ti | |
| Moyenne de la classe Office (2823 - 9298, n=72, 2 dernières années) | |
| Huawei MateBook X Pro 2022 | |
| Lenovo ThinkPad T14 G3-21CF004NGE | |
| Moyenne Intel Core i7-1260P, NVIDIA GeForce MX550 (5870 - 6235, n=2) | |
| HP EliteBook 840 G9 | |
| Lenovo ThinkPad T14 G3-21AJS00400 | |
| PCMark 10 / Essentials | |
| HP EliteBook 840 G9 | |
| Huawei MateBook X Pro 2022 | |
| Schenker Vision 14 2022 RTX 3050 Ti | |
| Moyenne de la classe Office (6567 - 11594, n=72, 2 dernières années) | |
| Moyenne Intel Core i7-1260P, NVIDIA GeForce MX550 (9729 - 10132, n=2) | |
| Lenovo ThinkPad T14 G3-21CF004NGE | |
| Lenovo ThinkPad T14 G3-21AJS00400 | |
| PCMark 10 / Productivity | |
| Moyenne Intel Core i7-1260P, NVIDIA GeForce MX550 (8189 - 9245, n=2) | |
| Moyenne de la classe Office (3041 - 17243, n=72, 2 dernières années) | |
| Huawei MateBook X Pro 2022 | |
| Schenker Vision 14 2022 RTX 3050 Ti | |
| Lenovo ThinkPad T14 G3-21CF004NGE | |
| Lenovo ThinkPad T14 G3-21AJS00400 | |
| HP EliteBook 840 G9 | |
| PCMark 10 / Digital Content Creation | |
| Schenker Vision 14 2022 RTX 3050 Ti | |
| Moyenne de la classe Office (2049 - 13541, n=72, 2 dernières années) | |
| Lenovo ThinkPad T14 G3-21CF004NGE | |
| HP EliteBook 840 G9 | |
| Moyenne Intel Core i7-1260P, NVIDIA GeForce MX550 (6891 - 7021, n=2) | |
| Lenovo ThinkPad T14 G3-21AJS00400 | |
| Huawei MateBook X Pro 2022 | |
| CrossMark / Overall | |
| Huawei MateBook X Pro 2022 | |
| HP EliteBook 840 G9 | |
| Schenker Vision 14 2022 RTX 3050 Ti | |
| Lenovo ThinkPad T14 G3-21AJS00400 | |
| Moyenne Intel Core i7-1260P, NVIDIA GeForce MX550 (n=1) | |
| Moyenne de la classe Office (381 - 2010, n=82, 2 dernières années) | |
| Lenovo ThinkPad T14 G3-21CF004NGE | |
| CrossMark / Productivity | |
| Huawei MateBook X Pro 2022 | |
| HP EliteBook 840 G9 | |
| Schenker Vision 14 2022 RTX 3050 Ti | |
| Lenovo ThinkPad T14 G3-21AJS00400 | |
| Moyenne Intel Core i7-1260P, NVIDIA GeForce MX550 (n=1) | |
| Moyenne de la classe Office (464 - 1880, n=82, 2 dernières années) | |
| Lenovo ThinkPad T14 G3-21CF004NGE | |
| CrossMark / Creativity | |
| Huawei MateBook X Pro 2022 | |
| HP EliteBook 840 G9 | |
| Schenker Vision 14 2022 RTX 3050 Ti | |
| Moyenne de la classe Office (319 - 2361, n=82, 2 dernières années) | |
| Lenovo ThinkPad T14 G3-21AJS00400 | |
| Moyenne Intel Core i7-1260P, NVIDIA GeForce MX550 (n=1) | |
| Lenovo ThinkPad T14 G3-21CF004NGE | |
| CrossMark / Responsiveness | |
| Huawei MateBook X Pro 2022 | |
| HP EliteBook 840 G9 | |
| Schenker Vision 14 2022 RTX 3050 Ti | |
| Lenovo ThinkPad T14 G3-21AJS00400 | |
| Moyenne Intel Core i7-1260P, NVIDIA GeForce MX550 (n=1) | |
| Moyenne de la classe Office (360 - 1781, n=82, 2 dernières années) | |
| Lenovo ThinkPad T14 G3-21CF004NGE | |
| PCMark 10 Score | 5870 points | |
Aide | ||
| AIDA64 / Memory Copy | |
| Moyenne de la classe Office (20075 - 110930, n=86, 2 dernières années) | |
| Huawei MateBook X Pro 2022 | |
| HP EliteBook 840 G9 | |
| Moyenne Intel Core i7-1260P (25125 - 71544, n=25) | |
| Lenovo ThinkPad T14 G3-21CF004NGE | |
| Schenker Vision 14 2022 RTX 3050 Ti | |
| Lenovo ThinkPad T14 G3-21AJS00400 | |
| AIDA64 / Memory Read | |
| Huawei MateBook X Pro 2022 | |
| HP EliteBook 840 G9 | |
| Moyenne de la classe Office (10084 - 128030, n=87, 2 dernières années) | |
| Moyenne Intel Core i7-1260P (24983 - 72065, n=25) | |
| Lenovo ThinkPad T14 G3-21CF004NGE | |
| Schenker Vision 14 2022 RTX 3050 Ti | |
| Lenovo ThinkPad T14 G3-21AJS00400 | |
| AIDA64 / Memory Write | |
| Moyenne de la classe Office (20073 - 119858, n=87, 2 dernières années) | |
| Huawei MateBook X Pro 2022 | |
| HP EliteBook 840 G9 | |
| Moyenne Intel Core i7-1260P (23512 - 66799, n=25) | |
| Lenovo ThinkPad T14 G3-21CF004NGE | |
| Schenker Vision 14 2022 RTX 3050 Ti | |
| Lenovo ThinkPad T14 G3-21AJS00400 | |
| AIDA64 / Memory Latency | |
| Lenovo ThinkPad T14 G3-21CF004NGE | |
| Huawei MateBook X Pro 2022 | |
| Moyenne de la classe Office (7.6 - 162.9, n=82, 2 dernières années) | |
| HP EliteBook 840 G9 | |
| Lenovo ThinkPad T14 G3-21AJS00400 | |
| Schenker Vision 14 2022 RTX 3050 Ti | |
| Moyenne Intel Core i7-1260P (77.9 - 118.4, n=21) | |
* ... Moindre est la valeur, meilleures sont les performances
Latences DPC
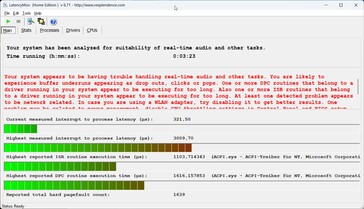
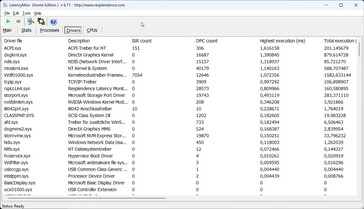
Dans notre test de latence standardisé (surf sur Internet, reproduction de vidéos YouTube 4K et charge du CPU), l'unité de test avec sa version actuelle du BIOS montre quelques limitations significatives pour l'utilisation d'applications audio en temps réel. Mais il pourrait aussi y avoir des limitations créées par le pilote Nvidia, puisqu'il y a eu des problèmes à cet égard pour plusieurs versions du pilote. Le modèle Modèle AMD du T14 G3n'a pas rencontré de problèmes à ce niveau.
| DPC Latencies / LatencyMon - interrupt to process latency (max), Web, Youtube, Prime95 | |
| HP EliteBook 840 G9 | |
| Lenovo ThinkPad T14 G3-21AJS00400 | |
| Huawei MateBook X Pro 2022 | |
| Schenker Vision 14 2022 RTX 3050 Ti | |
| Lenovo ThinkPad T14 G3-21CF004NGE | |
* ... Moindre est la valeur, meilleures sont les performances
Solution de stockage
Notre unité de test utilise la version 1 To du Samsung PM9A1, qui est la variante OEM du 980 Pro. Bien que le disque SSD PCIe 4.0 offre de très bons taux de transfert, les taux chutent après un certain temps sous une charge constante. Cependant, cela n'a pas d'impact sur le fonctionnement quotidien de l'entreprise. Après le premier démarrage, l'utilisateur dispose de 904 Go d'espace de stockage. Vous trouverez d'autres tests de performance des disques durs SSD ici.
* ... Moindre est la valeur, meilleures sont les performances
Disk Throttling: DiskSpd Read Loop, Queue Depth 8
Carte graphique
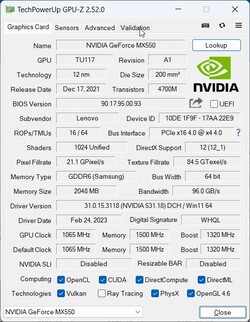
En plus de la carte graphique intégrée Iris Xe Graphics G7du processeur, Lenovo a également équipé notre configuration de test d'une carte graphique dédiée, la GeForce MX550de Nvidia avec 2 Go de VRAM. La carte graphique est autorisée à consommer un maximum de 30 watts et offre également un avantage notable dans les benchmarks par rapport à l'iGPU légèrement dépassé d'Intel. Cependant, la carte graphique intégrée Radeon 680M intégrée dans le modèle AMD se situe au même niveau, du moins dans les tests synthétiques. On peut donc déjà se demander pourquoi une carte graphique supplémentaire serait nécessaire.
D'autre part, le GPU GeForce a un léger avantage par rapport à la Radeon 680M intégrée dans les tests de jeu réels, mais cet avantage n'est pas vraiment énorme. Ceux qui aiment jouer à des jeux sur leur ordinateur portable de travail après avoir terminé leur journée de travail sont nettement mieux servis par le Schenker Vision 14et der RTX 3050 Tipar exemple.
En charge constante et en fonctionnement sur batterie, les performances graphiques restent stables. Vous trouverez d'autres tests de performance du GPU dans notre section technique.
| 3DMark 11 Performance | 10068 points | |
| 3DMark Fire Strike Score | 5764 points | |
| 3DMark Time Spy Score | 2695 points | |
Aide | ||
| Blender / v3.3 Classroom OPTIX/RTX | |
| Lenovo ThinkPad T14 G3-21AJS00400 | |
| Moyenne NVIDIA GeForce MX550 (n=1) | |
| Moyenne de la classe Office (29 - 242, n=3, 2 dernières années) | |
| Schenker Vision 14 2022 RTX 3050 Ti | |
| Blender / v3.3 Classroom CUDA | |
| Lenovo ThinkPad T14 G3-21AJS00400 | |
| Moyenne NVIDIA GeForce MX550 (n=1) | |
| Moyenne de la classe Office (53 - 214, n=4, 2 dernières années) | |
| Schenker Vision 14 2022 RTX 3050 Ti | |
| Blender / v3.3 Classroom CPU | |
| HP EliteBook 840 G9 | |
| Lenovo ThinkPad T14 G3-21AJS00400 | |
| Moyenne NVIDIA GeForce MX550 (n=1) | |
| Moyenne de la classe Office (245 - 3964, n=80, 2 dernières années) | |
| Huawei MateBook X Pro 2022 | |
| Lenovo ThinkPad T14 G3-21CF004NGE | |
| Schenker Vision 14 2022 RTX 3050 Ti | |
| Blender / v3.3 Classroom HIP/AMD | |
| Moyenne de la classe Office (296 - 586, n=6, 2 dernières années) | |
| Lenovo ThinkPad T14 G3-21CF004NGE | |
* ... Moindre est la valeur, meilleures sont les performances
| The Witcher 3 - 1920x1080 Ultra Graphics & Postprocessing (HBAO+) | |
| Schenker Vision 14 2022 RTX 3050 Ti | |
| Lenovo ThinkPad T14 G3-21AJS00400 | |
| Lenovo ThinkPad T14 G3-21CF004NGE | |
| HP EliteBook 840 G9 | |
| Moyenne de la classe Office (3.8 - 32.5, n=17, 2 dernières années) | |
| Huawei MateBook X Pro 2022 | |
| Final Fantasy XV Benchmark - 1920x1080 High Quality | |
| Schenker Vision 14 2022 RTX 3050 Ti | |
| Lenovo ThinkPad T14 G3-21CF004NGE | |
| Moyenne de la classe Office (6.45 - 79.5, n=77, 2 dernières années) | |
| Lenovo ThinkPad T14 G3-21AJS00400 | |
| Huawei MateBook X Pro 2022 | |
| HP EliteBook 840 G9 | |
| Dota 2 Reborn - 1920x1080 ultra (3/3) best looking | |
| Schenker Vision 14 2022 RTX 3050 Ti | |
| Lenovo ThinkPad T14 G3-21AJS00400 | |
| Lenovo ThinkPad T14 G3-21CF004NGE | |
| HP EliteBook 840 G9 | |
| Huawei MateBook X Pro 2022 | |
| Moyenne de la classe Office (13.4 - 135, n=82, 2 dernières années) | |
The Witcher 3 FPS Chart
| Bas | Moyen | Élevé | Ultra | 4K | |
|---|---|---|---|---|---|
| GTA V (2015) | 159.9 | 152.3 | 73.4 | 33.7 | |
| The Witcher 3 (2015) | 149 | 89 | 48 | 24 | |
| Dota 2 Reborn (2015) | 142.1 | 127 | 110.4 | 101.1 | |
| Final Fantasy XV Benchmark (2018) | 69.2 | 34.3 | 20.8 | ||
| X-Plane 11.11 (2018) | 109.9 | 95.2 | 73.4 | ||
| Far Cry 5 (2018) | 95 | 40 | 32 | 30 | |
| Strange Brigade (2018) | 147 | 59 | 51 | 45 | |
| F1 2021 (2021) | 152.7 | 53.5 | 47.4 | 25.7 | |
| F1 22 (2022) | 59.4 | 51.3 | 41.2 | 28.1 |
Émissions et gestion de l'énergie
Niveaux de bruit
Le modèle Intel du ThinkPad T14 G3 est un compagnon très silencieux à faible charge, mais la montée en régime du ventilateur est un peu gênante. Même si la vitesse est rapidement réduite, le ventilateur monte en régime de manière très perceptible. Lorsque la charge est plus importante, l'appareil devient légèrement plus bruyant que la version AMD, et nous mesurons un maximum de presque 40 dB(A) en jouant et pendant le test de stress. Notre appareil de test ne produit pas d'autres bruits électroniques.
Degré de la nuisance sonore
| Au repos |
| 23.6 / 23.6 / 23.6 dB(A) |
| Fortement sollicité |
| 35.1 / 39.6 dB(A) |
 | ||
30 dB silencieux 40 dB(A) audible 50 dB(A) bruyant |
||
min: | ||
| Lenovo ThinkPad T14 G3-21AJS00400 GeForce MX550, i7-1260P, Samsung PM9A1 MZVL21T0HCLR | Lenovo ThinkPad T14 G3-21CF004NGE Radeon 680M, R7 PRO 6850U, Kioxia BG5 KBG5AZNV512G | HP EliteBook 840 G9 Iris Xe G7 96EUs, i7-1280P, SK hynix PC801 HFS512GEJ9X101N BF | Schenker Vision 14 2022 RTX 3050 Ti GeForce RTX 3050 Ti Laptop GPU, i7-12700H, Samsung SSD 980 Pro 1TB MZ-V8P1T0BW | Huawei MateBook X Pro 2022 Iris Xe G7 96EUs, i7-1260P, Silicon Motion PCIe-8 SSD 1TB | |
|---|---|---|---|---|---|
| Noise | 1% | -3% | -14% | 0% | |
| arrêt / environnement * (dB) | 23.6 | 24.2 -3% | 24.3 -3% | 24.4 -3% | 23.5 -0% |
| Idle Minimum * (dB) | 23.6 | 24.2 -3% | 24.5 -4% | 24.4 -3% | 23.5 -0% |
| Idle Average * (dB) | 23.6 | 24.2 -3% | 24.5 -4% | 24.4 -3% | 23.5 -0% |
| Idle Maximum * (dB) | 23.6 | 25.8 -9% | 26 -10% | 27.8 -18% | 25.9 -10% |
| Load Average * (dB) | 35.1 | 32.2 8% | 32.3 8% | 43.3 -23% | 33.8 4% |
| Witcher 3 ultra * (dB) | 39.6 | 34.1 14% | 39 2% | 48.2 -22% | 35.4 11% |
| Load Maximum * (dB) | 39.6 | 38.8 2% | 44.7 -13% | 48.8 -23% | 40.6 -3% |
* ... Moindre est la valeur, meilleures sont les performances
Températures
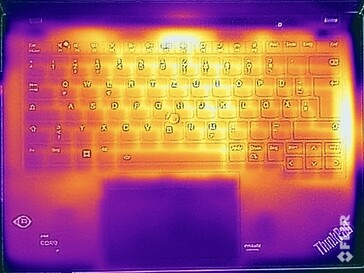
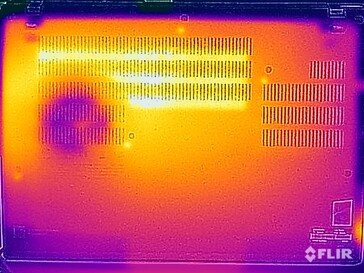
Lenovo a une bonne maîtrise des températures de surface du ThinkPad T14 G3 dans l'ensemble, mais à faible charge, l'appareil devient malheureusement déjà légèrement plus chaud que le modèle AMD. Sous une charge plus importante, nous mesurons une température maximale légèrement supérieure à 40 °C, ce qui n'entraîne donc aucune limitation, et vous pouvez toujours taper confortablement et garder l'appareil sur vos genoux.
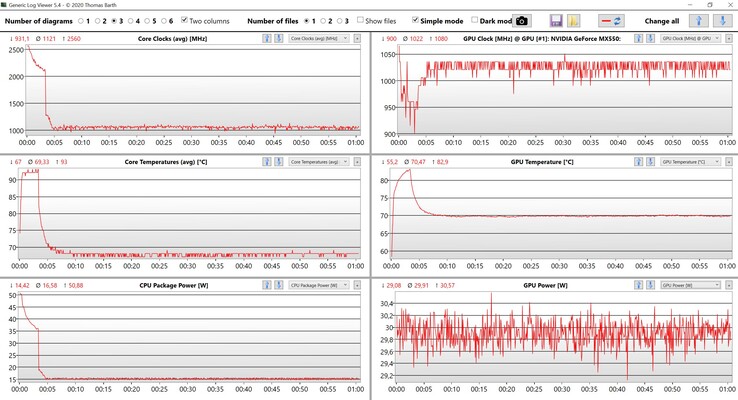
Pendant le test de stress, les performances du GPU restent stables à environ 30 watts, mais le processeur doit réduire massivement ses performances après quelques minutes, passant d'un maximum de 50 watts à seulement 15 watts. Si vous regardez la consommation, vous pouvez également voir immédiatement que l'alimentation de 65 watts ne sera jamais en mesure de fournir suffisamment de puissance ici, mais nous y reviendrons plus tard.
(-) La température maximale du côté supérieur est de 46.4 °C / 116 F, par rapport à la moyenne de 34.3 °C / 94 F, allant de 21.2 à 62.5 °C pour la classe Office.
(±) Le fond chauffe jusqu'à un maximum de 43.1 °C / 110 F, contre une moyenne de 36.8 °C / 98 F
(+) En utilisation inactive, la température moyenne du côté supérieur est de 29.9 °C / 86 F, par rapport à la moyenne du dispositif de 29.5 °C / 85 F.
(±) En jouant à The Witcher 3, la température moyenne du côté supérieur est de 37.5 °C / 100 F, alors que la moyenne de l'appareil est de 29.5 °C / 85 F.
(+) Les repose-poignets et le pavé tactile atteignent la température maximale de la peau (34.5 °C / 94.1 F) et ne sont donc pas chauds.
(-) La température moyenne de la zone de l'appui-paume de dispositifs similaires était de 27.5 °C / 81.5 F (-7 °C / #-12.6 F).
| Lenovo ThinkPad T14 G3-21AJS00400 Intel Core i7-1260P, NVIDIA GeForce MX550 | Lenovo ThinkPad T14 G3-21CF004NGE AMD Ryzen 7 PRO 6850U, AMD Radeon 680M | HP EliteBook 840 G9 Intel Core i7-1280P, Intel Iris Xe Graphics G7 96EUs | Schenker Vision 14 2022 RTX 3050 Ti Intel Core i7-12700H, NVIDIA GeForce RTX 3050 Ti Laptop GPU | Huawei MateBook X Pro 2022 Intel Core i7-1260P, Intel Iris Xe Graphics G7 96EUs | |
|---|---|---|---|---|---|
| Heat | 6% | 27% | -3% | 7% | |
| Maximum Upper Side * (°C) | 46.4 | 48.2 -4% | 32.8 29% | 48.4 -4% | 43.1 7% |
| Maximum Bottom * (°C) | 43.1 | 52.8 -23% | 36.6 15% | 57.1 -32% | 42 3% |
| Idle Upper Side * (°C) | 33.9 | 24.4 28% | 21.6 36% | 28.1 17% | 29.4 13% |
| Idle Bottom * (°C) | 31.4 | 24.5 22% | 22.2 29% | 29 8% | 29.4 6% |
* ... Moindre est la valeur, meilleures sont les performances
Intervenants
Lenovo ThinkPad T14 G3-21AJS00400 analyse audio
(±) | le niveau sonore du haut-parleur est moyen mais bon (77.8# dB)
Basses 100 - 315 Hz
(-) | presque aucune basse - en moyenne 24.9% plus bas que la médiane
(±) | la linéarité des basses est moyenne (11.7% delta à la fréquence précédente)
Médiums 400 - 2000 Hz
(+) | médiane équilibrée - seulement 2.4% de la médiane
(+) | les médiums sont linéaires (4% delta à la fréquence précédente)
Aiguës 2 - 16 kHz
(+) | des sommets équilibrés - à seulement 2.5% de la médiane
(+) | les aigus sont linéaires (3.8% delta à la fréquence précédente)
Globalement 100 - 16 000 Hz
(±) | la linéarité du son global est moyenne (18% de différence avec la médiane)
Par rapport à la même classe
» 29% de tous les appareils testés de cette catégorie étaient meilleurs, 7% similaires, 64% pires
» Le meilleur avait un delta de 7%, la moyenne était de 21%, le pire était de 53%.
Par rapport à tous les appareils testés
» 37% de tous les appareils testés étaient meilleurs, 8% similaires, 55% pires
» Le meilleur avait un delta de 4%, la moyenne était de 24%, le pire était de 134%.
Huawei MateBook X Pro 2022 analyse audio
(+) | les haut-parleurs peuvent jouer relativement fort (85.5# dB)
Basses 100 - 315 Hz
(±) | basse réduite - en moyenne 5% inférieure à la médiane
(+) | les basses sont linéaires (5.3% delta à la fréquence précédente)
Médiums 400 - 2000 Hz
(+) | médiane équilibrée - seulement 1.5% de la médiane
(+) | les médiums sont linéaires (2.5% delta à la fréquence précédente)
Aiguës 2 - 16 kHz
(+) | des sommets équilibrés - à seulement 2.1% de la médiane
(+) | les aigus sont linéaires (5.3% delta à la fréquence précédente)
Globalement 100 - 16 000 Hz
(+) | le son global est linéaire (5% différence à la médiane)
Par rapport à la même classe
» 0% de tous les appareils testés de cette catégorie étaient meilleurs, 0% similaires, 100% pires
» Le meilleur avait un delta de 5%, la moyenne était de 18%, le pire était de 53%.
Par rapport à tous les appareils testés
» 0% de tous les appareils testés étaient meilleurs, 0% similaires, 100% pires
» Le meilleur avait un delta de 4%, la moyenne était de 24%, le pire était de 134%.
Consommation électrique
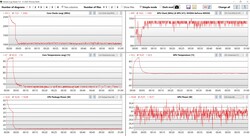
Le modèle Intel consomme plus d'énergie que la Version AMDdans tous les scénarios, même en mode veille (mais la différence de panneau peut aussi jouer un rôle). En outre, l'alimentation de 65 watts n'est pas suffisamment dimensionnée en charge, puisque l'appareil doit puiser de l'énergie dans la batterie au cours des trois premières minutes, la capacité de la batterie chutant également à ~95%. Ce n'est qu'après que le processeur ait atteint 15 watts (voir ci-dessus) que l'alimentation est en mesure de fournir une puissance suffisante pendant le test de stress.
Nous devons dire que Lenovo limite clairement les performances dans ce scénario. En utilisant un bloc d'alimentation de 100 watts, nous avons pu mesurer une consommation maximale de 101 watts au début du test de stress, avant qu'elle ne se stabilise à ~85 watts. La performance du CPU devrait être meilleure, mais d'un autre côté, cela aurait aussi un effet sur le bruit du ventilateur et les températures de surface.
| Éteint/en veille | |
| Au repos | |
| Fortement sollicité |
|
Légende:
min: | |
| Lenovo ThinkPad T14 G3-21AJS00400 GeForce MX550, i7-1260P, Samsung PM9A1 MZVL21T0HCLR | Lenovo ThinkPad T14 G3-21CF004NGE Radeon 680M, R7 PRO 6850U, Kioxia BG5 KBG5AZNV512G | HP EliteBook 840 G9 Iris Xe G7 96EUs, i7-1280P, SK hynix PC801 HFS512GEJ9X101N BF | Schenker Vision 14 2022 RTX 3050 Ti GeForce RTX 3050 Ti Laptop GPU, i7-12700H, Samsung SSD 980 Pro 1TB MZ-V8P1T0BW | Huawei MateBook X Pro 2022 Iris Xe G7 96EUs, i7-1260P, Silicon Motion PCIe-8 SSD 1TB | |
|---|---|---|---|---|---|
| Power Consumption | 26% | 10% | -63% | -55% | |
| Idle Minimum * (Watt) | 4.3 | 2.4 44% | 2.2 49% | 7.5 -74% | 6.5 -51% |
| Idle Average * (Watt) | 6.2 | 5.3 15% | 5.3 15% | 10.4 -68% | 13.7 -121% |
| Idle Maximum * (Watt) | 7 | 5.6 20% | 8.5 -21% | 11.4 -63% | 14.4 -106% |
| Load Average * (Watt) | 63.5 | 39.7 37% | 54.3 14% | 83.3 -31% | 64.6 -2% |
| Witcher 3 ultra * (Watt) | 52.5 | 42.8 18% | 51 3% | 92.7 -77% | 57.2 -9% |
| Load Maximum * (Watt) | 66.1 | 50.6 23% | 67.3 -2% | 110.3 -67% | 90.9 -38% |
* ... Moindre est la valeur, meilleures sont les performances
Power Consumption The Witcher 3 / Stress Test
Power Consumption with External Monitor
Autonomie de la batterie
Le même comportement se retrouve dans les tests de batterie, et le modèle Intel est clairement surpassé par la version AMD dans nos deux tests WLAN (une fois à pleine luminosité et ensuite à 150 cd/m²). Nous avons mesuré entre 7 et 8 heures en surf, tandis que le modèle AMD a duré ~9,5-13 heures.
Points positifs
Points négatifs
Verdict - Le ThinkPad T14 G3 est meilleur avec AMD
Si l'on considère le ThinkPad T14 G3 seul, il s'agit d'un bon ordinateur portable professionnel, même avec la combinaison Intel/Nvidia, avec des performances graphiques légèrement supérieures à celles de l'iGPU vieillissant d'Intel. Par rapport à la version Version AMDil y a quelques avantages, comme la performance plus élevée du processeur Intel à un seul cœur et la performance de jeu légèrement meilleure de la carte dédiée GeForce MX550. En outre, le modèle Intel offre Thunderbolt 4 et un emplacement SO-DIMM, ce qui permet d'étendre la mémoire de travail.
D'un autre côté, il y a aussi des inconvénients tels que la consommation d'énergie nettement plus élevée sous charge, le bloc d'alimentation de 65 watts inclus étant beaucoup trop faible, ce qui entraîne un étranglement artificiel de la performance sous la charge combinée du CPU/GPU. Le ventilateur est également plus bruyant et la durée de vie de la batterie est plus courte. Parallèlement, le processeur AMD affiche les mêmes performances dans les tests multicœurs, tout en consommant moins d'énergie.
En raison de la carte graphique supplémentaire, le ThinkPad T14 G3 consomme également plus d'énergie, alors que les performances supplémentaires par rapport à la version AMD sont très faibles. Le module supplémentaire ne vaut donc guère la peine, et ceux qui peuvent se passer de Thunderbolt 4 obtiendront un meilleur ordinateur portable professionnel avec une plus grande autonomie en choisissant la version AMD du ThinkPad T14 G3.
Un autre problème est celui de la dalle, mais cela vaut aussi pour tous les modèles du ThinkPad T14 G3. Par exemple, la dalle LG a laissé une meilleure impression lors du test que le modèle d'AU Optronics, même s'il s'agit dans les deux cas d'un écran LowPower de 14 pouces. Nous avons déjà vu cette loterie de panneaux dans les modèles précédents, et vous ne savez malheureusement jamais à l'avance quel panneau est utilisé.
Même si le T14 G3 est déjà sur le marché depuis un certain temps, les nouveaux CPU mobiles Raptor Lake d'Intel sont une mise à jour plutôt décevante dans l'ensemble, et à ce stade, nous ne savons pas quand les nouveaux modèles AMD arriveront. En tout cas, nous ne nous attendons pas à une mise à jour dans les prochains mois.
Prix et disponibilité
La version Intel du Lenovo ThinkPad T14 G3 est disponible chez Lenovo à partir de 1012,32 $, et la configuration Nvidia à partir de 1067,52 $.
Lenovo ThinkPad T14 G3-21AJS00400
- 03/21/2023 v7 (old)
Andreas Osthoff
Transparency
La sélection des appareils à examiner est effectuée par notre équipe éditoriale. L'échantillon de test a été prêté à l'auteur par le fabricant ou le détaillant pour les besoins de cet examen. Le prêteur n'a pas eu d'influence sur cette évaluation et le fabricant n'a pas reçu de copie de cette évaluation avant sa publication. Il n'y avait aucune obligation de publier cet article. En tant que média indépendant, Notebookcheck n'est pas soumis à l'autorité des fabricants, des détaillants ou des éditeurs.
Voici comment Notebookcheck teste
Chaque année, Notebookcheck examine de manière indépendante des centaines d'ordinateurs portables et de smartphones en utilisant des procédures standardisées afin de garantir que tous les résultats sont comparables. Nous avons continuellement développé nos méthodes de test depuis environ 20 ans et avons établi des normes industrielles dans le processus. Dans nos laboratoires de test, des équipements de mesure de haute qualité sont utilisés par des techniciens et des rédacteurs expérimentés. Ces tests impliquent un processus de validation en plusieurs étapes. Notre système d'évaluation complexe repose sur des centaines de mesures et de points de référence bien fondés, ce qui garantit l'objectivité.

