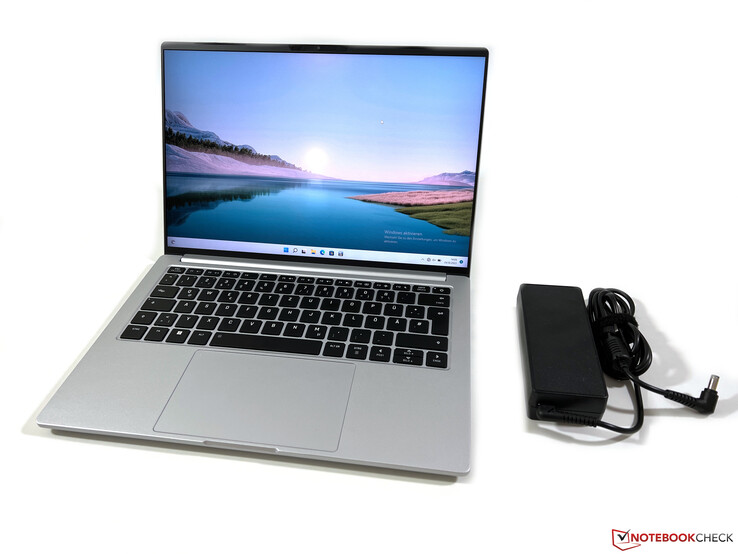
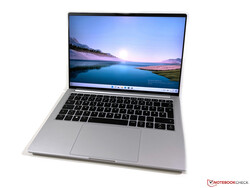
Test du Schenker Vision 14 : énormes améliorations des performances du Core i7-12700H
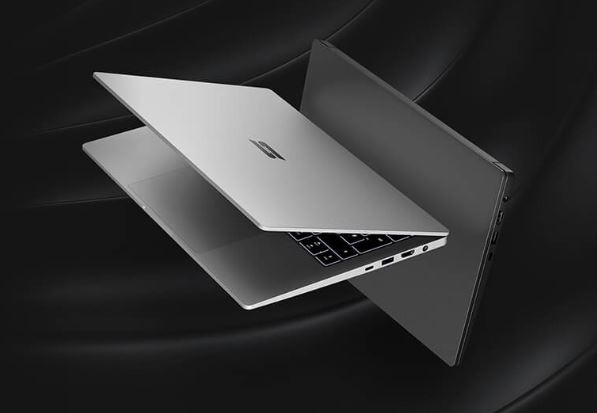
L'année dernière, Schenker a lancé un ordinateur portable de 14 pouces très intéressant qui brille par son extrême portabilité grâce à son faible poids d'un peu plus d'un kilo (2,2 lbs), appelé le Vision 14sans pour autant faire de compromis en termes de sélection de ports ou de performances. Plus tôt dans l'année, l'appareil a été rafraîchi avec un processeur Intel Tiger Lake-H35 et une solution de refroidissement plus efficace comprenant du métal liquide ainsi qu'un processeur RTX 3050 Ti dédié GeForce RTX 3050 Ti GPU en option. Nos principaux reproches concernant l'ordinateur portable susmentionné étaient les performances médiocres du processeur Intel de 11e génération et l'autonomie relativement faible.
Bien que Schenker ait annoncé le rafraîchissement du Vision 14 il y a quelques mois, nous n'avons eu la chance de l'examiner que maintenant en raison de problèmes de chaîne d'approvisionnement. Contrairement à notre première impression, le nouvel appareil est une mise à niveau assez importante, qui s'accompagne également d'une batterie massive de 99 Wh en option et a nécessité certaines modifications de la disposition interne. En outre, l'ancien processeur quadricœur de la génération Tiger Lake a été remplacé par un modèle Alder Lake plus récent. Contrairement à la plupart des autres appareils de cette catégorie, Schenker n'a pas opté pour un processeur Alder Lake-P (TDP de 28 W), mais pour un processeur de 45 watts Core i7-12700H.
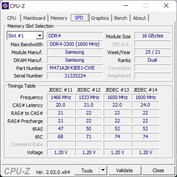
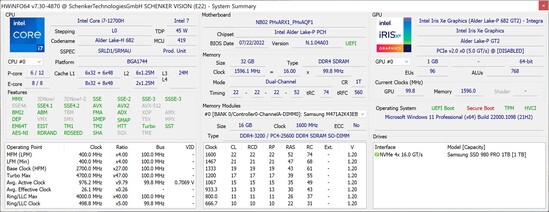
Nous avons reçu deux versions du Vision 14 de la part de Schenker, l'une avec et l'autre sans le GPU dédié GeForce. Étant donné qu'elles sont par ailleurs identiques (Core i7-12700H, panneau 3K, batterie de 99-Wh), nous allons énumérer les petites différences dans cette revue au lieu d'examiner les deux appareils séparément. Le nouveau Vision 14 avec iGPU est proposé à partir de 1659 USD, tandis que le modèle RTX 3050 Ti peut être acheté à partir de 1931 USD environ. Les modèles peuvent être configurés avec un large éventail d'options de RAM et de SSD ; notre appareil de test est livré avec 32 Go de RAM et un SSD PCIe-4.0 de 1 To (Samsung 980 Pro) pour environ 2200 USD.
Comparaison avec les concurrents potentiels
Note | Date | Modèle | Poids | Épaisseur | Taille | Résolution | Prix |
|---|---|---|---|---|---|---|---|
| 88.8 % v7 (old) | 10/22 | Schenker Vision 14 2022 RTX 3050 Ti i7-12700H, GeForce RTX 3050 Ti Laptop GPU | 1.3 kg | 16.6 mm | 14.00" | 2880x1800 | |
| 90.3 % v7 (old) | 09/22 | Huawei MateBook X Pro 2022 i7-1260P, Iris Xe G7 96EUs | 1.3 kg | 15.6 mm | 14.20" | 3120x2080 | |
| 90.6 % v7 (old) | 05/22 | Lenovo Yoga 9i 14 2022 i7-1260P i7-1260P, Iris Xe G7 96EUs | 1.4 kg | 15.25 mm | 14.00" | 3840x2400 | |
| 87.2 % v7 (old) | 09/22 | Dell Inspiron 14 Plus 7420 i7-12700H, GeForce RTX 3050 4GB Laptop GPU | 1.7 kg | 18.87 mm | 14.00" | 2240x1400 | |
| 86.3 % v7 (old) | 07/22 | Asus Vivobook Pro 14 M3401QC-KM007T R5 5600H, GeForce RTX 3050 4GB Laptop GPU | 1.5 kg | 19 mm | 14.00" | 2880x1800 | |
| 92.7 % v7 (old) | 11/21 | Apple MacBook Pro 14 2021 M1 Pro Entry M1 Pro 8-Core, M1 Pro 14-Core GPU | 1.6 kg | 15.5 mm | 14.20" | 3024x1964 |
Top 10
» Le Top 10 des PC portables multimédia
» Le Top 10 des PC portables de jeu
» Le Top 10 des PC portables de jeu légers
» Le Top 10 des ordinateurs portables bureautiques
» Le Top 10 des PC portables bureautiques premium/professionnels
» Le Top 10 des Stations de travail mobiles
» Le Top 10 des Ultraportables
» Le Top 10 des Ultrabooks
» Le Top 10 des Convertibles
» Le Top 10 des Tablettes
» Le Top 10 des Tablettes Windows
» Le Top 10 des Smartphones
» Le Top 10 des PC Portables á moins de 300 euros
» Le Top 10 des PC Portables á moins de 500 euros
» Le Top 25 des meilleurs écrans d'ordinateurs
Etui - Magnesium Vision 14 en deux couleurs
La conception générale du Schenker Vision 14 est resté inchangé et il existe des modèles noirs et argentés. Si les bords de l'écran sont en plastique, les autres parties (couvercle, unité de base) sont en alliage de magnésium. La rigidité reste excellente, mais l'écran est très fin, ce qui le rend assez flexible, comme en témoignent les déformations qui se produisent lorsqu'on exerce une pression ciblée sur l'arrière du couvercle. Lors d'une utilisation quotidienne, il n'y a aucune limite.
La charnière reste un point faible du Vision 14. Bien que la fermeté de la charnière ait été améliorée (~0,32 Nm contre 0,25 Nm sur le prédécesseur) selon Schenker, il y a toujours un tremblement perceptible lors du réglage de l'angle (jusqu'à 160 degrés). L'ouverture de l'écran d'une seule main est possible aussi bien sur le nouveau que sur l'ancien modèle. La version argentée est moins sensible aux traces de doigts et de graisse que le modèle noir lors d'une utilisation quotidienne.
Avec une batterie de 99 Wh et une RTX 3050 Ti GeForce, le poids de notre appareil de test de 1310 g (~2,89 lbs) dépasse celui de son prédécesseur de presque 200 g (~0,44 lbs), ce qui en fait le modèle le plus lourd du Vision 14. Le modèle 53-Wh, plus léger (~1,1 kg / ~2,43 lbs). Avec 1269 g (~2,80 lbs), la variante 99-Wh du Vision 14 sans la RTX 3050 Ti est à peine plus légère. Les nouveaux modèles 99-Wh sont également plus épais de 1 mm (16,6 contre 15,6 mm / 0,65 contre 0,61 in).
En comparaison, même la configuration la plus élevée de notre appareil de test pèse sensiblement moins que les autres appareils de notre comparaison avec les cartes graphiques dédiées. Avec 513 g (~1,13 lbs), l'adaptateur secteur inclus est relativement lourd.
Connectivité - Vision 14 avec Thunderbolt 4 et lecteur de carte
Aucun changement n'a été apporté en termes de connectivité, ce qui signifie que les utilisateurs continuent de bénéficier de la même sélection généreuse de ports, dont Thunderbolt 4. Un lecteur de cartes de taille normale est également disponible. Schenker utilise toujours le module Wi-Fi Intel AX201, qui atteint de bonnes vitesses de transfert dans nos tests. Comme la configuration de l'antenne du Vision 14 ne prend pas en charge les réseaux 6 GHz, les modules Wi-Fi 6E (tels que l'AX211) ne sont pas disponibles.
| SD Card Reader | |
| average JPG Copy Test (av. of 3 runs) | |
| Apple MacBook Pro 14 2021 M1 Pro Entry (AV PRO V60) | |
| Schenker Vision 14 (Angelbird AV Pro V60) | |
| Schenker Vision 14 2022 RTX 3050 Ti | |
| Moyenne de la classe Subnotebook (18.4 - 142, n=14, 2 dernières années) | |
| Asus Vivobook Pro 14 M3401QC-KM007T (AV Pro SD microSD 128 GB V60) | |
| Dell Inspiron 14 Plus 7420 (AV PRO microSD 128 GB V60) | |
| maximum AS SSD Seq Read Test (1GB) | |
| Schenker Vision 14 (Angelbird AV Pro V60) | |
| Schenker Vision 14 2022 RTX 3050 Ti | |
| Moyenne de la classe Subnotebook (22.5 - 207, n=14, 2 dernières années) | |
| Asus Vivobook Pro 14 M3401QC-KM007T (AV Pro SD microSD 128 GB V60) | |
| Dell Inspiron 14 Plus 7420 (AV PRO microSD 128 GB V60) | |
Webcam
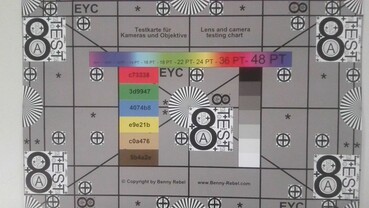
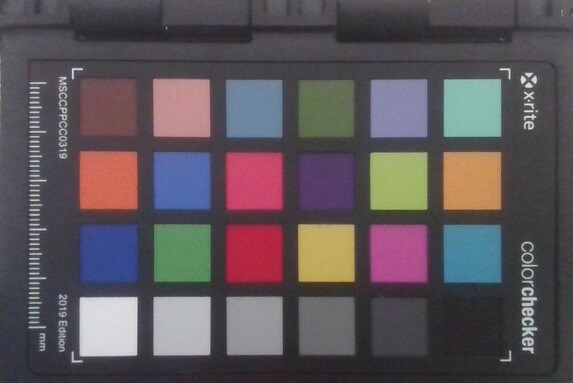
Le capteur de la webcam a été mis à niveau de l'ancienne version 720p à une version 1080p. Cela améliore légèrement la netteté de l'image, tout en maintenant les écarts de couleur assez faibles dans l'ensemble.
Maintenance
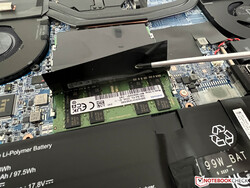
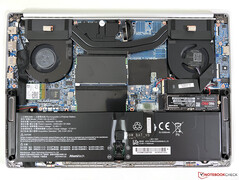
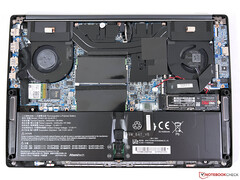
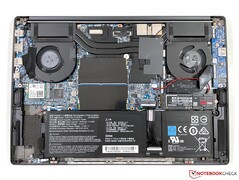
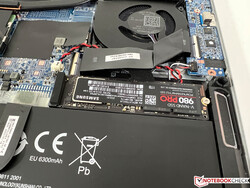
La plaque inférieure peut être facilement retirée pour révéler immédiatement la nouvelle batterie 99-Wh à l'intérieur ainsi que plusieurs changements coïncidant avec la carte mère et les haut-parleurs. Cela signifie que la nouvelle batterie ne s'adapte pas aux modèles précédents du Vision 14. Il convient de noter que l'emplacement secondaire M.2-2280 n'est pas disponible sur les modèles équipés de la plus grande batterie. La mémoire vive et le module Wi-Fi sont toujours évolutifs.
Dispositifs d'entrée - Clavier rétroéclairé et pavé tactile en verre
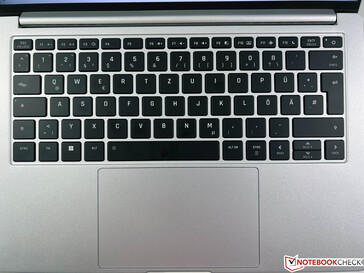
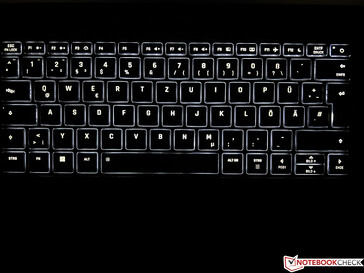
Les dispositifs d'entrée restent inchangés par rapport au modèle précédent. Le clavier rétroéclairé offre une expérience de frappe confortable avec des claquements de touches silencieux. Le pavé tactile en verre (13 x 8 cm / 5,12 x 3,15 in) est lui aussi de bonne qualité, mais ses clics sont très bruyants.
Écran - Vision 14 Still avec 3K IPS et 90 Hz
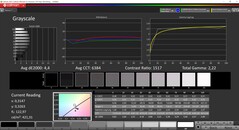
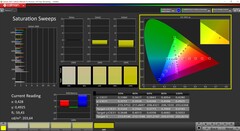
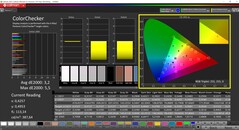
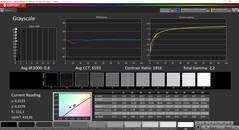
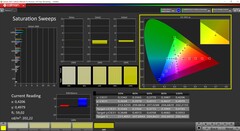
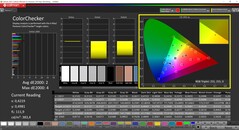
Il n'y a pas grand-chose à dire pour l'écran, puisque le constructeur mise toujours sur la même dalle 3K mate (16:10, 2880 x 1800 pixels). La qualité d'affichage est excellente et les zones lumineuses ne semblent pas granuleuses malgré la couche mate. Dans notre analyse professionnelle du logiciel CalMAN, la dalle s'en sort également bien. Il atteint une luminosité moyenne de ~415 nits et un bon taux de contraste de 1500:1. En sortie d'usine, il y a une légère teinte, mais nous avons pu la corriger grâce à notre calibration. Avec une couverture sRGB complète, l'édition de photos est également possible. L'écran ne fait pas appel au PWM.
| |||||||||||||||||||||||||
Homogénéité de la luminosité: 89 %
Valeur mesurée au centre, sur batterie: 424 cd/m²
Contraste: 1504:1 (Valeurs des noirs: 0.28 cd/m²)
ΔE ColorChecker Calman: 3.2 | ∀{0.5-29.43 Ø4.78}
calibrated: 2
ΔE Greyscale Calman: 4.4 | ∀{0.09-98 Ø5}
75.3% AdobeRGB 1998 (Argyll 3D)
97.4% sRGB (Argyll 3D)
74.1% Display P3 (Argyll 3D)
Gamma: 2.22
CCT: 6384 K
| Schenker Vision 14 2022 RTX 3050 Ti MNE007ZA1-1, IPS, 2880x1800, 14" | Schenker Vision 14 MNE007ZA1, IPS, 2880x1800, 14" | Huawei MateBook X Pro 2022 TMX1422, IPS, 3120x2080, 14.2" | Lenovo Yoga 9i 14 2022 i7-1260P LEN140WQUXGA, OLED, 3840x2400, 14" | Dell Inspiron 14 Plus 7420 InfoVision 140NWHE, IPS, 2240x1400, 14" | Asus Vivobook Pro 14 M3401QC-KM007T SAMSUNG: SDC4171, OLED, 2880x1800, 14" | Apple MacBook Pro 14 2021 M1 Pro Entry Mini-LED, 3024x1964, 14.2" | |
|---|---|---|---|---|---|---|---|
| Display | 0% | 15% | 22% | -4% | 21% | 34% | |
| Display P3 Coverage (%) | 74.1 | 74.3 0% | 94.6 28% | 98.7 33% | 68.8 -7% | 99.41 34% | 99.3 34% |
| sRGB Coverage (%) | 97.4 | 97.6 0% | 99.5 2% | 99.8 2% | 99.3 2% | 99.94 3% | |
| AdobeRGB 1998 Coverage (%) | 75.3 | 75.7 1% | 86.5 15% | 98.5 31% | 69.5 -8% | 94.79 26% | |
| Response Times | -28% | 1% | 86% | -31% | 85% | -132% | |
| Response Time Grey 50% / Grey 80% * (ms) | 31.5 ? | 40.4 ? -28% | 25.4 ? 19% | 2.8 ? 91% | 32.8 ? -4% | 3 ? 90% | 58.4 ? -85% |
| Response Time Black / White * (ms) | 14.5 ? | 18.4 ? -27% | 17.1 ? -18% | 2.8 ? 81% | 22.8 ? -57% | 3 ? 79% | 40.4 ? -179% |
| PWM Frequency (Hz) | 239.2 ? | 360 | 14880 | ||||
| Screen | 11% | 31% | 3006% | 5% | 53% | 439% | |
| Brightness middle (cd/m²) | 421 | 407 -3% | 603 43% | 361 -14% | 331.1 -21% | 384 -9% | 489 16% |
| Brightness (cd/m²) | 416 | 407 -2% | 586 41% | 362 -13% | 326 -22% | 385 -7% | 479 15% |
| Brightness Distribution (%) | 89 | 94 6% | 91 2% | 98 10% | 85 -4% | 98 10% | 94 6% |
| Black Level * (cd/m²) | 0.28 | 0.25 11% | 0.39 -39% | 0.001 100% | 0.29 -4% | 0.07 75% | 0.01 96% |
| Contrast (:1) | 1504 | 1628 8% | 1546 3% | 361000 23903% | 1142 -24% | 5486 265% | 48900 3151% |
| Colorchecker dE 2000 * | 3.2 | 2.6 19% | 1.1 66% | 2.8 12% | 2.23 30% | 1.75 45% | 0.8 75% |
| Colorchecker dE 2000 max. * | 5.5 | 4.4 20% | 2.2 60% | 5.8 -5% | 5.44 1% | 3.41 38% | 1.3 76% |
| Colorchecker dE 2000 calibrated * | 2 | 2 -0% | 1.2 40% | 0.63 68% | 2.32 -16% | ||
| Greyscale dE 2000 * | 4.4 | 2.7 39% | 1.5 66% | 1.9 57% | 3.6 18% | 1.06 76% | 1.1 75% |
| Gamma | 2.22 99% | 2.18 101% | 2.17 101% | 2.16 102% | 2.21 100% | 2.39 92% | 2.24 98% |
| CCT | 6384 102% | 6316 103% | 6549 99% | 6181 105% | 6022 108% | 6440 101% | |
| Moyenne finale (programmes/paramètres) | -6% /
3% | 16% /
23% | 1038% /
1868% | -10% /
-2% | 53% /
51% | 114% /
298% |
* ... Moindre est la valeur, meilleures sont les performances
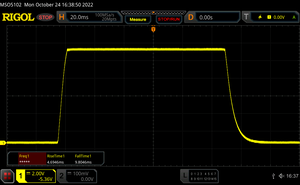
Temps de réponse de l'écran
| ↔ Temps de réponse noir à blanc | ||
|---|---|---|
| 14.5 ms ... hausse ↗ et chute ↘ combinées | ↗ 4.7 ms hausse | |
| ↘ 9.8 ms chute | ||
| L'écran montre de bons temps de réponse, mais insuffisant pour du jeu compétitif. En comparaison, tous les appareils testés affichent entre 0.1 (minimum) et 240 (maximum) ms. » 34 % des appareils testés affichent de meilleures performances. Cela signifie que les latences relevées sont meilleures que la moyenne (20.2 ms) de tous les appareils testés. | ||
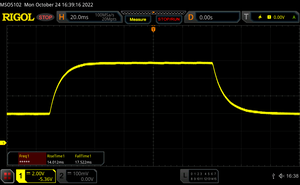
| ↔ Temps de réponse gris 50% à gris 80% | ||
| 31.5 ms ... hausse ↗ et chute ↘ combinées | ↗ 14 ms hausse | |
| ↘ 17.5 ms chute | ||
| L'écran souffre de latences très élevées, à éviter pour le jeu. En comparaison, tous les appareils testés affichent entre 0.165 (minimum) et 636 (maximum) ms. » 41 % des appareils testés affichent de meilleures performances. Cela signifie que les latences relevées sont similaires à la moyenne (31.6 ms) de tous les appareils testés. | ||
Scintillement / MLI (Modulation de largeur d'impulsion)
| Scintillement / MLI (Modulation de largeur d'impulsion) non décelé | |||
En comparaison, 53 % des appareils testés n'emploient pas MDI pour assombrir leur écran. Nous avons relevé une moyenne à 8108 (minimum : 5 - maximum : 343500) Hz dans le cas où une MDI était active. | |||
Performances - Alder Lake-H & GeForce RTX 3050 Ti
Conditions d'essai
Il y a une fois de plus deux profils de base avec trois sous-profils chacun, disponibles sur le logiciel Control Center préinstallé (silence et performance). De manière pratique, il est possible de passer d'un profil de base à l'autre à l'aide de la touche F3. Le tableau suivant répertorie les données de performance pour les différents profils de puissance.
| Profil | Stress CPU | Stress GPU | Stress combiné CPU+GPU | Bruit max. du ventilateur |
|---|---|---|---|---|
| Silencieux 20 dB | 10 watts | 20 watts | CPU : 10 wattsGPU : 20 watts |
32,5 dB(A) |
| Silencieux 30 dB | 13 watts | 25 watts | CPU : 13 wattsGPU : 25 watts |
40 dB(A) |
| Silencieux 40 dB | 15 watts | 35 watts | CPU : 15 wattsGPU : 35 watts |
45,8 dB(A) |
| Performance équilibrée | 60 -> 20 watts | 45 watts | CPU : 20 wattsGPU : 40 watts |
45,8 dB(A) |
| Performance Enthusiast | 60 -> 40 watts | 45 watts | CPU : 25 wattsGPU : 35 watts |
48,8 dB(A) |
| Performance Overboost | 60 -> 45 watts | 45 watts | CPU : 25 wattsGPU : 35 watts |
51,1 dB(A) |
Il y a deux différences notables entre notre appareil de test et le ancien modèle. Alors que l'ancien Tiger Lake Core i7-11370H était limité à 46 watts, le nouveau Core i7-12700H peut atteindre 60 watts RTX 3050 Ti doit maintenant se contenter de 45 watts (35 watts TGP + 10 watts Dynamic Boost), alors que jusqu'à 50 watts étaient disponibles pour le GPU sur l'ancien modèle.
Comme le profil Performance Enthusiast offre les meilleurs compromis dans l'ensemble, nous l'avons choisi pour nos tests. Dans certaines des sections suivantes (et la section sur le bruit du système en particulier), nous examinerons de plus près d'autres profils également, bien que les utilisateurs puissent vouloir choisir l'un des profils les plus faibles pour bénéficier d'un bruit de ventilateur plus faible dans des scénarios quotidiens peu exigeants.
Processeur - Intel Core i7-12700H
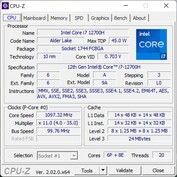
Le site Core i7-12700H est un processeur de 45 watts doté de 6 cœurs de performance et de 8 cœurs d'efficacité, ce qui lui permet de traiter simultanément jusqu'à 20 threads. Les limites du TDP (60/40 watts) sont bien respectées et les performances sont globalement excellentes. L'ancien Core i7-11370H est non seulement très en retard dans les tests multithread (le nouveau modèle est essentiellement deux fois plus rapide), mais aussi dans les tests single-thread grâce aux nouveaux cœurs de performance.
Cinebench R15 Multi Loop
Il faut maintenant se demander si le Core i7-12700H est plus intéressant à ces valeurs de TDP qu'un processeur Alder Lake-P tel que le Core i7-1260P (avec 4 cœurs de performance). La réponse est sans équivoque : oui, car c'est le nombre de cœurs de performance qui compte en définitive. Comme nous le savons, les cœurs de performance deviennent de plus en plus inefficaces à des vitesses d'horloge plus élevées. Bien que la répartition du TDP disponible entre un plus grand nombre de cœurs de performance se traduise par des vitesses d'horloge légèrement inférieures, elle se traduit également par des températures plus basses qui, à leur tour, bénéficient aux performances. De plus, les deux cœurs supplémentaires font plus que compenser les vitesses d'horloge légèrement inférieures. Bien que ce soit également le cas pour un Core i7-1280P (même configuration de cœur que le i7-12700H), l'équipementier ne propose pas de puces Alder Lake-P pour la version barebone du Vision 14 avec double caloduc.
L'avantage du Core i7-12700H devient très apparent dans une comparaison avec le Lenovo Yoga 9i 14qui utilise le Core i7-1260P à un TDP très similaire de 64/38 watts. Quoi qu'il en soit, le Core i7-12700H le surpasse de façon spectaculaire dans les tests multithread (~18 % dans notre boucle multi CB R15). Cela dit, il convient de noter que le Core i7-12700H n'est pas en mesure de libérer tout son potentiel ici, ce qui nécessiterait plus de 120 watts pour les vitesses d'horloge maximales de tous les cœurs. Les performances du processeur de la version iGPU du Vision 14 sont identiques.
En mode batterie, le processeur est limité à 45, puis à 40 watts, ce qui signifie que le niveau de performance reste assez élevé. La baisse de performance devient plus significative à des niveaux de batterie inférieurs à 20 %. Vous trouverez d'autres benchmarks du processeur dans notre section technique.
Cinebench R23: Multi Core | Single Core
Cinebench R20: CPU (Multi Core) | CPU (Single Core)
Cinebench R15: CPU Multi 64Bit | CPU Single 64Bit
Blender: v2.79 BMW27 CPU
7-Zip 18.03: 7z b 4 | 7z b 4 -mmt1
Geekbench 5.5: Multi-Core | Single-Core
HWBOT x265 Benchmark v2.2: 4k Preset
LibreOffice : 20 Documents To PDF
R Benchmark 2.5: Overall mean
| CPU Performance rating | |
| Moyenne Intel Core i7-12700H | |
| Dell Inspiron 14 Plus 7420 | |
| Schenker Vision 14 2022 RTX 3050 Ti | |
| Apple MacBook Pro 14 2021 M1 Pro Entry -8! | |
| Moyenne de la classe Subnotebook | |
| Lenovo Yoga 9i 14 2022 i7-1260P | |
| Huawei MateBook X Pro 2022 | |
| Asus Vivobook Pro 14 M3401QC-KM007T | |
| Schenker Vision 14 | |
| Cinebench R23 / Multi Core | |
| Moyenne Intel Core i7-12700H (4032 - 19330, n=64) | |
| Schenker Vision 14 2022 RTX 3050 Ti | |
| Dell Inspiron 14 Plus 7420 | |
| Moyenne de la classe Subnotebook (1555 - 21812, n=76, 2 dernières années) | |
| Lenovo Yoga 9i 14 2022 i7-1260P | |
| Apple MacBook Pro 14 2021 M1 Pro Entry | |
| Huawei MateBook X Pro 2022 | |
| Asus Vivobook Pro 14 M3401QC-KM007T | |
| Schenker Vision 14 | |
| Cinebench R23 / Single Core | |
| Lenovo Yoga 9i 14 2022 i7-1260P | |
| Dell Inspiron 14 Plus 7420 | |
| Moyenne Intel Core i7-12700H (778 - 1826, n=63) | |
| Moyenne de la classe Subnotebook (358 - 2165, n=77, 2 dernières années) | |
| Schenker Vision 14 2022 RTX 3050 Ti | |
| Huawei MateBook X Pro 2022 | |
| Apple MacBook Pro 14 2021 M1 Pro Entry | |
| Schenker Vision 14 | |
| Asus Vivobook Pro 14 M3401QC-KM007T | |
| Cinebench R20 / CPU (Multi Core) | |
| Moyenne Intel Core i7-12700H (1576 - 7407, n=64) | |
| Schenker Vision 14 2022 RTX 3050 Ti | |
| Dell Inspiron 14 Plus 7420 | |
| Moyenne de la classe Subnotebook (579 - 8541, n=70, 2 dernières années) | |
| Lenovo Yoga 9i 14 2022 i7-1260P | |
| Huawei MateBook X Pro 2022 | |
| Asus Vivobook Pro 14 M3401QC-KM007T | |
| Schenker Vision 14 | |
| Cinebench R20 / CPU (Single Core) | |
| Schenker Vision 14 2022 RTX 3050 Ti | |
| Dell Inspiron 14 Plus 7420 | |
| Moyenne Intel Core i7-12700H (300 - 704, n=64) | |
| Huawei MateBook X Pro 2022 | |
| Lenovo Yoga 9i 14 2022 i7-1260P | |
| Moyenne de la classe Subnotebook (128 - 826, n=70, 2 dernières années) | |
| Schenker Vision 14 | |
| Asus Vivobook Pro 14 M3401QC-KM007T | |
| Cinebench R15 / CPU Multi 64Bit | |
| Moyenne Intel Core i7-12700H (1379 - 2916, n=70) | |
| Dell Inspiron 14 Plus 7420 | |
| Schenker Vision 14 2022 RTX 3050 Ti | |
| Moyenne de la classe Subnotebook (327 - 3345, n=70, 2 dernières années) | |
| Huawei MateBook X Pro 2022 | |
| Huawei MateBook X Pro 2022 | |
| Lenovo Yoga 9i 14 2022 i7-1260P | |
| Asus Vivobook Pro 14 M3401QC-KM007T | |
| Apple MacBook Pro 14 2021 M1 Pro Entry | |
| Schenker Vision 14 | |
| Schenker Vision 14 | |
| Cinebench R15 / CPU Single 64Bit | |
| Schenker Vision 14 2022 RTX 3050 Ti | |
| Moyenne de la classe Subnotebook (72.4 - 322, n=70, 2 dernières années) | |
| Dell Inspiron 14 Plus 7420 | |
| Moyenne Intel Core i7-12700H (113 - 263, n=65) | |
| Huawei MateBook X Pro 2022 | |
| Lenovo Yoga 9i 14 2022 i7-1260P | |
| Schenker Vision 14 | |
| Asus Vivobook Pro 14 M3401QC-KM007T | |
| Apple MacBook Pro 14 2021 M1 Pro Entry | |
| Blender / v2.79 BMW27 CPU | |
| Schenker Vision 14 | |
| Moyenne de la classe Subnotebook (159 - 2271, n=73, 2 dernières années) | |
| Asus Vivobook Pro 14 M3401QC-KM007T | |
| Huawei MateBook X Pro 2022 | |
| Lenovo Yoga 9i 14 2022 i7-1260P | |
| Schenker Vision 14 2022 RTX 3050 Ti | |
| Dell Inspiron 14 Plus 7420 | |
| Moyenne Intel Core i7-12700H (168 - 732, n=63) | |
| 7-Zip 18.03 / 7z b 4 | |
| Moyenne Intel Core i7-12700H (22844 - 73067, n=63) | |
| Dell Inspiron 14 Plus 7420 | |
| Schenker Vision 14 2022 RTX 3050 Ti | |
| Moyenne de la classe Subnotebook (11668 - 77867, n=70, 2 dernières années) | |
| Lenovo Yoga 9i 14 2022 i7-1260P | |
| Huawei MateBook X Pro 2022 | |
| Asus Vivobook Pro 14 M3401QC-KM007T | |
| Schenker Vision 14 | |
| 7-Zip 18.03 / 7z b 4 -mmt1 | |
| Schenker Vision 14 2022 RTX 3050 Ti | |
| Moyenne Intel Core i7-12700H (2743 - 5972, n=63) | |
| Dell Inspiron 14 Plus 7420 | |
| Schenker Vision 14 | |
| Moyenne de la classe Subnotebook (2643 - 6442, n=72, 2 dernières années) | |
| Huawei MateBook X Pro 2022 | |
| Asus Vivobook Pro 14 M3401QC-KM007T | |
| Lenovo Yoga 9i 14 2022 i7-1260P | |
| Geekbench 5.5 / Multi-Core | |
| Dell Inspiron 14 Plus 7420 | |
| Moyenne Intel Core i7-12700H (5144 - 13745, n=64) | |
| Schenker Vision 14 2022 RTX 3050 Ti | |
| Moyenne de la classe Subnotebook (2557 - 17218, n=65, 2 dernières années) | |
| Lenovo Yoga 9i 14 2022 i7-1260P | |
| Huawei MateBook X Pro 2022 | |
| Apple MacBook Pro 14 2021 M1 Pro Entry | |
| Asus Vivobook Pro 14 M3401QC-KM007T | |
| Schenker Vision 14 | |
| Geekbench 5.5 / Single-Core | |
| Moyenne de la classe Subnotebook (726 - 2350, n=65, 2 dernières années) | |
| Schenker Vision 14 2022 RTX 3050 Ti | |
| Apple MacBook Pro 14 2021 M1 Pro Entry | |
| Lenovo Yoga 9i 14 2022 i7-1260P | |
| Huawei MateBook X Pro 2022 | |
| Moyenne Intel Core i7-12700H (803 - 1851, n=64) | |
| Dell Inspiron 14 Plus 7420 | |
| Schenker Vision 14 | |
| Asus Vivobook Pro 14 M3401QC-KM007T | |
| HWBOT x265 Benchmark v2.2 / 4k Preset | |
| Moyenne Intel Core i7-12700H (4.67 - 21.8, n=64) | |
| Dell Inspiron 14 Plus 7420 | |
| Schenker Vision 14 2022 RTX 3050 Ti | |
| Moyenne de la classe Subnotebook (0.97 - 25.1, n=70, 2 dernières années) | |
| Lenovo Yoga 9i 14 2022 i7-1260P | |
| Huawei MateBook X Pro 2022 | |
| Asus Vivobook Pro 14 M3401QC-KM007T | |
| Schenker Vision 14 | |
| LibreOffice / 20 Documents To PDF | |
| Asus Vivobook Pro 14 M3401QC-KM007T | |
| Moyenne de la classe Subnotebook (38.5 - 220, n=69, 2 dernières années) | |
| Dell Inspiron 14 Plus 7420 | |
| Schenker Vision 14 | |
| Lenovo Yoga 9i 14 2022 i7-1260P | |
| Moyenne Intel Core i7-12700H (34.2 - 95.3, n=63) | |
| Schenker Vision 14 2022 RTX 3050 Ti | |
| Huawei MateBook X Pro 2022 | |
| R Benchmark 2.5 / Overall mean | |
| Asus Vivobook Pro 14 M3401QC-KM007T | |
| Schenker Vision 14 | |
| Moyenne de la classe Subnotebook (0.403 - 1.456, n=71, 2 dernières années) | |
| Lenovo Yoga 9i 14 2022 i7-1260P | |
| Huawei MateBook X Pro 2022 | |
| Dell Inspiron 14 Plus 7420 | |
| Moyenne Intel Core i7-12700H (0.4441 - 1.052, n=63) | |
| Schenker Vision 14 2022 RTX 3050 Ti | |
* ... Moindre est la valeur, meilleures sont les performances
AIDA64: FP32 Ray-Trace | FPU Julia | CPU SHA3 | CPU Queen | FPU SinJulia | FPU Mandel | CPU AES | CPU ZLib | FP64 Ray-Trace | CPU PhotoWorxx
| Performance rating | |
| Moyenne Intel Core i7-12700H | |
| Moyenne de la classe Subnotebook | |
| Schenker Vision 14 2022 RTX 3050 Ti | |
| Dell Inspiron 14 Plus 7420 | |
| Asus Vivobook Pro 14 M3401QC-KM007T | |
| Huawei MateBook X Pro 2022 | |
| Lenovo Yoga 9i 14 2022 i7-1260P | |
| AIDA64 / FP32 Ray-Trace | |
| Moyenne de la classe Subnotebook (1135 - 32888, n=69, 2 dernières années) | |
| Schenker Vision 14 2022 RTX 3050 Ti | |
| Dell Inspiron 14 Plus 7420 | |
| Asus Vivobook Pro 14 M3401QC-KM007T | |
| Moyenne Intel Core i7-12700H (2585 - 17957, n=63) | |
| Lenovo Yoga 9i 14 2022 i7-1260P | |
| Huawei MateBook X Pro 2022 | |
| AIDA64 / FPU Julia | |
| Asus Vivobook Pro 14 M3401QC-KM007T | |
| Moyenne de la classe Subnotebook (5218 - 123315, n=69, 2 dernières années) | |
| Schenker Vision 14 2022 RTX 3050 Ti | |
| Dell Inspiron 14 Plus 7420 | |
| Moyenne Intel Core i7-12700H (12439 - 90760, n=63) | |
| Huawei MateBook X Pro 2022 | |
| Lenovo Yoga 9i 14 2022 i7-1260P | |
| AIDA64 / CPU SHA3 | |
| Moyenne de la classe Subnotebook (444 - 5287, n=69, 2 dernières années) | |
| Moyenne Intel Core i7-12700H (833 - 4242, n=63) | |
| Schenker Vision 14 2022 RTX 3050 Ti | |
| Dell Inspiron 14 Plus 7420 | |
| Asus Vivobook Pro 14 M3401QC-KM007T | |
| Lenovo Yoga 9i 14 2022 i7-1260P | |
| Huawei MateBook X Pro 2022 | |
| AIDA64 / CPU Queen | |
| Moyenne Intel Core i7-12700H (57923 - 103202, n=63) | |
| Dell Inspiron 14 Plus 7420 | |
| Schenker Vision 14 2022 RTX 3050 Ti | |
| Huawei MateBook X Pro 2022 | |
| Asus Vivobook Pro 14 M3401QC-KM007T | |
| Moyenne de la classe Subnotebook (10579 - 115682, n=69, 2 dernières années) | |
| Lenovo Yoga 9i 14 2022 i7-1260P | |
| AIDA64 / FPU SinJulia | |
| Moyenne Intel Core i7-12700H (3249 - 9939, n=63) | |
| Asus Vivobook Pro 14 M3401QC-KM007T | |
| Schenker Vision 14 2022 RTX 3050 Ti | |
| Dell Inspiron 14 Plus 7420 | |
| Moyenne de la classe Subnotebook (744 - 18418, n=69, 2 dernières années) | |
| Huawei MateBook X Pro 2022 | |
| Lenovo Yoga 9i 14 2022 i7-1260P | |
| AIDA64 / FPU Mandel | |
| Asus Vivobook Pro 14 M3401QC-KM007T | |
| Moyenne de la classe Subnotebook (3341 - 65433, n=69, 2 dernières années) | |
| Dell Inspiron 14 Plus 7420 | |
| Schenker Vision 14 2022 RTX 3050 Ti | |
| Moyenne Intel Core i7-12700H (7135 - 44760, n=63) | |
| Huawei MateBook X Pro 2022 | |
| Lenovo Yoga 9i 14 2022 i7-1260P | |
| AIDA64 / CPU AES | |
| Asus Vivobook Pro 14 M3401QC-KM007T | |
| Moyenne Intel Core i7-12700H (31839 - 144360, n=63) | |
| Schenker Vision 14 2022 RTX 3050 Ti | |
| Dell Inspiron 14 Plus 7420 | |
| Huawei MateBook X Pro 2022 | |
| Moyenne de la classe Subnotebook (638 - 161430, n=69, 2 dernières années) | |
| Lenovo Yoga 9i 14 2022 i7-1260P | |
| AIDA64 / CPU ZLib | |
| Moyenne Intel Core i7-12700H (305 - 1171, n=63) | |
| Schenker Vision 14 2022 RTX 3050 Ti | |
| Dell Inspiron 14 Plus 7420 | |
| Moyenne de la classe Subnotebook (164.9 - 1379, n=69, 2 dernières années) | |
| Lenovo Yoga 9i 14 2022 i7-1260P | |
| Huawei MateBook X Pro 2022 | |
| Asus Vivobook Pro 14 M3401QC-KM007T | |
| AIDA64 / FP64 Ray-Trace | |
| Moyenne de la classe Subnotebook (610 - 17495, n=69, 2 dernières années) | |
| Schenker Vision 14 2022 RTX 3050 Ti | |
| Dell Inspiron 14 Plus 7420 | |
| Moyenne Intel Core i7-12700H (1437 - 9692, n=63) | |
| Asus Vivobook Pro 14 M3401QC-KM007T | |
| Lenovo Yoga 9i 14 2022 i7-1260P | |
| Huawei MateBook X Pro 2022 | |
| AIDA64 / CPU PhotoWorxx | |
| Moyenne de la classe Subnotebook (6569 - 64588, n=69, 2 dernières années) | |
| Huawei MateBook X Pro 2022 | |
| Dell Inspiron 14 Plus 7420 | |
| Moyenne Intel Core i7-12700H (12863 - 52207, n=63) | |
| Schenker Vision 14 2022 RTX 3050 Ti | |
| Lenovo Yoga 9i 14 2022 i7-1260P | |
| Asus Vivobook Pro 14 M3401QC-KM007T | |
Performance du système
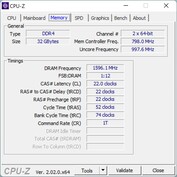
L'impression subjective de réactivité du Vision 14 est confirmée par nos benchmarks synthétiques. Lors de nos tests, nous n'avons rencontré aucun problème. La décision de Schenker de ne pas utiliser de RAM DDR5 (en raison du coût, selon le fabricant), n'a pas d'impact sur l'utilisation quotidienne.
CrossMark: Overall | Productivity | Creativity | Responsiveness
| PCMark 10 / Score | |
| Moyenne de la classe Subnotebook (4920 - 8424, n=56, 2 dernières années) | |
| Moyenne Intel Core i7-12700H, NVIDIA GeForce RTX 3050 Ti Laptop GPU (6623 - 7075, n=5) | |
| Dell Inspiron 14 Plus 7420 | |
| Schenker Vision 14 2022 RTX 3050 Ti | |
| Huawei MateBook X Pro 2022 | |
| Schenker Vision 14 | |
| Asus Vivobook Pro 14 M3401QC-KM007T | |
| Lenovo Yoga 9i 14 2022 i7-1260P | |
| PCMark 10 / Essentials | |
| Lenovo Yoga 9i 14 2022 i7-1260P | |
| Huawei MateBook X Pro 2022 | |
| Moyenne de la classe Subnotebook (8552 - 11406, n=56, 2 dernières années) | |
| Schenker Vision 14 2022 RTX 3050 Ti | |
| Moyenne Intel Core i7-12700H, NVIDIA GeForce RTX 3050 Ti Laptop GPU (9540 - 10970, n=5) | |
| Dell Inspiron 14 Plus 7420 | |
| Asus Vivobook Pro 14 M3401QC-KM007T | |
| Schenker Vision 14 | |
| PCMark 10 / Productivity | |
| Moyenne de la classe Subnotebook (5435 - 16132, n=56, 2 dernières années) | |
| Moyenne Intel Core i7-12700H, NVIDIA GeForce RTX 3050 Ti Laptop GPU (8530 - 9555, n=5) | |
| Dell Inspiron 14 Plus 7420 | |
| Schenker Vision 14 | |
| Huawei MateBook X Pro 2022 | |
| Schenker Vision 14 2022 RTX 3050 Ti | |
| Asus Vivobook Pro 14 M3401QC-KM007T | |
| Lenovo Yoga 9i 14 2022 i7-1260P | |
| PCMark 10 / Digital Content Creation | |
| Moyenne de la classe Subnotebook (5722 - 12442, n=56, 2 dernières années) | |
| Moyenne Intel Core i7-12700H, NVIDIA GeForce RTX 3050 Ti Laptop GPU (8855 - 9542, n=5) | |
| Schenker Vision 14 2022 RTX 3050 Ti | |
| Dell Inspiron 14 Plus 7420 | |
| Asus Vivobook Pro 14 M3401QC-KM007T | |
| Lenovo Yoga 9i 14 2022 i7-1260P | |
| Schenker Vision 14 | |
| Huawei MateBook X Pro 2022 | |
| CrossMark / Overall | |
| Huawei MateBook X Pro 2022 | |
| Moyenne Intel Core i7-12700H, NVIDIA GeForce RTX 3050 Ti Laptop GPU (1654 - 1872, n=5) | |
| Dell Inspiron 14 Plus 7420 | |
| Lenovo Yoga 9i 14 2022 i7-1260P | |
| Schenker Vision 14 2022 RTX 3050 Ti | |
| Moyenne de la classe Subnotebook (365 - 2038, n=70, 2 dernières années) | |
| Schenker Vision 14 | |
| Apple MacBook Pro 14 2021 M1 Pro Entry | |
| Asus Vivobook Pro 14 M3401QC-KM007T | |
| CrossMark / Productivity | |
| Huawei MateBook X Pro 2022 | |
| Moyenne Intel Core i7-12700H, NVIDIA GeForce RTX 3050 Ti Laptop GPU (1595 - 1792, n=5) | |
| Schenker Vision 14 2022 RTX 3050 Ti | |
| Dell Inspiron 14 Plus 7420 | |
| Lenovo Yoga 9i 14 2022 i7-1260P | |
| Schenker Vision 14 | |
| Moyenne de la classe Subnotebook (364 - 1918, n=70, 2 dernières années) | |
| Asus Vivobook Pro 14 M3401QC-KM007T | |
| Apple MacBook Pro 14 2021 M1 Pro Entry | |
| CrossMark / Creativity | |
| Apple MacBook Pro 14 2021 M1 Pro Entry | |
| Dell Inspiron 14 Plus 7420 | |
| Huawei MateBook X Pro 2022 | |
| Moyenne Intel Core i7-12700H, NVIDIA GeForce RTX 3050 Ti Laptop GPU (1699 - 1993, n=5) | |
| Lenovo Yoga 9i 14 2022 i7-1260P | |
| Moyenne de la classe Subnotebook (372 - 2396, n=70, 2 dernières années) | |
| Schenker Vision 14 2022 RTX 3050 Ti | |
| Schenker Vision 14 | |
| Asus Vivobook Pro 14 M3401QC-KM007T | |
| CrossMark / Responsiveness | |
| Huawei MateBook X Pro 2022 | |
| Moyenne Intel Core i7-12700H, NVIDIA GeForce RTX 3050 Ti Laptop GPU (1383 - 1768, n=5) | |
| Lenovo Yoga 9i 14 2022 i7-1260P | |
| Schenker Vision 14 2022 RTX 3050 Ti | |
| Schenker Vision 14 | |
| Dell Inspiron 14 Plus 7420 | |
| Moyenne de la classe Subnotebook (312 - 1889, n=70, 2 dernières années) | |
| Asus Vivobook Pro 14 M3401QC-KM007T | |
| Apple MacBook Pro 14 2021 M1 Pro Entry | |
| PCMark 10 Score | 6623 points | |
Aide | ||
| AIDA64 / Memory Copy | |
| Moyenne de la classe Subnotebook (14554 - 109035, n=69, 2 dernières années) | |
| Huawei MateBook X Pro 2022 | |
| Dell Inspiron 14 Plus 7420 | |
| Moyenne Intel Core i7-12700H (25615 - 80511, n=63) | |
| Schenker Vision 14 2022 RTX 3050 Ti | |
| Asus Vivobook Pro 14 M3401QC-KM007T | |
| AIDA64 / Memory Read | |
| Moyenne de la classe Subnotebook (15948 - 127174, n=69, 2 dernières années) | |
| Huawei MateBook X Pro 2022 | |
| Dell Inspiron 14 Plus 7420 | |
| Moyenne Intel Core i7-12700H (25586 - 79442, n=63) | |
| Asus Vivobook Pro 14 M3401QC-KM007T | |
| Schenker Vision 14 2022 RTX 3050 Ti | |
| AIDA64 / Memory Write | |
| Moyenne de la classe Subnotebook (15709 - 117898, n=69, 2 dernières années) | |
| Huawei MateBook X Pro 2022 | |
| Dell Inspiron 14 Plus 7420 | |
| Moyenne Intel Core i7-12700H (23679 - 88660, n=63) | |
| Schenker Vision 14 2022 RTX 3050 Ti | |
| Asus Vivobook Pro 14 M3401QC-KM007T | |
| AIDA64 / Memory Latency | |
| Dell Inspiron 14 Plus 7420 | |
| Huawei MateBook X Pro 2022 | |
| Moyenne de la classe Subnotebook (6.8 - 187.8, n=68, 2 dernières années) | |
| Schenker Vision 14 2022 RTX 3050 Ti | |
| Asus Vivobook Pro 14 M3401QC-KM007T | |
| Moyenne Intel Core i7-12700H (76.2 - 133.9, n=61) | |
* ... Moindre est la valeur, meilleures sont les performances
Latence DPC
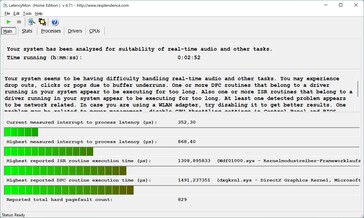
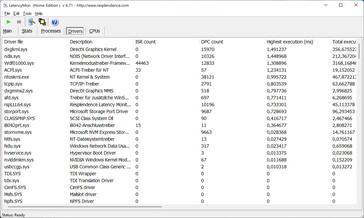
Le Vision 14 présente des latences légèrement accrues dans notre test de latence standardisé sur la version actuelle du BIOS, ce qui en fait un choix sous-optimal pour les applications en temps réel. Aucune image n'a été perdue pendant la lecture de vidéos 4K sur YouTube.
| DPC Latencies / LatencyMon - interrupt to process latency (max), Web, Youtube, Prime95 | |
| Asus Vivobook Pro 14 M3401QC-KM007T | |
| Lenovo Yoga 9i 14 2022 i7-1260P | |
| Huawei MateBook X Pro 2022 | |
| Schenker Vision 14 2022 RTX 3050 Ti | |
| Dell Inspiron 14 Plus 7420 | |
* ... Moindre est la valeur, meilleures sont les performances
Solution de stockage
Comme nous l'avons mentionné précédemment, le choix de la batterie de 99 Wh signifie qu'il n'y a pas d'emplacement secondaire M.2-2280. Notre appareil de test est équipé du Samsung Pro 1 To, qui atteint des vitesses de transfert allant jusqu'à 7 Go/s, ce qui en fait l'un des disques les plus rapides actuellement disponibles. Il n'y a pas non plus de problèmes thermiques et les performances restent tout à fait constantes, même en cas de charge continue. Plus de benchmarks SSD sont disponibles ici.
* ... Moindre est la valeur, meilleures sont les performances
Disk Throttling: DiskSpd Read Loop, Queue Depth 8
Performances du GPU
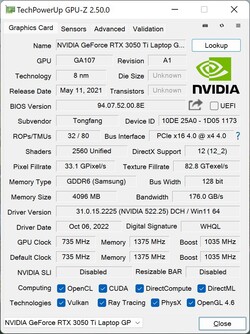
Le Vision 14 utilise toujours la populaire Nvidia GeForce RTX 3050 Ti avec un TGP de 35 watts (et un Dynamic Boost supplémentaire de 10 watts pour le CPU). La Nvidia RTX 3050 Ti est évaluée pour un TGP de 35-80 watts, ce qui signifie que notre modèle de test utilise une version plus faible de la puce. Le benchmarking du Vision 14 reflète cela avec des résultats qui sont légèrement inférieurs pour ce GPU.
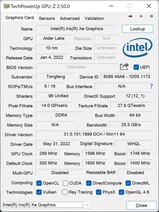
Par rapport à son prédécesseur avec la RTX 3050 Tile dernier Vision 14 est capable de s'assurer une petite avance et se retrouve à égalité avec le M1 Pro GPU dans le modèle de base Apple MacBook Pro 14. Si l'on choisit la version iGPU de la Vision 14, la carte Intel Iris Xe Graphics G7 d'Intel avec 96 UEs est utilisé à la place, ce qui se traduit par des performances de GPU nettement plus faibles, comme le montrent les concurrents suivants Lenovo Yoga 9i 14 et Huawei MateBook X Pro.
Les performances du GPU restent cohérentes même en cas de charge continue, bien qu'elles souffrent un peu en mode batterie (~ 75 %). Plus de benchmarks GPU peuvent être trouvés ici.
| 3DMark 11 Performance | 16439 points | |
| 3DMark Fire Strike Score | 11233 points | |
| 3DMark Time Spy Score | 5098 points | |
Aide | ||
| Blender / v3.3 Classroom OPTIX/RTX | |
| Moyenne de la classe Subnotebook (n=12 dernières années) | |
| Dell Inspiron 14 Plus 7420 | |
| Asus VivoBook Pro 16X OLED N7600PC-L2026X | |
| Schenker Vision 14 2022 RTX 3050 Ti | |
| Moyenne NVIDIA GeForce RTX 3050 Ti Laptop GPU (48 - 60, n=7) | |
| Dell Precision 7670 | |
| Lenovo ThinkBook 16p G3 ARH | |
| Blender / v3.3 Classroom CUDA | |
| Moyenne de la classe Subnotebook (n=12 dernières années) | |
| Asus VivoBook Pro 16X OLED N7600PC-L2026X | |
| Dell Inspiron 14 Plus 7420 | |
| Schenker Vision 14 2022 RTX 3050 Ti | |
| Moyenne NVIDIA GeForce RTX 3050 Ti Laptop GPU (83 - 104, n=7) | |
| Dell Precision 7670 | |
| Lenovo ThinkBook 16p G3 ARH | |
| Blender / v3.3 Classroom CPU | |
| Asus VivoBook Pro 16X OLED N7600PC-L2026X | |
| Huawei MateBook X Pro 2022 | |
| Lenovo ThinkPad T14 G3-21CF004NGE | |
| Moyenne de la classe Subnotebook (241 - 861, n=72, 2 dernières années) | |
| Dell Inspiron 14 Plus 7420 | |
| Schenker Vision 14 2022 RTX 3050 Ti | |
| Moyenne NVIDIA GeForce RTX 3050 Ti Laptop GPU (379 - 557, n=7) | |
| Lenovo ThinkBook 16p G3 ARH | |
| Dell Precision 7670 | |
* ... Moindre est la valeur, meilleures sont les performances
Performances en matière de jeux
Puisque les performances de jeu sont encore principalement définies par la GeForce RTX 3050 Timême si certains résultats de benchmark montrent les avantages du processeur plus rapide, il n'y a que des différences mineures entre le nouveau et l'ancien Vision 14 ancien Vision 14 en particulier avec des paramètres de qualité très élevés. De nombreux titres modernes fonctionnent de manière fluide, même avec des détails élevés ou maximaux, bien que les paramètres graphiques devront être réduits dans les titres très exigeants tels que Cyberpunk 2077 ou F1 2022 afin d'obtenir des taux d'images fluides.
Witcher 3 FPS Graph
Les performances de jeu restent constantes sous un stress continu, comme le montre notre Witcher 3 boucle le montre. Cependant, il peut être intéressant de tester si les profils d'alimentation plus silencieux peuvent fournir suffisamment de performances de jeu, en fonction du jeu. En mode batterie, les performances de jeu sont considérablement réduites et les détails doivent être réduits de manière drastique pour que les jeux restent jouables.
| Bas | Moyen | Élevé | Ultra | QHD | |
|---|---|---|---|---|---|
| GTA V (2015) | 170.6 | 163.3 | 121 | 67.5 | 48.4 |
| The Witcher 3 (2015) | 249 | 264 | 92 | 44.2 | |
| Dota 2 Reborn (2015) | 148.1 | 121.9 | 114.4 | 109.1 | |
| Final Fantasy XV Benchmark (2018) | 130.6 | 71 | 50.1 | 36.2 | |
| X-Plane 11.11 (2018) | 112.4 | 99.6 | 82.3 | ||
| Far Cry 5 (2018) | 121 | 87 | 79 | 75 | 53 |
| Strange Brigade (2018) | 259 | 126.9 | 100.8 | 86 | 63 |
| F1 2021 (2021) | 223 | 148 | 120.8 | 59.2 | 41 |
| Cyberpunk 2077 1.6 (2022) | 56 | 49 | 40 | 31 | 20 |
| F1 22 (2022) | 136.1 | 124.8 | 93 | 28 | 16.1 |
Emissions - Vision 14 devient trop bruyante
Bruit du système
Par rapport au modèle précédent, rien n'a changé en termes de solution de refroidissement. Le Vision 14 utilise toujours deux ventilateurs et deux caloducs. Bien que certains résultats aient été légèrement modifiés, ils correspondent essentiellement à ceux du ancien modèle. Nos résultats pour différents scénarios sont répertoriés dans le tableau suivant. Nous n'avons remarqué aucun bruit électronique.
| Profil | Cinebench R23 Multi | Witcher 3 Ultra | Test de stress |
|---|---|---|---|
| Silencieux 20 dB | 26 dB(A) | 32,5 dB(A) | 32,5 dB(A) |
| Silencieux 30 dB | 26 dB(A) | 40 dB(A) | 40 dB(A) |
| Silencieux 40 dB | 27,8 dB(A) | 45,8 dB(A) | 45,8 dB(A) |
| Performance Balanced | 29.2 dB(A) | 45.8 dB(A) | 45.8 dB(A) |
| Performance Enthusiast | 46 dB(A) | 48.2dB(A) | 48.8 dB(A) |
| Performance Overboost | 48,2 dB(A) | 51,1 dB(A) | 51,1 dB(A) |
Degré de la nuisance sonore
| Au repos |
| 24.4 / 24.4 / 27.8 dB(A) |
| Fortement sollicité |
| 43.3 / 48.8 dB(A) |
 | ||
30 dB silencieux 40 dB(A) audible 50 dB(A) bruyant |
||
min: | ||
| Schenker Vision 14 2022 RTX 3050 Ti GeForce RTX 3050 Ti Laptop GPU, i7-12700H, Samsung SSD 980 Pro 1TB MZ-V8P1T0BW | Huawei MateBook X Pro 2022 Iris Xe G7 96EUs, i7-1260P, Silicon Motion PCIe-8 SSD 1TB | Lenovo Yoga 9i 14 2022 i7-1260P Iris Xe G7 96EUs, i7-1260P, Samsung PM9A1 MZVL21T0HCLR | Dell Inspiron 14 Plus 7420 GeForce RTX 3050 4GB Laptop GPU, i7-12700H, SK Hynix BC711 512GB HFM512GD3GX013N | Asus Vivobook Pro 14 M3401QC-KM007T GeForce RTX 3050 4GB Laptop GPU, R5 5600H, Intel SSD 670p SSDPEKNU512GZ | Apple MacBook Pro 14 2021 M1 Pro Entry M1 Pro 14-Core GPU, M1 Pro 8-Core, Apple SSD AP0512 | Schenker Vision 14 GeForce RTX 3050 Ti Laptop GPU, i7-11370H, Samsung SSD 980 Pro 1TB MZ-V8P1T0BW | |
|---|---|---|---|---|---|---|---|
| Noise | 12% | 6% | 1% | -11% | 12% | 2% | |
| arrêt / environnement * (dB) | 24.4 | 23.5 4% | 24.1 1% | 23.2 5% | 25.4 -4% | 24.8 -2% | 24.3 -0% |
| Idle Minimum * (dB) | 24.4 | 23.5 4% | 24.1 1% | 23.2 5% | 25.4 -4% | 24.8 -2% | 24.3 -0% |
| Idle Average * (dB) | 24.4 | 23.5 4% | 24.1 1% | 23.2 5% | 25.4 -4% | 24.8 -2% | 24.3 -0% |
| Idle Maximum * (dB) | 27.8 | 25.9 7% | 30 -8% | 23.2 17% | 30.9 -11% | 24.8 11% | 25.9 7% |
| Load Average * (dB) | 43.3 | 33.8 22% | 39.4 9% | 47.5 -10% | 56 -29% | 27.8 36% | 43.3 -0% |
| Witcher 3 ultra * (dB) | 48.2 | 35.4 27% | 39.4 18% | 51.7 -7% | 27.8 42% | 44.6 7% | |
| Load Maximum * (dB) | 48.8 | 40.6 17% | 39.4 19% | 51.7 -6% | 56 -15% | 49.5 -1% | 49.5 -1% |
* ... Moindre est la valeur, meilleures sont les performances
Température
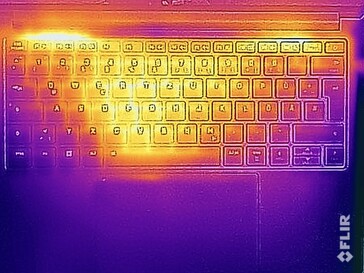
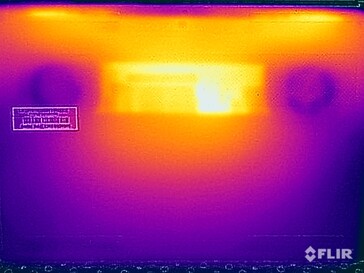
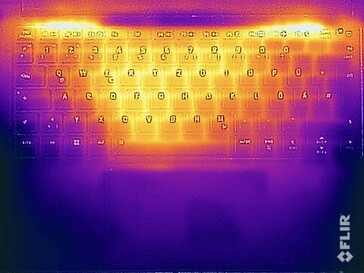
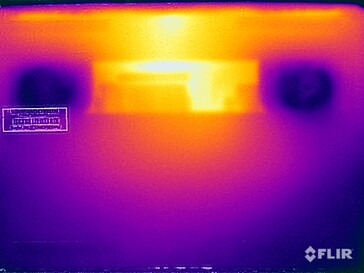
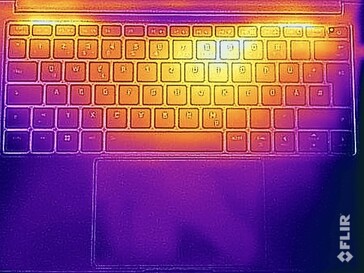
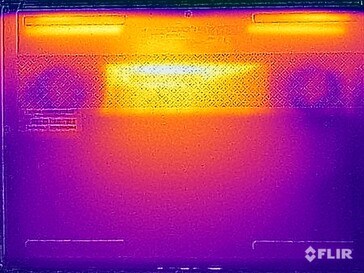
Il existe également des similitudes frappantes avec le prédécesseur en ce qui concerne les températures de surface. En mode veille et lors de l'exécution de tâches peu exigeantes, les températures restent basses, tandis que la zone centrale au-dessus du clavier et la zone centrale inférieure peuvent atteindre près de 50 °C et plus de 50 °C, respectivement. Nous vous déconseillons d'utiliser l'ordinateur portable sur vos genoux dans ces scénarios. Avec seulement jusqu'à 45 °C (113 °F) sous charge, la version iGPU reste nettement plus fraîche.
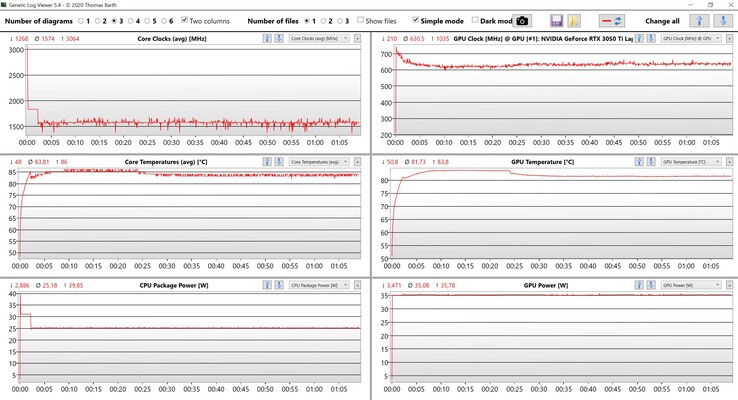
Pendant notre test de stress, la carte graphique reste à 35 watts de manière constante, tandis que le processeur consomme initialement environ 31 watts avant de se stabiliser à 25 watts après quelques minutes. La pleine performance est encore disponible directement après le test de stress.
(-) La température maximale du côté supérieur est de 48.4 °C / 119 F, par rapport à la moyenne de 35.9 °C / 97 F, allant de 21.4 à 59 °C pour la classe Subnotebook.
(-) Le fond chauffe jusqu'à un maximum de 57.1 °C / 135 F, contre une moyenne de 39.3 °C / 103 F
(+) En utilisation inactive, la température moyenne du côté supérieur est de 26.6 °C / 80 F, par rapport à la moyenne du dispositif de 30.8 °C / 87 F.
(-) En jouant à The Witcher 3, la température moyenne du côté supérieur est de 40.8 °C / 105 F, alors que la moyenne de l'appareil est de 30.8 °C / 87 F.
(+) Les repose-poignets et le pavé tactile sont plus froids que la température de la peau avec un maximum de 28.5 °C / 83.3 F et sont donc froids au toucher.
(±) La température moyenne de la zone de l'appui-paume de dispositifs similaires était de 28.2 °C / 82.8 F (-0.3 °C / #-0.5 F).
| Schenker Vision 14 2022 RTX 3050 Ti Intel Core i7-12700H, NVIDIA GeForce RTX 3050 Ti Laptop GPU | Huawei MateBook X Pro 2022 Intel Core i7-1260P, Intel Iris Xe Graphics G7 96EUs | Lenovo Yoga 9i 14 2022 i7-1260P Intel Core i7-1260P, Intel Iris Xe Graphics G7 96EUs | Dell Inspiron 14 Plus 7420 Intel Core i7-12700H, NVIDIA GeForce RTX 3050 4GB Laptop GPU | Asus Vivobook Pro 14 M3401QC-KM007T AMD Ryzen 5 5600H, NVIDIA GeForce RTX 3050 4GB Laptop GPU | Apple MacBook Pro 14 2021 M1 Pro Entry Apple M1 Pro 8-Core, Apple M1 Pro 14-Core GPU | Schenker Vision 14 Intel Core i7-11370H, NVIDIA GeForce RTX 3050 Ti Laptop GPU | |
|---|---|---|---|---|---|---|---|
| Heat | 8% | 4% | 14% | -7% | 16% | -2% | |
| Maximum Upper Side * (°C) | 48.4 | 43.1 11% | 47.5 2% | 40 17% | 42.3 13% | 46.8 3% | 49.7 -3% |
| Maximum Bottom * (°C) | 57.1 | 42 26% | 52.2 9% | 36.4 36% | 49.6 13% | 40.9 28% | 56 2% |
| Idle Upper Side * (°C) | 28.1 | 29.4 -5% | 27.1 4% | 27 4% | 34.2 -22% | 24.2 14% | 28.8 -2% |
| Idle Bottom * (°C) | 29 | 29.4 -1% | 28.5 2% | 29.2 -1% | 37.9 -31% | 24.2 17% | 30.6 -6% |
* ... Moindre est la valeur, meilleures sont les performances
Haut-parleurs
En raison de la grande batterie, deux nouveaux modules de haut-parleurs ont dû être utilisés. La différence n'est cependant pas perceptible et la qualité audio reste l'un des points faibles du Vision 14. Les haut-parleurs ont un son très fin et ne peuvent pas rivaliser avec ceux d'autres ordinateurs portables multimédias.
Schenker Vision 14 2022 RTX 3050 Ti analyse audio
(±) | le niveau sonore du haut-parleur est moyen mais bon (81.9# dB)
Basses 100 - 315 Hz
(-) | presque aucune basse - en moyenne 20.6% plus bas que la médiane
(±) | la linéarité des basses est moyenne (9% delta à la fréquence précédente)
Médiums 400 - 2000 Hz
(±) | médiane supérieure - en moyenne 6.7% supérieure à la médiane
(+) | les médiums sont linéaires (5.8% delta à la fréquence précédente)
Aiguës 2 - 16 kHz
(+) | des sommets équilibrés - à seulement 4.3% de la médiane
(+) | les aigus sont linéaires (4.9% delta à la fréquence précédente)
Globalement 100 - 16 000 Hz
(±) | la linéarité du son global est moyenne (20.4% de différence avec la médiane)
Par rapport à la même classe
» 64% de tous les appareils testés de cette catégorie étaient meilleurs, 8% similaires, 27% pires
» Le meilleur avait un delta de 5%, la moyenne était de 18%, le pire était de 53%.
Par rapport à tous les appareils testés
» 53% de tous les appareils testés étaient meilleurs, 8% similaires, 39% pires
» Le meilleur avait un delta de 4%, la moyenne était de 24%, le pire était de 134%.
Apple MacBook Pro 14 2021 M1 Pro Entry analyse audio
(+) | les haut-parleurs peuvent jouer relativement fort (84.9# dB)
Basses 100 - 315 Hz
(+) | bonne basse - seulement 4.3% loin de la médiane
(+) | les basses sont linéaires (5.9% delta à la fréquence précédente)
Médiums 400 - 2000 Hz
(+) | médiane équilibrée - seulement 1.1% de la médiane
(+) | les médiums sont linéaires (1.9% delta à la fréquence précédente)
Aiguës 2 - 16 kHz
(+) | des sommets équilibrés - à seulement 2.9% de la médiane
(+) | les aigus sont linéaires (3% delta à la fréquence précédente)
Globalement 100 - 16 000 Hz
(+) | le son global est linéaire (5.6% différence à la médiane)
Par rapport à la même classe
» 2% de tous les appareils testés de cette catégorie étaient meilleurs, 1% similaires, 97% pires
» Le meilleur avait un delta de 5%, la moyenne était de 17%, le pire était de 45%.
Par rapport à tous les appareils testés
» 0% de tous les appareils testés étaient meilleurs, 0% similaires, 100% pires
» Le meilleur avait un delta de 4%, la moyenne était de 24%, le pire était de 134%.
Gestion de l'énergie - Autonomie accrue grâce à la batterie de 99 Wh
Consommation d'énergie
Bien que la consommation d'énergie ait été légèrement améliorée par rapport au ancien modèlela consommation de plus de 11 watts du Vision 14 n'en fait toujours pas un appareil très efficace, ce qui est une conséquence de la dalle 3K. Nous avons mesuré une consommation maximale de 110 watts (qui chute et se stabilise à ~93 watts après quelques minutes). La capacité de la batterie n'ayant pas changé pendant le test, l'adaptateur secteur de 90 watts inclus semble disposer de quelques réserves cachées. Charger et alimenter l'appareil avec un chargeur USB-C (minimum 65 watts) est généralement possible, les modèles de 90 watts seront alors probablement incapables d'atteindre le plein potentiel de performance du Vision 14 ou seront obligés de recourir à l'accès à la batterie en pleine charge.
| Éteint/en veille | |
| Au repos | |
| Fortement sollicité |
|
Légende:
min: | |
| Schenker Vision 14 2022 RTX 3050 Ti i7-12700H, GeForce RTX 3050 Ti Laptop GPU, Samsung SSD 980 Pro 1TB MZ-V8P1T0BW, IPS, 2880x1800, 14" | Huawei MateBook X Pro 2022 i7-1260P, Iris Xe G7 96EUs, Silicon Motion PCIe-8 SSD 1TB, IPS, 3120x2080, 14.2" | Lenovo Yoga 9i 14 2022 i7-1260P i7-1260P, Iris Xe G7 96EUs, Samsung PM9A1 MZVL21T0HCLR, OLED, 3840x2400, 14" | Dell Inspiron 14 Plus 7420 i7-12700H, GeForce RTX 3050 4GB Laptop GPU, SK Hynix BC711 512GB HFM512GD3GX013N, IPS, 2240x1400, 14" | Asus Vivobook Pro 14 M3401QC-KM007T R5 5600H, GeForce RTX 3050 4GB Laptop GPU, Intel SSD 670p SSDPEKNU512GZ, OLED, 2880x1800, 14" | Apple MacBook Pro 14 2021 M1 Pro Entry M1 Pro 8-Core, M1 Pro 14-Core GPU, Apple SSD AP0512, Mini-LED, 3024x1964, 14.2" | Schenker Vision 14 i7-11370H, GeForce RTX 3050 Ti Laptop GPU, Samsung SSD 980 Pro 1TB MZ-V8P1T0BW, IPS, 2880x1800, 14" | Moyenne NVIDIA GeForce RTX 3050 Ti Laptop GPU | Moyenne de la classe Subnotebook | |
|---|---|---|---|---|---|---|---|---|---|
| Power Consumption | 6% | 16% | -19% | 13% | 27% | -7% | -23% | 39% | |
| Idle Minimum * (Watt) | 7.5 | 6.5 13% | 7.1 5% | 6.3 16% | 6.6 12% | 2.9 61% | 6.7 11% | 8.2 ? -9% | 4 ? 47% |
| Idle Average * (Watt) | 10.4 | 13.7 -32% | 10 4% | 10.3 1% | 9.6 8% | 11.6 -12% | 12.6 -21% | 12.6 ? -21% | 6.85 ? 34% |
| Idle Maximum * (Watt) | 11.4 | 14.4 -26% | 10.8 5% | 20 -75% | 7.3 36% | 11.9 -4% | 15.4 -35% | 17.2 ? -51% | 8.47 ? 26% |
| Load Average * (Watt) | 83.3 | 64.6 22% | 64 23% | 106.2 -27% | 73 12% | 49.5 41% | 85.7 -3% | 92 ? -10% | 44.4 ? 47% |
| Witcher 3 ultra * (Watt) | 92.7 | 57.2 38% | 47.7 49% | 96.1 -4% | 74.4 20% | 58.2 37% | 83 10% | ||
| Load Maximum * (Watt) | 110.3 | 90.9 18% | 97 12% | 136.5 -24% | 119 -8% | 68.5 38% | 110.9 -1% | 139.1 ? -26% | 67.4 ? 39% |
* ... Moindre est la valeur, meilleures sont les performances
Power Consumption Witcher 3 / Stress Test
Power Consumption external Monitor
Autonomie de la batterie
Avec 99 Wh, la nouvelle batterie offre presque deux fois plus de capacité, ce qui se traduit sans surprise par une autonomie nettement améliorée. Alors que le prédécesseur ne pouvait tenir qu'entre 4,5 et 5,5 heures dans notre test Wi-Fi, selon le réglage de la luminosité, le nouveau modèle atteint 8 à 10 heures et 11 heures de lecture vidéo à une luminosité de 150 nits (environ 36 % de luminosité maximale dans le cas de notre appareil de test). Si ces résultats sont bons, ils montrent également que la dalle 3K n'est tout simplement pas très efficace. Un appareil avec une telle capacité de batterie aurait pu autrement atteindre des durées d'exécution encore meilleures.
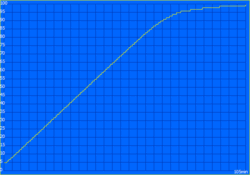
Lorsque l'appareil est allumé, le processus de charge dure 105 minutes ; 50 % de la batterie est déjà disponible après 36 minutes. Le modèle iGPU du Vision 14 atteint essentiellement les mêmes résultats avec un écart de quelques minutes.
| Schenker Vision 14 2022 RTX 3050 Ti i7-12700H, GeForce RTX 3050 Ti Laptop GPU, 99.8 Wh | Huawei MateBook X Pro 2022 i7-1260P, Iris Xe G7 96EUs, 60 Wh | Lenovo Yoga 9i 14 2022 i7-1260P i7-1260P, Iris Xe G7 96EUs, 75 Wh | Dell Inspiron 14 Plus 7420 i7-12700H, GeForce RTX 3050 4GB Laptop GPU, 64 Wh | Asus Vivobook Pro 14 M3401QC-KM007T R5 5600H, GeForce RTX 3050 4GB Laptop GPU, 63 Wh | Apple MacBook Pro 14 2021 M1 Pro Entry M1 Pro 8-Core, M1 Pro 14-Core GPU, 69.9 Wh | Schenker Vision 14 i7-11370H, GeForce RTX 3050 Ti Laptop GPU, 53 Wh | Moyenne de la classe Subnotebook | |
|---|---|---|---|---|---|---|---|---|
| Autonomie de la batterie | -26% | -8% | -43% | -8% | 9% | -39% | 25% | |
| H.264 (h) | 11.1 | 7.6 -32% | 12.6 14% | 15 35% | 6.8 -39% | 16.7 ? 50% | ||
| WiFi v1.3 (h) | 10.1 | 7.5 -26% | 8.6 -15% | 7.2 -29% | 9.5 -6% | 13.6 35% | 5.5 -46% | 13.3 ? 32% |
| Load (h) | 2.1 | 1.7 -19% | 1.6 -24% | 0.9 -57% | 1.9 -10% | 1.2 -43% | 1.4 -33% | 1.945 ? -7% |
| Reader / Idle (h) | 11.9 | 11.5 | 30.7 ? |
Points positifs
Points négatifs
Verdict - Vision 14 avec des améliorations significatives
Avec la dernière version du Vision 14, Schenker répond aux deux principales critiques que nous avions formulées à l'égard de son prédécesseur. Le nouveau processeur Alder Lake-H45 offre beaucoup plus de performances que l'ancienne puce Tiger Lake, ce qui fait du Vision 14 l'un des modèles les plus rapides de sa catégorie d'appareils. De même, la RTX 3050 Ti offre des performances convenables, bien que les développements dans ce domaine aient été rares depuis un certain temps, ce qui nous rend encore plus enthousiastes pour les prochains GPU RTX 4000.
Grâce à la nouvelle batterie de 99 Wh, l'autonomie augmente également de façon spectaculaire, bien que cela se fasse au prix d'un poids plus élevé d'environ 0,44 lb, d'une épaisseur accrue de 1 mm (~0,04 in) et de l'emplacement SSD M.2-2280 secondaire. Bien que la version plus légère avec une batterie plus petite de 53 Wh soit toujours disponible, elle doit être configurée avec le GPU dédié GeForce. Pour les utilisateurs qui n'ont pas besoin de longues durées d'exécution, le modèle plus léger reste une recommandation facile.
Grâce au Core i7-12700H et à la batterie de 99 Wh, le nouveau Vision 14 n'est plus aussi limité en termes de performances du CPU ou d'autonomie de la batterie. Bien que le châssis de 14 pouces soit légèrement plus lourd et légèrement plus épais, la combinaison de bonnes performances, d'une grande variété de ports, de bonnes options de maintenance et d'un magnifique écran 3K à 90 Hz font du Vision 14 un excellent ordinateur portable de 14 pouces extrêmement passionnant.
Le Vision 14 conserve son très faible encombrement, ses options de port suffisantes, ses emplacements de RAM et son module Wi-Fi amovible malgré son châssis légèrement plus épais et plus lourd. Bien que l'incompatibilité avec les réseaux modernes à 6 GHz (Wi-Fi 6E) soit un inconvénient, les utilisateurs ne seront probablement pas limités par cela pendant un certain temps. En outre, les charnières du couvercle ne sont pas aussi serrées que celles des concurrents, ce qui entraîne un vacillement assez important. Bien que l'adaptateur secteur de 90 watts soit trop faible nominalement, il semble être suffisant pour la consommation de pointe de 110 watts. En outre, les utilisateurs devront toujours faire face à des températures de surface élevées et à des ventilateurs bruyants en cas de charge élevée ou de jeu. Ceci est simplement le résultat de composants très performants dans un châssis compact.
Les concurrents ayant des caractéristiques de performance similaires et des GPU dédiés sont nettement plus lourds que le Vision 14 et c'est essentiellement la performance maximale actuellement disponible dans ce petit facteur de forme. Cependant, le Vision 14 avec la RTX 3050 Ti n'est pas exactement une bonne affaire, son prix étant similaire à celui de l'actuel MacBook Pro 14 (bien qu'avec moins de RAM et de stockage). Ce dernier est probablement un meilleur choix pour les utilisateurs qui ne dépendent pas de Windows en raison du mini panneau LED, de la puce M1 Pro efficace et de l'excellente configuration des haut-parleurs. En attendant, le Dell Inspiron 14 Plus 7420 - tout en étant sensiblement plus lourd et plus épais, est une alternative beaucoup moins chère.
Prix et disponibilité
Le Schenker Vision 14 peut être configuré sur sur Bestware.com à partir de 1659 Euros (~1659 USD).https://bestware.com/de/schenker-vision-14-e22.html
Schenker Vision 14 2022 RTX 3050 Ti
- 10/25/2022 v7 (old)
Andreas Osthoff


