Test du HP EliteBook 840 G9 : l'alternative au Lenovo ThinkPad X1 Carbon
L'EliteBook 840 G9 est la version Intel de l'EliteBook 845 G9 que nous avions récemment examiné dans deux configurations différentes. Pour cette page d'examen, nous nous concentrerons sur les performances de la configuration EliteBook 840 G9 Core i7-1280P, car les détails sur le châssis, le clavier, la facilité d'entretien et d'autres attributs physiques peuvent être trouvés sur notre site Web aMD existant pages d'examen
La sélection d'UGS est beaucoup plus large que sur la plupart des ordinateurs portables grand public car l'EliteBook intègre beaucoup plus de fonctionnalités optionnelles. Les processeurs vont du Core i5-1250P au Core i7-1280P, les écrans de 250-nit à 1000-nit, et de 8 à 64 GB de RAM parmi d'autres options auxiliaires comme indiqué ici. L'unité que nous avons testée est équipée du processeur Core i7-1280P le plus élevé, mais d'un écran 400-nit de niveau intermédiaire et de 16 Go de RAM pour un peu moins de 3 000 USD
Les alternatives à l'EliteBook 840 G9 comprennent d'autres ordinateurs portables professionnels de 14 pouces comme le Lenovo ThinkPad X1 Carbon Gen 10 ou le Dell Latitude 9430 ou Latitude 7420
Plus de commentaires sur HP :
Comparaison avec les concurrents potentiels
Note | Date | Modèle | Poids | Épaisseur | Taille | Résolution | Prix |
|---|---|---|---|---|---|---|---|
| 88.7 % v7 (old) | 12/22 | HP EliteBook 840 G9 i7-1280P, Iris Xe G7 96EUs | 1.5 kg | 19 mm | 14.00" | 1920x1200 | |
| 88.6 % v7 (old) | 07/22 | HP EliteBook 845 G9 6F6H6EA R9 PRO 6950HS, Radeon 680M | 1.5 kg | 19.3 mm | 14.00" | 1920x1200 | |
| 89.8 % v7 (old) | 08/21 | HP EliteBook 840 Aero G8 3E4Q6AA i7-1185G7, Iris Xe G7 96EUs | 1.2 kg | 17.9 mm | 14.00" | 1920x1080 | |
| 90.2 % v7 (old) | 12/22 | Lenovo ThinkPad X1 Carbon G10 Core i7-1265U i7-1265U, Iris Xe G7 96EUs | 1.2 kg | 15.36 mm | 14.00" | 1920x1200 | |
| 86.6 % v7 (old) | 10/22 | LG Gram 14Z90Q i5-1240P, Iris Xe G7 80EUs | 980 g | 16.8 mm | 14.00" | 1920x1200 | |
| 90.1 % v7 (old) | 04/22 | Dell Latitude 7420 JW6MH i5-1145G7, Iris Xe G7 80EUs | 1.3 kg | 17.3 mm | 14.00" | 1920x1080 |
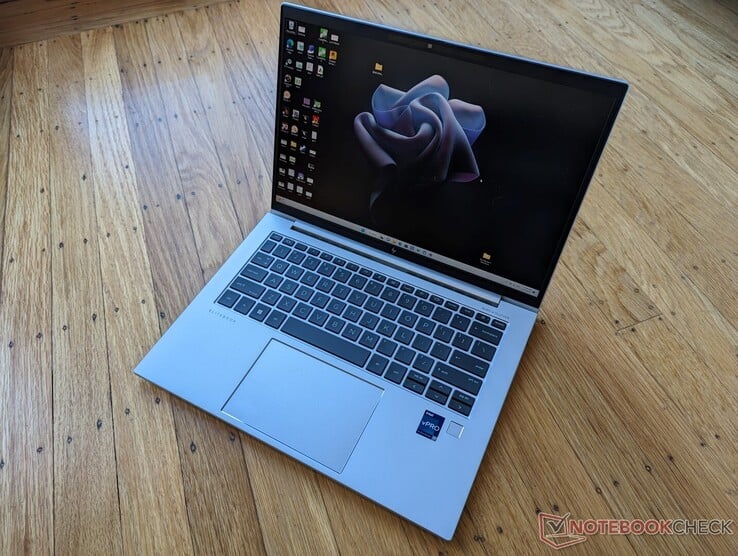
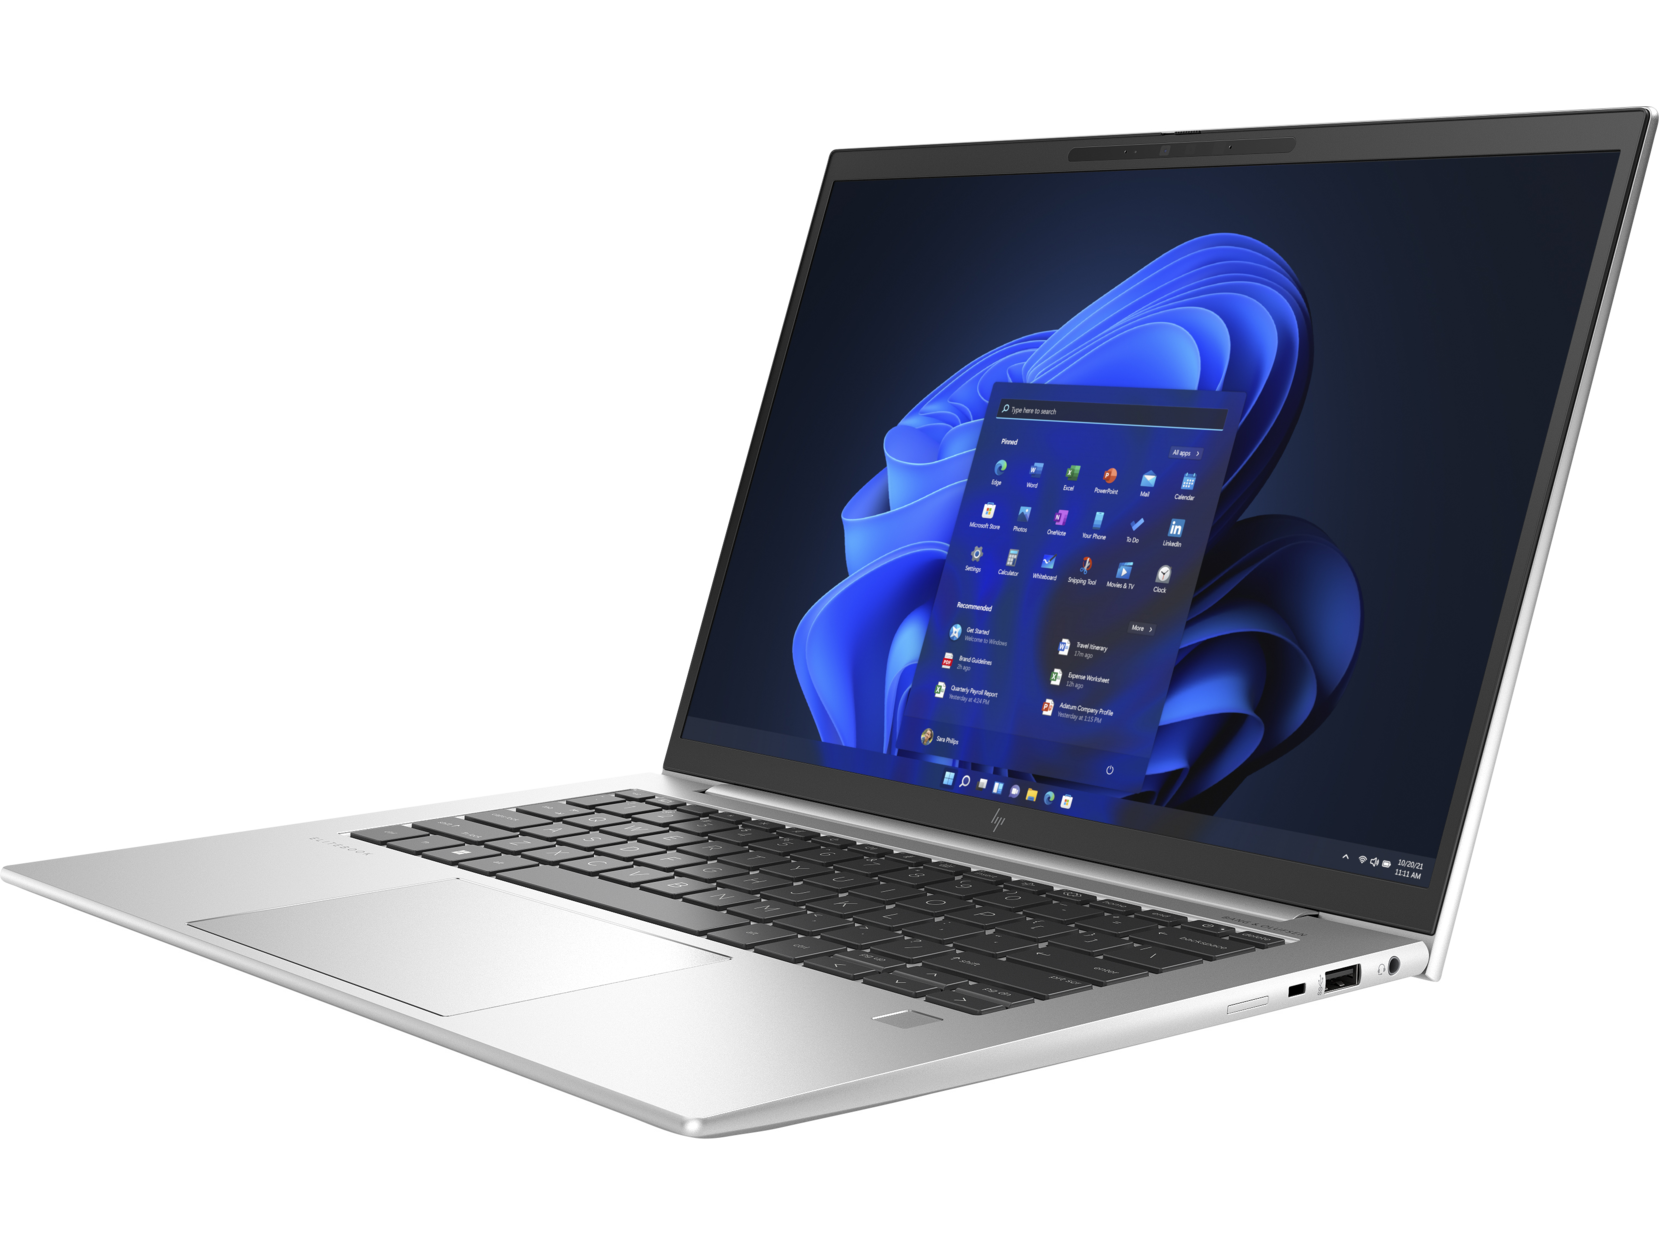
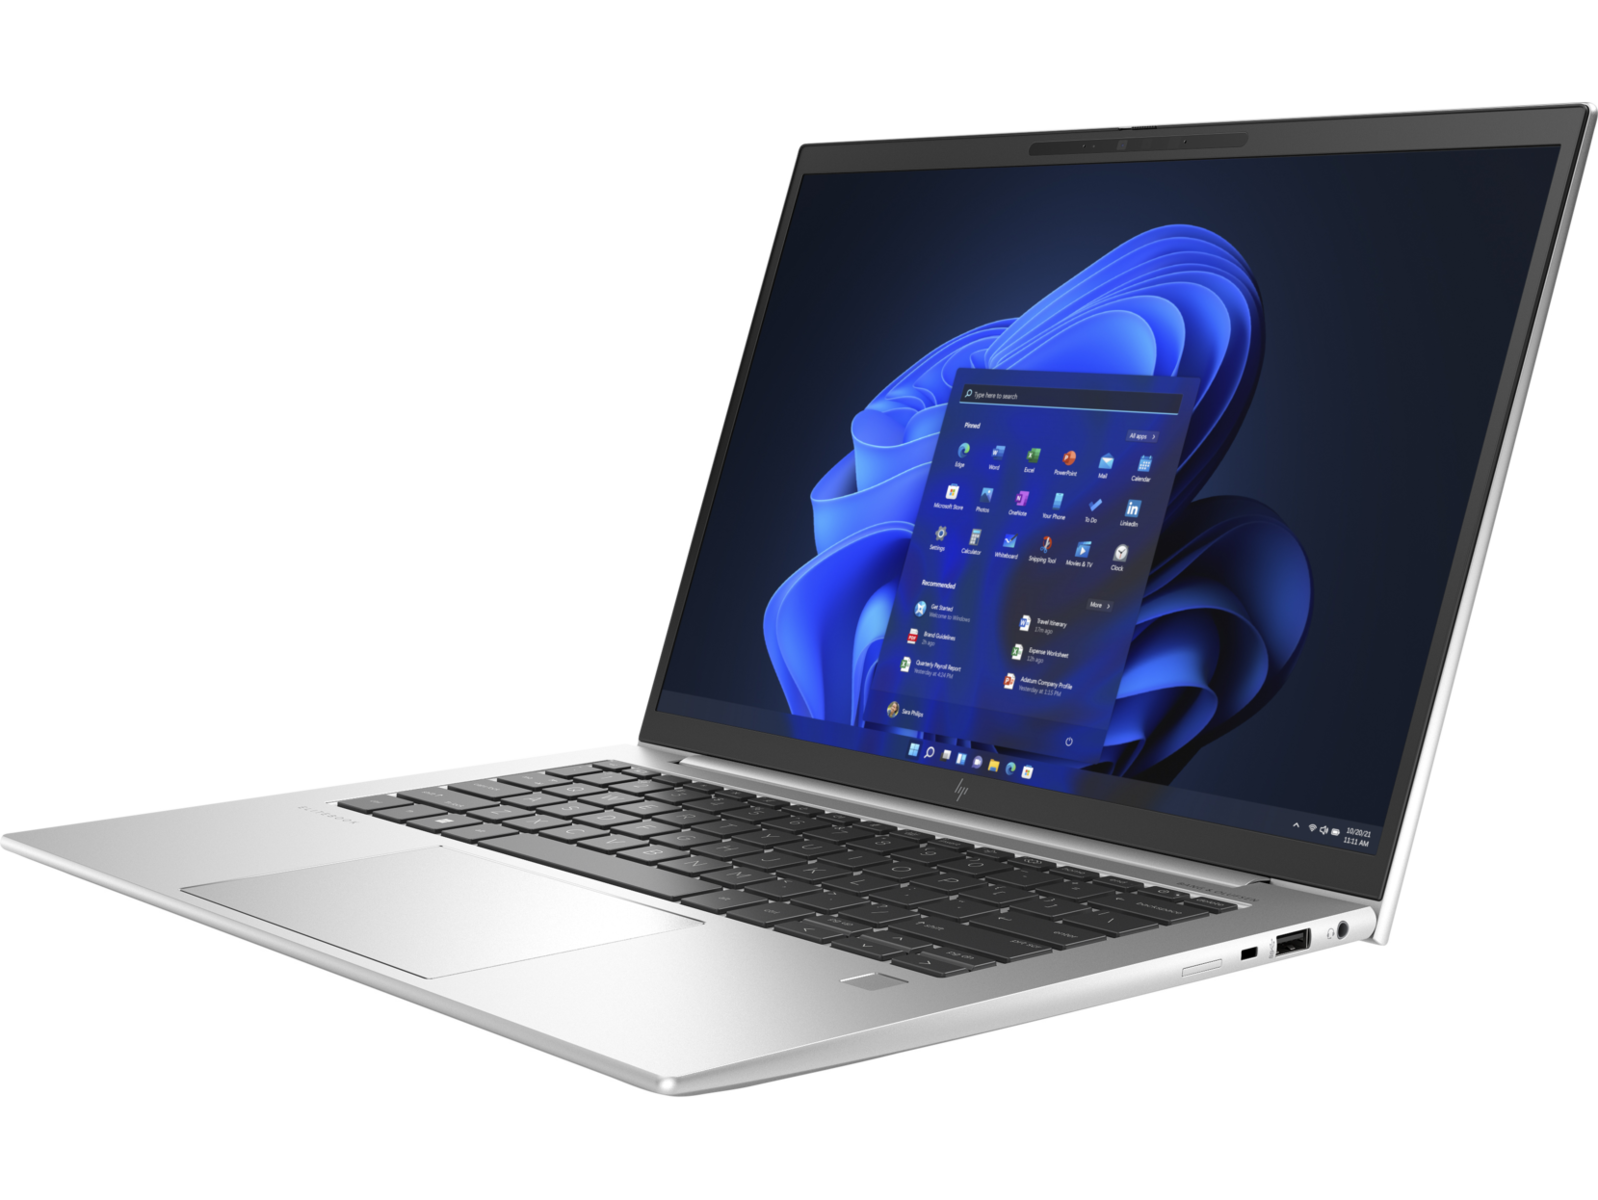
Boîtier - Identique à celui de l'EliteBook 845 G9
Bien que le châssis soit visuellement identique à celui du EliteBook 845 G9, un rapide coup d'œil aux ports USB-C le long du bord gauche permettra de distinguer facilement les deux modèles. Le 840 G9 aura une étiquette Thunderbolt à côté des ports tandis que le 845 G9 alimenté par AMD omet complètement l'étiquette en raison de son manque de support.
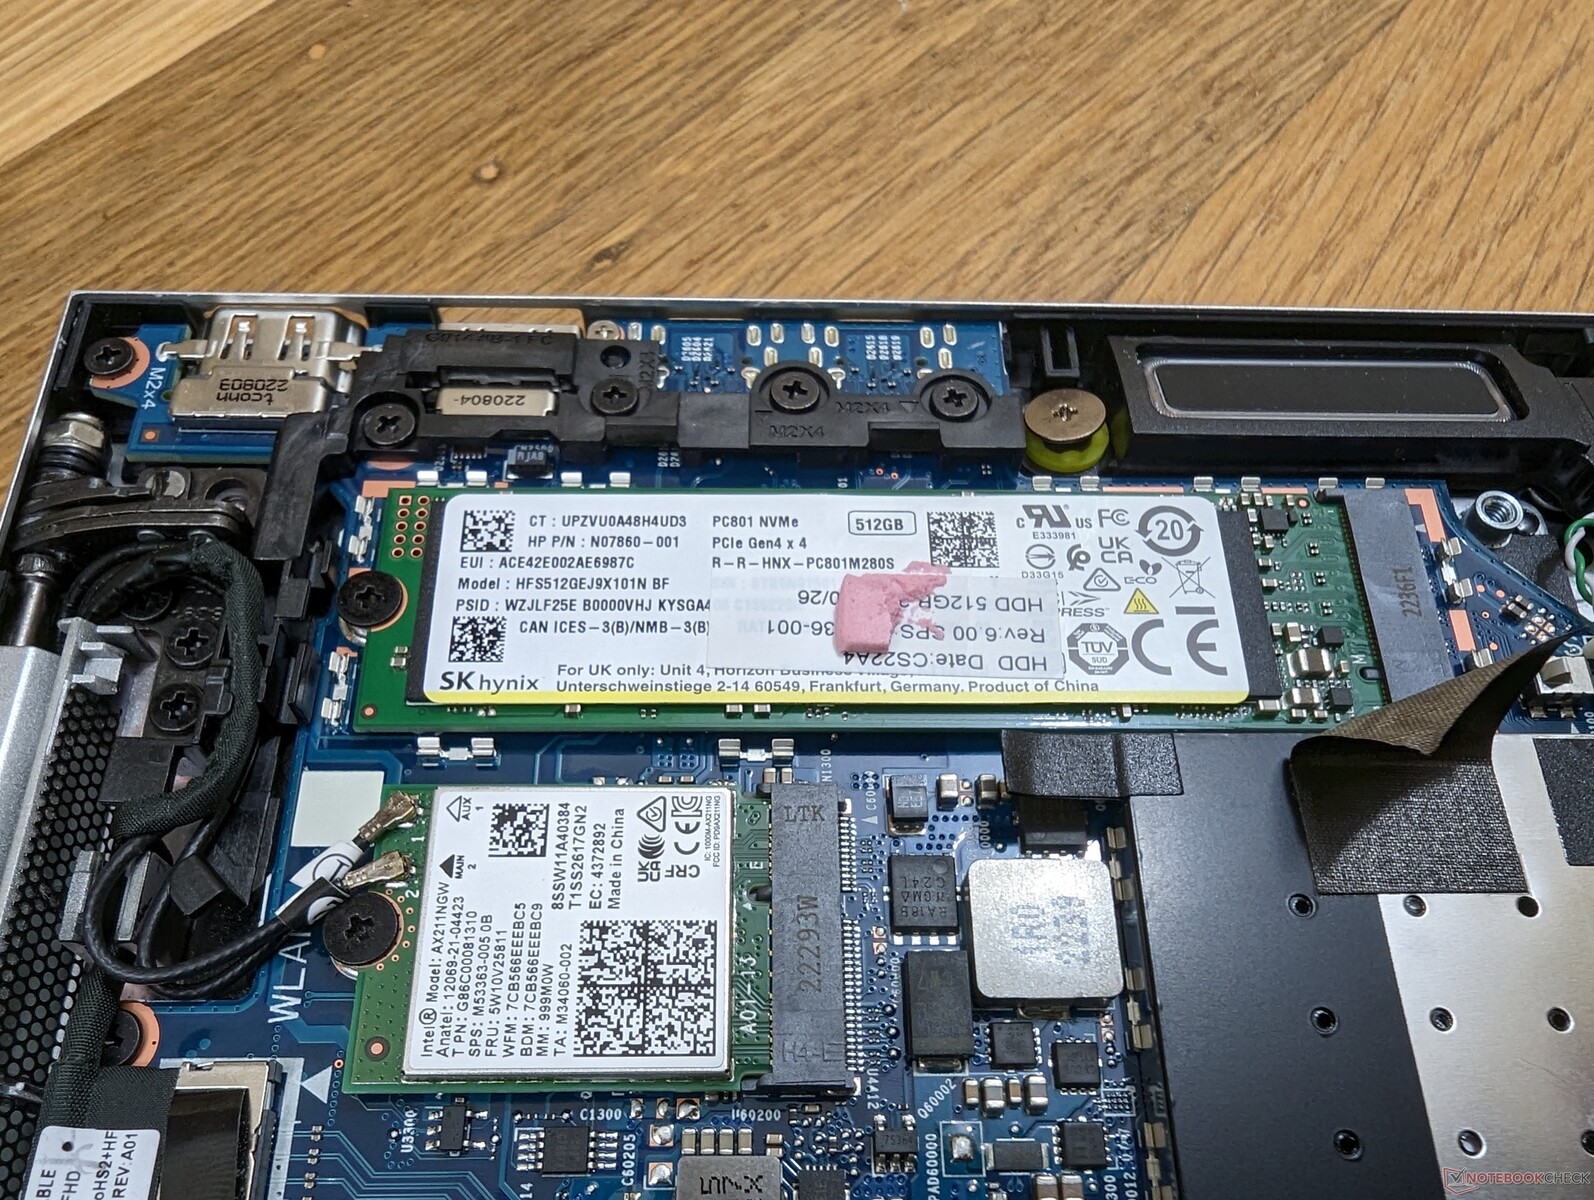
Pour la maintenance, HP propose un guide vidéo complet https://www.youtube.com/watch?v=HOFzfWRy37w du début à la fin sur la façon de retirer et de remplacer chaque composant majeur du modèle. Nous espérons que d'autres grands fabricants pourront s'inspirer de cette pratique à l'avenir, afin d'éviter aux utilisateurs finaux d'avoir à se poser des questions.
Communication
Un Intel AX211 est fourni en standard sur la plupart des configurations 840 G9, car il s'agit d'une série alimentée par Intel, après tout. En revanche, le 845 G9 alimenté par AMD utilise un Qualcomm Fast Connect 6900 pour fournir la même fonctionnalité Wi-Fi 6E. Les performances globales sont comparables entre les deux, d'après nos tests avec un routeur Asus AXE11000.
Le réseau WAN est en option avec le choix entre un Intel XMM 7560 R+ LTE ou le 5000 5G.
| Networking | |
| iperf3 transmit AX12 | |
| Dell Latitude 7420 JW6MH | |
| HP EliteBook 840 Aero G8 3E4Q6AA | |
| iperf3 receive AX12 | |
| Dell Latitude 7420 JW6MH | |
| HP EliteBook 840 Aero G8 3E4Q6AA | |
| iperf3 receive AXE11000 6GHz | |
| LG Gram 14Z90Q | |
| HP EliteBook 845 G9 6F6H6EA | |
| HP EliteBook 840 G9 | |
| Lenovo ThinkPad X1 Carbon G10 Core i7-1265U | |
| iperf3 receive AXE11000 | |
| HP EliteBook 840 G9 | |
| Lenovo ThinkPad X1 Carbon G10 Core i7-1265U | |
| iperf3 transmit AXE11000 | |
| Lenovo ThinkPad X1 Carbon G10 Core i7-1265U | |
| HP EliteBook 840 G9 | |
| iperf3 transmit AXE11000 6GHz | |
| HP EliteBook 845 G9 6F6H6EA | |
| Lenovo ThinkPad X1 Carbon G10 Core i7-1265U | |
| HP EliteBook 840 G9 | |
Webcam
La webcam de 5 MP n'est peut-être pas aussi nette que la webcam de 8 MP de la récente Dragonfly Folio G3mais elle reste bien meilleure que les webcams de 1 ou 2 MP de la plupart des autres ordinateurs portables. HP est bien en avance sur la courbe à cet égard
Un obturateur coulissant pour webcam est fourni en standard pour plus de confidentialité, tandis que le capteur infrarouge pour la prise en charge de Hello est en option.


Accessoires et garantie
Il n'y a pas d'extras dans la boîte de détail en dehors de l'adaptateur secteur et de la paperasse. La fenêtre de garantie standard n'est malheureusement que d'un an, contre trois ans pour la plupart des modèles concurrents de Dell Latitude.
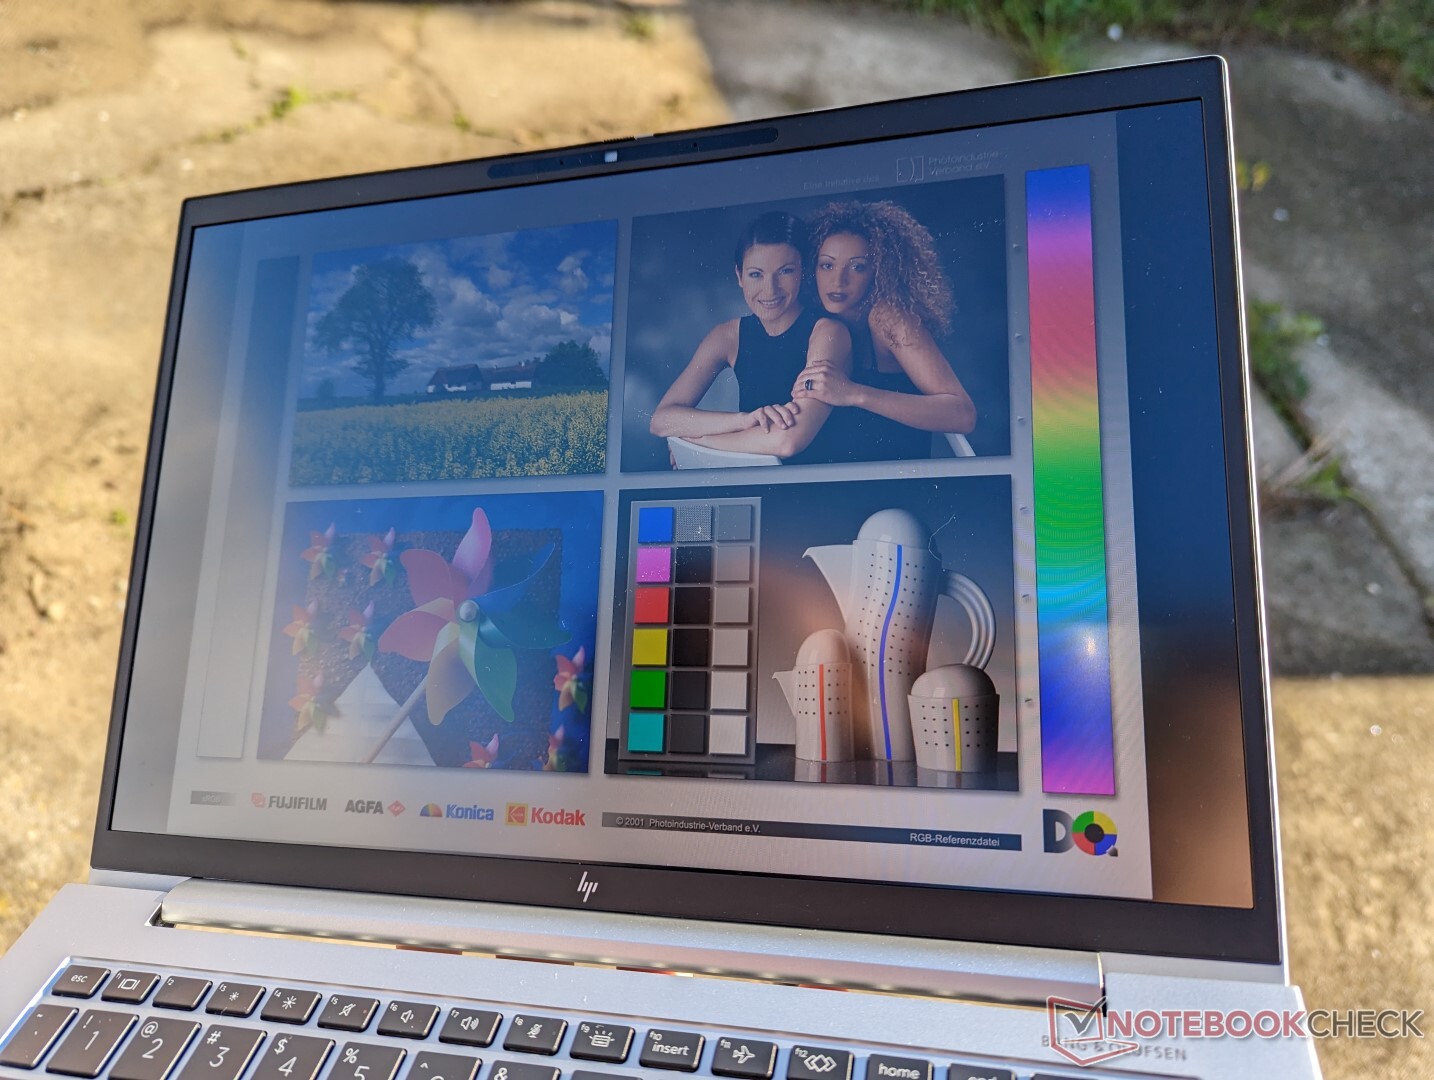
Affichage - Couleurs superbes, temps de réponse lent
HP propose sept options de panneaux distinctes :
- 250 nits, sans WWAN
- 250 nits, WWAN
- 400 nits, faible lumière bleue, pas de WWAN
- 400 nits, faible lumière bleue, WWAN
- 250 nits, écran tactile, pas de WWAN
- 1000 nits, faible lumière bleue, Sure View, WWAN
- 250 nits, écran tactile, WWAN
- 1000 nits, faible lumière bleue, Sure View, pas de WWAN
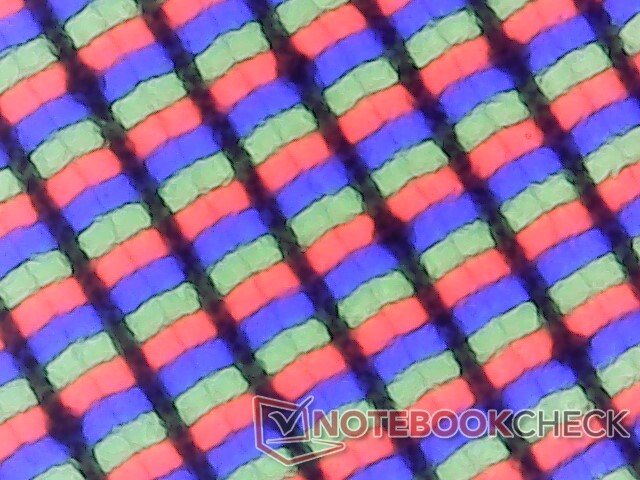
Nos mesures ci-dessous reflètent uniquement l'option en gras ci-dessus. Il est intéressant de noter que tous les écrans sont des IPS mattes 1920 x 1200 60 Hz, sans option OLED. Malheureusement, Sure View est lié à l'option de la dalle 1000-nit, que les utilisateurs le veuillent ou non
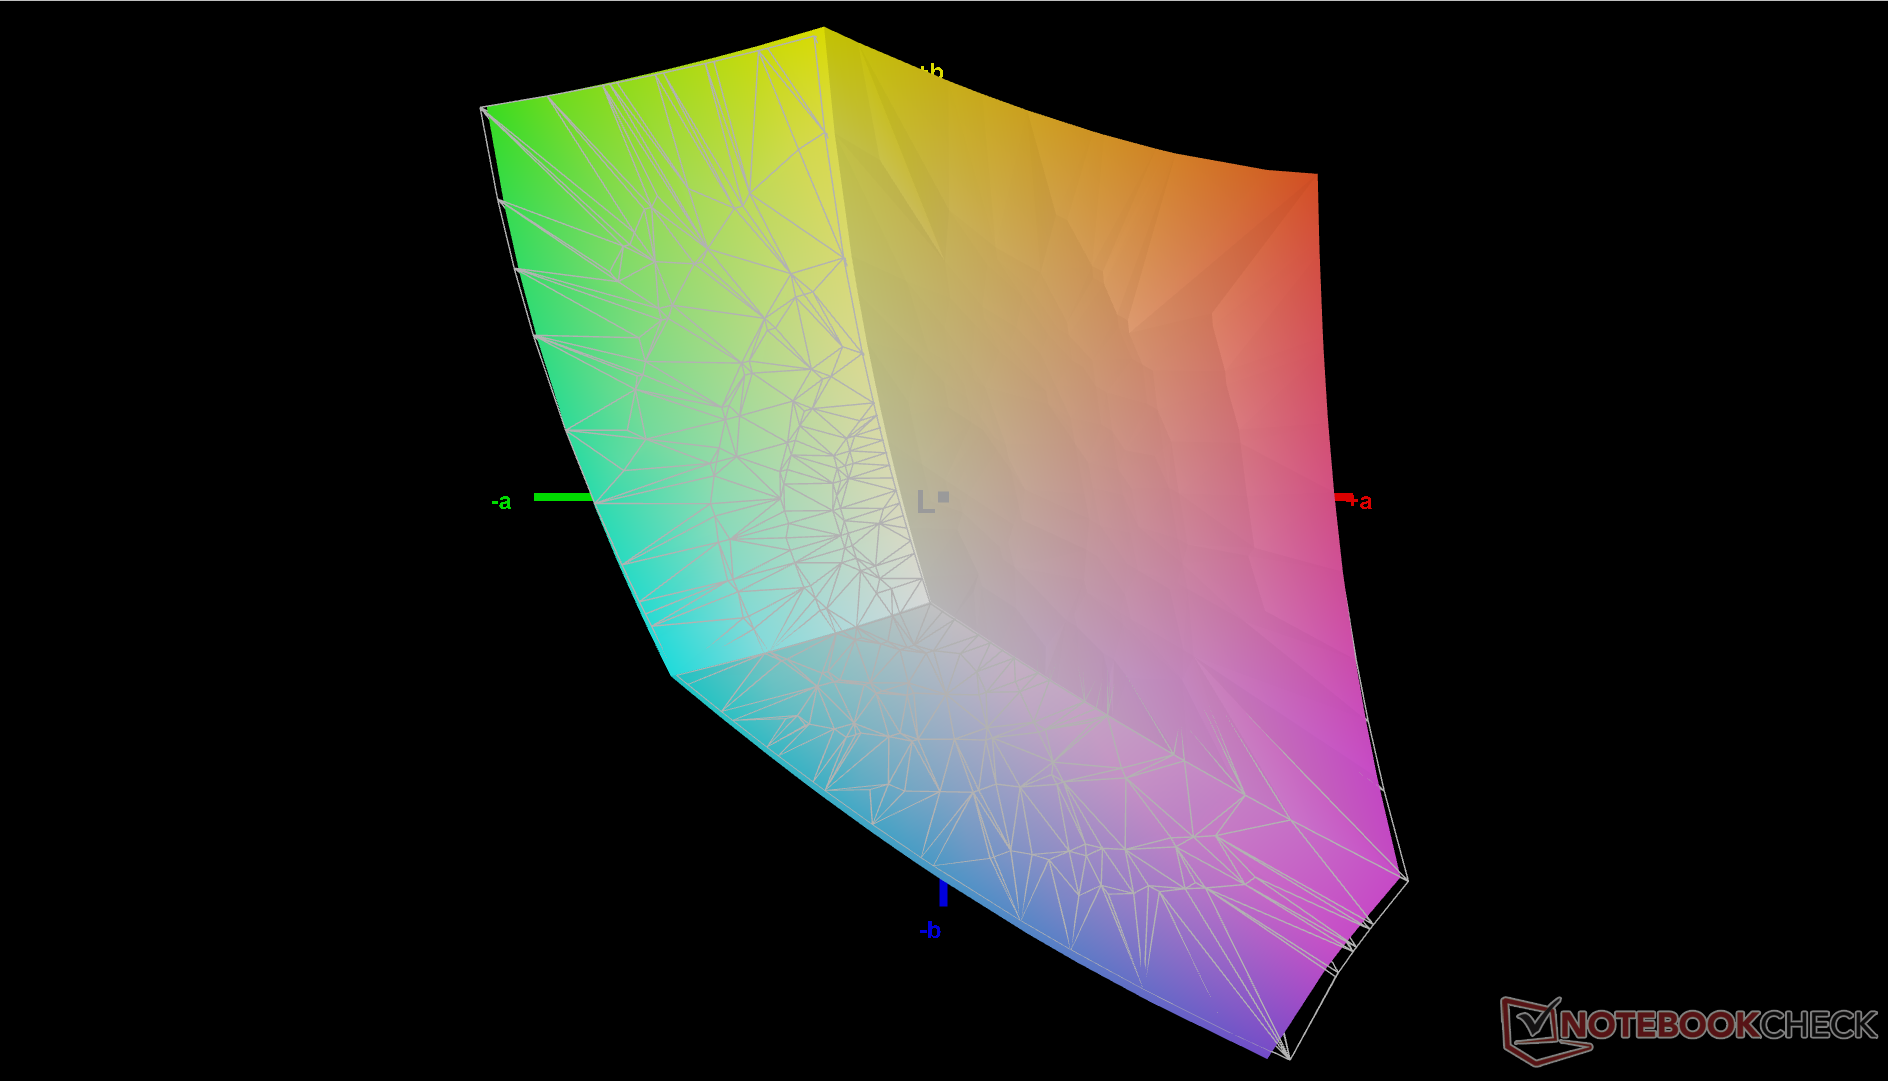
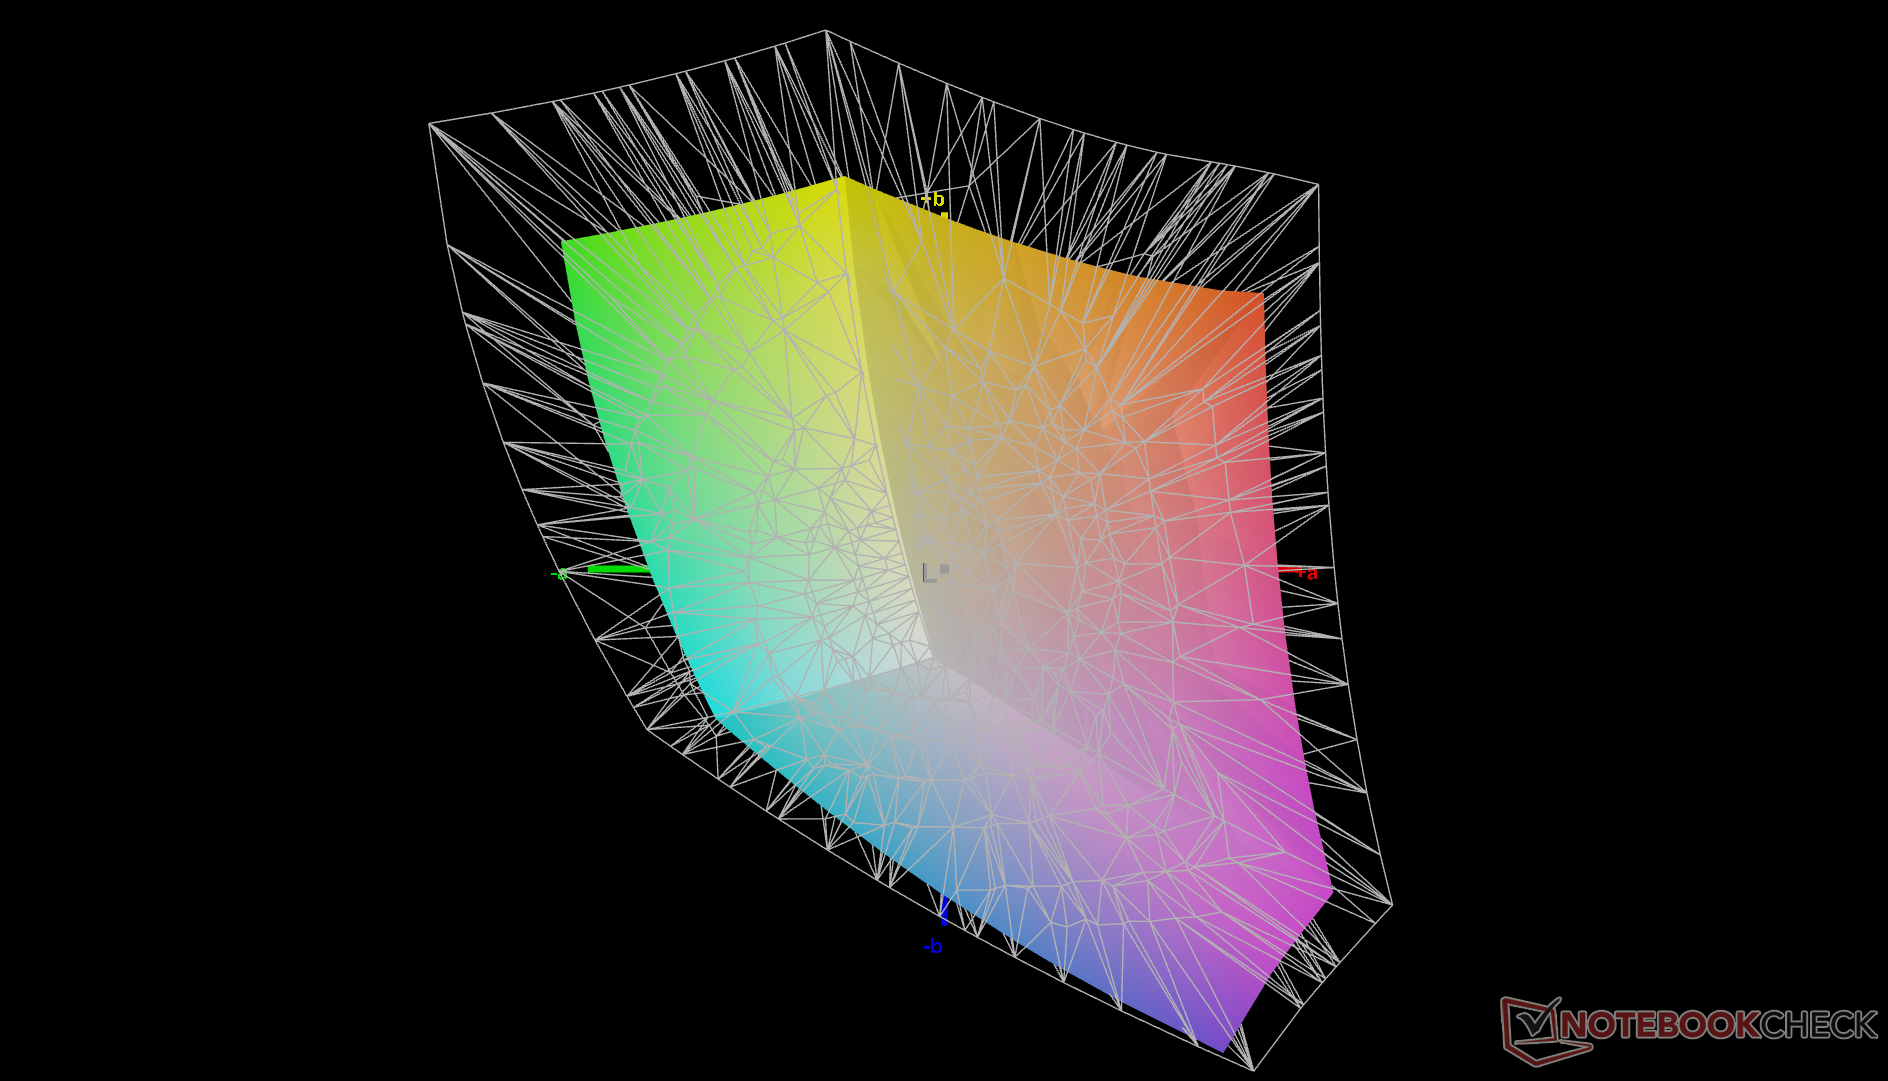
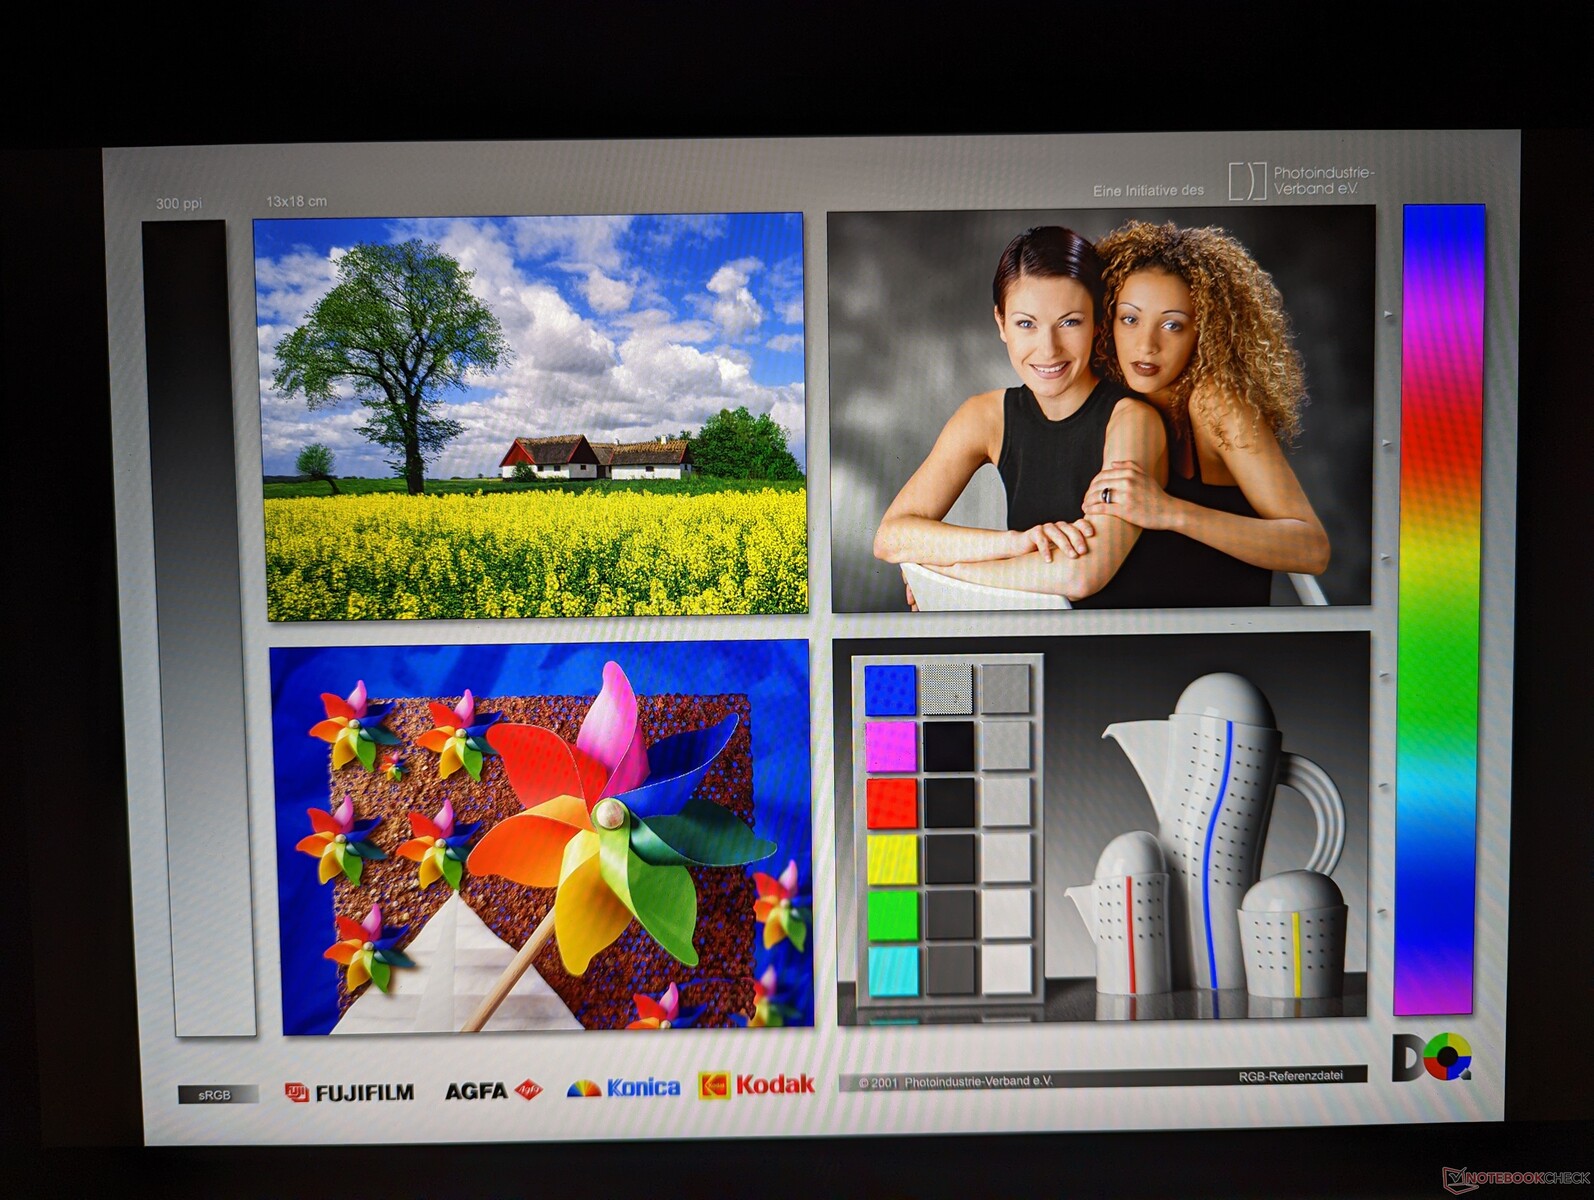
En dehors des limitations ci-dessus, la dalle Chi Mei de notre appareil est de haute qualité en termes de couverture des couleurs et de contraste. Son plus gros inconvénient est son temps de réponse très lent en noir et blanc et en gris et ses images fantômes. Bien qu'ils ne soient pas rares sur les ordinateurs portables de bureau ou d'entreprise, ils sont très lents ici, au point d'être une source de distraction lors de la navigation sur Internet ou du streaming vidéo.
| |||||||||||||||||||||||||
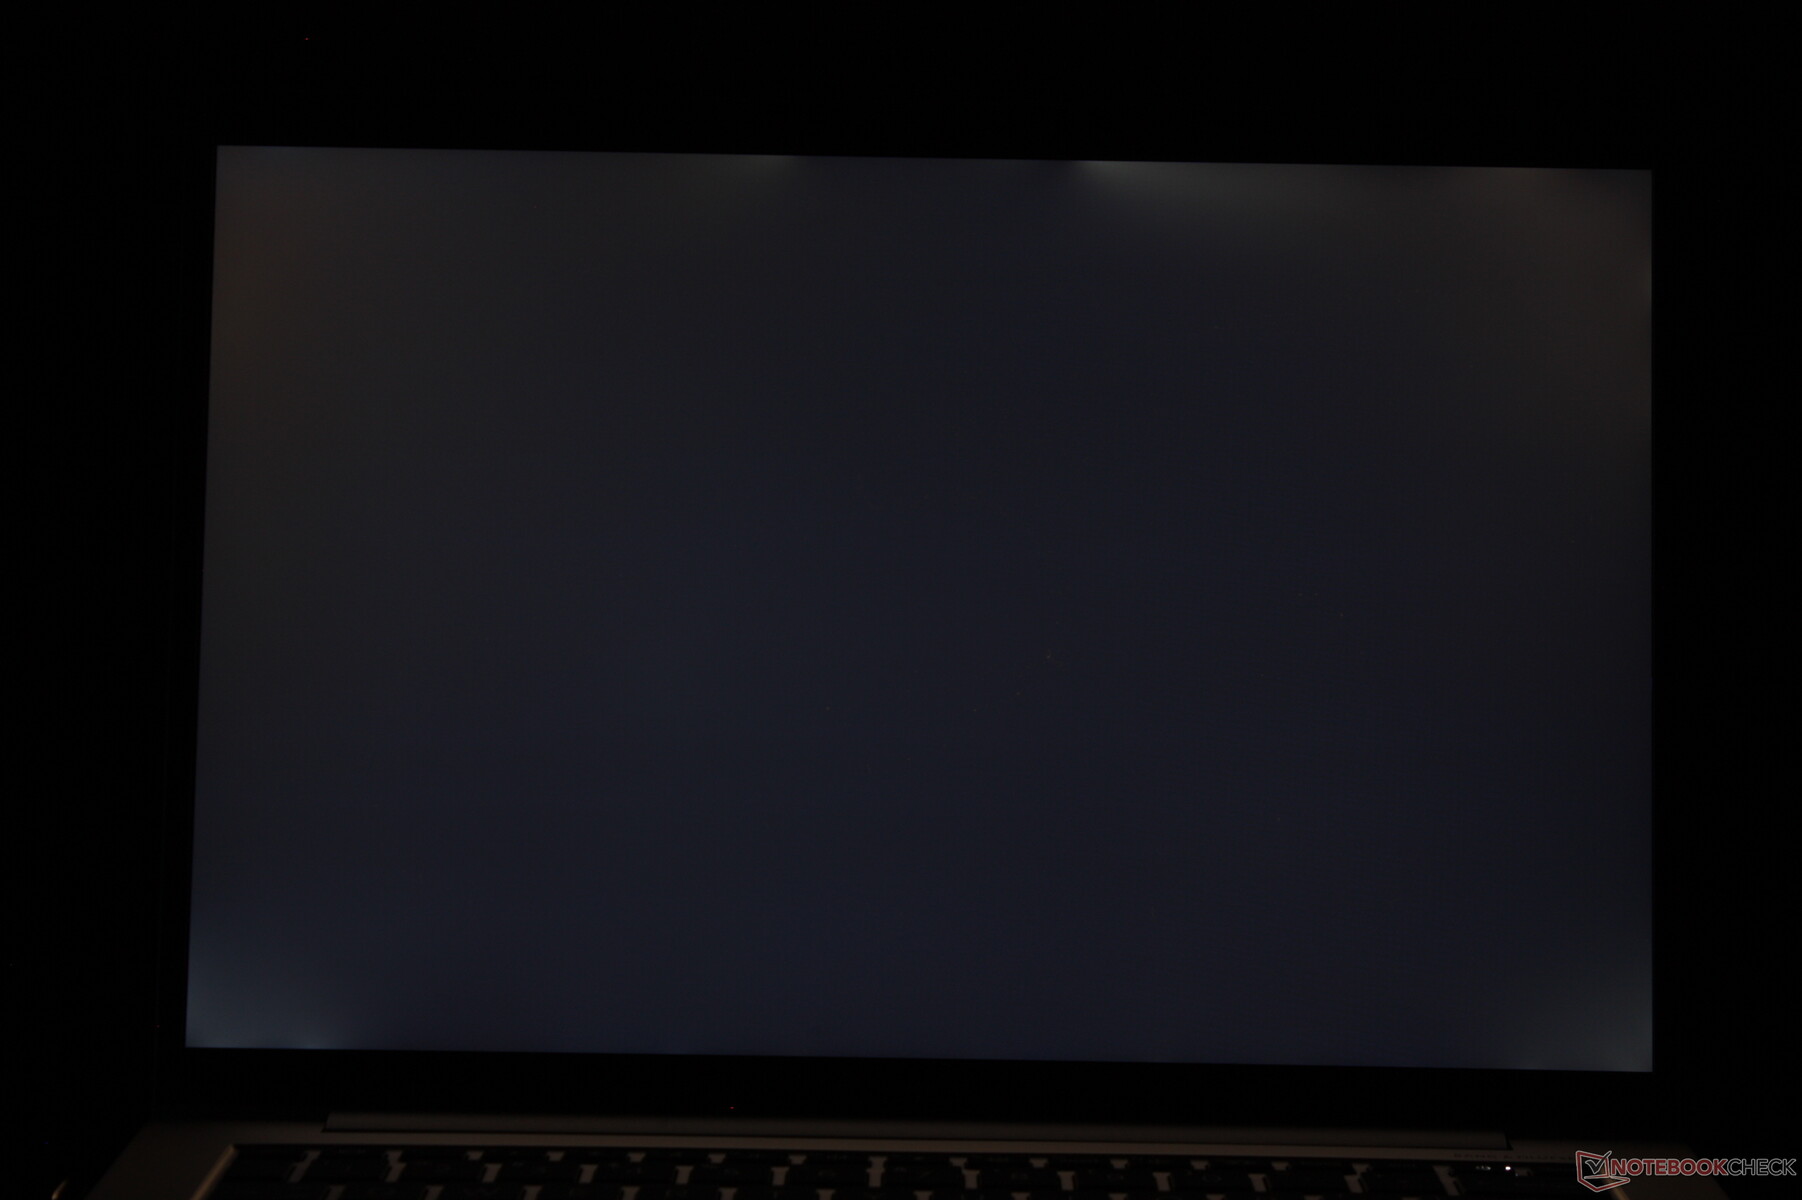
Homogénéité de la luminosité: 86 %
Valeur mesurée au centre, sur batterie: 391.3 cd/m²
Contraste: 1223:1 (Valeurs des noirs: 0.32 cd/m²)
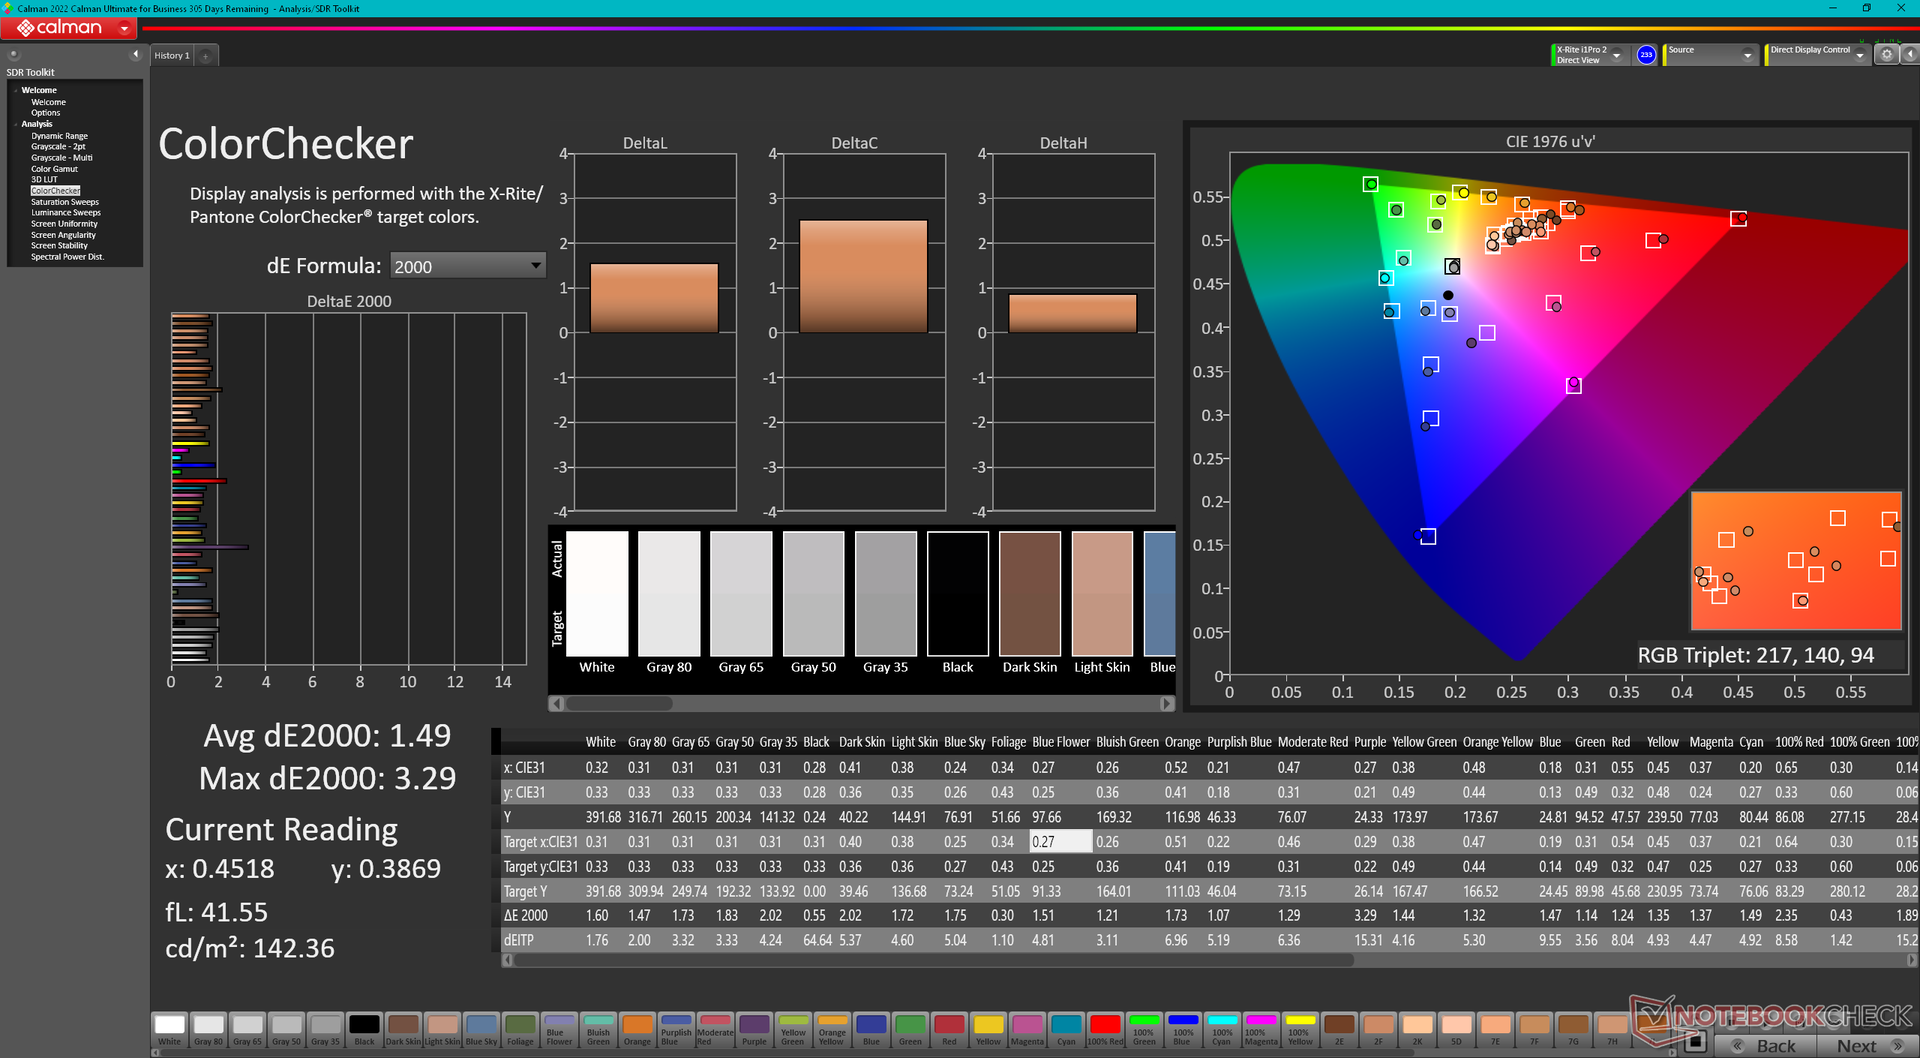
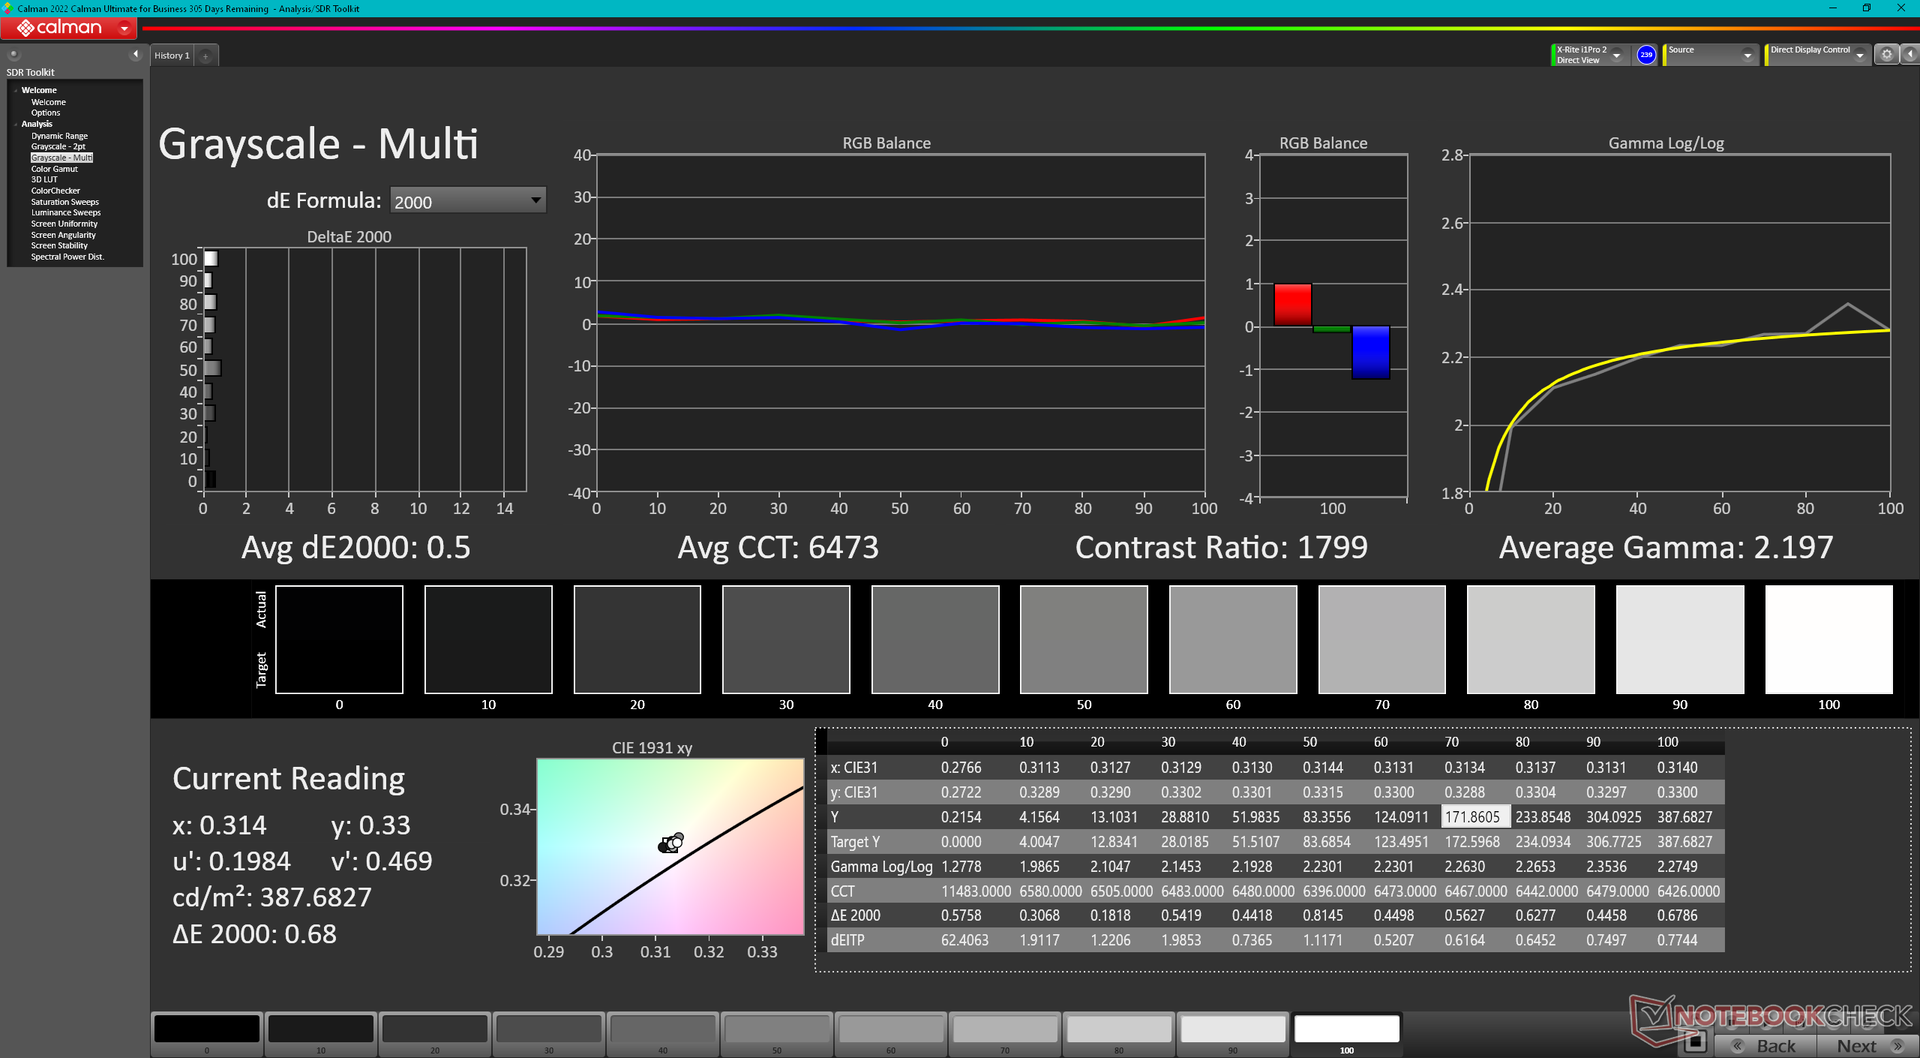
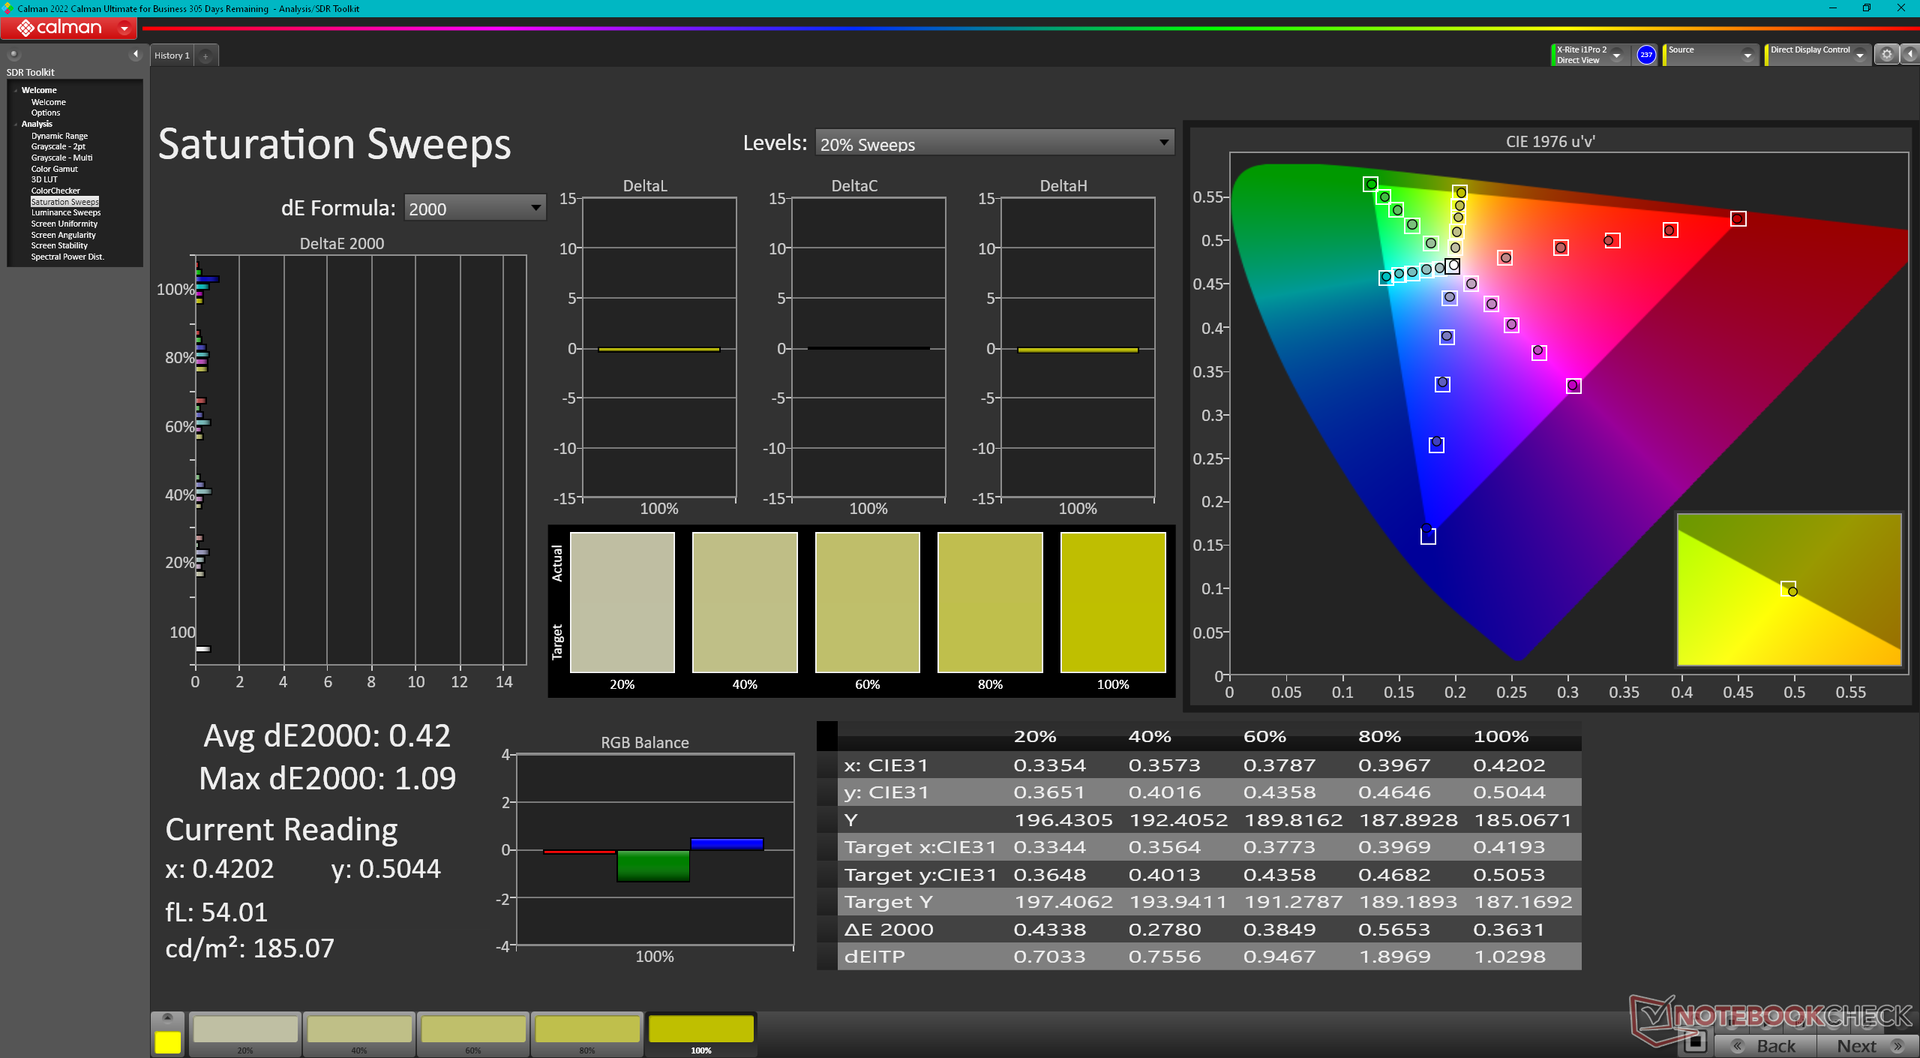
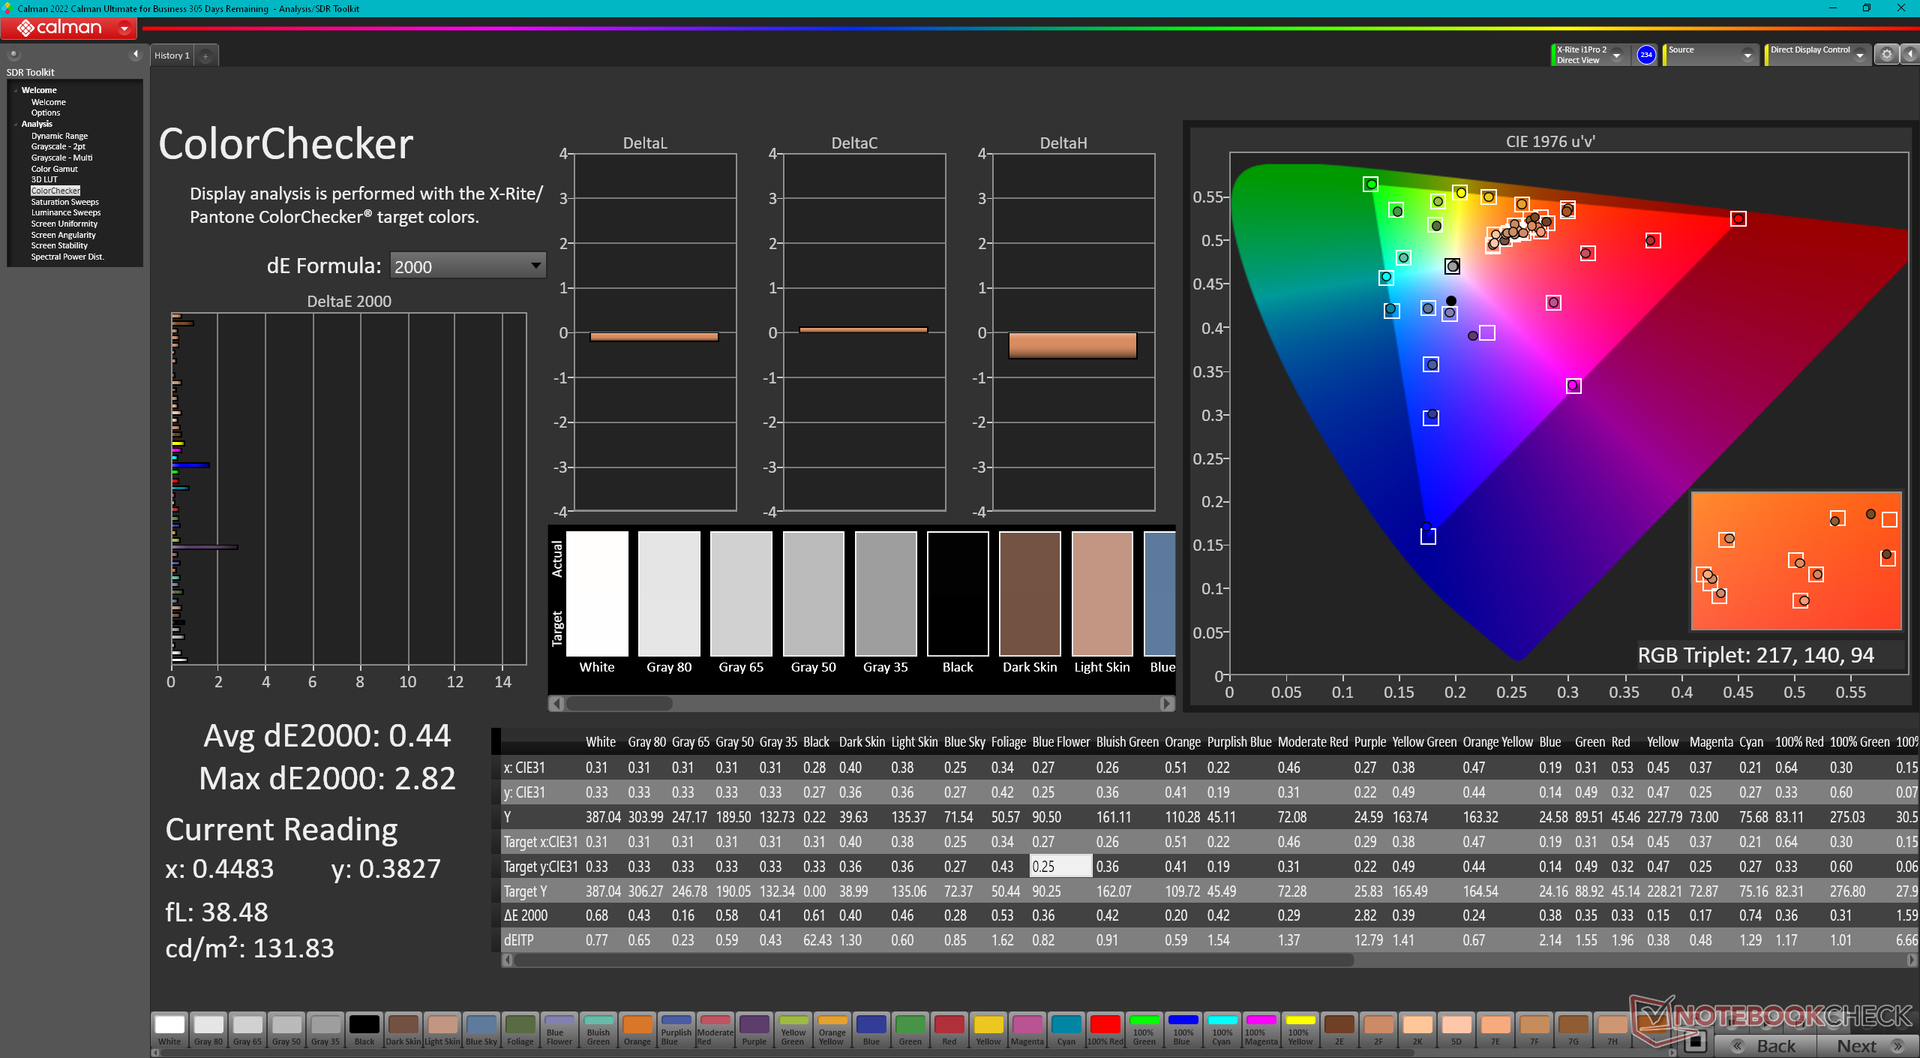
ΔE ColorChecker Calman: 1.49 | ∀{0.5-29.43 Ø4.73}
calibrated: 0.44
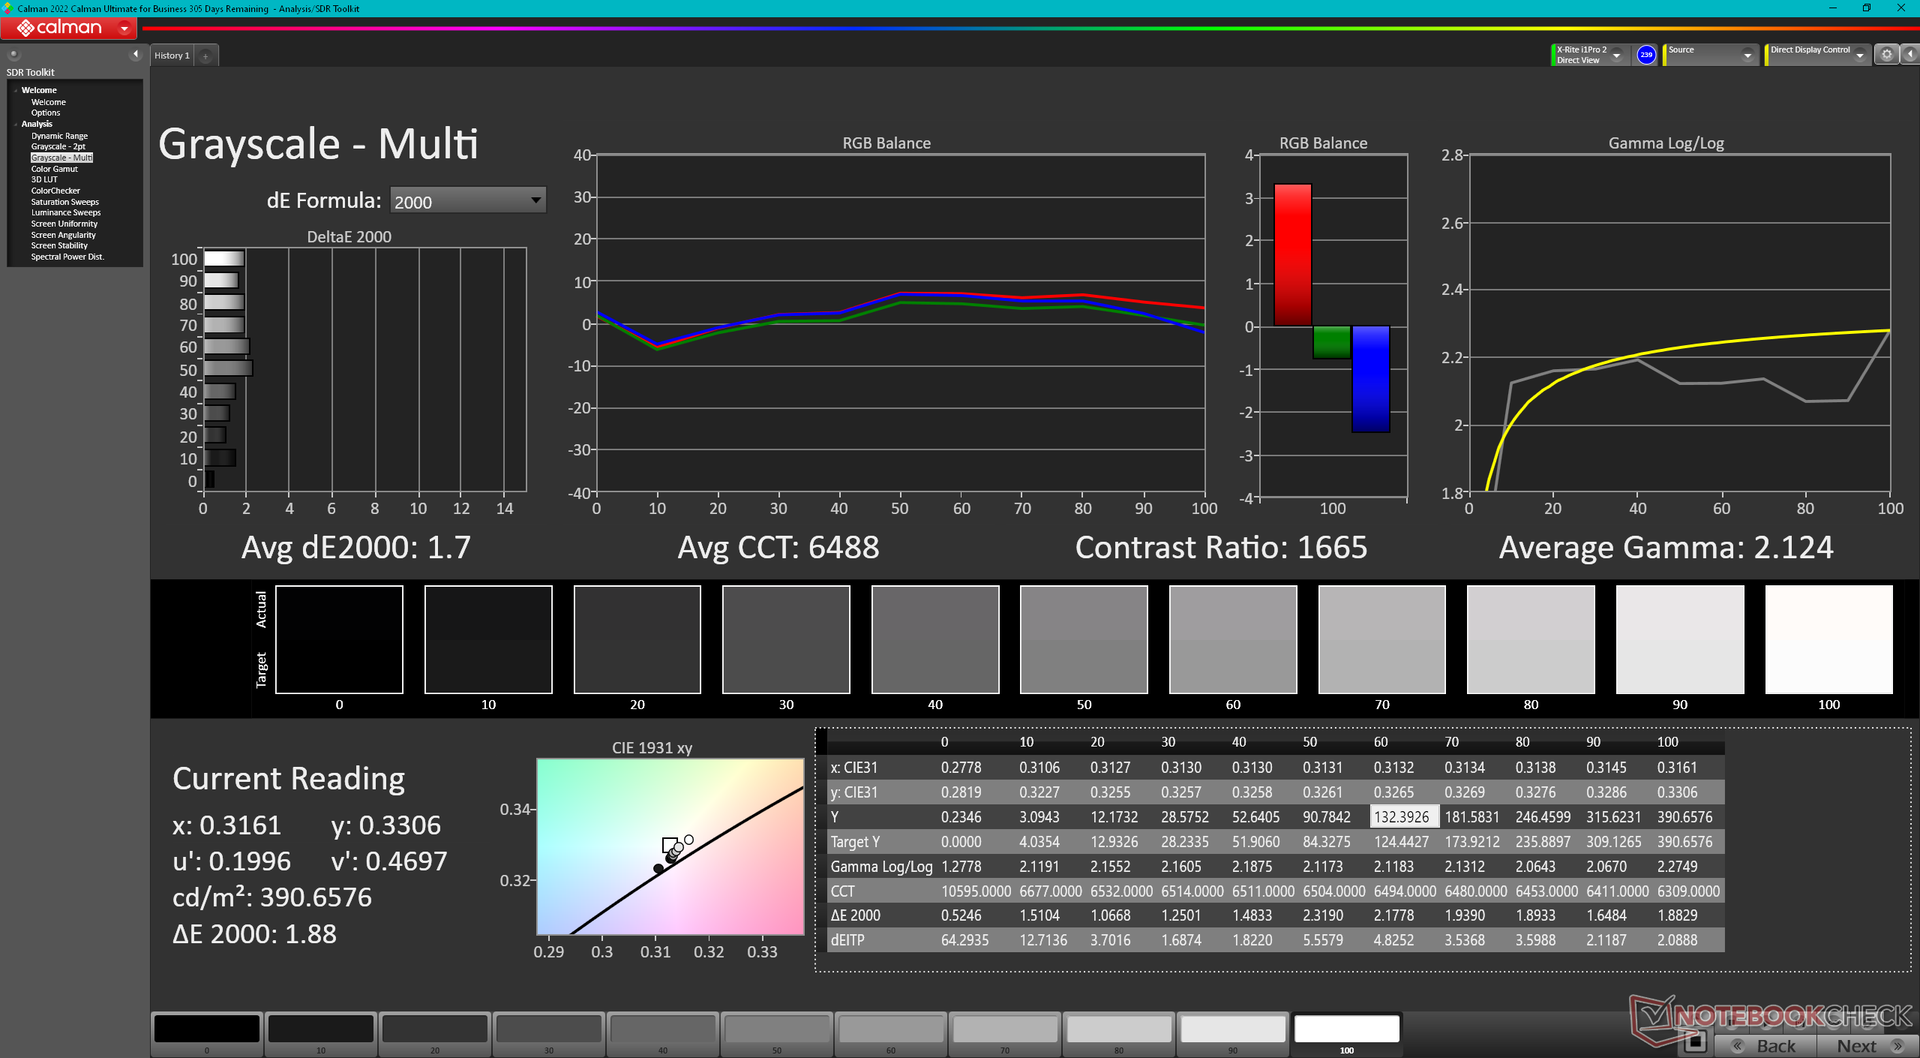
ΔE Greyscale Calman: 1.7 | ∀{0.09-98 Ø4.97}
69.7% AdobeRGB 1998 (Argyll 3D)
98.7% sRGB (Argyll 3D)
67.6% Display P3 (Argyll 3D)
Gamma: 2.12
CCT: 6488 K
| HP EliteBook 840 G9 Chi Mei CMN1435, IPS, 1920x1200, 14" | HP EliteBook 845 G9 6F6H6EA InfoVision X140NV4J, IPS, 1920x1200, 14" | HP EliteBook 840 Aero G8 3E4Q6AA AU Optronics AUO068B, IPS, 1920x1080, 14" | Lenovo ThinkPad X1 Carbon G10 Core i7-1265U R140NW4D R0, IPS, 1920x1200, 14" | LG Gram 14Z90Q LG LP140WU1-SPF1, IPS, 1920x1200, 14" | Dell Latitude 7420 JW6MH Chi Mei CMN1416 CHF07 140HCG, IPS, 1920x1080, 14" | |
|---|---|---|---|---|---|---|
| Display | 1% | -0% | 1% | 23% | 0% | |
| Display P3 Coverage (%) | 67.6 | 69 2% | 68 1% | 68.7 2% | 98.4 46% | 68 1% |
| sRGB Coverage (%) | 98.7 | 99 0% | 97.6 -1% | 99.5 1% | 99.9 1% | 99 0% |
| AdobeRGB 1998 Coverage (%) | 69.7 | 70 0% | 69.3 -1% | 70.2 1% | 85.9 23% | 70 0% |
| Response Times | 54% | 33% | 12% | 38% | 31% | |
| Response Time Grey 50% / Grey 80% * (ms) | 66 ? | 31 ? 53% | 48 ? 27% | 55.2 ? 16% | 47.5 ? 28% | 55 ? 17% |
| Response Time Black / White * (ms) | 46.4 ? | 21 ? 55% | 28.8 ? 38% | 43.2 ? 7% | 24.5 ? 47% | 26 ? 44% |
| PWM Frequency (Hz) | ||||||
| Screen | -41% | -69% | -5% | -63% | -6% | |
| Brightness middle (cd/m²) | 391.3 | 678 73% | 466.4 19% | 421.9 8% | 341 -13% | 408 4% |
| Brightness (cd/m²) | 368 | 745 102% | 426 16% | 420 14% | 305 -17% | 378 3% |
| Brightness Distribution (%) | 86 | 69 -20% | 84 -2% | 87 1% | 87 1% | 86 0% |
| Black Level * (cd/m²) | 0.32 | 0.33 -3% | 0.32 -0% | 0.29 9% | 0.26 19% | 0.22 31% |
| Contrast (:1) | 1223 | 2055 68% | 1458 19% | 1455 19% | 1312 7% | 1855 52% |
| Colorchecker dE 2000 * | 1.49 | 3.56 -139% | 2.84 -91% | 1.69 -13% | 3.11 -109% | 1.54 -3% |
| Colorchecker dE 2000 max. * | 3.29 | 7.23 -120% | 4.73 -44% | 3.55 -8% | 8.29 -152% | 2.72 17% |
| Colorchecker dE 2000 calibrated * | 0.44 | 1.05 -139% | 2.27 -416% | 0.5 -14% | 0.83 -89% | 1.08 -145% |
| Greyscale dE 2000 * | 1.7 | 4.93 -190% | 3.7 -118% | 2.8 -65% | 5.3 -212% | 1.95 -15% |
| Gamma | 2.12 104% | 2.63 84% | 2.13 103% | 2.13 103% | 2.037 108% | 2.33 94% |
| CCT | 6488 100% | 7114 91% | 6886 94% | 6442 101% | 7571 86% | 6806 96% |
| Moyenne finale (programmes/paramètres) | 5% /
-18% | -12% /
-40% | 3% /
-2% | -1% /
-30% | 8% /
0% |
* ... Moindre est la valeur, meilleures sont les performances
L'écran est déjà bien calibré, avec des valeurs moyennes de deltaE pour les niveaux de gris et les couleurs de seulement 1,7 et 1,49, respectivement. Le fait de calibrer nous-mêmes l'écran avec un colorimètre X-Rite améliorerait encore ces valeurs comme le montrent les captures d'écran ci-dessous, mais cela ne sera pas nécessaire pour la plupart des utilisateurs. Notre profil ICM calibré est disponible ci-dessus si les propriétaires veulent essayer de l'appliquer.

Temps de réponse de l'écran
| ↔ Temps de réponse noir à blanc | ||
|---|---|---|
| 46.4 ms ... hausse ↗ et chute ↘ combinées | ↗ 24.4 ms hausse | 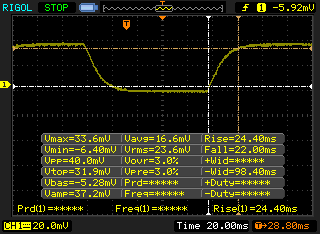 |
| ↘ 22 ms chute | ||
| L'écran souffre de latences très élevées, à éviter pour le jeu. En comparaison, tous les appareils testés affichent entre 0.1 (minimum) et 240 (maximum) ms. » 99 % des appareils testés affichent de meilleures performances. Cela signifie que les latences relevées sont moins bonnes que la moyenne (19.9 ms) de tous les appareils testés. | ||
| ↔ Temps de réponse gris 50% à gris 80% | ||
| 66 ms ... hausse ↗ et chute ↘ combinées | ↗ 35.2 ms hausse | 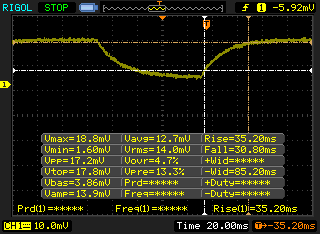 |
| ↘ 30.8 ms chute | ||
| L'écran souffre de latences très élevées, à éviter pour le jeu. En comparaison, tous les appareils testés affichent entre 0.165 (minimum) et 636 (maximum) ms. » 98 % des appareils testés affichent de meilleures performances. Cela signifie que les latences relevées sont moins bonnes que la moyenne (31.1 ms) de tous les appareils testés. | ||
Scintillement / MLI (Modulation de largeur d'impulsion)
| Scintillement / MLI (Modulation de largeur d'impulsion) non décelé | 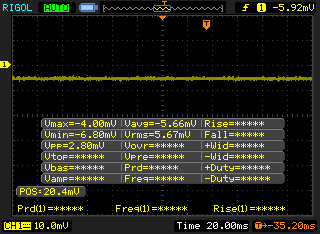 | ||
En comparaison, 52 % des appareils testés n'emploient pas MDI pour assombrir leur écran. Nous avons relevé une moyenne à 7794 (minimum : 5 - maximum : 343500) Hz dans le cas où une MDI était active. | |||
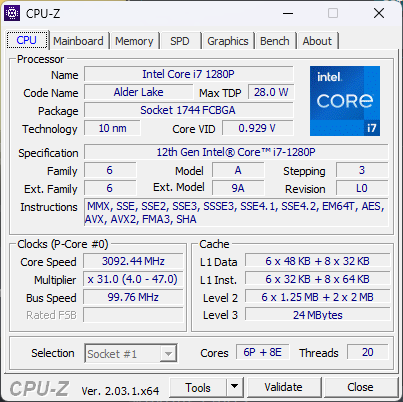
Performances - Option Core i7 série P la plus rapide
Conditions d'essai
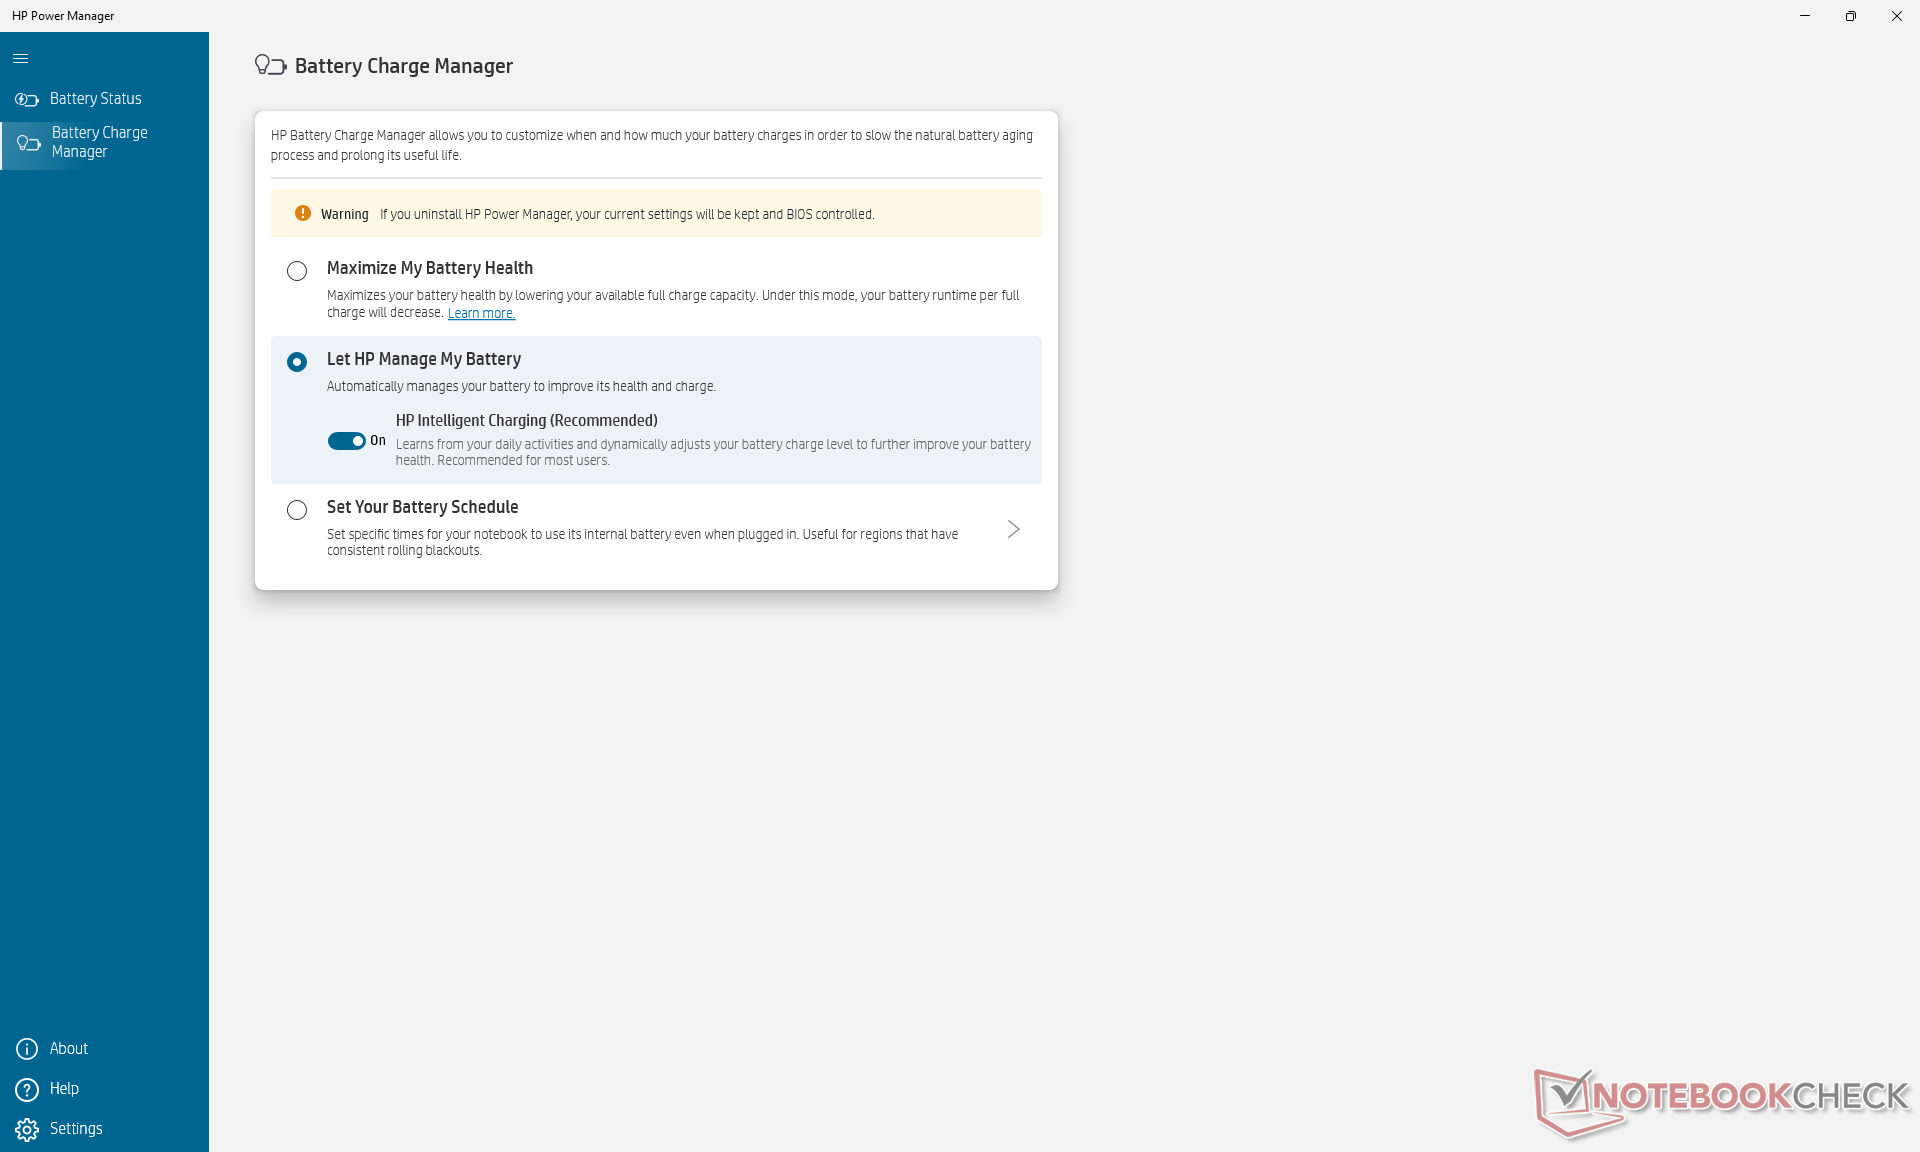
Nous avons réglé notre appareil en mode "Meilleures performances" via Windows avant d'exécuter les benchmarks ci-dessous. Curieusement, l'application Power Manager préinstallée ne comprend pas de paramètres d'alimentation supplémentaires, contrairement à ce que nous avons observé sur la récente Dragonfly Folio G3.
Processeur
Les performances du processeur sont mitigées en raison du potentiel limité de Turbo Boost du système. Lors de l'exécution de CineBench R15 xT en boucle, par exemple, le score initial de 1992 points tombe sensiblement à 1458 points après une seule exécution, ce qui représente une baisse de performance de 27%. Cette baisse est plus importante que sur la plupart des autres ordinateurs portables, y compris les modèles Core U-series. En comparaison, leRyzen 9 PRO 6950HS de l'EliteBook 845 G9 a donné des résultats stables pendant toute la durée du test.
Beaucoup d'autres ordinateurs portables avec le même Core i7-1280P Sont capables d'offrir des performances plus rapides que notre HP en raison de leurs solutions de refroidissement plus puissantes. Le plus grand MSI Summit E16 Flippar exemple, peut offrir des performances multithread 25 à 50 % plus rapides que notre EliteBook 840 G9.
Cinebench R15 Multi Loop
Cinebench R23: Multi Core | Single Core
Cinebench R15: CPU Multi 64Bit | CPU Single 64Bit
Blender: v2.79 BMW27 CPU
7-Zip 18.03: 7z b 4 | 7z b 4 -mmt1
Geekbench 5.5: Multi-Core | Single-Core
HWBOT x265 Benchmark v2.2: 4k Preset
LibreOffice : 20 Documents To PDF
R Benchmark 2.5: Overall mean
* ... Moindre est la valeur, meilleures sont les performances
| Blender - v3.3 Classroom CPU | |
| LG Gram 14Z90Q | |
| Lenovo ThinkPad X1 Carbon G10 Core i7-1265U | |
| Moyenne Intel Iris Xe Graphics G7 96EUs (336 - 1259, n=109) | |
| HP EliteBook 840 G9 | |
* ... Moindre est la valeur, meilleures sont les performances
AIDA64: FP32 Ray-Trace | FPU Julia | CPU SHA3 | CPU Queen | FPU SinJulia | FPU Mandel | CPU AES | CPU ZLib | FP64 Ray-Trace | CPU PhotoWorxx
| Performance rating | |
| HP EliteBook 845 G9 6F6H6EA | |
| Moyenne Intel Core i7-1280P | |
| HP EliteBook 840 G9 | |
| Lenovo ThinkPad X1 Carbon G10 Core i7-1265U | |
| Dell Latitude 7420 JW6MH | |
| HP EliteBook 840 Aero G8 3E4Q6AA | |
| LG Gram 14Z90Q | |
| AIDA64 / FP32 Ray-Trace | |
| HP EliteBook 845 G9 6F6H6EA | |
| Moyenne Intel Core i7-1280P (7466 - 13068, n=6) | |
| HP EliteBook 840 G9 | |
| Lenovo ThinkPad X1 Carbon G10 Core i7-1265U | |
| Dell Latitude 7420 JW6MH | |
| HP EliteBook 840 Aero G8 3E4Q6AA | |
| LG Gram 14Z90Q | |
| AIDA64 / FPU Julia | |
| HP EliteBook 845 G9 6F6H6EA | |
| Moyenne Intel Core i7-1280P (38904 - 66081, n=6) | |
| HP EliteBook 840 G9 | |
| Lenovo ThinkPad X1 Carbon G10 Core i7-1265U | |
| Dell Latitude 7420 JW6MH | |
| HP EliteBook 840 Aero G8 3E4Q6AA | |
| LG Gram 14Z90Q | |
| AIDA64 / CPU SHA3 | |
| HP EliteBook 845 G9 6F6H6EA | |
| Moyenne Intel Core i7-1280P (1826 - 2992, n=6) | |
| HP EliteBook 840 G9 | |
| Dell Latitude 7420 JW6MH | |
| Lenovo ThinkPad X1 Carbon G10 Core i7-1265U | |
| HP EliteBook 840 Aero G8 3E4Q6AA | |
| LG Gram 14Z90Q | |
| AIDA64 / CPU Queen | |
| HP EliteBook 845 G9 6F6H6EA | |
| HP EliteBook 840 G9 | |
| Moyenne Intel Core i7-1280P (80180 - 100358, n=6) | |
| LG Gram 14Z90Q | |
| Lenovo ThinkPad X1 Carbon G10 Core i7-1265U | |
| HP EliteBook 840 Aero G8 3E4Q6AA | |
| Dell Latitude 7420 JW6MH | |
| AIDA64 / FPU SinJulia | |
| HP EliteBook 845 G9 6F6H6EA | |
| Moyenne Intel Core i7-1280P (5880 - 8571, n=6) | |
| HP EliteBook 840 G9 | |
| Dell Latitude 7420 JW6MH | |
| Lenovo ThinkPad X1 Carbon G10 Core i7-1265U | |
| HP EliteBook 840 Aero G8 3E4Q6AA | |
| LG Gram 14Z90Q | |
| AIDA64 / FPU Mandel | |
| HP EliteBook 845 G9 6F6H6EA | |
| Moyenne Intel Core i7-1280P (18907 - 32766, n=6) | |
| HP EliteBook 840 G9 | |
| Dell Latitude 7420 JW6MH | |
| Lenovo ThinkPad X1 Carbon G10 Core i7-1265U | |
| HP EliteBook 840 Aero G8 3E4Q6AA | |
| LG Gram 14Z90Q | |
| AIDA64 / CPU AES | |
| Dell Latitude 7420 JW6MH | |
| HP EliteBook 840 Aero G8 3E4Q6AA | |
| Moyenne Intel Core i7-1280P (40691 - 99367, n=6) | |
| HP EliteBook 845 G9 6F6H6EA | |
| HP EliteBook 840 G9 | |
| Lenovo ThinkPad X1 Carbon G10 Core i7-1265U | |
| LG Gram 14Z90Q | |
| AIDA64 / CPU ZLib | |
| HP EliteBook 845 G9 6F6H6EA | |
| Moyenne Intel Core i7-1280P (540 - 880, n=6) | |
| HP EliteBook 840 G9 | |
| Lenovo ThinkPad X1 Carbon G10 Core i7-1265U | |
| Dell Latitude 7420 JW6MH | |
| HP EliteBook 840 Aero G8 3E4Q6AA | |
| LG Gram 14Z90Q | |
| AIDA64 / FP64 Ray-Trace | |
| HP EliteBook 845 G9 6F6H6EA | |
| Moyenne Intel Core i7-1280P (4006 - 7184, n=6) | |
| HP EliteBook 840 G9 | |
| Lenovo ThinkPad X1 Carbon G10 Core i7-1265U | |
| Dell Latitude 7420 JW6MH | |
| HP EliteBook 840 Aero G8 3E4Q6AA | |
| LG Gram 14Z90Q | |
| AIDA64 / CPU PhotoWorxx | |
| Moyenne Intel Core i7-1280P (36663 - 48416, n=6) | |
| Lenovo ThinkPad X1 Carbon G10 Core i7-1265U | |
| HP EliteBook 840 G9 | |
| Dell Latitude 7420 JW6MH | |
| HP EliteBook 840 Aero G8 3E4Q6AA | |
| LG Gram 14Z90Q | |
| HP EliteBook 845 G9 6F6H6EA | |
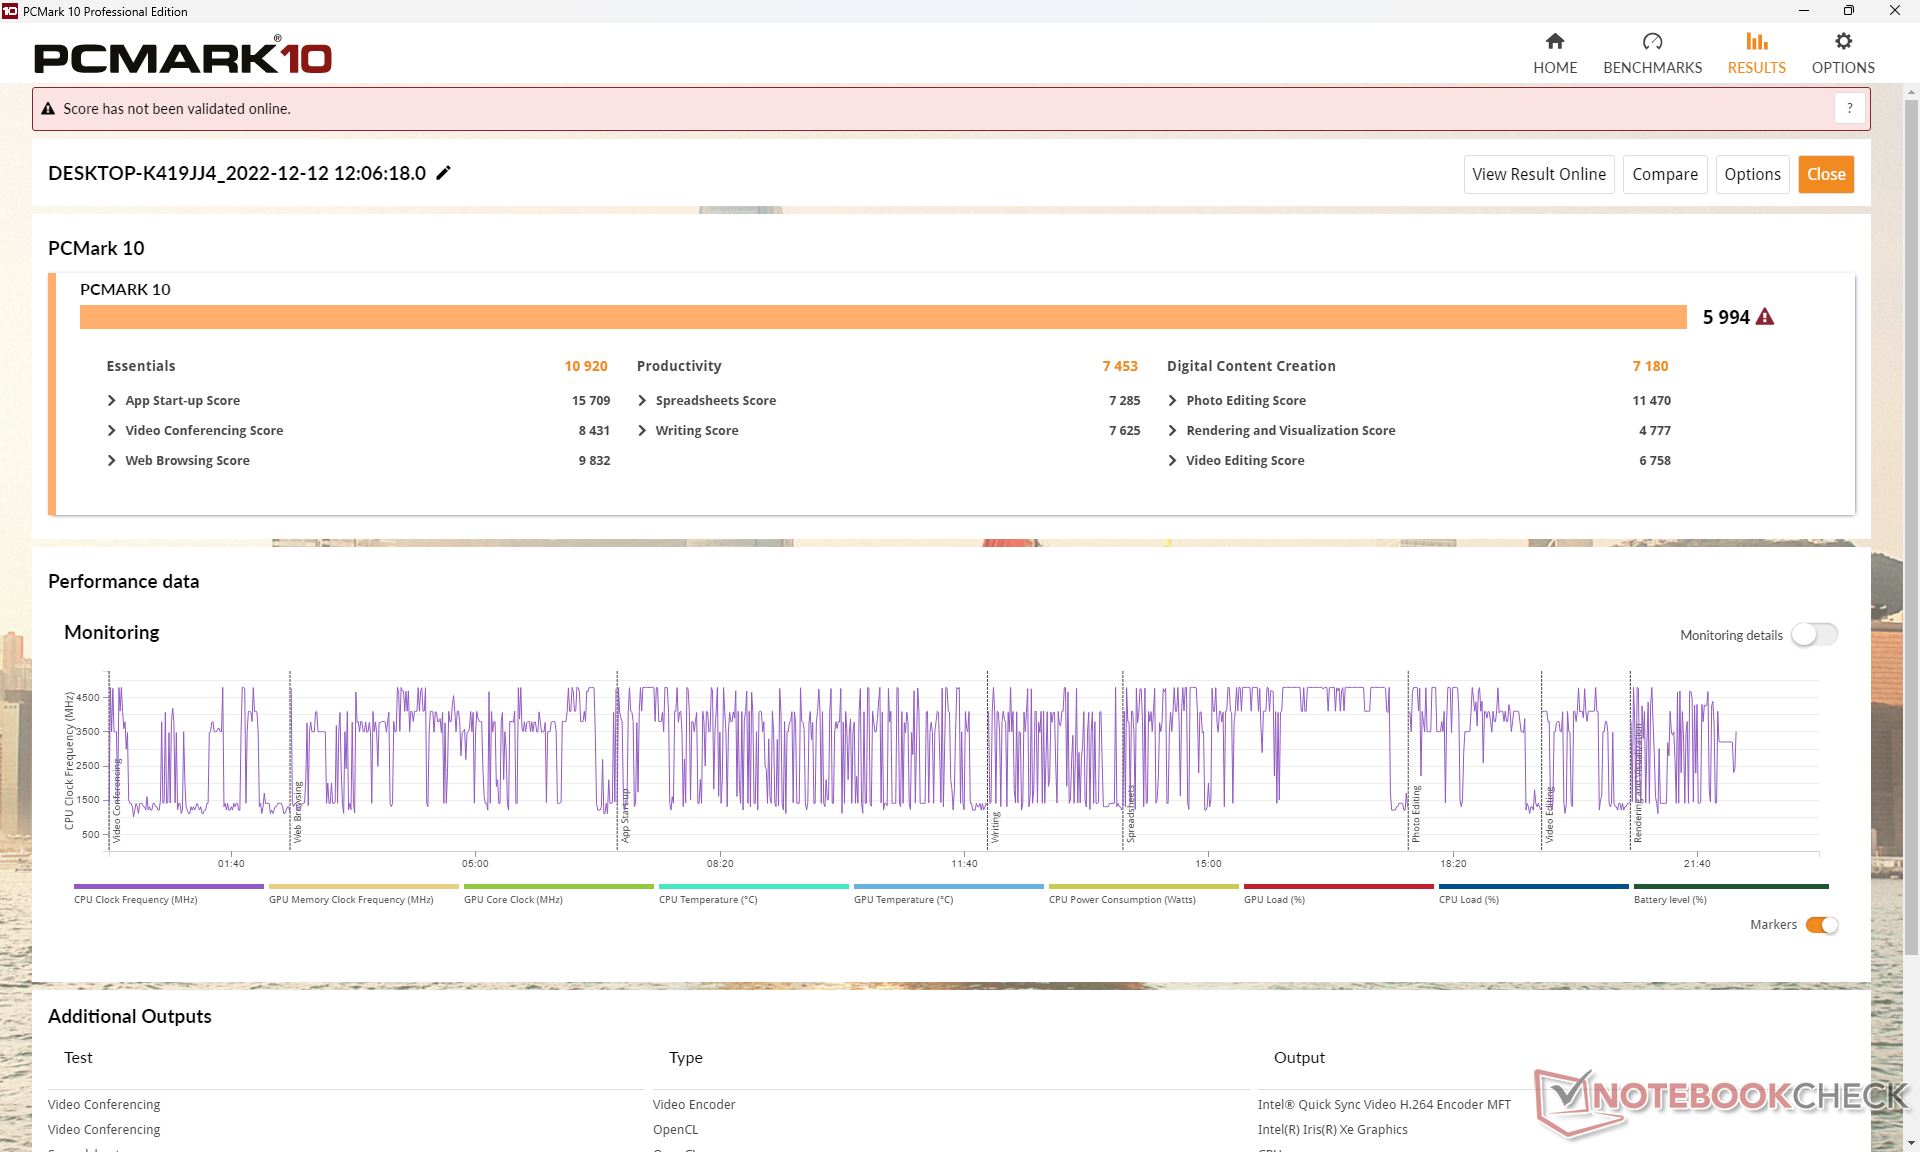
Performance du système
Les résultats de PCMark sont comparables à ceux de la version AMD, sauf dans le subtest Productivité, probablement parce que le Ryzen 9 PRO 6950HS offre des performances brutes multithread plus rapides, comme le montrent les benchmarks ci-dessus.
CrossMark: Overall | Productivity | Creativity | Responsiveness
| PCMark 10 / Score | |
| HP EliteBook 840 G9 | |
| HP EliteBook 845 G9 6F6H6EA | |
| Moyenne Intel Core i7-1280P, Intel Iris Xe Graphics G7 96EUs (5410 - 5994, n=4) | |
| Lenovo ThinkPad X1 Carbon G10 Core i7-1265U | |
| LG Gram 14Z90Q | |
| Dell Latitude 7420 JW6MH | |
| HP EliteBook 840 Aero G8 3E4Q6AA | |
| PCMark 10 / Essentials | |
| HP EliteBook 840 G9 | |
| Lenovo ThinkPad X1 Carbon G10 Core i7-1265U | |
| Moyenne Intel Core i7-1280P, Intel Iris Xe Graphics G7 96EUs (9719 - 10920, n=4) | |
| Dell Latitude 7420 JW6MH | |
| LG Gram 14Z90Q | |
| HP EliteBook 840 Aero G8 3E4Q6AA | |
| HP EliteBook 845 G9 6F6H6EA | |
| PCMark 10 / Productivity | |
| HP EliteBook 845 G9 6F6H6EA | |
| HP EliteBook 840 G9 | |
| Lenovo ThinkPad X1 Carbon G10 Core i7-1265U | |
| Moyenne Intel Core i7-1280P, Intel Iris Xe Graphics G7 96EUs (6301 - 7453, n=4) | |
| HP EliteBook 840 Aero G8 3E4Q6AA | |
| Dell Latitude 7420 JW6MH | |
| LG Gram 14Z90Q | |
| PCMark 10 / Digital Content Creation | |
| HP EliteBook 845 G9 6F6H6EA | |
| HP EliteBook 840 G9 | |
| Moyenne Intel Core i7-1280P, Intel Iris Xe Graphics G7 96EUs (6450 - 7180, n=4) | |
| Lenovo ThinkPad X1 Carbon G10 Core i7-1265U | |
| LG Gram 14Z90Q | |
| Dell Latitude 7420 JW6MH | |
| HP EliteBook 840 Aero G8 3E4Q6AA | |
| CrossMark / Overall | |
| HP EliteBook 840 G9 | |
| Moyenne Intel Core i7-1280P, Intel Iris Xe Graphics G7 96EUs (1677 - 1773, n=4) | |
| Lenovo ThinkPad X1 Carbon G10 Core i7-1265U | |
| HP EliteBook 845 G9 6F6H6EA | |
| Dell Latitude 7420 JW6MH | |
| CrossMark / Productivity | |
| HP EliteBook 840 G9 | |
| Moyenne Intel Core i7-1280P, Intel Iris Xe Graphics G7 96EUs (1585 - 1709, n=4) | |
| Lenovo ThinkPad X1 Carbon G10 Core i7-1265U | |
| HP EliteBook 845 G9 6F6H6EA | |
| Dell Latitude 7420 JW6MH | |
| CrossMark / Creativity | |
| Moyenne Intel Core i7-1280P, Intel Iris Xe Graphics G7 96EUs (1849 - 1928, n=4) | |
| HP EliteBook 840 G9 | |
| Lenovo ThinkPad X1 Carbon G10 Core i7-1265U | |
| HP EliteBook 845 G9 6F6H6EA | |
| Dell Latitude 7420 JW6MH | |
| CrossMark / Responsiveness | |
| HP EliteBook 840 G9 | |
| Moyenne Intel Core i7-1280P, Intel Iris Xe Graphics G7 96EUs (1394 - 1746, n=4) | |
| Lenovo ThinkPad X1 Carbon G10 Core i7-1265U | |
| Dell Latitude 7420 JW6MH | |
| HP EliteBook 845 G9 6F6H6EA | |
| PCMark 10 Score | 5994 points | |
Aide | ||
| AIDA64 / Memory Copy | |
| Moyenne Intel Core i7-1280P (56337 - 73486, n=6) | |
| Lenovo ThinkPad X1 Carbon G10 Core i7-1265U | |
| Dell Latitude 7420 JW6MH | |
| HP EliteBook 840 G9 | |
| LG Gram 14Z90Q | |
| HP EliteBook 840 Aero G8 3E4Q6AA | |
| HP EliteBook 845 G9 6F6H6EA | |
| AIDA64 / Memory Read | |
| LG Gram 14Z90Q | |
| Lenovo ThinkPad X1 Carbon G10 Core i7-1265U | |
| Moyenne Intel Core i7-1280P (63221 - 73719, n=6) | |
| HP EliteBook 840 G9 | |
| Dell Latitude 7420 JW6MH | |
| HP EliteBook 840 Aero G8 3E4Q6AA | |
| HP EliteBook 845 G9 6F6H6EA | |
| AIDA64 / Memory Write | |
| Moyenne Intel Core i7-1280P (58729 - 68247, n=6) | |
| Lenovo ThinkPad X1 Carbon G10 Core i7-1265U | |
| LG Gram 14Z90Q | |
| HP EliteBook 840 G9 | |
| Dell Latitude 7420 JW6MH | |
| HP EliteBook 840 Aero G8 3E4Q6AA | |
| HP EliteBook 845 G9 6F6H6EA | |
| AIDA64 / Memory Latency | |
| LG Gram 14Z90Q | |
| Moyenne Intel Core i7-1280P (93.1 - 153.3, n=6) | |
| HP EliteBook 845 G9 6F6H6EA | |
| Dell Latitude 7420 JW6MH | |
| HP EliteBook 840 G9 | |
| Lenovo ThinkPad X1 Carbon G10 Core i7-1265U | |
| HP EliteBook 840 Aero G8 3E4Q6AA | |
* ... Moindre est la valeur, meilleures sont les performances
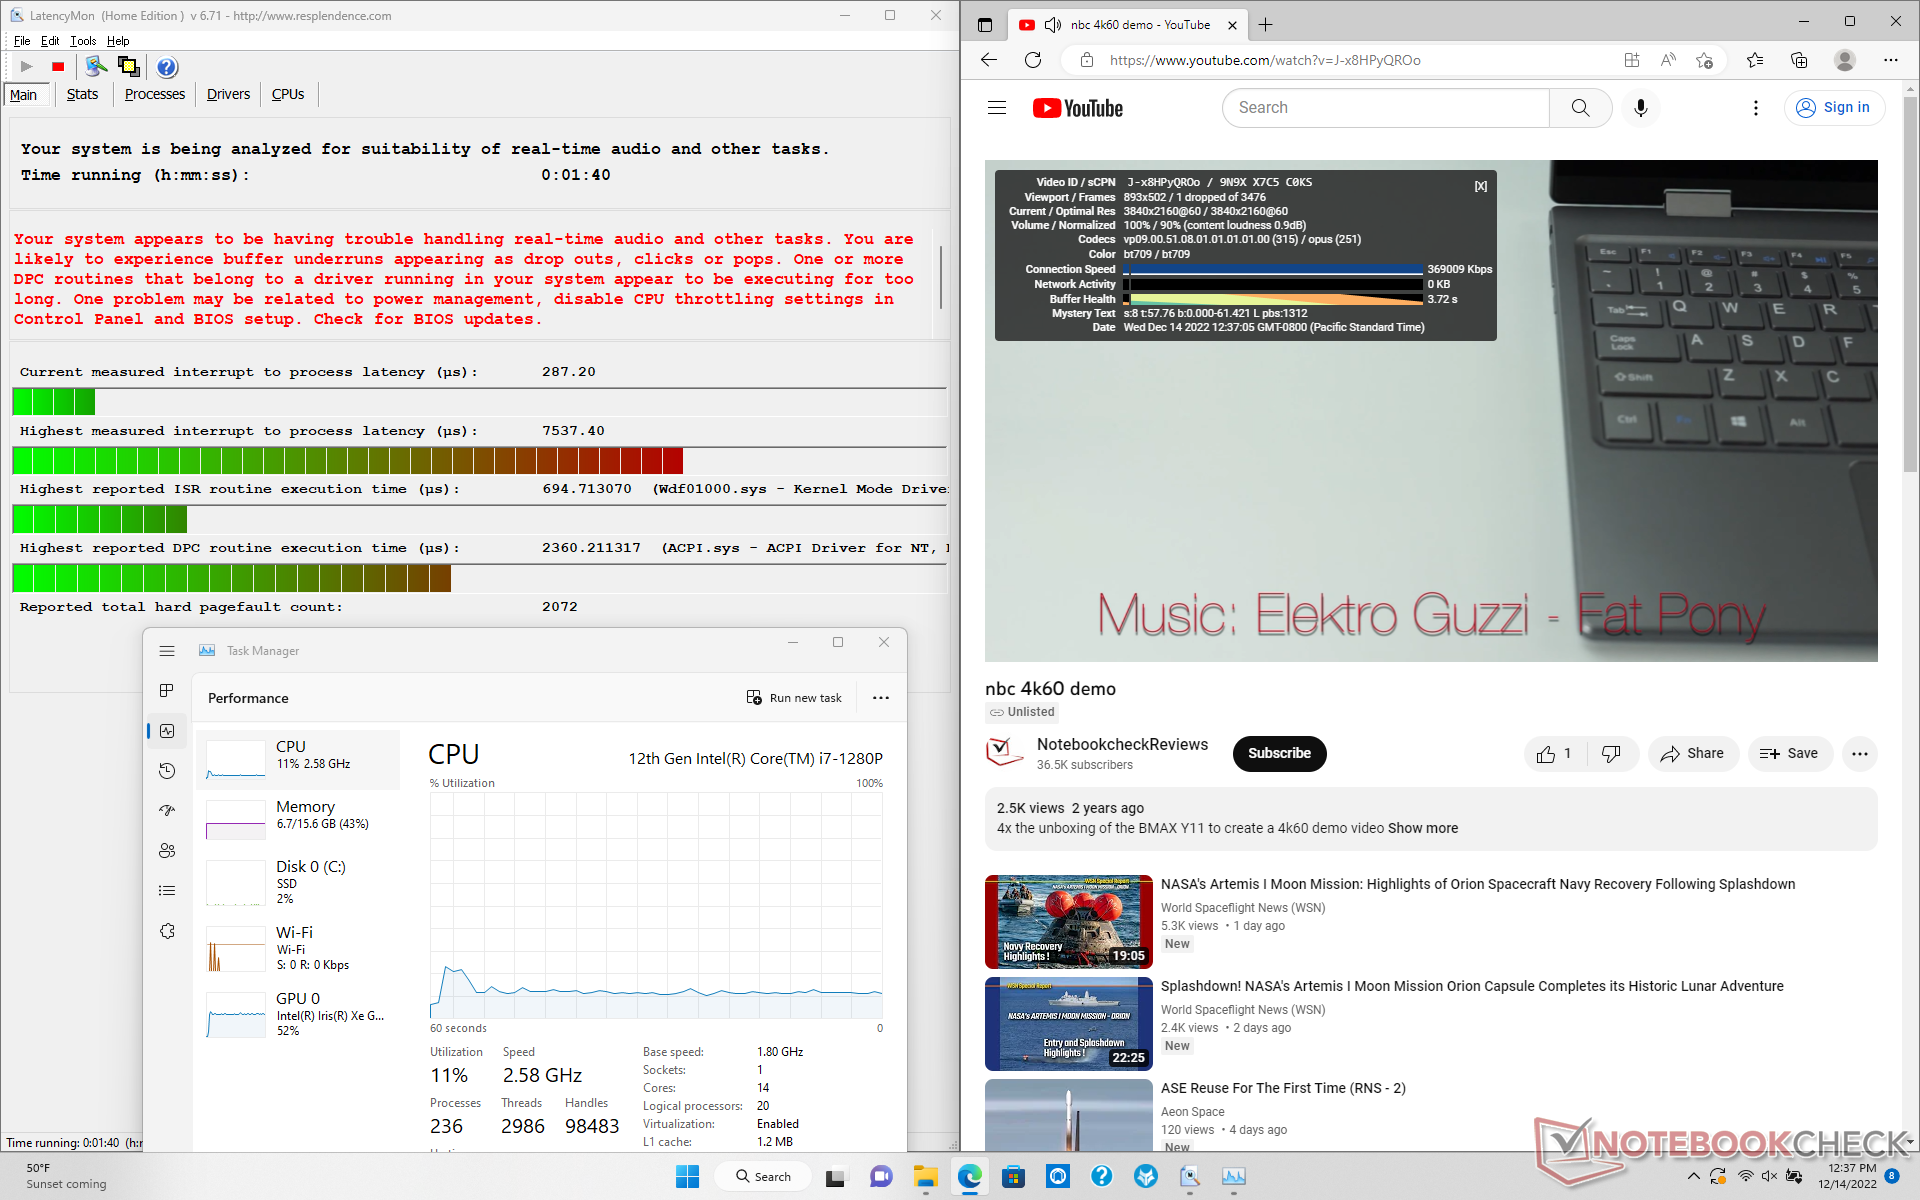
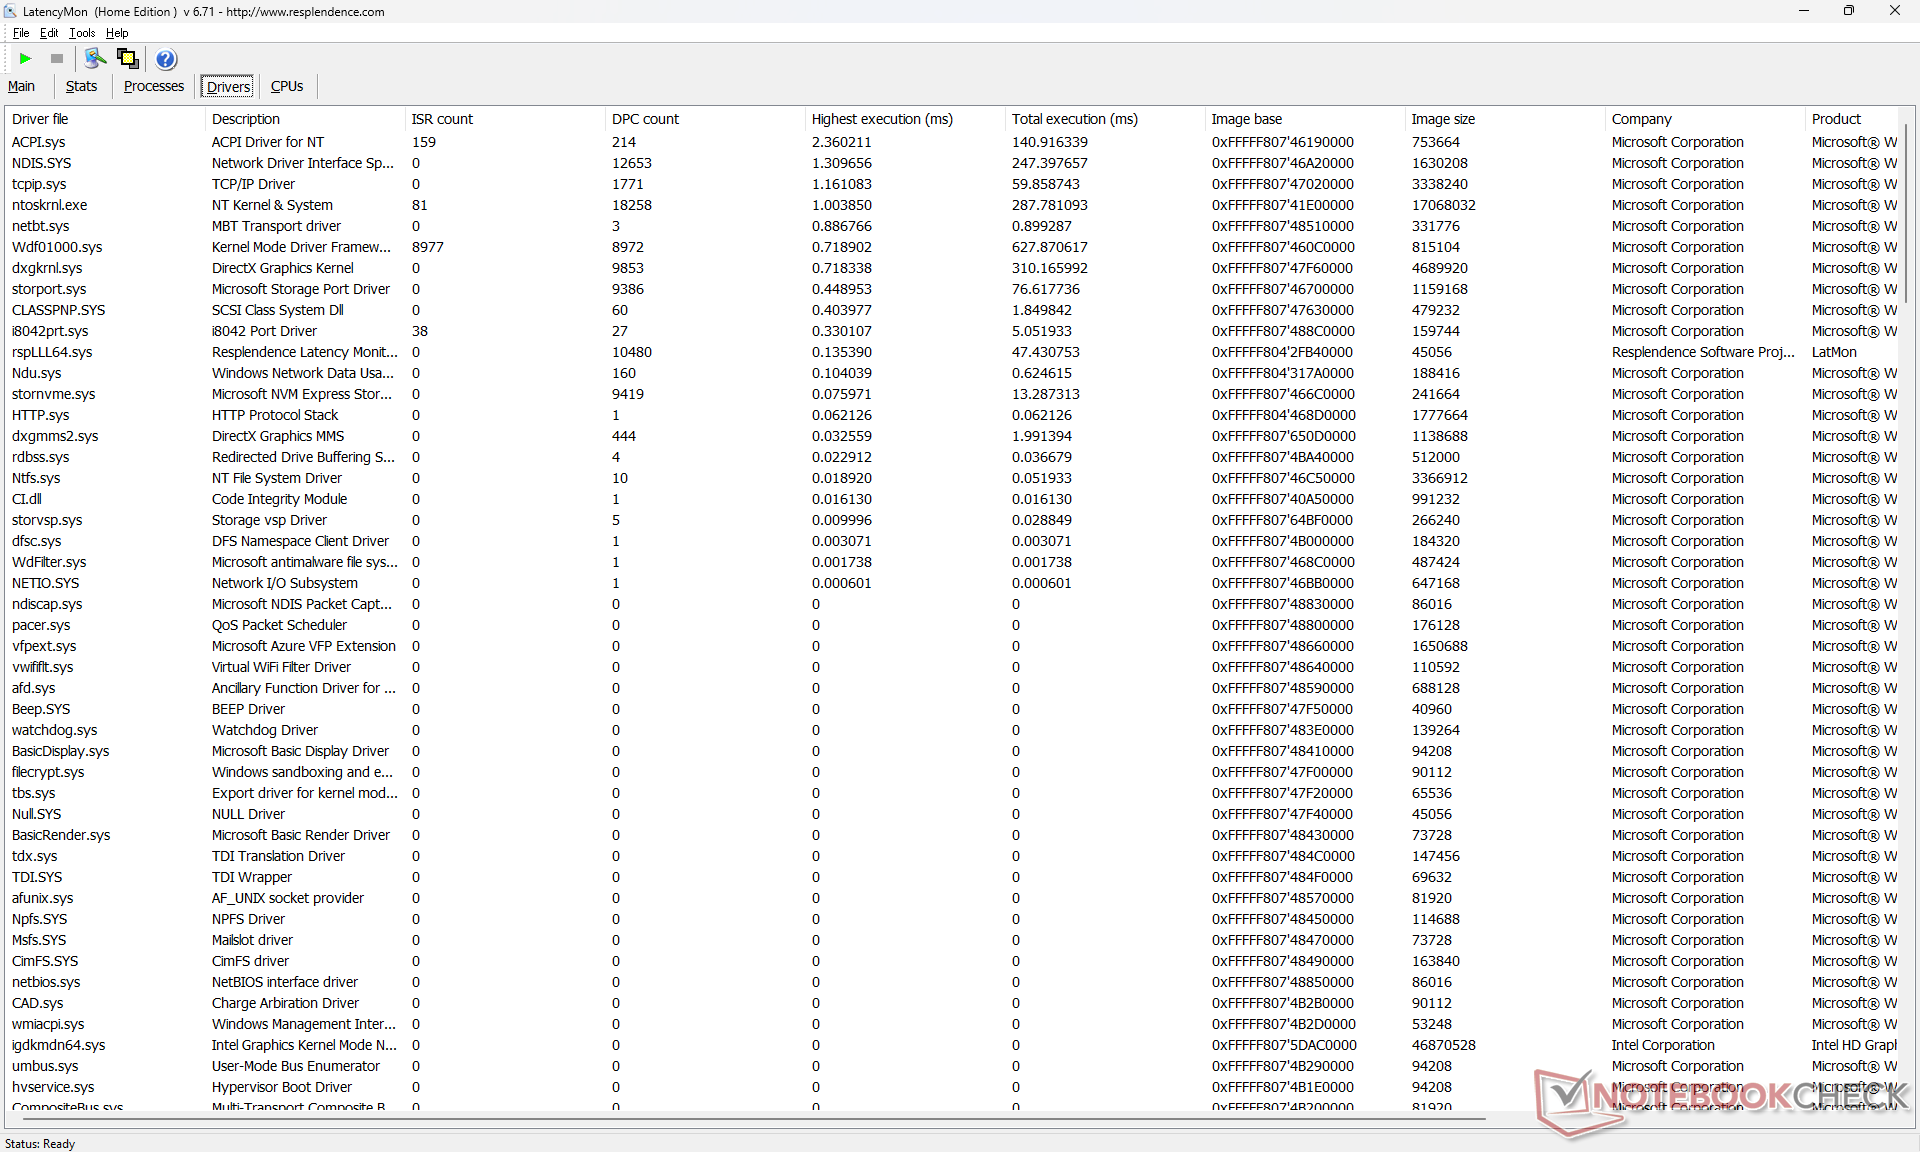
Latence DPC
LatencyMon révèle des problèmes de CPD lors de l'ouverture de plusieurs onglets de navigateur sur notre page d'accueil. la lecture de vidéos 4K à 60 FPS est par ailleurs presque parfaite, avec une seule image perdue au début de notre vidéo de test.
| DPC Latencies / LatencyMon - interrupt to process latency (max), Web, Youtube, Prime95 | |
| HP EliteBook 840 G9 | |
| HP EliteBook 840 Aero G8 3E4Q6AA | |
| Lenovo ThinkPad X1 Carbon G10 Core i7-1265U | |
| HP EliteBook 845 G9 6F6H6EA | |
| LG Gram 14Z90Q | |
| Dell Latitude 7420 JW6MH | |
* ... Moindre est la valeur, meilleures sont les performances
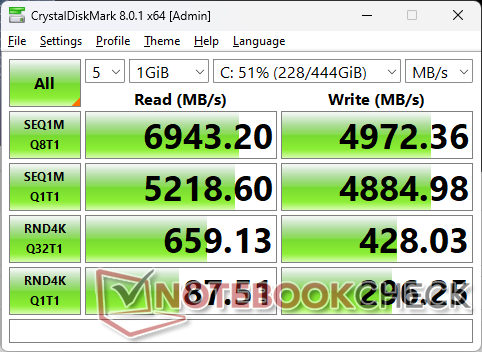
Périphériques de stockage
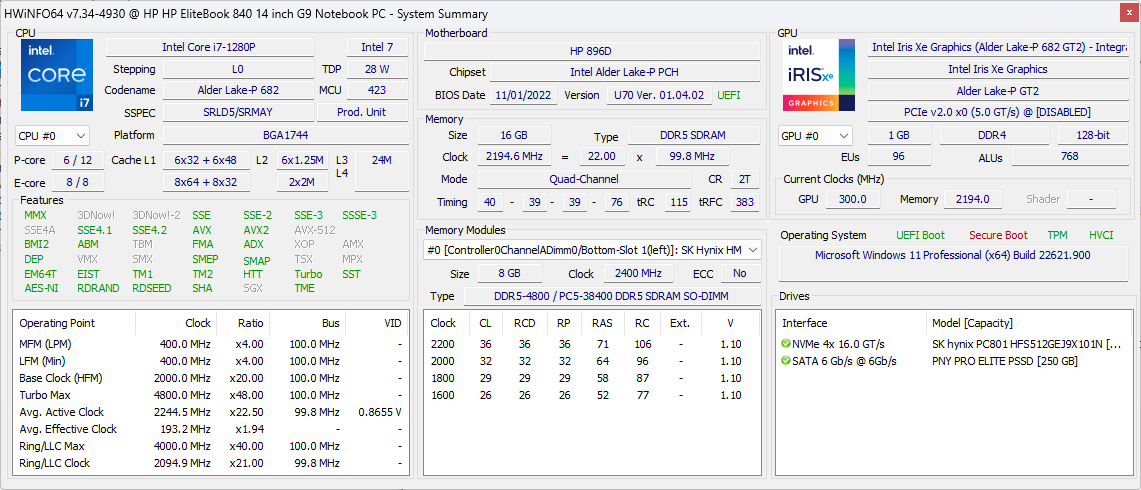
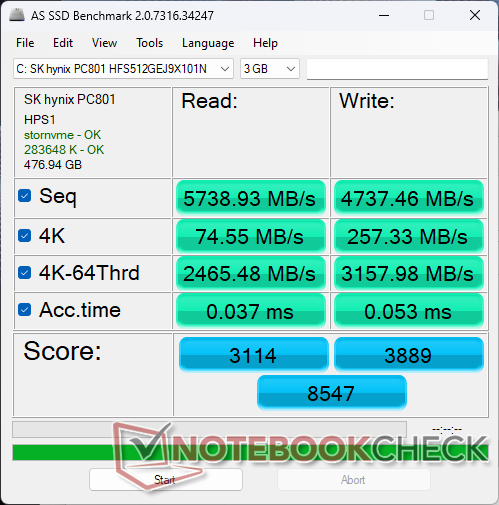
Notre unité est livrée avec un disque dur de 512 Go SK hynix PC801 PCIe4 x4 NVMe SSD capable d'atteindre des taux de lecture et d'écriture séquentiels de 7000 Mo/s et 5000 Mo/s, respectivement. Cependant, les taux de lecture soutenus sont un peu plus lents, à 5800 Mo/s, probablement en raison des limites de température.

| Drive Performance rating - Percent | |
| HP EliteBook 840 G9 | |
| LG Gram 14Z90Q | |
| HP EliteBook 845 G9 6F6H6EA | |
| Lenovo ThinkPad X1 Carbon G10 Core i7-1265U | |
| HP EliteBook 840 Aero G8 3E4Q6AA | |
| Dell Latitude 7420 JW6MH | |
* ... Moindre est la valeur, meilleures sont les performances
Disk Throttling: DiskSpd Read Loop, Queue Depth 8
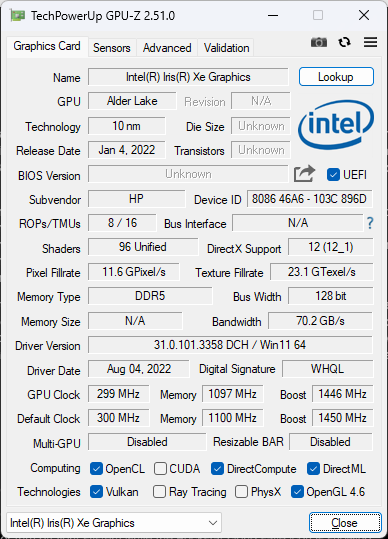
Performances du GPU - supérieures à la moyenne Iris Xe 96 EUs
Bien que le Core i7-1280P utilise le même processeur intégré que le Core i7-1280P Iris Xe 96 EUs Que sur le Core i7-1165G7 ou le Core i7-1265U, les performances graphiques sont légèrement plus rapides sur le HP car le CPU Core-P a une enveloppe thermique plus élevée. En conséquence, les utilisateurs peuvent s'attendre à des taux de trame de 15 à 25 % plus rapides que ceux d'un ordinateur portable moyen équipé d'un Iris Xe 96 EU. Si vous passez à une configuration Core i5 avec l Iris Xe 80 EU se traduira par une baisse de 20 à 30 % des performances graphiques.
Il est intéressant de noter que notre GPU Intel est plus performant que la carte concurrente Radeon 680M dans l'EliteBook 845 G9, malgré le fait que la Radeon 680M peut fonctionner plus rapidement sur d'autres ordinateurs portables comme leLenovo Yoga 7 14. Il est clair que le GPU Radeon intégré dans l'EliteBook est sous-performant.
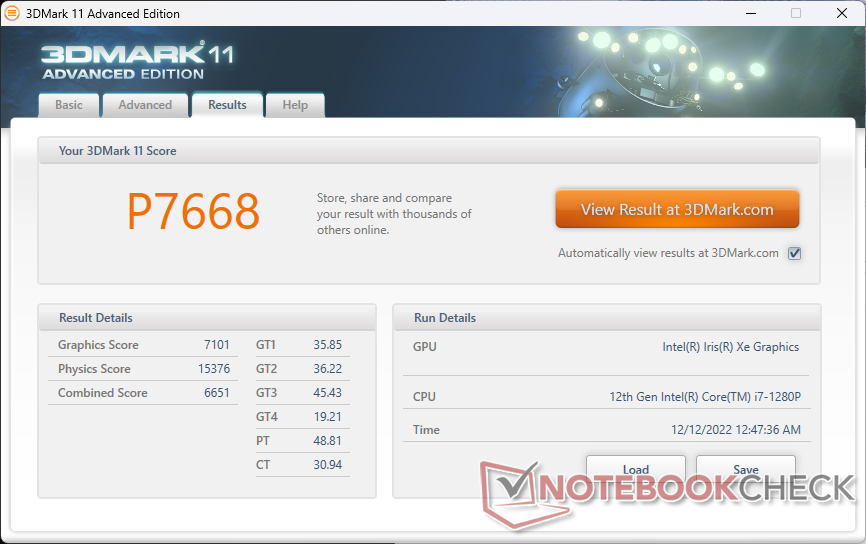
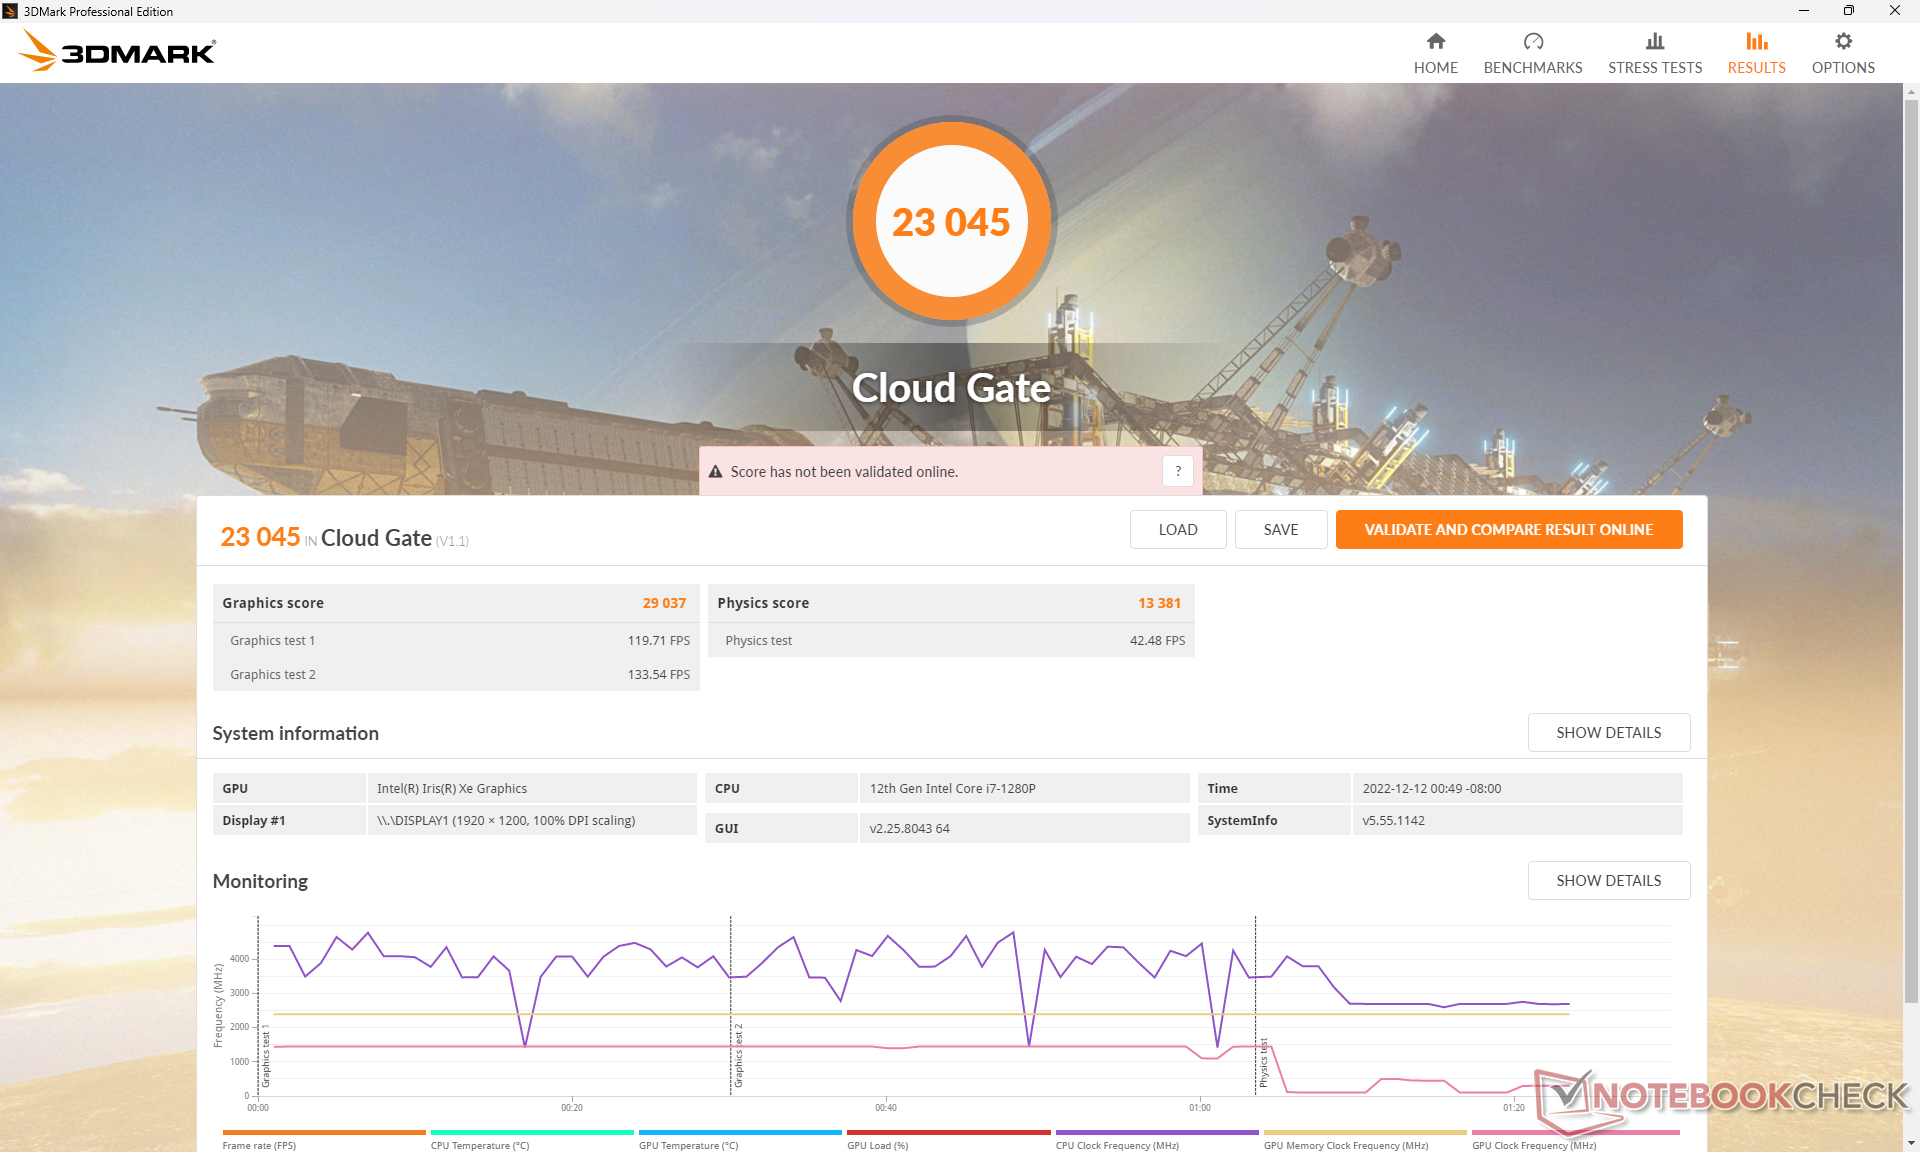
| 3DMark 11 Performance | 7668 points | |
| 3DMark Cloud Gate Standard Score | 23045 points | |
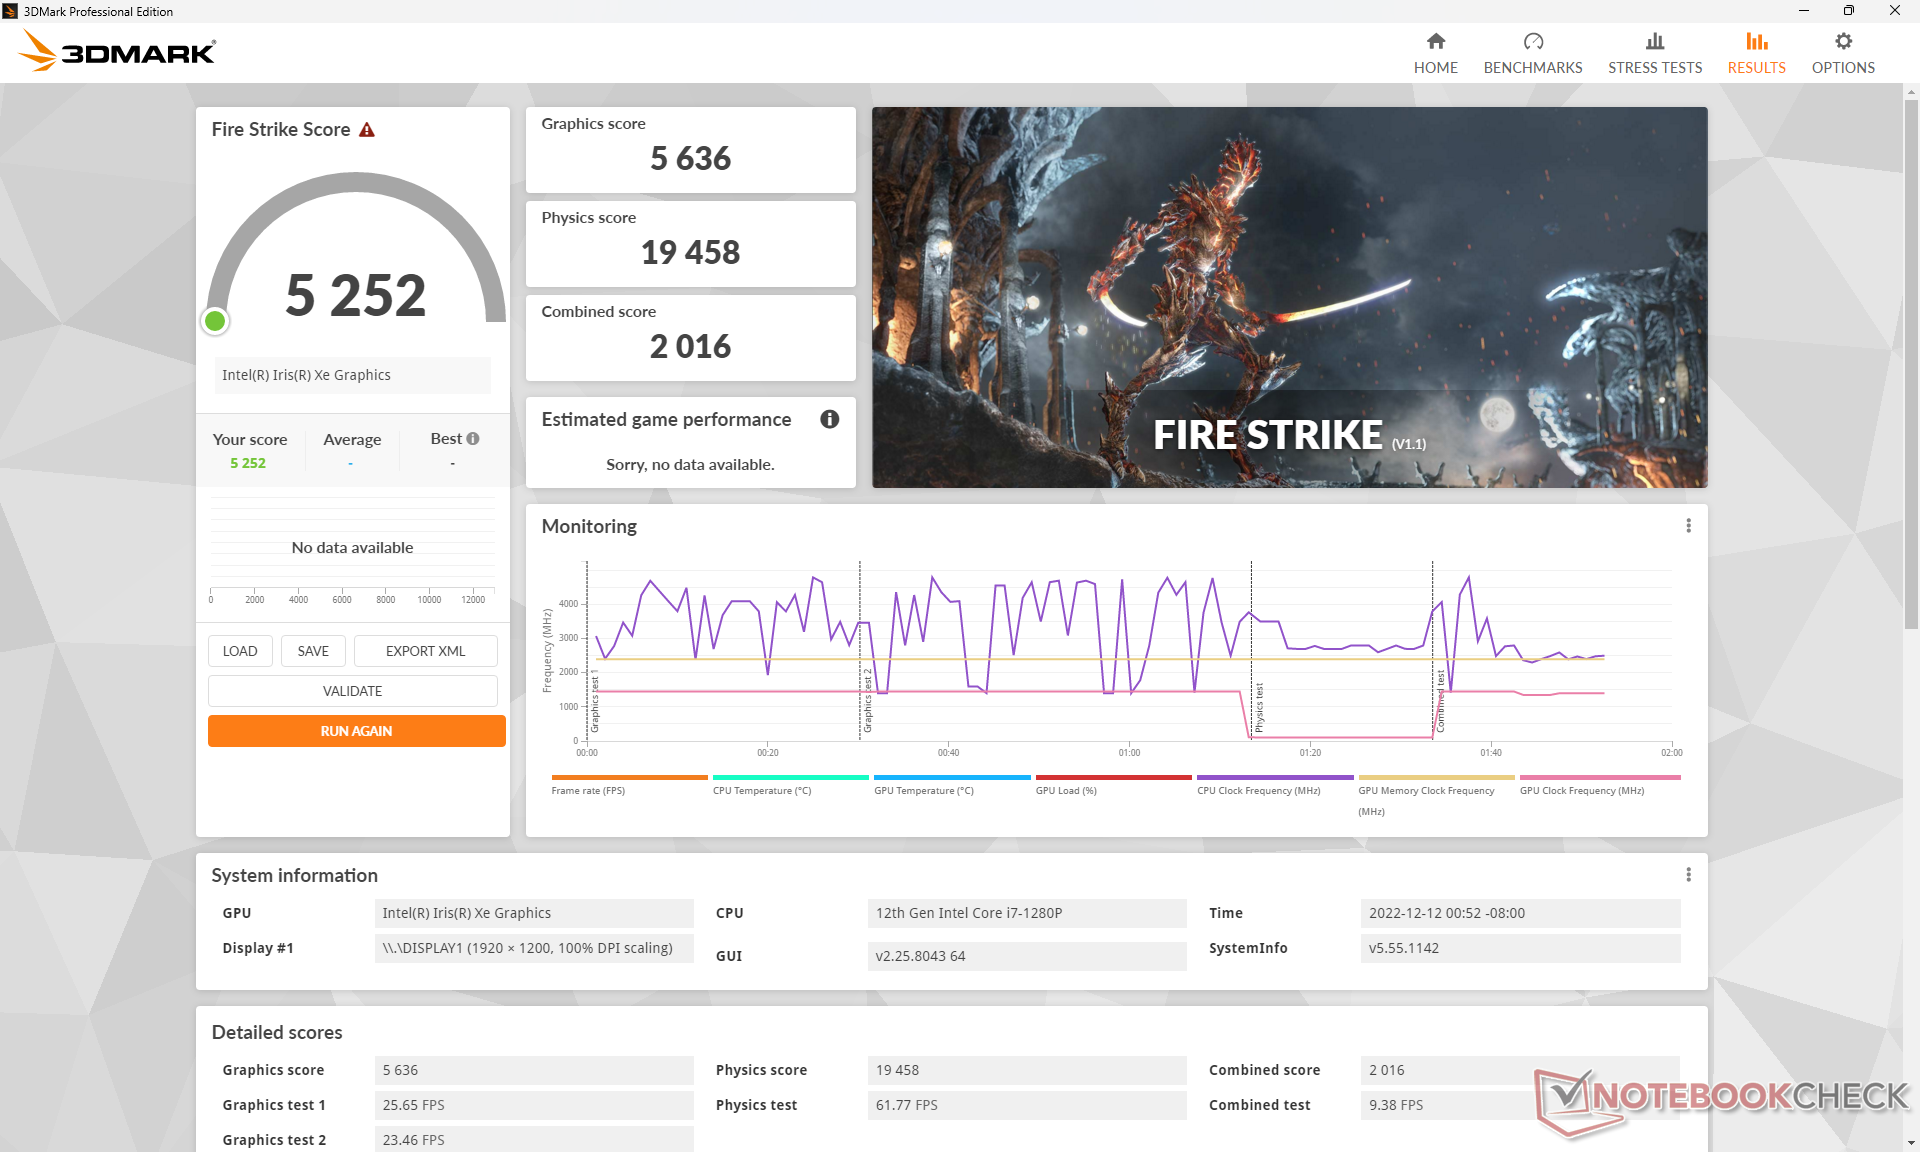
| 3DMark Fire Strike Score | 5252 points | |
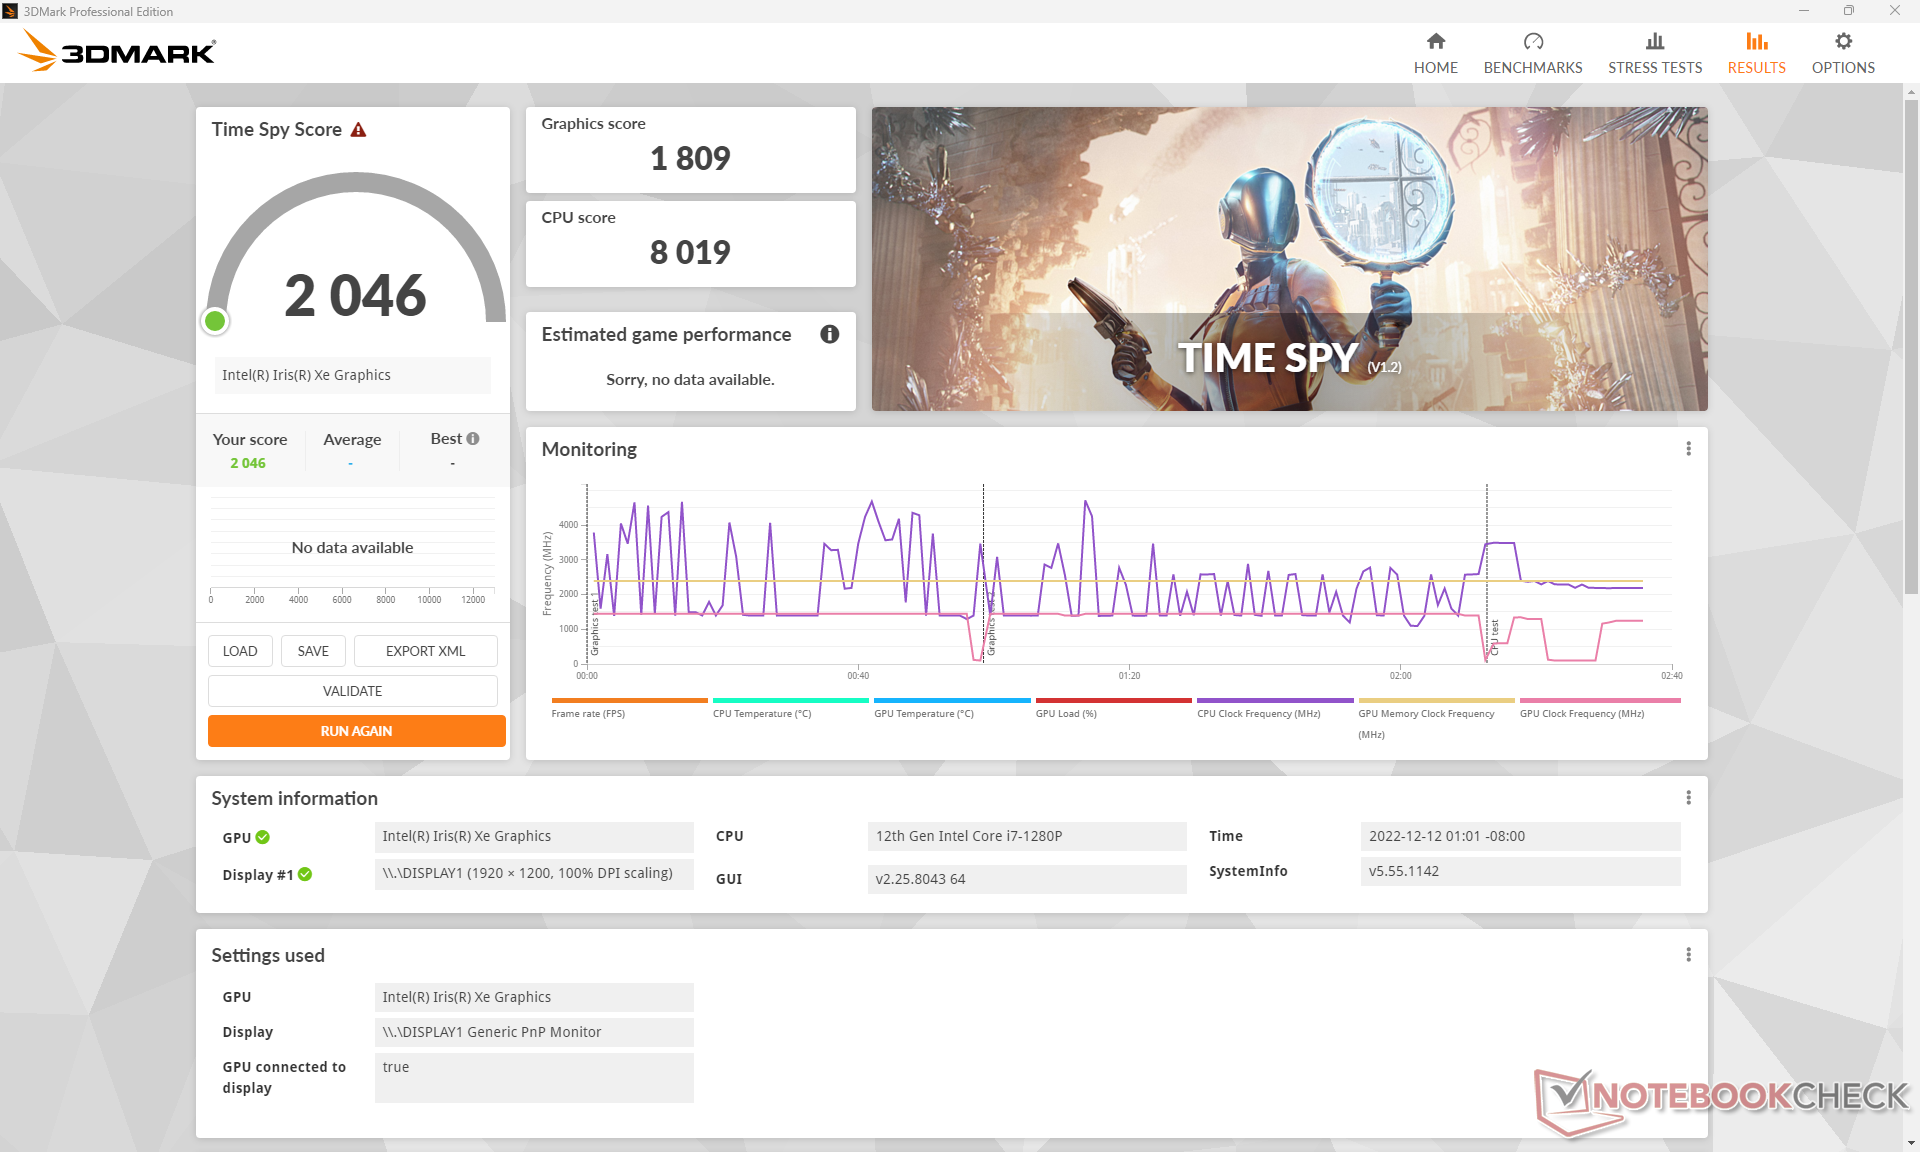
| 3DMark Time Spy Score | 2046 points | |
Aide | ||
Witcher 3 FPS Chart
| Bas | Moyen | Élevé | Ultra | |
|---|---|---|---|---|
| GTA V (2015) | 108.6 | 97.3 | 23.4 | 10.2 |
| The Witcher 3 (2015) | 100.1 | 59.3 | 35 | 16.4 |
| Dota 2 Reborn (2015) | 108.3 | 84.9 | 68.8 | 61.8 |
| Final Fantasy XV Benchmark (2018) | 46.9 | 26.1 | 18.4 | |
| X-Plane 11.11 (2018) | 46.1 | 34.5 | 33.7 | |
| Strange Brigade (2018) | 95.1 | 43.4 | 35.9 | 27.4 |
| Cyberpunk 2077 1.6 (2022) | 19.6 | 16.8 | 13 | 10.8 |
Emissions - Frais et silencieux
Bruit du système
Le bruit et le comportement du ventilateur sont similaires à ceux que nous avons enregistrés sur la version AMD du modèle. Le ventilateur interne fait un excellent travail en restant au ralenti aussi longtemps que possible lors de l'exécution de charges plus lourdes. L'exécution de la première scène de benchmark de 3DMark 06 une fois, par exemple, se traduirait par un bruit de ventilateur de seulement 32 dB(A) contre un fond silencieux de 24 dB(A). Le ventilateur se stabilise finalement à environ 39 dB(A) après des exécutions répétées avec seulement des impulsions temporaires allant jusqu'à 45 dB(A). Le bruit global du ventilateur est plus fort que ce que nous avons enregistré l'année dernière sur le EliteBook 840 Aero G8 qui utilise un CPU Core U-series de 11ème génération plus lent.
Degré de la nuisance sonore
| Au repos |
| 24.5 / 24.5 / 26 dB(A) |
| Fortement sollicité |
| 32.3 / 44.7 dB(A) |
 | ||
30 dB silencieux 40 dB(A) audible 50 dB(A) bruyant |
||
min: | ||
| HP EliteBook 840 G9 Iris Xe G7 96EUs, i7-1280P, SK hynix PC801 HFS512GEJ9X101N BF | HP EliteBook 845 G9 6F6H6EA Radeon 680M, R9 PRO 6950HS, WDC PC SN810 1TB | HP EliteBook 840 Aero G8 3E4Q6AA Iris Xe G7 96EUs, i7-1185G7, SK Hynix PC711 512GB HFS512GDE9X073N | Lenovo ThinkPad X1 Carbon G10 Core i7-1265U Iris Xe G7 96EUs, i7-1265U, Kioxia BG5 KBG5AZNV1T02 | LG Gram 14Z90Q Iris Xe G7 80EUs, i5-1240P, Samsung PM9A1 MZVL2512HCJQ | Dell Latitude 7420 JW6MH Iris Xe G7 80EUs, i5-1145G7, SK Hynix BC711 HFM512GD3HX015N | |
|---|---|---|---|---|---|---|
| Noise | -5% | 13% | 3% | -1% | -8% | |
| arrêt / environnement * (dB) | 24.3 | 25.5 -5% | 24.1 1% | 23.2 5% | 25 -3% | 25.3 -4% |
| Idle Minimum * (dB) | 24.5 | 25.5 -4% | 24.2 1% | 23.2 5% | 26 -6% | 25.3 -3% |
| Idle Average * (dB) | 24.5 | 25.5 -4% | 24.2 1% | 23.2 5% | 27 -10% | 25.3 -3% |
| Idle Maximum * (dB) | 26 | 25.5 2% | 24.2 7% | 23.2 11% | 28 -8% | 25.3 3% |
| Load Average * (dB) | 32.3 | 38.1 -18% | 26.9 17% | 38.6 -20% | 35 -8% | 44.9 -39% |
| Witcher 3 ultra * (dB) | 39 | 27.9 28% | 38.5 1% | 36 8% | ||
| Load Maximum * (dB) | 44.7 | 44 2% | 29.9 33% | 38.3 14% | 36 19% | 44.9 -0% |
* ... Moindre est la valeur, meilleures sont les performances
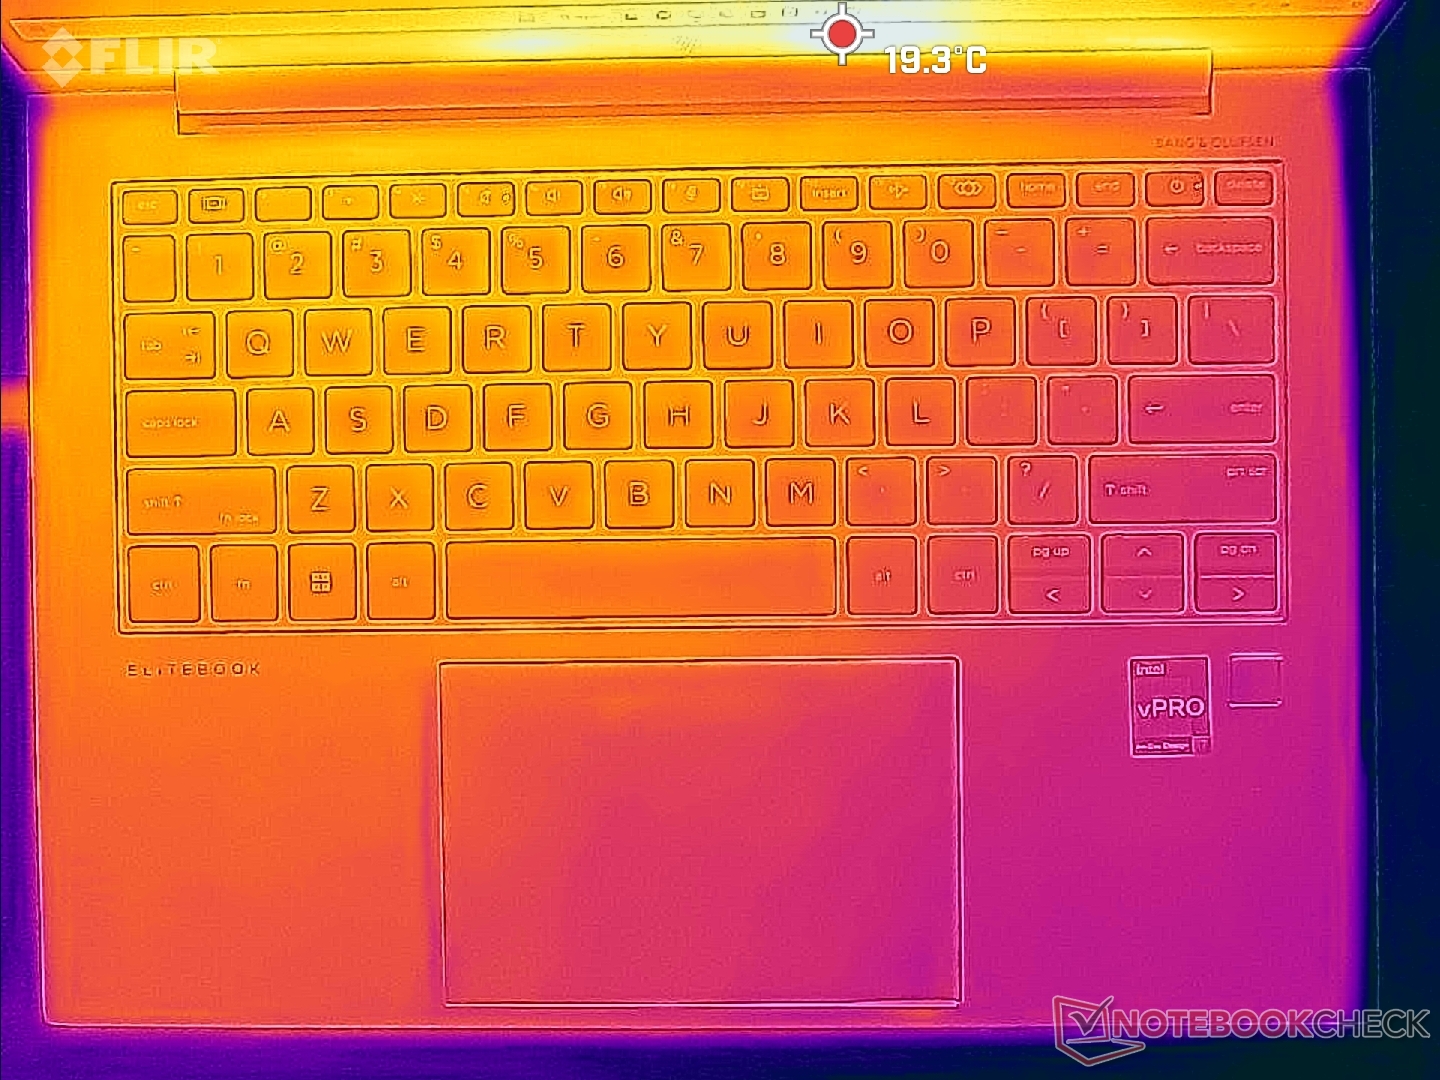
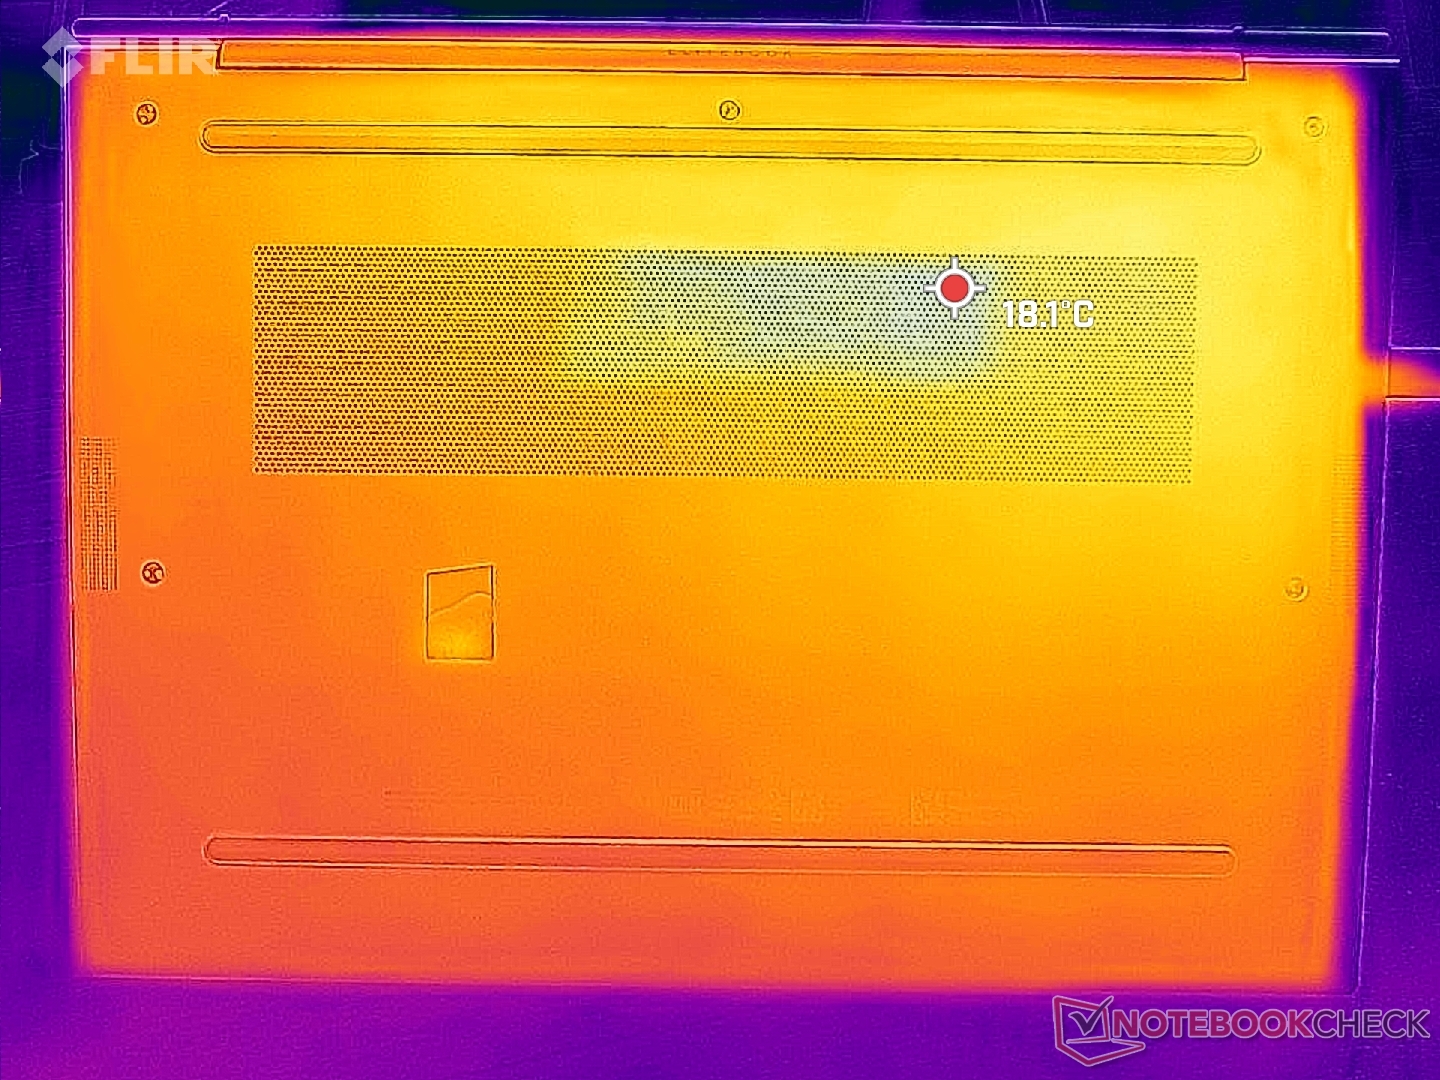
Température
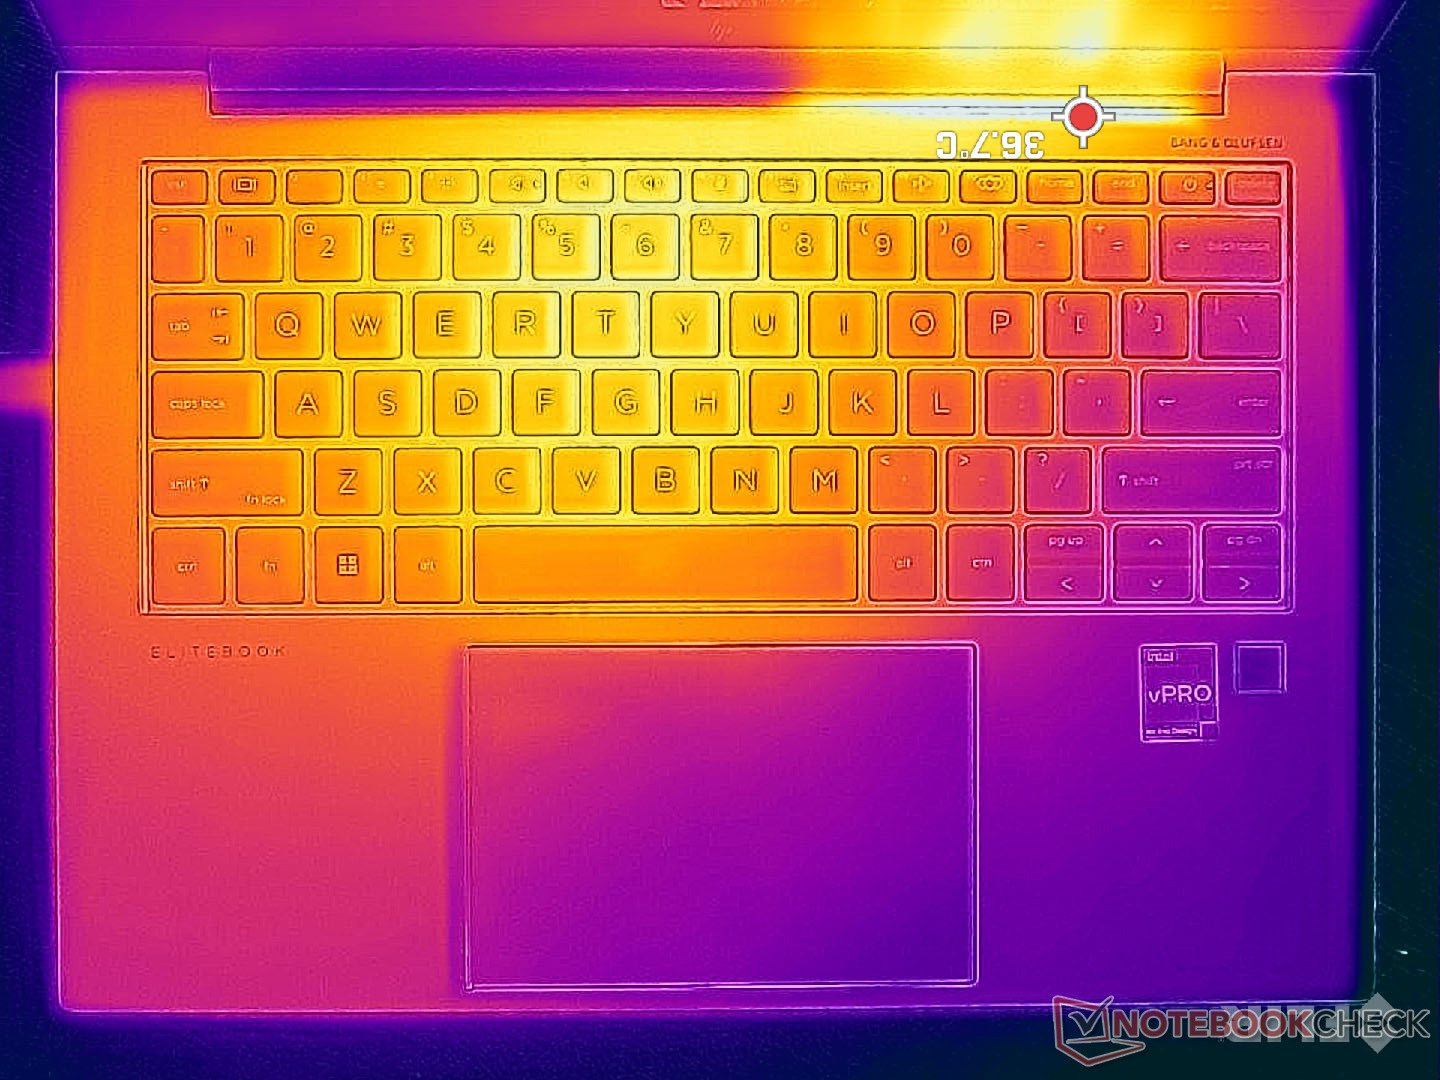
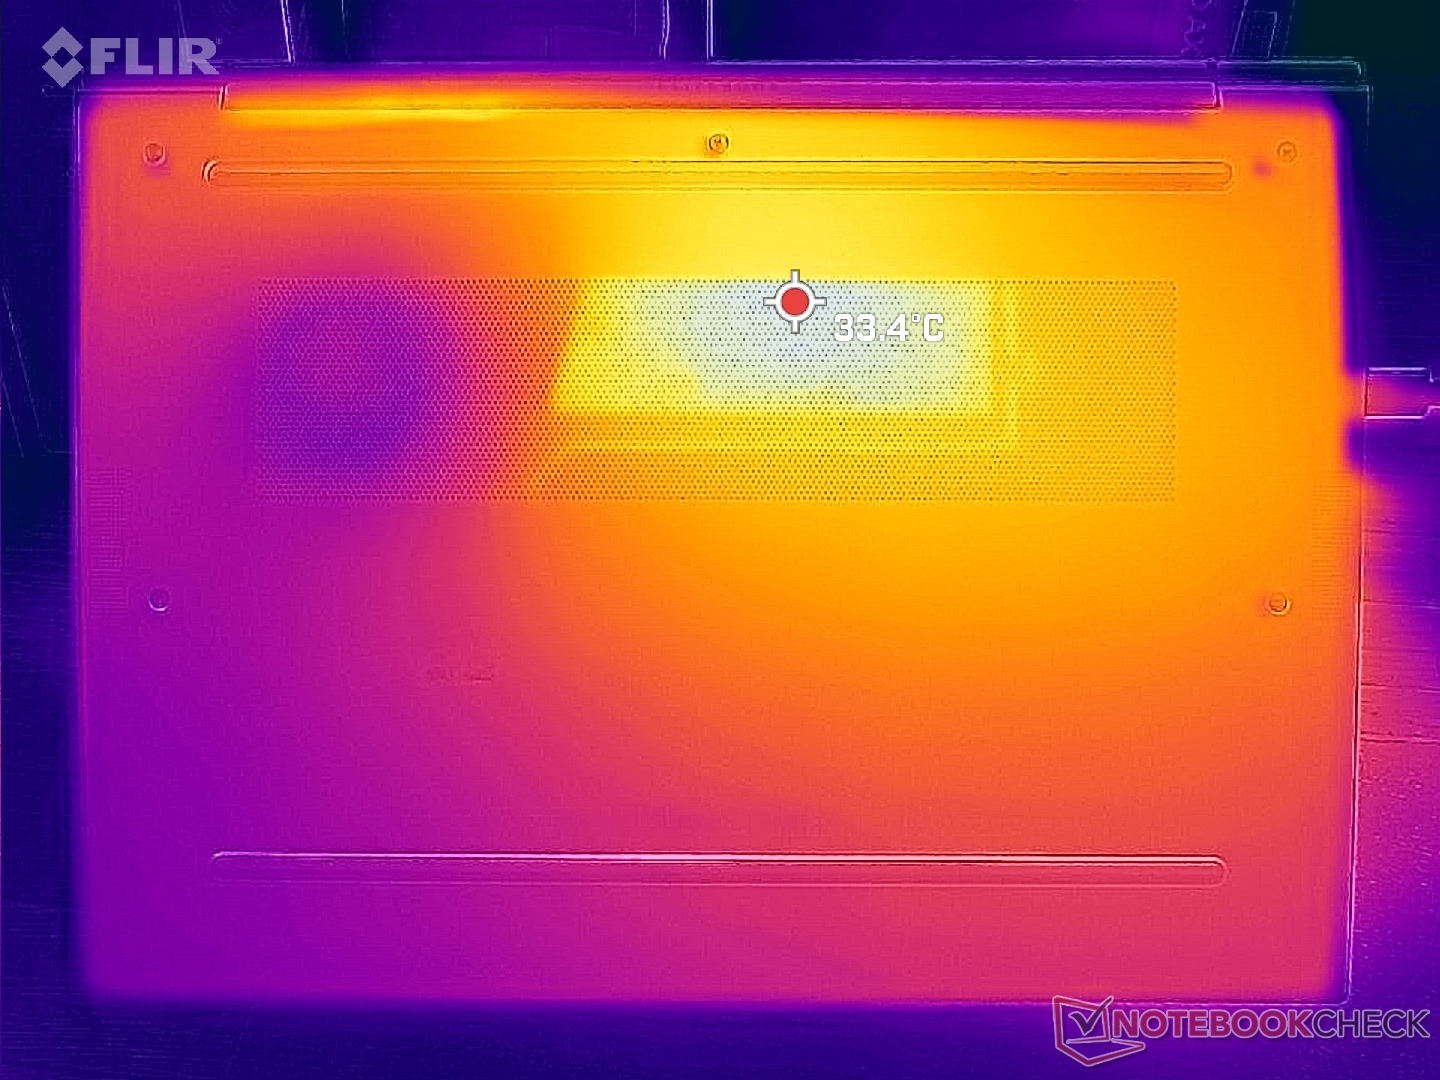
Les températures de surface sont plus chaudes vers le centre, où les points chauds sur le clavier et le fond peuvent atteindre environ 33 C et 36 C, respectivement, contre un peu plus de 40 C sur le ThinkPad X1 Carbon Gen 10. Le système ne devient jamais inconfortablement chaud sur la peau.
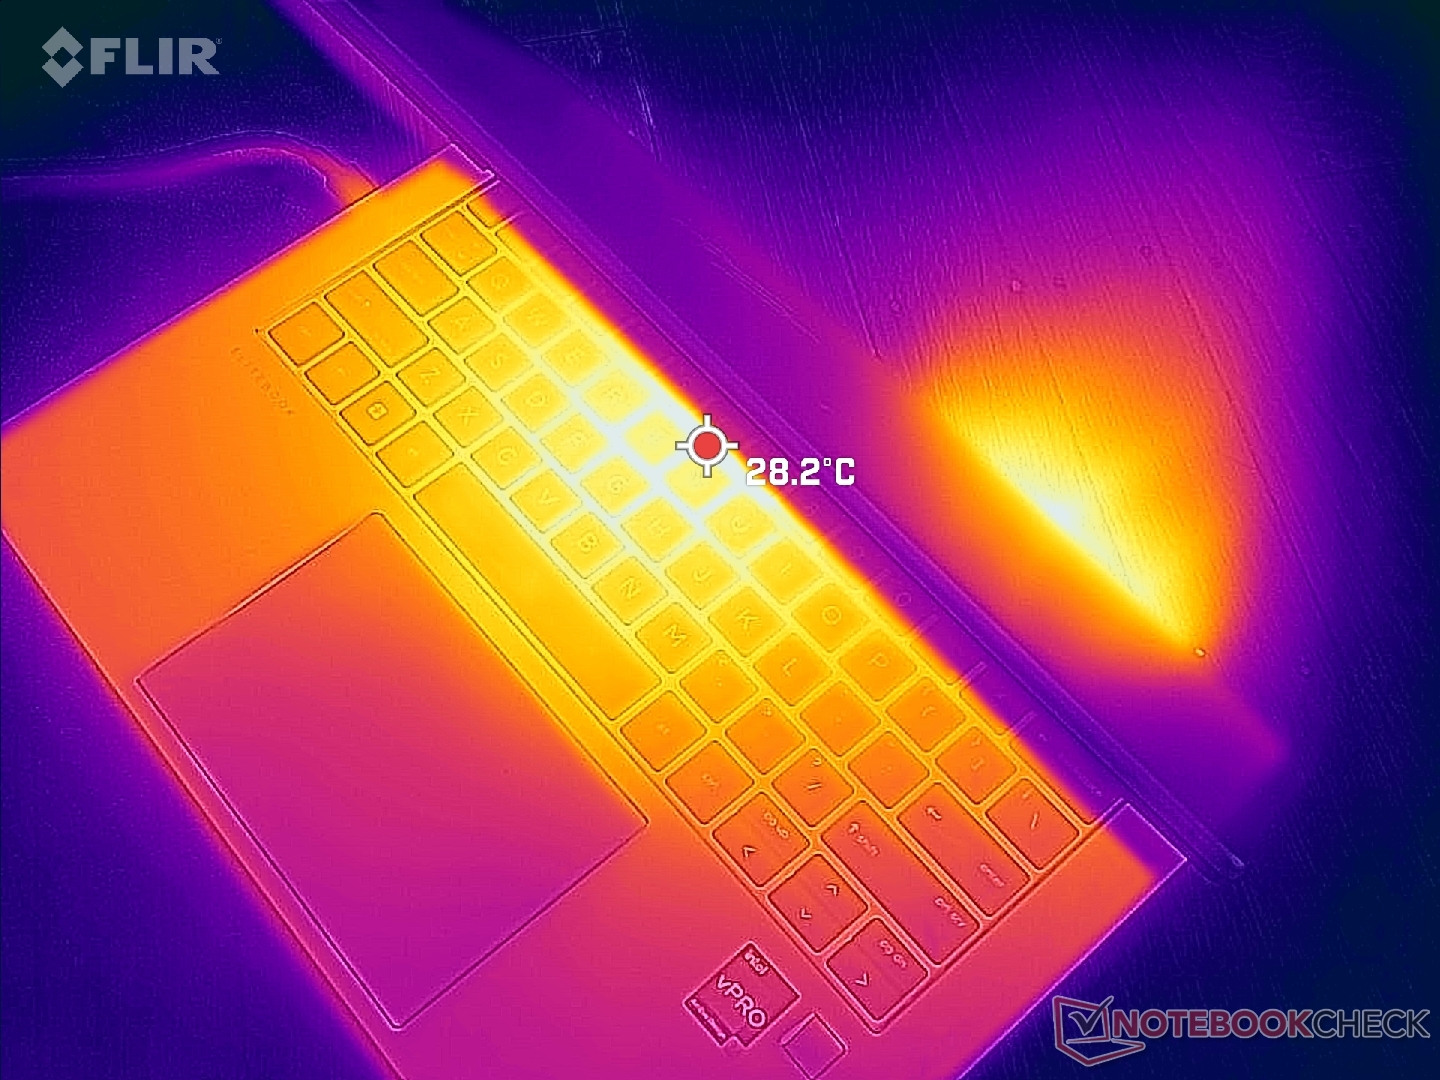
(+) La température maximale du côté supérieur est de 32.8 °C / 91 F, par rapport à la moyenne de 34.3 °C / 94 F, allant de 21.2 à 62.5 °C pour la classe Office.
(+) Le fond chauffe jusqu'à un maximum de 36.6 °C / 98 F, contre une moyenne de 36.8 °C / 98 F
(+) En utilisation inactive, la température moyenne du côté supérieur est de 20.7 °C / 69 F, par rapport à la moyenne du dispositif de 29.5 °C / 85 F.
(+) Les repose-poignets et le pavé tactile sont plus froids que la température de la peau avec un maximum de 23.2 °C / 73.8 F et sont donc froids au toucher.
(+) La température moyenne de la zone de l'appui-paume de dispositifs similaires était de 27.5 °C / 81.5 F (+4.3 °C / #7.7 F).
| HP EliteBook 840 G9 Intel Core i7-1280P, Intel Iris Xe Graphics G7 96EUs | HP EliteBook 845 G9 6F6H6EA AMD Ryzen 9 PRO 6950HS, AMD Radeon 680M | HP EliteBook 840 Aero G8 3E4Q6AA Intel Core i7-1185G7, Intel Iris Xe Graphics G7 96EUs | Lenovo ThinkPad X1 Carbon G10 Core i7-1265U Intel Core i7-1265U, Intel Iris Xe Graphics G7 96EUs | LG Gram 14Z90Q Intel Core i5-1240P, Intel Iris Xe Graphics G7 80EUs | Dell Latitude 7420 JW6MH Intel Core i5-1145G7, Intel Iris Xe Graphics G7 80EUs | |
|---|---|---|---|---|---|---|
| Heat | -42% | -42% | -13% | -26% | -18% | |
| Maximum Upper Side * (°C) | 32.8 | 49.4 -51% | 39.2 -20% | 41.2 -26% | 43 -31% | 37.1 -13% |
| Maximum Bottom * (°C) | 36.6 | 48 -31% | 51.2 -40% | 41 -12% | 45 -23% | 38.7 -6% |
| Idle Upper Side * (°C) | 21.6 | 30.8 -43% | 33 -53% | 23.2 -7% | 27 -25% | 27.3 -26% |
| Idle Bottom * (°C) | 22.2 | 31.4 -41% | 34 -53% | 23.4 -5% | 28 -26% | 28.1 -27% |
* ... Moindre est la valeur, meilleures sont les performances
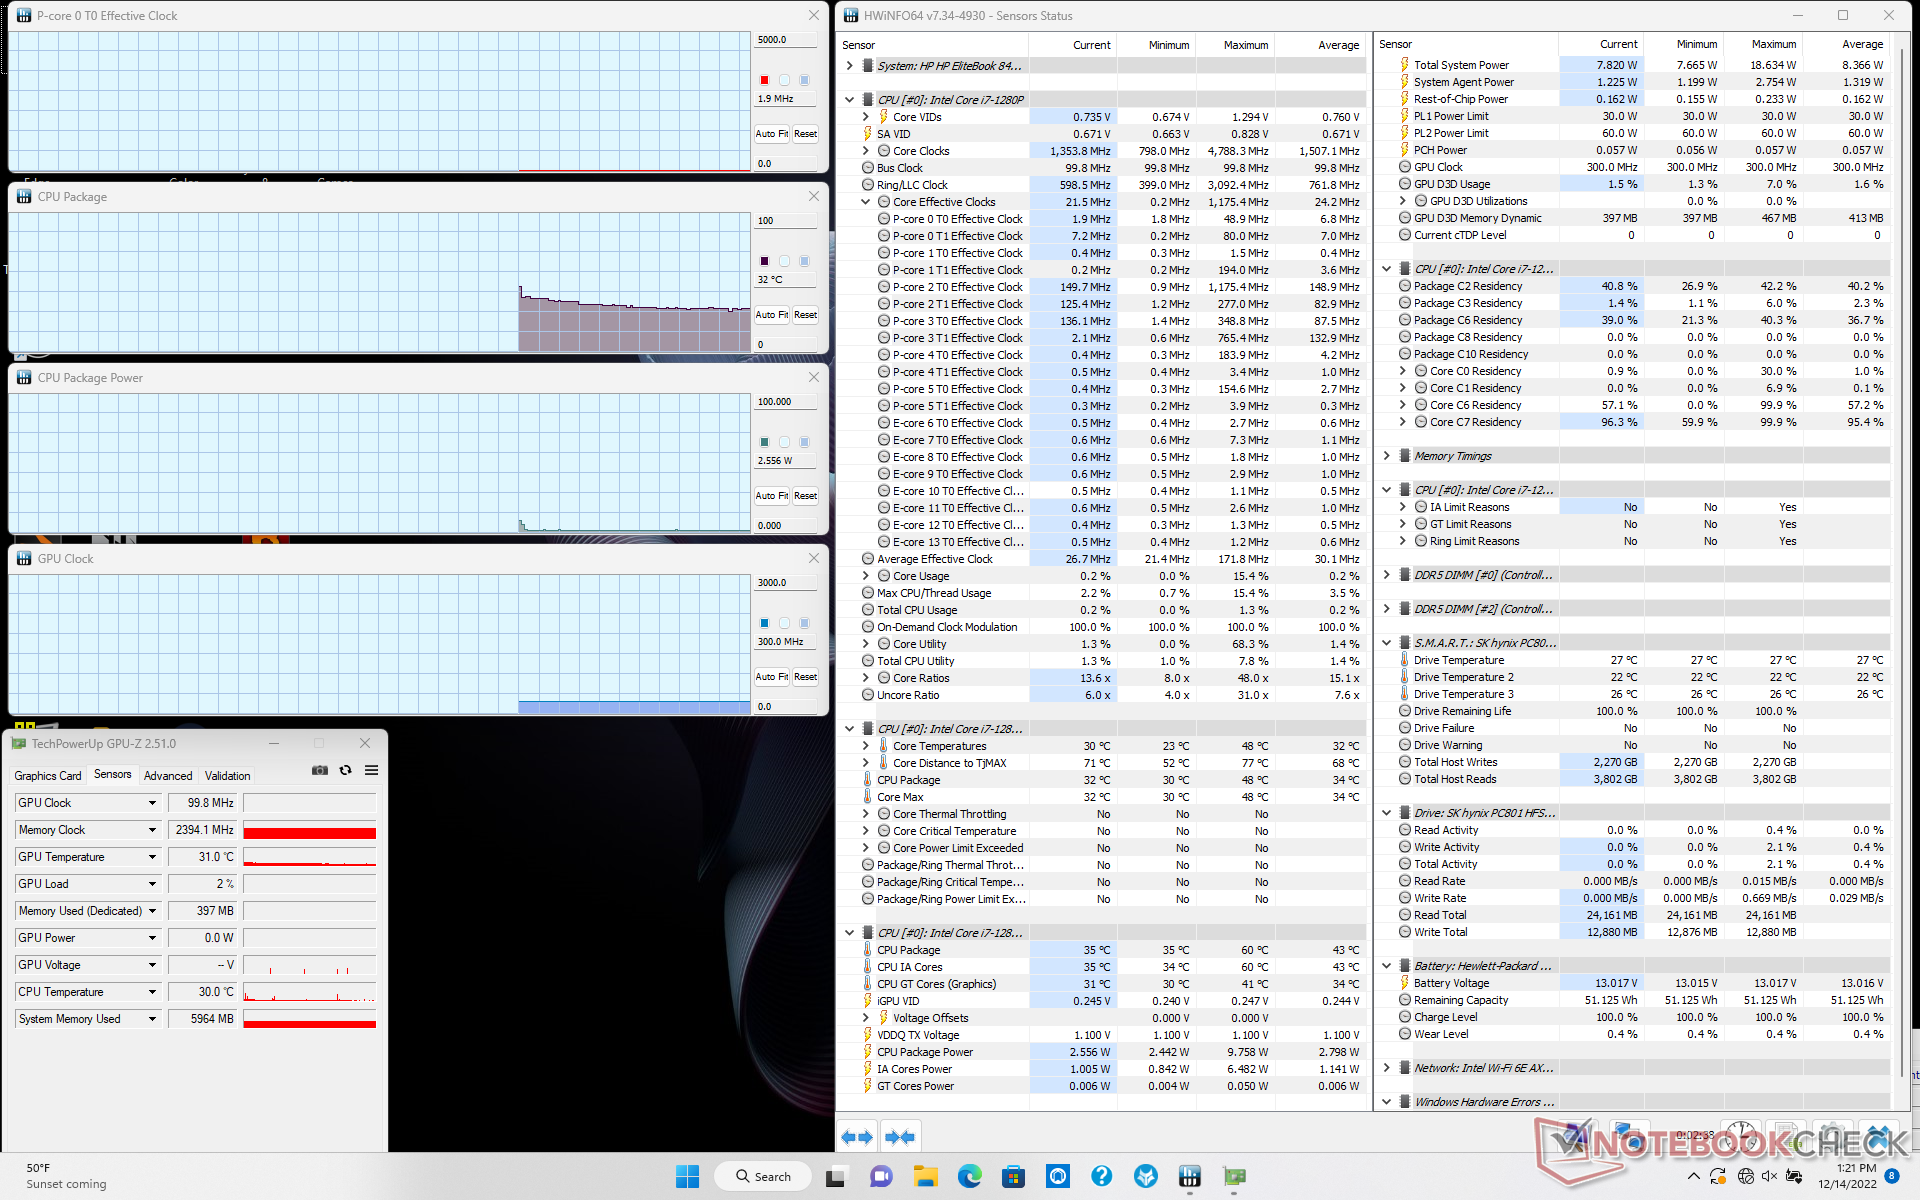
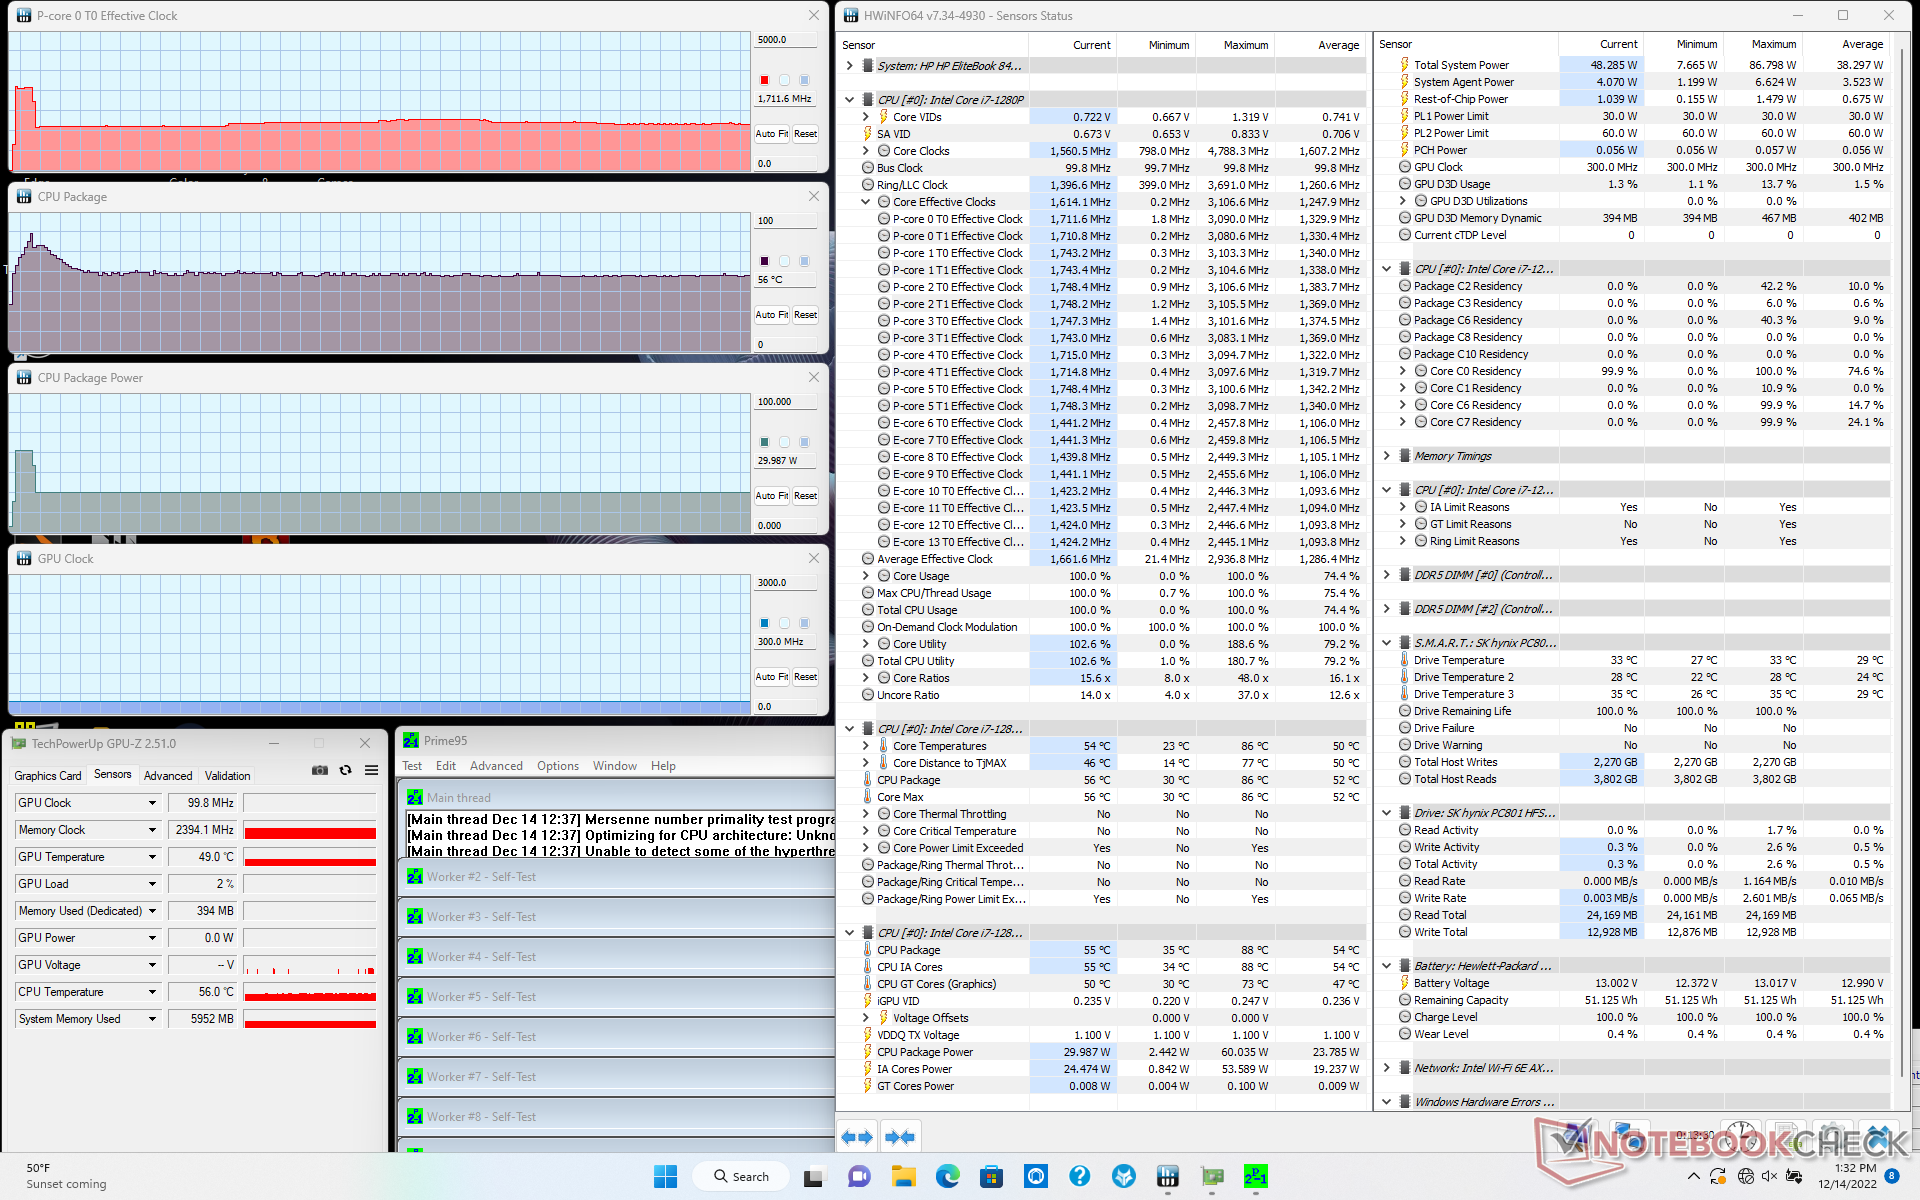
Test de stress
Lors de l'exécution de Prime95, le CPU passe à 3 GHz et 60 W pendant environ 20 secondes ou jusqu'à ce que la température centrale atteigne 86 C. Ensuite, il descend à seulement 1,6 GHz et 30 W afin de maintenir une température centrale plus fraîche de 65 C. Il est dommage qu'il n'y ait pas d'option pour augmenter le plafond de température pour des fréquences d'horloge soutenues plus élevées, car le CPU ici est sous-performant par rapport à la plupart des autres ordinateurs portables avec le même processeur Core i7-1280P.
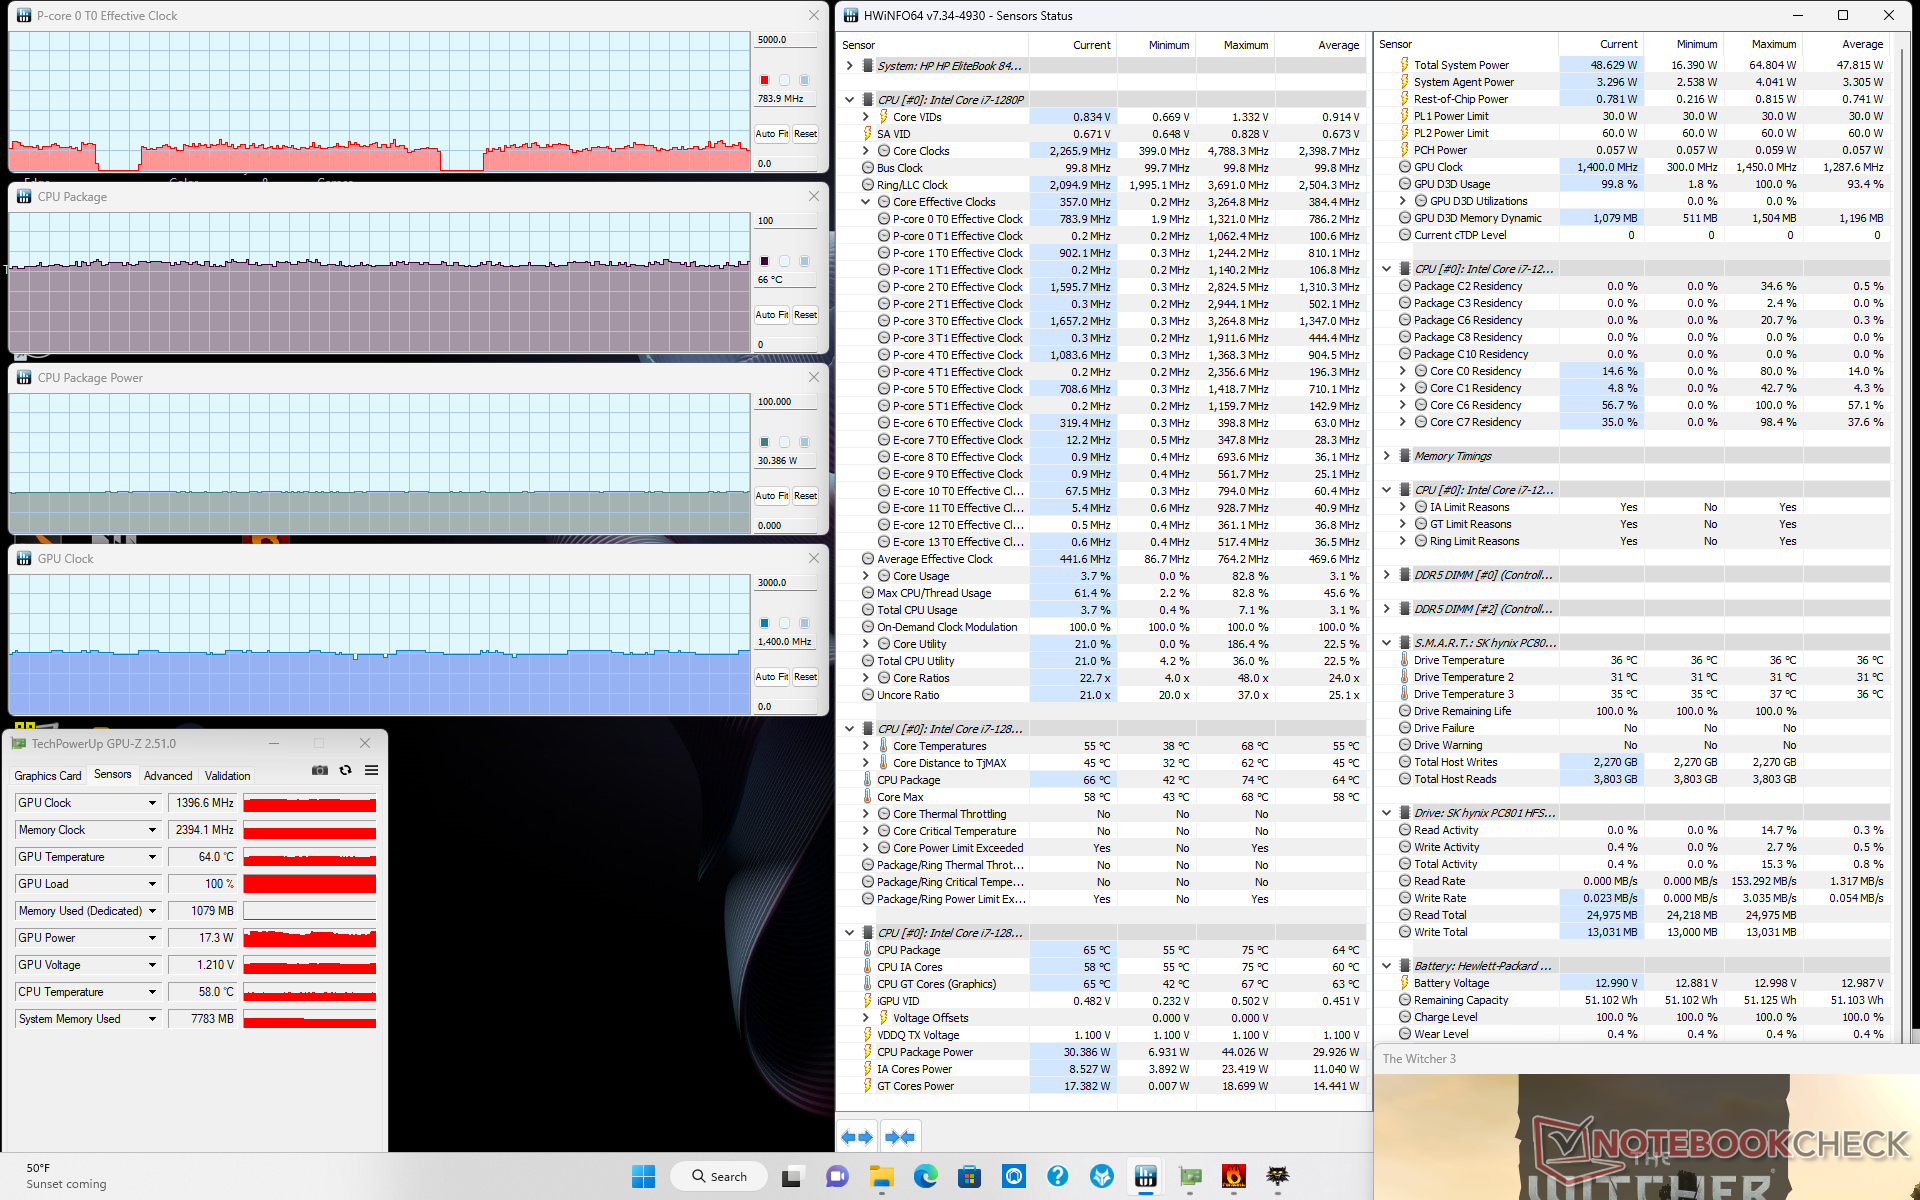
Les fréquences d'horloge et la température du GPU en fonctionnement Witcher 3 se stabilisent à 1397 MHz et 66°C, respectivement, contre 1097 MHz et 65°C sur le Dragonfly Folio G3 Dragonfly Folio G3 équipé du même GPU intégré. Les fréquences d'horloge plus élevées aident à propulser l'EliteBook au-dessus de la plupart des ordinateurs portables équipés de Core U en ce qui concerne les performances graphiques.
Le fonctionnement sur batterie réduit légèrement les performances. Un test 3DMark 11 sur batterie donnerait des scores de physique et de graphisme de 13157 et 6717 points, respectivement, contre 15376 et 7101 points sur secteur.
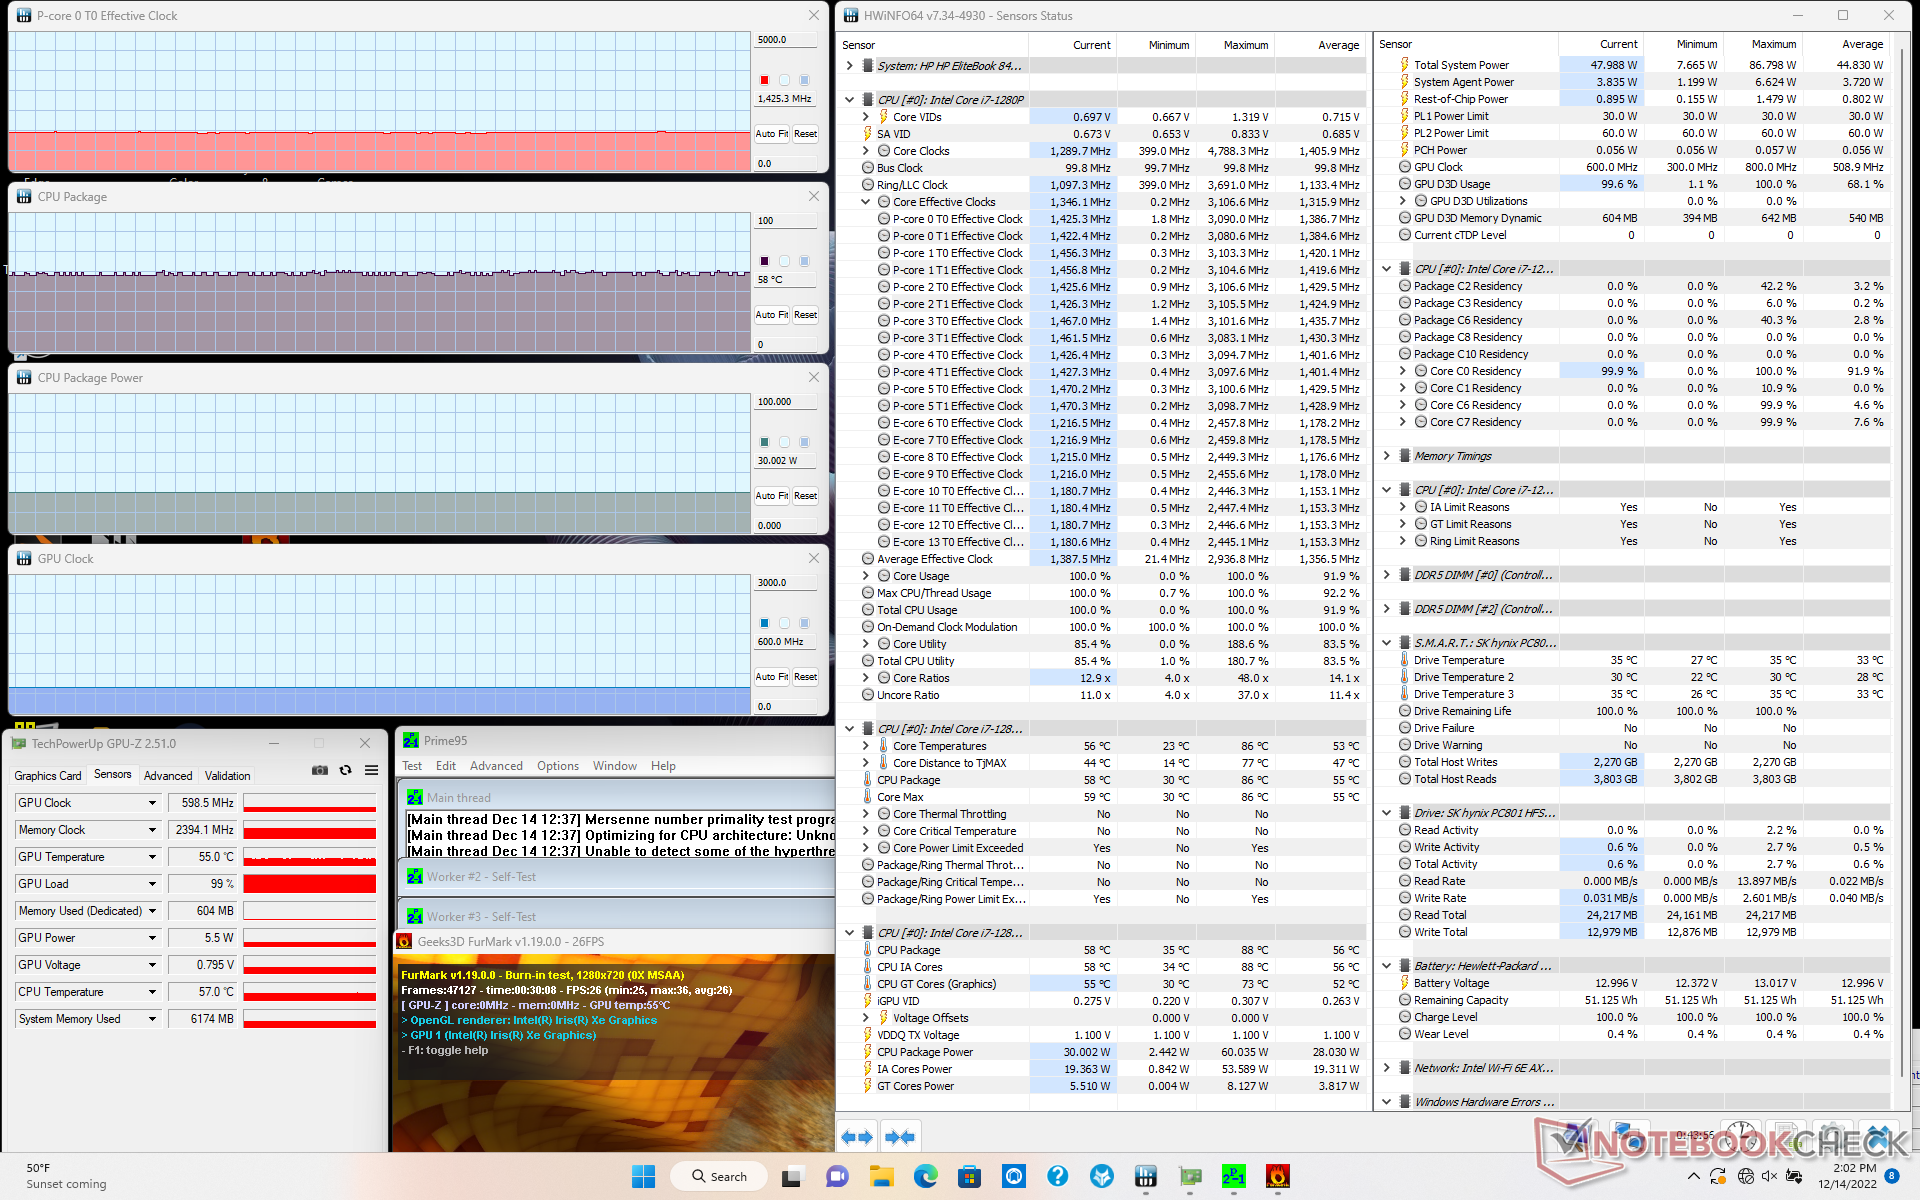
| Fréquence du CPU (GHz) | Fréquence du GPU (MHz) | Température moyenne du CPU (°C) | |
| Système au repos | -- | -- | 32 |
| Prime95 Stress | 1.7 | -- | 56 |
| Prime95 + FurMark Stress | 1.4 | 599 | 58 |
| Witcher 3 Stress | ~0.8 | 1397 | 66 |
Haut-parleurs
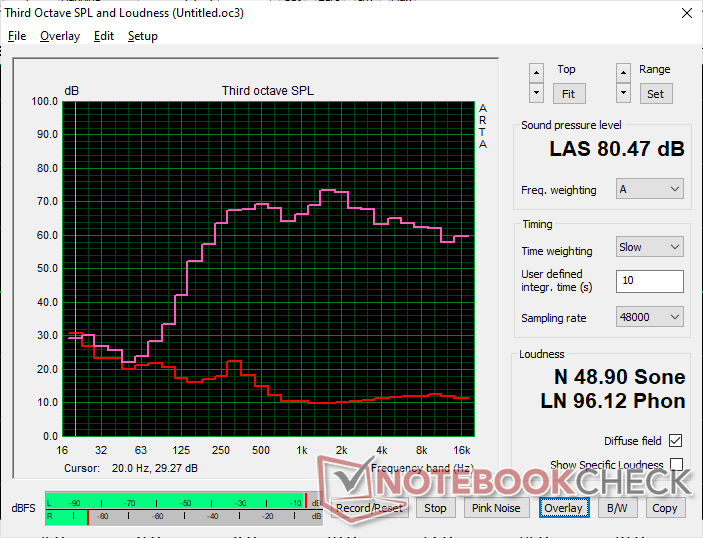
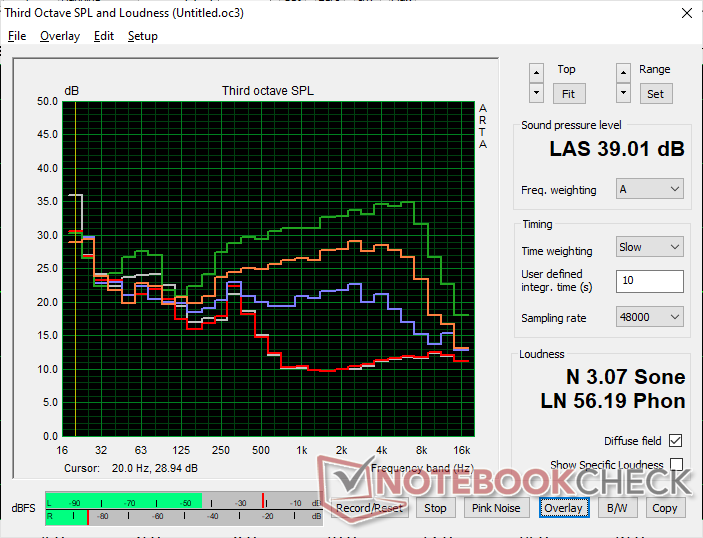
HP EliteBook 840 G9 analyse audio
(±) | le niveau sonore du haut-parleur est moyen mais bon (80.5# dB)
Basses 100 - 315 Hz
(±) | basse réduite - en moyenne 12.6% inférieure à la médiane
(±) | la linéarité des basses est moyenne (12.4% delta à la fréquence précédente)
Médiums 400 - 2000 Hz
(+) | médiane équilibrée - seulement 4.6% de la médiane
(+) | les médiums sont linéaires (3.9% delta à la fréquence précédente)
Aiguës 2 - 16 kHz
(+) | des sommets équilibrés - à seulement 2% de la médiane
(+) | les aigus sont linéaires (3.9% delta à la fréquence précédente)
Globalement 100 - 16 000 Hz
(+) | le son global est linéaire (12.9% différence à la médiane)
Par rapport à la même classe
» 6% de tous les appareils testés de cette catégorie étaient meilleurs, 2% similaires, 92% pires
» Le meilleur avait un delta de 7%, la moyenne était de 21%, le pire était de 53%.
Par rapport à tous les appareils testés
» 12% de tous les appareils testés étaient meilleurs, 3% similaires, 85% pires
» Le meilleur avait un delta de 4%, la moyenne était de 24%, le pire était de 134%.
Apple MacBook Pro 16 2021 M1 Pro analyse audio
(+) | les haut-parleurs peuvent jouer relativement fort (84.7# dB)
Basses 100 - 315 Hz
(+) | bonne basse - seulement 3.8% loin de la médiane
(+) | les basses sont linéaires (5.2% delta à la fréquence précédente)
Médiums 400 - 2000 Hz
(+) | médiane équilibrée - seulement 1.3% de la médiane
(+) | les médiums sont linéaires (2.1% delta à la fréquence précédente)
Aiguës 2 - 16 kHz
(+) | des sommets équilibrés - à seulement 1.9% de la médiane
(+) | les aigus sont linéaires (2.7% delta à la fréquence précédente)
Globalement 100 - 16 000 Hz
(+) | le son global est linéaire (4.6% différence à la médiane)
Par rapport à la même classe
» 0% de tous les appareils testés de cette catégorie étaient meilleurs, 0% similaires, 100% pires
» Le meilleur avait un delta de 5%, la moyenne était de 17%, le pire était de 45%.
Par rapport à tous les appareils testés
» 0% de tous les appareils testés étaient meilleurs, 0% similaires, 100% pires
» Le meilleur avait un delta de 4%, la moyenne était de 24%, le pire était de 134%.
Gestion de l'énergie
Consommation d'énergie
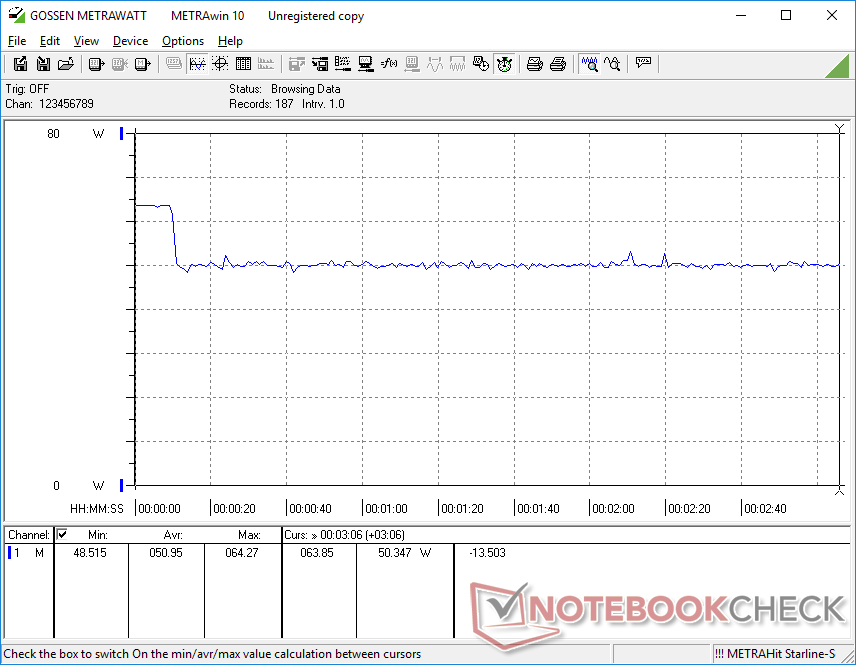
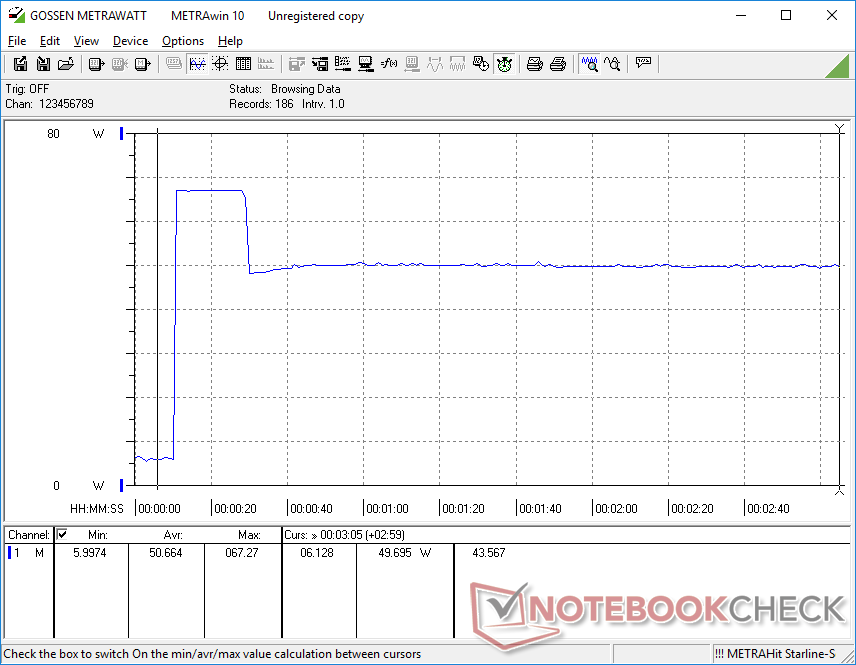
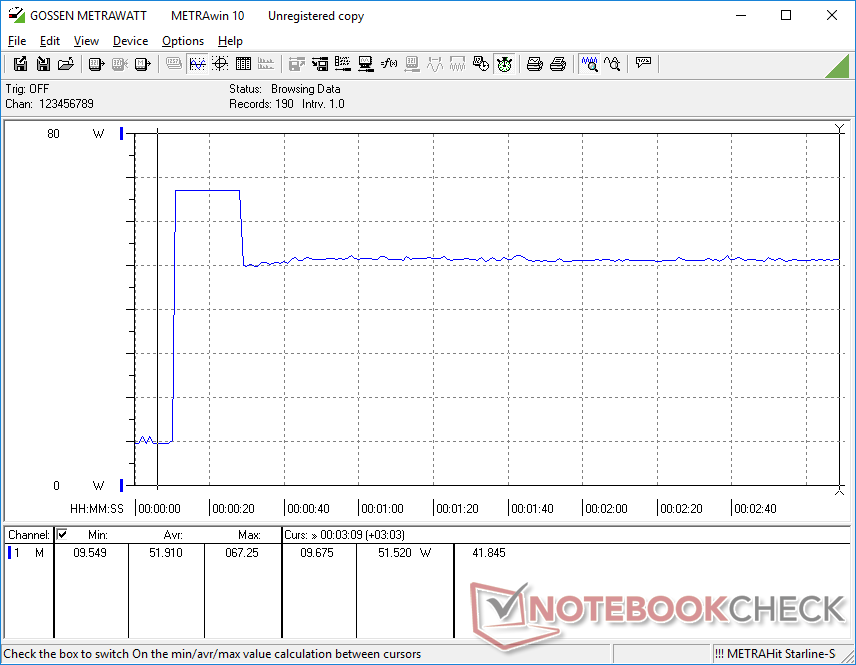
Notre tableau comparatif ci-dessous montre que la version AMD est plus exigeante que notre unité Intel. Toutefois, l'écart est en grande partie attribué à la dalle de 1000 lumens de notre version AMD, alors que notre version Intel utilise une dalle de 400 lumens, moins exigeante. Le fonctionnement au ralenti sur le bureau avec le réglage de la luminosité maximale consommerait environ 9 W et 18 W sur les unités Intel et AMD, respectivement. En tenant compte de cela, les différences de consommation d'énergie globale entre les deux modèles deviennent plus mineures malgré toutes leurs différences de performance.
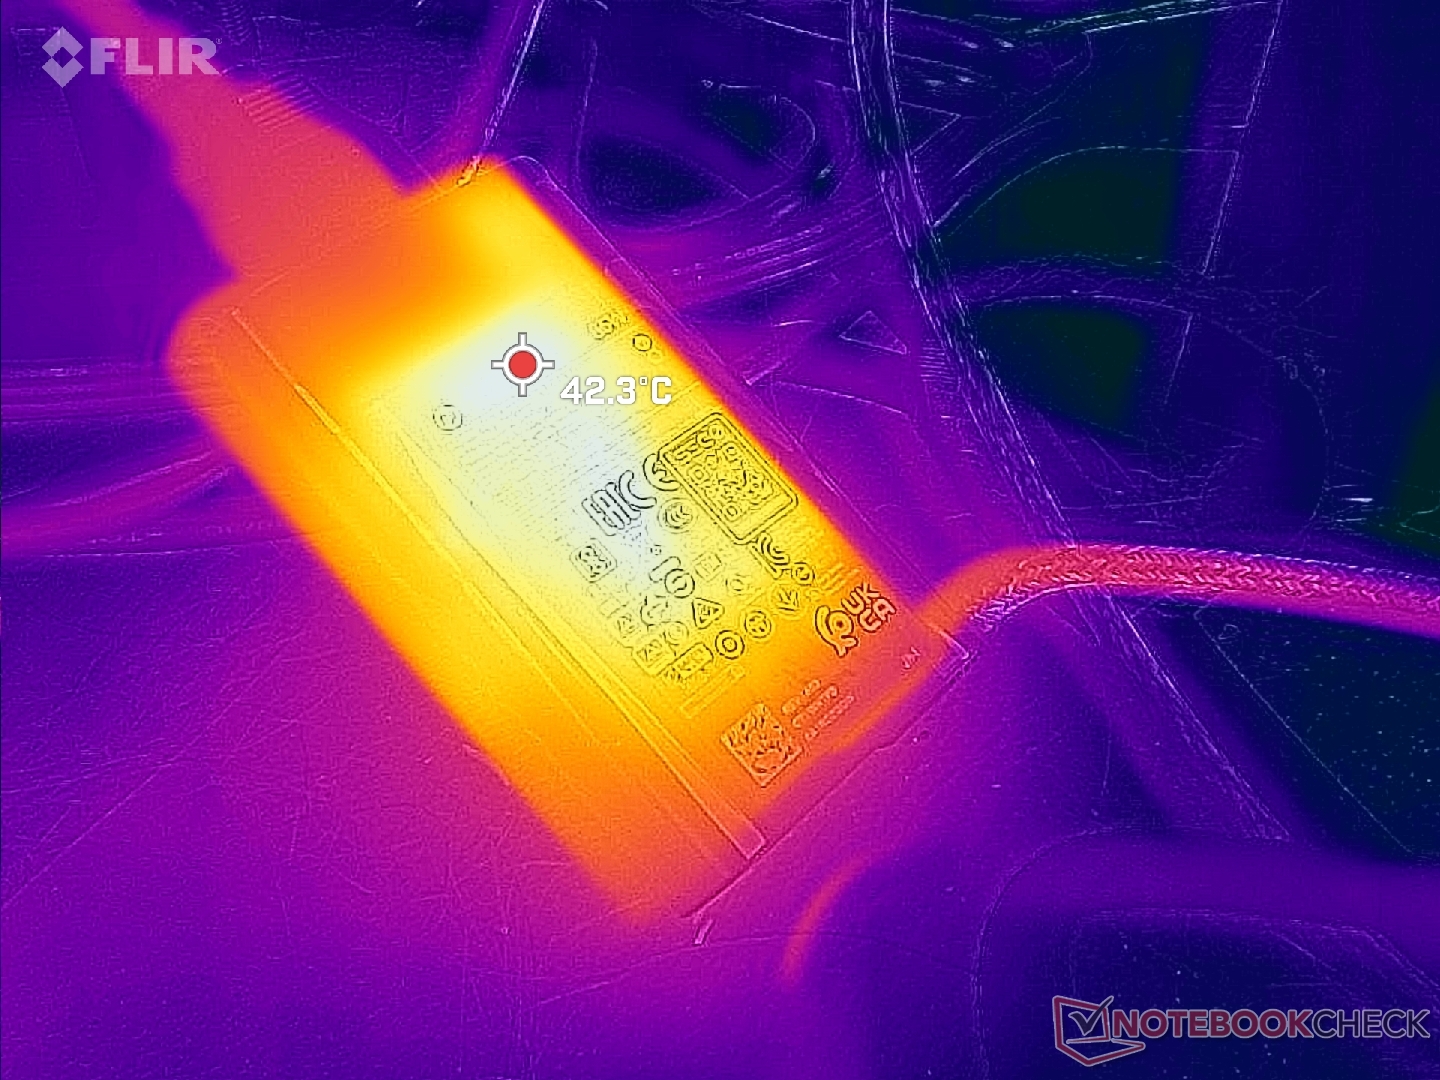
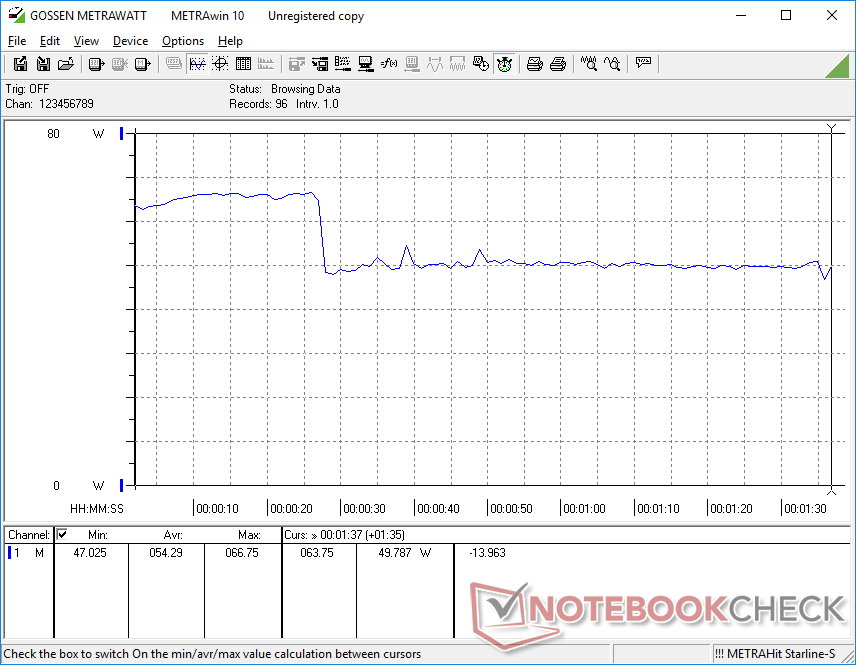
Nous avons pu enregistrer une consommation maximale de 68 W sur le petit (~8,8 x 5,3 x 2,1 cm) adaptateur secteur 65 W lors de l'exécution du stress Prime95. Ce taux n'est que temporaire comme le montrent les graphiques ci-dessous en raison des limitations thermiques.
| Éteint/en veille | |
| Au repos | |
| Fortement sollicité |
|
Légende:
min: | |
| HP EliteBook 840 G9 i7-1280P, Iris Xe G7 96EUs, SK hynix PC801 HFS512GEJ9X101N BF, IPS, 1920x1200, 14" | HP EliteBook 845 G9 6F6H6EA R9 PRO 6950HS, Radeon 680M, WDC PC SN810 1TB, IPS, 1920x1200, 14" | HP EliteBook 840 Aero G8 3E4Q6AA i7-1185G7, Iris Xe G7 96EUs, SK Hynix PC711 512GB HFS512GDE9X073N, IPS, 1920x1080, 14" | Lenovo ThinkPad X1 Carbon G10 Core i7-1265U i7-1265U, Iris Xe G7 96EUs, Kioxia BG5 KBG5AZNV1T02, IPS, 1920x1200, 14" | LG Gram 14Z90Q i5-1240P, Iris Xe G7 80EUs, Samsung PM9A1 MZVL2512HCJQ, IPS, 1920x1200, 14" | Dell Latitude 7420 JW6MH i5-1145G7, Iris Xe G7 80EUs, SK Hynix BC711 HFM512GD3HX015N, IPS, 1920x1080, 14" | |
|---|---|---|---|---|---|---|
| Power Consumption | -80% | 5% | -8% | -5% | 8% | |
| Idle Minimum * (Watt) | 2.2 | 6.4 -191% | 3.2 -45% | 2.8 -27% | 3 -36% | 2.7 -23% |
| Idle Average * (Watt) | 5.3 | 12.4 -134% | 5.4 -2% | 6 -13% | 6 -13% | 6 -13% |
| Idle Maximum * (Watt) | 8.5 | 18 -112% | 6.9 19% | 10.9 -28% | 12 -41% | 7.6 11% |
| Load Average * (Watt) | 54.3 | 63 -16% | 38.9 28% | 51.8 5% | 40 26% | 37 32% |
| Witcher 3 ultra * (Watt) | 51 | 63.6 -25% | 37 27% | 51.6 -1% | 36.5 28% | 33.2 35% |
| Load Maximum * (Watt) | 67.3 | 68 -1% | 66.5 1% | 55.6 17% | 63 6% | 65 3% |
* ... Moindre est la valeur, meilleures sont les performances
Power Consumption Witcher 3 / Stresstest
Power Consumption external Monitor
Autonomie de la batterie - Un peu plus courte que celle de l'AMD
L'autonomie du WLAN est inférieure de près de deux heures à celle que nous avons enregistrée sur l'EliteBook 845 G9 alimenté par AMD lorsque les deux ordinateurs sont réglés sur une luminosité de 150 nit et le profil d'alimentation équilibré. Malgré cela, 7,5 heures de navigation continue devraient être satisfaisantes pour la plupart des utilisateurs.
Le chargement de la batterie vide à la pleine capacité est rapide et dure environ 90 minutes. Les chargeurs USB-C tiers sont techniquement pris en charge, mais leur fonctionnement n'est pas garanti si leur niveau de sortie ne correspond pas à celui du chargeur HP inclus (20V/3,25A).
| HP EliteBook 840 G9 i7-1280P, Iris Xe G7 96EUs, 51 Wh | HP EliteBook 845 G9 6F6H6EA R9 PRO 6950HS, Radeon 680M, 51 Wh | HP EliteBook 840 Aero G8 3E4Q6AA i7-1185G7, Iris Xe G7 96EUs, 53 Wh | Lenovo ThinkPad X1 Carbon G10 Core i7-1265U i7-1265U, Iris Xe G7 96EUs, 57 Wh | LG Gram 14Z90Q i5-1240P, Iris Xe G7 80EUs, 72 Wh | Dell Latitude 7420 JW6MH i5-1145G7, Iris Xe G7 80EUs, 63 Wh | |
|---|---|---|---|---|---|---|
| Autonomie de la batterie | 22% | 50% | -13% | 57% | 86% | |
| WiFi v1.3 (h) | 7.6 | 9.3 22% | 11.4 50% | 6.6 -13% | 11.9 57% | 14.1 86% |
| Load (h) | 1.3 | 2.5 | 2.8 | 2.6 | ||
| Reader / Idle (h) | 24.8 | 28.9 | 23.5 |
Points positifs
Points négatifs
Verdict - Avantages et inconvénients
Le Core i7-1280P EliteBook 840 G9 peut-il tenir tête au Ryzen 9 Pro 6950HS ? EliteBook 845 G9? En termes de potentiel brut du processeur, le modèle AMD est le meilleur choix car ses performances ne sont pas aussi limitées que celles du modèle Intel. En termes de performances graphiques, cependant, la Radeon 680M du modèle AMD semble sous-performer au point de se retrouver derrière l'Iris Xe 96 EUs. Ainsi, la meilleure option dépendra de l'intensité du CPU ou du GPU dans vos charges de travail spécifiques.
Outre les différences de processeur, l'autonomie de la batterie est plus longue sur le modèle AMD, tandis que le modèle Intel bénéficie de la prise en charge de Thunderbolt. Il est regrettable que la fonction Sure View soit imposée sur toutes les options de dalles de 1000 nits, car certains utilisateurs peuvent ne pas vouloir de cette fonction de confidentialité en raison de son impact sur la qualité de l'image, même lorsqu'elle est désactivée. Pour les futurs modèles, nous aimerions voir des panneaux avec des temps de réponse plus rapides pour réduire les images fantômes et peut-être un plafond de température du cœur plus élevé pour tirer plus de performances Turbo Boost du CPU Intel.
Prix et disponibilité
HP expédie maintenant l'EliteBook 840 G9 à partir de 2200 $ US pour la configuration de base ou environ 3000 $ US pour notre configuration spécifique. Cependant, les prix sur peuvent commencer beaucoup plus bas pour les UGS pré-configurées sans toutes les personnalisations sélectionnables par l'utilisateur.
HP EliteBook 840 G9
- 12/17/2022 v7 (old)
Allen Ngo
Price comparison

