Test du MSI GP66 Leopard 11UH : un joueur bon marché avec RTX 3080
En avril dernier, nous avons examiné le prédécesseur MSI GP66 Leopard 10UG avec un CPU Comet Lake et avons fait l'éloge du boîtier redessiné. Le nouveau GP66 Leopard 11UH est maintenant équipé d'un CPU Tiger Lake et le boîtier a également changé. Mais le mieux, c'est que ce puissant gamer peut déjà être acheté pour moins de 2 000 euros en configuration avec RTX 3080 !
Le GP66 11UH est également disponible avec un écran QHD ou RTX 3070 comme alternative ; notre modèle de test est équipé d'un écran rapide Full HD.
Le MSI est apparemment l'un des ordinateurs portables de jeu les moins chers avec RTX 3080, il n'est donc pas facile de trouver une véritable concurrence dans cette gamme de prix. C'est pourquoi nous avons également utilisé pour la comparaison des modèles un peu plus chers (jusqu'à +500 euros) ici :Aorus 15P YDle ASUS ROG Strix Scar 15le Schenker XMG Neo 15 ainsi que le modèle nettement plus cher Alienware m15 R6
Possible competitors in comparison
Note | Date | Modèle | Poids | Épaisseur | Taille | Résolution | Prix |
|---|---|---|---|---|---|---|---|
| 85.4 % v7 (old) | 12/21 | MSI GP66 Leopard 11UH-028 i7-11800H, GeForce RTX 3080 Laptop GPU | 2.3 kg | 23.4 mm | 15.60" | 1920x1080 | |
| 84.2 % v7 (old) | 04/21 | MSI GP66 Leopard 10UG i7-10870H, GeForce RTX 3070 Laptop GPU | 2.3 kg | 23.4 mm | 15.60" | 1920x1080 | |
| 86.4 % v7 (old) | 06/21 | Aorus 15P YD i7-11800H, GeForce RTX 3080 Laptop GPU | 2.2 kg | 27 mm | 15.60" | 1920x1080 | |
| 86.3 % v7 (old) | 07/21 | Asus ROG Strix Scar 15 G533QS R9 5900HX, GeForce RTX 3080 Laptop GPU | 2.3 kg | 27.2 mm | 15.60" | 2560x1440 | |
| 87 % v7 (old) | 06/21 | Schenker XMG Neo 15 Tiger Lake i7-11800H, GeForce RTX 3080 Laptop GPU | 2.2 kg | 26 mm | 15.60" | 2560x1440 | |
| 86.1 % v7 (old) | 11/21 | Alienware m15 R6, i7-11800H RTX 3080 i7-11800H, GeForce RTX 3080 Laptop GPU | 2.5 kg | 22.85 mm | 15.60" | 1920x1080 |
Affaire - Les légers défauts de fabrication de MSI
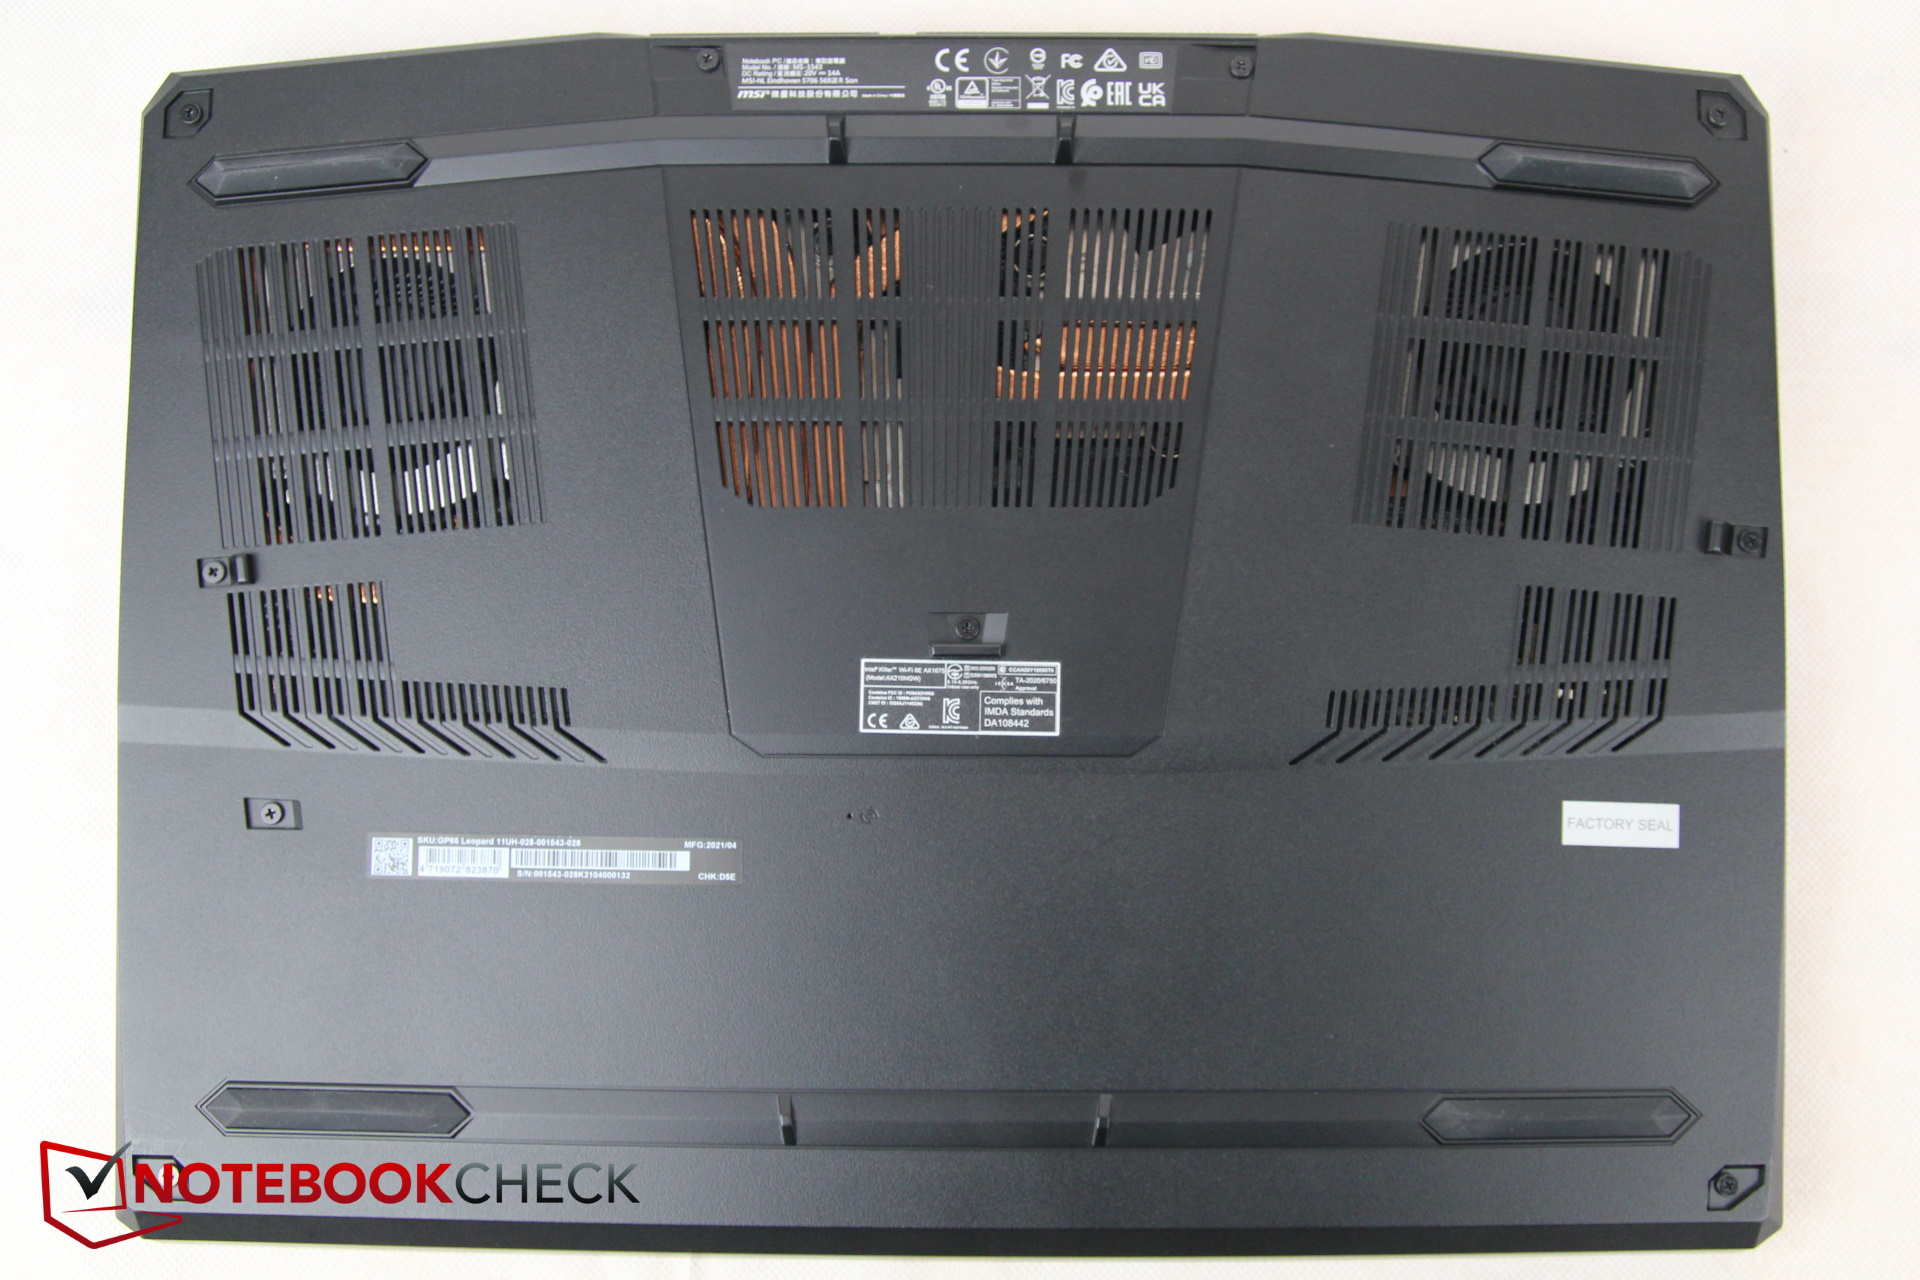
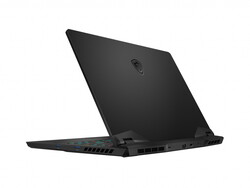
Le boîtier lui-même reste assez similaire, mais il y a quelques changements cruciaux dans les ports (voir ci-dessous). Le couvercle de l'écran et la base sont en métal foncé et lisse, tandis que le fond est toujours en plastique. À l'arrière, le système de refroidissement s'étend, augmentant la profondeur de l'ordinateur portable, comme sur l'Alienware
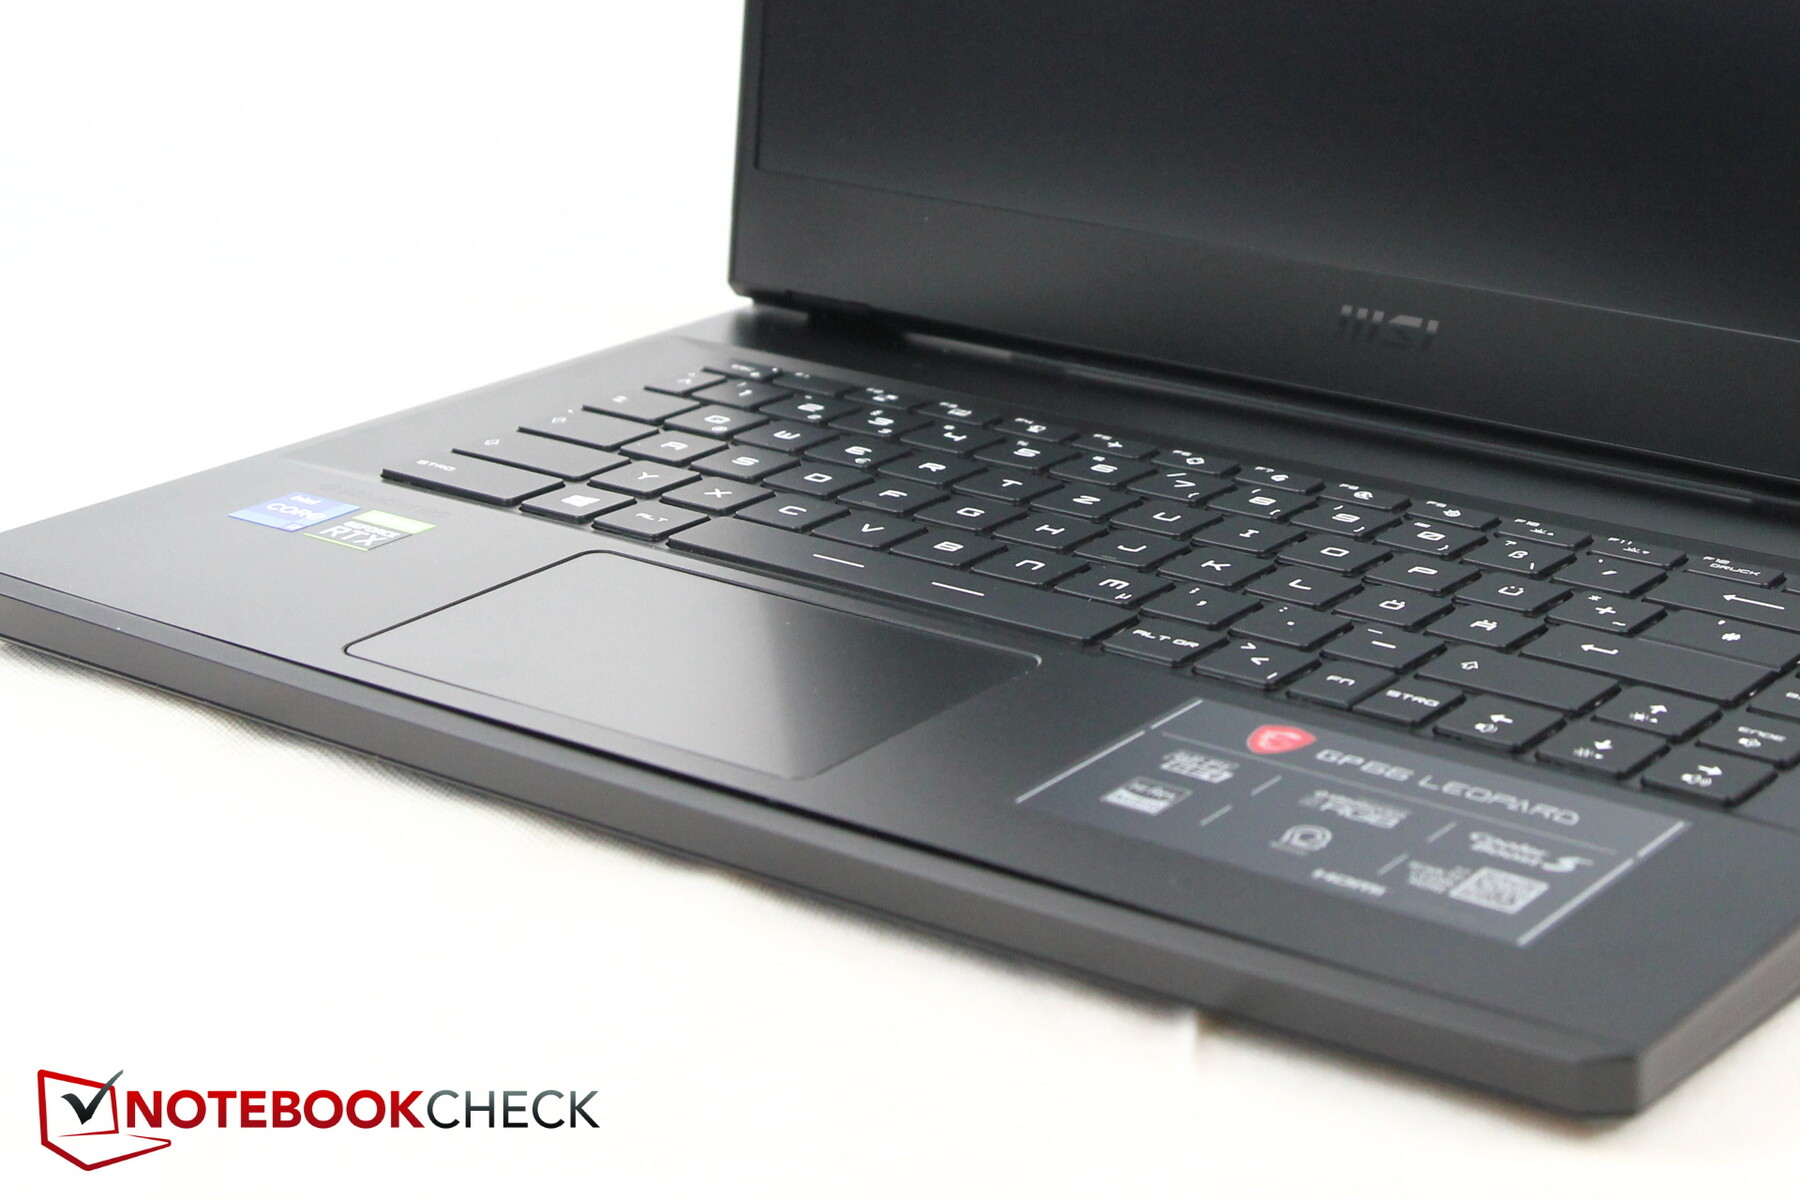
Le couvercle est étonnamment solide, tout comme la base en théorie. Cependant, notre échantillon de test présente un problème : lorsque nous appuyons sur la base à gauche du pavé tactile, ce dernier se soulève du pavé tactile et de grands espaces apparaissent - c'est probablement une raison pour laquelle le pavé tactile cliquette
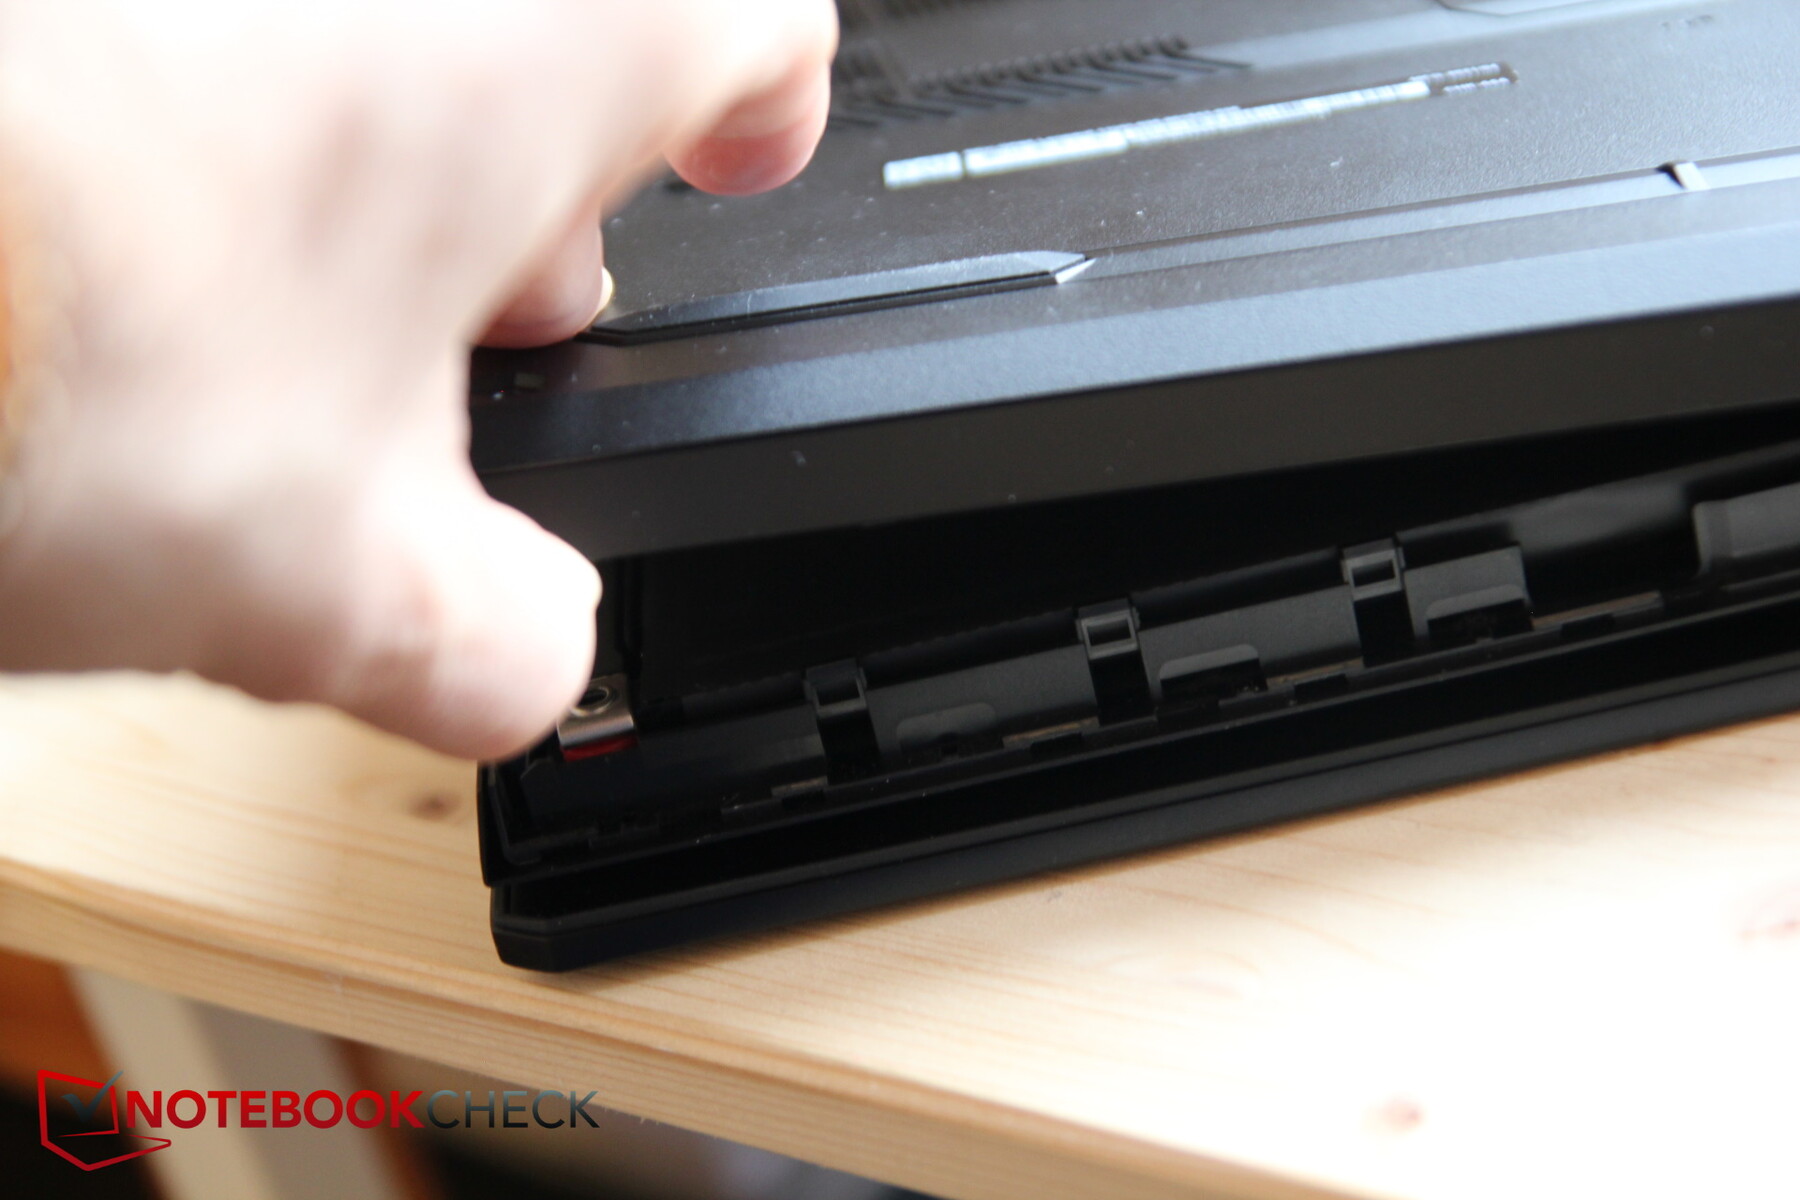
D'une manière générale, la base ne semble être reliée à la surface que de manière assez lâche, et le bord avant se détache également très rapidement, comme vous pouvez également le voir sur la photo. Cela devrait faciliter l'entretien, mais d'un autre côté, cela ne donne pas vraiment une bonne impression en termes de qualité de construction. La construction elle-même a l'air très solide cependant, donc cela devrait être correct sur l'unité non défectueuse.
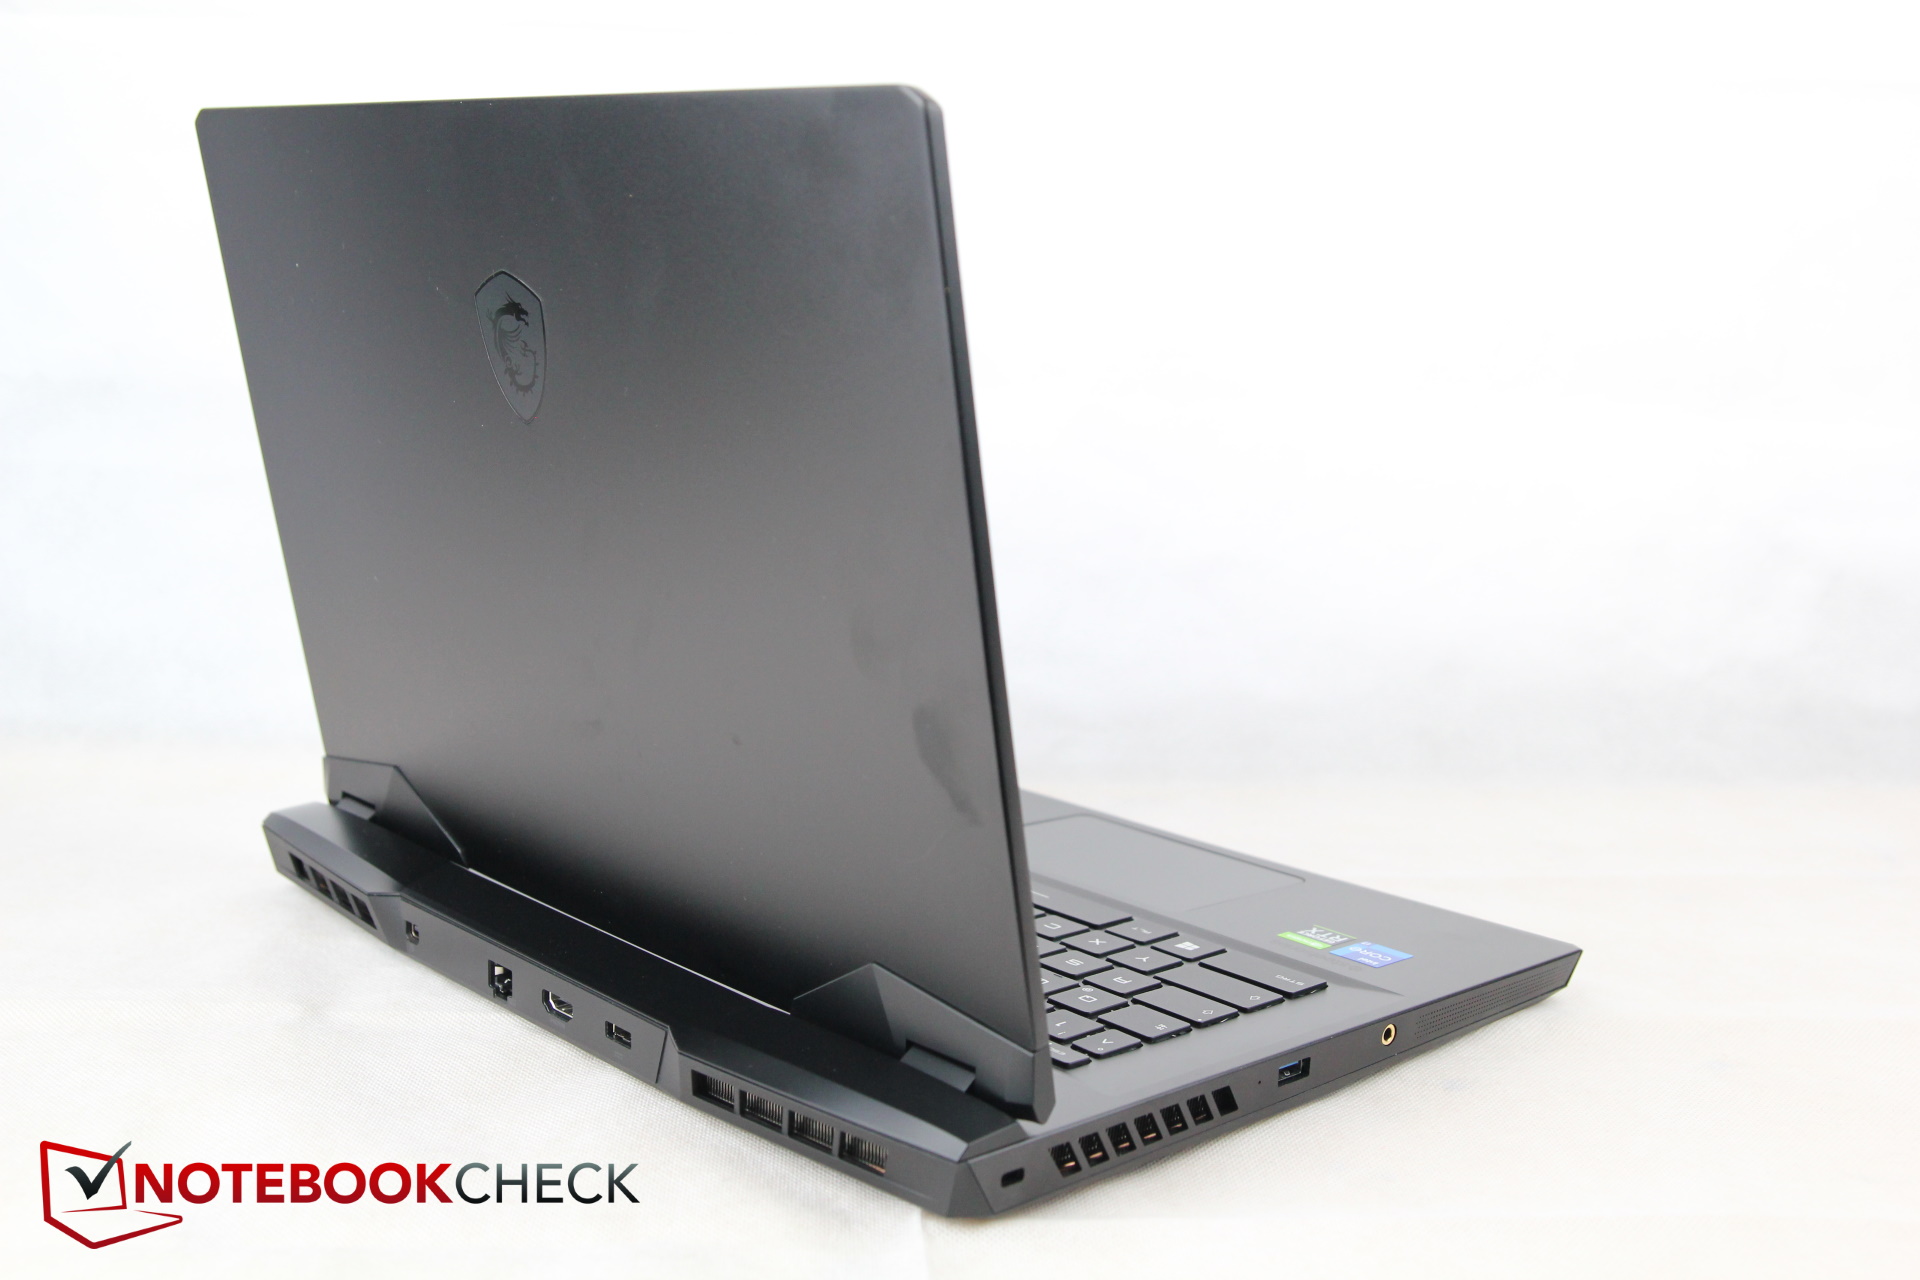
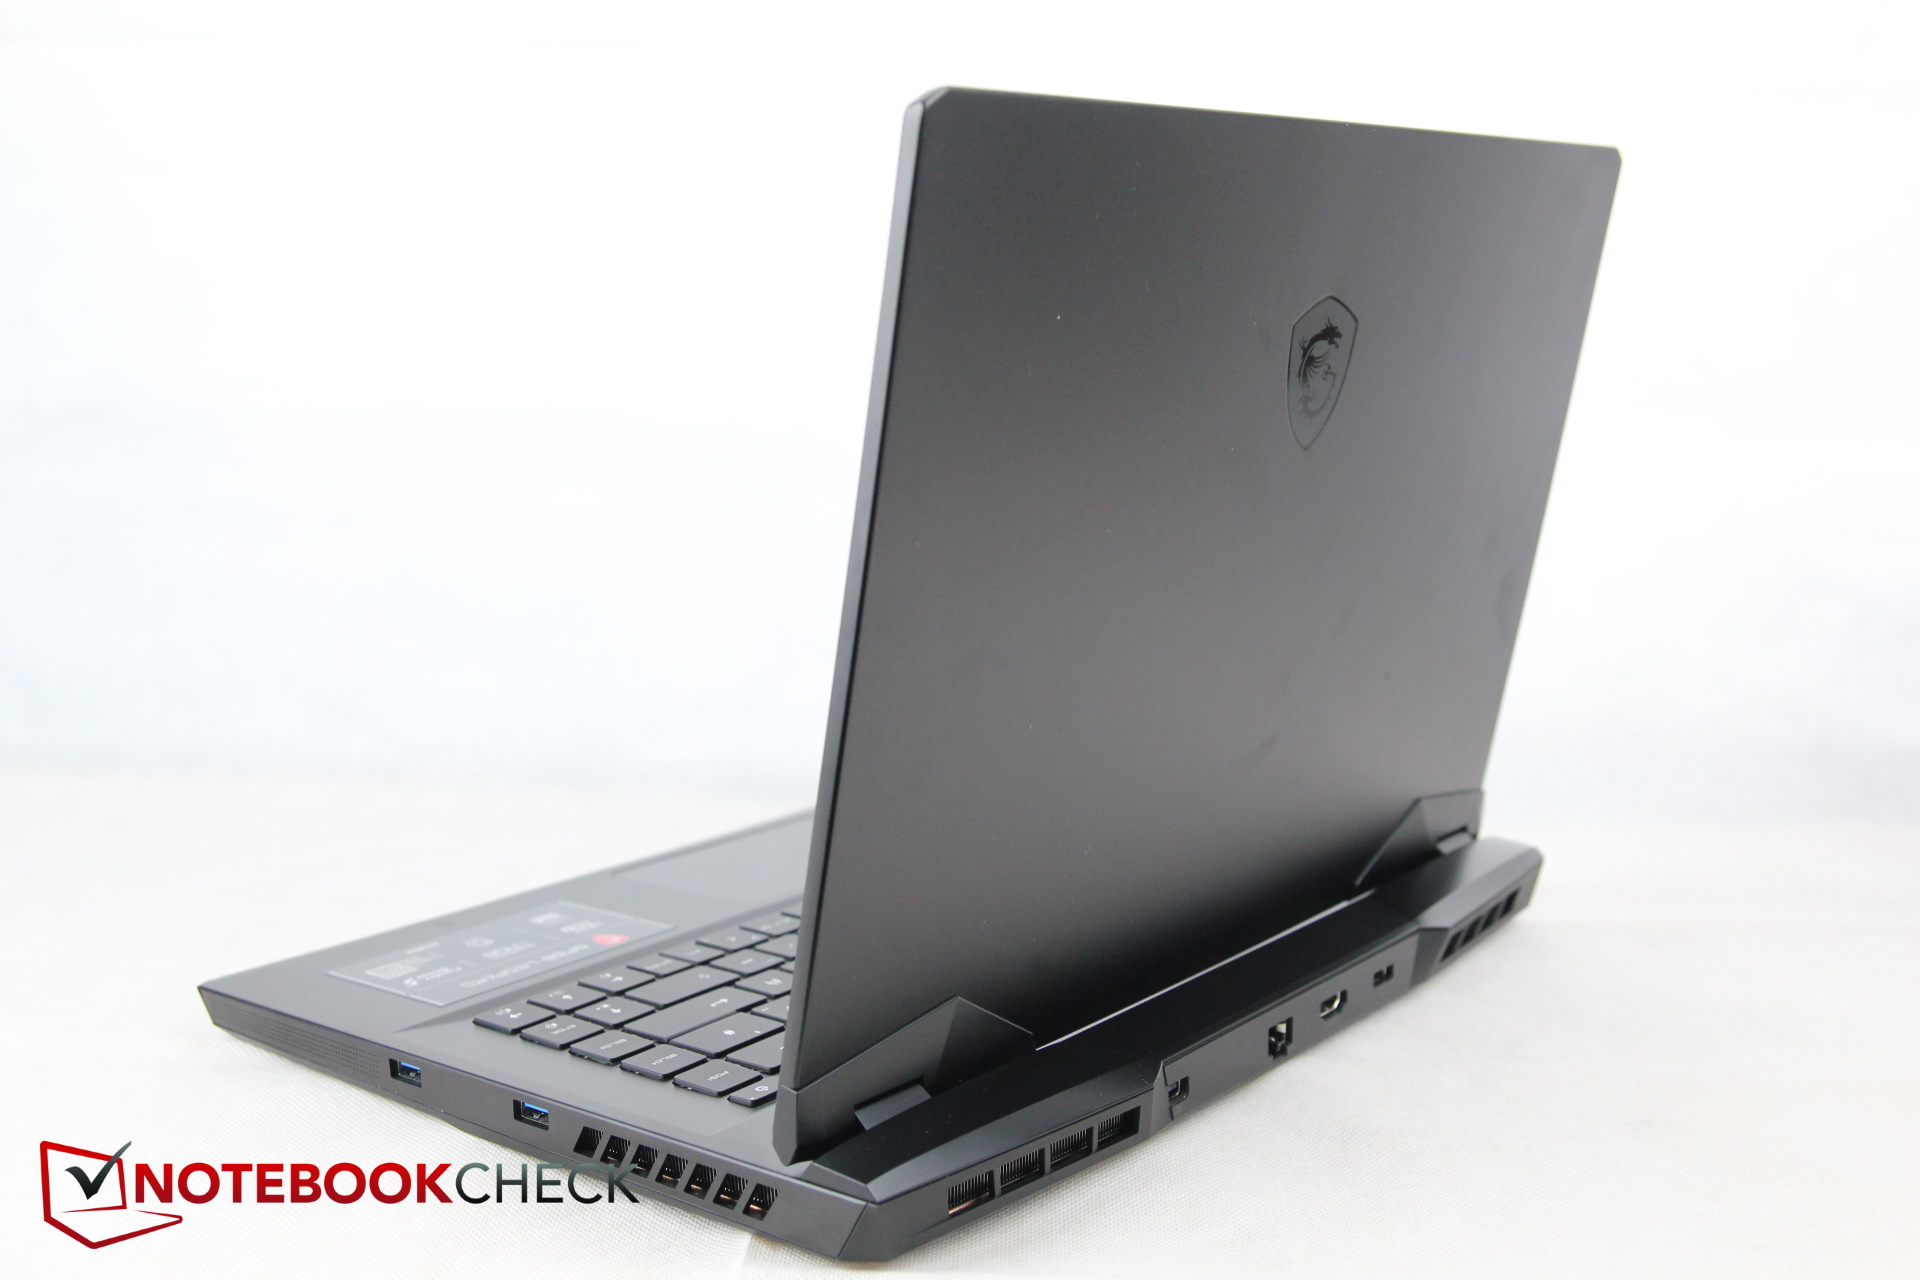
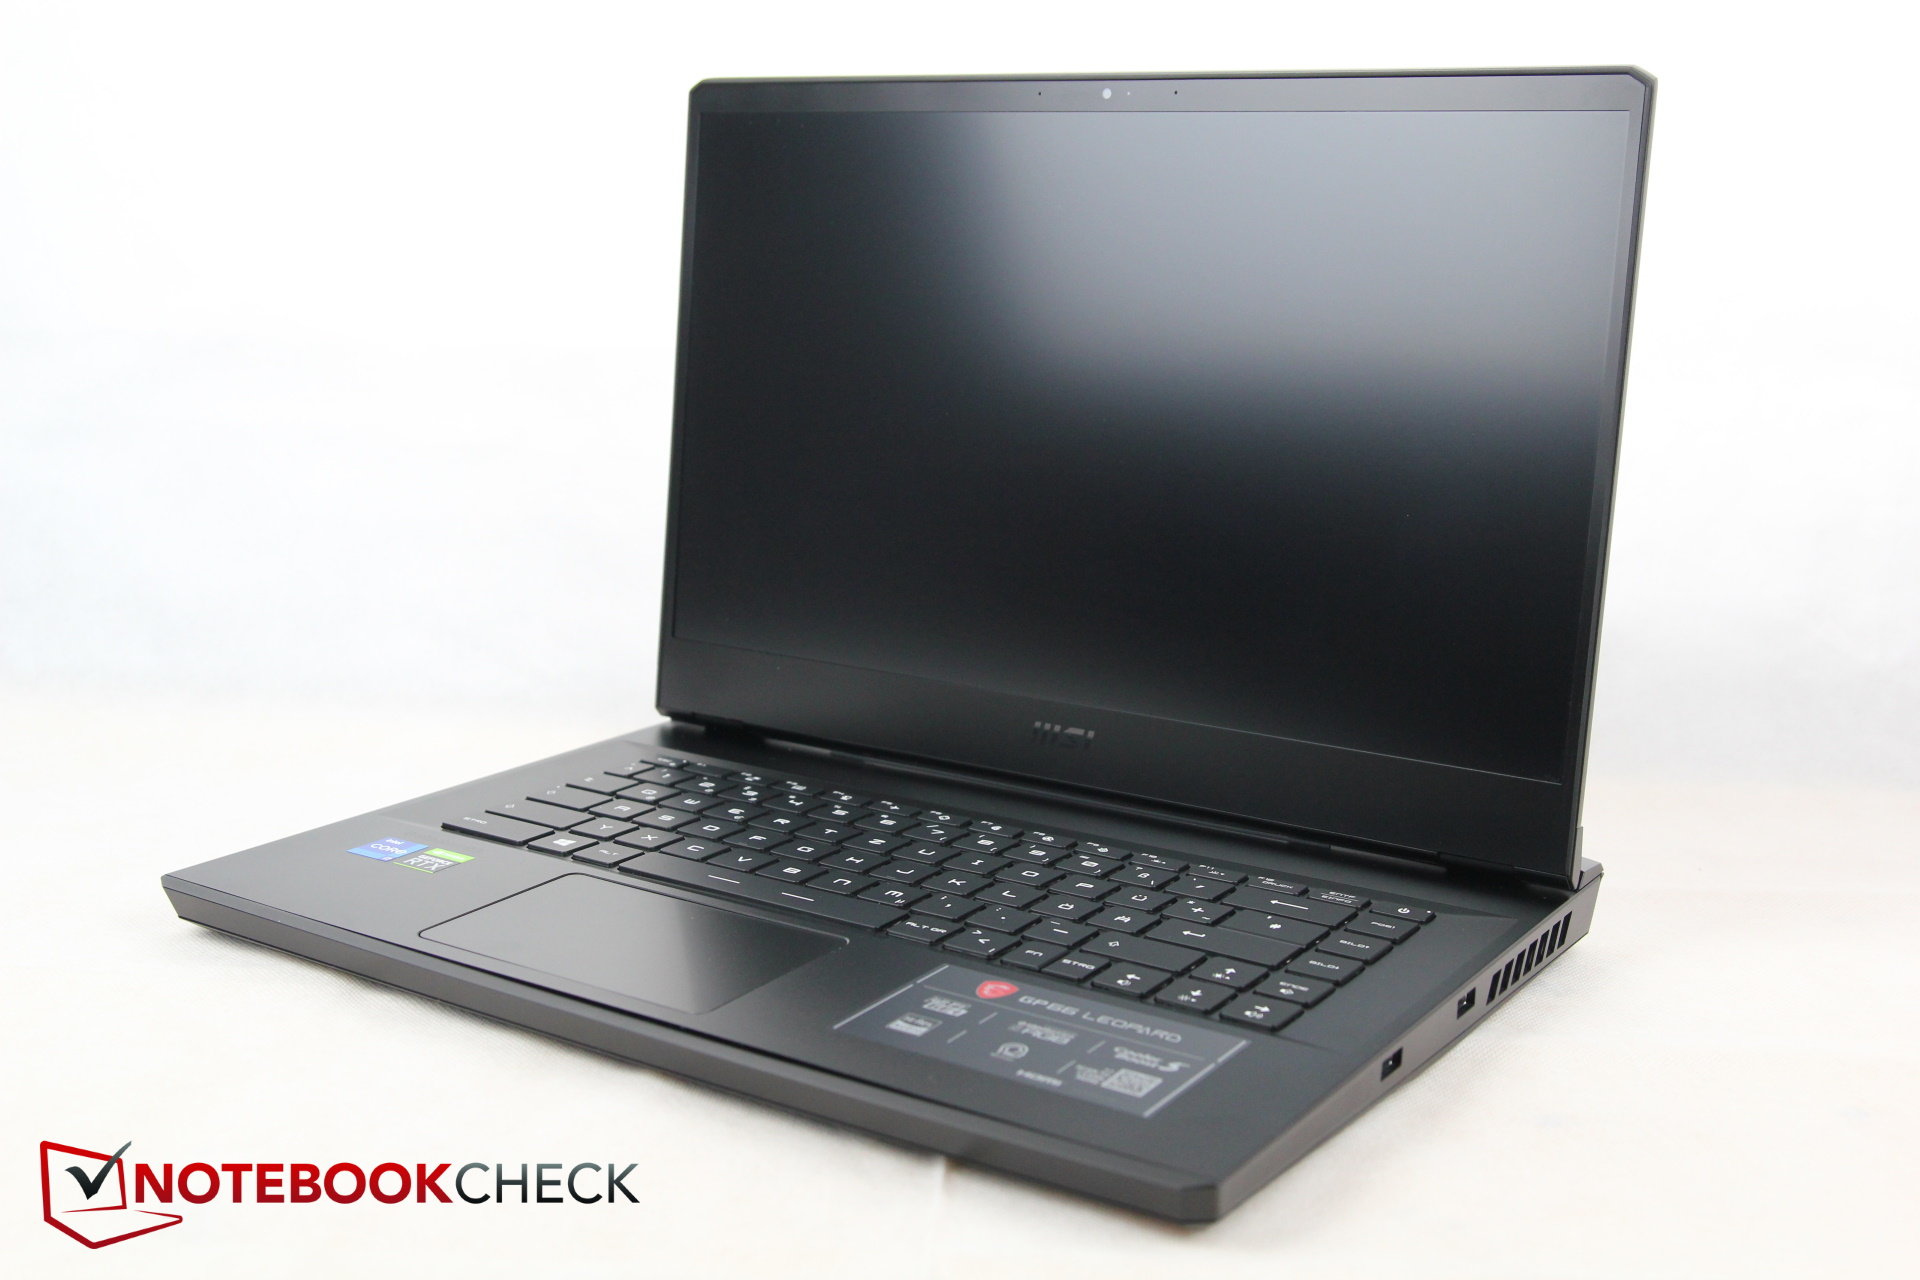
Le GP66 est plus profond que la plupart de ses rivaux en raison de son système de refroidissement en saillie. Ainsi, il est très similaire à l'Alienware, qui est encore 5 mm plus profond. Heureusement, il n'est pas aussi lourd que ce dernier, mais se situe au même niveau que le reste de la concurrence. En dehors de cela, c'est l'un des appareils les plus fins du comparatif. Là encore, seul le nouvel Alienware est un peu plus fin.
Caractéristiques - Honnêtement MSI, pas d'USB-C ?
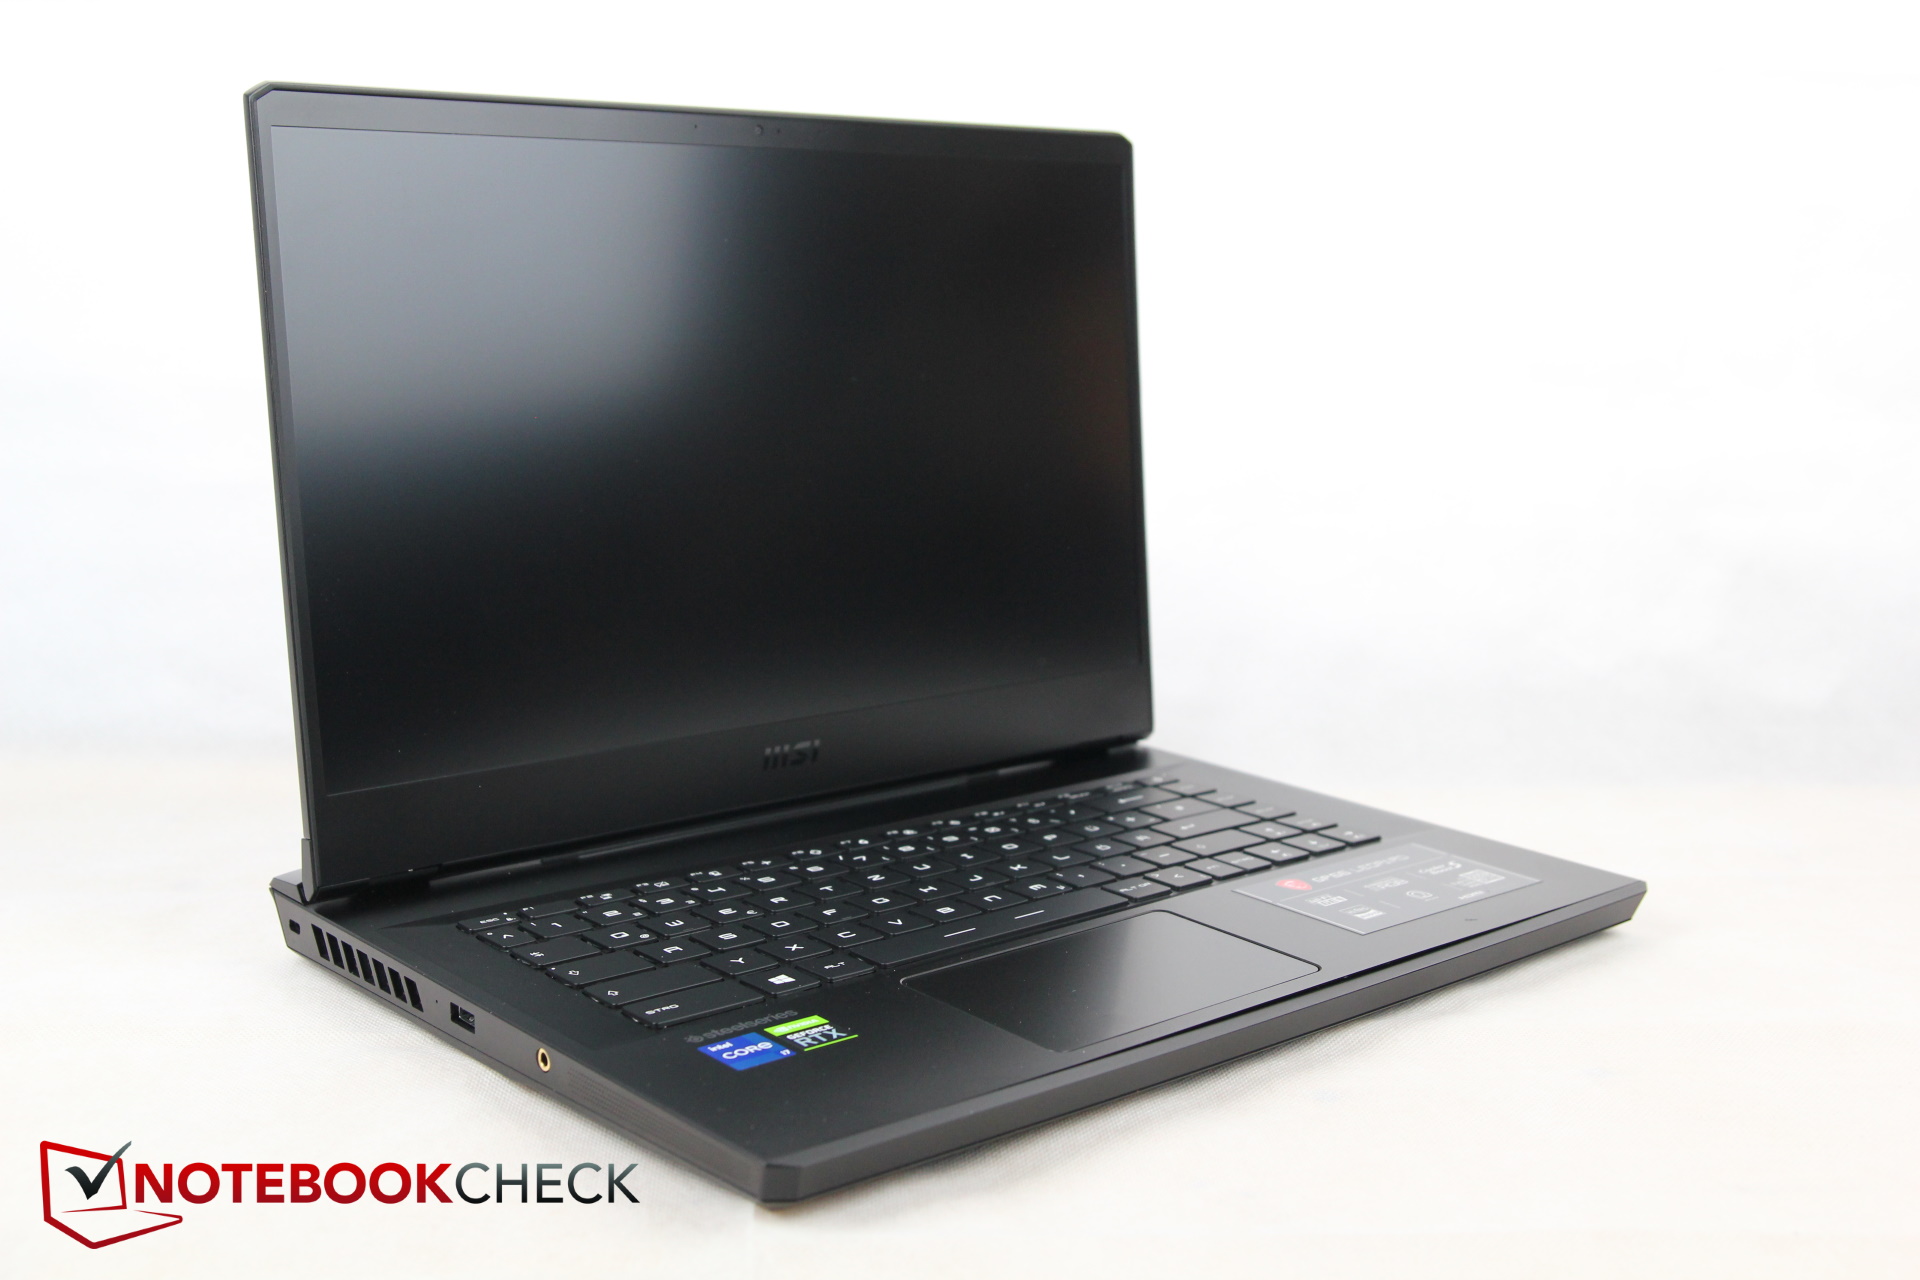
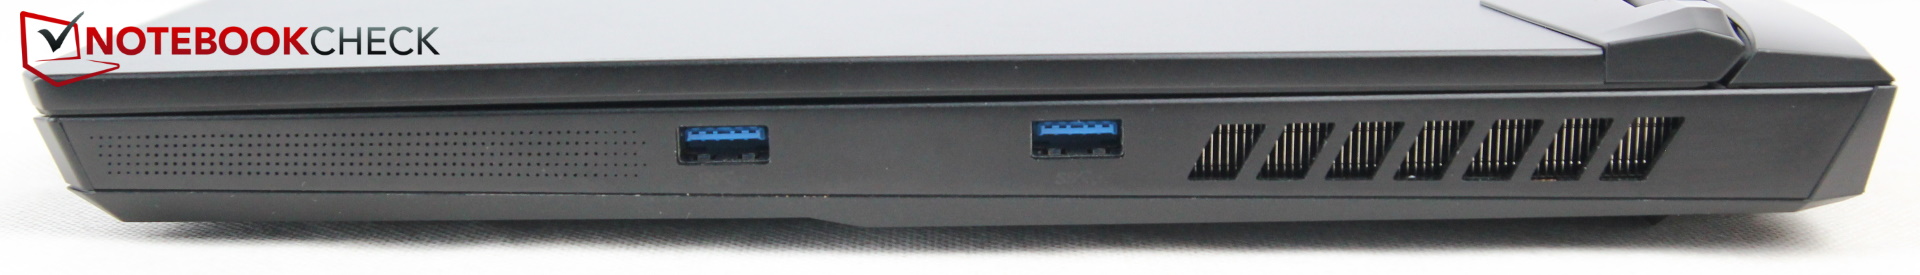
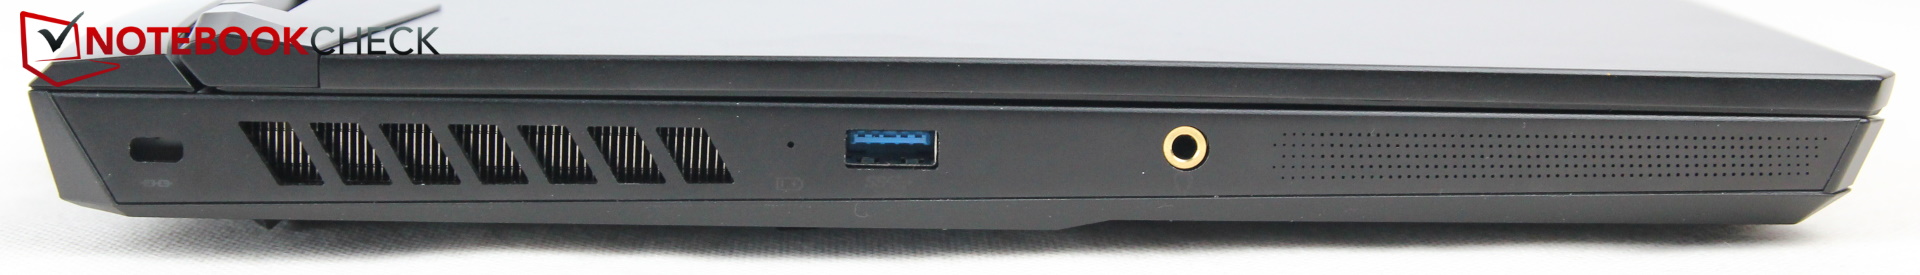
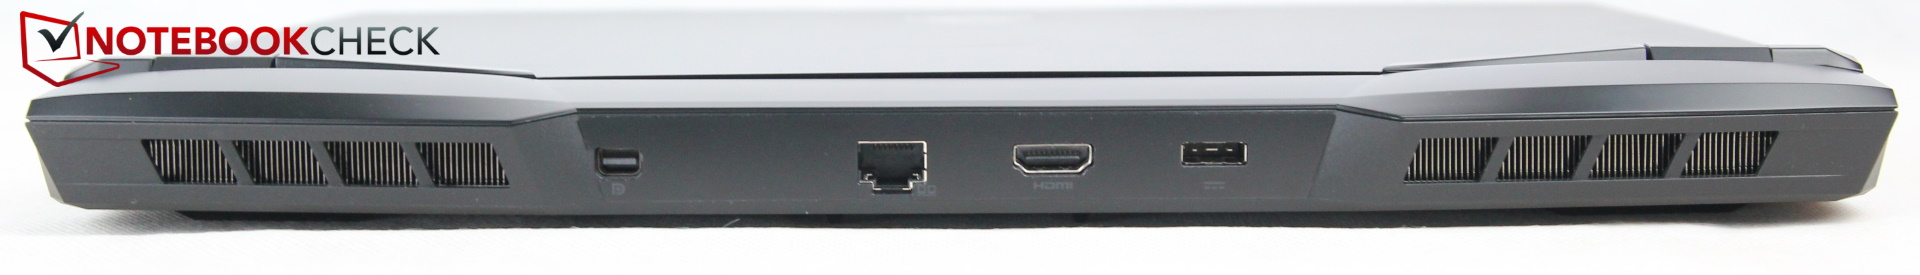
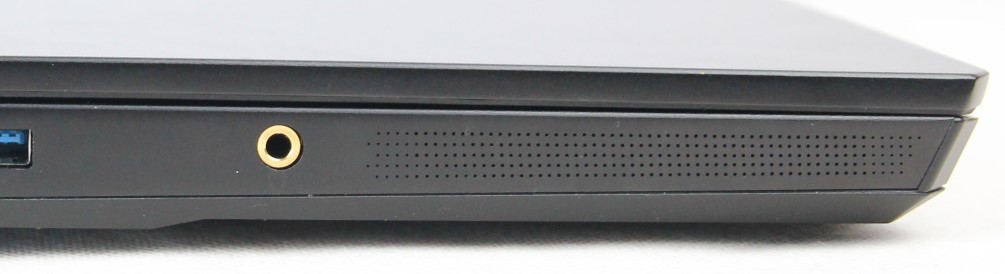
Par rapport à son prédécesseur, le GP66 10UG, MSI a laissé tomber le port MiniDP au profit d'un port USB-C. Avec l'actuel GP66 11UH, MSI fait un pas en arrière et ramène le Mini DisplayPort, ce qui est une bonne chose. Mais le fabricant supprime également le port USB-C ! Ainsi, le GP66 Leopard est le seul ordinateur portable moderne sans port USB-C ! Nous ne savons pas pourquoi MSI a fait cela, puisque le port USB-C est devenu la norme absolue de nos jours. L'effet secondaire est donc que l'ordinateur portable ne dispose que de trois ports USB. Il n'y a pas non plus de lecteur SD.
Les quelques ports restants sont bien répartis sur les trois côtés, c'est-à-dire à gauche, à droite et à l'arrière du boîtier. MSI doit vraiment être félicité ici, car il y a beaucoup d'espace entre les différents ports, ce qui relativise au moins un peu les choses au vu de la maigre variété d'options. Tous les câbles potentiellement épais (HDMI, DP, LAN, alimentation) sont acheminés vers l'arrière, et il n'y a qu'un port USB-A et un port casque sur les côtés - très bien
Communication
MSI remplace l'Intel AX201 par un Killer Wi-Fi 6E AX1675 avec support Bluetooth 5.2. Cela ne rend pas le Wi-Fi beaucoup plus rapide. Bien qu'il se situe dans la gamme des gigabits, il est en deçà du potentiel du module. En particulier, la courbe de réception a une pente descendante, mais la puissance d'émission est assez constante.
Webcam
Une webcam HD standard fournit au mieux une image acceptable dans Zoom, Teams et d'autres applications de conférence. L'image semble délavée, même en cas de bonne lumière, et les écarts de couleur sont assez prononcés, notamment dans les gammes de couleurs rouge et verte.


Sécurité
Un port Kensington est présent, tout comme le TPM. Cependant, il n'y a pas de scanner d'empreintes digitales ou d'autres technologies de sécurité - ce qui est acceptable pour un ordinateur portable de jeu.
Maintenance
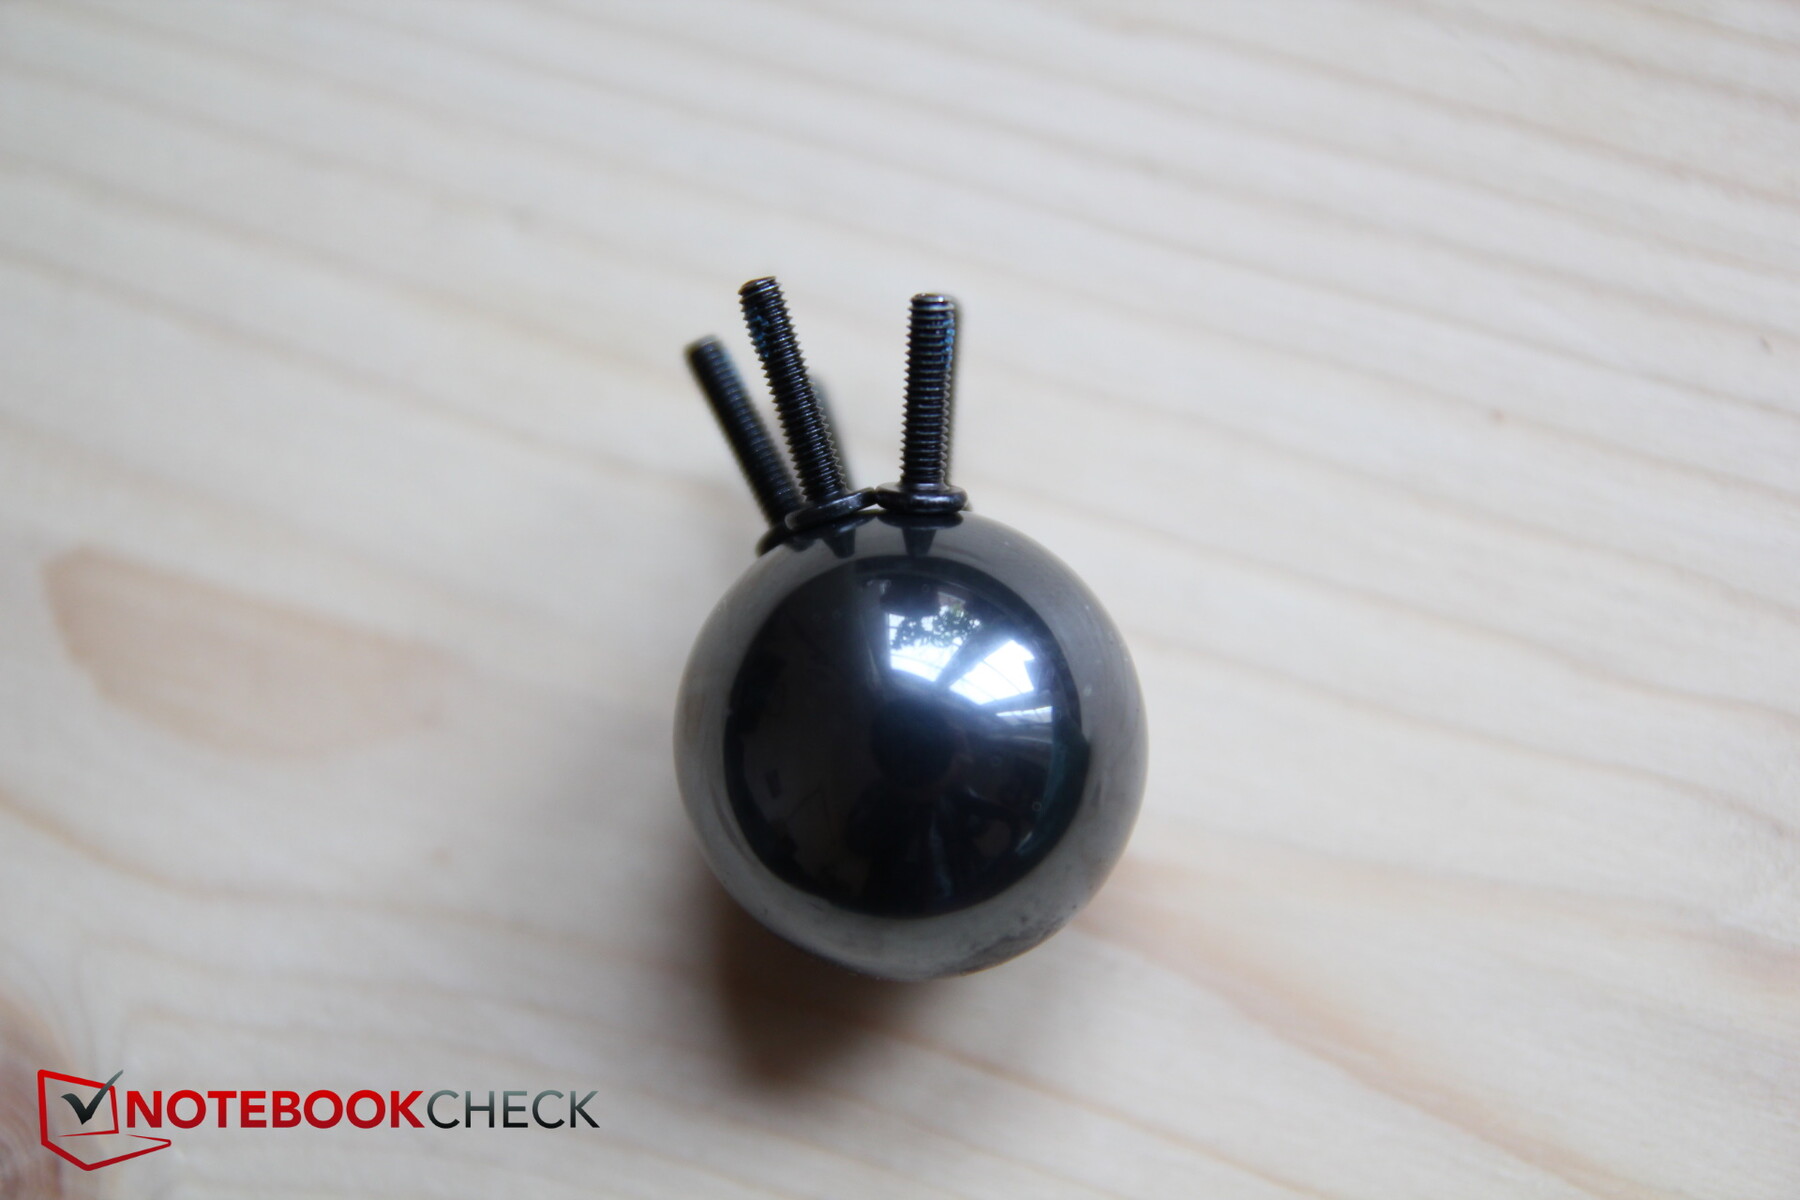
La plaque de base est fixée par au moins 10 vis Phillips (1 plus courte que toutes les autres) et divers loquets. Et bien que le bord avant de notre modèle était déjà partiellement détaché auparavant, la maintenance s'est avérée plus compliquée que prévu.
Le bord avant s'est bien détaché, mais les côtés et le bord arrière pas du tout. En particulier dans la zone de la prise casque, la plaque de base était encore si bien verrouillée (pas directement sur le bord, mais à l'intérieur) que nous avons dû abandonner la tentative d'ouverture malgré l'outil à levier, de peur d'endommager la fine plaque de plastique. Le bord arrière n'a pas cédé non plus. Les vis cachées n'auraient pas dû être le problème, du moins sur le côté.
La construction intérieure devrait être similaire à celle du MSI GP66 Leopard 10UG (voir la section maintenance), mais son ouverture a également été problématique
Accessoires et garantie
En dehors de l'alimentation, il n'y a pas d'autres accessoires dans la boîte. Remarque : MSI livre le GP66 Leopard sans système d'exploitation, mais divers magasins devraient inclure une licence Windows.
MSI offre une garantie de 2 ans avec un service d'enlèvement et de retour.
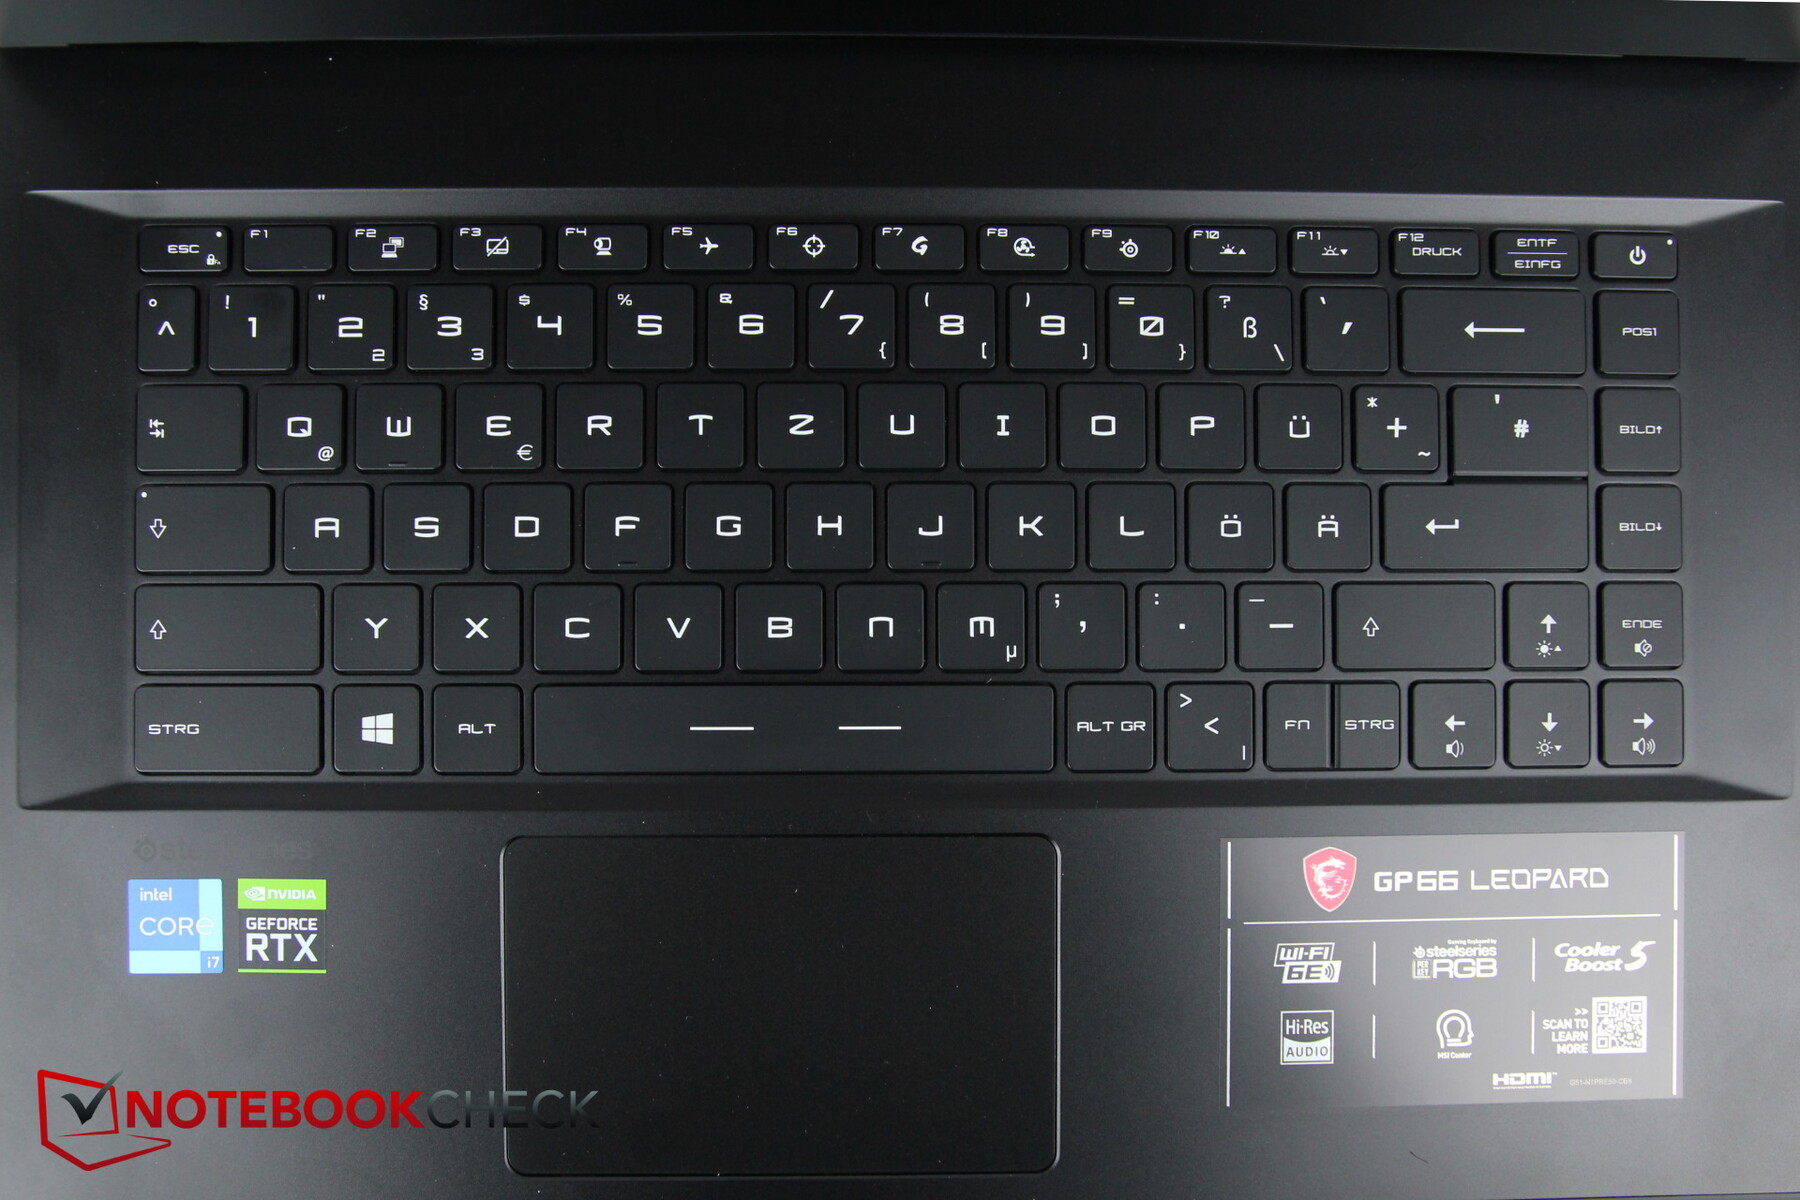
Périphériques d'entrée - Bon clavier, le pavé tactile cliquetis
Clavier
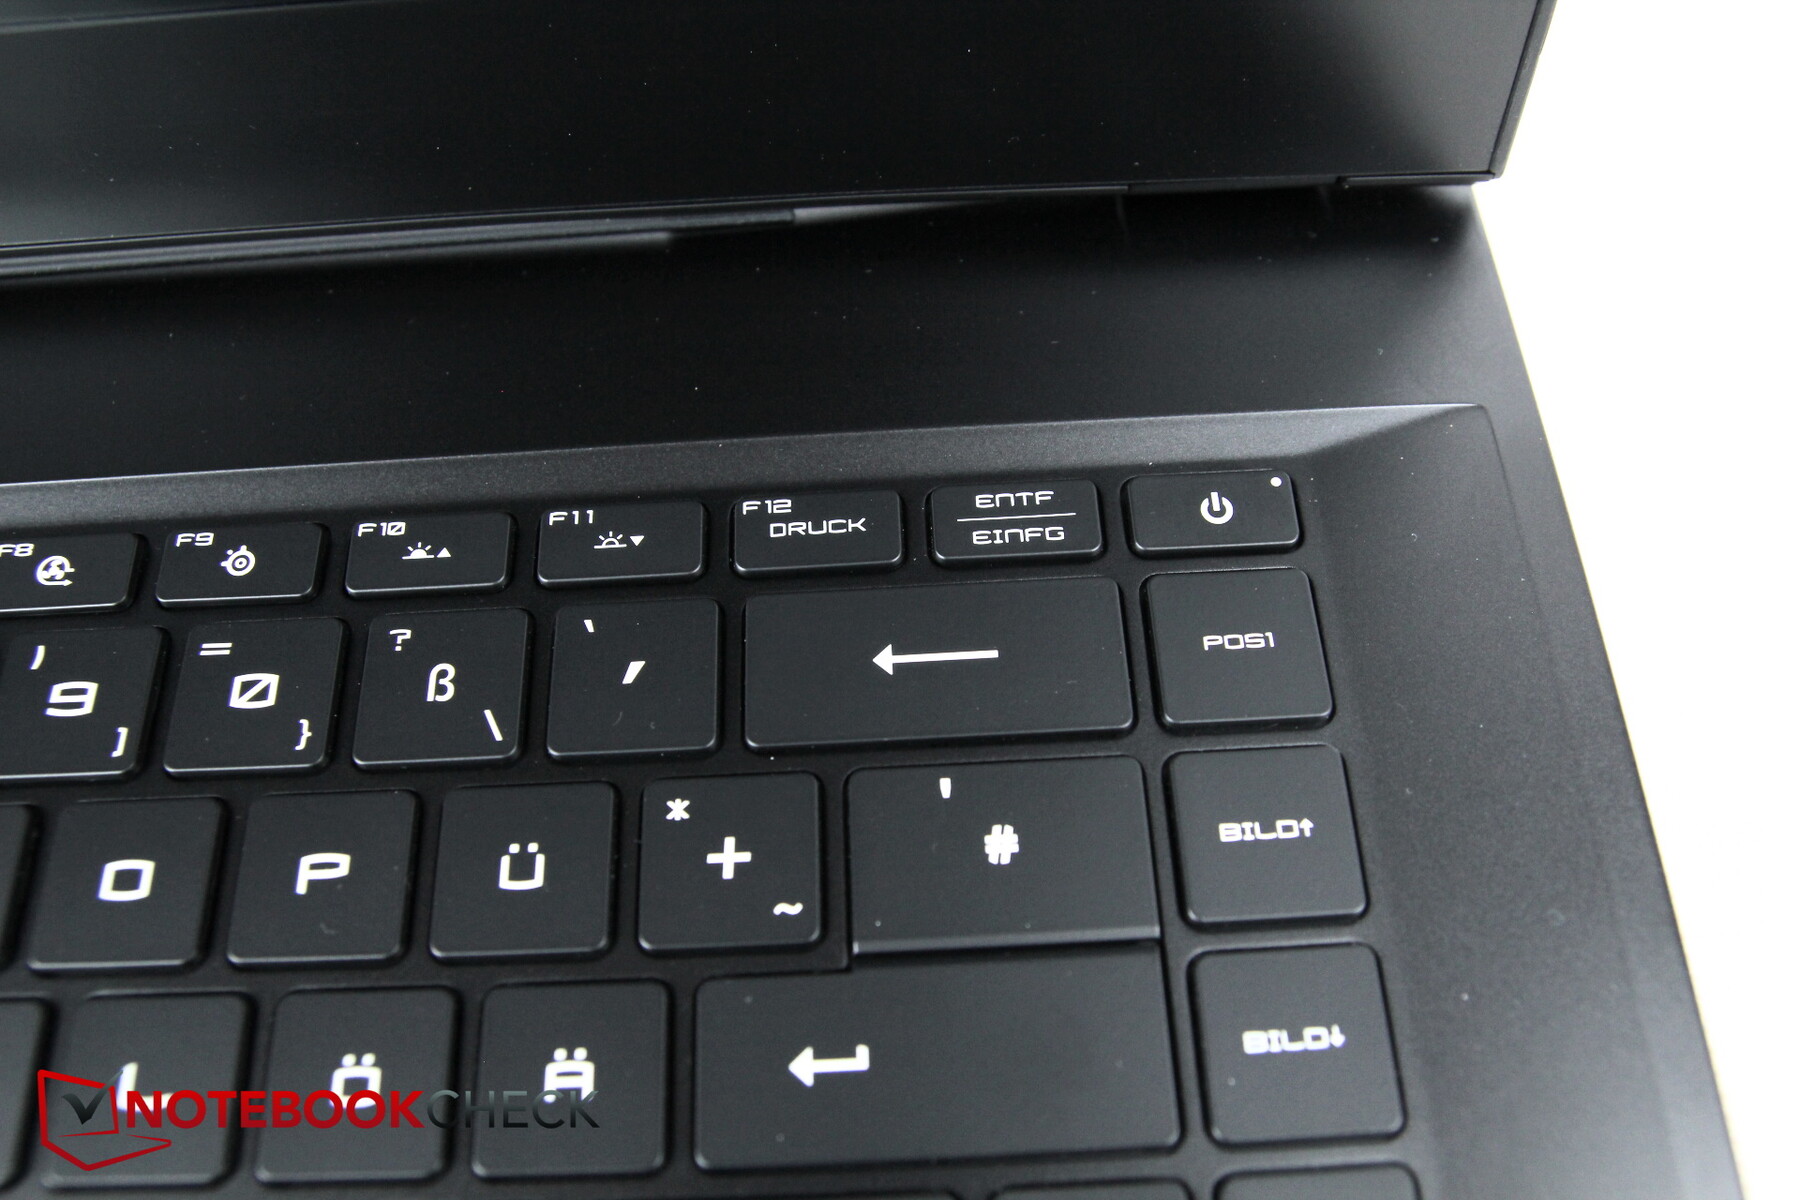
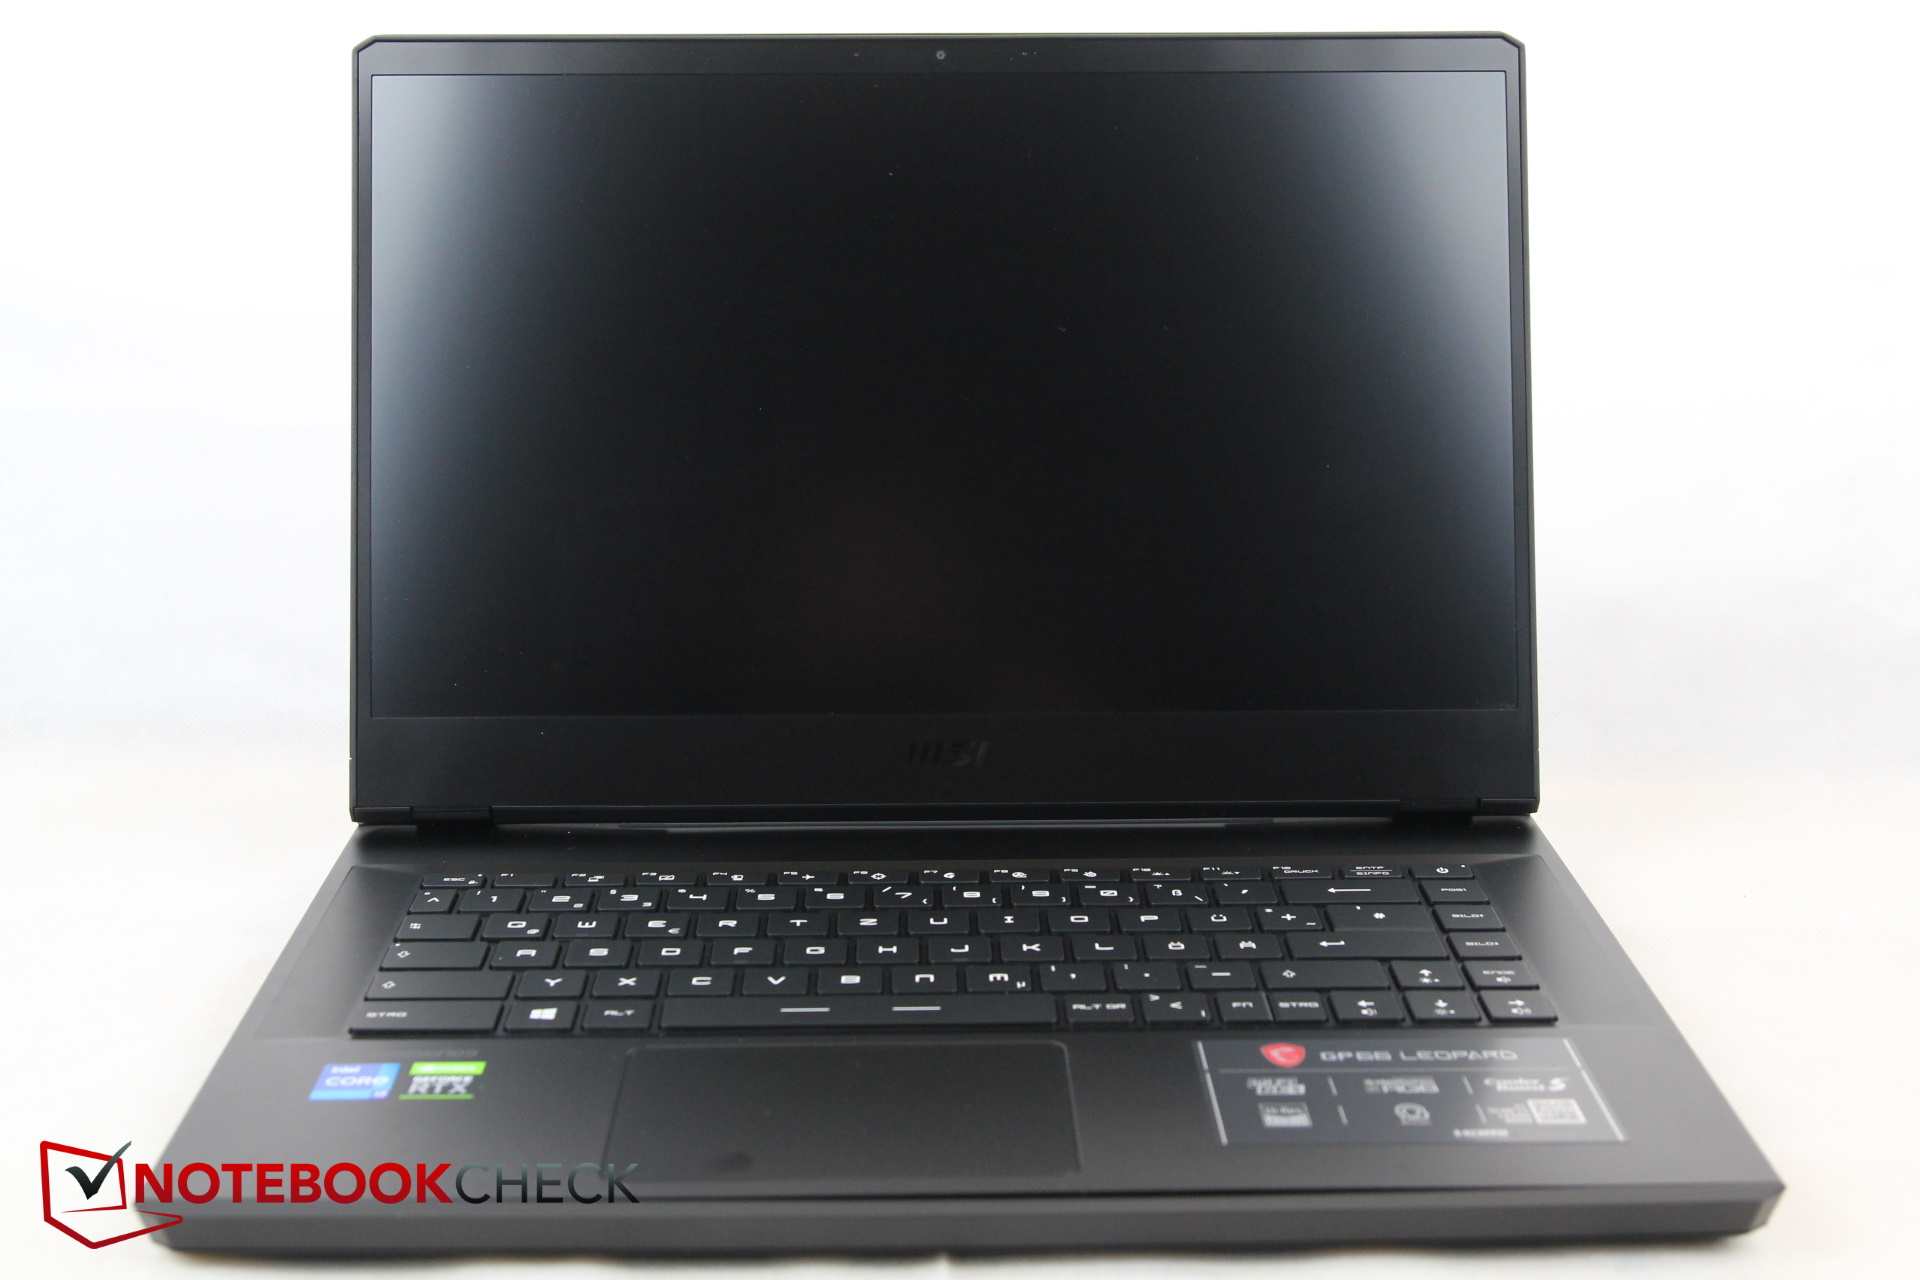
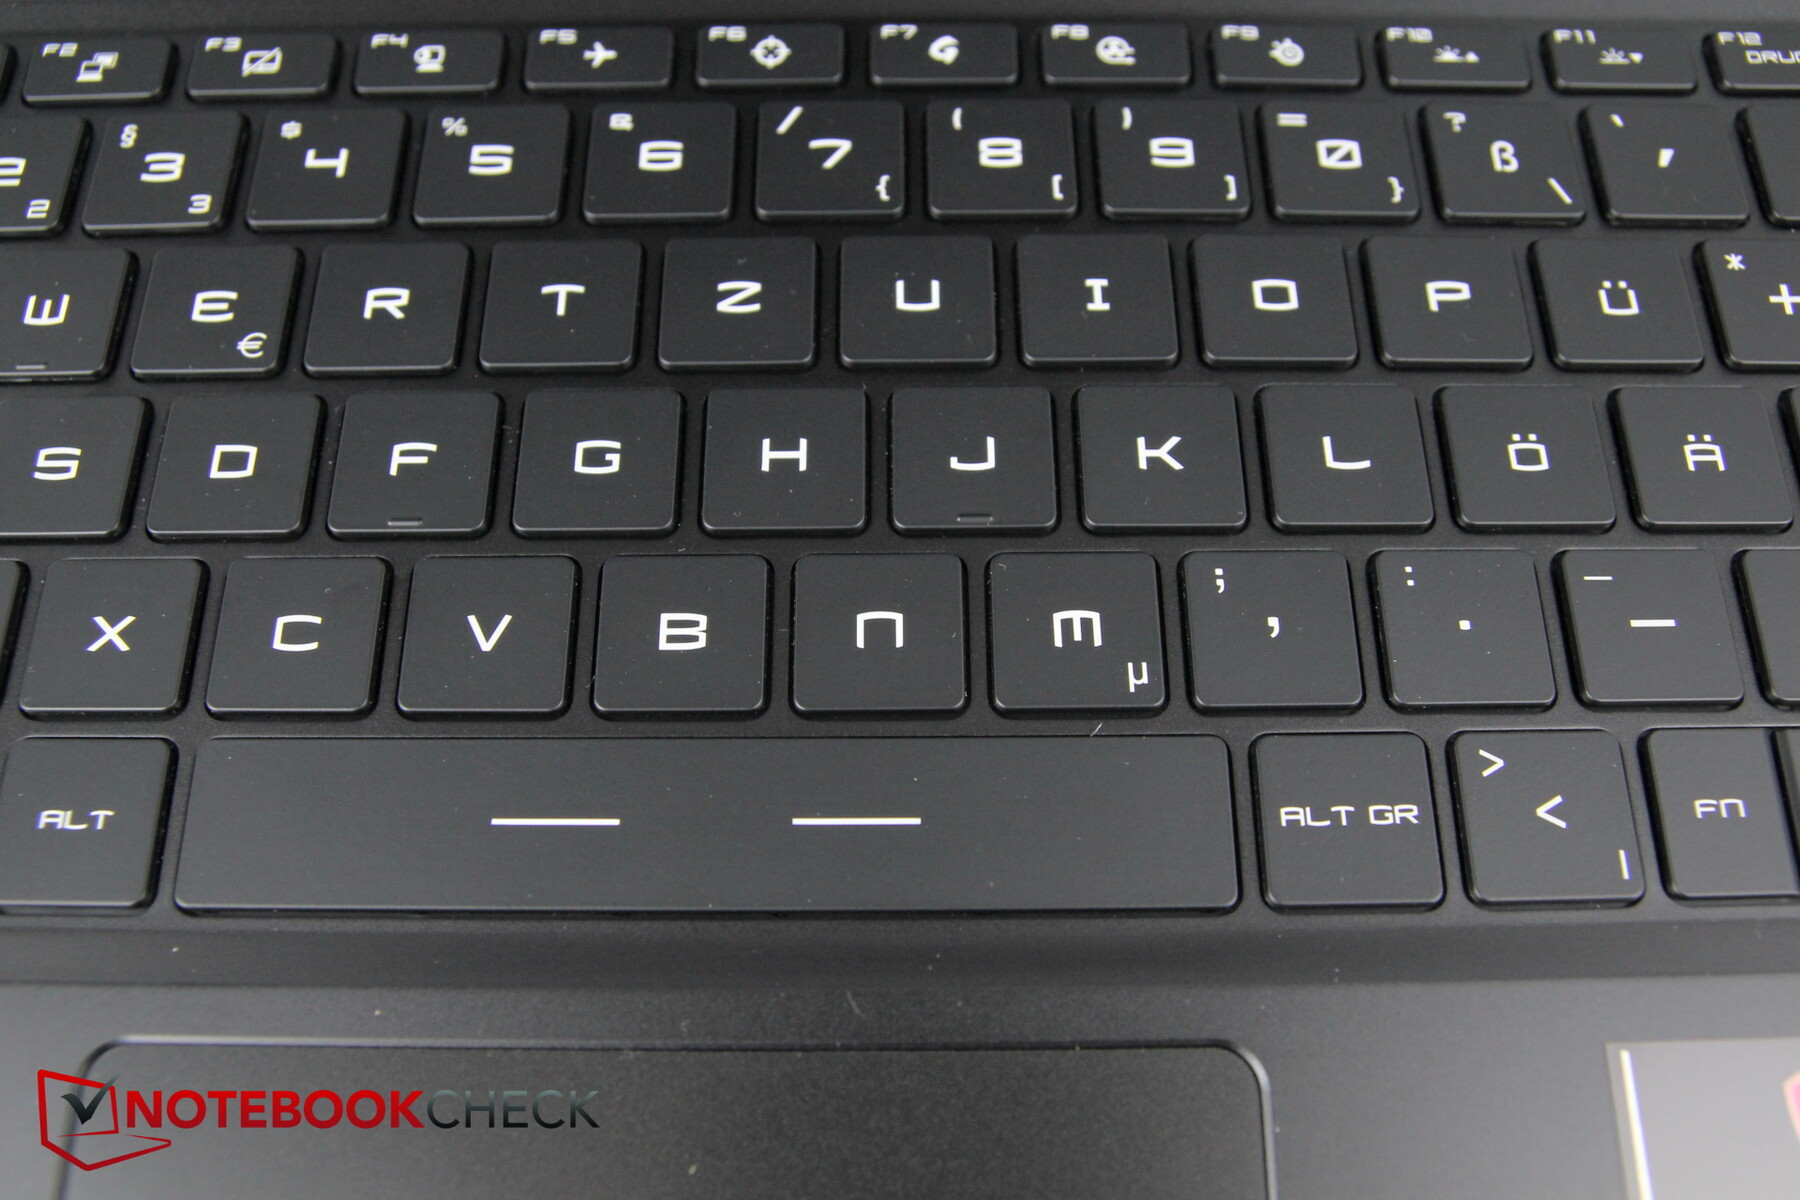
Malgré sa taille de 15,6 pouces, le Leopard ne dispose pas d'un NumPad. En revanche, cela garantit que toutes les touches sont assez grandes et également bien espacées. Les caractères sont grands et faciles à lire, même si la police choisie est un peu inhabituelle, ce qui devrait explicitement plaire aux joueurs. La touche d'alimentation fait partie du clavier et se trouve dans le coin supérieur droit. Elle peut être déclenchée involontairement pendant le traitement du texte en raison de la proximité de "insert" et "pos1"
La frappe est assez courte, mais le retour d'information reste net. Le bruit de la frappe est très modéré, seule la barre d'espacement est un peu plus bruyante. Dans l'ensemble, la saisie sur le GP66 est amusante et rapide.
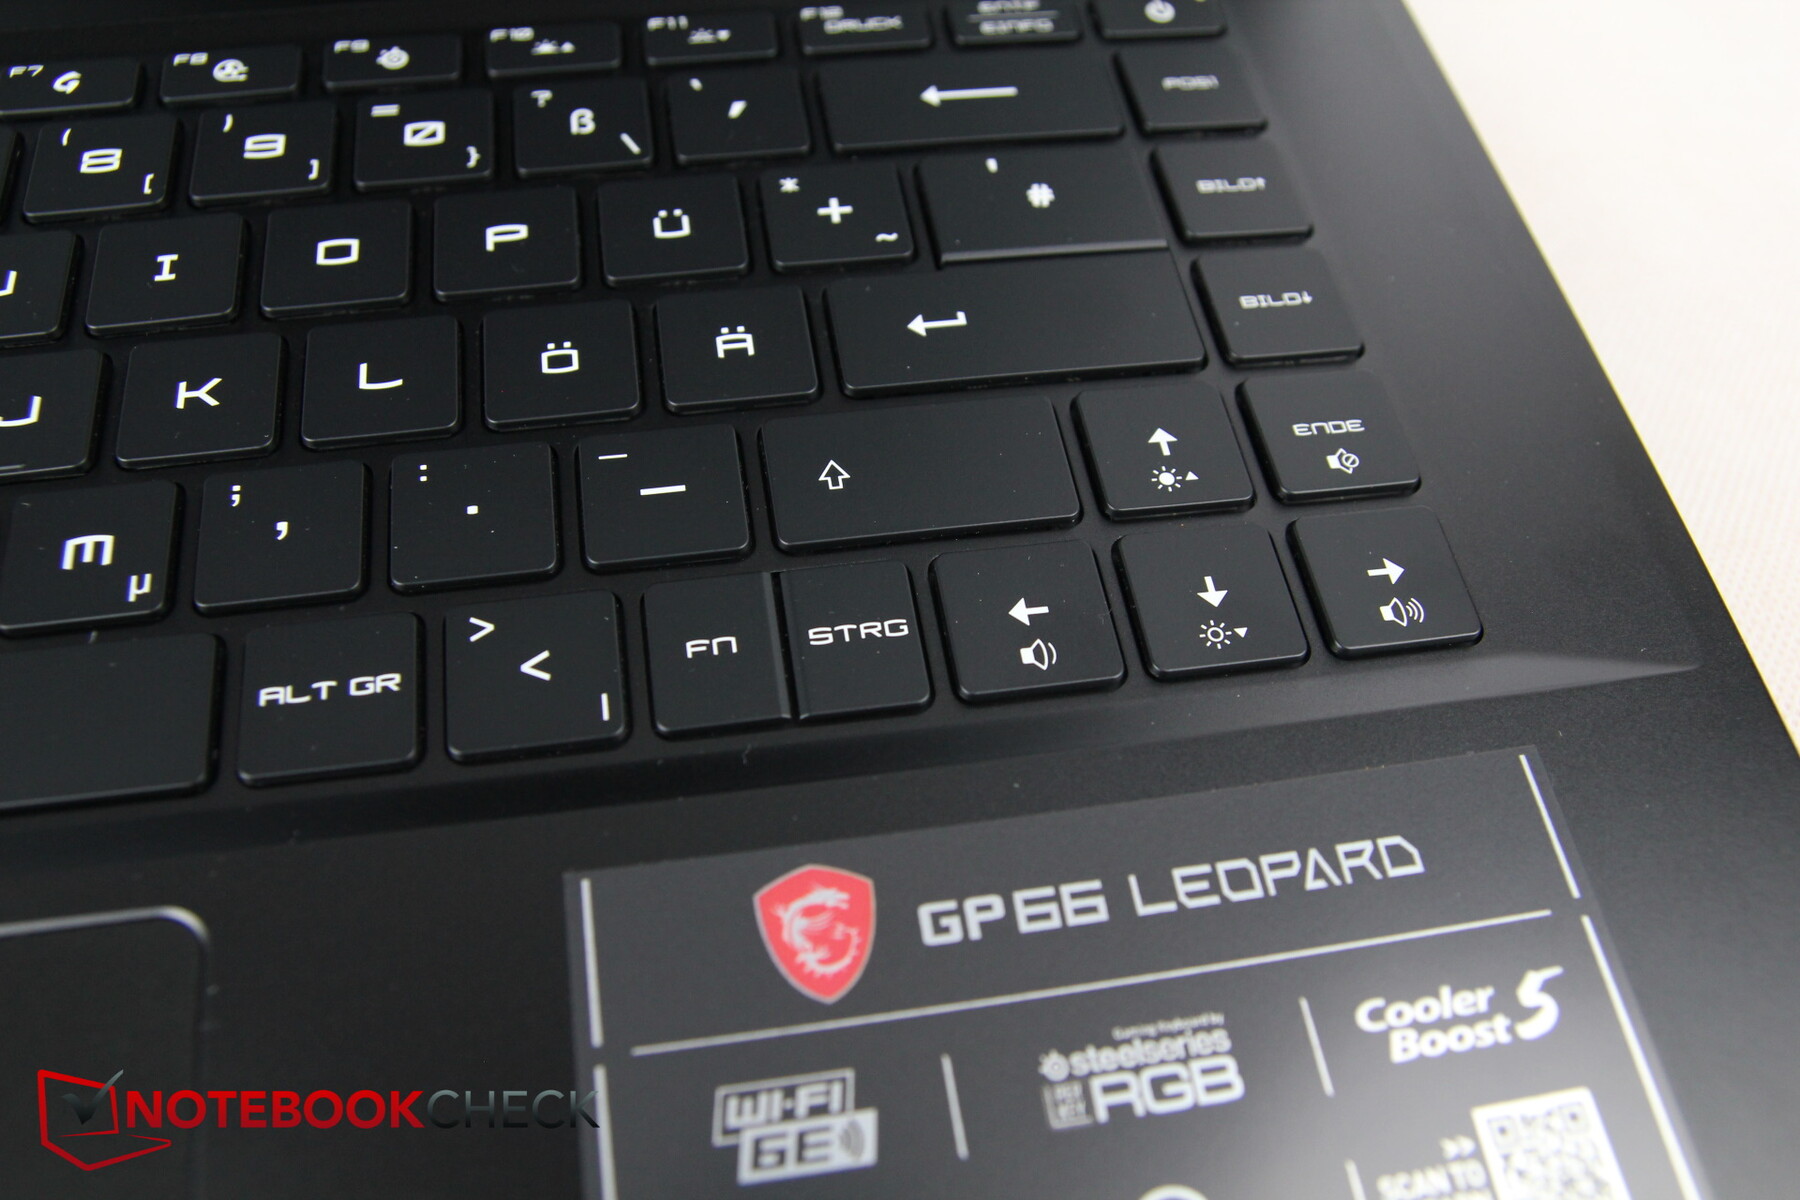
MSI a résolu un problème de manière très peu conventionnelle : la touche " fn ", si importante, n'est pas à gauche, mais à droite et partage sa place avec la touche Ctrl de droite. D'une part, cela signifie que vous devez réfléchir à deux fois et que les combinaisons de touches sont parfois assez maladroites car vous ne pouvez pas utiliser les deux mains pour des combinaisons de touches très éloignées ou vous devez appuyer sur la deuxième touche avec la main gauche. La touche est également très étroite, ce qui est particulièrement défavorable puisqu'elle est généralement pressée avec le pouce droit. Au moins, vous pouvez aussi échanger la fonction de la touche fn avec la touche Windows dans le MSI Center.
Dans ce contexte, il y a une fonctionnalité cool avec une faiblesse : le clavier a un rétroéclairage à 3 niveaux. Lorsque vous appuyez sur la touche fn, l'éclairage de toutes les autres touches est temporairement désactivé et seules les fonctions spéciales des touches F, c'est-à-dire les touches avec lesquelles la touche fn peut maintenant être combinée, s'allument en rouge. Cette fonction présente toutefois un inconvénient : si nous modifions le niveau d'éclairage du rétroéclairage, nous ne voyons pas immédiatement l'effet de cette modification, car les touches spéciales qui s'allument en rouge ne modifient pas le niveau d'éclairage, contrairement aux autres touches.
Pavé tactile
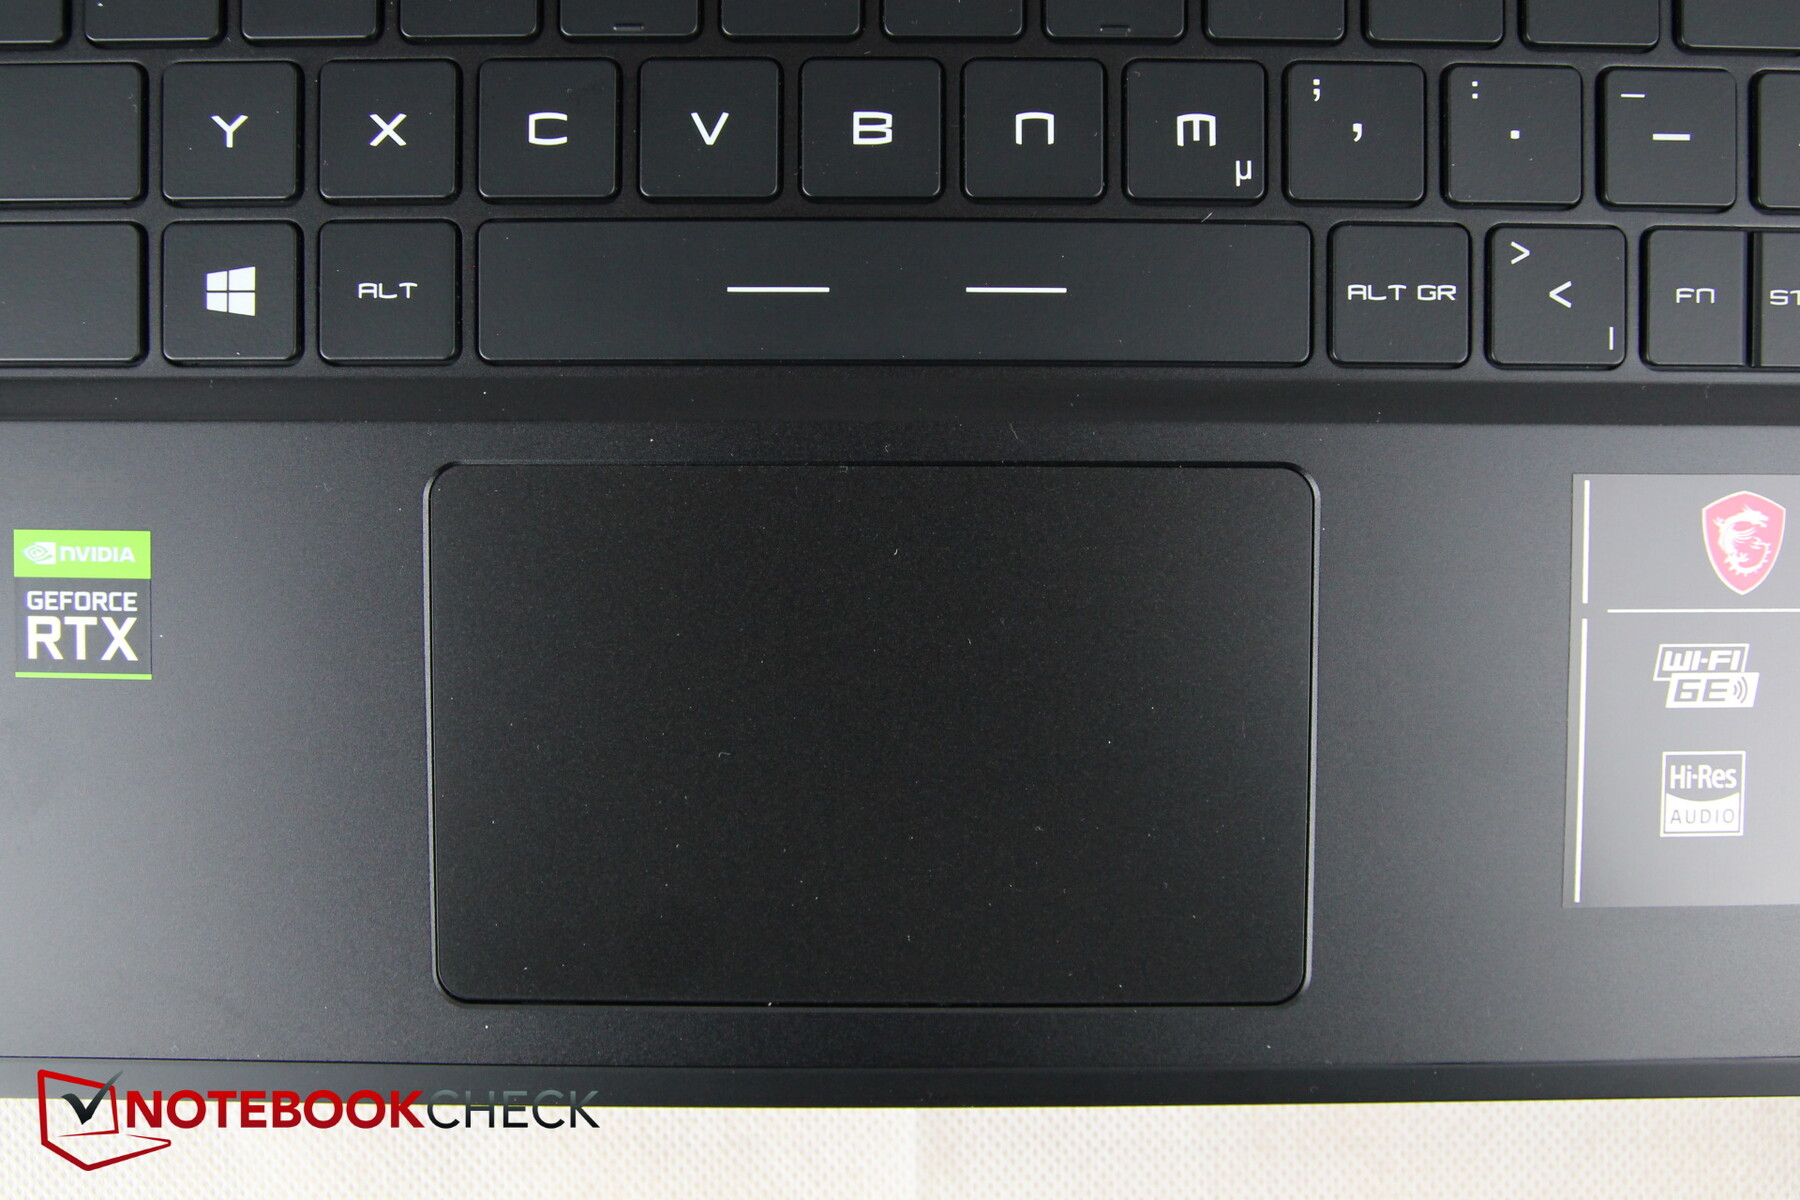
Le pavé tactile mesure environ 10,5 cm sur 6,5 cm et comporte des boutons de clic internes. Les capacités de glisse de la surface sont bonnes, mais elle faiblit clairement lors de mouvements lents ou de doigts mouillés. Le pavé est également assez imprécis dans les coins inférieurs.
Comme nous l'avons mentionné au début, le pavé tactile de notre modèle de test cliquette lorsque vous le touchez légèrement avec votre doigt. C'est assez gênant et aussi assez bruyant quand on veut déclencher des clics avec un tapotement du doigt.
Le clic des touches intégrées est assez lent, en particulier les doubles clics semblent inutilement pénibles, que l'on préfère déclencher avec un tapotement du doigt, où le bruit de cliquetis se fait à nouveau entendre. Dans l'ensemble, le pavé tactile, contrairement au clavier, ne fait pas la meilleure figure.
Afficher
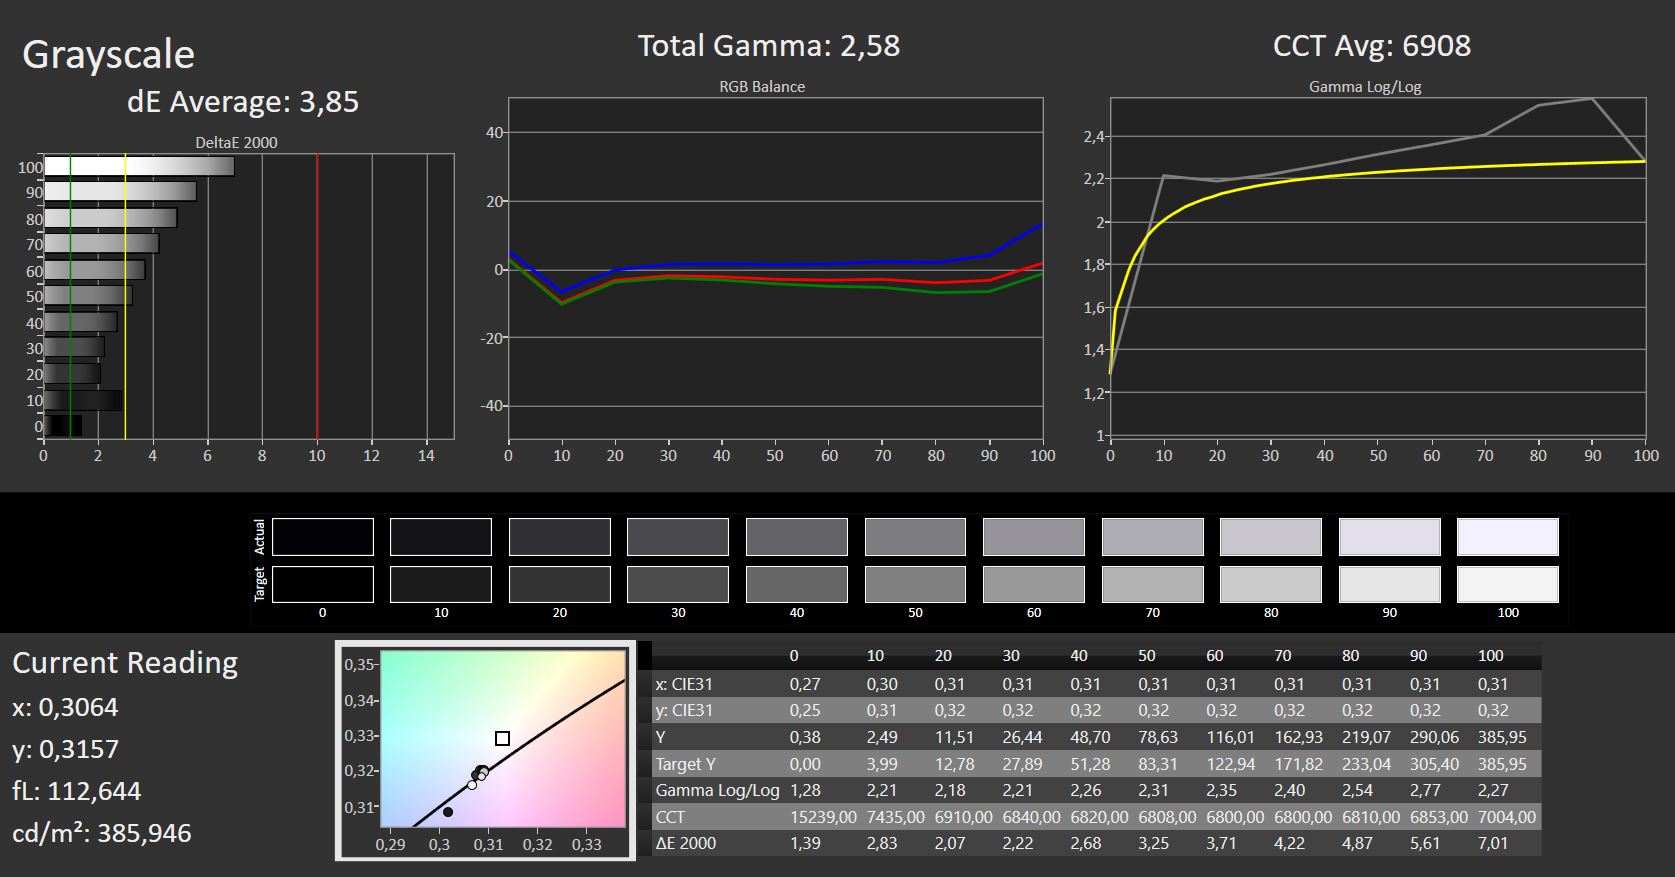
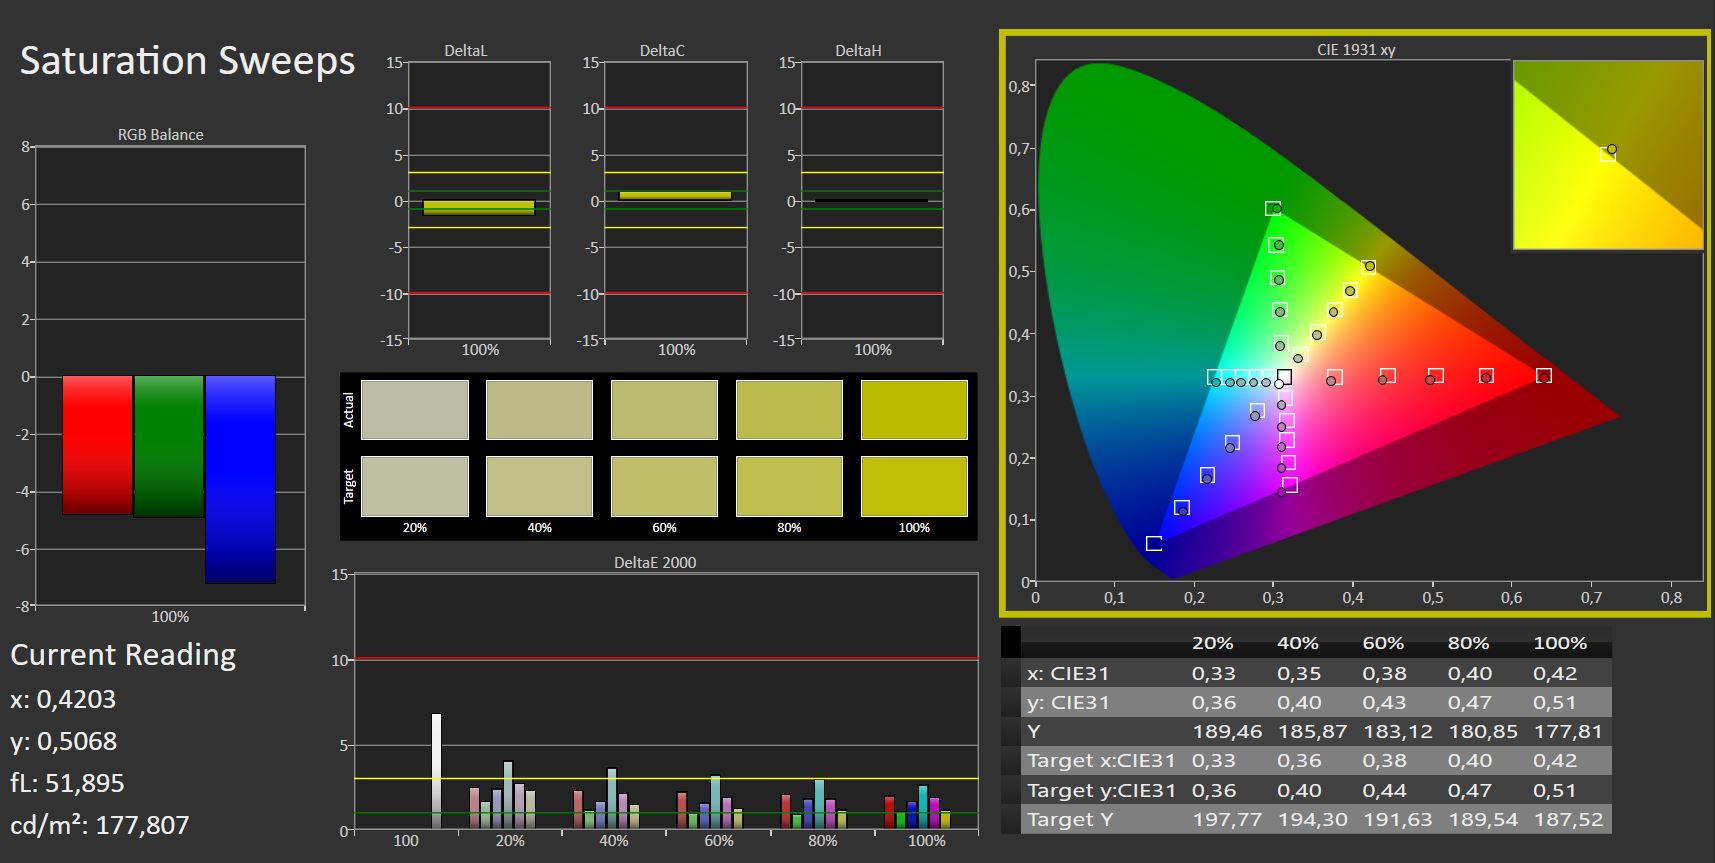
MSI utilise un panneau IPS Full HD mat de LG Display avec 144 Hz. Il s'agit de la même dalle que sur le Schenker XMG Apex 15 NH57E. Sa luminosité moyenne d'environ 360 nits est la plus élevée de la comparaison, et sa distribution de 87 pour cent est décente. Le GP66 est également disponible avec une dalle QHD (2560 x 1440 pixels).
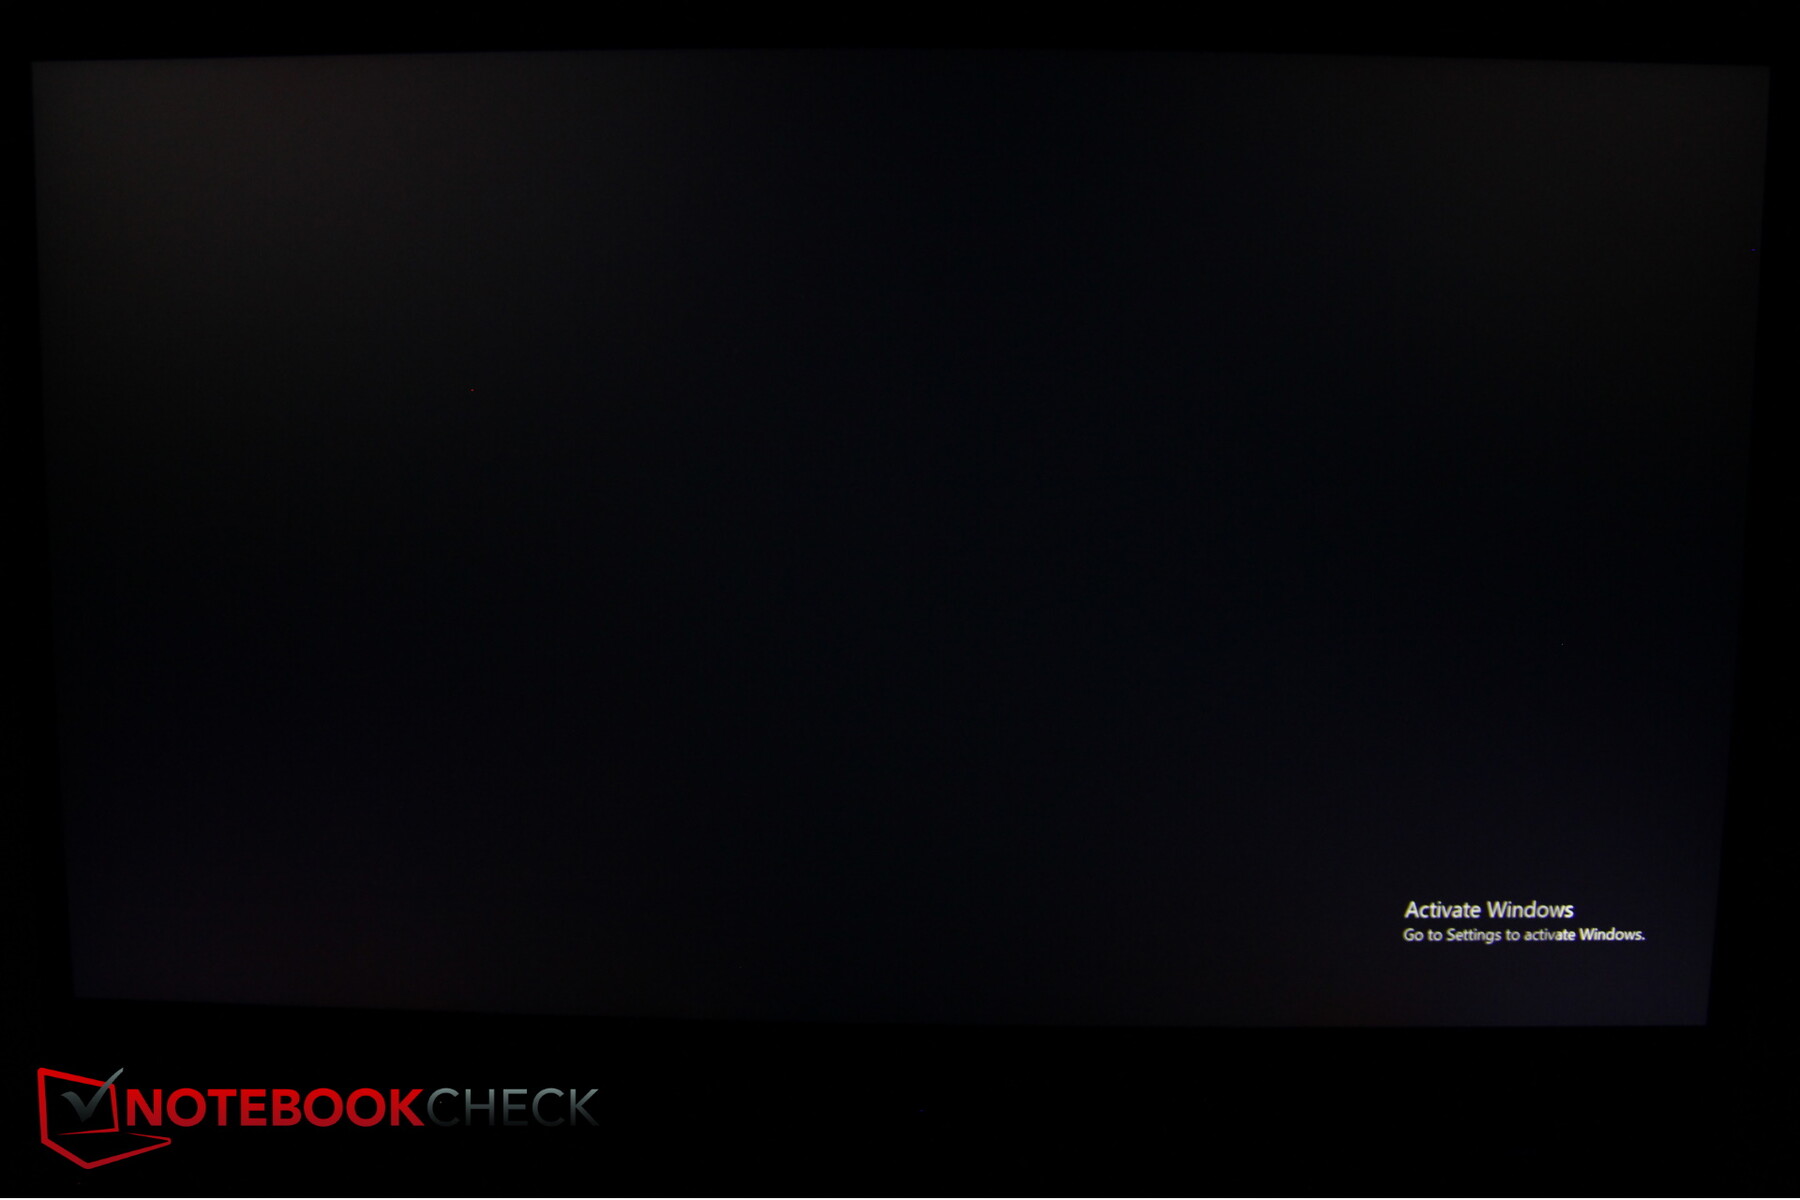
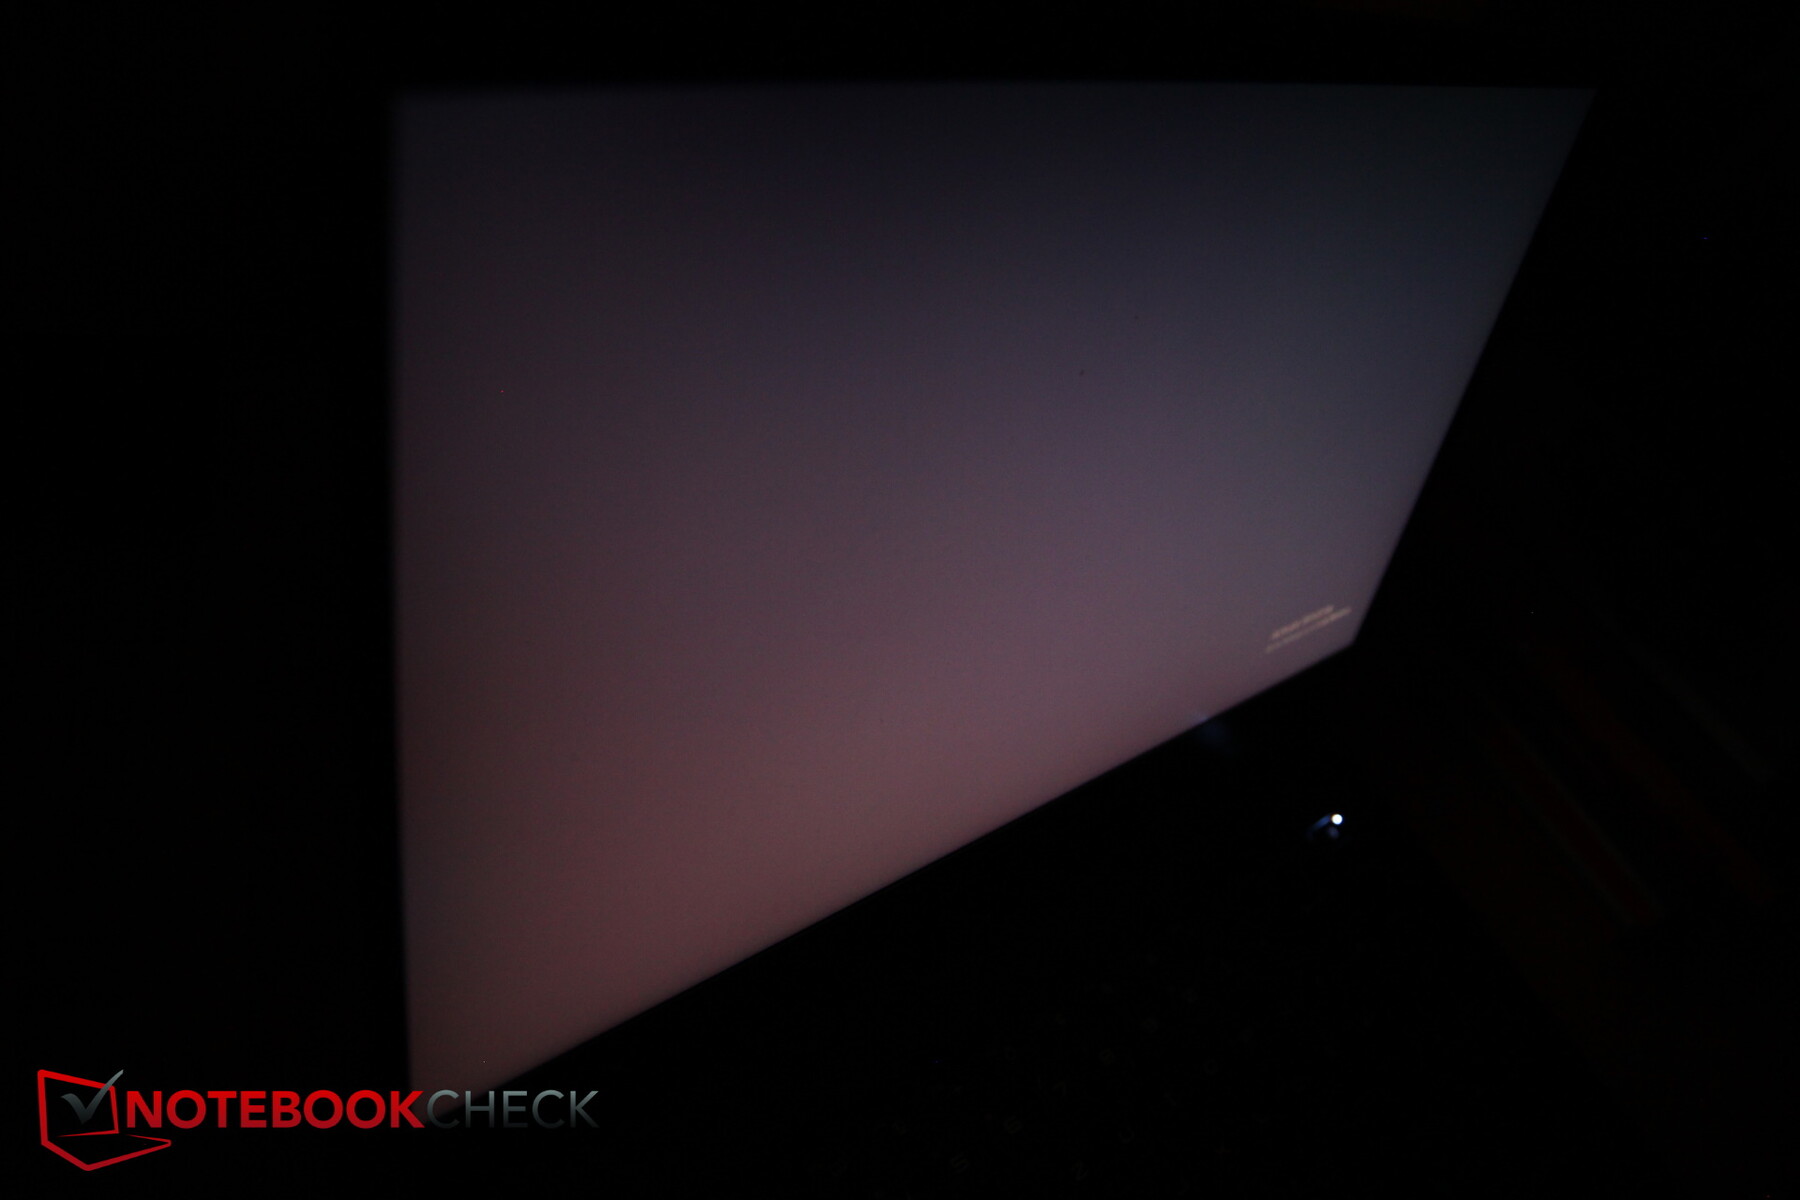
La valeur du noir est trop élevée, c'est pourquoi le contraste n'atteint pas des sommets, mais il reste comparable à celui de la concurrence. Seul le Schenker XMG Neo est nettement meilleur ici. Lorsque l'on regarde l'écran de côté avec une image noire, on peut clairement voir la forte lueur d'arrière-plan. La valeur du noir s'améliore naturellement avec une luminosité réduite.
Le saignement de l'écran est à peine significatif sur notre modèle de test, la grille de pixels est un peu granuleuse en raison de la surface mate. Les temps de réponse du panneau sont corrects, le PWM n'est pas utilisé.
| |||||||||||||||||||||||||
Homogénéité de la luminosité: 87 %
Valeur mesurée au centre, sur batterie: 390 cd/m²
Contraste: 951:1 (Valeurs des noirs: 0.41 cd/m²)
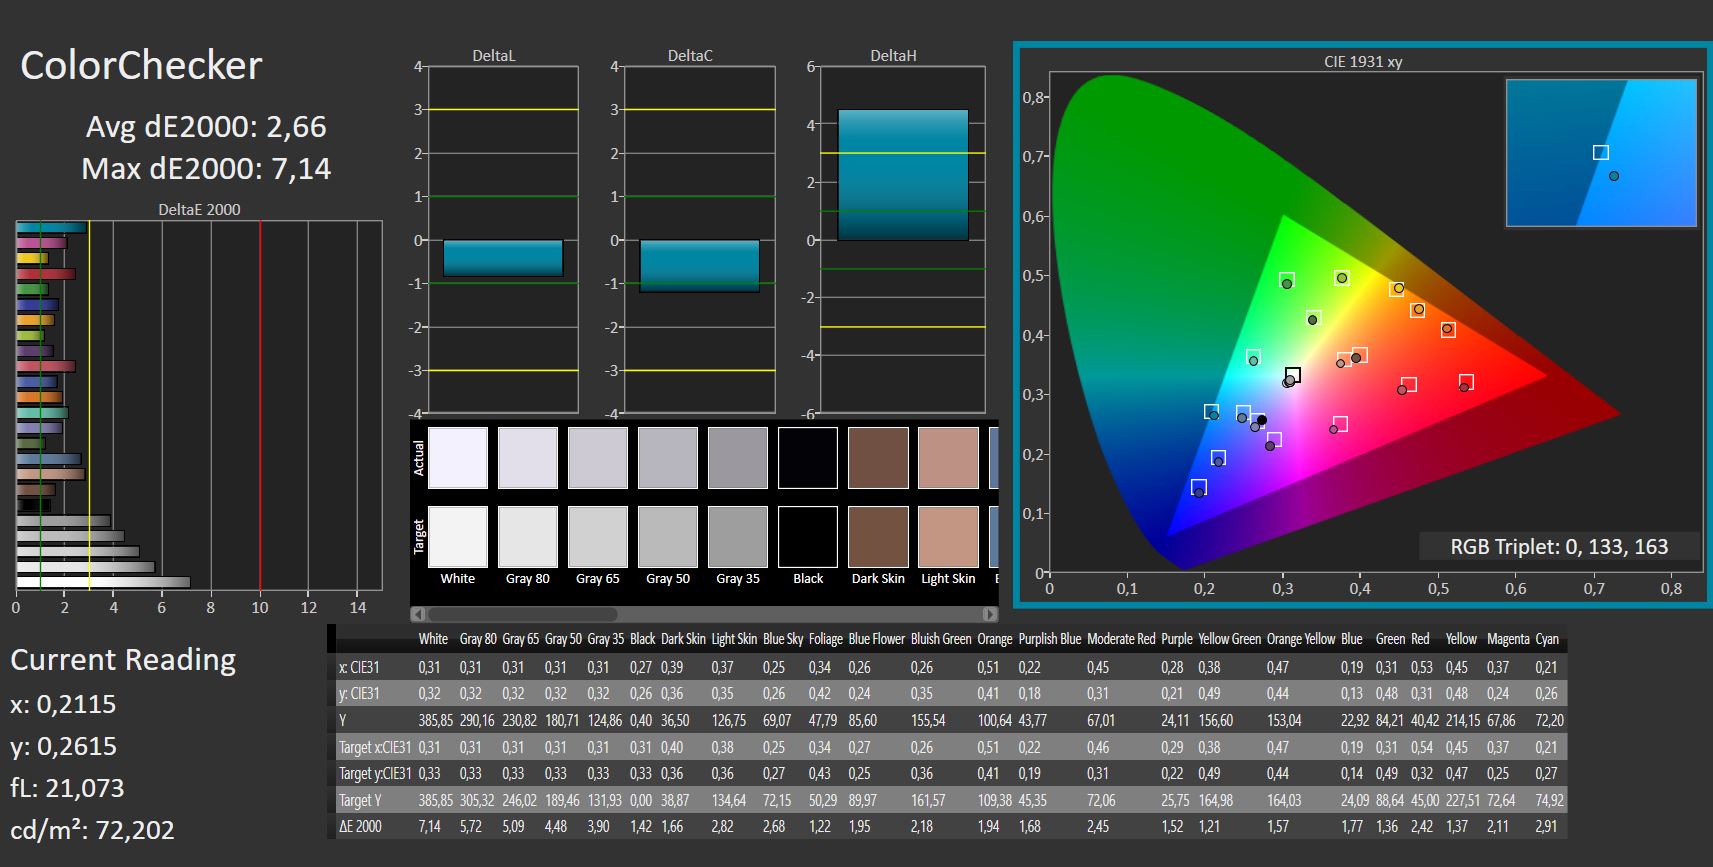
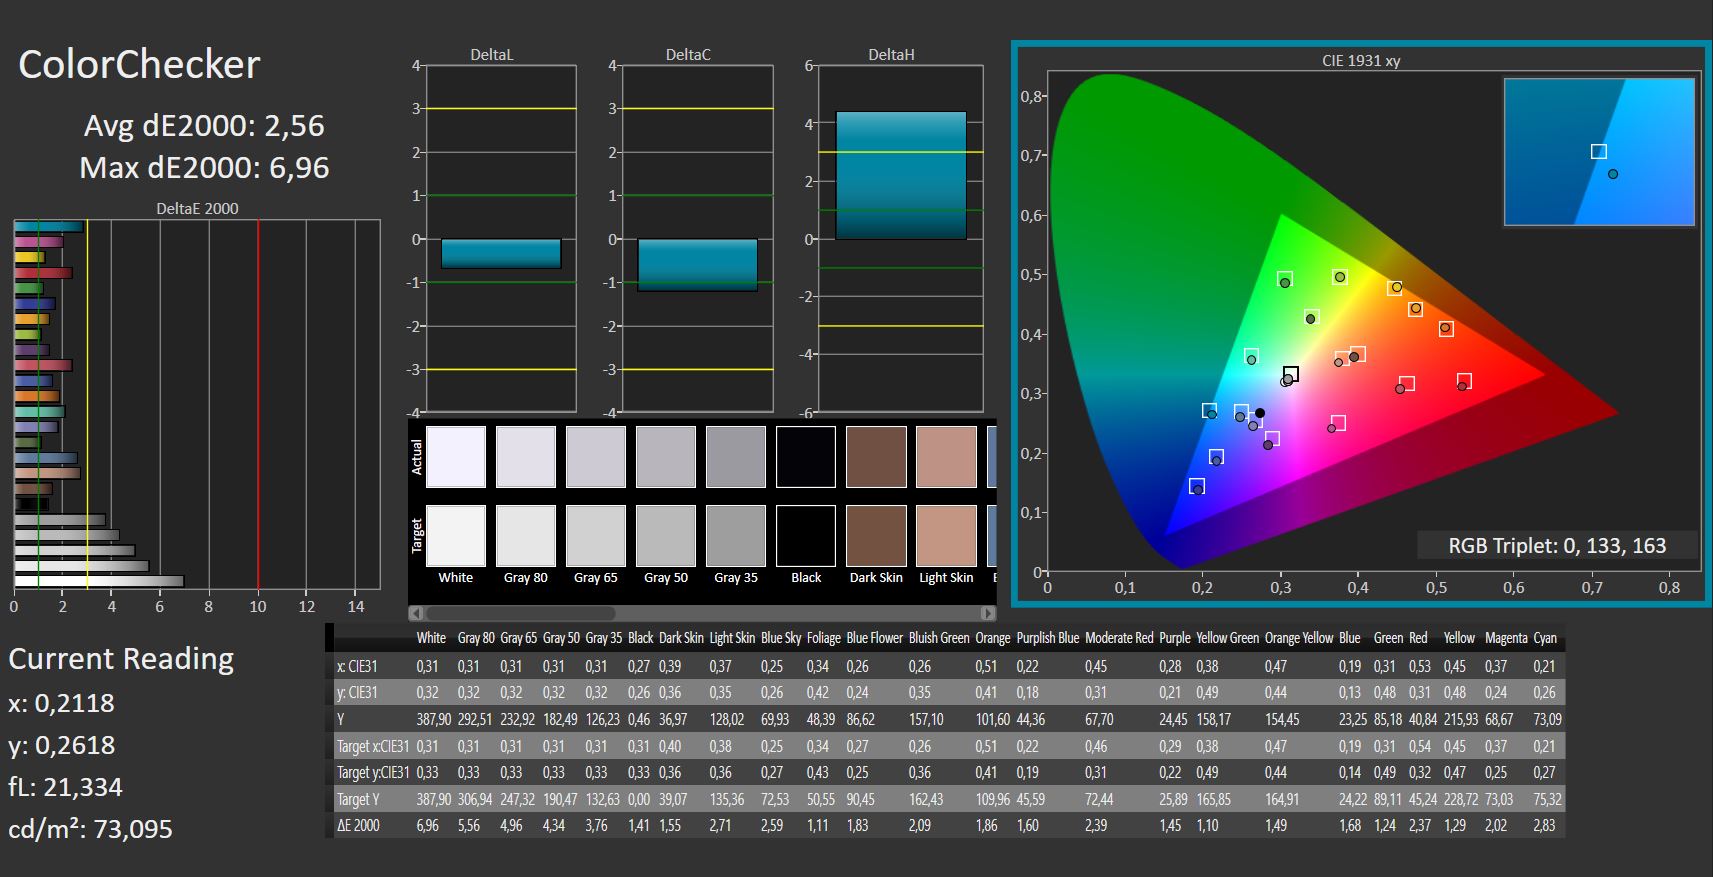
ΔE ColorChecker Calman: 2.66 | ∀{0.5-29.43 Ø4.71}
calibrated: 2.56
ΔE Greyscale Calman: 3.63 | ∀{0.09-98 Ø4.96}
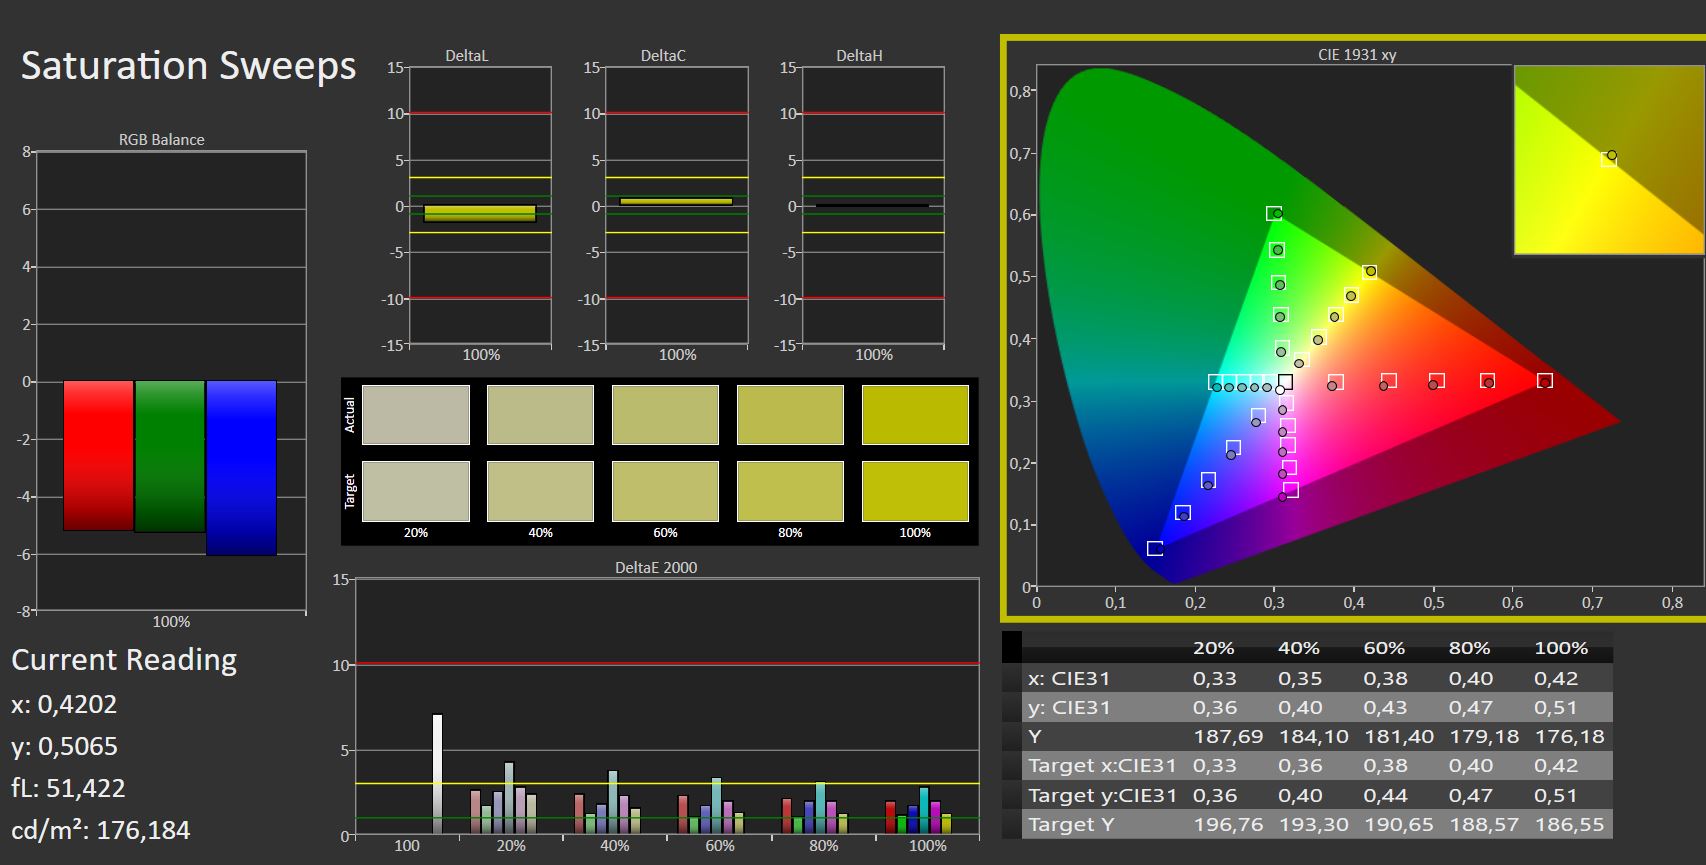
66% AdobeRGB 1998 (Argyll 3D)
95.8% sRGB (Argyll 3D)
65.2% Display P3 (Argyll 3D)
Gamma: 2.57
CCT: 6894 K
| MSI GP66 Leopard 11UH-028 LGD0625 (LP156WFG-SPB3), IPS, 1920x1080, 15.6" | MSI GP66 Leopard 10UG Sharp LQ156M1JW03, IPS, 1920x1080, 15.6" | Aorus 15P YD BOE09B9, IPS, 1920x1080, 15.6" | Asus ROG Strix Scar 15 G533QS BOE CQ NE156QHM-NY1, IPS, 2560x1440, 15.6" | Schenker XMG Neo 15 Tiger Lake BOE CQ NE156QHM-NY2, IPS, 2560x1440, 15.6" | Alienware m15 R6, i7-11800H RTX 3080 AU Optronics AUO9092 (B156HAN), IPS, 1920x1080, 15.6" | |
|---|---|---|---|---|---|---|
| Display | 5% | 7% | 28% | 4% | 11% | |
| Display P3 Coverage (%) | 65.2 | 68.3 5% | 70.2 8% | 97.6 50% | 68.6 5% | 74.1 14% |
| sRGB Coverage (%) | 95.8 | 99.2 4% | 98.5 3% | 99.9 4% | 98.6 3% | 99.5 4% |
| AdobeRGB 1998 Coverage (%) | 66 | 70.4 7% | 72.4 10% | 85.3 29% | 69.3 5% | 75.7 15% |
| Response Times | 7% | 6% | -8% | -13% | 64% | |
| Response Time Grey 50% / Grey 80% * (ms) | 14 ? | 13.6 ? 3% | 14 ? -0% | 14 ? -0% | 16 ? -14% | 2.8 80% |
| Response Time Black / White * (ms) | 10.8 ? | 9.6 ? 11% | 9.6 ? 11% | 12.4 ? -15% | 12 ? -11% | 5.6 48% |
| PWM Frequency (Hz) | 23580 ? | |||||
| Screen | -15% | -7% | -3% | -4% | -1% | |
| Brightness middle (cd/m²) | 390 | 225.9 -42% | 337 -14% | 304.3 -22% | 324 -17% | 359 -8% |
| Brightness (cd/m²) | 362 | 211 -42% | 316 -13% | 286 -21% | 307 -15% | 344 -5% |
| Brightness Distribution (%) | 87 | 83 -5% | 85 -2% | 76 -13% | 91 5% | 85 -2% |
| Black Level * (cd/m²) | 0.41 | 0.23 44% | 0.31 24% | 0.33 20% | 0.27 34% | 0.35 15% |
| Contrast (:1) | 951 | 982 3% | 1087 14% | 922 -3% | 1200 26% | 1026 8% |
| Colorchecker dE 2000 * | 2.66 | 3.98 -50% | 3.87 -45% | 2.76 -4% | 3.36 -26% | 3.3 -24% |
| Colorchecker dE 2000 max. * | 7.14 | 8.95 -25% | 8.09 -13% | 5.57 22% | 9.87 -38% | 4.84 32% |
| Colorchecker dE 2000 calibrated * | 2.56 | 1.15 55% | 1.15 55% | 2.38 7% | 1.23 52% | 3.28 -28% |
| Greyscale dE 2000 * | 3.63 | 6.4 -76% | 6.1 -68% | 4 -10% | 5.8 -60% | 3.66 -1% |
| Gamma | 2.57 86% | 2.25 98% | 2.132 103% | 2.14 103% | 2.311 95% | 2.43 91% |
| CCT | 6894 94% | 6991 93% | 6891 94% | 6844 95% | 7087 92% | 5896 110% |
| Color Space (Percent of AdobeRGB 1998) (%) | 64.5 | 72 | 69 | |||
| Color Space (Percent of sRGB) (%) | 99.3 | 94 | 93 | |||
| Moyenne finale (programmes/paramètres) | -1% /
-8% | 2% /
-2% | 6% /
3% | -4% /
-4% | 25% /
11% |
* ... Moindre est la valeur, meilleures sont les performances
La concurrence n'est que légèrement meilleure en termes de couverture de l'espace couleur. Seul le ROG d'Asus est clairement en avance ici, puisqu'il couvre également AdobeRGB presque complètement, alors que notre MSI n'en couvre que 66%. Par conséquent, l'Asus est préférable pour l'édition d'images
L'écran est bien configuré en sortie d'usine, et un calibrage manuel ne l'améliore pas beaucoup.

Temps de réponse de l'écran
| ↔ Temps de réponse noir à blanc | ||
|---|---|---|
| 10.8 ms ... hausse ↗ et chute ↘ combinées | ↗ 6.2 ms hausse | 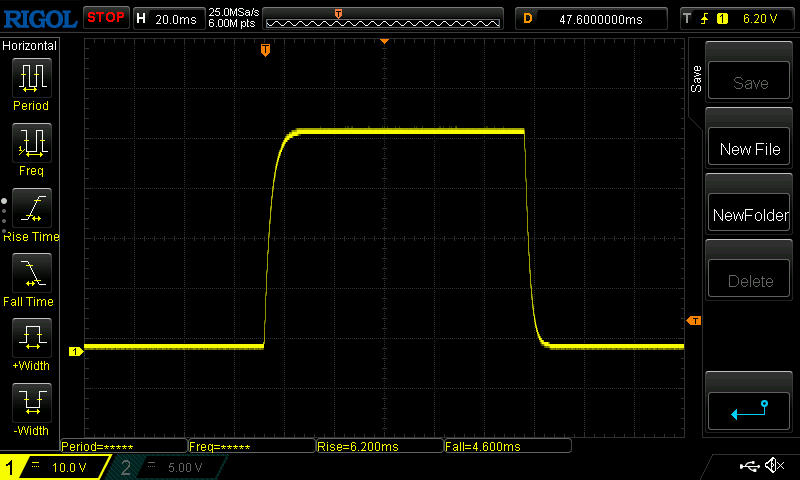 |
| ↘ 4.6 ms chute | ||
| L'écran montre de bons temps de réponse, mais insuffisant pour du jeu compétitif. En comparaison, tous les appareils testés affichent entre 0.1 (minimum) et 240 (maximum) ms. » 29 % des appareils testés affichent de meilleures performances. Cela signifie que les latences relevées sont meilleures que la moyenne (19.8 ms) de tous les appareils testés. | ||
| ↔ Temps de réponse gris 50% à gris 80% | ||
| 14 ms ... hausse ↗ et chute ↘ combinées | ↗ 7 ms hausse | 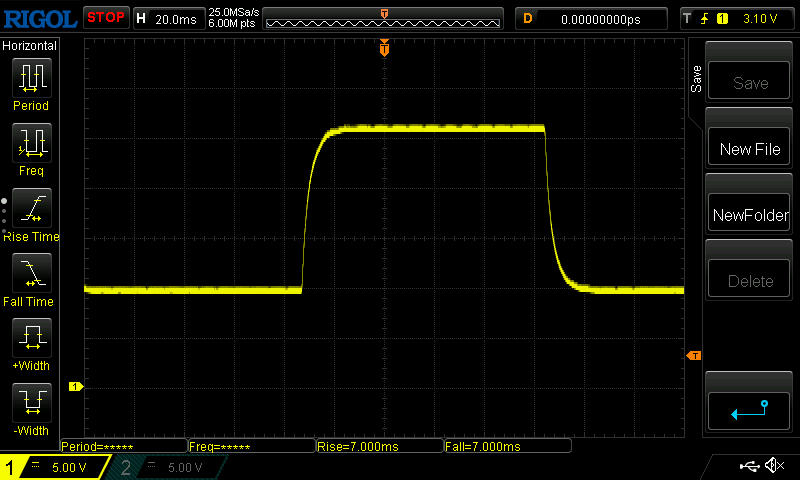 |
| ↘ 7 ms chute | ||
| L'écran montre de bons temps de réponse, mais insuffisant pour du jeu compétitif. En comparaison, tous les appareils testés affichent entre 0.165 (minimum) et 636 (maximum) ms. » 28 % des appareils testés affichent de meilleures performances. Cela signifie que les latences relevées sont meilleures que la moyenne (30.9 ms) de tous les appareils testés. | ||
Scintillement / MLI (Modulation de largeur d'impulsion)
| Scintillement / MLI (Modulation de largeur d'impulsion) non décelé |  | ||
En comparaison, 52 % des appareils testés n'emploient pas MDI pour assombrir leur écran. Nous avons relevé une moyenne à 7744 (minimum : 5 - maximum : 343500) Hz dans le cas où une MDI était active. | |||
En raison de la bonne luminosité et de la surface mate, la visibilité à l'extérieur est bonne - au moins à l'ombre et avec une vue directe du dessus. La lumière directe du soleil ainsi que les angles de vue obliques sont à éviter.
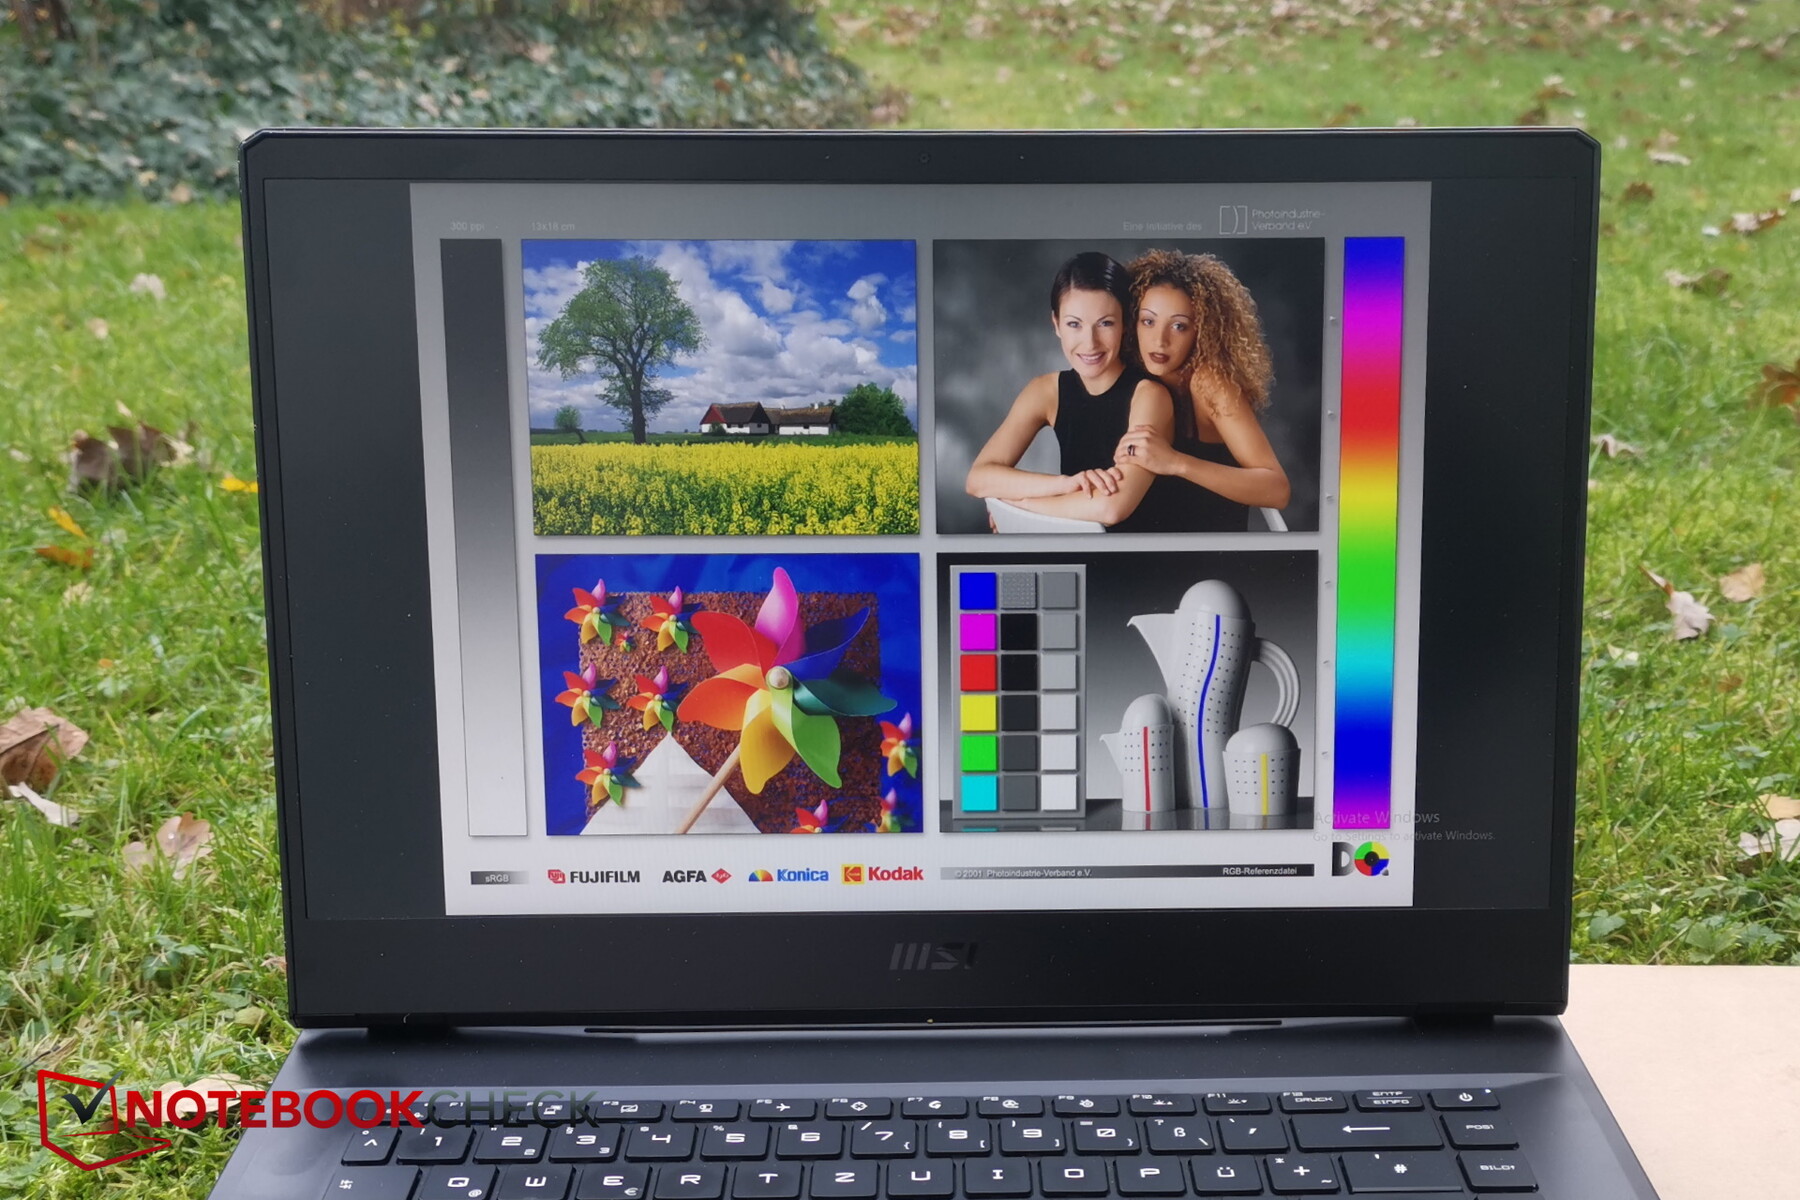
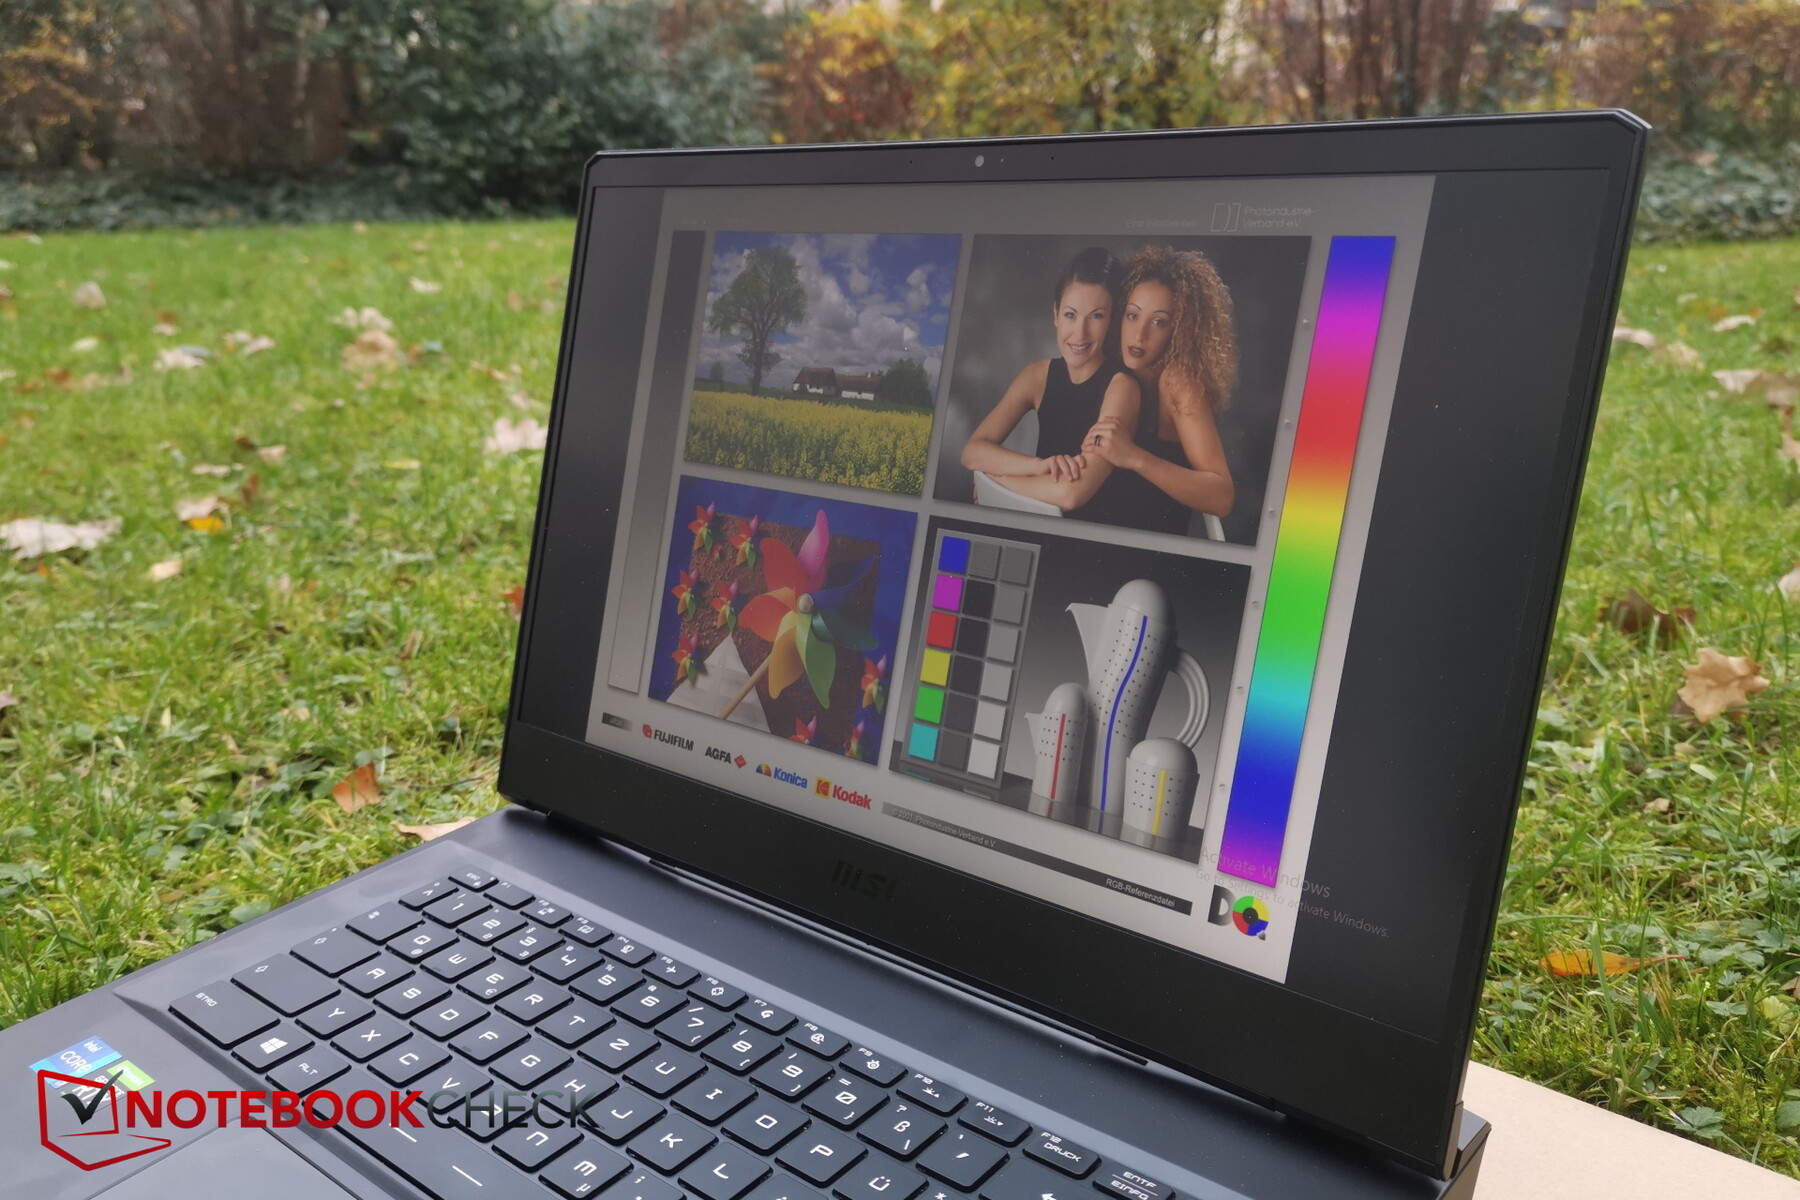
Lorsque l'on regarde sous des angles extrêmes, on perd un peu de luminosité, mais très peu, comme c'est le cas pour les écrans IPS, et le contenu reste bien reconnaissable

Performance - Seul le CPU bénéficie du MSI Center
Le Léopard de MSI est un ordinateur portable de jeu, ce qui est indiqué par la RTX 3080. Théoriquement, l'ordinateur portable devrait être capable de rendre tous les jeux actuels de manière fluide dans la résolution native et également avoir suffisamment de réserves pour les résolutions 4K
Conditions d'essai
Nous avons effectué tous les benchmarks alors que le MSI Center n'était pas encore installé. Après tout, le GP66 n'est officiellement livré qu'avec FreeDOS et non avec une licence Windows. Le curseur de performance Windows de notre unité de test était toujours réglé sur "Best Performance" pour les tests de performance.
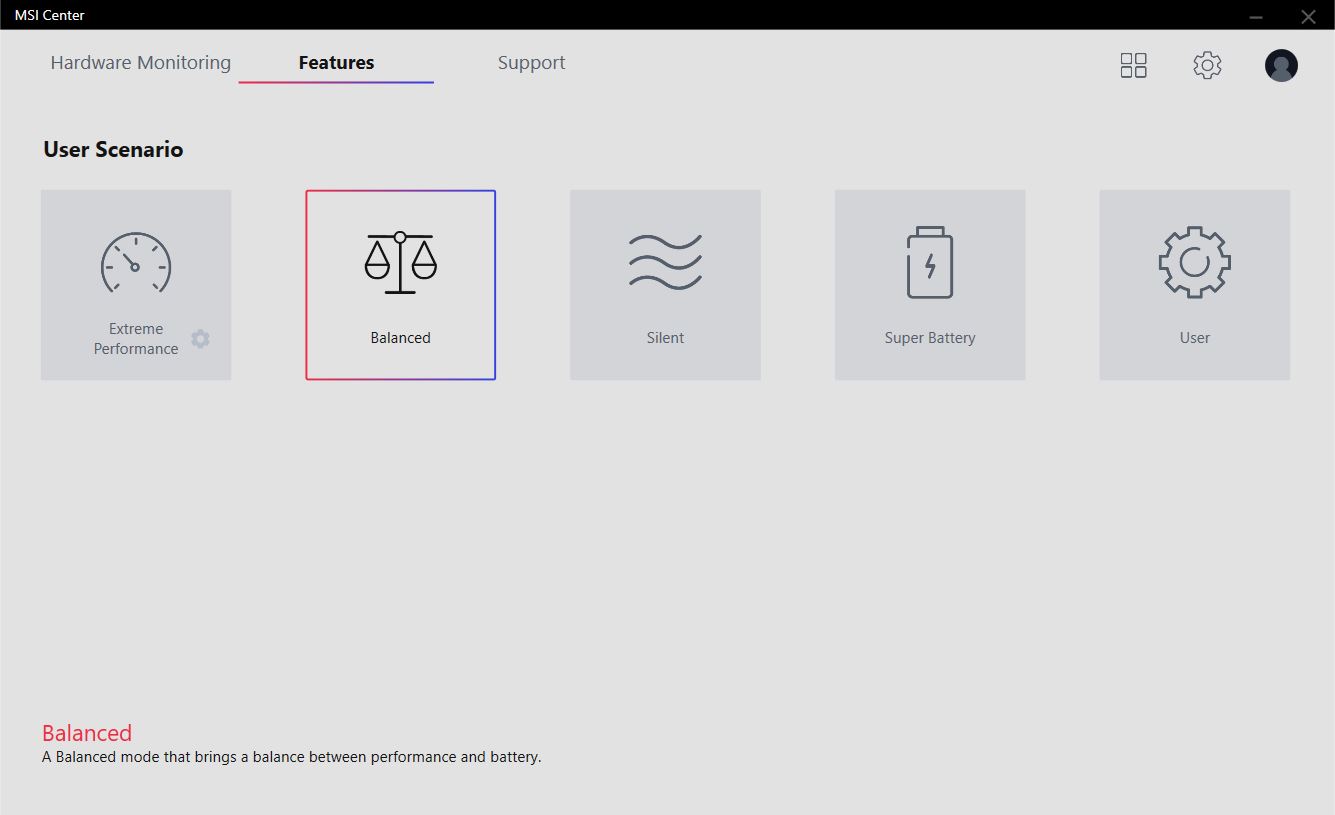
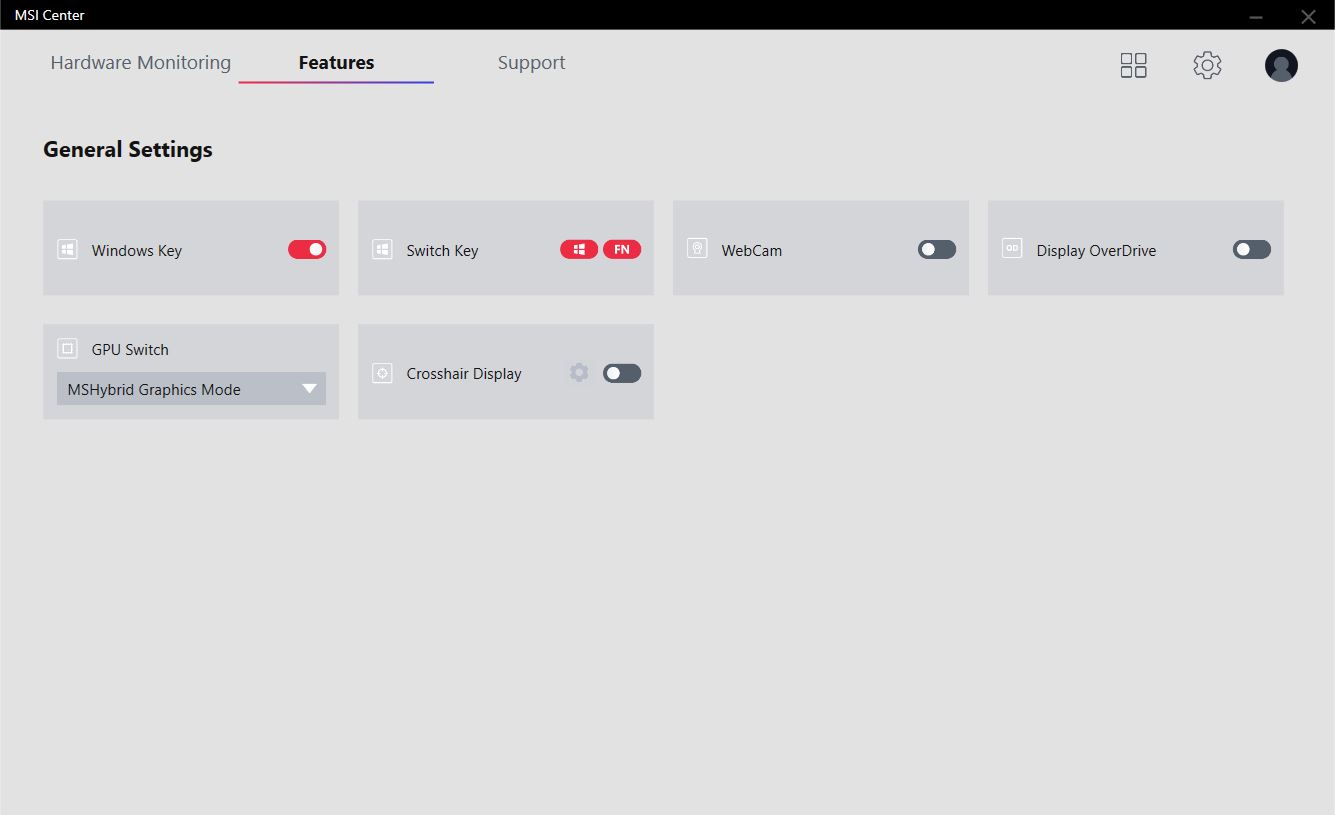
Le MSI Center, par contre, utilise d'autres modes de performance, qui sont cachés sous "User Scenario". Nous examinerons les différences avec le mode Windows dans les sections consacrées aux performances. Dans les paramètres MSI, vous pouvez également choisir entre le mode graphique hybride et le mode GPU discret uniquement.
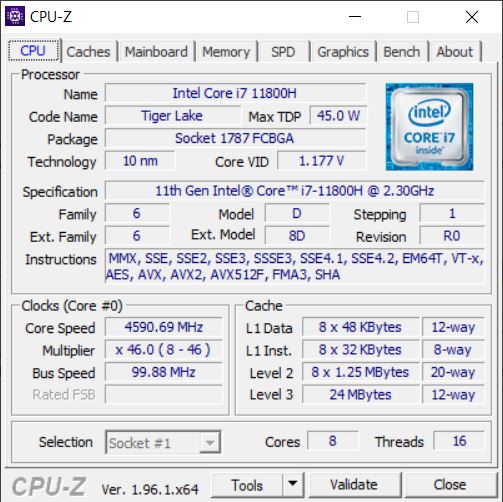
Processeur
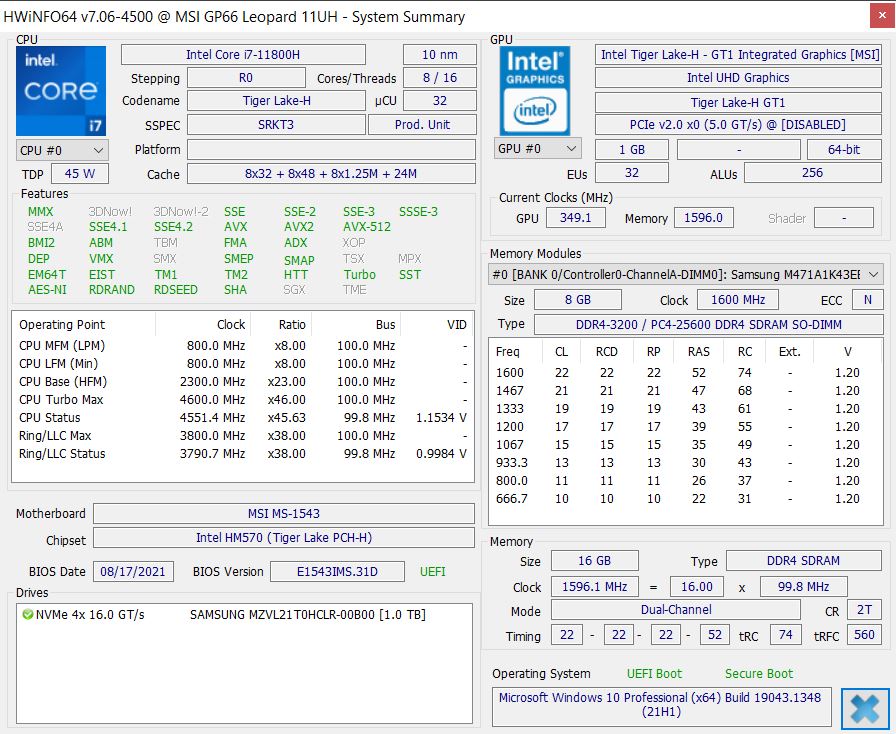
Comme beaucoup d'ordinateurs portables de jeu Intel actuels, le MSI Leopard est équipé d'un processeur Intel Core i7-11800H d'Intel. Il possède huit cœurs, qui tournent individuellement à des fréquences comprises entre 2,3 et 4,6 GHz. Une horloge maximale de 4,2 GHz est possible lorsque tous les cœurs sont sollicités.
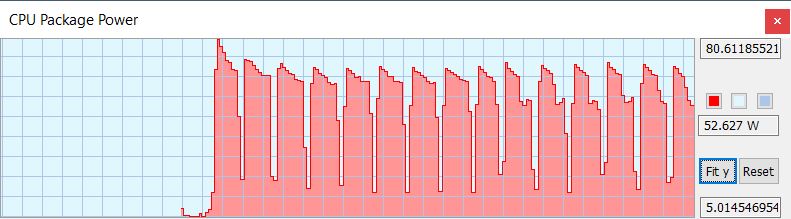
Dans notre boucle Cinebench, les performances ne diminuent que très peu et, globalement, le GP 66 11UH est environ 25 % plus rapide que son prédécesseur. Via HWinfo, nous pouvons voir que le CPU se permet 80 W au début, mais les runs suivants commencent plutôt à 75 W et finissent avec 53 W. Néanmoins, les résultats dépassent de peu ceux de l'Aorus avec le même CPU.
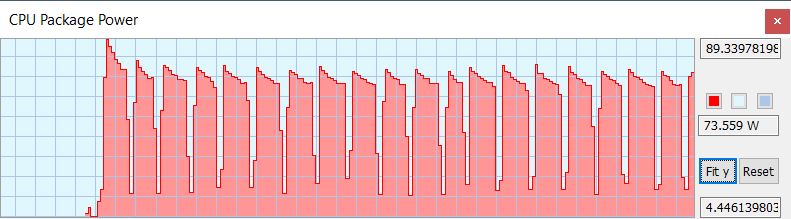
Le mode "Extreme Performance" profite particulièrement à la puissance du CPU. Au lieu de 75 W auparavant, le CPU peut même se permettre 90 W pendant une courte période, qui revient rapidement à 74 W au lieu de 53 W en une seule course. Cependant, même en mode Extrême, le GP66 n'atteint pas tout à fait les performances du XMG Neo débridé ou du Asus ROG avec un CPU AMD.
Les performances chutent de manière significative sur batterie : d'environ 2 000 points auparavant, il ne reste que 1 178 points.
Cinebench R15 Multi endurance test
Cinebench R23: Multi Core | Single Core
Cinebench R20: CPU (Multi Core) | CPU (Single Core)
Cinebench R15: CPU Multi 64Bit | CPU Single 64Bit
Blender: v2.79 BMW27 CPU
7-Zip 18.03: 7z b 4 | 7z b 4 -mmt1
Geekbench 5.5: Multi-Core | Single-Core
HWBOT x265 Benchmark v2.2: 4k Preset
LibreOffice : 20 Documents To PDF
R Benchmark 2.5: Overall mean
| CPU Performance rating | |
| Moyenne de la classe Gaming | |
| Schenker XMG Neo 15 Tiger Lake | |
| MSI GP66 Leopard 11UH-028 | |
| Asus ROG Strix Scar 15 G533QS -2! | |
| Alienware m15 R6, i7-11800H RTX 3080 | |
| Moyenne Intel Core i7-11800H | |
| Aorus 15P YD -2! | |
| MSI GP66 Leopard 10UG | |
| Cinebench R23 / Multi Core | |
| Moyenne de la classe Gaming (10488 - 42661, n=104, 2 dernières années) | |
| Schenker XMG Neo 15 Tiger Lake | |
| Asus ROG Strix Scar 15 G533QS | |
| Alienware m15 R6, i7-11800H RTX 3080 | |
| MSI GP66 Leopard 11UH-028 | |
| Moyenne Intel Core i7-11800H (6508 - 14088, n=48) | |
| MSI GP66 Leopard 10UG | |
| Cinebench R23 / Single Core | |
| Moyenne de la classe Gaming (1601 - 2415, n=104, 2 dernières années) | |
| MSI GP66 Leopard 11UH-028 | |
| Schenker XMG Neo 15 Tiger Lake | |
| Moyenne Intel Core i7-11800H (1386 - 1522, n=45) | |
| Alienware m15 R6, i7-11800H RTX 3080 | |
| Asus ROG Strix Scar 15 G533QS | |
| MSI GP66 Leopard 10UG | |
| Cinebench R20 / CPU (Multi Core) | |
| Moyenne de la classe Gaming (4029 - 16433, n=103, 2 dernières années) | |
| Schenker XMG Neo 15 Tiger Lake | |
| Asus ROG Strix Scar 15 G533QS | |
| Aorus 15P YD | |
| MSI GP66 Leopard 11UH-028 | |
| Alienware m15 R6, i7-11800H RTX 3080 | |
| Moyenne Intel Core i7-11800H (2498 - 5408, n=50) | |
| MSI GP66 Leopard 10UG | |
| Cinebench R20 / CPU (Single Core) | |
| Moyenne de la classe Gaming (622 - 913, n=103, 2 dernières années) | |
| Aorus 15P YD | |
| MSI GP66 Leopard 11UH-028 | |
| Schenker XMG Neo 15 Tiger Lake | |
| Alienware m15 R6, i7-11800H RTX 3080 | |
| Moyenne Intel Core i7-11800H (520 - 586, n=47) | |
| Asus ROG Strix Scar 15 G533QS | |
| MSI GP66 Leopard 10UG | |
| Cinebench R15 / CPU Multi 64Bit | |
| Moyenne de la classe Gaming (1578 - 6330, n=102, 2 dernières années) | |
| Asus ROG Strix Scar 15 G533QS | |
| Schenker XMG Neo 15 Tiger Lake | |
| Alienware m15 R6, i7-11800H RTX 3080 | |
| MSI GP66 Leopard 11UH-028 | |
| Aorus 15P YD | |
| Moyenne Intel Core i7-11800H (1342 - 2173, n=50) | |
| MSI GP66 Leopard 10UG | |
| Cinebench R15 / CPU Single 64Bit | |
| Moyenne de la classe Gaming (188.8 - 350, n=103, 2 dernières années) | |
| Asus ROG Strix Scar 15 G533QS | |
| Aorus 15P YD | |
| Schenker XMG Neo 15 Tiger Lake | |
| MSI GP66 Leopard 11UH-028 | |
| Alienware m15 R6, i7-11800H RTX 3080 | |
| Moyenne Intel Core i7-11800H (201 - 231, n=46) | |
| MSI GP66 Leopard 10UG | |
| Blender / v2.79 BMW27 CPU | |
| Aorus 15P YD | |
| MSI GP66 Leopard 10UG | |
| Moyenne Intel Core i7-11800H (217 - 454, n=46) | |
| Alienware m15 R6, i7-11800H RTX 3080 | |
| MSI GP66 Leopard 11UH-028 | |
| Asus ROG Strix Scar 15 G533QS | |
| Schenker XMG Neo 15 Tiger Lake | |
| Moyenne de la classe Gaming (79 - 330, n=101, 2 dernières années) | |
| 7-Zip 18.03 / 7z b 4 | |
| Moyenne de la classe Gaming (33491 - 148086, n=102, 2 dernières années) | |
| Asus ROG Strix Scar 15 G533QS | |
| Schenker XMG Neo 15 Tiger Lake | |
| MSI GP66 Leopard 11UH-028 | |
| Alienware m15 R6, i7-11800H RTX 3080 | |
| Moyenne Intel Core i7-11800H (33718 - 56758, n=46) | |
| Aorus 15P YD | |
| MSI GP66 Leopard 10UG | |
| 7-Zip 18.03 / 7z b 4 -mmt1 | |
| Moyenne de la classe Gaming (4824 - 7436, n=102, 2 dernières années) | |
| Schenker XMG Neo 15 Tiger Lake | |
| Aorus 15P YD | |
| MSI GP66 Leopard 11UH-028 | |
| Asus ROG Strix Scar 15 G533QS | |
| Moyenne Intel Core i7-11800H (5138 - 5732, n=46) | |
| Alienware m15 R6, i7-11800H RTX 3080 | |
| MSI GP66 Leopard 10UG | |
| Geekbench 5.5 / Multi-Core | |
| Moyenne de la classe Gaming (6460 - 28263, n=102, 2 dernières années) | |
| Schenker XMG Neo 15 Tiger Lake | |
| Alienware m15 R6, i7-11800H RTX 3080 | |
| MSI GP66 Leopard 11UH-028 | |
| Aorus 15P YD | |
| Moyenne Intel Core i7-11800H (4655 - 9851, n=40) | |
| MSI GP66 Leopard 10UG | |
| Geekbench 5.5 / Single-Core | |
| Moyenne de la classe Gaming (1403 - 2474, n=102, 2 dernières années) | |
| Schenker XMG Neo 15 Tiger Lake | |
| Aorus 15P YD | |
| MSI GP66 Leopard 11UH-028 | |
| Alienware m15 R6, i7-11800H RTX 3080 | |
| Moyenne Intel Core i7-11800H (1429 - 1625, n=40) | |
| MSI GP66 Leopard 10UG | |
| HWBOT x265 Benchmark v2.2 / 4k Preset | |
| Moyenne de la classe Gaming (11.5 - 44.4, n=102, 2 dernières années) | |
| Schenker XMG Neo 15 Tiger Lake | |
| Asus ROG Strix Scar 15 G533QS | |
| MSI GP66 Leopard 11UH-028 | |
| Moyenne Intel Core i7-11800H (7.38 - 17.4, n=46) | |
| Alienware m15 R6, i7-11800H RTX 3080 | |
| MSI GP66 Leopard 10UG | |
| Aorus 15P YD | |
| LibreOffice / 20 Documents To PDF | |
| Asus ROG Strix Scar 15 G533QS | |
| Moyenne de la classe Gaming (33.2 - 88.8, n=102, 2 dernières années) | |
| MSI GP66 Leopard 10UG | |
| MSI GP66 Leopard 11UH-028 | |
| Schenker XMG Neo 15 Tiger Lake | |
| Moyenne Intel Core i7-11800H (38.6 - 59.9, n=45) | |
| Alienware m15 R6, i7-11800H RTX 3080 | |
| Aorus 15P YD | |
| R Benchmark 2.5 / Overall mean | |
| MSI GP66 Leopard 10UG | |
| MSI GP66 Leopard 11UH-028 | |
| Moyenne Intel Core i7-11800H (0.548 - 0.615, n=46) | |
| Aorus 15P YD | |
| Alienware m15 R6, i7-11800H RTX 3080 | |
| Schenker XMG Neo 15 Tiger Lake | |
| Asus ROG Strix Scar 15 G533QS | |
| Moyenne de la classe Gaming (0.3439 - 0.59, n=102, 2 dernières années) | |
* ... Moindre est la valeur, meilleures sont les performances
AIDA64: FP32 Ray-Trace | FPU Julia | CPU SHA3 | CPU Queen | FPU SinJulia | FPU Mandel | CPU AES | CPU ZLib | FP64 Ray-Trace | CPU PhotoWorxx
| Performance rating | |
| Moyenne de la classe Gaming | |
| Asus ROG Strix Scar 15 G533QS | |
| Alienware m15 R6, i7-11800H RTX 3080 | |
| MSI GP66 Leopard 11UH-028 | |
| Moyenne Intel Core i7-11800H | |
| MSI GP66 Leopard 10UG | |
| AIDA64 / FP32 Ray-Trace | |
| Moyenne de la classe Gaming (10227 - 85542, n=102, 2 dernières années) | |
| Alienware m15 R6, i7-11800H RTX 3080 | |
| Asus ROG Strix Scar 15 G533QS | |
| MSI GP66 Leopard 11UH-028 | |
| Moyenne Intel Core i7-11800H (8772 - 15961, n=20) | |
| MSI GP66 Leopard 10UG | |
| AIDA64 / FPU Julia | |
| Moyenne de la classe Gaming (51376 - 372155, n=102, 2 dernières années) | |
| Asus ROG Strix Scar 15 G533QS | |
| Alienware m15 R6, i7-11800H RTX 3080 | |
| MSI GP66 Leopard 11UH-028 | |
| MSI GP66 Leopard 10UG | |
| Moyenne Intel Core i7-11800H (39404 - 65636, n=20) | |
| AIDA64 / CPU SHA3 | |
| Moyenne de la classe Gaming (2180 - 10115, n=102, 2 dernières années) | |
| Alienware m15 R6, i7-11800H RTX 3080 | |
| MSI GP66 Leopard 11UH-028 | |
| Moyenne Intel Core i7-11800H (2599 - 4439, n=20) | |
| Asus ROG Strix Scar 15 G533QS | |
| MSI GP66 Leopard 10UG | |
| AIDA64 / CPU Queen | |
| Moyenne de la classe Gaming (49785 - 173351, n=86, 2 dernières années) | |
| Asus ROG Strix Scar 15 G533QS | |
| MSI GP66 Leopard 11UH-028 | |
| Alienware m15 R6, i7-11800H RTX 3080 | |
| Moyenne Intel Core i7-11800H (85233 - 91941, n=20) | |
| MSI GP66 Leopard 10UG | |
| AIDA64 / FPU SinJulia | |
| Moyenne de la classe Gaming (4424 - 33636, n=102, 2 dernières années) | |
| Asus ROG Strix Scar 15 G533QS | |
| MSI GP66 Leopard 11UH-028 | |
| Alienware m15 R6, i7-11800H RTX 3080 | |
| MSI GP66 Leopard 10UG | |
| Moyenne Intel Core i7-11800H (6420 - 9792, n=20) | |
| AIDA64 / FPU Mandel | |
| Moyenne de la classe Gaming (25115 - 196829, n=102, 2 dernières années) | |
| Asus ROG Strix Scar 15 G533QS | |
| Alienware m15 R6, i7-11800H RTX 3080 | |
| MSI GP66 Leopard 11UH-028 | |
| Moyenne Intel Core i7-11800H (23365 - 39464, n=20) | |
| MSI GP66 Leopard 10UG | |
| AIDA64 / CPU AES | |
| Alienware m15 R6, i7-11800H RTX 3080 | |
| MSI GP66 Leopard 11UH-028 | |
| Asus ROG Strix Scar 15 G533QS | |
| Moyenne Intel Core i7-11800H (74617 - 149388, n=20) | |
| Moyenne de la classe Gaming (39258 - 247074, n=102, 2 dernières années) | |
| MSI GP66 Leopard 10UG | |
| AIDA64 / CPU ZLib | |
| Moyenne de la classe Gaming (574 - 2531, n=102, 2 dernières années) | |
| Asus ROG Strix Scar 15 G533QS | |
| Alienware m15 R6, i7-11800H RTX 3080 | |
| MSI GP66 Leopard 11UH-028 | |
| MSI GP66 Leopard 10UG | |
| Moyenne Intel Core i7-11800H (461 - 830, n=43) | |
| AIDA64 / FP64 Ray-Trace | |
| Moyenne de la classe Gaming (5509 - 45446, n=102, 2 dernières années) | |
| Alienware m15 R6, i7-11800H RTX 3080 | |
| Asus ROG Strix Scar 15 G533QS | |
| MSI GP66 Leopard 11UH-028 | |
| Moyenne Intel Core i7-11800H (4545 - 8717, n=21) | |
| MSI GP66 Leopard 10UG | |
| AIDA64 / CPU PhotoWorxx | |
| Moyenne de la classe Gaming (12271 - 89891, n=102, 2 dernières années) | |
| Asus ROG Strix Scar 15 G533QS | |
| Alienware m15 R6, i7-11800H RTX 3080 | |
| MSI GP66 Leopard 11UH-028 | |
| MSI GP66 Leopard 10UG | |
| Moyenne Intel Core i7-11800H (11898 - 26757, n=21) | |
Performance du système
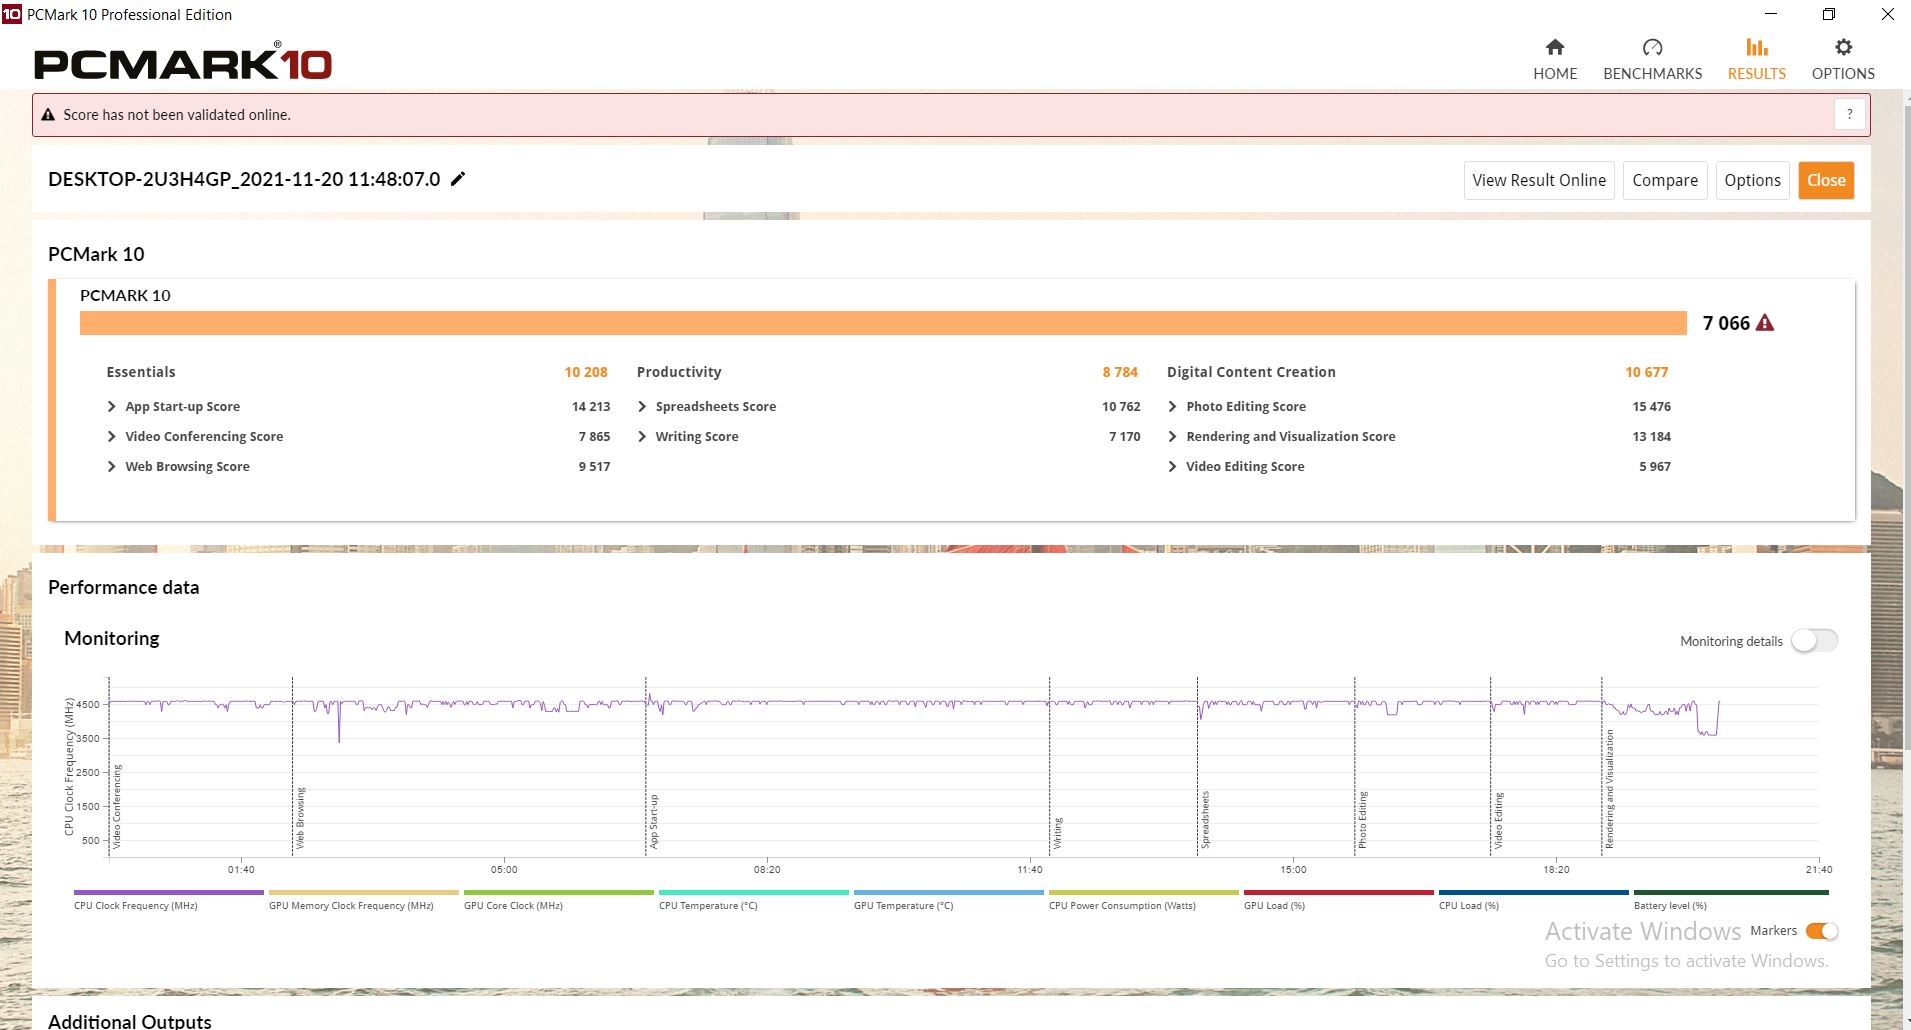
Le Léopard se comporte à peu près comme prévu dans PCMark 10. Néanmoins, les rivaux sont souvent un peu plus performants, mais il est plus probable que cela soit dû à la précision des mesures.
| PCMark 10 / Score | |
| Moyenne de la classe Gaming (5828 - 12414, n=93, 2 dernières années) | |
| Asus ROG Strix Scar 15 G533QS | |
| Aorus 15P YD | |
| Schenker XMG Neo 15 Tiger Lake | |
| Alienware m15 R6, i7-11800H RTX 3080 | |
| Moyenne Intel Core i7-11800H, NVIDIA GeForce RTX 3080 Laptop GPU (6673 - 7470, n=11) | |
| MSI GP66 Leopard 11UH-028 | |
| MSI GP66 Leopard 10UG | |
| PCMark 10 / Essentials | |
| Moyenne de la classe Gaming (8810 - 11935, n=97, 2 dernières années) | |
| Aorus 15P YD | |
| Moyenne Intel Core i7-11800H, NVIDIA GeForce RTX 3080 Laptop GPU (9862 - 11064, n=11) | |
| Schenker XMG Neo 15 Tiger Lake | |
| Asus ROG Strix Scar 15 G533QS | |
| MSI GP66 Leopard 11UH-028 | |
| Alienware m15 R6, i7-11800H RTX 3080 | |
| MSI GP66 Leopard 10UG | |
| PCMark 10 / Productivity | |
| Moyenne de la classe Gaming (6845 - 25323, n=95, 2 dernières années) | |
| Asus ROG Strix Scar 15 G533QS | |
| Alienware m15 R6, i7-11800H RTX 3080 | |
| Aorus 15P YD | |
| Moyenne Intel Core i7-11800H, NVIDIA GeForce RTX 3080 Laptop GPU (8278 - 9803, n=11) | |
| Schenker XMG Neo 15 Tiger Lake | |
| MSI GP66 Leopard 11UH-028 | |
| MSI GP66 Leopard 10UG | |
| PCMark 10 / Digital Content Creation | |
| Moyenne de la classe Gaming (7602 - 19954, n=95, 2 dernières années) | |
| Schenker XMG Neo 15 Tiger Lake | |
| Alienware m15 R6, i7-11800H RTX 3080 | |
| MSI GP66 Leopard 11UH-028 | |
| Moyenne Intel Core i7-11800H, NVIDIA GeForce RTX 3080 Laptop GPU (9881 - 11323, n=11) | |
| Aorus 15P YD | |
| MSI GP66 Leopard 10UG | |
| Asus ROG Strix Scar 15 G533QS | |
| PCMark 10 Score | 7066 points | |
Aide | ||
| AIDA64 / Memory Copy | |
| Moyenne de la classe Gaming (21750 - 129946, n=102, 2 dernières années) | |
| MSI GP66 Leopard 11UH-028 | |
| Alienware m15 R6, i7-11800H RTX 3080 | |
| Asus ROG Strix Scar 15 G533QS | |
| Moyenne Intel Core i7-11800H (24508 - 48144, n=21) | |
| MSI GP66 Leopard 10UG | |
| AIDA64 / Memory Read | |
| Moyenne de la classe Gaming (22956 - 118858, n=102, 2 dernières années) | |
| MSI GP66 Leopard 11UH-028 | |
| Alienware m15 R6, i7-11800H RTX 3080 | |
| Asus ROG Strix Scar 15 G533QS | |
| Moyenne Intel Core i7-11800H (25882 - 50365, n=20) | |
| MSI GP66 Leopard 10UG | |
| AIDA64 / Memory Write | |
| Moyenne de la classe Gaming (22297 - 135096, n=102, 2 dernières années) | |
| MSI GP66 Leopard 10UG | |
| Asus ROG Strix Scar 15 G533QS | |
| MSI GP66 Leopard 11UH-028 | |
| Alienware m15 R6, i7-11800H RTX 3080 | |
| Moyenne Intel Core i7-11800H (22240 - 46214, n=20) | |
| AIDA64 / Memory Latency | |
| Moyenne de la classe Gaming (75.3 - 165.4, n=102, 2 dernières années) | |
| Alienware m15 R6, i7-11800H RTX 3080 | |
| MSI GP66 Leopard 11UH-028 | |
| Asus ROG Strix Scar 15 G533QS | |
| MSI GP66 Leopard 10UG | |
| Moyenne Intel Core i7-11800H (71.9 - 104.1, n=44) | |
| Aorus 15P YD | |
| Schenker XMG Neo 15 Tiger Lake | |
* ... Moindre est la valeur, meilleures sont les performances
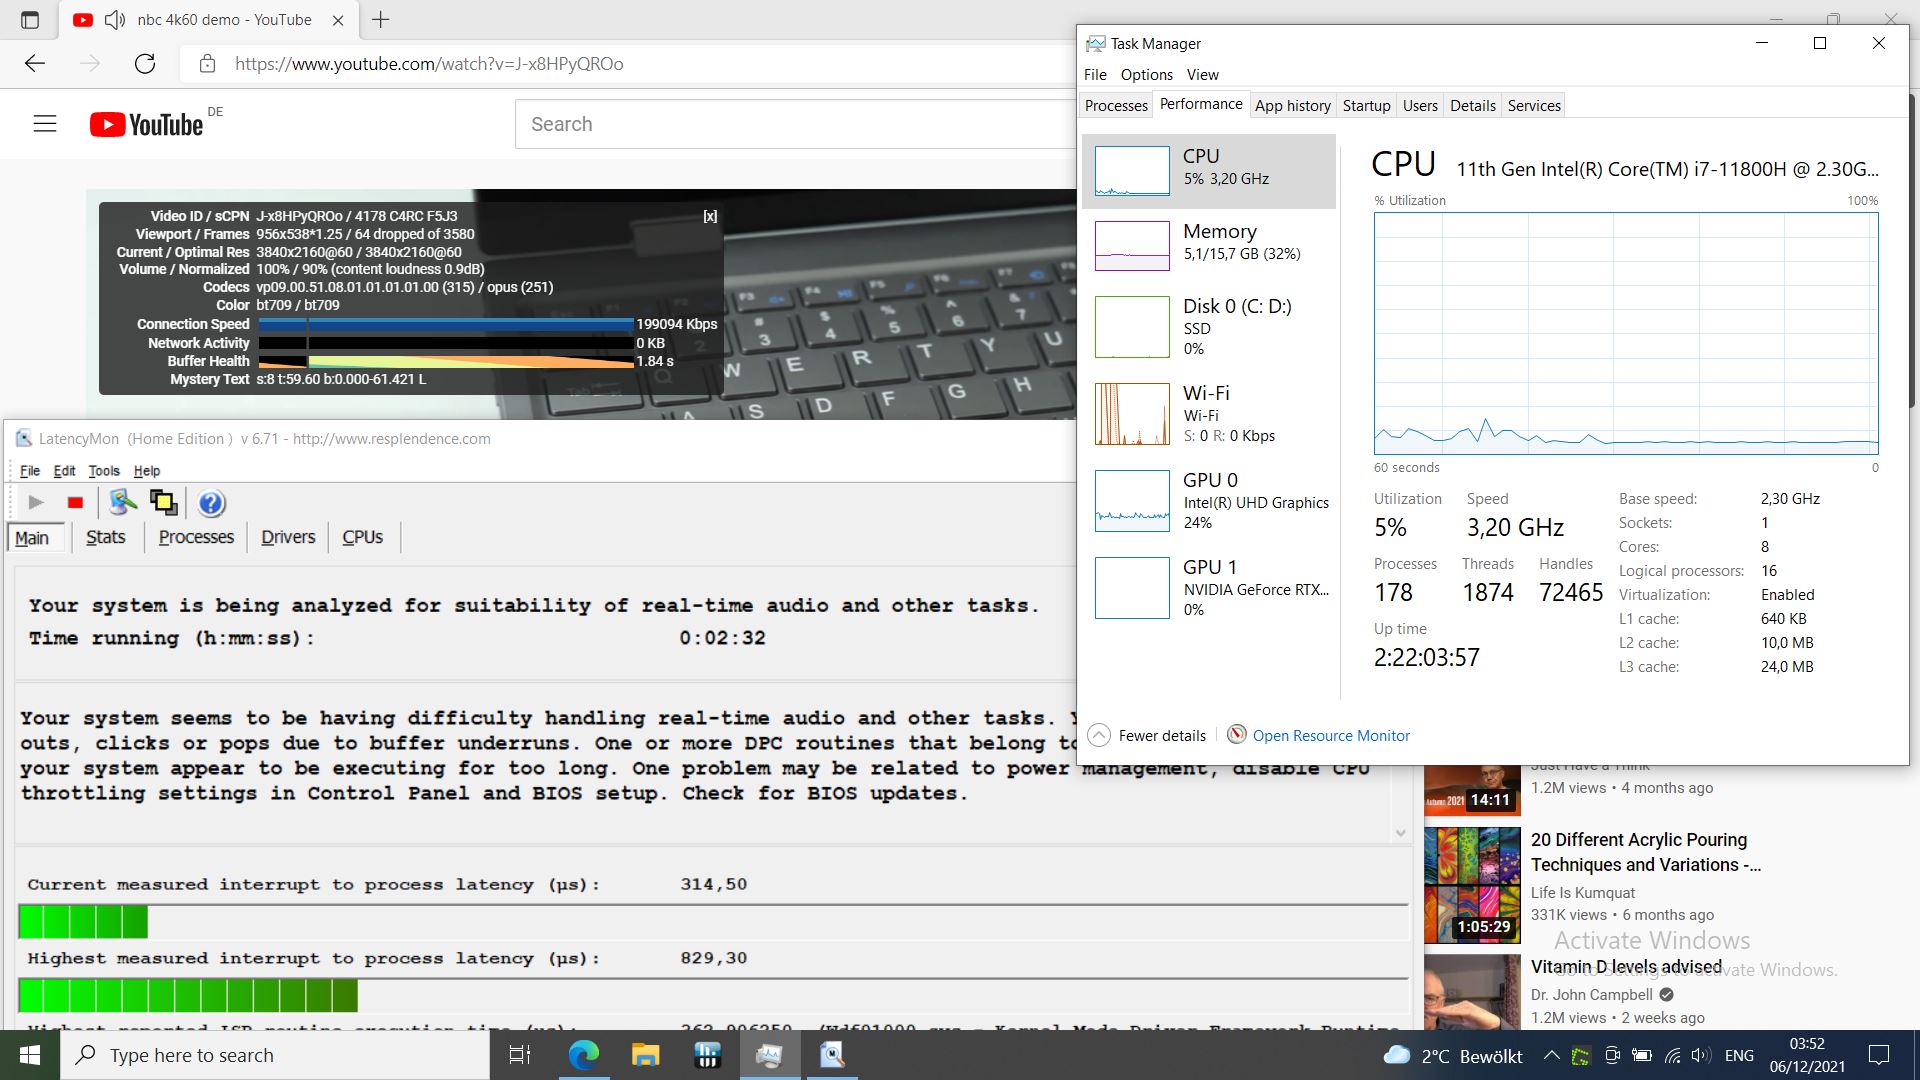
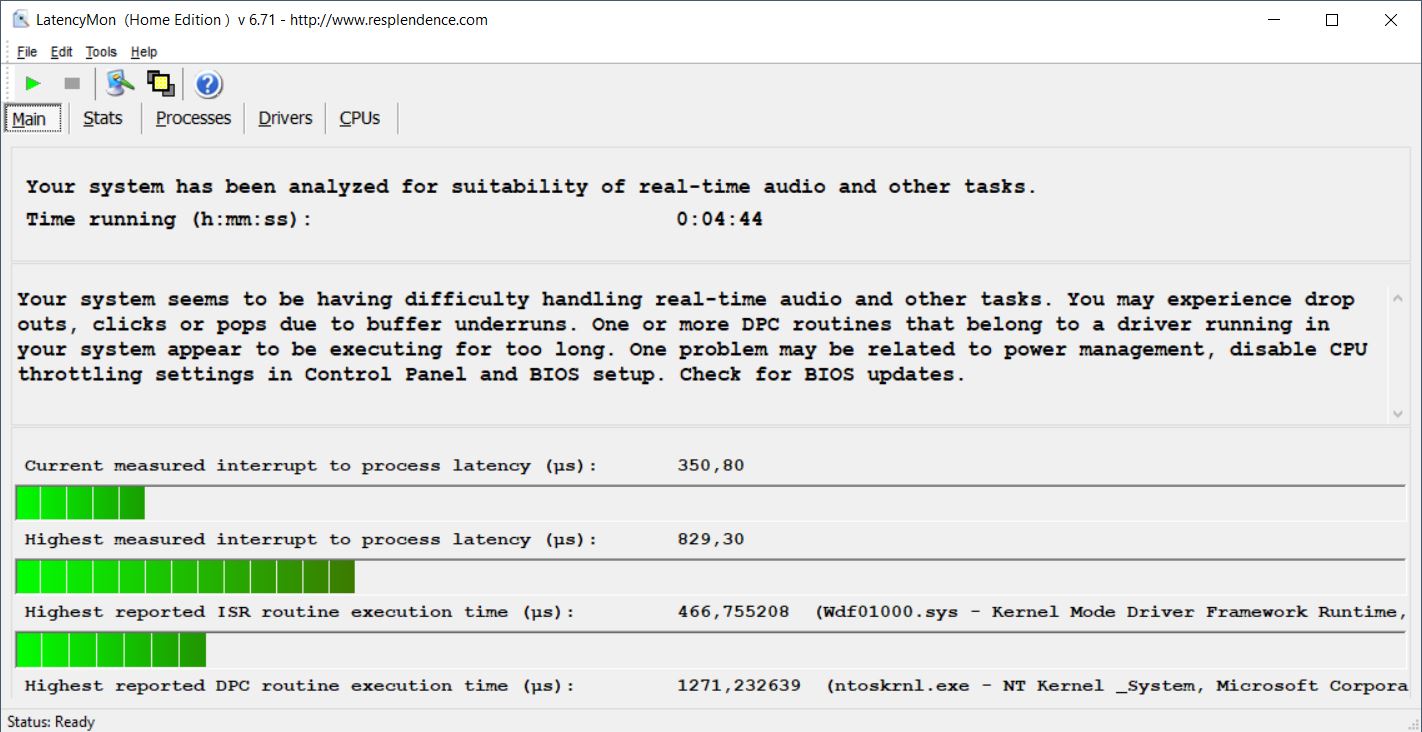
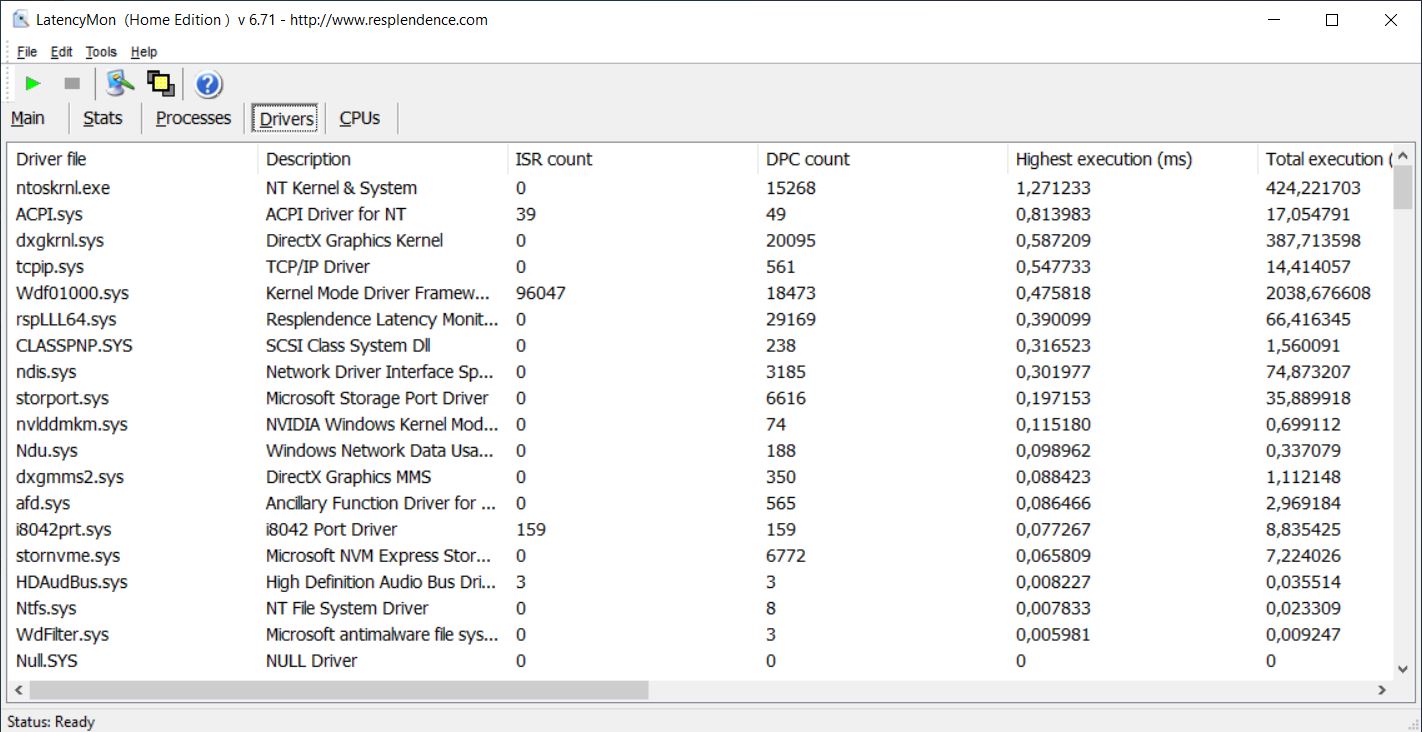
Latences DPC
Le GP66 a des problèmes de latence avec plusieurs onglets de navigateur ouverts ou notre vidéo YouTube 4K/60 fps. Le Léopard a collecté des images perdues toutes les secondes dans la vidéo de test, 64 à la fin. Entre autres, le noyau et le pilote système NT sont à blâmer. La concurrence présente des taux de latence tout aussi élevés, mais s'en sort mieux avec la lecture de vidéos, à l'exception de l'Alienware.
| DPC Latencies / LatencyMon - interrupt to process latency (max), Web, Youtube, Prime95 | |
| Asus ROG Strix Scar 15 G533QS | |
| Alienware m15 R6, i7-11800H RTX 3080 | |
| MSI GP66 Leopard 11UH-028 | |
| Aorus 15P YD | |
| Schenker XMG Neo 15 Tiger Lake | |
| MSI GP66 Leopard 10UG | |
* ... Moindre est la valeur, meilleures sont les performances
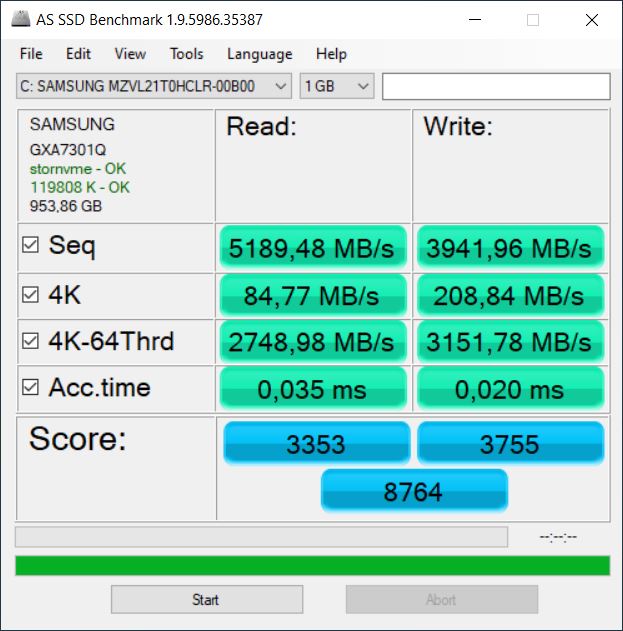
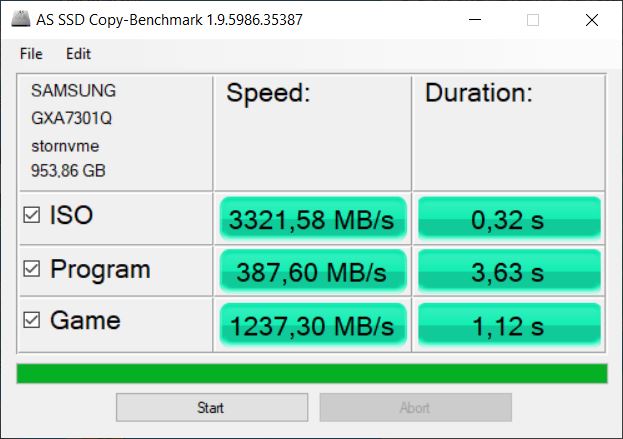
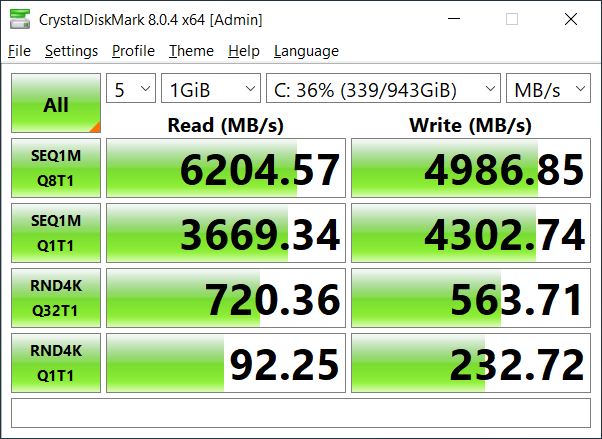
Stockage
Le SSD NVMe de Samsung installé avec 1 To de stockage est très rapide (Liste des meilleurs SSD/HDD), mais ses performances de pointe diminuent de plus de la moitié lors du test d'endurance. Cela ne devrait guère être remarqué dans une utilisation quotidienne, et les performances d'endurance restantes sont encore relativement élevées.

* ... Moindre est la valeur, meilleures sont les performances
Continuous load read: DiskSpd Read Loop, Queue Depth 8
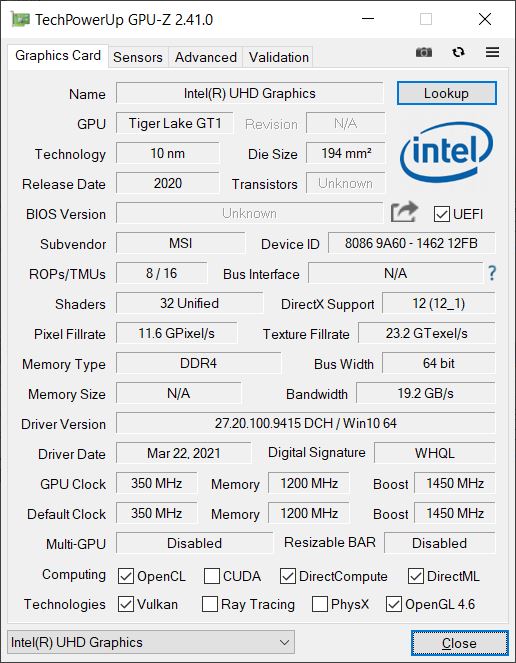
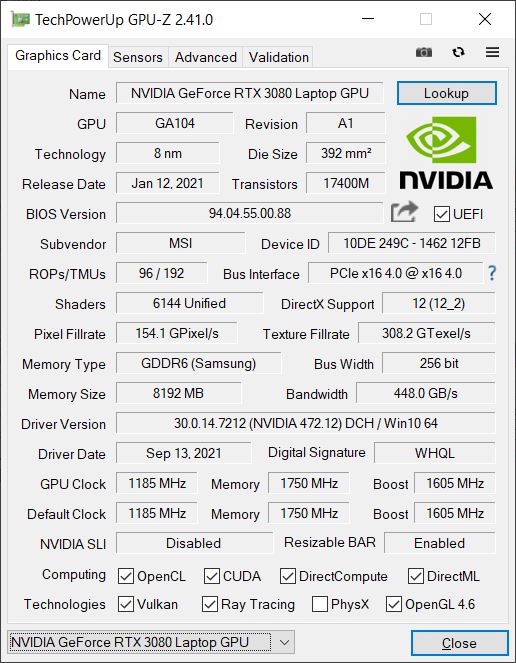
Carte graphique
Outre l'unité centrale intégréeIntel UHD Graphics Xe (32EUs)l'ordinateur portable dispose d'un GPU discret NVIDIA GeForce RTX 3080 GPU pour ordinateur portablequi garantit des taux de trame fluides. Le GPU est autorisé à consommer 140 W, y compris Dynamic Boost, alors que la même carte dans le Schenker XMG Neo s'autorise la pleine puissance de 165 W. D'autres variantes du GP66 sont également disponibles avec des cartes RTX 3070 équipées.
Ainsi, le Schenker a souvent quelques points d'avance dans les 3DMark, mais le Leopard peut mener le reste de la compétition.
Les performances graphiques baissent considérablement sur batterie, de 65 % dans 3DMark 11. Dans leWitcher 3(Ultra), le taux de trame a chuté spontanément d'un bon 120 fps à seulement un injouable 11 fps ! Ainsi, le jeu mobile n'est possible qu'au prix de très gros sacrifices.
| 3DMark 11 Performance | 30689 points | |
| 3DMark Cloud Gate Standard Score | 51452 points | |
| 3DMark Fire Strike Score | 24909 points | |
| 3DMark Time Spy Score | 11030 points | |
Aide | ||
Performances de jeu
Le MSI affiche tous les jeux testés en Full HD, même en réglages ultra, à environ 100 fps. Ainsi, il y a encore suffisamment de place pour afficher du contenu 4K.
Le Léopard s'en sort plutôt bien en comparaison, mais les différences entre les concurrents avec RTX 3080 sont plutôt faibles. Seul le XMG Neo avec 165 W RTX peut légèrement dépasser les performances de MSI, en fonction du jeu.
En mode performances extrêmes, nous avons obtenu un gain d'un peu moins de 5% dans The Witcher 3(Ultra). Le GPU est clairement plus décisif que le CPU qui bénéficie de ce mode.
| New World | |
| 1920x1080 Medium Video Quality | |
| MSI GP66 Leopard 11UH-028 | |
| Alienware m15 R6, i7-11800H RTX 3080 | |
| Moyenne NVIDIA GeForce RTX 3080 Laptop GPU (80.8 - 105.4, n=4) | |
| 1920x1080 High Video Quality | |
| MSI GP66 Leopard 11UH-028 | |
| Alienware m15 R6, i7-11800H RTX 3080 | |
| Moyenne NVIDIA GeForce RTX 3080 Laptop GPU (75.1 - 96.7, n=4) | |
| 1920x1080 Very High Video Quality | |
| MSI GP66 Leopard 11UH-028 | |
| Alienware m15 R6, i7-11800H RTX 3080 | |
| Moyenne NVIDIA GeForce RTX 3080 Laptop GPU (71.5 - 90.4, n=4) | |
Le site Witcher 3 démarre à environ 120 fps sur le GP66. Après les premières minutes, cette valeur baisse et se stabilise à un niveau assez constant de 110 fps, et cette valeur est toujours maintenue après une heure. À cet égard, l'ordinateur portable ne perd qu'une partie insignifiante de ses performances au fil du temps.
Witcher 3 FPS Diagramm
| Bas | Moyen | Élevé | Ultra | |
|---|---|---|---|---|
| GTA V (2015) | 184 | 177 | 166 | 103 |
| The Witcher 3 (2015) | 344.8 | 300 | 196.5 | 110.2 |
| Dota 2 Reborn (2015) | 168 | 151 | 143 | 135 |
| Final Fantasy XV Benchmark (2018) | 136 | |||
| X-Plane 11.11 (2018) | 121 | 107 | 85.7 | |
| Far Cry 5 (2018) | 152 | 123 | 119 | 111 |
| Strange Brigade (2018) | 492 | 267 | 223 | 197 |
| New World (2021) | 132.7 | 105.4 | 96.7 | 90.4 |
Émissions - Comportement exemplaire des ventilateurs
Émissions sonores
Les ventilateurs sont souvent silencieux lorsqu'ils tournent au ralenti et nous apprécions généralement le comportement adaptatif des ventilateurs car ils se calment très rapidement, même après une charge importante. Même après une heure complète surle site Witcher 3
, les ventilateurs se sont considérablement calmés environ 30 secondes plus tard et ont ronronné assez silencieusement au ralenti.En mode performances extrêmes, les ventilateurs restent également éteints la plupart du temps au ralenti et se calment assez rapidement, même après de fortes charges. Cependant, si vous activez en plus la fonction "Cooler Boost", les ventilateurs passent soudainement à la vitesse maximale avec un bruit de 58 dB.
L'écart de performance entre les versions Balanced, Extreme Performance et Extreme Performance plus Cooler Boost est intéressant - il est pratiquement inexistant ou à peine existant ! En revanche, il existe des différences significatives au niveau du bruit. Nous avons mesuré environ 47 dB sous Balanced, environ 53 dB sous Extreme Performance (indiqué ici comme valeur maximale) et les 58 dB susmentionnés avec Cooler Boost !
Ainsi, le GP66 est l'un des ordinateurs portables les plus silencieux en mode équilibré, et l'un des plus bruyants avec Cooler Boost. Nous n'avons détecté aucun bruit électronique
Degré de la nuisance sonore
| Au repos |
| 23 / 23 / 30.11 dB(A) |
| Fortement sollicité |
| 41.86 / 53 dB(A) |
 | ||
30 dB silencieux 40 dB(A) audible 50 dB(A) bruyant |
||
min: | ||
| MSI GP66 Leopard 11UH-028 GeForce RTX 3080 Laptop GPU, i7-11800H, Samsung PM9A1 MZVL21T0HCLR | MSI GP66 Leopard 10UG GeForce RTX 3070 Laptop GPU, i7-10870H, Kingston OM8PCP31024F | Aorus 15P YD GeForce RTX 3080 Laptop GPU, i7-11800H, Samsung PM9A1 MZVL21T0HCLR | Asus ROG Strix Scar 15 G533QS GeForce RTX 3080 Laptop GPU, R9 5900HX, ADATA Swordfish 2 TB | Schenker XMG Neo 15 Tiger Lake GeForce RTX 3080 Laptop GPU, i7-11800H, Samsung SSD 980 Pro 1TB MZ-V8P1T0BW | Alienware m15 R6, i7-11800H RTX 3080 GeForce RTX 3080 Laptop GPU, i7-11800H, Samsung PM9A1 MZVL21T0HCLR | |
|---|---|---|---|---|---|---|
| Noise | -5% | -12% | -8% | -12% | -2% | |
| arrêt / environnement * (dB) | 23 | 24.7 -7% | 25 -9% | 25.5 -11% | 25 -9% | 23 -0% |
| Idle Minimum * (dB) | 23 | 26.8 -17% | 26 -13% | 25.5 -11% | 27 -17% | 23 -0% |
| Idle Average * (dB) | 23 | 26.8 -17% | 30 -30% | 25.5 -11% | 30 -30% | 23 -0% |
| Idle Maximum * (dB) | 30.11 | 26.8 11% | 34 -13% | 37.1 -23% | 32 -6% | 30 -0% |
| Load Average * (dB) | 41.86 | 40.4 3% | 43 -3% | 39.2 6% | 46 -10% | 41.26 1% |
| Witcher 3 ultra * (dB) | 47.79 | 48.8 -2% | 50 -5% | 50.5 -6% | 52 -9% | 53.4 -12% |
| Load Maximum * (dB) | 53 | 57.2 -8% | 57 -8% | 51.8 2% | 55 -4% | 53.37 -1% |
* ... Moindre est la valeur, meilleures sont les performances
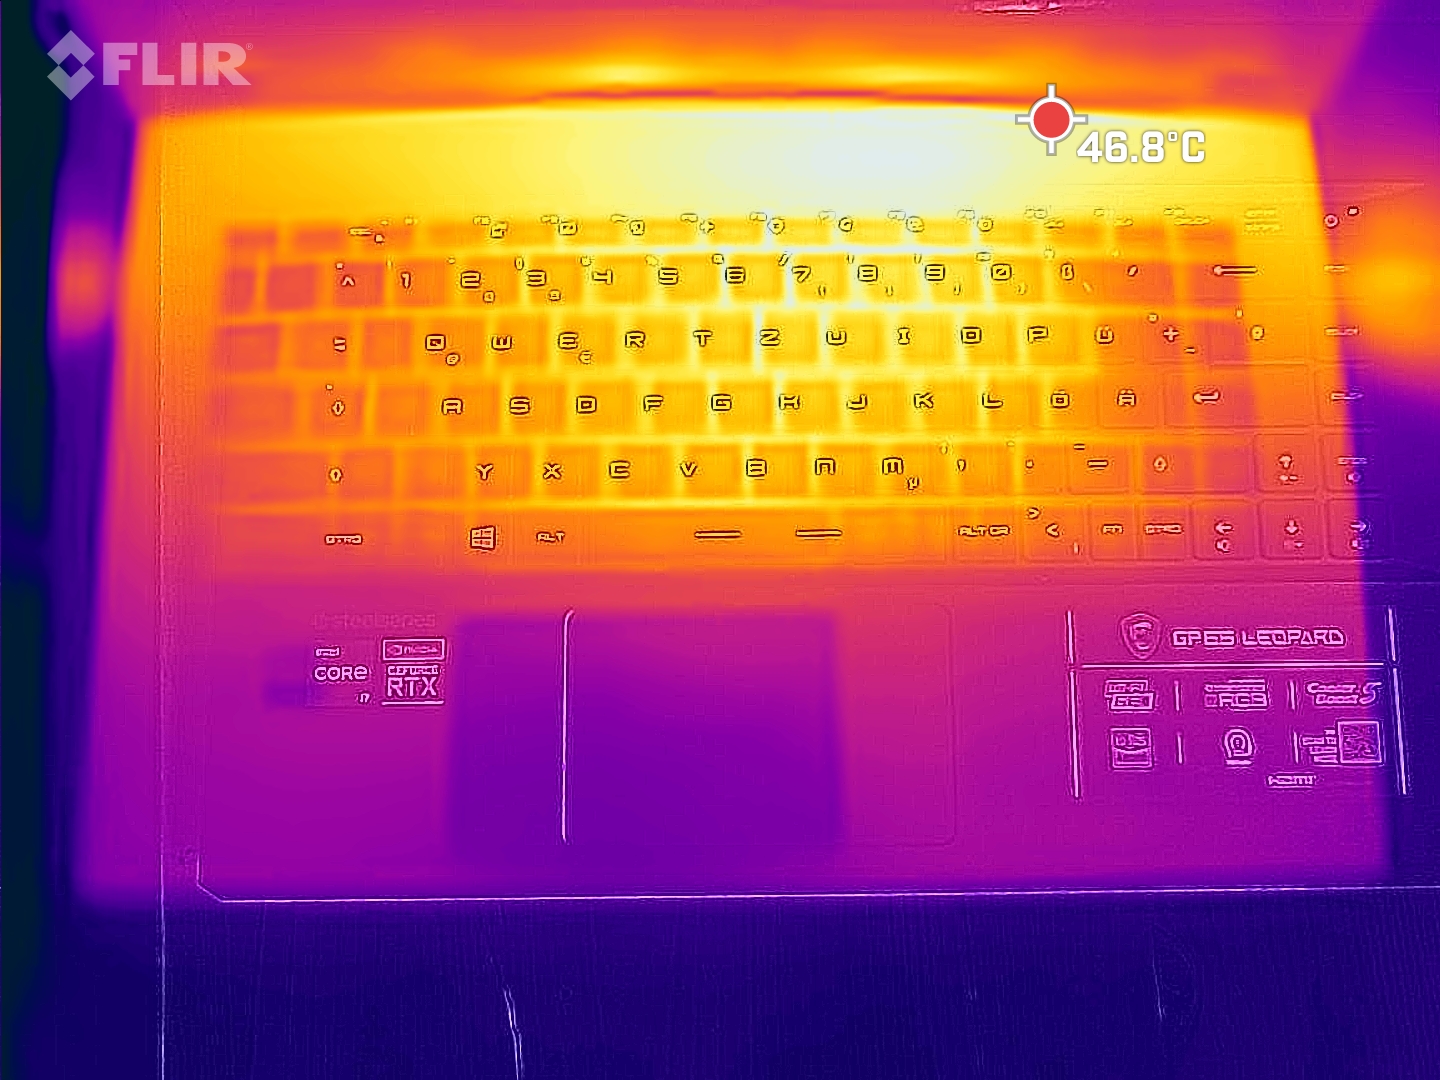
Température
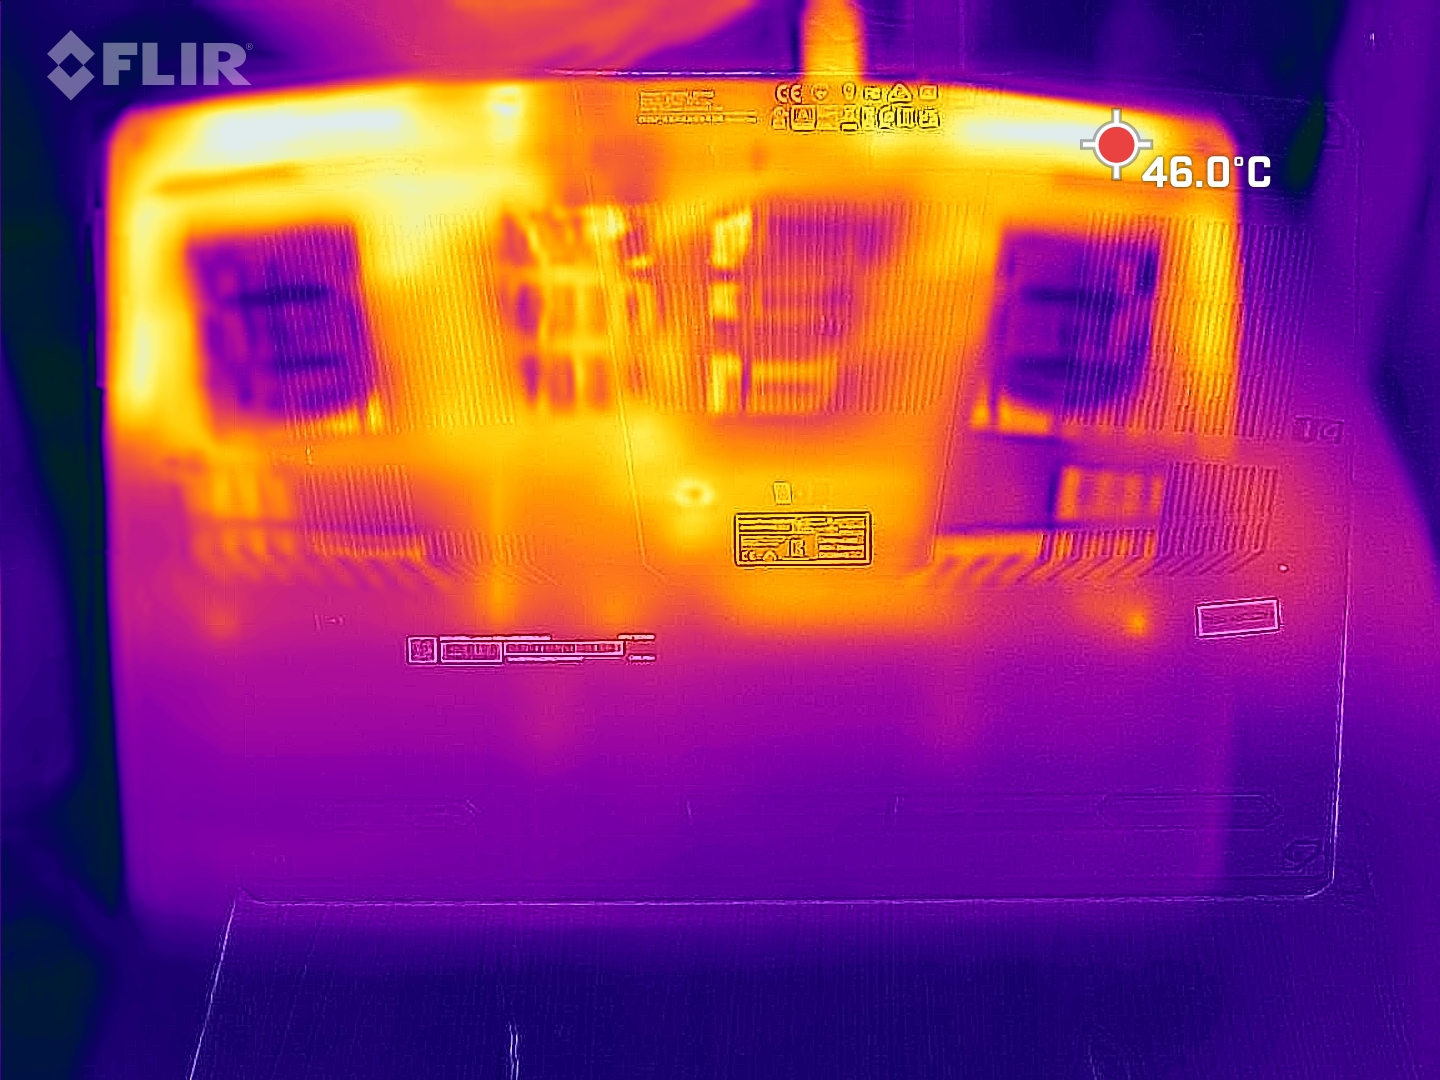
Les points chauds sur le dessus et le dessous atteignent jusqu'à 54 °C pendant le jeu, ce qui place le gamer au milieu parmi la concurrence. L'Alienware et l'Aorus chauffent plus, tandis que l'Asus et le XMG restent plus frais mais ont un système de refroidissement plus bruyant
Toutes les mesures susmentionnées ont été prises en mode équilibré. Comme les performances n'augmentent pas beaucoup dans les modes supérieurs, du moins pas dans les jeux, les températures vont probablement baisser encore plus à cause des ventilateurs qui tournent plus vite
(-) La température maximale du côté supérieur est de 49 °C / 120 F, par rapport à la moyenne de 40.4 °C / 105 F, allant de 21.2 à 68.8 °C pour la classe Gaming.
(-) Le fond chauffe jusqu'à un maximum de 47 °C / 117 F, contre une moyenne de 43.2 °C / 110 F
(+) En utilisation inactive, la température moyenne du côté supérieur est de 26.7 °C / 80 F, par rapport à la moyenne du dispositif de 33.9 °C / 93 F.
(-) En jouant à The Witcher 3, la température moyenne du côté supérieur est de 43.9 °C / 111 F, alors que la moyenne de l'appareil est de 33.9 °C / 93 F.
(+) Les repose-poignets et le pavé tactile atteignent la température maximale de la peau (32 °C / 89.6 F) et ne sont donc pas chauds.
(-) La température moyenne de la zone de l'appui-paume de dispositifs similaires était de 28.8 °C / 83.8 F (-3.2 °C / #-5.8 F).
| MSI GP66 Leopard 11UH-028 Intel Core i7-11800H, NVIDIA GeForce RTX 3080 Laptop GPU | MSI GP66 Leopard 10UG Intel Core i7-10870H, NVIDIA GeForce RTX 3070 Laptop GPU | Aorus 15P YD Intel Core i7-11800H, NVIDIA GeForce RTX 3080 Laptop GPU | Asus ROG Strix Scar 15 G533QS AMD Ryzen 9 5900HX, NVIDIA GeForce RTX 3080 Laptop GPU | Schenker XMG Neo 15 Tiger Lake Intel Core i7-11800H, NVIDIA GeForce RTX 3080 Laptop GPU | Alienware m15 R6, i7-11800H RTX 3080 Intel Core i7-11800H, NVIDIA GeForce RTX 3080 Laptop GPU | |
|---|---|---|---|---|---|---|
| Heat | 3% | -9% | -5% | -2% | -20% | |
| Maximum Upper Side * (°C) | 49 | 42.8 13% | 49 -0% | 43.4 11% | 39 20% | 61 -24% |
| Maximum Bottom * (°C) | 47 | 50 -6% | 57 -21% | 48.2 -3% | 50 -6% | 58 -23% |
| Idle Upper Side * (°C) | 31 | 33 -6% | 33 -6% | 35.2 -14% | 34 -10% | 38 -23% |
| Idle Bottom * (°C) | 33 | 29 12% | 36 -9% | 37 -12% | 37 -12% | 36 -9% |
* ... Moindre est la valeur, meilleures sont les performances
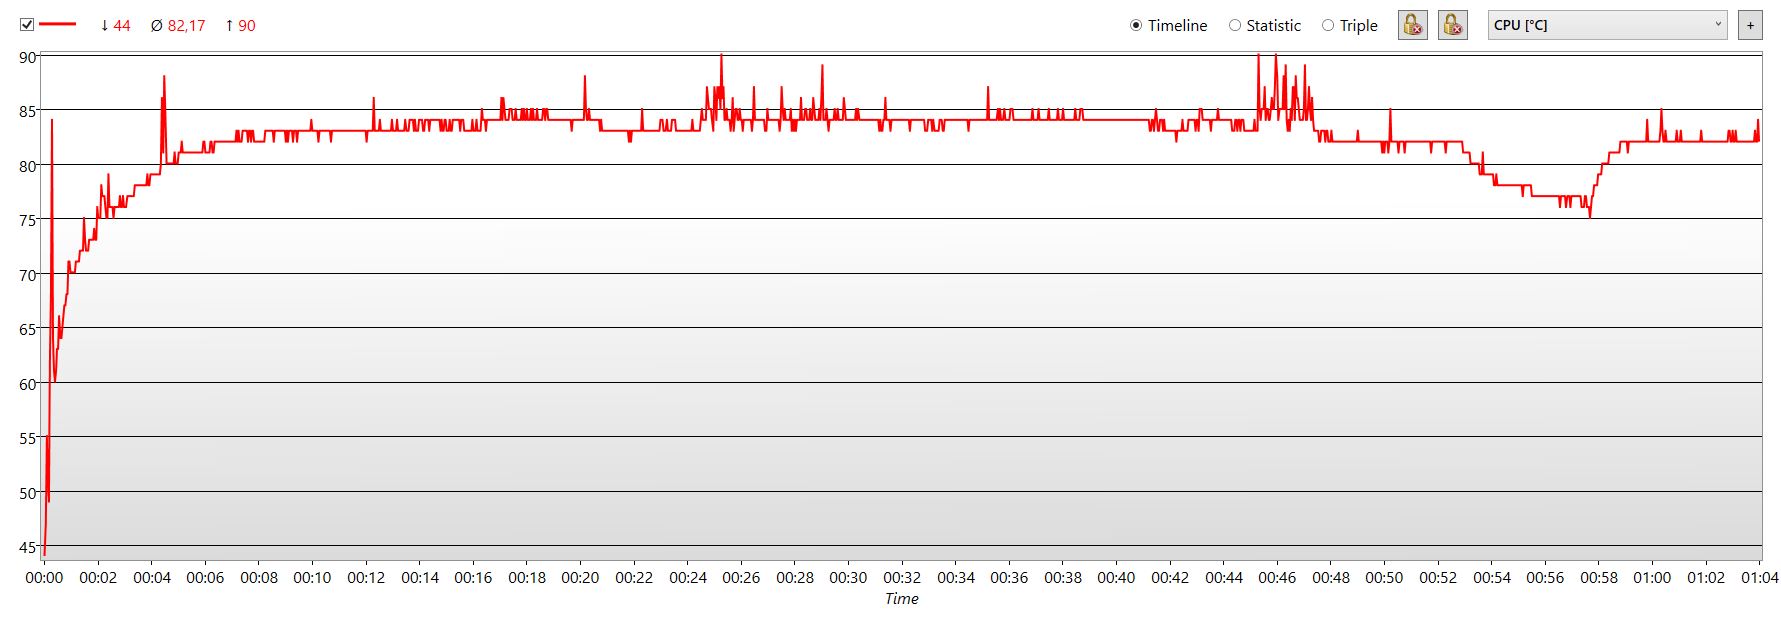
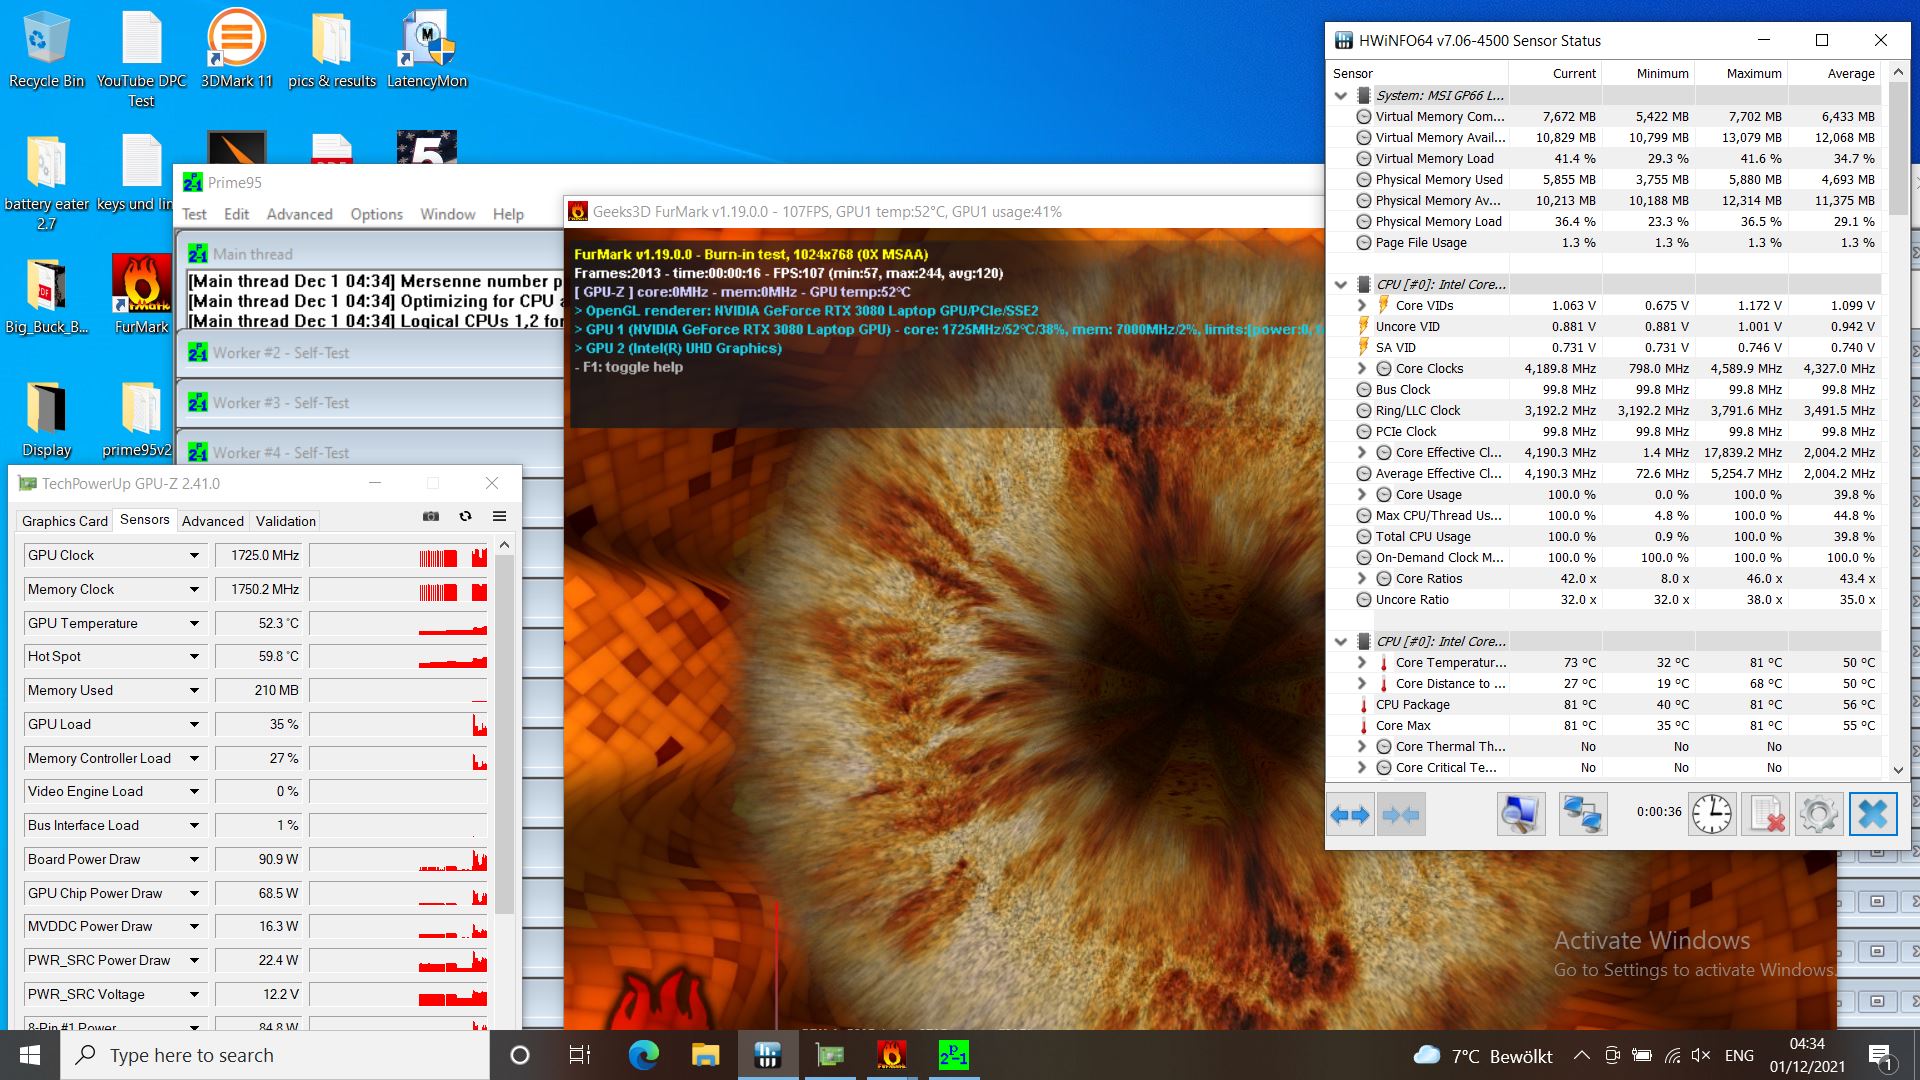
Test de stress
Les 8 cœurs du processeur commencent notre test de stress avec environ 4,2 GHz. Cependant, après que la température du cœur ait atteint 96 °C en une minute environ, la fréquence d'horloge est étranglée. Elle tombe brièvement sous les 3 GHz, mais dépasse à nouveau cette limite par la suite. Nous avons mesuré environ 3,3 GHz après une heure, et la température se stabilise entre 82 et 86 °C selon les fréquences d'horloge.
L'horloge du GPU fluctue entre 1,3 et 1,7 GHz pendant toute la durée du test. Les noyaux du GPU atteignent des températures allant jusqu'à 76 °C.
Le système se calme rapidement après le test de stress. Une autre exécution de 3DMark 11 directement après la fin du test de stress a donné à peu près le même score que précédemment
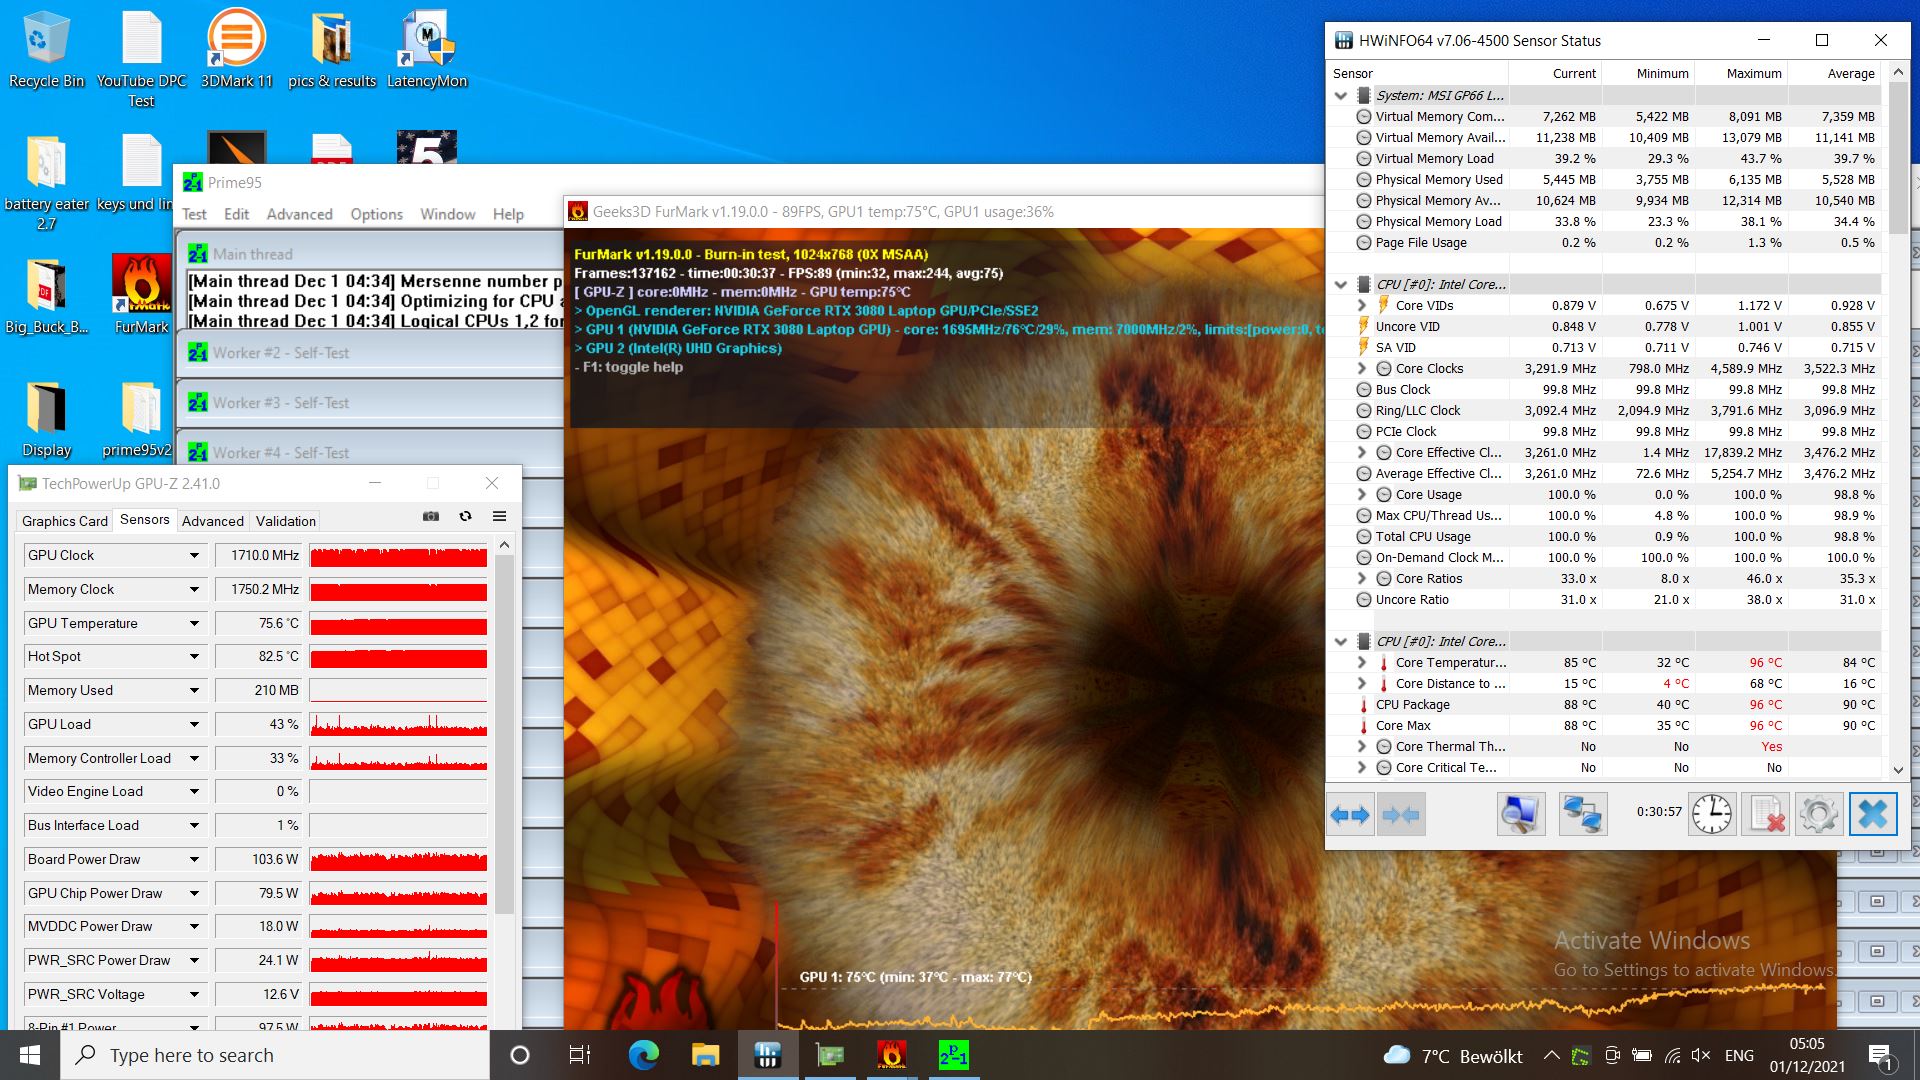
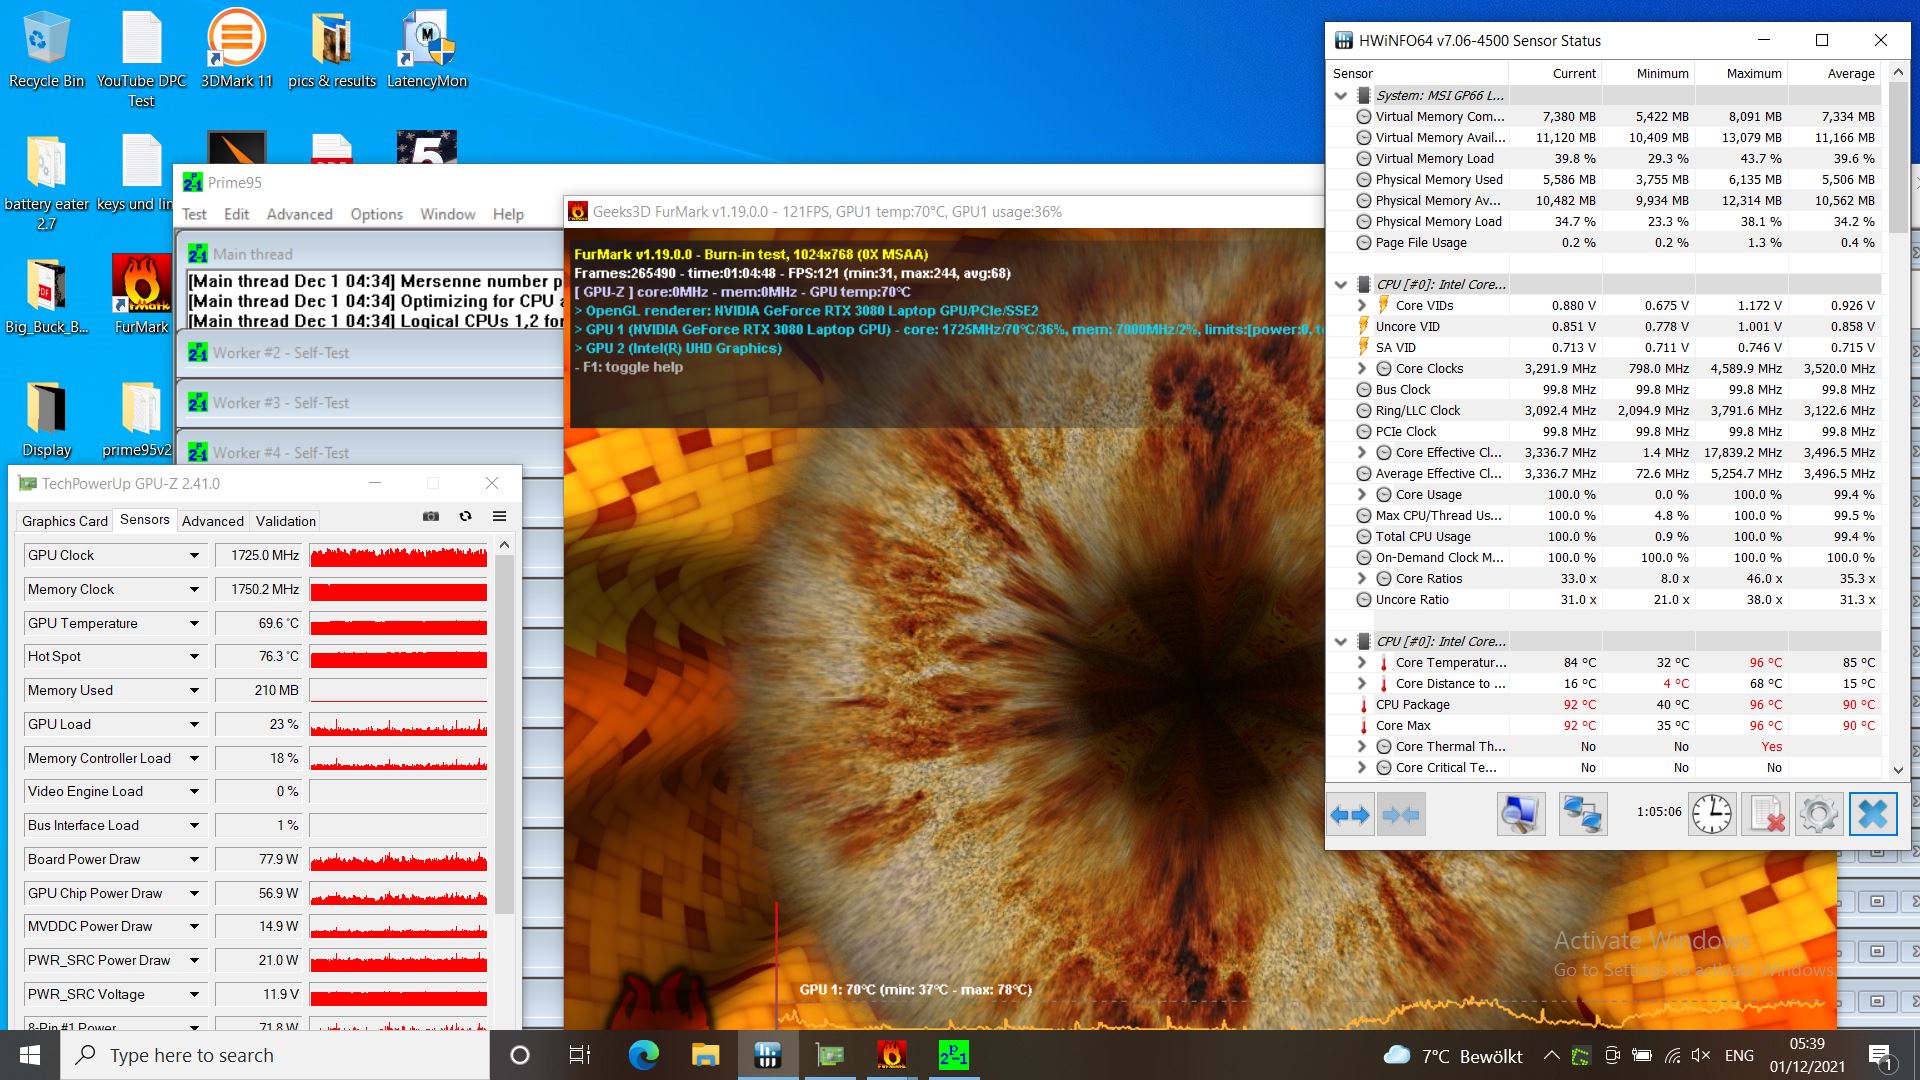
| Température moyenne du processeur(°C) Température moyennedu GPU (°C) | |
| Système en veille | 4,5 GHz |
| Prime95 + FurMark Stress | 2.8 - 3.3 GHz |
| Witcher 3 Stress | 4.2 GHz |
Haut-parleur
Du côté positif, les haut-parleurs peuvent jouer assez fort, et les médiums et les aigus semblent assez équilibrés. Néanmoins, ils souffrent naturellement de la plainte commune de tous les haut-parleurs conventionnels d'ordinateurs portables - le manque de basses. Les périphériques audio externes, tels que les casques, peuvent être connectés via le port casque mini-jack analogique plaqué or.
MSI GP66 Leopard 11UH-028 analyse audio
(+) | les haut-parleurs peuvent jouer relativement fort (85.6# dB)
Basses 100 - 315 Hz
(-) | presque aucune basse - en moyenne 22.9% plus bas que la médiane
(±) | la linéarité des basses est moyenne (8.9% delta à la fréquence précédente)
Médiums 400 - 2000 Hz
(+) | médiane équilibrée - seulement 2.8% de la médiane
(+) | les médiums sont linéaires (3.9% delta à la fréquence précédente)
Aiguës 2 - 16 kHz
(+) | des sommets équilibrés - à seulement 4.6% de la médiane
(+) | les aigus sont linéaires (6.6% delta à la fréquence précédente)
Globalement 100 - 16 000 Hz
(±) | la linéarité du son global est moyenne (16.9% de différence avec la médiane)
Par rapport à la même classe
» 44% de tous les appareils testés de cette catégorie étaient meilleurs, 11% similaires, 44% pires
» Le meilleur avait un delta de 6%, la moyenne était de 18%, le pire était de 132%.
Par rapport à tous les appareils testés
» 30% de tous les appareils testés étaient meilleurs, 8% similaires, 62% pires
» Le meilleur avait un delta de 4%, la moyenne était de 23%, le pire était de 134%.
Schenker XMG Neo 15 Tiger Lake analyse audio
(±) | le niveau sonore du haut-parleur est moyen mais bon (79# dB)
Basses 100 - 315 Hz
(-) | presque aucune basse - en moyenne 22.6% plus bas que la médiane
(±) | la linéarité des basses est moyenne (9.5% delta à la fréquence précédente)
Médiums 400 - 2000 Hz
(+) | médiane équilibrée - seulement 4.7% de la médiane
(±) | la linéarité des médiums est moyenne (9.1% delta à la fréquence précédente)
Aiguës 2 - 16 kHz
(+) | des sommets équilibrés - à seulement 4.1% de la médiane
(+) | les aigus sont linéaires (5.3% delta à la fréquence précédente)
Globalement 100 - 16 000 Hz
(±) | la linéarité du son global est moyenne (19.4% de différence avec la médiane)
Par rapport à la même classe
» 67% de tous les appareils testés de cette catégorie étaient meilleurs, 7% similaires, 26% pires
» Le meilleur avait un delta de 6%, la moyenne était de 18%, le pire était de 132%.
Par rapport à tous les appareils testés
» 48% de tous les appareils testés étaient meilleurs, 7% similaires, 45% pires
» Le meilleur avait un delta de 4%, la moyenne était de 23%, le pire était de 134%.
Gestion de l'alimentation - Leopard avec mini-batterie
Absorption d'énergie
Nous avons mesuré une consommation moyenne de 207 W en jouant à The Witcher 3, ce qui est un peu plus que les besoins de la concurrence. La consommation maximale est de 223 W, ce qui se situe entre les meilleurs consommateurs Aorus et Alienware et les autres concurrents plus frugaux.
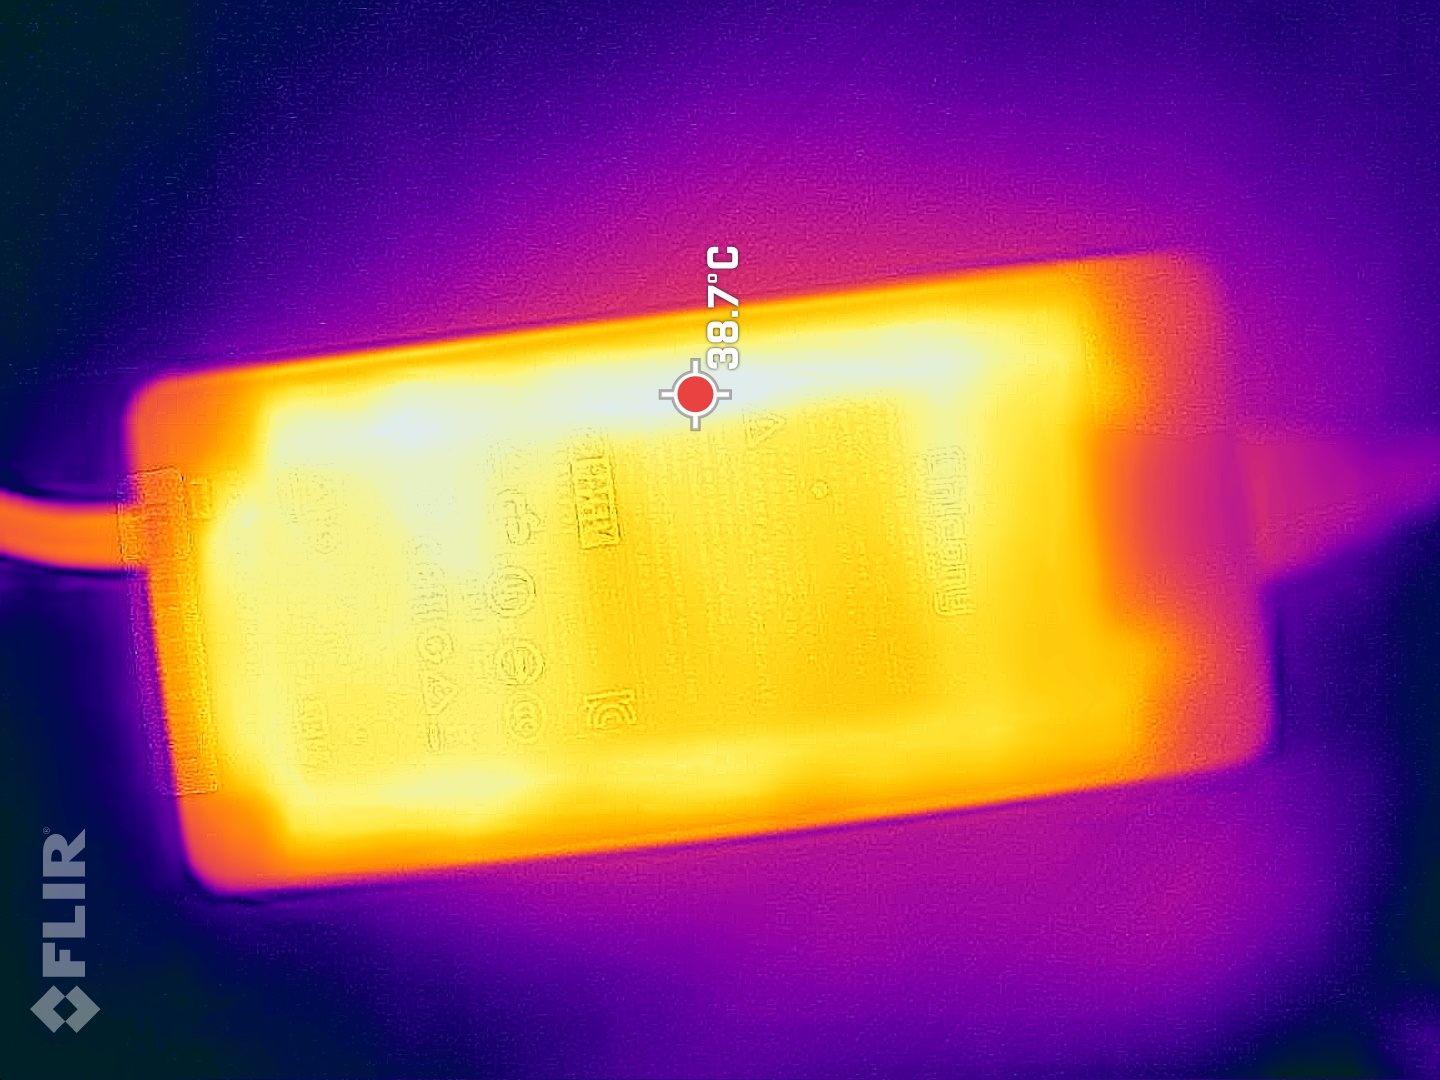
L'alimentation est généreusement dimensionnée avec 280 W et ne devrait pas avoir de problème de charge
| Au repos | |
| Fortement sollicité |
|
Légende:
min: | |
| MSI GP66 Leopard 11UH-028 i7-11800H, GeForce RTX 3080 Laptop GPU, Samsung PM9A1 MZVL21T0HCLR, IPS, 1920x1080, 15.6" | MSI GP66 Leopard 10UG i7-10870H, GeForce RTX 3070 Laptop GPU, Kingston OM8PCP31024F, IPS, 1920x1080, 15.6" | Aorus 15P YD i7-11800H, GeForce RTX 3080 Laptop GPU, Samsung PM9A1 MZVL21T0HCLR, IPS, 1920x1080, 15.6" | Asus ROG Strix Scar 15 G533QS R9 5900HX, GeForce RTX 3080 Laptop GPU, ADATA Swordfish 2 TB, IPS, 2560x1440, 15.6" | Schenker XMG Neo 15 Tiger Lake i7-11800H, GeForce RTX 3080 Laptop GPU, Samsung SSD 980 Pro 1TB MZ-V8P1T0BW, IPS, 2560x1440, 15.6" | Alienware m15 R6, i7-11800H RTX 3080 i7-11800H, GeForce RTX 3080 Laptop GPU, Samsung PM9A1 MZVL21T0HCLR, IPS, 1920x1080, 15.6" | Moyenne NVIDIA GeForce RTX 3080 Laptop GPU | Moyenne de la classe Gaming | |
|---|---|---|---|---|---|---|---|---|
| Power Consumption | -7% | -40% | -7% | -7% | -9% | -39% | -17% | |
| Idle Minimum * (Watt) | 13 | 15.3 -18% | 23 -77% | 11.2 14% | 15 -15% | 14 -8% | 19.8 ? -52% | 13.1 ? -1% |
| Idle Average * (Watt) | 17 | 21.2 -25% | 25 -47% | 16.4 4% | 17 -0% | 18 -6% | 24.3 ? -43% | 19 ? -12% |
| Idle Maximum * (Watt) | 18 | 22.3 -24% | 35 -94% | 29.4 -63% | 22 -22% | 29 -61% | 33.3 ? -85% | 24.6 ? -37% |
| Load Average * (Watt) | 96 | 82.3 14% | 101 -5% | 106.2 -11% | 101 -5% | 93 3% | 108.1 ? -13% | 111.3 ? -16% |
| Witcher 3 ultra * (Watt) | 207 | 191.2 8% | 190 8% | 189 9% | 195 6% | 190 8% | ||
| Load Maximum * (Watt) | 223 | 216.6 3% | 280 -26% | 213.6 4% | 230 -3% | 203 9% | 230 ? -3% | 260 ? -17% |
* ... Moindre est la valeur, meilleures sont les performances
Power consumption Witcher 3 / Stress test
Durée de vie de la batterie
MSI utilise une batterie de 65 Wh, ce qui est très peu pour un portable de jeu avec RTX 3080. La concurrence a des batteries de 84 ou 90 Wh et plus !
En conséquence, les durées d'exécution sont pauvres loin de la prise, et le prix budgétaire du Léopard se remarque ici. Seulement 3,5 heures de surf ou de visionnage de vidéos sont décevantes, la concurrence dure 40 à 100 pour cent de plus (Asus ROG). L'ordinateur portable ne peut offrir que trois quarts d'heure pour les jeux(The Witcher 3)
| MSI GP66 Leopard 11UH-028 i7-11800H, GeForce RTX 3080 Laptop GPU, 65 Wh | MSI GP66 Leopard 10UG i7-10870H, GeForce RTX 3070 Laptop GPU, 65 Wh | Aorus 15P YD i7-11800H, GeForce RTX 3080 Laptop GPU, 99 Wh | Asus ROG Strix Scar 15 G533QS R9 5900HX, GeForce RTX 3080 Laptop GPU, 90 Wh | Schenker XMG Neo 15 Tiger Lake i7-11800H, GeForce RTX 3080 Laptop GPU, 93 Wh | Alienware m15 R6, i7-11800H RTX 3080 i7-11800H, GeForce RTX 3080 Laptop GPU, 84 Wh | Moyenne de la classe Gaming | |
|---|---|---|---|---|---|---|---|
| Autonomie de la batterie | 13% | 61% | 60% | 83% | 44% | 86% | |
| H.264 (h) | 3.5 | 5.9 69% | 5.6 60% | 8.27 ? 136% | |||
| WiFi v1.3 (h) | 3.6 | 5.1 42% | 5.3 47% | 7.3 103% | 5.6 56% | 5 39% | 7.08 ? 97% |
| Witcher 3 ultra (h) | 0.8 | ||||||
| Load (h) | 1.2 | 1 -17% | 2.1 75% | 1.4 17% | 2.7 125% | 1.6 33% | 1.496 ? 25% |
| Reader / Idle (h) | 6.6 | 7.5 | 11.1 | 7.84 ? |
Points positifs
Points négatifs
Verdict : un bon budget pour un joueur de haute performance
Un ordinateur portable de jeu moderne avec une Nvidia RTX 3080 et des performances élevées et compétitives correspondantes pour moins de 2 000 euros est probablement une rareté de nos jours. Le MSI fait aussi beaucoup de choses bien en dehors de la performance pure malgré son bas prix. Par exemple, le système de refroidissement adaptatif nous a vraiment surpris positivement, même en mode Performance Extrême - des concurrents beaucoup plus chers comme les Alienwares peuvent s'inspirer de ce livre. Et l'écran n'est pas non plus un panneau bon marché, mais il surpasse au moins la concurrence en termes de luminosité.
Bien sûr, il faut aussi accepter quelques compromis dans cette catégorie de prix. Il s'agit notamment de l'autonomie médiocre de la batterie du Léopard et de la qualité de construction qui n'est pas optimale, ce qui se remarque également dans l'entretien plus compliqué. Nous sommes presque choqués que le nouveau modèle GP66 ne dispose plus d'un port USB-C, qui n'est plus d'actualité à la fin de 2021 ! Si vous pouvez passer outre, vous aurez du mal à trouver un gamer RTX 3080 moins cher à l'heure actuelle qui fait encore autant de choses bien en même temps.
Le Leopard GP66 11UH est un ordinateur portable de jeu à petit budget qui fait pâlir même les modèles haut de gamme à certains endroits. Bien sûr, il y a des inconvénients comme l'absence d'USB-C ou la faible autonomie de la batterie, mais les performances, le refroidissement et l'affichage entrent également dans des catégories supérieures.
La concurrence est rare dans cette gamme de prix avec ces spécifications. Et même les rivaux plus chers ne font pas tout mieux, voir le système de refroidissement. Les appareils de comparaison du test sont tous plus chers, mais ils sont tout sauf supérieurs en termes de performances, d'affichage et surtout de système de refroidissement. Cependant, il faut payer plus cher pour l'USB-C ou une plus grande autonomie de la batterie. Sinon, nous vous recommandons de jeter un coup d'œil à notre Liste des ordinateurs portables de jeu bon marché.
Prix et disponibilité
Notre modèle de test est actuellement le moins cher sur le site Computeruniverse, où l'ordinateur portable coûte actuellement 1 899 € (~2 140 $). Mais notre configuration est également disponible sur Cyberport pour un peu moins de€2,000 (~$2,253)pour mettre la main dessus.
MSI GP66 Leopard 11UH-028
- 12/08/2021 v7 (old)
Christian Hintze
Price comparison
