Test du MSI GP66 Leopard 10UG : refonte complète de la série
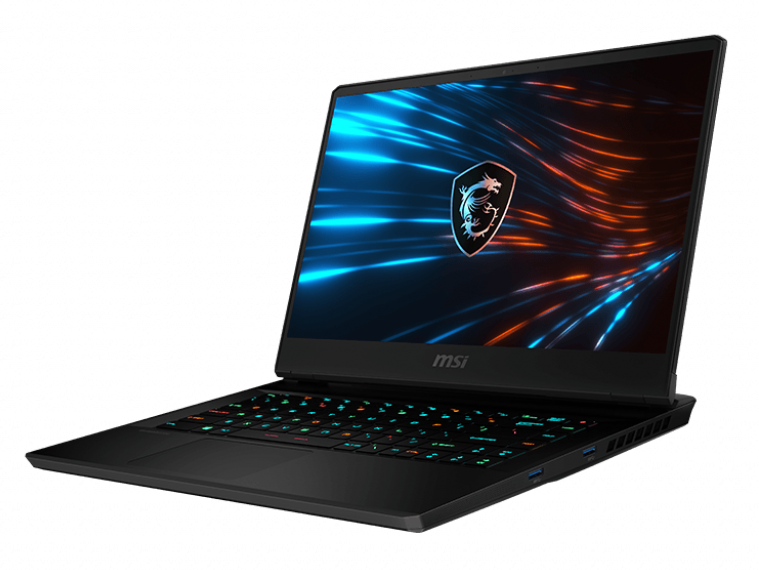
Dévoilé sur en début d'année aux côtés de la série mobile Nvidia Ampere, le GP66 présente un tout nouveau design par rapport à l'ancien GP65. Presque tout a changé, du clavier à la solution de refroidissement, pour marquer le début d'une nouvelle génération de la famille GP. Pour ceux qui ne sont pas familiers, la série GP abrite les ordinateurs portables de jeu de milieu de gamme de MSI, au-dessus des séries moins chères GL et GF et en dessous des séries plus chères GE et GT.
Les SKUs vont d'un CPU Intel Core-i7 10870H de 10e génération avec des graphiques RTX 3060 de GeForce jusqu'au Core i7-10875H avec RTX 3080. Notre configuration d'examen est une configuration intermédiaire avec le i7-10870H et la RTX 3070 pour environ $2500 USD selon la RAM et le stockage.
Parmi les modèles concurrents, on trouve d'autres portables de jeu de 15,6 pouces de milieu de gamme supérieure, comme le Gigabyte Aorus 15P, Asus ROG Zephyrus G15ou Lenovo Legion 7.
Plus de revues MSI :
potential competitors in comparison
Note | Date | Modèle | Poids | Épaisseur | Taille | Résolution | Prix |
|---|---|---|---|---|---|---|---|
| 84.2 % v7 (old) | 04/21 | MSI GP66 Leopard 10UG i7-10870H, GeForce RTX 3070 Laptop GPU | 2.3 kg | 23.4 mm | 15.60" | 1920x1080 | |
| 83.2 % v7 (old) | 06/20 | MSI GP65 10SFK-047US i7-10750H, GeForce RTX 2070 Mobile | 2.3 kg | 27.5 mm | 15.60" | 1920x1080 | |
| 85.4 % v7 (old) | 04/21 | Alienware m15 R4 i9-10980HK, GeForce RTX 3070 Laptop GPU | 2.3 kg | 20 mm | 15.60" | 1920x1080 | |
| 86.1 % v7 (old) | 02/21 | Aorus 15P XC i7-10870H, GeForce RTX 3070 Laptop GPU | 2.2 kg | 27 mm | 15.60" | 1920x1080 | |
| 83.8 % v7 (old) | 02/21 | Asus ROG Zephyrus G15 GA503Q R9 5900HS, GeForce RTX 3080 Laptop GPU | 2 kg | 20 mm | 15.60" | 2560x1440 | |
| 80.4 % v7 (old) | 03/21 | MSI GF65 Thin 10UE i7-10750H, GeForce RTX 3060 Laptop GPU | 1.9 kg | 21.7 mm | 15.60" | 1920x1080 |
Cas
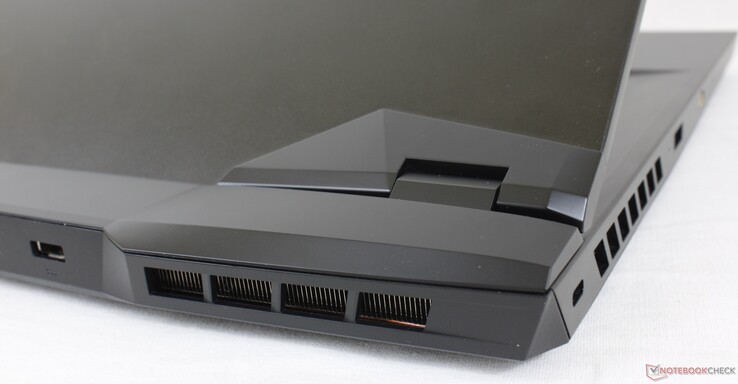
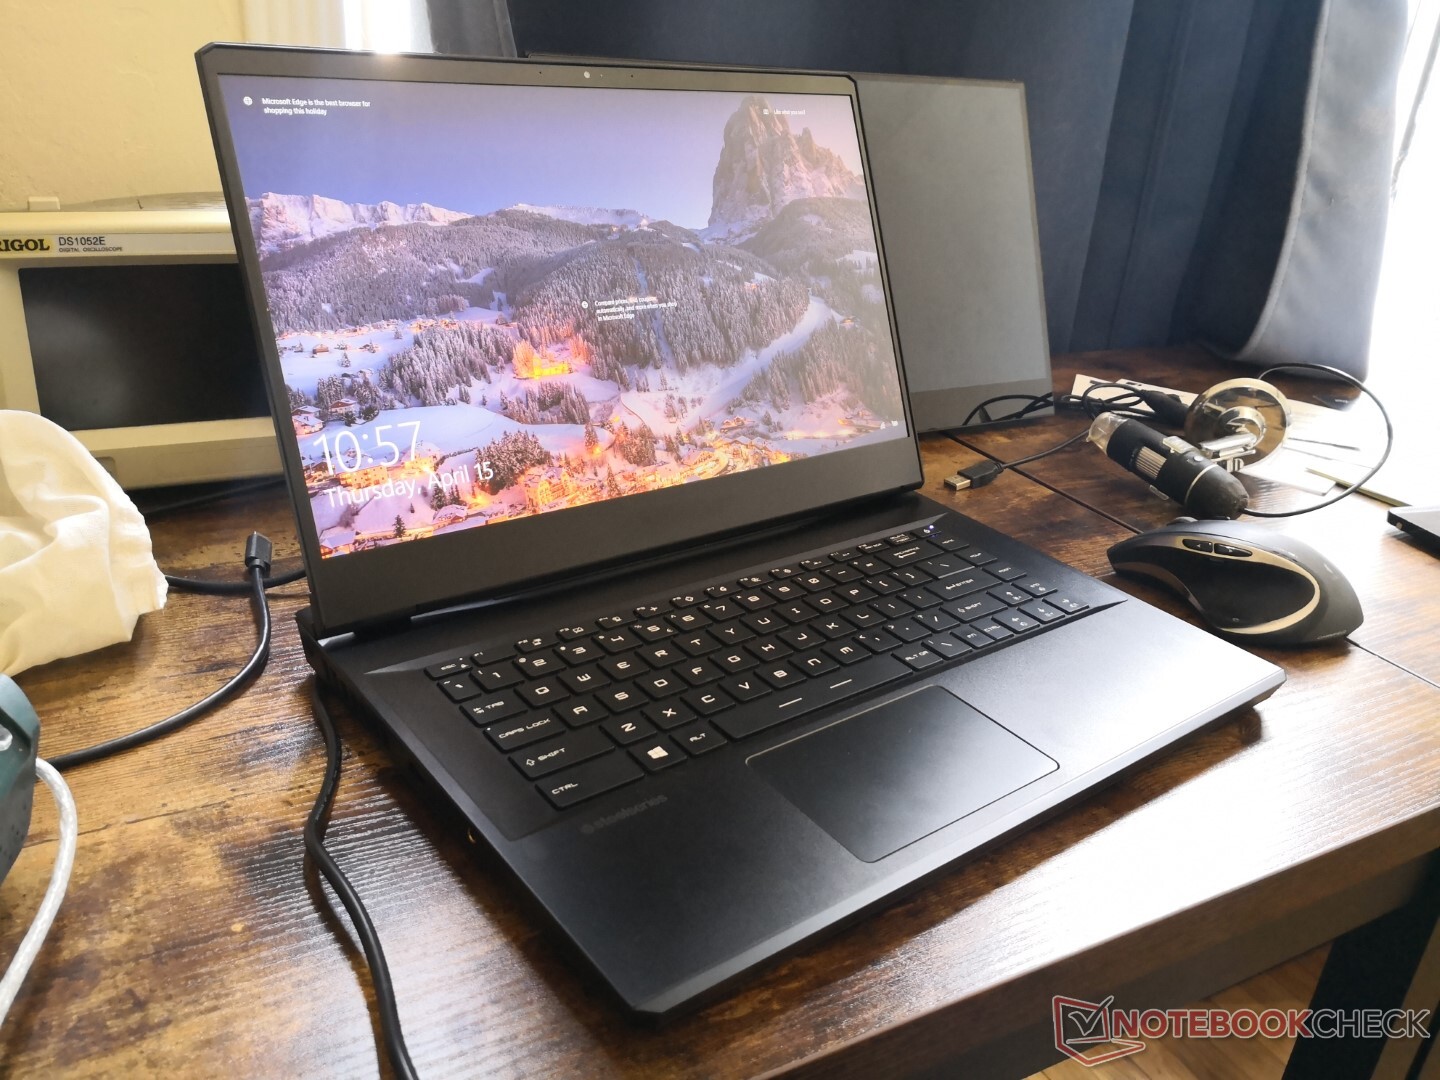
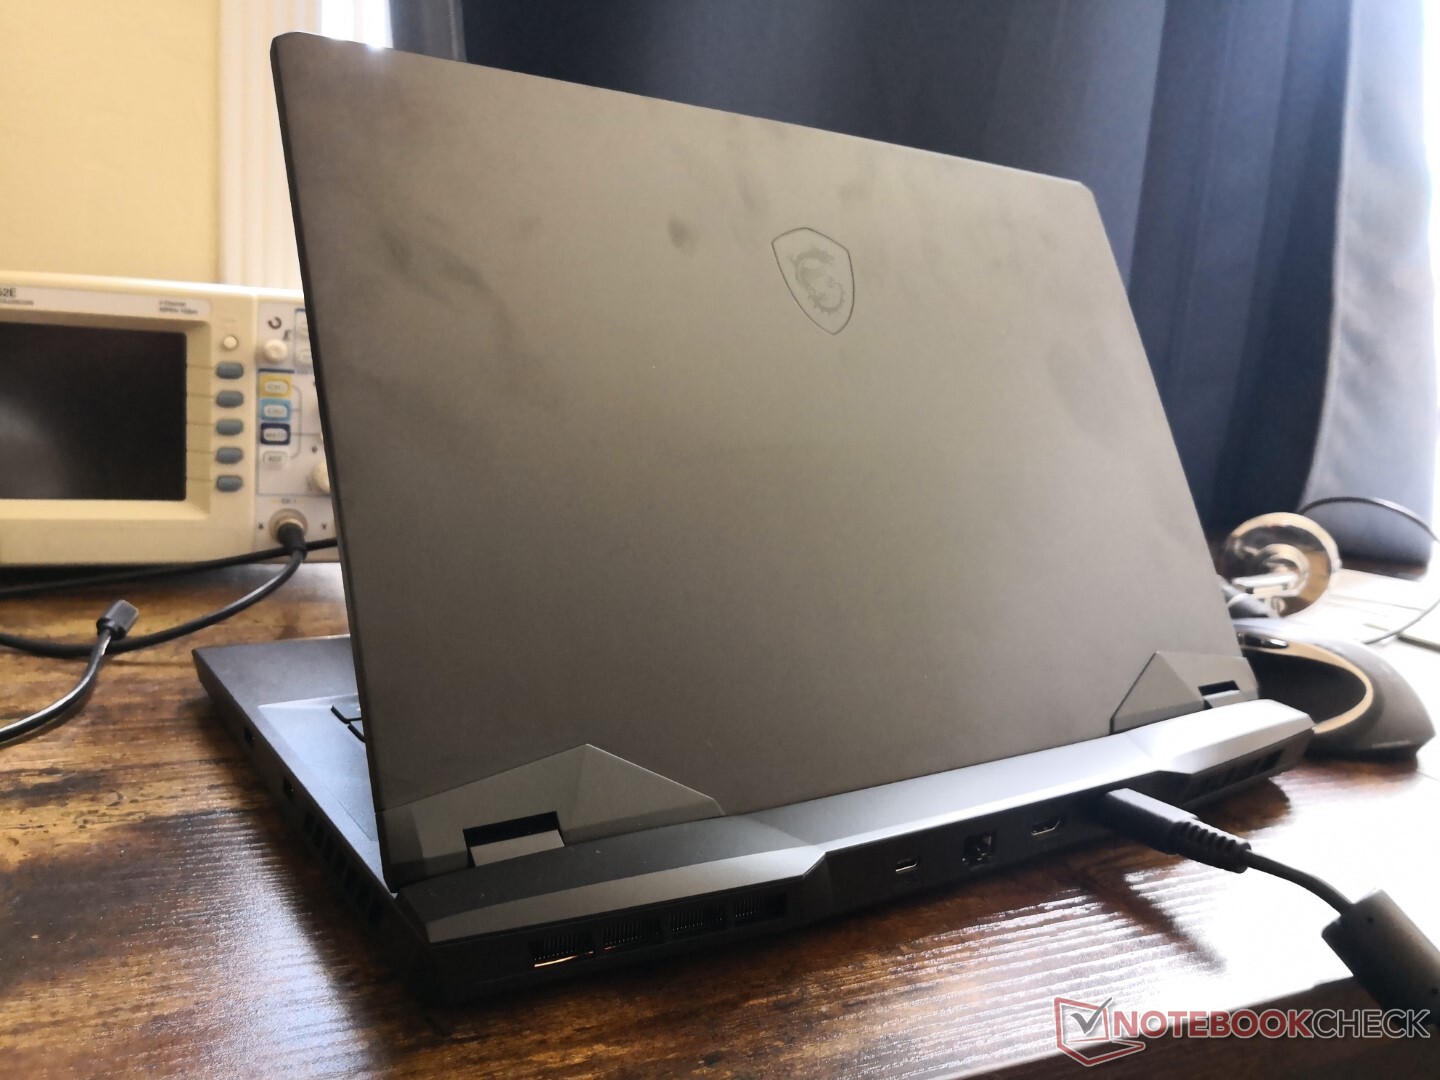
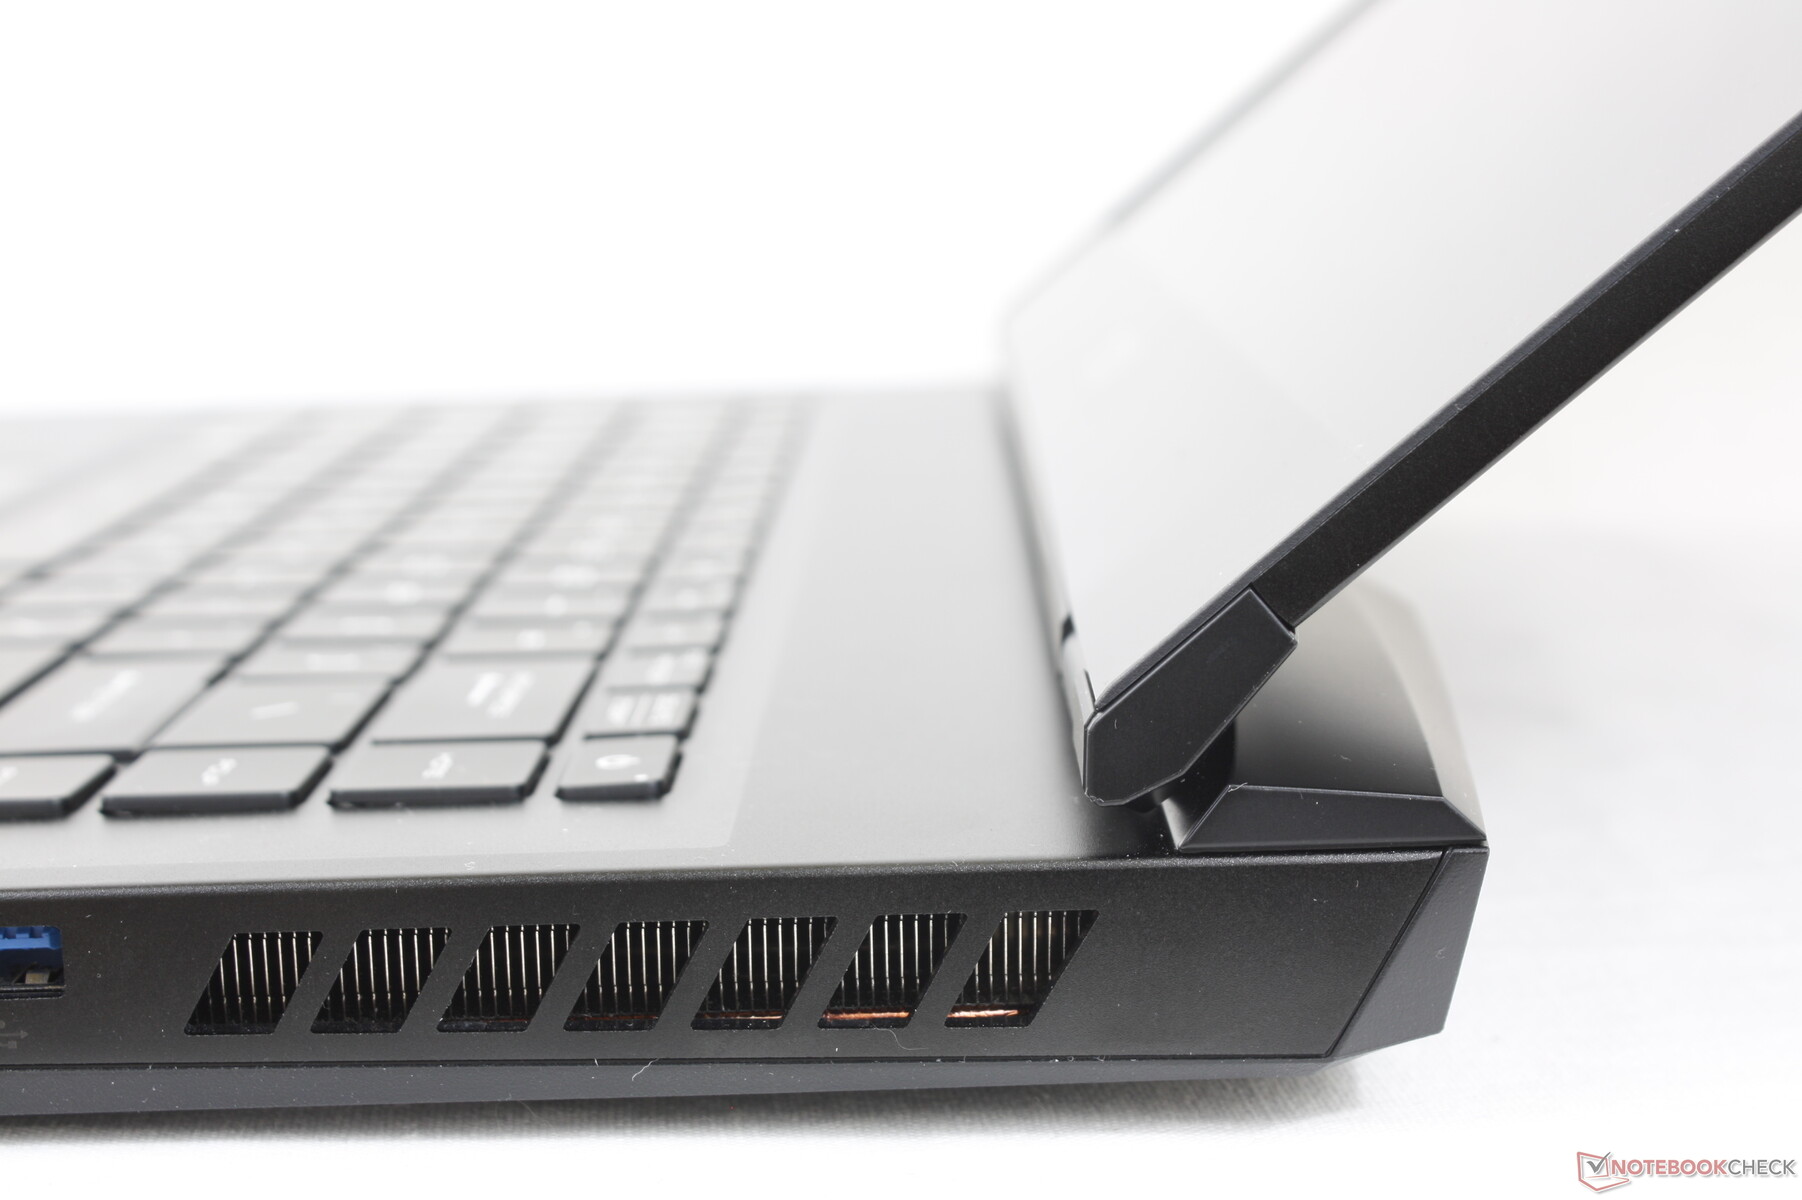
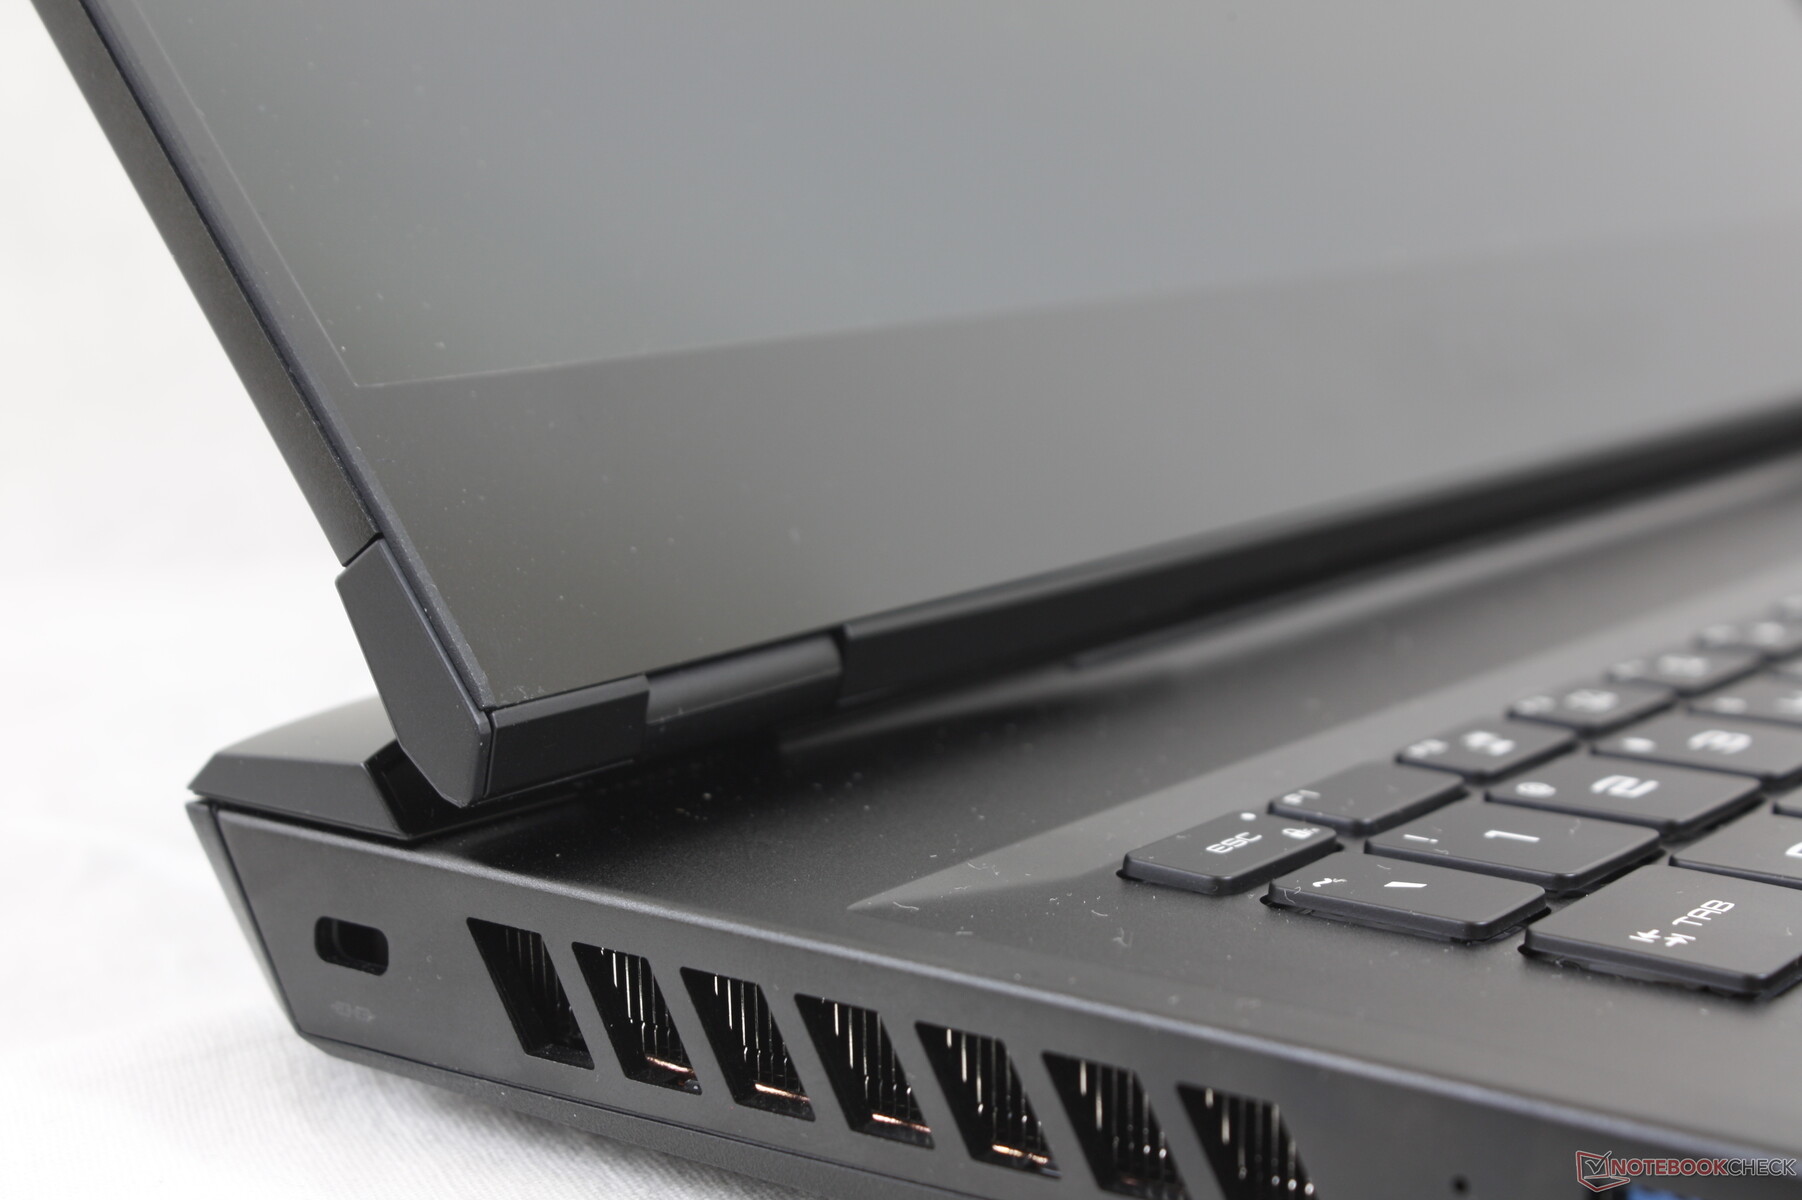
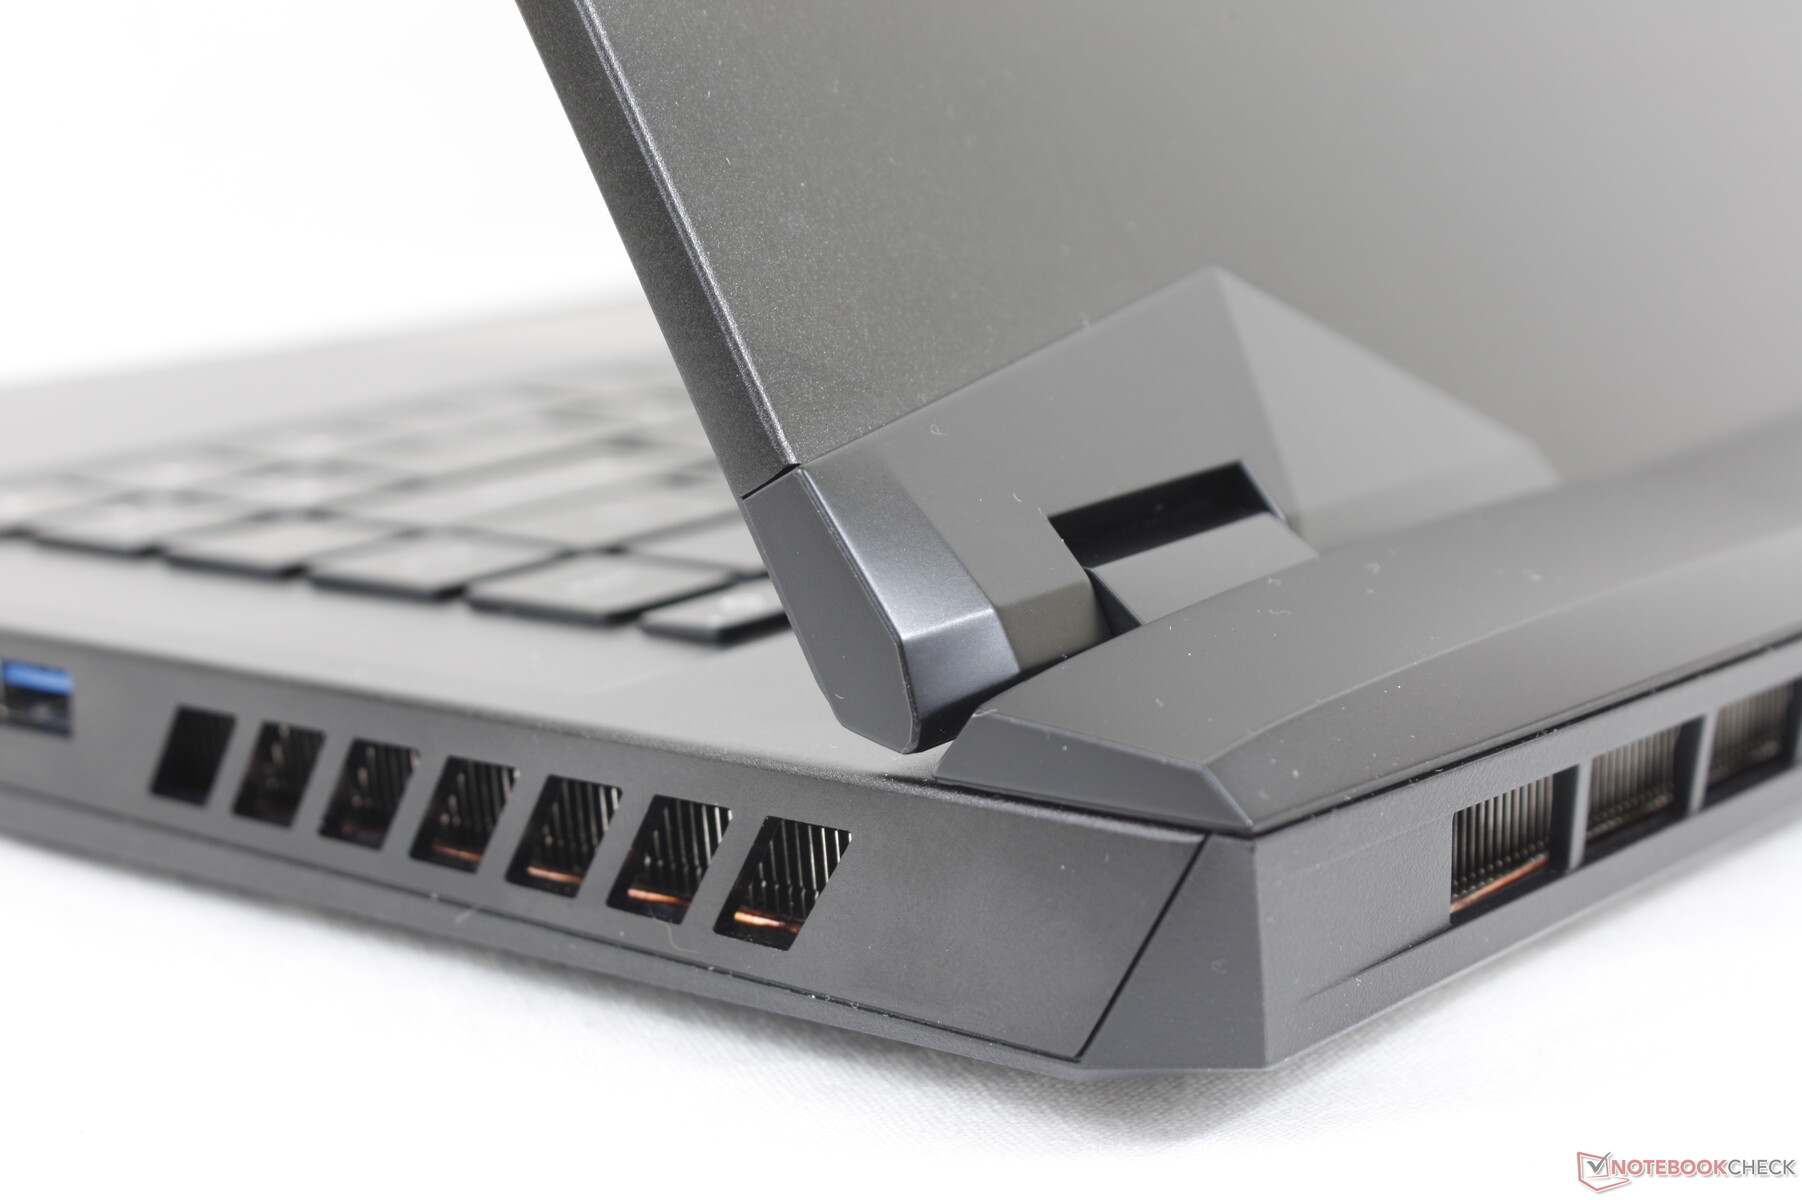
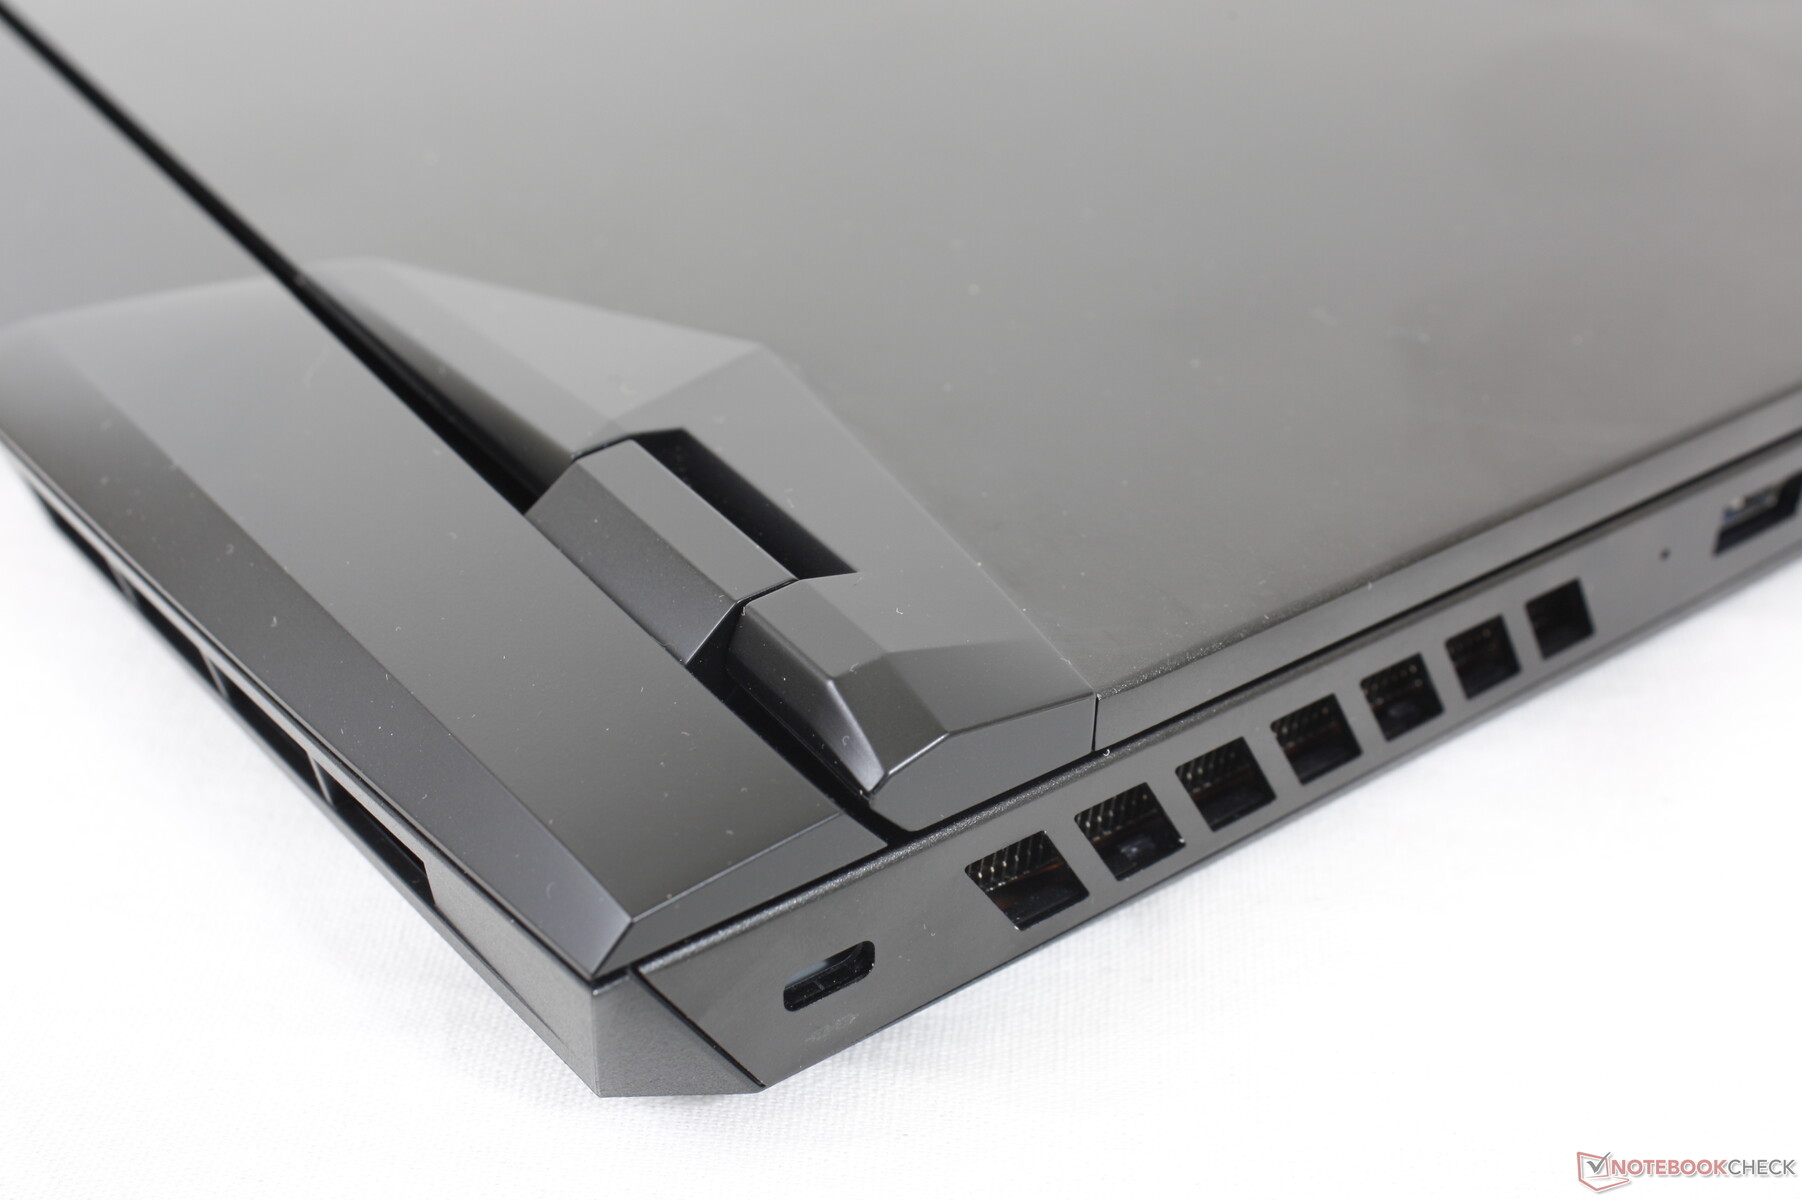
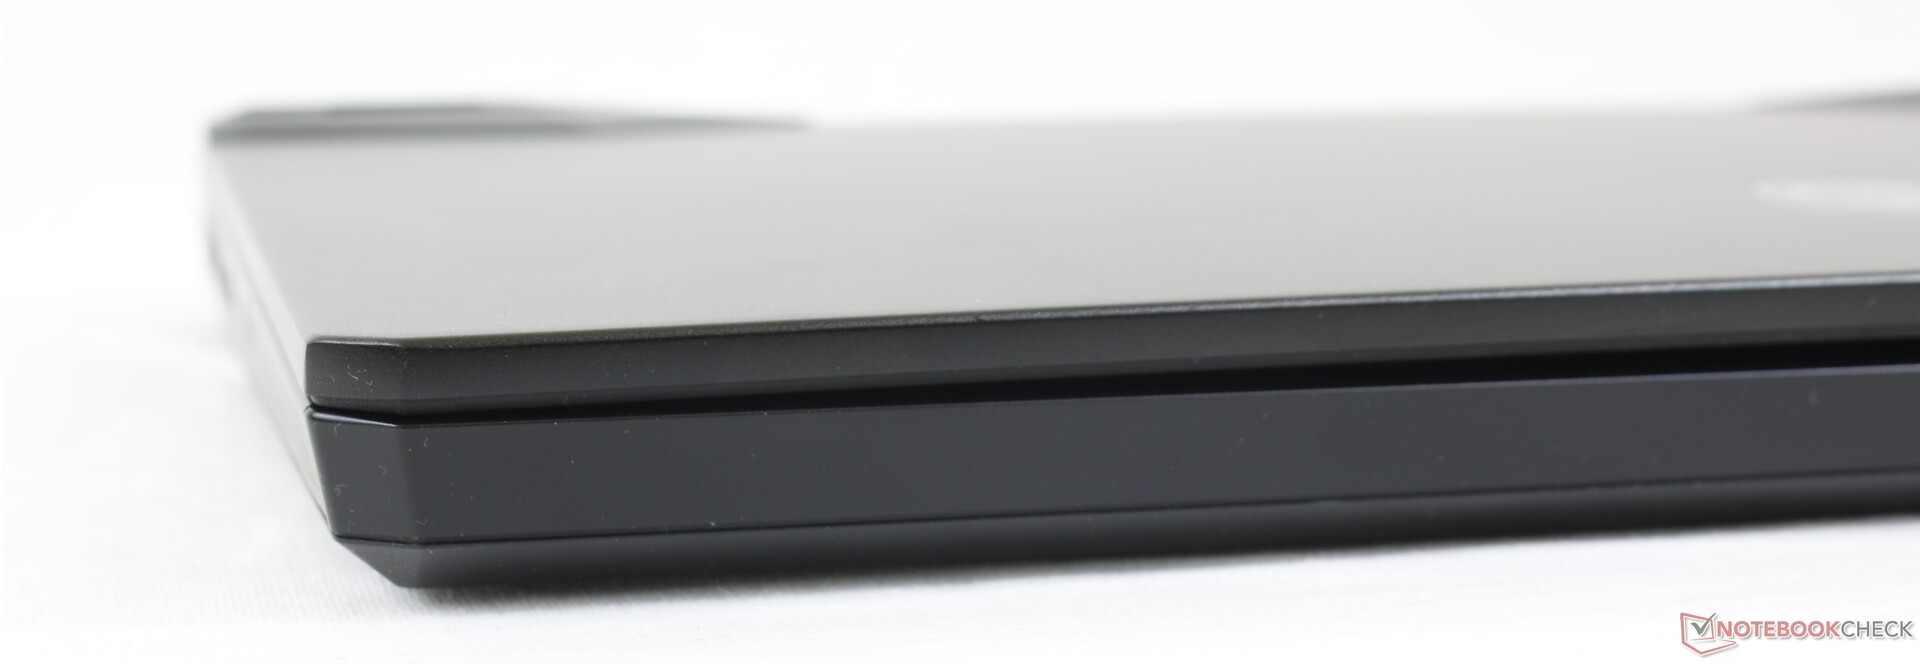
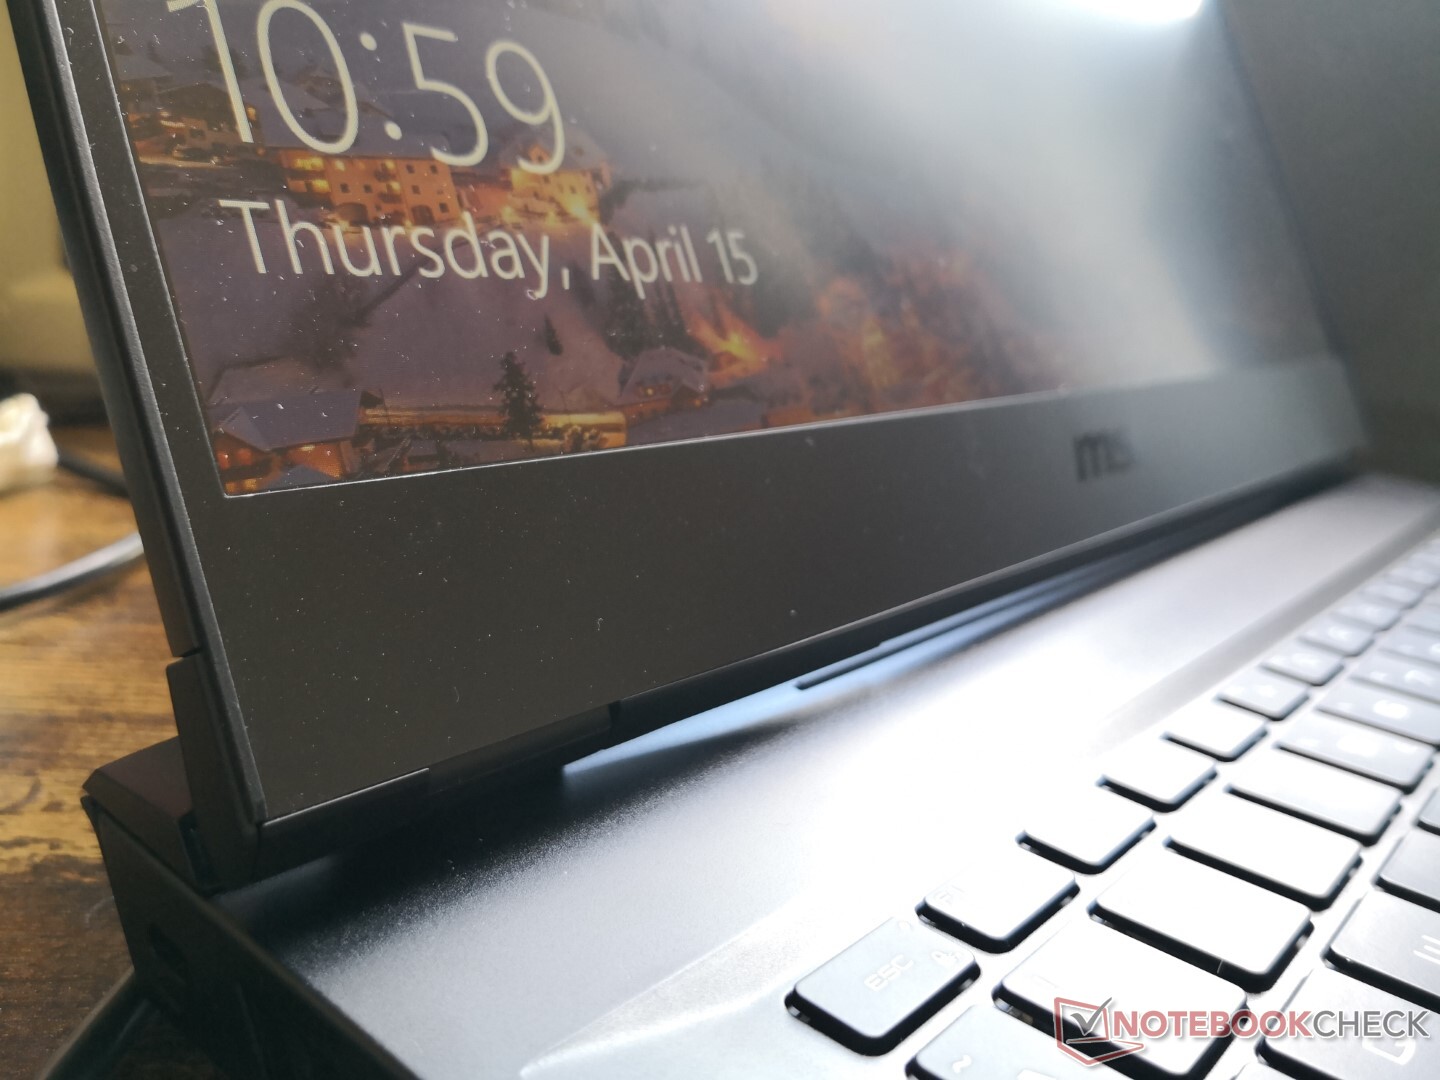
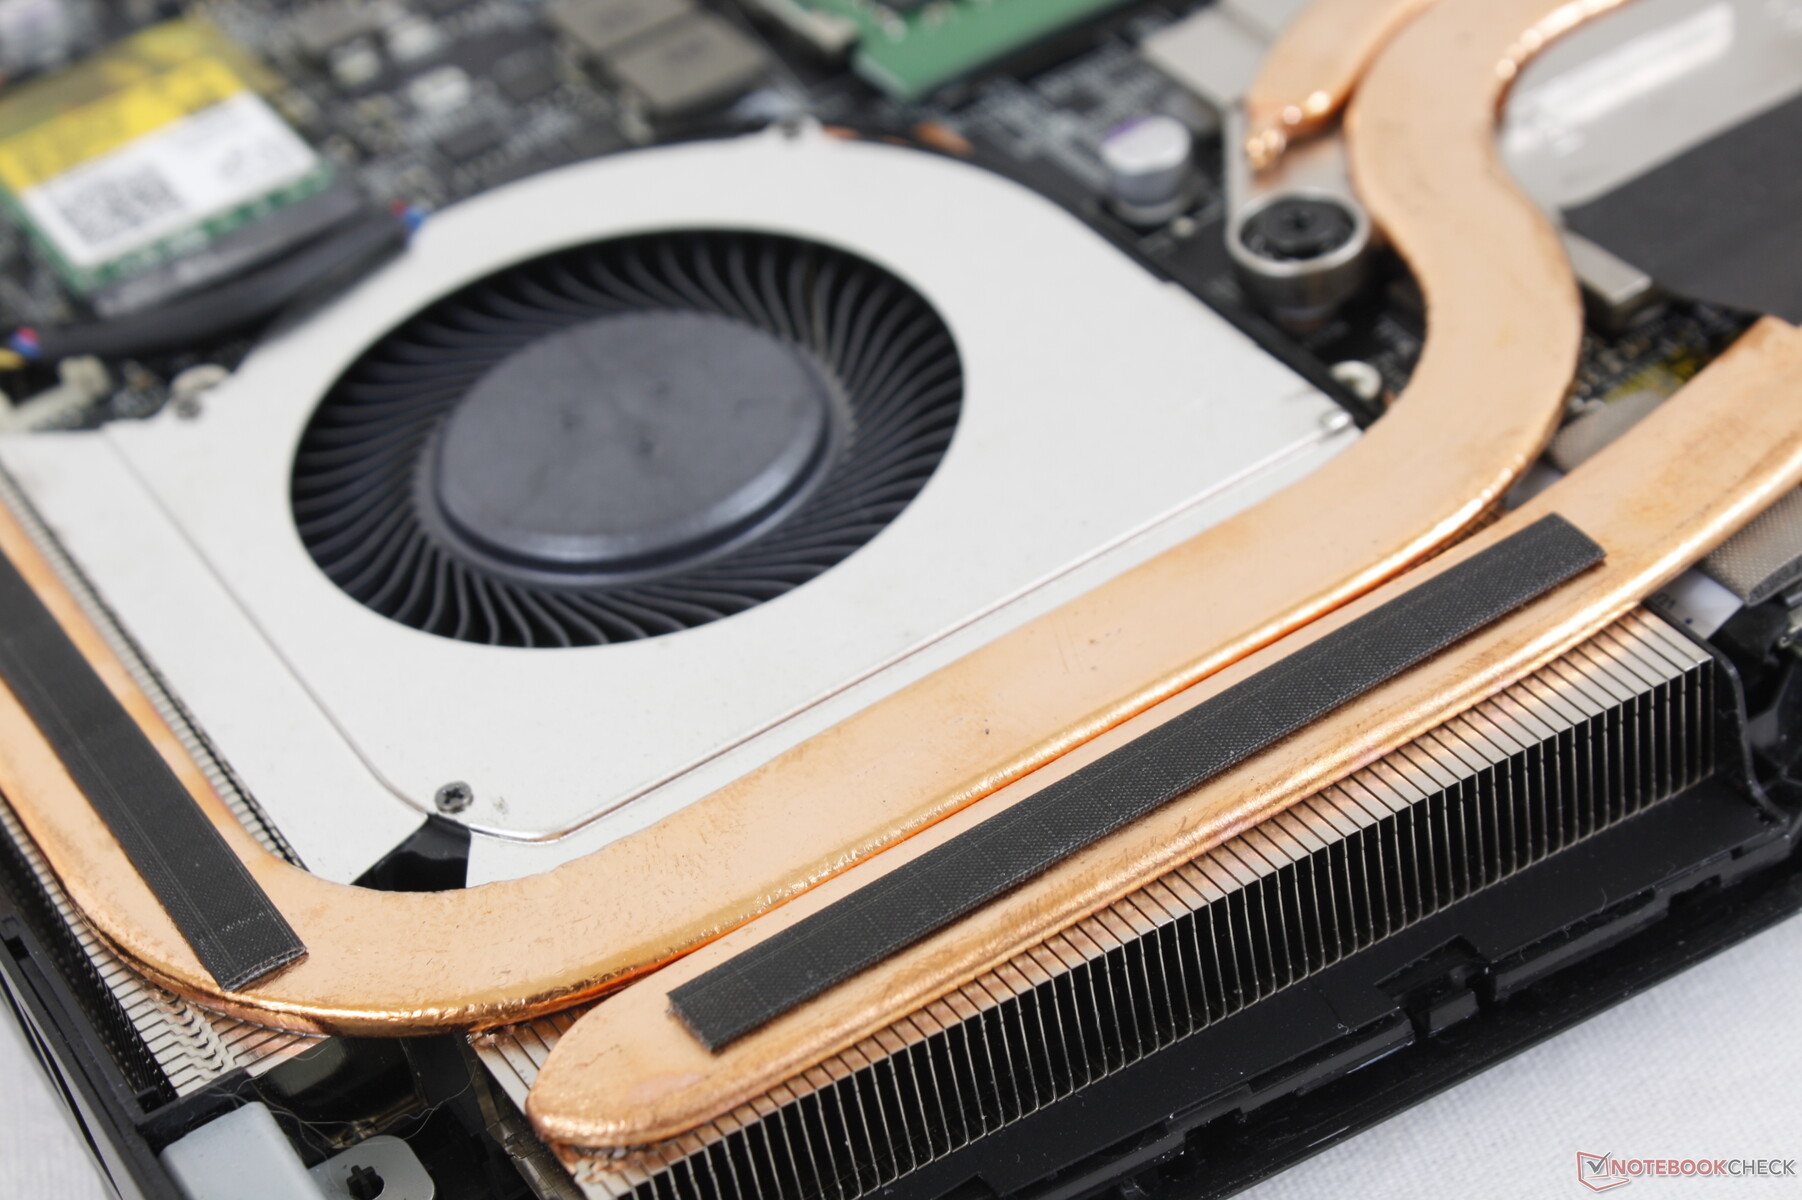
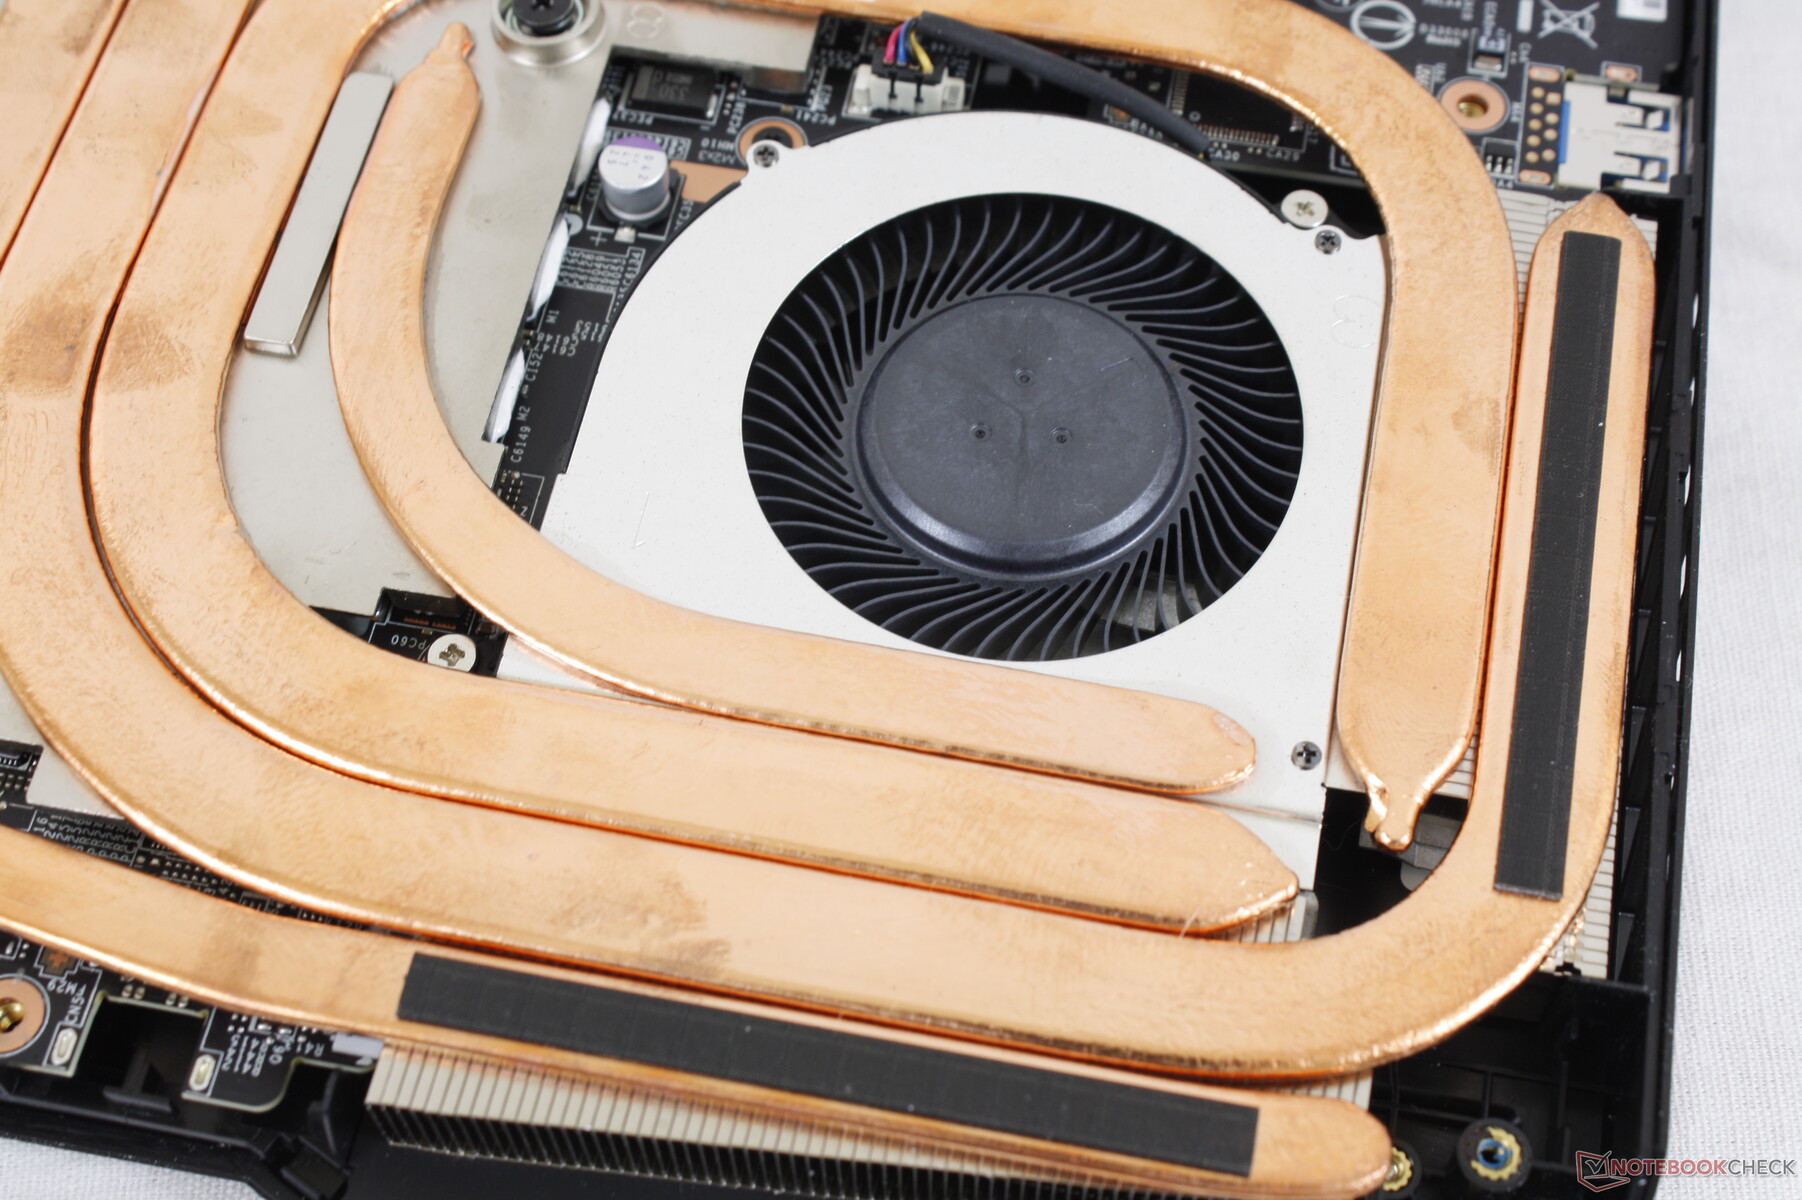
Le plus grand changement physique du GP65 au GP66 est l'arrière plus grand afin d'accueillir une solution de refroidissement plus puissante. La conception visuelle globale peut être décrite comme une version atténuée du GE66 avec leurs couvercles extérieurs en métal lisse similaires mais une couleur noire plus foncée. La barre de lumière RVB le long du bord avant du GE66 n'est pas présente sur le GP66 alors que l'éclairage RVB par touche du clavier est maintenu.
La qualité de fabrication est excellente, surtout pour la base. Le clavier ne présente qu'une flexion et un grincement minimes lorsque l'on plie ou que l'on tourne ses coins avant. Le couvercle, cependant, aurait pu être plus rigide, car les charnières ont tendance à vaciller lors du réglage des angles. Le couvercle extérieur fléchit aussi plus facilement que sur l'Asus ROG Strix G15 Asus ROG Strix G15 lorsqu'on applique une pression en son centre.
Le nouveau modèle est sensiblement plus long que l'ancien GP65 en raison de la nouvelle partie arrière "moteur à réaction". Sinon, le poids reste pratiquement le même d'une génération à l'autre, soit 2,3 kg, et le système est en fait plus fin cette fois-ci d'environ 4 mm. Le concurrent Alienware m15 R4 est encore plus grand, tandis que l'Asus Zephyrus G15 GA503Q est à la fois plus léger et plus petit.
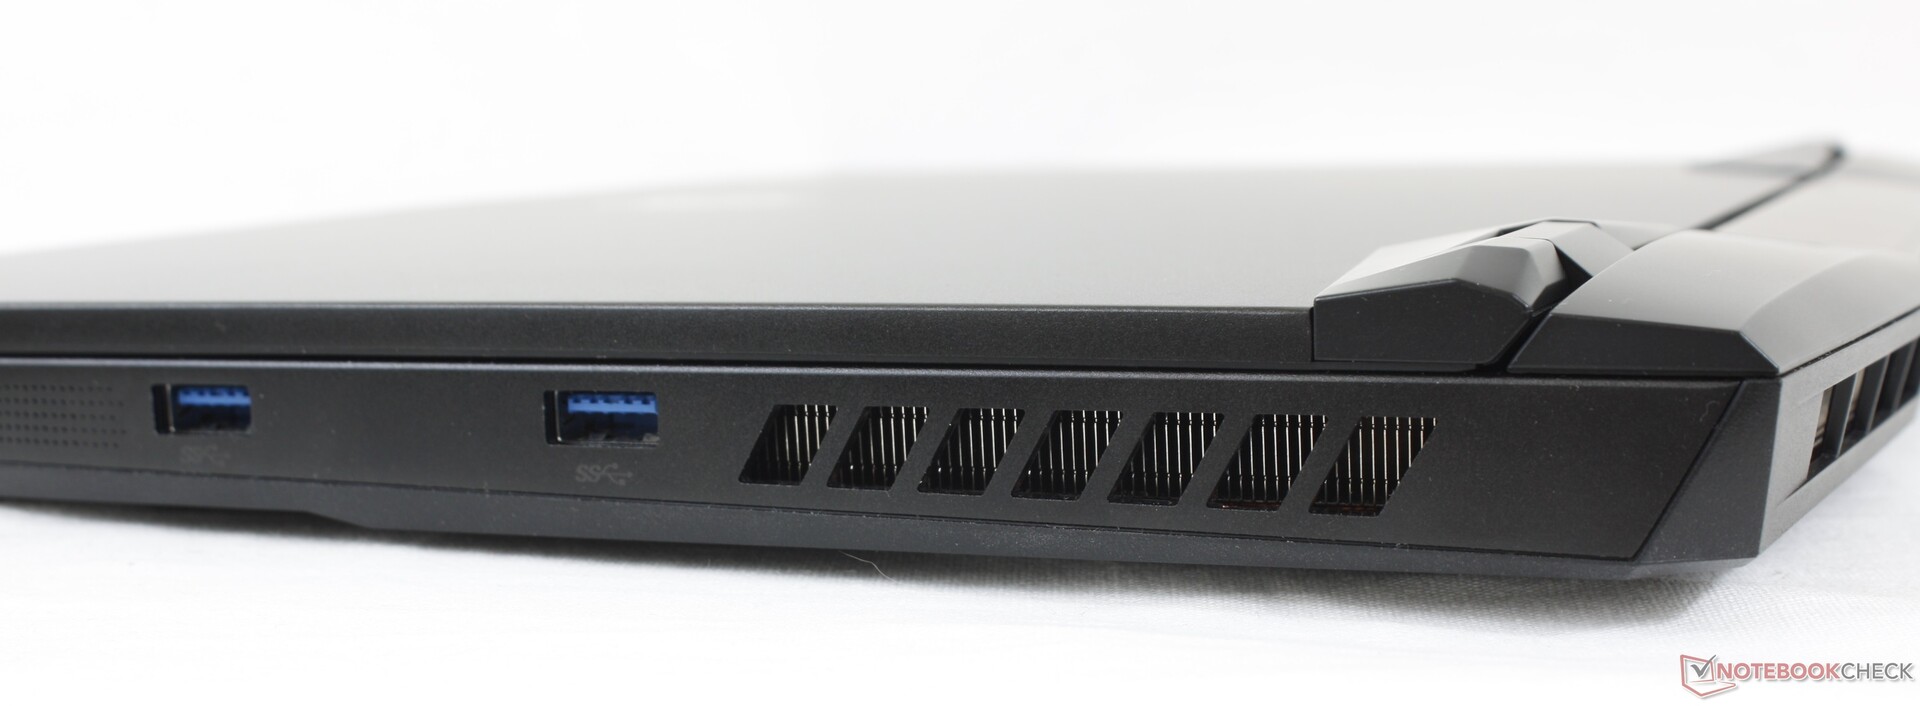
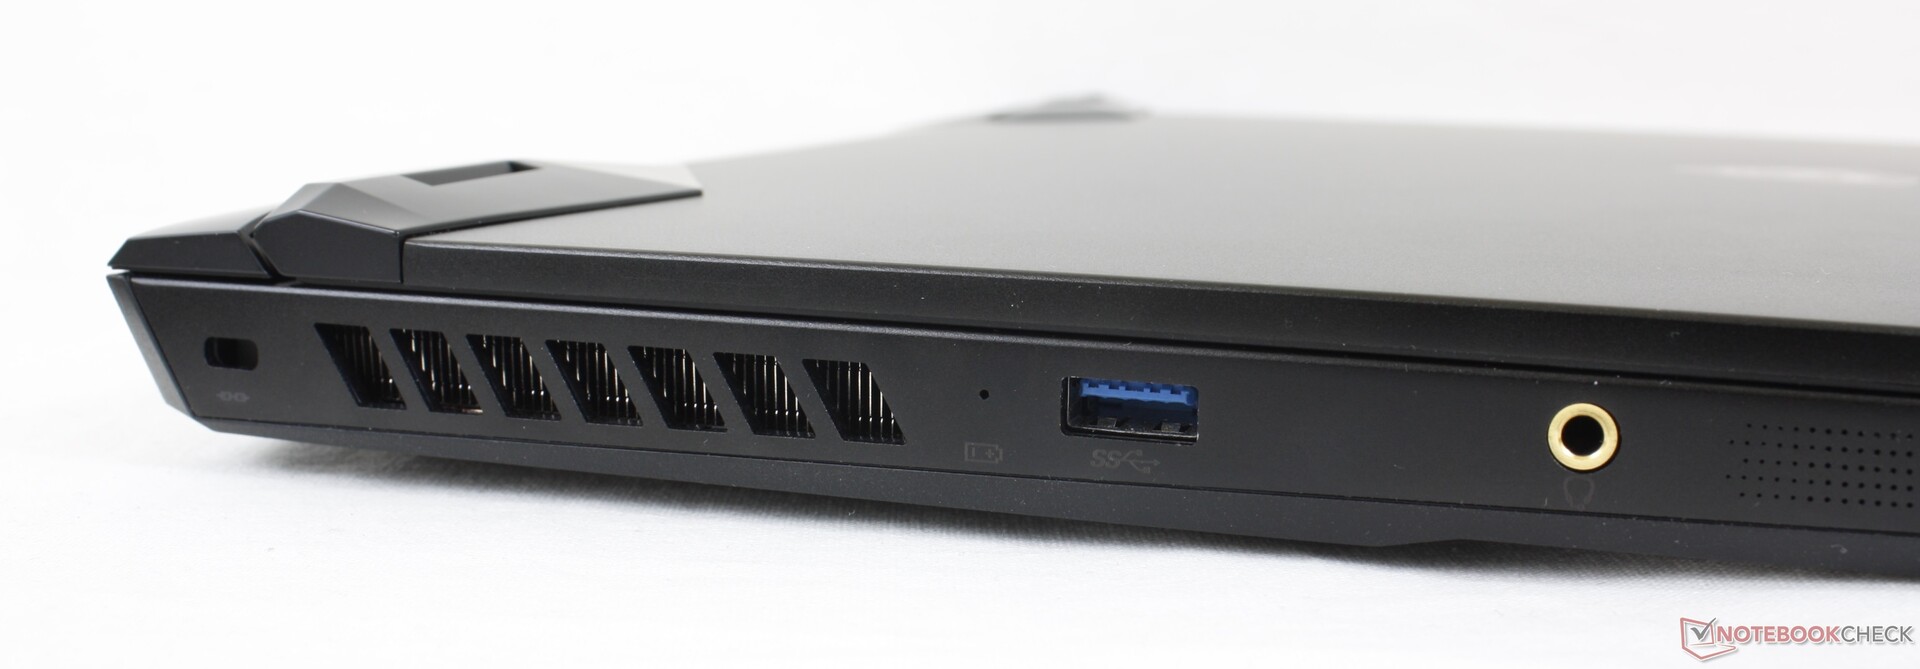
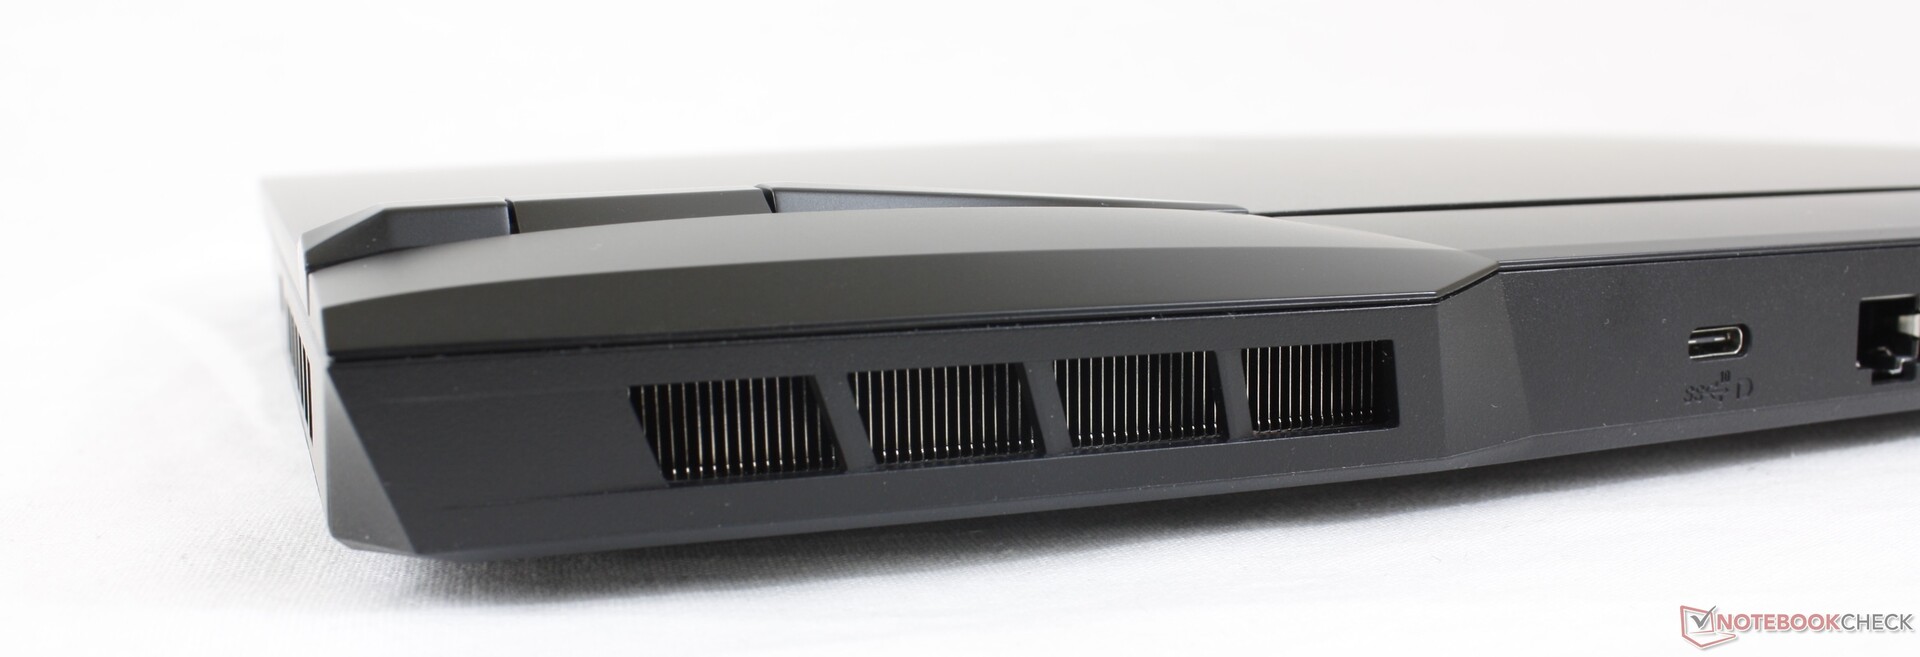
Connectivité
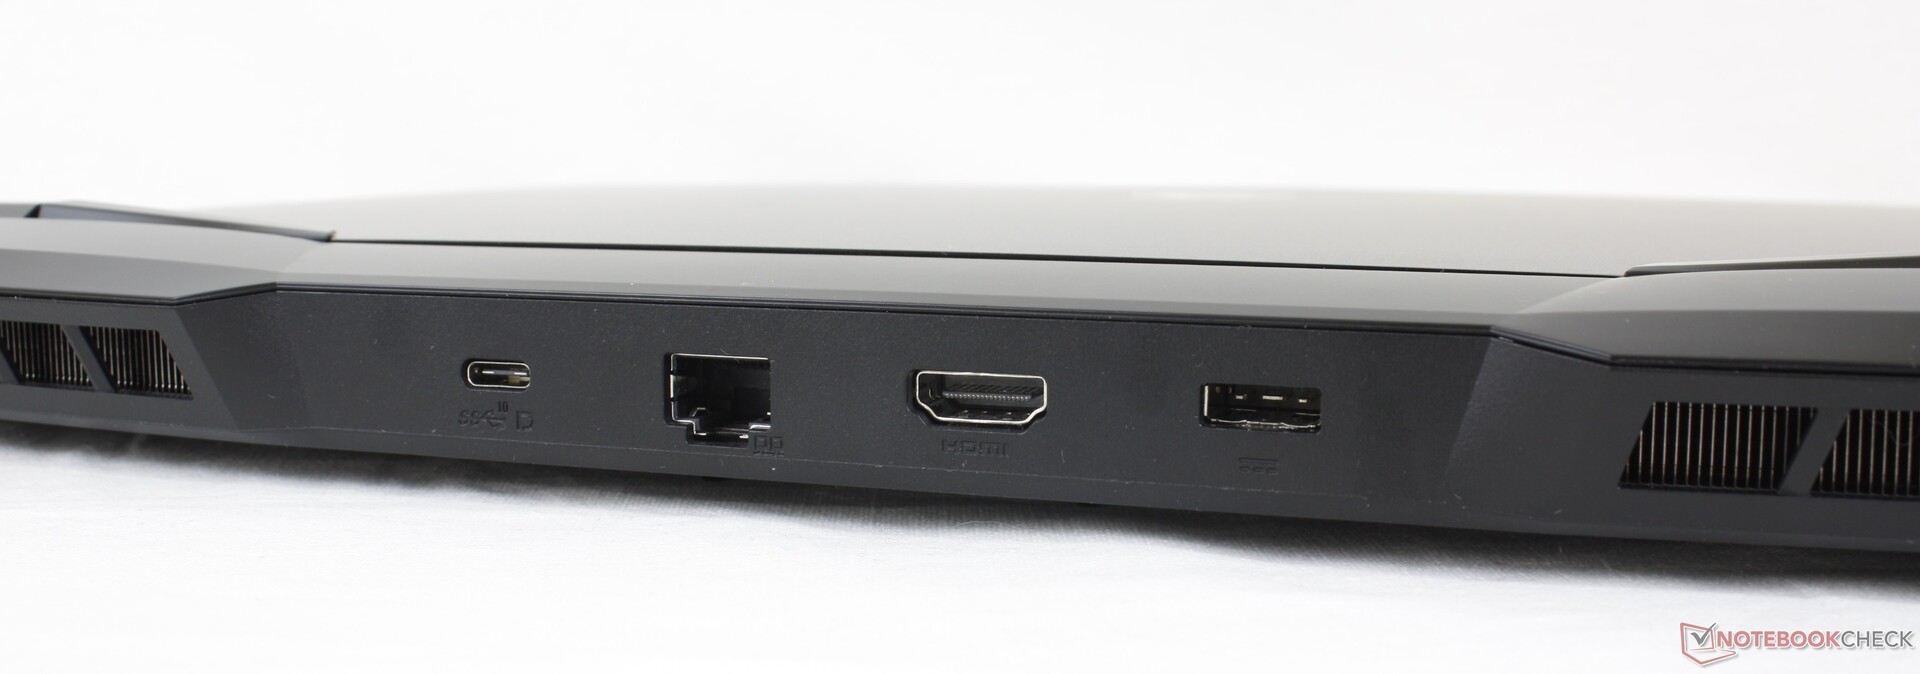
Les options et le positionnement des ports ont considérablement changé par rapport au GP65. Tout d'abord, les ports sont désormais répartis de manière plus homogène sur les bords gauche, droit et arrière, alors qu'ils étaient tous regroupés sur le GP65. Ensuite, le microphone de 3,5 mm et le port mini-DisplayPort ont disparu au profit du port DisplayPort-over-USB-C. Le HDMI est passé de 1.4 à 2.0 pour la prise en charge de la 4K60 et il y a un port USB-A supplémentaire, soit trois au total.
N'oubliez pas que Thunderbolt et USB-C Power Delivery ne sont pas pris en charge. Ainsi, les utilisateurs ne peuvent pas recharger le GP66 avec des adaptateurs USB-C, contrairement au Razer Blade 15 ou Alienware m15.
Communication
Webcam


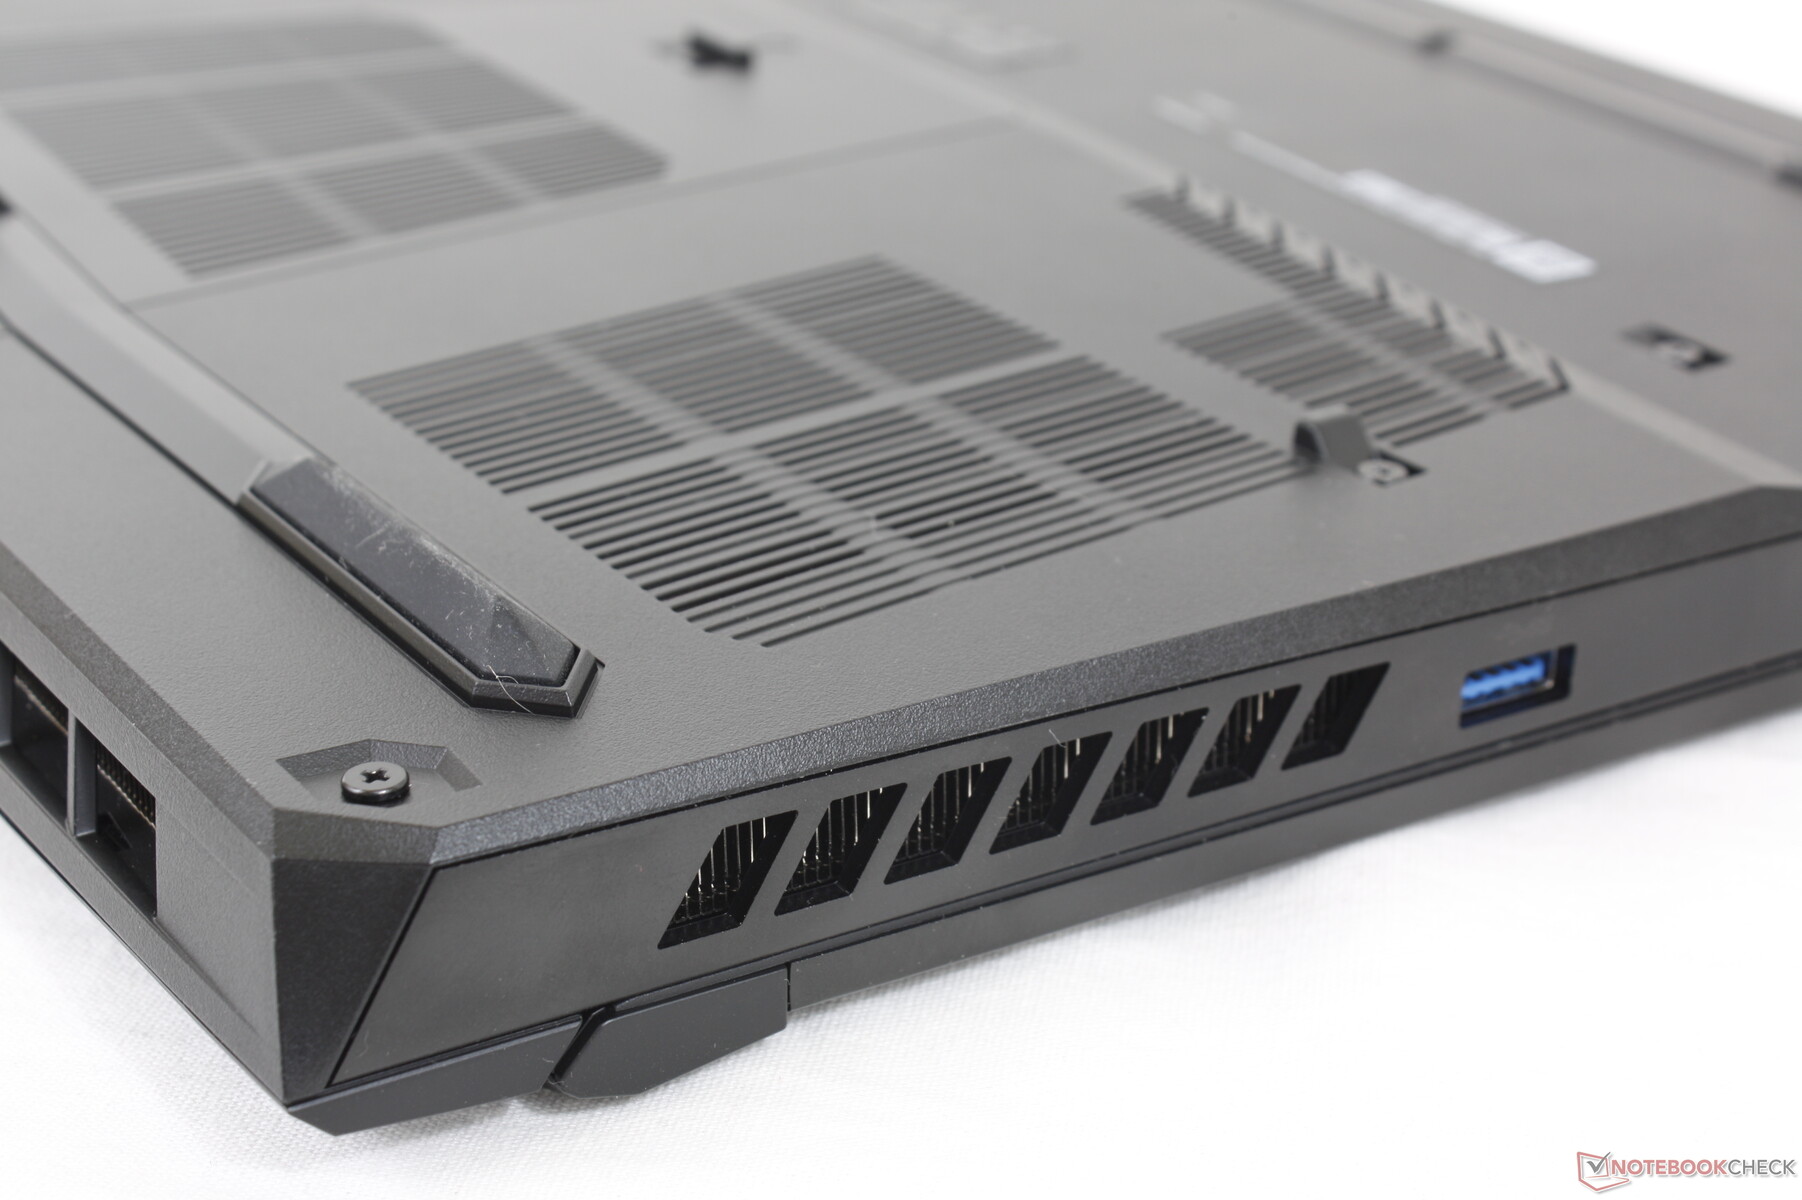
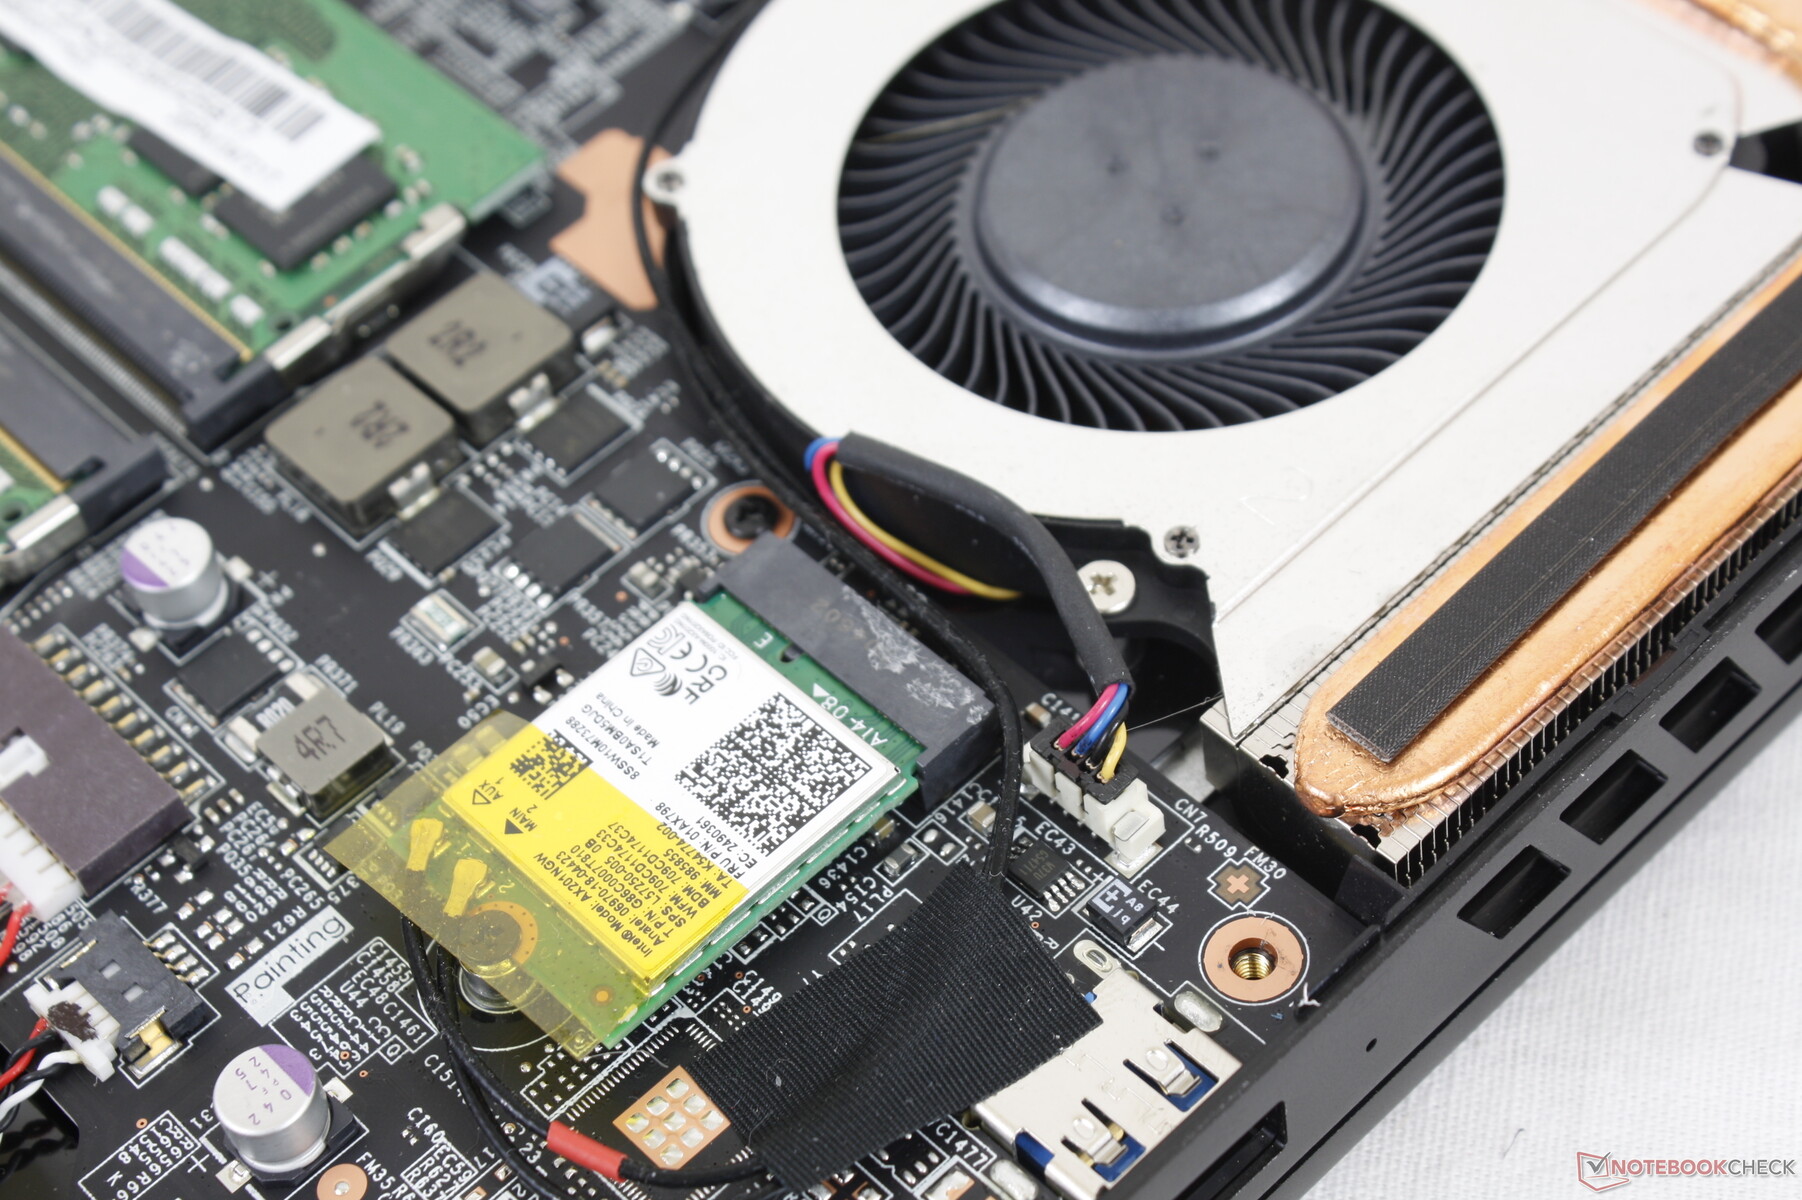
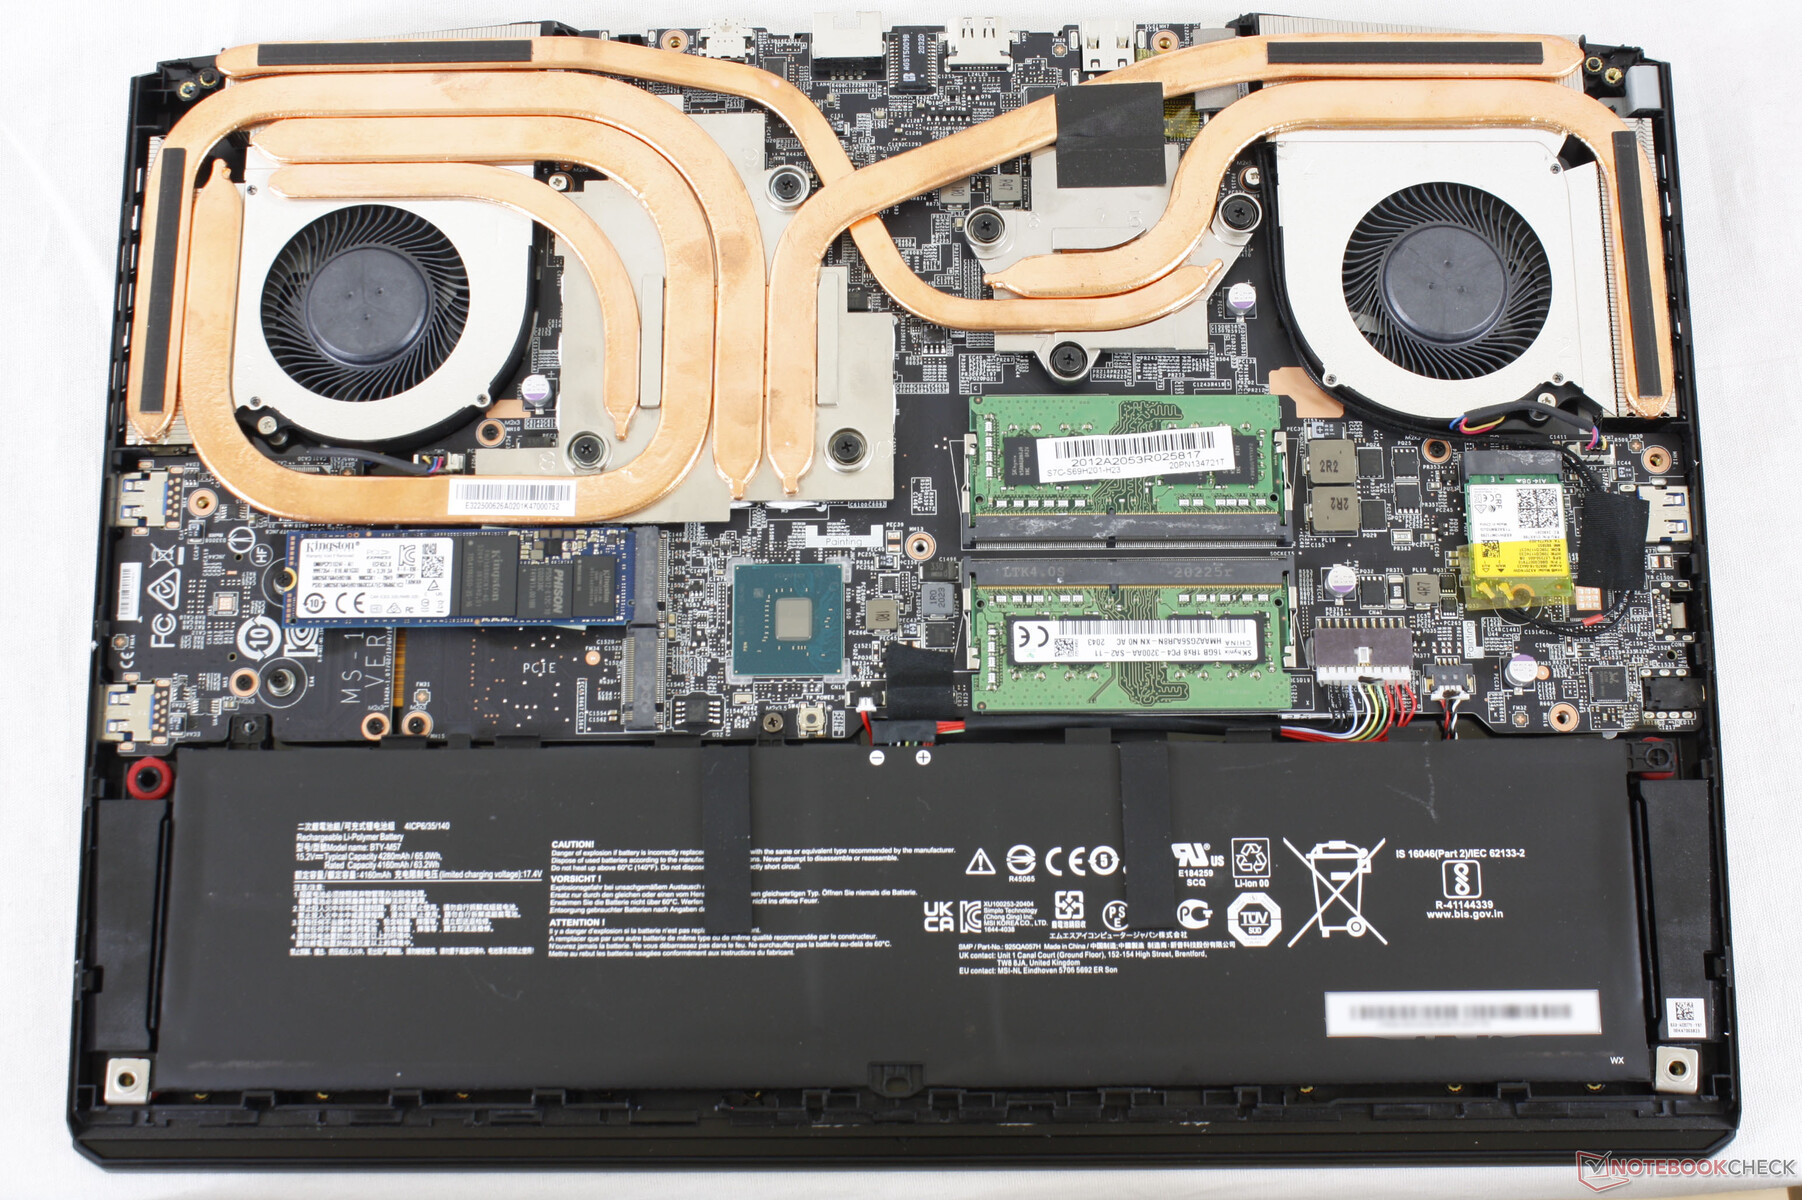
Maintenance
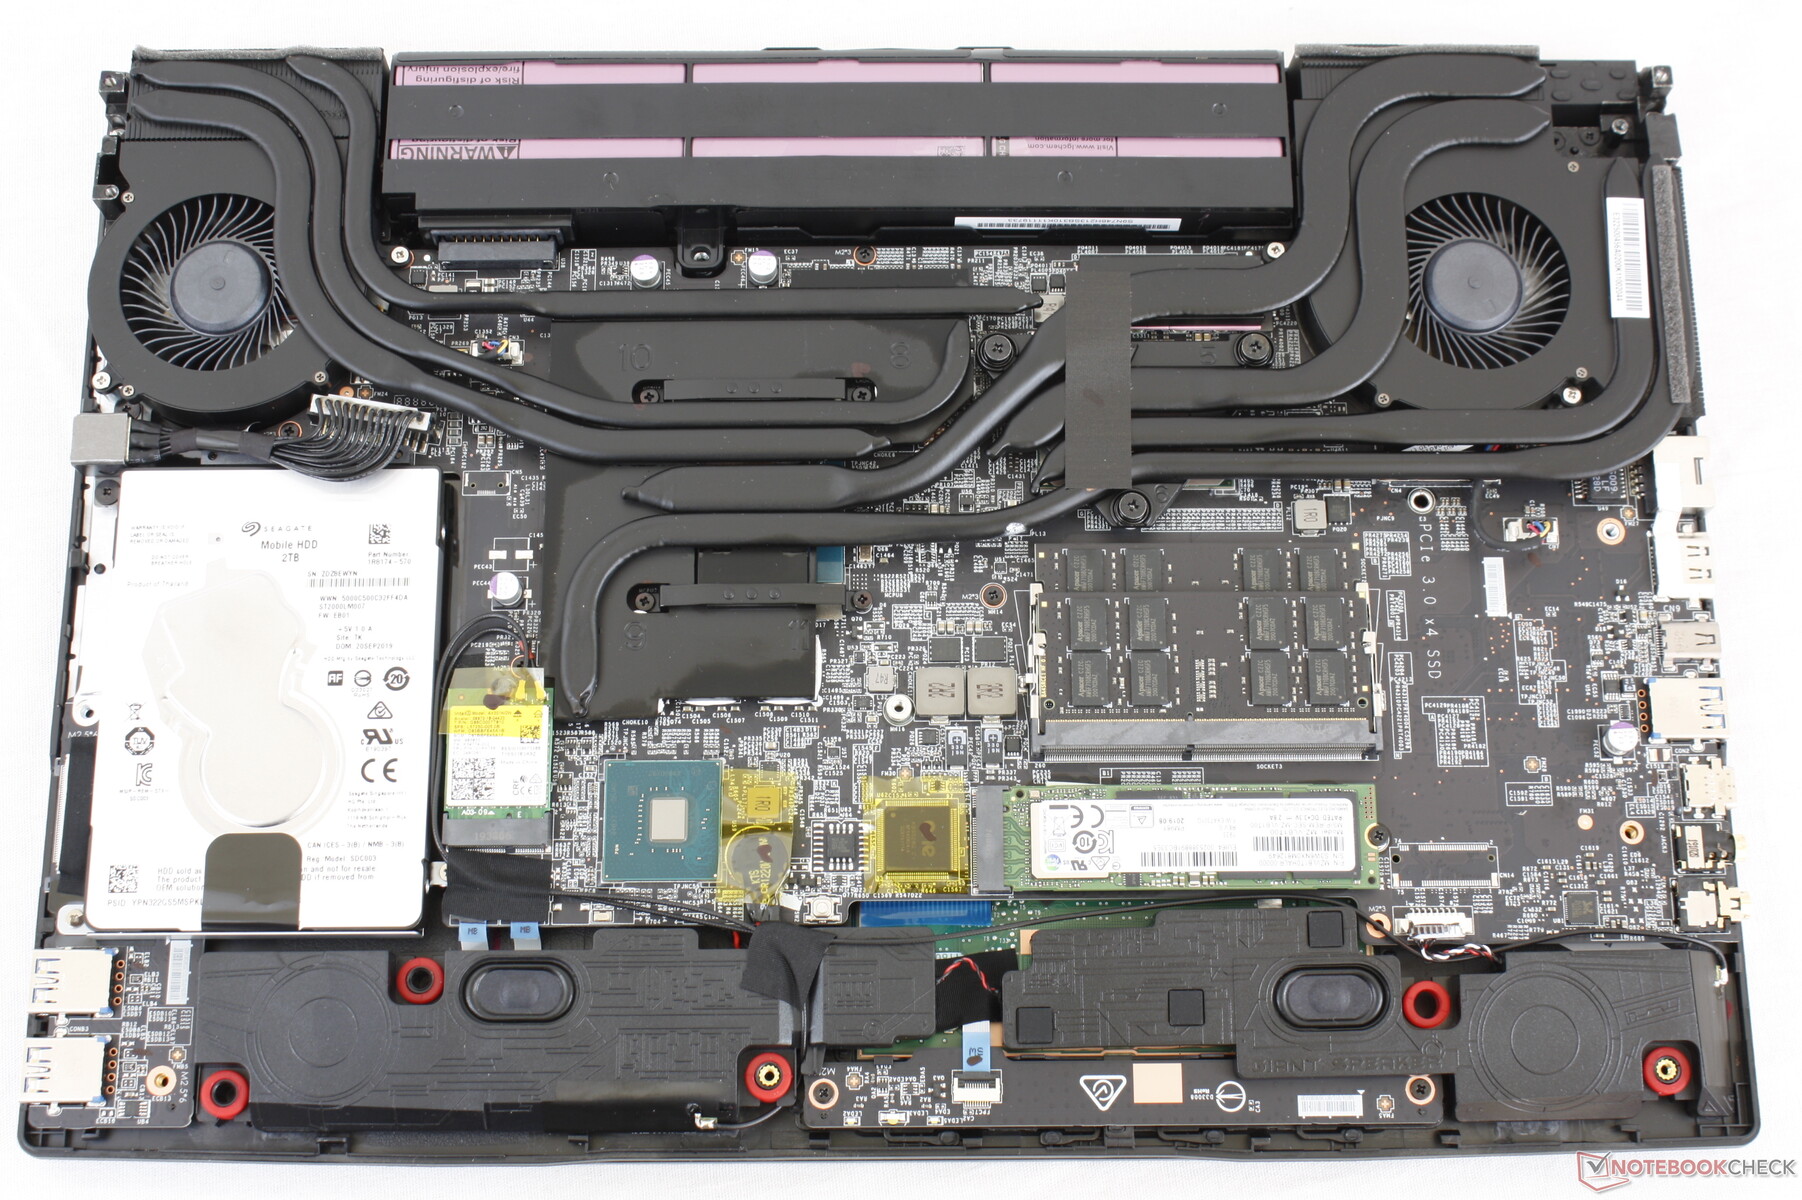
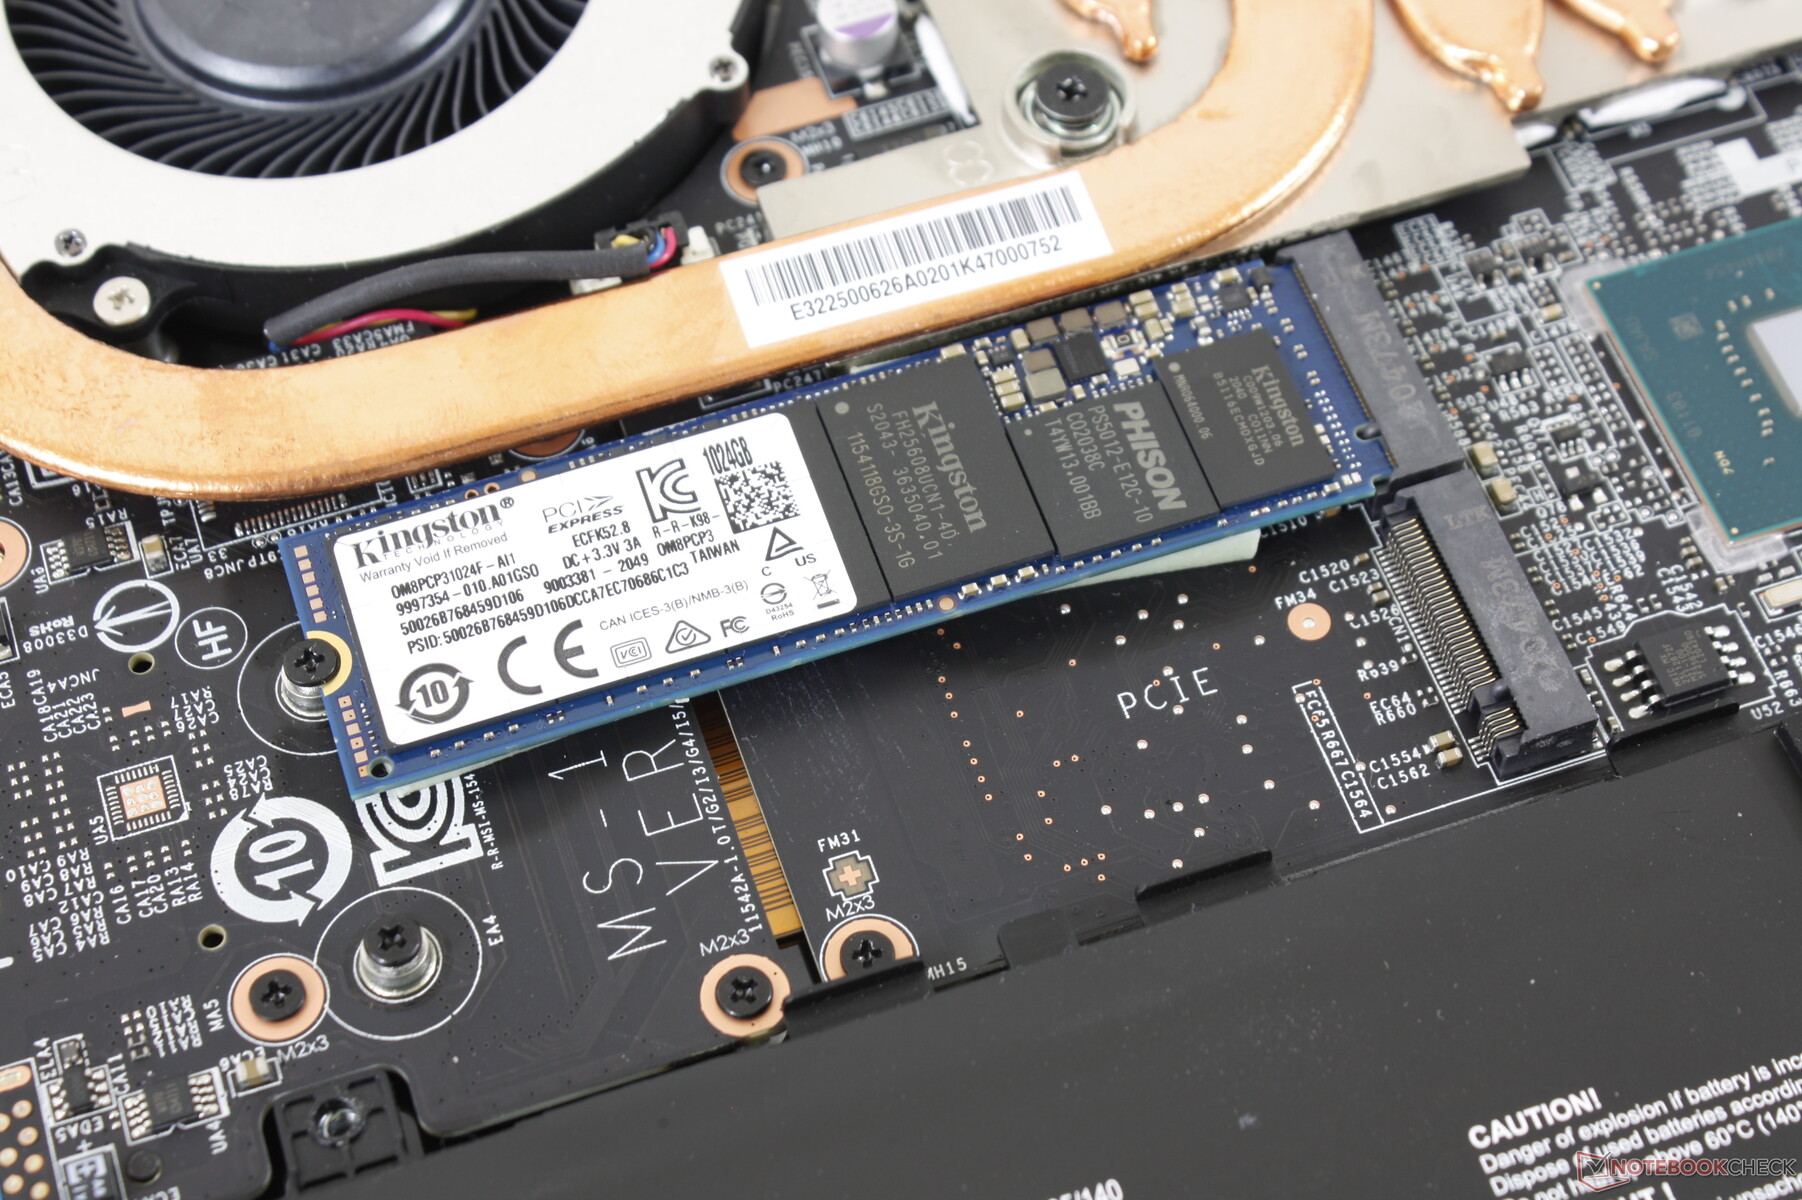
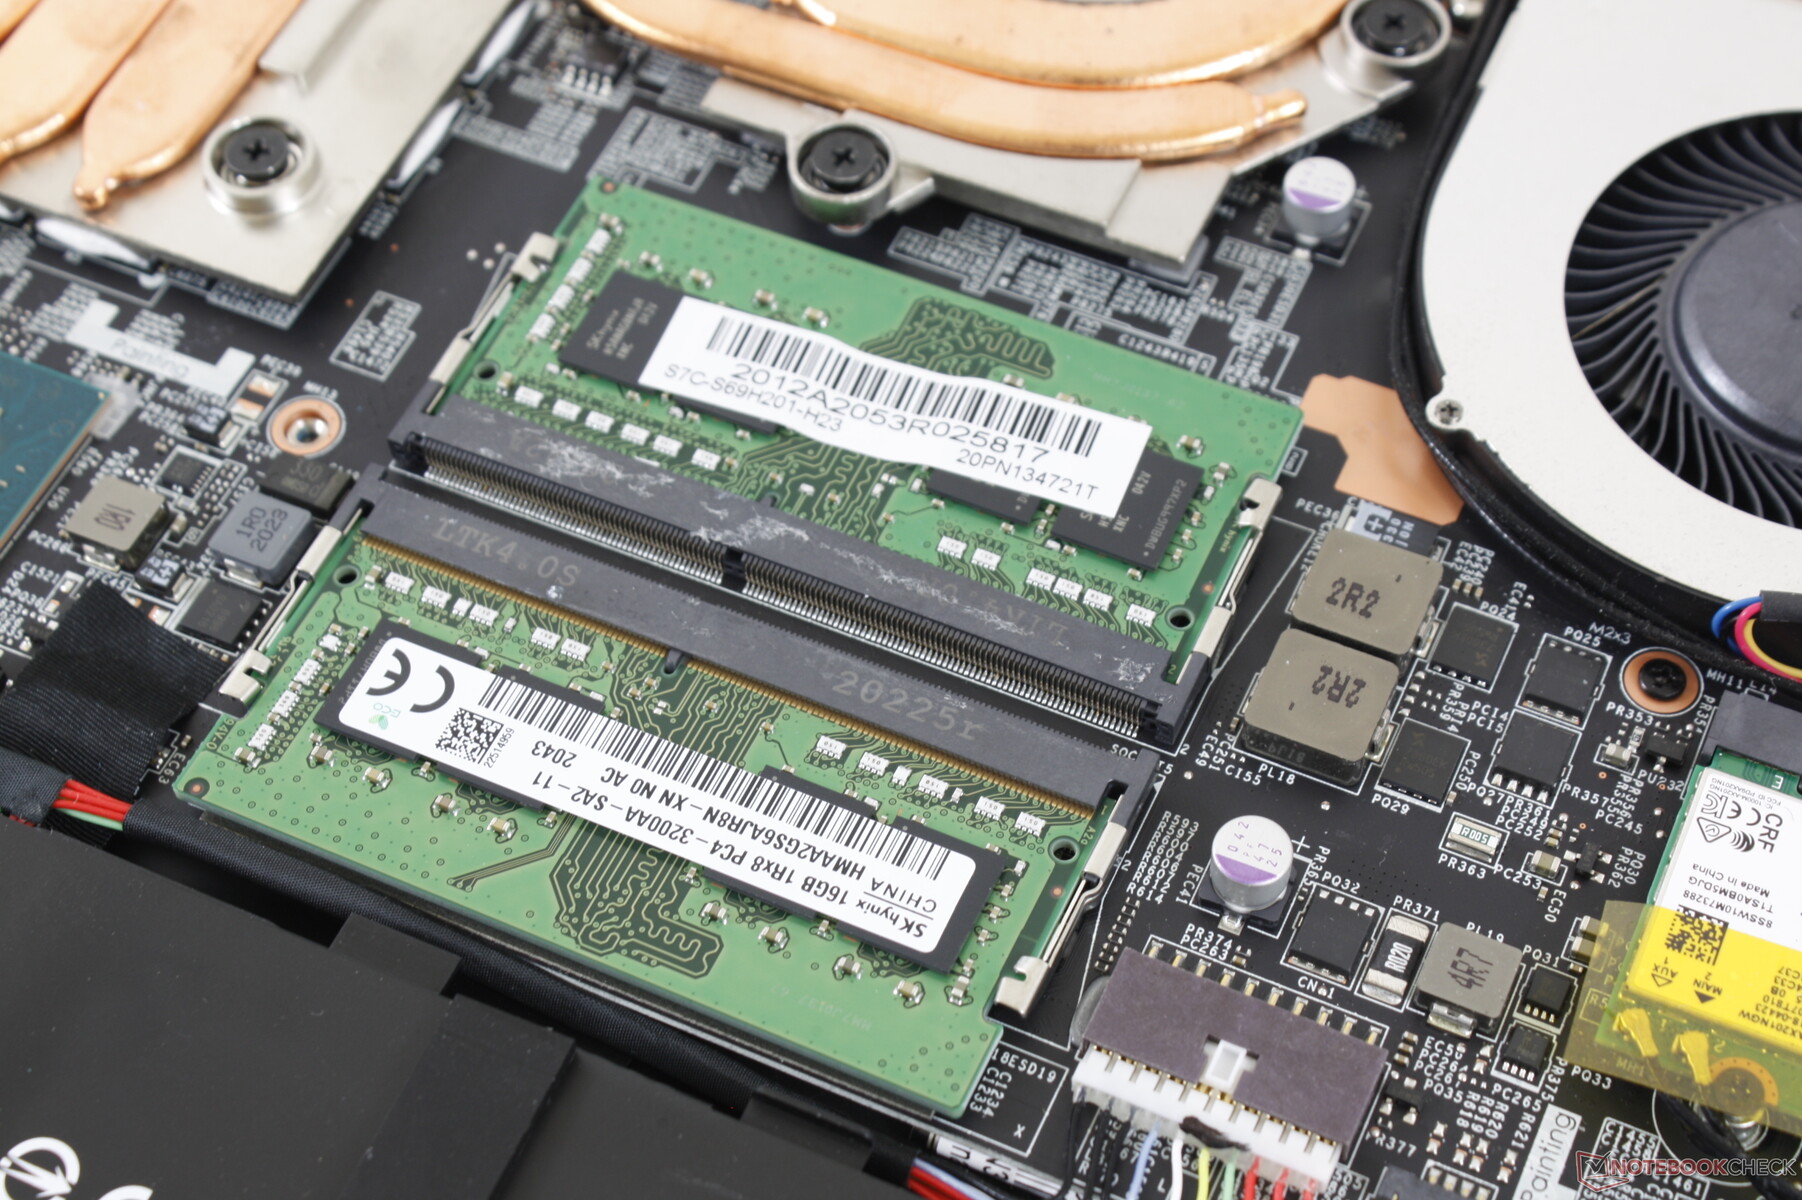
L'entretien est plus difficile que sur la GP65 car le panneau inférieur de la GP66 est beaucoup plus serré sur les bords et dans les coins. Un bord tranchant et une main attentive sont nécessaires pour retirer le panneau en toute sécurité. Une fois à l'intérieur, les utilisateurs auront un accès direct aux 2 slots M.2 2280, aux 2 SODIMM, à la batterie et au module WLAN.
Accessoires et garantie
Il n'y a pas d'extras dans la boîte, à part l'adaptateur secteur et les papiers. Le chiffon de nettoyage en velours qui est fourni avec les ordinateurs portables des séries GS et GT n'est pas inclus ici.
La garantie standard limitée d'un an du fabricant s'applique.
Périphériques d'entrée
Clavier
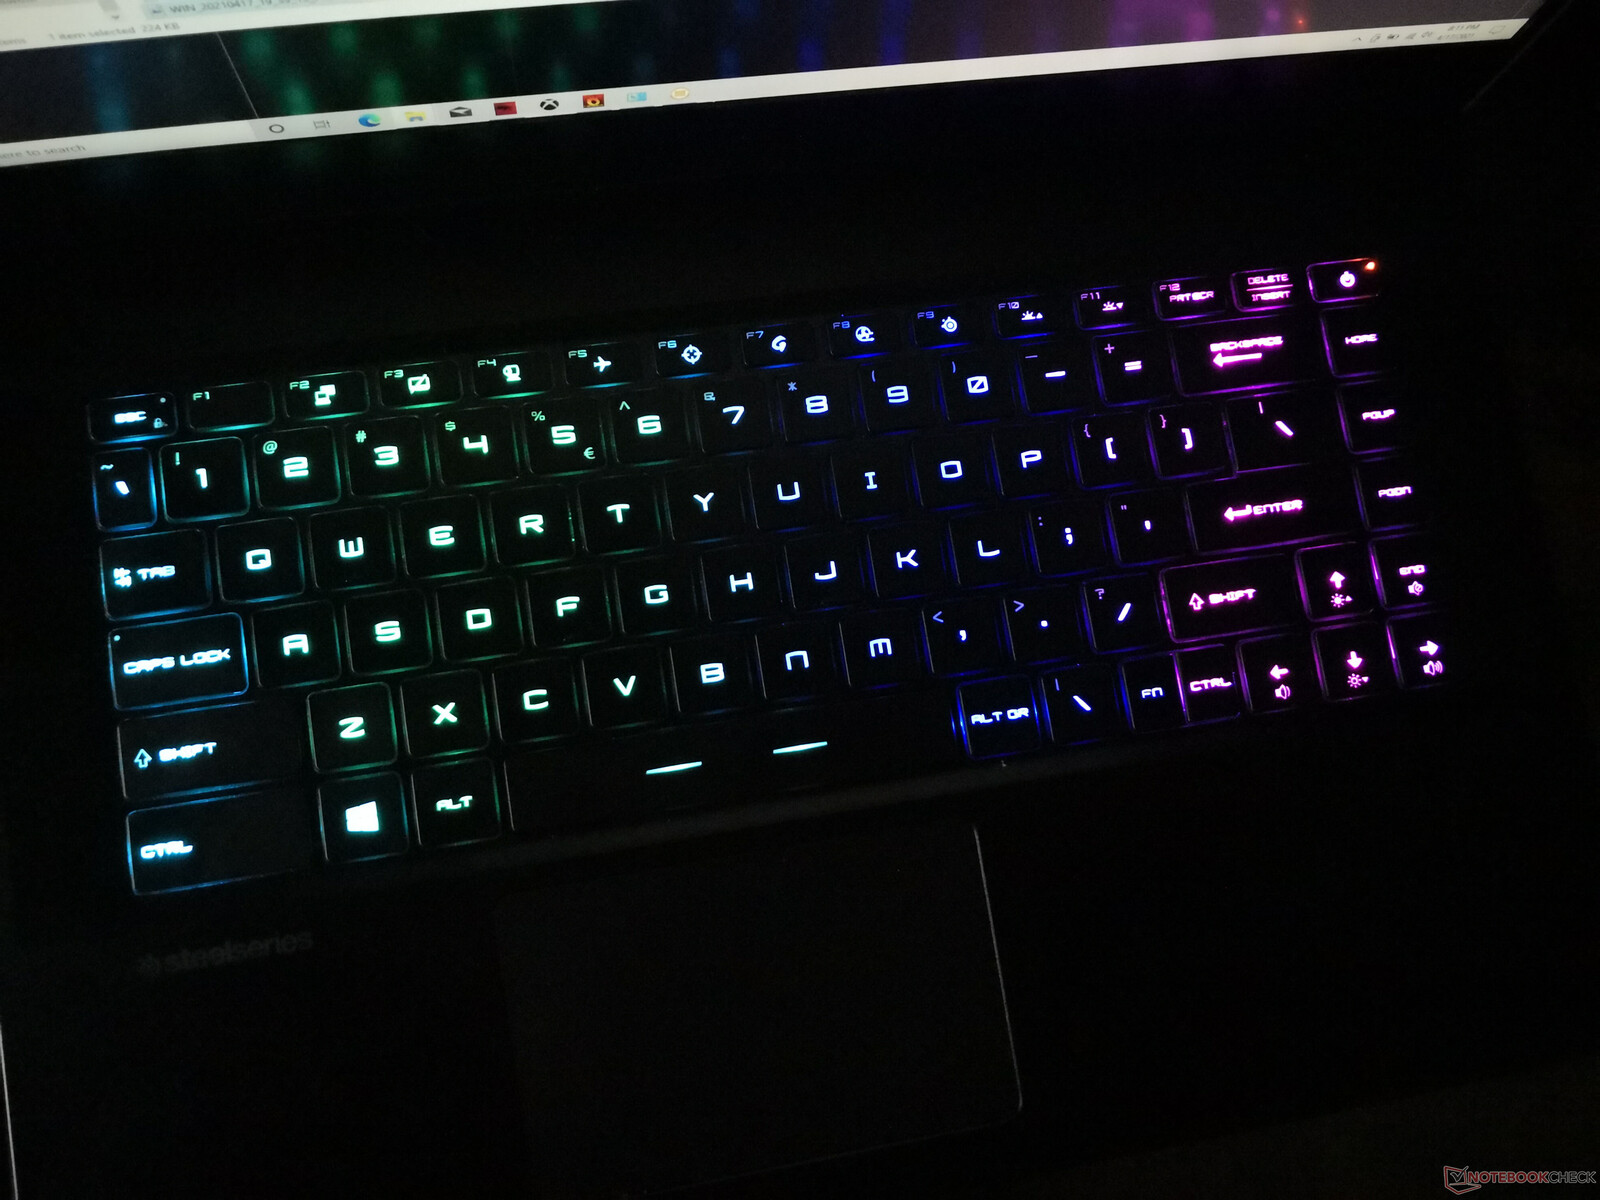
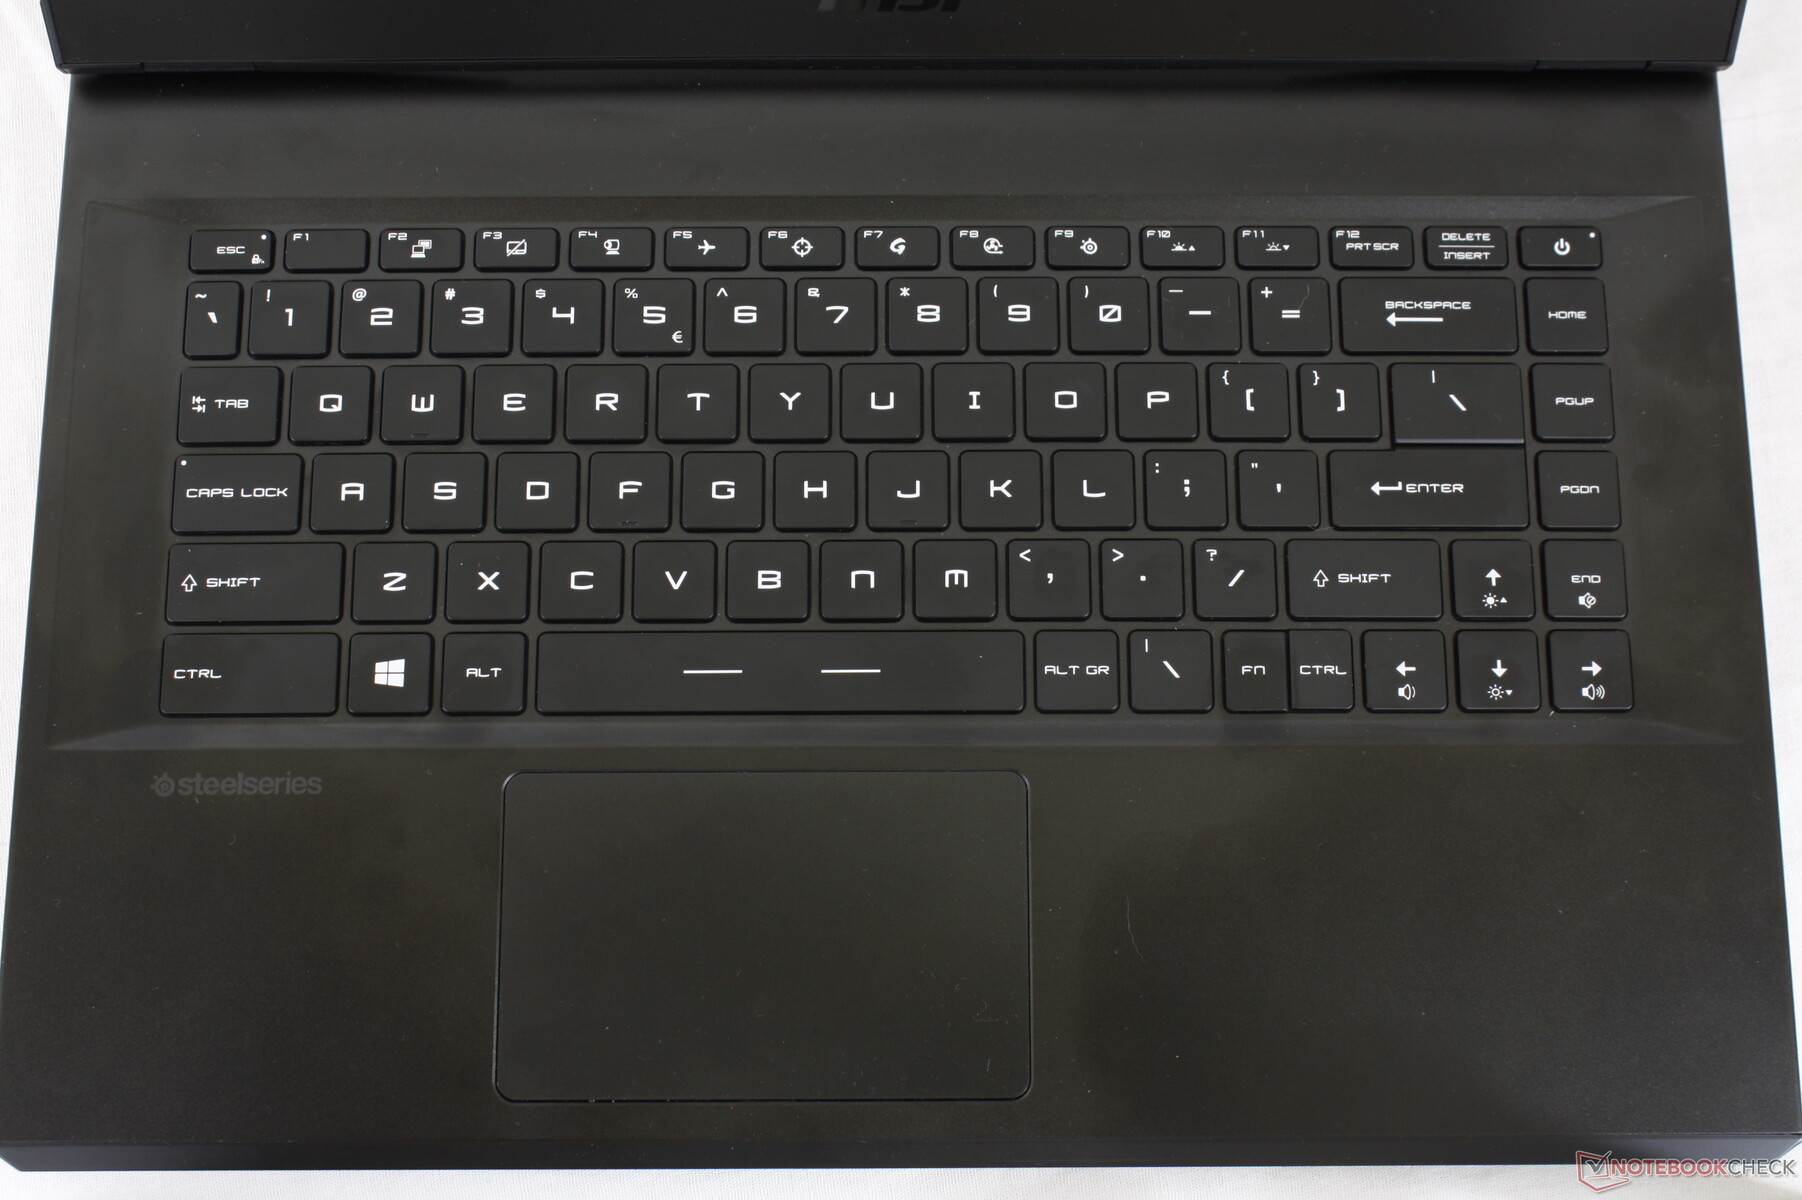
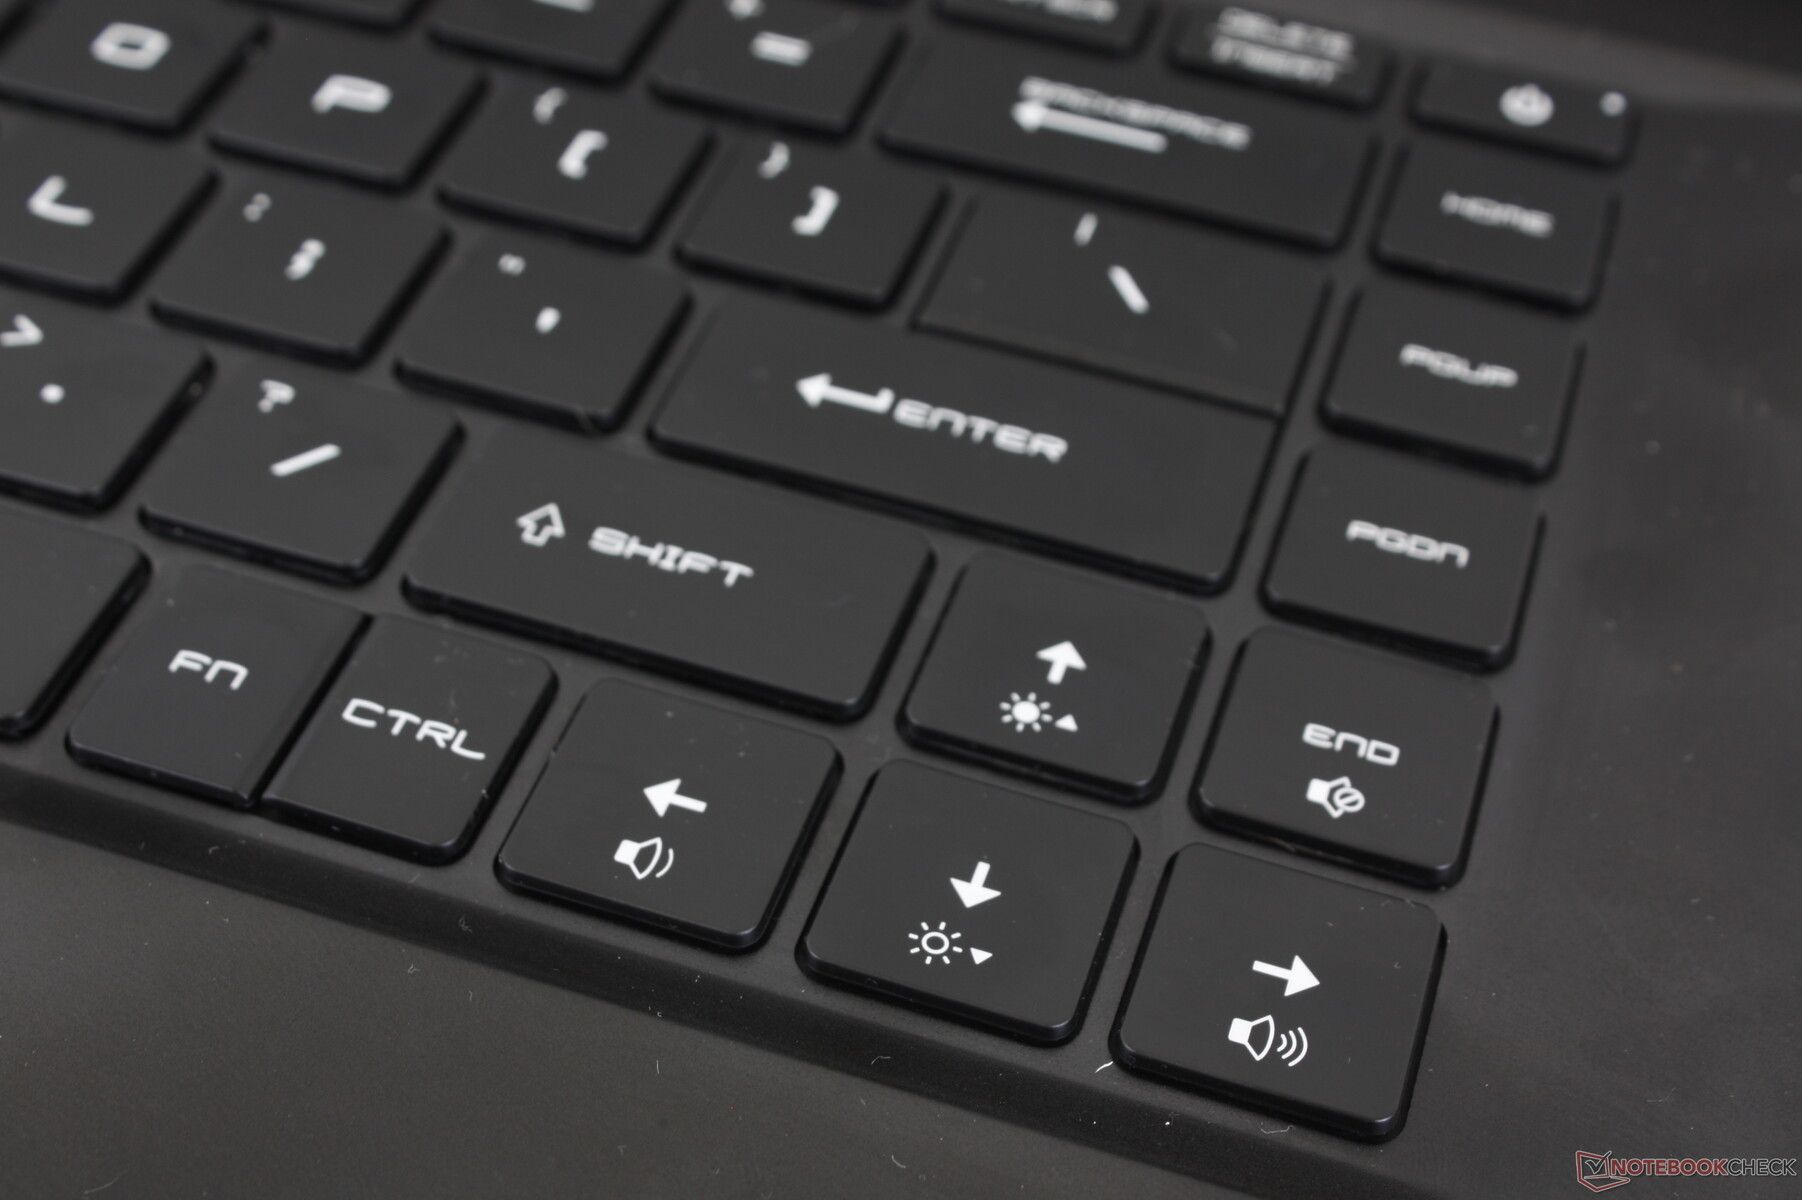
Le clavier est identique à celui du GE66 et est très différent de celui du GP65. Le NumPad, par exemple, a disparu et la course est plus courte, avec un retour d'information plus net. Le bruit est également légèrement plus fort et plus aigu qu'auparavant, notamment en ce qui concerne les touches Espace et Entrée
L'éclairage RVB par touche est de retour. L'éclairage pourrait toutefois être plus uniforme, car les symboles des touches secondaires ( !, @, #, etc.) ne sont pas aussi brillants que les symboles principaux (1, 2, 3, etc.).
Pavé tactile
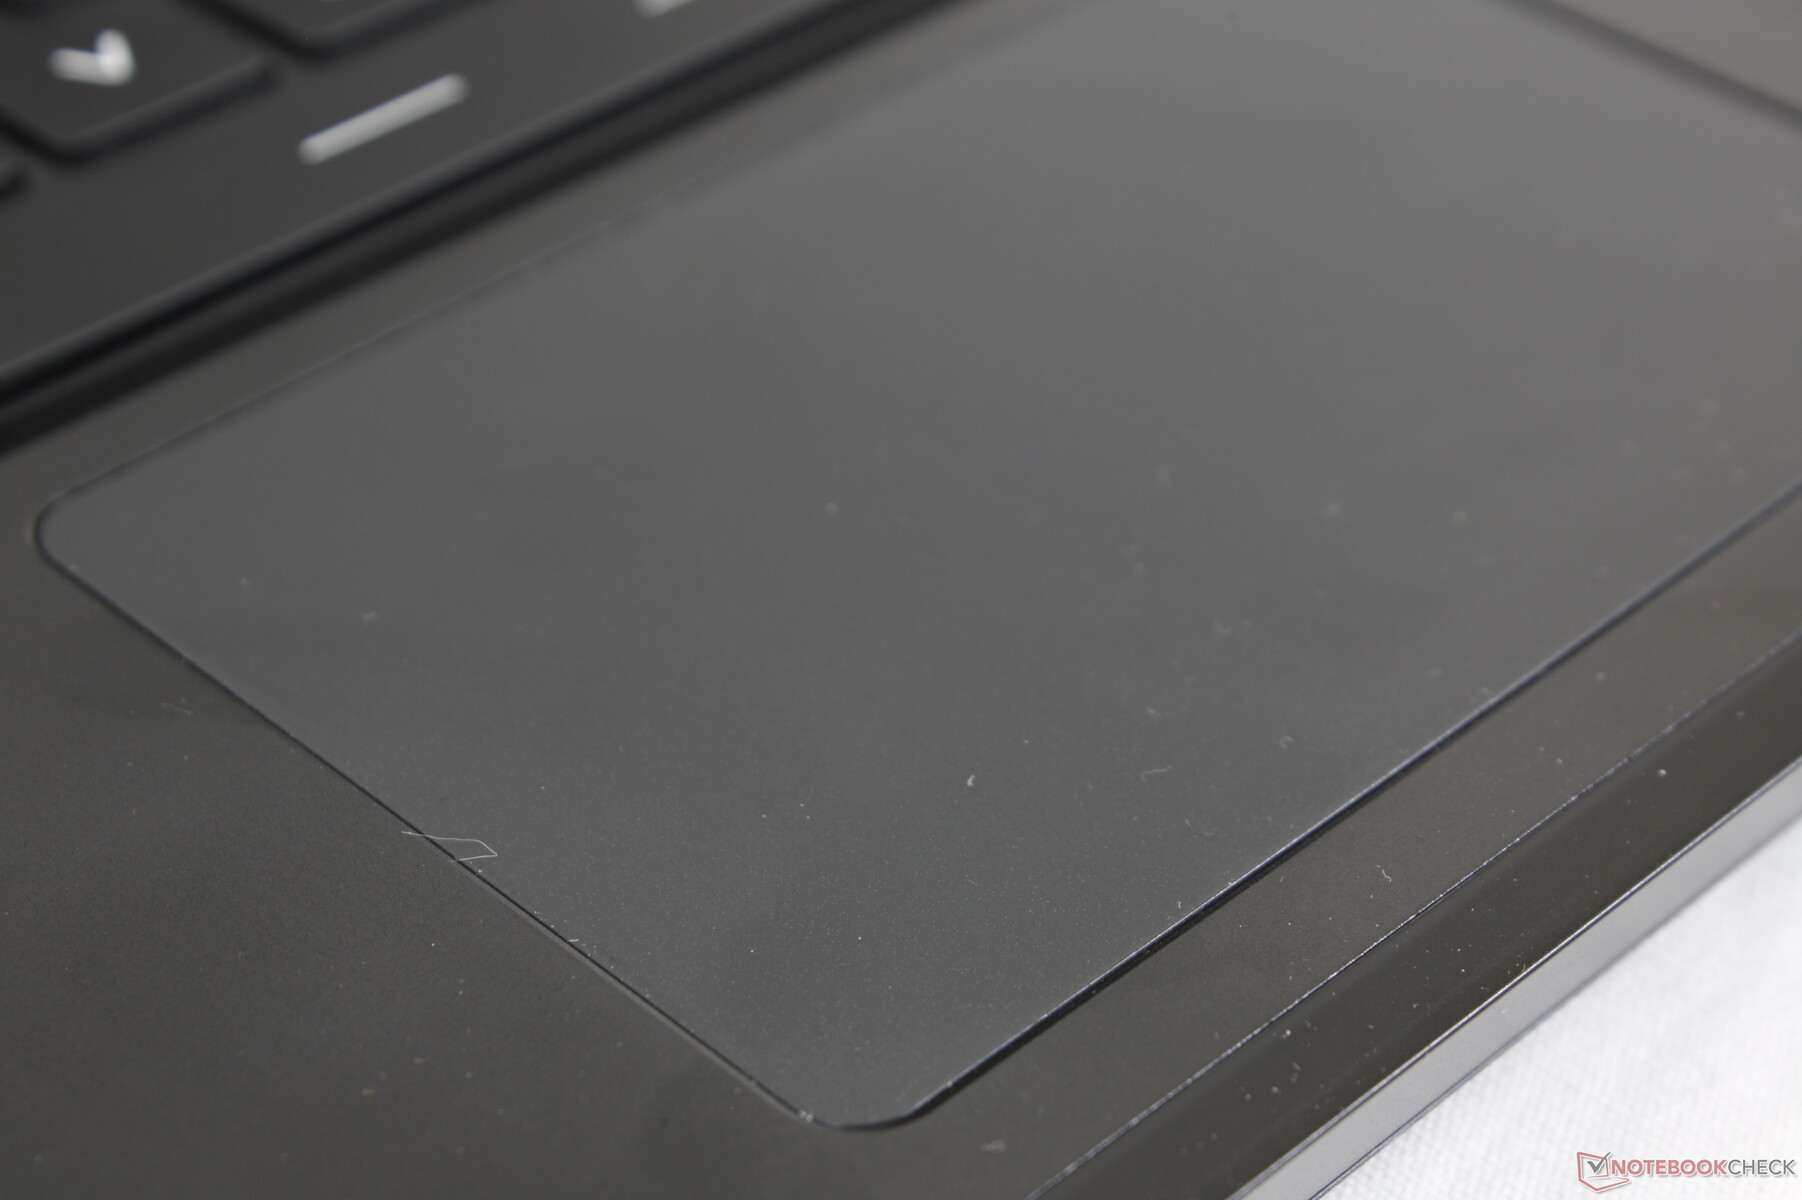
Le pavé tactile en plastique est relativement petit (10,5 x 6,5 cm), avec une glisse douce à vitesse moyenne et un peu d'adhérence à vitesse plus lentepour des clics plus précis. Ses touches de clic intégrées sont spongieuses et nécessitent plus de force que d'habitude pour être enregistrées, ce qui peut devenir fatigant si vous n'avez pas de souris externe. Bien que le nouveau pavé tactile soit utilisable, nous regrettons les boutons de souris dédiés et le pavé tactile plus ferme de l'ancien GP65.

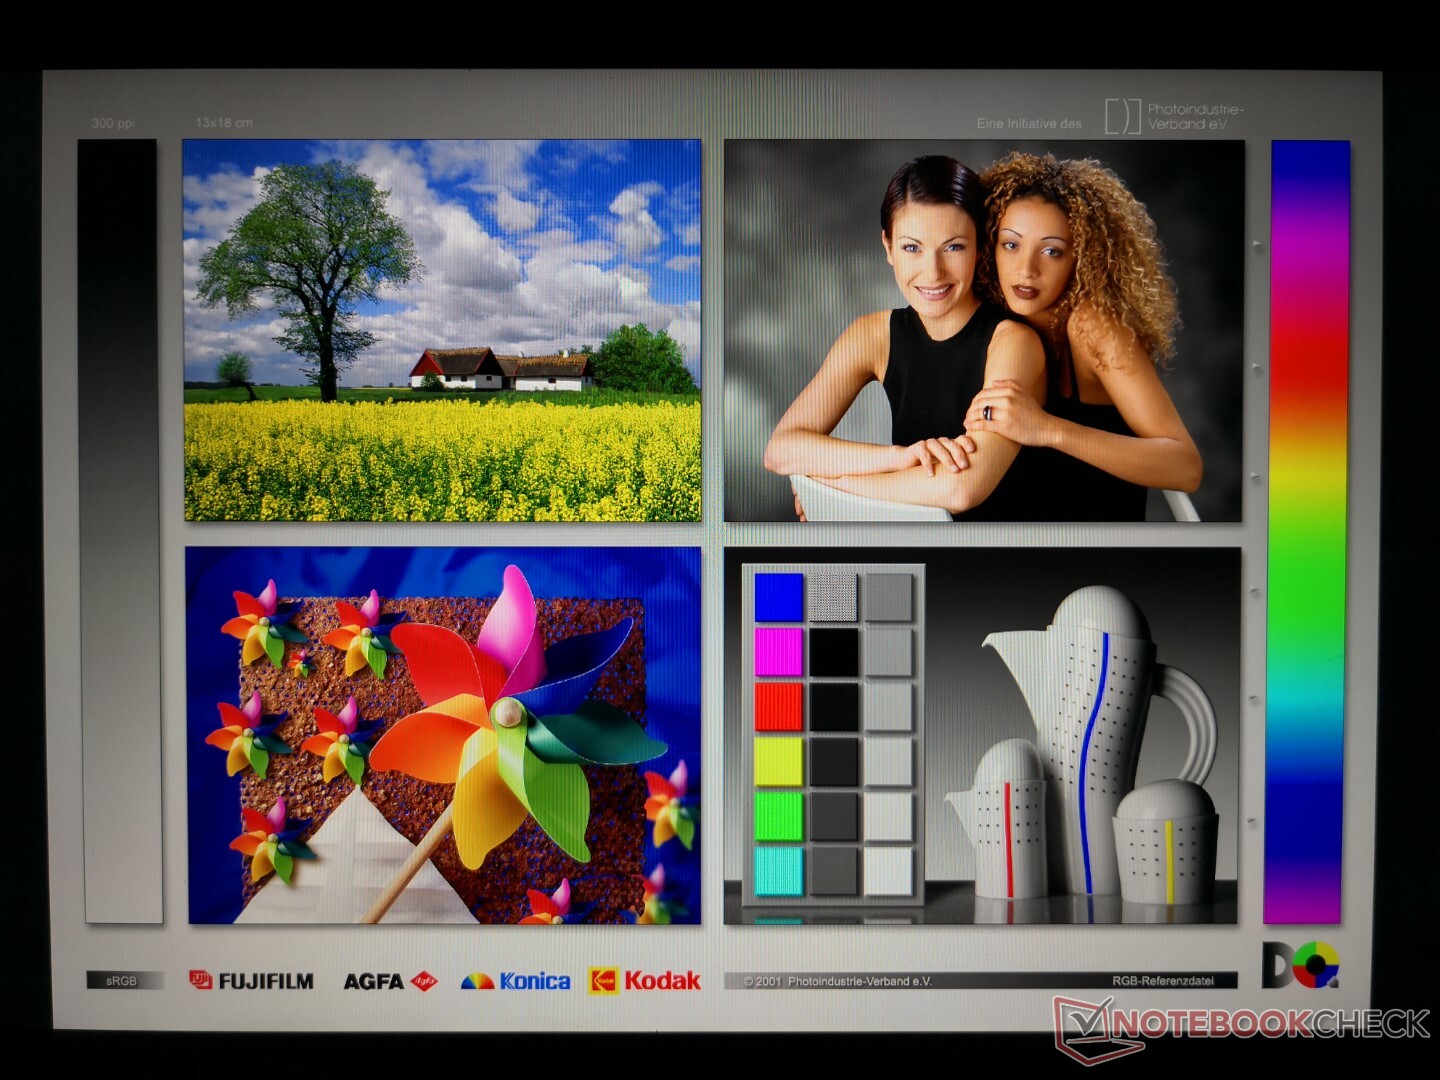
Afficher
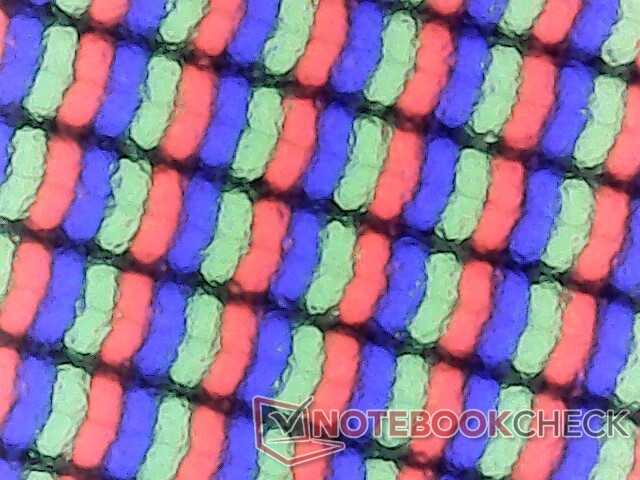
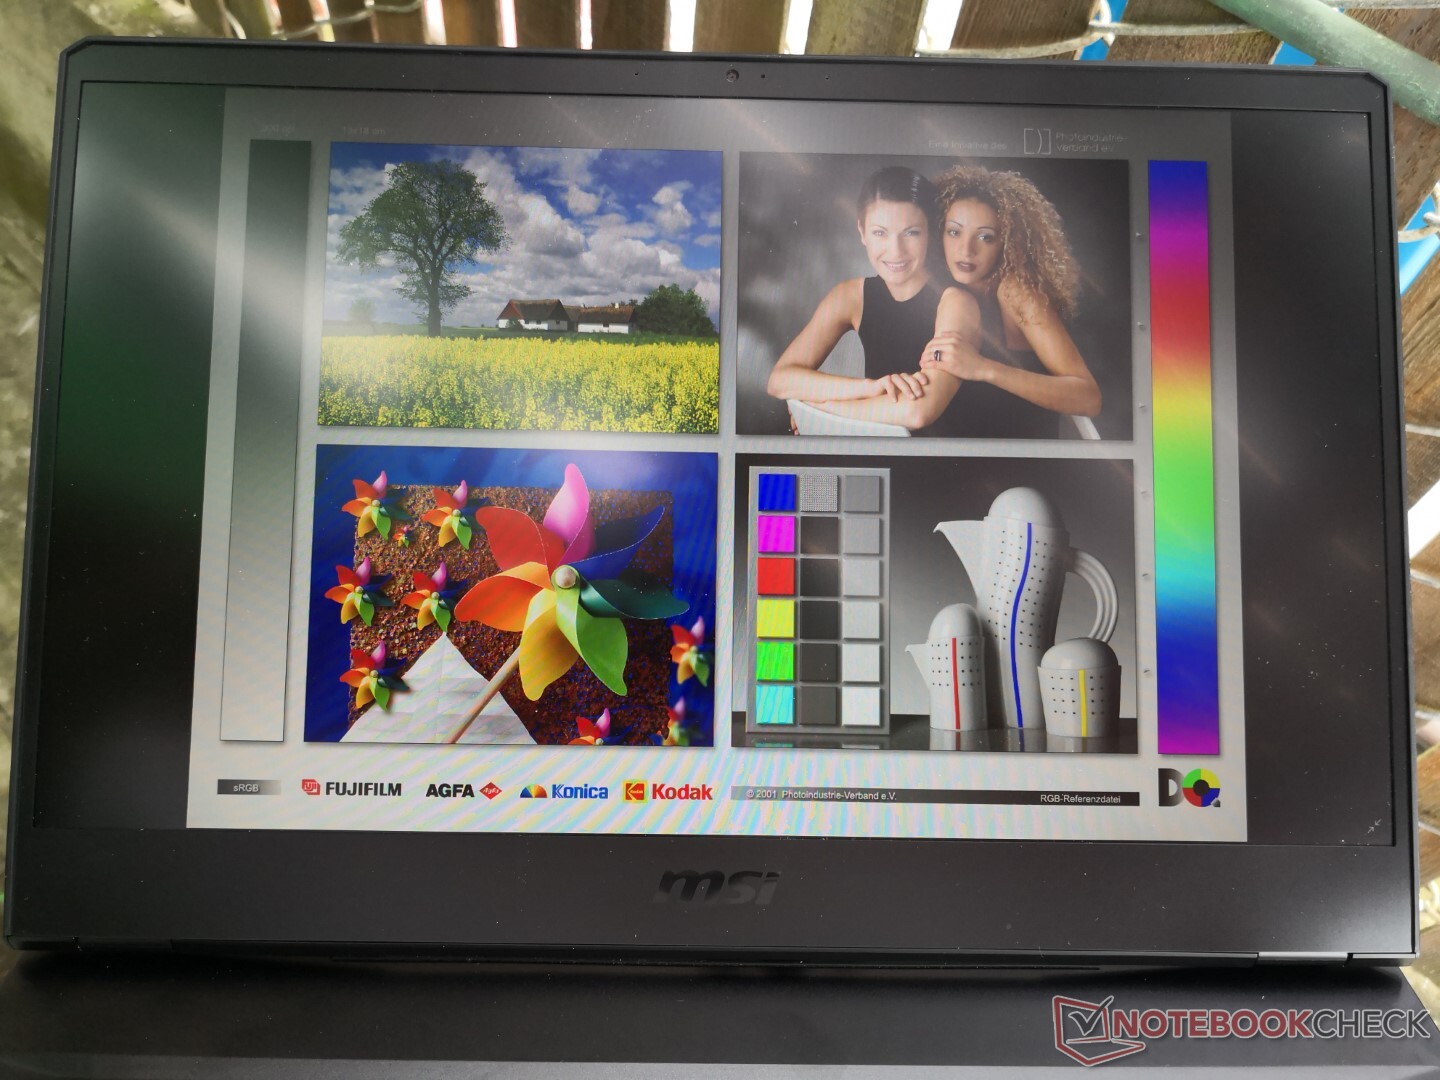
Notre configuration GP66 10UG utilise la même dalle Sharp LQ156M1JW03 240 Hz que celle du GE66 10SFS, GS65 Stealth 9SGRazer Blade 15, et Aorus 15P XC. Les couleurs, le contraste et les temps de réponse sont donc similaires entre tous ces ordinateurs portables, ce qui est une bonne chose puisque beaucoup de ces modèles sont des systèmes de jeu haut de gamme.
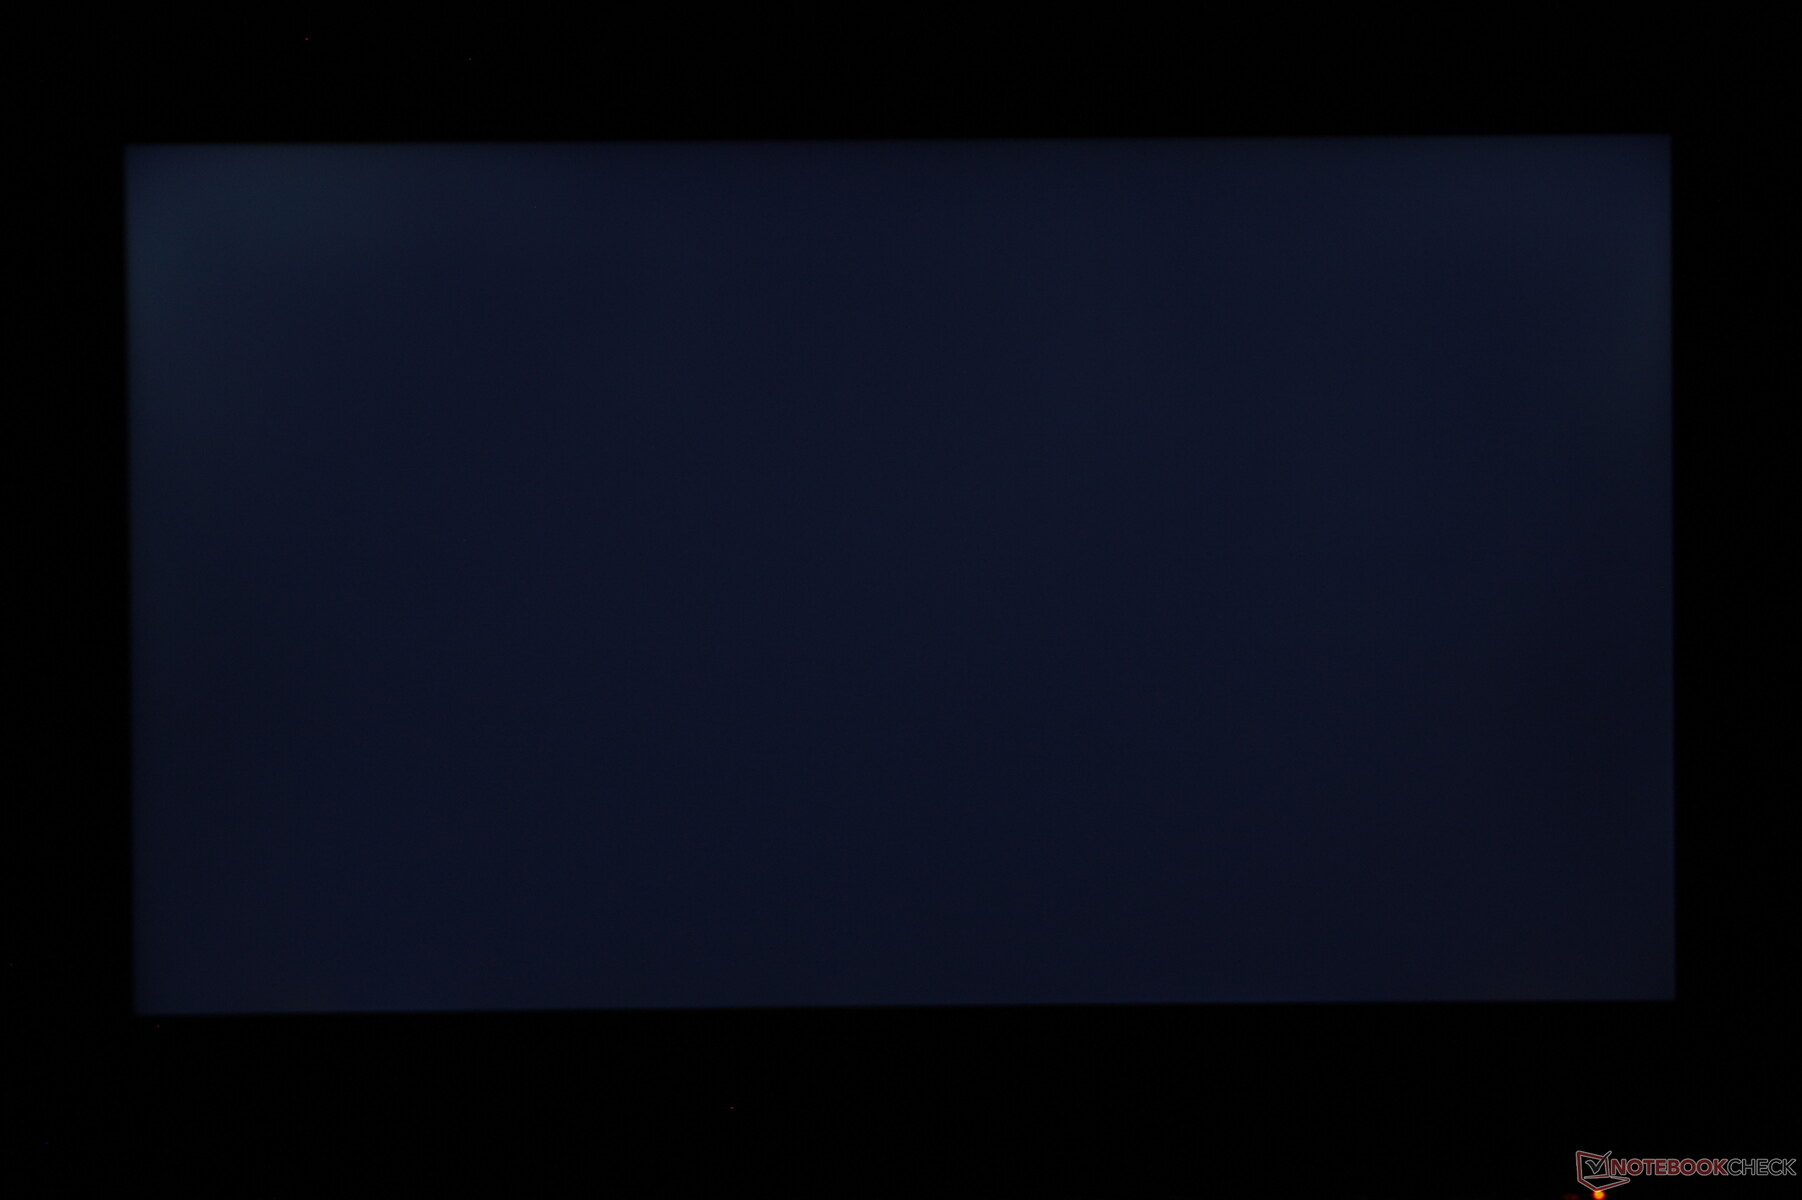
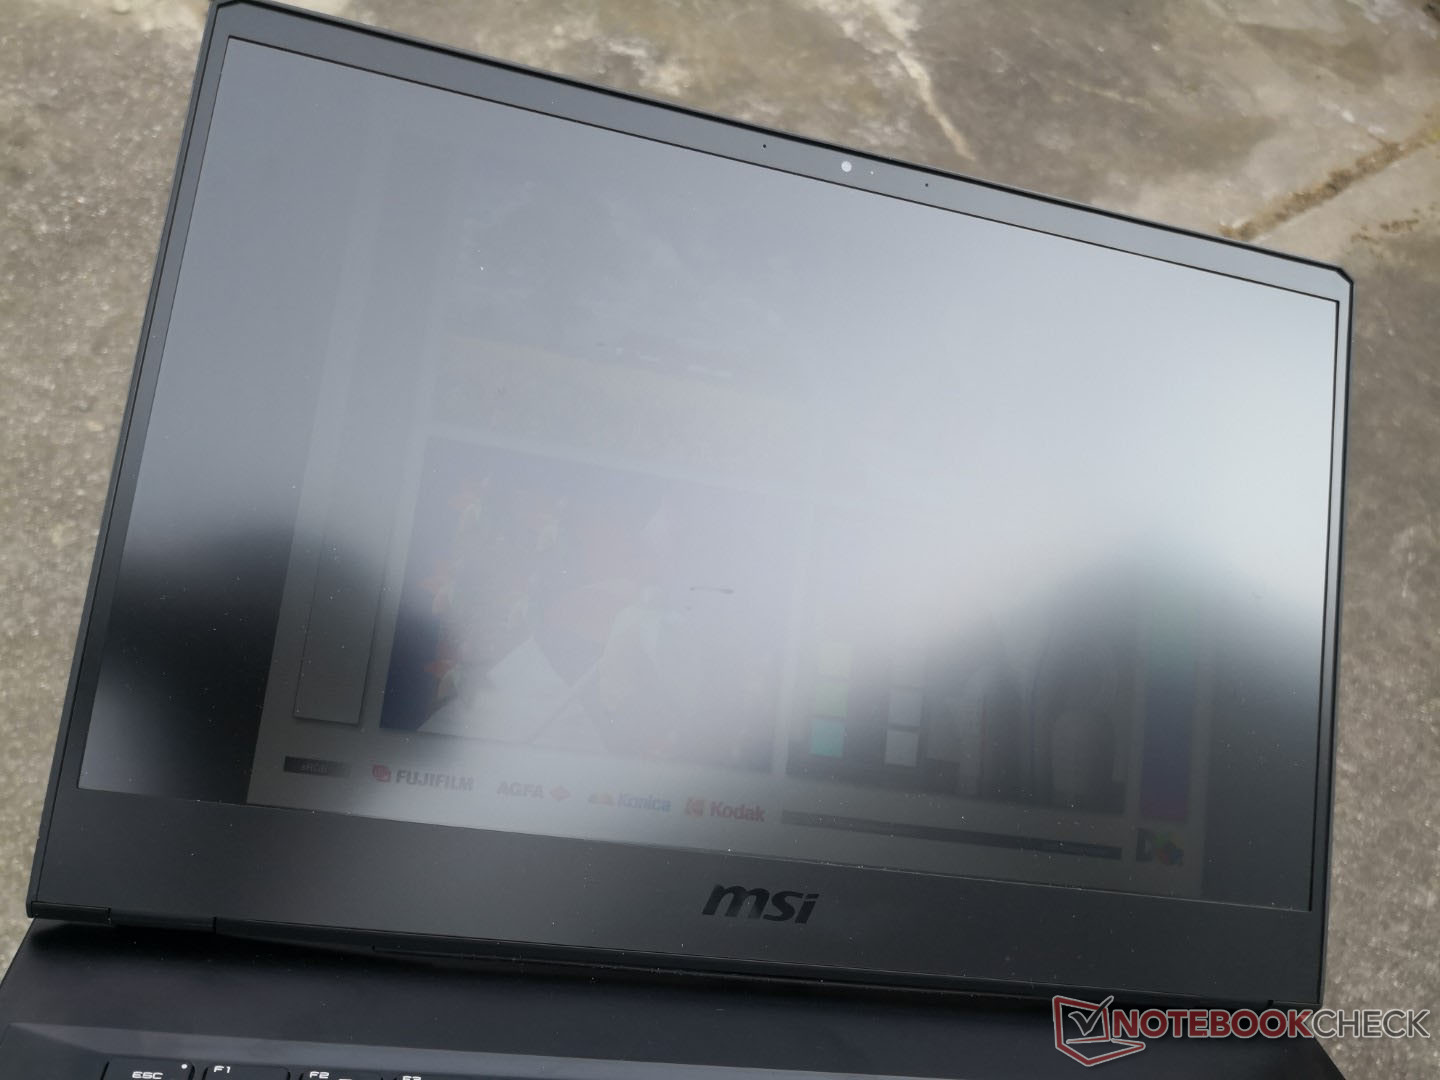
La principale différence de l'écran du GP66 par rapport aux ordinateurs portables susmentionnés est qu'il est nettement moins lumineux. La luminosité maximale est d'environ 210 nits, alors que la plupart des autres ordinateurs portables de jeu ont une luminosité de 300 nits ou plus.
| |||||||||||||||||||||||||
Homogénéité de la luminosité: 83 %
Valeur mesurée au centre, sur batterie: 225.9 cd/m²
Contraste: 982:1 (Valeurs des noirs: 0.23 cd/m²)
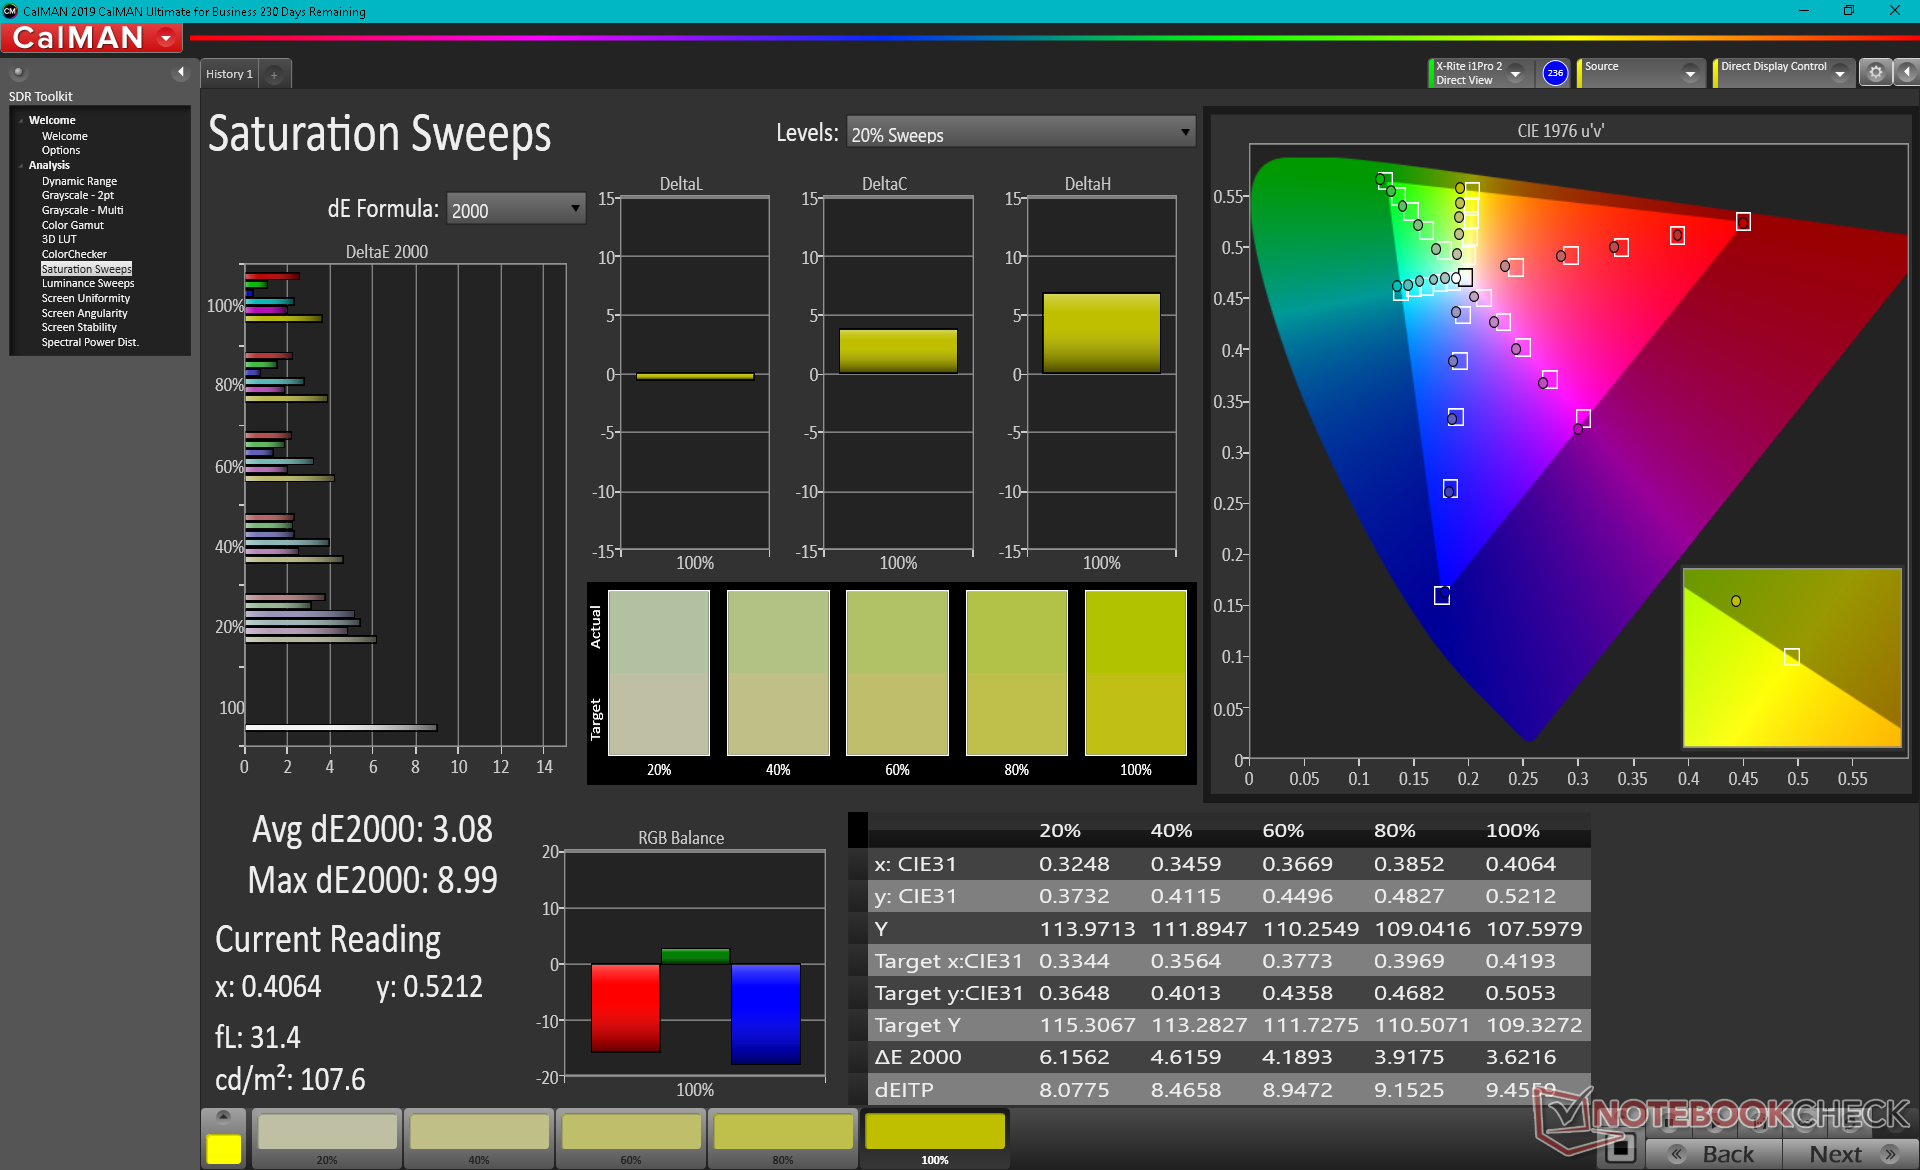
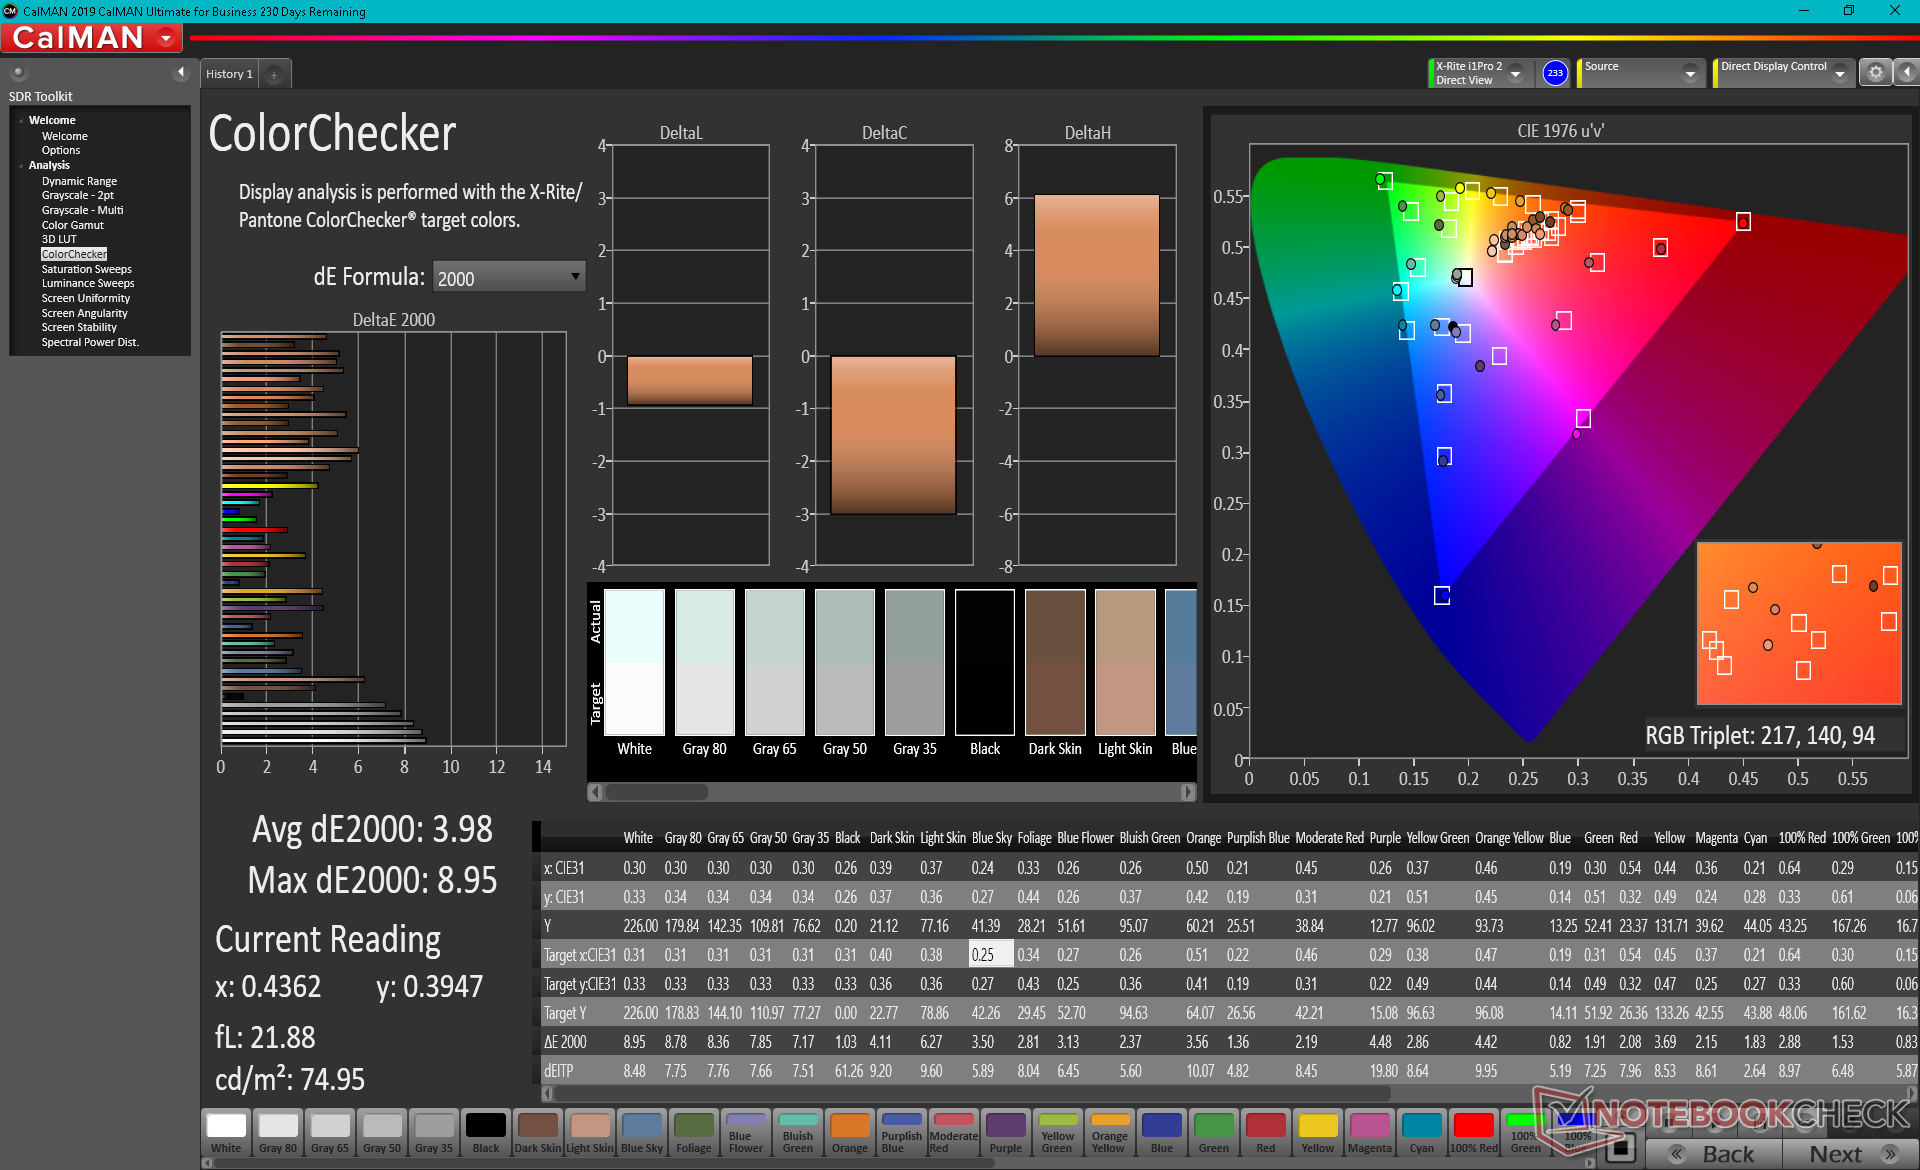
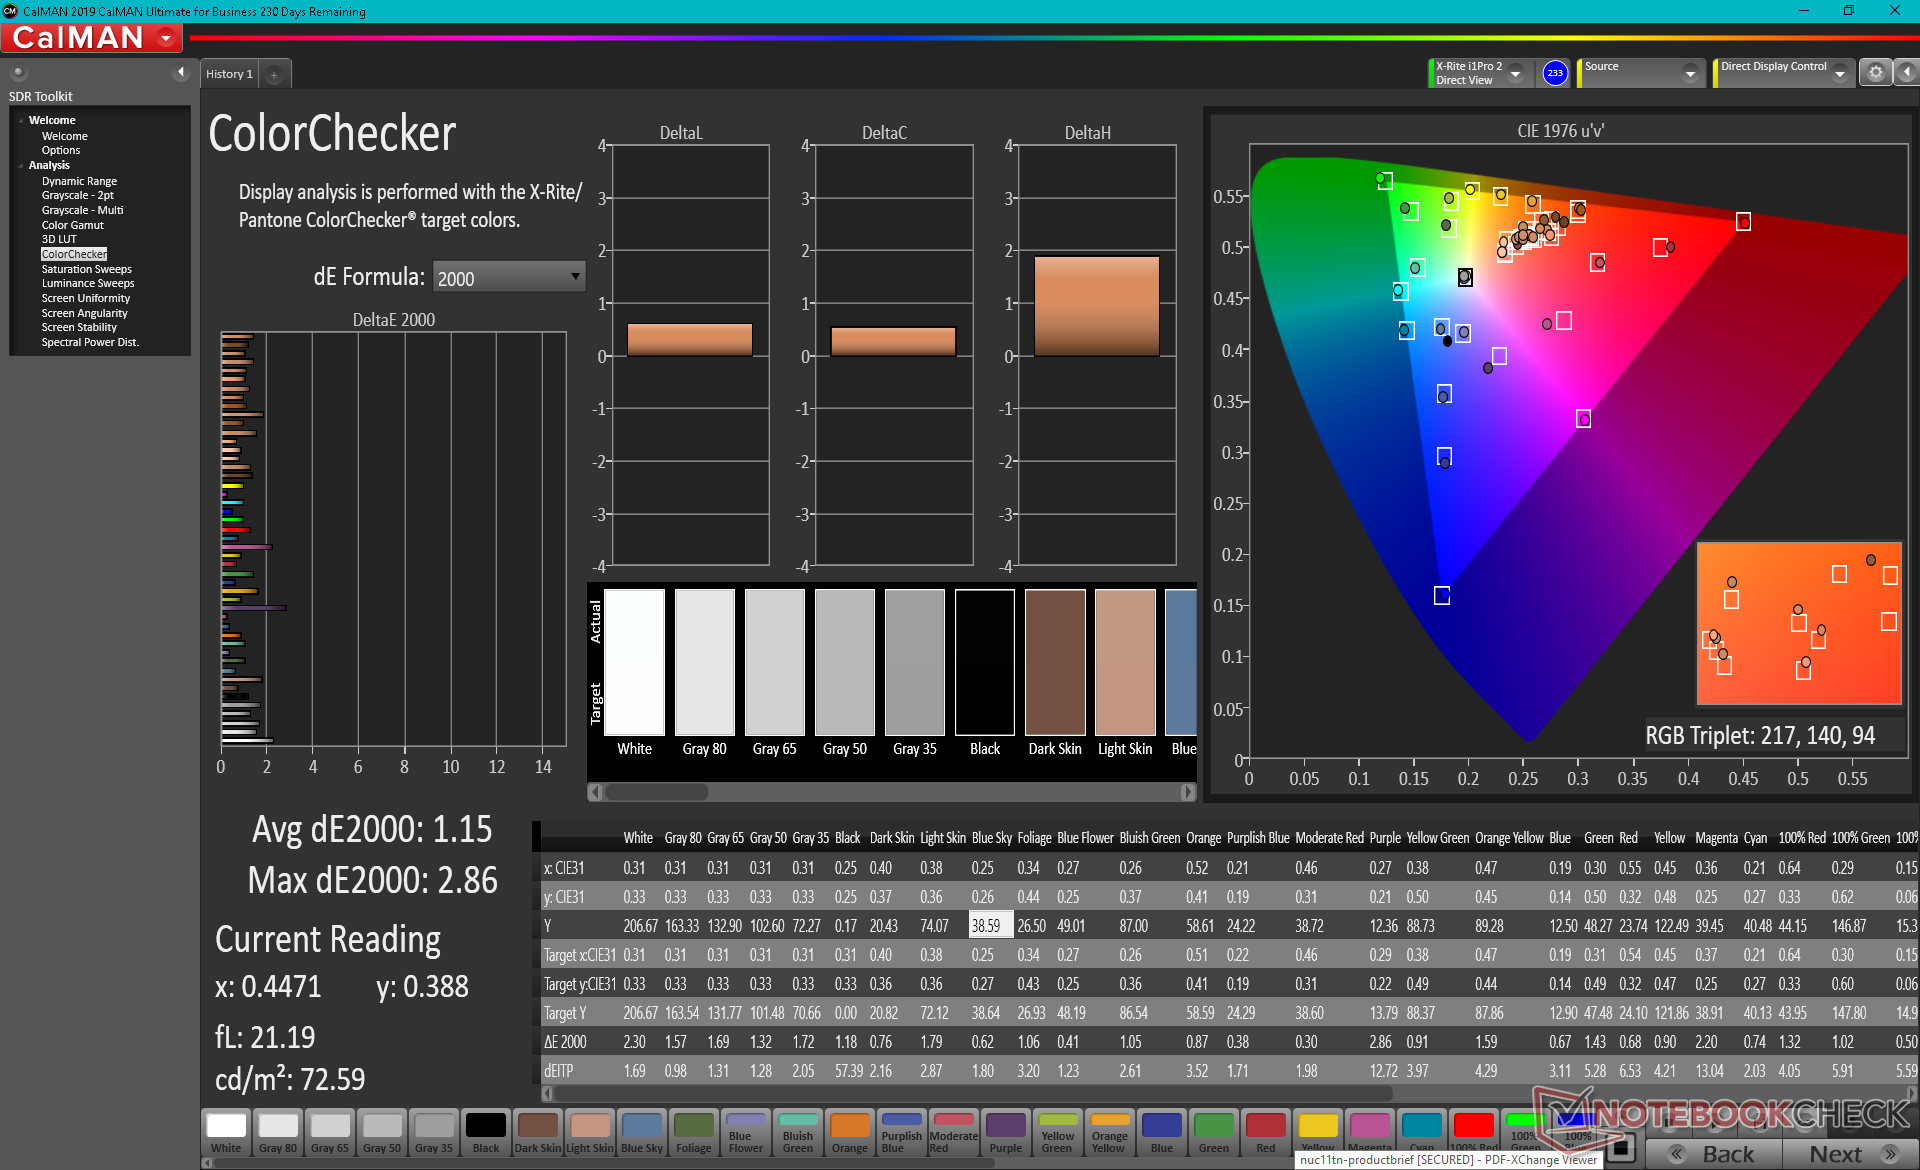
ΔE ColorChecker Calman: 3.98 | ∀{0.5-29.43 Ø4.71}
calibrated: 1.15
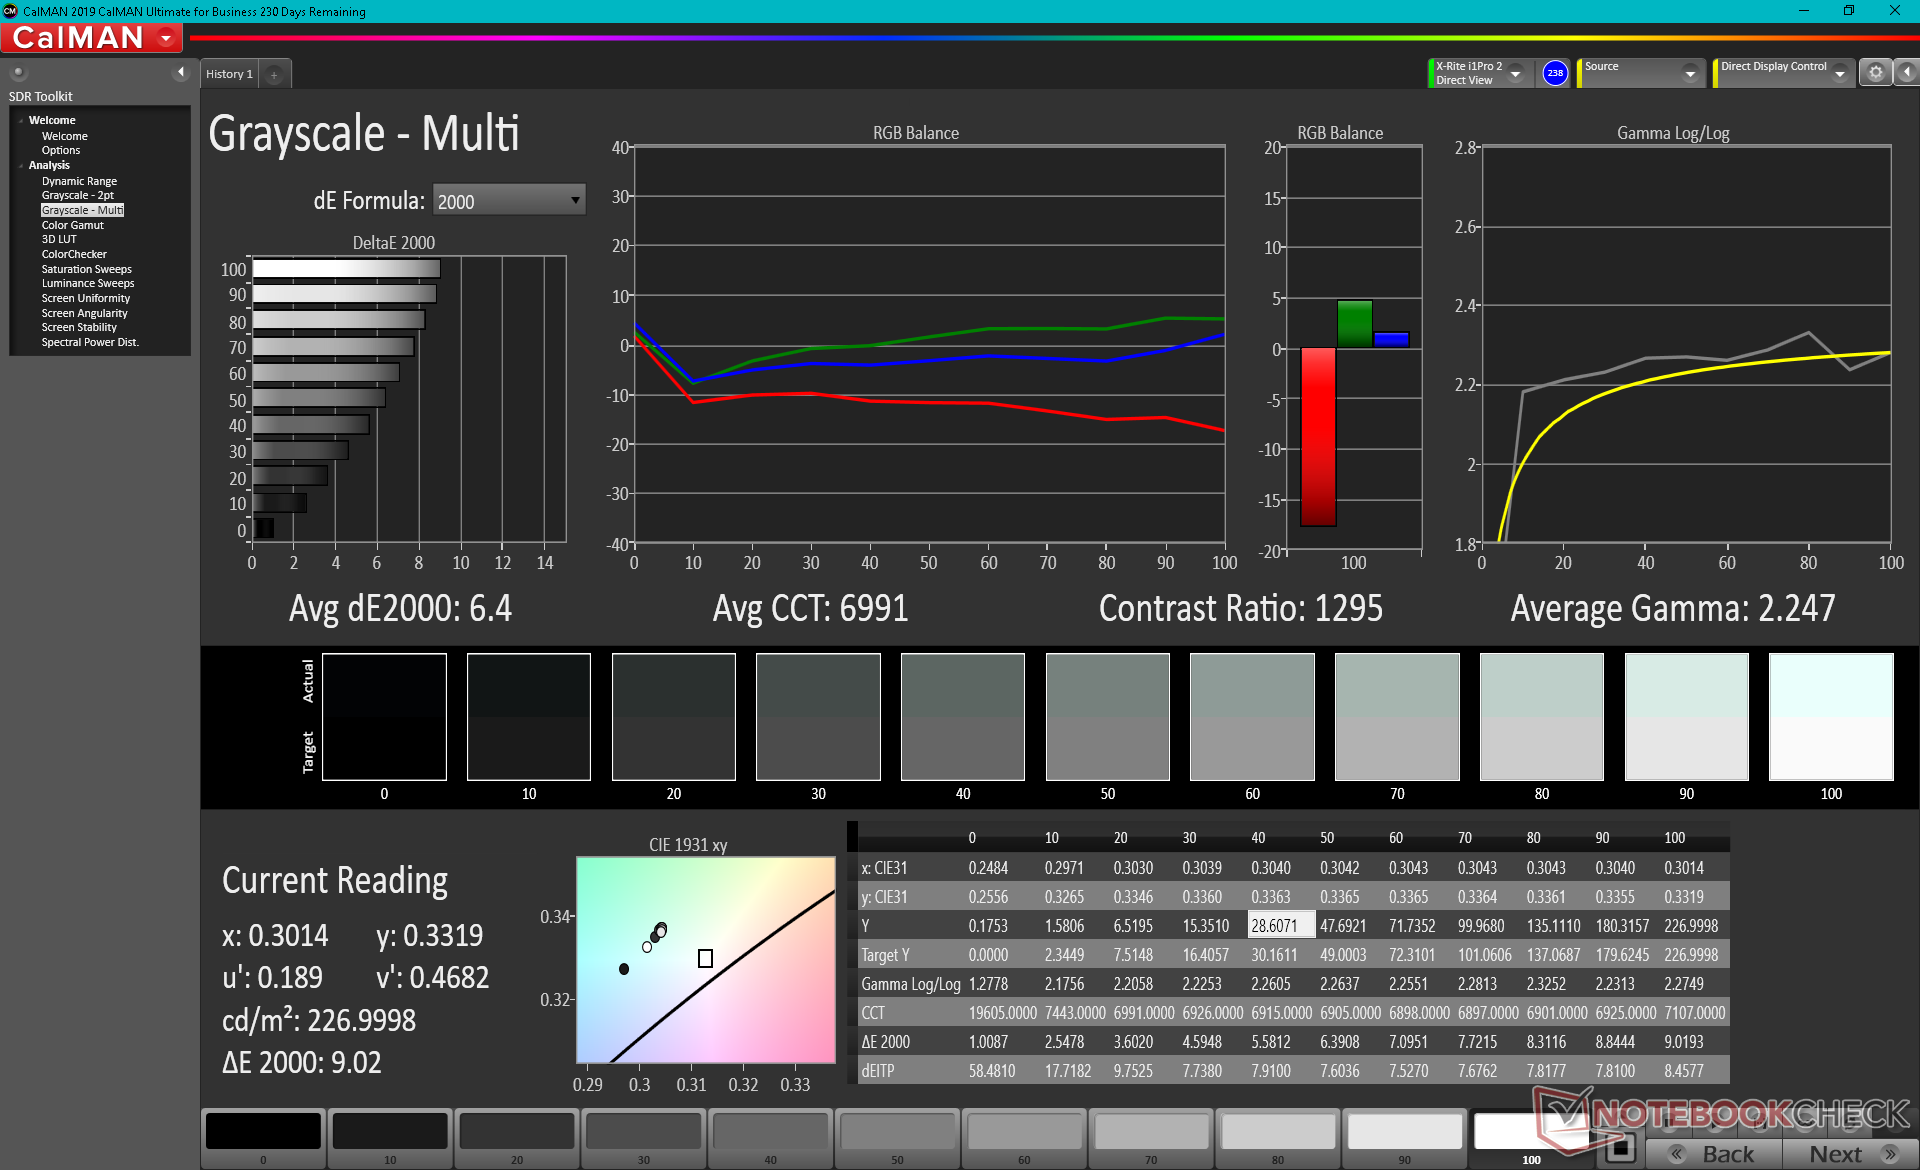
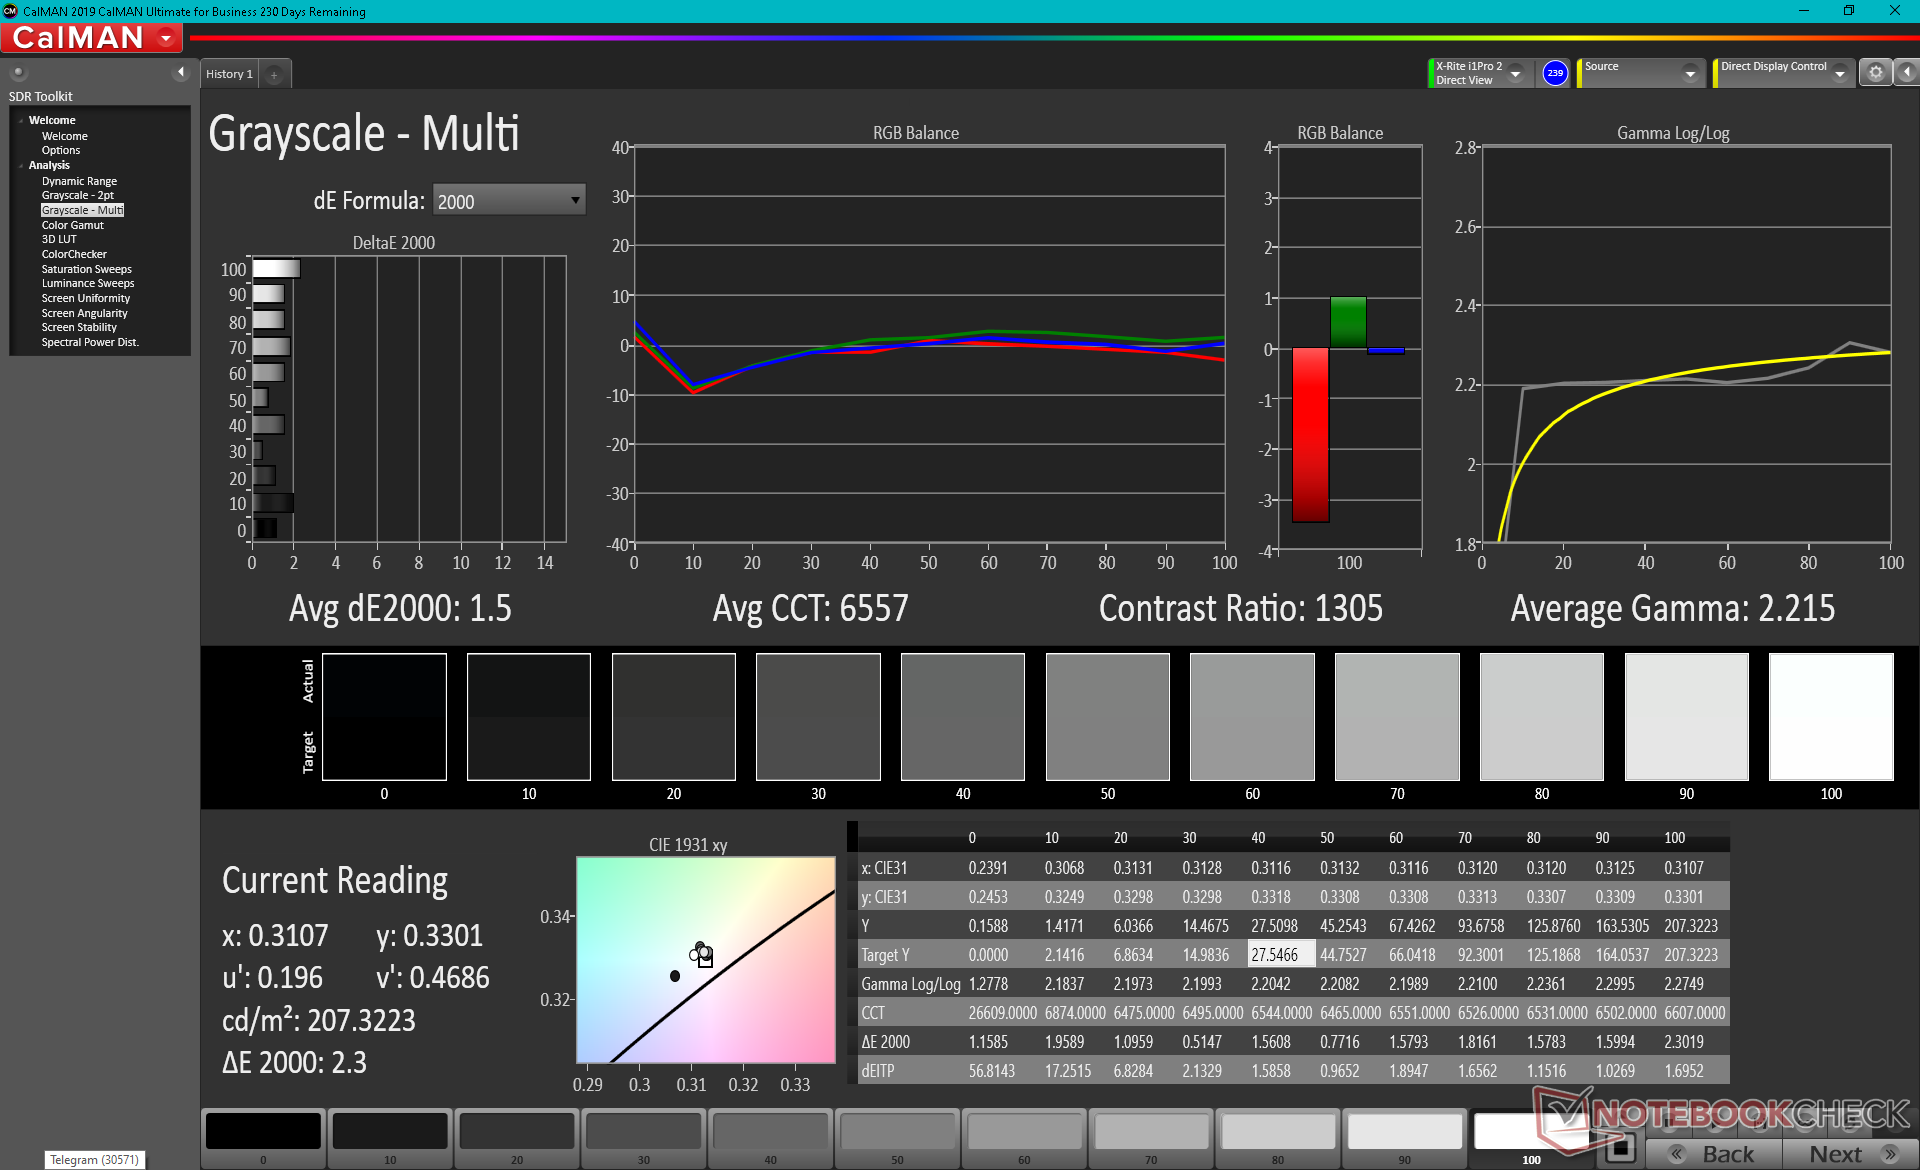
ΔE Greyscale Calman: 6.4 | ∀{0.09-98 Ø4.96}
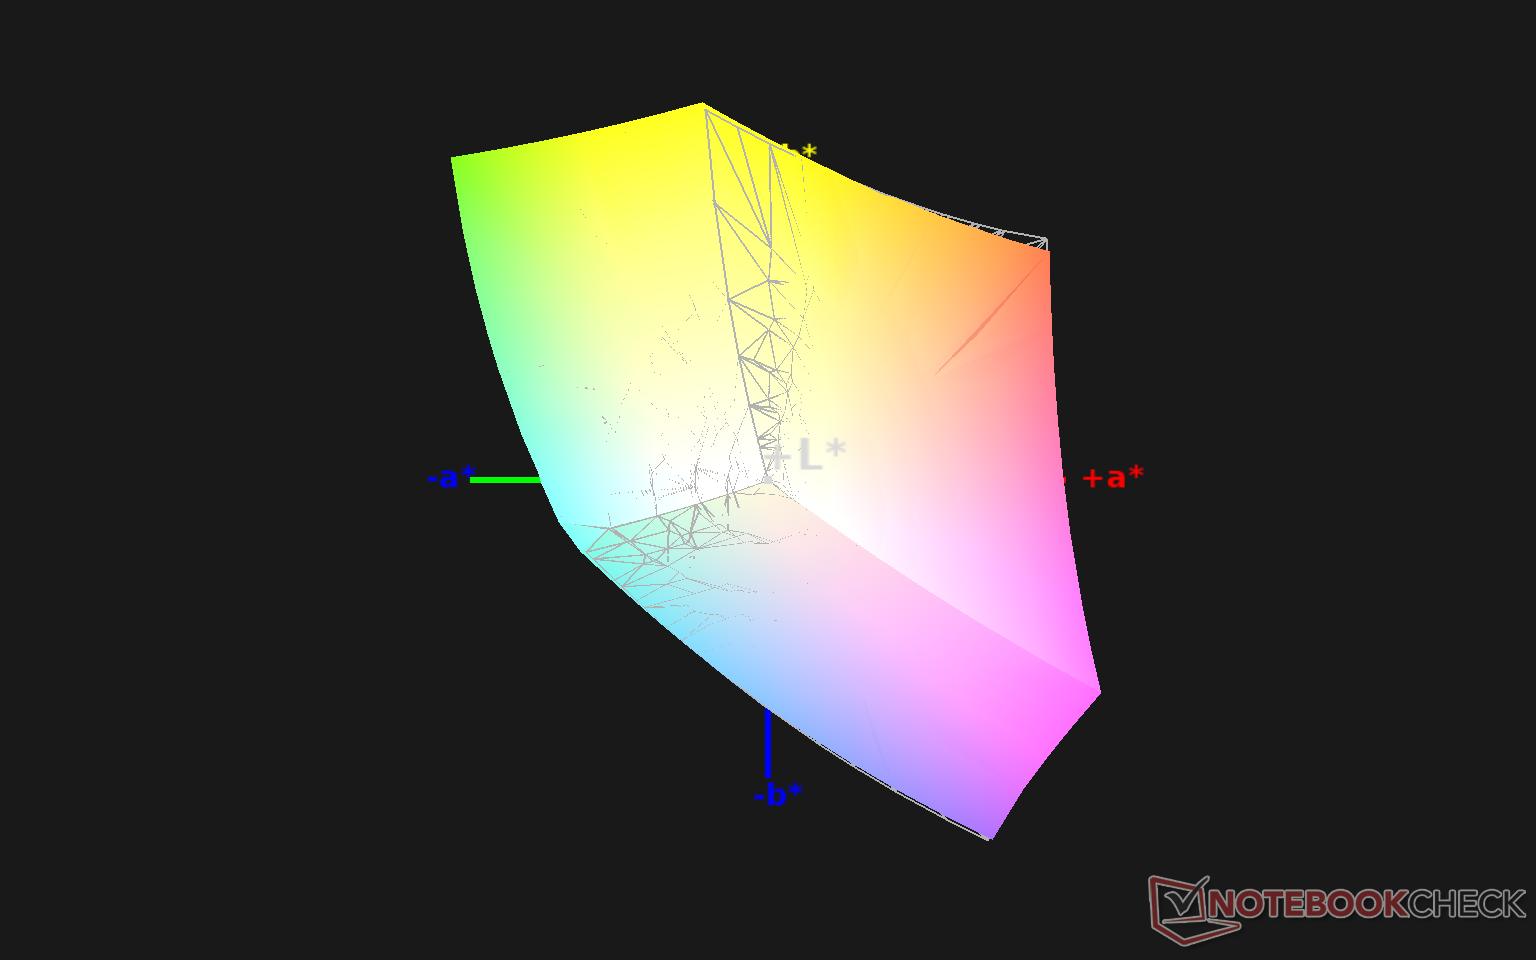
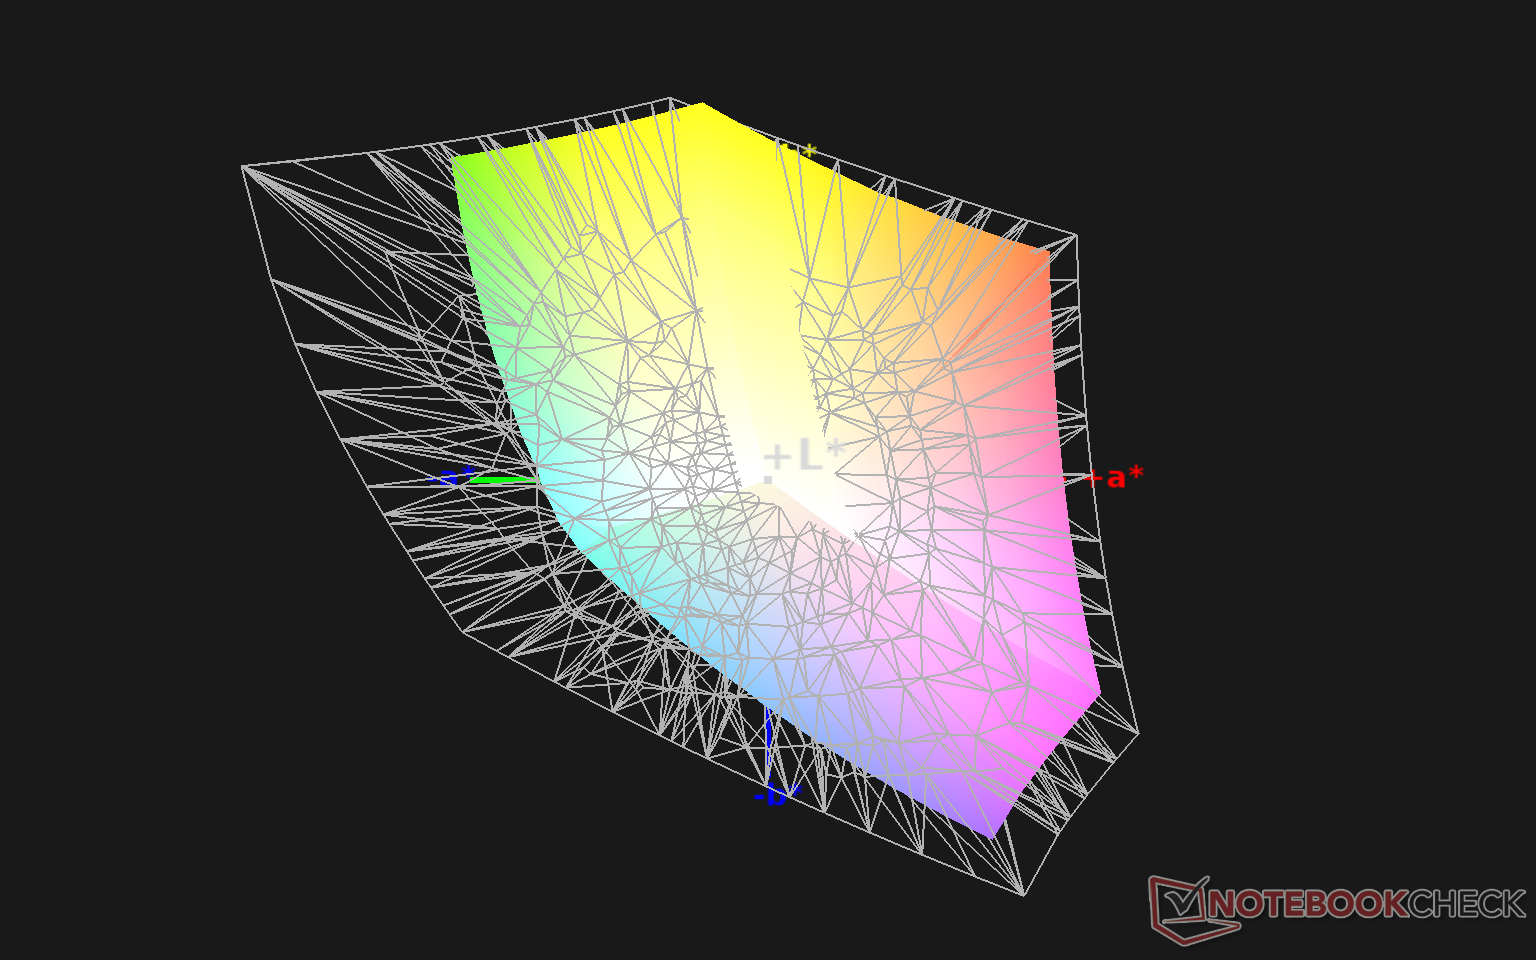
99.3% sRGB (Argyll 1.6.3 3D)
64.5% AdobeRGB 1998 (Argyll 1.6.3 3D)
70.4% AdobeRGB 1998 (Argyll 3D)
99.2% sRGB (Argyll 3D)
68.3% Display P3 (Argyll 3D)
Gamma: 2.25
CCT: 6991 K
| MSI GP66 Leopard 10UG Sharp LQ156M1JW03, IPS, 15.6", 1920x1080 | MSI GP65 10SFK-047US LG Philips LP156WFG-SPB3, IPS, 15.6", 1920x1080 | Alienware m15 R4 LG Philips LGD066E, IPS, 15.6", 1920x1080 | Aorus 15P XC Sharp LQ156M1JW03, IPS, 15.6", 1920x1080 | Asus ROG Zephyrus G15 GA503Q CMN N156KME-GNA (CMN152A), IPS-Level, 15.6", 2560x1440 | MSI GF65 Thin 10UE AU Optronics B156HAN08.4, IPS, 15.6", 1920x1080 | |
|---|---|---|---|---|---|---|
| Display | -7% | 1% | -2% | 22% | -44% | |
| Display P3 Coverage (%) | 68.3 | 63.5 -7% | 69.4 2% | 67.2 -2% | 97.3 42% | 37.65 -45% |
| sRGB Coverage (%) | 99.2 | 94.4 -5% | 99 0% | 98.7 -1% | 99.9 1% | 56.3 -43% |
| AdobeRGB 1998 Coverage (%) | 70.4 | 65.1 -8% | 70.5 0% | 68.6 -3% | 86.2 22% | 38.9 -45% |
| Response Times | -1% | 21% | 9% | 9% | -200% | |
| Response Time Grey 50% / Grey 80% * (ms) | 13.6 ? | 10.4 ? 24% | 7.4 ? 46% | 11.2 ? 18% | 8.8 ? 35% | 36.8 ? -171% |
| Response Time Black / White * (ms) | 9.6 ? | 12 ? -25% | 10 ? -4% | 9.6 ? -0% | 11.2 ? -17% | 31.6 ? -229% |
| PWM Frequency (Hz) | 23580 ? | 24040 ? | ||||
| Screen | -3% | 24% | 27% | 2% | -32% | |
| Brightness middle (cd/m²) | 225.9 | 384.9 70% | 333 47% | 298 32% | 327 45% | 266.5 18% |
| Brightness (cd/m²) | 211 | 358 70% | 303 44% | 278 32% | 309 46% | 262 24% |
| Brightness Distribution (%) | 83 | 87 5% | 86 4% | 88 6% | 89 7% | 91 10% |
| Black Level * (cd/m²) | 0.23 | 0.67 -191% | 0.29 -26% | 0.29 -26% | 0.33 -43% | 0.18 22% |
| Contrast (:1) | 982 | 574 -42% | 1148 17% | 1028 5% | 991 1% | 1481 51% |
| Colorchecker dE 2000 * | 3.98 | 2.43 39% | 1.8 55% | 0.96 76% | 4.49 -13% | 5.33 -34% |
| Colorchecker dE 2000 max. * | 8.95 | 4.58 49% | 4.49 50% | 3.22 64% | 8.42 6% | 18.28 -104% |
| Colorchecker dE 2000 calibrated * | 1.15 | 2.03 -77% | 1.13 2% | 0.83 28% | 2.27 -97% | 4.36 -279% |
| Greyscale dE 2000 * | 6.4 | 2.6 59% | 1.9 70% | 1.3 80% | 4.2 34% | 4.5 30% |
| Gamma | 2.25 98% | 2.2 100% | 2.265 97% | 2.242 98% | 2.173 101% | 2.35 94% |
| CCT | 6991 93% | 6981 93% | 6840 95% | 6519 100% | 7014 93% | 6289 103% |
| Color Space (Percent of AdobeRGB 1998) (%) | 64.5 | 59.7 -7% | 71 10% | 69 7% | 86 33% | 35.6 -45% |
| Color Space (Percent of sRGB) (%) | 99.3 | 93.9 -5% | 93 -6% | 91 -8% | 99 0% | 55.8 -44% |
| Moyenne finale (programmes/paramètres) | -4% /
-3% | 15% /
19% | 11% /
19% | 11% /
6% | -92% /
-55% |
* ... Moindre est la valeur, meilleures sont les performances
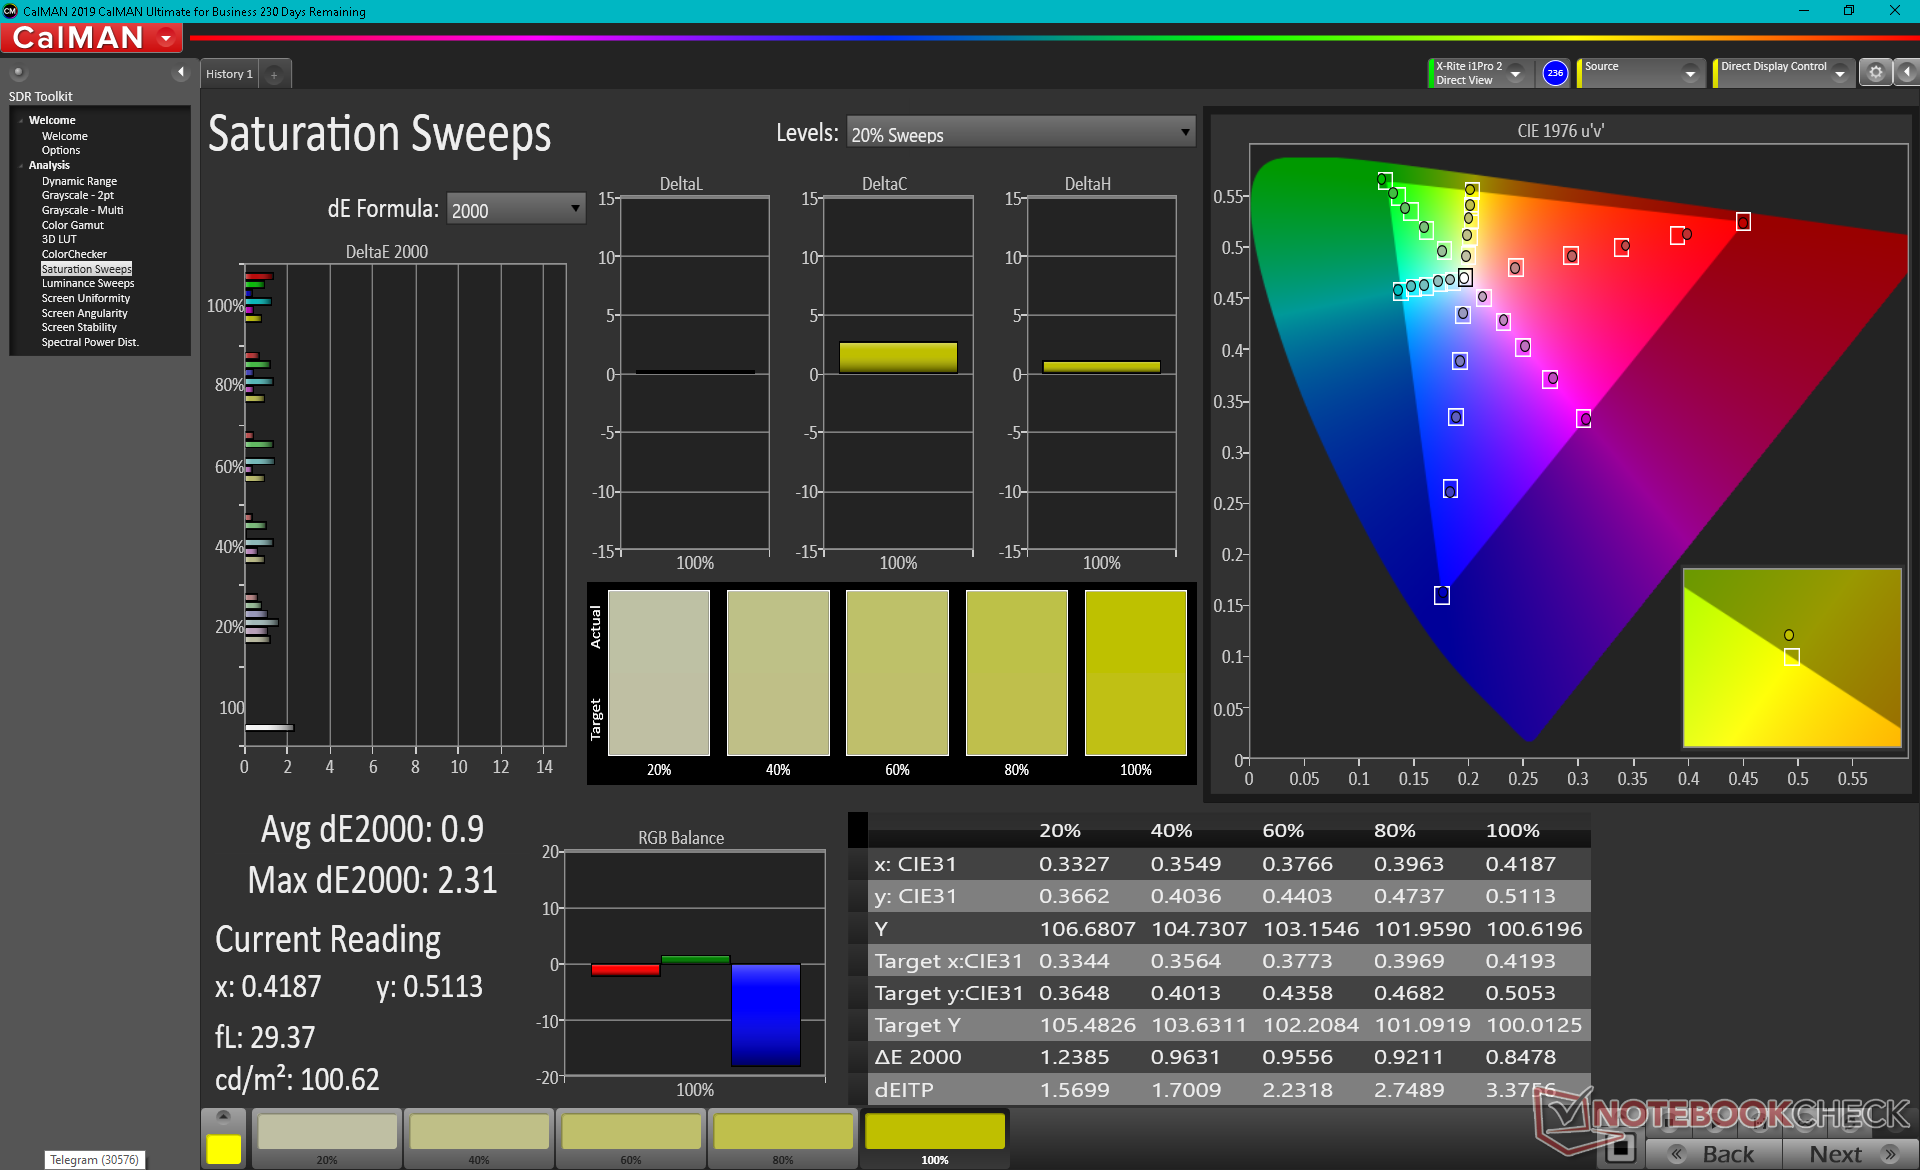
L'espace couleur couvre tout le sRGB pour être comparable à la plupart des ordinateurs portables de jeu haut de gamme. Nous sommes heureux que MSI n'utilise pas l'une de ces panneaux Panda bon marché qui ont généralement des couleurs beaucoup plus pauvres.
Les mesures du colorimètre X-Rite montrent un écran non calibré dès la sortie de la boîte, ce qui est normal puisque le GP66 n'est pas un ordinateur portable de jeu phare calibré par Pantone. La température des couleurs est trop froide et la précision des couleurs en souffre. Les couleurs s'améliorent considérablement une fois qu'elles sont correctement calibrées avec des valeurs finales de deltaE en niveaux de gris et en couleurs de seulement 1,5 et 1,15, respectivement. Nous vous recommandons d'appliquer notre profil ICM ci-dessus pour tirer le meilleur parti de l'écran si vous n'avez pas accès à un colorimètre.
Temps de réponse de l'écran
| ↔ Temps de réponse noir à blanc | ||
|---|---|---|
| 9.6 ms ... hausse ↗ et chute ↘ combinées | ↗ 5.2 ms hausse | 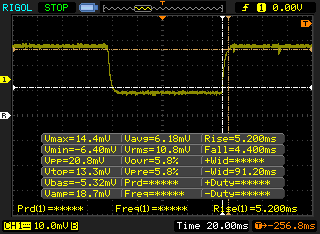 |
| ↘ 4.4 ms chute | ||
| L'écran montre de faibles temps de réponse, un bon écran pour jouer. En comparaison, tous les appareils testés affichent entre 0.1 (minimum) et 240 (maximum) ms. » 26 % des appareils testés affichent de meilleures performances. Cela signifie que les latences relevées sont meilleures que la moyenne (19.8 ms) de tous les appareils testés. | ||
| ↔ Temps de réponse gris 50% à gris 80% | ||
| 13.6 ms ... hausse ↗ et chute ↘ combinées | ↗ 7.6 ms hausse | 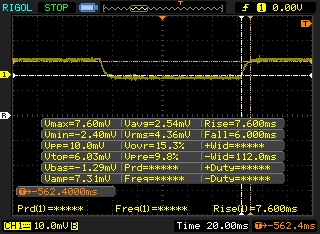 |
| ↘ 6 ms chute | ||
| L'écran montre de bons temps de réponse, mais insuffisant pour du jeu compétitif. En comparaison, tous les appareils testés affichent entre 0.165 (minimum) et 636 (maximum) ms. » 27 % des appareils testés affichent de meilleures performances. Cela signifie que les latences relevées sont meilleures que la moyenne (31 ms) de tous les appareils testés. | ||
Scintillement / MLI (Modulation de largeur d'impulsion)
| Scintillement / MLI (Modulation de largeur d'impulsion) décelé | 23580 Hz | ≤ 34 Niveau de luminosité | 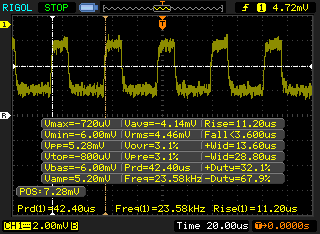 |
Le rétroéclairage de l'écran scintille à la fréquence de 23580 Hz (certainement du fait de l'utilisation d'une MDI - Modulation de largeur d'impulsion) à un niveau de luminosité inférieur ou égal à 34 % . Aucun scintillement ne devrait être perceptible au-dessus de cette valeur. La fréquence de rafraîchissement de 23580 Hz est élevée, la grande majorité des utilisateurs ne devrait pas percevoir de scintillements et être sujette à une fatigue oculaire accrue. En comparaison, 52 % des appareils testés n'emploient pas MDI pour assombrir leur écran. Nous avons relevé une moyenne à 7754 (minimum : 5 - maximum : 343500) Hz dans le cas où une MDI était active. | |||
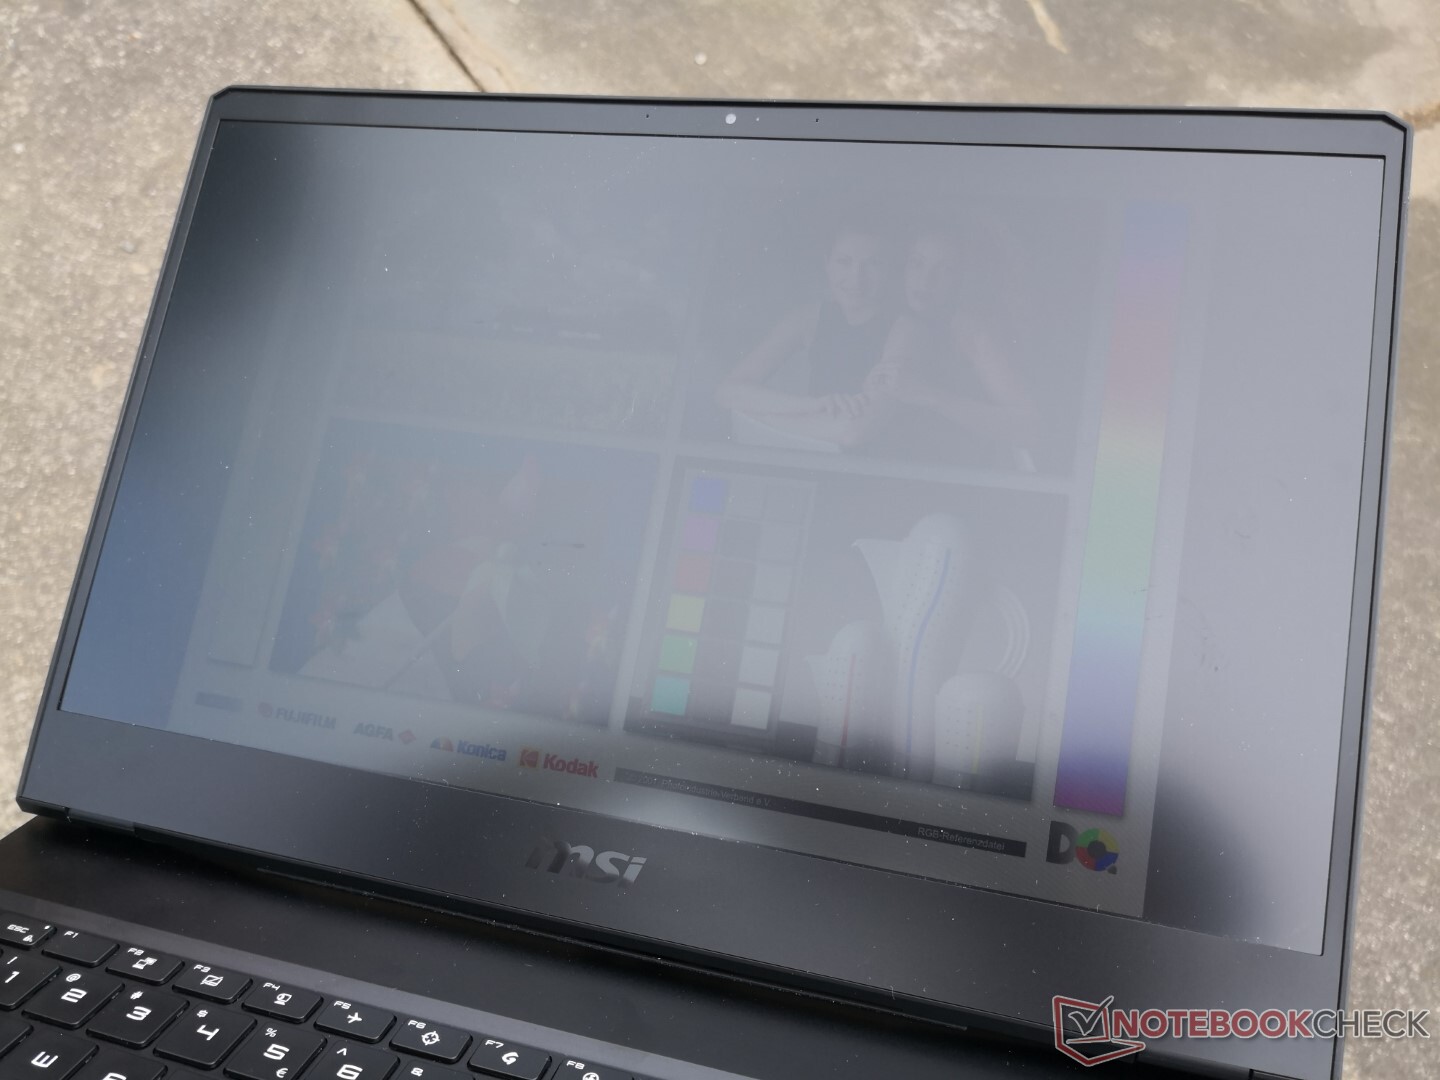
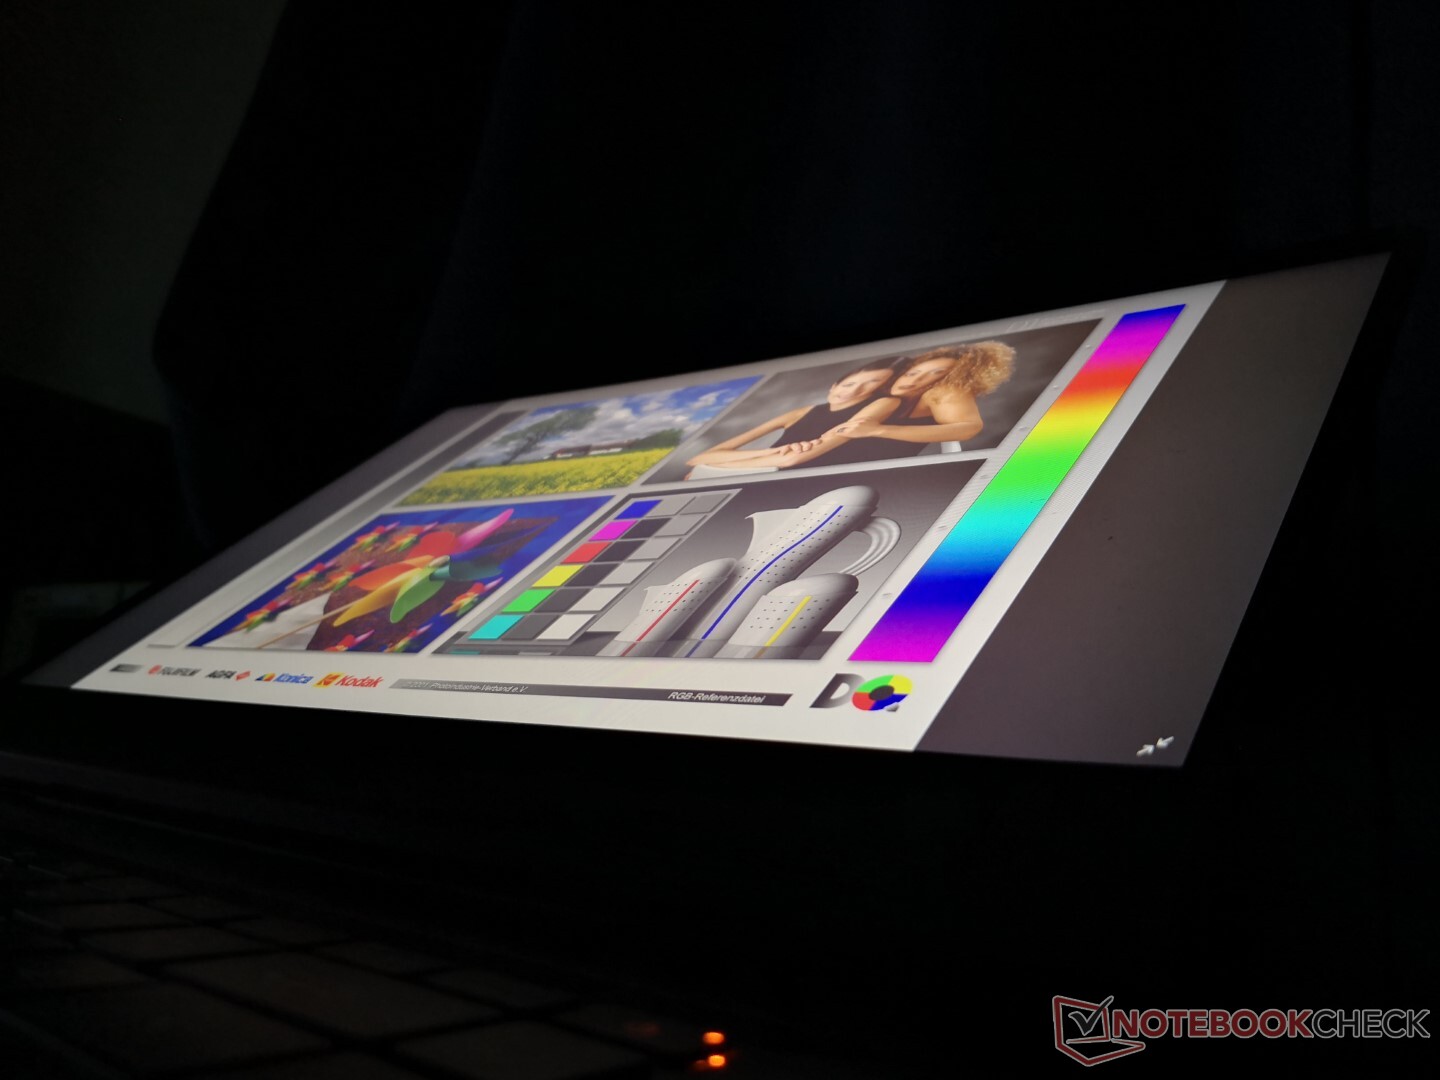
La visibilité en extérieur est faible car l'écran n'est pas très lumineux. Les reflets sont perceptibles dans la plupart des conditions et même s'ils peuvent être réduits, le contenu de l'écran apparaîtra de toute façon délavé.
Performance
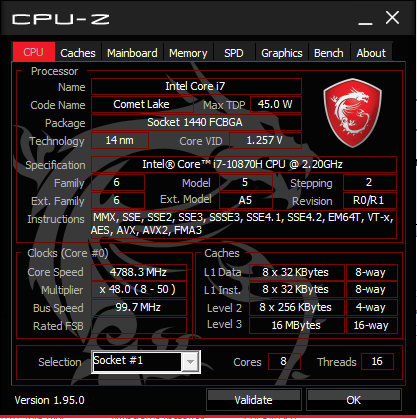
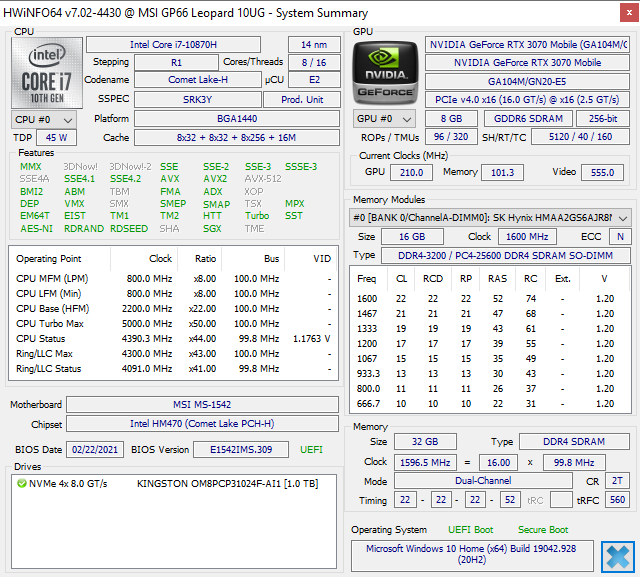
MSI ne propose pour l'instant que les options Core i7-10870H et Core i7-10875H de 10e génération Comet Lake-H, sans plus. Cependant, nous aurions pu nous contenter d'une seule de ces options car les différences entre les i7-10870H et i7-10875H sont incroyablement mineures. Les utilisateurs devront se tourner vers le moins cher Bravo ou Alpha moins chères pour les options AMD.
Les cartes graphiques vont de GeForce RTX 3060 à 3080 à 130 W TGP chacune. La commutation graphique automatique et manuelle est disponible via le logiciel Dragon Center. Nous recommandons aux propriétaires de se familiariser avec Dragon Center, car c'est là que se trouvent les principales fonctions.
Nous avons réglé notre unité en mode Performance Extrême avec le GPU Nvidia actif avant d'exécuter les benchmarks de performance ci-dessous.
Processeur
Les performances du processeur sont excellentes avec une durabilité Turbo Boost décente, comme le montrent les résultats de notre boucle CineBench R15 xT ci-dessous. Les performances sont même aussi rapides que celles du Core i9-10980HK dans l'Alienware m15 R4. Les différences entre le Core i7-10875H et Core i7-10870H ne sont que de quelques points de pourcentage.
Cinebench R15: CPU Multi 64Bit | CPU Single 64Bit
Blender: v2.79 BMW27 CPU
7-Zip 18.03: 7z b 4 -mmt1 | 7z b 4
Geekbench 5.5: Single-Core | Multi-Core
HWBOT x265 Benchmark v2.2: 4k Preset
LibreOffice : 20 Documents To PDF
R Benchmark 2.5: Overall mean
| LibreOffice / 20 Documents To PDF | |
| HP Pavilion Gaming 15-ec1206ng | |
| Schenker XMG Core 15 Ampere | |
| Moyenne Intel Core i7-10870H (46 - 64.4, n=12) | |
| Alienware m15 R4 | |
| MSI GP66 Leopard 10UG | |
| Razer Blade 15 Base Edition 2021, i7-10750H RTX 3060 | |
| Asus Zephyrus S15 GX502L | |
| MSI GT76 Titan DT 10SGS | |
| Asus ROG Zephyrus Duo 15 SE GX551QS | |
* ... Moindre est la valeur, meilleures sont les performances
Performance du système
Les résultats de PCMark sont là où nous nous attendons à ce qu'ils soient par rapport à d'autres ordinateurs portables avec le même CPU et GPU. Les scores sont systématiquement plus élevés que ceux du GP65 sauf dans le benchmark Essentials, probablement en raison du SSD NVMe plus lent de notre unité de test GP66.
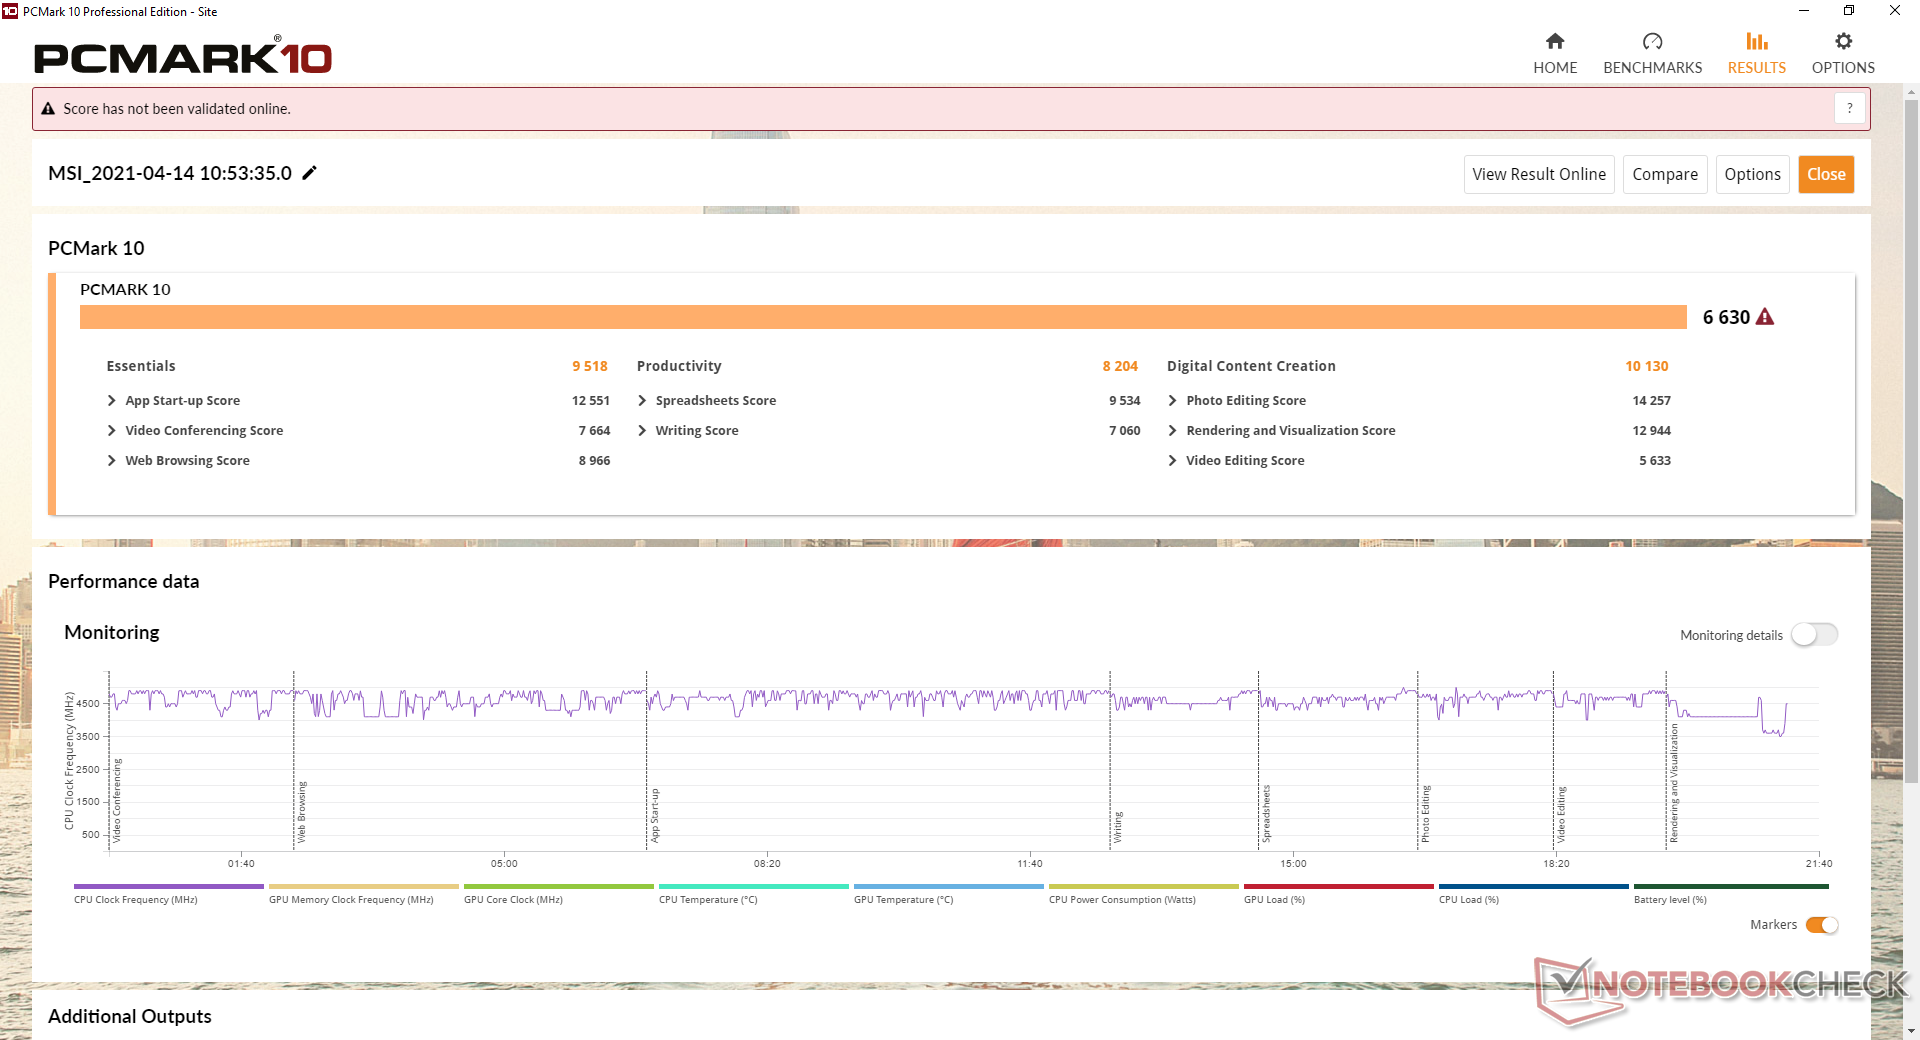
| PCMark 10 Score | 6630 points | |
Aide | ||
Latence DPC
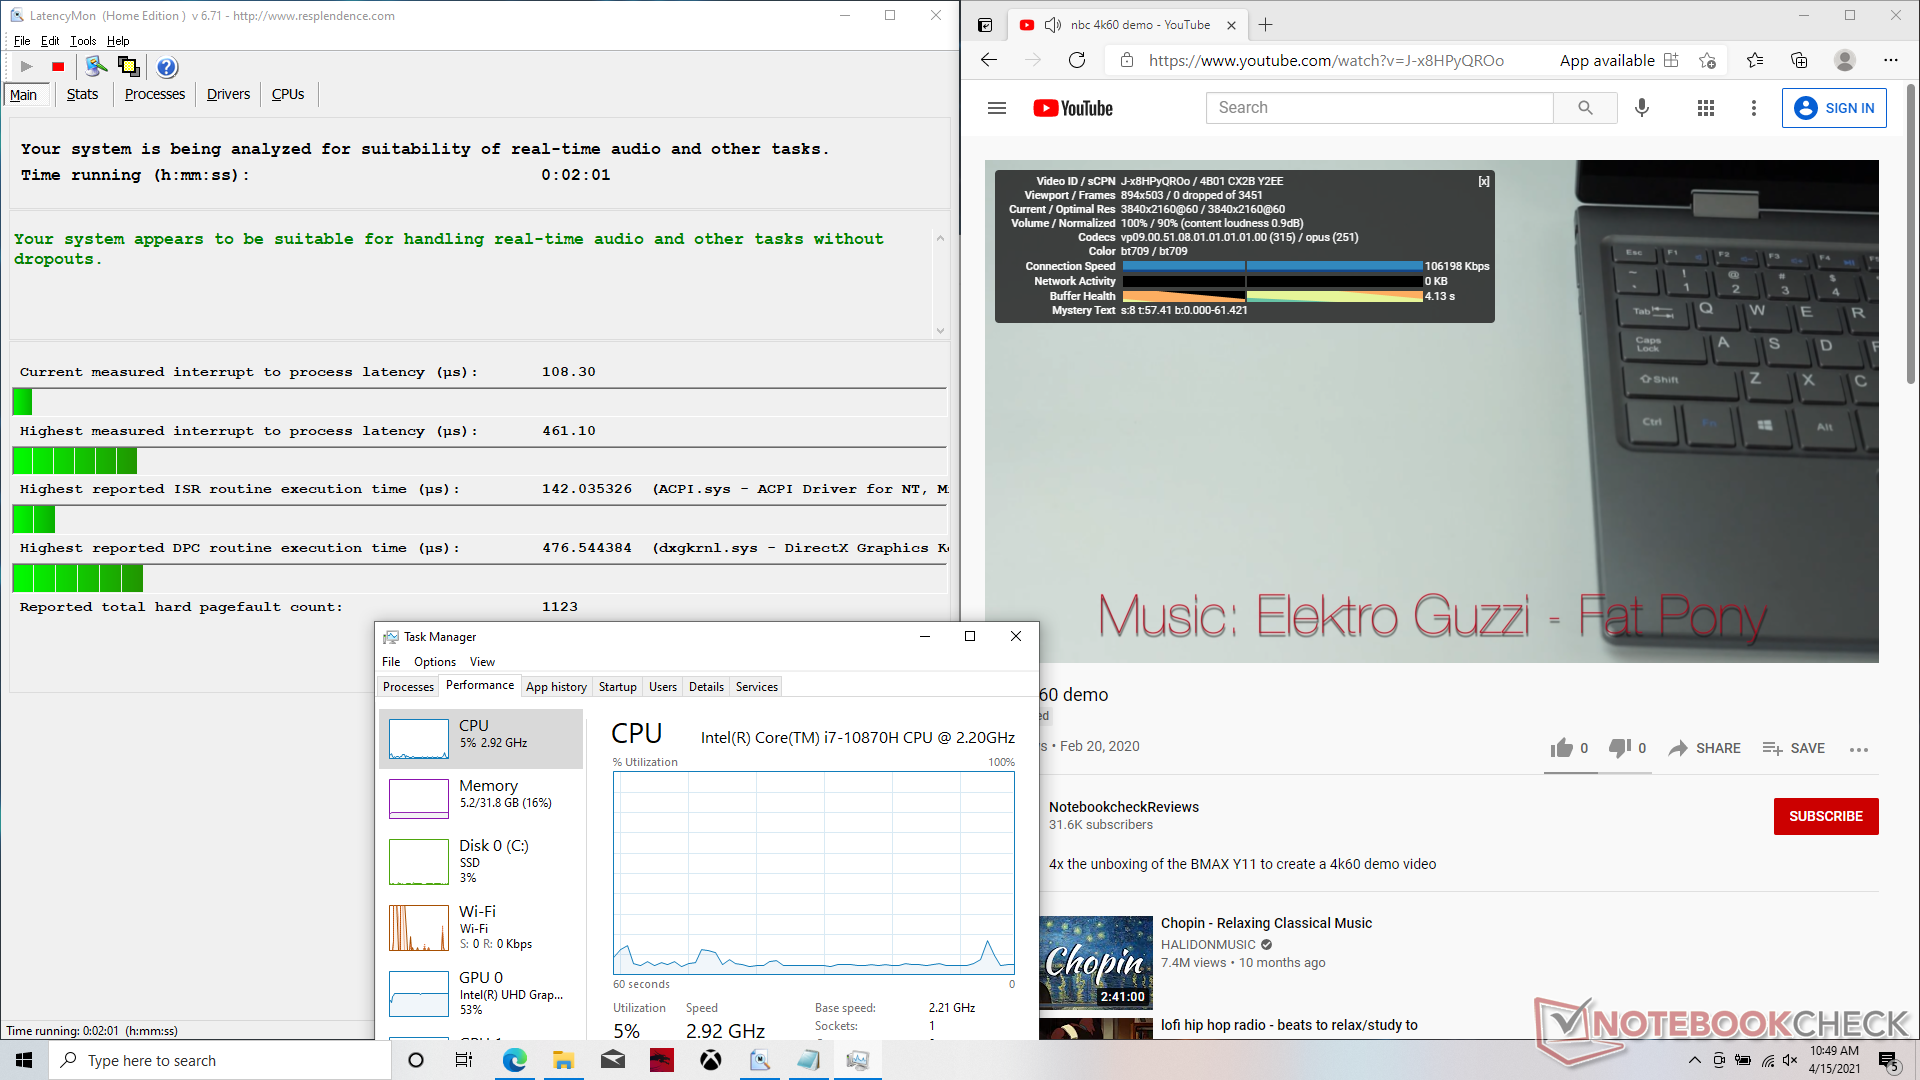
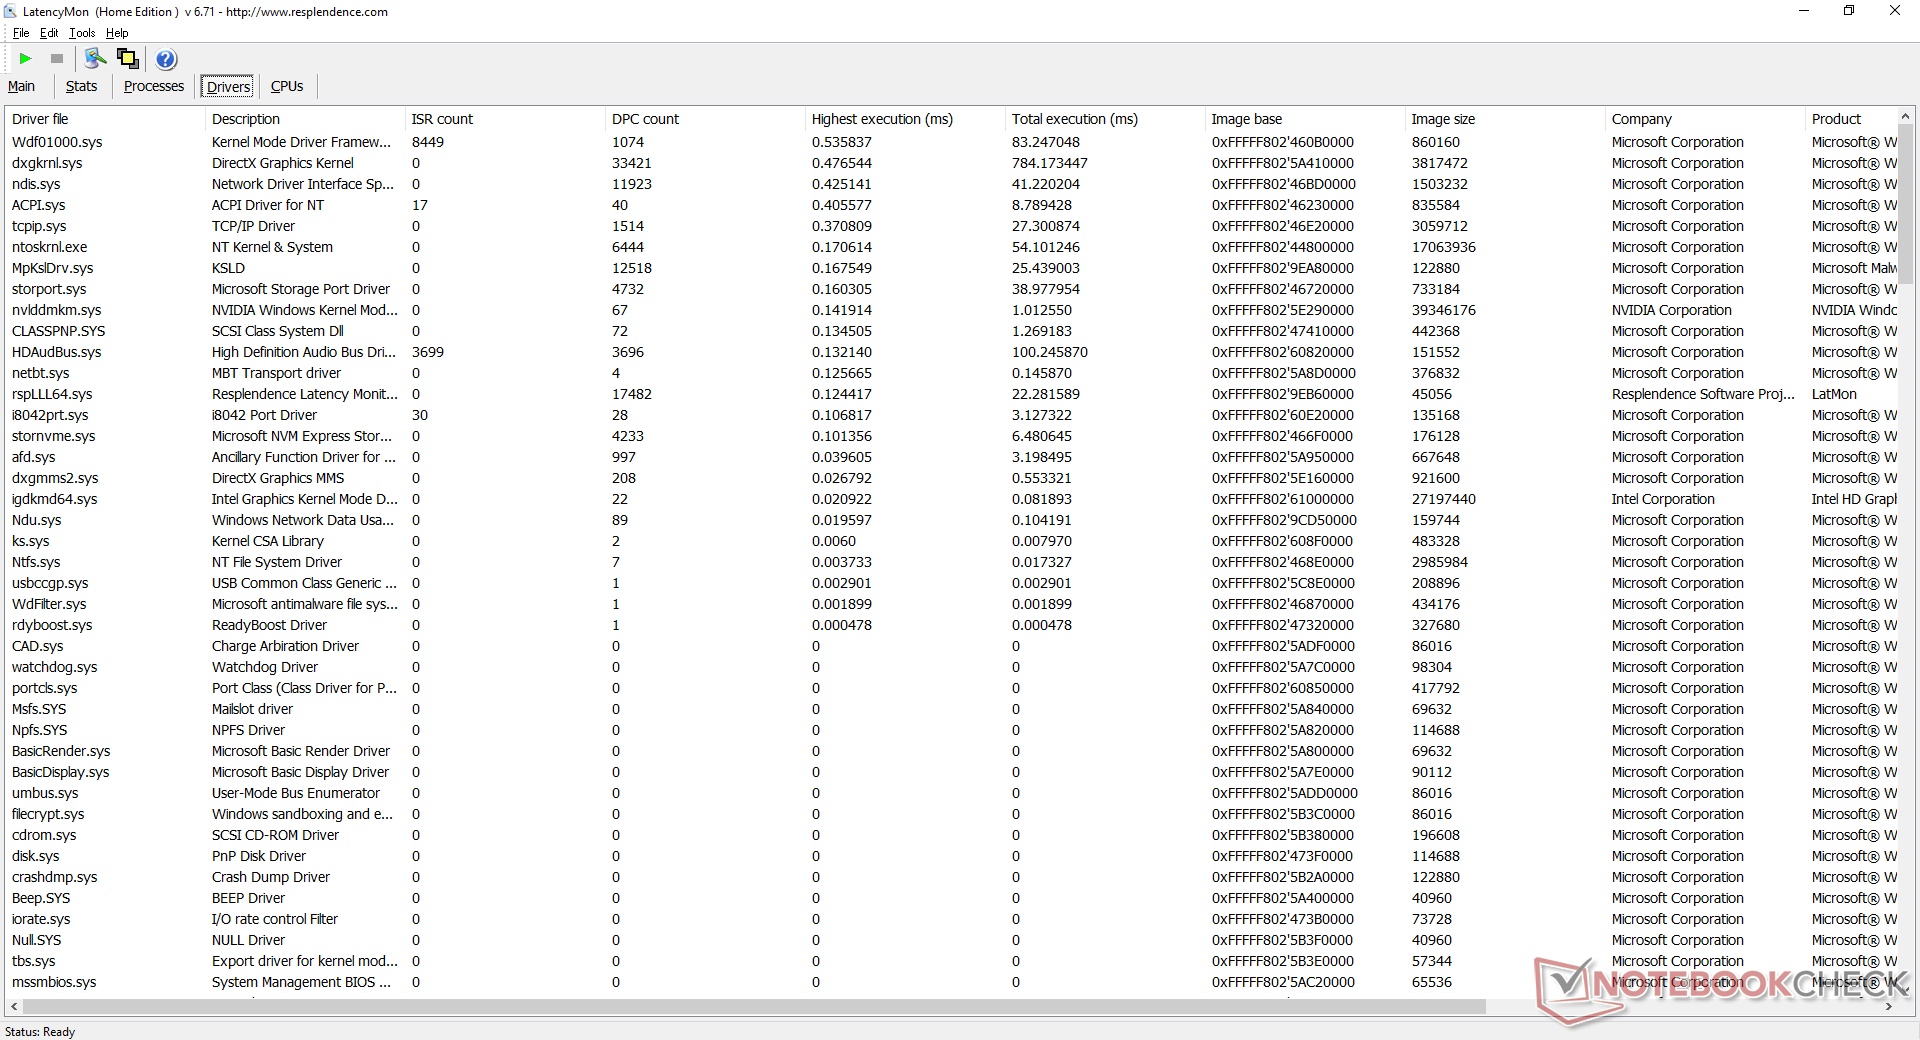
LatencyMon ne montre aucun problème de latence DPC lors de l'ouverture de plusieurs onglets de navigateur sur notre page d'accueil. La lecture de vidéos 4K à 60 FPS est fluide et sans perte d'images, comme on peut l'attendre d'un ordinateur portable de jeu.
| DPC Latencies / LatencyMon - interrupt to process latency (max), Web, Youtube, Prime95 | |
| Alienware m15 R4 | |
| Aorus 15P XC | |
| MSI GP65 10SFK-047US | |
| MSI GF65 Thin 10UE | |
| MSI GP66 Leopard 10UG | |
| Asus ROG Zephyrus G15 GA503Q | |
* ... Moindre est la valeur, meilleures sont les performances
Périphériques de stockage
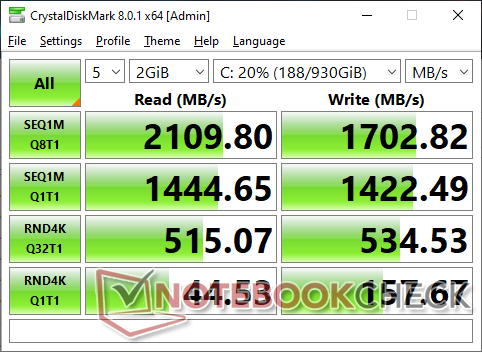
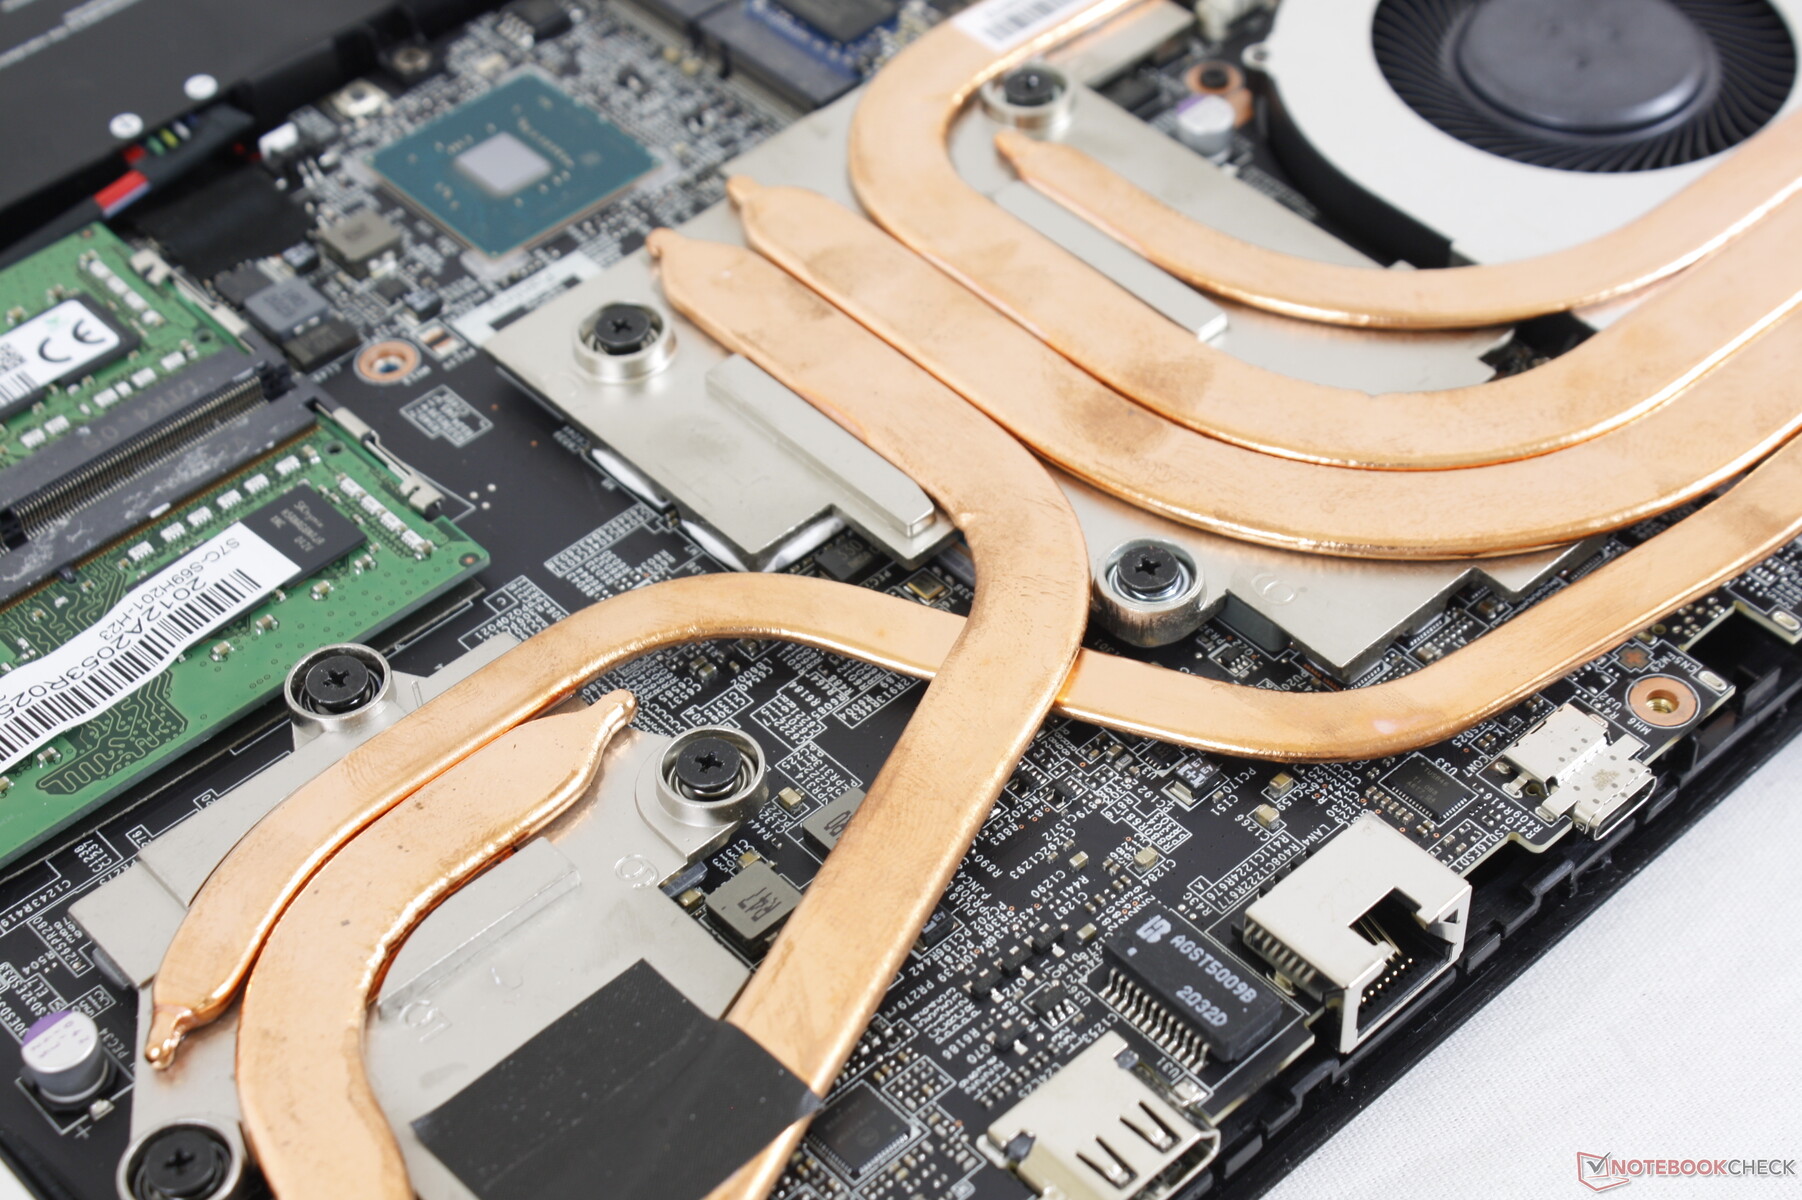
Alors que le GP65 pouvait prendre en charge jusqu'à trois disques internes (2x M.2, 1x 2,5 pouces SATA III), le GP66 peut prendre en charge jusqu'à 2x disques M.2 uniquement. Le Kingston OM8PCP31024F de 1 To dans notre unité est un disque NVMe de milieu de gamme qui est plus lent que le Samsung PM981 et le Micron 2300
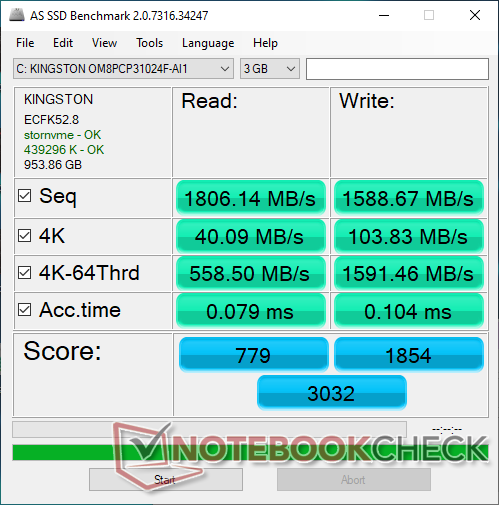
| MSI GP66 Leopard 10UG Kingston OM8PCP31024F | MSI GP65 10SFK-047US Samsung SSD PM981 MZVLB1T0HALR | Alienware m15 R4 Micron 2300 1TB MTFDHBA1T0TDV | Aorus 15P XC ESR512GTLCG-EAC-4 | Asus ROG Zephyrus G15 GA503Q SK Hynix HFM001TD3JX013N | MSI GF65 Thin 10UE Samsung SSD PM981 MZVLB1T0HALR | |
|---|---|---|---|---|---|---|
| AS SSD | 50% | 38% | 45% | 58% | 50% | |
| Seq Read (MB/s) | 1806 | 2066 14% | 2658 47% | 2694 49% | 2950 63% | 3002 66% |
| Seq Write (MB/s) | 1589 | 2418 52% | 2769 74% | 2327 46% | 1600 1% | 2420 52% |
| 4K Read (MB/s) | 40.09 | 54.2 35% | 46.07 15% | 47.77 19% | 53.6 34% | 48.46 21% |
| 4K Write (MB/s) | 103.8 | 129 24% | 87.2 -16% | 98.8 -5% | 126.8 22% | 114.3 10% |
| 4K-64 Read (MB/s) | 559 | 1865 234% | 1372 145% | 1746 212% | 1429 156% | 1873 235% |
| 4K-64 Write (MB/s) | 1591 | 1878 18% | 1247 -22% | 2267 42% | 2177 37% | 1882 18% |
| Access Time Read * (ms) | 0.079 | 0.042 47% | 0.052 34% | 0.079 -0% | 0.064 19% | 0.045 43% |
| Access Time Write * (ms) | 0.104 | 0.091 12% | 0.098 6% | 0.039 62% | 0.029 72% | 0.101 3% |
| Score Read (Points) | 779 | 2126 173% | 1684 116% | 2063 165% | 1778 128% | 2221 185% |
| Score Write (Points) | 1854 | 2249 21% | 1611 -13% | 2598 40% | 2464 33% | 2238 21% |
| Score Total (Points) | 3032 | 5482 81% | 4166 37% | 5698 88% | 5090 68% | 5565 84% |
| Copy ISO MB/s (MB/s) | 2674 | 2927 9% | 1877 -30% | 2421 -9% | ||
| Copy Program MB/s (MB/s) | 895 | 728 -19% | 555 -38% | 705 -21% | ||
| Copy Game MB/s (MB/s) | 1596 | 1614 1% | 1201 -25% | 1490 -7% | ||
| CrystalDiskMark 5.2 / 6 | 31% | 41% | 28% | 42% | 30% | |
| Write 4K (MB/s) | 153.2 | 145 -5% | 93.7 -39% | 130.2 -15% | 156.4 2% | 157.3 3% |
| Read 4K (MB/s) | 43.98 | 46.84 7% | 48.1 9% | 45.47 3% | 66.7 52% | 46.69 6% |
| Write Seq (MB/s) | 1527 | 2377 56% | 2785 82% | 2269 49% | 2318 52% | 2389 56% |
| Read Seq (MB/s) | 1112 | 2185 96% | 2598 134% | 1643 48% | 2151 93% | 2196 97% |
| Write 4K Q32T1 (MB/s) | 520 | 463.5 -11% | 481.9 -7% | 547 5% | 525 1% | 407.6 -22% |
| Read 4K Q32T1 (MB/s) | 516 | 527 2% | 521 1% | 654 27% | 452.1 -12% | 519 1% |
| Write Seq Q32T1 (MB/s) | 1697 | 2395 41% | 3362 98% | 2512 48% | 3055 80% | 2401 41% |
| Read Seq Q32T1 (MB/s) | 2110 | 3470 64% | 3200 52% | 3382 60% | 3607 71% | 3344 58% |
| Moyenne finale (programmes/paramètres) | 41% /
43% | 40% /
40% | 37% /
39% | 50% /
51% | 40% /
43% |
* ... Moindre est la valeur, meilleures sont les performances

Disk Throttling: DiskSpd Read Loop, Queue Depth 8
Performances du GPU
Les performances graphiques brutes ne sont que de 6 à 9 % inférieures à celles de la RTX 3080 de 130 W GeForce dans le Asus Zephyrus Duo 15 SE selon les benchmarks 3DMark. Les utilisateurs qui passent d'une ancienne RTX 2070 verront des gains notables allant jusqu'à 35 à 40 %. Néanmoins, un PC de bureau avec une " GeForce RTX 3070 est toujours environ 20 % plus rapide que notre version mobile Version mobile de la RTX 3070.
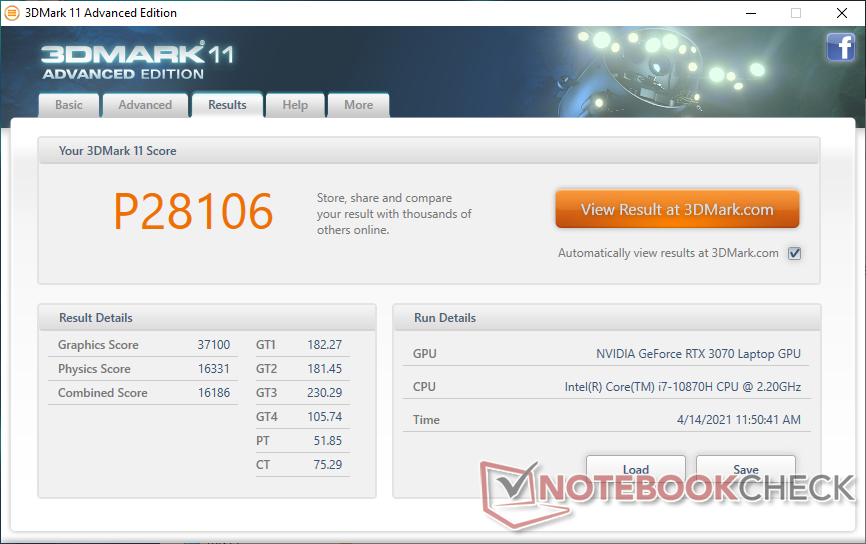
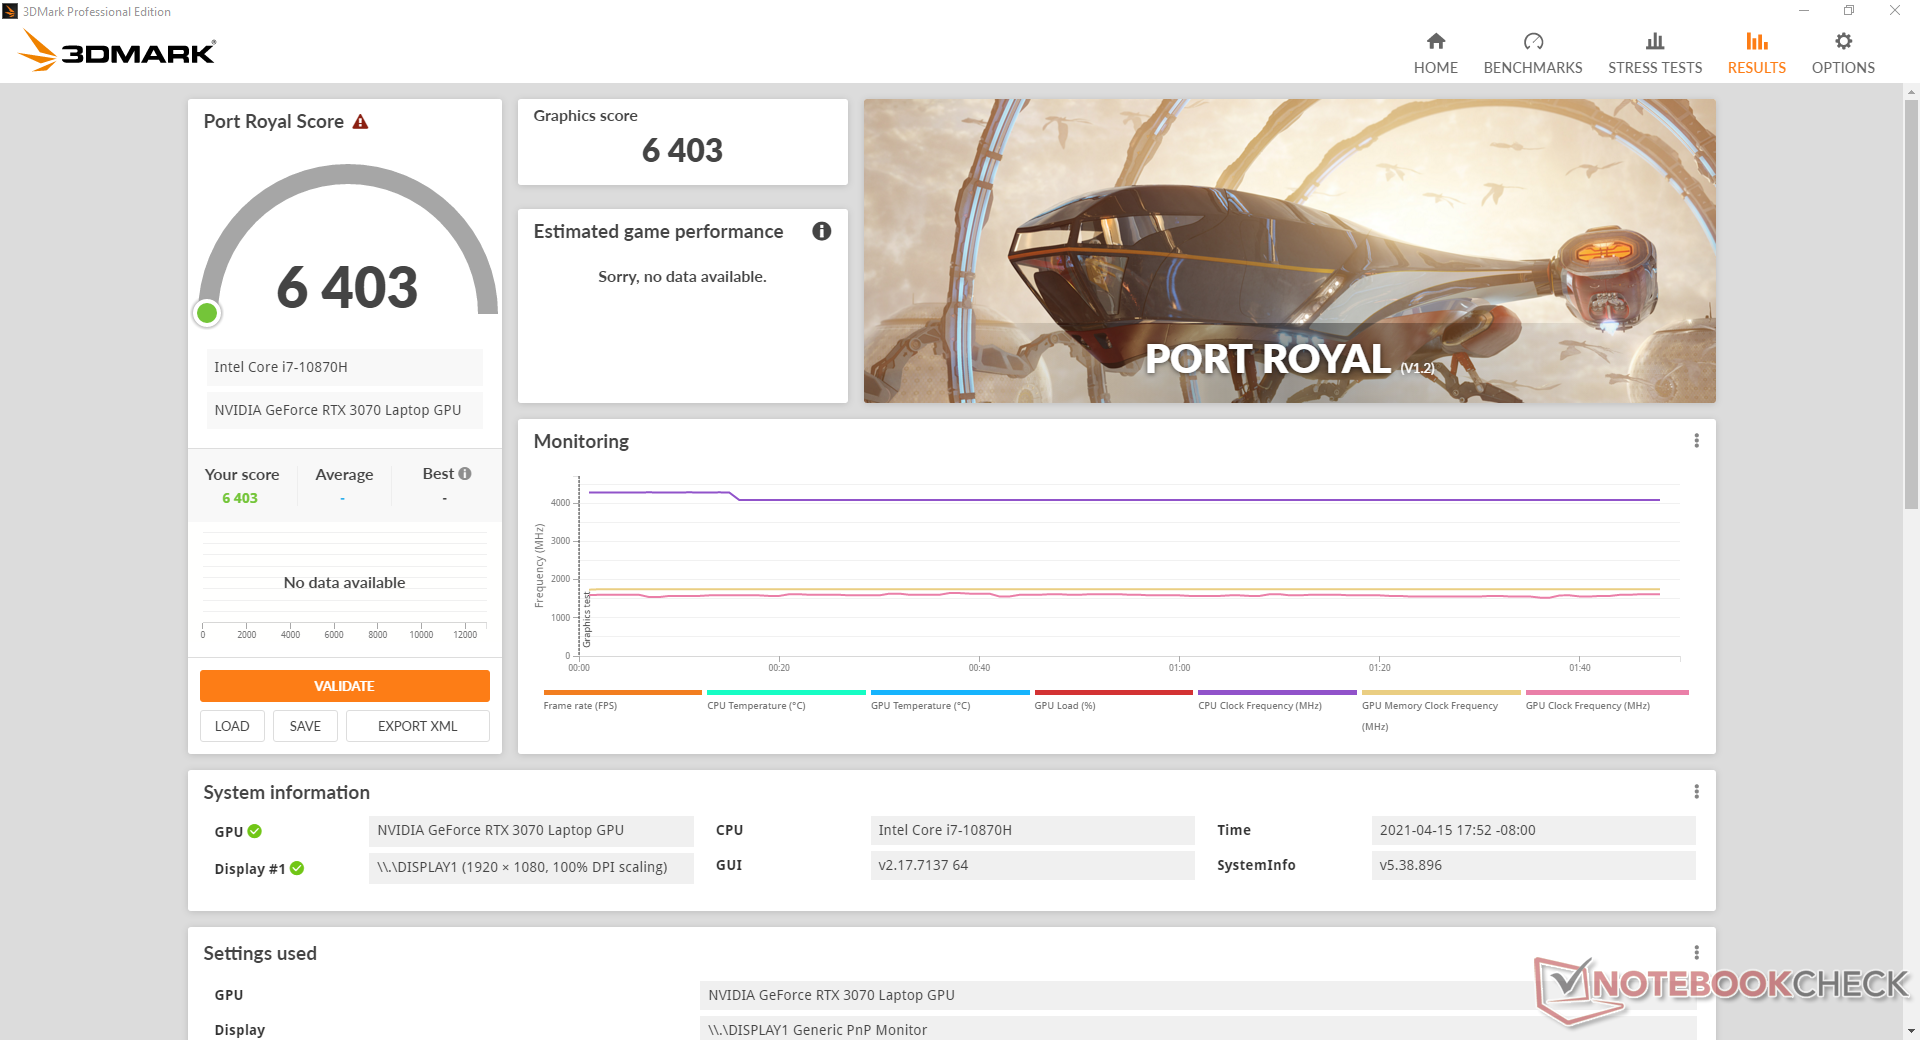
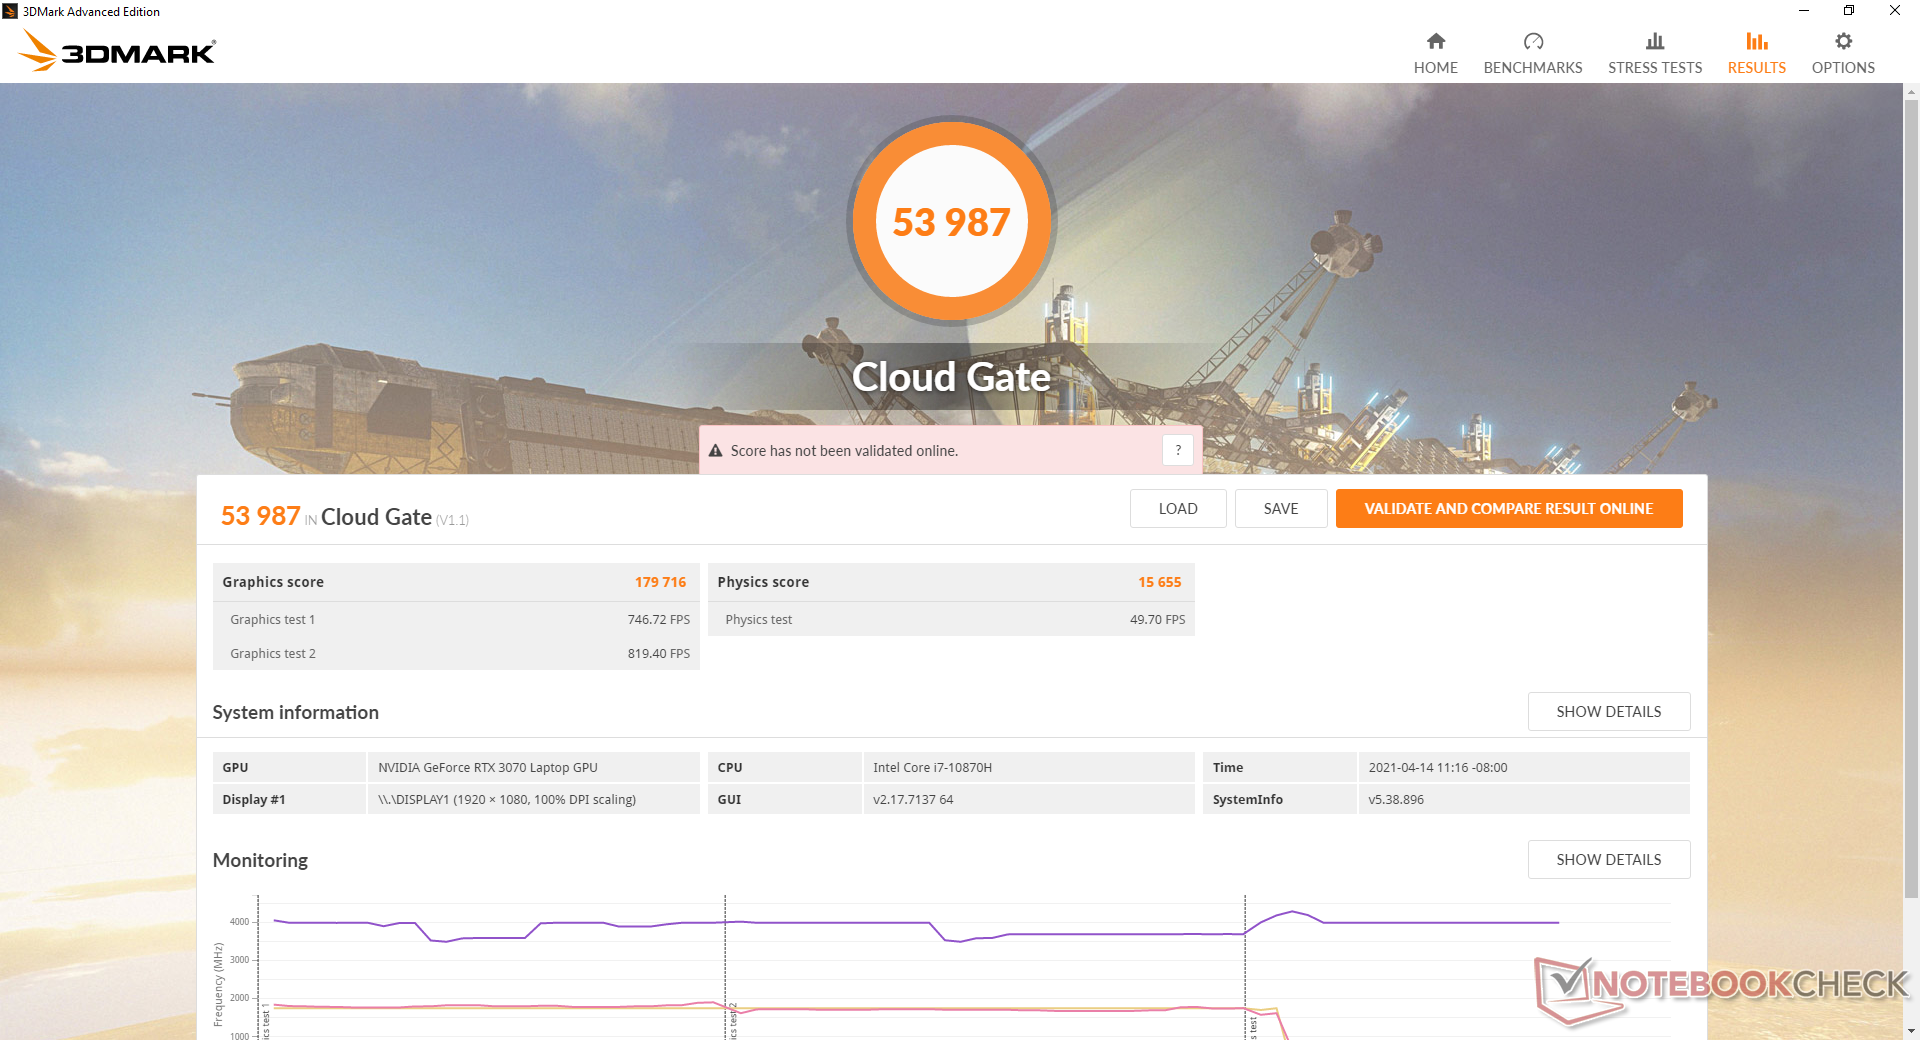
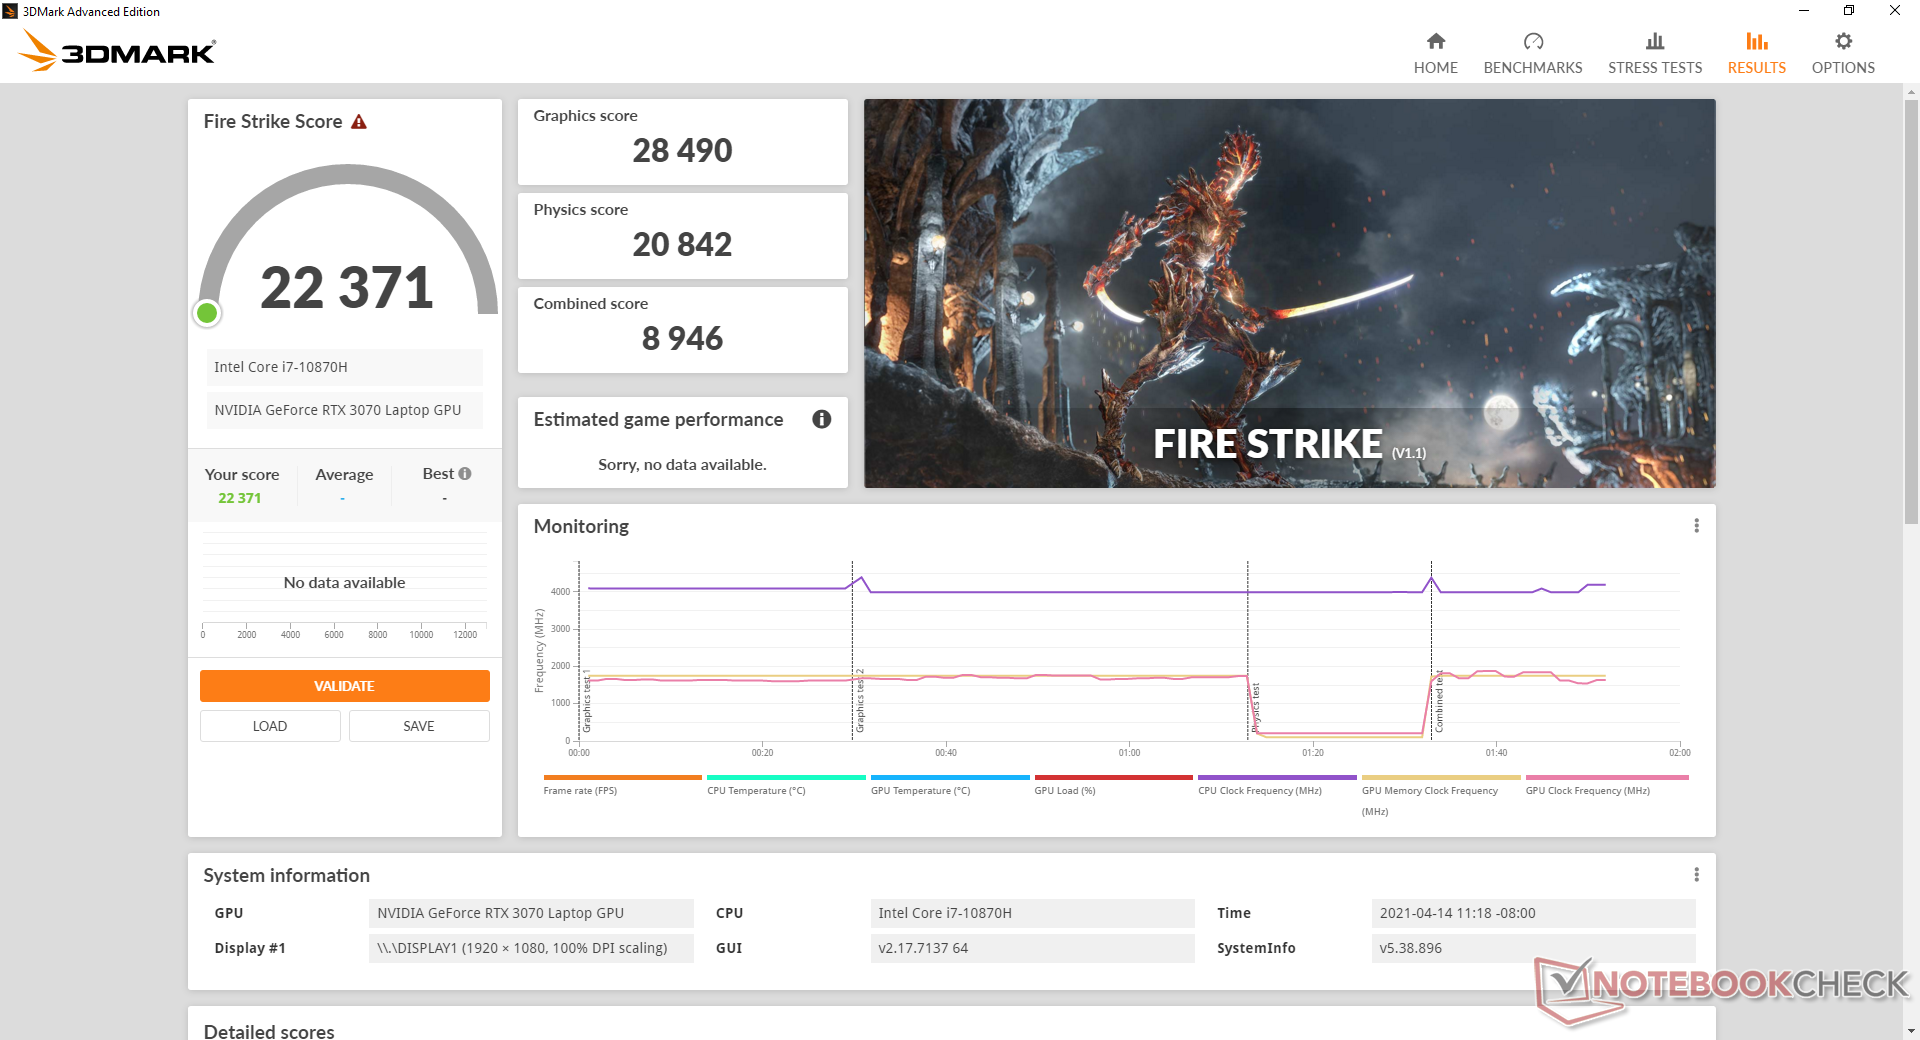
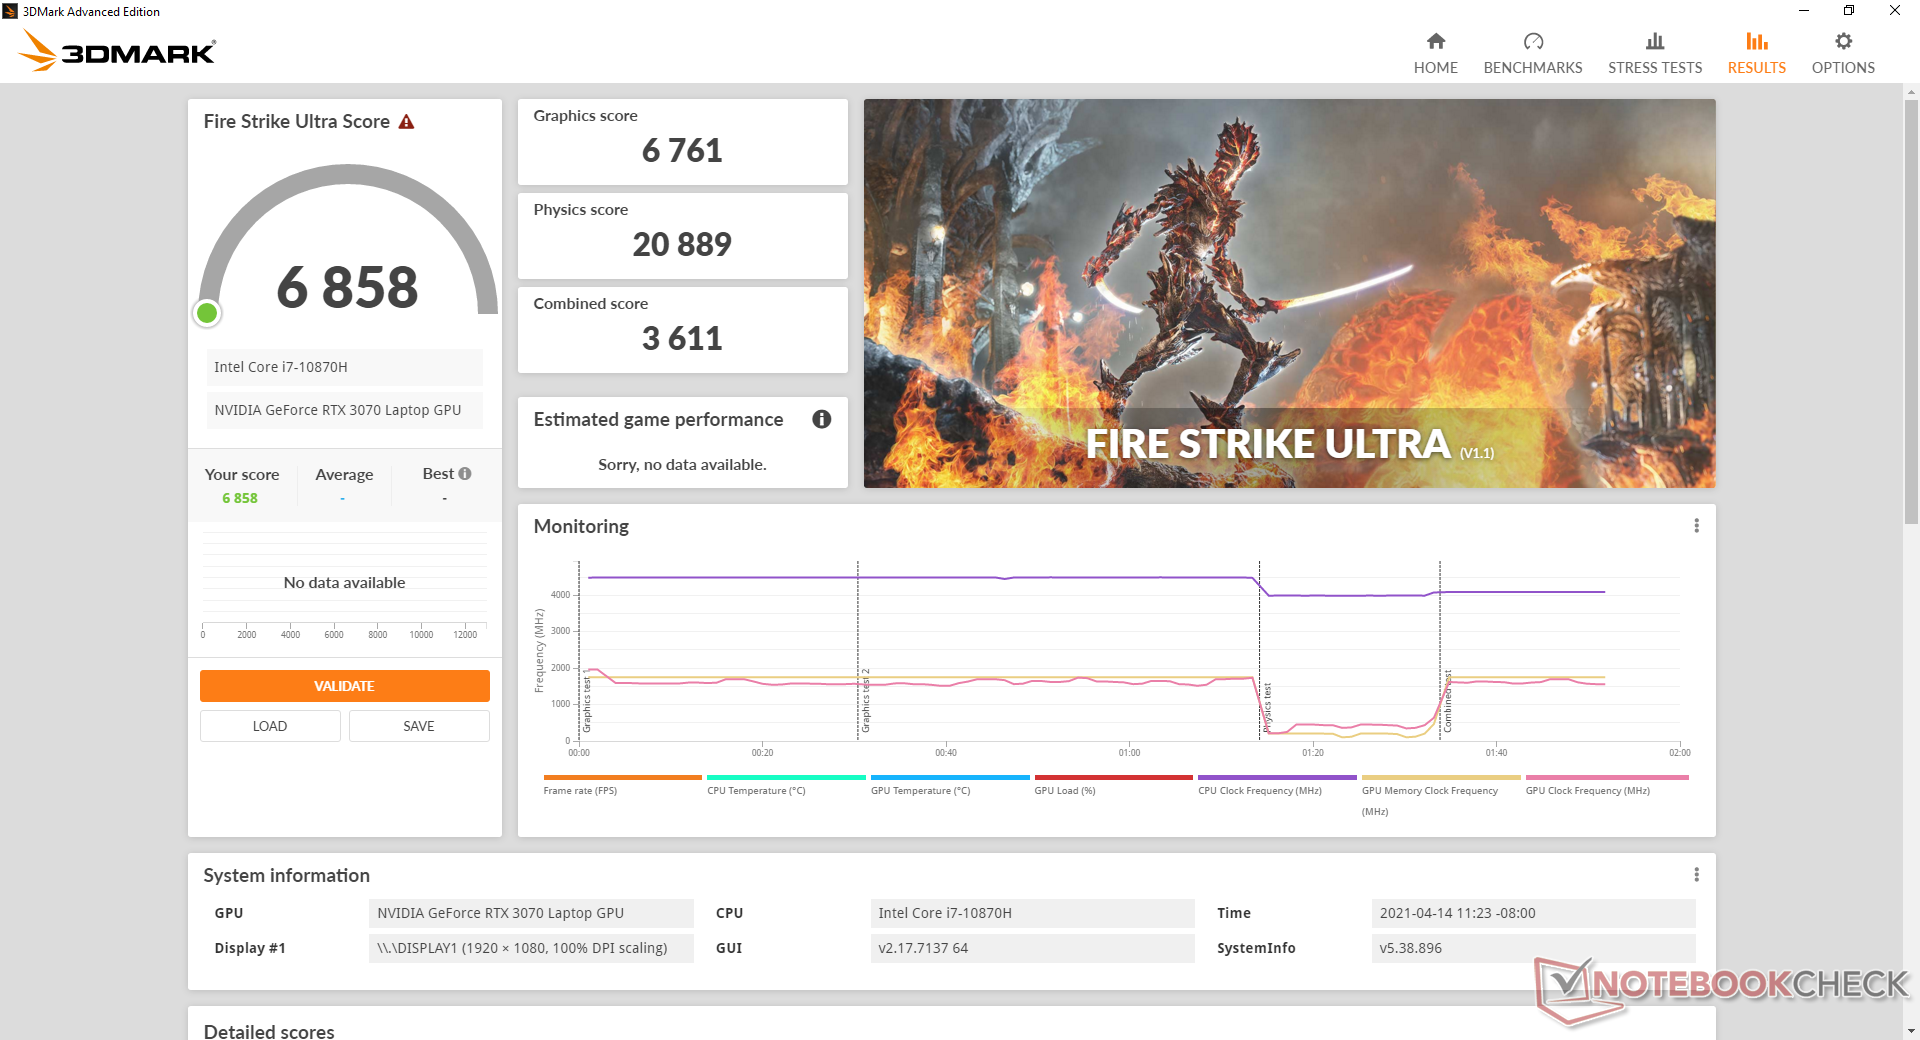
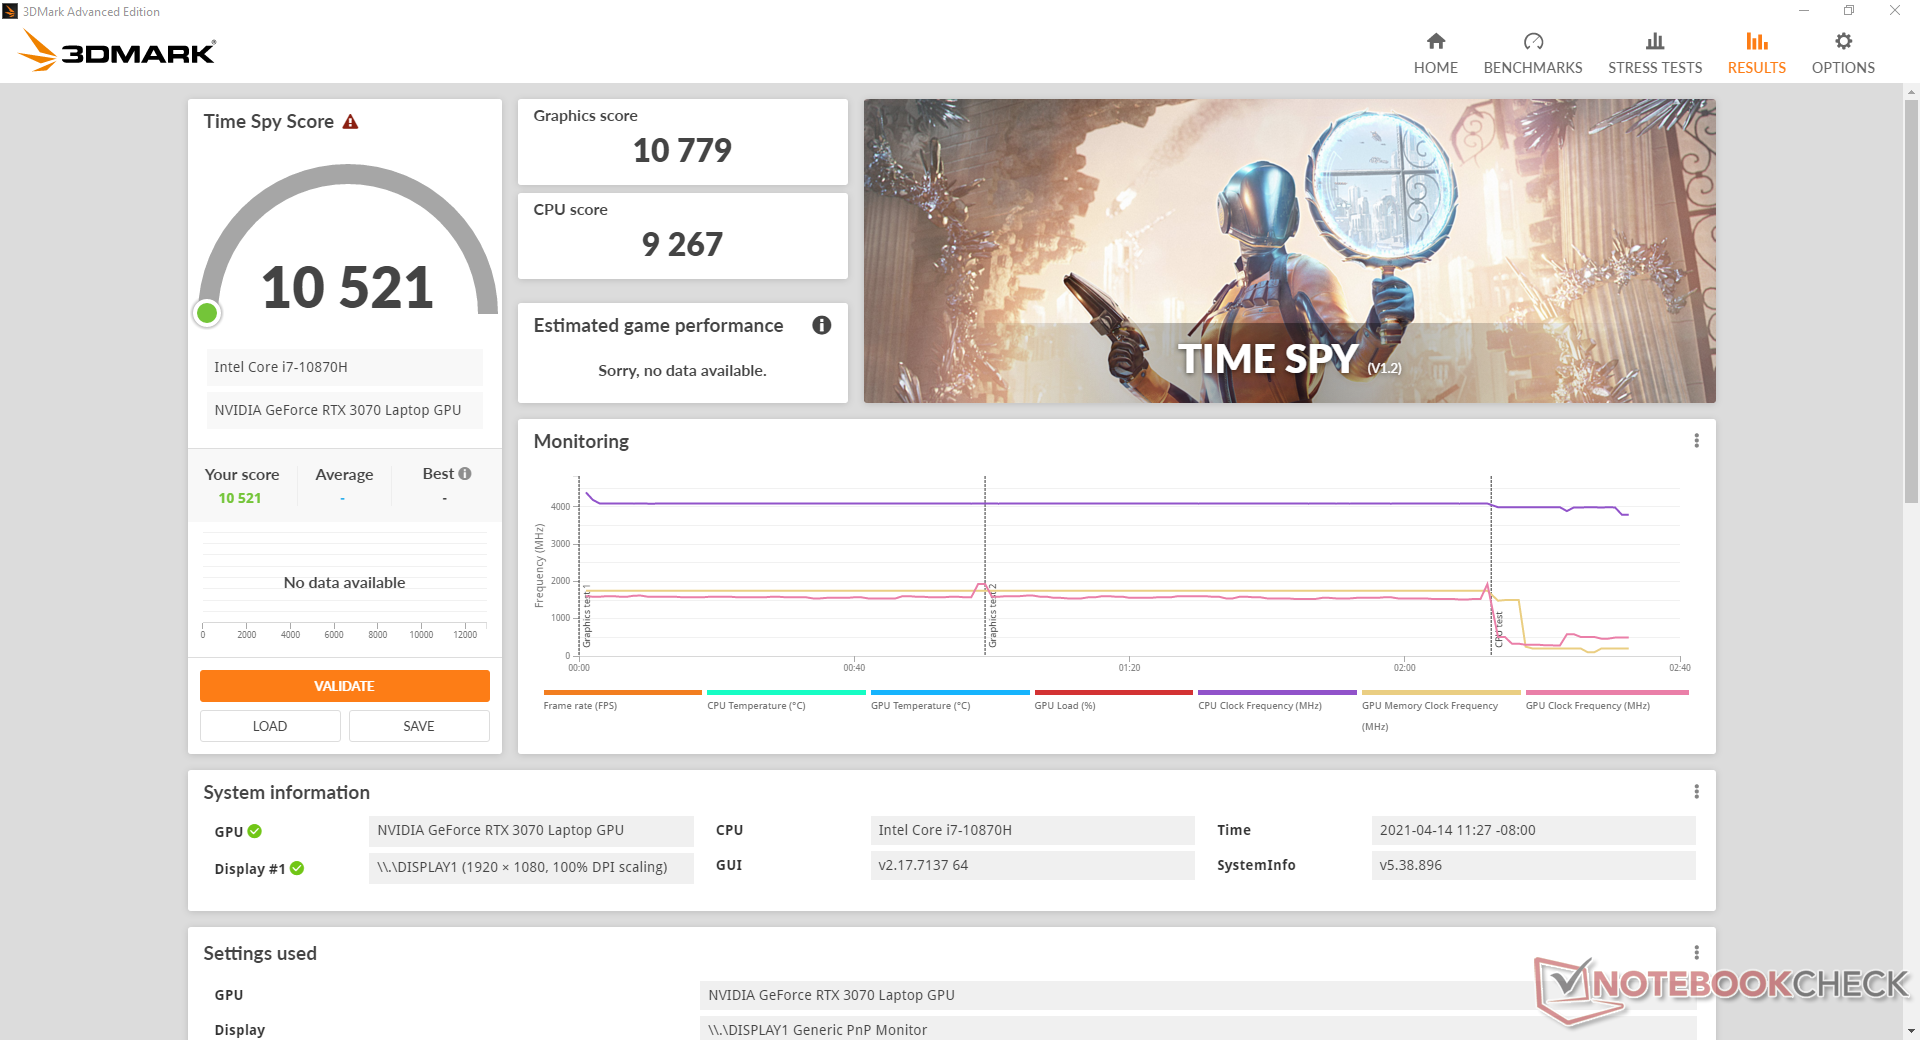
| 3DMark 11 Performance | 28106 points | |
| 3DMark Cloud Gate Standard Score | 53987 points | |
| 3DMark Fire Strike Score | 22371 points | |
| 3DMark Time Spy Score | 10521 points | |
Aide | ||
| Bas | Moyen | Élevé | Ultra | |
|---|---|---|---|---|
| GTA V (2015) | 181 | 166 | 96.6 | |
| The Witcher 3 (2015) | 362.7 | 298.1 | 206.9 | 107.9 |
| Dota 2 Reborn (2015) | 156 | 141 | 141 | 135 |
| Final Fantasy XV Benchmark (2018) | 175 | 142 | 103 | |
| X-Plane 11.11 (2018) | 116 | 104 | 85.7 | |
| Strange Brigade (2018) | 399 | 279 | 225 | 194 |
Emissions
Bruit du système
Les ventilateurs tournent au ralenti lorsque l'ordinateur portable est en veille sur le bureau, sans autre programme actif. Cependant, même une légère augmentation de l'utilisation du processeur fera démarrer le ventilateur du processeur et l'ordinateur portable ne sera donc pas vraiment silencieux dans la plupart des scénarios du monde réel. Nous avons pu enregistrer un bruit de 32,8 dB(A) lors d'une navigation web ou d'un streaming vidéo contre un fond silencieux de 24,7 dB(A). C'est assez pour être perceptible mais pas particulièrement gênant.
Le bruit du ventilateur lors des jeux tourne autour de 48,8 dB(A), sans pulsation ni comportement erratique du régime. C'est plus silencieux que ce que nous avons enregistré sur l'ancien GP65 tout en étant à égalité avec les derniers Alienware m15 R4, Aorus 15P, et Asus ROG Zephyrus G15 chacun avec des graphiques RTX 30.
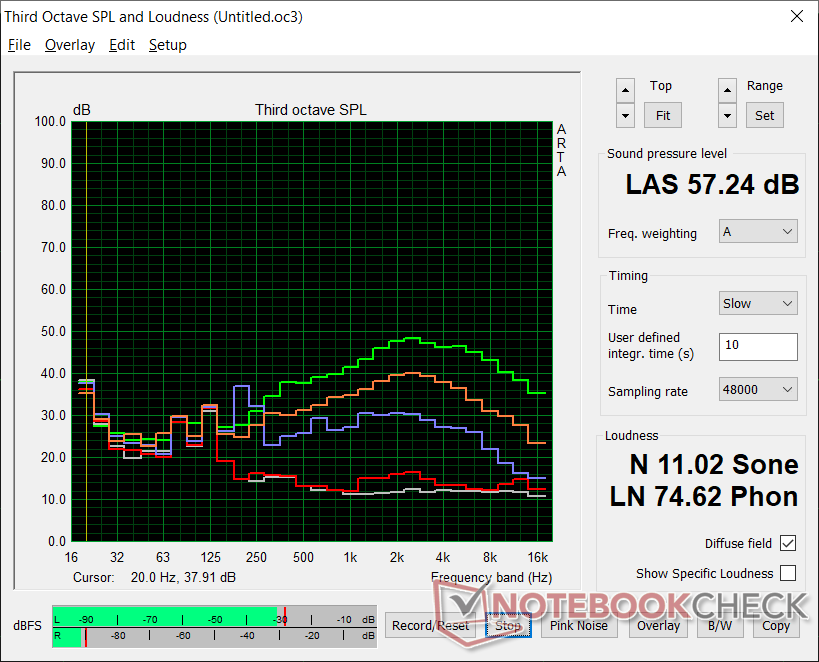
Si Cooler Boost (c'est-à-dire le mode ventilateur maximal) est activé, le bruit du ventilateur passe immédiatement à 57,2 dB(A), quelle que soit la charge à l'écran. Il s'agit d'une augmentation massive du bruit du ventilateur pour un gain de performance pas si important que cela, comme le détaille notre section sur le test de stress ci-dessous.
Notre appareil de test présente un léger grincement de bobine de 26,8 dB(A) sur un fond de 24,7 dB(A).
| MSI GP66 Leopard 10UG GeForce RTX 3070 Laptop GPU, i7-10870H, Kingston OM8PCP31024F | MSI GP65 10SFK-047US GeForce RTX 2070 Mobile, i7-10750H, Samsung SSD PM981 MZVLB1T0HALR | Alienware m15 R4 GeForce RTX 3070 Laptop GPU, i9-10980HK, Micron 2300 1TB MTFDHBA1T0TDV | Aorus 15P XC GeForce RTX 3070 Laptop GPU, i7-10870H, ESR512GTLCG-EAC-4 | Asus ROG Zephyrus G15 GA503Q GeForce RTX 3080 Laptop GPU, R9 5900HS, SK Hynix HFM001TD3JX013N | MSI GF65 Thin 10UE GeForce RTX 3060 Laptop GPU, i7-10750H, Samsung SSD PM981 MZVLB1T0HALR | |
|---|---|---|---|---|---|---|
| Noise | -15% | -4% | -4% | -4% | -9% | |
| arrêt / environnement * (dB) | 24.7 | 29.3 -19% | 24 3% | 24 3% | 25 -1% | 24.7 -0% |
| Idle Minimum * (dB) | 26.8 | 31.9 -19% | 25 7% | 25 7% | 26 3% | 33.1 -24% |
| Idle Average * (dB) | 26.8 | 31.9 -19% | 26 3% | 29 -8% | 27 -1% | 33.1 -24% |
| Idle Maximum * (dB) | 26.8 | 33.5 -25% | 37 -38% | 34 -27% | 31 -16% | 33.1 -24% |
| Load Average * (dB) | 40.4 | 47 -16% | 48 -19% | 44 -9% | 49 -21% | 42.7 -6% |
| Witcher 3 ultra * (dB) | 48.8 | 53.8 -10% | 47 4% | 49 -0% | 49 -0% | 40.6 17% |
| Load Maximum * (dB) | 57.2 | 56.7 1% | 49 14% | 53 7% | 51 11% | 59.4 -4% |
* ... Moindre est la valeur, meilleures sont les performances
Degré de la nuisance sonore
| Au repos |
| 26.8 / 26.8 / 26.8 dB(A) |
| Fortement sollicité |
| 40.4 / 57.2 dB(A) |
 | ||
30 dB silencieux 40 dB(A) audible 50 dB(A) bruyant |
||
min: | ||
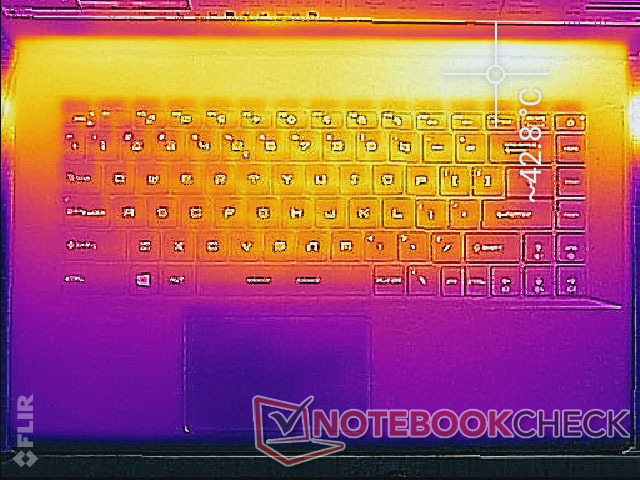
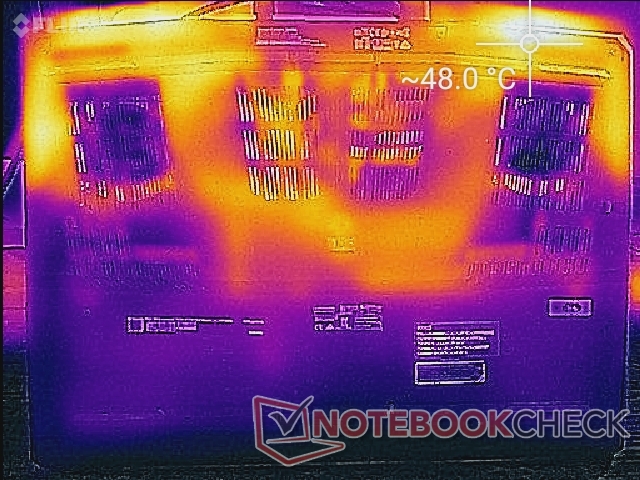
Température
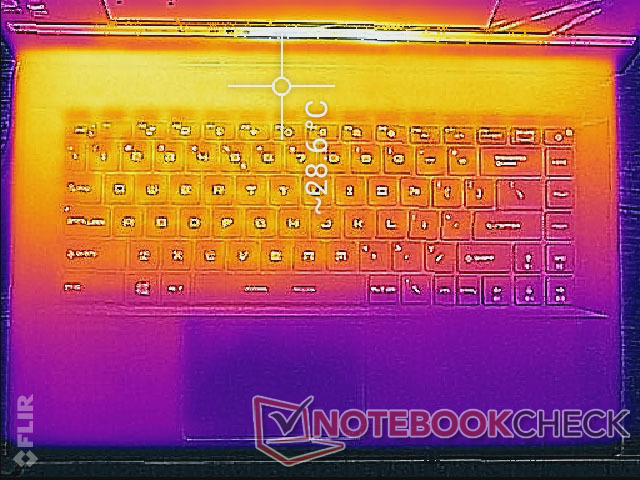
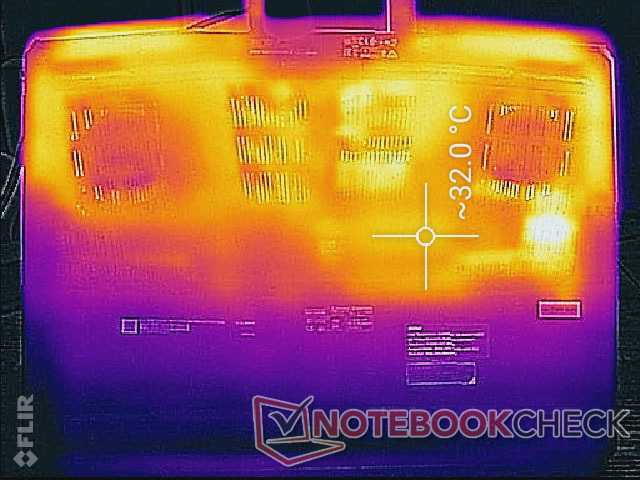
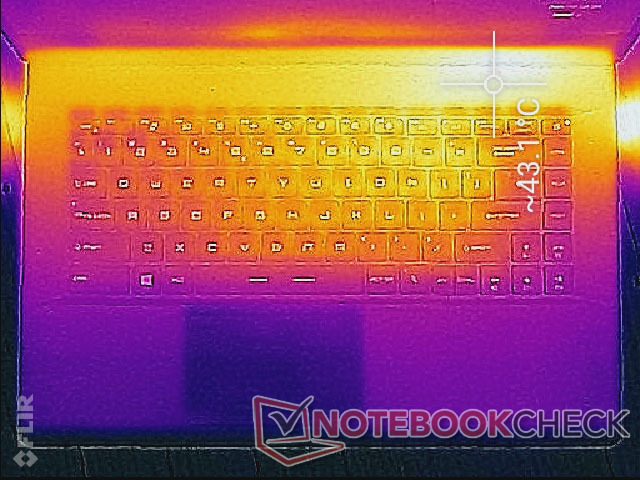
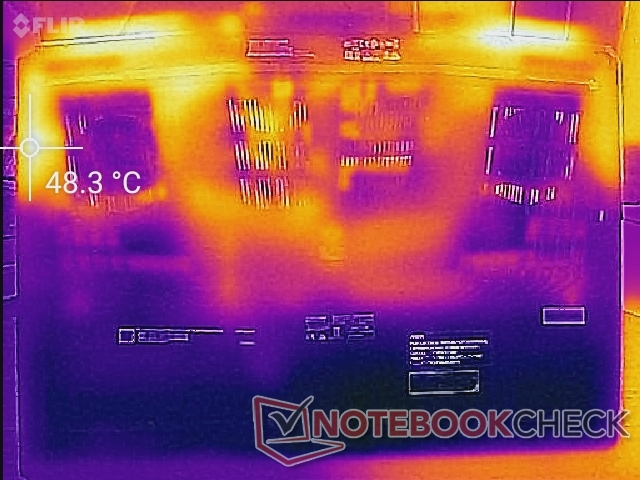
Les températures de surface sont légèrement plus basses que sur le GP65. Dans les jeux, les points chauds du GP66 atteignent 43 C et 48 C sur le dessus et le dessous de la base, respectivement, contre 46 C à 50 C sur le GP65. En outre, les points chauds sont désormais situés au-dessus de la première rangée de touches du clavier pour une expérience de frappe plus fraîche, alors que les points chauds du GP65 et même du GS66 sont plus proches du centre de leurs claviers.
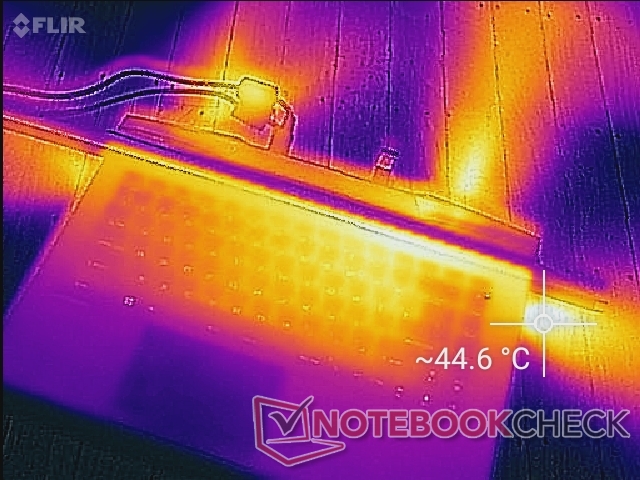
(±) La température maximale du côté supérieur est de 42.8 °C / 109 F, par rapport à la moyenne de 40.4 °C / 105 F, allant de 21.2 à 68.8 °C pour la classe Gaming.
(-) Le fond chauffe jusqu'à un maximum de 50 °C / 122 F, contre une moyenne de 43.2 °C / 110 F
(+) En utilisation inactive, la température moyenne du côté supérieur est de 29.4 °C / 85 F, par rapport à la moyenne du dispositif de 33.9 °C / 93 F.
(±) En jouant à The Witcher 3, la température moyenne du côté supérieur est de 33.4 °C / 92 F, alors que la moyenne de l'appareil est de 33.9 °C / 93 F.
(+) Les repose-poignets et le pavé tactile sont plus froids que la température de la peau avec un maximum de 25.8 °C / 78.4 F et sont donc froids au toucher.
(+) La température moyenne de la zone de l'appui-paume de dispositifs similaires était de 28.8 °C / 83.8 F (+3 °C / #5.4 F).
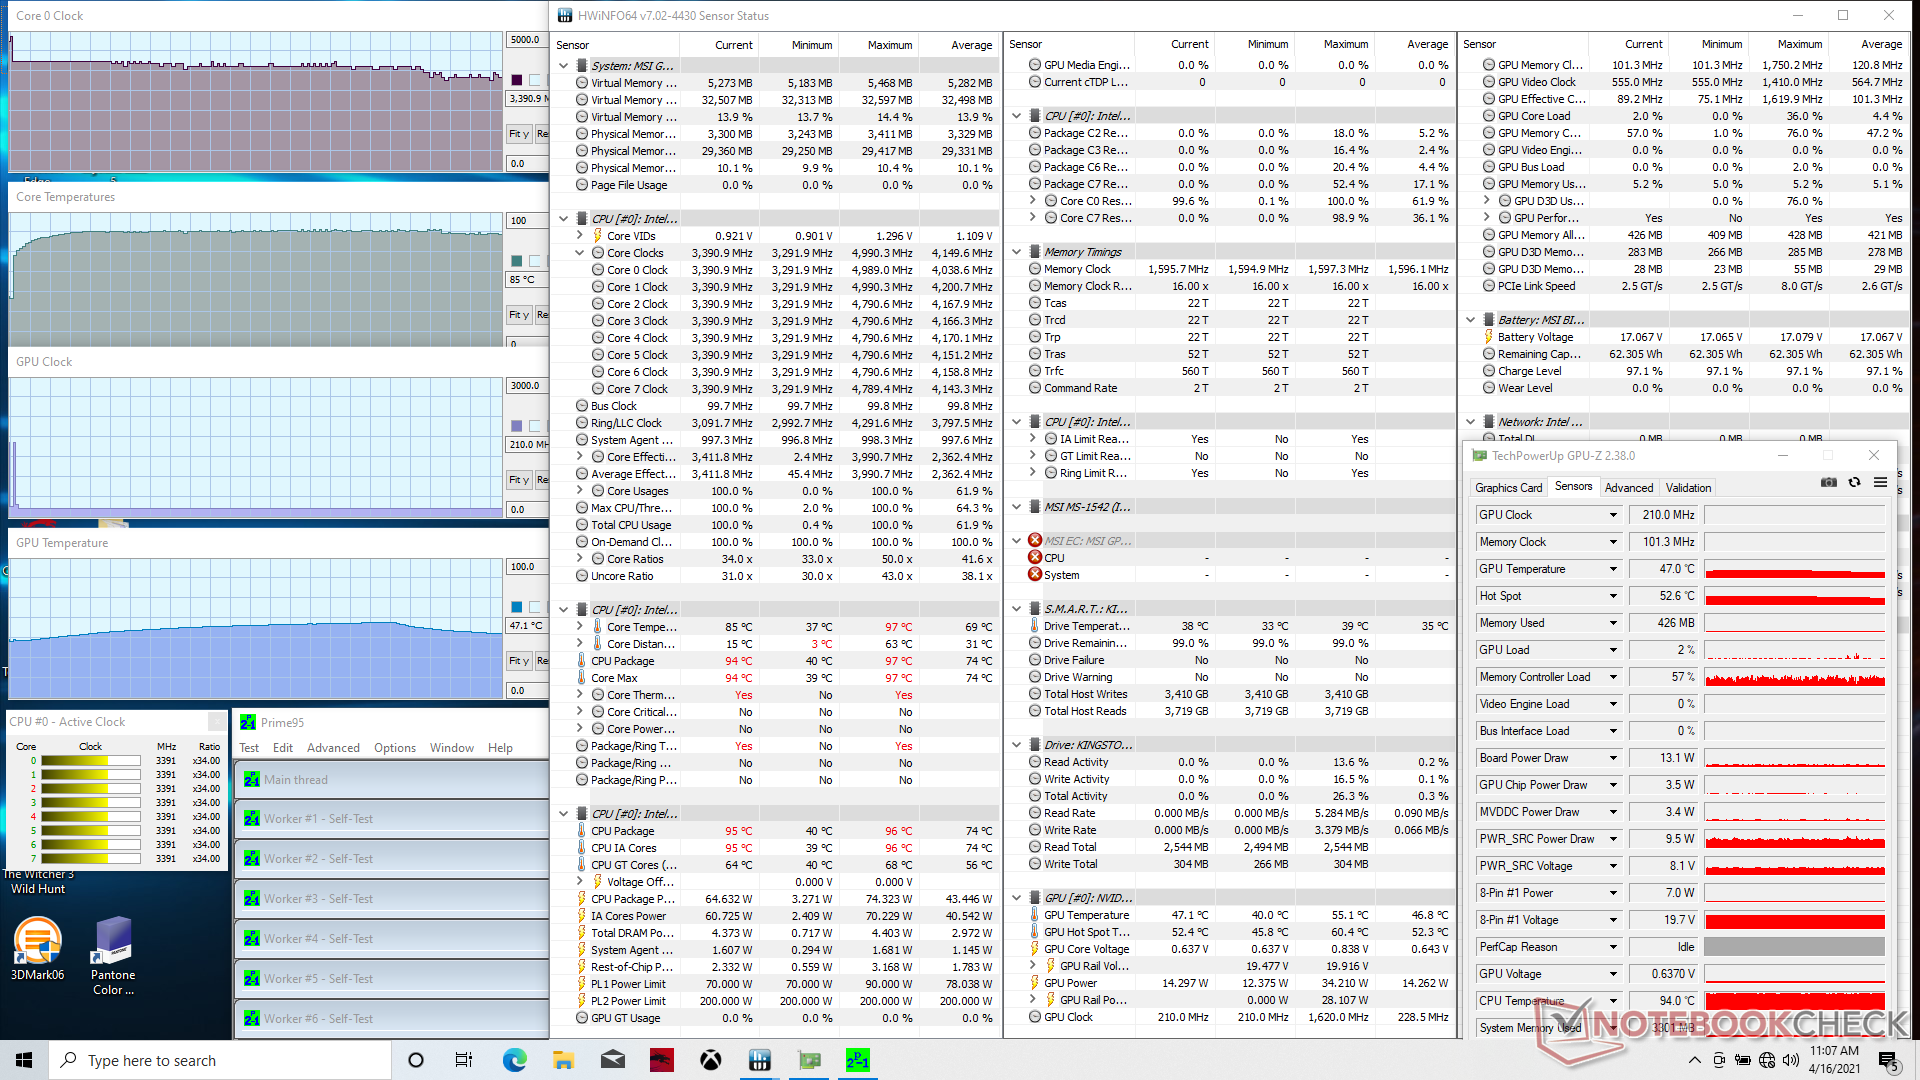
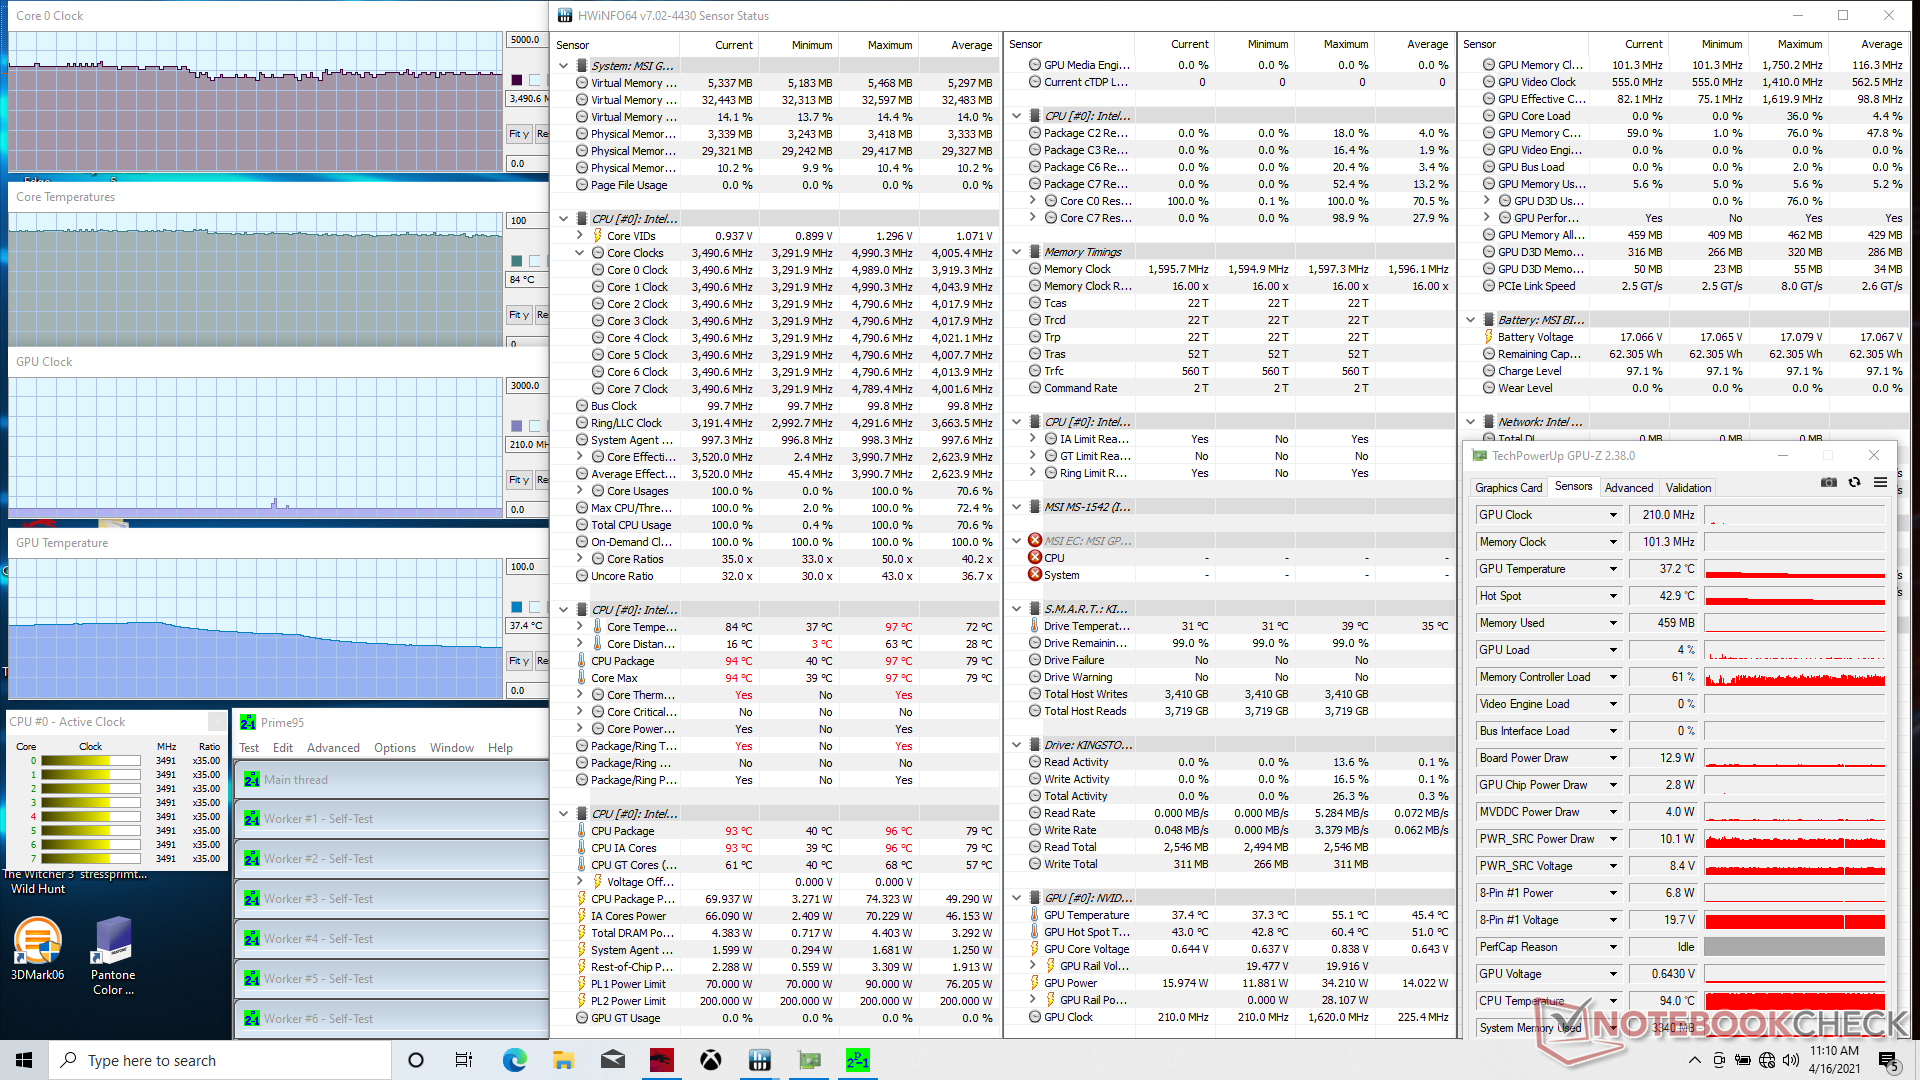
Test de stress
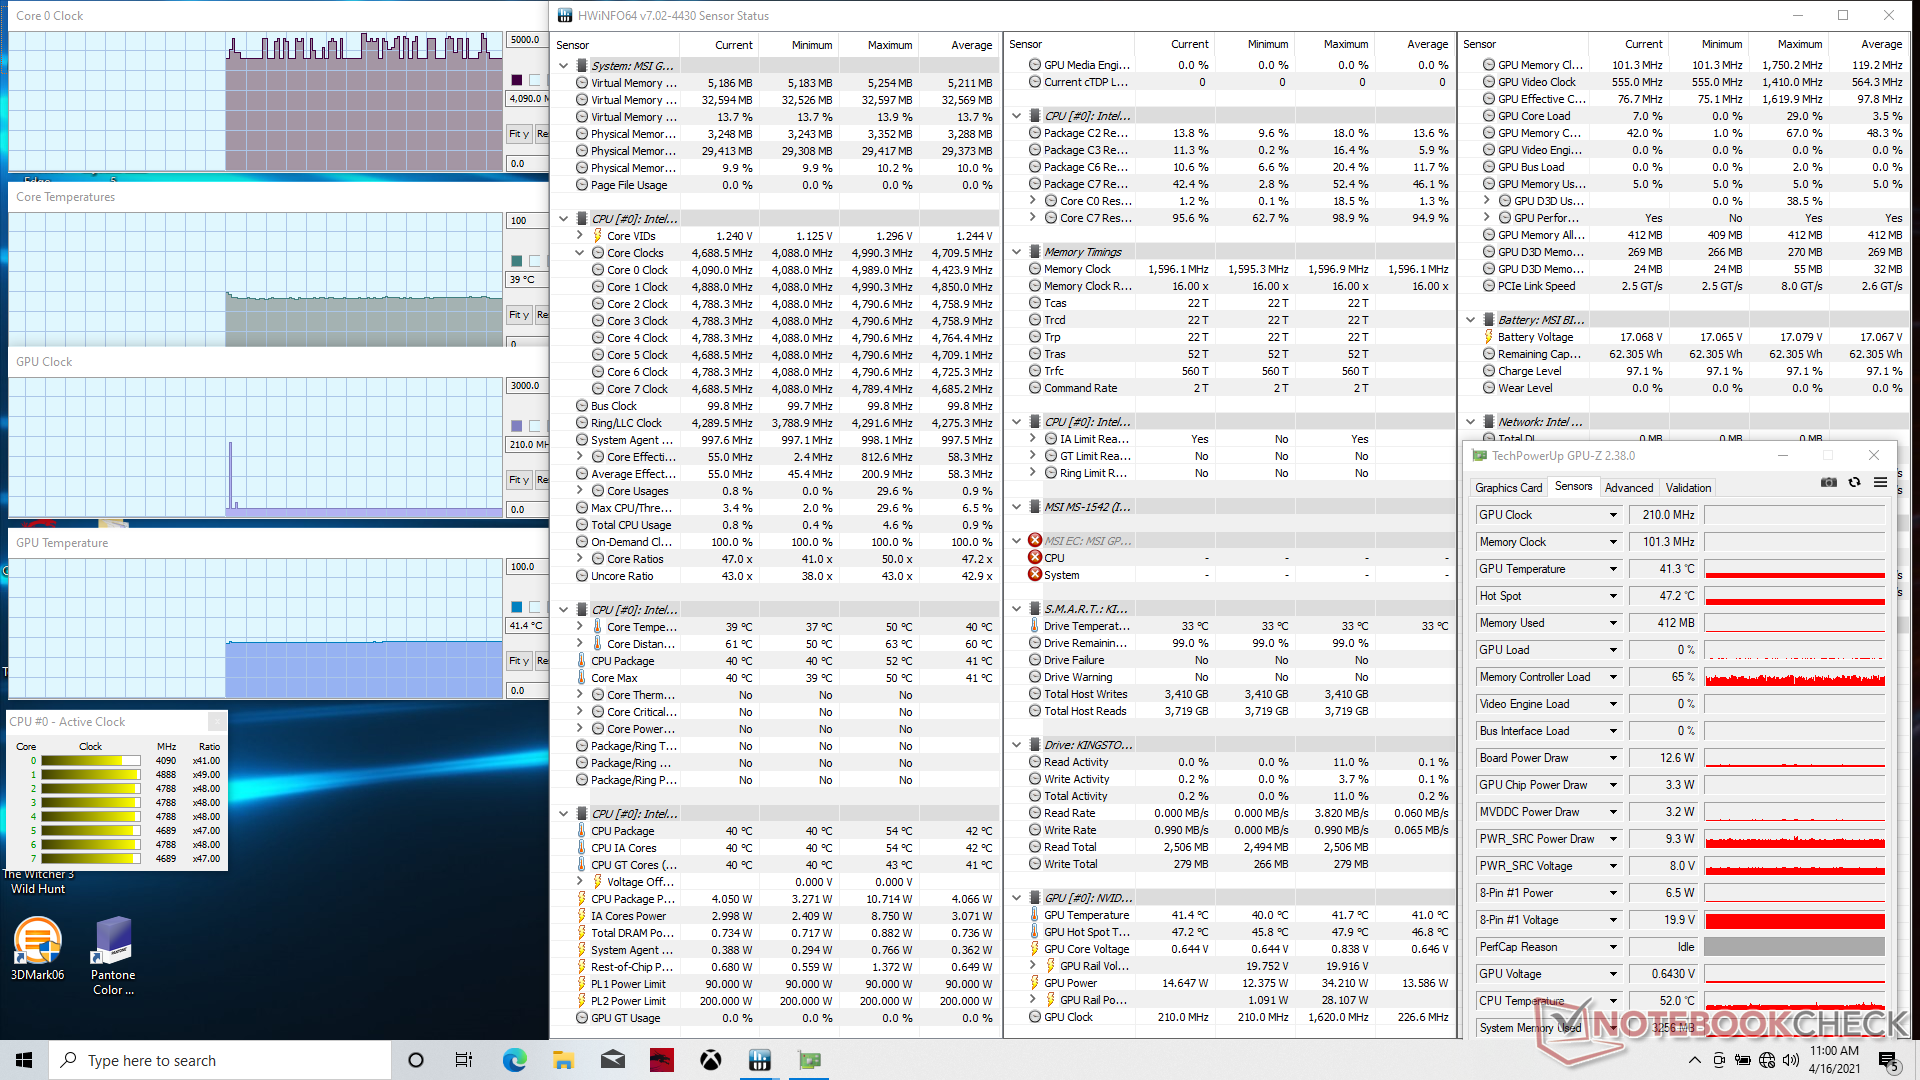
Lors de l'exécution de Prime95 pour stresser le processeur, les fréquences d'horloge du CPU augmentaient à 4 GHz jusqu'à atteindre une température centrale de 88 C environ 20 secondes plus tard. Par la suite, les fréquences d'horloge diminuent régulièrement et se stabilisent entre 3,2 et 3,4 GHz afin de maintenir une température centrale légèrement plus froide de 85 C. L'activation du mode Cooler Boost n'entraîne que des changements très mineurs des fréquences d'horloge et de la température du CPU.
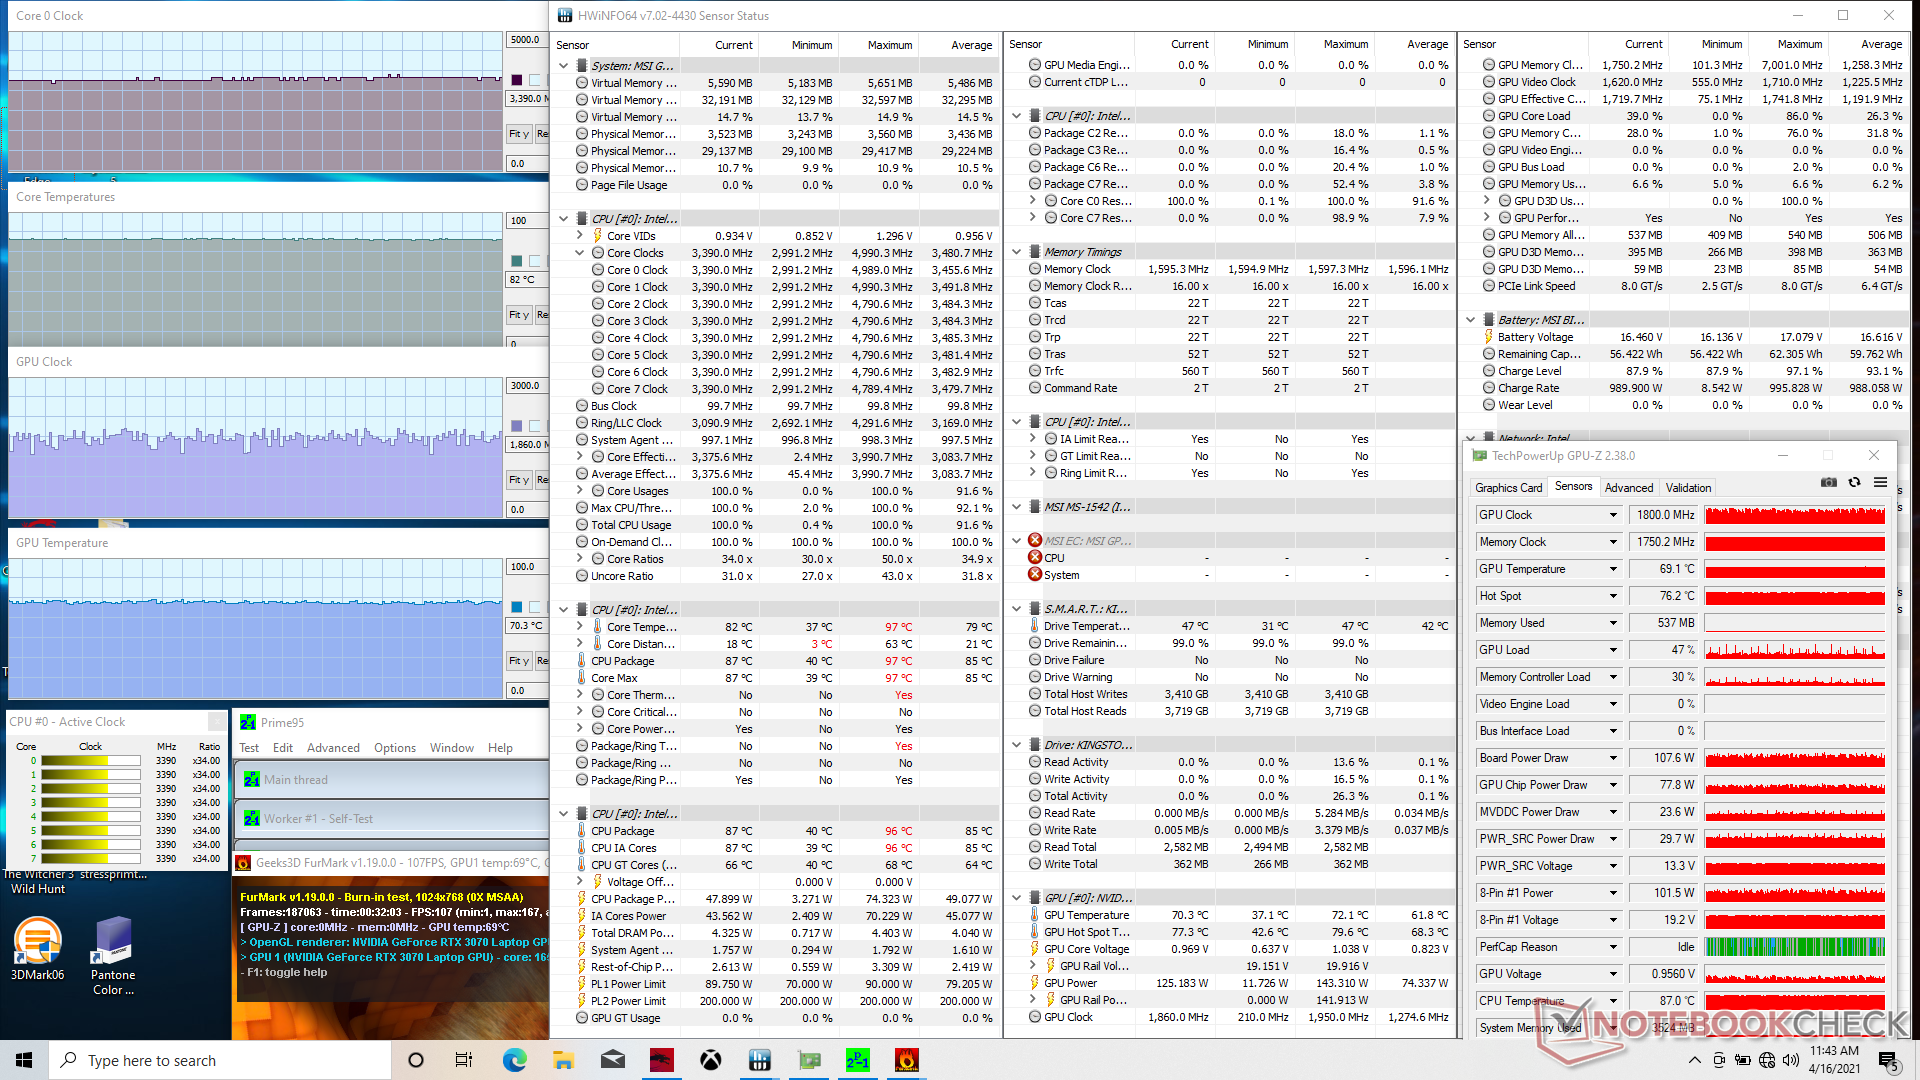
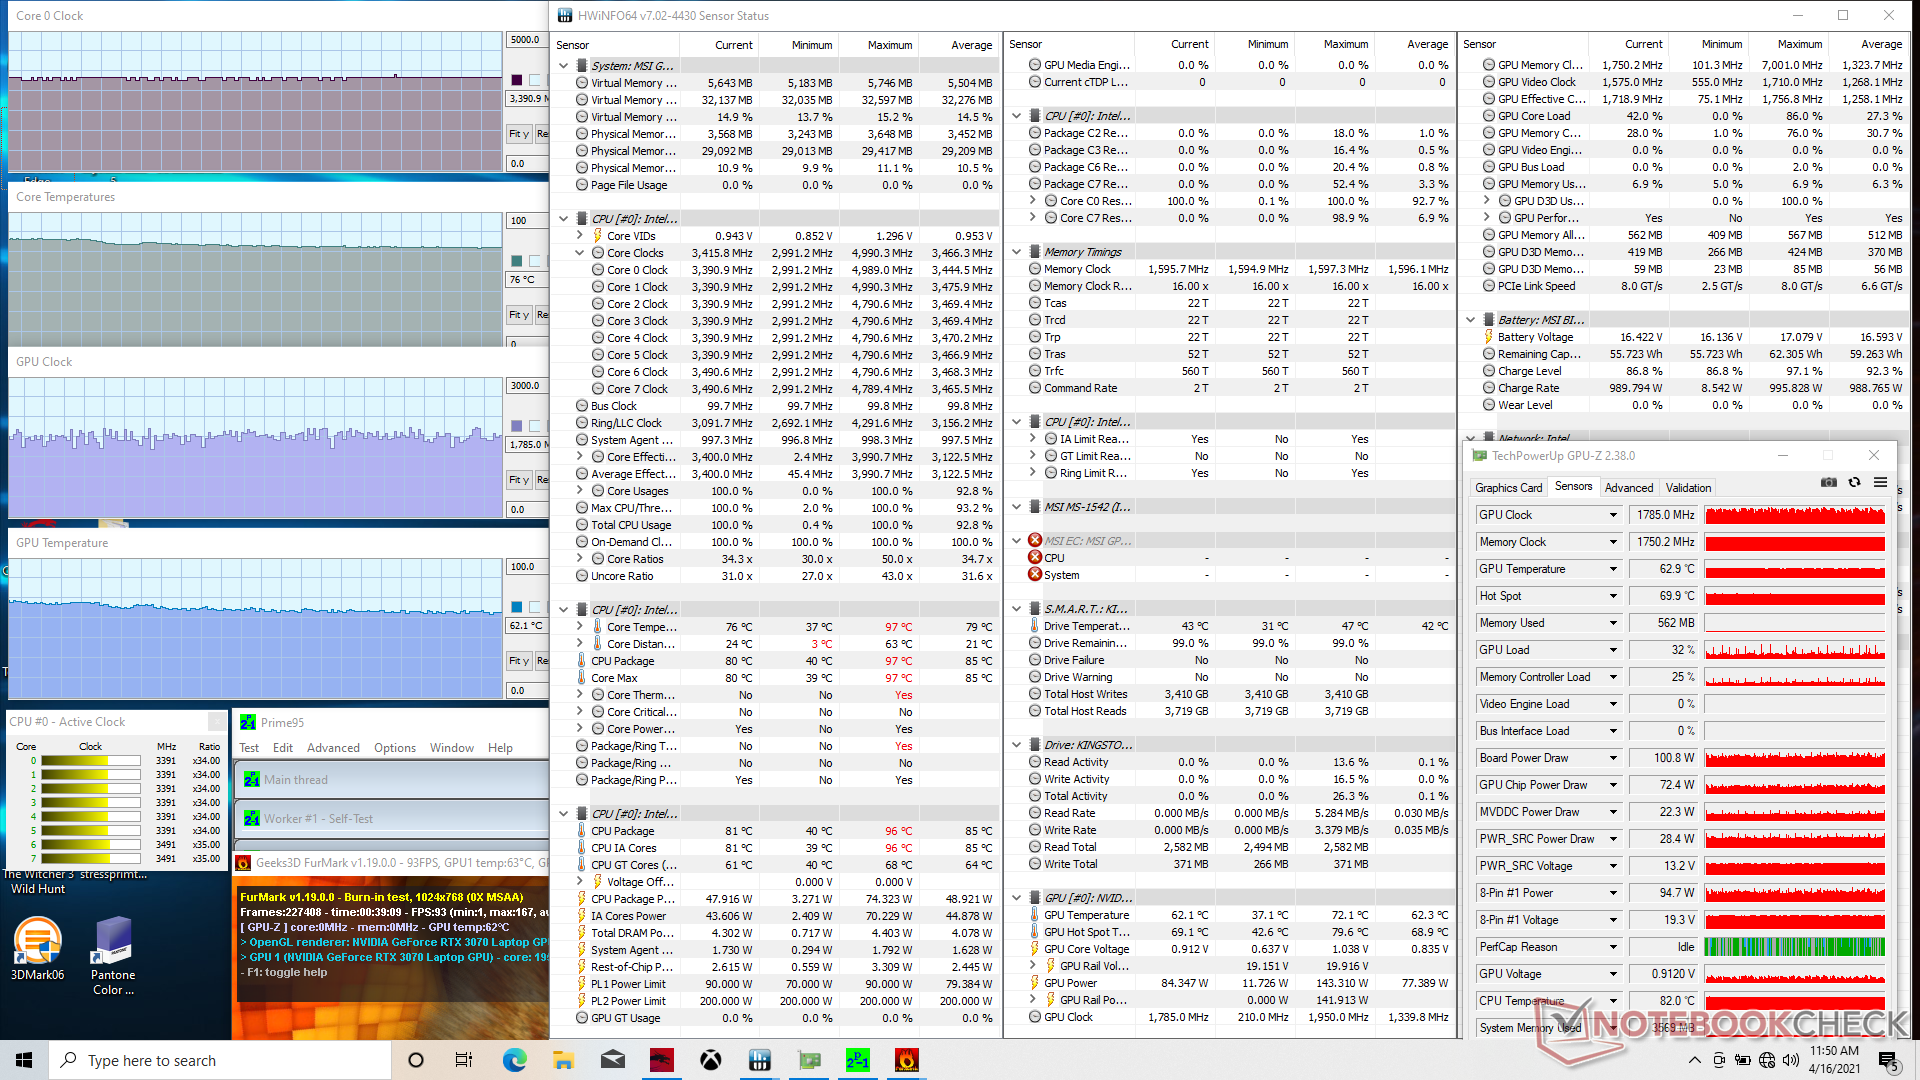
En exécutant Prime95 et FurMark simultanément, on obtient des températures stables du CPU et du GPU de 82 C et 70 C, respectivement. Si le mode Cooler Boost est activé, les températures des cœurs baisseraient d'environ 8 C chacune.
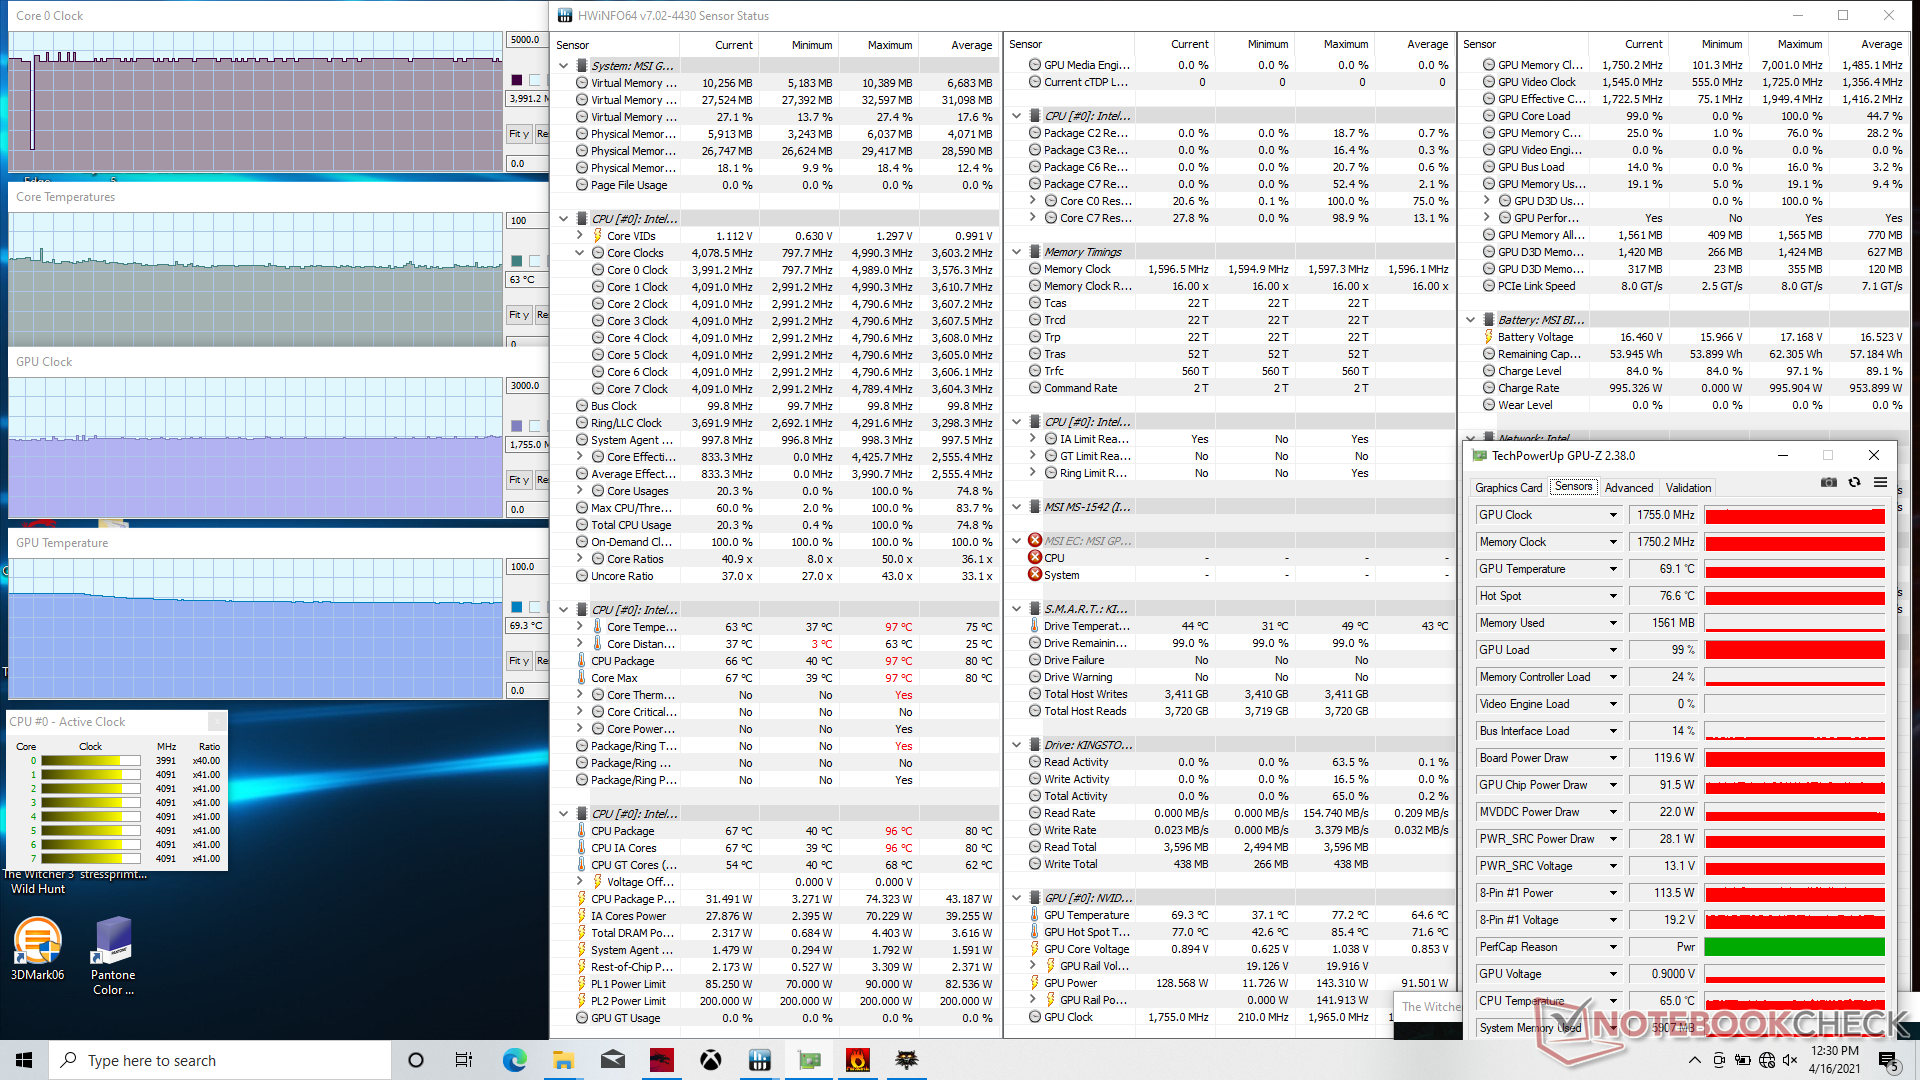
En exécutant Witcher 3 pour représenter le stress du jeu dans le monde réel, les températures du cœur se stabiliseraient dans la gamme 67 C à 76 C si Cooler Boost est désactivé et dans la gamme 63 à 69 C si Cooler Boost est activé. Les fréquences d'horloge du GPU augmentent aussi légèrement de 1680 MHz à 1755 MHz avec une consommation d'énergie de 120 W à 130 W comme annoncé par le fabricant. En effectuant ce même test sur le GP65, les températures du CPU et du GPU seraient plus élevées, soit 96°C et 79°C.
Le fonctionnement sur batterie limite les performances. Un test Fire Strike sur batterie a donné des résultats de 1 2004 points pour la physique et de 6385 points pour le graphisme, contre 20842 points et 28490 points sur secteur.

| Température moyennedu CPU(°C)Température moyennedu GPU (°C) |
| Système au repos |
| Prime95 Stress (Cooler Boost off) |
| Prime95 Stress (Cooler Boost on) |
| Prime95 + FurMark Stress (Cooler Boost off) |
| Prime95 + FurMark Stress (Cooler Boost on) |
| Witcher 3 Stress (Cooler Boost off) |
| Witcher 3 Stress (Cooler Boost on) |
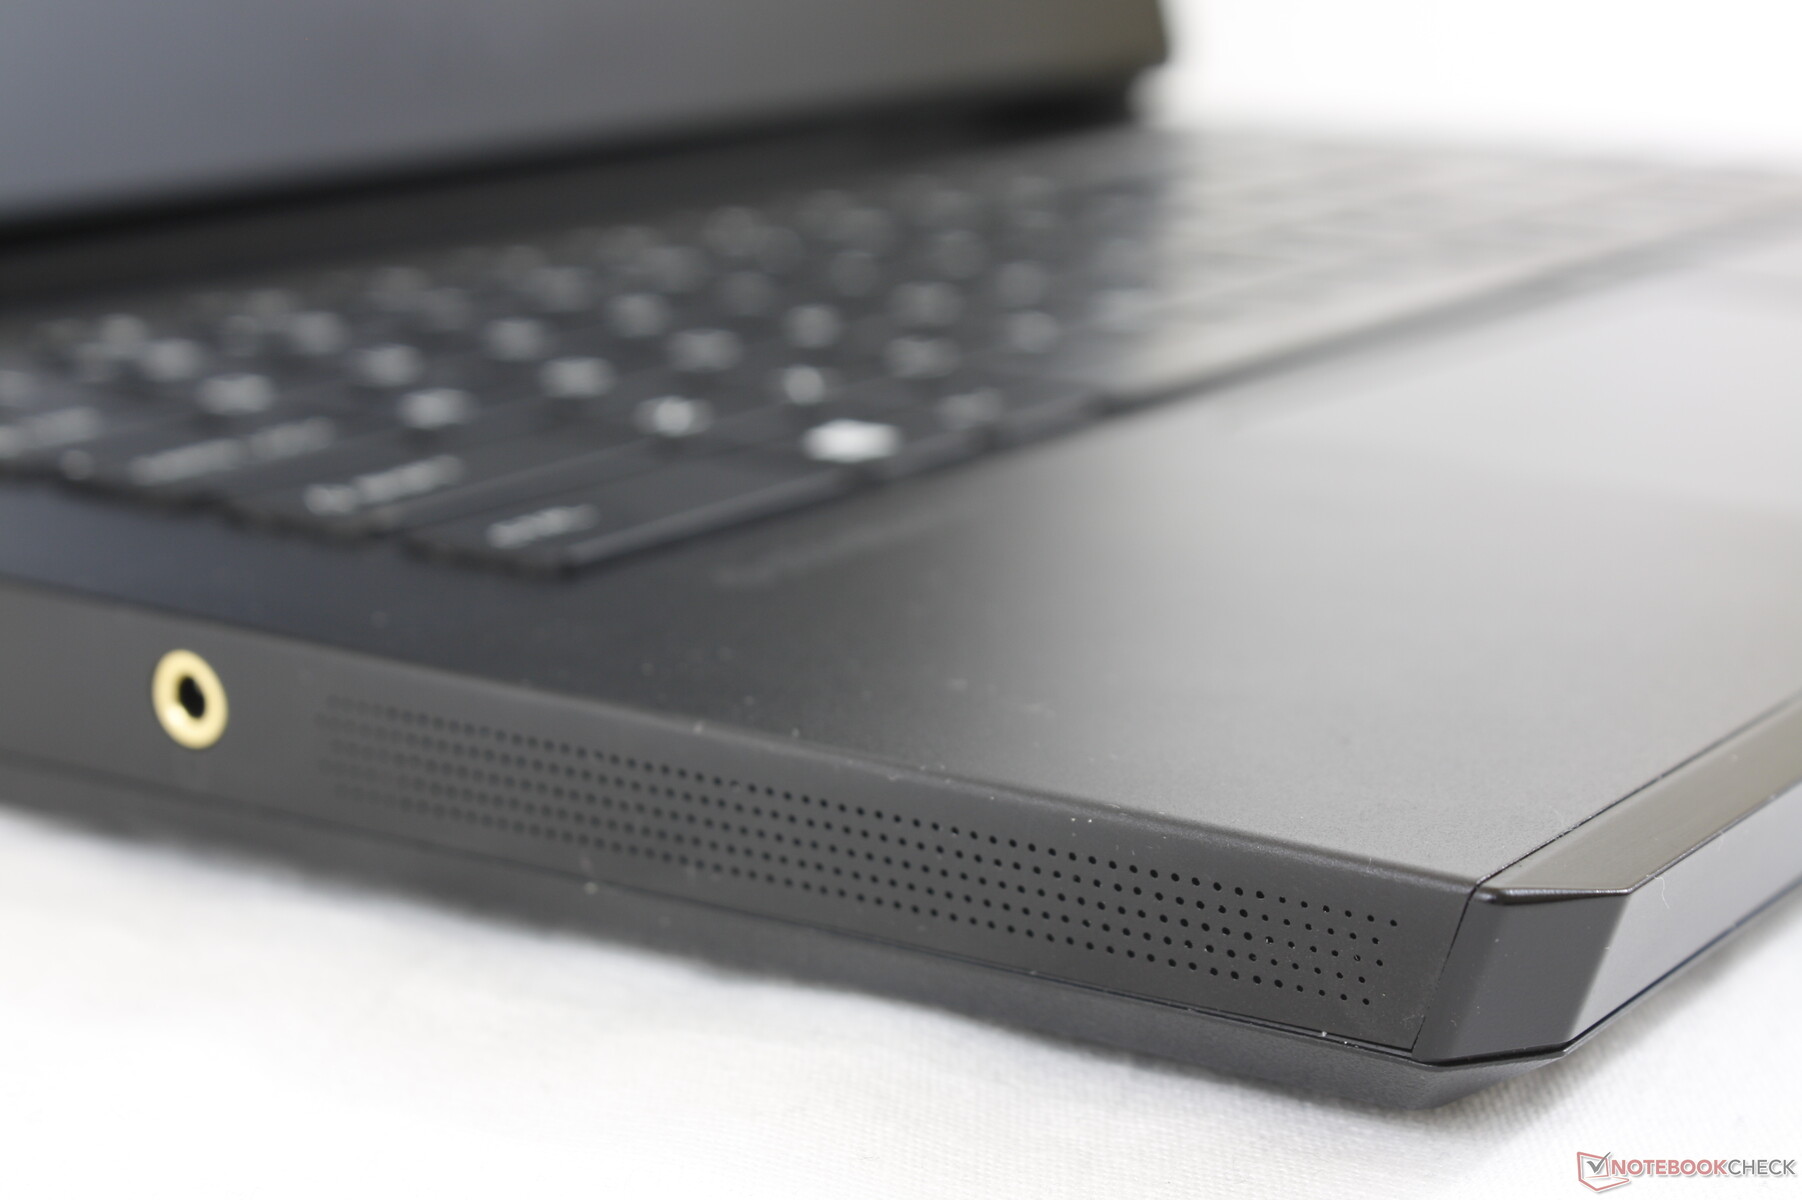
Haut-parleurs


MSI GP66 Leopard 10UG analyse audio
(±) | le niveau sonore du haut-parleur est moyen mais bon (81.3# dB)
Basses 100 - 315 Hz
(-) | presque aucune basse - en moyenne 18.4% plus bas que la médiane
(±) | la linéarité des basses est moyenne (11% delta à la fréquence précédente)
Médiums 400 - 2000 Hz
(±) | médiane supérieure - en moyenne 5.1% supérieure à la médiane
(+) | les médiums sont linéaires (4.6% delta à la fréquence précédente)
Aiguës 2 - 16 kHz
(±) | sommets plus élevés - en moyenne 5.9% plus élevés que la médiane
(±) | la linéarité des aigus est moyenne (9.2% delta à la fréquence précédente)
Globalement 100 - 16 000 Hz
(±) | la linéarité du son global est moyenne (19.3% de différence avec la médiane)
Par rapport à la même classe
» 65% de tous les appareils testés de cette catégorie étaient meilleurs, 8% similaires, 27% pires
» Le meilleur avait un delta de 6%, la moyenne était de 18%, le pire était de 132%.
Par rapport à tous les appareils testés
» 47% de tous les appareils testés étaient meilleurs, 8% similaires, 46% pires
» Le meilleur avait un delta de 4%, la moyenne était de 23%, le pire était de 134%.
Apple MacBook 12 (Early 2016) 1.1 GHz analyse audio
(+) | les haut-parleurs peuvent jouer relativement fort (83.6# dB)
Basses 100 - 315 Hz
(±) | basse réduite - en moyenne 11.3% inférieure à la médiane
(±) | la linéarité des basses est moyenne (14.2% delta à la fréquence précédente)
Médiums 400 - 2000 Hz
(+) | médiane équilibrée - seulement 2.4% de la médiane
(+) | les médiums sont linéaires (5.5% delta à la fréquence précédente)
Aiguës 2 - 16 kHz
(+) | des sommets équilibrés - à seulement 2% de la médiane
(+) | les aigus sont linéaires (4.5% delta à la fréquence précédente)
Globalement 100 - 16 000 Hz
(+) | le son global est linéaire (10.2% différence à la médiane)
Par rapport à la même classe
» 7% de tous les appareils testés de cette catégorie étaient meilleurs, 2% similaires, 90% pires
» Le meilleur avait un delta de 5%, la moyenne était de 18%, le pire était de 53%.
Par rapport à tous les appareils testés
» 5% de tous les appareils testés étaient meilleurs, 1% similaires, 94% pires
» Le meilleur avait un delta de 4%, la moyenne était de 23%, le pire était de 134%.
Energy Management
Consommation d'énergie
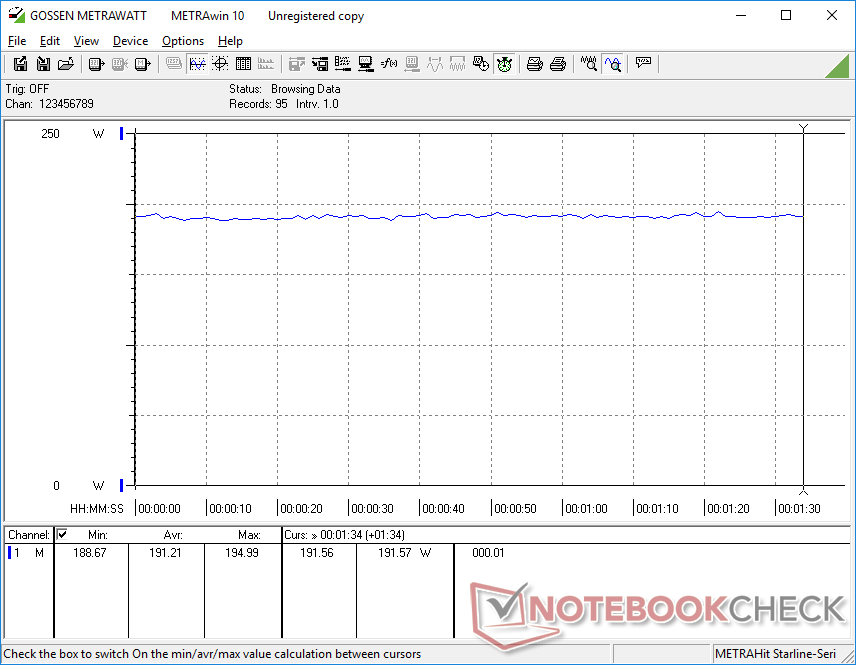
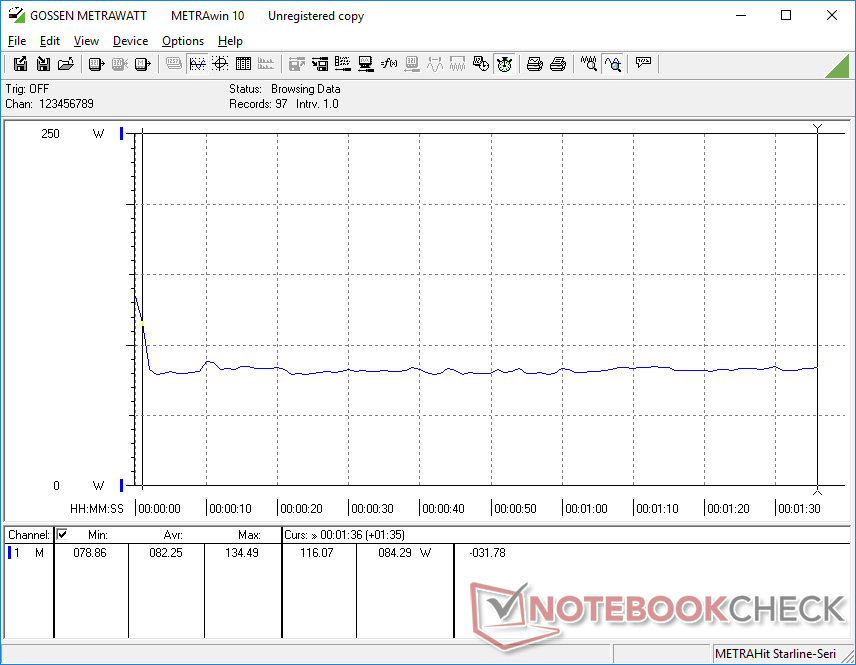
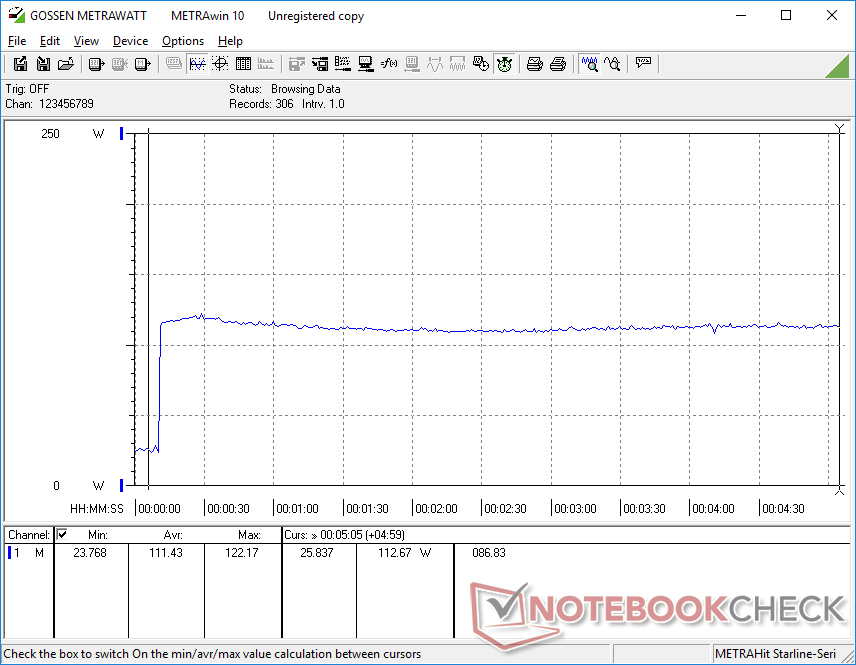
La consommation d'énergie globale est beaucoup plus proche de celle du GP65 que ce à quoi nous nous attendions. Par exemple, le fonctionnement au ralenti sur le bureau consomme entre 13 W et 23 W, ce qui correspond presque au GP65. L'exécution de Witcher 3 consomme en moyenne 191 W, soit seulement 3 % de plus que la GP65, tout en offrant une augmentation de 40 à 45 % des performances graphiques. L'augmentation de la performance par watt d'une génération à l'autre est impressionnante à cet égard
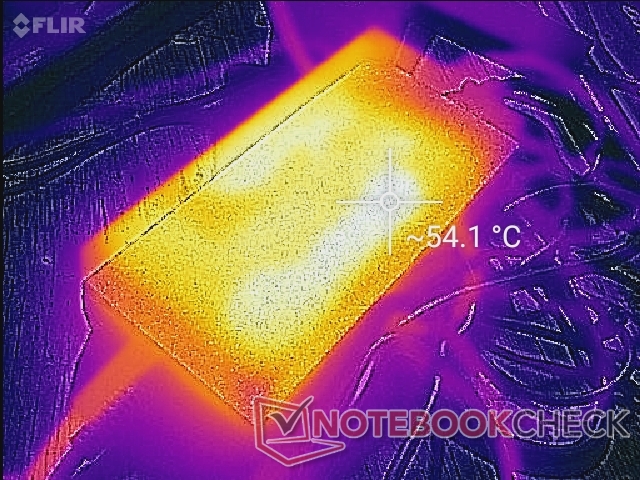
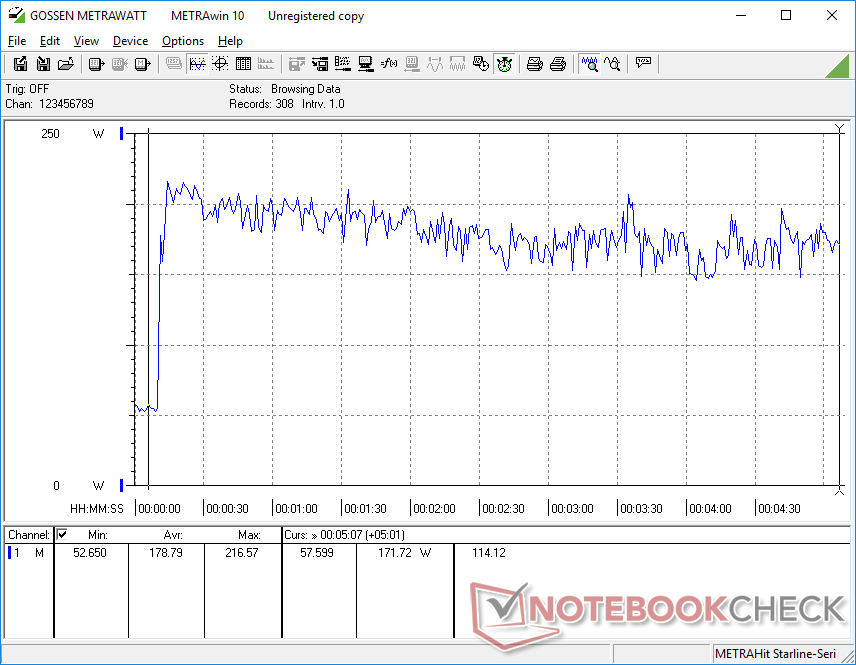
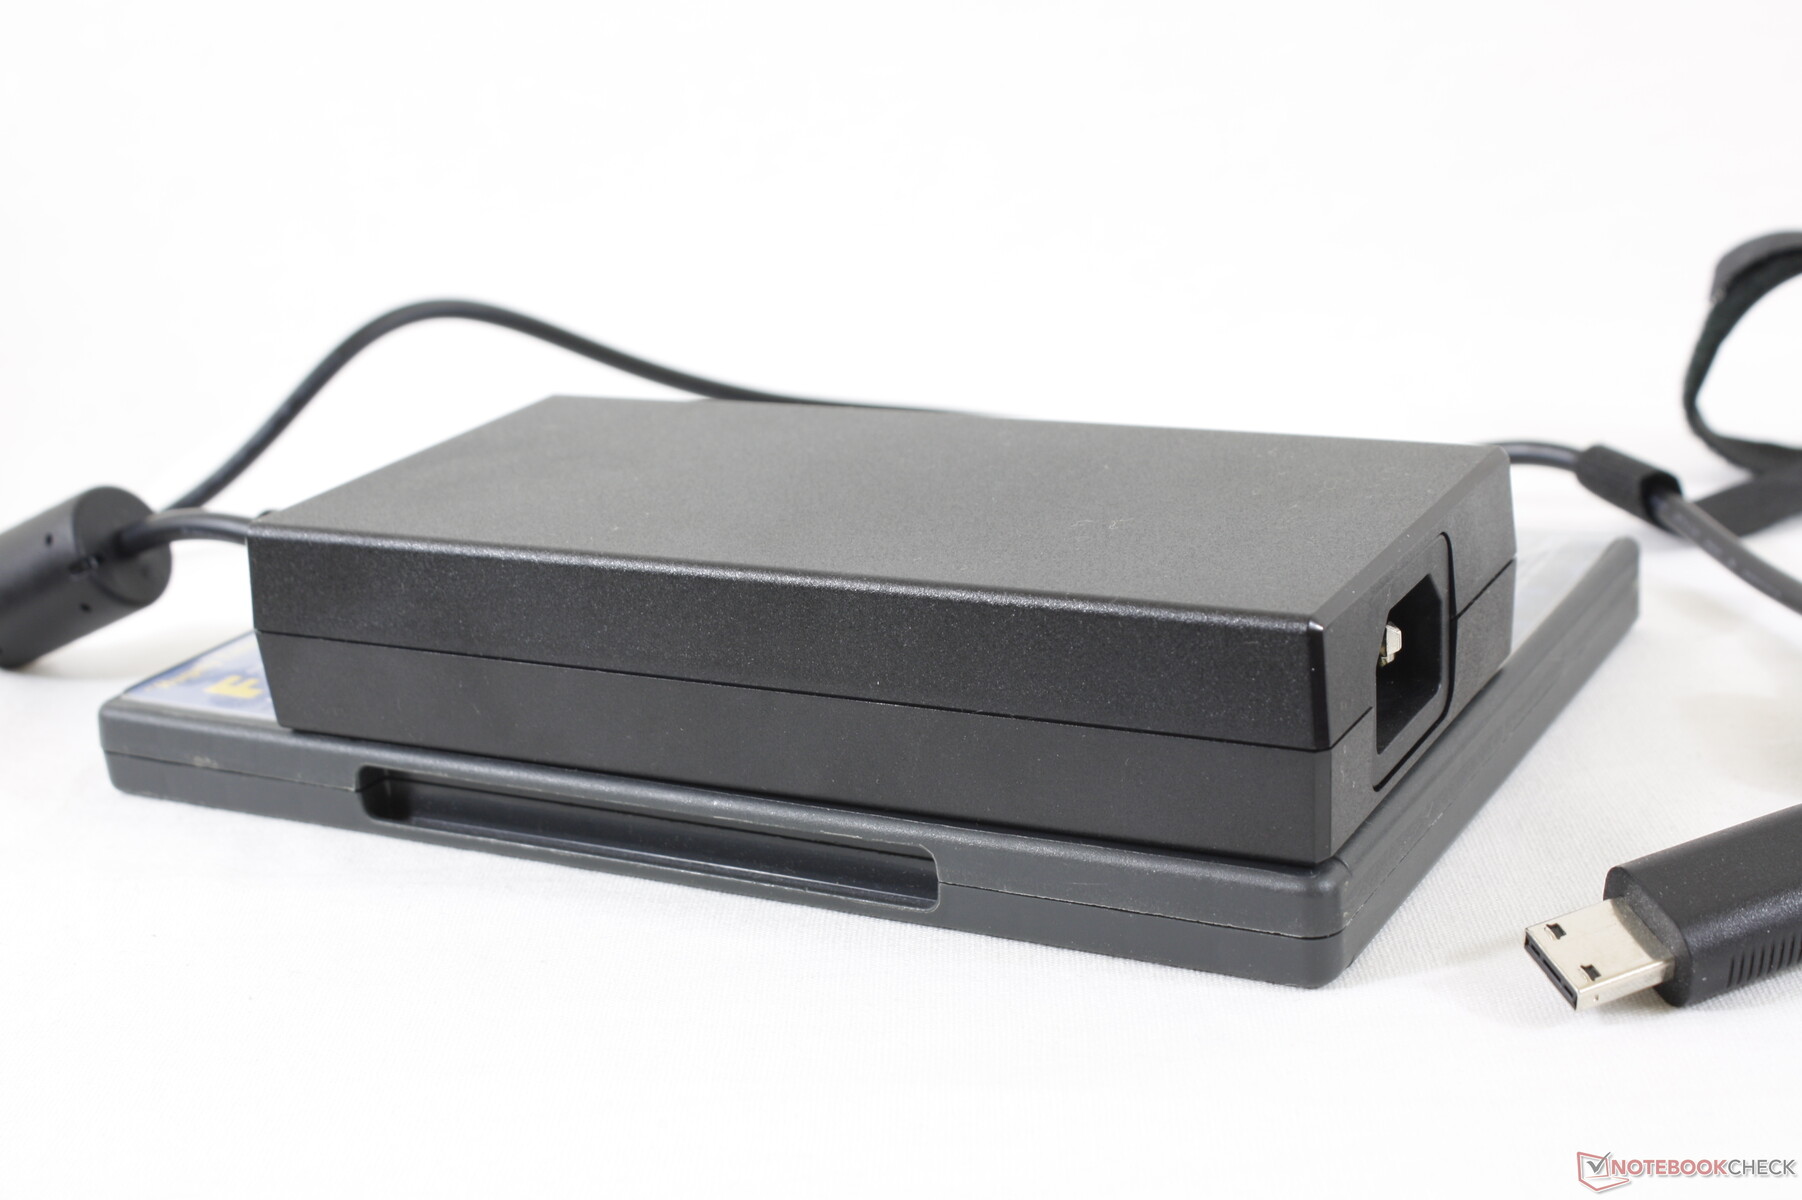
Nous avons pu enregistrer une consommation maximale de 216 W sur l'adaptateur secteur 230 W de taille moyenne (~15,3 x 7,3 x 3,0 cm).
| Éteint/en veille | |
| Au repos | |
| Fortement sollicité |
|
Légende:
min: | |
| MSI GP66 Leopard 10UG i7-10870H, GeForce RTX 3070 Laptop GPU, Kingston OM8PCP31024F, IPS, 1920x1080, 15.6" | MSI GP65 10SFK-047US i7-10750H, GeForce RTX 2070 Mobile, Samsung SSD PM981 MZVLB1T0HALR, IPS, 1920x1080, 15.6" | Alienware m15 R4 i9-10980HK, GeForce RTX 3070 Laptop GPU, Micron 2300 1TB MTFDHBA1T0TDV, IPS, 1920x1080, 15.6" | Aorus 15P XC i7-10870H, GeForce RTX 3070 Laptop GPU, ESR512GTLCG-EAC-4, IPS, 1920x1080, 15.6" | Asus ROG Zephyrus G15 GA503Q R9 5900HS, GeForce RTX 3080 Laptop GPU, SK Hynix HFM001TD3JX013N, IPS-Level, 2560x1440, 15.6" | MSI GF65 Thin 10UE i7-10750H, GeForce RTX 3060 Laptop GPU, Samsung SSD PM981 MZVLB1T0HALR, IPS, 1920x1080, 15.6" | |
|---|---|---|---|---|---|---|
| Power Consumption | -2% | -68% | -8% | 21% | 29% | |
| Idle Minimum * (Watt) | 15.3 | 14.2 7% | 35 -129% | 14 8% | 10 35% | 5.4 65% |
| Idle Average * (Watt) | 21.2 | 18.8 11% | 39 -84% | 17 20% | 12 43% | 12.8 40% |
| Idle Maximum * (Watt) | 22.3 | 23.9 -7% | 48 -115% | 33 -48% | 17 24% | 19.5 13% |
| Load Average * (Watt) | 82.3 | 96.9 -18% | 135 -64% | 96 -17% | 108 -31% | 86.6 -5% |
| Witcher 3 ultra * (Watt) | 191.2 | 185 3% | 194 -1% | 179 6% | 123 36% | 115.7 39% |
| Load Maximum * (Watt) | 216.6 | 233.4 -8% | 252 -16% | 256 -18% | 182 16% | 175.2 19% |
* ... Moindre est la valeur, meilleures sont les performances
Autonomie de la batterie
La capacité de la batterie est passée de 51 Wh sur le GP65 à 65 Wh sur le GP66. L'autonomie du réseau local sans fil (WLAN) est également beaucoup plus longue, avec un peu plus de 5 heures, soit près de 1,5 heure de plus que ce que nous avions enregistré sur le GP65.
L'autonomie maximale, cependant, aurait pu être meilleure. En réglant le système en mode Super Battery avec la luminosité au minimum et l'iGPU actif, on obtient une autonomie totale de seulement 6,5 heures, ce qui n'est pas beaucoup plus long que nos réglages WLAN.
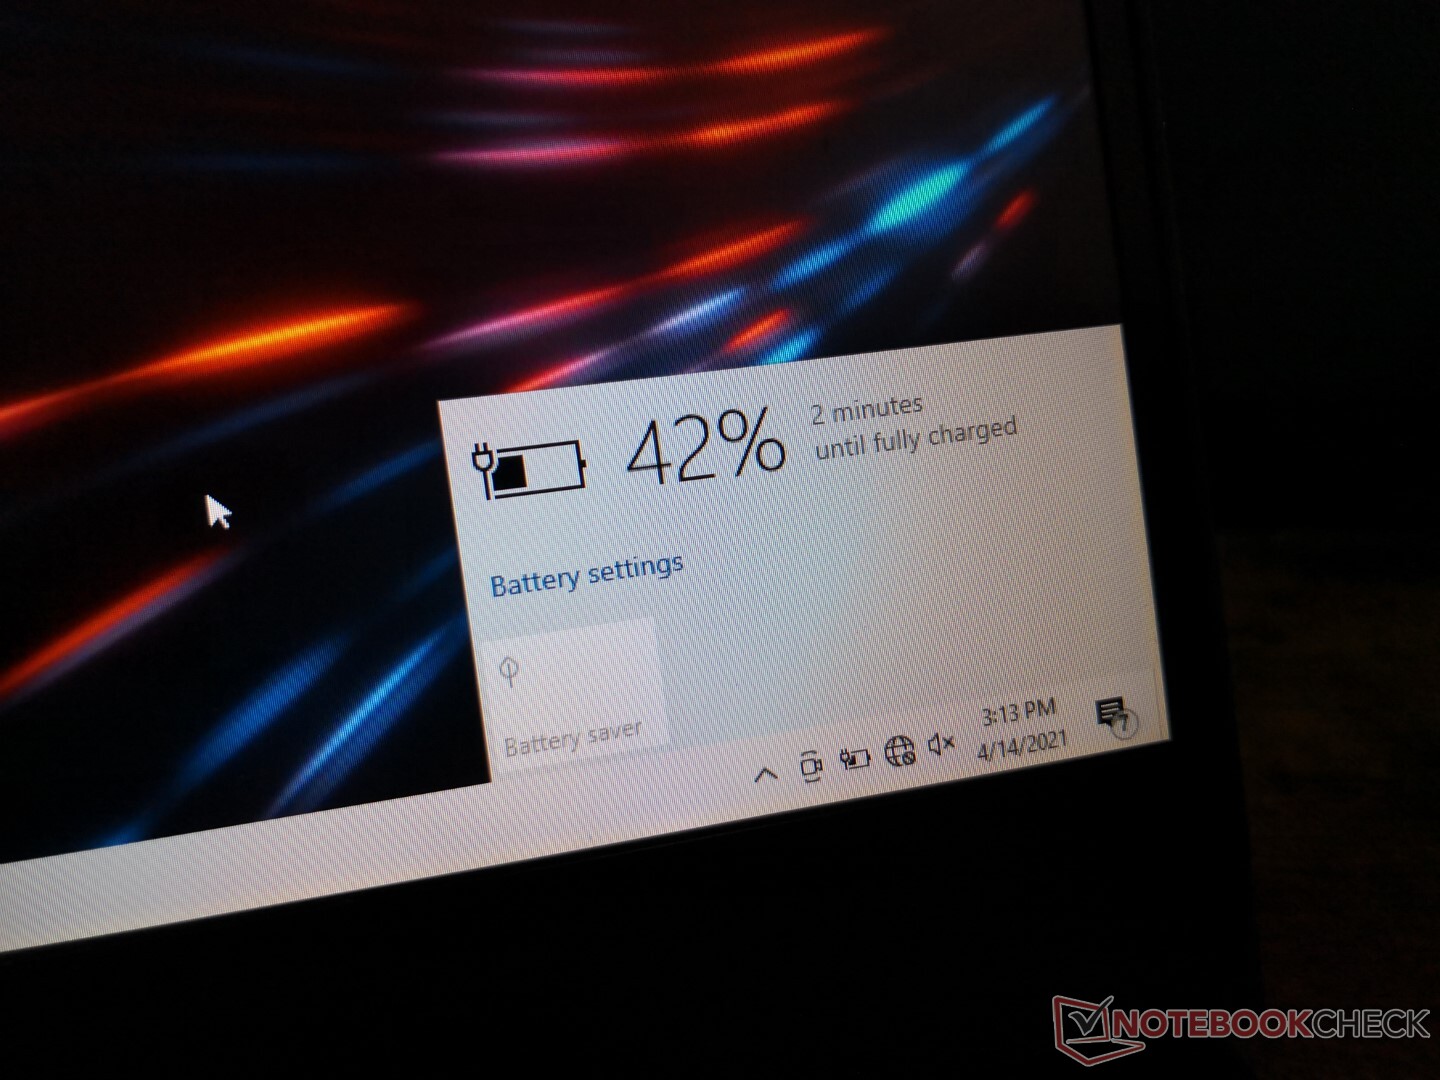
Le taux de recharge de la batterie vide à la pleine capacité est très lent : plus de 4 heures avec l'adaptateur secteur fourni. Nous soupçonnons qu'il y a un bug de charge car le temps de recharge estimé peut aussi parfois être inexact. En comparaison, la plupart des autres ordinateurs portables se rechargent complètement en seulement 1,5 à 2 heures.
La batterie se recharge encore plus lentement, voire pas du tout, lors de l'exécution de jeux. Par exemple, si vous jouez Witcher 3 sur l'adaptateur secteur à 20 % de charge pendant une heure, la batterie ne se recharge qu'à 23 % (soit +3 % en une heure).
| MSI GP66 Leopard 10UG i7-10870H, GeForce RTX 3070 Laptop GPU, 65 Wh | MSI GP65 10SFK-047US i7-10750H, GeForce RTX 2070 Mobile, 51 Wh | Alienware m15 R4 i9-10980HK, GeForce RTX 3070 Laptop GPU, 86 Wh | Aorus 15P XC i7-10870H, GeForce RTX 3070 Laptop GPU, 99 Wh | Asus ROG Zephyrus G15 GA503Q R9 5900HS, GeForce RTX 3080 Laptop GPU, 90 Wh | MSI GF65 Thin 10UE i7-10750H, GeForce RTX 3060 Laptop GPU, 51 Wh | |
|---|---|---|---|---|---|---|
| Autonomie de la batterie | -27% | -34% | 42% | 72% | 23% | |
| Reader / Idle (h) | 6.6 | 3.7 -44% | 9.5 44% | 12.1 83% | 11.1 68% | |
| WiFi v1.3 (h) | 5.1 | 3.7 -27% | 2.7 -47% | 6.7 31% | 9.4 84% | 4.6 -10% |
| Load (h) | 1 | 0.9 -10% | 1.5 50% | 1.5 50% | 1.1 10% |
Points positifs
Points négatifs
Verdict
Après deux ans d'utilisation du GP65 le GP66 est une refonte complète et une énorme amélioration globale. Il est peut-être devenu un peu plus grand d'une génération à l'autre, mais l'augmentation de la taille semble justifiée compte tenu de l'augmentation des performances graphiques, des améliorations du bruit des ventilateurs, des températures centrales plus basses, du design plus élégant et de la plus grande autonomie de la batterie. Les impressions générales sont très proches du GE66 qui est censé être le modèle haut de gamme.
Le GP66 dépasse son poids de milieu de gamme pour être aussi bon que de nombreux modèles haut de gamme.
Il y a cependant une énorme astérisque au-dessus de "milieu de gamme", car le GP66 n'est pas bon marché pour le moment malgré sa classification. Les prix varient énormément, de 2 500 à 3 000 dollars américains pour être dans la catégorie haut de gamme ou enthousiaste. Nous espérons que ce n'est qu'un problème d'approvisionnement qui peut être résolu en peu de temps, car nous pouvons certainement voir le GP66 devenir un modèle populaire en raison de ses attributs supérieurs à la moyenne tout autour.
En dépit de son prix élevé, il s'agit toujours d'un ordinateur portable de jeu de milieu de gamme et les utilisateurs doivent être conscients de ses lacunes. Il n'y a pas de Thunderbolt, de caméra IR ou de lecteur de carte SD, par exemple, et l'écran est faible par rapport à la plupart des autres ordinateurs portables de jeu. Le taux de recharge de la batterie, lent et irrégulier, mérite certainement d'être examiné de plus près. En attendant, ne vous attendez pas à ce que la batterie se recharge à un rythme décent lorsque vous jouez.
Prix et disponibilité
Seuls Newegg et Walmart ont des configurations MSI GP66 en stock à l'heure où nous écrivons ces lignes. L'option Newegg https://click.linksynergy.com/deeplink?id=taB4NgzQJ94&mid=44583&murl=https://www.newegg.com/black-msi-gp66-leopard-10ug-218/p/2WC-000C-04JB0est très similaire à notre unité de test, mais avec le Core i7-10875H plus rapide, pour 3 000 $ US Walmart a le SKU RTX 3080 avec la moitié de la RAM du système pour $3000 USD.
MSI GP66 Leopard 10UG
- 04/18/2021 v7 (old)
Allen Ngo
Price comparison

