Test du Razer Blade 15 Studio Edition 2020 (i7-10875H, RTX 5000 Max-Q, 4K UHD) : meilleurs grâce à de petits changements
Note | Date | Modèle | Poids | Épaisseur | Taille | Résolution | Prix |
|---|---|---|---|---|---|---|---|
| 87 % v7 (old) | 09/20 | Razer Blade 15 Studio Edition 2020 i7-10875H, Quadro RTX 5000 Max-Q | 2.2 kg | 13.98 mm | 15.60" | 3840x2160 | |
| 86.6 % v7 (old) | 12/19 | Razer Blade 15 Studio Edition i7-9750H, Quadro RTX 5000 Max-Q | 2.2 kg | 17.8 mm | 15.60" | 3840x2160 | |
| 89.8 % v7 (old) | 11/19 | Lenovo ThinkPad P53-20QN000YGE i7-9850H, Quadro RTX 5000 Max-Q | 2.7 kg | 29.4 mm | 15.60" | 1920x1080 | |
| 85 % v7 (old) | 07/19 | MSI P65 Creator 9SF-657 i9-9880H, GeForce RTX 2070 Max-Q | 1.9 kg | 18 mm | 15.60" | 3840x2160 | |
| 86.9 % v7 (old) | 11/19 | Dell Precision 5540 i9-9980HK, Quadro T2000 Max-Q | 2 kg | 17 mm | 15.60" | 3840x2160 |
| SD Card Reader | |
| average JPG Copy Test (av. of 3 runs) | |
| Lenovo ThinkPad P53-20QN000YGE (Toshiba Exceria Pro SDXC 64 GB UHS-II) | |
| Dell Precision 5540 (Toshiba Exceria Pro SDXC 64 GB UHS-II) | |
| Moyenne de la classe Workstation (49.6 - 681, n=14, 2 dernières années) | |
| Razer Blade 15 Studio Edition (Toshiba Exceria Pro SDXC 64 GB UHS-II) | |
| Razer Blade 15 Studio Edition 2020 (Toshiba Exceria Pro SDXC 64 GB UHS-II) | |
| maximum AS SSD Seq Read Test (1GB) | |
| Moyenne de la classe Workstation (87.6 - 1455, n=14, 2 dernières années) | |
| Lenovo ThinkPad P53-20QN000YGE (Toshiba Exceria Pro SDXC 64 GB UHS-II) | |
| Dell Precision 5540 (Toshiba Exceria Pro SDXC 64 GB UHS-II) | |


| |||||||||||||||||||||||||
Homogénéité de la luminosité: 93 %
Valeur mesurée au centre, sur batterie: 380 cd/m²
Contraste: 21111:1 (Valeurs des noirs: 0.018 cd/m²)
ΔE ColorChecker Calman: 5.47 | ∀{0.5-29.43 Ø4.72}
calibrated: 3.04
ΔE Greyscale Calman: 5.3 | ∀{0.09-98 Ø4.97}
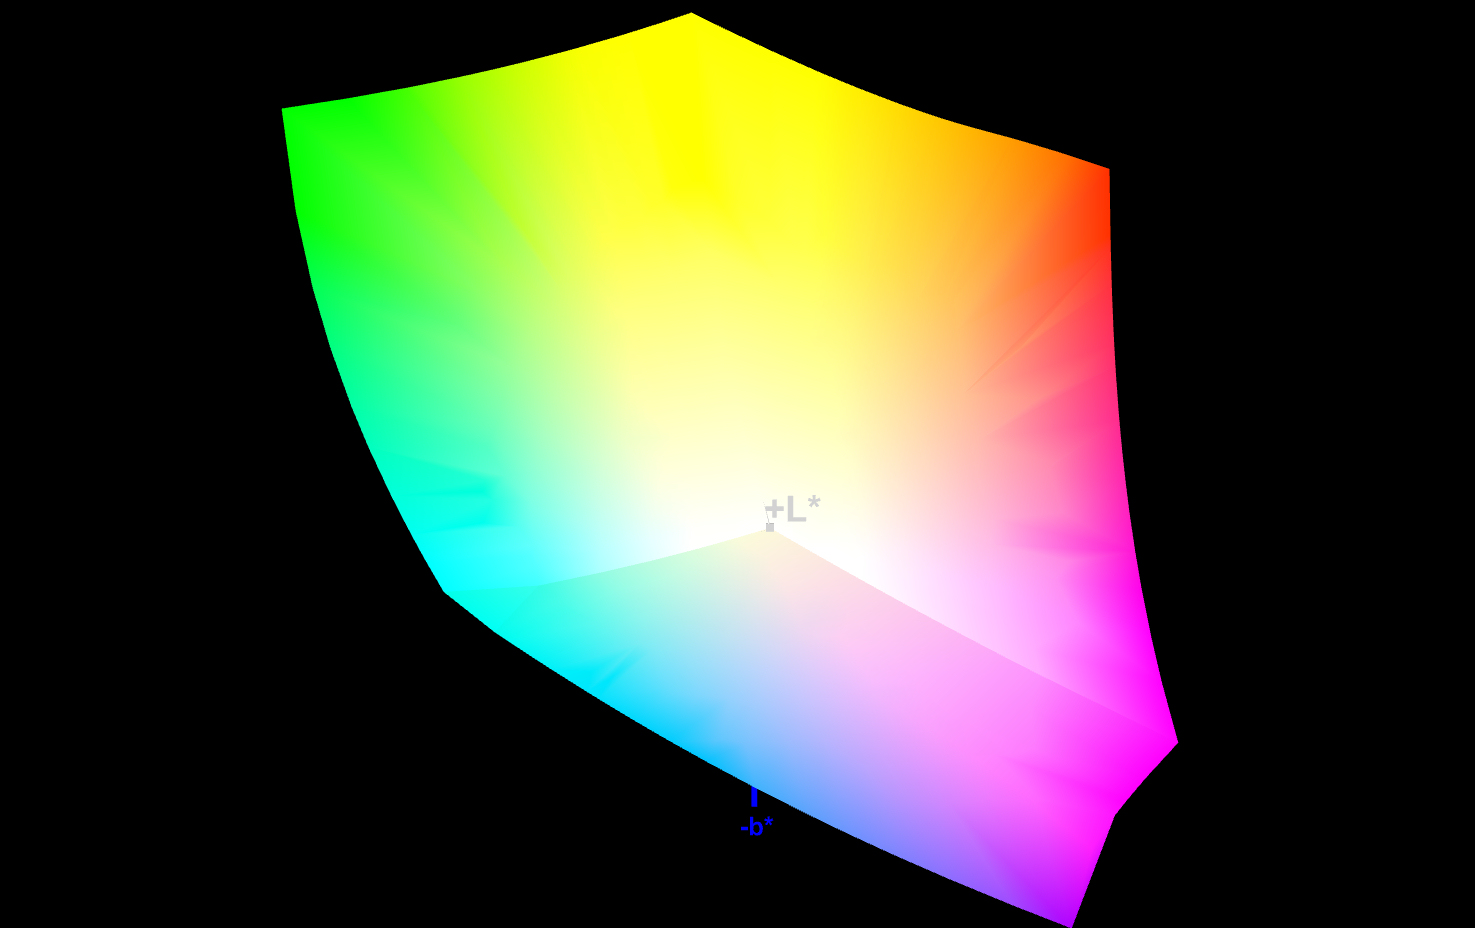
100% sRGB (Argyll 1.6.3 3D)
86% AdobeRGB 1998 (Argyll 1.6.3 3D)
97.3% AdobeRGB 1998 (Argyll 3D)
100% sRGB (Argyll 3D)
99.9% Display P3 (Argyll 3D)
Gamma: 2.15
CCT: 6128 K
| Razer Blade 15 Studio Edition 2020 Samsung SDCA029, OLED, 3840x2160, 15.6" | Razer Blade 15 Studio Edition Samsung SDCA029, OLED, 3840x2160, 15.6" | Lenovo ThinkPad P53-20QN000YGE N156HCE-GN1, IPS, 1920x1080, 15.6" | MSI P65 Creator 9SF-657 AU Optronics AUO41EB, IPS, 3840x2160, 15.6" | Dell Precision 5540 SDCA029, OLED, 3840x2160, 15.6" | |
|---|---|---|---|---|---|
| Display | -0% | -26% | -5% | 0% | |
| Display P3 Coverage (%) | 99.9 | 99.9 0% | 63.2 -37% | 84.4 -16% | 99.9 0% |
| sRGB Coverage (%) | 100 | 100 0% | 92.9 -7% | 100 0% | 100 0% |
| AdobeRGB 1998 Coverage (%) | 97.3 | 96.4 -1% | 64.3 -34% | 98.5 1% | 97.3 0% |
| Response Times | 13% | -695% | -925% | 25% | |
| Response Time Grey 50% / Grey 80% * (ms) | 4 ? | 3 ? 25% | 38.4 ? -860% | 51 ? -1175% | 2.8 ? 30% |
| Response Time Black / White * (ms) | 4 ? | 4 ? -0% | 25.2 ? -530% | 31 ? -675% | 3.2 ? 20% |
| PWM Frequency (Hz) | 26040 ? | 240.9 ? | |||
| Screen | -2% | -163% | -272% | 14% | |
| Brightness middle (cd/m²) | 380 | 361 -5% | 510 34% | 445 17% | 427 12% |
| Brightness (cd/m²) | 388 | 357 -8% | 468 21% | 462 19% | 411 6% |
| Brightness Distribution (%) | 93 | 89 -4% | 89 -4% | 83 -11% | 89 -4% |
| Black Level * (cd/m²) | 0.018 | 0.015 17% | 0.36 -1900% | 0.5 -2678% | |
| Contrast (:1) | 21111 | 24067 14% | 1417 -93% | 890 -96% | |
| Colorchecker dE 2000 * | 5.47 | 5.3 3% | 2.3 58% | 4.75 13% | 3.2 41% |
| Colorchecker dE 2000 max. * | 8.19 | 11.5 -40% | 5.5 33% | 7.79 5% | 8.4 -3% |
| Colorchecker dE 2000 calibrated * | 3.04 | 4.7 -55% | 1.2 61% | 2.8 8% | |
| Greyscale dE 2000 * | 5.3 | 2.1 60% | 3.2 40% | 4.49 15% | 1.8 66% |
| Gamma | 2.15 102% | 2.14 103% | 2.34 94% | 2.49 88% | 2.15 102% |
| CCT | 6128 106% | 6149 106% | 7036 92% | 7374 88% | 6176 105% |
| Color Space (Percent of AdobeRGB 1998) (%) | 86 | 86 0% | 59.4 -31% | 87 1% | 86.8 1% |
| Color Space (Percent of sRGB) (%) | 100 | 100 0% | 93.1 -7% | 100 0% | 100 0% |
| Moyenne finale (programmes/paramètres) | 4% /
0% | -295% /
-204% | -401% /
-305% | 13% /
13% |
* ... Moindre est la valeur, meilleures sont les performances

Temps de réponse de l'écran
| ↔ Temps de réponse noir à blanc | ||
|---|---|---|
| 4 ms ... hausse ↗ et chute ↘ combinées | ↗ 2 ms hausse | 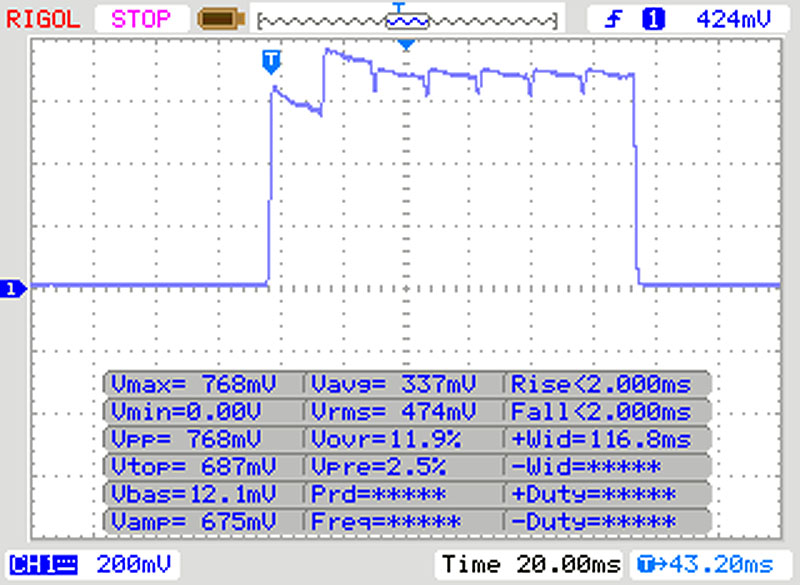 |
| ↘ 2 ms chute | ||
| L'écran montre de très faibles temps de réponse, parfait pour le jeu. En comparaison, tous les appareils testés affichent entre 0.1 (minimum) et 240 (maximum) ms. » 16 % des appareils testés affichent de meilleures performances. Cela signifie que les latences relevées sont meilleures que la moyenne (19.9 ms) de tous les appareils testés. | ||
| ↔ Temps de réponse gris 50% à gris 80% | ||
| 4 ms ... hausse ↗ et chute ↘ combinées | ↗ 2 ms hausse | 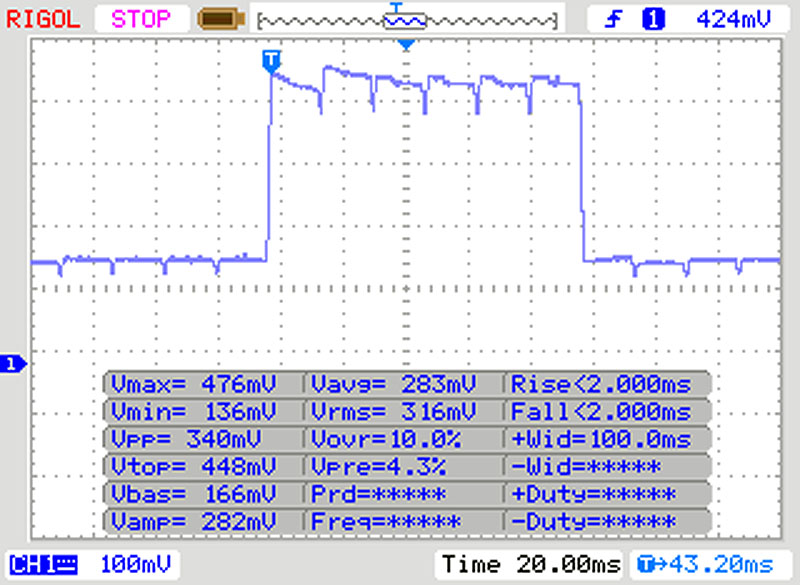 |
| ↘ 2 ms chute | ||
| L'écran montre de très faibles temps de réponse, parfait pour le jeu. En comparaison, tous les appareils testés affichent entre 0.165 (minimum) et 636 (maximum) ms. » 15 % des appareils testés affichent de meilleures performances. Cela signifie que les latences relevées sont meilleures que la moyenne (31.1 ms) de tous les appareils testés. | ||
Scintillement / MLI (Modulation de largeur d'impulsion)
| Scintillement / MLI (Modulation de largeur d'impulsion) non décelé | 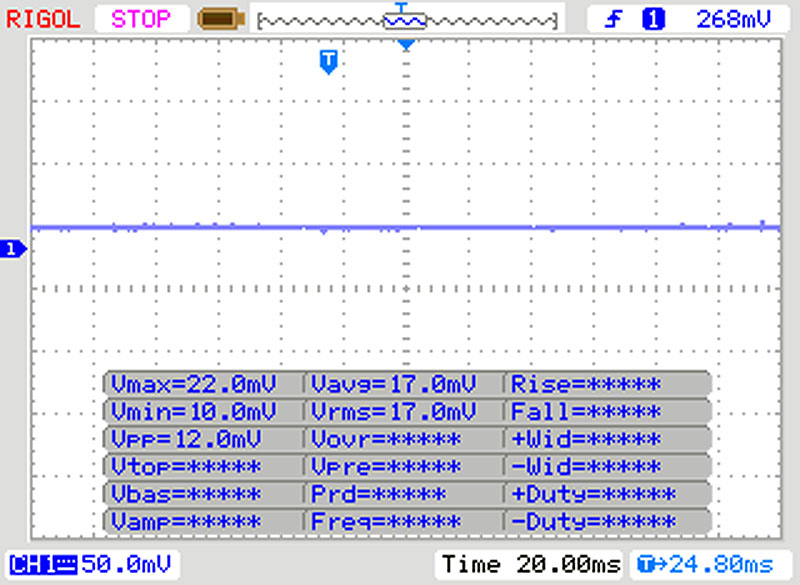 | ||
En comparaison, 52 % des appareils testés n'emploient pas MDI pour assombrir leur écran. Nous avons relevé une moyenne à 7784 (minimum : 5 - maximum : 343500) Hz dans le cas où une MDI était active. | |||

| Cinebench R15 | |
| CPU Single 64Bit | |
| Moyenne de la classe Workstation (191.4 - 328, n=25, 2 dernières années) | |
| Moyenne Intel Core i7-10875H (190 - 220, n=37) | |
| Razer Blade 15 Studio Edition 2020 (Max. CPU, max. GPU) | |
| Lenovo ThinkPad P53-20QN000YGE | |
| MSI P65 Creator 9SF-657 | |
| Dell Precision 5540 | |
| Razer Blade 15 Studio Edition 2020 | |
| Razer Blade 15 Studio Edition | |
| CPU Multi 64Bit | |
| Moyenne de la classe Workstation (2489 - 5810, n=25, 2 dernières années) | |
| Moyenne Intel Core i7-10875H (1003 - 1833, n=38) | |
| MSI P65 Creator 9SF-657 | |
| Dell Precision 5540 | |
| Razer Blade 15 Studio Edition 2020 (Max. CPU, max. GPU) | |
| Lenovo ThinkPad P53-20QN000YGE | |
| Razer Blade 15 Studio Edition 2020 | |
| Razer Blade 15 Studio Edition | |
| LibreOffice - 20 Documents To PDF | |
| Moyenne Intel Core i7-10875H (30.2 - 84.3, n=30) | |
| Moyenne de la classe Workstation (37.1 - 74.7, n=25, 2 dernières années) | |
| Razer Blade 15 Studio Edition 2020 | |
| R Benchmark 2.5 - Overall mean | |
| Razer Blade 15 Studio Edition 2020 | |
| Moyenne Intel Core i7-10875H (0.546 - 0.662, n=29) | |
| Moyenne de la classe Workstation (0.3825 - 0.603, n=25, 2 dernières années) | |
* ... Moindre est la valeur, meilleures sont les performances
| PCMark 8 Home Score Accelerated v2 | 3654 points | |
| PCMark 8 Creative Score Accelerated v2 | 3874 points | |
| PCMark 8 Work Score Accelerated v2 | 4638 points | |
| PCMark 10 Score | 4884 points | |
Aide | ||
| DPC Latencies / LatencyMon - interrupt to process latency (max), Web, Youtube, Prime95 | |
| Razer Blade 15 Studio Edition 2020 | |
* ... Moindre est la valeur, meilleures sont les performances

| Razer Blade 15 Studio Edition 2020 Samsung PM981a MZVLB1T0HBLR | Razer Blade 15 Studio Edition Samsung SSD PM981 MZVLB1T0HALR | Lenovo ThinkPad P53-20QN000YGE Samsung PM981a MZVLB1T0HBLR | MSI P65 Creator 9SF-657 2x Samsung SSD PM981 MZVLB512HAJQ (RAID 0) | Dell Precision 5540 SK hynix PC400 512 GB | Moyenne Samsung PM981a MZVLB1T0HBLR | |
|---|---|---|---|---|---|---|
| CrystalDiskMark 5.2 / 6 | -23% | -4% | 12% | -29% | -0% | |
| Write 4K (MB/s) | 132.9 | 100.4 -24% | 147 11% | 105.6 -21% | 98 -26% | 139.7 ? 5% |
| Read 4K (MB/s) | 46.73 | 42.03 -10% | 48.3 3% | 46.32 -1% | 41.25 -12% | 49.9 ? 7% |
| Write Seq (MB/s) | 2214 | 1185 -46% | 1402 -37% | 2910 31% | 1295 -42% | 2036 ? -8% |
| Read Seq (MB/s) | 2018 | 1132 -44% | 1503 -26% | 2820 40% | 1441 -29% | 2014 ? 0% |
| Write 4K Q32T1 (MB/s) | 478.9 | 371.4 -22% | 475.2 -1% | 545 14% | 429.2 -10% | 461 ? -4% |
| Read 4K Q32T1 (MB/s) | 540 | 422.6 -22% | 581 8% | 632 17% | 400.1 -26% | 499 ? -8% |
| Write Seq Q32T1 (MB/s) | 2975 | 2379 -20% | 2936 -1% | 3349 13% | 1366 -54% | 2903 ? -2% |
| Read Seq Q32T1 (MB/s) | 3195 | 3222 1% | 3539 11% | 3333 4% | 2201 -31% | 3479 ? 9% |
| AS SSD | -12% | 27% | 6% | -29% | 9% | |
| Seq Read (MB/s) | 1982 | 2328 17% | 2655 34% | 2860 44% | 1743 -12% | 2553 ? 29% |
| Seq Write (MB/s) | 2252 | 2344 4% | 2454 9% | 2604 16% | 930 -59% | 2084 ? -7% |
| 4K Read (MB/s) | 47.13 | 43.68 -7% | 59.1 25% | 45.15 -4% | 39.1 -17% | 53.1 ? 13% |
| 4K Write (MB/s) | 88.2 | 10.28 -88% | 138.1 57% | 100.2 14% | 92.1 4% | 131.2 ? 49% |
| 4K-64 Read (MB/s) | 1481 | 1469 -1% | 2009 36% | 1428 -4% | 956 -35% | 1477 ? 0% |
| 4K-64 Write (MB/s) | 1842 | 992 -46% | 1907 4% | 1401 -24% | 863 -53% | 1805 ? -2% |
| Access Time Read * (ms) | 0.087 | 0.067 23% | 0.054 38% | 0.049 44% | 0.074 15% | 0.04983 ? 43% |
| Access Time Write * (ms) | 0.04 | 0.035 12% | 0.028 30% | 0.037 7% | 0.053 -33% | 0.04222 ? -6% |
| Score Read (Points) | 1726 | 1745 1% | 2333 35% | 1759 2% | 1170 -32% | 1786 ? 3% |
| Score Write (Points) | 2155 | 1328 -38% | 2291 6% | 1762 -18% | 1048 -51% | 2144 ? -1% |
| Score Total (Points) | 4781 | 3968 -17% | 5810 22% | 4411 -8% | 2781 -42% | 4826 ? 1% |
| Copy ISO MB/s (MB/s) | 1982 | 1609 -19% | 2098 ? 6% | |||
| Copy Program MB/s (MB/s) | 501 | 445.1 -11% | 500 ? 0% | |||
| Copy Game MB/s (MB/s) | 1140 | 1089 -4% | 1132 ? -1% | |||
| Moyenne finale (programmes/paramètres) | -18% /
-16% | 12% /
14% | 9% /
9% | -29% /
-29% | 5% /
6% |
* ... Moindre est la valeur, meilleures sont les performances
Dauerleistung Lesen: DiskSpd Read Loop, Queue Depth 8
| 3DMark 11 Performance | 20883 points | |
| 3DMark Cloud Gate Standard Score | 32096 points | |
| 3DMark Fire Strike Score | 16179 points | |
| 3DMark Time Spy Score | 7326 points | |
Aide | ||
| 3DMark 11 - 1280x720 Performance GPU | |
| Moyenne de la classe Workstation (10888 - 69594, n=25, 2 dernières années) | |
| Razer Blade 15 Studio Edition 2020 (Max. CPU, max. GPU) | |
| Razer Blade 15 Studio Edition 2020 | |
| Moyenne NVIDIA Quadro RTX 5000 Max-Q (24156 - 28524, n=9) | |
| Razer Blade 15 Studio Edition | |
| Lenovo ThinkPad P53-20QN000YGE | |
| MSI P65 Creator 9SF-657 | |
| Dell Precision 5540 | |
| 3DMark | |
| 1280x720 Cloud Gate Standard Graphics | |
| Lenovo ThinkPad P53-20QN000YGE | |
| Moyenne de la classe Workstation (46927 - 152418, n=15, 2 dernières années) | |
| Moyenne NVIDIA Quadro RTX 5000 Max-Q (50993 - 126073, n=7) | |
| Razer Blade 15 Studio Edition 2020 | |
| MSI P65 Creator 9SF-657 | |
| Razer Blade 15 Studio Edition | |
| Dell Precision 5540 | |
| 1920x1080 Fire Strike Graphics | |
| Moyenne de la classe Workstation (7578 - 52560, n=25, 2 dernières années) | |
| Razer Blade 15 Studio Edition 2020 (Max. CPU, max. GPU) | |
| Razer Blade 15 Studio Edition 2020 | |
| Moyenne NVIDIA Quadro RTX 5000 Max-Q (18247 - 21115, n=10) | |
| Razer Blade 15 Studio Edition | |
| Lenovo ThinkPad P53-20QN000YGE | |
| MSI P65 Creator 9SF-657 | |
| Dell Precision 5540 | |
| 2560x1440 Time Spy Graphics | |
| Moyenne de la classe Workstation (2725 - 24806, n=25, 2 dernières années) | |
| Razer Blade 15 Studio Edition 2020 (Max. CPU, max. GPU) | |
| Razer Blade 15 Studio Edition 2020 | |
| Moyenne NVIDIA Quadro RTX 5000 Max-Q (6999 - 7977, n=10) | |
| Razer Blade 15 Studio Edition | |
| Lenovo ThinkPad P53-20QN000YGE | |
| Dell Precision 5540 | |
| The Witcher 3 - 1920x1080 Ultra Graphics & Postprocessing (HBAO+) | |
| Razer Blade 15 Studio Edition 2020 (Max. CPU, Max. GPU) | |
| Razer Blade 15 Studio Edition 2020 | |
| Razer Blade 15 Studio Edition | |
| Moyenne NVIDIA Quadro RTX 5000 Max-Q (71 - 88.5, n=10) | |
| MSI P65 Creator 9SF-657 | |
| Lenovo ThinkPad P53-20QN000YGE | |
| Moyenne de la classe Workstation (26.3 - 91.7, n=3, 2 dernières années) | |
| Dell Precision 5540 | |
| BioShock Infinite - 1920x1080 Ultra Preset, DX11 (DDOF) | |
| Razer Blade 15 Studio Edition 2020 (Max. CPU, max. GPU) | |
| Moyenne NVIDIA Quadro RTX 5000 Max-Q (167.2 - 174.3, n=3) | |
| Razer Blade 15 Studio Edition 2020 | |
| Razer Blade 15 Studio Edition | |
| MSI P65 Creator 9SF-657 | |
| Dell Precision 5540 | |
| Shadow of the Tomb Raider - 1920x1080 Highest Preset AA:T | |
| Razer Blade 15 Studio Edition 2020 (Max. CPU, max. GPU) | |
| Moyenne NVIDIA Quadro RTX 5000 Max-Q (85 - 90, n=3) | |
| Lenovo ThinkPad P53-20QN000YGE | |
| Razer Blade 15 Studio Edition 2020 | |
| Metro Exodus - 1920x1080 Ultra Quality AF:16x | |
| Razer Blade 15 Studio Edition 2020 | |
| Moyenne NVIDIA Quadro RTX 5000 Max-Q (55.4 - 59.2, n=2) | |
| Razer Blade 15 Studio Edition | |
| Control - 1920x1080 High Quality Preset | |
| Razer Blade 15 Studio Edition 2020 | |
| Moyenne NVIDIA Quadro RTX 5000 Max-Q (66.5 - 69.9, n=2) | |
| Razer Blade 15 Studio Edition | |
| Total War: Three Kingdoms - 1920x1080 Ultra (incl textures) | |
| Razer Blade 15 Studio Edition | |
| Moyenne NVIDIA Quadro RTX 5000 Max-Q (57.5 - 64.9, n=2) | |
| Razer Blade 15 Studio Edition 2020 | |
| Red Dead Redemption 2 - 1920x1080 High Settings | |
| Moyenne NVIDIA Quadro RTX 5000 Max-Q (54.8 - 63.9, n=2) | |
| Razer Blade 15 Studio Edition 2020 | |
| Doom Eternal - 1920x1080 Ultra Preset | |
| Moyenne NVIDIA Quadro RTX 5000 Max-Q (137.8 - 145.3, n=3) | |
| Razer Blade 15 Studio Edition 2020 | |

| Bas | Moyen | Élevé | Ultra | QHD | 4K | |
|---|---|---|---|---|---|---|
| BioShock Infinite (2013) | 365.3 | 321.5 | 296.5 | 168.5 | ||
| The Witcher 3 (2015) | 323.2 | 238.8 | 125.4 | 83.6 | 47.5 | |
| Dota 2 Reborn (2015) | 138.4 | 130.1 | 124.5 | 122.3 | ||
| X-Plane 11.11 (2018) | 109 | 94.9 | 78.7 | |||
| Far Cry 5 (2018) | 128 | 106 | 101 | 96 | 74 | 40 |
| Shadow of the Tomb Raider (2018) | 105 | 94 | 91 | 85 | 62 | 33 |
| Assassin´s Creed Odyssey (2018) | 107 | 91 | 80 | 57 | 48 | 31 |
| Battlefield V (2018) | 156.6 | 130.7 | 124.5 | 114.7 | 90.8 | 53.4 |
| Metro Exodus (2019) | 145.6 | 96.3 | 72.8 | 59.2 | 45.6 | 27 |
| Total War: Three Kingdoms (2019) | 243.7 | 129 | 80.9 | 57.5 | 34.1 | 18.5 |
| Control (2019) | 228.8 | 96.7 | 69.9 | 43 | 20 | |
| Call of Duty Modern Warfare 2019 (2019) | 156.5 | 111.2 | 99 | 86.7 | 62.2 | 34 |
| Star Wars Jedi Fallen Order (2019) | 105 | 99.5 | 89.7 | 66.3 | 34 | |
| Red Dead Redemption 2 (2019) | 124.2 | 84.8 | 54.8 | 39.7 | 32 | 19.8 |
| Doom Eternal (2020) | 216.7 | 161.9 | 145 | 140.6 | 92.5 | 47.1 |
| Gears Tactics (2020) | 177.7 | 126.6 | 90.7 | 73.6 | 50 | 24 |
| F1 2020 (2020) | 214 | 166 | 143 | 107 | 82.8 | 44.4 |
| Death Stranding (2020) | 127.2 | 112.6 | 103.8 | 101.5 | 73.7 | 41.1 |
Degré de la nuisance sonore
| Au repos |
| 30.1 / 30.1 / 30.1 dB(A) |
| Fortement sollicité |
| 42.3 / 42.1 dB(A) |
 | ||
30 dB silencieux 40 dB(A) audible 50 dB(A) bruyant |
||
min: | ||
| Razer Blade 15 Studio Edition 2020 i7-10875H, Quadro RTX 5000 Max-Q | Razer Blade 15 Studio Edition i7-9750H, Quadro RTX 5000 Max-Q | Lenovo ThinkPad P53-20QN000YGE i7-9850H, Quadro RTX 5000 Max-Q | MSI P65 Creator 9SF-657 i9-9880H, GeForce RTX 2070 Max-Q | Dell Precision 5540 i9-9980HK, Quadro T2000 Max-Q | Moyenne NVIDIA Quadro RTX 5000 Max-Q | Moyenne de la classe Workstation | |
|---|---|---|---|---|---|---|---|
| Noise | -1% | 12% | -5% | 11% | 3% | 9% | |
| arrêt / environnement * (dB) | 30.1 | 30.6 -2% | 28.3 6% | 30.2 -0% | 28.6 5% | 27.5 ? 9% | 24.1 ? 20% |
| Idle Minimum * (dB) | 30.1 | 30.6 -2% | 28.3 6% | 32.8 -9% | 28.6 5% | 28.7 ? 5% | 24.8 ? 18% |
| Idle Average * (dB) | 30.1 | 30.6 -2% | 28.3 6% | 32.8 -9% | 28.6 5% | 28.7 ? 5% | 25.4 ? 16% |
| Idle Maximum * (dB) | 30.1 | 30.6 -2% | 28.3 6% | 33.6 -12% | 28.6 5% | 28.7 ? 5% | 26.7 ? 11% |
| Load Average * (dB) | 42.3 | 43 -2% | 29.8 30% | 40.9 3% | 33.3 21% | 41 ? 3% | 39.2 ? 7% |
| Witcher 3 ultra * (dB) | 48.2 | 38.3 21% | 34.7 28% | ||||
| Load Maximum * (dB) | 42.1 | 41 3% | 38.3 9% | 42.7 -1% | 38 10% | 46.7 ? -11% | 50.4 ? -20% |
* ... Moindre est la valeur, meilleures sont les performances
(-) La température maximale du côté supérieur est de 54.1 °C / 129 F, par rapport à la moyenne de 38.2 °C / 101 F, allant de 22.2 à 69.8 °C pour la classe Workstation.
(-) Le fond chauffe jusqu'à un maximum de 54 °C / 129 F, contre une moyenne de 41.1 °C / 106 F
(+) En utilisation inactive, la température moyenne du côté supérieur est de 28.2 °C / 83 F, par rapport à la moyenne du dispositif de 32 °C / 90 F.
(-) En jouant à The Witcher 3, la température moyenne du côté supérieur est de 39.1 °C / 102 F, alors que la moyenne de l'appareil est de 32 °C / 90 F.
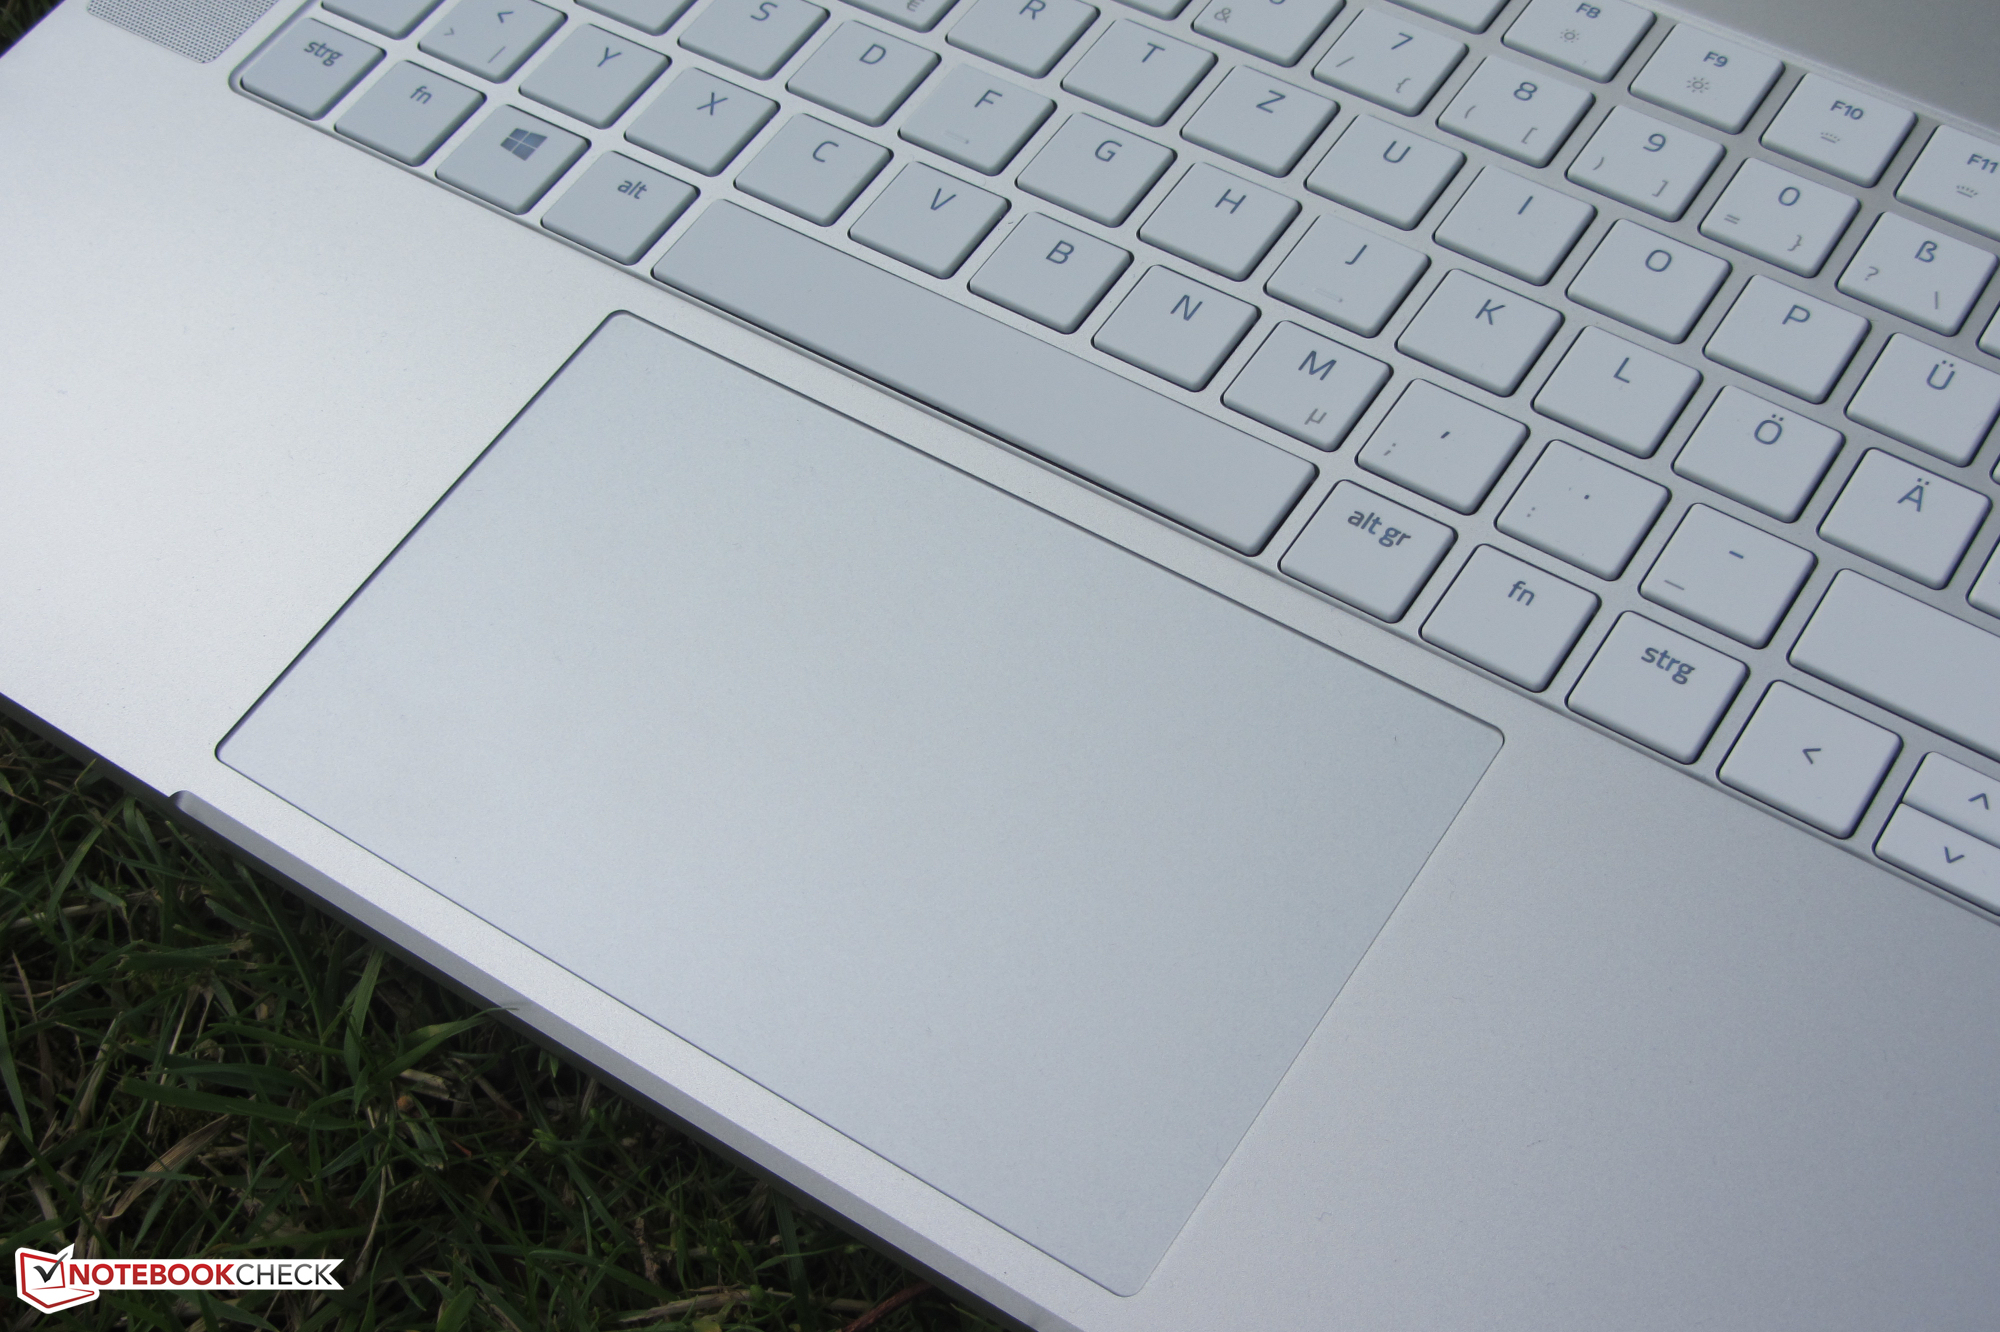
(-) Les repose-poignets et le pavé tactile peuvent devenir très chauds au toucher, avec un maximum de 40 °C / 104# F.
(-) La température moyenne de la zone de l'appui-paume de dispositifs similaires était de 27.8 °C / 82 F (-12.2 °C / #-22 F).
| Razer Blade 15 Studio Edition 2020 i7-10875H, Quadro RTX 5000 Max-Q | Razer Blade 15 Studio Edition i7-9750H, Quadro RTX 5000 Max-Q | Lenovo ThinkPad P53-20QN000YGE i7-9850H, Quadro RTX 5000 Max-Q | MSI P65 Creator 9SF-657 i9-9880H, GeForce RTX 2070 Max-Q | Dell Precision 5540 i9-9980HK, Quadro T2000 Max-Q | Moyenne NVIDIA Quadro RTX 5000 Max-Q | Moyenne de la classe Workstation | |
|---|---|---|---|---|---|---|---|
| Heat | 8% | 21% | 0% | 10% | 2% | 6% | |
| Maximum Upper Side * (°C) | 54.1 | 46.1 15% | 41.8 23% | 49.7 8% | 46.2 15% | 49.4 ? 9% | 43.8 ? 19% |
| Maximum Bottom * (°C) | 54 | 45.2 16% | 46.1 15% | 60.4 -12% | 45.7 15% | 53 ? 2% | 45 ? 17% |
| Idle Upper Side * (°C) | 28.9 | 28.9 -0% | 22.2 23% | 28.4 2% | 27.4 5% | 28.6 ? 1% | 30.6 ? -6% |
| Idle Bottom * (°C) | 29.7 | 29.6 -0% | 23 23% | 29.2 2% | 27.8 6% | 30.5 ? -3% | 31.6 ? -6% |
* ... Moindre est la valeur, meilleures sont les performances
Razer Blade 15 Studio Edition 2020 analyse audio
(±) | le niveau sonore du haut-parleur est moyen mais bon (75.1# dB)
Basses 100 - 315 Hz
(-) | presque aucune basse - en moyenne 18.3% plus bas que la médiane
(±) | la linéarité des basses est moyenne (10.1% delta à la fréquence précédente)
Médiums 400 - 2000 Hz
(+) | médiane équilibrée - seulement 4.6% de la médiane
(+) | les médiums sont linéaires (5.9% delta à la fréquence précédente)
Aiguës 2 - 16 kHz
(+) | des sommets équilibrés - à seulement 3.4% de la médiane
(+) | les aigus sont linéaires (3.8% delta à la fréquence précédente)
Globalement 100 - 16 000 Hz
(±) | la linéarité du son global est moyenne (19.1% de différence avec la médiane)
Par rapport à la même classe
» 67% de tous les appareils testés de cette catégorie étaient meilleurs, 6% similaires, 28% pires
» Le meilleur avait un delta de 7%, la moyenne était de 17%, le pire était de 35%.
Par rapport à tous les appareils testés
» 46% de tous les appareils testés étaient meilleurs, 7% similaires, 47% pires
» Le meilleur avait un delta de 4%, la moyenne était de 24%, le pire était de 134%.
| Éteint/en veille | |
| Au repos | |
| Fortement sollicité |
|
Légende:
min: | |
| Razer Blade 15 Studio Edition 2020 i7-10875H, Quadro RTX 5000 Max-Q | Razer Blade 15 Studio Edition i7-9750H, Quadro RTX 5000 Max-Q | Lenovo ThinkPad P53-20QN000YGE i7-9850H, Quadro RTX 5000 Max-Q | MSI P65 Creator 9SF-657 i9-9880H, GeForce RTX 2070 Max-Q | Dell Precision 5540 i9-9980HK, Quadro T2000 Max-Q | Moyenne NVIDIA Quadro RTX 5000 Max-Q | Moyenne de la classe Workstation | |
|---|---|---|---|---|---|---|---|
| Power Consumption | 15% | 18% | 7% | 33% | 6% | 20% | |
| Idle Minimum * (Watt) | 13.4 | 13.2 1% | 7.9 41% | 9.4 30% | 7.4 45% | 10.4 ? 22% | 8.94 ? 33% |
| Idle Average * (Watt) | 18 | 15 17% | 11.8 34% | 17.4 3% | 12.1 33% | 16.1 ? 11% | 13.8 ? 23% |
| Idle Maximum * (Watt) | 26.1 | 17.4 33% | 14.9 43% | 19.6 25% | 12.7 51% | 23.8 ? 9% | 17.5 ? 33% |
| Load Average * (Watt) | 115 | 99 14% | 96 17% | 103 10% | 98 15% | 109.5 ? 5% | 95 ? 17% |
| Witcher 3 ultra * (Watt) | 145 | 149 -3% | 89.9 38% | ||||
| Load Maximum * (Watt) | 165 | 148 10% | 207.8 -26% | 216 -31% | 135.1 18% | 189.5 ? -15% | 175.2 ? -6% |
* ... Moindre est la valeur, meilleures sont les performances
| Razer Blade 15 Studio Edition 2020 i7-10875H, Quadro RTX 5000 Max-Q, 80 Wh | Razer Blade 15 Studio Edition i7-9750H, Quadro RTX 5000 Max-Q, 80 Wh | Lenovo ThinkPad P53-20QN000YGE i7-9850H, Quadro RTX 5000 Max-Q, 90 Wh | MSI P65 Creator 9SF-657 i9-9880H, GeForce RTX 2070 Max-Q, 82 Wh | Dell Precision 5540 i9-9980HK, Quadro T2000 Max-Q, 97 Wh | Moyenne de la classe Workstation | |
|---|---|---|---|---|---|---|
| Autonomie de la batterie | 5% | 49% | -10% | 39% | 67% | |
| Reader / Idle (h) | 8.8 | 9.6 9% | 9.6 9% | 15 70% | 26.1 ? 197% | |
| H.264 (h) | 6.4 | 7.6 19% | 9.8 53% | 10.6 66% | 9.51 ? 49% | |
| WiFi v1.3 (h) | 5.7 | 5.5 -4% | 11.1 95% | 6 5% | 7.7 35% | 8.53 ? 50% |
| Load (h) | 2 | 1.9 -5% | 2 0% | 1.1 -45% | 1.7 -15% | 1.429 ? -29% |
Points positifs
Points négatifs
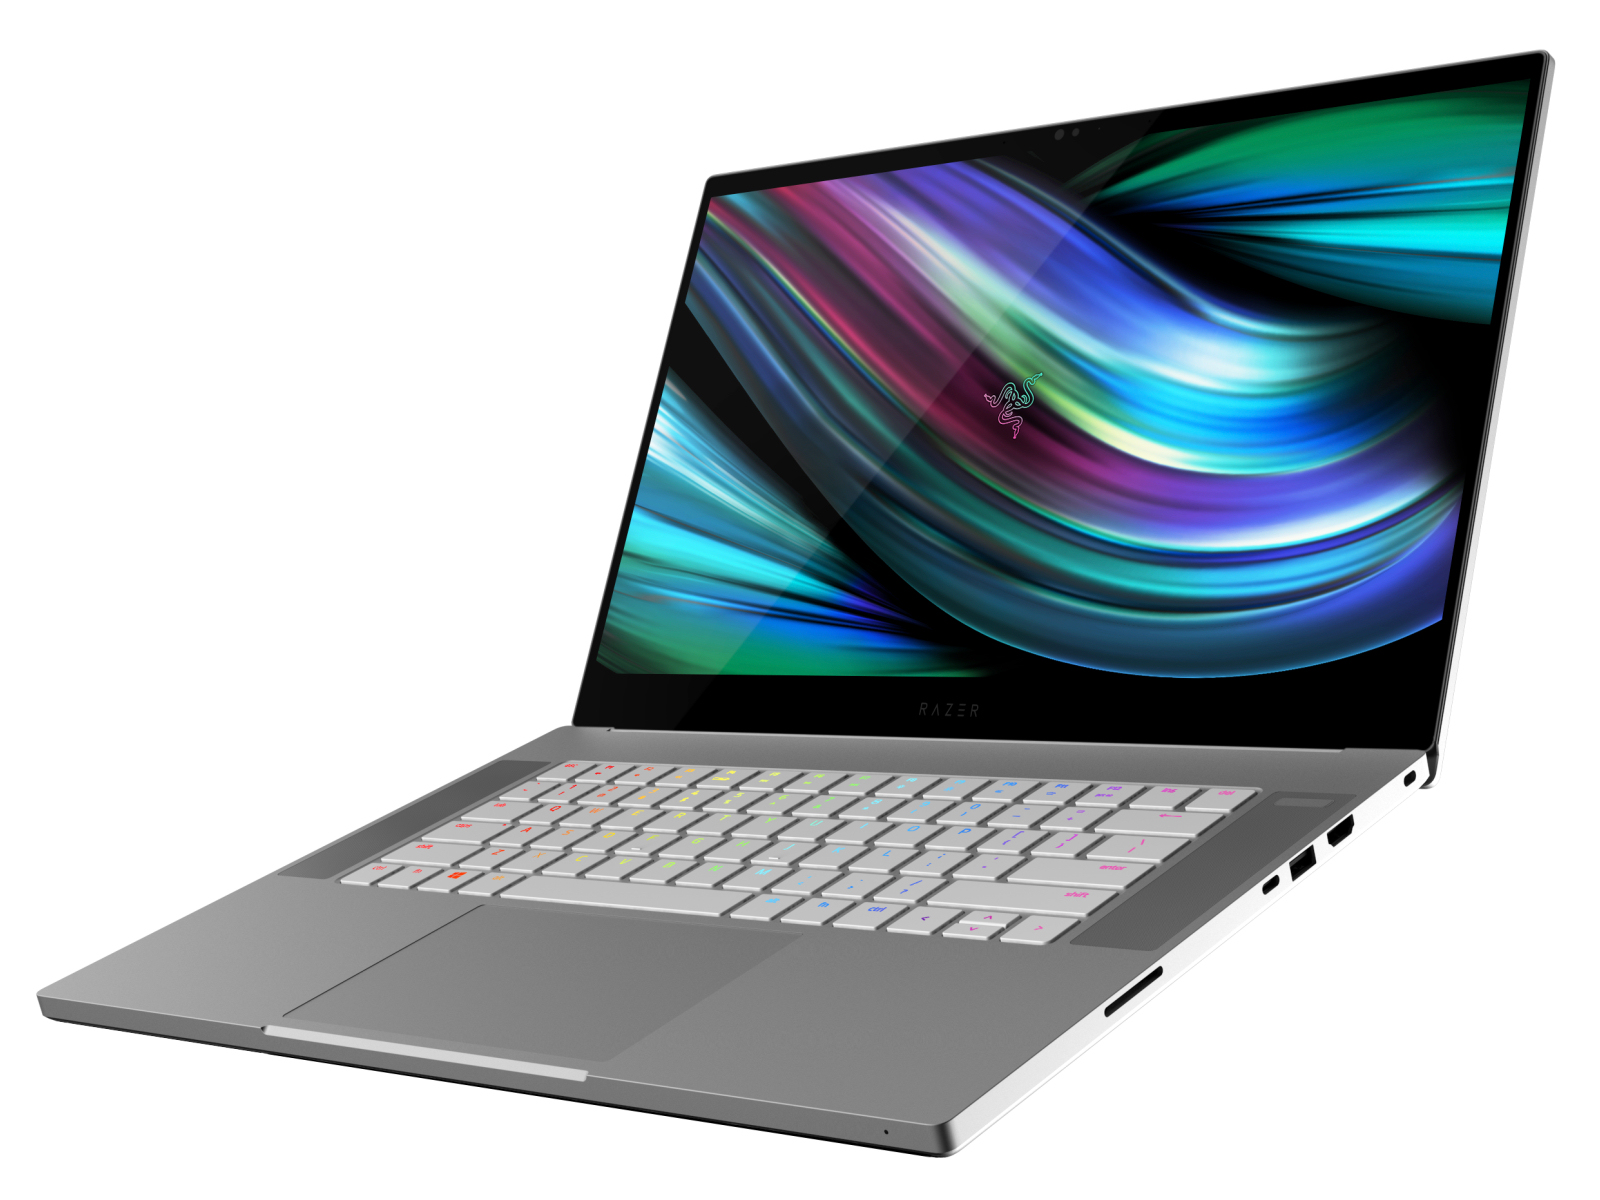
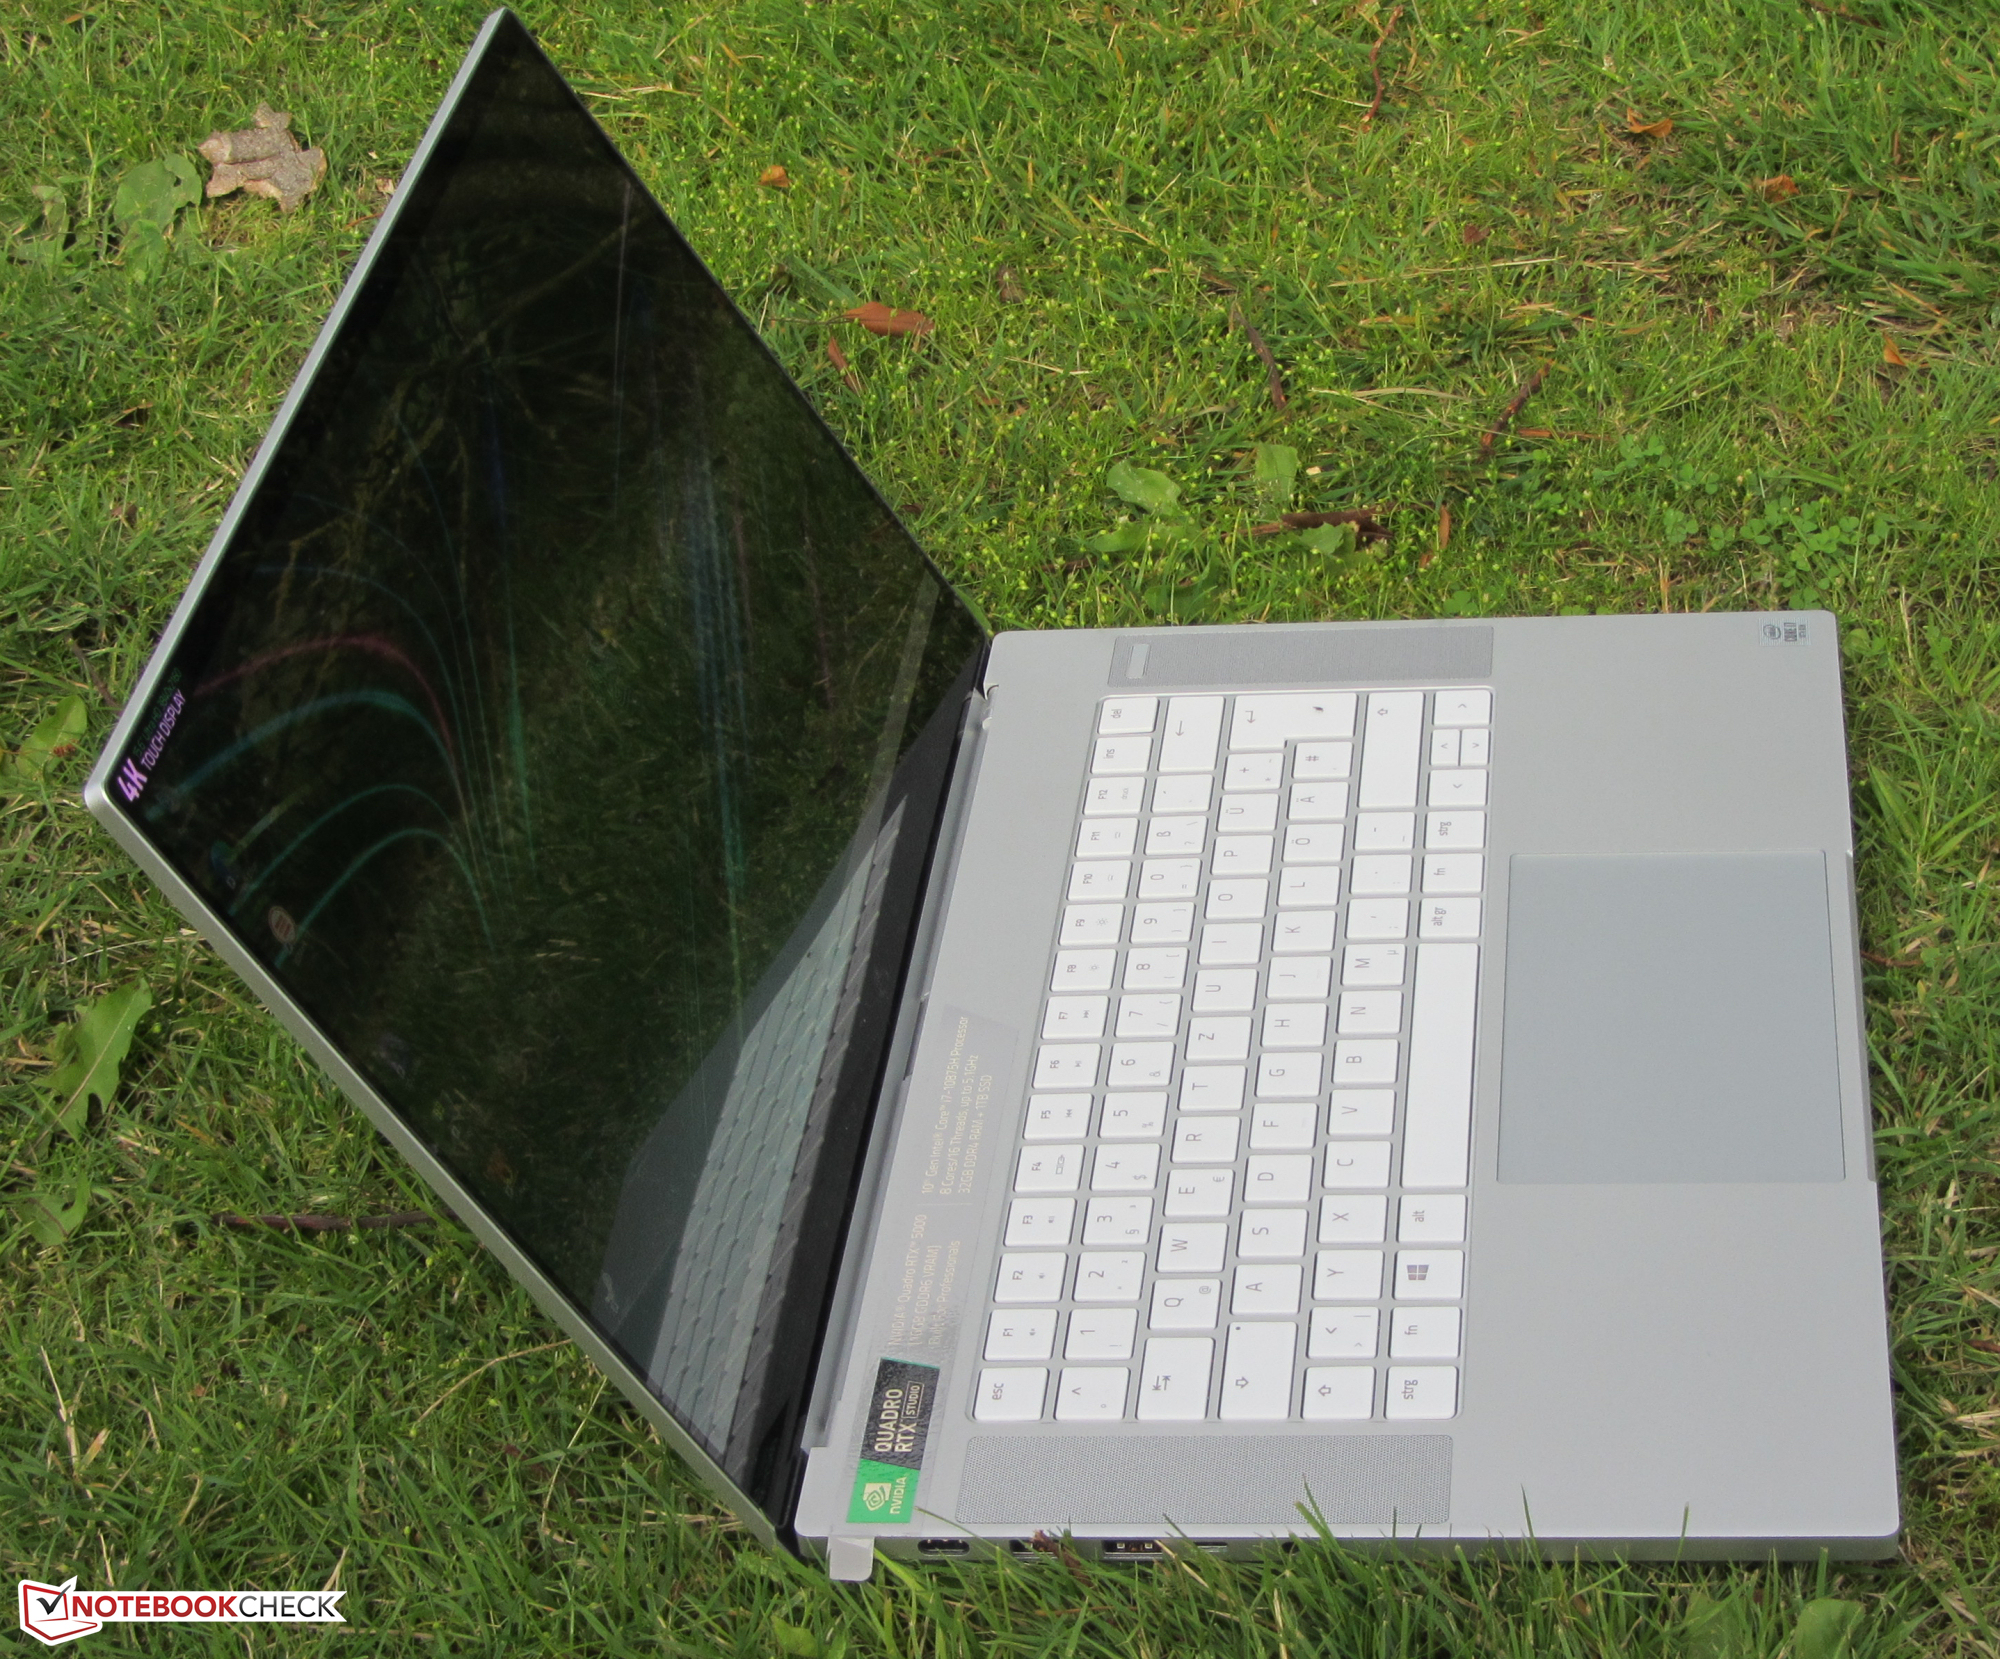
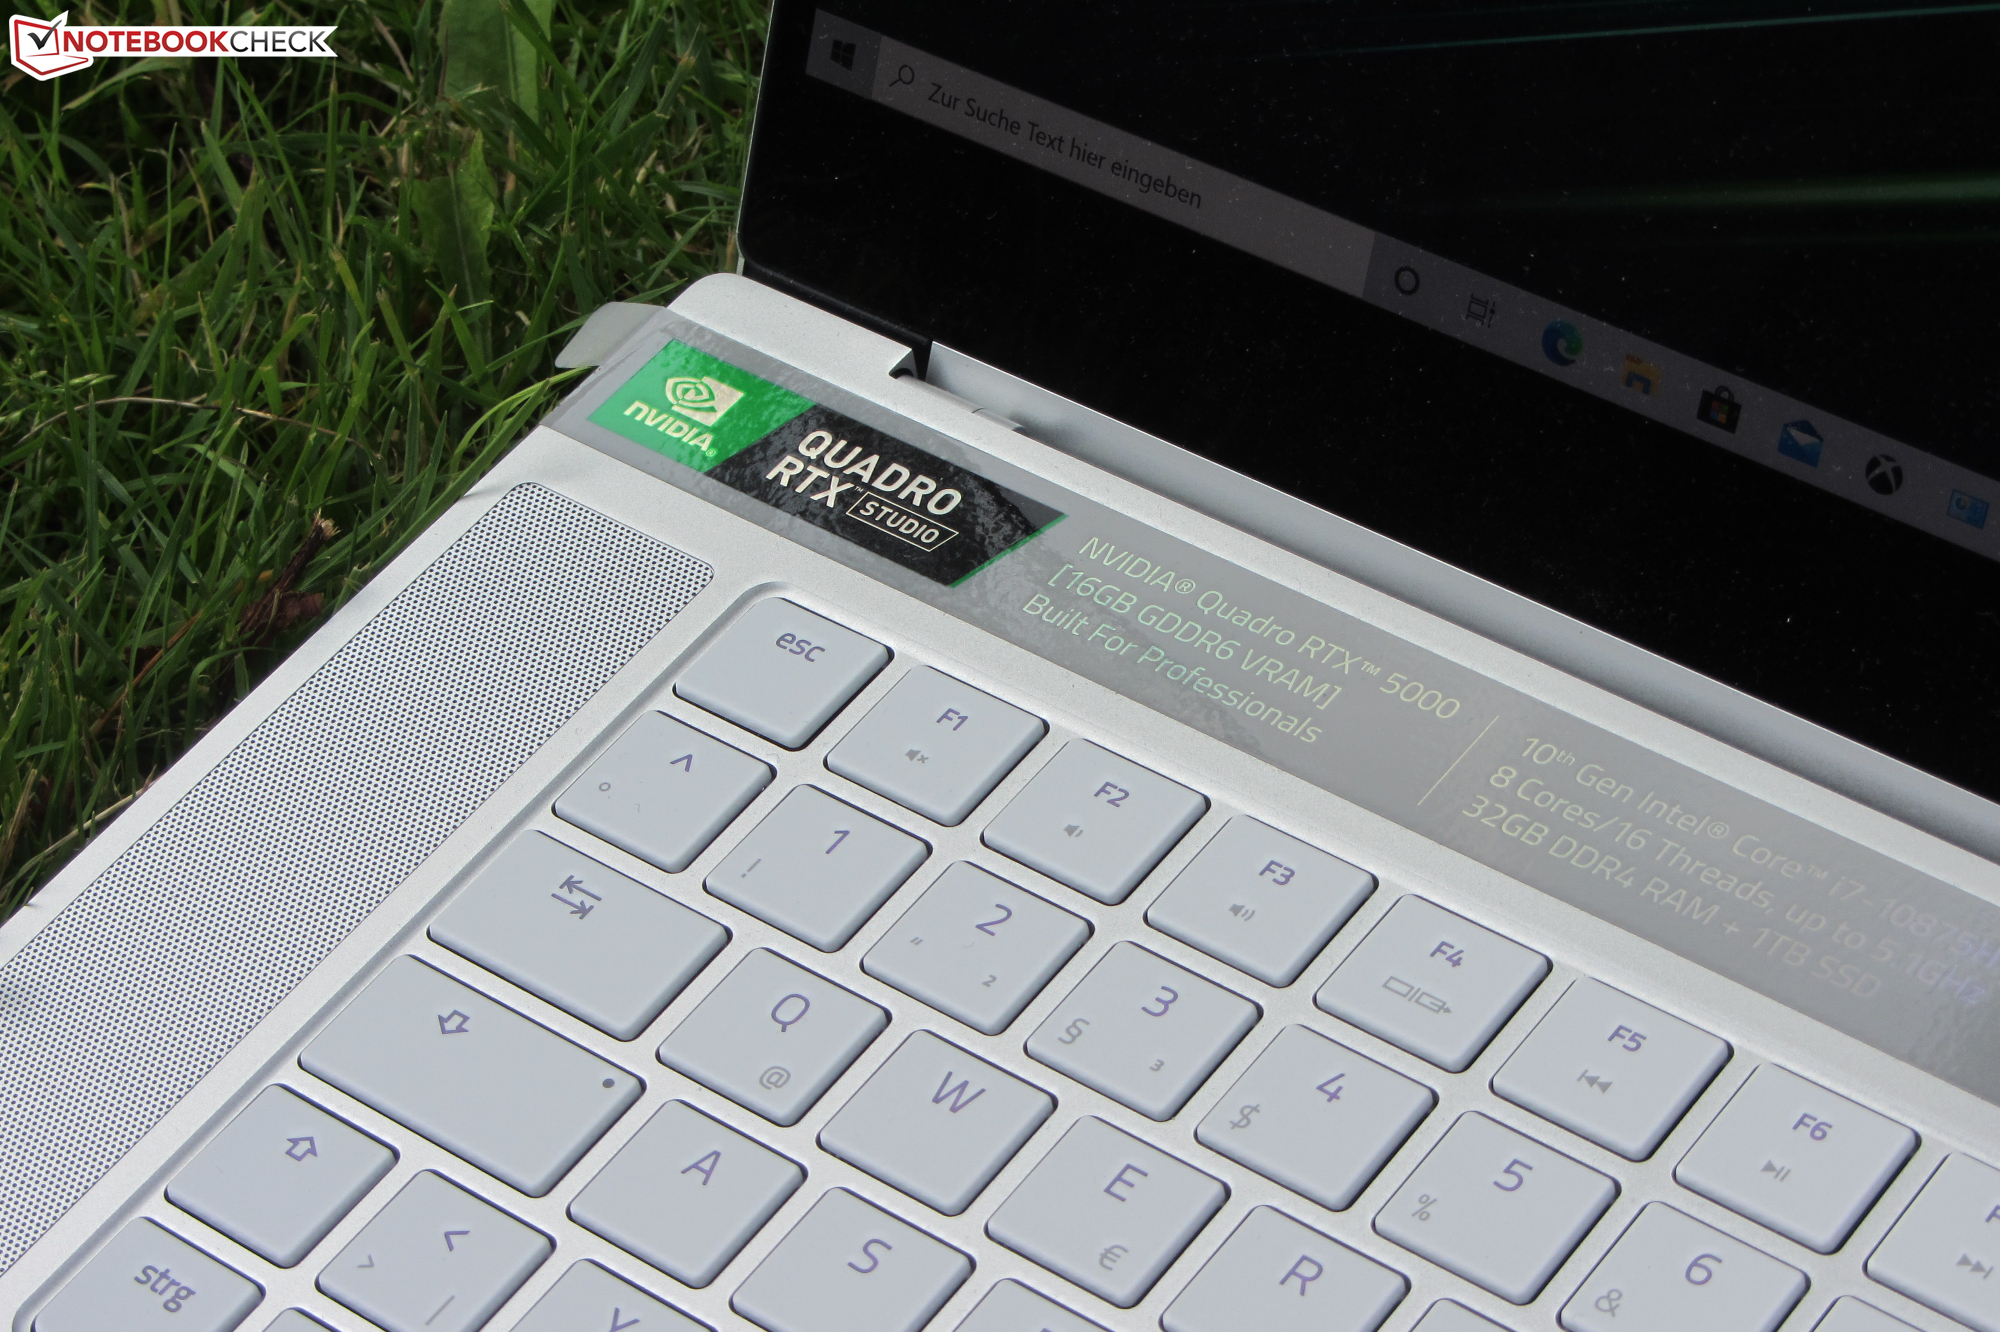
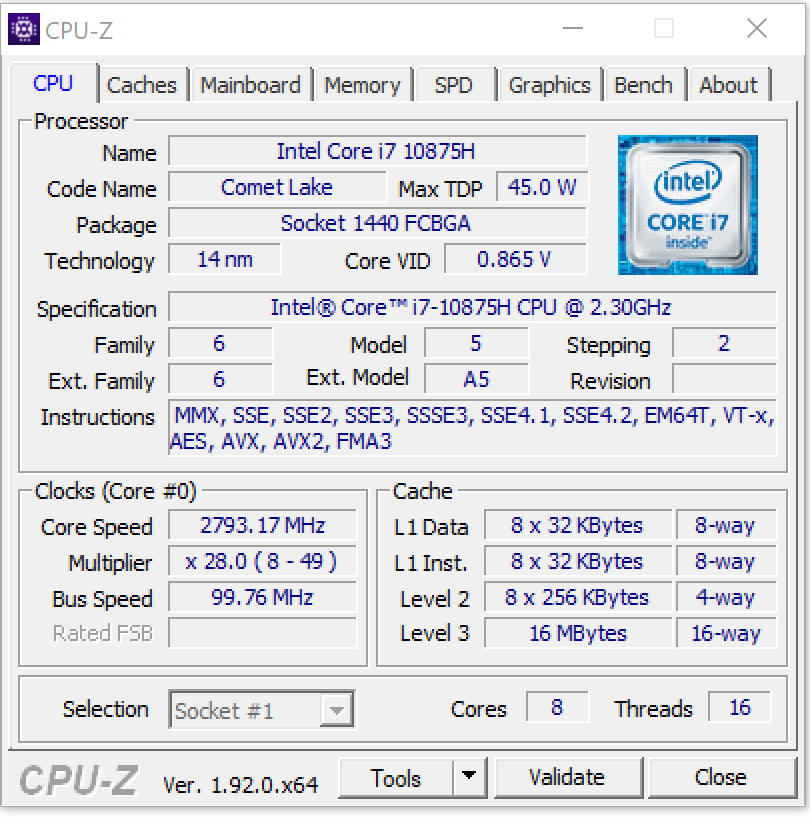
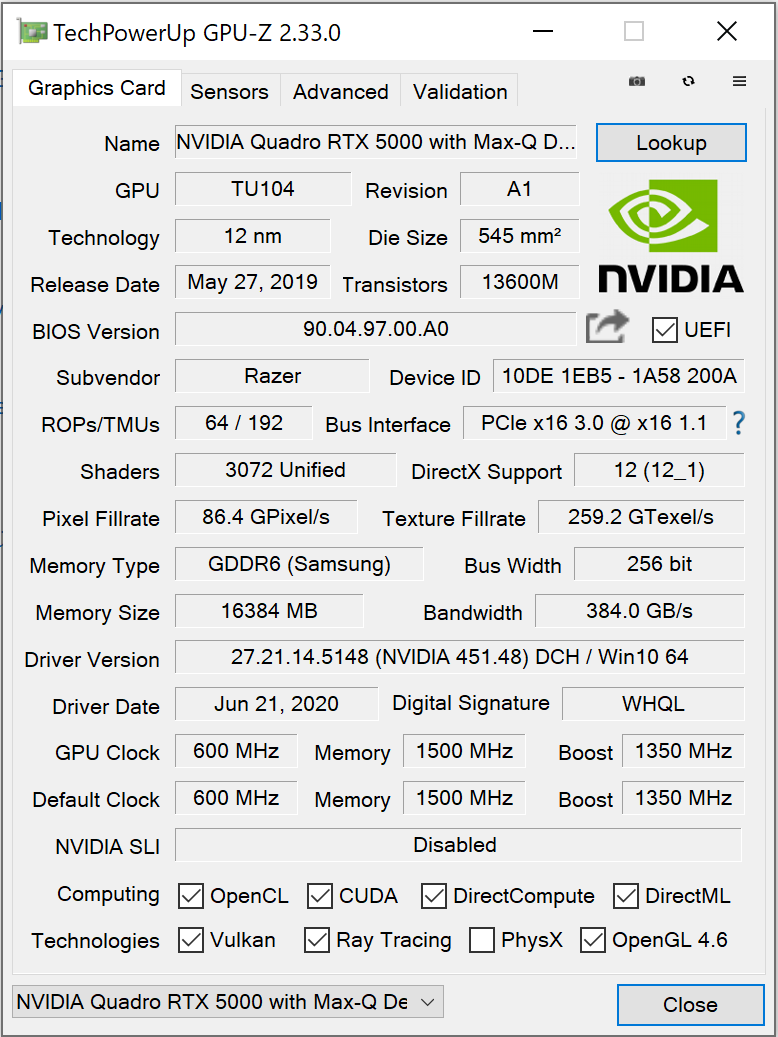
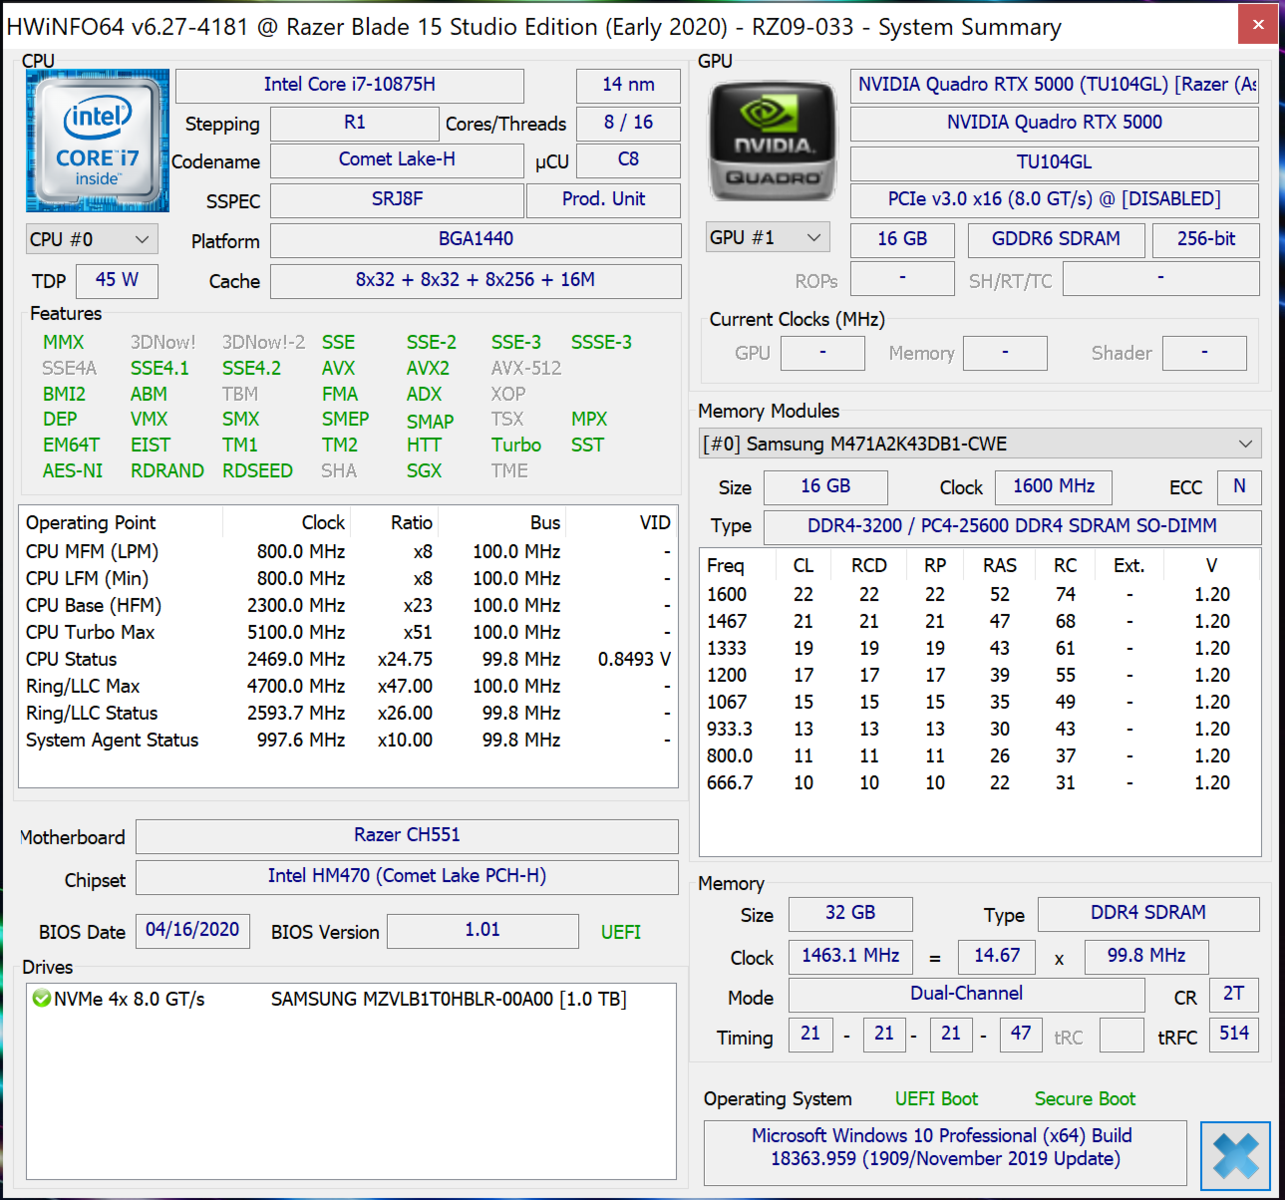
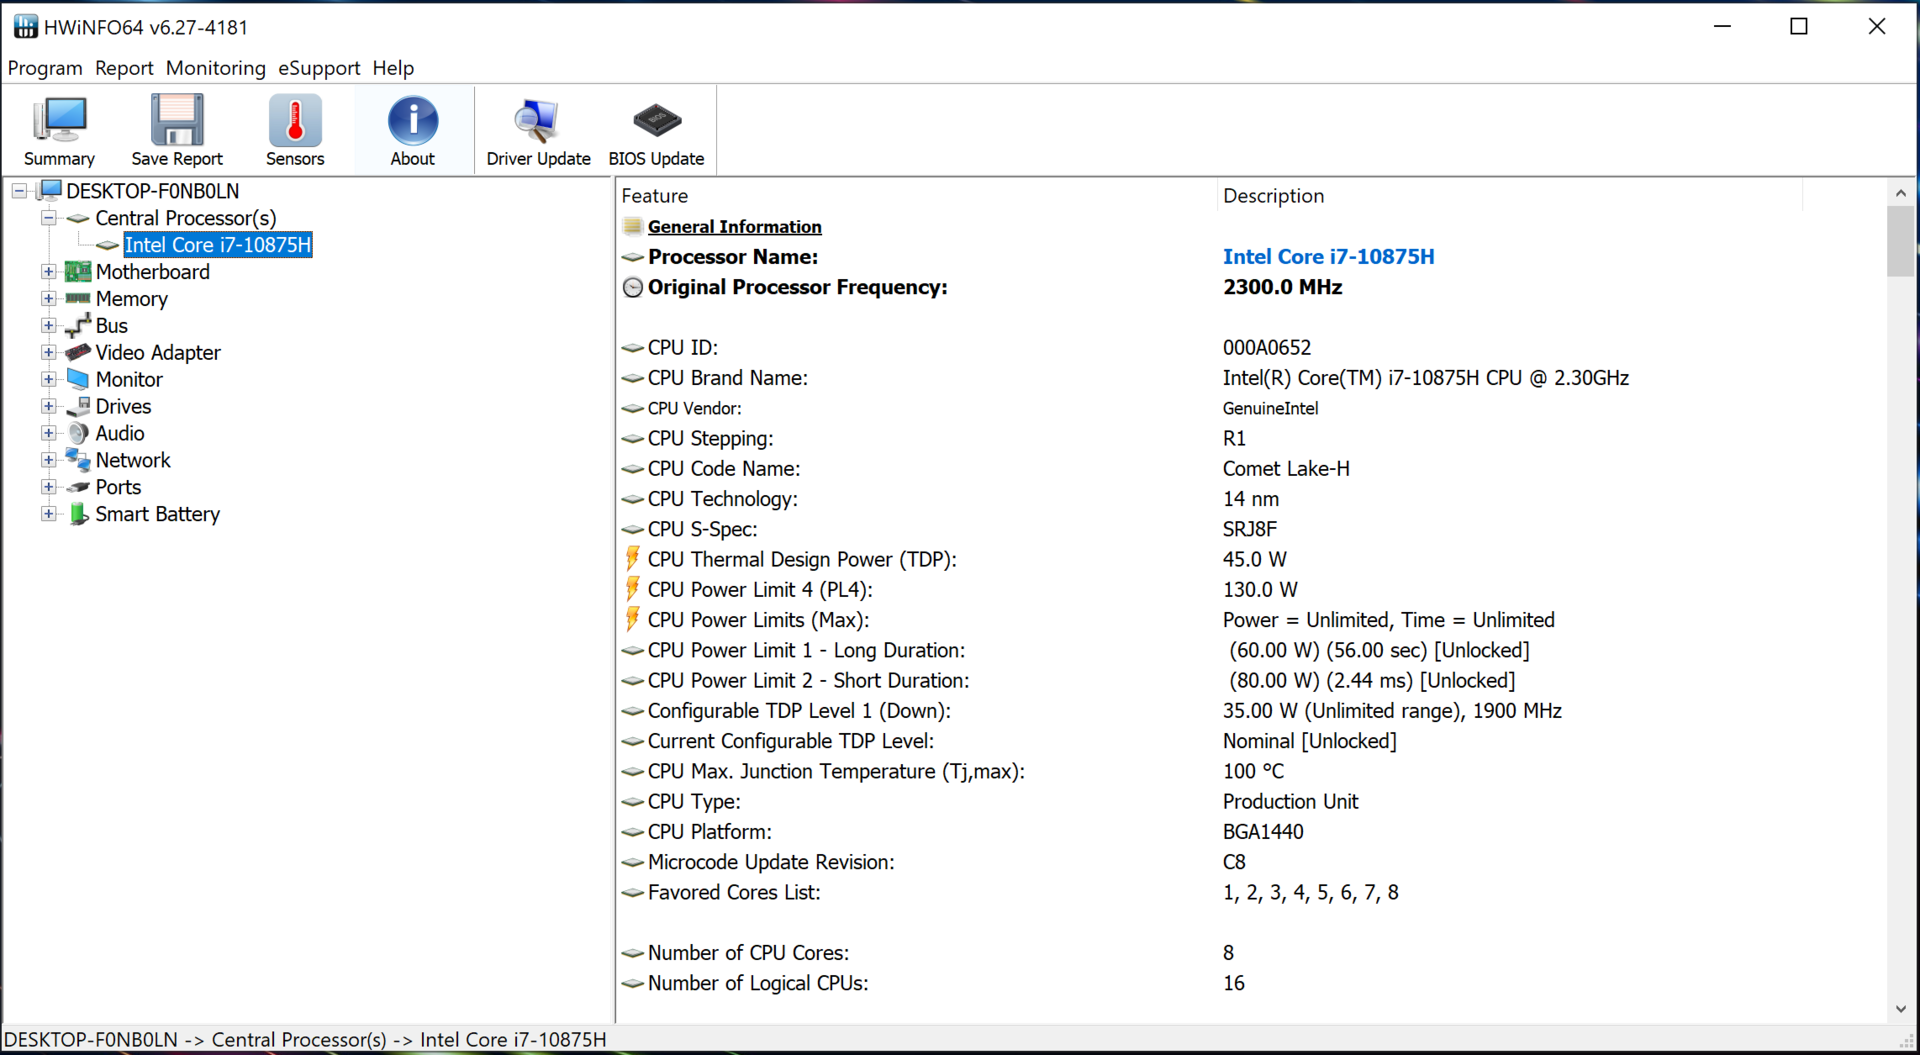
Le Razer Blade 15 est équipé d'une Nvidia Quadro RTX 5000 Max-Q et d'un Intel Core i7-10875H. Grâce à ses deux coeurs supplémentaires, le Core i7-10875H est plus performant que le processeur hexacoeur Coffee Lake du prédécesseur. Même s'il n'est pas un PC portable de jeu, le Blade 15 Studio Edition peut faire tourner fluidement tous les jeux actuels.
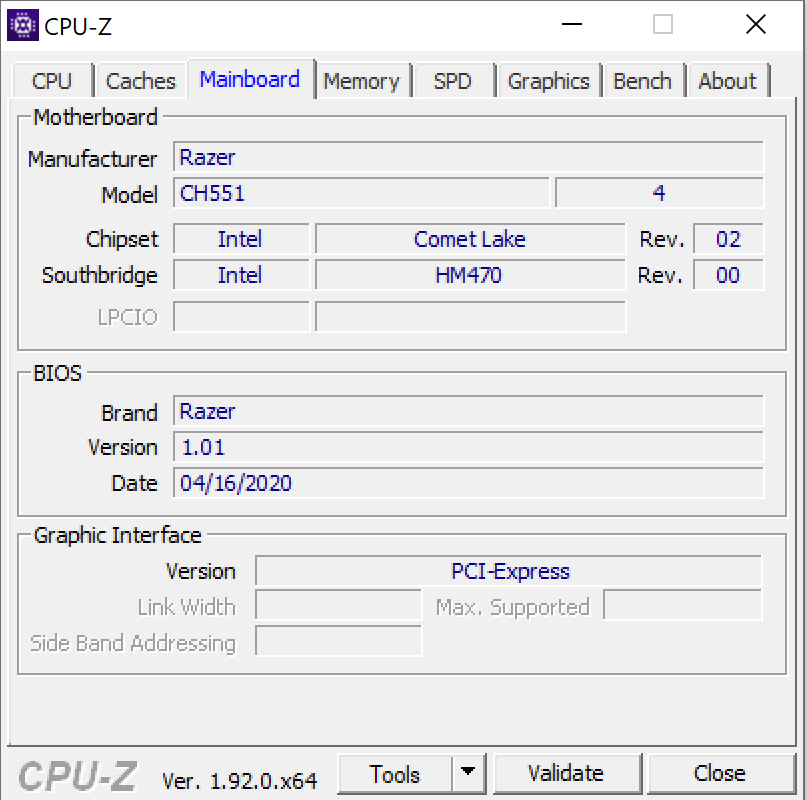
Razer a mis à jour le Blade 15 Studio Edition. La nouvelle architecture du CPU permet un gain de performances, et le choix des ports et meilleur.
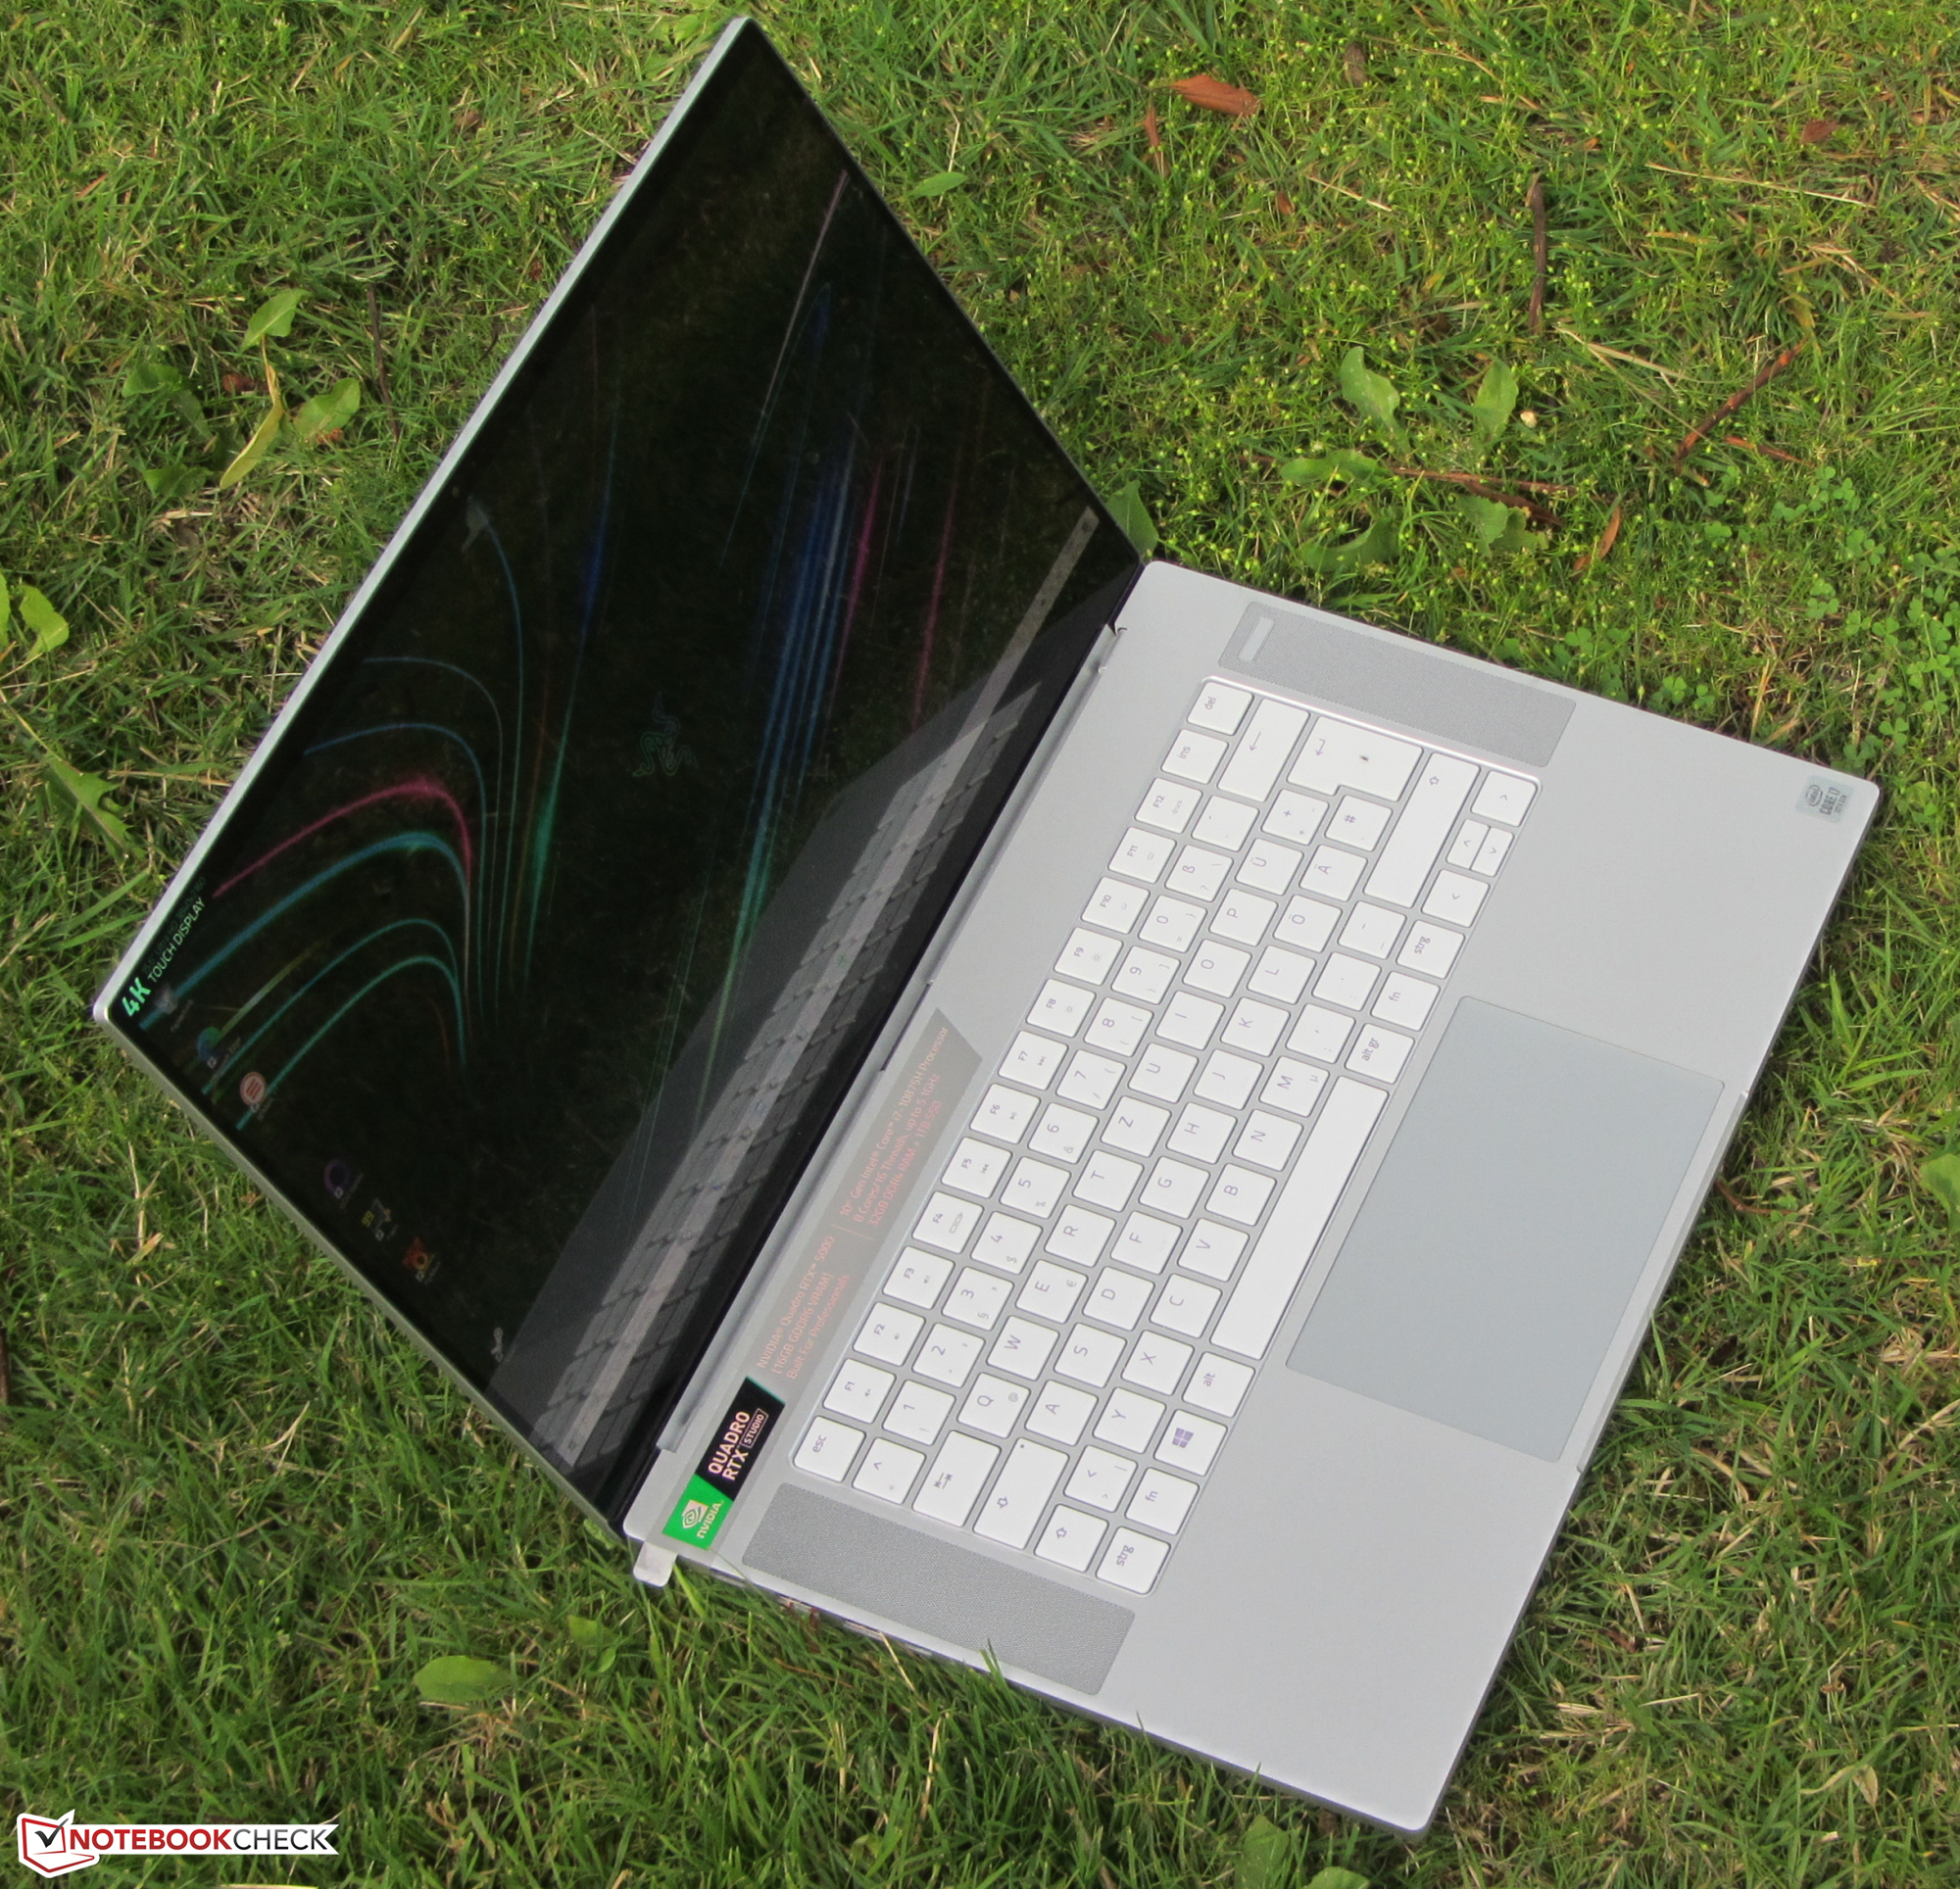
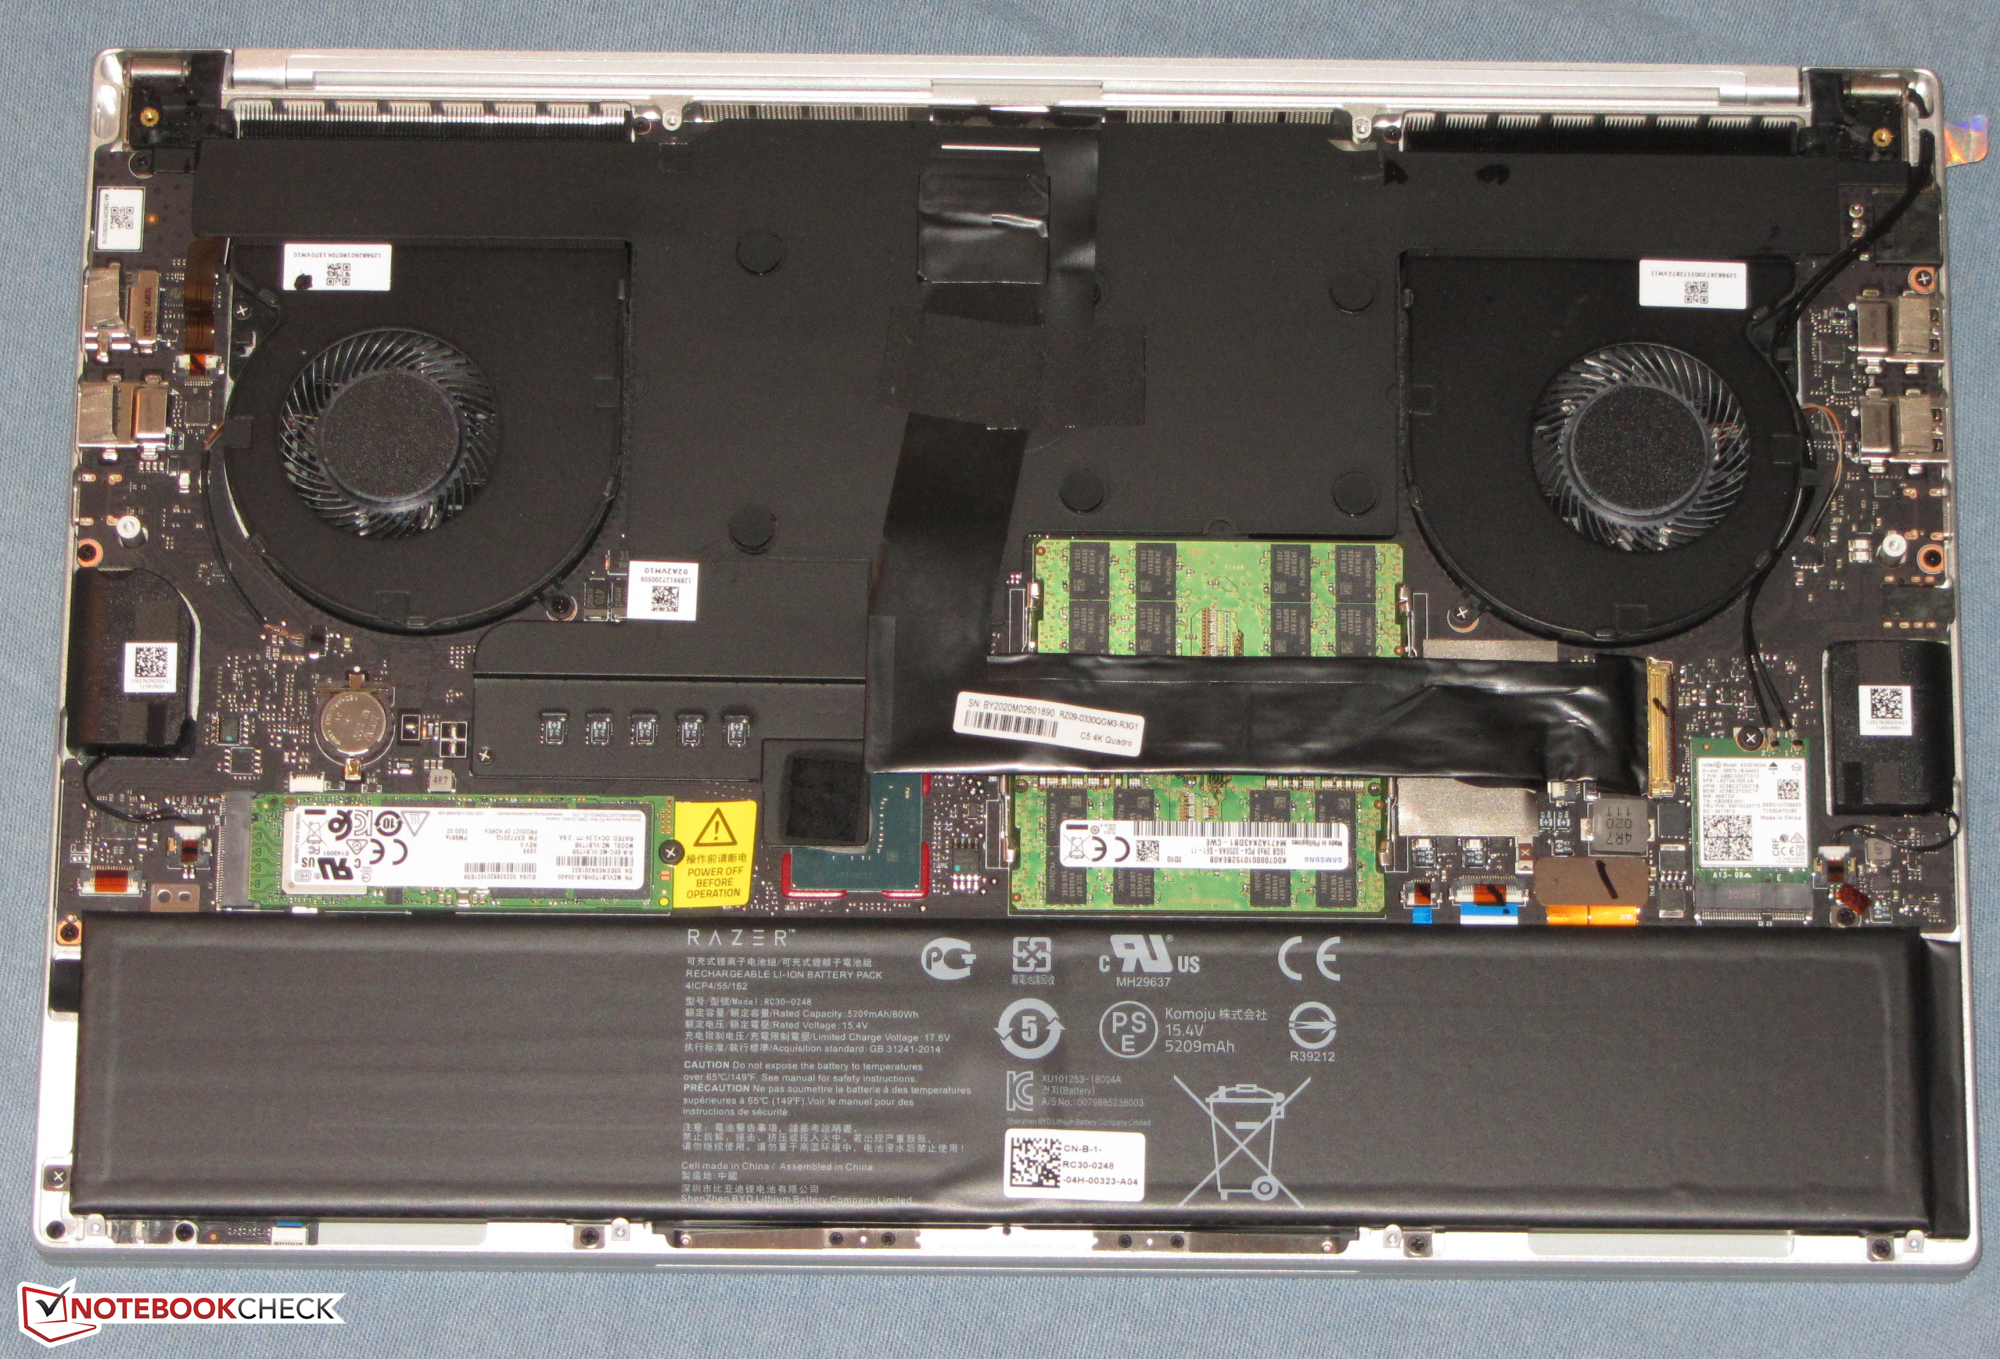
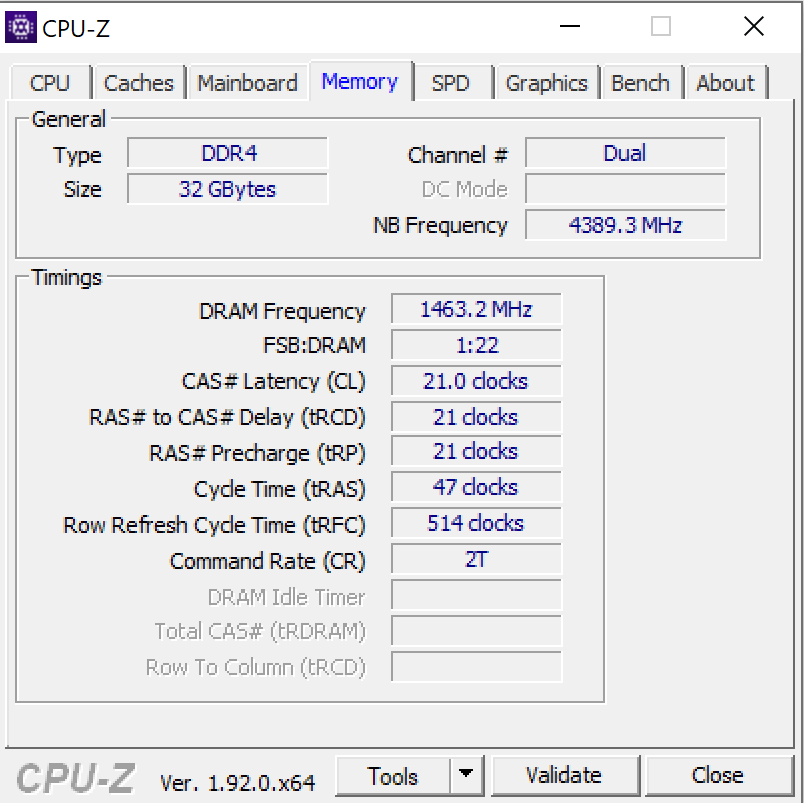
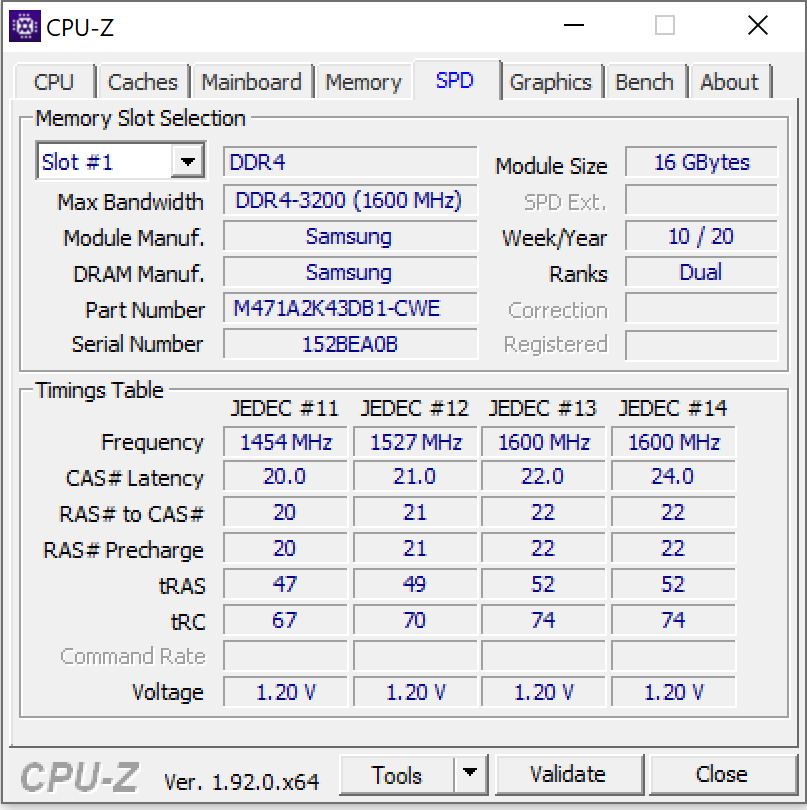
Le système possède 32 Go de RAM (en mode double canal), qui peuvent passer à 64 Go. Le SSD très rapide de 1 To peut également être changé. Ceux deux changements peuvent être faits facilement, la coque inférieure pouvant être enlevée sans difficultés.
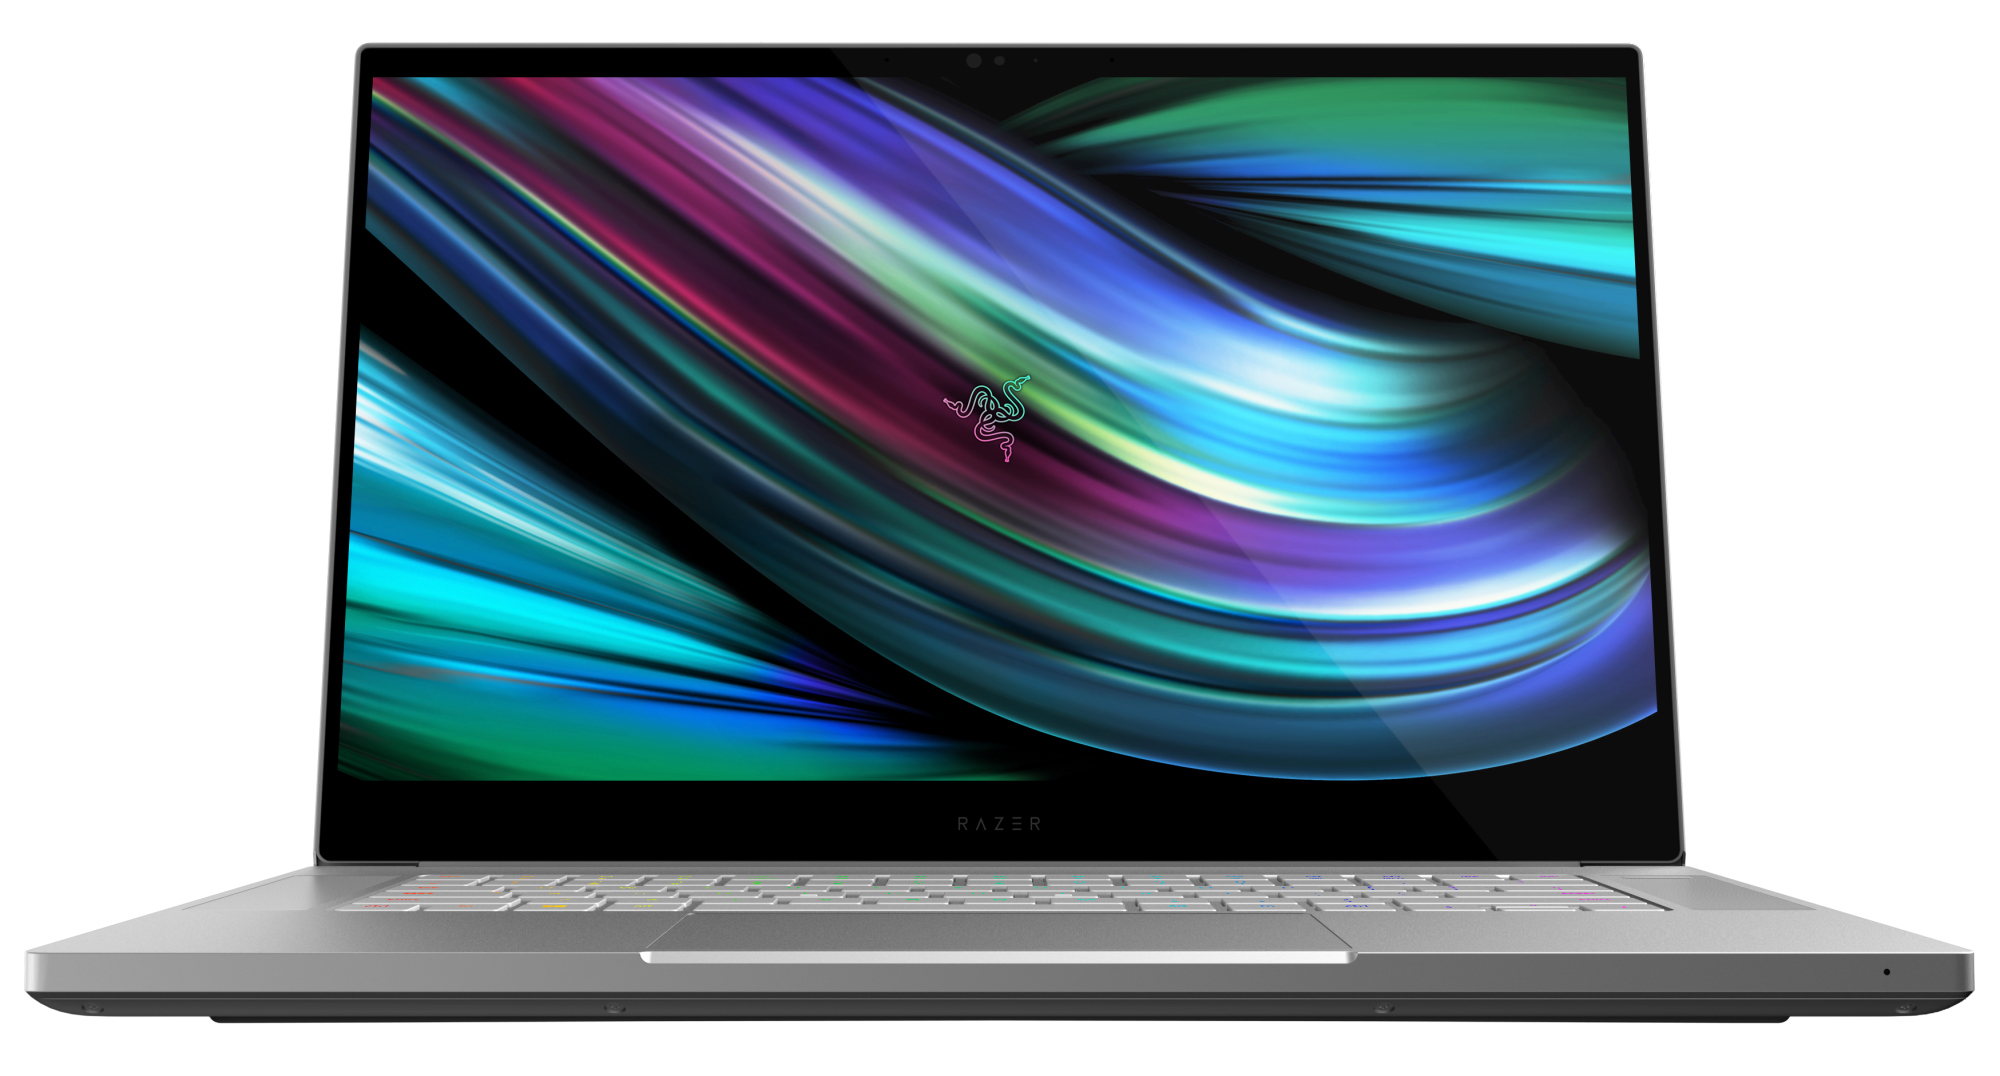
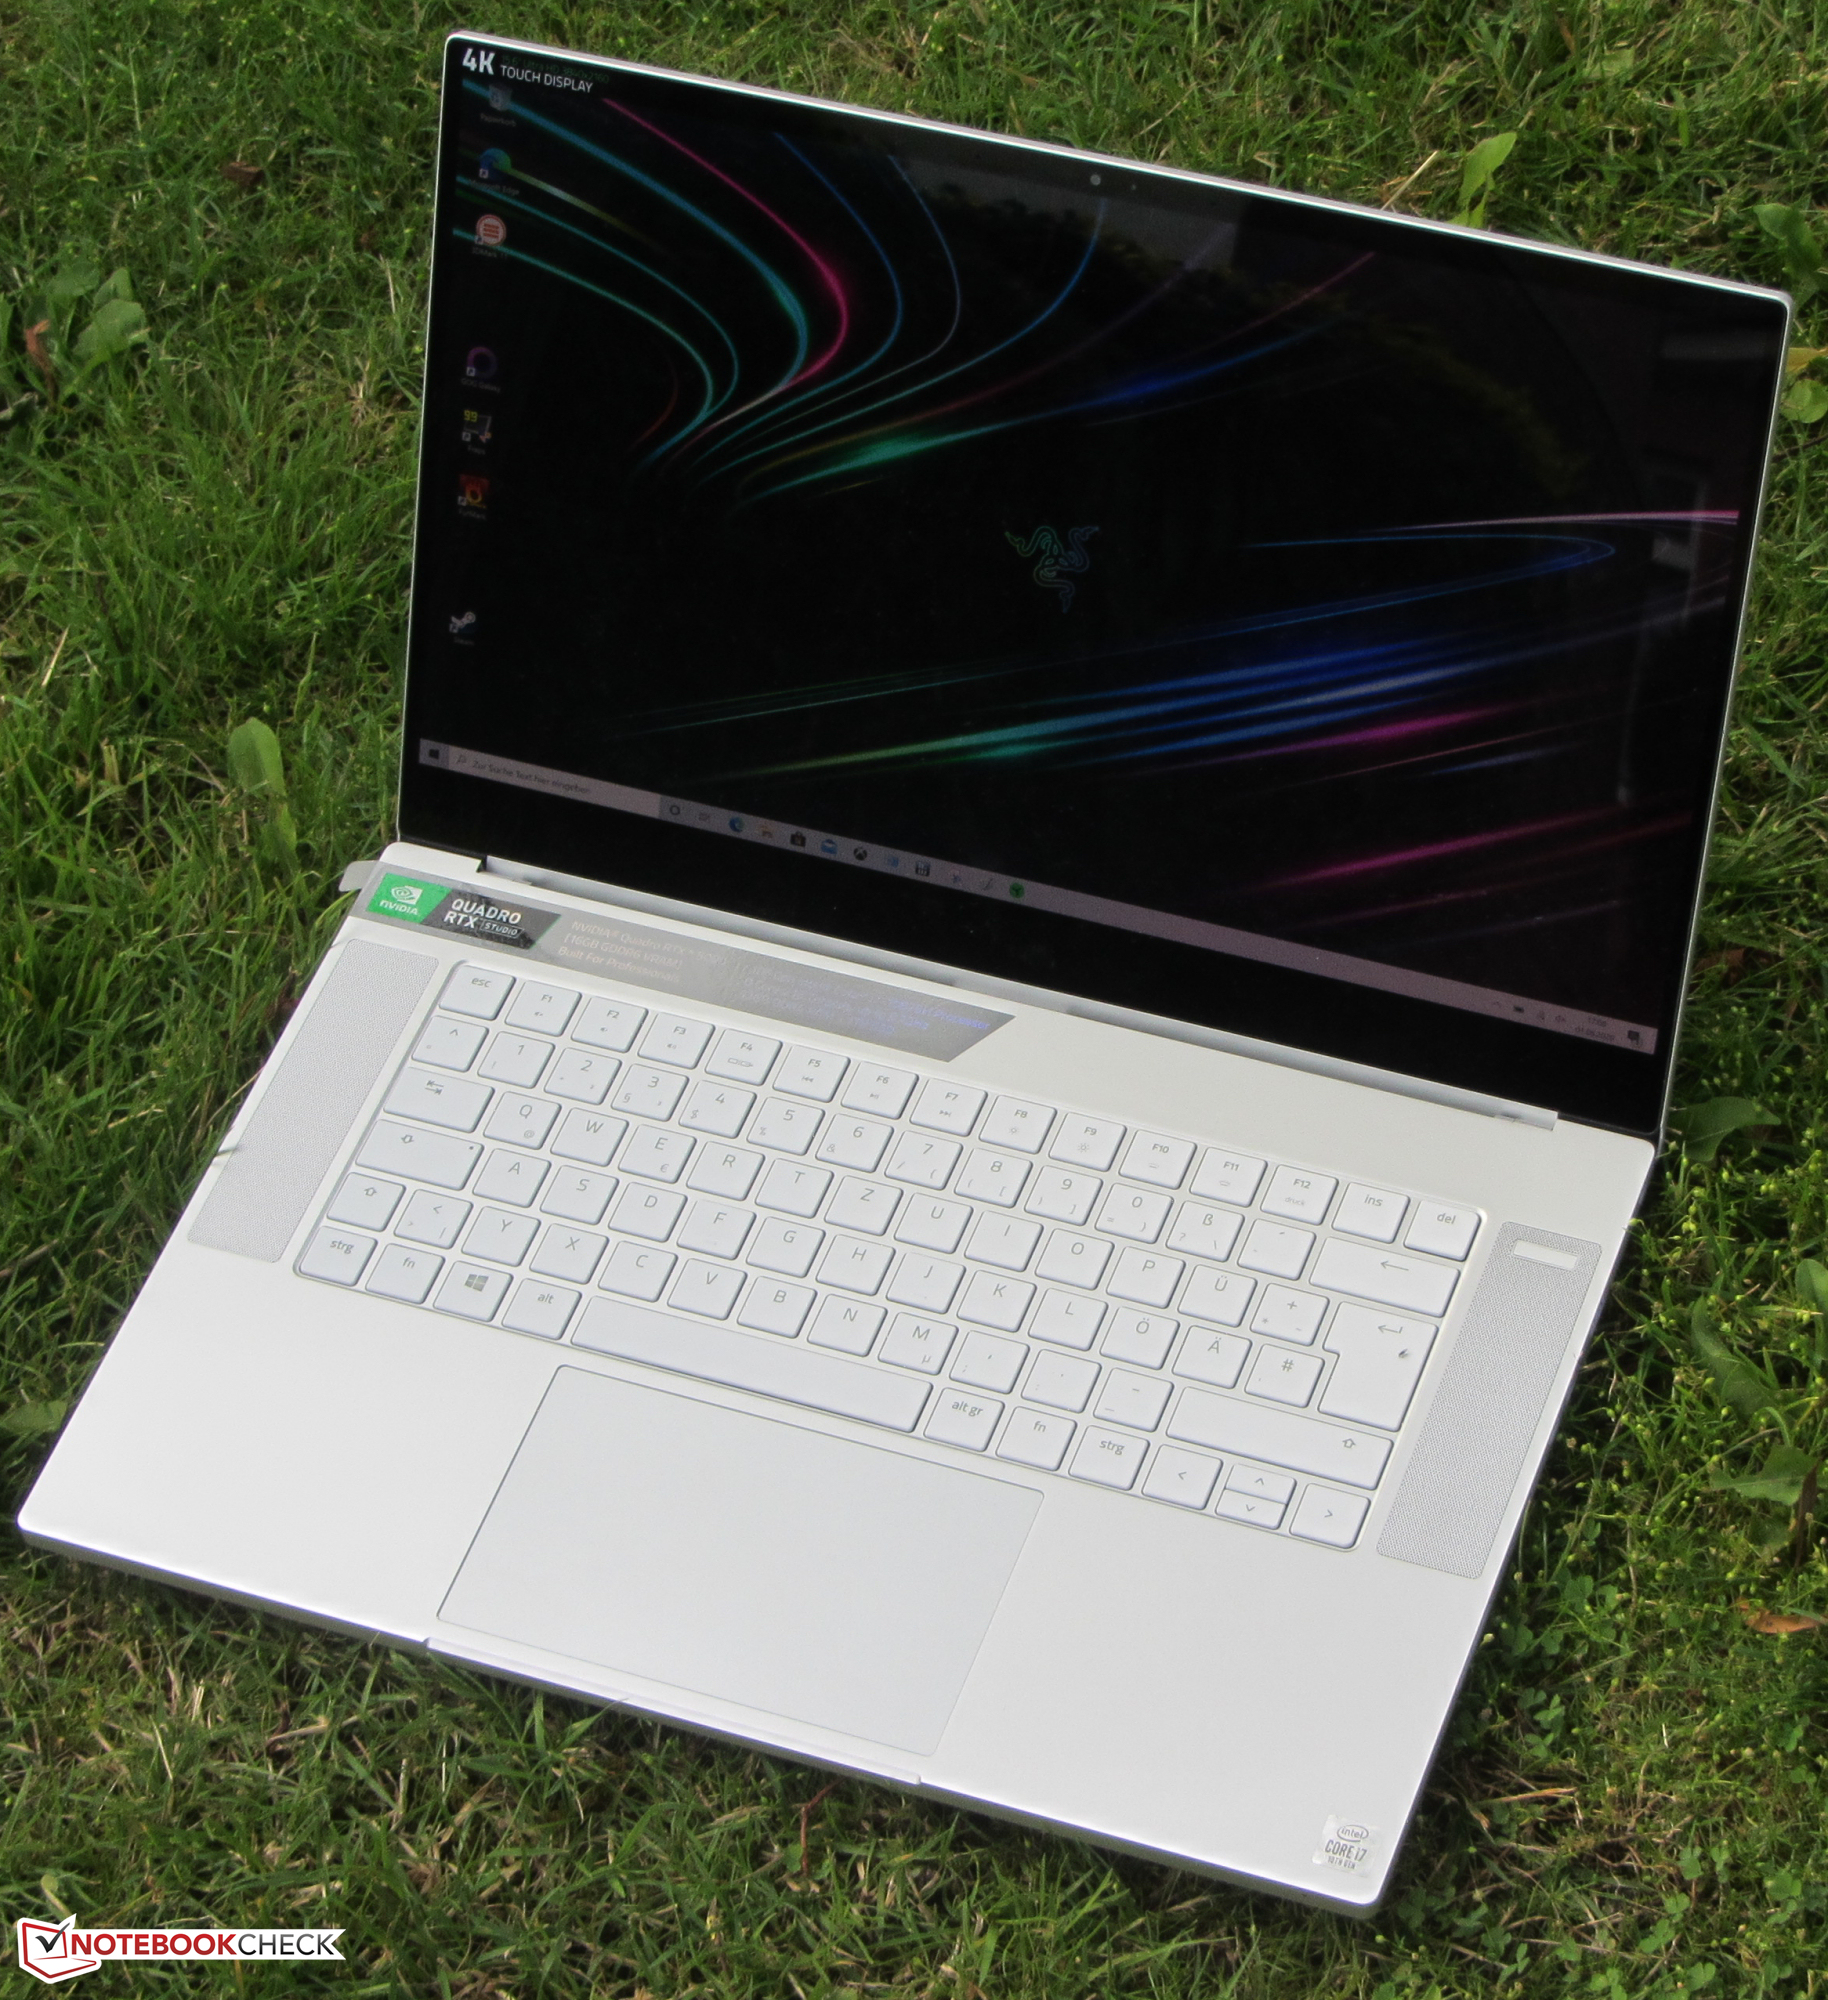
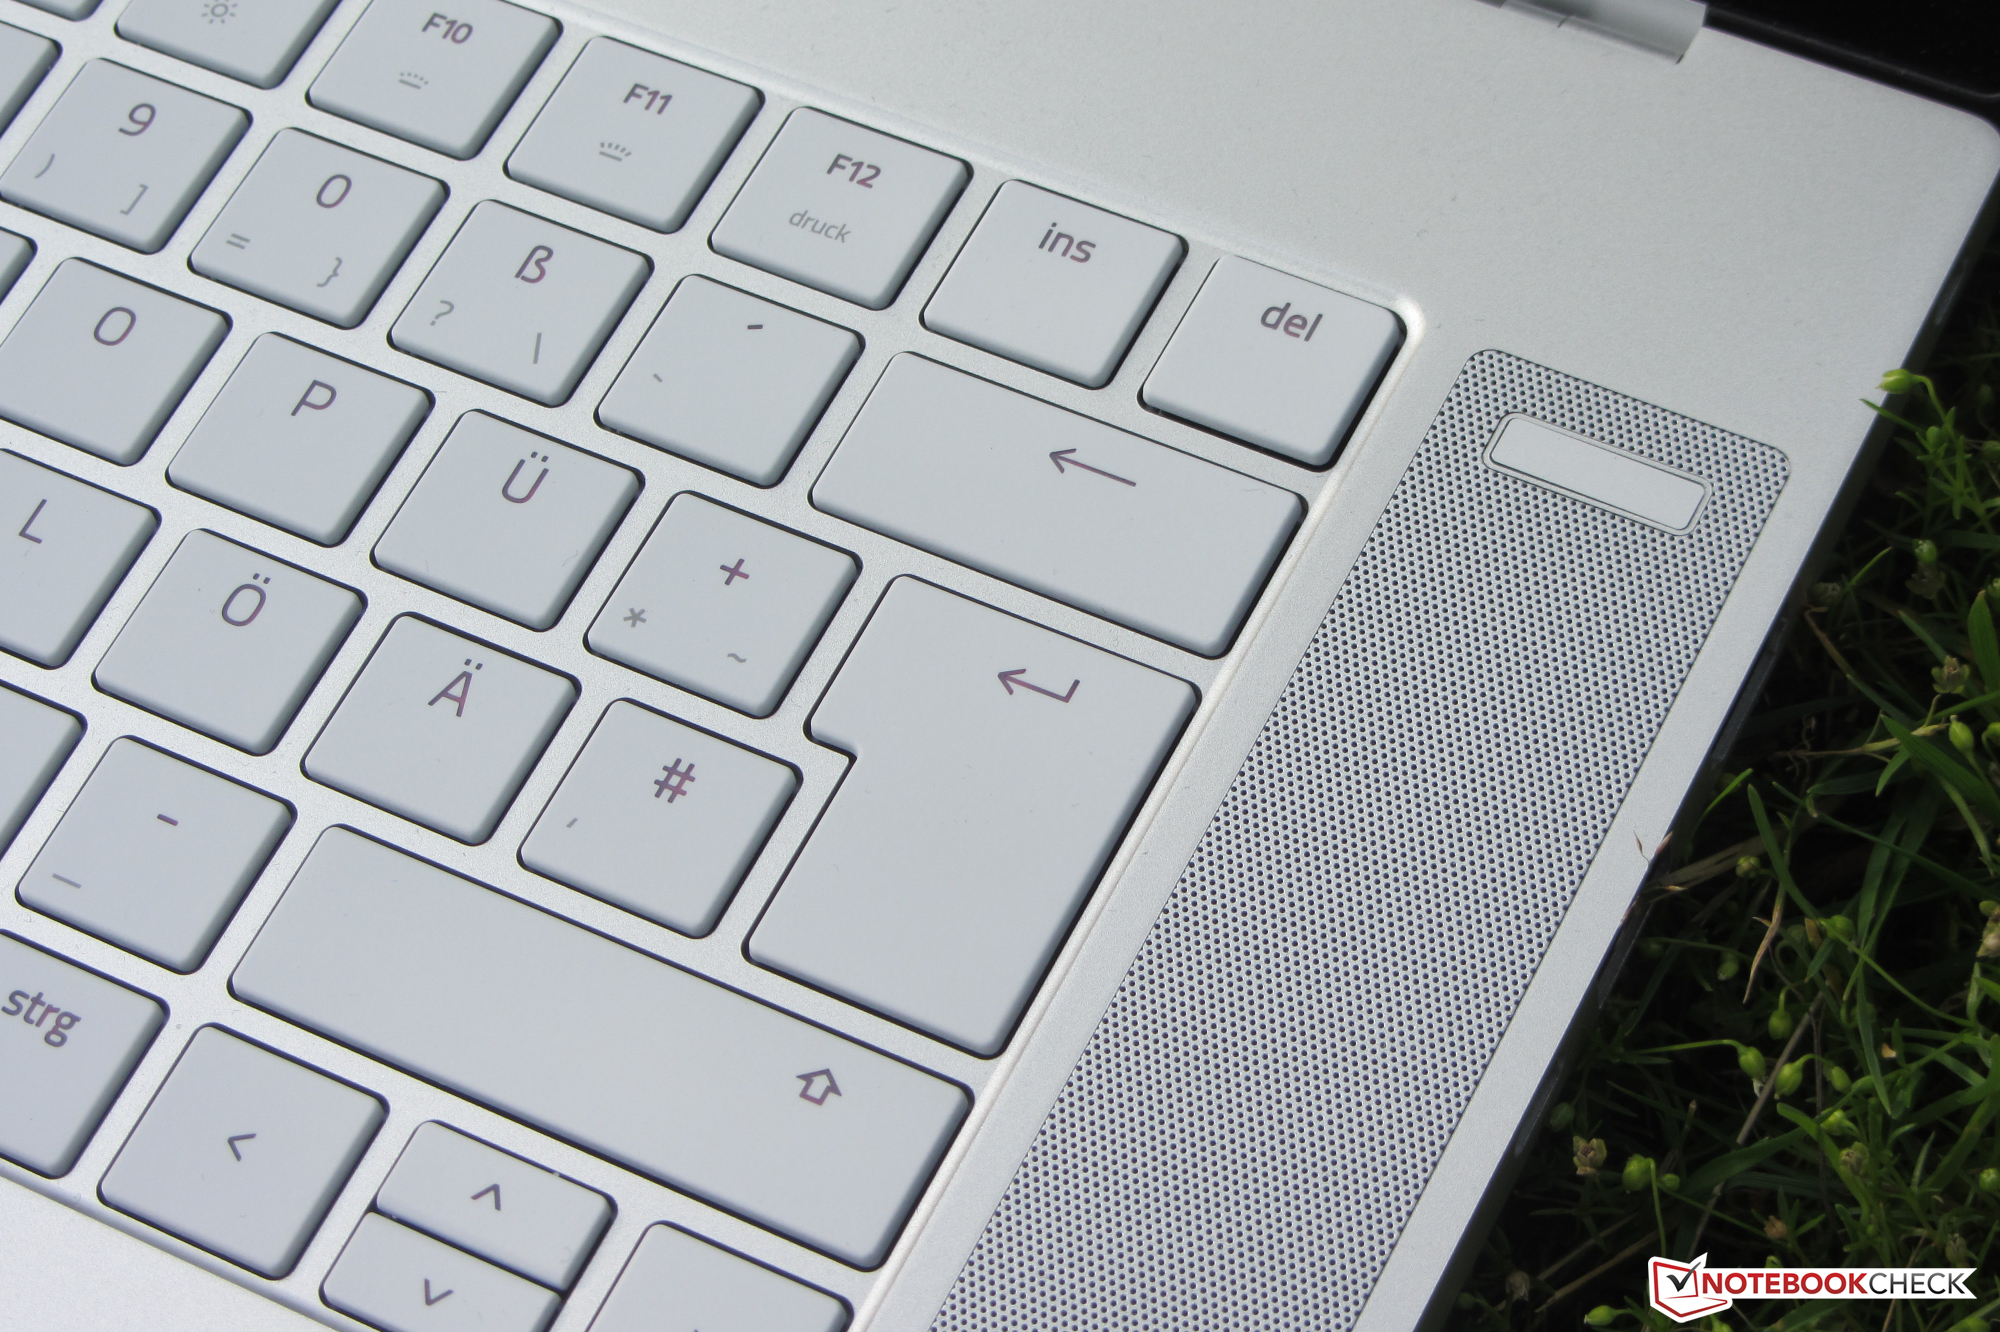
L'écran tactile OLED 4K impressionne avec des noirs profonds, une bonne luminosité, des angles de vision larges, des temps de réponse réduits et une bonne couverture des espaces colorimétriques (sRVB à 100 %). Les couleurs sont également fidèles.
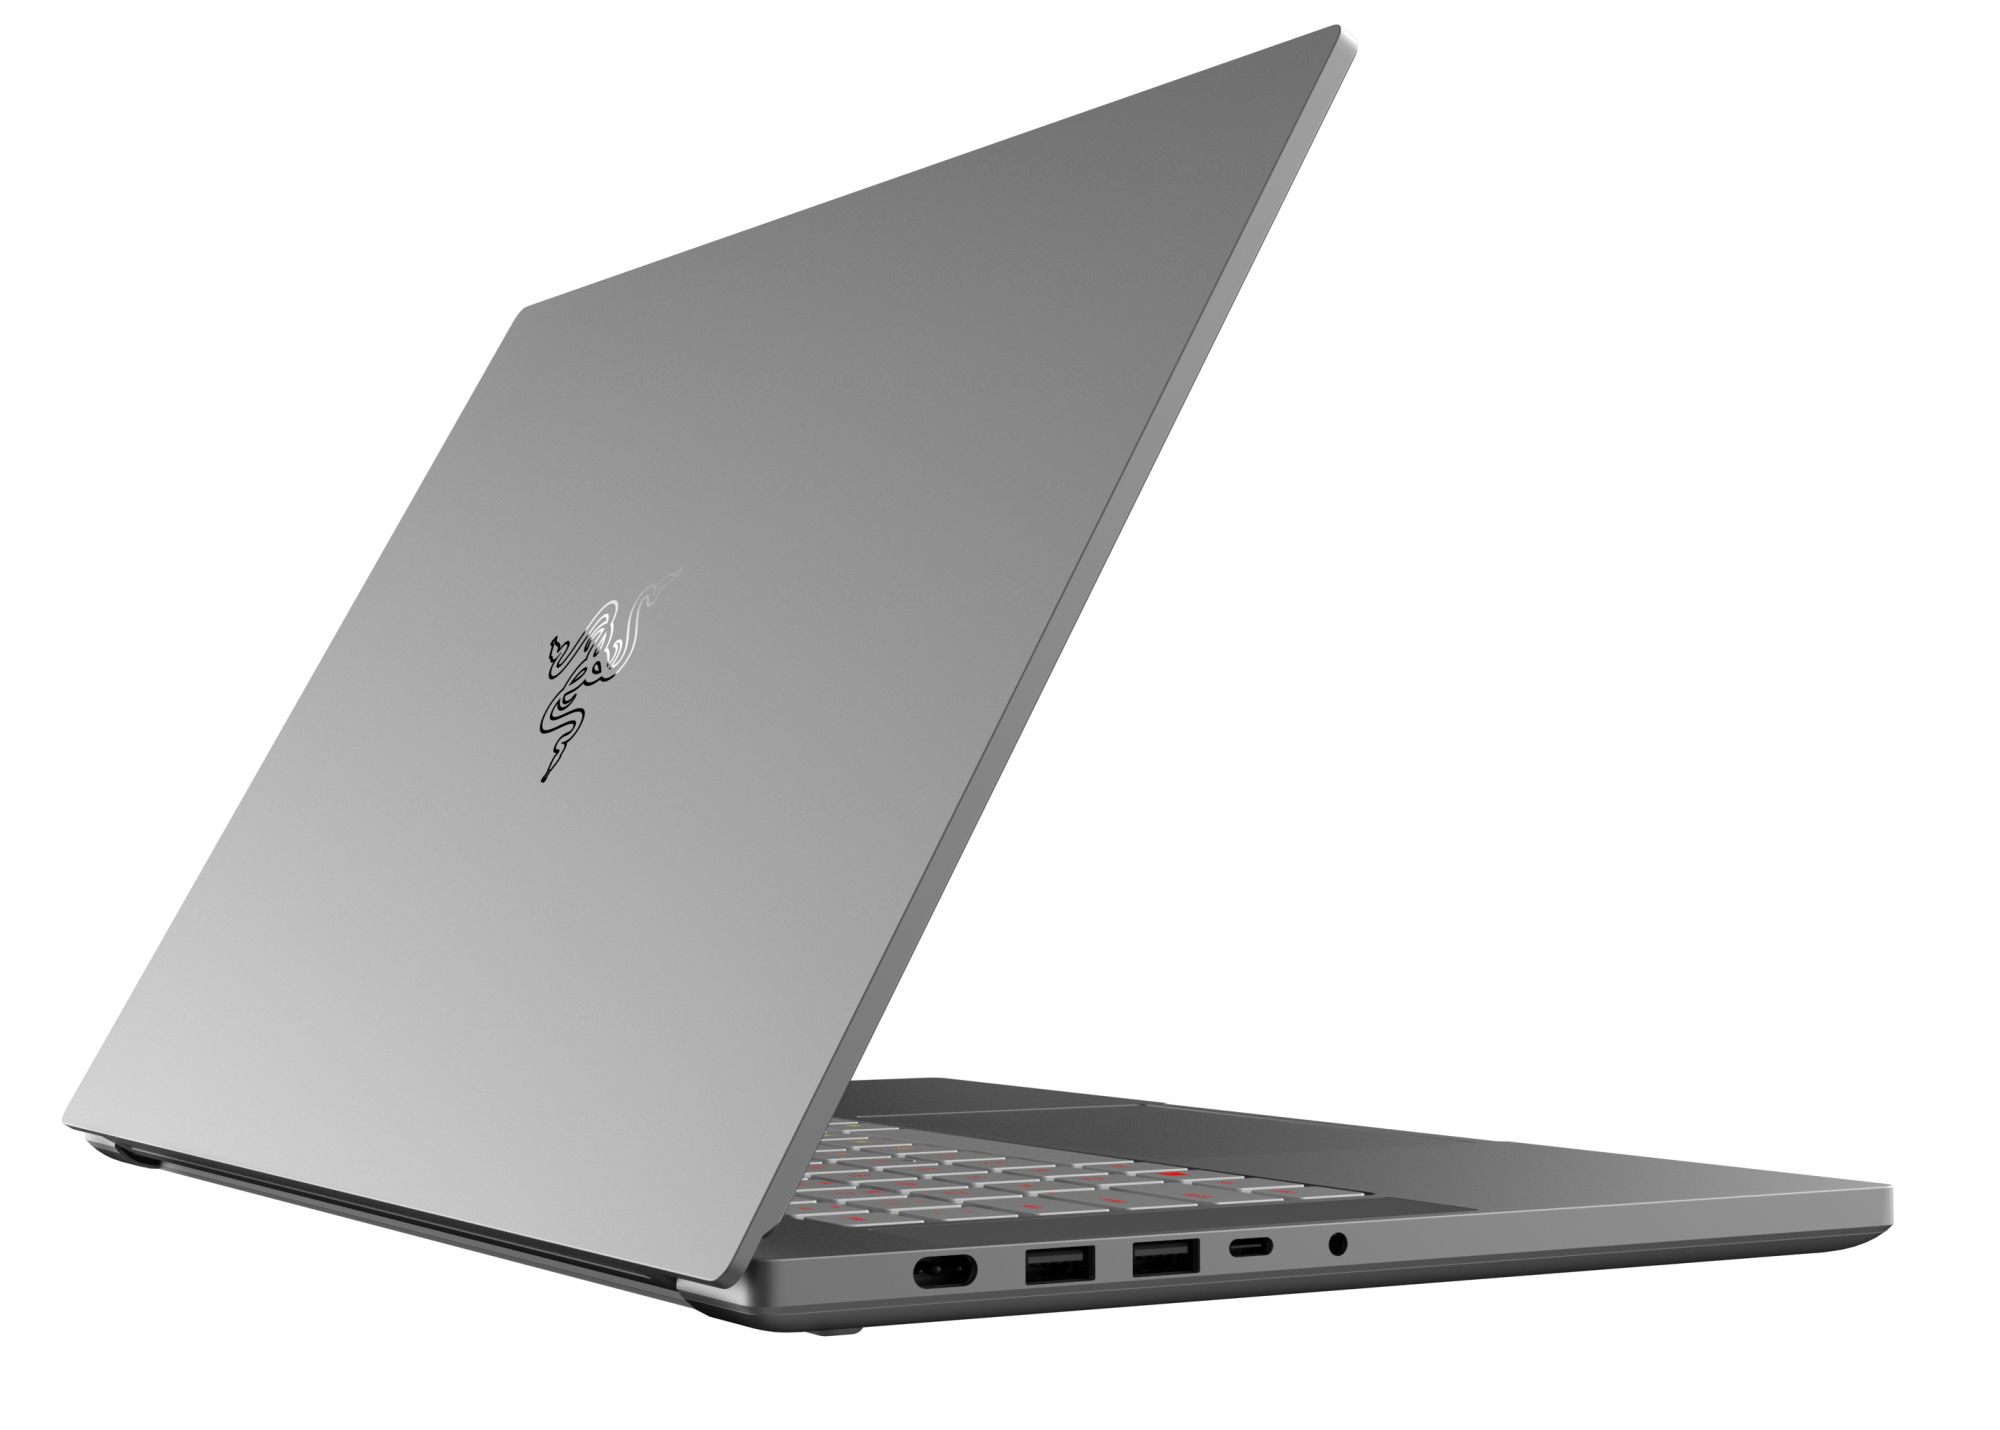
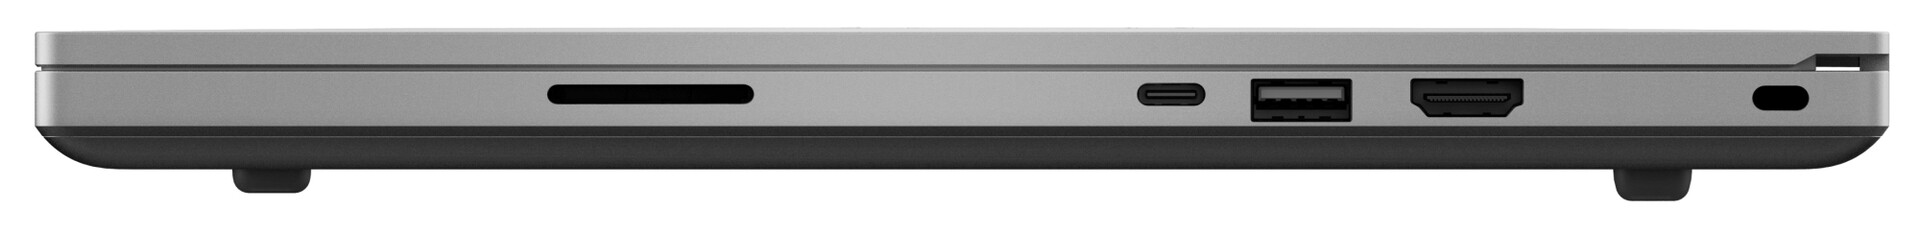
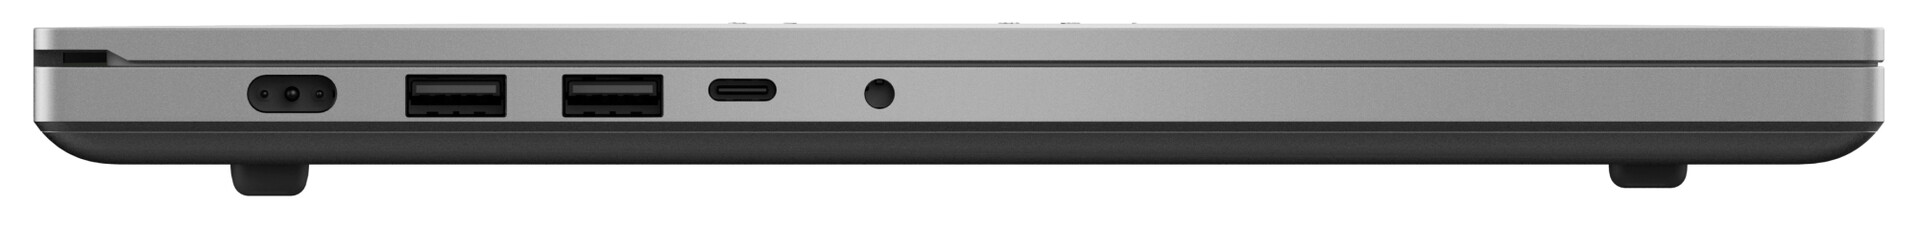
Le port miniDP a été remplacé par un port USB C 3.2 Gen 2, qui peut sortir un signal DisplayPort. Les ports USB A sont maintenant à des vitesses d'USB 3.2 Gen 2. Le port Thunderbolt 3 est toujours présent, pour connecter des stations d'accueil ou des GPU externes. La batterie peut être chargée par ce port Thunderbolt 3 - nous avons pu le charger avec un adaptateur secteur de 45 W.
L’intégralité de cette critique est disponible en anglais en suivant ce lien.
Razer Blade 15 Studio Edition 2020
- 08/03/2020 v7 (old)
Sascha Mölck