Test du Razer Blade 15 : les débuts de l'Intel Core i7-12800H
Razer a rafraîchi sa série Blade 15 cette année pour inclure les derniers CPU Intel et GPU Nvidia. Dans ce cas, le modèle reçoit des CPU Core i7-12800H et Core i9-12900H Alder Lake-H de 12e génération aux côtés des GeForce RTX 3070 Ti et 3080 Ti (110 W TGP) pour remplacer les anciennes options Core i7-11800H, Core i9-11900H, RTX 3070 et RTX 3080 (105 W TGP) de 11e génération. Cet examen se concentrera sur les différences de performances auxquelles les utilisateurs peuvent s'attendre lorsqu'ils passent d'un ancien Razer Blade 15 à la dernière configuration 2022 en revue.
Parmi les alternatives au Blade 15, on trouve d'autres ordinateurs portables ultrafins de 15,6 pouces pour le jeu, comme les modèles suivants Eurocom RX315, MSI GS66, ADATA XPG Xenia 15ou le Asus Zephyrus S series
Plus de commentaires sur Razer :
Comparaison avec les concurrents potentiels
Note | Date | Modèle | Poids | Épaisseur | Taille | Résolution | Prix |
|---|---|---|---|---|---|---|---|
| 89.1 % v7 (old) | 03/22 | Razer Blade 15 2022 i7-12800H, GeForce RTX 3080 Ti Laptop GPU | 2.1 kg | 16.99 mm | 15.60" | 2560x1440 | |
| 87.5 % v7 (old) | 05/21 | Razer Blade 15 Advanced Model Early 2021 i7-10875H, GeForce RTX 3080 Laptop GPU | 2 kg | 16.99 mm | 15.60" | 1920x1080 | |
| 85.9 % v7 (old) | 09/20 | Razer Blade 15 RTX 2080 Super Max-Q i7-10875H, GeForce RTX 2080 Super Max-Q | 2.2 kg | 17.8 mm | 15.60" | 1920x1080 | |
v (old) | 03/22 | Schenker XMG Neo 15 E22 (Early 2022, RTX 3080 Ti) i7-12700H, GeForce RTX 3080 Ti Laptop GPU | 2.2 kg | 26.6 mm | 15.60" | 2560x1440 | |
| 87.3 % v7 (old) | 10/21 | ADATA XPG Xenia 15 i7-11800H, GeForce RTX 3070 Laptop GPU | 1.9 kg | 20.5 mm | 15.60" | 2560x1440 | |
| 83 % v7 (old) | 01/22 | Eurocom Nightsky ARX315 R9 5900X, GeForce RTX 3070 Laptop GPU | 2.6 kg | 32.5 mm | 15.60" | 1920x1080 |
Cas
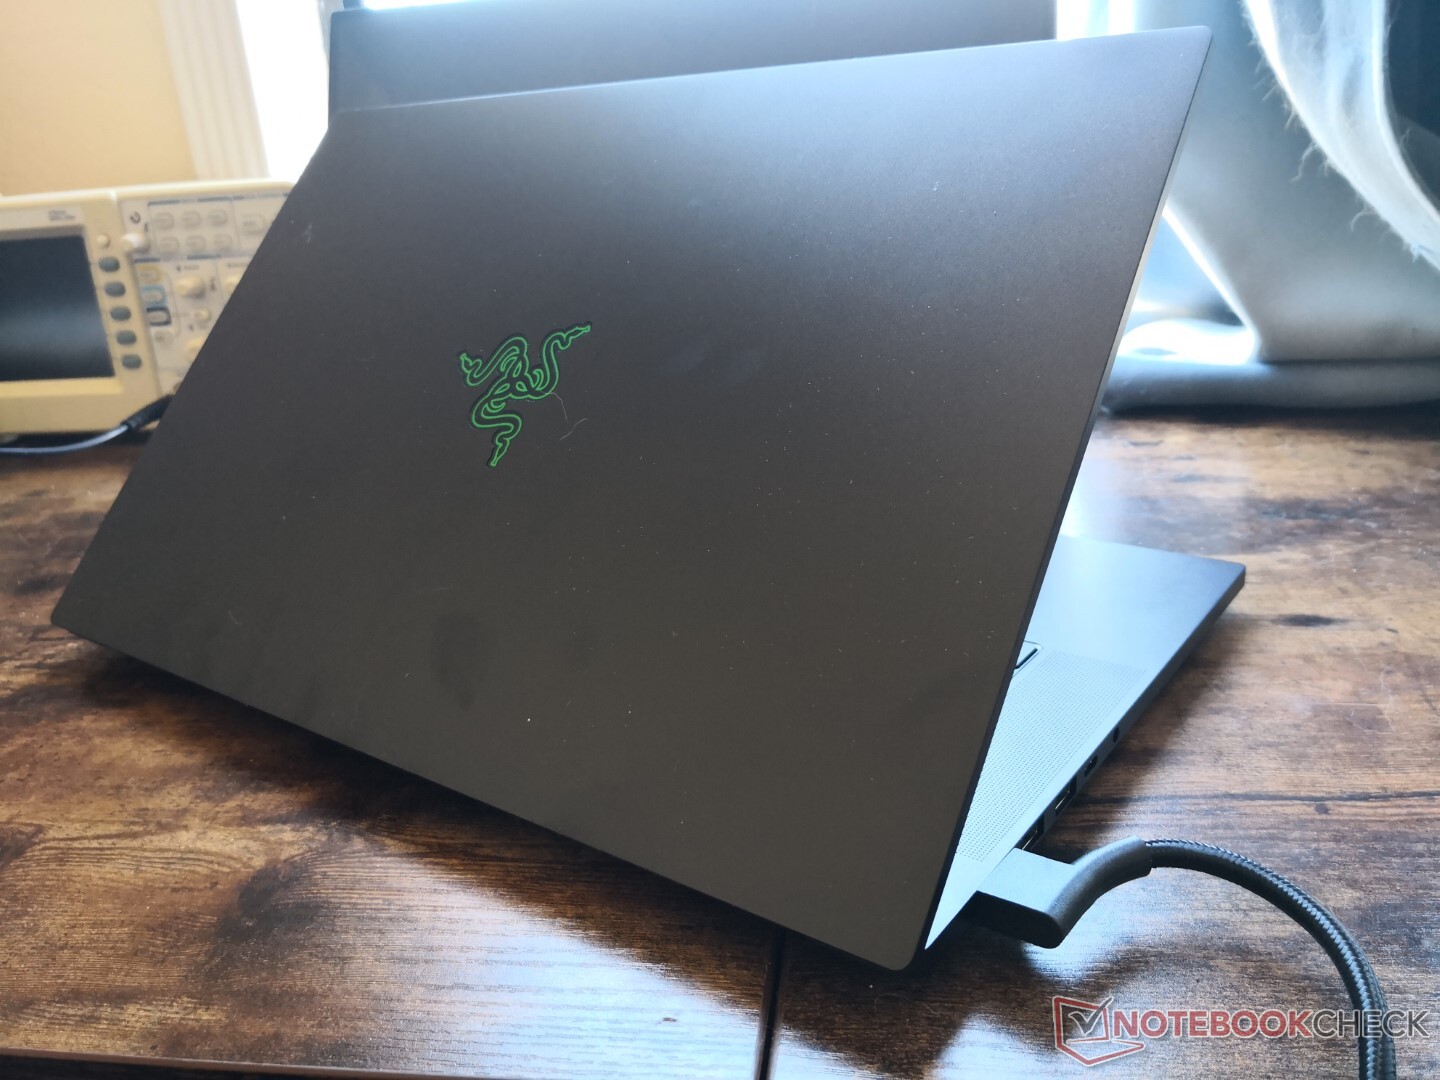
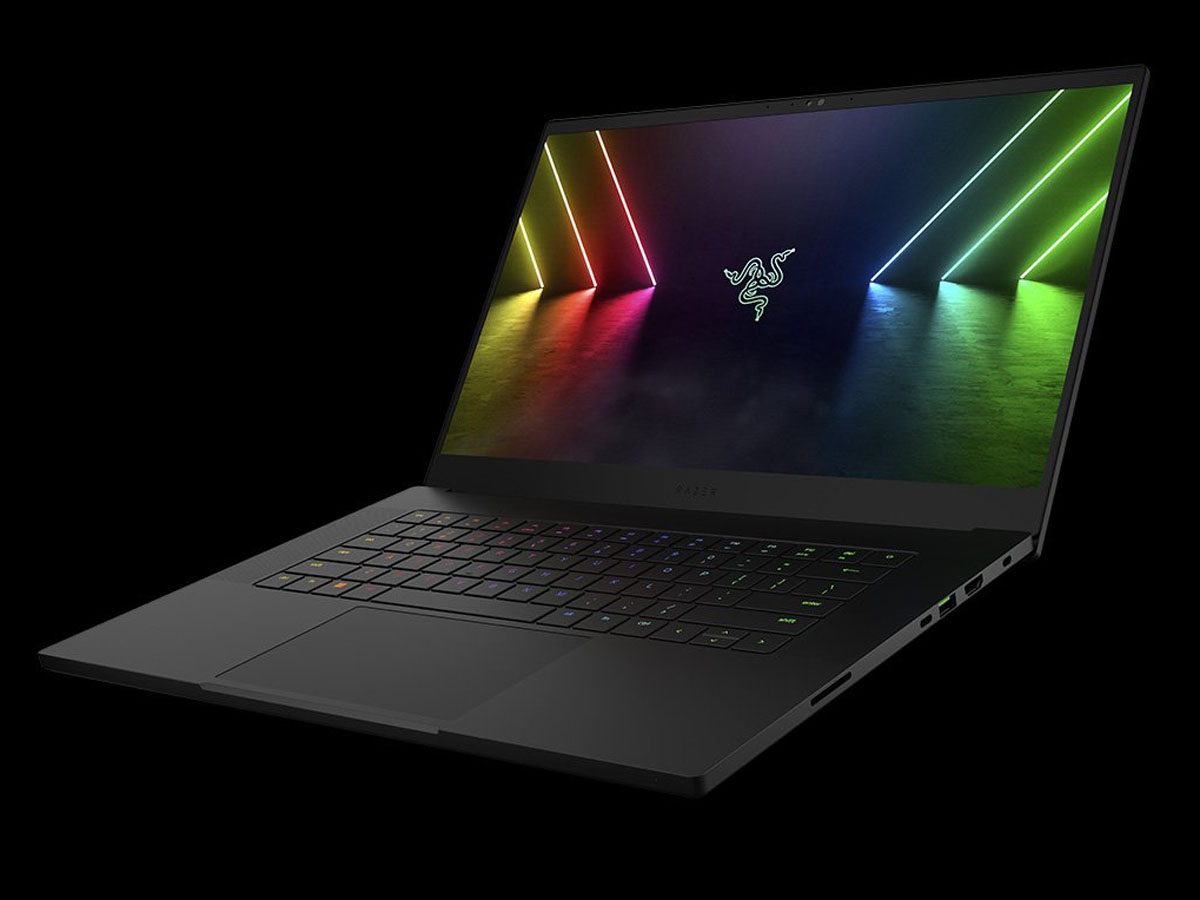
Le châssis reste en grande partie identique à celui du modèle avancé de l'année dernière et il n'y a donc aucun changement dans les dimensions ou la sensation du système. Si vous avez déjà manipulé un Blade Stealth, Lame 14, Blade 15ou Blade Pro 17 dans le passé, alors cette dernière version 2022 vous semblera familière.
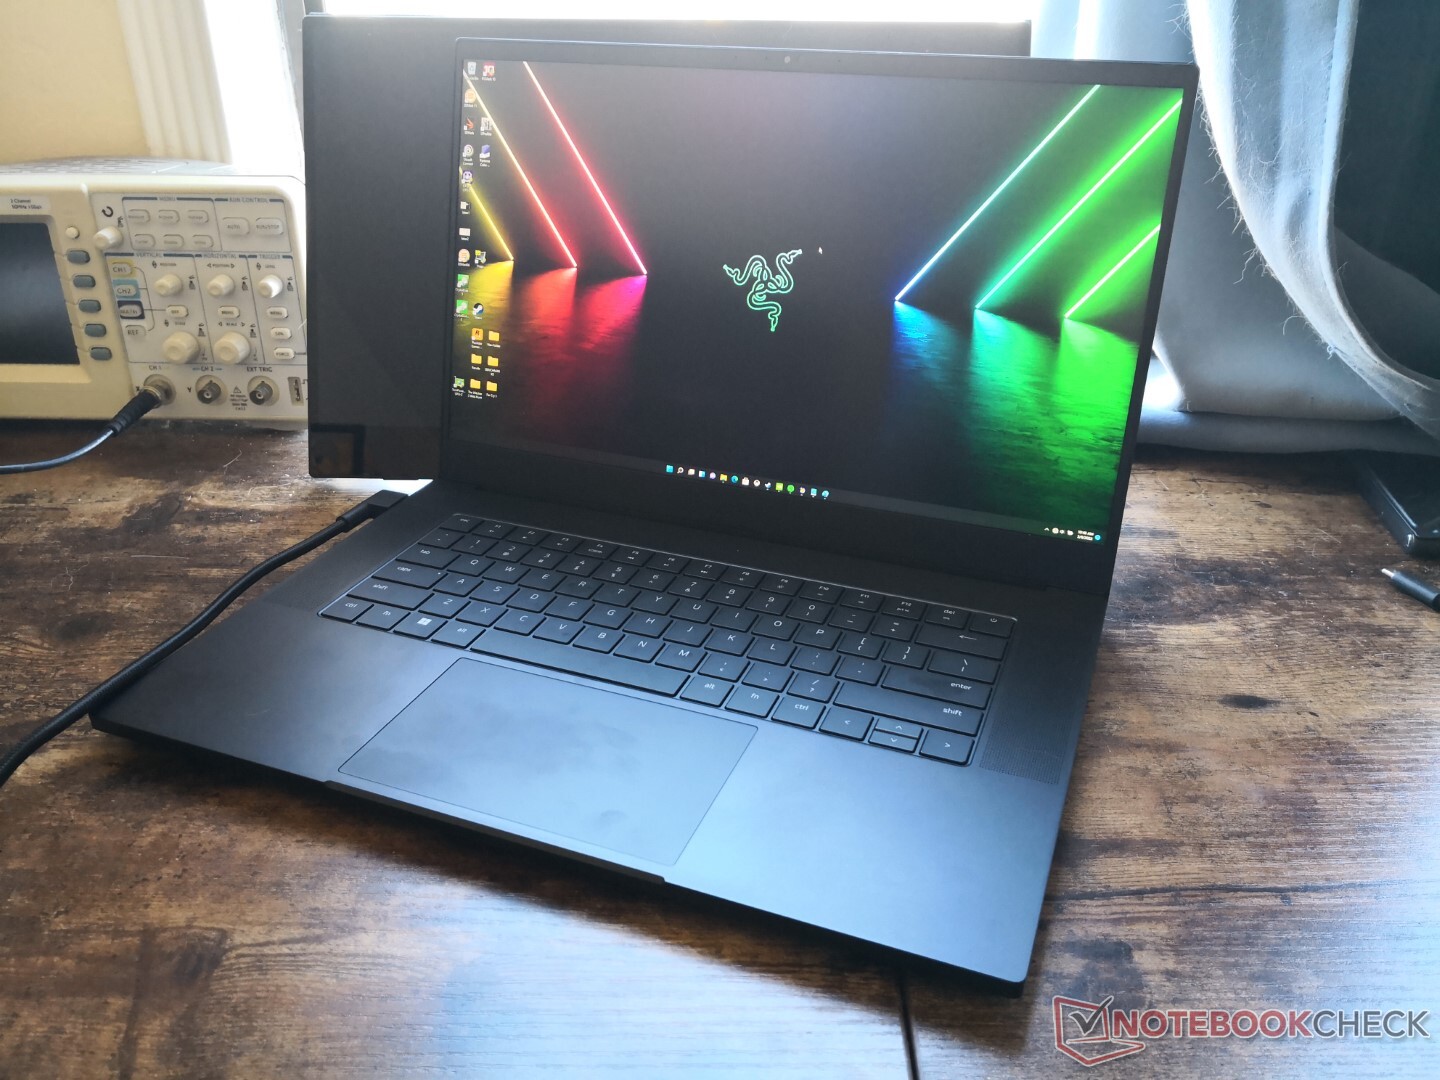
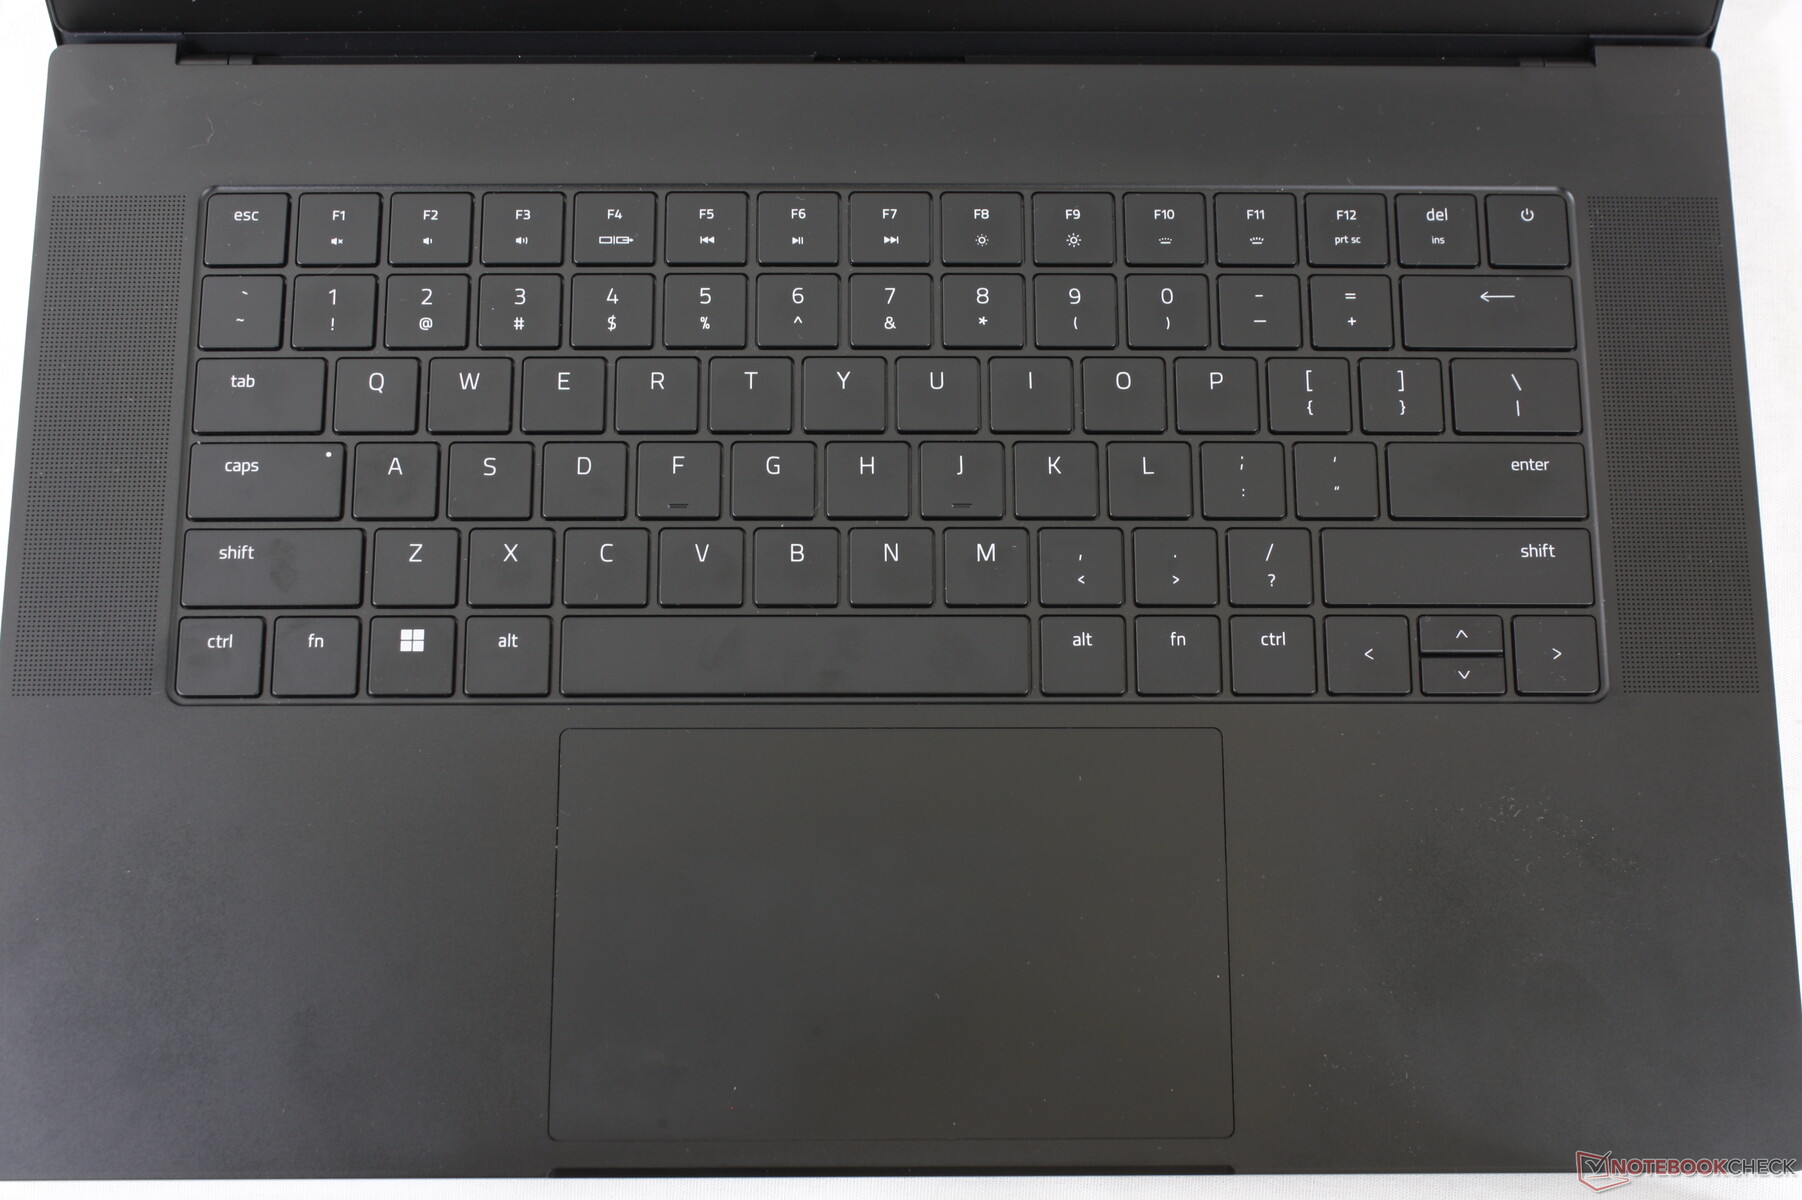
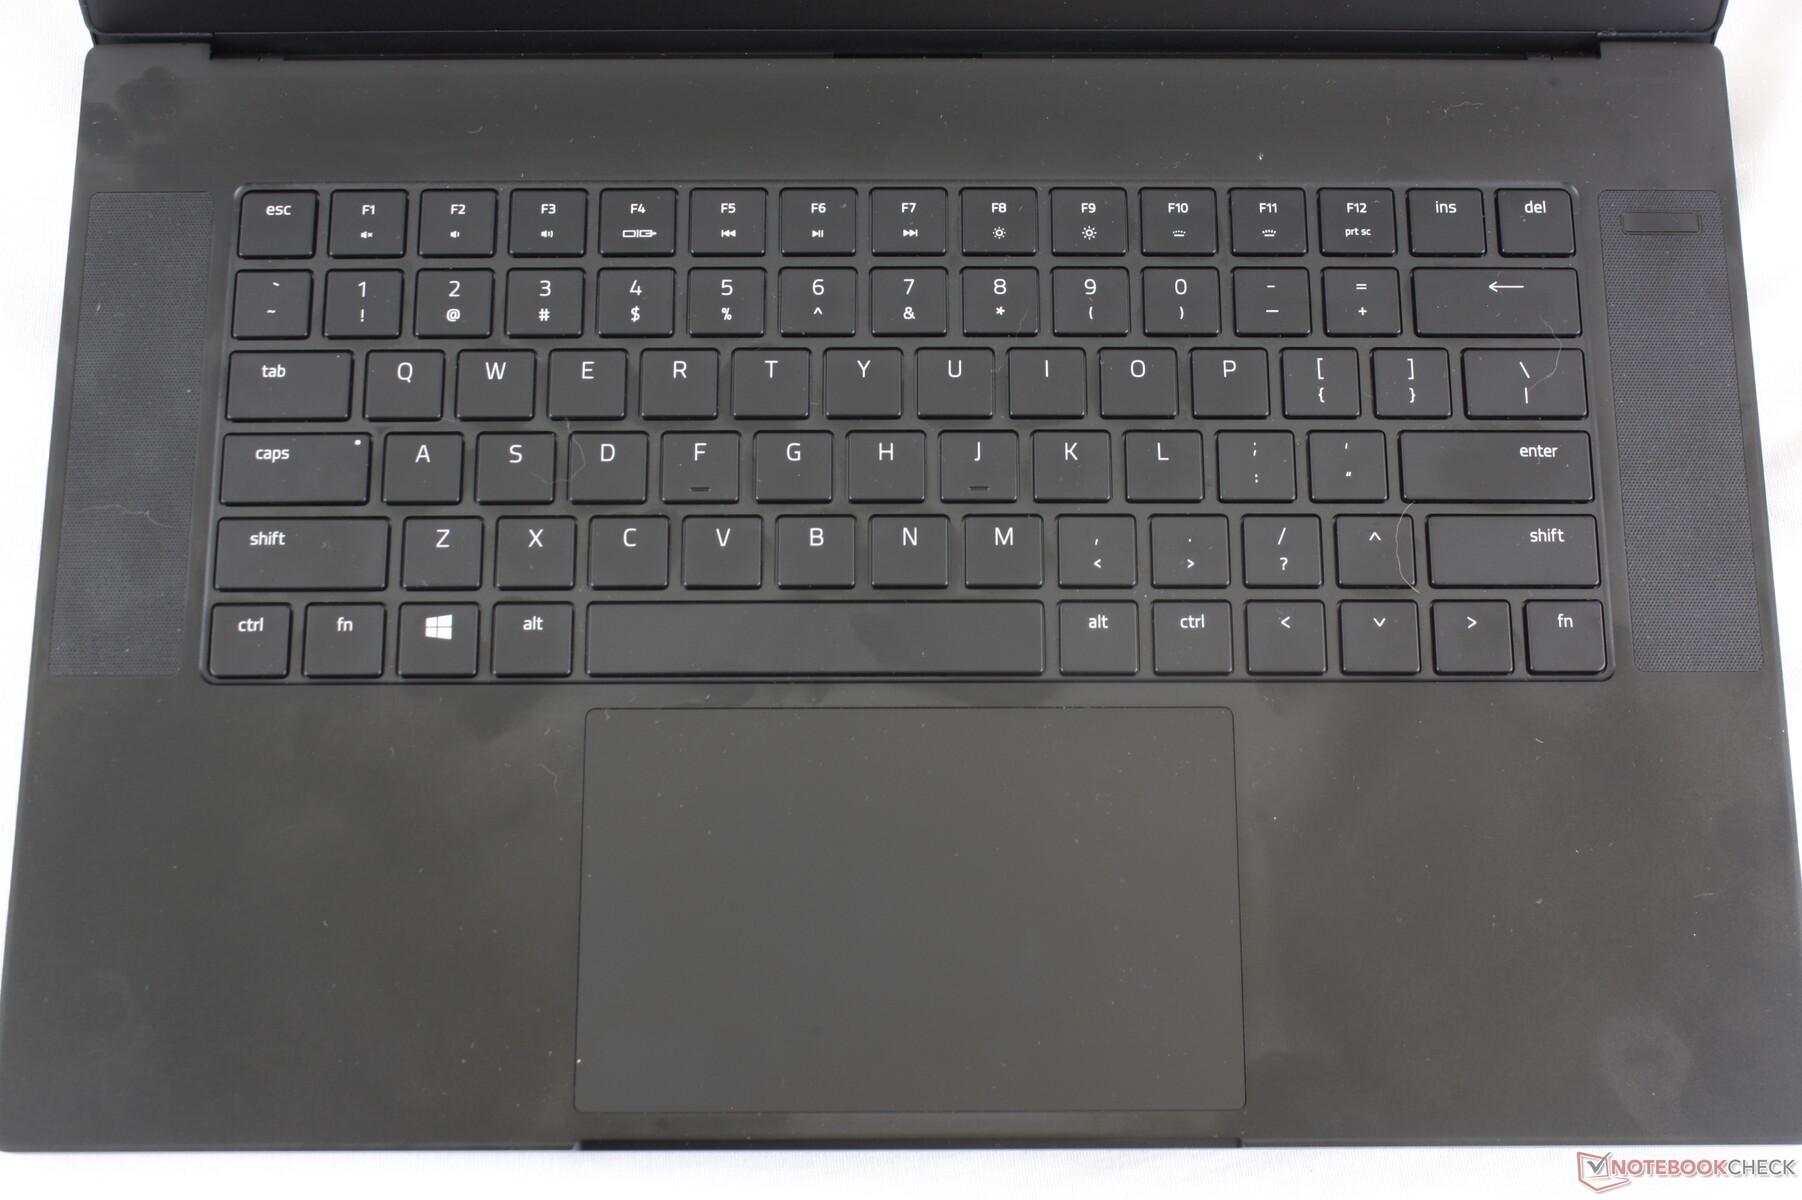
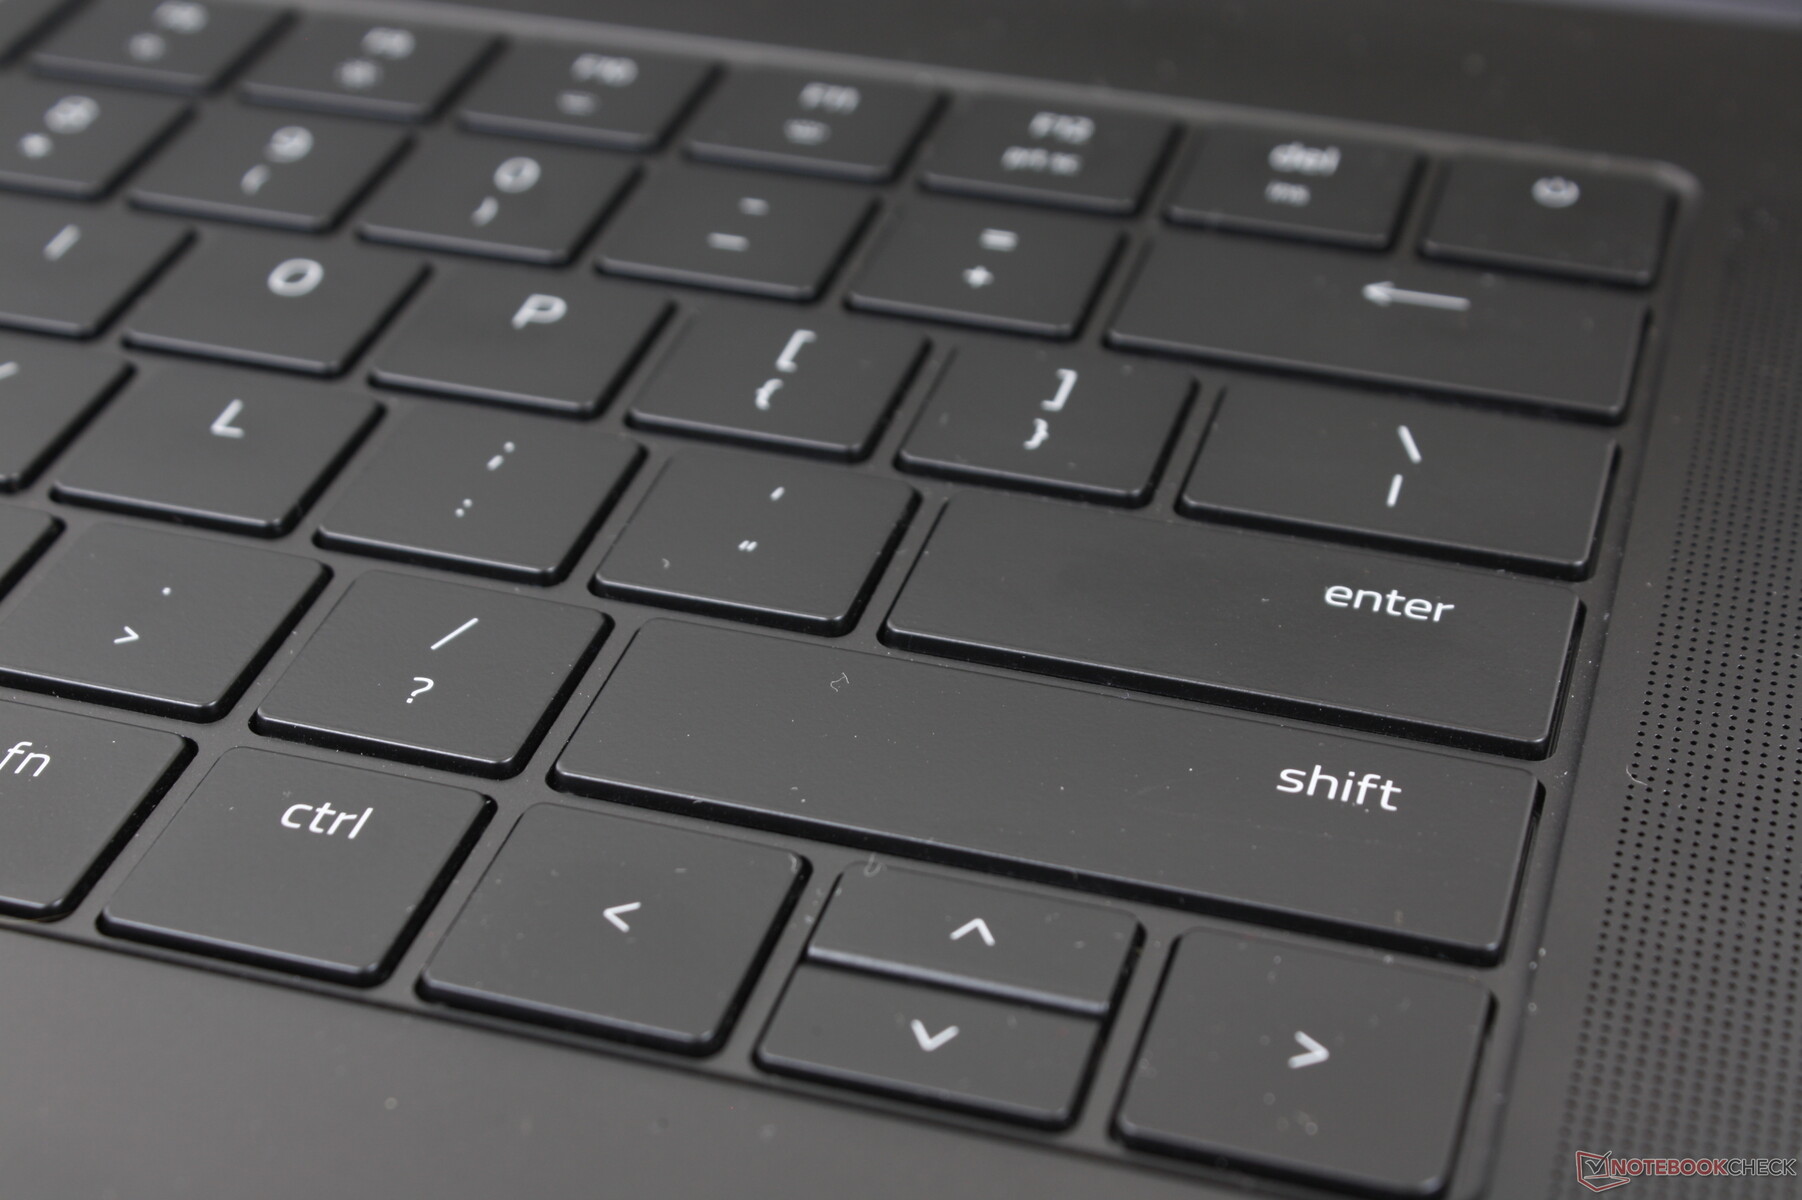
Le seul changement physique majeur cette année concerne les touches du clavier, qui sont désormais légèrement plus grandes qu'auparavant. Le bouton d'alimentation a également été déplacé, ce qui constitue un moyen facile de distinguer visuellement le modèle 2022 des modèles précédents.
Lecteur de carte SD
| SD Card Reader | |
| average JPG Copy Test (av. of 3 runs) | |
| Razer Blade 15 Advanced Model Early 2021 (AV PRO microSD 128 GB V60) | |
| Razer Blade 15 RTX 2080 Super Max-Q (Toshiba Exceria Pro SDXC 64 GB UHS-II) | |
| Razer Blade 15 2022 (Toshiba Exceria Pro SDXC 64 GB UHS-II) | |
| ADATA XPG Xenia 15 (AV Pro V60) | |
| Schenker XMG Neo 15 E22 (Early 2022, RTX 3080 Ti) | |
| Eurocom Nightsky ARX315 (AV Pro V60) | |
| maximum AS SSD Seq Read Test (1GB) | |
| Razer Blade 15 RTX 2080 Super Max-Q (Toshiba Exceria Pro SDXC 64 GB UHS-II) | |
| Razer Blade 15 Advanced Model Early 2021 (AV PRO microSD 128 GB V60) | |
| Razer Blade 15 2022 (Toshiba Exceria Pro SDXC 64 GB UHS-II) | |
| ADATA XPG Xenia 15 (AV Pro V60) | |
| Eurocom Nightsky ARX315 (AV Pro V60) | |
| Schenker XMG Neo 15 E22 (Early 2022, RTX 3080 Ti) | |
Communication
Le module WLAN a été mis à niveau vers le Killer AX1690i qui est essentiellement la version gaming de l'actuel Intel Wi-Fi 6E AX210.
Webcam


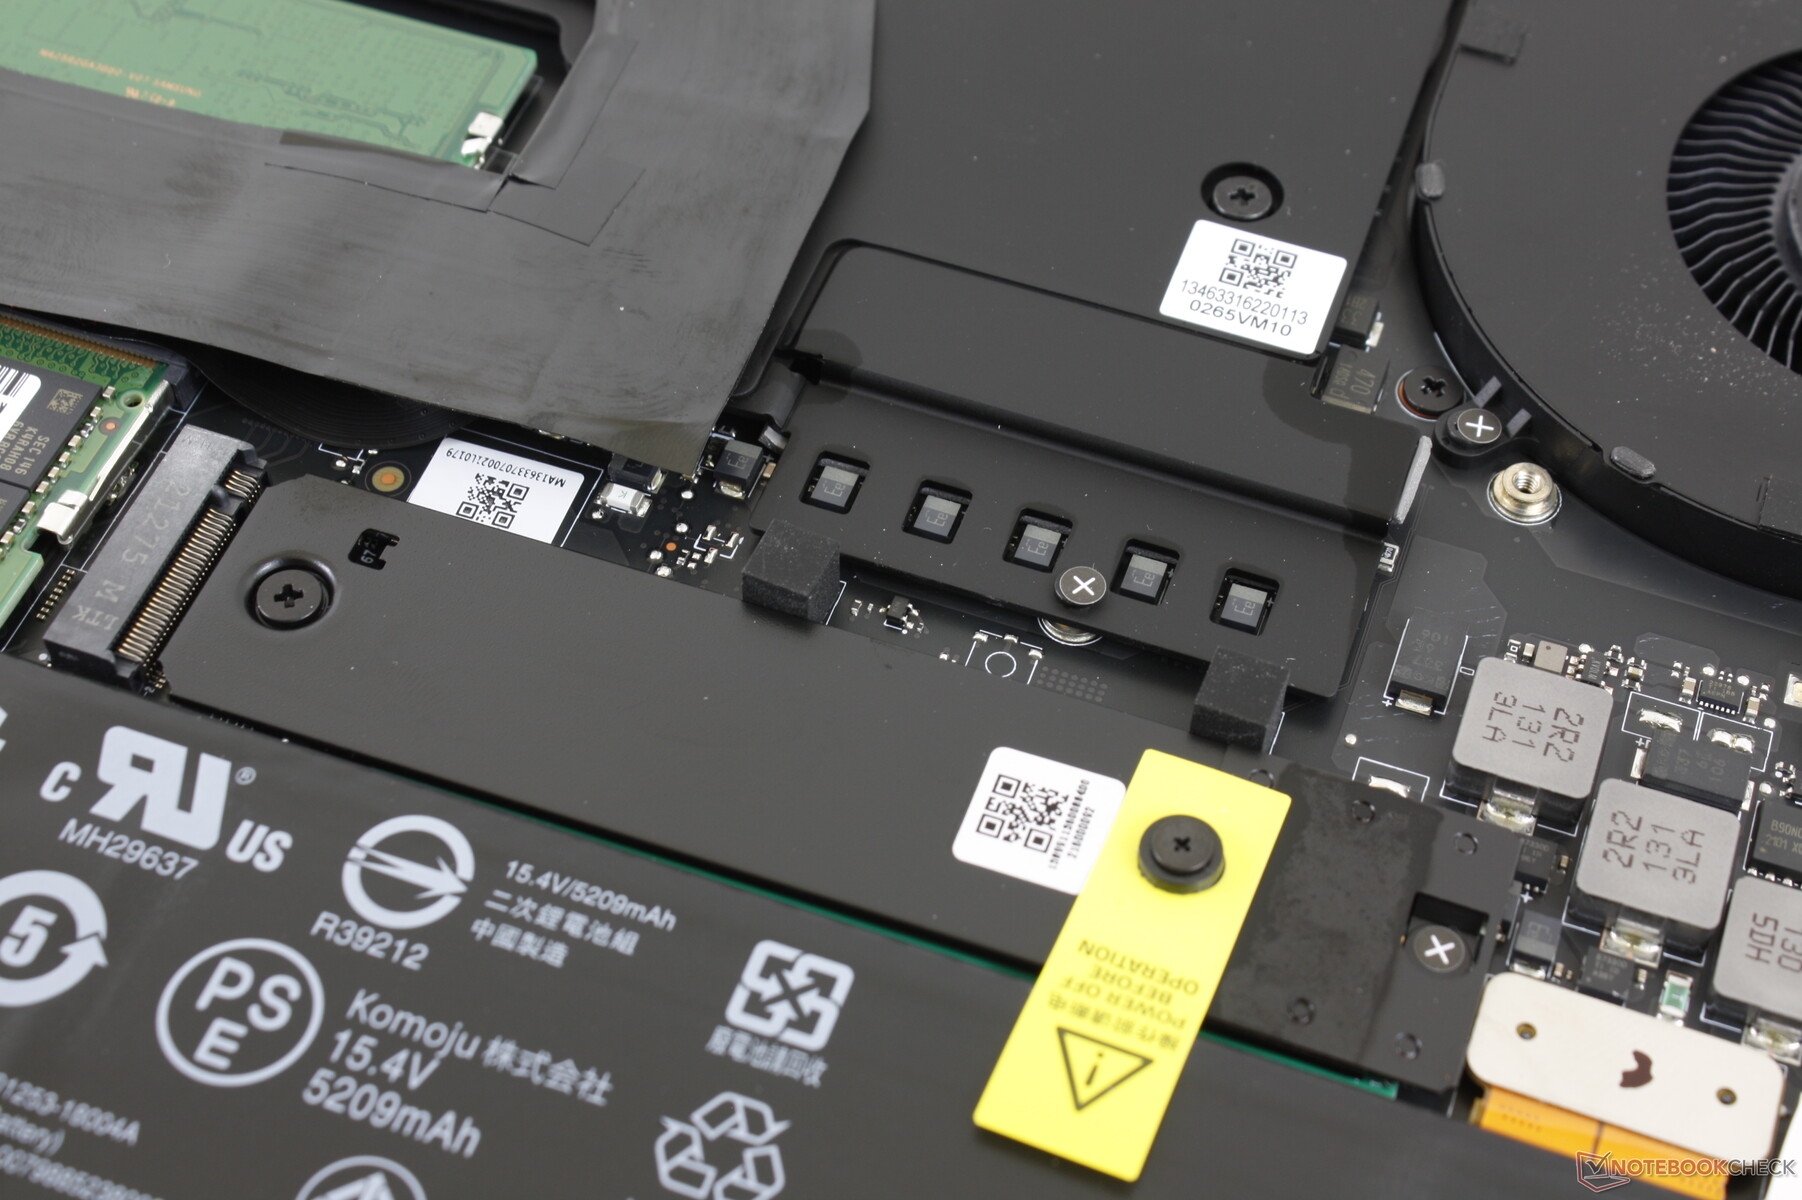
Maintenance
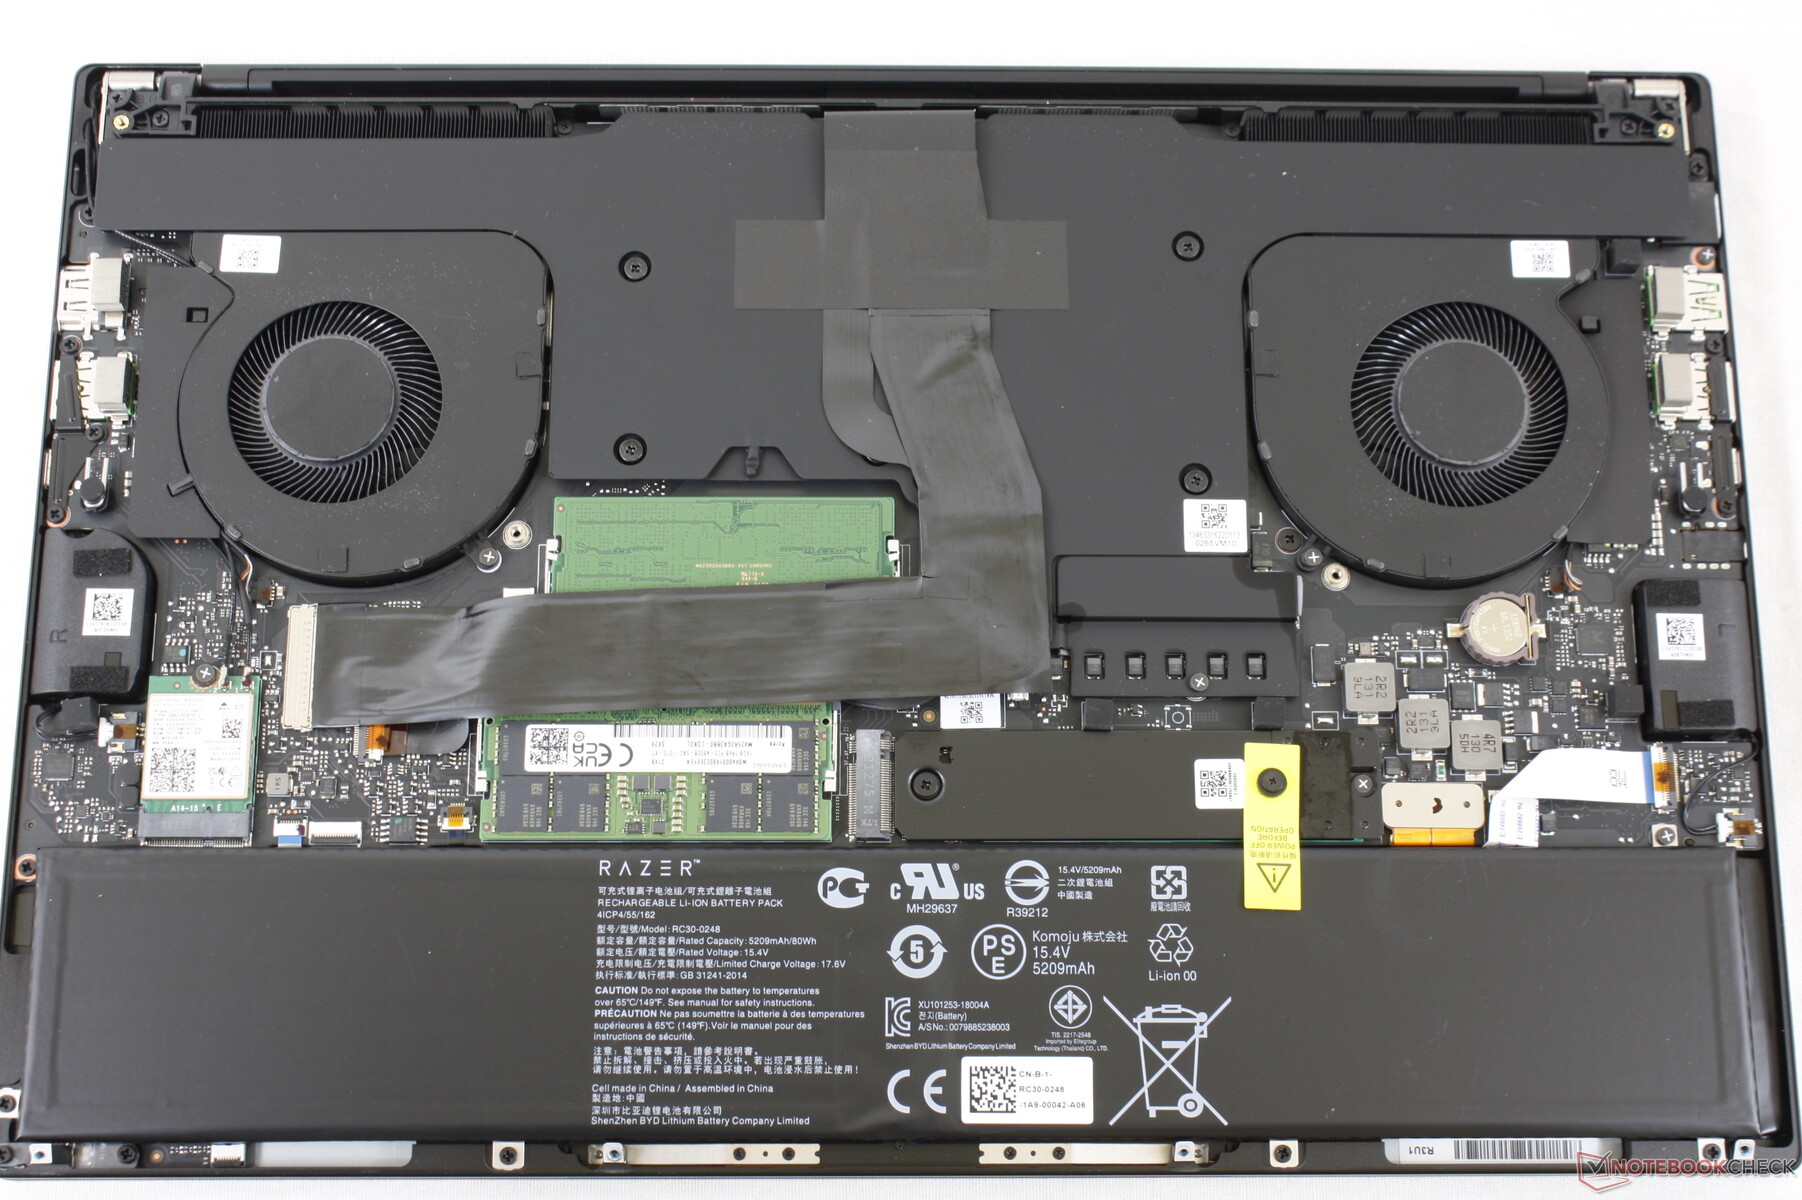
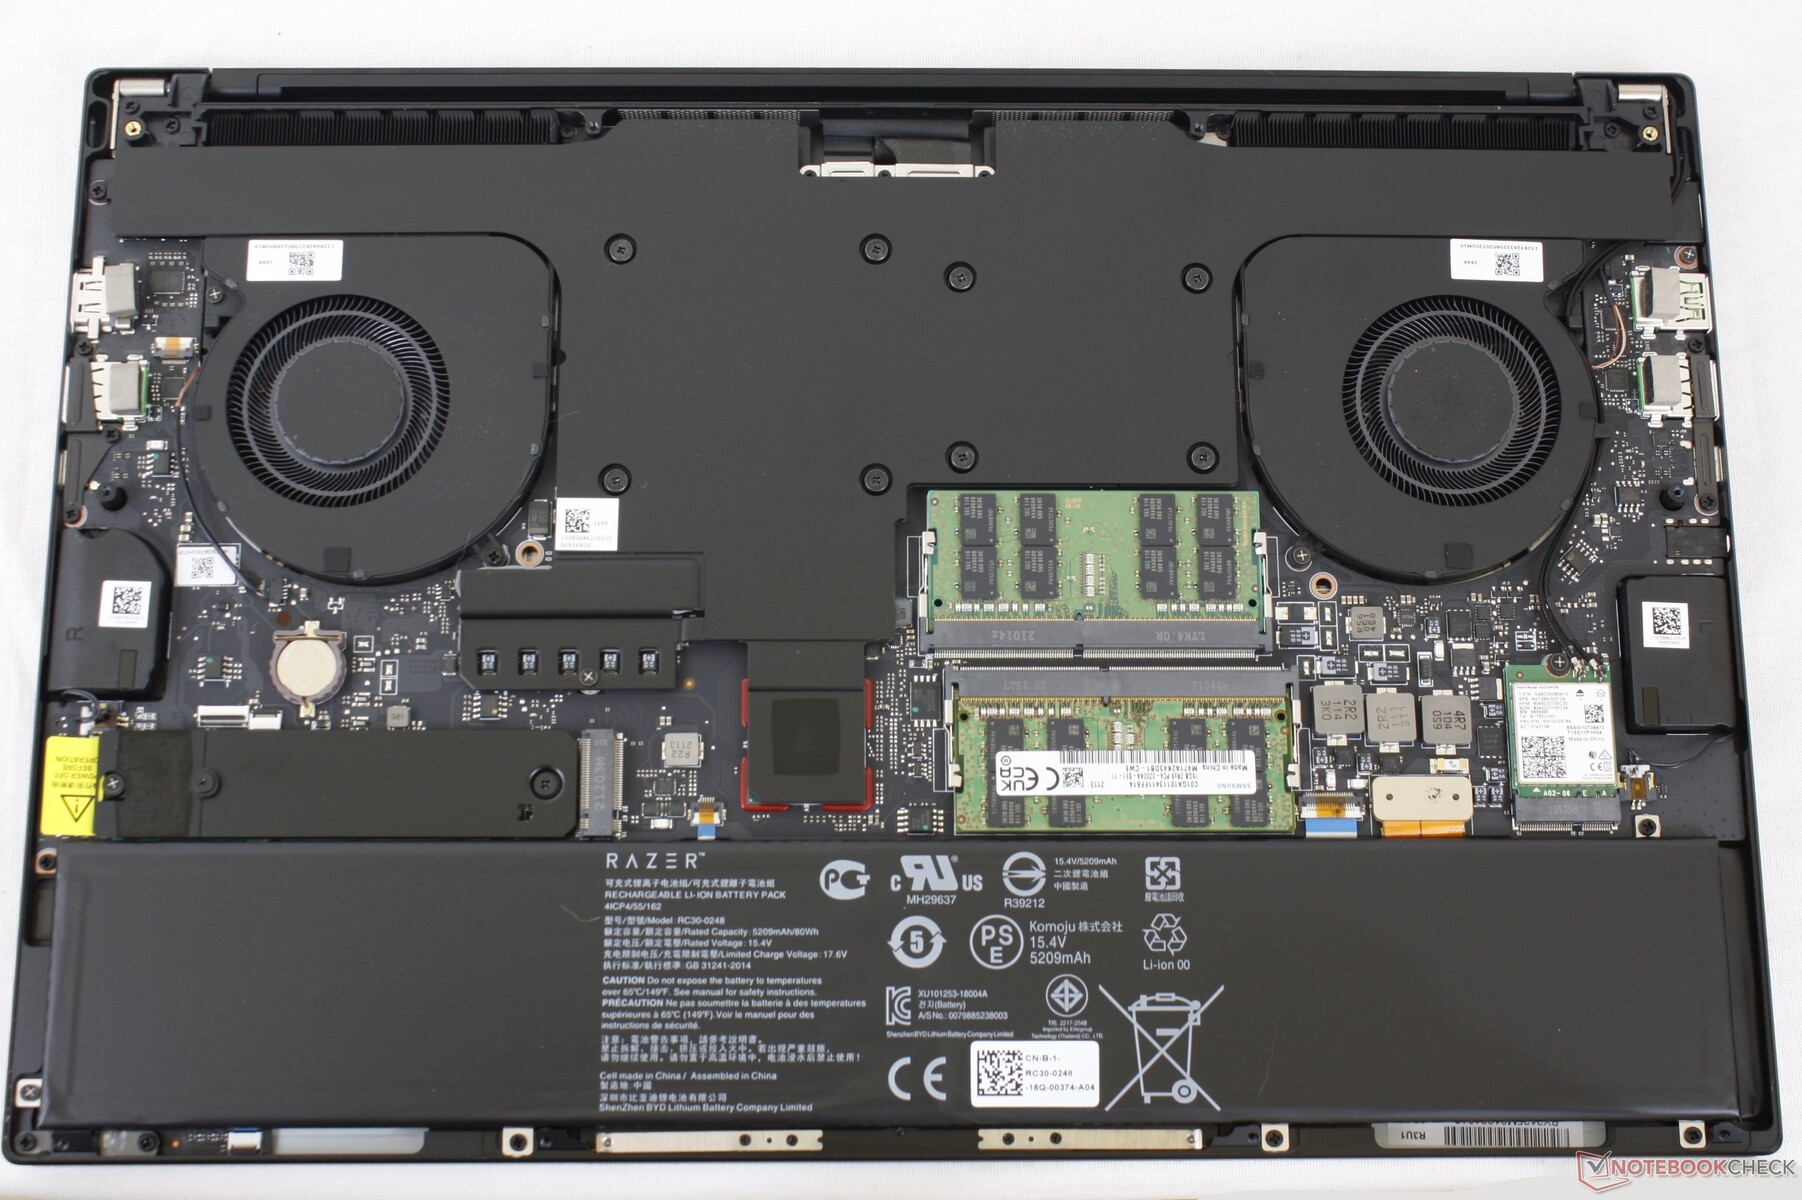
Il y a des changements mineurs aux internes et aux ventilateurs par rapport au modèle de l'année dernière, comme indiqué ci-dessous. Les 2 slots PCIe4 M.2 2280, les 2 slots SODIMM et le module WLAN amovible sont conservés.
Accessoires et garantie
Il n'y a pas d'extras dans la boîte, à part l'adaptateur secteur et les papiers.
Une garantie de base d'un an et une garantie de deux ans sur la batterie sont incluses pour tout nouvel achat d'un modèle Blade de 12e génération. Notez, cependant, que la garantie de deux ans sur la batterie ne s'applique pas actuellement aux anciens modèles Blade.
Périphériques d'entrée
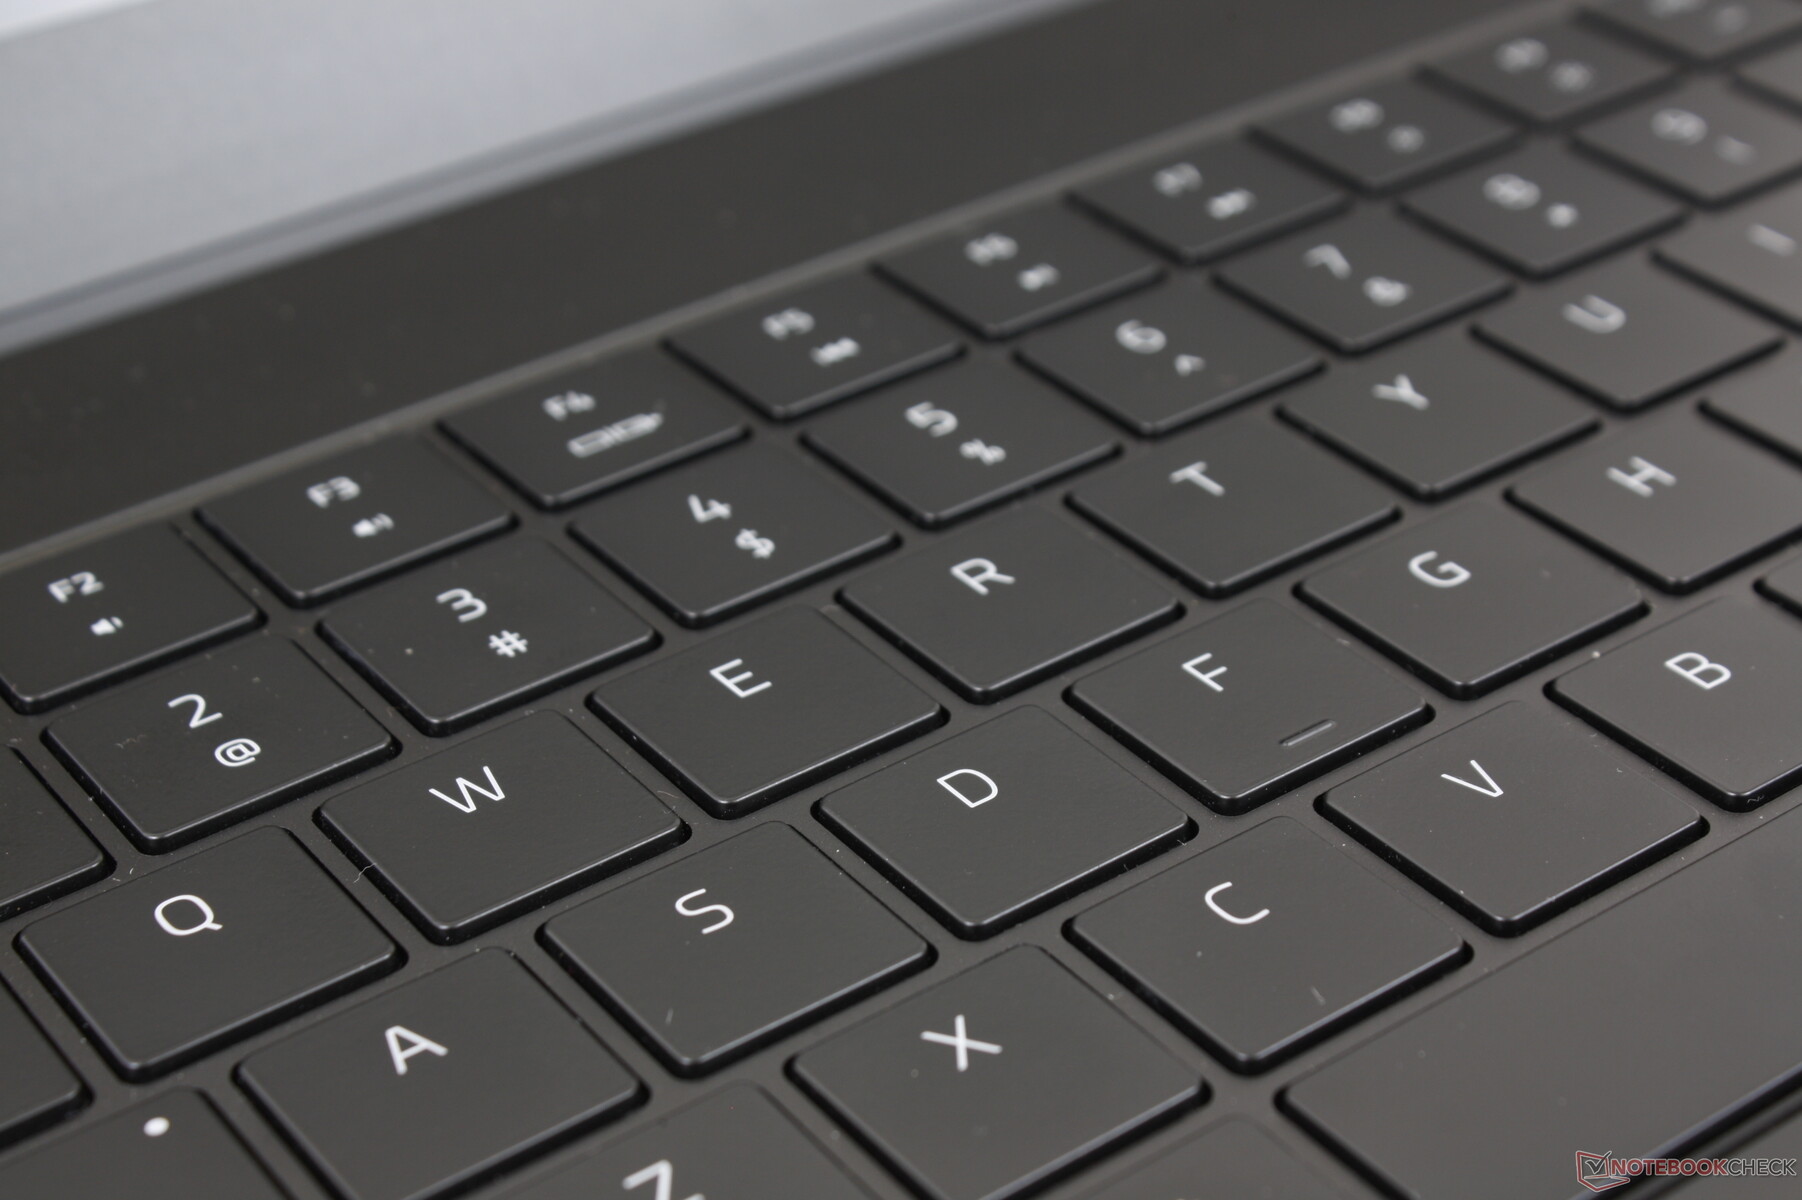
Bien que le grand pavé tactile reste le même, Razer a amélioré le clavier du 2022 Blade 15 avec des capsules de touches légèrement plus grandes que sur les modèles de la génération précédente afin de réduire les erreurs de frappe. En conséquence, l'espace entre chaque touche a été réduit. Le déplacement et le retour d'information sont autrement identiques d'une année sur l'autre.
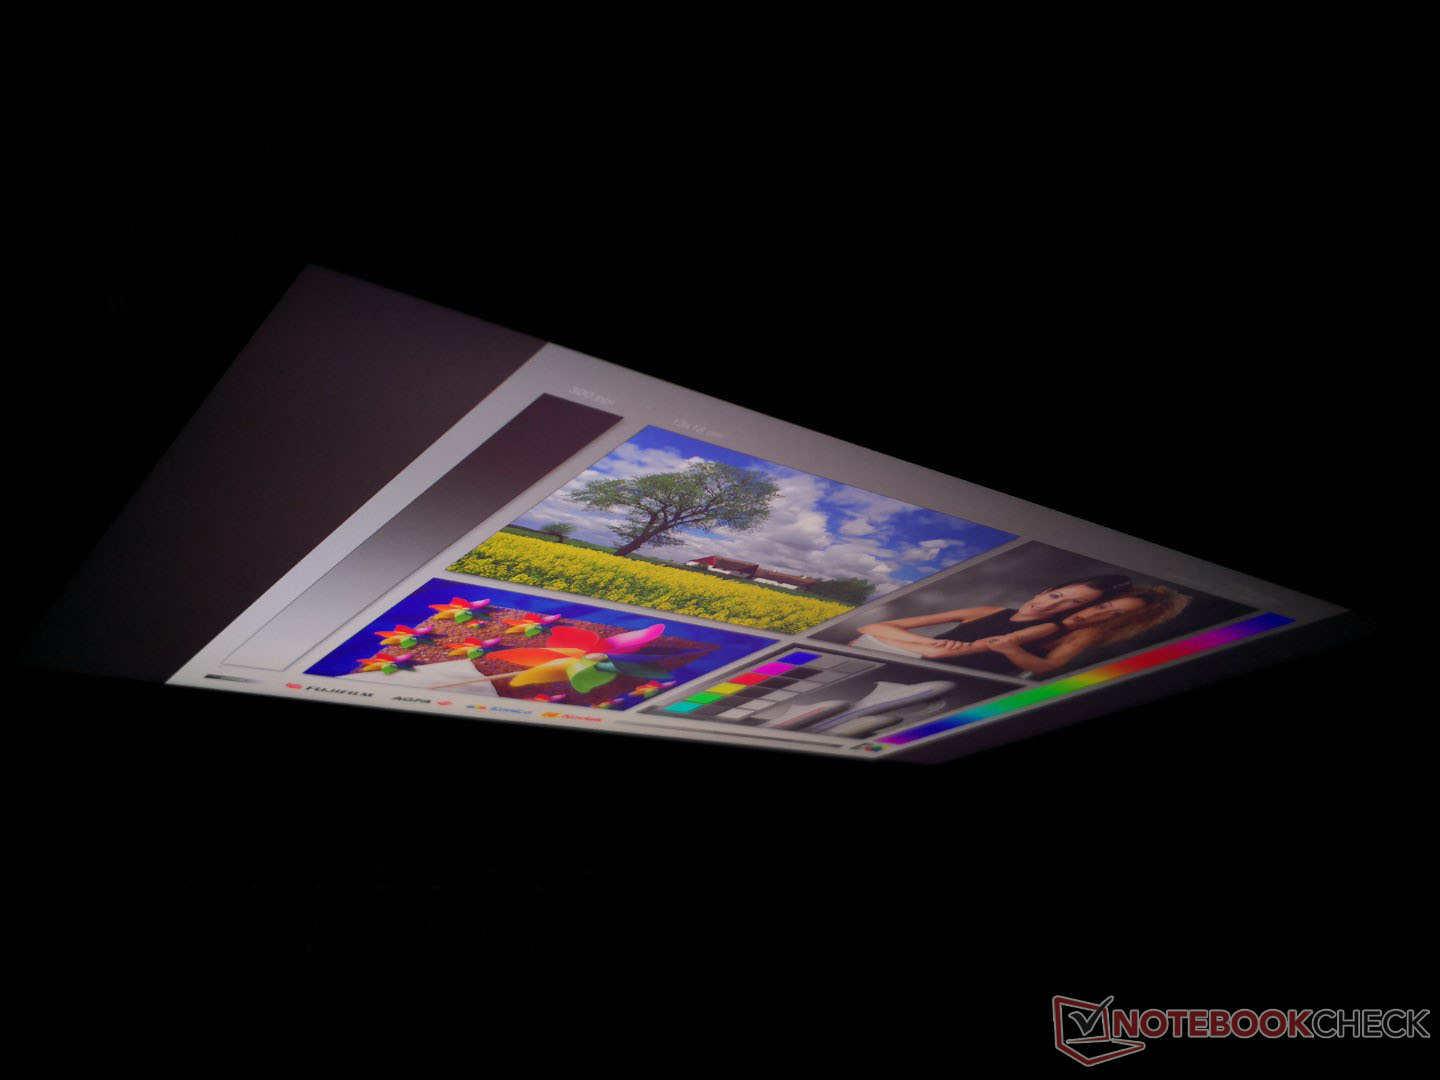
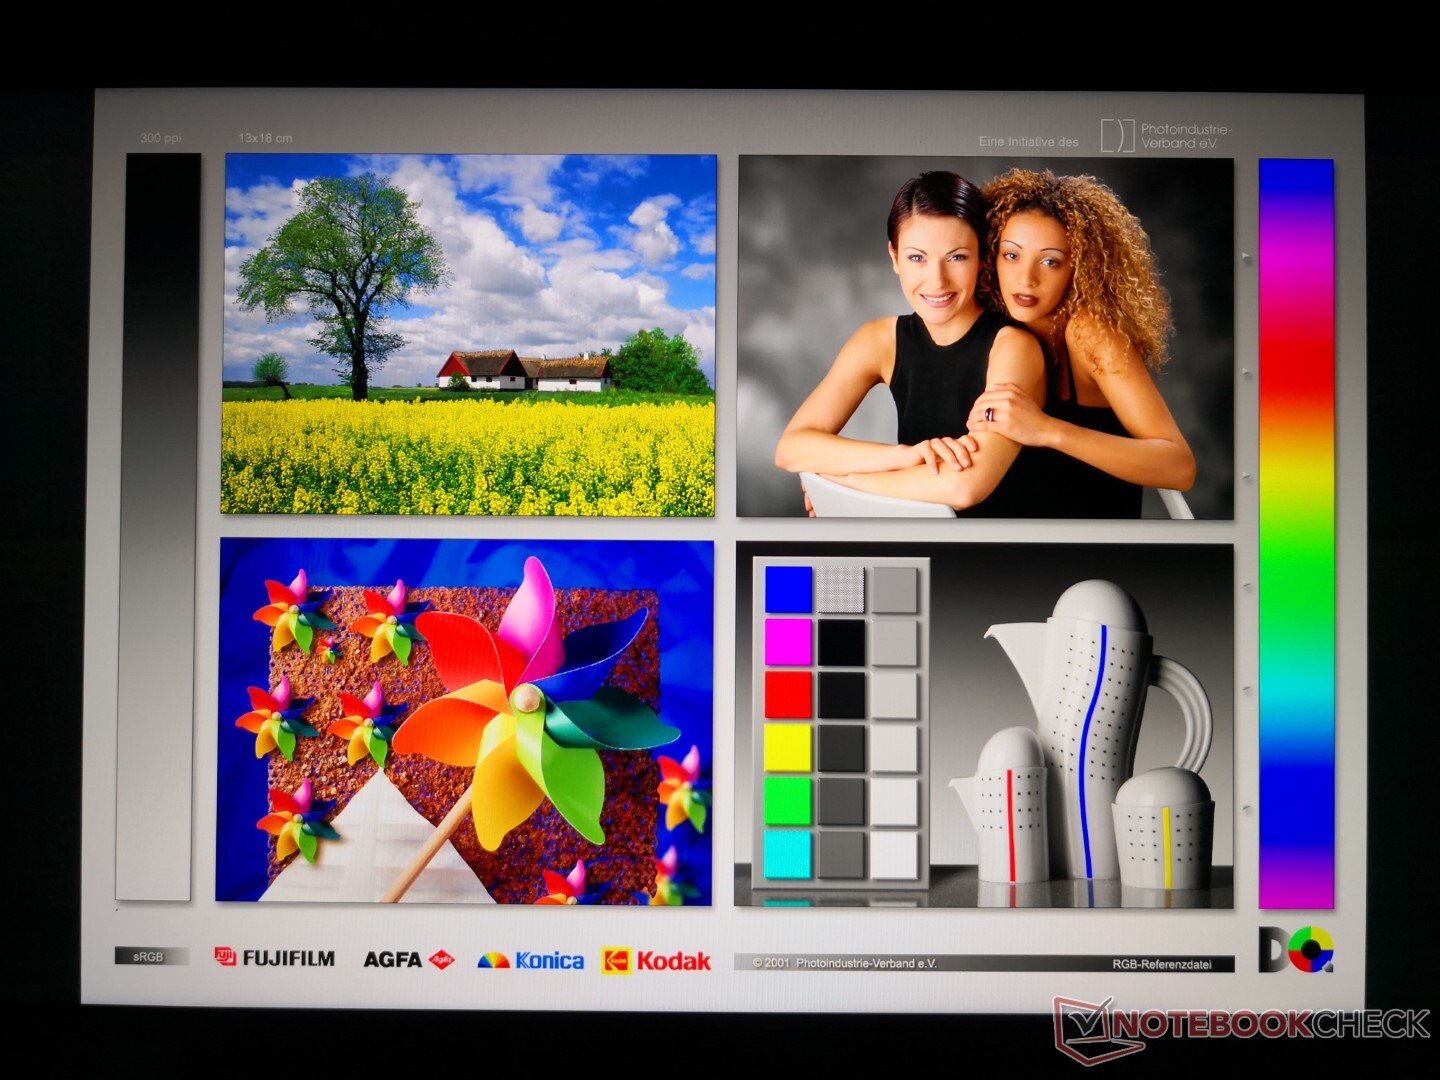
Afficher
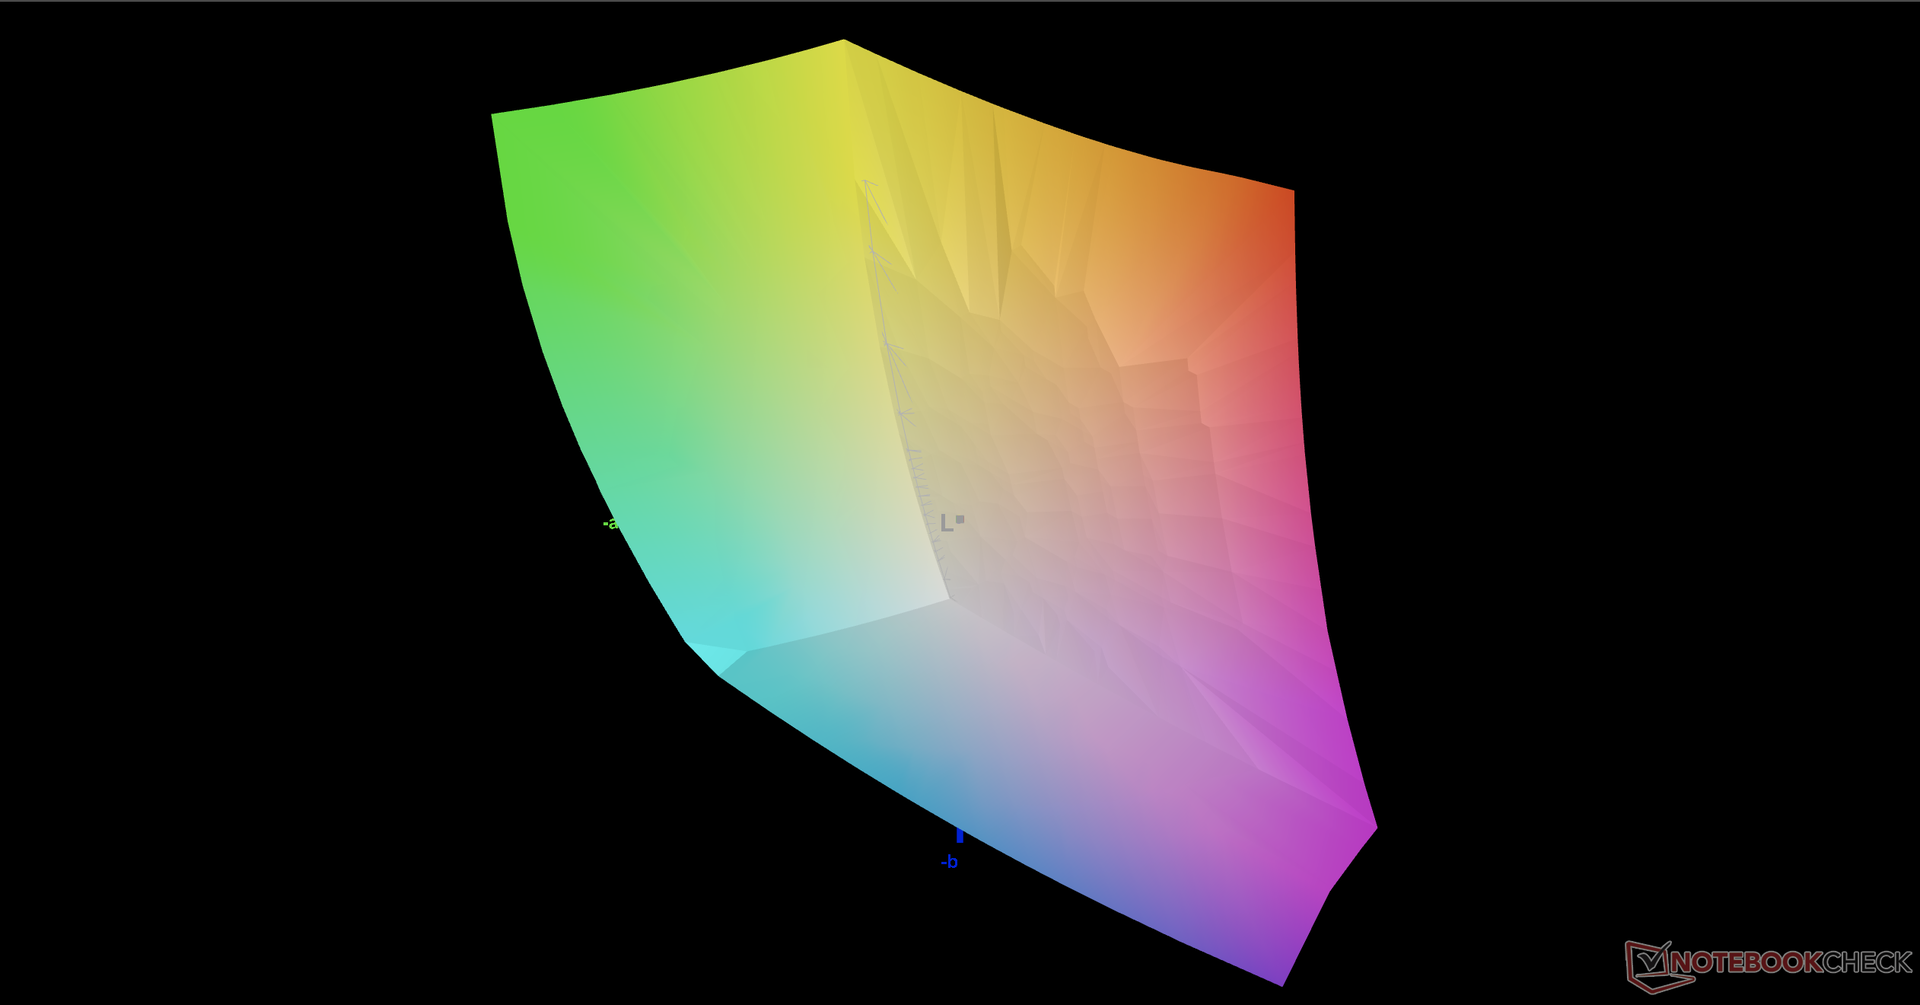
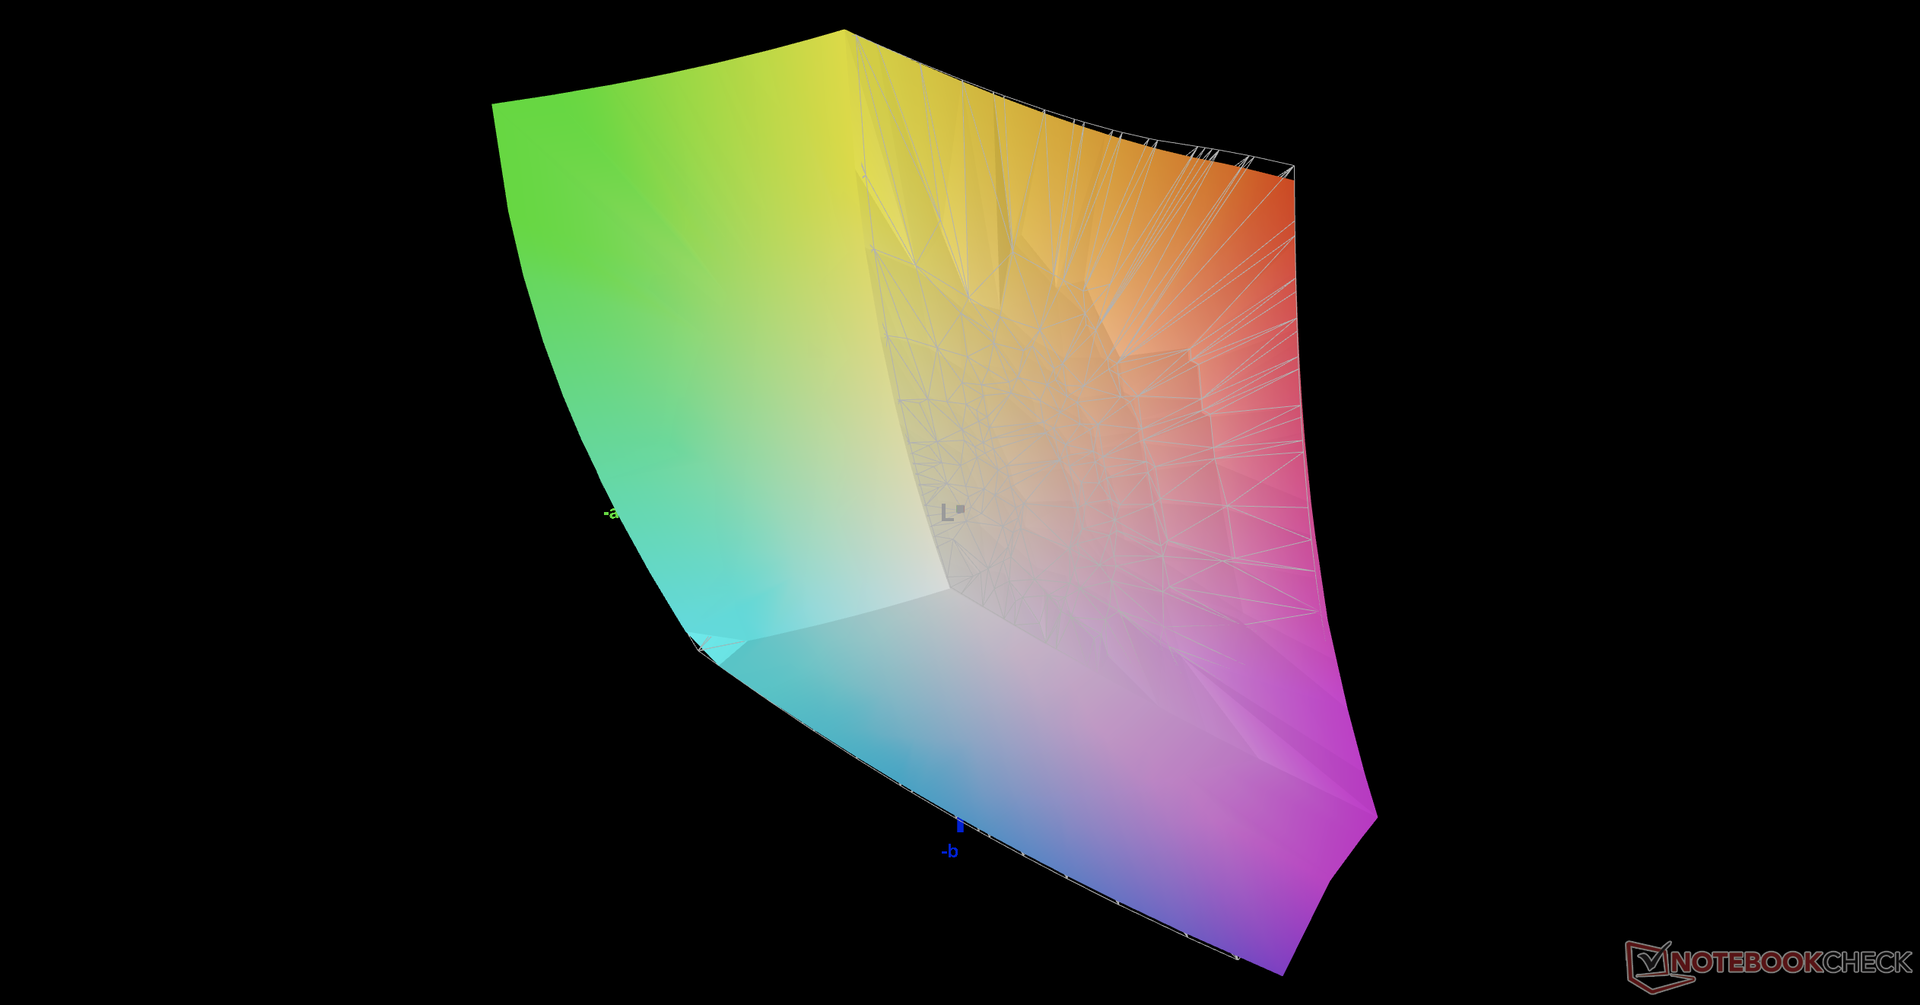
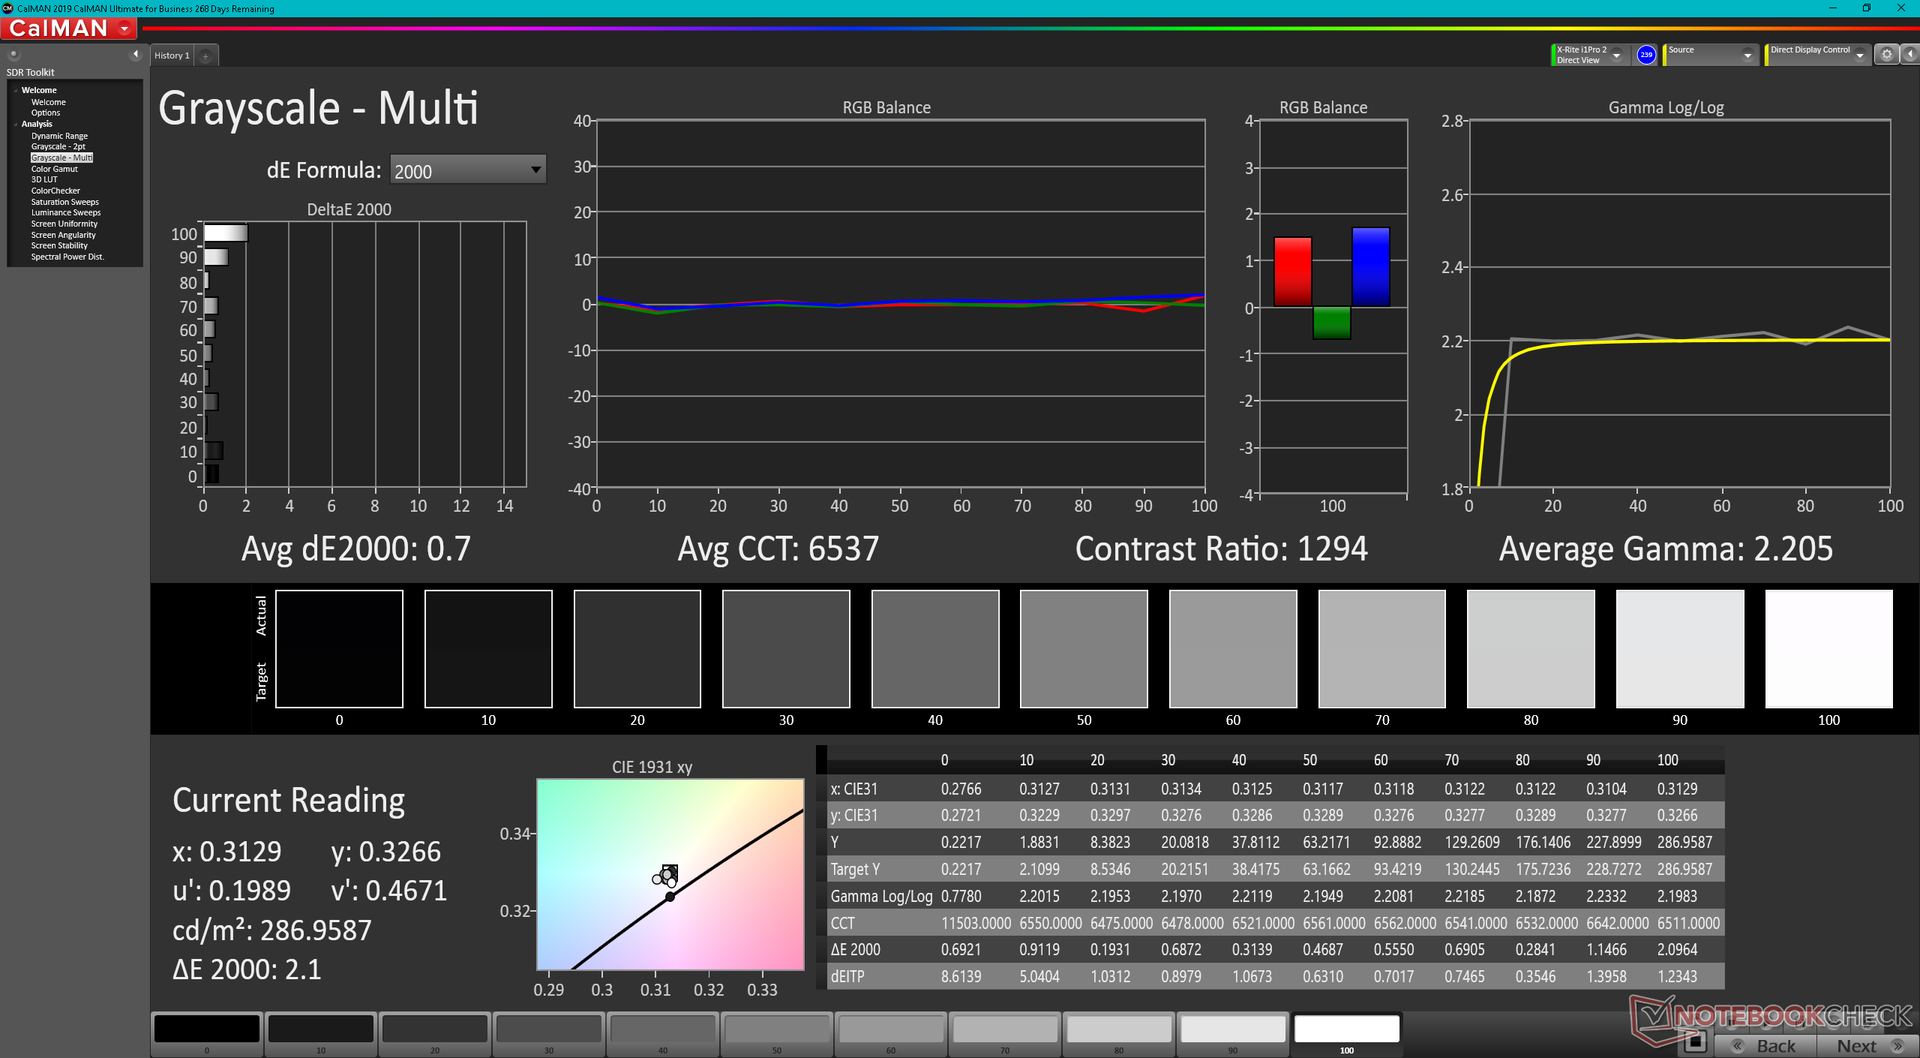
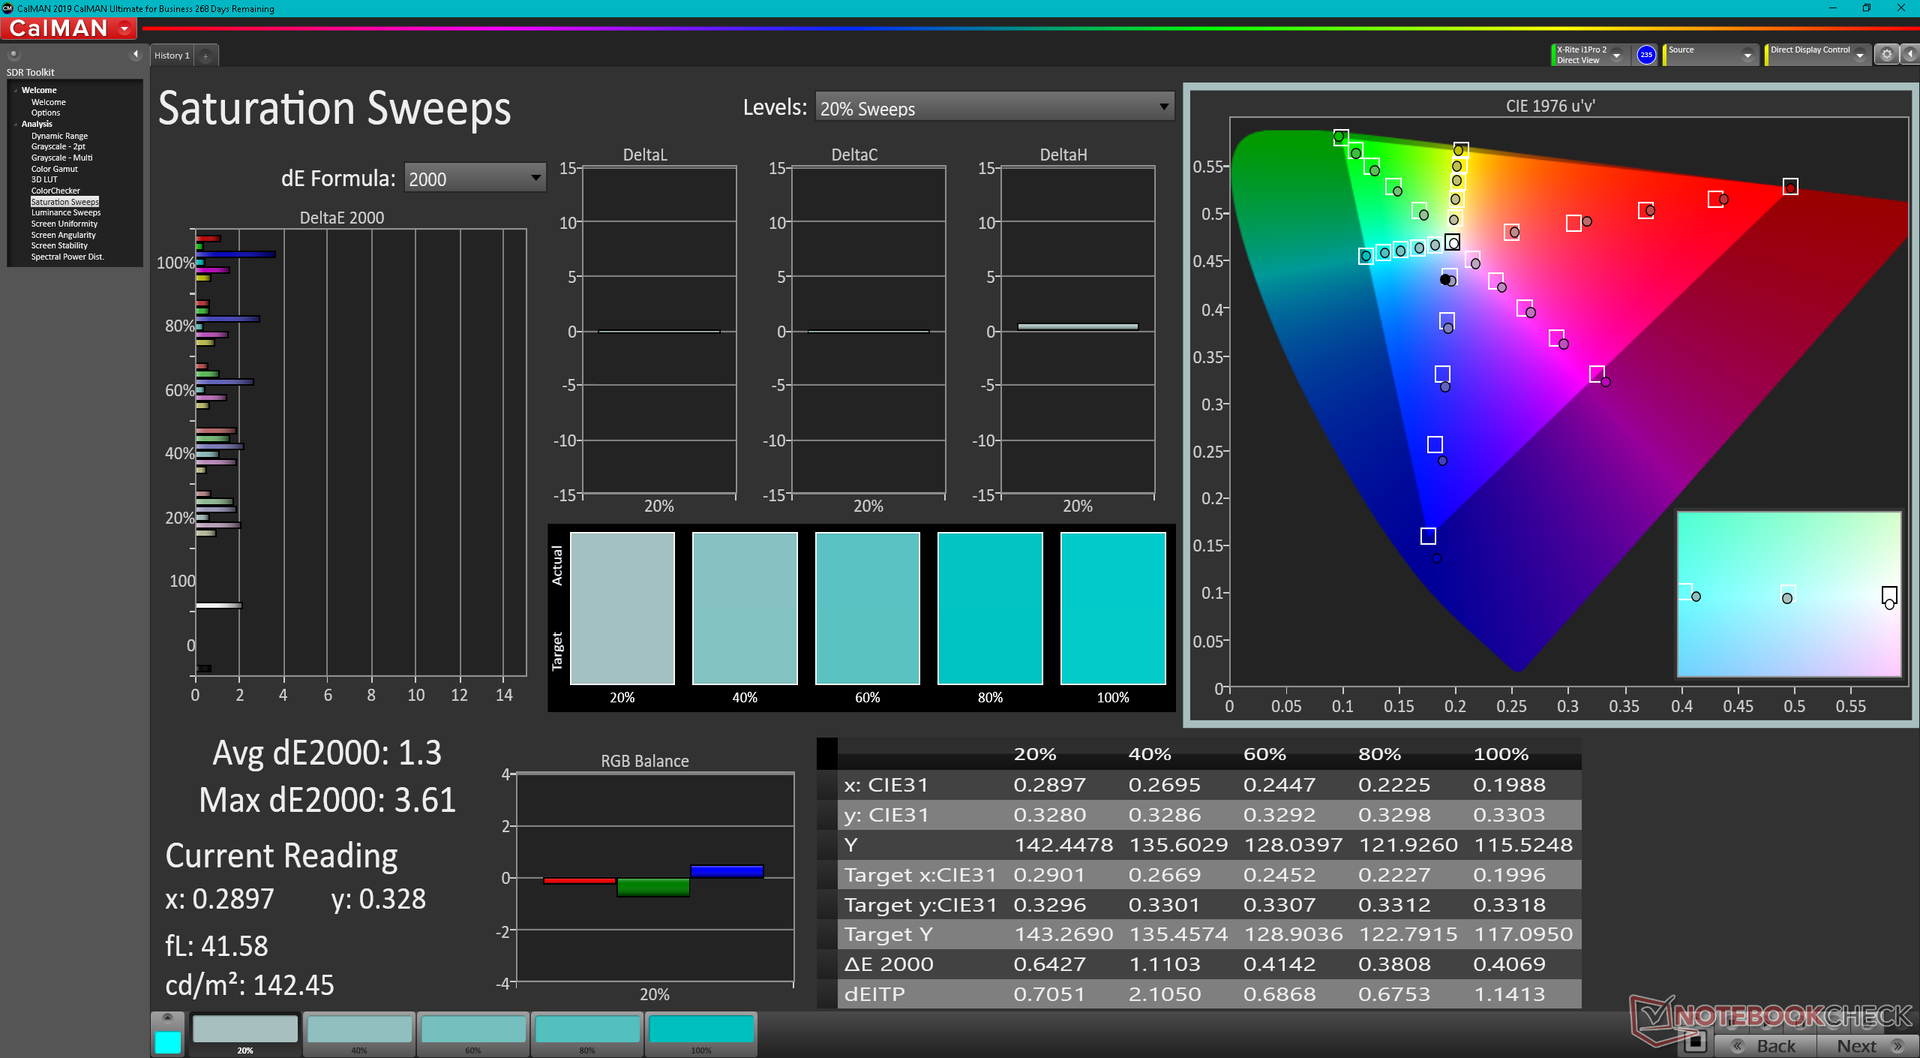
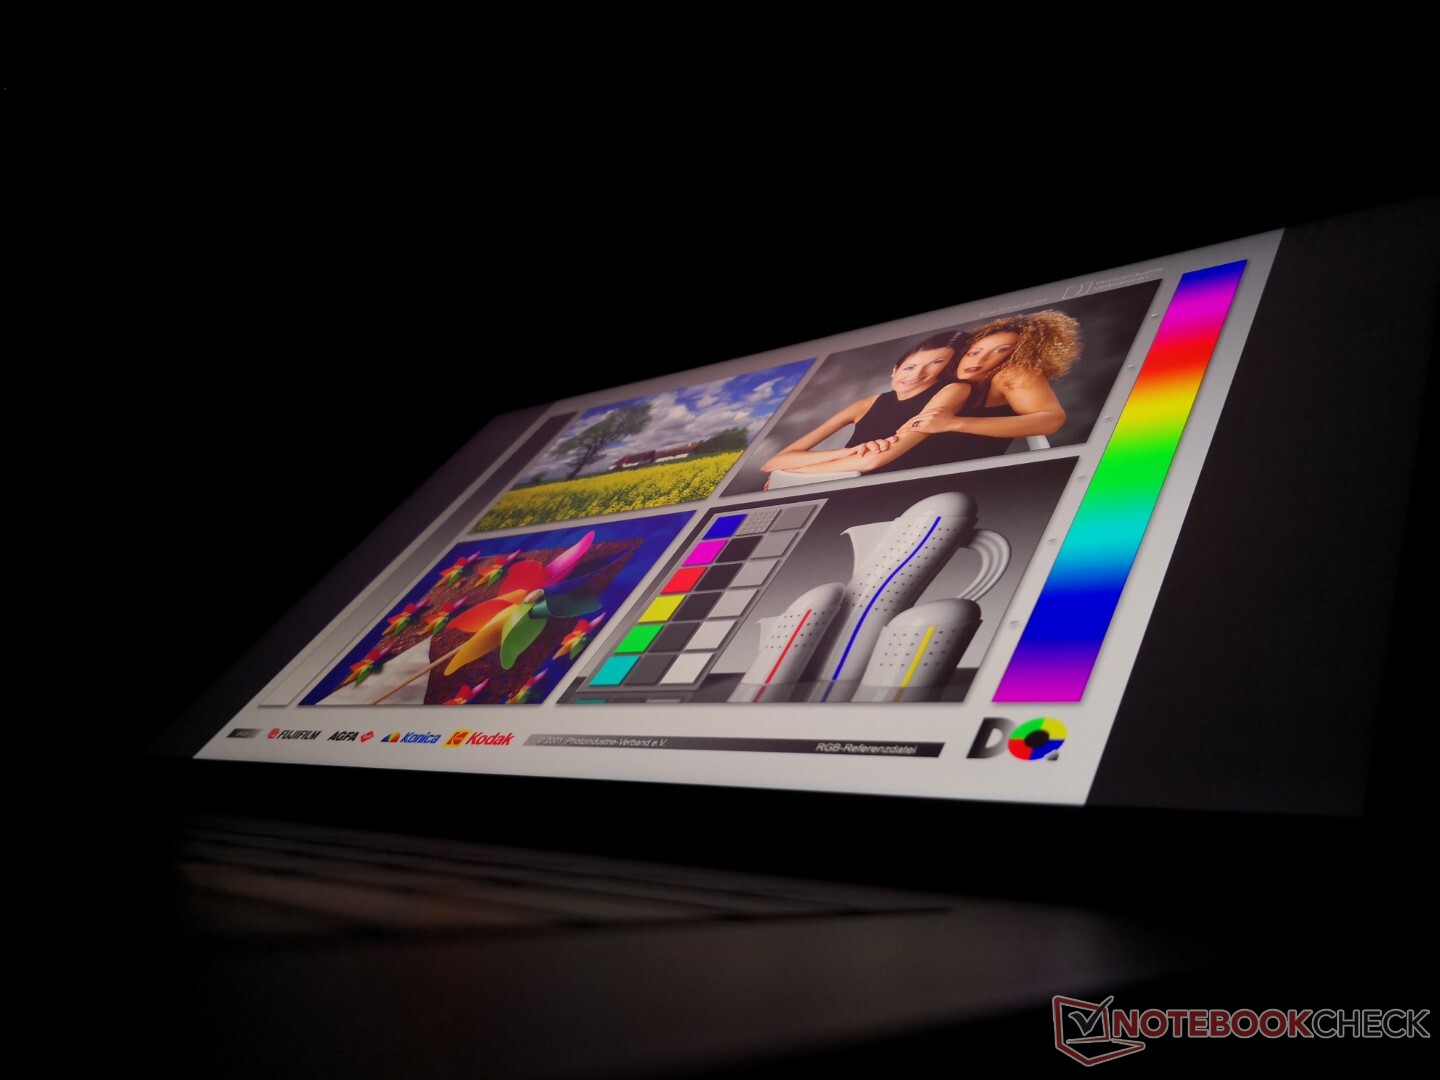
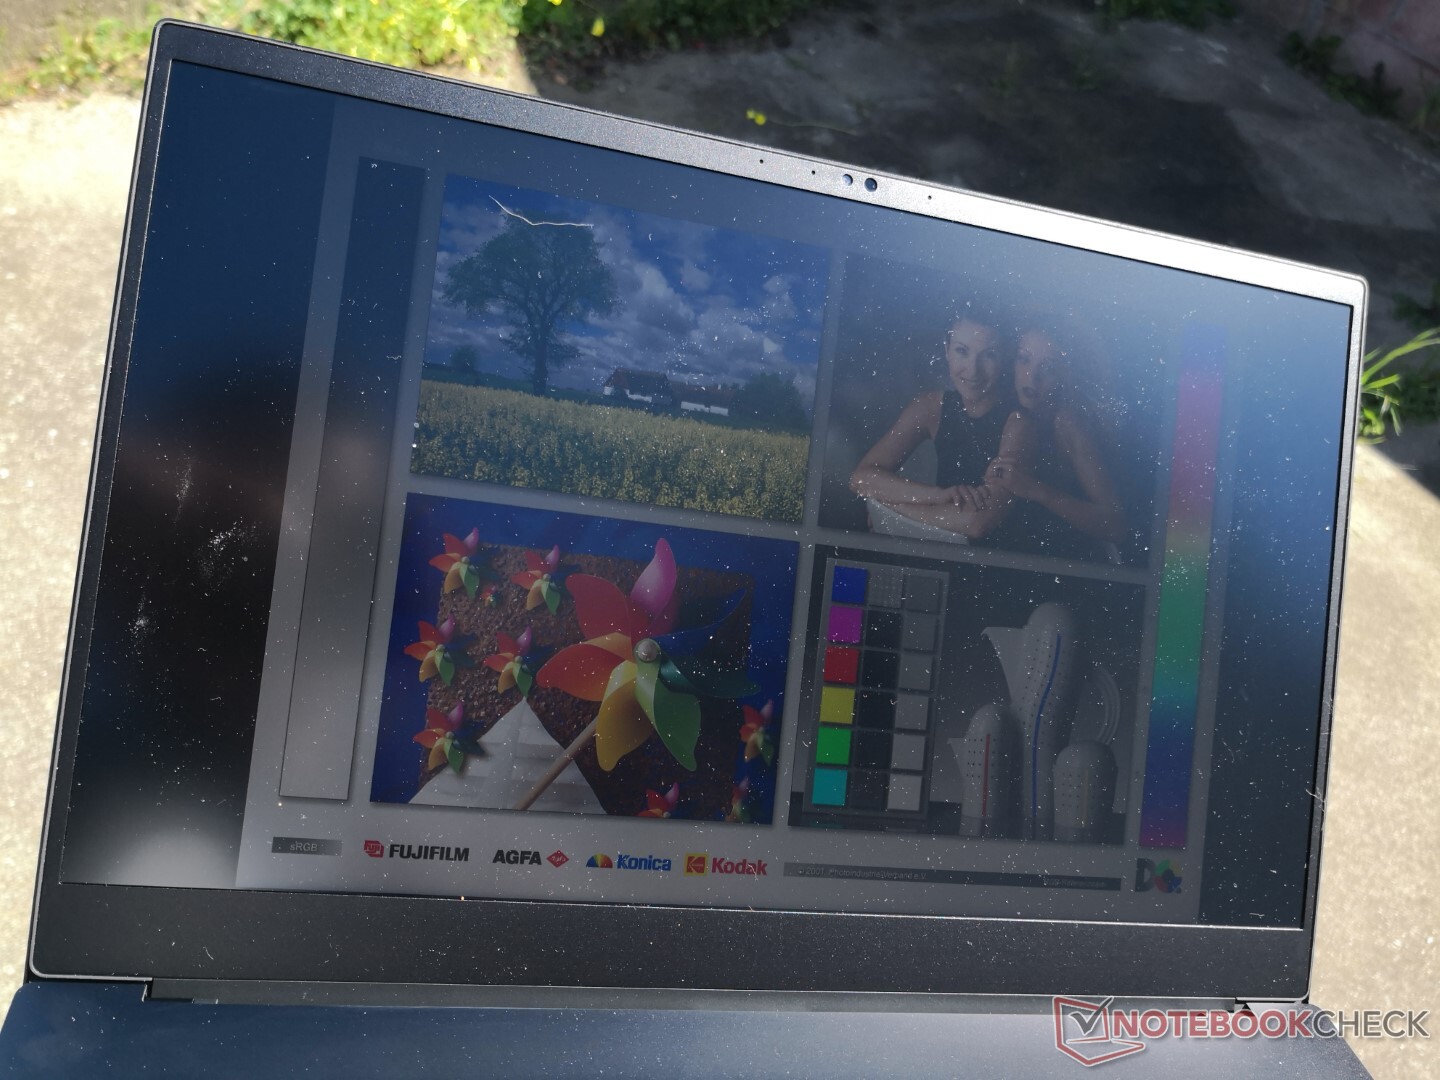
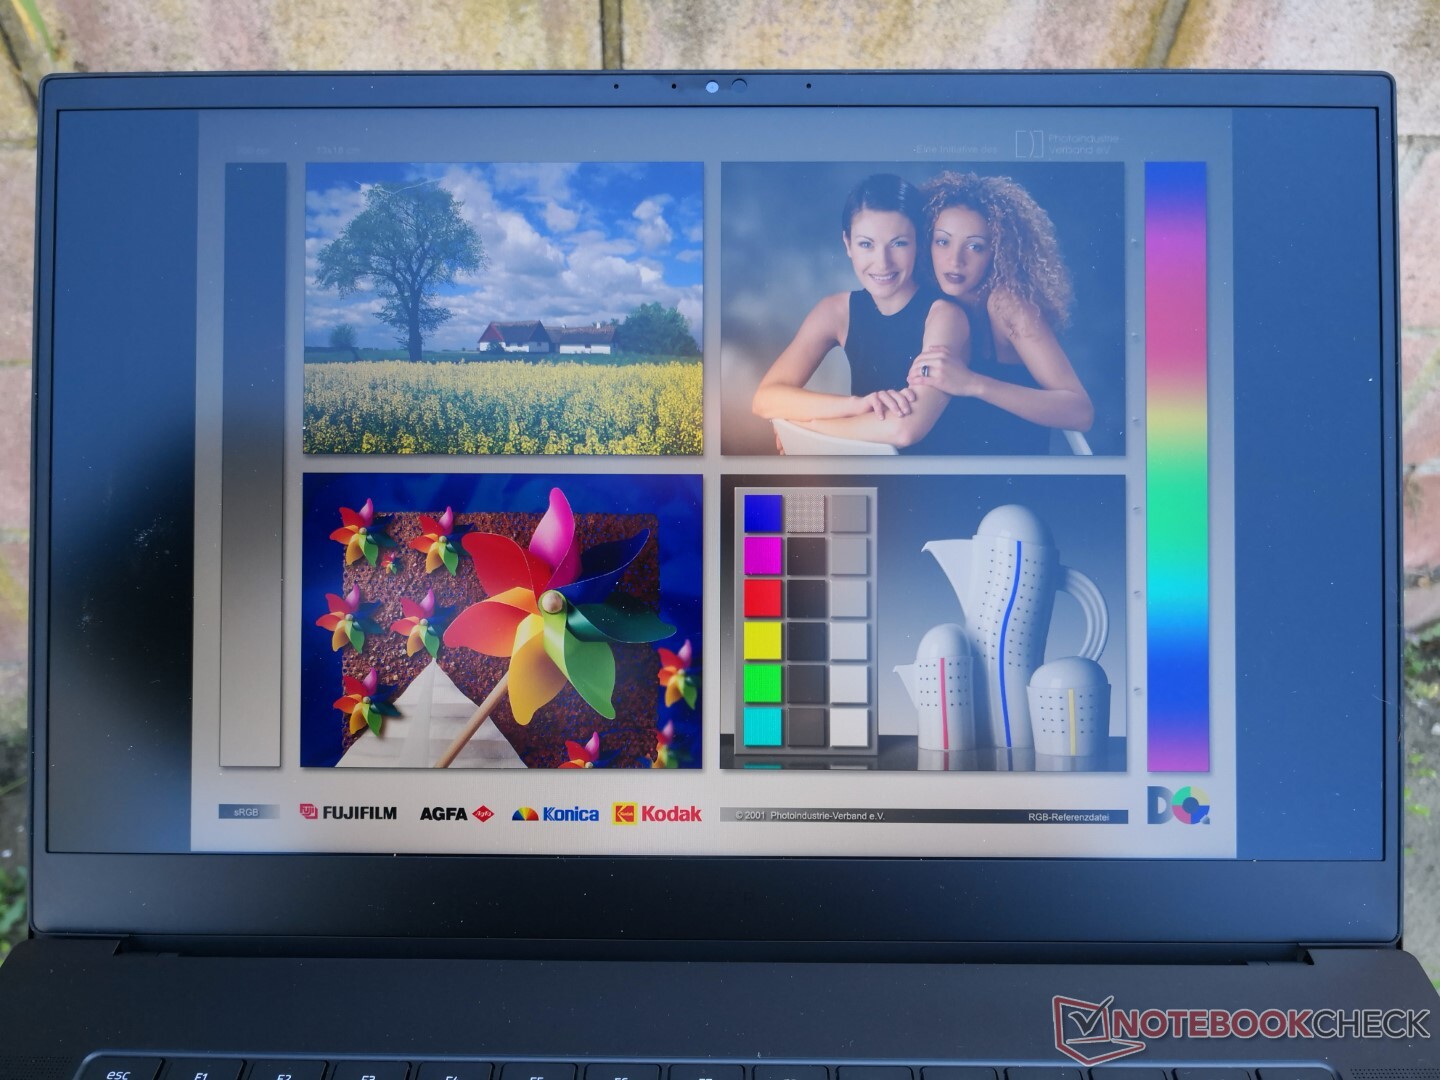
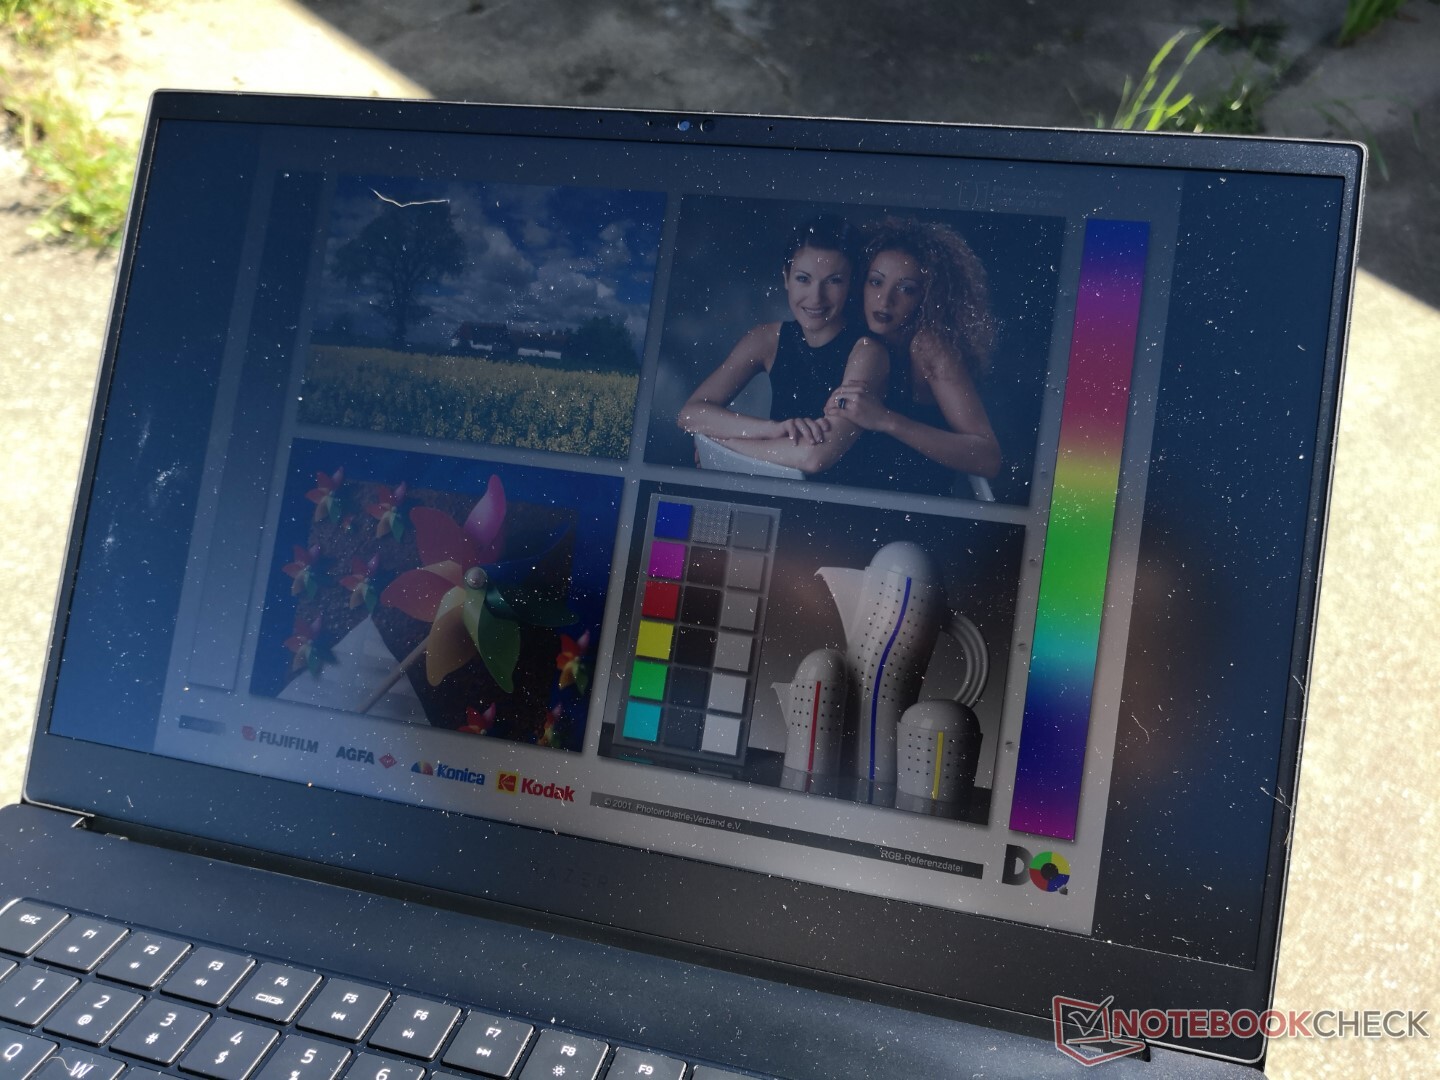
Le Blade 15 est l'un des rares ordinateurs portables de 15,6 pouces à être équipé d'une dalle 1440p à 240 Hz qui couvre l'intégralité de la norme DCI-P3. La dalle 1440p à 165 Hz du Xenia 15par exemple, couvre la totalité de la norme sRGB mais seulement 68 % de la norme P3. Les temps de réponse noir-blanc et gris-gris sont également très bons, ce qui signifie que ce panneau peut être utilisé à la fois pour les jeux et l'édition numérique. Les années précédentes, les propriétaires de Blade 15 auraient dû se contenter d'options 4K UHD pour bénéficier de la couverture complète de DCI-P3.

| |||||||||||||||||||||||||
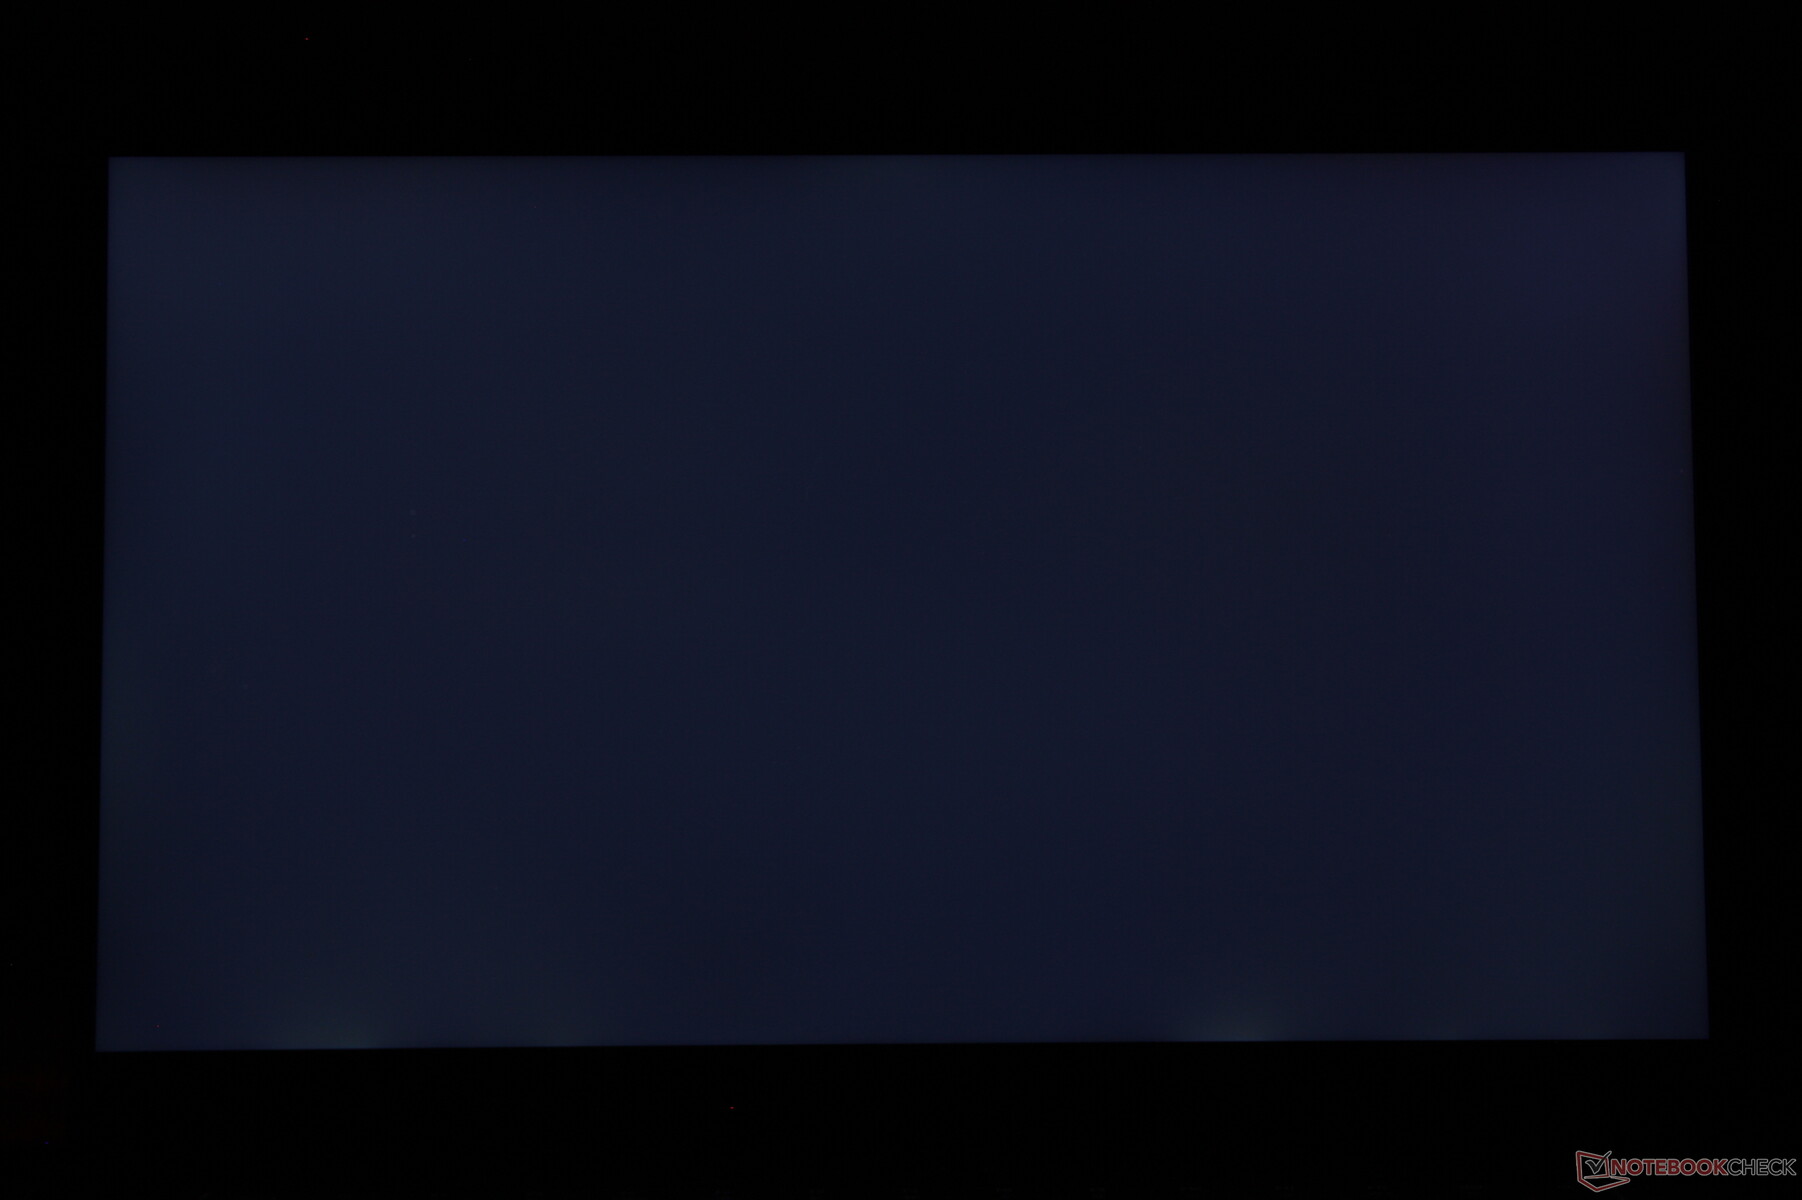
Homogénéité de la luminosité: 89 %
Valeur mesurée au centre, sur batterie: 286 cd/m²
Contraste: 1144:1 (Valeurs des noirs: 0.25 cd/m²)
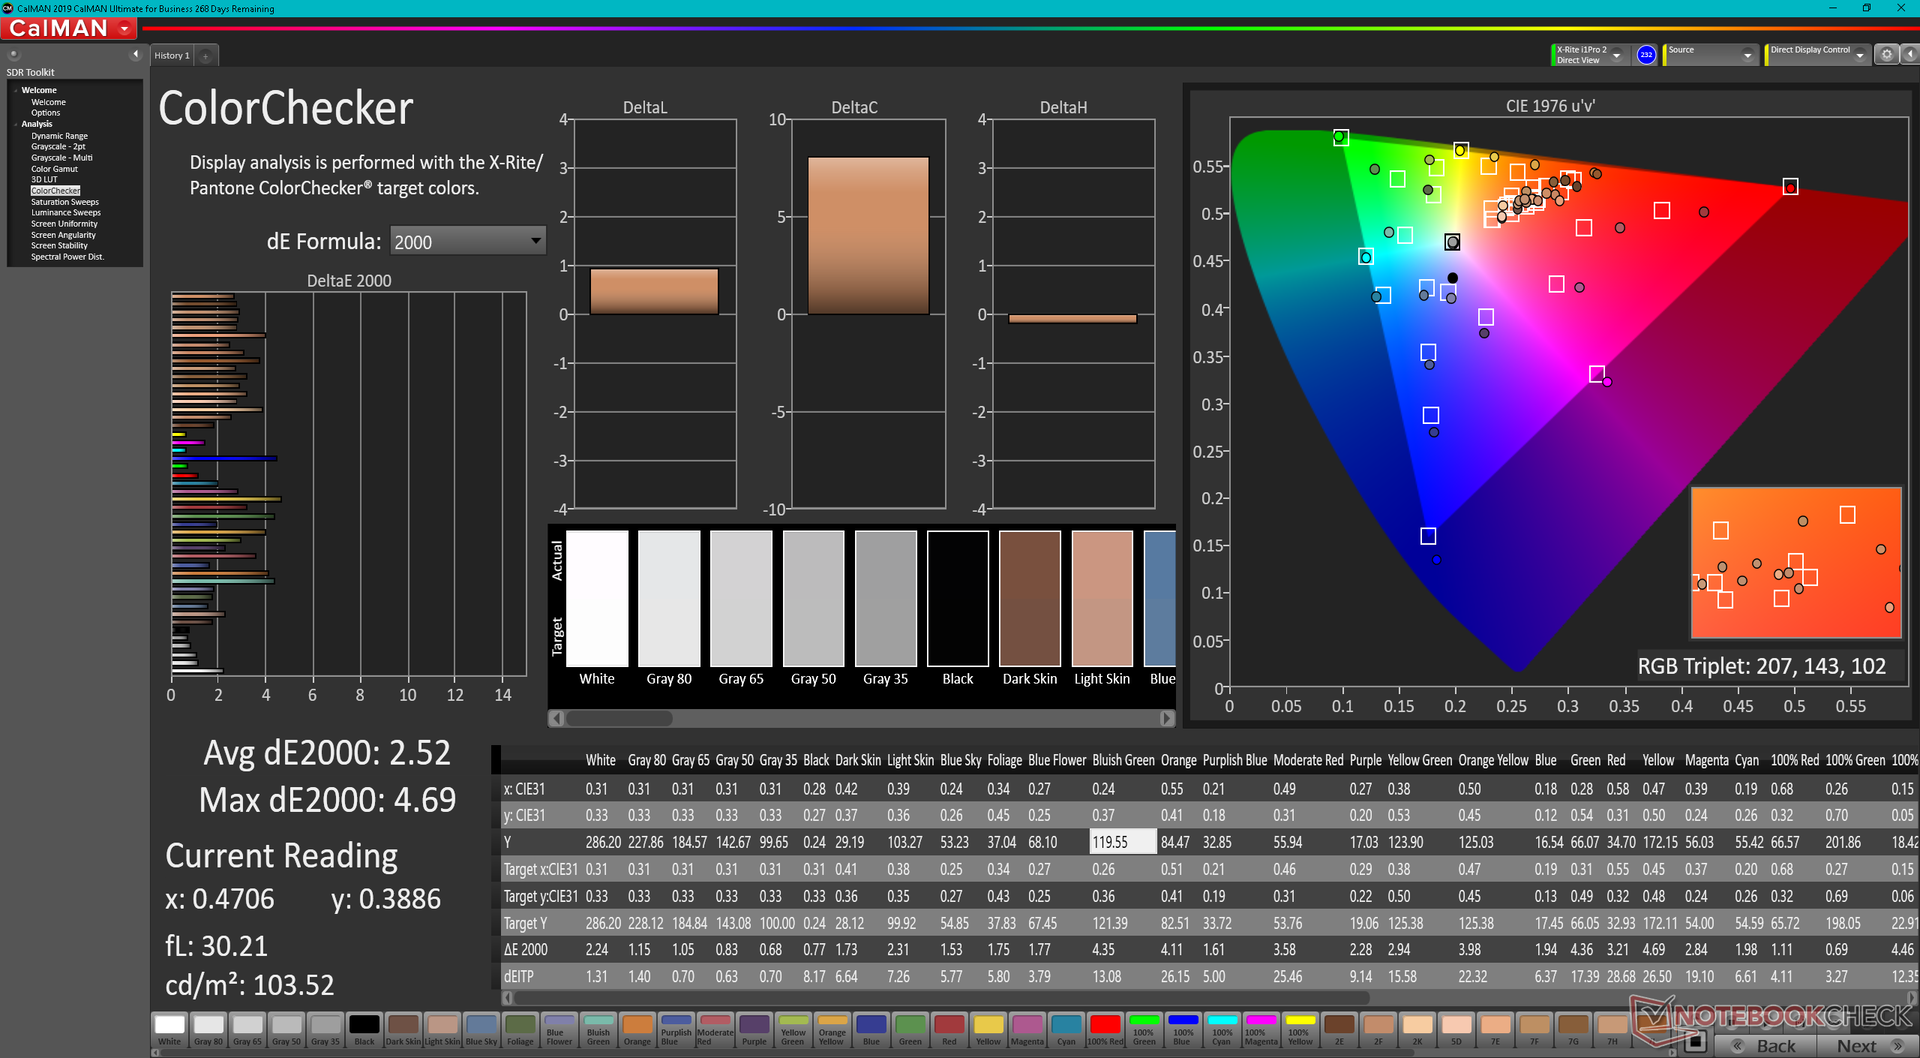
ΔE ColorChecker Calman: 2.74 | ∀{0.5-29.43 Ø4.72}
calibrated: 2.52
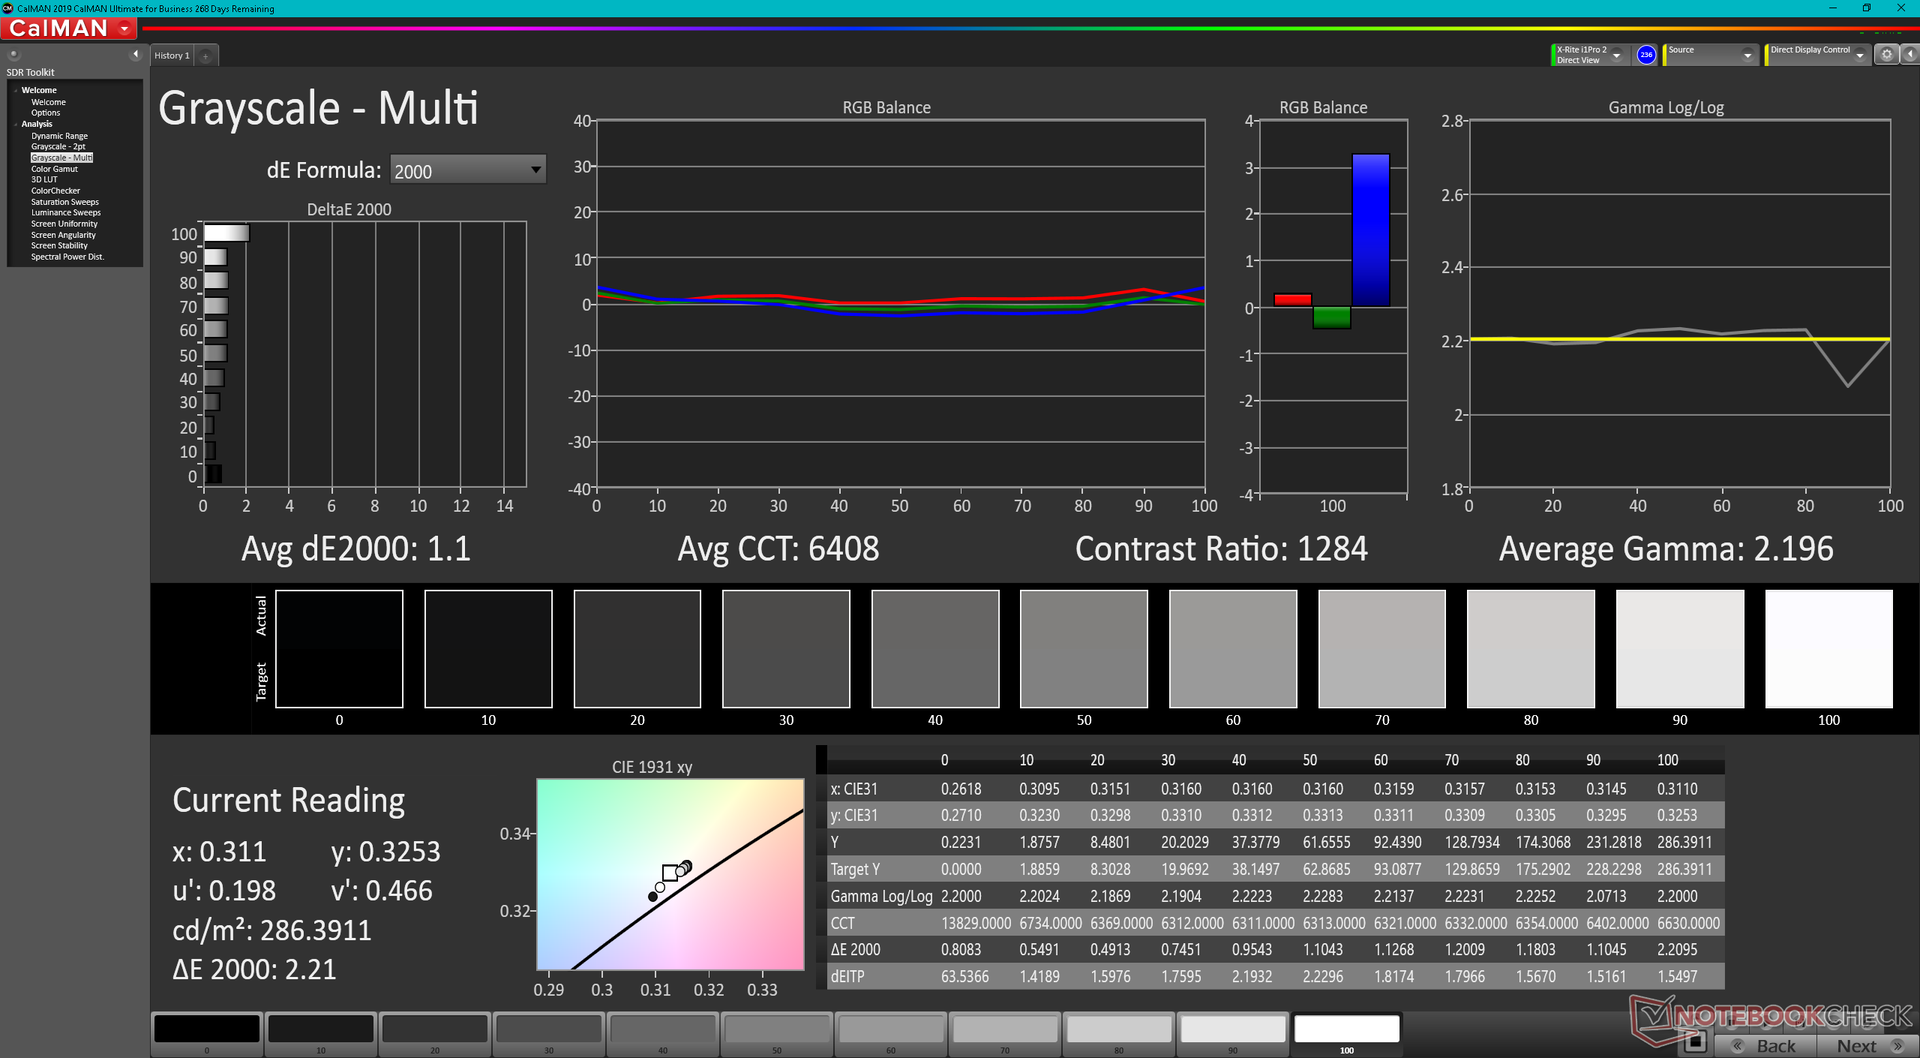
ΔE Greyscale Calman: 1.1 | ∀{0.09-98 Ø4.97}
86.8% AdobeRGB 1998 (Argyll 3D)
99.9% sRGB (Argyll 3D)
99.1% Display P3 (Argyll 3D)
Gamma: 2.2
CCT: 6408 K
| Razer Blade 15 2022 Sharp LQ156T1JW03, IPS, 2560x1440, 15.6" | Razer Blade 15 Advanced Model Early 2021 TL156VDXP02-0, IPS, 1920x1080, 15.6" | Razer Blade 15 RTX 2080 Super Max-Q AU Optronics B156HAN12.0, IPS, 1920x1080, 15.6" | Schenker XMG Neo 15 E22 (Early 2022, RTX 3080 Ti) BOE0A67 (BOE CQ NE156QHM-NZ1), IPS, 2560x1440, 15.6" | ADATA XPG Xenia 15 BOE CQ NE156QHM-NY2, IPS, 2560x1440, 15.6" | Eurocom Nightsky ARX315 Sharp LQ156M1JW03, IPS, 1920x1080, 15.6" | |
|---|---|---|---|---|---|---|
| Display | -20% | -16% | -18% | -15% | ||
| Display P3 Coverage (%) | 99.1 | 65.9 -34% | 70.2 -29% | 68.2 -31% | 67.9 -31% | |
| sRGB Coverage (%) | 99.9 | 96.4 -4% | 99 -1% | 98.1 -2% | 99.7 0% | |
| AdobeRGB 1998 Coverage (%) | 86.8 | 68 -22% | 71.4 -18% | 69.1 -20% | 73.7 -15% | |
| Response Times | -1% | 40% | 4% | 2% | -2% | |
| Response Time Grey 50% / Grey 80% * (ms) | 14.4 ? | 16 ? -11% | 6 ? 58% | 14.4 ? -0% | 13.6 ? 6% | 15.2 ? -6% |
| Response Time Black / White * (ms) | 11.6 ? | 10.4 ? 10% | 9 ? 22% | 10.8 ? 7% | 12 ? -3% | 11.2 ? 3% |
| PWM Frequency (Hz) | 23150 ? | |||||
| Screen | 20% | -6% | -28% | -62% | -38% | |
| Brightness middle (cd/m²) | 286 | 338 18% | 347 21% | 295 3% | 321.1 12% | 312.8 9% |
| Brightness (cd/m²) | 271 | 334 23% | 328 21% | 277 2% | 308 14% | 294 8% |
| Brightness Distribution (%) | 89 | 94 6% | 89 0% | 62 -30% | 82 -8% | 90 1% |
| Black Level * (cd/m²) | 0.25 | 0.24 4% | 0.285 -14% | 0.28 -12% | 0.38 -52% | 0.28 -12% |
| Contrast (:1) | 1144 | 1408 23% | 1218 6% | 1054 -8% | 845 -26% | 1117 -2% |
| Colorchecker dE 2000 * | 2.74 | 1.39 49% | 2.35 14% | 2.36 14% | 3.21 -17% | 2.96 -8% |
| Colorchecker dE 2000 max. * | 5.21 | 3.31 36% | 4.15 20% | 4.24 19% | 10.56 -103% | 6.23 -20% |
| Colorchecker dE 2000 calibrated * | 2.52 | 0.97 62% | 1.16 54% | 1.53 39% | ||
| Greyscale dE 2000 * | 1.1 | 1.6 -45% | 3.04 -176% | 3.43 -212% | 5.7 -418% | 4.2 -282% |
| Gamma | 2.2 100% | 2.291 96% | 2.35 94% | 2.44 90% | 2.09 105% | 2.32 95% |
| CCT | 6408 101% | 6626 98% | 6658 98% | 6266 104% | 7194 90% | 7145 91% |
| Color Space (Percent of AdobeRGB 1998) (%) | 68 | 65 | ||||
| Color Space (Percent of sRGB) (%) | 89 | 99 | ||||
| Moyenne finale (programmes/paramètres) | -0% /
8% | 6% /
-2% | -12% /
-22% | -26% /
-44% | -18% /
-27% |
* ... Moindre est la valeur, meilleures sont les performances
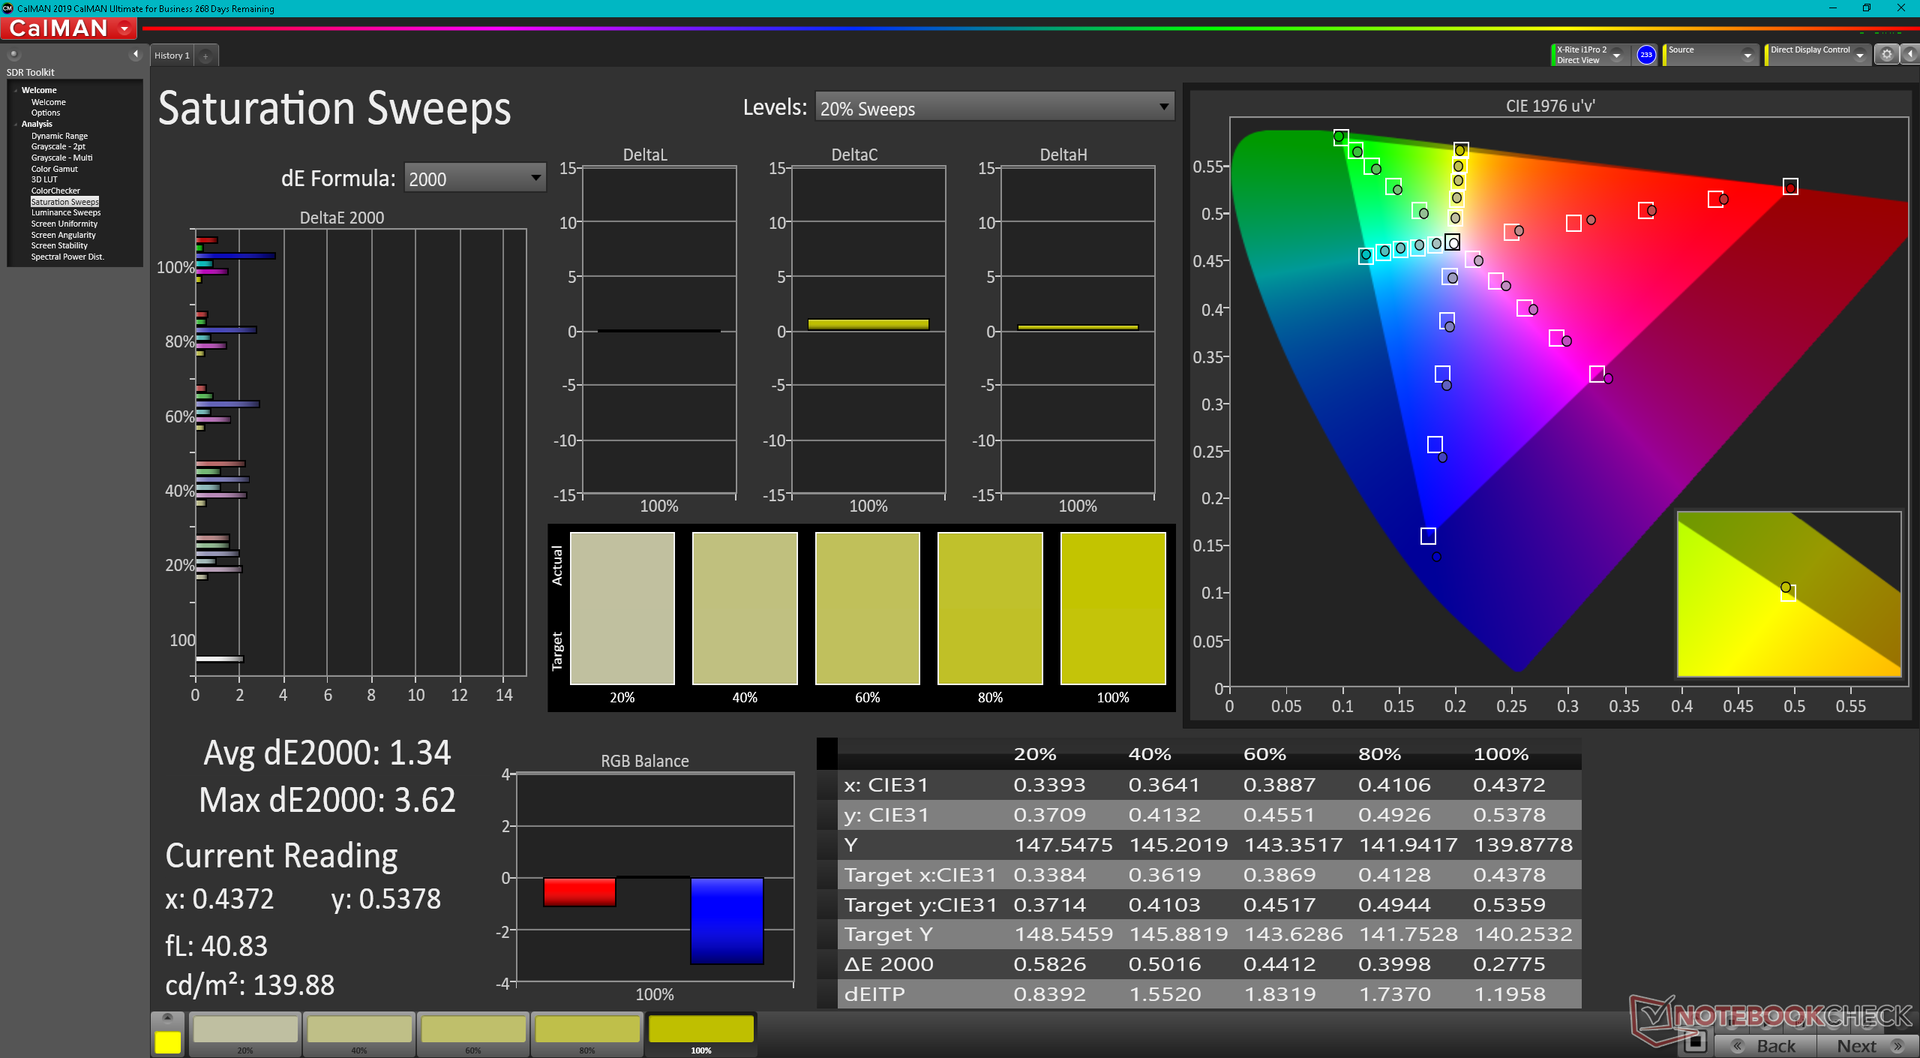
L'écran est bien calibré dès sa sortie de la boîte, avec des valeurs moyennes de DeltaE pour les niveaux de gris et les couleurs de seulement 1,1 et 2,74, respectivement, par rapport à la norme DCI-P3. Razer affirme qu'il calibre individuellement chaque panneau en usine et nos mesures indépendantes avec un colorimètre X-Rite peuvent confirmer la précision des couleurs et des niveaux de gris.

Temps de réponse de l'écran
| ↔ Temps de réponse noir à blanc | ||
|---|---|---|
| 11.6 ms ... hausse ↗ et chute ↘ combinées | ↗ 5.6 ms hausse | 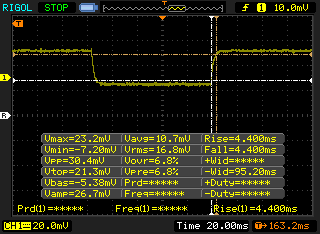 |
| ↘ 6 ms chute | ||
| L'écran montre de bons temps de réponse, mais insuffisant pour du jeu compétitif. En comparaison, tous les appareils testés affichent entre 0.1 (minimum) et 240 (maximum) ms. » 31 % des appareils testés affichent de meilleures performances. Cela signifie que les latences relevées sont meilleures que la moyenne (19.8 ms) de tous les appareils testés. | ||
| ↔ Temps de réponse gris 50% à gris 80% | ||
| 14.4 ms ... hausse ↗ et chute ↘ combinées | ↗ 6.8 ms hausse | 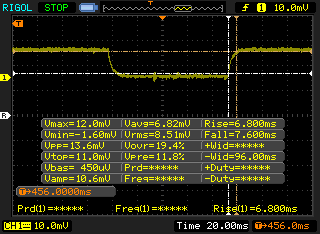 |
| ↘ 7.6 ms chute | ||
| L'écran montre de bons temps de réponse, mais insuffisant pour du jeu compétitif. En comparaison, tous les appareils testés affichent entre 0.165 (minimum) et 636 (maximum) ms. » 28 % des appareils testés affichent de meilleures performances. Cela signifie que les latences relevées sont meilleures que la moyenne (31 ms) de tous les appareils testés. | ||
Scintillement / MLI (Modulation de largeur d'impulsion)
| Scintillement / MLI (Modulation de largeur d'impulsion) non décelé | 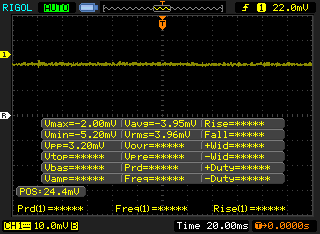 | ||
En comparaison, 52 % des appareils testés n'emploient pas MDI pour assombrir leur écran. Nous avons relevé une moyenne à 7781 (minimum : 5 - maximum : 343500) Hz dans le cas où une MDI était active. | |||
Performance
Conditions d'essai
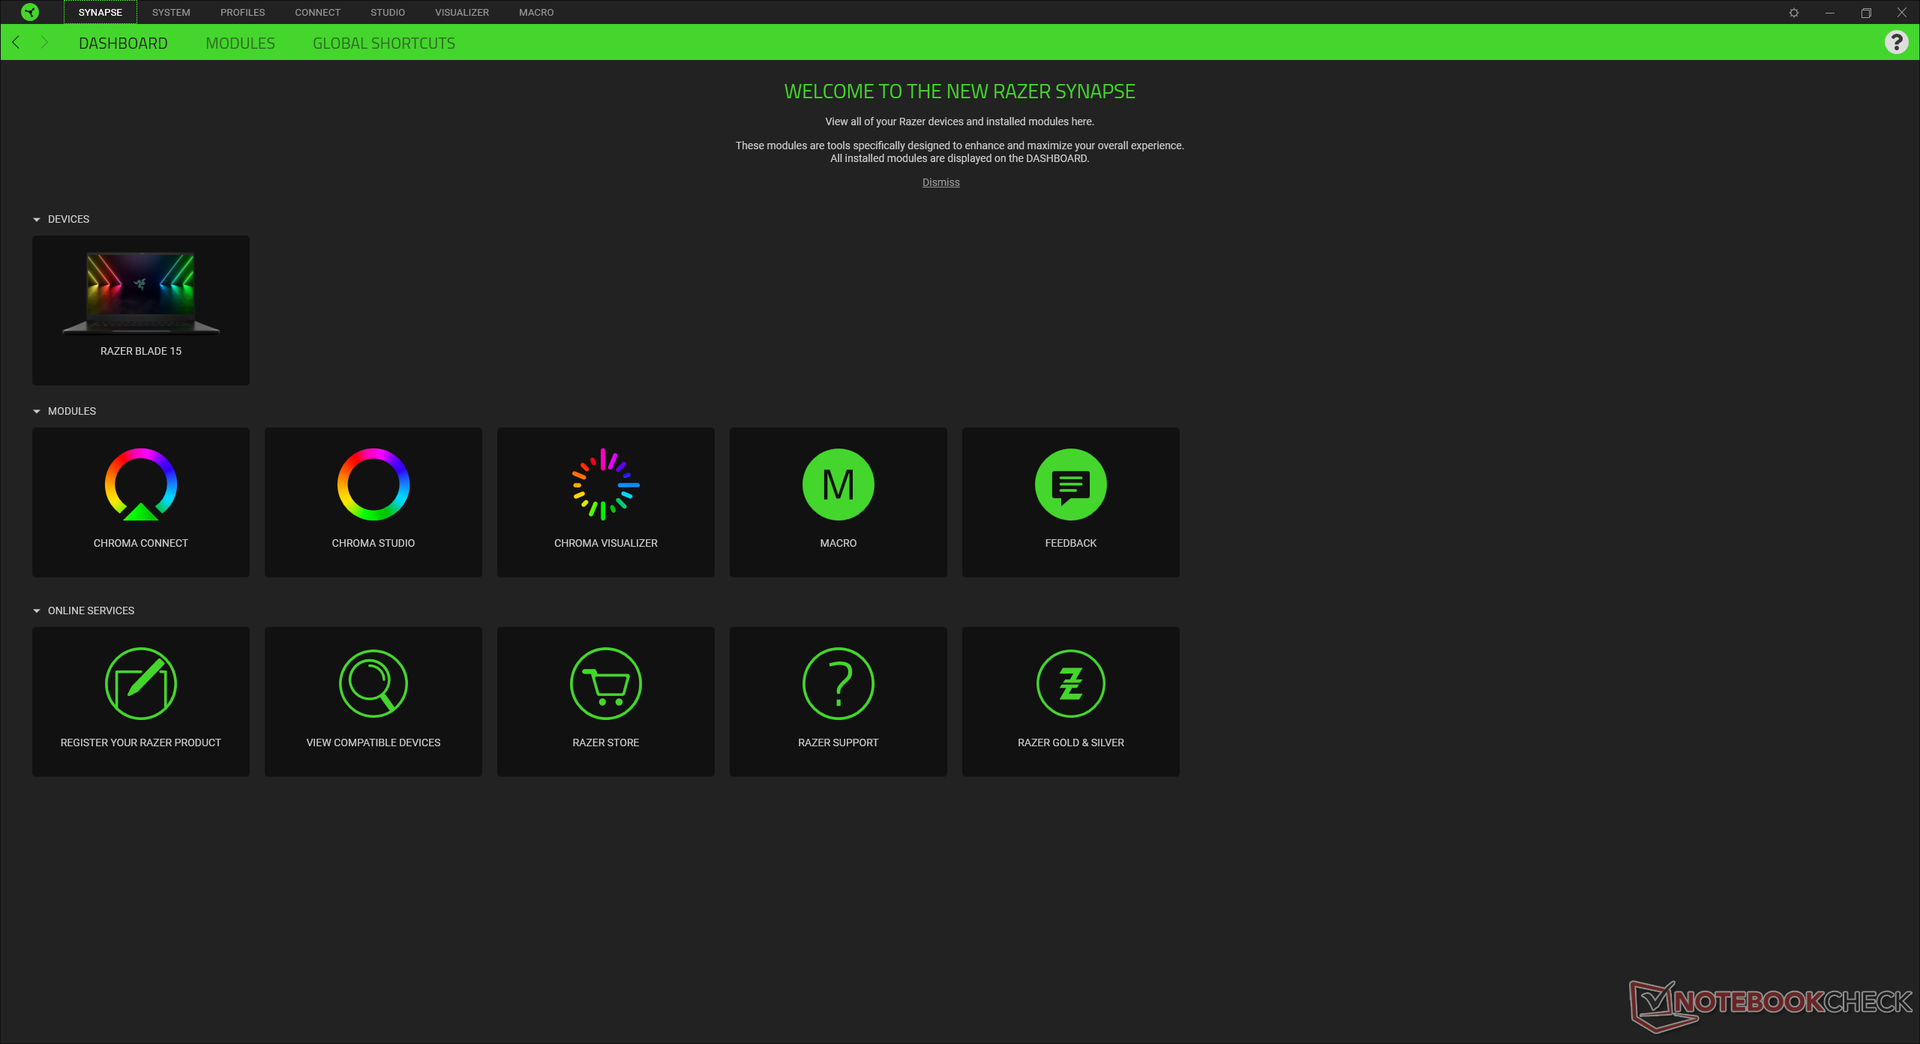
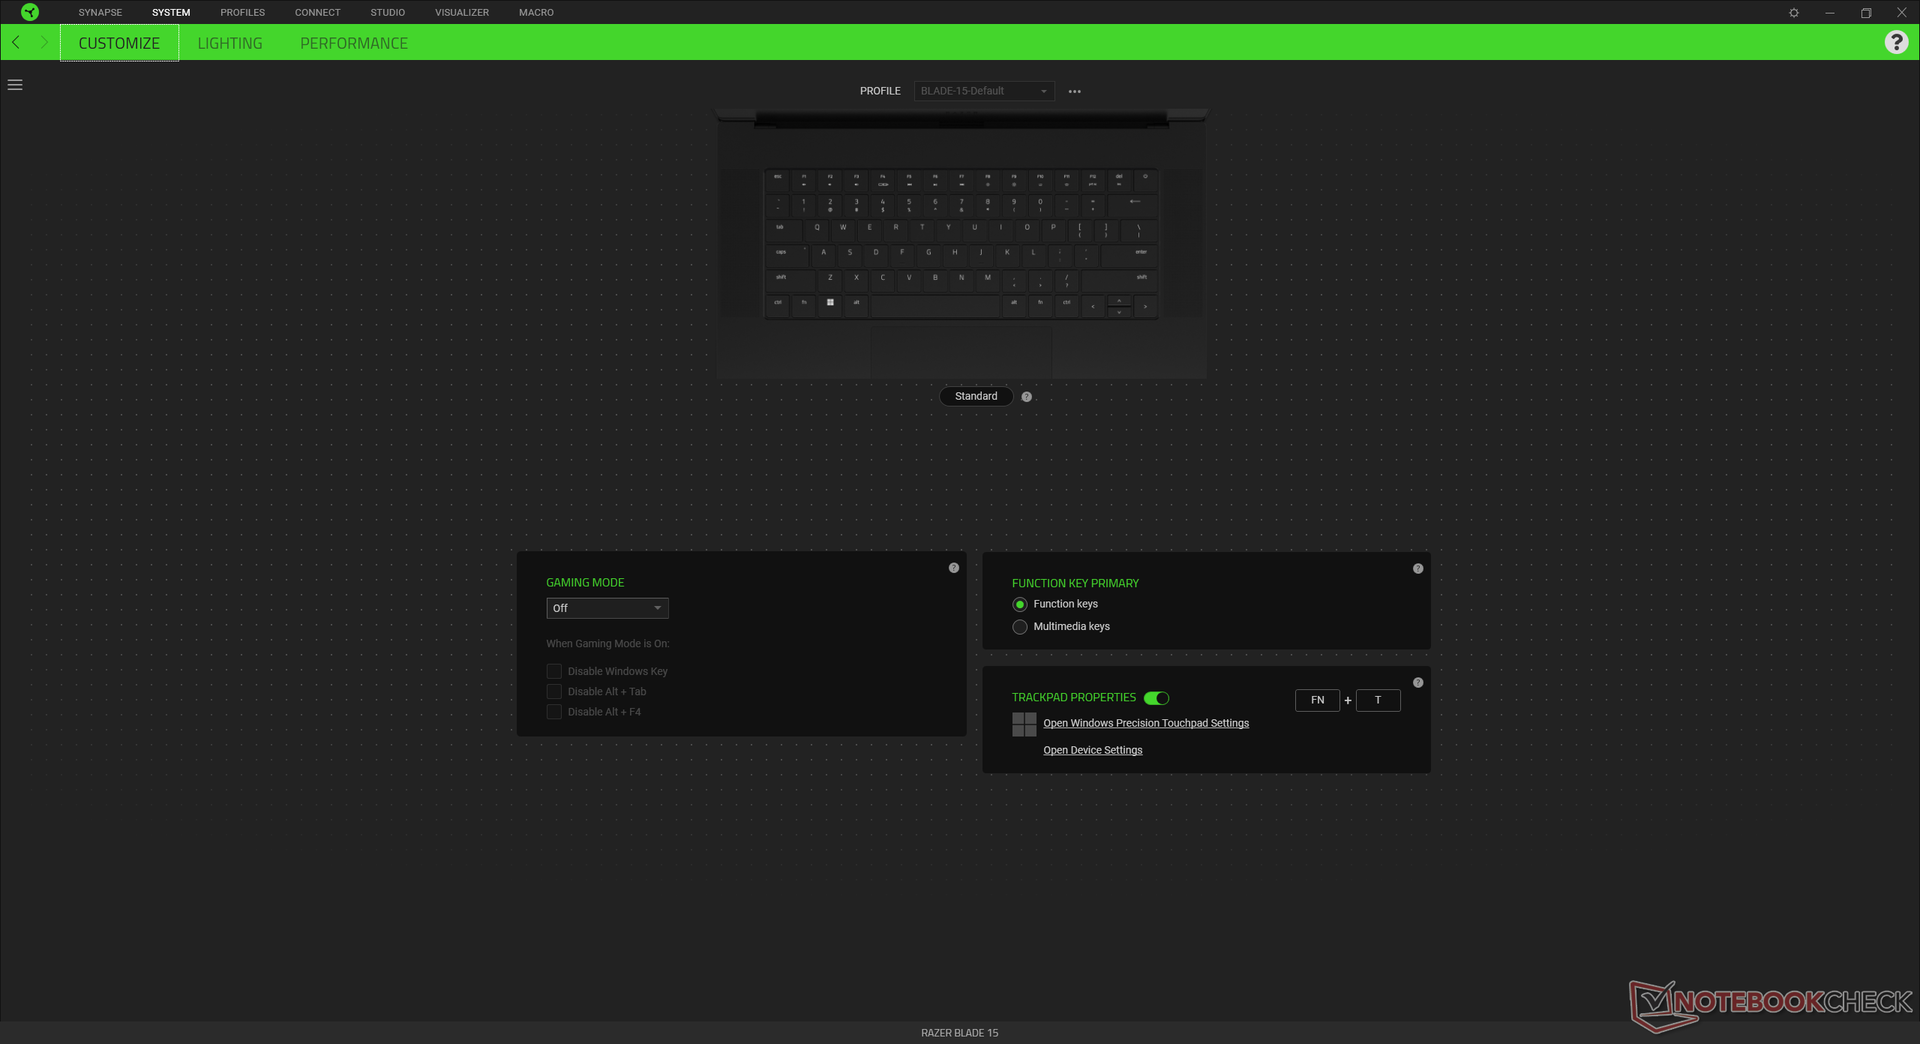
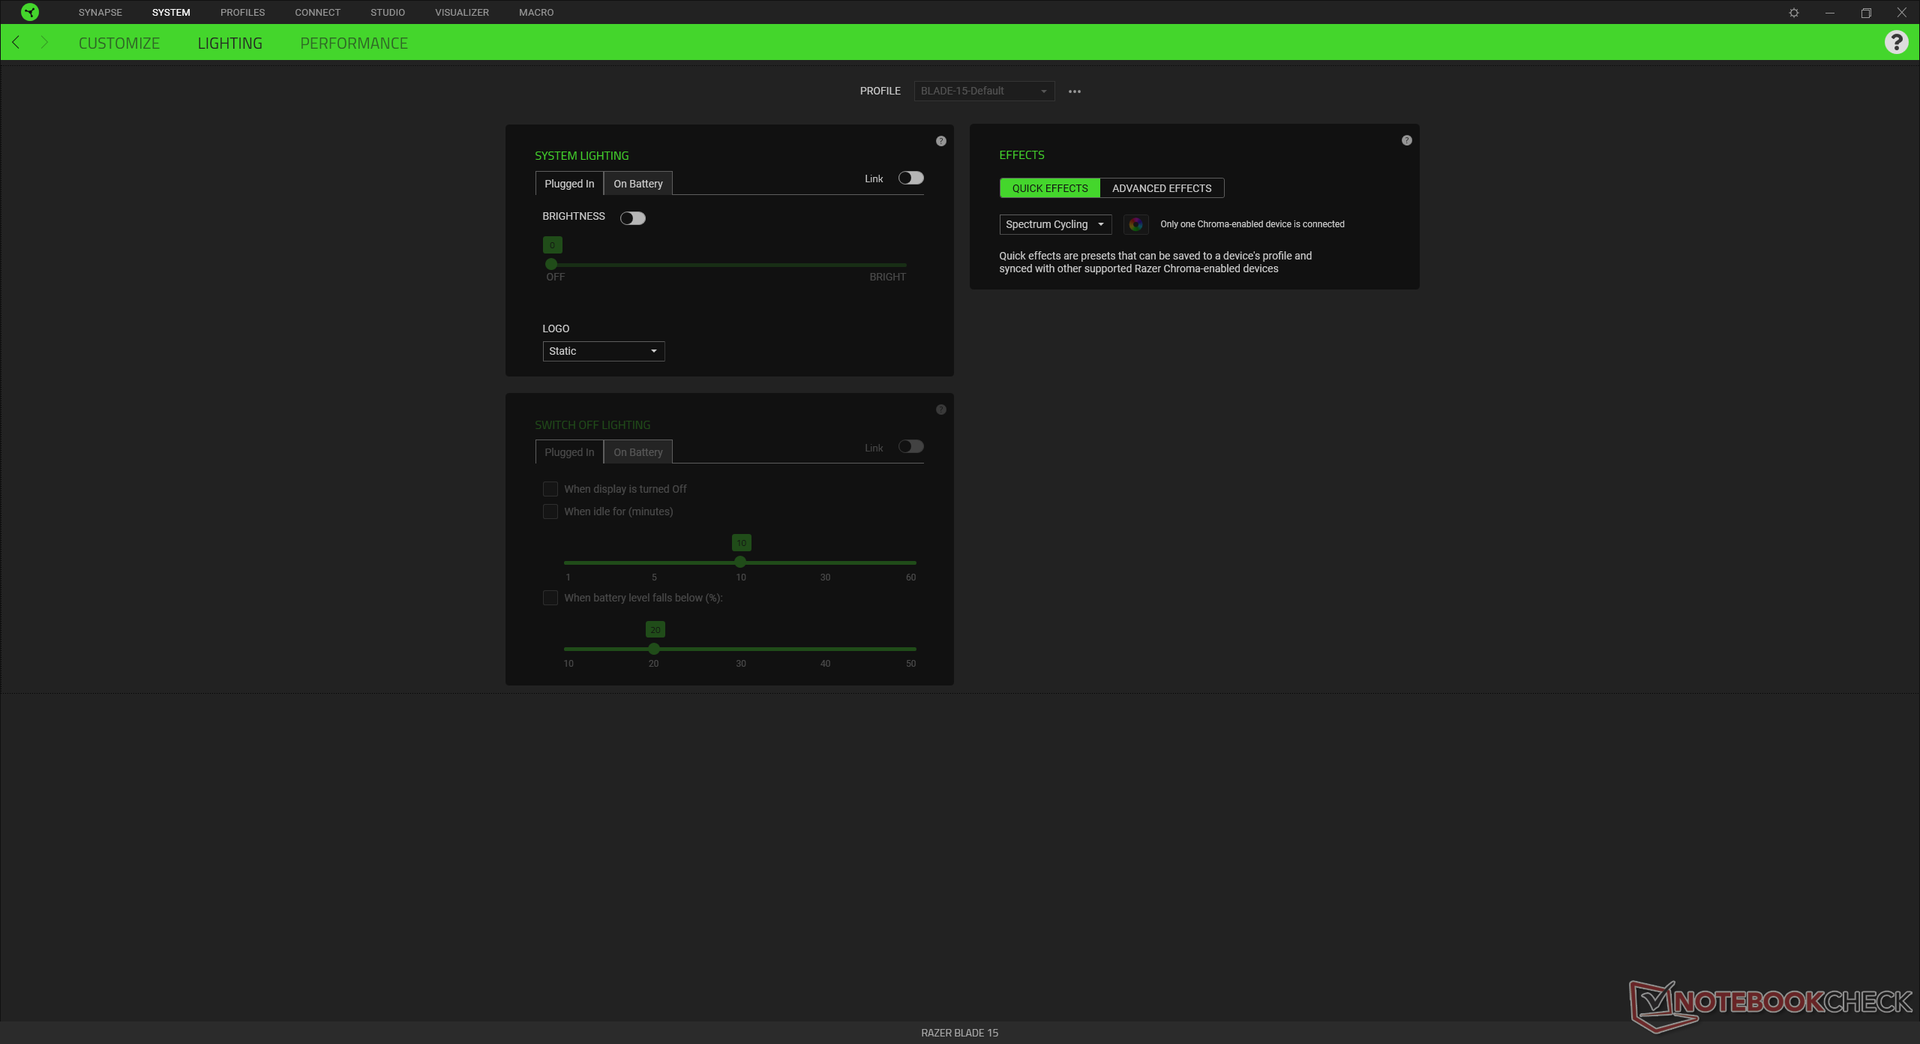
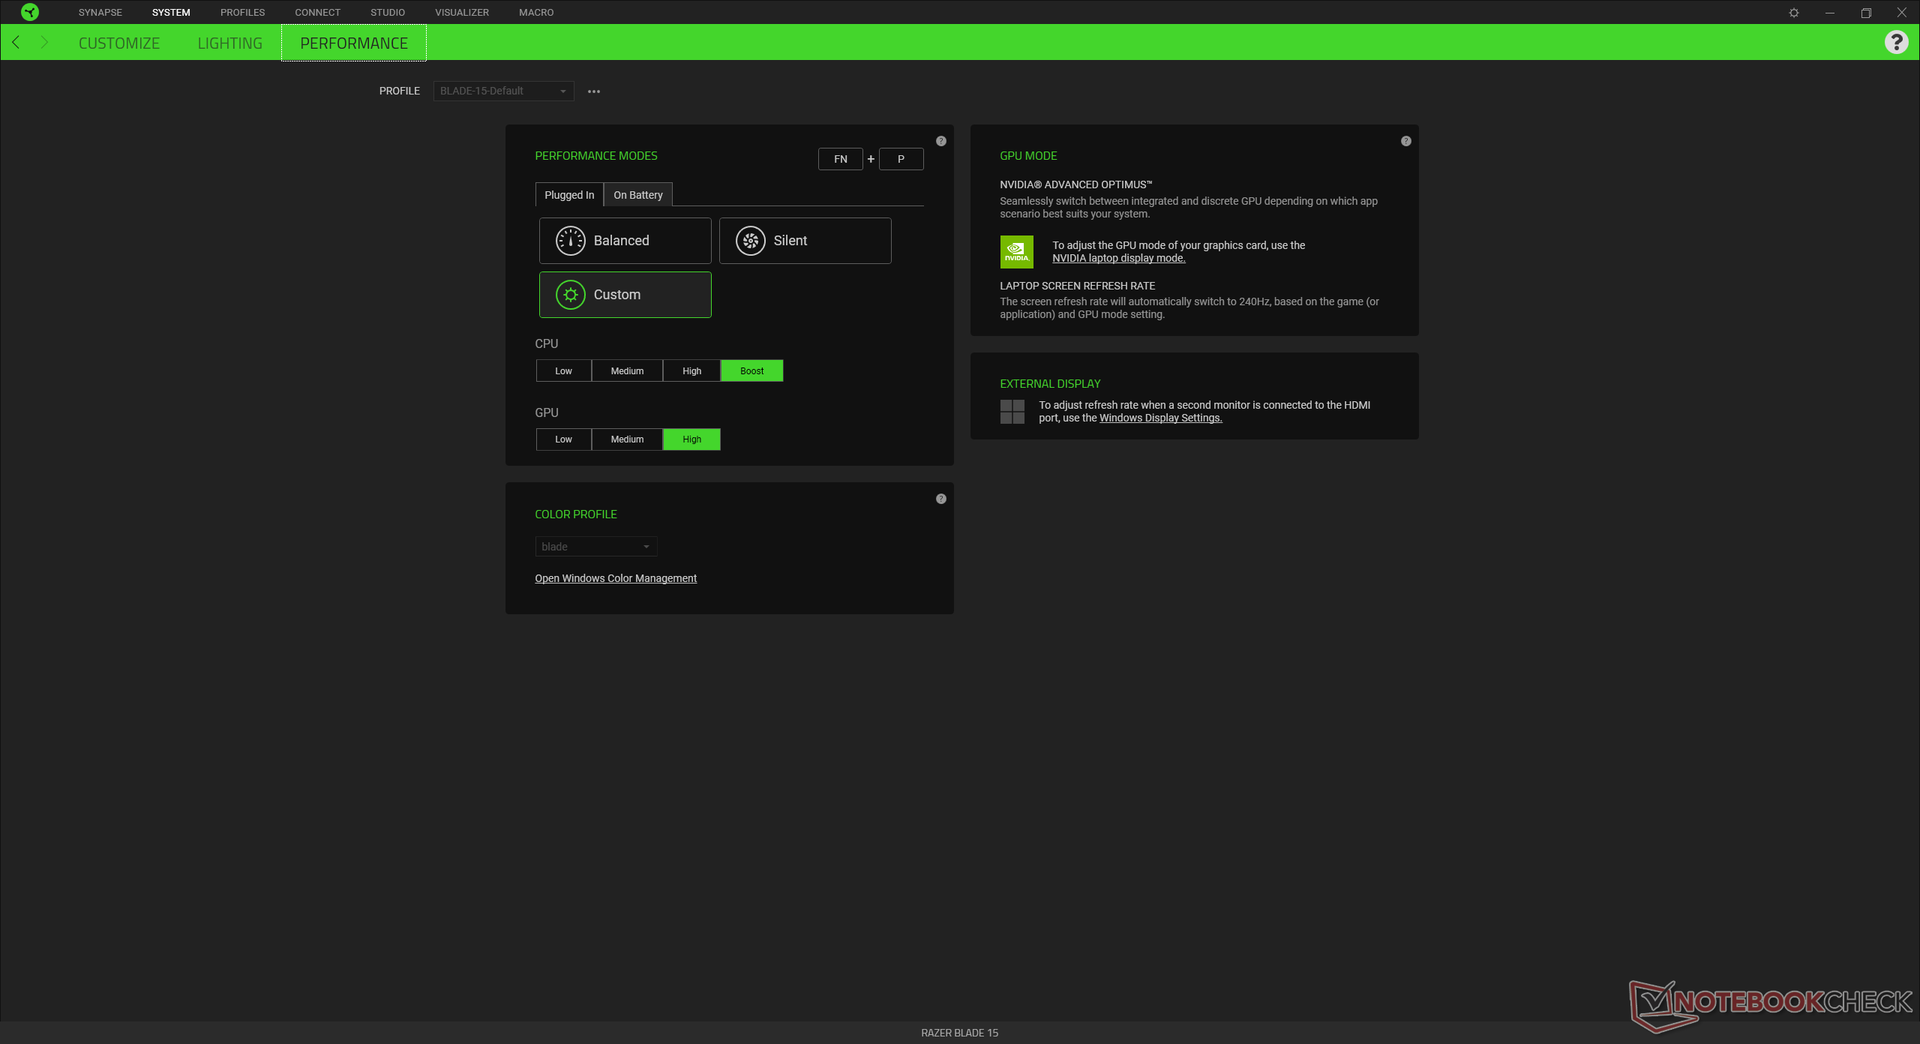
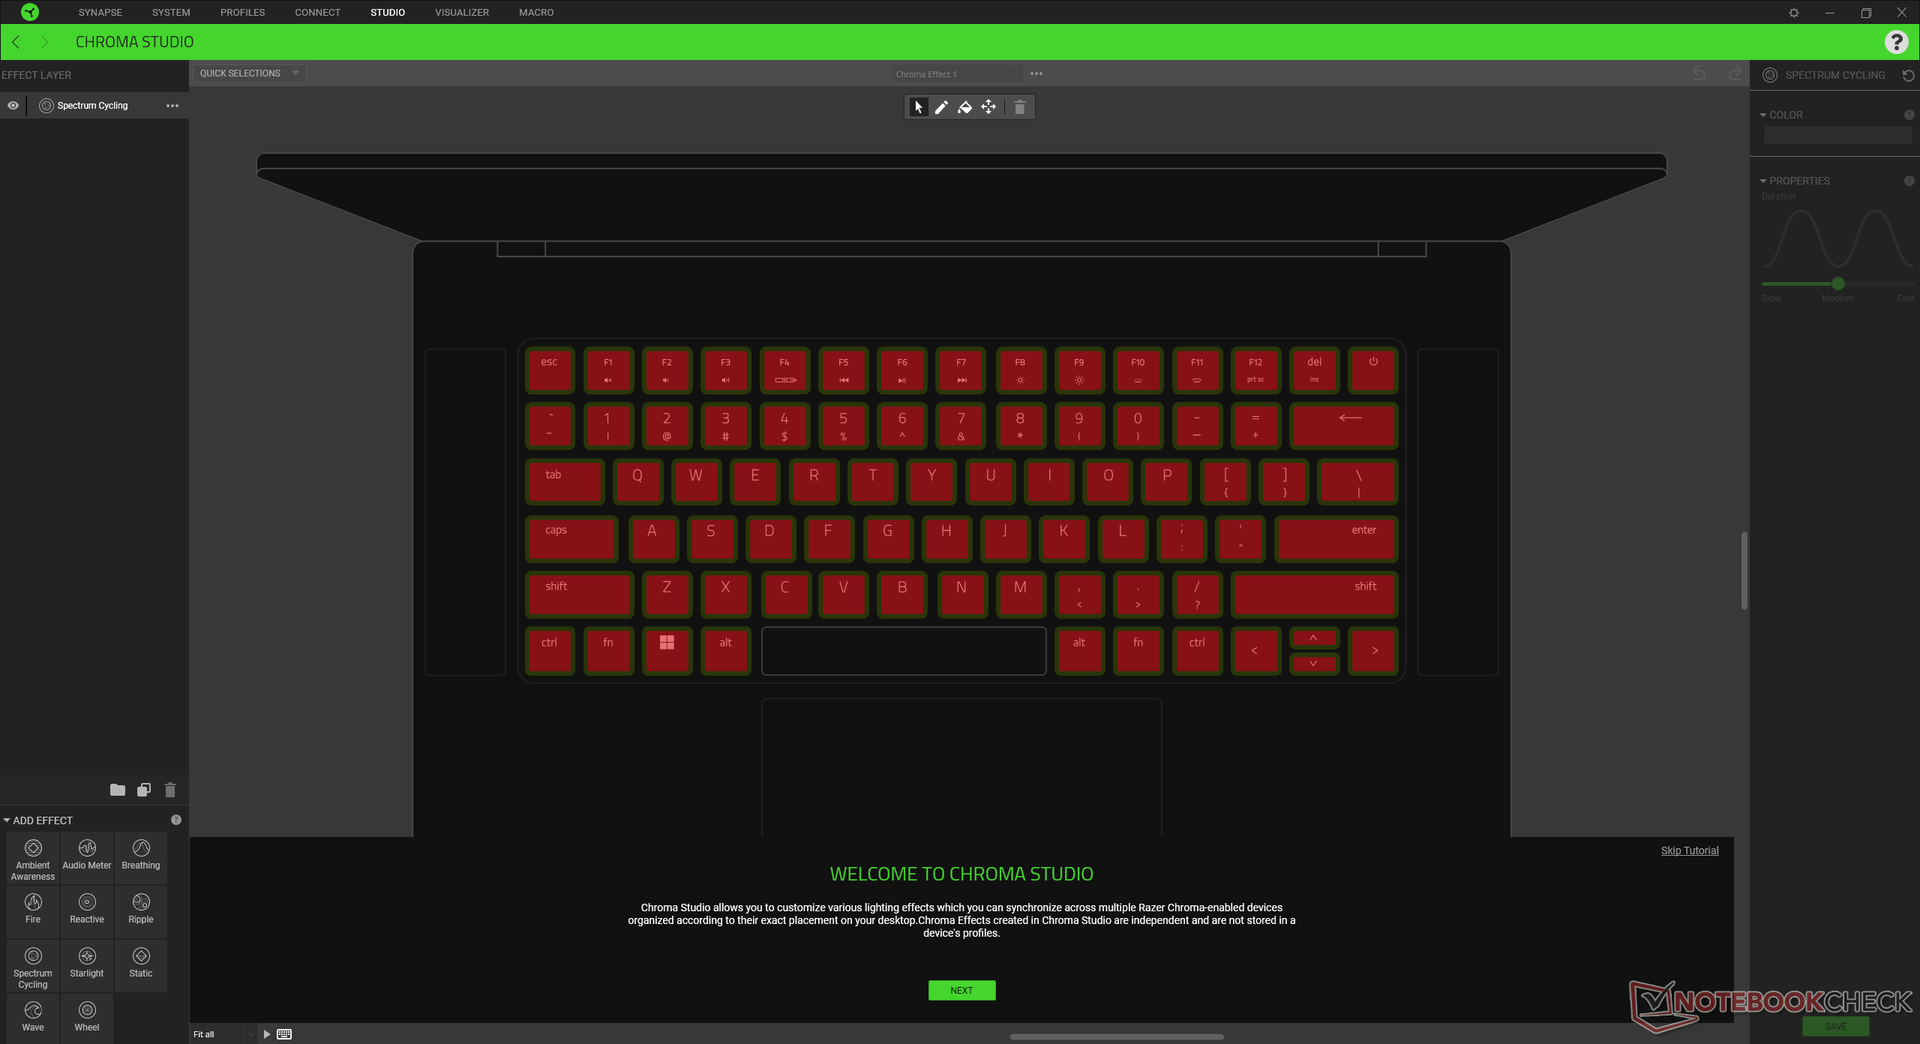
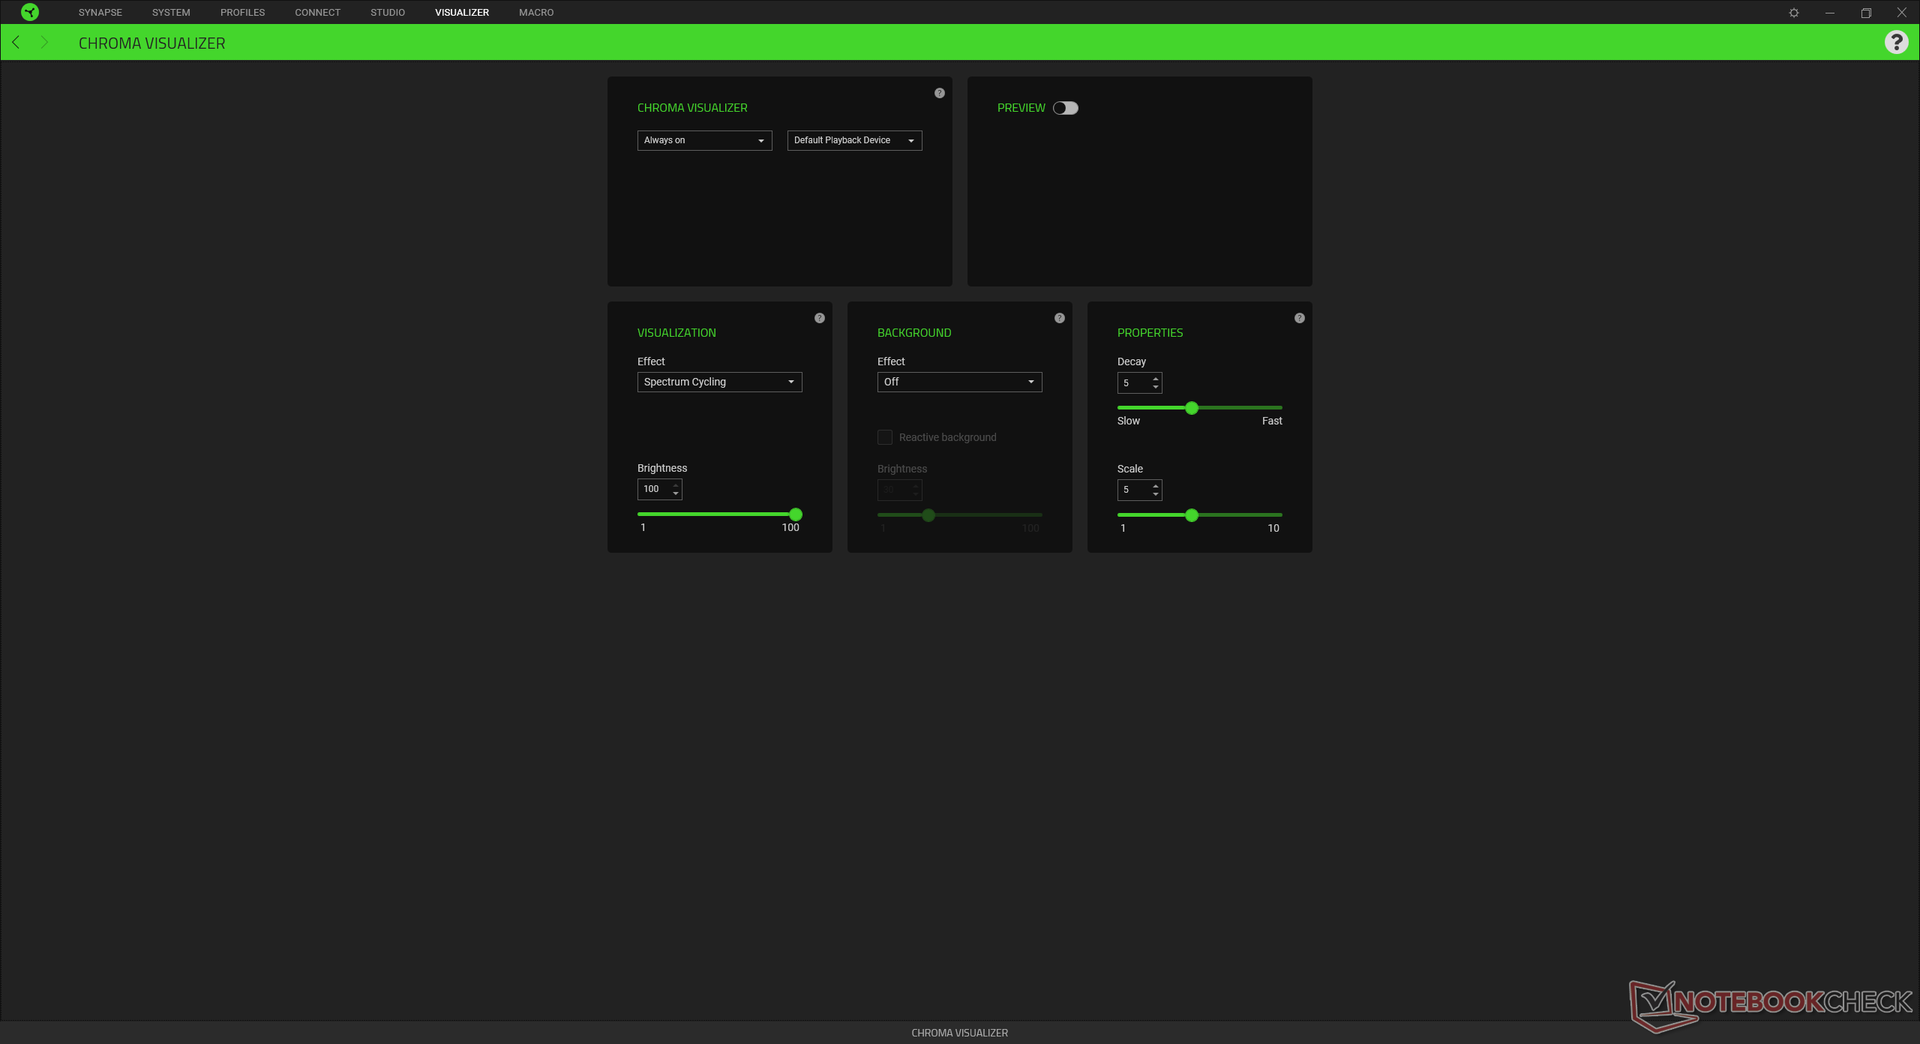
Notre unité a été configurée en mode de performance personnalisé avec le CPU sur Boost et le GPU sur High via le logiciel Razer Synapse avant d'exécuter les benchmarks de performance ci-dessous pour obtenir les meilleurs scores possibles. Nous avons également activé le dGPU en désactivant Optimus. Il est fortement recommandé de se familiariser avec Razer Synapse car il s'agit du logiciel central pour le contrôle des performances et des fonctionnalités.
Les utilisateurs peuvent basculer entre le dGPU seul ou Nvidia Optimus (MUX) sans avoir besoin de redémarrer le système puisque le Blade 15 est l'un des rares ordinateurs portables de jeu à prendre en charge Advanced Optimus ou Optimus 2.0. Gardez à l'esprit que G-Sync pour l'écran interne ne fonctionnera que lorsqu'il n'est pas en mode Optimus. De plus, la prise en charge de Thunderbolt 4 ne sera activée qu'en mode Optimus, comme sur les autres ordinateurs portables équipés de processeurs Alder Lake-H de 12e génération.
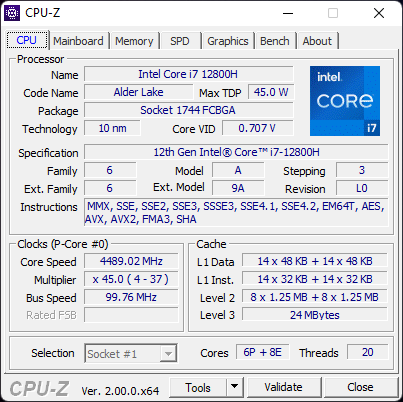
Processeur
Le site Core i7-12800H offre des performances mono et multi-thread 20 % plus rapides que la dernière génération de Core i7-11800H qu'il remplace directement. La mise à niveau vers le Core i9-12900H Devrait permettre d'augmenter les performances du processeur de 5 à 15 % supplémentaires, comme nous l'avons constaté sur le modèle MSI Vector GP66.
Cinebench R15 Multi Loop
Cinebench R23: Multi Core | Single Core
Cinebench R15: CPU Multi 64Bit | CPU Single 64Bit
Blender: v2.79 BMW27 CPU
7-Zip 18.03: 7z b 4 | 7z b 4 -mmt1
Geekbench 5.5: Multi-Core | Single-Core
HWBOT x265 Benchmark v2.2: 4k Preset
LibreOffice : 20 Documents To PDF
R Benchmark 2.5: Overall mean
| Cinebench R23 / Multi Core | |
| MSI Vector GP66 12UGS | |
| Razer Blade 15 2022 | |
| Moyenne Intel Core i7-12800H (9777 - 16597, n=5) | |
| Razer Blade 14 Ryzen 9 RTX 3070 | |
| Razer Blade 15 Advanced (Mid 2021) | |
| MSI Alpha 15 B5EEK-008 | |
| Aorus 15P XC | |
| Lenovo Legion C7 15IMH05 82EH0030GE | |
| Razer Blade 15 Advanced Model Early 2021 | |
| Cinebench R23 / Single Core | |
| MSI Vector GP66 12UGS | |
| Moyenne Intel Core i7-12800H (1796 - 1859, n=5) | |
| Razer Blade 15 2022 | |
| Razer Blade 15 Advanced (Mid 2021) | |
| MSI Alpha 15 B5EEK-008 | |
| Lenovo Legion C7 15IMH05 82EH0030GE | |
| Aorus 15P XC | |
| Razer Blade 14 Ryzen 9 RTX 3070 | |
| Razer Blade 15 Advanced Model Early 2021 | |
| Geekbench 5.5 / Multi-Core | |
| Razer Blade 15 2022 | |
| MSI Vector GP66 12UGS | |
| Moyenne Intel Core i7-12800H (9607 - 12940, n=5) | |
| Asus ROG Zephyrus M16 GU603H | |
| MSI Alpha 15 B5EEK-008 | |
| Lenovo Legion C7 15IMH05 82EH0030GE | |
| Aorus 15P XC | |
| Asus ROG Zephyrus G15 GA502IU-ES76 | |
| Razer Blade 15 Advanced Model Early 2021 | |
| Geekbench 5.5 / Single-Core | |
| MSI Vector GP66 12UGS | |
| Moyenne Intel Core i7-12800H (1739 - 1842, n=5) | |
| Razer Blade 15 2022 | |
| Asus ROG Zephyrus M16 GU603H | |
| MSI Alpha 15 B5EEK-008 | |
| Lenovo Legion C7 15IMH05 82EH0030GE | |
| Razer Blade 15 Advanced Model Early 2021 | |
| Aorus 15P XC | |
| Asus ROG Zephyrus G15 GA502IU-ES76 | |
* ... Moindre est la valeur, meilleures sont les performances
AIDA64: FP32 Ray-Trace | FPU Julia | CPU SHA3 | CPU Queen | FPU SinJulia | FPU Mandel | CPU AES | CPU ZLib | FP64 Ray-Trace | CPU PhotoWorxx
| Performance rating | |
| Eurocom Nightsky ARX315 | |
| Schenker XMG Neo 15 E22 (Early 2022, RTX 3080 Ti) | |
| Moyenne Intel Core i7-12800H | |
| Razer Blade 15 2022 | |
| Razer Blade 15 RTX 2080 Super Max-Q | |
| Razer Blade 15 Advanced Model Early 2021 | |
| ADATA XPG Xenia 15 -9! | |
| AIDA64 / FP32 Ray-Trace | |
| Eurocom Nightsky ARX315 | |
| Schenker XMG Neo 15 E22 (Early 2022, RTX 3080 Ti) | |
| Razer Blade 15 RTX 2080 Super Max-Q | |
| Moyenne Intel Core i7-12800H (5839 - 15206, n=5) | |
| Razer Blade 15 Advanced Model Early 2021 | |
| Razer Blade 15 2022 | |
| AIDA64 / FPU Julia | |
| Eurocom Nightsky ARX315 | |
| Razer Blade 15 RTX 2080 Super Max-Q | |
| Razer Blade 15 Advanced Model Early 2021 | |
| Moyenne Intel Core i7-12800H (27801 - 80002, n=5) | |
| Schenker XMG Neo 15 E22 (Early 2022, RTX 3080 Ti) | |
| Razer Blade 15 2022 | |
| AIDA64 / CPU SHA3 | |
| Schenker XMG Neo 15 E22 (Early 2022, RTX 3080 Ti) | |
| Eurocom Nightsky ARX315 | |
| Moyenne Intel Core i7-12800H (2013 - 3684, n=5) | |
| Razer Blade 15 2022 | |
| Razer Blade 15 RTX 2080 Super Max-Q | |
| Razer Blade 15 Advanced Model Early 2021 | |
| AIDA64 / CPU Queen | |
| Eurocom Nightsky ARX315 | |
| Schenker XMG Neo 15 E22 (Early 2022, RTX 3080 Ti) | |
| Moyenne Intel Core i7-12800H (85965 - 108084, n=5) | |
| Razer Blade 15 2022 | |
| Razer Blade 15 RTX 2080 Super Max-Q | |
| Razer Blade 15 Advanced Model Early 2021 | |
| AIDA64 / FPU SinJulia | |
| Eurocom Nightsky ARX315 | |
| Schenker XMG Neo 15 E22 (Early 2022, RTX 3080 Ti) | |
| Razer Blade 15 2022 | |
| Moyenne Intel Core i7-12800H (7027 - 9658, n=5) | |
| Razer Blade 15 RTX 2080 Super Max-Q | |
| Razer Blade 15 Advanced Model Early 2021 | |
| AIDA64 / FPU Mandel | |
| Eurocom Nightsky ARX315 | |
| Schenker XMG Neo 15 E22 (Early 2022, RTX 3080 Ti) | |
| Razer Blade 15 RTX 2080 Super Max-Q | |
| Moyenne Intel Core i7-12800H (15765 - 38179, n=5) | |
| Razer Blade 15 Advanced Model Early 2021 | |
| Razer Blade 15 2022 | |
| AIDA64 / CPU AES | |
| Eurocom Nightsky ARX315 | |
| Schenker XMG Neo 15 E22 (Early 2022, RTX 3080 Ti) | |
| Moyenne Intel Core i7-12800H (55371 - 73928, n=5) | |
| Razer Blade 15 2022 | |
| Razer Blade 15 RTX 2080 Super Max-Q | |
| Razer Blade 15 Advanced Model Early 2021 | |
| AIDA64 / FP64 Ray-Trace | |
| Eurocom Nightsky ARX315 | |
| Schenker XMG Neo 15 E22 (Early 2022, RTX 3080 Ti) | |
| Razer Blade 15 RTX 2080 Super Max-Q | |
| Moyenne Intel Core i7-12800H (3257 - 8559, n=5) | |
| Razer Blade 15 Advanced Model Early 2021 | |
| Razer Blade 15 2022 | |
| AIDA64 / CPU PhotoWorxx | |
| Razer Blade 15 2022 | |
| Schenker XMG Neo 15 E22 (Early 2022, RTX 3080 Ti) | |
| Moyenne Intel Core i7-12800H (31329 - 40992, n=5) | |
| Razer Blade 15 Advanced Model Early 2021 | |
| Eurocom Nightsky ARX315 | |
| Razer Blade 15 RTX 2080 Super Max-Q | |
Performance du système
| PCMark 10 / Score | |
| Razer Blade 15 2022 | |
| Moyenne Intel Core i7-12800H, NVIDIA GeForce RTX 3080 Ti Laptop GPU (7313 - 7744, n=3) | |
| Razer Blade 15 Advanced (Mid 2021) | |
| Razer Blade 17 RTX 3070 | |
| Razer Blade 14 Ryzen 9 RTX 3070 | |
| Razer Blade 15 RTX 2070 Super Max-Q | |
| Razer Blade Pro 17 2021 (QHD Touch) | |
| Razer Blade 15 Base Edition 2021, i7-10750H RTX 3060 | |
| Razer Blade 15 Advanced Model Early 2021 | |
| PCMark 10 / Essentials | |
| Razer Blade 15 Advanced (Mid 2021) | |
| Razer Blade 17 RTX 3070 | |
| Razer Blade 15 2022 | |
| Moyenne Intel Core i7-12800H, NVIDIA GeForce RTX 3080 Ti Laptop GPU (10597 - 10814, n=3) | |
| Razer Blade 14 Ryzen 9 RTX 3070 | |
| Razer Blade 15 RTX 2070 Super Max-Q | |
| Razer Blade 15 Base Edition 2021, i7-10750H RTX 3060 | |
| Razer Blade Pro 17 2021 (QHD Touch) | |
| Razer Blade 15 Advanced Model Early 2021 | |
| PCMark 10 / Productivity | |
| Razer Blade 15 2022 | |
| Moyenne Intel Core i7-12800H, NVIDIA GeForce RTX 3080 Ti Laptop GPU (9470 - 9675, n=3) | |
| Razer Blade 14 Ryzen 9 RTX 3070 | |
| Razer Blade 17 RTX 3070 | |
| Razer Blade 15 Advanced (Mid 2021) | |
| Razer Blade 15 RTX 2070 Super Max-Q | |
| Razer Blade Pro 17 2021 (QHD Touch) | |
| Razer Blade 15 Advanced Model Early 2021 | |
| Razer Blade 15 Base Edition 2021, i7-10750H RTX 3060 | |
| PCMark 10 / Digital Content Creation | |
| Razer Blade 15 2022 | |
| Moyenne Intel Core i7-12800H, NVIDIA GeForce RTX 3080 Ti Laptop GPU (10351 - 12306, n=3) | |
| Razer Blade 15 Advanced (Mid 2021) | |
| Razer Blade 17 RTX 3070 | |
| Razer Blade 15 RTX 2070 Super Max-Q | |
| Razer Blade 14 Ryzen 9 RTX 3070 | |
| Razer Blade Pro 17 2021 (QHD Touch) | |
| Razer Blade 15 Base Edition 2021, i7-10750H RTX 3060 | |
| Razer Blade 15 Advanced Model Early 2021 | |
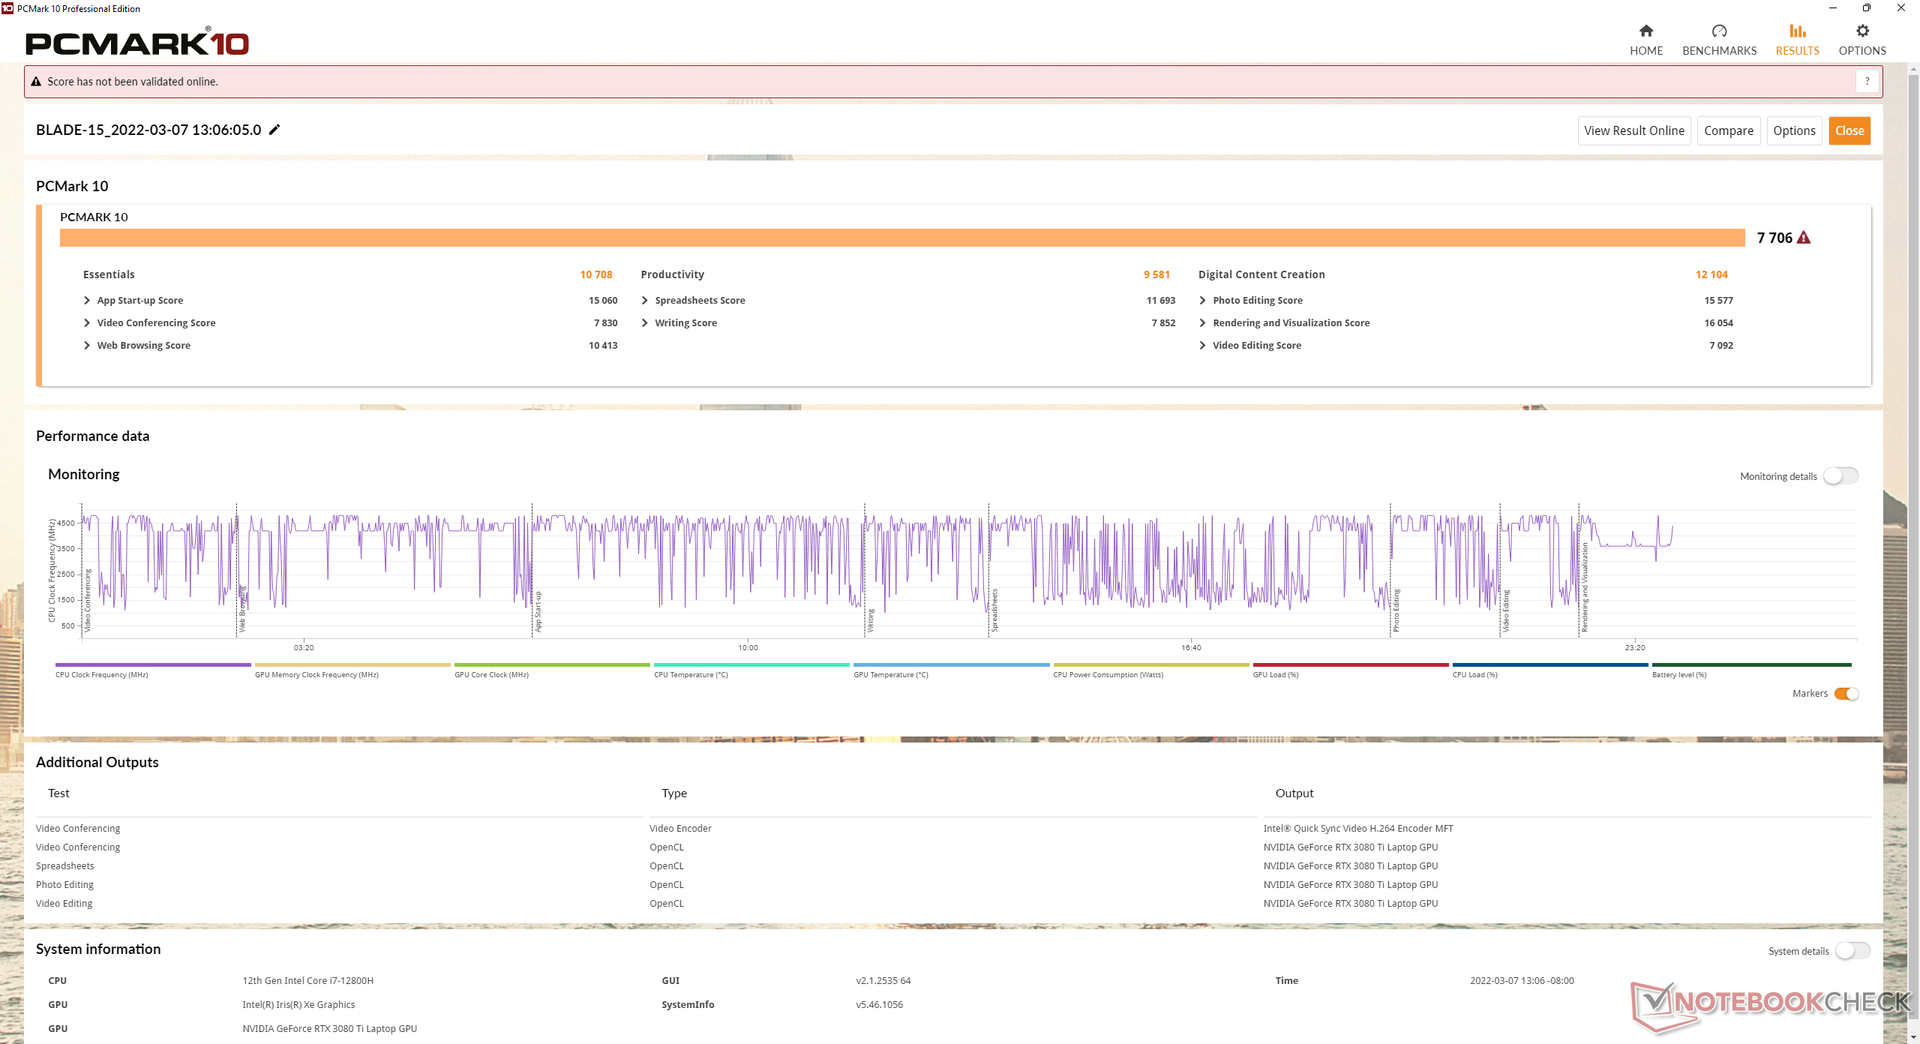
| PCMark 10 Score | 7706 points | |
Aide | ||
| AIDA64 / Memory Copy | |
| Schenker XMG Neo 15 E22 (Early 2022, RTX 3080 Ti) | |
| Razer Blade 15 2022 | |
| Moyenne Intel Core i7-12800H (48643 - 62522, n=5) | |
| Eurocom Nightsky ARX315 | |
| Razer Blade 15 Advanced Model Early 2021 | |
| Razer Blade 15 RTX 2080 Super Max-Q | |
| AIDA64 / Memory Read | |
| Schenker XMG Neo 15 E22 (Early 2022, RTX 3080 Ti) | |
| Razer Blade 15 2022 | |
| Moyenne Intel Core i7-12800H (56629 - 66199, n=5) | |
| Eurocom Nightsky ARX315 | |
| Razer Blade 15 Advanced Model Early 2021 | |
| Razer Blade 15 RTX 2080 Super Max-Q | |
| AIDA64 / Memory Write | |
| Razer Blade 15 2022 | |
| Schenker XMG Neo 15 E22 (Early 2022, RTX 3080 Ti) | |
| Moyenne Intel Core i7-12800H (50923 - 66074, n=5) | |
| Eurocom Nightsky ARX315 | |
| Razer Blade 15 Advanced Model Early 2021 | |
| Razer Blade 15 RTX 2080 Super Max-Q | |
| AIDA64 / Memory Latency | |
| Eurocom Nightsky ARX315 | |
| Razer Blade 15 Advanced Model Early 2021 | |
| Razer Blade 15 RTX 2080 Super Max-Q | |
| Moyenne Intel Core i7-12800H (89.3 - 95.2, n=5) | |
| ADATA XPG Xenia 15 | |
| Schenker XMG Neo 15 E22 (Early 2022, RTX 3080 Ti) | |
| Razer Blade 15 2022 | |
* ... Moindre est la valeur, meilleures sont les performances
Latence DPC
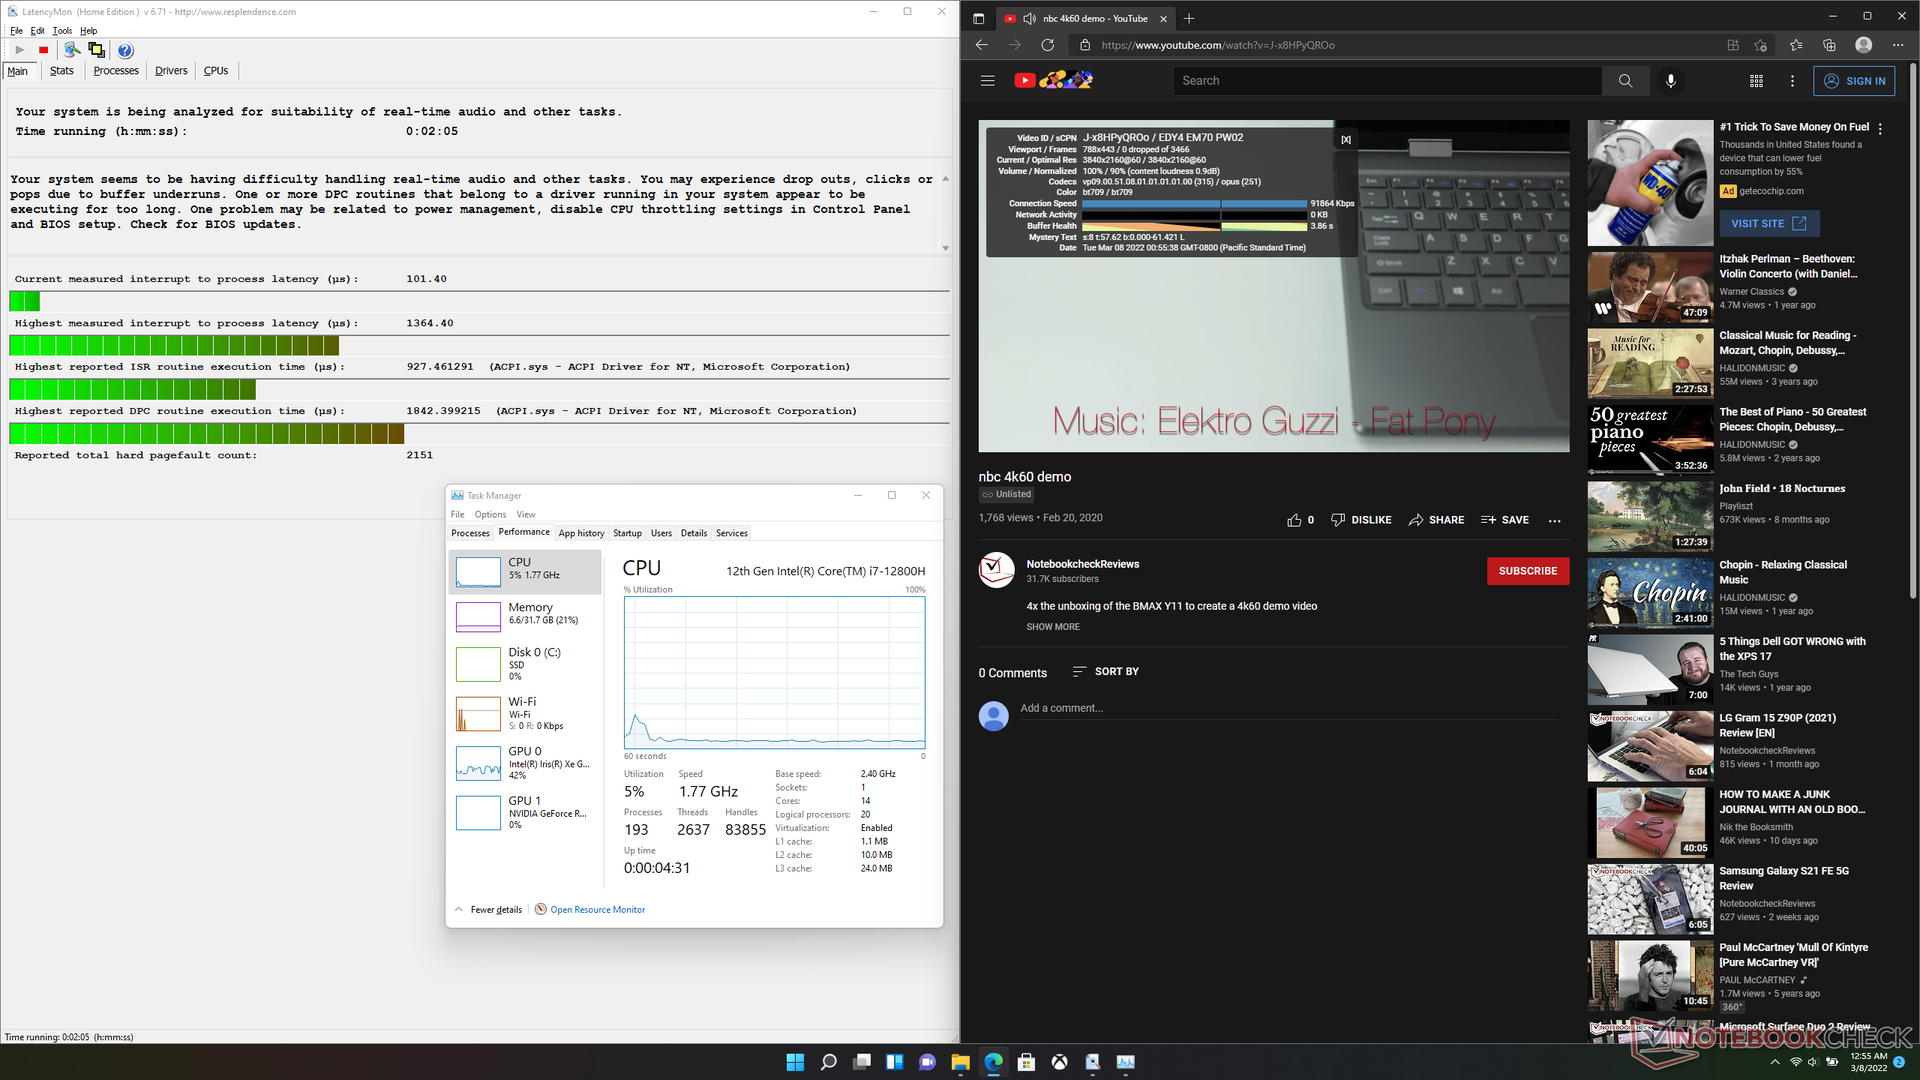
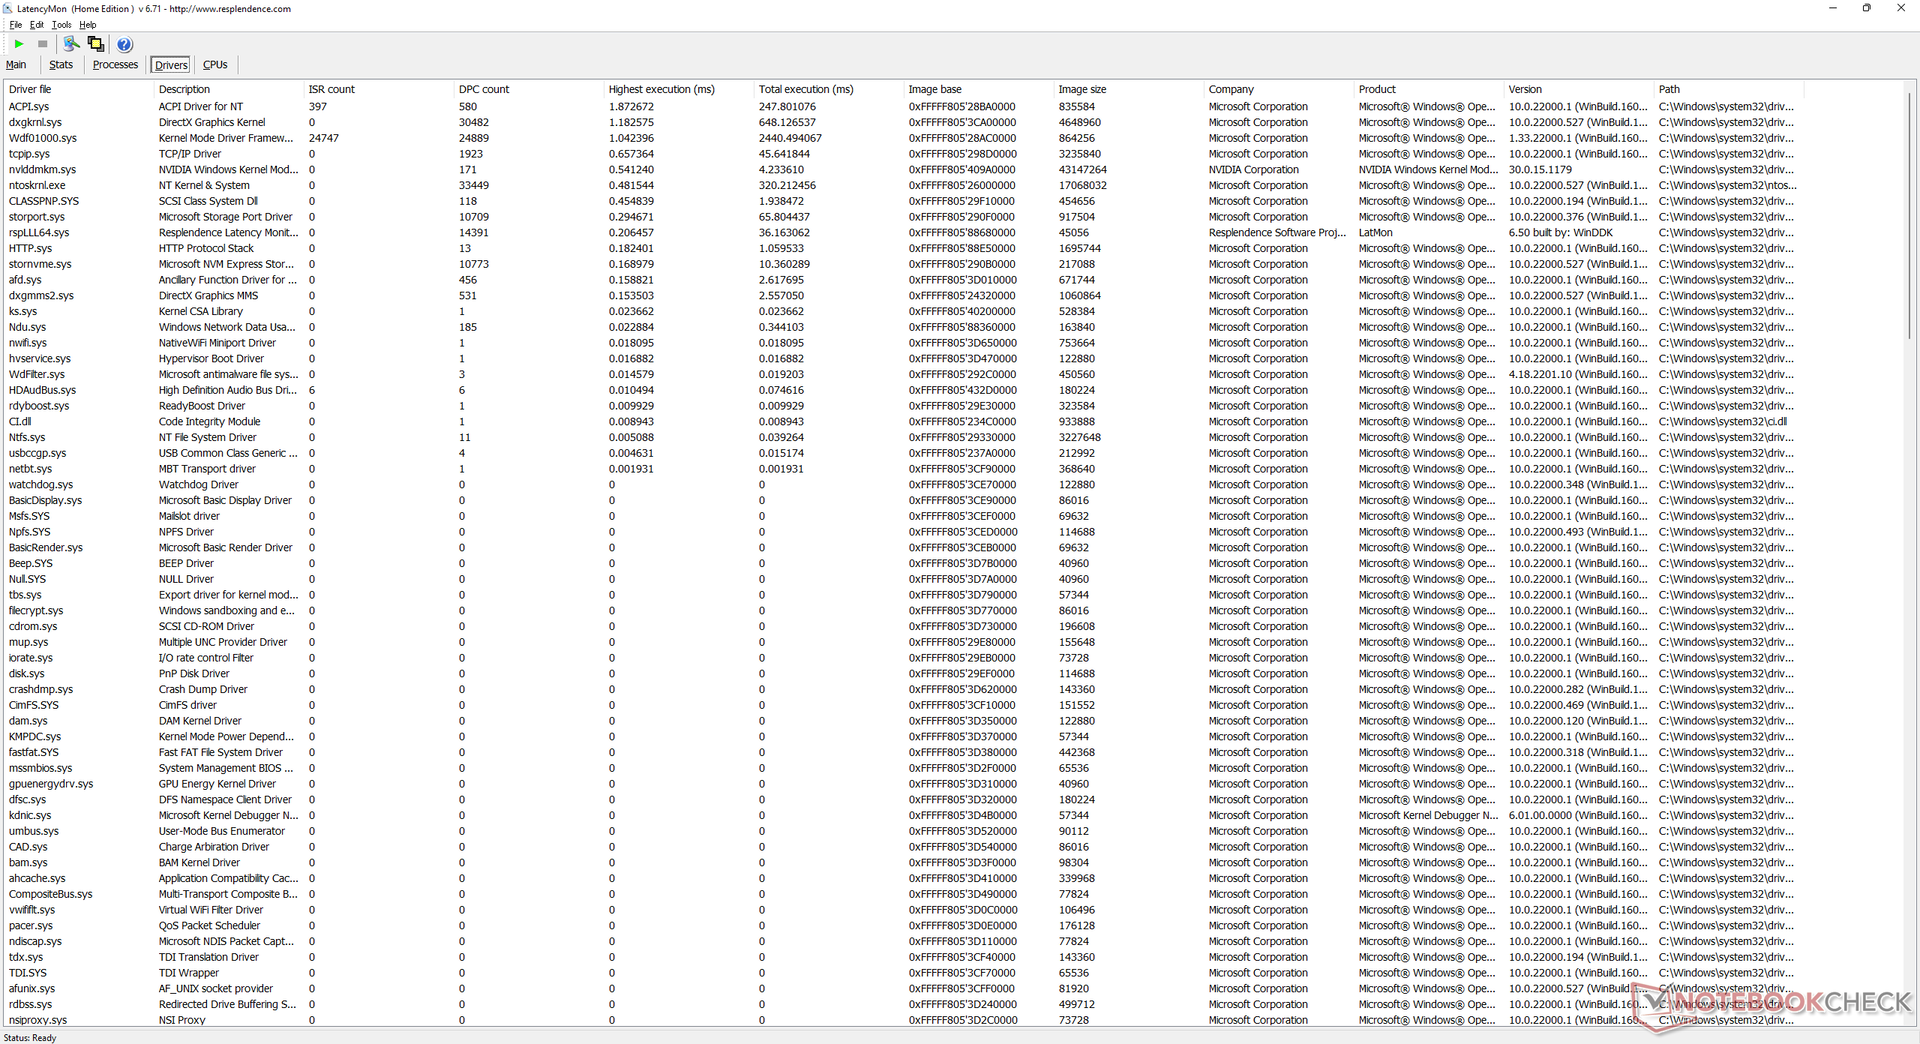
LatencyMon montre des problèmes de DPC lors de l'ouverture de plusieurs onglets de navigateur sur notre page d'accueil. la lecture de vidéos 4K à 60 FPS est par ailleurs fluide et sans perte d'images en mode Optimus.
| DPC Latencies / LatencyMon - interrupt to process latency (max), Web, Youtube, Prime95 | |
| ADATA XPG Xenia 15 | |
| Razer Blade 15 2022 | |
| Schenker XMG Neo 15 E22 (Early 2022, RTX 3080 Ti) | |
| Razer Blade 15 RTX 2080 Super Max-Q | |
| Razer Blade 15 Advanced Model Early 2021 | |
| Eurocom Nightsky ARX315 | |
* ... Moindre est la valeur, meilleures sont les performances
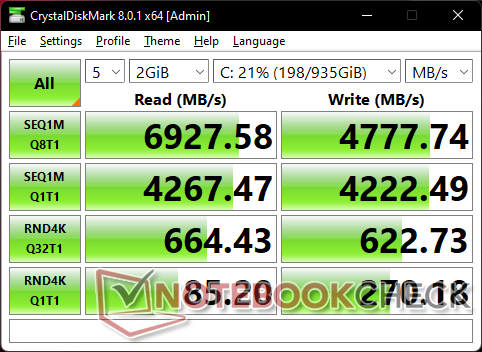
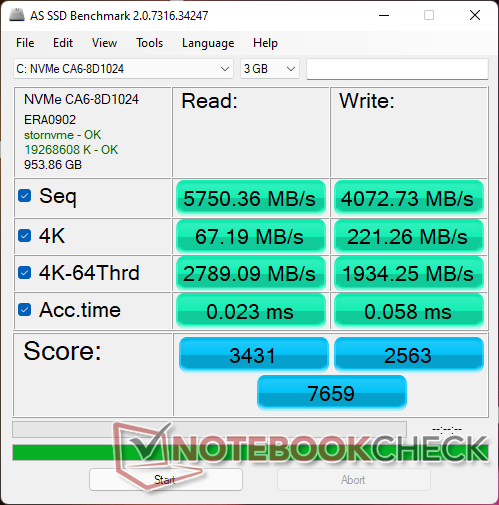
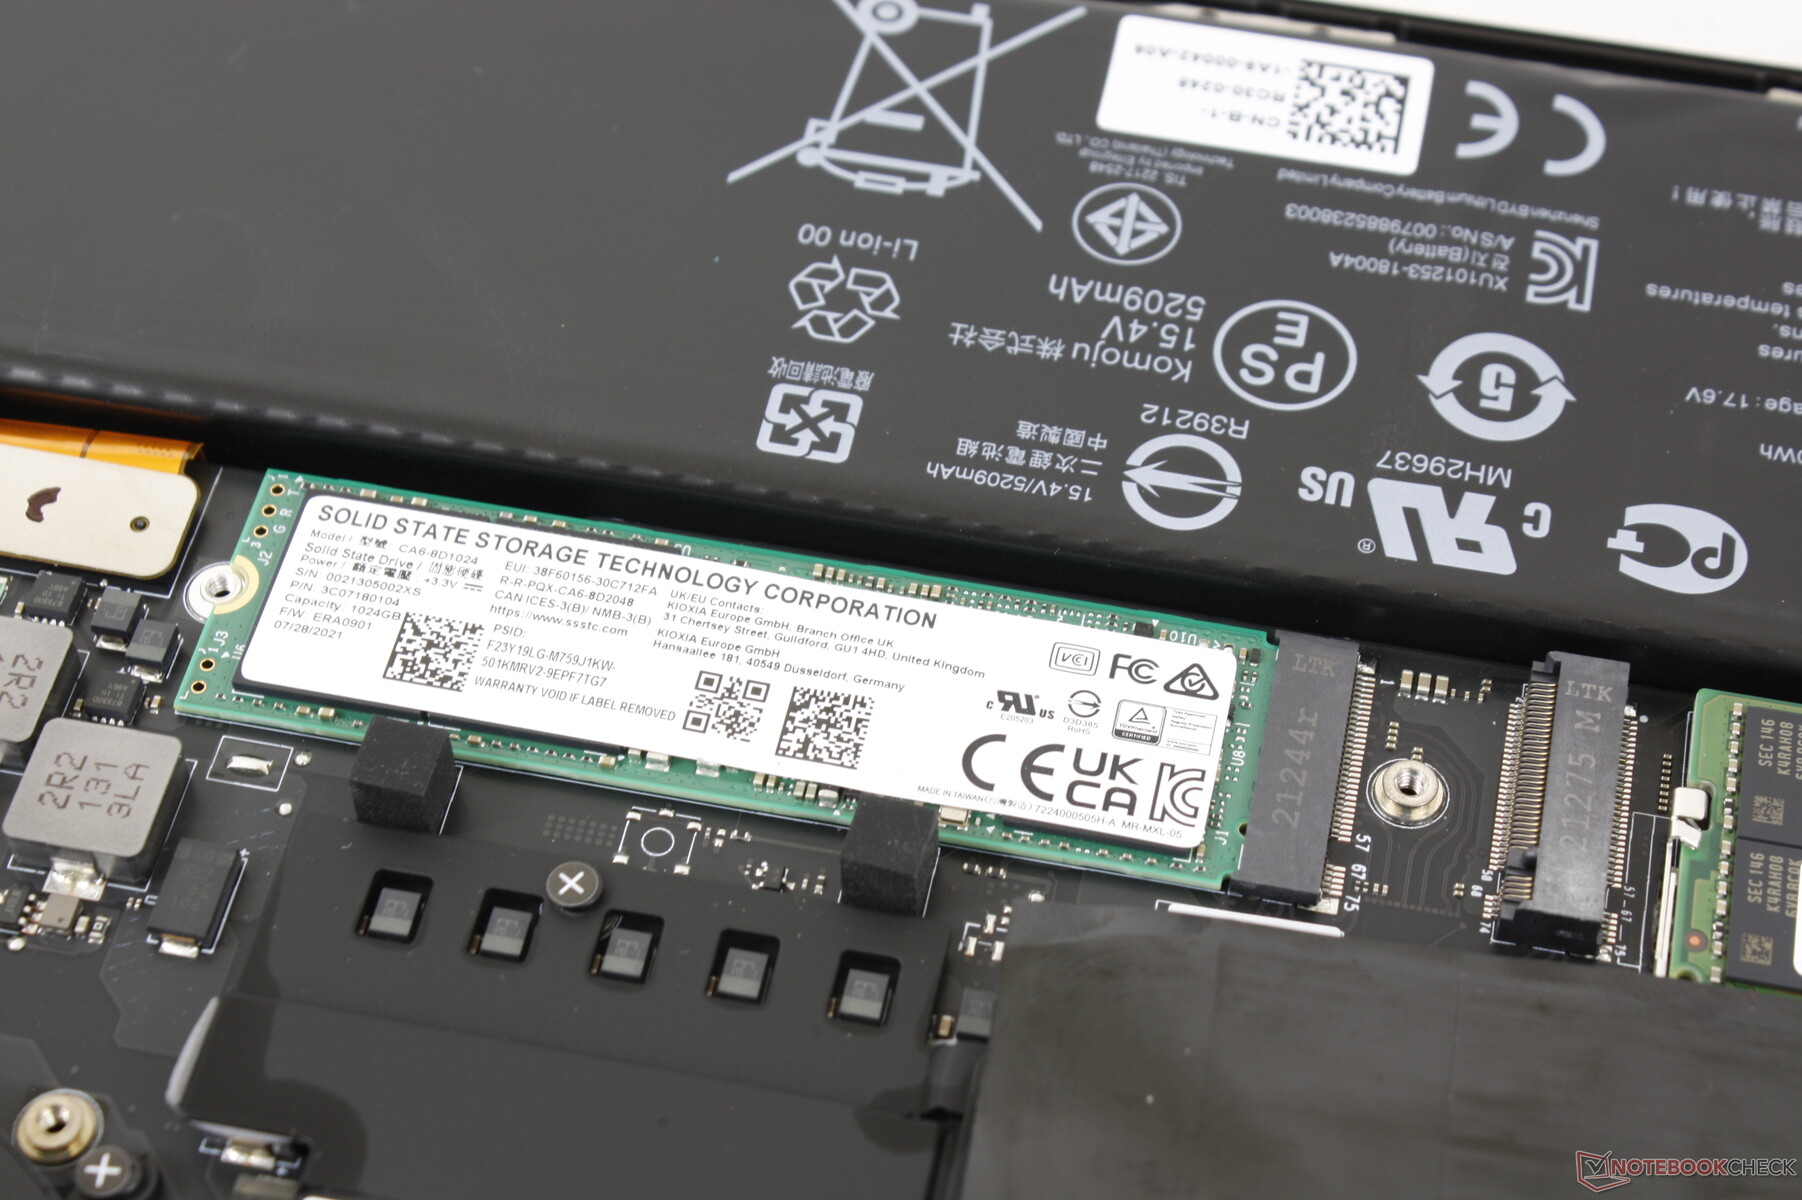
Périphériques de stockage
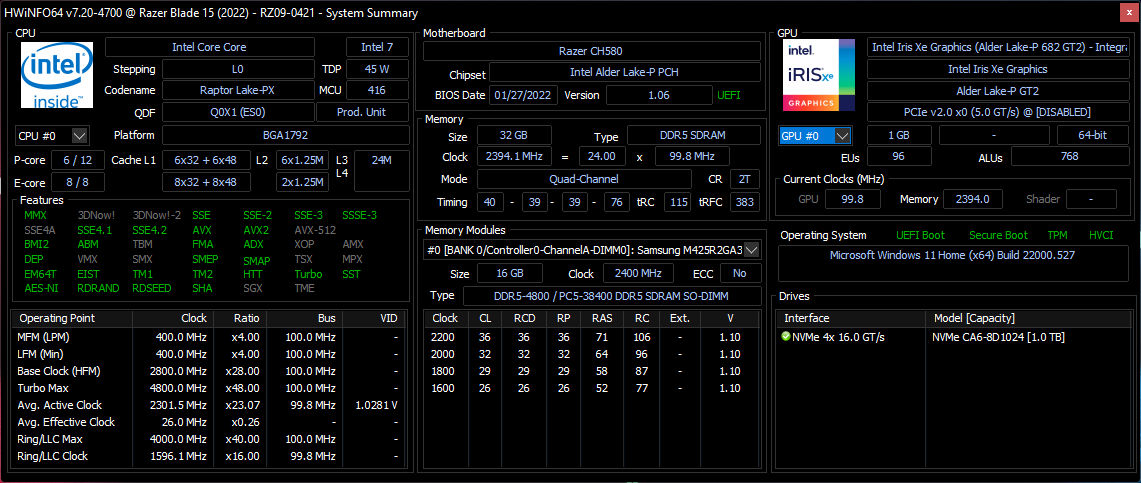
Presque tous les ordinateurs portables Razer Blade utilisent des disques SSD Lite-On ou Samsung et le dernier Blade 15 ne fait pas exception. Notre unité de test est équipée du 1 To Lite-On CA6-8D1024 PCIe4 x4 NVMe SSD pour des taux de lecture et d'écriture séquentiels pouvant atteindre 6800 Mo/s et 4800 Mo/s, respectivement. Notre test DiskSpd Read Loop montre que le disque n'a aucun problème à maintenir ses niveaux de performance maximum pendant des périodes prolongées.

* ... Moindre est la valeur, meilleures sont les performances
Disk Throttling: DiskSpd Read Loop, Queue Depth 8
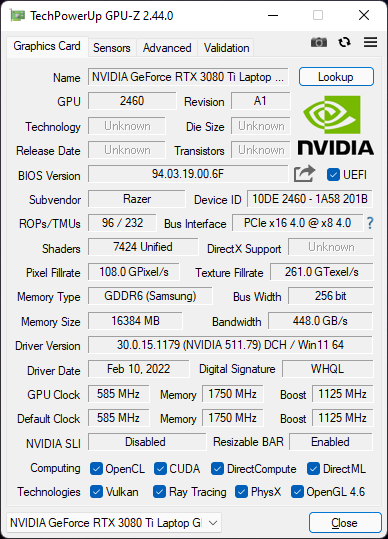
Performances du GPU
Les performances graphiques sont environ 15 à 25 % supérieures à celles du Blade 15 RTX 3080 ou 30 à 45 % plus rapide que le Blade 15 RTX 2080 Max-Q. Certaines alternatives comme le Schenker XMG Neo 15 E22 ou le Schenker Uniwill Technology GM7AG8P sont plus rapides.Schenker Uniwill Technology GM7AG8P sont équipées de versions plus puissantes de 150+ W du même GPU GeForce RTX 3080 Ti pour une augmentation des performances de 10 à 15 % par rapport à notre Blade 15 RTX 3080 Ti.
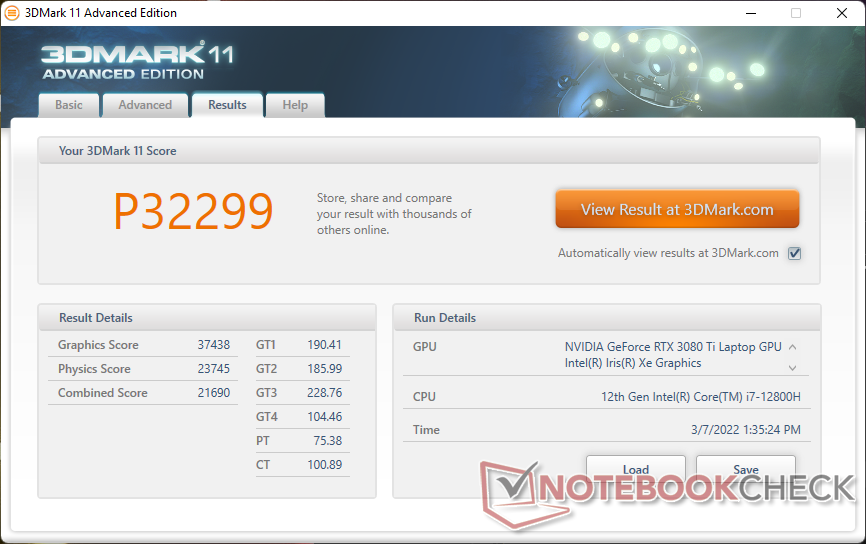
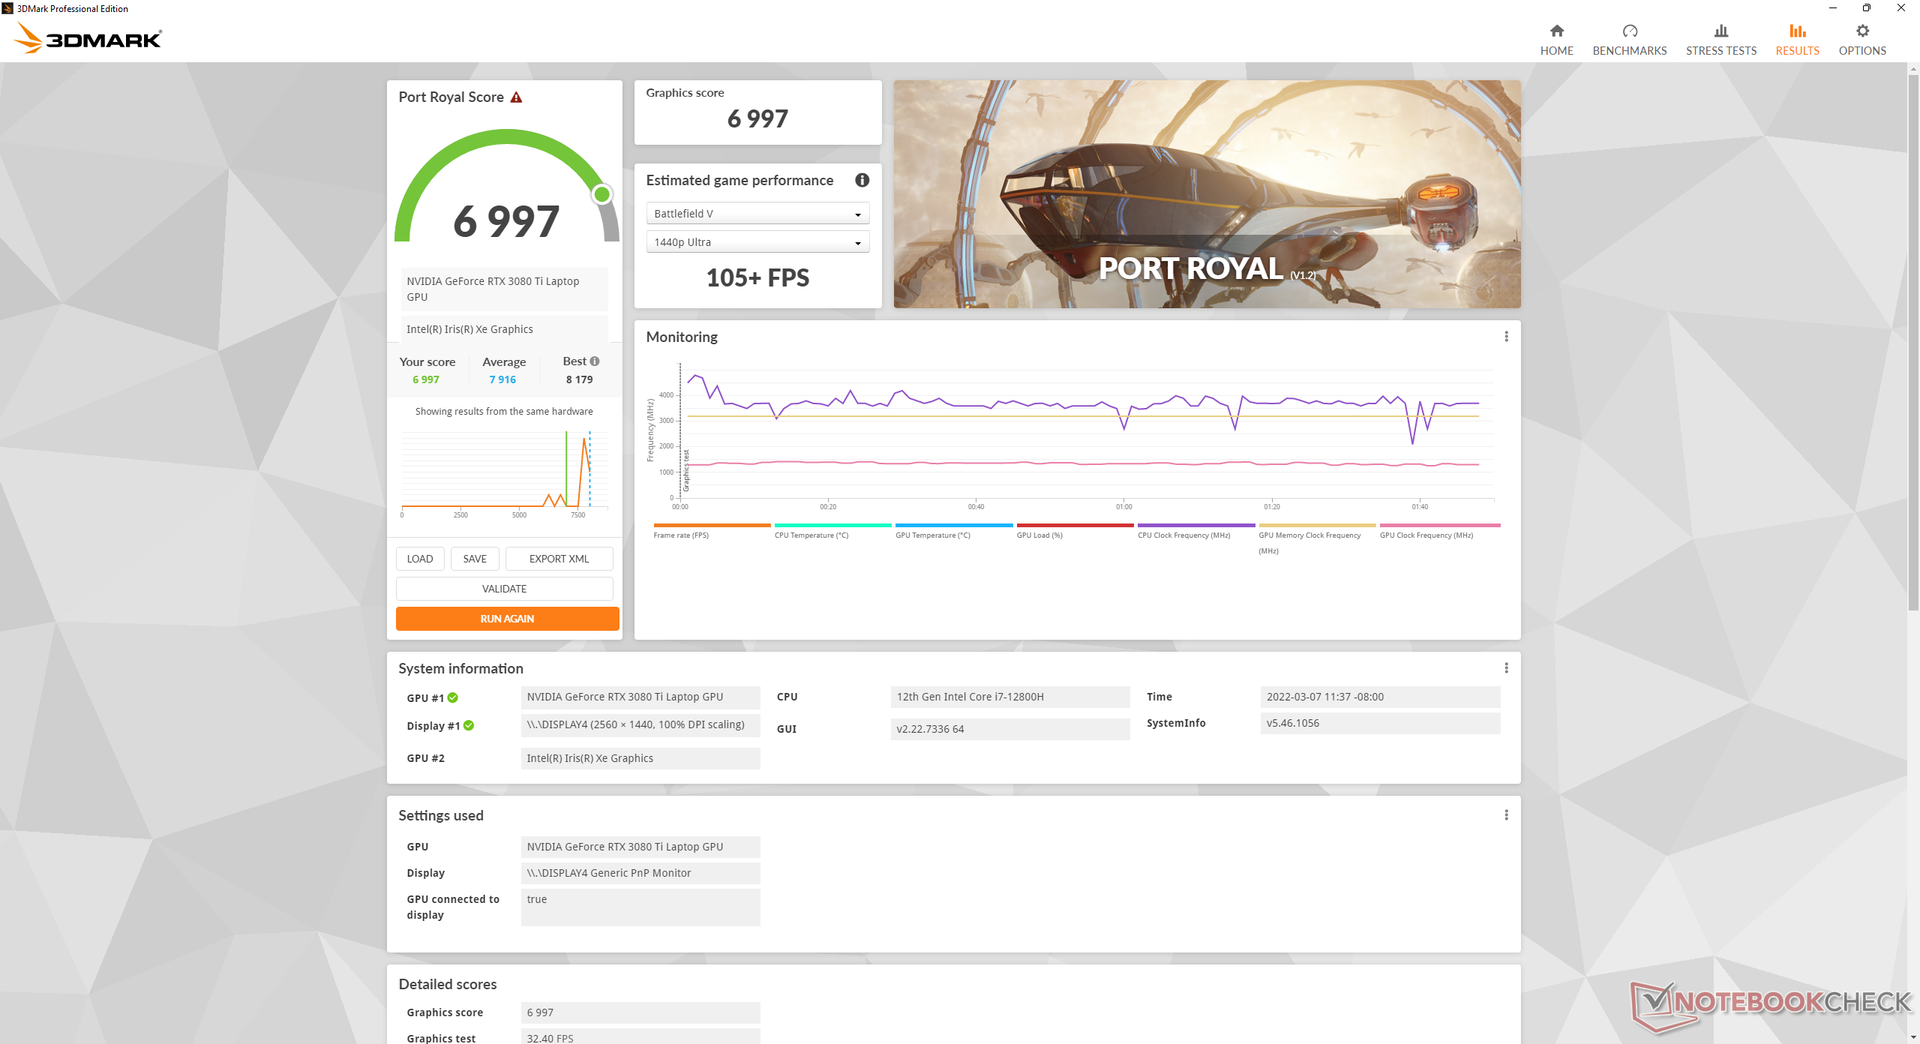
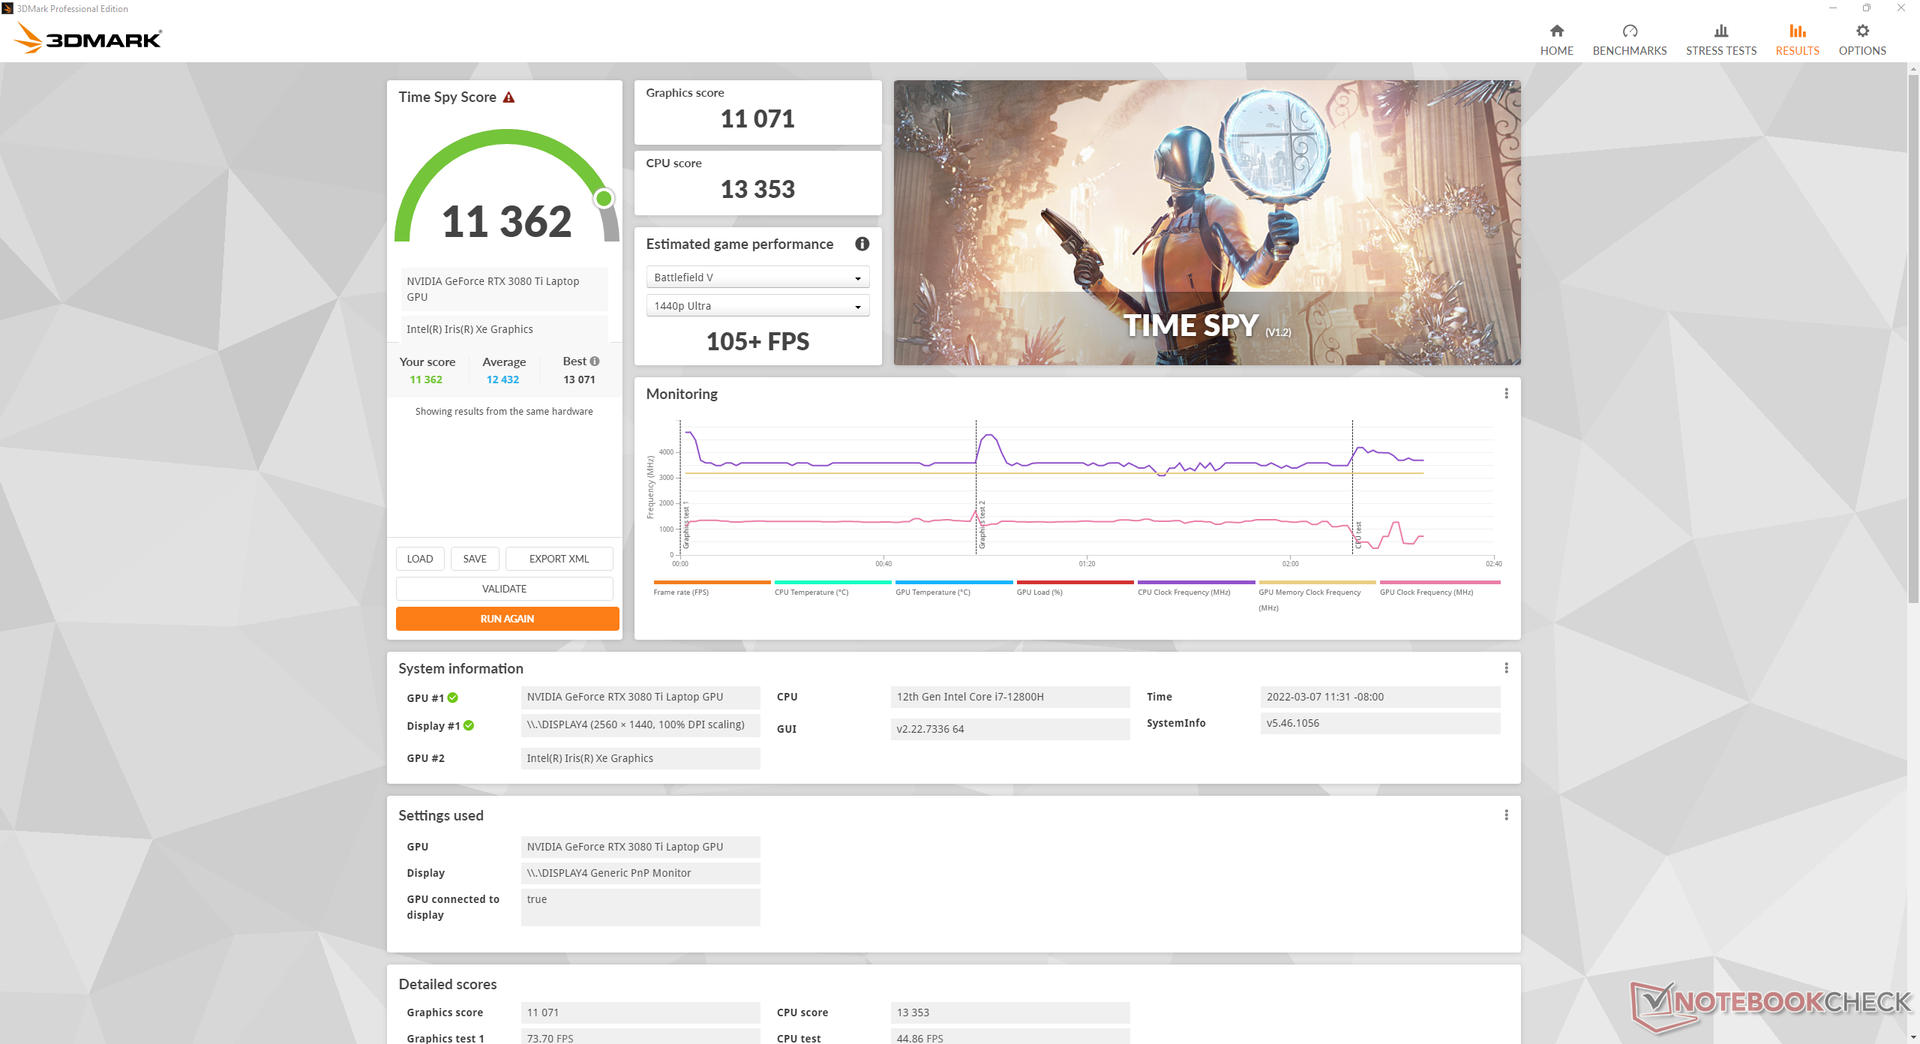
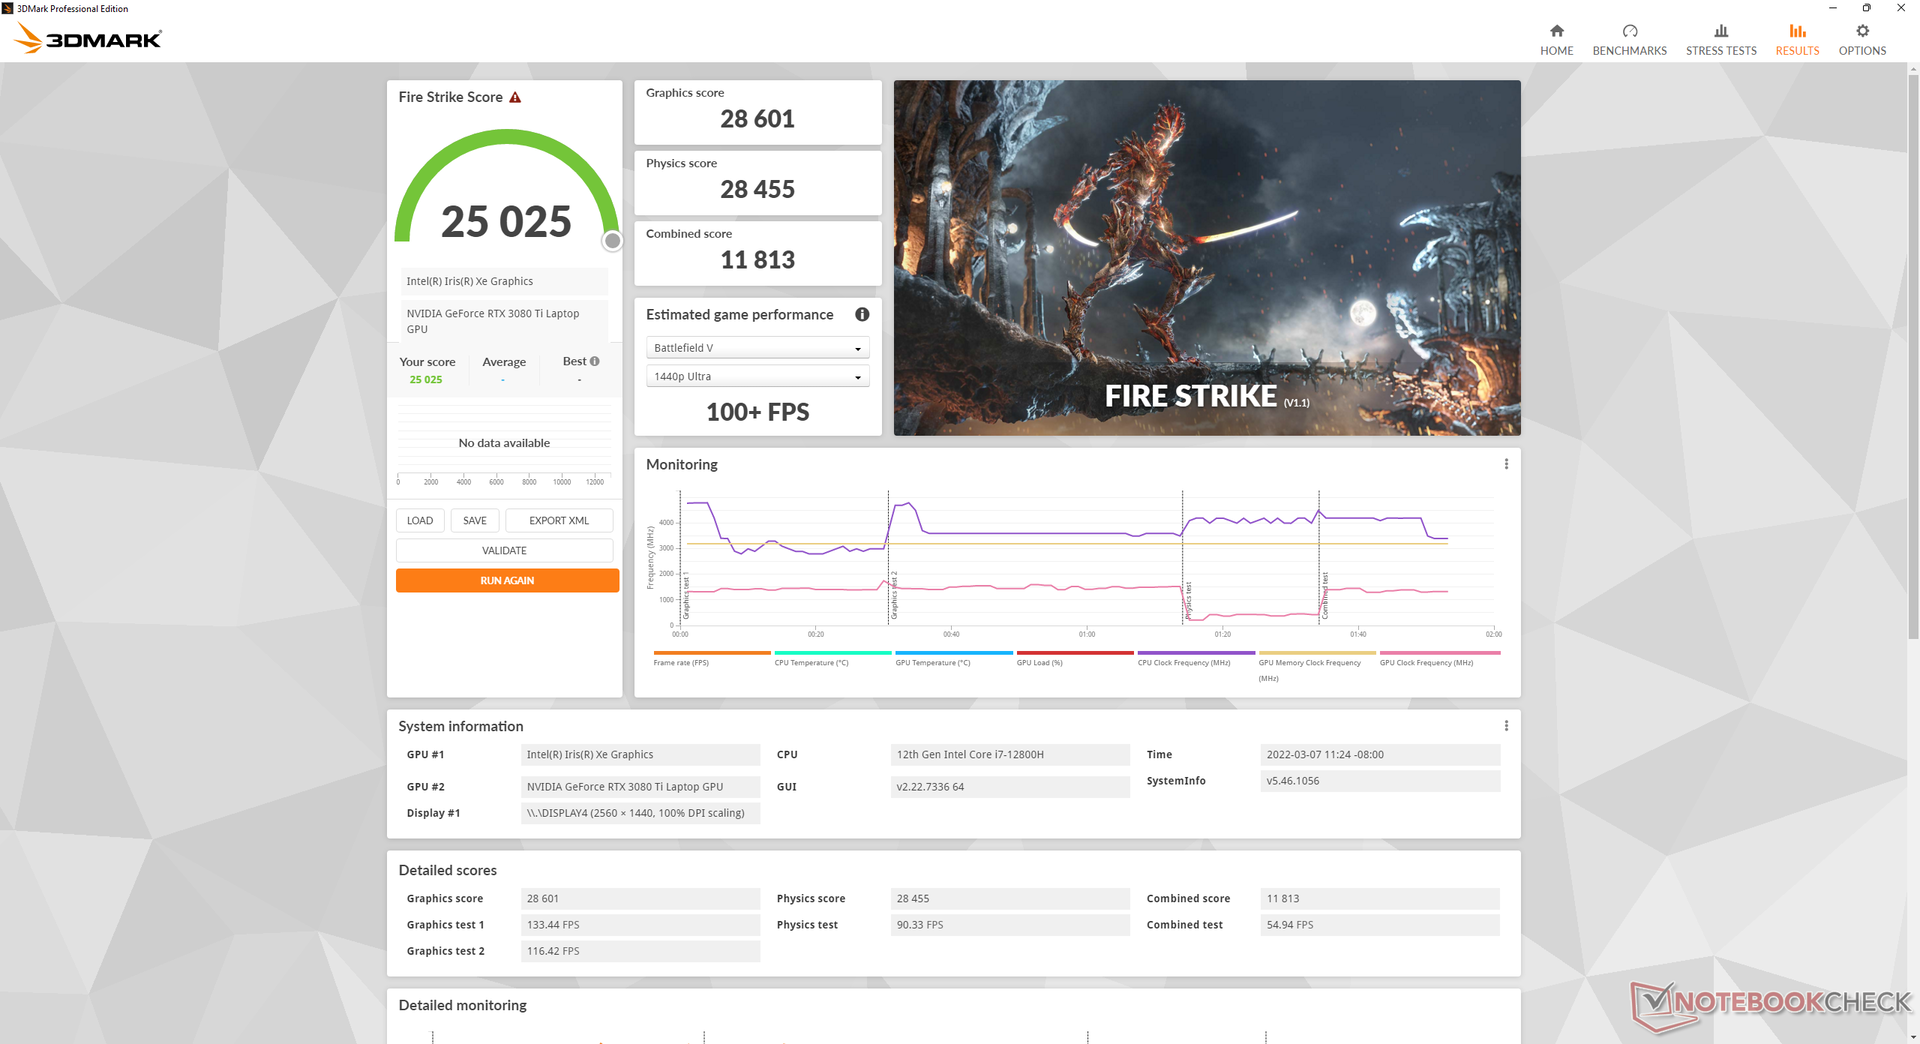
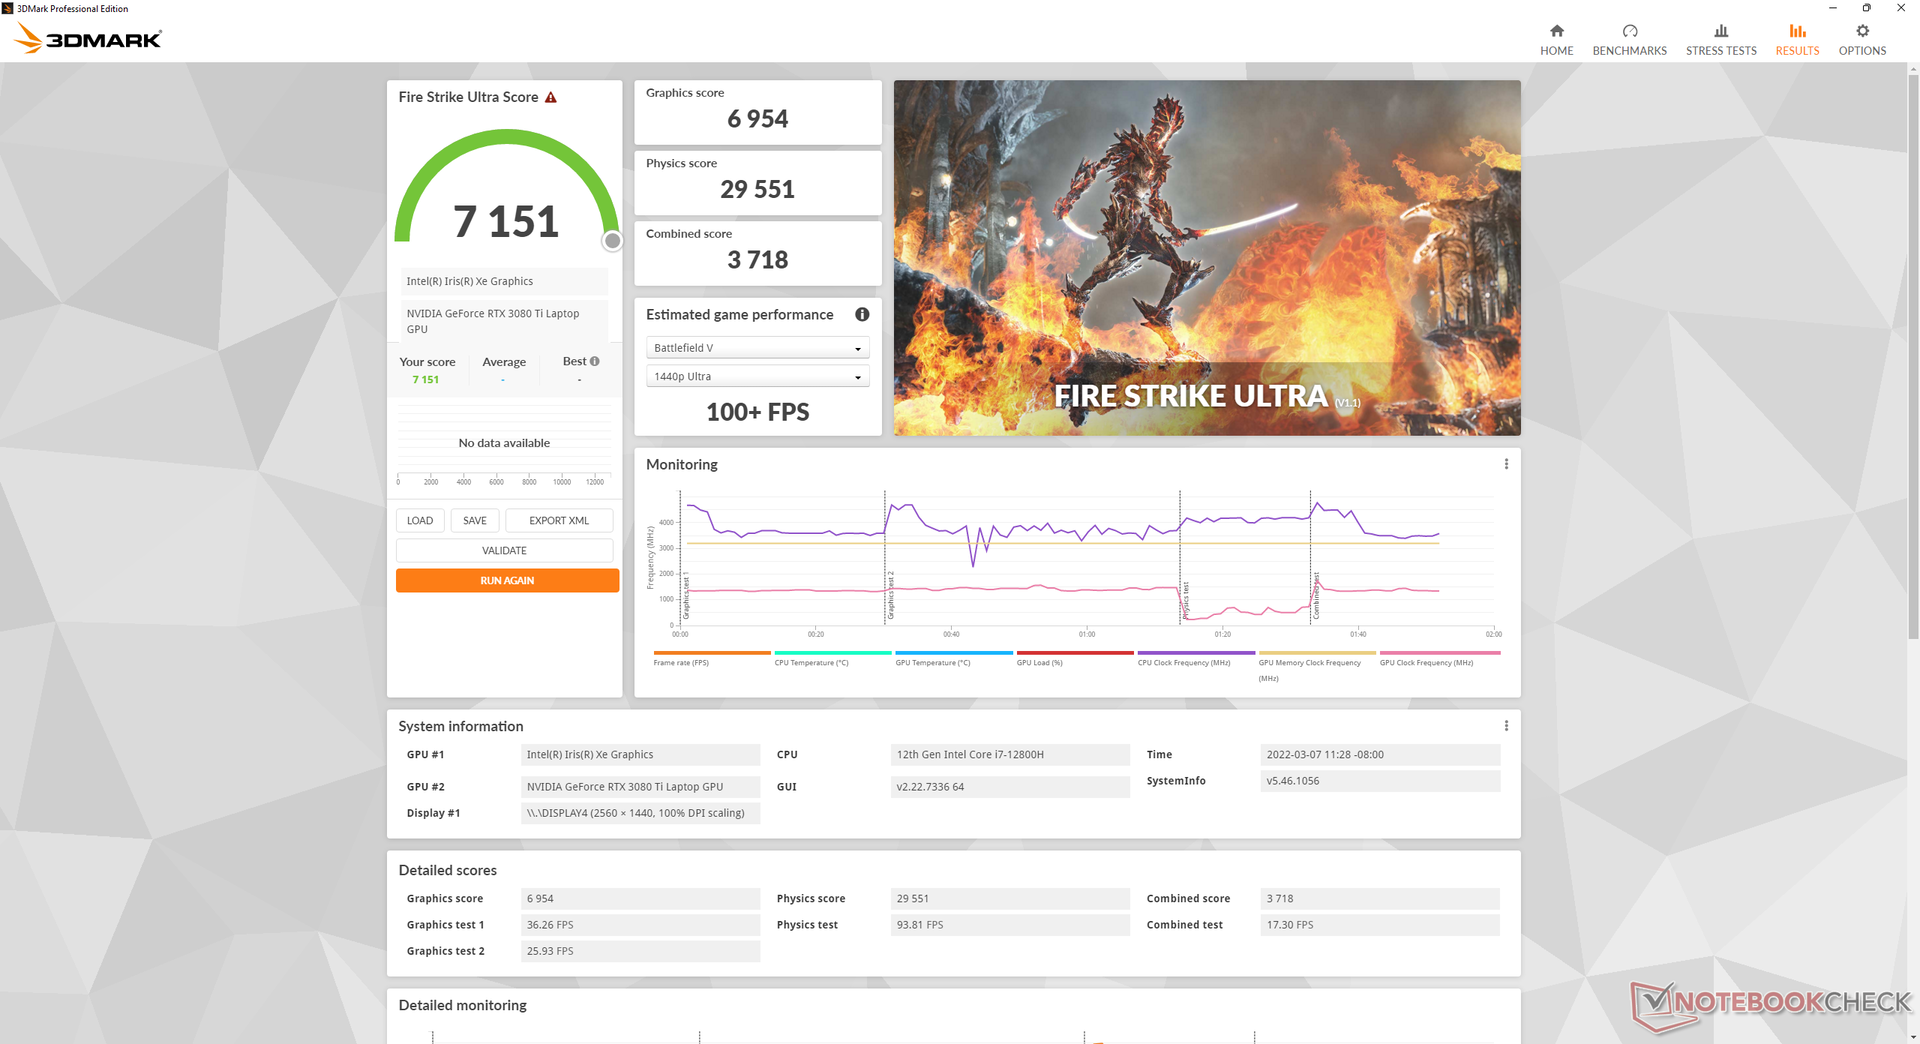
| 3DMark 11 Performance | 32299 points | |
| 3DMark Cloud Gate Standard Score | 60579 points | |
| 3DMark Fire Strike Score | 25025 points | |
| 3DMark Time Spy Score | 11362 points | |
Aide | ||
Witcher 3 FPS Chart
| Bas | Moyen | Élevé | Ultra | QHD | |
|---|---|---|---|---|---|
| GTA V (2015) | 186 | 181 | 177 | 118 | 97.8 |
| The Witcher 3 (2015) | 457.4 | 320.9 | 213.7 | 107.2 | |
| Dota 2 Reborn (2015) | 181 | 169 | 164 | 156 | |
| Final Fantasy XV Benchmark (2018) | 178 | 141 | 106 | 82.9 | |
| X-Plane 11.11 (2018) | 158 | 140 | 110 | ||
| Far Cry 5 (2018) | 179 | 151 | 144 | 135 | 107 |
| Strange Brigade (2018) | 442 | 252 | 205 | 184 | 132 |
Émissions
Bruit du système
Le bruit des ventilateurs dépend du profil d'alimentation de Synapse. Nous recommandons de faire fonctionner le système en mode silencieux lors de la navigation sur Internet ou de la diffusion de vidéos en continu, car les ventilateurs émettent des impulsions plus fréquentes en mode équilibré ou haute performance. L'inconvénient du mode Silencieux est que les repose-poignets et la partie inférieure de l'ordinateur portable seront sensiblement plus chauds car les ventilateurs fonctionnent beaucoup plus lentement.
Le bruit du ventilateur lorsque le site Witcher 3 fonctionne en mode Haute performance est similaire à celui que nous avons enregistré sur les anciens modèles Blade 15, soit environ 45 dB(A), ce qui est toujours beaucoup plus silencieux que sur le XPG Xenia 15 ou l'Eurocom Nightsky ARX3000.Eurocom Nightsky ARX315. Cependant, cela peut augmenter jusqu'à 49 à 52 dB(A) si le CPU est sollicité davantage.
Degré de la nuisance sonore
| Au repos |
| 26.2 / 26.2 / 28.4 dB(A) |
| Fortement sollicité |
| 44.7 / 51.9 dB(A) |
 | ||
30 dB silencieux 40 dB(A) audible 50 dB(A) bruyant |
||
min: | ||
| Razer Blade 15 2022 GeForce RTX 3080 Ti Laptop GPU, i7-12800H, SSSTC CA6-8D1024 | Razer Blade 15 Advanced Model Early 2021 GeForce RTX 3080 Laptop GPU, i7-10875H, Samsung PM981a MZVLB1T0HBLR | Razer Blade 15 RTX 2080 Super Max-Q GeForce RTX 2080 Super Max-Q, i7-10875H, Samsung PM981a MZVLB1T0HBLR | Schenker XMG Neo 15 E22 (Early 2022, RTX 3080 Ti) GeForce RTX 3080 Ti Laptop GPU, i7-12700H, Samsung SSD 980 Pro 250GB MZ-V8P250BW | ADATA XPG Xenia 15 GeForce RTX 3070 Laptop GPU, i7-11800H, ADATA XPG Gammix S70 1TB | Eurocom Nightsky ARX315 GeForce RTX 3070 Laptop GPU, R9 5900X, Samsung SSD 980 Pro 1TB MZ-V8P1T0BW | |
|---|---|---|---|---|---|---|
| Noise | -4% | -8% | 2% | 5% | -15% | |
| arrêt / environnement * (dB) | 25.4 | 24 6% | 30.1 -19% | 24 6% | 24.8 2% | 25.3 -0% |
| Idle Minimum * (dB) | 26.2 | 26 1% | 30.1 -15% | 24 8% | 24.9 5% | 25.9 1% |
| Idle Average * (dB) | 26.2 | 28 -7% | 30.1 -15% | 24 8% | 24.9 5% | 27.9 -6% |
| Idle Maximum * (dB) | 28.4 | 40 -41% | 30.1 -6% | 27.76 2% | 24.9 12% | 40.8 -44% |
| Load Average * (dB) | 44.7 | 45 -1% | 46.8 -5% | 38.81 13% | 28.8 36% | 55.2 -23% |
| Witcher 3 ultra * (dB) | 44.7 | 43 4% | 48.4 -8% | 54.2 -21% | 52.7 -18% | 52.4 -17% |
| Load Maximum * (dB) | 51.9 | 45 13% | 46 11% | 54.18 -4% | 54.9 -6% | 60.3 -16% |
* ... Moindre est la valeur, meilleures sont les performances
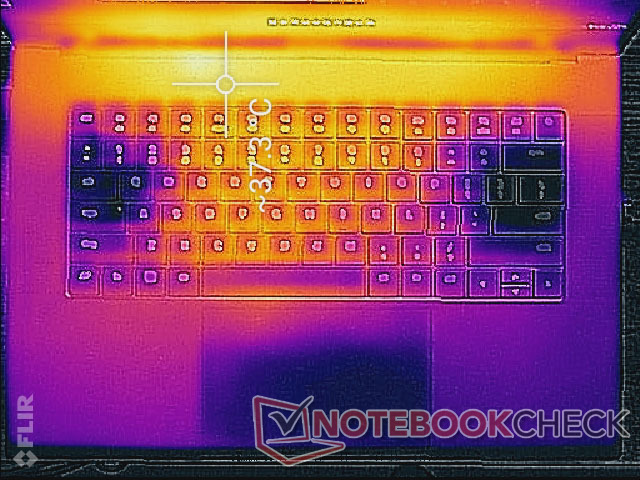
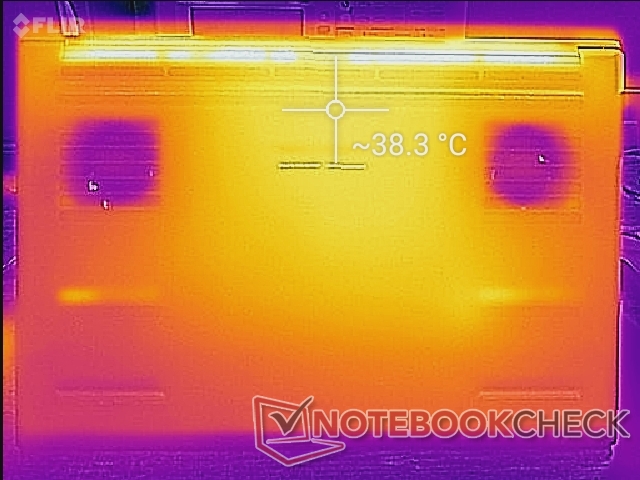
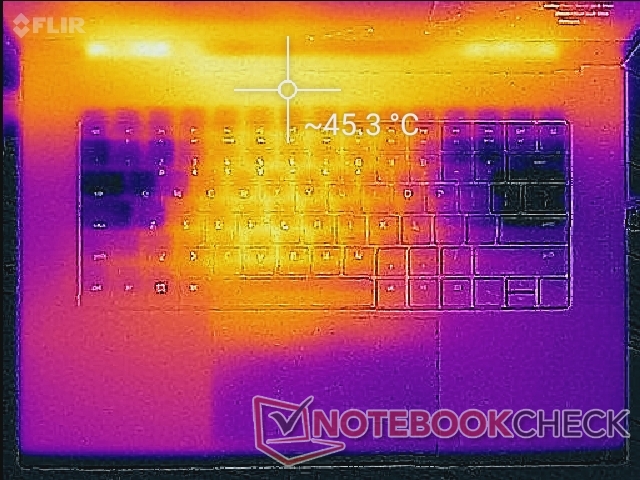
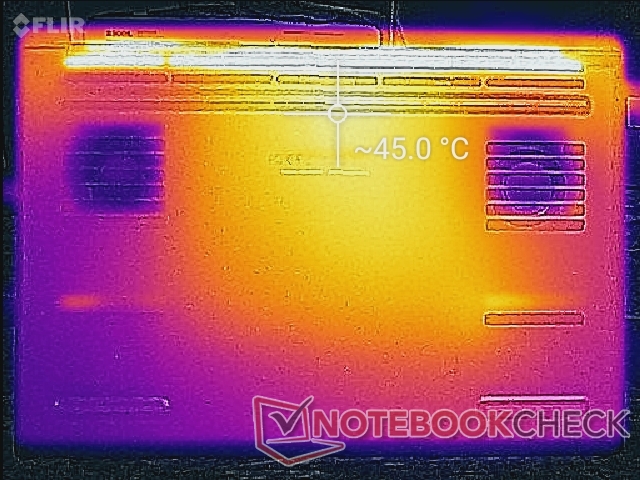
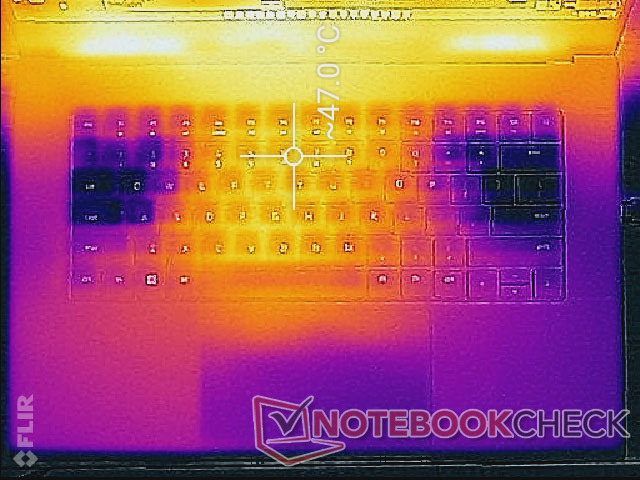
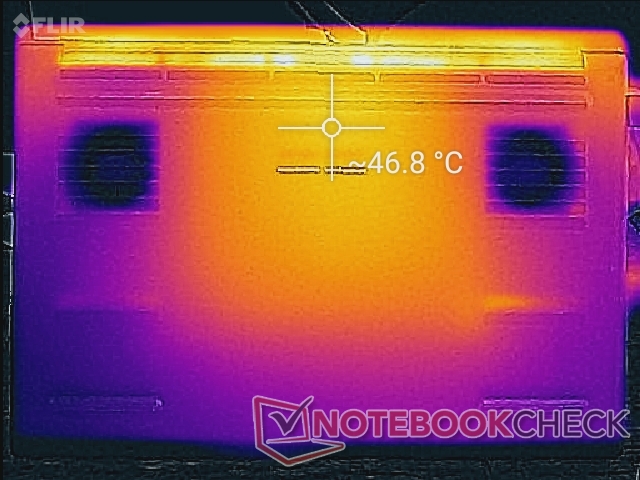
Température
Les températures de surface sont chaudes, même lorsque l'appareil tourne au ralenti sur le bureau. Les points chauds peuvent atteindre plus de 37 C sur le dessus et le dessous, des chiffres comparables à ceux de l'ultrafin XPG Xenia 15 ou MSI Vector GP66 dans des conditions similaires. Attendez-vous à ce que le centre du clavier atteigne une température de 48°C lorsque vous jouez.
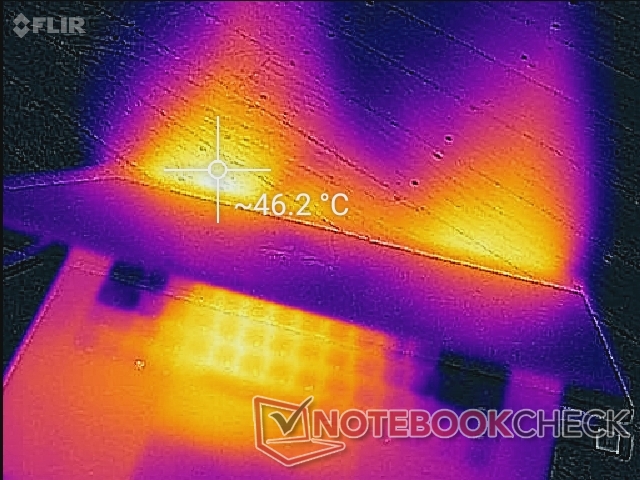
(-) La température maximale du côté supérieur est de 50 °C / 122 F, par rapport à la moyenne de 40.4 °C / 105 F, allant de 21.2 à 68.8 °C pour la classe Gaming.
(-) Le fond chauffe jusqu'à un maximum de 47 °C / 117 F, contre une moyenne de 43.2 °C / 110 F
(±) En utilisation inactive, la température moyenne du côté supérieur est de 32.4 °C / 90 F, par rapport à la moyenne du dispositif de 33.9 °C / 93 F.
(±) En jouant à The Witcher 3, la température moyenne du côté supérieur est de 36 °C / 97 F, alors que la moyenne de l'appareil est de 33.9 °C / 93 F.
(+) Les repose-poignets et le pavé tactile atteignent la température maximale de la peau (34 °C / 93.2 F) et ne sont donc pas chauds.
(-) La température moyenne de la zone de l'appui-paume de dispositifs similaires était de 28.8 °C / 83.8 F (-5.2 °C / #-9.4 F).
| Razer Blade 15 2022 Intel Core i7-12800H, NVIDIA GeForce RTX 3080 Ti Laptop GPU | Razer Blade 15 Advanced Model Early 2021 Intel Core i7-10875H, NVIDIA GeForce RTX 3080 Laptop GPU | Razer Blade 15 RTX 2080 Super Max-Q Intel Core i7-10875H, NVIDIA GeForce RTX 2080 Super Max-Q | Schenker XMG Neo 15 E22 (Early 2022, RTX 3080 Ti) Intel Core i7-12700H, NVIDIA GeForce RTX 3080 Ti Laptop GPU | ADATA XPG Xenia 15 Intel Core i7-11800H, NVIDIA GeForce RTX 3070 Laptop GPU | Eurocom Nightsky ARX315 AMD Ryzen 9 5900X, NVIDIA GeForce RTX 3070 Laptop GPU | |
|---|---|---|---|---|---|---|
| Heat | 6% | 7% | -7% | -12% | 6% | |
| Maximum Upper Side * (°C) | 50 | 49 2% | 52 -4% | 52 -4% | 49 2% | 36.2 28% |
| Maximum Bottom * (°C) | 47 | 54 -15% | 53 -13% | 68 -45% | 64.2 -37% | 49.6 -6% |
| Idle Upper Side * (°C) | 37.4 | 30 20% | 29.3 22% | 32 14% | 37.6 -1% | 32.6 13% |
| Idle Bottom * (°C) | 38.4 | 32 17% | 30.2 21% | 36 6% | 42.2 -10% | 43.2 -13% |
* ... Moindre est la valeur, meilleures sont les performances
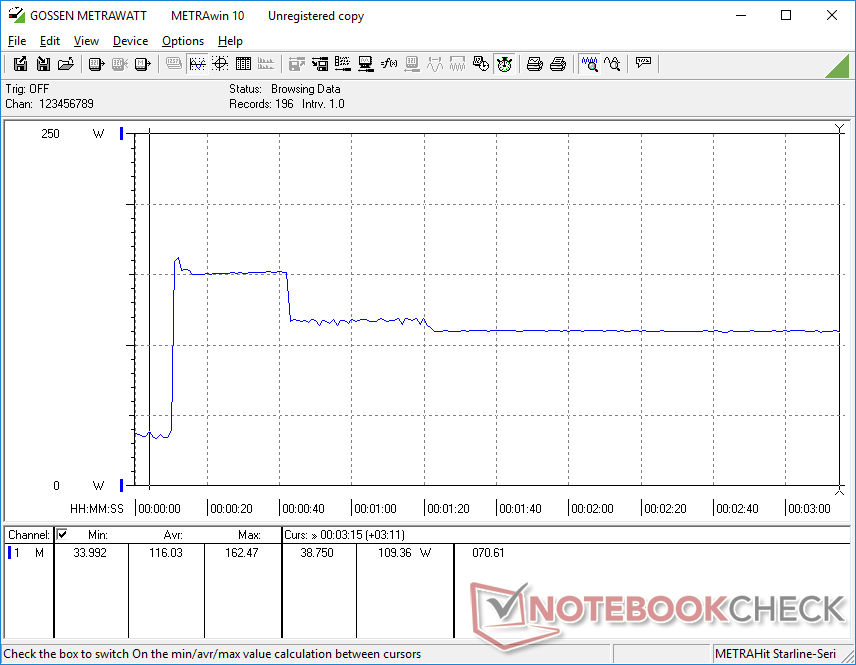
Test de stress
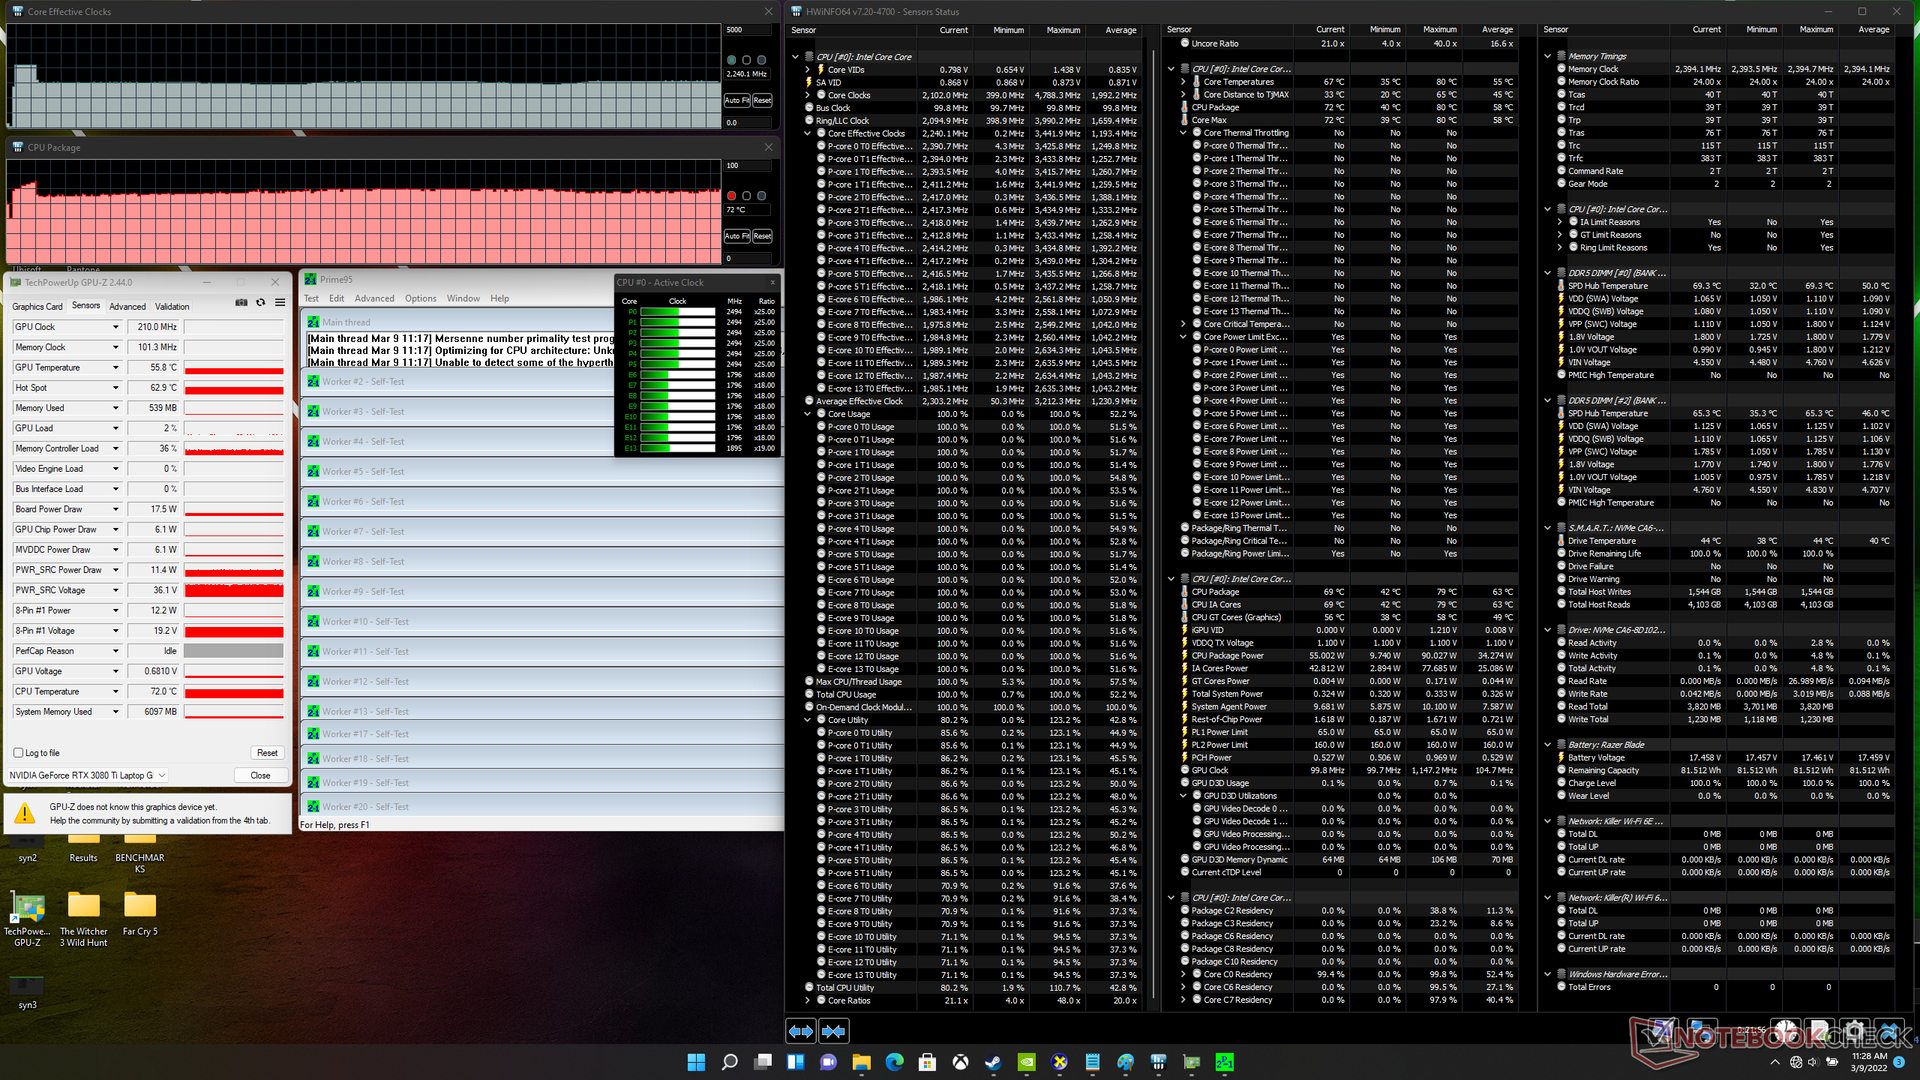
Lorsqu'il est sollicité par Prime95, le CPU passe à 3,1 GHz pendant les premières secondes jusqu'à atteindre une température de 80 C. Ensuite, les fréquences d'horloge et la température se stabilisent autour de 2,2 GHz et 66 C, respectivement. La consommation du processeur a également diminué, passant du pic initial de 90 W à 55 W, ce qui est plus stable.
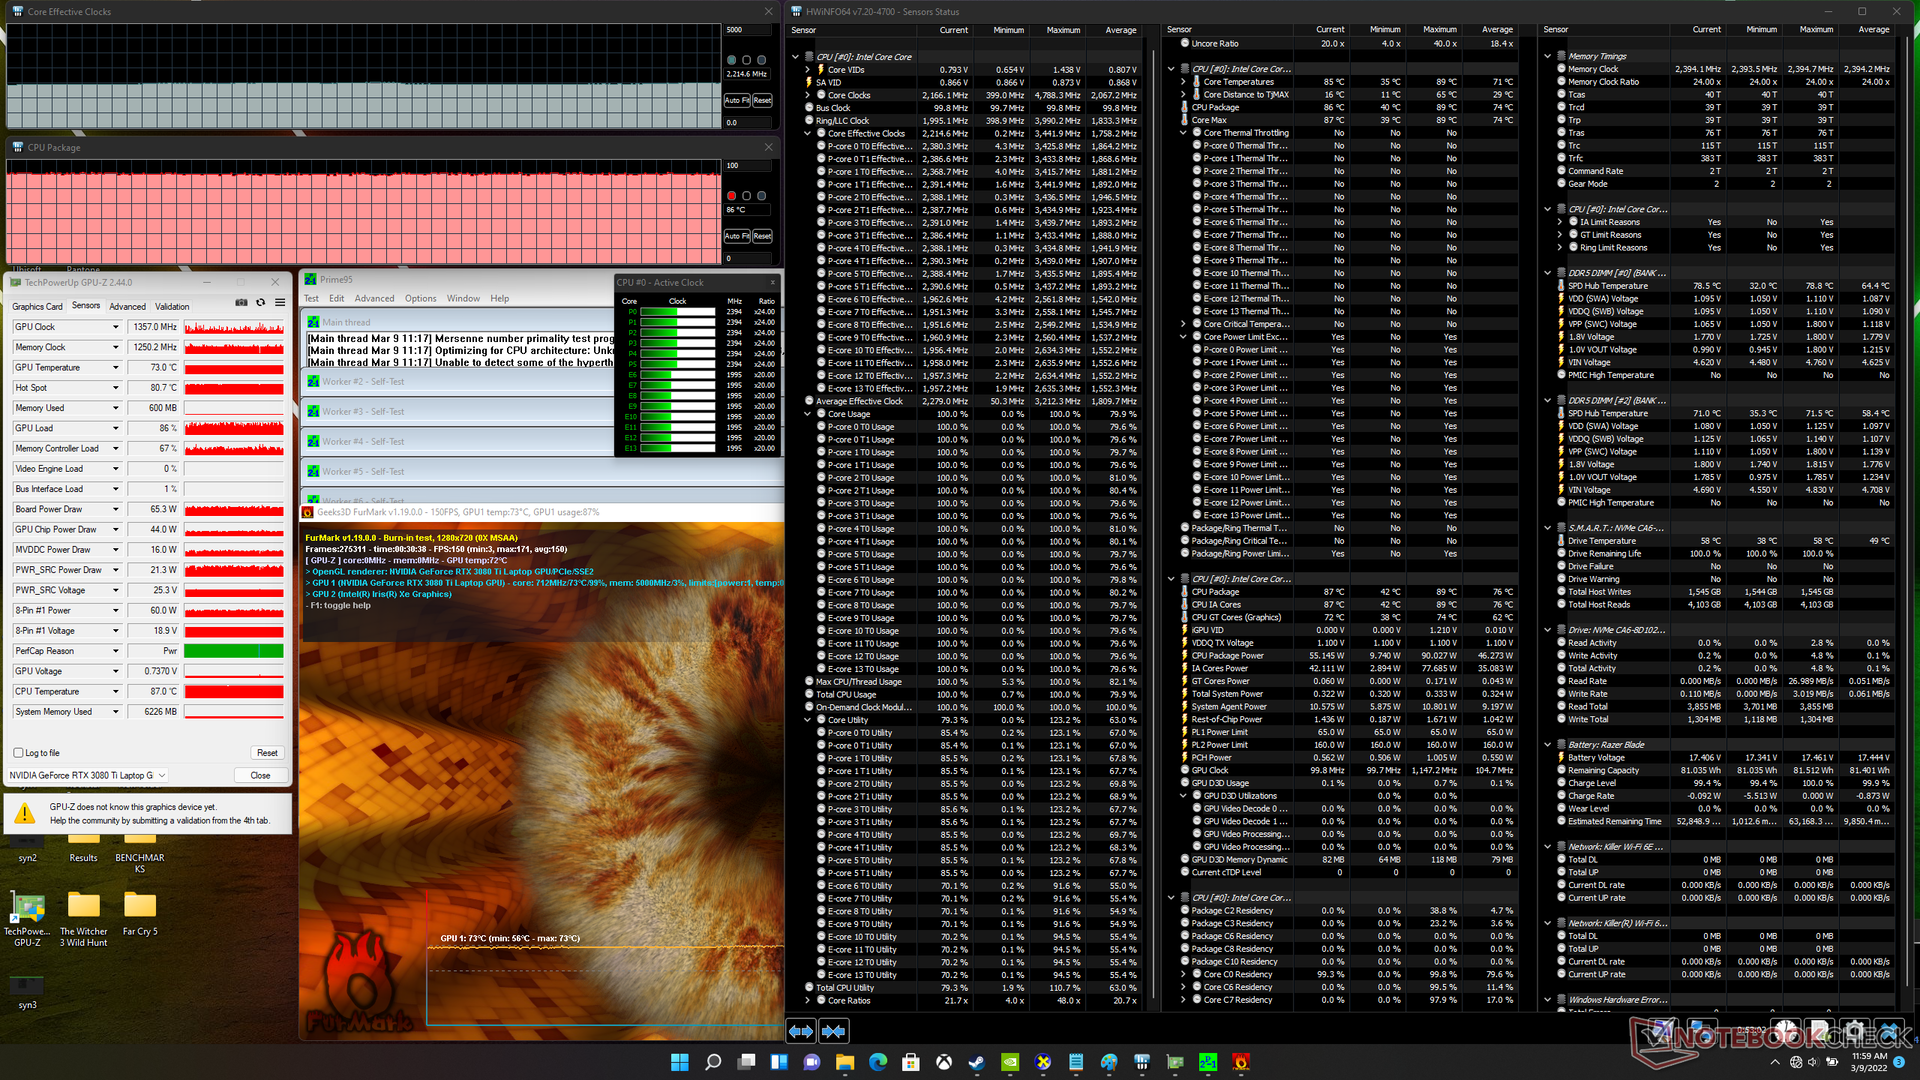
L'exécution de Witcher 3 ferait en sorte que le CPU et le GPU se stabilisent à 74 C et 67 C, respectivement, par rapport à 73 C et 71 C sur le modèle Blade 15 RTX 3080 de l'année dernière (ou 67 C et 75 C sur le modèle Blade 15 de base). Les températures du cœur ne sont donc pas très différentes d'une année sur l'autre, malgré l'augmentation des performances du CPU et du GPU.
Le fonctionnement sur batterie limite les performances. Un test Fire Strike sur batteries donnerait des scores de physique et de graphisme de 10560 et 8439 points, respectivement, contre 28455 et 28601 points sur secteur.
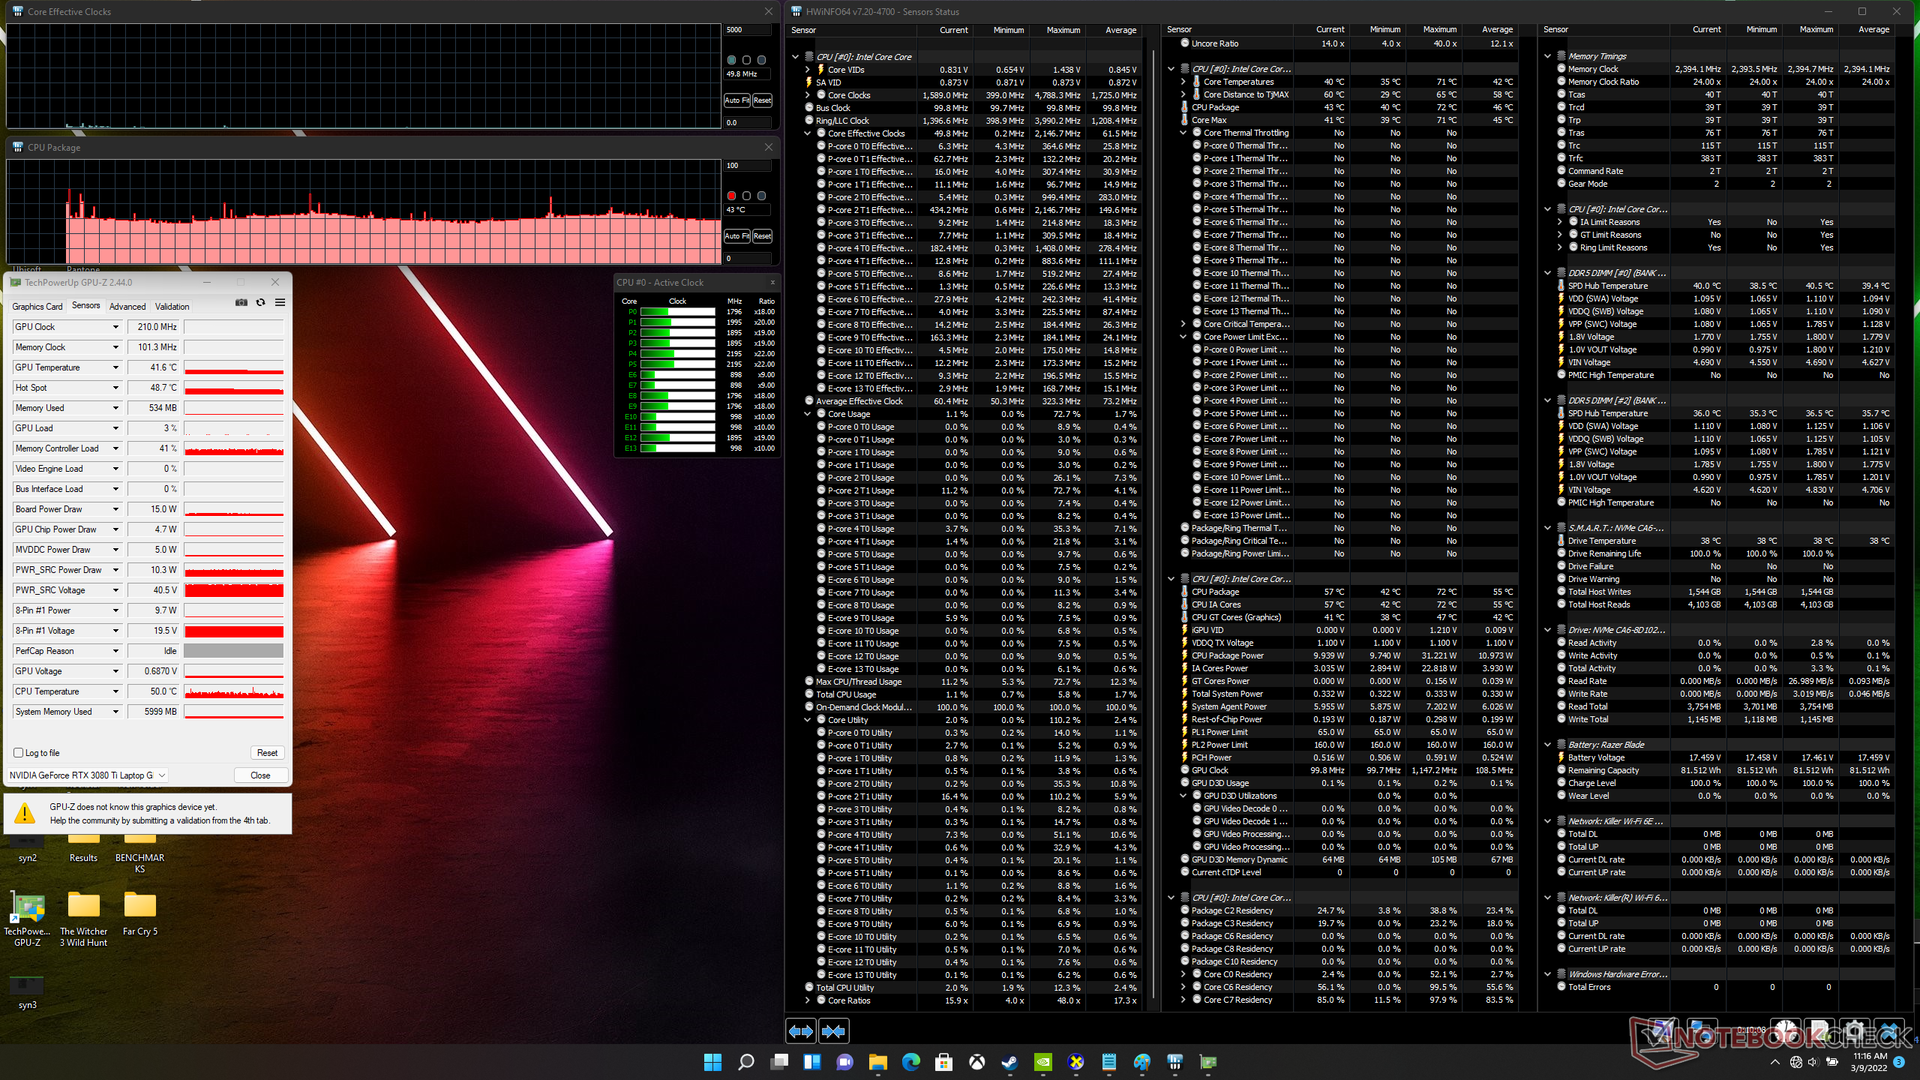
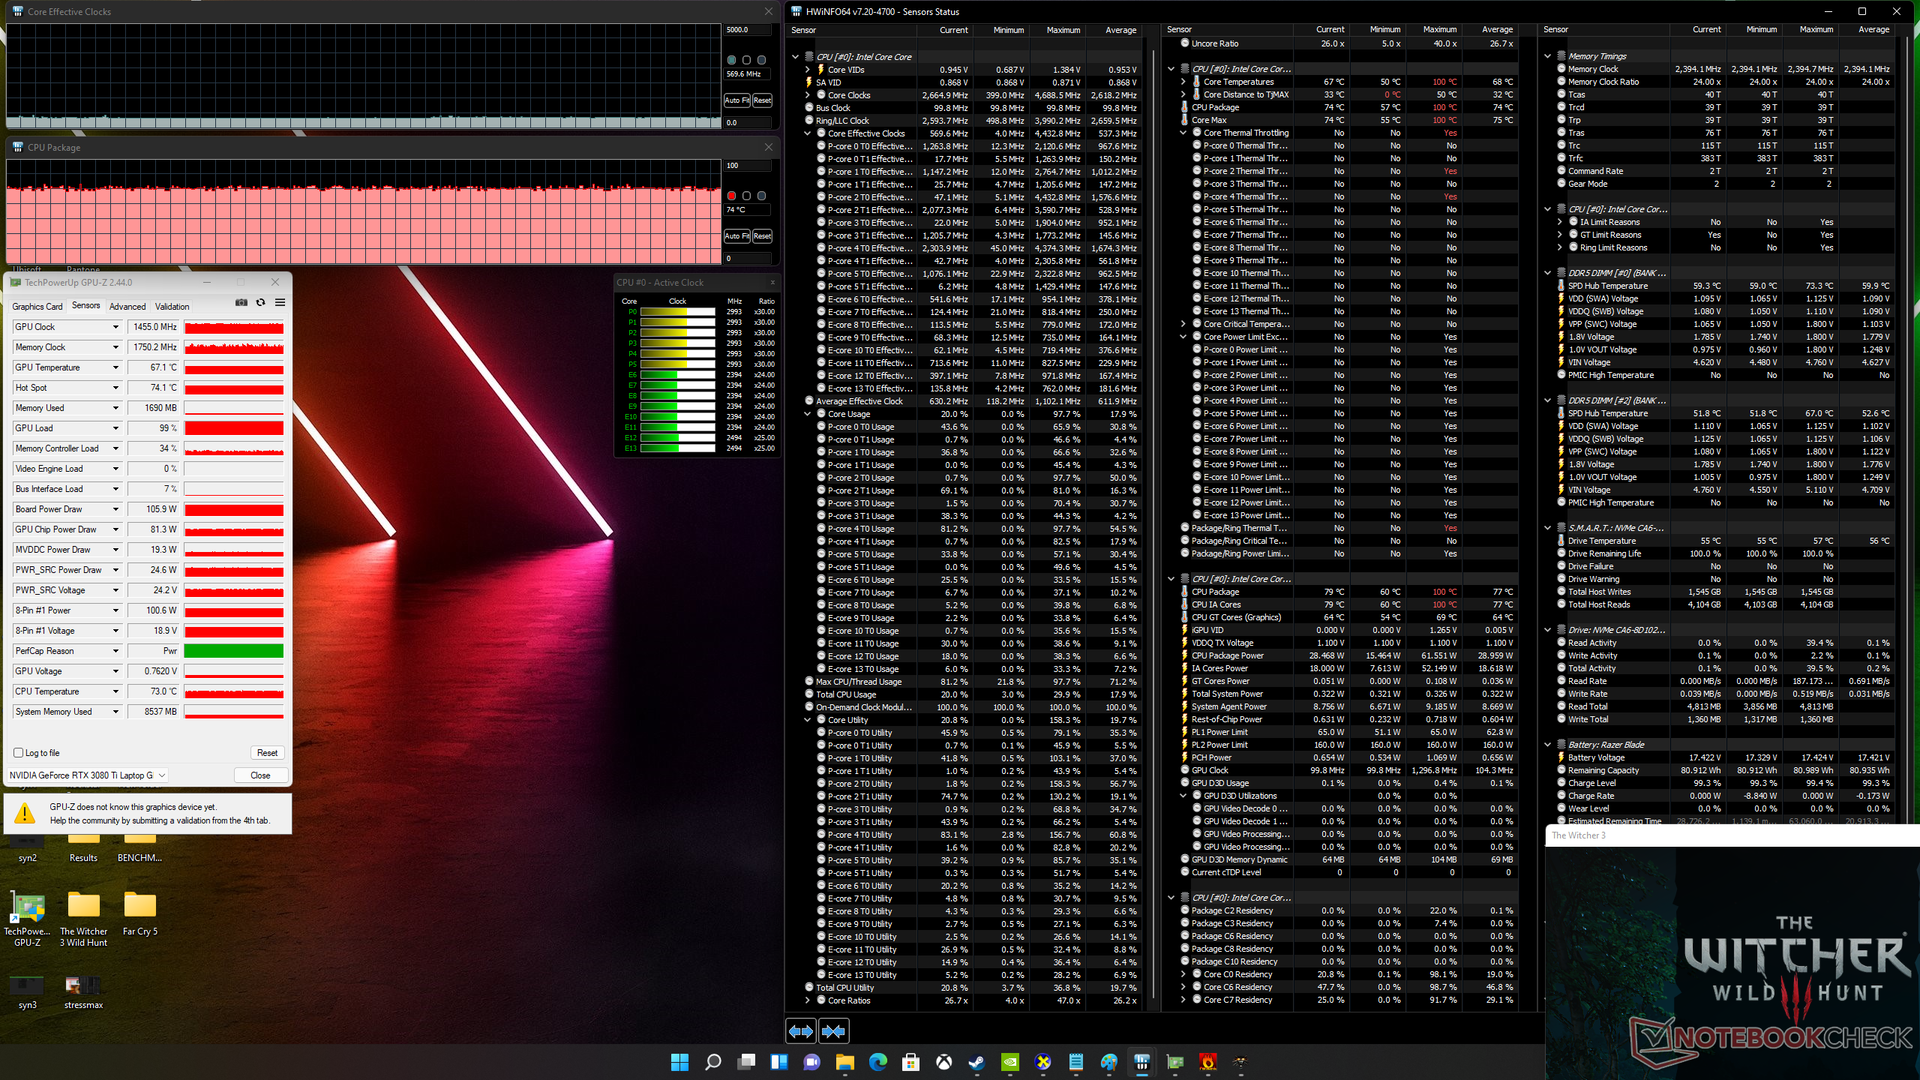
| Fréquence CPU (GHz) | Fréquence GPU (MHz) | Température CPU moyenne (°C) | Température GPU moyenne (°C) | |
| Système au repos | -- | -- | 43 | 42 |
| Prime95 Stress | 2.2 | -- | 72 | 56 |
| Prime95+ FurMark Stress | 2.2 | ~1357 | 86 | 73 |
| Witcher 3 Stress | 0.6 | 1455 | 74 | 67 |
Haut-parleurs
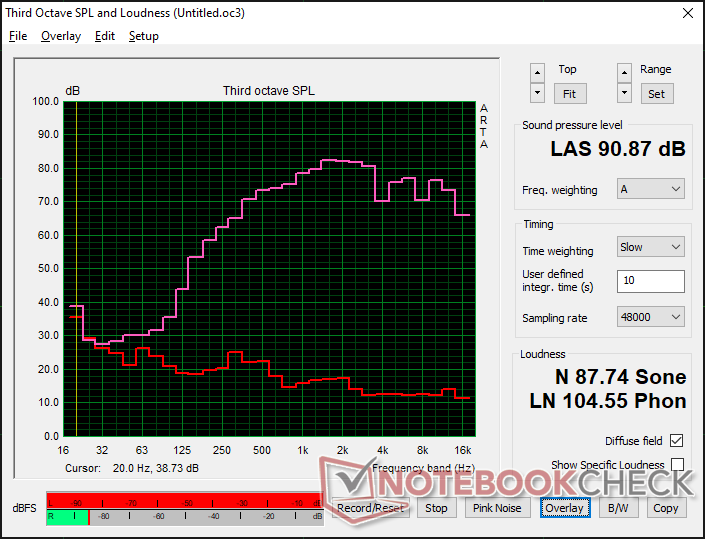
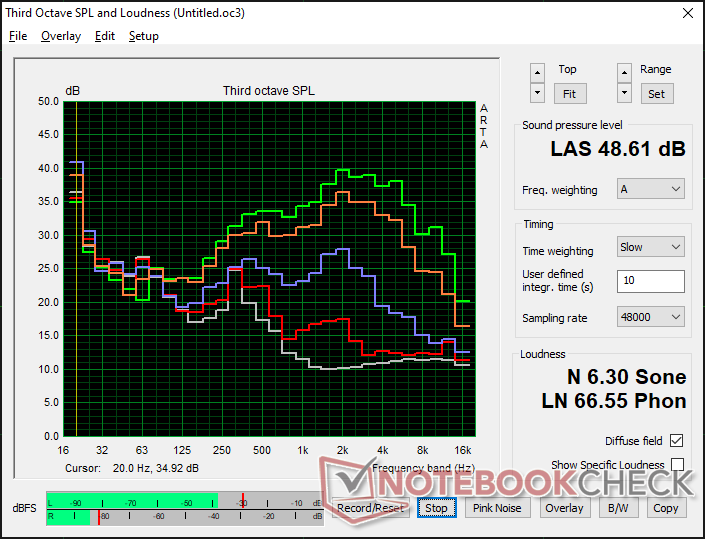
Razer Blade 15 2022 analyse audio
(+) | les haut-parleurs peuvent jouer relativement fort (90.9# dB)
Basses 100 - 315 Hz
(-) | presque aucune basse - en moyenne 21% plus bas que la médiane
(±) | la linéarité des basses est moyenne (9.7% delta à la fréquence précédente)
Médiums 400 - 2000 Hz
(+) | médiane équilibrée - seulement 3.9% de la médiane
(+) | les médiums sont linéaires (3.9% delta à la fréquence précédente)
Aiguës 2 - 16 kHz
(+) | des sommets équilibrés - à seulement 4.2% de la médiane
(±) | la linéarité des aigus est moyenne (7.8% delta à la fréquence précédente)
Globalement 100 - 16 000 Hz
(±) | la linéarité du son global est moyenne (15.7% de différence avec la médiane)
Par rapport à la même classe
» 36% de tous les appareils testés de cette catégorie étaient meilleurs, 7% similaires, 57% pires
» Le meilleur avait un delta de 6%, la moyenne était de 18%, le pire était de 132%.
Par rapport à tous les appareils testés
» 24% de tous les appareils testés étaient meilleurs, 5% similaires, 71% pires
» Le meilleur avait un delta de 4%, la moyenne était de 24%, le pire était de 134%.
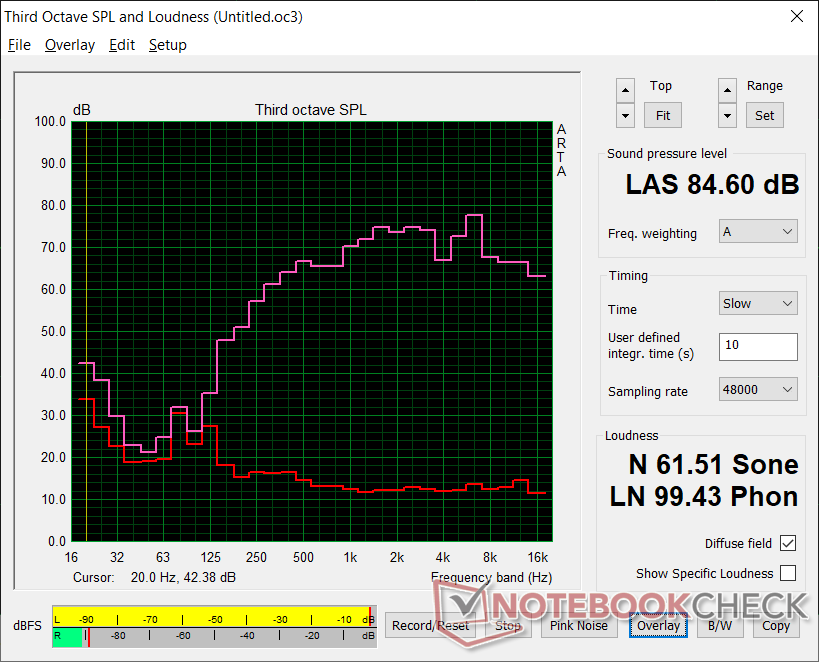
Apple MacBook Pro 16 2021 M1 Pro analyse audio
(+) | les haut-parleurs peuvent jouer relativement fort (84.7# dB)
Basses 100 - 315 Hz
(+) | bonne basse - seulement 3.8% loin de la médiane
(+) | les basses sont linéaires (5.2% delta à la fréquence précédente)
Médiums 400 - 2000 Hz
(+) | médiane équilibrée - seulement 1.3% de la médiane
(+) | les médiums sont linéaires (2.1% delta à la fréquence précédente)
Aiguës 2 - 16 kHz
(+) | des sommets équilibrés - à seulement 1.9% de la médiane
(+) | les aigus sont linéaires (2.7% delta à la fréquence précédente)
Globalement 100 - 16 000 Hz
(+) | le son global est linéaire (4.6% différence à la médiane)
Par rapport à la même classe
» 0% de tous les appareils testés de cette catégorie étaient meilleurs, 0% similaires, 100% pires
» Le meilleur avait un delta de 5%, la moyenne était de 17%, le pire était de 45%.
Par rapport à tous les appareils testés
» 0% de tous les appareils testés étaient meilleurs, 0% similaires, 100% pires
» Le meilleur avait un delta de 4%, la moyenne était de 24%, le pire était de 134%.
Gestion de l'énergie
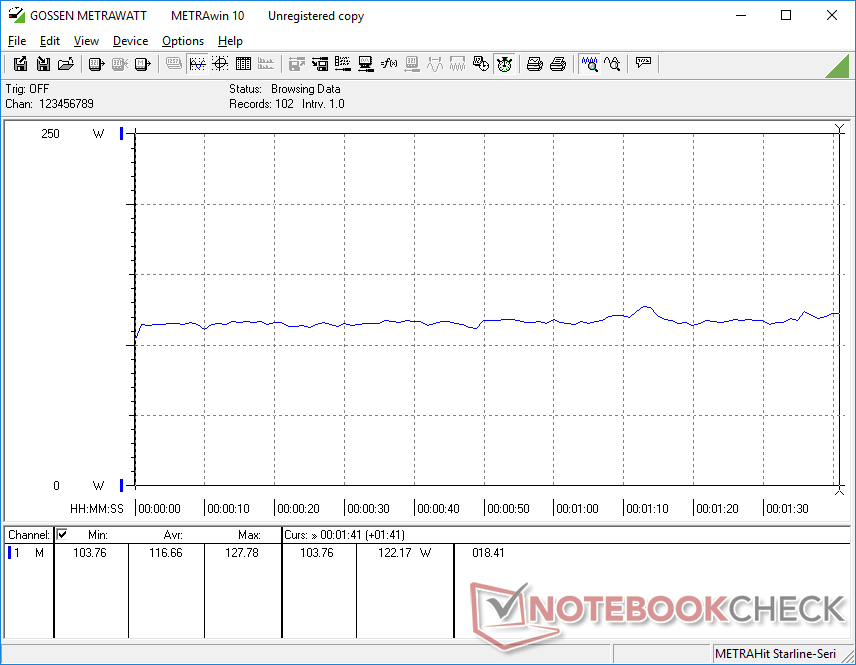
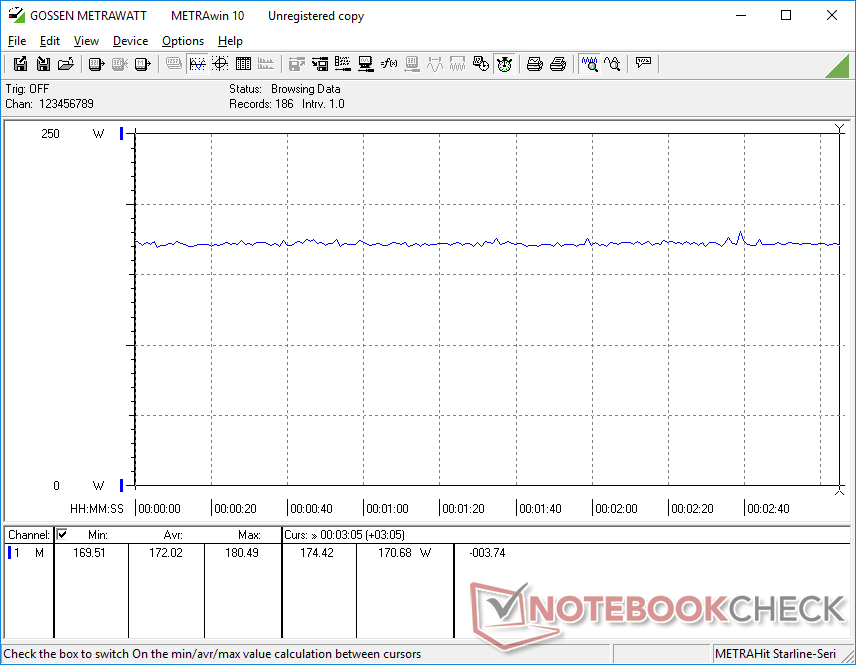
Consommation d'énergie
Les utilisateurs bénéficient d'une performance multithread du processeur plus de deux fois supérieure et d'une augmentation de 15 à 25 % des performances graphiques par rapport au Blade 15 du début des années 2021. La consommation d'énergie est ensuite plus élevée sur notre dernier modèle Blade 15, jusqu'à 60 W lorsqu'il est pleinement sollicité ou environ 30 W lorsqu'il fonctionne avec des jeux. Le Schenker XMG Neo 15 E22 avec sa RTX 3080 Ti de 175 W consommera encore plus d'énergie que notre Blade 15 et sa RTX 3080 Ti de 110 W
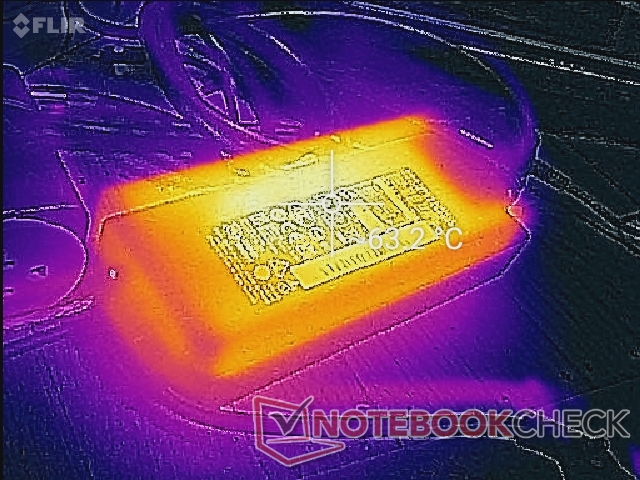
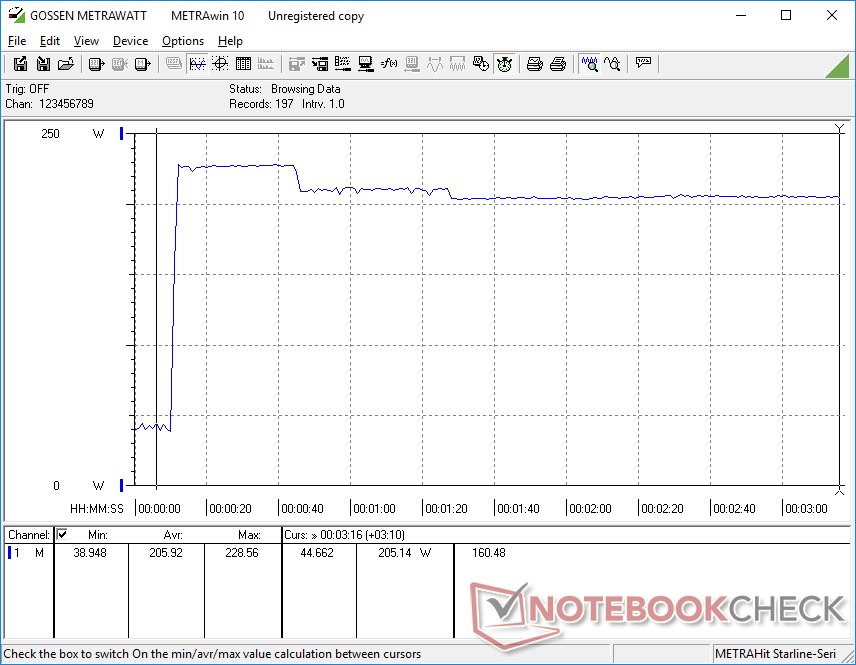
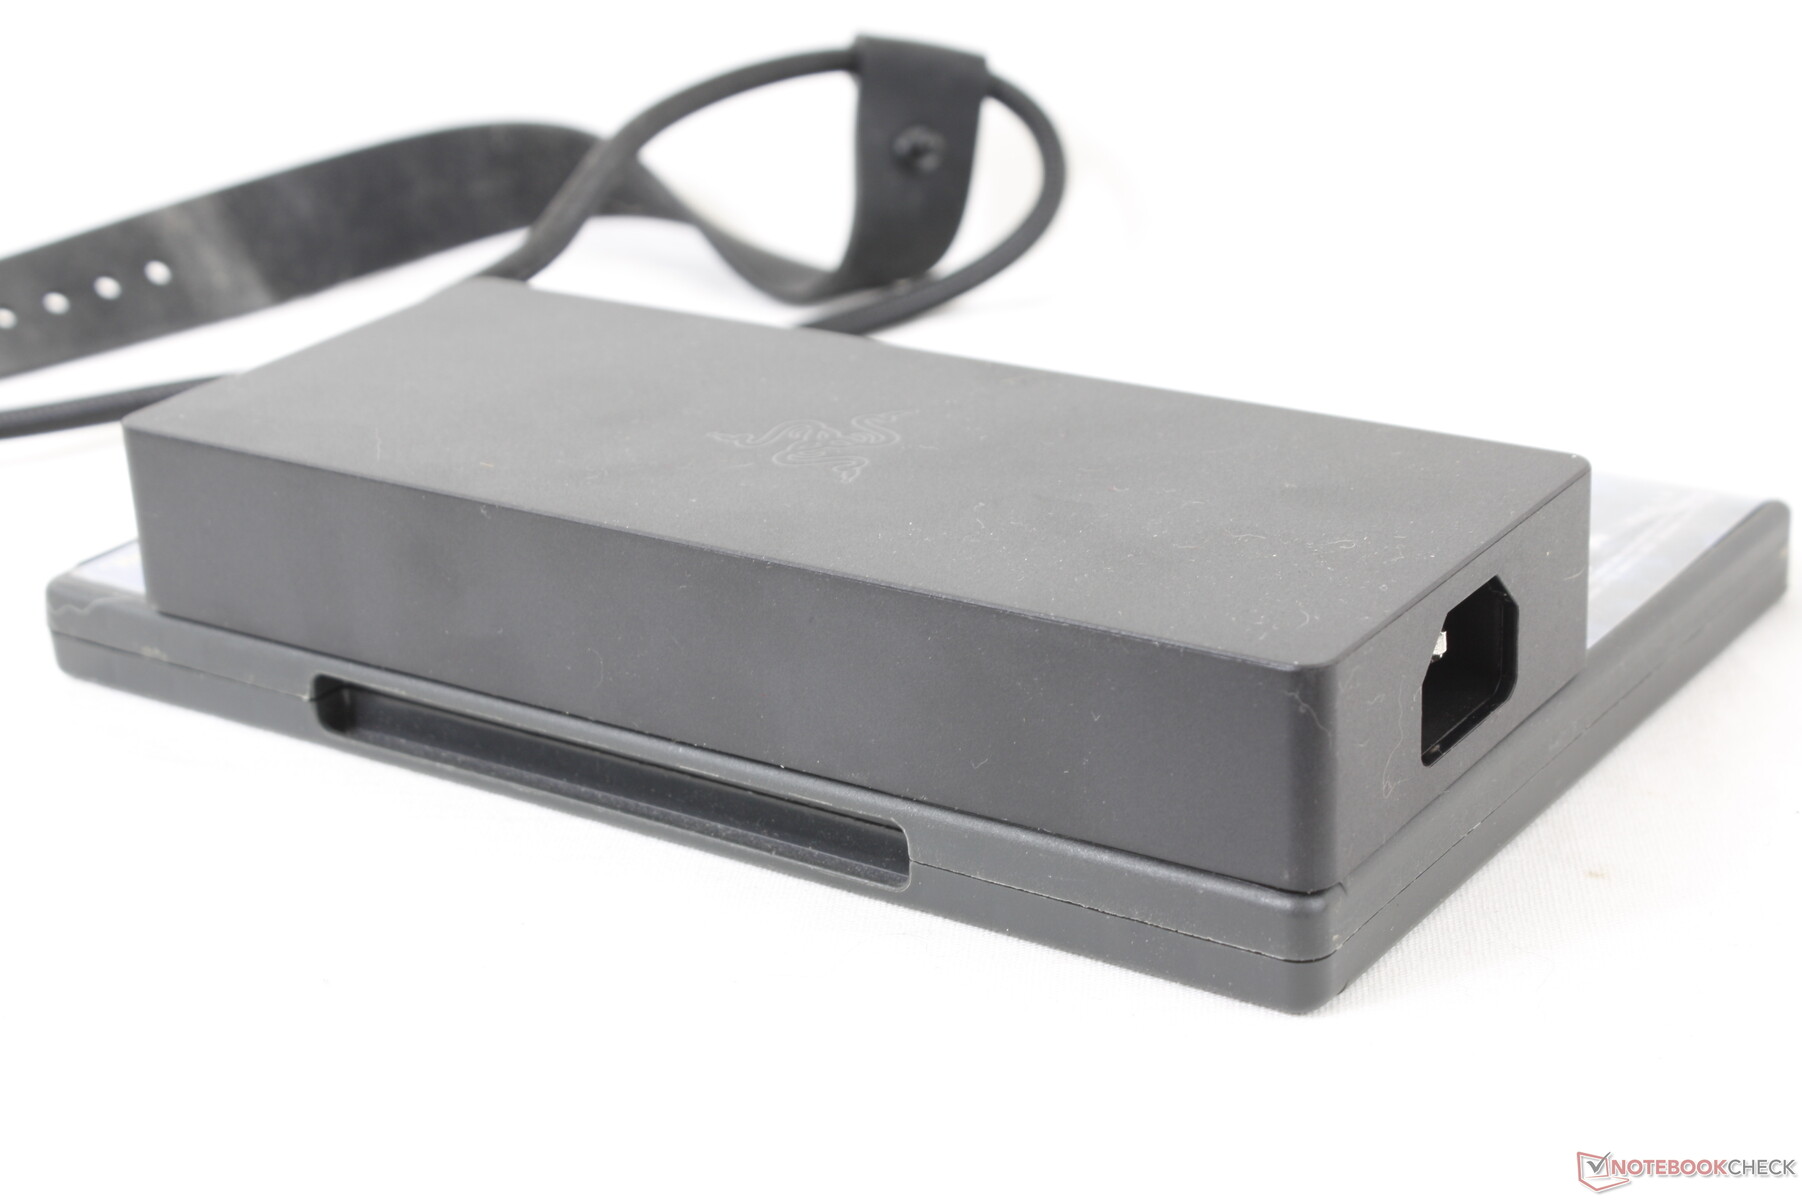
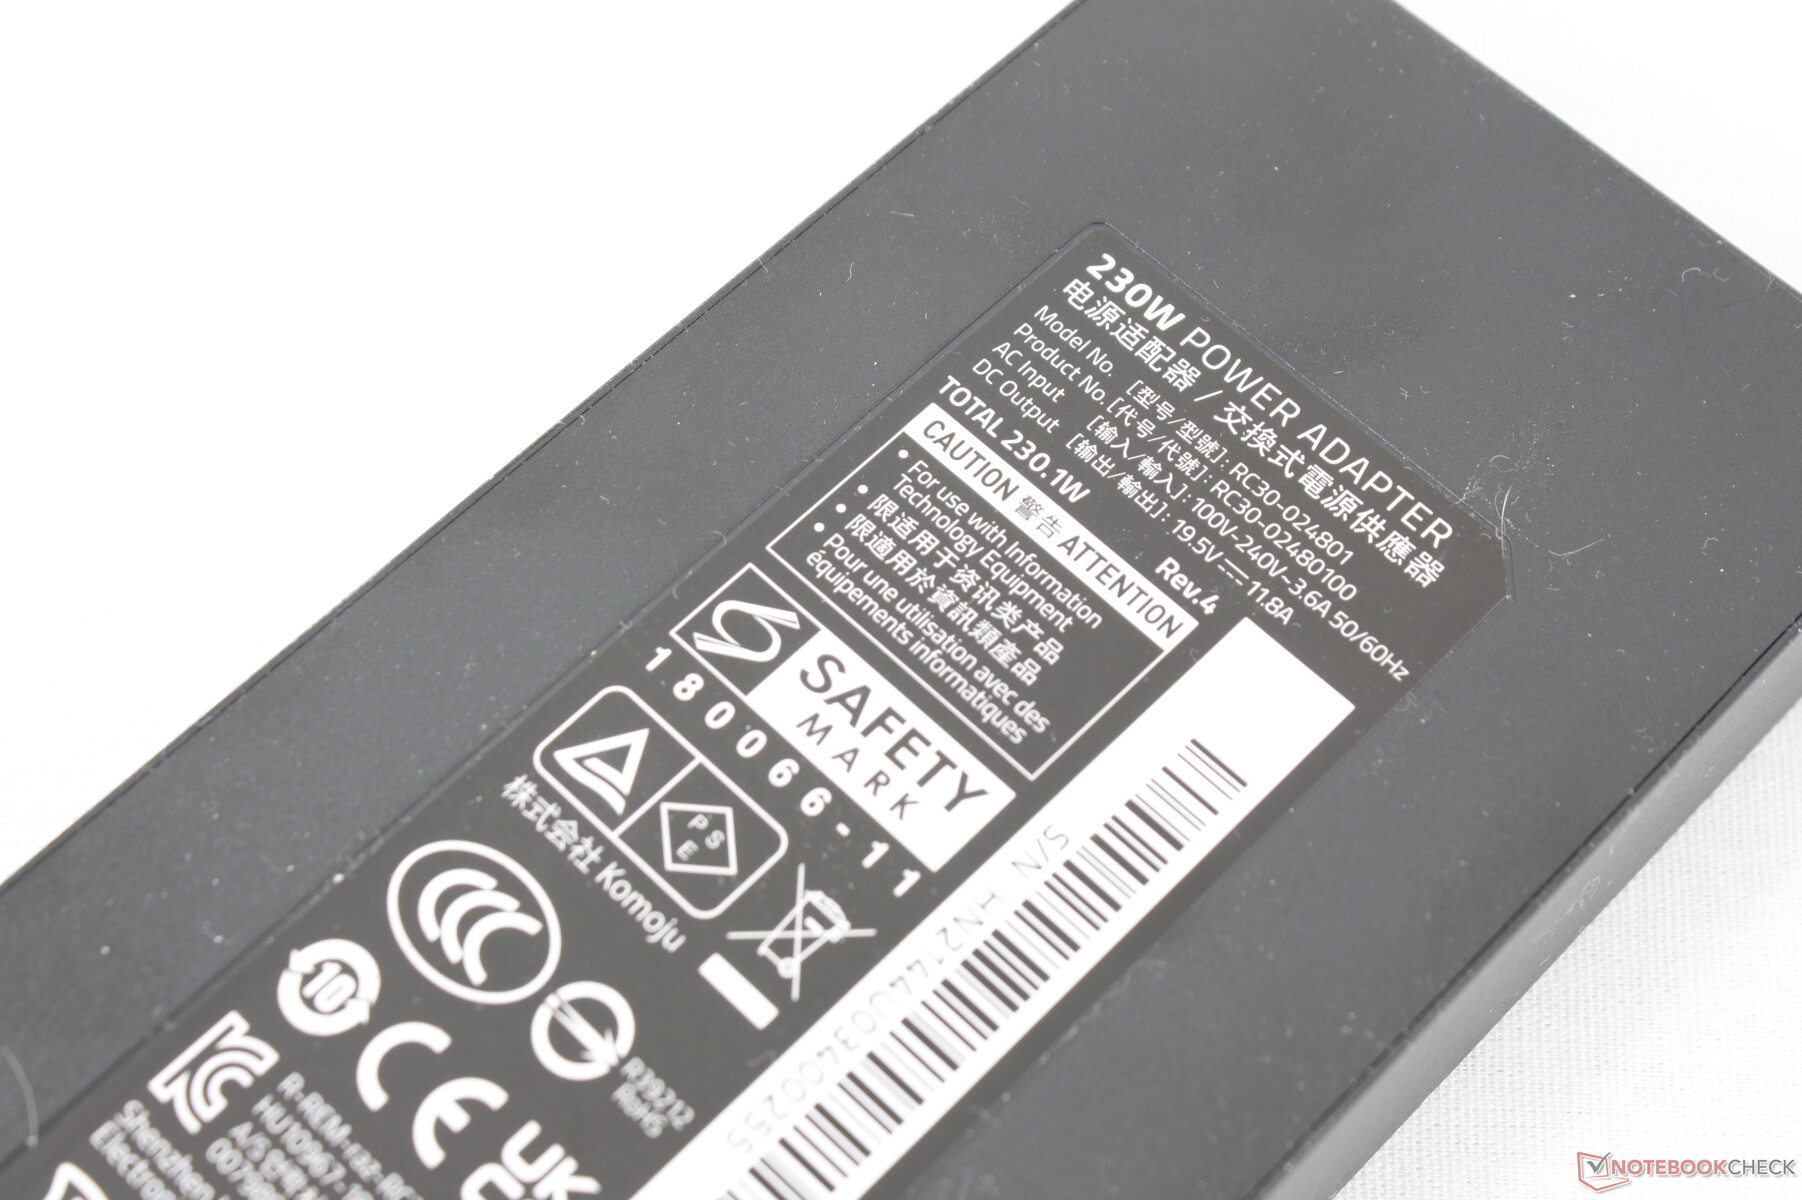
L'adaptateur secteur 230 W est relativement petit (~17 x 7 x 2,5 cm) par rapport à la plupart des autres adaptateurs de puissance équivalente, ce qui facilite son transport. Nous avons pu enregistrer une consommation maximale temporaire de 228 W lorsque le CPU et le GPU sont utilisés à 100%.
| Éteint/en veille | |
| Au repos | |
| Fortement sollicité |
|
Légende:
min: | |
| Razer Blade 15 2022 i7-12800H, GeForce RTX 3080 Ti Laptop GPU, SSSTC CA6-8D1024, IPS, 2560x1440, 15.6" | Razer Blade 15 Advanced Model Early 2021 i7-10875H, GeForce RTX 3080 Laptop GPU, Samsung PM981a MZVLB1T0HBLR, IPS, 1920x1080, 15.6" | Razer Blade 15 RTX 2080 Super Max-Q i7-10875H, GeForce RTX 2080 Super Max-Q, Samsung PM981a MZVLB1T0HBLR, IPS, 1920x1080, 15.6" | Schenker XMG Neo 15 E22 (Early 2022, RTX 3080 Ti) i7-12700H, GeForce RTX 3080 Ti Laptop GPU, Samsung SSD 980 Pro 250GB MZ-V8P250BW, IPS, 2560x1440, 15.6" | ADATA XPG Xenia 15 i7-11800H, GeForce RTX 3070 Laptop GPU, ADATA XPG Gammix S70 1TB, IPS, 2560x1440, 15.6" | Eurocom Nightsky ARX315 R9 5900X, GeForce RTX 3070 Laptop GPU, Samsung SSD 980 Pro 1TB MZ-V8P1T0BW, IPS, 1920x1080, 15.6" | |
|---|---|---|---|---|---|---|
| Power Consumption | 39% | 37% | 15% | 27% | -54% | |
| Idle Minimum * (Watt) | 33.2 | 13 61% | 10.6 68% | 14 58% | 8.9 73% | 55 -66% |
| Idle Average * (Watt) | 36.4 | 15 59% | 13.1 64% | 18 51% | 14.4 60% | 68.2 -87% |
| Idle Maximum * (Watt) | 37.6 | 22 41% | 15.8 58% | 19 49% | 31.1 17% | 72.5 -93% |
| Load Average * (Watt) | 116.7 | 98 16% | 131 -12% | 115 1% | 97 17% | 149.2 -28% |
| Witcher 3 ultra * (Watt) | 172 | 126 27% | 146 15% | 228 -33% | 188 -9% | 233 -35% |
| Load Maximum * (Watt) | 228.6 | 165 28% | 169 26% | 307 -34% | 222.2 3% | 255.8 -12% |
* ... Moindre est la valeur, meilleures sont les performances
Power Consumption Witcher 3 / Stresstest
Power Consumption external Monitor
Autonomie de la batterie
Les durées d'utilisation du WLAN sont plus courtes que sur les modèles de la génération précédente, probablement en partie à cause de l'écran 1440p 240 Hz plus exigeant. Nous sommes capables d'obtenir presque 5 heures d'utilisation du WLAN dans le monde réel avec le profil d'alimentation équilibré, Nvidia Optimus réglé sur l'iGPU et l'écran réglé sur 150 nits. En comparaison, nous sommes capables d'obtenir 6 heures ou plus sur le 2021 Blade 15 dans des conditions de test similaires
Le chargement de la batterie vide à la pleine capacité avec l'adaptateur secteur inclus prend moins de 90 minutes. Le système peut également être chargé via des adaptateurs USB-C tiers.
| Razer Blade 15 2022 i7-12800H, GeForce RTX 3080 Ti Laptop GPU, 80 Wh | Razer Blade 15 Advanced Model Early 2021 i7-10875H, GeForce RTX 3080 Laptop GPU, 80 Wh | Razer Blade 15 RTX 2080 Super Max-Q i7-10875H, GeForce RTX 2080 Super Max-Q, 80 Wh | Schenker XMG Neo 15 E22 (Early 2022, RTX 3080 Ti) i7-12700H, GeForce RTX 3080 Ti Laptop GPU, 93 Wh | ADATA XPG Xenia 15 i7-11800H, GeForce RTX 3070 Laptop GPU, 94 Wh | Eurocom Nightsky ARX315 R9 5900X, GeForce RTX 3070 Laptop GPU, 62 Wh | |
|---|---|---|---|---|---|---|
| Autonomie de la batterie | 84% | 24% | 37% | 78% | -80% | |
| WiFi v1.3 (h) | 4.9 | 9 84% | 6.1 24% | 6.7 37% | 8.7 78% | 1 -80% |
| Reader / Idle (h) | 14.4 | 8.7 | 14 | |||
| H.264 (h) | 8.9 | 7.3 | 6.9 | |||
| Load (h) | 2 | 1.9 | 3.8 | 1.5 |
Points positifs
Points négatifs
Verdict
Le 2022 Blade 15 offre des performances graphiques environ 15 à 25 % plus rapides et des performances de CPU 20 % plus rapides que le modèle Core i7-11800H et RTX 3080 de l'année dernière. Heureusement, le système n'a pas besoin de fonctionner de manière sensiblement plus bruyante ou plus chaude pour obtenir des résultats plus rapides, mais la consommation d'énergie et l'autonomie de la batterie en prennent un coup. La consommation plus élevée en particulier semble être une tendance parmi de nombreux ordinateurs portables Core de 12e génération, y compris le Schenker Uniwill Technology GM7AG8P ou MSI Vector GP66 par rapport à leurs homologues de la génération précédente. Nous sommes également heureux de ne pas voir les performances du CPU inférieures à la moyenne, ce qui était le cas pour le modèle Core i7-10875H de 10e génération.
Le Blade 15 équipé d'un processeur Intel de 12e génération offre encore plus de performances dans un design familier sans avoir à faire de compromis sur le bruit ou la chaleur. Ne vous attendez pas à ce que l'autonomie de la batterie soit plus longue, cependant.
En gardant cela à l'esprit, le tout nouveau Blade 15 est la mise à jour annuelle itérative d'un châssis déjà excellent. Les claviers traditionnels plus grands sont les bienvenus, en particulier pour ceux qui n'étaient pas fans de l'" expérience " de clavier optique de Razer sur le Blade 15 de 2019, tandis que l'adaptateur secteur relativement petit mérite une certaine reconnaissance pour être plus portable que la plupart des autres. Peut-être que le modèle de l'année prochaine peut enfin ajouter un obturateur de webcam que de nombreux ordinateurs portables moins chers viennent avec aujourd'hui.
Prix et disponibilité
Razer expédie maintenant les 2022 Blade 15 et Blade 17. Notre configuration spécifique est disponible pour $3700 USD.
Razer Blade 15 2022
- 03/12/2022 v7 (old)
Allen Ngo
Price comparison

