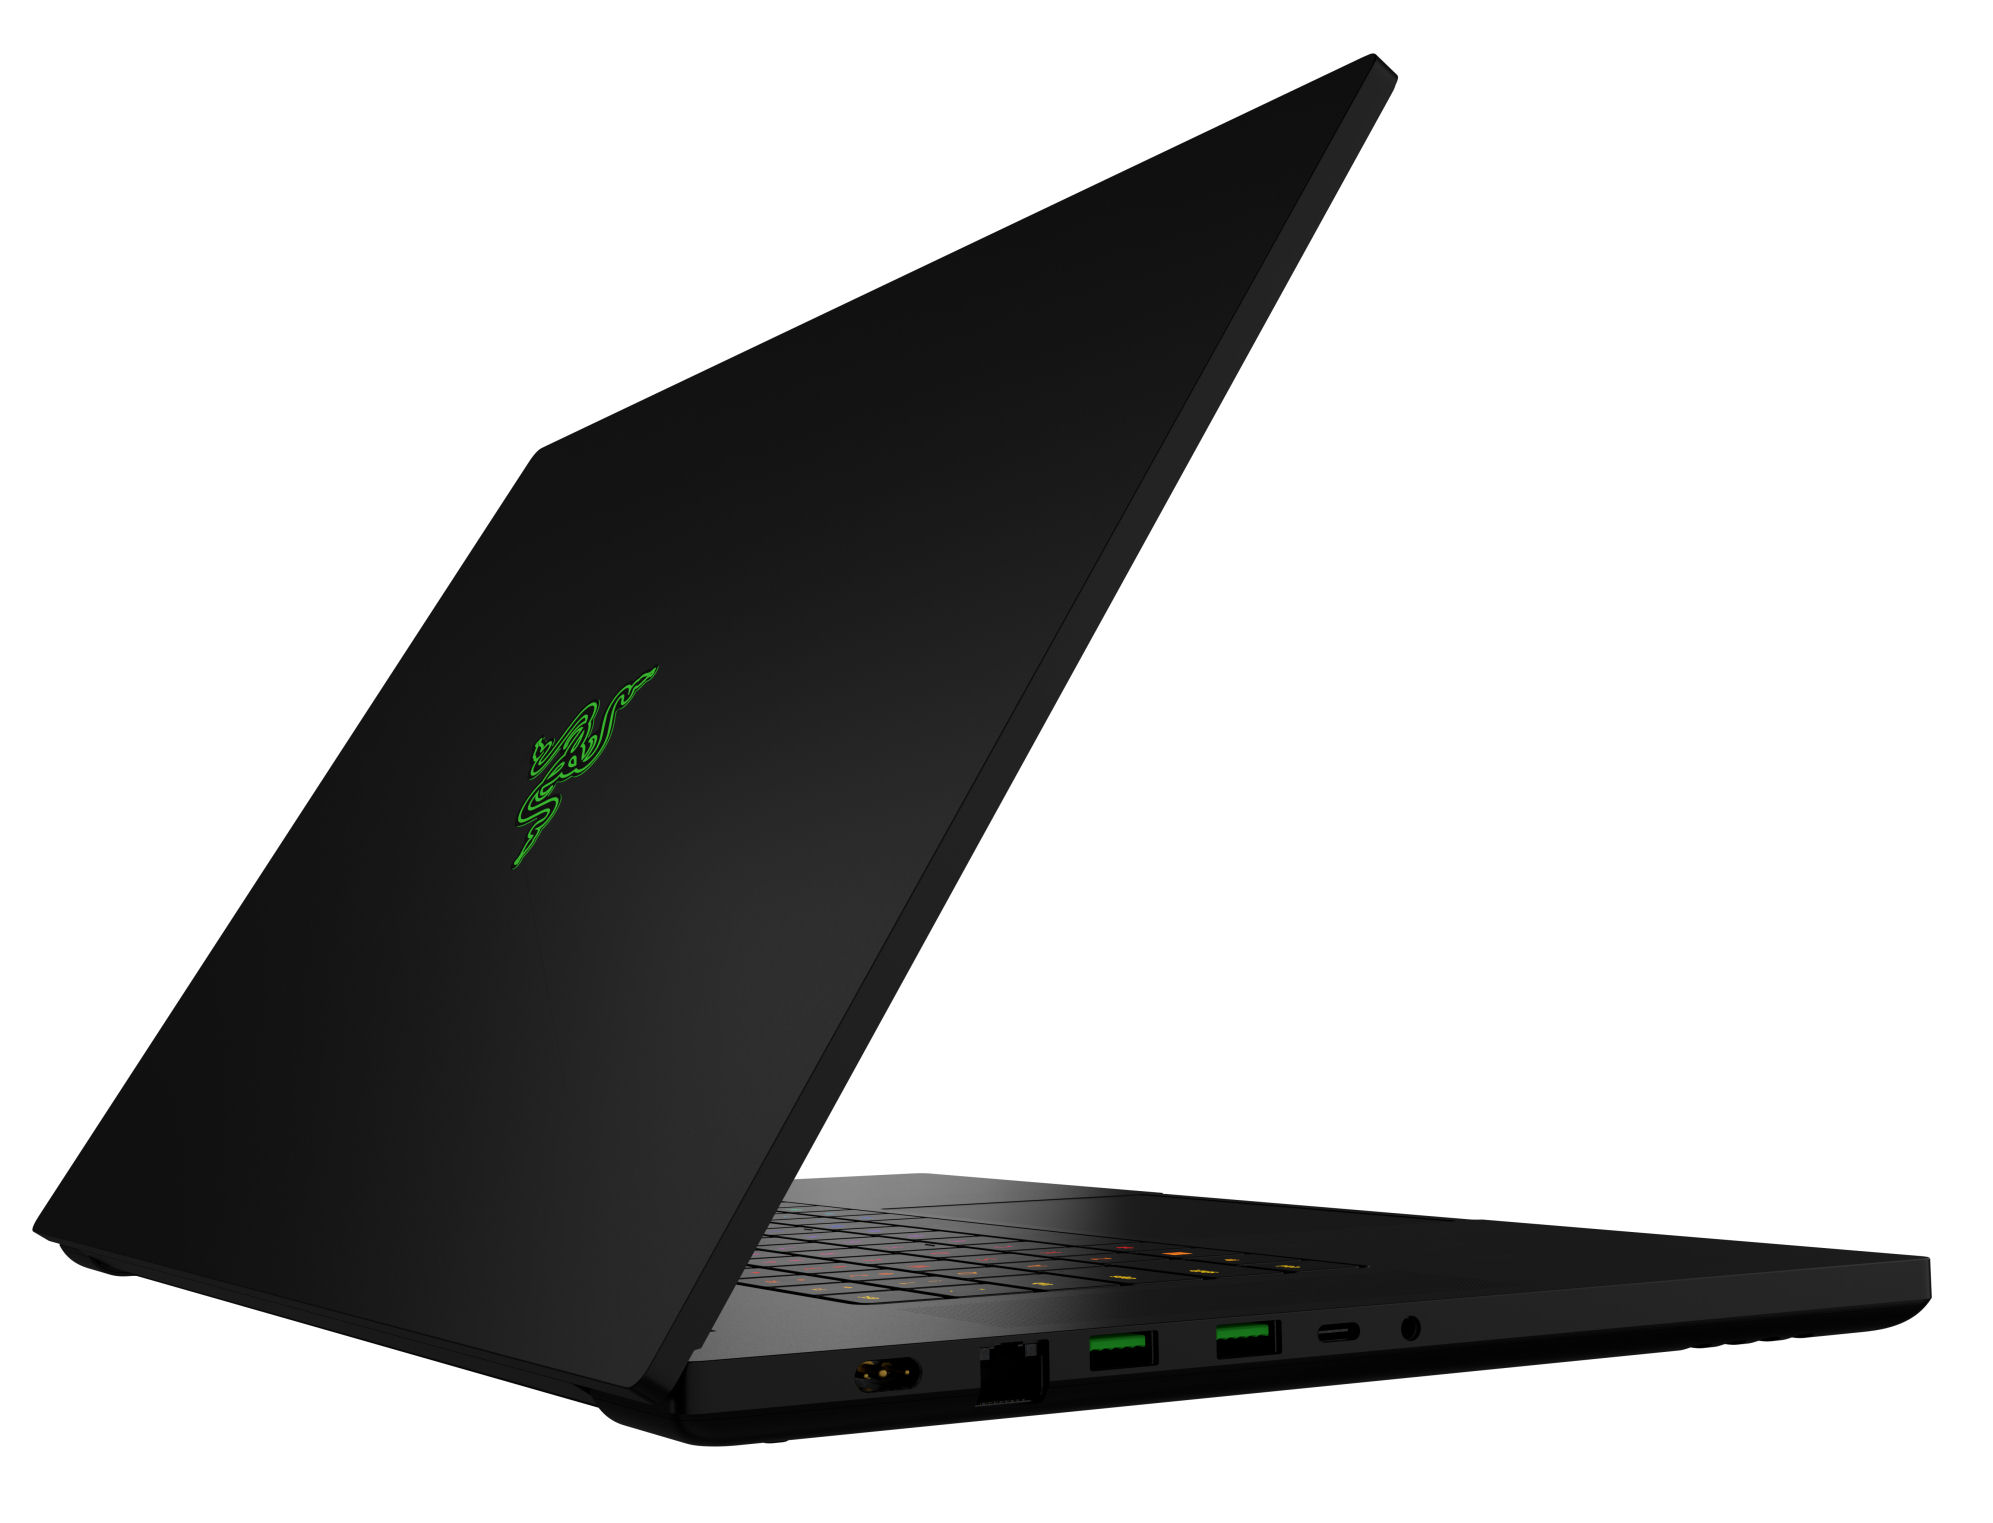
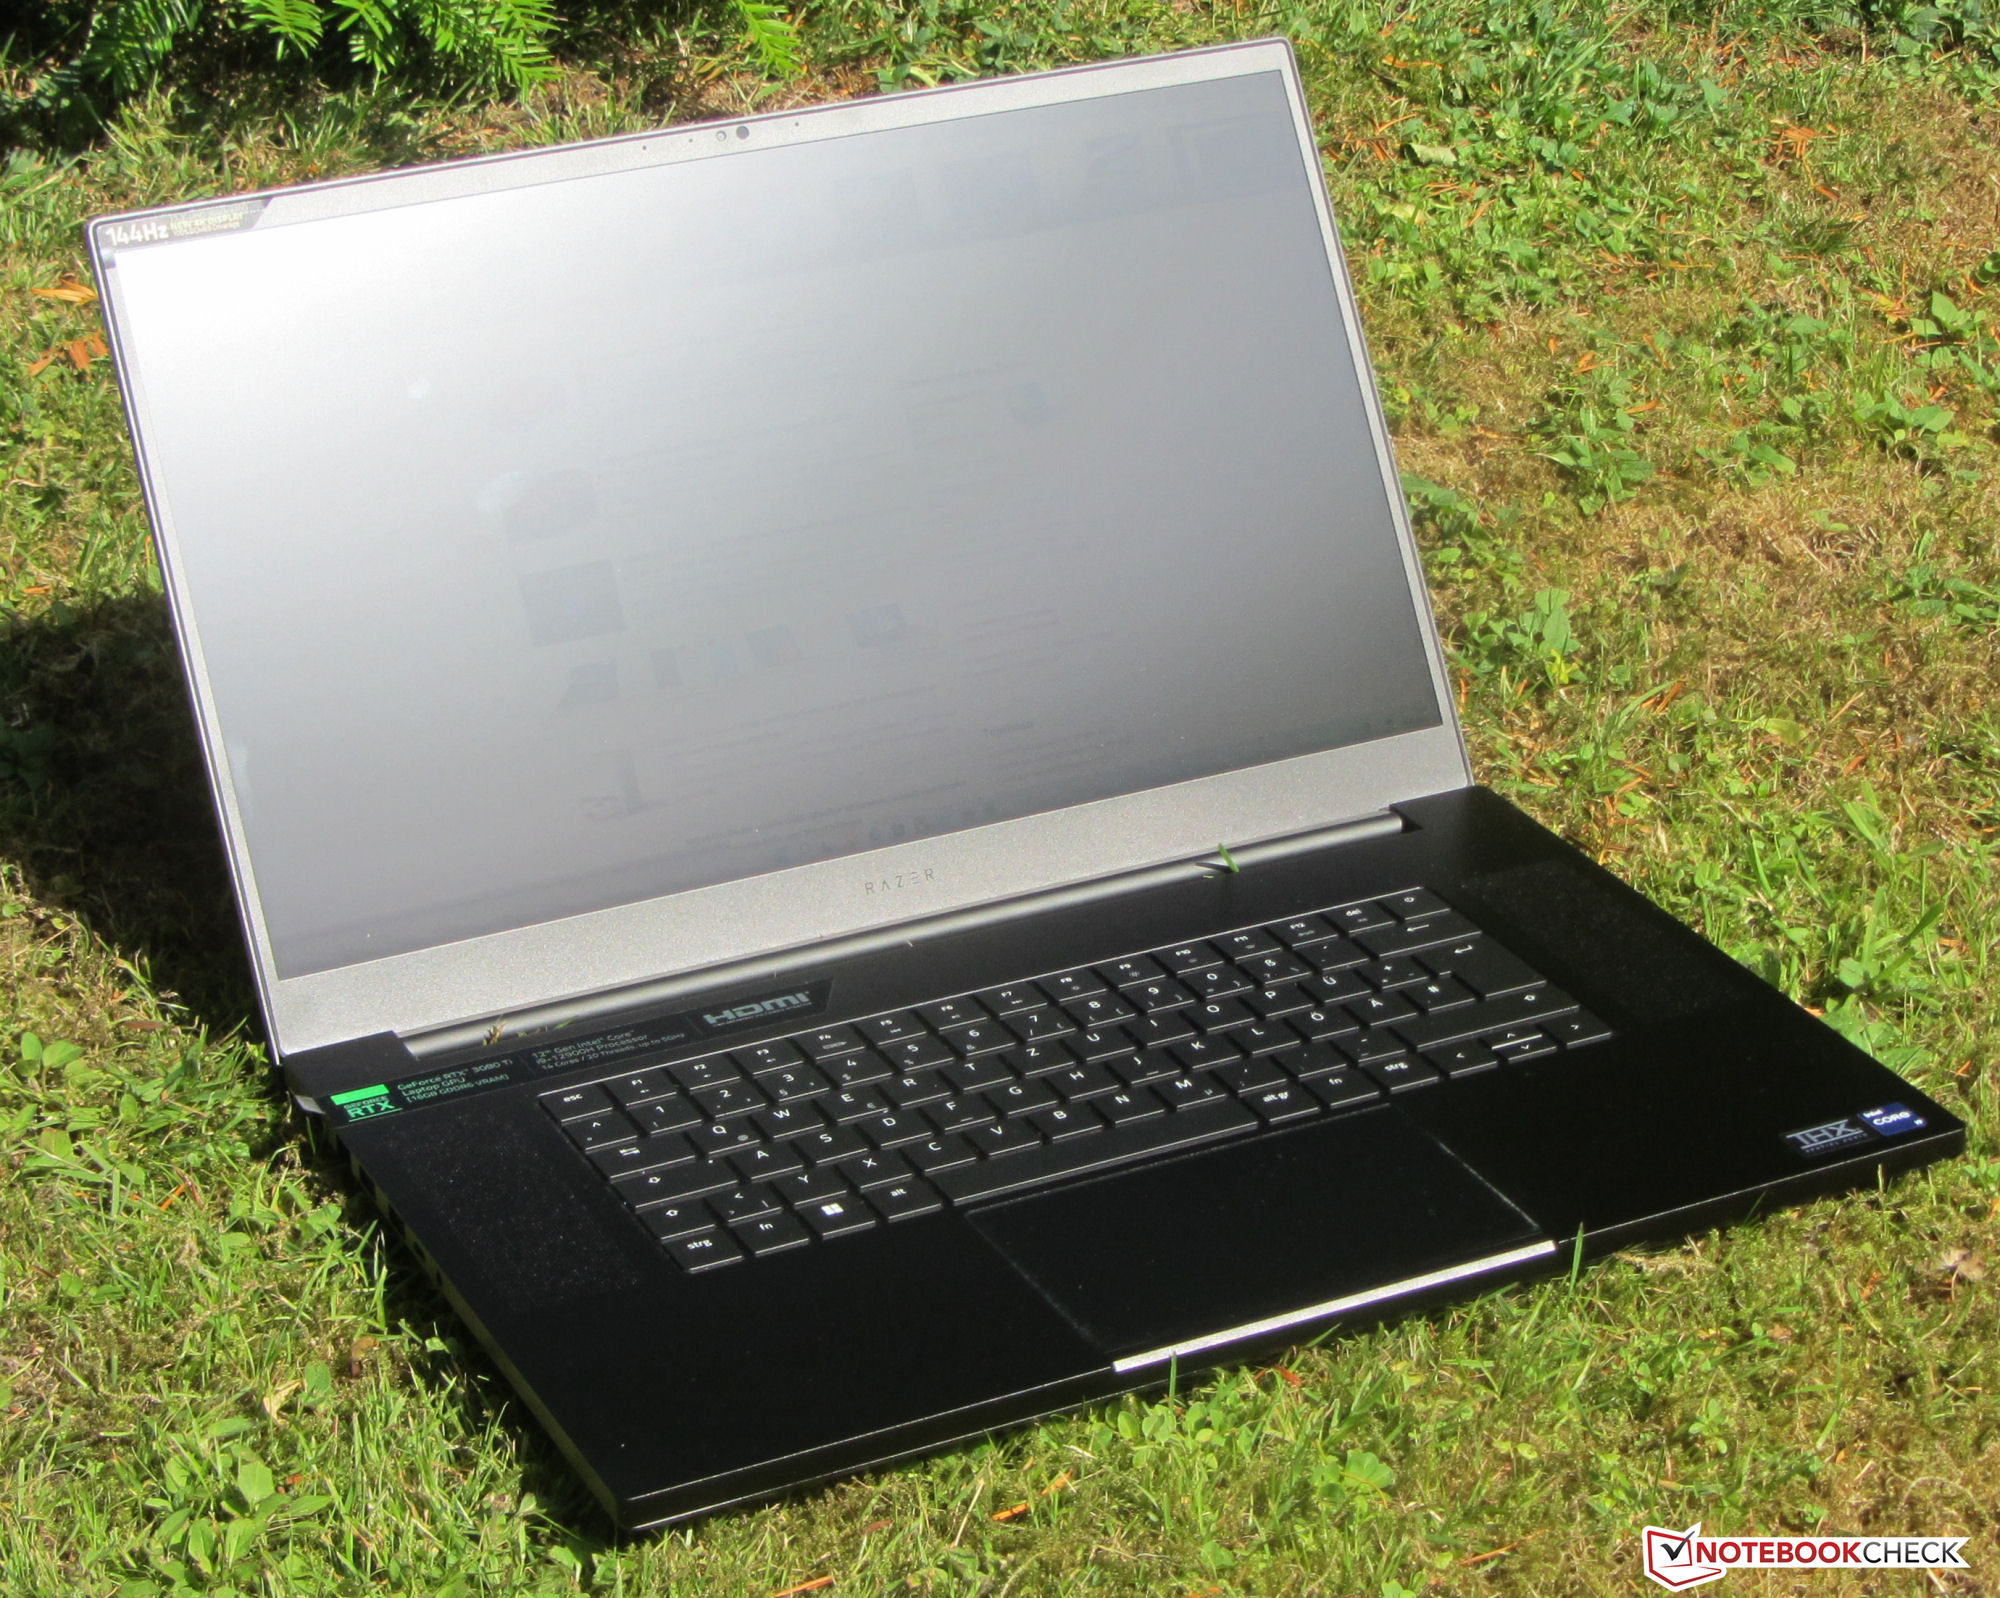
Test du Razer Blade 17 (début 2022) : portable de jeu 4k élégant avec un écran lumineux
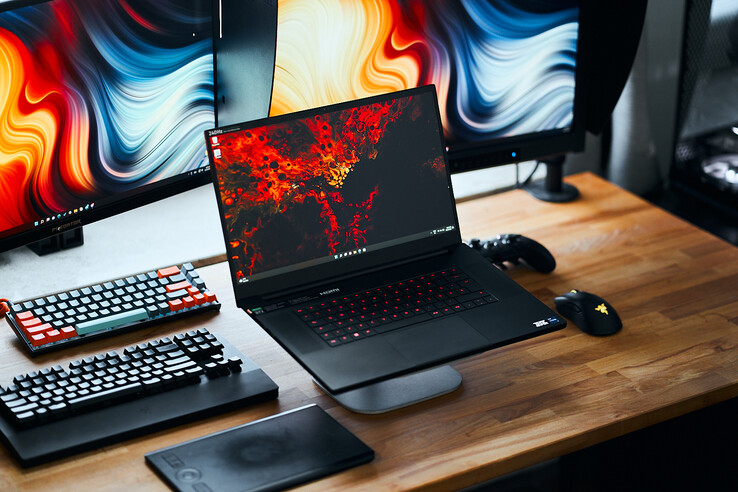
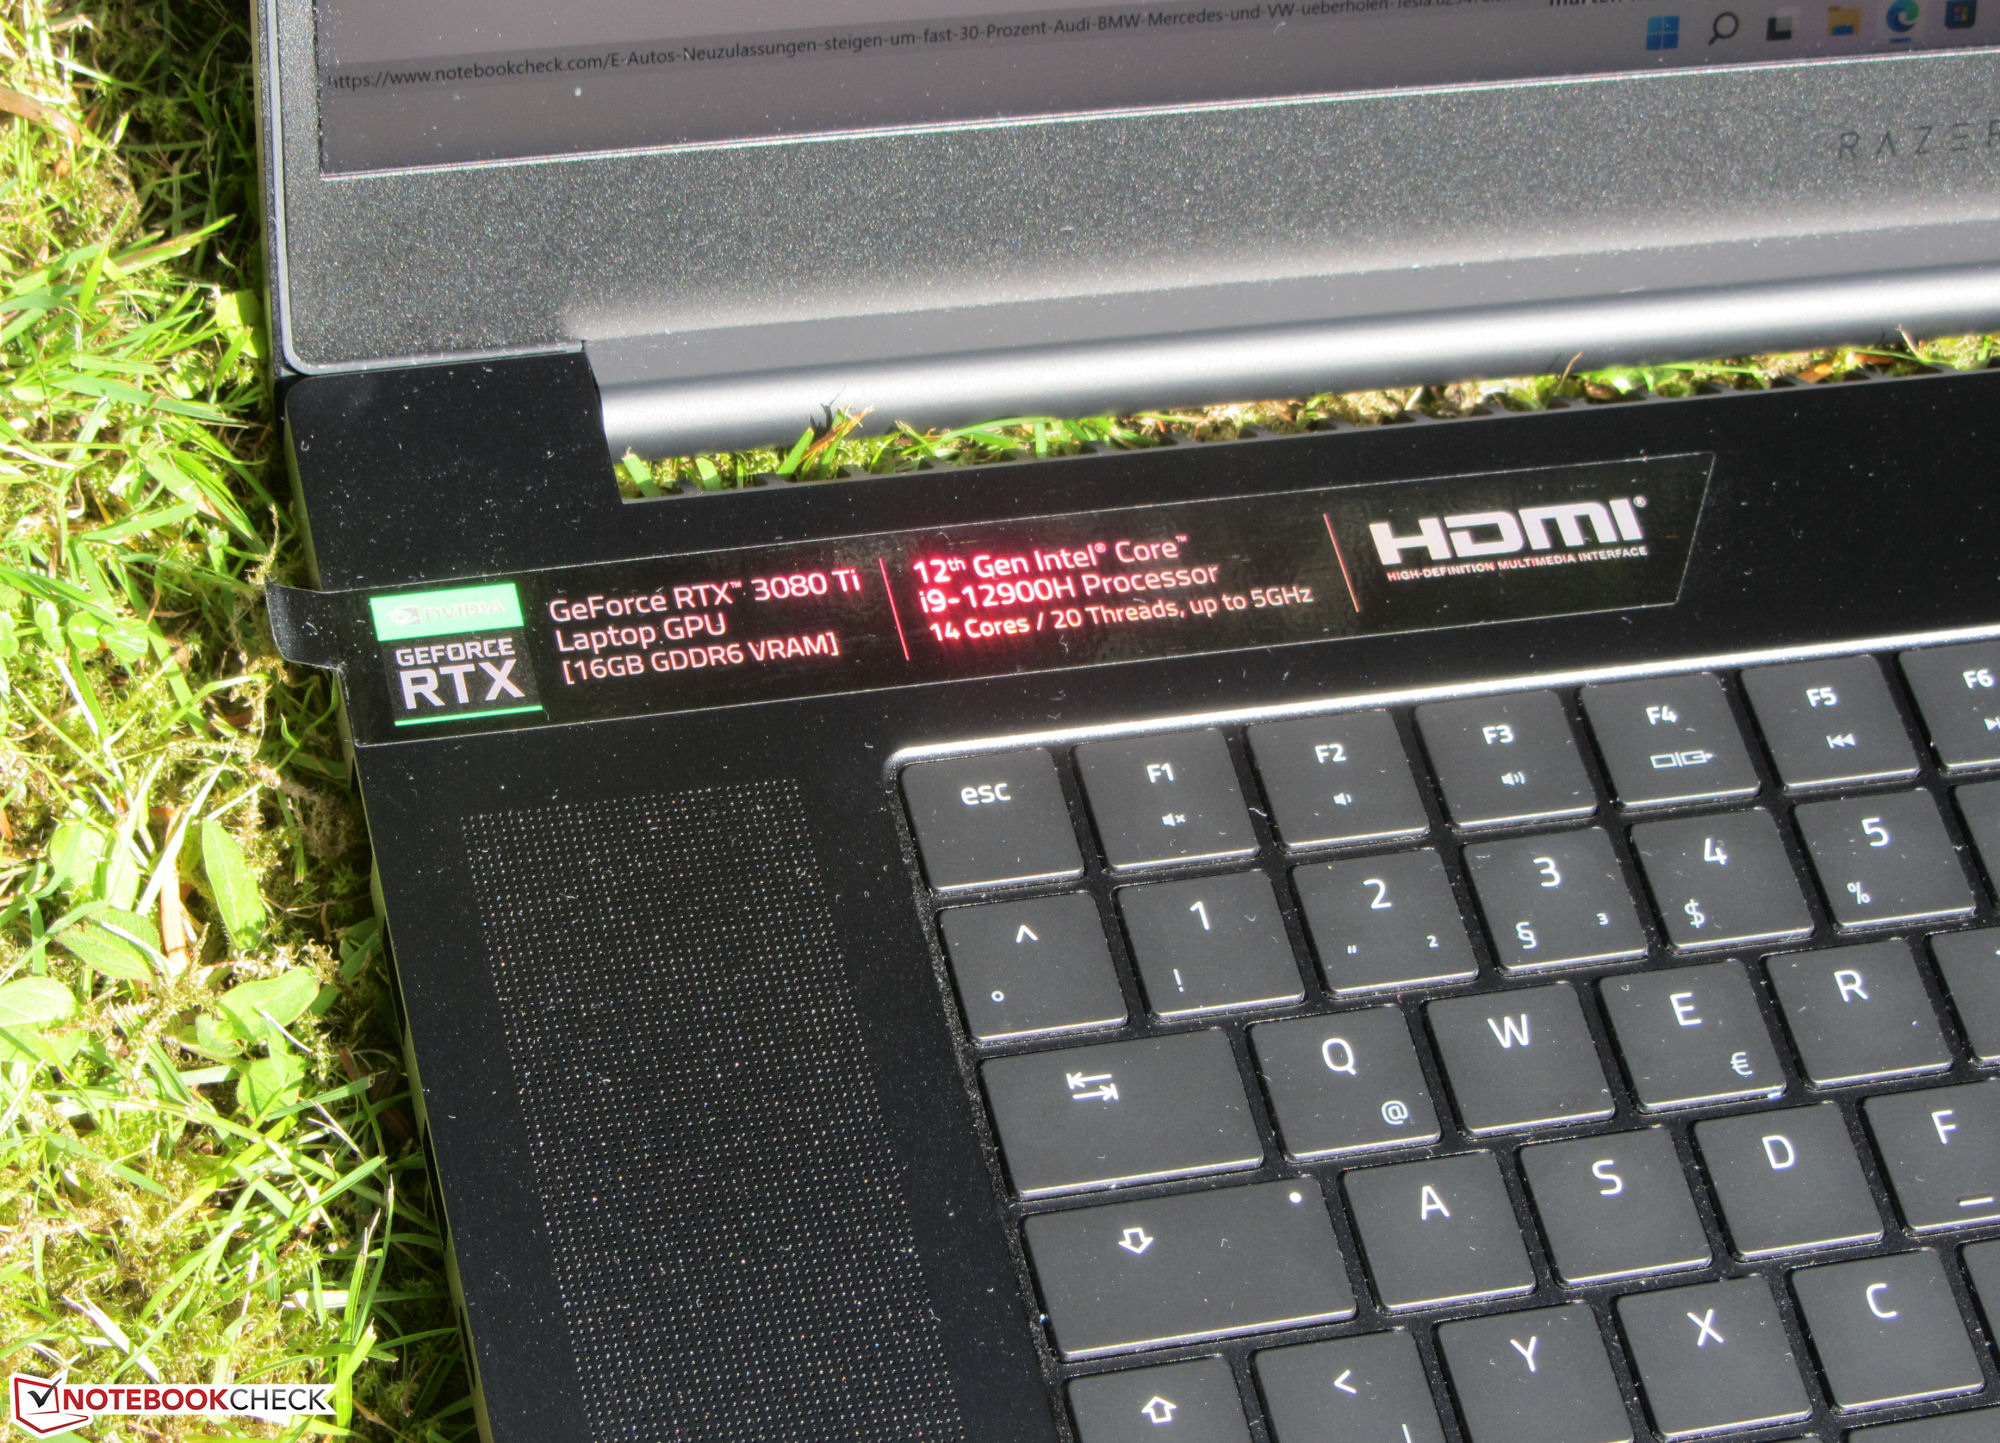
Le Razer Blade 17 est destiné aux joueurs et aux professionnels de la création - notamment dans notre configuration haut de gamme testée avec un CPU Core i9-12900H, un GPU pour ordinateur portable GeForce RTX 3080 Ti et un écran 4k de 17,3 pouces aux couleurs précises. Le prix se situe aux alentours de 4 700 euros (~4 900 dollars). En plus de la RTX 3080 Ti, son Frère américainque nous avons déjà testé était équipé d'un processeur Core i7-12800H et d'un écran QHD (240 Hz). Parmi les concurrents, on trouve des ordinateurs portables extrêmement puissants, comme le Alienware x17 R2 P48EleMedion Erazer Beast X30et leMSI Stealth GS77 12UHS.
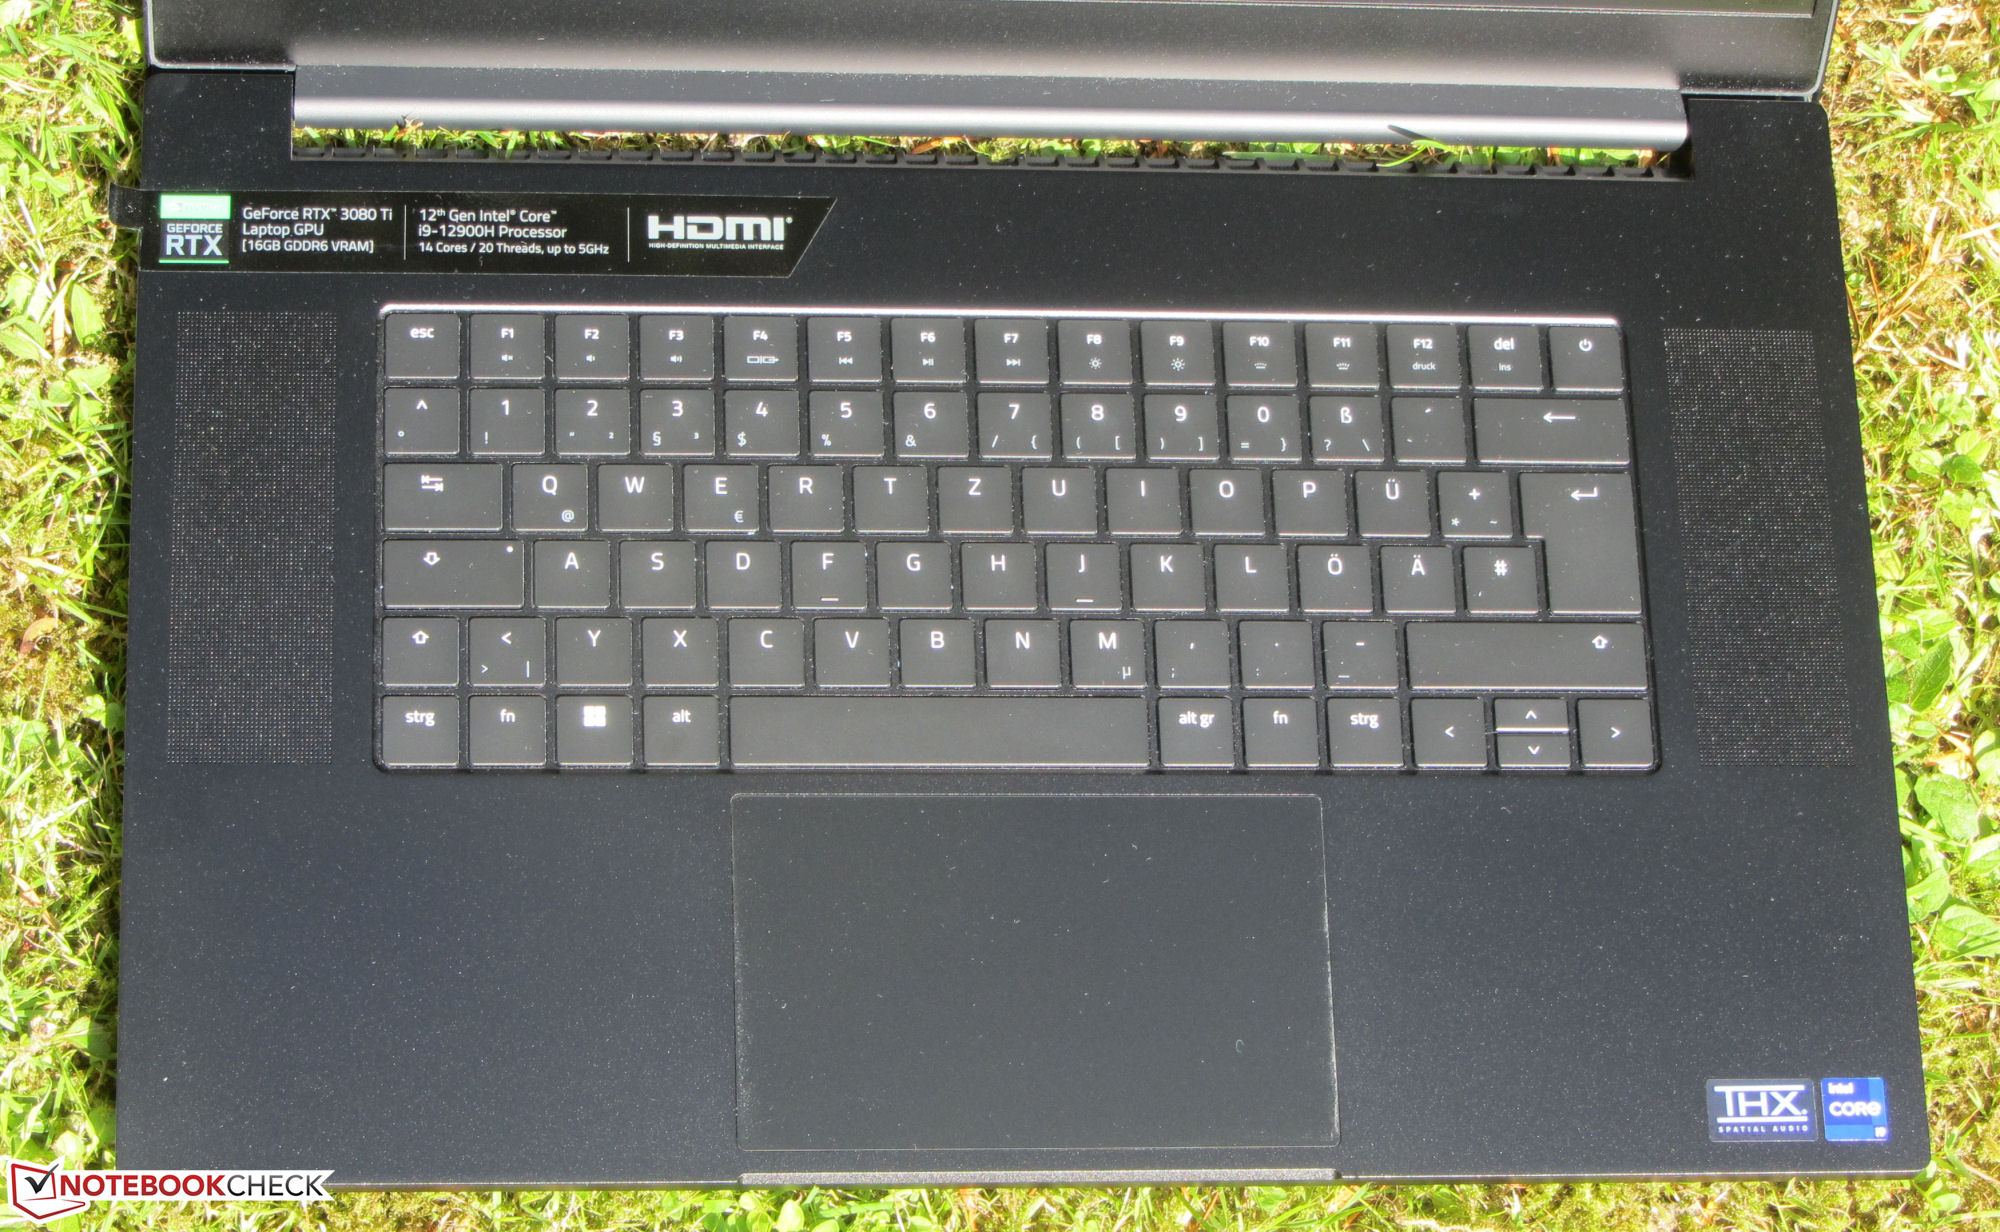
Vous pouvez trouver des informations sur le boîtier, le matériel de connexion, les périphériques d'entrée et les haut-parleurs dans notre revue du Blade 17 2022 (Core i7, QHD) de construction identique.
Comparaison avec les concurrents potentiels
Note | Date | Modèle | Poids | Épaisseur | Taille | Résolution | Prix |
|---|---|---|---|---|---|---|---|
| 89.9 % v7 (old) | 07/22 | Razer Blade 17 Early 2022 i9-12900H, GeForce RTX 3080 Ti Laptop GPU | 2.8 kg | 19.9 mm | 17.30" | 3840x2160 | |
| 89.2 % v7 (old) | 05/22 | Alienware x17 R2 P48E i9-12900HK, GeForce RTX 3080 Ti Laptop GPU | 3.1 kg | 20.9 mm | 17.30" | 1920x1080 | |
| 86.7 % v7 (old) | 05/22 | Medion Erazer Beast X30 i9-12900HK, GeForce RTX 3080 Ti Laptop GPU | 2.2 kg | 23 mm | 17.30" | 2560x1440 | |
| 87.2 % v7 (old) | 04/22 | MSI Stealth GS77 12UHS-083US i7-12700H, GeForce RTX 3080 Ti Laptop GPU | 2.9 kg | 20.8 mm | 17.30" | 2560x1440 |
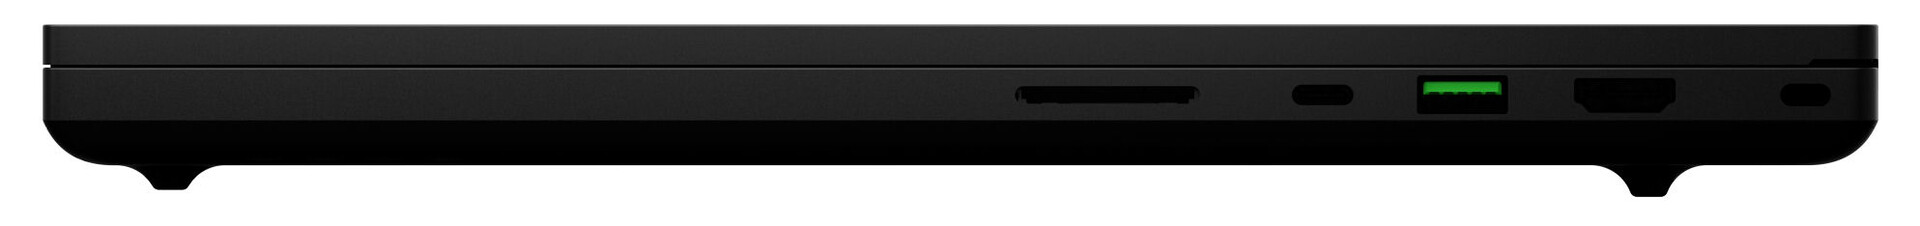
| SD Card Reader | |
| average JPG Copy Test (av. of 3 runs) | |
| Alienware x17 R2 P48E (AV Pro V60) | |
| Razer Blade 17 Early 2022 (AV PRO microSD 128 GB V60) | |
| Razer Blade 17 RTX 3080 Ti (AV Pro V60) | |
| Moyenne de la classe Gaming (20.9 - 210, n=54, 2 dernières années) | |
| MSI Stealth GS77 12UHS-083US (AV Pro V60) | |
| Medion Erazer Beast X30 (AV PRO microSD 128 GB V60) | |
| maximum AS SSD Seq Read Test (1GB) | |
| Alienware x17 R2 P48E (AV Pro V60) | |
| Razer Blade 17 RTX 3080 Ti (AV Pro V60) | |
| Moyenne de la classe Gaming (25.5 - 261, n=51, 2 dernières années) | |
| Medion Erazer Beast X30 (AV PRO microSD 128 GB V60) | |
| MSI Stealth GS77 12UHS-083US (AV Pro V60) | |
| Networking - iperf3 receive AXE11000 | |
| Medion Erazer Beast X30 | |
| Razer Blade 17 Early 2022 | |
| Moyenne de la classe Gaming (680 - 1745, n=88, 2 dernières années) | |
| Moyenne Killer Wi-Fi 6E AX1690i 160MHz (917 - 1727, n=9) | |


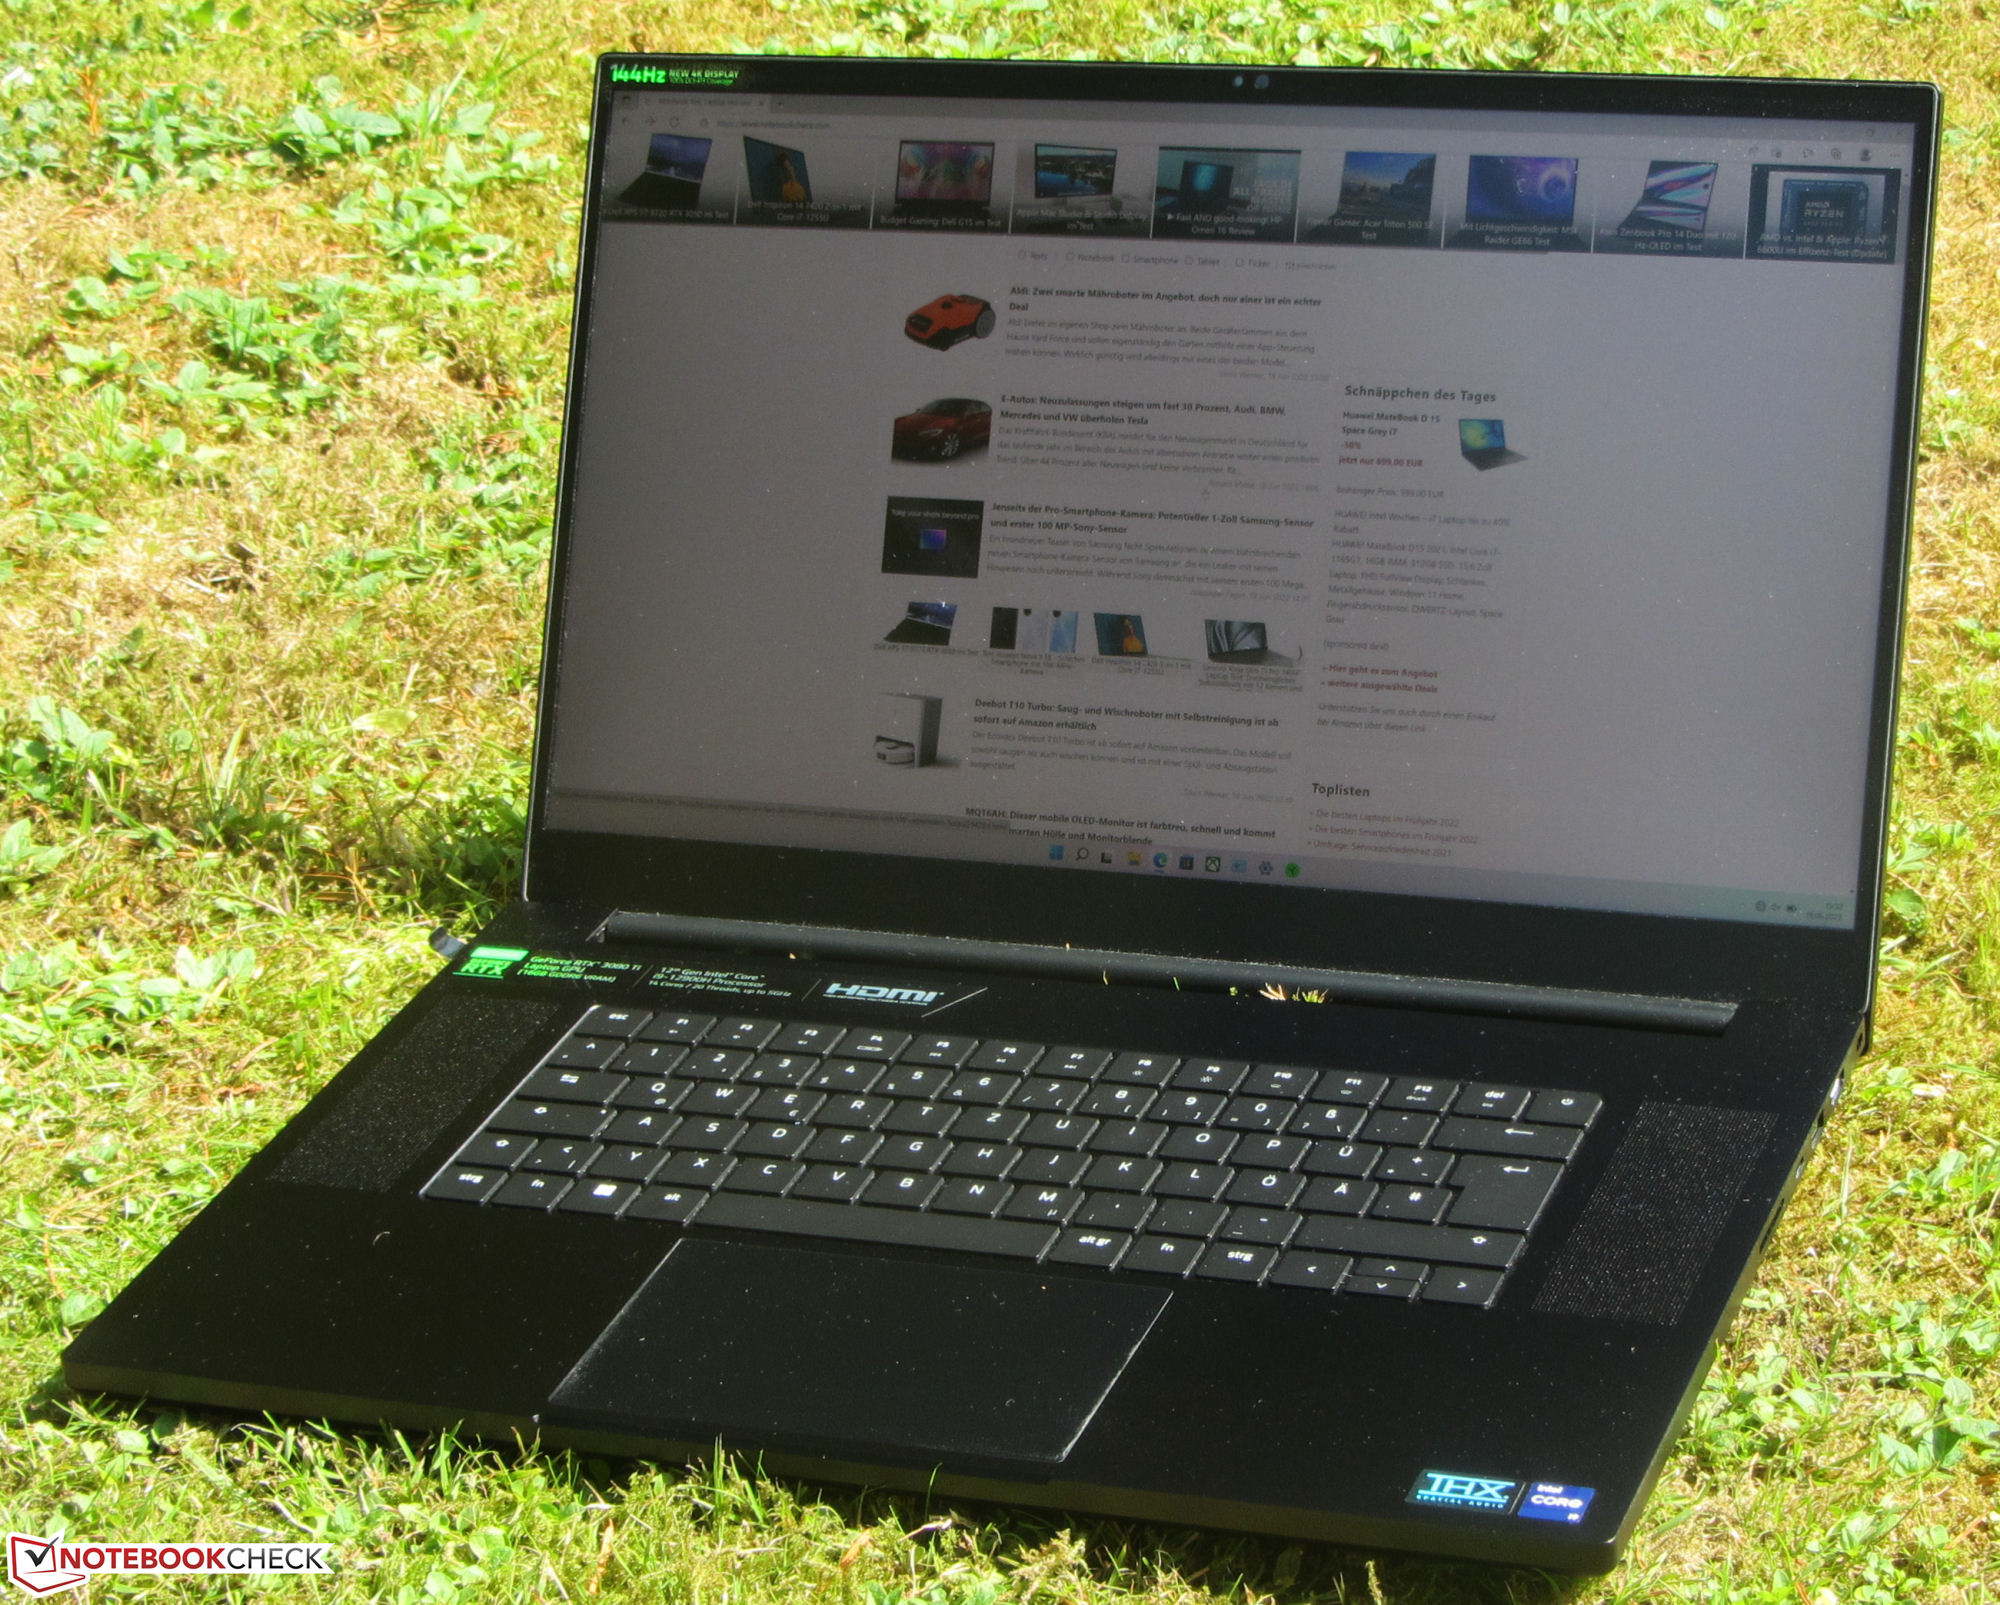
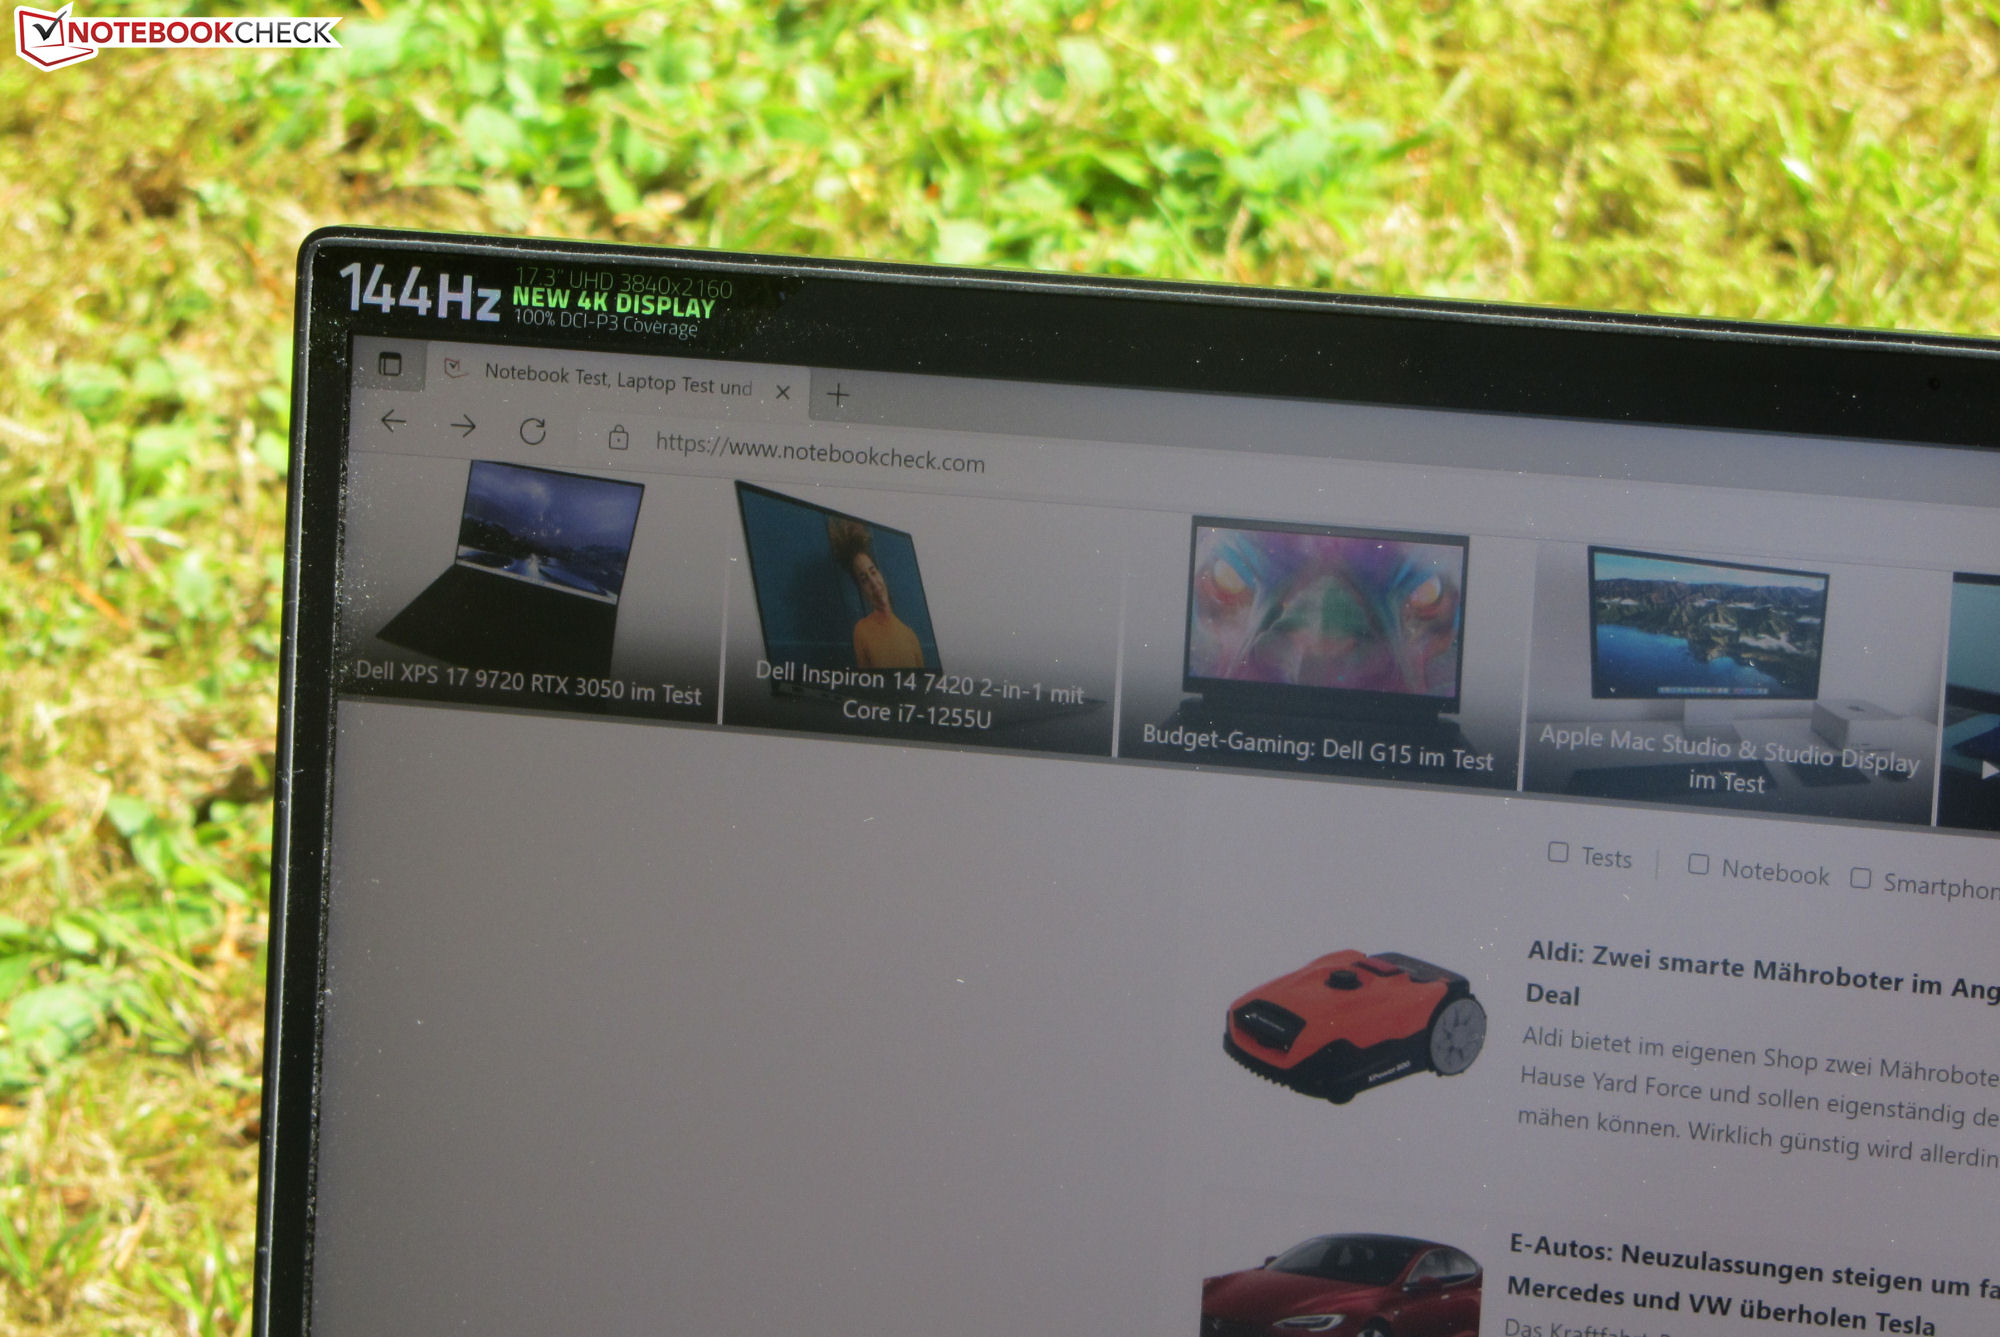
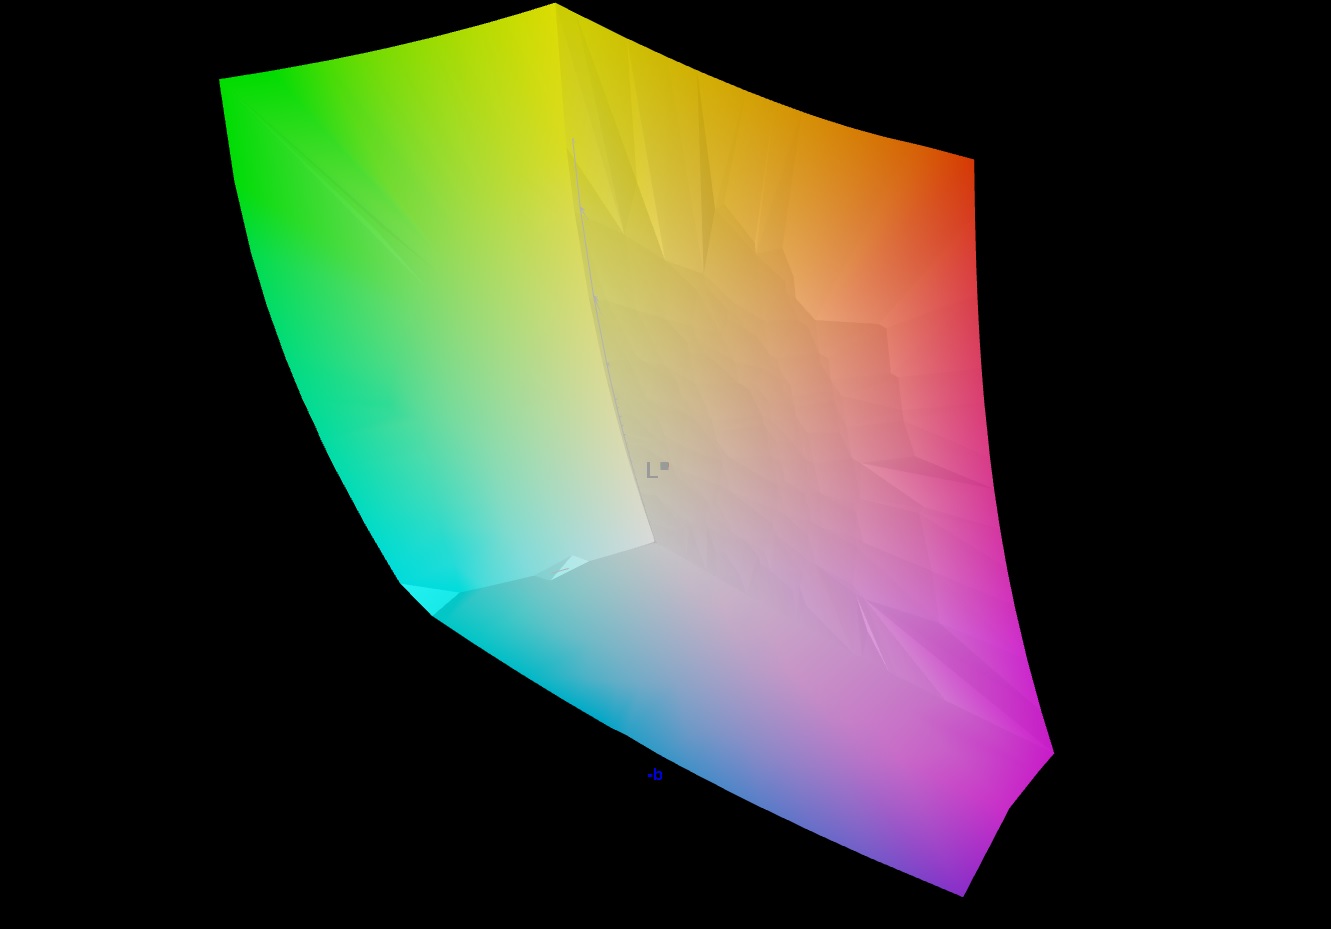
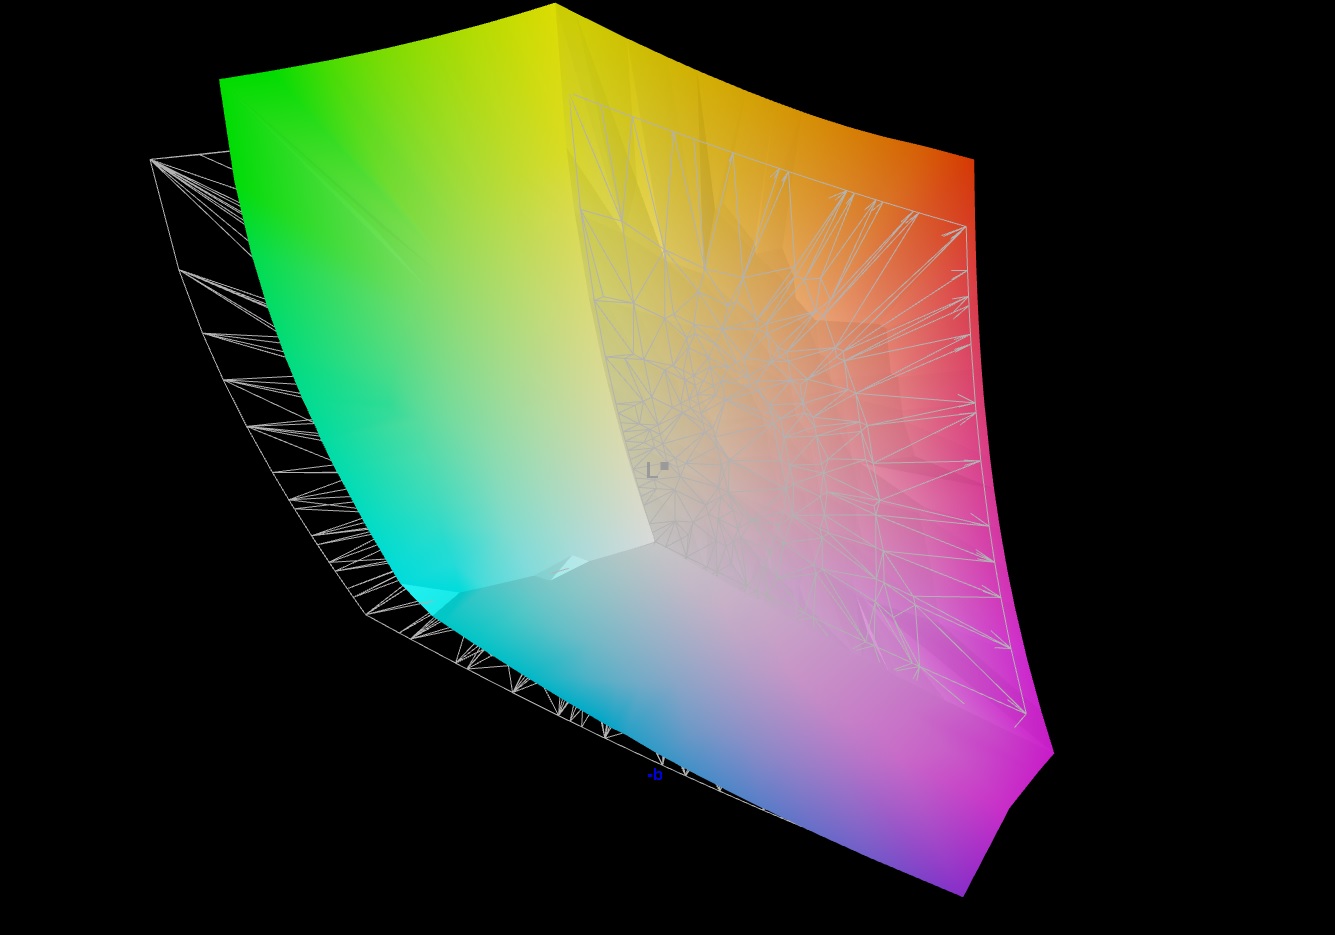
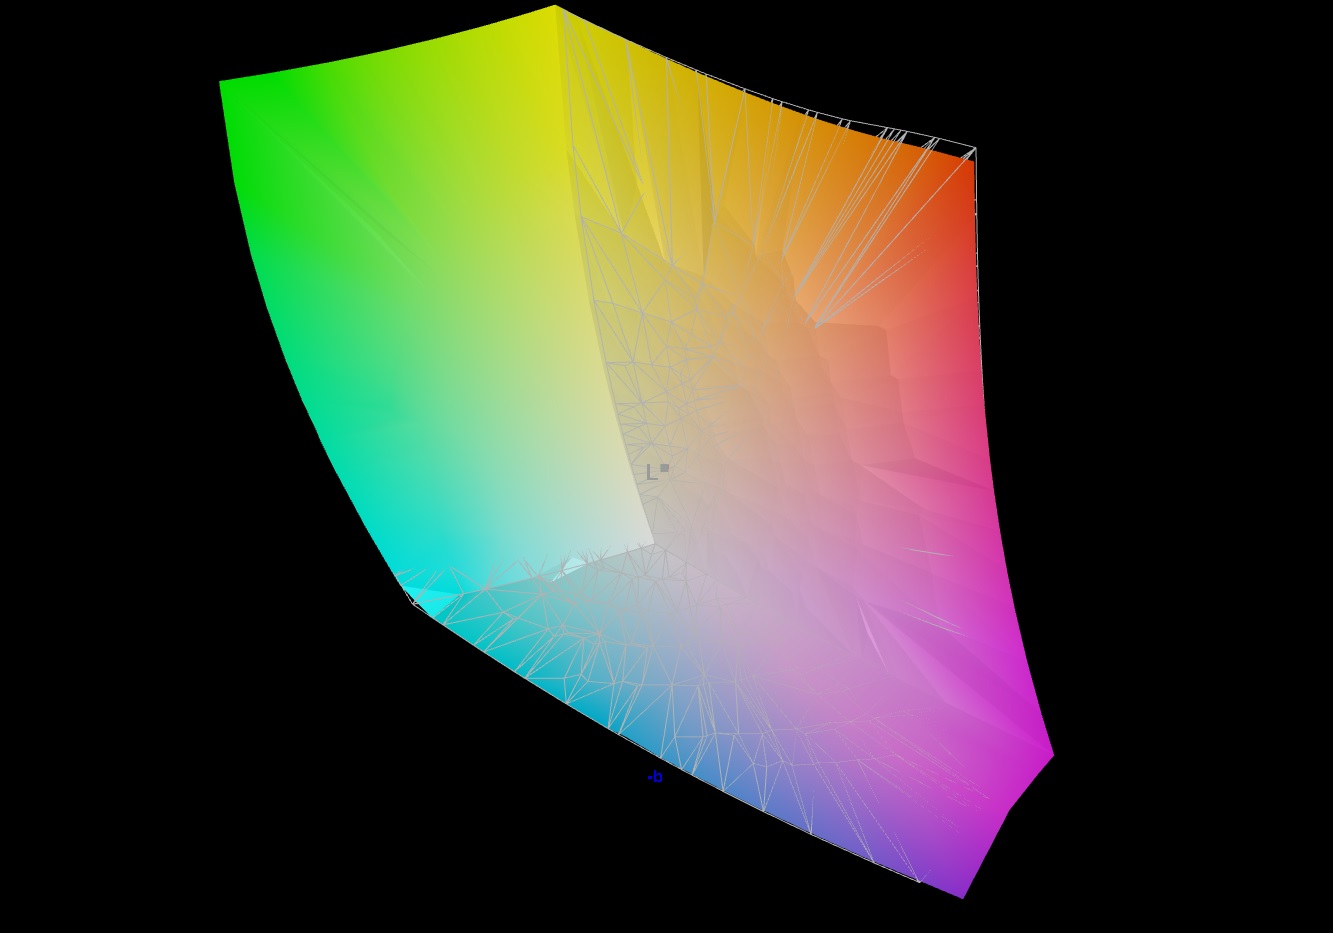
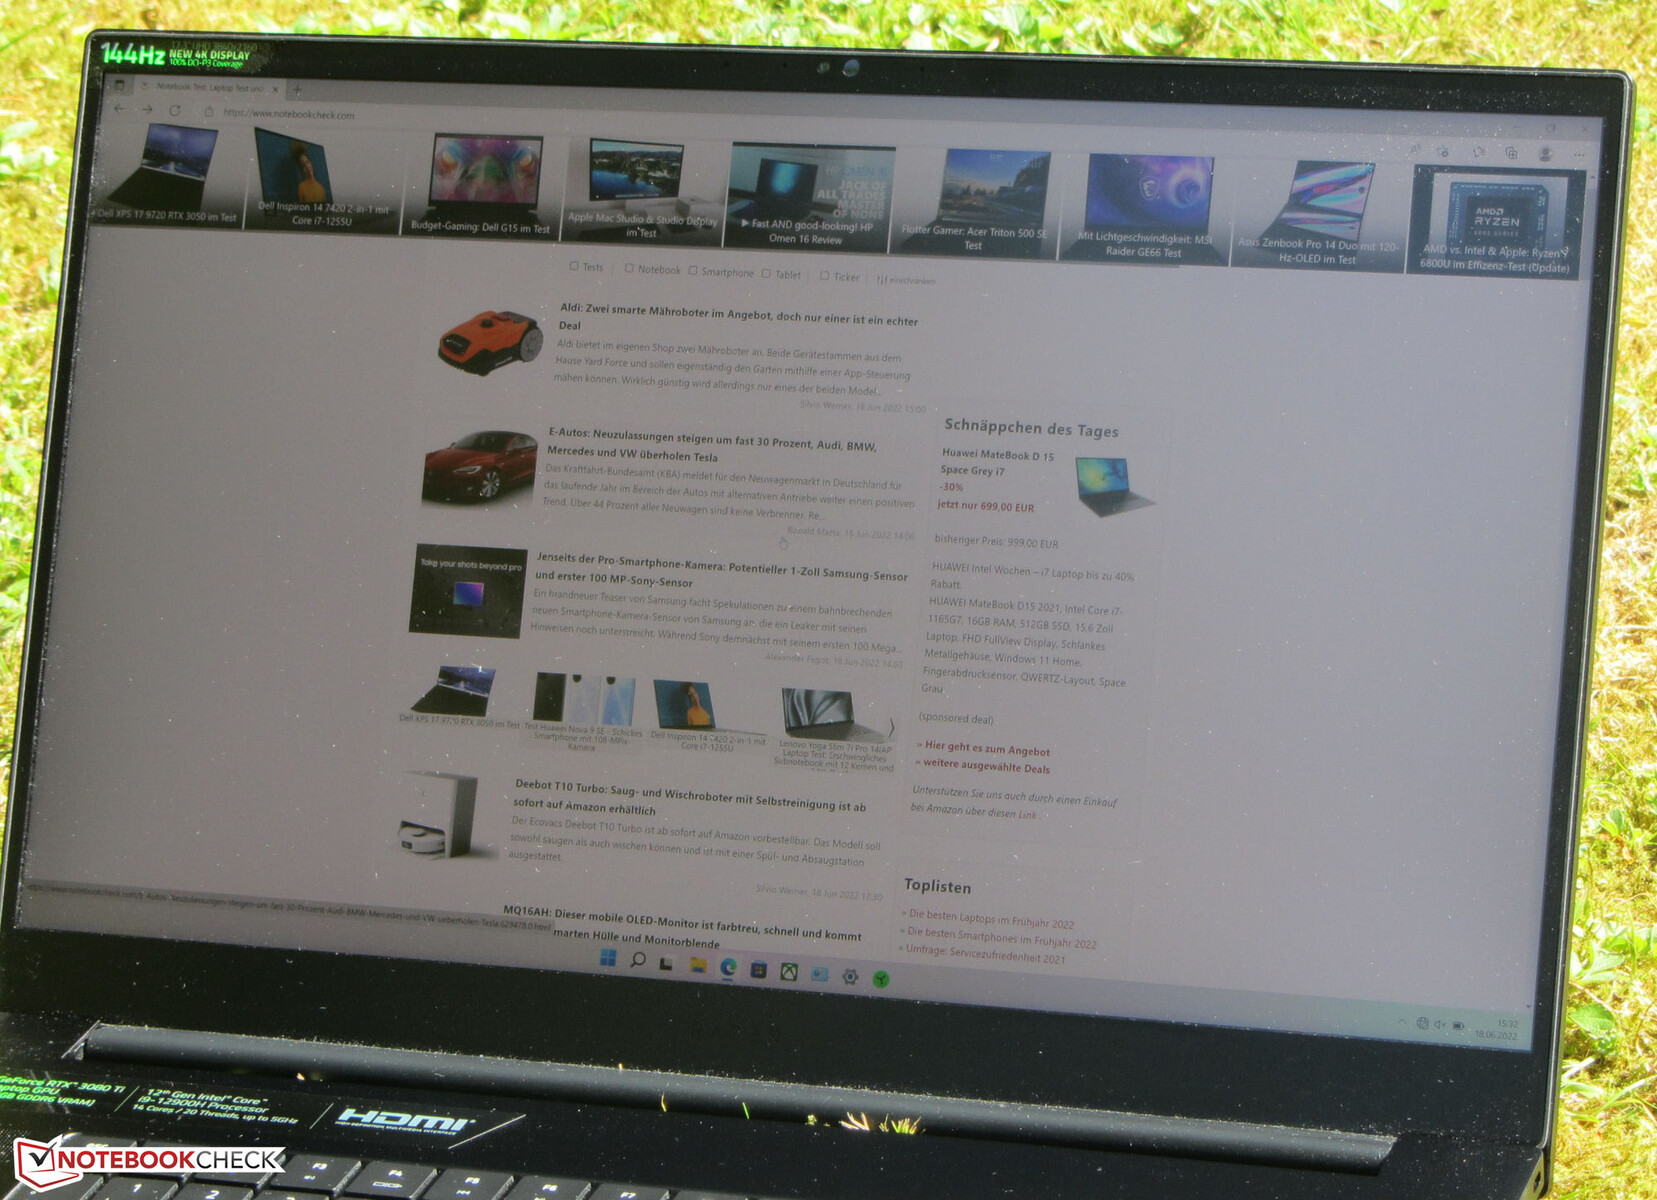
Affichage - Lumineux et avec des couleurs précises
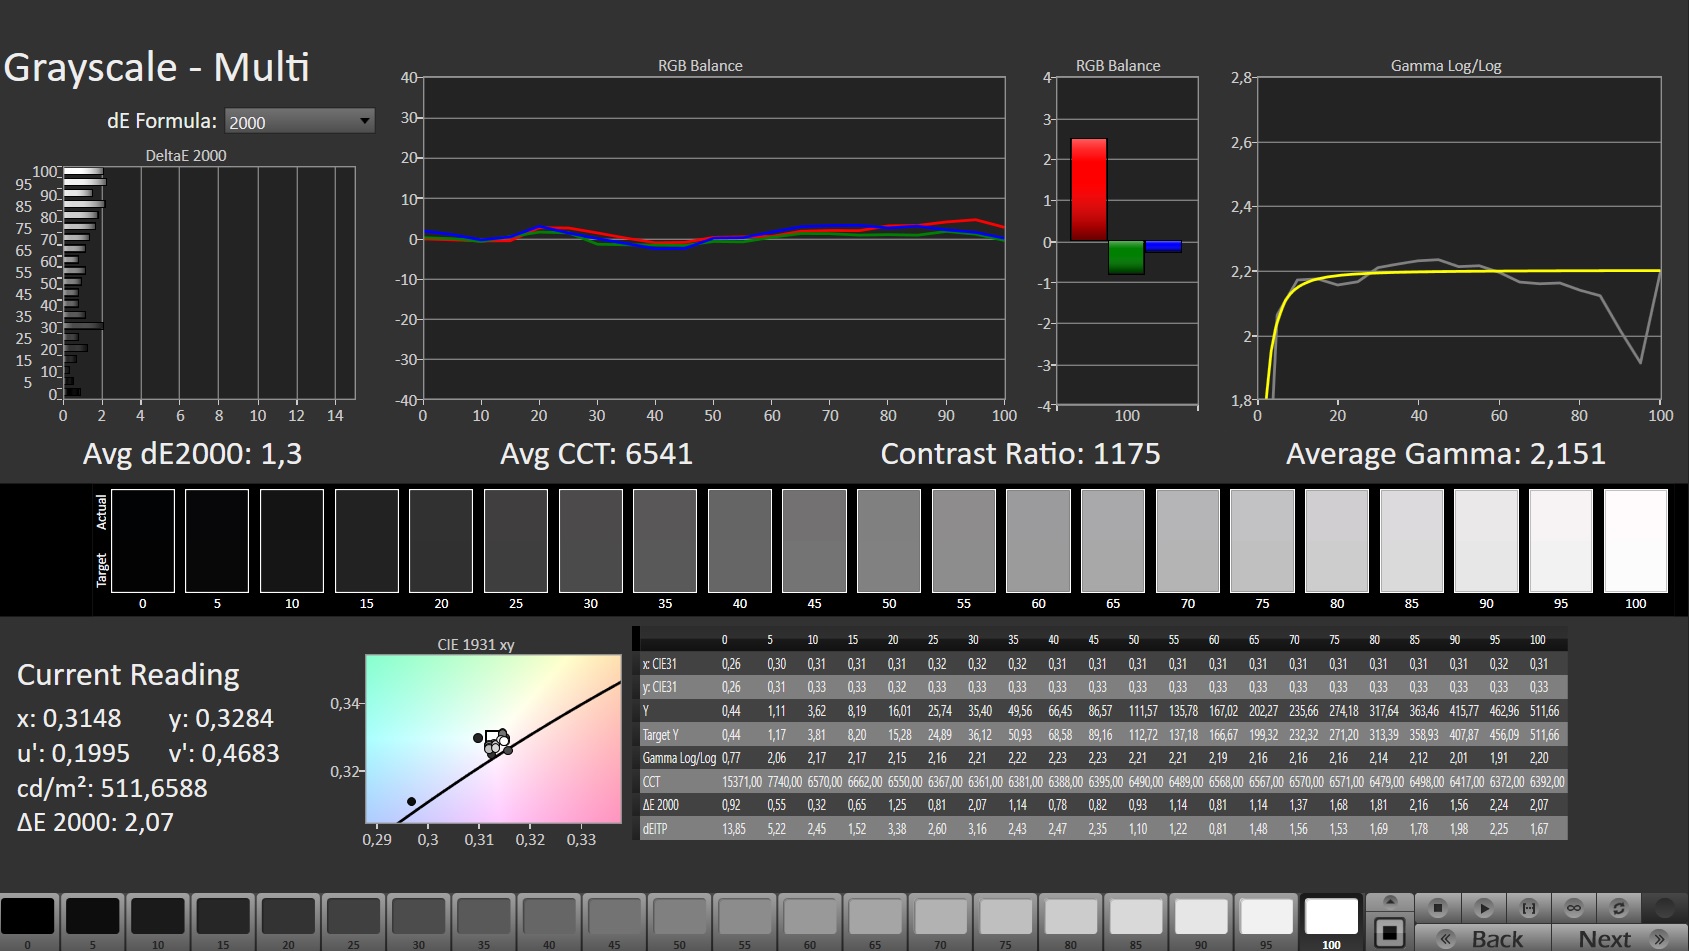
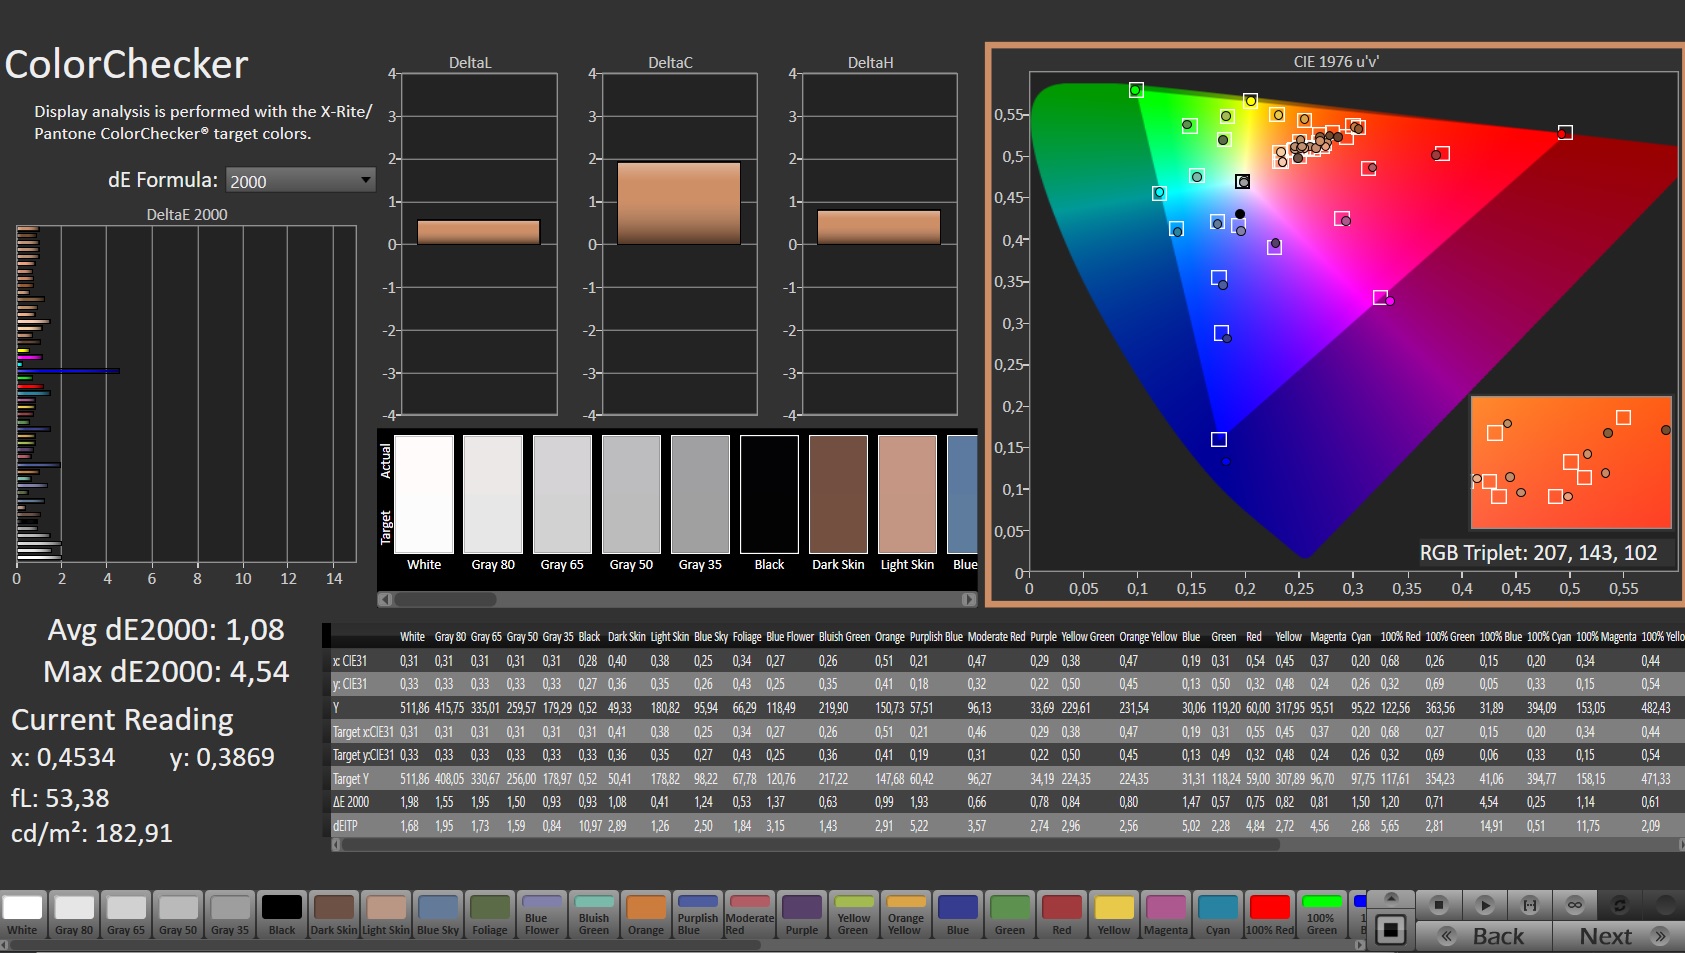
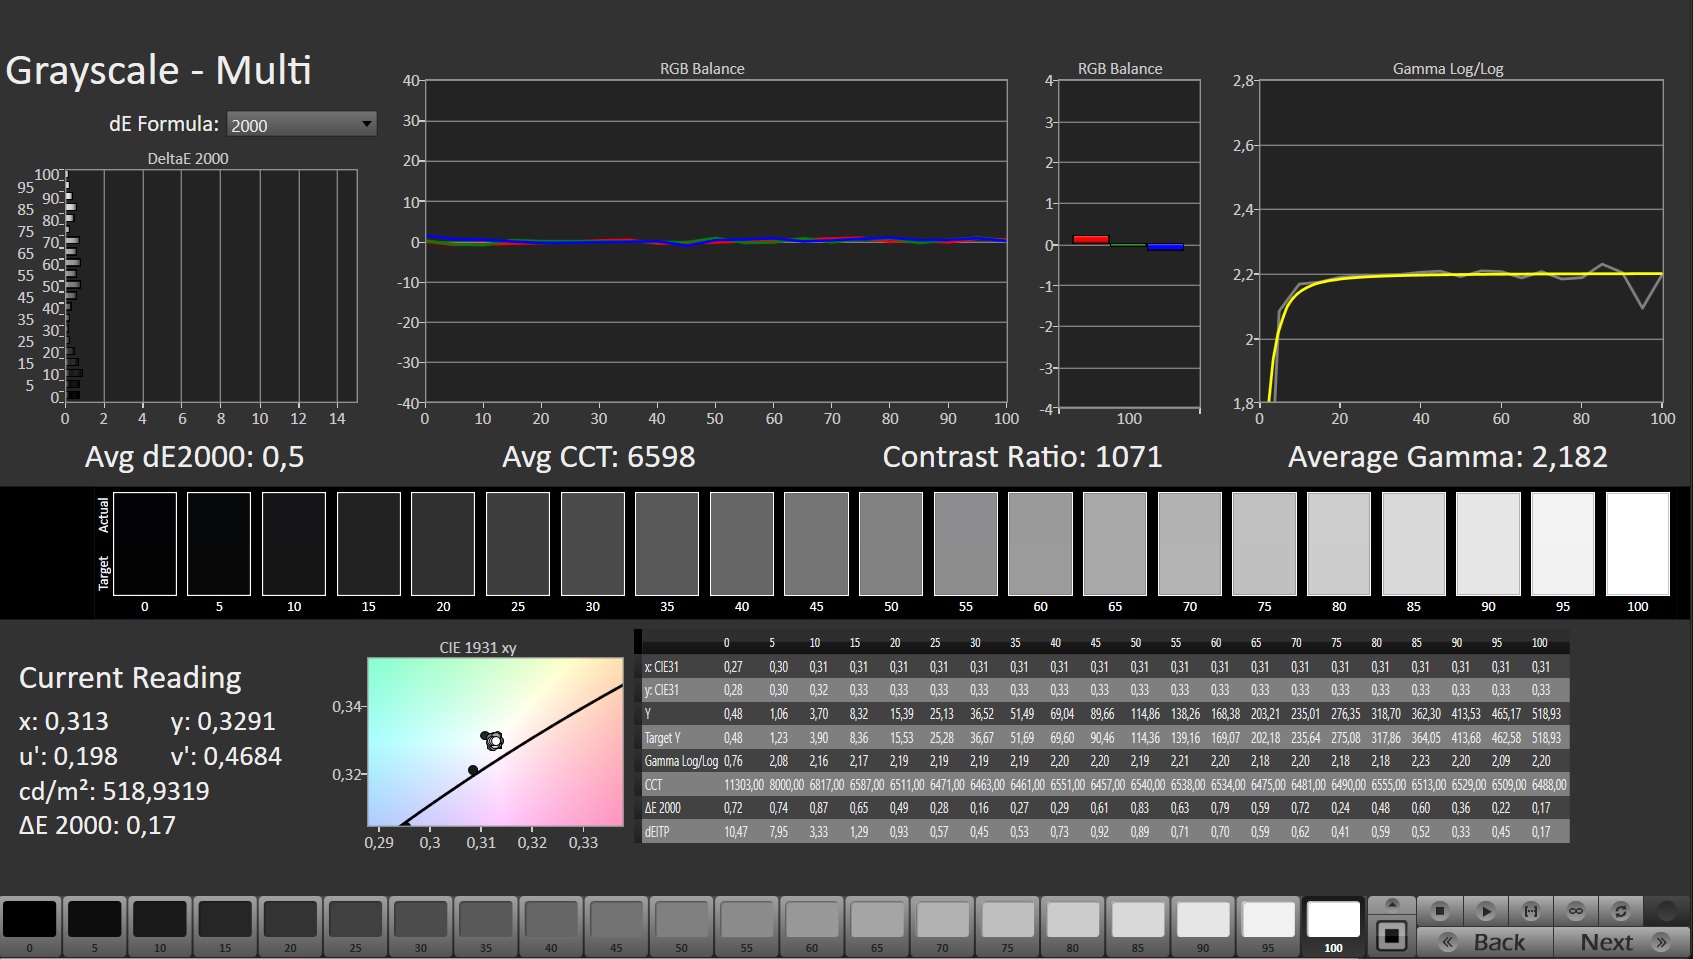
Dans notre unité de test, Razer utilise un impressionnant écran de 17,3 pouces avec une résolution 4K (3840 x 2160 pixels) et un taux de rafraîchissement de 144 Hz qui offre une luminosité plus élevée (486,3 cd/m²) et des temps de réponse plus courts que les écrans des concurrents. Cela vaut également pour la comparaison avec la dalle QHD du Modèle américain que nous avons déjà testé. Le contraste de 1 143:1 est également à un niveau élevé, et nous n'avons pas observé de scintillement PWM pendant nos mesures.
| |||||||||||||||||||||||||
Homogénéité de la luminosité: 84 %
Valeur mesurée au centre, sur batterie: 503 cd/m²
Contraste: 1143:1 (Valeurs des noirs: 0.44 cd/m²)
ΔE ColorChecker Calman: 1.08 | ∀{0.5-29.43 Ø4.71}
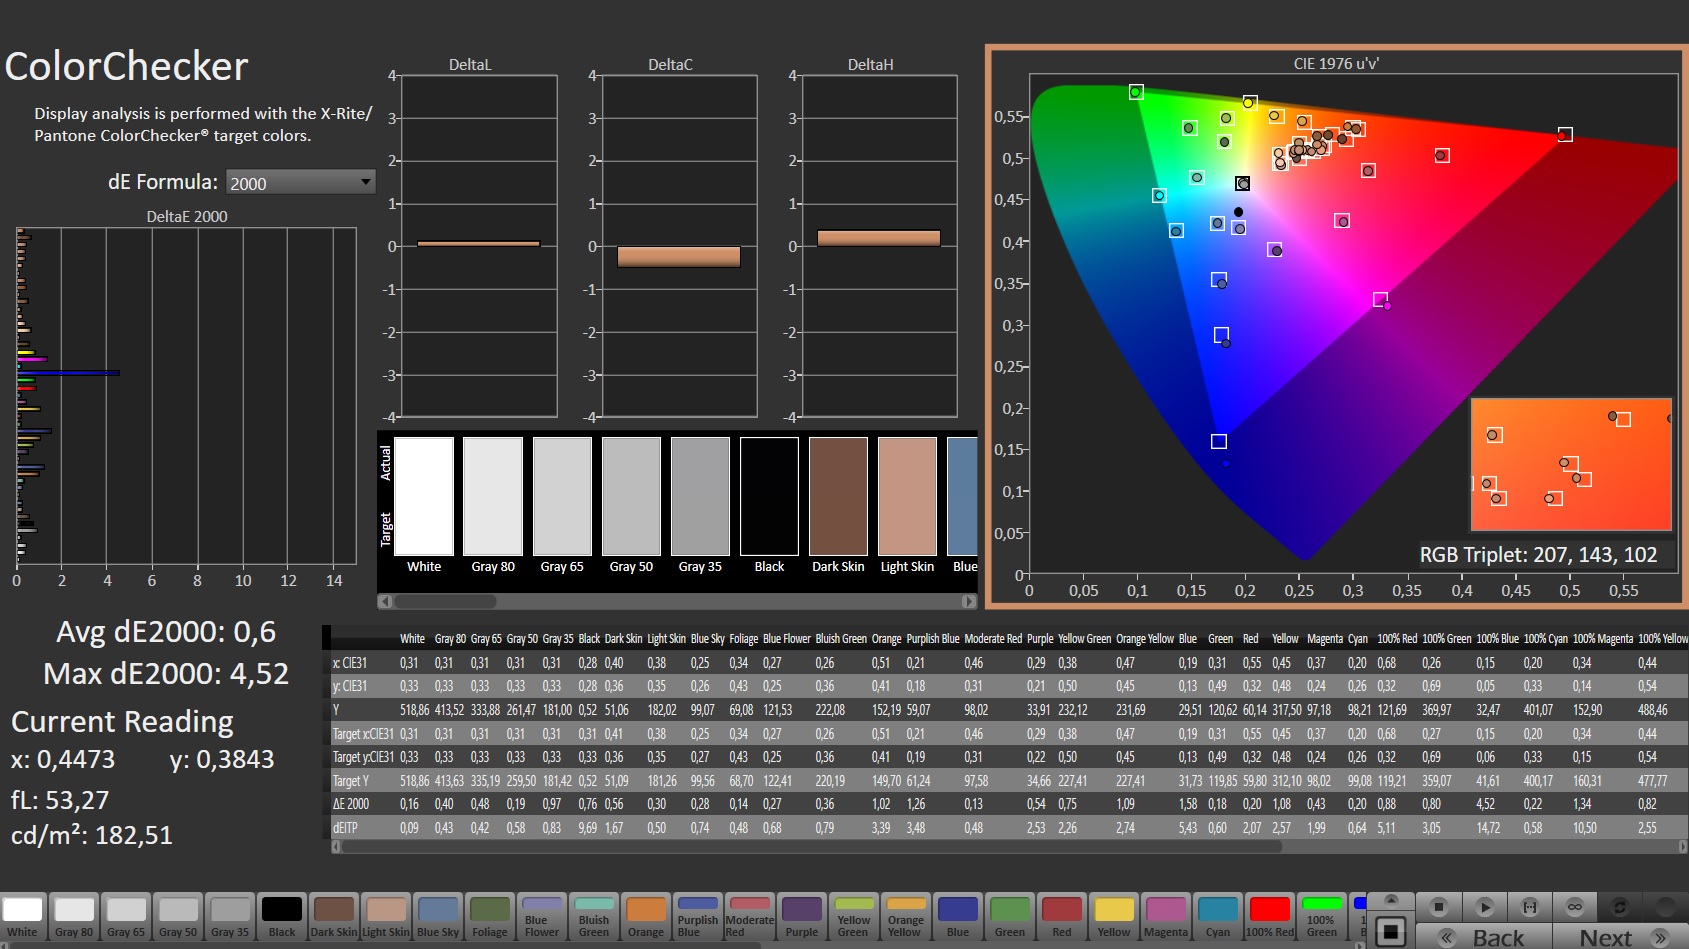
calibrated: 0.6
ΔE Greyscale Calman: 1.3 | ∀{0.09-98 Ø4.96}
87.3% AdobeRGB 1998 (Argyll 3D)
100% sRGB (Argyll 3D)
99.4% Display P3 (Argyll 3D)
Gamma: 2.151
CCT: 6541 K
| Razer Blade 17 Early 2022 AU Optronics B173ZAN06.9, IPS, 3840x2160, 17.3" | Alienware x17 R2 P48E AU Optronics B173HAN, IPS, 1920x1080, 17.3" | Medion Erazer Beast X30 BOE CQ NE173QHM-NZ3, IPS, 2560x1440, 17.3" | MSI Stealth GS77 12UHS-083US BOE NE173QHM-NZ1, IPS, 2560x1440, 17.3" | Razer Blade 17 RTX 3080 Ti BOE NE173QHM-NZ1, IPS, 2560x1440, 17.3" | |
|---|---|---|---|---|---|
| Display | -10% | -18% | -2% | -1% | |
| Display P3 Coverage (%) | 99.4 | 79.2 -20% | 67.7 -32% | 96.2 -3% | 98.7 -1% |
| sRGB Coverage (%) | 100 | 99.8 0% | 97.6 -2% | 99.7 0% | 99.9 0% |
| AdobeRGB 1998 Coverage (%) | 87.3 | 79.6 -9% | 69.2 -21% | 85.8 -2% | 86.2 -1% |
| Response Times | -65% | -73% | -132% | -120% | |
| Response Time Grey 50% / Grey 80% * (ms) | 7.5 ? | 12.4 ? -65% | 14.7 ? -96% | 17.6 ? -135% | 17.6 ? -135% |
| Response Time Black / White * (ms) | 5.6 ? | 9.2 ? -64% | 8.4 ? -50% | 12.8 ? -129% | 11.4 ? -104% |
| PWM Frequency (Hz) | |||||
| Screen | -63% | -58% | -92% | -37% | |
| Brightness middle (cd/m²) | 503 | 365.4 -27% | 377 -25% | 334.8 -33% | 335.9 -33% |
| Brightness (cd/m²) | 486 | 344 -29% | 352 -28% | 305 -37% | 294 -40% |
| Brightness Distribution (%) | 84 | 85 1% | 86 2% | 79 -6% | 75 -11% |
| Black Level * (cd/m²) | 0.44 | 0.29 34% | 0.32 27% | 0.34 23% | 0.38 14% |
| Contrast (:1) | 1143 | 1260 10% | 1178 3% | 985 -14% | 884 -23% |
| Colorchecker dE 2000 * | 1.08 | 3.17 -194% | 2.91 -169% | 4.1 -280% | 2.82 -161% |
| Colorchecker dE 2000 max. * | 4.54 | 7.69 -69% | 6.78 -49% | 7.28 -60% | 5.04 -11% |
| Colorchecker dE 2000 calibrated * | 0.6 | 0.51 15% | 1.3 -117% | ||
| Greyscale dE 2000 * | 1.3 | 5.3 -308% | 3.4 -162% | 5.6 -331% | 1.7 -31% |
| Gamma | 2.151 102% | 2.18 101% | 2.109 104% | 2.16 102% | 2.14 103% |
| CCT | 6541 99% | 5879 111% | 7273 89% | 6314 103% | 6382 102% |
| Moyenne finale (programmes/paramètres) | -46% /
-52% | -50% /
-51% | -75% /
-77% | -53% /
-41% |
* ... Moindre est la valeur, meilleures sont les performances
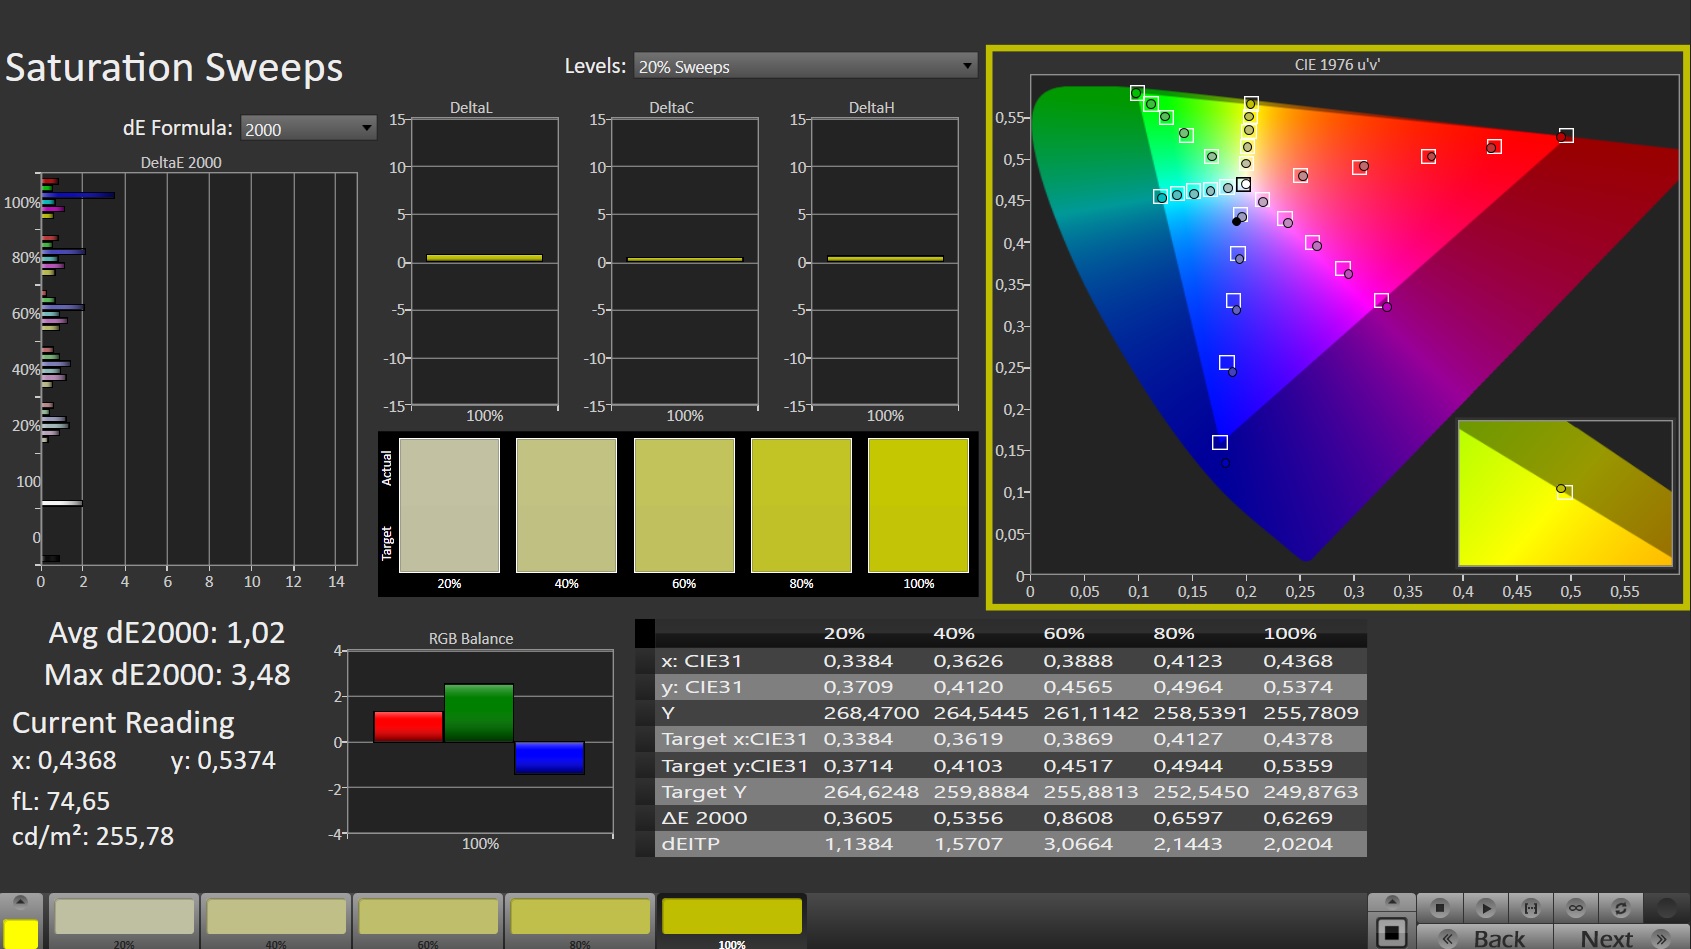
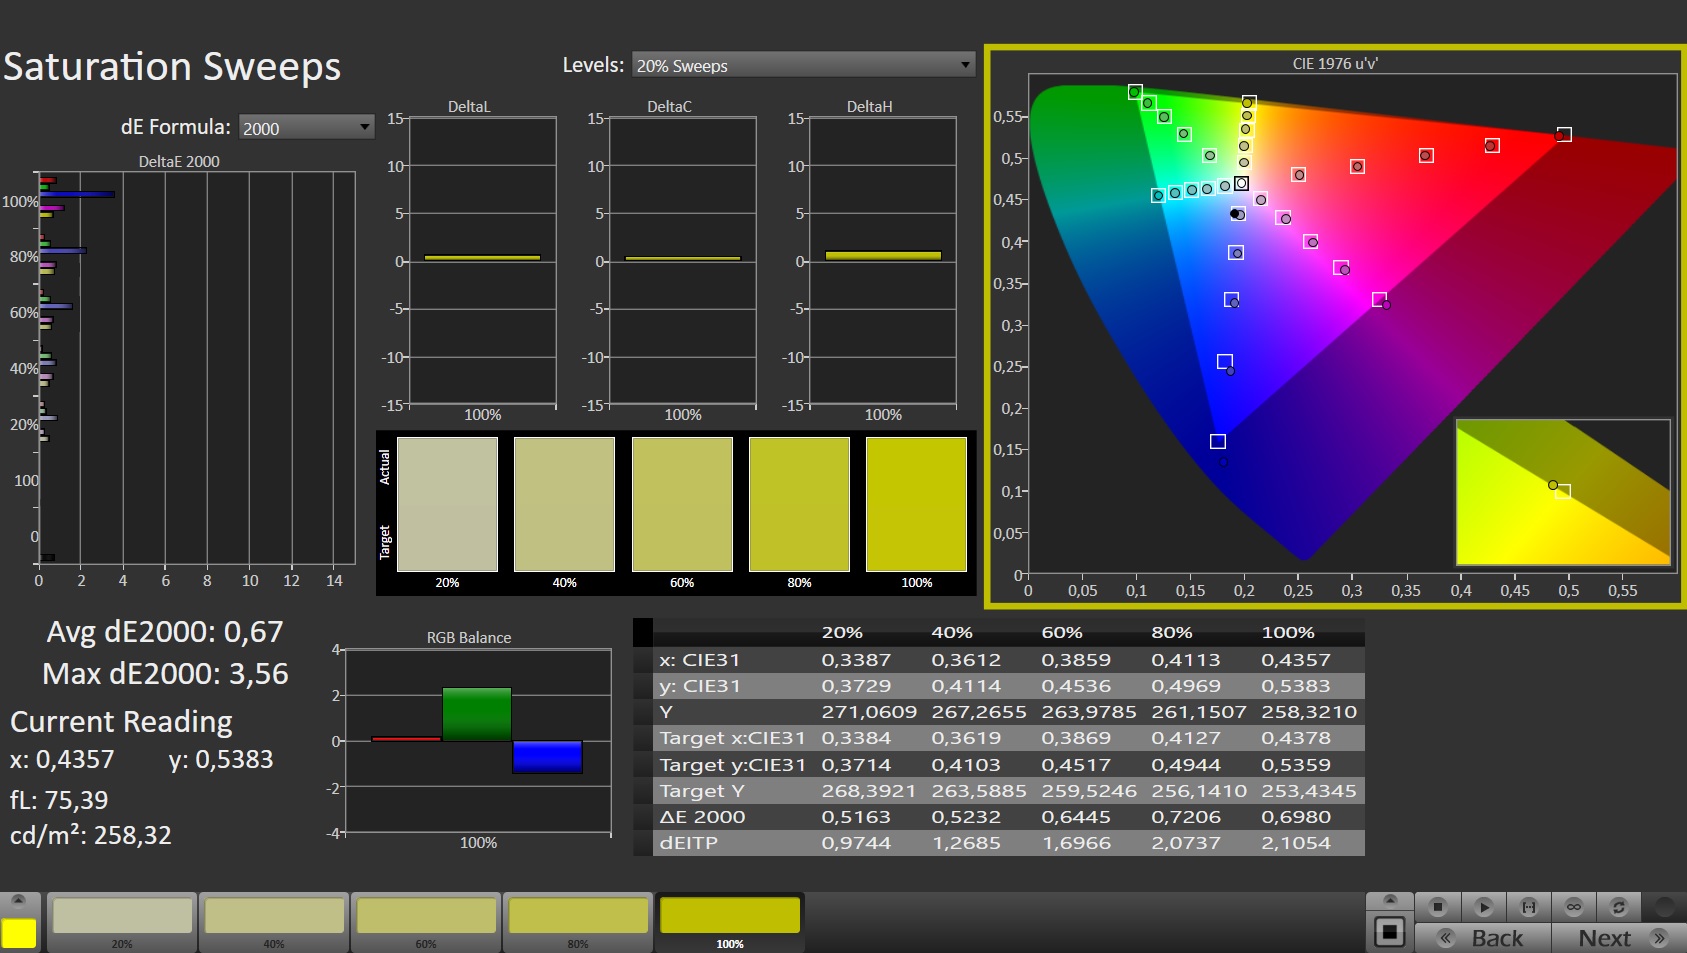
En termes de reproduction des couleurs et de couverture de l'espace colorimétrique, la dalle 4K et la dalle QHD du modèle frère sont similaires, les deux modèles délivrant de bonnes valeurs de niveaux presque identiques déjà à l'état de livraison. Les écarts de couleur moyens restent dans la fourchette cible de DeltaE < 3. Un calibrage apporte des améliorations supplémentaires, et notre fichier de profil est lié dans la fenêtre d'information sur l'écran ci-dessus pour votre téléchargement gratuit. Cependant, le panneau 4K montre une légère faiblesse dans les tons bleus, même après la calibration. Les deux écrans sont capables de couvrir complètement les espaces de couleur sRGB et DCI-P3, et l'espace de couleur AdobeRGB est au moins couvert à 86 et 87% respectivement.
Temps de réponse de l'écran
| ↔ Temps de réponse noir à blanc | ||
|---|---|---|
| 5.6 ms ... hausse ↗ et chute ↘ combinées | ↗ 1.6 ms hausse | 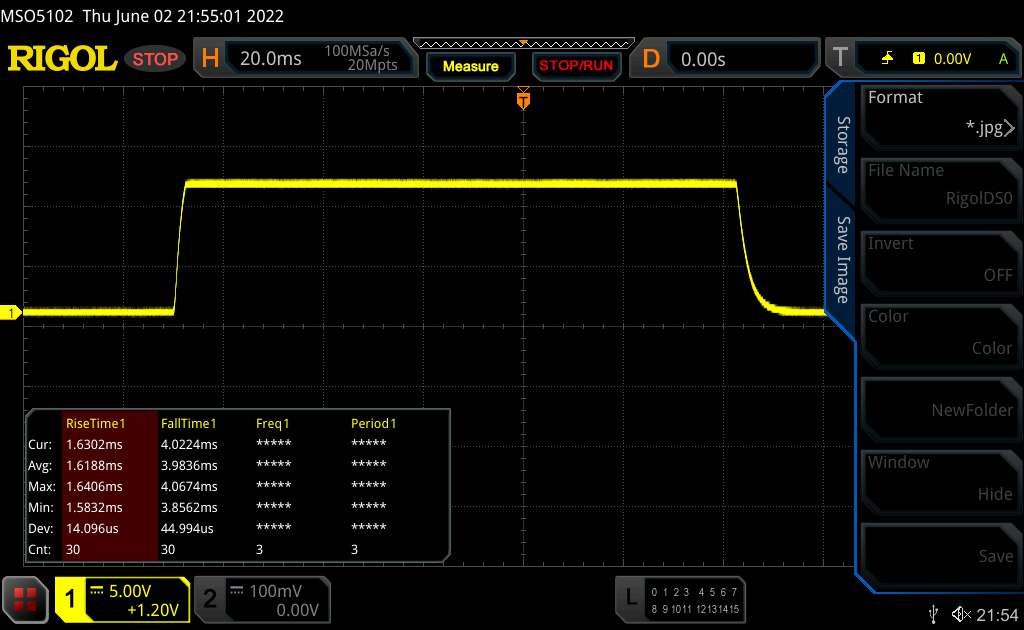 |
| ↘ 4 ms chute | ||
| L'écran montre de très faibles temps de réponse, parfait pour le jeu. En comparaison, tous les appareils testés affichent entre 0.1 (minimum) et 240 (maximum) ms. » 18 % des appareils testés affichent de meilleures performances. Cela signifie que les latences relevées sont meilleures que la moyenne (19.8 ms) de tous les appareils testés. | ||
| ↔ Temps de réponse gris 50% à gris 80% | ||
| 7.5 ms ... hausse ↗ et chute ↘ combinées | ↗ 2.1 ms hausse |  |
| ↘ 5.4 ms chute | ||
| L'écran montre de très faibles temps de réponse, parfait pour le jeu. En comparaison, tous les appareils testés affichent entre 0.165 (minimum) et 636 (maximum) ms. » 20 % des appareils testés affichent de meilleures performances. Cela signifie que les latences relevées sont meilleures que la moyenne (31 ms) de tous les appareils testés. | ||
Scintillement / MLI (Modulation de largeur d'impulsion)
| Scintillement / MLI (Modulation de largeur d'impulsion) non décelé |  | ||
En comparaison, 52 % des appareils testés n'emploient pas MDI pour assombrir leur écran. Nous avons relevé une moyenne à 7754 (minimum : 5 - maximum : 343500) Hz dans le cas où une MDI était active. | |||
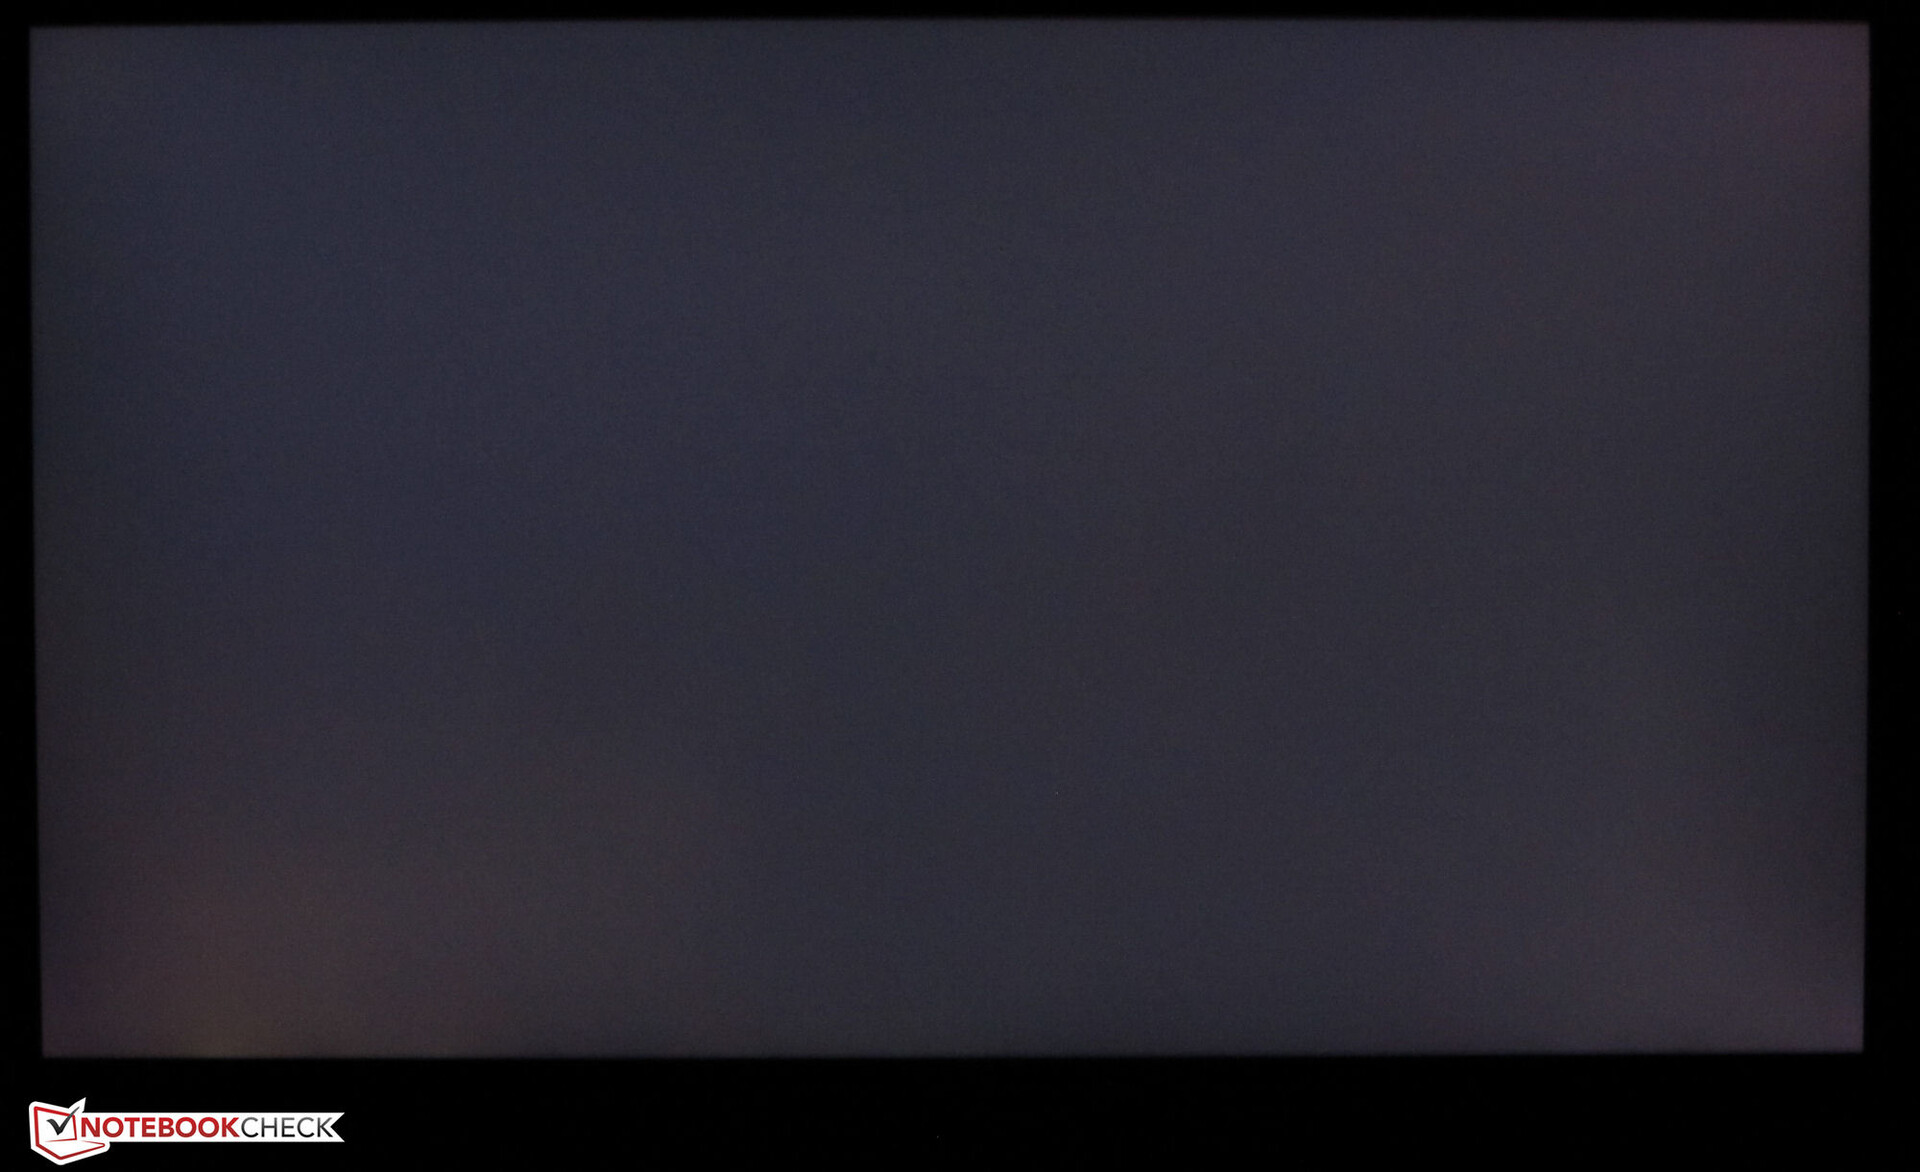
La dalle IPS offre des angles de vision stables et permet de lire sous tous les angles. Grâce à la luminosité assez élevée de l'écran, vous pouvez également lire son contenu facilement en extérieur.

Performance - L'ordinateur portable Razer utilise Alder Lake et Ampere
Avec le Blade 17, Razer propose un ordinateur portable de jeu de 17,3 pouces capable de porter à l'écran tous les jeux actuels en toute fluidité.
Conditions d'essai
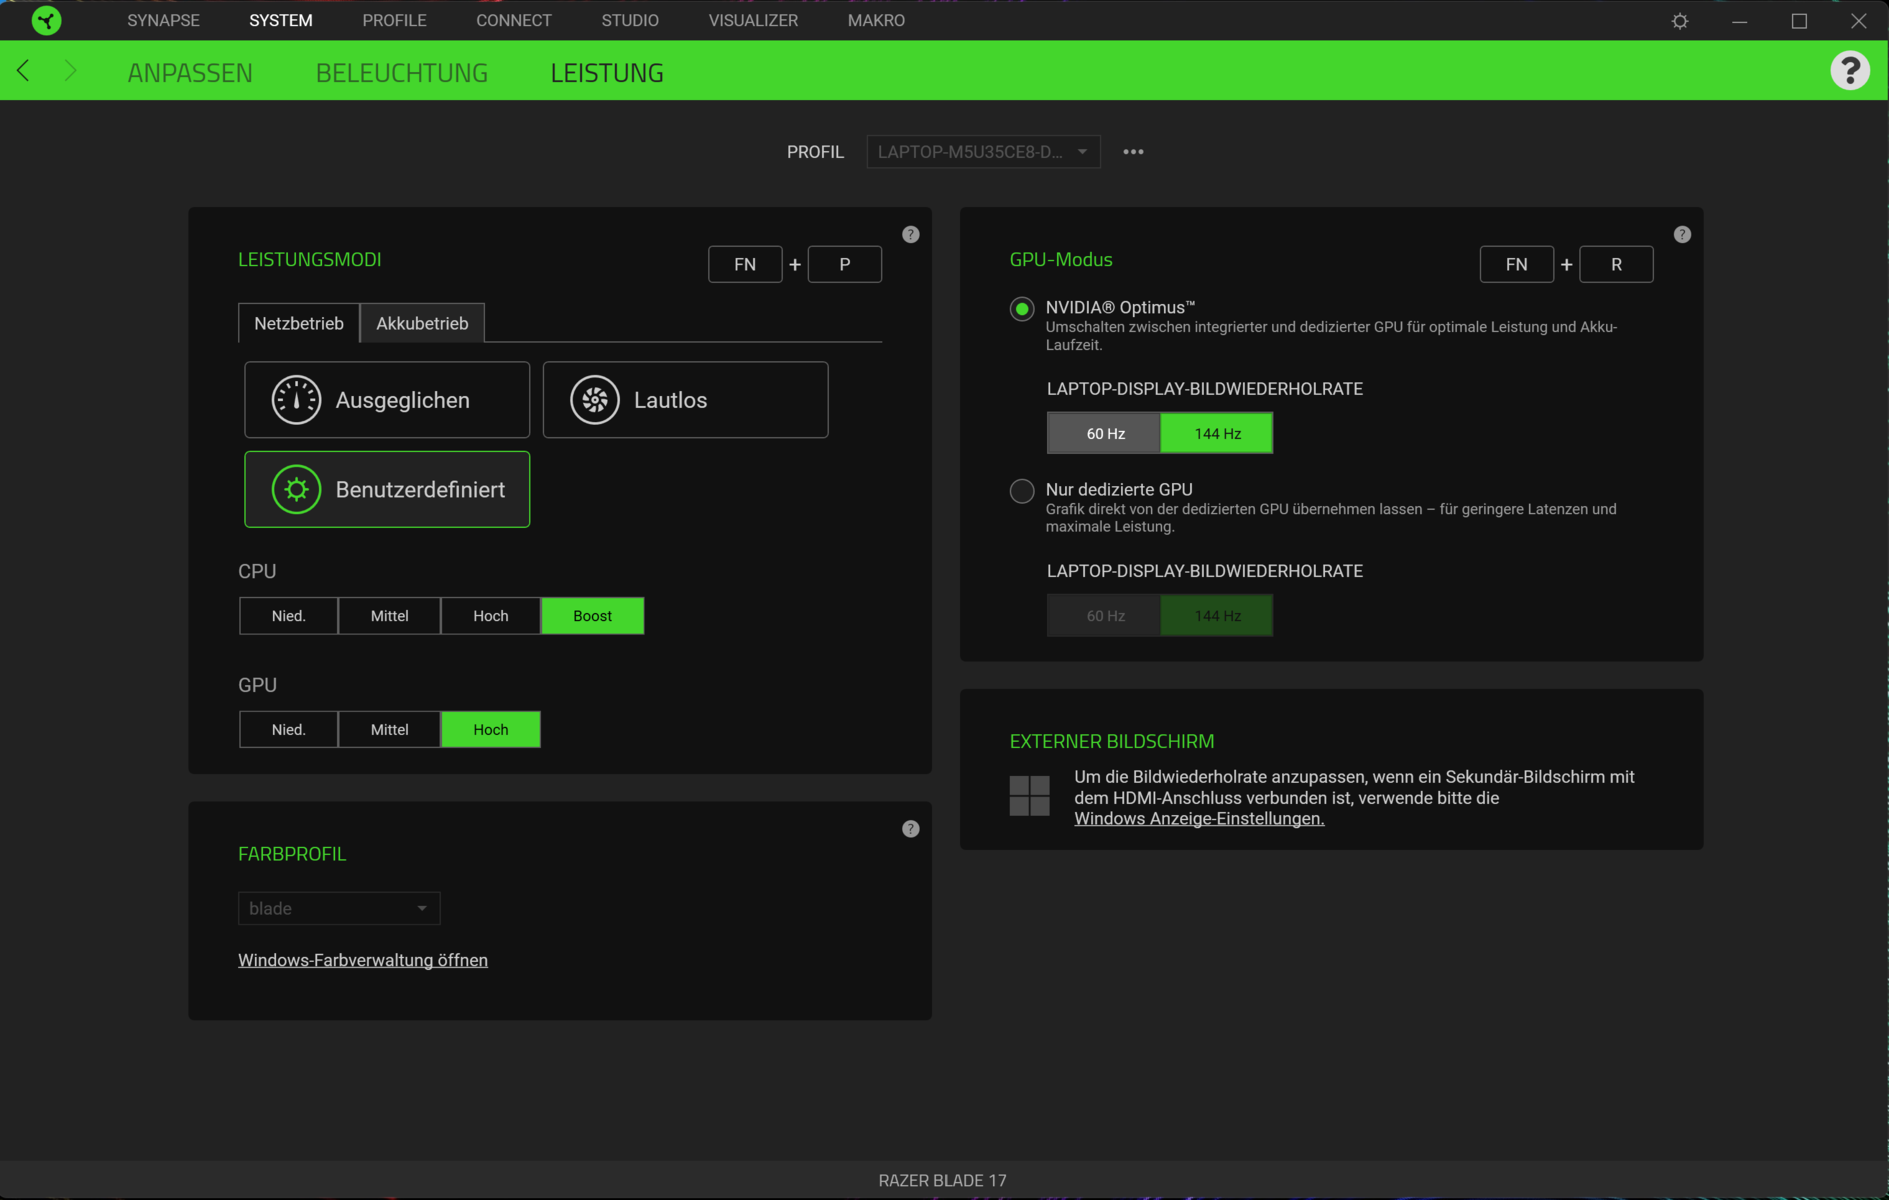
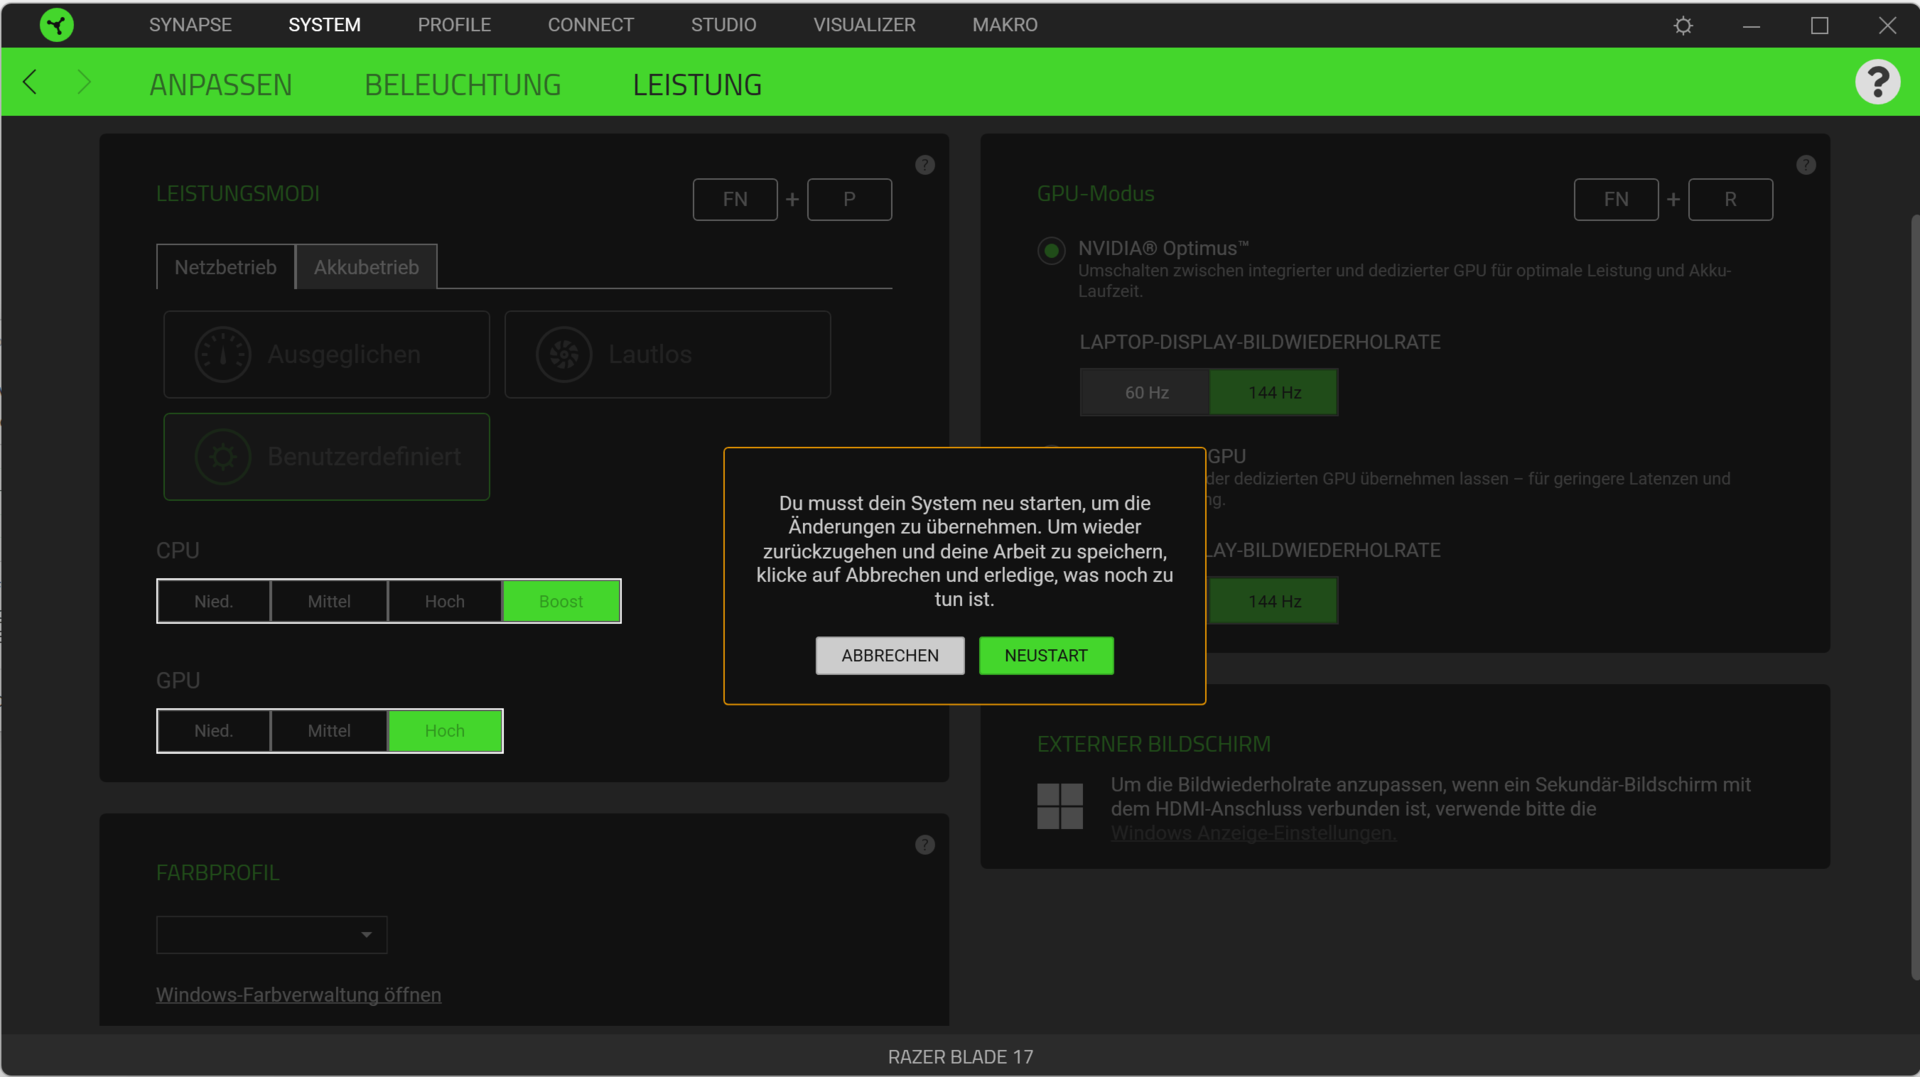
Vous pouvez basculer entre les trois profils de performance disponibles ("Équilibré", "Silencieux" et "Défini par l'utilisateur") en utilisant la combinaison de touches "Fn" + "P". Le profil "User defined" vous permet de définir les sous-présets pour le CPU ("Low", "Medium", "High" et "Boost") et le GPU ("Low", "Medium" et "High") via le logiciel Razer Synapse. En mode batterie, le seul profil disponible est "Balanced"
Lors de notre test, nous avons utilisé le profil " User defined " avec les sous-présets " Medium " (CPU) et " High " (GPU), qui est le réglage par défaut en l'état de livraison. En outre, nous avons exécuté plusieurs benchmarks en utilisant le profil "Silent", à la performance maximale (CPU : "Boost", GPU : "High"), et en mode dGPU. Vous pouvez trouver les résultats dans les graphiques ci-dessous.
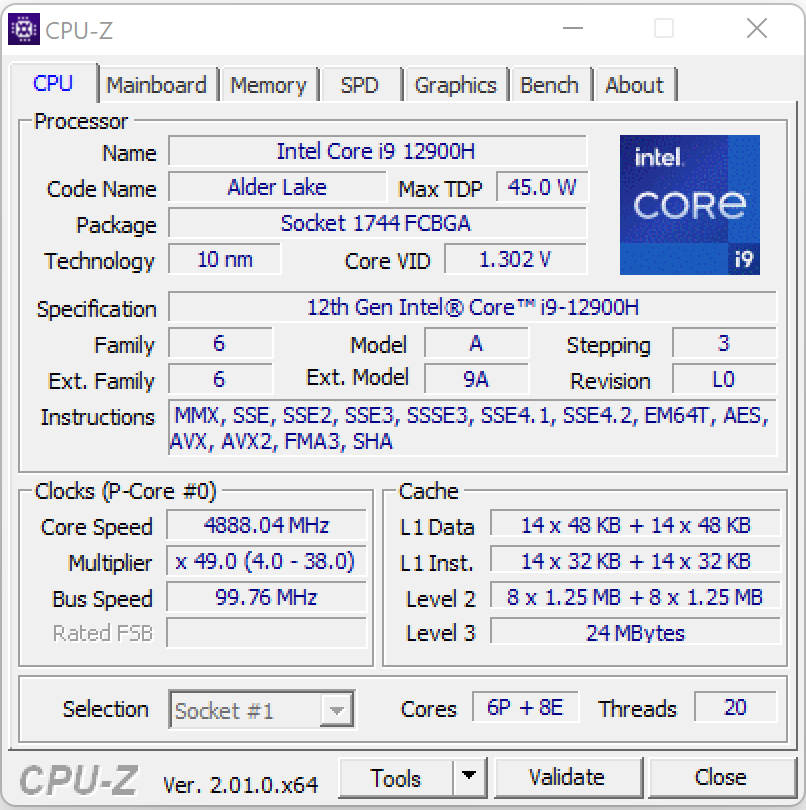
Processeur
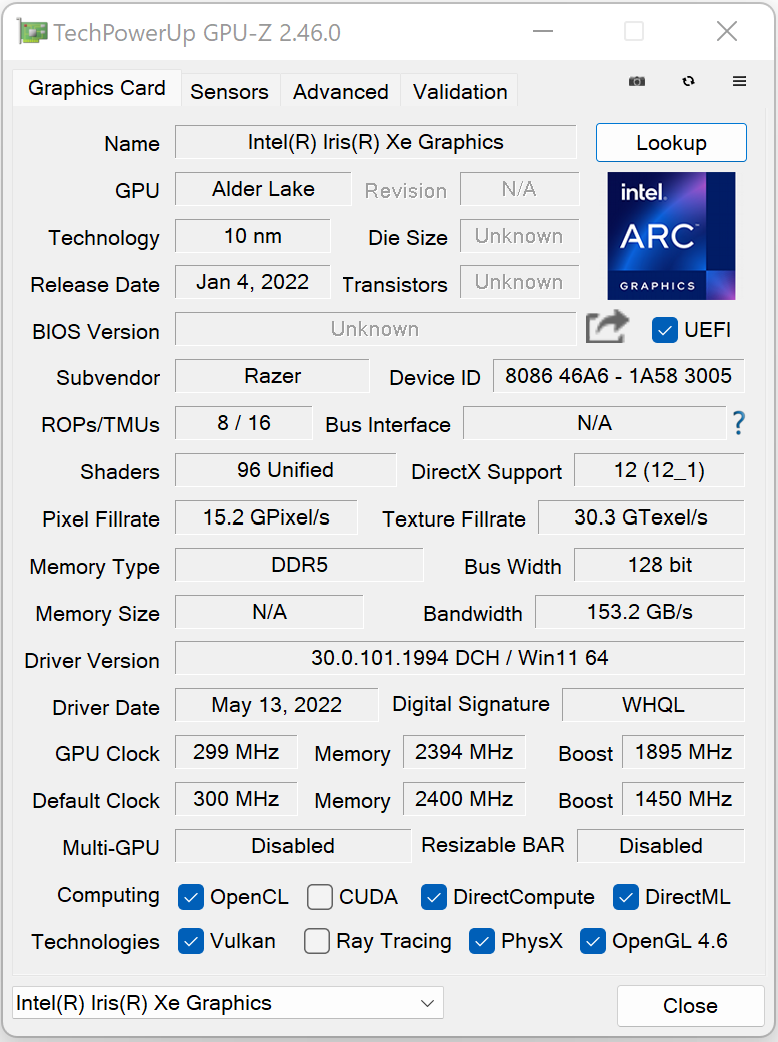
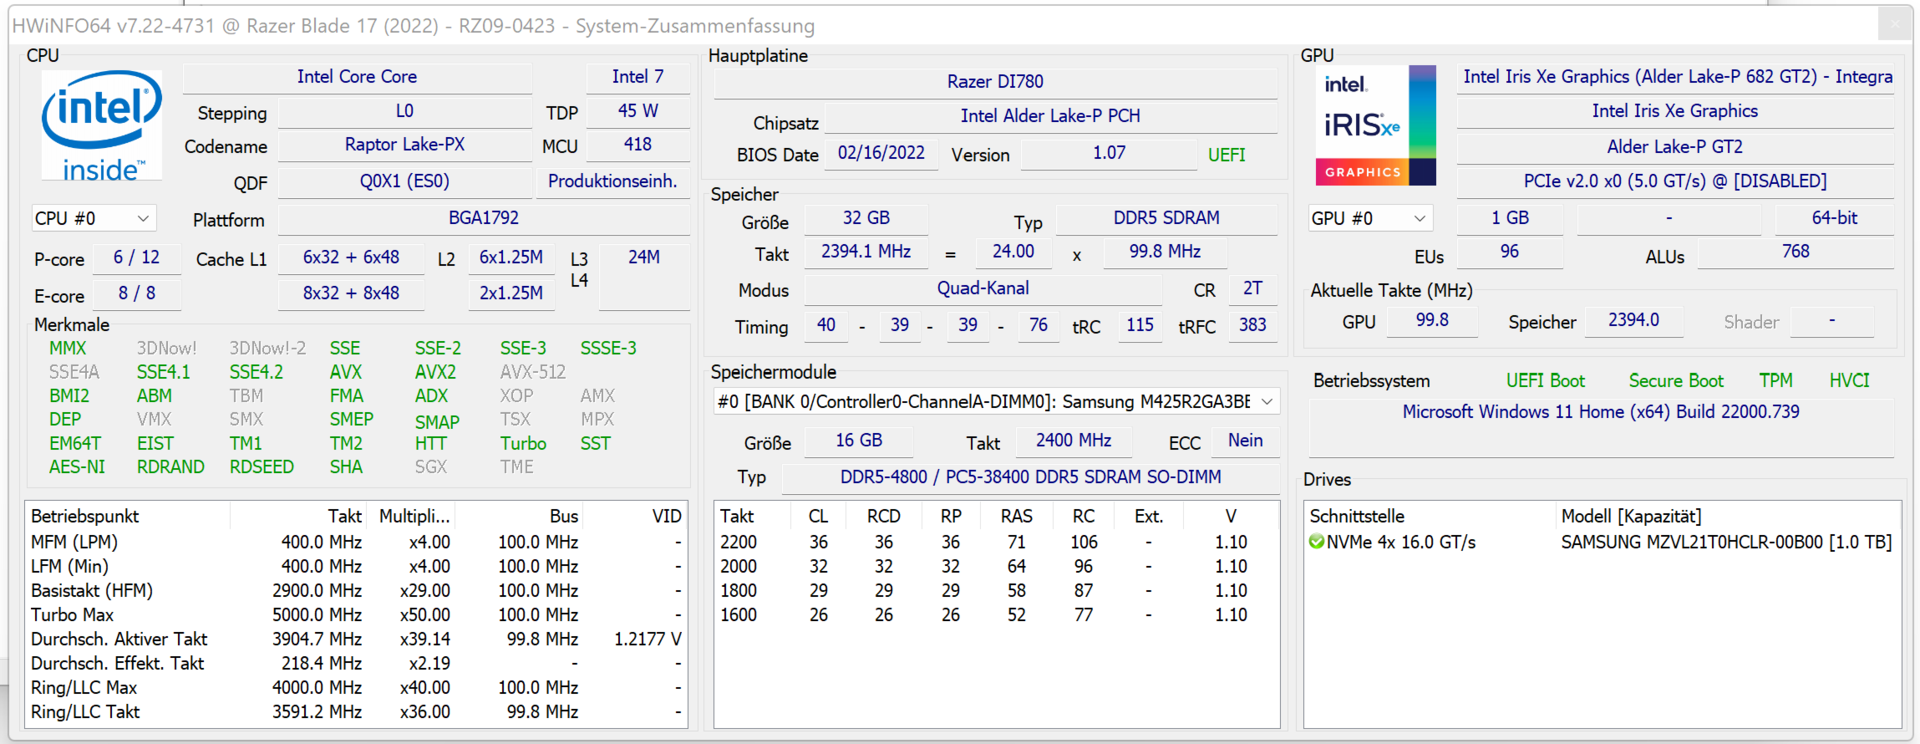
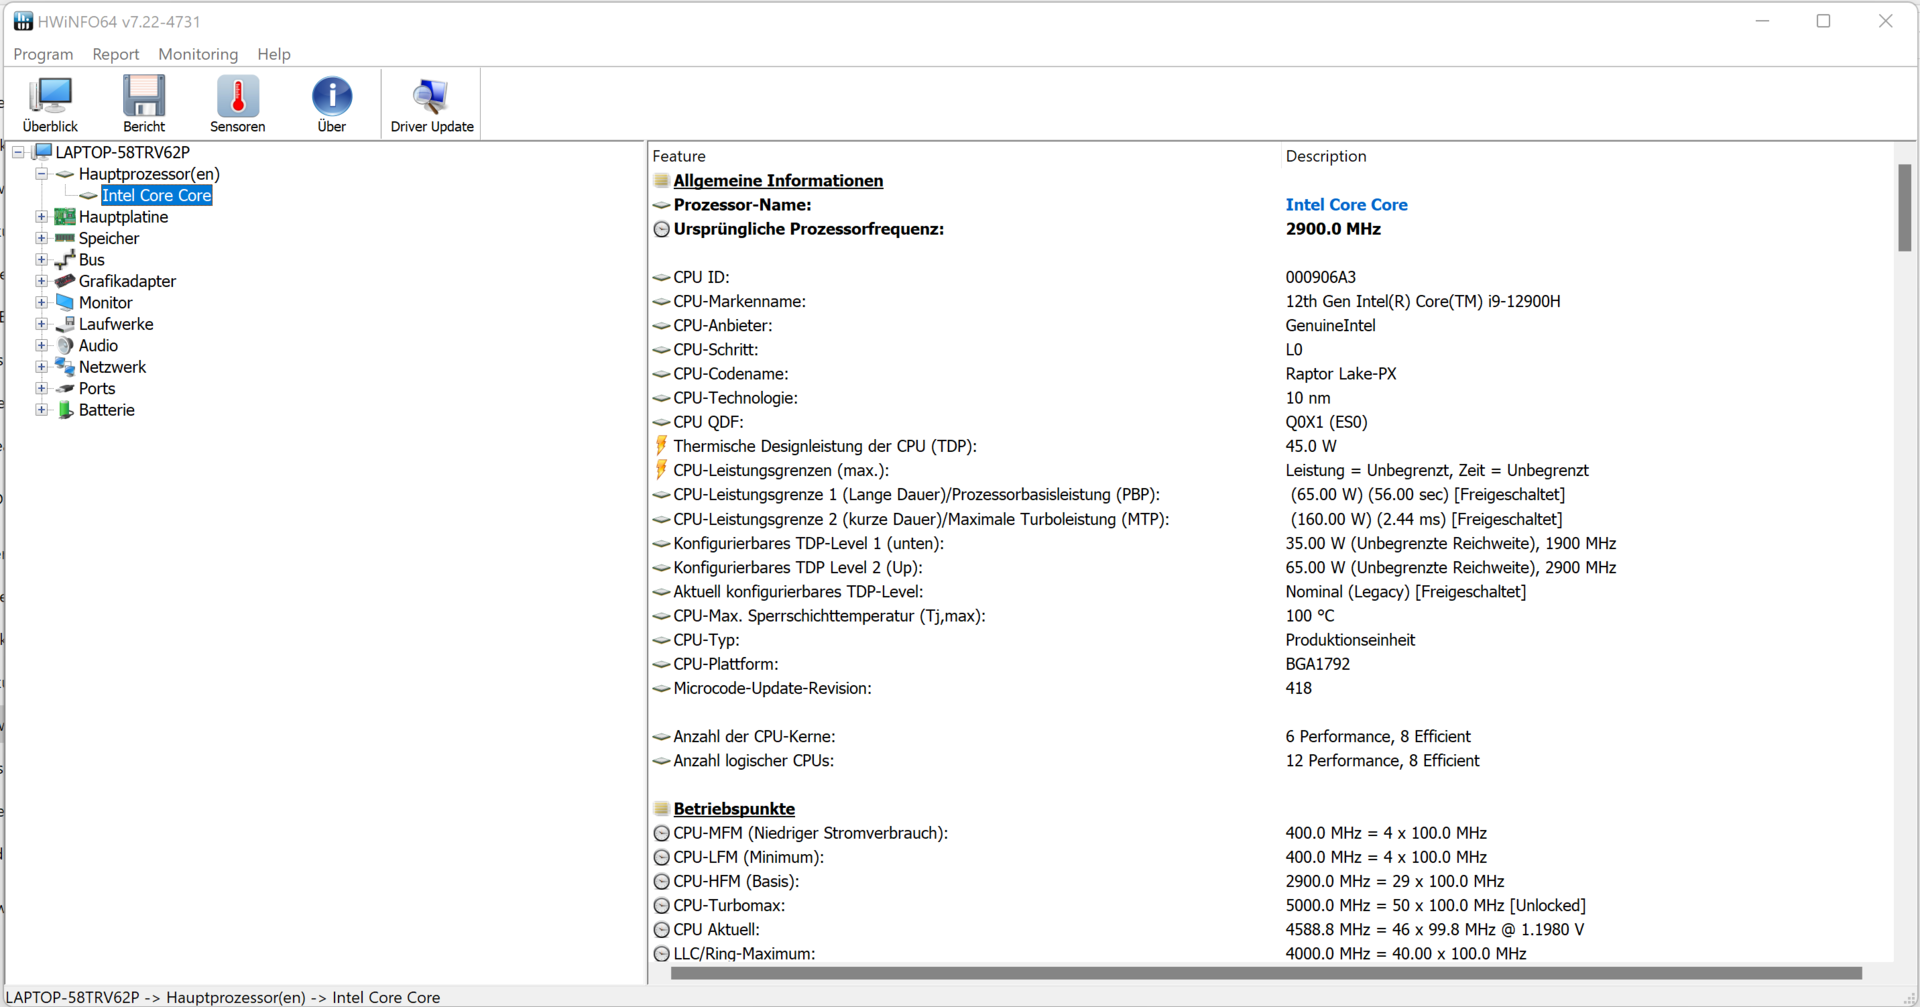
Le siteCore i9-12900H(Alder Lake) se compose de six cœurs de performance (Hyperthreading, 2,5 à 5 GHz) et de huit cœurs d'efficacité (sans Hyperthreading, 1,8 à 3,8 GHz). Au total, cela donne 20 cœurs logiques de processeur.
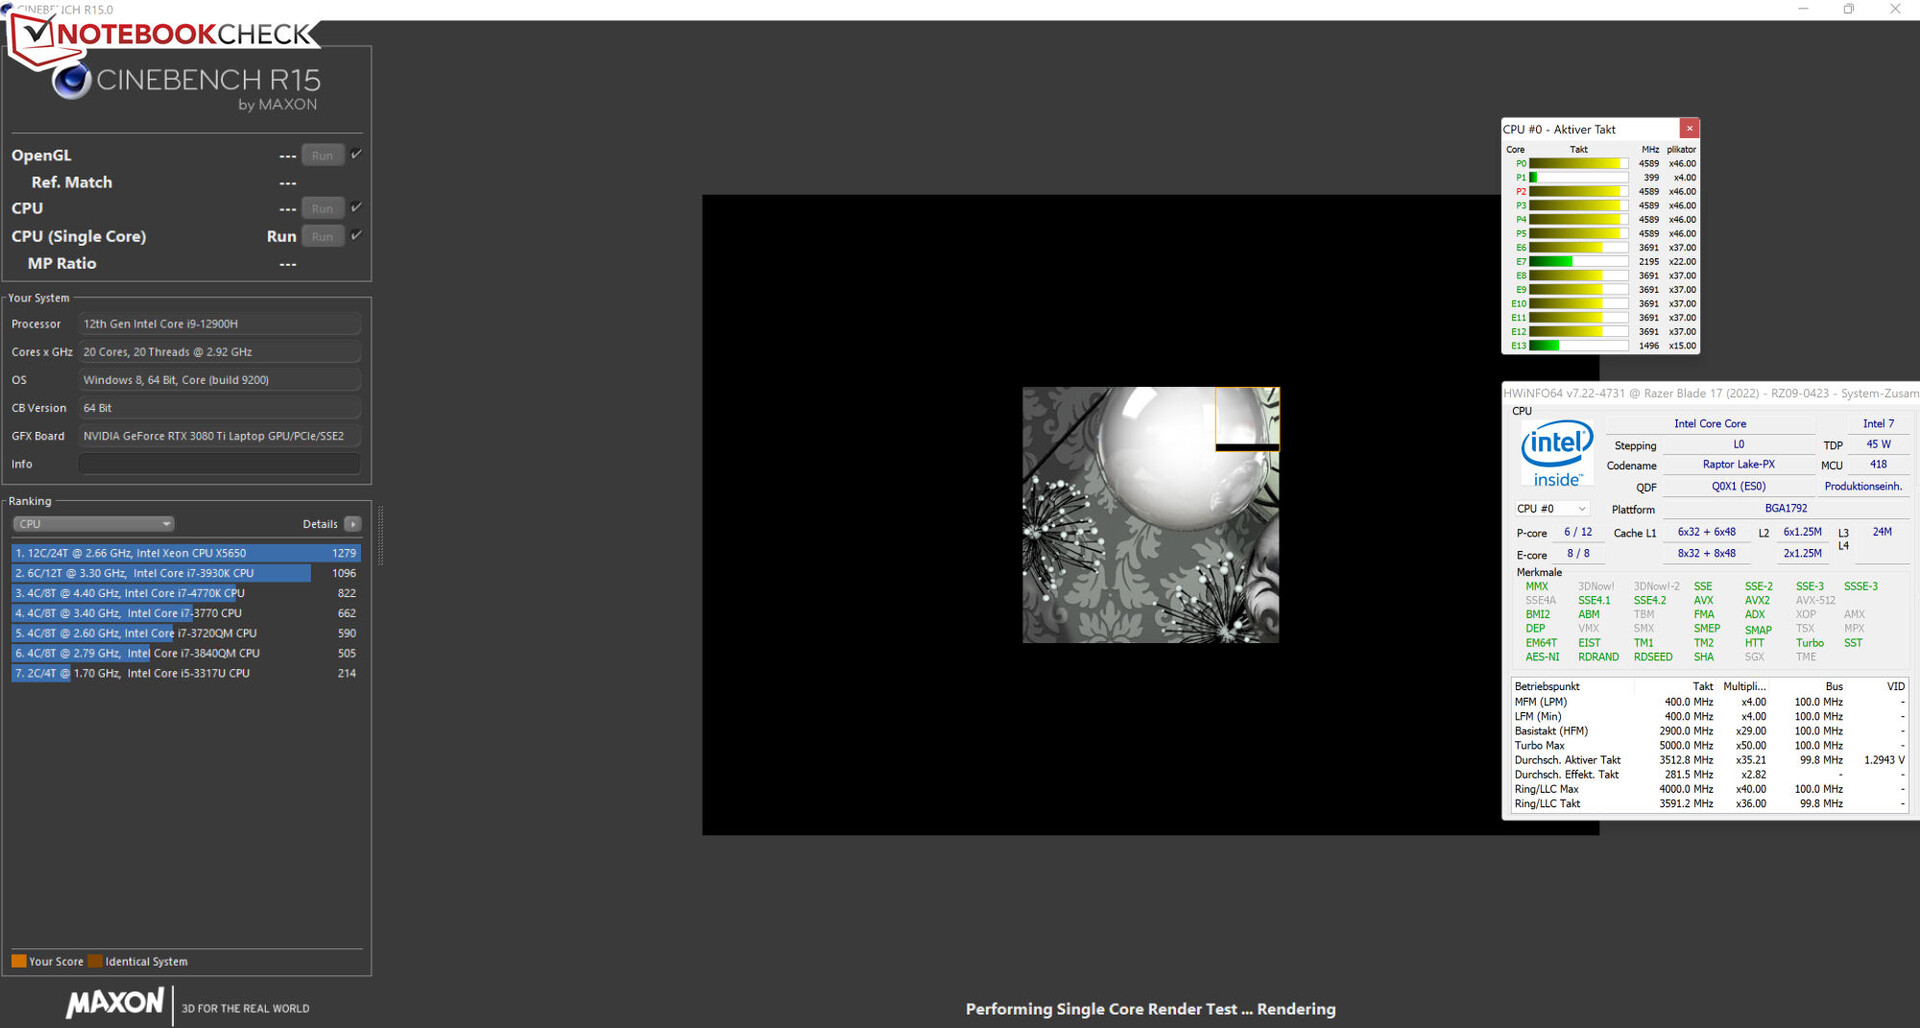
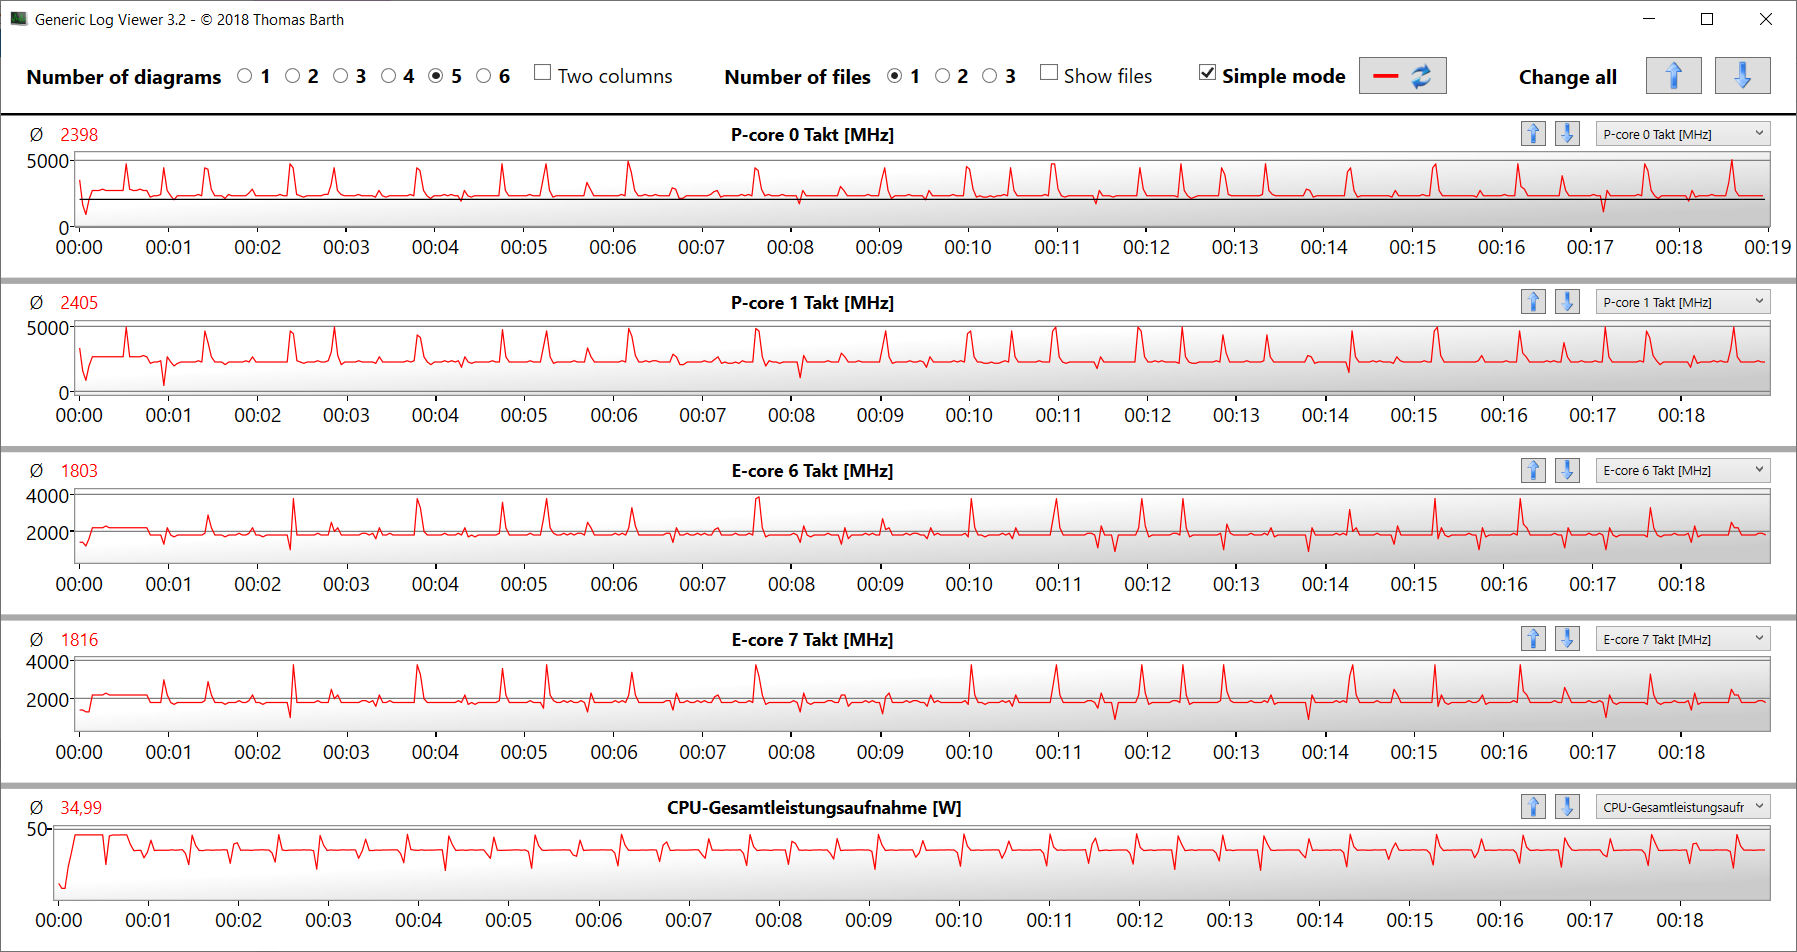
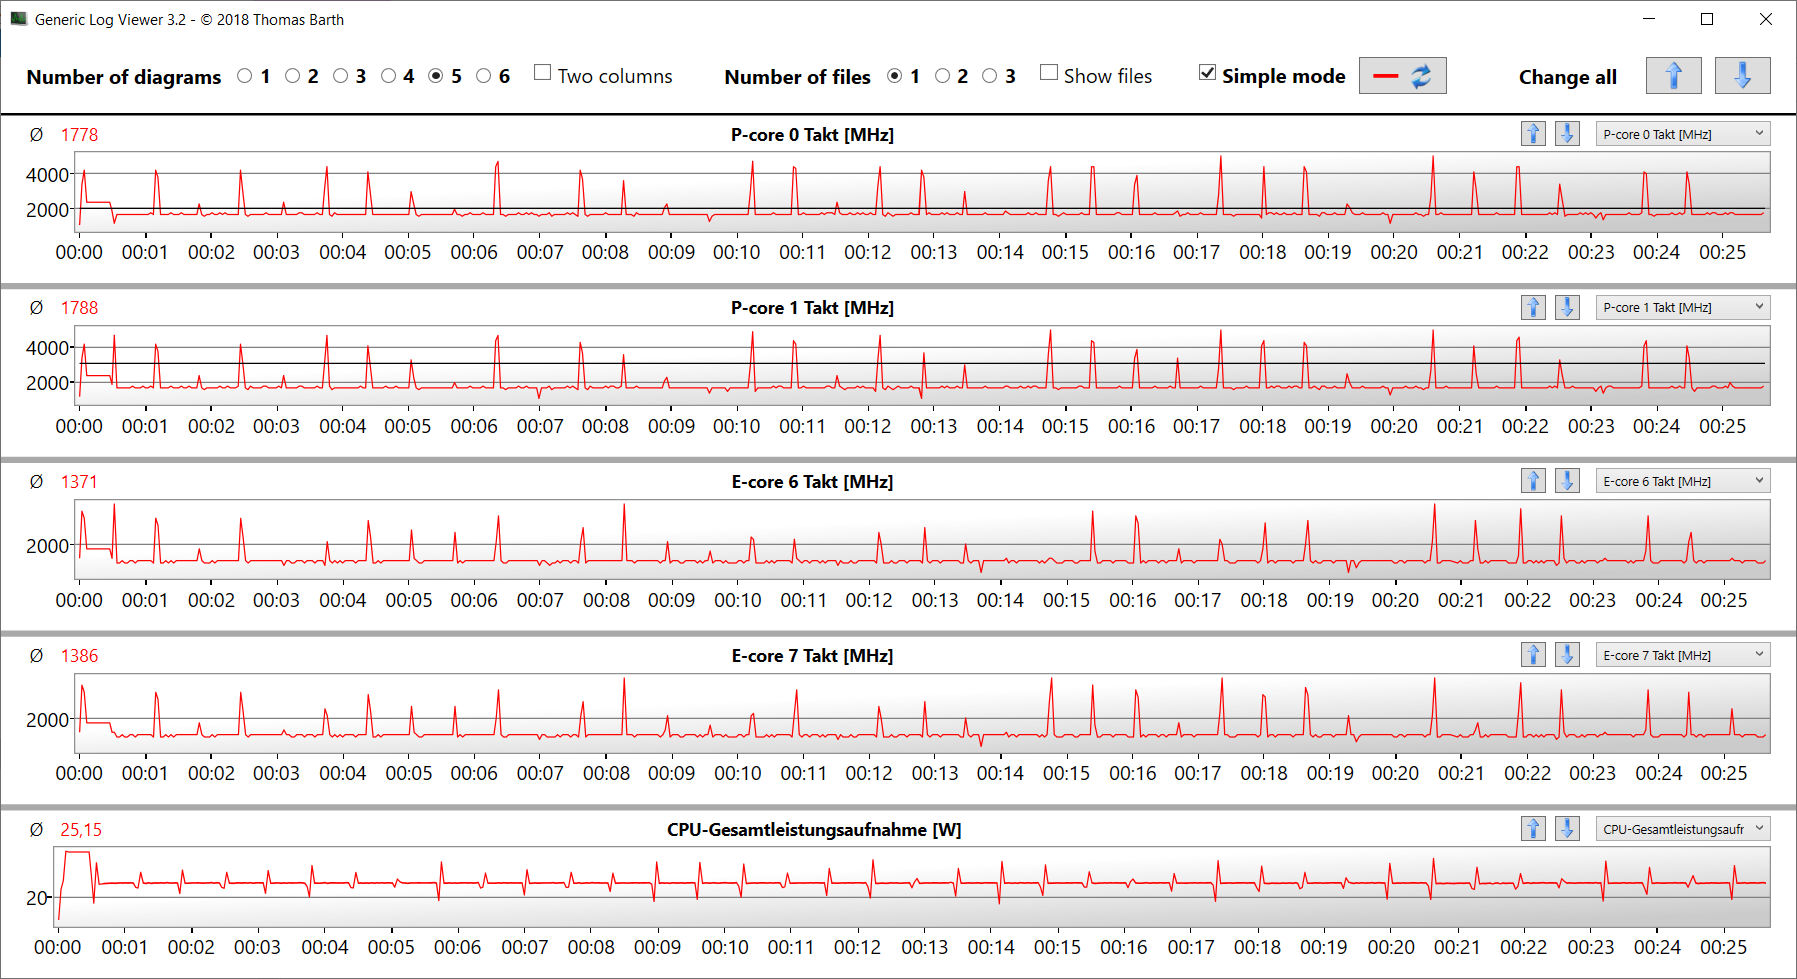
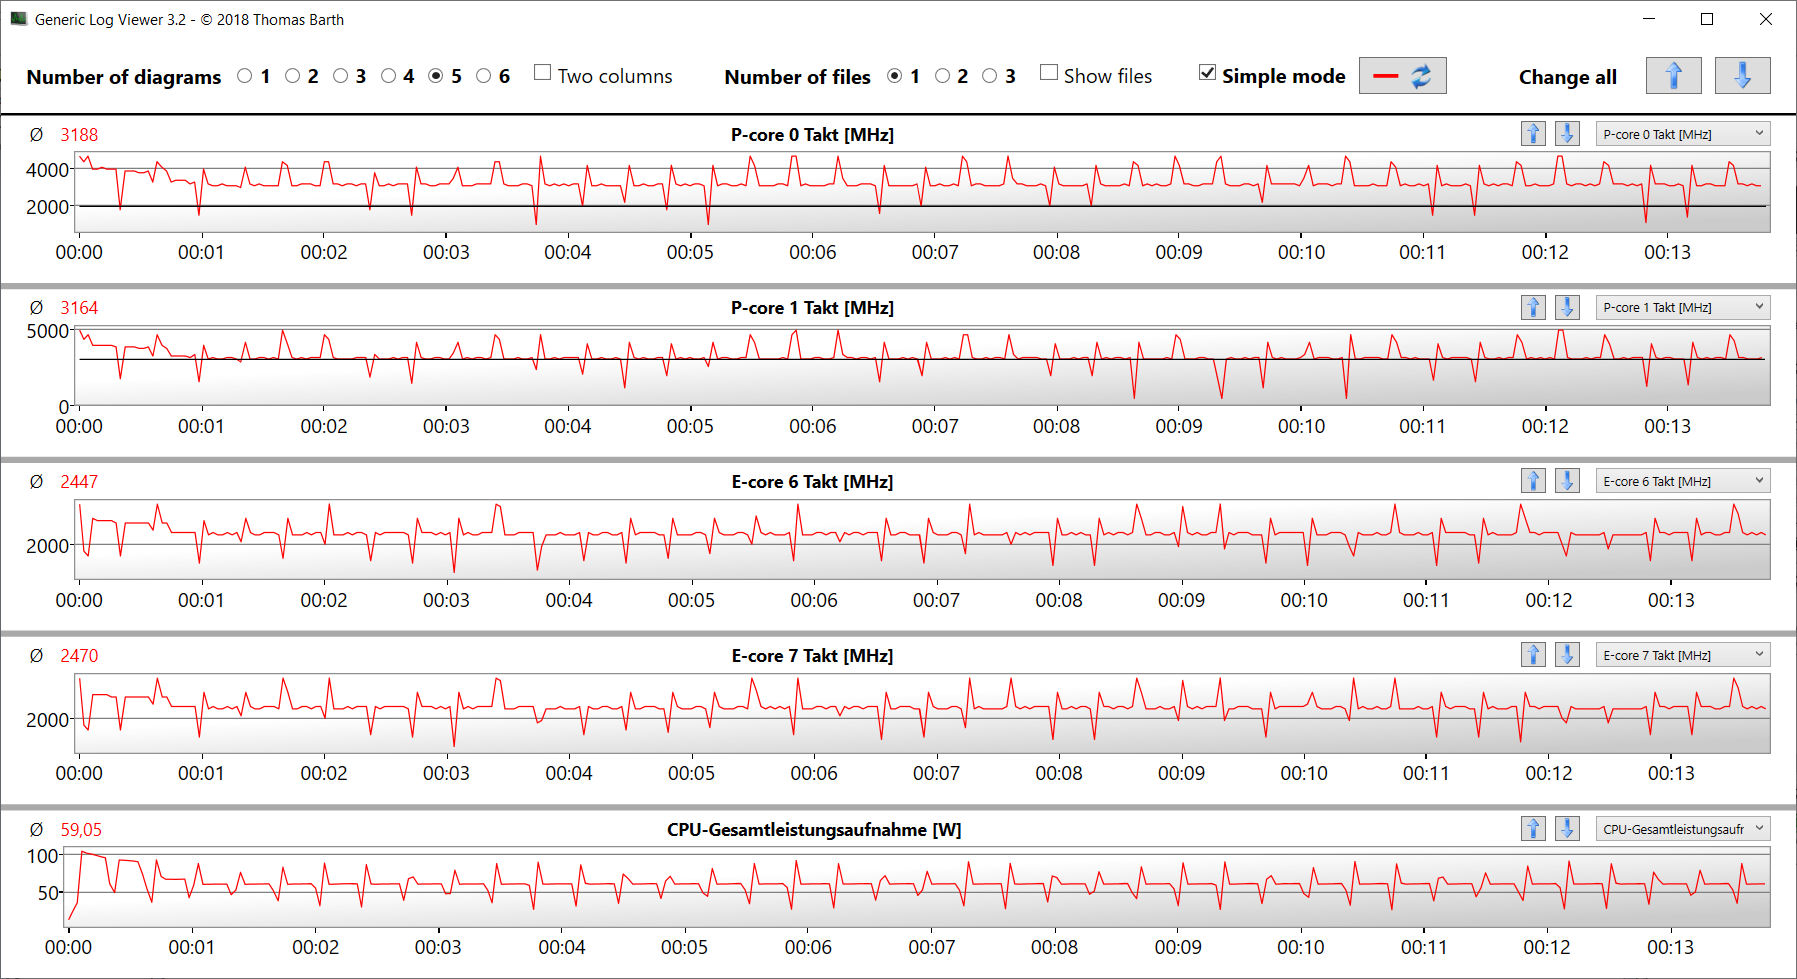
Lors du test CB15 Multi Thread, le sous-preset CPU "Medium" assure des vitesses (cœurs P : 2,6 à 2,7 GHz, cœurs E : 2,1 GHz) juste au-dessus de la vitesse d'horloge de base. Le test Single Thread se termine avec des vitesses d'horloge élevées (cœurs P : 4 à 4,6 GHz, cœurs E : 2,1 à 3,7 GHz). En fonctionnement sur batterie, les valeurs sont nettement inférieures.
En utilisant les mêmes préréglages du processeur, le Core i9 n'offre qu'un léger avantage de performance dans les pics par rapport au Core i7-12800Hdu même modèle. Ce n'est pas surprenant, car les deux CPU offrent le même nombre de cœurs et le Core i9 offre une vitesse maximale légèrement supérieure (5 GHz contre 4,8 GHz)
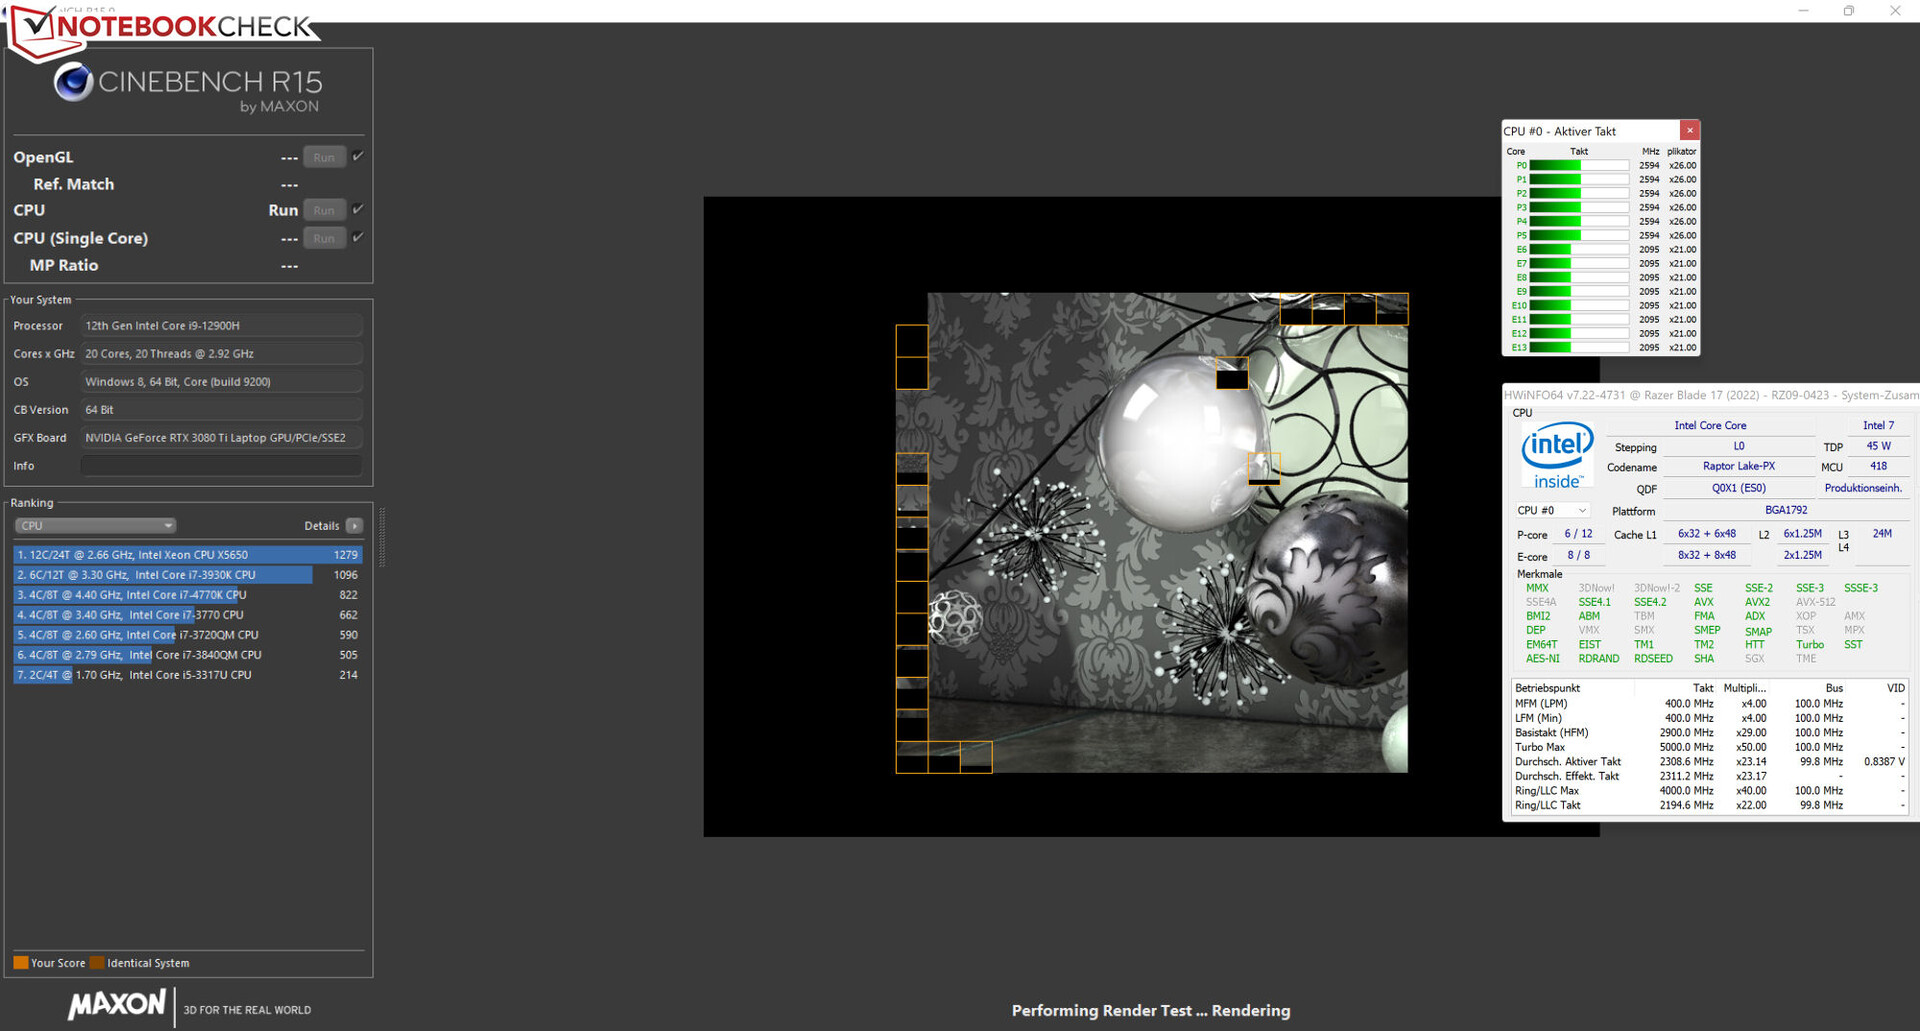
En fonctionnement multithread, l'intensité de l'utilisation du Turbo dépend beaucoup du sous-preset CPU sélectionné. Dans tous les cas, le CPU est capable de fonctionner constamment à une vitesse d'horloge régulière, comme le montre le test en boucle CB15. On remarque que la vitesse d'horloge du CPU diminue légèrement entre la première et la deuxième/troisième exécution, quel que soit le préréglage sélectionné. Le CPU i9 n'apportera un avantage notable à l'utilisateur par rapport au CPU i7 que dans certains brefs pics de charge. Sous des charges plus longues, l'écart de performance entre les deux processeurs se réduit, et ils finissent par être très proches l'un de l'autre.
Cinebench R15 Multi Constant Load Test
| CPU Performance rating - Percent | |
| Moyenne de la classe Gaming | |
| Alienware x17 R2 P48E | |
| MSI Stealth GS77 12UHS-083US | |
| Razer Blade 17 Early 2022 | |
| Medion Erazer Beast X30 | |
| Moyenne Intel Core i9-12900H | |
| Razer Blade 17 RTX 3080 Ti | |
| Razer Blade 17 Early 2022 | |
| Razer Blade 17 Early 2022 | |
| Cinebench R23 | |
| Multi Core | |
| Moyenne de la classe Gaming (10488 - 42661, n=107, 2 dernières années) | |
| Medion Erazer Beast X30 | |
| Alienware x17 R2 P48E | |
| MSI Stealth GS77 12UHS-083US | |
| Razer Blade 17 Early 2022 (Max.) | |
| Razer Blade 17 RTX 3080 Ti | |
| Moyenne Intel Core i9-12900H (7359 - 19648, n=28) | |
| Razer Blade 17 Early 2022 | |
| Razer Blade 17 Early 2022 (Lautlos) | |
| Single Core | |
| Moyenne de la classe Gaming (1166 - 2415, n=107, 2 dernières années) | |
| Razer Blade 17 Early 2022 | |
| Alienware x17 R2 P48E | |
| Razer Blade 17 Early 2022 (Max.) | |
| Razer Blade 17 RTX 3080 Ti | |
| Moyenne Intel Core i9-12900H (1634 - 1930, n=28) | |
| MSI Stealth GS77 12UHS-083US | |
| Razer Blade 17 Early 2022 (Lautlos) | |
| Medion Erazer Beast X30 | |
| Cinebench R20 | |
| CPU (Multi Core) | |
| Moyenne de la classe Gaming (4029 - 16433, n=106, 2 dernières années) | |
| Medion Erazer Beast X30 | |
| Alienware x17 R2 P48E | |
| MSI Stealth GS77 12UHS-083US | |
| Razer Blade 17 Early 2022 (Max.) | |
| Razer Blade 17 RTX 3080 Ti | |
| Moyenne Intel Core i9-12900H (2681 - 7471, n=28) | |
| Razer Blade 17 Early 2022 | |
| Razer Blade 17 Early 2022 (Lautlos) | |
| CPU (Single Core) | |
| Moyenne de la classe Gaming (442 - 913, n=106, 2 dernières années) | |
| Alienware x17 R2 P48E | |
| Razer Blade 17 Early 2022 (Max.) | |
| Razer Blade 17 RTX 3080 Ti | |
| Moyenne Intel Core i9-12900H (624 - 738, n=28) | |
| Razer Blade 17 Early 2022 | |
| MSI Stealth GS77 12UHS-083US | |
| Razer Blade 17 Early 2022 (Lautlos) | |
| Medion Erazer Beast X30 | |
| Cinebench R15 | |
| CPU Multi 64Bit | |
| Moyenne de la classe Gaming (1578 - 6330, n=105, 2 dernières années) | |
| Alienware x17 R2 P48E | |
| Medion Erazer Beast X30 | |
| Razer Blade 17 Early 2022 (Max.) | |
| MSI Stealth GS77 12UHS-083US | |
| Moyenne Intel Core i9-12900H (1395 - 3077, n=28) | |
| Razer Blade 17 RTX 3080 Ti | |
| Razer Blade 17 Early 2022 | |
| Razer Blade 17 Early 2022 (Lautlos) | |
| CPU Single 64Bit | |
| Moyenne de la classe Gaming (188.8 - 350, n=106, 2 dernières années) | |
| Alienware x17 R2 P48E | |
| Razer Blade 17 Early 2022 (Max.) | |
| Razer Blade 17 RTX 3080 Ti | |
| Moyenne Intel Core i9-12900H (235 - 277, n=29) | |
| MSI Stealth GS77 12UHS-083US | |
| Razer Blade 17 Early 2022 | |
| Razer Blade 17 Early 2022 (Lautlos) | |
| Medion Erazer Beast X30 | |
| Blender - v2.79 BMW27 CPU | |
| Razer Blade 17 Early 2022 (Lautlos) | |
| Razer Blade 17 Early 2022 | |
| Moyenne Intel Core i9-12900H (160 - 451, n=28) | |
| Razer Blade 17 RTX 3080 Ti | |
| Razer Blade 17 Early 2022 (Max.) | |
| MSI Stealth GS77 12UHS-083US | |
| Medion Erazer Beast X30 | |
| Alienware x17 R2 P48E | |
| Moyenne de la classe Gaming (79 - 330, n=104, 2 dernières années) | |
| 7-Zip 18.03 | |
| 7z b 4 | |
| Moyenne de la classe Gaming (33491 - 148086, n=105, 2 dernières années) | |
| Medion Erazer Beast X30 | |
| Alienware x17 R2 P48E | |
| MSI Stealth GS77 12UHS-083US | |
| Razer Blade 17 Early 2022 (Max.) | |
| Razer Blade 17 RTX 3080 Ti | |
| Moyenne Intel Core i9-12900H (34684 - 76677, n=28) | |
| Razer Blade 17 Early 2022 | |
| Razer Blade 17 Early 2022 (Lautlos) | |
| 7z b 4 -mmt1 | |
| Moyenne de la classe Gaming (4199 - 7436, n=105, 2 dernières années) | |
| Razer Blade 17 Early 2022 | |
| Moyenne Intel Core i9-12900H (5302 - 6289, n=28) | |
| Razer Blade 17 RTX 3080 Ti | |
| Alienware x17 R2 P48E | |
| Razer Blade 17 Early 2022 (Max.) | |
| MSI Stealth GS77 12UHS-083US | |
| Razer Blade 17 Early 2022 (Lautlos) | |
| Medion Erazer Beast X30 | |
| Geekbench 5.5 | |
| Multi-Core | |
| Moyenne de la classe Gaming (6460 - 28263, n=105, 2 dernières années) | |
| Alienware x17 R2 P48E | |
| Razer Blade 17 Early 2022 (Max.) | |
| MSI Stealth GS77 12UHS-083US | |
| Razer Blade 17 RTX 3080 Ti | |
| Medion Erazer Beast X30 | |
| Moyenne Intel Core i9-12900H (8519 - 14376, n=31) | |
| Razer Blade 17 Early 2022 | |
| Razer Blade 17 Early 2022 (Lautlos) | |
| Single-Core | |
| Moyenne de la classe Gaming (986 - 2474, n=105, 2 dernières années) | |
| Alienware x17 R2 P48E | |
| Moyenne Intel Core i9-12900H (1631 - 1897, n=31) | |
| Razer Blade 17 Early 2022 | |
| Razer Blade 17 Early 2022 (Max.) | |
| Razer Blade 17 Early 2022 (Lautlos) | |
| Razer Blade 17 RTX 3080 Ti | |
| MSI Stealth GS77 12UHS-083US | |
| Medion Erazer Beast X30 | |
| HWBOT x265 Benchmark v2.2 - 4k Preset | |
| Moyenne de la classe Gaming (11.5 - 44.4, n=105, 2 dernières années) | |
| Alienware x17 R2 P48E | |
| Medion Erazer Beast X30 | |
| MSI Stealth GS77 12UHS-083US | |
| Razer Blade 17 Early 2022 (Max.) | |
| Moyenne Intel Core i9-12900H (8.05 - 22.5, n=28) | |
| Razer Blade 17 RTX 3080 Ti | |
| Razer Blade 17 Early 2022 | |
| Razer Blade 17 Early 2022 (Lautlos) | |
| LibreOffice - 20 Documents To PDF | |
| Moyenne de la classe Gaming (33.2 - 88.8, n=105, 2 dernières années) | |
| Medion Erazer Beast X30 | |
| Razer Blade 17 Early 2022 (Lautlos) | |
| Razer Blade 17 RTX 3080 Ti | |
| Razer Blade 17 Early 2022 (Max.) | |
| MSI Stealth GS77 12UHS-083US | |
| Moyenne Intel Core i9-12900H (36.8 - 59.8, n=28) | |
| Alienware x17 R2 P48E | |
| Razer Blade 17 Early 2022 | |
| R Benchmark 2.5 - Overall mean | |
| Medion Erazer Beast X30 | |
| Razer Blade 17 Early 2022 (Lautlos) | |
| MSI Stealth GS77 12UHS-083US | |
| Razer Blade 17 RTX 3080 Ti | |
| Moyenne Intel Core i9-12900H (0.4218 - 0.506, n=28) | |
| Razer Blade 17 Early 2022 (Max.) | |
| Razer Blade 17 Early 2022 | |
| Alienware x17 R2 P48E | |
| Moyenne de la classe Gaming (0.3439 - 0.759, n=106, 2 dernières années) | |
* ... Moindre est la valeur, meilleures sont les performances
AIDA64: FP32 Ray-Trace | FPU Julia | CPU SHA3 | CPU Queen | FPU SinJulia | FPU Mandel | CPU AES | CPU ZLib | FP64 Ray-Trace | CPU PhotoWorxx
| Performance rating | |
| Moyenne de la classe Gaming | |
| Alienware x17 R2 P48E | |
| Medion Erazer Beast X30 | |
| Moyenne Intel Core i9-12900H | |
| MSI Stealth GS77 12UHS-083US | |
| Razer Blade 17 Early 2022 | |
| Razer Blade 17 RTX 3080 Ti | |
| Razer Blade 17 Early 2022 | |
| Razer Blade 17 Early 2022 | |
| AIDA64 / FP32 Ray-Trace | |
| Moyenne de la classe Gaming (10227 - 85542, n=105, 2 dernières années) | |
| Moyenne Intel Core i9-12900H (4074 - 18289, n=29) | |
| Alienware x17 R2 P48E (v6.50.5800) | |
| Medion Erazer Beast X30 (v6.50.5800) | |
| MSI Stealth GS77 12UHS-083US (v6.50.5800) | |
| Razer Blade 17 Early 2022 (v6.50.5800, Max.) | |
| Razer Blade 17 RTX 3080 Ti (v6.50.5800) | |
| Razer Blade 17 Early 2022 (v6.50.5800) | |
| Razer Blade 17 Early 2022 (v6.50.5800, Lautlos) | |
| AIDA64 / FPU Julia | |
| Moyenne de la classe Gaming (51376 - 238426, n=105, 2 dernières années) | |
| Moyenne Intel Core i9-12900H (22307 - 93236, n=29) | |
| Alienware x17 R2 P48E (v6.50.5800) | |
| Medion Erazer Beast X30 (v6.50.5800) | |
| MSI Stealth GS77 12UHS-083US (v6.50.5800) | |
| Razer Blade 17 Early 2022 (v6.50.5800, Max.) | |
| Razer Blade 17 RTX 3080 Ti (v6.50.5800) | |
| Razer Blade 17 Early 2022 (v6.50.5800) | |
| Razer Blade 17 Early 2022 (v6.50.5800, Lautlos) | |
| AIDA64 / CPU SHA3 | |
| Moyenne de la classe Gaming (2180 - 10115, n=105, 2 dernières années) | |
| Alienware x17 R2 P48E (v6.50.5800) | |
| Medion Erazer Beast X30 (v6.50.5800) | |
| MSI Stealth GS77 12UHS-083US (v6.50.5800) | |
| Moyenne Intel Core i9-12900H (1378 - 4215, n=29) | |
| Razer Blade 17 Early 2022 (v6.50.5800, Max.) | |
| Razer Blade 17 RTX 3080 Ti (v6.50.5800) | |
| Razer Blade 17 Early 2022 (v6.50.5800) | |
| Razer Blade 17 Early 2022 (v6.50.5800, Lautlos) | |
| AIDA64 / CPU Queen | |
| Moyenne de la classe Gaming (49785 - 173351, n=90, 2 dernières années) | |
| Alienware x17 R2 P48E (v6.50.5800) | |
| Razer Blade 17 Early 2022 (v6.50.5800, Max.) | |
| Medion Erazer Beast X30 (v6.50.5800) | |
| Razer Blade 17 RTX 3080 Ti (v6.50.5800) | |
| Moyenne Intel Core i9-12900H (78172 - 111241, n=28) | |
| MSI Stealth GS77 12UHS-083US (v6.50.5800) | |
| Razer Blade 17 Early 2022 (v6.50.5800) | |
| Razer Blade 17 Early 2022 (v6.50.5800, Lautlos) | |
| AIDA64 / FPU SinJulia | |
| Moyenne de la classe Gaming (4424 - 33636, n=105, 2 dernières années) | |
| Alienware x17 R2 P48E (v6.50.5800) | |
| Medion Erazer Beast X30 (v6.50.5800) | |
| MSI Stealth GS77 12UHS-083US (v6.50.5800) | |
| Razer Blade 17 Early 2022 (v6.50.5800, Max.) | |
| Razer Blade 17 RTX 3080 Ti (v6.50.5800) | |
| Moyenne Intel Core i9-12900H (5709 - 10410, n=29) | |
| Razer Blade 17 Early 2022 (v6.50.5800) | |
| Razer Blade 17 Early 2022 (v6.50.5800, Lautlos) | |
| AIDA64 / FPU Mandel | |
| Moyenne de la classe Gaming (25115 - 128721, n=105, 2 dernières années) | |
| Moyenne Intel Core i9-12900H (11257 - 45581, n=29) | |
| Alienware x17 R2 P48E (v6.50.5800) | |
| Medion Erazer Beast X30 (v6.50.5800) | |
| MSI Stealth GS77 12UHS-083US (v6.50.5800) | |
| Razer Blade 17 Early 2022 (v6.50.5800, Max.) | |
| Razer Blade 17 RTX 3080 Ti (v6.50.5800) | |
| Razer Blade 17 Early 2022 (v6.50.5800) | |
| Razer Blade 17 Early 2022 (v6.50.5800, Lautlos) | |
| AIDA64 / CPU AES | |
| Moyenne de la classe Gaming (39258 - 247074, n=105, 2 dernières années) | |
| Alienware x17 R2 P48E (v6.50.5800) | |
| MSI Stealth GS77 12UHS-083US (v6.50.5800) | |
| Moyenne Intel Core i9-12900H (31935 - 151546, n=29) | |
| Medion Erazer Beast X30 (v6.50.5800) | |
| Razer Blade 17 Early 2022 (v6.50.5800, Max.) | |
| Razer Blade 17 RTX 3080 Ti (v6.50.5800) | |
| Razer Blade 17 Early 2022 (v6.50.5800) | |
| Razer Blade 17 Early 2022 (v6.50.5800, Lautlos) | |
| AIDA64 / CPU ZLib | |
| Moyenne de la classe Gaming (574 - 2531, n=105, 2 dernières années) | |
| Alienware x17 R2 P48E (v6.50.5800) | |
| Medion Erazer Beast X30 (v6.50.5800) | |
| MSI Stealth GS77 12UHS-083US (v6.50.5800) | |
| Razer Blade 17 Early 2022 (v6.50.5800, Max.) | |
| Moyenne Intel Core i9-12900H (449 - 1193, n=29) | |
| Razer Blade 17 RTX 3080 Ti (v6.50.5800) | |
| Razer Blade 17 Early 2022 (v6.50.5800) | |
| Razer Blade 17 Early 2022 (v6.50.5800, Lautlos) | |
| AIDA64 / FP64 Ray-Trace | |
| Moyenne de la classe Gaming (5509 - 45446, n=105, 2 dernières années) | |
| Moyenne Intel Core i9-12900H (2235 - 10511, n=29) | |
| Alienware x17 R2 P48E (v6.50.5800) | |
| Medion Erazer Beast X30 (v6.50.5800) | |
| MSI Stealth GS77 12UHS-083US (v6.50.5800) | |
| Razer Blade 17 Early 2022 (v6.50.5800, Max.) | |
| Razer Blade 17 RTX 3080 Ti (v6.50.5800) | |
| Razer Blade 17 Early 2022 (v6.50.5800) | |
| Razer Blade 17 Early 2022 (v6.50.5800, Lautlos) | |
| AIDA64 / CPU PhotoWorxx | |
| Moyenne de la classe Gaming (12271 - 89891, n=105, 2 dernières années) | |
| Razer Blade 17 RTX 3080 Ti (v6.50.5800) | |
| Razer Blade 17 Early 2022 (v6.50.5800, Max.) | |
| Medion Erazer Beast X30 (v6.50.5800) | |
| MSI Stealth GS77 12UHS-083US (v6.50.5800) | |
| Razer Blade 17 Early 2022 (v6.50.5800) | |
| Moyenne Intel Core i9-12900H (20960 - 48269, n=30) | |
| Razer Blade 17 Early 2022 (v6.50.5800, Lautlos) | |
| Alienware x17 R2 P48E (v6.50.5800) | |
Performance du système
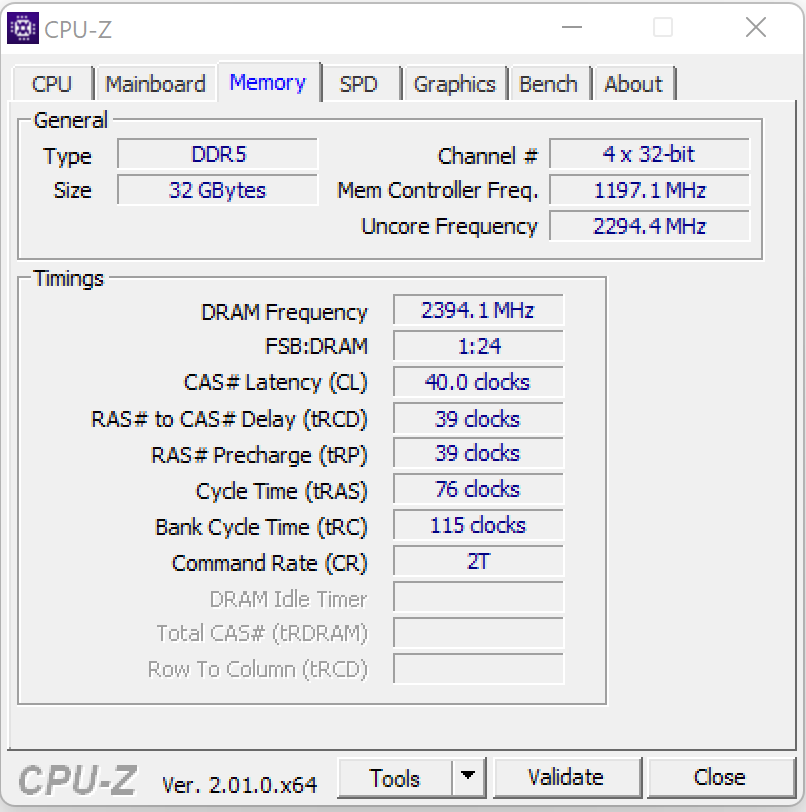
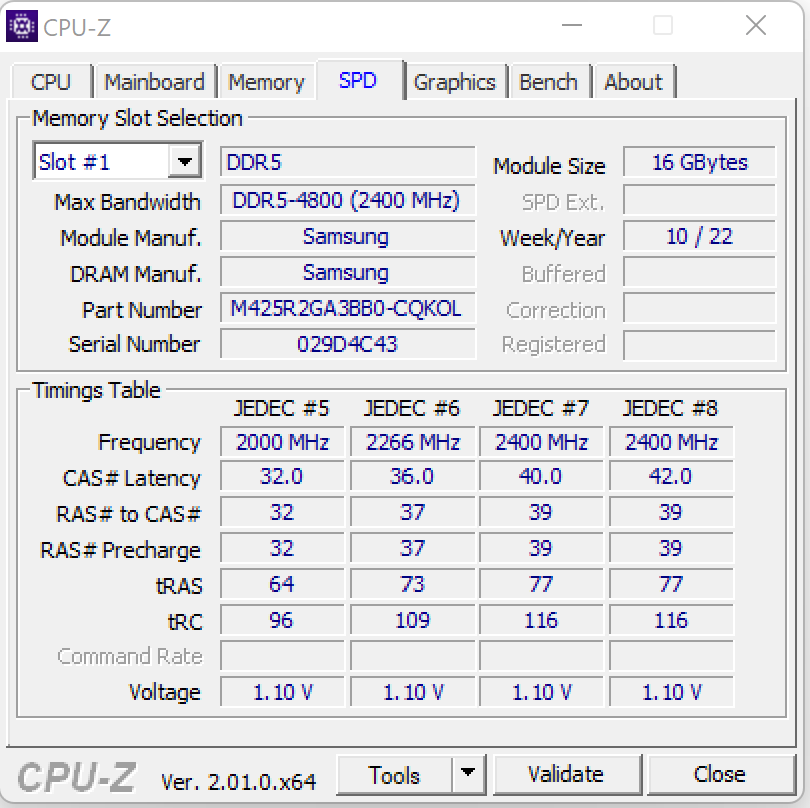
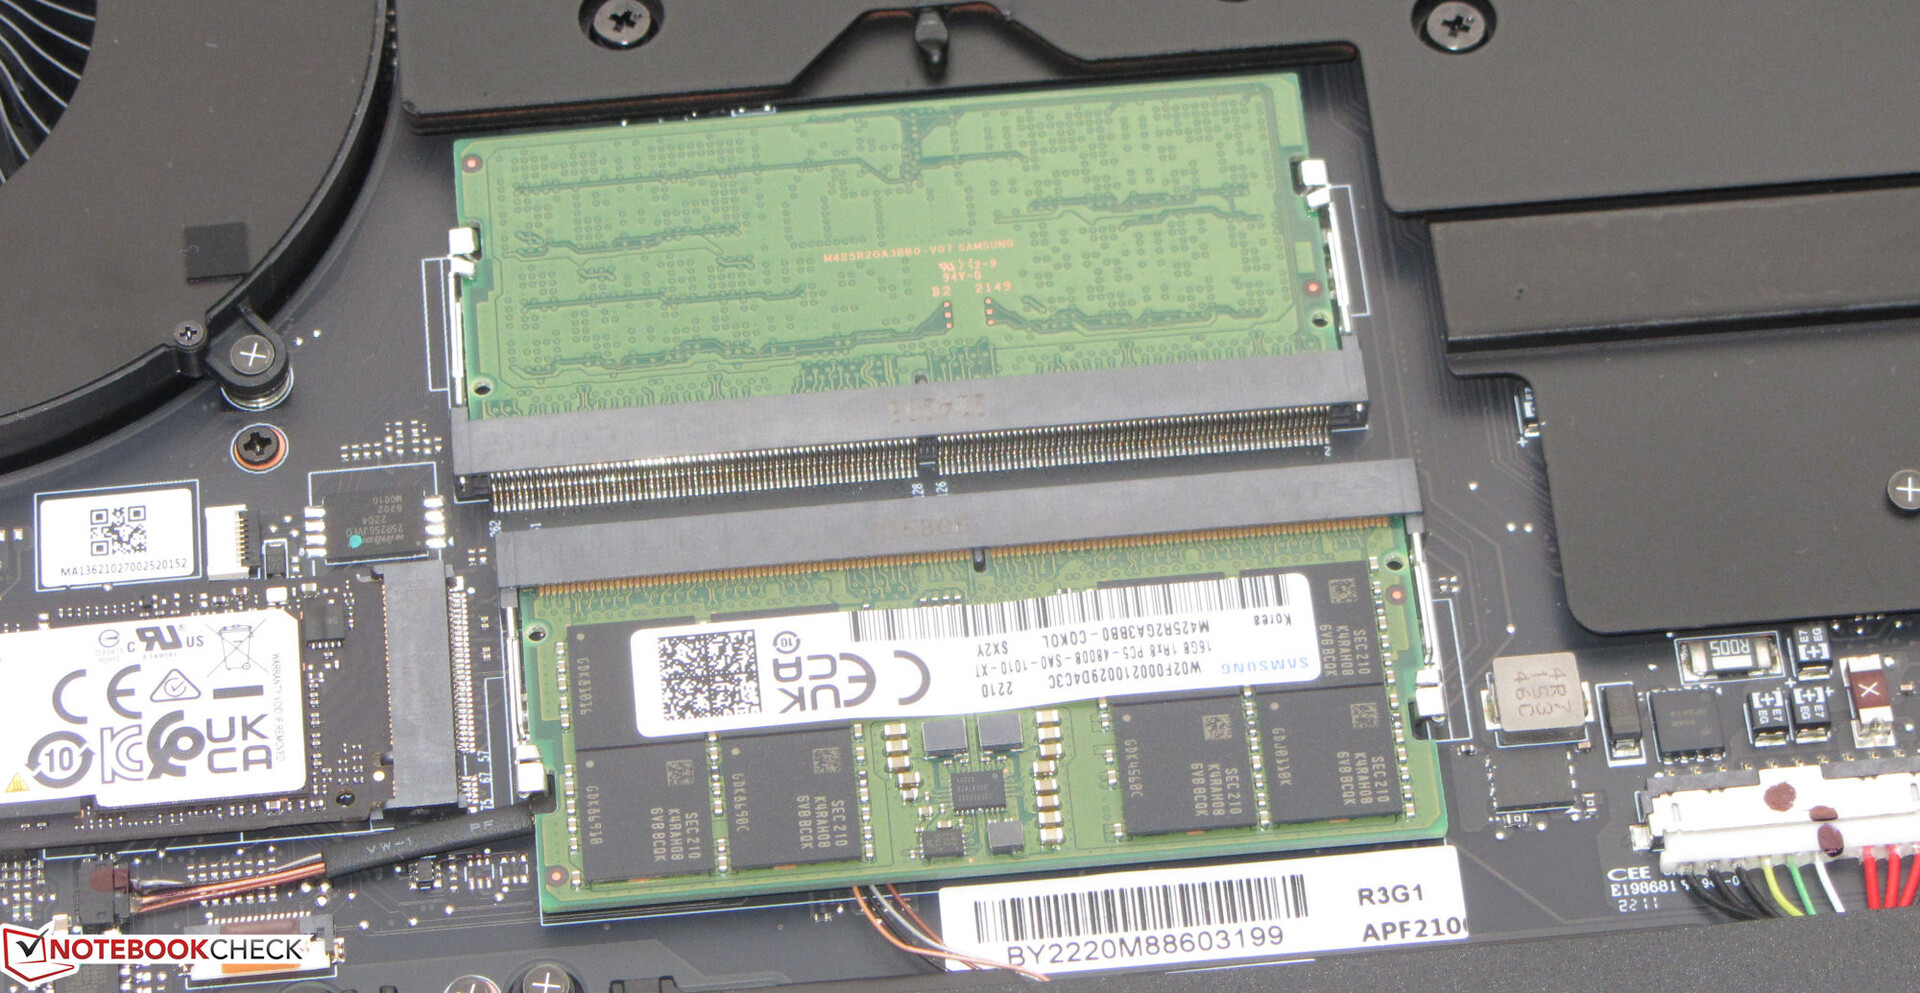
Le matériel du système fonctionne sans problème et offre des performances de calcul plus que suffisantes pour les jeux, la découpe vidéo et le rendu. Les taux de transfert de la mémoire de travail se situent à des niveaux normaux pour le stockage DDR5-4800. Ils sont accompagnés de bons résultats de PC Mark.
CrossMark: Overall | Productivity | Creativity | Responsiveness
| PCMark 10 / Score | |
| Moyenne de la classe Gaming (5828 - 12414, n=93, 2 dernières années) | |
| Alienware x17 R2 P48E | |
| Razer Blade 17 RTX 3080 Ti | |
| Moyenne Intel Core i9-12900H, NVIDIA GeForce RTX 3080 Ti Laptop GPU (7139 - 8083, n=6) | |
| MSI Stealth GS77 12UHS-083US | |
| Medion Erazer Beast X30 | |
| Razer Blade 17 Early 2022 | |
| PCMark 10 / Essentials | |
| Alienware x17 R2 P48E | |
| Razer Blade 17 RTX 3080 Ti | |
| Moyenne Intel Core i9-12900H, NVIDIA GeForce RTX 3080 Ti Laptop GPU (10254 - 11178, n=6) | |
| Moyenne de la classe Gaming (8810 - 11935, n=97, 2 dernières années) | |
| MSI Stealth GS77 12UHS-083US | |
| Razer Blade 17 Early 2022 | |
| Medion Erazer Beast X30 | |
| PCMark 10 / Productivity | |
| Moyenne de la classe Gaming (6845 - 25323, n=95, 2 dernières années) | |
| Alienware x17 R2 P48E | |
| Moyenne Intel Core i9-12900H, NVIDIA GeForce RTX 3080 Ti Laptop GPU (9102 - 11186, n=6) | |
| MSI Stealth GS77 12UHS-083US | |
| Razer Blade 17 RTX 3080 Ti | |
| Medion Erazer Beast X30 | |
| Razer Blade 17 Early 2022 | |
| PCMark 10 / Digital Content Creation | |
| Moyenne de la classe Gaming (7602 - 19954, n=95, 2 dernières années) | |
| Alienware x17 R2 P48E | |
| Razer Blade 17 RTX 3080 Ti | |
| Moyenne Intel Core i9-12900H, NVIDIA GeForce RTX 3080 Ti Laptop GPU (9847 - 12627, n=6) | |
| MSI Stealth GS77 12UHS-083US | |
| Medion Erazer Beast X30 | |
| Razer Blade 17 Early 2022 | |
| CrossMark / Overall | |
| Moyenne de la classe Gaming (1366 - 2409, n=94, 2 dernières années) | |
| Alienware x17 R2 P48E | |
| Moyenne Intel Core i9-12900H, NVIDIA GeForce RTX 3080 Ti Laptop GPU (1696 - 1965, n=3) | |
| Razer Blade 17 Early 2022 | |
| Medion Erazer Beast X30 | |
| CrossMark / Productivity | |
| Moyenne de la classe Gaming (1386 - 2254, n=94, 2 dernières années) | |
| Alienware x17 R2 P48E | |
| Moyenne Intel Core i9-12900H, NVIDIA GeForce RTX 3080 Ti Laptop GPU (1622 - 1870, n=3) | |
| Razer Blade 17 Early 2022 | |
| Medion Erazer Beast X30 | |
| CrossMark / Creativity | |
| Moyenne de la classe Gaming (1343 - 2786, n=94, 2 dernières années) | |
| Alienware x17 R2 P48E | |
| Medion Erazer Beast X30 | |
| Moyenne Intel Core i9-12900H, NVIDIA GeForce RTX 3080 Ti Laptop GPU (1855 - 2135, n=3) | |
| Razer Blade 17 Early 2022 | |
| CrossMark / Responsiveness | |
| Moyenne de la classe Gaming (1226 - 2334, n=94, 2 dernières années) | |
| Alienware x17 R2 P48E | |
| Razer Blade 17 Early 2022 | |
| Moyenne Intel Core i9-12900H, NVIDIA GeForce RTX 3080 Ti Laptop GPU (1483 - 1777, n=3) | |
| Medion Erazer Beast X30 | |
| PCMark 8 Home Score Accelerated v2 | 4671 points | |
| PCMark 8 Creative Score Accelerated v2 | 6358 points | |
| PCMark 8 Work Score Accelerated v2 | 5464 points | |
| PCMark 10 Score | 7139 points | |
Aide | ||
| AIDA64 / Memory Copy | |
| Moyenne de la classe Gaming (21750 - 129946, n=105, 2 dernières années) | |
| Razer Blade 17 RTX 3080 Ti (v6.50.5800) | |
| MSI Stealth GS77 12UHS-083US (v6.50.5800) | |
| Medion Erazer Beast X30 (v6.50.5800) | |
| Razer Blade 17 Early 2022 (v6.50.5800, Max.) | |
| Razer Blade 17 Early 2022 (v6.50.5800, Lautlos) | |
| Razer Blade 17 Early 2022 (v6.50.5800) | |
| Moyenne Intel Core i9-12900H (34438 - 74264, n=29) | |
| Alienware x17 R2 P48E (v6.50.5800) | |
| AIDA64 / Memory Read | |
| Moyenne de la classe Gaming (22956 - 118858, n=105, 2 dernières années) | |
| Razer Blade 17 RTX 3080 Ti (v6.50.5800) | |
| Medion Erazer Beast X30 (v6.50.5800) | |
| Razer Blade 17 Early 2022 (v6.50.5800, Max.) | |
| MSI Stealth GS77 12UHS-083US (v6.50.5800) | |
| Razer Blade 17 Early 2022 (v6.50.5800, Lautlos) | |
| Razer Blade 17 Early 2022 (v6.50.5800) | |
| Moyenne Intel Core i9-12900H (36365 - 74642, n=29) | |
| Alienware x17 R2 P48E (v6.50.5800) | |
| AIDA64 / Memory Write | |
| Moyenne de la classe Gaming (22297 - 135096, n=105, 2 dernières années) | |
| Razer Blade 17 RTX 3080 Ti (v6.50.5800) | |
| MSI Stealth GS77 12UHS-083US (v6.50.5800) | |
| Razer Blade 17 Early 2022 (v6.50.5800, Max.) | |
| Medion Erazer Beast X30 (v6.50.5800) | |
| Razer Blade 17 Early 2022 (v6.50.5800, Lautlos) | |
| Moyenne Intel Core i9-12900H (32276 - 67858, n=29) | |
| Razer Blade 17 Early 2022 (v6.50.5800) | |
| Alienware x17 R2 P48E (v6.50.5800) | |
| AIDA64 / Memory Latency | |
| Moyenne de la classe Gaming (75.3 - 259, n=105, 2 dernières années) | |
| Alienware x17 R2 P48E (v6.50.5800) | |
| MSI Stealth GS77 12UHS-083US (v6.50.5800) | |
| Moyenne Intel Core i9-12900H (74.7 - 118.1, n=28) | |
| Razer Blade 17 RTX 3080 Ti (v6.50.5800) | |
| Medion Erazer Beast X30 (v6.50.5800) | |
| Razer Blade 17 Early 2022 (v6.50.5800, Max.) | |
| Razer Blade 17 Early 2022 (v6.50.5800, Lautlos) | |
* ... Moindre est la valeur, meilleures sont les performances
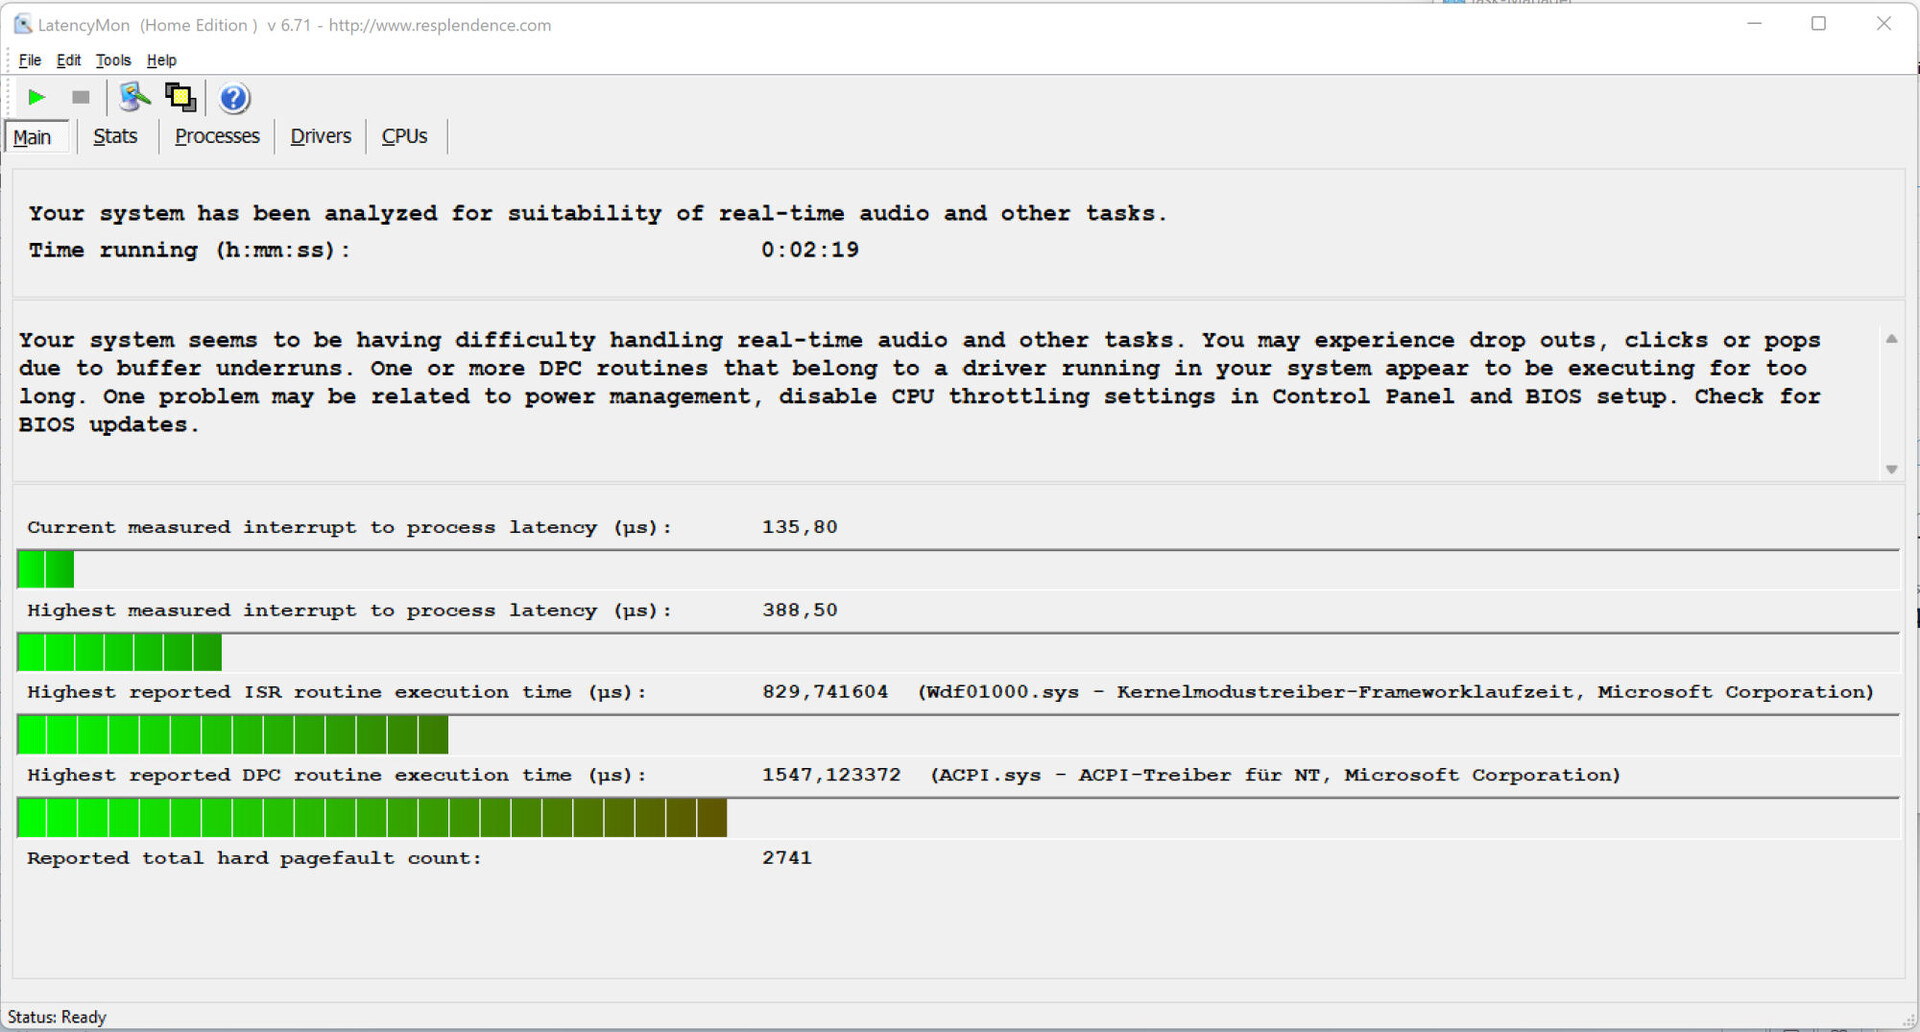
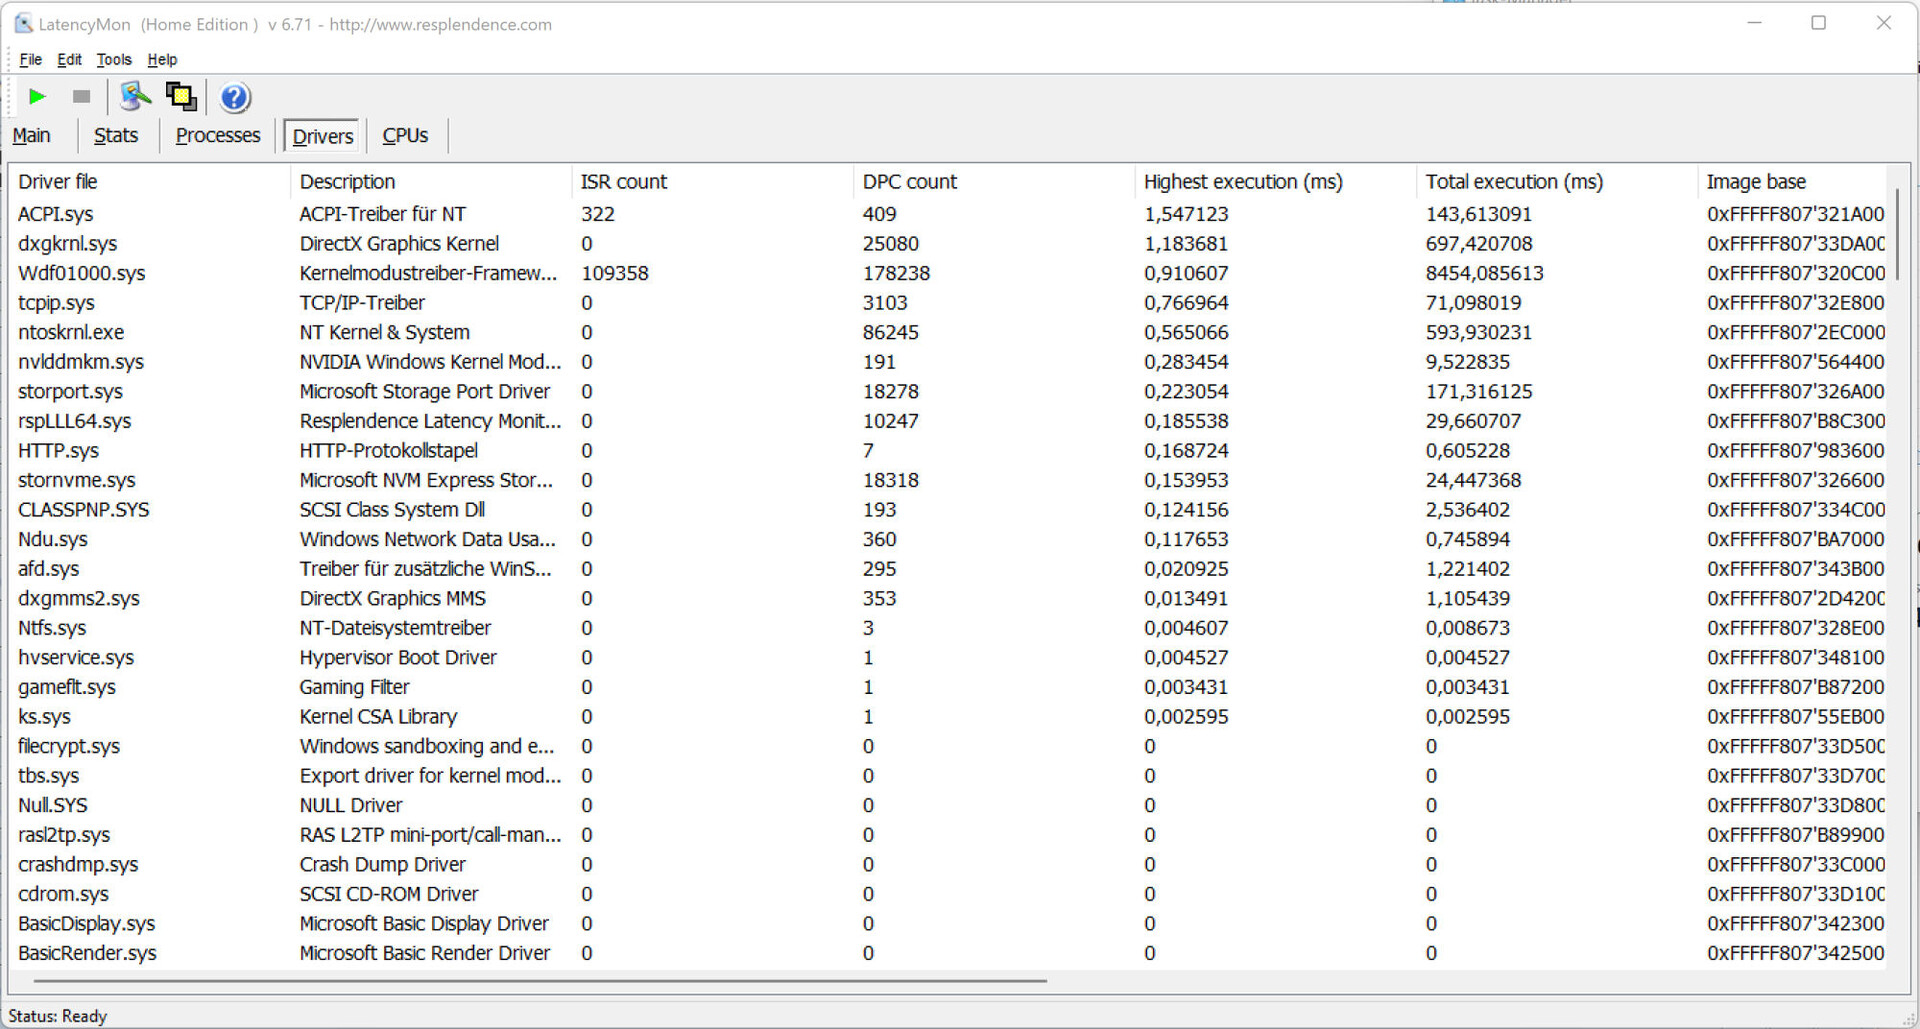
Latences DPC
Le test standardisé Latency Monitor (surf sur le Web, reproduction vidéo 4k, Prime95 High Load) a révélé un comportement manifeste dans les latences DPC. Le système ne semble pas être adapté au traitement vidéo et audio en temps réel. Les futures mises à jour logicielles pourraient apporter des améliorations ou même empirer les choses.
| DPC Latencies / LatencyMon - interrupt to process latency (max), Web, Youtube, Prime95 | |
| MSI Stealth GS77 12UHS-083US | |
| Alienware x17 R2 P48E | |
| Razer Blade 17 RTX 3080 Ti | |
| Medion Erazer Beast X30 | |
| Razer Blade 17 Early 2022 | |
* ... Moindre est la valeur, meilleures sont les performances
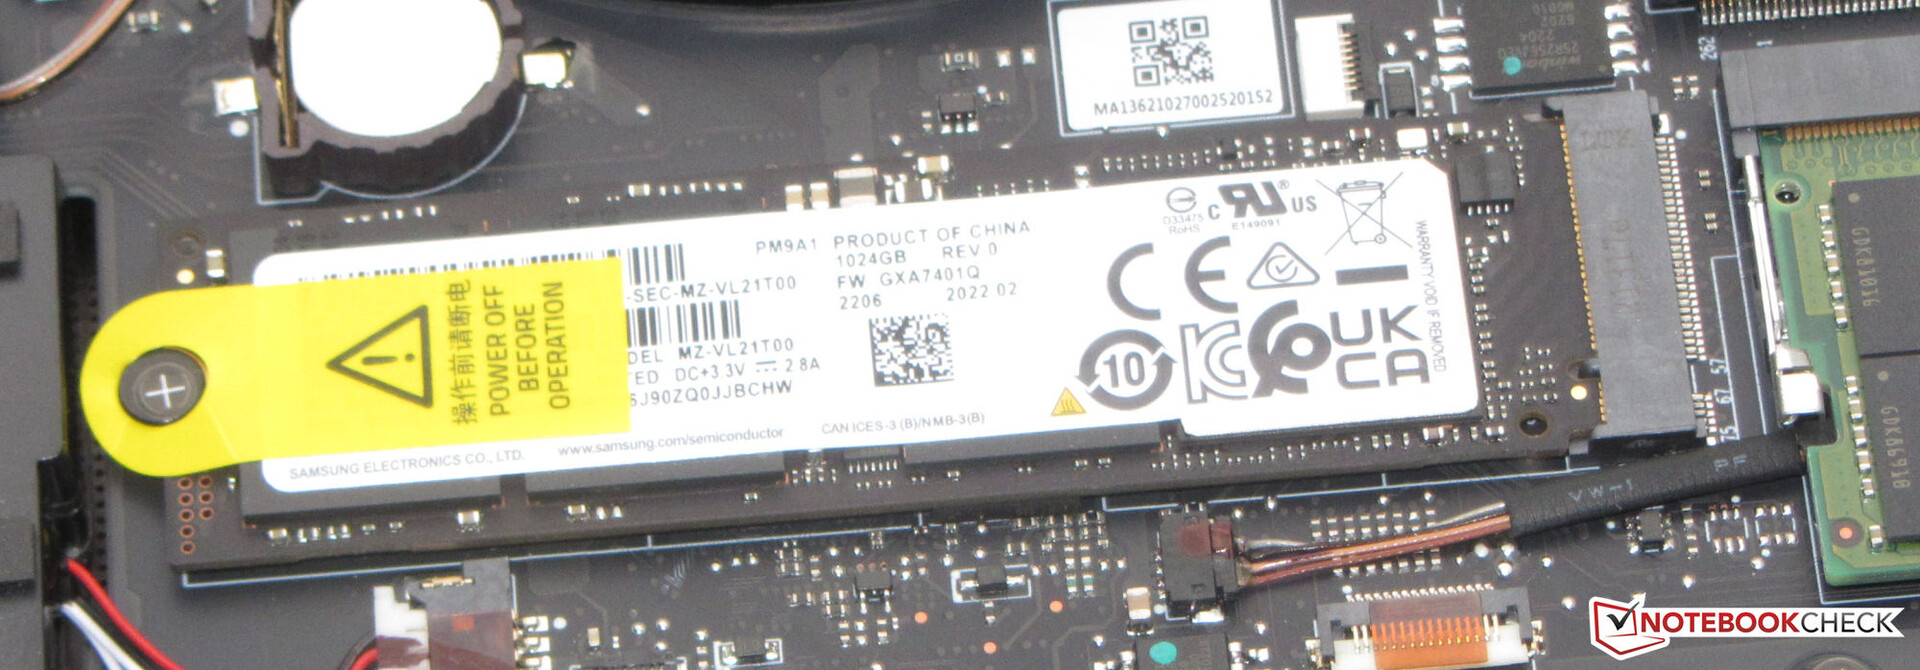
Solution de stockage
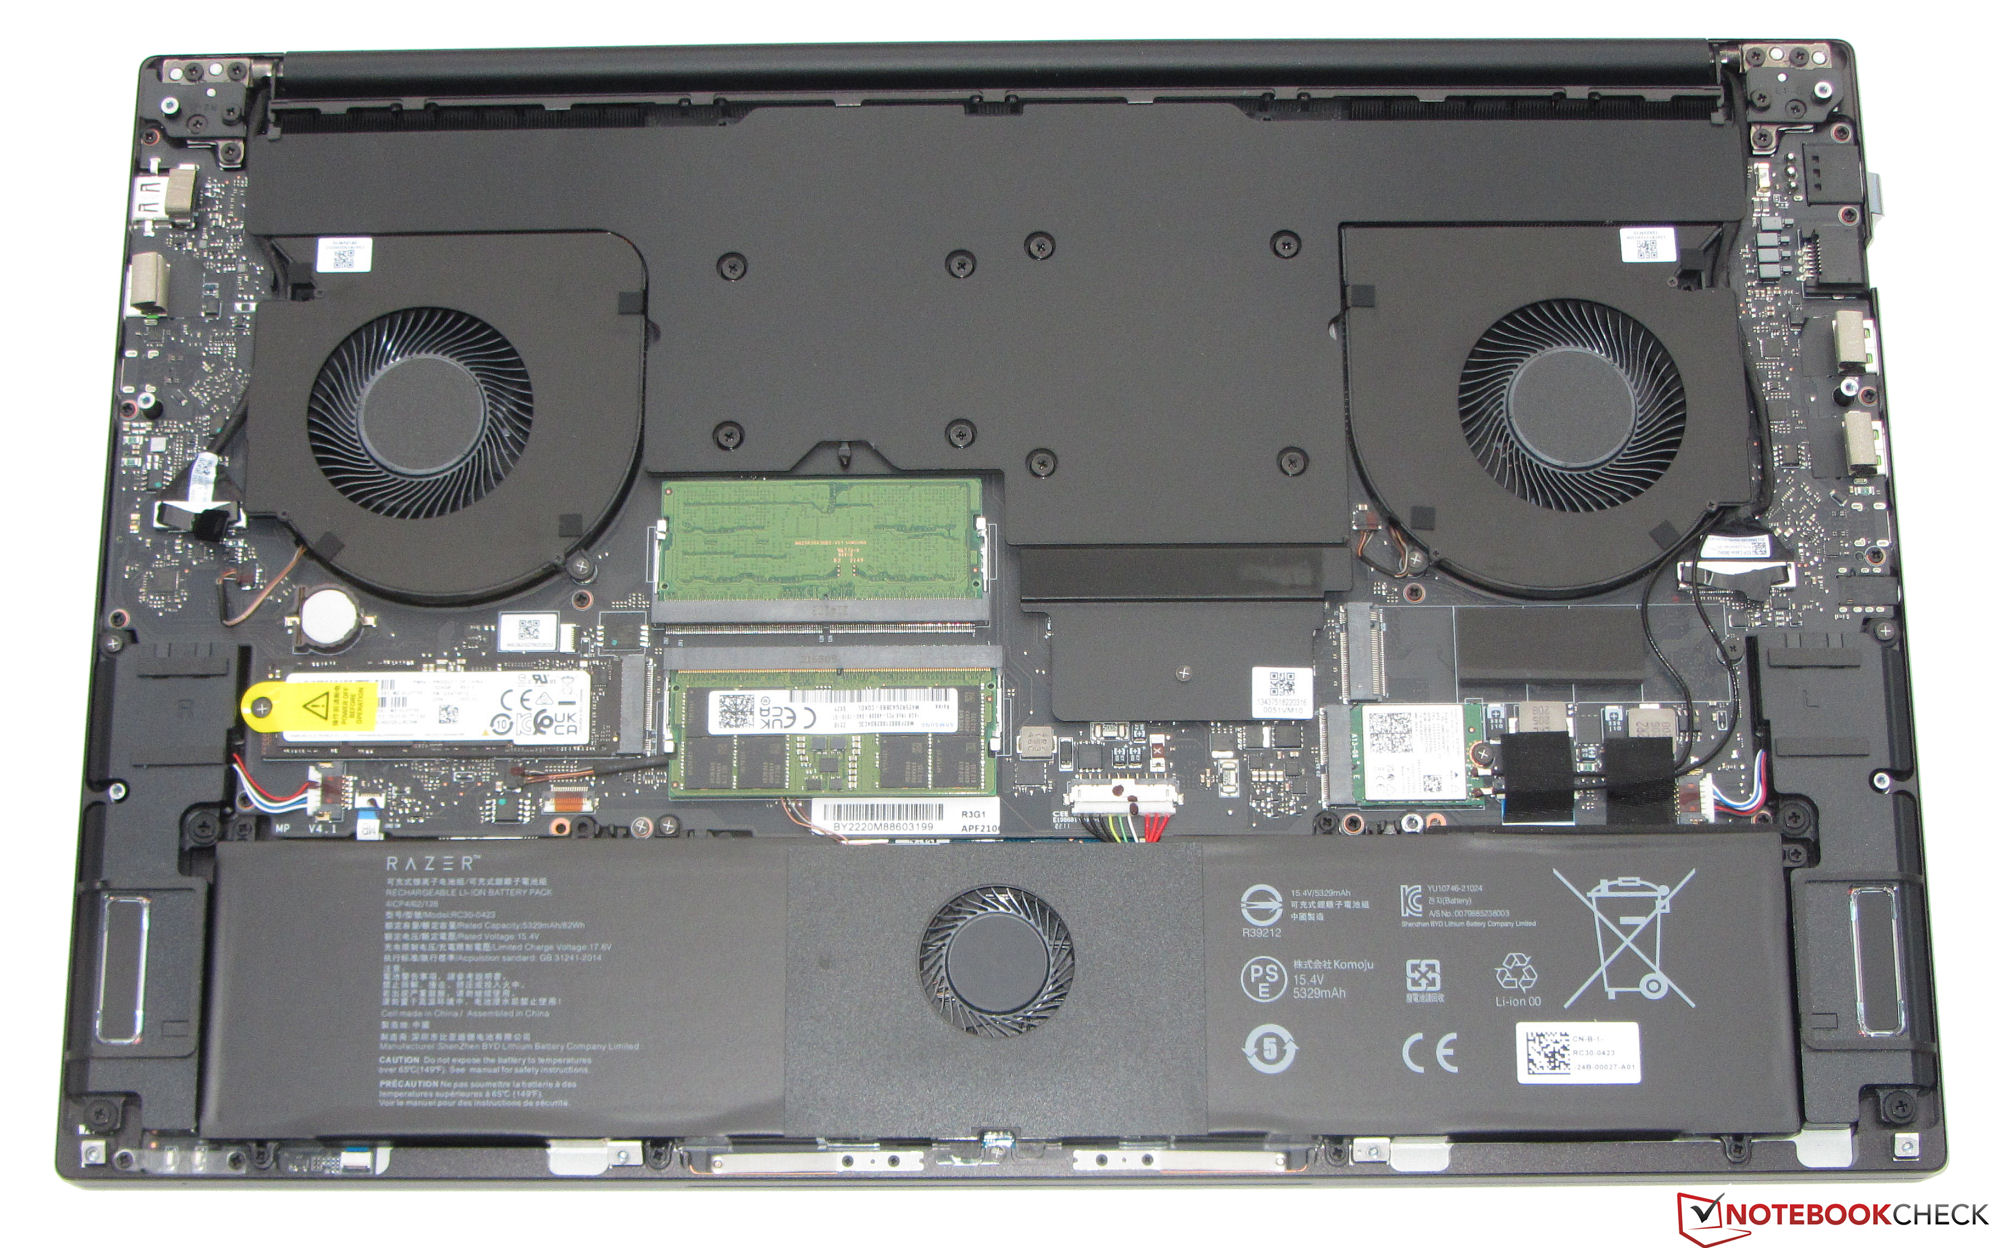
Razer a équipé le Blade d'un SSD de 1 To (PCIe 4, M.2-2280) de Samsung qui offre de très bons taux de transfert. En outre, l'ordinateur portable offre de l'espace pour un deuxième SSD (PCIe 4, M.2-2280).

* ... Moindre est la valeur, meilleures sont les performances
Constant Performance Reading: DiskSpd Read Loop, Queue Depth 8
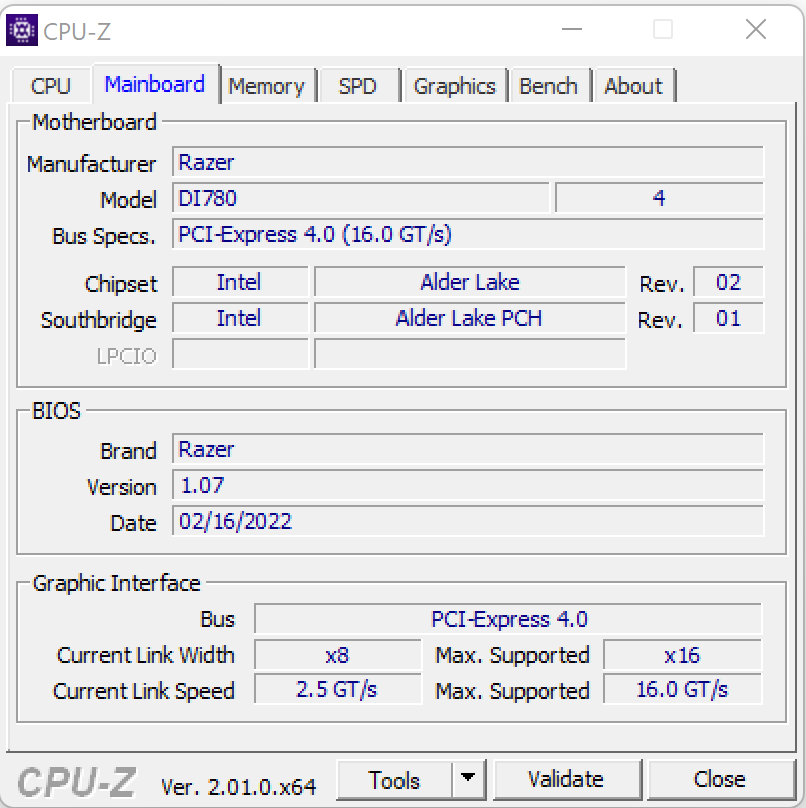
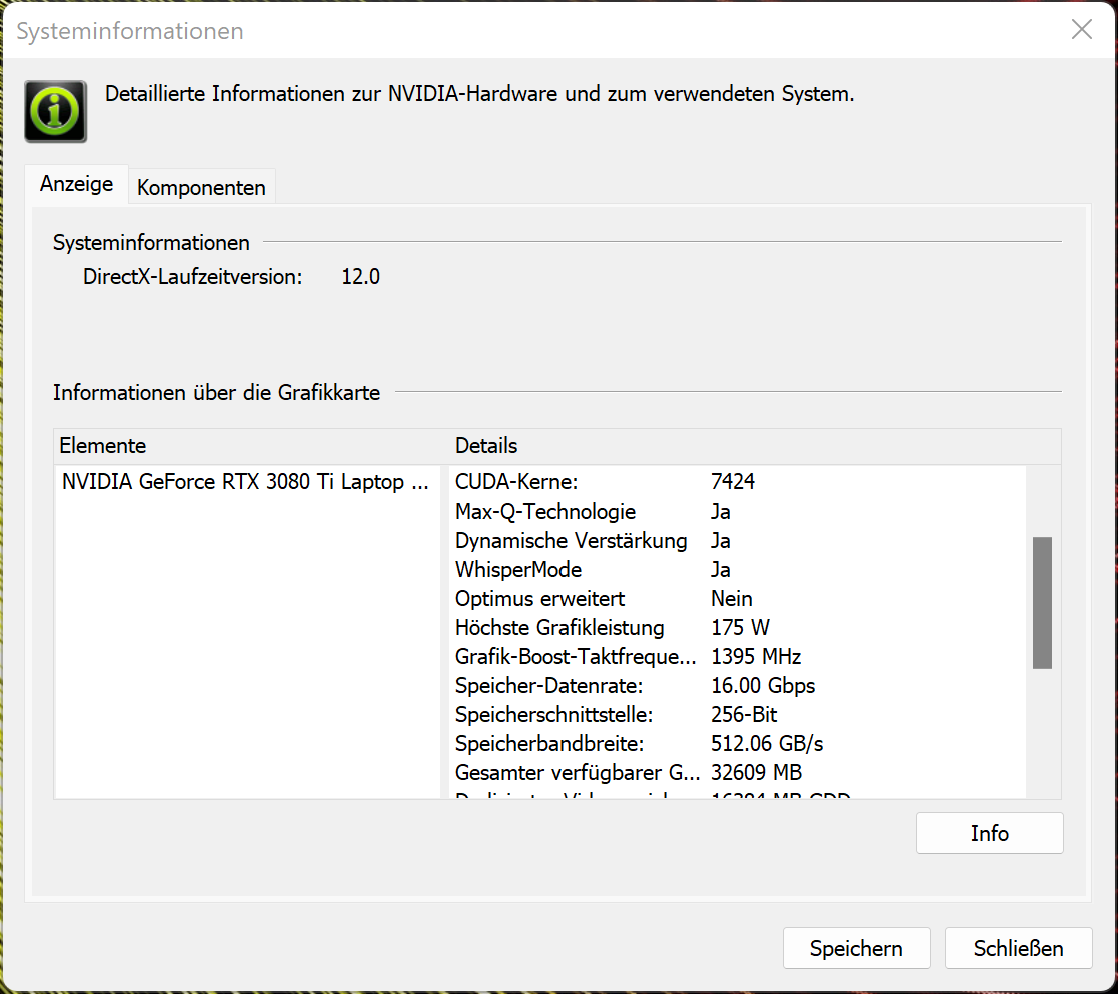
Carte graphique
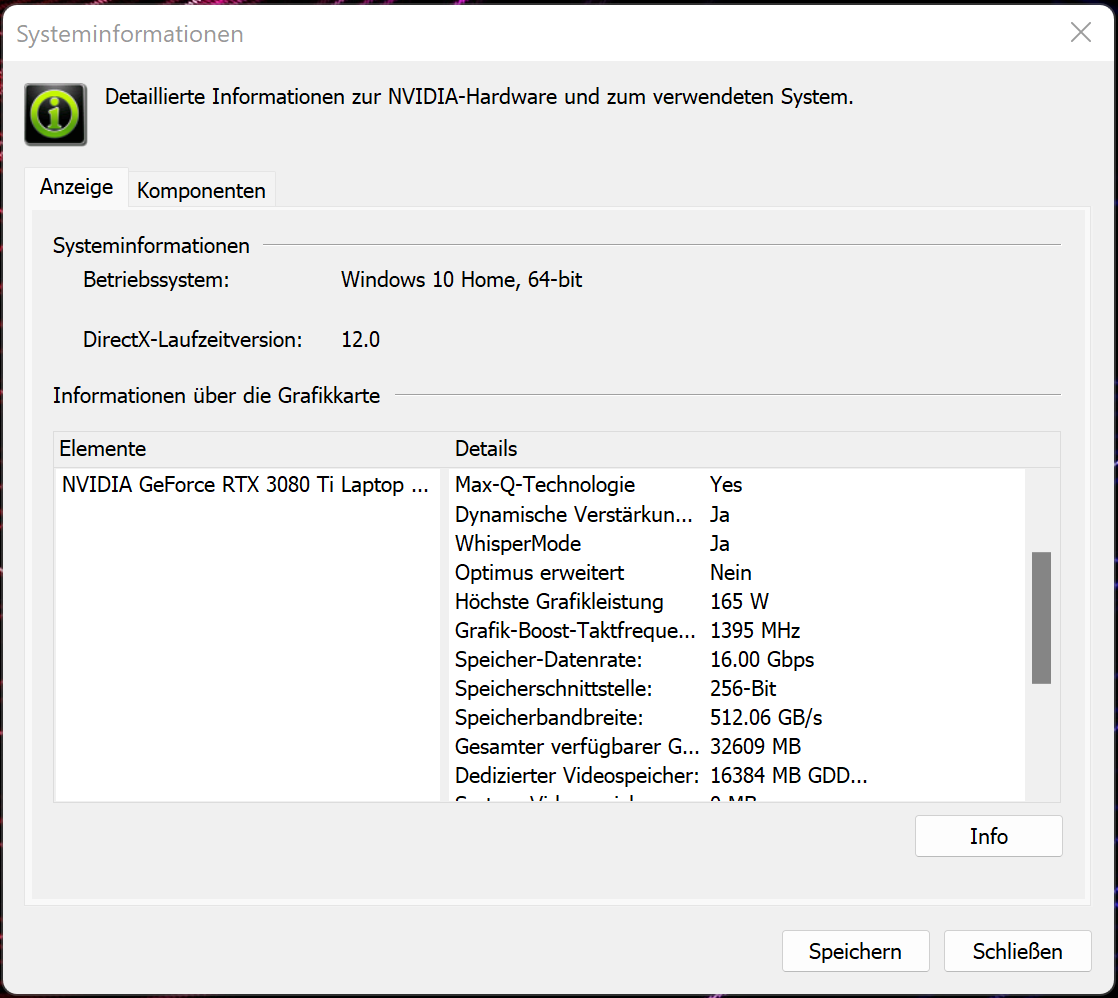
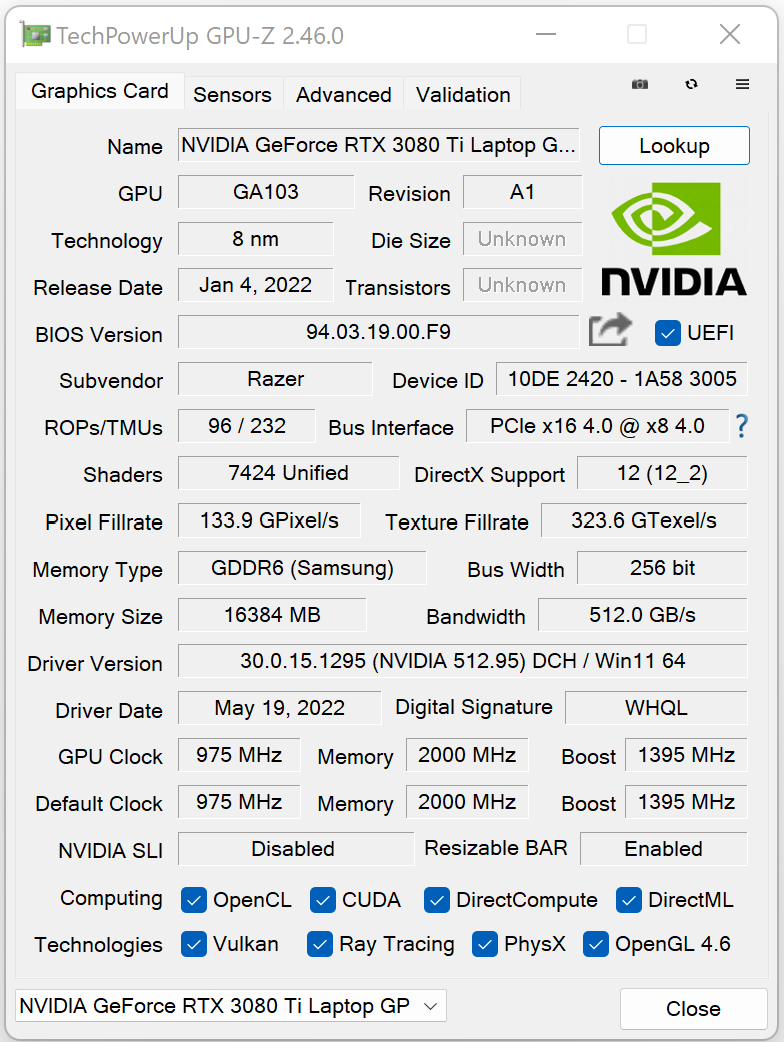
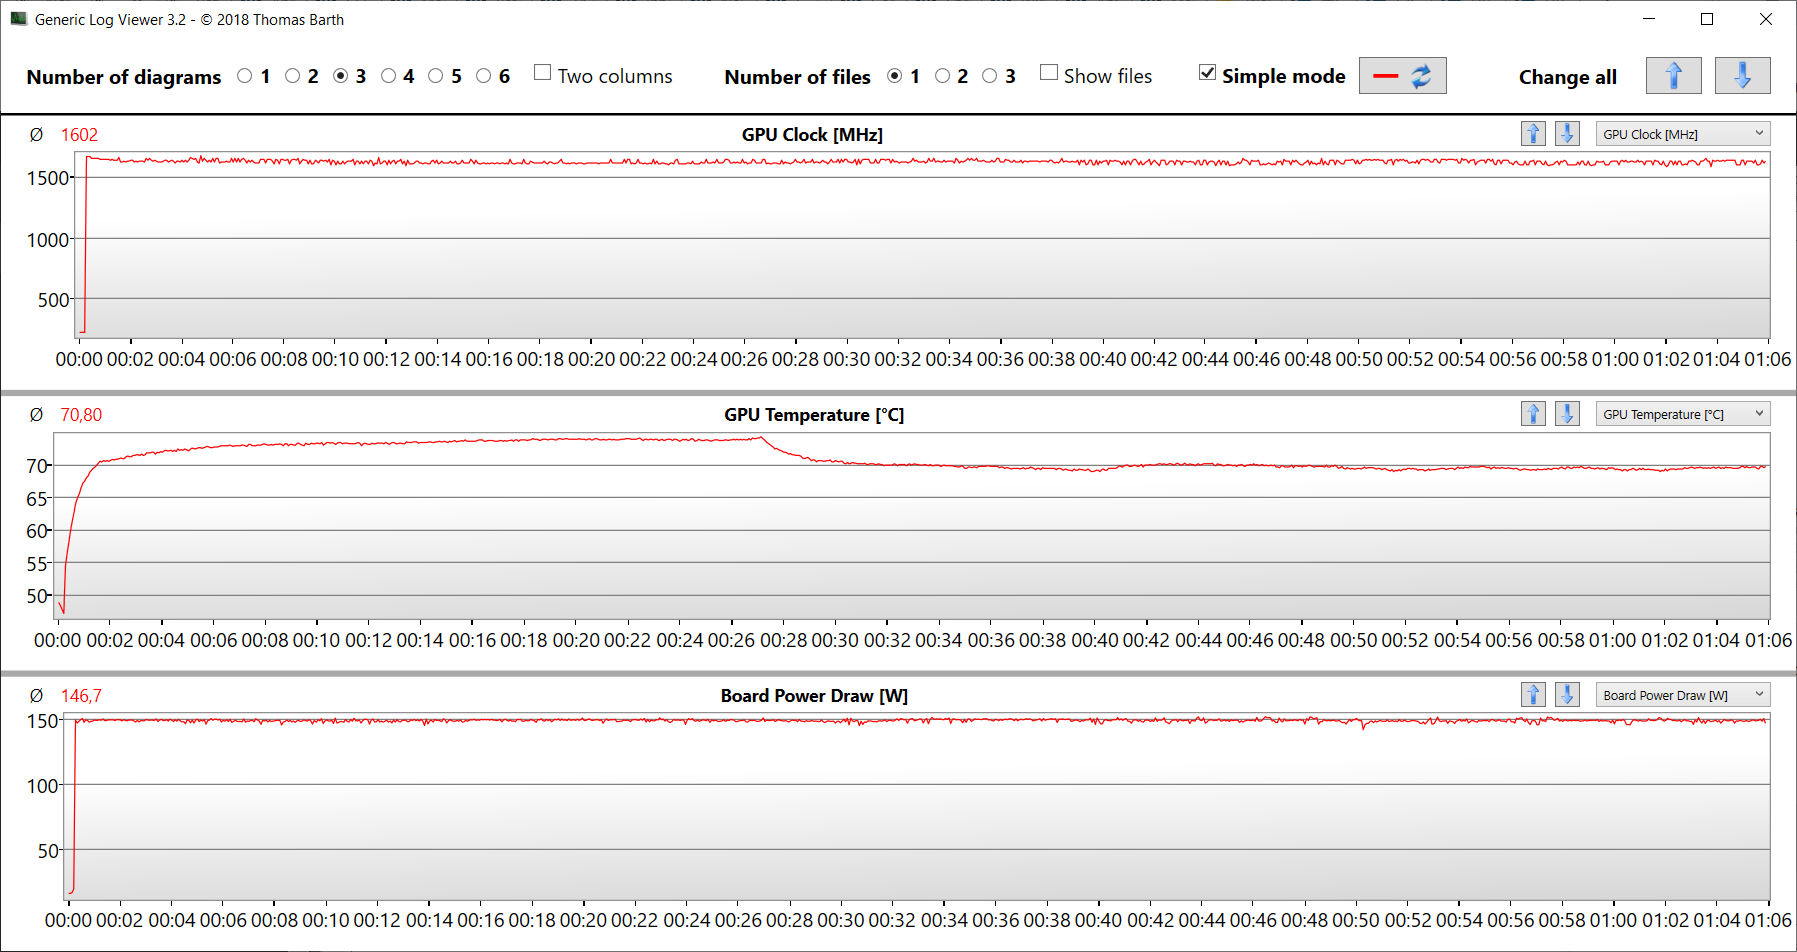
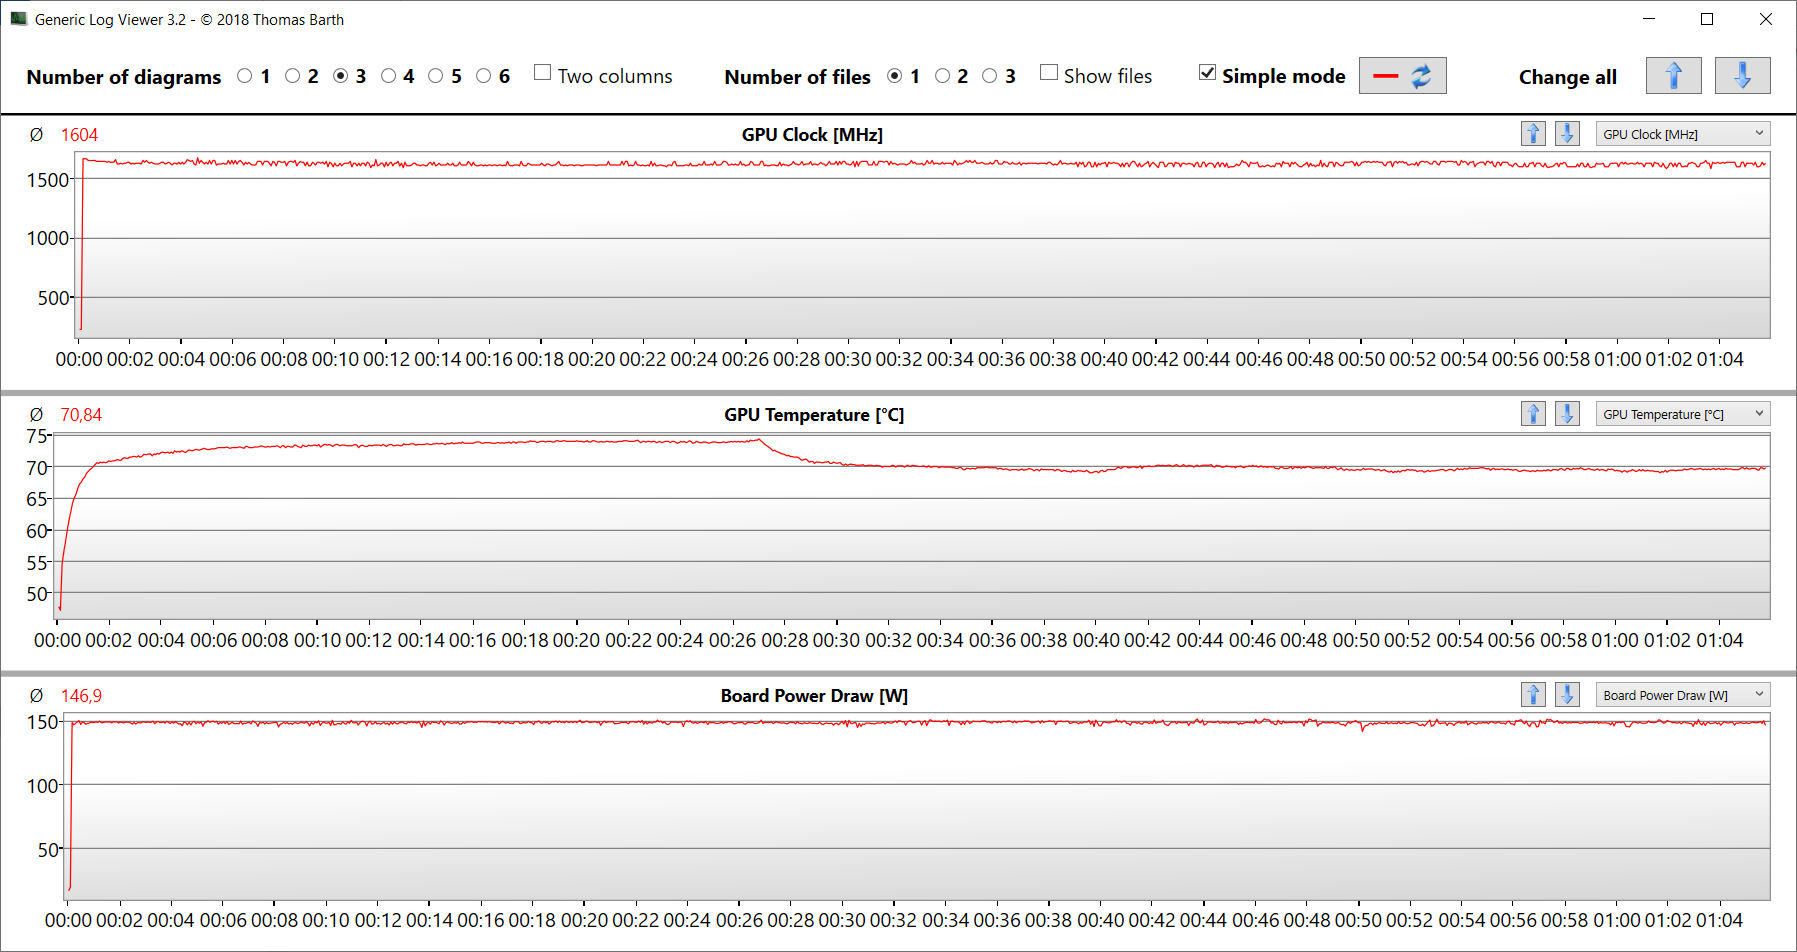
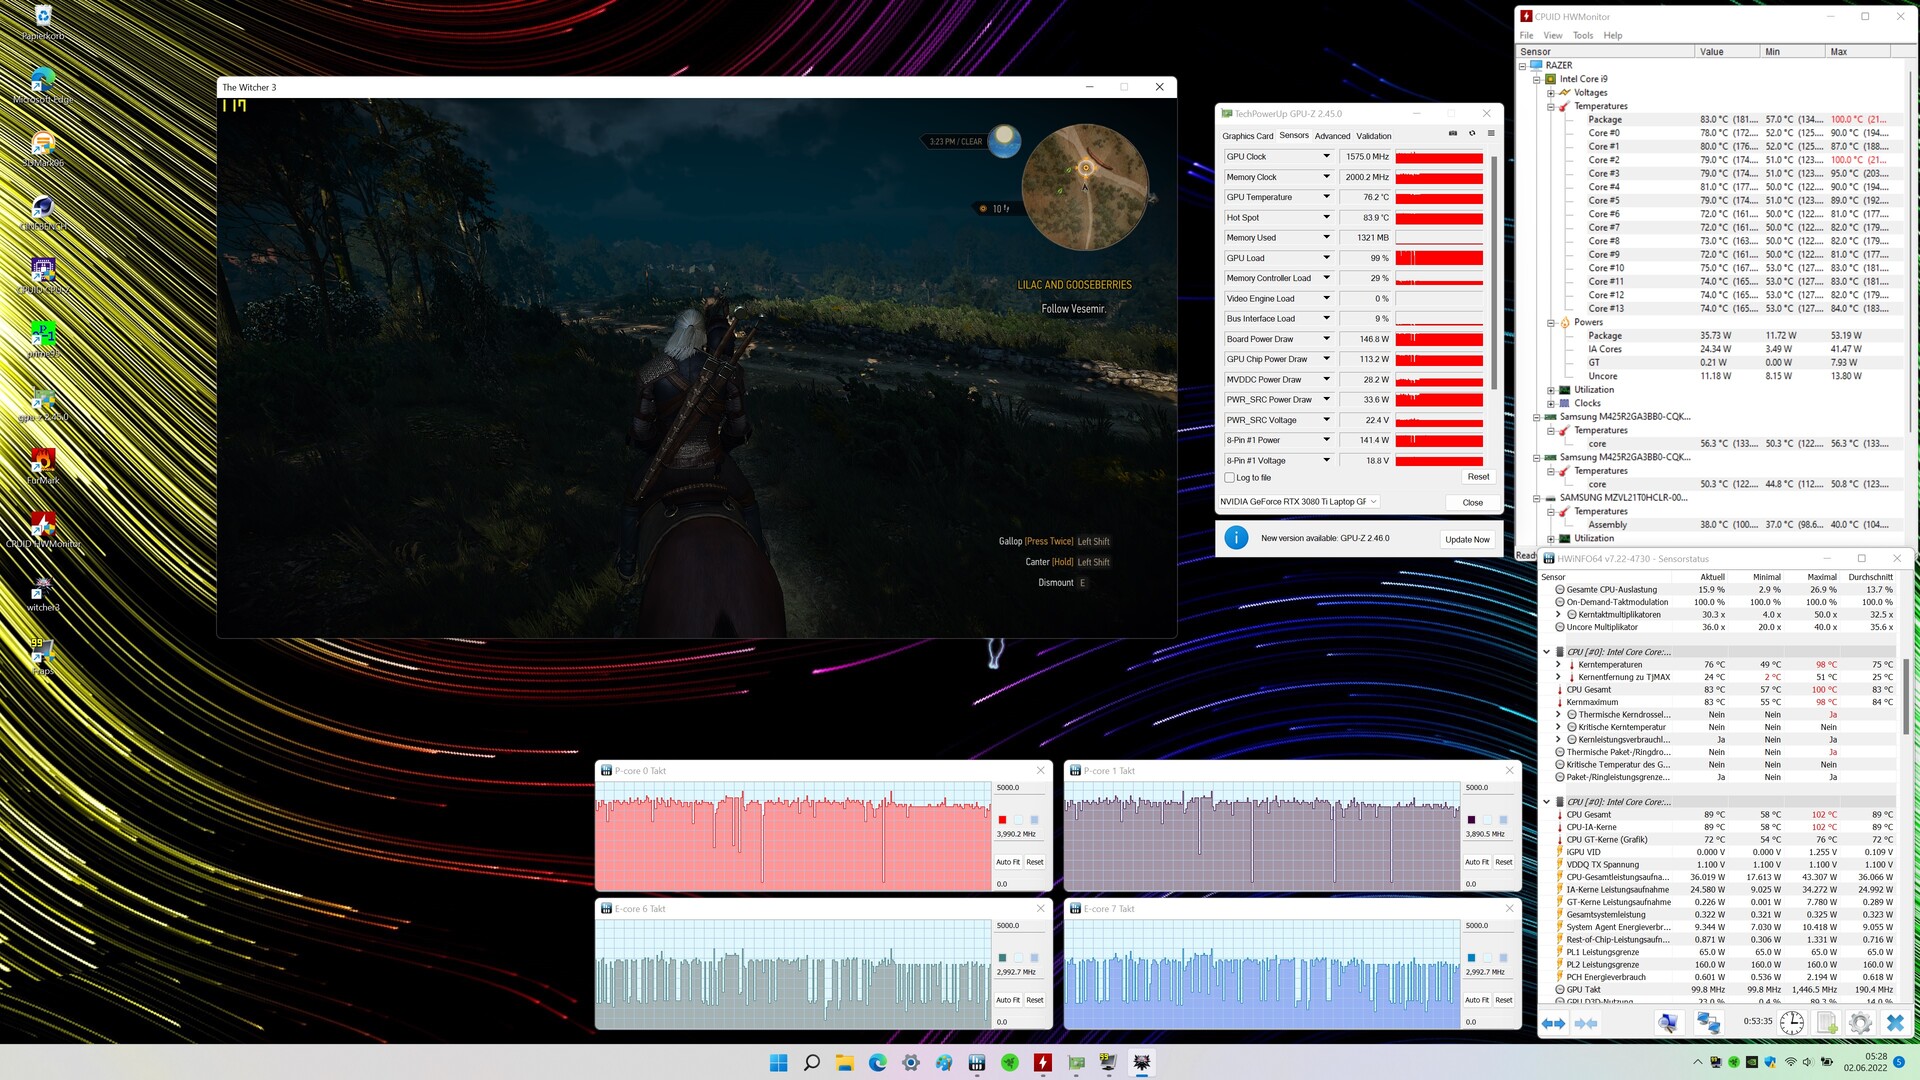
Une mise à jour du BIOS datant de juin 2022 augmente le TGP de la carte intégrée GeForce RTX 3080 Ti Laptopintégré (VRAM : 16 384 MB GDDR6) de 165 à 175 watts - sans montrer d'effet sur les résultats du benchmark. Cependant, dans tous les cas, les résultats se situent toujours au-dessus de la moyenne de la RTX 3080 Ti que nous avons déterminée précédemment. Le TGP n'est pas pleinement utilisé, ce qui est démontré par notre test The Witcher 3. Les performances graphiques peuvent être augmentées sans mise à jour du BIOS, puisque l'ordinateur portable offre l'option de sortie directe des images via le GPU GeForce.
| 3DMark Performance rating - Percent | |
| Moyenne de la classe Gaming -2! | |
| Alienware x17 R2 P48E -25! | |
| Razer Blade 17 RTX 3080 Ti -25! | |
| Razer Blade 17 Early 2022 -2! | |
| Razer Blade 17 Early 2022 -25! | |
| Razer Blade 17 Early 2022 -25! | |
| Medion Erazer Beast X30 -25! | |
| Moyenne NVIDIA GeForce RTX 3080 Ti Laptop GPU | |
| Asus ROG Zephyrus Duo 16 GX650RX -2! | |
| Razer Blade 17 Early 2022 -25! | |
| MSI Stealth GS77 12UHS-083US -25! | |
| Gigabyte Aero 16 YE5 -1! | |
| 3DMark 11 - 1280x720 Performance GPU | |
| Moyenne de la classe Gaming (21841 - 80022, n=104, 2 dernières années) | |
| Alienware x17 R2 P48E | |
| Razer Blade 17 Early 2022 (Max.) | |
| Razer Blade 17 Early 2022 | |
| Razer Blade 17 RTX 3080 Ti | |
| Medion Erazer Beast X30 | |
| Razer Blade 17 Early 2022 (dGPU, 175W) | |
| Asus ROG Zephyrus Duo 16 GX650RX | |
| Moyenne NVIDIA GeForce RTX 3080 Ti Laptop GPU (13920 - 45841, n=45) | |
| Razer Blade 17 Early 2022 (Lautlos) | |
| MSI Stealth GS77 12UHS-083US | |
| Gigabyte Aero 16 YE5 | |
| 3DMark 11 Performance | 30538 points | |
| 3DMark Cloud Gate Standard Score | 42346 points | |
| 3DMark Fire Strike Score | 24291 points | |
| 3DMark Time Spy Score | 11457 points | |
| 3DMark Steel Nomad Score | 3076 points | |
Aide | ||
Performances en matière de jeux
Le matériel permet de jouer en 4k avec des paramètres élevés à maximaux. En général, les fréquences d'images se situent au-dessus de la moyenne pour la RTX 3080 Ti. La sortie directe des images via le GPU GeForce entraîne une augmentation parfois significative des valeurs. Avec des paramètres de performance similaires, le modèle frère produit des valeurs à un niveau identique. Les taux de rafraîchissement restent constants, même sur une longue période, comme le montre notre test The Witcher 3 (FHD, paramètres maximaux, durée d'exécution de 60 minutes).
| The Witcher 3 - 1920x1080 Ultra Graphics & Postprocessing (HBAO+) | |
| Moyenne de la classe Gaming (104.7 - 240, n=7, 2 dernières années) | |
| Alienware x17 R2 P48E | |
| Razer Blade 17 RTX 3080 Ti | |
| Razer Blade 17 Early 2022 (dGPU, 175W) | |
| Razer Blade 17 Early 2022 (Max.) | |
| Razer Blade 17 Early 2022 | |
| Medion Erazer Beast X30 | |
| Razer Blade 17 Early 2022 (Lautlos) | |
| Moyenne NVIDIA GeForce RTX 3080 Ti Laptop GPU (30 - 130.6, n=43) | |
| MSI Stealth GS77 12UHS-083US | |
| Dota 2 Reborn | |
| 1920x1080 ultra (3/3) best looking | |
| Alienware x17 R2 P48E | |
| Razer Blade 17 RTX 3080 Ti | |
| MSI Stealth GS77 12UHS-083US | |
| Moyenne de la classe Gaming (84.8 - 248, n=107, 2 dernières années) | |
| Razer Blade 17 Early 2022 (Max.) | |
| Razer Blade 17 Early 2022 (dGPU, 175W) | |
| Medion Erazer Beast X30 | |
| Moyenne NVIDIA GeForce RTX 3080 Ti Laptop GPU (29.9 - 170.5, n=45) | |
| Razer Blade 17 Early 2022 | |
| Razer Blade 17 Early 2022 (Lautlos) | |
| 3840x2160 ultra (3/3) best looking | |
| Moyenne de la classe Gaming (114.9 - 199.2, n=32, 2 dernières années) | |
| Razer Blade 17 Early 2022 (dGPU, 175W) | |
| Razer Blade 17 Early 2022 (Max.) | |
| Moyenne NVIDIA GeForce RTX 3080 Ti Laptop GPU (70.8 - 155.6, n=19) | |
| Razer Blade 17 Early 2022 | |
| Razer Blade 17 Early 2022 (Lautlos) | |
| X-Plane 11.11 | |
| 3840x2160 high (fps_test=3) | |
| Razer Blade 17 Early 2022 (dGPU, 175W) | |
| Moyenne de la classe Gaming (60 - 124.1, n=32, 2 dernières années) | |
| Razer Blade 17 Early 2022 (Max.) | |
| Moyenne NVIDIA GeForce RTX 3080 Ti Laptop GPU (32.9 - 109.5, n=20) | |
| Razer Blade 17 Early 2022 | |
| Razer Blade 17 Early 2022 (Lautlos) | |
| 1920x1080 high (fps_test=3) | |
| Alienware x17 R2 P48E | |
| Razer Blade 17 Early 2022 (dGPU, 175W) | |
| Razer Blade 17 RTX 3080 Ti | |
| Razer Blade 17 Early 2022 (Max.) | |
| MSI Stealth GS77 12UHS-083US | |
| Moyenne NVIDIA GeForce RTX 3080 Ti Laptop GPU (32.6 - 127, n=45) | |
| Medion Erazer Beast X30 | |
| Moyenne de la classe Gaming (55.5 - 143.5, n=109, 2 dernières années) | |
| Razer Blade 17 Early 2022 | |
| Razer Blade 17 Early 2022 (Lautlos) | |
| Final Fantasy XV Benchmark | |
| 3840x2160 High Quality | |
| Moyenne de la classe Gaming (49.1 - 111.8, n=33, 2 dernières années) | |
| Razer Blade 17 Early 2022 (1.3, dGPU, 175W) | |
| Razer Blade 17 Early 2022 (1.3, Max.) | |
| Razer Blade 17 Early 2022 (1.3) | |
| Moyenne NVIDIA GeForce RTX 3080 Ti Laptop GPU (35.1 - 61.2, n=18) | |
| Razer Blade 17 Early 2022 (1.3, Lautlos) | |
| 1920x1080 High Quality | |
| Moyenne de la classe Gaming (41 - 215, n=95, 2 dernières années) | |
| Alienware x17 R2 P48E (1.3) | |
| Razer Blade 17 Early 2022 (1.3, dGPU, 175W) | |
| Razer Blade 17 RTX 3080 Ti (1.3) | |
| Razer Blade 17 Early 2022 (1.3, Max.) | |
| Moyenne NVIDIA GeForce RTX 3080 Ti Laptop GPU (30.7 - 140.6, n=42) | |
| Razer Blade 17 Early 2022 (1.3) | |
| MSI Stealth GS77 12UHS-083US (1.3) | |
| Medion Erazer Beast X30 (1.3) | |
| Razer Blade 17 Early 2022 (1.3, Lautlos) | |
| GTA V | |
| 1920x1080 Highest AA:4xMSAA + FX AF:16x | |
| Moyenne de la classe Gaming (48.3 - 186.9, n=94, 2 dernières années) | |
| Alienware x17 R2 P48E | |
| Razer Blade 17 Early 2022 (Max.) | |
| Razer Blade 17 Early 2022 (dGPU, 175W) | |
| Razer Blade 17 RTX 3080 Ti | |
| MSI Stealth GS77 12UHS-083US | |
| Moyenne NVIDIA GeForce RTX 3080 Ti Laptop GPU (30 - 139.2, n=42) | |
| Medion Erazer Beast X30 | |
| Razer Blade 17 Early 2022 | |
| Razer Blade 17 Early 2022 (Lautlos) | |
| 3840x2160 Highest AA:4xMSAA + FX AF:16x | |
| Moyenne de la classe Gaming (53.9 - 123.2, n=25, 2 dernières années) | |
| Razer Blade 17 Early 2022 (Max.) | |
| Razer Blade 17 Early 2022 | |
| Razer Blade 17 Early 2022 (dGPU, 175W) | |
| Moyenne NVIDIA GeForce RTX 3080 Ti Laptop GPU (37.7 - 67.2, n=14) | |
| Razer Blade 17 Early 2022 (Lautlos) | |
| Strange Brigade | |
| 3840x2160 ultra AA:ultra AF:16 | |
| Moyenne de la classe Gaming (83 - 187.2, n=34, 2 dernières années) | |
| Razer Blade 17 Early 2022 (1.47.22.14 D3D12, dGPU, 175W) | |
| Razer Blade 17 Early 2022 (1.47.22.14 D3D12) | |
| Moyenne NVIDIA GeForce RTX 3080 Ti Laptop GPU (61.7 - 100.7, n=15) | |
| Razer Blade 17 Early 2022 (1.47.22.14 D3D12, Lautlos) | |
| 1920x1080 ultra AA:ultra AF:16 | |
| Moyenne de la classe Gaming (76.3 - 458, n=87, 2 dernières années) | |
| Razer Blade 17 RTX 3080 Ti (1.47.22.14 D3D12) | |
| Razer Blade 17 Early 2022 (1.47.22.14 D3D12, dGPU, 175W) | |
| Alienware x17 R2 P48E (1.47.22.14 D3D12) | |
| Razer Blade 17 Early 2022 (1.47.22.14 D3D12) | |
| Medion Erazer Beast X30 (1.47.22.14 D3D12) | |
| Moyenne NVIDIA GeForce RTX 3080 Ti Laptop GPU (42.3 - 224, n=41) | |
| Razer Blade 17 Early 2022 (1.47.22.14 D3D12, Lautlos) | |
| MSI Stealth GS77 12UHS-083US (1.47.22.14 D3D12) | |
| F1 2021 | |
| 3840x2160 Ultra High Preset + Raytracing AA:T AF:16x | |
| Razer Blade 17 Early 2022 (874931, dGPU, 175W) | |
| Razer Blade 17 Early 2022 (874931, Max.) | |
| Razer Blade 17 Early 2022 (874931) | |
| Moyenne NVIDIA GeForce RTX 3080 Ti Laptop GPU (41.1 - 70.2, n=18) | |
| Razer Blade 17 Early 2022 (874931, Lautlos) | |
| 1920x1080 Ultra High Preset + Raytracing AA:T AF:16x | |
| Razer Blade 17 Early 2022 (874931, dGPU, 175W) | |
| Razer Blade 17 Early 2022 (874931, Max.) | |
| Razer Blade 17 Early 2022 (874931) | |
| Medion Erazer Beast X30 (874931) | |
| Moyenne NVIDIA GeForce RTX 3080 Ti Laptop GPU (30.2 - 160.6, n=30) | |
| Razer Blade 17 Early 2022 (874931, Lautlos) | |
| Far Cry 5 | |
| 3840x2160 Ultra Preset AA:T | |
| Moyenne de la classe Gaming (n=12 dernières années) | |
| Razer Blade 17 Early 2022 | |
| Razer Blade 17 Early 2022 (dGPU, 175W) | |
| Moyenne NVIDIA GeForce RTX 3080 Ti Laptop GPU (45 - 76, n=9) | |
| 1920x1080 Ultra Preset AA:T | |
| Moyenne NVIDIA GeForce RTX 3080 Ti Laptop GPU (111 - 162, n=24) | |
| Medion Erazer Beast X30 | |
| MSI Stealth GS77 12UHS-083US | |
| Razer Blade 17 RTX 3080 Ti | |
| Razer Blade 17 Early 2022 (dGPU, 175W) | |
| Razer Blade 17 Early 2022 | |
| Moyenne de la classe Gaming (70 - 151, n=6, 2 dernières années) | |
The Witcher 3 FPS Chart
| Bas | Moyen | Élevé | Ultra | QHD | 4K | |
|---|---|---|---|---|---|---|
| GTA V (2015) | 179.4 | 175.2 | 166 | 106 | 102.7 | 118 |
| The Witcher 3 (2015) | 328 | 289 | 218 | 119.6 | 89.6 | |
| Dota 2 Reborn (2015) | 176.1 | 149.2 | 140 | 131.9 | 117.3 | |
| Final Fantasy XV Benchmark (2018) | 155.9 | 139.3 | 112.2 | 90.8 | 55.2 | |
| X-Plane 11.11 (2018) | 127.9 | 115.5 | 95.6 | 82.1 | ||
| Far Cry 5 (2018) | 148 | 127 | 122 | 116 | 110 | 70 |
| Strange Brigade (2018) | 382 | 272 | 229 | 204 | 152.7 | 91.1 |
| F1 2021 (2021) | 295 | 255 | 219 | 132.8 | 104.3 | 62.5 |
| Baldur's Gate 3 (2023) | 117.7 | 84.4 | 46 | |||
| Cyberpunk 2077 (2023) | 91.43 | 57.12 | 25.46 |
Émissions - Le Blade 17 ne chauffe pas excessivement
Émissions sonores
En fonctionnement quotidien (bureau, Internet), l'ordinateur portable ne produit pas de bruit excessif. Parfois, les ventilateurs restent même complètement éteints et le silence règne. En charge, il peut devenir bruyant avec un niveau sonore maximal de 51 dB(A) (test de stress, The Witcher 3 test).
Le profil de performance "Silencieux" se prête à une utilisation quotidienne. Bien que l'ordinateur portable ne fonctionne pas silencieusement, il produit moins de bruit et de chaleur. La performance informatique réduite est également suffisante pour les jeux.
Degré de la nuisance sonore
| Au repos |
| 26 / 27 / 32 dB(A) |
| Fortement sollicité |
| 50 / 51 dB(A) |
 | ||
30 dB silencieux 40 dB(A) audible 50 dB(A) bruyant |
||
min: | ||
| Razer Blade 17 Early 2022 GeForce RTX 3080 Ti Laptop GPU, i9-12900H, Samsung PM9A1 MZVL21T0HCLR | Alienware x17 R2 P48E GeForce RTX 3080 Ti Laptop GPU, i9-12900HK, 2x Samsung PM9A1 1TB (RAID 0) | Medion Erazer Beast X30 GeForce RTX 3080 Ti Laptop GPU, i9-12900HK, Samsung PM9A1 MZVL21T0HCLR | MSI Stealth GS77 12UHS-083US GeForce RTX 3080 Ti Laptop GPU, i7-12700H, Micron 3400 1TB MTFDKBA1T0TFH | Razer Blade 17 RTX 3080 Ti GeForce RTX 3080 Ti Laptop GPU, i7-12800H, Samsung PM9A1 MZVL21T0HCLR | |
|---|---|---|---|---|---|
| Noise | 14% | -2% | 8% | 11% | |
| arrêt / environnement * (dB) | 26 | 22.7 13% | 26 -0% | 24.5 6% | 23.3 10% |
| Idle Minimum * (dB) | 26 | 23.1 11% | 27 -4% | 24.5 6% | 23.3 10% |
| Idle Average * (dB) | 27 | 23.1 14% | 29 -7% | 24.5 9% | 23.3 14% |
| Idle Maximum * (dB) | 32 | 23.1 28% | 34 -6% | 30.8 4% | 26.3 18% |
| Load Average * (dB) | 50 | 31.9 36% | 48 4% | 34.6 31% | 38.2 24% |
| Witcher 3 ultra * (dB) | 51 | 52.5 -3% | 51 -0% | 46.2 9% | 50.9 -0% |
| Load Maximum * (dB) | 51 | 52.5 -3% | 53 -4% | 56.8 -11% | 49.1 4% |
* ... Moindre est la valeur, meilleures sont les performances
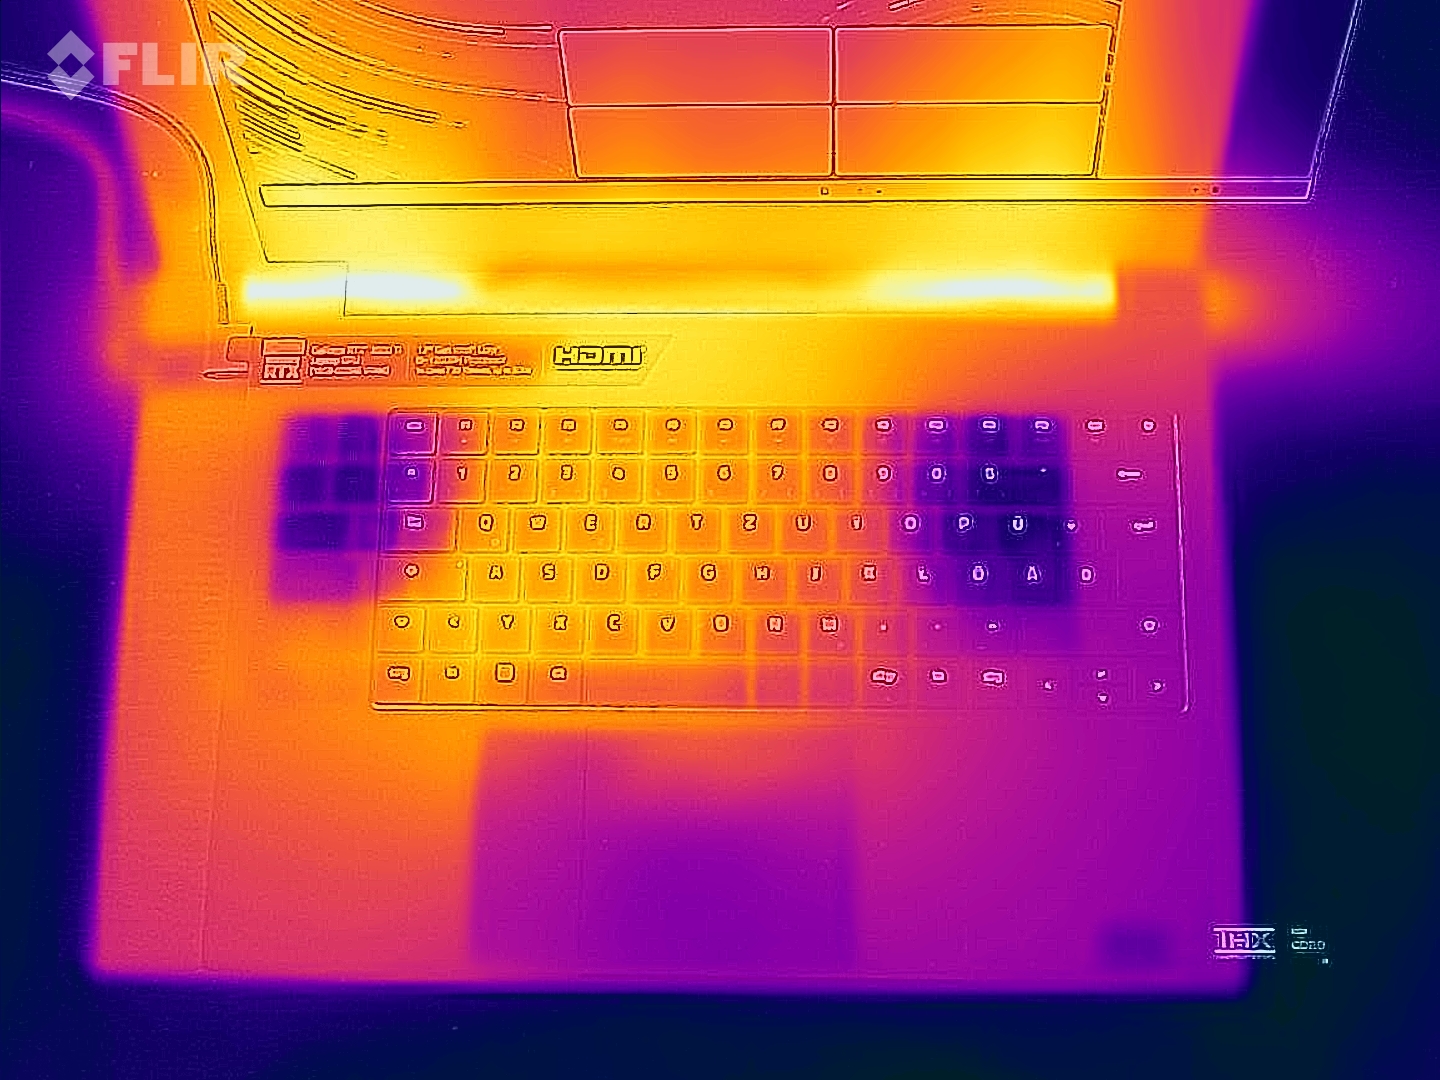
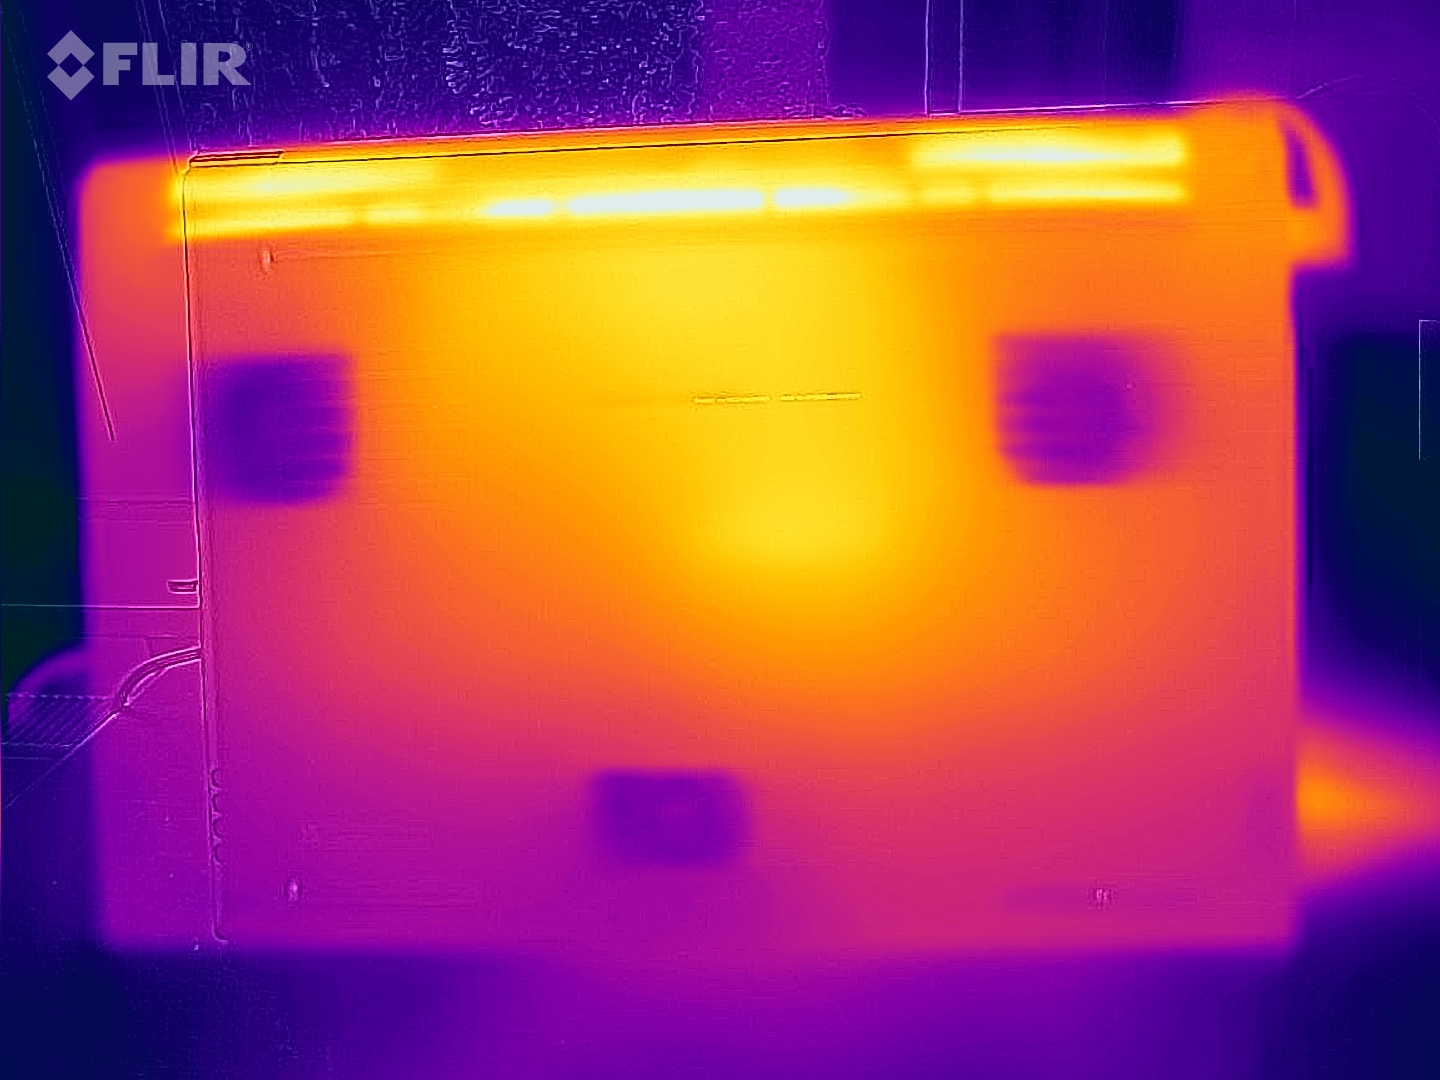
Températures
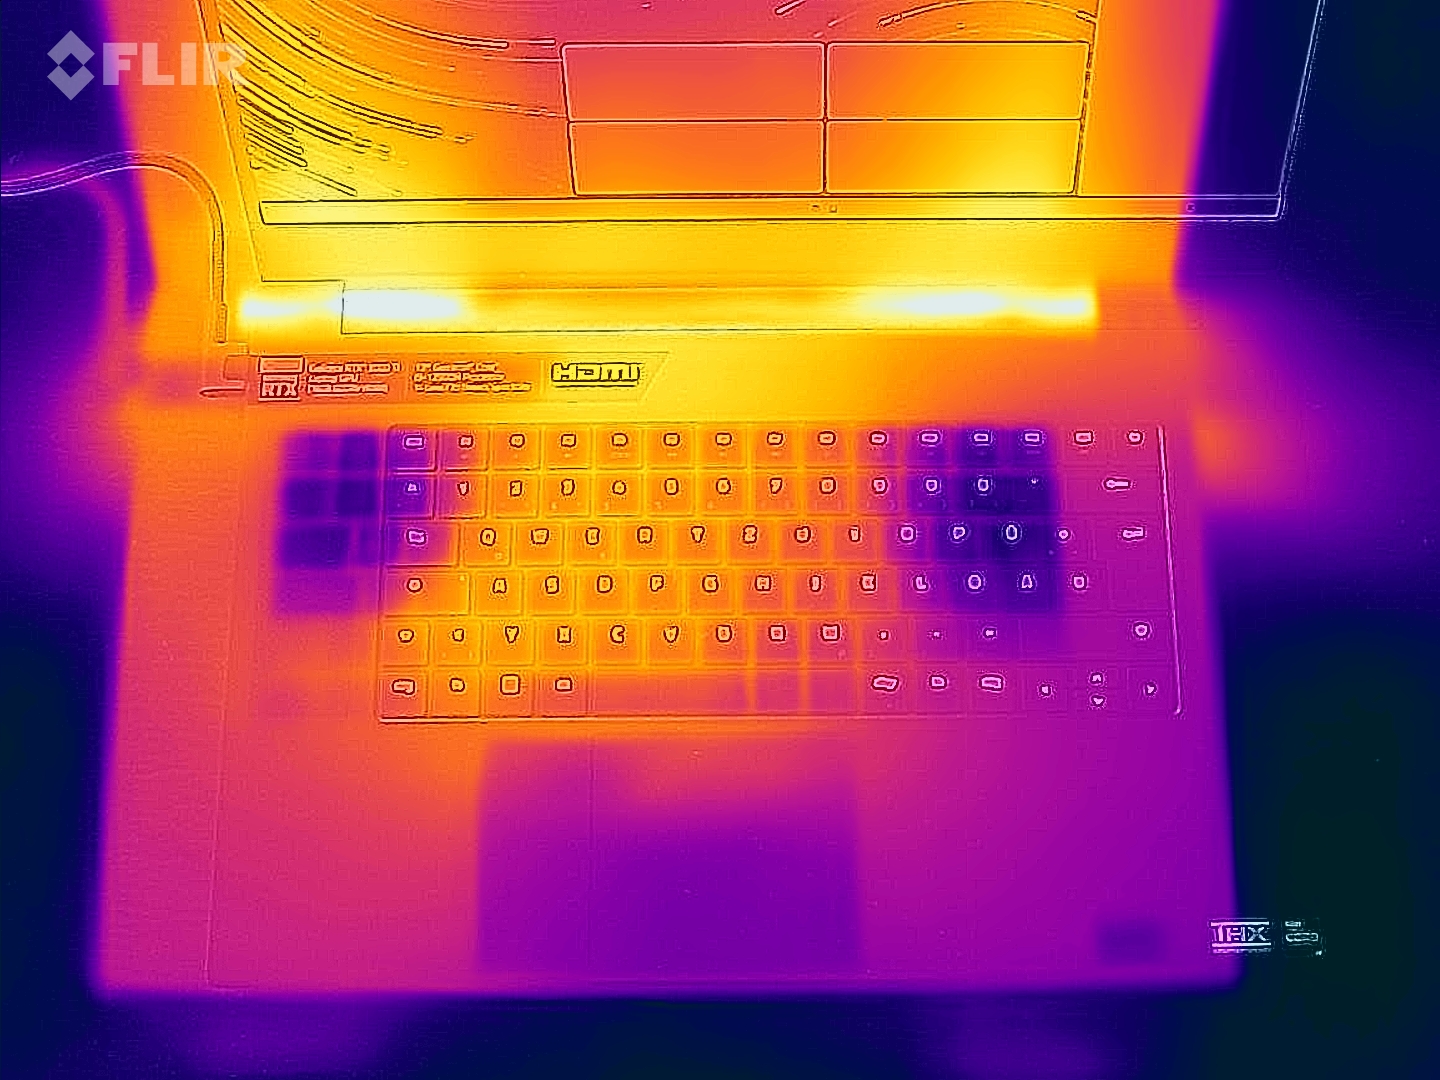
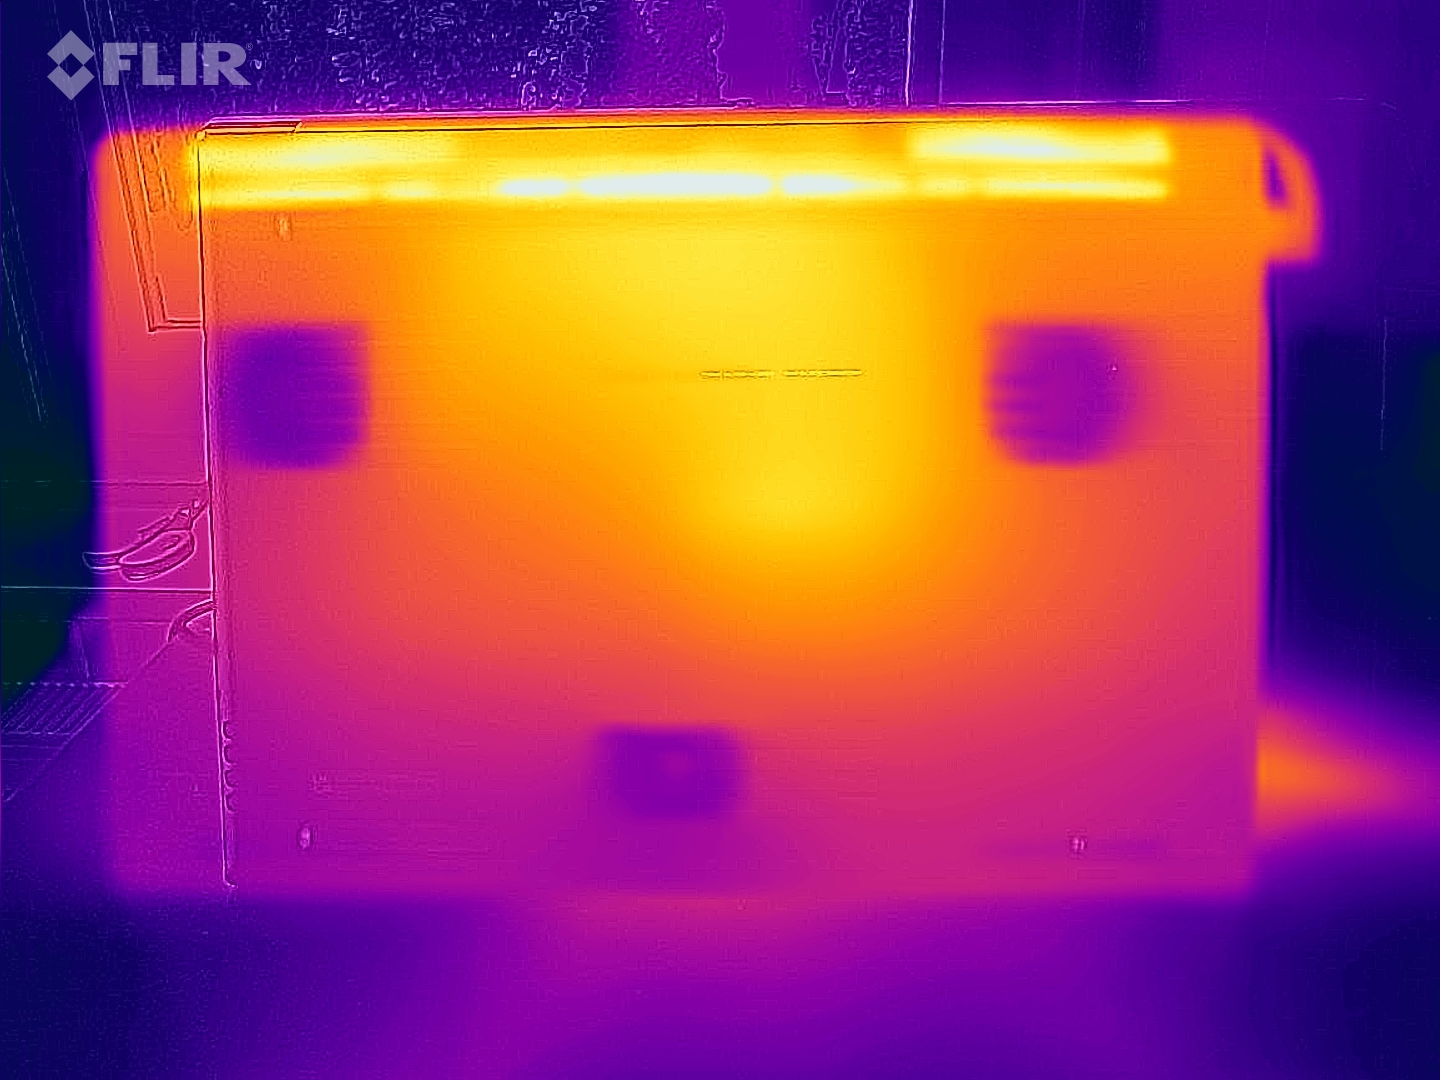
Dans le cadre d'une utilisation quotidienne (bureau, Internet), les températures du boîtier restent dans la plage verte. Bien que l'ordinateur portable se réchauffe sensiblement sous charge (test de stress, The Witcher 3 test), le développement de chaleur reste dans des limites acceptables. Cependant, les températures du CPU peuvent parfois atteindre la zone rouge.
(-) La température maximale du côté supérieur est de 50 °C / 122 F, par rapport à la moyenne de 40.4 °C / 105 F, allant de 21.2 à 68.8 °C pour la classe Gaming.
(-) Le fond chauffe jusqu'à un maximum de 56 °C / 133 F, contre une moyenne de 43.2 °C / 110 F
(±) En utilisation inactive, la température moyenne du côté supérieur est de 33 °C / 91 F, par rapport à la moyenne du dispositif de 33.9 °C / 93 F.
(-) En jouant à The Witcher 3, la température moyenne du côté supérieur est de 42.7 °C / 109 F, alors que la moyenne de l'appareil est de 33.9 °C / 93 F.
(-) Les repose-poignets et le pavé tactile peuvent devenir très chauds au toucher, avec un maximum de 42 °C / 107.6# F.
(-) La température moyenne de la zone de l'appui-paume de dispositifs similaires était de 28.8 °C / 83.8 F (-13.2 °C / #-23.8 F).
| Razer Blade 17 Early 2022 Intel Core i9-12900H, NVIDIA GeForce RTX 3080 Ti Laptop GPU | Alienware x17 R2 P48E Intel Core i9-12900HK, NVIDIA GeForce RTX 3080 Ti Laptop GPU | Medion Erazer Beast X30 Intel Core i9-12900HK, NVIDIA GeForce RTX 3080 Ti Laptop GPU | MSI Stealth GS77 12UHS-083US Intel Core i7-12700H, NVIDIA GeForce RTX 3080 Ti Laptop GPU | Razer Blade 17 RTX 3080 Ti Intel Core i7-12800H, NVIDIA GeForce RTX 3080 Ti Laptop GPU | |
|---|---|---|---|---|---|
| Heat | 15% | -1% | 3% | 5% | |
| Maximum Upper Side * (°C) | 50 | 49.6 1% | 55 -10% | 50.6 -1% | 46 8% |
| Maximum Bottom * (°C) | 56 | 42.4 24% | 62 -11% | 59.6 -6% | 46.8 16% |
| Idle Upper Side * (°C) | 36 | 29.2 19% | 32 11% | 30 17% | 36.2 -1% |
| Idle Bottom * (°C) | 38 | 32 16% | 36 5% | 37.4 2% | 38.6 -2% |
* ... Moindre est la valeur, meilleures sont les performances
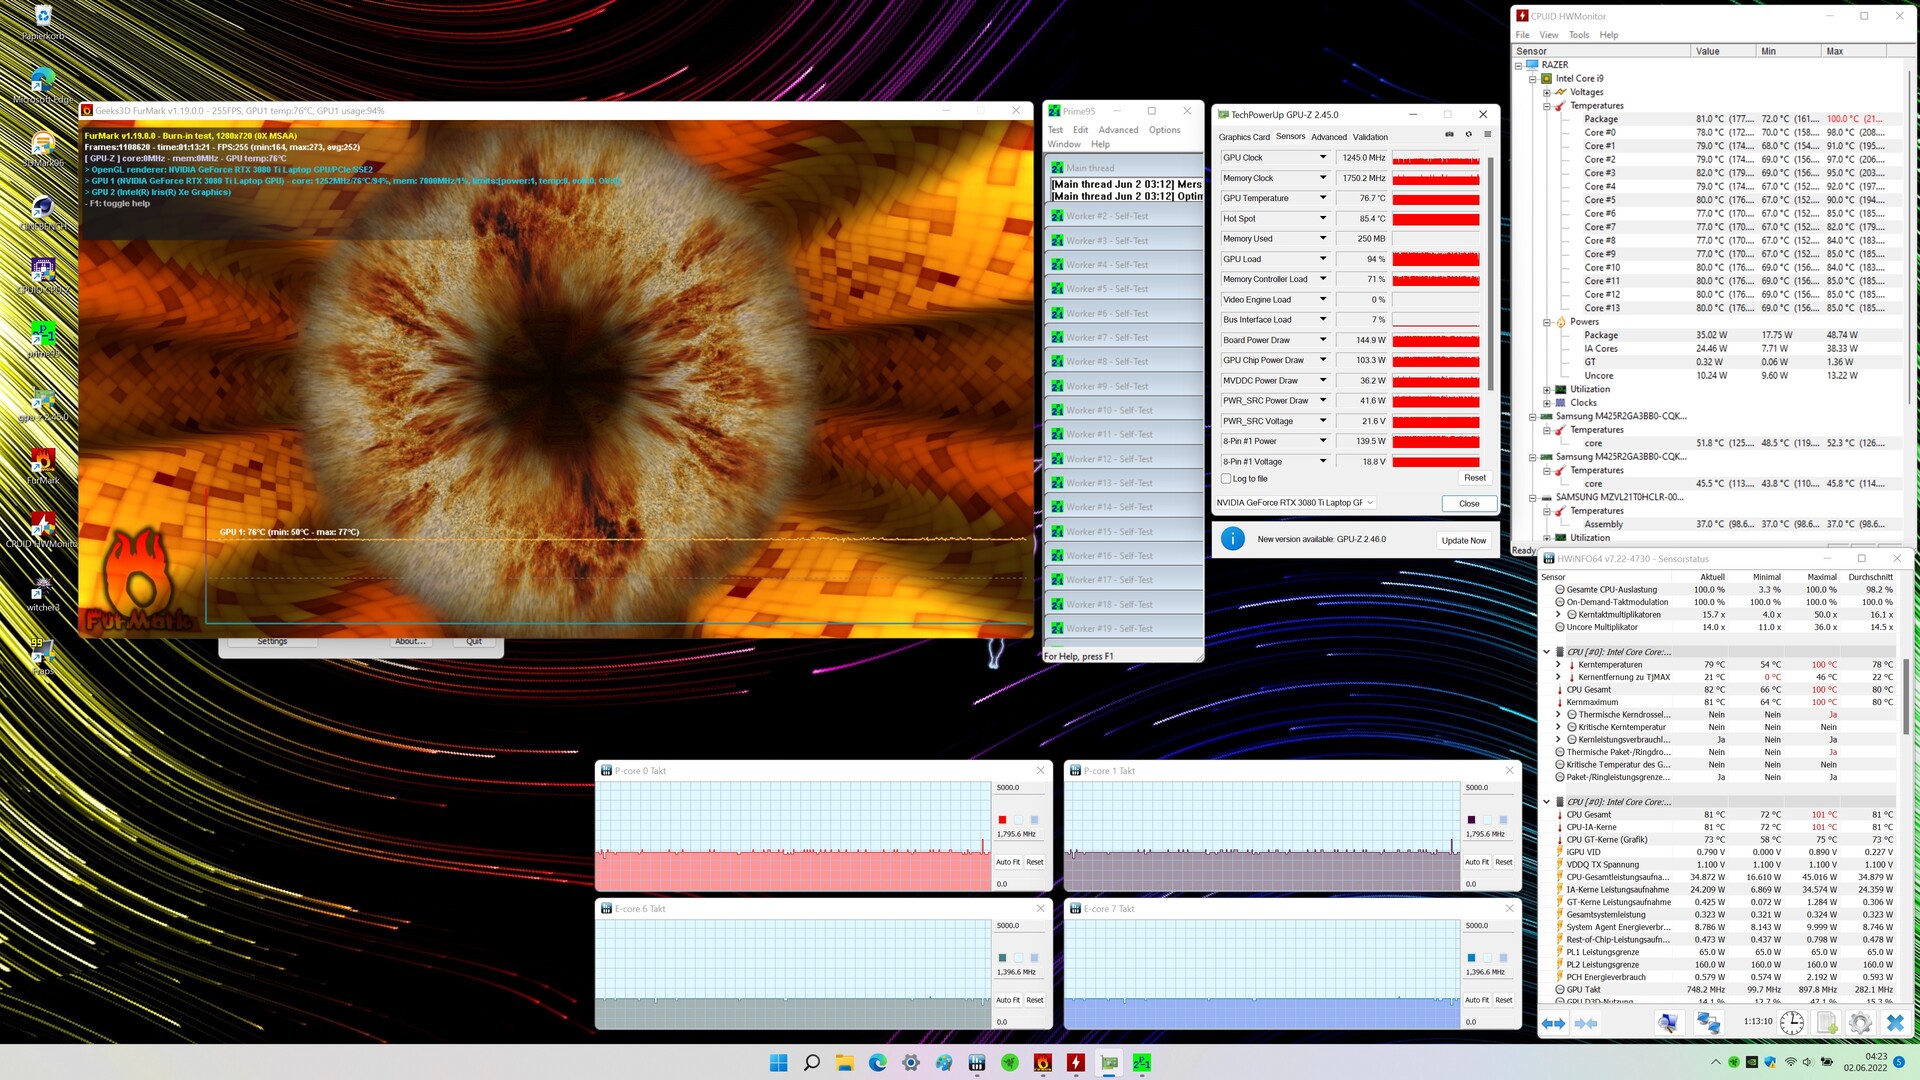
Test de stress
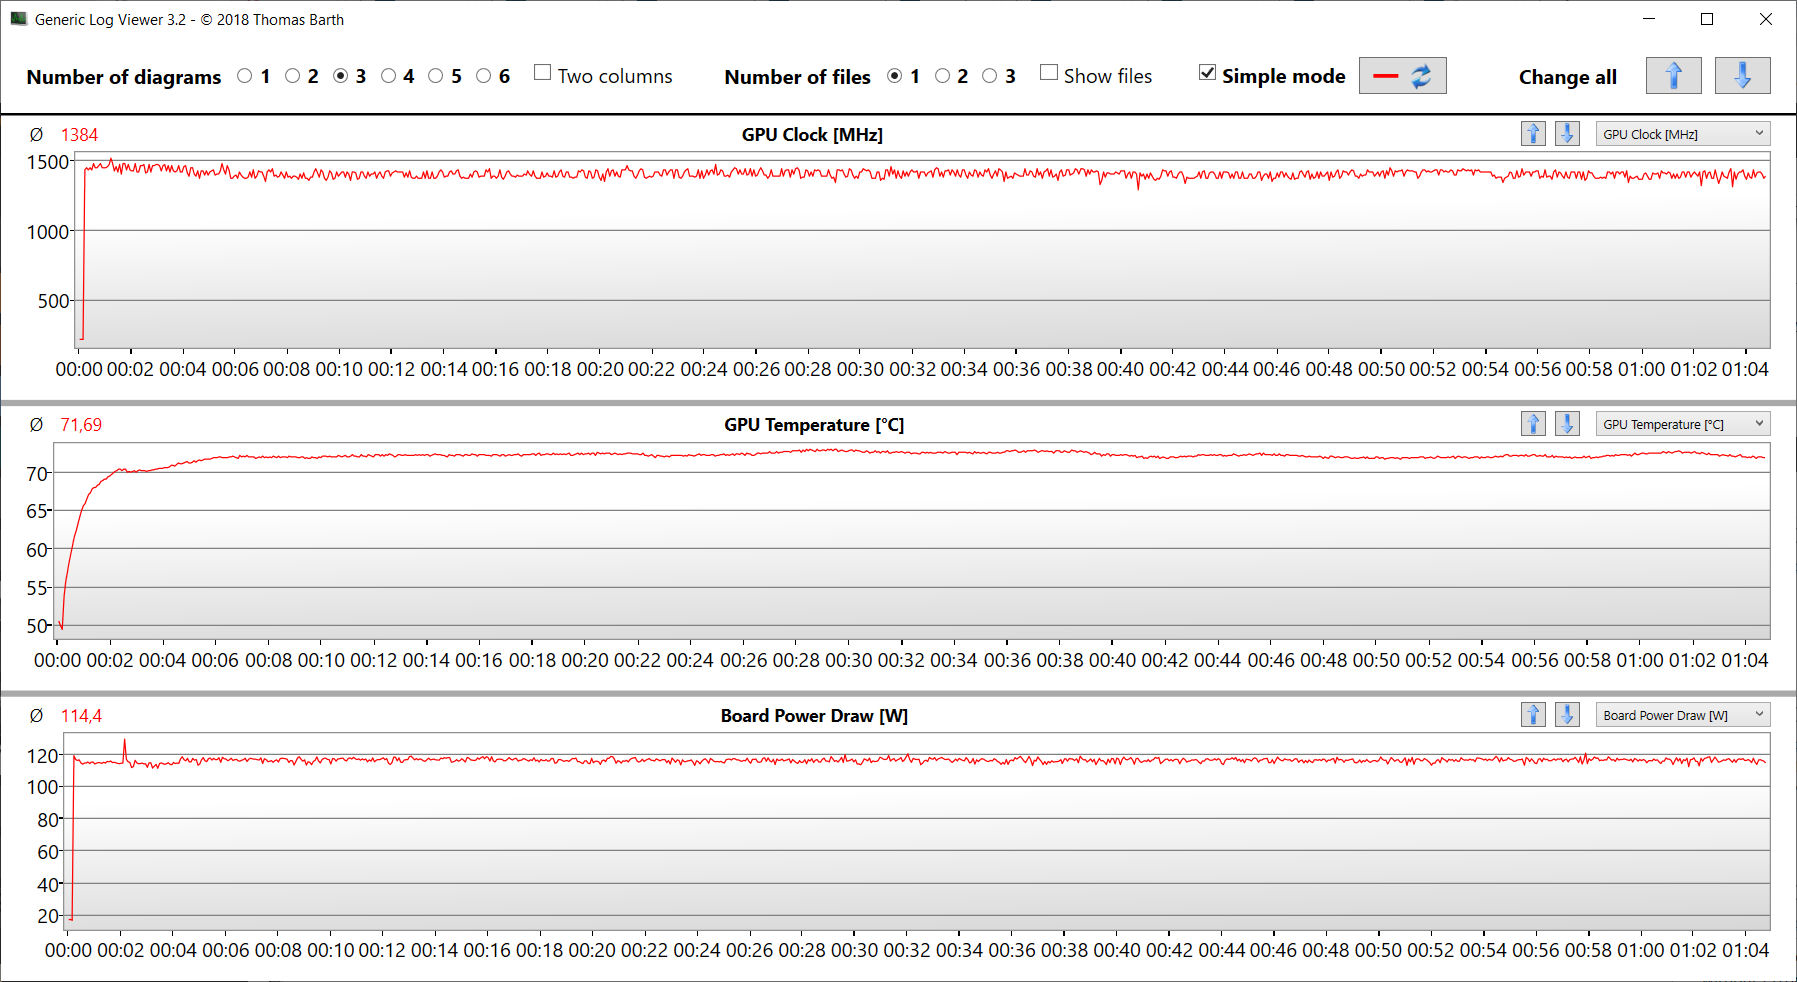
Dès le début du test de stress (avec Prime95 et Furmark en cours d'exécution pendant au moins une heure), le CPU tourne à des vitesses d'horloge basses (cœurs P : 2,1 à 2,2 GHz ; cœurs E : 1,6 à 1,7 GHz). En continuant, les valeurs tombent à 1,8 GHz pour les cœurs P et à 1,4 GHz pour les cœurs E. La vitesse d'horloge du GPU passe d'environ 1500 MHz à environ 1250 MHz. Le test de stress représente un scénario extrême, et nous l'utilisons pour évaluer si le système reste stable à pleine charge.
Haut-parleurs
Razer Blade 17 Early 2022 analyse audio
(+) | les haut-parleurs peuvent jouer relativement fort (83# dB)
Basses 100 - 315 Hz
(±) | basse réduite - en moyenne 7.4% inférieure à la médiane
(±) | la linéarité des basses est moyenne (9.7% delta à la fréquence précédente)
Médiums 400 - 2000 Hz
(+) | médiane équilibrée - seulement 3% de la médiane
(+) | les médiums sont linéaires (3.7% delta à la fréquence précédente)
Aiguës 2 - 16 kHz
(+) | des sommets équilibrés - à seulement 2.5% de la médiane
(+) | les aigus sont linéaires (6.1% delta à la fréquence précédente)
Globalement 100 - 16 000 Hz
(+) | le son global est linéaire (9.2% différence à la médiane)
Par rapport à la même classe
» 3% de tous les appareils testés de cette catégorie étaient meilleurs, 1% similaires, 96% pires
» Le meilleur avait un delta de 6%, la moyenne était de 18%, le pire était de 132%.
Par rapport à tous les appareils testés
» 3% de tous les appareils testés étaient meilleurs, 1% similaires, 96% pires
» Le meilleur avait un delta de 4%, la moyenne était de 23%, le pire était de 134%.
MSI Stealth GS77 12UHS-083US analyse audio
(+) | les haut-parleurs peuvent jouer relativement fort (84.8# dB)
Basses 100 - 315 Hz
(±) | basse réduite - en moyenne 9.4% inférieure à la médiane
(±) | la linéarité des basses est moyenne (9.8% delta à la fréquence précédente)
Médiums 400 - 2000 Hz
(±) | médiane supérieure - en moyenne 7% supérieure à la médiane
(+) | les médiums sont linéaires (4.9% delta à la fréquence précédente)
Aiguës 2 - 16 kHz
(±) | sommets plus élevés - en moyenne 5.8% plus élevés que la médiane
(±) | la linéarité des aigus est moyenne (7.9% delta à la fréquence précédente)
Globalement 100 - 16 000 Hz
(±) | la linéarité du son global est moyenne (15.9% de différence avec la médiane)
Par rapport à la même classe
» 38% de tous les appareils testés de cette catégorie étaient meilleurs, 7% similaires, 56% pires
» Le meilleur avait un delta de 6%, la moyenne était de 18%, le pire était de 132%.
Par rapport à tous les appareils testés
» 25% de tous les appareils testés étaient meilleurs, 5% similaires, 70% pires
» Le meilleur avait un delta de 4%, la moyenne était de 23%, le pire était de 134%.
Gestion de l'alimentation - L'ordinateur portable Razer offre une maigre autonomie de batterie
Consommation d'énergie
En fonctionnement à vide, la consommation d'énergie s'avère relativement élevée, jusqu'à 34 watts, et certains des concurrents sont ici plus efficaces. En charge élevée, la consommation du Blade se situe à un niveau similaire à celui des concurrents, et parfois même inférieur. Le site Alienware x17 R2 P48Ereprésente une aberration vers le haut. Bien qu'il consomme beaucoup plus d'énergie, il produit généralement les meilleurs résultats aux tests de référence. L'alimentation de 280 watts fournie est suffisamment importante.
Remarque : le modèle, le frère du
QHD, a été testé avec le préréglage CPU "Boost" et le mode dGPU activé. Cela explique sa consommation plus élevée en mode veille et sous faible charge</i>| Éteint/en veille | |
| Au repos | |
| Fortement sollicité |
|
Légende:
min: | |
| Razer Blade 17 Early 2022 i9-12900H, GeForce RTX 3080 Ti Laptop GPU, Samsung PM9A1 MZVL21T0HCLR, IPS, 3840x2160, 17.3" | Alienware x17 R2 P48E i9-12900HK, GeForce RTX 3080 Ti Laptop GPU, 2x Samsung PM9A1 1TB (RAID 0), IPS, 1920x1080, 17.3" | Medion Erazer Beast X30 i9-12900HK, GeForce RTX 3080 Ti Laptop GPU, Samsung PM9A1 MZVL21T0HCLR, IPS, 2560x1440, 17.3" | MSI Stealth GS77 12UHS-083US i7-12700H, GeForce RTX 3080 Ti Laptop GPU, Micron 3400 1TB MTFDKBA1T0TFH, IPS, 2560x1440, 17.3" | Razer Blade 17 RTX 3080 Ti i7-12800H, GeForce RTX 3080 Ti Laptop GPU, Samsung PM9A1 MZVL21T0HCLR, IPS, 2560x1440, 17.3" | Moyenne NVIDIA GeForce RTX 3080 Ti Laptop GPU | Moyenne de la classe Gaming | |
|---|---|---|---|---|---|---|---|
| Power Consumption | -32% | 13% | 9% | -41% | -2% | 14% | |
| Idle Minimum * (Watt) | 17 | 24.1 -42% | 12 29% | 20 -18% | 29.8 -75% | 17.2 ? -1% | 13 ? 24% |
| Idle Average * (Watt) | 23 | 28.5 -24% | 16 30% | 21.4 7% | 37.1 -61% | 23.3 ? -1% | 19 ? 17% |
| Idle Maximum * (Watt) | 34 | 60 -76% | 22 35% | 27 21% | 60.8 -79% | 30.8 ? 9% | 24.6 ? 28% |
| Load Average * (Watt) | 120 | 128.7 -7% | 118 2% | 100.5 16% | 135.3 -13% | 121.2 ? -1% | 110.7 ? 8% |
| Witcher 3 ultra * (Watt) | 229 | 254 -11% | 223 3% | 165 28% | 243 -6% | ||
| Load Maximum * (Watt) | 243 | 323 -33% | 290 -19% | 247.1 -2% | 273.1 -12% | 276 ? -14% | 259 ? -7% |
* ... Moindre est la valeur, meilleures sont les performances
Power Consumption The Witcher 3 / Stress Test
Power Consumption With External Monitor
Autonomie de la batterie
Dans le test WLAN (chargement de sites Web via un script) et le test vidéo (lecture du court-métrage Big Buck Bunny (codage H.264, FHD) en boucle constante), l'ordinateur portable de 17,3 pouces atteint des durées d'exécution de 3:49 h et 4:50 h respectivement. En raison de la résolution d'affichage inférieure du QHD Bladeil n'est pas surprenant qu'il puisse atteindre une plus grande autonomie en utilisant la même batterie de 82 Wh.
| Razer Blade 17 Early 2022 i9-12900H, GeForce RTX 3080 Ti Laptop GPU, 82 Wh | Alienware x17 R2 P48E i9-12900HK, GeForce RTX 3080 Ti Laptop GPU, 87 Wh | Medion Erazer Beast X30 i9-12900HK, GeForce RTX 3080 Ti Laptop GPU, 91.2 Wh | MSI Stealth GS77 12UHS-083US i7-12700H, GeForce RTX 3080 Ti Laptop GPU, 99 Wh | Razer Blade 17 RTX 3080 Ti i7-12800H, GeForce RTX 3080 Ti Laptop GPU, 82 Wh | Moyenne de la classe Gaming | |
|---|---|---|---|---|---|---|
| Autonomie de la batterie | -48% | 33% | 32% | 8% | 41% | |
| Reader / Idle (h) | 7.1 | 3.9 -45% | 7.7 8% | 10.8 52% | 8 13% | 8.27 ? 16% |
| H.264 (h) | 4.8 | 6.4 33% | 8.32 ? 73% | |||
| WiFi v1.3 (h) | 3.8 | 2 -47% | 5.7 50% | 6.2 63% | 5.5 45% | 7.11 ? 87% |
| Load (h) | 1.7 | 0.8 -53% | 2.4 41% | 1.4 -18% | 1.1 -35% | 1.502 ? -12% |
Points positifs
Points négatifs
Verdict : de nombreuses performances dans un boîtier compact
Notre configuration de test du Blade 17 vise les joueurs et les professionnels de la création. Un processeur Core i9-12900H, un GPU GeForce RTX 3080 Ti Laptop (175 watts TGP après la mise à jour du BIOS, 16 Go de VRAM) et 32 Go de mémoire de travail équipent l'ordinateur portable pour le traitement vidéo, le rendu et les jeux 4k au plus haut niveau. En outre, un SSD PCIe-4 rapide (1 To) assure des temps de chargement et de stockage courts.
Avec le Blade 17 (début 2022), Razer livre un appareil de travail réussi et puissant pour les professionnels créatifs. Mais cela a aussi son prix.
Le processeur et le GPU sont capables de fonctionner constamment à des vitesses d'horloge élevées. Comme d'habitude pour cette catégorie d'appareils, le bruit et le développement de chaleur sont à un niveau élevé. Une autonomie réaliste de 4 à 5 heures reste correcte pour un puissant ordinateur portable 4K. Le clou du spectacle est l'écran lumineux et réactif de 17,3 pouces (4K, IPS, 144 Hz) avec une reproduction précise des couleurs (DCI-P3 : 100%).
Le Blade coûte environ 4 650 euros (~4847 $), soit environ 400 euros (~417 $) de plus que le modèle QHD Modèle QHD. Le jeu en vaut-il la chandelle ? Le Core i9 ne délivre pratiquement aucune puissance supplémentaire par rapport au Core i7 du modèle frère, notamment en charge constante. Et le frère et la sœur offrent une meilleure autonomie. Un autre point pour le modèle QHD que nous avons testé précédemment est le support d'Advanced Optimus. Le 4k Blade ne l'offre pas.
L'écran 4K offre une luminosité nettement supérieure et des temps de réponse plus courts que la dalle QHD. Si en plus de la résolution supérieure, ces critères ne sont pas déterminants, vous pouvez sans crainte choisir un Blade QHD. Les panneaux QHD et 4K sont aussi bons l'un que l'autre en termes de reproduction des couleurs et de couverture de l'espace colorimétrique.
Comme alternative au Blade 17, vous pouvez également vous procurer le Medion Erazer Beast X30. Il a presque les mêmes dimensions mais apporte moins de poids à la balance. En termes de performances graphiques, il reste légèrement en retrait par rapport au portable de Razer.
Prix et disponibilité
Le Razer Blade 17 dans une configuration similaire (Core i9-12900H, GeForce RTX 3080 Ti Laptop, 32 GB RAM, 1 TB SSD, 4k display) est disponible pour $4,300 chez Amazonet également auprès de Razer directement pour le même prix.
Razer Blade 17 Early 2022
- 07/05/2022 v7 (old)
Sascha Mölck
Price comparison

