Critiques du Intel Core i9-12900H processeur
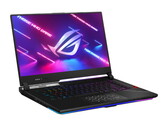
Test de l'Asus ROG Strix Scar 15 G533zm : PC portable de jeu RTX 3060 moderne aux nombreuses qualités
Après avoir testé le Scar 15 G533zw avec une RTX 3070 Ti, nous venons de mettre la main sur le G533zm avec une RTX 3060. L'ordinateur portable Scar est personnalisable et offre de nombreuses fonctionnalités modernes, telles que le Wi-Fi 6E, la RAM DDR5 et le Thunderbolt 4. Dans notre test, nous verrons si ces fonctionnalités sont suffisantes pour justifier le prix assez élevé de 1 999 € (2 166 $) pour un ordinateur portable de jeu RTX 3060.
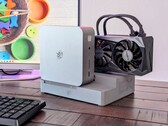
Intel Core i9-12900H, NVIDIA GeForce RTX 3060 Laptop GPU, 15.6", 2.3 kgTest du Beelink GTI12 Ultra EX Docking Station : plus abordable que prévu
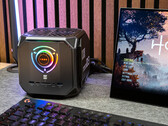
Les stations d'accueil pour mini PC eGPU étaient à la fois rares et coûteuses il y a quelques années, mais la station d'accueil Beelink EX est l'une des options les moins chères à ce jour, sans avoir à sacrifier les fonctionnalités ou la qualité en cours de route.
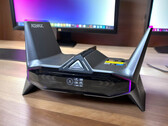
Intel Core i9-12900H, NVIDIA GeForce RTX 3070, 1.3 kgTest de l'Acemagic M2A Starship : PC de jeu-vaisseau spatial avec i9-12900H et RTX 3080
Avec le M2A Starship, Acemagic dispose d'un PC de jeu très accrocheur dans son portefeuille. Le design inhabituel du mini-PC, semblable à celui d'un vaisseau spatial, attire l'attention, mais le matériel déjà utilisé dans le Acemagic Tank03 est familier. Dans cet article, nous avons analysé les performances pratiques de l'Intel Core i9-12900H et du GPU pour ordinateur portable NvidiaGeForce-RTX-3080 dans ce boîtier unique.
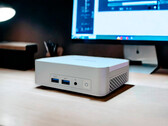
Intel Core i9-12900H, NVIDIA GeForce RTX 3080 Laptop GPU, 2.1 kgTest du Geekom XT12 Pro : alternative élégante au NUC avec i9-12900H, RAM DDR4 32 Go, SSD 1 To
Geekom vous présentait il y a quelques jours le XT12 Pro comme un mini-PC NUC puissant et performant. Cependant, basé sur un Intel Core i9-12900H, vous devez vous contenter d'un processeur un peu plus ancien. A l'aide de nombreuses mesures et benchmarks, nous avons analysé si Geekom peut tenir sa promesse d'efficacité et comment le XT12 Pro se comporte par rapport à la concurrence.
Intel Core i9-12900H, Iris Xe G7 96EUs, 545 gTest de l'Acemagic Tank 03 : le mini PC de jeu Core i9-12900H et RTX 3080 gère les jeux actuels
Avec le Tank 03, Acemagic propose un mini-PC très spécial dans son portefeuille qui se distingue par des performances énormes dans un espace très réduit. C'est du moins ce que promettent les spécifications techniques. Découvrez dans cet article ce que l'Intel Core i9-12900H associé au GPU Nvidia GeForce RTX-3080 Laptop peut faire dans la pratique. La particularité de ce mini PC est qu'il offre trois profils de performances différents que nous examinons également en détail.
Intel Core i9-12900H, NVIDIA GeForce RTX 3080 Laptop GPU, 2.2 kgAcemagic Tank03: NVIDIA GeForce RTX 3080 Laptop GPU
Critique » Test de l'Acemagic Tank 03 : le mini PC de jeu Core i9-12900H et RTX 3080 gère les jeux actuels
Critique » Test de l'Acemagic Tank 03 : le mini PC de jeu Core i9-12900H et RTX 3080 gère les jeux actuels
Razer Blade 15 OLED (Early 2022): NVIDIA GeForce RTX 3070 Ti Laptop GPU, 15.60", 2 kg
Critique » Test du Razer Blade 15 OLED (début 2022) : PC portable de jeu compact avec RTX 3070 Ti
Asus ProArt StudioBook 16 H7600ZW: NVIDIA GeForce RTX 3070 Ti Laptop GPU, 16.00", 2.4 kg
Critique » Test de l'Asus ProArt StudioBook 16 H7600ZW : l'alternative au MacBook Pro pour les créatifs
Asus ROG Zephyrus M16 GU603Z: NVIDIA GeForce RTX 3070 Ti Laptop GPU, 16.00", 2.1 kg
Critique » Test de l'Asus ROG Zephyrus M16 : un ordinateur portable de jeu bien équilibré
Minisforum Neptune Series NAD9: Intel Iris Xe Graphics G7 96EUs, 1.2 kg
Critique » Test du Minisforum Neptune Series NAD9 : PC de bureau compact avec Intel Core i9-12900H
Asus ZenBook Pro 16X OLED UX7602ZM-ME115W: NVIDIA GeForce RTX 3060 Laptop GPU, 16.00", 2.4 kg
Critique » Test de l'Asus Zenbook Pro 16X OLED : un PC portable extrême avec une astuce spéciale
Acer Predator Triton 300 SE: NVIDIA GeForce RTX 3060 Laptop GPU, 14.00", 1.7 kg
Critique » Test de l'Acer Predator Triton 300 SE PT314 : 14 pouces avec refroidissement par métal liquide
Uniwell Technology GM7AG8N Liquid Cooling Box: NVIDIA GeForce RTX 3080 Ti Laptop GPU, 17.00", 2.7 kg
Critique » Test de l'Uniwell Technology GM7AG8N : boîtier de refroidissement liquide plus silencieux que prévu
Alienware x15 R2 P111F: NVIDIA GeForce RTX 3080 Ti Laptop GPU, 15.60", 2.4 kg
Critique » Test de l'Alienware x15 R2 : l'ultrabook ovni s'envole avec Core i9-12900H et RTX 3080 Ti 140 W
MSI Creator Z17 A12UGST-054: NVIDIA GeForce RTX 3070 Ti Laptop GPU, 17.00", 2.5 kg
Critique » Test du MSI Creator Z17 : que peuvent obtenir les créatifs et les joueurs pour 4 000 € ?
Dell Precision 5000 5470: NVIDIA RTX A1000 Laptop GPU, 14.00", 1.6 kg
Critique » Test du Dell Precision 5470 : les débuts de la Nvidia RTX A1000
Schenker XMG Pro 17 E22: NVIDIA GeForce RTX 3080 Ti Laptop GPU, 17.30", 2.8 kg
Critique » Test du Schenker XMG Pro 17 E22 : le PC portable de jeu avec RTX 3080 Ti est à la hauteur
Razer Blade 17 Early 2022: NVIDIA GeForce RTX 3080 Ti Laptop GPU, 17.30", 2.8 kg
Critique » Test du Razer Blade 17 (début 2022) : portable de jeu 4k élégant avec un écran lumineux
MSI Creator Z16P B12UHST: NVIDIA GeForce RTX 3080 Ti Laptop GPU, 16.00", 2.4 kg
Critique » Test du MSI Creator Z16P : Travail créatif avec un i9 et la RTX 3080 Ti
Asus ROG Strix Scar 15 G533ZW-LN106WS: NVIDIA GeForce RTX 3070 Ti Laptop GPU, 15.60", 2.3 kg
Critique » Test de l'Asus ROG Strix Scar 15 G533ZW : 1440p 240 Hz, Core i9 Alder Lake, RTX 3070 Ti 150 W
MSI Pulse GL66 12UEK: NVIDIA GeForce RTX 3060 Laptop GPU, 15.60", 2.3 kg
Critique » Test du MSI Pulse GL66 : hausse des performances ou seulement du prix grâce au i9-12900H ?
MSI Vector GP66 12UGS: NVIDIA GeForce RTX 3070 Ti Laptop GPU, 15.60", 2.3 kg
Critique » Test de l'ordinateur portable MSI Vector GP66 12UGS : 150 W TGP GeForce RTX 3070 Ti sweet spot
Asus ROG Flow Z13 GZ301ZE: NVIDIA GeForce RTX 3050 Ti Laptop GPU, 13.40", 1.2 kg
Critique » Test de l'Asus ROG Flow Z13 : tablette de jeu avec un puissant processeur Alder Lake i9
Schenker Uniwill Technology GM7AG8P: NVIDIA GeForce RTX 3080 Ti Laptop GPU, 17.30", 2.3 kg
Critique » Test de l'Uniwill Technology GM7AG8P : les débuts de l'Intel Core i9-12900H
Acer Nitro 5 AN515-58, i9-12900H RTX 4060: NVIDIA GeForce RTX 4060 Laptop GPU, 15.60", 2.6 kg
Autres tests » Acer Nitro 5 AN515-58, i9-12900H RTX 4060
Acer Nitro 5 AN517-55-96S6: NVIDIA GeForce RTX 4060 Laptop GPU, 17.30", 3 kg
Autres tests » Acer Nitro 5 AN517-55-96S6
Asus ZenBook Pro 16X OLED UX7602ZM-ME115W: NVIDIA GeForce RTX 3060 Laptop GPU, 16.00", 2.4 kg
Autres tests » Asus ZenBook Pro 16X OLED UX7602ZM-ME115W
MSI Crosshair 15 B12UEZ, i9-12900H: NVIDIA GeForce RTX 3060 Laptop GPU, 15.60", 2.3 kg
Autres tests » MSI Crosshair 15 B12UEZ, i9-12900H
Acer Predator Helios 300 PH315-55-98R7: NVIDIA GeForce RTX 3070 Ti Laptop GPU, 15.60", 2.6 kg
Autres tests » Acer Predator Helios 300 PH315-55-98R7
Razer Blade 15 OLED (Early 2022): NVIDIA GeForce RTX 3070 Ti Laptop GPU, 15.60", 2 kg
Autres tests » Razer Blade 15 OLED (Early 2022)
Alienware x15 R2 P111F: NVIDIA GeForce RTX 3080 Ti Laptop GPU, 15.60", 2.4 kg
Autres tests » Alienware x15 R2 P111F
HP ZBook Studio 16 G9, i9-12900H RTX 3080 Ti: NVIDIA GeForce RTX 3080 Ti Laptop GPU, 16.00", 1.7 kg
Autres tests » HP ZBook Studio 16 G9, i9-12900H RTX 3080 Ti
HP Omen 16-k0097ng: NVIDIA GeForce RTX 3070 Ti Laptop GPU, 16.10", 2.4 kg
Autres tests » HP Omen 16-k0097ng
Acer Predator Helios 300 PH315-55s-98TX: NVIDIA GeForce RTX 3080 Laptop GPU, 15.60", 2.6 kg
Autres tests » Acer Predator Helios 300 PH315-55s-98TX
Acer Predator Helios 300 PH317-56-94RD: NVIDIA GeForce RTX 3080 Laptop GPU, 17.30", 3 kg
Autres tests » Acer Predator Helios 300 PH317-56-94RD
Asus ROG Strix SCAR 15 G533ZX-LN060W: NVIDIA GeForce RTX 3080 Ti Laptop GPU, 15.60", 2.4 kg
Autres tests » Asus ROG Strix SCAR 15 G533ZX-LN060W
HP ZBook Studio 16 G9 62U30EA: NVIDIA RTX A3000 Laptop GPU, 16.00", 1.7 kg
Autres tests » HP ZBook Studio 16 G9 62U30EA
Asus ProArt StudioBook 16 H7600ZM-L2038X: NVIDIA GeForce RTX 3060 Laptop GPU, 16.00", 2.4 kg
Autres tests » Asus ProArt StudioBook 16 H7600ZM-L2038X
Lenovo Legion 5 Pro 16IAH7H, i9-12900H RTX 3070 Ti: NVIDIA GeForce RTX 3070 Ti Laptop GPU, 16.00", 2.5 kg
Autres tests » Lenovo Legion 5 Pro 16IAH7H, i9-12900H RTX 3070 Ti
Razer Blade 15 2022 RZ09-0421NGG3-R3G1: NVIDIA GeForce RTX 3070 Ti Laptop GPU, 15.60", 2 kg
Autres tests » Razer Blade 15 2022 RZ09-0421NGG3-R3G1
Acer Predator Helios 300 PH315-55-902L: NVIDIA GeForce RTX 3070 Ti Laptop GPU, 15.60", 2.6 kg
Autres tests » Acer Predator Helios 300 PH315-55-902L
HP Envy 16-h0795ng: NVIDIA GeForce RTX 3060 Laptop GPU, 16.00", 2.7 kg
Autres tests » HP Envy 16-h0795ng
Dell Precision 5000 5470: NVIDIA RTX A1000 Laptop GPU, 14.00", 1.6 kg
Autres tests » Dell Precision 5000 5470
MSI Pulse GL76 12UGK-091UK: NVIDIA GeForce RTX 3070 Laptop GPU, 17.30", 2.6 kg
Autres tests » MSI Pulse GL76 12UGK-091UK
Acer Predator Triton 300SE PT314-52s-99PC: NVIDIA GeForce RTX 3060 Laptop GPU, 14.00", 1.7 kg
Autres tests » Acer Predator Triton 300SE PT314-52s-99PC
MSI Creator Pro Z17 A12UMST: NVIDIA RTX A5500 Laptop GPU, 17.00", 2.5 kg
Autres tests » MSI Creator Pro Z17 A12UMST
MSI Creator Z16P B12UGST: NVIDIA GeForce RTX 3070 Ti Laptop GPU, 16.00", 2.4 kg
Autres tests » MSI Creator Z16P B12UGST
Dell XPS 15 9520, i9-12900H 3050 Ti: NVIDIA GeForce RTX 3050 Ti Laptop GPU, 15.60", 1.9 kg
Autres tests » Dell XPS 15 9520, i9-12900H 3050 Ti
Dell Precision 15 3571, 12900H RTX A1000: NVIDIA RTX A1000 Laptop GPU, 15.60", 1.8 kg
Autres tests » Dell Precision 15 3571, 12900H RTX A1000
MSI Pulse GL66 12UEK: NVIDIA GeForce RTX 3060 Laptop GPU, 15.60", 2.3 kg
Autres tests » MSI Pulse GL66 12UEK
MSI Stealth GS66 12UGS-025: NVIDIA GeForce RTX 3070 Ti Laptop GPU, 15.60", 2.1 kg
Autres tests » MSI Stealth GS66 12UGS-025
Origin PC EVO17-S 2022, i9 3080 Ti: NVIDIA GeForce RTX 3080 Ti Laptop GPU, 17.30", 2.7 kg
Autres tests » Origin PC EVO17-S 2022, i9 3080 Ti
MSI Creator Z17 A12UHST-052: NVIDIA GeForce RTX 3080 Ti Laptop GPU, 17.30", 2.5 kg
Autres tests » MSI Creator Z17 A12UHST-052
Asus Zenbook Pro 14 Duo UX8402ZE-M3030W: NVIDIA GeForce RTX 3050 Ti Laptop GPU, 14.50", 1.8 kg
Autres tests » Asus Zenbook Pro Duo 14 UX8402ZE-M3030W
Asus Zenbook Pro 16X UX7602ZM-ME023W: NVIDIA GeForce RTX 3060 Laptop GPU, 16.00", 2.4 kg
Autres tests » Asus Zenbook Pro 16X UX7602ZM-ME023W
Asus ROG Strix G17 G733ZM-LL034W: NVIDIA GeForce RTX 3060 Laptop GPU, 17.30", 2.9 kg
Autres tests » Asus ROG Strix G17 G733ZM-LL034W
Asus ZenBook 14X UX5401ZA-L7078W: Intel Iris Xe Graphics G7 96EUs, 14.00", 1.4 kg
Autres tests » Asus ZenBook 14X UX5401ZA-L7078W
Asus ROG Strix Scar 15 G533ZW-AS94: NVIDIA GeForce RTX 3070 Ti Laptop GPU, 15.60", 2.4 kg
Autres tests » Asus ROG Strix Scar 15 G533ZW-AS94
Acer Predator Triton 500SE PT516-52s-98LC: NVIDIA GeForce RTX 3080 Ti Laptop GPU, 16.00", 2.4 kg
Autres tests » Acer Predator Triton 500SE PT516-52s-98LC
Razer Blade 17 Early 2022: NVIDIA GeForce RTX 3080 Ti Laptop GPU, 17.30", 2.8 kg
Autres tests » Razer Blade 17 Early 2022
Asus ROG Zephyrus M16 GU603ZX-K8001W: NVIDIA GeForce RTX 3080 Ti Laptop GPU, 16.00", 1.9 kg
Autres tests » Asus ROG Zephyrus M16 GU603ZX-K8001W
MSI Stealth GS66 12UHS-091: NVIDIA GeForce RTX 3080 Ti Laptop GPU, 15.60", 2.1 kg
Autres tests » MSI Stealth GS66 12UHS-091
MSI Creator Z16P B12UHST-046: NVIDIA GeForce RTX 3080 Ti Laptop GPU, 16.00", 2.3 kg
Autres tests » MSI Creator Z16P B12UHST-046
Asus ROG Zephyrus M16 GU603ZW-K8062W: NVIDIA GeForce RTX 3070 Ti Laptop GPU, 16.00", 1.9 kg
Autres tests » Asus ROG Zephyrus M16 GU603ZW-K8062W
Asus ROG Strix G17 G733ZX-LL009W: NVIDIA GeForce RTX 3080 Ti Laptop GPU, 17.30", 2.9 kg
Autres tests » Asus ROG Strix G17 G733ZX-LL009W
Asus ROG Strix Scar 15 G533zm: NVIDIA GeForce RTX 3060 Laptop GPU, 15.60", 2.3 kg
Autres tests » Asus ROG Strix Scar 15 G533zm
Asus ROG Strix Scar 15 G533ZW-LN106WS: NVIDIA GeForce RTX 3070 Ti Laptop GPU, 15.60", 2.3 kg
Autres tests » Asus ROG Strix Scar 15 G533ZW-LN106WS
Asus ROG Strix Scar 15 G533ZW-LN017W: NVIDIA GeForce RTX 3070 Ti Laptop GPU, 15.60", 2.4 kg
Autres tests » Asus ROG Strix Scar 15 G533ZW-LN017W
Asus ROG Strix Scar 15 G533ZX-XS96: NVIDIA GeForce RTX 3080 Ti Laptop GPU, 15.60", 2.4 kg
Autres tests » Asus ROG Strix Scar 15 G533ZX-XS96
Asus ROG Strix G17 G733ZW-LL103W: NVIDIA GeForce RTX 3070 Ti Laptop GPU, 17.30", 2.9 kg
Autres tests » Asus ROG Strix G17 G733ZW-LL103W
MSI Stealth GS77 12UHS-063: NVIDIA GeForce RTX 3080 Ti Laptop GPU, 17.30", 2.8 kg
Autres tests » MSI Stealth GS77 12UHS-063
Asus ROG Flow Z13 GZ301ZE: NVIDIA GeForce RTX 3050 Ti Laptop GPU, 13.40", 1.2 kg
Autres tests » Asus ROG Flow Z13 GZ301ZE
Acemagic M2A: NVIDIA GeForce RTX 3080 Laptop GPU, 2.1 kg
» Anniversaire d'Acemagic 2026 : Grande campagne de réduction sur les mini-PC, les ordinateurs portables et les systèmes NAS
Acemagic Tank03: NVIDIA GeForce RTX 3080 Laptop GPU, 2.2 kg
» Anniversaire d'Acemagic 2026 : Grande campagne de réduction sur les mini-PC, les ordinateurs portables et les systèmes NAS
Beelink GTI12 Ultra EX Docking Station: NVIDIA GeForce RTX 3070, 1.3 kg
» La station d'accueil eGPU Beelink pour mini PC avec connecteur PCIe de taille normale devient open-source
MSI Vector GP66 12UGS: NVIDIA GeForce RTX 3070 Ti Laptop GPU, 15.60", 2.3 kg
» MSI GP66 Leopard vs. Vector GP66 : Quelle est la différence ?
Schenker Uniwill Technology GM7AG8P: NVIDIA GeForce RTX 3080 Ti Laptop GPU, 17.30", 2.3 kg
» 27 PC AMD Ryzen 9 5900HX contre le Core i9-12900H : Intel arrive en tête, mais il y a un hic