Test du Razer Blade 17 2022 Core i7 RTX 3080 Ti : surpuissant
Chaque fois qu'une nouvelle génération de processeurs d'Intel ou de Nvidia est disponible, vous pouvez compter sur Razer pour mettre à jour sa série de Blade avec les dernières options de CPU ou de GPU. Le Blade 17 2022 est une mise à jour interne du Blade 17 2021 avec des CPU Intel Alder Lake-H de 12e génération et des GPU GeForce RTX 3070 Ti et 3080 Ti remplaçant les options de 11e génération Tiger Lake-H et RTX 3070 et 3080 d'antan. Comme nous l'avons détaillé dans notre aperçu d'Alder Lakeles nouveaux processeurs de 12e génération introduisent des processeurs P performants et des processeurs E efficaces, tandis que la série mobile GeForce Ti est destinée à tirer davantage de performances du même chipset Ampere de Nvidia
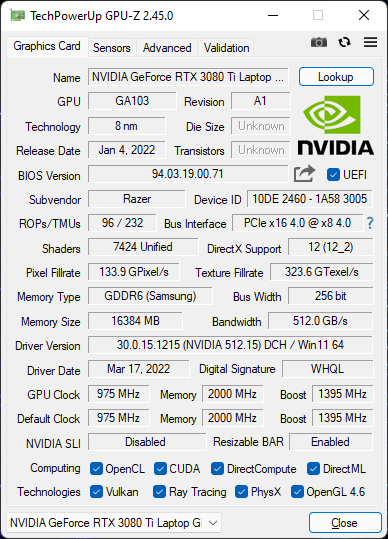
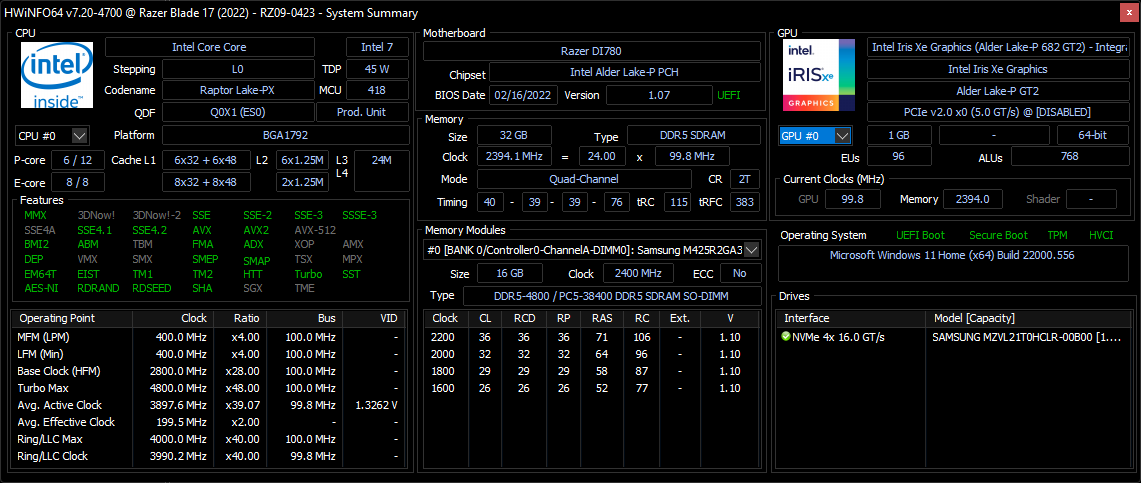
L'unité Blade 17 que nous avons examinée est une configuration haut de gamme avec le Core i7-12800H, le GPU RTX 3080 Ti et un écran QHD 240 Hz pour environ 4 000 USD. D'autres SKU sont disponibles avec les GPU RTX 3060 ou RTX 3070 Ti, des écrans FHD ou UHD, ou le CPU Core i9-12900H à différents prix de départ. Contrairement au GPU de 100 W du Blade 17 Intel de 10e génération ou du GPU de 130 W du Blade 17 de 11e génération, le GPU de ce Blade 17 de 12e génération vise un TGP encore plus élevé de 165 W pour des performances potentiellement plus élevées
Les alternatives au Blade 17 incluent d'autres ordinateurs portables de jeu ultra-minces comme le MSI GS76 ou GS77 de MSI, L'Asus Zephyrus S17, Aorus 17G, Alienware x17ou Maingear Vector Pro
Plus de commentaires sur Razer
Comparaison avec les concurrents potentiels
Note | Date | Modèle | Poids | Épaisseur | Taille | Résolution | Prix |
|---|---|---|---|---|---|---|---|
| 91.2 % v7 (old) | 03/22 | Razer Blade 17 RTX 3080 Ti i7-12800H, GeForce RTX 3080 Ti Laptop GPU | 2.7 kg | 19.9 mm | 17.30" | 2560x1440 | |
| 87.8 % v7 (old) | 02/21 | Razer Blade Pro 17 2021 (QHD Touch) i7-10875H, GeForce RTX 3080 Laptop GPU | 3 kg | 19.9 mm | 17.30" | 3840x2160 | |
| 86.2 % v7 (old) | 09/21 | MSI GS76 Stealth 11UH i9-11900H, GeForce RTX 3080 Laptop GPU | 2.4 kg | 20 mm | 17.30" | 3840x2160 | |
| 90.1 % v7 (old) | 07/21 | Asus ROG Zephyrus S17 GX703HSD i9-11900H, GeForce RTX 3080 Laptop GPU | 2.8 kg | 19.9 mm | 17.30" | 2560x1440 | |
| 86 % v7 (old) | 06/21 | Aorus 17G YD i7-11800H, GeForce RTX 3080 Laptop GPU | 2.8 kg | 26 mm | 17.30" | 1920x1080 | |
| 89 % v7 (old) | 09/21 | Alienware x17 RTX 3080 P48E i7-11800H, GeForce RTX 3080 Laptop GPU | 3.2 kg | 21.4 mm | 17.30" | 3840x2160 |
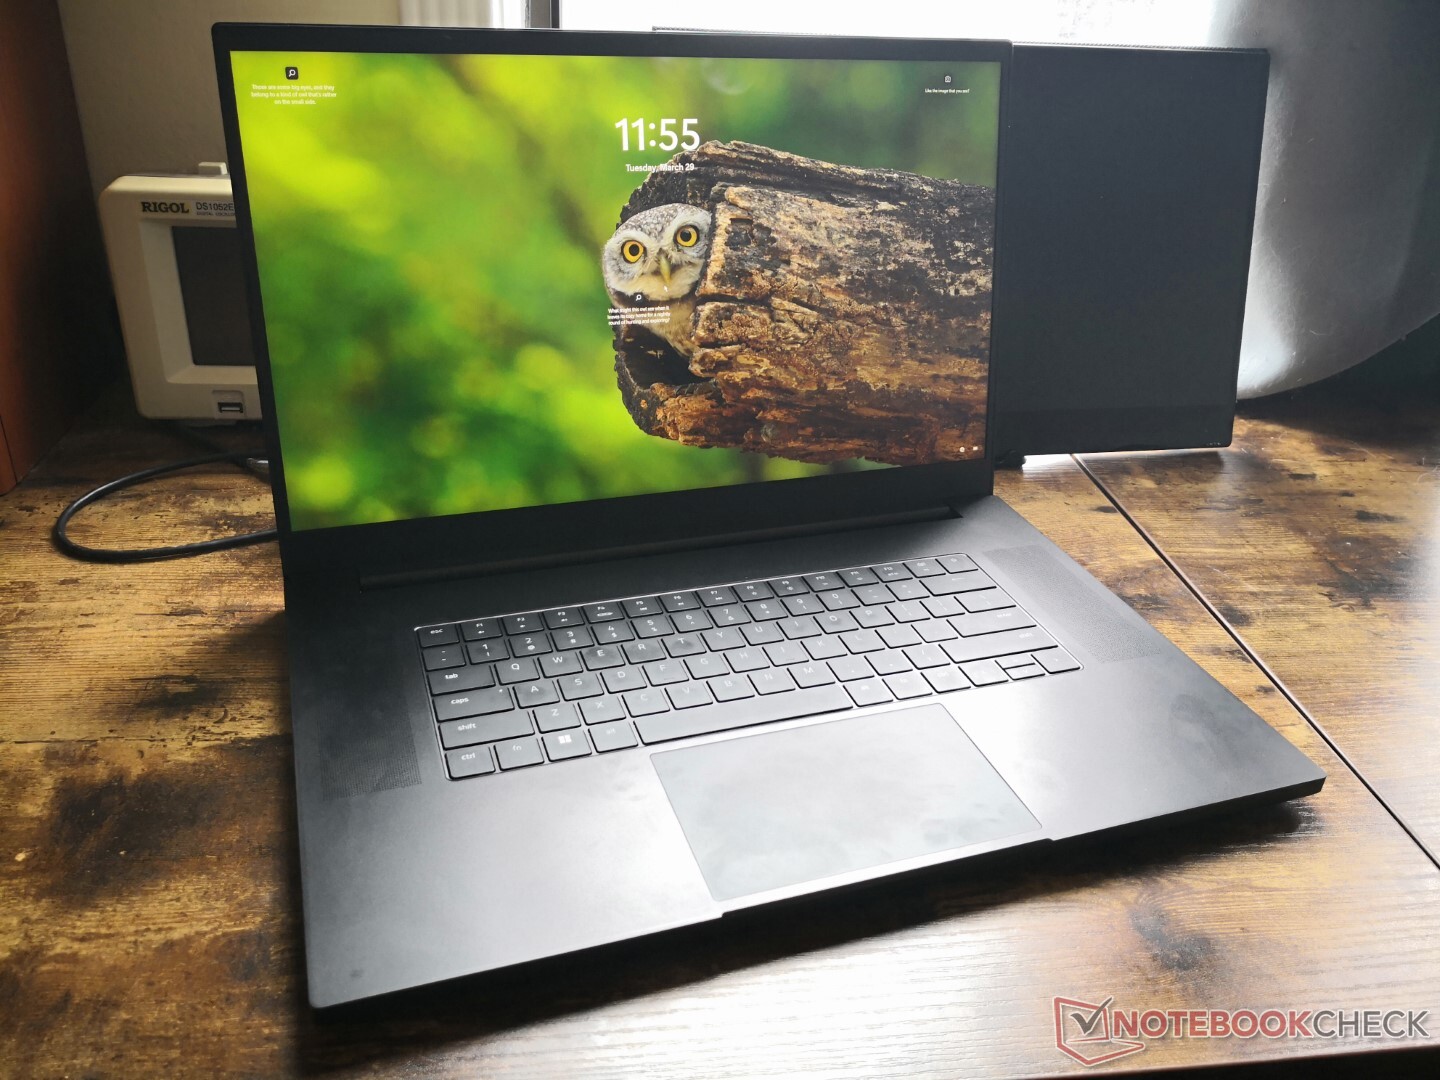
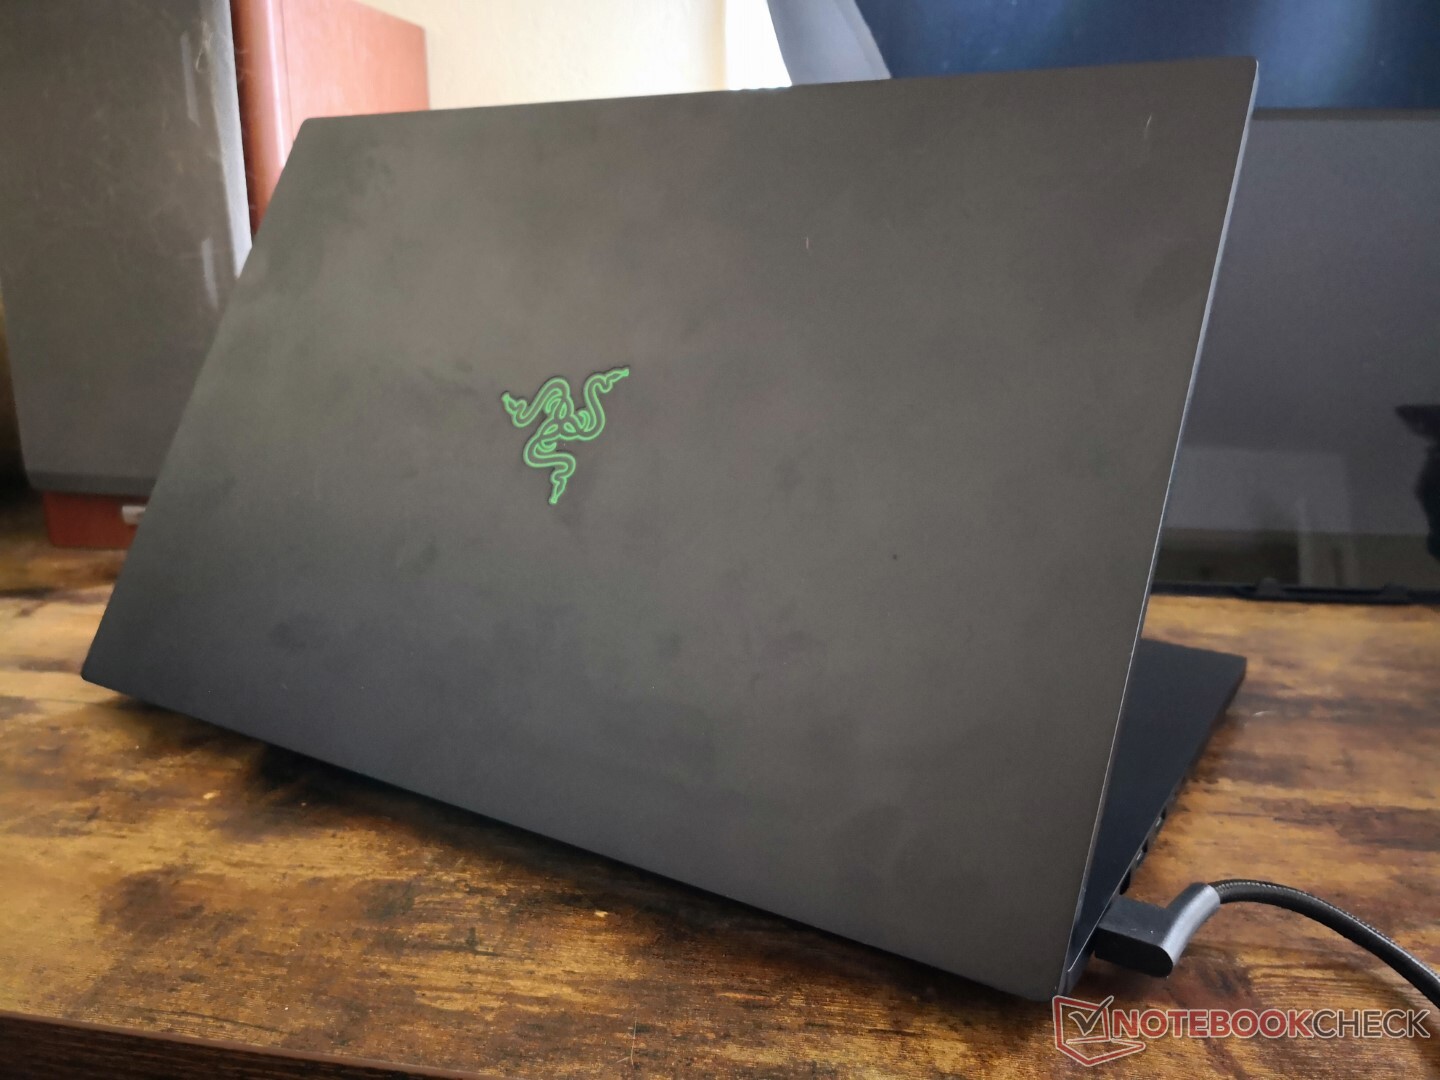
Cas - Même, mais différent
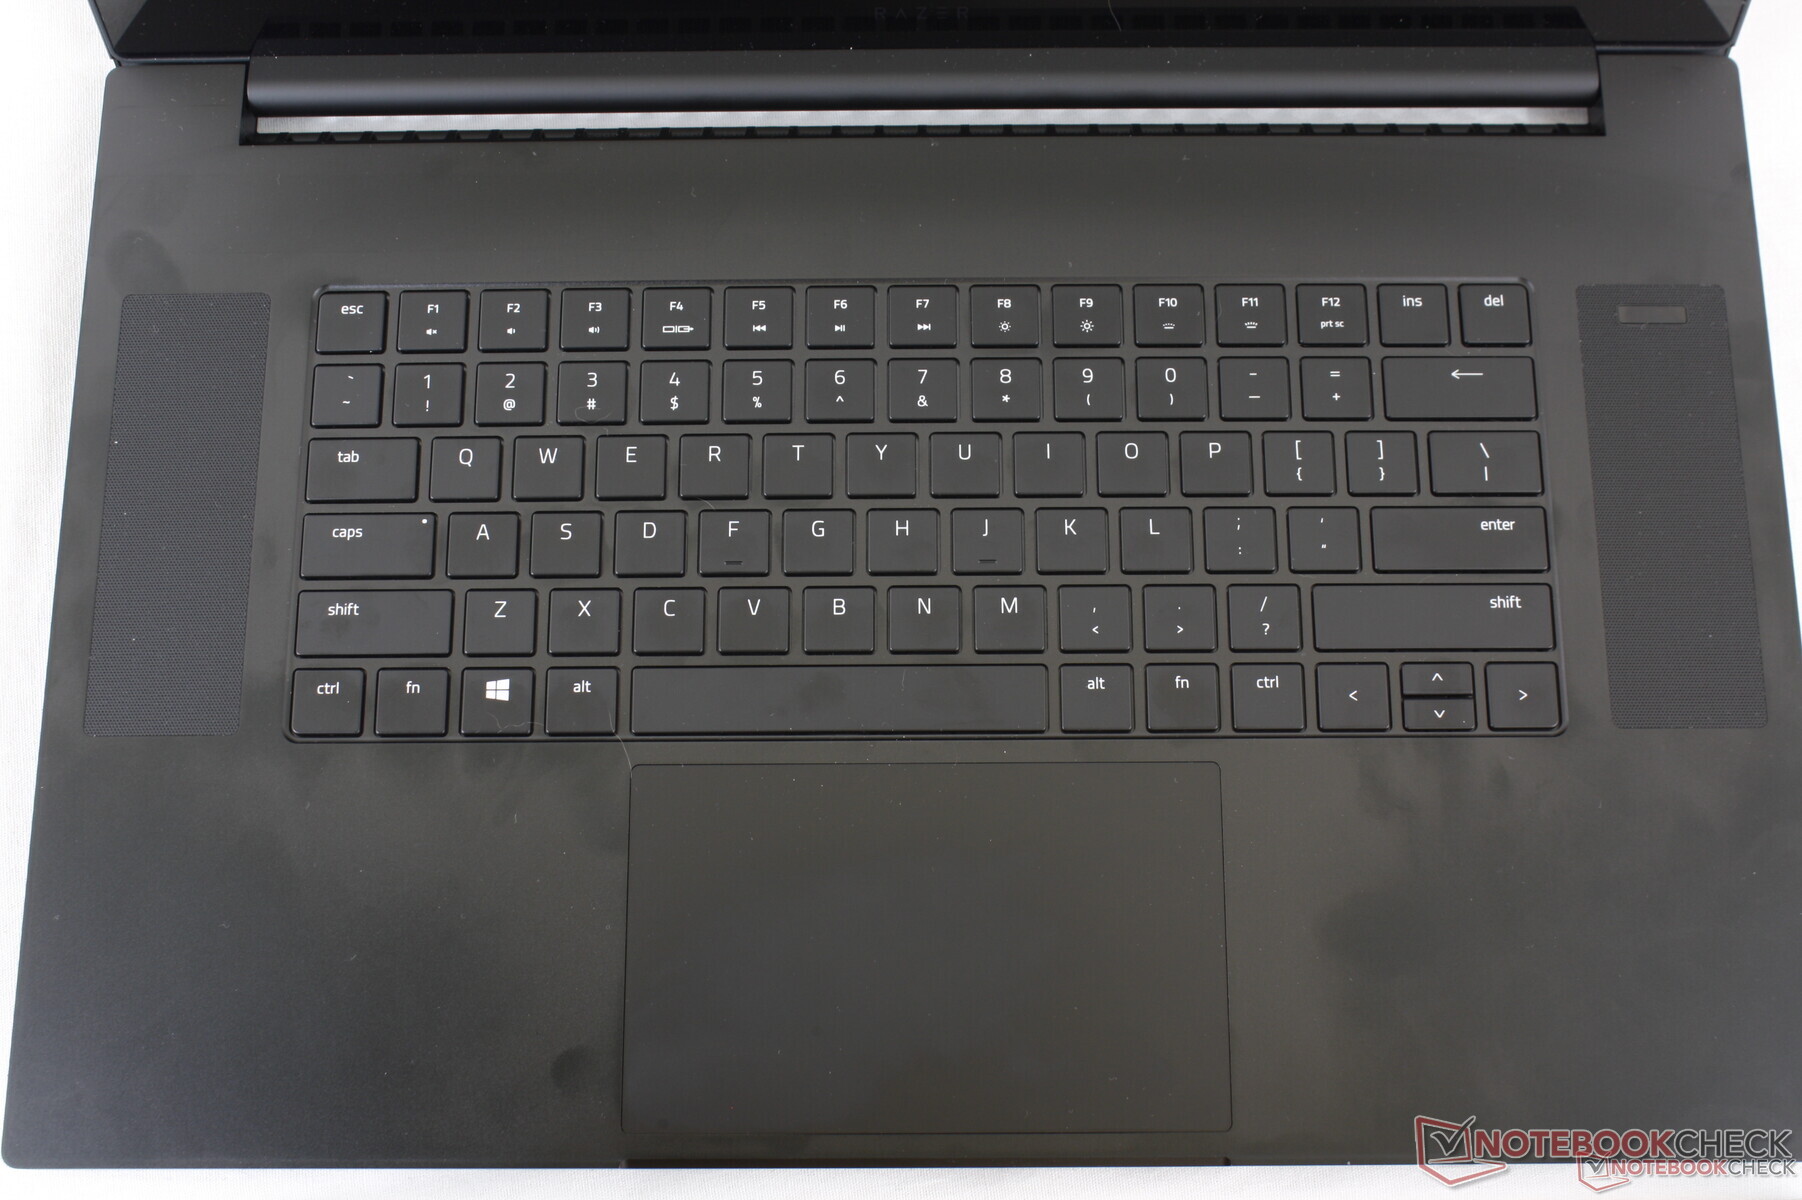
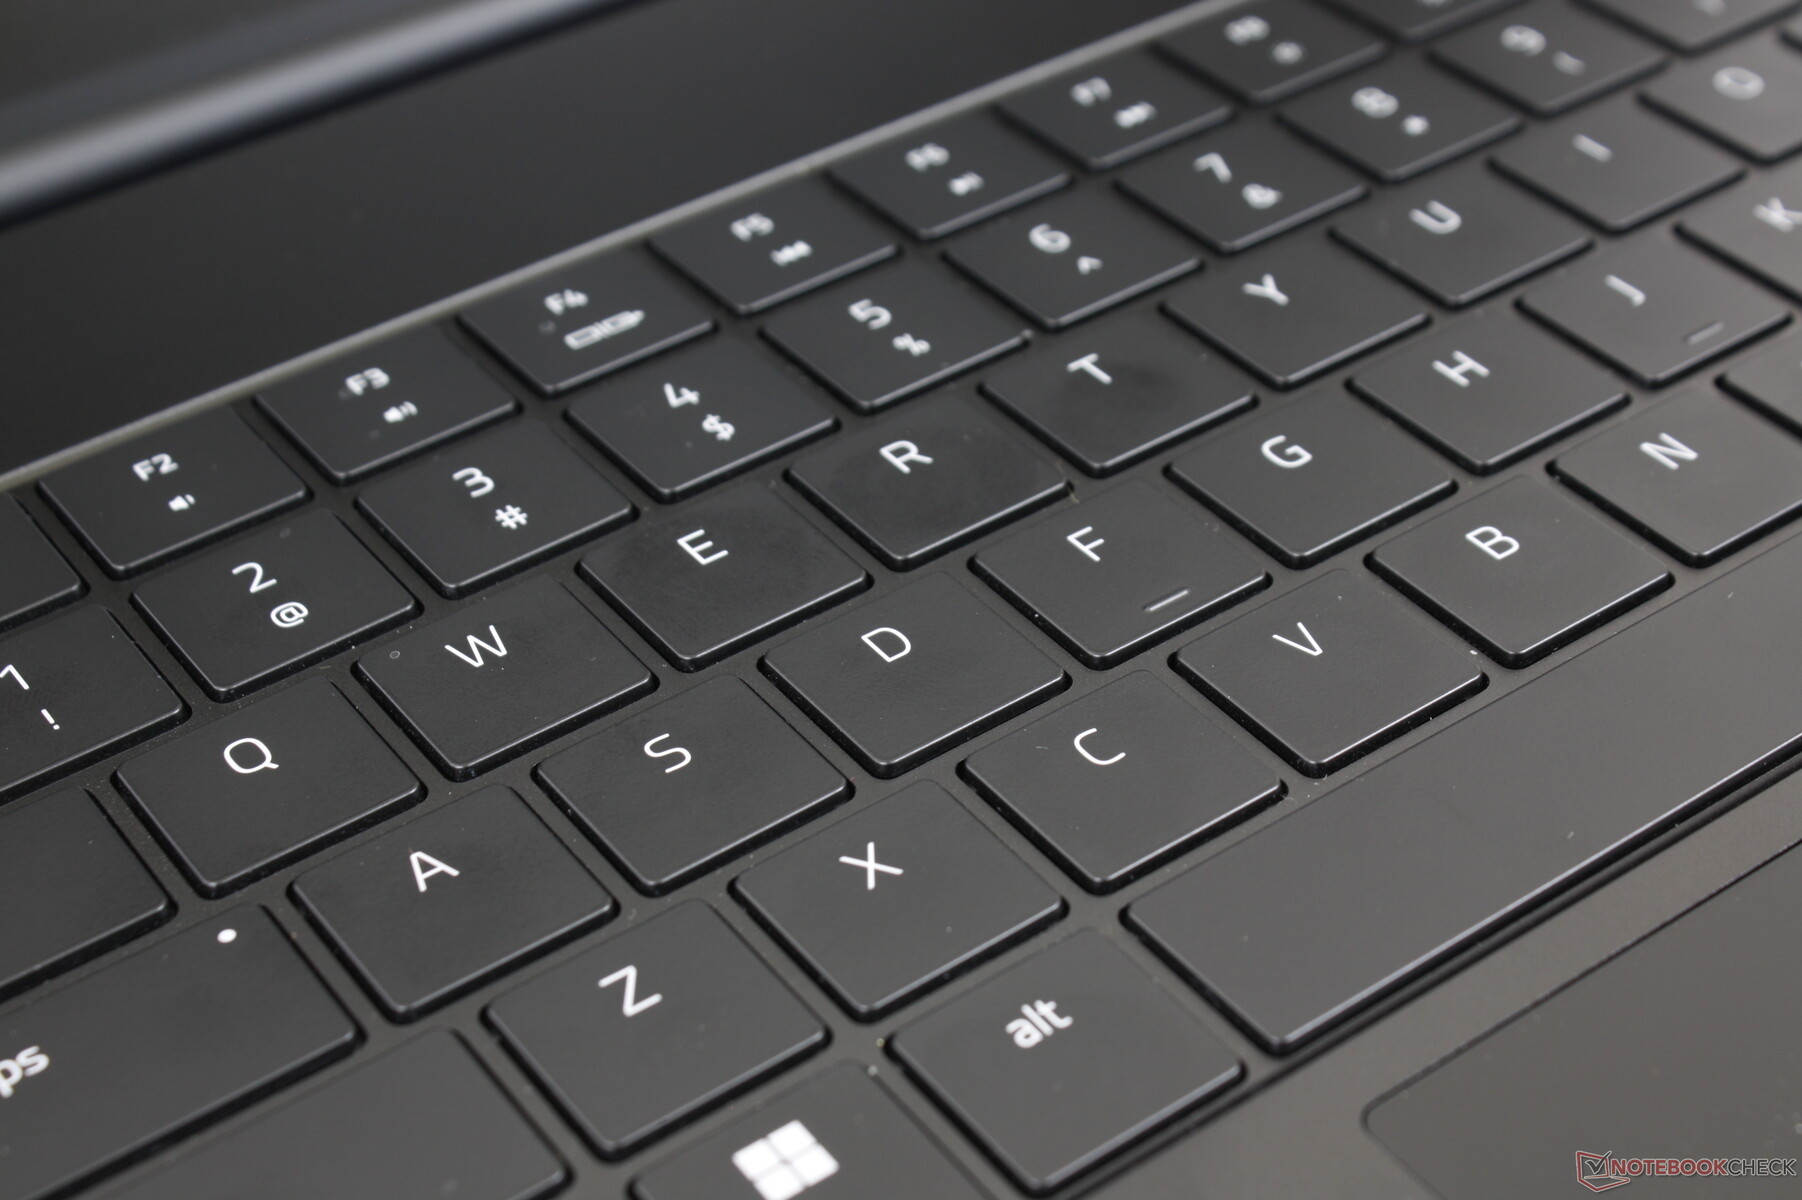
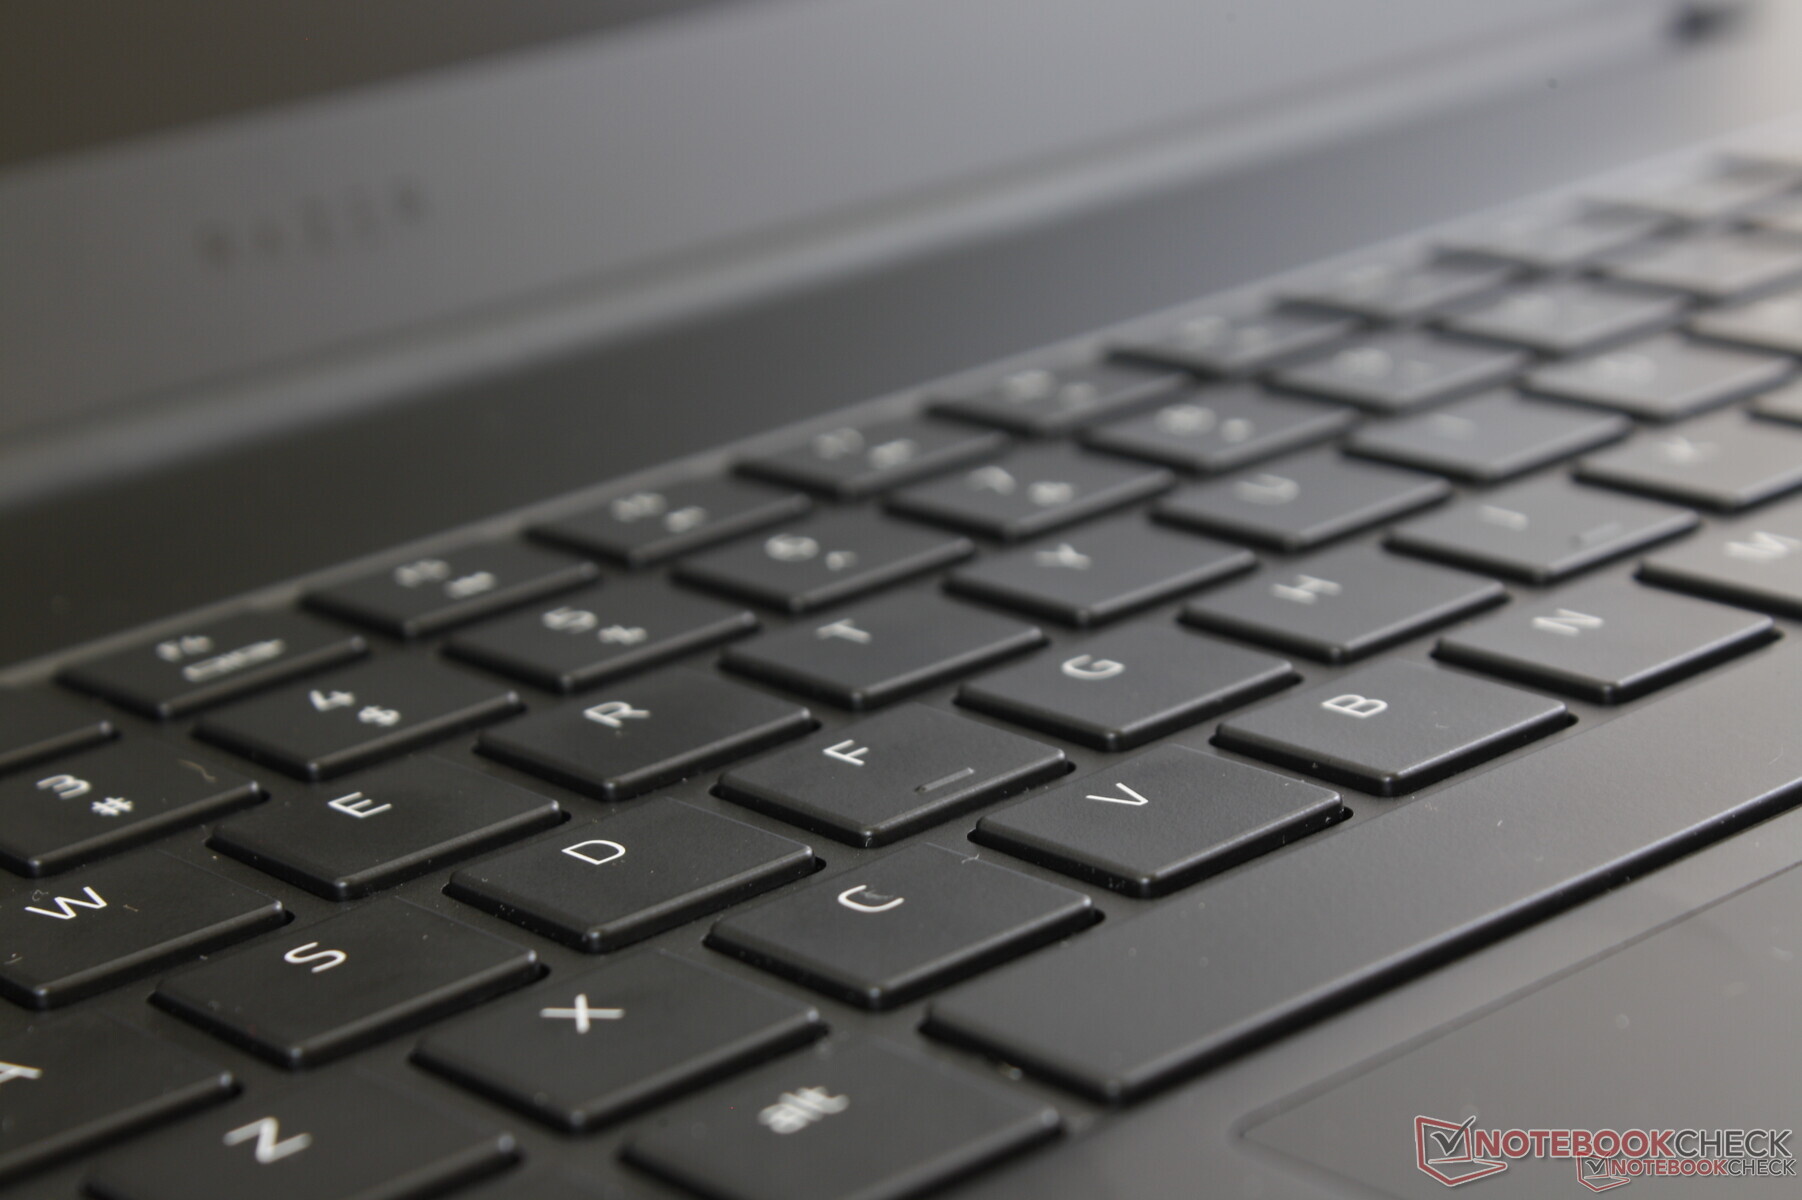
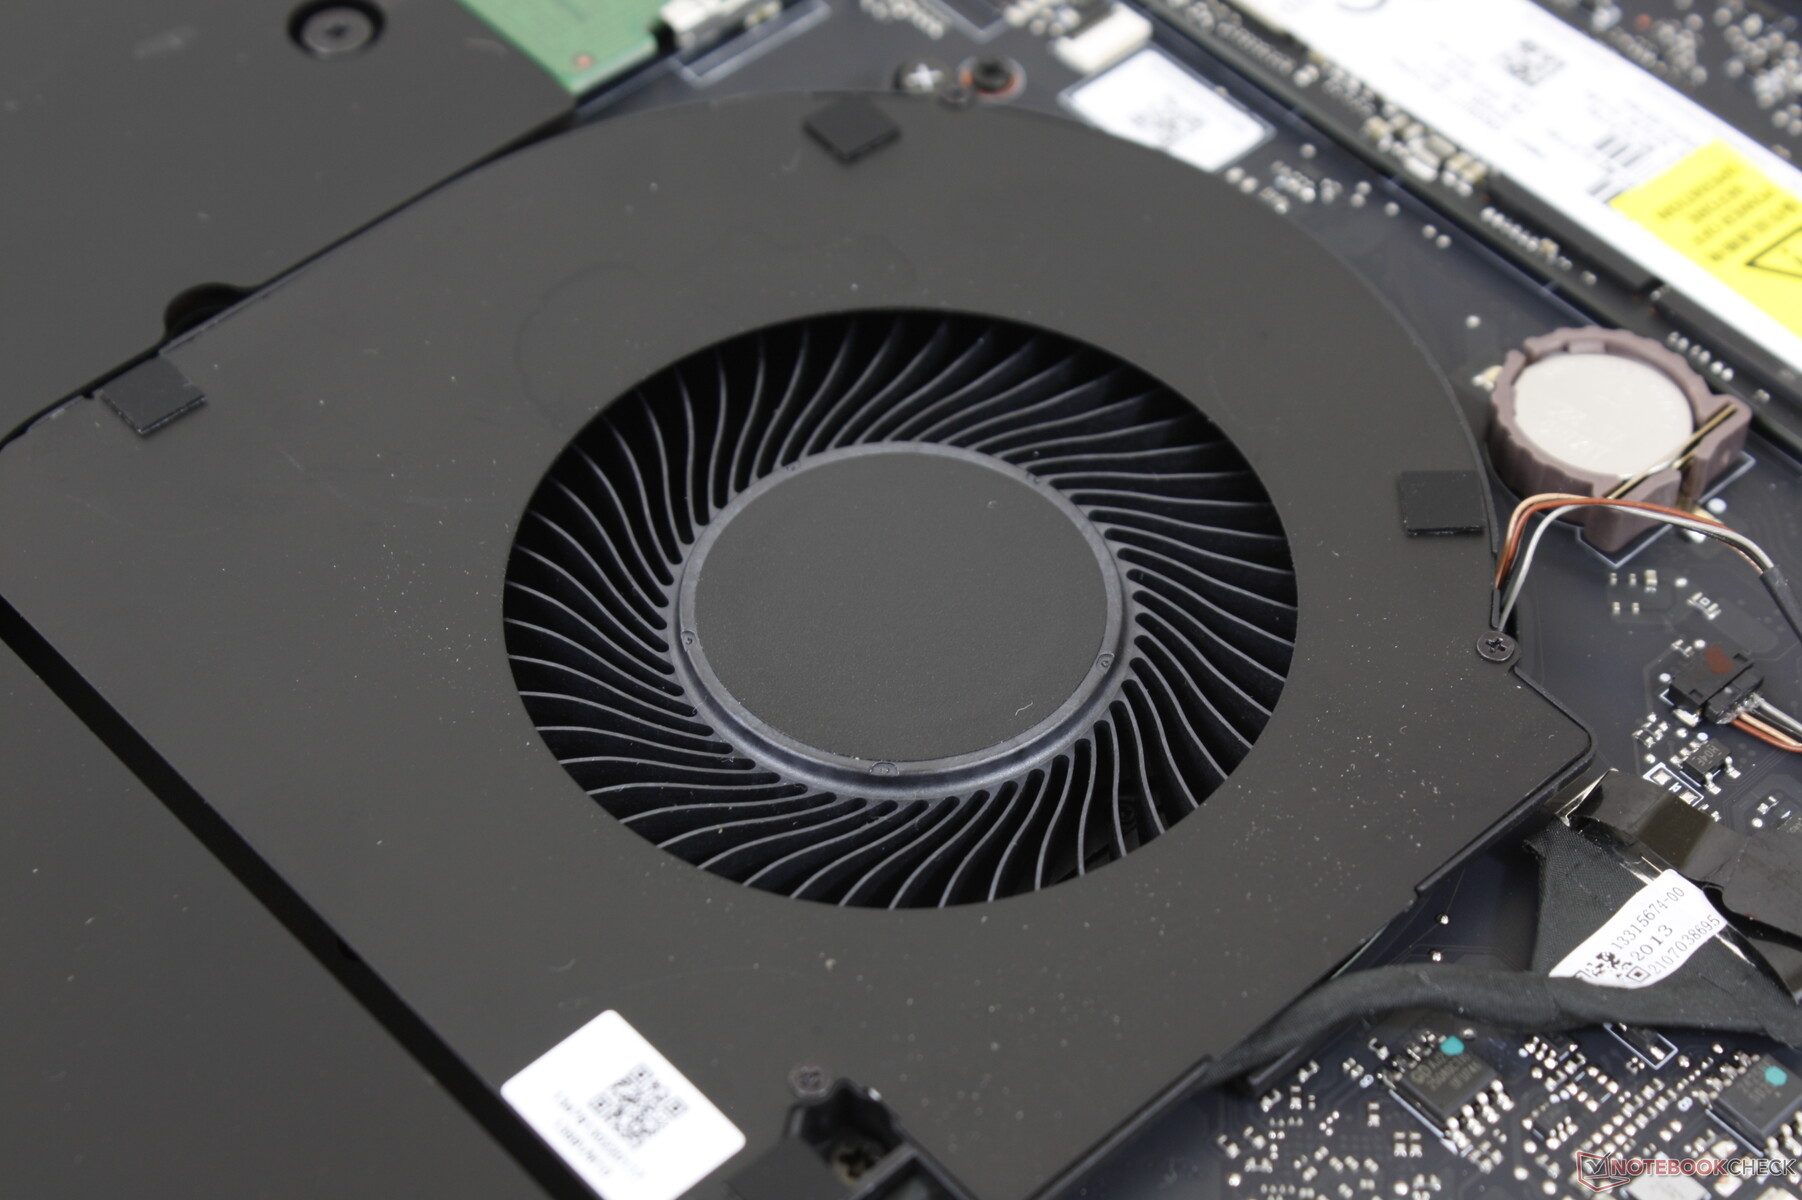
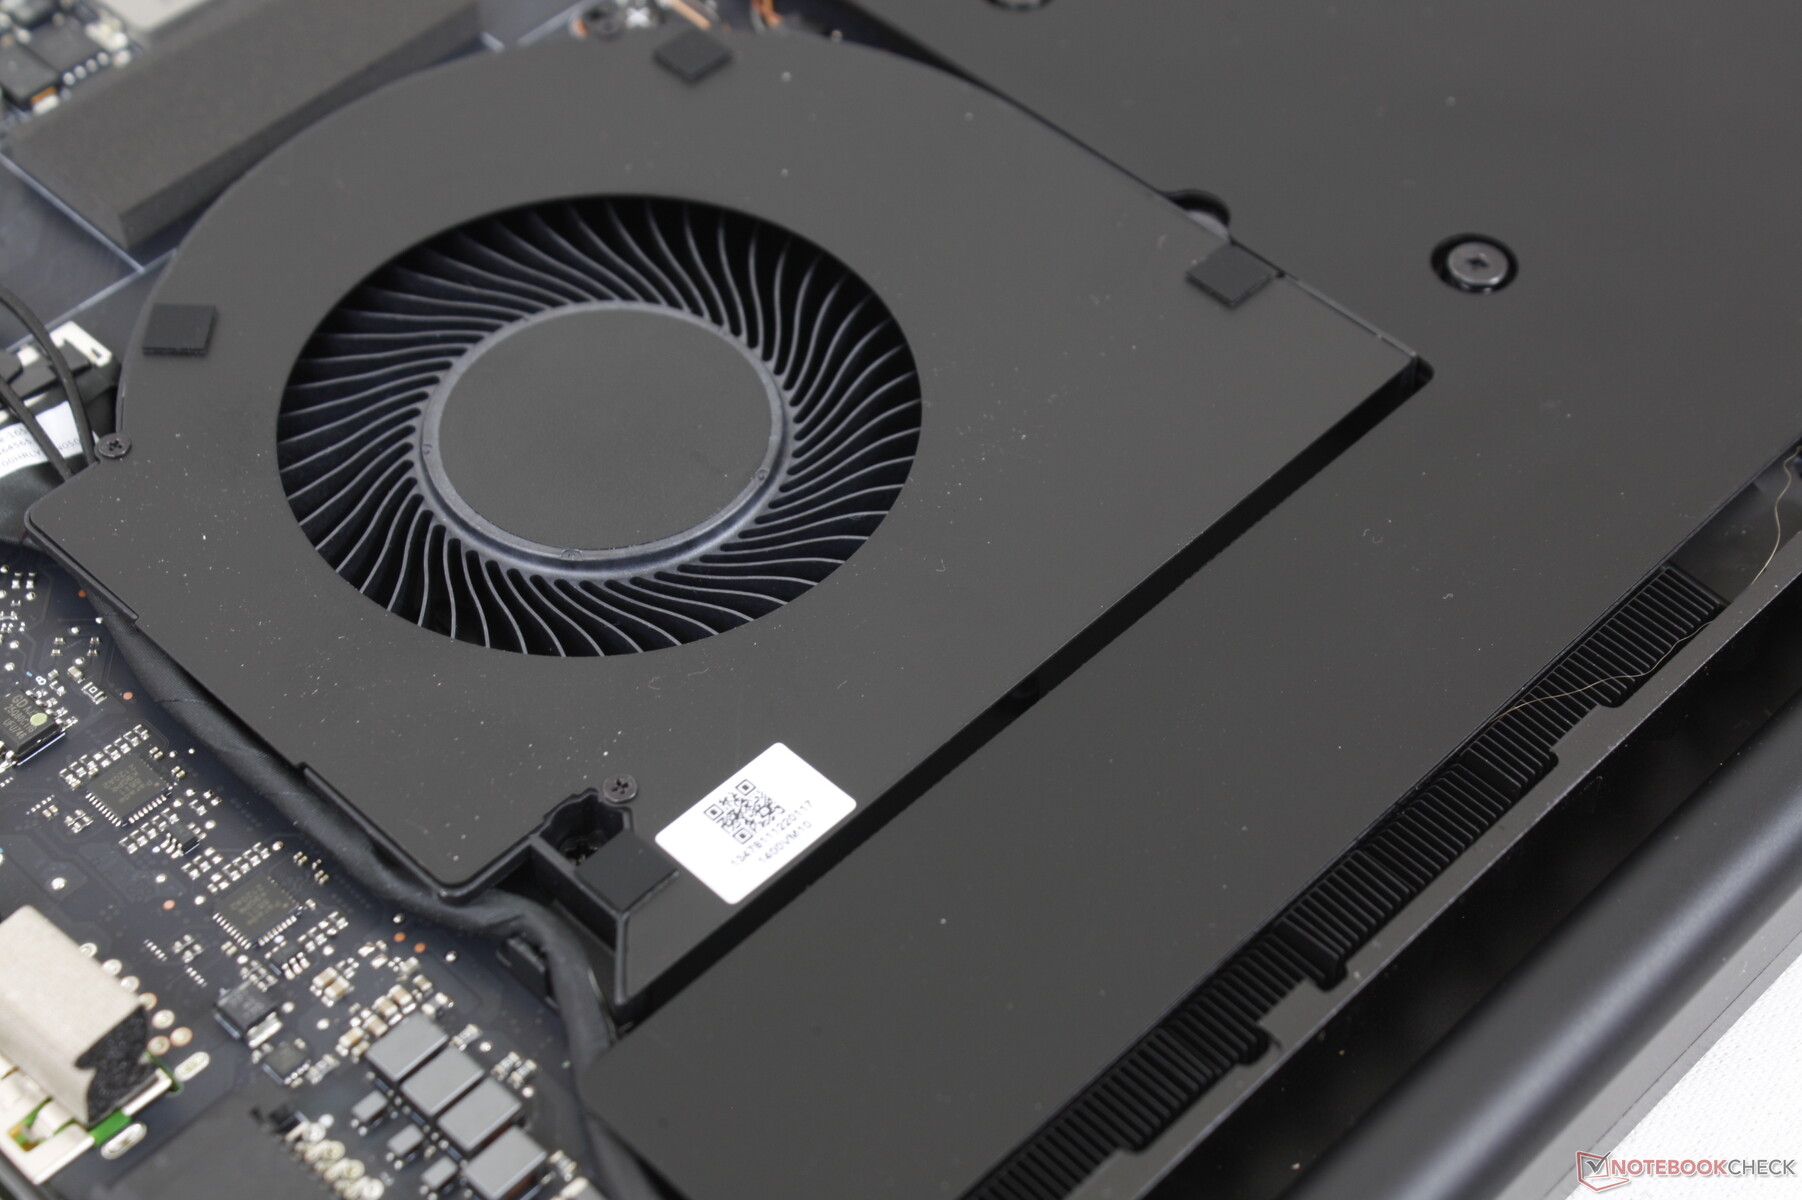
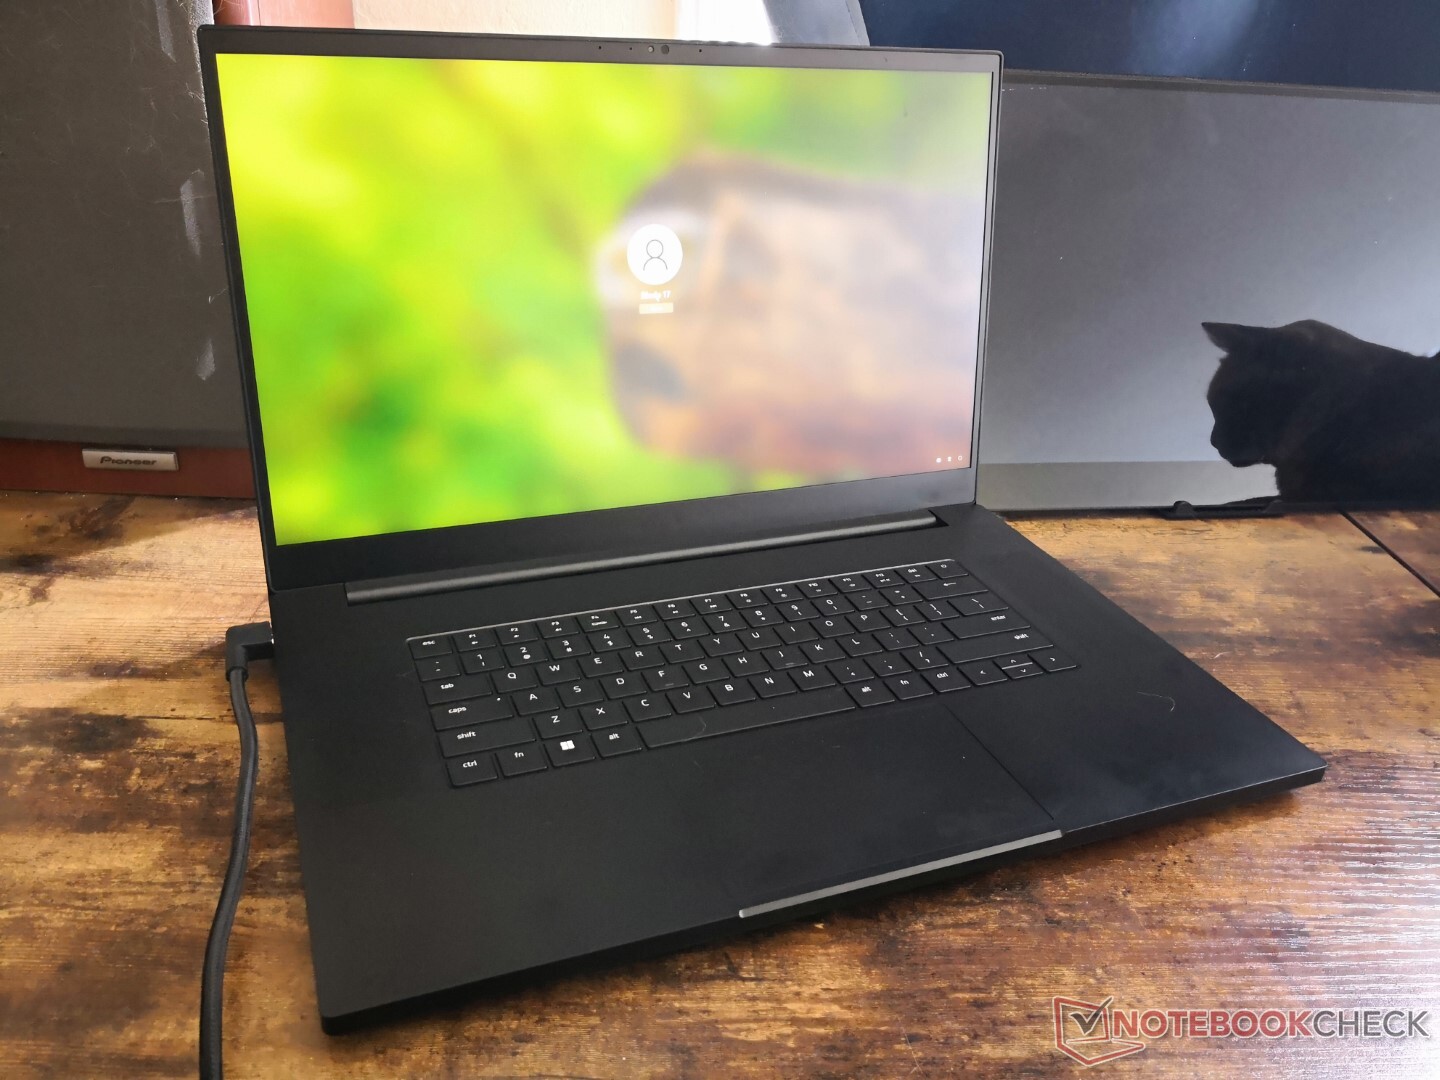
Le châssis externe est identique au modèle de l'année dernière, mais avec deux différences visuelles essentielles. Tout d'abord, les touches du clavier sont désormais plus grandes que sur les anciens modèles. Deuxièmement, vous ne pouvez plus voir que trois ventilateurs à travers les grilles sur le fond de l'unité au lieu de quatre puisque Razer a retiré un des ventilateurs. Ces petits changements ont un impact sur la batterie et les températures générales, comme le montrera notre test.
Connectivité - Maintenant avec deux ports Thunderbolt 4
Les options de port restent identiques à celles du modèle Intel de 10e génération, à l'exception d'une différence essentielle : les deux ports USB-C prennent désormais en charge Thunderbolt au lieu d'un seul. Le nouveau modèle est également compatible avec l'adaptateur secteur de l'année dernière, mais les performances peuvent être affectées puisque le nouveau modèle 2022 utilise un adaptateur 280 W de plus grande capacité.
Lecteur de carte SD
| SD Card Reader | |
| average JPG Copy Test (av. of 3 runs) | |
| Razer Blade Pro 17 2021 (QHD Touch) (Toshiba Exceria Pro SDXC 64 GB UHS-II) | |
| MSI GS76 Stealth 11UH (AV PRO microSD 128 GB V60) | |
| Aorus 17G YD (AV PRO microSD 128 GB V60) | |
| Asus ROG Zephyrus S17 GX703HSD | |
| Alienware x17 RTX 3080 P48E (AV Pro V60) | |
| Razer Blade 17 RTX 3080 Ti (AV Pro V60) | |
| maximum AS SSD Seq Read Test (1GB) | |
| Asus ROG Zephyrus S17 GX703HSD | |
| Alienware x17 RTX 3080 P48E (AV Pro V60) | |
| MSI GS76 Stealth 11UH (AV PRO microSD 128 GB V60) | |
| Aorus 17G YD (AV PRO microSD 128 GB V60) | |
| Razer Blade Pro 17 2021 (QHD Touch) (Toshiba Exceria Pro SDXC 64 GB UHS-II) | |
| Razer Blade 17 RTX 3080 Ti (AV Pro V60) | |
Communication
Webcam
La webcam est de 1080p ou 2 MP, contrairement aux webcams de 720p ou 1 MP de la plupart des autres ordinateurs portables, pour une image plus nette. Windows Hello est également pris en charge, mais il n'y a toujours pas de volet de confidentialité.


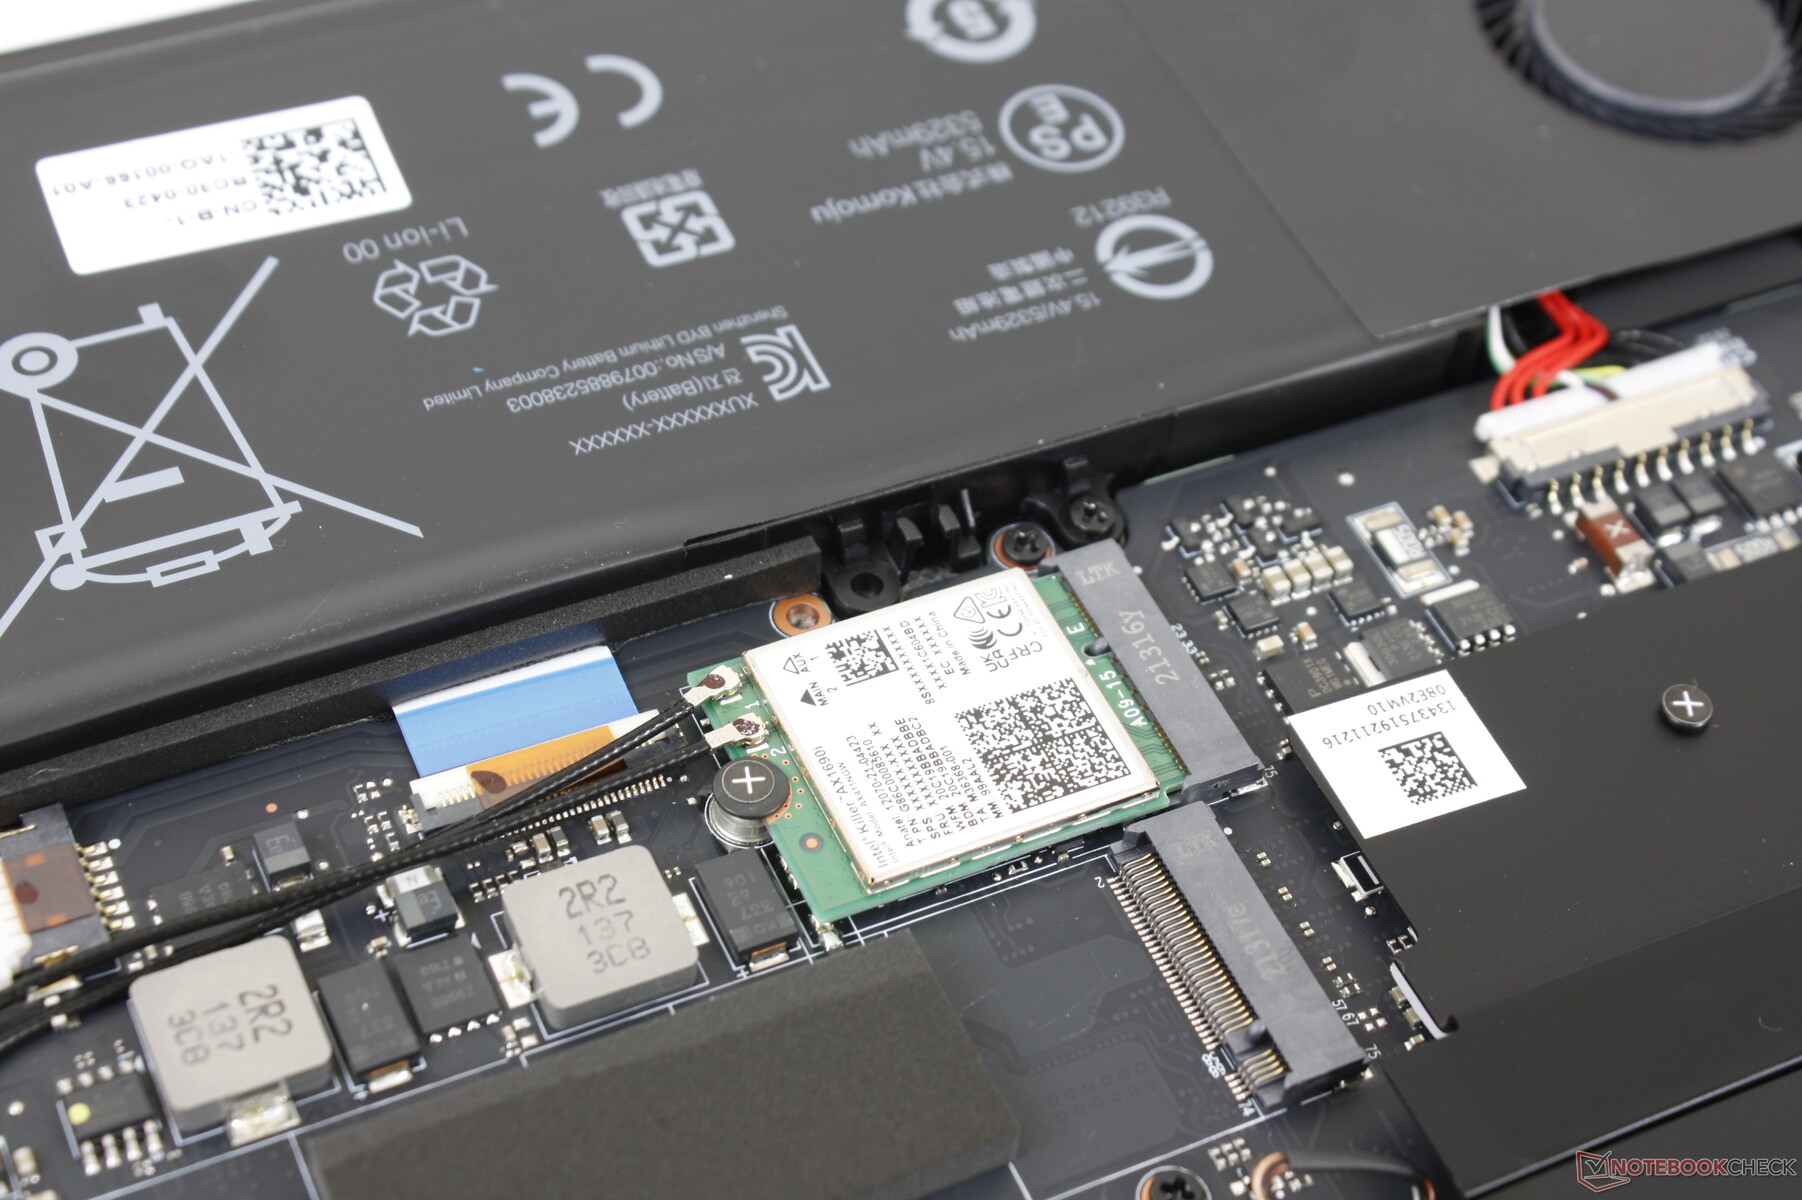
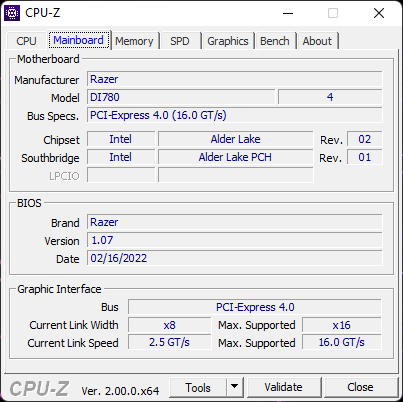
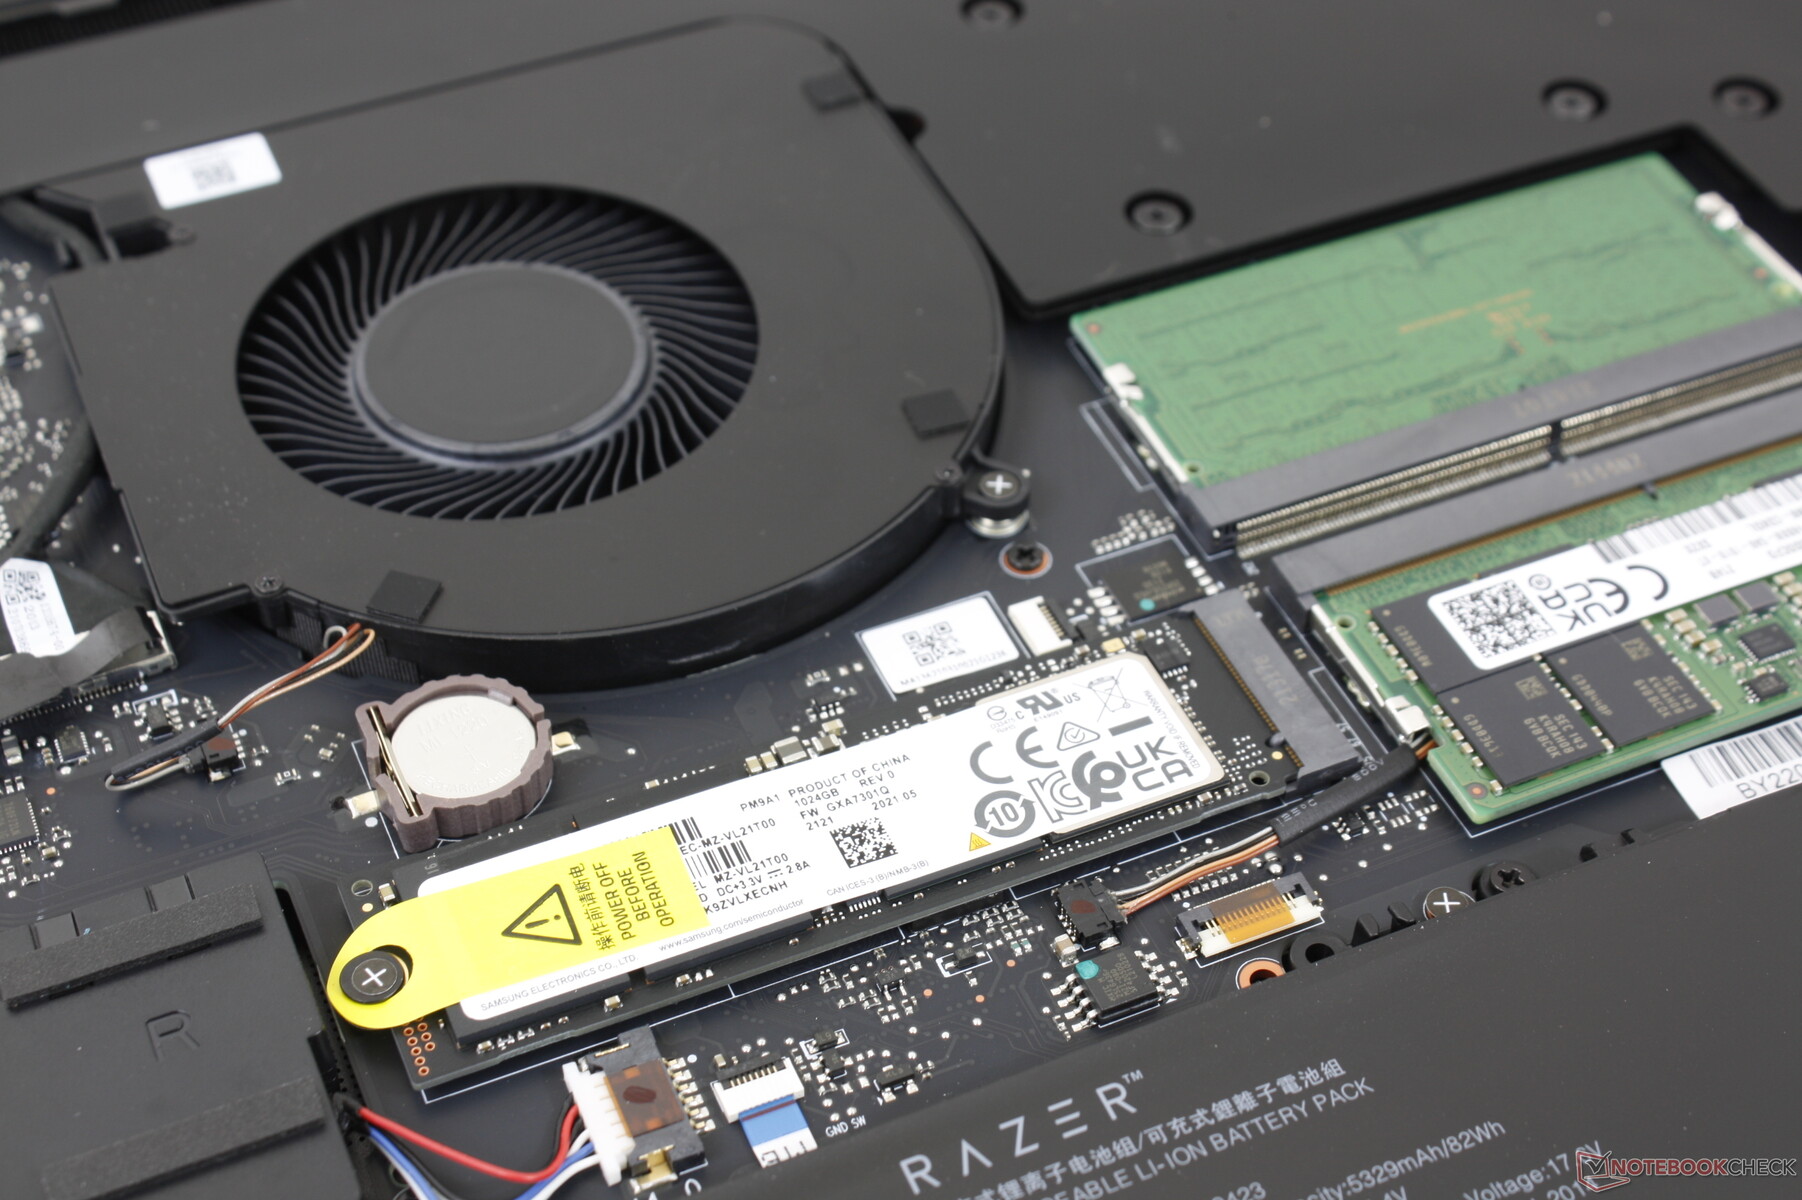
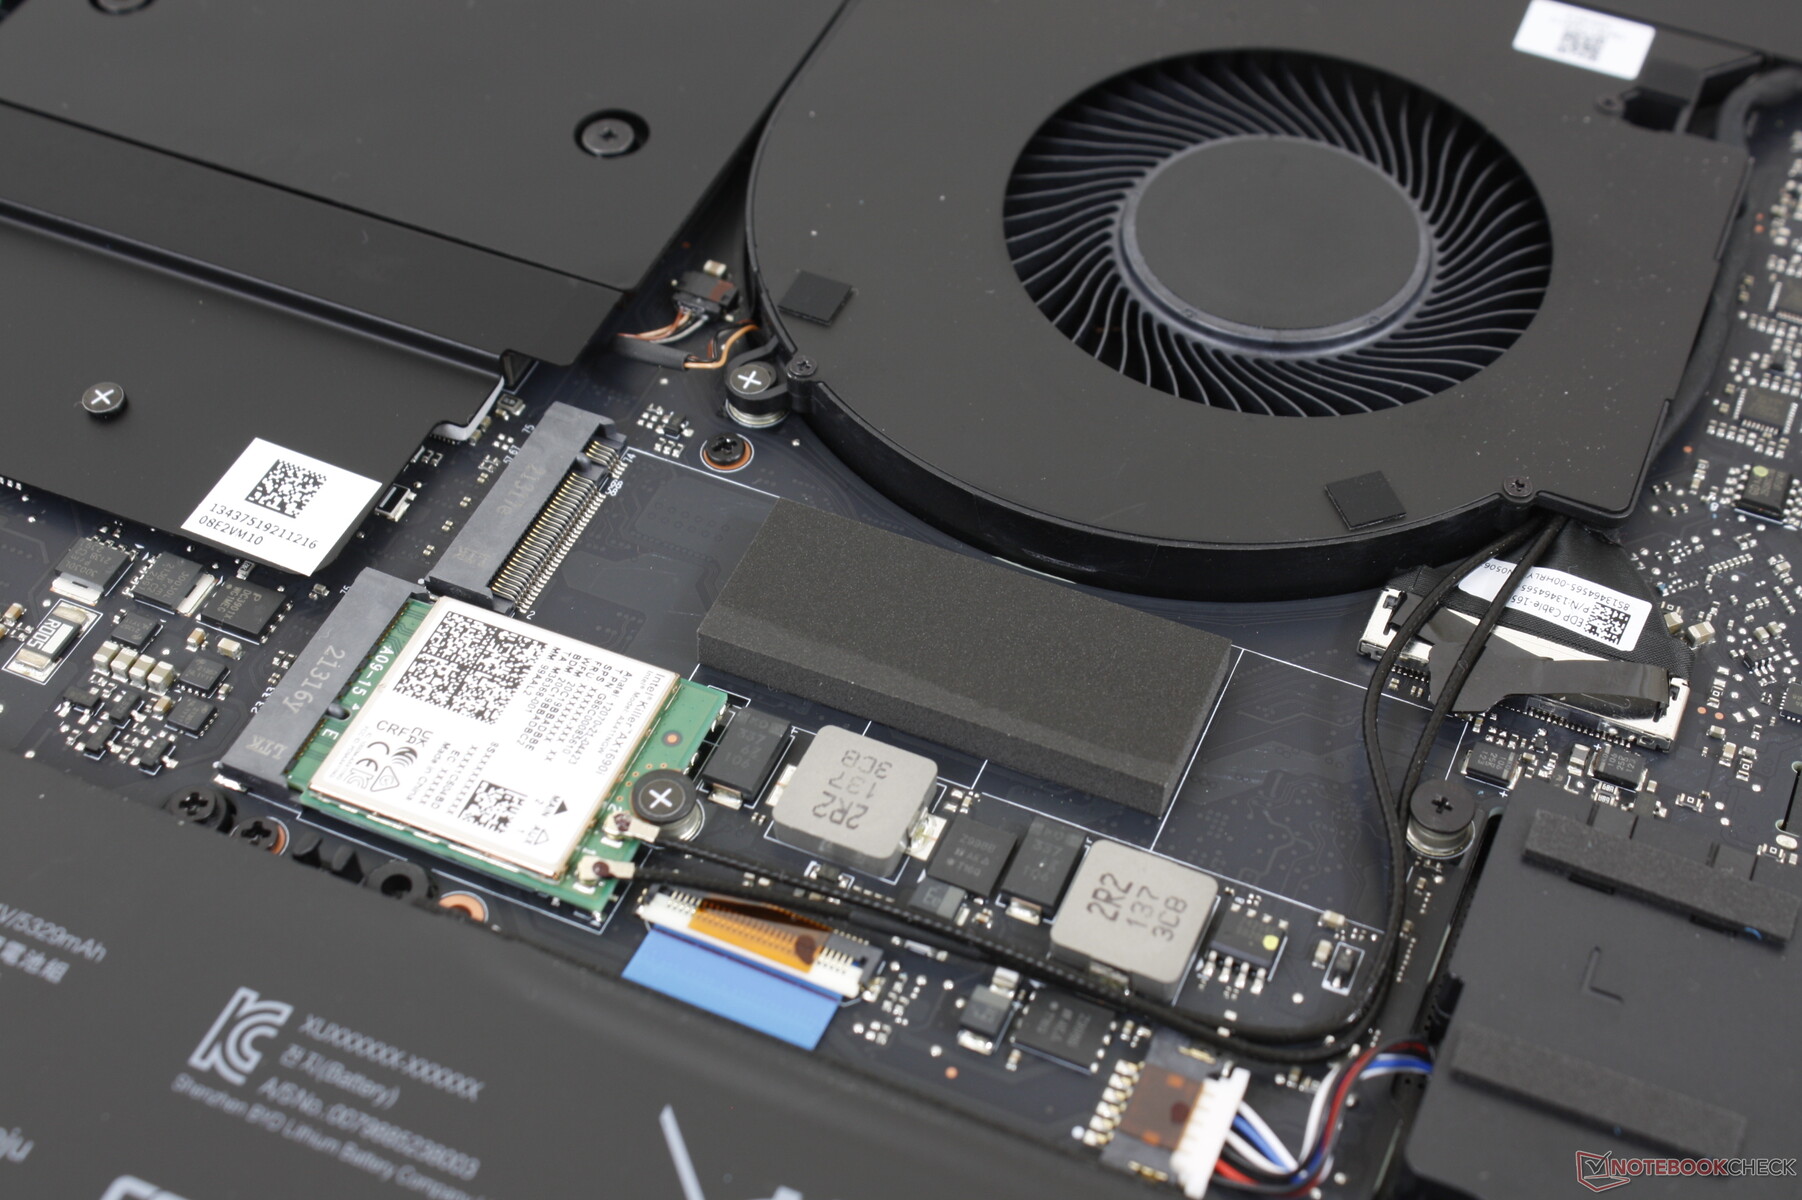
Maintenance
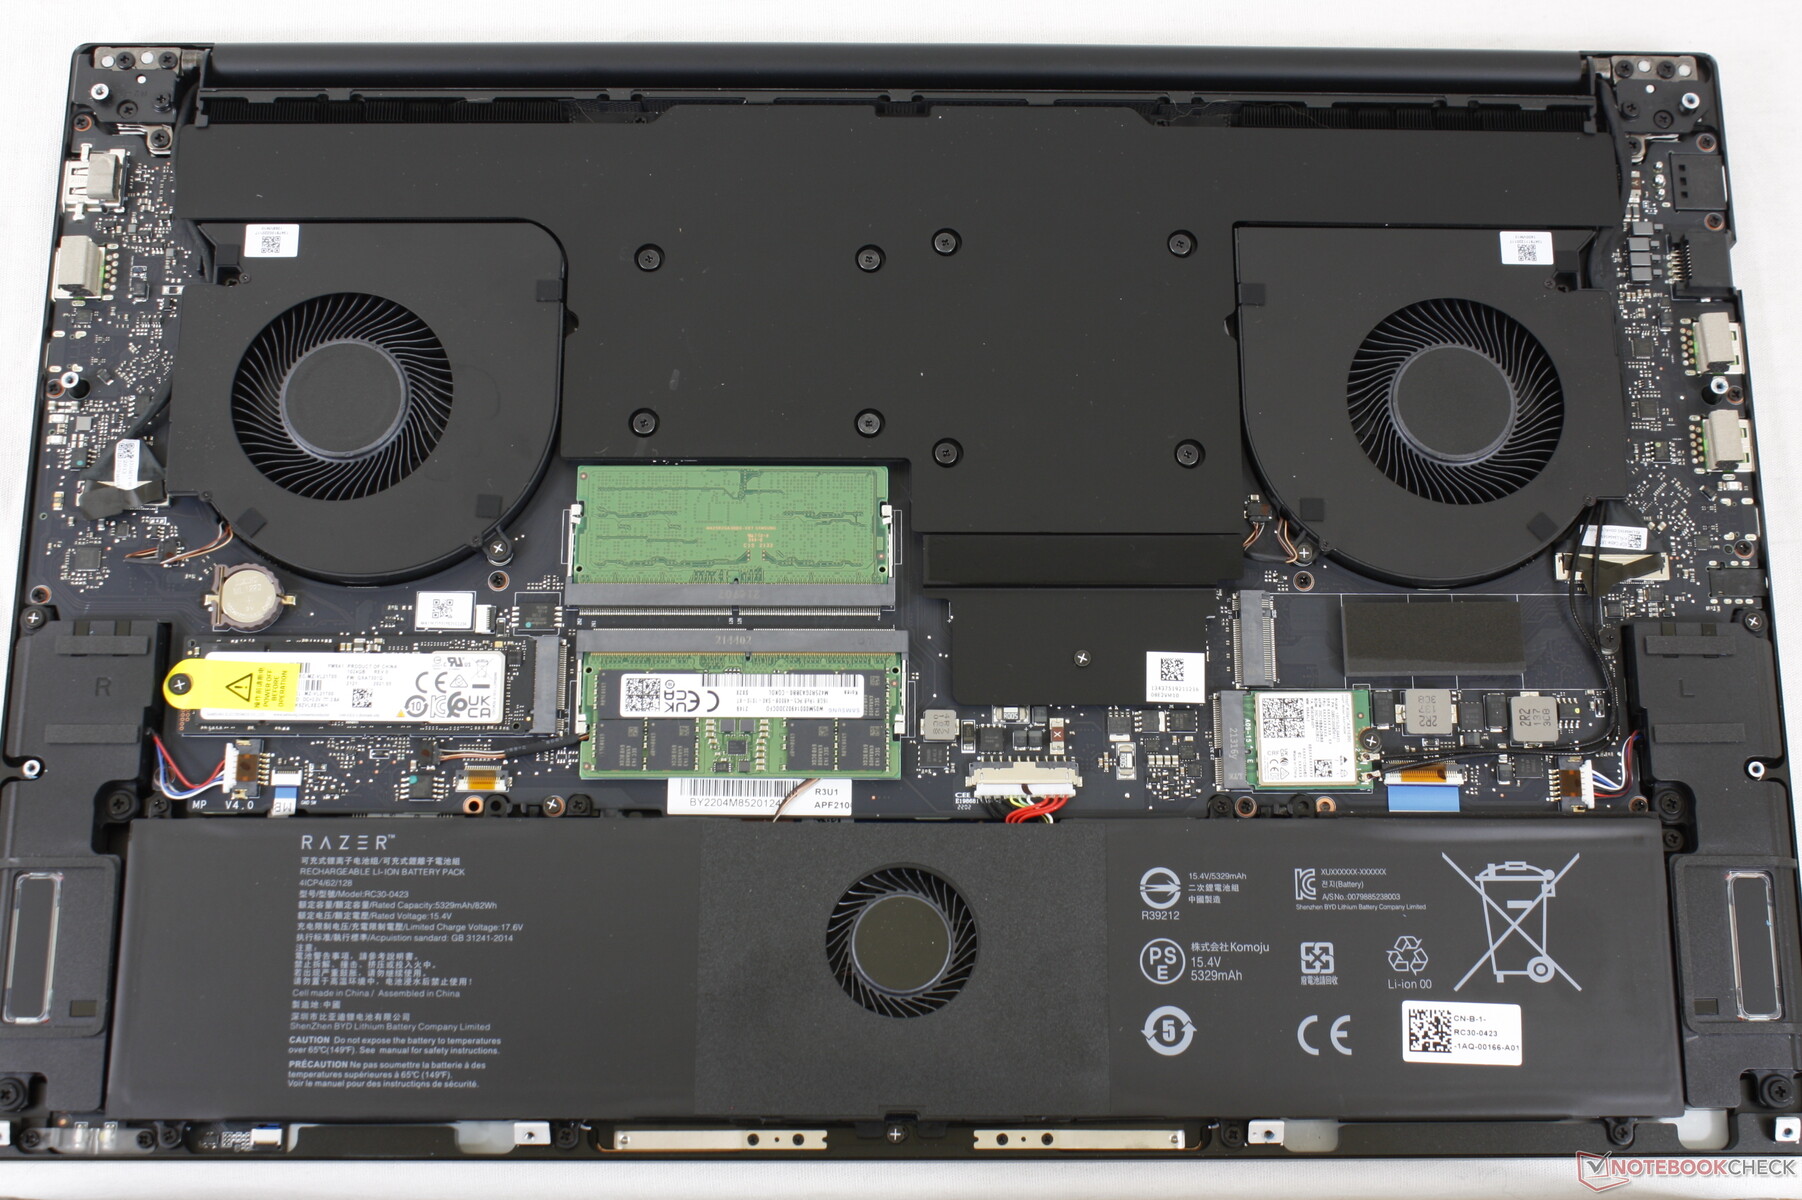
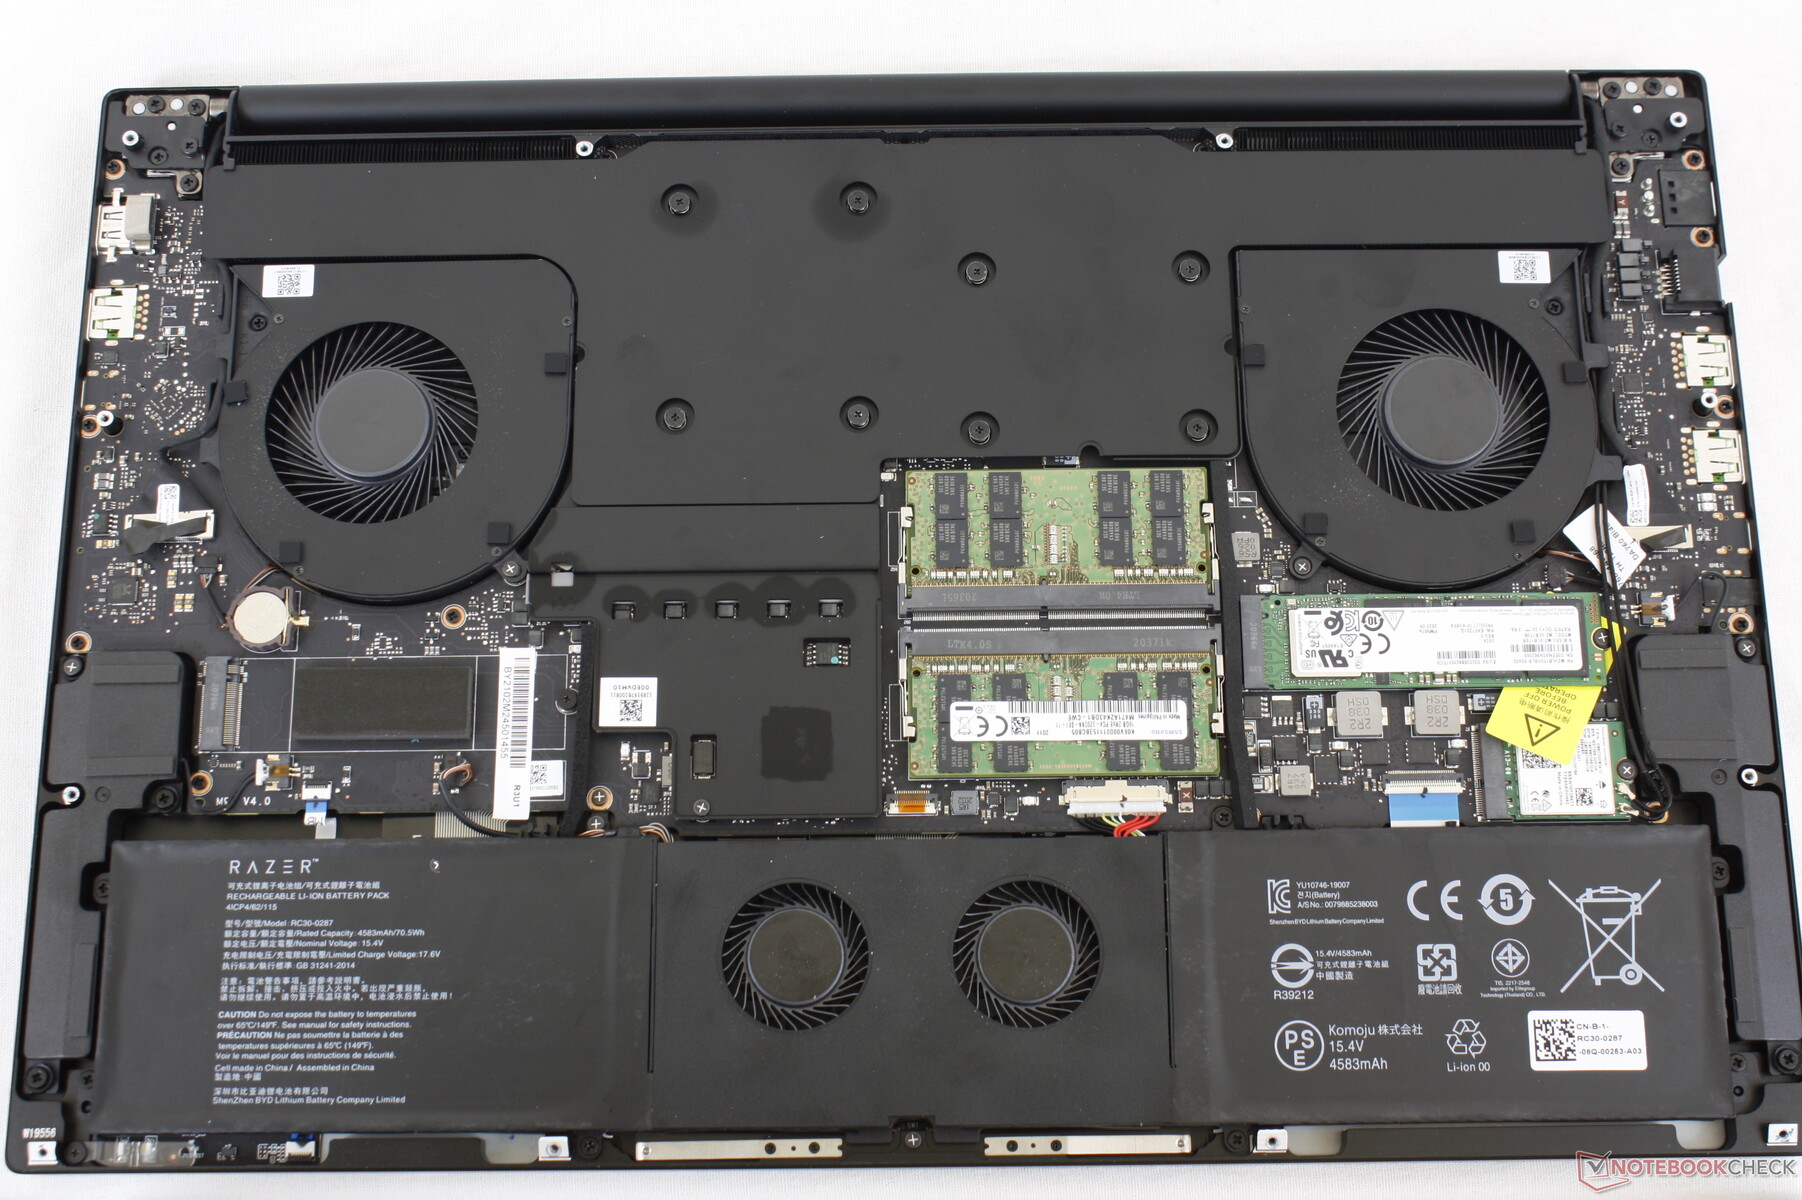
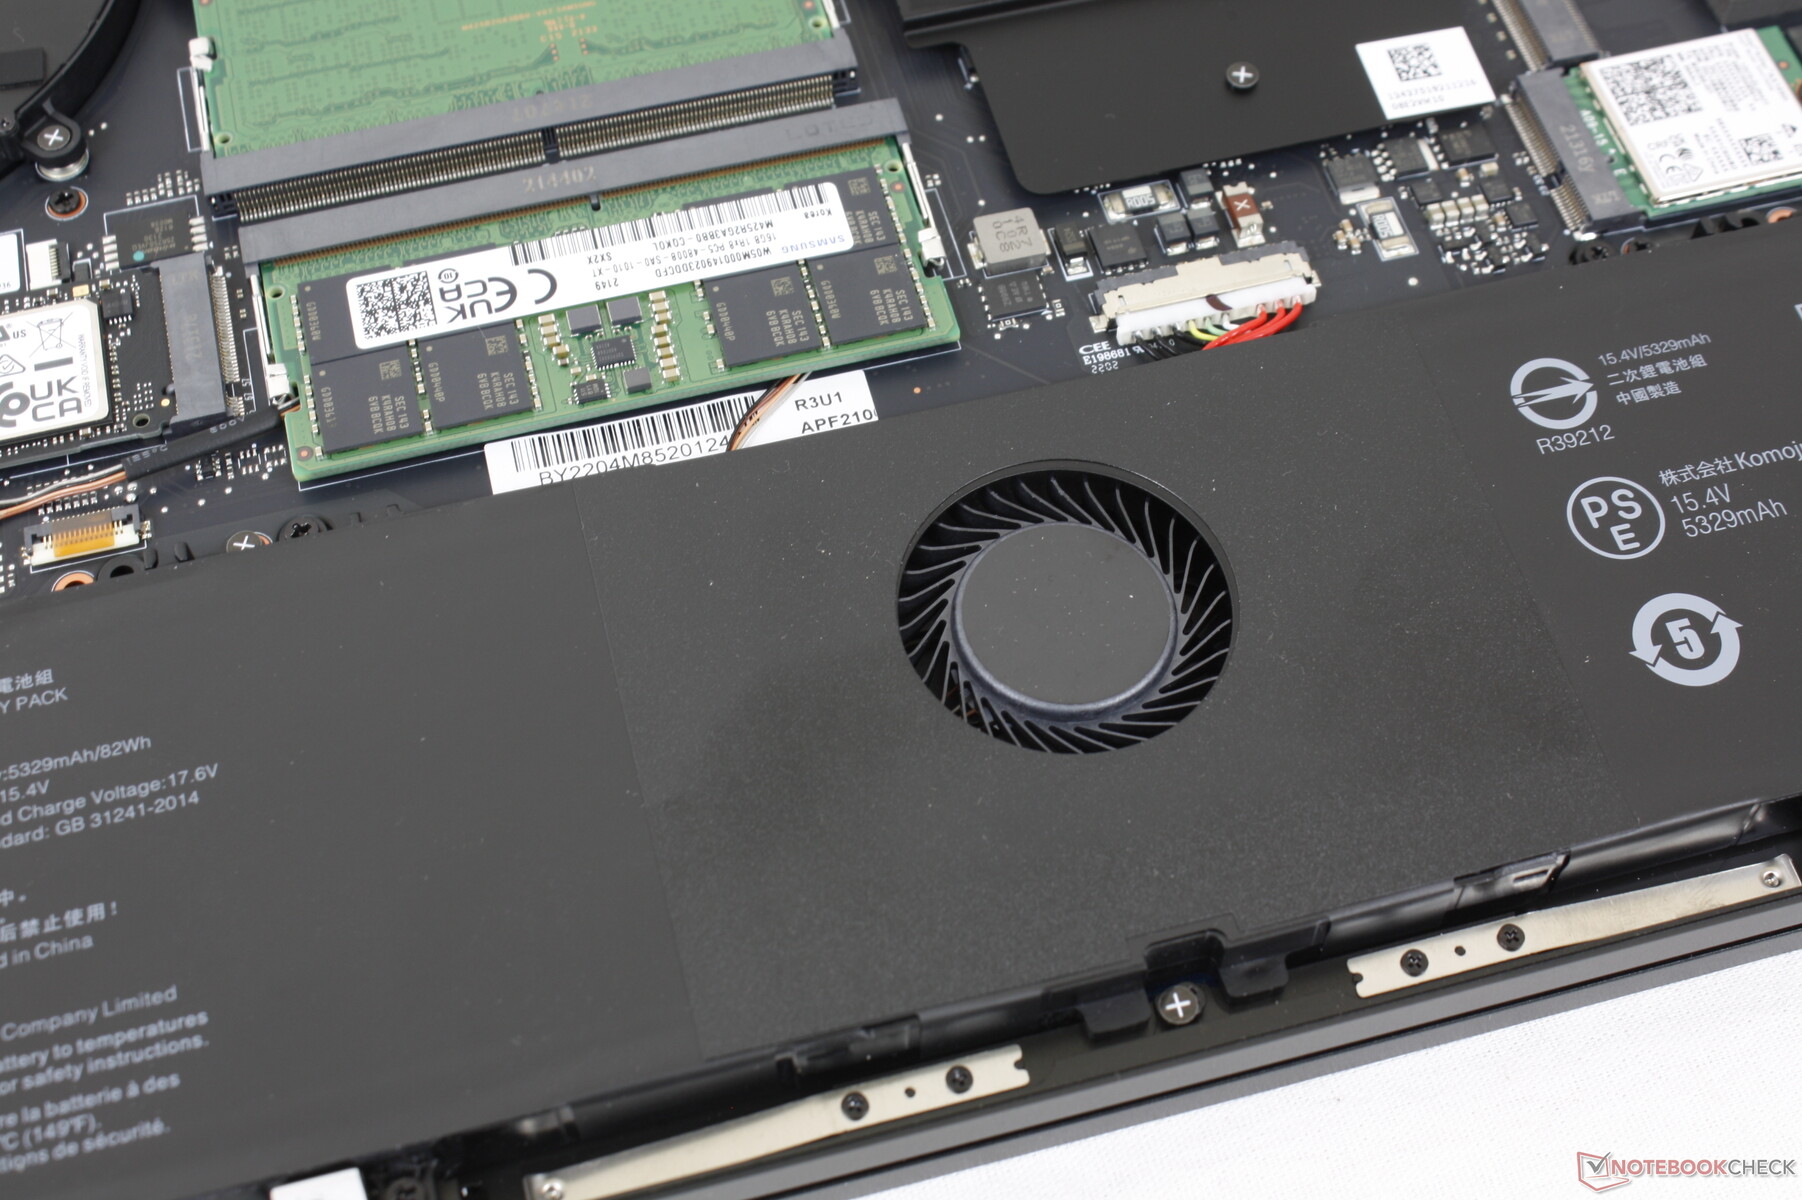
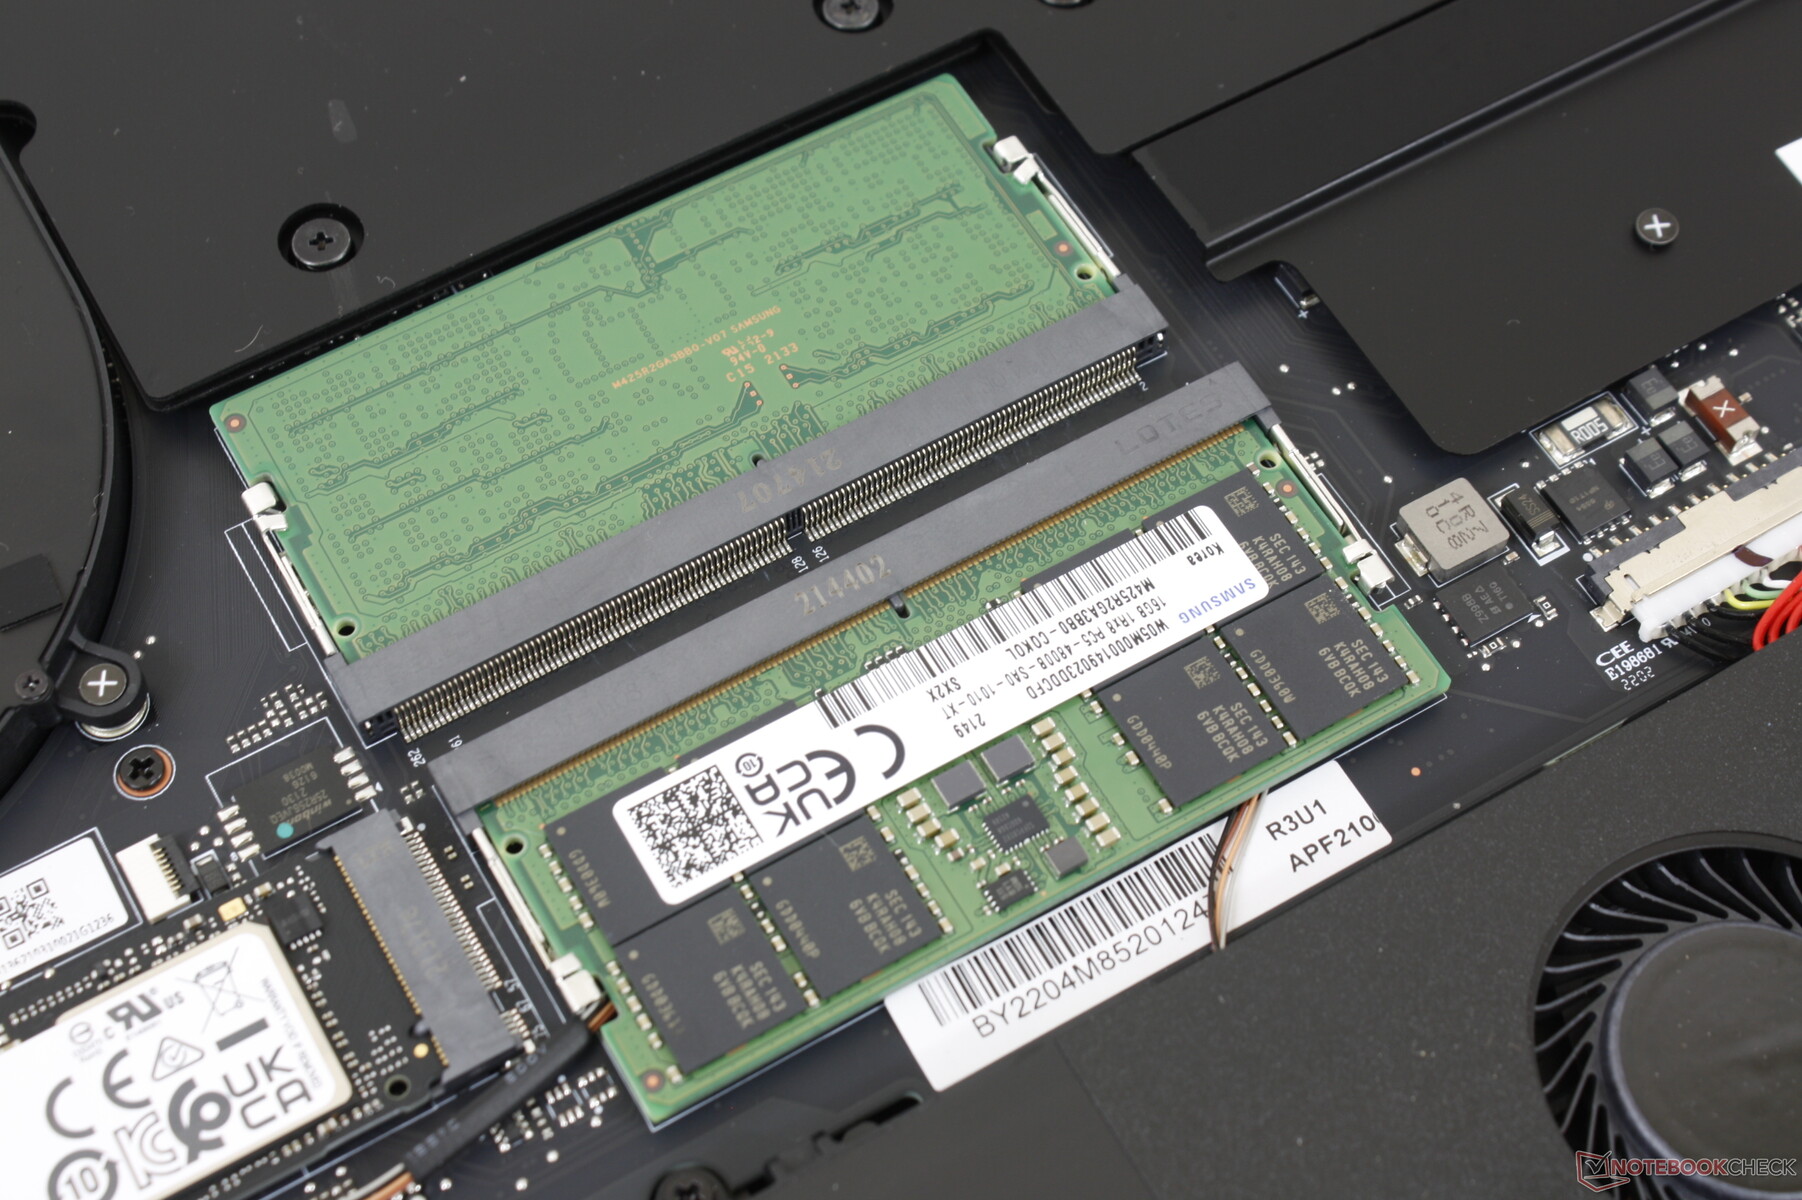
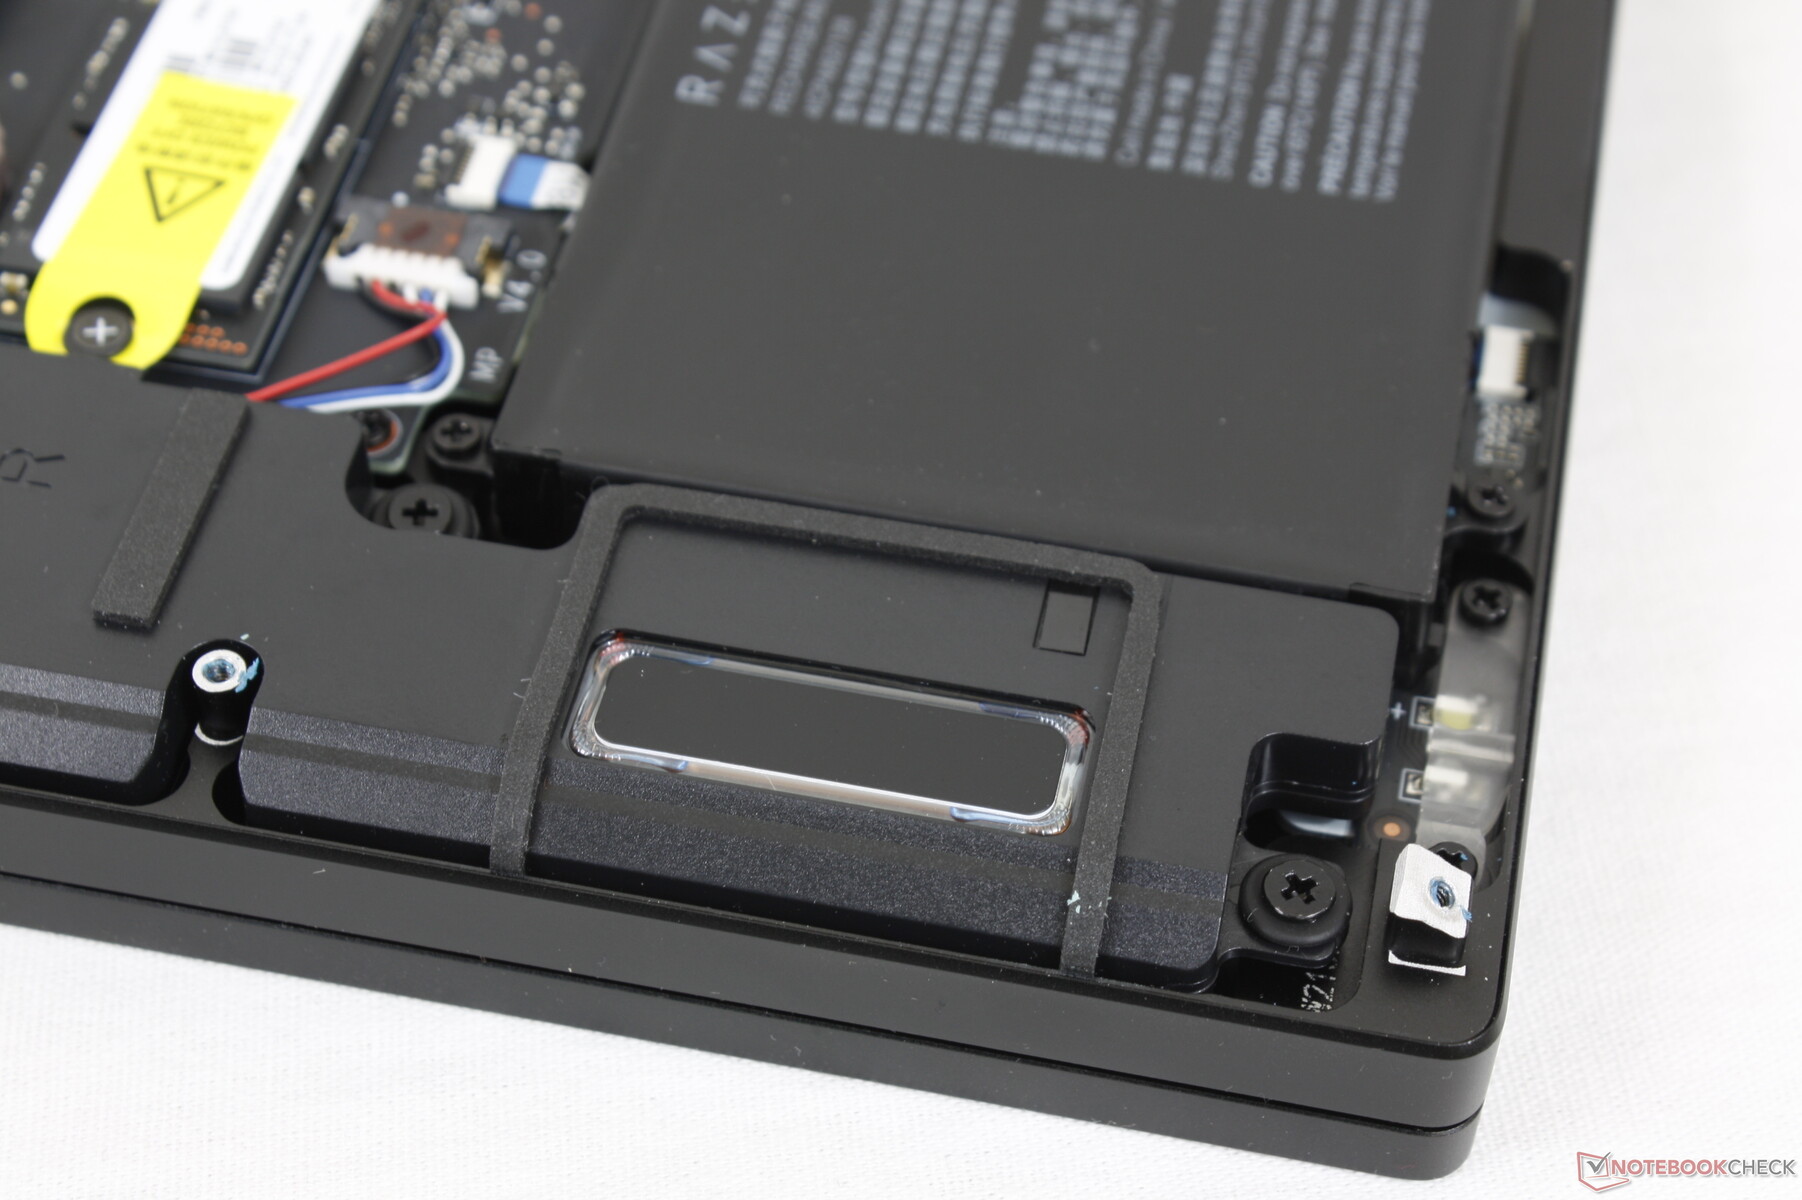
Le panneau inférieur est à nouveau relativement facile à retirer avec une clé Torx T5. Bien que les utilisateurs aient un accès direct aux 2 slots SODIMM DDR5 et aux 2 slots SSD M.2 PCIe4, la disposition de la carte mère a sensiblement changé par rapport au modèle de l'année dernière comme le montrent les images comparatives ci-dessous.
Accessoires et garantie
La boîte comprend l'adaptateur secteur, des documents et une feuille d'autocollants du logo Razer. Razer introduit une garantie limitée de deux ans sur la batterie en standard, en plus de la garantie limitée d'un an sur l'ordinateur portable, pour tout nouvel achat d'un modèle Blade de 12e génération.
Dispositifs d'entrée - Touches plus grandes, même pavé tactile
Clavier
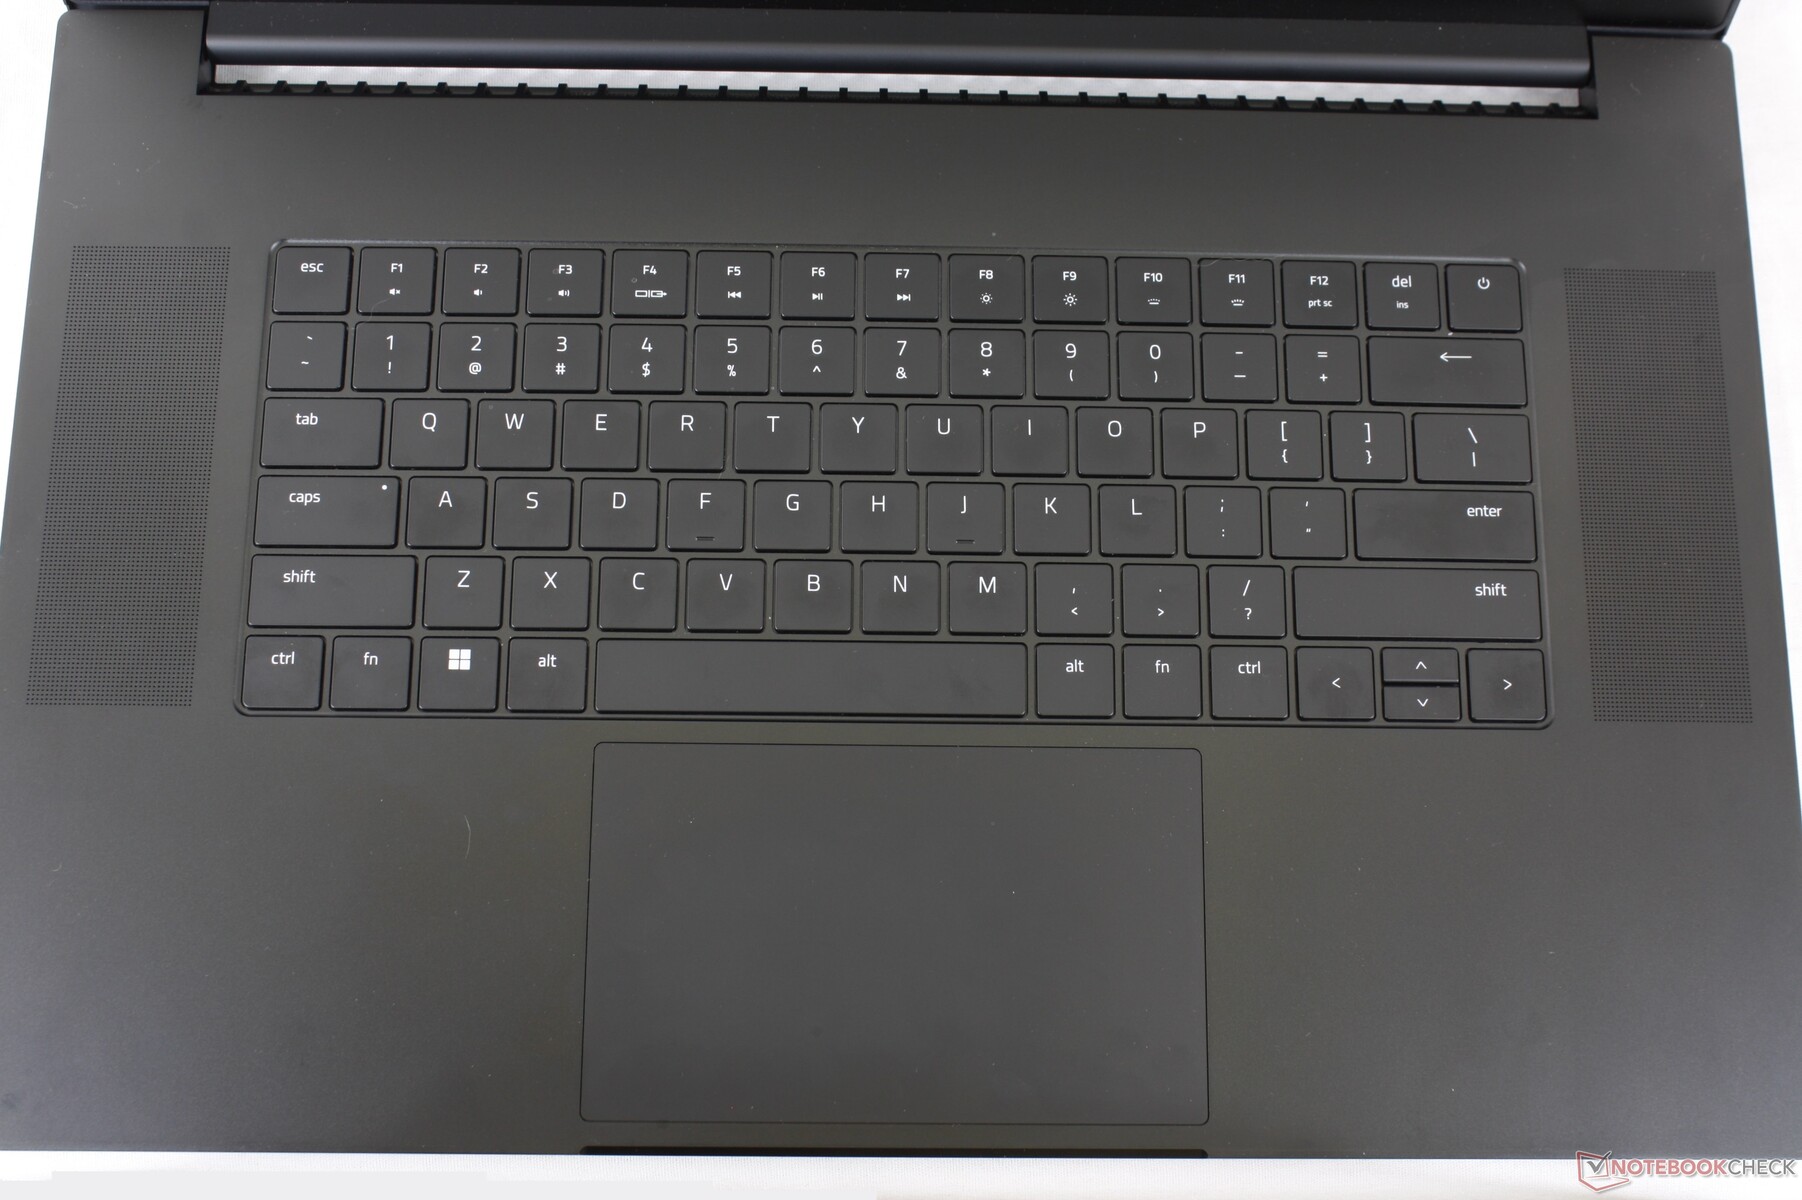
Le 2022 Blade 17 partage le même clavier que le 2022 Blade 15 2022 Blade 15. Razer a augmenté la taille des touches tout en conservant la même longueur et largeur du clavier pour faciliter la frappe. Le feedback et la course sont identiques au modèle de l'année dernière malgré le changement de taille. Nous pensons que plus d'utilisateurs adopteront cette petite mise à jour d'une année sur l'autre plutôt qu'un changement complet vers des touches optiques ou mécaniques qui aurait probablement divisé les fans de Razer.
Pavé tactile
Le pavé tactile n'a pas été modifié, pour le meilleur ou pour le pire. Bien que nous aimions la surface spacieuse (13 x 8 cm) et la traction douce, le retour spongieux lors de la pression reste insatisfaisant. Les actions de glisser-déposer sont donc plus difficiles par rapport aux ordinateurs portables avec des boutons de souris dédiés comme le Asus TUF FX506 d'Asus. De la graisse disgracieuse a également tendance à s'accumuler sur la surface mate.
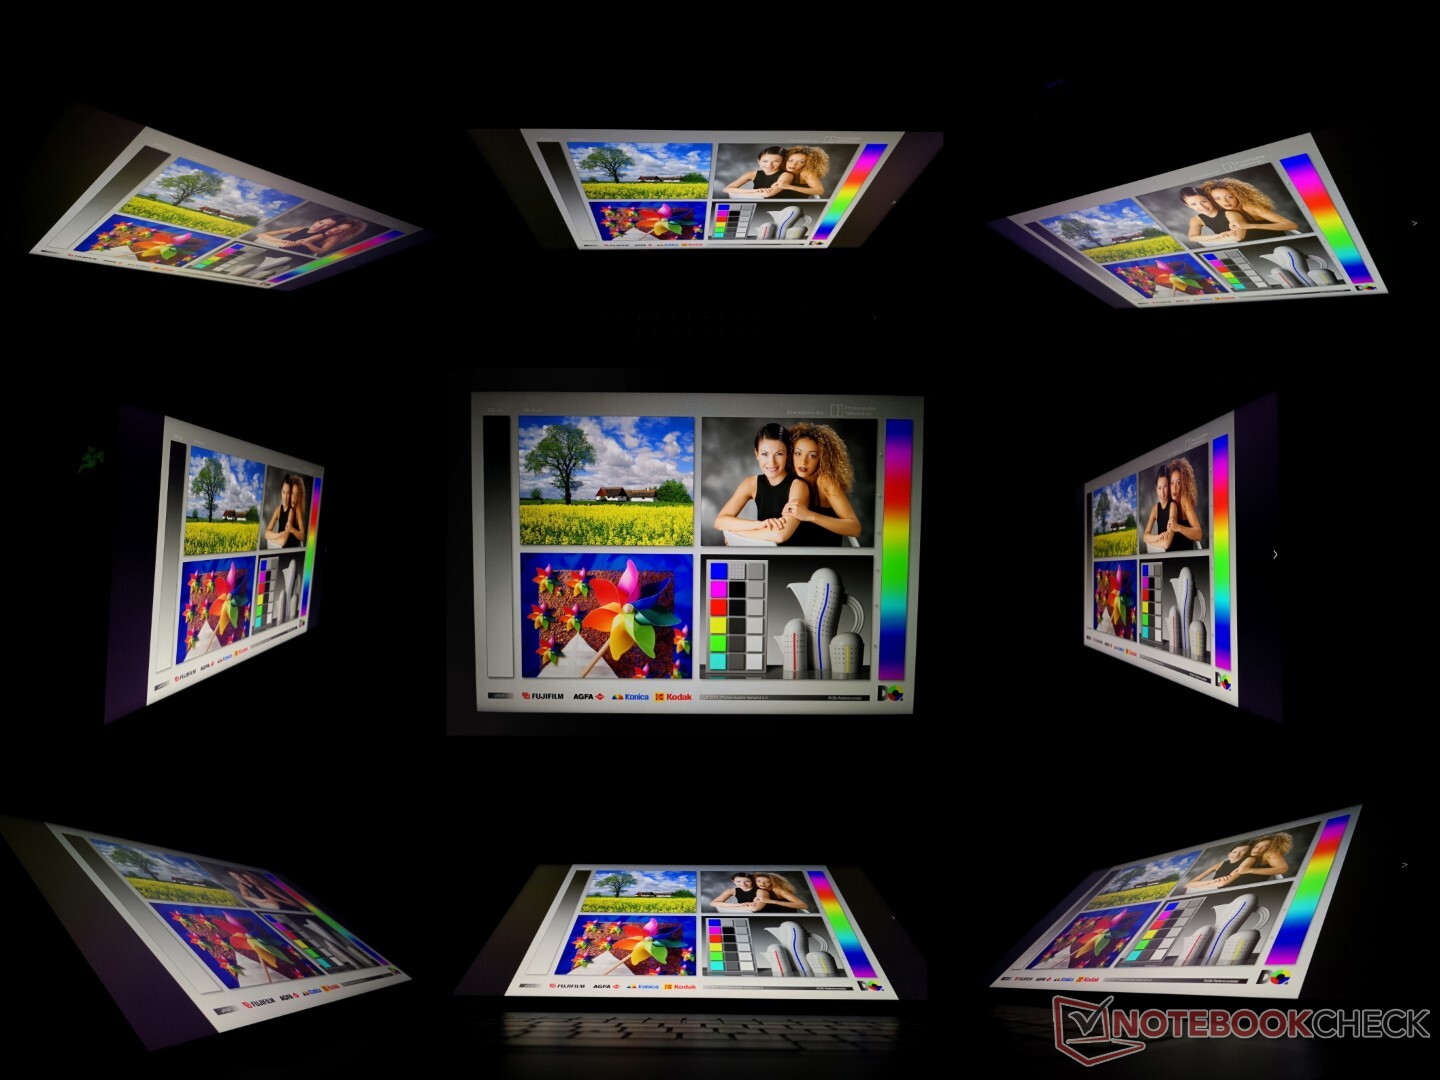
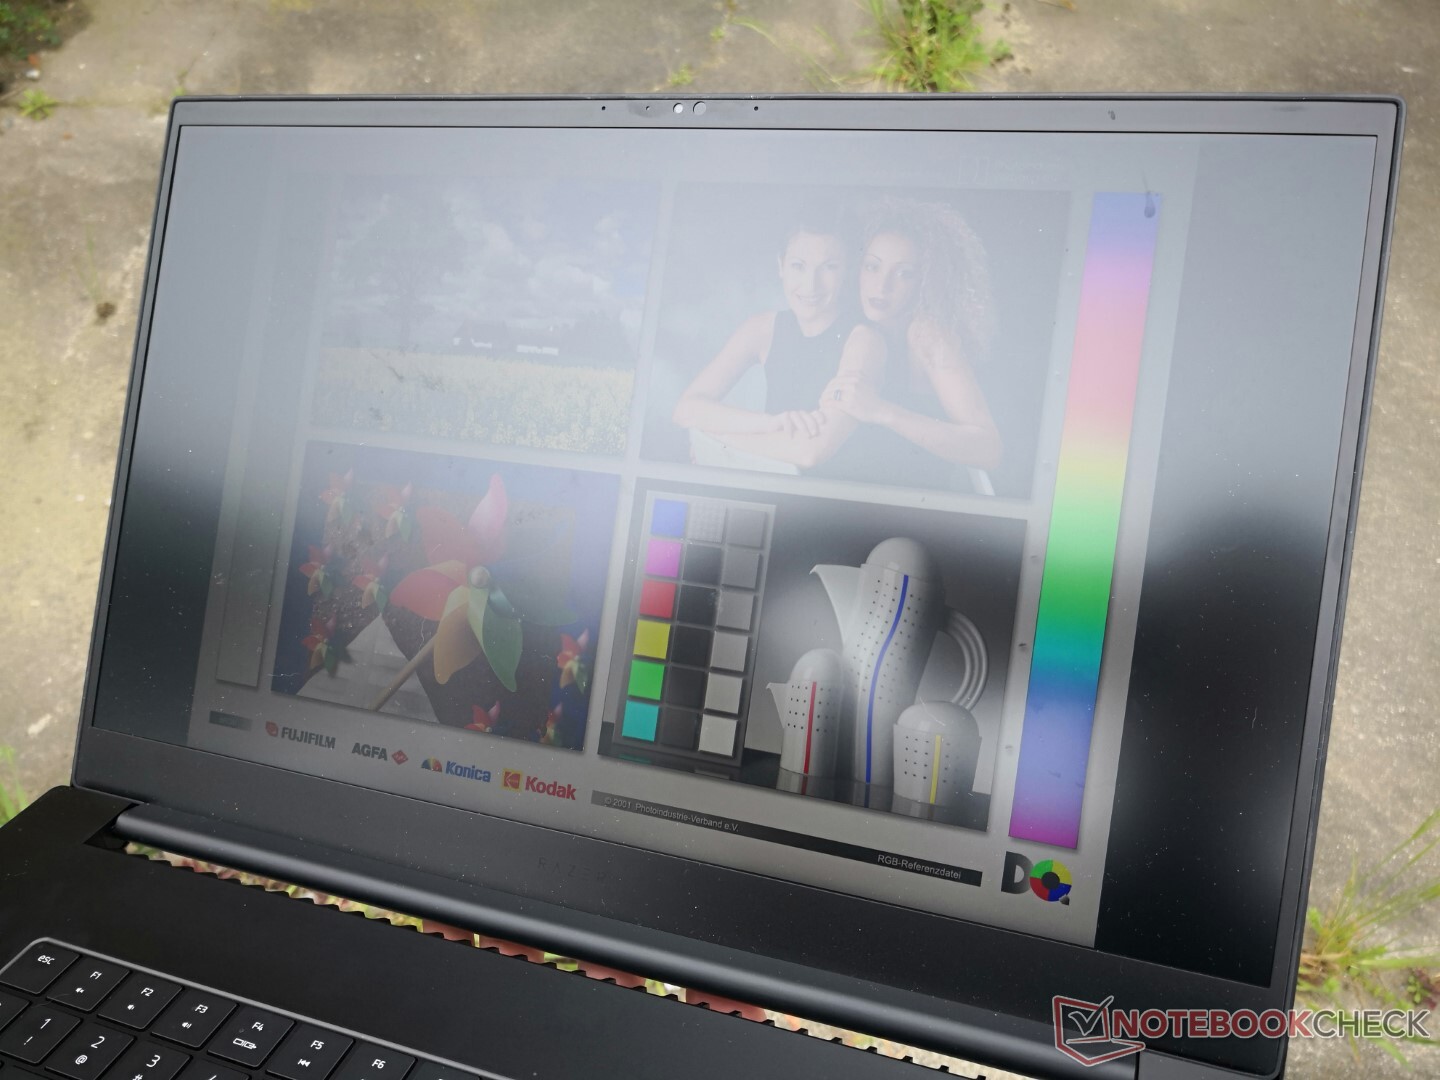
Écran - Aucune option OLED pour le moment
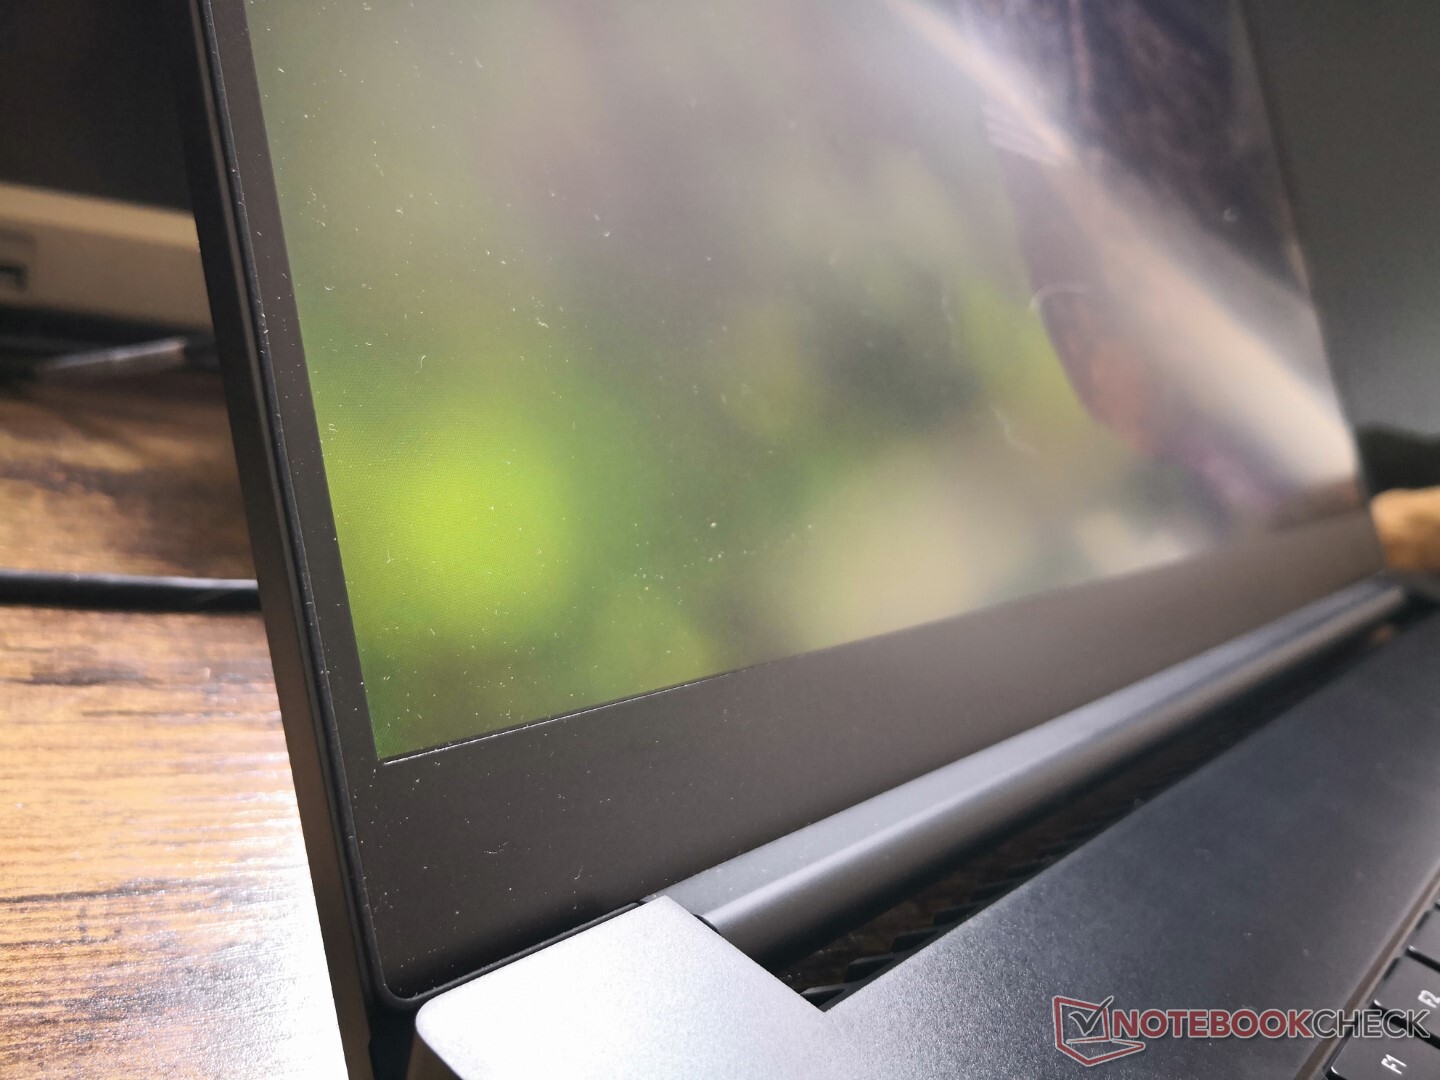
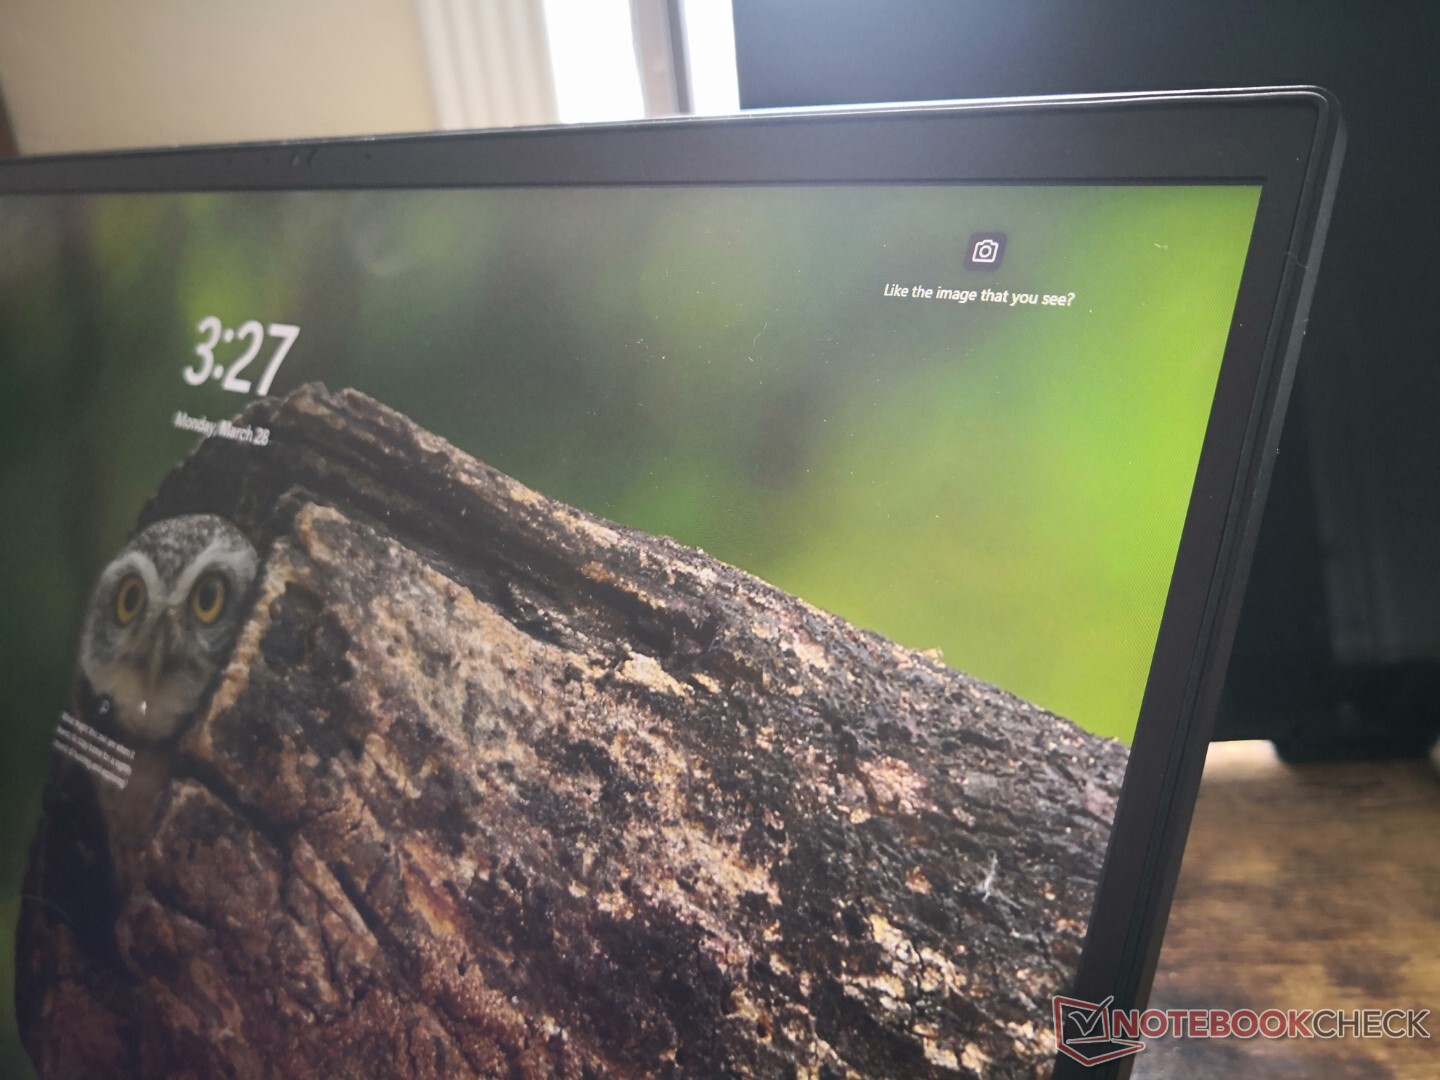
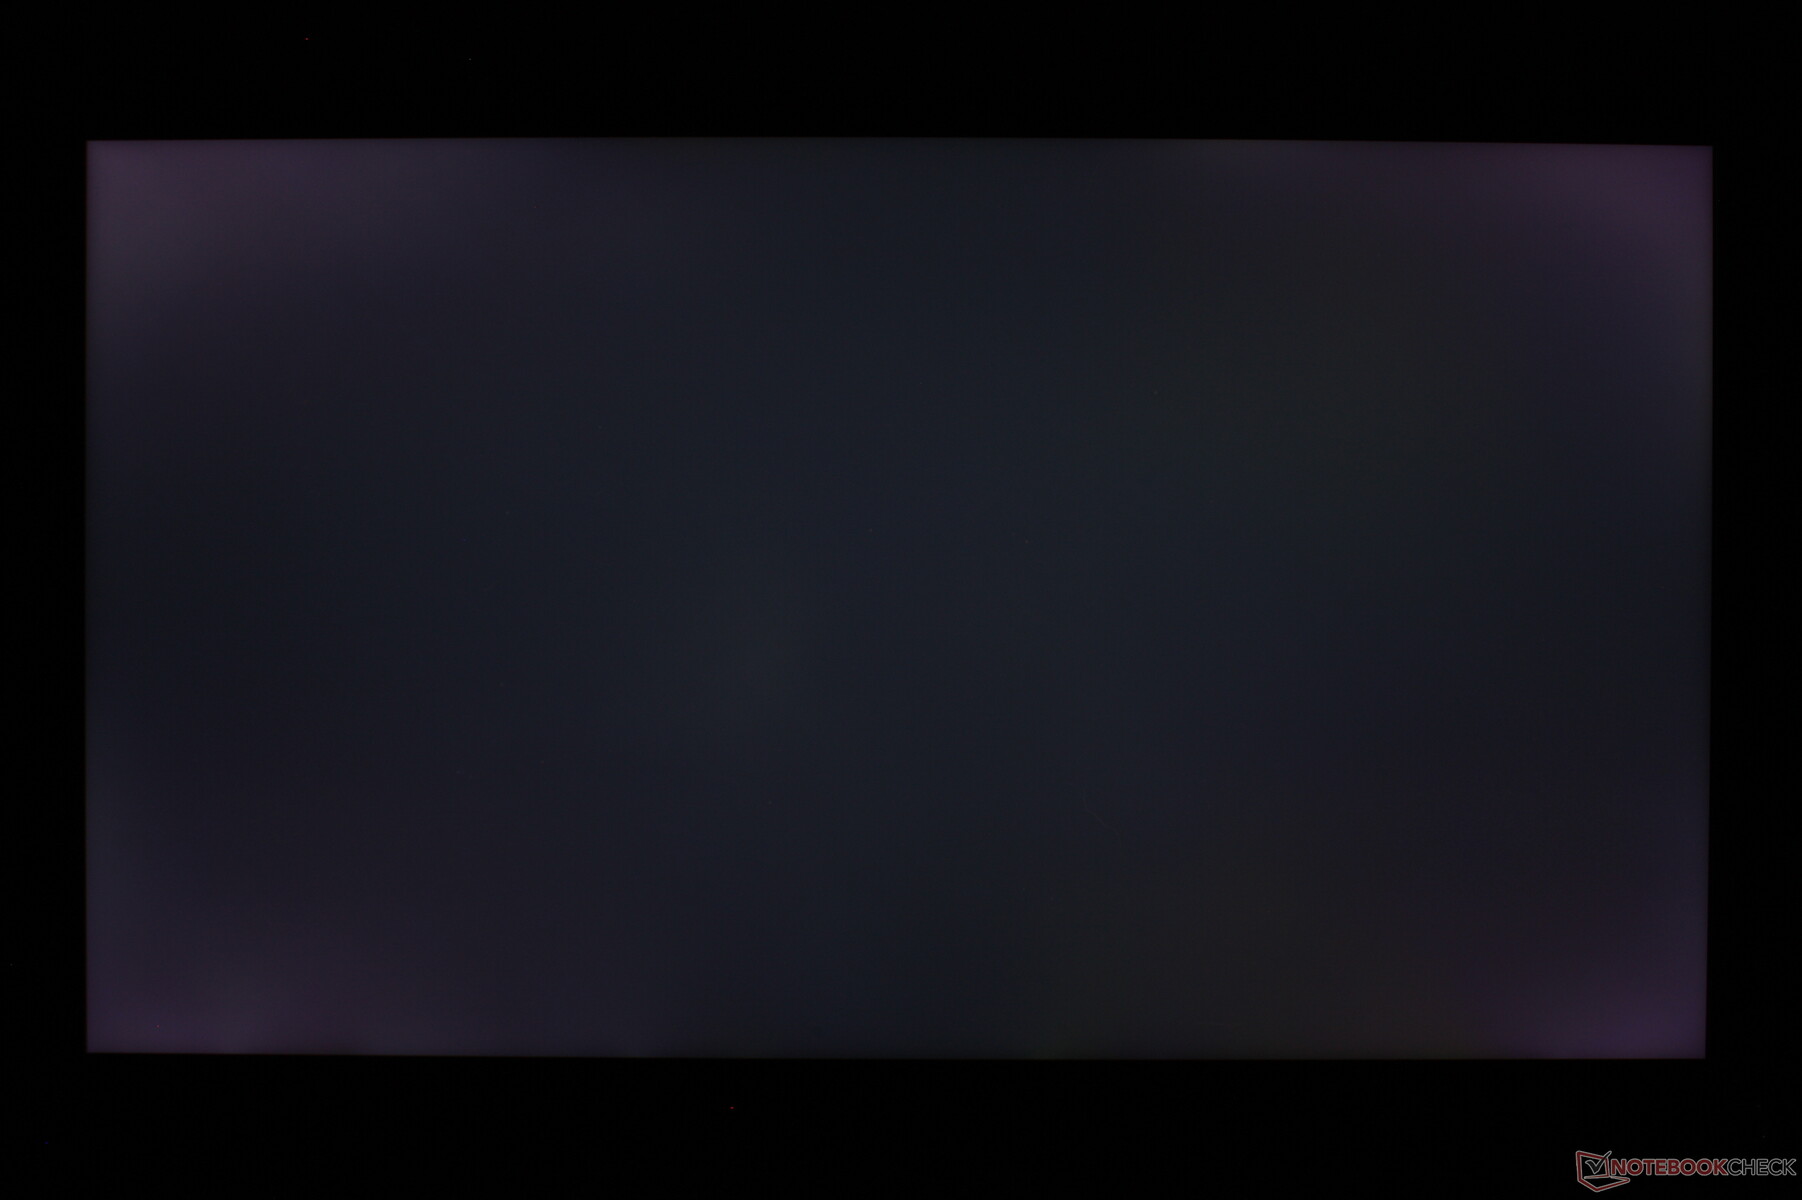
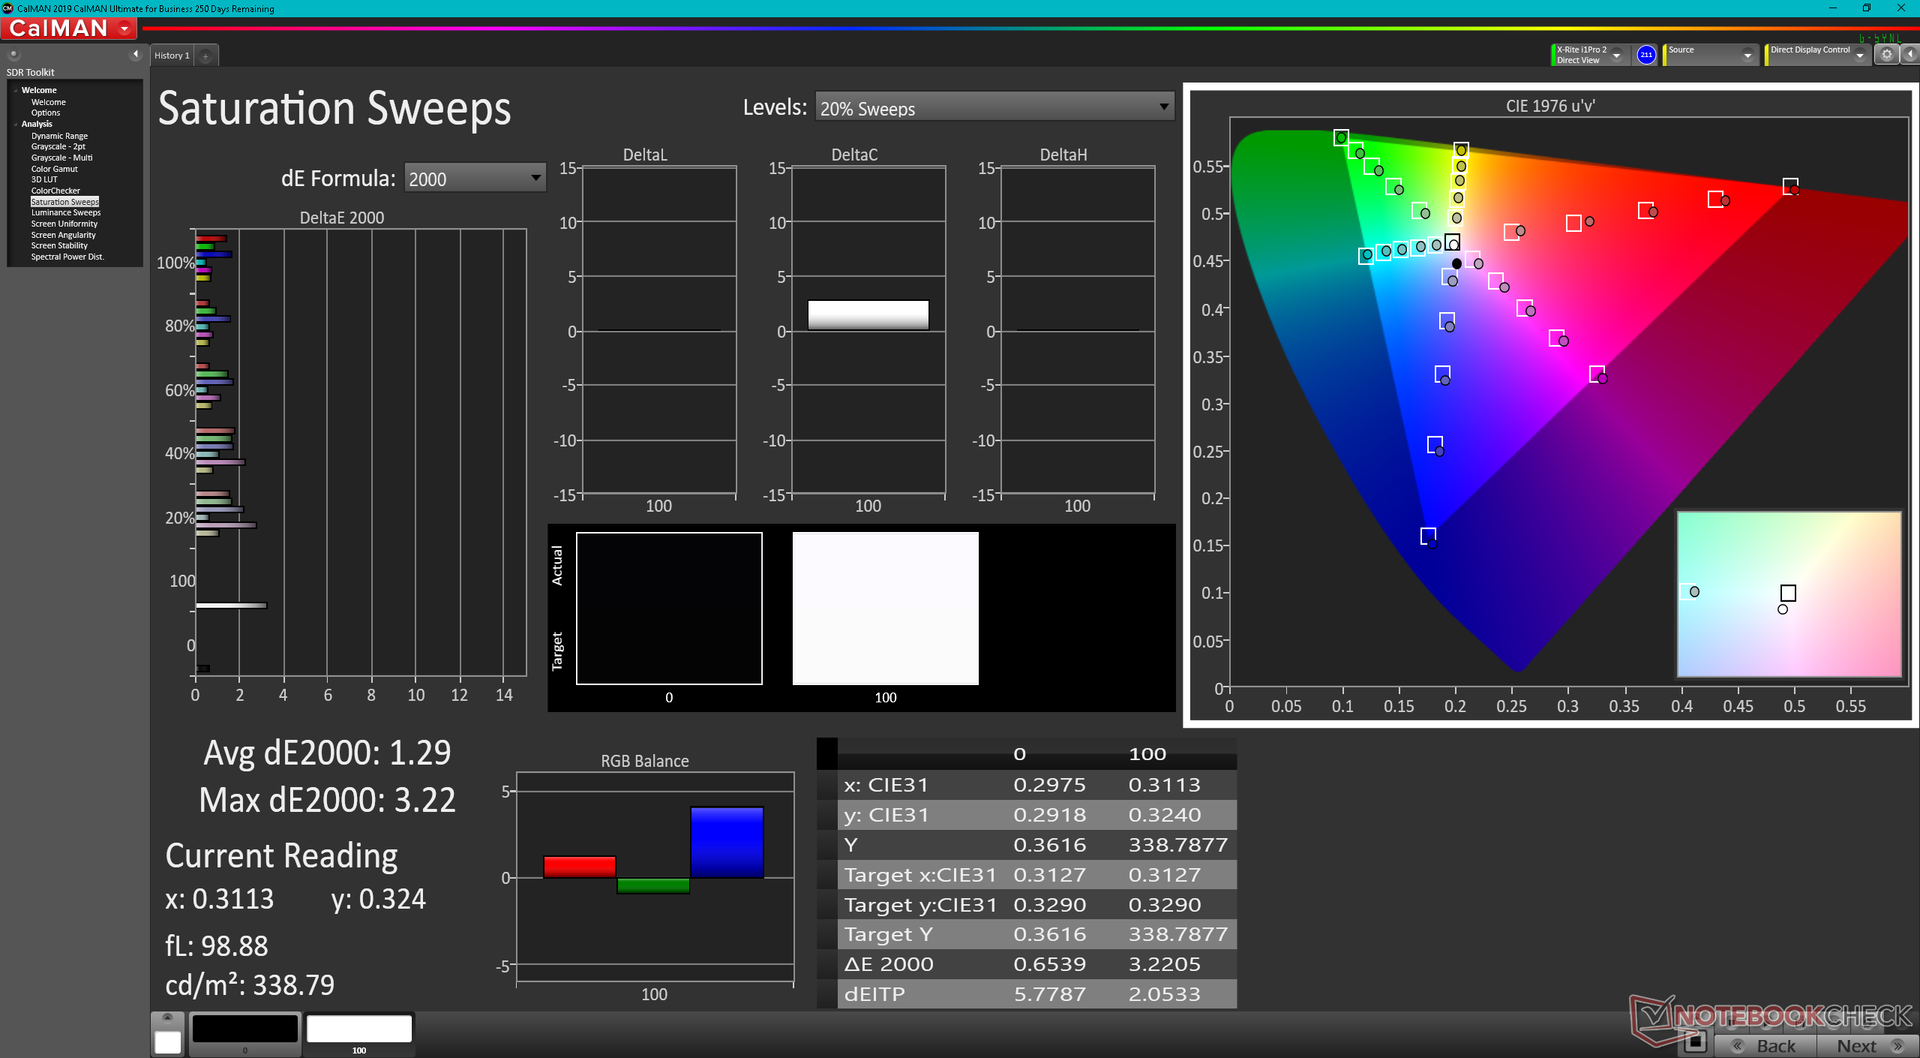
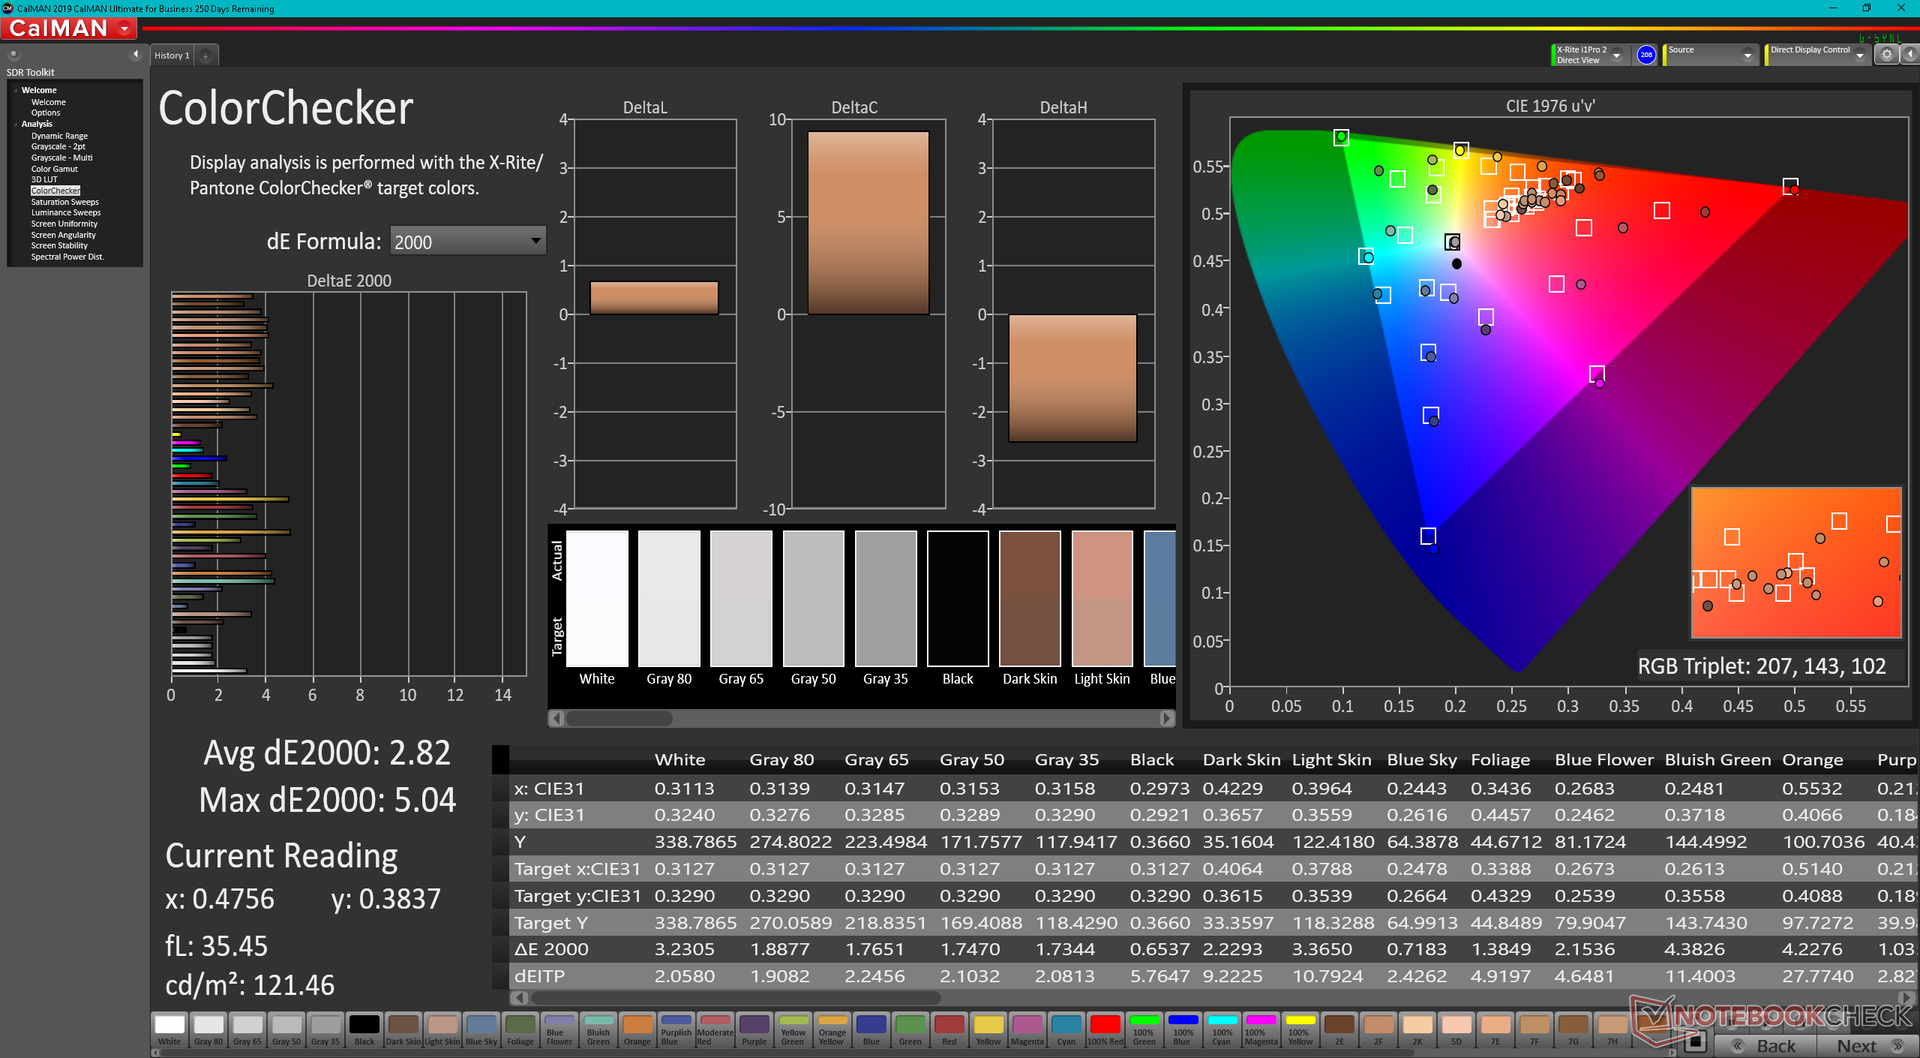
La dalle IPS BOE NE173QHM-NZ1 de notre unité de test est adaptée à la fois à l'édition graphique et aux jeux. Il couvre entièrement la gamme de couleurs DCI-P3 pour satisfaire les artistes numériques tout en offrant des temps de réponse noir-blanc rapides, des taux de rafraîchissement rapides et la compatibilité G-Sync que les joueurs recherchent. Le contraste pourrait être meilleur, surtout si on le compare aux options OLED que Razer propose sur certaines unités du Blade 15, mais c'est typique des panneaux IPS.

| |||||||||||||||||||||||||
Homogénéité de la luminosité: 75 %
Valeur mesurée au centre, sur batterie: 335.8 cd/m²
Contraste: 884:1 (Valeurs des noirs: 0.38 cd/m²)
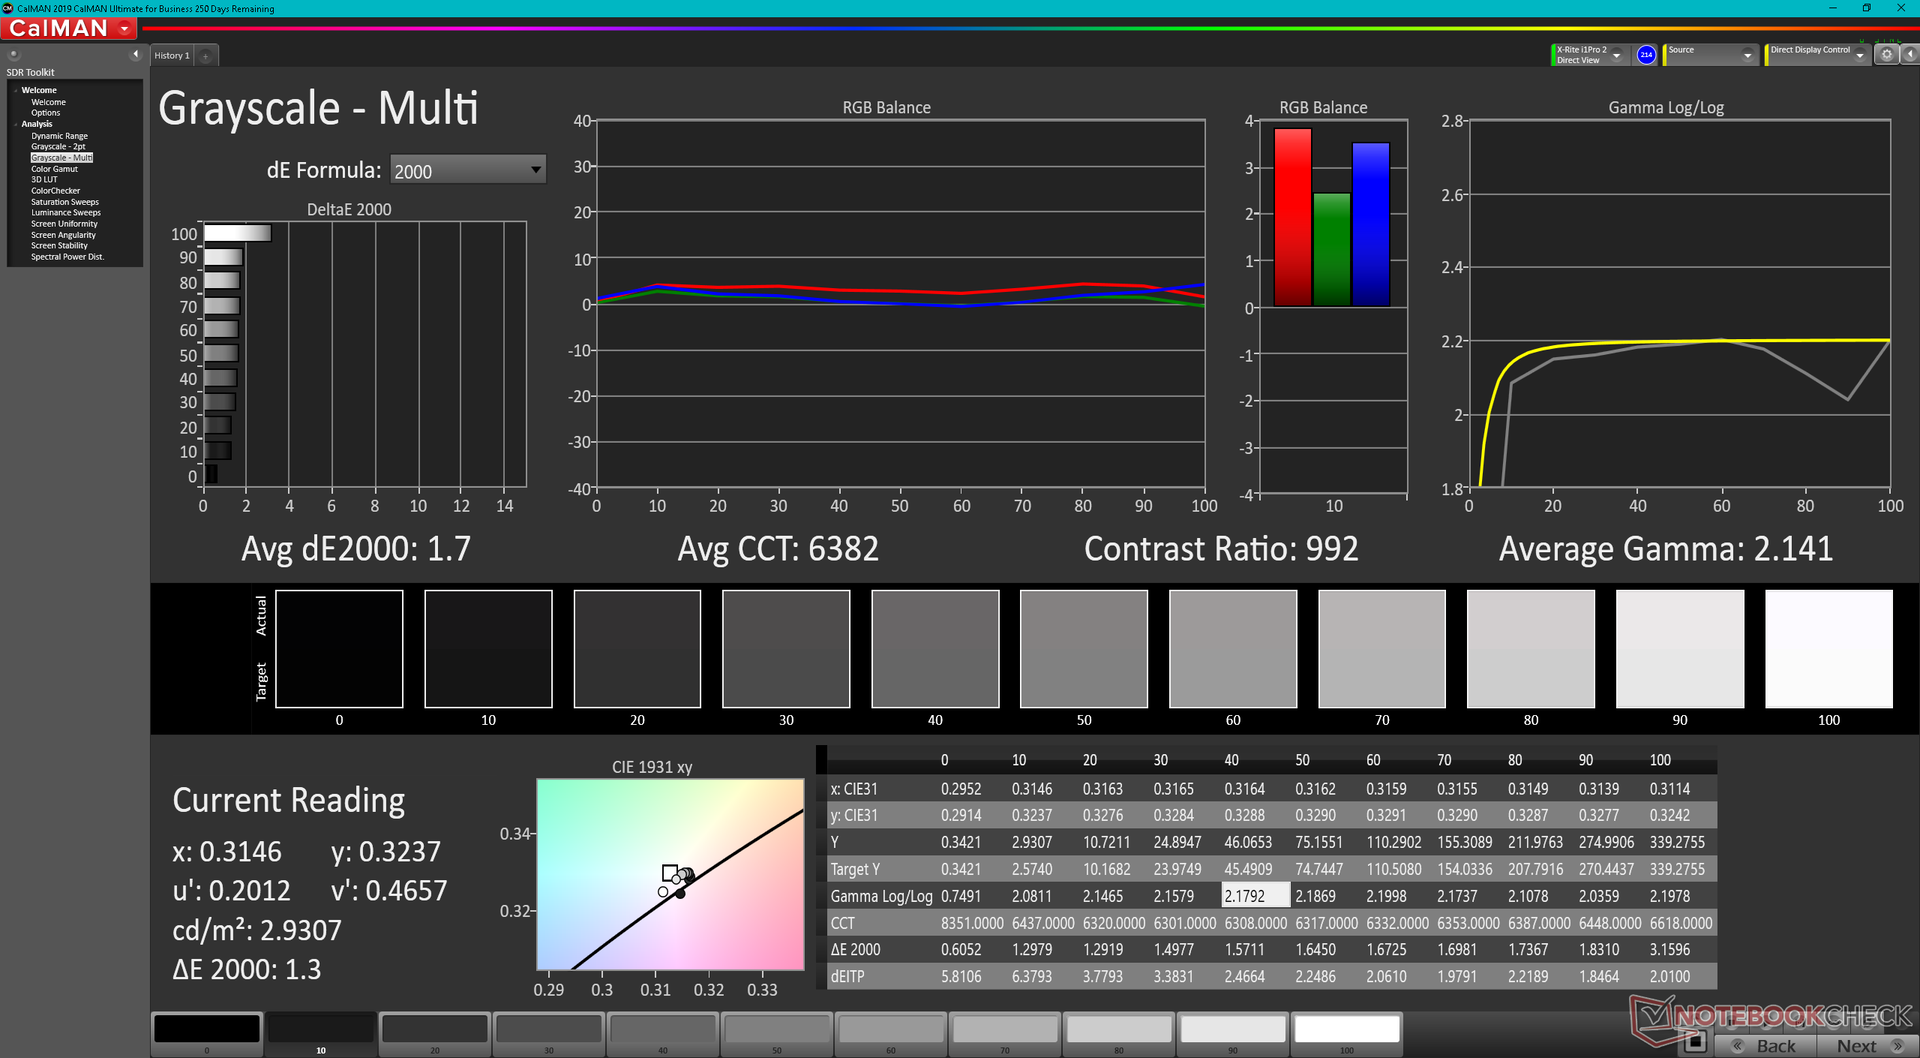
ΔE ColorChecker Calman: 2.82 | ∀{0.5-29.43 Ø4.71}
ΔE Greyscale Calman: 1.7 | ∀{0.09-98 Ø4.96}
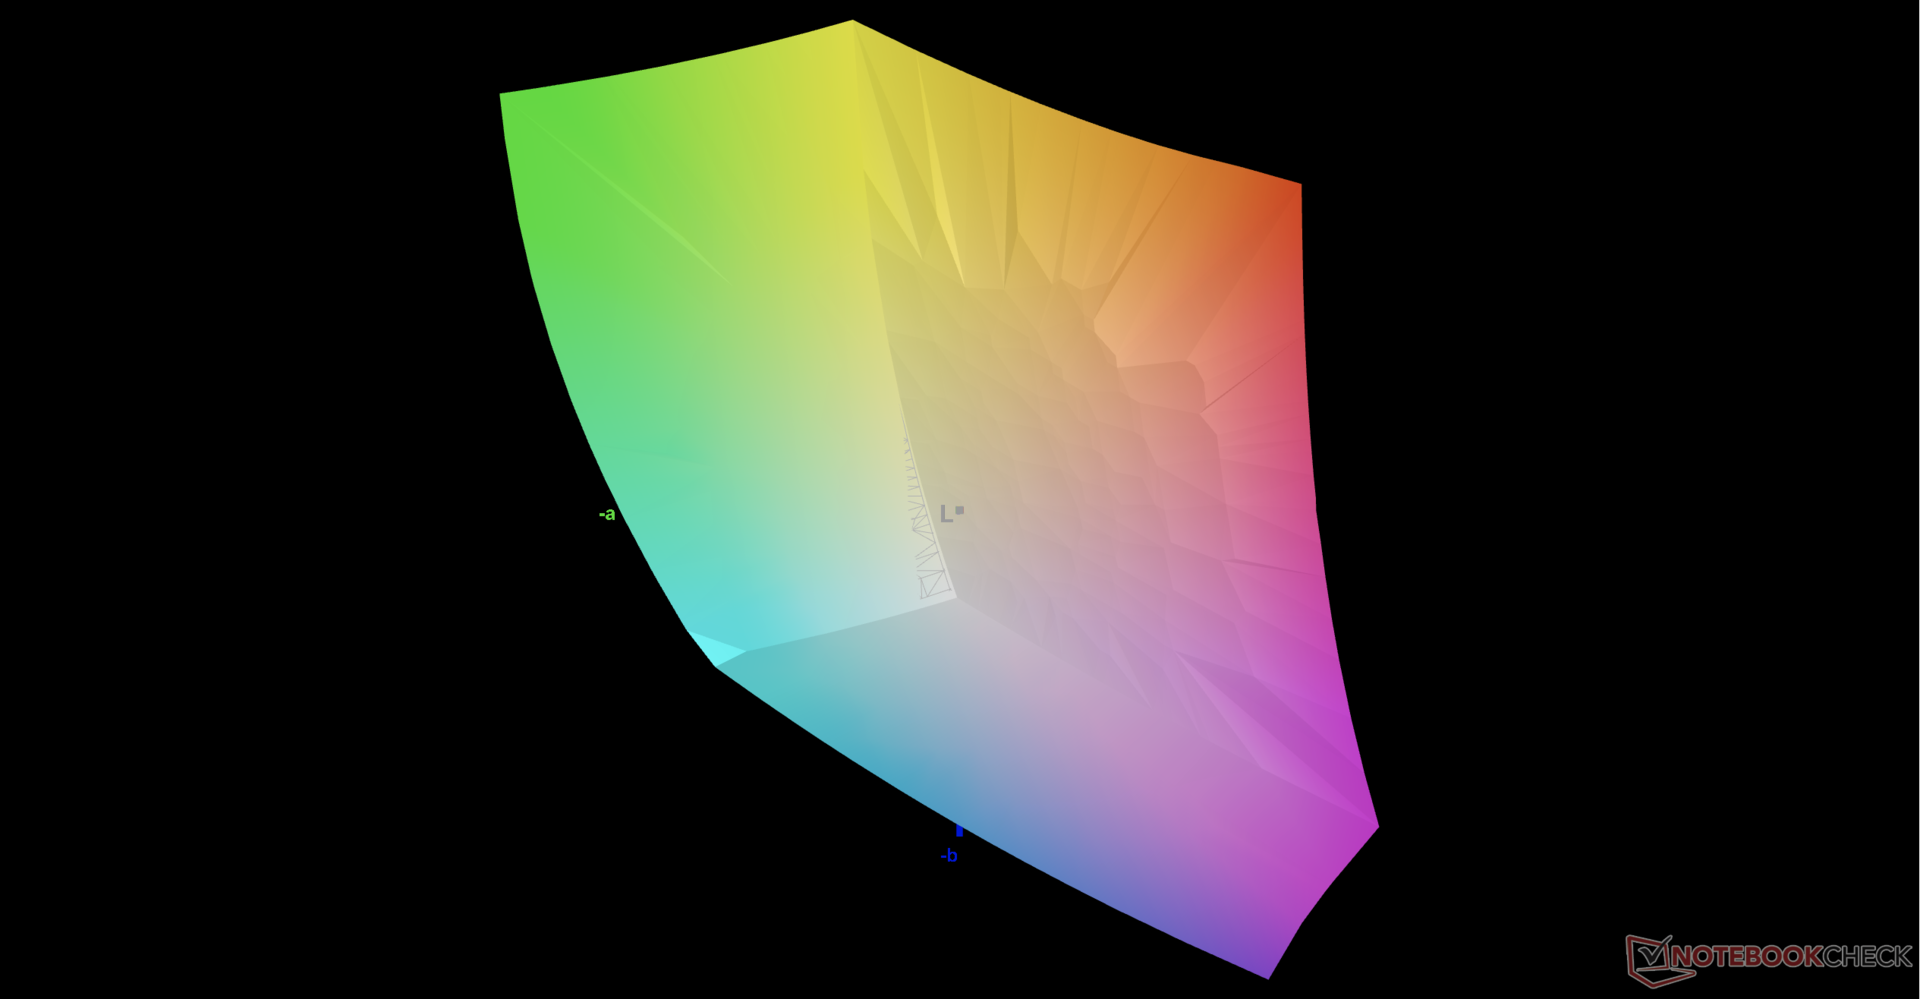
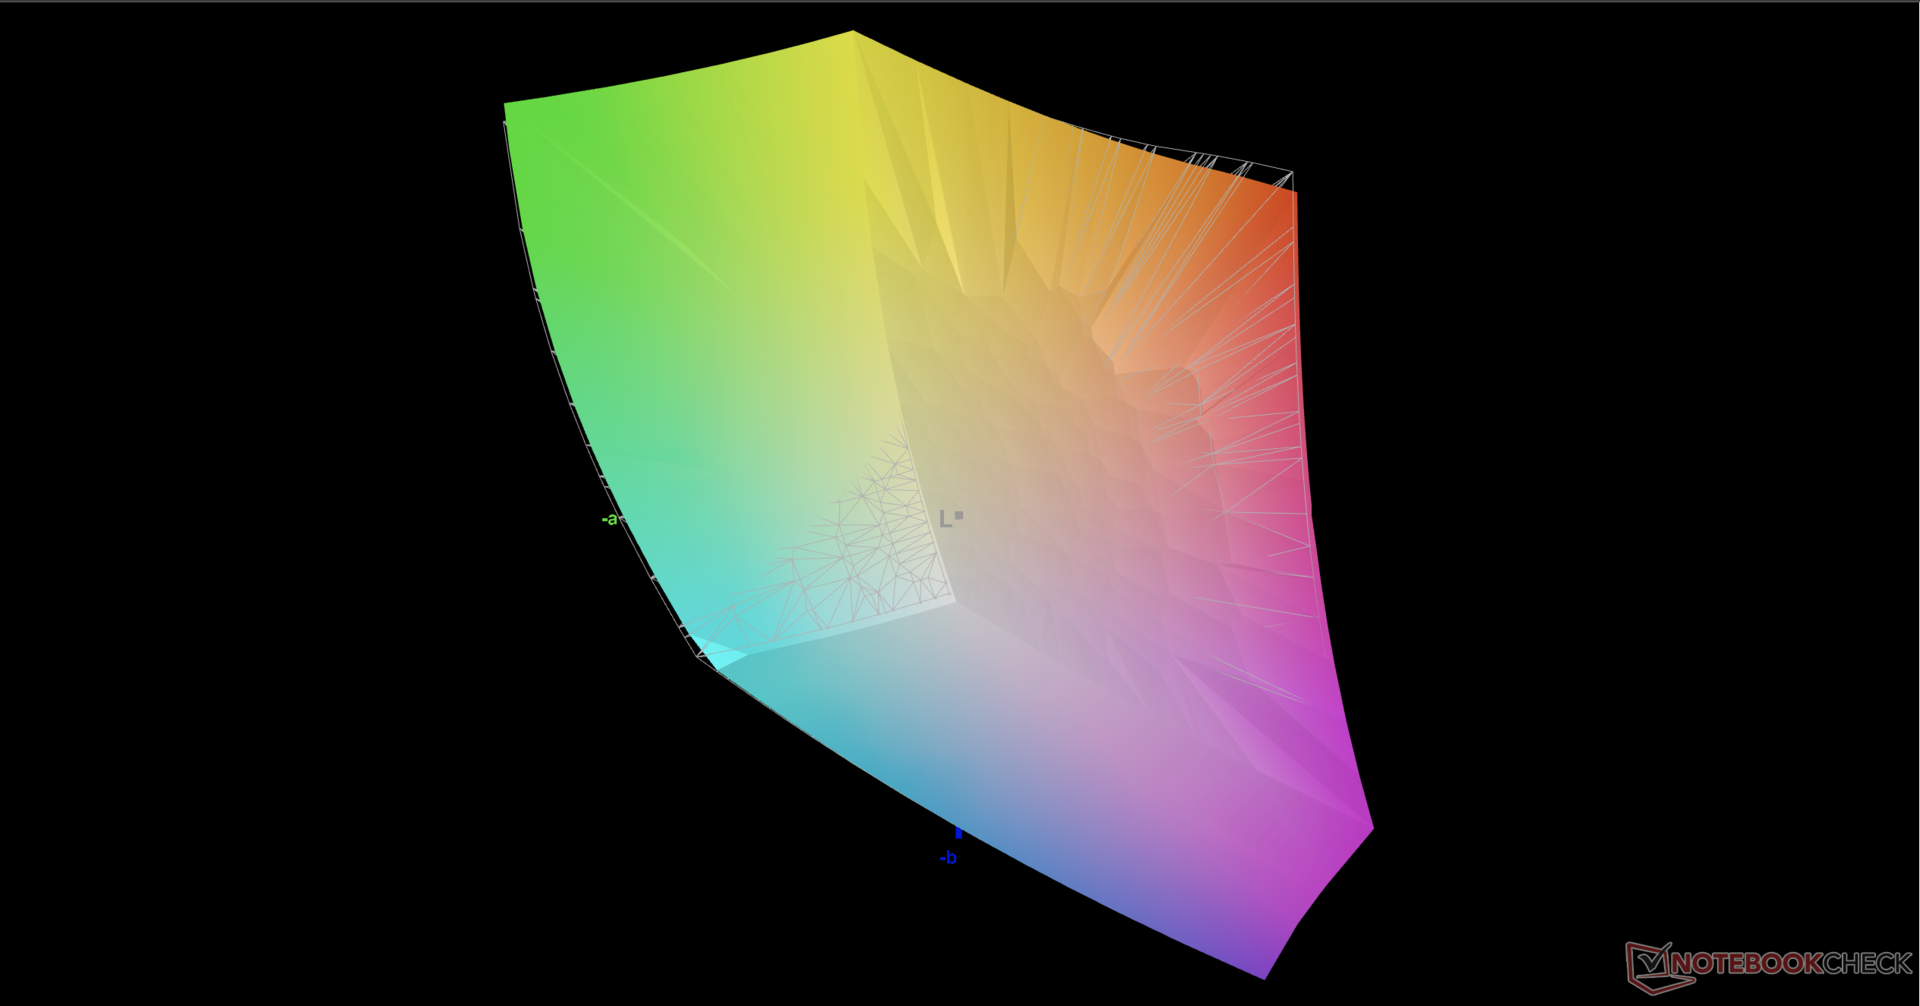
86.2% AdobeRGB 1998 (Argyll 3D)
99.9% sRGB (Argyll 3D)
98.7% Display P3 (Argyll 3D)
Gamma: 2.14
CCT: 6382 K
| Razer Blade 17 RTX 3080 Ti BOE NE173QHM-NZ1, IPS, 2560x1440, 17.3" | Razer Blade Pro 17 2021 (QHD Touch) AU Optronics B173ZAN03.3, IPS, 3840x2160, 17.3" | MSI GS76 Stealth 11UH AUO B173ZAN06.1 (AUODE95), IPS, 3840x2160, 17.3" | Asus ROG Zephyrus S17 GX703HSD BOE099D (BOE CQ NE173QHM-NY3), IPS, 2560x1440, 17.3" | Aorus 17G YD Sharp LQ173M1JW04, IPS, 1920x1080, 17.3" | Alienware x17 RTX 3080 P48E AU Optronics B173ZAN, IPS, 3840x2160, 17.3" | |
|---|---|---|---|---|---|---|
| Display | 2% | -22% | -3% | -14% | 2% | |
| Display P3 Coverage (%) | 98.7 | 88.6 -10% | 63 -36% | 94.2 -5% | 72.3 -27% | 88.3 -11% |
| sRGB Coverage (%) | 99.9 | 100 0% | 94.8 -5% | 98.7 -1% | 100 0% | 100 0% |
| AdobeRGB 1998 Coverage (%) | 86.2 | 99.9 16% | 65 -25% | 84.4 -2% | 73.7 -15% | 100 16% |
| Response Times | 5% | 47% | 52% | 21% | 14% | |
| Response Time Grey 50% / Grey 80% * (ms) | 17.6 ? | 15.2 ? 14% | 8.8 ? 50% | 4.8 73% | 13.6 ? 23% | 14.4 ? 18% |
| Response Time Black / White * (ms) | 11.4 ? | 12 ? -5% | 6.4 ? 44% | 8 30% | 9.2 ? 19% | 10.4 ? 9% |
| PWM Frequency (Hz) | ||||||
| Screen | -76% | 10% | -8% | -10% | -8% | |
| Brightness middle (cd/m²) | 335.9 | 407.2 21% | 474 41% | 322 -4% | 286 -15% | 438.7 31% |
| Brightness (cd/m²) | 294 | 403 37% | 454 54% | 288 -2% | 282 -4% | 435 48% |
| Brightness Distribution (%) | 75 | 90 20% | 88 17% | 72 -4% | 73 -3% | 91 21% |
| Black Level * (cd/m²) | 0.38 | 0.42 -11% | 0.46 -21% | 0.3 21% | 0.24 37% | 0.48 -26% |
| Contrast (:1) | 884 | 970 10% | 1030 17% | 1073 21% | 1192 35% | 914 3% |
| Colorchecker dE 2000 * | 2.82 | 7.25 -157% | 1.5 47% | 3.05 -8% | 2.79 1% | 4.34 -54% |
| Colorchecker dE 2000 max. * | 5.04 | 12.51 -148% | 5.59 -11% | 5.23 -4% | 6.23 -24% | 7.3 -45% |
| Greyscale dE 2000 * | 1.7 | 8.1 -376% | 2.8 -65% | 3.11 -83% | 3.5 -106% | 2.4 -41% |
| Gamma | 2.14 103% | 2.24 98% | 2.158 102% | 2.13 103% | 2.358 93% | 2.09 105% |
| CCT | 6382 102% | 5925 110% | 6597 99% | 6553 99% | 6147 106% | 6413 101% |
| Colorchecker dE 2000 calibrated * | 3.62 | 0.86 | 1.92 | 0.82 | 0.72 | |
| Color Space (Percent of AdobeRGB 1998) (%) | 88.1 | 84 | 74 | |||
| Color Space (Percent of sRGB) (%) | 100 | 99 | 96 | |||
| Moyenne finale (programmes/paramètres) | -23% /
-45% | 12% /
8% | 14% /
2% | -1% /
-6% | 3% /
-2% |
* ... Moindre est la valeur, meilleures sont les performances
Razer calibre chaque écran en usine et nos mesures indépendantes avec un colorimètre X-Rite le prouvent. Les valeurs moyennes de l'échelle de gris et du DeltaE de ColorChecker ne sont respectivement que de 1,7 et 2,82, ce qui montre que l'étalonnage par l'utilisateur final n'est pas nécessaire.
Temps de réponse de l'écran
| ↔ Temps de réponse noir à blanc | ||
|---|---|---|
| 11.4 ms ... hausse ↗ et chute ↘ combinées | ↗ 4.8 ms hausse | 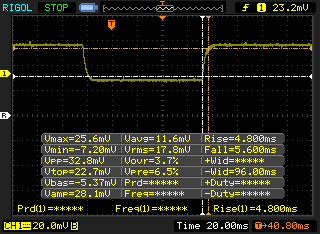 |
| ↘ 5.6 ms chute | ||
| L'écran montre de bons temps de réponse, mais insuffisant pour du jeu compétitif. En comparaison, tous les appareils testés affichent entre 0.1 (minimum) et 240 (maximum) ms. » 31 % des appareils testés affichent de meilleures performances. Cela signifie que les latences relevées sont meilleures que la moyenne (19.8 ms) de tous les appareils testés. | ||
| ↔ Temps de réponse gris 50% à gris 80% | ||
| 17.6 ms ... hausse ↗ et chute ↘ combinées | ↗ 8.4 ms hausse | 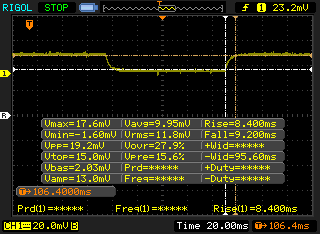 |
| ↘ 9.2 ms chute | ||
| L'écran montre de bons temps de réponse, mais insuffisant pour du jeu compétitif. En comparaison, tous les appareils testés affichent entre 0.165 (minimum) et 636 (maximum) ms. » 32 % des appareils testés affichent de meilleures performances. Cela signifie que les latences relevées sont meilleures que la moyenne (31 ms) de tous les appareils testés. | ||
Scintillement / MLI (Modulation de largeur d'impulsion)
| Scintillement / MLI (Modulation de largeur d'impulsion) non décelé | 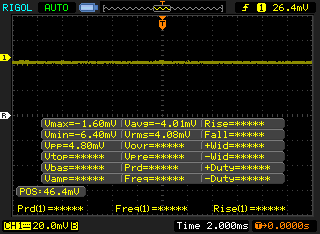 | ||
En comparaison, 52 % des appareils testés n'emploient pas MDI pour assombrir leur écran. Nous avons relevé une moyenne à 7754 (minimum : 5 - maximum : 343500) Hz dans le cas où une MDI était active. | |||
Performance - Graphique de 165 W avec Intel 12e génération
Conditions d'essai
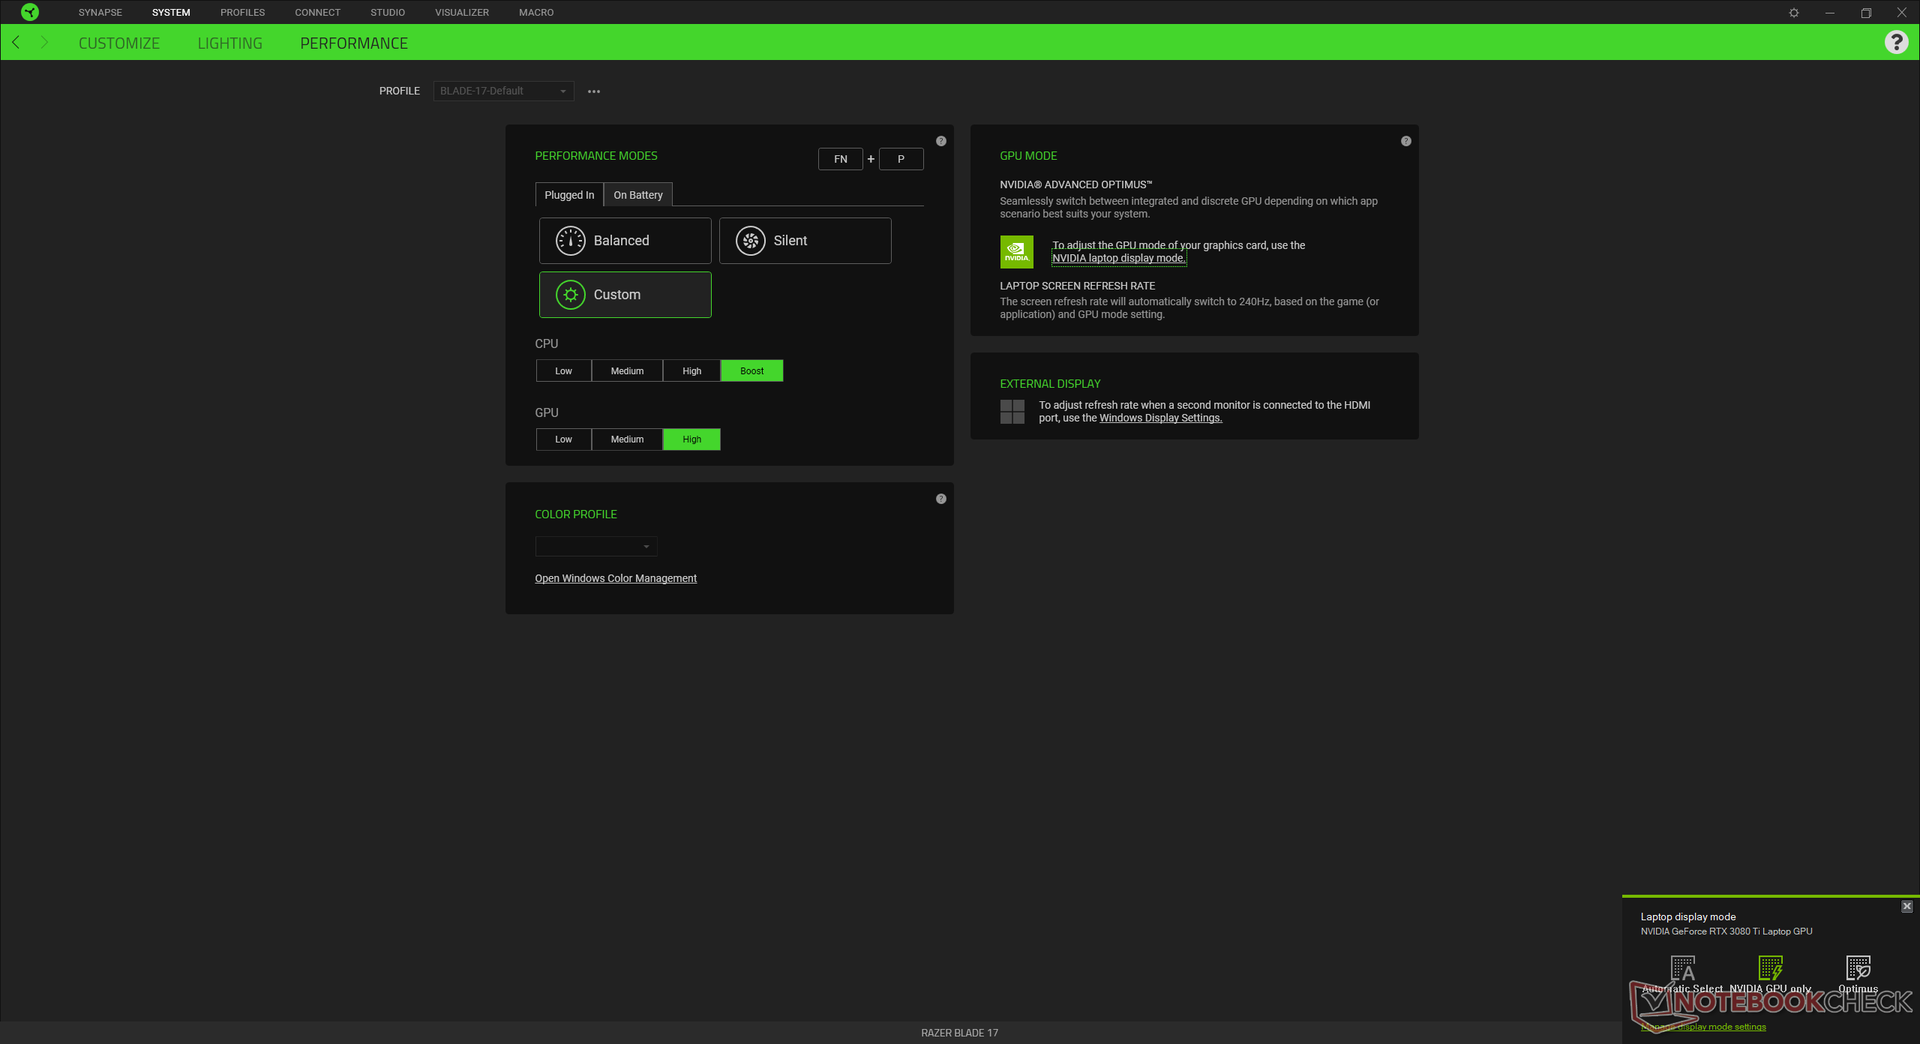
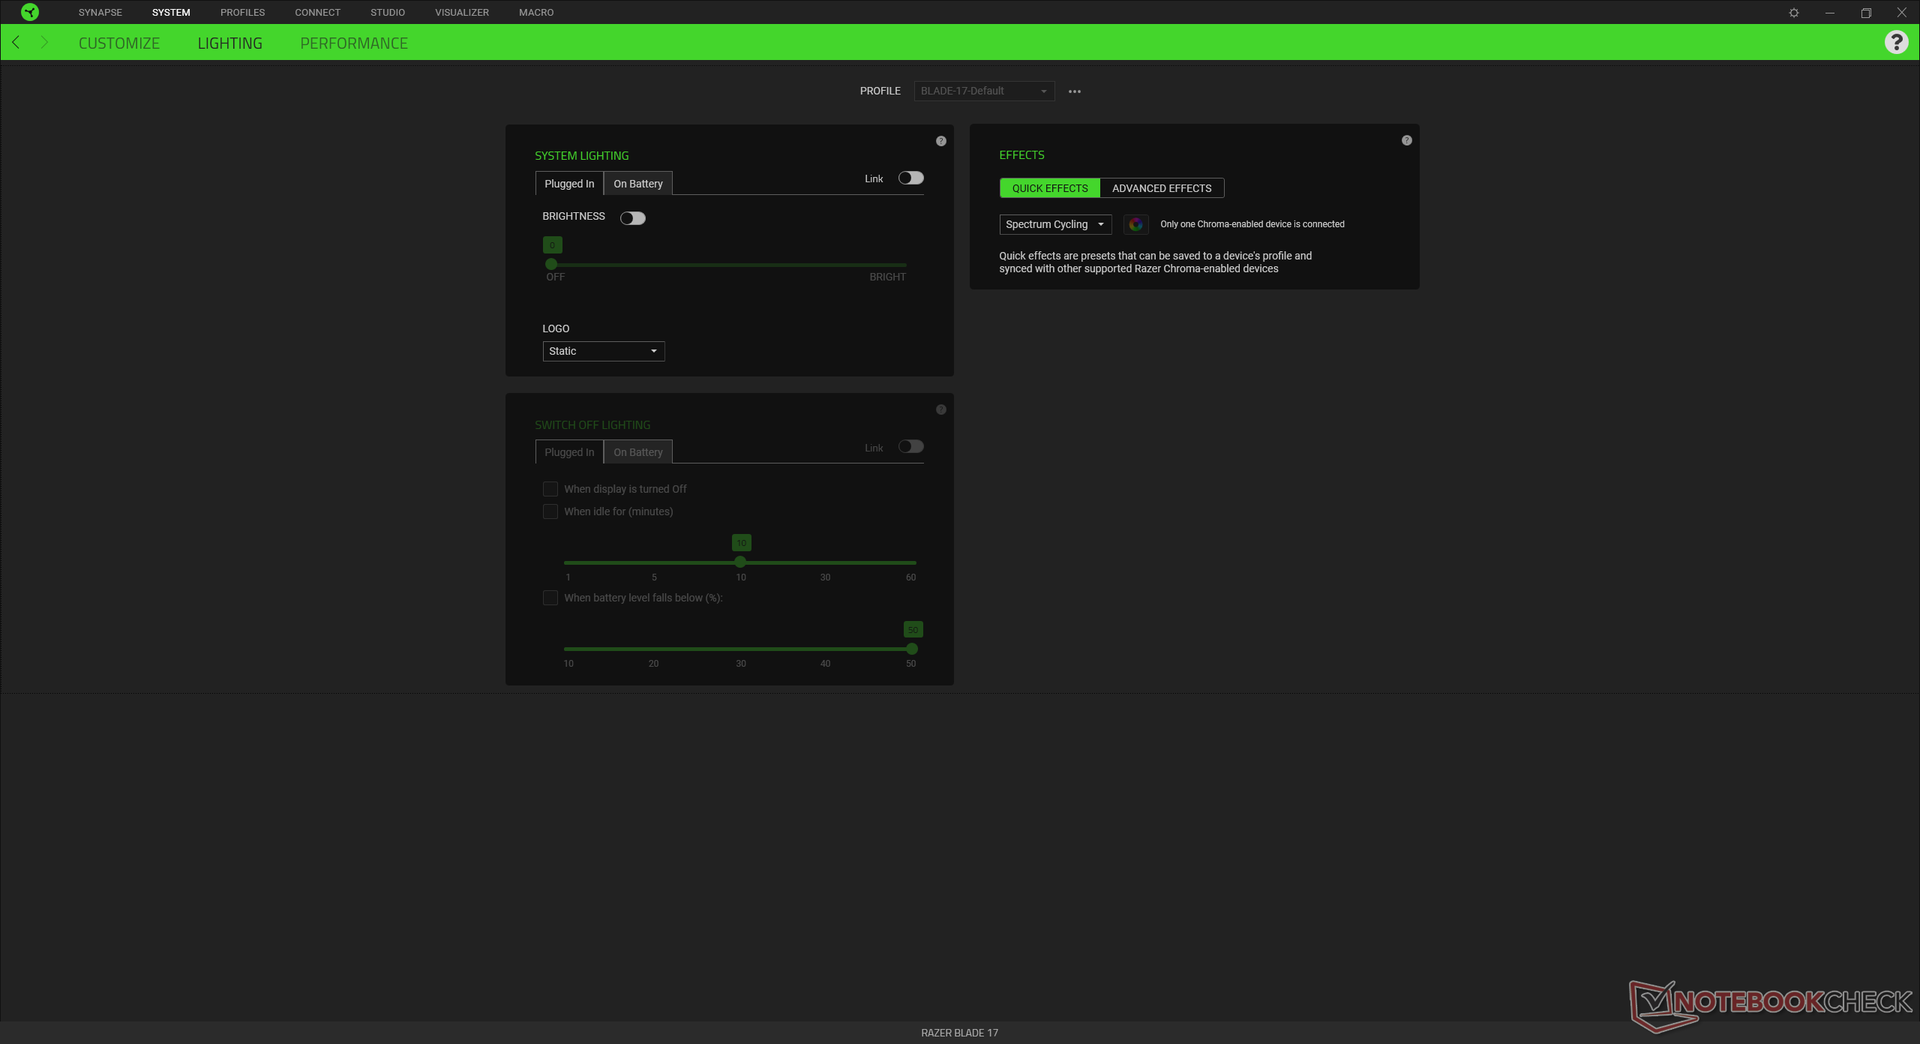
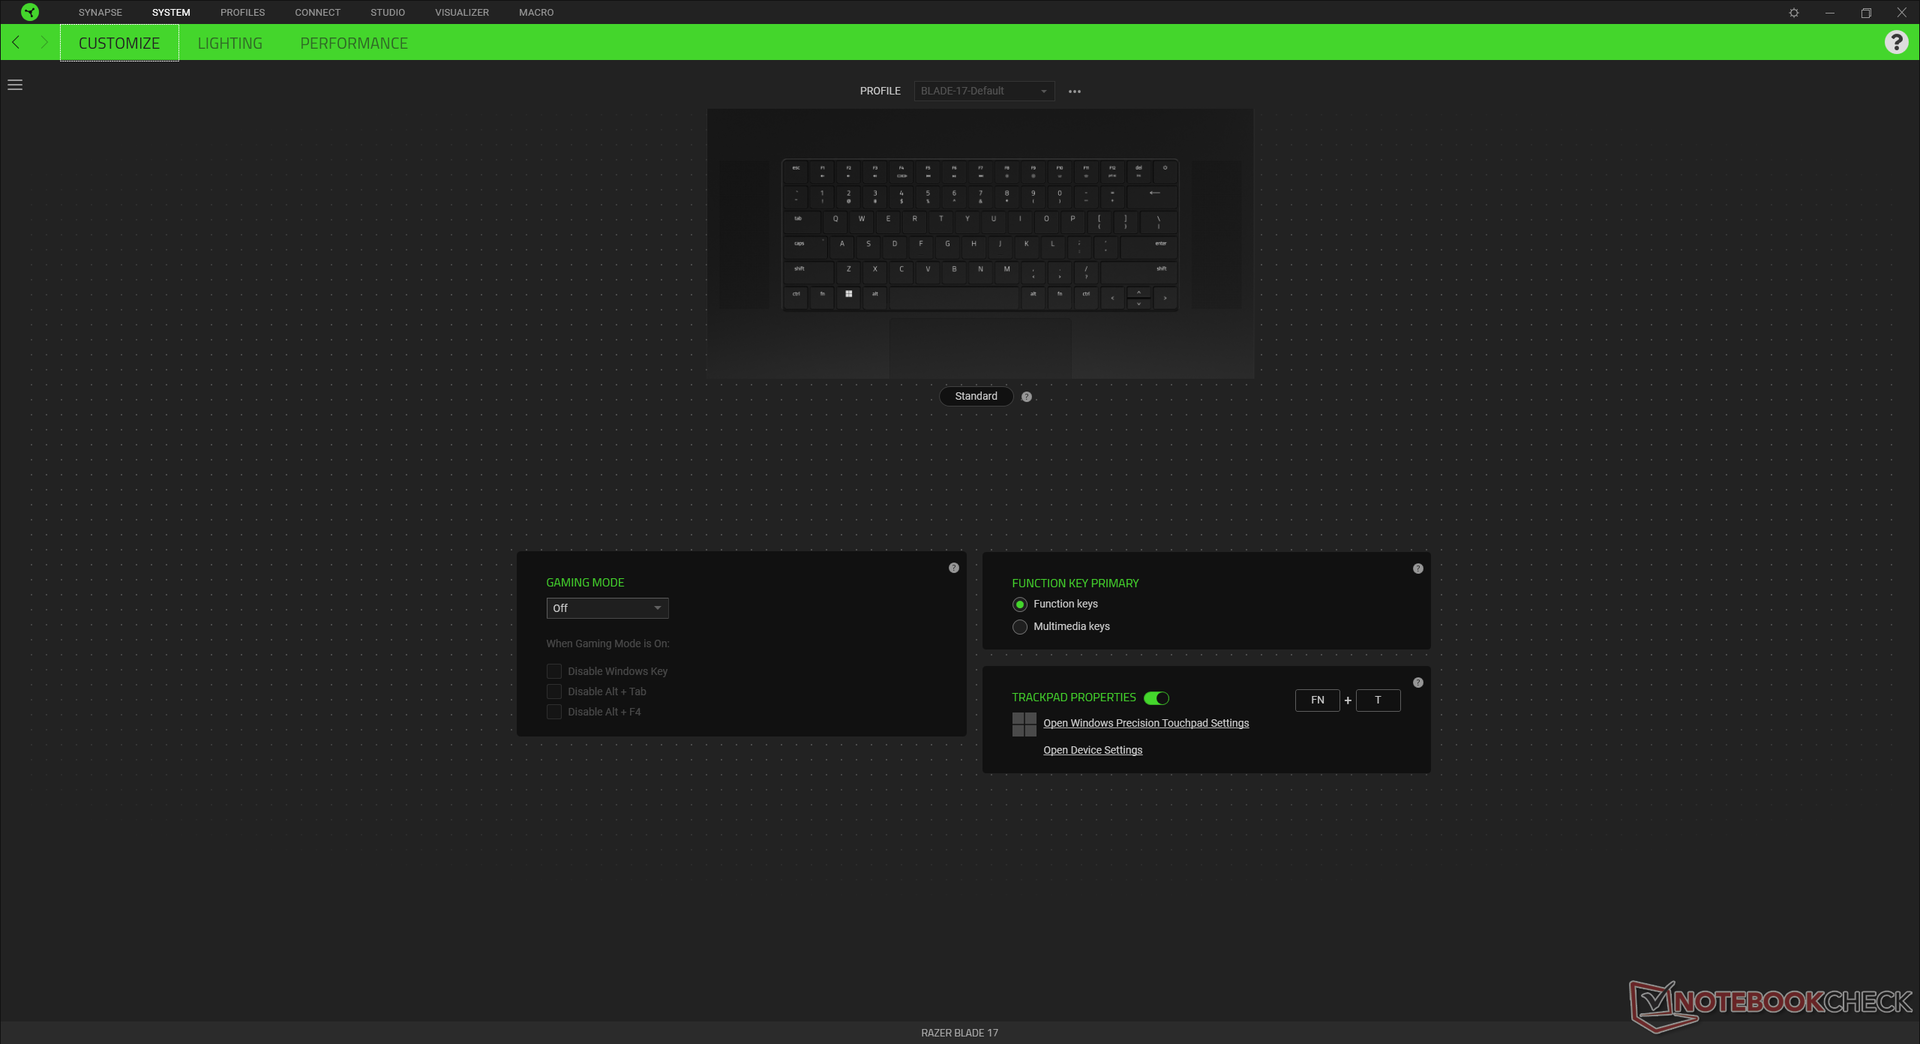
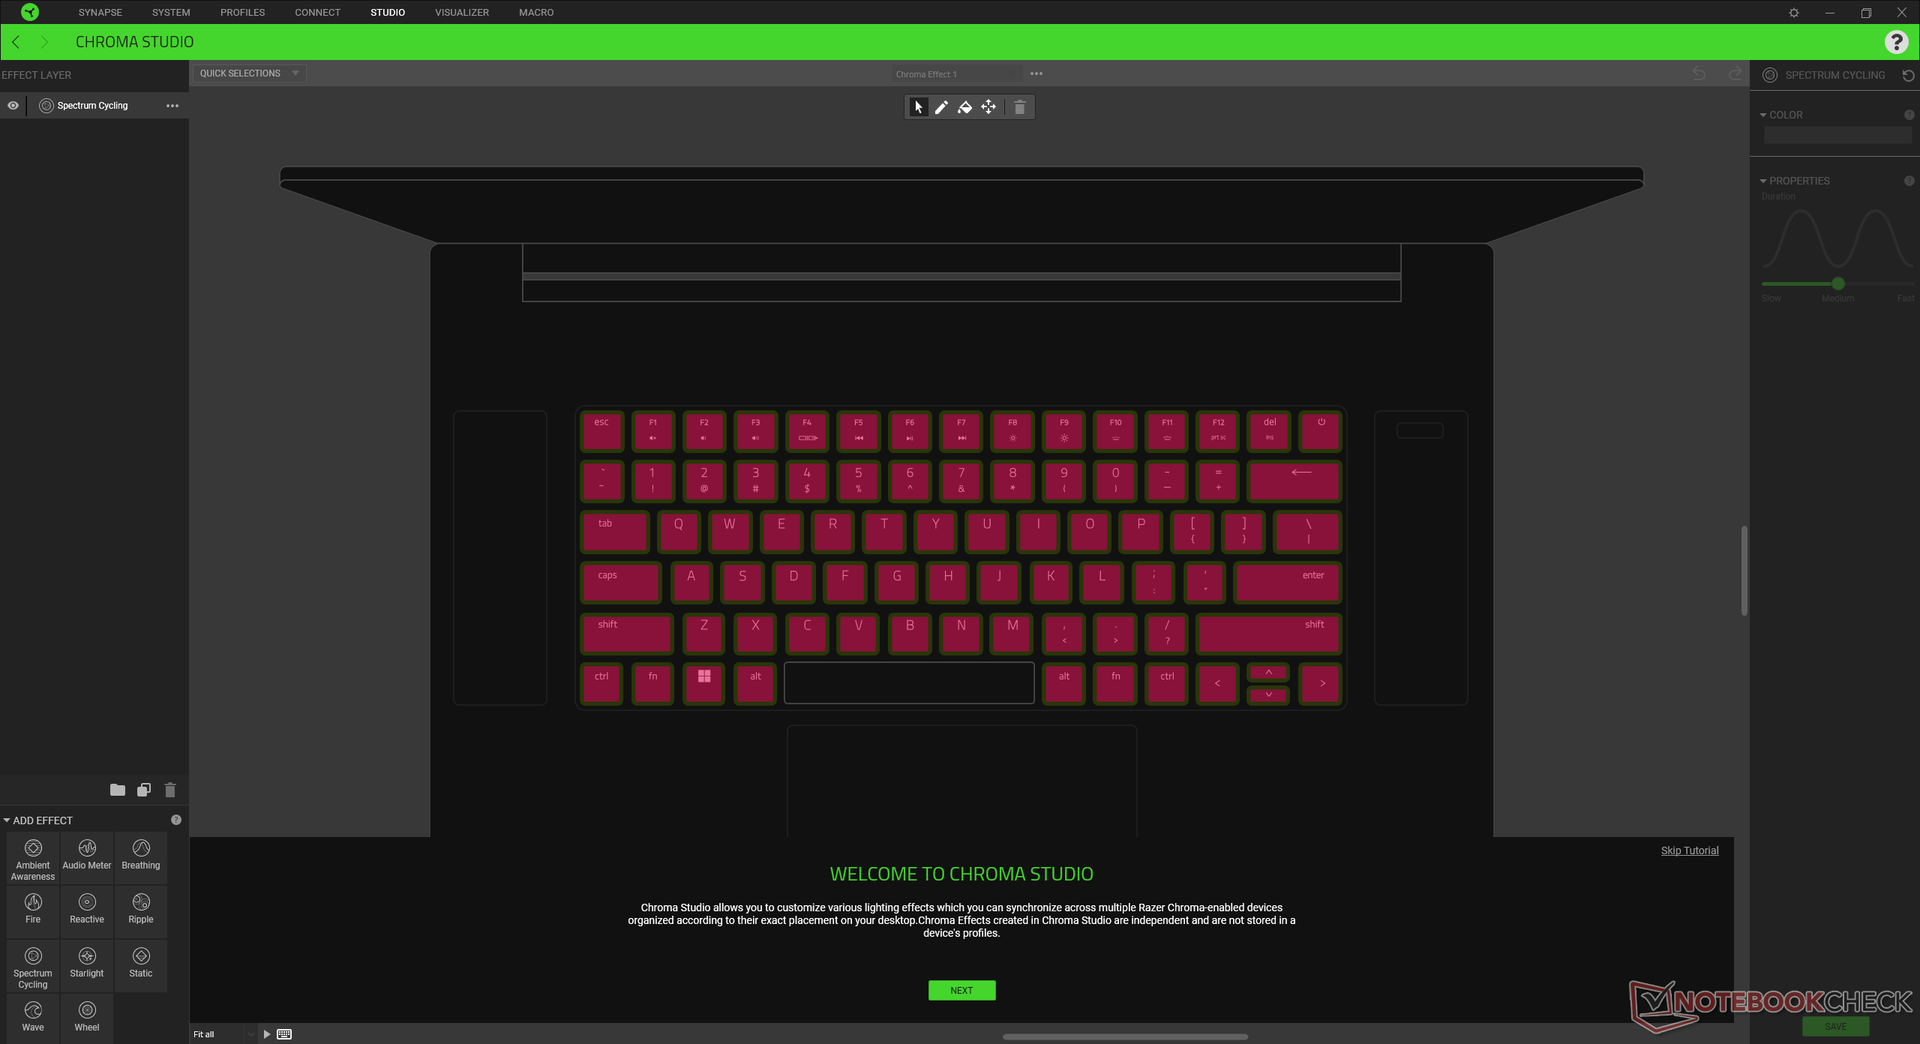
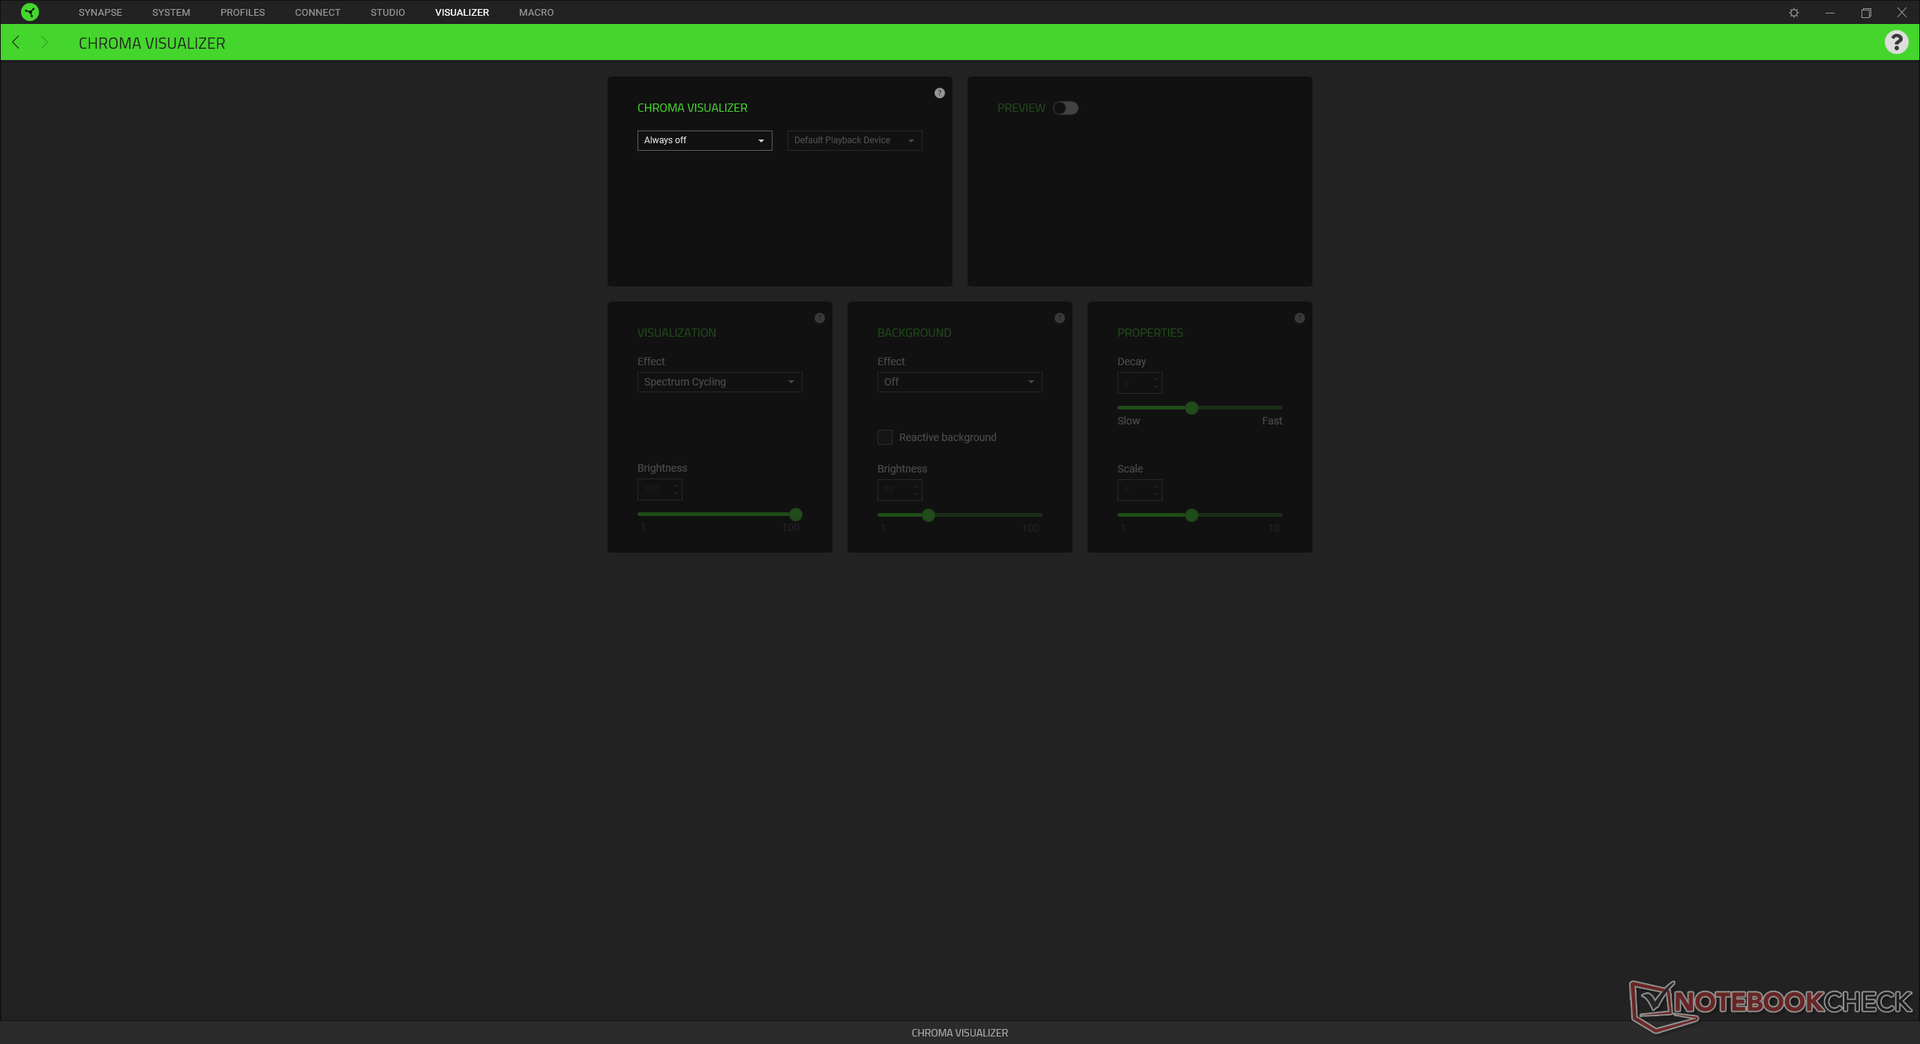
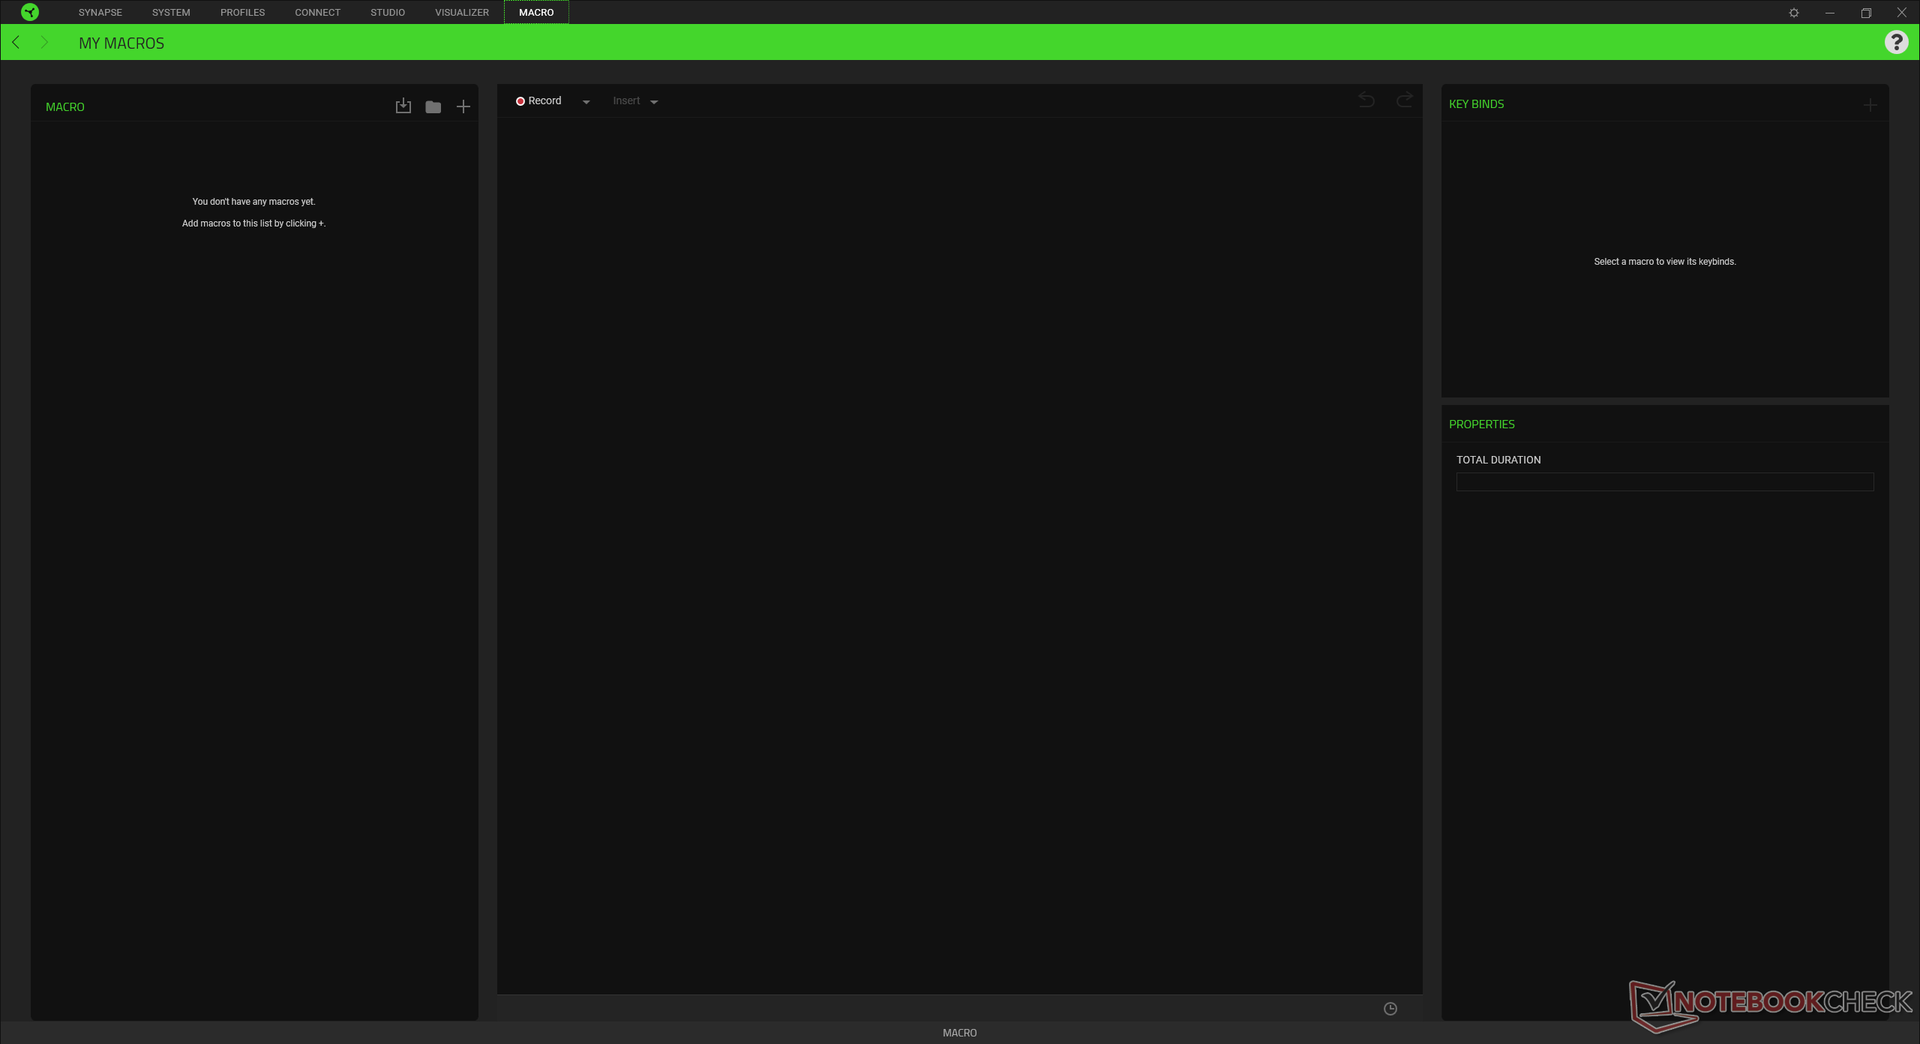
Notre appareil était réglé en mode manuel, avec le processeur et le processeur graphique respectivement sur Boost et High, pour obtenir les meilleurs résultats possibles aux tests de référence. Les utilisateurs doivent se familiariser avec le logiciel Synapse car il sert de centre de contrôle pour les fonctions spécifiques au système et les profils de performance.
Le Blade 17 est l'un des rares ordinateurs portables de jeu à prendre en charge Advanced Optimus, ce qui signifie que les utilisateurs peuvent basculer entre les modes Optimus et dGPU G-Sync sans avoir besoin de redémarrer.
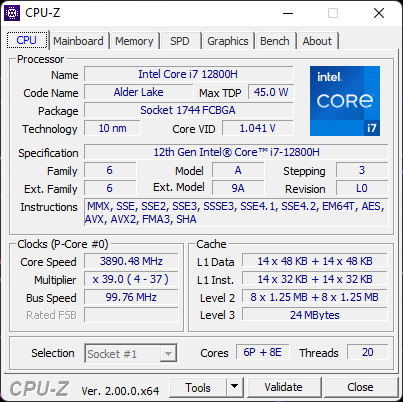
Processeur
Les performances du processeur sont conformes à ce que nous attendons des autres ordinateurs portables fonctionnant avec le même processeur Core i7-12800H core i7-12800H. Les performances brutes sont d'environ 20 à 25 % et 50 à 70 % supérieures à celles du 11e génération du Core i7-11800H et du 10e génération Core i7-10875Hrespectivement, sur les modèles Blade 17 d'ancienne génération. La mise à niveau vers le Core i9-12900H ne devrait offrir qu'une augmentation de 10 % des performances par rapport à notre configuration Core i7-12800H.
La durabilité des performances est excellente, sans baisse importante des fréquences d'horloge au fil du temps lors de l'exécution de CineBench R15 xT en boucle.
Cinebench R15 Multi Loop
Cinebench R20: CPU (Multi Core) | CPU (Single Core)
Cinebench R15: CPU Multi 64Bit | CPU Single 64Bit
Blender: v2.79 BMW27 CPU
7-Zip 18.03: 7z b 4 | 7z b 4 -mmt1
Geekbench 5.5: Multi-Core | Single-Core
HWBOT x265 Benchmark v2.2: 4k Preset
LibreOffice : 20 Documents To PDF
R Benchmark 2.5: Overall mean
| HWBOT x265 Benchmark v2.2 / 4k Preset | |
| MSI GE76 Raider | |
| Schenker Uniwill Technology GM7AG8P | |
| Razer Blade 17 RTX 3080 Ti | |
| Moyenne Intel Core i7-12800H (11.7 - 19.4, n=5) | |
| Schenker XMG Apex 17 M21 | |
| Razer Blade 17 RTX 3070 | |
| Gigabyte A7 X1 | |
| MSI GE76 Raider 10UH | |
| Lenovo Legion 5 17ACH6H-82JY0003GE | |
| Razer Blade Pro 17 2021 (QHD Touch) | |
| Acer Nitro 5 AN517-53-54DQ | |
* ... Moindre est la valeur, meilleures sont les performances
AIDA64: FP32 Ray-Trace | FPU Julia | CPU SHA3 | CPU Queen | FPU SinJulia | FPU Mandel | CPU AES | CPU ZLib | FP64 Ray-Trace | CPU PhotoWorxx
| Performance rating | |
| Schenker XMG Pro 17 (Late 2021, RTX 3080) | |
| MSI GE76 Raider | |
| Lenovo Legion 5 17ACH6H-82JY0003GE | |
| Schenker Uniwill Technology GM7AG8P | |
| Moyenne Intel Core i7-12800H | |
| Razer Blade 17 RTX 3080 Ti | |
| AIDA64 / FP32 Ray-Trace | |
| Schenker XMG Pro 17 (Late 2021, RTX 3080) | |
| Lenovo Legion 5 17ACH6H-82JY0003GE | |
| MSI GE76 Raider | |
| Moyenne Intel Core i7-12800H (5839 - 15206, n=5) | |
| Schenker Uniwill Technology GM7AG8P | |
| Razer Blade 17 RTX 3080 Ti | |
| AIDA64 / FPU Julia | |
| Lenovo Legion 5 17ACH6H-82JY0003GE | |
| Schenker XMG Pro 17 (Late 2021, RTX 3080) | |
| Moyenne Intel Core i7-12800H (27801 - 80002, n=5) | |
| MSI GE76 Raider | |
| Schenker Uniwill Technology GM7AG8P | |
| Razer Blade 17 RTX 3080 Ti | |
| AIDA64 / CPU SHA3 | |
| Schenker XMG Pro 17 (Late 2021, RTX 3080) | |
| MSI GE76 Raider | |
| Schenker Uniwill Technology GM7AG8P | |
| Moyenne Intel Core i7-12800H (2013 - 3684, n=5) | |
| Lenovo Legion 5 17ACH6H-82JY0003GE | |
| Razer Blade 17 RTX 3080 Ti | |
| AIDA64 / CPU Queen | |
| MSI GE76 Raider | |
| Razer Blade 17 RTX 3080 Ti | |
| Schenker Uniwill Technology GM7AG8P | |
| Moyenne Intel Core i7-12800H (85965 - 108084, n=5) | |
| Schenker XMG Pro 17 (Late 2021, RTX 3080) | |
| Lenovo Legion 5 17ACH6H-82JY0003GE | |
| AIDA64 / FPU SinJulia | |
| MSI GE76 Raider | |
| Schenker Uniwill Technology GM7AG8P | |
| Schenker XMG Pro 17 (Late 2021, RTX 3080) | |
| Lenovo Legion 5 17ACH6H-82JY0003GE | |
| Razer Blade 17 RTX 3080 Ti | |
| Moyenne Intel Core i7-12800H (7027 - 9658, n=5) | |
| AIDA64 / FPU Mandel | |
| Lenovo Legion 5 17ACH6H-82JY0003GE | |
| Schenker XMG Pro 17 (Late 2021, RTX 3080) | |
| MSI GE76 Raider | |
| Moyenne Intel Core i7-12800H (15765 - 38179, n=5) | |
| Schenker Uniwill Technology GM7AG8P | |
| Razer Blade 17 RTX 3080 Ti | |
| AIDA64 / CPU AES | |
| Schenker XMG Pro 17 (Late 2021, RTX 3080) | |
| MSI GE76 Raider | |
| Lenovo Legion 5 17ACH6H-82JY0003GE | |
| Schenker Uniwill Technology GM7AG8P | |
| Moyenne Intel Core i7-12800H (55371 - 73928, n=5) | |
| Razer Blade 17 RTX 3080 Ti | |
| AIDA64 / CPU ZLib | |
| MSI GE76 Raider | |
| Schenker Uniwill Technology GM7AG8P | |
| Moyenne Intel Core i7-12800H (701 - 1047, n=5) | |
| Razer Blade 17 RTX 3080 Ti | |
| Schenker XMG Pro 17 (Late 2021, RTX 3080) | |
| Lenovo Legion 5 17ACH6H-82JY0003GE | |
| AIDA64 / FP64 Ray-Trace | |
| Schenker XMG Pro 17 (Late 2021, RTX 3080) | |
| Lenovo Legion 5 17ACH6H-82JY0003GE | |
| MSI GE76 Raider | |
| Schenker Uniwill Technology GM7AG8P | |
| Moyenne Intel Core i7-12800H (3257 - 8559, n=5) | |
| Razer Blade 17 RTX 3080 Ti | |
| AIDA64 / CPU PhotoWorxx | |
| Razer Blade 17 RTX 3080 Ti | |
| Schenker Uniwill Technology GM7AG8P | |
| MSI GE76 Raider | |
| Moyenne Intel Core i7-12800H (31329 - 40992, n=5) | |
| Schenker XMG Pro 17 (Late 2021, RTX 3080) | |
| Lenovo Legion 5 17ACH6H-82JY0003GE | |
Performance du système
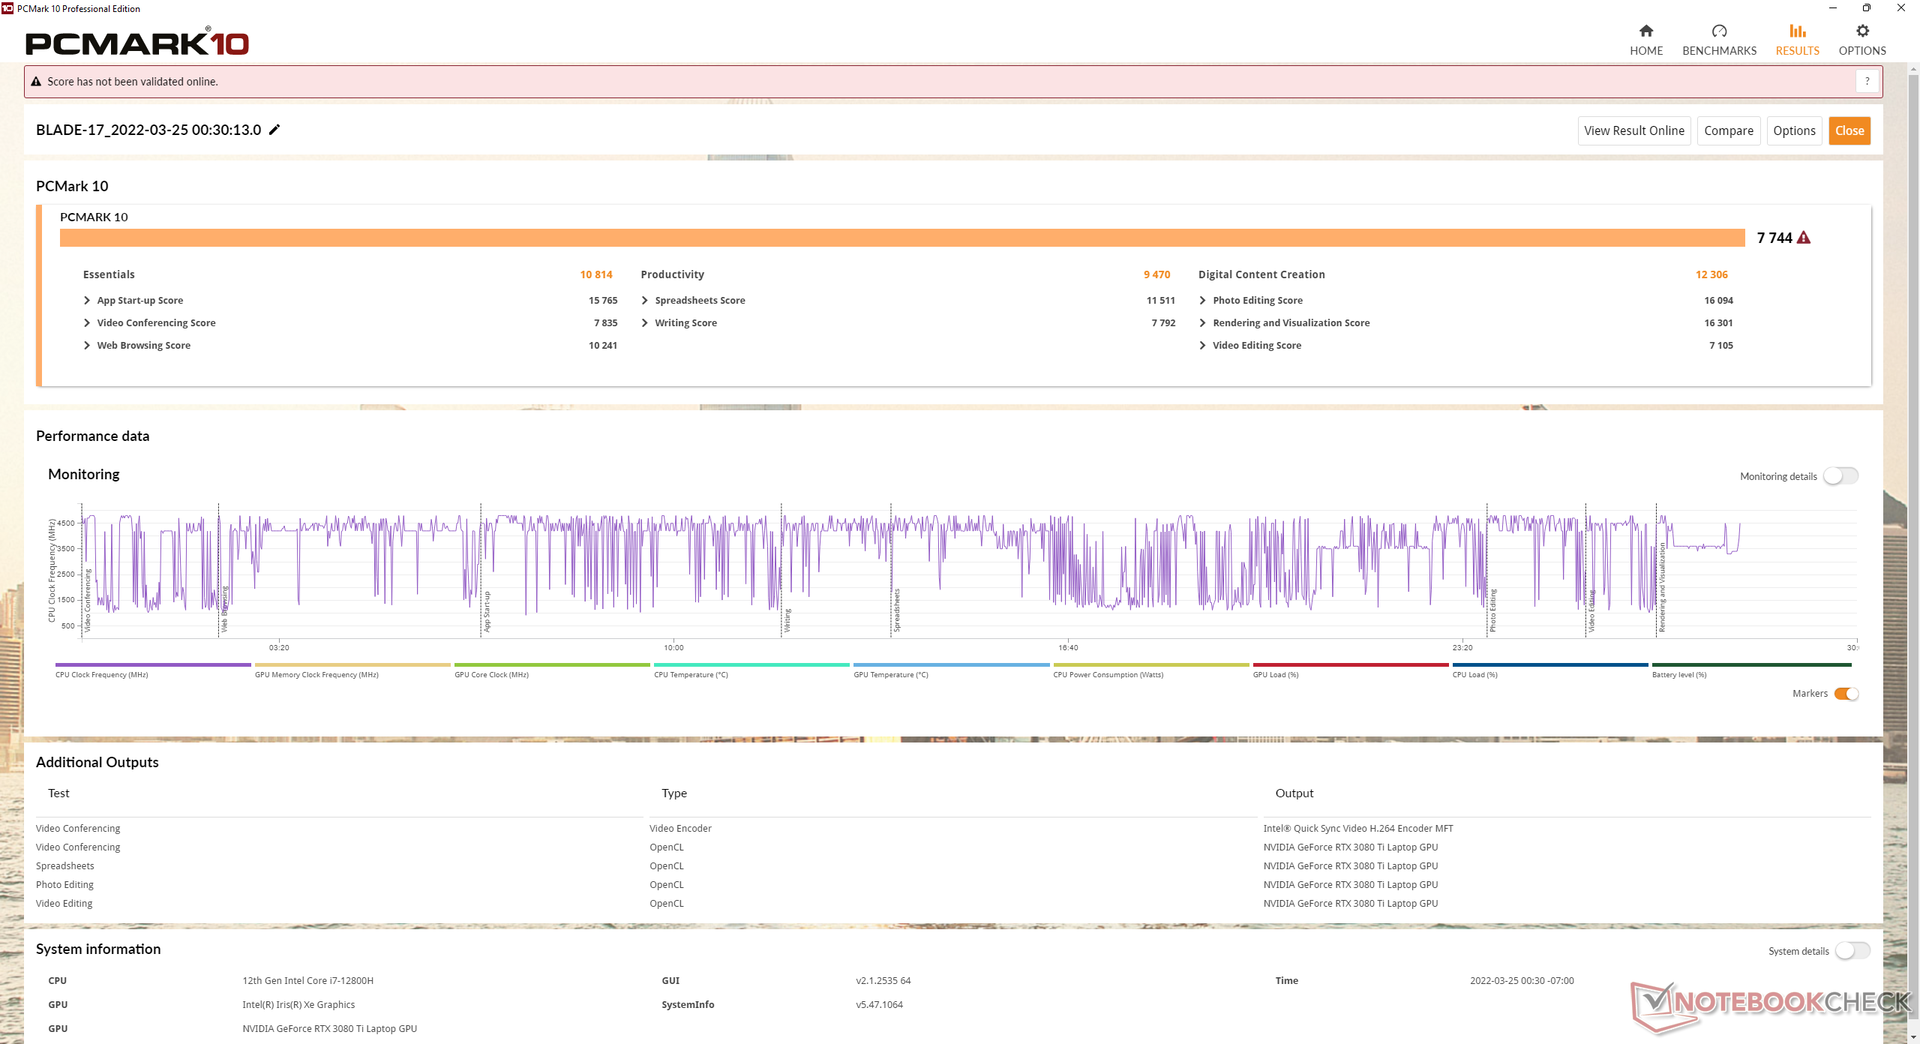
Les résultats de PCMark 10 sont systématiquement supérieurs à ceux que nous avons enregistrés sur le modèle de l'année dernière, notamment dans le subtest de création de contenu numérique. Razer semble également avoir résolu le problème du logiciel Synapse qui ne se lance pas lorsqu'il n'est pas connecté à Internet.
| PCMark 10 / Score | |
| Razer Blade 17 RTX 3080 Ti | |
| Moyenne Intel Core i7-12800H, NVIDIA GeForce RTX 3080 Ti Laptop GPU (7313 - 7744, n=3) | |
| Alienware x17 RTX 3080 P48E | |
| Asus ROG Zephyrus S17 GX703HSD | |
| Aorus 17G YD | |
| MSI GS76 Stealth 11UH | |
| Razer Blade Pro 17 2021 (QHD Touch) | |
| PCMark 10 / Essentials | |
| Razer Blade 17 RTX 3080 Ti | |
| Moyenne Intel Core i7-12800H, NVIDIA GeForce RTX 3080 Ti Laptop GPU (10597 - 10814, n=3) | |
| Asus ROG Zephyrus S17 GX703HSD | |
| Aorus 17G YD | |
| Alienware x17 RTX 3080 P48E | |
| Razer Blade Pro 17 2021 (QHD Touch) | |
| MSI GS76 Stealth 11UH | |
| PCMark 10 / Productivity | |
| Alienware x17 RTX 3080 P48E | |
| Moyenne Intel Core i7-12800H, NVIDIA GeForce RTX 3080 Ti Laptop GPU (9470 - 9675, n=3) | |
| Razer Blade 17 RTX 3080 Ti | |
| Aorus 17G YD | |
| Asus ROG Zephyrus S17 GX703HSD | |
| MSI GS76 Stealth 11UH | |
| Razer Blade Pro 17 2021 (QHD Touch) | |
| PCMark 10 / Digital Content Creation | |
| Razer Blade 17 RTX 3080 Ti | |
| Moyenne Intel Core i7-12800H, NVIDIA GeForce RTX 3080 Ti Laptop GPU (10351 - 12306, n=3) | |
| Alienware x17 RTX 3080 P48E | |
| Asus ROG Zephyrus S17 GX703HSD | |
| Aorus 17G YD | |
| MSI GS76 Stealth 11UH | |
| Razer Blade Pro 17 2021 (QHD Touch) | |
| PCMark 10 Score | 7744 points | |
Aide | ||
| AIDA64 / Memory Copy | |
| MSI GE76 Raider | |
| Razer Blade 17 RTX 3080 Ti | |
| Schenker Uniwill Technology GM7AG8P | |
| Moyenne Intel Core i7-12800H (48643 - 62522, n=5) | |
| Schenker XMG Pro 17 (Late 2021, RTX 3080) | |
| Schenker XMG Apex 17 M21 | |
| Lenovo Legion 5 17ACH6H-82JY0003GE | |
| AIDA64 / Memory Read | |
| Razer Blade 17 RTX 3080 Ti | |
| MSI GE76 Raider | |
| Schenker Uniwill Technology GM7AG8P | |
| Moyenne Intel Core i7-12800H (56629 - 66199, n=5) | |
| Schenker XMG Pro 17 (Late 2021, RTX 3080) | |
| Schenker XMG Apex 17 M21 | |
| Lenovo Legion 5 17ACH6H-82JY0003GE | |
| AIDA64 / Memory Write | |
| Razer Blade 17 RTX 3080 Ti | |
| Schenker Uniwill Technology GM7AG8P | |
| MSI GE76 Raider | |
| Moyenne Intel Core i7-12800H (50923 - 66074, n=5) | |
| Schenker XMG Apex 17 M21 | |
| Schenker XMG Pro 17 (Late 2021, RTX 3080) | |
| Lenovo Legion 5 17ACH6H-82JY0003GE | |
| AIDA64 / Memory Latency | |
| MSI GE76 Raider | |
| Schenker XMG Pro 17 (Late 2021, RTX 3080) | |
| Schenker XMG Apex 17 M21 | |
| Lenovo Legion 5 17ACH6H-82JY0003GE | |
| Moyenne Intel Core i7-12800H (89.3 - 95.2, n=5) | |
| Schenker Uniwill Technology GM7AG8P | |
| Razer Blade 17 RTX 3080 Ti | |
* ... Moindre est la valeur, meilleures sont les performances
Latence DPC
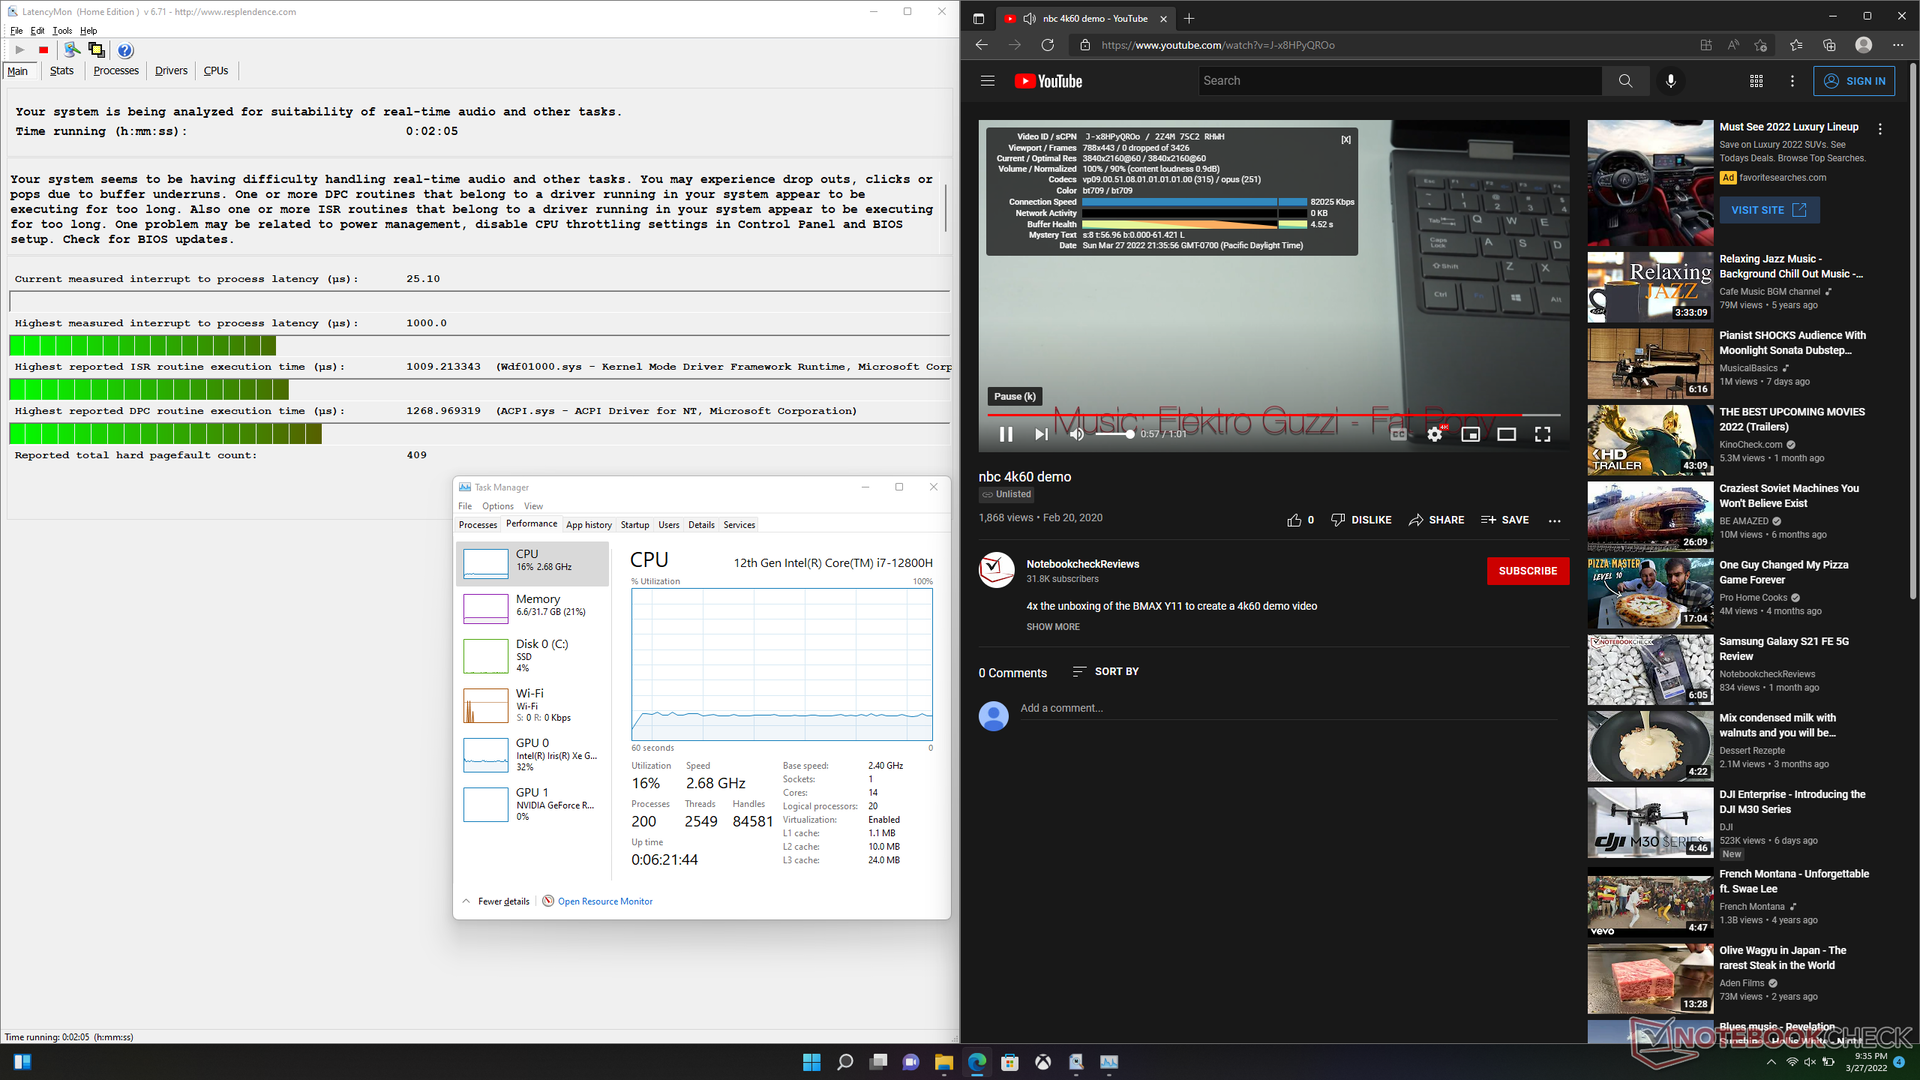
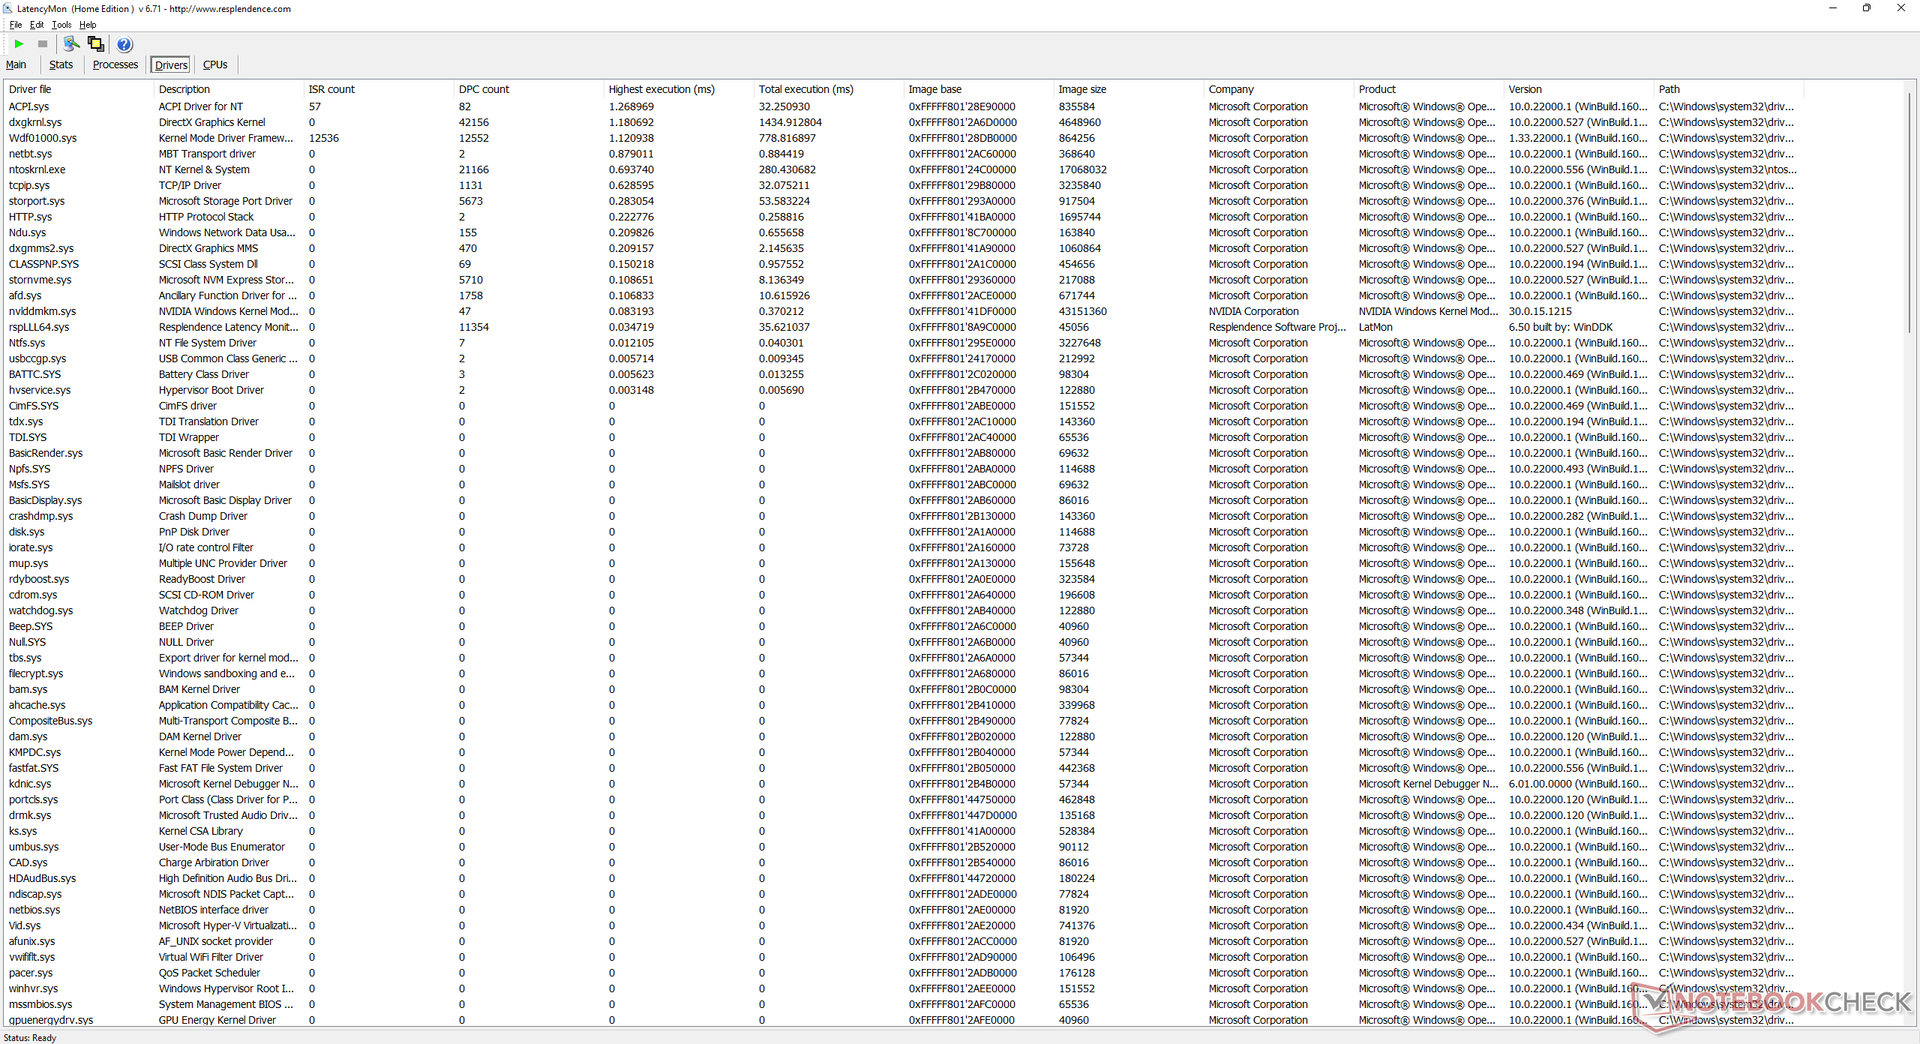
LatencyMon montre des problèmes mineurs de DPC lors de l'ouverture de plusieurs onglets de navigateur sur notre page d'accueil. la lecture de vidéos 4K à 60 FPS est par ailleurs parfaite, sans perte d'images.
| DPC Latencies / LatencyMon - interrupt to process latency (max), Web, Youtube, Prime95 | |
| Alienware x17 RTX 3080 P48E | |
| Razer Blade Pro 17 2021 (QHD Touch) | |
| Asus ROG Zephyrus S17 GX703HSD | |
| Aorus 17G YD | |
| Razer Blade 17 RTX 3080 Ti | |
| MSI GS76 Stealth 11UH | |
* ... Moindre est la valeur, meilleures sont les performances
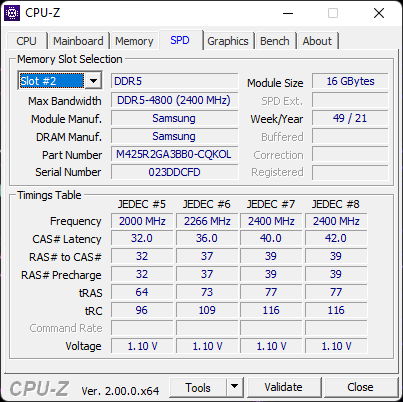
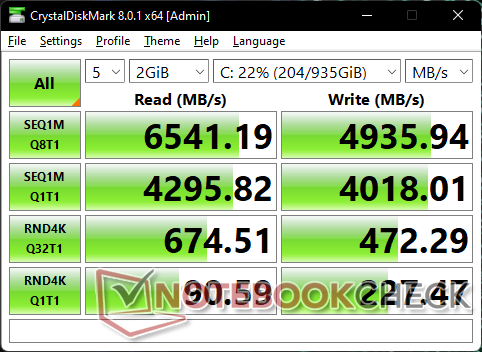
Périphériques de stockage - Jusqu'à deux SSD M.2 PCIe4 x4
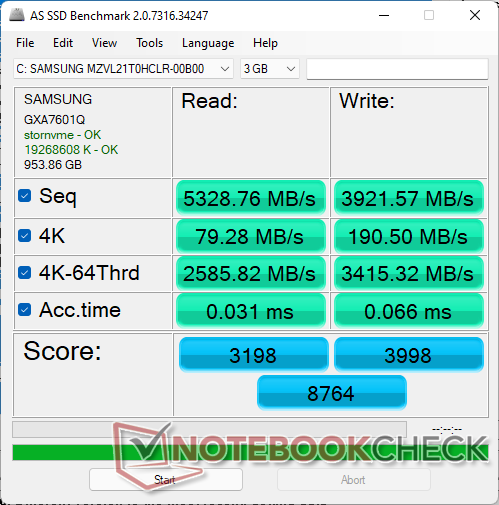
La plupart, si ce n'est toutes les UGS Blade 17 sont livrées avec des SSD Samsung. Notre unité de test est livré avec leSamsung PM9A1 qui est l'un des SSD PCIe4 x4 les plus rapides du marché. Le disque n'a aucun problème à maintenir des taux de transfert très rapides de plus de 6600 Mo/s dans notre unité, ce qui suggère une excellente dissipation de la chaleur, contrairement à l'Uniwill Technology GM7AG8P.Uniwill Technology GM7AG8P.

* ... Moindre est la valeur, meilleures sont les performances
Disk Throttling: DiskSpd Read Loop, Queue Depth 8
Performances du GPU
Après avoir testé plus d'une demi-douzaine d'ordinateurs portables avec mobile GeForce RTX 3080 Ti au moment de l'examen, celui de notre Blade 17 a des performances confortablement supérieures à la moyenne d'environ 15 %. La cible TGP élevée de 165 W est sans aucun doute une raison importante pour l'avantage de performance comme d'autres ordinateurs portables avec le même GPU RTX 3080 Ti comme le Blade 15 ou Gigabyte Aero 16 YE5 ont tendance à viser des objectifs TGP beaucoup plus bas, autour de 100 W. Les utilisateurs peuvent s'attendre à une augmentation des performances graphiques brutes d'environ 20 pour cent par rapport à la 10e ou 11e génération de l'Intel Blade 17 avec le GPU régulier mobile RTX 3080 ordinaire.
L'exécution du système en mode dGPU équilibré au lieu du mode dGPU de performance maximale entraînera un déficit de performance graphique d'environ 5 à 7 % seulement.
Si vous passez à la carte rTX 3070 Ti mobile de notre RTX 3080 Ti mobile entraînera un déficit de performances de seulement 10 % environ
Bien entendu, la "vraie" RTX 3080 Ti pour ordinateur de bureau offrira toujours un grand bond en avant dans les performances du GPU, de près de 50 % par rapport à notre version mobile.
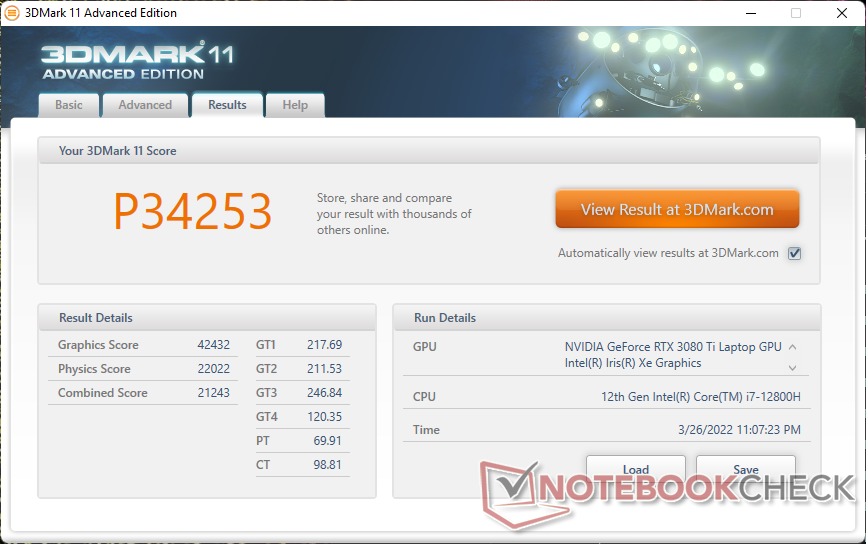


| 3DMark 11 Performance | 34253 points | |
| 3DMark Cloud Gate Standard Score | 62059 points | |
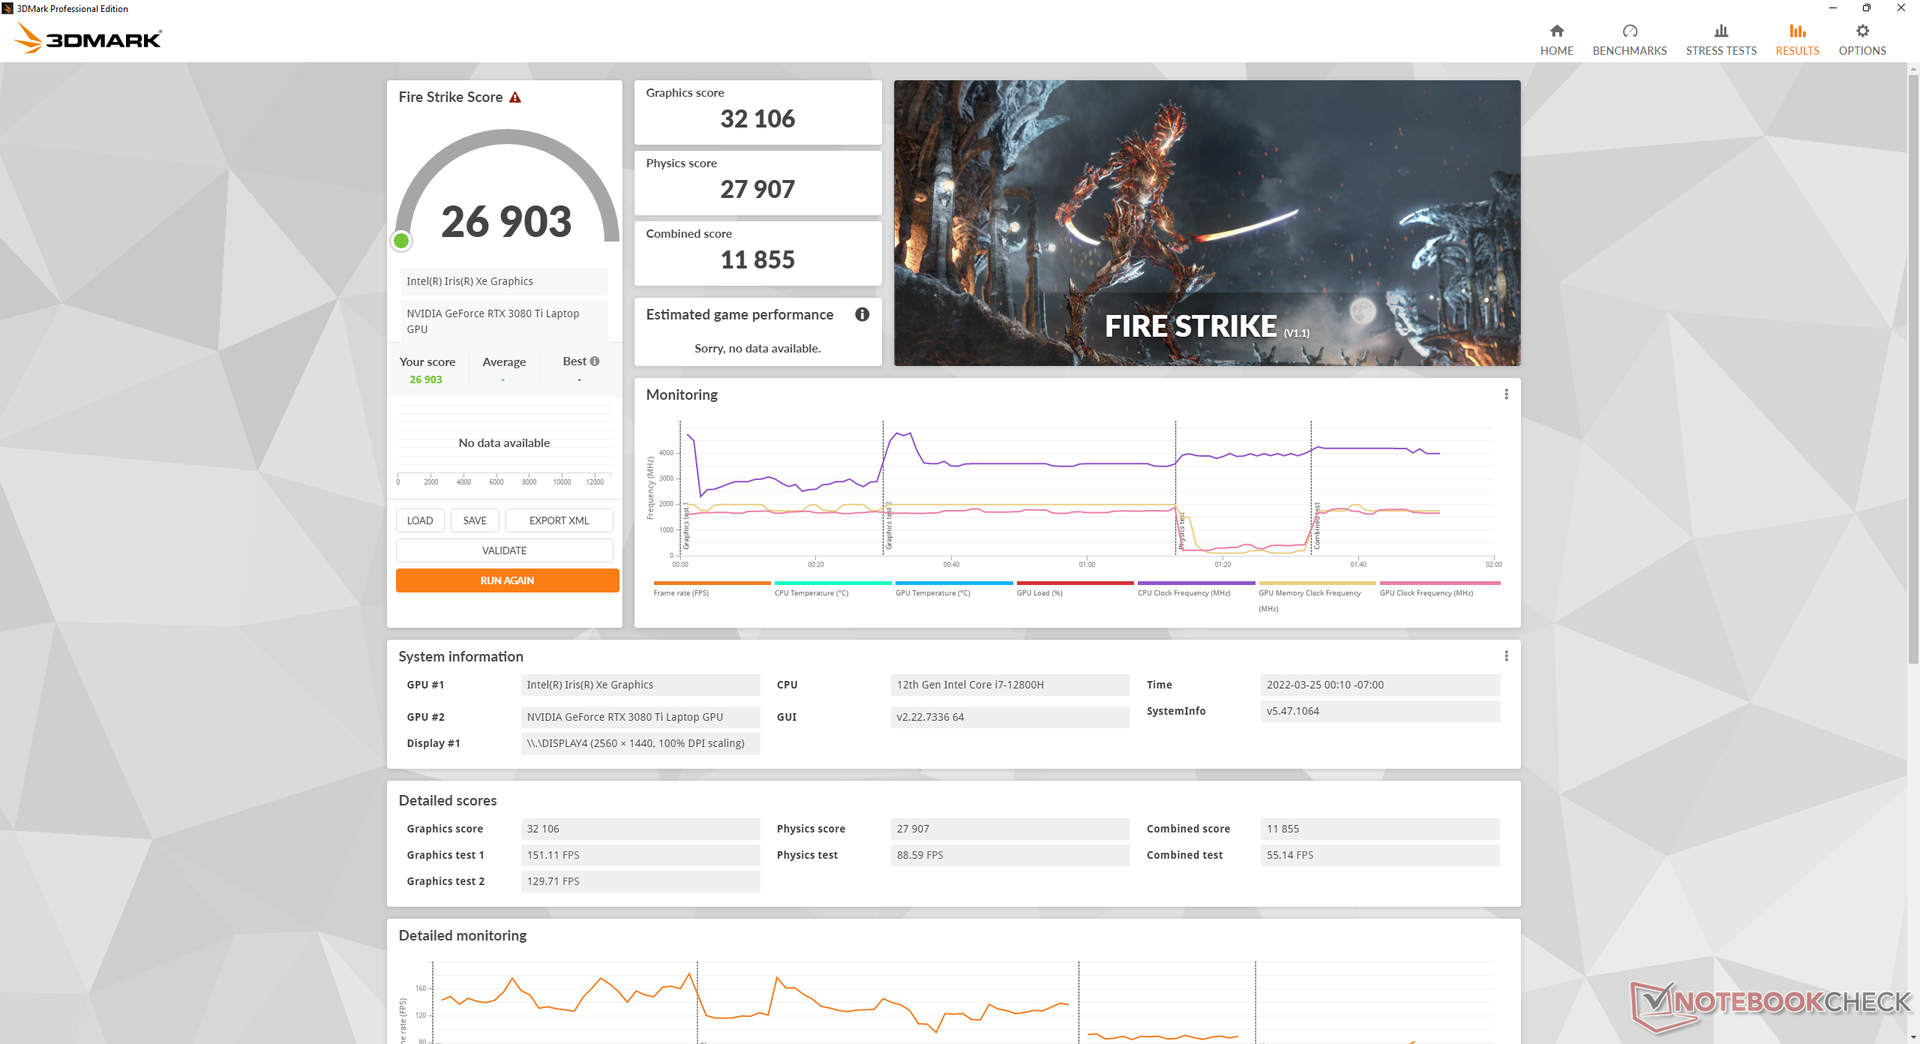
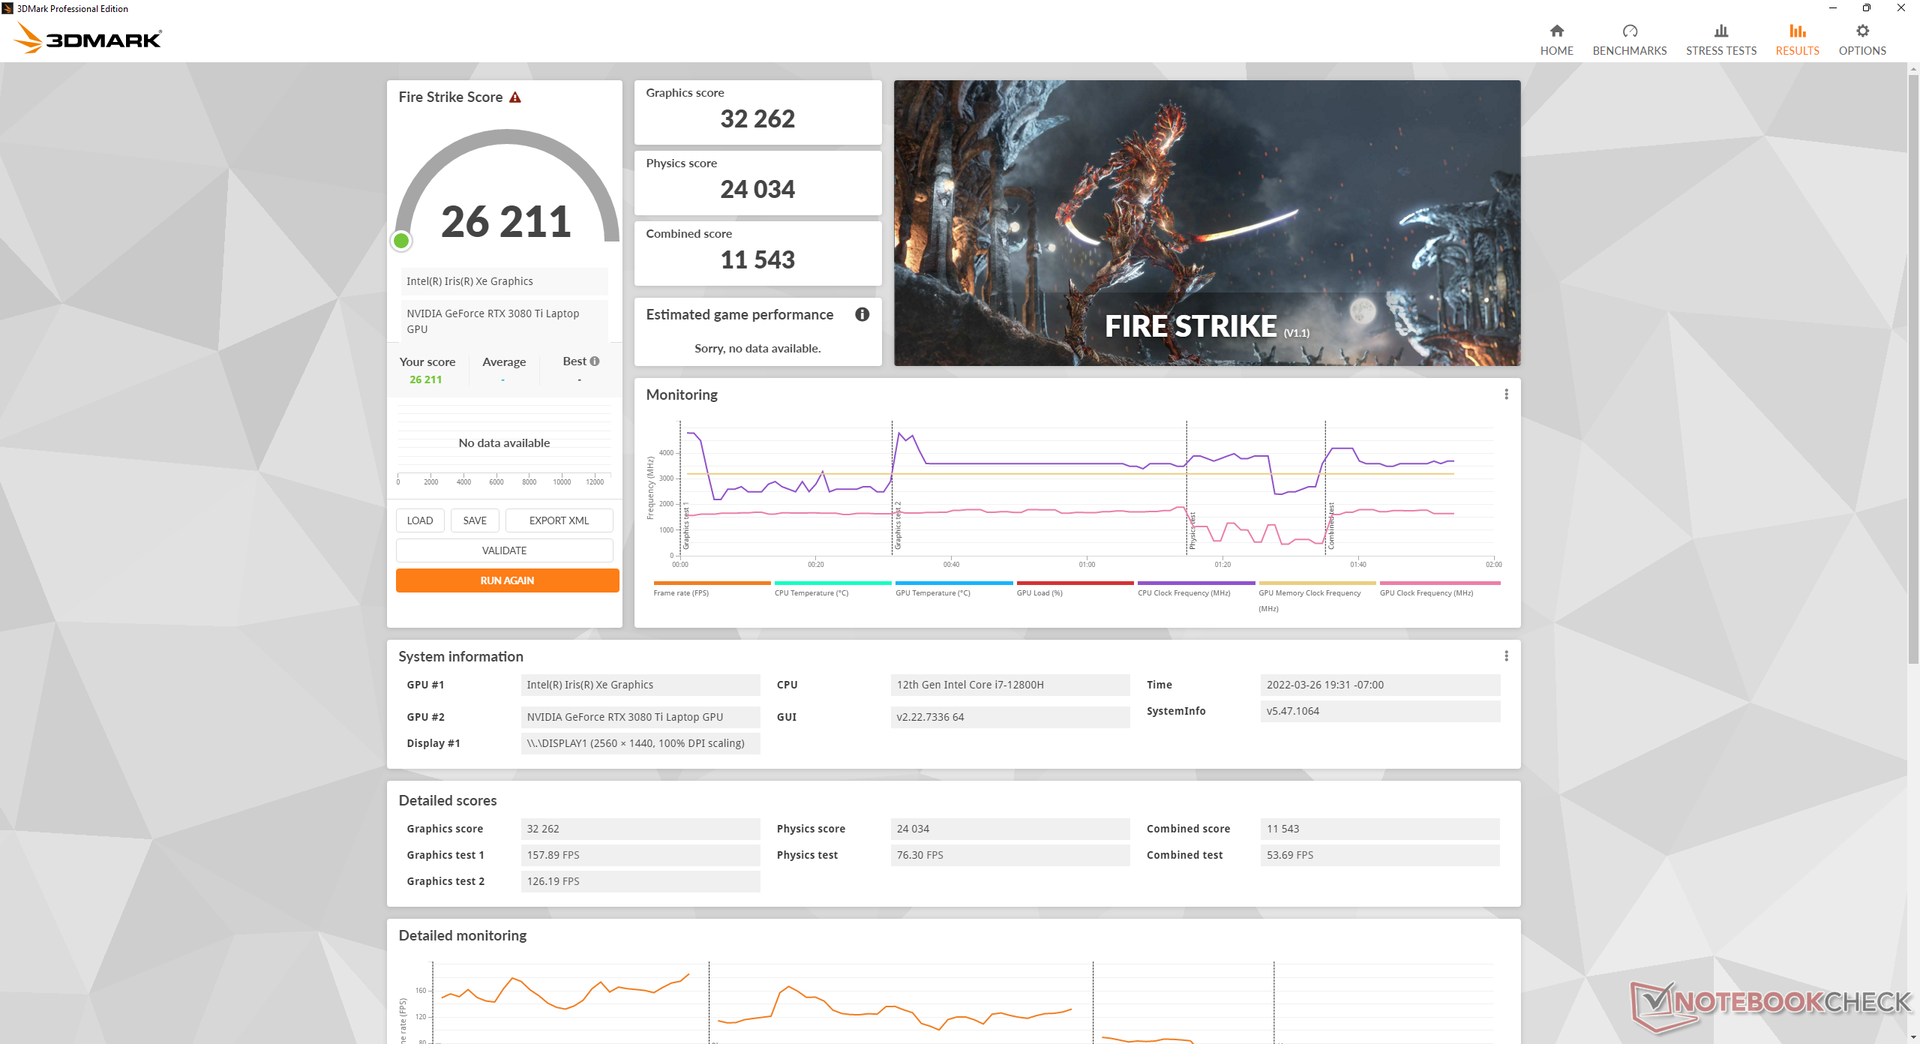
| 3DMark Fire Strike Score | 26903 points | |
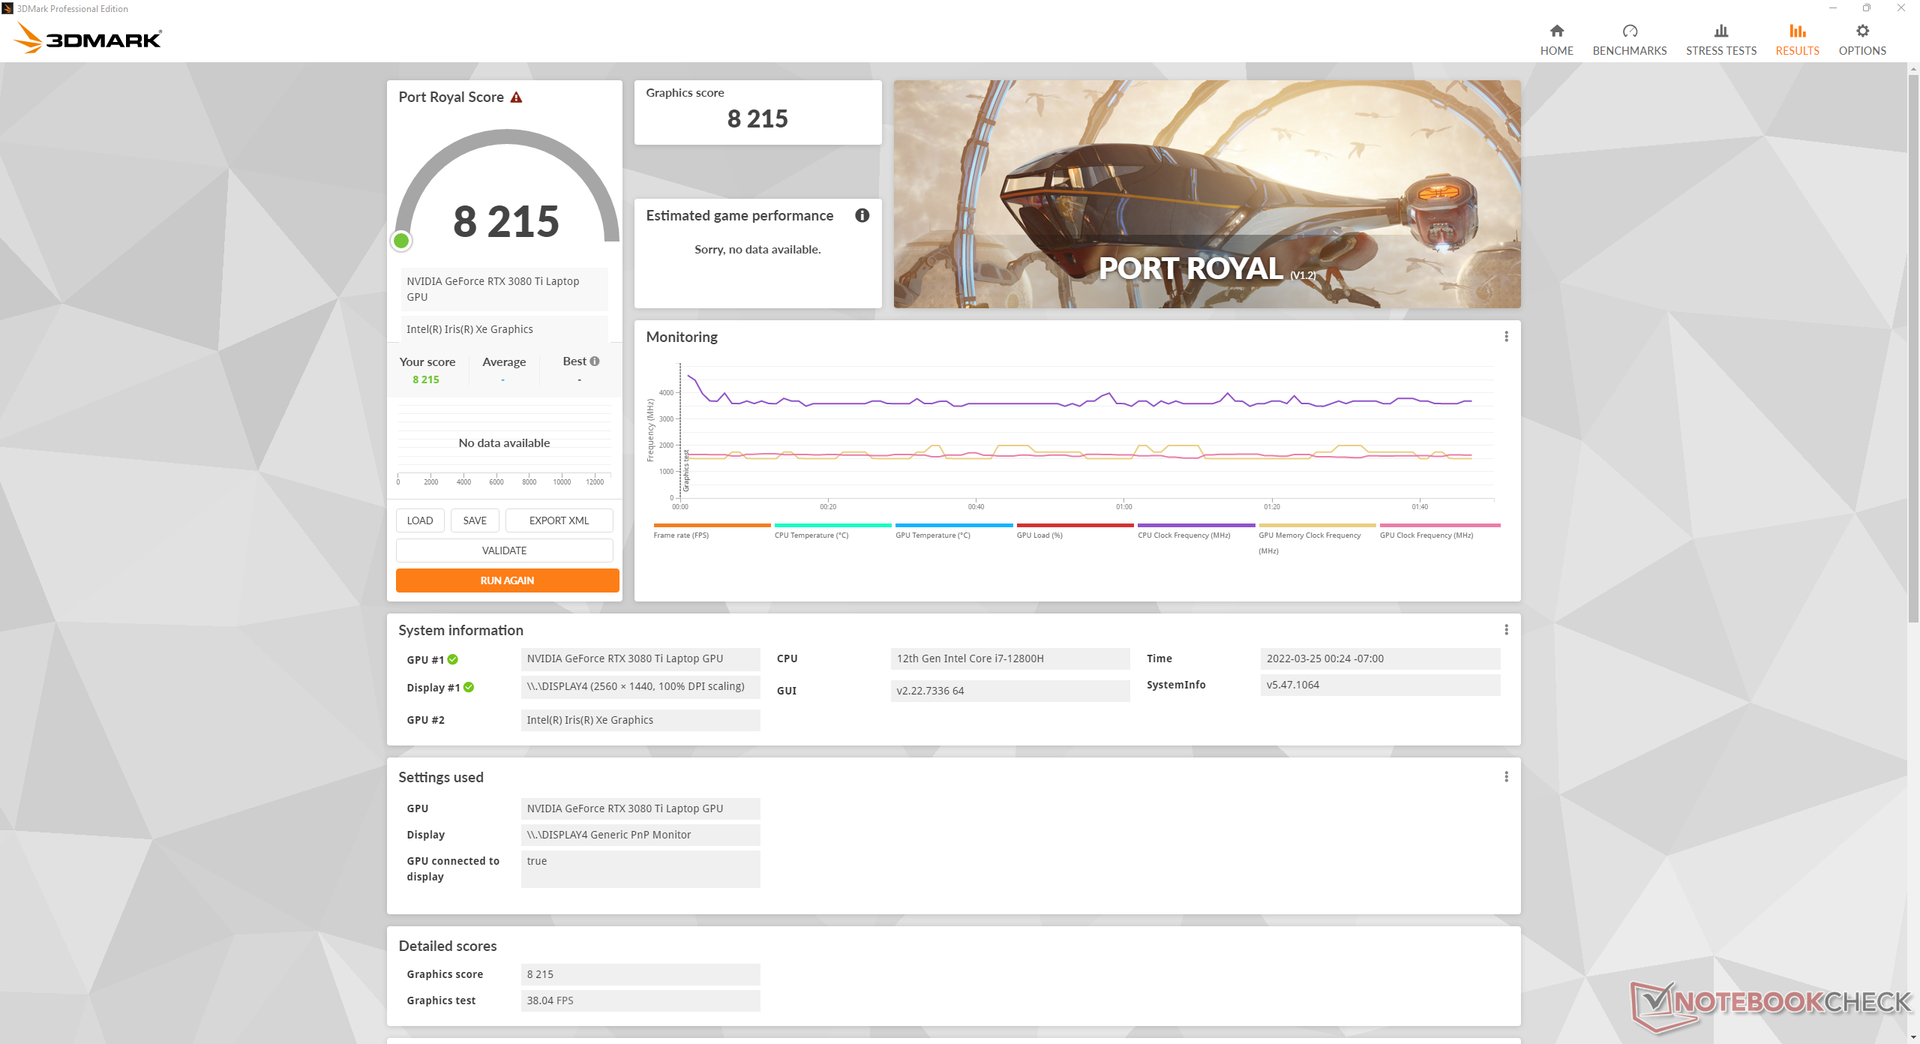
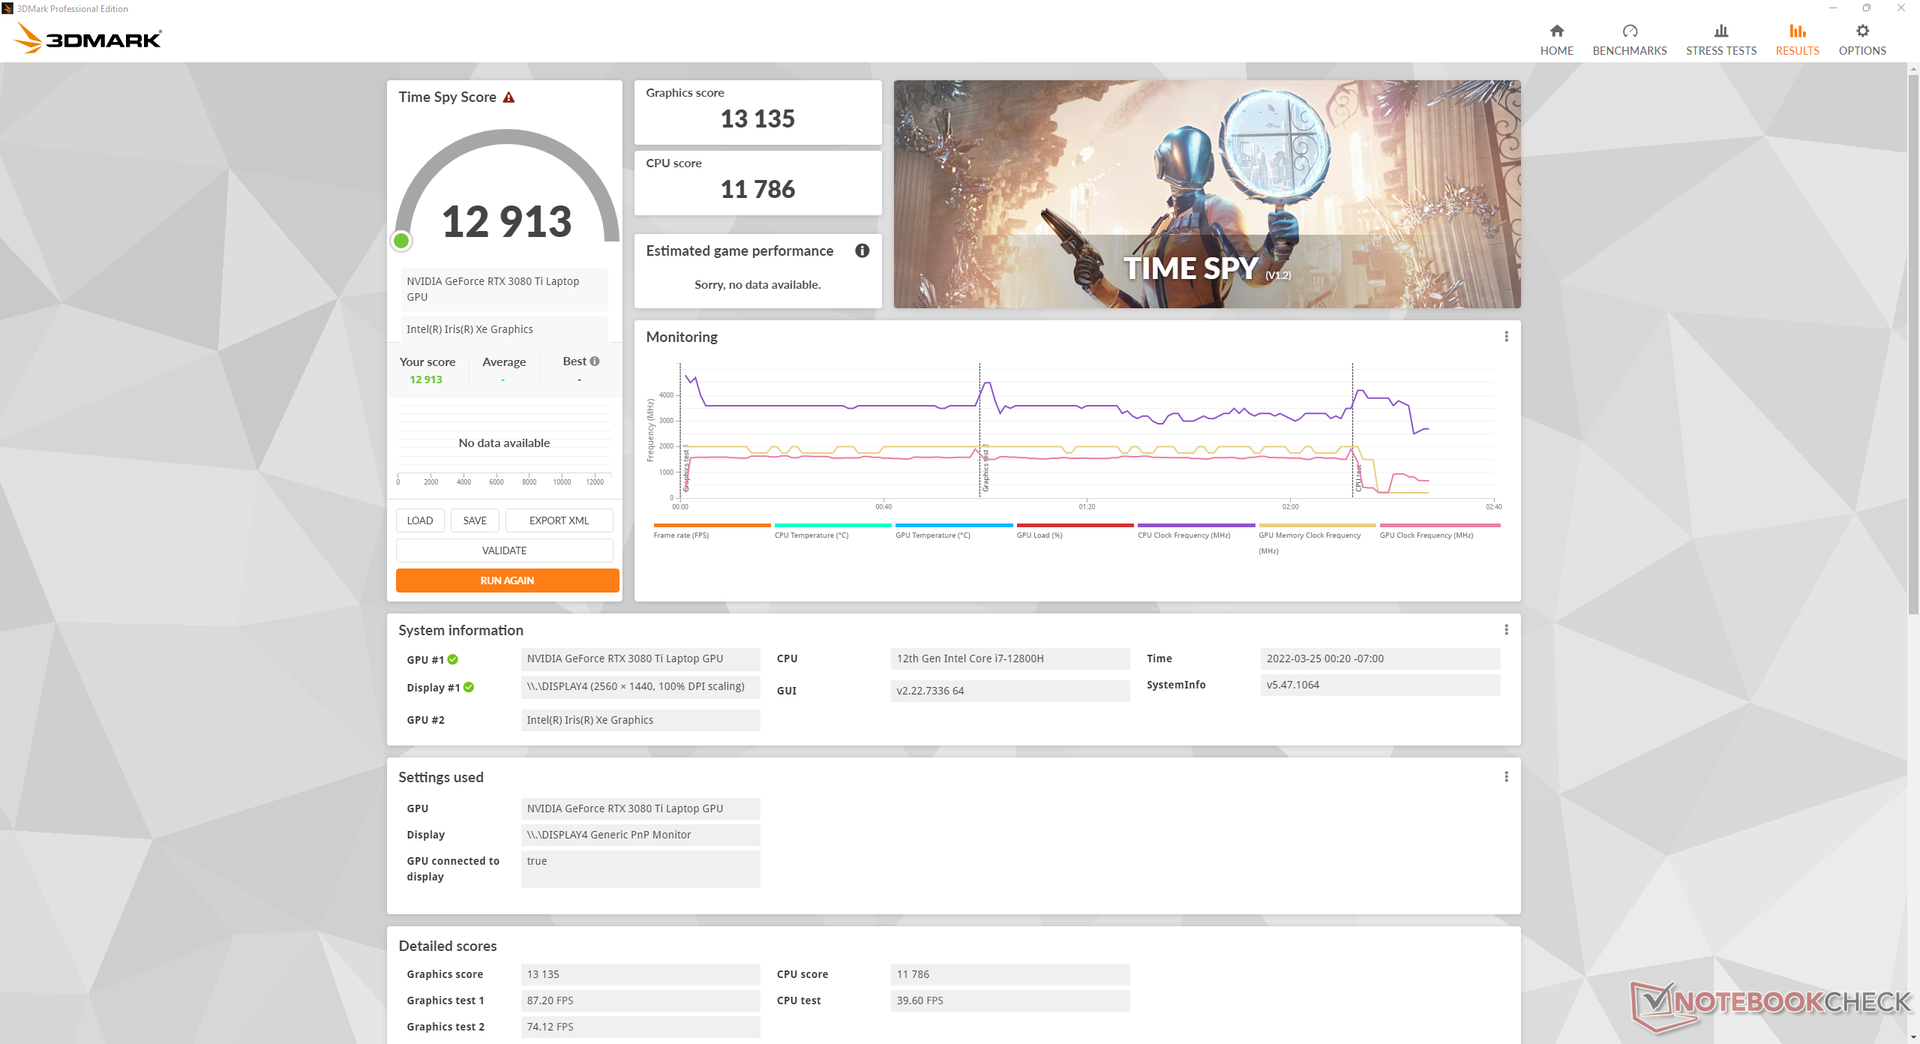
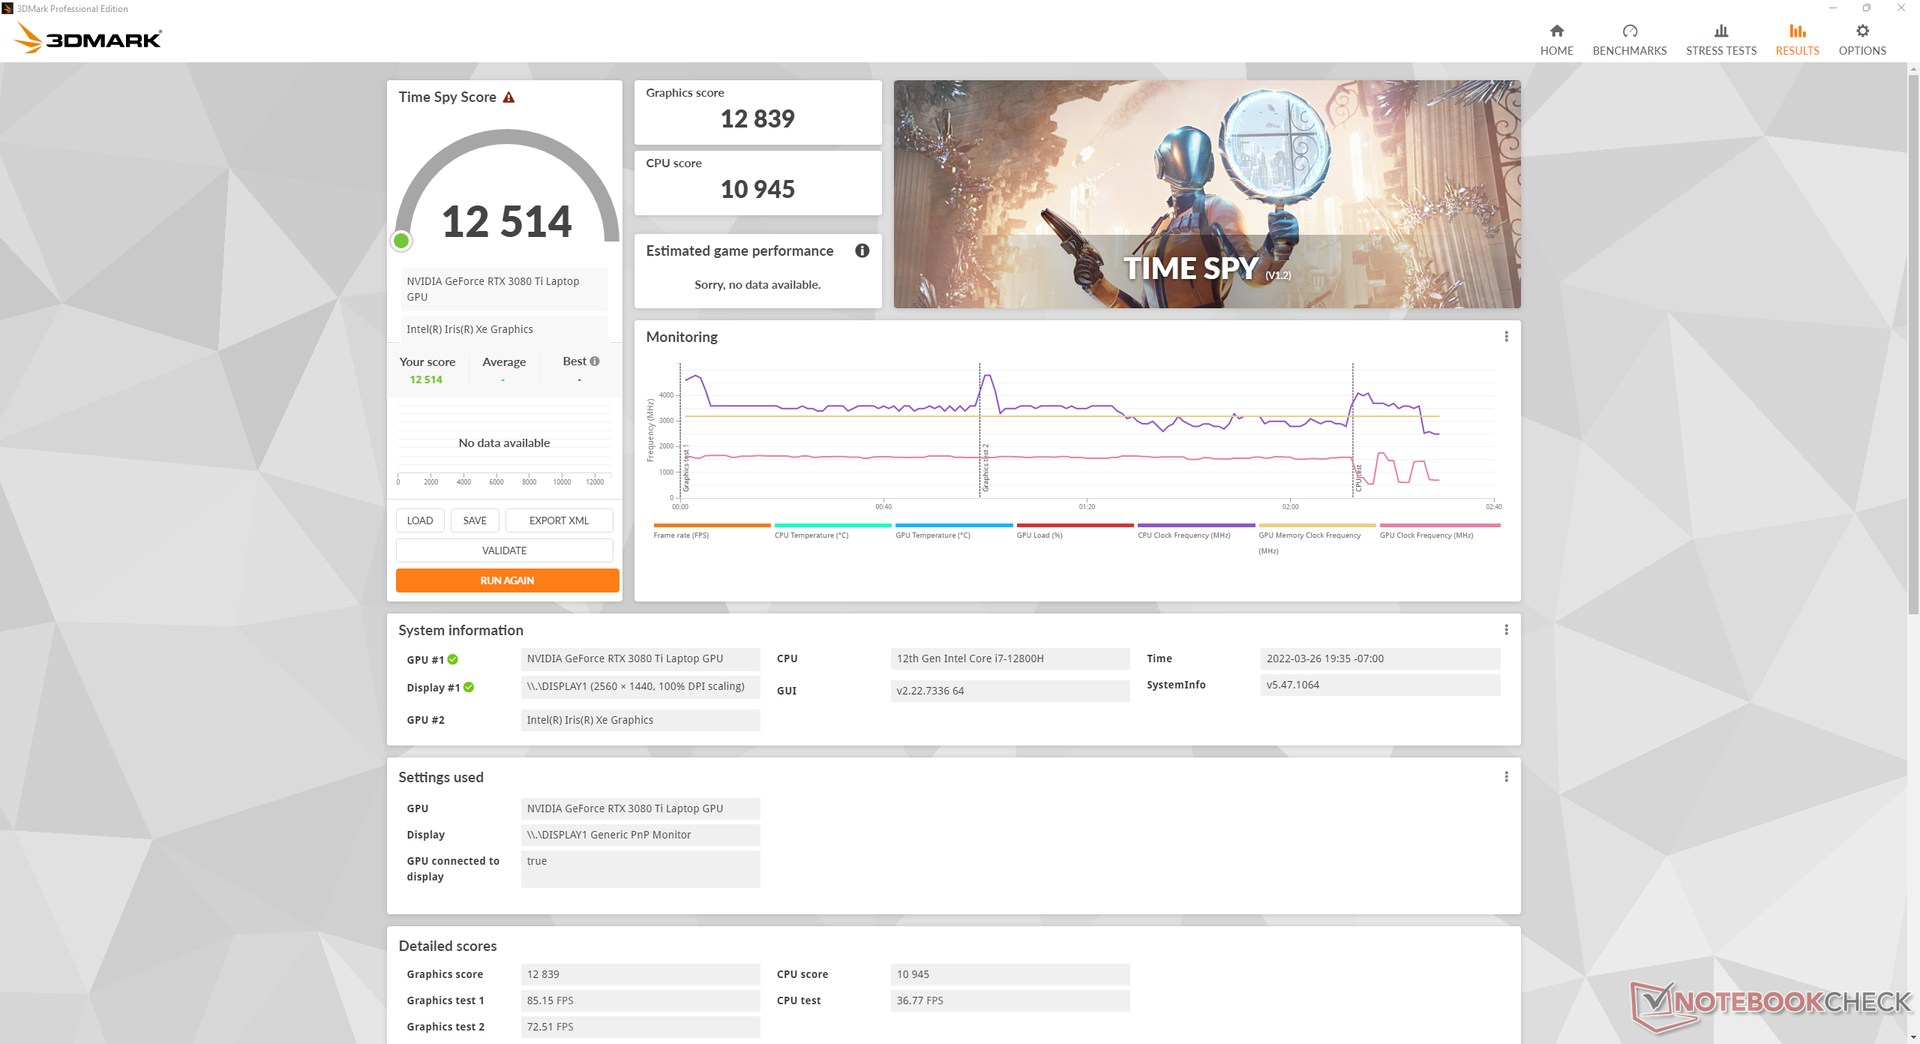
| 3DMark Time Spy Score | 12913 points | |
Aide | ||
Witcher 3 FPS Chart
| Bas | Moyen | Élevé | Ultra | QHD | |
|---|---|---|---|---|---|
| GTA V (2015) | 186 | 182 | 176 | 113 | 105 |
| The Witcher 3 (2015) | 459 | 340.9 | 250.4 | 124.6 | |
| Dota 2 Reborn (2015) | 183 | 171 | 165 | 157 | |
| Final Fantasy XV Benchmark (2018) | 168 | 152 | 121 | 93.3 | |
| X-Plane 11.11 (2018) | 158 | 139 | 111 | ||
| Far Cry 5 (2018) | 171 | 149 | 134 | 125 | 120 |
| Strange Brigade (2018) | 431 | 296 | 242 | 215 | 158 |
| Cyberpunk 2077 1.6 (2022) | 119.1 | 112.1 | 106 | 106.5 | 59.7 |
Émissions
Bruit du système - Bruyant seulement pendant le jeu
Il n'y a pas de changement significatif au niveau du bruit des ventilateurs, malgré le passage de quatre à trois ventilateurs. Les utilisateurs voudront utiliser les modes Economiseur d'énergie ou Equilibre lorsqu'ils n'exécutent pas d'applications exigeantes pour obtenir des ventilateurs plus silencieux.
Le bruit du ventilateur en mode équilibré est d'environ 43,2 dB(A), contre 50,9 dB(A) en mode performances maximales, malgré un léger déficit graphique de 5 à 7 %. Ainsi, les utilisateurs peuvent envisager de jouer en mode équilibré si le bruit du ventilateur est une préoccupation.
Degré de la nuisance sonore
| Au repos |
| 23.3 / 23.3 / 26.3 dB(A) |
| Fortement sollicité |
| 38.2 / 49.1 dB(A) |
 | ||
30 dB silencieux 40 dB(A) audible 50 dB(A) bruyant |
||
min: | ||
| Razer Blade 17 RTX 3080 Ti GeForce RTX 3080 Ti Laptop GPU, i7-12800H, Samsung PM9A1 MZVL21T0HCLR | Razer Blade Pro 17 2021 (QHD Touch) GeForce RTX 3080 Laptop GPU, i7-10875H, Samsung PM981a MZVLB1T0HBLR | MSI GS76 Stealth 11UH GeForce RTX 3080 Laptop GPU, i9-11900H, Samsung PM9A1 MZVL22T0HBLB | Asus ROG Zephyrus S17 GX703HSD GeForce RTX 3080 Laptop GPU, i9-11900H, Samsung PM9A1 MZVL22T0HBLB | Aorus 17G YD GeForce RTX 3080 Laptop GPU, i7-11800H, Samsung PM9A1 MZVL2512HCJQ | Alienware x17 RTX 3080 P48E GeForce RTX 3080 Laptop GPU, i7-11800H, 2x WDC PC SN730 SDBPNTY-1T00 (RAID 0) | |
|---|---|---|---|---|---|---|
| Noise | -12% | -12% | 2% | -25% | -4% | |
| arrêt / environnement * (dB) | 23.3 | 26.1 -12% | 24 -3% | 23 1% | 25 -7% | 24.9 -7% |
| Idle Minimum * (dB) | 23.3 | 26.1 -12% | 24 -3% | 23 1% | 32 -37% | 24.9 -7% |
| Idle Average * (dB) | 23.3 | 26.5 -14% | 25 -7% | 23 1% | 33 -42% | 24.9 -7% |
| Idle Maximum * (dB) | 26.3 | 30.7 -17% | 42 -60% | 23 13% | 39 -48% | 29.6 -13% |
| Load Average * (dB) | 38.2 | 43.5 -14% | 46 -20% | 41 -7% | 43 -13% | 31.1 19% |
| Witcher 3 ultra * (dB) | 50.9 | 54 -6% | 48 6% | 45 12% | 52 -2% | 49.7 2% |
| Load Maximum * (dB) | 49.1 | 55 -12% | 48 2% | 52 -6% | 61 -24% | 54.8 -12% |
* ... Moindre est la valeur, meilleures sont les performances
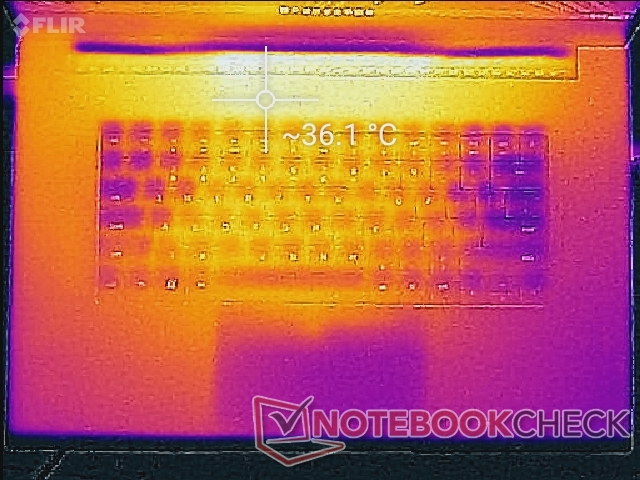
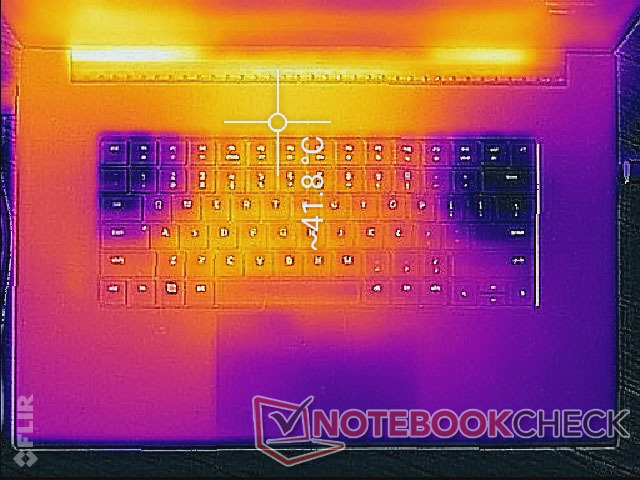
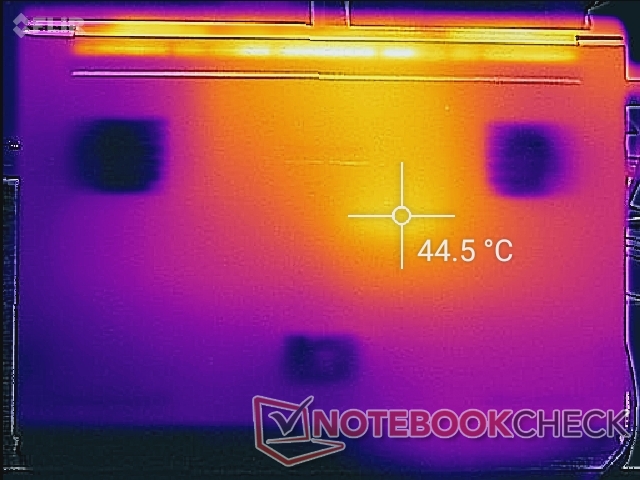
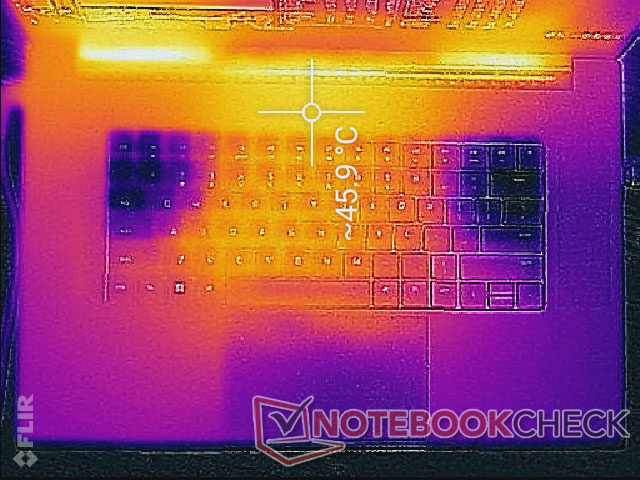
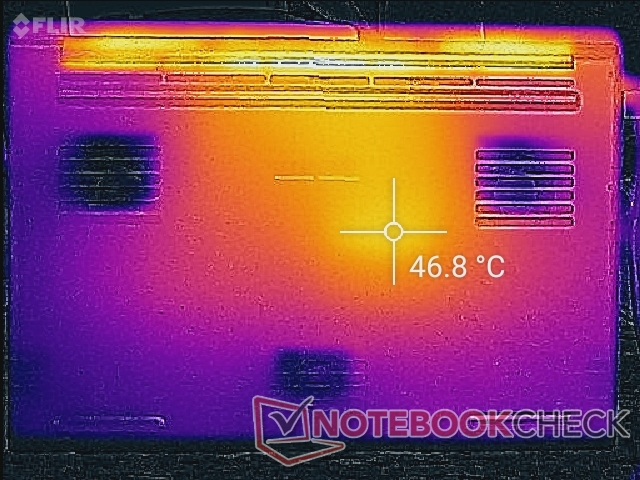
Température - plus chaude qu'avant
Les températures de surface sont légèrement plus élevées sur le modèle 2022 que sur le modèle 2021. Le centre du clavier peut être chaud jusqu'à 38°C quand on joue, alors que le même endroit sur le modèle 2021 était un peu plus froid de quelques degrés. En outre, le système continue d'être très chaud à environ 31 C à 35 C lorsqu'il n'y a pas de charges exigeantes par rapport à seulement 27 C à 30 C sur le MSI GS76. Les températures plus élevées de la peau sont le prix à payer pour des ventilateurs globalement plus silencieux pendant les charges de traitement faibles.
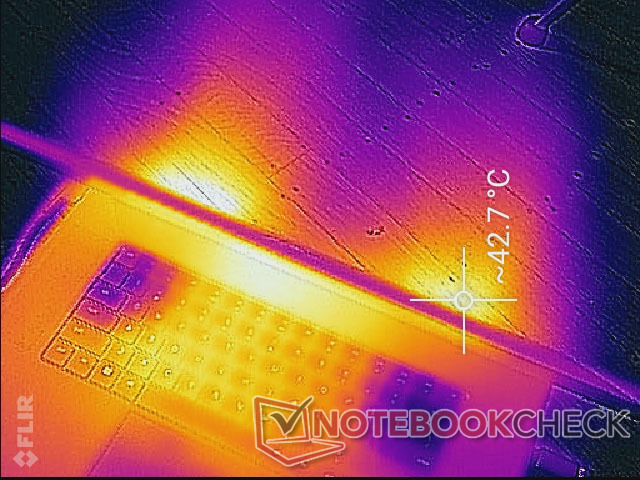
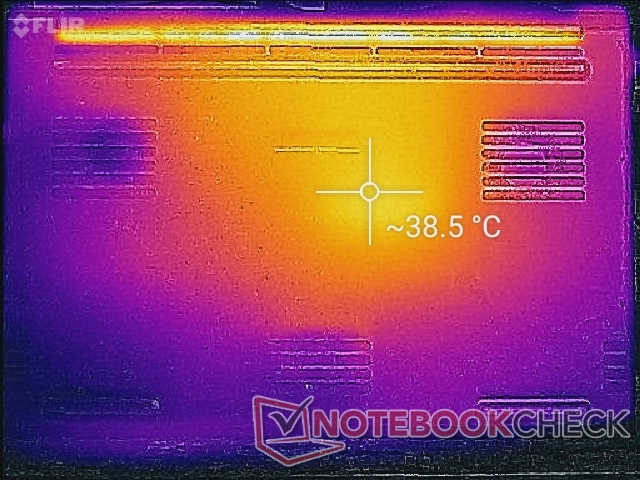
(-) La température maximale du côté supérieur est de 46 °C / 115 F, par rapport à la moyenne de 40.4 °C / 105 F, allant de 21.2 à 68.8 °C pour la classe Gaming.
(-) Le fond chauffe jusqu'à un maximum de 46.8 °C / 116 F, contre une moyenne de 43.2 °C / 110 F
(+) En utilisation inactive, la température moyenne du côté supérieur est de 31.5 °C / 89 F, par rapport à la moyenne du dispositif de 33.9 °C / 93 F.
(±) En jouant à The Witcher 3, la température moyenne du côté supérieur est de 33.2 °C / 92 F, alors que la moyenne de l'appareil est de 33.9 °C / 93 F.
(+) Les repose-poignets et le pavé tactile atteignent la température maximale de la peau (32.4 °C / 90.3 F) et ne sont donc pas chauds.
(-) La température moyenne de la zone de l'appui-paume de dispositifs similaires était de 28.8 °C / 83.8 F (-3.6 °C / #-6.5 F).
| Razer Blade 17 RTX 3080 Ti Intel Core i7-12800H, NVIDIA GeForce RTX 3080 Ti Laptop GPU | Razer Blade Pro 17 2021 (QHD Touch) Intel Core i7-10875H, NVIDIA GeForce RTX 3080 Laptop GPU | MSI GS76 Stealth 11UH Intel Core i9-11900H, NVIDIA GeForce RTX 3080 Laptop GPU | Asus ROG Zephyrus S17 GX703HSD Intel Core i9-11900H, NVIDIA GeForce RTX 3080 Laptop GPU | Aorus 17G YD Intel Core i7-11800H, NVIDIA GeForce RTX 3080 Laptop GPU | Alienware x17 RTX 3080 P48E Intel Core i7-11800H, NVIDIA GeForce RTX 3080 Laptop GPU | |
|---|---|---|---|---|---|---|
| Heat | 10% | 4% | -7% | 12% | -4% | |
| Maximum Upper Side * (°C) | 46 | 38.2 17% | 49 -7% | 59 -28% | 36 22% | 58.4 -27% |
| Maximum Bottom * (°C) | 46.8 | 42.2 10% | 57 -22% | 53 -13% | 52 -11% | 49 -5% |
| Idle Upper Side * (°C) | 36.2 | 33.6 7% | 28 23% | 35 3% | 29 20% | 33.6 7% |
| Idle Bottom * (°C) | 38.6 | 36.2 6% | 30 22% | 35 9% | 33 15% | 34.6 10% |
* ... Moindre est la valeur, meilleures sont les performances
Test de stress
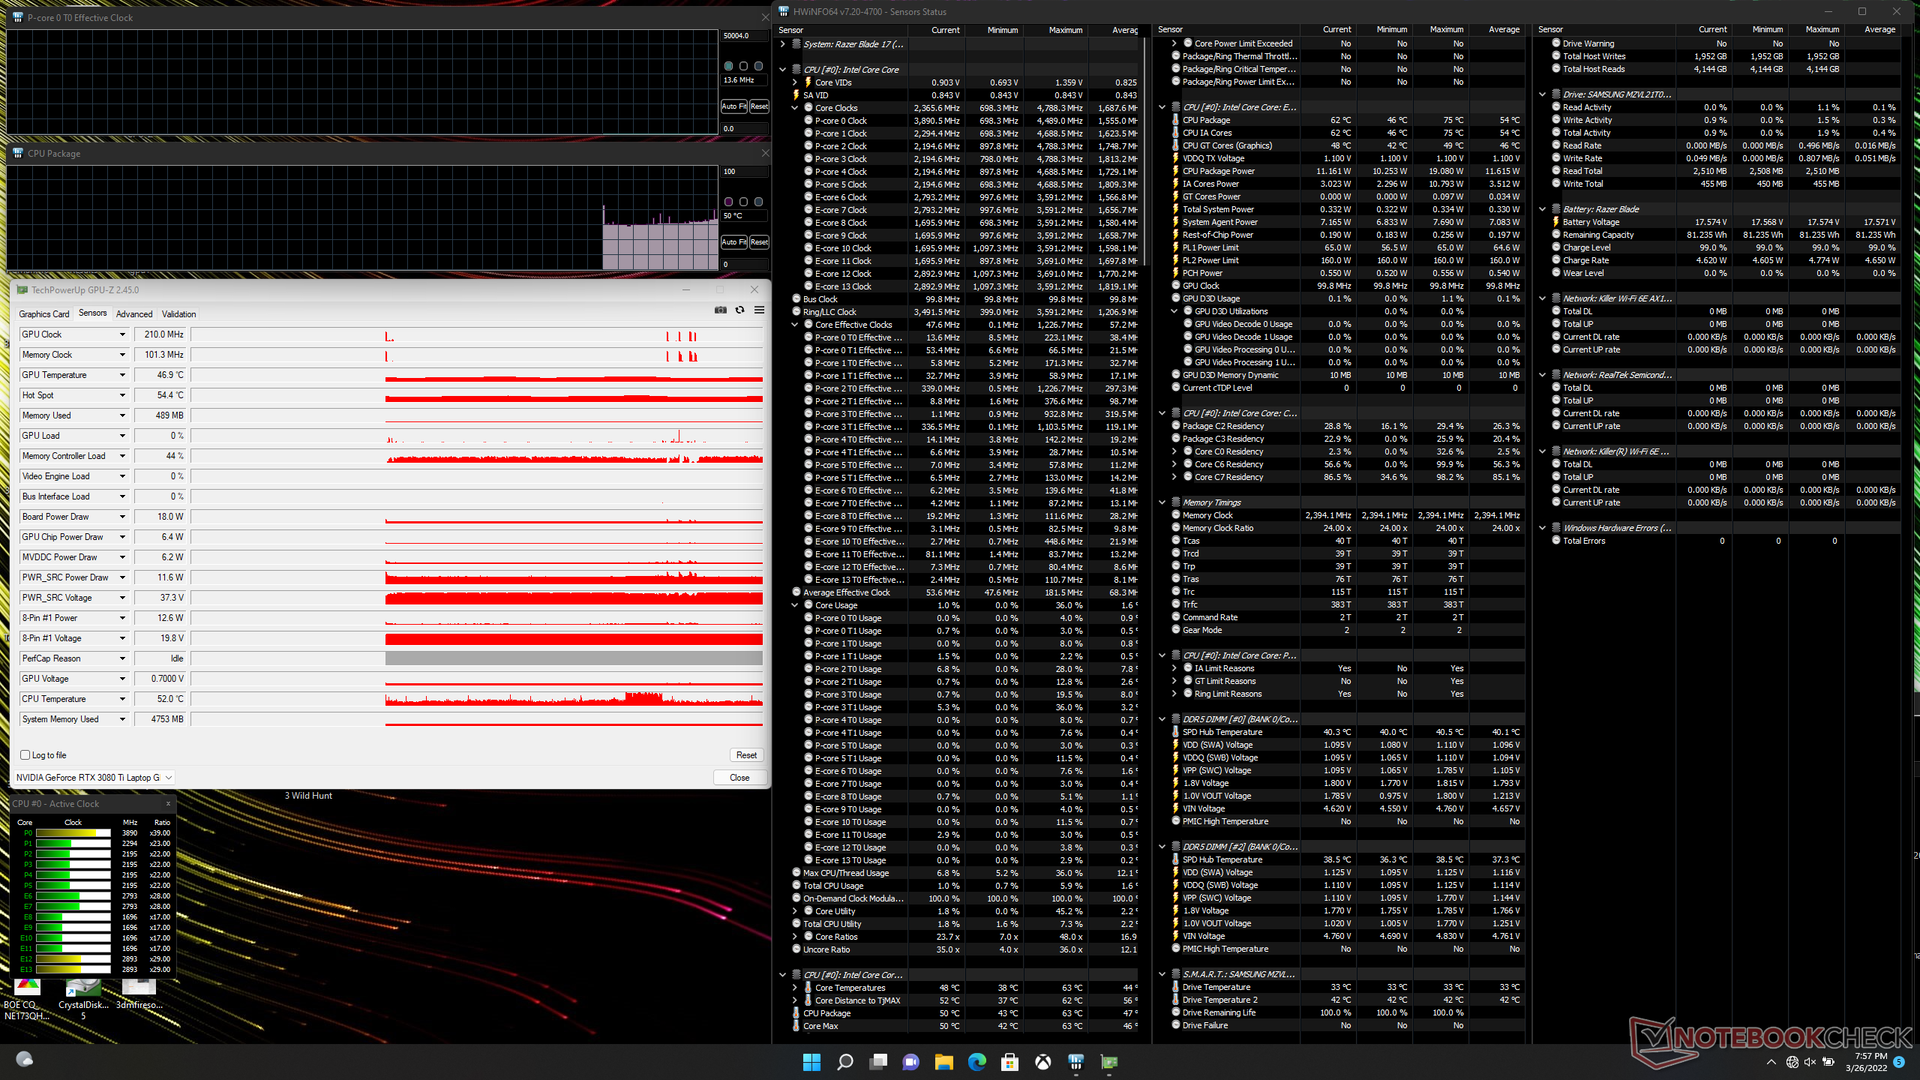
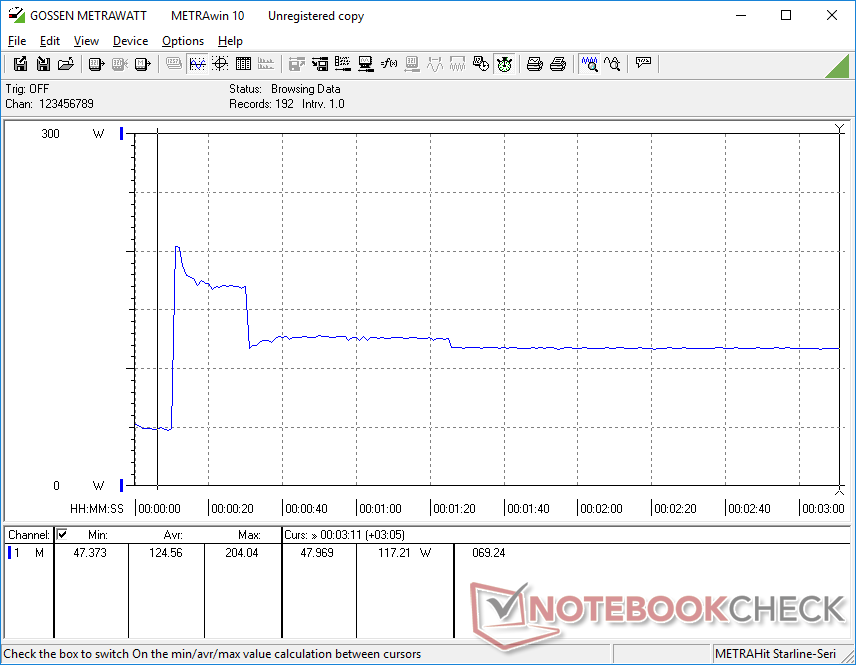
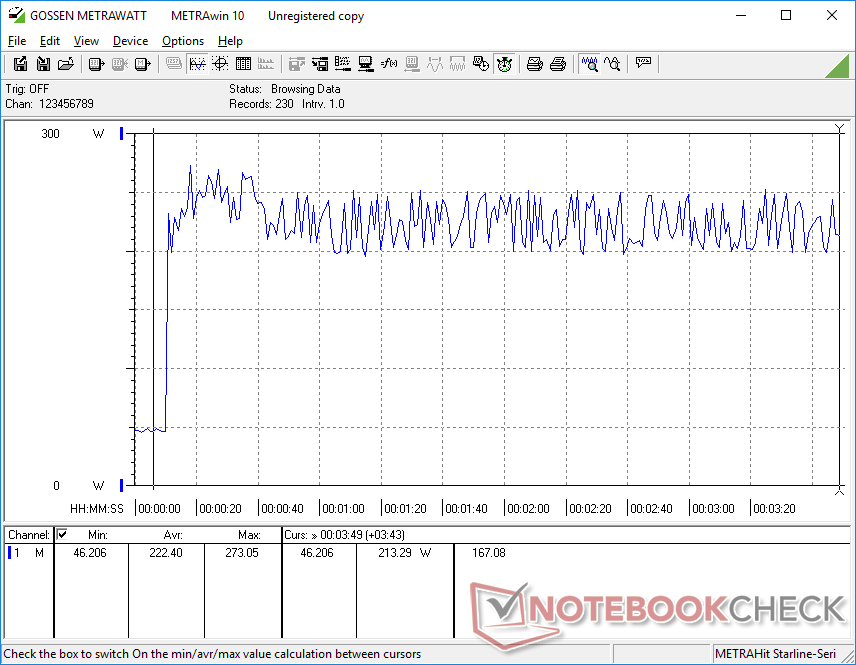
Lors d'un test de stress avec Prime95 en mode Performance maximale, le processeur a atteint 3,6 GHz pendant les 20 premières secondes environ, à une température centrale de 99 °C. Les fréquences d'horloge et la température ont ensuite chuté à 2,7 GHz et 83 °C avant de se stabiliser à 2,5 GHz et 72 °C. La fréquence d'horloge et la température tombent ensuite à 2,7 GHz et 83°C avant de se stabiliser à 2,5 GHz et 72°C. La puissance de l'unité centrale peut atteindre 107 W au début du test de stress avant de se stabiliser à 61 W, contre 90 W et 65 W pour la lame 17 d'Intel de 11e génération.
L'exécution de Witcher 3 en mode Performances maximales se traduirait par une consommation constante de 162 W sur la carte graphique, contre 143 W en mode Équilibré. Ainsi, les utilisateurs doivent faire fonctionner le Blade 17 sur ses paramètres de performances maximales pour extraire le plus de performances possible lors des jeux. Les températures du CPU et du GPU se stabilisent à 81 C et 77 C, respectivement, contre 79 C et 72 C sur l'Intel Blade 17 de 11e génération avec carte graphique RTX 3070 ou 65 C et 64 C sur l'Intel Blade 17 de 10e génération avec carte graphique RTX 3080. Les températures du cœur plus élevées sur notre modèle Intel de 12e génération ne sont pas surprenantes compte tenu de son TDP et de ses objectifs TGP plus élevés.
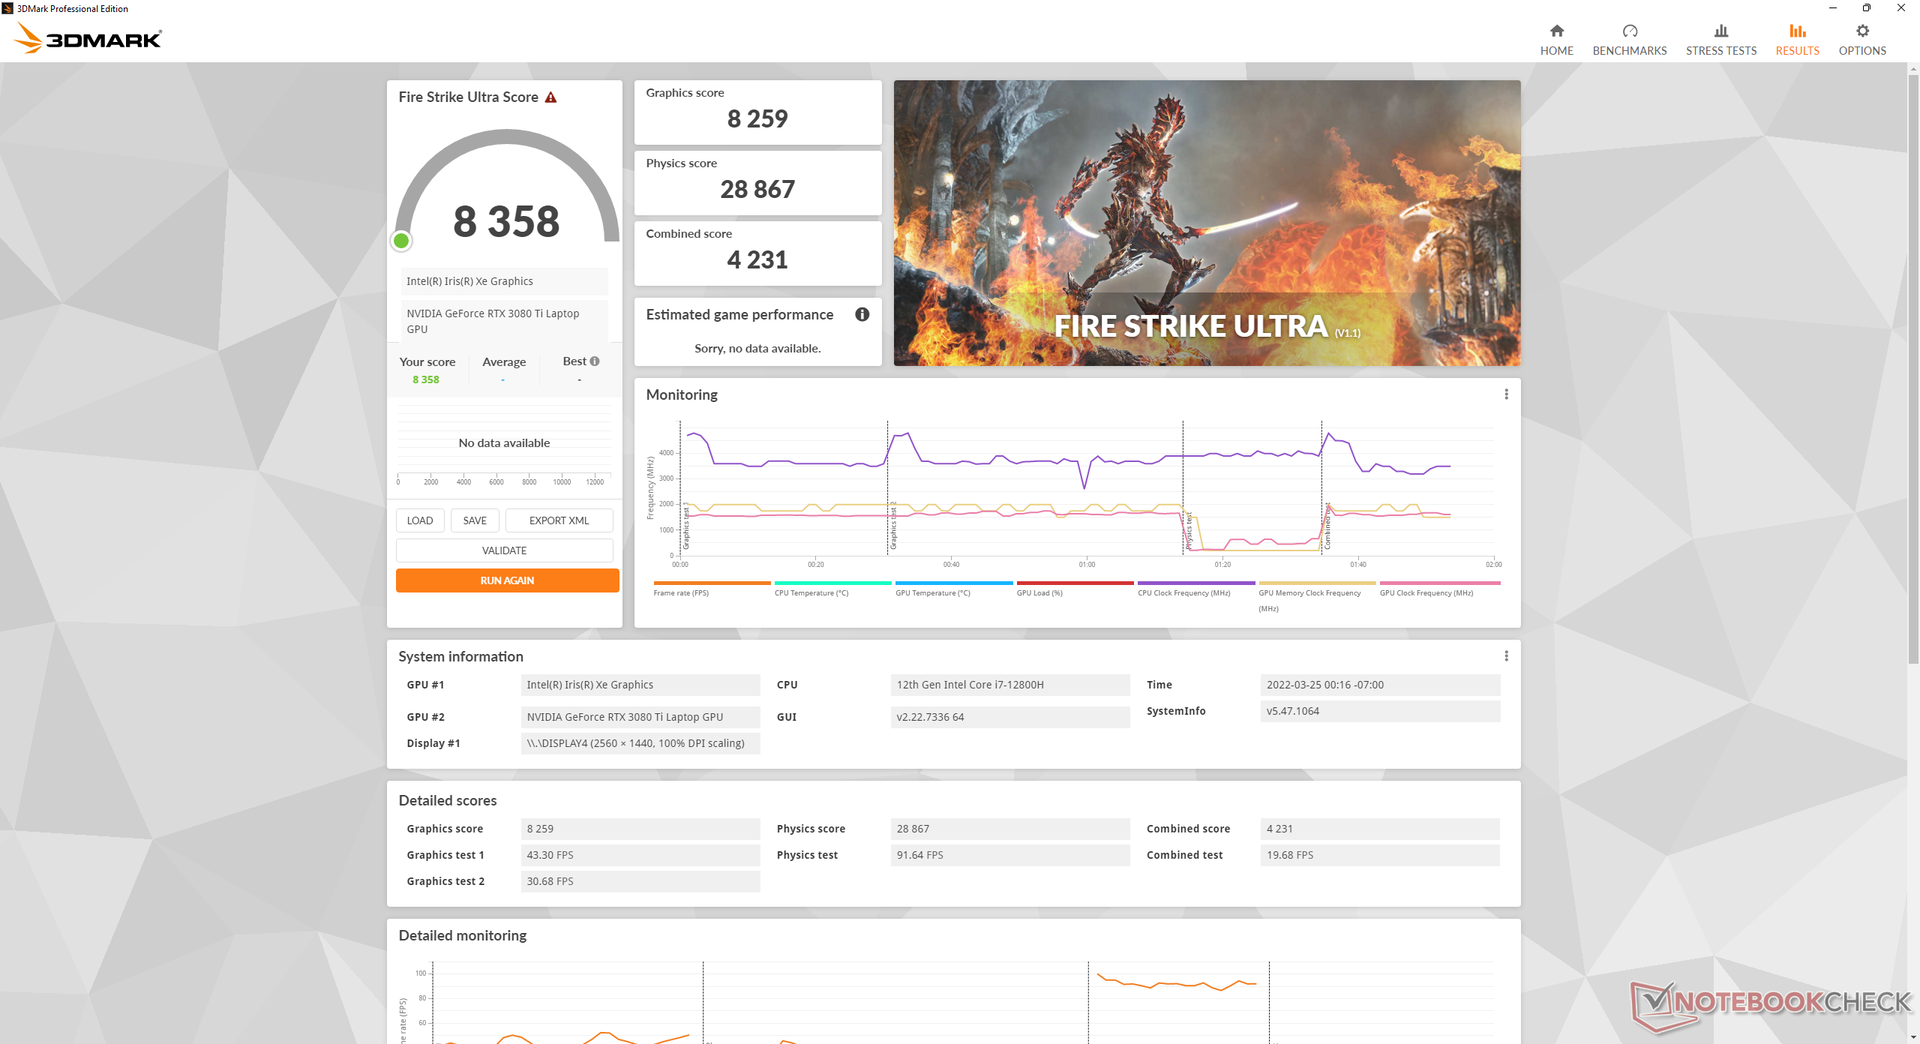
Le fonctionnement sur batterie limite considérablement les performances car le système ne peut pas être réglé sur un profil d'alimentation plus élevé que le profil équilibré. Un test de Fire Strike sur batteries donnerait des scores de physique et de graphisme de 11785 et 9465 points, respectivement, contre 27907 et 32106 points sur secteur.
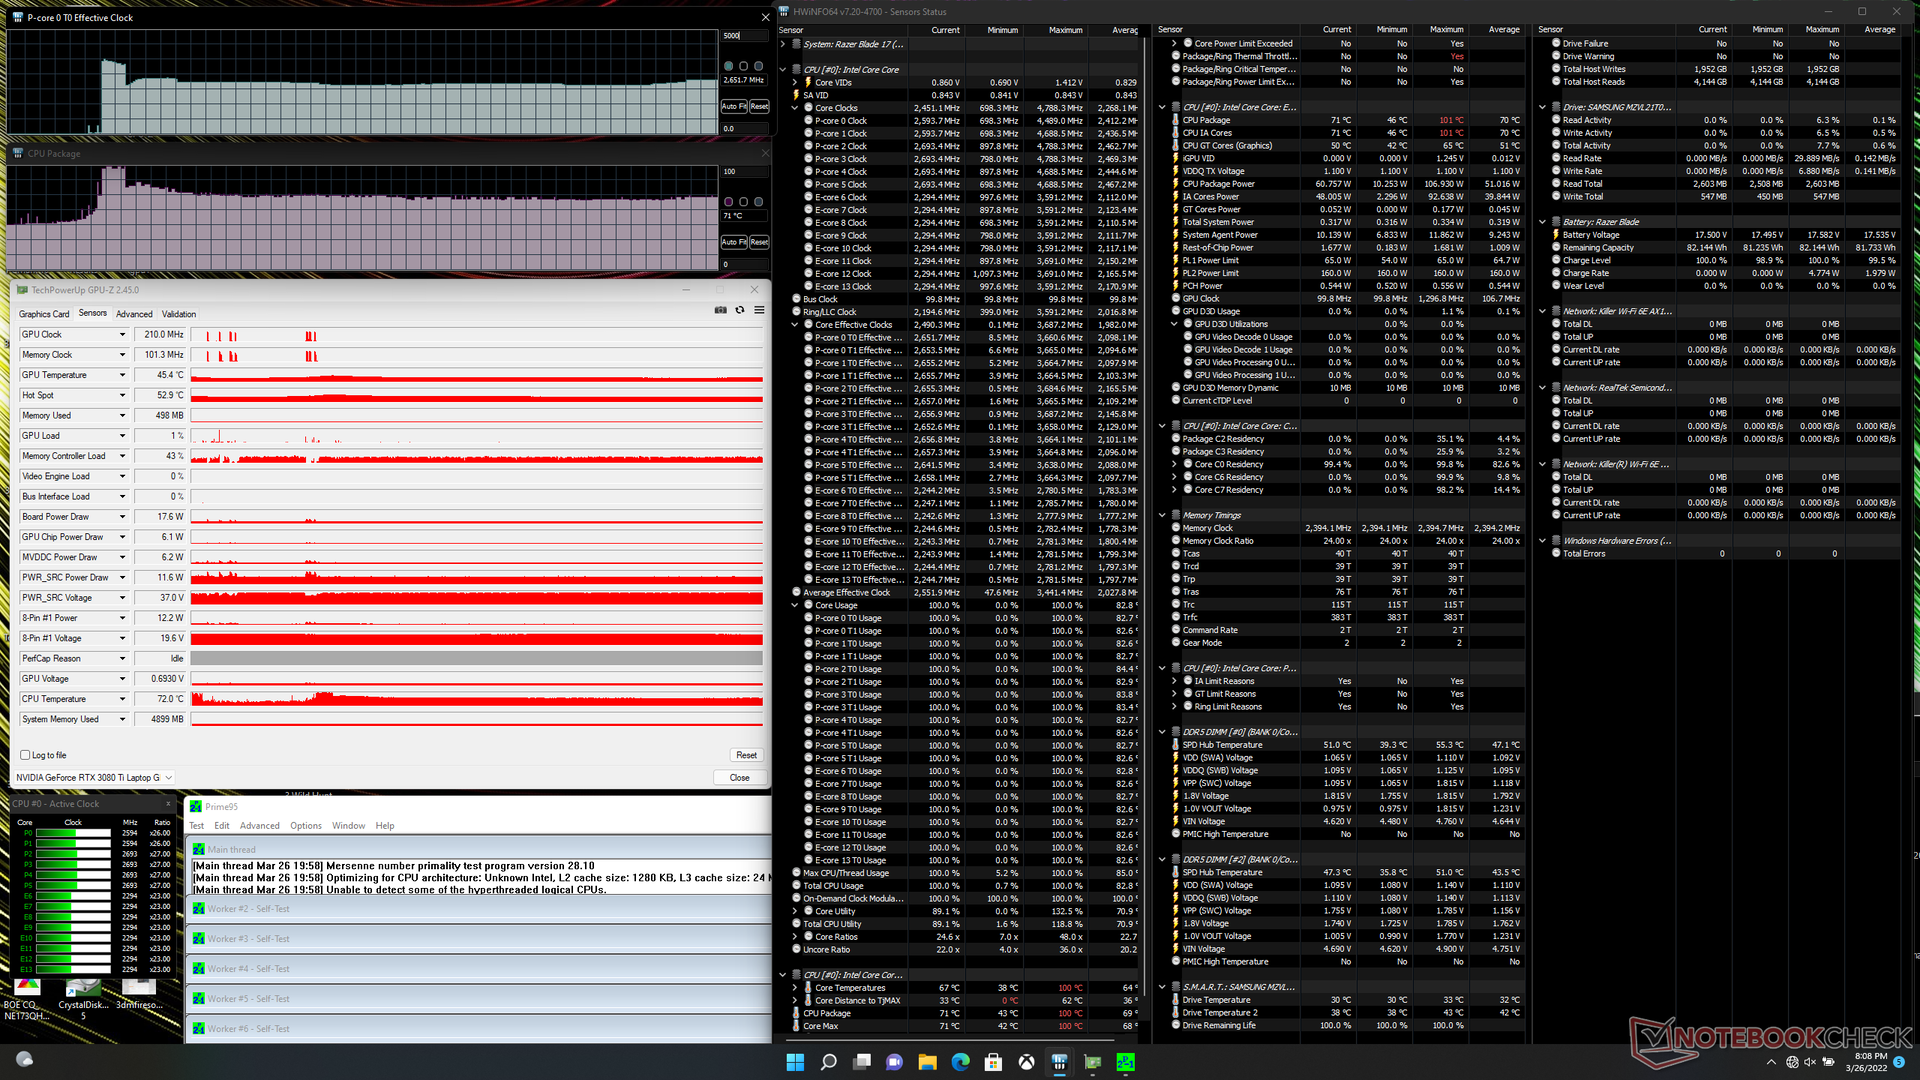
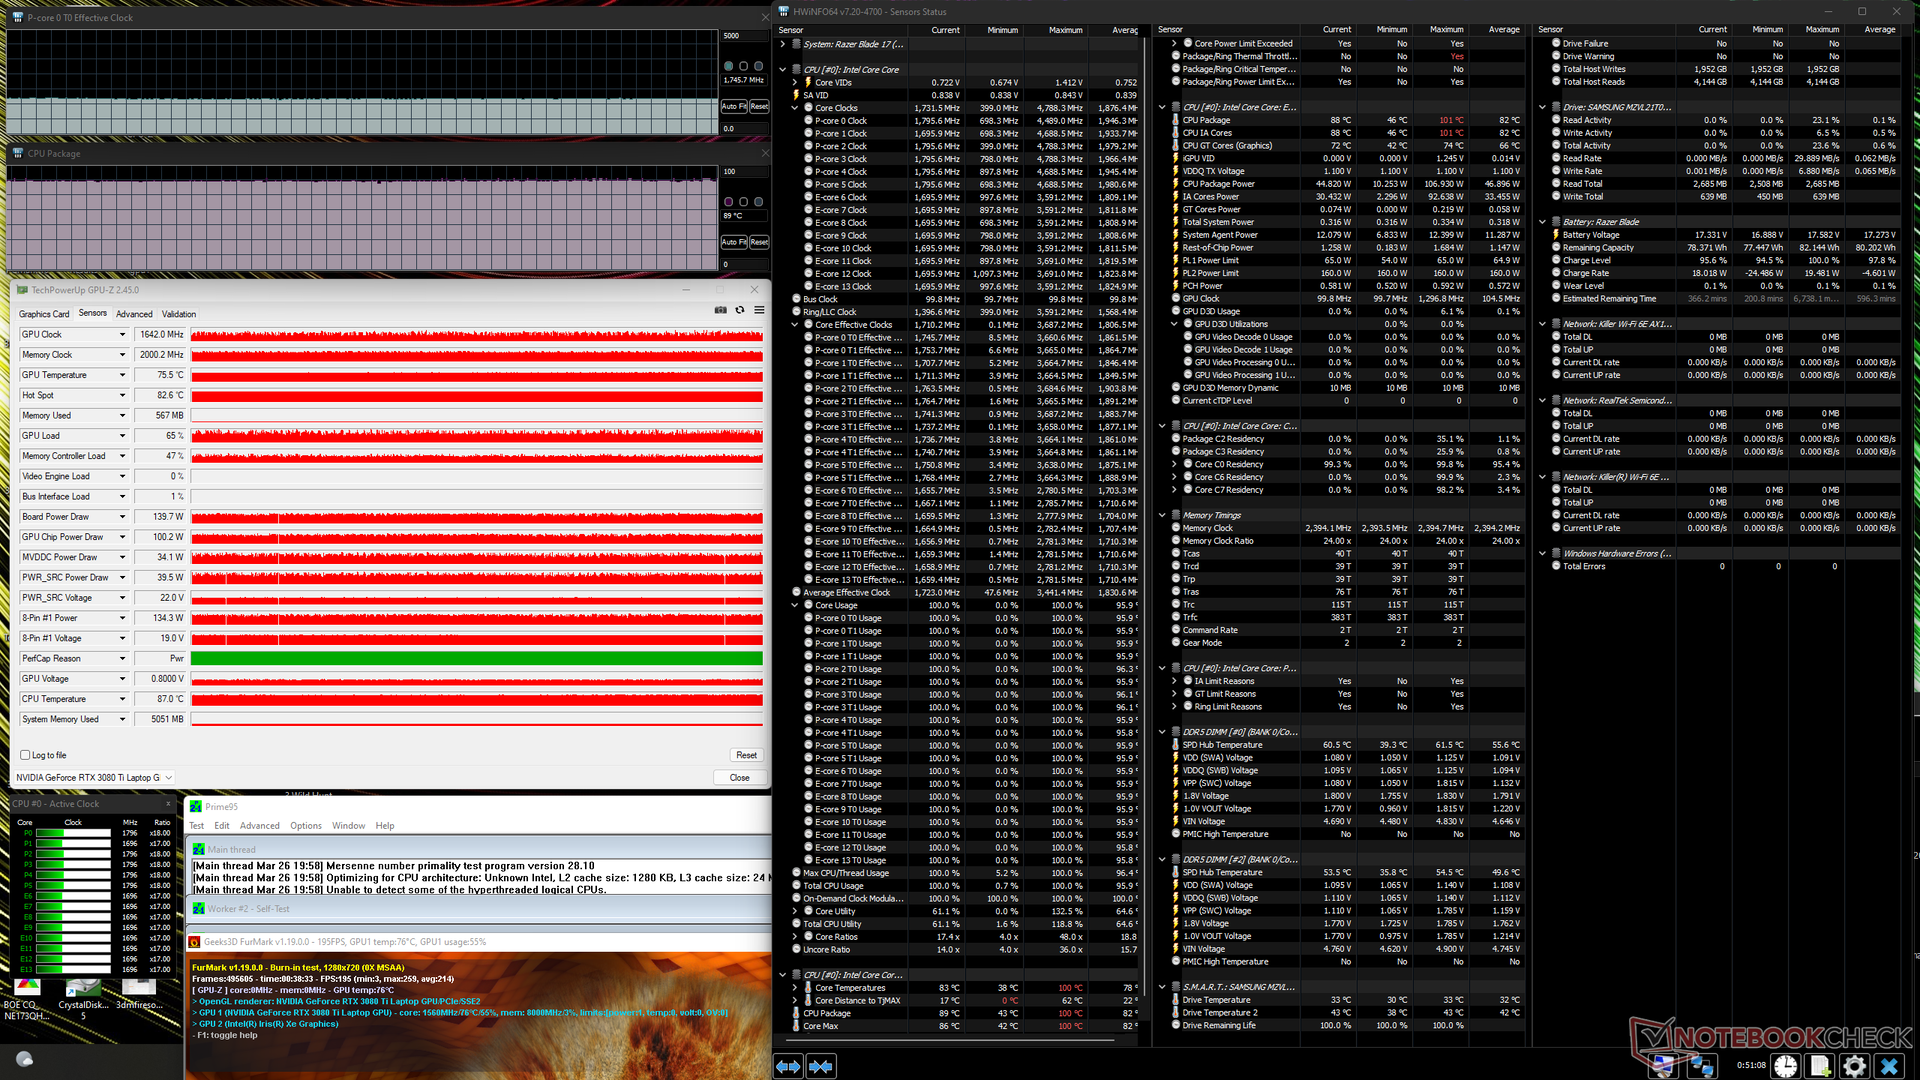
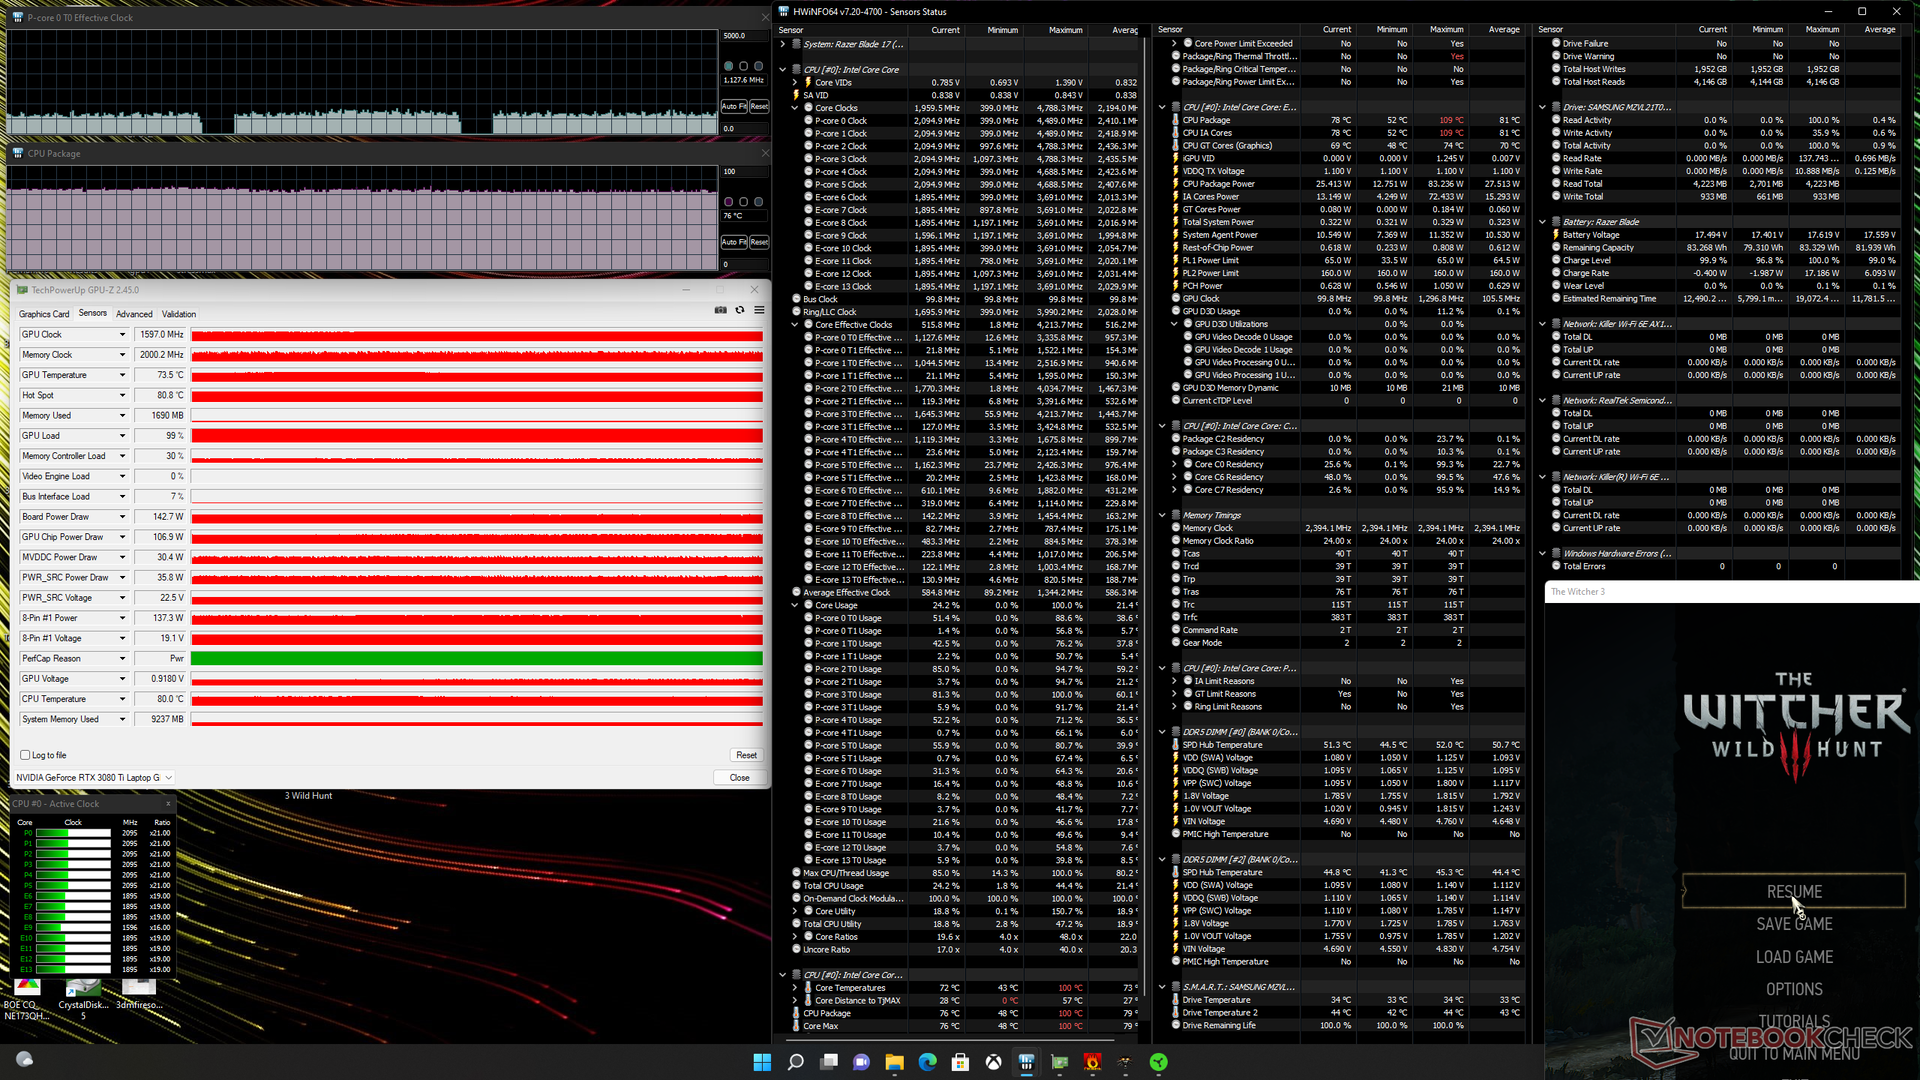
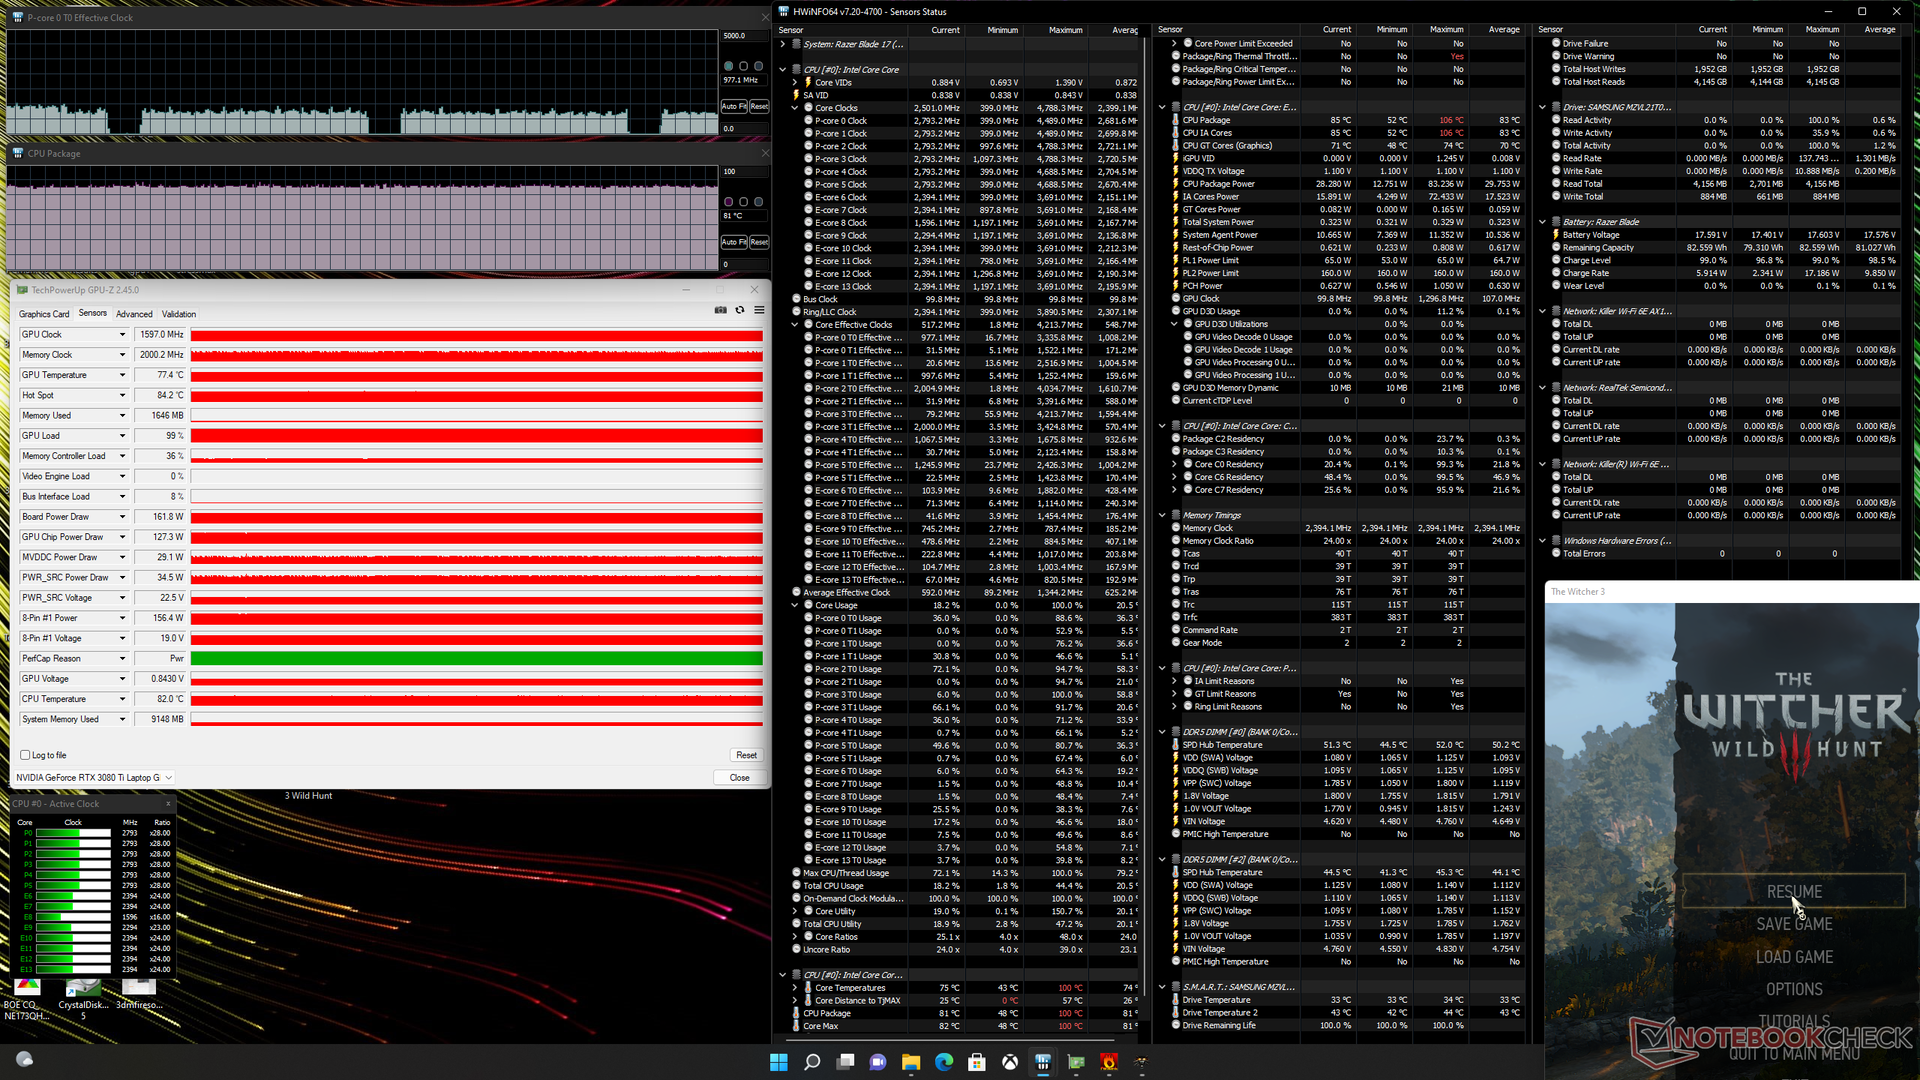
| Fréquence du CPU (GHz) | Fréquence du GPU (MHz) | Température moyenne du CPU (°C) | Température moyenne du GPU (°C) | |
| Système au repos | -- | -- | 50 | 47 |
| Prime95 Stress | 2.4 - 2.6 | -- | 71 | 45 |
| Prime95 + FurMark Stress | 1.8 | ~1642 | 89 | 76 |
| Witcher 3 Stress (mode équilibré) | ~1.1 | 1597 | 76 | 74 |
| Witcher 3 Stress (mode Performance maximale) | ~1.1 | 1597 | 81 | 77 |
Haut-parleurs
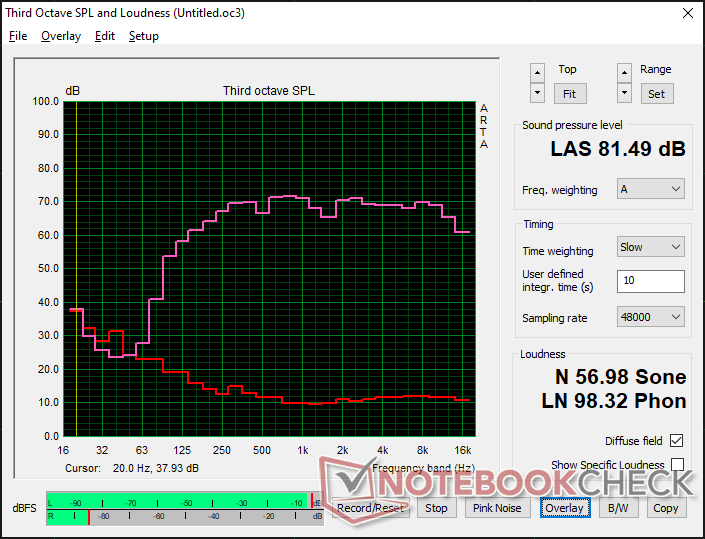
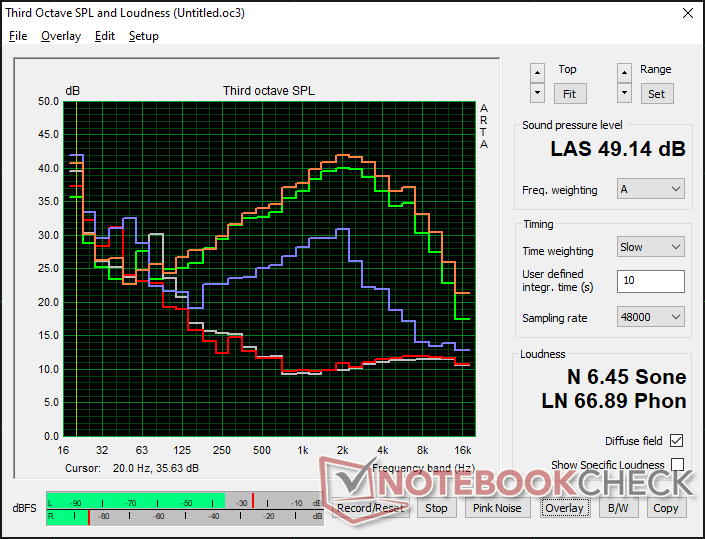
Razer Blade 17 RTX 3080 Ti analyse audio
(±) | le niveau sonore du haut-parleur est moyen mais bon (81.5# dB)
Basses 100 - 315 Hz
(±) | basse réduite - en moyenne 6.7% inférieure à la médiane
(±) | la linéarité des basses est moyenne (8.3% delta à la fréquence précédente)
Médiums 400 - 2000 Hz
(+) | médiane équilibrée - seulement 2.1% de la médiane
(+) | les médiums sont linéaires (4.3% delta à la fréquence précédente)
Aiguës 2 - 16 kHz
(+) | des sommets équilibrés - à seulement 0.7% de la médiane
(+) | les aigus sont linéaires (1.7% delta à la fréquence précédente)
Globalement 100 - 16 000 Hz
(+) | le son global est linéaire (6.8% différence à la médiane)
Par rapport à la même classe
» 0% de tous les appareils testés de cette catégorie étaient meilleurs, 0% similaires, 99% pires
» Le meilleur avait un delta de 6%, la moyenne était de 18%, le pire était de 132%.
Par rapport à tous les appareils testés
» 1% de tous les appareils testés étaient meilleurs, 0% similaires, 99% pires
» Le meilleur avait un delta de 4%, la moyenne était de 23%, le pire était de 134%.
Apple MacBook Pro 16 2021 M1 Pro analyse audio
(+) | les haut-parleurs peuvent jouer relativement fort (84.7# dB)
Basses 100 - 315 Hz
(+) | bonne basse - seulement 3.8% loin de la médiane
(+) | les basses sont linéaires (5.2% delta à la fréquence précédente)
Médiums 400 - 2000 Hz
(+) | médiane équilibrée - seulement 1.3% de la médiane
(+) | les médiums sont linéaires (2.1% delta à la fréquence précédente)
Aiguës 2 - 16 kHz
(+) | des sommets équilibrés - à seulement 1.9% de la médiane
(+) | les aigus sont linéaires (2.7% delta à la fréquence précédente)
Globalement 100 - 16 000 Hz
(+) | le son global est linéaire (4.6% différence à la médiane)
Par rapport à la même classe
» 0% de tous les appareils testés de cette catégorie étaient meilleurs, 0% similaires, 100% pires
» Le meilleur avait un delta de 5%, la moyenne était de 17%, le pire était de 45%.
Par rapport à tous les appareils testés
» 0% de tous les appareils testés étaient meilleurs, 0% similaires, 100% pires
» Le meilleur avait un delta de 4%, la moyenne était de 23%, le pire était de 134%.
Gestion de l'énergie
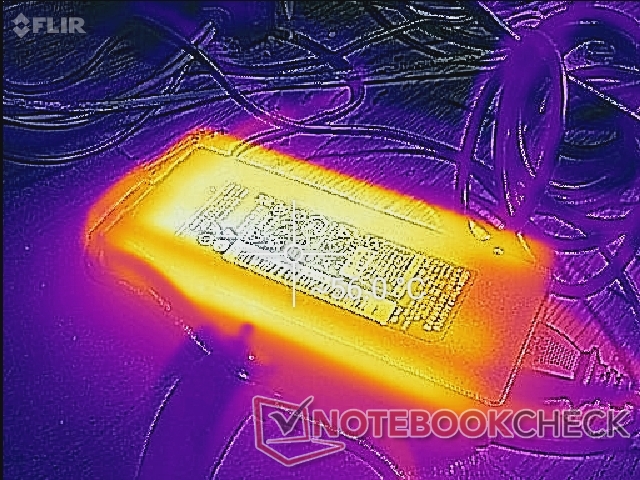
Consommation d'énergie - la plus élevée à ce jour pour la série Blade
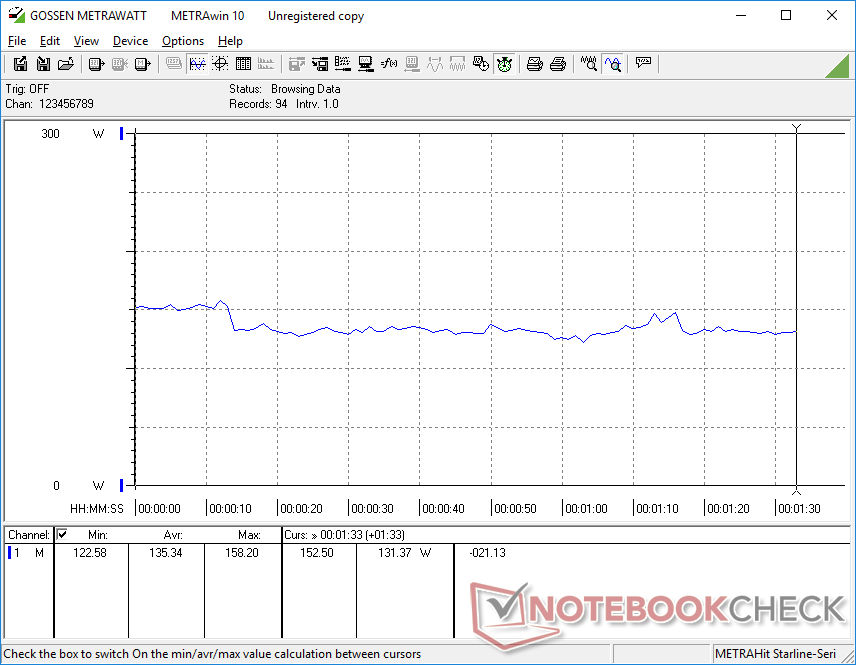
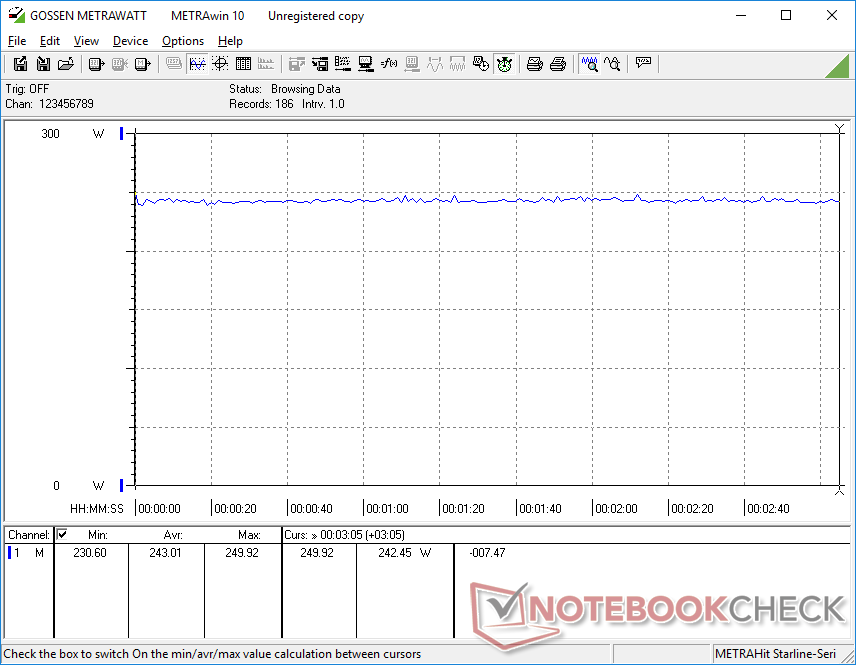
Le nouveau modèle est beaucoup plus gourmand en énergie qu'auparavant. Le simple fait de tourner au ralenti sur le bureau consomme entre 30 et 61 W selon le réglage de la luminosité et le profil d'alimentation, contre près de la moitié pour le 2021 Blade 17, le MSI GS76 ou l'Asus ROG Zephyrus S17. En fait, l'utilisation de Witcher 3 consommerait 30 % d'énergie en plus pour une augmentation de 20 à 25 % des performances graphiques et de 25 % des performances du CPU par rapport à la RTX 3070 et au Core i7-11800H du 2021 Blade 17.
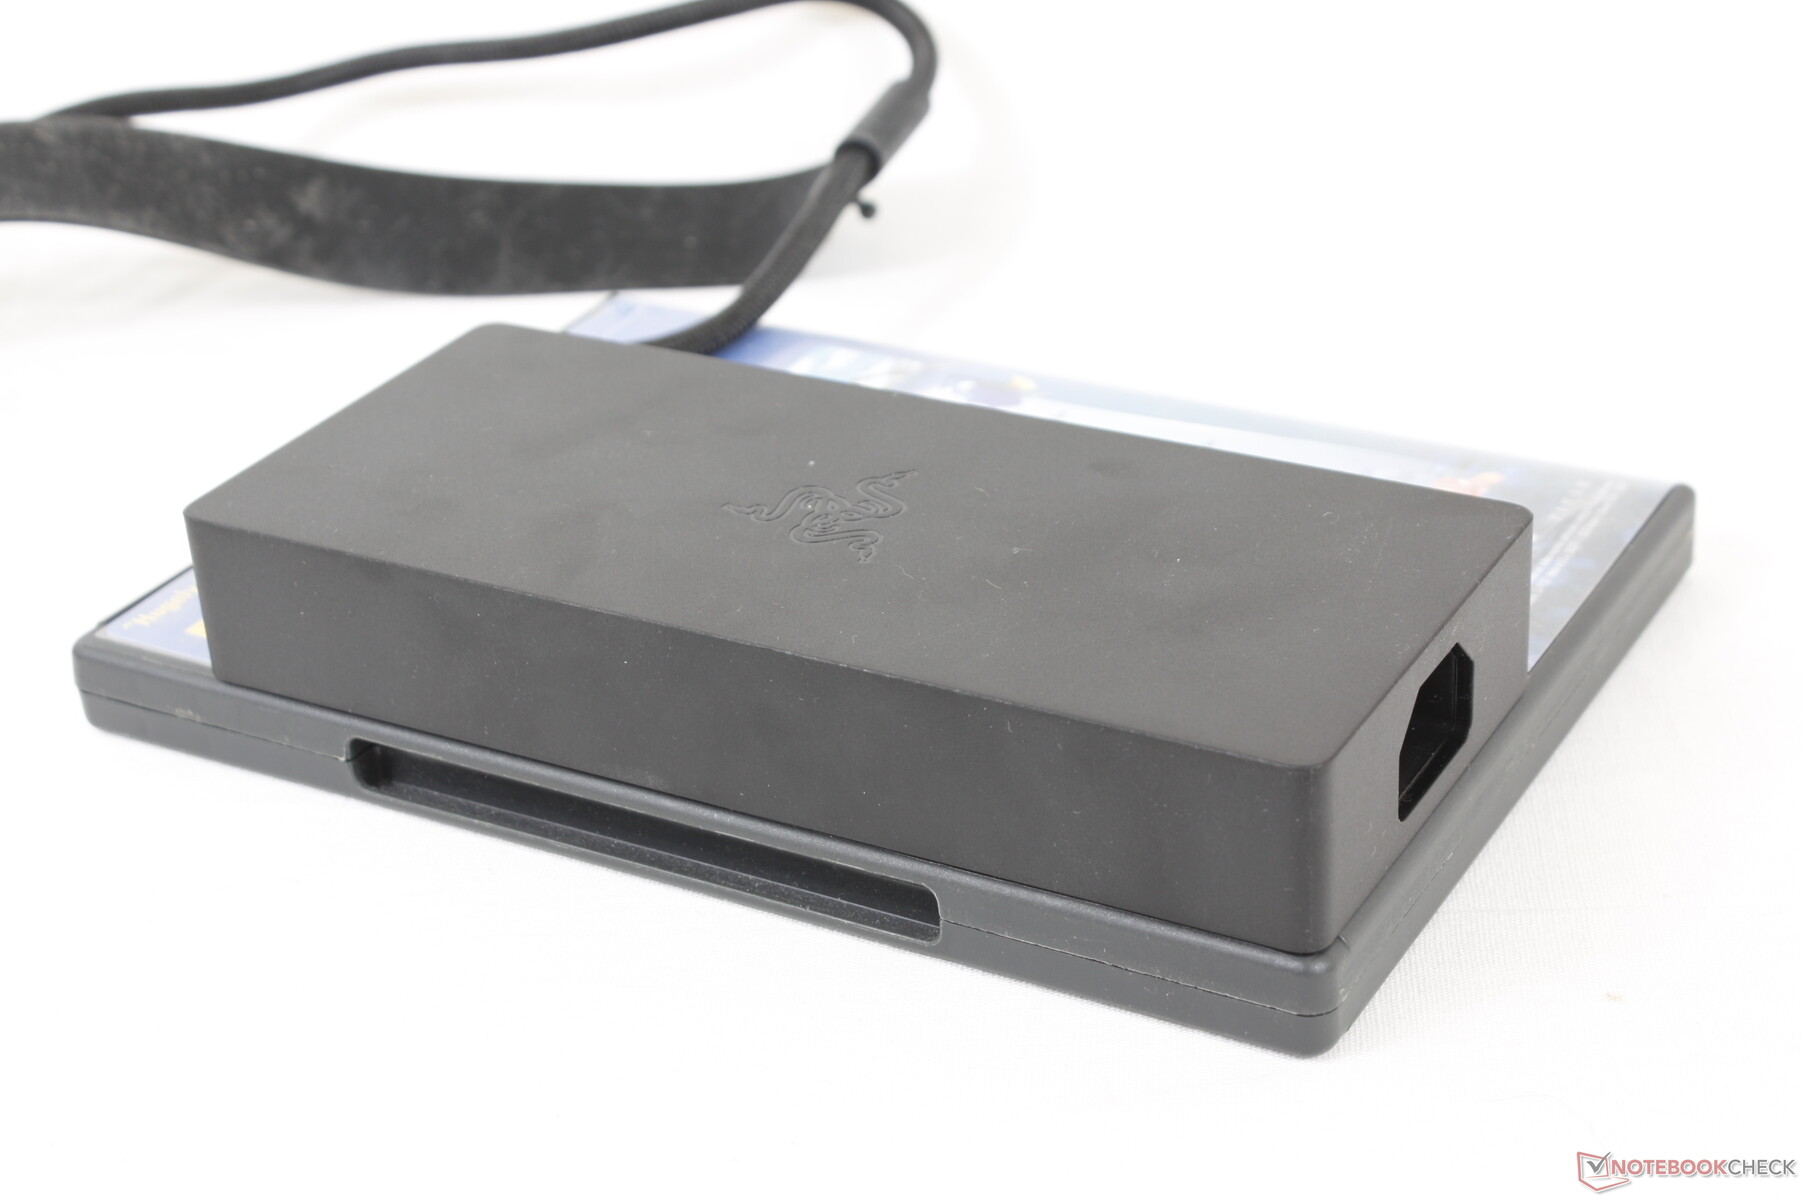
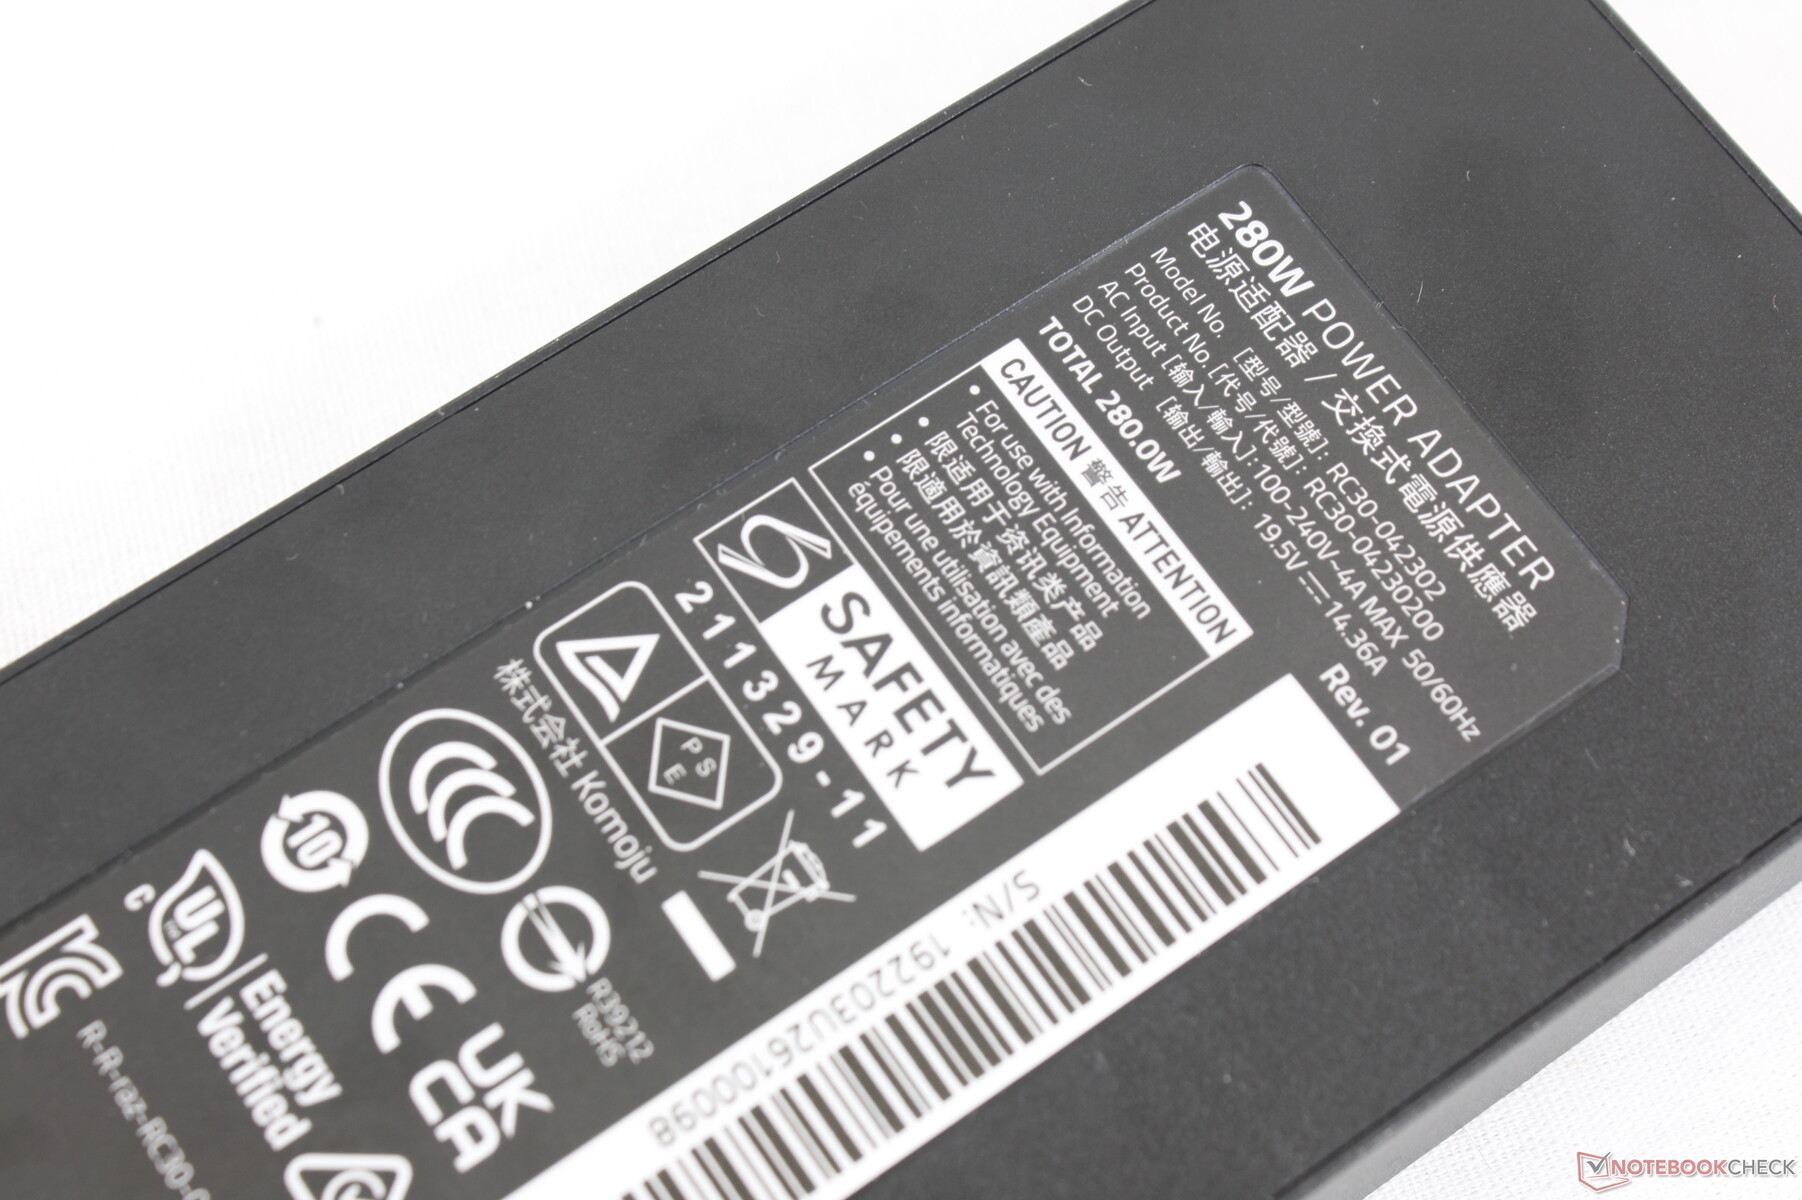
Pour s'adapter aux processeurs plus exigeants de cette année, le Blade 17 2022 est livré avec un adaptateur secteur de 280 W de plus grande capacité que l'adaptateur secteur de 230 W fourni avec le modèle 2021. Heureusement, la taille globale de l'adaptateur secteur est restée pratiquement la même d'une année sur l'autre (~16,4 x 7 x 2,5 cm contre ~17 x 7 x 2,5 cm) malgré la puissance de sortie plus élevée.
| Éteint/en veille | |
| Au repos | |
| Fortement sollicité |
|
Légende:
min: | |
| Razer Blade 17 RTX 3080 Ti i7-12800H, GeForce RTX 3080 Ti Laptop GPU, Samsung PM9A1 MZVL21T0HCLR, IPS, 2560x1440, 17.3" | Razer Blade Pro 17 2021 (QHD Touch) i7-10875H, GeForce RTX 3080 Laptop GPU, Samsung PM981a MZVLB1T0HBLR, IPS, 3840x2160, 17.3" | MSI GS76 Stealth 11UH i9-11900H, GeForce RTX 3080 Laptop GPU, Samsung PM9A1 MZVL22T0HBLB, IPS, 3840x2160, 17.3" | Asus ROG Zephyrus S17 GX703HSD i9-11900H, GeForce RTX 3080 Laptop GPU, Samsung PM9A1 MZVL22T0HBLB, IPS, 2560x1440, 17.3" | Aorus 17G YD i7-11800H, GeForce RTX 3080 Laptop GPU, Samsung PM9A1 MZVL2512HCJQ, IPS, 1920x1080, 17.3" | Alienware x17 RTX 3080 P48E i7-11800H, GeForce RTX 3080 Laptop GPU, 2x WDC PC SN730 SDBPNTY-1T00 (RAID 0), IPS, 3840x2160, 17.3" | |
|---|---|---|---|---|---|---|
| Power Consumption | 34% | 38% | 27% | 27% | 24% | |
| Idle Minimum * (Watt) | 29.8 | 15.2 49% | 14 53% | 21.7 27% | 24 19% | 10.2 66% |
| Idle Average * (Watt) | 37.1 | 20.3 45% | 19 49% | 27 27% | 26 30% | 21.2 43% |
| Idle Maximum * (Watt) | 60.8 | 37.3 39% | 31 49% | 33 46% | 38 37% | 48.4 20% |
| Load Average * (Watt) | 135.3 | 114.9 15% | 97 28% | 108 20% | 101 25% | 118.7 12% |
| Witcher 3 ultra * (Watt) | 243 | 158.4 35% | 156 36% | 195 20% | 164 33% | 249 -2% |
| Load Maximum * (Watt) | 273.1 | 223.7 18% | 231 15% | 210 23% | 230 16% | 262 4% |
* ... Moindre est la valeur, meilleures sont les performances
Power Consumption Witcher 3 / Stresstest
Power Consumption external Monitor
Autonomie de la batterie - stable d'une année sur l'autre
La capacité de la batterie est plus importante que celle du 2021 Blade 17 en raison de la suppression du quatrième ventilateur. Les temps d'exécution ne sont pas meilleurs, cependant, car le nouveau CPU et le GPU sont plus exigeants cette fois-ci. Nous avons remarqué des résultats similaires entre le 2021 et le 2022 Blade 15 2021 et 2022.
La charge du vide au plein avec l'adaptateur secteur inclus prend environ 90 minutes. La charge USB-C est prise en charge, contrairement à la Asus TUF Gaming F15.
| Razer Blade 17 RTX 3080 Ti i7-12800H, GeForce RTX 3080 Ti Laptop GPU, 82 Wh | Razer Blade Pro 17 2021 (QHD Touch) i7-10875H, GeForce RTX 3080 Laptop GPU, 70.5 Wh | MSI GS76 Stealth 11UH i9-11900H, GeForce RTX 3080 Laptop GPU, 99.9 Wh | Asus ROG Zephyrus S17 GX703HSD i9-11900H, GeForce RTX 3080 Laptop GPU, 90 Wh | Aorus 17G YD i7-11800H, GeForce RTX 3080 Laptop GPU, 99 Wh | Alienware x17 RTX 3080 P48E i7-11800H, GeForce RTX 3080 Laptop GPU, 87 Wh | |
|---|---|---|---|---|---|---|
| Autonomie de la batterie | 19% | 19% | 91% | 22% | -11% | |
| Reader / Idle (h) | 8 | 9.9 24% | 9.9 24% | 9 13% | 7 -12% | |
| WiFi v1.3 (h) | 5.5 | 5.9 7% | 6.4 16% | 7.5 36% | 6 9% | 5.9 7% |
| Load (h) | 1.1 | 1.4 27% | 1.3 18% | 2.7 145% | 1.6 45% | 0.8 -27% |
| H.264 (h) | 7.2 | 6.2 | ||||
| Witcher 3 ultra (h) | 1 |
Points positifs
Points négatifs
Verdict - Plus de watts, plus de puissance
Le design du Blade 17 a été présenté en 2019 avec des graphiques de 100 W GeForce. Ce rafraîchissement de 2022 embarque un GPU encore plus puissant de 165 W sans que la taille ou le design du châssis ne soit modifié de manière significative. Les performances se sont améliorées, bien sûr, mais la consommation d'énergie globalement plus élevée entraîne des températures plus élevées, une brique d'alimentation plus dense et une autonomie généralement plus courte que les précédents modèles Blade 17 dotés de processeurs plus anciens.
Heureusement, Razer a ajusté certains aspects du modèle 2022 pour compenser ses besoins énergétiques plus élevés. La batterie interne, par exemple, est plus grande, mais au détriment d'un ventilateur entier qui aurait autrement contribué au refroidissement. Par ailleurs, l'adaptateur secteur 280 W, souvent négligé, est l'un des plus petits et des plus légers que nous ayons vus par rapport à d'autres adaptateurs haute capacité, ce qui facilite un peu les déplacements avec le Blade 17. Le fabricant était bien conscient des composants de plus en plus gourmands en énergie pendant le développement et a pris des mesures pour atténuer certains des inconvénients inévitables.
En se concentrant aussi fortement sur les performances, le GPU de 165 W du Razer est capable de surpasser la plupart des autres ordinateurs portables équipés du même GPU. Les autres ordinateurs portables ultraplats ont tendance à avoir des objectifs TGP inférieurs à ceux du Blade 17 pour des performances toujours plus faibles. Le Blade 17 2022 est donc l'une des meilleures recommandations pour les joueurs qui veulent maximiser les performances graphiques mobiles sans se contenter d'options plus épaisses comme la série GT de MSI ou un Chimera de Asus ROG. Peut-être que les futurs modèles de Blade 17 pourraient incorporer un refroidissement par métal liquide pour améliorer les températures.
Prix et disponibilité
Razer est vend maintenant notre configuration telle qu'examinée pour environ $4000 USD. Amazon et Best Buy n'ont pas de stock à ce jour.
Razer Blade 17 RTX 3080 Ti
- 07/05/2022 v7 (old)
Allen Ngo
Price comparison

