Test du MSI Stealth GS77 : une bonne alternative au Razer Blade 17 ?
Lorsque MSI a présenté le GS76 avec la 11ème génération d'Intel l'année dernière, le modèle utilisait un design de châssis complètement différent de celui du précédent GS75. Pour 2022, le GS77 avec la 12ème génération d'Intel est arrivé pour remplacer le GS76 avec encore une nouvelle conception de châssis. Nous sommes vraiment surpris de voir un nouveau look si tôt pour la série GS de MSI, surtout que la plupart des autres ordinateurs portables utilisent le même squelette de châssis pendant au moins quelques années d'affilée avant de recevoir un lifting
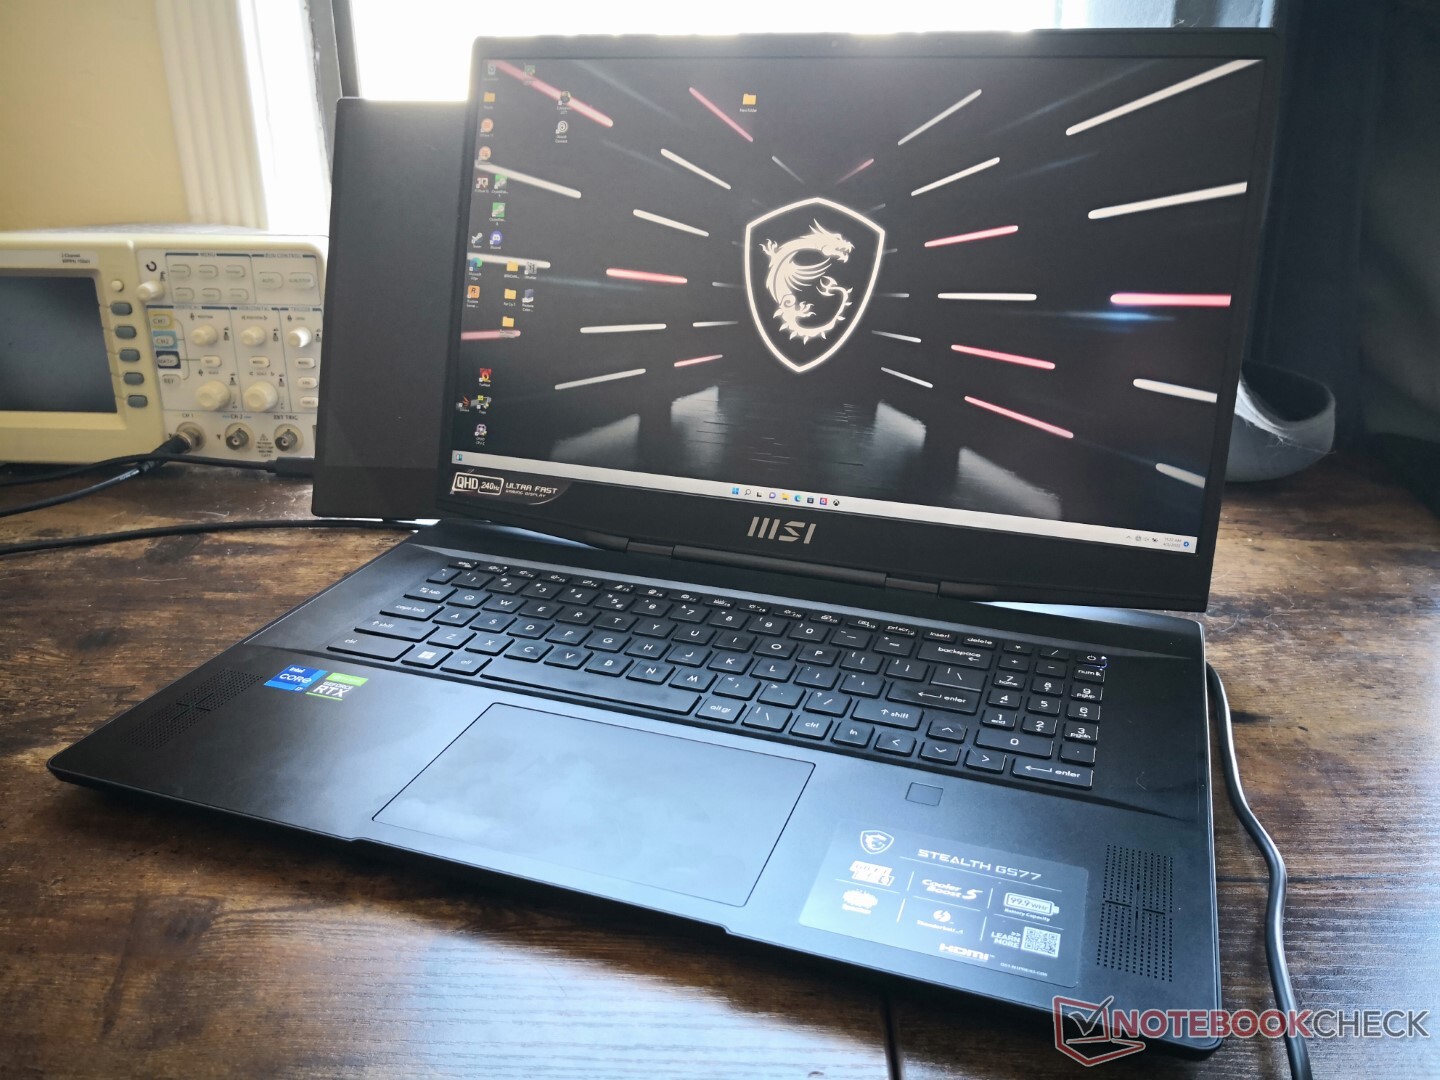
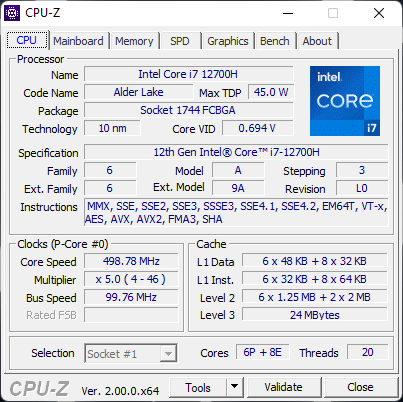
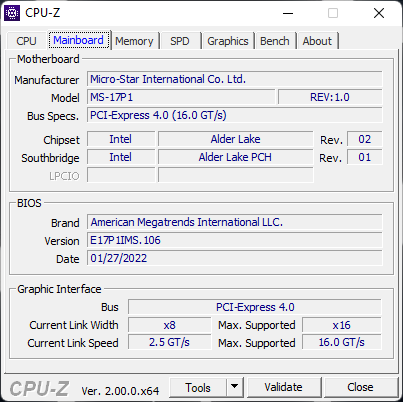
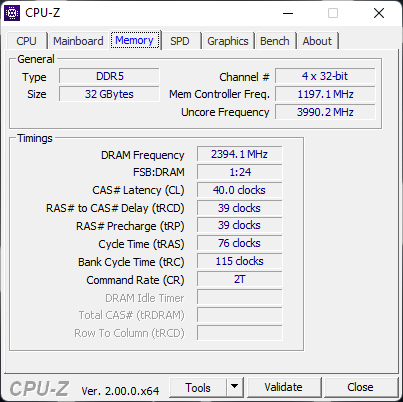
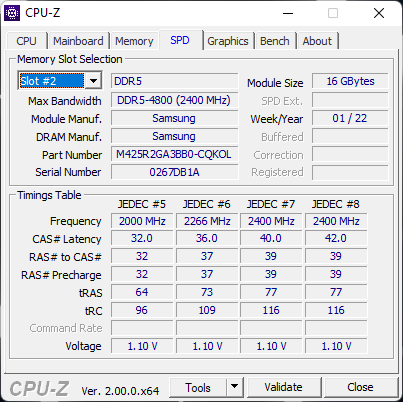
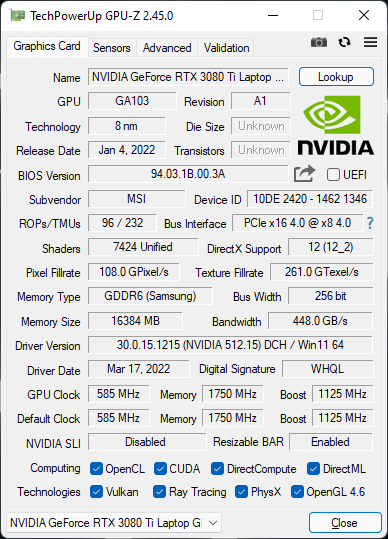
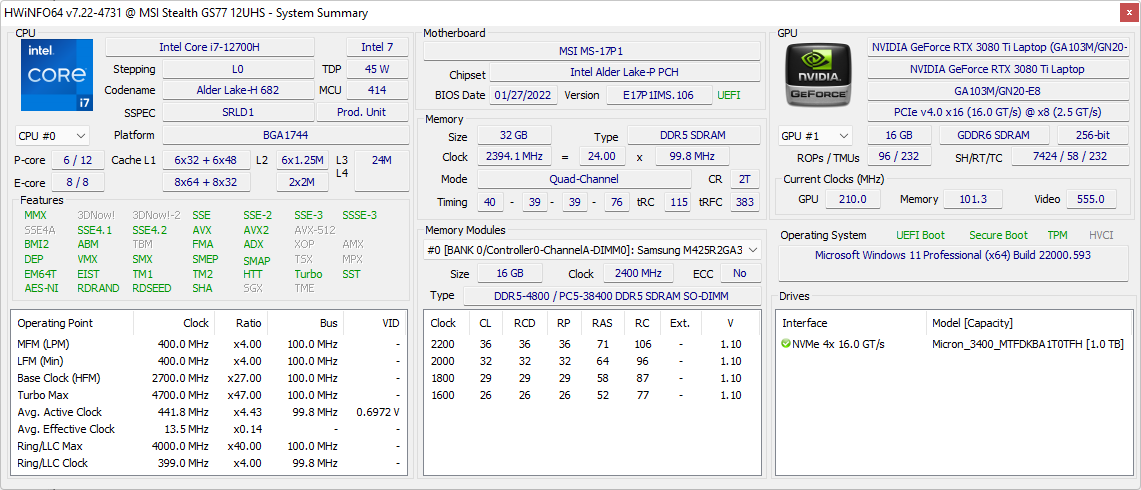
GeForce Notre configuration est une courtoisie de Xotic PC avec un CPU Core i7-12700H de 12e génération, un GPU RTX 3080 Ti TGP de 105 W, 32 Go de RAM DDR5-4800, un écran IPS 240 Hz 1440p et un SSD NVMe PCIe4 x4 de 1 To pour environ 3700 USD. D'autres UGS sont disponibles avec le Core i9-12900H, le RTX 3070 Ti, le RTX 3080, des panneaux 360 Hz FHD ou 120 Hz UHD à la place
Parmi les modèles concurrents, on trouve d'autres ultrafins comme le Razer Blade 17, Dell Alienware x17,Asus ROG Zephyrus S17et Gigabyte Aorus 17 série
Plus de commentaires sur MSI
Comparaison avec les concurrents potentiels
Note | Date | Modèle | Poids | Épaisseur | Taille | Résolution | Prix |
|---|---|---|---|---|---|---|---|
| 87.2 % v7 (old) | 04/22 | MSI Stealth GS77 12UHS-083US i7-12700H, GeForce RTX 3080 Ti Laptop GPU | 2.9 kg | 20.8 mm | 17.30" | 2560x1440 | |
| 86.2 % v7 (old) | 09/21 | MSI GS76 Stealth 11UH i9-11900H, GeForce RTX 3080 Laptop GPU | 2.4 kg | 20 mm | 17.30" | 3840x2160 | |
| 91.2 % v7 (old) | 03/22 | Razer Blade 17 RTX 3080 Ti i7-12800H, GeForce RTX 3080 Ti Laptop GPU | 2.7 kg | 19.9 mm | 17.30" | 2560x1440 | |
| 87.5 % v7 (old) | 01/22 | MSI GE76 Raider i9-12900HK, GeForce RTX 3080 Ti Laptop GPU | 3 kg | 26 mm | 17.30" | 1920x1080 | |
| 89 % v7 (old) | 09/21 | Alienware x17 RTX 3080 P48E i7-11800H, GeForce RTX 3080 Laptop GPU | 3.2 kg | 21.4 mm | 17.30" | 3840x2160 | |
| 90.1 % v7 (old) | 07/21 | Asus ROG Zephyrus S17 GX703HSD i9-11900H, GeForce RTX 3080 Laptop GPU | 2.8 kg | 19.9 mm | 17.30" | 2560x1440 |
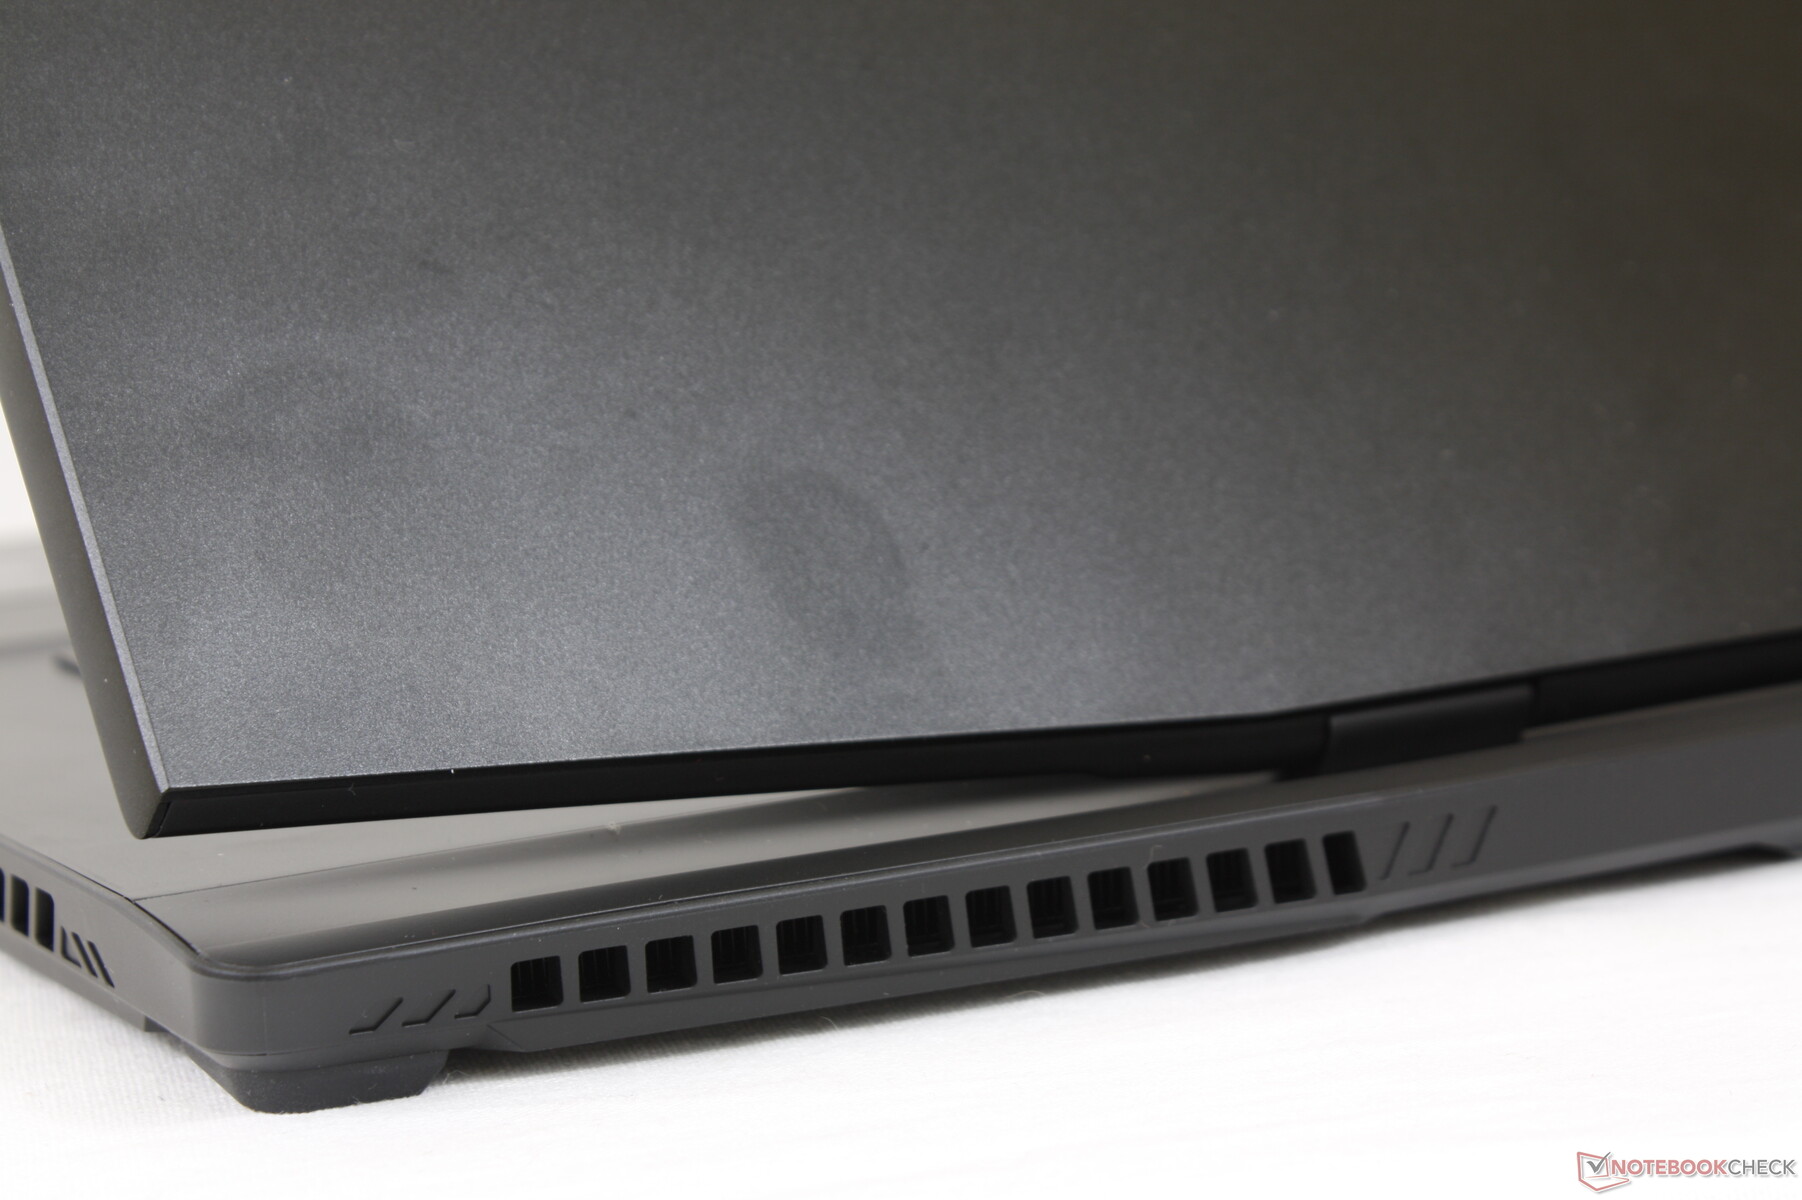
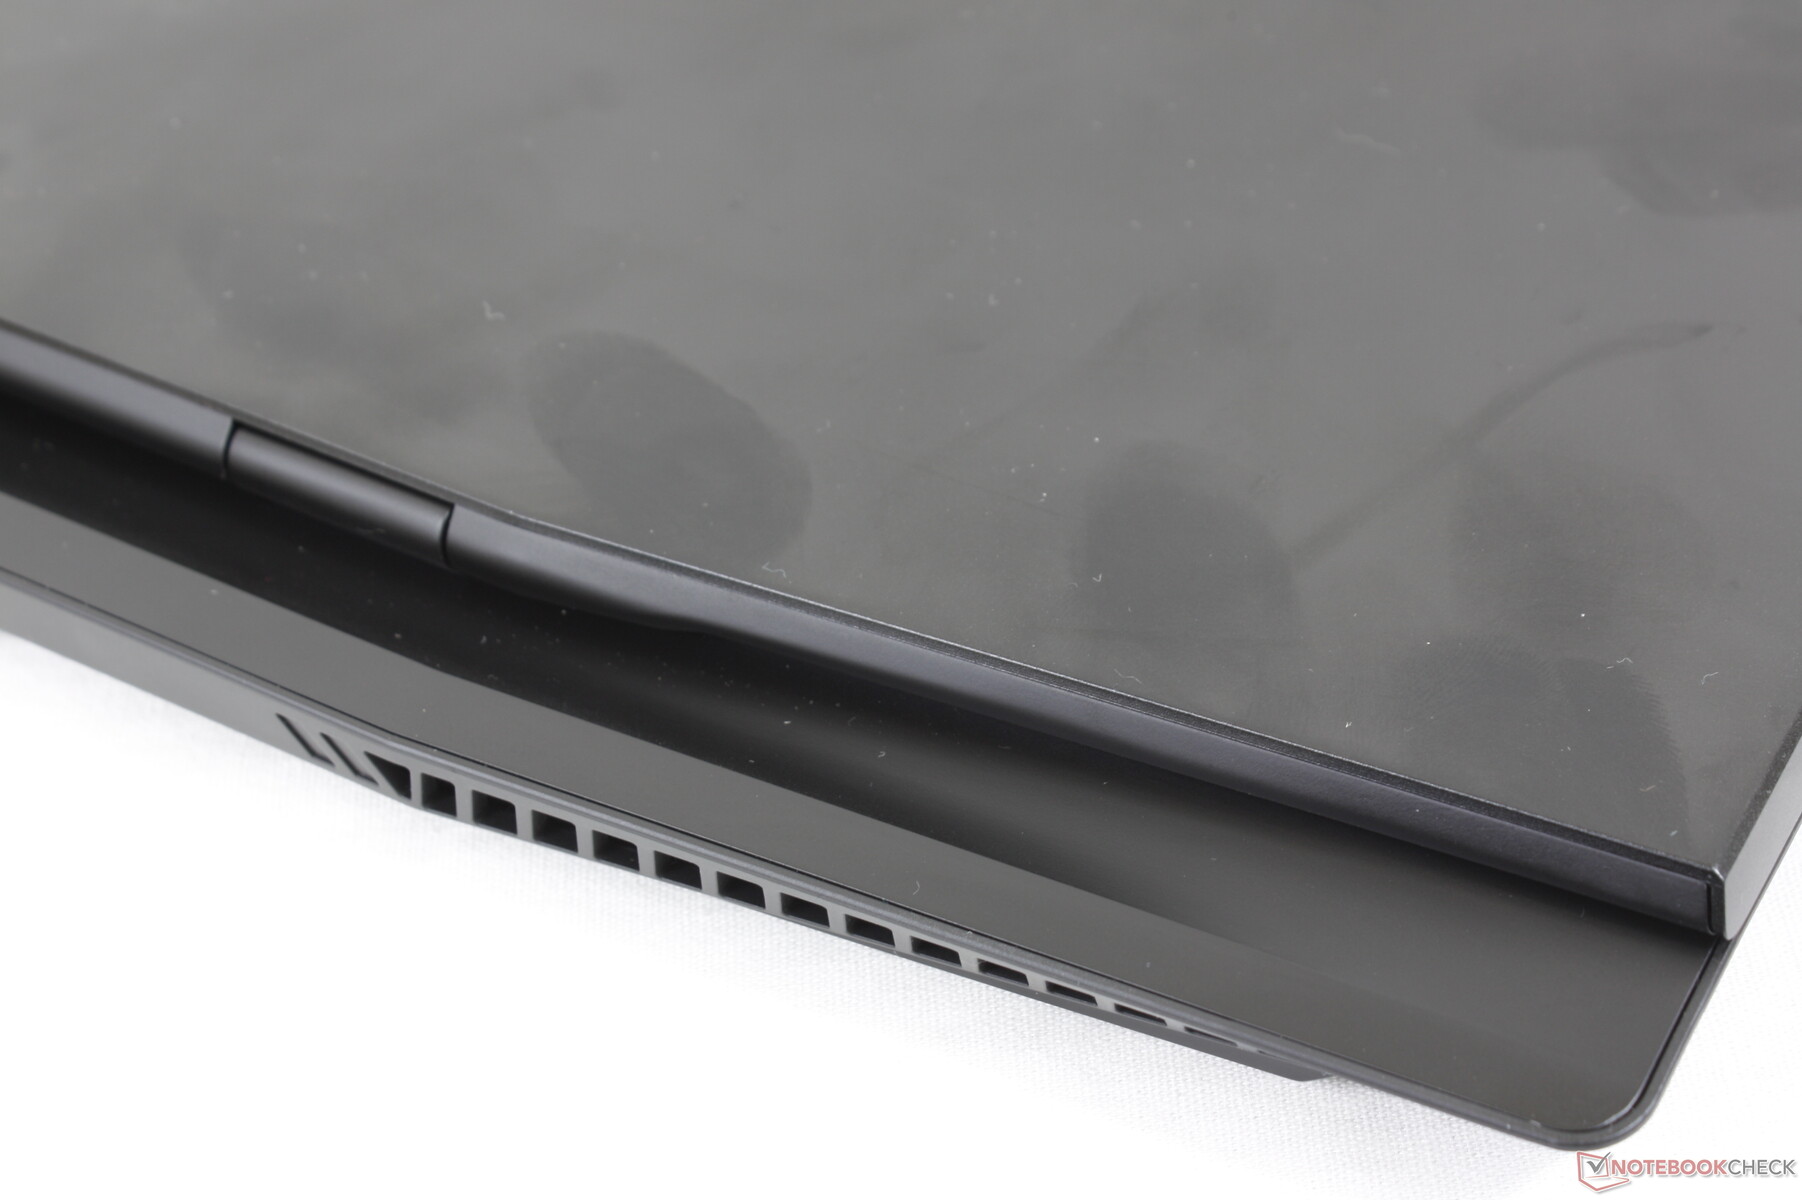
Cas - Plus grand, plus lourd, plus résistant
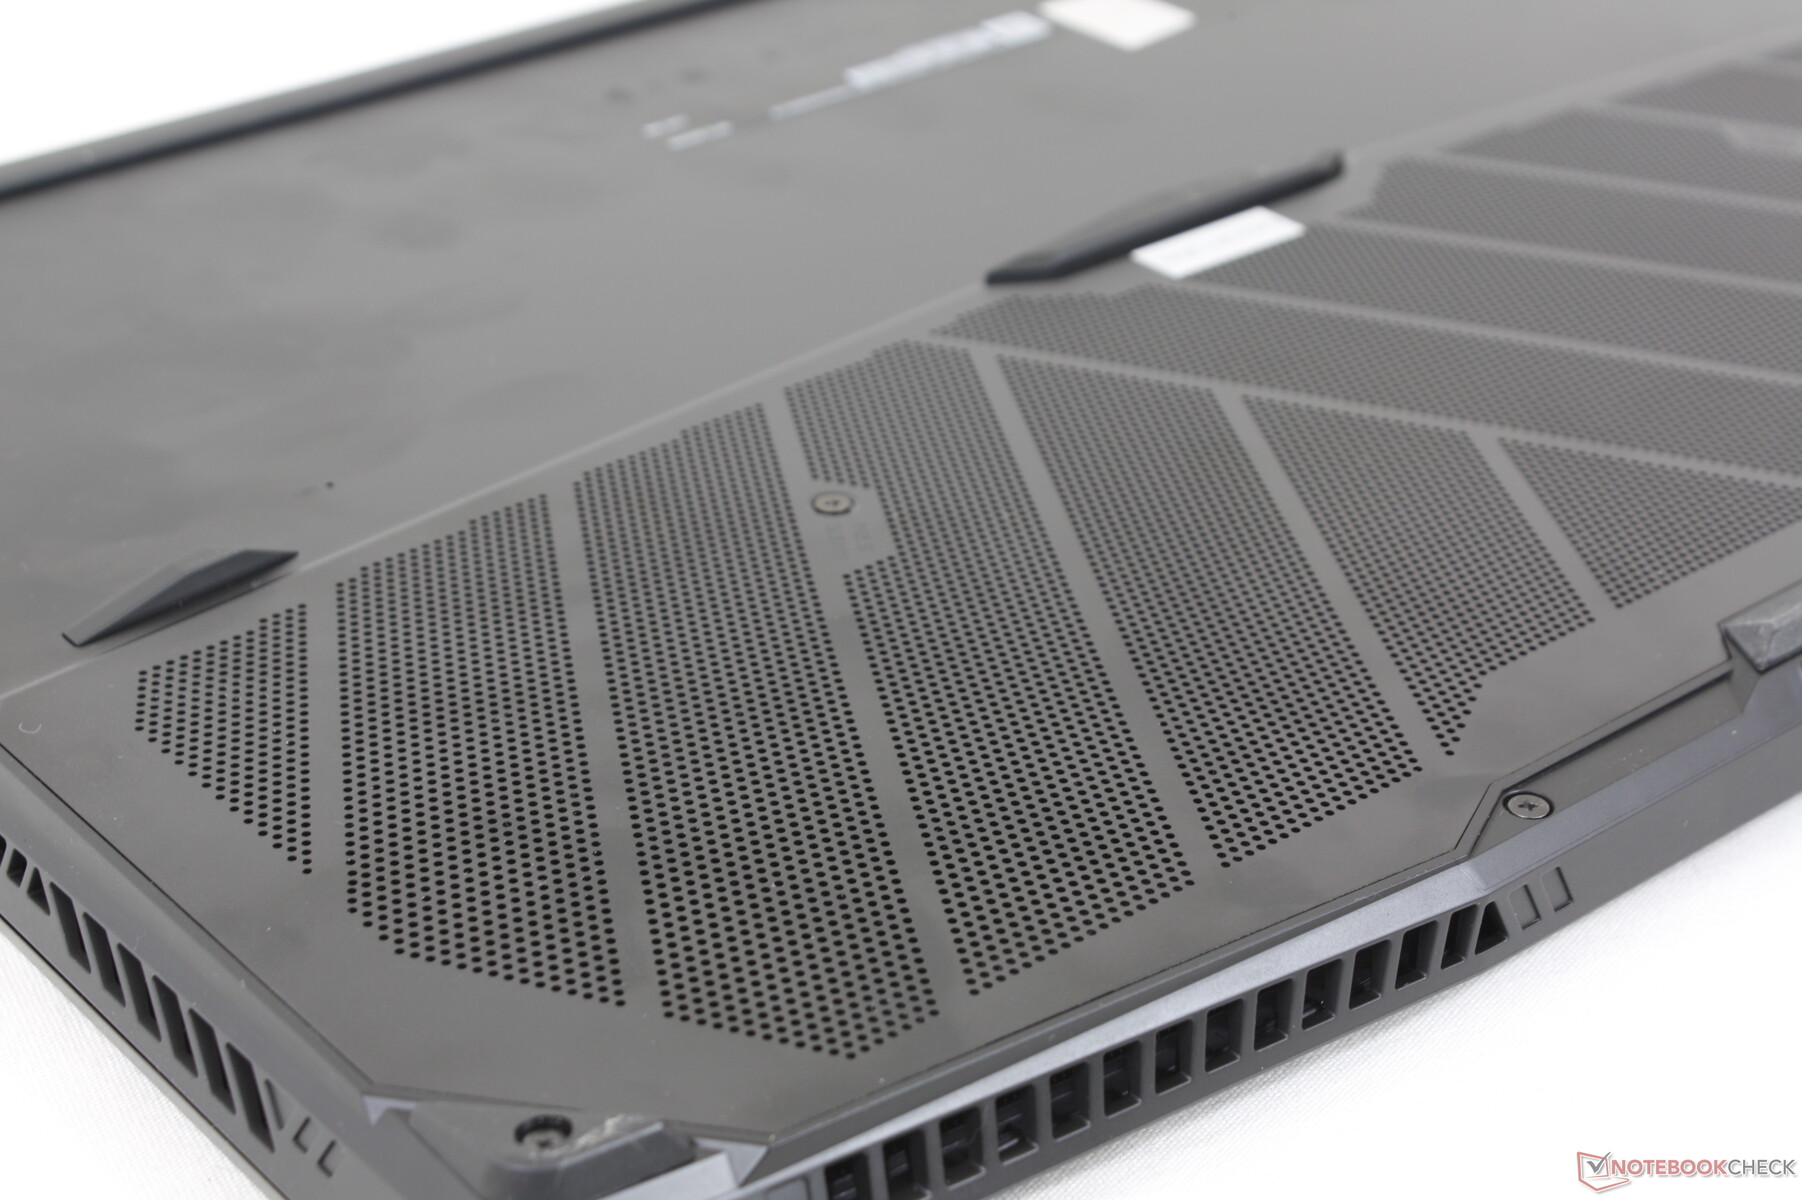
L'une de nos plus grandes critiques à l'égard du GS76 était qu'il sacrifiait trop de performances pour un facteur de forme plus mince et plus léger. Le GS77 redessiné a remédié à ce problème en introduisant un moteur à réaction en saillie à l'arrière, comme sur l'Alienware x17 ou la série GT de MSI. Nous sommes heureux de constater que la rigidité du châssis a également été améliorée, la base et le couvercle étant plus résistants aux torsions et aux dépressions qu'auparavant.
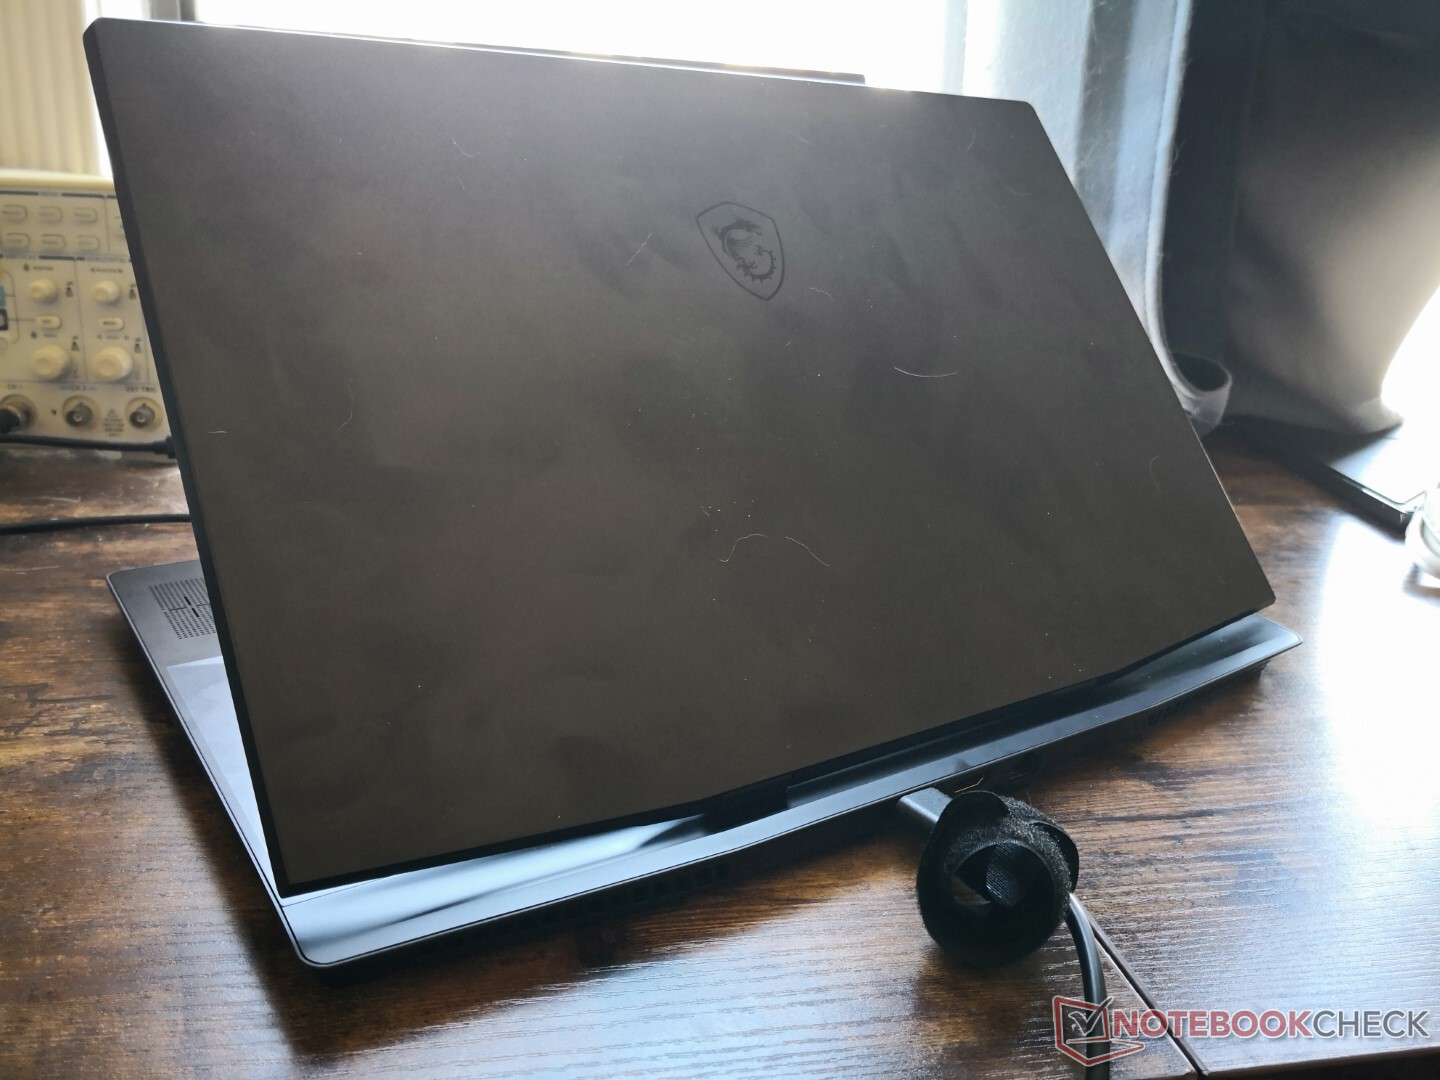
Le GS77 est sensiblement plus grand et plus lourd que le GS76, respectivement de 14 % et 21 %. L'augmentation de la taille et du poids peut être principalement attribuée à l'arrière plus large du GS77 et à son squelette plus épais. Le modèle se situe entre le Blade 17 et l'Alienware x17 en termes de taille et de poids. En comparaison, l'ancien GS75 était nettement plus léger de plus de 600 grammes.
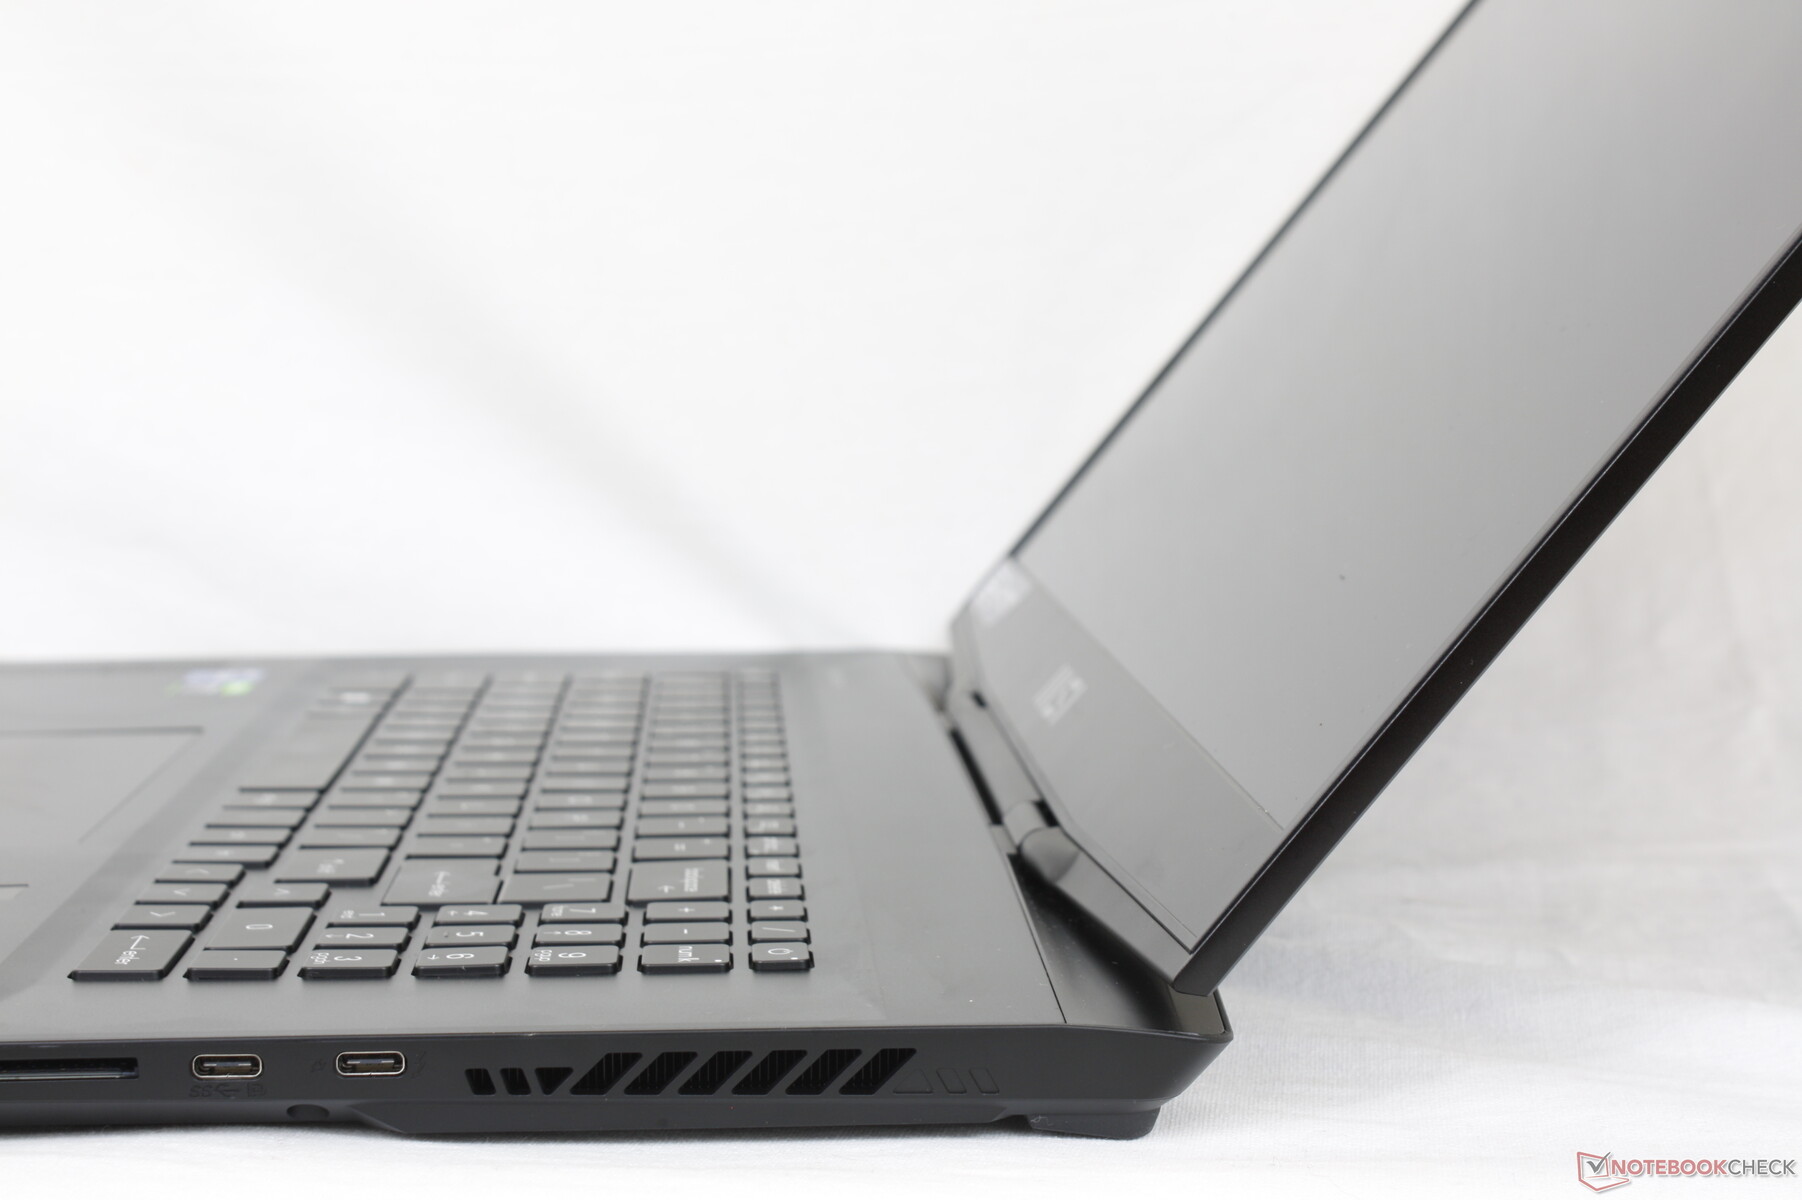
Connectivité - Comme avant
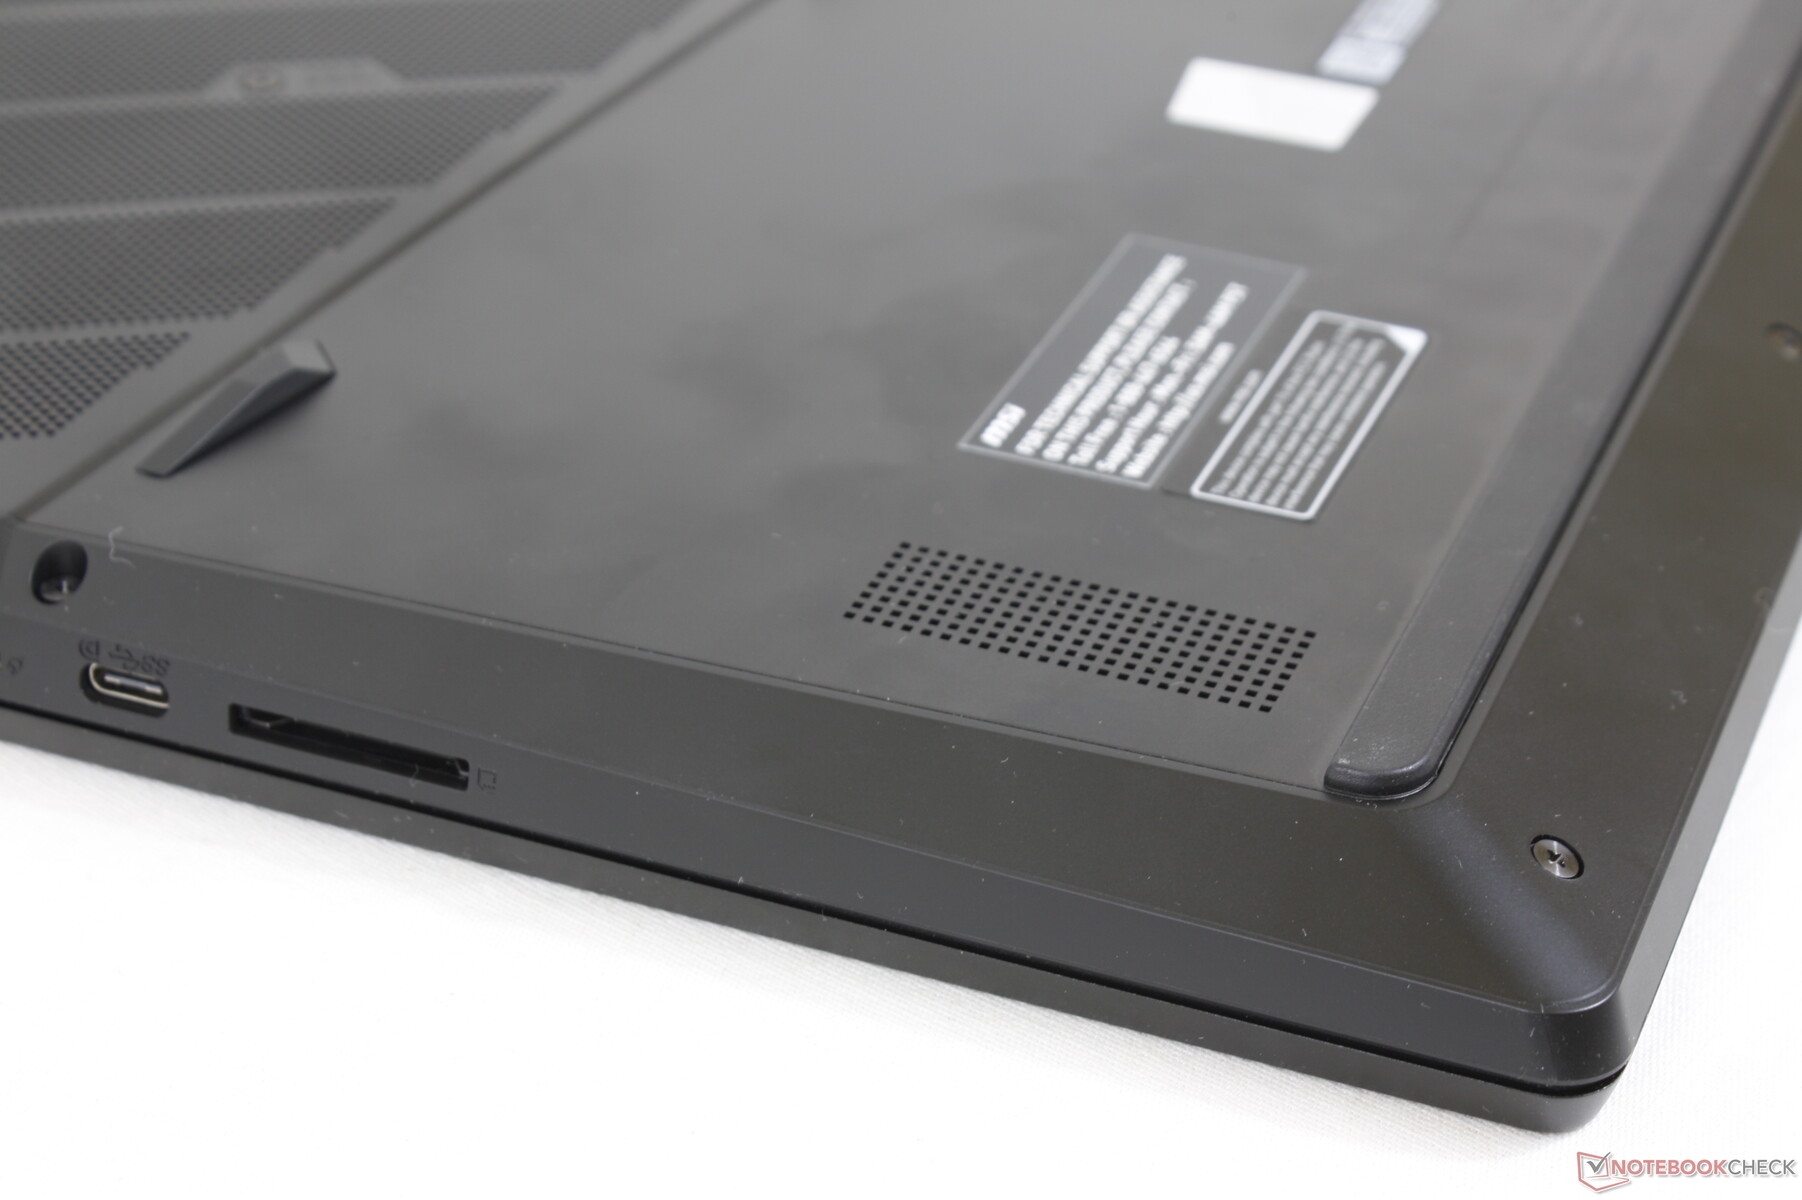
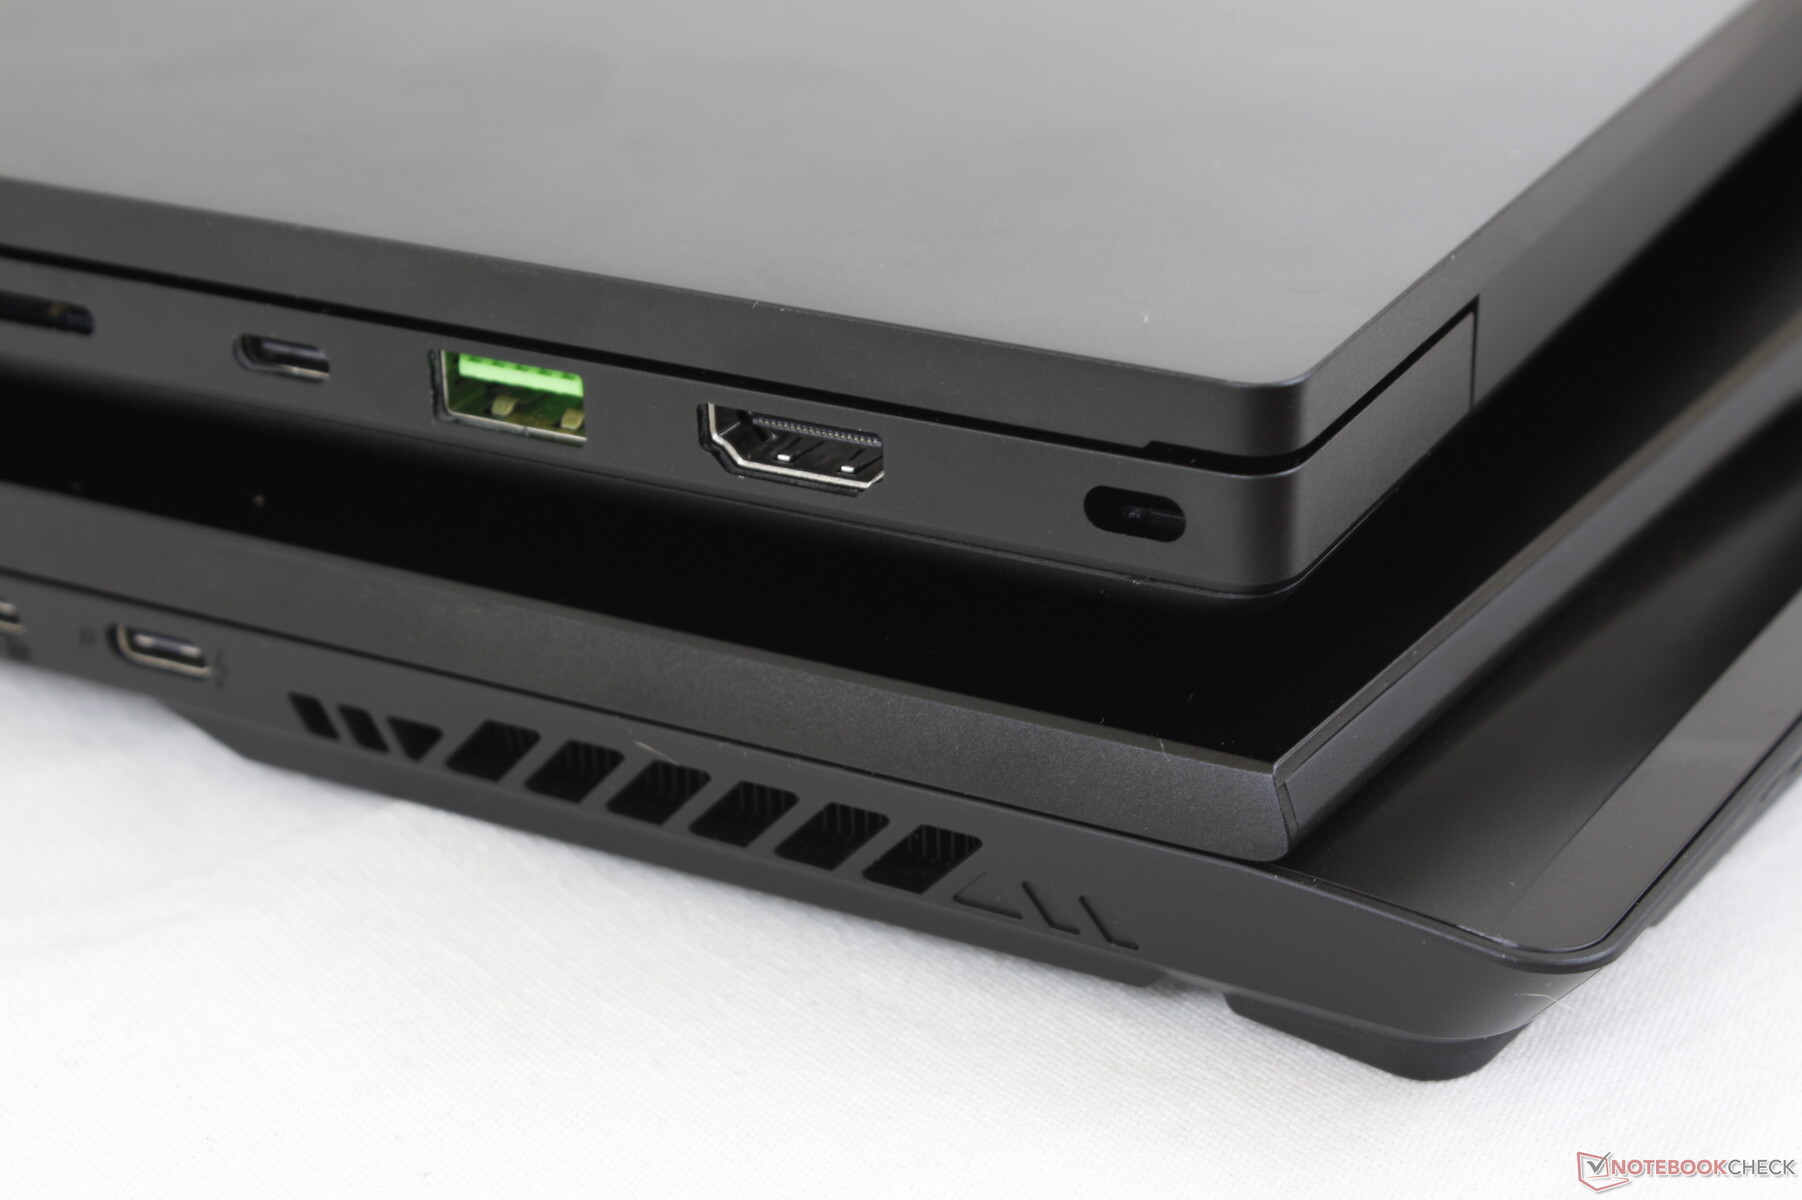
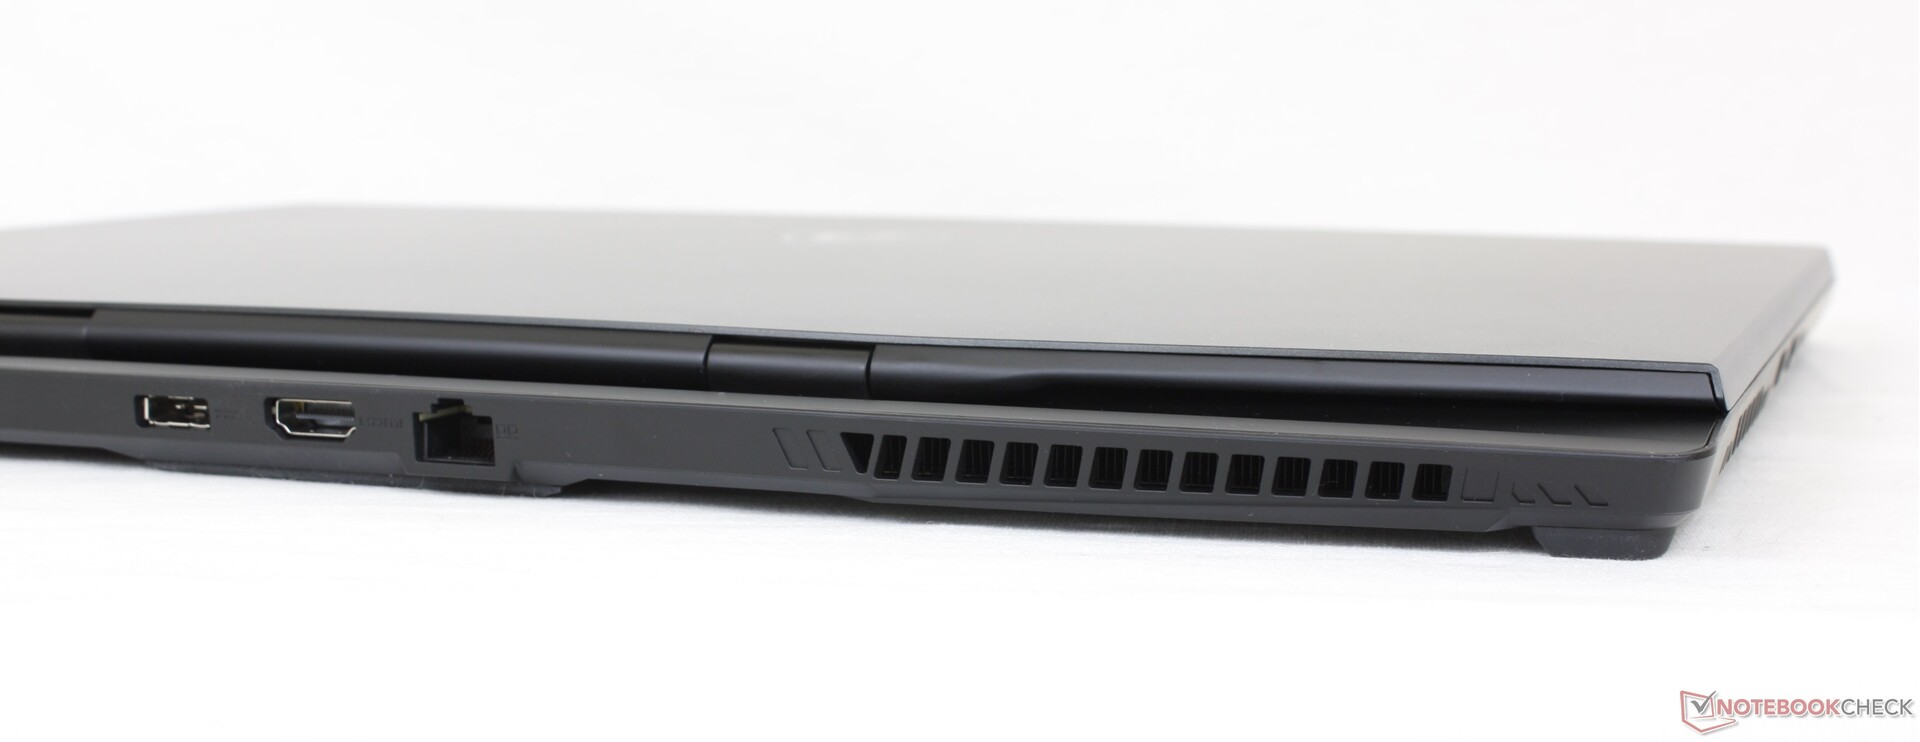
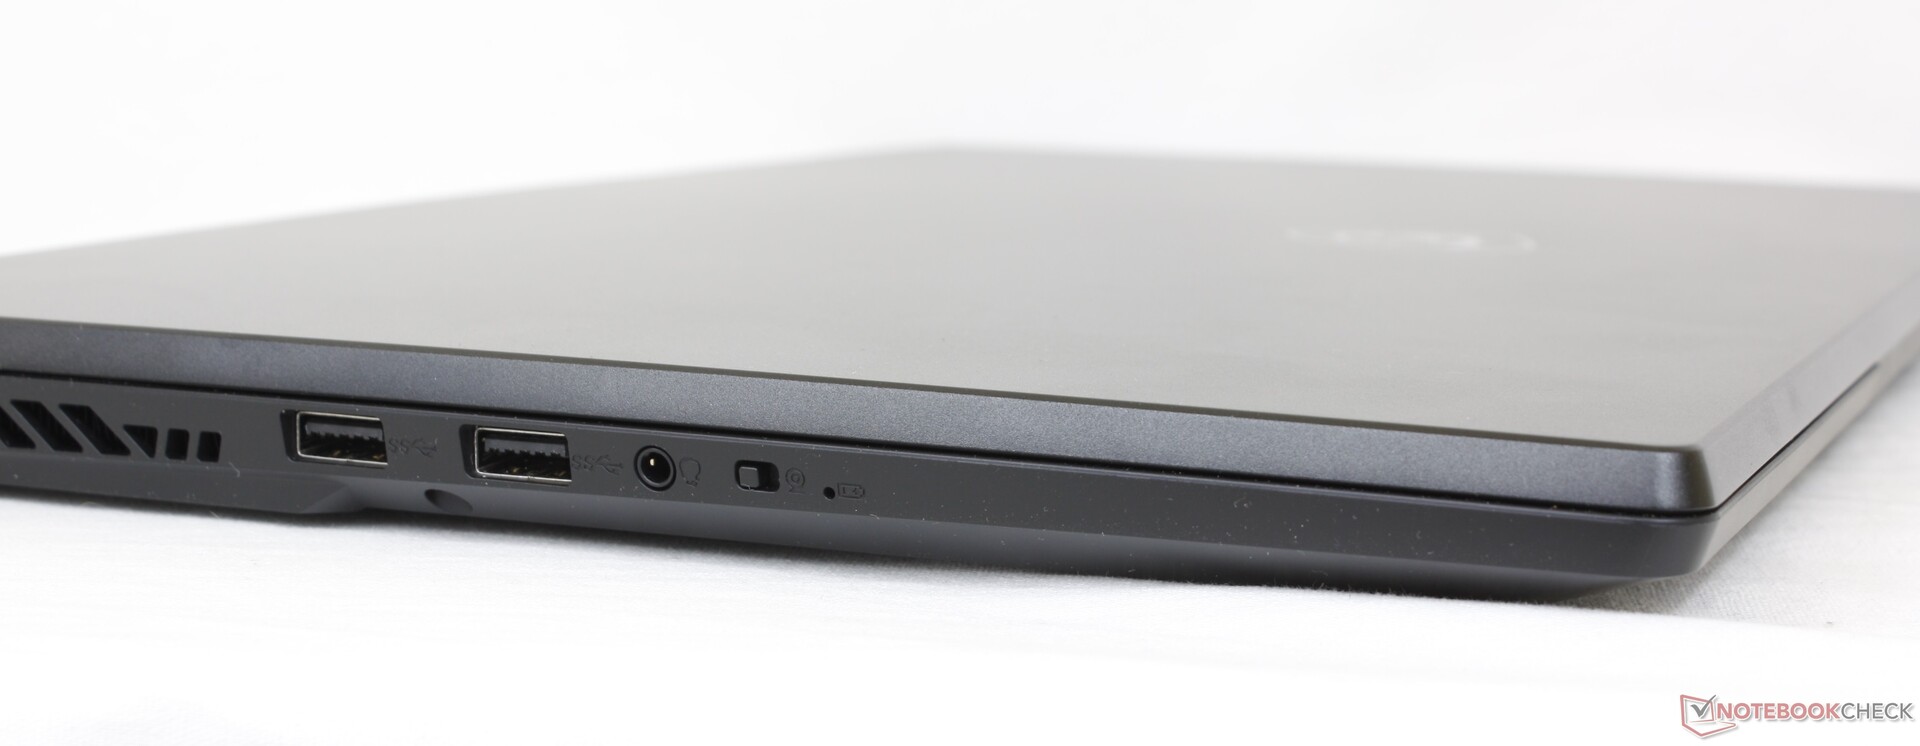
Les ports sont identiques à ceux du GS76, mais ils ont été réorganisés. Alors que le GS76 n'avait aucun port à l'arrière, le GS77 a une répartition plus équilibrée : 3 à gauche, 3 à droite et 3 à l'arrière.
Les utilisateurs doivent noter que seul un des deux ports USB-C le long du bord droit prend en charge Thunderbolt, comme sur le GS76. De plus, le port de l'adaptateur secteur a été modifié et les anciens adaptateurs secteur ne sont donc pas compatibles.
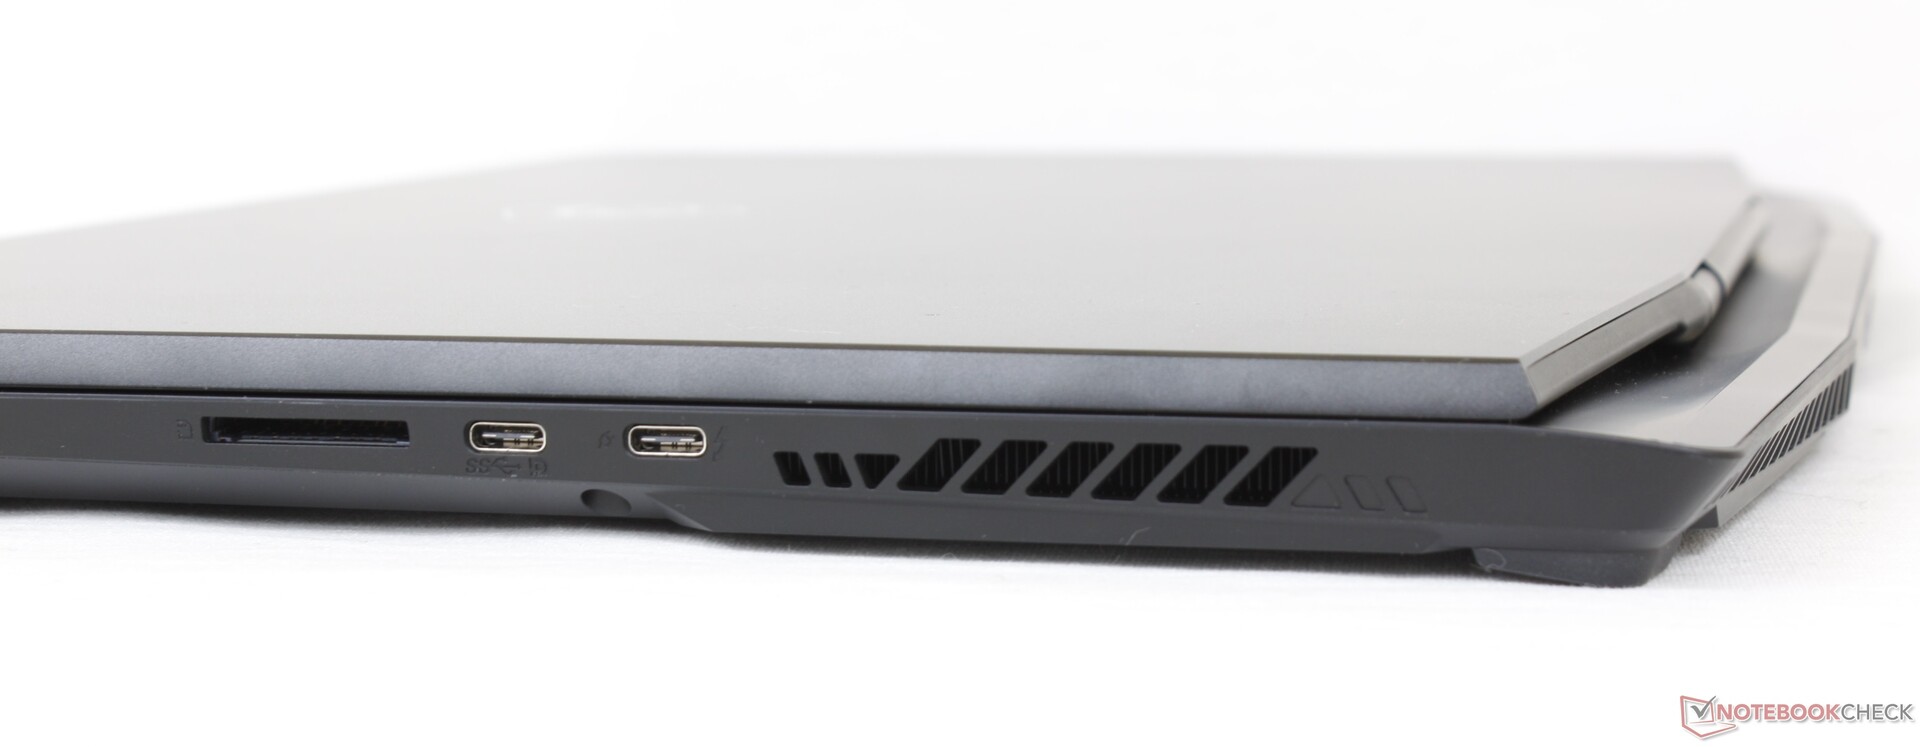
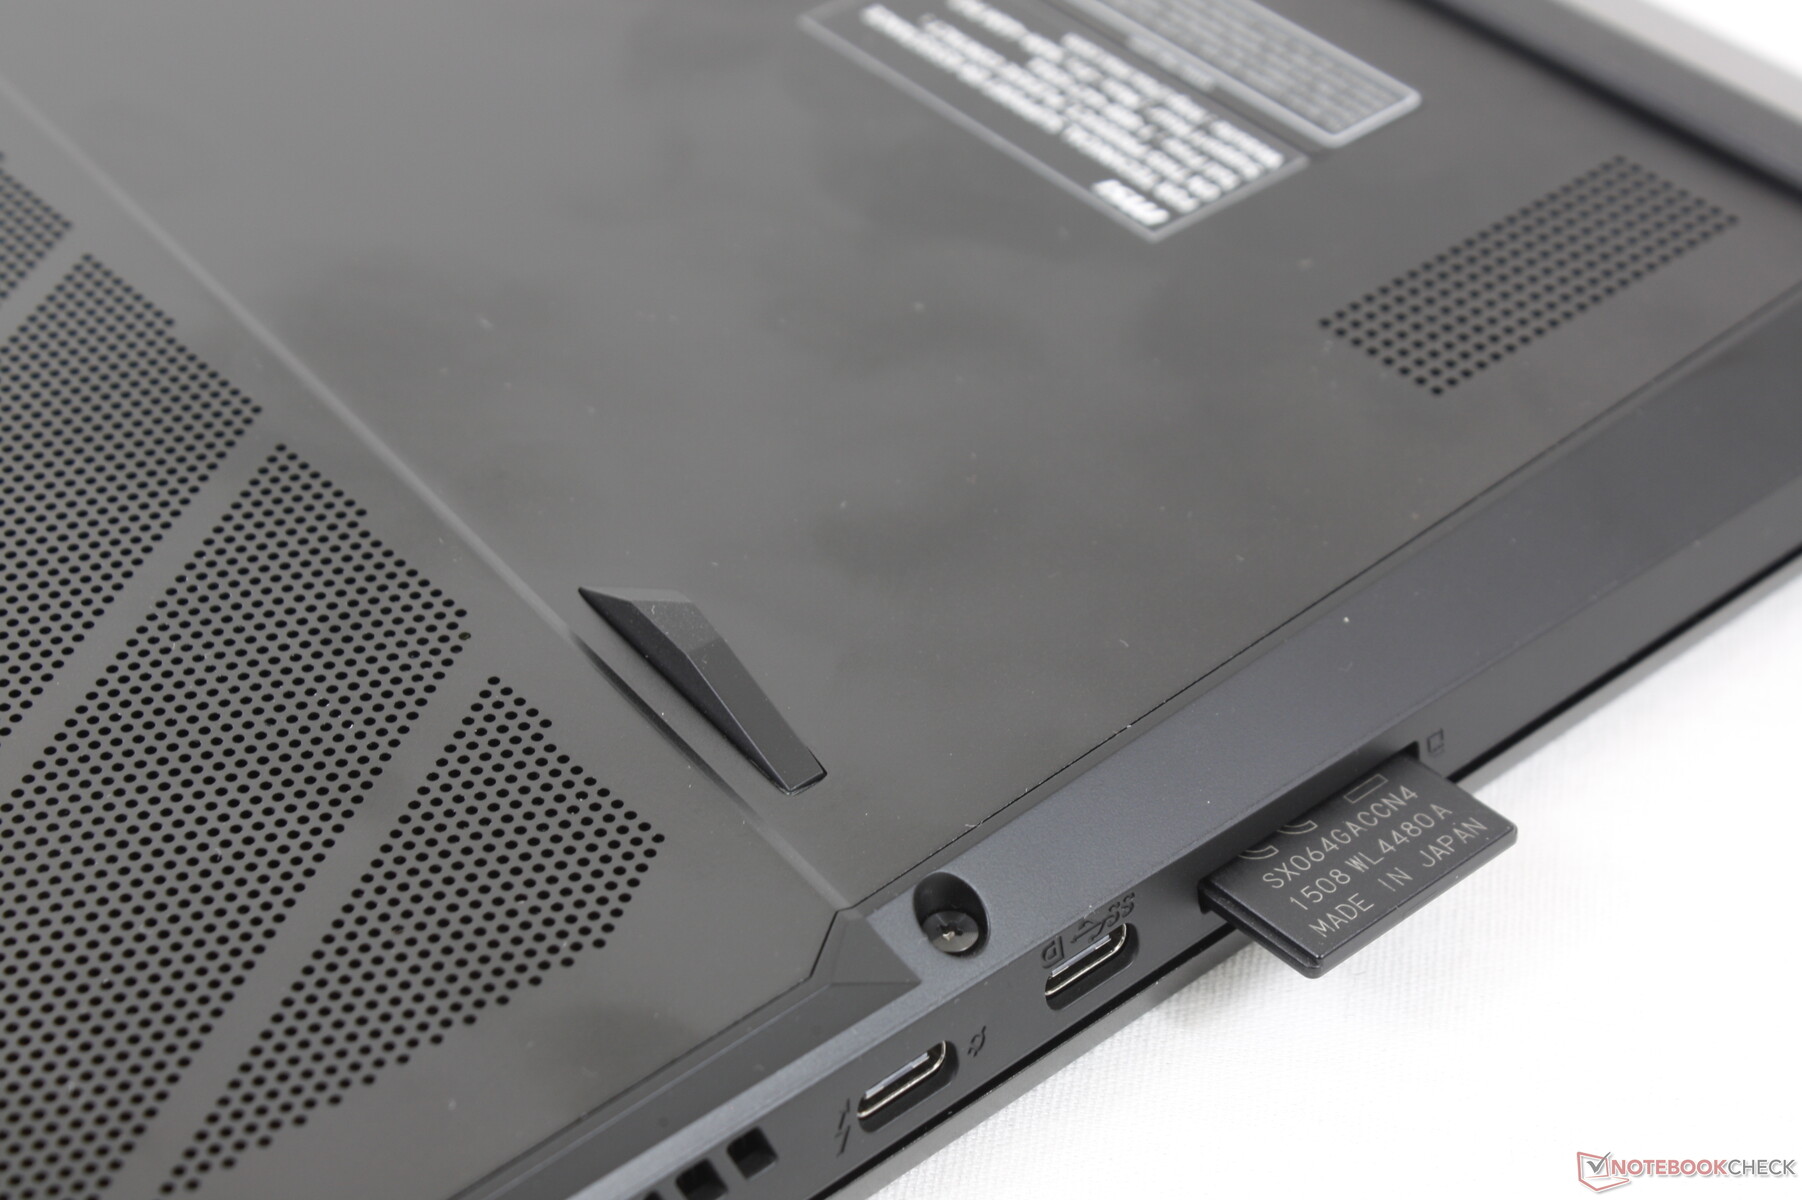
Lecteur de carte SD
MSI a plus que divisé par deux la vitesse de son lecteur SD intégré par rapport à la dernière génération de GS76. Le transfert de 1 Go de photos de notre carte de test UHS-II vers le bureau sur notre GS77 prend environ 14 secondes, contre seulement 5 à 6 secondes sur le GS76. Les utilisateurs qui ont souvent recours au lecteur SD peuvent être déçus par cette baisse.
| SD Card Reader | |
| average JPG Copy Test (av. of 3 runs) | |
| MSI GS76 Stealth 11UH (AV PRO microSD 128 GB V60) | |
| Asus ROG Zephyrus S17 GX703HSD | |
| Alienware x17 RTX 3080 P48E (AV Pro V60) | |
| Razer Blade 17 RTX 3080 Ti (AV Pro V60) | |
| MSI Stealth GS77 12UHS-083US (AV Pro V60) | |
| maximum AS SSD Seq Read Test (1GB) | |
| Asus ROG Zephyrus S17 GX703HSD | |
| Alienware x17 RTX 3080 P48E (AV Pro V60) | |
| MSI GS76 Stealth 11UH (AV PRO microSD 128 GB V60) | |
| Razer Blade 17 RTX 3080 Ti (AV Pro V60) | |
| MSI Stealth GS77 12UHS-083US (AV Pro V60) | |
Communication
Webcam
La webcam est passée de 720p sur le GS76 à 1080p sur le GS77 pour une image globalement plus nette. La fonction IR est prise en charge pour Windows Hello et un obturateur électronique est accessible le long du bord gauche.


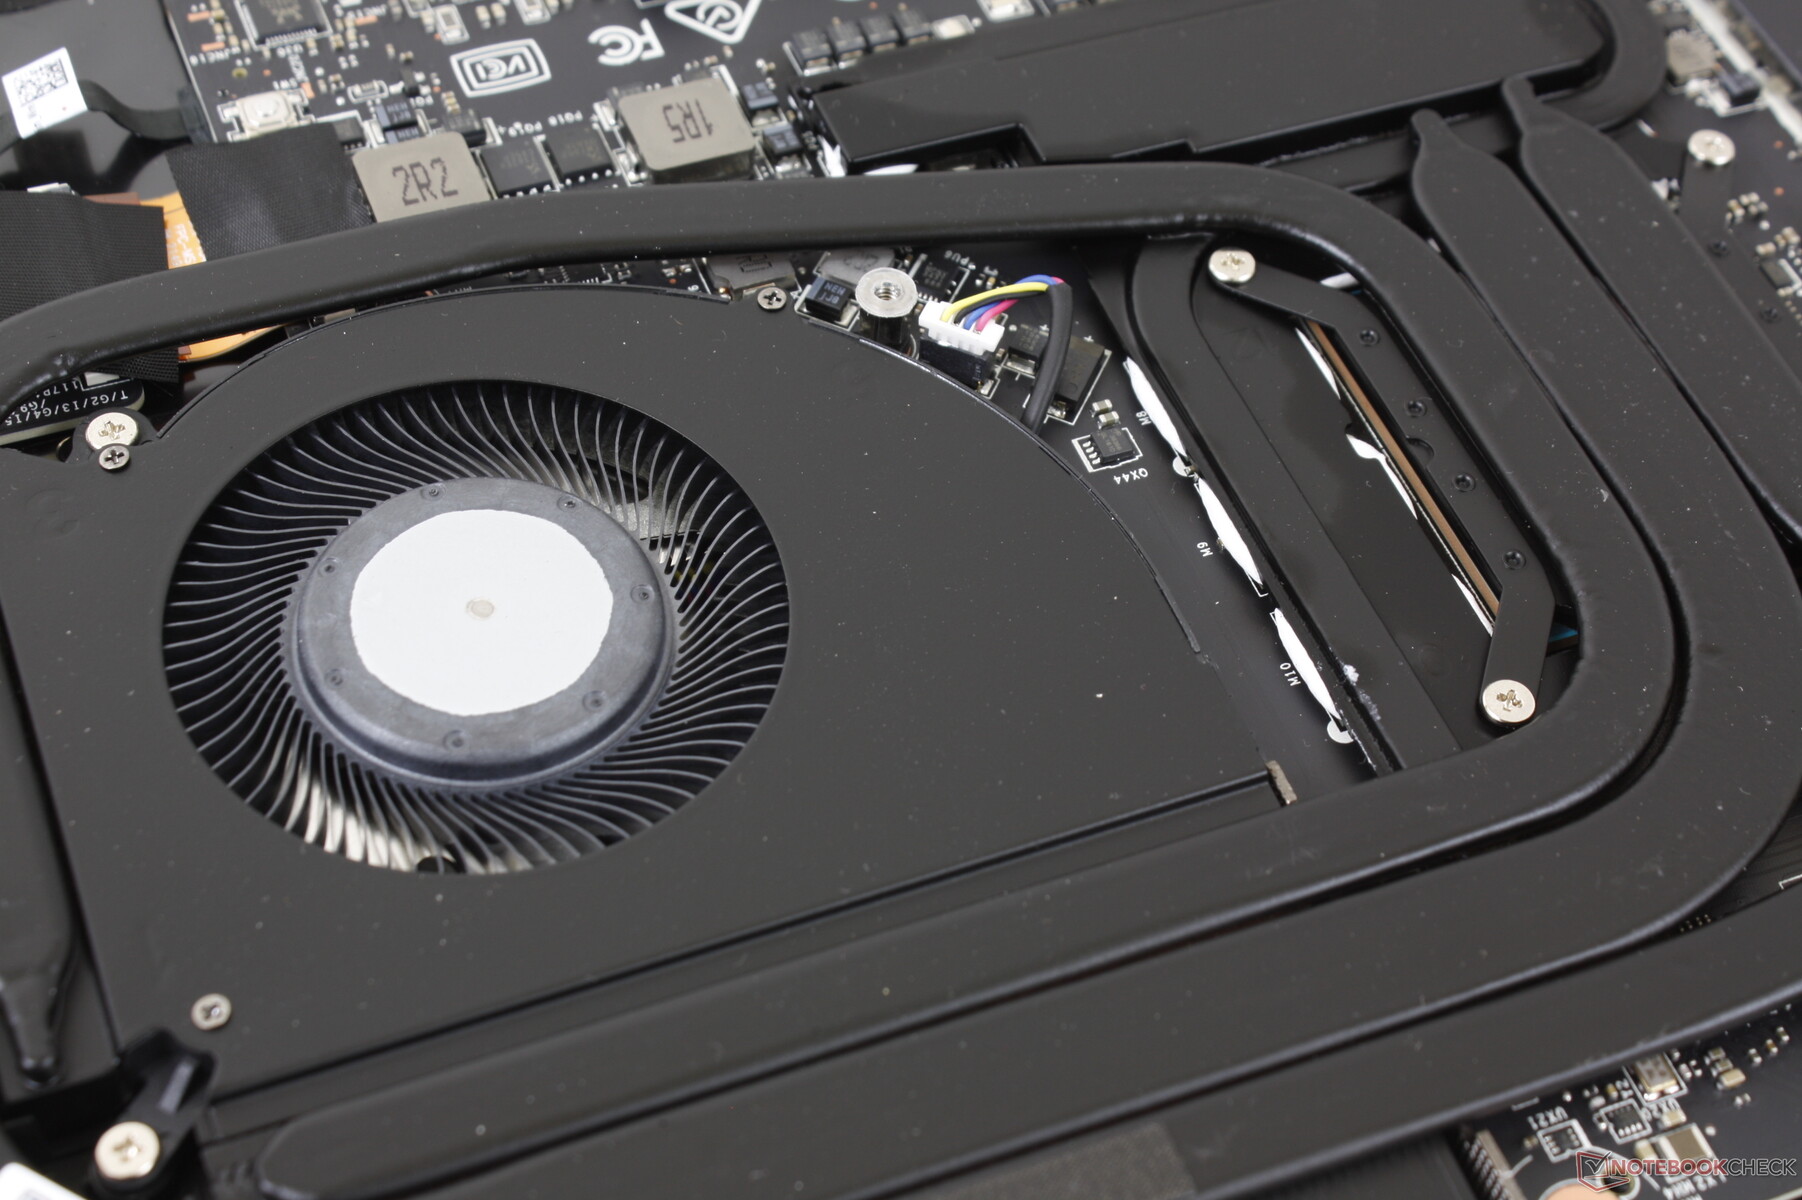
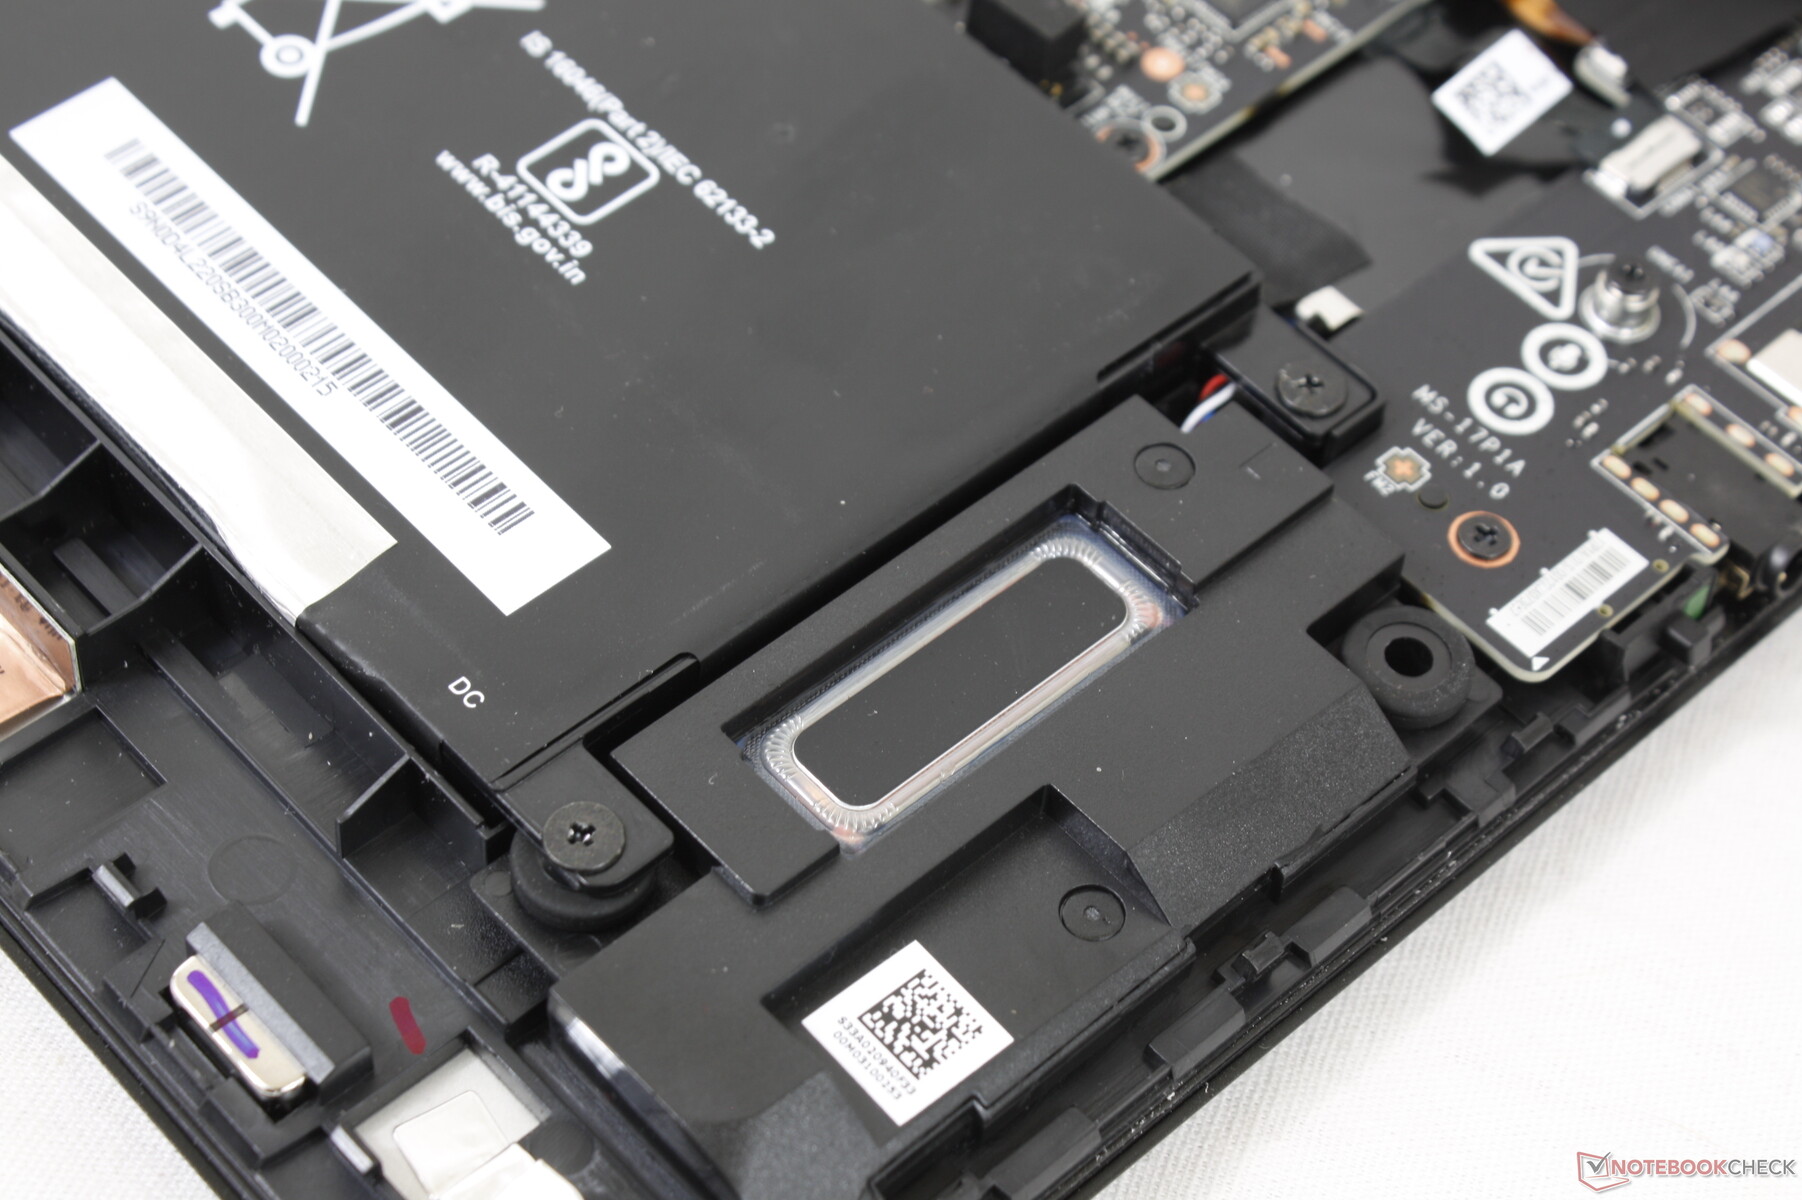
Maintenance
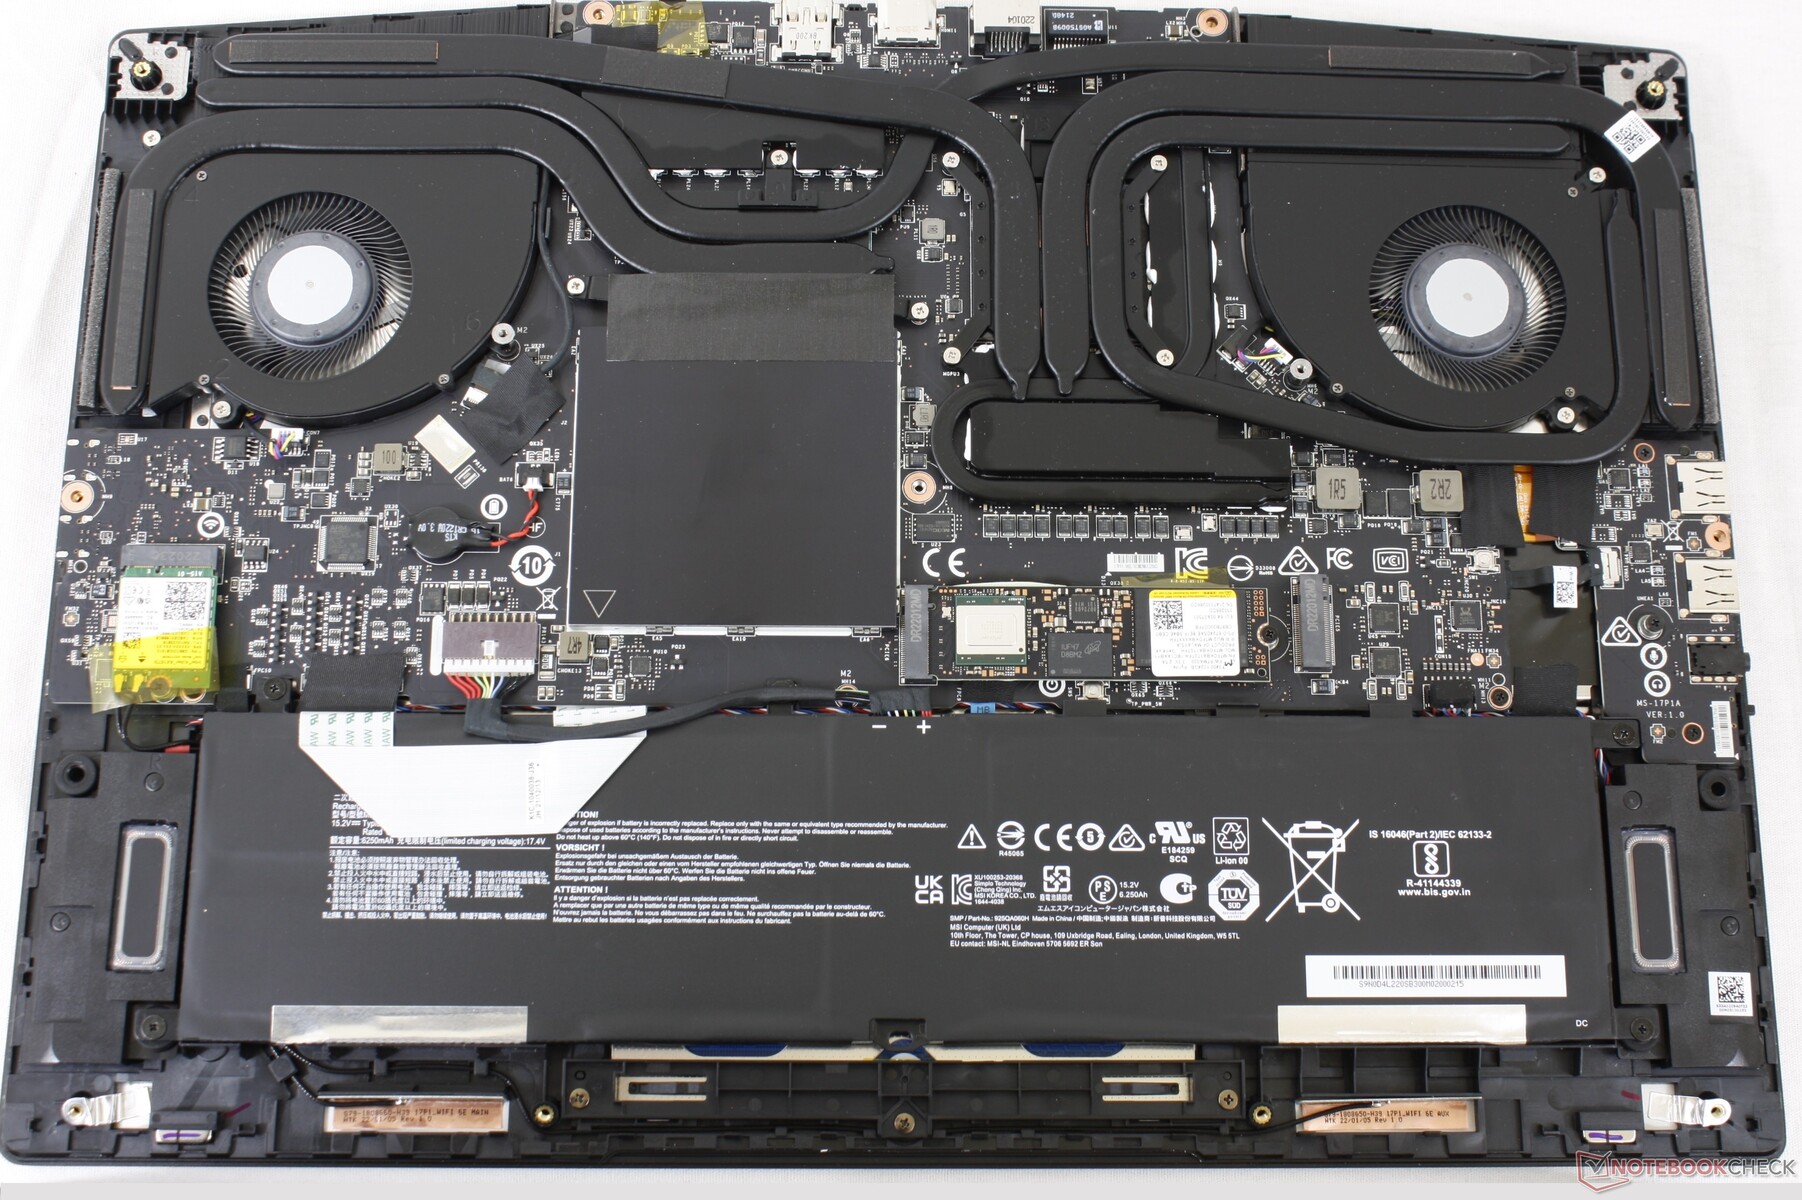
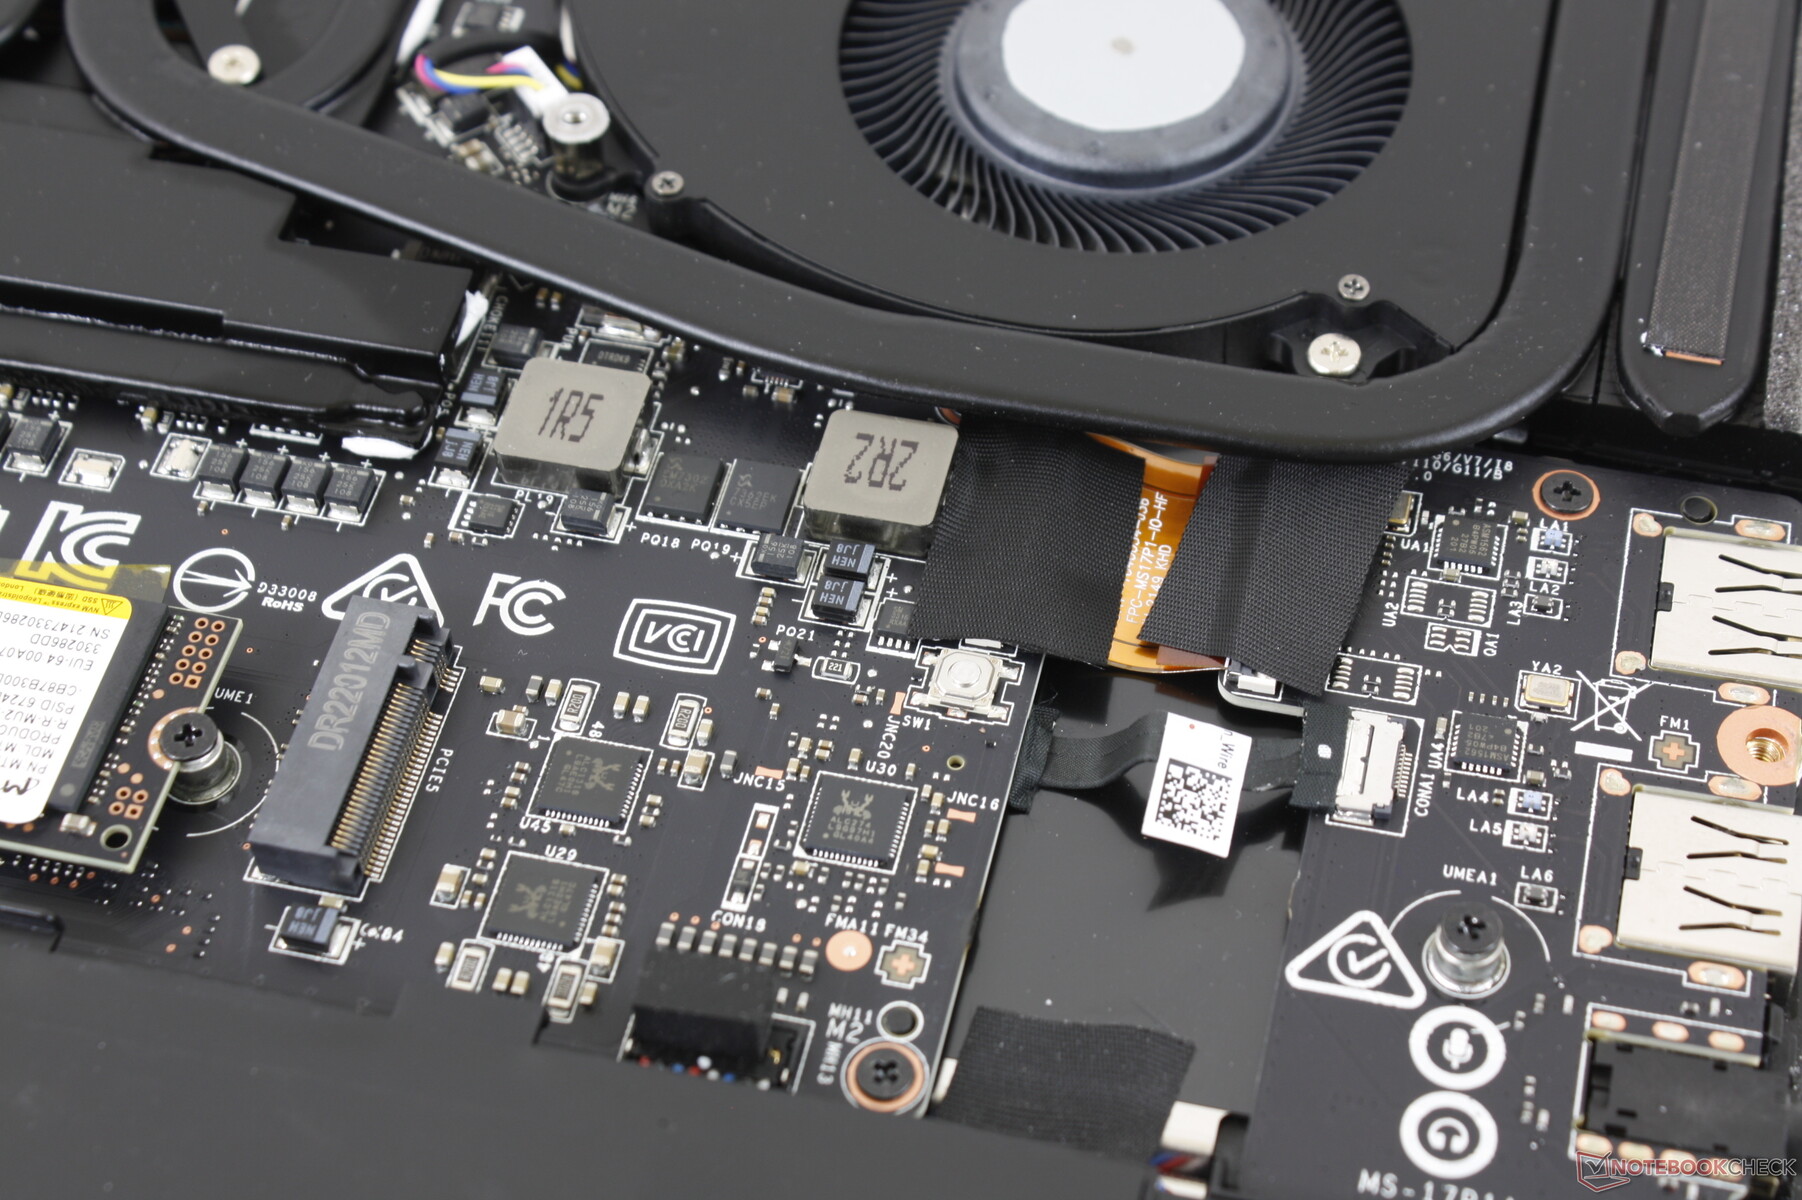
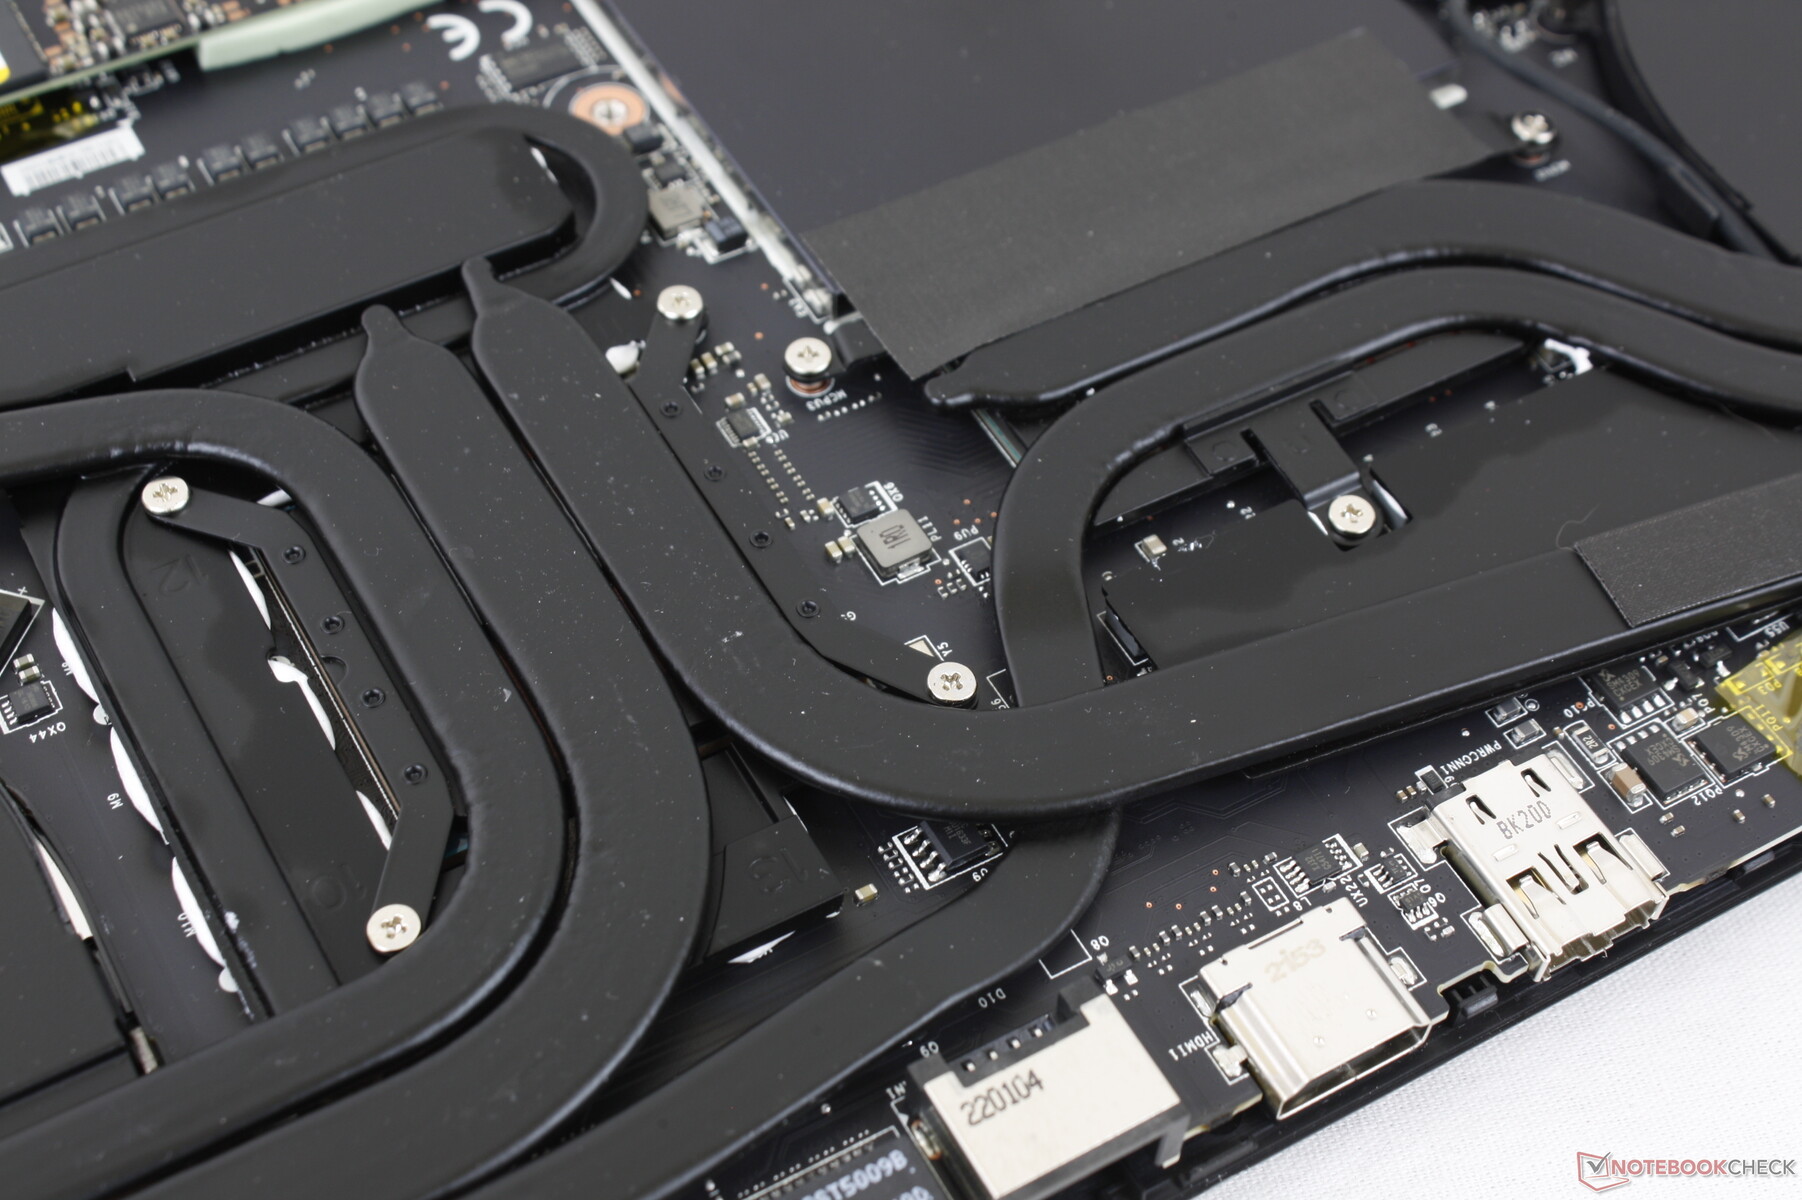
Le panneau inférieur se détache assez facilement après avoir retiré les 11 vis Philips situées en dessous. Gardez à l'esprit qu'un autocollant de sceau d'usine doit être brisé, contrairement à la plupart des autres ordinateurs portables de jeux de fabricants concurrents
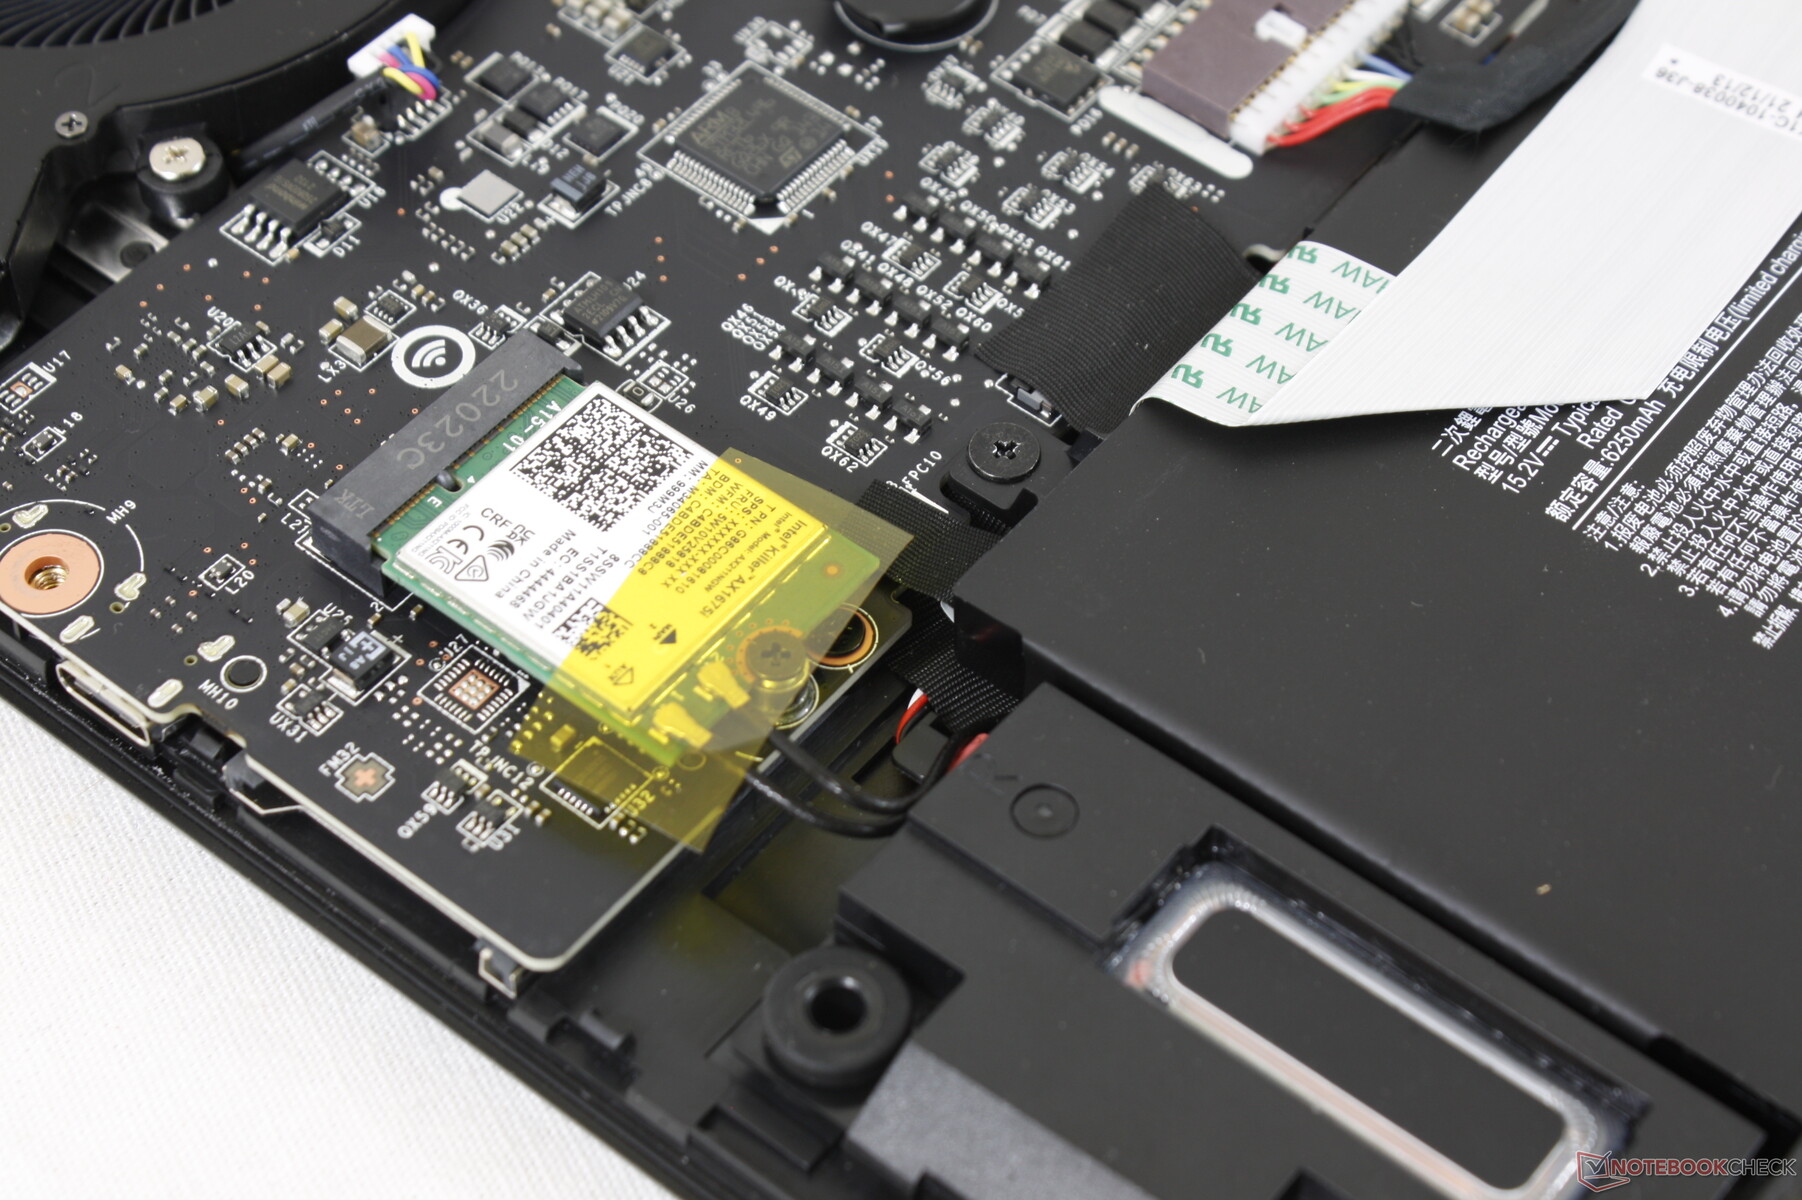
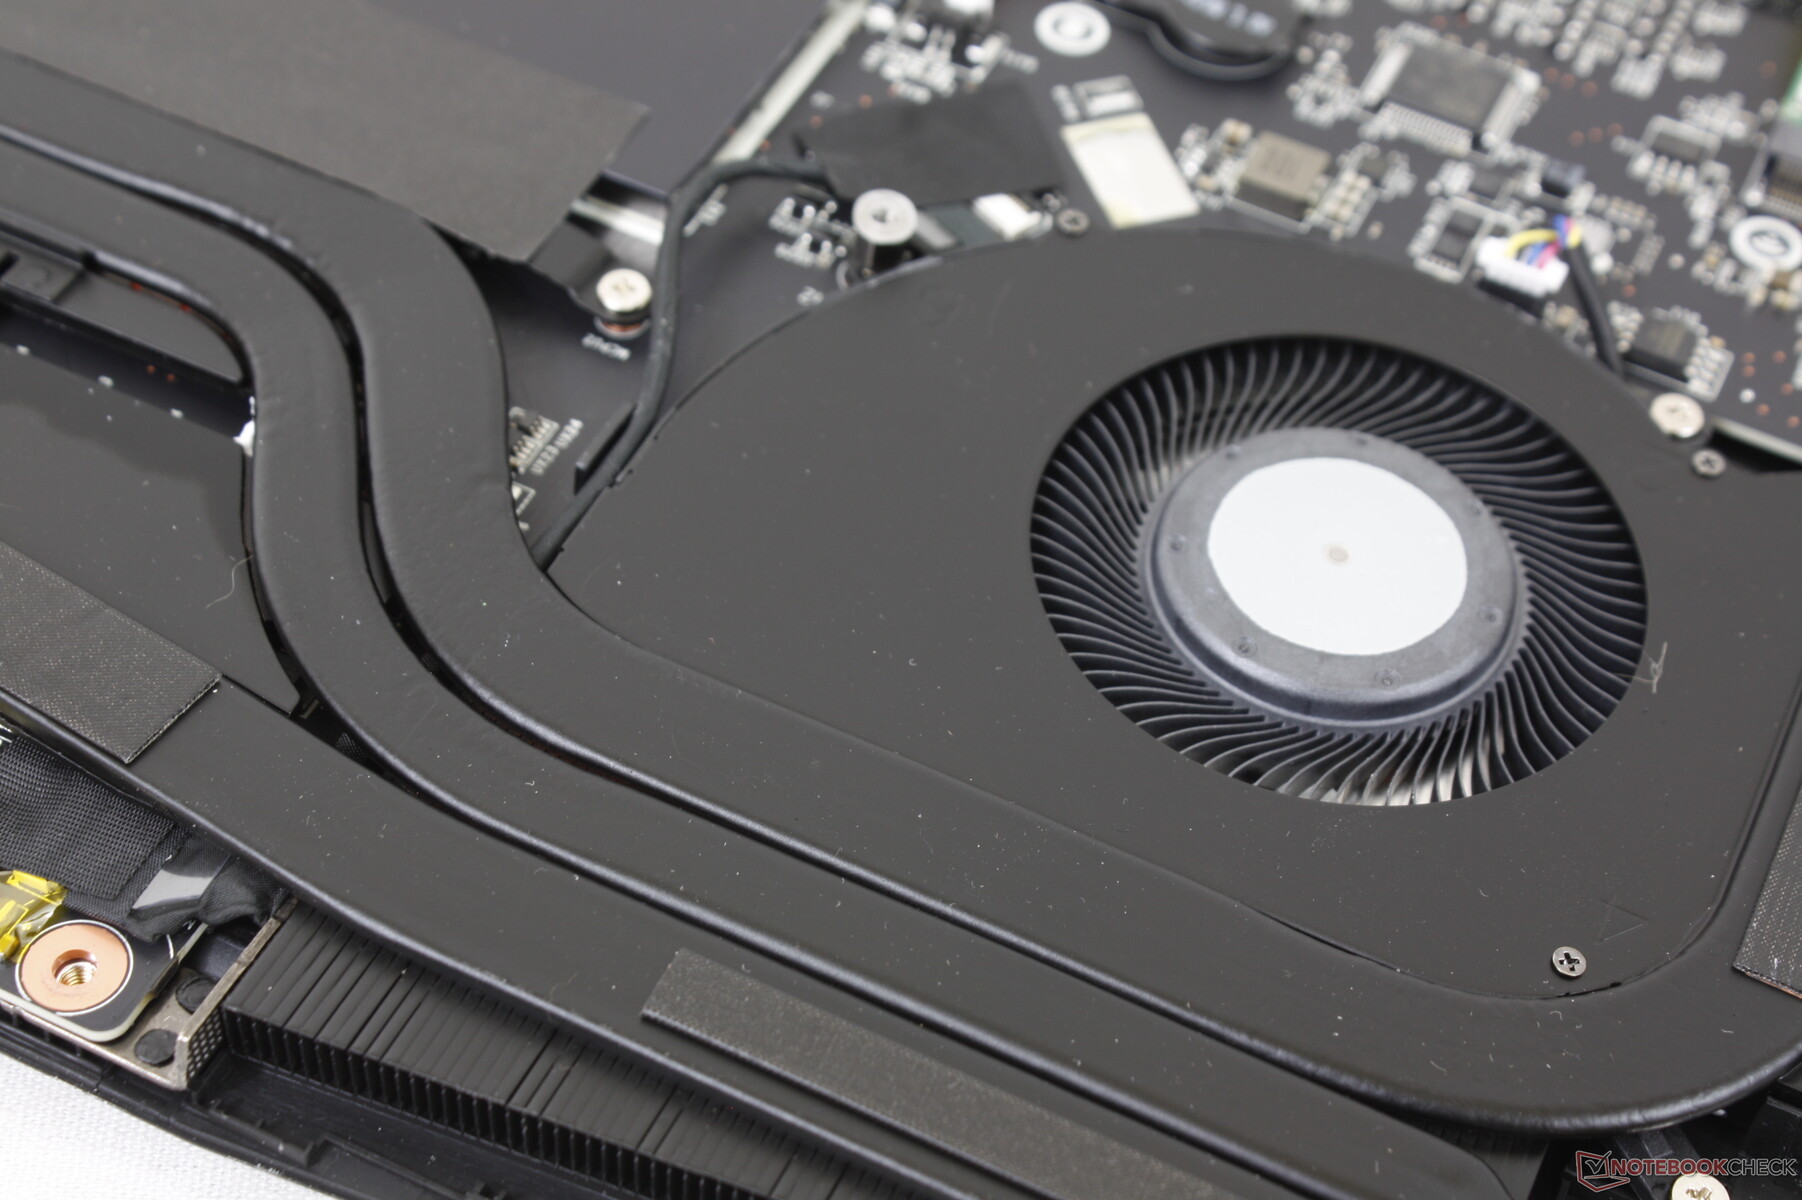
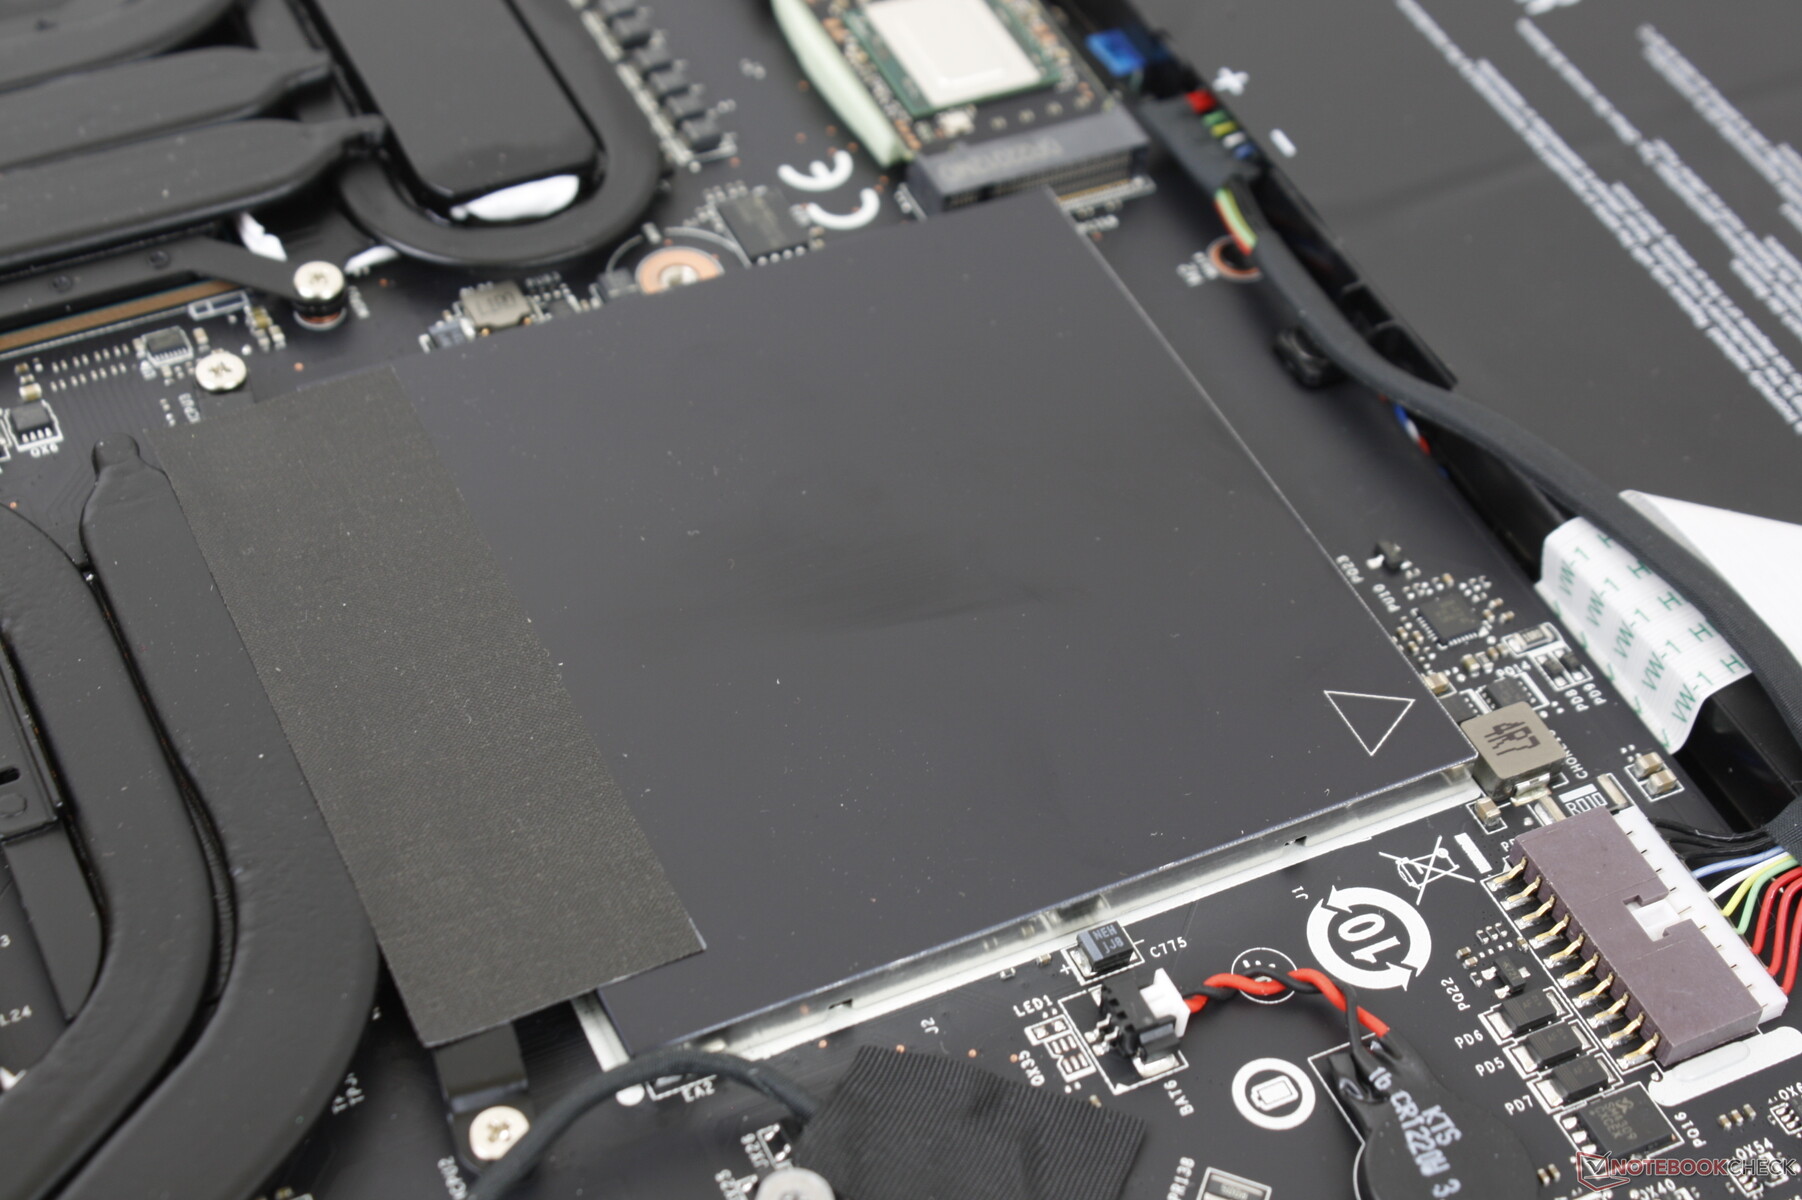
Une fois à l'intérieur, les utilisateurs auront accès à deux emplacements SODIMM, deux emplacements pour SSD PCIe4 x4 2280 et le module WLAN amovible. Les deux emplacements SODIMM sont protégés par leur propre couvercle en aluminium.
Accessoires et garantie
La boîte de détail comprend un essuie-écran en velours en plus des documents et de l'adaptateur secteur. Une garantie fabricant d'un an s'applique avec des options d'extension si elle est achetée chez Xotic PC.
Périphériques d'entrée - Sideways Step
Clavier
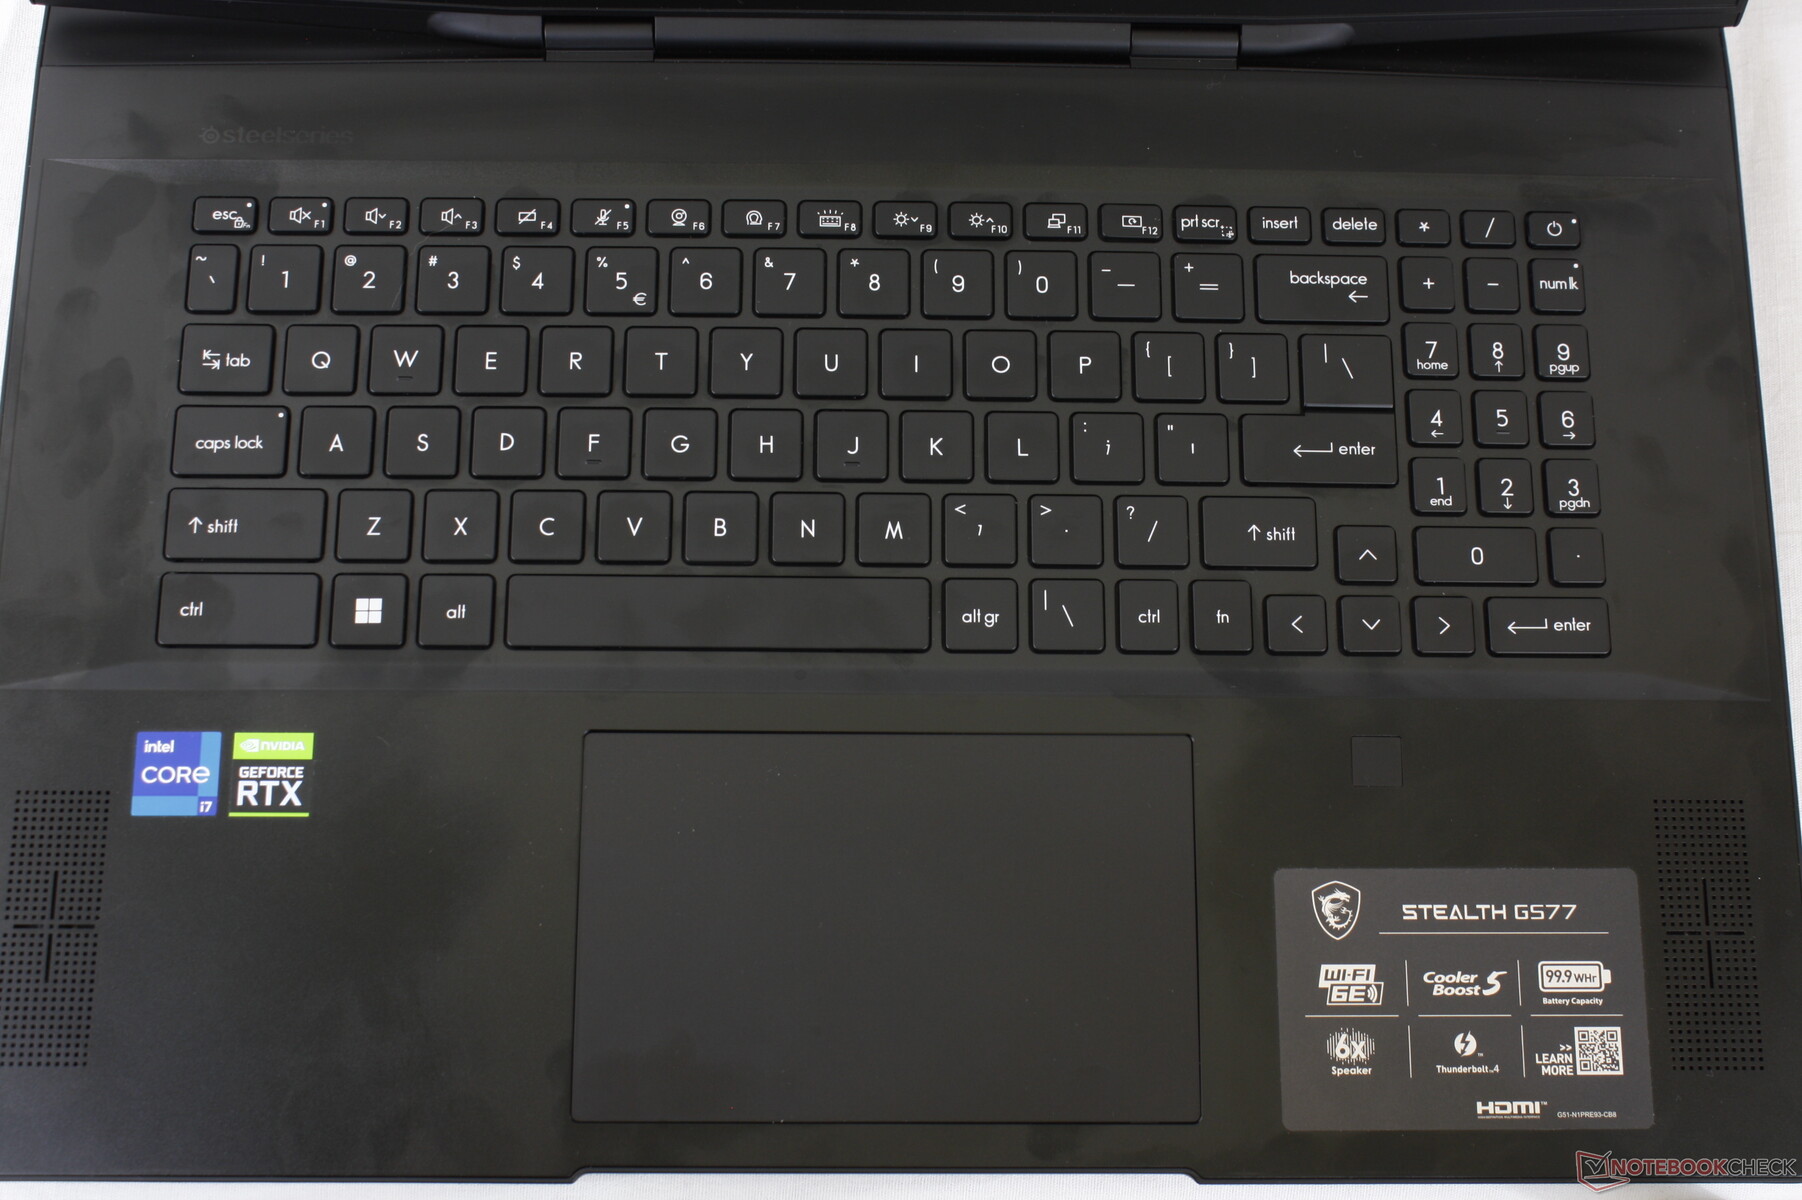
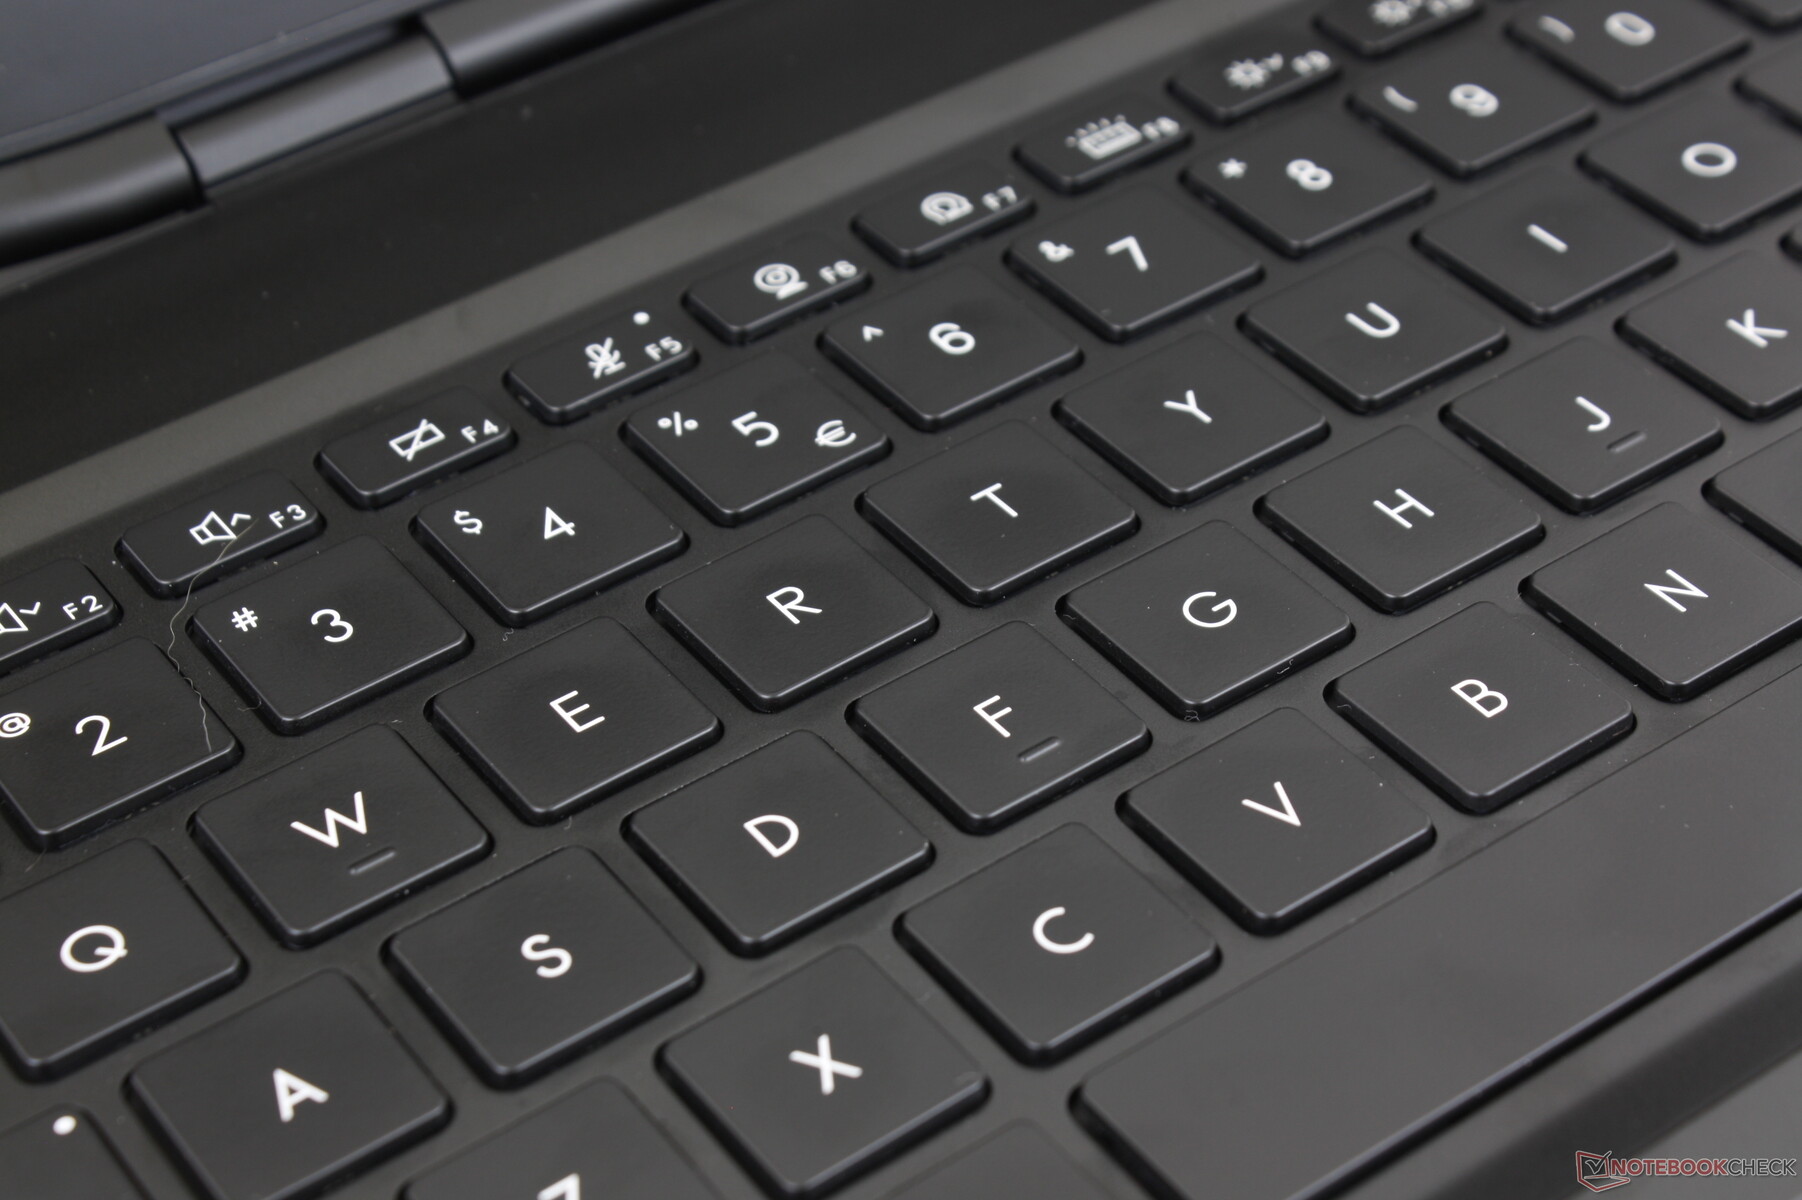
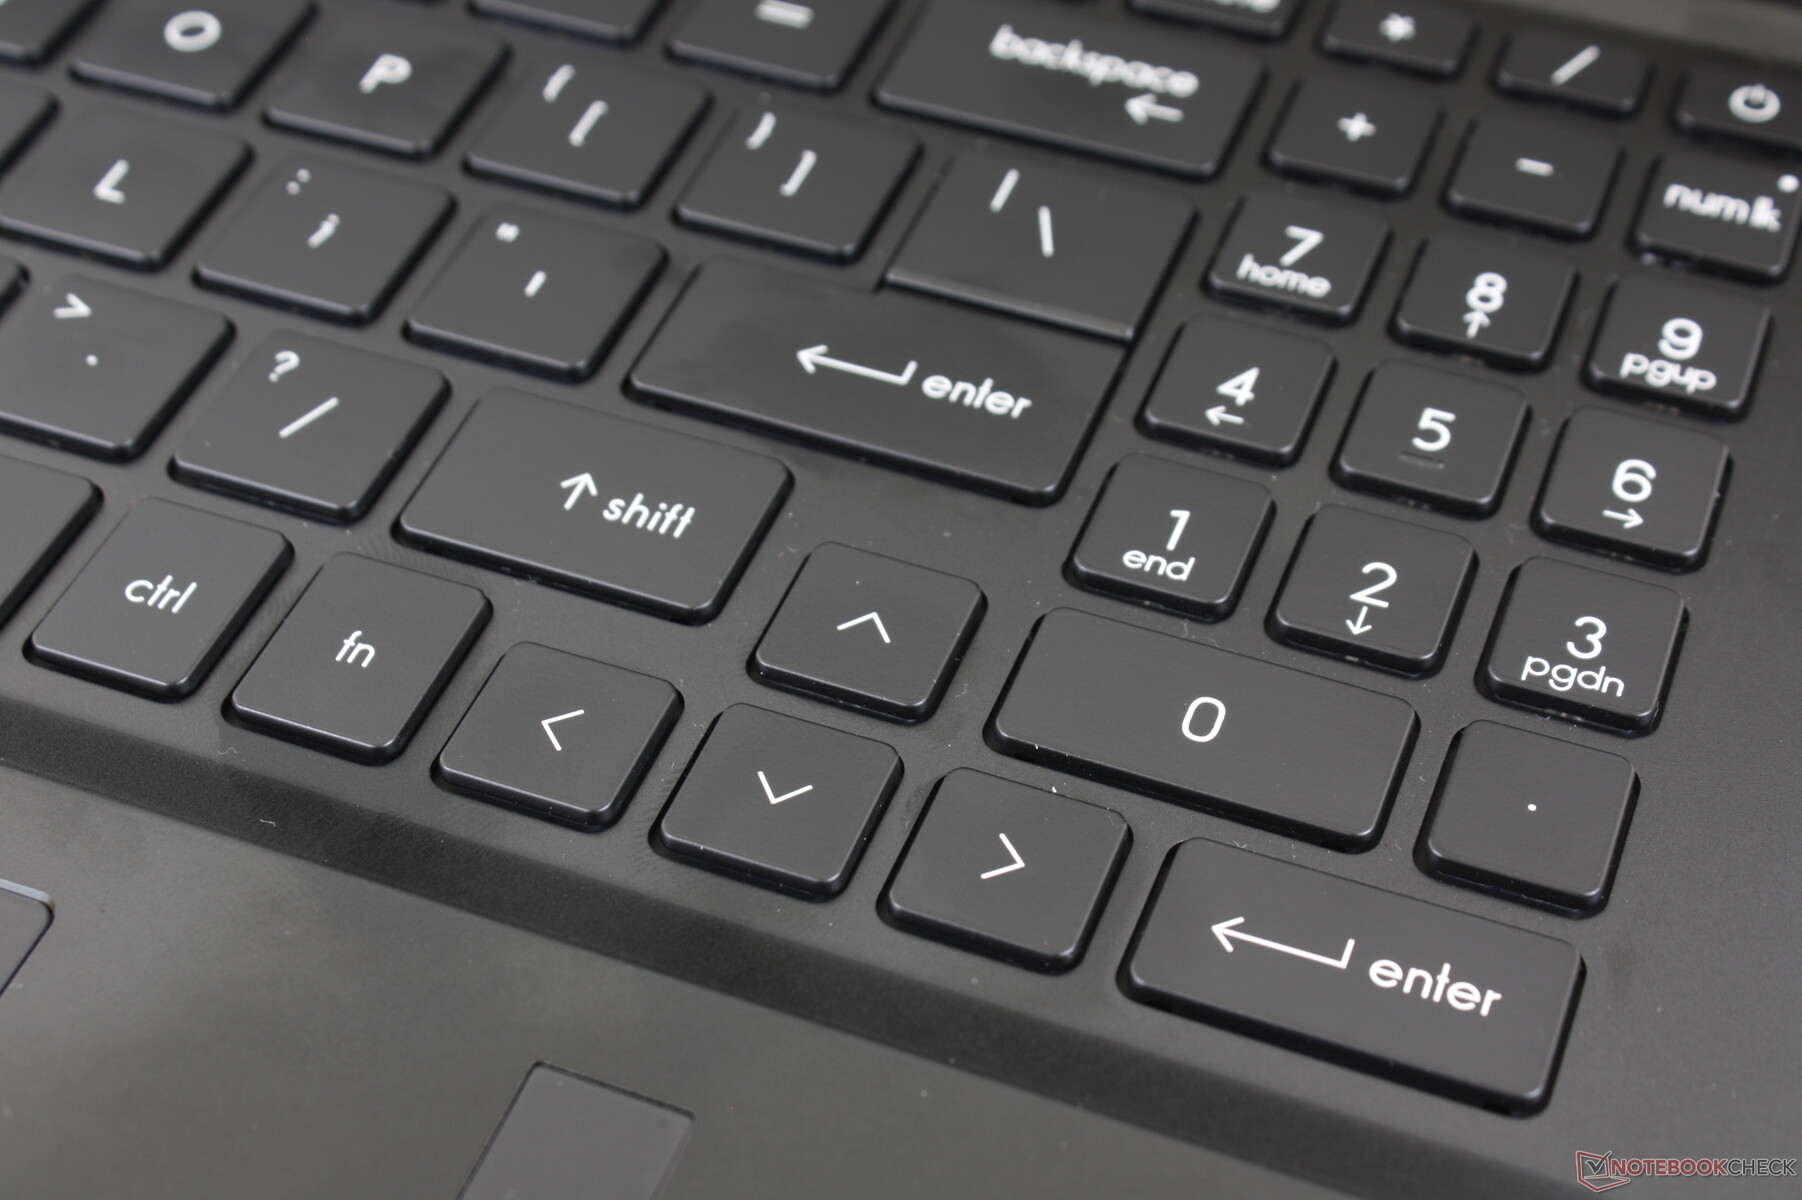
Les touches du clavier sont légèrement plus souples et plus silencieuses que celles du Blade 17. Ainsi, ce n'est pas nécessairement mieux ou pire, car certains utilisateurs peuvent préférer une expérience de frappe plus silencieuse, même si cela signifie avoir un retour d'information légèrement plus spongieux. Le GS77 intègre même un pavé numérique dédié alors que le Blade n'en dispose pas
La taille des touches est le seul inconvénient majeur du clavier GS77. En particulier, le pavé numérique, les touches fléchées et la rangée supérieure de touches de fonction sont tous beaucoup plus petits que les touches QWERTY principales et sont donc nettement plus spongieux et plus faibles en retour. Au moins, les touches de fonction du Blade 17 sont de la même taille que les touches QWERTY principales pour une meilleure uniformité.
Pavé tactile
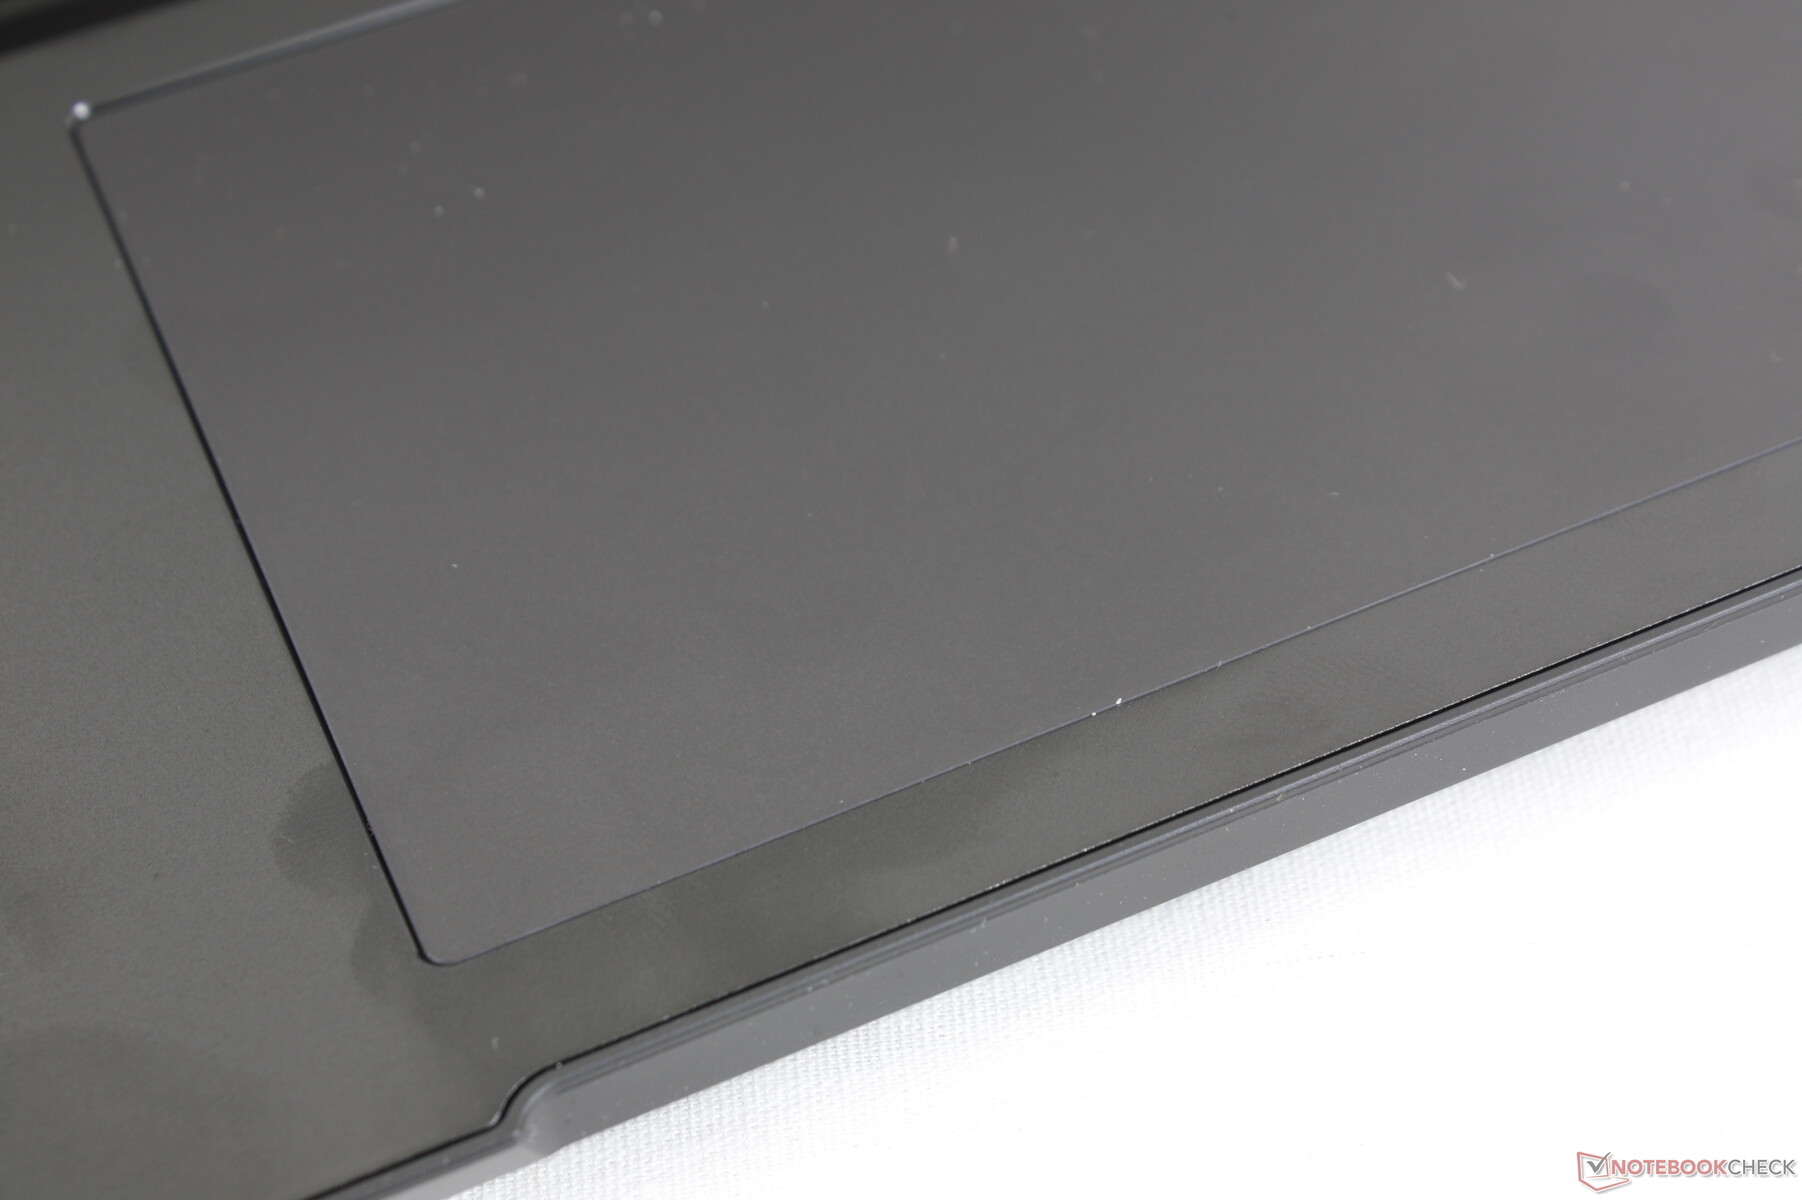
Le pavé tactile est légèrement plus grand que celui du Blade 17 (13,2 x 8,2 cm contre 13 x 8 cm). La traction est très douce, même en glissant à des vitesses lentes, pour une sensation très similaire à celle du clickpad du Blade 17. La plus grande différence entre les deux est leur feedback respectif, car le clic sur le GS77 est à la fois plus ferme et plus fort que sur le Razer.
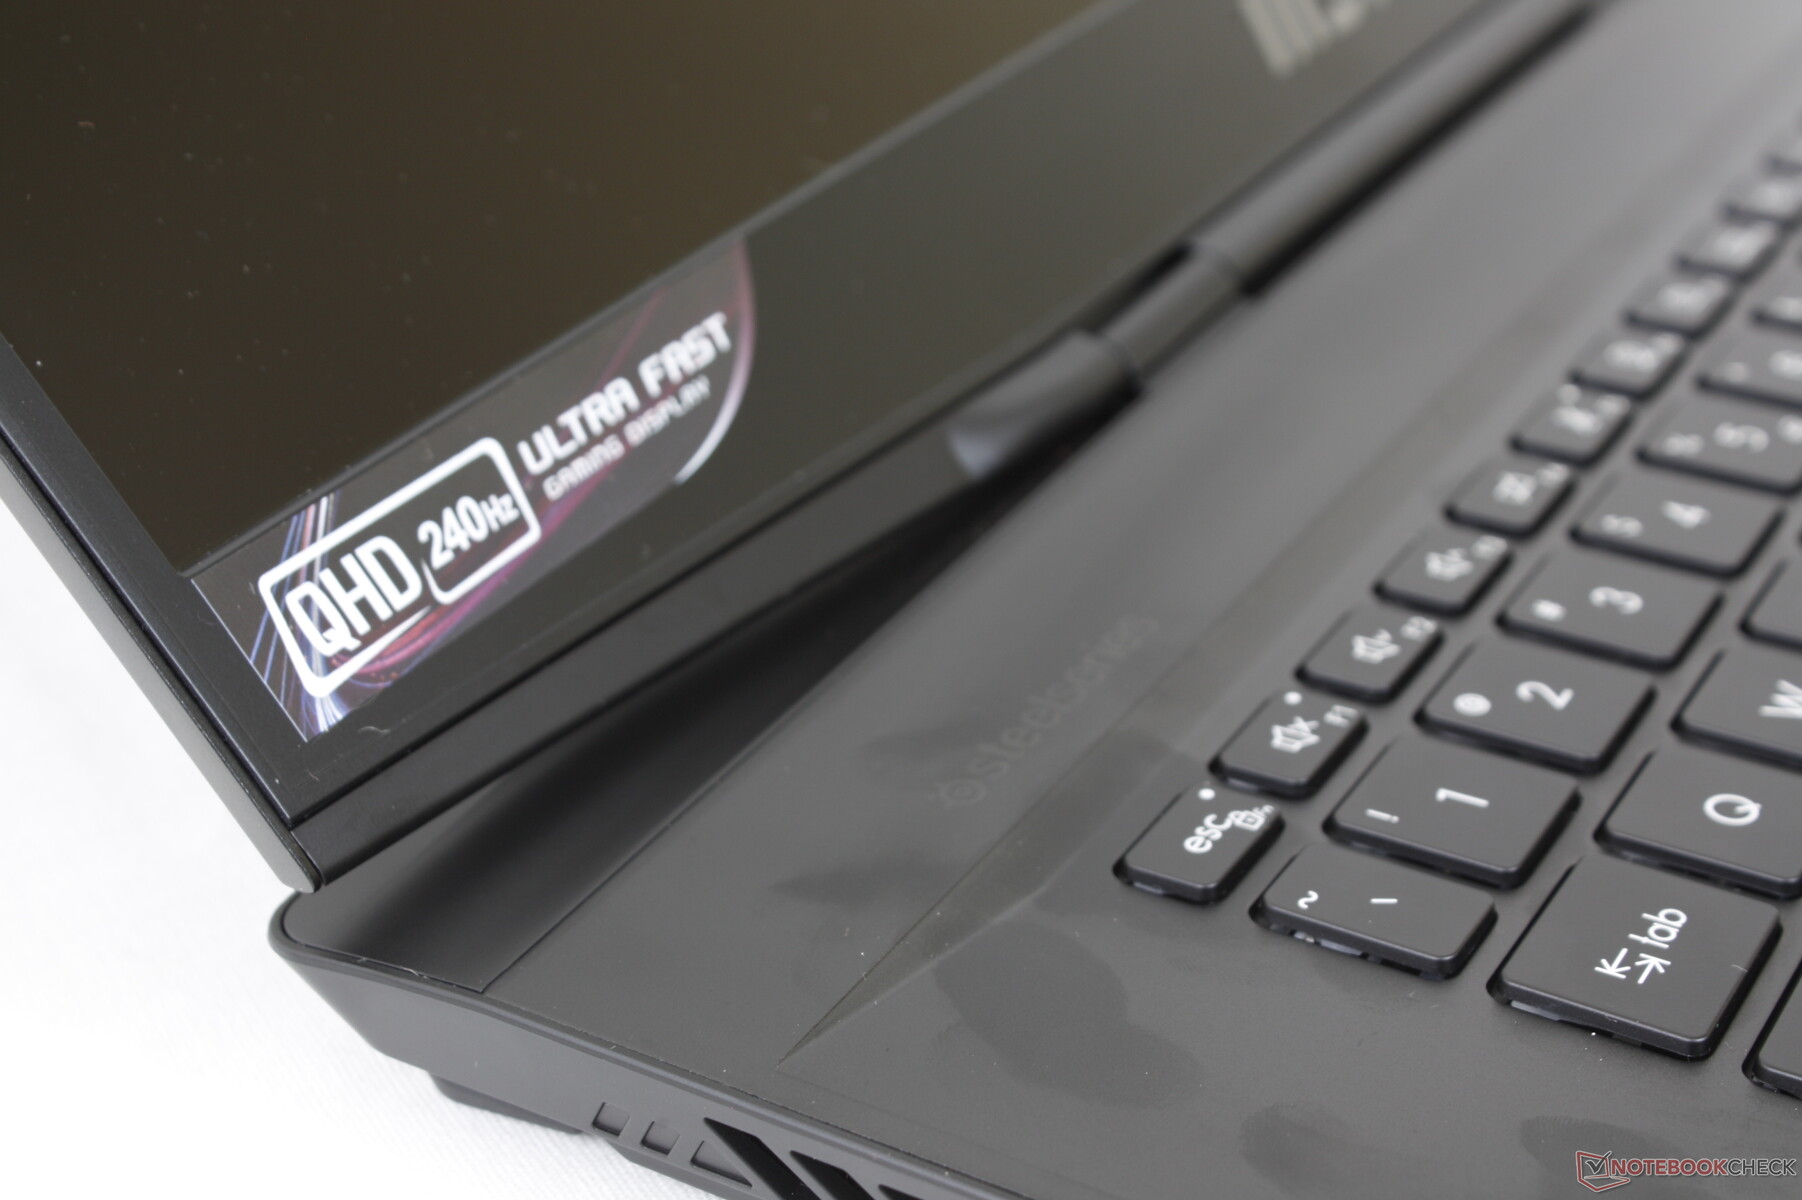
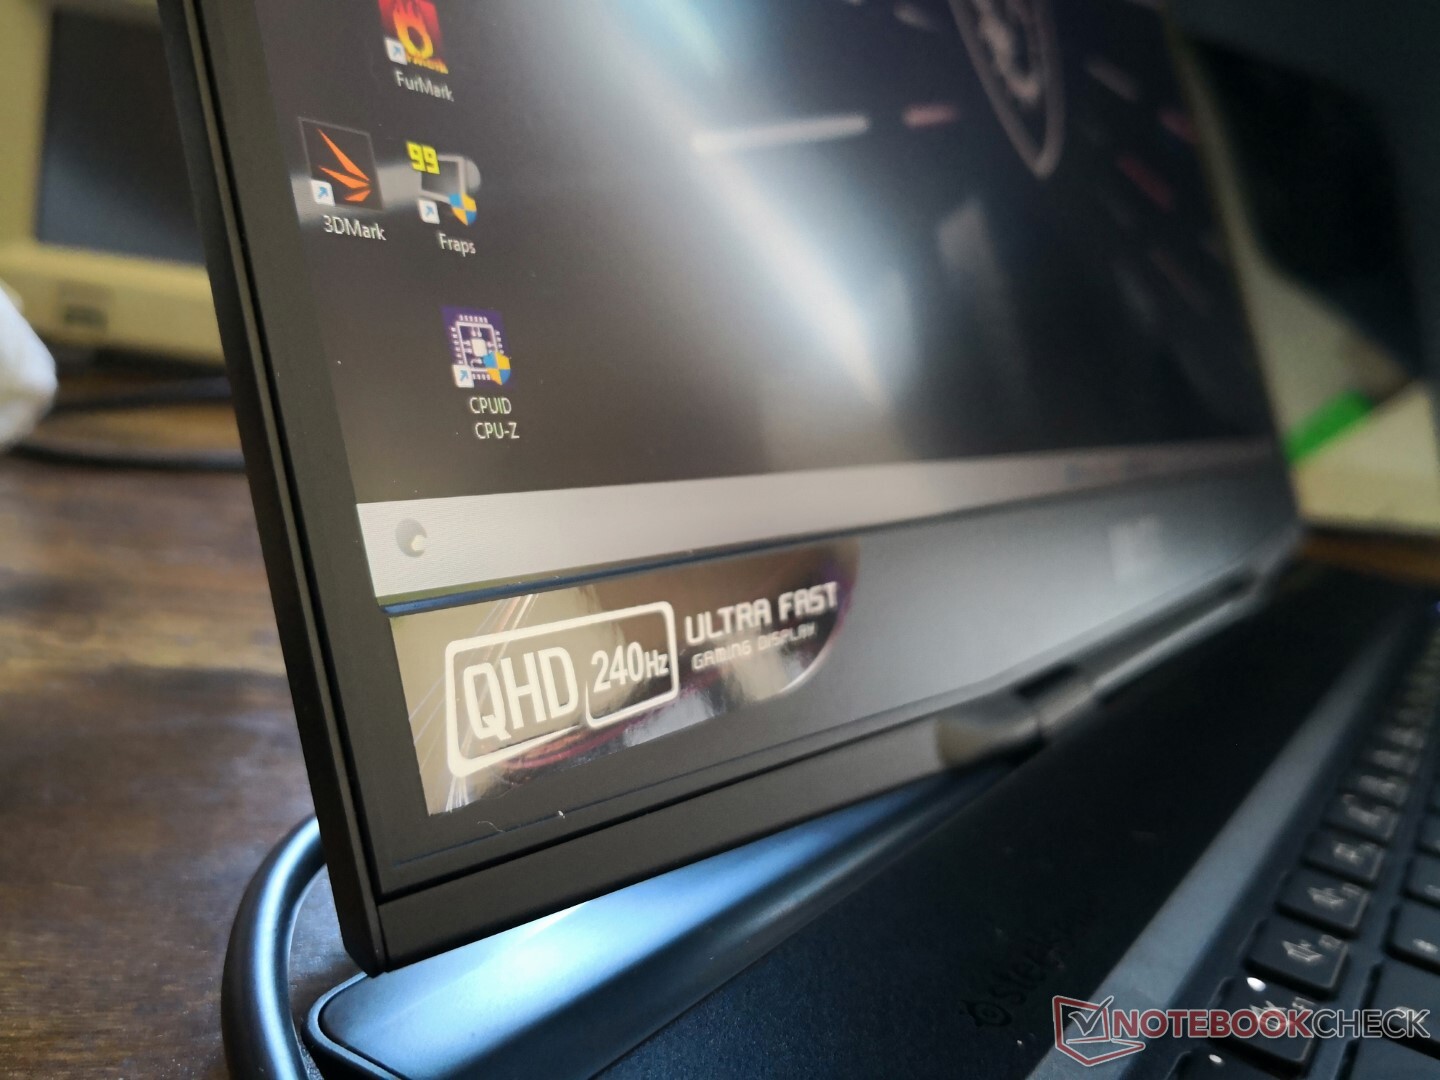
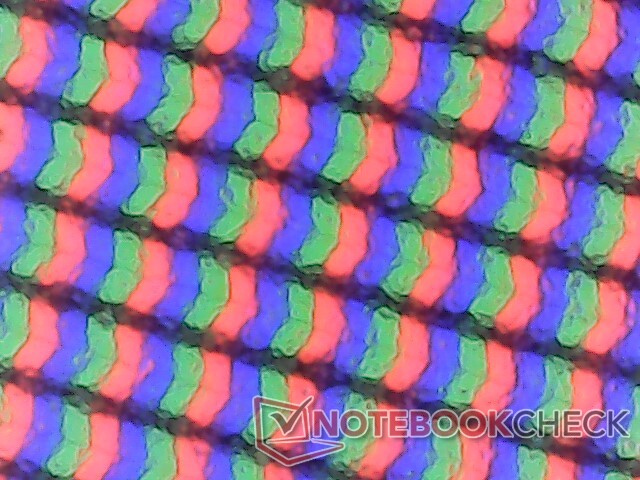
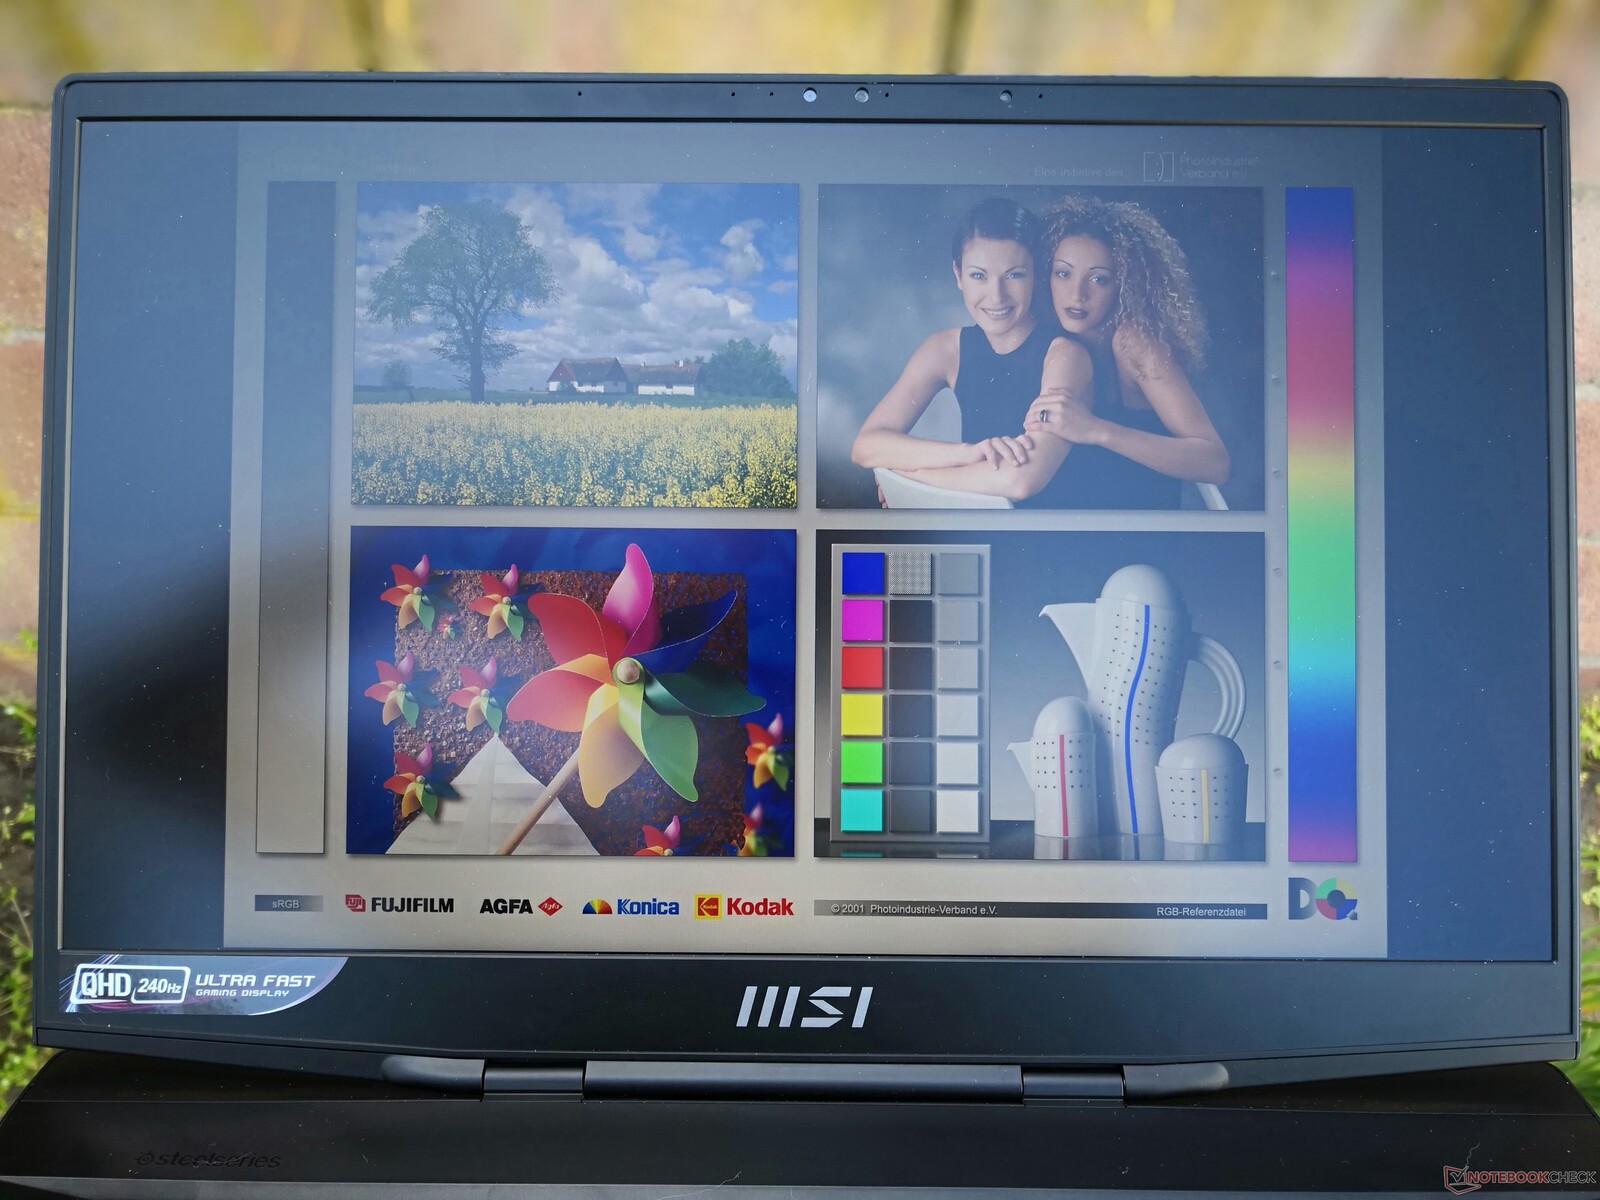
Affichage - Haute fréquence de rafraîchissement en standard
Le GS77 utilise exactement la même dalle IPS 1440p BOE NE173QHM-NZ1 de haute qualité que Razer utilise pour son Blade 17. Ainsi, les attributs essentiels tels que le taux de rafraîchissement natif de 240 Hz, les temps de réponse rapides, le rapport de contraste décent de ~1000:1 et la couverture DCI-P3 complète sont identiques entre les deux ordinateurs portables concurrents de 17,3 pouces.
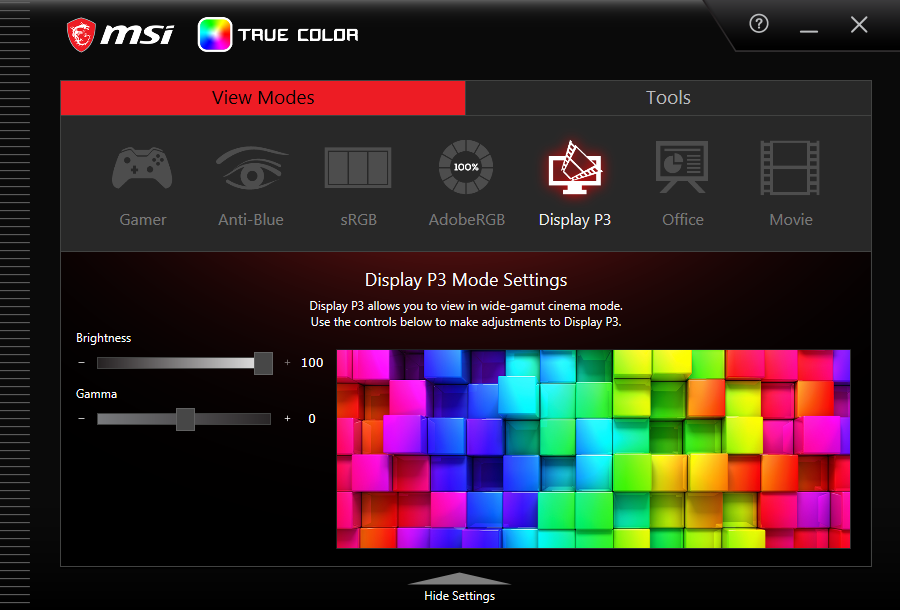
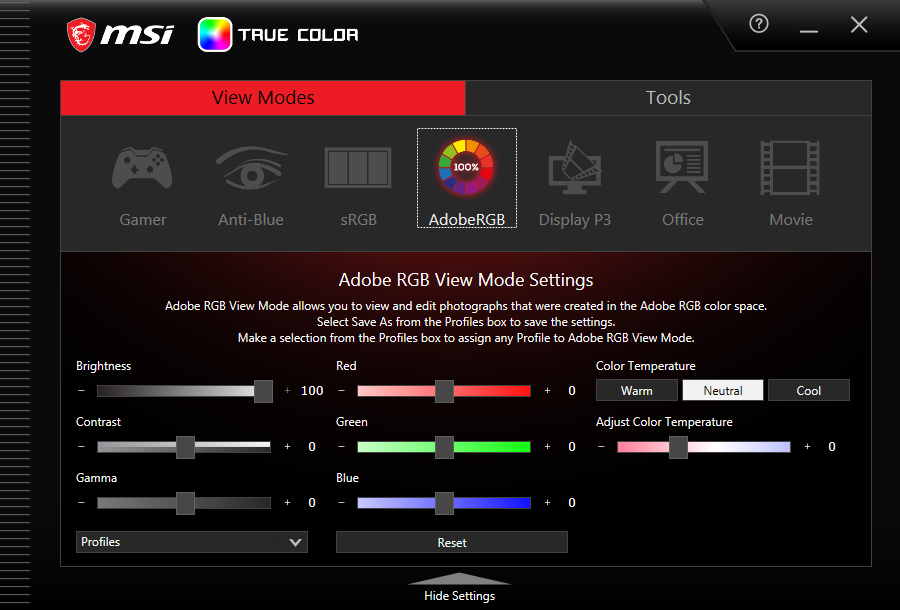
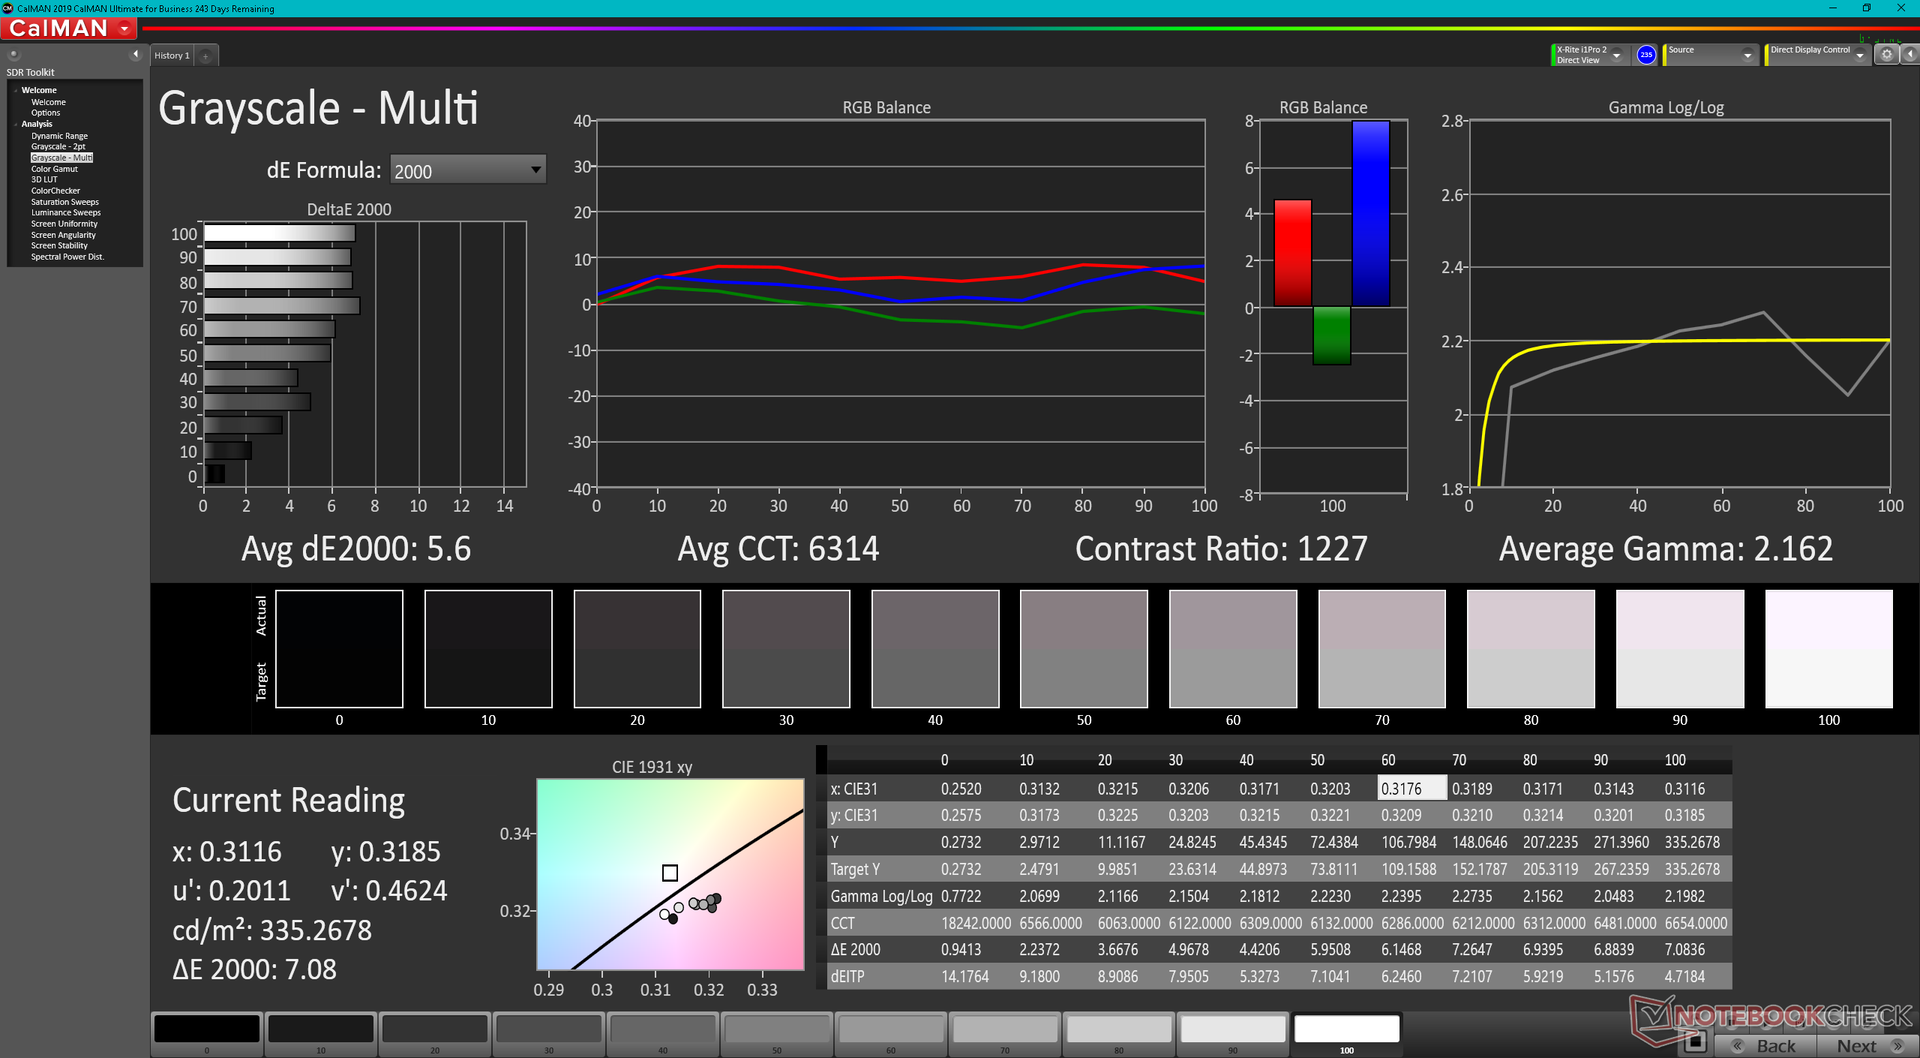
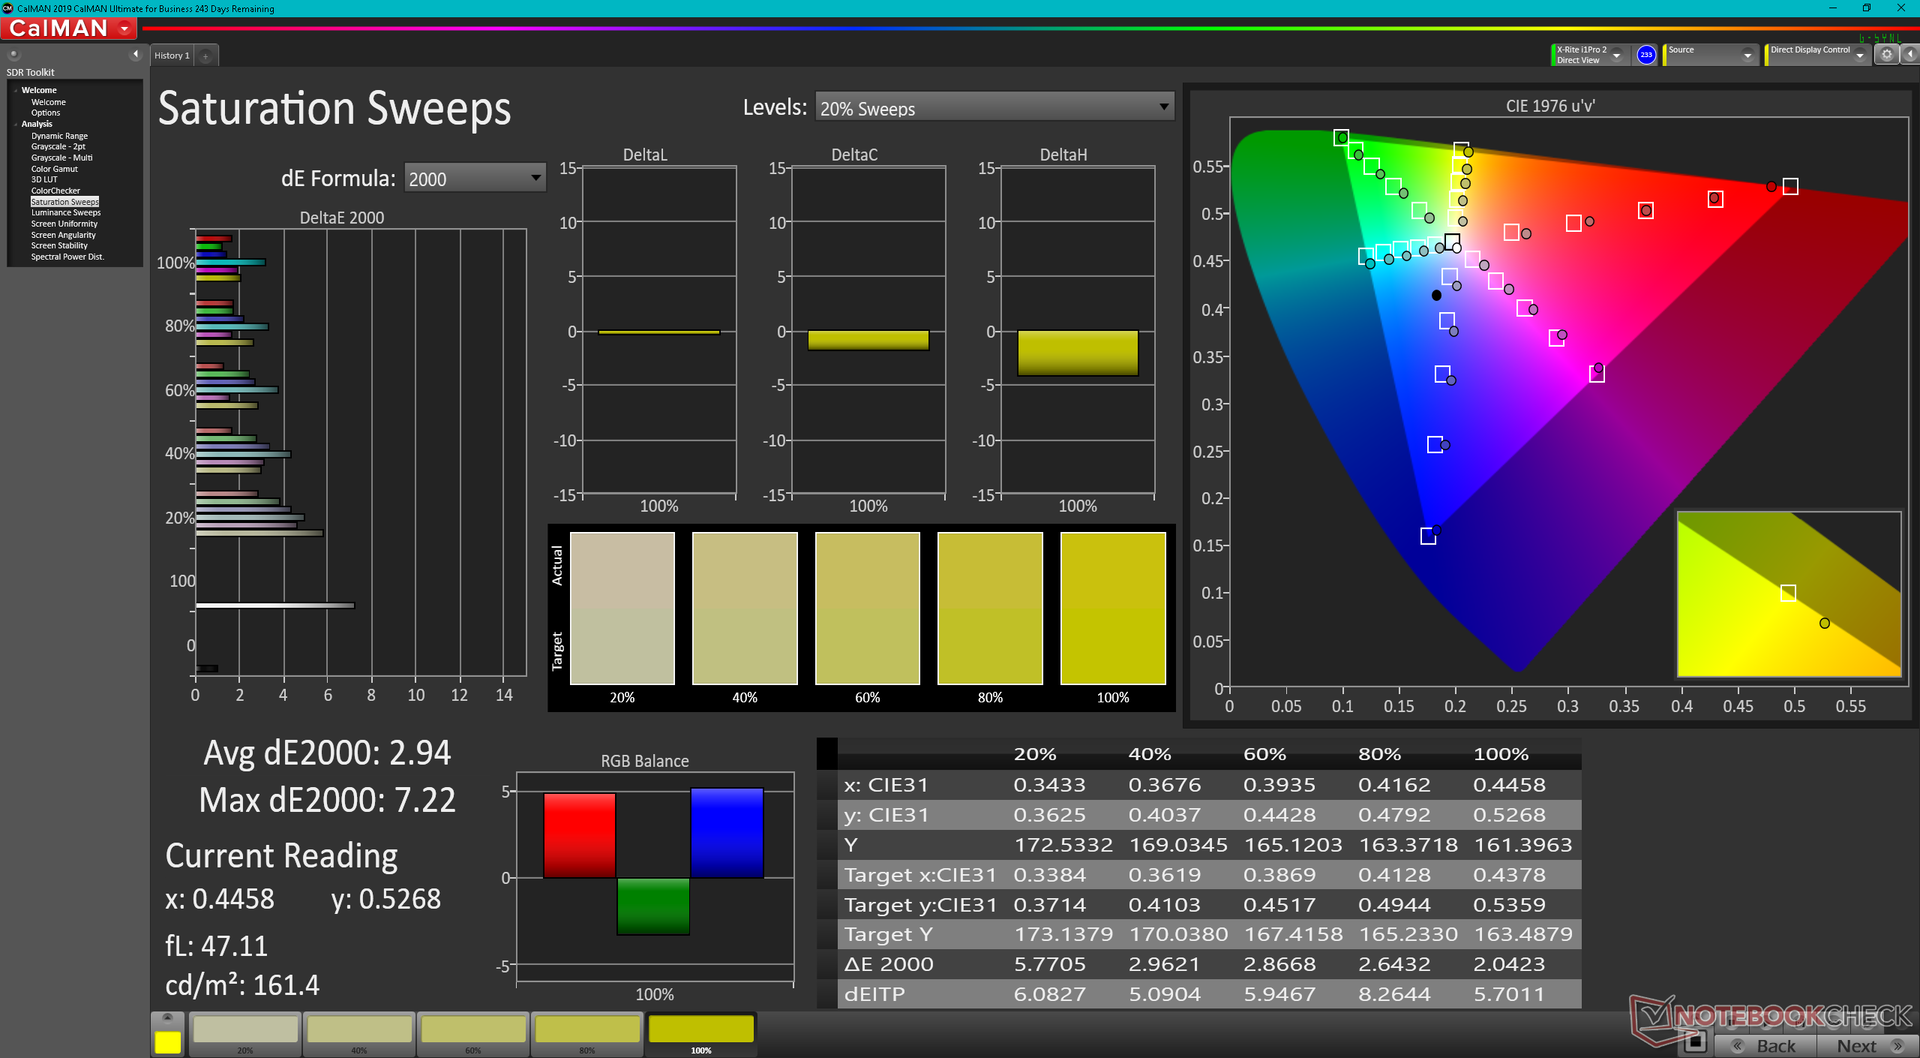
Il existe néanmoins deux différences majeures entre l'écran du GS77 et celui du Blade 17. Tout d'abord, l'écran du GS77 ne prend pas en charge G-Sync ou la synchronisation adaptative, car ce modèle ne prend pas en charge Advanced Optimus ou MUX. Deuxièmement, l'écran du GS77 n'est pas calibré en usine et les couleurs sont donc sensiblement faussées même lorsque le profil est réglé sur DCI-P3.
| |||||||||||||||||||||||||
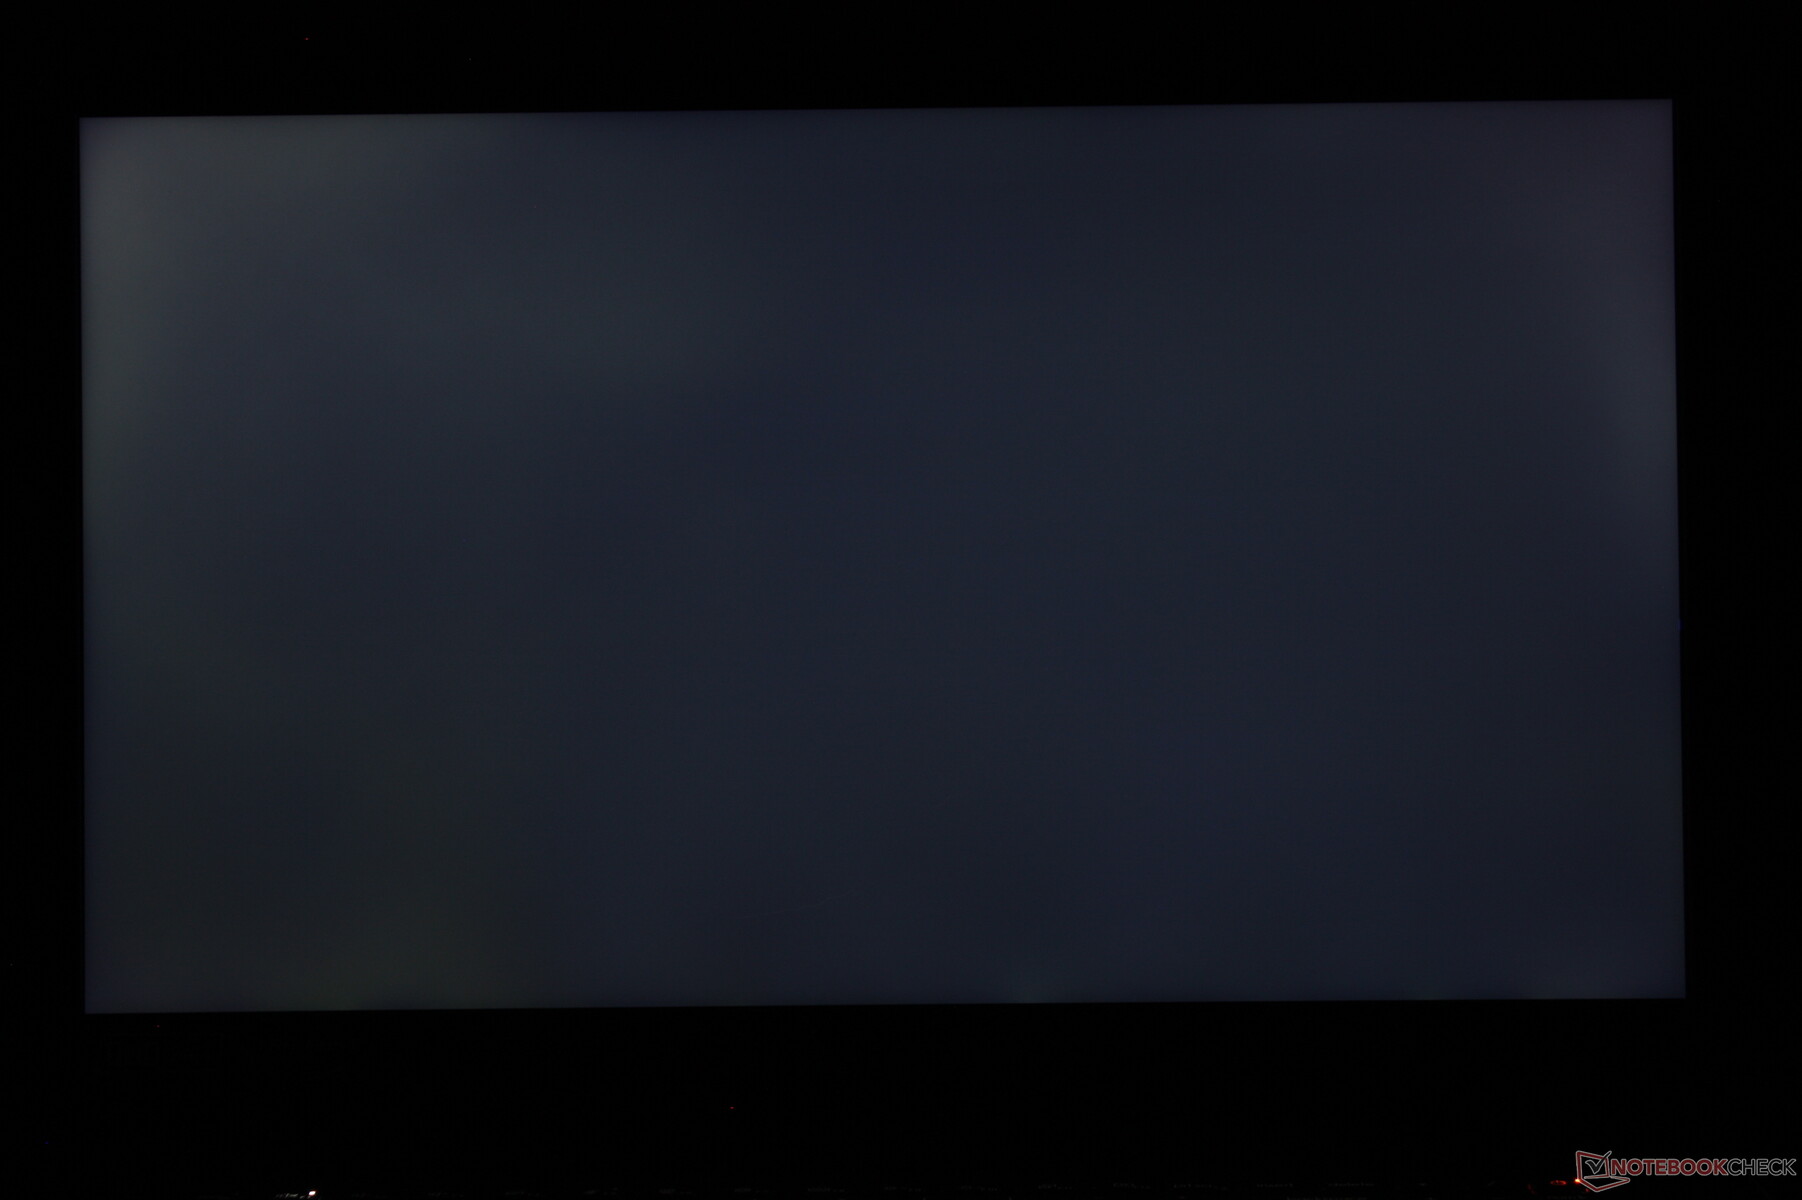
Homogénéité de la luminosité: 79 %
Valeur mesurée au centre, sur batterie: 334.8 cd/m²
Contraste: 985:1 (Valeurs des noirs: 0.34 cd/m²)
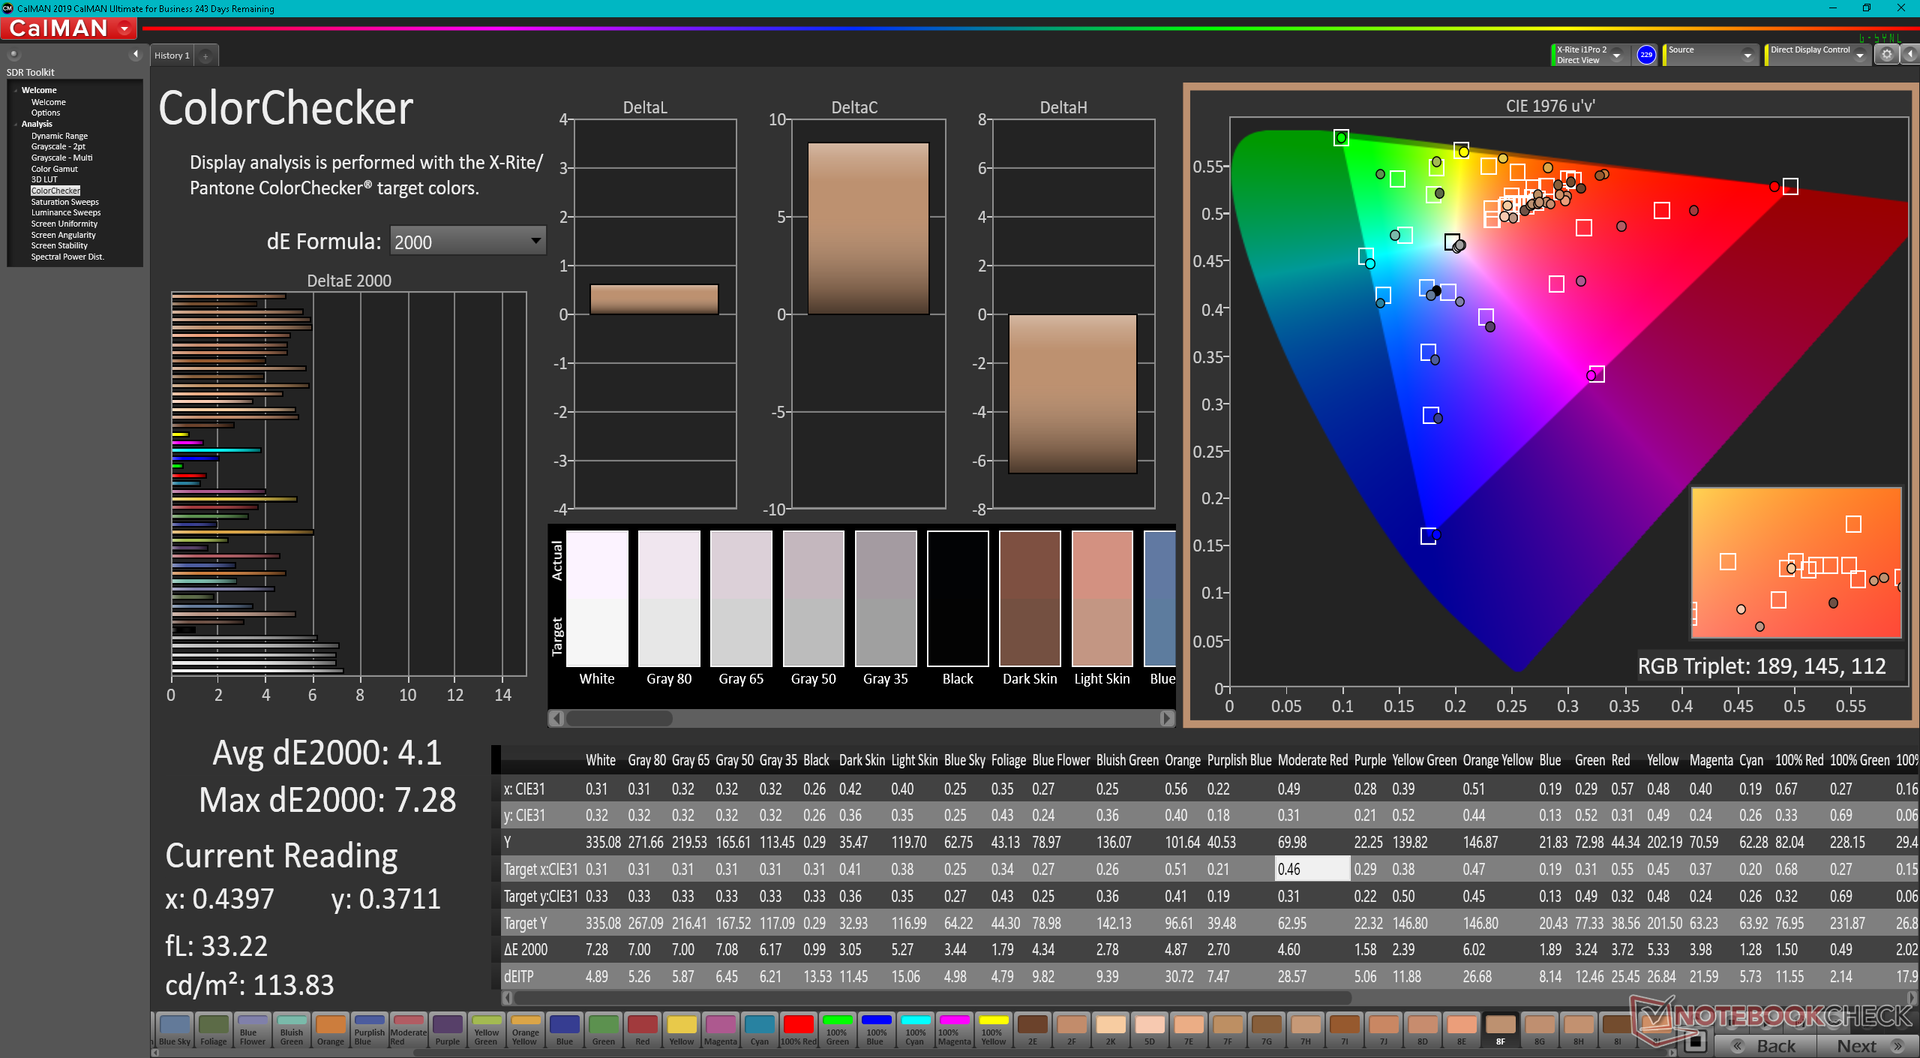
ΔE ColorChecker Calman: 4.1 | ∀{0.5-29.43 Ø4.71}
ΔE Greyscale Calman: 5.6 | ∀{0.09-98 Ø4.96}
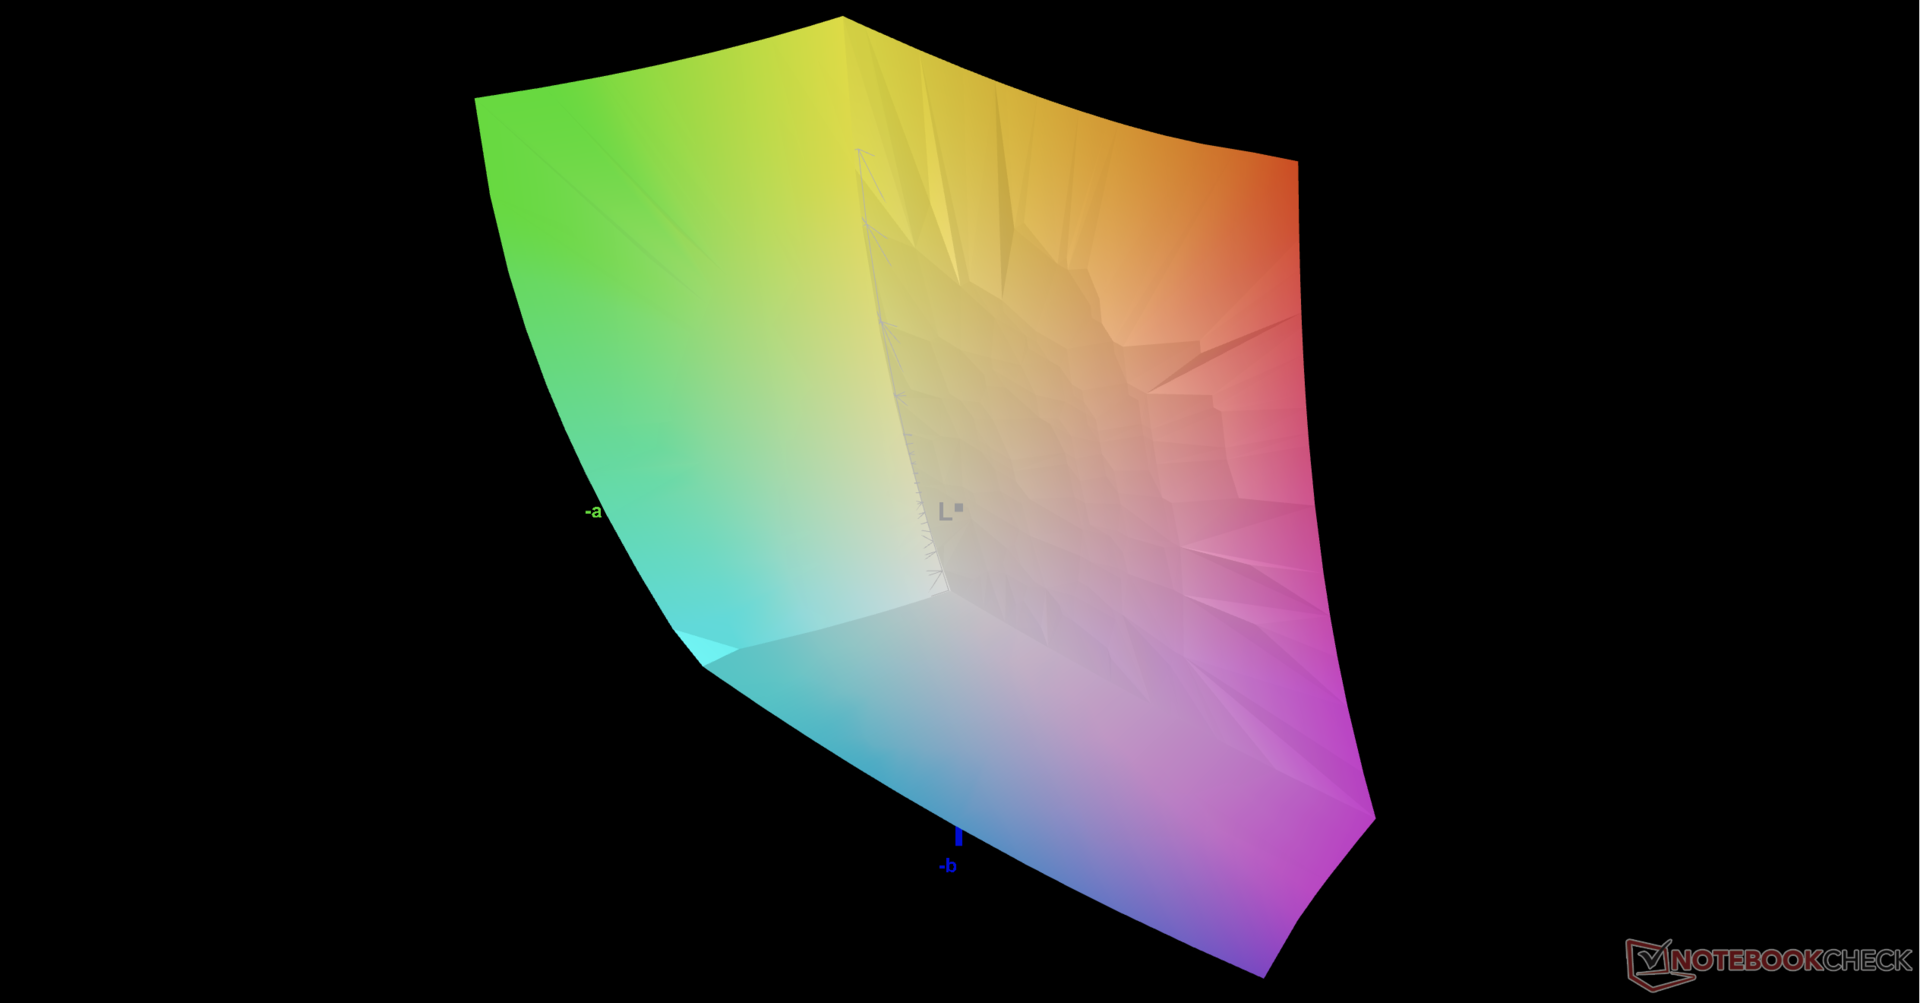
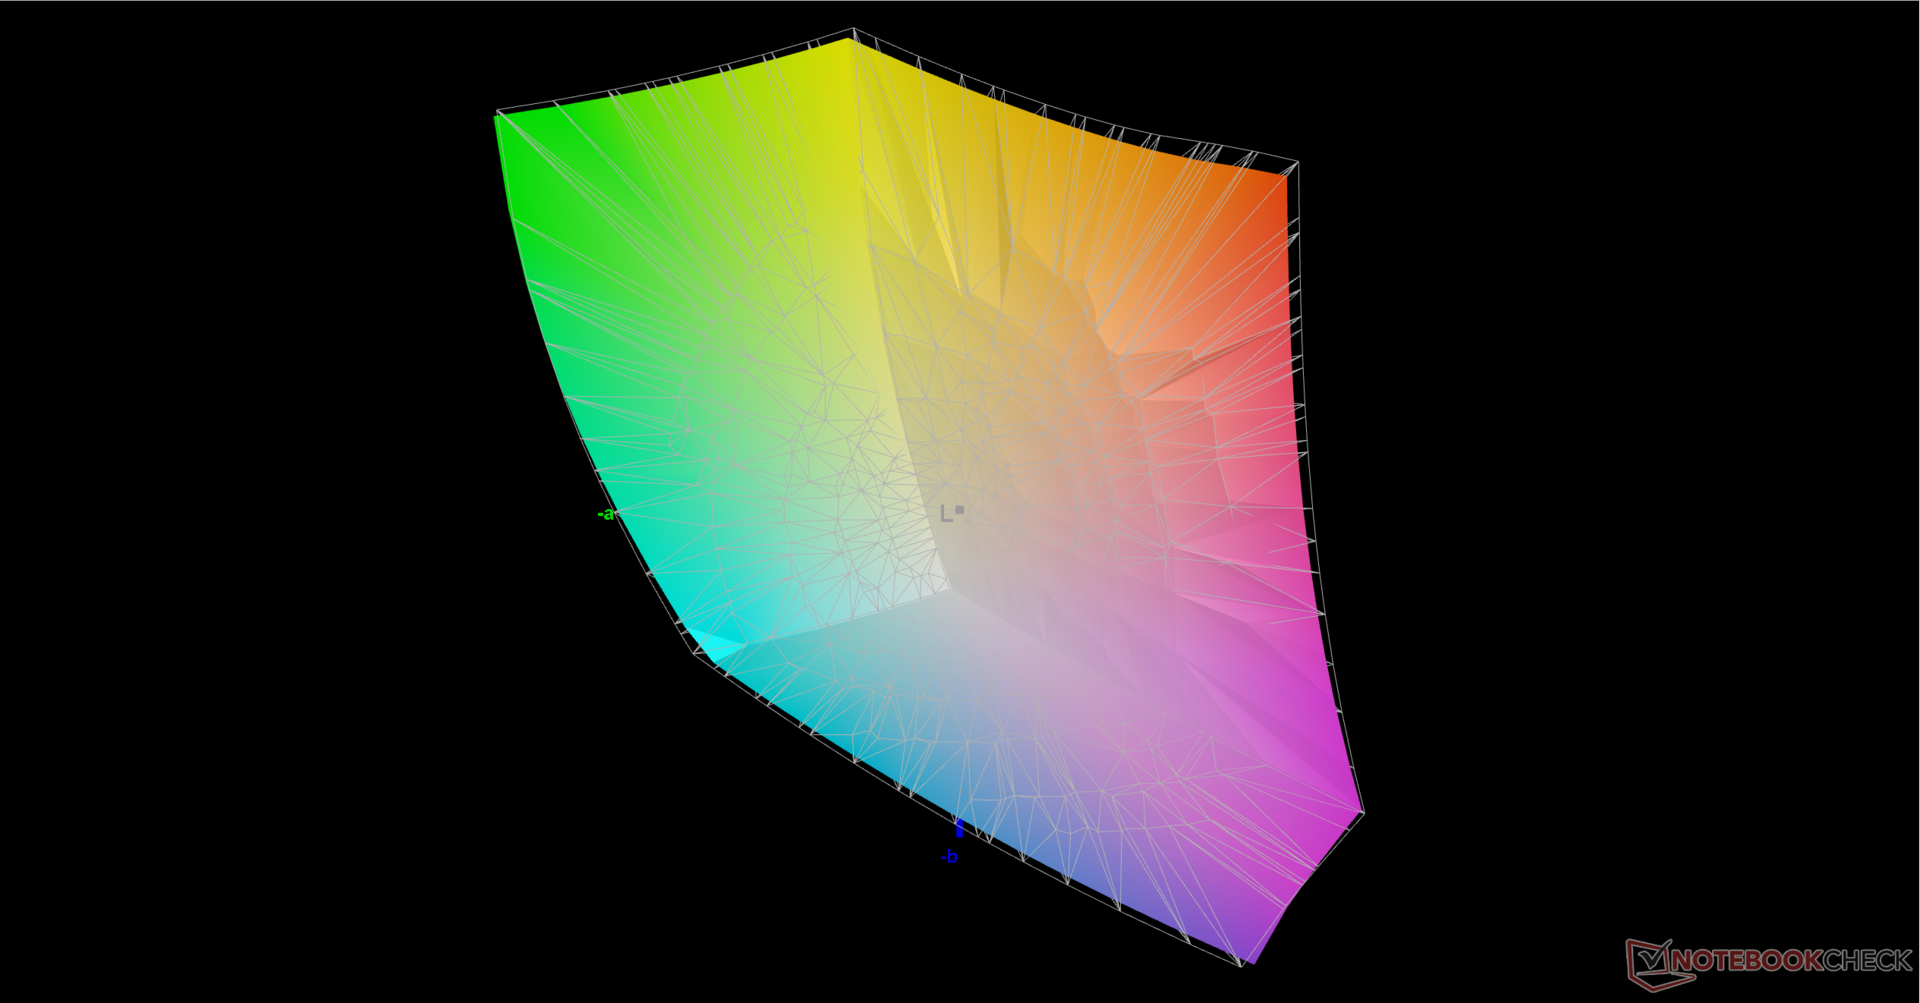
85.8% AdobeRGB 1998 (Argyll 3D)
99.7% sRGB (Argyll 3D)
96.2% Display P3 (Argyll 3D)
Gamma: 2.16
CCT: 6314 K
| MSI Stealth GS77 12UHS-083US BOE NE173QHM-NZ1, IPS, 2560x1440, 17.3" | MSI GS76 Stealth 11UH AUO B173ZAN06.1 (AUODE95), IPS, 3840x2160, 17.3" | Razer Blade 17 RTX 3080 Ti BOE NE173QHM-NZ1, IPS, 2560x1440, 17.3" | MSI GE76 Raider AU Optronics B173HAN05.4 (AUOE295), IPS-Level, 1920x1080, 17.3" | Alienware x17 RTX 3080 P48E AU Optronics B173ZAN, IPS, 3840x2160, 17.3" | Asus ROG Zephyrus S17 GX703HSD BOE099D (BOE CQ NE173QHM-NY3), IPS, 2560x1440, 17.3" | |
|---|---|---|---|---|---|---|
| Display | -21% | 1% | -21% | 3% | -2% | |
| Display P3 Coverage (%) | 96.2 | 63 -35% | 98.7 3% | 63.1 -34% | 88.3 -8% | 94.2 -2% |
| sRGB Coverage (%) | 99.7 | 94.8 -5% | 99.9 0% | 94 -6% | 100 0% | 98.7 -1% |
| AdobeRGB 1998 Coverage (%) | 85.8 | 65 -24% | 86.2 0% | 65.2 -24% | 100 17% | 84.4 -2% |
| Response Times | 50% | 6% | 47% | 19% | 55% | |
| Response Time Grey 50% / Grey 80% * (ms) | 17.6 ? | 8.8 ? 50% | 17.6 ? -0% | 5.6 ? 68% | 14.4 ? 18% | 4.8 73% |
| Response Time Black / White * (ms) | 12.8 ? | 6.4 ? 50% | 11.4 ? 11% | 9.6 ? 25% | 10.4 ? 19% | 8 37% |
| PWM Frequency (Hz) | ||||||
| Screen | 26% | 13% | 30% | 12% | 13% | |
| Brightness middle (cd/m²) | 334.8 | 474 42% | 335.9 0% | 290 -13% | 438.7 31% | 322 -4% |
| Brightness (cd/m²) | 305 | 454 49% | 294 -4% | 290 -5% | 435 43% | 288 -6% |
| Brightness Distribution (%) | 79 | 88 11% | 75 -5% | 96 22% | 91 15% | 72 -9% |
| Black Level * (cd/m²) | 0.34 | 0.46 -35% | 0.38 -12% | 0.23 32% | 0.48 -41% | 0.3 12% |
| Contrast (:1) | 985 | 1030 5% | 884 -10% | 1261 28% | 914 -7% | 1073 9% |
| Colorchecker dE 2000 * | 4.1 | 1.5 63% | 2.82 31% | 1.59 61% | 4.34 -6% | 3.05 26% |
| Colorchecker dE 2000 max. * | 7.28 | 5.59 23% | 5.04 31% | 3.17 56% | 7.3 -0% | 5.23 28% |
| Greyscale dE 2000 * | 5.6 | 2.8 50% | 1.7 70% | 2.5 55% | 2.4 57% | 3.11 44% |
| Gamma | 2.16 102% | 2.158 102% | 2.14 103% | 2.253 98% | 2.09 105% | 2.13 103% |
| CCT | 6314 103% | 6597 99% | 6382 102% | 6640 98% | 6413 101% | 6553 99% |
| Colorchecker dE 2000 calibrated * | 0.86 | 0.87 | 0.72 | 1.92 | ||
| Color Space (Percent of AdobeRGB 1998) (%) | 84 | |||||
| Color Space (Percent of sRGB) (%) | 99 | |||||
| Moyenne finale (programmes/paramètres) | 18% /
19% | 7% /
9% | 19% /
20% | 11% /
11% | 22% /
16% |
* ... Moindre est la valeur, meilleures sont les performances
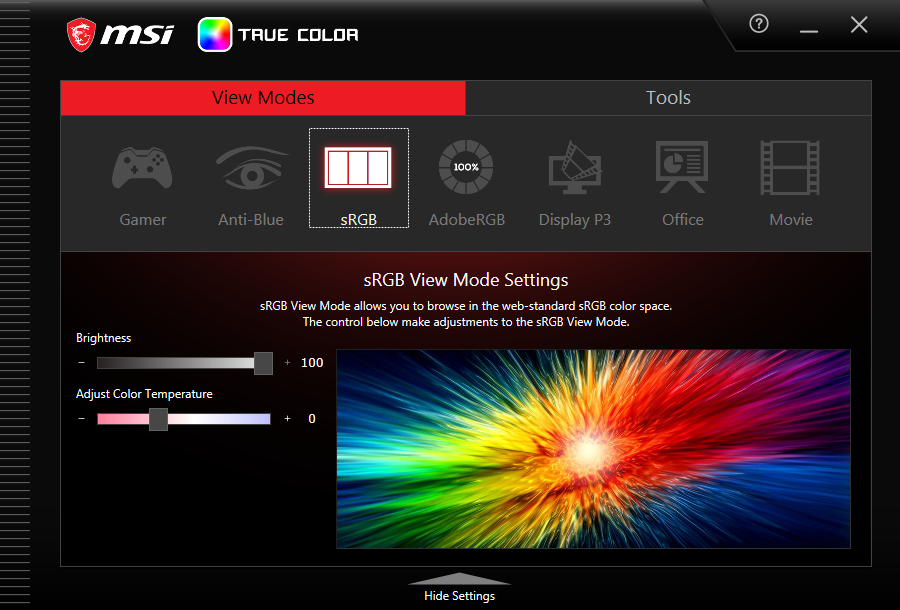
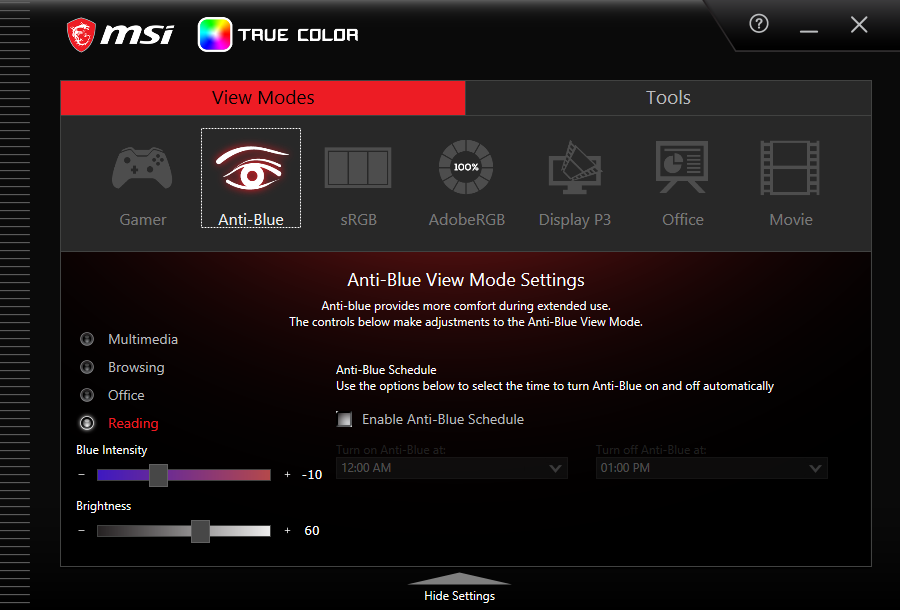
Comme mentionné ci-dessus, MSI ne calibre pas chaque panneau en usine et cela se voit avec notre colorimètre X-Rite. La température des couleurs est trop chaude et les valeurs DeltaE moyennes sont relativement élevées sur le GS77. Heureusement, les utilisateurs peuvent ajuster manuellement la température des couleurs et les valeurs RVB via le logiciel MSI True Color préinstallé sans trop de problèmes.
Temps de réponse de l'écran
| ↔ Temps de réponse noir à blanc | ||
|---|---|---|
| 12.8 ms ... hausse ↗ et chute ↘ combinées | ↗ 7.6 ms hausse | 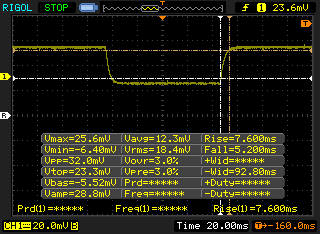 |
| ↘ 5.2 ms chute | ||
| L'écran montre de bons temps de réponse, mais insuffisant pour du jeu compétitif. En comparaison, tous les appareils testés affichent entre 0.1 (minimum) et 240 (maximum) ms. » 33 % des appareils testés affichent de meilleures performances. Cela signifie que les latences relevées sont meilleures que la moyenne (19.8 ms) de tous les appareils testés. | ||
| ↔ Temps de réponse gris 50% à gris 80% | ||
| 17.6 ms ... hausse ↗ et chute ↘ combinées | ↗ 10 ms hausse | 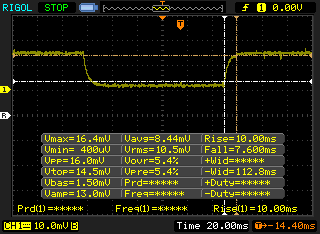 |
| ↘ 7.6 ms chute | ||
| L'écran montre de bons temps de réponse, mais insuffisant pour du jeu compétitif. En comparaison, tous les appareils testés affichent entre 0.165 (minimum) et 636 (maximum) ms. » 32 % des appareils testés affichent de meilleures performances. Cela signifie que les latences relevées sont meilleures que la moyenne (31 ms) de tous les appareils testés. | ||
Scintillement / MLI (Modulation de largeur d'impulsion)
| Scintillement / MLI (Modulation de largeur d'impulsion) non décelé | 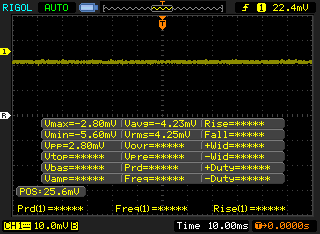 | ||
En comparaison, 52 % des appareils testés n'emploient pas MDI pour assombrir leur écran. Nous avons relevé une moyenne à 7757 (minimum : 5 - maximum : 343500) Hz dans le cas où une MDI était active. | |||
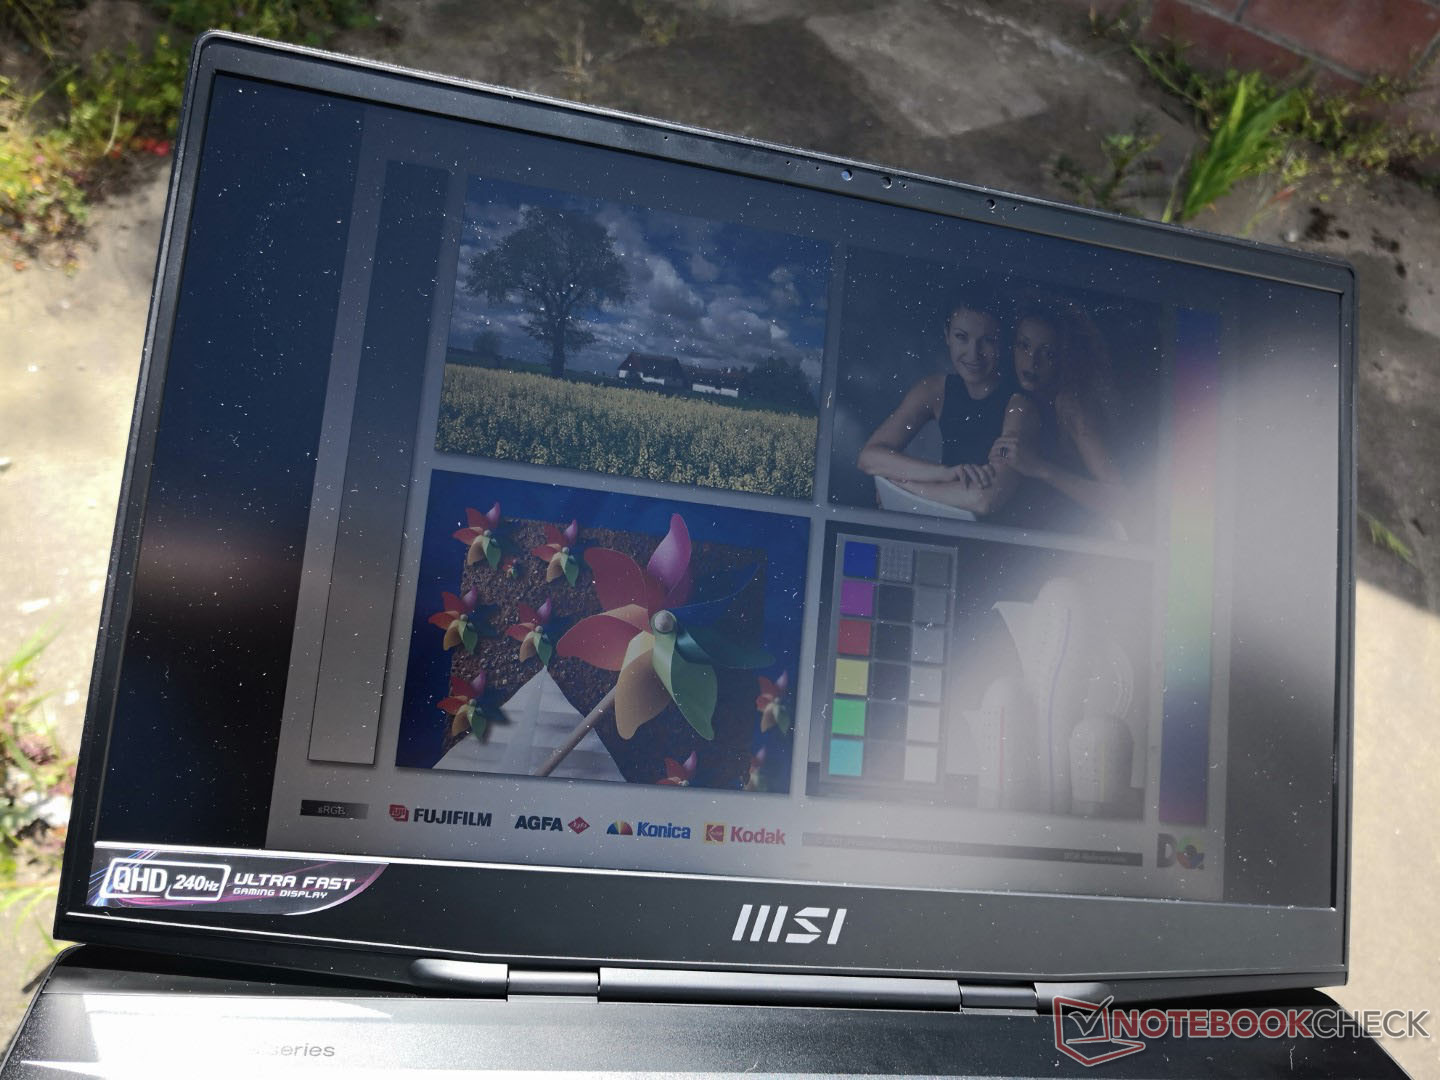
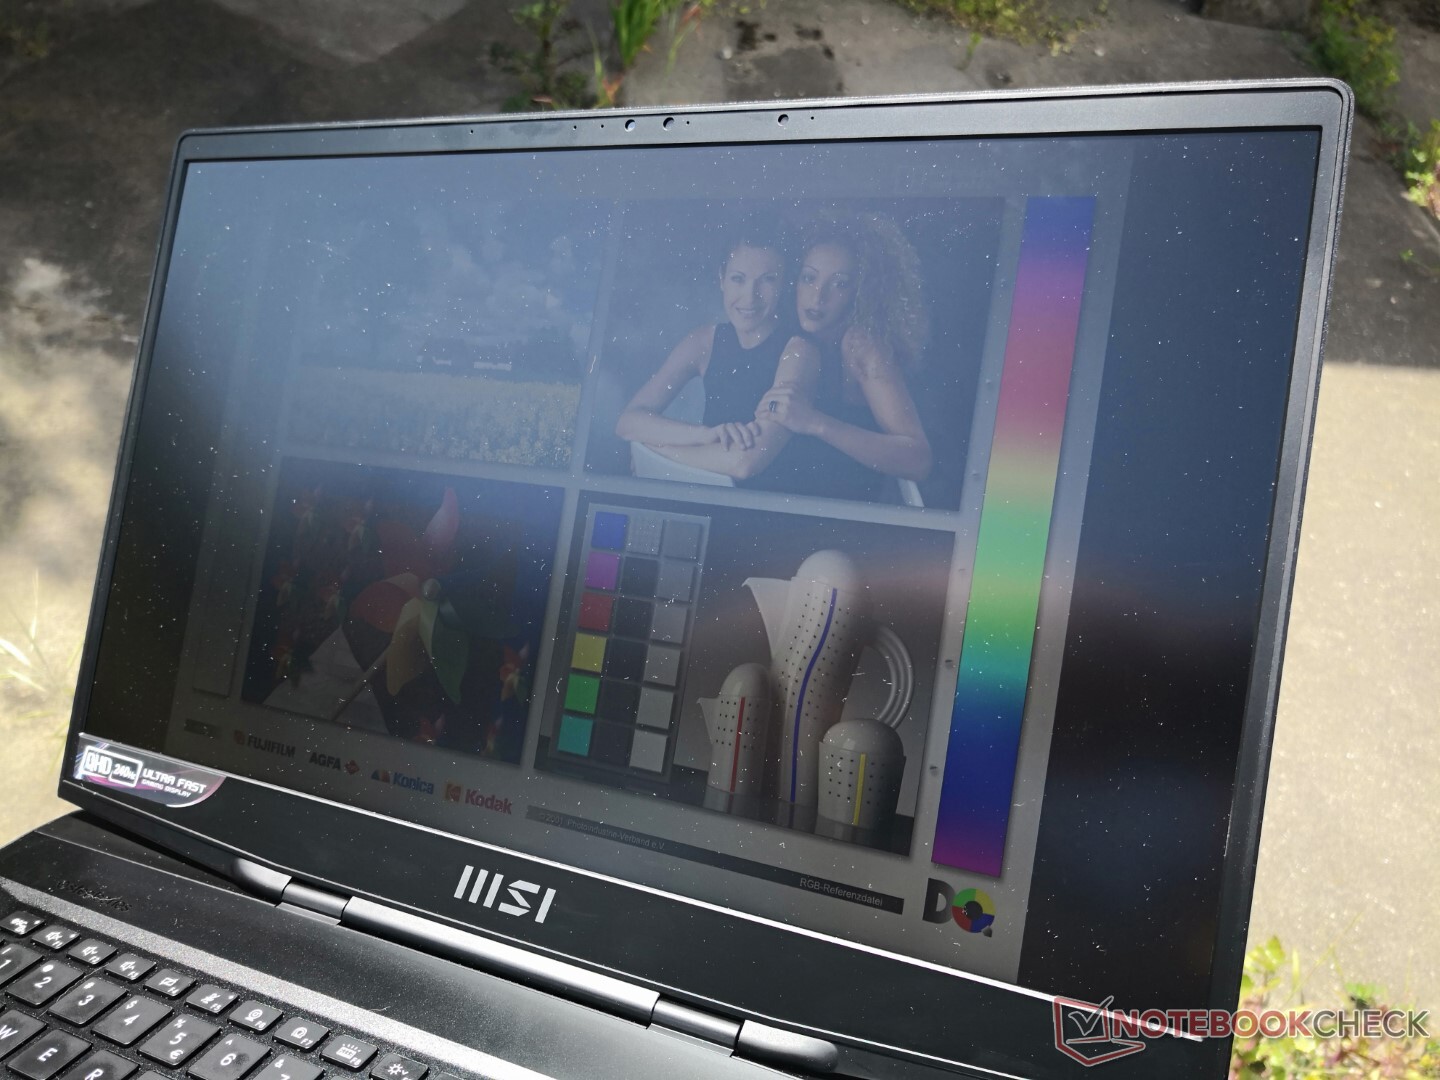
Notre écran 1440p est presque 30 % moins lumineux que ce que nous avons enregistré sur le GS76 4K pour être à un niveau plus similaire à celui du Blade 17. La visibilité extérieure n'est par la suite pas aussi bonne que sur le modèle de l'année dernière.
Performances - Intel 12e génération avec graphiques TGP 105 W
Conditions d'essai
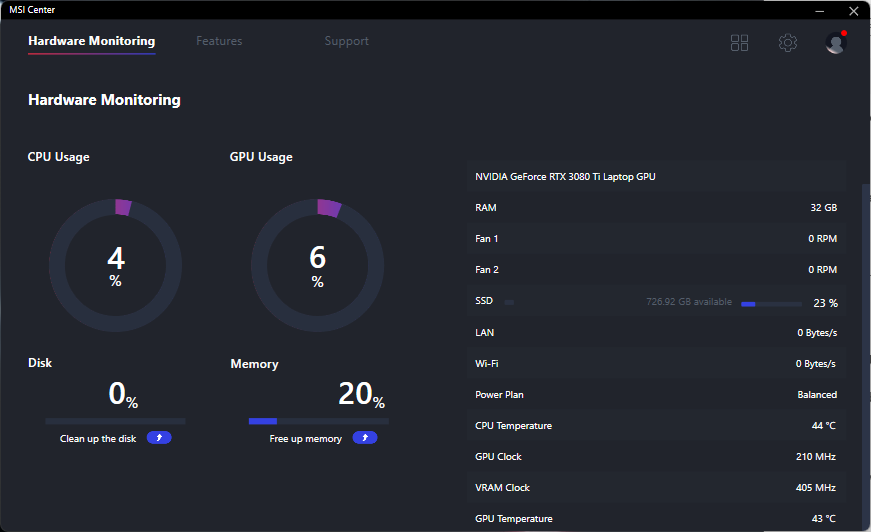
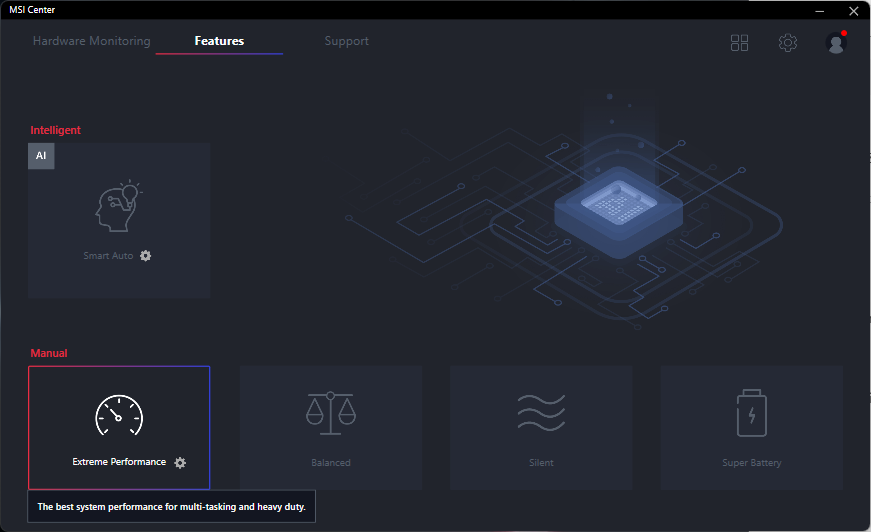
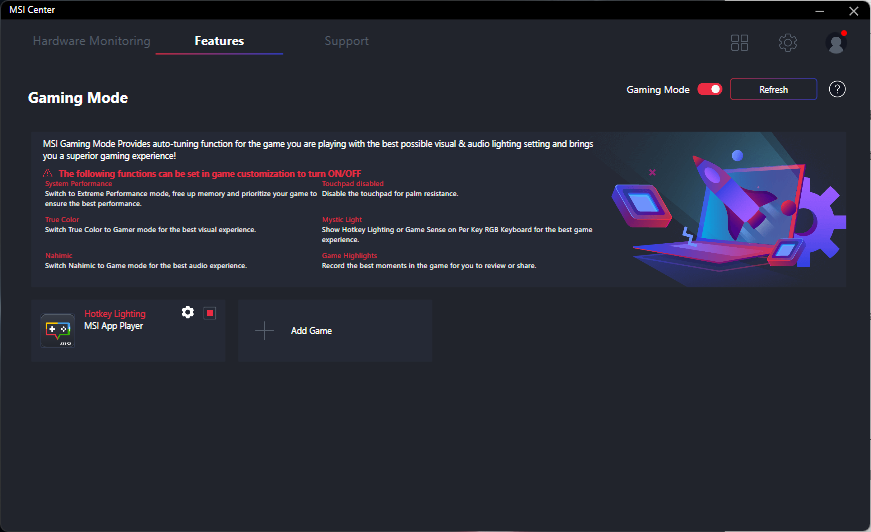
Nous avons réglé notre appareil en mode Performance Extrême via le logiciel préinstallé MSI Control Center avant d'exécuter les benchmarks ci-dessous. Nous recommandons aux utilisateurs de se familiariser avec ce logiciel, car c'est ici que sont activées les principales fonctions du système.
Processeur - Gains importants d'une année sur l'autre
Les performances du CPU sont excellentes, avec des résultats qui se situent à un ou deux points de pourcentage près de ceux de l'ordinateur portable moyen de notre base de données équipé du même CPU Core i7-12700H. Les performances multithread sont même systématiquement supérieures à celles du Core i7-12800H du Blade 17 de 6 à 8 %. Bien que l'avantage soit relativement mineur, il explique les taux d'images légèrement plus élevés lors des jeux à des résolutions inférieures sur le GS77 par rapport au Blade 17.
Le GS77 est équipé d'un
Core i9-12900H mais l'augmentation des performances ne devrait être que de quelques points de pourcentage par rapport à notre Core i7-12700H, d'après notre expérience avec une poignée d'ordinateurs portables Core i9-12900H déjà sur le marché.L'amélioration des performances d'une année sur l'autre par rapport à la série Tiger Lake-H de 11e génération d'Intel est plus significative. Par rapport au Core i9-11900H du modèle GS76notre Core i7-12700H est environ 15 % et 25 à 30 % plus rapide dans les opérations monofil et multifil, respectivement.
Cinebench R15 Multi Loop
Cinebench R23: Multi Core | Single Core
Cinebench R15: CPU Multi 64Bit | CPU Single 64Bit
Blender: v2.79 BMW27 CPU
7-Zip 18.03: 7z b 4 | 7z b 4 -mmt1
Geekbench 5.5: Multi-Core | Single-Core
HWBOT x265 Benchmark v2.2: 4k Preset
LibreOffice : 20 Documents To PDF
R Benchmark 2.5: Overall mean
Cinebench R23: Multi Core | Single Core
Cinebench R15: CPU Multi 64Bit | CPU Single 64Bit
Blender: v2.79 BMW27 CPU
7-Zip 18.03: 7z b 4 | 7z b 4 -mmt1
Geekbench 5.5: Multi-Core | Single-Core
HWBOT x265 Benchmark v2.2: 4k Preset
LibreOffice : 20 Documents To PDF
R Benchmark 2.5: Overall mean
* ... Moindre est la valeur, meilleures sont les performances
AIDA64: FP32 Ray-Trace | FPU Julia | CPU SHA3 | CPU Queen | FPU SinJulia | FPU Mandel | CPU AES | CPU ZLib | FP64 Ray-Trace | CPU PhotoWorxx
| Performance rating | |
| MSI GE76 Raider | |
| Moyenne Intel Core i7-12700H | |
| MSI Stealth GS77 12UHS-083US | |
| Razer Blade 17 RTX 3080 Ti | |
| AIDA64 / FP32 Ray-Trace | |
| Moyenne Intel Core i7-12700H (2585 - 17957, n=64) | |
| MSI GE76 Raider | |
| MSI Stealth GS77 12UHS-083US | |
| Razer Blade 17 RTX 3080 Ti | |
| AIDA64 / FPU Julia | |
| Moyenne Intel Core i7-12700H (12439 - 90760, n=64) | |
| MSI GE76 Raider | |
| MSI Stealth GS77 12UHS-083US | |
| Razer Blade 17 RTX 3080 Ti | |
| AIDA64 / CPU SHA3 | |
| MSI GE76 Raider | |
| MSI Stealth GS77 12UHS-083US | |
| Moyenne Intel Core i7-12700H (833 - 4242, n=64) | |
| Razer Blade 17 RTX 3080 Ti | |
| AIDA64 / CPU Queen | |
| MSI GE76 Raider | |
| Razer Blade 17 RTX 3080 Ti | |
| MSI Stealth GS77 12UHS-083US | |
| Moyenne Intel Core i7-12700H (57923 - 103202, n=63) | |
| AIDA64 / FPU SinJulia | |
| MSI GE76 Raider | |
| MSI Stealth GS77 12UHS-083US | |
| Razer Blade 17 RTX 3080 Ti | |
| Moyenne Intel Core i7-12700H (3249 - 9939, n=64) | |
| AIDA64 / FPU Mandel | |
| Moyenne Intel Core i7-12700H (7135 - 44760, n=64) | |
| MSI GE76 Raider | |
| MSI Stealth GS77 12UHS-083US | |
| Razer Blade 17 RTX 3080 Ti | |
| AIDA64 / CPU AES | |
| MSI GE76 Raider | |
| MSI Stealth GS77 12UHS-083US | |
| Moyenne Intel Core i7-12700H (31839 - 144360, n=64) | |
| Razer Blade 17 RTX 3080 Ti | |
| AIDA64 / CPU ZLib | |
| MSI GE76 Raider | |
| MSI Stealth GS77 12UHS-083US | |
| Moyenne Intel Core i7-12700H (305 - 1171, n=64) | |
| Razer Blade 17 RTX 3080 Ti | |
| AIDA64 / FP64 Ray-Trace | |
| Moyenne Intel Core i7-12700H (1437 - 9692, n=64) | |
| MSI GE76 Raider | |
| MSI Stealth GS77 12UHS-083US | |
| Razer Blade 17 RTX 3080 Ti | |
| AIDA64 / CPU PhotoWorxx | |
| Razer Blade 17 RTX 3080 Ti | |
| MSI GE76 Raider | |
| MSI Stealth GS77 12UHS-083US | |
| Moyenne Intel Core i7-12700H (12863 - 52207, n=64) | |
Performance du système
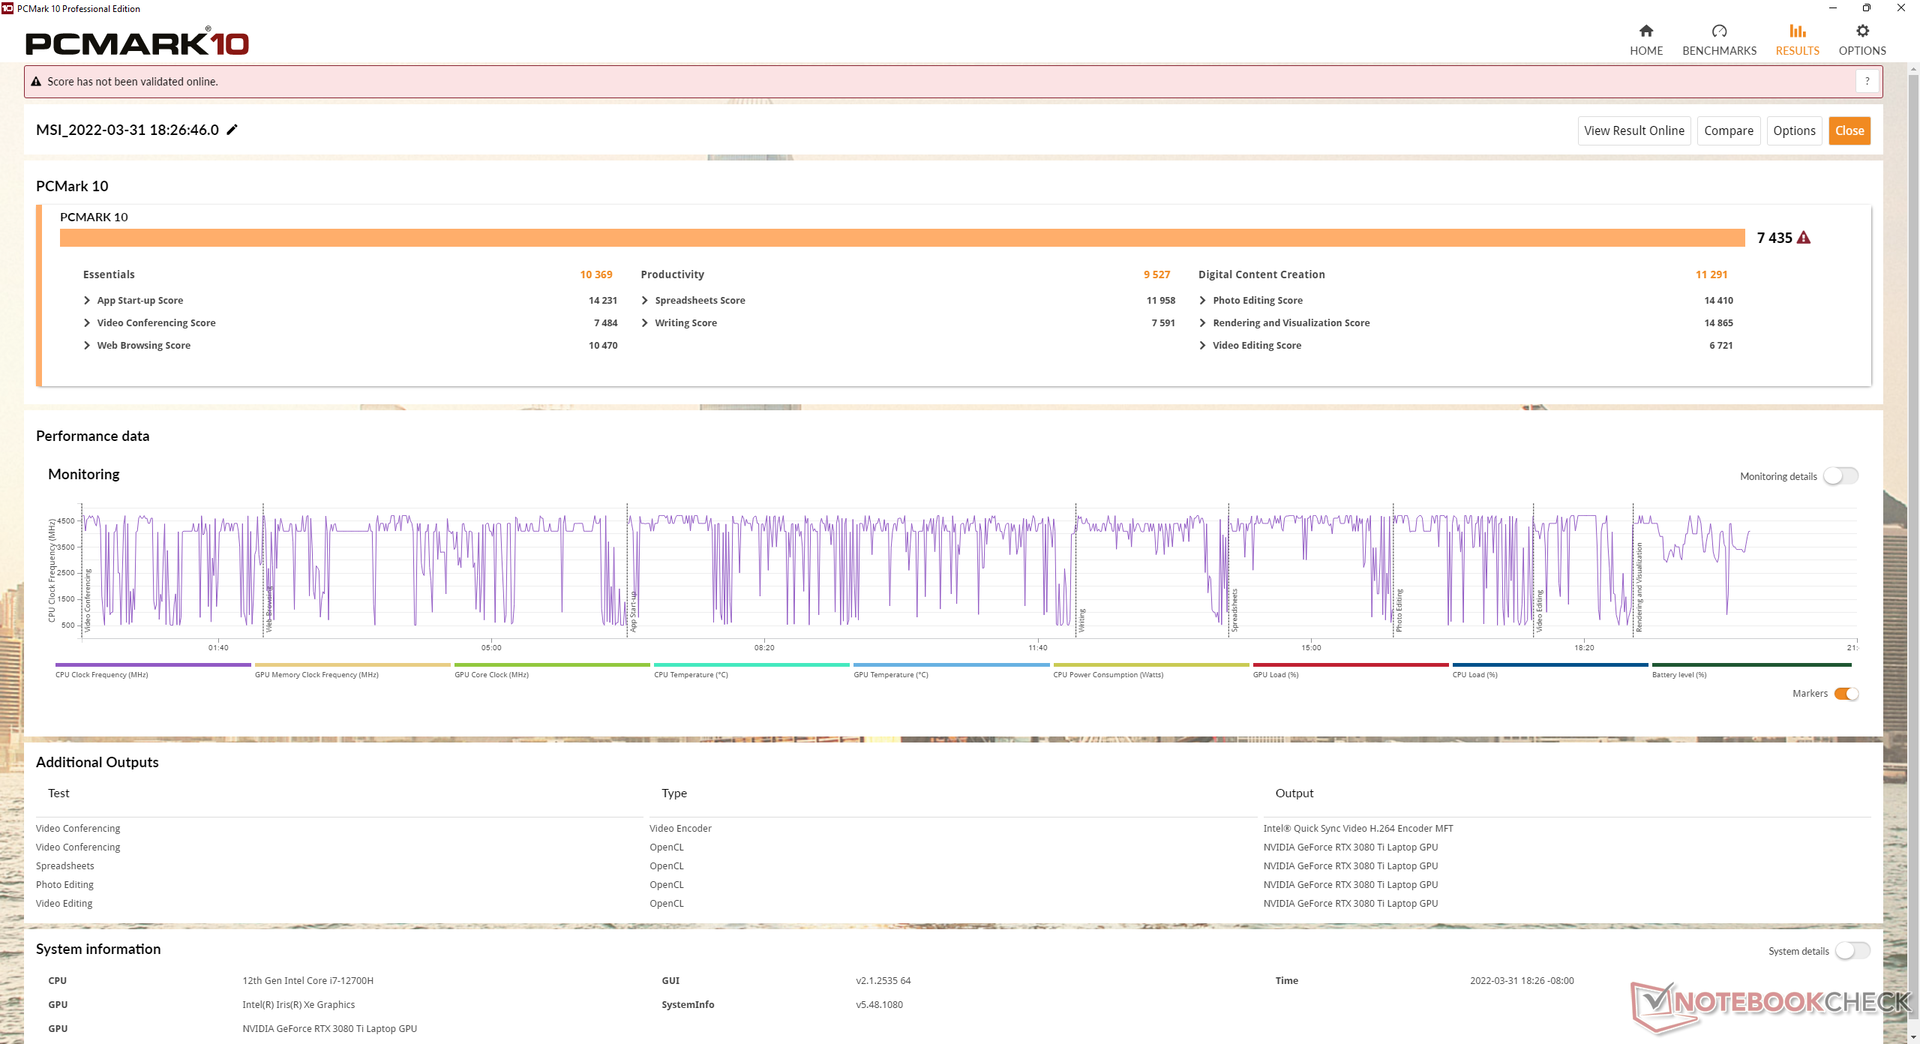
Les résultats PCMark sont systématiquement supérieurs à ceux du GS76 de l'année dernière mais légèrement inférieurs à ceux du dernier Blade 17
Nous avons rencontré quelques problèmes liés au mode veille et à la fréquence de rafraîchissement qui méritent d'être mentionnés sur notre unité de test. Lors de la mise en veille du système, la consommation d'énergie était parfois anormalement élevée, avec des températures de surface très chaudes. Pendant ce temps, certains jeux, dont Witcher 3 far Cry 5 et Strange Brigade devenaient noirs lorsque le taux de rafraîchissement natif de l'écran était réglé sur 240 Hz au lieu de 60 Hz. Aucun de ces problèmes n'est apparu sur notre Blade 17, même si les deux ordinateurs portables utilisent les mêmes panneaux 240 Hz de BOE.
| PCMark 10 / Score | |
| MSI GE76 Raider | |
| Razer Blade 17 RTX 3080 Ti | |
| Alienware x17 RTX 3080 P48E | |
| MSI Stealth GS77 12UHS-083US | |
| Moyenne Intel Core i7-12700H, NVIDIA GeForce RTX 3080 Ti Laptop GPU (6868 - 7638, n=7) | |
| Asus ROG Zephyrus S17 GX703HSD | |
| MSI GS76 Stealth 11UH | |
| PCMark 10 / Essentials | |
| Razer Blade 17 RTX 3080 Ti | |
| MSI GE76 Raider | |
| Asus ROG Zephyrus S17 GX703HSD | |
| Moyenne Intel Core i7-12700H, NVIDIA GeForce RTX 3080 Ti Laptop GPU (9987 - 11318, n=7) | |
| MSI Stealth GS77 12UHS-083US | |
| Alienware x17 RTX 3080 P48E | |
| MSI GS76 Stealth 11UH | |
| PCMark 10 / Productivity | |
| MSI GE76 Raider | |
| Alienware x17 RTX 3080 P48E | |
| MSI Stealth GS77 12UHS-083US | |
| Moyenne Intel Core i7-12700H, NVIDIA GeForce RTX 3080 Ti Laptop GPU (8944 - 10726, n=7) | |
| Razer Blade 17 RTX 3080 Ti | |
| Asus ROG Zephyrus S17 GX703HSD | |
| MSI GS76 Stealth 11UH | |
| PCMark 10 / Digital Content Creation | |
| MSI GE76 Raider | |
| Razer Blade 17 RTX 3080 Ti | |
| Alienware x17 RTX 3080 P48E | |
| MSI Stealth GS77 12UHS-083US | |
| Moyenne Intel Core i7-12700H, NVIDIA GeForce RTX 3080 Ti Laptop GPU (8956 - 12249, n=7) | |
| Asus ROG Zephyrus S17 GX703HSD | |
| MSI GS76 Stealth 11UH | |
| PCMark 10 Score | 7435 points | |
Aide | ||
| AIDA64 / Memory Copy | |
| MSI GE76 Raider | |
| Razer Blade 17 RTX 3080 Ti | |
| MSI Stealth GS77 12UHS-083US | |
| Moyenne Intel Core i7-12700H (25615 - 80511, n=64) | |
| AIDA64 / Memory Read | |
| Razer Blade 17 RTX 3080 Ti | |
| MSI GE76 Raider | |
| MSI Stealth GS77 12UHS-083US | |
| Moyenne Intel Core i7-12700H (25586 - 79442, n=64) | |
| AIDA64 / Memory Write | |
| Razer Blade 17 RTX 3080 Ti | |
| MSI Stealth GS77 12UHS-083US | |
| MSI GE76 Raider | |
| Moyenne Intel Core i7-12700H (23679 - 88660, n=64) | |
| AIDA64 / Memory Latency | |
| MSI Stealth GS77 12UHS-083US | |
| MSI GE76 Raider | |
| Moyenne Intel Core i7-12700H (76.2 - 133.9, n=62) | |
| Asus ROG Zephyrus S17 GX703HSD | |
| Alienware x17 RTX 3080 P48E | |
| Razer Blade 17 RTX 3080 Ti | |
* ... Moindre est la valeur, meilleures sont les performances
Latence DPC
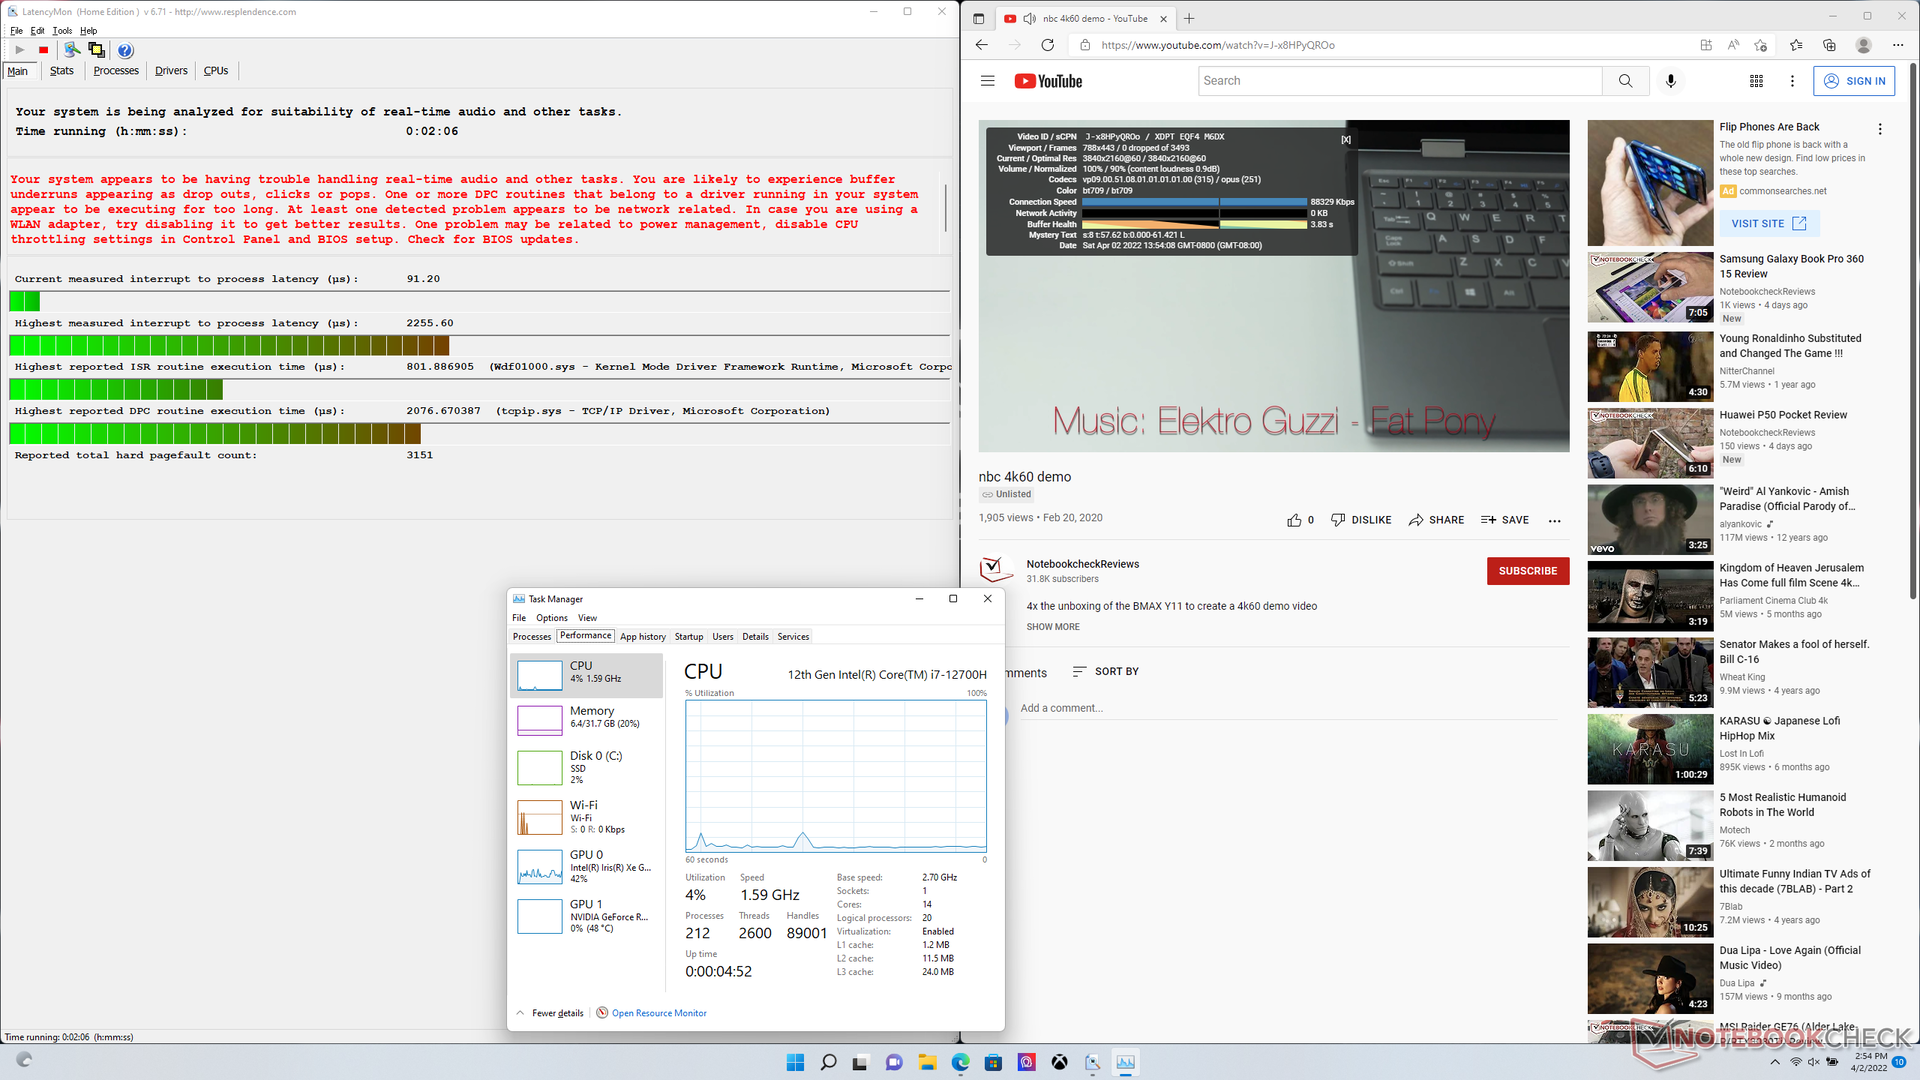
LatencyMon montre des problèmes de CPD lors de l'ouverture de plusieurs onglets de navigateur sur notre page d'accueil. la lecture de vidéos 4K à 60 FPS est par ailleurs totalement fluide et ne présente aucune perte d'images lors de nos tests sur l'iGPU.
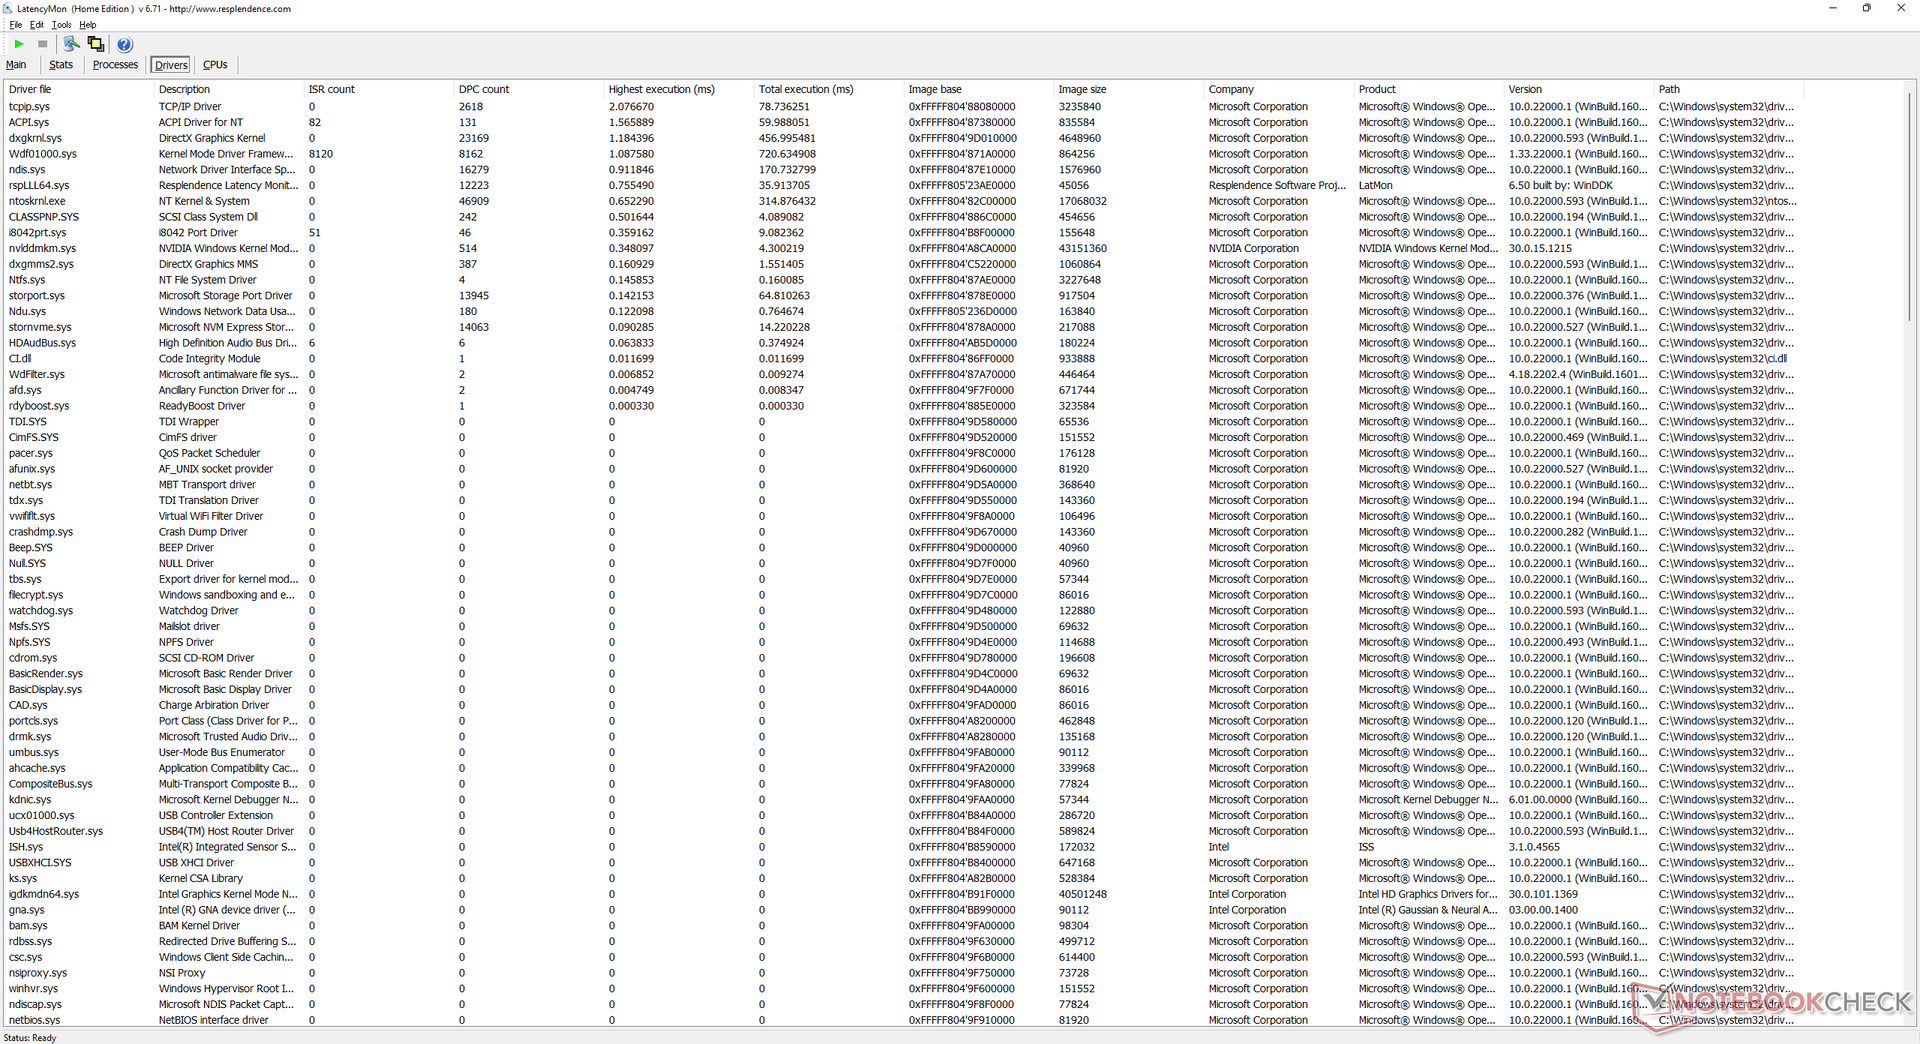
| DPC Latencies / LatencyMon - interrupt to process latency (max), Web, Youtube, Prime95 | |
| Alienware x17 RTX 3080 P48E | |
| MSI Stealth GS77 12UHS-083US | |
| MSI GE76 Raider | |
| Asus ROG Zephyrus S17 GX703HSD | |
| Razer Blade 17 RTX 3080 Ti | |
| MSI GS76 Stealth 11UH | |
* ... Moindre est la valeur, meilleures sont les performances
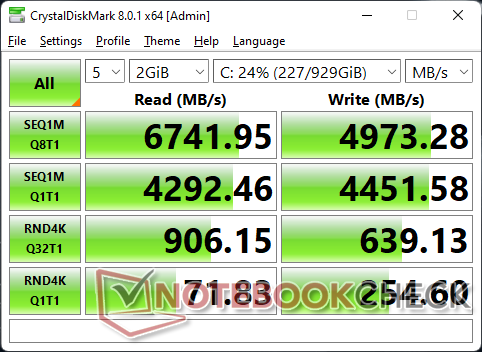
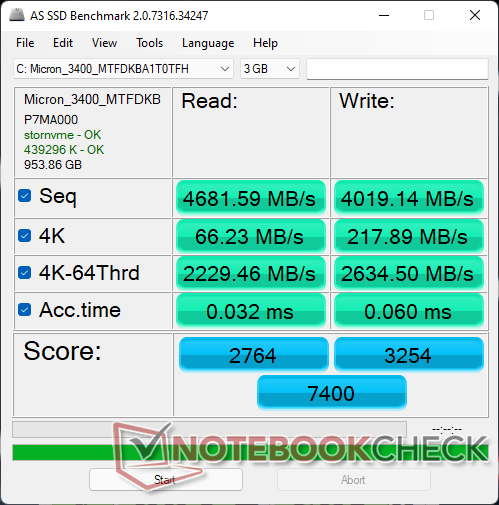
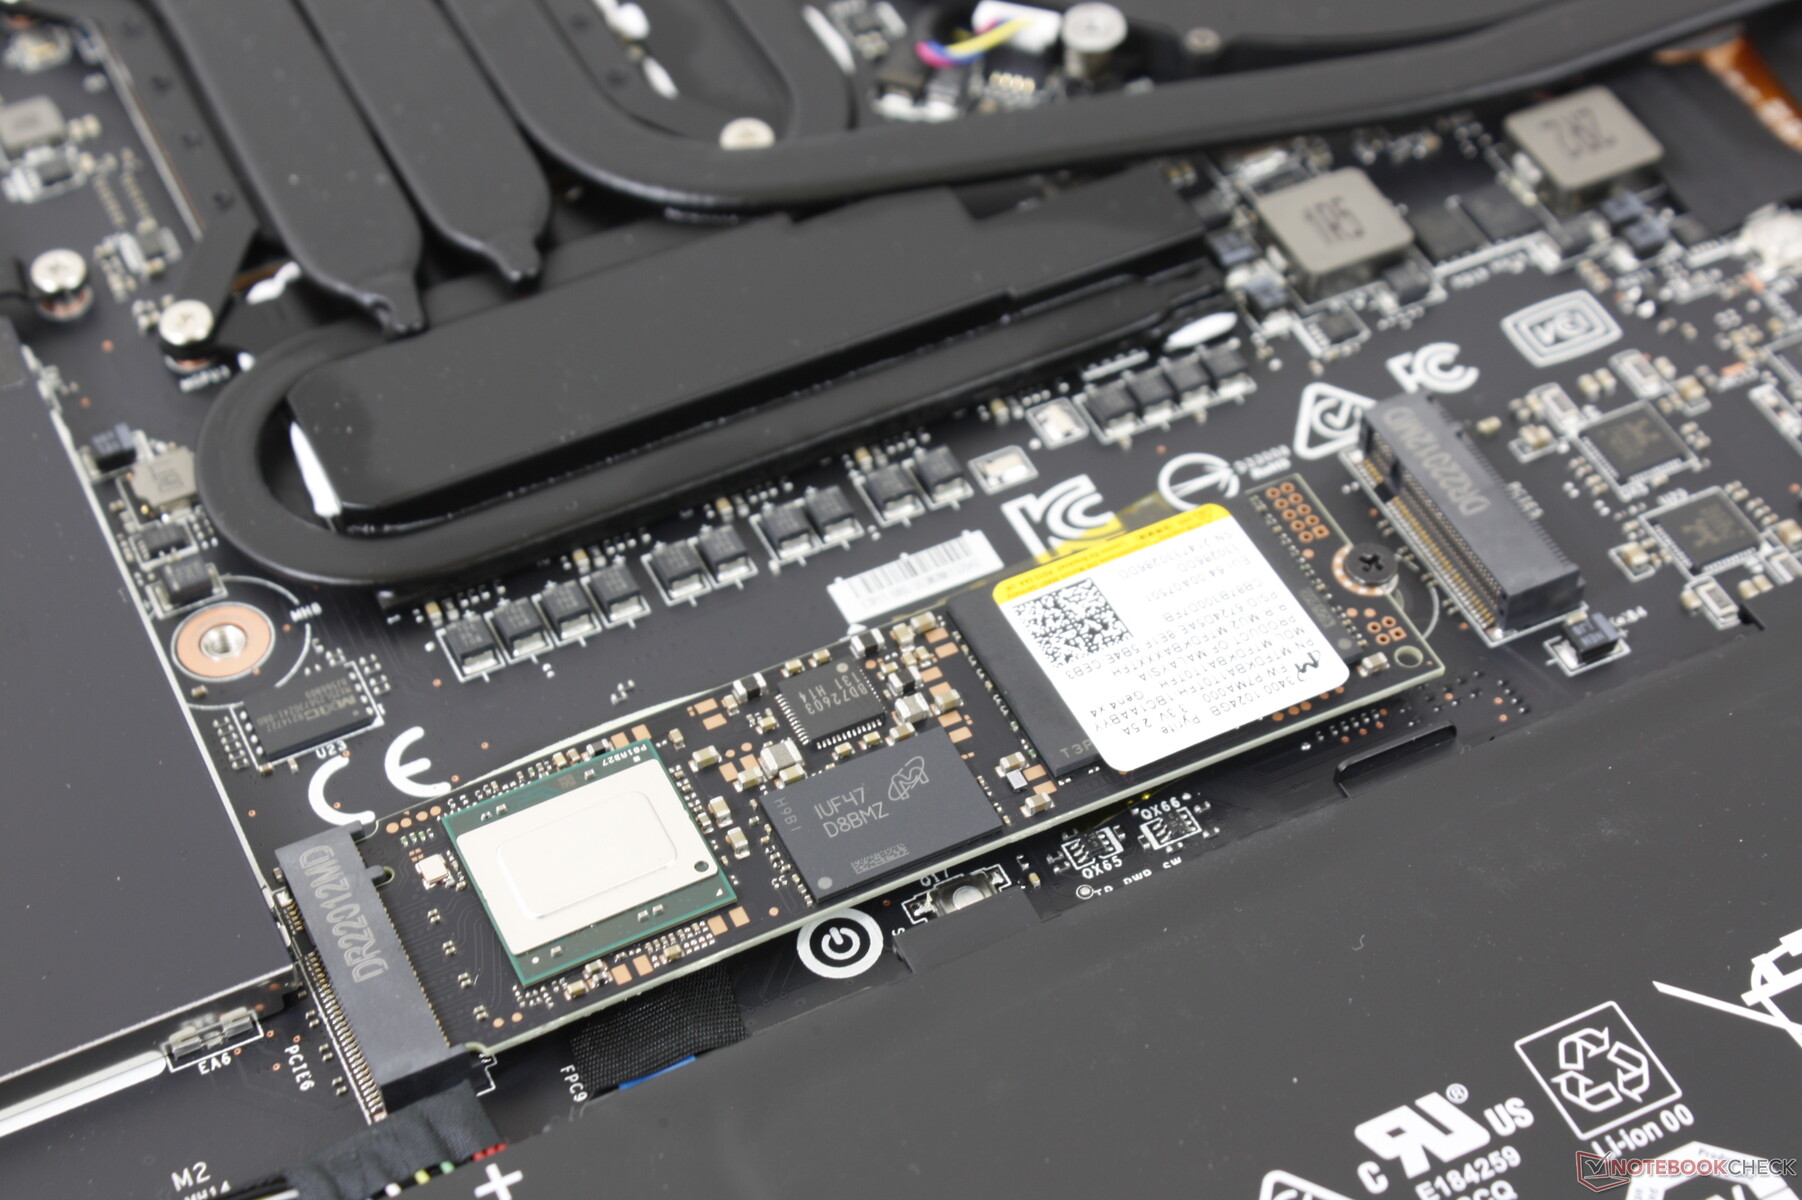
Périphériques de stockage - Jusqu'à 2 SSD PCIe4 x4 NVMe
Notre unité de test était livrée avec un SSD NVMe Micron 3400 PCIe4 x4. Bien qu'il s'agisse d'un disque haut de gamme, les performances semblent être systématiquement plus lentes que celles du Samsung PM9A1 qui équipe en standard la plupart des ordinateurs portables de jeu phares. La durabilité des performances est néanmoins excellente lorsqu'elle est soumise à notre test en boucle DiskSpd.

| Drive Performance rating - Percent | |
| Asus ROG Zephyrus S17 GX703HSD | |
| MSI GE76 Raider | |
| Razer Blade 17 RTX 3080 Ti | |
| MSI GS76 Stealth 11UH | |
| MSI Stealth GS77 12UHS-083US | |
| Alienware x17 RTX 3080 P48E | |
* ... Moindre est la valeur, meilleures sont les performances
Disk Throttling: DiskSpd Read Loop, Queue Depth 8
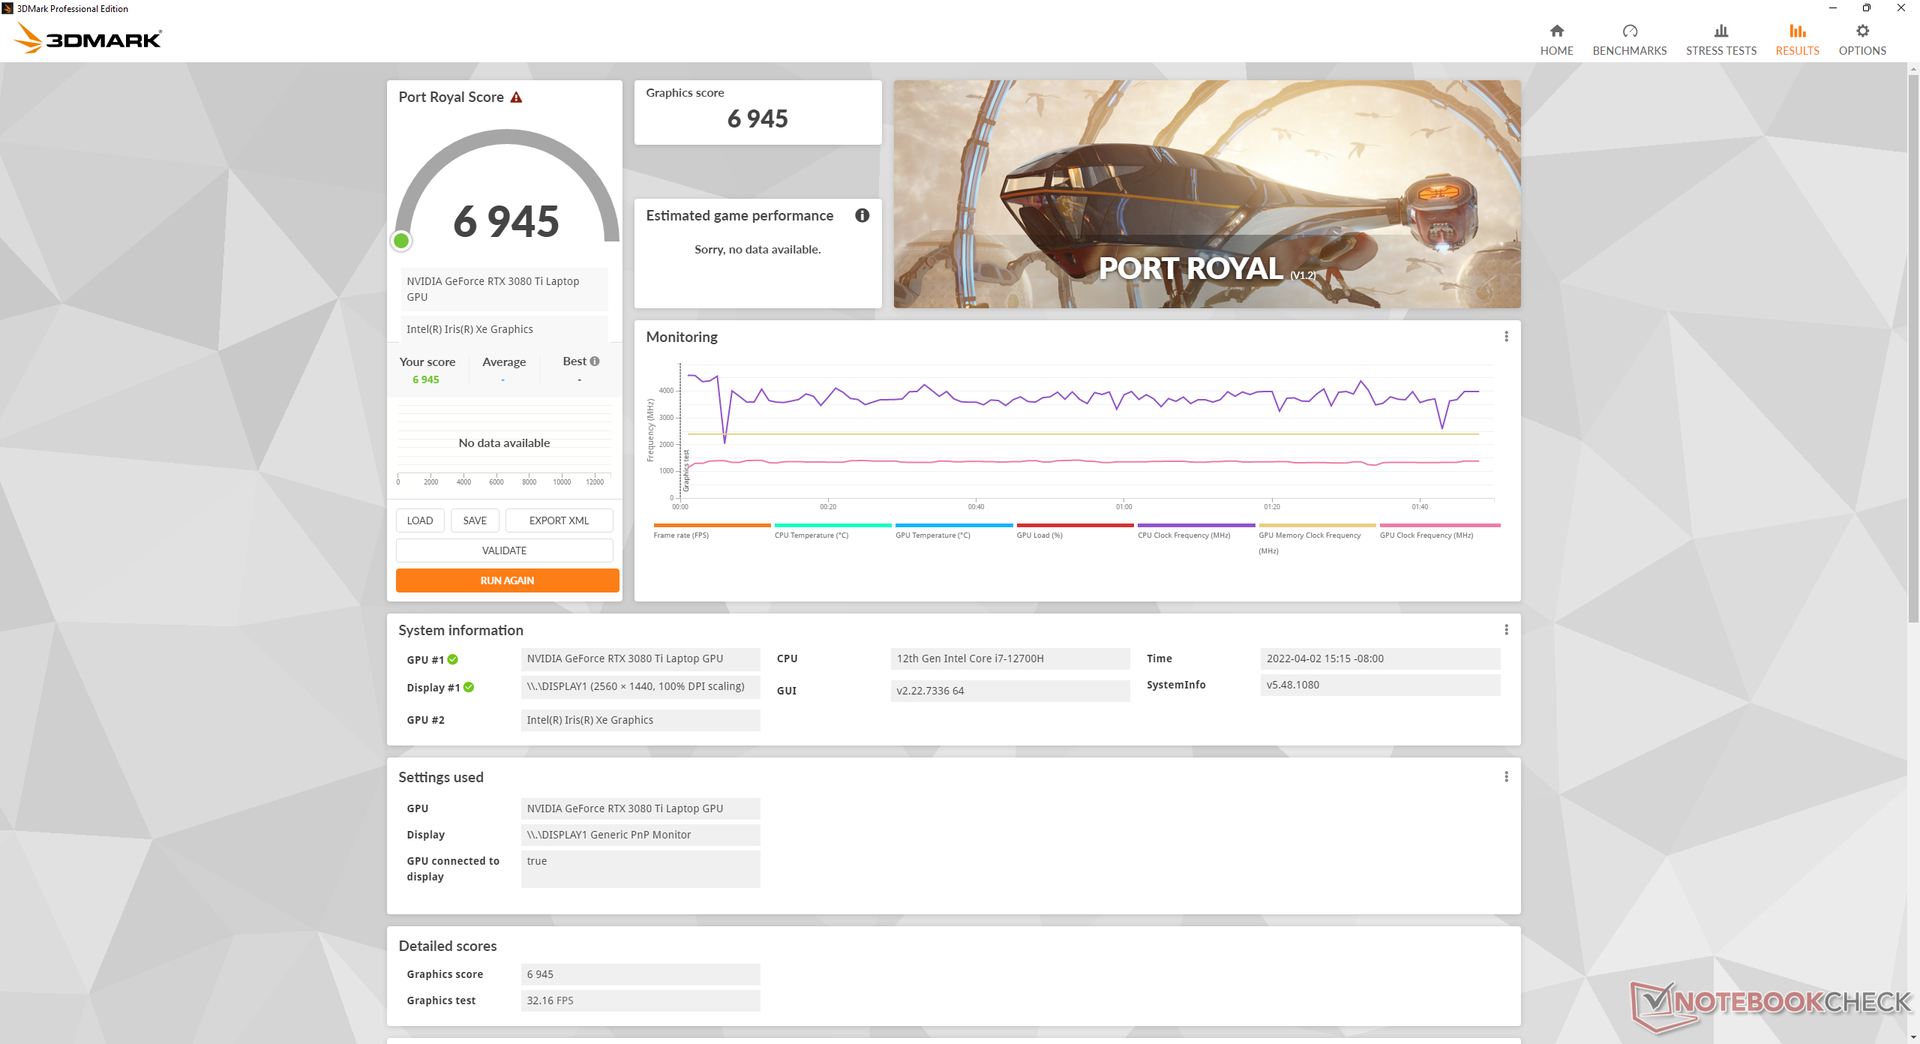
Performances du GPU - Légèrement plus rapide que la RTX 3080
Le site GeForce RTX 3080 Ti dans le GS77 offre un gain de performance de 12 à 15 % par rapport à la RTX 3080 du GS76 de l'année dernière. En comparaison avec la RTX 3080 Ti de 165 W du Blade 17, cependant, notre RTX 3080 Ti de 105 W est environ 13 à 18% plus lente. Cette différence de performance est plus visible dans les jeux à haute résolution, où notre GS77 est toujours derrière l'alternative de Razer. Autrement, la différence de performance entre une RTX 3080 Ti de 105 W et une RTX 3080 Ti de 165 W sera beaucoup plus mineure à 1080p ou à des résolutions inférieures où les titres sont susceptibles d'être liés au CPU.
L'utilisation du GS77 sur le profil d'alimentation Balanced au lieu de Extreme Performance réduira les performances du GPU d'environ 12 %.
Le site ordinateur de bureau GeForce RTX 3080 Ti est toujours significativement plus rapide que notre version mobile d'environ 65 à 80 %.
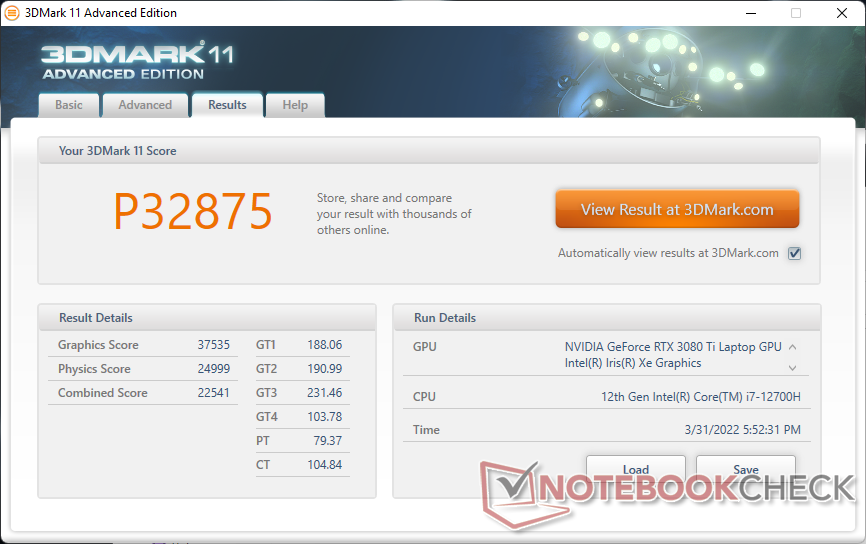
| 3DMark 11 Performance | 32875 points | |
| 3DMark Cloud Gate Standard Score | 55980 points | |
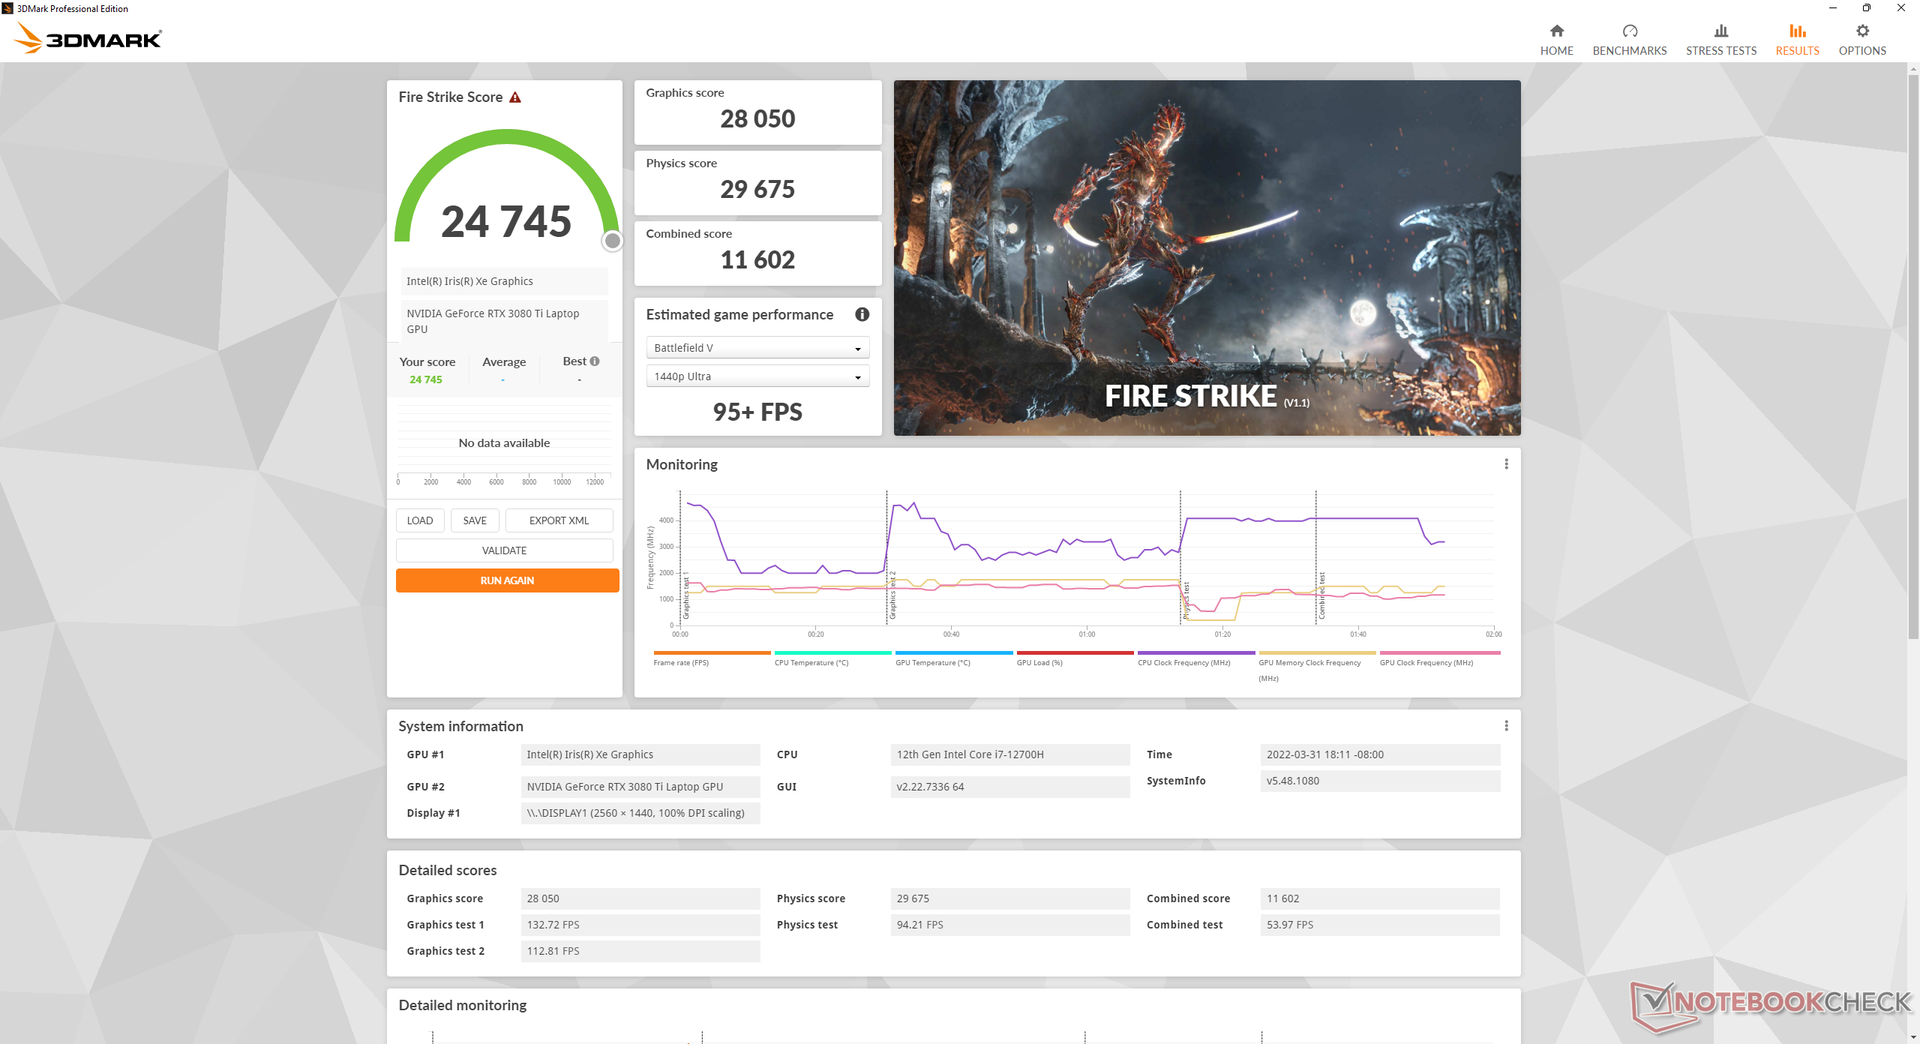
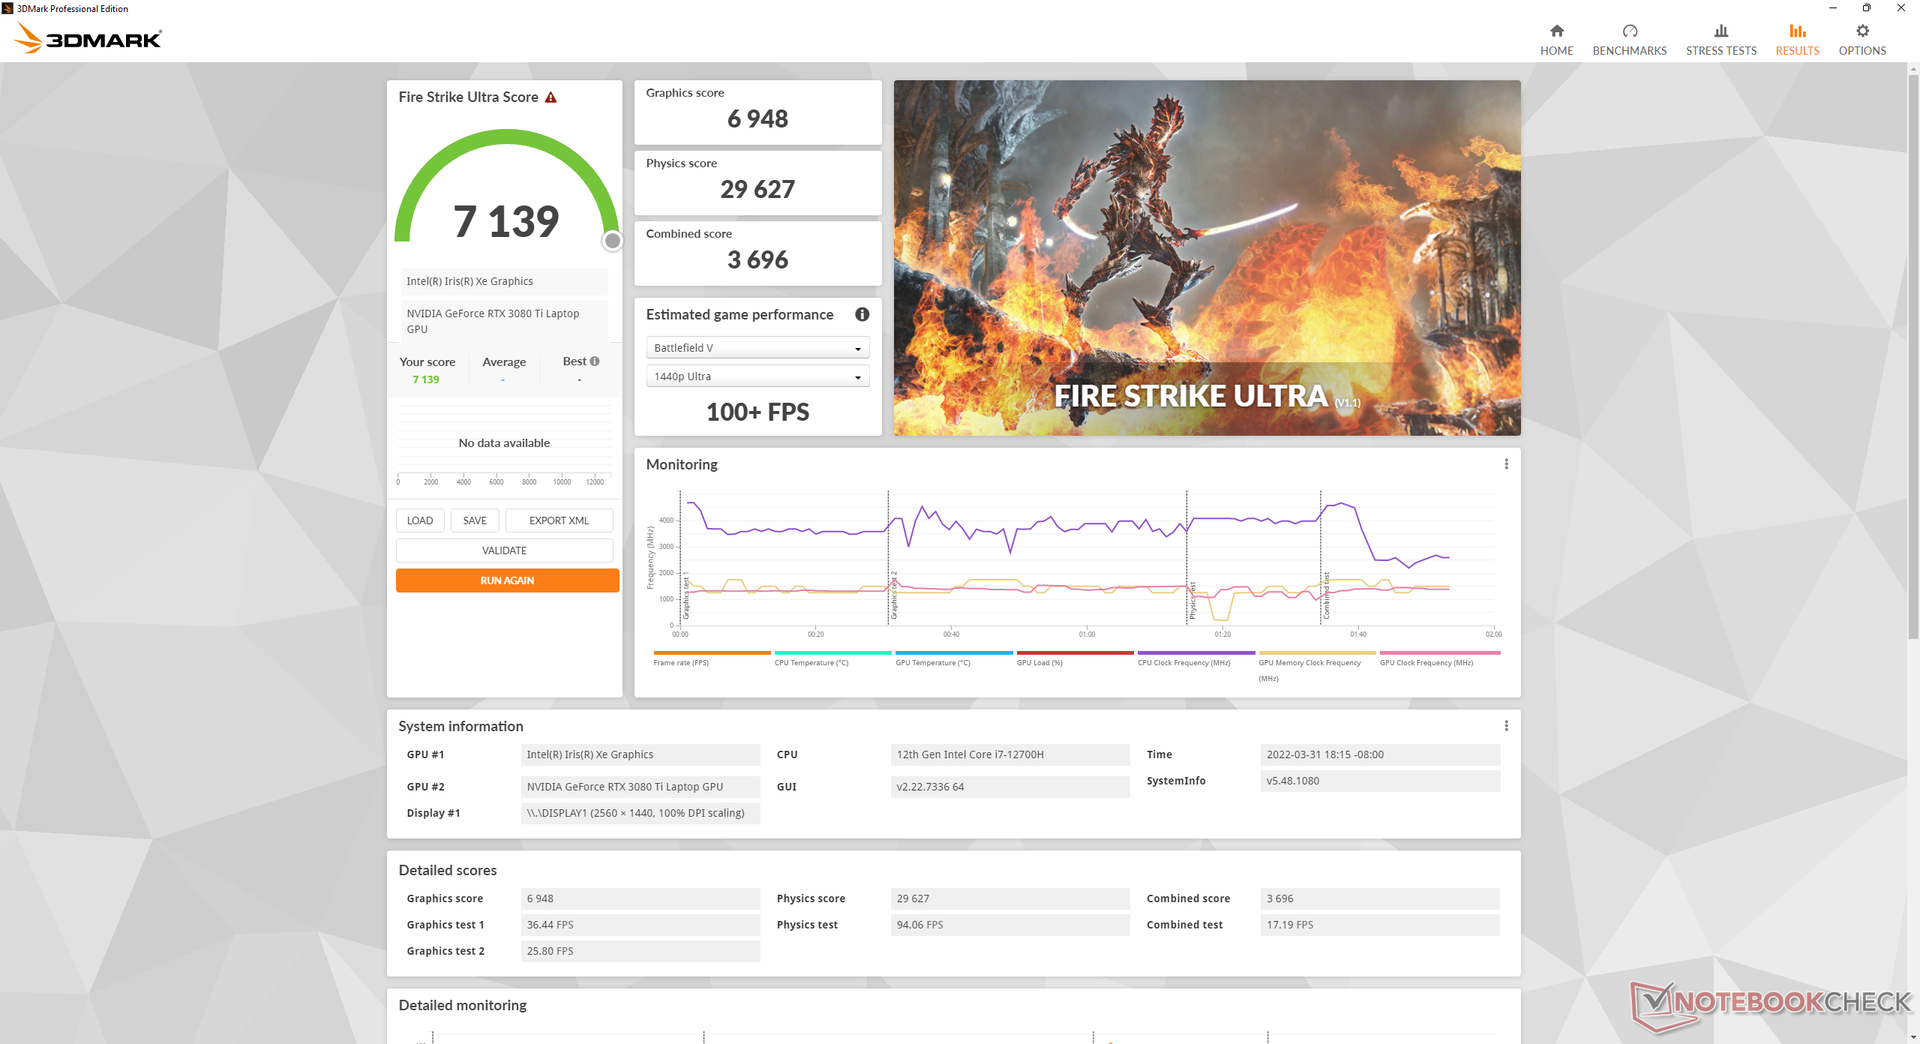
| 3DMark Fire Strike Score | 24745 points | |
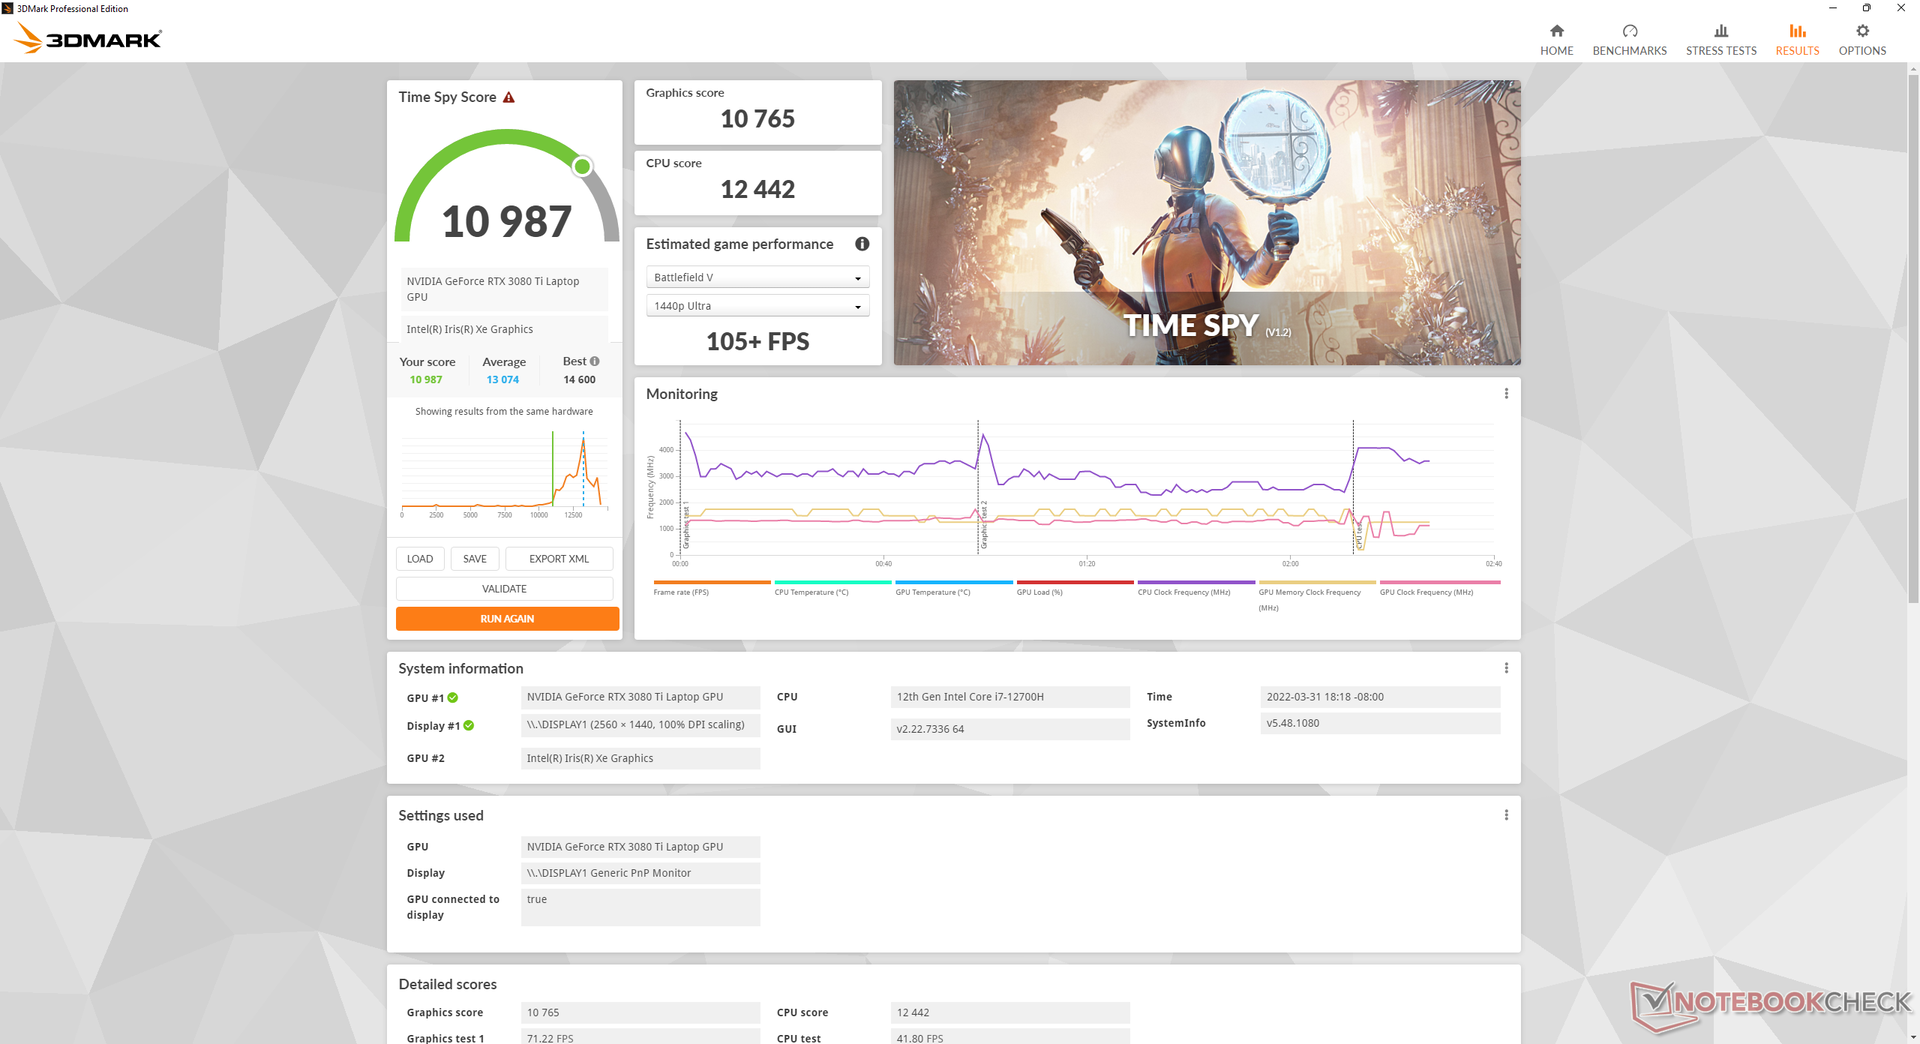
| 3DMark Time Spy Score | 10987 points | |
Aide | ||
Witcher 3 FPS Chart
| Bas | Moyen | Élevé | Ultra | QHD | |
|---|---|---|---|---|---|
| GTA V (2015) | 186 | 185 | 175 | 113 | 94.2 |
| The Witcher 3 (2015) | 447.2 | 298.8 | 206.8 | 109.1 | |
| Dota 2 Reborn (2015) | 182 | 169 | 161 | 154 | |
| Final Fantasy XV Benchmark (2018) | 196 | 130 | 101 | 79.5 | |
| X-Plane 11.11 (2018) | 146 | 126 | 103 | ||
| Far Cry 5 (2018) | 190 | 145 | 136 | 129 | 101 |
| Strange Brigade (2018) | 447 | 239 | 196 | 177 | 126 |
| Cyberpunk 2077 1.6 (2022) | 133.2 | 113.6 | 92.9 | 92.8 | 49.7 |
Émissions
System Noise - Fini les triples ventilateurs
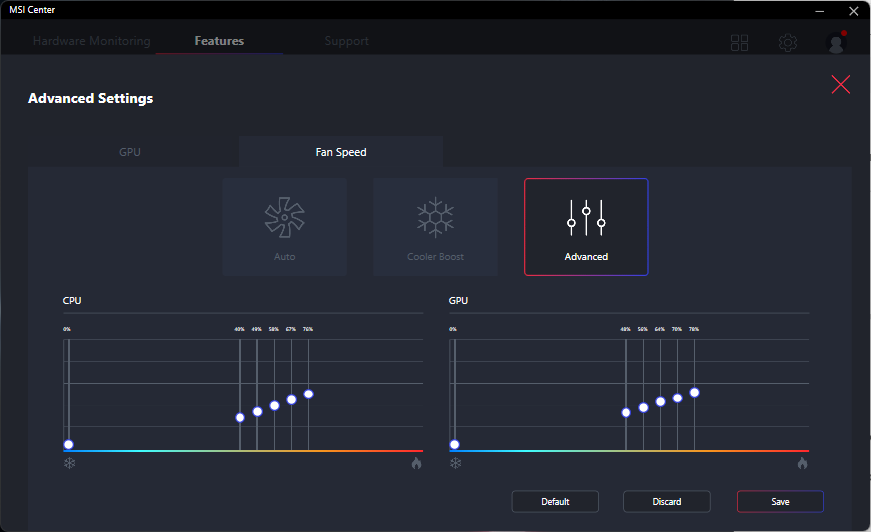
Les ventilateurs internes font un bon travail en restant silencieux lorsqu'ils sont réglés sur les modes Economiseur de batterie ou Silencieux. Le bruit du ventilateur peut occasionnellement atteindre 31 dB(A) sur un fond silencieux de 24,5 dB(A) lors de la navigation ou de la diffusion de vidéos en continu, pour être audible mais pas gênant
Le bruit du ventilateur en mode Witcher 3 en mode Performances extrêmes est nettement plus silencieux que sur le Blade 17 (46 dB(A) contre 51 dB(A)). Cependant, si le mode Cooler Boost est activé, le GS77 devient le portable le plus bruyant avec 57 dB(A). Heureusement, le mode Cooler Boost n'est pas nécessaire pour exploiter pleinement les performances de l'ordinateur
L'exécution du même jeuen mode Équilibré au lieu du mode Performances extrêmes se traduit par un bruit de ventilateur légèrement plus faible de 44,1 dB(A), mais avec une baisse des performances graphiques de 12 %, comme indiqué précédemment. Les utilisateurs préoccupés par le bruit du ventilateur peuvent envisager de jouer sur ces profils de puissance inférieure.
Degré de la nuisance sonore
| Au repos |
| 24.5 / 24.5 / 30.8 dB(A) |
| Fortement sollicité |
| 34.6 / 56.8 dB(A) |
 | ||
30 dB silencieux 40 dB(A) audible 50 dB(A) bruyant |
||
min: | ||
| MSI Stealth GS77 12UHS-083US GeForce RTX 3080 Ti Laptop GPU, i7-12700H, Micron 3400 1TB MTFDKBA1T0TFH | MSI GS76 Stealth 11UH GeForce RTX 3080 Laptop GPU, i9-11900H, Samsung PM9A1 MZVL22T0HBLB | Razer Blade 17 RTX 3080 Ti GeForce RTX 3080 Ti Laptop GPU, i7-12800H, Samsung PM9A1 MZVL21T0HCLR | MSI GE76 Raider GeForce RTX 3080 Ti Laptop GPU, i9-12900HK, Samsung PM9A1 MZVL22T0HBLB | Alienware x17 RTX 3080 P48E GeForce RTX 3080 Laptop GPU, i7-11800H, 2x WDC PC SN730 SDBPNTY-1T00 (RAID 0) | Asus ROG Zephyrus S17 GX703HSD GeForce RTX 3080 Laptop GPU, i9-11900H, Samsung PM9A1 MZVL22T0HBLB | |
|---|---|---|---|---|---|---|
| Noise | -8% | 3% | -15% | 1% | 5% | |
| arrêt / environnement * (dB) | 24.5 | 24 2% | 23.3 5% | 26 -6% | 24.9 -2% | 23 6% |
| Idle Minimum * (dB) | 24.5 | 24 2% | 23.3 5% | 26 -6% | 24.9 -2% | 23 6% |
| Idle Average * (dB) | 24.5 | 25 -2% | 23.3 5% | 27 -10% | 24.9 -2% | 23 6% |
| Idle Maximum * (dB) | 30.8 | 42 -36% | 26.3 15% | 40 -30% | 29.6 4% | 23 25% |
| Load Average * (dB) | 34.6 | 46 -33% | 38.2 -10% | 50 -45% | 31.1 10% | 41 -18% |
| Witcher 3 ultra * (dB) | 46.2 | 48 -4% | 50.9 -10% | 53 -15% | 49.7 -8% | 45 3% |
| Load Maximum * (dB) | 56.8 | 48 15% | 49.1 14% | 53 7% | 54.8 4% | 52 8% |
* ... Moindre est la valeur, meilleures sont les performances
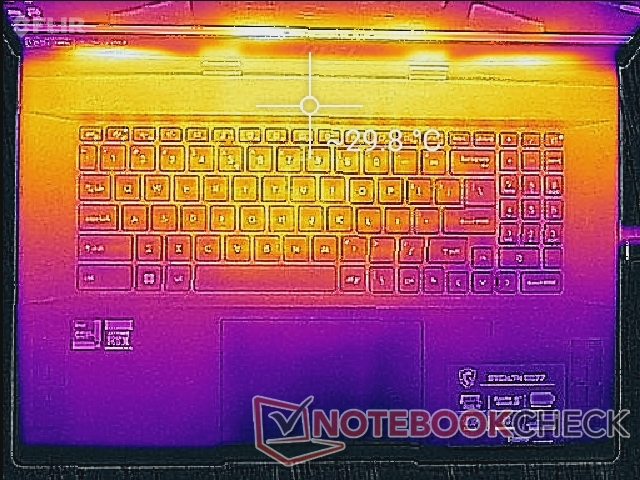
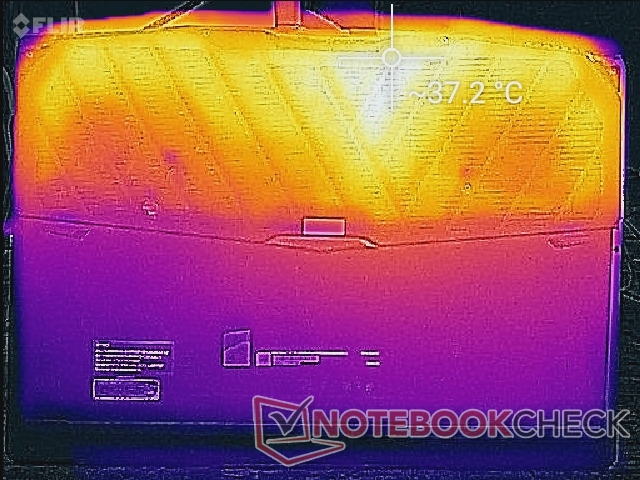
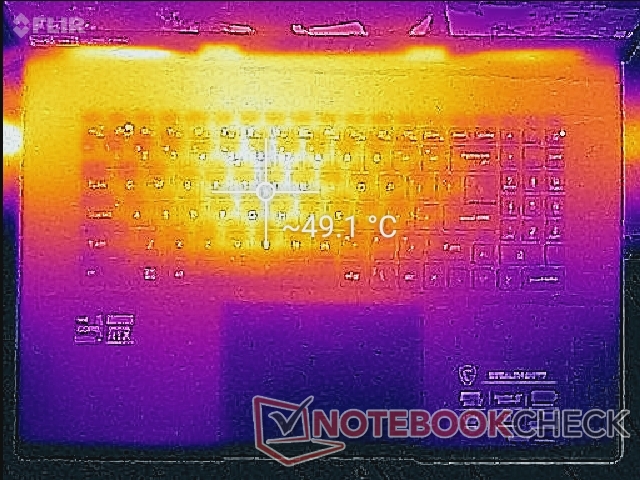
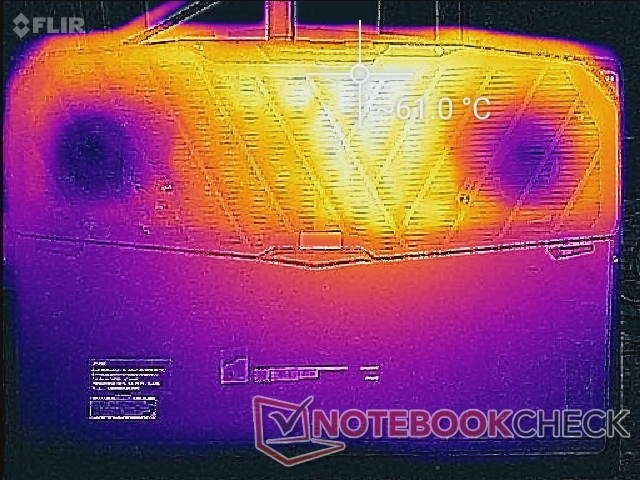
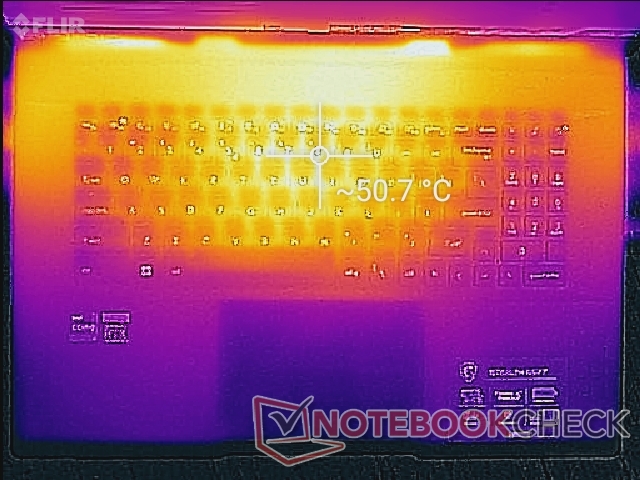
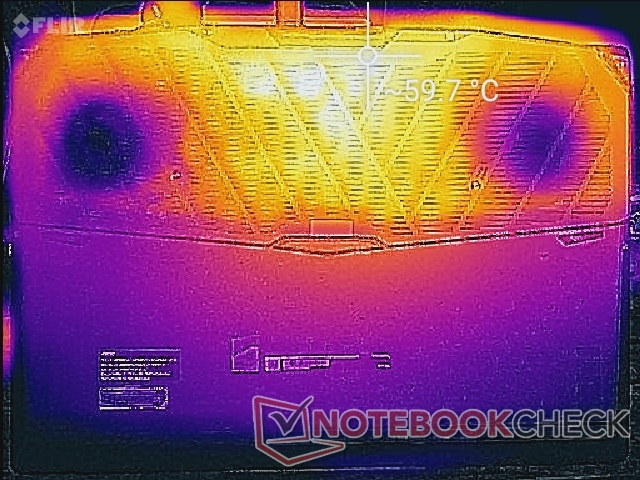
Température
Les points chauds de la surface lorsque l'on joue sont à peu près les mêmes que ceux que nous avons enregistrés sur le GS76, soit environ 49 C près du centre du clavier et 61 C sur la partie inférieure. La répartition de la température est meilleure sur le nouveau modèle, cependant, car les repose-poignets sont maintenant beaucoup plus frais à moins de 30 C, contre 35 C ou plus sur le GS76
Les touches WASD du Blade 17 sont plus froides que celles du GS77, car le modèle de Razer aspire l'air frais de ses touches WASD. Cela peut être vu en comparant les cartes de température entre le GS77 et le Blade 17.
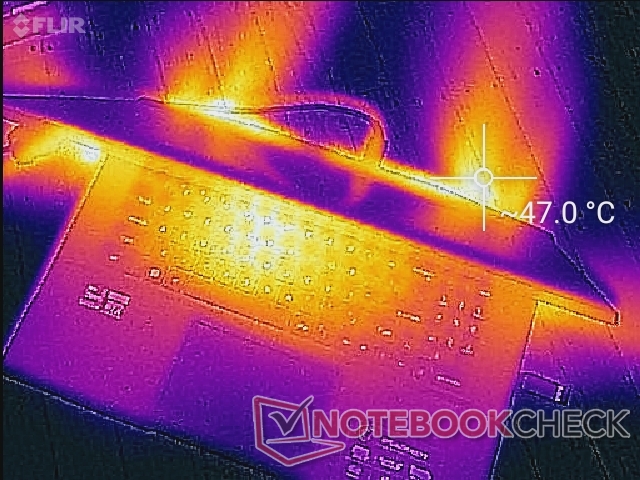

(-) La température maximale du côté supérieur est de 50.6 °C / 123 F, par rapport à la moyenne de 40.4 °C / 105 F, allant de 21.2 à 68.8 °C pour la classe Gaming.
(-) Le fond chauffe jusqu'à un maximum de 59.6 °C / 139 F, contre une moyenne de 43.2 °C / 110 F
(+) En utilisation inactive, la température moyenne du côté supérieur est de 26.9 °C / 80 F, par rapport à la moyenne du dispositif de 33.9 °C / 93 F.
(±) En jouant à The Witcher 3, la température moyenne du côté supérieur est de 36.2 °C / 97 F, alors que la moyenne de l'appareil est de 33.9 °C / 93 F.
(+) Les repose-poignets et le pavé tactile sont plus froids que la température de la peau avec un maximum de 30 °C / 86 F et sont donc froids au toucher.
(±) La température moyenne de la zone de l'appui-paume de dispositifs similaires était de 28.8 °C / 83.8 F (-1.2 °C / #-2.2 F).
| MSI Stealth GS77 12UHS-083US Intel Core i7-12700H, NVIDIA GeForce RTX 3080 Ti Laptop GPU | MSI GS76 Stealth 11UH Intel Core i9-11900H, NVIDIA GeForce RTX 3080 Laptop GPU | Razer Blade 17 RTX 3080 Ti Intel Core i7-12800H, NVIDIA GeForce RTX 3080 Ti Laptop GPU | MSI GE76 Raider Intel Core i9-12900HK, NVIDIA GeForce RTX 3080 Ti Laptop GPU | Alienware x17 RTX 3080 P48E Intel Core i7-11800H, NVIDIA GeForce RTX 3080 Laptop GPU | Asus ROG Zephyrus S17 GX703HSD Intel Core i9-11900H, NVIDIA GeForce RTX 3080 Laptop GPU | |
|---|---|---|---|---|---|---|
| Heat | 9% | 2% | 7% | -1% | -4% | |
| Maximum Upper Side * (°C) | 50.6 | 49 3% | 46 9% | 43 15% | 58.4 -15% | 59 -17% |
| Maximum Bottom * (°C) | 59.6 | 57 4% | 46.8 21% | 47 21% | 49 18% | 53 11% |
| Idle Upper Side * (°C) | 30 | 28 7% | 36.2 -21% | 33 -10% | 33.6 -12% | 35 -17% |
| Idle Bottom * (°C) | 37.4 | 30 20% | 38.6 -3% | 37 1% | 34.6 7% | 35 6% |
* ... Moindre est la valeur, meilleures sont les performances
Test de stress
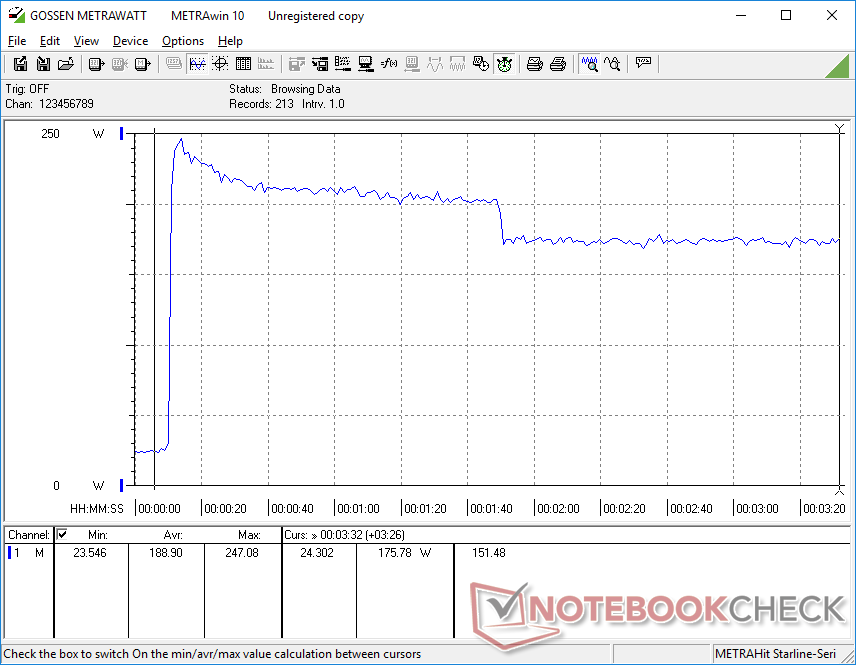
Lors de l'exécution de Prime95 pour stresser le processeur, les fréquences d'horloge et la température du cœur augmentaient jusqu'à 4 GHz et 95 C pendant les deux premières secondes avant de se stabiliser dans la plage de 2,7 à 3 GHz afin d'empêcher le processeur de chauffer davantage. En comparaison, le Core i7-12800H du Blade 17 fonctionne plus lentement et plus froidement à 2.4 à 2.6 GHz et 71 C, respectivement, lorsqu'il est soumis aux mêmes conditions Prime95. MSI pousse donc son CPU beaucoup plus chaud afin de maximiser les performances du processeur. La puissance de l'ensemble du CPU sur le GS77 atteindrait 122,7 W au début du test avant de se stabiliser autour de 71 W, ce qui est à nouveau supérieur aux 61 W que nous avons enregistrés sur le Razer.
L'horloge du GPU, l'horloge de la mémoire et la température se stabilisent respectivement à 1 432 MHz, 1 750 MHz et 75 °C lorsque la batterie est utilisée Witcher 3. En effectuant ce même test sur le Blade 17, l'horloge du GPU, l'horloge de la mémoire et la température sont respectivement de 1597 MHz, 2000 MHz et 77°C. Les performances plus rapides du GPU du Razer peuvent être principalement attribuées à sa cible TGP beaucoup plus élevée par rapport à notre MSI (165 W contre 105 W). En effet, GPU-Z a enregistré une consommation constante de 104,5 W lors de l'exécution du jeu.
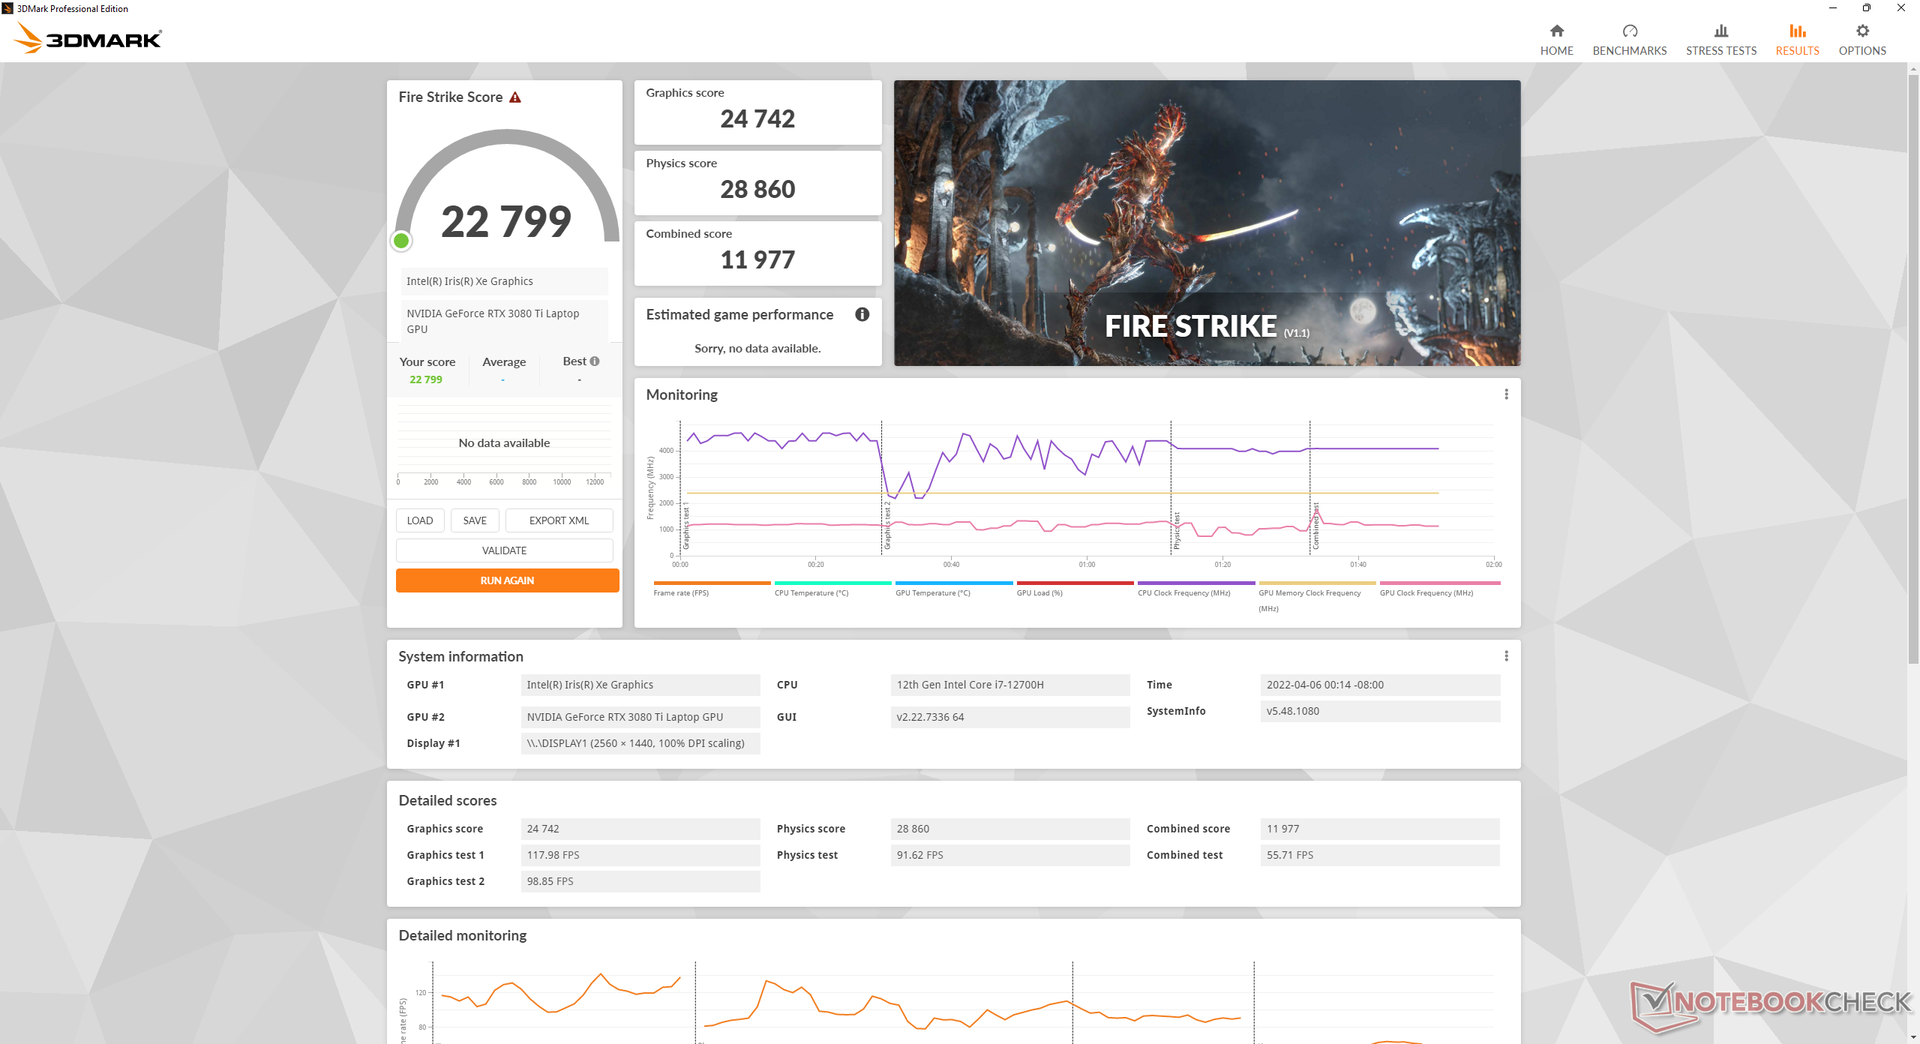
Le fonctionnement sur batterie limite les performances. Un test Fire Strike sur batteries donnerait des scores de physique et de graphisme de 29675 et 28050 points, respectivement, contre 14170 et 6220 points sur secteur.
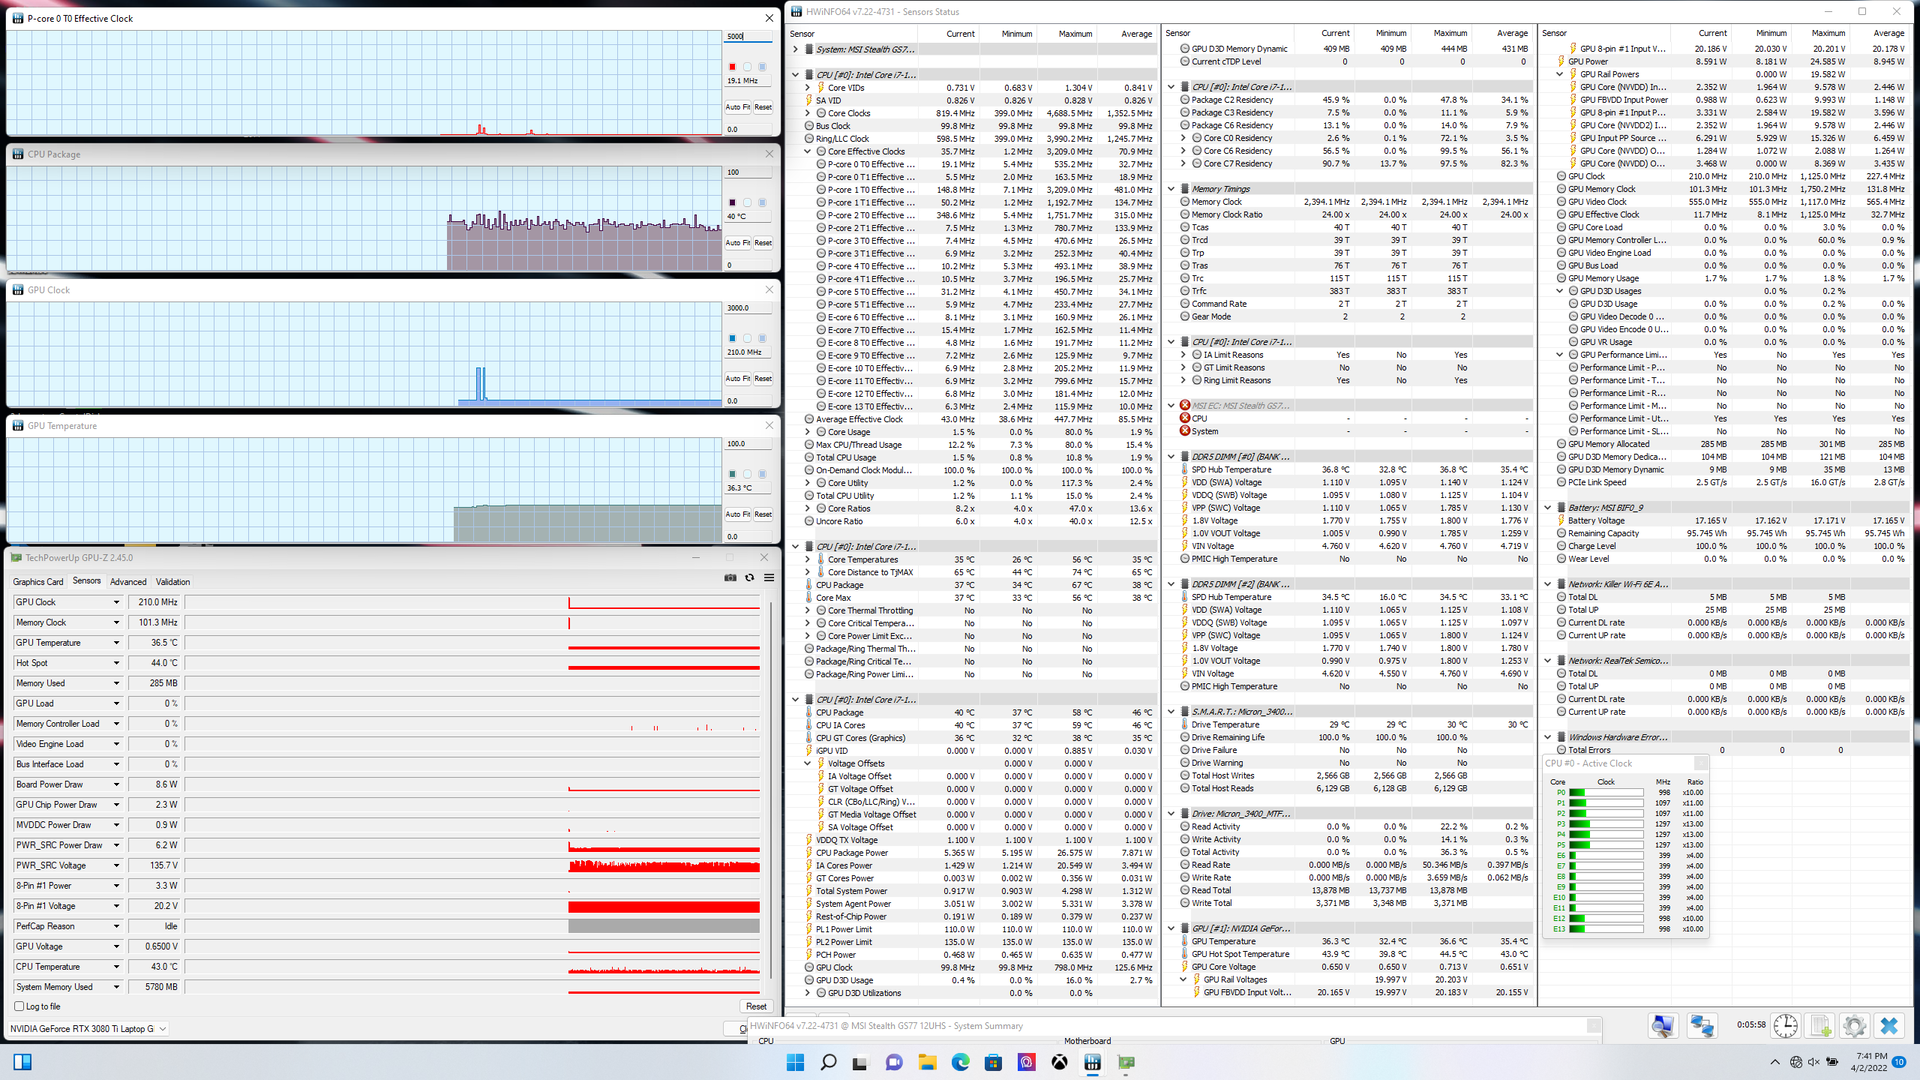
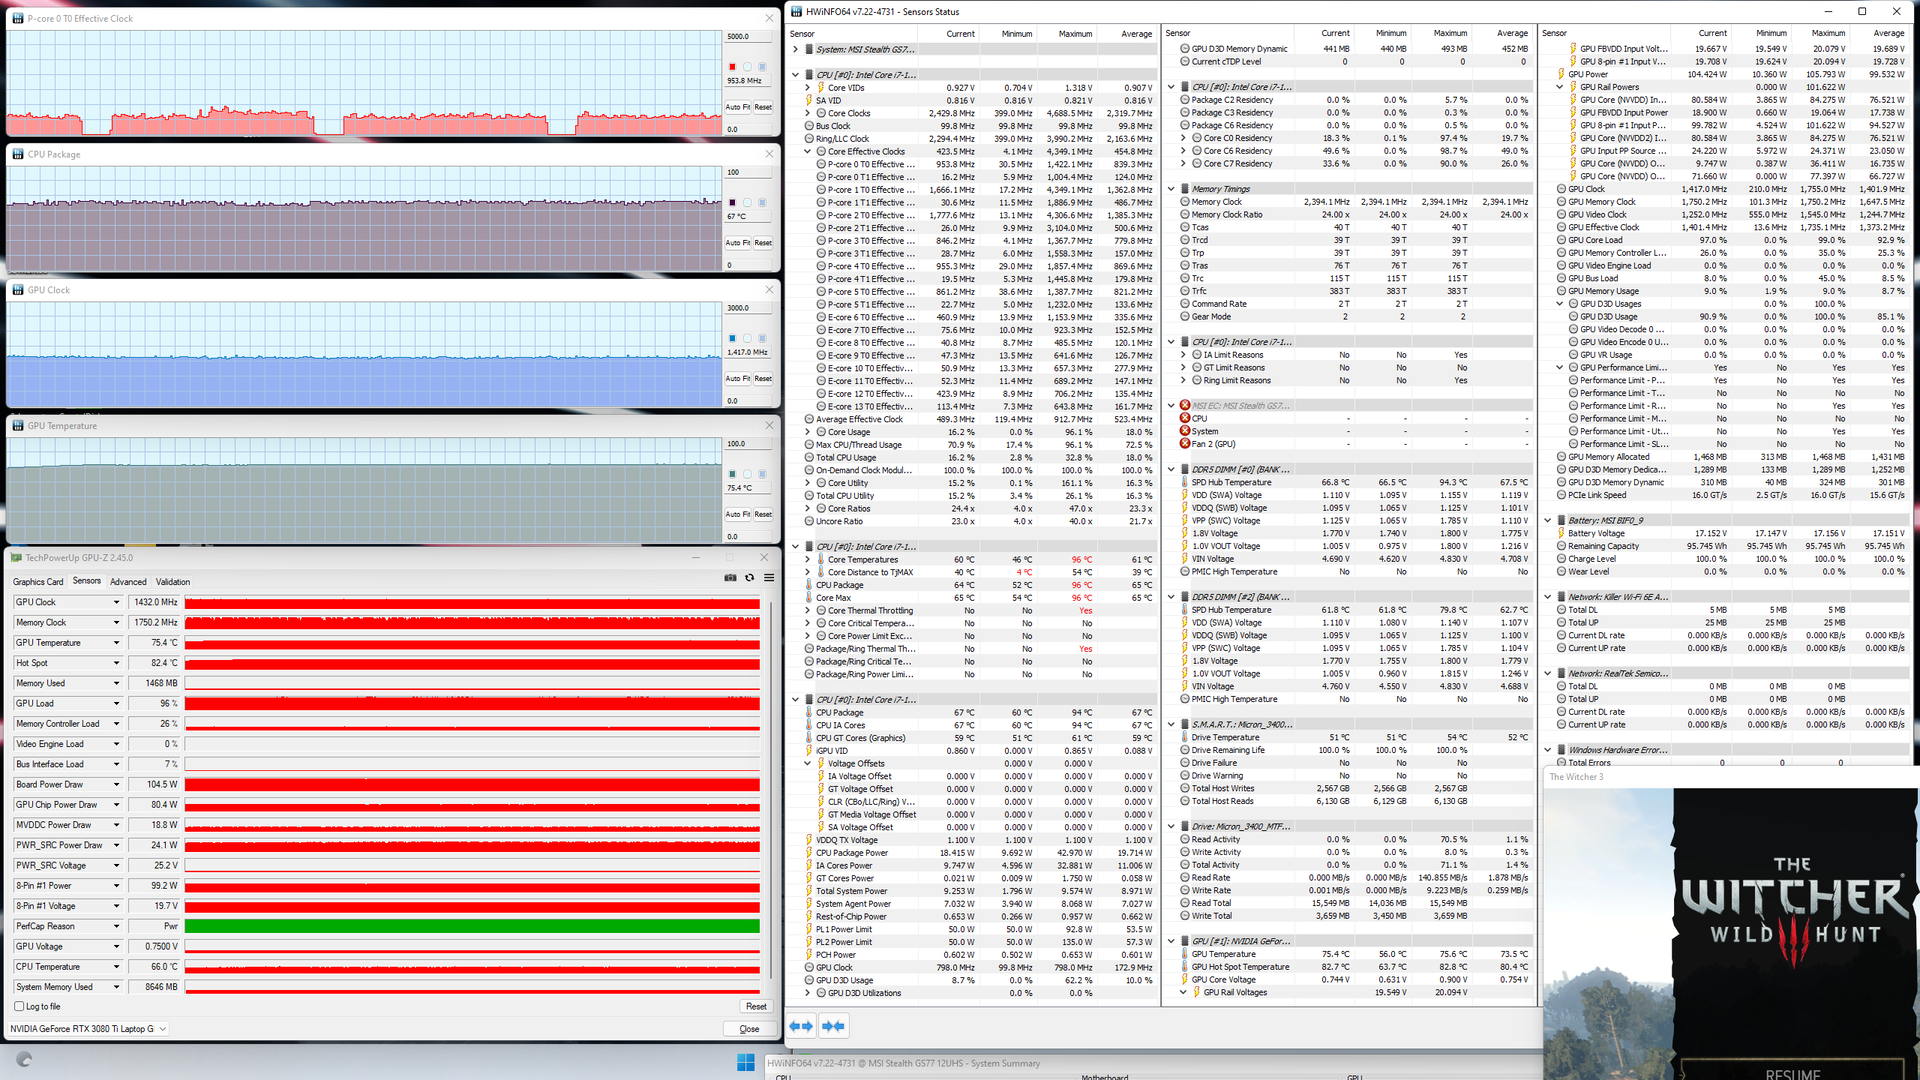
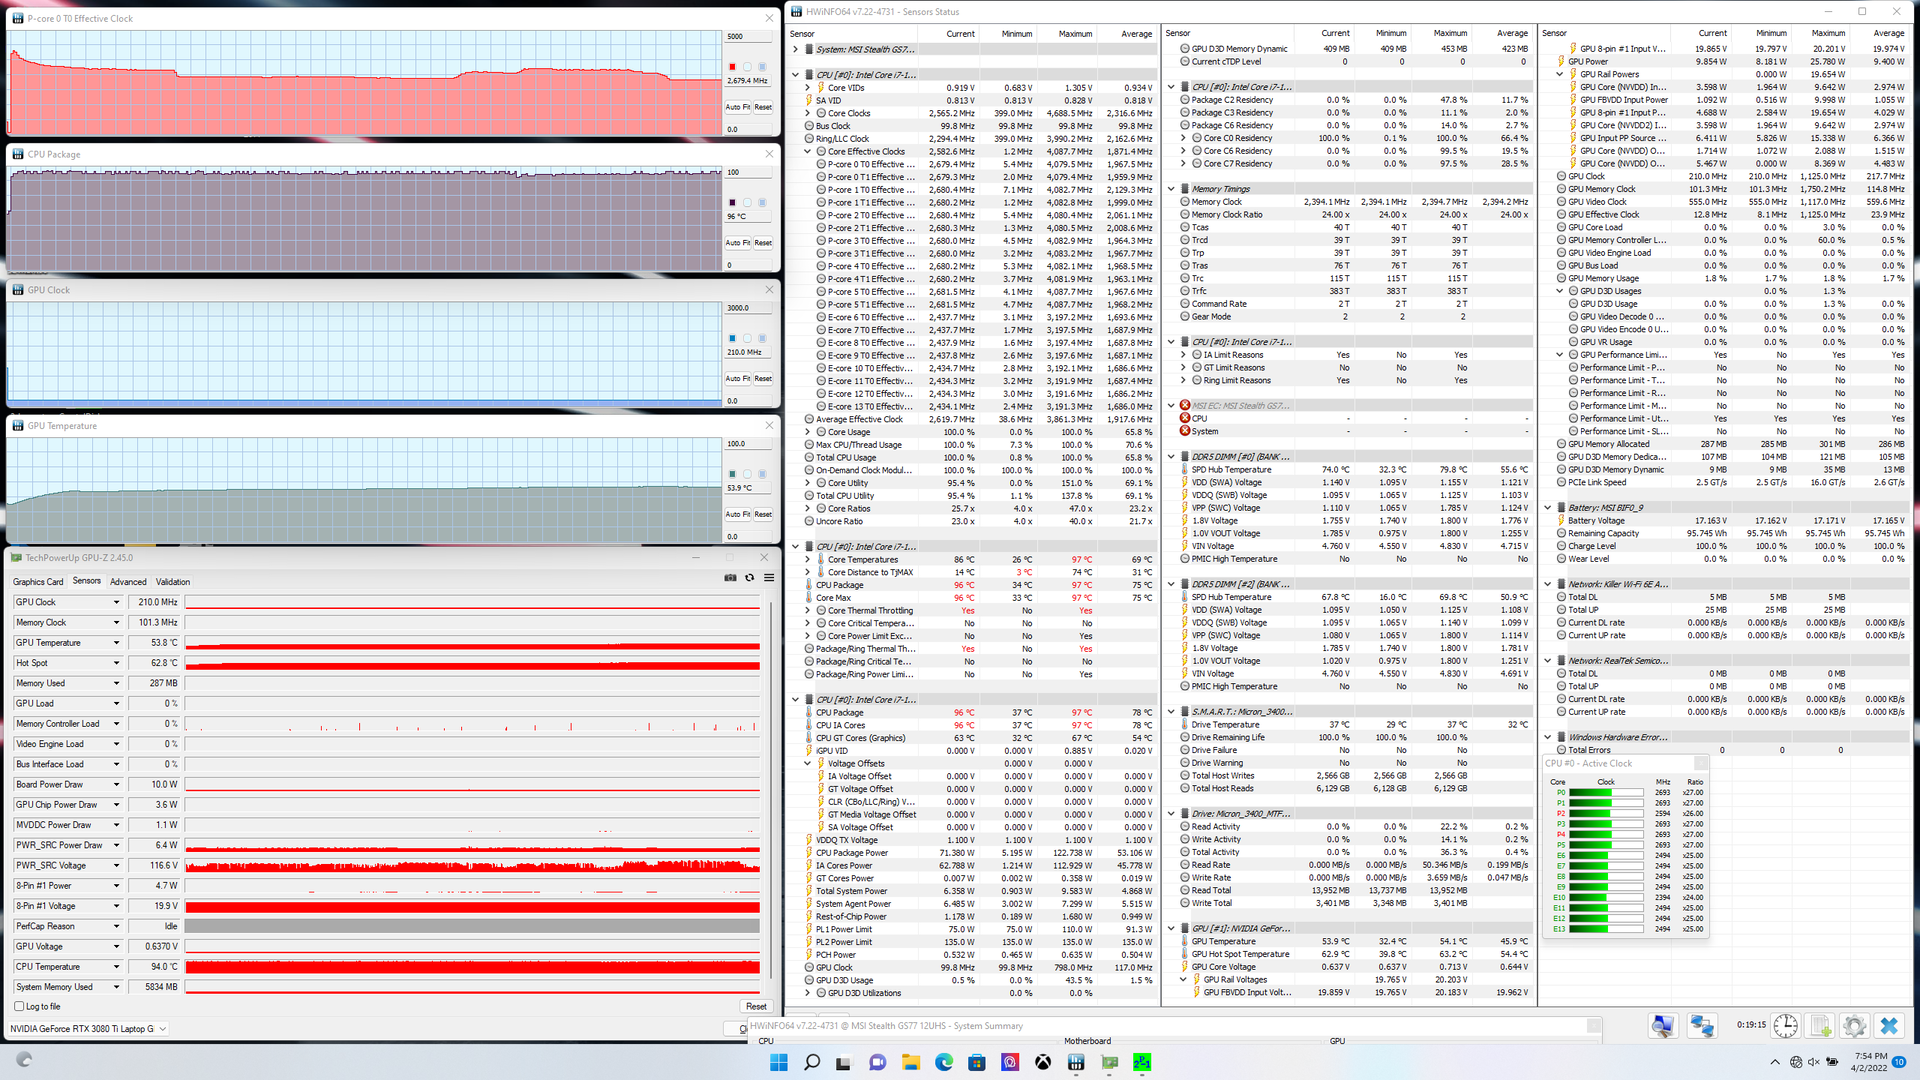
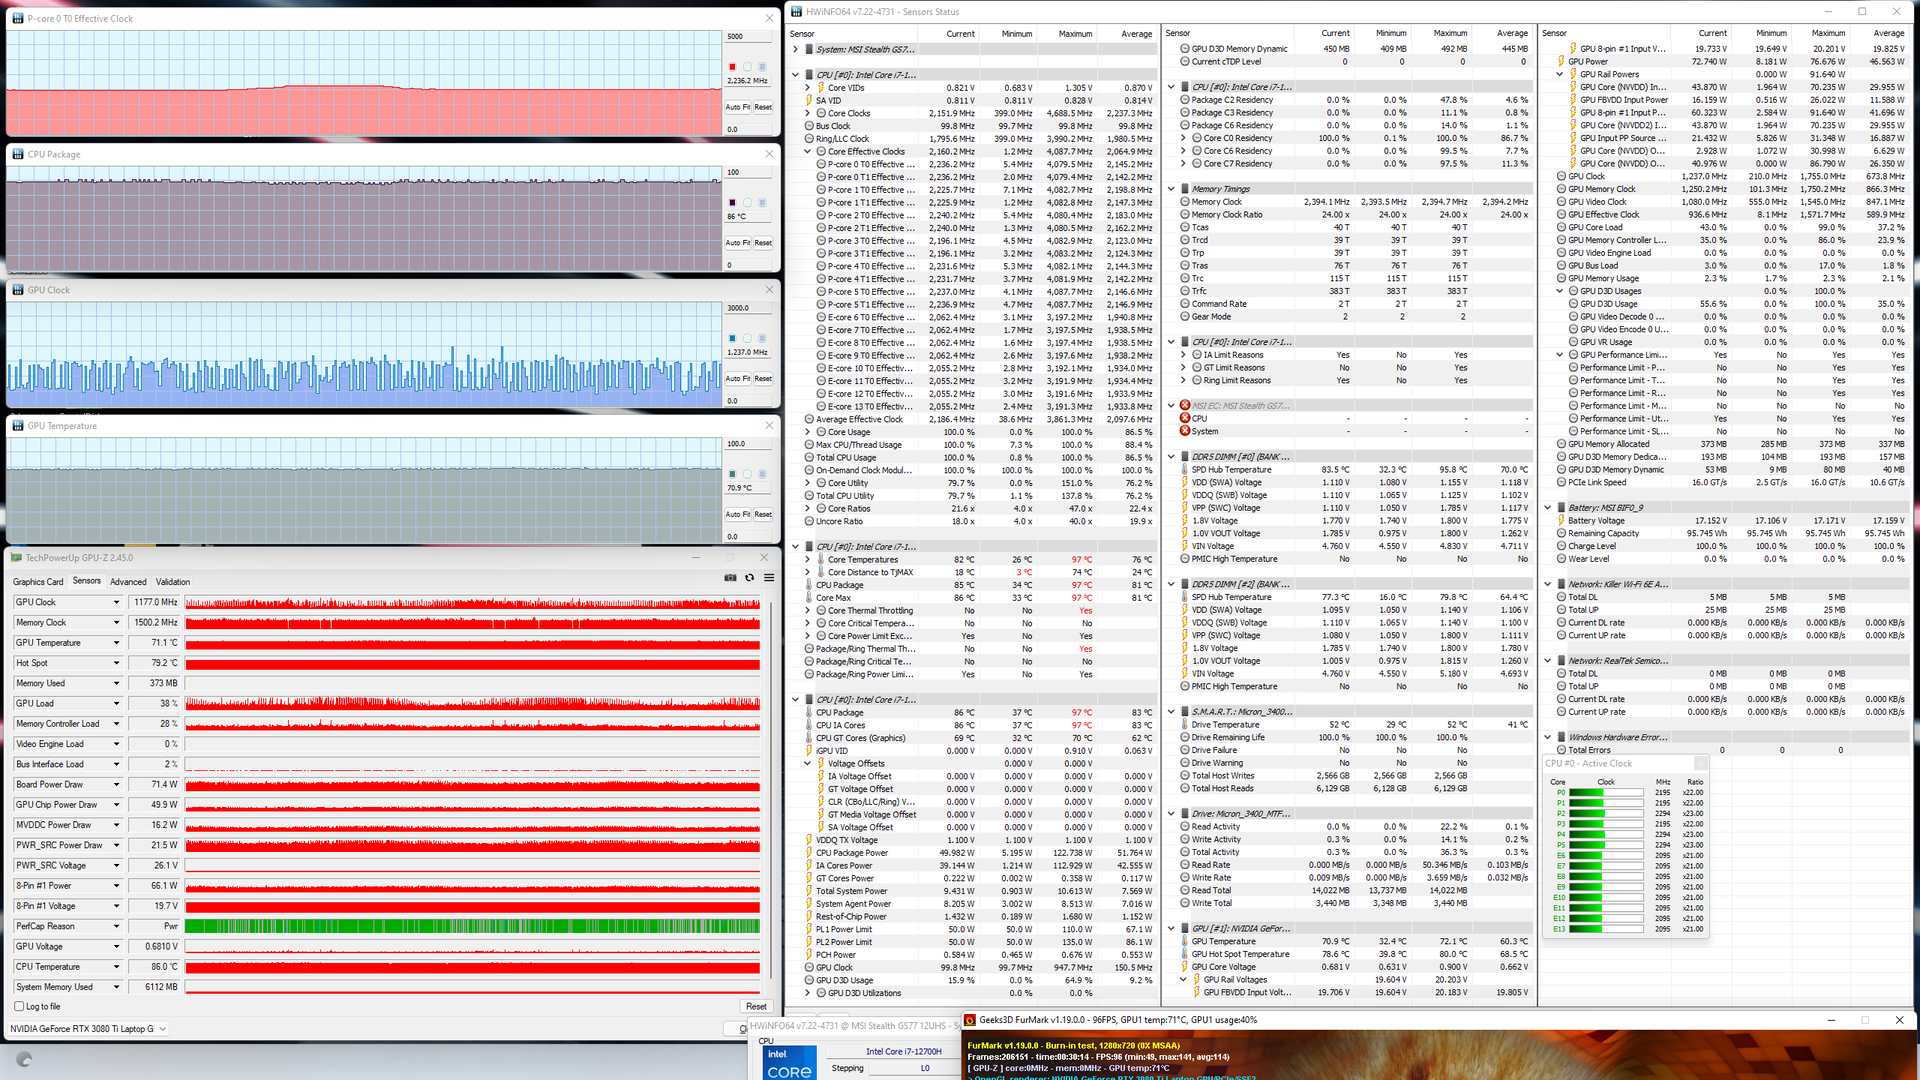
| Fréquence CPU (GHz) | Fréquence GPU (MHz) | Température CPU moyenne (°C) | Température GPU moyenne (°C) | |
| Système au repos | -- | -- | 40 | 37 |
| Prime95 Stress | 2.7 - 3.0 | -- | 96 | 54 |
| Prime95 + FurMark Stress | 2.2 | 430 - 1237 | 86 | 71 |
| Witcher 3 Stress | ~1.0 | 1432 | 67 | 75 |
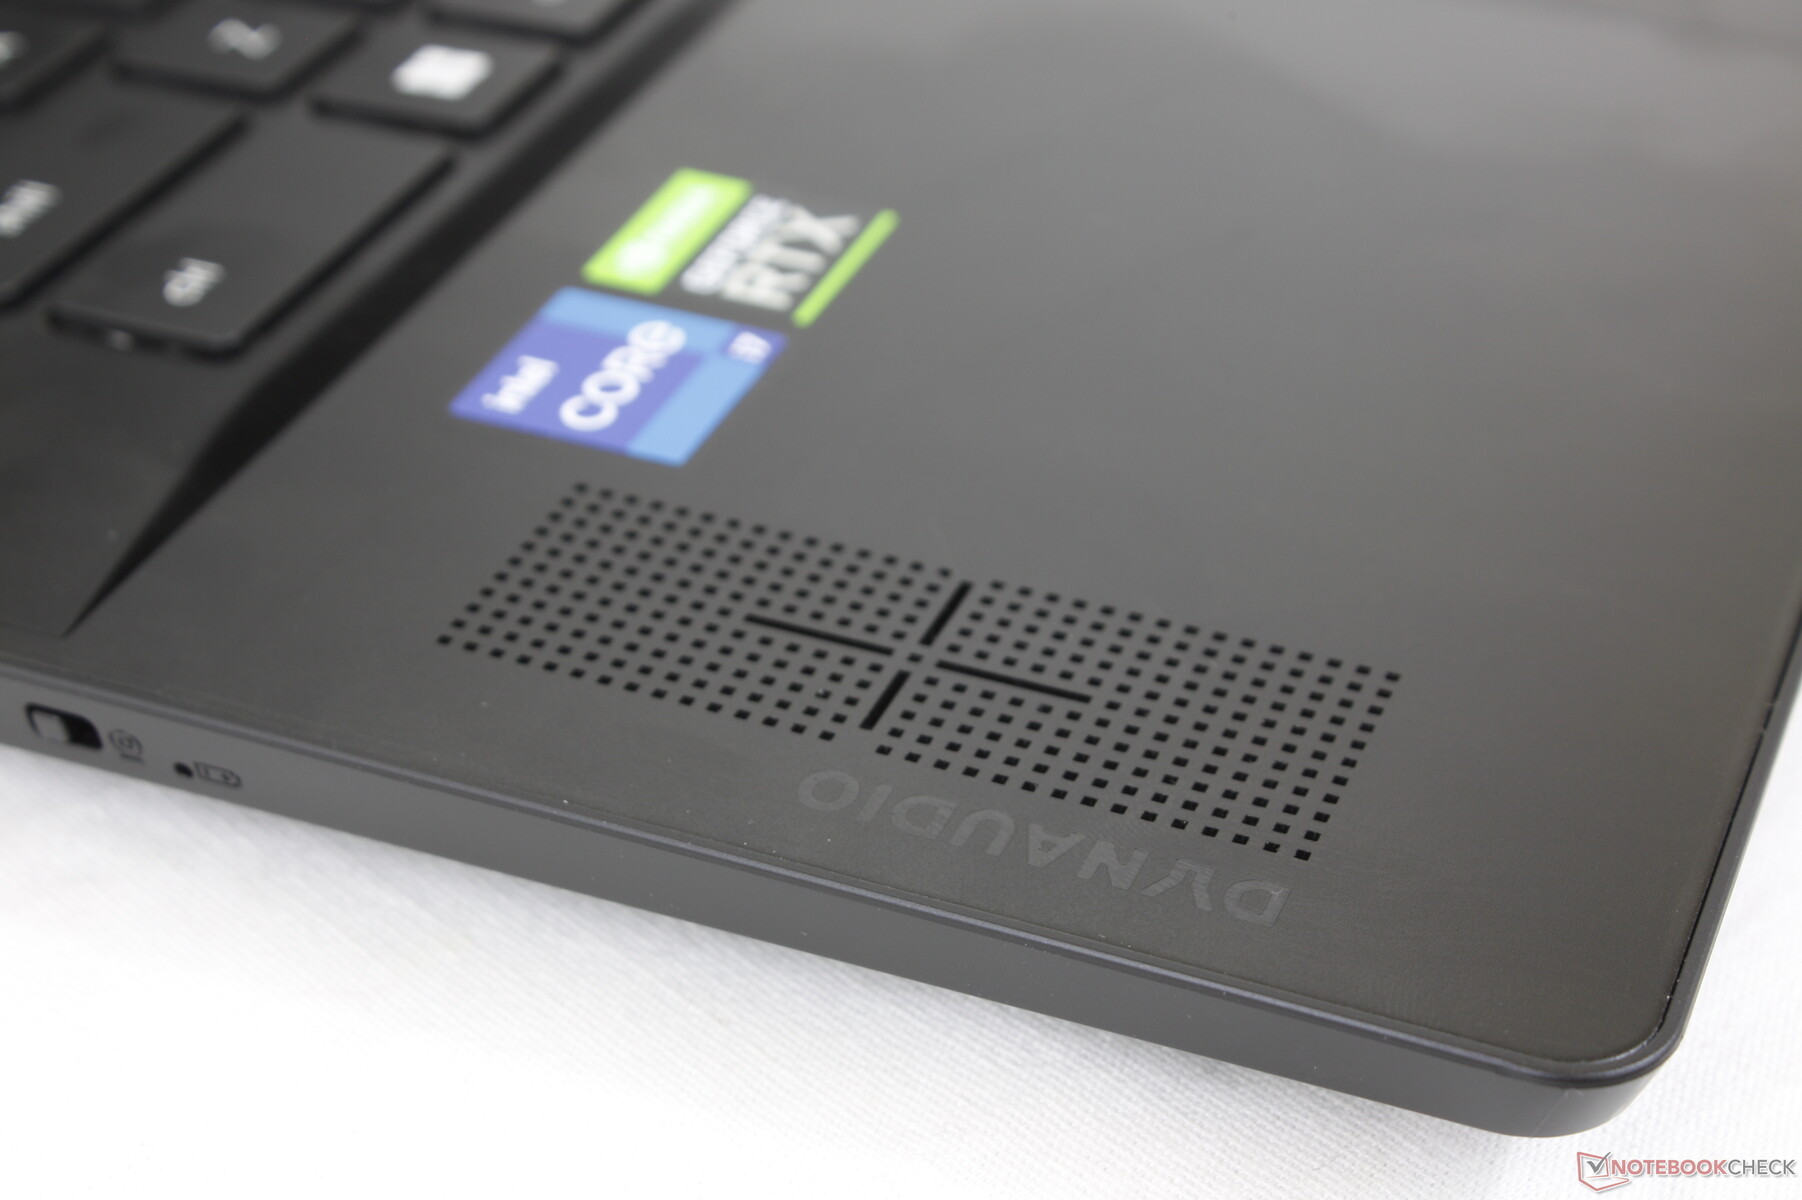
Haut-parleurs
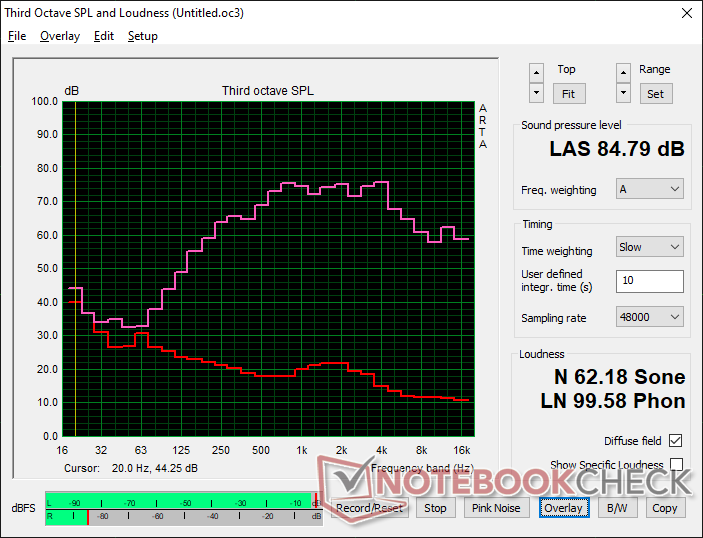
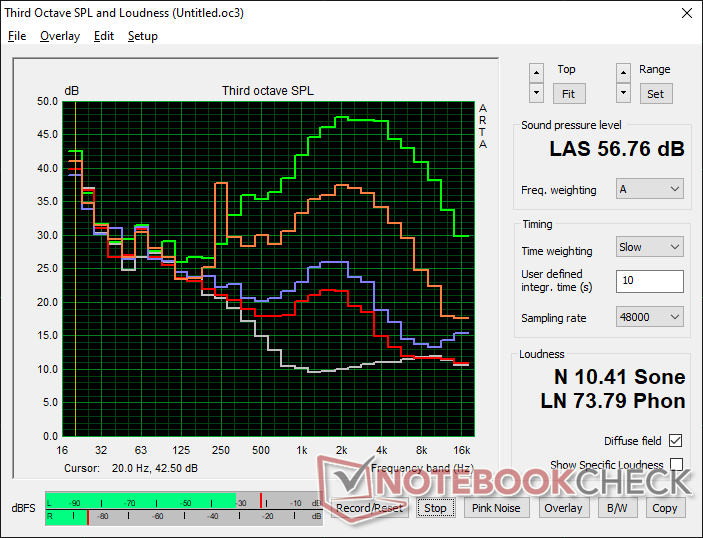
MSI Stealth GS77 12UHS-083US analyse audio
(+) | les haut-parleurs peuvent jouer relativement fort (84.8# dB)
Basses 100 - 315 Hz
(±) | basse réduite - en moyenne 9.4% inférieure à la médiane
(±) | la linéarité des basses est moyenne (9.8% delta à la fréquence précédente)
Médiums 400 - 2000 Hz
(±) | médiane supérieure - en moyenne 7% supérieure à la médiane
(+) | les médiums sont linéaires (4.9% delta à la fréquence précédente)
Aiguës 2 - 16 kHz
(±) | sommets plus élevés - en moyenne 5.8% plus élevés que la médiane
(±) | la linéarité des aigus est moyenne (7.9% delta à la fréquence précédente)
Globalement 100 - 16 000 Hz
(±) | la linéarité du son global est moyenne (15.9% de différence avec la médiane)
Par rapport à la même classe
» 38% de tous les appareils testés de cette catégorie étaient meilleurs, 7% similaires, 56% pires
» Le meilleur avait un delta de 6%, la moyenne était de 18%, le pire était de 132%.
Par rapport à tous les appareils testés
» 25% de tous les appareils testés étaient meilleurs, 5% similaires, 70% pires
» Le meilleur avait un delta de 4%, la moyenne était de 23%, le pire était de 134%.
Apple MacBook Pro 16 2021 M1 Pro analyse audio
(+) | les haut-parleurs peuvent jouer relativement fort (84.7# dB)
Basses 100 - 315 Hz
(+) | bonne basse - seulement 3.8% loin de la médiane
(+) | les basses sont linéaires (5.2% delta à la fréquence précédente)
Médiums 400 - 2000 Hz
(+) | médiane équilibrée - seulement 1.3% de la médiane
(+) | les médiums sont linéaires (2.1% delta à la fréquence précédente)
Aiguës 2 - 16 kHz
(+) | des sommets équilibrés - à seulement 1.9% de la médiane
(+) | les aigus sont linéaires (2.7% delta à la fréquence précédente)
Globalement 100 - 16 000 Hz
(+) | le son global est linéaire (4.6% différence à la médiane)
Par rapport à la même classe
» 0% de tous les appareils testés de cette catégorie étaient meilleurs, 0% similaires, 100% pires
» Le meilleur avait un delta de 5%, la moyenne était de 17%, le pire était de 45%.
Par rapport à tous les appareils testés
» 0% de tous les appareils testés étaient meilleurs, 0% similaires, 100% pires
» Le meilleur avait un delta de 4%, la moyenne était de 23%, le pire était de 134%.
Gestion de l'énergie
Consommation d'énergie - Un peu plus gourmand en énergie
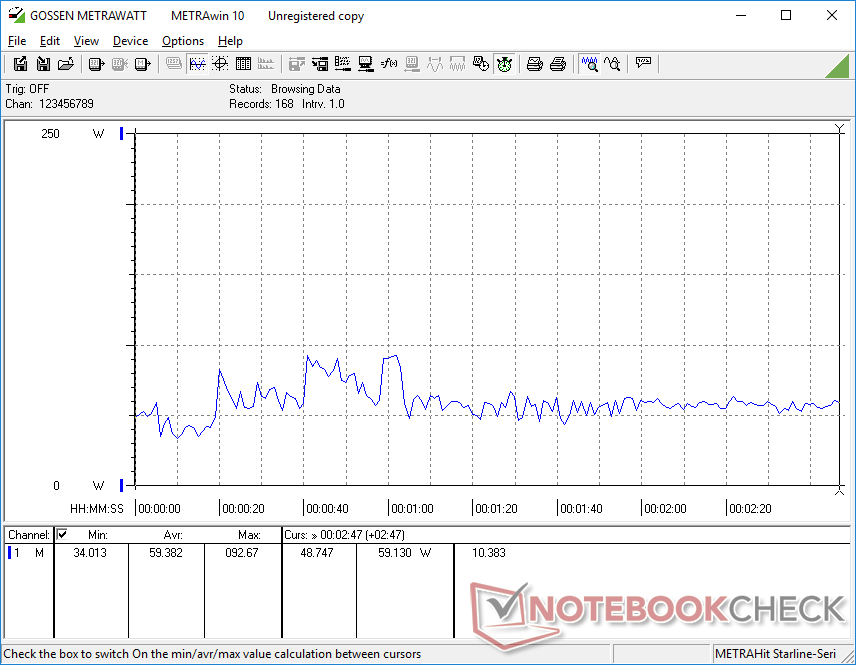
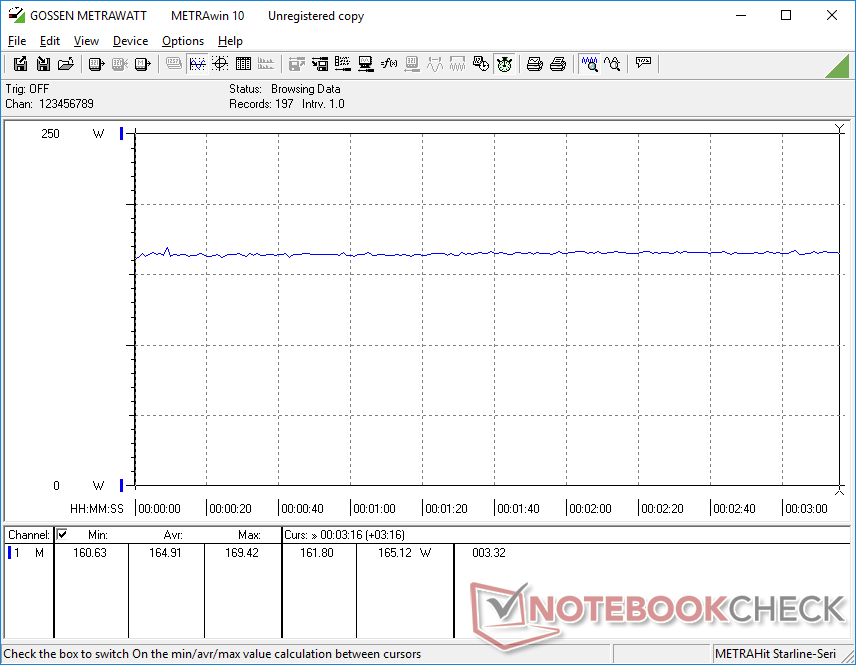
Le GS77 n'est pas plus exigeant que le GS76 de l'année dernière, malgré l'augmentation des performances. L'exécution de Witcher 3par exemple, le GS77 ne consomme que 5 % d'énergie en plus pour une augmentation de 12 à 15 % des performances graphiques par rapport à la RTX 3080. La faible différence de consommation d'énergie peut être attribuée au fait que le CPU et le GPU du GS77 visent des niveaux de TDP et de TGP relativement similaires à ceux des processeurs du GS76. En revanche, l'objectif TGP entre les modèles Blade 17 2021 et 2022 a considérablement augmenté, passant de 100 W à 165 W, ce qui entraîne des niveaux de consommation d'énergie nettement supérieurs pour le Blade 17 par rapport au GS77, comme le montre le tableau ci-dessous.
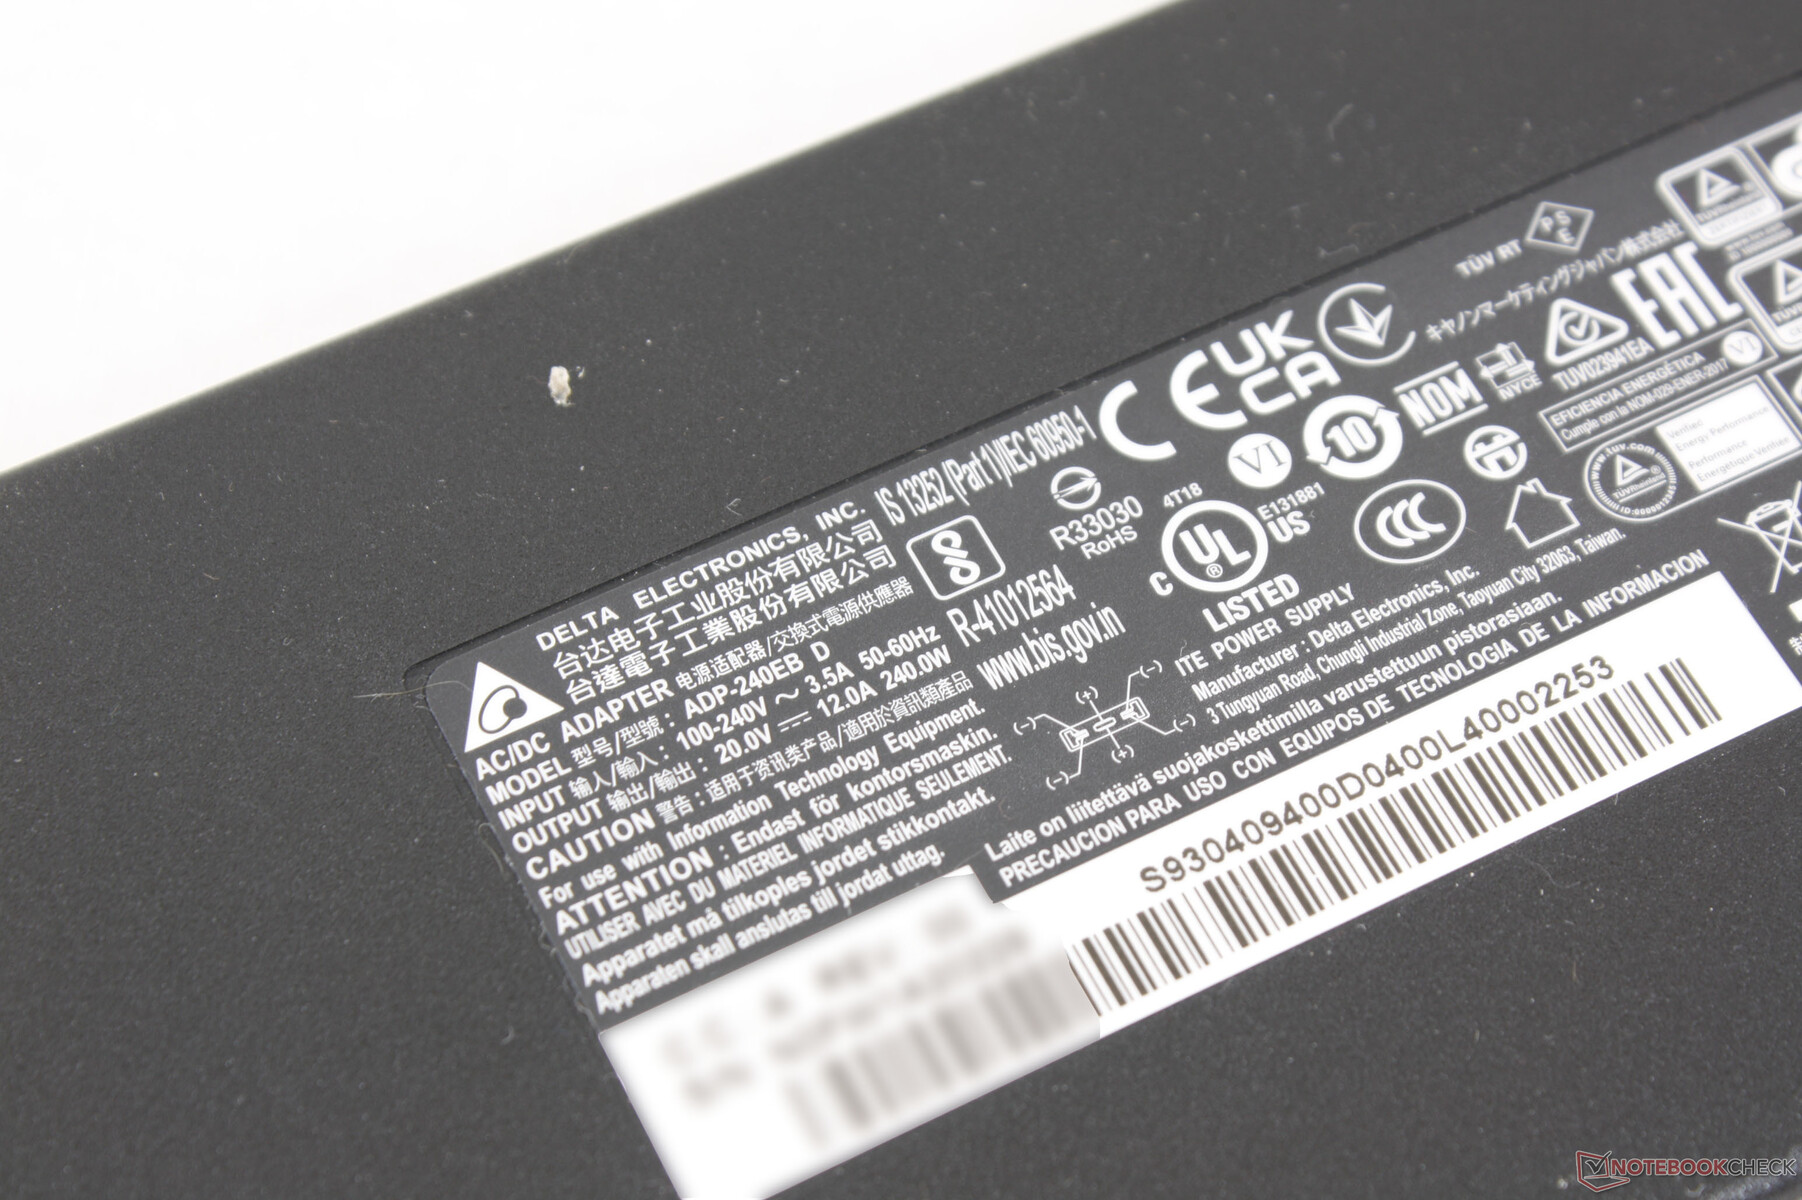
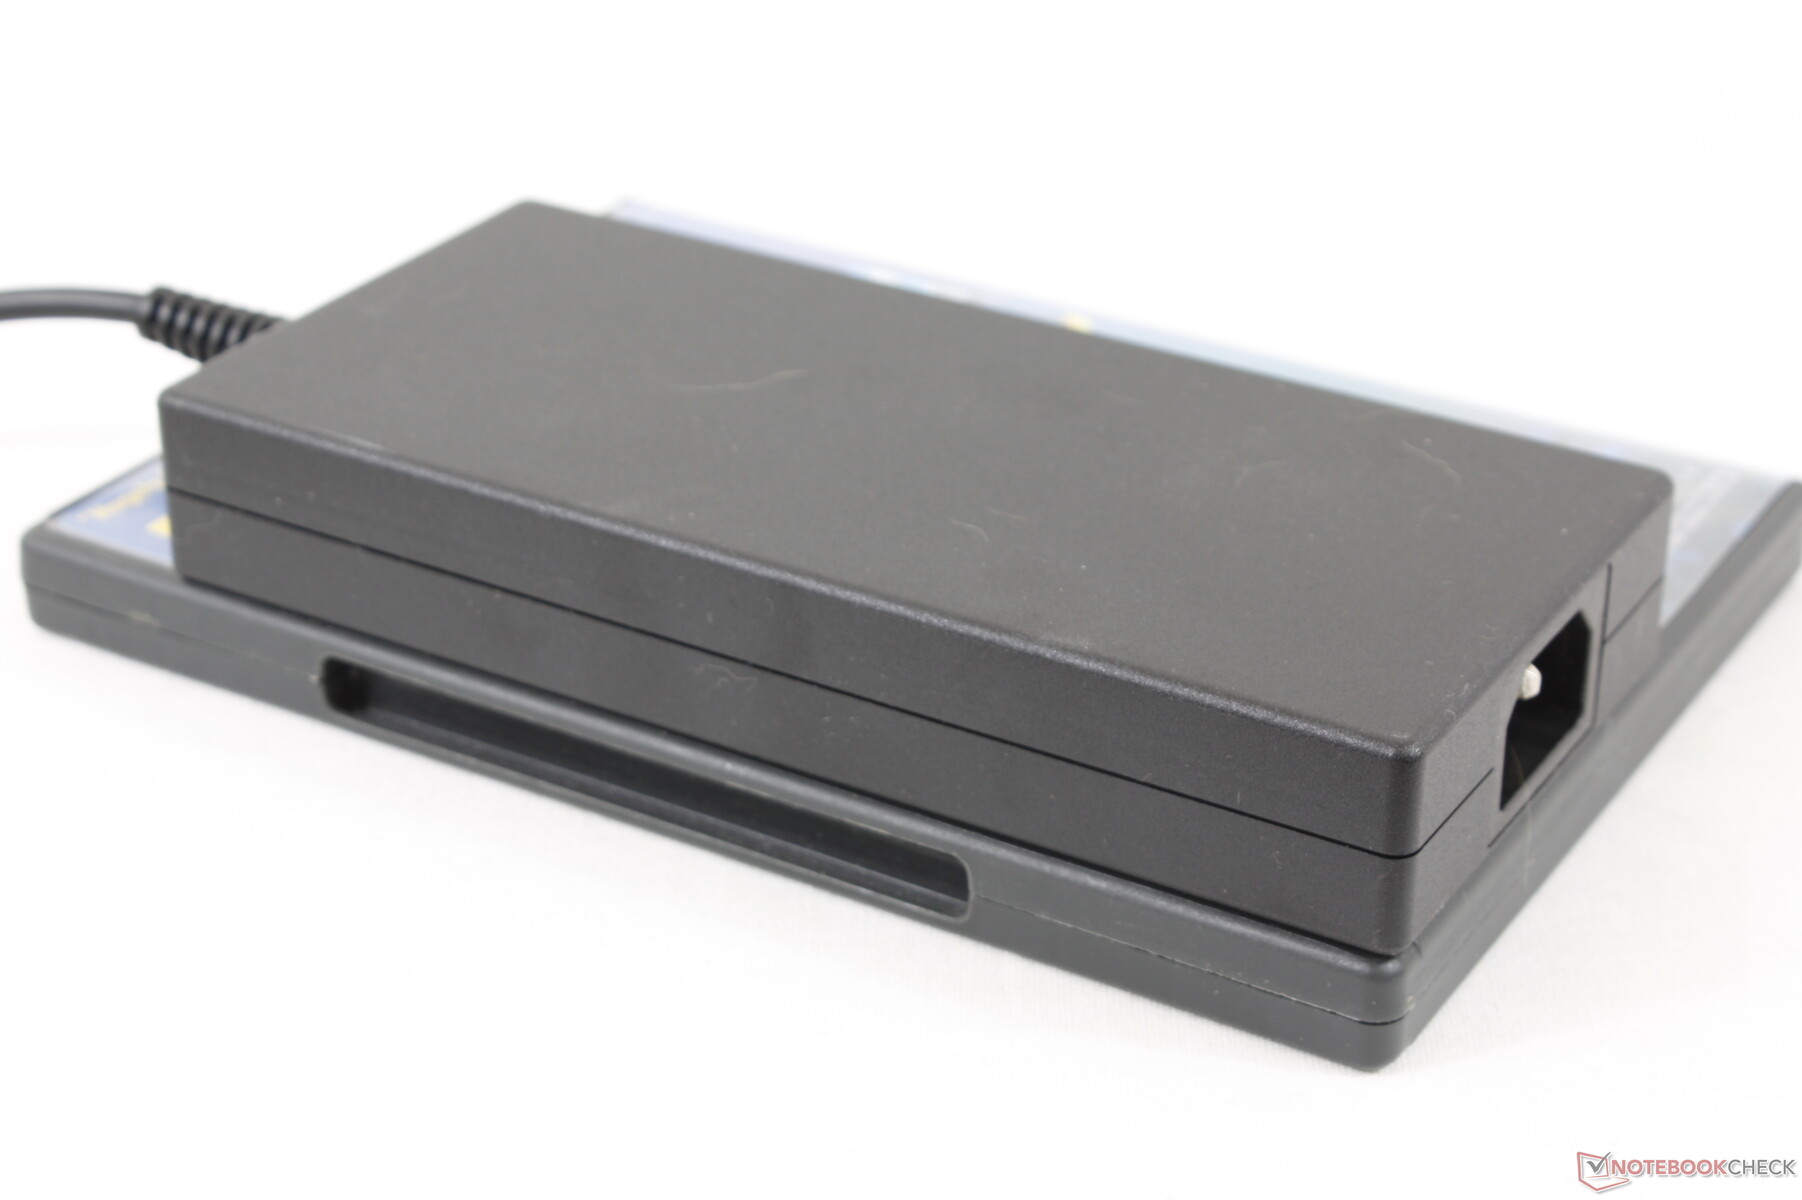
Un adaptateur secteur de 240 W est fourni en standard alors que le Blade 17 est livré avec un adaptateur de 280 W de plus grande capacité. On pourrait s'attendre à ce que l'adaptateur Razer soit plus grand, mais l'adaptateur 240 W de MSI est en fait légèrement plus grand (~16,4 x 7,5 x 2,5 cm contre ~16,4 x 7 x 2,5 cm).

| Éteint/en veille | |
| Au repos | |
| Fortement sollicité |
|
Légende:
min: | |
| MSI Stealth GS77 12UHS-083US i7-12700H, GeForce RTX 3080 Ti Laptop GPU, Micron 3400 1TB MTFDKBA1T0TFH, IPS, 2560x1440, 17.3" | MSI GS76 Stealth 11UH i9-11900H, GeForce RTX 3080 Laptop GPU, Samsung PM9A1 MZVL22T0HBLB, IPS, 3840x2160, 17.3" | Razer Blade 17 RTX 3080 Ti i7-12800H, GeForce RTX 3080 Ti Laptop GPU, Samsung PM9A1 MZVL21T0HCLR, IPS, 2560x1440, 17.3" | MSI GE76 Raider i9-12900HK, GeForce RTX 3080 Ti Laptop GPU, Samsung PM9A1 MZVL22T0HBLB, IPS-Level, 1920x1080, 17.3" | Alienware x17 RTX 3080 P48E i7-11800H, GeForce RTX 3080 Laptop GPU, 2x WDC PC SN730 SDBPNTY-1T00 (RAID 0), IPS, 3840x2160, 17.3" | Asus ROG Zephyrus S17 GX703HSD i9-11900H, GeForce RTX 3080 Laptop GPU, Samsung PM9A1 MZVL22T0HBLB, IPS, 2560x1440, 17.3" | |
|---|---|---|---|---|---|---|
| Power Consumption | 7% | -57% | -4% | -17% | -11% | |
| Idle Minimum * (Watt) | 20 | 14 30% | 29.8 -49% | 12 40% | 10.2 49% | 21.7 -9% |
| Idle Average * (Watt) | 21.4 | 19 11% | 37.1 -73% | 17 21% | 21.2 1% | 27 -26% |
| Idle Maximum * (Watt) | 27 | 31 -15% | 60.8 -125% | 28 -4% | 48.4 -79% | 33 -22% |
| Load Average * (Watt) | 100.5 | 97 3% | 135.3 -35% | 118 -17% | 118.7 -18% | 108 -7% |
| Witcher 3 ultra * (Watt) | 165 | 156 5% | 243 -47% | 252 -53% | 249 -51% | 195 -18% |
| Load Maximum * (Watt) | 247.1 | 231 7% | 273.1 -11% | 272 -10% | 262 -6% | 210 15% |
* ... Moindre est la valeur, meilleures sont les performances
Power Consumption Witcher 3 / Stresstest
Power Consumption external Monitor
Autonomie de la batterie - 99 Wh à la rescousse
Les durées d'exécution sont presque identiques à celles que nous avons enregistrées sur le GS76 de l'année dernière et légèrement supérieures à celles que nous avons enregistrées sur le nouveau Blade 17. Les derniers modèles GS sont remarquables pour leur grande batterie de 99 Wh, contre 90 Wh ou moins sur la plupart des autres ordinateurs portables de jeu.
Le chargement d'une batterie vide à sa pleine capacité prend presque 2,5 heures, soit environ 1 heure de plus que la plupart des autres ordinateurs portables. Le système peut également être rechargé via USB-C grâce à son unique port Thunderbolt 4.
| MSI Stealth GS77 12UHS-083US i7-12700H, GeForce RTX 3080 Ti Laptop GPU, 99 Wh | MSI GS76 Stealth 11UH i9-11900H, GeForce RTX 3080 Laptop GPU, 99.9 Wh | Razer Blade 17 RTX 3080 Ti i7-12800H, GeForce RTX 3080 Ti Laptop GPU, 82 Wh | MSI GE76 Raider i9-12900HK, GeForce RTX 3080 Ti Laptop GPU, 99.99 Wh | Alienware x17 RTX 3080 P48E i7-11800H, GeForce RTX 3080 Laptop GPU, 87 Wh | Asus ROG Zephyrus S17 GX703HSD i9-11900H, GeForce RTX 3080 Laptop GPU, 90 Wh | |
|---|---|---|---|---|---|---|
| Autonomie de la batterie | -4% | -19% | -18% | -28% | 57% | |
| Reader / Idle (h) | 10.8 | 9.9 -8% | 8 -26% | 7 -35% | ||
| WiFi v1.3 (h) | 6.2 | 6.4 3% | 5.5 -11% | 5.1 -18% | 5.9 -5% | 7.5 21% |
| Load (h) | 1.4 | 1.3 -7% | 1.1 -21% | 0.8 -43% | 2.7 93% | |
| H.264 (h) | 7.2 | |||||
| Witcher 3 ultra (h) | 1 |
Points positifs
Points négatifs
Verdict - Meilleur que le GS76... Principalement

Le GS77 fait quelques pas en avant et quelques pas en arrière par rapport au GS76. Les améliorations sont nombreuses, notamment le squelette plus solide et plus rigide, la webcam à plus haute résolution, le pavé tactile plus grand, la facilité d'entretien, les durées d'utilisation de la batterie relativement similaires, les nouvelles options d'affichage et les meilleures performances à peu près aux mêmes niveaux de TDP et de TGP qu'auparavant. Les performances du processeur sont meilleures que prévu, même par rapport à d'autres ordinateurs portables équipés de processeurs Core i7 ou Core i9. Le nouveau modèle donne l'impression d'être plus solide que l'ancien pour des impressions de meilleure qualité également.
En revanche, le GS77 a régressé sur certains aspects clés. La taille et le poids du châssis, en particulier, sont sensiblement plus grands et plus lourds que ceux du GS76, ce qui signifie que le GS77 n'est pas aussi facile à transporter que son prédécesseur. L'écran QHD 240 Hz n'est pas non plus aussi lumineux que l'écran 4K du GS76, tandis que le lecteur de carte SD est maintenant plus de deux fois plus lent. L'angle maximal des charnières est également beaucoup plus étroit cette fois-ci, ce qui réduit la liberté de mouvement.
Dans l'ensemble, le nouveau modèle constitue un progrès général pour la série GS, malgré quelques revers malheureux. Le GPU TGP de 105 W est quelque peu inquiétant, cependant, car il peut suggérer que les futurs SKU seront également bloqués dans des GPU de ~100 W alors que le Blade 17 refroidi par chambre à vapeur peut utiliser des versions plus puissantes de 165 W. MSI a raté l'occasion d'ajouter d'autres caractéristiques souhaitables au GS77, y compris un commutateur MUX, un écran calibré en usine, ou le support interne de G-Sync, qui sont tous disponibles sur le plus petit Razer Blade 17.
Prix et disponibilité
MSI Stealth GS77 12UHS-083US
- 04/07/2022 v7 (old)
Allen Ngo
Price comparison

