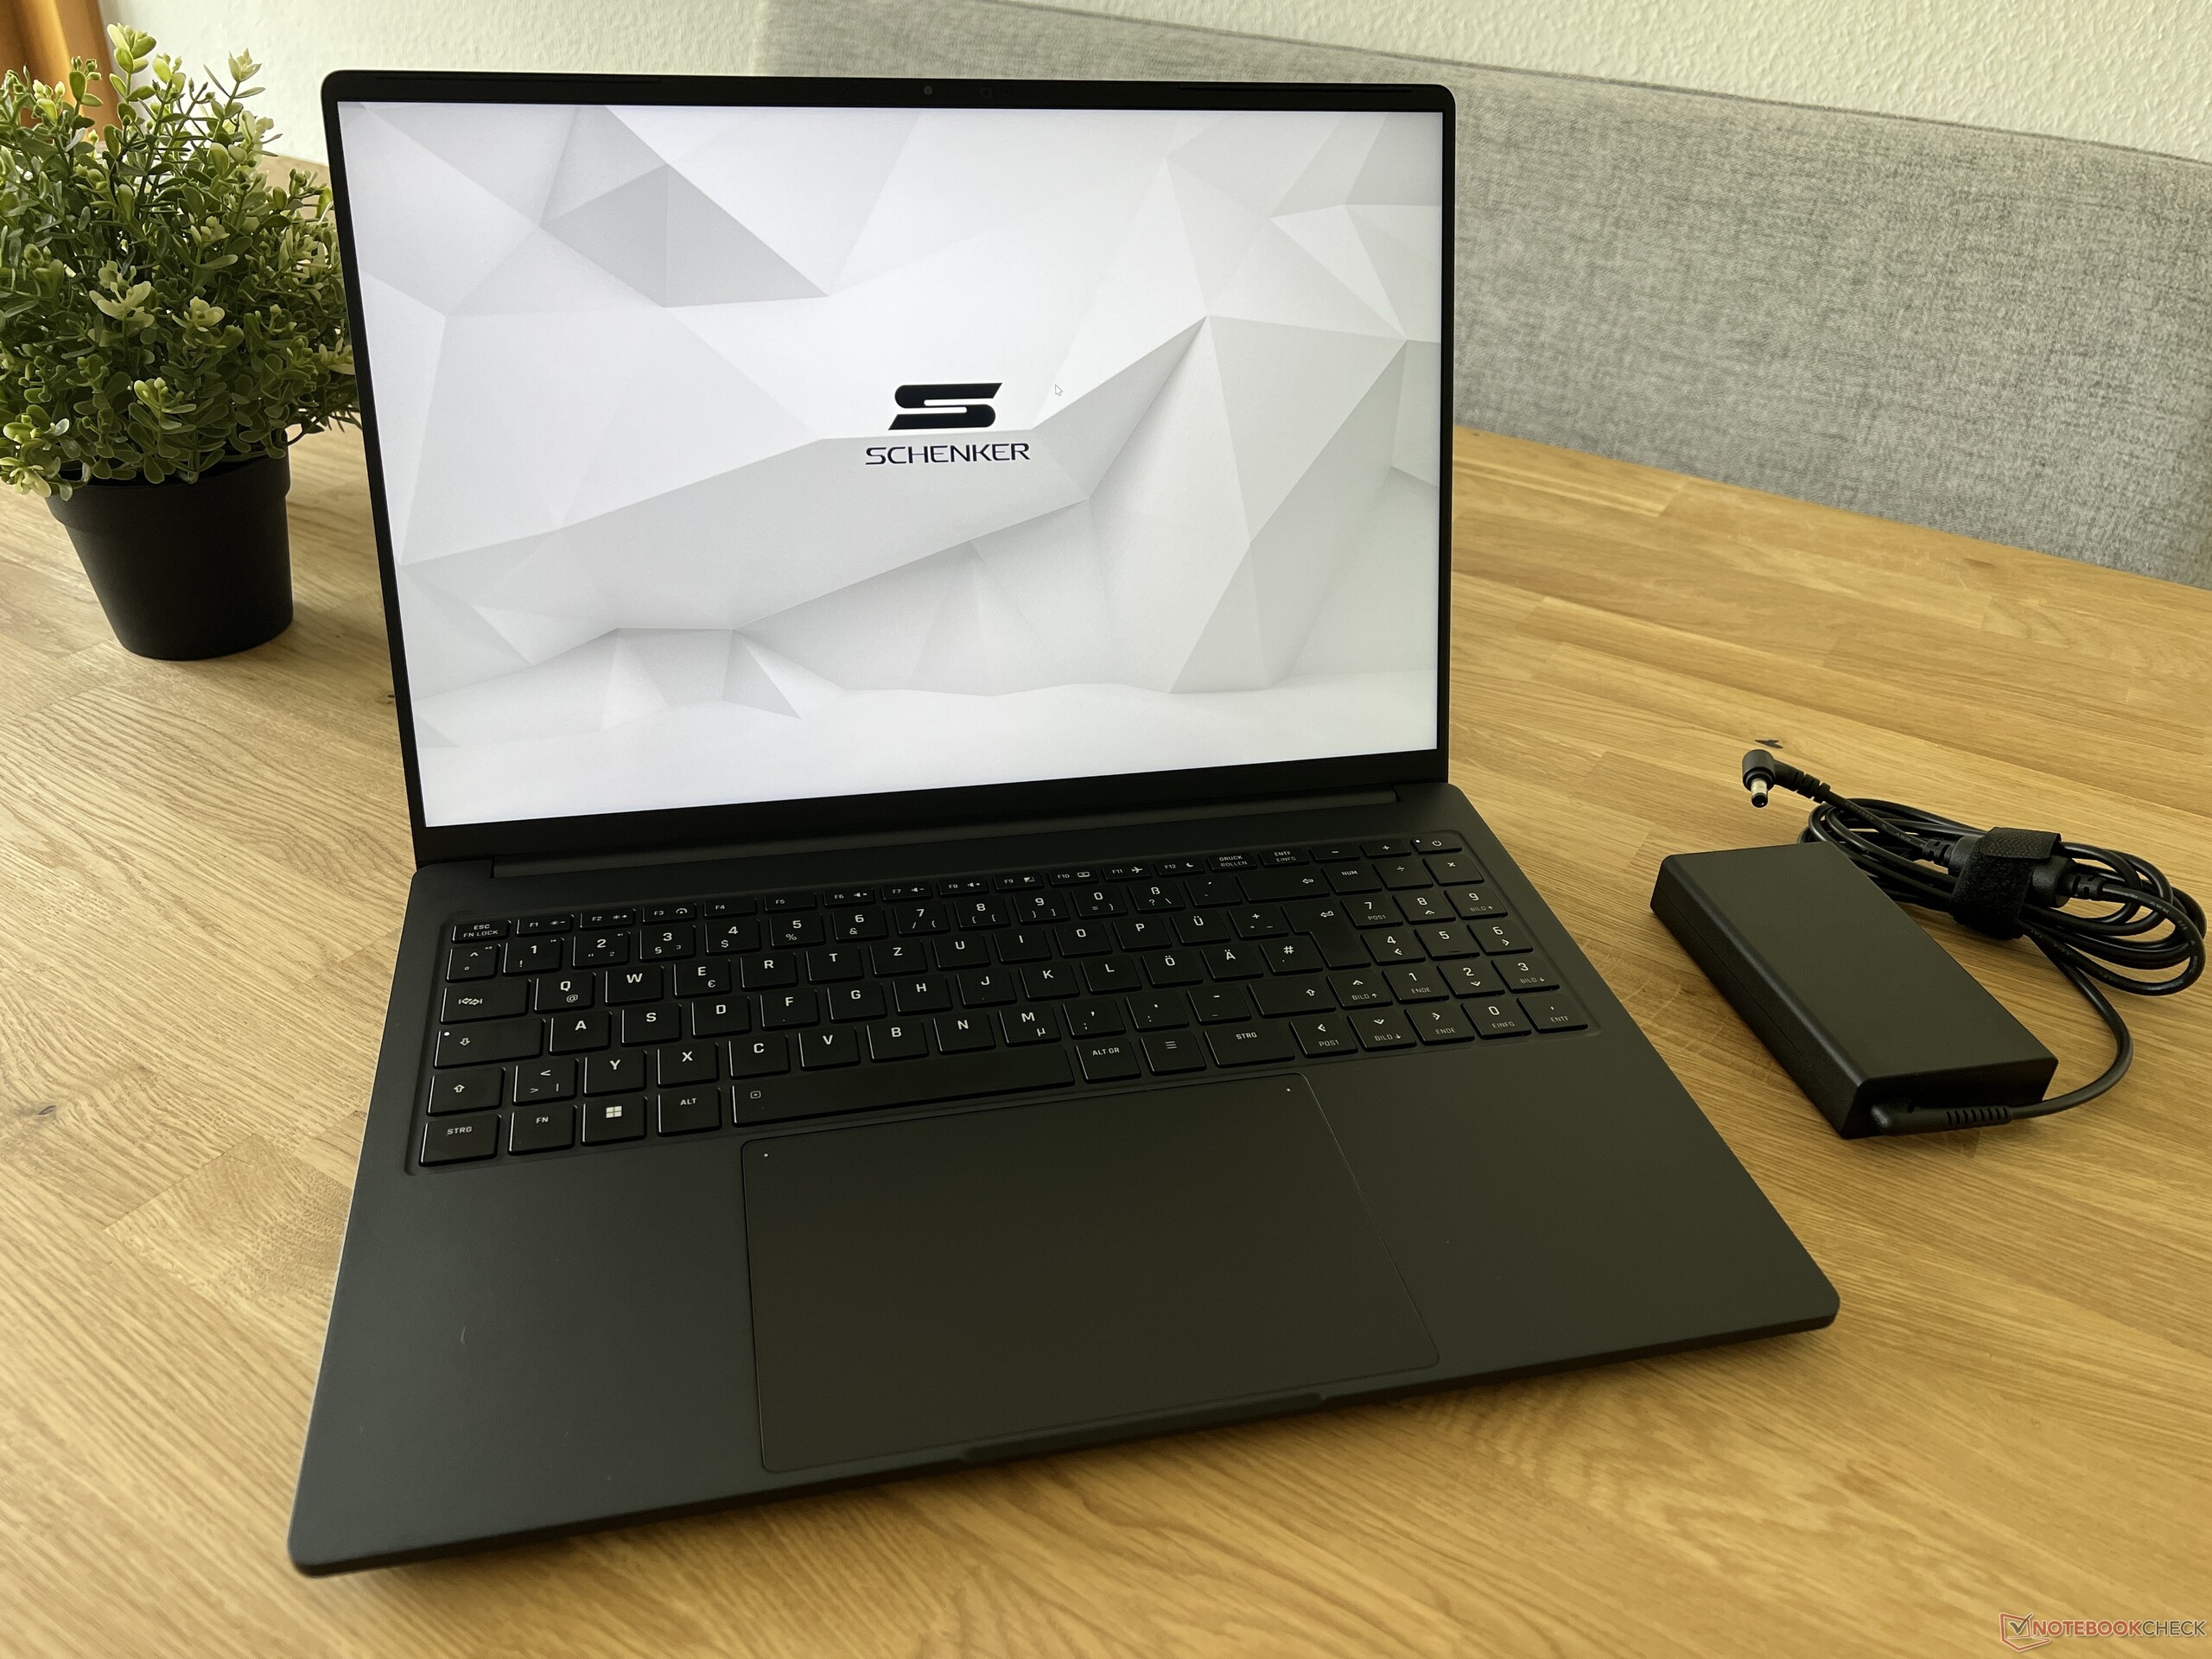
Test du Schenker Vision 16 Pro 2023 : 1,6 kg de légèreté et de puissance avec RTX 4070
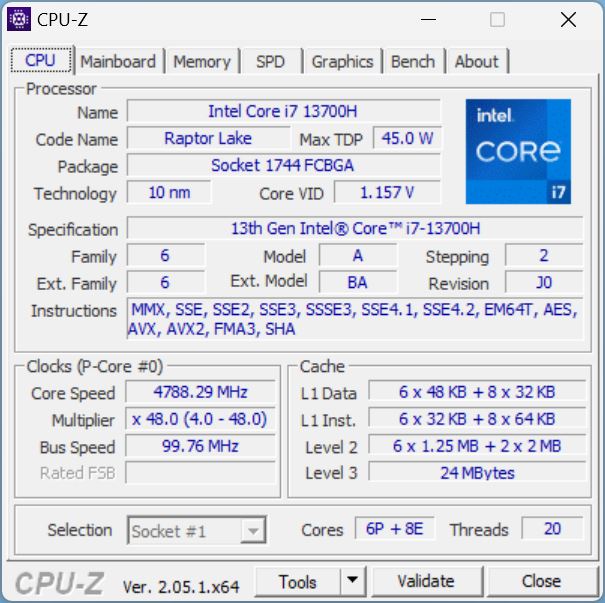
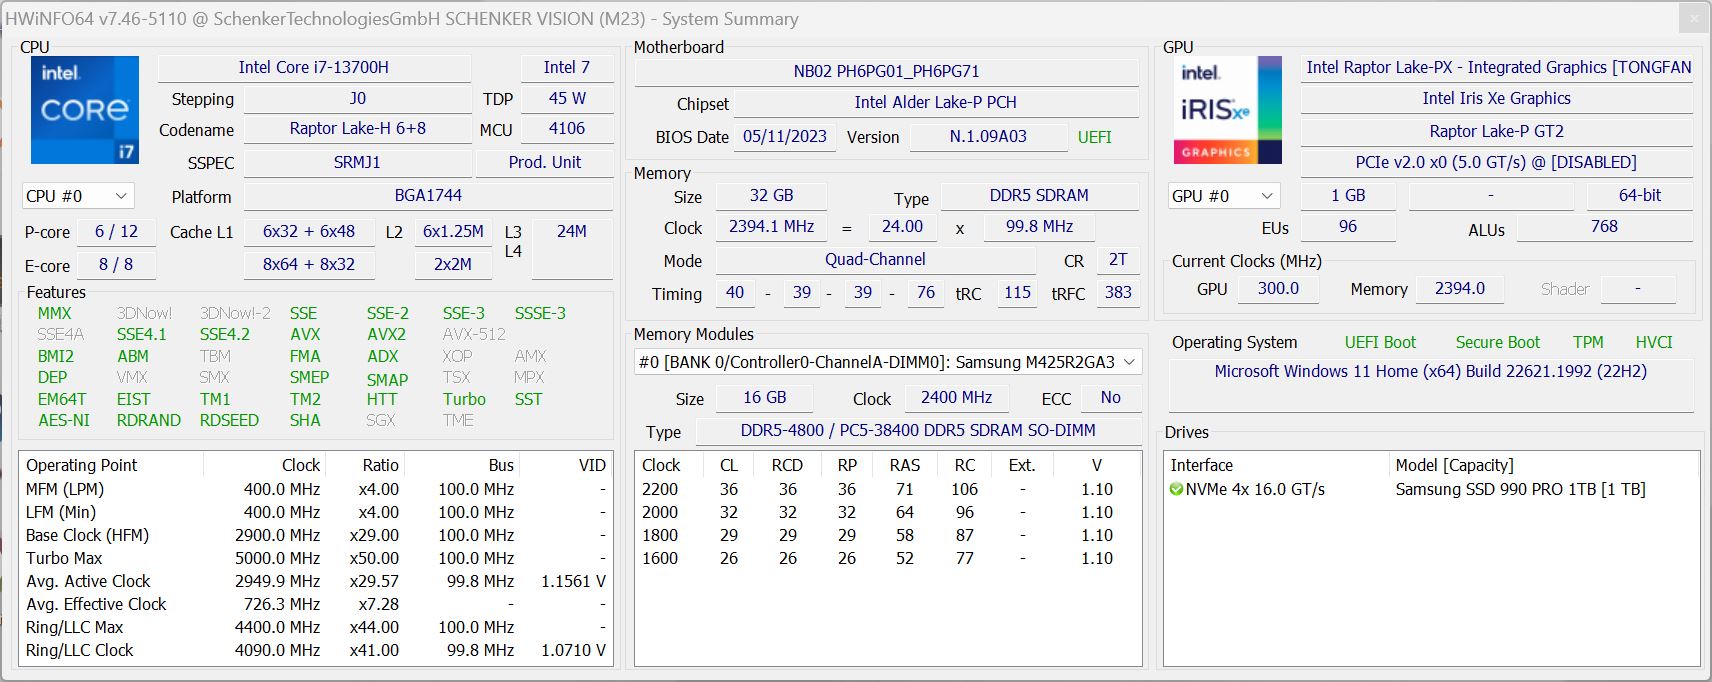
Schenker a mis à jour le Vision 16 Pro pour 2023, offrant à nouveau un ordinateur portable de 16 pouces extrêmement léger et très performant. Le processeur a été remplacé par l'actuel processeur Intel Core i7-13700H Raptor Lake d'Intel, et comme carte graphique, vous pouvez choisir la nouvelle carte GeForce RTX 4060 Laptop ou laRTX 4070 Laptopchacun avec une puissance maximale de 95 watts. En plus de ces deux mises à jour, il y a également quelques améliorations dans le système de refroidissement (nouveaux ventilateurs), et en plus du processeur, le GPU utilise désormais un refroidissement par métal liquide pour un transfert de chaleur optimal.
Le prix du nouveau modèle avec le Core i7-13700H, GeForce RTX 4060 Laptop, 16 Go de RAM, et un SSD de 500 Go commence à partir de 2.099 Euros (~$2361). Notre configuration de test avec l'ordinateur portable RTX 4070 plus rapide, 32 Go de RAM, un SSD de 1 To et Windows 11 préinstallé coûte environ 2 600 euros (~2 924 $), ce qui correspond également au prix du prédécesseur.
Comparaison avec les concurrents potentiels
Note | Date | Modèle | Poids | Épaisseur | Taille | Résolution | Prix |
|---|---|---|---|---|---|---|---|
| 88.6 % v7 (old) | 07/23 | Schenker VISION 16 Pro (M23) i7-13700H, GeForce RTX 4070 Laptop GPU | 1.6 kg | 17.1 mm | 16.00" | 2560x1600 | |
| 88.8 % v7 (old) | 05/23 | Samsung Galaxy Book3 Ultra 16, i9-13900H RTX 4070 i9-13900H, GeForce RTX 4070 Laptop GPU | 1.8 kg | 16.8 mm | 16.00" | 2880x1800 | |
| 88.8 % v7 (old) | 07/23 | MSI Stealth 16 Studio A13VG i7-13700H, GeForce RTX 4070 Laptop GPU | 2 kg | 19.95 mm | 16.00" | 2560x1600 | |
| 90.3 % v7 (old) | 04/23 | Dell XPS 15 9530 RTX 4070 i7-13700H, GeForce RTX 4070 Laptop GPU | 1.9 kg | 18 mm | 15.60" | 3456x2160 | |
| 86.1 % v7 (old) | 06/23 | Asus ProArt Studiobook 16 OLED H7604 i9-13980HX, GeForce RTX 4070 Laptop GPU | 2.4 kg | 23.9 mm | 16.00" | 3200x2000 | |
| 93.7 % v7 (old) | 03/23 | Apple MacBook Pro 16 2023 M2 Max M2 Max, M2 Max 38-Core GPU | 2.2 kg | 16.8 mm | 16.20" | 3456x2234 |
Boîtier - Boîtier léger en magnésium de 1,6 kg (~3,5 lb)
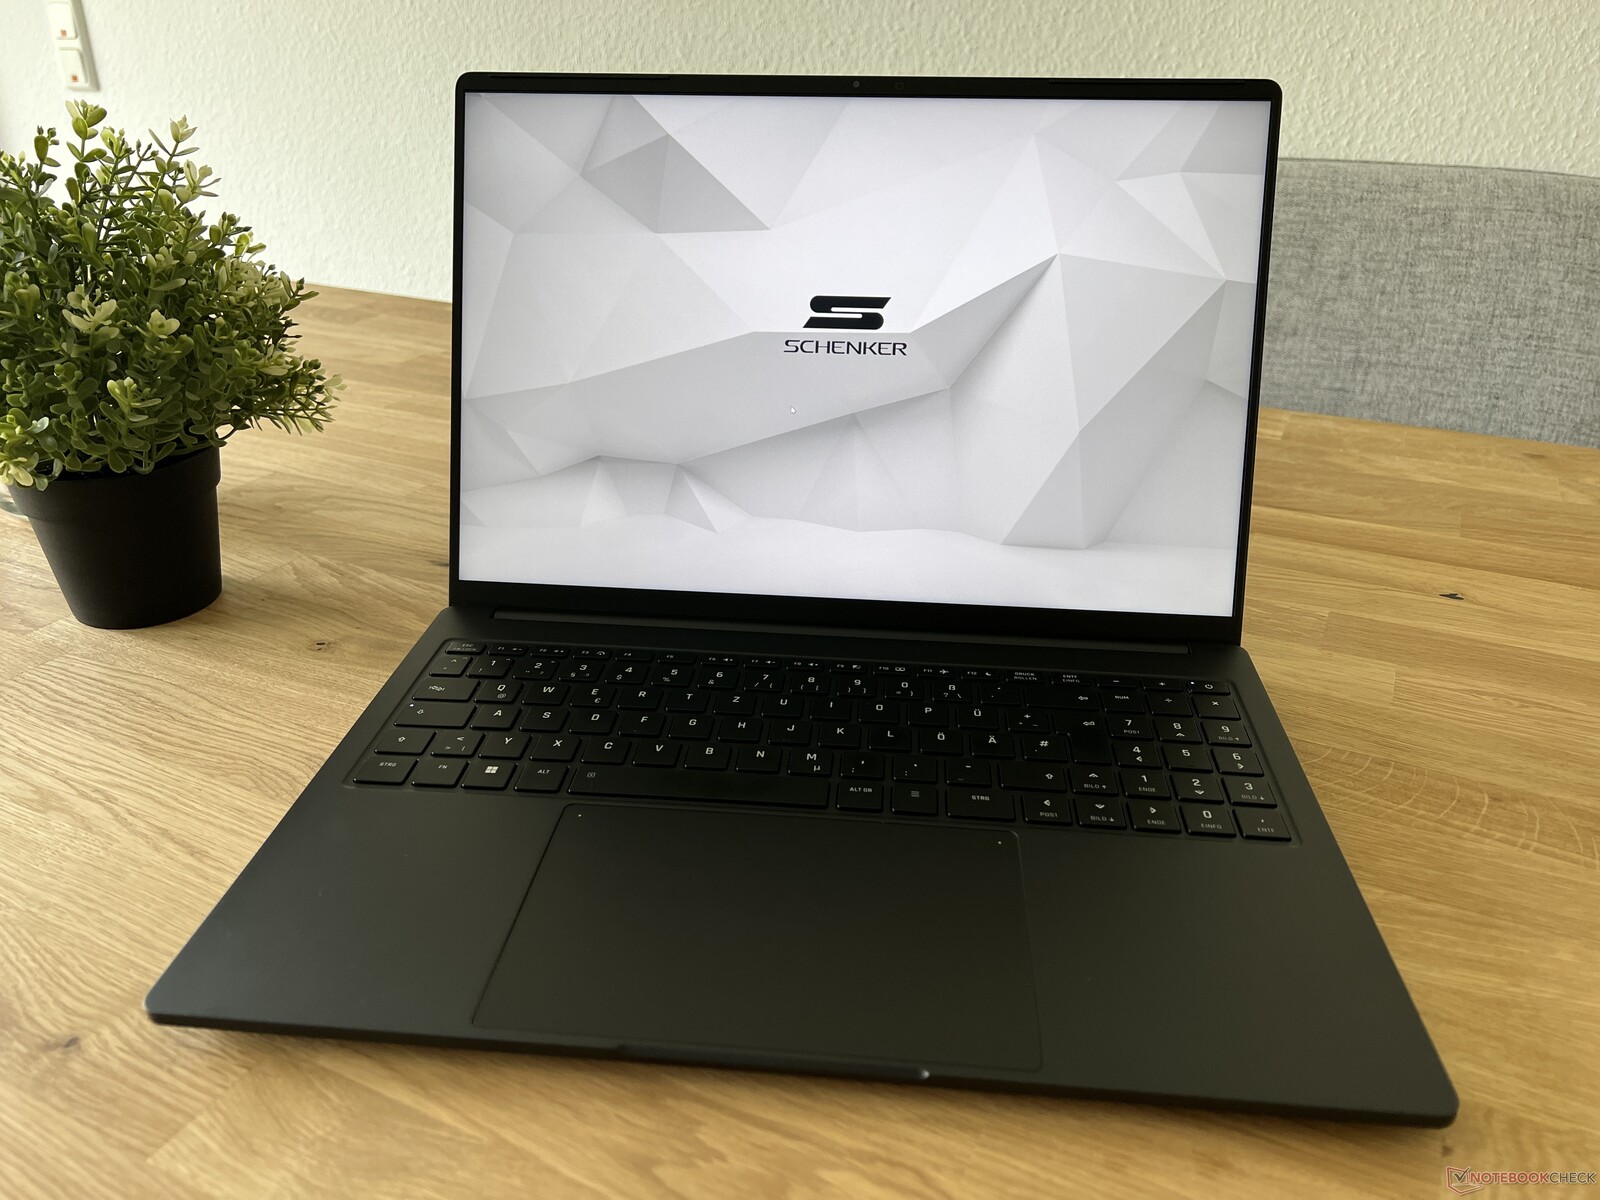
Depuis l'année dernière, Schenker n'a rien changé au boîtier, et cette fois-ci, c'est la version noire que nous testons. Avec seulement 1,6 kg, le boîtier en magnésium (unité de base et couvercle de l'écran) continue d'être extrêmement léger pour un ordinateur portable rapide de 16 pouces. L'unité de base est très robuste, et seul le centre du clavier peut être enfoncé de façon minimale, sans que cela ne pose de problème dans le cadre d'une utilisation quotidienne. Le fin couvercle de l'écran est légèrement plus flexible, et les charnières continuent de permettre quelques oscillations visibles.
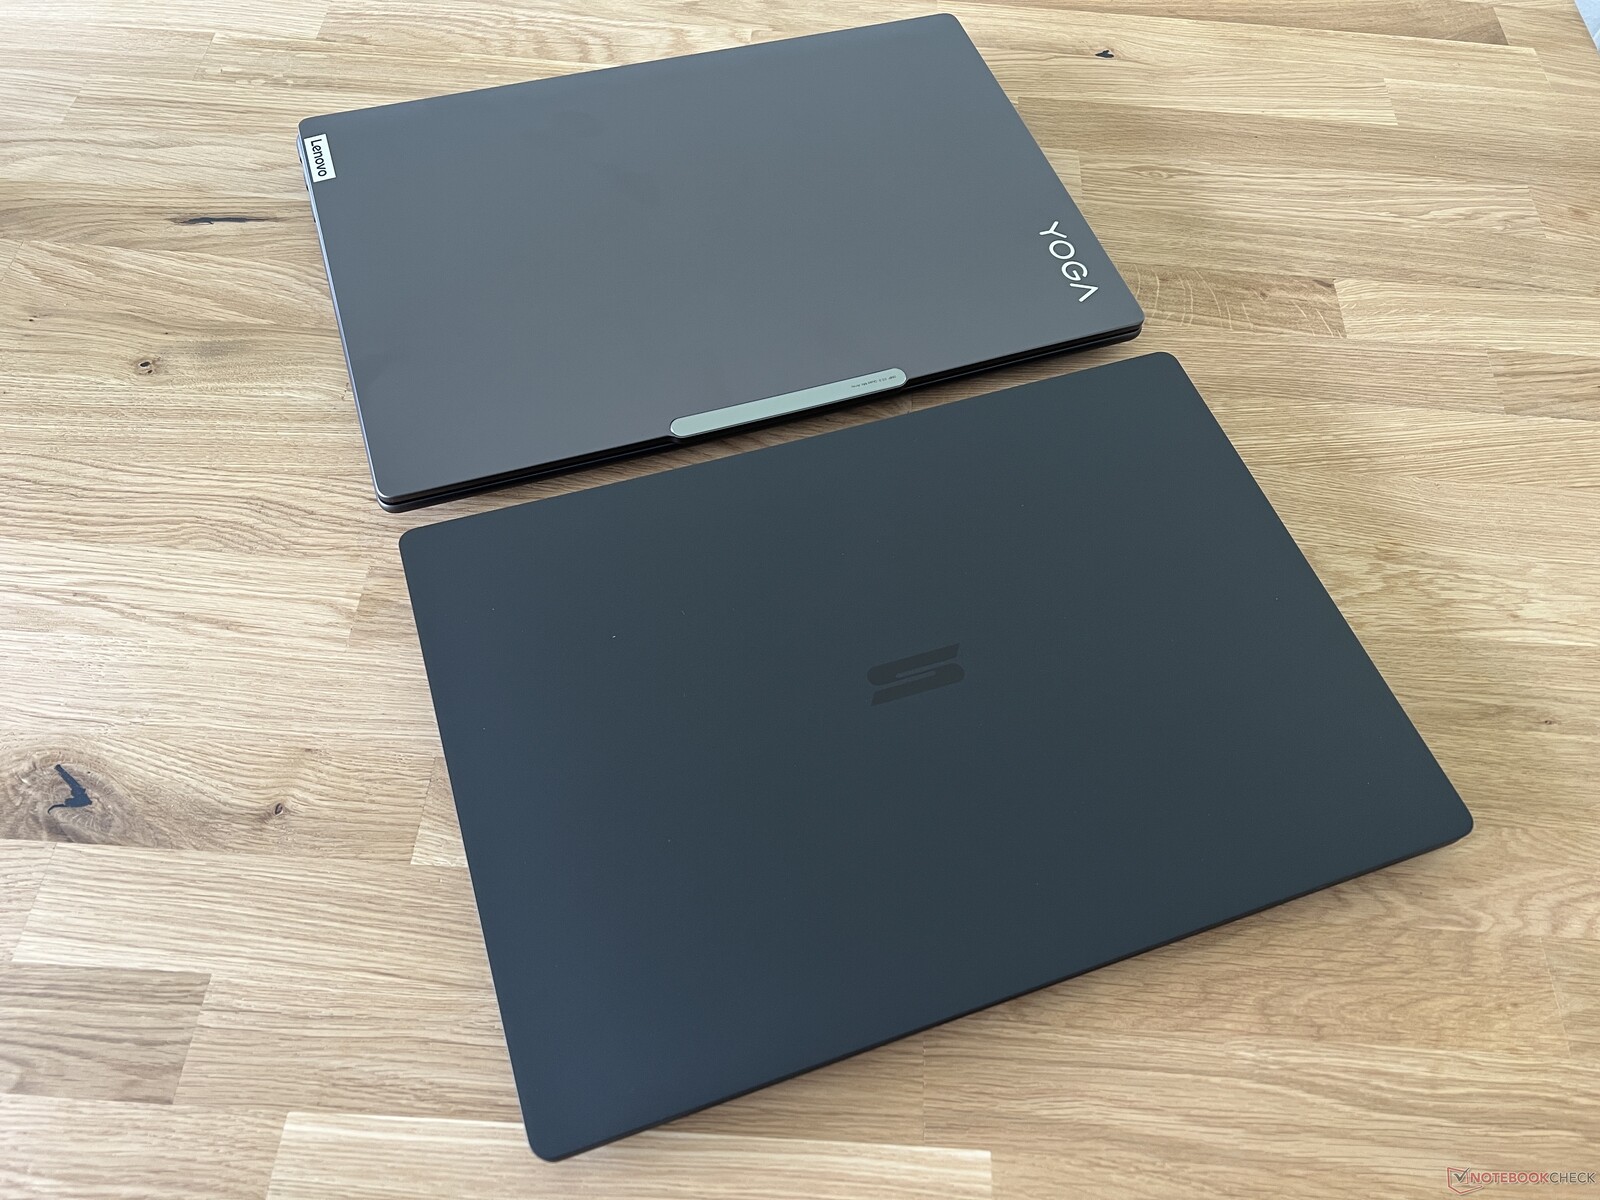
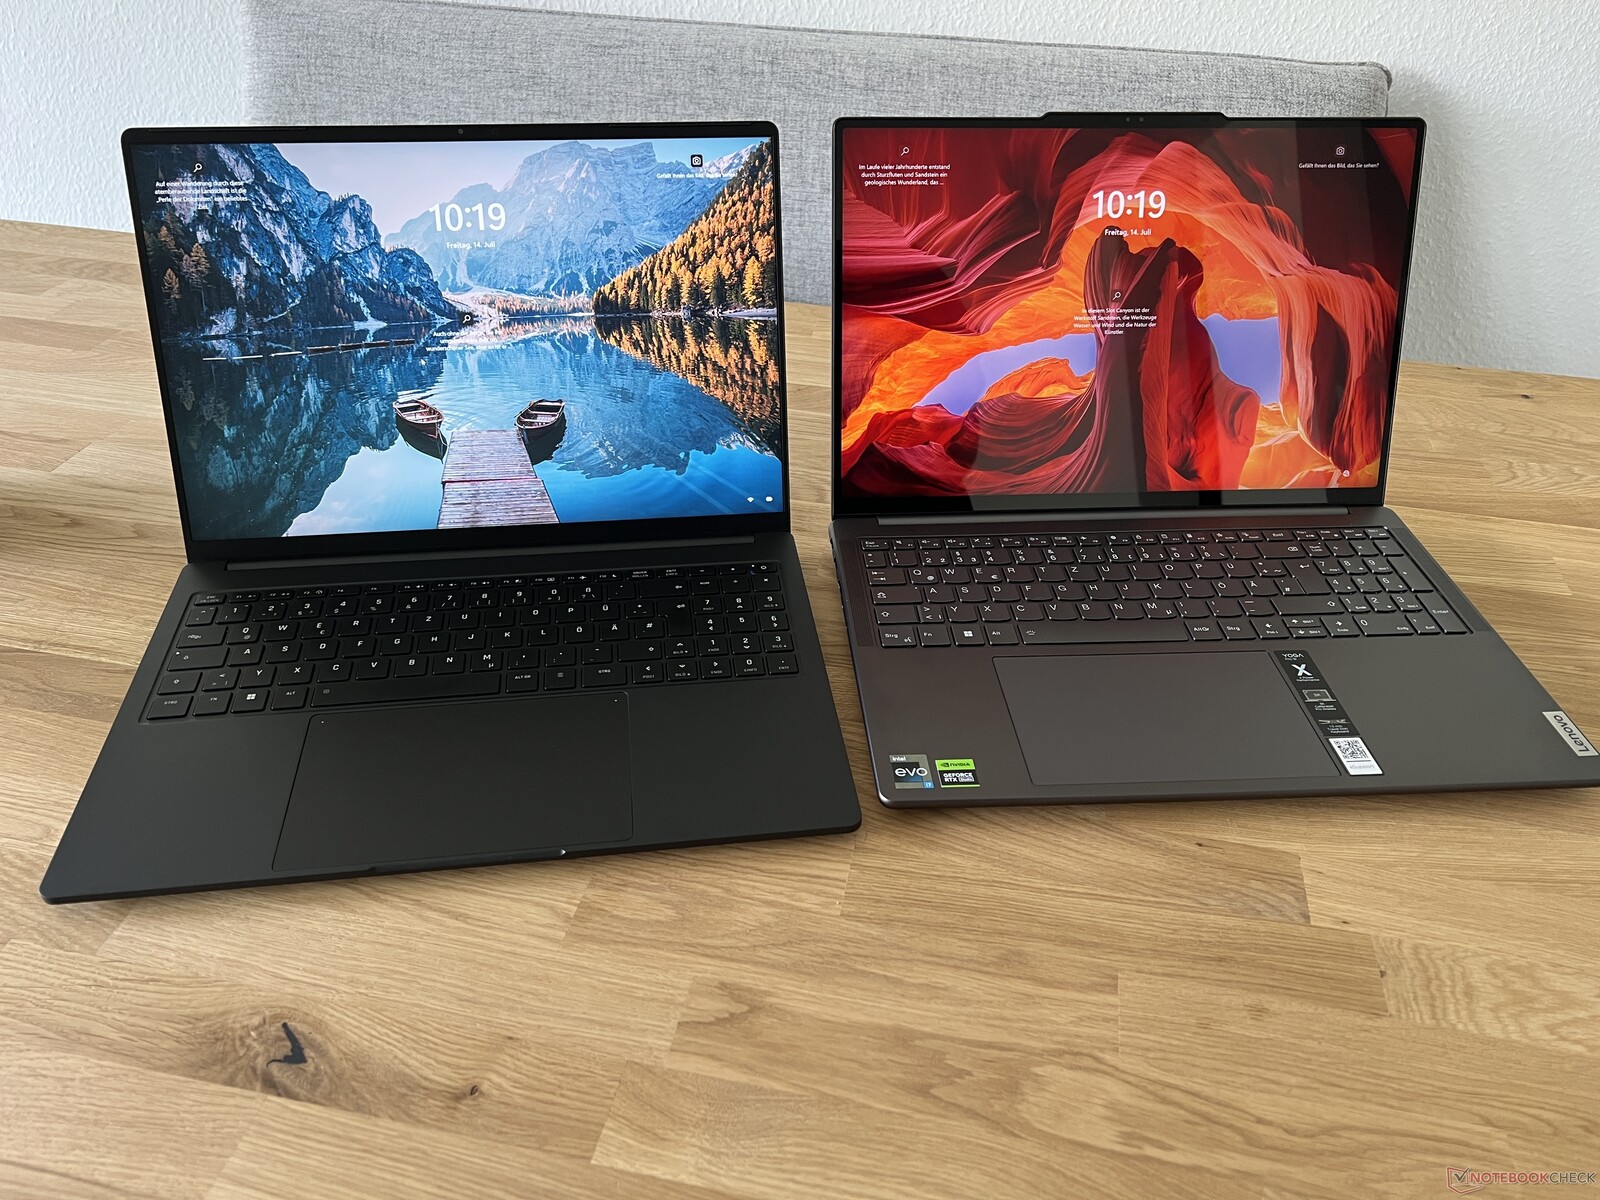
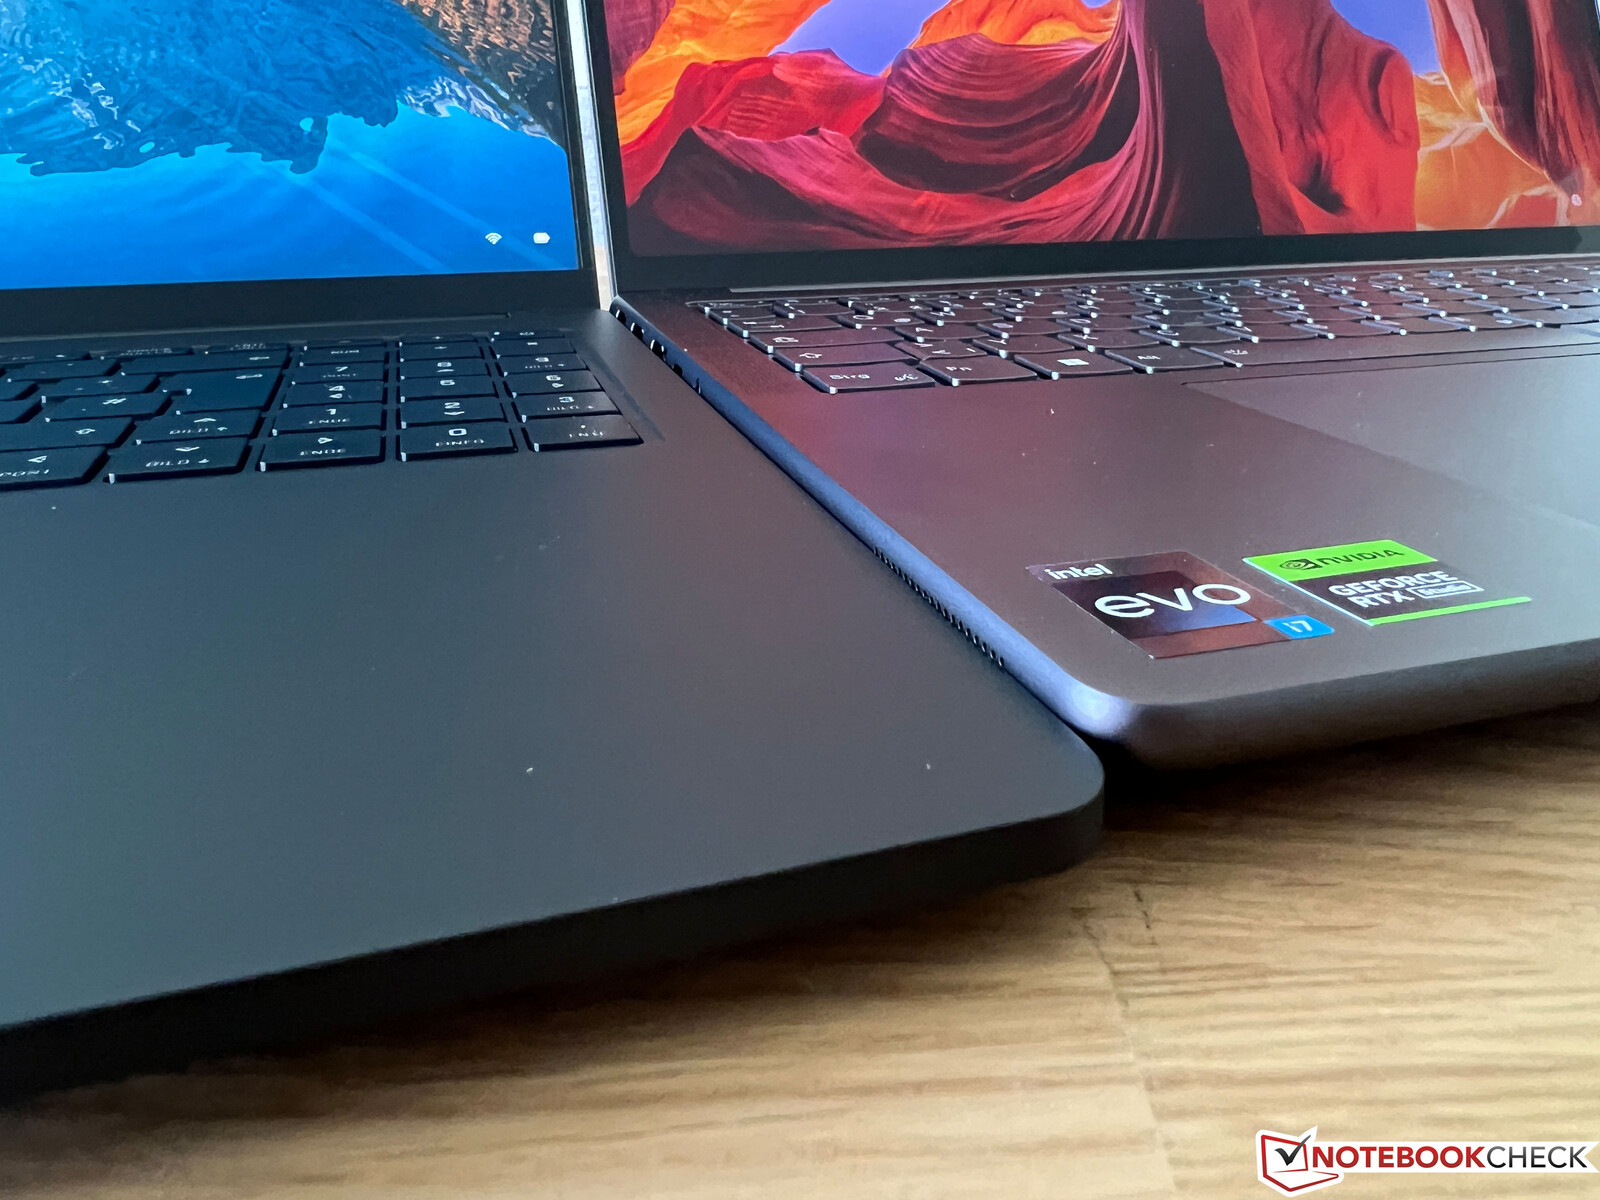
En termes de taille, le Vision 16 Pro est de loin l'ordinateur portable le plus compact et le plus léger à la fois. Nous avons également pris quelques photos de comparaison avec le nouveau Lenovo Yoga Pro 9 16, que nous testons également en ce moment. Leurs empreintes sont pratiquement identiques, mais vous pouvez voir la différence dans la hauteur, en particulier de l'unité de base.
Équipement - Thunderbolt et lecteur de cartes
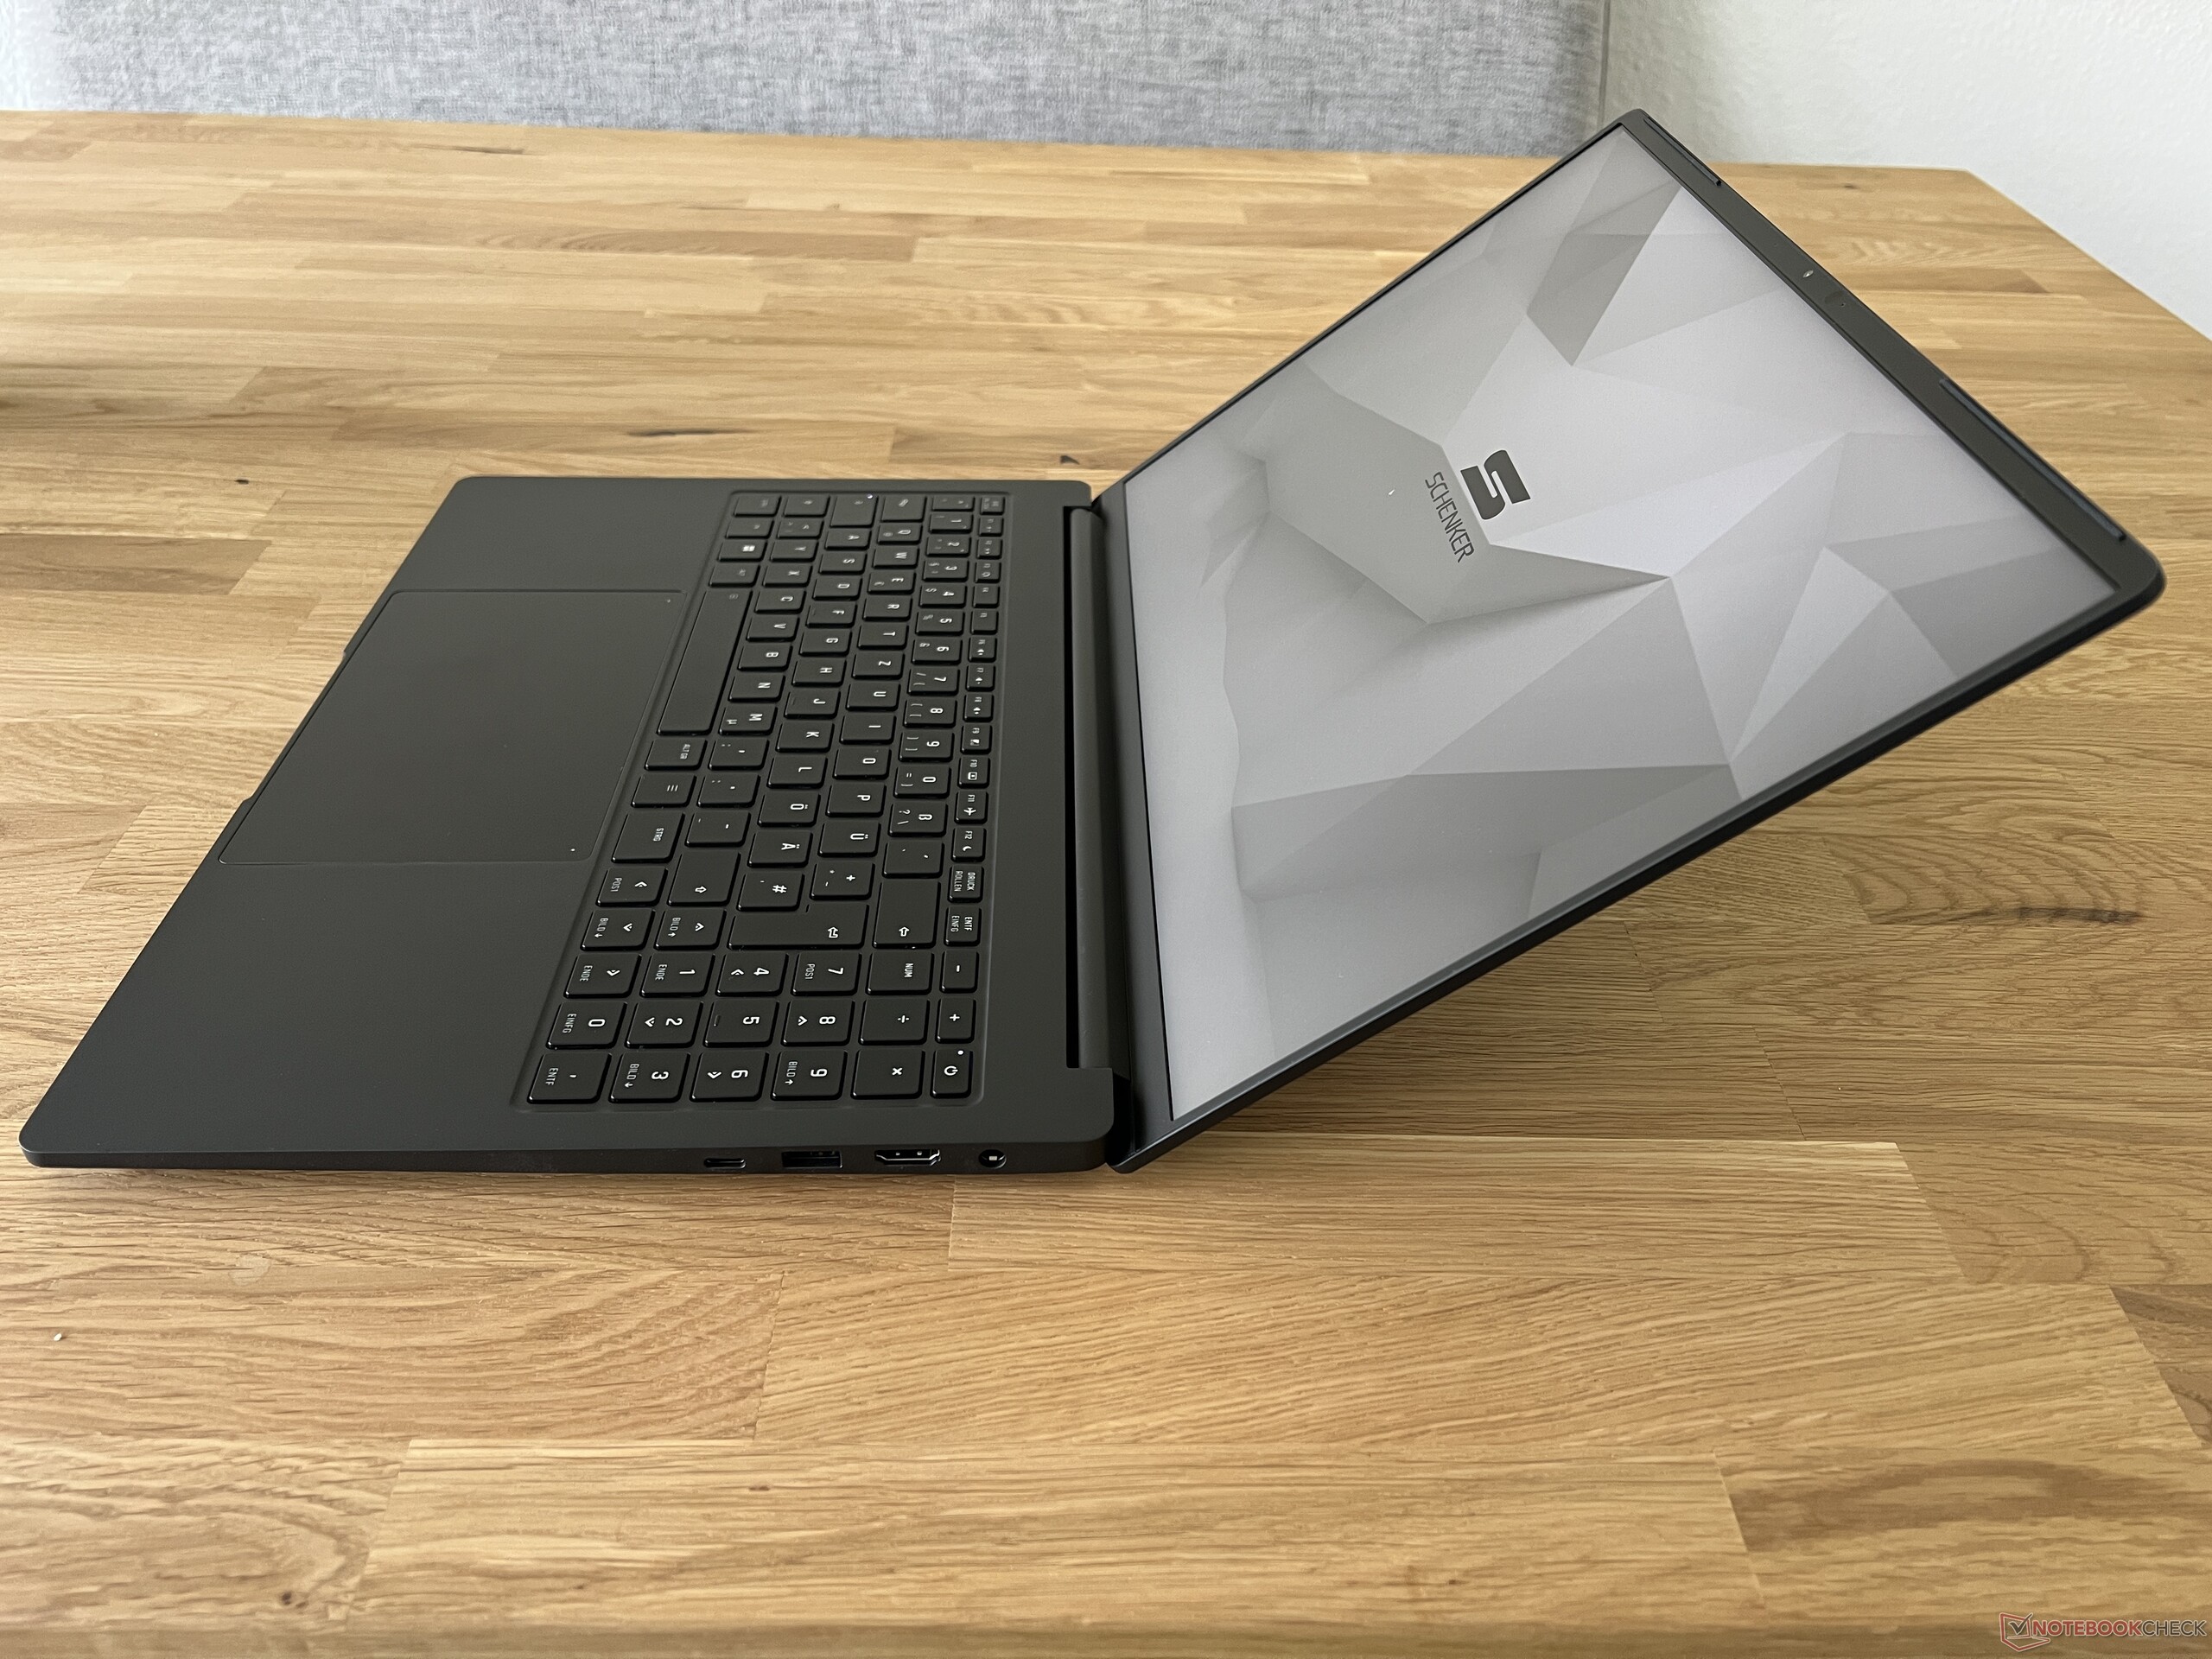
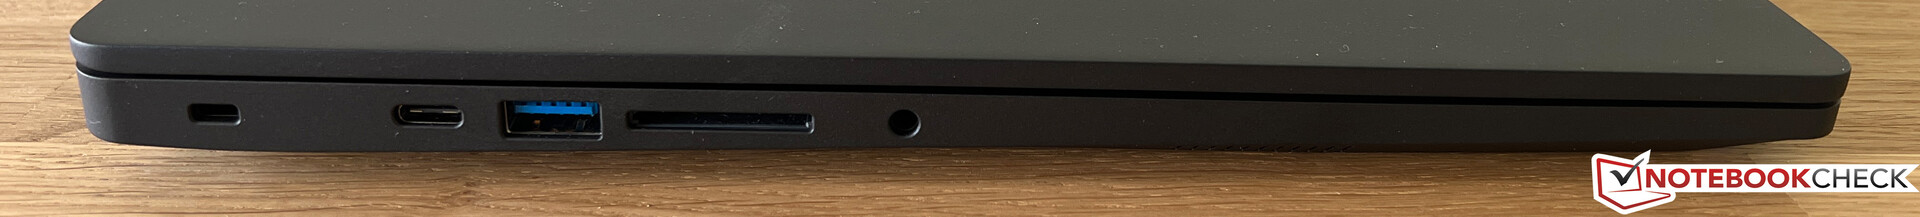
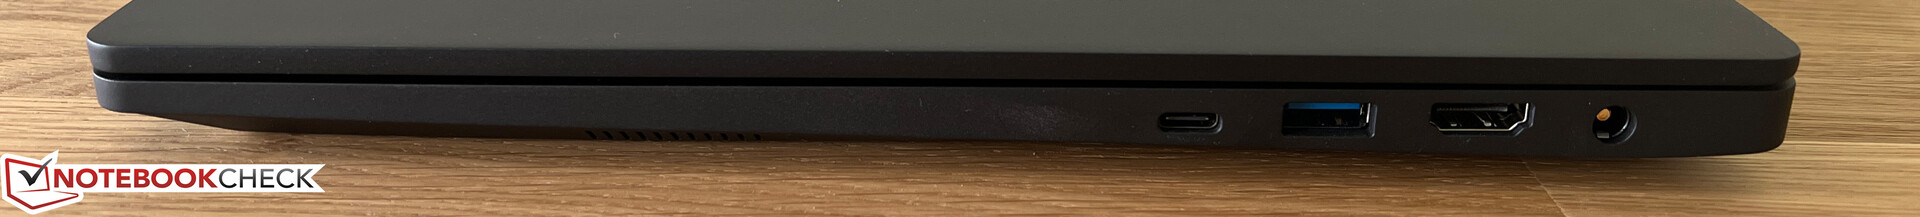
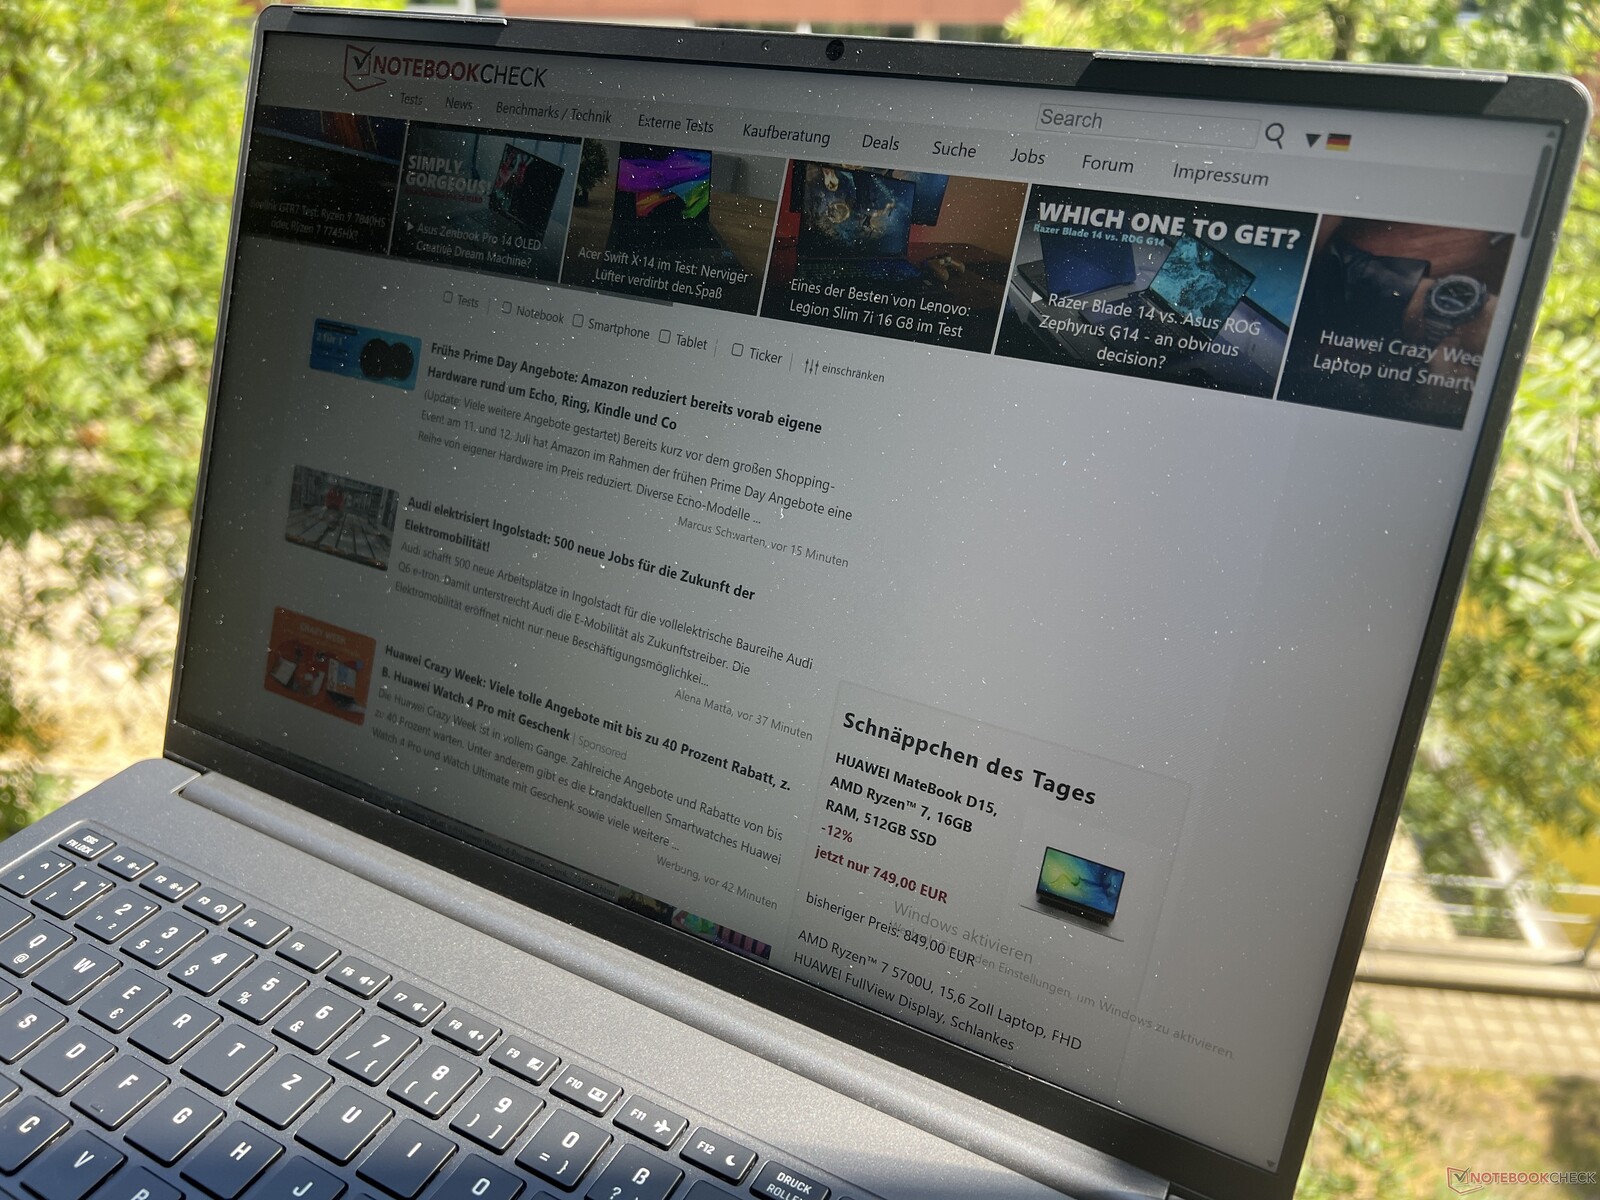
Malgré son boîtier mince, la Vision 16 Pro offre toutes les connexions importantes, y compris Thunderbolt 4 et 2x USB-A, ce qui rend les adaptateurs inutiles dans la pratique. Les connexions sont réparties sur les deux côtés et sont placées dans la zone arrière. En déplacement, il est également possible de recharger l'ordinateur portable via USB-C (min. 65 watts, max. 100 watts). Par rapport à celui du modèle de l'année dernière, le lecteur de cartes est devenu nettement plus lent, ce que nous avons testé avec deux cartes SD. Il faut également accepter quelques légers compromis dans le module WLAN, car la configuration de l'antenne du Vision 16 Pro ne prend pas en charge les réseaux à 6 GHz (Wi-Fi 6E). Le module AX201 d'Intel est toujours utilisé (Wi-Fi 6) et les taux de transfert sont très bons. La webcam 1080p réalise des enregistrements corrects dans des conditions de luminosité raisonnables. En outre, un module IR pour la reconnaissance faciale via Windows Hello est également présent.
| SD Card Reader | |
| average JPG Copy Test (av. of 3 runs) | |
| Apple MacBook Pro 16 2023 M2 Max (Angelbird AV Pro V60) | |
| MSI Stealth 16 Studio A13VG | |
| Dell XPS 15 9530 RTX 4070 (Toshiba Exceria Pro SDXC 64 GB UHS-II) | |
| Moyenne de la classe Multimedia (23 - 531, n=41, 2 dernières années) | |
| Schenker Vision 16 Pro RTX 3070 Ti (AV Pro V60) | |
| Samsung Galaxy Book3 Ultra 16, i9-13900H RTX 4070 (AV Pro SD microSD 128 GB V60) | |
| Asus ProArt Studiobook 16 OLED H7604 (Angelibird AV Pro V60) | |
| Schenker VISION 16 Pro (M23) (Angelbird AV Pro V60) | |
| maximum AS SSD Seq Read Test (1GB) | |
| Apple MacBook Pro 16 2023 M2 Max (Angelbird AV Pro V60) | |
| Moyenne de la classe Multimedia (37.3 - 1455, n=40, 2 dernières années) | |
| Dell XPS 15 9530 RTX 4070 (Toshiba Exceria Pro SDXC 64 GB UHS-II) | |
| MSI Stealth 16 Studio A13VG | |
| Samsung Galaxy Book3 Ultra 16, i9-13900H RTX 4070 (AV Pro SD microSD 128 GB V60) | |
| Asus ProArt Studiobook 16 OLED H7604 (Angelibird AV Pro V60) | |
| Schenker Vision 16 Pro RTX 3070 Ti (AV Pro V60) | |
| Schenker VISION 16 Pro (M23) (Angelbird AV Pro V60) | |
| Networking | |
| Schenker VISION 16 Pro (M23) | |
| iperf3 transmit AXE11000 | |
| iperf3 receive AXE11000 | |
| Samsung Galaxy Book3 Ultra 16, i9-13900H RTX 4070 | |
| iperf3 transmit AXE11000 | |
| iperf3 receive AXE11000 | |
| iperf3 transmit AXE11000 6GHz | |
| iperf3 receive AXE11000 6GHz | |
| MSI Stealth 16 Studio A13VG | |
| iperf3 transmit AXE11000 | |
| iperf3 receive AXE11000 | |
| iperf3 transmit AXE11000 6GHz | |
| iperf3 receive AXE11000 6GHz | |
| Dell XPS 15 9530 RTX 4070 | |
| iperf3 transmit AXE11000 | |
| iperf3 receive AXE11000 | |
| Asus ProArt Studiobook 16 OLED H7604 | |
| iperf3 transmit AXE11000 | |
| iperf3 receive AXE11000 | |
| Apple MacBook Pro 16 2023 M2 Max | |
| iperf3 transmit AXE11000 6GHz | |
| iperf3 receive AXE11000 6GHz | |
| Schenker Vision 16 Pro RTX 3070 Ti | |
| iperf3 transmit AXE11000 | |
| iperf3 receive AXE11000 | |

 GeForce RTX 4070 Laptop GPU, i7-13700H, Samsung 990 Pro 1 TB")
 GeForce RTX 4070 Laptop GPU, i7-13700H, Samsung 990 Pro 1 TB")
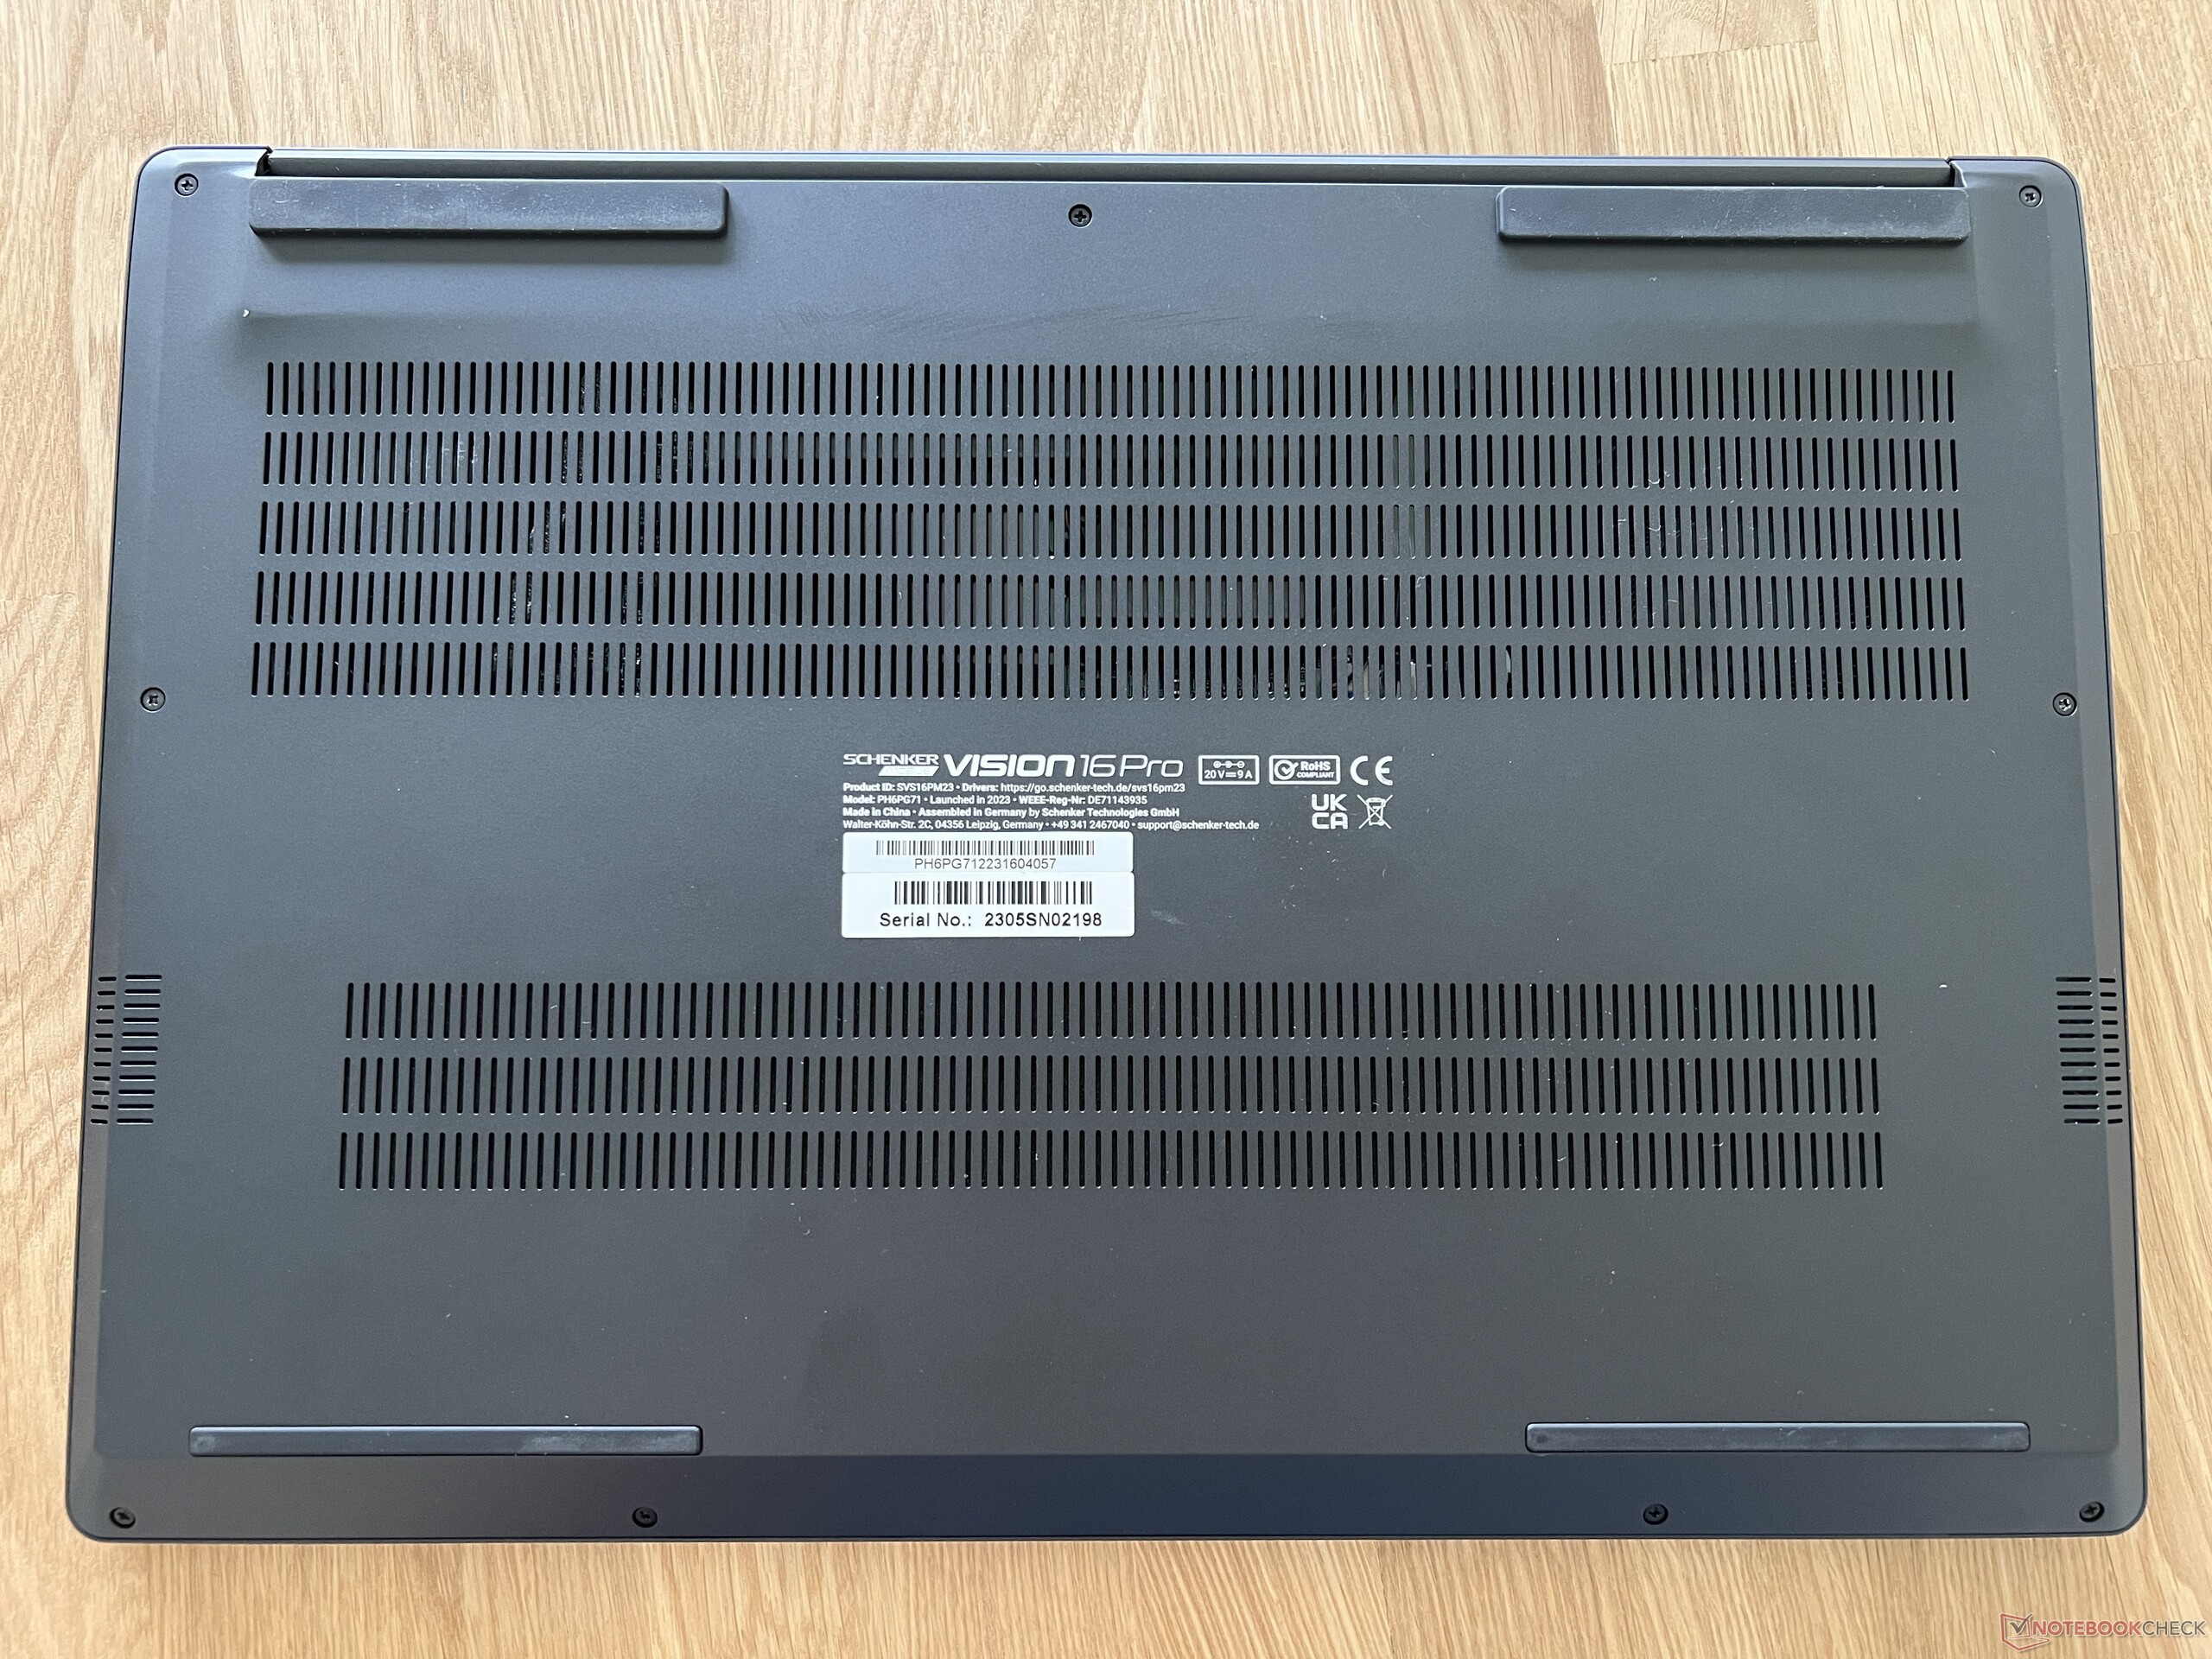
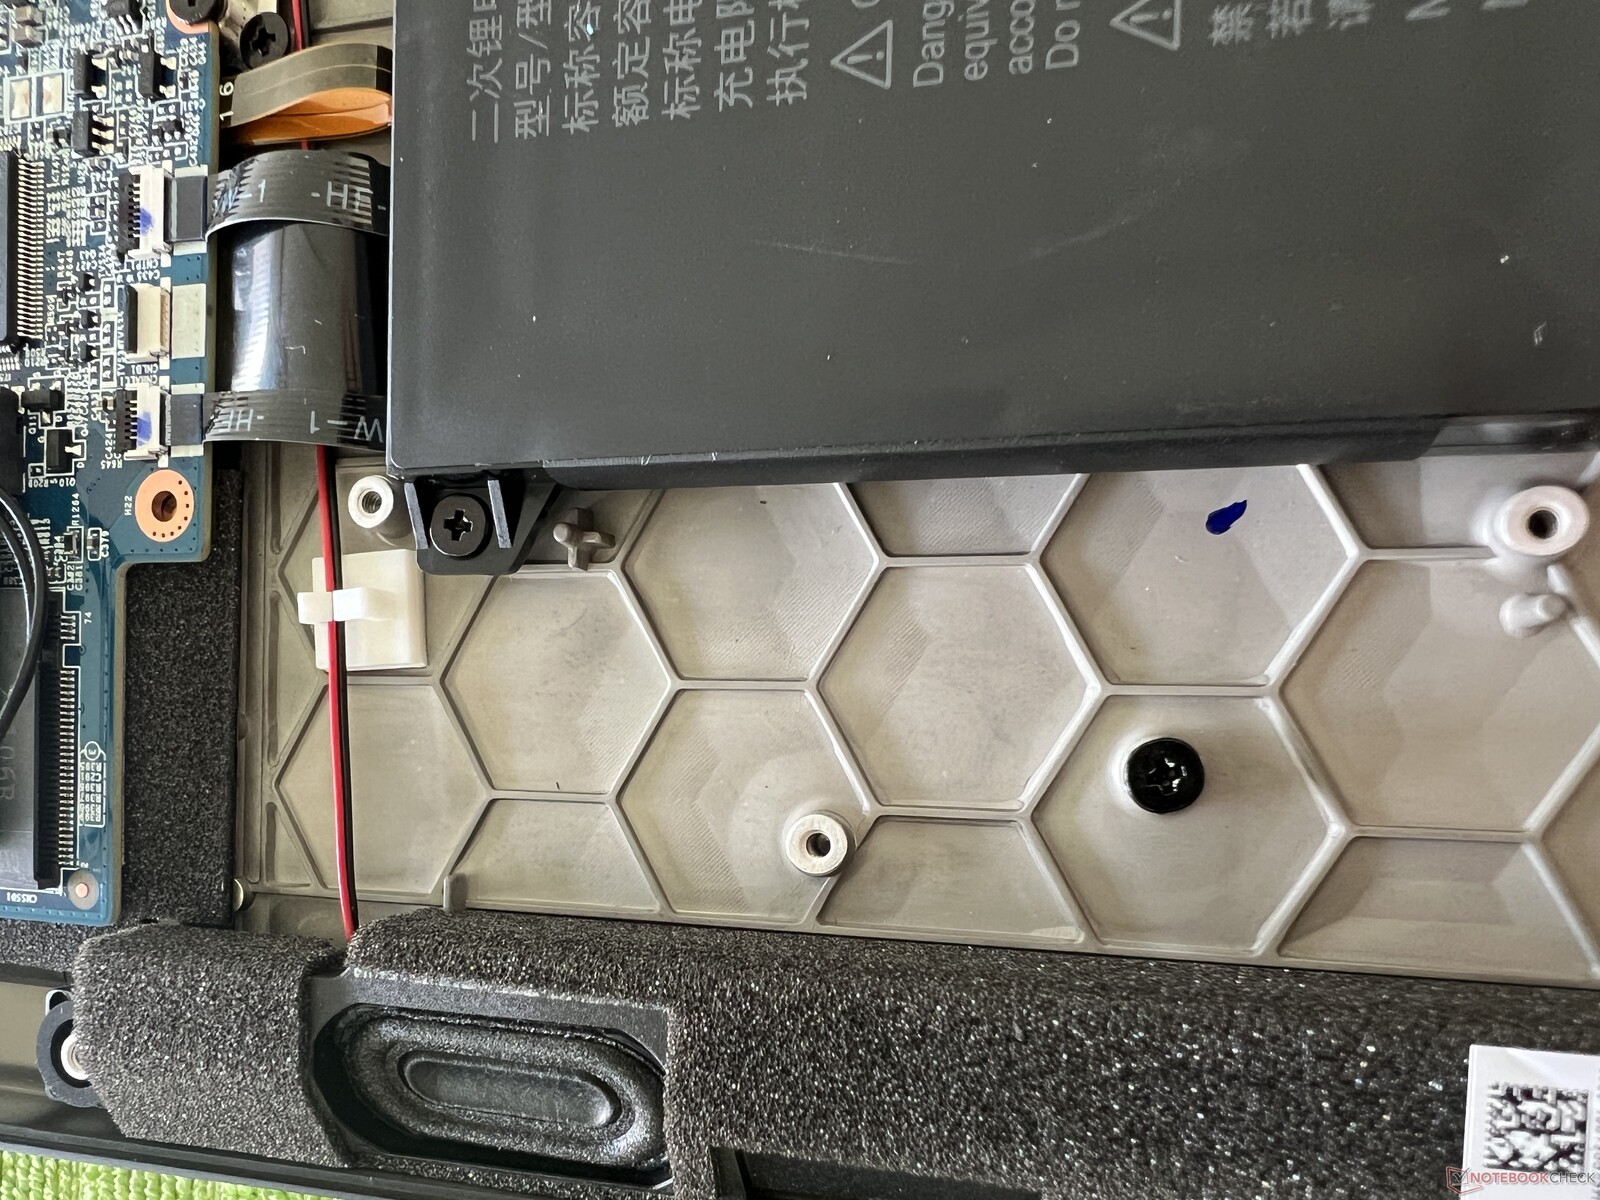
Maintenance
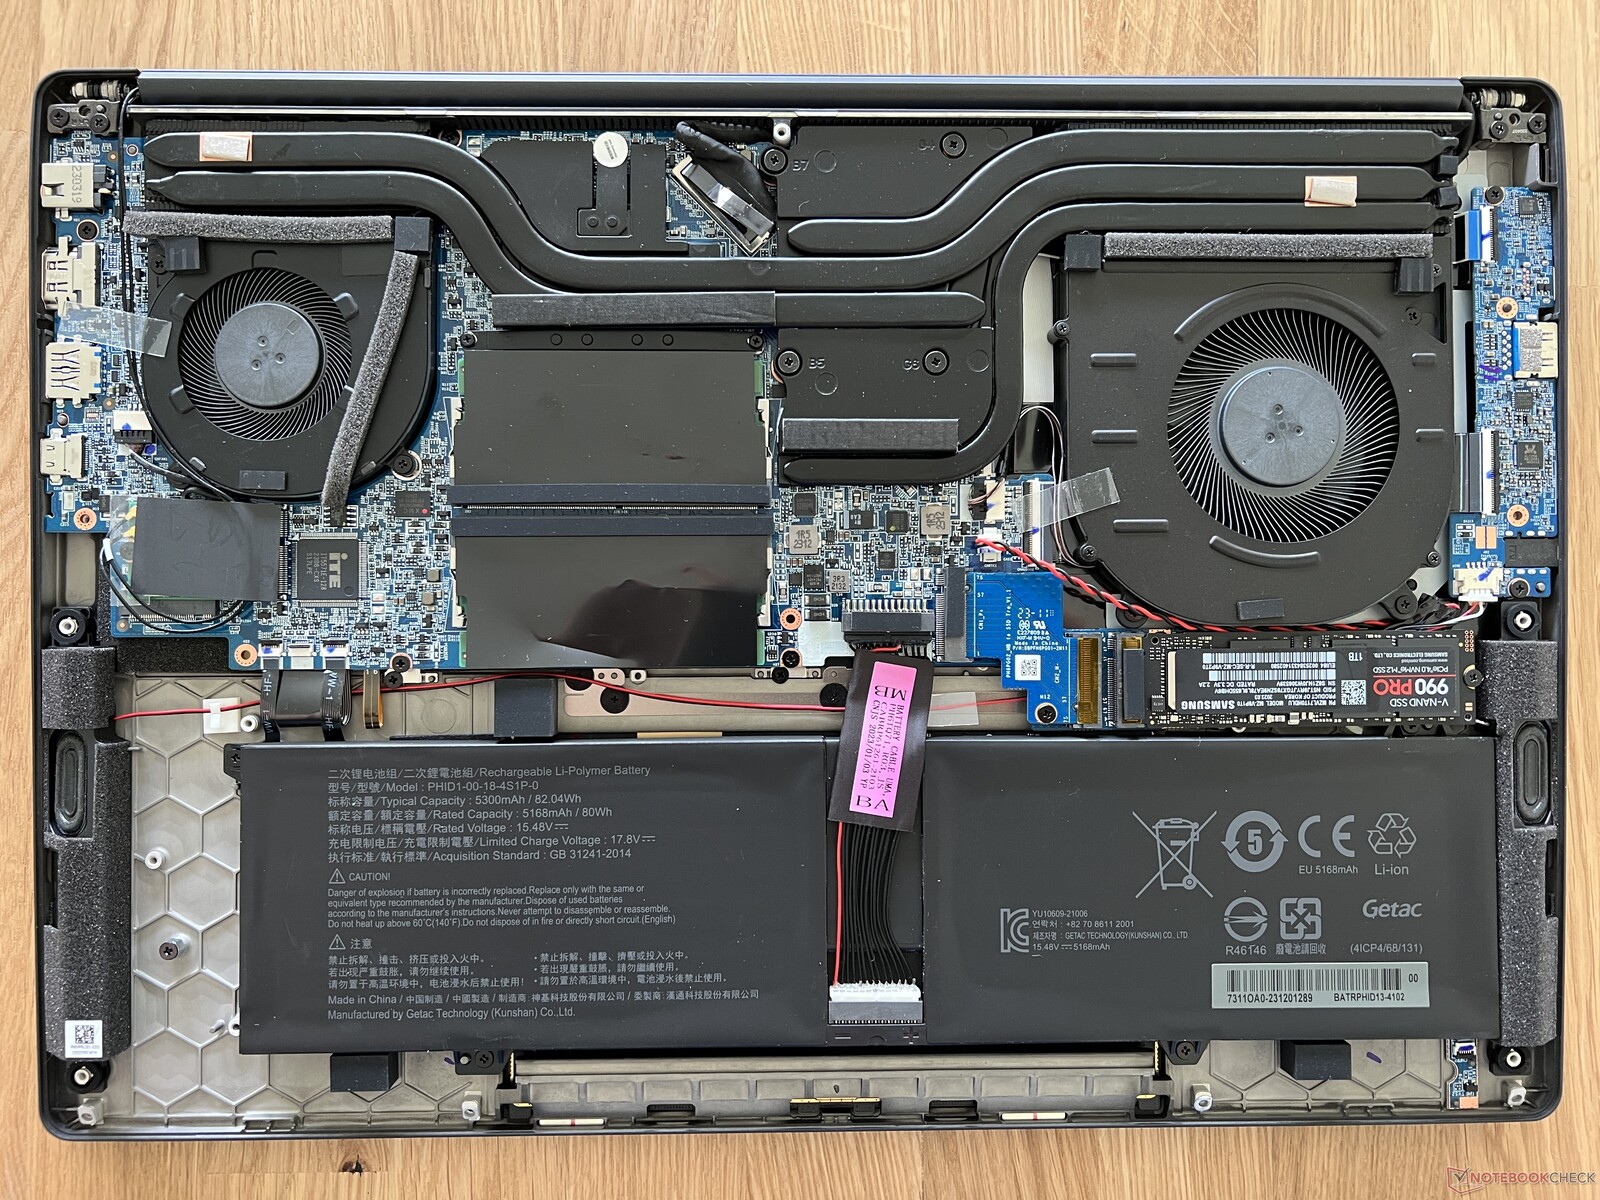
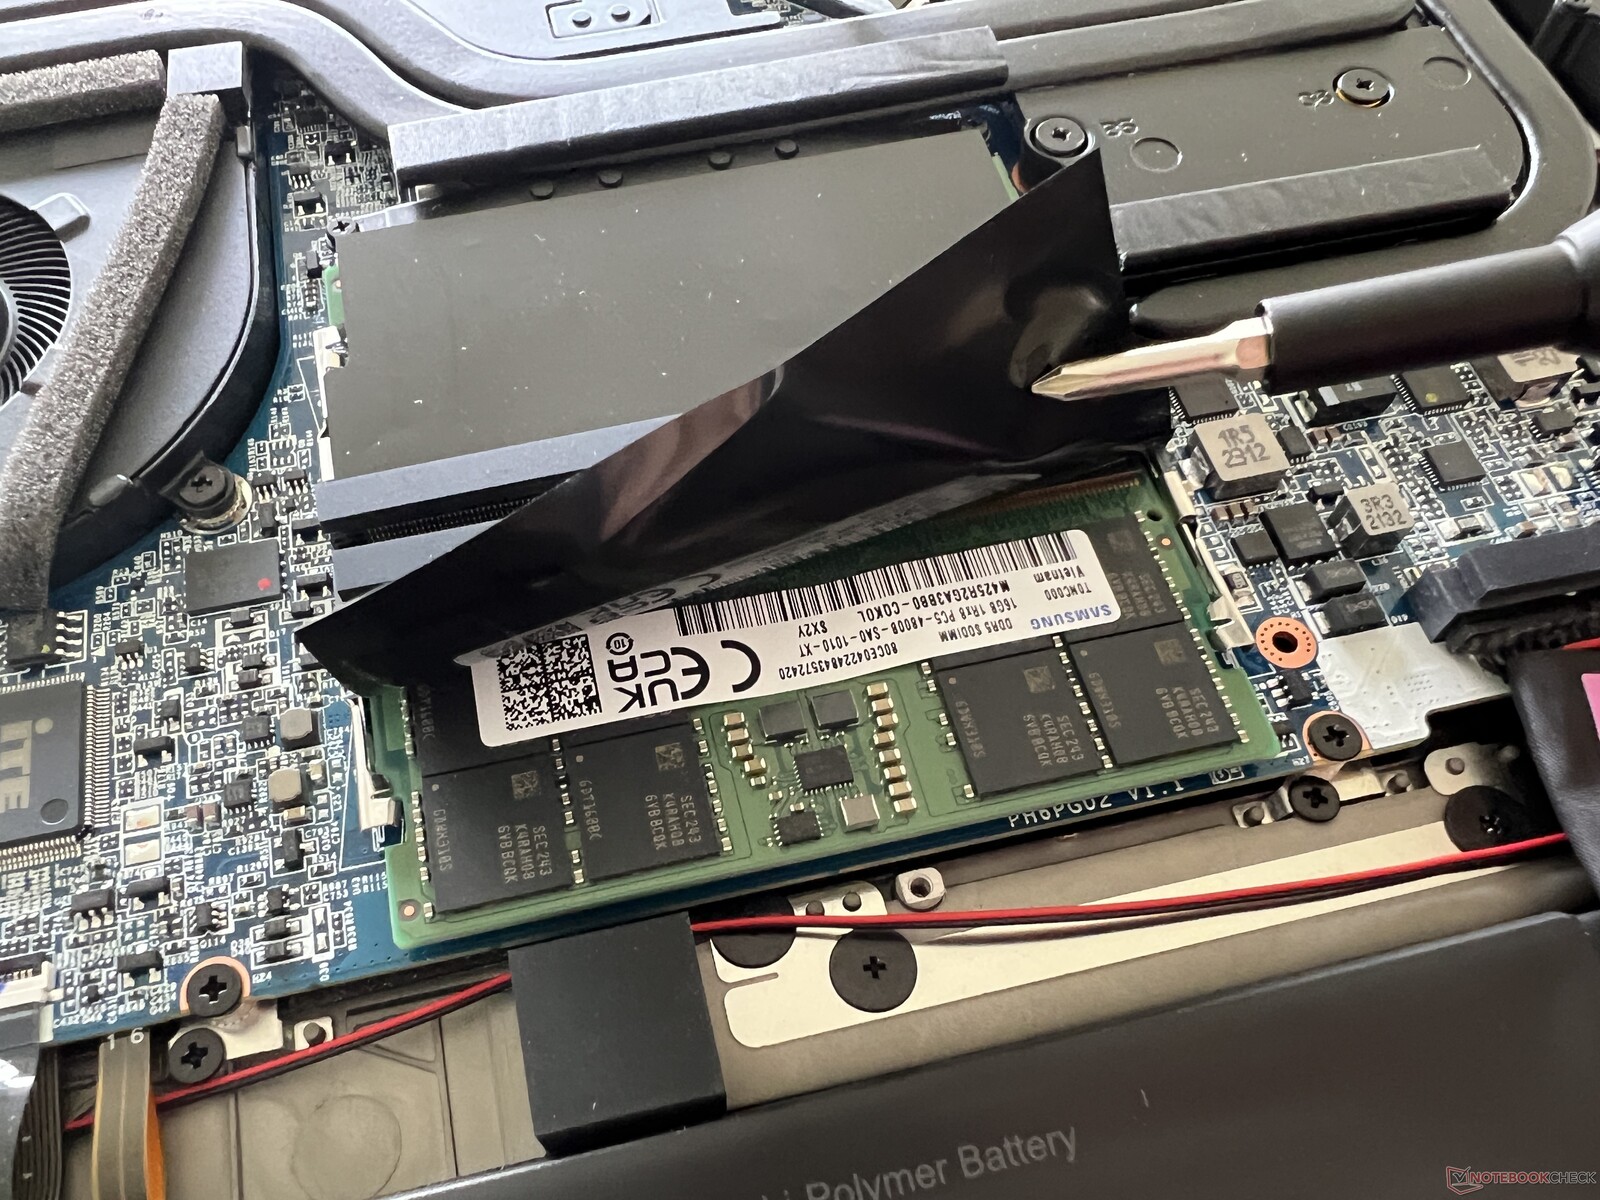
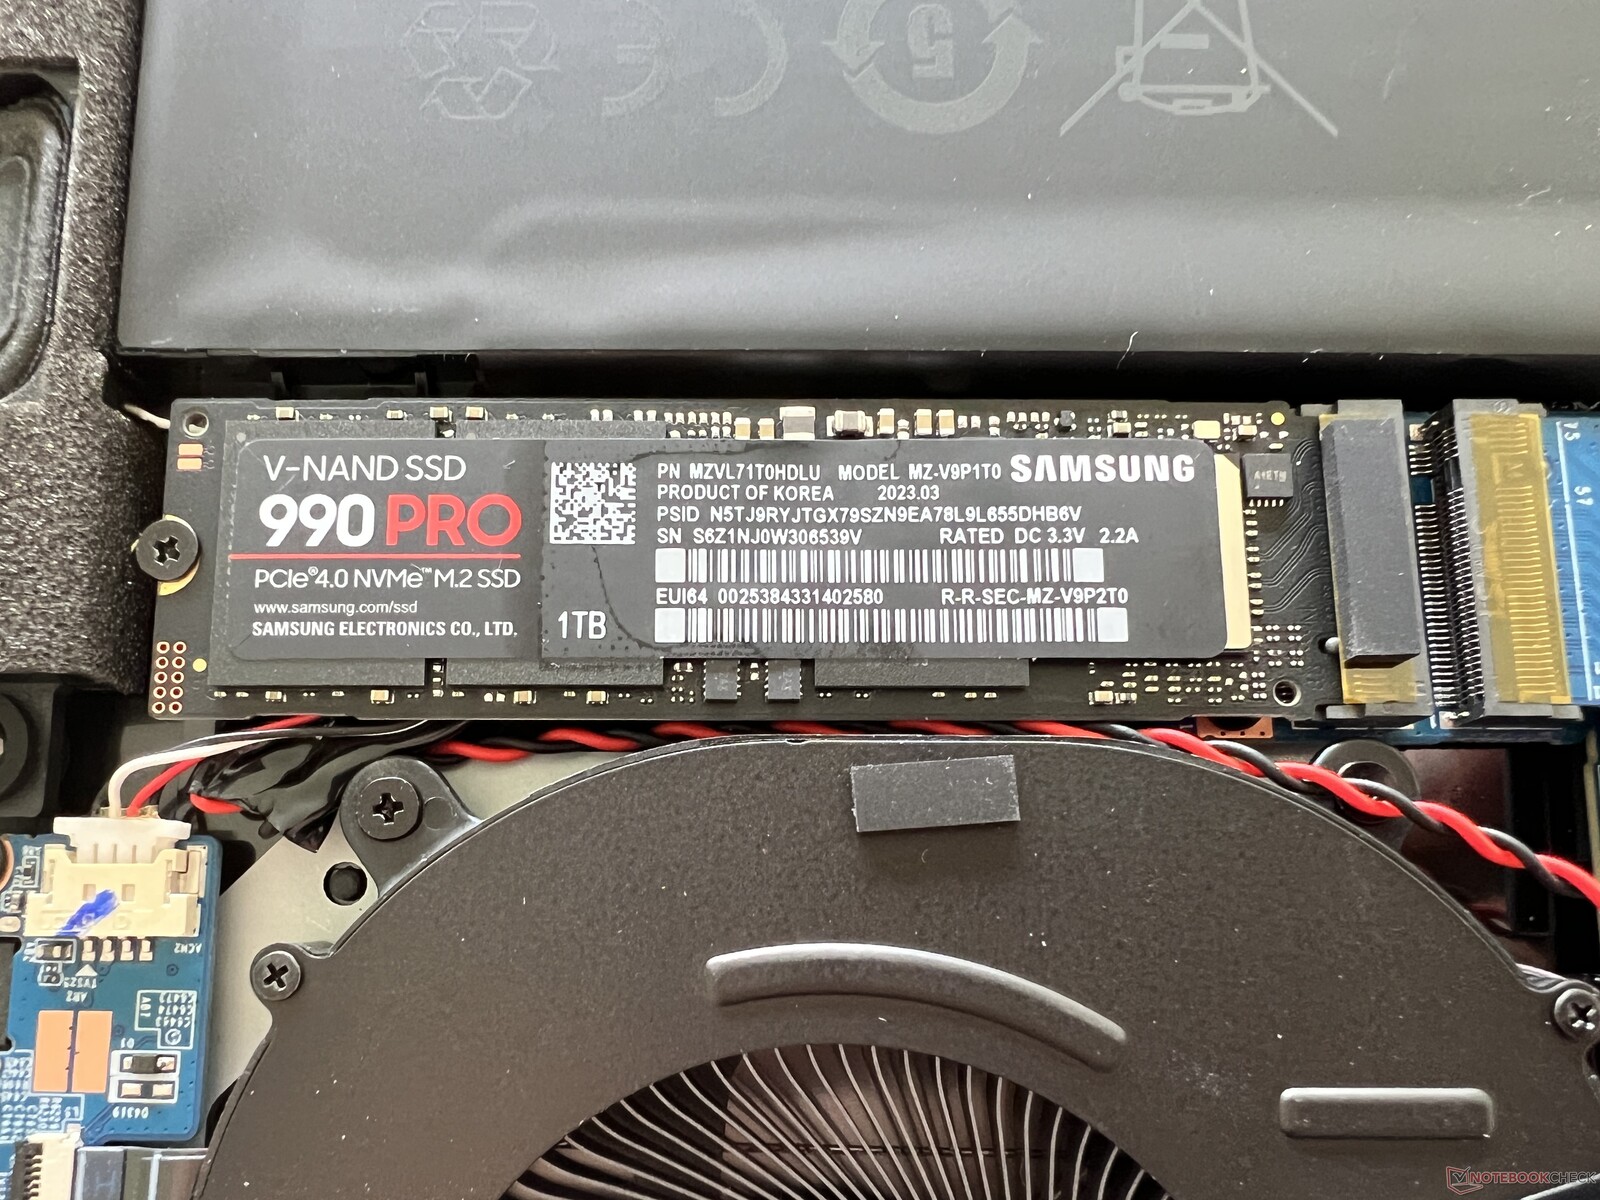
Le fond du boîtier est fixé à l'aide de quelques vis Phillips ordinaires et peut être facilement retiré. À l'intérieur, vous pouvez voir que, mis à part un léger changement dans le positionnement des caloducs, la configuration est pratiquement identique. Les utilisateurs ont accès aux deux ventilateurs, aux emplacements SO-DIMM et aux deux emplacements pour les disques SSD M.2 2280. Seul un deuxième disque SSD unilatéral est pris en charge.
Périphériques d'entrée - Grand pavé numérique et bloc numérique
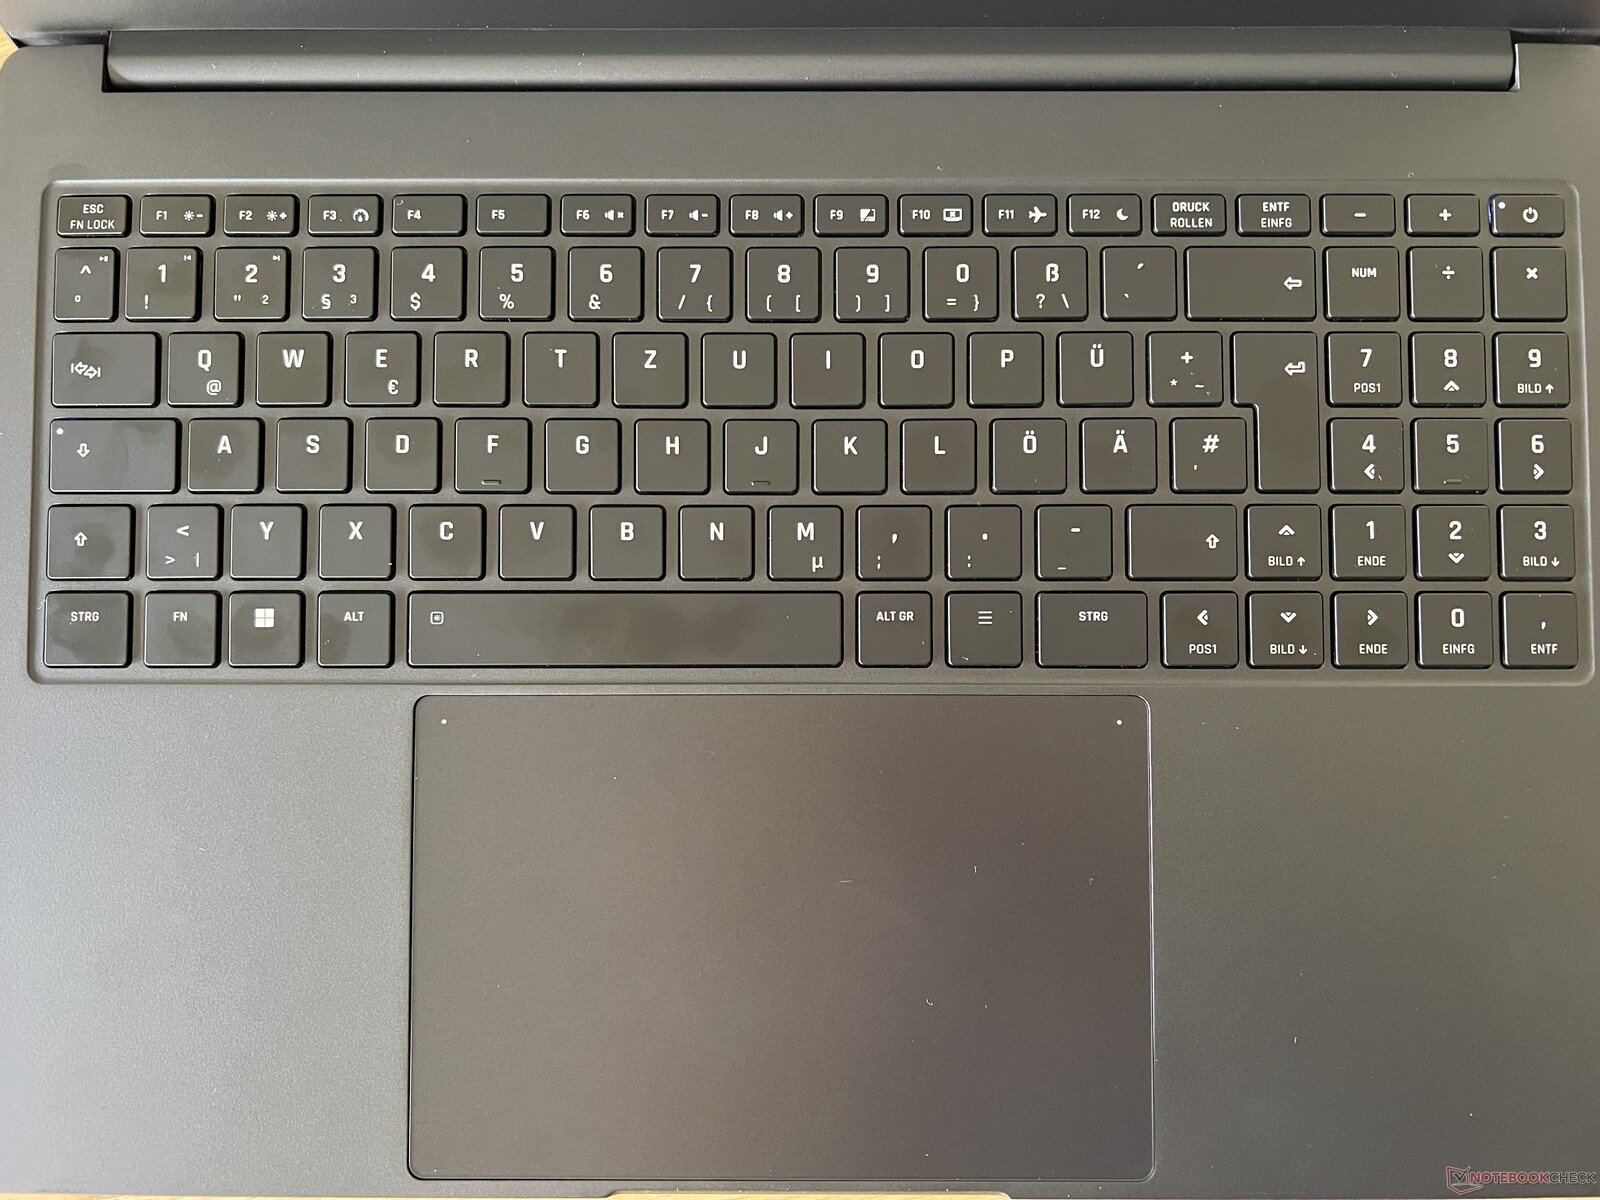
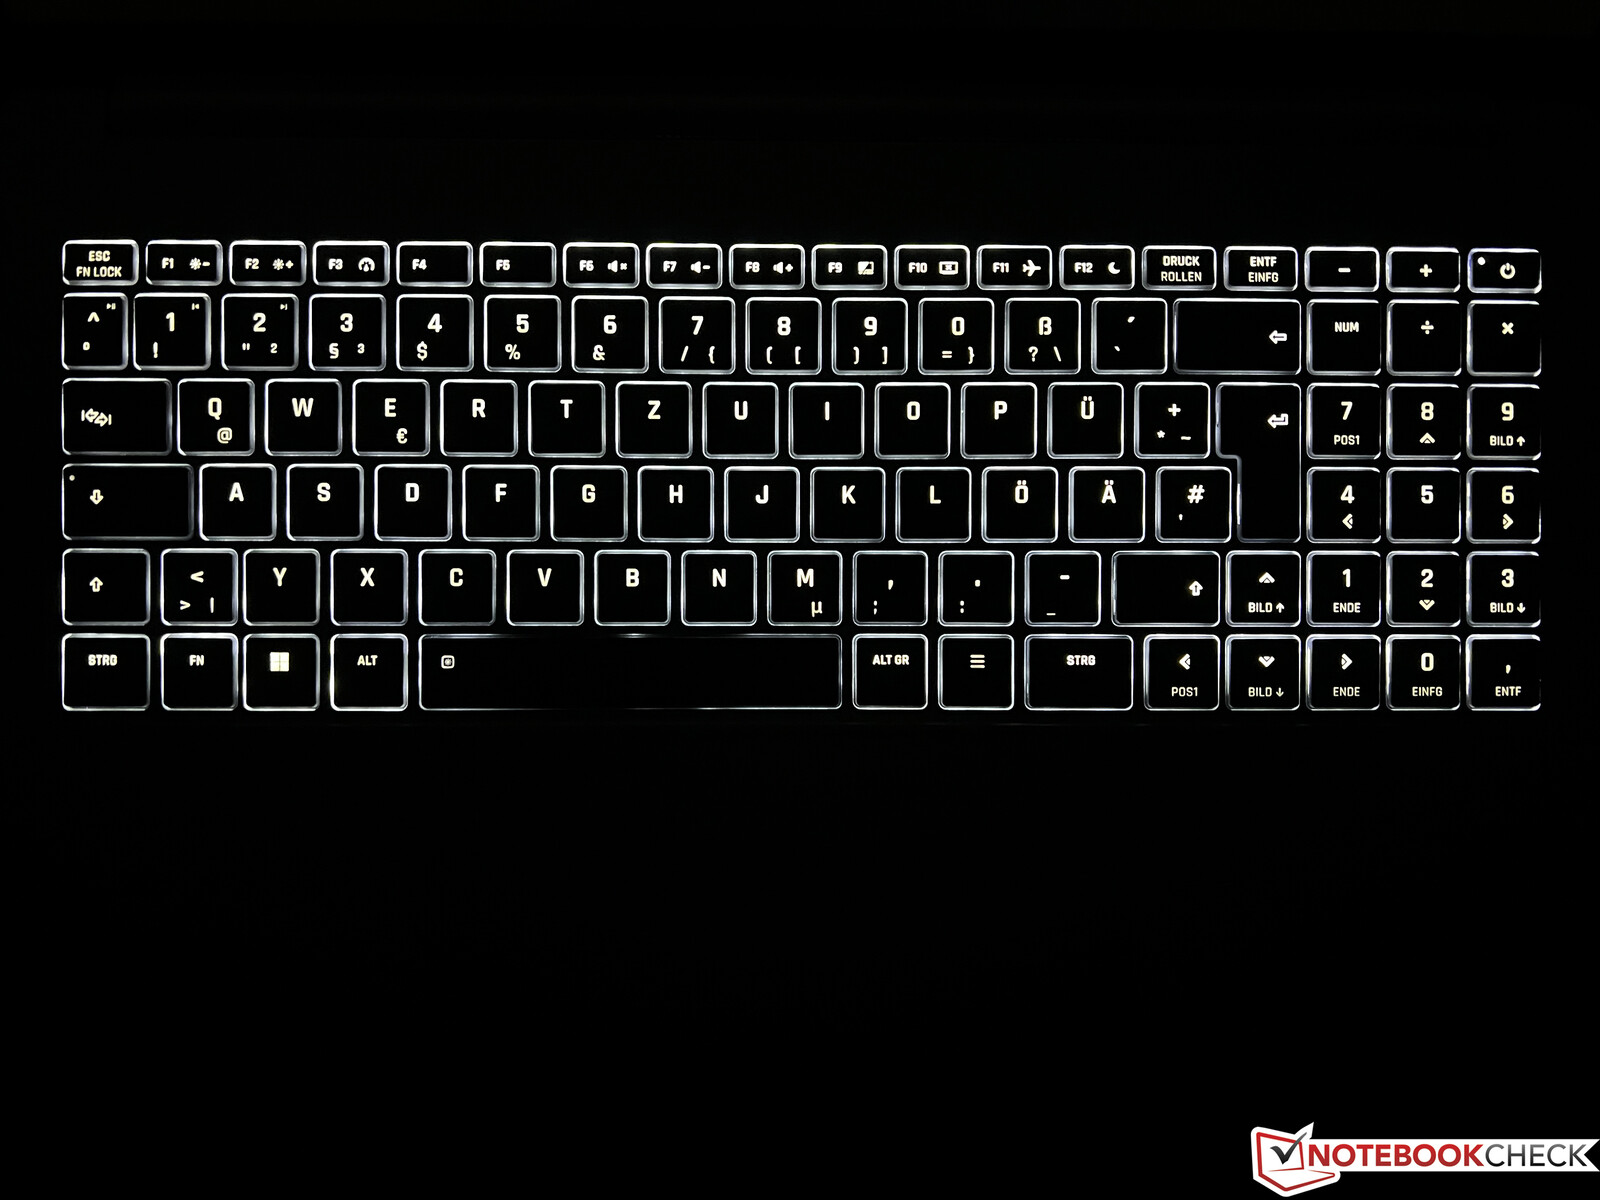
Le clavier pleine grandeur offre un bloc numérique dédié et de grandes touches fléchées, mais cela signifie également qu'il n'y a pas de touche Entrée supplémentaire et que la taille de la touche Majuscule est réduite. Dans l'ensemble, le clavier est très précis et confortable, et les frappes sont également silencieuses, seules les touches Espace et Entrée étant légèrement plus bruyantes. Dans les environnements sombres, l'éclairage blanc à deux niveaux du clavier est utile. L'énorme ClickPad en verre (15,4 x 10 cm, ~6 x 4 in) peut être utilisé facilement et offre beaucoup d'espace pour les gestes et les mouvements du curseur. Seuls les bruits de clics sont un peu forts.
Écran - Panneau WQHD avec 240 Hz
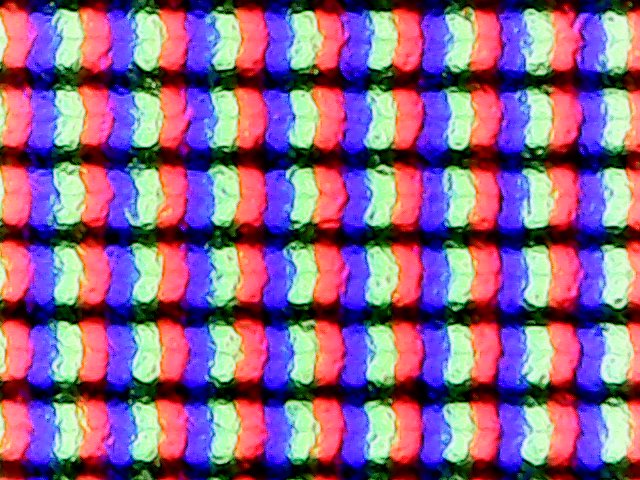
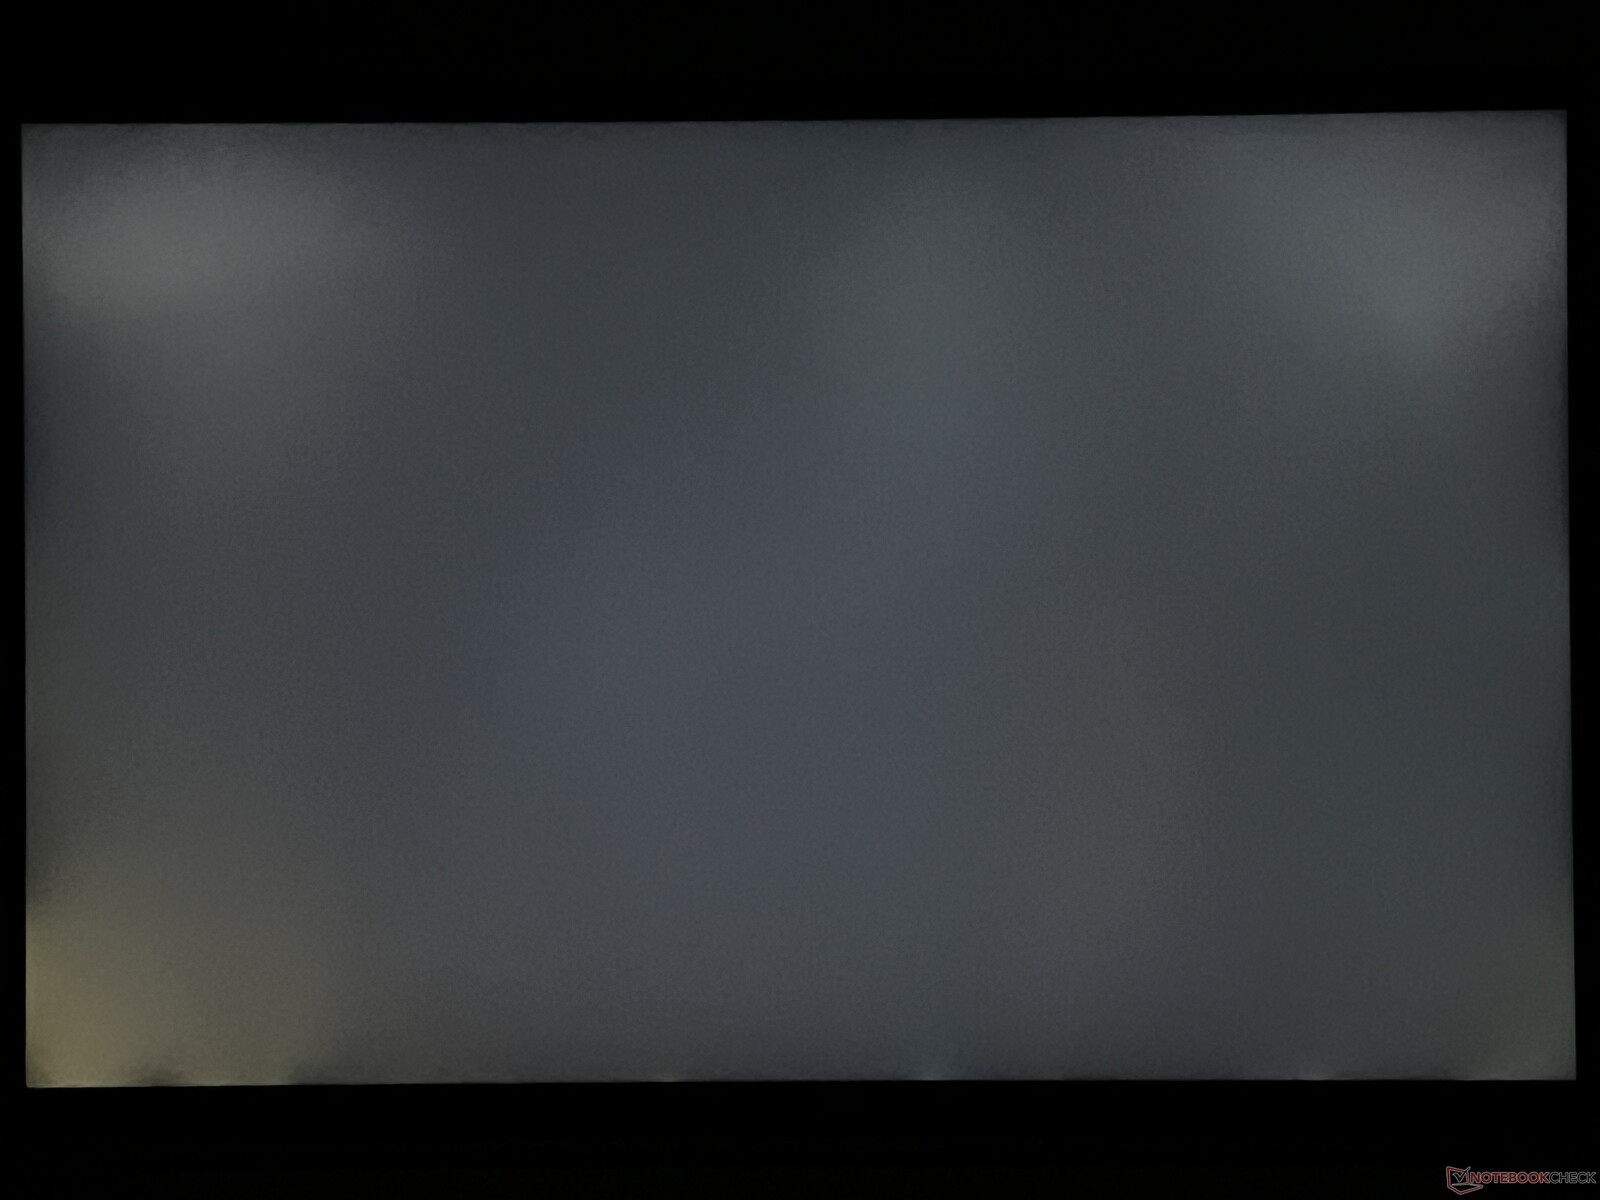
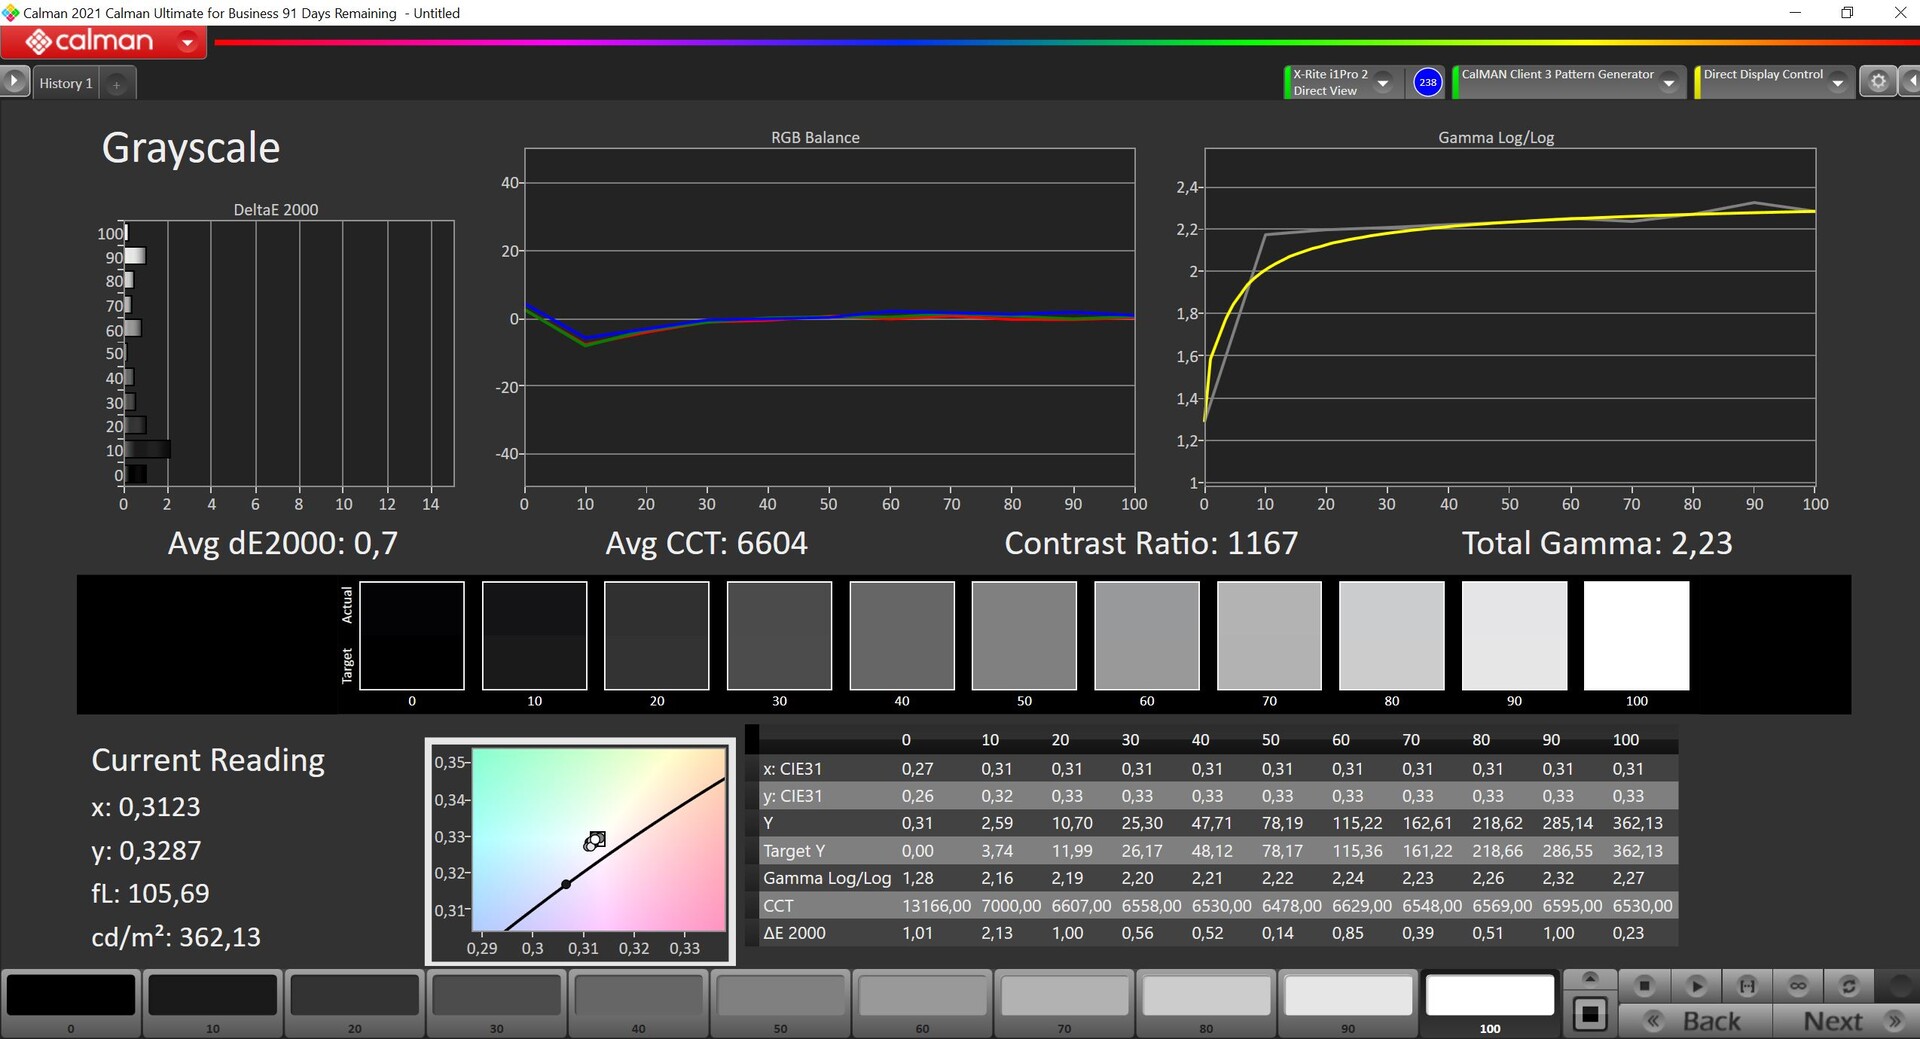
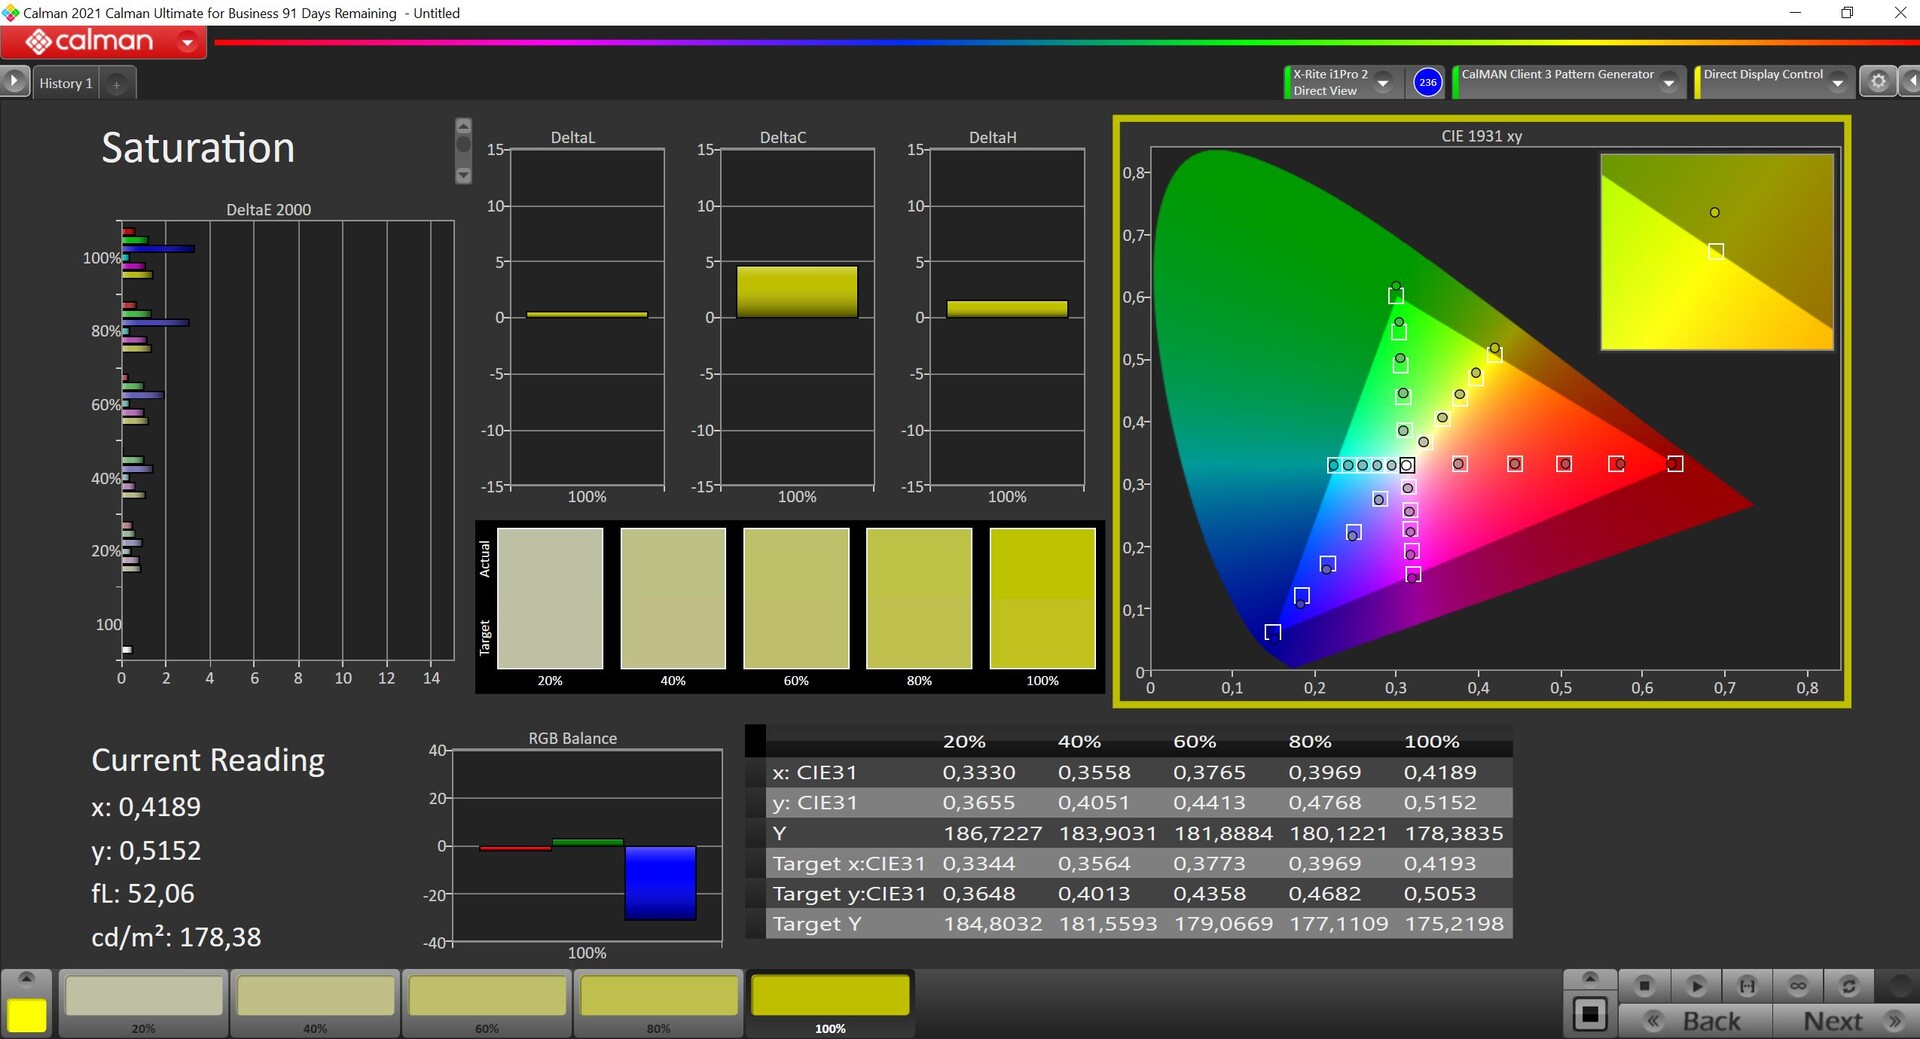
L'écran n'a pas changé et reste un écran WQHD mat avec une résolution de 2 560 x 1 600 pixels et un taux de rafraîchissement de 240 Hz. L'impression subjective de l'image est très bonne, puisque même les zones lumineuses sont affichées sans aucune granulation. La luminosité de l'écran (NE160QDM-NZ1) est spécifiée à 350 cd/m², et notre écran dépasse même légèrement cette valeur avec une moyenne de 370 cd/m². La valeur noire est de 0,3 cd/m², ce qui donne un bon rapport de contraste de plus de 1 200:1.
Le taux de rafraîchissement de 240 Hz donne une impression de fluidité lors des mouvements, et les temps de réponse sont également rapides. Les halos lumineux ne sont visibles que dans les images sombres à pleine luminosité, mais ce n'est pas un problème dans la pratique. Le PWM n'est pas utilisé.
| |||||||||||||||||||||||||
Homogénéité de la luminosité: 88 %
Valeur mesurée au centre, sur batterie: 384 cd/m²
Contraste: 1280:1 (Valeurs des noirs: 0.3 cd/m²)
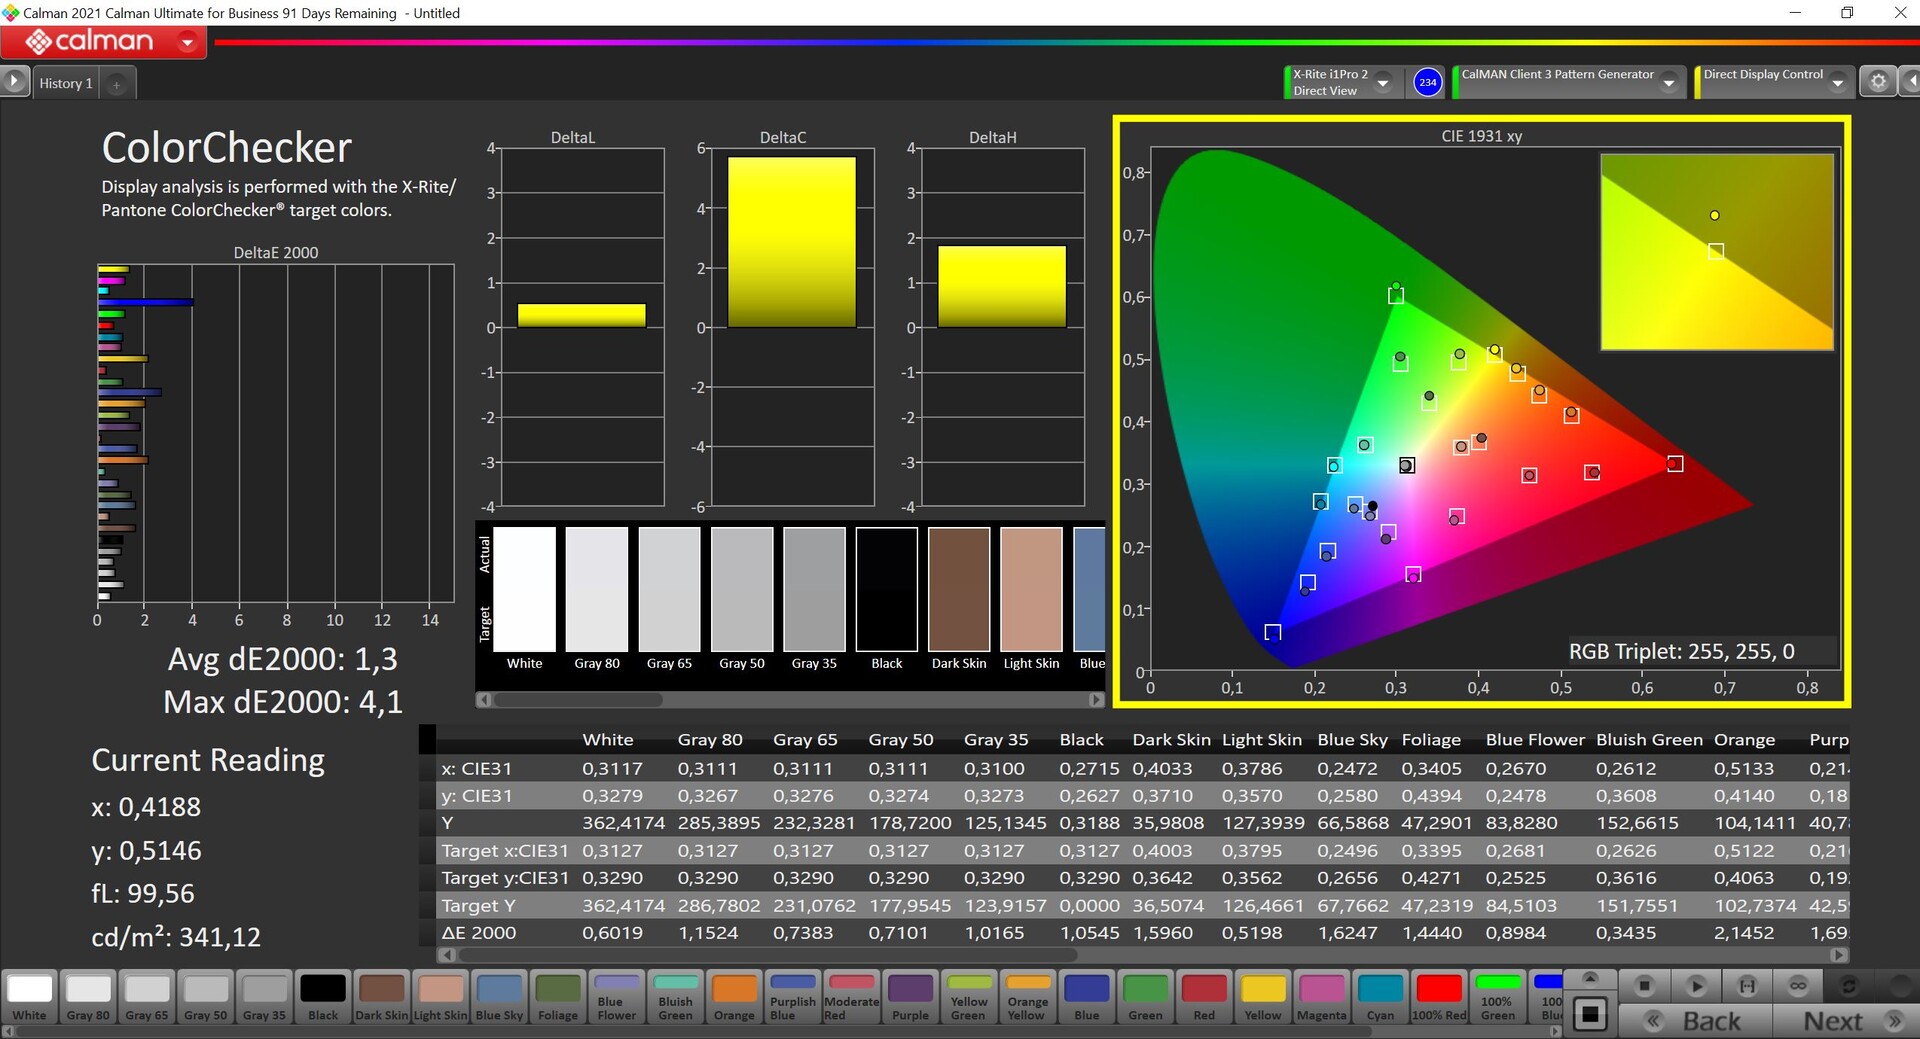
ΔE ColorChecker Calman: 3.4 | ∀{0.5-29.43 Ø4.72}
calibrated: 1.3
ΔE Greyscale Calman: 3.4 | ∀{0.09-98 Ø4.97}
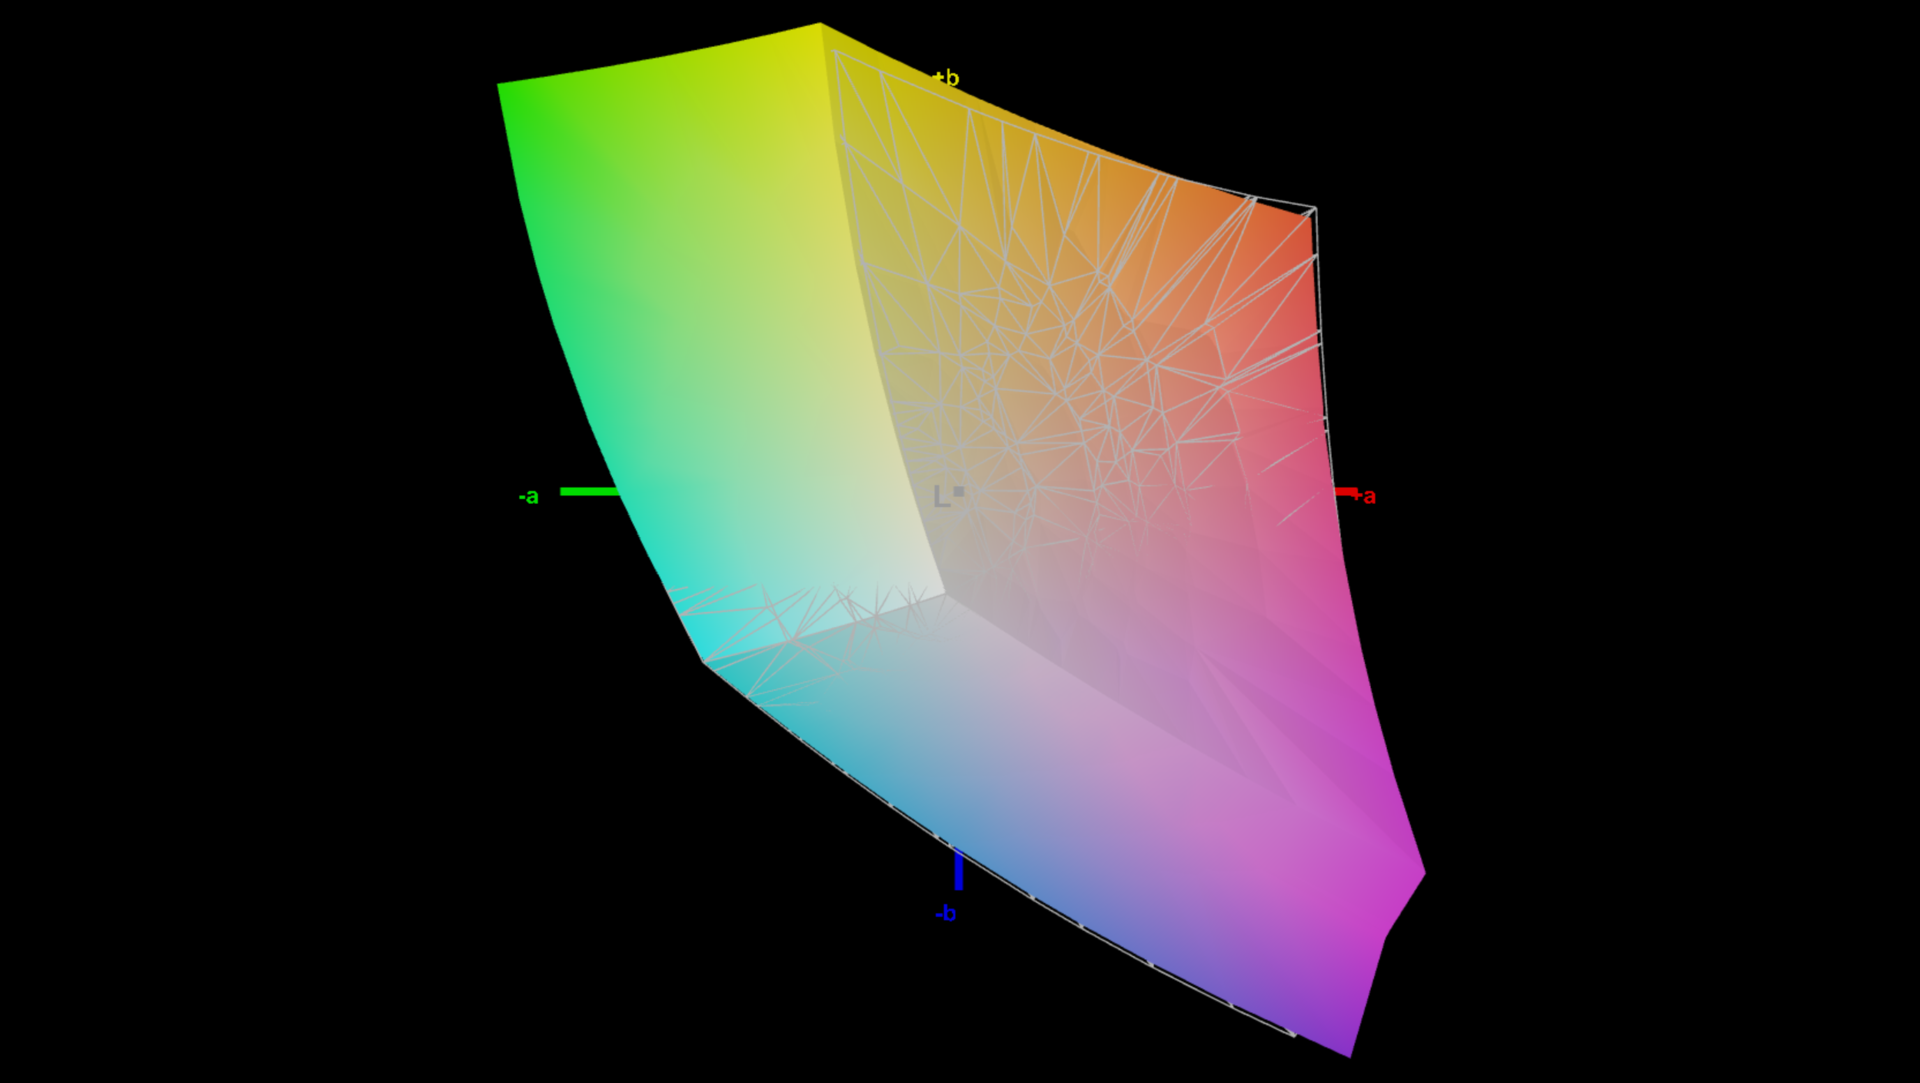
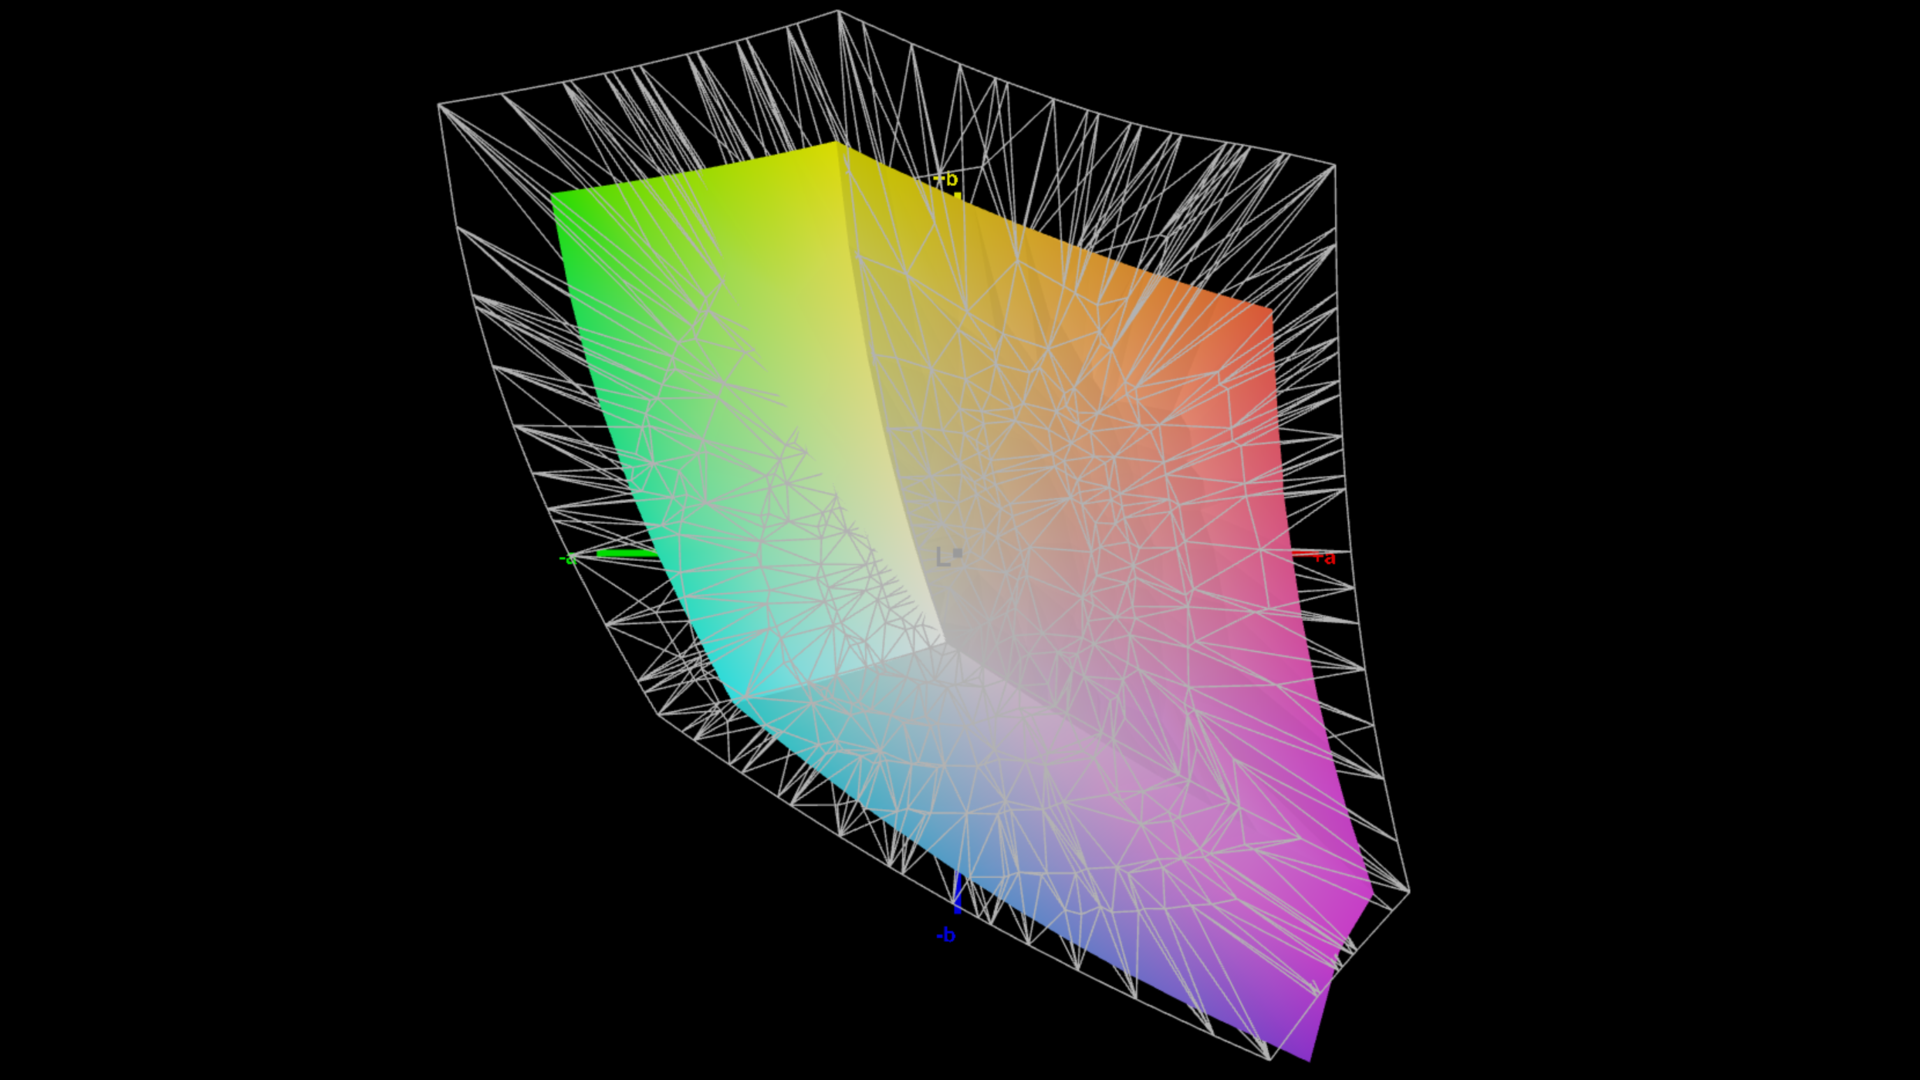
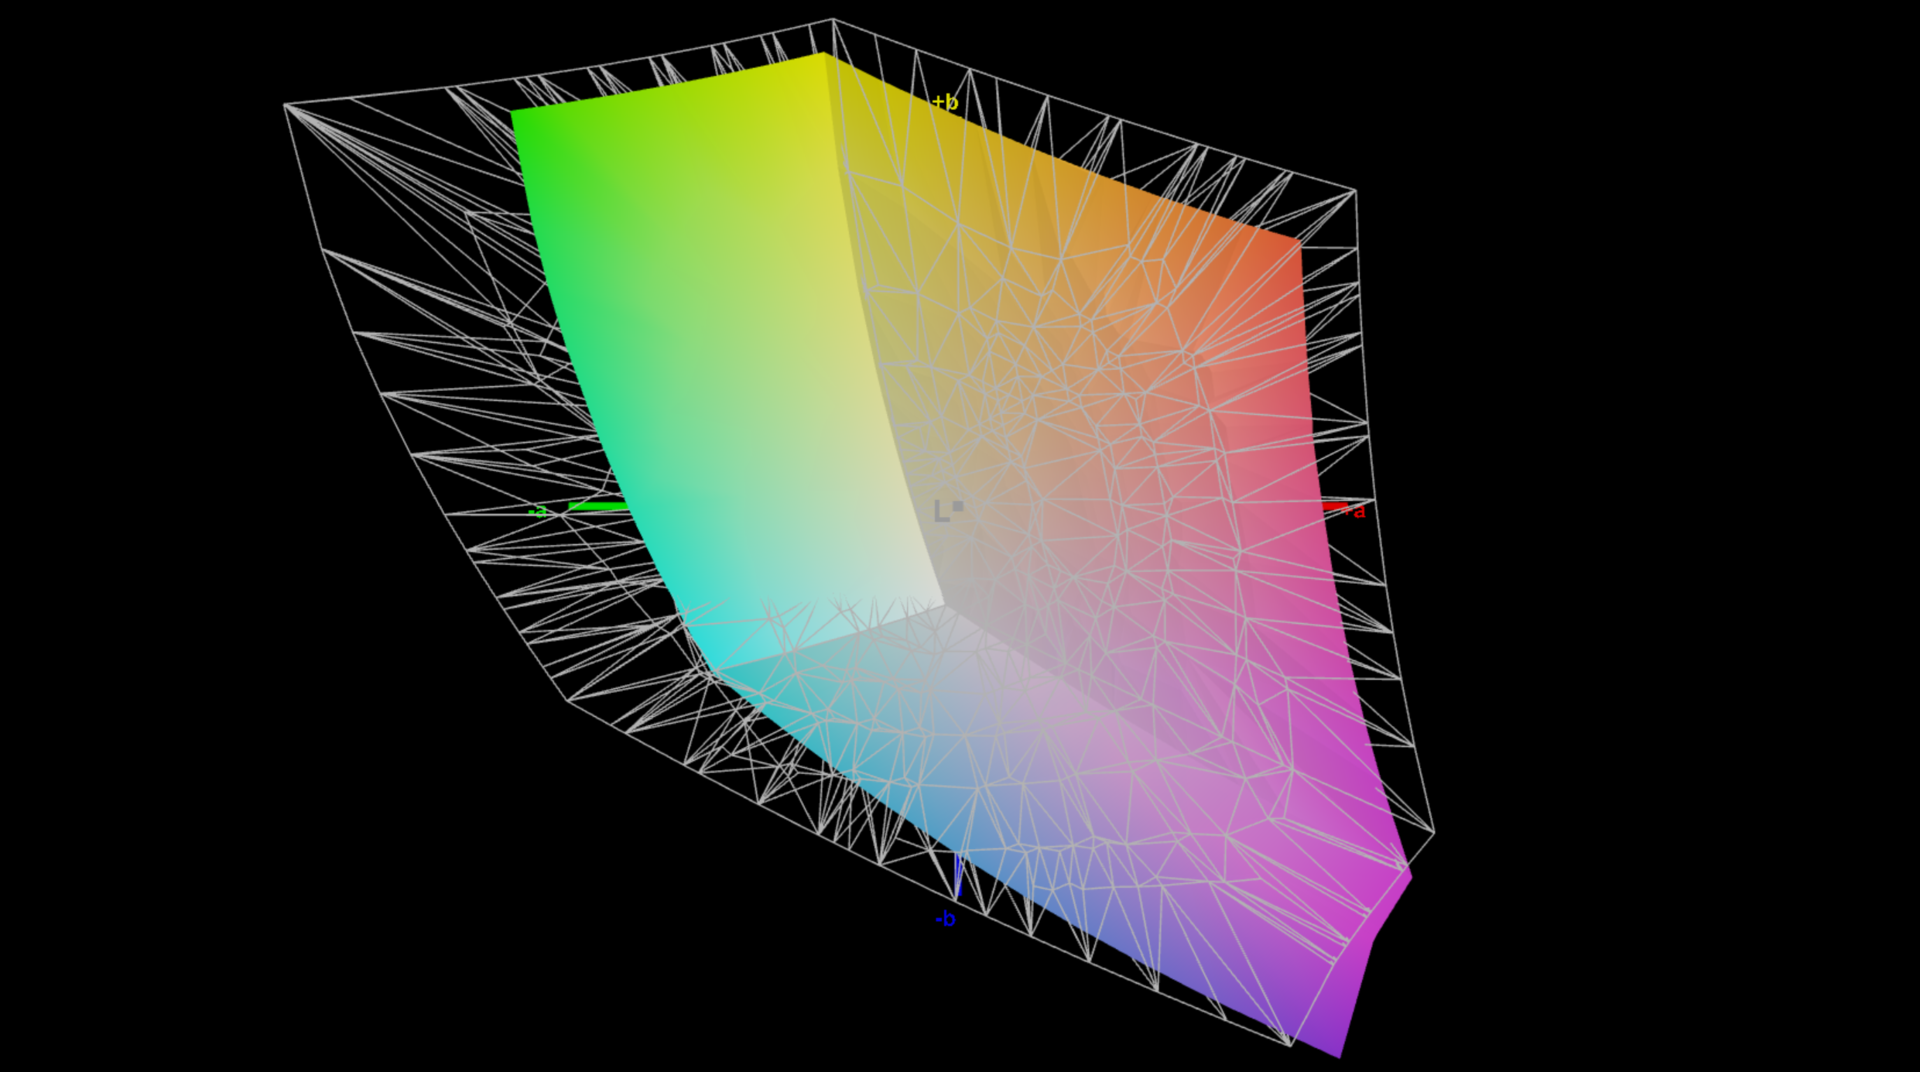
70% AdobeRGB 1998 (Argyll 3D)
98.8% sRGB (Argyll 3D)
68.8% Display P3 (Argyll 3D)
Gamma: 2.16
CCT: 7462 K
| Schenker VISION 16 Pro (M23) NE160QDM-NZ1, IPS, 2560x1600, 16" | Samsung Galaxy Book3 Ultra 16, i9-13900H RTX 4070 Samsung SDC4185 ATNA60CL03-0, OLED / AMOLED, 2880x1800, 16" | MSI Stealth 16 Studio A13VG AUO26A9, IPS, 2560x1600, 16" | Dell XPS 15 9530 RTX 4070 Samsung 156XG01, OLED, 3456x2160, 15.6" | Asus ProArt Studiobook 16 OLED H7604 ATNA60BX01-1, OLED, 3200x2000, 16" | Apple MacBook Pro 16 2023 M2 Max Mini-LED, 3456x2234, 16.2" | Schenker Vision 16 Pro RTX 3070 Ti N160QDM-NZ1, IPS, 2560x1600, 16" | |
|---|---|---|---|---|---|---|---|
| Display | 26% | 21% | 29% | 25% | 24% | -1% | |
| Display P3 Coverage (%) | 68.8 | 95.3 39% | 96.4 40% | 99.8 45% | 99.6 45% | 99 44% | 68.7 0% |
| sRGB Coverage (%) | 98.8 | 99.1 0% | 99.7 1% | 100 1% | 100 1% | 100 1% | 96.7 -2% |
| AdobeRGB 1998 Coverage (%) | 70 | 97.4 39% | 84.8 21% | 98.4 41% | 89.4 28% | 88.5 26% | 70 0% |
| Response Times | 80% | 50% | 82% | 93% | -486% | -5% | |
| Response Time Grey 50% / Grey 80% * (ms) | 13.7 ? | 2 ? 85% | 4.4 ? 68% | 1.68 ? 88% | 0.59 ? 96% | 80.5 ? -488% | 14.3 ? -4% |
| Response Time Black / White * (ms) | 8.1 ? | 2 ? 75% | 5.6 ? 31% | 1.94 ? 76% | 0.79 ? 90% | 47.2 ? -483% | 8.6 ? -6% |
| PWM Frequency (Hz) | 250 ? | 239 | 240 ? | 14880 ? | |||
| Screen | 21% | -16% | 0% | 159% | 4950% | -14% | |
| Brightness middle (cd/m²) | 384 | 403 5% | 424 10% | 389.5 1% | 349 -9% | 504 31% | 364 -5% |
| Brightness (cd/m²) | 371 | 408 10% | 411 11% | 392 6% | 350 -6% | 487 31% | 347 -6% |
| Brightness Distribution (%) | 88 | 98 11% | 88 0% | 98 11% | 95 8% | 94 7% | 89 1% |
| Black Level * (cd/m²) | 0.3 | 0.37 -23% | 0.02 93% | 0.001 100% | 0.3 -0% | ||
| Contrast (:1) | 1280 | 1146 -10% | 17450 1263% | 504000 39275% | 1213 -5% | ||
| Colorchecker dE 2000 * | 3.4 | 2.63 23% | 3.04 11% | 4.95 -46% | 2.1 38% | 1.5 56% | 3.3 3% |
| Colorchecker dE 2000 max. * | 9.2 | 4.07 56% | 7.5 18% | 8.65 6% | 5.5 40% | 3.3 64% | 6.6 28% |
| Colorchecker dE 2000 calibrated * | 1.3 | 3.04 -134% | 1.53 -18% | 2.1 -62% | 2.5 -92% | ||
| Greyscale dE 2000 * | 3.4 | 2.69 21% | 4.34 -28% | 2 41% | 1.2 65% | 2.1 38% | 5.2 -53% |
| Gamma | 2.16 102% | 2.48 89% | 2.32 95% | 2.27 97% | 2.19 100% | 2.25 98% | 2.14 103% |
| CCT | 7462 87% | 6907 94% | 6952 93% | 6265 104% | 6545 99% | 6882 94% | 6331 103% |
| Moyenne finale (programmes/paramètres) | 42% /
33% | 18% /
1% | 37% /
21% | 92% /
121% | 1496% /
2977% | -7% /
-10% |
* ... Moindre est la valeur, meilleures sont les performances
Nous mesurons le panneau à l'état de livraison avec le logiciel professionnel CalMAN. Schenker propose le téléchargement d'un profil calibré dans le Control Center, qui est ensuite téléchargé automatiquement à l'aide du numéro de série. Bien que cela améliore la situation et élimine la teinte des couleurs, la luminosité maximale est légèrement réduite d'environ 30 cd/m². Cette solution n'est pas vraiment parfaite, comme nous le verrons bientôt, mais ceux qui ne peuvent pas calibrer leur panneau (ou télécharger notre profil calibré à partir du lien ci-dessus) obtiendront tout de même une amélioration notable.
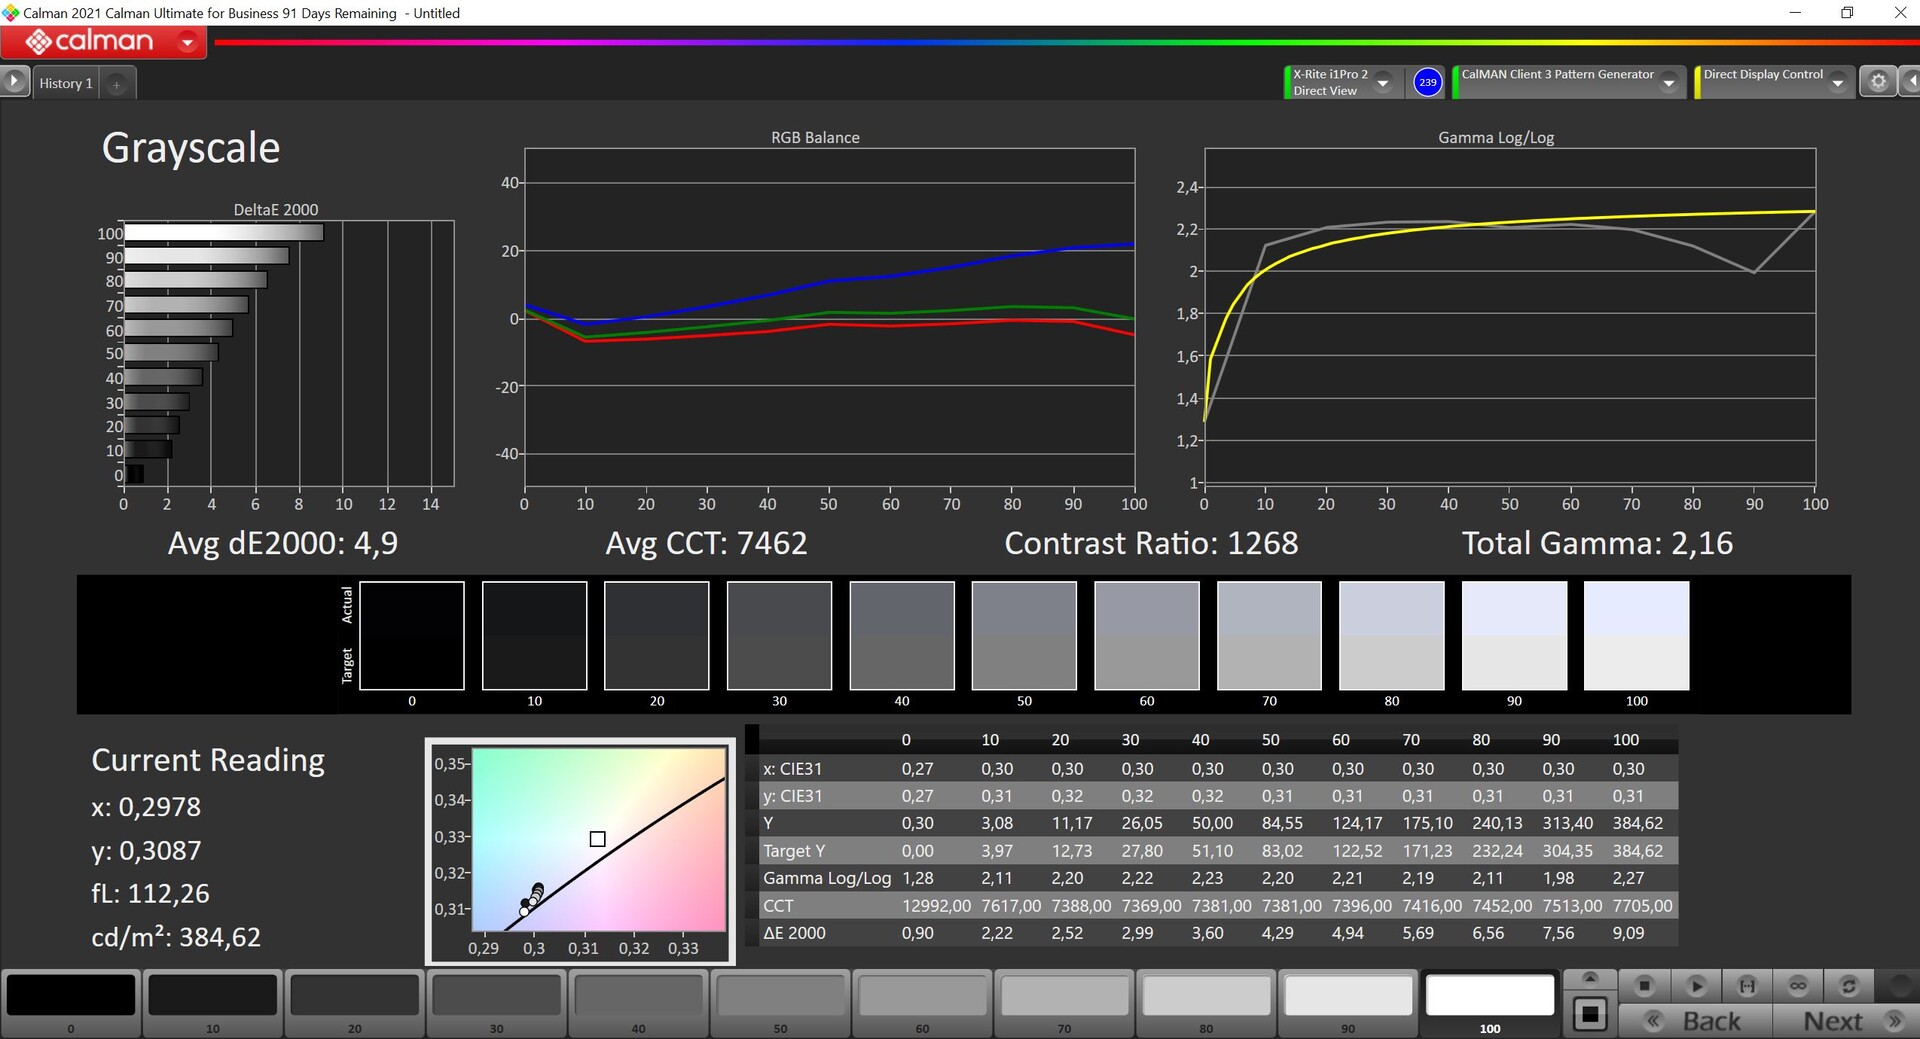
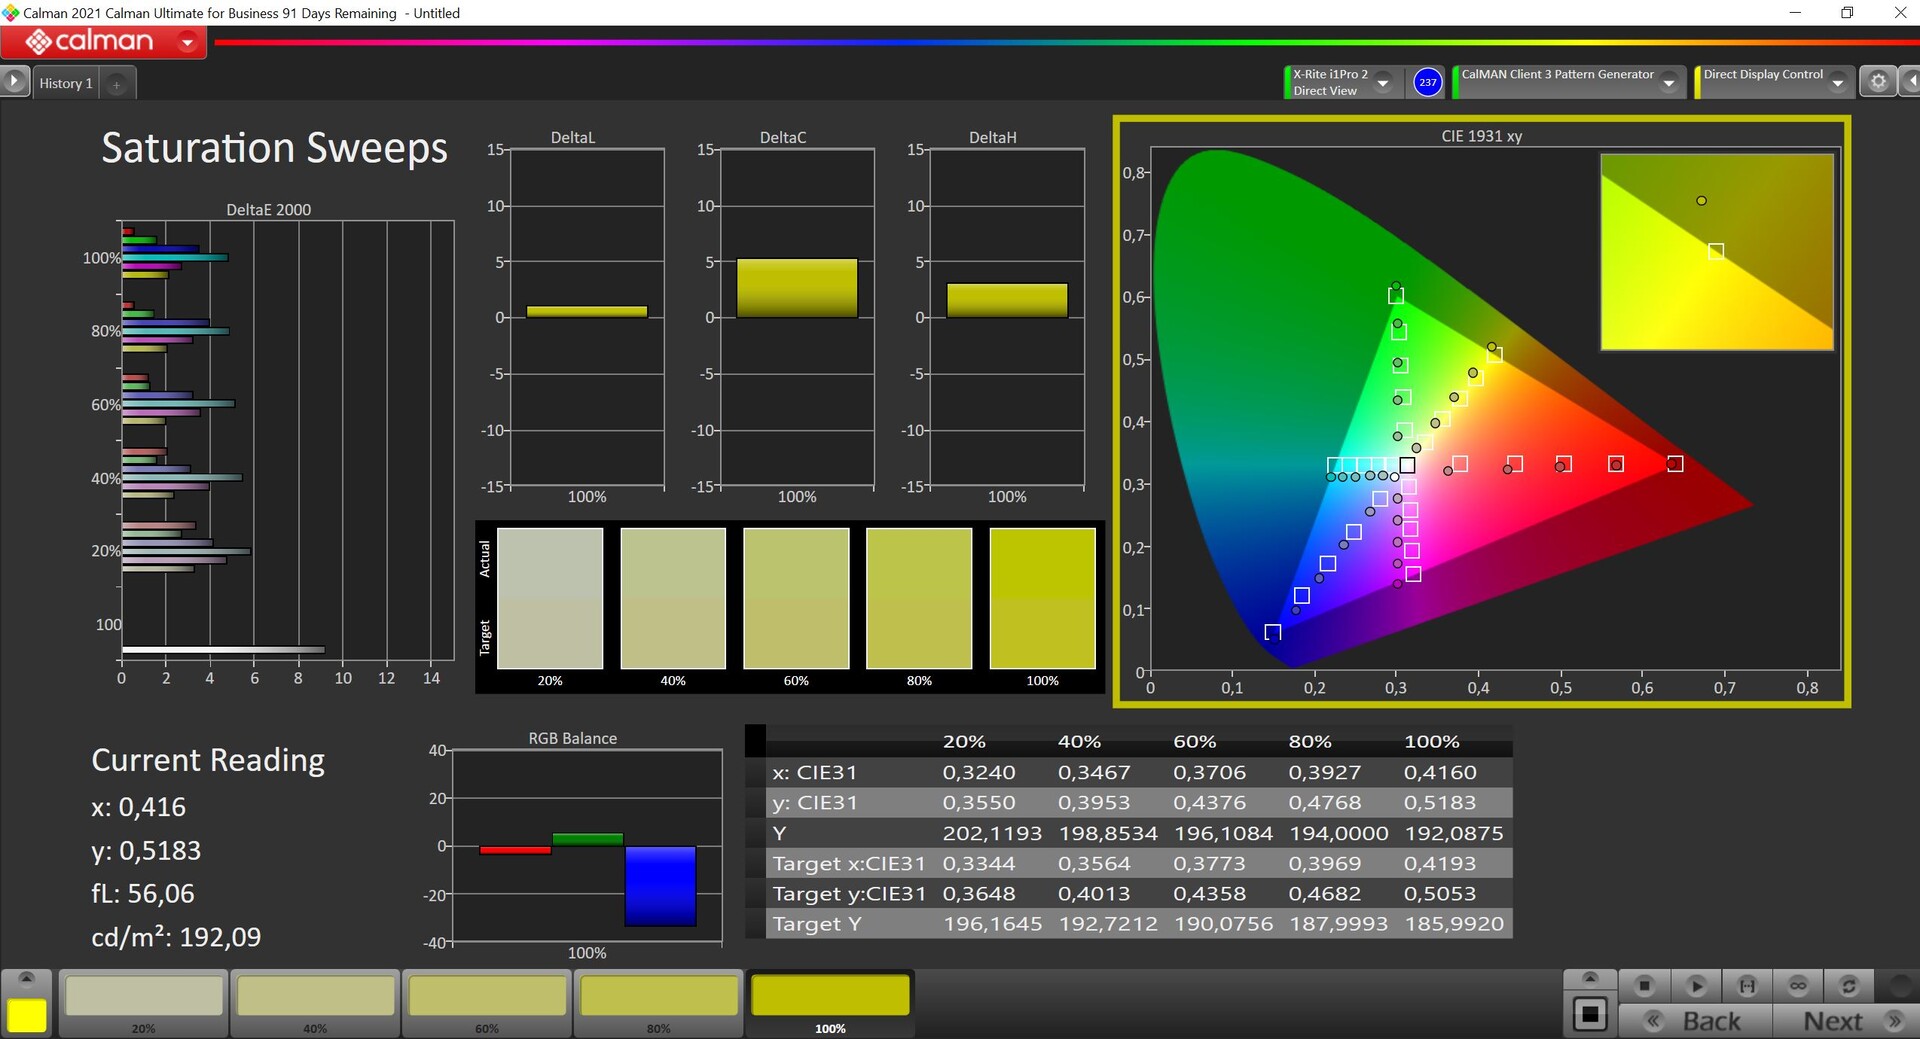
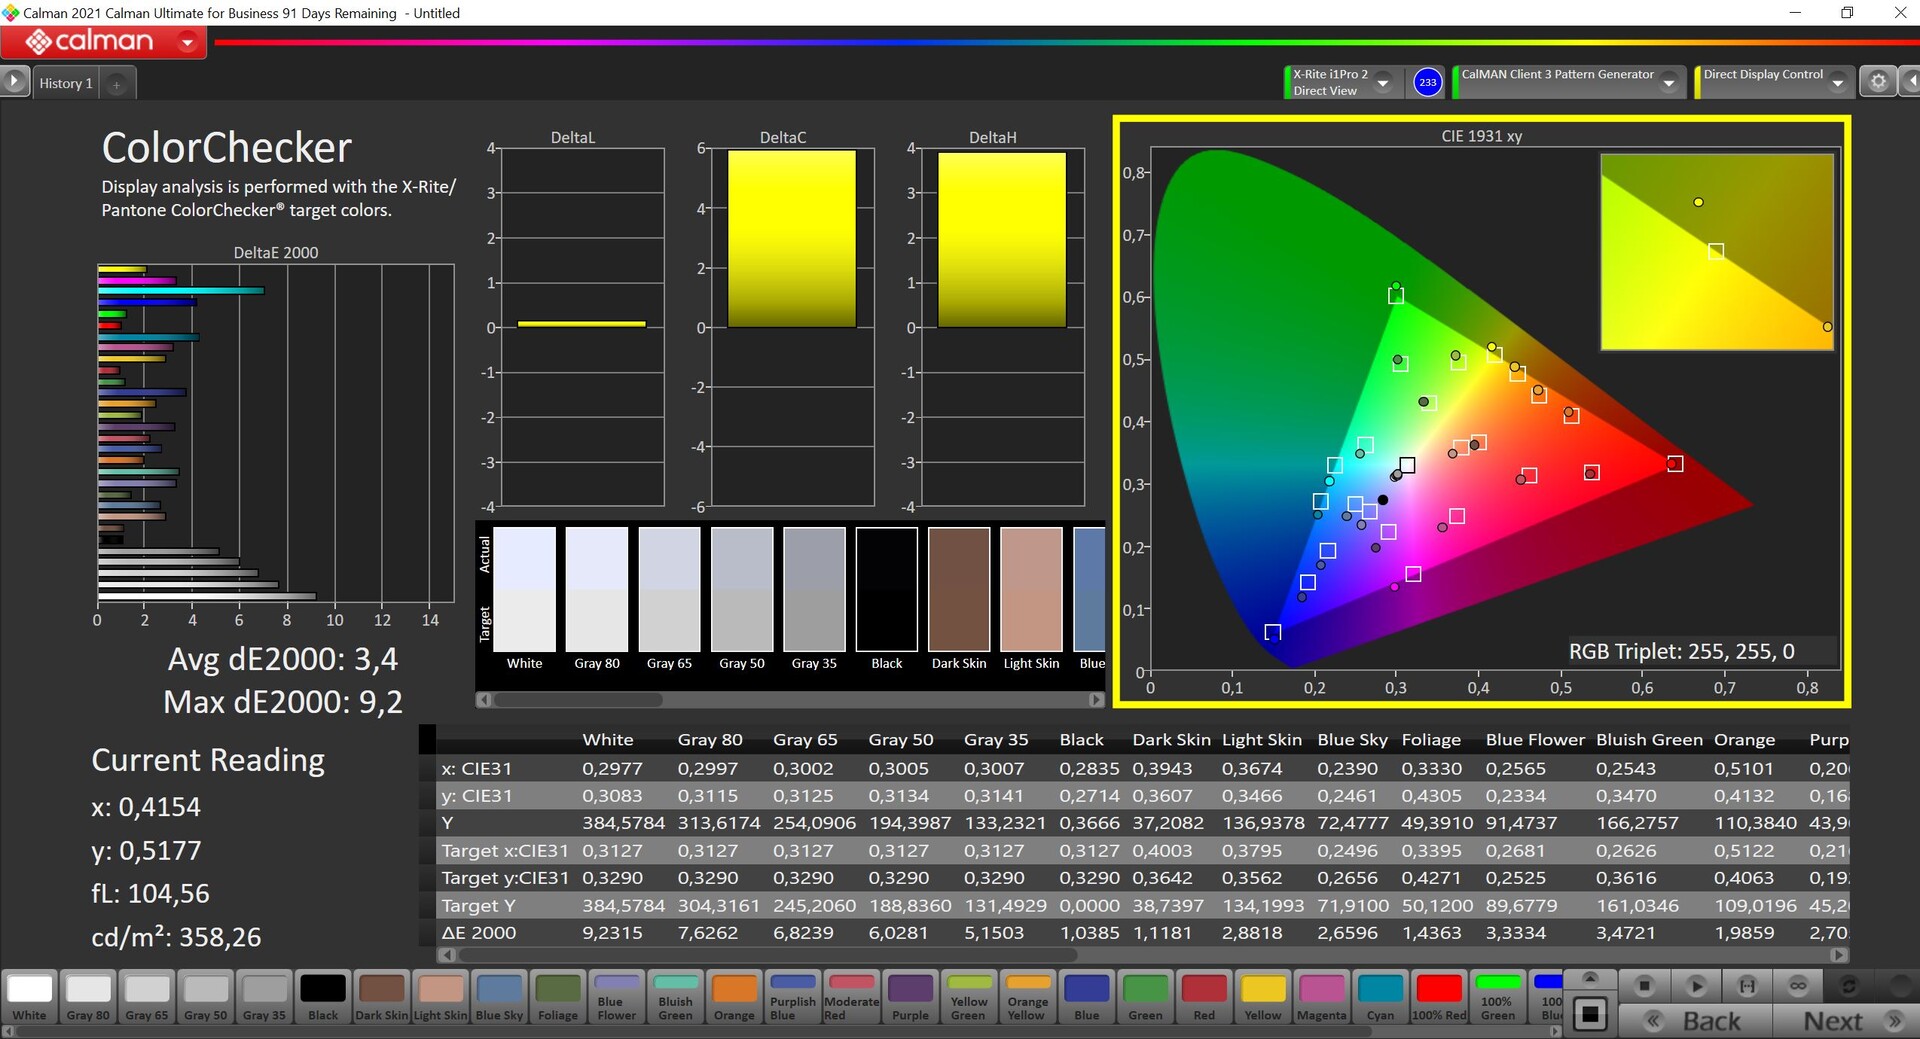


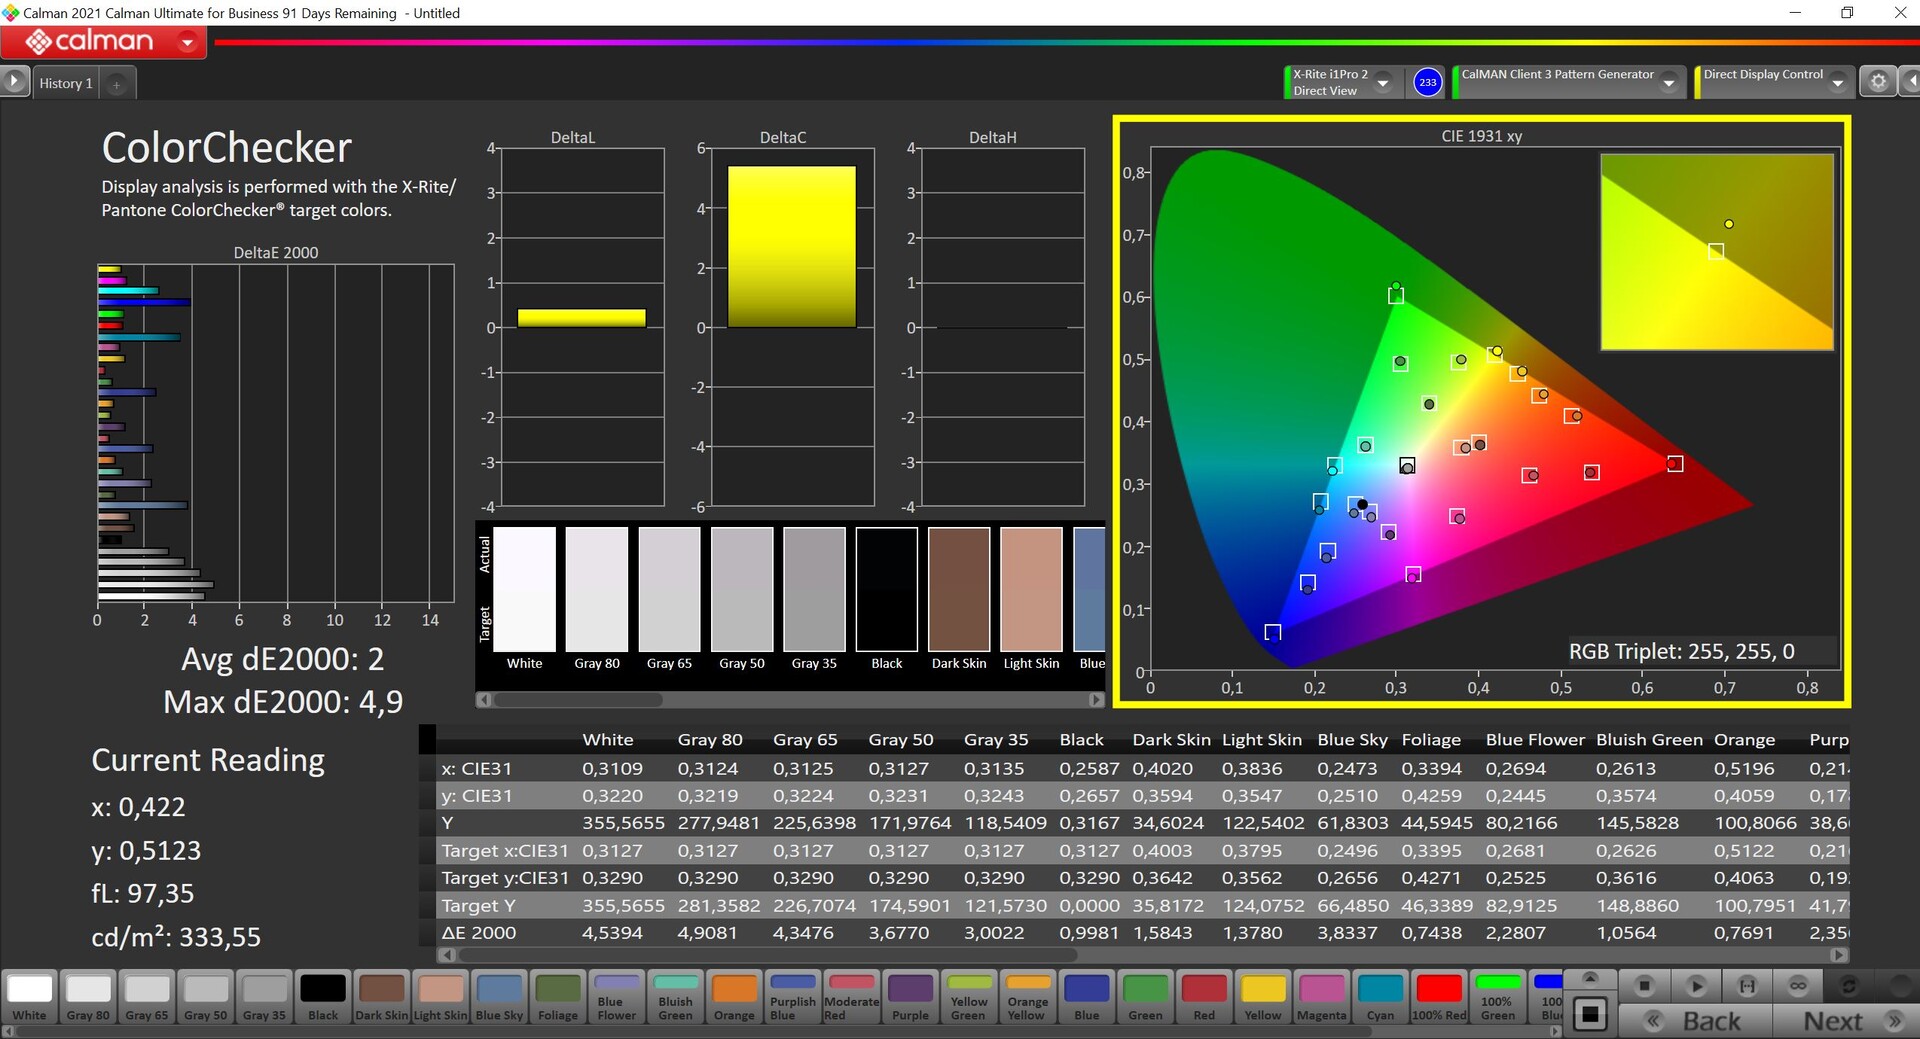
En utilisant notre propre étalonnage, nous sommes en mesure d'améliorer encore l'affichage, l'échelle de gris étant maintenant au niveau de référence et les écarts de couleur étant encore plus faibles. Cependant, il reste quelques valeurs aberrantes dans les tons bleus où les écarts sont légèrement supérieurs à la limite importante de 3. Mais dans l'ensemble, l'écran est encore tout à fait adapté au traitement des images dans le petit espace colorimétrique sRGB, qui est pratiquement couvert dans son intégralité.
Temps de réponse de l'écran
| ↔ Temps de réponse noir à blanc | ||
|---|---|---|
| 8.1 ms ... hausse ↗ et chute ↘ combinées | ↗ 3.8 ms hausse | 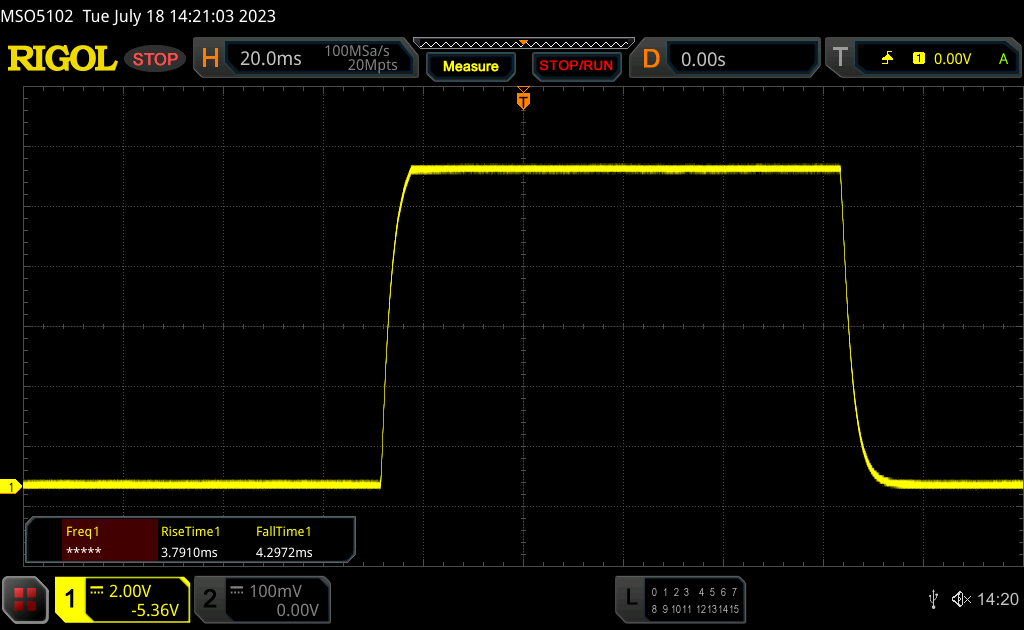 |
| ↘ 4.3 ms chute | ||
| L'écran montre de faibles temps de réponse, un bon écran pour jouer. En comparaison, tous les appareils testés affichent entre 0.1 (minimum) et 240 (maximum) ms. » 24 % des appareils testés affichent de meilleures performances. Cela signifie que les latences relevées sont meilleures que la moyenne (19.8 ms) de tous les appareils testés. | ||
| ↔ Temps de réponse gris 50% à gris 80% | ||
| 13.7 ms ... hausse ↗ et chute ↘ combinées | ↗ 6.7 ms hausse | 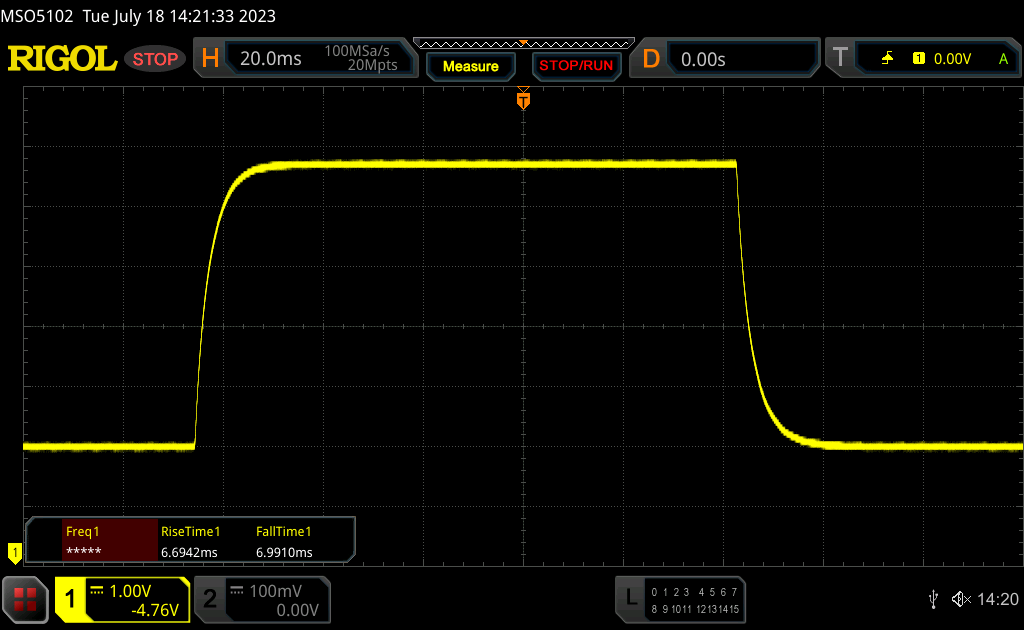 |
| ↘ 7 ms chute | ||
| L'écran montre de bons temps de réponse, mais insuffisant pour du jeu compétitif. En comparaison, tous les appareils testés affichent entre 0.165 (minimum) et 636 (maximum) ms. » 28 % des appareils testés affichent de meilleures performances. Cela signifie que les latences relevées sont meilleures que la moyenne (31 ms) de tous les appareils testés. | ||
Scintillement / MLI (Modulation de largeur d'impulsion)
| Scintillement / MLI (Modulation de largeur d'impulsion) non décelé | 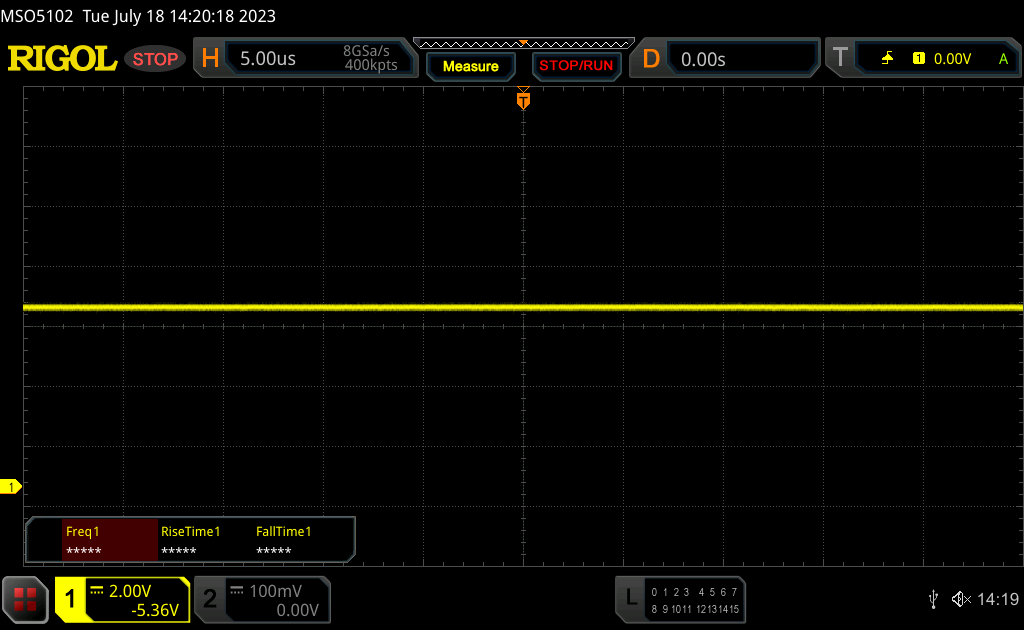 | ||
En comparaison, 52 % des appareils testés n'emploient pas MDI pour assombrir leur écran. Nous avons relevé une moyenne à 7750 (minimum : 5 - maximum : 343500) Hz dans le cas où une MDI était active. | |||
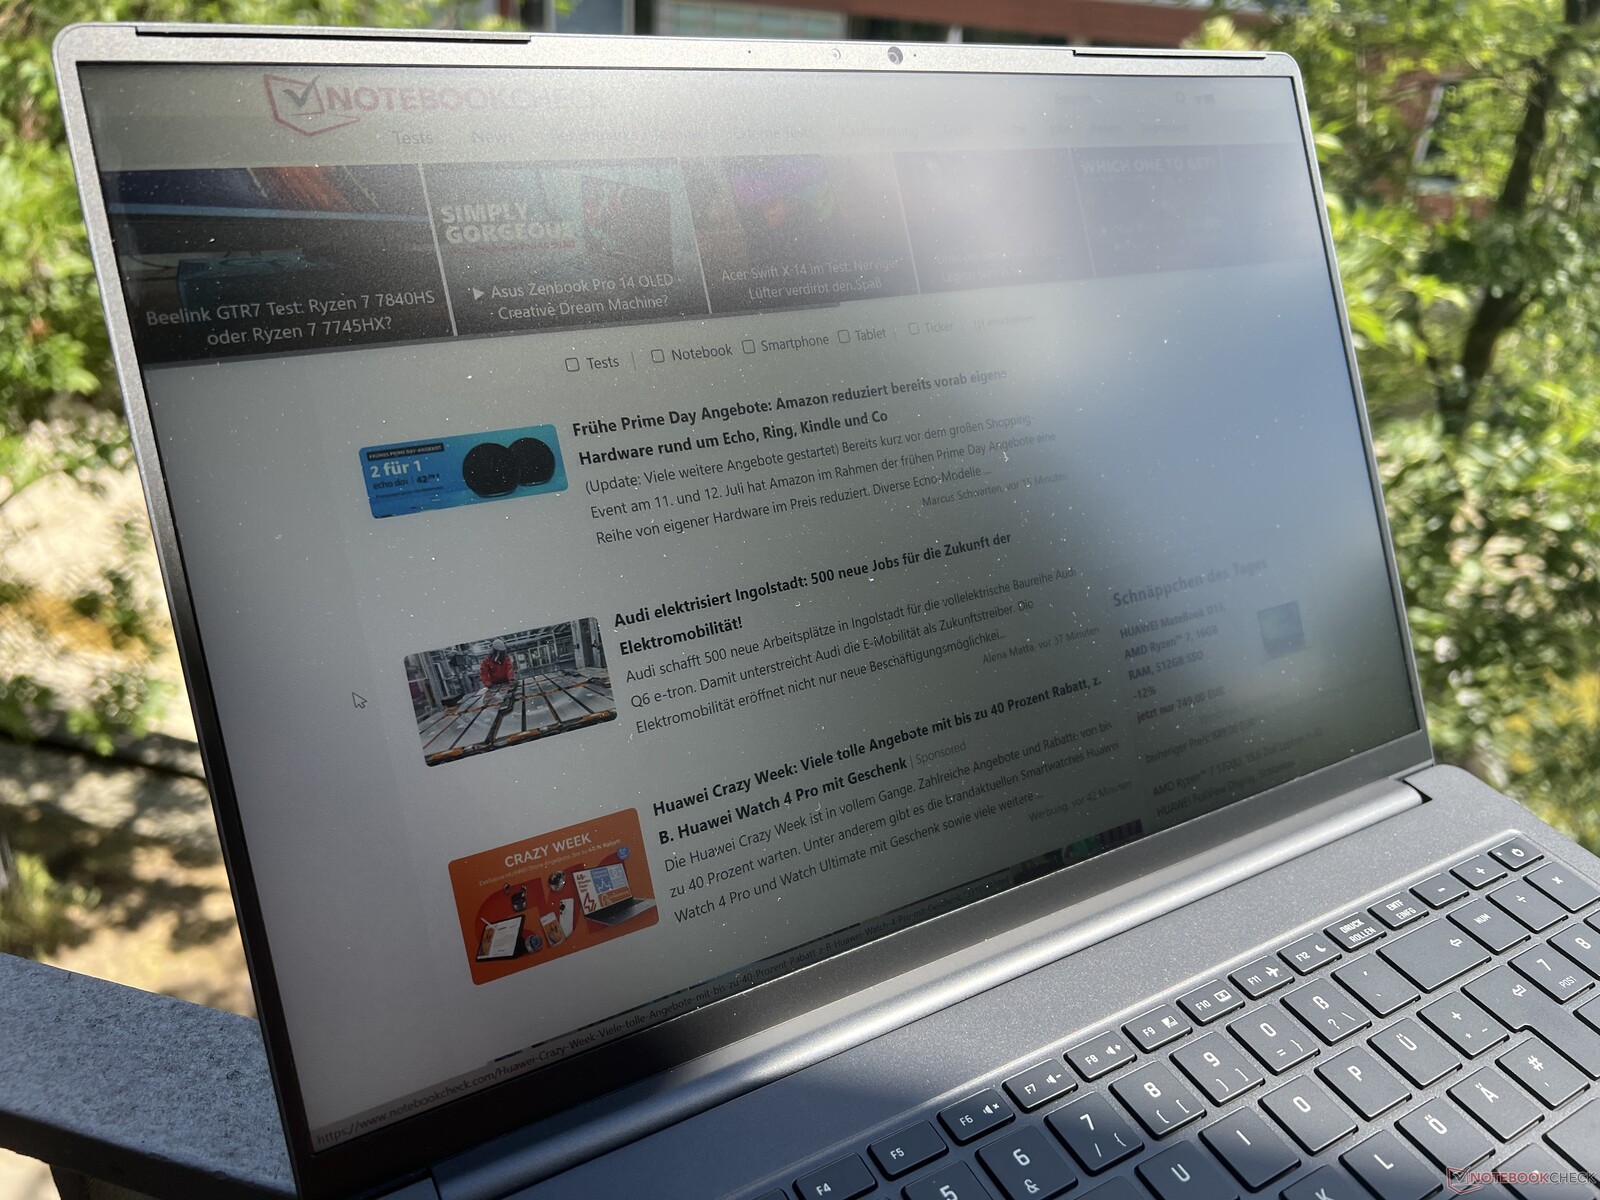
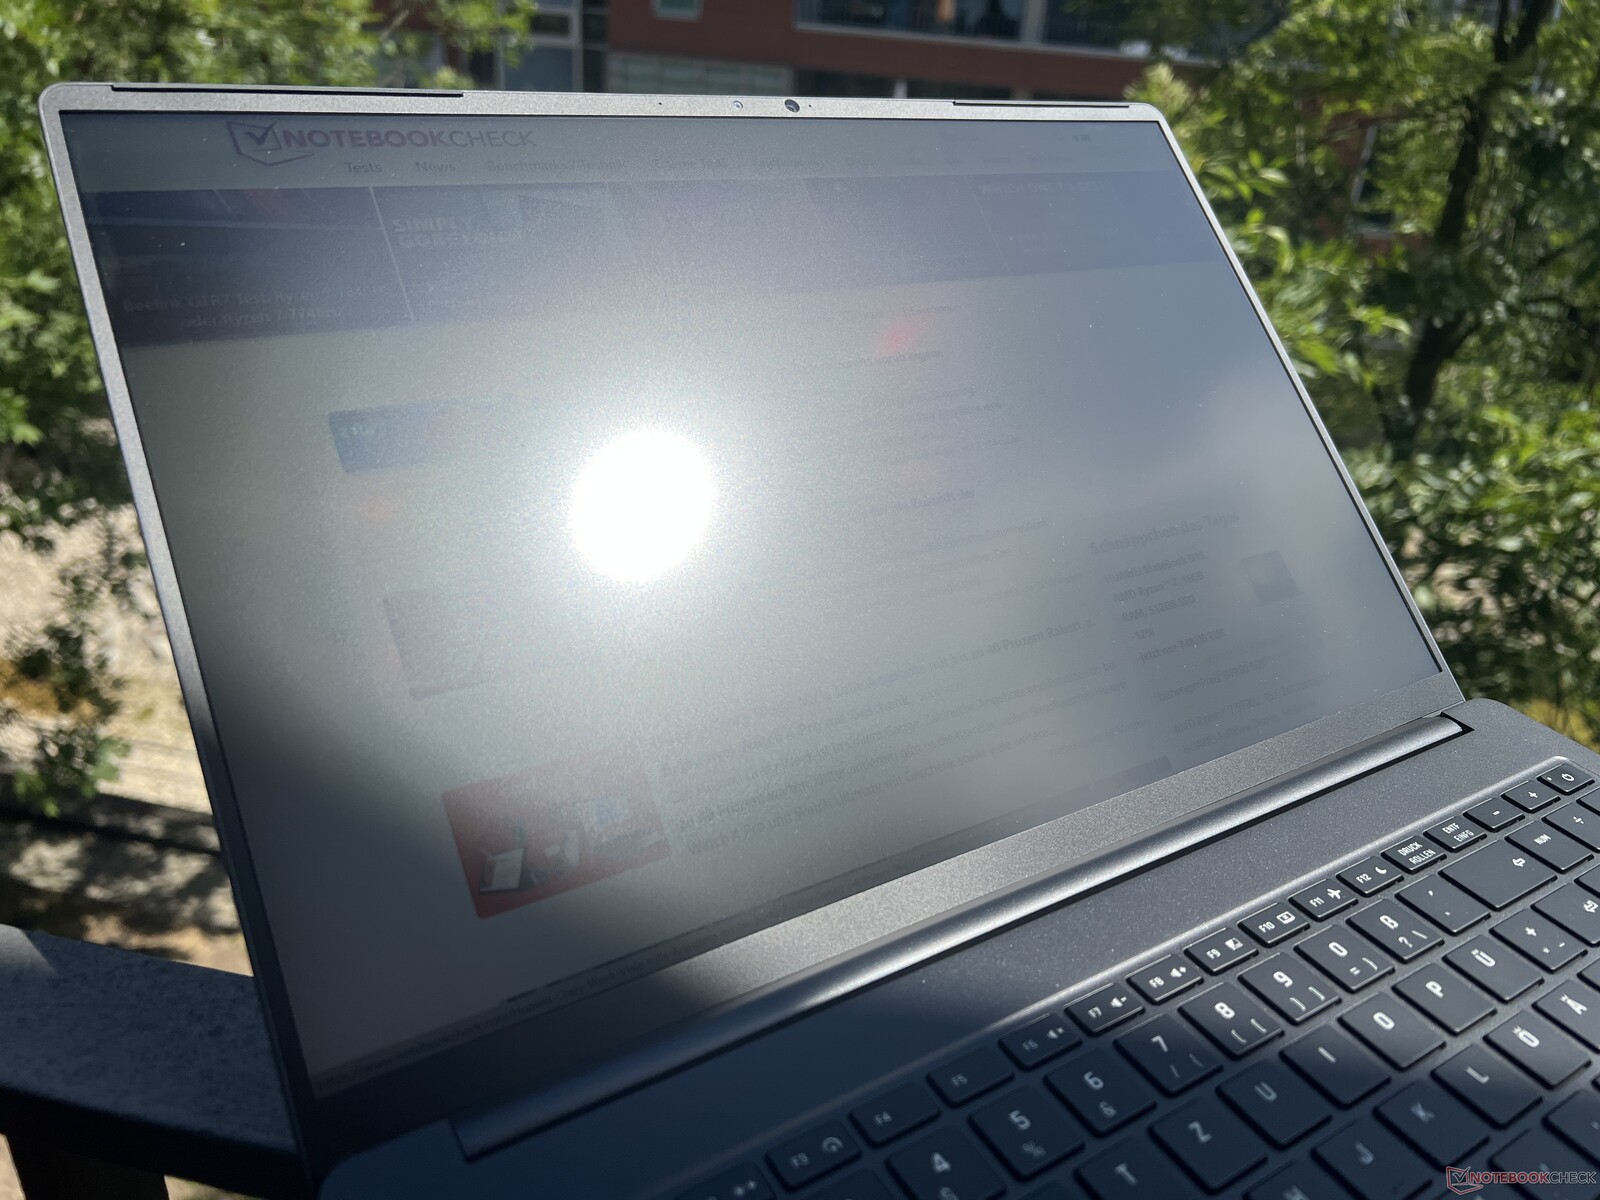

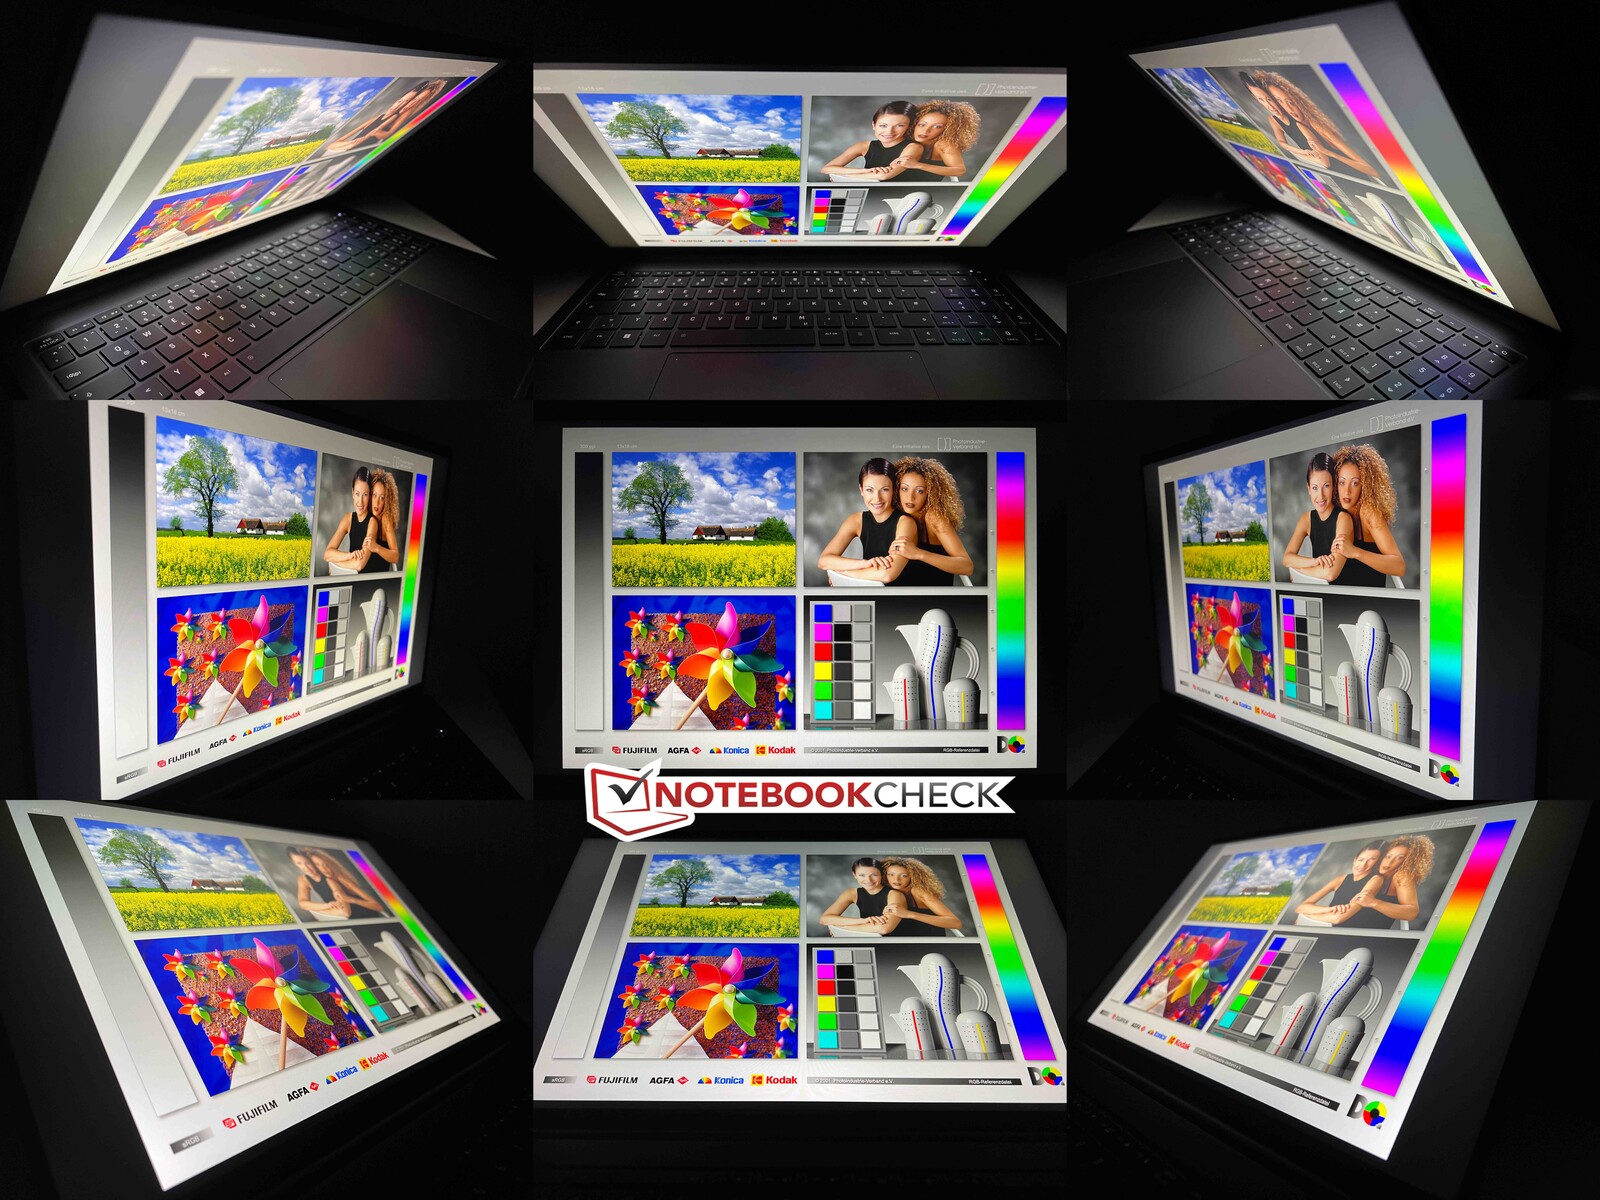
Tant que vous évitez les reflets des sources de lumière directe, la Vision 16 Pro peut également être utilisée sans problème dans un environnement lumineux. La stabilité de l'angle de vision est bonne dans l'ensemble, mais il y a un éclaircissement visible et une réduction du contraste lorsque l'on regarde d'un angle supérieur.
Performance - Ordinateur portable RTX 4070 avec 95 watts
Conditions d'essai
Schenker propose différents profils de puissance dans le centre de contrôle, mais contrairement à son prédécesseur, il n'y a plus de profil manuel qui vous permettrait de configurer les limites TDP du processeur. Nous avons à nouveau effectué les tests et les mesures en mode Enthusiast Performance, qui fixe les valeurs TDP du processeur à 60/45 watts (ou 55/35 watts lorsque le dGPU est activé). Le GPU est capable de consommer 95 watts (70W TGP + 25W Dynamic Boost) ici, et dans le mode Enthusiast Balanced il est de 85 watts (60 + 25W).
Processeur - Core i7-13700H
Le Core i7-13700H de l'actuelle génération Raptor Lake d'Intel est le successeur direct du Core i7-12700H, et il n'y a pas de changement en dehors de quelques légères augmentations des vitesses d'horloge maximales. Le Vision 16 Pro est l'un des rares appareils à ne pas avoir de limites de puissance extrêmement élevées de plus de 100 watts. Cela présente quelques avantages dans le cadre d'une utilisation quotidienne, car les températures ne grimpent pas aussi rapidement et les performances ne chutent pas aussi brutalement en cas de charge constante. En revanche, les performances multicœurs en charge courte sont également inférieures à celles des concurrents et à peine supérieures à celles de l'ancien modèle. En mode Turbo, l'ancien modèle était même nettement plus rapide. En mode batterie, la consommation d'énergie est limitée à 36 watts, ce qui fait chuter les performances multicœur de 20 % sans chargeur. Vous trouverez d'autres tests de performance du processeur dans notre section technique.
Cinebench R15 Multi Constant Load Test
Cinebench R23: Multi Core | Single Core
Cinebench R20: CPU (Multi Core) | CPU (Single Core)
Cinebench R15: CPU Multi 64Bit | CPU Single 64Bit
Blender: v2.79 BMW27 CPU
7-Zip 18.03: 7z b 4 | 7z b 4 -mmt1
Geekbench 5.5: Multi-Core | Single-Core
HWBOT x265 Benchmark v2.2: 4k Preset
LibreOffice : 20 Documents To PDF
R Benchmark 2.5: Overall mean
| CPU Performance rating | |
| Asus ProArt Studiobook 16 OLED H7604 | |
| MSI Stealth 16 Studio A13VG | |
| Apple MacBook Pro 16 2023 M2 Max -6! | |
| Dell XPS 15 9530 RTX 4070 | |
| Moyenne de la classe Multimedia | |
| Schenker VISION 16 Pro (M23) | |
| Moyenne Intel Core i7-13700H | |
| Schenker Vision 16 Pro RTX 3070 Ti | |
| Samsung Galaxy Book3 Ultra 16, i9-13900H RTX 4070 | |
| Cinebench R23 / Multi Core | |
| Asus ProArt Studiobook 16 OLED H7604 | |
| MSI Stealth 16 Studio A13VG | |
| Moyenne de la classe Multimedia (4861 - 33362, n=78, 2 dernières années) | |
| Dell XPS 15 9530 RTX 4070 | |
| Moyenne Intel Core i7-13700H (5890 - 20034, n=29) | |
| Apple MacBook Pro 16 2023 M2 Max | |
| Schenker VISION 16 Pro (M23) | |
| Samsung Galaxy Book3 Ultra 16, i9-13900H RTX 4070 | |
| Schenker Vision 16 Pro RTX 3070 Ti | |
| Cinebench R23 / Single Core | |
| Asus ProArt Studiobook 16 OLED H7604 | |
| Moyenne de la classe Multimedia (1128 - 2459, n=70, 2 dernières années) | |
| Schenker VISION 16 Pro (M23) | |
| MSI Stealth 16 Studio A13VG | |
| Dell XPS 15 9530 RTX 4070 | |
| Schenker Vision 16 Pro RTX 3070 Ti | |
| Moyenne Intel Core i7-13700H (1323 - 1914, n=29) | |
| Apple MacBook Pro 16 2023 M2 Max | |
| Samsung Galaxy Book3 Ultra 16, i9-13900H RTX 4070 | |
| Cinebench R20 / CPU (Multi Core) | |
| Asus ProArt Studiobook 16 OLED H7604 | |
| MSI Stealth 16 Studio A13VG | |
| Moyenne de la classe Multimedia (1887 - 12912, n=61, 2 dernières années) | |
| Dell XPS 15 9530 RTX 4070 | |
| Moyenne Intel Core i7-13700H (2322 - 7674, n=29) | |
| Schenker VISION 16 Pro (M23) | |
| Schenker Vision 16 Pro RTX 3070 Ti | |
| Samsung Galaxy Book3 Ultra 16, i9-13900H RTX 4070 | |
| Apple MacBook Pro 16 2023 M2 Max | |
| Cinebench R20 / CPU (Single Core) | |
| Asus ProArt Studiobook 16 OLED H7604 | |
| Schenker VISION 16 Pro (M23) | |
| Moyenne de la classe Multimedia (425 - 853, n=61, 2 dernières années) | |
| MSI Stealth 16 Studio A13VG | |
| Schenker Vision 16 Pro RTX 3070 Ti | |
| Dell XPS 15 9530 RTX 4070 | |
| Moyenne Intel Core i7-13700H (508 - 741, n=29) | |
| Apple MacBook Pro 16 2023 M2 Max | |
| Samsung Galaxy Book3 Ultra 16, i9-13900H RTX 4070 | |
| Cinebench R15 / CPU Multi 64Bit | |
| Asus ProArt Studiobook 16 OLED H7604 | |
| MSI Stealth 16 Studio A13VG | |
| Schenker Vision 16 Pro RTX 3070 Ti | |
| Schenker Vision 16 Pro RTX 3070 Ti | |
| Dell XPS 15 9530 RTX 4070 | |
| Moyenne de la classe Multimedia (856 - 5224, n=65, 2 dernières années) | |
| Moyenne Intel Core i7-13700H (905 - 2982, n=29) | |
| Schenker VISION 16 Pro (M23) | |
| Samsung Galaxy Book3 Ultra 16, i9-13900H RTX 4070 | |
| Apple MacBook Pro 16 2023 M2 Max | |
| Cinebench R15 / CPU Single 64Bit | |
| Asus ProArt Studiobook 16 OLED H7604 | |
| Moyenne de la classe Multimedia (184.8 - 326, n=63, 2 dernières années) | |
| Schenker VISION 16 Pro (M23) | |
| MSI Stealth 16 Studio A13VG | |
| Dell XPS 15 9530 RTX 4070 | |
| Schenker Vision 16 Pro RTX 3070 Ti | |
| Moyenne Intel Core i7-13700H (213 - 278, n=29) | |
| Apple MacBook Pro 16 2023 M2 Max | |
| Samsung Galaxy Book3 Ultra 16, i9-13900H RTX 4070 | |
| Blender / v2.79 BMW27 CPU | |
| Schenker Vision 16 Pro RTX 3070 Ti | |
| Moyenne de la classe Multimedia (100 - 557, n=62, 2 dernières années) | |
| Samsung Galaxy Book3 Ultra 16, i9-13900H RTX 4070 | |
| Moyenne Intel Core i7-13700H (169 - 555, n=29) | |
| Schenker VISION 16 Pro (M23) | |
| Dell XPS 15 9530 RTX 4070 | |
| MSI Stealth 16 Studio A13VG | |
| Asus ProArt Studiobook 16 OLED H7604 | |
| 7-Zip 18.03 / 7z b 4 | |
| Asus ProArt Studiobook 16 OLED H7604 | |
| MSI Stealth 16 Studio A13VG | |
| Schenker VISION 16 Pro (M23) | |
| Moyenne Intel Core i7-13700H (27322 - 76344, n=29) | |
| Dell XPS 15 9530 RTX 4070 | |
| Moyenne de la classe Multimedia (26062 - 130368, n=59, 2 dernières années) | |
| Schenker Vision 16 Pro RTX 3070 Ti | |
| Samsung Galaxy Book3 Ultra 16, i9-13900H RTX 4070 | |
| 7-Zip 18.03 / 7z b 4 -mmt1 | |
| Asus ProArt Studiobook 16 OLED H7604 | |
| Schenker VISION 16 Pro (M23) | |
| MSI Stealth 16 Studio A13VG | |
| Dell XPS 15 9530 RTX 4070 | |
| Moyenne de la classe Multimedia (3666 - 7545, n=60, 2 dernières années) | |
| Moyenne Intel Core i7-13700H (4825 - 6238, n=29) | |
| Schenker Vision 16 Pro RTX 3070 Ti | |
| Samsung Galaxy Book3 Ultra 16, i9-13900H RTX 4070 | |
| Geekbench 5.5 / Multi-Core | |
| Asus ProArt Studiobook 16 OLED H7604 | |
| Apple MacBook Pro 16 2023 M2 Max | |
| Dell XPS 15 9530 RTX 4070 | |
| MSI Stealth 16 Studio A13VG | |
| Moyenne de la classe Multimedia (4652 - 20422, n=60, 2 dernières années) | |
| Schenker VISION 16 Pro (M23) | |
| Moyenne Intel Core i7-13700H (6165 - 14215, n=29) | |
| Schenker Vision 16 Pro RTX 3070 Ti | |
| Samsung Galaxy Book3 Ultra 16, i9-13900H RTX 4070 | |
| Geekbench 5.5 / Single-Core | |
| Asus ProArt Studiobook 16 OLED H7604 | |
| Apple MacBook Pro 16 2023 M2 Max | |
| Moyenne de la classe Multimedia (805 - 2974, n=60, 2 dernières années) | |
| Dell XPS 15 9530 RTX 4070 | |
| Schenker VISION 16 Pro (M23) | |
| MSI Stealth 16 Studio A13VG | |
| Schenker Vision 16 Pro RTX 3070 Ti | |
| Moyenne Intel Core i7-13700H (1362 - 1919, n=29) | |
| Samsung Galaxy Book3 Ultra 16, i9-13900H RTX 4070 | |
| HWBOT x265 Benchmark v2.2 / 4k Preset | |
| Asus ProArt Studiobook 16 OLED H7604 | |
| MSI Stealth 16 Studio A13VG | |
| Moyenne de la classe Multimedia (5.26 - 36.1, n=60, 2 dernières années) | |
| Dell XPS 15 9530 RTX 4070 | |
| Schenker VISION 16 Pro (M23) | |
| Moyenne Intel Core i7-13700H (6.72 - 21.2, n=29) | |
| Samsung Galaxy Book3 Ultra 16, i9-13900H RTX 4070 | |
| Schenker Vision 16 Pro RTX 3070 Ti | |
| LibreOffice / 20 Documents To PDF | |
| Samsung Galaxy Book3 Ultra 16, i9-13900H RTX 4070 | |
| MSI Stealth 16 Studio A13VG | |
| Moyenne de la classe Multimedia (23.9 - 146.7, n=61, 2 dernières années) | |
| Moyenne Intel Core i7-13700H (31.3 - 62.4, n=29) | |
| Schenker VISION 16 Pro (M23) | |
| Asus ProArt Studiobook 16 OLED H7604 | |
| Dell XPS 15 9530 RTX 4070 | |
| Schenker Vision 16 Pro RTX 3070 Ti | |
| R Benchmark 2.5 / Overall mean | |
| Samsung Galaxy Book3 Ultra 16, i9-13900H RTX 4070 | |
| Moyenne Intel Core i7-13700H (0.4308 - 0.607, n=29) | |
| Moyenne de la classe Multimedia (0.3604 - 0.947, n=60, 2 dernières années) | |
| Schenker Vision 16 Pro RTX 3070 Ti | |
| MSI Stealth 16 Studio A13VG | |
| Dell XPS 15 9530 RTX 4070 | |
| Schenker VISION 16 Pro (M23) | |
| Asus ProArt Studiobook 16 OLED H7604 | |
* ... Moindre est la valeur, meilleures sont les performances
AIDA64: FP32 Ray-Trace | FPU Julia | CPU SHA3 | CPU Queen | FPU SinJulia | FPU Mandel | CPU AES | CPU ZLib | FP64 Ray-Trace | CPU PhotoWorxx
| Performance rating | |
| Asus ProArt Studiobook 16 OLED H7604 | |
| MSI Stealth 16 Studio A13VG | |
| Moyenne de la classe Multimedia | |
| Schenker VISION 16 Pro (M23) | |
| Dell XPS 15 9530 RTX 4070 | |
| Moyenne Intel Core i7-13700H | |
| Samsung Galaxy Book3 Ultra 16, i9-13900H RTX 4070 | |
| Schenker Vision 16 Pro RTX 3070 Ti | |
| AIDA64 / FP32 Ray-Trace | |
| Asus ProArt Studiobook 16 OLED H7604 | |
| MSI Stealth 16 Studio A13VG | |
| Moyenne de la classe Multimedia (2214 - 50388, n=57, 2 dernières années) | |
| Samsung Galaxy Book3 Ultra 16, i9-13900H RTX 4070 | |
| Dell XPS 15 9530 RTX 4070 | |
| Moyenne Intel Core i7-13700H (4986 - 18908, n=29) | |
| Schenker VISION 16 Pro (M23) | |
| Schenker Vision 16 Pro RTX 3070 Ti | |
| AIDA64 / FPU Julia | |
| Asus ProArt Studiobook 16 OLED H7604 | |
| Moyenne de la classe Multimedia (12867 - 201874, n=58, 2 dernières années) | |
| MSI Stealth 16 Studio A13VG | |
| Schenker VISION 16 Pro (M23) | |
| Moyenne Intel Core i7-13700H (25360 - 92359, n=29) | |
| Dell XPS 15 9530 RTX 4070 | |
| Schenker Vision 16 Pro RTX 3070 Ti | |
| Samsung Galaxy Book3 Ultra 16, i9-13900H RTX 4070 | |
| AIDA64 / CPU SHA3 | |
| Asus ProArt Studiobook 16 OLED H7604 | |
| MSI Stealth 16 Studio A13VG | |
| Moyenne de la classe Multimedia (626 - 8623, n=58, 2 dernières années) | |
| Samsung Galaxy Book3 Ultra 16, i9-13900H RTX 4070 | |
| Moyenne Intel Core i7-13700H (1339 - 4224, n=29) | |
| Schenker VISION 16 Pro (M23) | |
| Dell XPS 15 9530 RTX 4070 | |
| Schenker Vision 16 Pro RTX 3070 Ti | |
| AIDA64 / CPU Queen | |
| Asus ProArt Studiobook 16 OLED H7604 | |
| MSI Stealth 16 Studio A13VG | |
| Dell XPS 15 9530 RTX 4070 | |
| Schenker VISION 16 Pro (M23) | |
| Moyenne Intel Core i7-13700H (59324 - 107159, n=29) | |
| Schenker Vision 16 Pro RTX 3070 Ti | |
| Samsung Galaxy Book3 Ultra 16, i9-13900H RTX 4070 | |
| Moyenne de la classe Multimedia (13483 - 181505, n=45, 2 dernières années) | |
| AIDA64 / FPU SinJulia | |
| Asus ProArt Studiobook 16 OLED H7604 | |
| MSI Stealth 16 Studio A13VG | |
| Schenker VISION 16 Pro (M23) | |
| Moyenne de la classe Multimedia (886 - 28794, n=58, 2 dernières années) | |
| Moyenne Intel Core i7-13700H (4800 - 11050, n=29) | |
| Dell XPS 15 9530 RTX 4070 | |
| Schenker Vision 16 Pro RTX 3070 Ti | |
| Samsung Galaxy Book3 Ultra 16, i9-13900H RTX 4070 | |
| AIDA64 / FPU Mandel | |
| Asus ProArt Studiobook 16 OLED H7604 | |
| MSI Stealth 16 Studio A13VG | |
| Moyenne de la classe Multimedia (6395 - 105740, n=57, 2 dernières années) | |
| Samsung Galaxy Book3 Ultra 16, i9-13900H RTX 4070 | |
| Moyenne Intel Core i7-13700H (12321 - 45118, n=29) | |
| Dell XPS 15 9530 RTX 4070 | |
| Schenker VISION 16 Pro (M23) | |
| Schenker Vision 16 Pro RTX 3070 Ti | |
| AIDA64 / CPU AES | |
| Asus ProArt Studiobook 16 OLED H7604 | |
| MSI Stealth 16 Studio A13VG | |
| Moyenne Intel Core i7-13700H (28769 - 151254, n=29) | |
| Schenker VISION 16 Pro (M23) | |
| Moyenne de la classe Multimedia (8171 - 126790, n=58, 2 dernières années) | |
| Dell XPS 15 9530 RTX 4070 | |
| Schenker Vision 16 Pro RTX 3070 Ti | |
| Samsung Galaxy Book3 Ultra 16, i9-13900H RTX 4070 | |
| AIDA64 / CPU ZLib | |
| Asus ProArt Studiobook 16 OLED H7604 | |
| MSI Stealth 16 Studio A13VG | |
| Samsung Galaxy Book3 Ultra 16, i9-13900H RTX 4070 | |
| Moyenne de la classe Multimedia (143.8 - 2022, n=58, 2 dernières années) | |
| Schenker VISION 16 Pro (M23) | |
| Moyenne Intel Core i7-13700H (389 - 1215, n=29) | |
| Dell XPS 15 9530 RTX 4070 | |
| Schenker Vision 16 Pro RTX 3070 Ti | |
| AIDA64 / FP64 Ray-Trace | |
| Asus ProArt Studiobook 16 OLED H7604 | |
| MSI Stealth 16 Studio A13VG | |
| Moyenne de la classe Multimedia (1014 - 26875, n=58, 2 dernières années) | |
| Dell XPS 15 9530 RTX 4070 | |
| Moyenne Intel Core i7-13700H (2540 - 10135, n=29) | |
| Schenker VISION 16 Pro (M23) | |
| Schenker Vision 16 Pro RTX 3070 Ti | |
| Samsung Galaxy Book3 Ultra 16, i9-13900H RTX 4070 | |
| AIDA64 / CPU PhotoWorxx | |
| Moyenne de la classe Multimedia (8187 - 88154, n=58, 2 dernières années) | |
| Asus ProArt Studiobook 16 OLED H7604 | |
| Samsung Galaxy Book3 Ultra 16, i9-13900H RTX 4070 | |
| MSI Stealth 16 Studio A13VG | |
| Schenker VISION 16 Pro (M23) | |
| Dell XPS 15 9530 RTX 4070 | |
| Schenker Vision 16 Pro RTX 3070 Ti | |
| Moyenne Intel Core i7-13700H (12872 - 52727, n=29) | |
Performance du système
Les résultats des tests synthétiques sont très bons, mais les appareils de comparaison sont très proches et il n'y aura pas de différences notables dans l'utilisation quotidienne. Il s'agit simplement d'ordinateurs très réactifs dotés de composants modernes. Nous n'avons rencontré aucun problème de stabilité durant nos tests.
CrossMark: Overall | Productivity | Creativity | Responsiveness
| PCMark 10 / Score | |
| Moyenne de la classe Multimedia (4325 - 10386, n=56, 2 dernières années) | |
| Asus ProArt Studiobook 16 OLED H7604 | |
| Moyenne Intel Core i7-13700H, NVIDIA GeForce RTX 4070 Laptop GPU (7158 - 7956, n=8) | |
| Schenker VISION 16 Pro (M23) | |
| MSI Stealth 16 Studio A13VG | |
| Dell XPS 15 9530 RTX 4070 | |
| Samsung Galaxy Book3 Ultra 16, i9-13900H RTX 4070 | |
| PCMark 10 / Essentials | |
| Dell XPS 15 9530 RTX 4070 | |
| Asus ProArt Studiobook 16 OLED H7604 | |
| Schenker VISION 16 Pro (M23) | |
| Moyenne Intel Core i7-13700H, NVIDIA GeForce RTX 4070 Laptop GPU (10252 - 11449, n=8) | |
| Moyenne de la classe Multimedia (8025 - 11664, n=55, 2 dernières années) | |
| MSI Stealth 16 Studio A13VG | |
| Samsung Galaxy Book3 Ultra 16, i9-13900H RTX 4070 | |
| PCMark 10 / Productivity | |
| Moyenne de la classe Multimedia (7323 - 18233, n=55, 2 dernières années) | |
| Asus ProArt Studiobook 16 OLED H7604 | |
| Schenker VISION 16 Pro (M23) | |
| Moyenne Intel Core i7-13700H, NVIDIA GeForce RTX 4070 Laptop GPU (8501 - 10769, n=8) | |
| MSI Stealth 16 Studio A13VG | |
| Dell XPS 15 9530 RTX 4070 | |
| Samsung Galaxy Book3 Ultra 16, i9-13900H RTX 4070 | |
| PCMark 10 / Digital Content Creation | |
| Moyenne Intel Core i7-13700H, NVIDIA GeForce RTX 4070 Laptop GPU (10358 - 12908, n=8) | |
| MSI Stealth 16 Studio A13VG | |
| Schenker VISION 16 Pro (M23) | |
| Dell XPS 15 9530 RTX 4070 | |
| Asus ProArt Studiobook 16 OLED H7604 | |
| Moyenne de la classe Multimedia (3651 - 16240, n=55, 2 dernières années) | |
| Samsung Galaxy Book3 Ultra 16, i9-13900H RTX 4070 | |
| CrossMark / Overall | |
| Asus ProArt Studiobook 16 OLED H7604 | |
| Apple MacBook Pro 16 2023 M2 Max | |
| Schenker VISION 16 Pro (M23) | |
| Dell XPS 15 9530 RTX 4070 | |
| Moyenne Intel Core i7-13700H, NVIDIA GeForce RTX 4070 Laptop GPU (1768 - 2073, n=6) | |
| Moyenne de la classe Multimedia (866 - 2728, n=64, 2 dernières années) | |
| MSI Stealth 16 Studio A13VG | |
| Schenker Vision 16 Pro RTX 3070 Ti | |
| Samsung Galaxy Book3 Ultra 16, i9-13900H RTX 4070 | |
| CrossMark / Productivity | |
| Asus ProArt Studiobook 16 OLED H7604 | |
| Schenker VISION 16 Pro (M23) | |
| Moyenne Intel Core i7-13700H, NVIDIA GeForce RTX 4070 Laptop GPU (1645 - 2006, n=6) | |
| Moyenne de la classe Multimedia (931 - 2489, n=64, 2 dernières années) | |
| Dell XPS 15 9530 RTX 4070 | |
| MSI Stealth 16 Studio A13VG | |
| Apple MacBook Pro 16 2023 M2 Max | |
| Schenker Vision 16 Pro RTX 3070 Ti | |
| Samsung Galaxy Book3 Ultra 16, i9-13900H RTX 4070 | |
| CrossMark / Creativity | |
| Apple MacBook Pro 16 2023 M2 Max | |
| Asus ProArt Studiobook 16 OLED H7604 | |
| Moyenne de la classe Multimedia (907 - 3465, n=64, 2 dernières années) | |
| Dell XPS 15 9530 RTX 4070 | |
| Moyenne Intel Core i7-13700H, NVIDIA GeForce RTX 4070 Laptop GPU (1936 - 2137, n=6) | |
| Schenker VISION 16 Pro (M23) | |
| MSI Stealth 16 Studio A13VG | |
| Schenker Vision 16 Pro RTX 3070 Ti | |
| Samsung Galaxy Book3 Ultra 16, i9-13900H RTX 4070 | |
| CrossMark / Responsiveness | |
| Asus ProArt Studiobook 16 OLED H7604 | |
| Schenker VISION 16 Pro (M23) | |
| Moyenne Intel Core i7-13700H, NVIDIA GeForce RTX 4070 Laptop GPU (1451 - 2202, n=6) | |
| MSI Stealth 16 Studio A13VG | |
| Dell XPS 15 9530 RTX 4070 | |
| Moyenne de la classe Multimedia (605 - 2024, n=64, 2 dernières années) | |
| Apple MacBook Pro 16 2023 M2 Max | |
| Schenker Vision 16 Pro RTX 3070 Ti | |
| Samsung Galaxy Book3 Ultra 16, i9-13900H RTX 4070 | |
| PCMark 10 Score | 7368 points | |
Aide | ||
| AIDA64 / Memory Copy | |
| Moyenne de la classe Multimedia (11299 - 132135, n=58, 2 dernières années) | |
| Asus ProArt Studiobook 16 OLED H7604 | |
| Samsung Galaxy Book3 Ultra 16, i9-13900H RTX 4070 | |
| MSI Stealth 16 Studio A13VG | |
| Dell XPS 15 9530 RTX 4070 | |
| Schenker VISION 16 Pro (M23) | |
| Schenker Vision 16 Pro RTX 3070 Ti | |
| Moyenne Intel Core i7-13700H (24334 - 78081, n=29) | |
| AIDA64 / Memory Read | |
| Moyenne de la classe Multimedia (11624 - 174586, n=58, 2 dernières années) | |
| Asus ProArt Studiobook 16 OLED H7604 | |
| MSI Stealth 16 Studio A13VG | |
| Schenker VISION 16 Pro (M23) | |
| Samsung Galaxy Book3 Ultra 16, i9-13900H RTX 4070 | |
| Dell XPS 15 9530 RTX 4070 | |
| Schenker Vision 16 Pro RTX 3070 Ti | |
| Moyenne Intel Core i7-13700H (23681 - 79656, n=29) | |
| AIDA64 / Memory Write | |
| Samsung Galaxy Book3 Ultra 16, i9-13900H RTX 4070 | |
| Moyenne de la classe Multimedia (11755 - 134998, n=58, 2 dernières années) | |
| Asus ProArt Studiobook 16 OLED H7604 | |
| MSI Stealth 16 Studio A13VG | |
| Moyenne Intel Core i7-13700H (22986 - 99898, n=29) | |
| Dell XPS 15 9530 RTX 4070 | |
| Schenker VISION 16 Pro (M23) | |
| Schenker Vision 16 Pro RTX 3070 Ti | |
| AIDA64 / Memory Latency | |
| Moyenne de la classe Multimedia (7 - 535, n=57, 2 dernières années) | |
| Samsung Galaxy Book3 Ultra 16, i9-13900H RTX 4070 | |
| Moyenne Intel Core i7-13700H (82.4 - 136.8, n=29) | |
| Schenker Vision 16 Pro RTX 3070 Ti | |
| MSI Stealth 16 Studio A13VG | |
| Dell XPS 15 9530 RTX 4070 | |
| Asus ProArt Studiobook 16 OLED H7604 | |
| Schenker VISION 16 Pro (M23) | |
* ... Moindre est la valeur, meilleures sont les performances
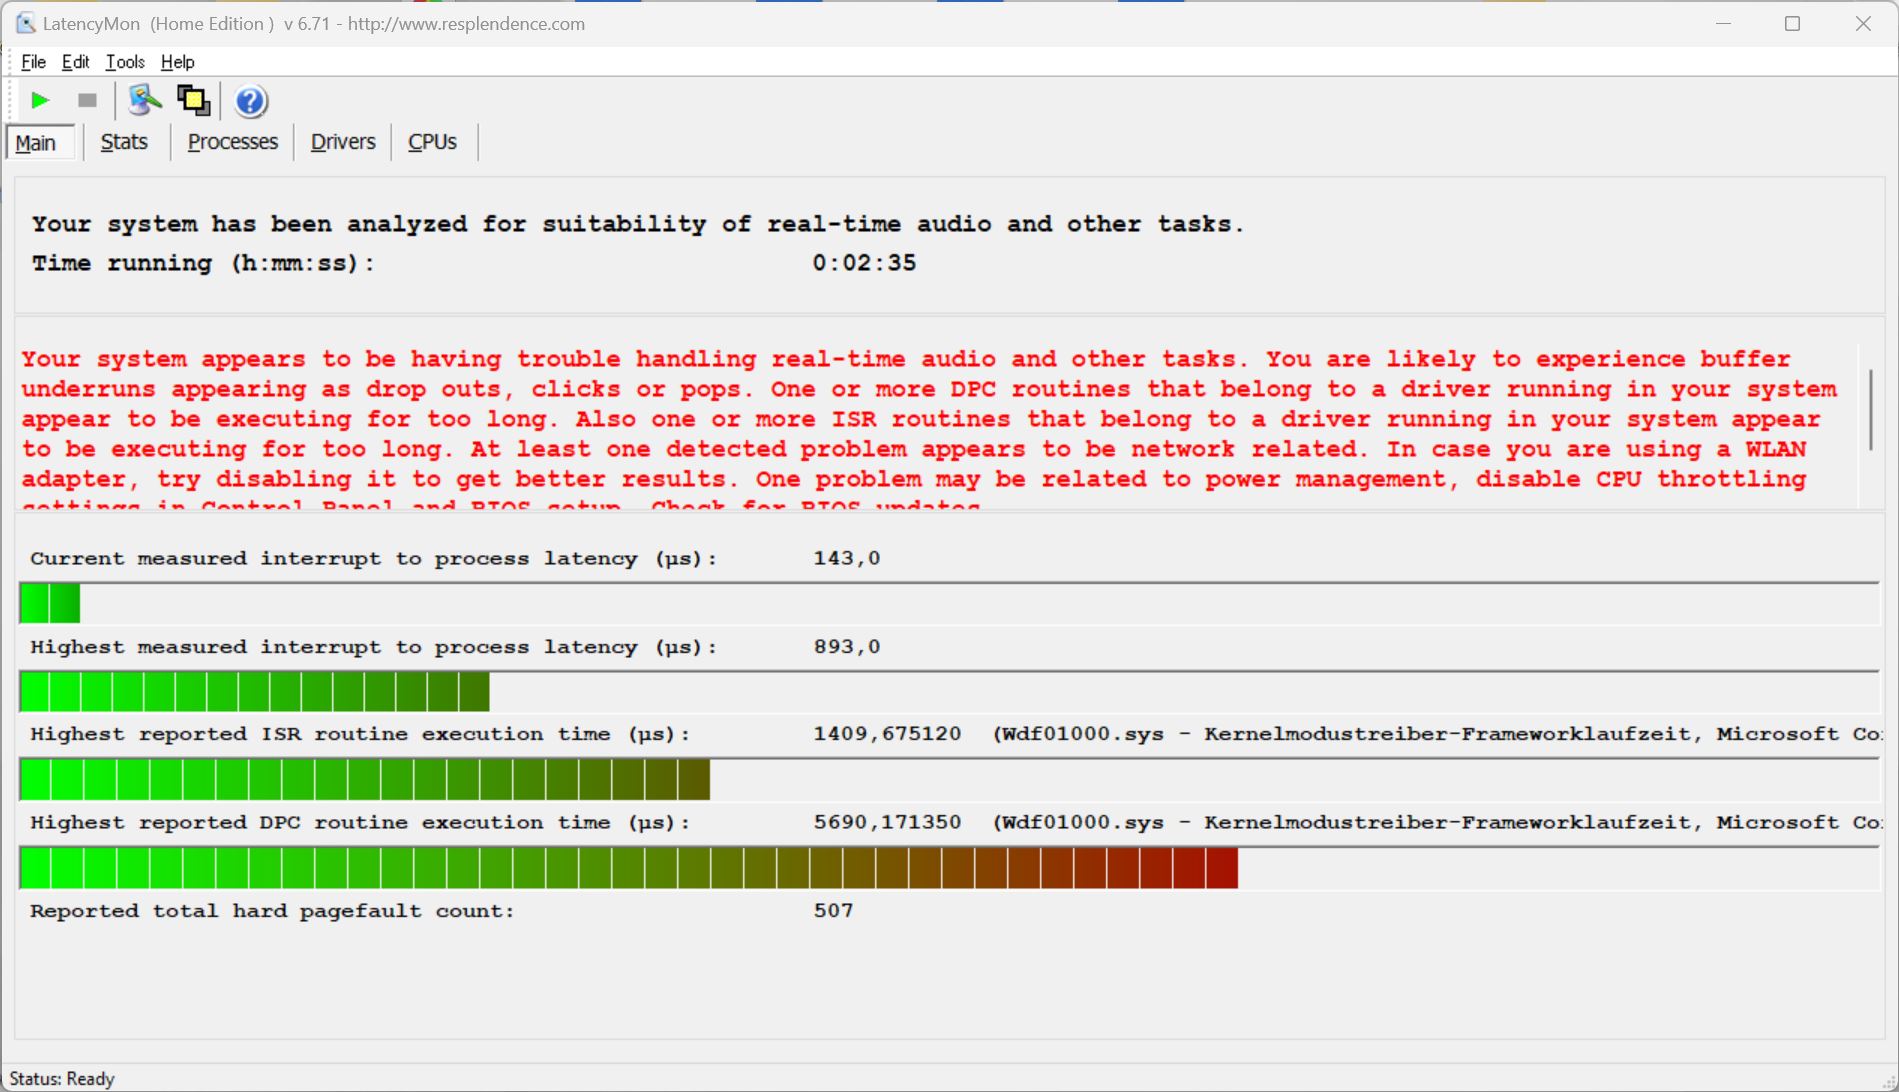
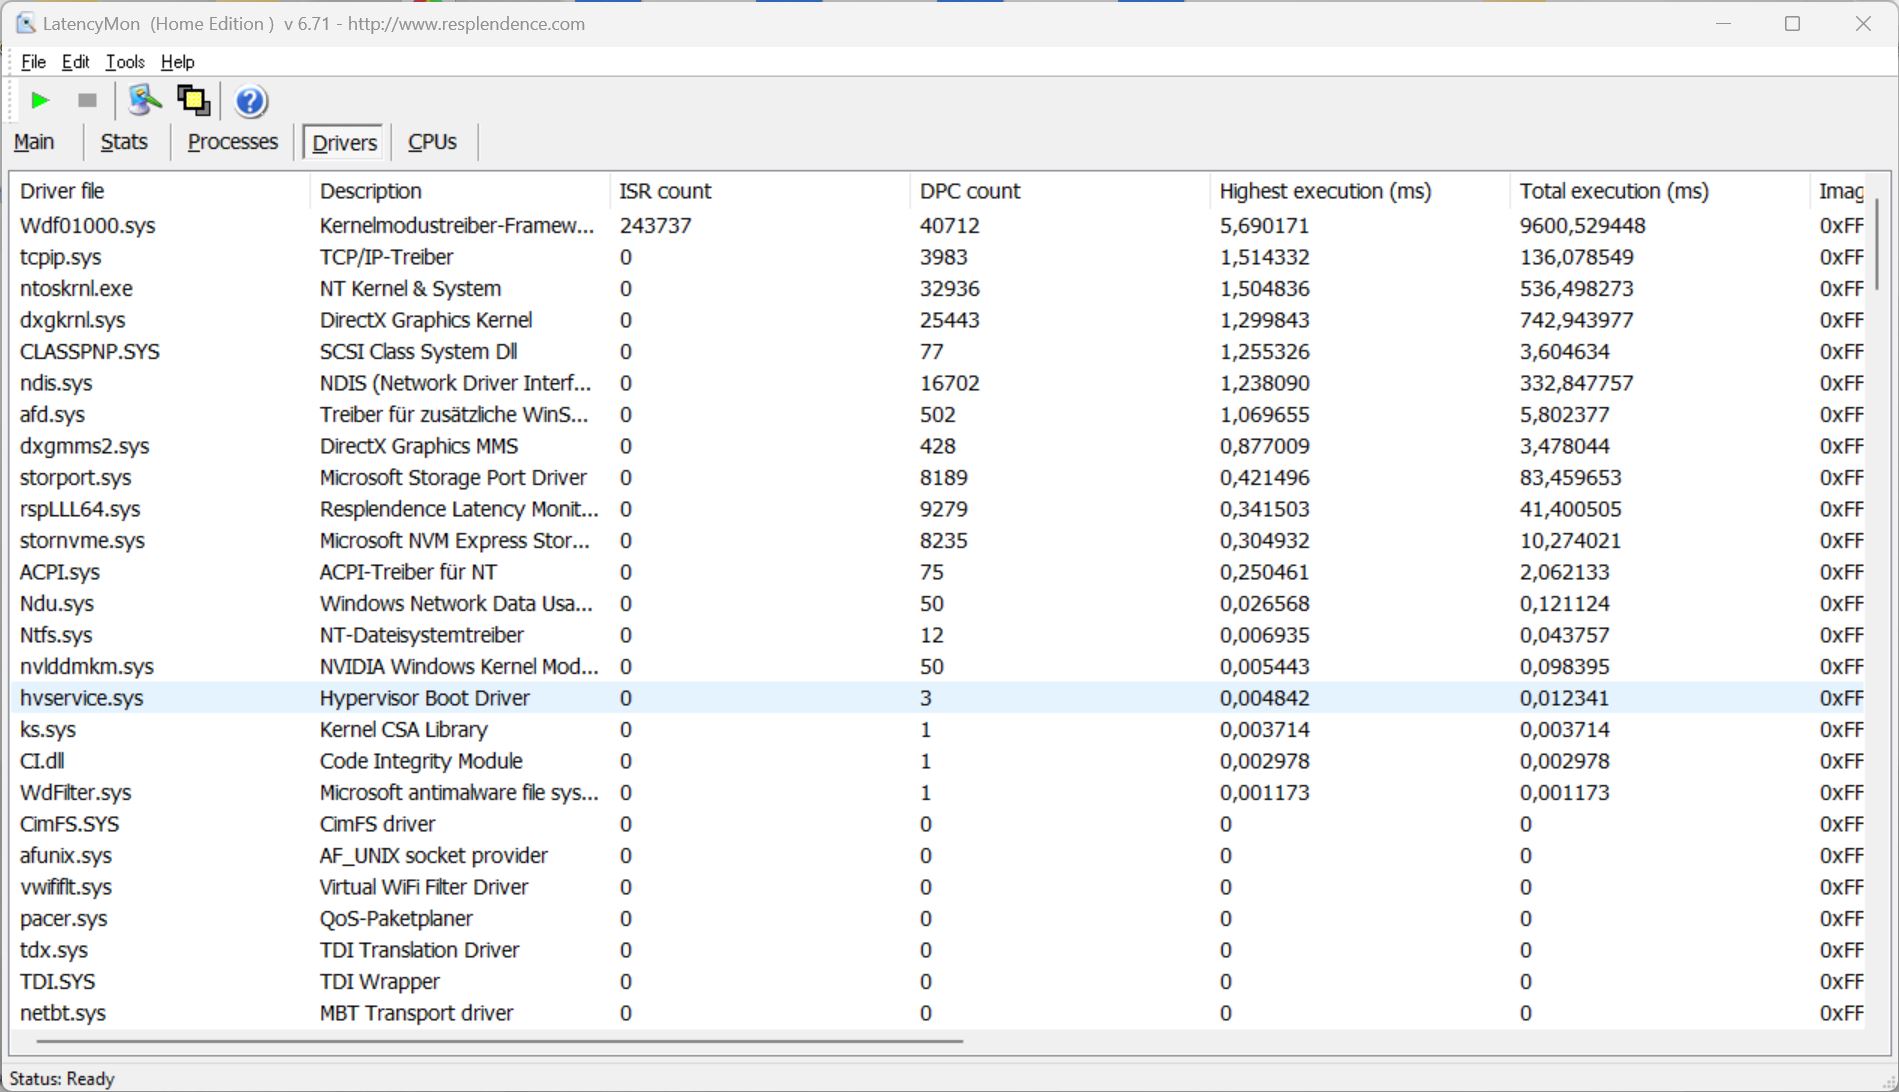
Latences DPC
Dans notre test de latence standardisé (avec navigation sur Internet, reproduction YouTube en 4K et charge du processeur), avec la version du BIOS en vigueur au moment du test, notre unité de test montre quelques légères limitations pour une utilisation dans des applications audio en temps réel.
| DPC Latencies / LatencyMon - interrupt to process latency (max), Web, Youtube, Prime95 | |
| MSI Stealth 16 Studio A13VG | |
| Samsung Galaxy Book3 Ultra 16, i9-13900H RTX 4070 | |
| Asus ProArt Studiobook 16 OLED H7604 | |
| Dell XPS 15 9530 RTX 4070 | |
| Schenker VISION 16 Pro (M23) | |
| Schenker Vision 16 Pro RTX 3070 Ti | |
* ... Moindre est la valeur, meilleures sont les performances
Solution de stockage
Le Vision 16 Pro offre deux emplacements PCIe 4.0 rapides pour les SSD, le second emplacement situé à côté de la batterie ne pouvant accueillir qu'un SSD à une seule face. Notre unité de test utilise la version 1 To du Samsung 990 Pro, et après le premier démarrage, 870 Go de stockage sont encore disponibles pour l'utilisateur. Les taux de transfert du SSD sont très élevés et les performances restent stables même après des chargements prolongés, ce qui n'est pas du tout le cas des SSD haute performance actuels. Vous trouverez d'autres tests de performance de SSD ici.

* ... Moindre est la valeur, meilleures sont les performances
Disk Throttling: DiskSpd Read Loop, Queue Depth 8
Carte graphique - RTX 4070 Laptop
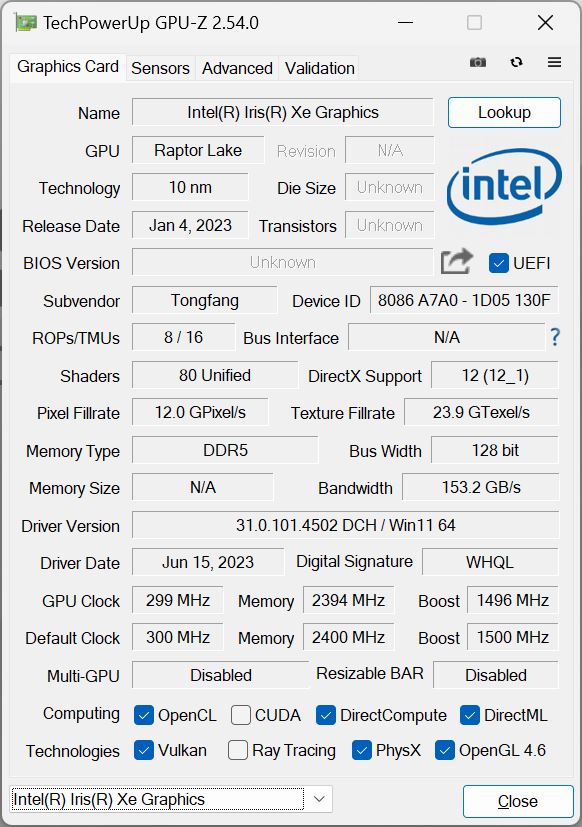
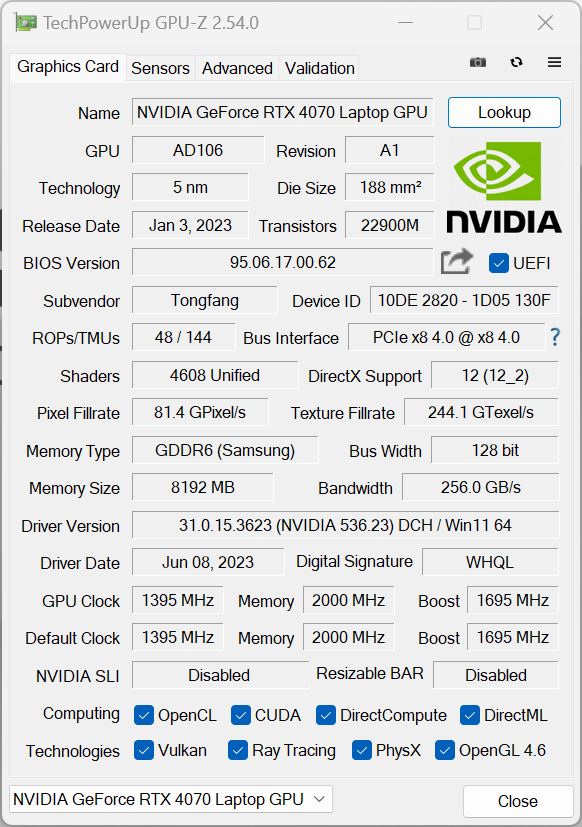
Comme dans le modèle de l'année dernière, un GPU Nvidia actuel avec un TGP maximum de 95 watts est utilisé (70W TGP + 25W Dynamic Boost du CPU), mais cette année, le nouvelle RTX 4070 Laptopest utilisé. Cependant, leRTX 4080 Laptopqui est le successeur direct de la RTX 3080 il n'y a pas de commutateur MUX dans l'ordinateur portable multimédia, de sorte que la commutation graphique se fait régulièrement via Optimus.
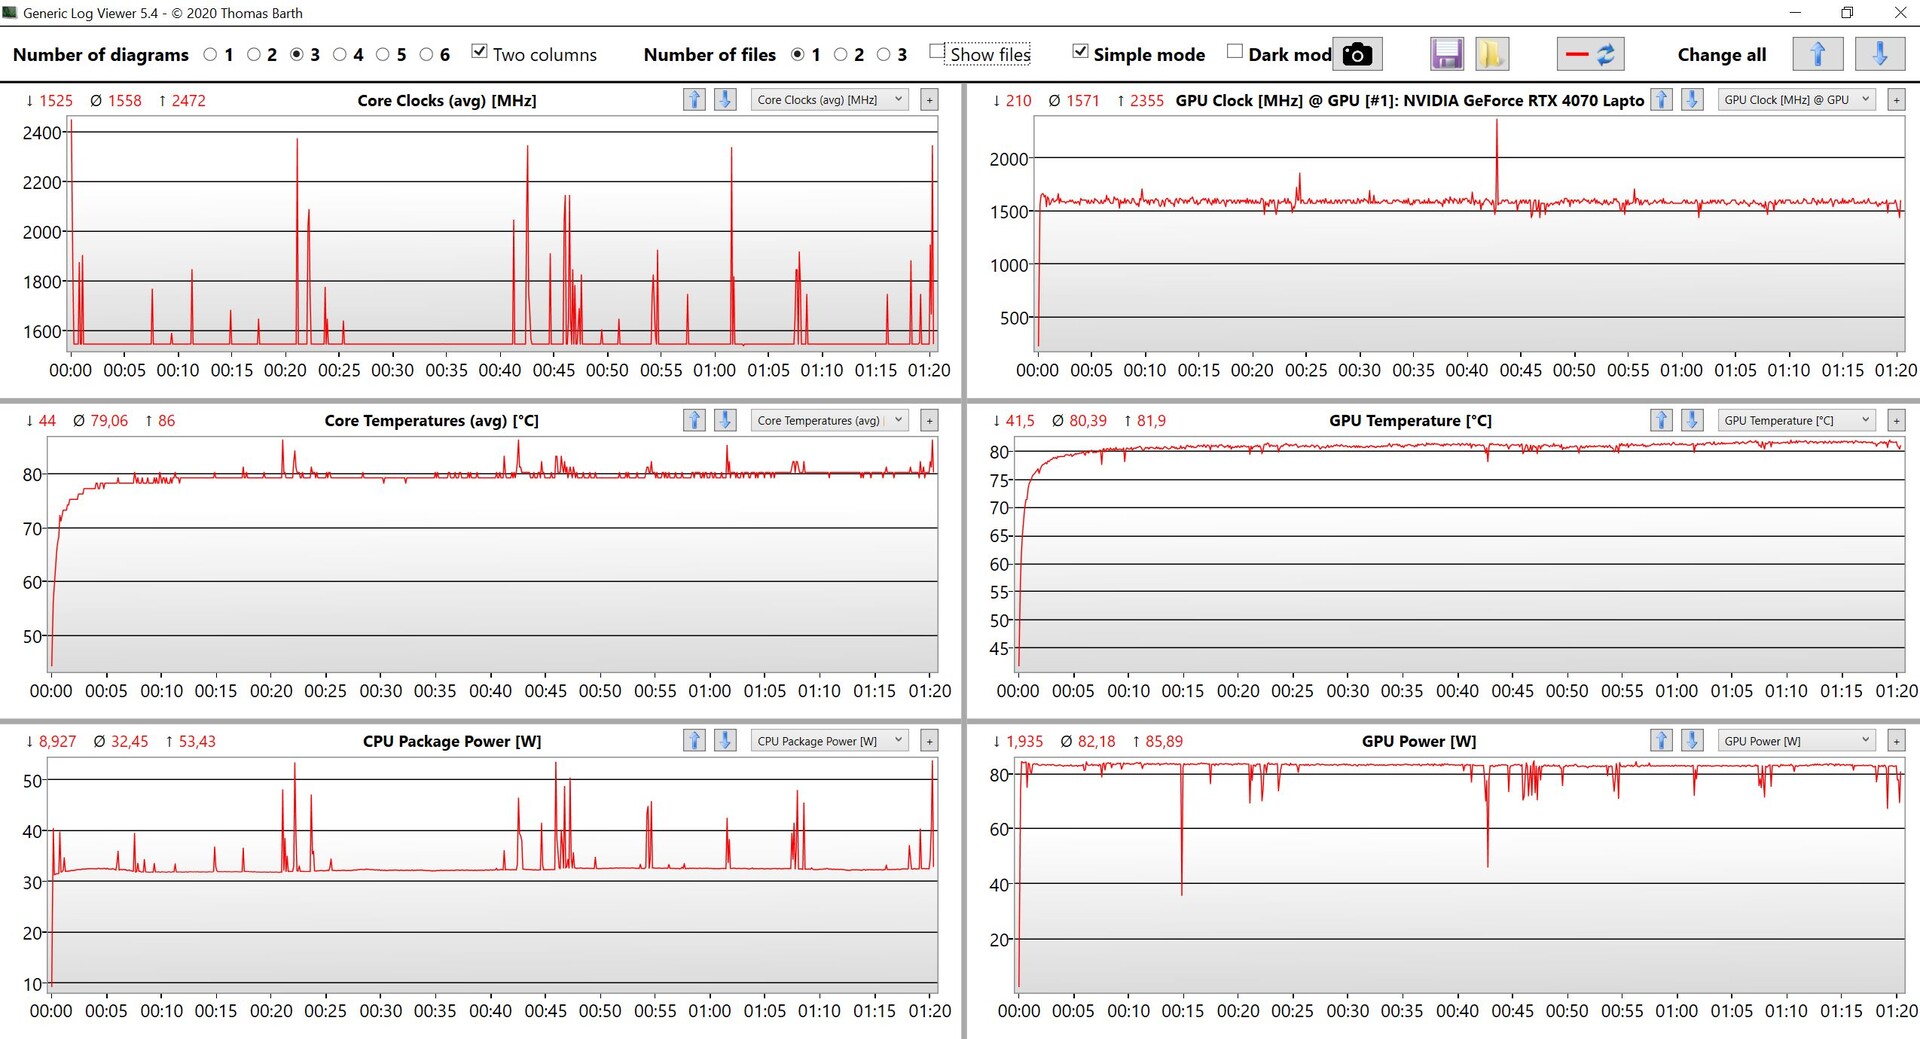
Avec un maximum de 95 watts, il s'agit d'une version rapide de l'ordinateur portable RTX 4070, car elle est proche du maximum de 105 watts que le 4070 consomme généralement dans les jeux. Seulement dans certains tests synthétiques comme FurMark, la consommation peut être plus élevée, mais cela ne joue aucun rôle dans la pratique. Vous pouvez également le voir facilement dans les 3DMarks, où le Schenker Vision 16 Pro se retrouve pratiquement au même niveau que le ProArt Studiobook 16 qui spécifie un TGP de 130 watts pour le RTX 4070 Laptop. Par rapport à la Vision 16 Prode l'année dernière avec la RTX 3070 Tiil y a une augmentation de la vitesse d'environ 25-30%.
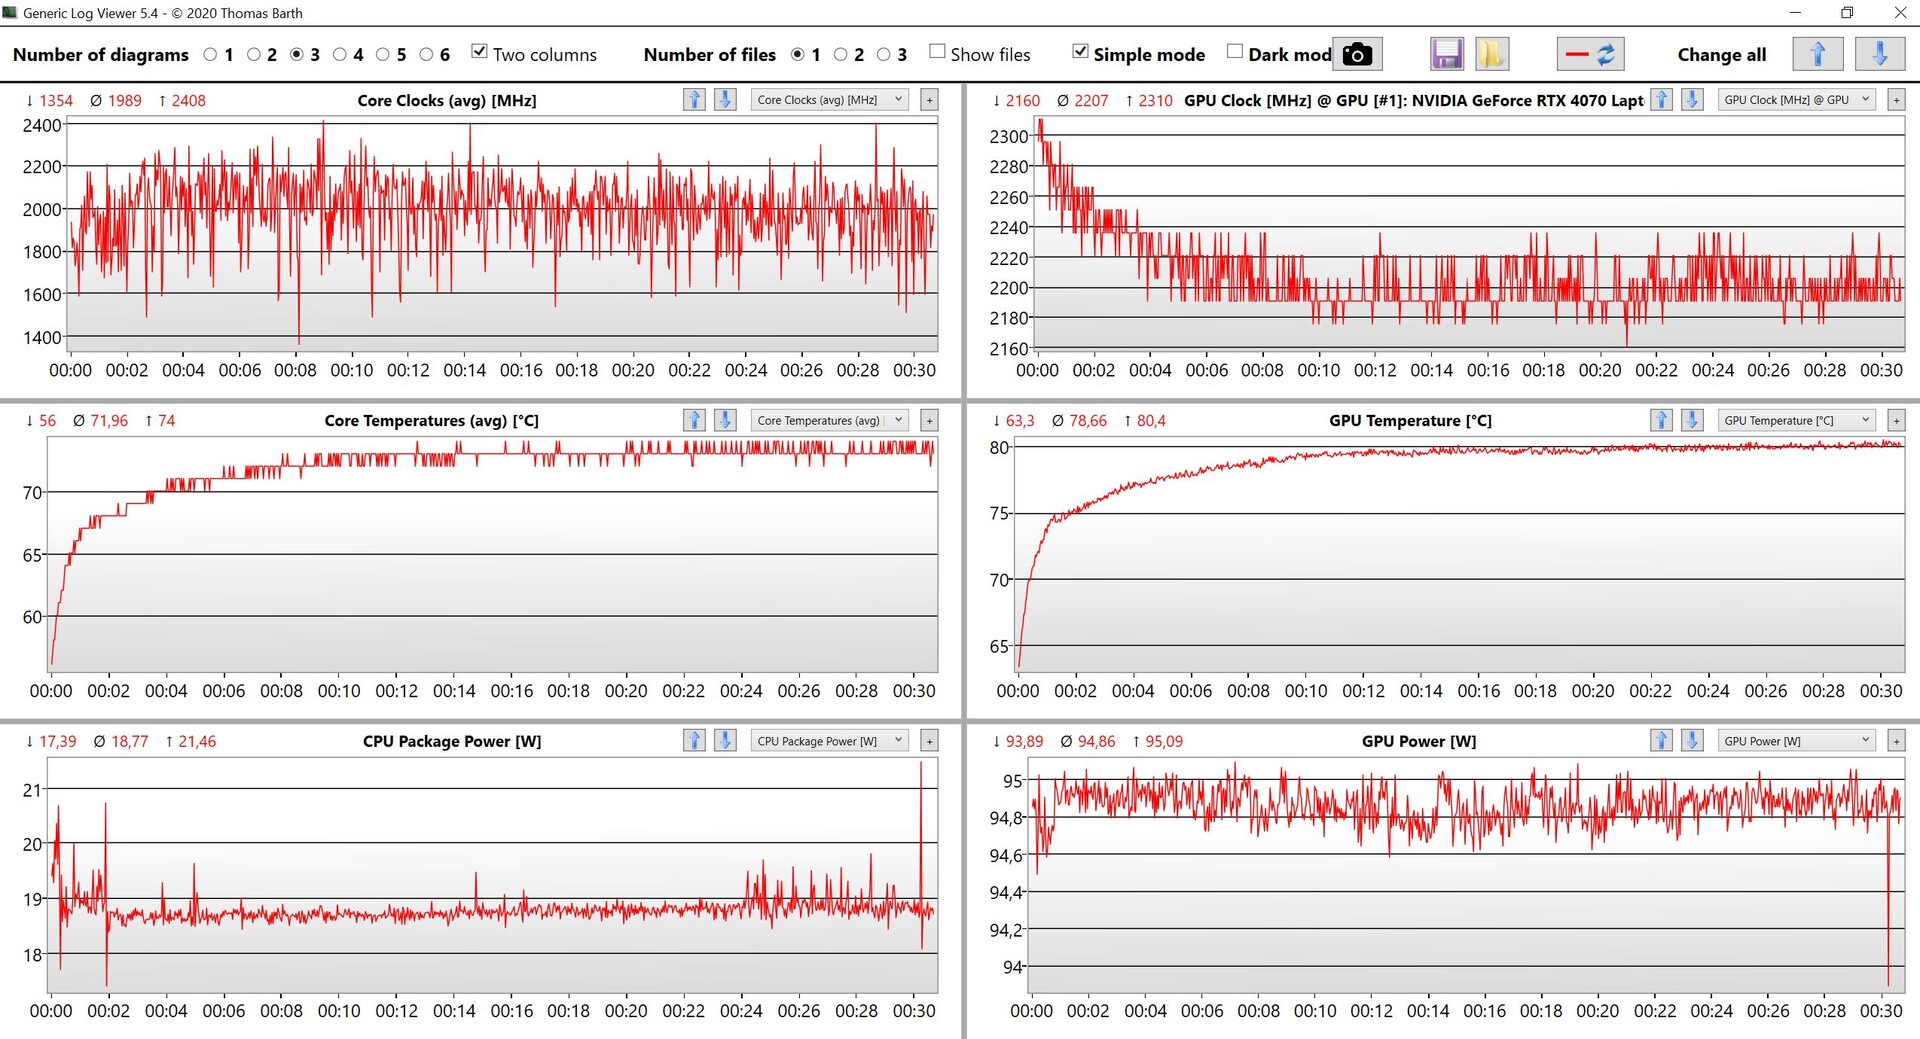
Notre unité de test passe sans problème le test de stress Time Spy à 98,2 %, mais la consommation d'énergie du GPU est limitée à 36 watts en fonctionnement sur batterie. Sans chargeur, les performances du GPU sont donc inférieures d'environ 40 %. Vous trouverez d'autres tests de performance du GPU ici.
| 3DMark 11 Performance | 32729 points | |
| 3DMark Fire Strike Score | 24151 points | |
| 3DMark Time Spy Score | 11566 points | |
Aide | ||
| Blender / v3.3 Classroom METAL | |
| Apple MacBook Pro 16 2023 M2 Max | |
| Moyenne de la classe Multimedia (17.8 - 68, n=5, 2 dernières années) | |
| Blender / v3.3 Classroom OPTIX/RTX | |
| Moyenne de la classe Multimedia (12 - 105, n=24, 2 dernières années) | |
| Dell XPS 15 9530 RTX 4070 | |
| Schenker Vision 16 Pro RTX 3070 Ti | |
| Samsung Galaxy Book3 Ultra 16, i9-13900H RTX 4070 | |
| MSI Stealth 16 Studio A13VG | |
| Schenker VISION 16 Pro (M23) | |
| Asus ProArt Studiobook 16 OLED H7604 | |
| Moyenne NVIDIA GeForce RTX 4070 Laptop GPU (18 - 30, n=68) | |
| Blender / v3.3 Classroom CUDA | |
| Moyenne de la classe Multimedia (20 - 186, n=24, 2 dernières années) | |
| Dell XPS 15 9530 RTX 4070 | |
| Schenker Vision 16 Pro RTX 3070 Ti | |
| Samsung Galaxy Book3 Ultra 16, i9-13900H RTX 4070 | |
| MSI Stealth 16 Studio A13VG | |
| Asus ProArt Studiobook 16 OLED H7604 | |
| Schenker VISION 16 Pro (M23) | |
| Moyenne NVIDIA GeForce RTX 4070 Laptop GPU (32 - 50, n=67) | |
| Blender / v3.3 Classroom CPU | |
| Schenker Vision 16 Pro RTX 3070 Ti | |
| Samsung Galaxy Book3 Ultra 16, i9-13900H RTX 4070 | |
| Moyenne de la classe Multimedia (134.5 - 1042, n=65, 2 dernières années) | |
| Schenker VISION 16 Pro (M23) | |
| Dell XPS 15 9530 RTX 4070 | |
| Apple MacBook Pro 16 2023 M2 Max | |
| MSI Stealth 16 Studio A13VG | |
| Moyenne NVIDIA GeForce RTX 4070 Laptop GPU (158 - 440, n=67) | |
| Asus ProArt Studiobook 16 OLED H7604 | |
* ... Moindre est la valeur, meilleures sont les performances
Performance des jeux
La performance relativement faible du CPU peut avoir un effet négatif sur la performance de jeu, car la performance de Vision 16 Pro chute parfois, comparée à celle d'autres ordinateurs portables avec la RTX 4070 Laptop. Cependant, la performance est tout à fait suffisante pour jouer à des jeux modernes tels que Cyberpunk 2077 ou Star Wars : Jedi Survivor en résolution QHD, et reste stable pendant les sessions de jeu les plus longues.
| The Witcher 3 - 1920x1080 Ultra Graphics & Postprocessing (HBAO+) | |
| MSI Stealth 16 Studio A13VG | |
| Asus ProArt Studiobook 16 OLED H7604 | |
| Schenker VISION 16 Pro (M23) | |
| Schenker Vision 16 Pro RTX 3070 Ti | |
| Samsung Galaxy Book3 Ultra 16, i9-13900H RTX 4070 | |
| Dell XPS 15 9530 RTX 4070 | |
| Moyenne de la classe Multimedia (11 - 121, n=11, 2 dernières années) | |
The Witcher 3 FPS Chart
| Bas | Moyen | Élevé | Ultra | QHD | |
|---|---|---|---|---|---|
| GTA V (2015) | 170 | 156.9 | 96.5 | 80.6 | |
| The Witcher 3 (2015) | 226 | 105.4 | |||
| Dota 2 Reborn (2015) | 178.4 | 161.3 | 152.4 | 143.8 | |
| Final Fantasy XV Benchmark (2018) | 175.3 | 143.2 | 109 | 81.6 | |
| X-Plane 11.11 (2018) | 154.8 | 138.4 | 109.7 | ||
| Far Cry 5 (2018) | 168 | 134 | 127 | 120 | 108 |
| Strange Brigade (2018) | 362 | 270 | 223 | 196.7 | 131.6 |
| F1 2021 (2021) | 339 | 276 | 234 | 133.1 | 104.3 |
| Cyberpunk 2077 1.6 (2022) | 106 | 102 | 101 | 82 | 52 |
| F1 22 (2022) | 220 | 183 | 72.6 | 47 | |
| Star Wars Jedi Survivor (2023) | 84 | 76 | 72 | 67 | 44 |
Émissions - Ventilateurs bruyants à pleine puissance
Émissions sonores
Vous pouvez configurer dans le BIOS si les deux ventilateurs doivent fonctionner en permanence à faible vitesse ou non, ce qui présente l'avantage de mieux gérer les pics de charge. Bien que cette option ait été activée dans notre unité de test, les ventilateurs sont restés immobiles dans de nombreux cas, même dans le mode de performance le plus rapide. Les ventilateurs ne deviennent clairement audibles que sous charge, lorsque le GPU joue un rôle plus important en raison de la consommation d'énergie plus élevée. Avec environ 53 dB(A) dans les jeux et dans le test de stress, la Vision 16 Pro est maintenant aussi bruyante que son prédécesseur en mode Turbo. Nous listons les mesures des différents modes dans le tableau suivant :
| Application | Silent | Performance Balanced | Performance Enthusiast |
|---|---|---|---|
| 3DMark 06 | 37,7 dB(A) | 47,2 dB(A) | 47,2 dB(A) |
| Witcher 3 | 37.7 dB(A) | 49,9 dB(A) | 53,1 dB(A) |
| Test d'effort | 40,6 dB(A) | 49,9 dB(A) | 53,1 dB(A) |
En particulier dans le cadre d'une utilisation quotidienne, mais aussi avec des jeux plus anciens ou moins exigeants, il vaut la peine de passer en mode silencieux (soit via le Control Center, soit à l'aide de la touche F3), car les performances restent suffisantes et les ventilateurs sont nettement plus silencieux, avec environ 38 à 40 dB(A). Nous n'avons pas remarqué d'autres bruits électroniques dans notre unité de test.
Degré de la nuisance sonore
| Au repos |
| 25.9 / 25.9 / 32 dB(A) |
| Fortement sollicité |
| 47.2 / 53.1 dB(A) |
 | ||
30 dB silencieux 40 dB(A) audible 50 dB(A) bruyant |
||
min: | ||
| Schenker VISION 16 Pro (M23) GeForce RTX 4070 Laptop GPU, i7-13700H, Samsung 990 Pro 1 TB | Samsung Galaxy Book3 Ultra 16, i9-13900H RTX 4070 GeForce RTX 4070 Laptop GPU, i9-13900H, Samsung PM9A1 MZVL21T0HCLR | MSI Stealth 16 Studio A13VG GeForce RTX 4070 Laptop GPU, i7-13700H, Micron 3400 2TB MTFDKBA2T0TFH | Dell XPS 15 9530 RTX 4070 GeForce RTX 4070 Laptop GPU, i7-13700H, SK hynix PC801 HFS001TEJ9X101N | Asus ProArt Studiobook 16 OLED H7604 GeForce RTX 4070 Laptop GPU, i9-13980HX, Phison EM2804TBMTCB47 | Apple MacBook Pro 16 2023 M2 Max M2 Max 38-Core GPU, M2 Max, Apple SSD AP2048Z | Schenker Vision 16 Pro RTX 3070 Ti GeForce RTX 3070 Ti Laptop GPU, i7-12700H, Samsung SSD 980 Pro 1TB MZ-V8P1T0BW | |
|---|---|---|---|---|---|---|---|
| Noise | 6% | 13% | 20% | 4% | 18% | 11% | |
| arrêt / environnement * (dB) | 25.9 | 25.2 3% | 24 7% | 23.1 11% | 24.5 5% | 23.9 8% | 22.9 12% |
| Idle Minimum * (dB) | 25.9 | 25.2 3% | 24 7% | 23.1 11% | 24.5 5% | 23.9 8% | 24.3 6% |
| Idle Average * (dB) | 25.9 | 25.2 3% | 24 7% | 23.1 11% | 24.5 5% | 23.9 8% | 24.3 6% |
| Idle Maximum * (dB) | 32 | 31.3 2% | 24 25% | 24.2 24% | 24.5 23% | 23.9 25% | 24.3 24% |
| Load Average * (dB) | 47.2 | 38.8 18% | 34.81 26% | 27.1 43% | 47.6 -1% | 36.6 22% | 38.5 18% |
| Witcher 3 ultra * (dB) | 53.1 | 44.05 17% | 40.1 24% | 55.9 -5% | 35.1 34% | 51 4% | |
| Load Maximum * (dB) | 53.1 | 51.2 4% | 51.57 3% | 44.6 16% | 56.7 -7% | 43.2 19% | 51 4% |
* ... Moindre est la valeur, meilleures sont les performances
Températures
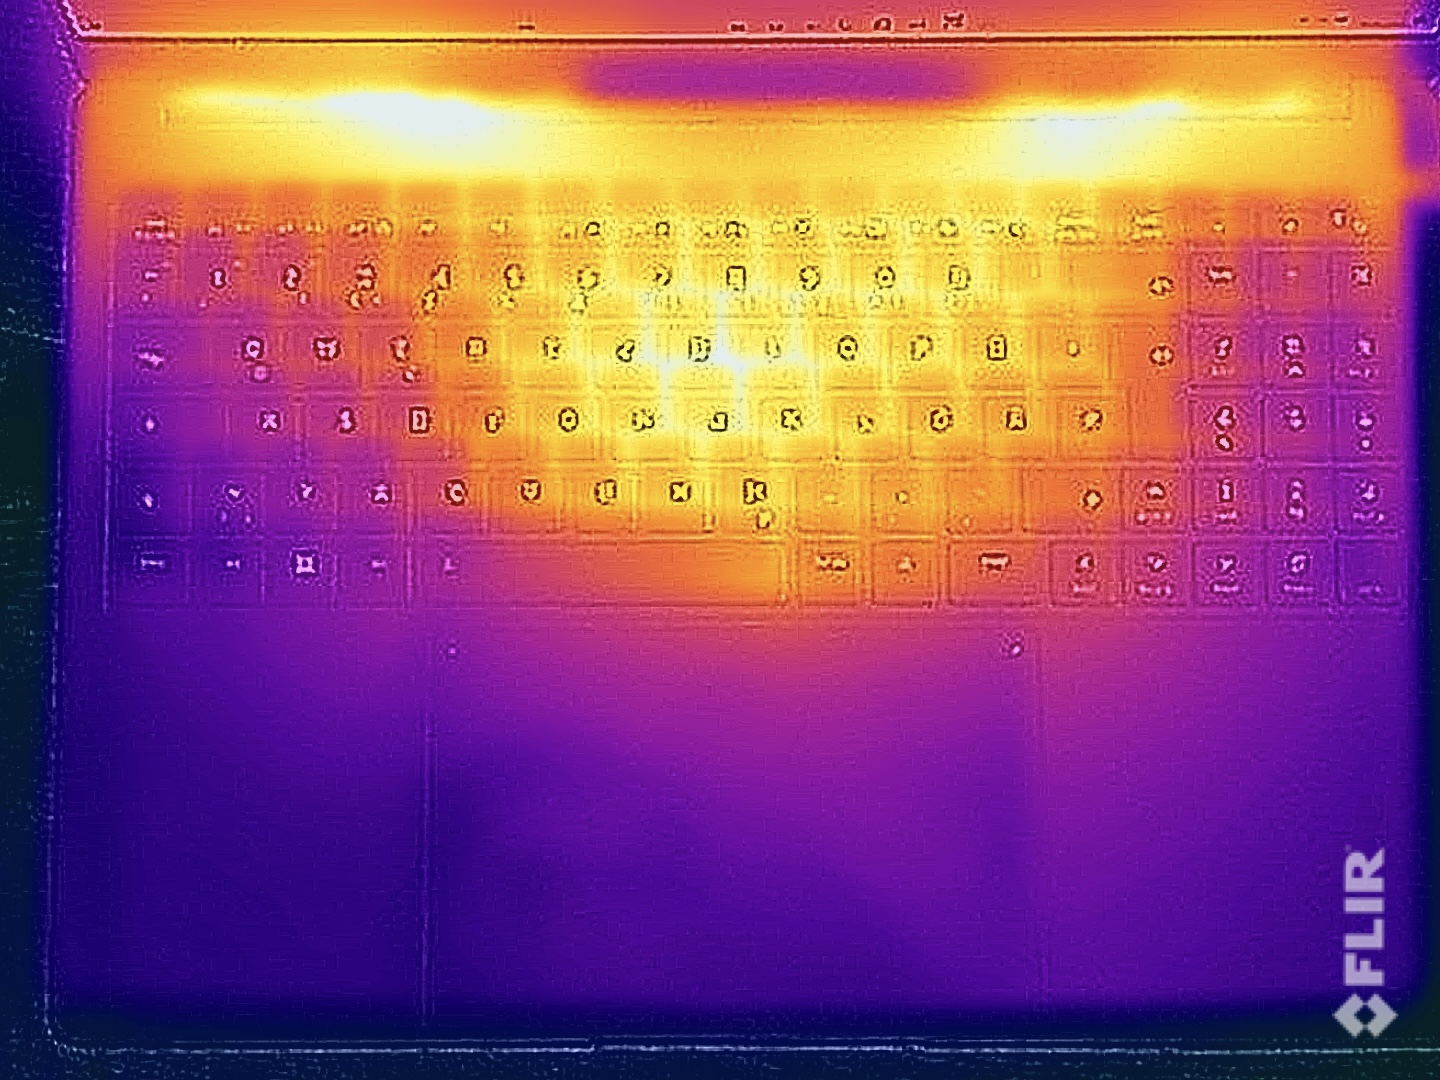
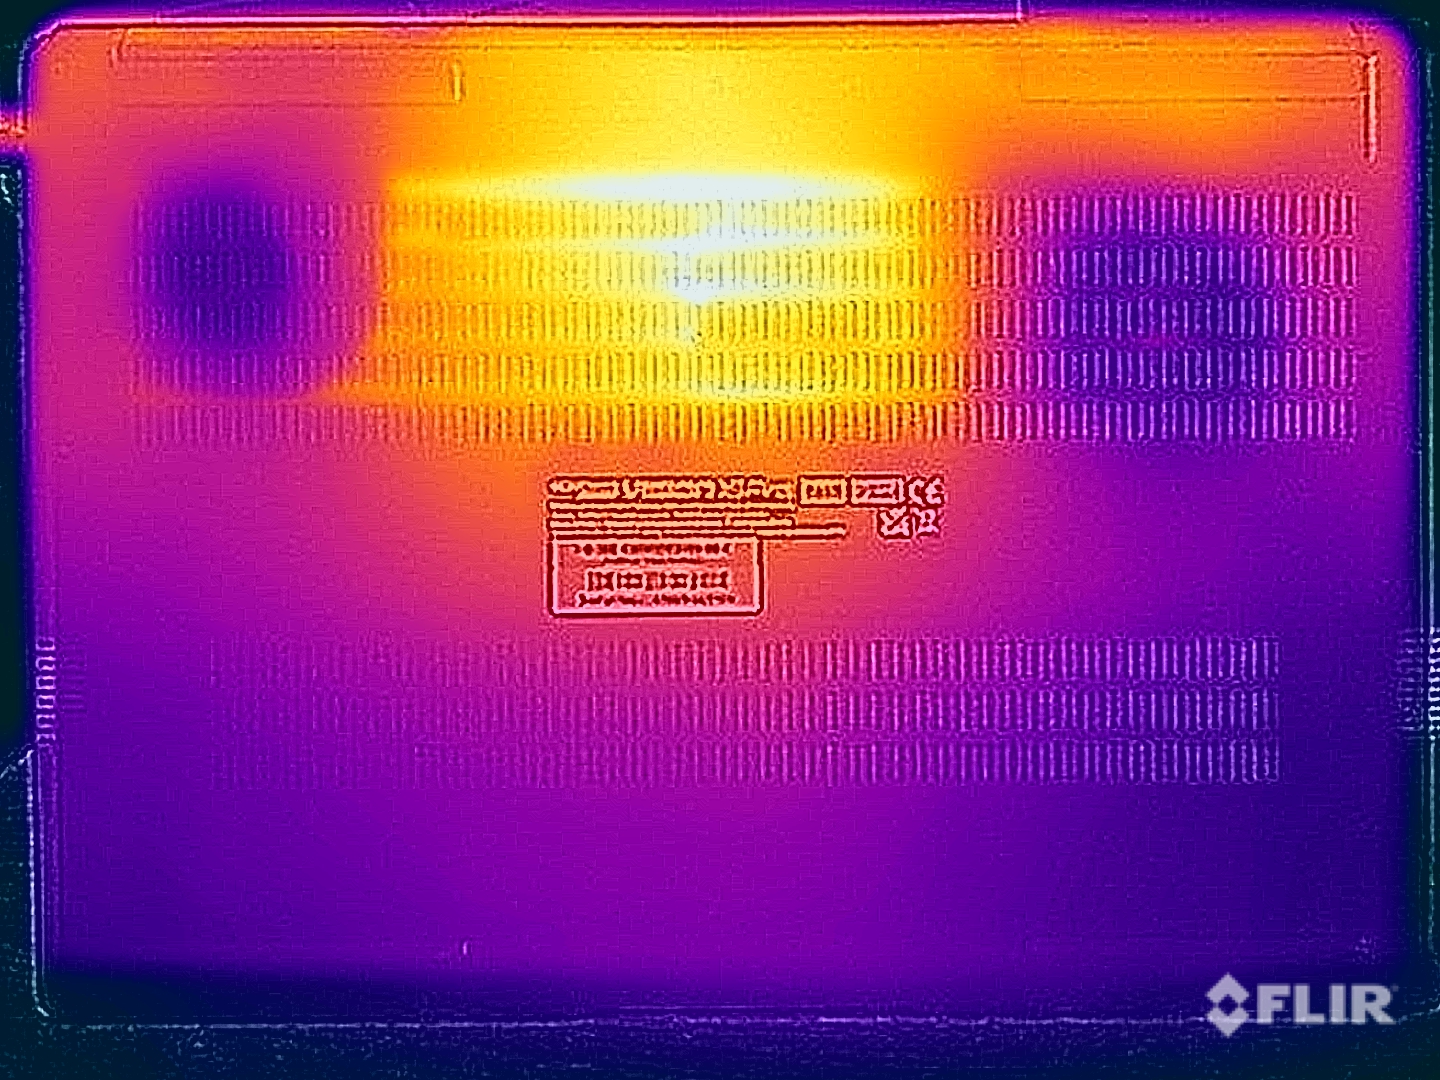
Bien qu'il n'y ait pas de problèmes de température dans le cadre d'une utilisation quotidienne, vous ne devriez pas placer l'appareil sur vos genoux lorsque vous jouez ou lorsque les composants sont soumis à une charge élevée. Dans le cas extrême, nous avons mesuré des températures supérieures à 50 °C dans la zone centrale du bas. La zone centrale du clavier se réchauffe également à plus de 45 °C, ce qui est perceptible lors de la frappe. En revanche, les touches WASD typiques restent nettement plus froides, ce qui est appréciable pour les jeux. Le chargeur, nettement plus compact, ne chauffe que légèrement par rapport à l'ancien modèle, et la température maximale de 44 °C ne pose aucun problème.
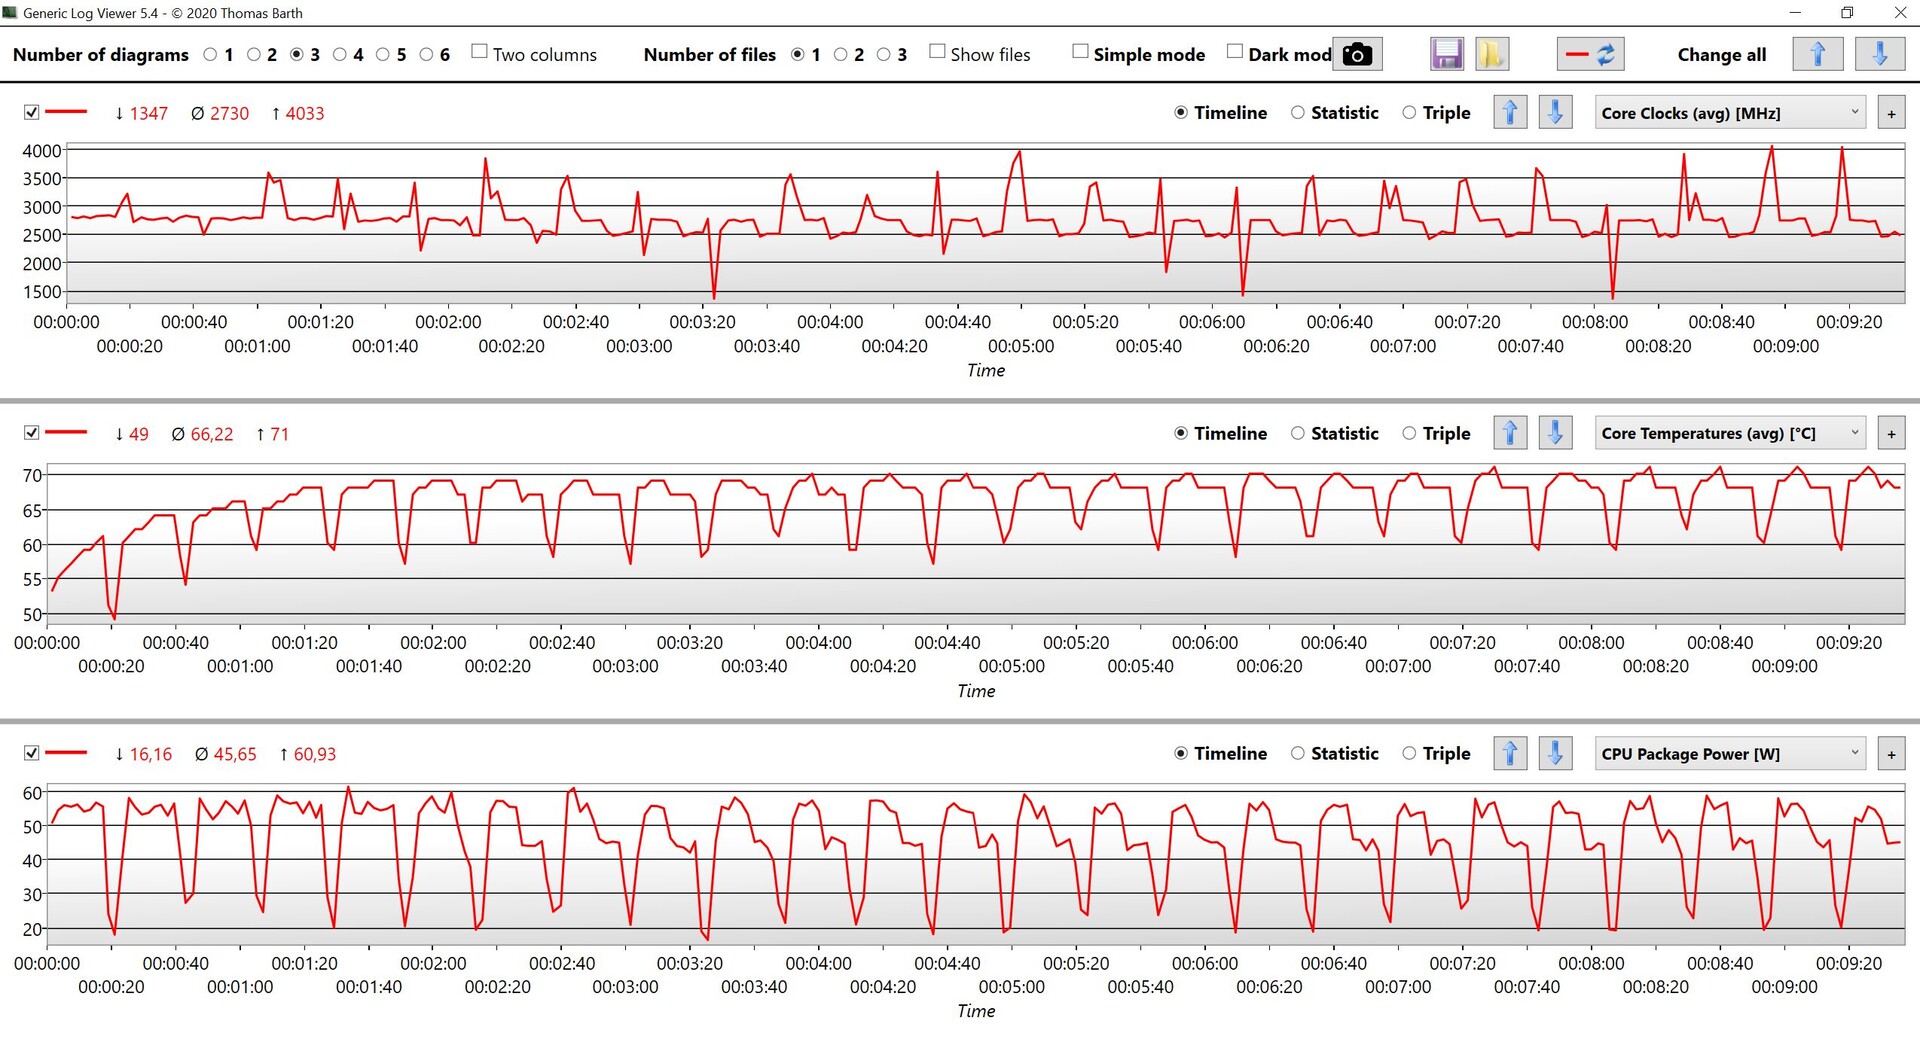
Lors du test de stress, la priorité est donnée à la carte graphique, qui fonctionne de manière stable à environ 82 watts. Le processeur, quant à lui, se stabilise rapidement à environ 32 watts. Dans l'ensemble, il s'agit d'un résultat convenable pour un appareil aussi mince.
(-) La température maximale du côté supérieur est de 46.7 °C / 116 F, par rapport à la moyenne de 36.8 °C / 98 F, allant de 21 à 71 °C pour la classe Multimedia.
(-) Le fond chauffe jusqu'à un maximum de 54.1 °C / 129 F, contre une moyenne de 39.1 °C / 102 F
(+) En utilisation inactive, la température moyenne du côté supérieur est de 24.7 °C / 76 F, par rapport à la moyenne du dispositif de 31.3 °C / 88 F.
(±) En jouant à The Witcher 3, la température moyenne du côté supérieur est de 37.7 °C / 100 F, alors que la moyenne de l'appareil est de 31.3 °C / 88 F.
(+) Les repose-poignets et le pavé tactile sont plus froids que la température de la peau avec un maximum de 28 °C / 82.4 F et sont donc froids au toucher.
(±) La température moyenne de la zone de l'appui-paume de dispositifs similaires était de 28.7 °C / 83.7 F (+0.7 °C / #1.3 F).
| Schenker VISION 16 Pro (M23) Intel Core i7-13700H, NVIDIA GeForce RTX 4070 Laptop GPU | Samsung Galaxy Book3 Ultra 16, i9-13900H RTX 4070 Intel Core i9-13900H, NVIDIA GeForce RTX 4070 Laptop GPU | MSI Stealth 16 Studio A13VG Intel Core i7-13700H, NVIDIA GeForce RTX 4070 Laptop GPU | Dell XPS 15 9530 RTX 4070 Intel Core i7-13700H, NVIDIA GeForce RTX 4070 Laptop GPU | Asus ProArt Studiobook 16 OLED H7604 Intel Core i9-13980HX, NVIDIA GeForce RTX 4070 Laptop GPU | Apple MacBook Pro 16 2023 M2 Max Apple M2 Max, Apple M2 Max 38-Core GPU | Schenker Vision 16 Pro RTX 3070 Ti Intel Core i7-12700H, NVIDIA GeForce RTX 3070 Ti Laptop GPU | |
|---|---|---|---|---|---|---|---|
| Heat | -10% | -32% | -8% | -9% | 15% | 1% | |
| Maximum Upper Side * (°C) | 46.7 | 45.9 2% | 60 -28% | 45.6 2% | 44.1 6% | 44.2 5% | 50.8 -9% |
| Maximum Bottom * (°C) | 54.1 | 50.9 6% | 61 -13% | 42 22% | 48 11% | 42.9 21% | 46.3 14% |
| Idle Upper Side * (°C) | 26.5 | 31.6 -19% | 38.2 -44% | 34.4 -30% | 32.7 -23% | 22.4 15% | 27.2 -3% |
| Idle Bottom * (°C) | 26.8 | 34.2 -28% | 37.7 -41% | 33.2 -24% | 34.9 -30% | 22.3 17% | 26.6 1% |
* ... Moindre est la valeur, meilleures sont les performances
Intervenants
Rien n'a changé dans le système de haut-parleurs, et les hautes fréquences sont particulièrement précises. Dans l'ensemble, les performances sont également correctes, mais la Vision 16 Pro n'atteint pas encore les excellentes performances duMacBook Pro 16.
Schenker VISION 16 Pro (M23) analyse audio
(±) | le niveau sonore du haut-parleur est moyen mais bon (77.6# dB)
Basses 100 - 315 Hz
(±) | basse réduite - en moyenne 14.7% inférieure à la médiane
(-) | les basses ne sont pas linéaires (15% delta à la fréquence précédente)
Médiums 400 - 2000 Hz
(+) | médiane équilibrée - seulement 3.1% de la médiane
(+) | les médiums sont linéaires (4.6% delta à la fréquence précédente)
Aiguës 2 - 16 kHz
(+) | des sommets équilibrés - à seulement 1.3% de la médiane
(+) | les aigus sont linéaires (4.1% delta à la fréquence précédente)
Globalement 100 - 16 000 Hz
(+) | le son global est linéaire (13.1% différence à la médiane)
Par rapport à la même classe
» 26% de tous les appareils testés de cette catégorie étaient meilleurs, 5% similaires, 69% pires
» Le meilleur avait un delta de 5%, la moyenne était de 17%, le pire était de 45%.
Par rapport à tous les appareils testés
» 13% de tous les appareils testés étaient meilleurs, 3% similaires, 84% pires
» Le meilleur avait un delta de 4%, la moyenne était de 23%, le pire était de 134%.
Apple MacBook Pro 16 2023 M2 Max analyse audio
(+) | les haut-parleurs peuvent jouer relativement fort (86.1# dB)
Basses 100 - 315 Hz
(+) | bonne basse - seulement 3.9% loin de la médiane
(+) | les basses sont linéaires (5.7% delta à la fréquence précédente)
Médiums 400 - 2000 Hz
(+) | médiane équilibrée - seulement 1.2% de la médiane
(+) | les médiums sont linéaires (1.5% delta à la fréquence précédente)
Aiguës 2 - 16 kHz
(+) | des sommets équilibrés - à seulement 2.5% de la médiane
(+) | les aigus sont linéaires (1.7% delta à la fréquence précédente)
Globalement 100 - 16 000 Hz
(+) | le son global est linéaire (4.9% différence à la médiane)
Par rapport à la même classe
» 0% de tous les appareils testés de cette catégorie étaient meilleurs, 0% similaires, 99% pires
» Le meilleur avait un delta de 5%, la moyenne était de 17%, le pire était de 45%.
Par rapport à tous les appareils testés
» 0% de tous les appareils testés étaient meilleurs, 0% similaires, 100% pires
» Le meilleur avait un delta de 4%, la moyenne était de 23%, le pire était de 134%.
Gestion de l'énergie - Amélioration de la durée de vie de la batterie
Consommation électrique
Dans nos mesures de la consommation, le nouveau modèle 2023 s'avère légèrement plus efficace, seule la consommation maximale de 173 watts étant pratiquement identique. Mais cette valeur tombe rapidement à environ 150 watts (y compris pendant les jeux), de sorte que le chargeur de 180 watts inclus est suffisamment grand. D'ailleurs, il n'est pas seulement beaucoup plus compact, mais aussi beaucoup plus léger (489 contre 811 grammes, 17,2 contre 28,6 oz).
| Éteint/en veille | |
| Au repos | |
| Fortement sollicité |
|
Légende:
min: | |
| Schenker VISION 16 Pro (M23) i7-13700H, GeForce RTX 4070 Laptop GPU, Samsung 990 Pro 1 TB, IPS, 2560x1600, 16" | Samsung Galaxy Book3 Ultra 16, i9-13900H RTX 4070 i9-13900H, GeForce RTX 4070 Laptop GPU, Samsung PM9A1 MZVL21T0HCLR, OLED / AMOLED, 2880x1800, 16" | MSI Stealth 16 Studio A13VG i7-13700H, GeForce RTX 4070 Laptop GPU, Micron 3400 2TB MTFDKBA2T0TFH, IPS, 2560x1600, 16" | Dell XPS 15 9530 RTX 4070 i7-13700H, GeForce RTX 4070 Laptop GPU, SK hynix PC801 HFS001TEJ9X101N, OLED, 3456x2160, 15.6" | Asus ProArt Studiobook 16 OLED H7604 i9-13980HX, GeForce RTX 4070 Laptop GPU, Phison EM2804TBMTCB47, OLED, 3200x2000, 16" | Apple MacBook Pro 16 2023 M2 Max M2 Max, M2 Max 38-Core GPU, Apple SSD AP2048Z, Mini-LED, 3456x2234, 16.2" | Schenker Vision 16 Pro RTX 3070 Ti i7-12700H, GeForce RTX 3070 Ti Laptop GPU, Samsung SSD 980 Pro 1TB MZ-V8P1T0BW, IPS, 2560x1600, 16" | Moyenne NVIDIA GeForce RTX 4070 Laptop GPU | Moyenne de la classe Multimedia | |
|---|---|---|---|---|---|---|---|---|---|
| Power Consumption | 28% | -28% | -38% | -53% | -3% | -12% | -50% | 21% | |
| Idle Minimum * (Watt) | 8.6 | 4.3 50% | 11 -28% | 20 -133% | 12.8 -49% | 5.2 40% | 9 -5% | 13.2 ? -53% | 5.67 ? 34% |
| Idle Average * (Watt) | 12 | 4.6 62% | 18 -50% | 20.7 -73% | 19.9 -66% | 16.5 -38% | 13.3 -11% | 18.2 ? -52% | 10.1 ? 16% |
| Idle Maximum * (Watt) | 12.4 | 11.4 8% | 19 -53% | 22.4 -81% | 20.3 -64% | 16.8 -35% | 14.3 -15% | 24.6 ? -98% | 12.3 ? 1% |
| Load Average * (Watt) | 80 | 97 -21% | 91 -14% | 77.1 4% | 131.4 -64% | 113 -41% | 107 -34% | 97 ? -21% | 65.6 ? 18% |
| Witcher 3 ultra * (Watt) | 147.7 | 100.9 32% | 130 12% | 95.4 35% | 196.5 -33% | 92 38% | 155.2 -5% | ||
| Load Maximum * (Watt) | 173.1 | 107 38% | 228 -32% | 133.4 23% | 246.8 -43% | 145 16% | 172 1% | 221 ? -28% | 113.2 ? 35% |
* ... Moindre est la valeur, meilleures sont les performances
Power Consumption The Witcher 3 / Stress Test
Power Consumption With External Monitor
Autonomie de la batterie
La durée de vie de la batterie est également légèrement meilleure, ce qui correspond à des valeurs de consommation légèrement plus efficaces. Avec une luminosité ajustée de 150 cd/m² (correspondant à 39% de la luminosité maximale de notre unité de test), notre test WLAN dure un peu plus de 7,5 heures avec 60 ou 240 Hz, ce qui rend le Vision 16 Pro 2023 nettement plus compétitif. Seul le MacBook Pro 16 joue dans une autre catégorie, avec une autonomie de près de 15 heures. Le test vidéo à 150 cd/m² dure également près de 8 heures.
À la luminosité maximale de l'écran, le taux de rafraîchissement fait une différence, puisque le test WLAN à 240 Hz dure à peine 6 heures, alors qu'il dure encore plus de 7 heures à 60 Hz. Nous aimerions que, comme pour le Vision 14 plus petit, Schenker propose une version du Vision 16 Pro avec une batterie plus grande et sans slot M.2 secondaire.
| Schenker VISION 16 Pro (M23) i7-13700H, GeForce RTX 4070 Laptop GPU, 80 Wh | Samsung Galaxy Book3 Ultra 16, i9-13900H RTX 4070 i9-13900H, GeForce RTX 4070 Laptop GPU, 76 Wh | MSI Stealth 16 Studio A13VG i7-13700H, GeForce RTX 4070 Laptop GPU, 99.9 Wh | Dell XPS 15 9530 RTX 4070 i7-13700H, GeForce RTX 4070 Laptop GPU, 86 Wh | Asus ProArt Studiobook 16 OLED H7604 i9-13980HX, GeForce RTX 4070 Laptop GPU, 90 Wh | Apple MacBook Pro 16 2023 M2 Max M2 Max, M2 Max 38-Core GPU, 99.6 Wh | Schenker Vision 16 Pro RTX 3070 Ti i7-12700H, GeForce RTX 3070 Ti Laptop GPU, 80 Wh | Moyenne de la classe Multimedia | |
|---|---|---|---|---|---|---|---|---|
| Autonomie de la batterie | -4% | 28% | 9% | -22% | 72% | -15% | 64% | |
| H.264 (h) | 7.8 | 9 15% | 7.7 -1% | 6 -23% | 18.7 140% | 6.1 -22% | 16.3 ? 109% | |
| WiFi v1.3 (h) | 7.8 | 8 3% | 7.8 0% | 8 3% | 5.6 -28% | 14.8 90% | 6 -23% | 12.1 ? 55% |
| Load (h) | 1.3 | 0.9 -31% | 2.4 85% | 1.5 15% | 1.1 -15% | 1.1 -15% | 1.3 0% | 1.654 ? 27% |
Points positifs
Points négatifs
Verdict - La Vision 16 Pro continue d'impressionner par sa légèreté et sa minceur
Alors que le nouveau modèle 2023 de la Vision 16 Pro comprend les mises à jour attendues avec un processeur Intel Raptor Lake et le nouvel ordinateur portable Nvidia GeForce RTX 4070, il y a également quelques ajustements supplémentaires dans les profils de puissance. Le Vision 16 Pro est l'un des rares cas où le processeur de 45 watts fonctionne vraiment à cette valeur sans que la limite de puissance à court terme soit absurdement élevée. Cela signifie que la performance reste assez constante et que les températures ne sautent pas aussi rapidement, mais en même temps, la performance est également légèrement inférieure, en particulier dans les benchmarks courts. Cependant, cela ne joue pas vraiment de rôle dans l'utilisation quotidienne. D'autre part, nous ne comprenons pas vraiment pourquoi Schenker a supprimé le mode manuel ou Turbo qui permettait d'ajuster les valeurs TDP du CPU. Sur le modèle précédent, ce mode permettait d'augmenter sensiblement les performances du processeur.
Avec le même TDP maximum de 95 watts, le nouveau GeForce RTX 4070 Laptop délivre environ 25-30% de performance en plus que l'ancienne RTX 3070 Ti, mais il n'y a pas de successeur direct à l'ancienne RTX 3080. A part cela, il y a peu de raisons de se plaindre de la performance globale, et les taux de transfert du SSD PCIe 4.0 rapide restent également constants. Nous ne comprenons pas pourquoi il y a maintenant un lecteur de carte nettement plus lent.
Le Schenker Vision 16 Pro offre beaucoup de performances dans un boîtier très fin et léger, y compris dans la version 2023. Malgré cela, il n'y a pas de compromis en ce qui concerne les connexions ou les options de maintenance.
L'écran IPS mat à 240 Hz offre subjectivement une bonne qualité d'image, et le profil calibré fourni par Schenker permet de remédier à la teinte des couleurs. Mais au moins, le PWM n'est pas utilisé.
Les options d'affichage sont également les plus grands avantages des concurrents, qui offrent souvent des panneaux OLED ou MiniLED. On peut se demander si c'est toujours mieux (mot-clé : PWM), mais l'impression subjective de l'image est légèrement meilleure et il y a des avantages dans l'espace colorimétrique et le HDR. La performance pure du CPU (multi-core) est également souvent meilleure que celle des concurrents, mais surtout en ce qui concerne la performance graphique, le Vision 16 Pro n'a pas à se cacher derrière les comparateurs Asus ProArt Studiobook 16 ou MSI Stealth 16 Studio. En particulier, leDell XPS 15avec la version 50 watts de l'ordinateur portable RTX 4070 est nettement moins performant à cet égard.
Prix et disponibilité
La nouvelle Vision 16 Pro M23 peut être configurée sur Bestware à partir de 2 099 Euros (~$2,361). Pour notre configuration de test avec les mises à jour vers la RTX 4070 Laptopet plus de RAM et de stockage SSD, vous devez payer environ 2,600 Euros (~$2,924).
Schenker VISION 16 Pro (M23)
- 07/18/2023 v7 (old)
Andreas Osthoff
Transparency
La sélection des appareils à examiner est effectuée par notre équipe éditoriale. L'échantillon de test a été prêté à l'auteur par le fabricant ou le détaillant pour les besoins de cet examen. Le prêteur n'a pas eu d'influence sur cette évaluation et le fabricant n'a pas reçu de copie de cette évaluation avant sa publication. Il n'y avait aucune obligation de publier cet article. En tant que média indépendant, Notebookcheck n'est pas soumis à l'autorité des fabricants, des détaillants ou des éditeurs.
Voici comment Notebookcheck teste
Chaque année, Notebookcheck examine de manière indépendante des centaines d'ordinateurs portables et de smartphones en utilisant des procédures standardisées afin de garantir que tous les résultats sont comparables. Nous avons continuellement développé nos méthodes de test depuis environ 20 ans et avons établi des normes industrielles dans le processus. Dans nos laboratoires de test, des équipements de mesure de haute qualité sont utilisés par des techniciens et des rédacteurs expérimentés. Ces tests impliquent un processus de validation en plusieurs étapes. Notre système d'évaluation complexe repose sur des centaines de mesures et de points de référence bien fondés, ce qui garantit l'objectivité.Price comparison

