Test du Dell XPS 15 9530 RTX 4070 : à la fois impressionnant et décevant

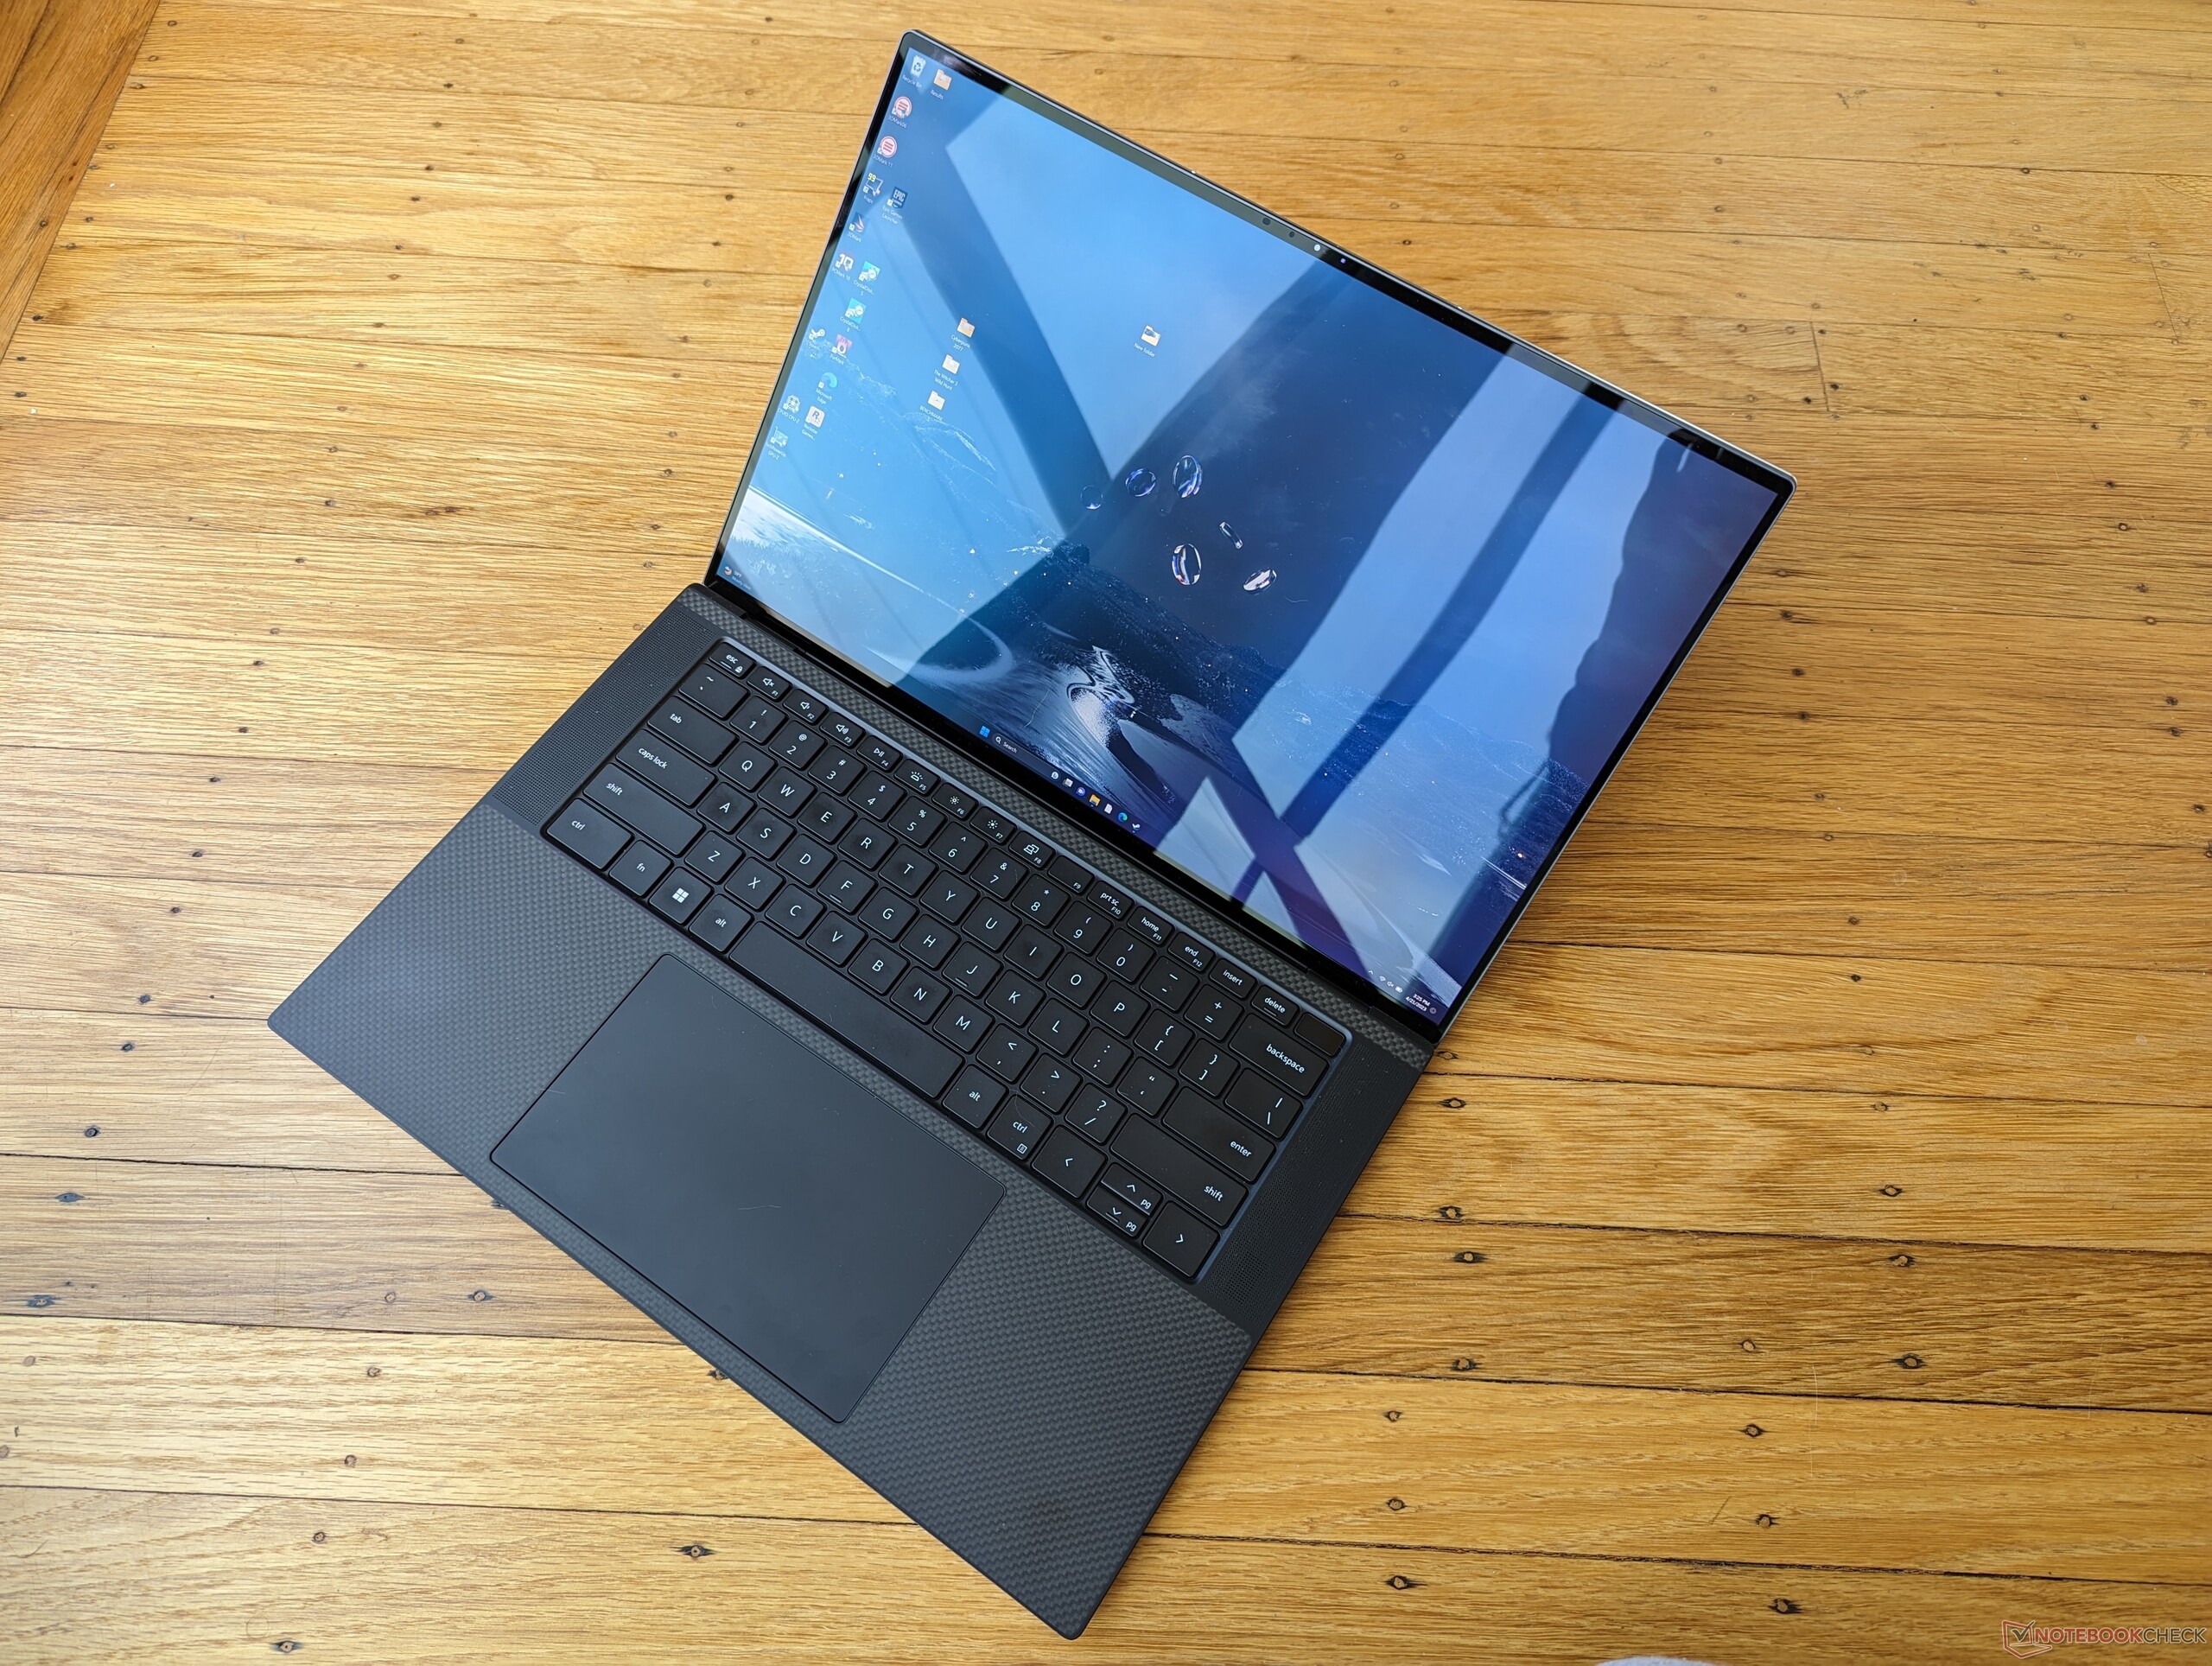
Le XPS 15 9530 est une mise à jour interne du XPS 15 9520 de 2022. Les CPU Alder Lake-H de 12e génération et les GPU Nvidia Ampere du modèle de l'année dernière ont été remplacés par des options Raptor Lake-H et Ada Lovelace de 13e génération, respectivement. Pour le reste, le châssis et les options d'affichage restent identiques d'une année sur l'autre, et nous vous recommandons donc de consulter nos avis sur le XPS 15 9520, 9510et 9500 pour en savoir plus sur les caractéristiques physiques du modèle.
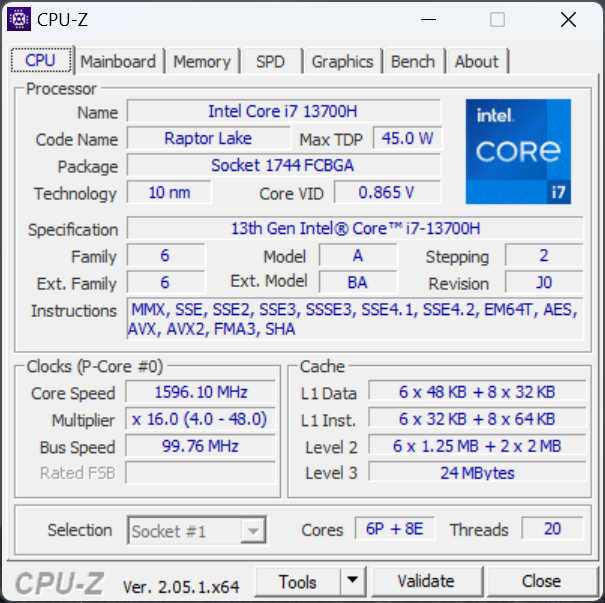
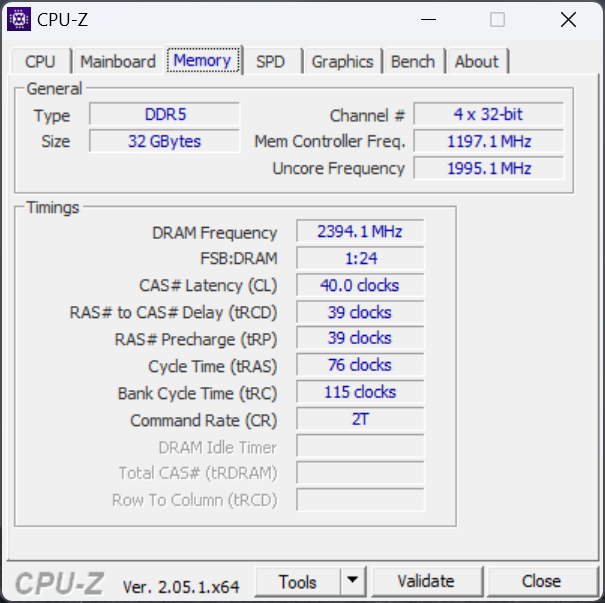
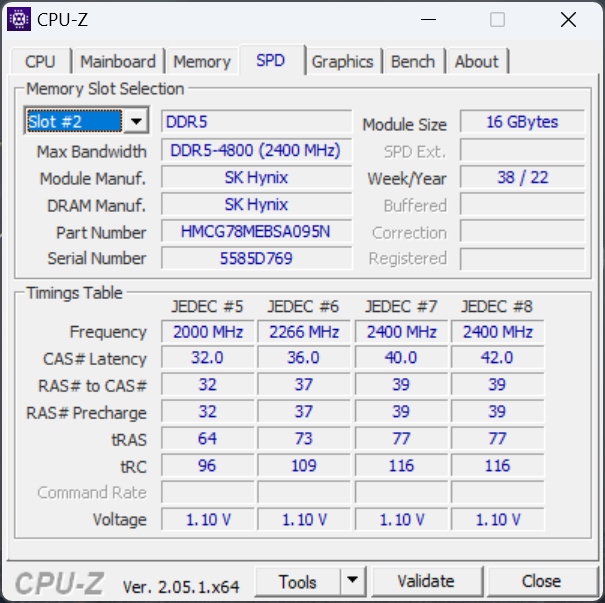
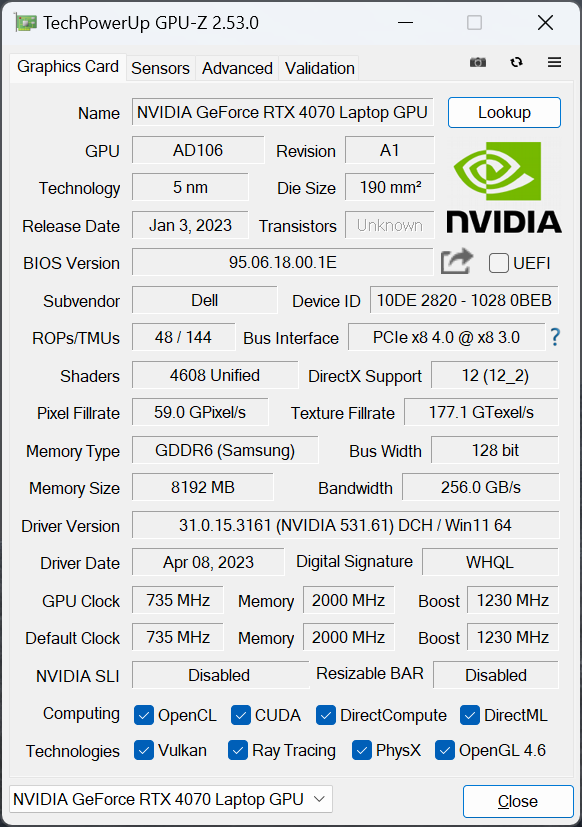
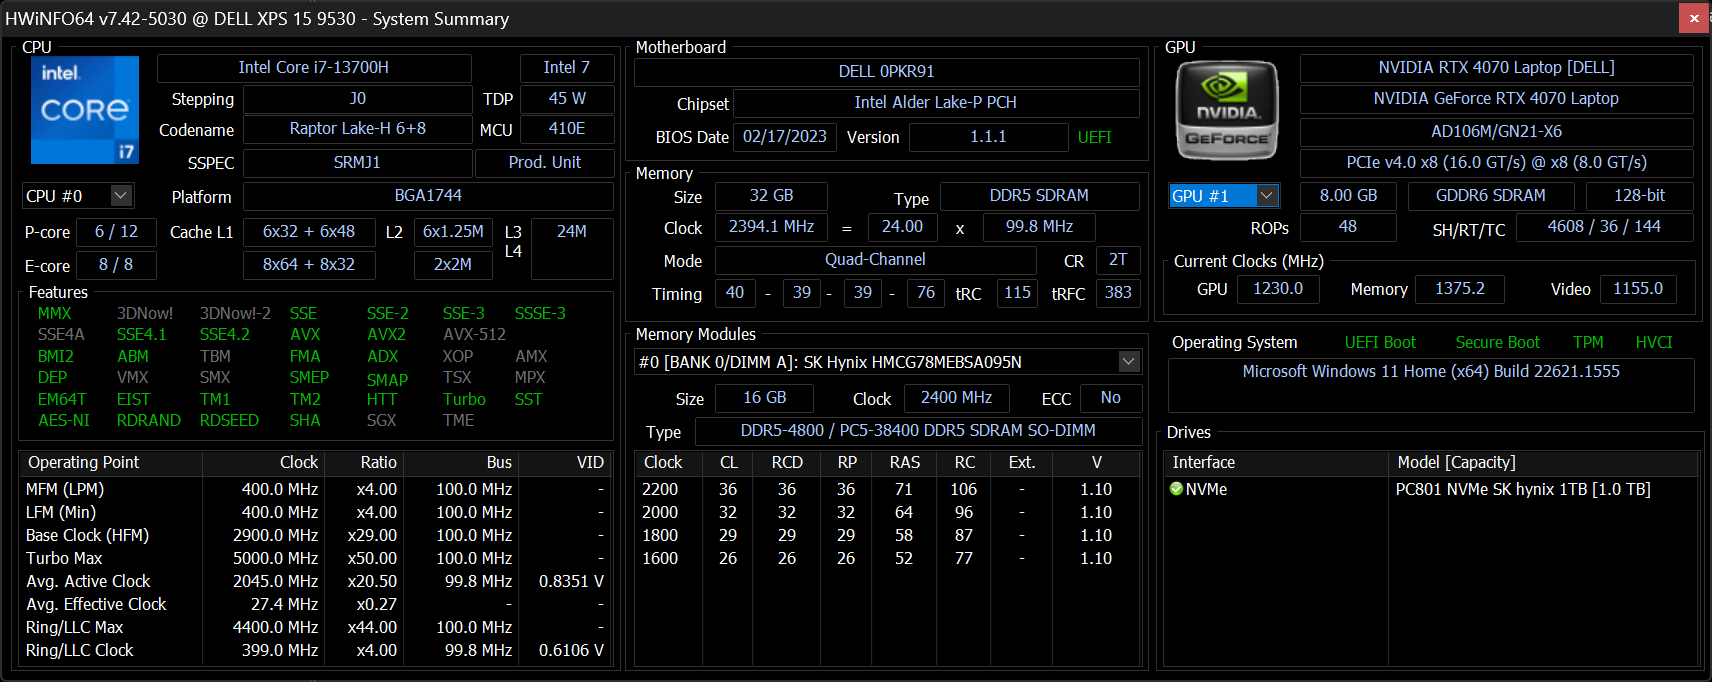
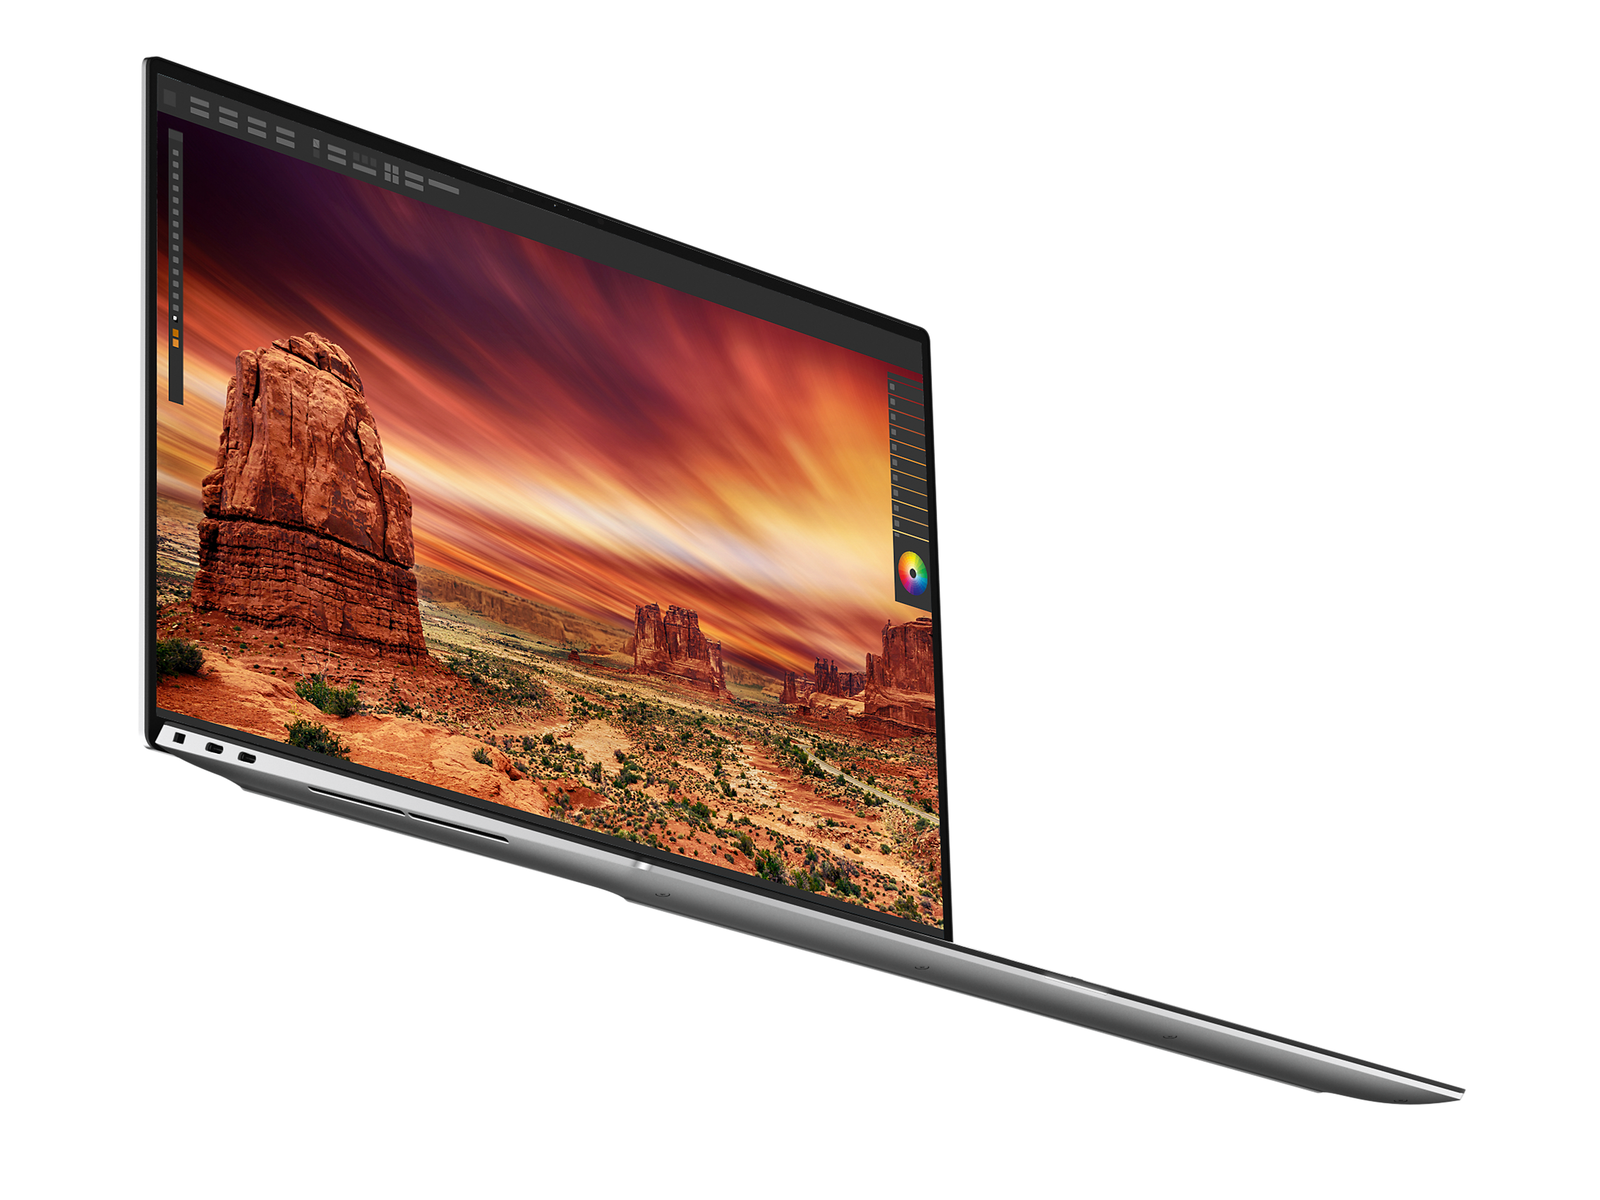
Notre modèle d'évaluation est une configuration haut de gamme avec le Core i7-13700H, la RTX 4070, 32 Go de RAM, 1 TB SSD, et un écran tactile OLED brillant de 3,5K pour environ $2800 USD. D'autres modèles sont disponibles avec le Core i9-13900H plus rapide, la RTX 4060 plus lente, ou un écran FHD+ mat de moindre résolution. Notez qu'il s'agit de l'un des rares ordinateurs portables dotés d'une RTX 4070 de 50 W GeForce, contre 100 W ou plus sur la plupart des autres ordinateurs portables équipés du même GPU.
Les concurrents comprennent d'autres ordinateurs portables multimédias haut de gamme de 15 pouces comme leAsus Zenbook Pro 15, MSI Summit E15,Gigabyte Aero 15ou le Razer Blade 15 Studio.
Plus de commentaires sur Dell :
Comparaison avec les concurrents potentiels
Note | Date | Modèle | Poids | Épaisseur | Taille | Résolution | Prix |
|---|---|---|---|---|---|---|---|
| 90.3 % v7 (old) | 04/23 | Dell XPS 15 9530 RTX 4070 i7-13700H, GeForce RTX 4070 Laptop GPU | 1.9 kg | 18 mm | 15.60" | 3456x2160 | |
| 89.5 % v7 (old) | 05/22 | Dell XPS 15 9520 RTX 3050 Ti i7-12700H, GeForce RTX 3050 Ti Laptop GPU | 1.9 kg | 18 mm | 15.60" | 3456x2160 | |
| 90.1 % v7 (old) | 07/20 | Dell XPS 15 9500 Core i7 4K UHD i7-10875H, GeForce GTX 1650 Ti Mobile | 2 kg | 18 mm | 15.60" | 3840x2400 | |
| 87.7 % v7 (old) | 05/22 | Asus Zenbook Pro 15 OLED UM535Q R9 5900HX, GeForce RTX 3050 Ti Laptop GPU | 1.9 kg | 18 mm | 15.60" | 1920x1080 | |
| 85.4 % v7 (old) | 12/22 | MSI Prestige 15 A12UD-093 i7-1280P, GeForce RTX 3050 Ti Laptop GPU | 1.8 kg | 20.1 mm | 15.60" | 3840x2160 | |
| 85.6 % v7 (old) | 08/21 | Gigabyte Aero 15 OLED XD i7-11800H, GeForce RTX 3070 Laptop GPU | 2.2 kg | 20 mm | 15.60" | 3840x2160 |
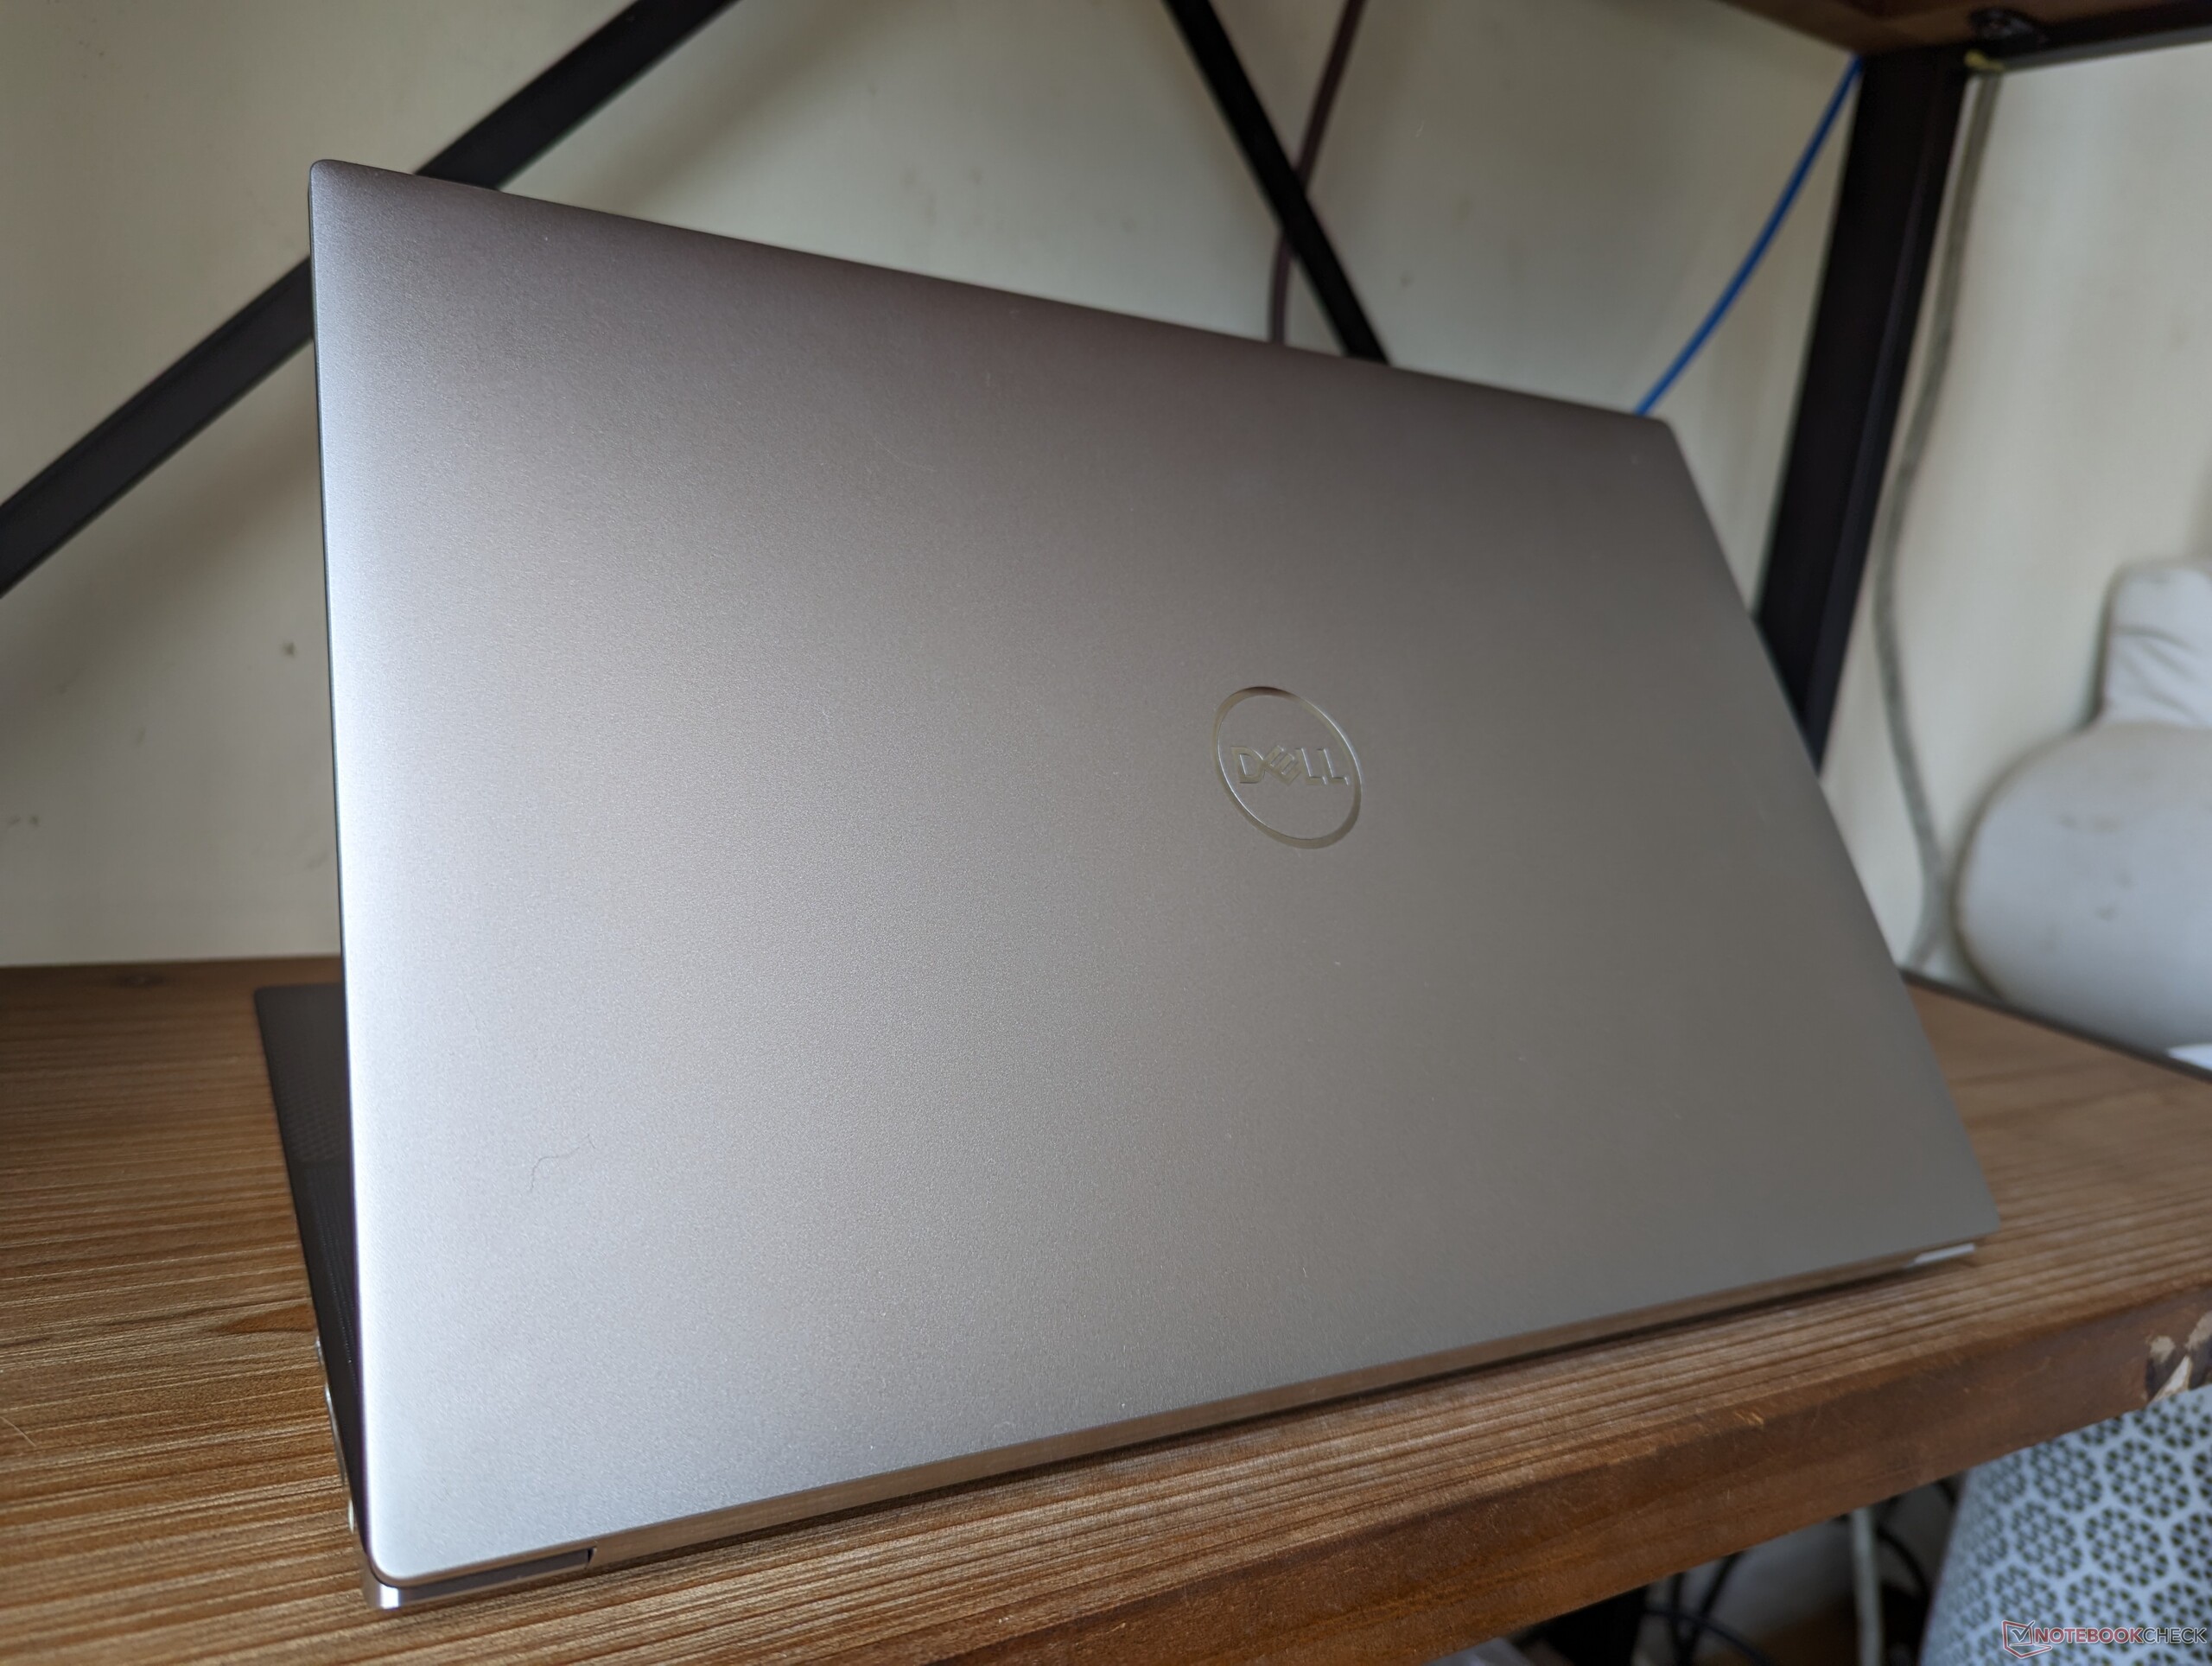
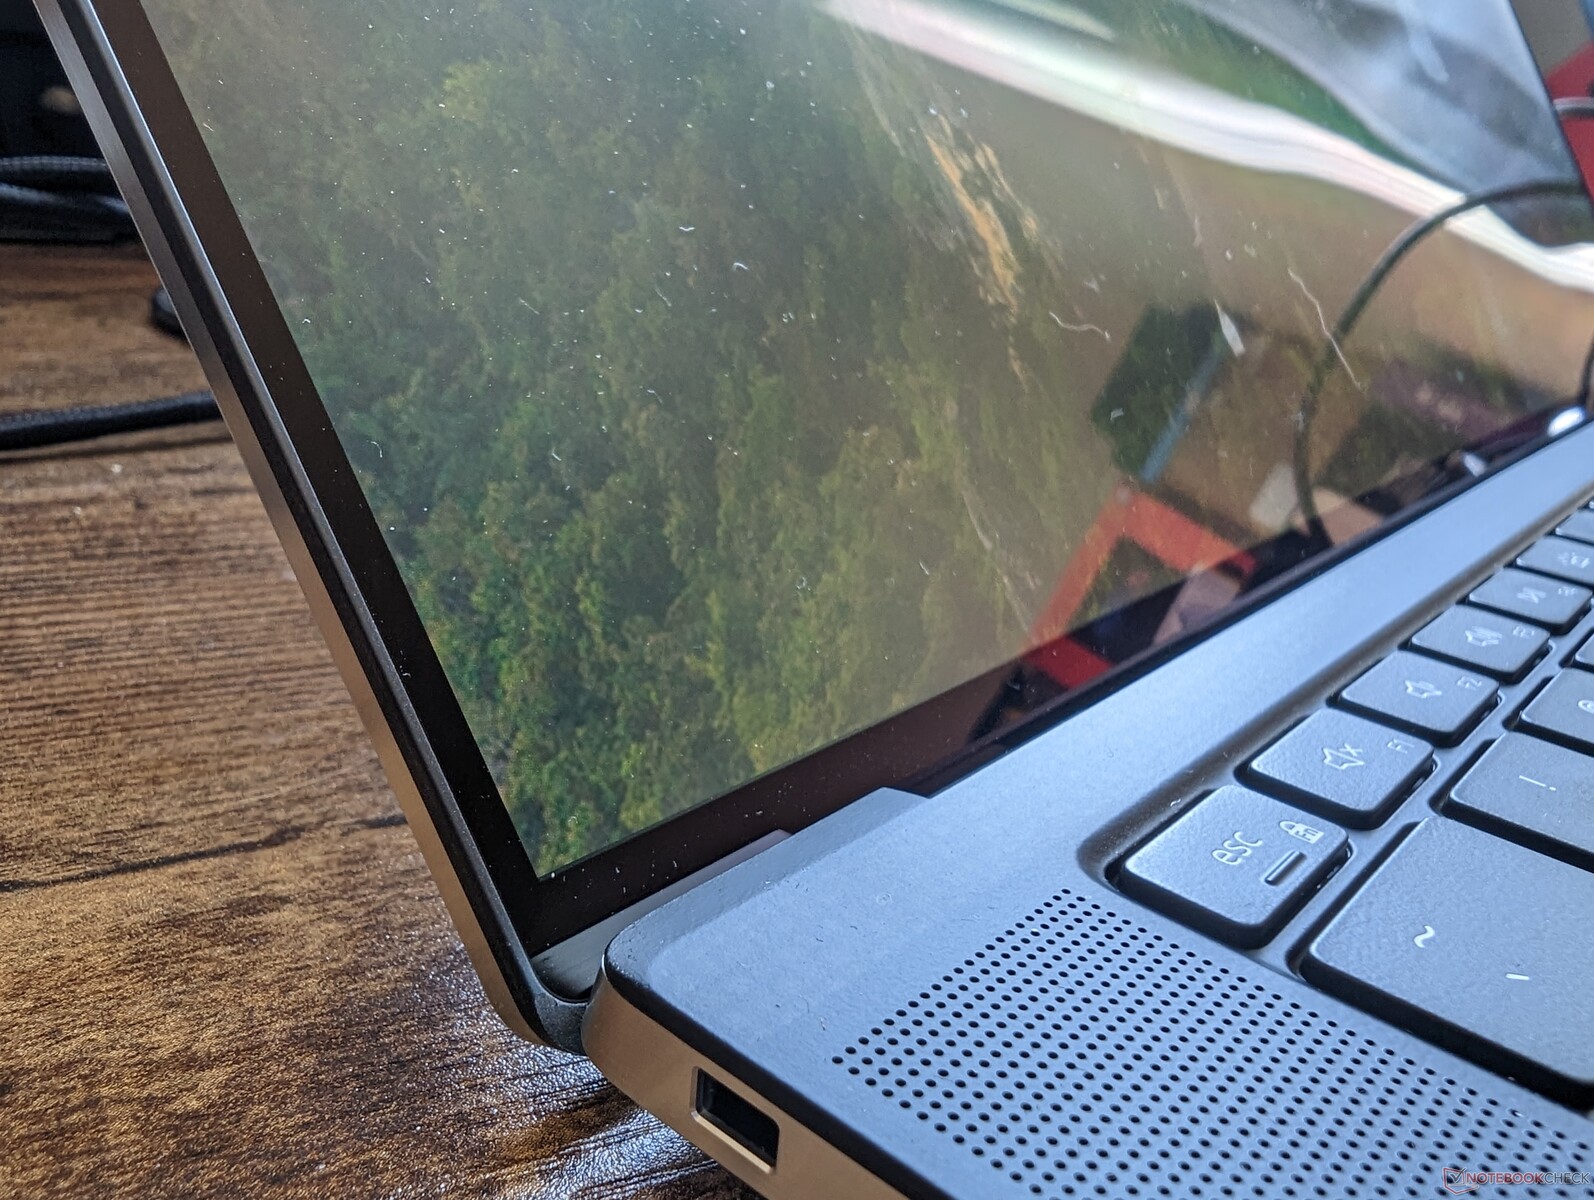
Boîtier - Pas de changement majeur depuis le XPS 15 9500
Lecteur de carte SD
| SD Card Reader | |
| average JPG Copy Test (av. of 3 runs) | |
| Dell XPS 15 9500 Core i7 4K UHD (Toshiba Exceria Pro SDXC 64 GB UHS-II) | |
| Gigabyte Aero 15 OLED XD (AV PRO microSD 128 GB V60) | |
| Dell XPS 15 9520 RTX 3050 Ti (Toshiba Exceria Pro SDXC 64 GB UHS-II) | |
| Dell XPS 15 9530 RTX 4070 (Toshiba Exceria Pro SDXC 64 GB UHS-II) | |
| Asus Zenbook Pro 15 OLED UM535Q (Toshiba Exceria Pro SDXC 64 GB UHS-II) | |
| MSI Prestige 15 A12UD-093 (AV Pro SD microSD 128 GB V60) | |
| maximum AS SSD Seq Read Test (1GB) | |
| Dell XPS 15 9500 Core i7 4K UHD (Toshiba Exceria Pro SDXC 64 GB UHS-II) | |
| Gigabyte Aero 15 OLED XD (AV PRO microSD 128 GB V60) | |
| Dell XPS 15 9530 RTX 4070 (Toshiba Exceria Pro SDXC 64 GB UHS-II) | |
| Dell XPS 15 9520 RTX 3050 Ti (Toshiba Exceria Pro SDXC 64 GB UHS-II) | |
| MSI Prestige 15 A12UD-093 (AV Pro SD microSD 128 GB V60) | |
| Asus Zenbook Pro 15 OLED UM535Q (Toshiba Exceria Pro SDXC 64 GB UHS-II) | |
Communication
Un Intel AX211 est livré en standard pour le Wi-Fi 6E et le Bluetooth 5.2. Nous avons pu nous connecter à notre réseau Asus AXE11000 Wi-Fi 6 sans problème, mais le portable n'a étrangement pas reconnu notre réseau Wi-Fi 6E 6 GHz et ne s'y est pas connecté. D'autres appareils compatibles Wi-Fi 6E, comme le Pixel 7 Pro ont pu reconnaître notre réseau 6 GHz et s'y connecter sans problème.
| Networking | |
| iperf3 transmit AX12 | |
| Gigabyte Aero 15 OLED XD | |
| Dell XPS 15 9500 Core i7 4K UHD | |
| Asus Zenbook Pro 15 OLED UM535Q | |
| iperf3 receive AX12 | |
| Dell XPS 15 9500 Core i7 4K UHD | |
| Gigabyte Aero 15 OLED XD | |
| Asus Zenbook Pro 15 OLED UM535Q | |
| iperf3 transmit AXE11000 | |
| Dell XPS 15 9530 RTX 4070 | |
| Dell XPS 15 9520 RTX 3050 Ti | |
| MSI Prestige 15 A12UD-093 | |
| iperf3 receive AXE11000 | |
| Dell XPS 15 9520 RTX 3050 Ti | |
| Dell XPS 15 9530 RTX 4070 | |
| MSI Prestige 15 A12UD-093 | |
| iperf3 transmit AXE11000 6GHz | |
| MSI Prestige 15 A12UD-093 | |
| iperf3 receive AXE11000 6GHz | |
| MSI Prestige 15 A12UD-093 | |
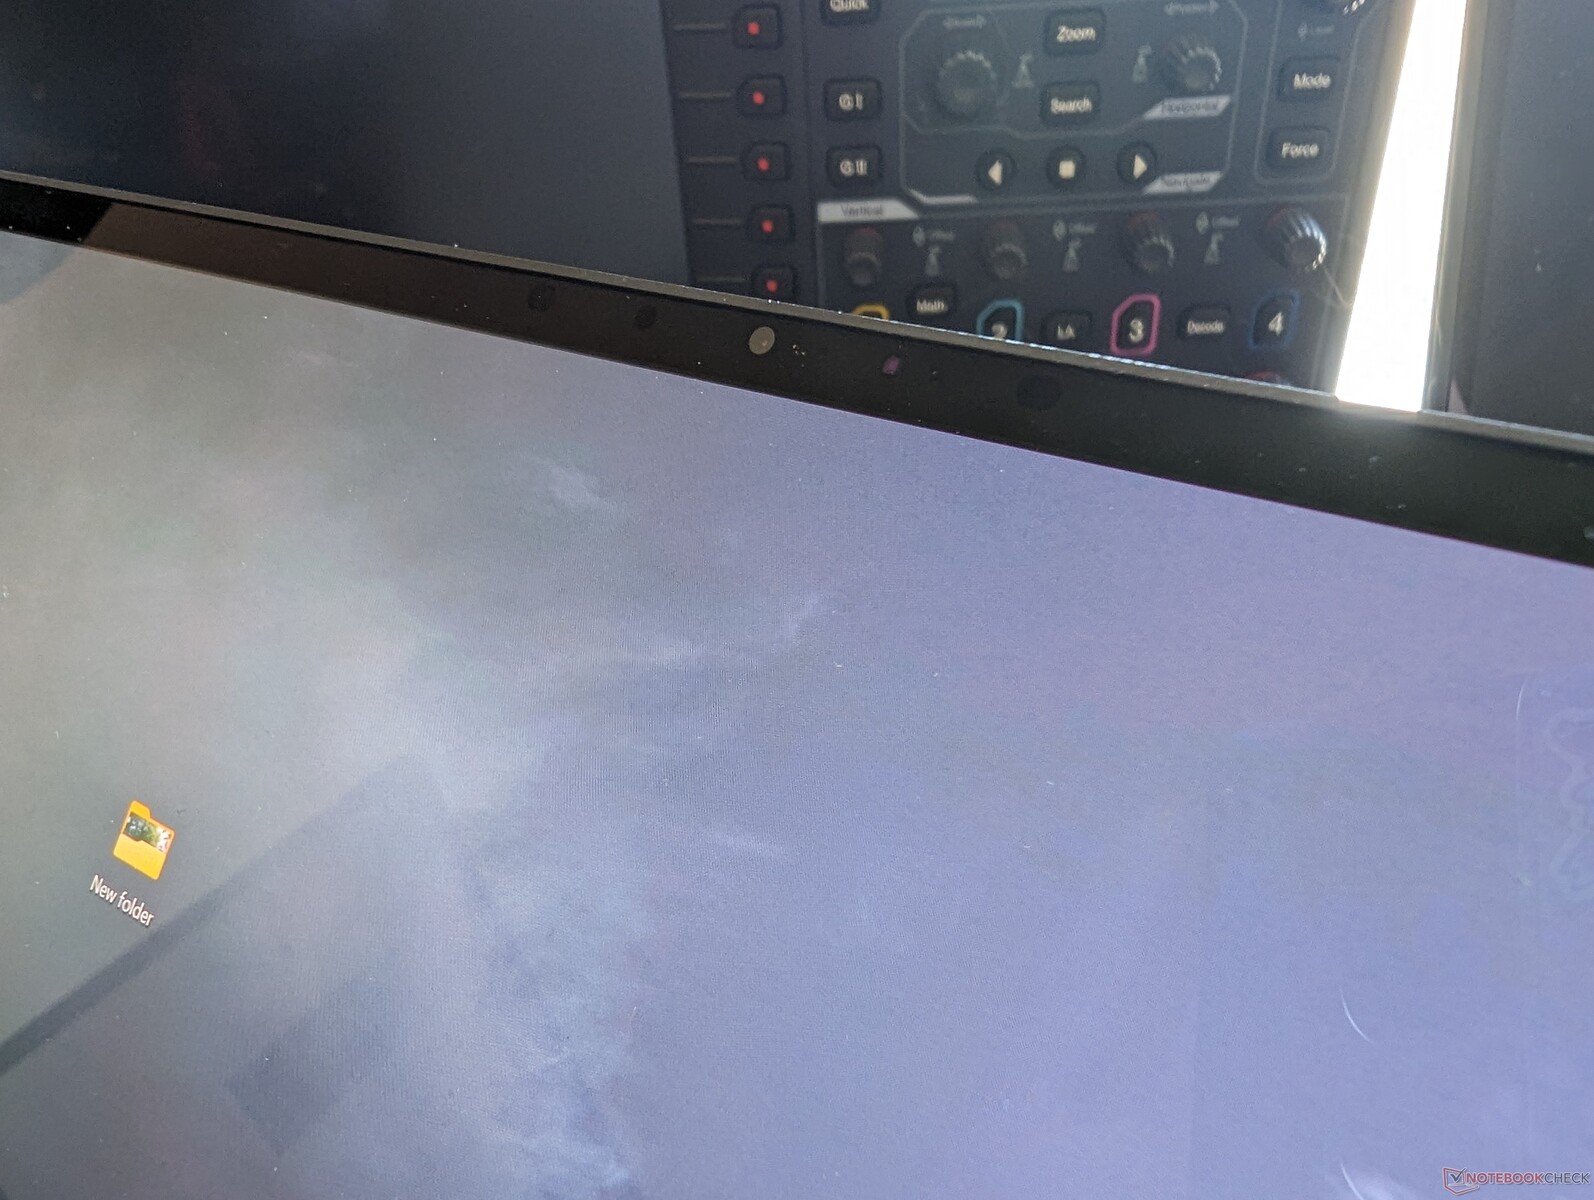
Webcam - La résolution de 1 MP devient embarrassante
Le dernier XPS 15 est toujours équipé d'une webcam basse résolution de 1 MP/720p sans obturateur de confidentialité, malgré son prix de vente de plus de 2000 USD. Les modèles concurrents comme le HP Spectre x360 16 ou la série Razer Blade ont déjà évolué vers des capteurs de 2 MP ou même de 5 MP. Inutile de dire que la qualité de l'image est très floue sur un écran OLED par ailleurs magnifique. Au moins, l'infrarouge est pris en charge.
Dell explique que la faible résolution de la webcam est une conséquence de l'un des cadres les plus étroits sur un ordinateur portable. Une webcam à plus haute résolution aurait pour effet d'épaissir le cadre.


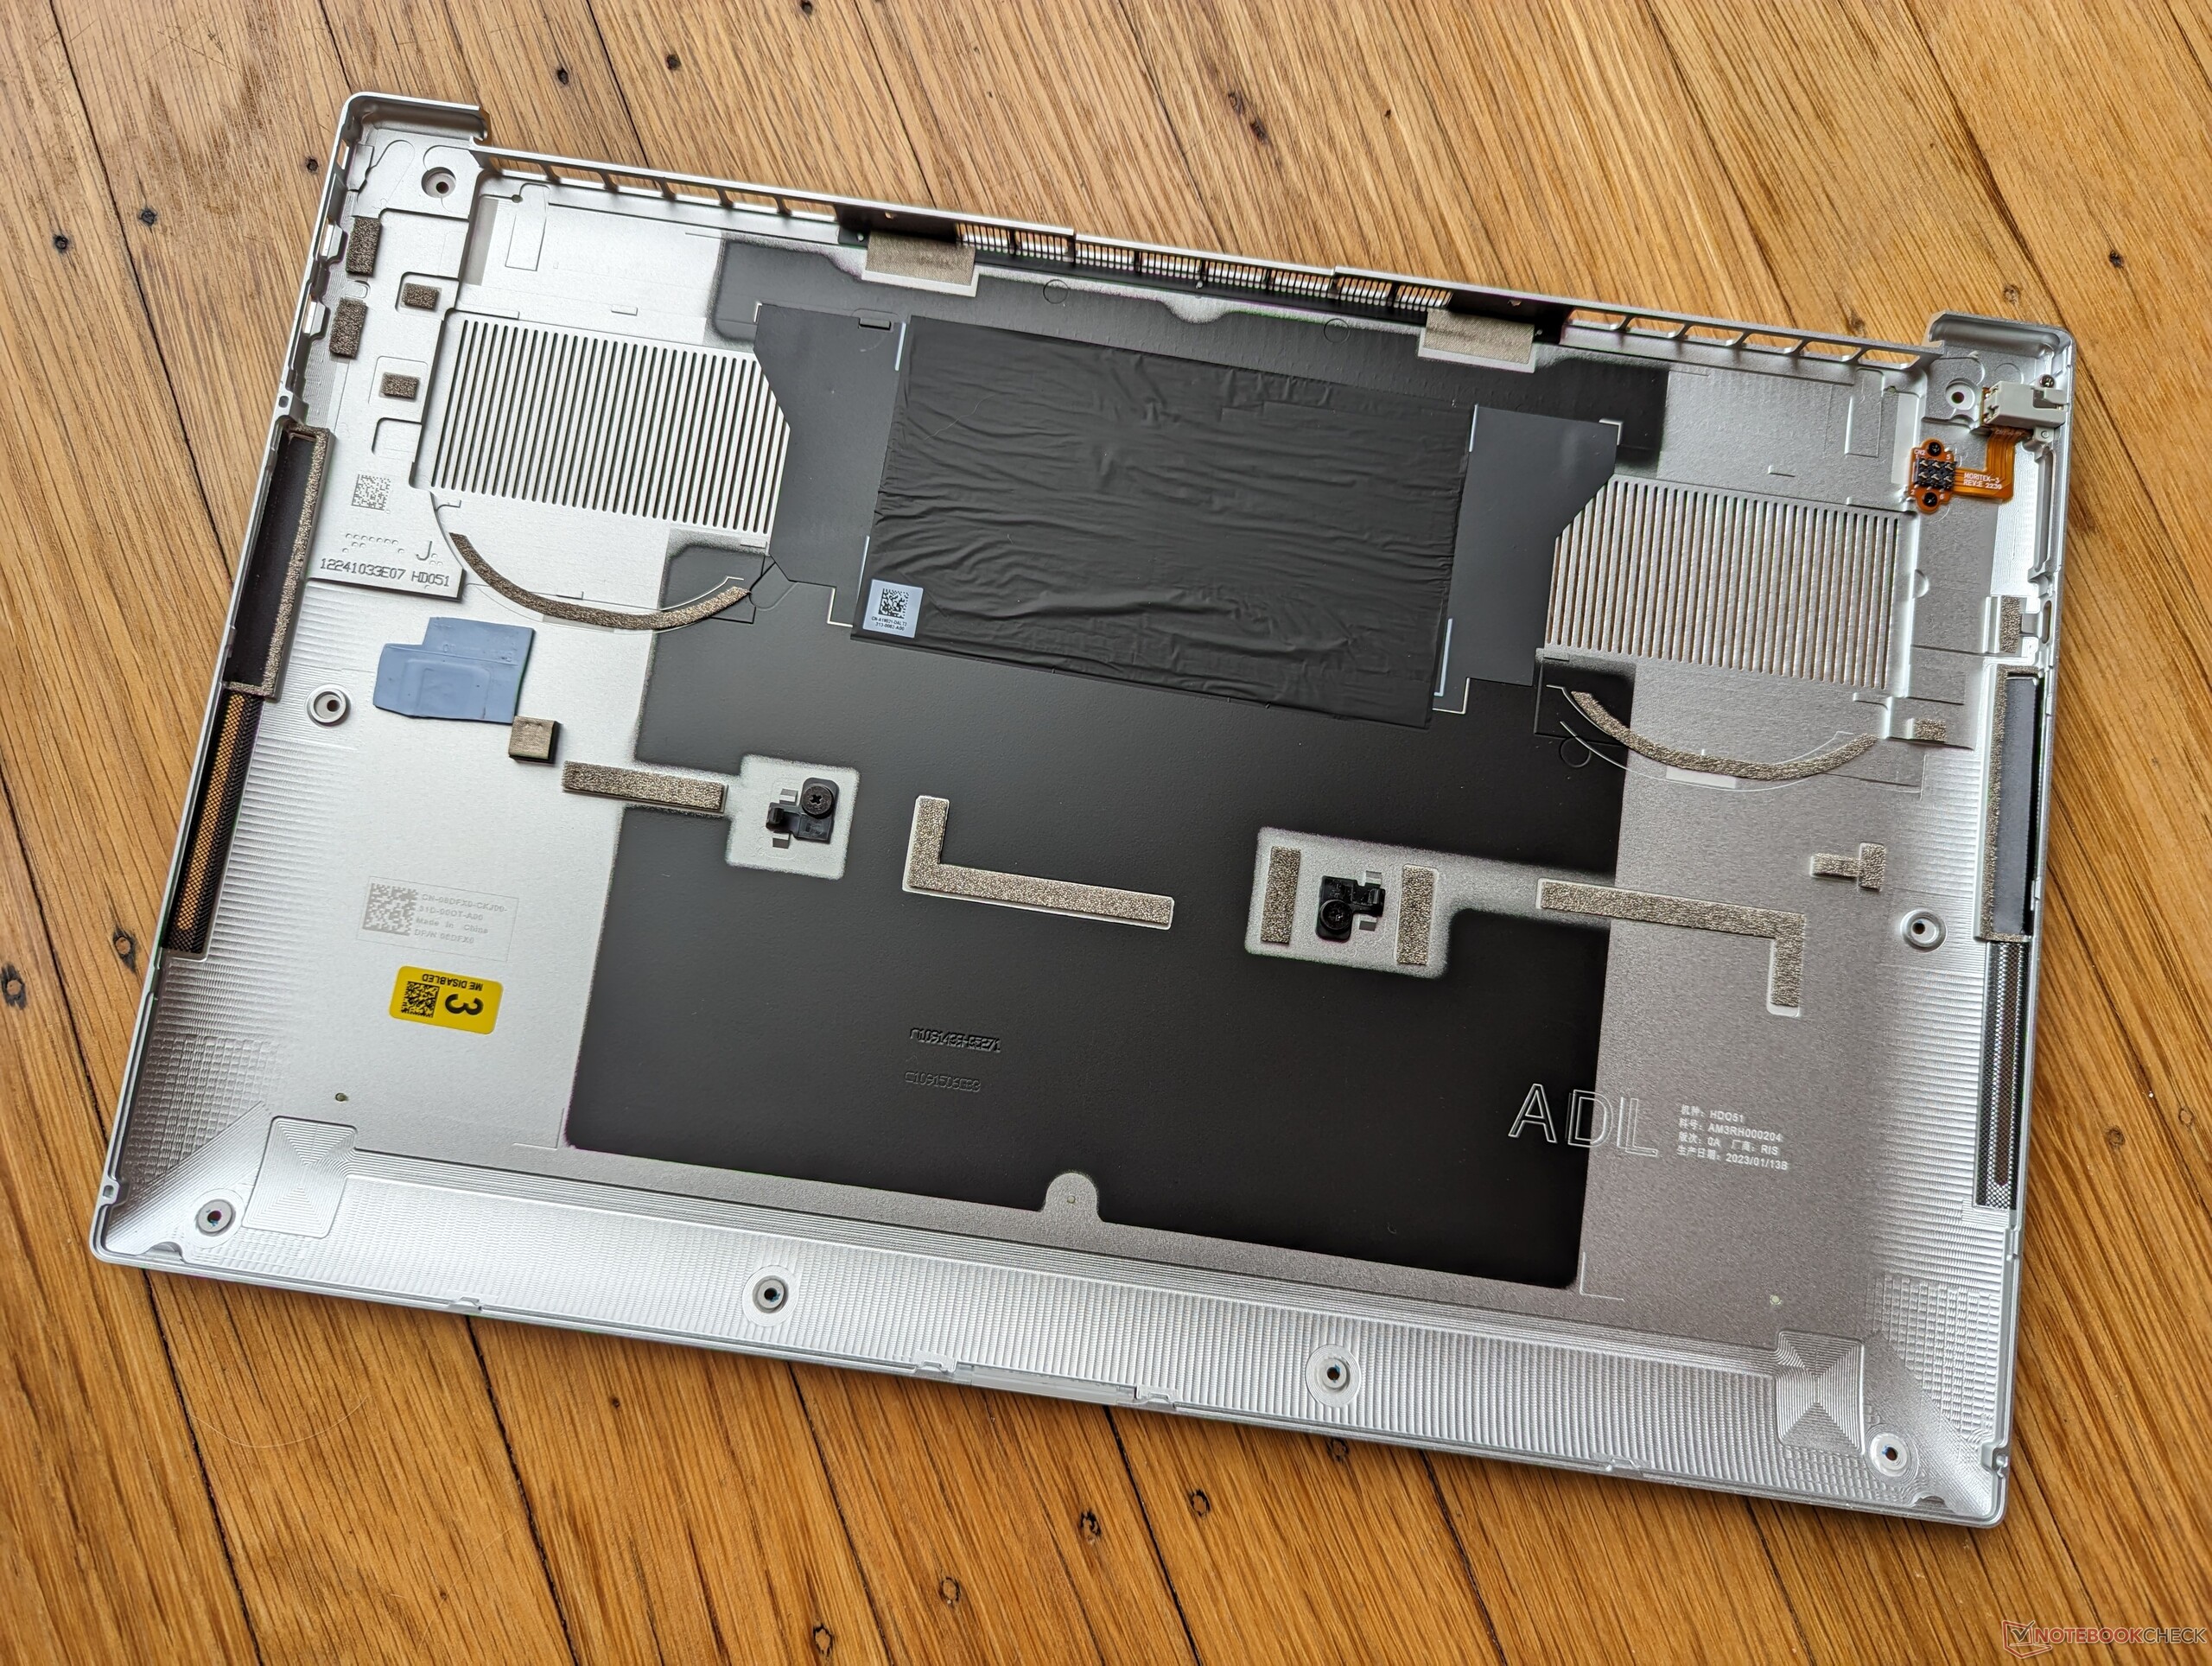
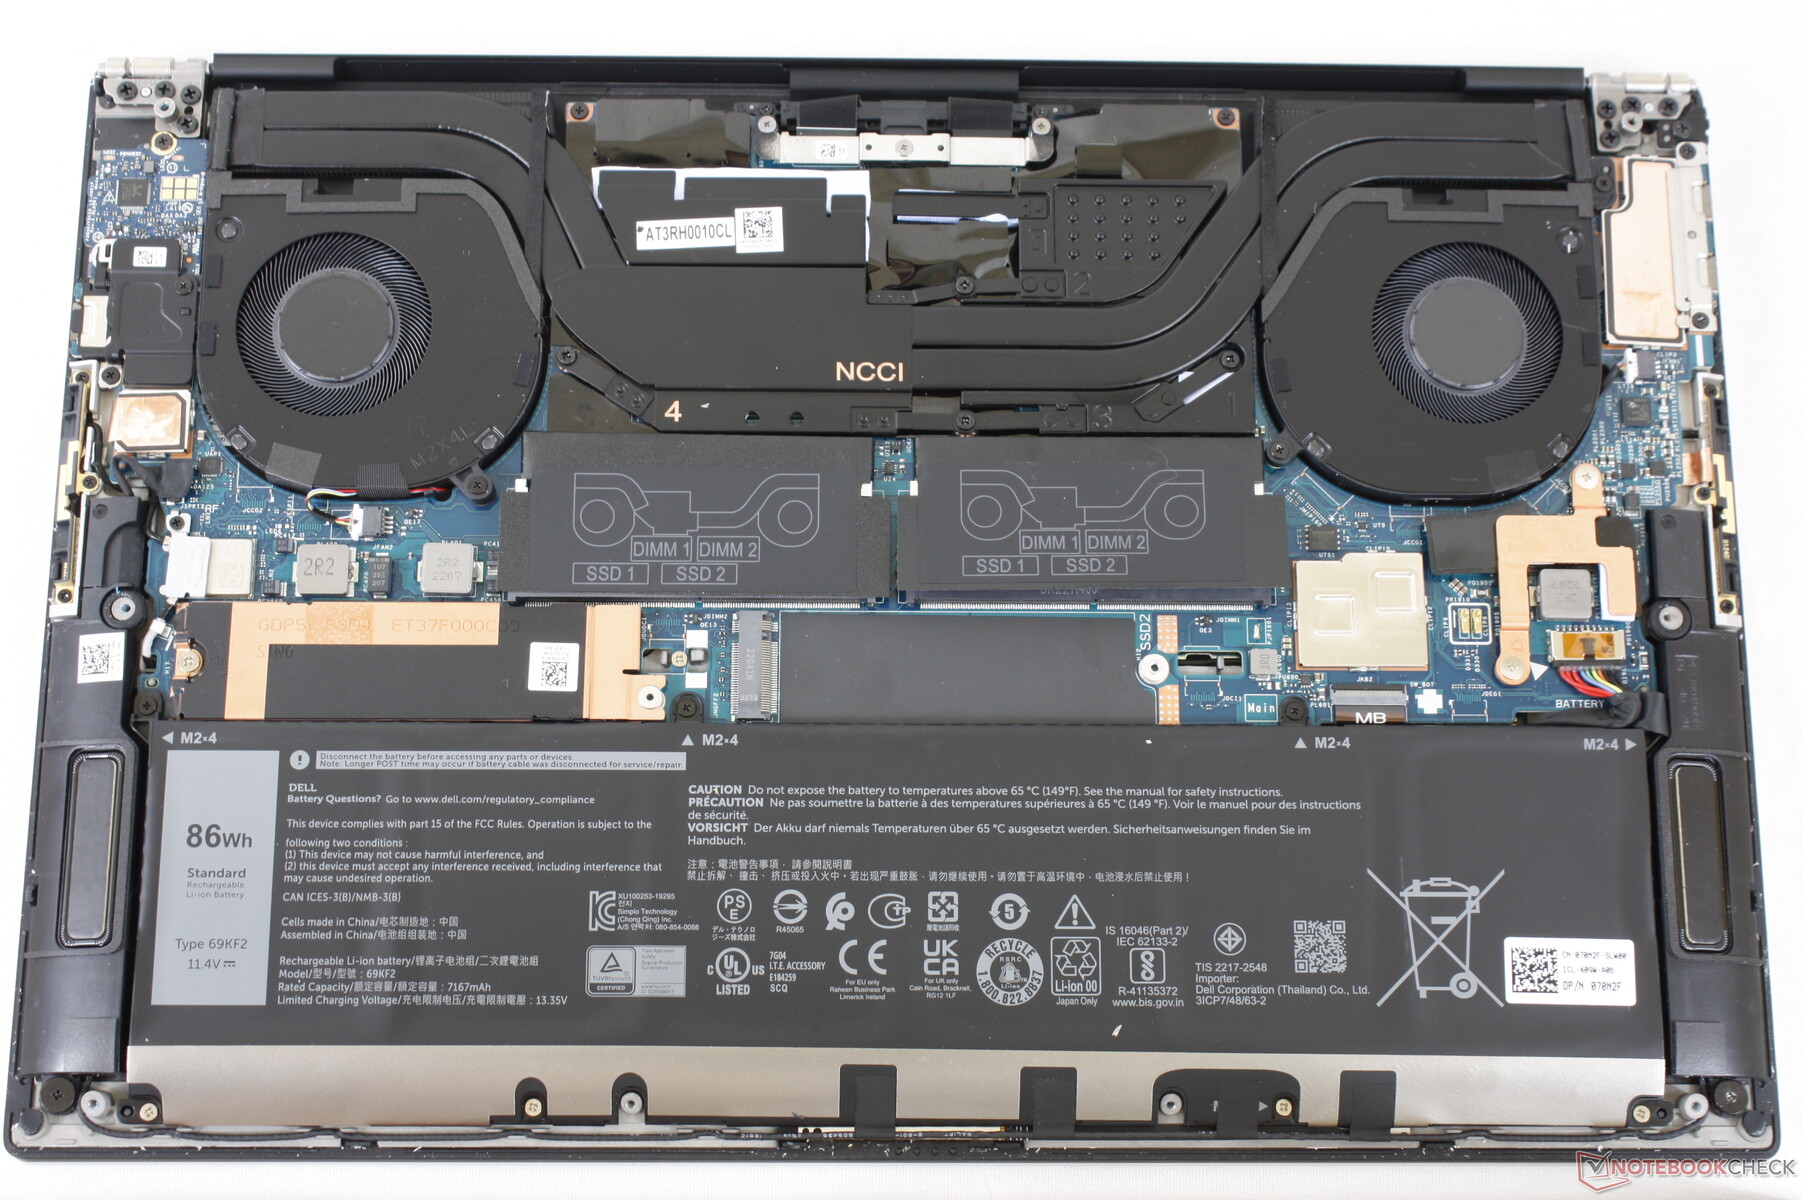
Maintenance
Accessoires et garantie
Dell inclut toujours un adaptateur USB-C vers USB-A et HDMI pratique dans chaque boîte de vente au détail, ce que nous apprécions. La garantie limitée habituelle d'un an du fabricant s'applique.
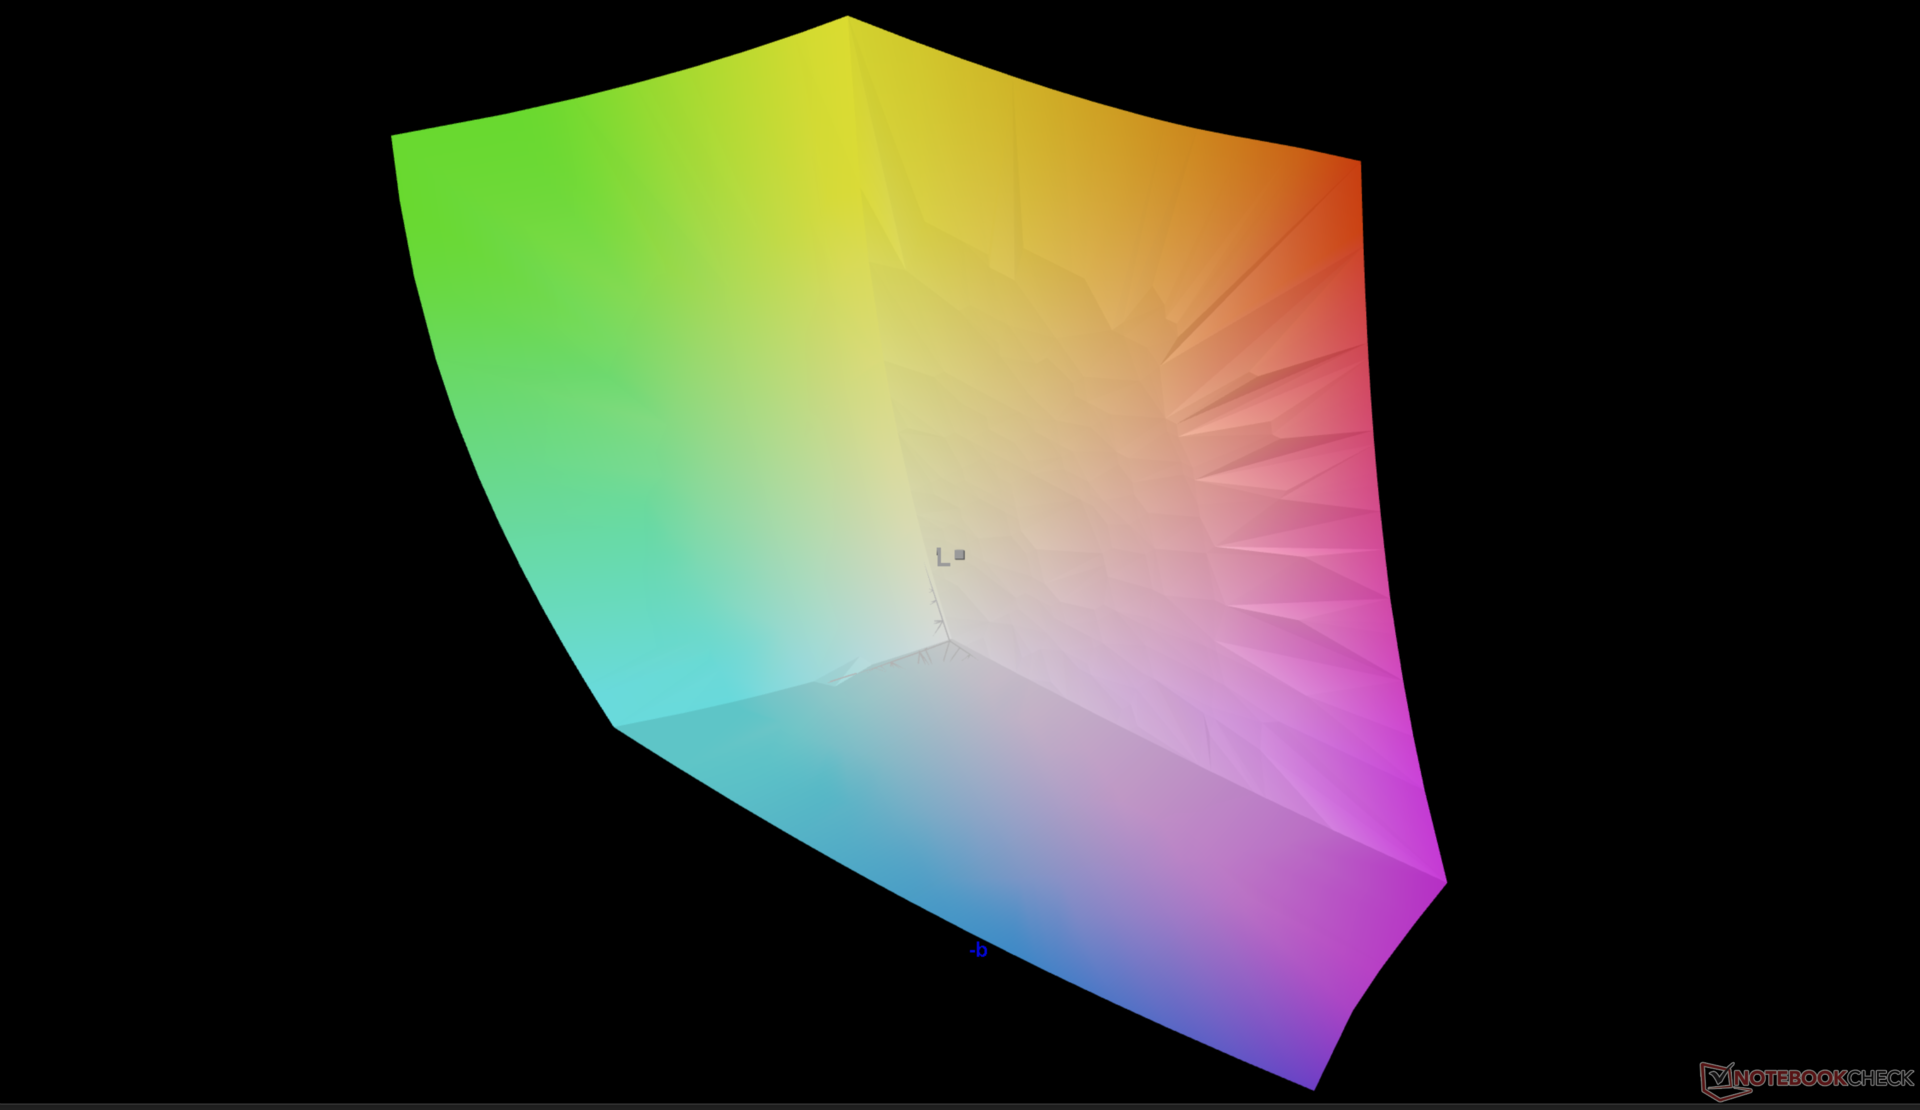
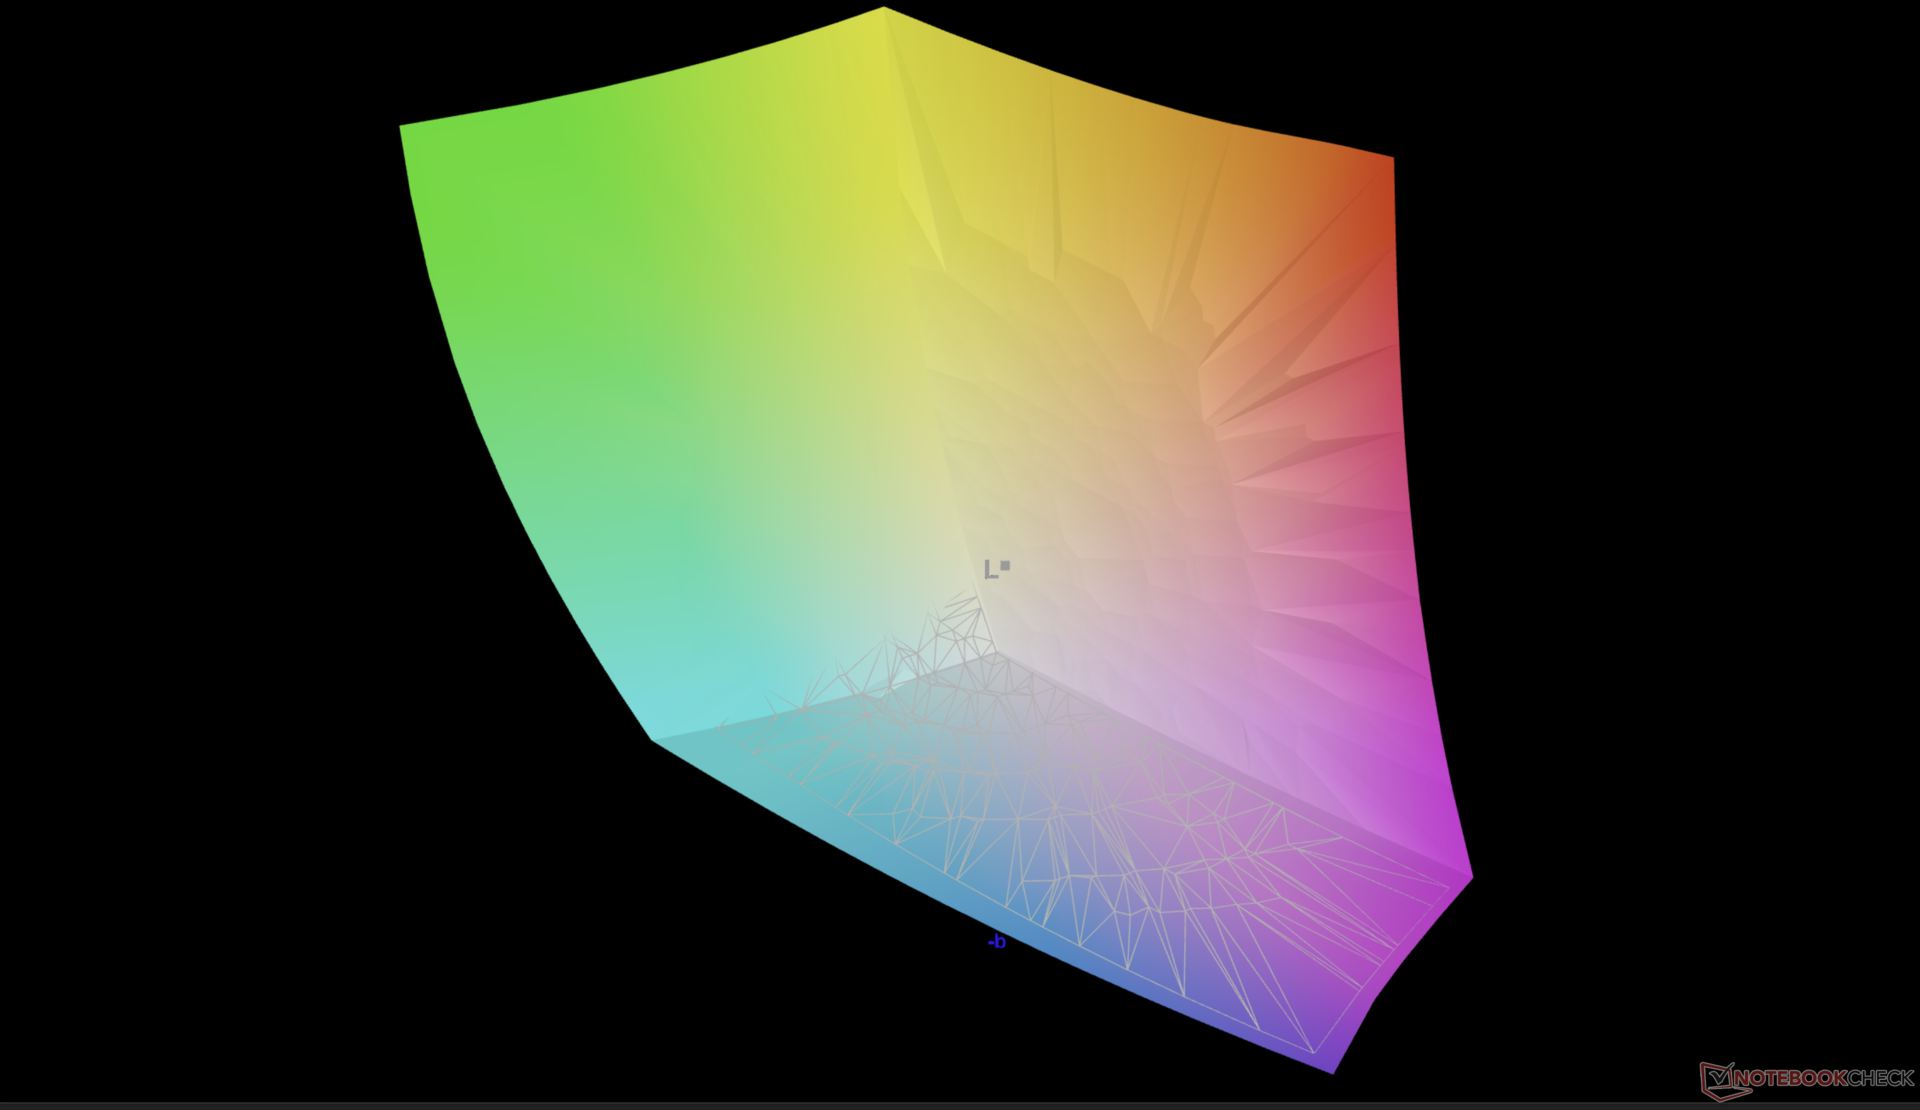
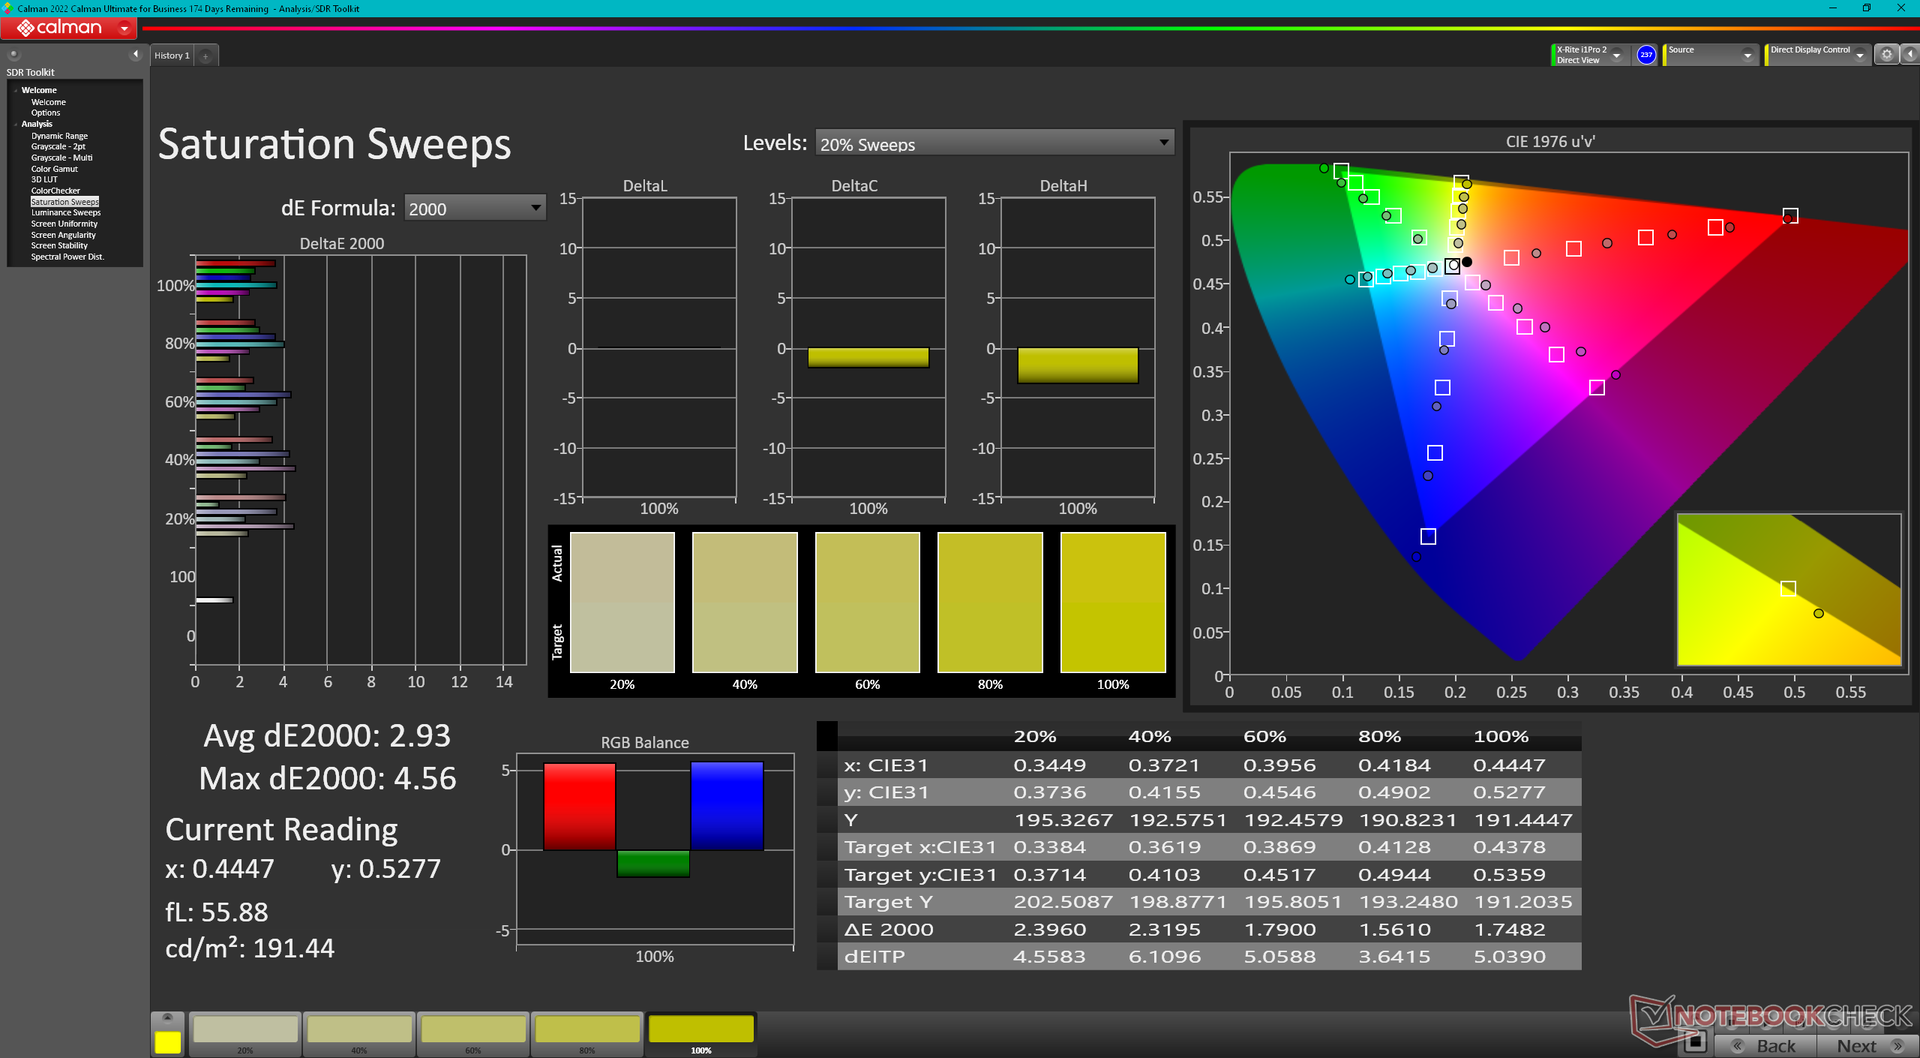
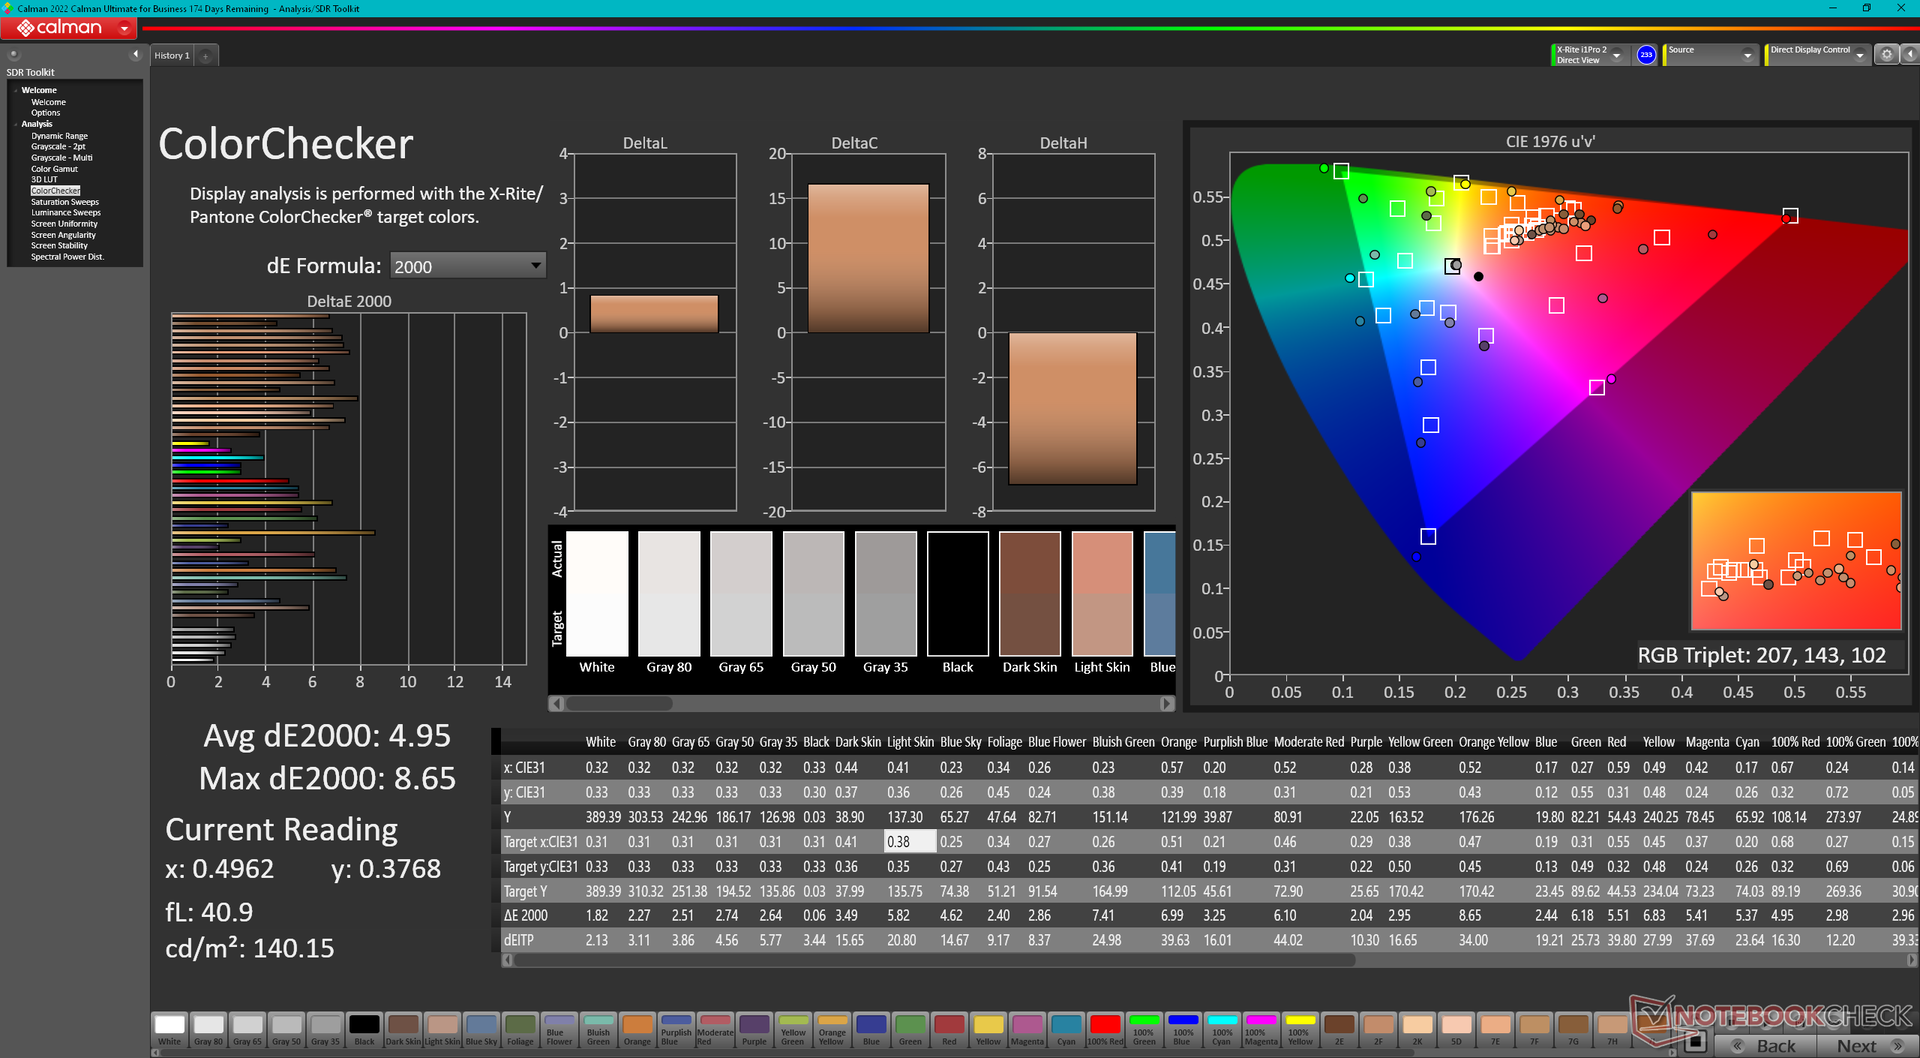
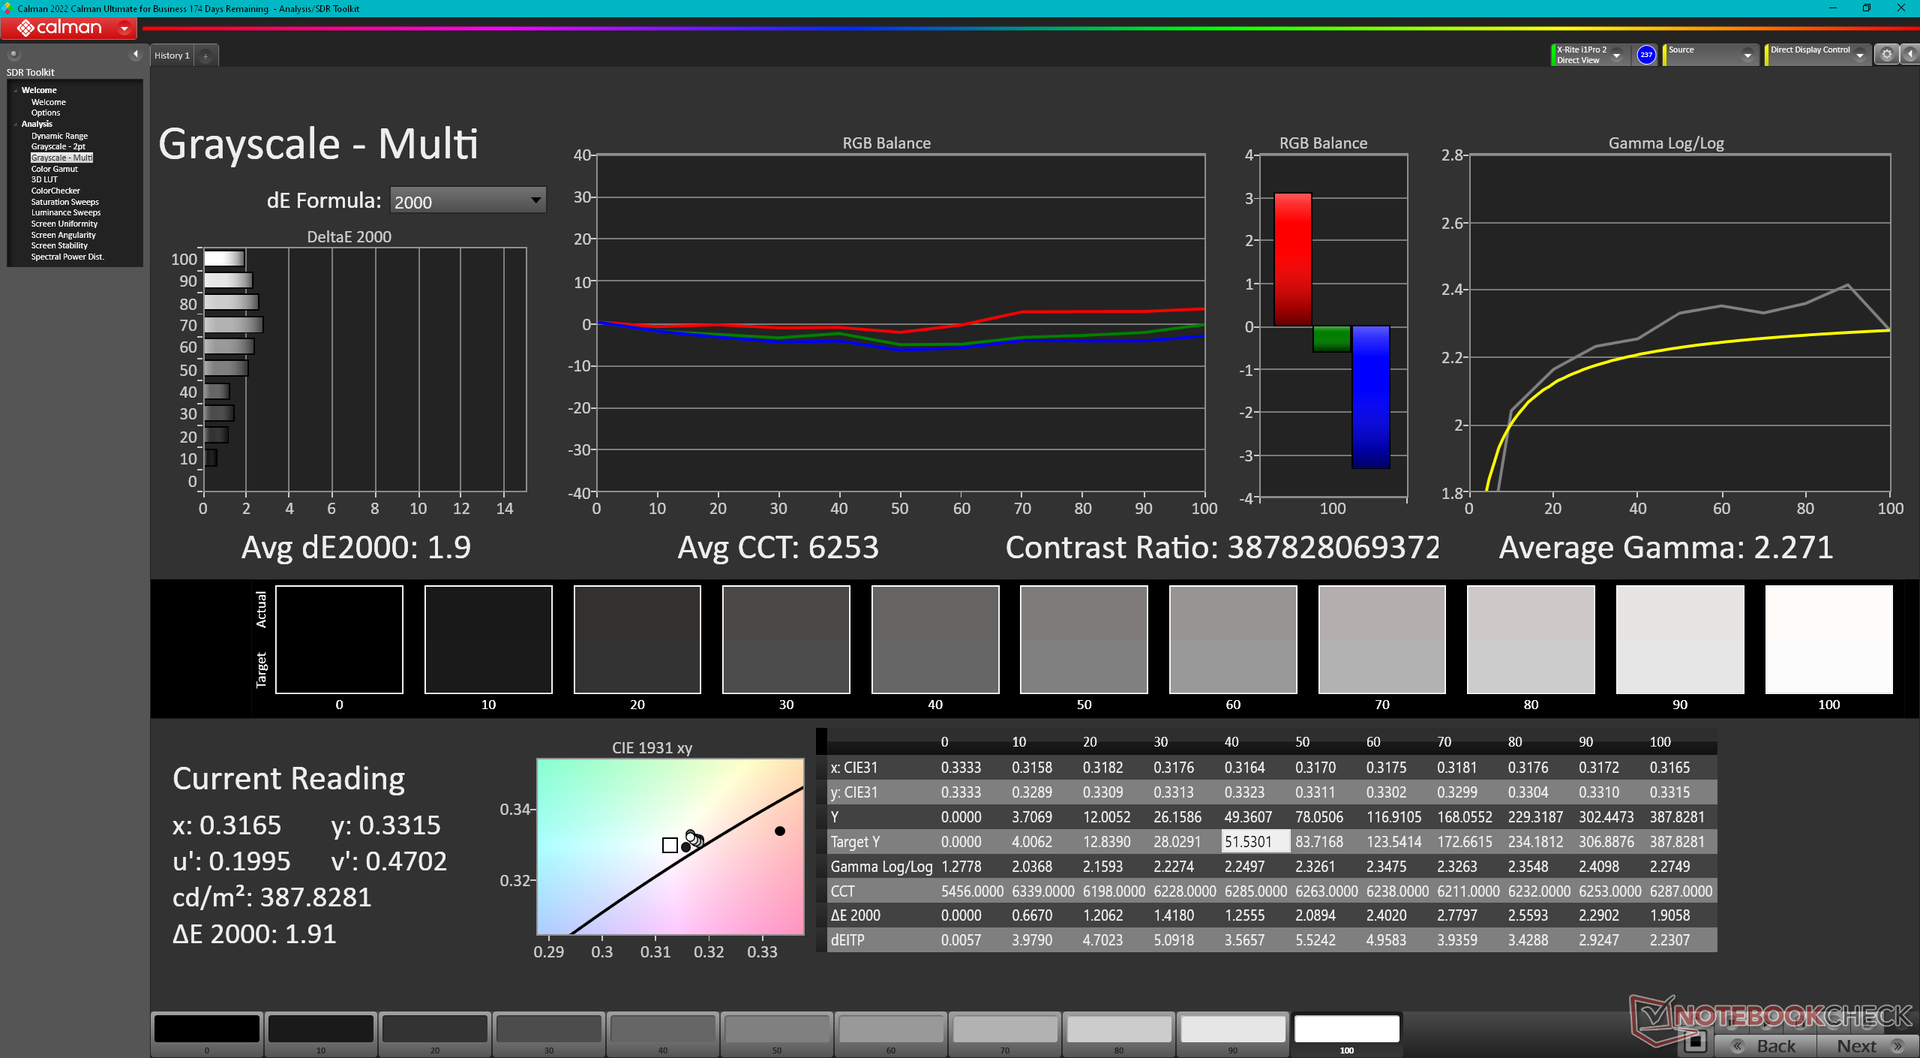
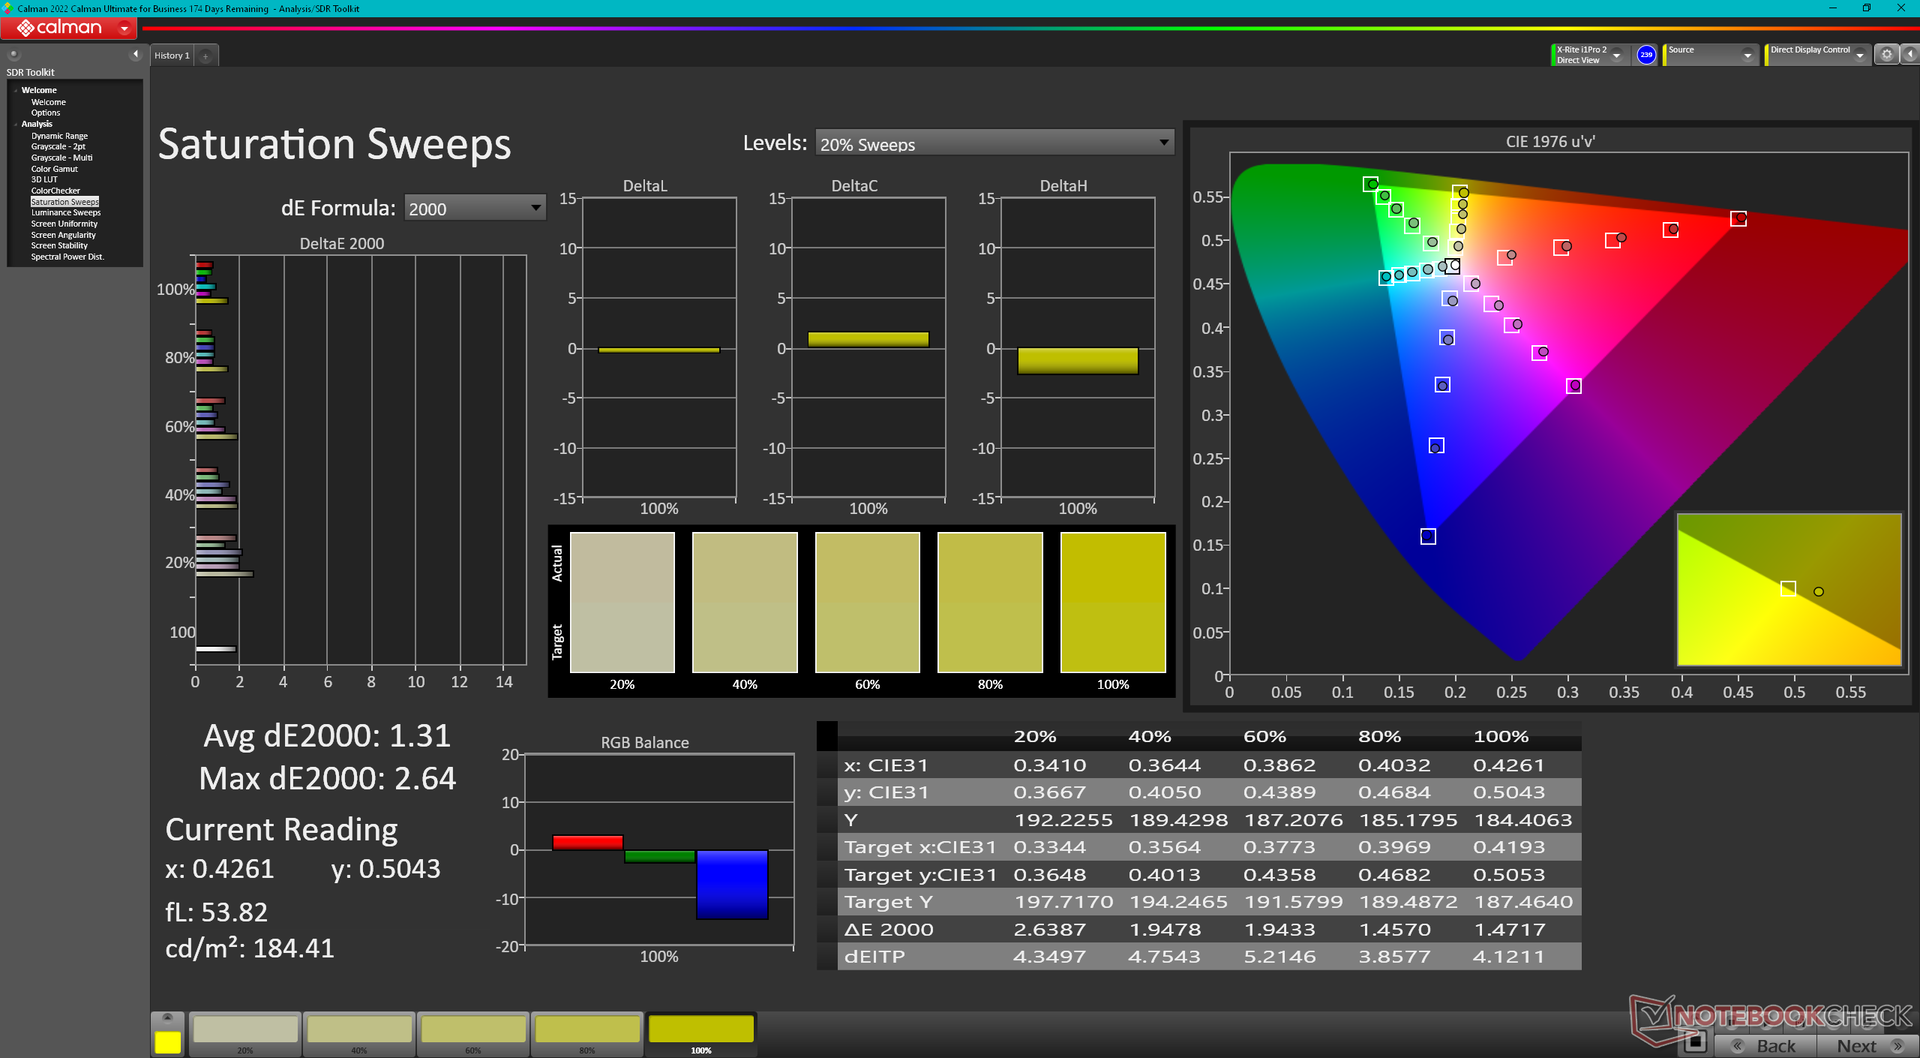
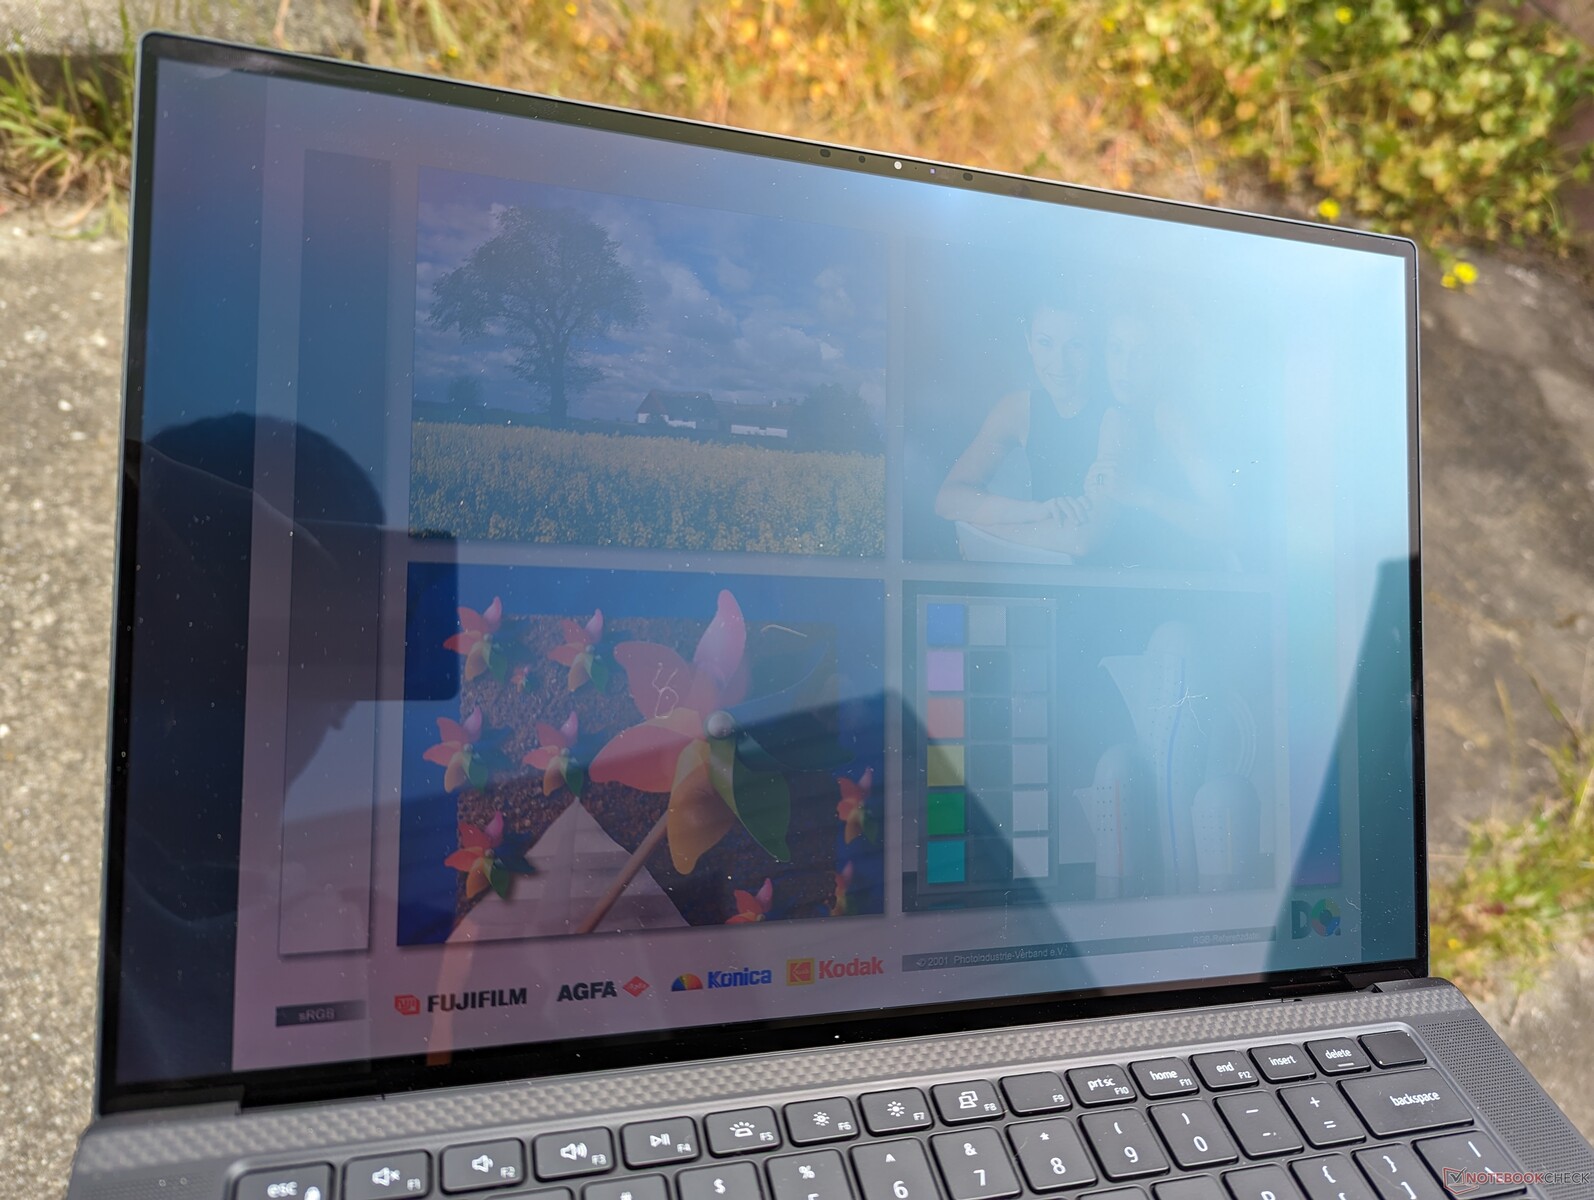
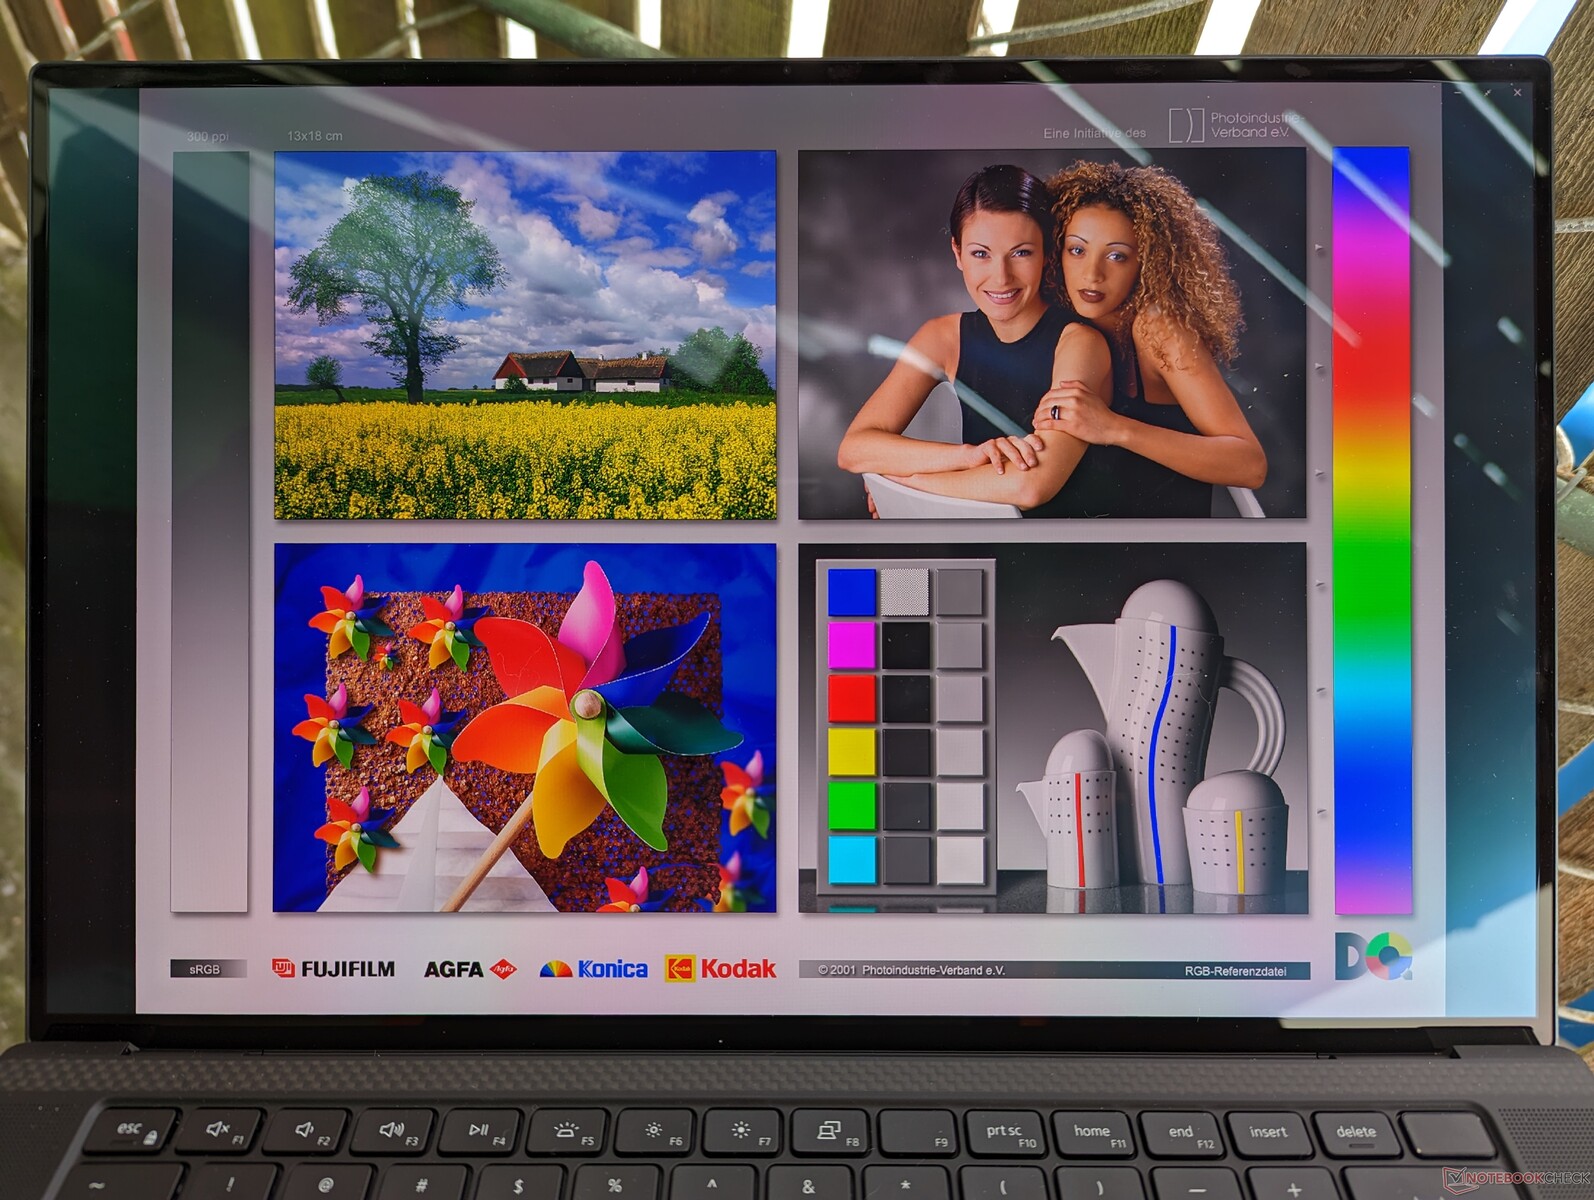
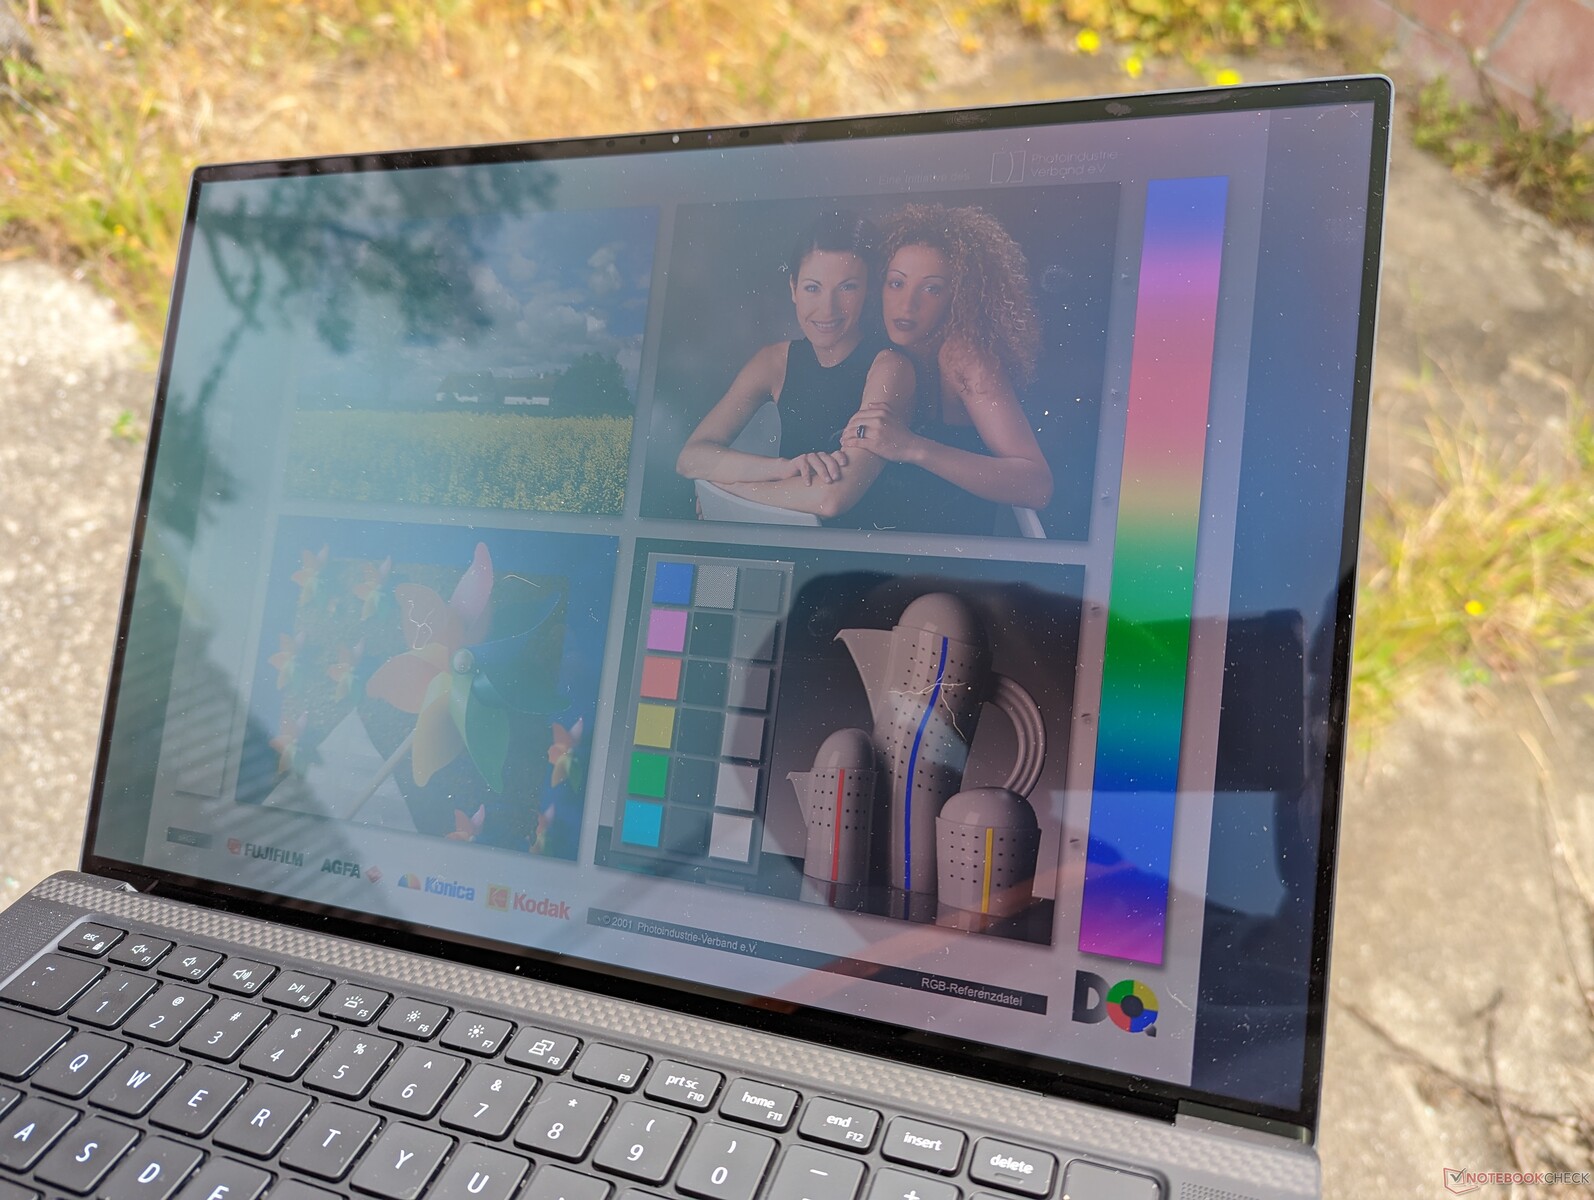
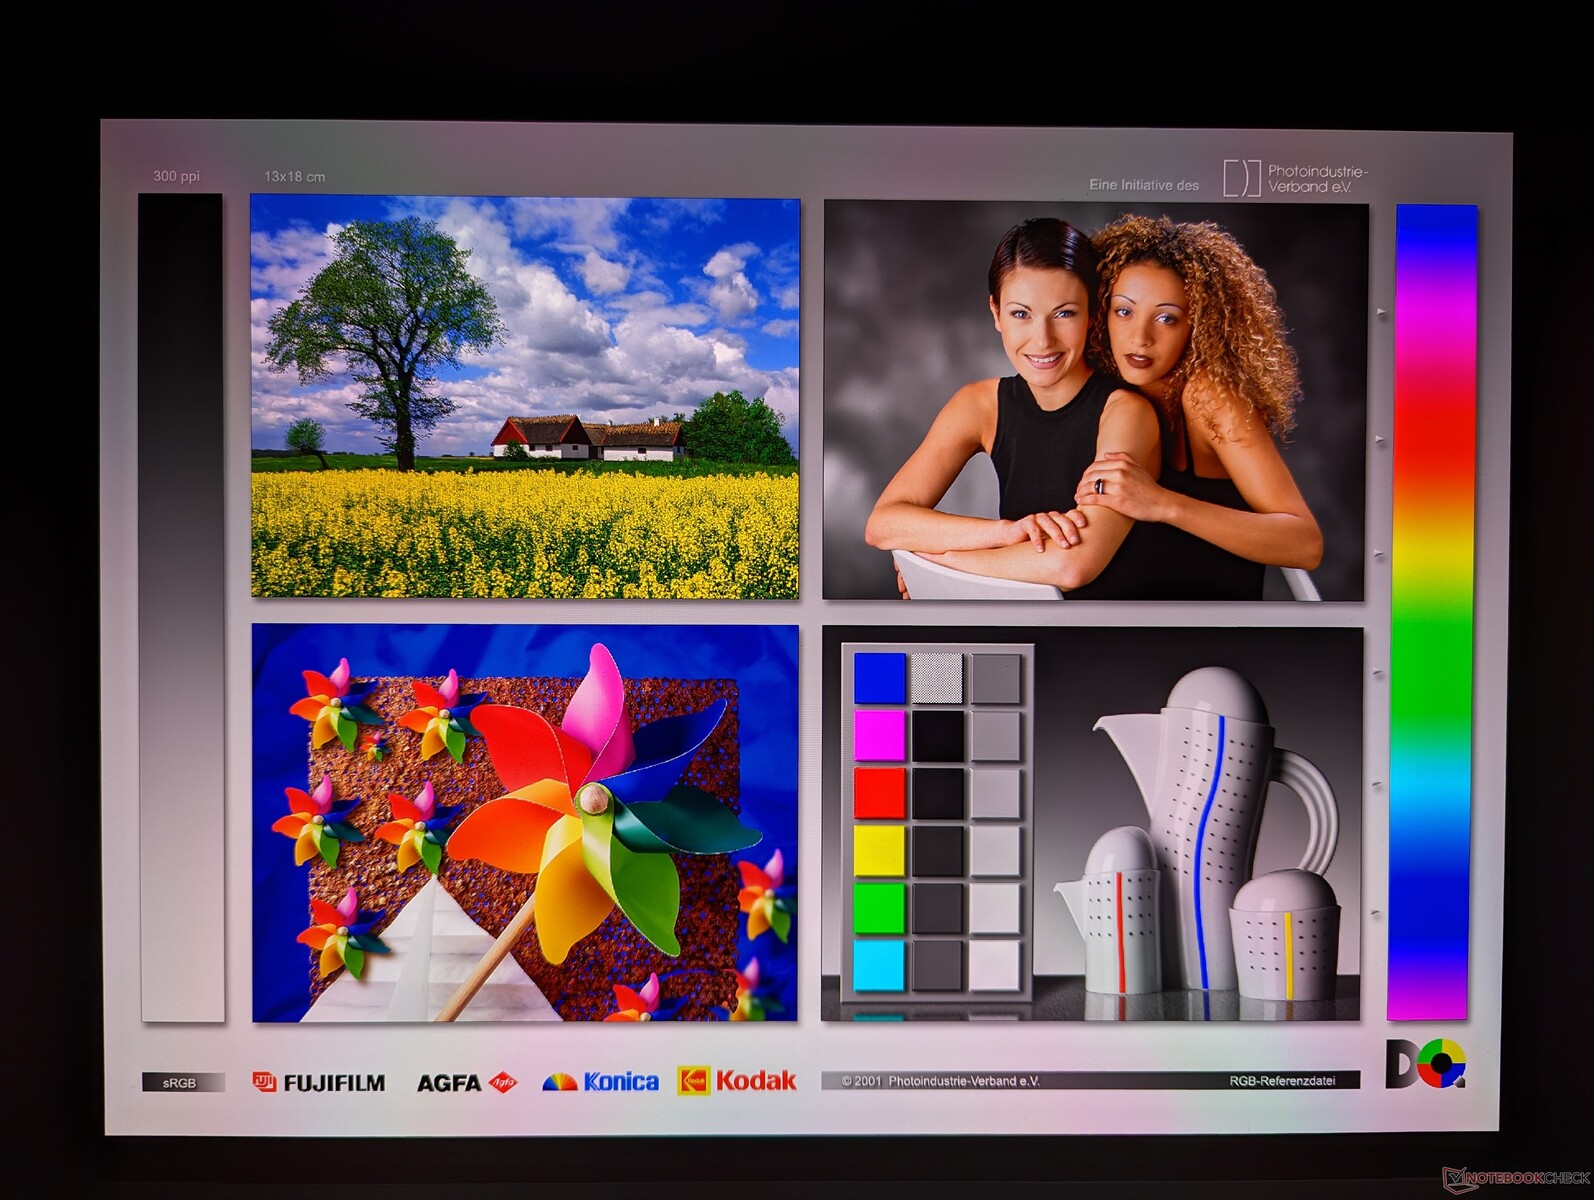
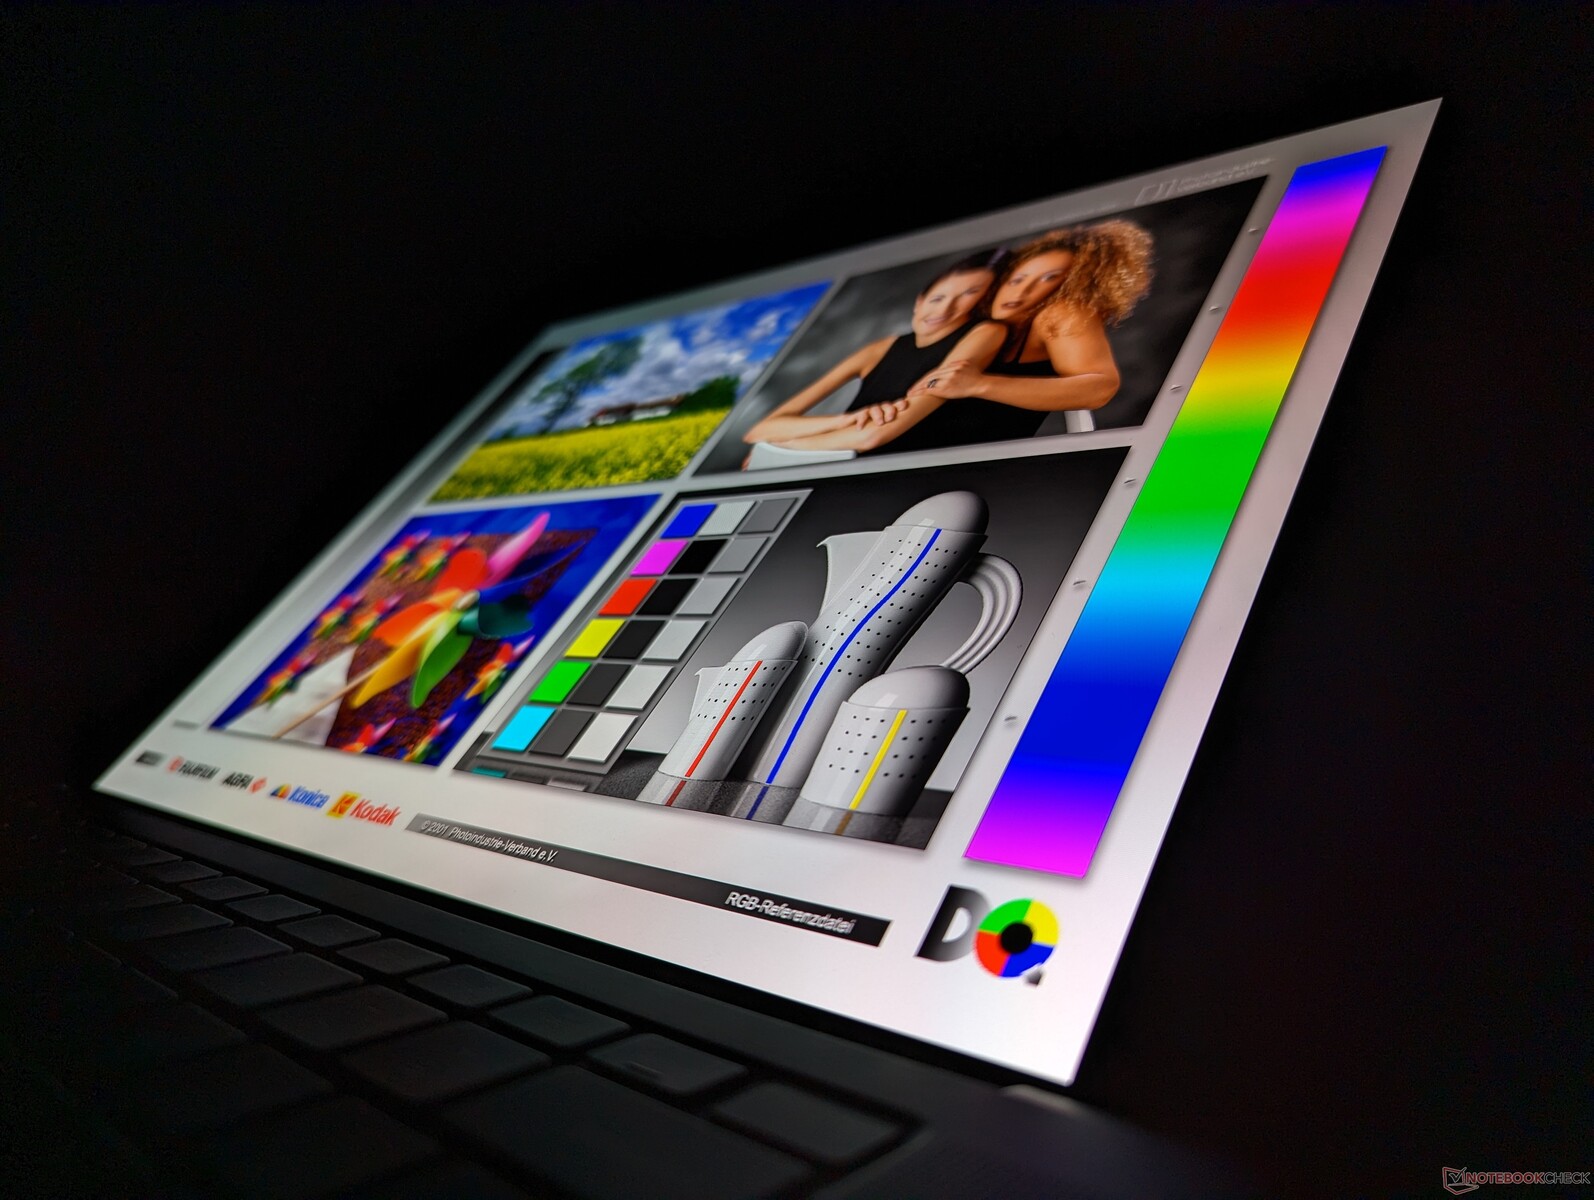
Écran - L'écran OLED 3,5K de Samsung est toujours aussi impressionnant
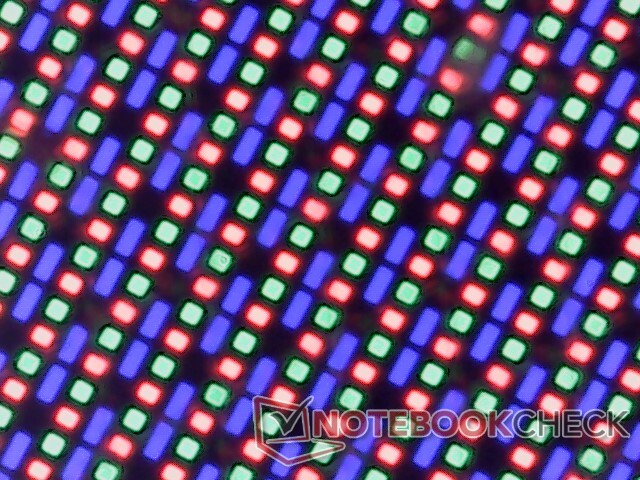
Dell utilise le même panneau OLED Samsung 156XG01 sur ses modèles XPS 15 2023 et 2022 pour une expérience visuelle similaire. Ce n'est pas nécessairement une mauvaise chose car le panneau Samsung offre des couleurs DCI-P3 complètes et une image nette, mais nous aimerions voir des options de panneaux 90 Hz ou plus rapides à l'avenir. Certains modèles Asus VivoBookpar exemple, sont livrés avec des panneaux OLED de 120 Hz pour une expérience visuelle beaucoup plus fluide.
| |||||||||||||||||||||||||
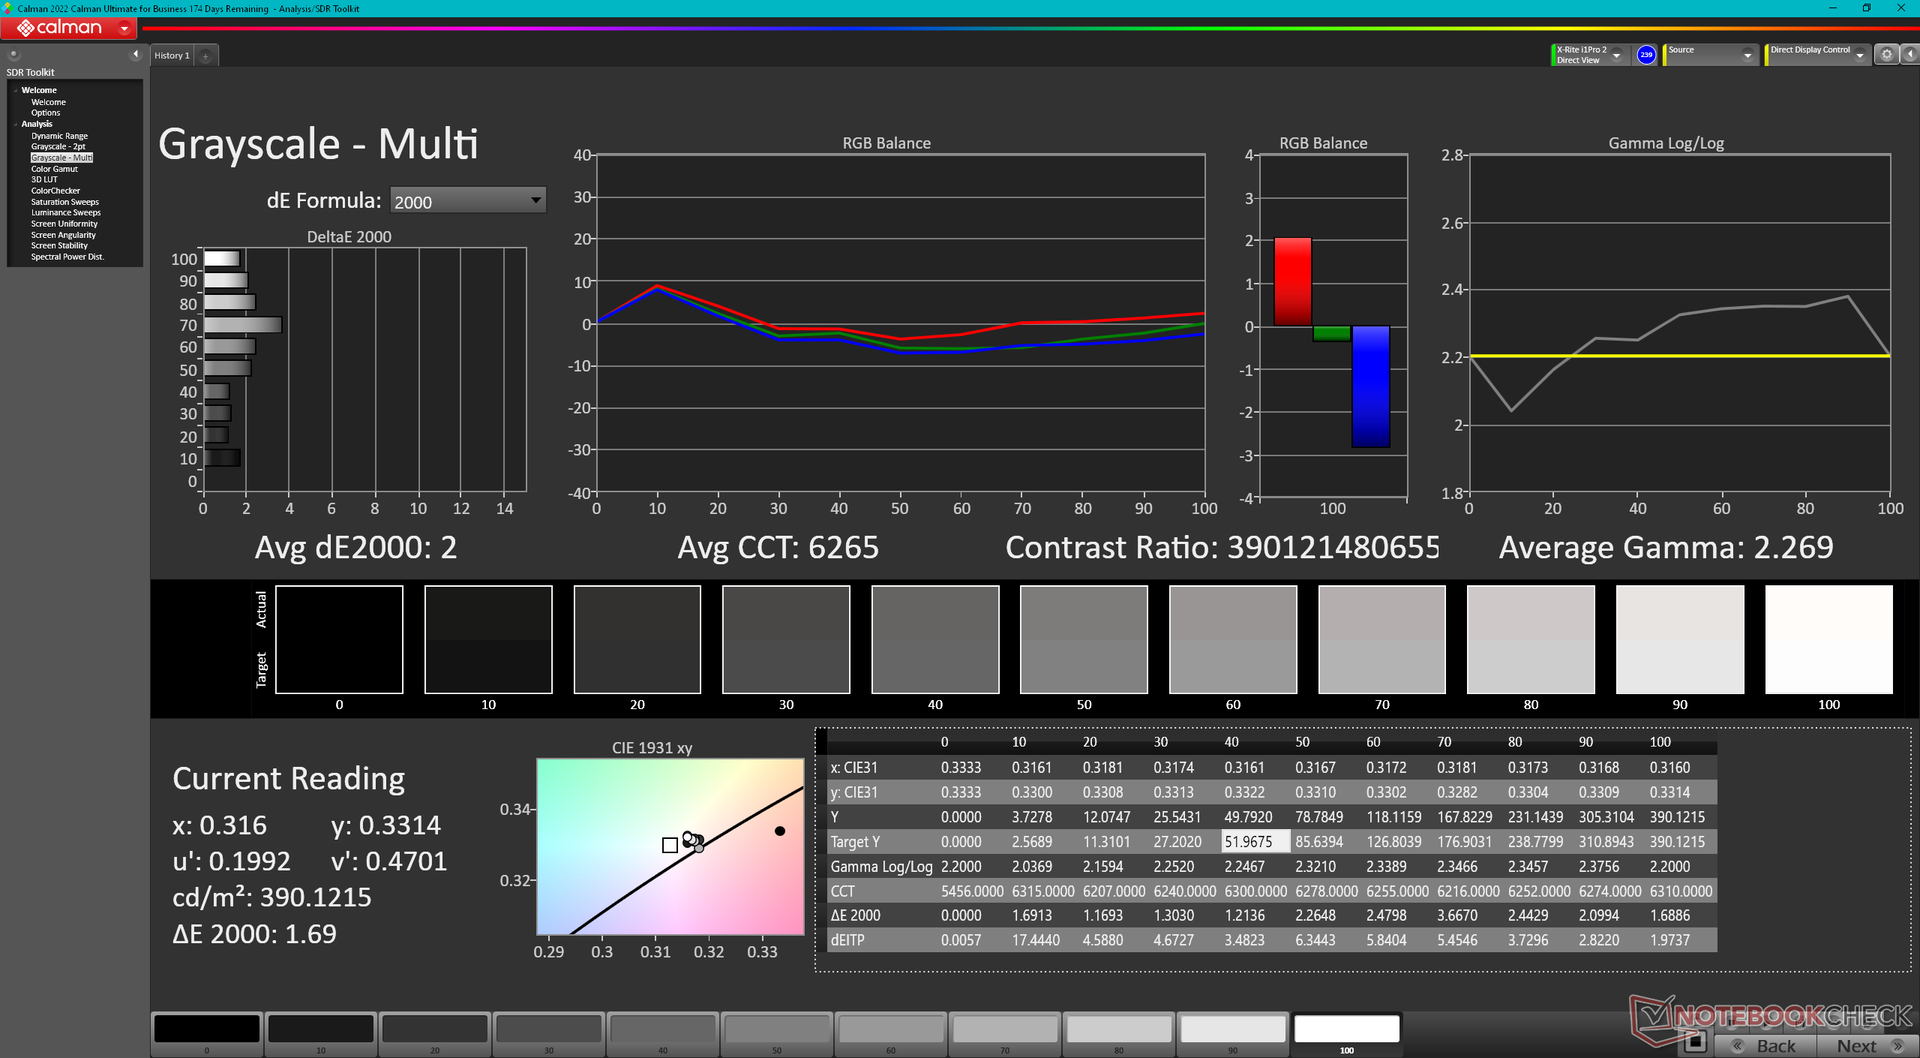
Homogénéité de la luminosité: 98 %
Valeur mesurée au centre, sur batterie: 389.5 cd/m²
Contraste: ∞:1 (Valeurs des noirs: 0 cd/m²)
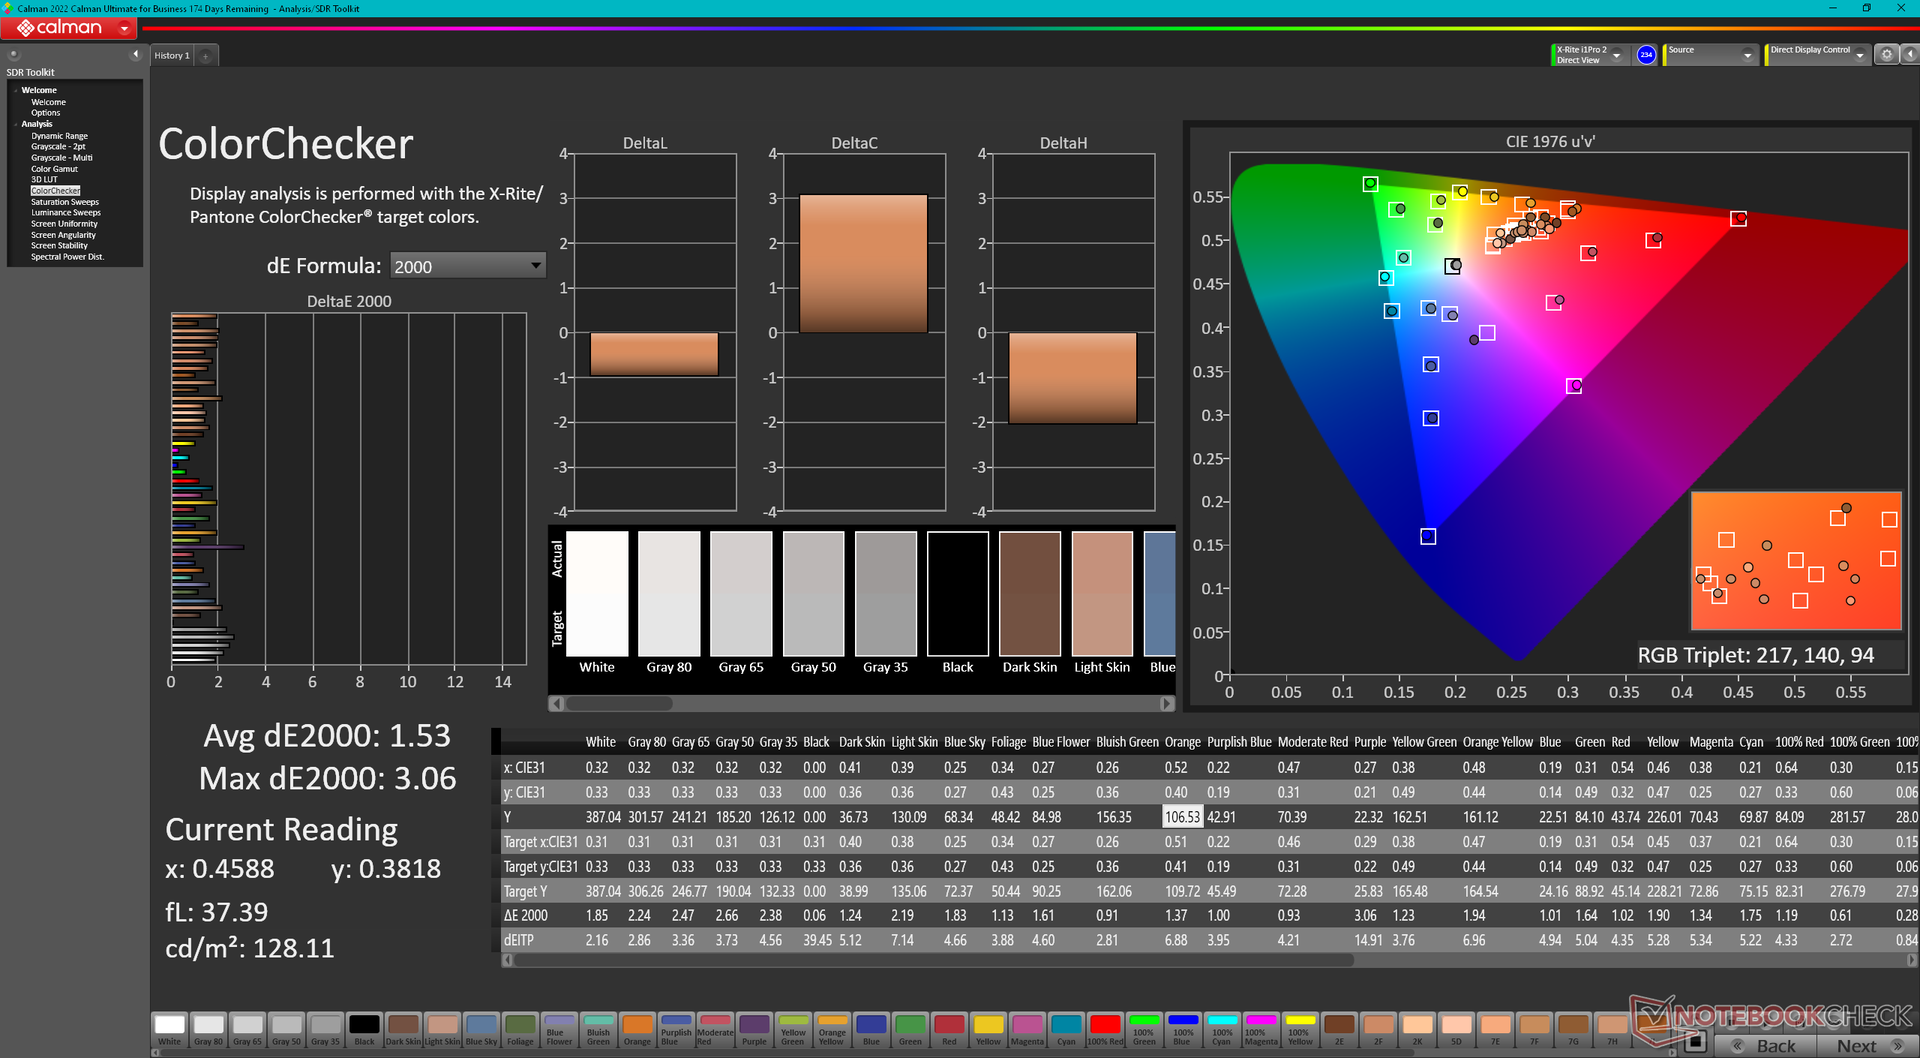
ΔE ColorChecker Calman: 4.95 | ∀{0.5-29.43 Ø4.71}
calibrated: 1.53
ΔE Greyscale Calman: 2 | ∀{0.09-98 Ø4.96}
98.4% AdobeRGB 1998 (Argyll 3D)
100% sRGB (Argyll 3D)
99.8% Display P3 (Argyll 3D)
Gamma: 2.27
CCT: 6265 K
| Dell XPS 15 9530 RTX 4070 Samsung 156XG01, OLED, 3456x2160, 15.6" | Dell XPS 15 9520 RTX 3050 Ti Samsung 156XG01, OLED, 3456x2160, 15.6" | Dell XPS 15 9500 Core i7 4K UHD Sharp LQ156R1, IPS, 3840x2400, 15.6" | Asus Zenbook Pro 15 OLED UM535Q Samsung ATNA56YX03-0, OLED, 1920x1080, 15.6" | MSI Prestige 15 A12UD-093 Sharp LQ156D1JW42, IPS, 3840x2160, 15.6" | Gigabyte Aero 15 OLED XD Samsung SDC4143, OLED, 3840x2160, 15.6" | |
|---|---|---|---|---|---|---|
| Display | -5% | -3% | -12% | -9% | 0% | |
| Display P3 Coverage (%) | 99.8 | 97.8 -2% | 89.7 -10% | 79.3 -21% | 80.48 -19% | 99.9 0% |
| sRGB Coverage (%) | 100 | 99.9 0% | 100 0% | 95.6 -4% | 96.95 -3% | 100 0% |
| AdobeRGB 1998 Coverage (%) | 98.4 | 86 -13% | 99.8 1% | 87.3 -11% | 94.02 -4% | 99.5 1% |
| Response Times | -6% | -2363% | -22% | -2088% | -35% | |
| Response Time Grey 50% / Grey 80% * (ms) | 1.68 ? | 1.9 ? -13% | 54 ? -3114% | 2.1 ? -25% | 51 ? -2936% | 2.8 ? -67% |
| Response Time Black / White * (ms) | 1.94 ? | 1.9 ? 2% | 33.2 ? -1611% | 2.3 ? -19% | 26 ? -1240% | 2 ? -3% |
| PWM Frequency (Hz) | 239 | 59.52 ? | 60.2 | 240 ? | ||
| Screen | -0% | -17% | 13% | 18% | 7% | |
| Brightness middle (cd/m²) | 389.5 | 381.4 -2% | 557.9 43% | 342.9 -12% | 441 13% | 440 13% |
| Brightness (cd/m²) | 392 | 384 -2% | 541 38% | 346 -12% | 416 6% | 446 14% |
| Brightness Distribution (%) | 98 | 95 -3% | 91 -7% | 98 0% | 85 -13% | 92 -6% |
| Black Level * (cd/m²) | 0.39 | 0.155 | 0.04 | |||
| Colorchecker dE 2000 * | 4.95 | 4.34 12% | 4.54 8% | 2.42 51% | 1.51 69% | 2.53 49% |
| Colorchecker dE 2000 max. * | 8.65 | 9.24 -7% | 7.92 8% | 4.05 53% | 3.56 59% | 7.82 10% |
| Colorchecker dE 2000 calibrated * | 1.53 | 3.82 -150% | 2.57 -68% | |||
| Greyscale dE 2000 * | 2 | 2 -0% | 3.2 -60% | 2.1 -5% | 2.49 -25% | 1.2 40% |
| Gamma | 2.27 97% | 2.13 103% | 1.99 111% | 2.21 100% | 2.17 101% | 2.206 100% |
| CCT | 6265 104% | 6210 105% | 6451 101% | 6364 102% | 6292 103% | 6371 102% |
| Contrast (:1) | 1431 | 2845 | 11000 | |||
| Color Space (Percent of AdobeRGB 1998) (%) | 89.5 | |||||
| Color Space (Percent of sRGB) (%) | 100 | |||||
| Moyenne finale (programmes/paramètres) | -4% /
-3% | -794% /
-405% | -7% /
-0% | -693% /
-372% | -9% /
-1% |
* ... Moindre est la valeur, meilleures sont les performances
L'écran est calibré de manière satisfaisante dès sa sortie de l'emballage, mais les utilisateurs peuvent toujours appliquer notre profil ICM calibré ci-dessus pour améliorer légèrement la précision des couleurs. Dell a enfin intégré les différents profils de couleurs tels que sRGB, AdobeRGB, DCI-P3 et autres dans le menu Windows Display pour faciliter le changement de profil.
Temps de réponse de l'écran
| ↔ Temps de réponse noir à blanc | ||
|---|---|---|
| 1.94 ms ... hausse ↗ et chute ↘ combinées | ↗ 0.97 ms hausse | 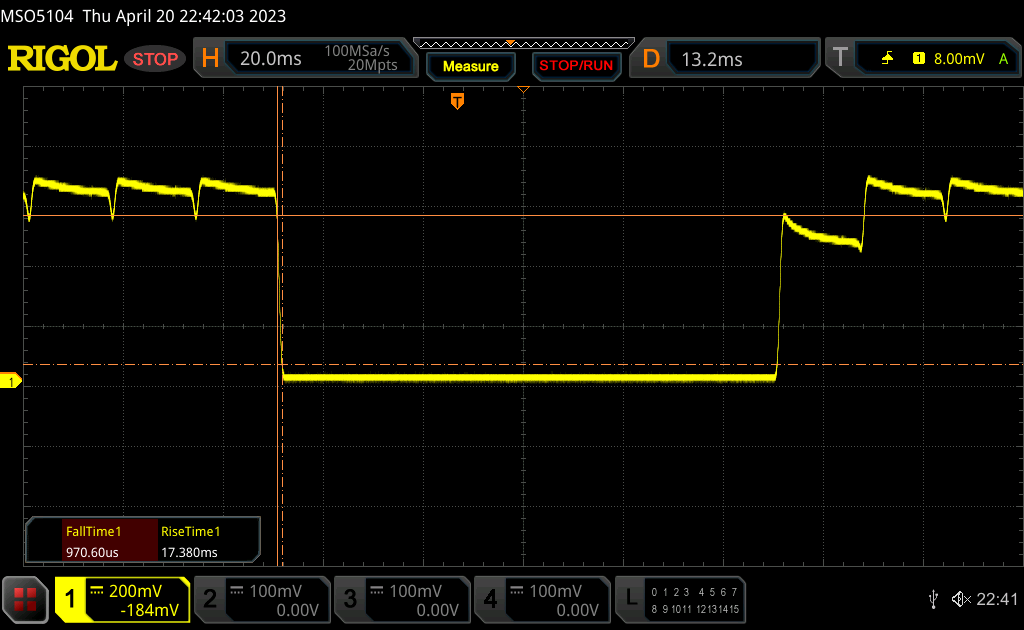 |
| ↘ 0.97 ms chute | ||
| L'écran montre de très faibles temps de réponse, parfait pour le jeu. En comparaison, tous les appareils testés affichent entre 0.1 (minimum) et 240 (maximum) ms. » 11 % des appareils testés affichent de meilleures performances. Cela signifie que les latences relevées sont meilleures que la moyenne (19.8 ms) de tous les appareils testés. | ||
| ↔ Temps de réponse gris 50% à gris 80% | ||
| 1.68 ms ... hausse ↗ et chute ↘ combinées | ↗ 0.8 ms hausse | 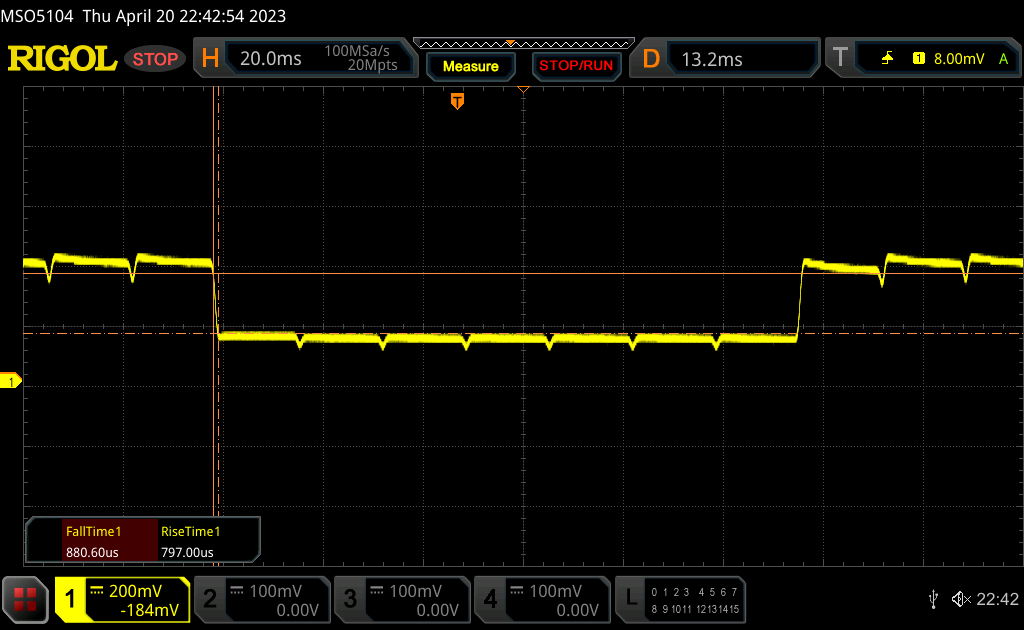 |
| ↘ 0.88 ms chute | ||
| L'écran montre de très faibles temps de réponse, parfait pour le jeu. En comparaison, tous les appareils testés affichent entre 0.165 (minimum) et 636 (maximum) ms. » 8 % des appareils testés affichent de meilleures performances. Cela signifie que les latences relevées sont meilleures que la moyenne (31 ms) de tous les appareils testés. | ||
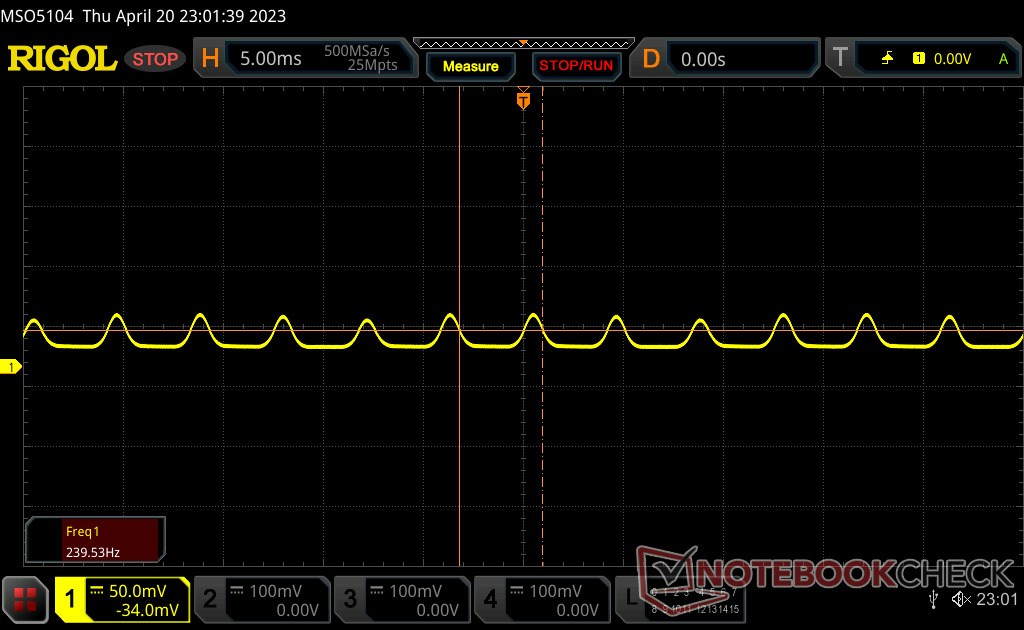
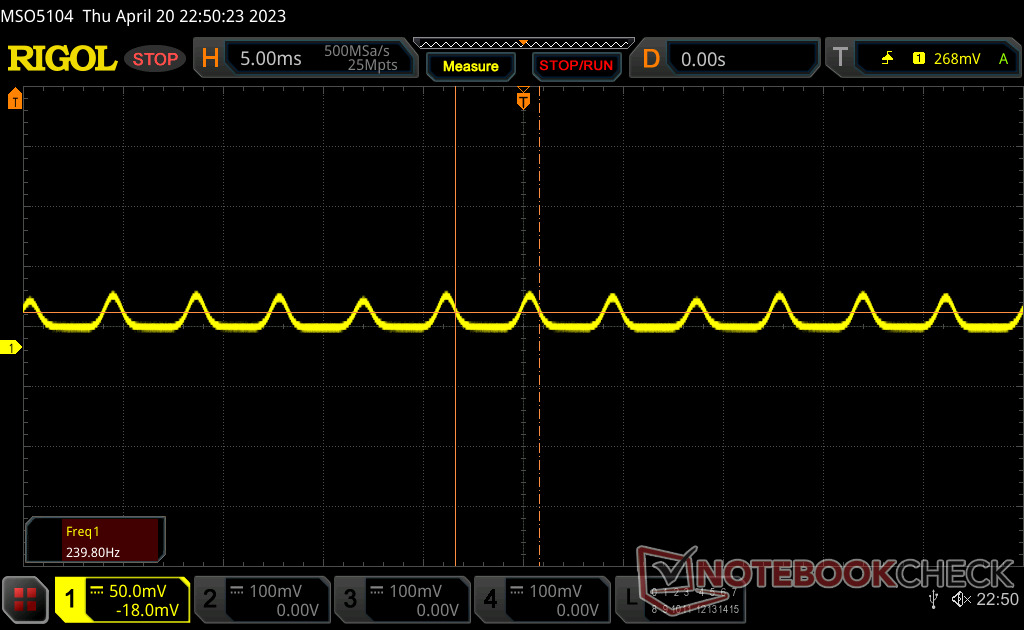
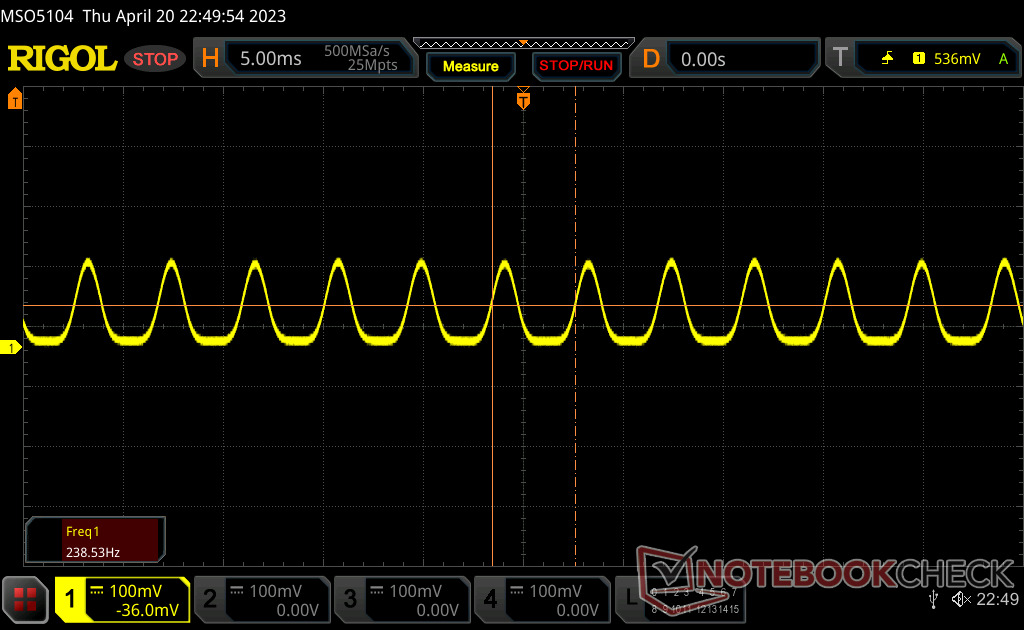
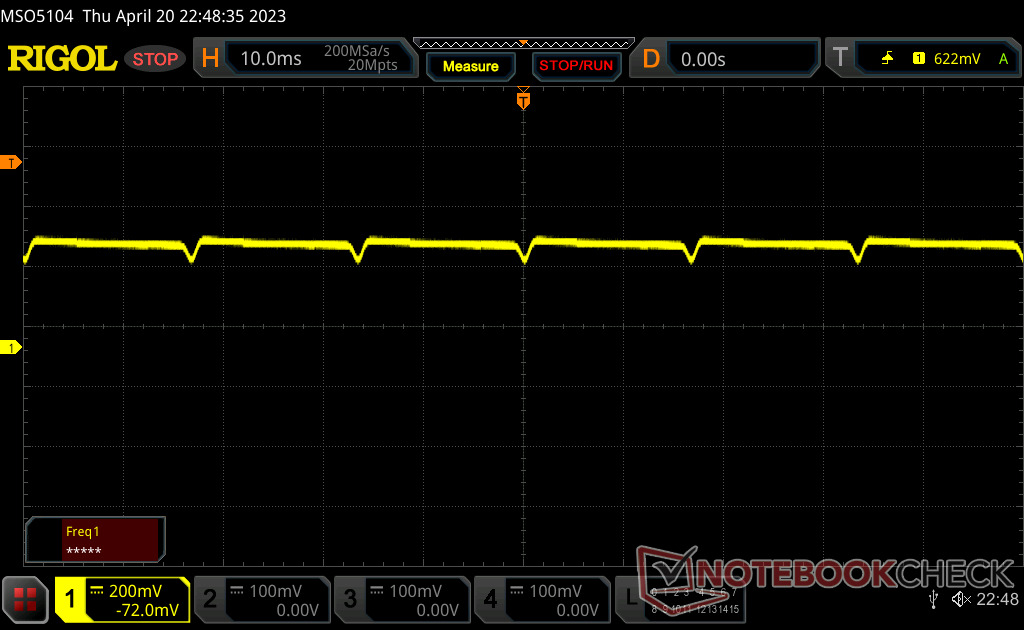
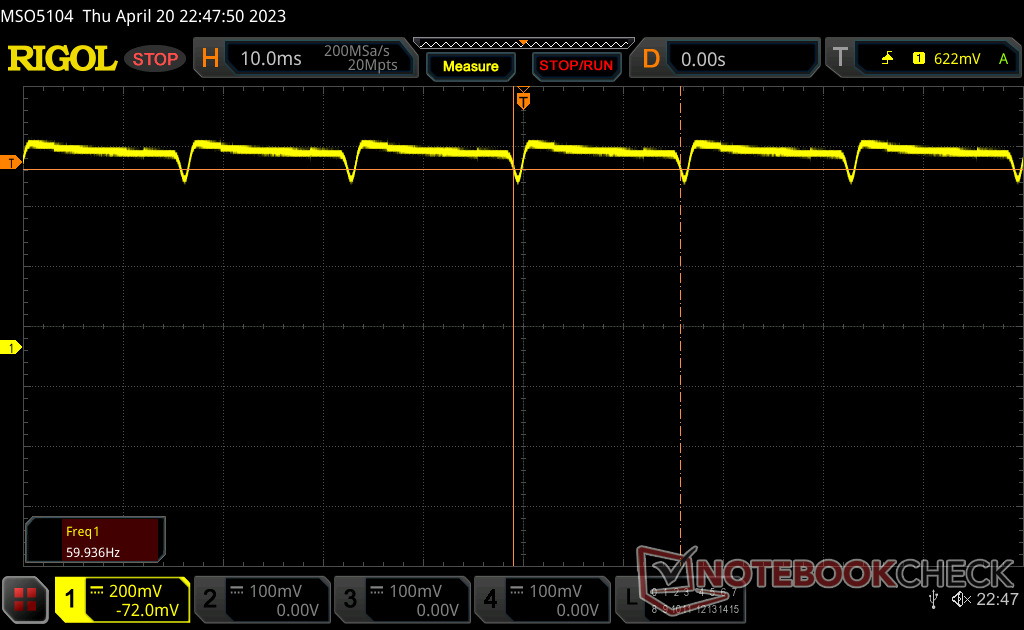
Scintillement / MLI (Modulation de largeur d'impulsion)
| Scintillement / MLI (Modulation de largeur d'impulsion) décelé | 239 Hz | 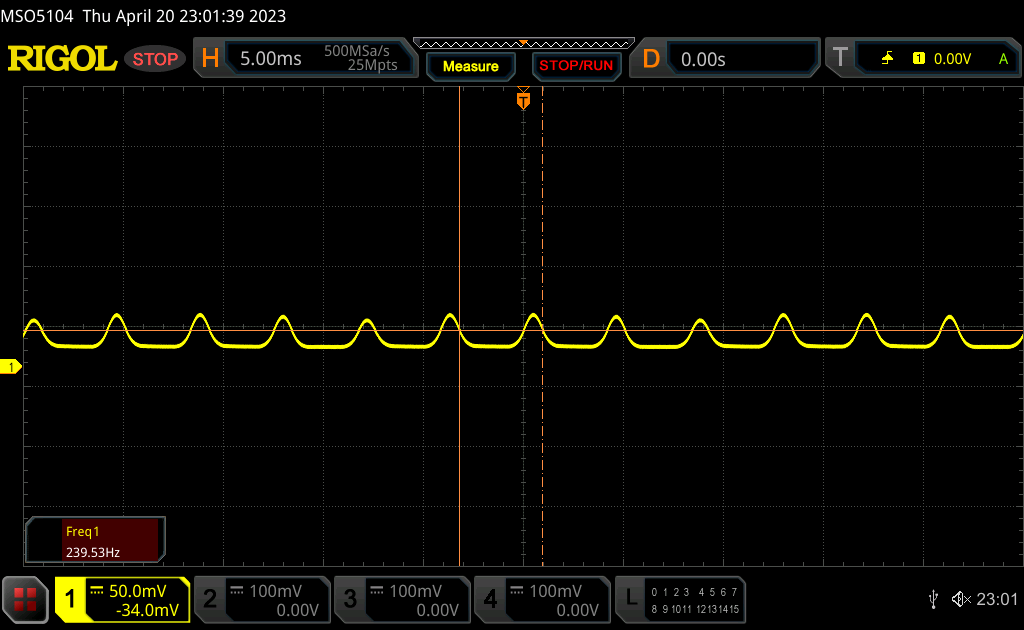 | |
Le rétroéclairage de l'écran scintille à la fréquence de 239 Hz (certainement du fait de l'utilisation d'une MDI - Modulation de largeur d'impulsion) . La fréquence de rafraîchissement de 239 Hz est relativement faible, les personnes les plus sensibles devraient percevoir un scintillement et être sujettes à une fatigue oculaire accrue (avec le niveau de luminosité indiqué) En comparaison, 52 % des appareils testés n'emploient pas MDI pour assombrir leur écran. Nous avons relevé une moyenne à 7757 (minimum : 5 - maximum : 343500) Hz dans le cas où une MDI était active. | |||
Le scintillement est présent à tous les niveaux de luminosité, comme sur les panneaux OLED d'autres ordinateurs portables. Nous avons pu enregistrer des fréquences de 240 Hz de 0 à 52 % de luminosité et de 60 Hz de 53 à 100 % de luminosité.

Performance - 13e génération Intel + GeForce RTX 4070 Graphique
Conditions d'essai
Nous avons réglé notre appareil sur les modes Performance et dGPU avant d'effectuer les tests ci-dessous. Les modes Advanced Optimus ou MUX ne sont pas pris en charge.
Processeur
Les performances du processeur sont mitigées en raison du potentiel Turbo Boost limité du système. Par exemple, notre Core i7-13700H CineBench R15 xT serait 19 % plus élevé que celui du Core i7-12700H i7-12700H du XPS 15 9520 de l'année dernière. Cependant, après plusieurs boucles de tests, l'écart de performance s'est réduit et s'est rapproché du processeur de l'année dernière. Le MSI Stealth 14 Studio, plus petit, qui utilise le même processeur Core i7-13700H que notre XPS 15 9530, présente un comportement similaire.
La mise à niveau vers le processeur Core i9-13900H devrait améliorer les performances de 15 à 25 %. Cependant, les bénéfices pourraient être plus minimes car les CPU Core i9 ont tendance à s'étrangler plus fortement sur les ordinateurs portables multimédias fins comme le XPS 15.
Cinebench R15 Multi Loop
Cinebench R23: Multi Core | Single Core
Cinebench R20: CPU (Multi Core) | CPU (Single Core)
Cinebench R15: CPU Multi 64Bit | CPU Single 64Bit
Blender: v2.79 BMW27 CPU
7-Zip 18.03: 7z b 4 | 7z b 4 -mmt1
Geekbench 5.5: Multi-Core | Single-Core
HWBOT x265 Benchmark v2.2: 4k Preset
LibreOffice : 20 Documents To PDF
R Benchmark 2.5: Overall mean
| CPU Performance rating | |
| Asus Zephyrus Duo 16 GX650PY-NM006W | |
| Uniwill GM6PX7X RTX 4070 | |
| Asus ROG Zephyrus M16 GU604VY-NM042X | |
| Alienware x15 R2 P111F | |
| Dell XPS 15 9530 RTX 4070 | |
| Moyenne Intel Core i7-13700H | |
| Dell XPS 15 9520 RTX 3050 Ti | |
| MSI Prestige 15 A12UD-093 -1! | |
| Asus ROG Strix G15 G513RW | |
| Asus Zenbook Pro 15 OLED UM535Q | |
| Gigabyte Aero 15 OLED XD | |
| Dell XPS 15 9500 Core i7 4K UHD -2! | |
| Cinebench R23 / Multi Core | |
| Asus Zephyrus Duo 16 GX650PY-NM006W | |
| Uniwill GM6PX7X RTX 4070 | |
| Asus ROG Zephyrus M16 GU604VY-NM042X | |
| Alienware x15 R2 P111F | |
| Dell XPS 15 9530 RTX 4070 | |
| Moyenne Intel Core i7-13700H (5890 - 20034, n=29) | |
| Dell XPS 15 9520 RTX 3050 Ti | |
| Asus ROG Strix G15 G513RW | |
| Asus Zenbook Pro 15 OLED UM535Q | |
| MSI Prestige 15 A12UD-093 | |
| Gigabyte Aero 15 OLED XD | |
| Cinebench R23 / Single Core | |
| Asus ROG Zephyrus M16 GU604VY-NM042X | |
| Asus Zephyrus Duo 16 GX650PY-NM006W | |
| Alienware x15 R2 P111F | |
| Dell XPS 15 9530 RTX 4070 | |
| Uniwill GM6PX7X RTX 4070 | |
| Moyenne Intel Core i7-13700H (1323 - 1914, n=29) | |
| Dell XPS 15 9520 RTX 3050 Ti | |
| MSI Prestige 15 A12UD-093 | |
| Asus ROG Strix G15 G513RW | |
| Asus Zenbook Pro 15 OLED UM535Q | |
| Gigabyte Aero 15 OLED XD | |
| Cinebench R20 / CPU (Multi Core) | |
| Asus Zephyrus Duo 16 GX650PY-NM006W | |
| Uniwill GM6PX7X RTX 4070 | |
| Asus ROG Zephyrus M16 GU604VY-NM042X | |
| Alienware x15 R2 P111F | |
| Dell XPS 15 9530 RTX 4070 | |
| Moyenne Intel Core i7-13700H (2322 - 7674, n=29) | |
| Dell XPS 15 9520 RTX 3050 Ti | |
| Asus ROG Strix G15 G513RW | |
| Asus Zenbook Pro 15 OLED UM535Q | |
| MSI Prestige 15 A12UD-093 | |
| Gigabyte Aero 15 OLED XD | |
| Dell XPS 15 9500 Core i7 4K UHD | |
| Cinebench R20 / CPU (Single Core) | |
| Asus Zephyrus Duo 16 GX650PY-NM006W | |
| Asus ROG Zephyrus M16 GU604VY-NM042X | |
| Alienware x15 R2 P111F | |
| Uniwill GM6PX7X RTX 4070 | |
| Dell XPS 15 9530 RTX 4070 | |
| Moyenne Intel Core i7-13700H (508 - 741, n=29) | |
| Dell XPS 15 9520 RTX 3050 Ti | |
| MSI Prestige 15 A12UD-093 | |
| Asus ROG Strix G15 G513RW | |
| Asus Zenbook Pro 15 OLED UM535Q | |
| Gigabyte Aero 15 OLED XD | |
| Dell XPS 15 9500 Core i7 4K UHD | |
| Cinebench R15 / CPU Multi 64Bit | |
| Asus Zephyrus Duo 16 GX650PY-NM006W | |
| Uniwill GM6PX7X RTX 4070 | |
| Asus ROG Zephyrus M16 GU604VY-NM042X | |
| Alienware x15 R2 P111F | |
| Dell XPS 15 9530 RTX 4070 | |
| Moyenne Intel Core i7-13700H (905 - 2982, n=29) | |
| MSI Prestige 15 A12UD-093 | |
| Dell XPS 15 9520 RTX 3050 Ti | |
| Asus ROG Strix G15 G513RW | |
| Asus Zenbook Pro 15 OLED UM535Q | |
| Gigabyte Aero 15 OLED XD | |
| Dell XPS 15 9500 Core i7 4K UHD | |
| Cinebench R15 / CPU Single 64Bit | |
| Asus Zephyrus Duo 16 GX650PY-NM006W | |
| Asus ROG Zephyrus M16 GU604VY-NM042X | |
| Alienware x15 R2 P111F | |
| Dell XPS 15 9530 RTX 4070 | |
| Uniwill GM6PX7X RTX 4070 | |
| Moyenne Intel Core i7-13700H (213 - 278, n=29) | |
| Dell XPS 15 9520 RTX 3050 Ti | |
| Asus ROG Strix G15 G513RW | |
| Asus Zenbook Pro 15 OLED UM535Q | |
| Dell XPS 15 9500 Core i7 4K UHD | |
| Gigabyte Aero 15 OLED XD | |
| MSI Prestige 15 A12UD-093 | |
| Blender / v2.79 BMW27 CPU | |
| Dell XPS 15 9500 Core i7 4K UHD | |
| Gigabyte Aero 15 OLED XD | |
| MSI Prestige 15 A12UD-093 | |
| Asus Zenbook Pro 15 OLED UM535Q | |
| Asus ROG Strix G15 G513RW | |
| Moyenne Intel Core i7-13700H (169 - 555, n=29) | |
| Dell XPS 15 9520 RTX 3050 Ti | |
| Dell XPS 15 9530 RTX 4070 | |
| Alienware x15 R2 P111F | |
| Asus ROG Zephyrus M16 GU604VY-NM042X | |
| Uniwill GM6PX7X RTX 4070 | |
| Asus Zephyrus Duo 16 GX650PY-NM006W | |
| 7-Zip 18.03 / 7z b 4 | |
| Asus Zephyrus Duo 16 GX650PY-NM006W | |
| Uniwill GM6PX7X RTX 4070 | |
| Asus ROG Zephyrus M16 GU604VY-NM042X | |
| Alienware x15 R2 P111F | |
| Dell XPS 15 9520 RTX 3050 Ti | |
| Moyenne Intel Core i7-13700H (27322 - 76344, n=29) | |
| Dell XPS 15 9530 RTX 4070 | |
| Asus ROG Strix G15 G513RW | |
| Asus Zenbook Pro 15 OLED UM535Q | |
| MSI Prestige 15 A12UD-093 | |
| Gigabyte Aero 15 OLED XD | |
| Dell XPS 15 9500 Core i7 4K UHD | |
| 7-Zip 18.03 / 7z b 4 -mmt1 | |
| Asus Zephyrus Duo 16 GX650PY-NM006W | |
| Asus ROG Zephyrus M16 GU604VY-NM042X | |
| Dell XPS 15 9530 RTX 4070 | |
| Uniwill GM6PX7X RTX 4070 | |
| Moyenne Intel Core i7-13700H (4825 - 6238, n=29) | |
| Alienware x15 R2 P111F | |
| Asus ROG Strix G15 G513RW | |
| Dell XPS 15 9520 RTX 3050 Ti | |
| Asus Zenbook Pro 15 OLED UM535Q | |
| MSI Prestige 15 A12UD-093 | |
| Gigabyte Aero 15 OLED XD | |
| Dell XPS 15 9500 Core i7 4K UHD | |
| Geekbench 5.5 / Multi-Core | |
| Asus Zephyrus Duo 16 GX650PY-NM006W | |
| Uniwill GM6PX7X RTX 4070 | |
| Asus ROG Zephyrus M16 GU604VY-NM042X | |
| Alienware x15 R2 P111F | |
| Dell XPS 15 9530 RTX 4070 | |
| Dell XPS 15 9520 RTX 3050 Ti | |
| MSI Prestige 15 A12UD-093 | |
| Moyenne Intel Core i7-13700H (6165 - 14215, n=29) | |
| Asus ROG Strix G15 G513RW | |
| Gigabyte Aero 15 OLED XD | |
| Asus Zenbook Pro 15 OLED UM535Q | |
| Dell XPS 15 9500 Core i7 4K UHD | |
| Geekbench 5.5 / Single-Core | |
| Asus Zephyrus Duo 16 GX650PY-NM006W | |
| Asus ROG Zephyrus M16 GU604VY-NM042X | |
| Dell XPS 15 9530 RTX 4070 | |
| Alienware x15 R2 P111F | |
| Uniwill GM6PX7X RTX 4070 | |
| Moyenne Intel Core i7-13700H (1362 - 1919, n=29) | |
| Dell XPS 15 9520 RTX 3050 Ti | |
| Asus ROG Strix G15 G513RW | |
| MSI Prestige 15 A12UD-093 | |
| Asus Zenbook Pro 15 OLED UM535Q | |
| Gigabyte Aero 15 OLED XD | |
| Dell XPS 15 9500 Core i7 4K UHD | |
| HWBOT x265 Benchmark v2.2 / 4k Preset | |
| Asus Zephyrus Duo 16 GX650PY-NM006W | |
| Uniwill GM6PX7X RTX 4070 | |
| Asus ROG Zephyrus M16 GU604VY-NM042X | |
| Alienware x15 R2 P111F | |
| Dell XPS 15 9530 RTX 4070 | |
| Moyenne Intel Core i7-13700H (6.72 - 21.2, n=29) | |
| Asus ROG Strix G15 G513RW | |
| Asus Zenbook Pro 15 OLED UM535Q | |
| Dell XPS 15 9520 RTX 3050 Ti | |
| Gigabyte Aero 15 OLED XD | |
| Dell XPS 15 9500 Core i7 4K UHD | |
| LibreOffice / 20 Documents To PDF | |
| Asus ROG Strix G15 G513RW | |
| MSI Prestige 15 A12UD-093 | |
| MSI Prestige 15 A12UD-093 | |
| Asus Zephyrus Duo 16 GX650PY-NM006W | |
| Dell XPS 15 9500 Core i7 4K UHD | |
| Asus ROG Zephyrus M16 GU604VY-NM042X | |
| Asus Zenbook Pro 15 OLED UM535Q | |
| Moyenne Intel Core i7-13700H (31.3 - 62.4, n=29) | |
| Gigabyte Aero 15 OLED XD | |
| Alienware x15 R2 P111F | |
| Dell XPS 15 9530 RTX 4070 | |
| Dell XPS 15 9520 RTX 3050 Ti | |
| Uniwill GM6PX7X RTX 4070 | |
| R Benchmark 2.5 / Overall mean | |
| Gigabyte Aero 15 OLED XD | |
| Dell XPS 15 9500 Core i7 4K UHD | |
| Asus Zenbook Pro 15 OLED UM535Q | |
| Asus ROG Strix G15 G513RW | |
| Moyenne Intel Core i7-13700H (0.4308 - 0.607, n=29) | |
| Uniwill GM6PX7X RTX 4070 | |
| Dell XPS 15 9520 RTX 3050 Ti | |
| MSI Prestige 15 A12UD-093 | |
| Dell XPS 15 9530 RTX 4070 | |
| Alienware x15 R2 P111F | |
| Asus ROG Zephyrus M16 GU604VY-NM042X | |
| Asus Zephyrus Duo 16 GX650PY-NM006W | |
* ... Moindre est la valeur, meilleures sont les performances
AIDA64: FP32 Ray-Trace | FPU Julia | CPU SHA3 | CPU Queen | FPU SinJulia | FPU Mandel | CPU AES | CPU ZLib | FP64 Ray-Trace | CPU PhotoWorxx
| Performance rating | |
| Asus Zenbook Pro 15 OLED UM535Q | |
| Dell XPS 15 9530 RTX 4070 | |
| Moyenne Intel Core i7-13700H | |
| MSI Prestige 15 A12UD-093 | |
| Dell XPS 15 9520 RTX 3050 Ti | |
| Dell XPS 15 9500 Core i7 4K UHD | |
| Gigabyte Aero 15 OLED XD -9! | |
| AIDA64 / FP32 Ray-Trace | |
| Asus Zenbook Pro 15 OLED UM535Q | |
| Dell XPS 15 9530 RTX 4070 | |
| Moyenne Intel Core i7-13700H (4986 - 18908, n=29) | |
| MSI Prestige 15 A12UD-093 | |
| Dell XPS 15 9500 Core i7 4K UHD | |
| Dell XPS 15 9520 RTX 3050 Ti | |
| AIDA64 / FPU Julia | |
| Asus Zenbook Pro 15 OLED UM535Q | |
| Moyenne Intel Core i7-13700H (25360 - 92359, n=29) | |
| Dell XPS 15 9530 RTX 4070 | |
| Dell XPS 15 9500 Core i7 4K UHD | |
| MSI Prestige 15 A12UD-093 | |
| Dell XPS 15 9520 RTX 3050 Ti | |
| AIDA64 / CPU SHA3 | |
| Asus Zenbook Pro 15 OLED UM535Q | |
| Moyenne Intel Core i7-13700H (1339 - 4224, n=29) | |
| Dell XPS 15 9530 RTX 4070 | |
| Dell XPS 15 9500 Core i7 4K UHD | |
| Dell XPS 15 9520 RTX 3050 Ti | |
| MSI Prestige 15 A12UD-093 | |
| AIDA64 / CPU Queen | |
| Dell XPS 15 9530 RTX 4070 | |
| Asus Zenbook Pro 15 OLED UM535Q | |
| Dell XPS 15 9520 RTX 3050 Ti | |
| Moyenne Intel Core i7-13700H (59324 - 107159, n=29) | |
| Dell XPS 15 9500 Core i7 4K UHD | |
| MSI Prestige 15 A12UD-093 | |
| AIDA64 / FPU SinJulia | |
| Asus Zenbook Pro 15 OLED UM535Q | |
| Dell XPS 15 9500 Core i7 4K UHD | |
| Moyenne Intel Core i7-13700H (4800 - 11050, n=29) | |
| Dell XPS 15 9530 RTX 4070 | |
| Dell XPS 15 9520 RTX 3050 Ti | |
| MSI Prestige 15 A12UD-093 | |
| AIDA64 / FPU Mandel | |
| Asus Zenbook Pro 15 OLED UM535Q | |
| Moyenne Intel Core i7-13700H (12321 - 45118, n=29) | |
| Dell XPS 15 9530 RTX 4070 | |
| Dell XPS 15 9500 Core i7 4K UHD | |
| MSI Prestige 15 A12UD-093 | |
| Dell XPS 15 9520 RTX 3050 Ti | |
| AIDA64 / CPU AES | |
| Asus Zenbook Pro 15 OLED UM535Q | |
| MSI Prestige 15 A12UD-093 | |
| Dell XPS 15 9520 RTX 3050 Ti | |
| Moyenne Intel Core i7-13700H (28769 - 151254, n=29) | |
| Dell XPS 15 9530 RTX 4070 | |
| Dell XPS 15 9500 Core i7 4K UHD | |
| AIDA64 / CPU ZLib | |
| Moyenne Intel Core i7-13700H (389 - 1215, n=29) | |
| Dell XPS 15 9530 RTX 4070 | |
| Dell XPS 15 9520 RTX 3050 Ti | |
| Asus Zenbook Pro 15 OLED UM535Q | |
| MSI Prestige 15 A12UD-093 | |
| Dell XPS 15 9500 Core i7 4K UHD | |
| Gigabyte Aero 15 OLED XD | |
| AIDA64 / FP64 Ray-Trace | |
| Asus Zenbook Pro 15 OLED UM535Q | |
| Dell XPS 15 9530 RTX 4070 | |
| Moyenne Intel Core i7-13700H (2540 - 10135, n=29) | |
| MSI Prestige 15 A12UD-093 | |
| Dell XPS 15 9520 RTX 3050 Ti | |
| Dell XPS 15 9500 Core i7 4K UHD | |
| AIDA64 / CPU PhotoWorxx | |
| Dell XPS 15 9530 RTX 4070 | |
| MSI Prestige 15 A12UD-093 | |
| Moyenne Intel Core i7-13700H (12872 - 52727, n=29) | |
| Dell XPS 15 9520 RTX 3050 Ti | |
| Dell XPS 15 9500 Core i7 4K UHD | |
| Asus Zenbook Pro 15 OLED UM535Q | |
Performance du système
CrossMark: Overall | Productivity | Creativity | Responsiveness
| PCMark 10 / Score | |
| Moyenne Intel Core i7-13700H, NVIDIA GeForce RTX 4070 Laptop GPU (7158 - 7956, n=8) | |
| Dell XPS 15 9530 RTX 4070 | |
| Dell XPS 15 9520 RTX 3050 Ti | |
| Gigabyte Aero 15 OLED XD | |
| Asus Zenbook Pro 15 OLED UM535Q | |
| MSI Prestige 15 A12UD-093 | |
| Dell XPS 15 9500 Core i7 4K UHD | |
| PCMark 10 / Essentials | |
| Dell XPS 15 9530 RTX 4070 | |
| Dell XPS 15 9520 RTX 3050 Ti | |
| Moyenne Intel Core i7-13700H, NVIDIA GeForce RTX 4070 Laptop GPU (10252 - 11449, n=8) | |
| Asus Zenbook Pro 15 OLED UM535Q | |
| MSI Prestige 15 A12UD-093 | |
| Gigabyte Aero 15 OLED XD | |
| Dell XPS 15 9500 Core i7 4K UHD | |
| PCMark 10 / Productivity | |
| Gigabyte Aero 15 OLED XD | |
| Asus Zenbook Pro 15 OLED UM535Q | |
| Dell XPS 15 9520 RTX 3050 Ti | |
| Moyenne Intel Core i7-13700H, NVIDIA GeForce RTX 4070 Laptop GPU (8501 - 10769, n=8) | |
| MSI Prestige 15 A12UD-093 | |
| Dell XPS 15 9530 RTX 4070 | |
| Dell XPS 15 9500 Core i7 4K UHD | |
| PCMark 10 / Digital Content Creation | |
| Moyenne Intel Core i7-13700H, NVIDIA GeForce RTX 4070 Laptop GPU (10358 - 12908, n=8) | |
| Dell XPS 15 9530 RTX 4070 | |
| Gigabyte Aero 15 OLED XD | |
| Dell XPS 15 9520 RTX 3050 Ti | |
| Asus Zenbook Pro 15 OLED UM535Q | |
| MSI Prestige 15 A12UD-093 | |
| Dell XPS 15 9500 Core i7 4K UHD | |
| CrossMark / Overall | |
| Dell XPS 15 9530 RTX 4070 | |
| Moyenne Intel Core i7-13700H, NVIDIA GeForce RTX 4070 Laptop GPU (1768 - 2073, n=6) | |
| Dell XPS 15 9520 RTX 3050 Ti | |
| MSI Prestige 15 A12UD-093 | |
| Asus Zenbook Pro 15 OLED UM535Q | |
| CrossMark / Productivity | |
| Dell XPS 15 9520 RTX 3050 Ti | |
| Moyenne Intel Core i7-13700H, NVIDIA GeForce RTX 4070 Laptop GPU (1645 - 2006, n=6) | |
| Dell XPS 15 9530 RTX 4070 | |
| MSI Prestige 15 A12UD-093 | |
| Asus Zenbook Pro 15 OLED UM535Q | |
| CrossMark / Creativity | |
| Dell XPS 15 9530 RTX 4070 | |
| Moyenne Intel Core i7-13700H, NVIDIA GeForce RTX 4070 Laptop GPU (1936 - 2137, n=6) | |
| Dell XPS 15 9520 RTX 3050 Ti | |
| MSI Prestige 15 A12UD-093 | |
| Asus Zenbook Pro 15 OLED UM535Q | |
| CrossMark / Responsiveness | |
| Dell XPS 15 9520 RTX 3050 Ti | |
| Moyenne Intel Core i7-13700H, NVIDIA GeForce RTX 4070 Laptop GPU (1451 - 2202, n=6) | |
| Dell XPS 15 9530 RTX 4070 | |
| MSI Prestige 15 A12UD-093 | |
| Asus Zenbook Pro 15 OLED UM535Q | |
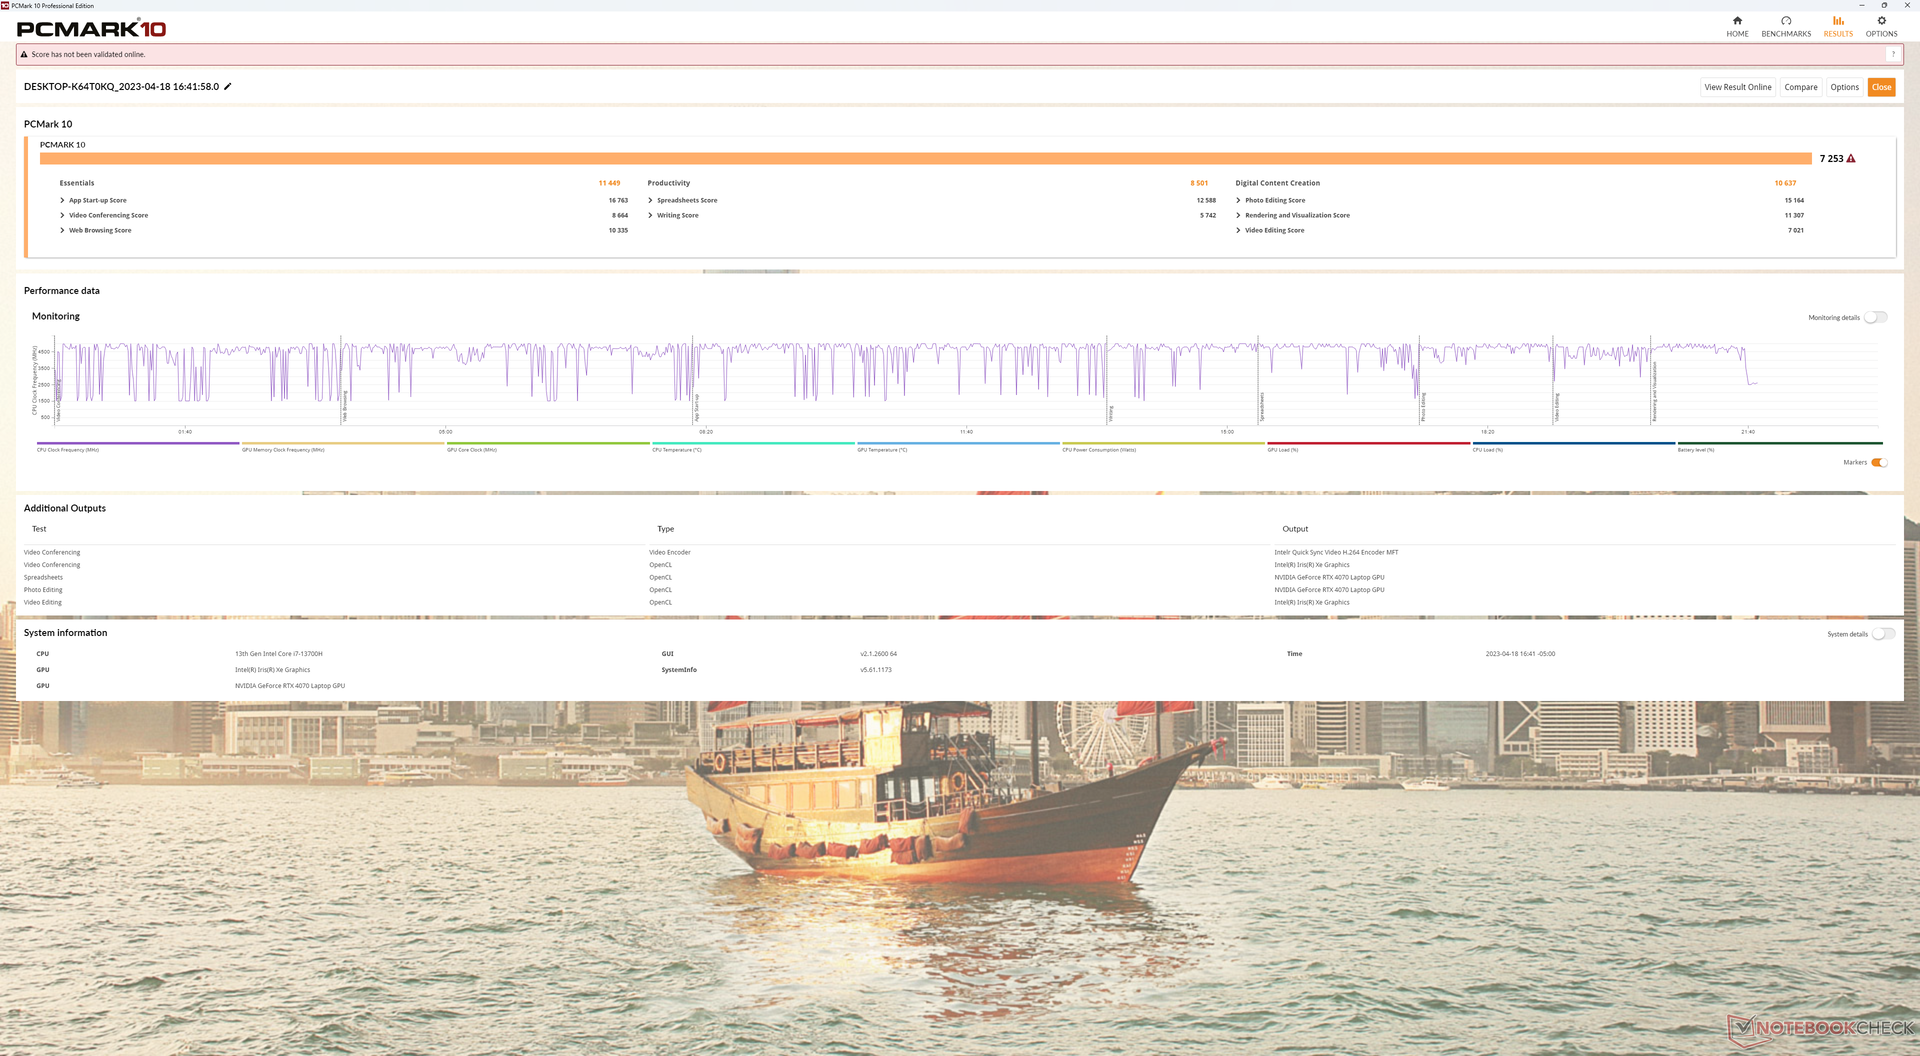
| PCMark 10 Score | 7253 points | |
Aide | ||
| AIDA64 / Memory Copy | |
| Dell XPS 15 9530 RTX 4070 | |
| MSI Prestige 15 A12UD-093 | |
| Moyenne Intel Core i7-13700H (24334 - 78081, n=29) | |
| Dell XPS 15 9520 RTX 3050 Ti | |
| Asus Zenbook Pro 15 OLED UM535Q | |
| Dell XPS 15 9500 Core i7 4K UHD | |
| AIDA64 / Memory Read | |
| Dell XPS 15 9530 RTX 4070 | |
| Moyenne Intel Core i7-13700H (23681 - 79656, n=29) | |
| MSI Prestige 15 A12UD-093 | |
| Dell XPS 15 9520 RTX 3050 Ti | |
| Asus Zenbook Pro 15 OLED UM535Q | |
| Dell XPS 15 9500 Core i7 4K UHD | |
| AIDA64 / Memory Write | |
| Moyenne Intel Core i7-13700H (22986 - 99898, n=29) | |
| Dell XPS 15 9530 RTX 4070 | |
| MSI Prestige 15 A12UD-093 | |
| Dell XPS 15 9520 RTX 3050 Ti | |
| Asus Zenbook Pro 15 OLED UM535Q | |
| Dell XPS 15 9500 Core i7 4K UHD | |
| AIDA64 / Memory Latency | |
| Dell XPS 15 9520 RTX 3050 Ti | |
| MSI Prestige 15 A12UD-093 | |
| Asus Zenbook Pro 15 OLED UM535Q | |
| Moyenne Intel Core i7-13700H (82.4 - 136.8, n=29) | |
| Dell XPS 15 9530 RTX 4070 | |
| Dell XPS 15 9500 Core i7 4K UHD | |
| Gigabyte Aero 15 OLED XD | |
* ... Moindre est la valeur, meilleures sont les performances
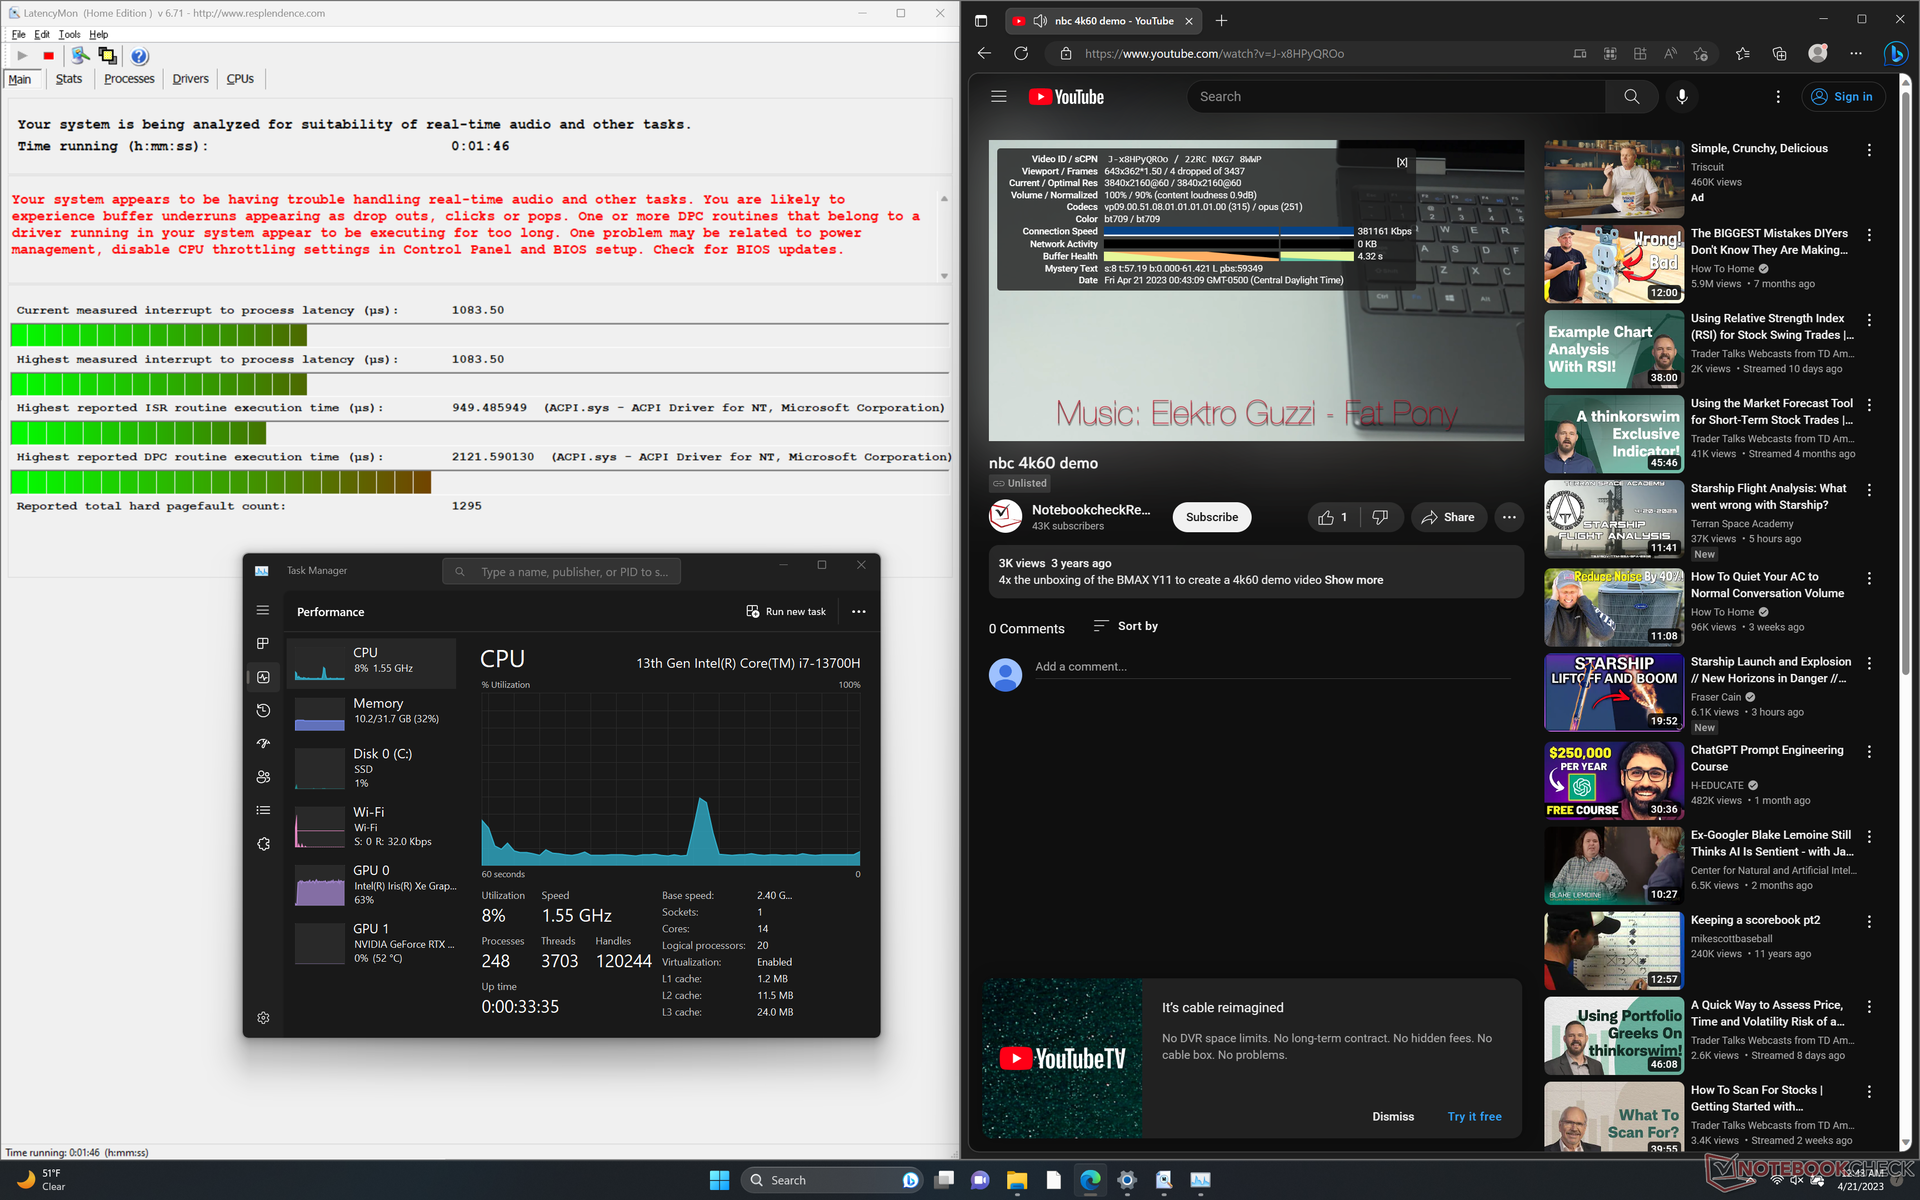
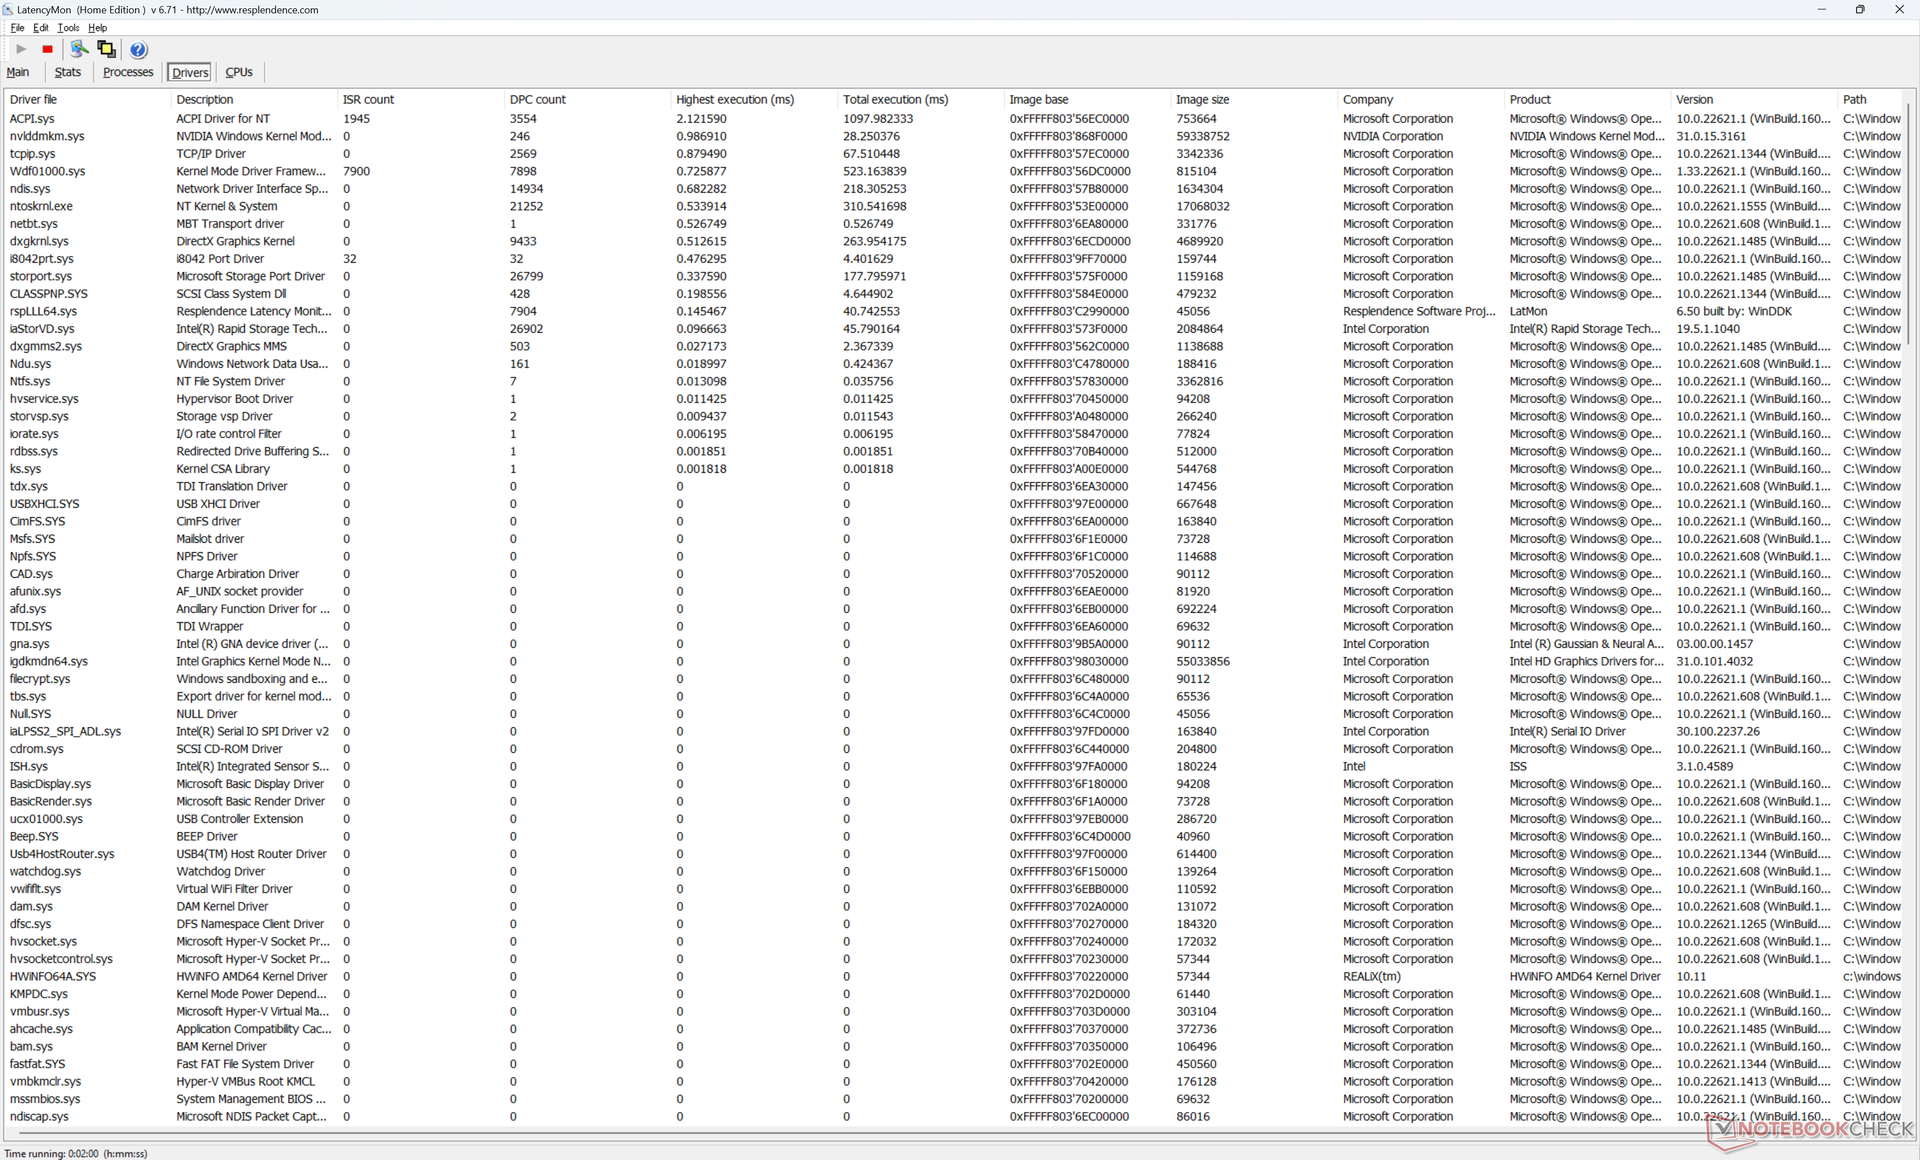
Latence DPC
LatencyMon révèle des problèmes de DPC lors de l'ouverture de plusieurs onglets de notre page d'accueil. la lecture de vidéos 4K60 est également imparfaite, avec 4 images perdues au cours de notre test vidéo d'une minute.
| DPC Latencies / LatencyMon - interrupt to process latency (max), Web, Youtube, Prime95 | |
| Dell XPS 15 9500 Core i7 4K UHD | |
| MSI Prestige 15 A12UD-093 | |
| Dell XPS 15 9530 RTX 4070 | |
| Dell XPS 15 9520 RTX 3050 Ti | |
| Gigabyte Aero 15 OLED XD | |
| Asus Zenbook Pro 15 OLED UM535Q | |
* ... Moindre est la valeur, meilleures sont les performances
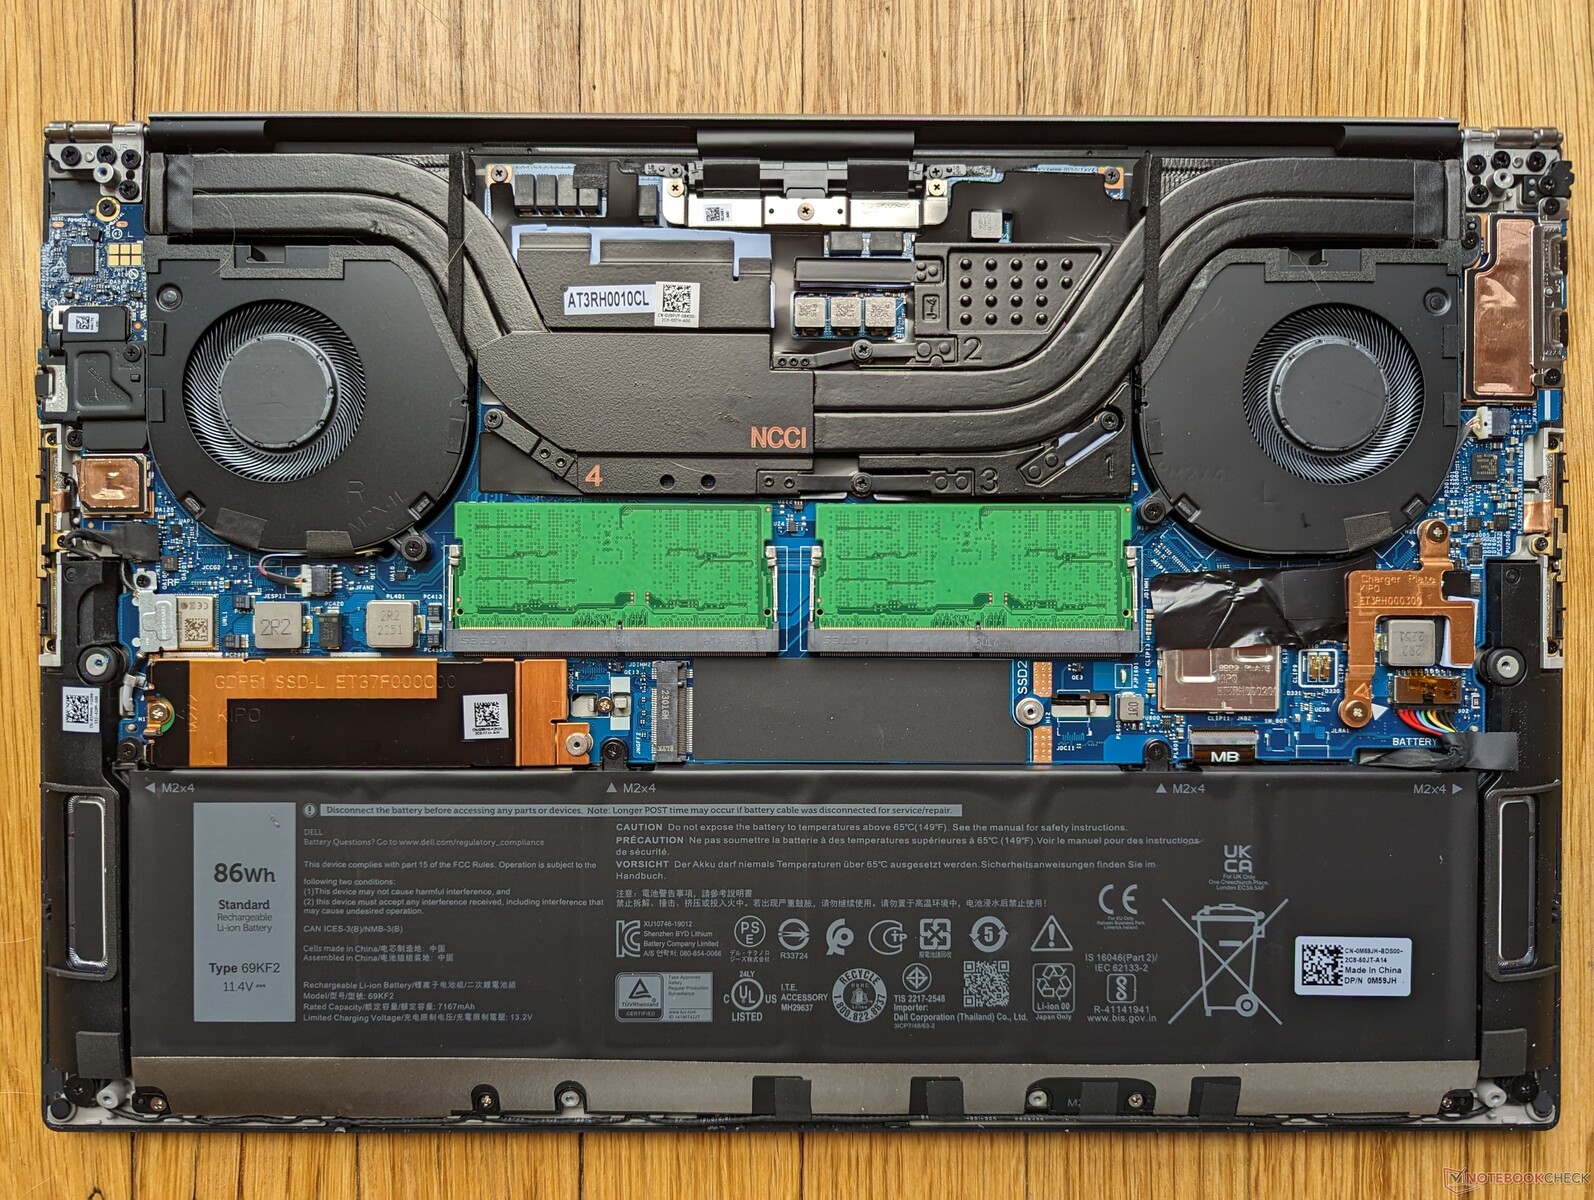
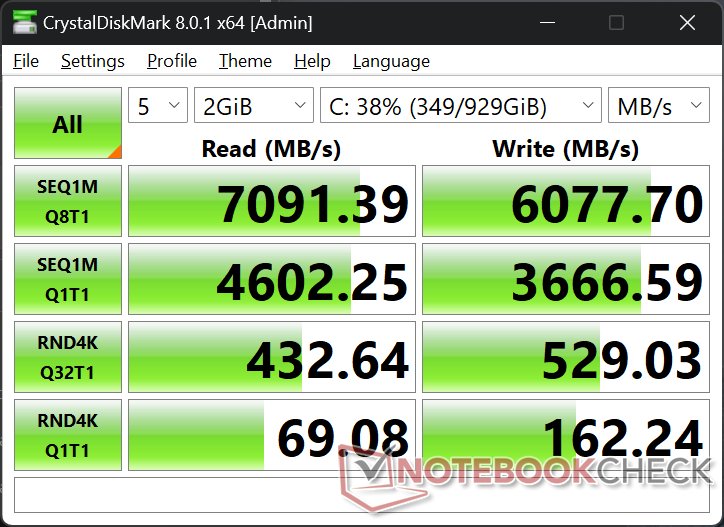
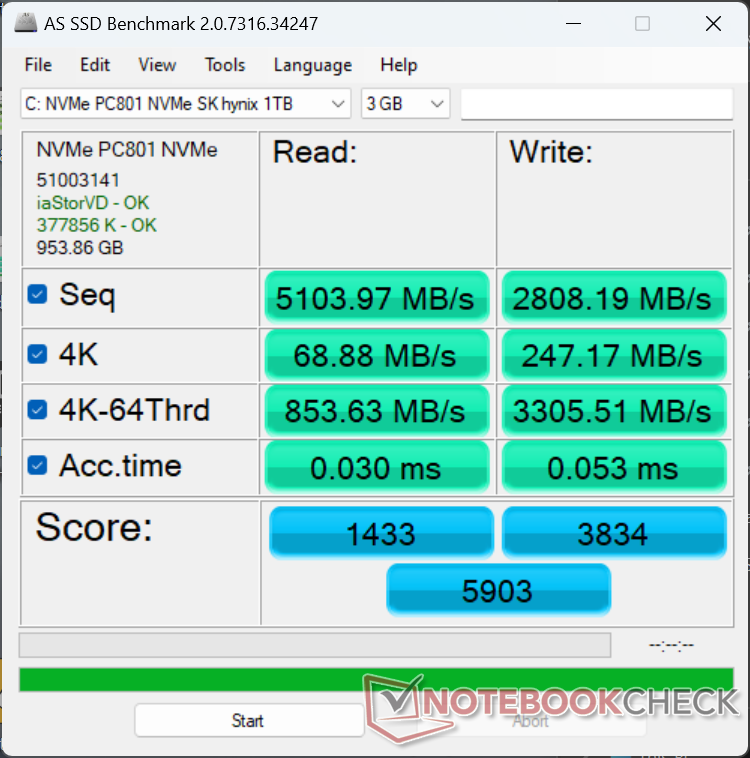
Périphériques de stockage - Jusqu'à deux lecteurs PCIe4
L'appareil que nous avons examiné est équipé d'un SK Hynix PC801 PCIe4 x4 NVMe SSD à la place du WD SN810 de notre ancien XPS 15 9510. Les performances sont généralement comparables entre les deux disques SSD, mais ils sont moins performants que le populaire Samsung PM9A1.
La durabilité des performances est excellente et il n'y a pas d'étranglement en cas de stress. Il est dommage que les disques durs PCIe5 ne soient pas proposés à la caisse.

| Drive Performance rating - Percent | |
| Gigabyte Aero 15 OLED XD | |
| Dell XPS 15 9530 RTX 4070 | |
| Dell XPS 15 9520 RTX 3050 Ti | |
| MSI Prestige 15 A12UD-093 | |
| Asus Zenbook Pro 15 OLED UM535Q | |
| Dell XPS 15 9500 Core i7 4K UHD | |
* ... Moindre est la valeur, meilleures sont les performances
Disk Throttling: DiskSpd Read Loop, Queue Depth 8
Performances du GPU - La moitié du TGP équivaut à la moitié de la puissance
De toute évidence, les performances graphiques devraient être inférieures à celles d'un ordinateur portable RTX 4070 "moyen" ordinateur portable "moyen" GeForce RTX 4070 en raison de l'objectif de 50 W TGP du XPS 15, mais nous n'avions aucune idée de l'ampleur de ce retard. Maintenant que nous avons une unité de test en main, le déficit peut être assez frappant, jusqu'à 40 à 50 pour cent plus lent que la moyenne de notre base de données selon les benchmarks 3DMark. C'est tellement mauvais que même un ordinateur portable RTX 2070 vieux de quatre ans comme le HP Omen 15 peut faire à peu près la même chose que notre XPS 15 RTX 4070 plus cher. Si vous avez l'intention de jouer à beaucoup de jeux, alors le XPS 15 devient une proposition de valeur médiocre.
La bonne nouvelle est que les performances graphiques sont toujours plus rapides que celles de la RTX 3050 Ti du XPS 15 9520 de l'année dernière, d'environ 30 à 35 %. Il y a donc un gain appréciable d'une année sur l'autre, même s'il s'agit de l'une des itérations les plus lentes de la RTX 4070 mobile que nous ayons vues.
Il est intéressant de noter que l'accélération graphique lors de l'exécution d'outils logiciels 3D est beaucoup plus rapide que prévu par rapport au TGP de 50 W. Blender Classroom avec l'accélération CUDA, par exemple, se termine en 46 secondes, ce qui est seulement 25 % plus lent que la moyenne des ordinateurs portables RTX 4070 où les TGP de 100 W ou plus sont typiques. L'ancienne RTX 3050 Ti prendrait presque 2,5 fois plus de temps sur le même benchmark. Les créateurs de contenu seront donc les plus avantagés en choisissant le XPS 15 2023 plutôt que les modèles plus anciens.
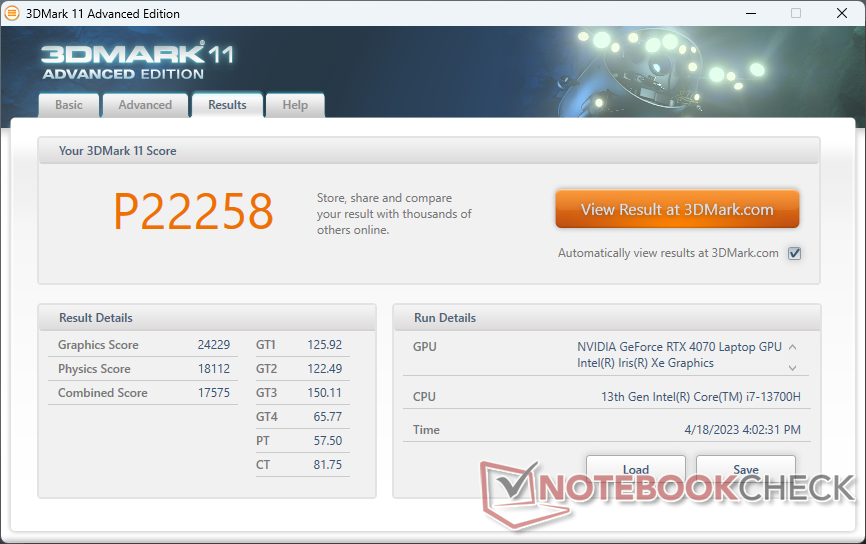
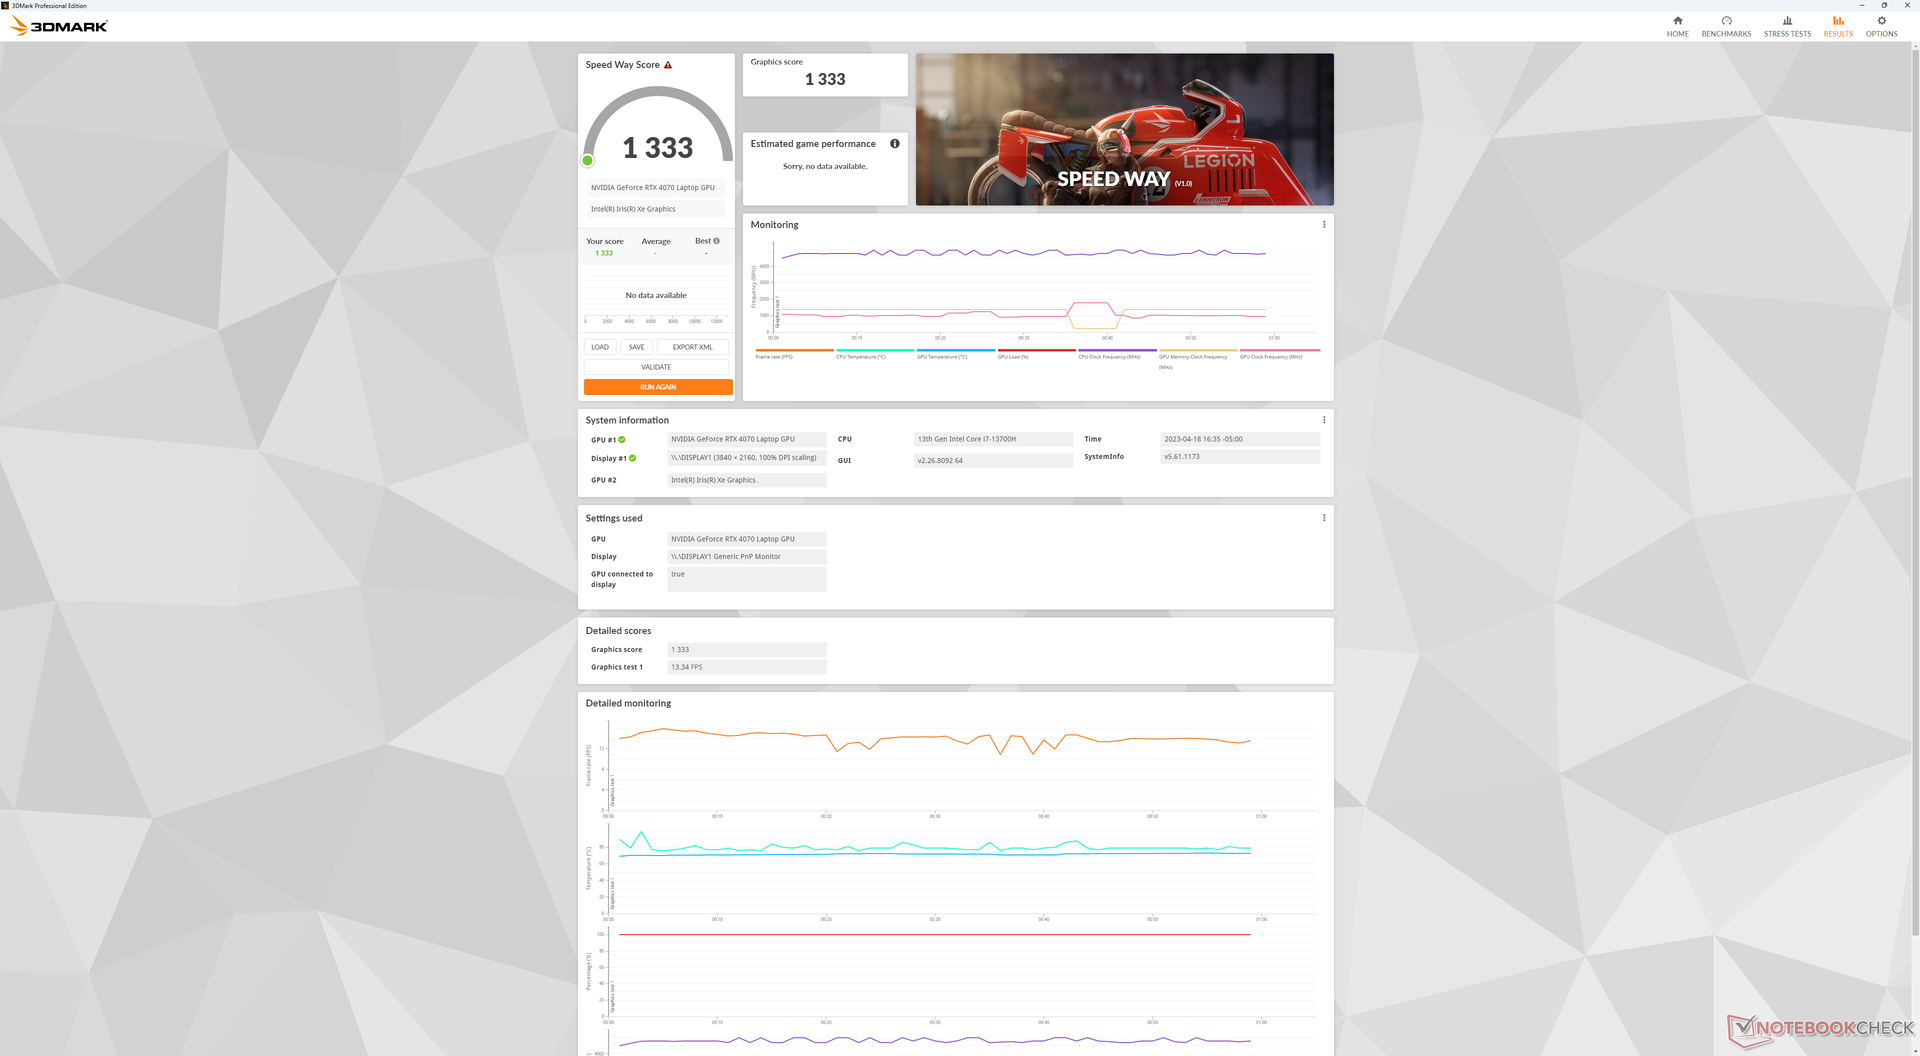
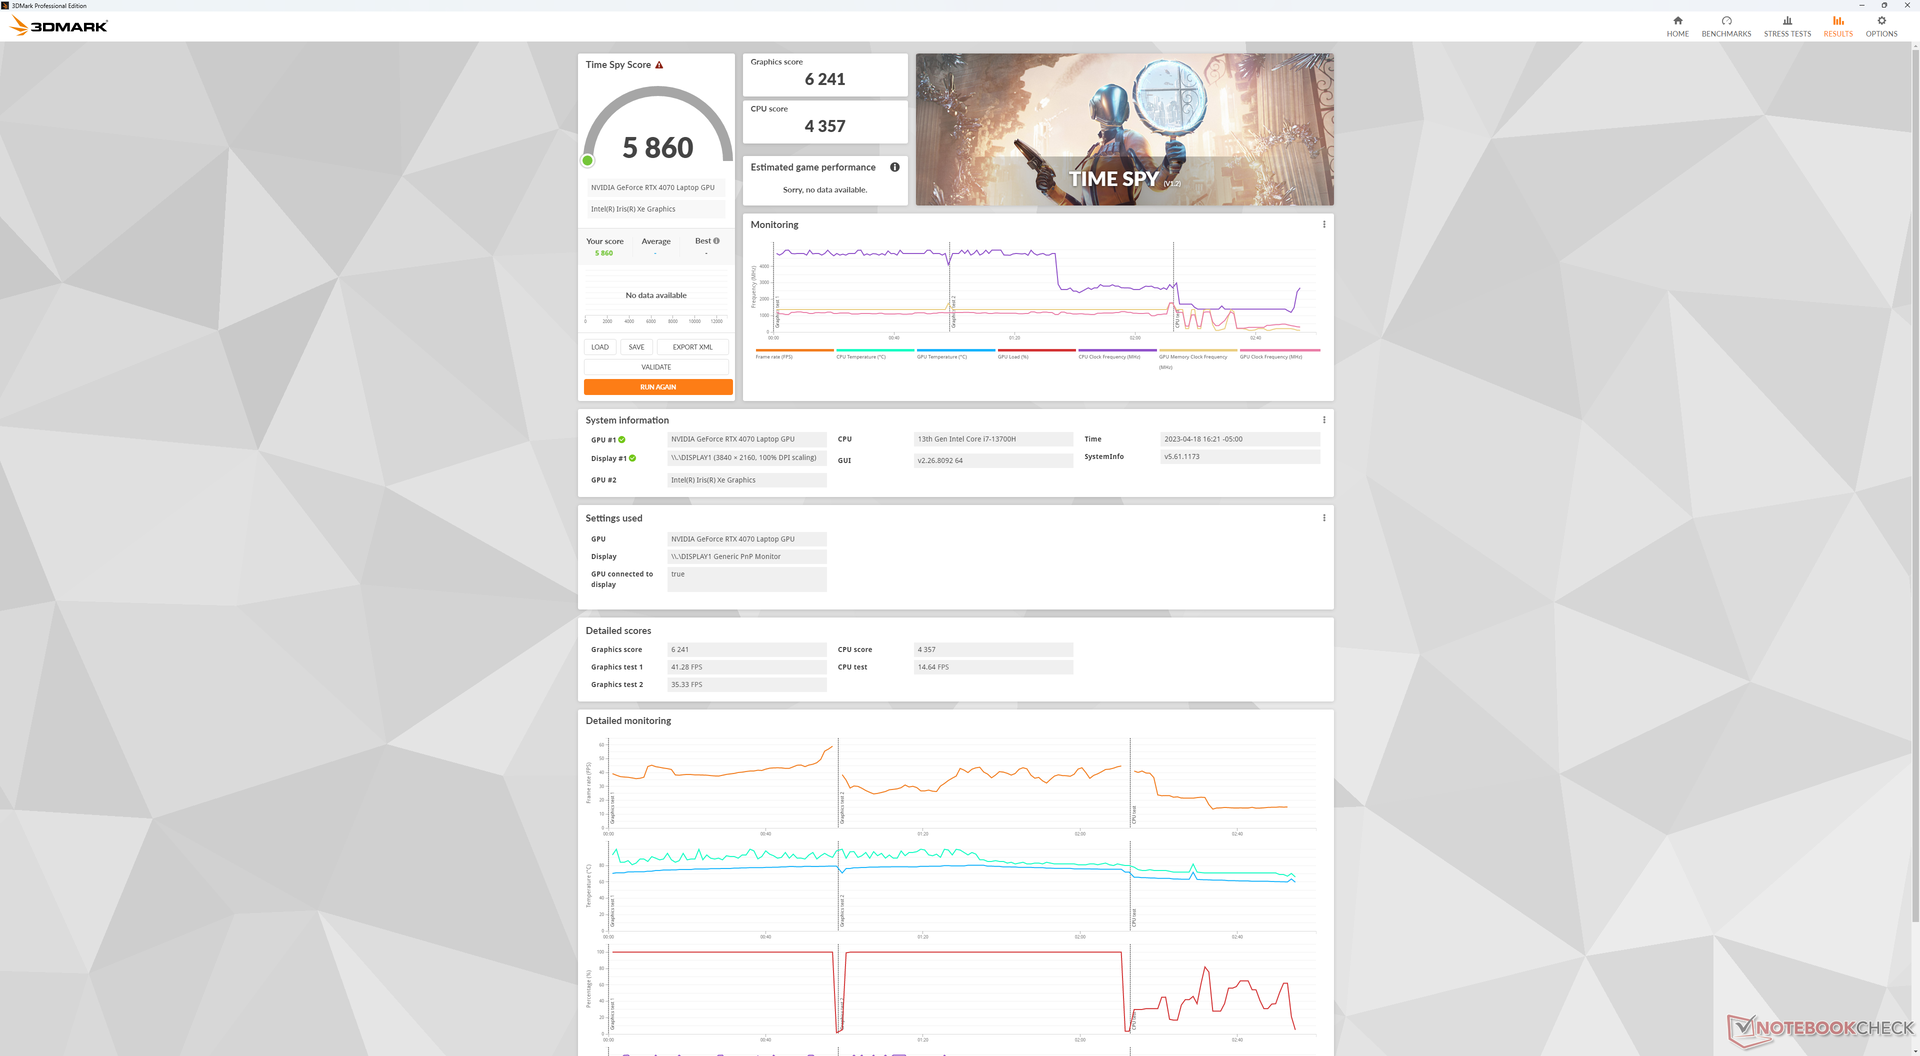
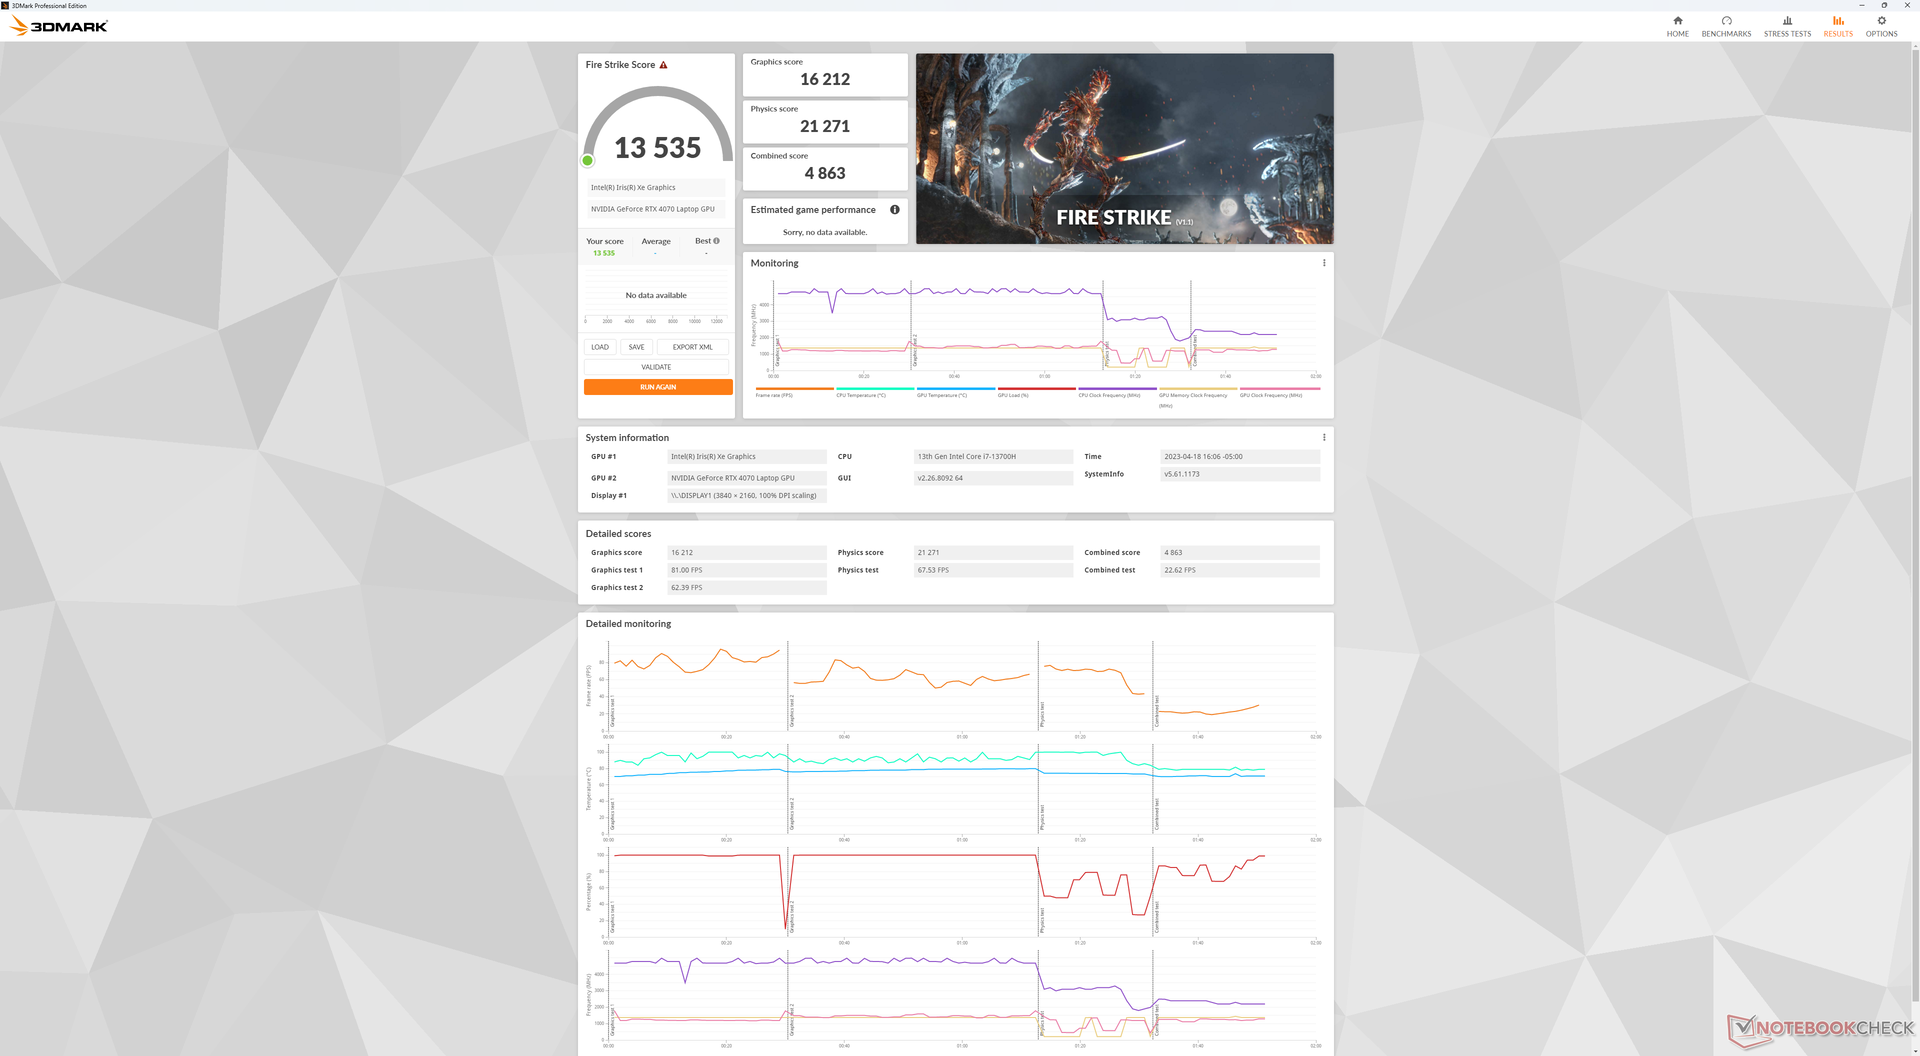
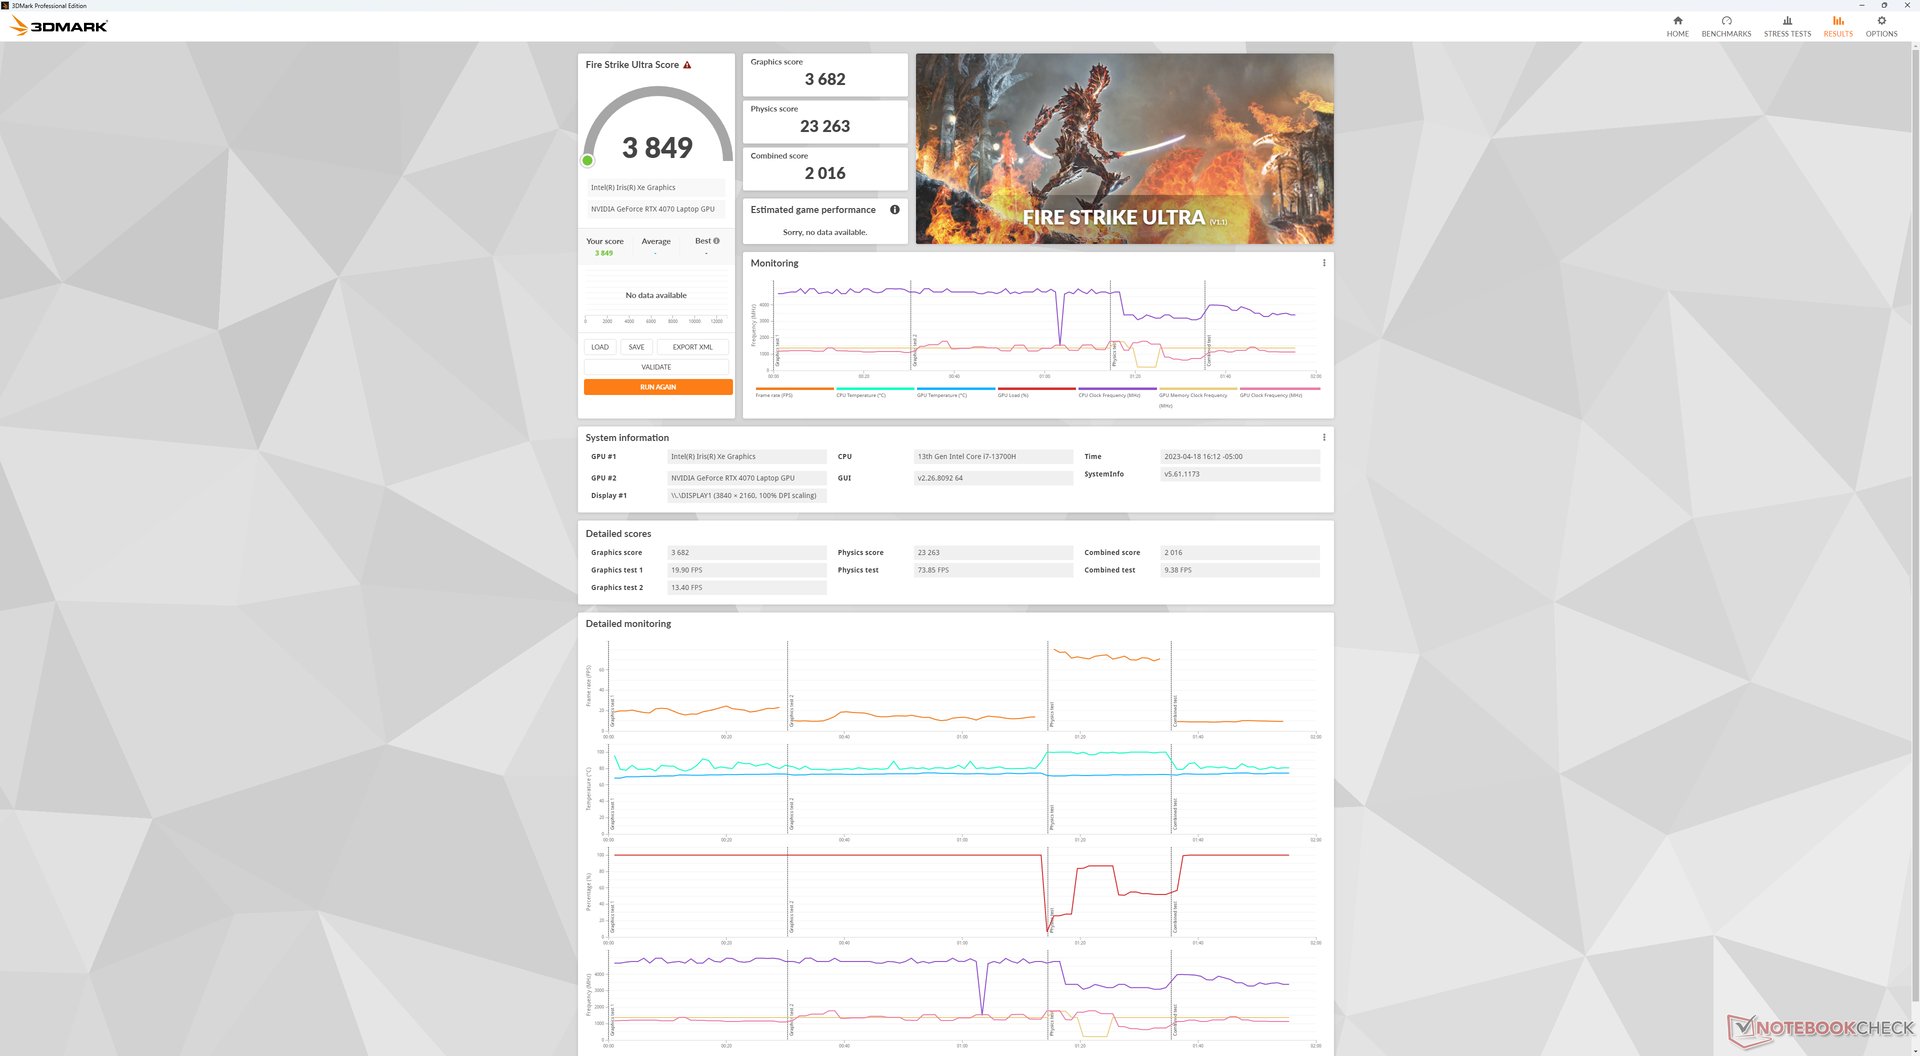
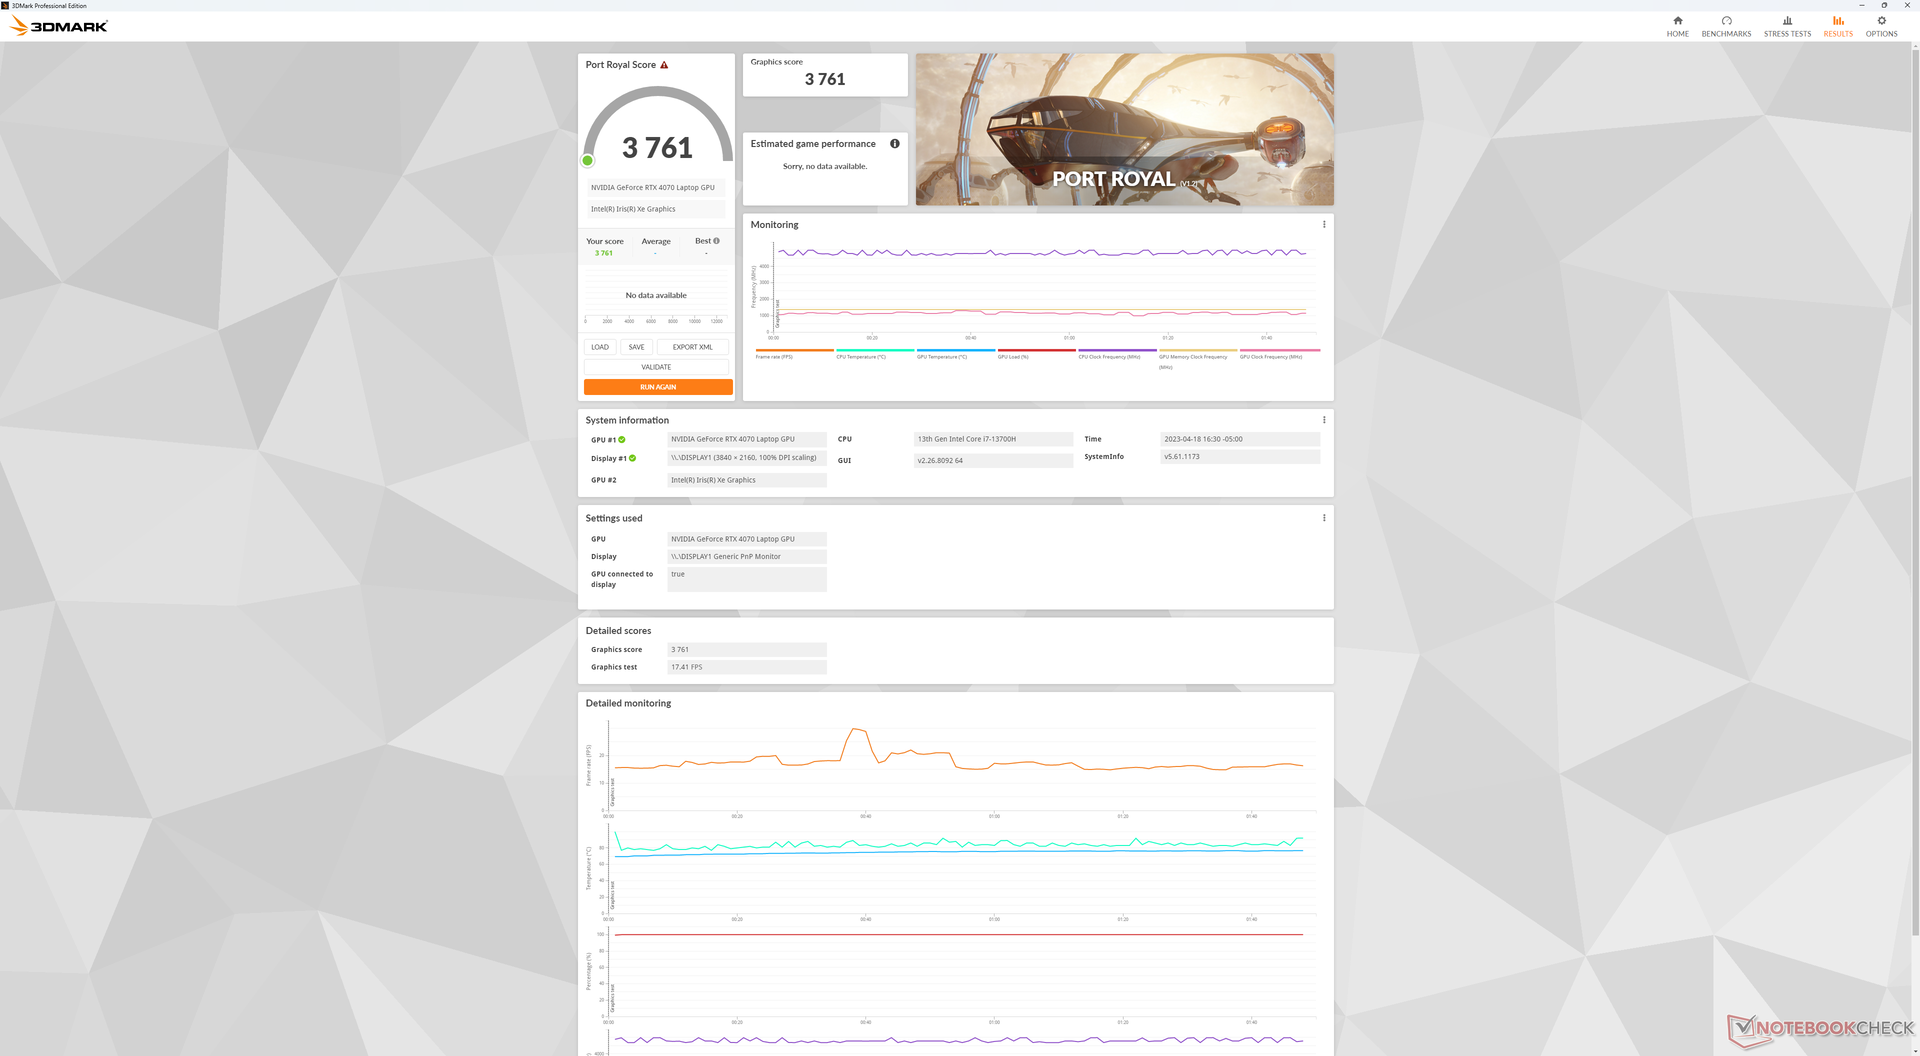
| 3DMark 11 Performance | 22258 points | |
| 3DMark Fire Strike Score | 13535 points | |
| 3DMark Time Spy Score | 5860 points | |
Aide | ||
| Blender | |
| v3.3 Classroom OPTIX/RTX | |
| MSI Prestige 15 A12UD-093 | |
| Dell XPS 15 9530 RTX 4070 | |
| Moyenne NVIDIA GeForce RTX 4070 Laptop GPU (18 - 30, n=68) | |
| v3.3 Classroom CUDA | |
| MSI Prestige 15 A12UD-093 | |
| Dell XPS 15 9530 RTX 4070 | |
| Moyenne NVIDIA GeForce RTX 4070 Laptop GPU (32 - 50, n=67) | |
| v3.3 Classroom CPU | |
| MSI Prestige 15 A12UD-093 | |
| Dell XPS 15 9530 RTX 4070 | |
| Moyenne NVIDIA GeForce RTX 4070 Laptop GPU (158 - 440, n=67) | |
* ... Moindre est la valeur, meilleures sont les performances
Performance des jeux
Malgré les performances décevantes de la RTX 4070 mentionnées ci-dessus, le système peut toujours faire tourner n'importe quel titre actuel avec des paramètres moyens-élevés à 1080p et 60 FPS. Plus haut, cependant, et le GPU commence à se battre. Des titres exigeants comme Cyberpunk 2077 ou Returnal descendent à 40 FPS si les paramètres sont supérieurs à la moyenne, ce qui entraîne un déchirement de l'écran sans l'assistance de G-Sync. La plupart des jeux, à l'exception des jeux multijoueurs peu exigeants comme DOTA 2, peuvent à peine fonctionner dans la résolution native de 3,5K.
En outre, les performances peuvent être instables dans les jeux. Les taux de rafraîchissement au ralenti sur Witcher 3 passait périodiquement de 50 FPS à 40 FPS avant de remonter à 50 FPS sans raison apparente. Un tel comportement suggère une mauvaise hiérarchisation des activités en arrière-plan.
Un autre inconvénient regrettable est que les taux d'images à des réglages très bas peuvent parfois être plus lents que les taux d'images à des réglages plus élevés. Cela a été observé lors de l'utilisation de Cyberpunk 2077 et Returnal avec des paramètres 1080p bas où les taux d'images étaient systématiquement plus lents qu'avec des paramètres 1080p moyens, même après plusieurs tests. Ce comportement suggère une limitation de l'alimentation et une lutte de puissance entre le CPU et le GPU lorsque les deux sont sollicités.
| The Witcher 3 - 1920x1080 Ultra Graphics & Postprocessing (HBAO+) | |
| Asus Zephyrus Duo 16 GX650PY-NM006W | |
| Uniwill GM6PX7X RTX 4070 | |
| Alienware x15 R2 P111F | |
| Gigabyte Aero 15 OLED XD | |
| Dell XPS 15 9530 RTX 4070 | |
| MSI Stealth 15M A11SEK | |
| Dell XPS 15 9500 Core i7 4K UHD | |
| Dell XPS 15 9520 RTX 3050 Ti | |
| GTA V - 1920x1080 Highest AA:4xMSAA + FX AF:16x | |
| Asus Zephyrus Duo 16 GX650PY-NM006W | |
| Uniwill GM6PX7X RTX 4070 | |
| Gigabyte Aero 15 OLED XD | |
| MSI Stealth 15M A11SEK | |
| Dell XPS 15 9530 RTX 4070 | |
| Dell XPS 15 9520 RTX 3050 Ti | |
| Final Fantasy XV Benchmark - 1920x1080 High Quality | |
| Asus Zephyrus Duo 16 GX650PY-NM006W | |
| Uniwill GM6PX7X RTX 4070 | |
| Alienware x15 R2 P111F | |
| Gigabyte Aero 15 OLED XD | |
| Dell XPS 15 9530 RTX 4070 | |
| MSI Stealth 15M A11SEK | |
| Dell XPS 15 9520 RTX 3050 Ti | |
| Strange Brigade - 1920x1080 ultra AA:ultra AF:16 | |
| Asus Zephyrus Duo 16 GX650PY-NM006W | |
| Uniwill GM6PX7X RTX 4070 | |
| Alienware x15 R2 P111F | |
| Gigabyte Aero 15 OLED XD | |
| Dell XPS 15 9530 RTX 4070 | |
| MSI Stealth 15M A11SEK | |
| Dell XPS 15 9520 RTX 3050 Ti | |
| Returnal | |
| 1920x1080 Low Preset | |
| Moyenne NVIDIA GeForce RTX 4070 Laptop GPU (65 - 119, n=11) | |
| Dell XPS 15 9530 RTX 4070 | |
| 1920x1080 Medium Preset | |
| Moyenne NVIDIA GeForce RTX 4070 Laptop GPU (69 - 117, n=12) | |
| Dell XPS 15 9530 RTX 4070 | |
| 1920x1080 High Preset | |
| Moyenne NVIDIA GeForce RTX 4070 Laptop GPU (64 - 106, n=12) | |
| Dell XPS 15 9530 RTX 4070 | |
| 1920x1080 Epic Preset | |
| Moyenne NVIDIA GeForce RTX 4070 Laptop GPU (54 - 90, n=12) | |
| Dell XPS 15 9530 RTX 4070 | |
| 2560x1440 Epic Preset | |
| Moyenne NVIDIA GeForce RTX 4070 Laptop GPU (39 - 66, n=12) | |
| Dell XPS 15 9530 RTX 4070 | |
| 3840x2160 Epic Preset | |
| Moyenne NVIDIA GeForce RTX 4070 Laptop GPU (21 - 39, n=8) | |
| Dell XPS 15 9530 RTX 4070 | |
Witcher 3 FPS Chart
| Bas | Moyen | Élevé | Ultra | QHD | 4K | |
|---|---|---|---|---|---|---|
| GTA V (2015) | 180 | 168.1 | 134.3 | 63.5 | 52.9 | 53 |
| The Witcher 3 (2015) | 354.2 | 233.3 | 123.9 | 69.8 | 47 | 26.5 |
| Dota 2 Reborn (2015) | 189.5 | 163.1 | 147.6 | 137 | 88.4 | |
| Final Fantasy XV Benchmark (2018) | 108.6 | 84 | 66 | 48.8 | 26.6 | |
| X-Plane 11.11 (2018) | 134.2 | 91.6 | 90.6 | 67.3 | ||
| Strange Brigade (2018) | 334 | 172.1 | 136.6 | 117.7 | 79.9 | 42.7 |
| Cyberpunk 2077 1.6 (2022) | 55.3 | 70 | 57.5 | 48 | 30 | 12.8 |
| Tiny Tina's Wonderlands (2022) | 98.1 | 92.5 | 74.3 | 58.6 | 49.8 | 39.2 |
| F1 22 (2022) | 155.1 | 148.5 | 123.5 | 39.2 | 10.6 | 4.7 |
| Returnal (2023) | 65 | 69 | 64 | 54 | 39 | 21 |
Émissions
System Noise - Pas trop fort pour la taille
Le bruit du ventilateur lors de la navigation sur le web ou de la lecture de vidéos en continu tend à se situer autour de 24 dB(A) sur un fond silencieux de 23 dB(A), ce qui le rend presque inaudible. L'introduction de charges plus élevées comme les jeux induit un bruit de ventilateur entre 40 et 45 dB(A), ce qui est plus silencieux que le Zenbook Pro 15 de l'Asus.Asus Zenbook Pro 15 ou leGigabyte Aero 15 sous charge. Le XPS 15 n'est généralement pas aussi bruyant que d'autres ordinateurs portables multimédias de 15 pouces à hautes performances.
Degré de la nuisance sonore
| Au repos |
| 23.1 / 23.1 / 24.2 dB(A) |
| Fortement sollicité |
| 27.1 / 44.6 dB(A) |
 | ||
30 dB silencieux 40 dB(A) audible 50 dB(A) bruyant |
||
min: | ||
| Dell XPS 15 9530 RTX 4070 GeForce RTX 4070 Laptop GPU, i7-13700H, SK hynix PC801 HFS001TEJ9X101N | Dell XPS 15 9520 RTX 3050 Ti GeForce RTX 3050 Ti Laptop GPU, i7-12700H, WDC PC SN810 512GB | Dell XPS 15 9500 Core i7 4K UHD GeForce GTX 1650 Ti Mobile, i7-10875H, SK Hynix PC611 512GB | Asus Zenbook Pro 15 OLED UM535Q GeForce RTX 3050 Ti Laptop GPU, R9 5900HX, WDC PC SN730 SDBPNTY-1T00 | MSI Prestige 15 A12UD-093 GeForce RTX 3050 Ti Laptop GPU, i7-1280P, Micron 3400 1TB MTFDKBA1T0TFH | Gigabyte Aero 15 OLED XD GeForce RTX 3070 Laptop GPU, i7-11800H, Samsung PM9A1 MZVL21T0HCLR | |
|---|---|---|---|---|---|---|
| Noise | 0% | -24% | -7% | -22% | -35% | |
| arrêt / environnement * (dB) | 23.1 | 22.8 1% | 28.4 -23% | 22.8 1% | 26 -13% | 25 -8% |
| Idle Minimum * (dB) | 23.1 | 22.9 1% | 28.4 -23% | 22.9 1% | 26 -13% | 30 -30% |
| Idle Average * (dB) | 23.1 | 22.9 1% | 28.4 -23% | 22.9 1% | 30.7 -33% | 32 -39% |
| Idle Maximum * (dB) | 24.2 | 22.9 5% | 28.4 -17% | 22.9 5% | 30.7 -27% | 35 -45% |
| Load Average * (dB) | 27.1 | 30.9 -14% | 46 -70% | 33.2 -23% | 41.9 -55% | 44 -62% |
| Witcher 3 ultra * (dB) | 40.1 | 37.8 6% | 42 -5% | 47.3 -18% | 51 -27% | |
| Load Maximum * (dB) | 44.6 | 44.7 -0% | 47.1 -6% | 52.8 -18% | 40.7 9% | 60 -35% |
* ... Moindre est la valeur, meilleures sont les performances
Température
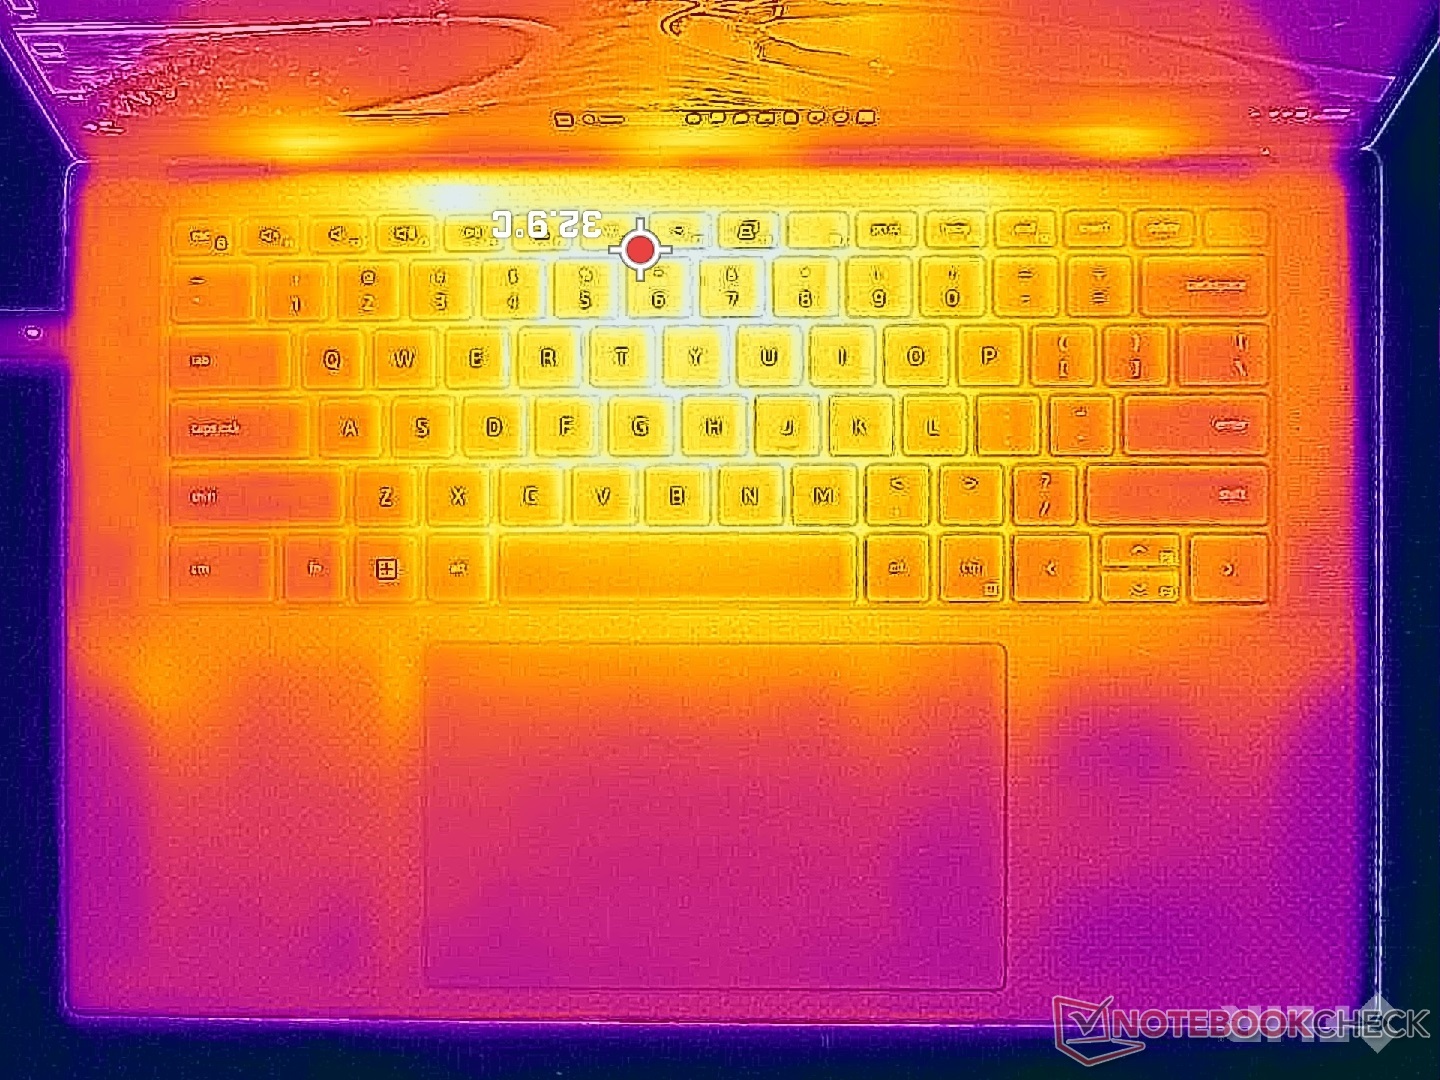
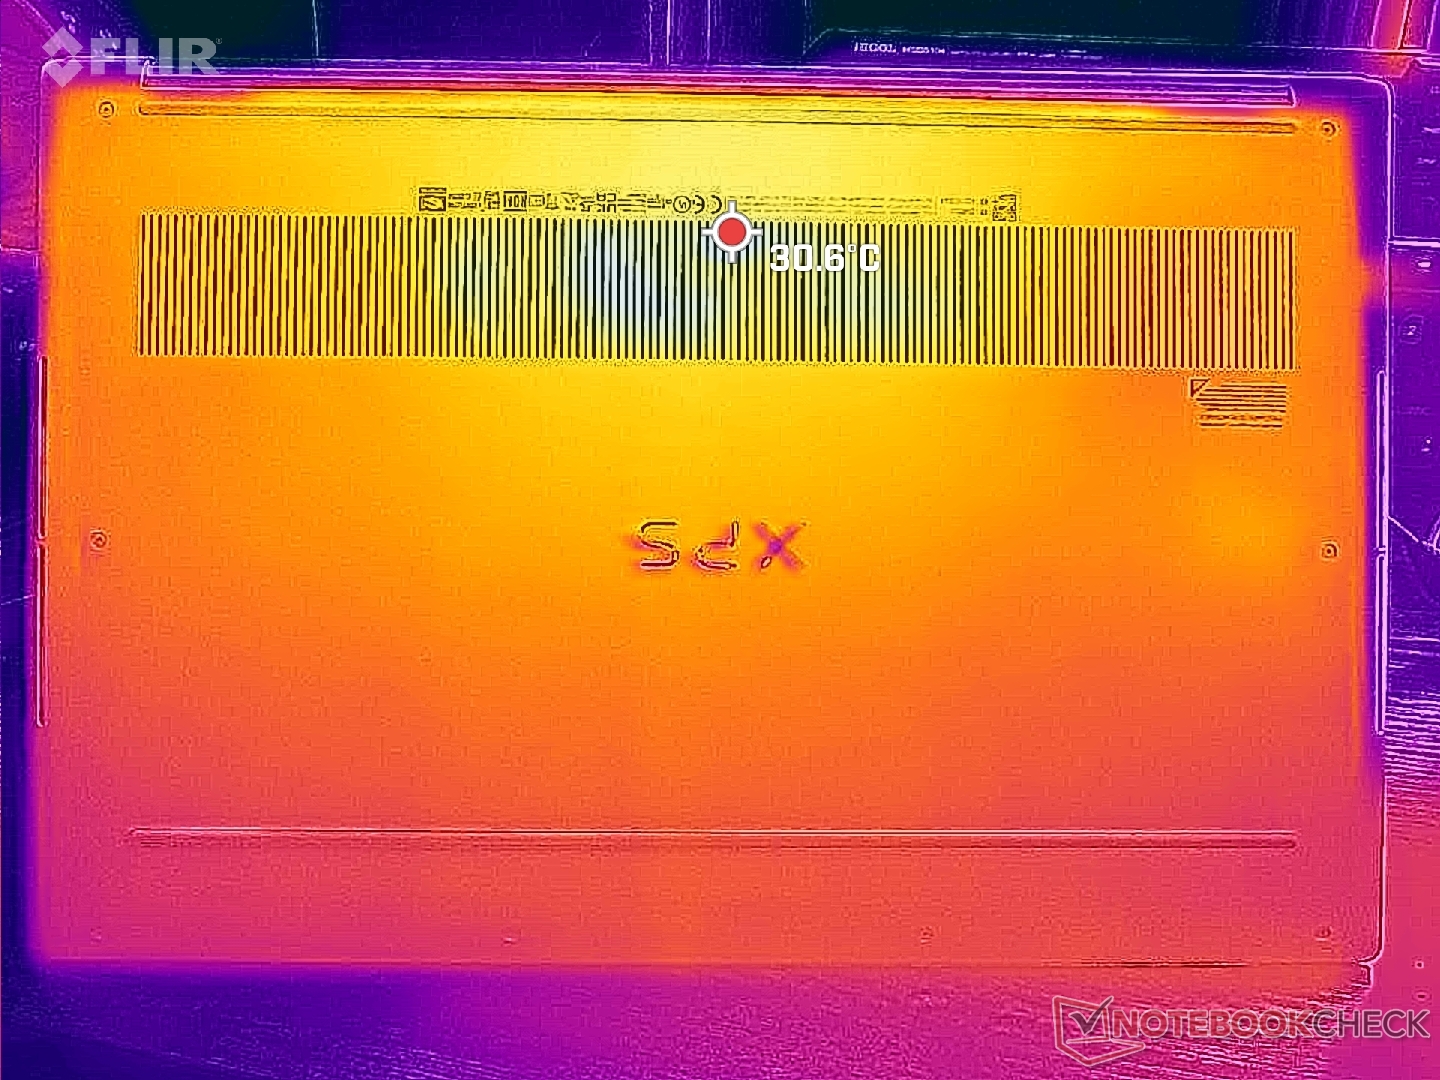
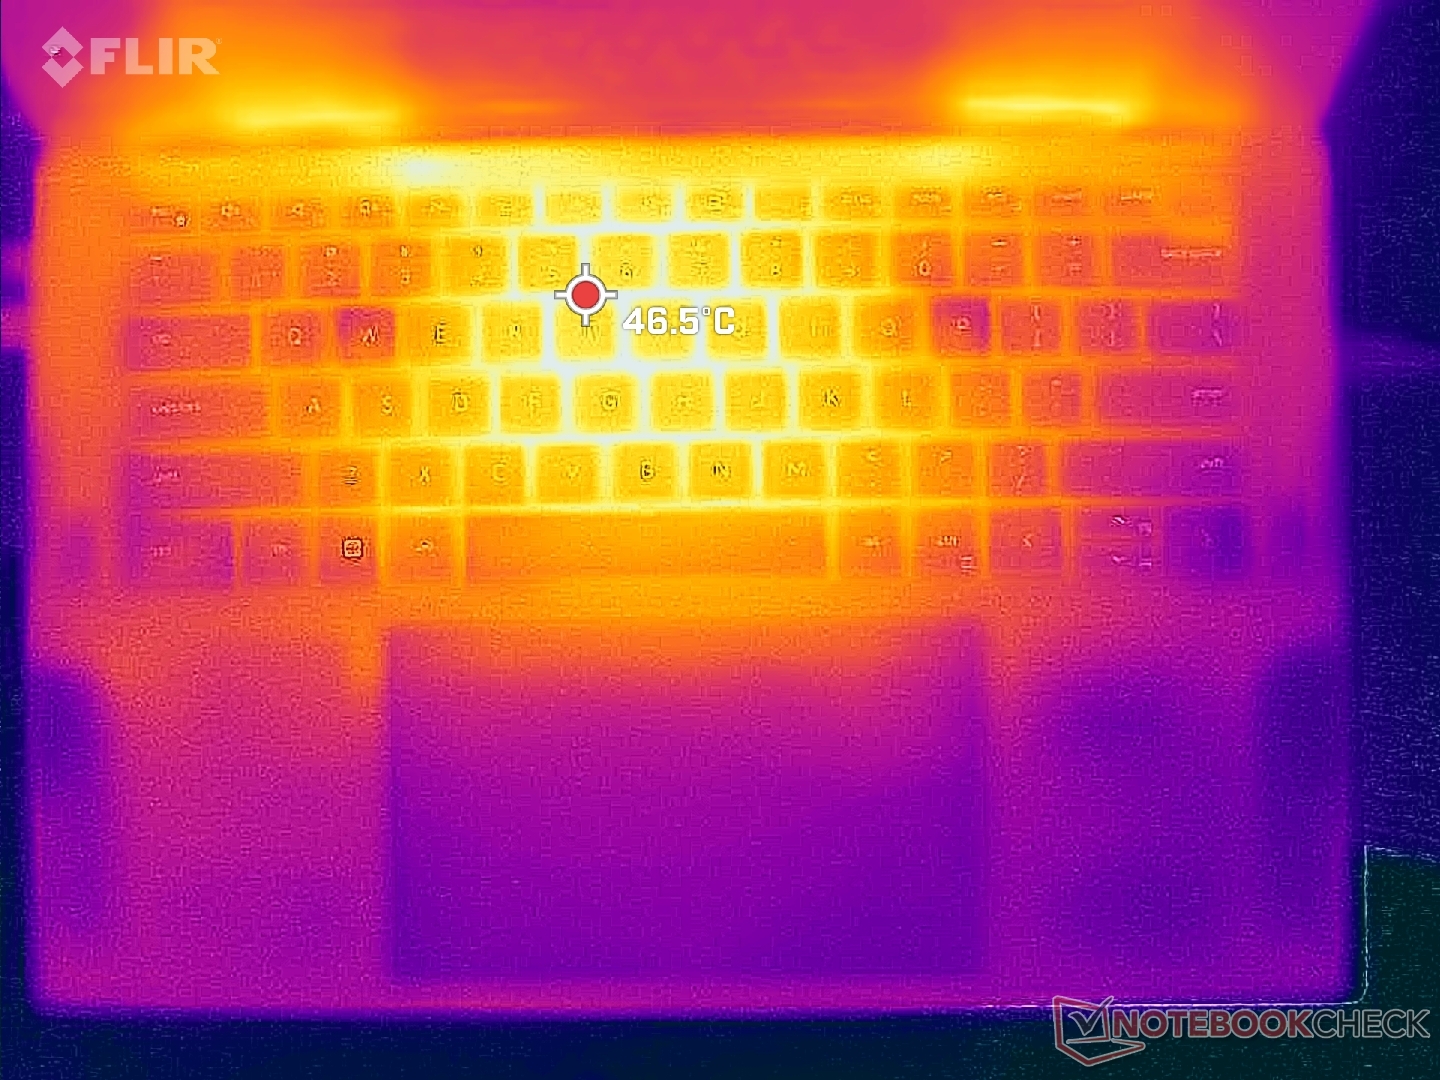
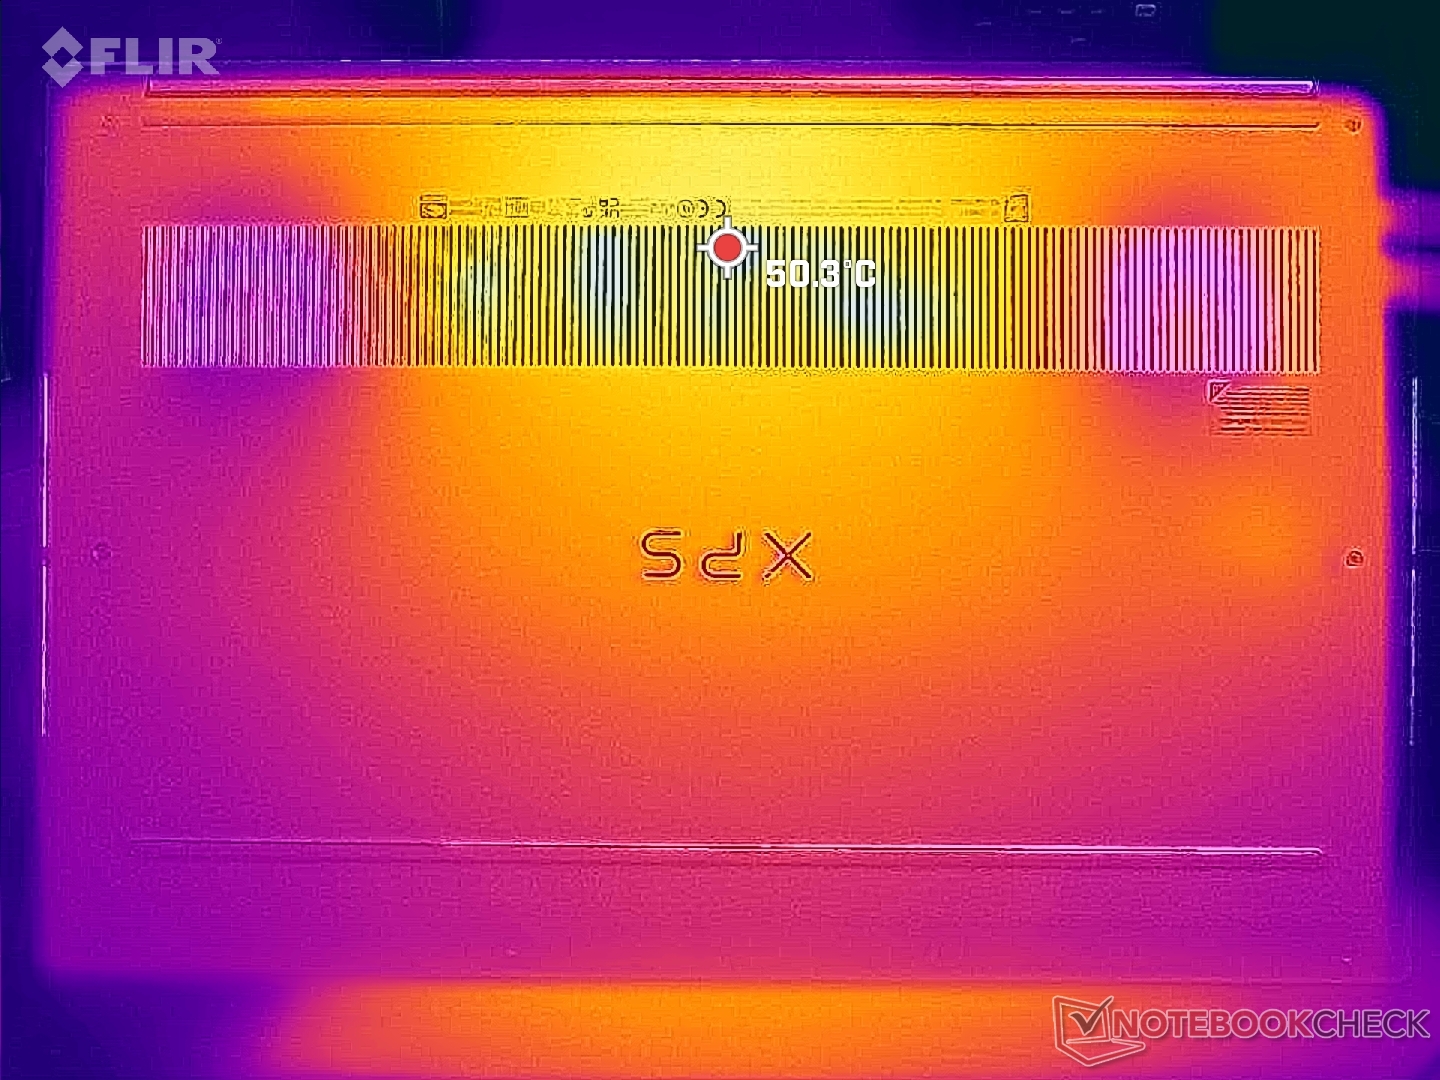
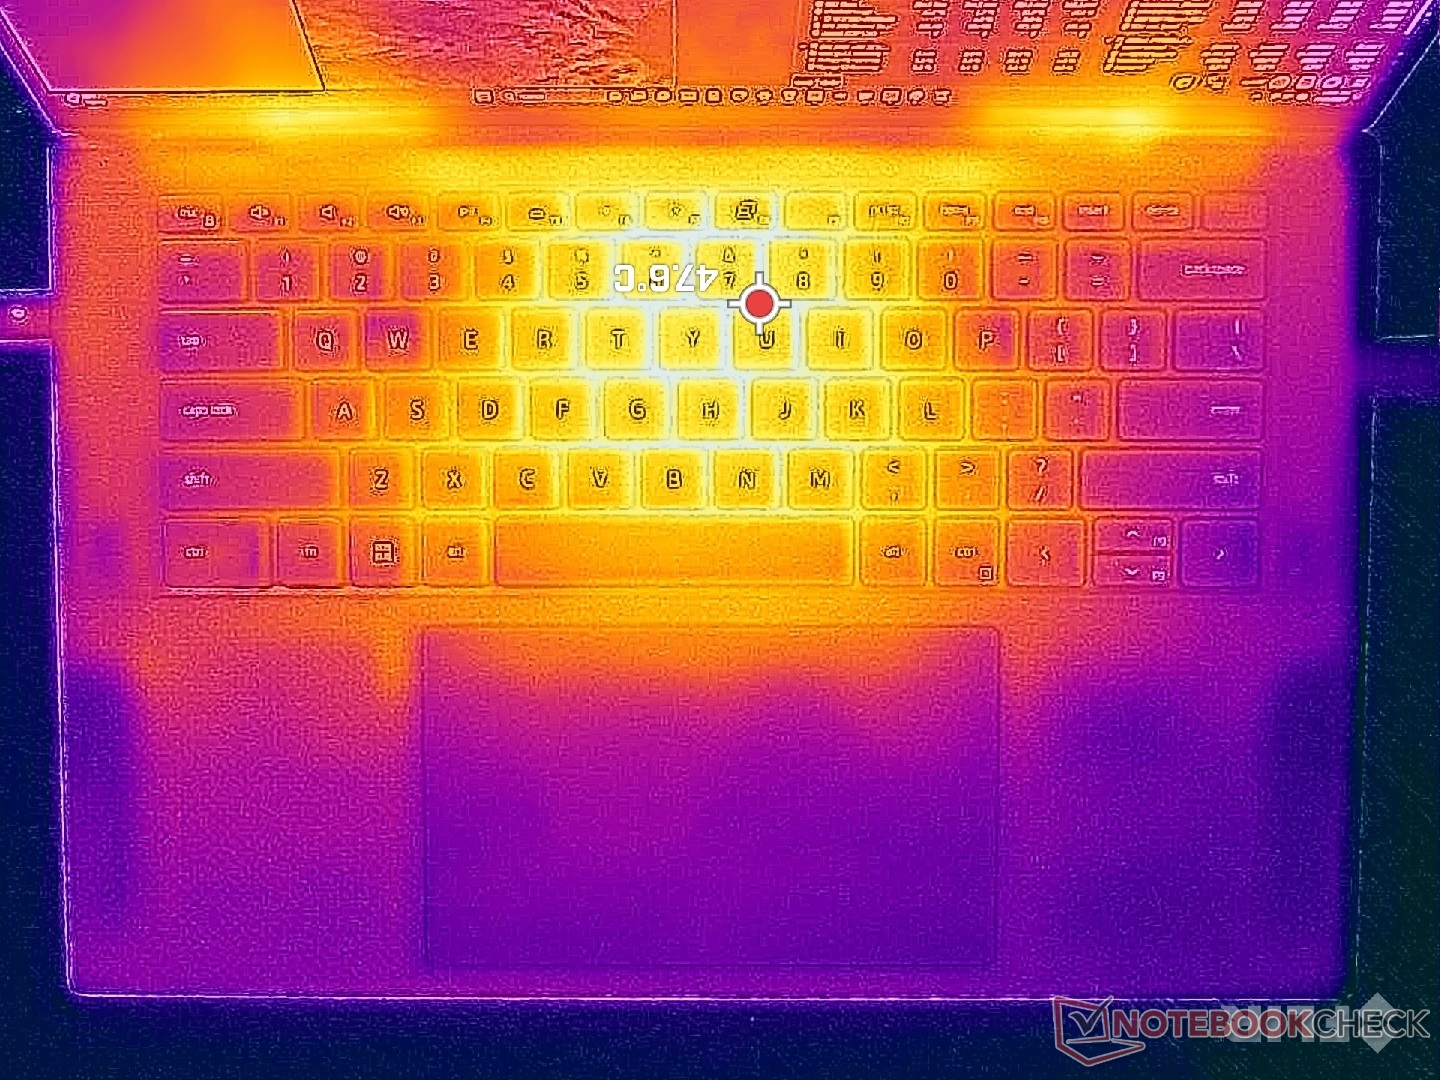
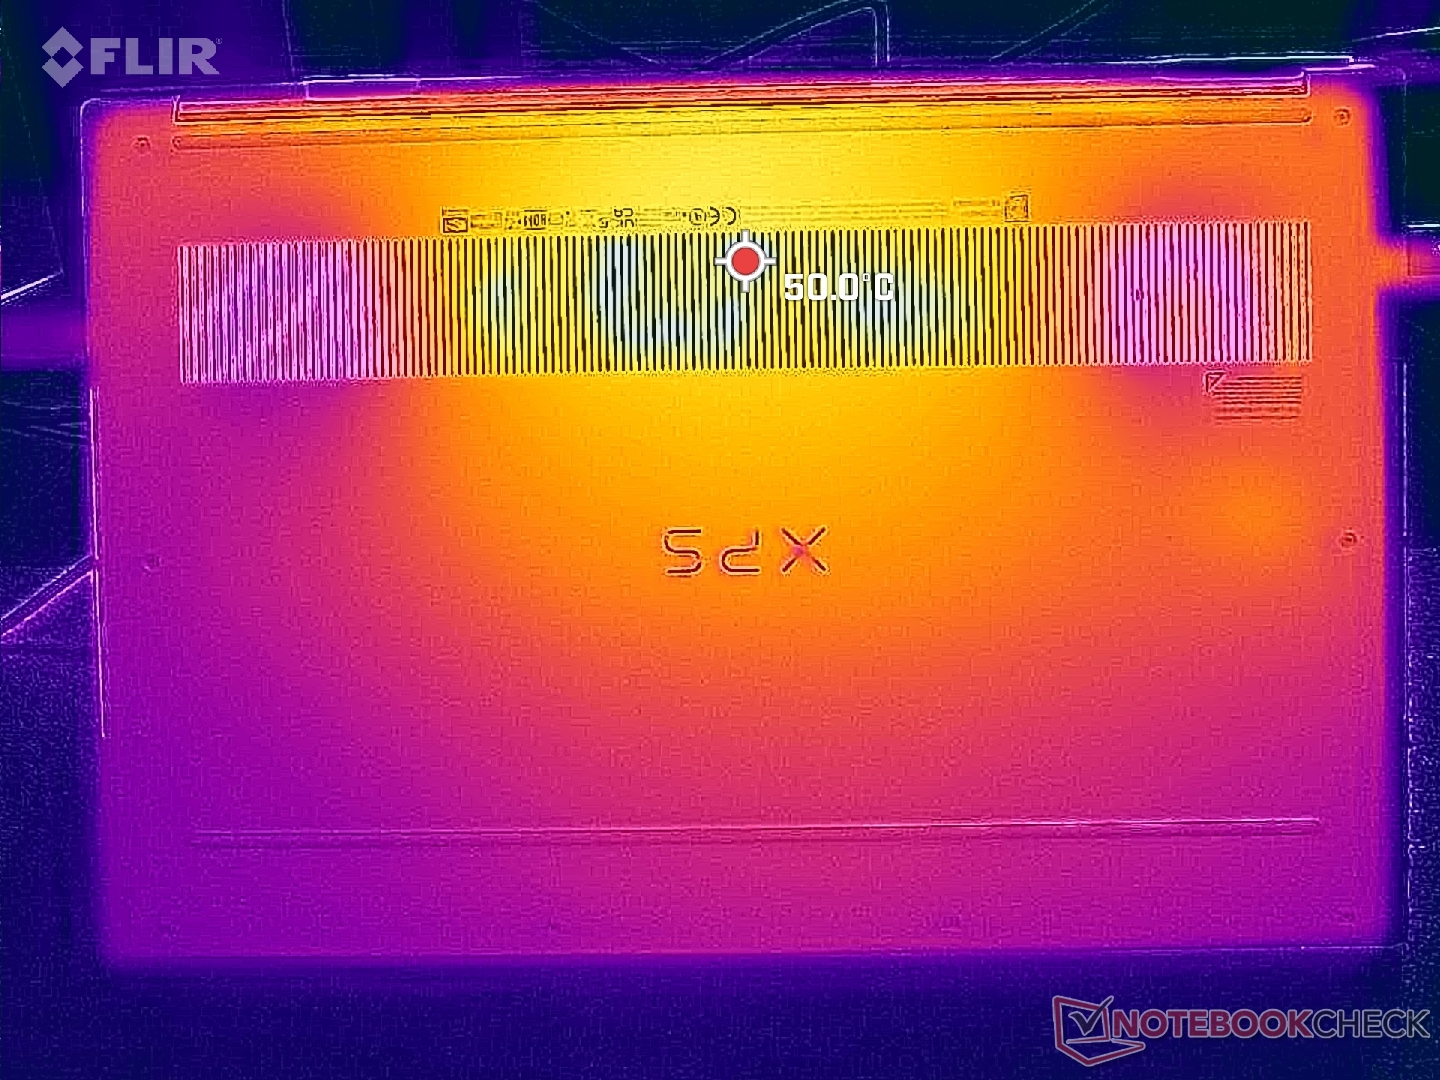
Les températures de surface sont relativement élevées (environ 30°C), même lorsque l'ordinateur tourne au ralenti, en raison de la densité de puissance élevée du châssis fin. Ce n'est pas différent du modèle de l'année dernière, cependant, puisque l'enveloppe de puissance est restée à peu près la même. La température de la peau peut atteindre 45°C sur la face inférieure du châssis lors de l'exécution de charges exigeantes telles que les jeux.
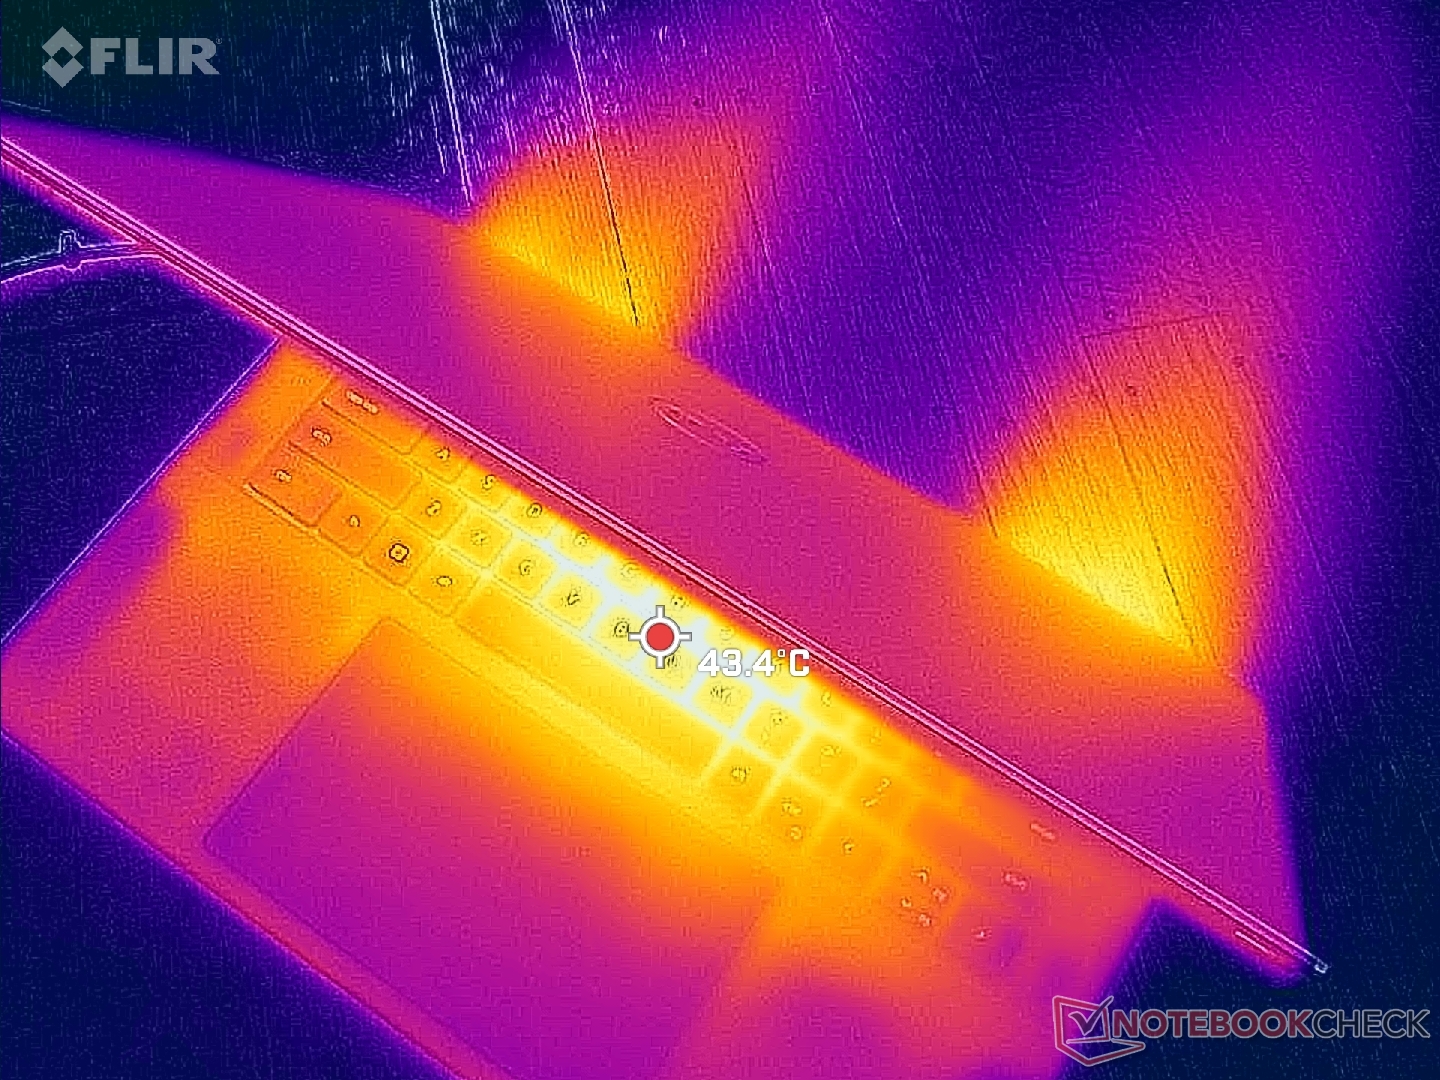
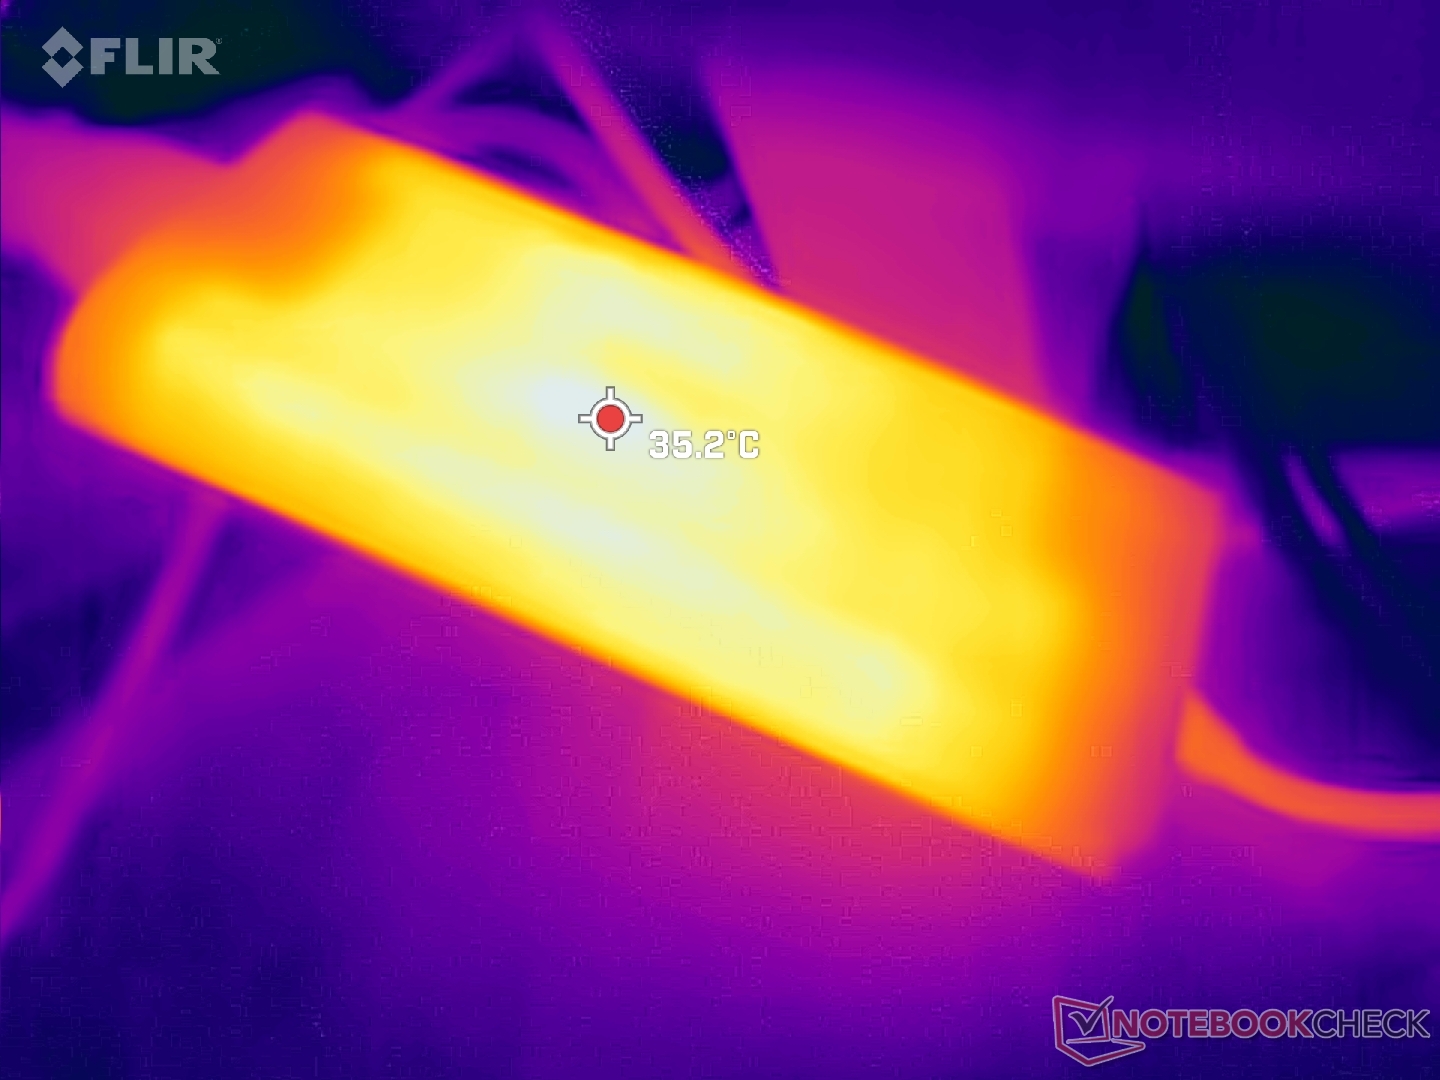
(-) La température maximale du côté supérieur est de 45.6 °C / 114 F, par rapport à la moyenne de 36.8 °C / 98 F, allant de 21 à 71 °C pour la classe Multimedia.
(±) Le fond chauffe jusqu'à un maximum de 42 °C / 108 F, contre une moyenne de 39.1 °C / 102 F
(+) En utilisation inactive, la température moyenne du côté supérieur est de 31.1 °C / 88 F, par rapport à la moyenne du dispositif de 31.3 °C / 88 F.
(±) En jouant à The Witcher 3, la température moyenne du côté supérieur est de 37.2 °C / 99 F, alors que la moyenne de l'appareil est de 31.3 °C / 88 F.
(+) Les repose-poignets et le pavé tactile sont plus froids que la température de la peau avec un maximum de 30.6 °C / 87.1 F et sont donc froids au toucher.
(±) La température moyenne de la zone de l'appui-paume de dispositifs similaires était de 28.7 °C / 83.7 F (-1.9 °C / #-3.4 F).
| Dell XPS 15 9530 RTX 4070 Intel Core i7-13700H, NVIDIA GeForce RTX 4070 Laptop GPU | Dell XPS 15 9520 RTX 3050 Ti Intel Core i7-12700H, NVIDIA GeForce RTX 3050 Ti Laptop GPU | Dell XPS 15 9500 Core i7 4K UHD Intel Core i7-10875H, NVIDIA GeForce GTX 1650 Ti Mobile | Asus Zenbook Pro 15 OLED UM535Q AMD Ryzen 9 5900HX, NVIDIA GeForce RTX 3050 Ti Laptop GPU | MSI Prestige 15 A12UD-093 Intel Core i7-1280P, NVIDIA GeForce RTX 3050 Ti Laptop GPU | Gigabyte Aero 15 OLED XD Intel Core i7-11800H, NVIDIA GeForce RTX 3070 Laptop GPU | |
|---|---|---|---|---|---|---|
| Heat | -5% | -2% | -4% | -3% | -9% | |
| Maximum Upper Side * (°C) | 45.6 | 51.4 -13% | 44 4% | 36 21% | 49 -7% | 45 1% |
| Maximum Bottom * (°C) | 42 | 51 -21% | 48.8 -16% | 47.2 -12% | 52.6 -25% | 54 -29% |
| Idle Upper Side * (°C) | 34.4 | 30 13% | 33 4% | 37 -8% | 29.7 14% | 34 1% |
| Idle Bottom * (°C) | 33.2 | 33 1% | 32.4 2% | 39.2 -18% | 30.7 8% | 36 -8% |
* ... Moindre est la valeur, meilleures sont les performances
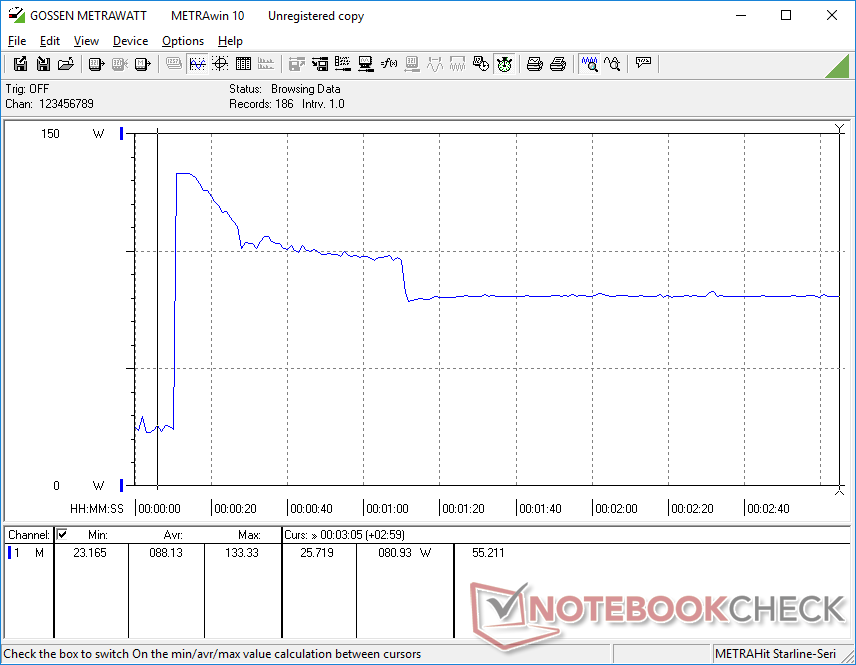
Test de stress - Températures élevées du processeur
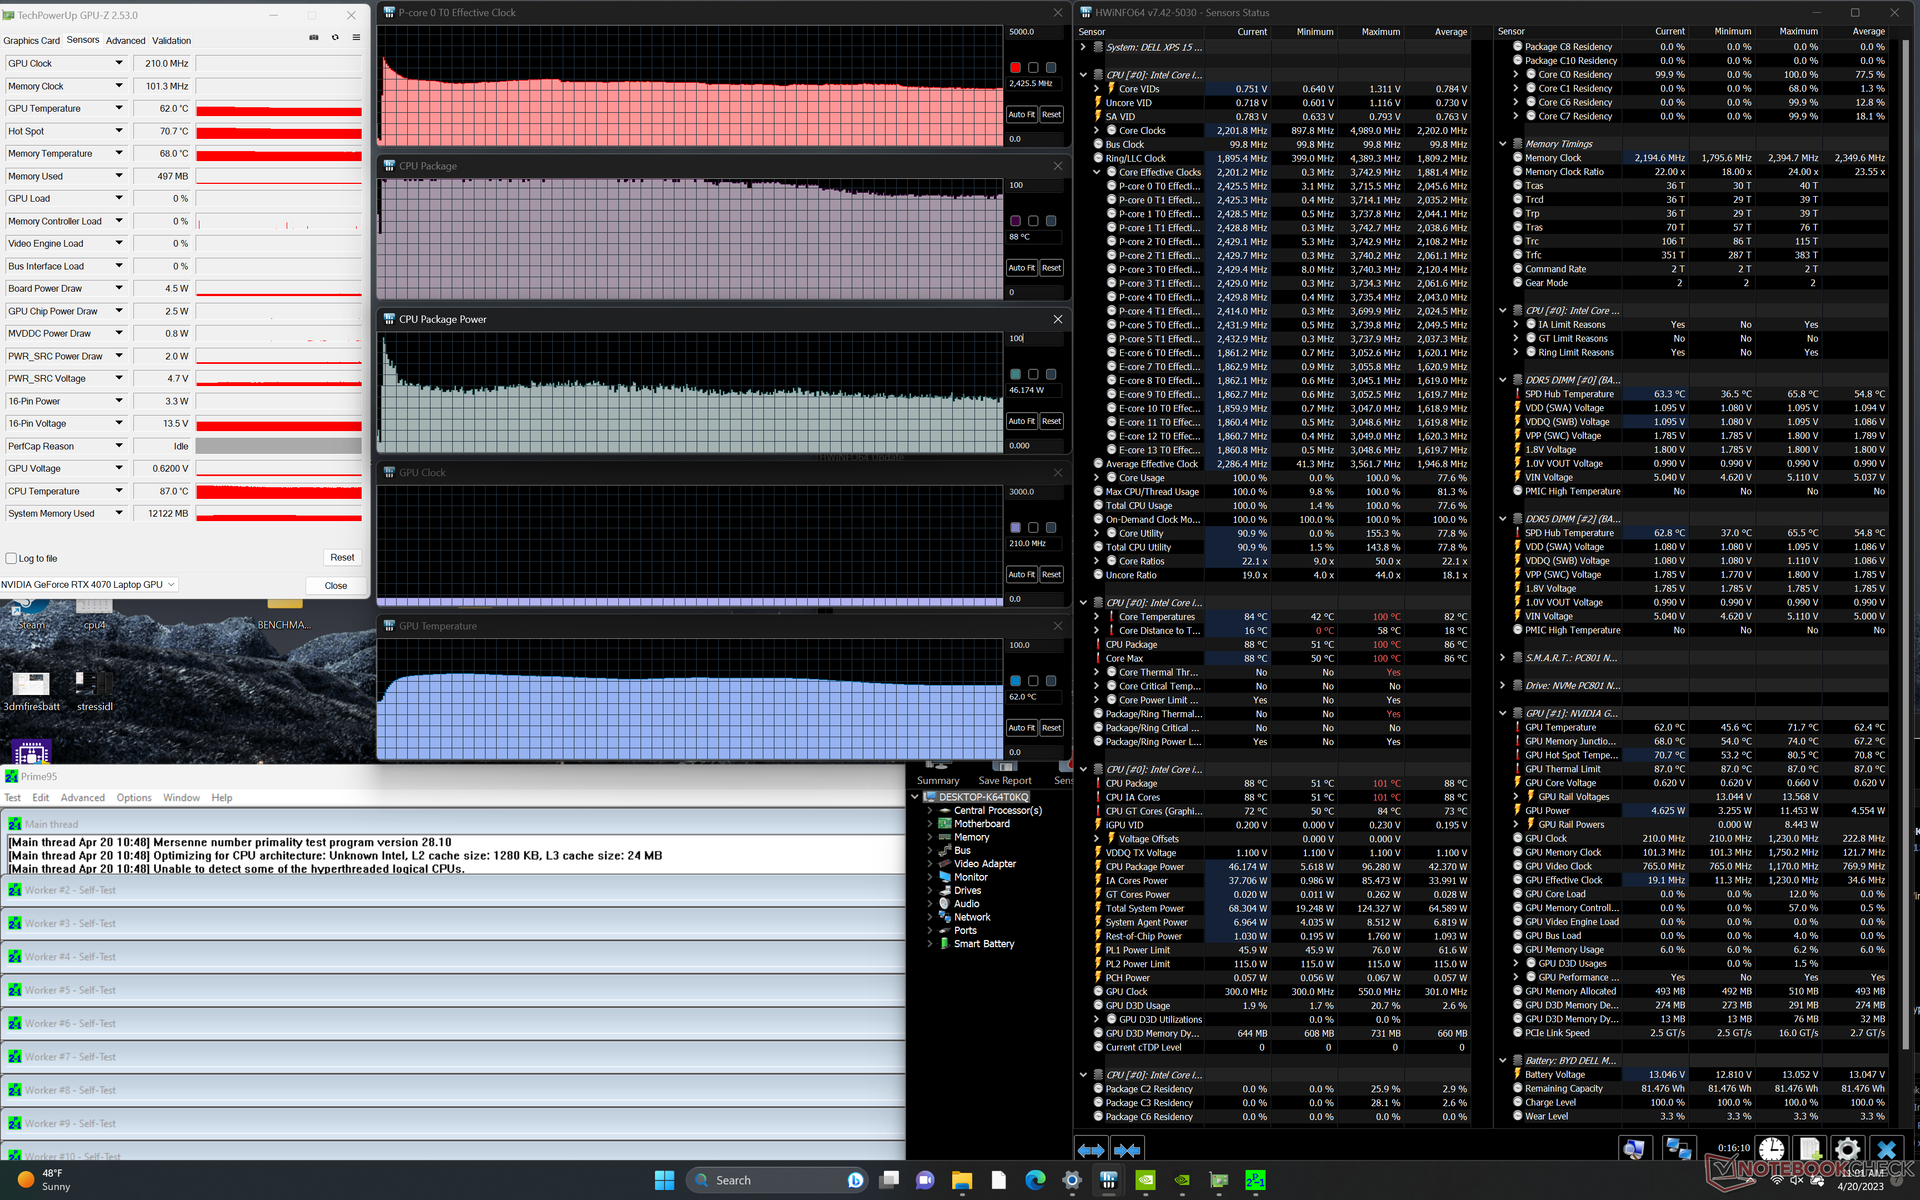
Le processeur atteignait 3,7 GHz et 96 W pendant seulement une ou deux secondes lors de l'initialisation du stress Prime95. Ces valeurs chutent ensuite régulièrement jusqu'à 2,7 GHz et 55 W, en raison de la température très élevée du cœur (88 à 100 °C) lorsque le processeur est soumis à une sollicitation maximale. En comparaison, en répétant ce même test sur l'Asus Zenbook Pro 15 UM5 alimenté par AMD, on obtient une puissance de 55 W Asus Zenbook Pro 15 UM535Q aurait donné une température plus basse de 76°C. La température du cœur plus élevée que la moyenne sur le système Dell n'est pas surprenante puisqu'il s'agit d'une caractéristique commune de la série XPS 15. Le passage à la configuration Core i9 pourrait donc n'apporter qu'un léger avantage, puisque notre configuration Core i7 frôle déjà le plafond des 100 C.
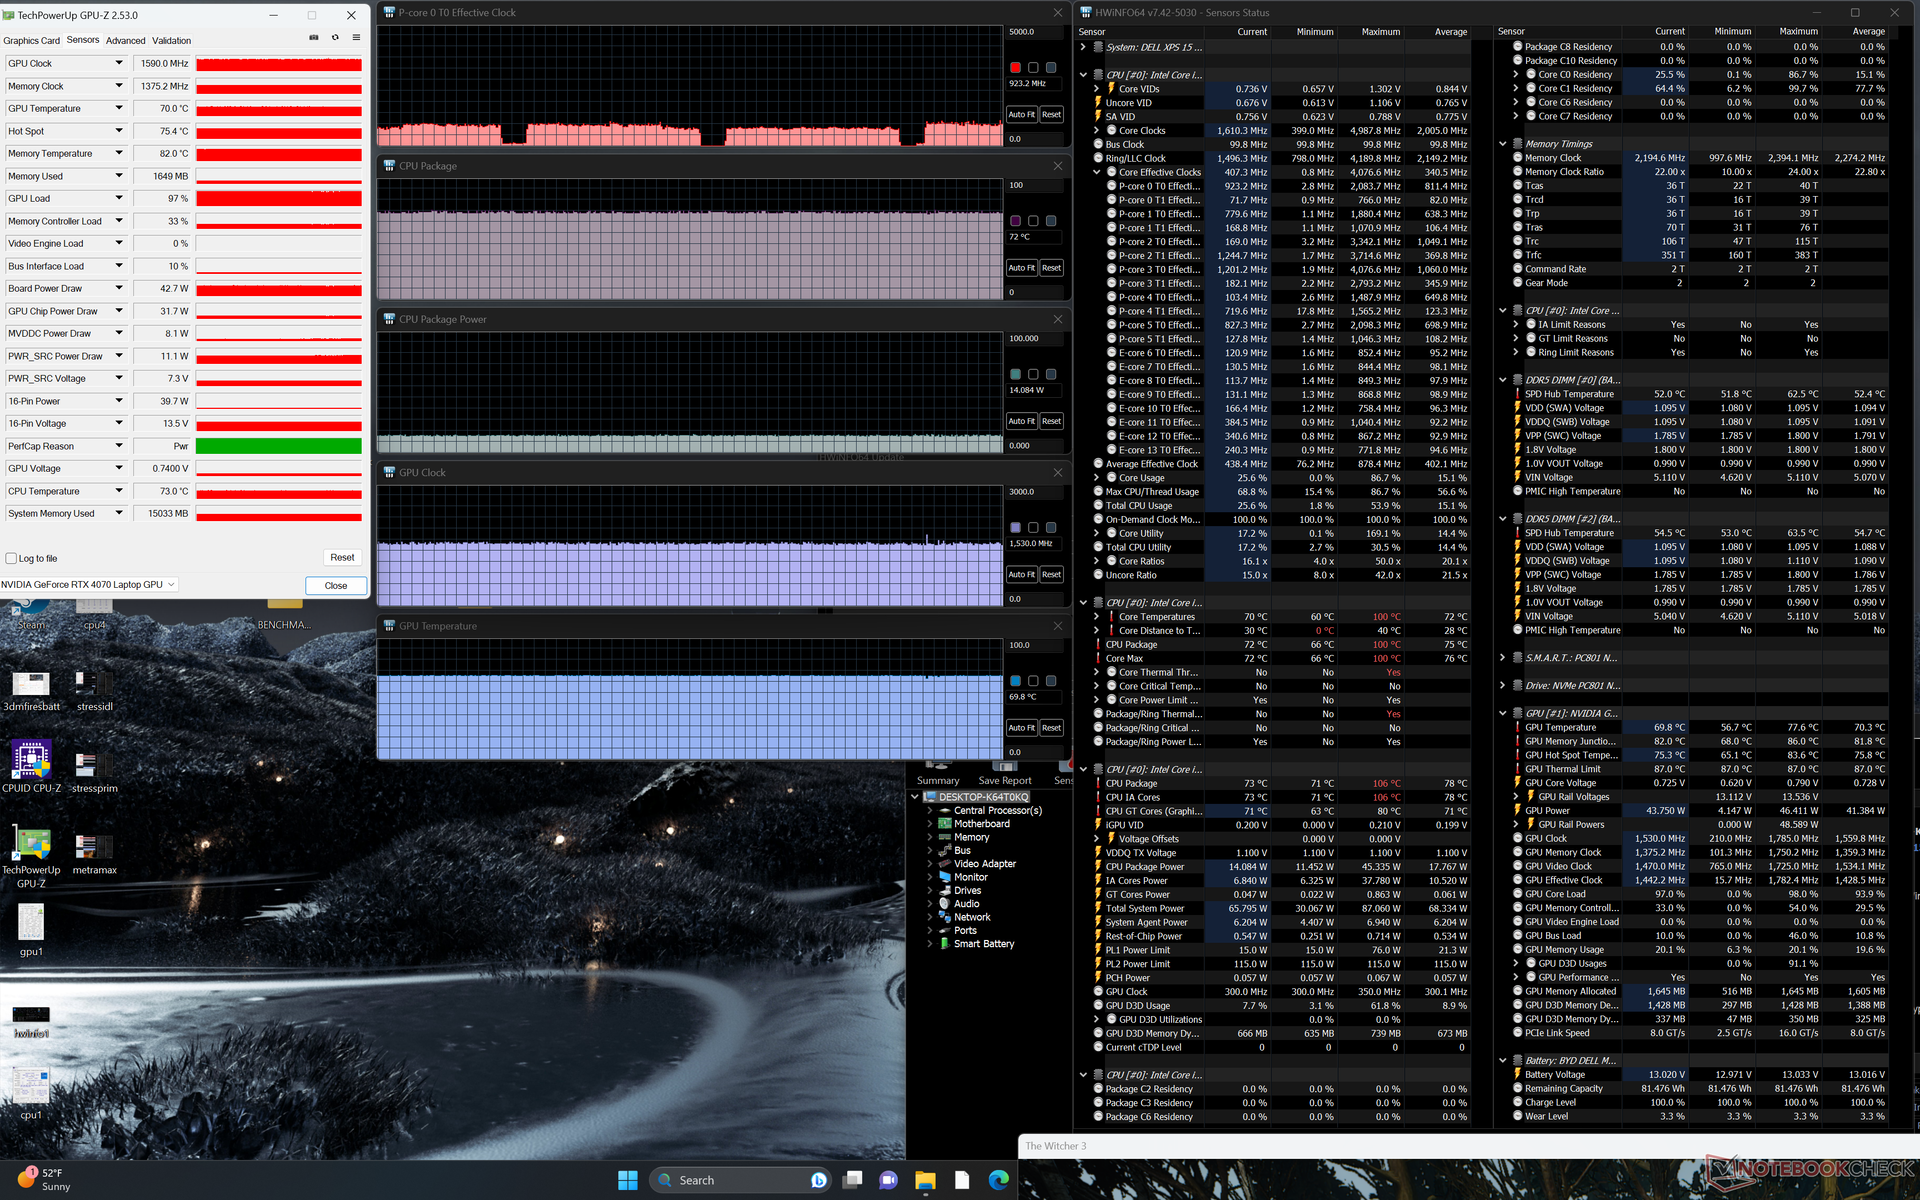
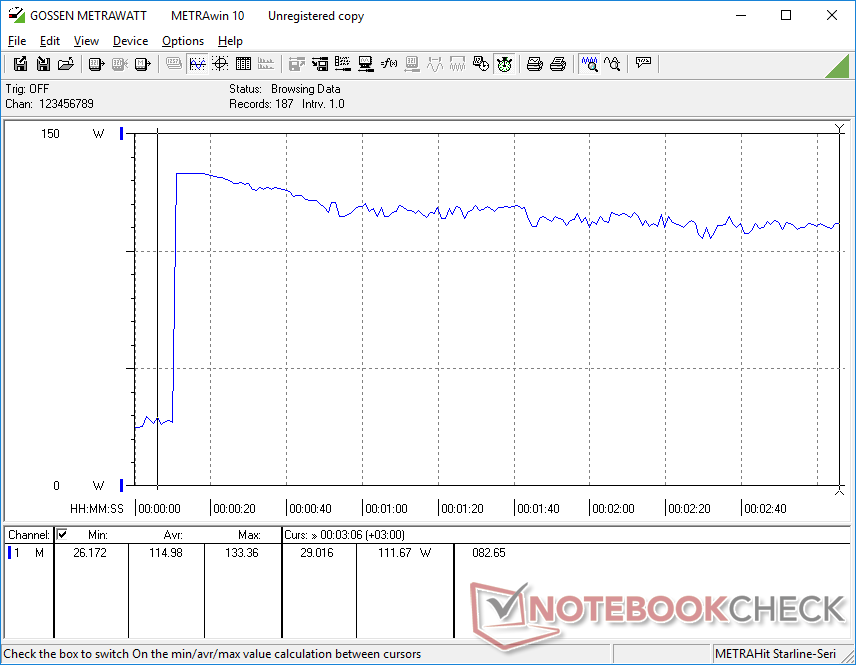
Lors de l'exécution Witcher 3 pour représenter des charges de jeu typiques, le GPU se stabilise à 1590 MHz pour le cœur, 1375 MHz pour la mémoire, 70 C et 43 W par rapport à un objectif de 50 W. En répétant ce même test sur la plus grande carteUniwill GM6PX7X IDX avec une RTX 4070 plus puissante de 130 W donnerait une horloge centrale, une horloge mémoire, une température et une puissance GPU stables de 2370 MHz, 2125 MHz, 73 C et 100 W, respectivement. La différence de performance entre la RTX 4070 de 50 W et celle de plus de 100 W est très claire dans cet exemple.
Il est surprenant de constater que le fonctionnement sur batterie n'a pas d'impact sur les performances, ce qui est rare pour un ordinateur portable équipé d'une RTX sur GeForce. Un test 3DMark 11 sur batterie donnerait des scores en physique et en graphique de 20751 et 24569 points, respectivement, contre 18112 et 24229 points sur secteur.
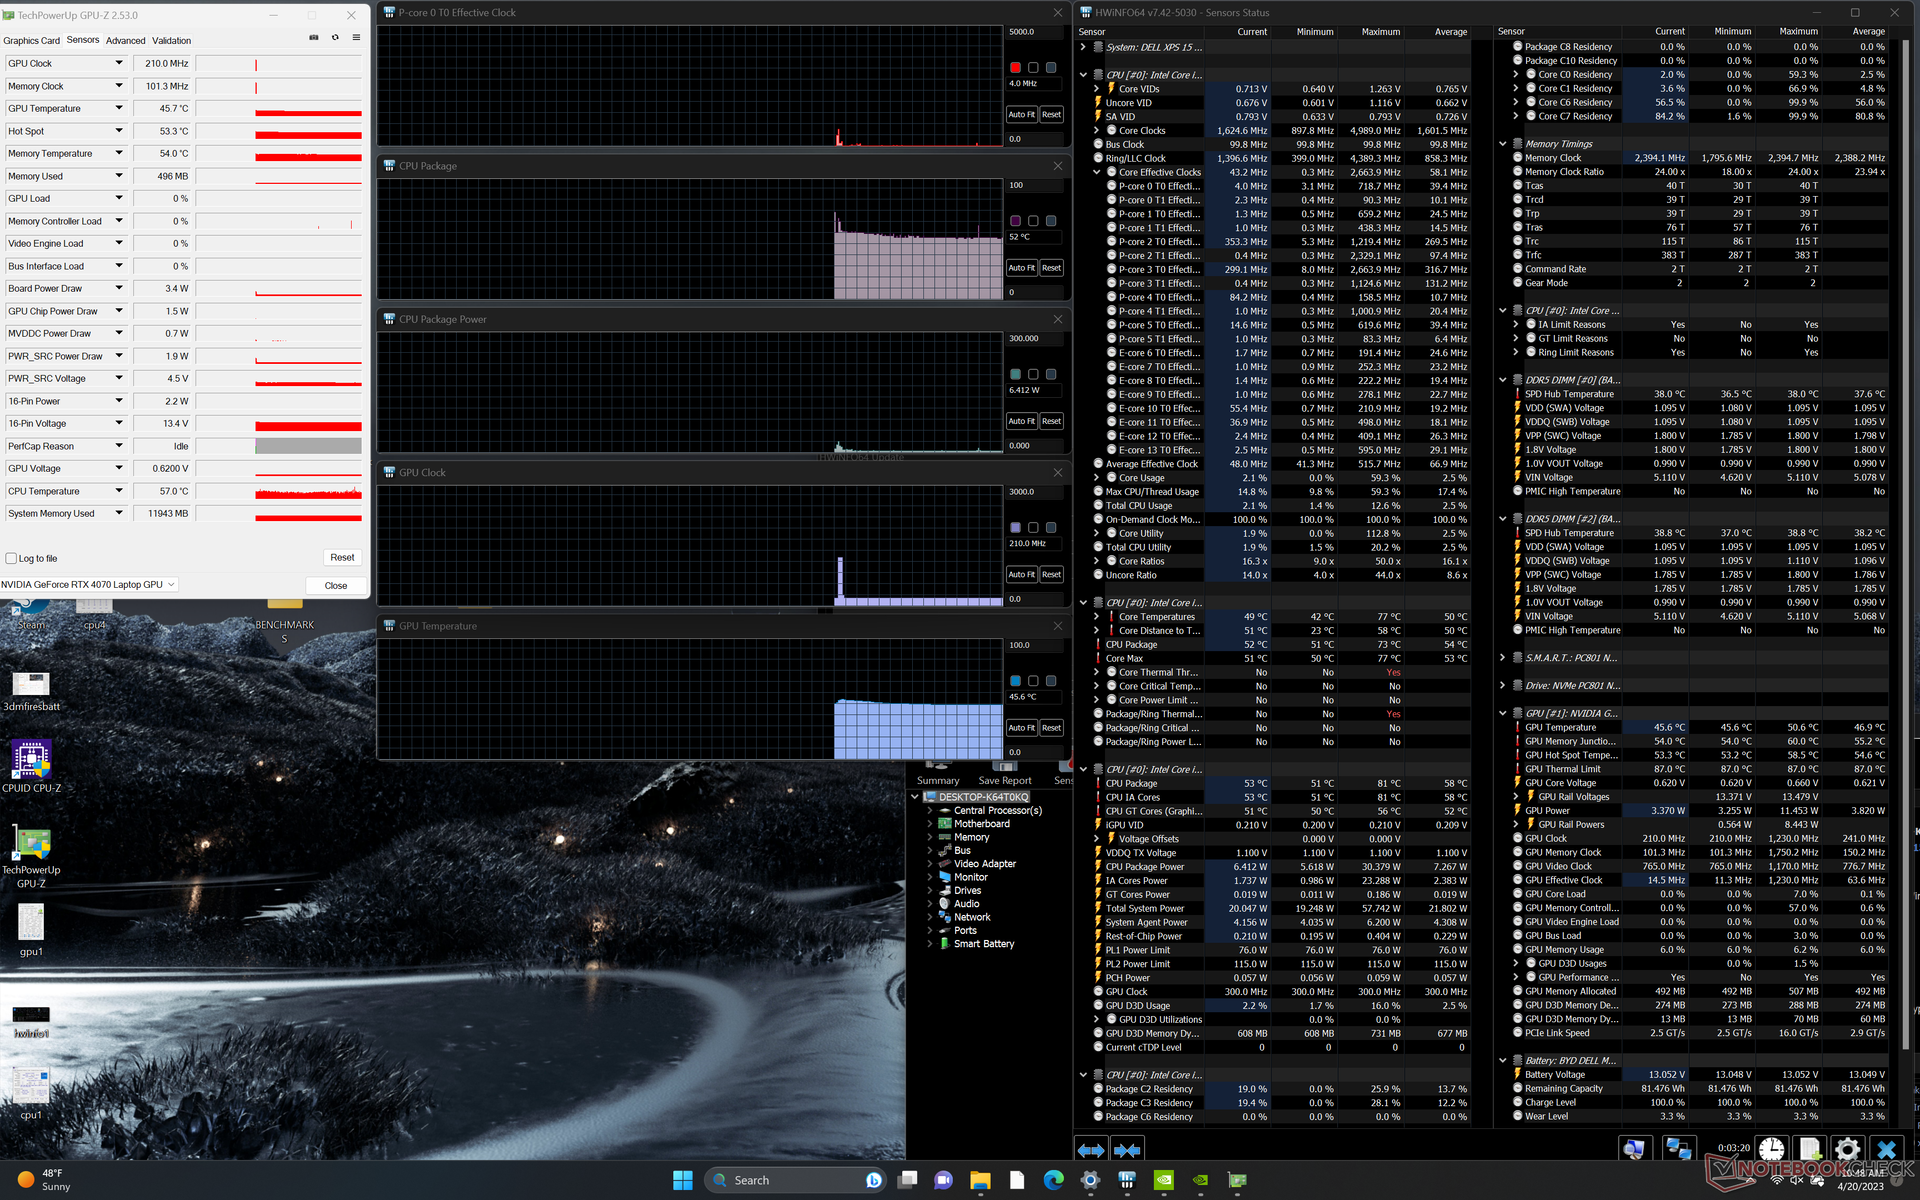
| Horloge du CPU (GHz) | Horloge du GPU (MHz) | Température moyenne du CPU (°C) | Température moyenne du GPU (°C) | |
| Système en veille | -- | -- | 52 | 46 |
| Prime95 Stress | 2.4 | -- | 88 | 62 |
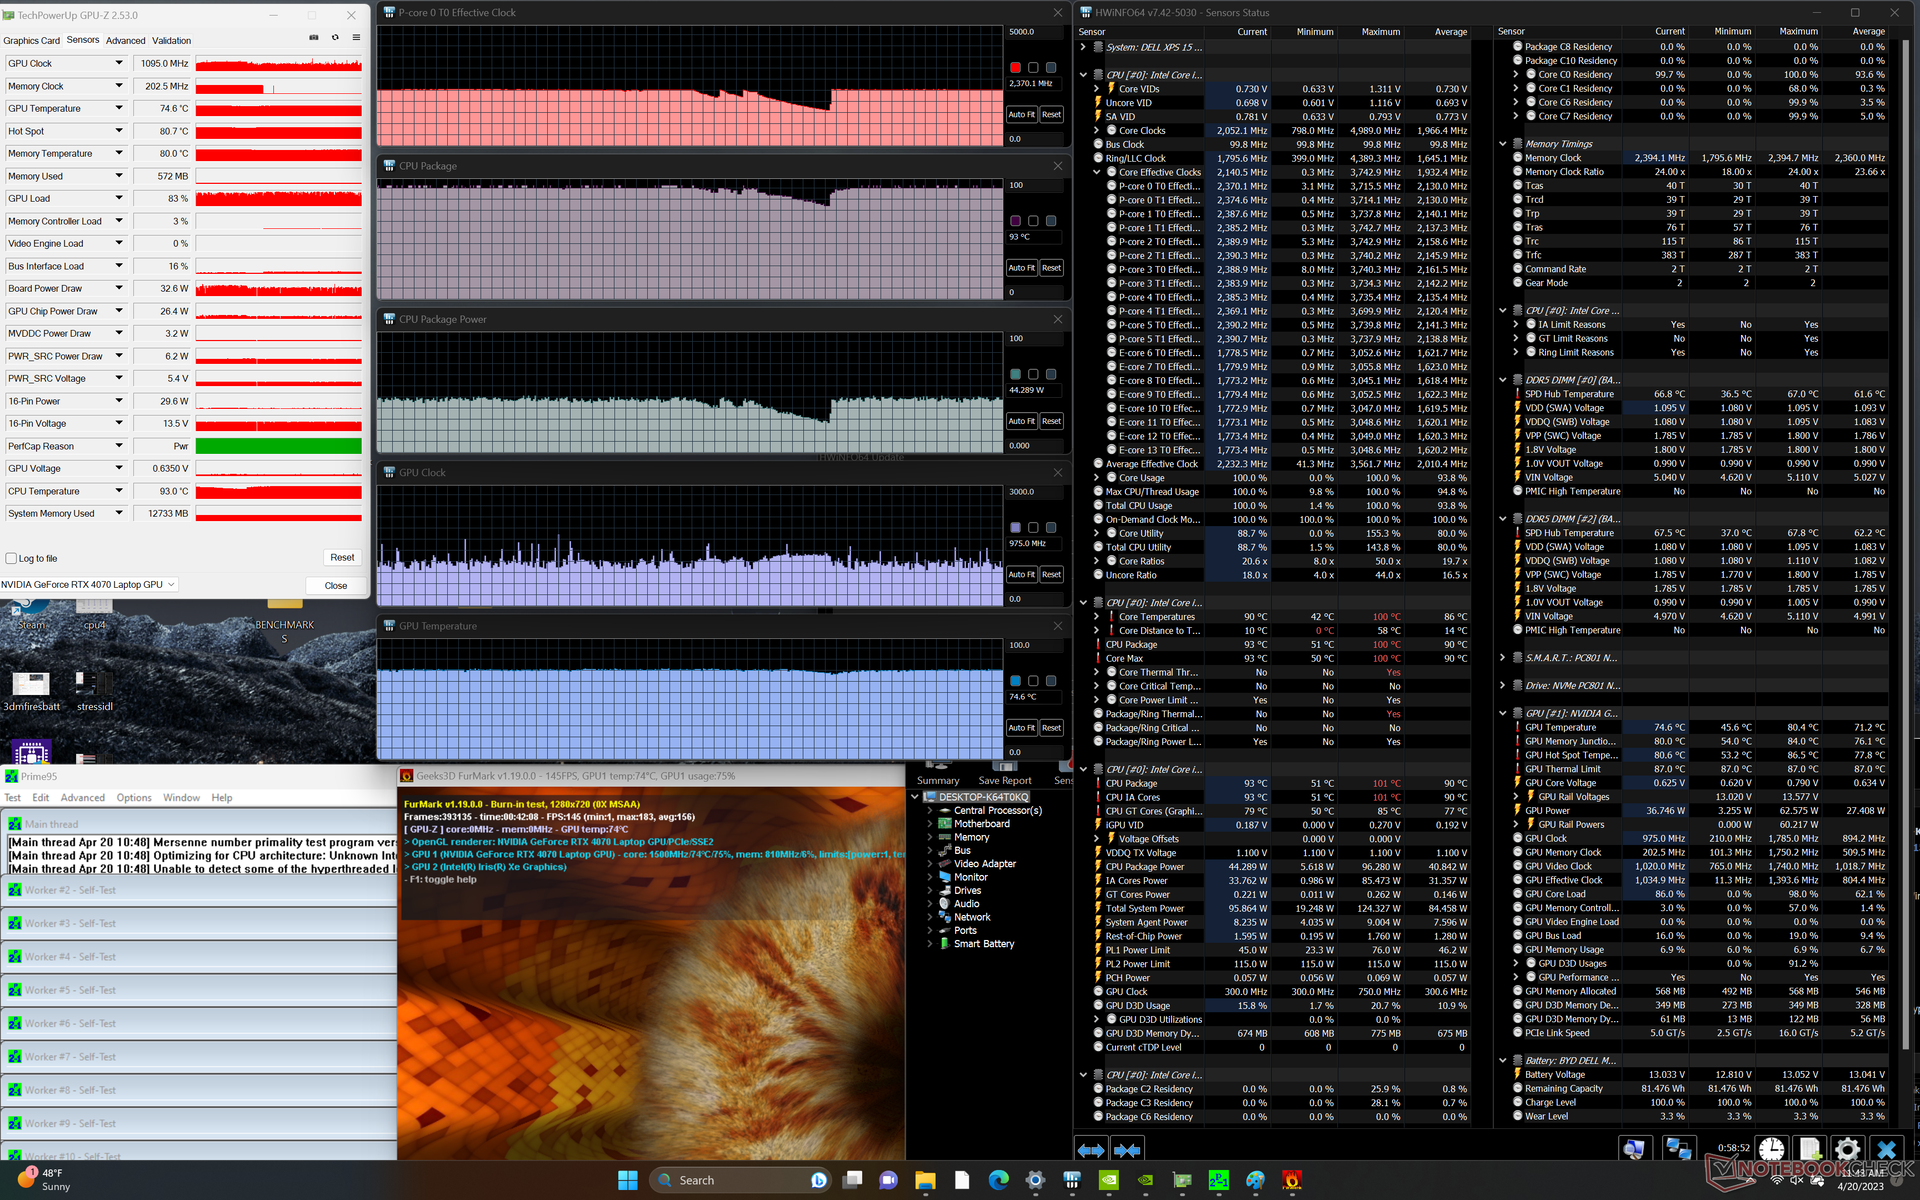
| Prime95 + FurMark Stress | 2.4 | ~1095 | 93 | 75 |
| Witcher 3 Stress | ~0.9 | 1590 | 72 | 70 |
Intervenants
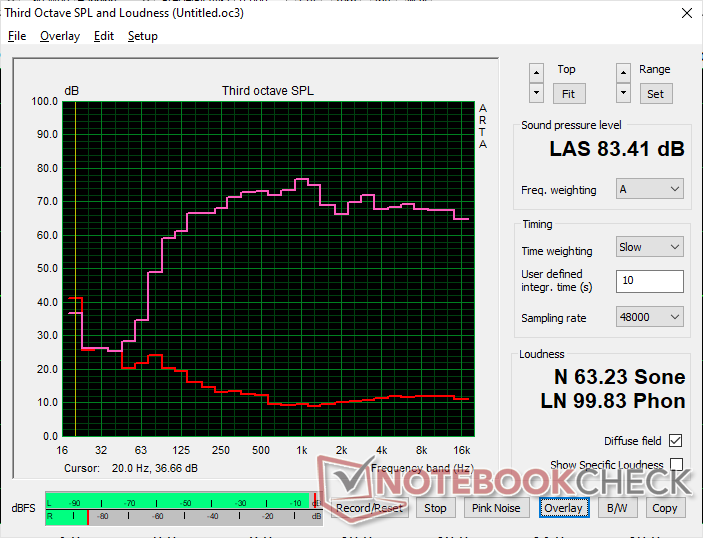
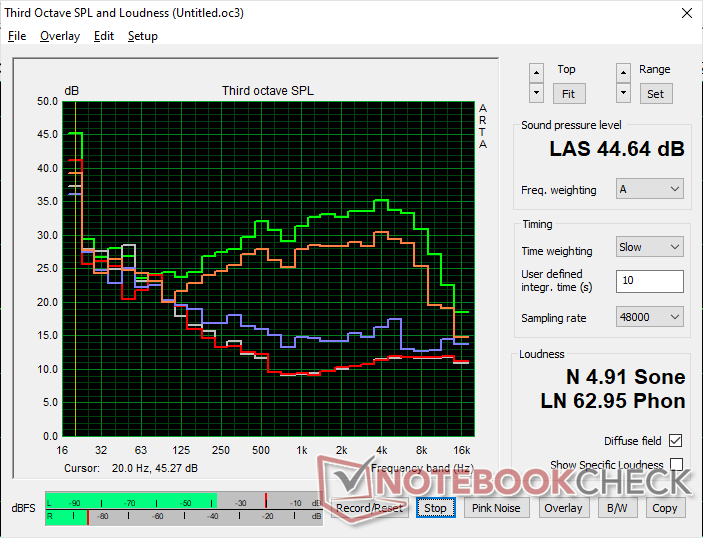
Dell XPS 15 9530 RTX 4070 analyse audio
(+) | les haut-parleurs peuvent jouer relativement fort (83.4# dB)
Basses 100 - 315 Hz
(+) | bonne basse - seulement 3.9% loin de la médiane
(+) | les basses sont linéaires (6.8% delta à la fréquence précédente)
Médiums 400 - 2000 Hz
(+) | médiane équilibrée - seulement 4.4% de la médiane
(+) | les médiums sont linéaires (4.1% delta à la fréquence précédente)
Aiguës 2 - 16 kHz
(+) | des sommets équilibrés - à seulement 1.1% de la médiane
(+) | les aigus sont linéaires (3.3% delta à la fréquence précédente)
Globalement 100 - 16 000 Hz
(+) | le son global est linéaire (6.4% différence à la médiane)
Par rapport à la même classe
» 4% de tous les appareils testés de cette catégorie étaient meilleurs, 1% similaires, 95% pires
» Le meilleur avait un delta de 5%, la moyenne était de 17%, le pire était de 45%.
Par rapport à tous les appareils testés
» 1% de tous les appareils testés étaient meilleurs, 0% similaires, 99% pires
» Le meilleur avait un delta de 4%, la moyenne était de 23%, le pire était de 134%.
Apple MacBook Pro 16 2021 M1 Pro analyse audio
(+) | les haut-parleurs peuvent jouer relativement fort (84.7# dB)
Basses 100 - 315 Hz
(+) | bonne basse - seulement 3.8% loin de la médiane
(+) | les basses sont linéaires (5.2% delta à la fréquence précédente)
Médiums 400 - 2000 Hz
(+) | médiane équilibrée - seulement 1.3% de la médiane
(+) | les médiums sont linéaires (2.1% delta à la fréquence précédente)
Aiguës 2 - 16 kHz
(+) | des sommets équilibrés - à seulement 1.9% de la médiane
(+) | les aigus sont linéaires (2.7% delta à la fréquence précédente)
Globalement 100 - 16 000 Hz
(+) | le son global est linéaire (4.6% différence à la médiane)
Par rapport à la même classe
» 0% de tous les appareils testés de cette catégorie étaient meilleurs, 0% similaires, 100% pires
» Le meilleur avait un delta de 5%, la moyenne était de 17%, le pire était de 45%.
Par rapport à tous les appareils testés
» 0% de tous les appareils testés étaient meilleurs, 0% similaires, 100% pires
» Le meilleur avait un delta de 4%, la moyenne était de 23%, le pire était de 134%.
Gestion de l'énergie - Core H et GeForce RTX sur USB-C
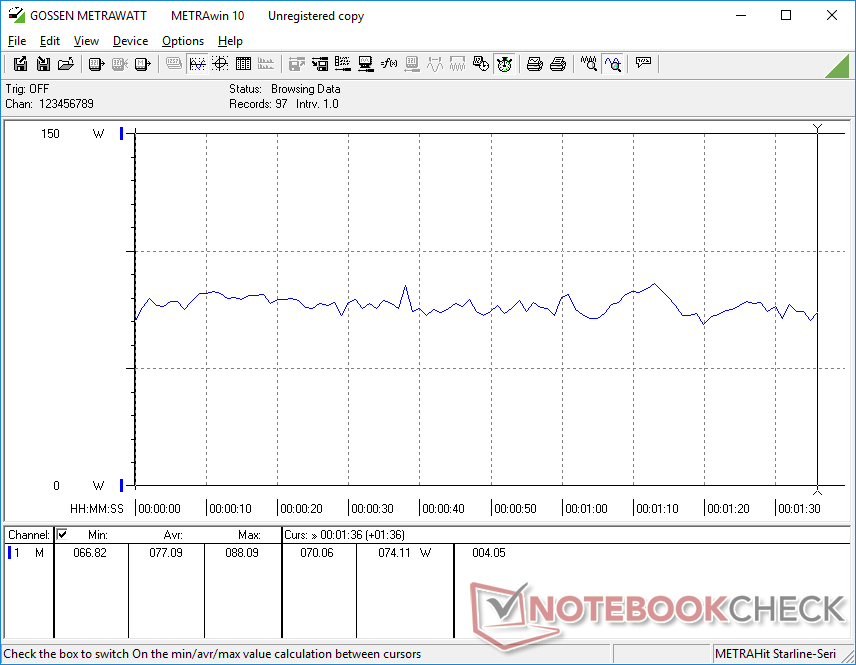
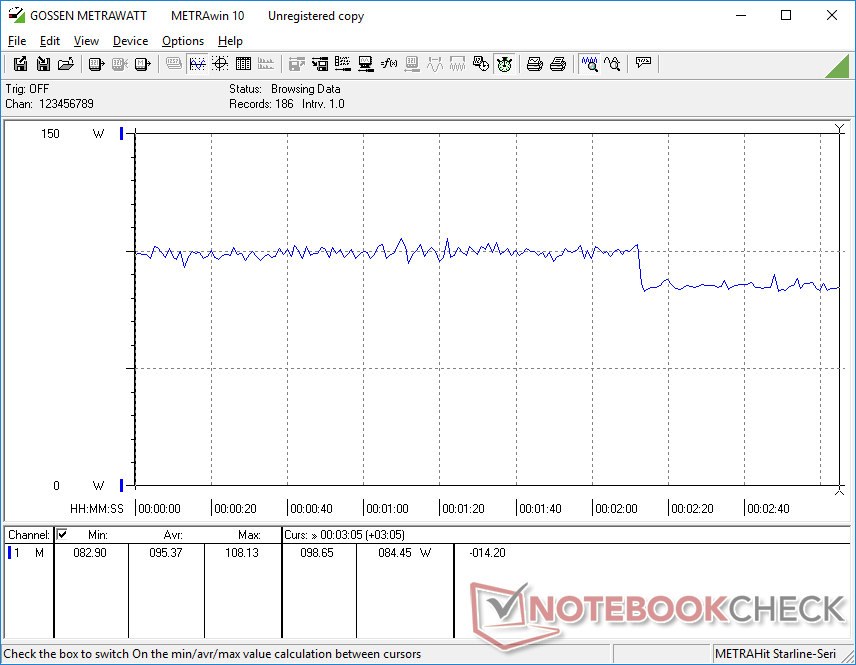
Consommation électrique
La consommation d'énergie est généralement plus élevée par rapport au modèle de l'année dernière. Au ralenti sur le bureau avec les paramètres les plus bas, par exemple, le XPS 15 9530 consomme environ 20 W contre seulement 5 à 6 W pour l'ancien XPS 15 9520. Dans les jeux, la consommation serait environ 25 % plus élevée, ce qui signifie que les performances supplémentaires par rapport à l'ancienne RTX 3050 Ti ne sont pas vraiment gratuites.
Nous avons pu enregistrer une consommation maximale temporaire de 133 W avec l'adaptateur secteur 130 W de taille petite-moyenne (~14.3 x 6.6 x 2.2cm). Le XPS 15 est l'un des premiers ordinateurs portables équipés d'un processeur Core H-series et d'un GPU GeForce RTX 4070 à être alimenté uniquement par USB-C. Cela présente certainement des avantages en termes de portabilité et de polyvalence, mais les performances et la charge peuvent en pâtir en raison de l'enveloppe de puissance limitée. Le chargement de la batterie vide à la batterie pleine, par exemple, est plus lent que d'habitude, avec environ 2,5 heures, et ce sera encore plus lent si l'on exécute des charges exigeantes simultanément.
Heureusement, la batterie ne se décharge pas lentement lorsque l'on joue ou que l'on exécute des tâches exigeantes, contrairement à ce que nous avons observé sur les anciens modèles XPS 17.
| Éteint/en veille | |
| Au repos | |
| Fortement sollicité |
|
Légende:
min: | |
| Dell XPS 15 9530 RTX 4070 i7-13700H, GeForce RTX 4070 Laptop GPU, SK hynix PC801 HFS001TEJ9X101N, OLED, 3456x2160, 15.6" | Dell XPS 15 9520 RTX 3050 Ti i7-12700H, GeForce RTX 3050 Ti Laptop GPU, WDC PC SN810 512GB, OLED, 3456x2160, 15.6" | Dell XPS 15 9500 Core i7 4K UHD i7-10875H, GeForce GTX 1650 Ti Mobile, SK Hynix PC611 512GB, IPS, 3840x2400, 15.6" | Asus Zenbook Pro 15 OLED UM535Q R9 5900HX, GeForce RTX 3050 Ti Laptop GPU, WDC PC SN730 SDBPNTY-1T00, OLED, 1920x1080, 15.6" | MSI Prestige 15 A12UD-093 i7-1280P, GeForce RTX 3050 Ti Laptop GPU, Micron 3400 1TB MTFDKBA1T0TFH, IPS, 3840x2160, 15.6" | Gigabyte Aero 15 OLED XD i7-11800H, GeForce RTX 3070 Laptop GPU, Samsung PM9A1 MZVL21T0HCLR, OLED, 3840x2160, 15.6" | |
|---|---|---|---|---|---|---|
| Power Consumption | 28% | 12% | 34% | 51% | -39% | |
| Idle Minimum * (Watt) | 20 | 5.5 72% | 5.7 71% | 5.5 72% | 5.4 73% | 23 -15% |
| Idle Average * (Watt) | 20.7 | 7.2 65% | 13.5 35% | 7.4 64% | 11.8 43% | 26 -26% |
| Idle Maximum * (Watt) | 22.4 | 16 29% | 19.6 12% | 14.9 33% | 12.7 43% | 34 -52% |
| Load Average * (Watt) | 77.1 | 91.8 -19% | 114.1 -48% | 78.2 -1% | 45.9 40% | 99 -28% |
| Witcher 3 ultra * (Watt) | 95.4 | 74.6 22% | 93 3% | 80.1 16% | 45.7 52% | 163 -71% |
| Load Maximum * (Watt) | 133.4 | 134.7 -1% | 135.2 -1% | 110.9 17% | 63 53% | 190 -42% |
* ... Moindre est la valeur, meilleures sont les performances
Power Consumption Witcher 3 / Stresstest
Power Consumption external Monitor
Autonomie de la batterie - Un peu plus courte, mais pas mauvaise
Les durées d'exécution sont généralement plus courtes que sur le modèle de l'année dernière, ce qui n'est pas surprenant car le processeur Intel de 13ème génération et le GPU GeForce 40 sont dans des enveloppes de puissance similaires à celles de leurs prédécesseurs respectifs. Nous avons pu enregistrer 8 heures d'utilisation réelle du WLAN, soit 40 minutes de moins que sur le XPS 15 de 2022. C'est encore bien, même si c'est un peu moins que les modèles concurrents comme l'Asus Zenbook Pro 15.
L'autonomie de la batterie peut être prolongée en affichant des couleurs plus sombres au lieu du blanc sur la configuration OLED, comme détaillé ici. Nous nous attendons à ce que le SKU IPS à plus faible résolution fournisse des durées de vie plus longues que celles que nous avons enregistrées ici.
| Dell XPS 15 9530 RTX 4070 i7-13700H, GeForce RTX 4070 Laptop GPU, 86 Wh | Dell XPS 15 9520 RTX 3050 Ti i7-12700H, GeForce RTX 3050 Ti Laptop GPU, 86 Wh | Dell XPS 15 9500 Core i7 4K UHD i7-10875H, GeForce GTX 1650 Ti Mobile, 86 Wh | Asus Zenbook Pro 15 OLED UM535Q R9 5900HX, GeForce RTX 3050 Ti Laptop GPU, 96 Wh | MSI Prestige 15 A12UD-093 i7-1280P, GeForce RTX 3050 Ti Laptop GPU, 80 Wh | Gigabyte Aero 15 OLED XD i7-11800H, GeForce RTX 3070 Laptop GPU, 99 Wh | |
|---|---|---|---|---|---|---|
| Autonomie de la batterie | 51% | 49% | 109% | 2% | 6% | |
| Reader / Idle (h) | 11.5 | 14.8 29% | 23 100% | 26.2 128% | ||
| WiFi v1.3 (h) | 8 | 8.8 10% | 9.1 14% | 12.8 60% | 8.9 11% | 8.5 6% |
| Load (h) | 1.5 | 3.2 113% | 2 33% | 3.6 140% | 1.4 -7% | |
| H.264 (h) | 7.1 | |||||
| Witcher 3 ultra (h) | 2.2 |
Points positifs
Points négatifs
Verdict - sacrifier la performance à la minceur
Le Core i7-13700H et le GeForce RTX 4070 sont généralement réservés aux ordinateurs portables de jeu de plus grande taille, comme leAsus ROG Strix G18 ouAorus 15X ASF chacun équipé d'un bloc d'alimentation volumineux de plus de 200 W. Les intégrer dans des modèles plus fins et moins gourmands en énergie comme le XPS 15 peut certainement fonctionner, mais les performances en pâtissent inévitablement. Dans ce cas, le TGP a été réduit de moitié ou plus pour des performances médiocres par dollar. Si vous avez l'intention d'utiliser à la fois des éditeurs graphiques et des jeux, une machine dédiée aux jeux comme le Alienware x15 surpassera largement notre XPS 15, même s'il est configuré avec le même processeur et le même GPU.
L'impact sur les performances des éditeurs graphiques n'est pas aussi important que l'impact sur les performances des jeux par rapport à des ordinateurs portables plus grands avec des objectifs TGP plus élevés. Cela s'explique en grande partie par le fait que même une RTX 4070 de 50 W dispose du même nombre de cœurs CUDA pour l'accélération qu'une version de plus de 100 W. Le XPS 15 9530 excelle donc dans la création de contenu, avec seulement quelques jeux occasionnels. Il s'agit d'un ordinateur portable Nvidia Studio, après tout.
Le XPS 15 9530 est l'ordinateur portable de création de contenu à posséder si vous souhaitez équilibrer performances et portabilité. Cependant, ne vous attendez pas à ce qu'il soit aussi performant que la plupart des autres ordinateurs portables équipés du même GPU.
Il y a beaucoup de changements que nous aimerions voir sur les prochains modèles. Tout d'abord, des options d'affichage plus récentes avec des taux de rafraîchissement de 90 Hz ou 120 Hz contribueraient grandement à améliorer l'expérience de l'utilisateur. Deuxièmement, la webcam 720p est épouvantable, car elle semble inchangée par rapport à ce qu'elle était il y a dix ans. Troisièmement, une solution de refroidissement révisée, potentiellement avec du métal liquide, pourrait aider à augmenter les performances Turbo Boost sans avoir besoin d'épaissir le design. Enfin, les problèmes de DPC, les sauts d'images et les chutes d'images devraient certainement être examinés, en particulier pour un ordinateur portable phare destiné à la création de contenu. Il y a beaucoup de choses à aimer dans le XPS 15, surtout si vous appréciez sa portabilité semblable à celle d'un MacBook Pro, mais les processeurs à l'intérieur dépassent le châssis et se sentent quelque peu limités à cause de cela.
Prix et disponibilité
Le XPS 15 9530 n'est pas encore disponible chez les revendeurs à l'heure où nous écrivons ces lignes. La meilleure chance d'obtenir un modèle est de s'adresser directement à Dell. Les prix commencent à 2250 USD pour la configuration de base et vont jusqu'à 4700 USD pour une configuration complète avec le maximum de stockage et de RAM.
Dell XPS 15 9530 RTX 4070
- 04/23/2023 v7 (old)
Allen Ngo
Transparency
La sélection des appareils à examiner est effectuée par notre équipe éditoriale. L'échantillon de test a été prêté à l'auteur par le fabricant ou le détaillant pour les besoins de cet examen. Le prêteur n'a pas eu d'influence sur cette évaluation et le fabricant n'a pas reçu de copie de cette évaluation avant sa publication. Il n'y avait aucune obligation de publier cet article. En tant que média indépendant, Notebookcheck n'est pas soumis à l'autorité des fabricants, des détaillants ou des éditeurs.
Voici comment Notebookcheck teste
Chaque année, Notebookcheck examine de manière indépendante des centaines d'ordinateurs portables et de smartphones en utilisant des procédures standardisées afin de garantir que tous les résultats sont comparables. Nous avons continuellement développé nos méthodes de test depuis environ 20 ans et avons établi des normes industrielles dans le processus. Dans nos laboratoires de test, des équipements de mesure de haute qualité sont utilisés par des techniciens et des rédacteurs expérimentés. Ces tests impliquent un processus de validation en plusieurs étapes. Notre système d'évaluation complexe repose sur des centaines de mesures et de points de référence bien fondés, ce qui garantit l'objectivité.Price comparison

