Test du Schenker XMG Pro 15 E23 (PD50SND-G) : l'équilibre entre travail et jeu, c'est possible !
Les ordinateurs portables Schenker sont régulièrement mis à jour et l'année dernière, nous avons examiné deux des prédécesseurs du XMG Pro 15. L'un d'entre eux était équipé d'uneTiger Lake CPUl'autre avec un Alder Lakeet tous deux équipés d'une RTX 3080. En ce qui concerne le processeur, notre appareil de test est équipé de la dernière génération Raptor Lake et a opté pour une RTX 4060 de Nvidia.Nvidia GeForce RTX 4060. Mais l'ordinateur portable n'a pas seulement reçu des ajustements internes puisque le design a également été légèrement remanié. L'appareil est désormais basé sur le barebone Clevo PD50SND-G.
La comparaison avec son prédécesseur est intéressante car, bien que la carte graphique soit issue de la dernière génération Ada Lovelace de Nvidia, sa classe a été abaissée de 80 à 60. Une autre option de configuration est fournie sous la forme de laRTX 4070. Les deux cartes graphiques consomment entre 140 et 150 watts. Le Pro 15 E23 a réussi à réaliser une performance impressionnante et il tient la dragée haute à des ordinateurs portables de jeu tels que le Dell G15 5530 ou leAorus 15X ASF. Un peu plus loin, on trouve l'Asus ZenBook Pro 14 Duo.Asus ZenBook Pro 14 Duo. L'ordinateur portable multimédia peut toutefois se targuer d'afficher un nombre élevé d'images par seconde dans de nombreux titres actuels.
Comparaison avec les concurrents potentiels
Note | Date | Modèle | Poids | Épaisseur | Taille | Résolution | Prix |
|---|---|---|---|---|---|---|---|
| 86.2 % v7 (old) | 07/23 | Schenker XMG Pro 15 (E23) i9-13900HX, GeForce RTX 4060 Laptop GPU | 2.4 kg | 24.9 mm | 15.60" | 2560x1440 | |
| 86.9 % v7 (old) | 07/22 | Schenker XMG Pro 15 (i7-12700H, RTX 3080 Ti) i7-12700H, GeForce RTX 3080 Ti Laptop GPU | 2.4 kg | 25 mm | 15.60" | 2560x1440 | |
| 84.2 % v7 (old) | 06/23 | Dell G15 5530 i7-13650HX, GeForce RTX 4060 Laptop GPU | 3 kg | 26.95 mm | 15.60" | 1920x1080 | |
| 86.3 % v7 (old) | 06/23 | Asus TUF A15 FA507 R7 7735HS, GeForce RTX 4050 Laptop GPU | 2.2 kg | 24.9 mm | 15.60" | 1920x1080 | |
| 86.2 % v7 (old) | 04/23 | Aorus 15X ASF i7-13700HX, GeForce RTX 4070 Laptop GPU | 2.3 kg | 19.7 mm | 15.60" | 2560x1440 | |
| 87 % v7 (old) | 06/23 | Asus ZenBook Pro 14 Duo UX8402VV-P1021W i9-13900H, GeForce RTX 4060 Laptop GPU | 1.8 kg | 21 mm | 14.50" | 2880x1800 | |
| 82.4 % v7 (old) | 04/23 | MSI Cyborg 15 A12VF i7-12650H, GeForce RTX 4060 Laptop GPU | 2 kg | 22.9 mm | 15.60" | 1920x1080 | |
| 88.4 % v7 (old) | 06/23 | Alienware x16 R1 i9-13900HK, GeForce RTX 4080 Laptop GPU | 2.6 kg | 18.57 mm | 16.00" | 2560x1600 |
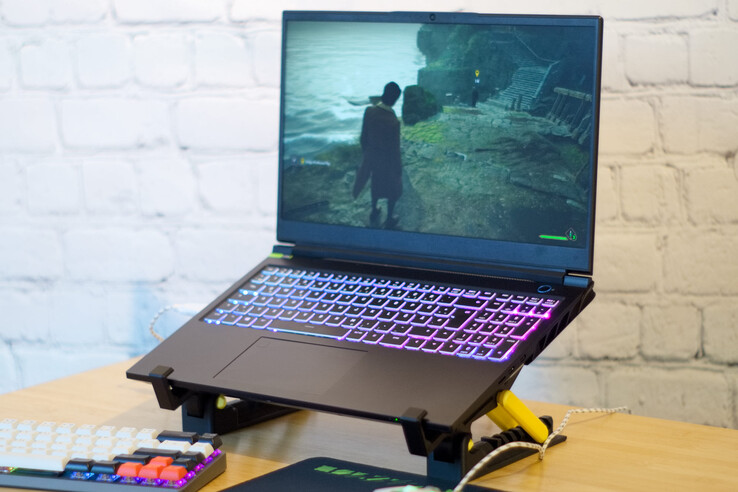
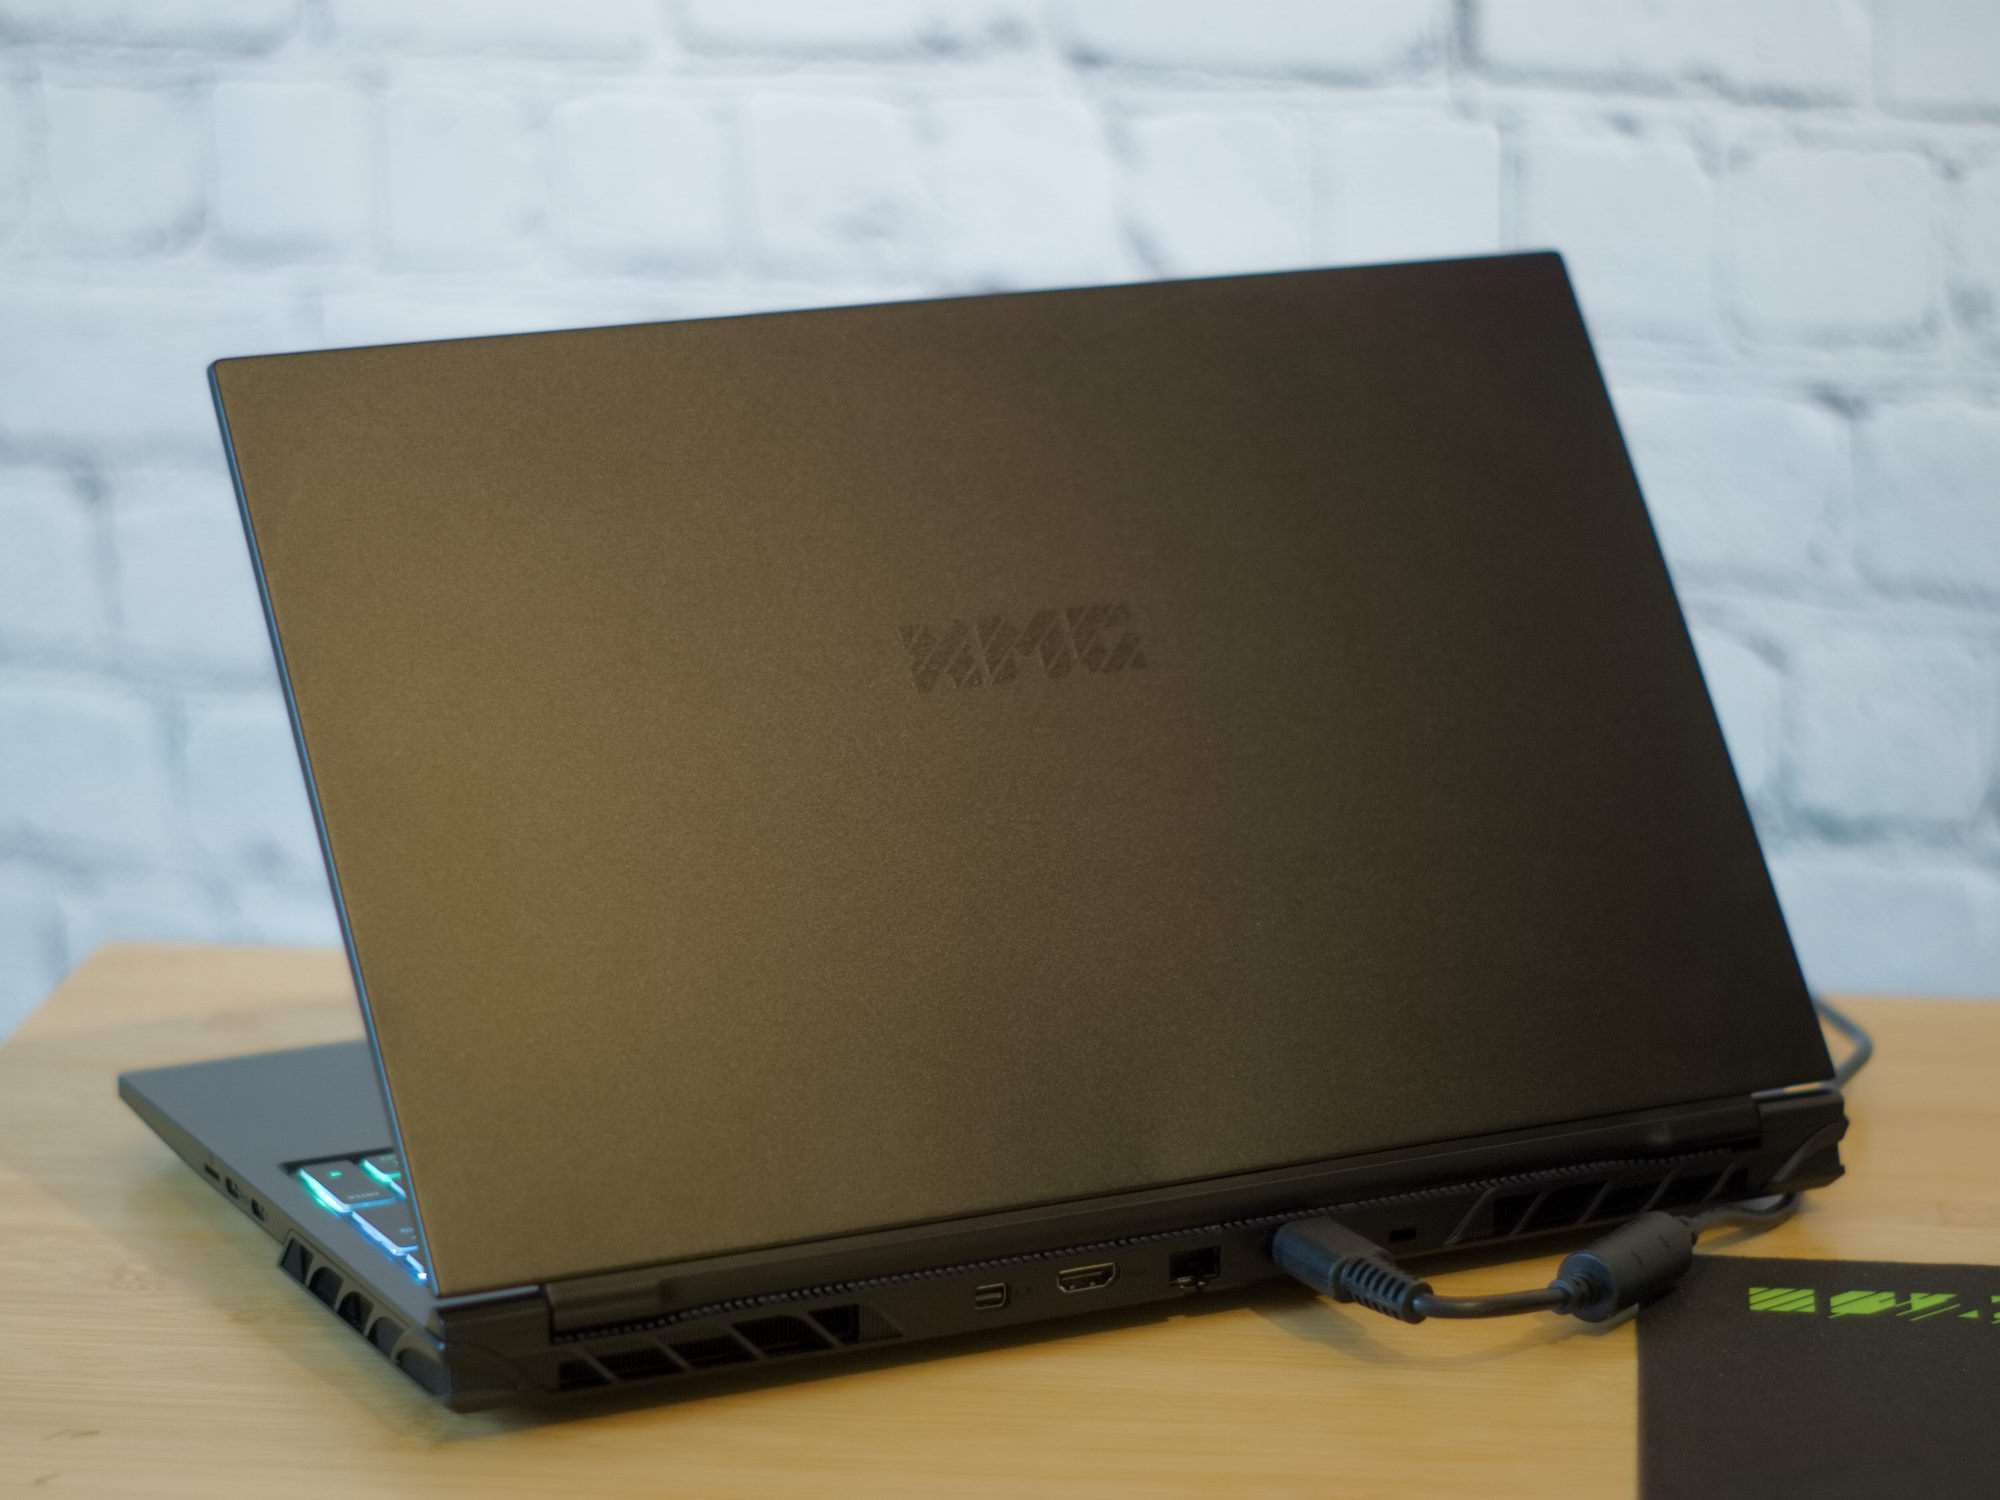
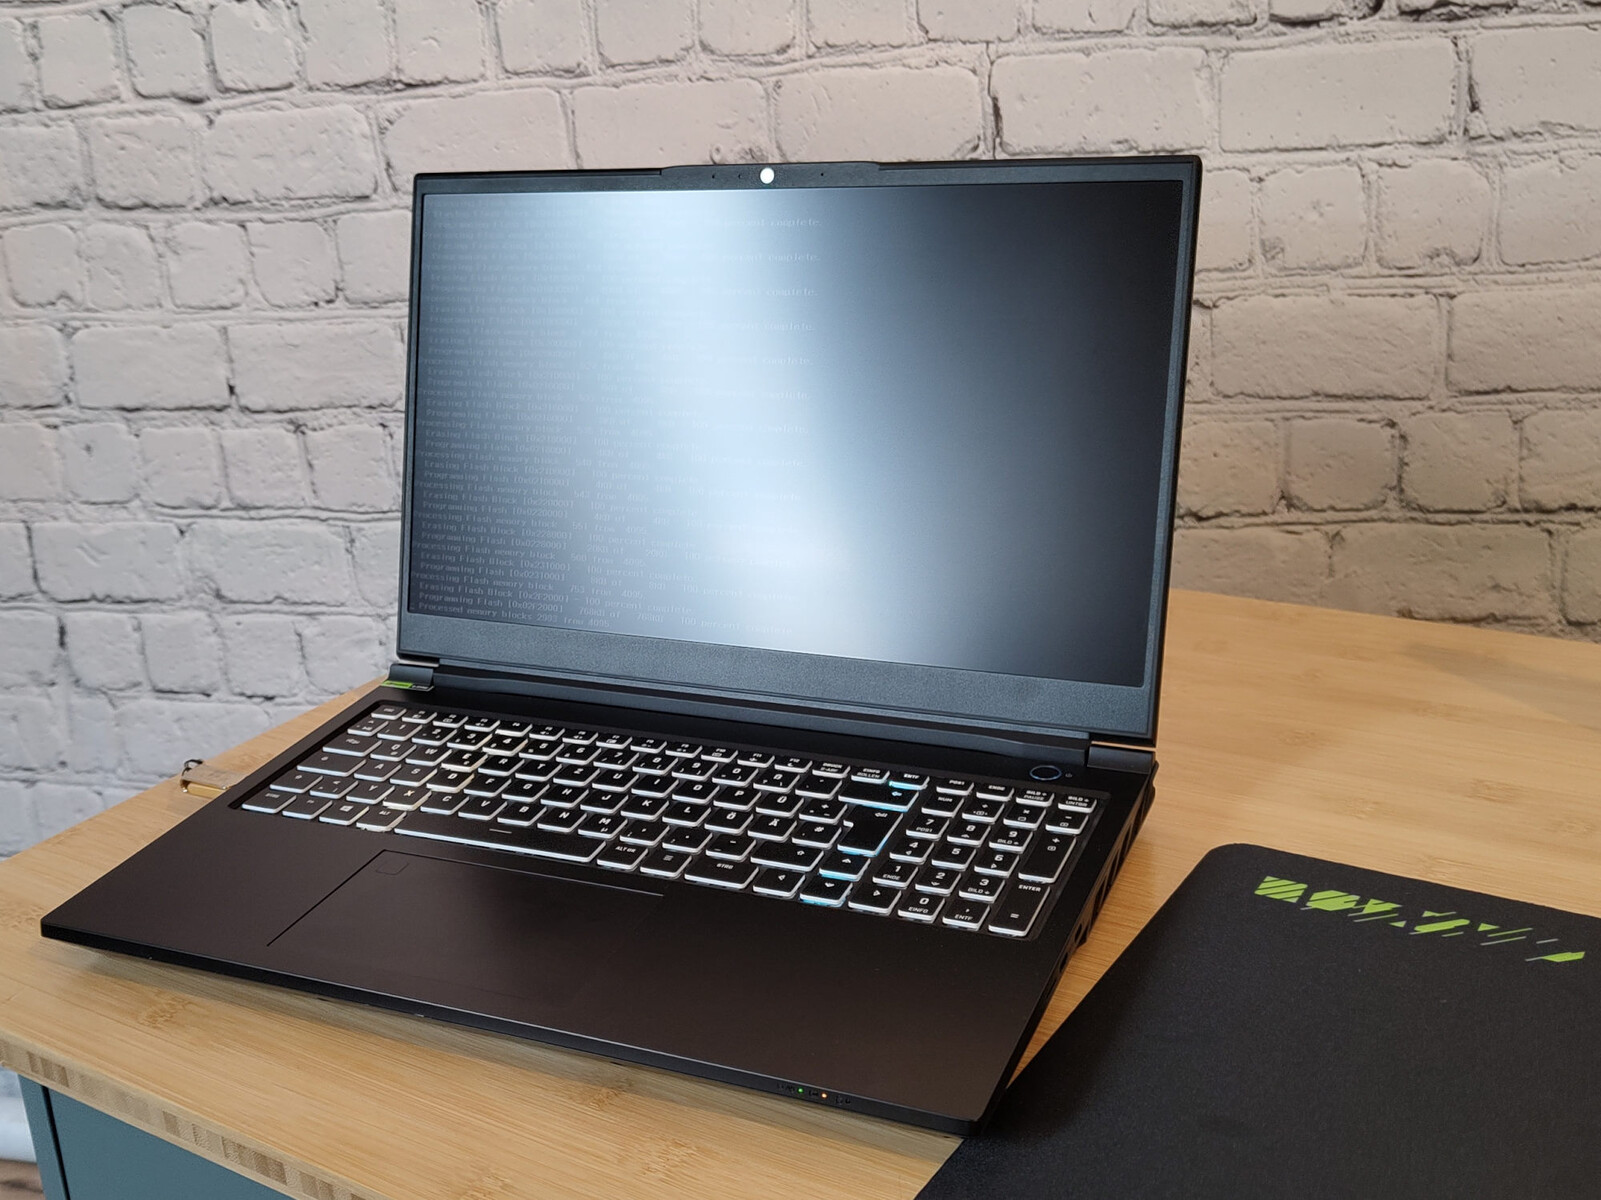
Boîtier et caractéristiques - Haute teneur en métal
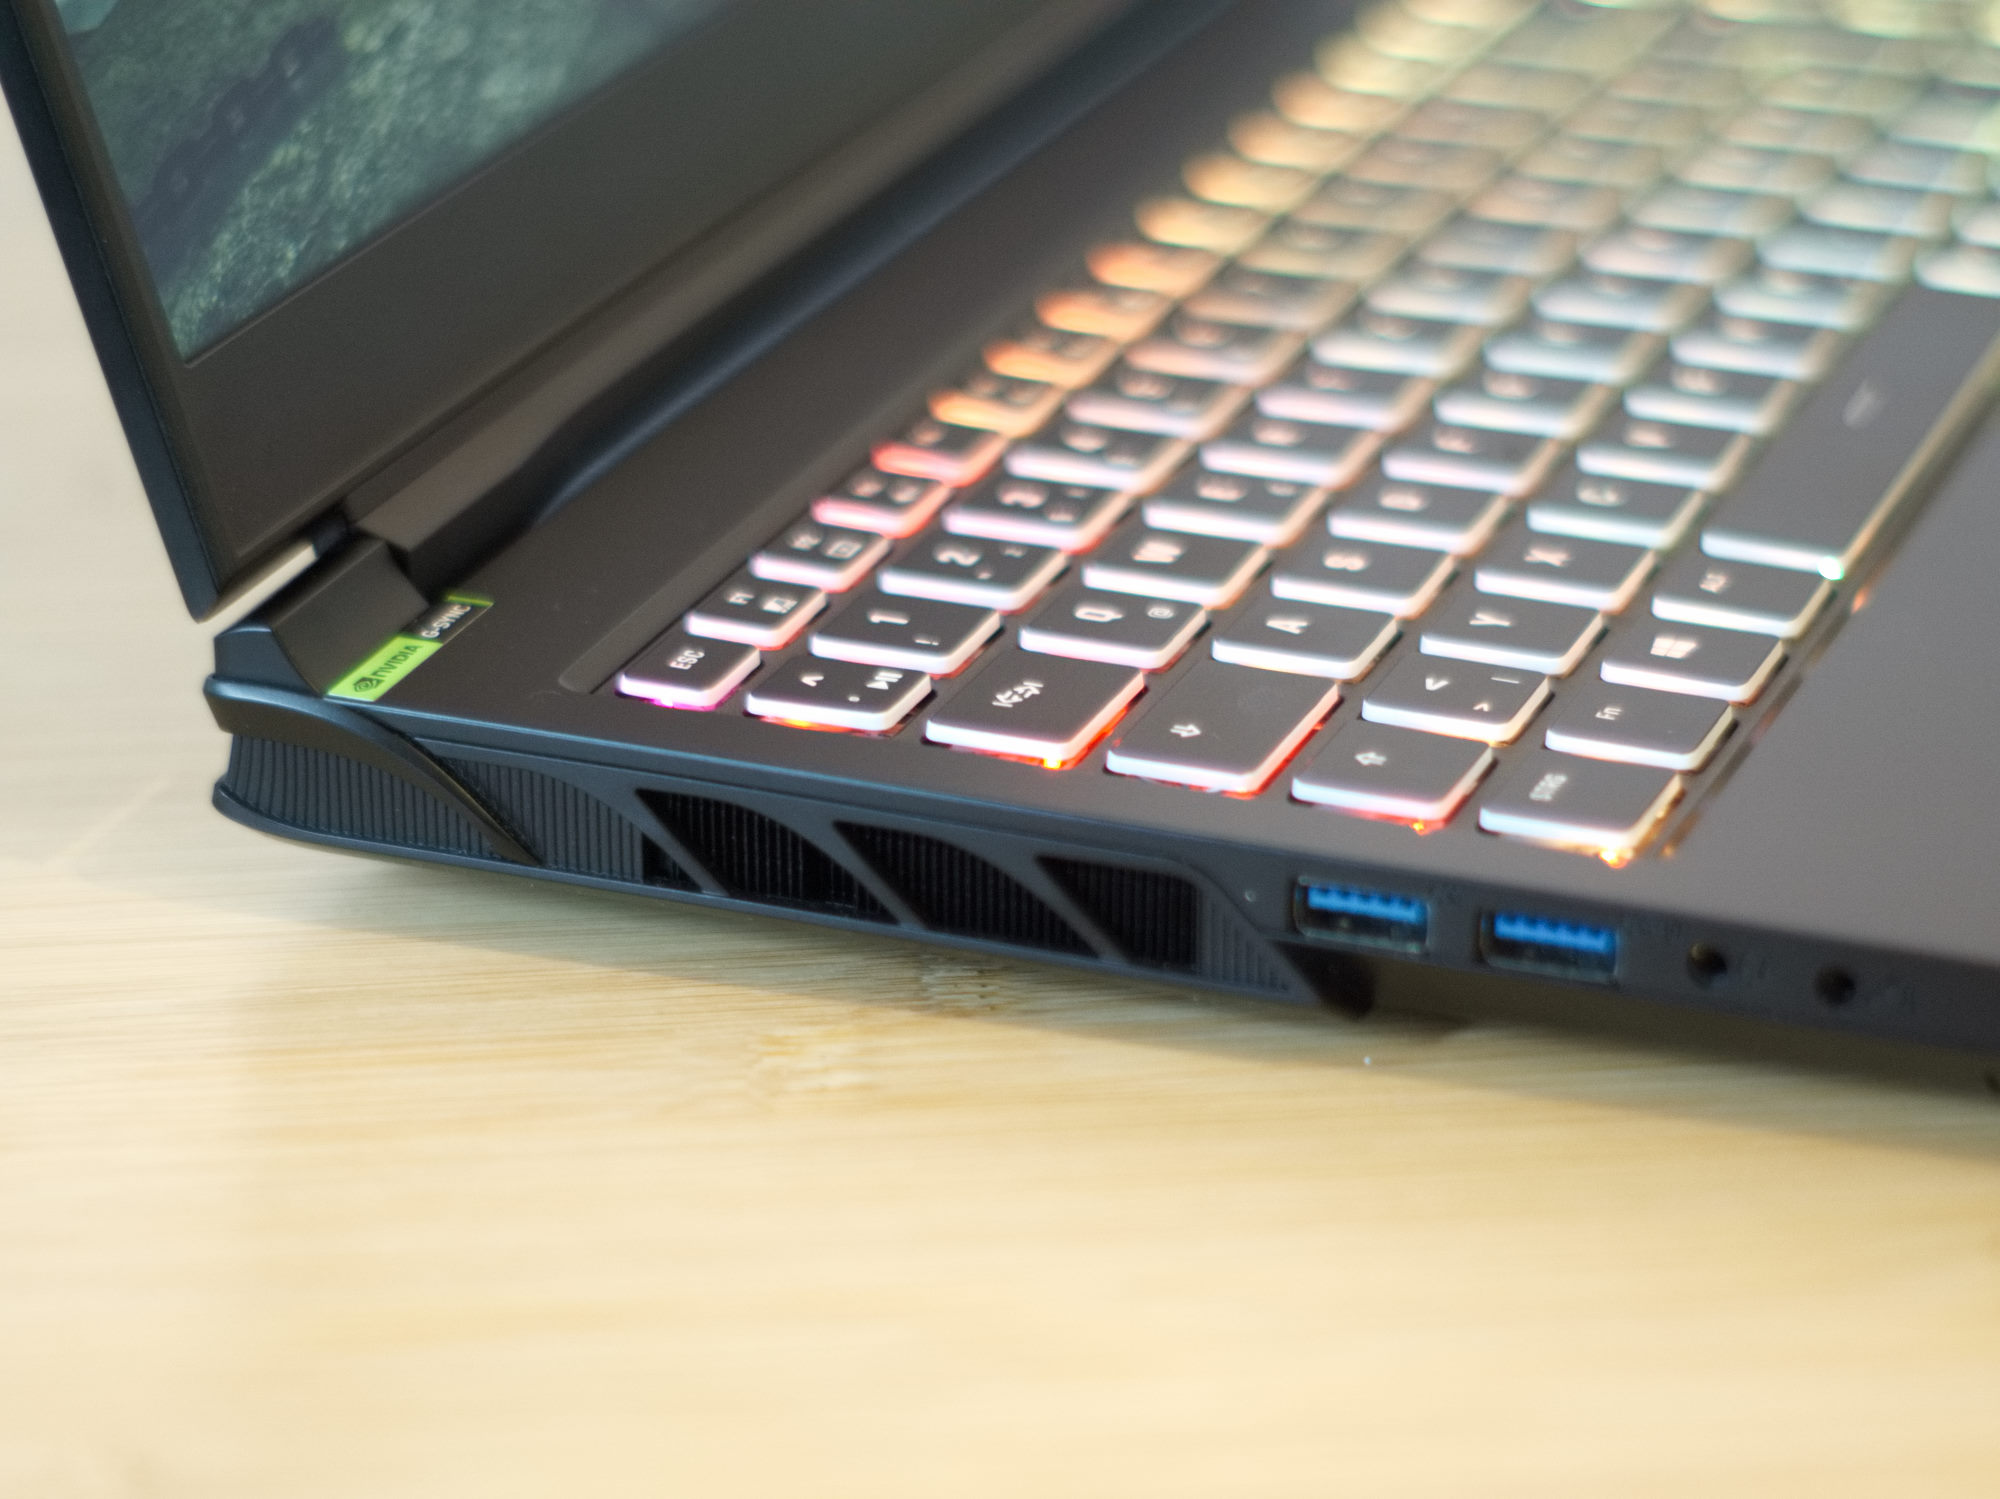
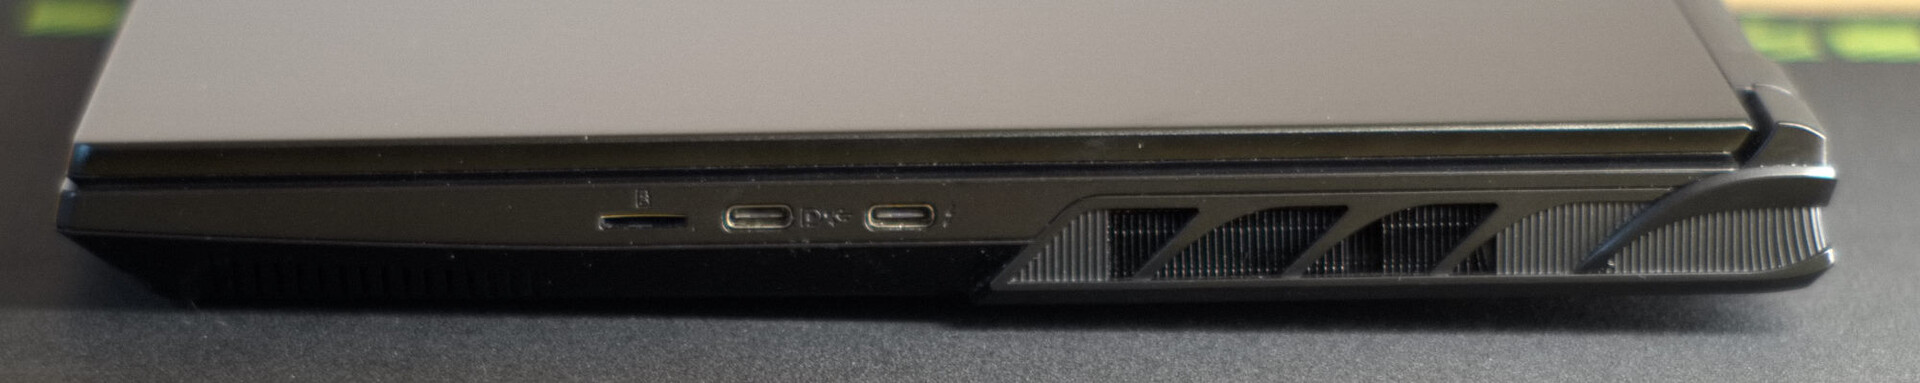
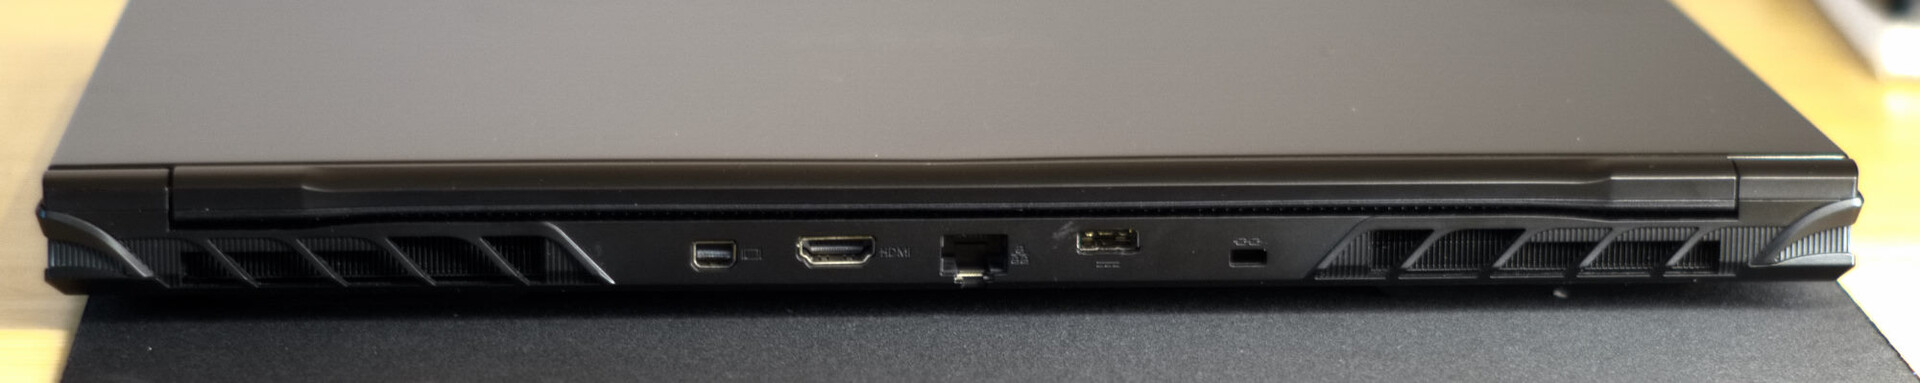
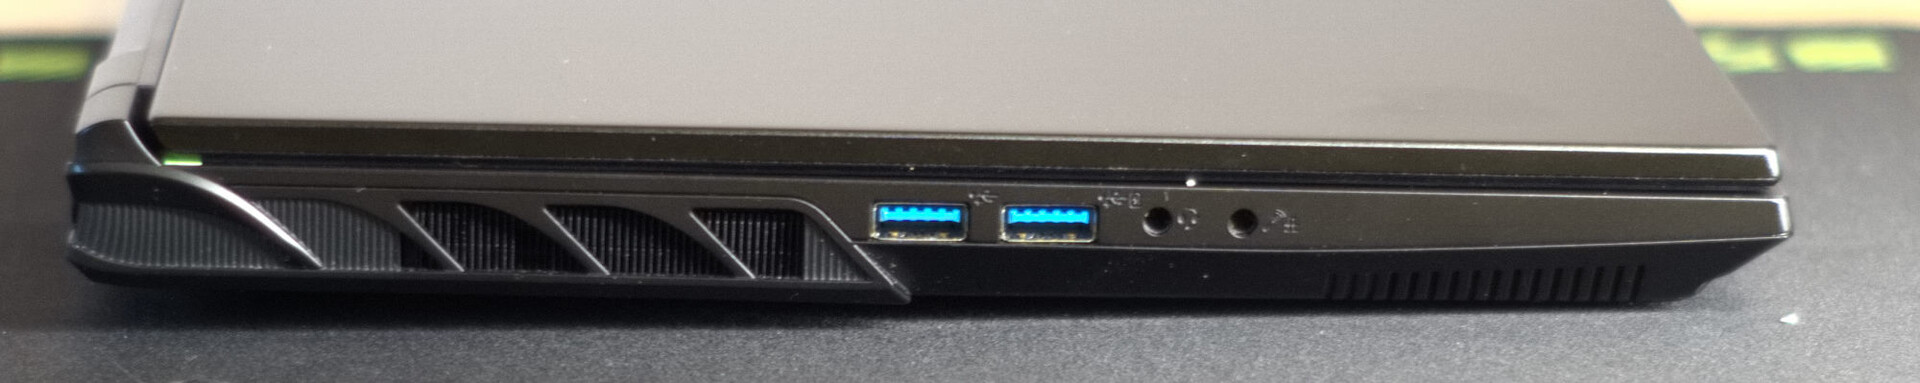
Par rapport à son prédécesseur, le Pro 15 E23 a reçu quelques ajustements de détail mineurs. Ceux qui sont concernés sont essentiellement les évents sur les côtés de l'ordinateur portable et une permutation de position de l'emplacement RJ45 et d'un emplacement USB-C. Désormais, tous les ports USB se trouvent sur les côtés de l'appareil.
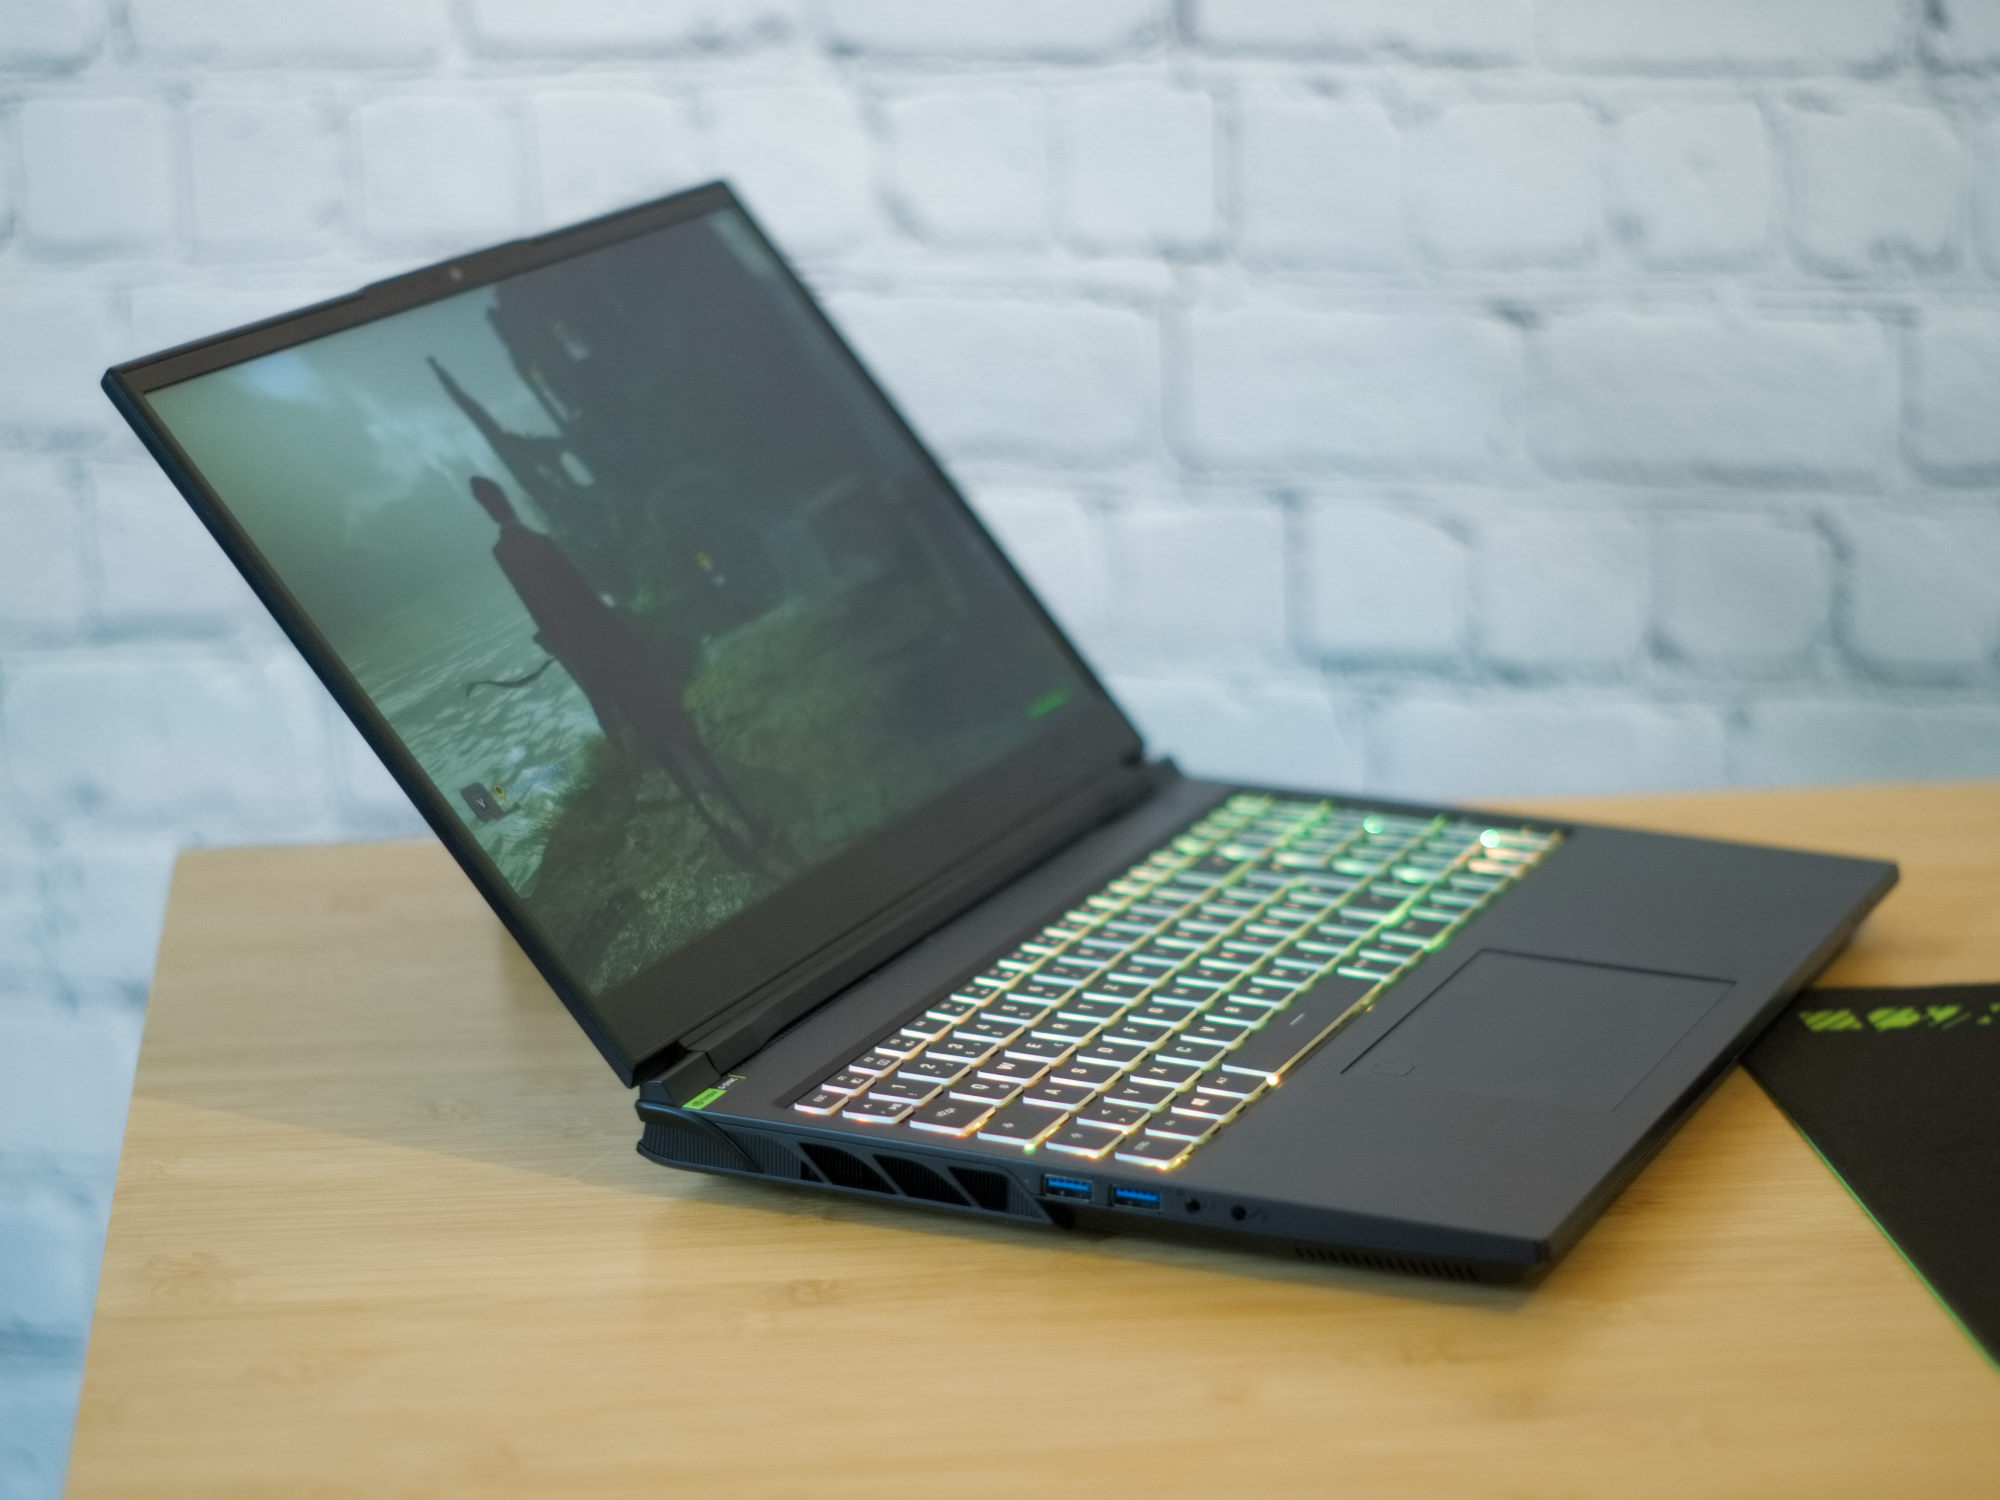
Le design reste sobre, noir et largement dépourvu de marque. La taille et le poids de l'ordinateur portable sont presque identiques à ceux de son prédécesseur. Le couvercle de l'écran et le bas de la coque sont toujours en aluminium, tandis que le haut de la coque est en plastique. L'écran est encadré par un large bord en plastique qui ne fait que 5 mm d'épaisseur sur les côtés, un centimètre en haut et deux centimètres en bas. Il est possible d'obtenir un petit grincement de l'écran et de la base en les tordant. Mais pour y parvenir, il faut déployer des efforts considérables, car toutes les pièces de l'ordinateur portable sont très bien construites et solides. Le clavier et le couvercle de l'écran ne fléchissent que sous l'effet d'une forte pression et les charnières maintiennent solidement l'écran dans toutes les positions imaginables entre 0° et 135°.
Lecteur de carte SD, Wi-Fi et webcam
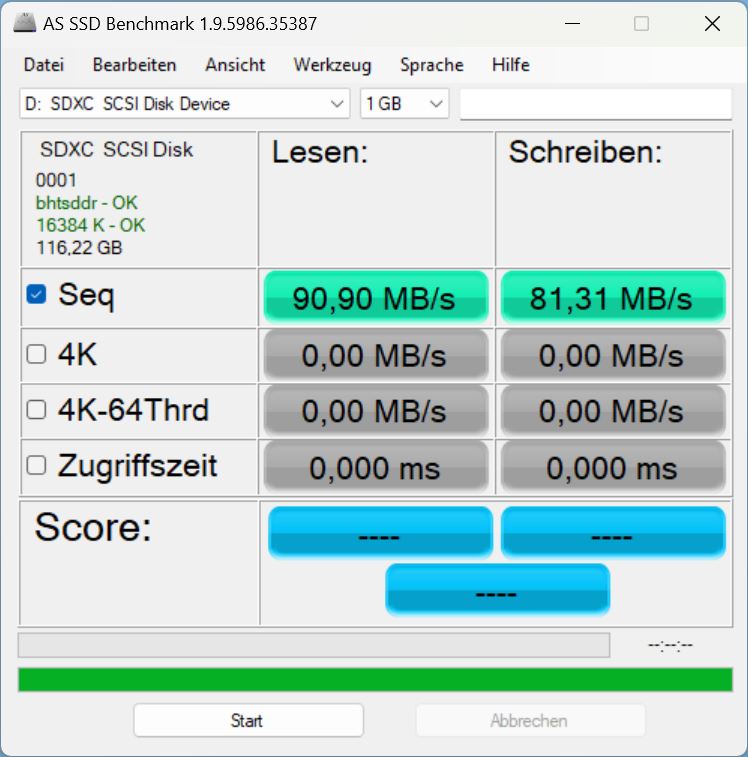
Le Das Pro 15 possède, du moins par rapport à de nombreux autres ordinateurs portables de jeu, un lecteur de carte microSD. Avec notre carte microSD AV Pro (V60), nous avons enregistré de bonnes vitesses de transfert de l'ordre de 80 à 90 MB/s.
Sur le réseau 6 GHz, l'Intel Wi-Fi 6E AX211 de l'ordinateur portable a montré des vitesses de données généralement excellentes, mais sur le réseau 5 GHz, il a donné des chiffres plutôt inférieurs à la moyenne en ce qui concerne les vitesses de transfert.
Pour les streamers, la qualité de la webcam Full HD intégrée risque d'être insuffisante, surtout dans de mauvaises conditions d'éclairage. Toutefois, elle peut être utilisée pour des appels vidéo occasionnels.
| SD Card Reader | |
| average JPG Copy Test (av. of 3 runs) | |
| Moyenne de la classe Gaming (20.9 - 210, n=54, 2 dernières années) | |
| Schenker XMG Pro 15 (E23) | |
| Schenker XMG Pro 15 (i7-12700H, RTX 3080 Ti) | |
| Asus ZenBook Pro 14 Duo UX8402VV-P1021W (AV Pro SD microSD 128 GB V60) | |
| Alienware x16 R1 (AV PRO microSD 128 GB V60) | |
| maximum AS SSD Seq Read Test (1GB) | |
| Alienware x16 R1 (AV PRO microSD 128 GB V60) | |
| Moyenne de la classe Gaming (25.5 - 261, n=51, 2 dernières années) | |
| Schenker XMG Pro 15 (i7-12700H, RTX 3080 Ti) | |
| Schenker XMG Pro 15 (E23) | |
| Asus ZenBook Pro 14 Duo UX8402VV-P1021W (AV Pro SD microSD 128 GB V60) | |

 GeForce RTX 4060 Laptop GPU, i9-13900HX, Crucial P5 Plus 1TB CT1000P5PSSD8")
 GeForce RTX 4060 Laptop GPU, i9-13900HX, Crucial P5 Plus 1TB CT1000P5PSSD8")
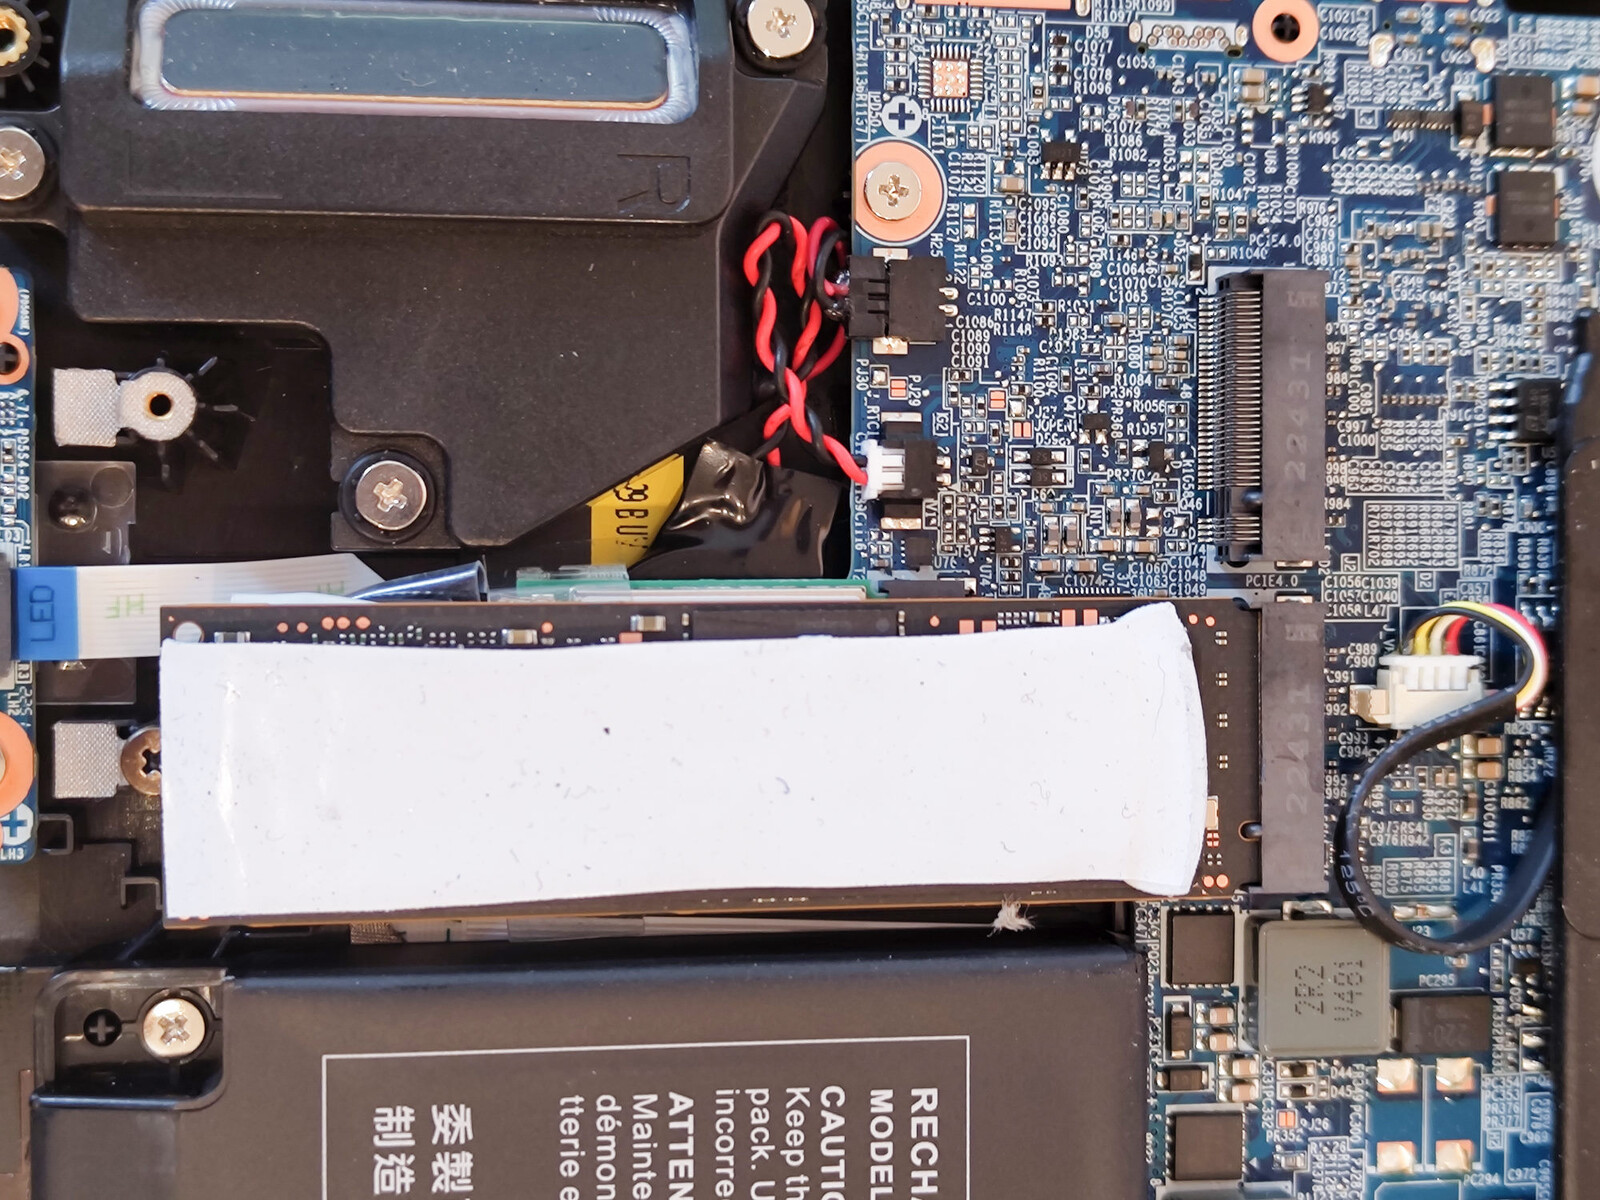
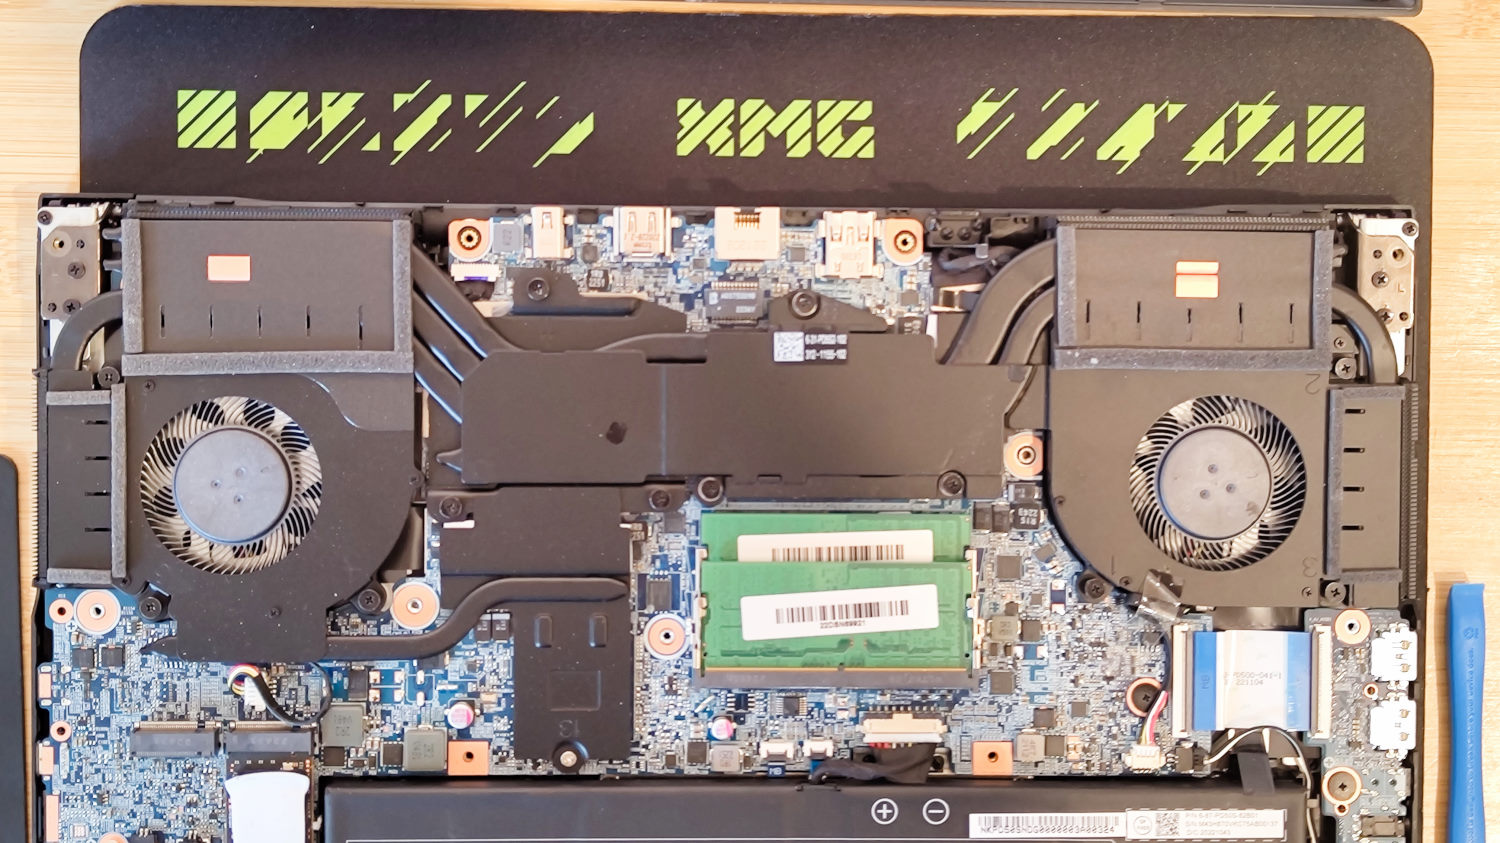
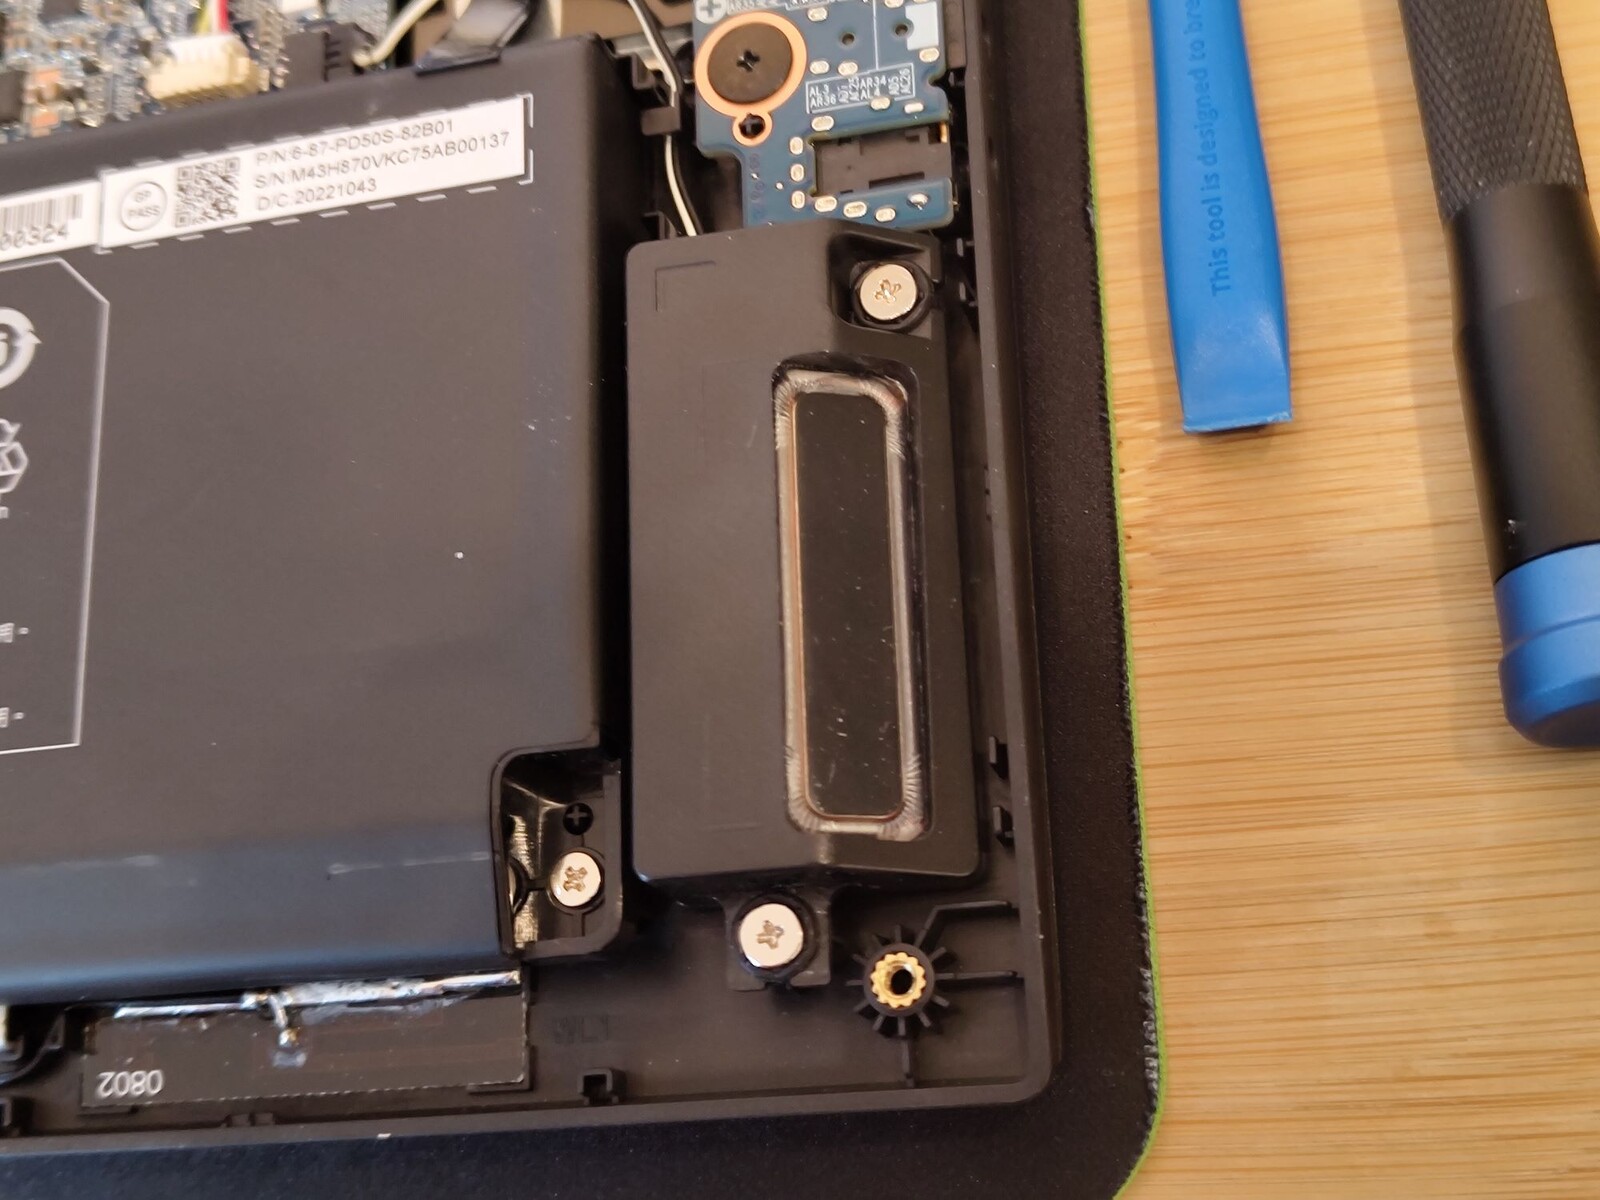
Accessoires et entretien
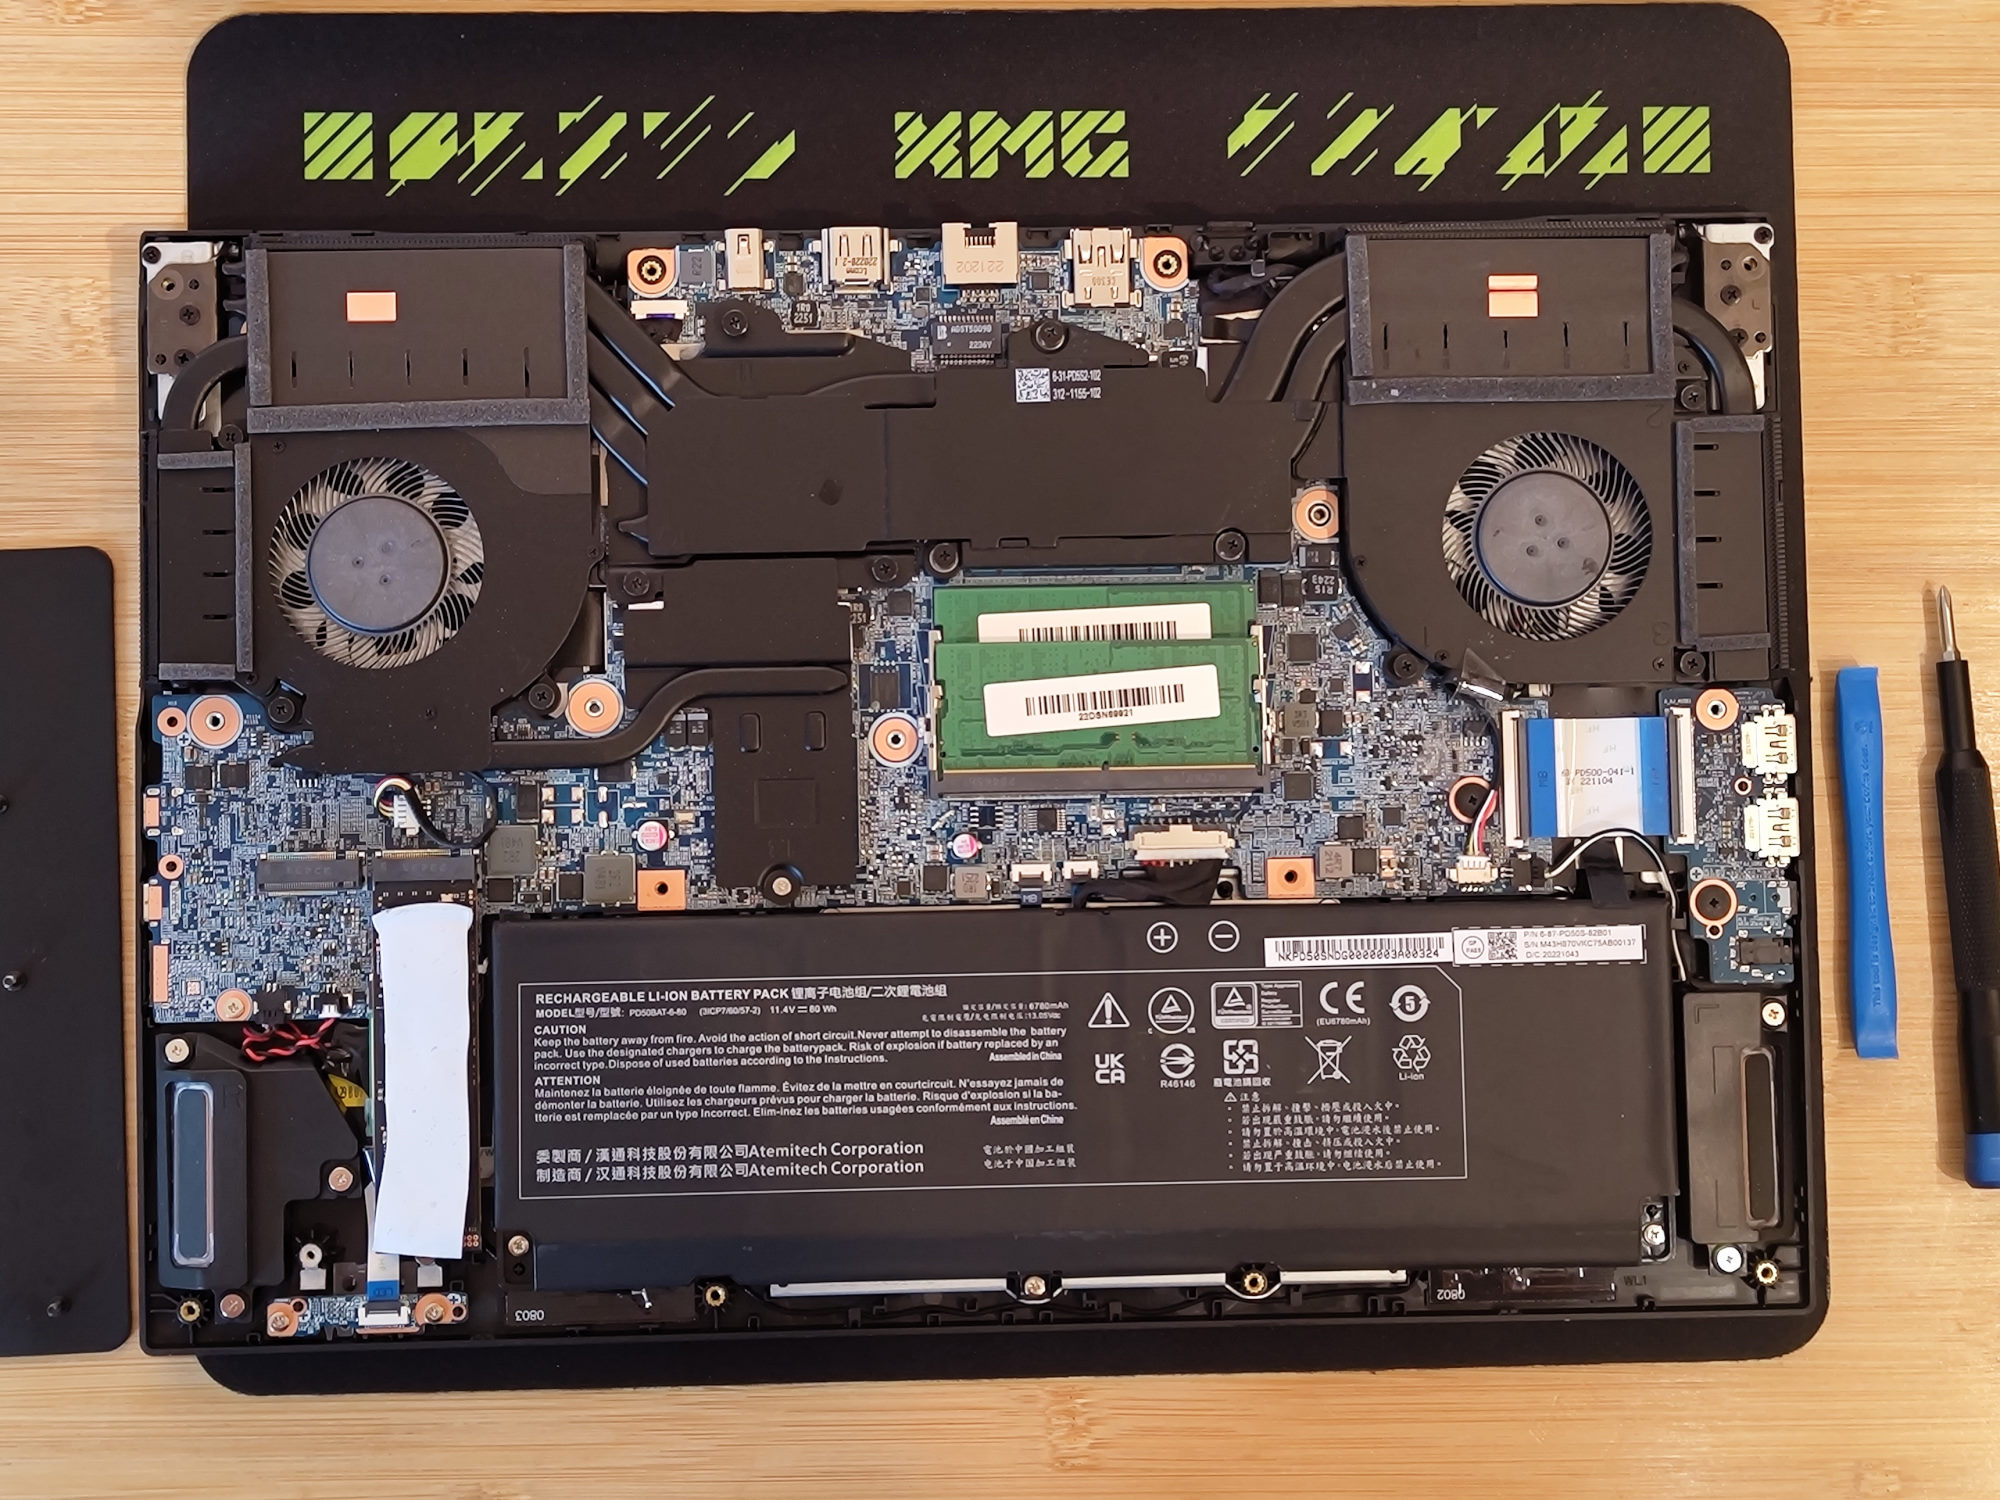
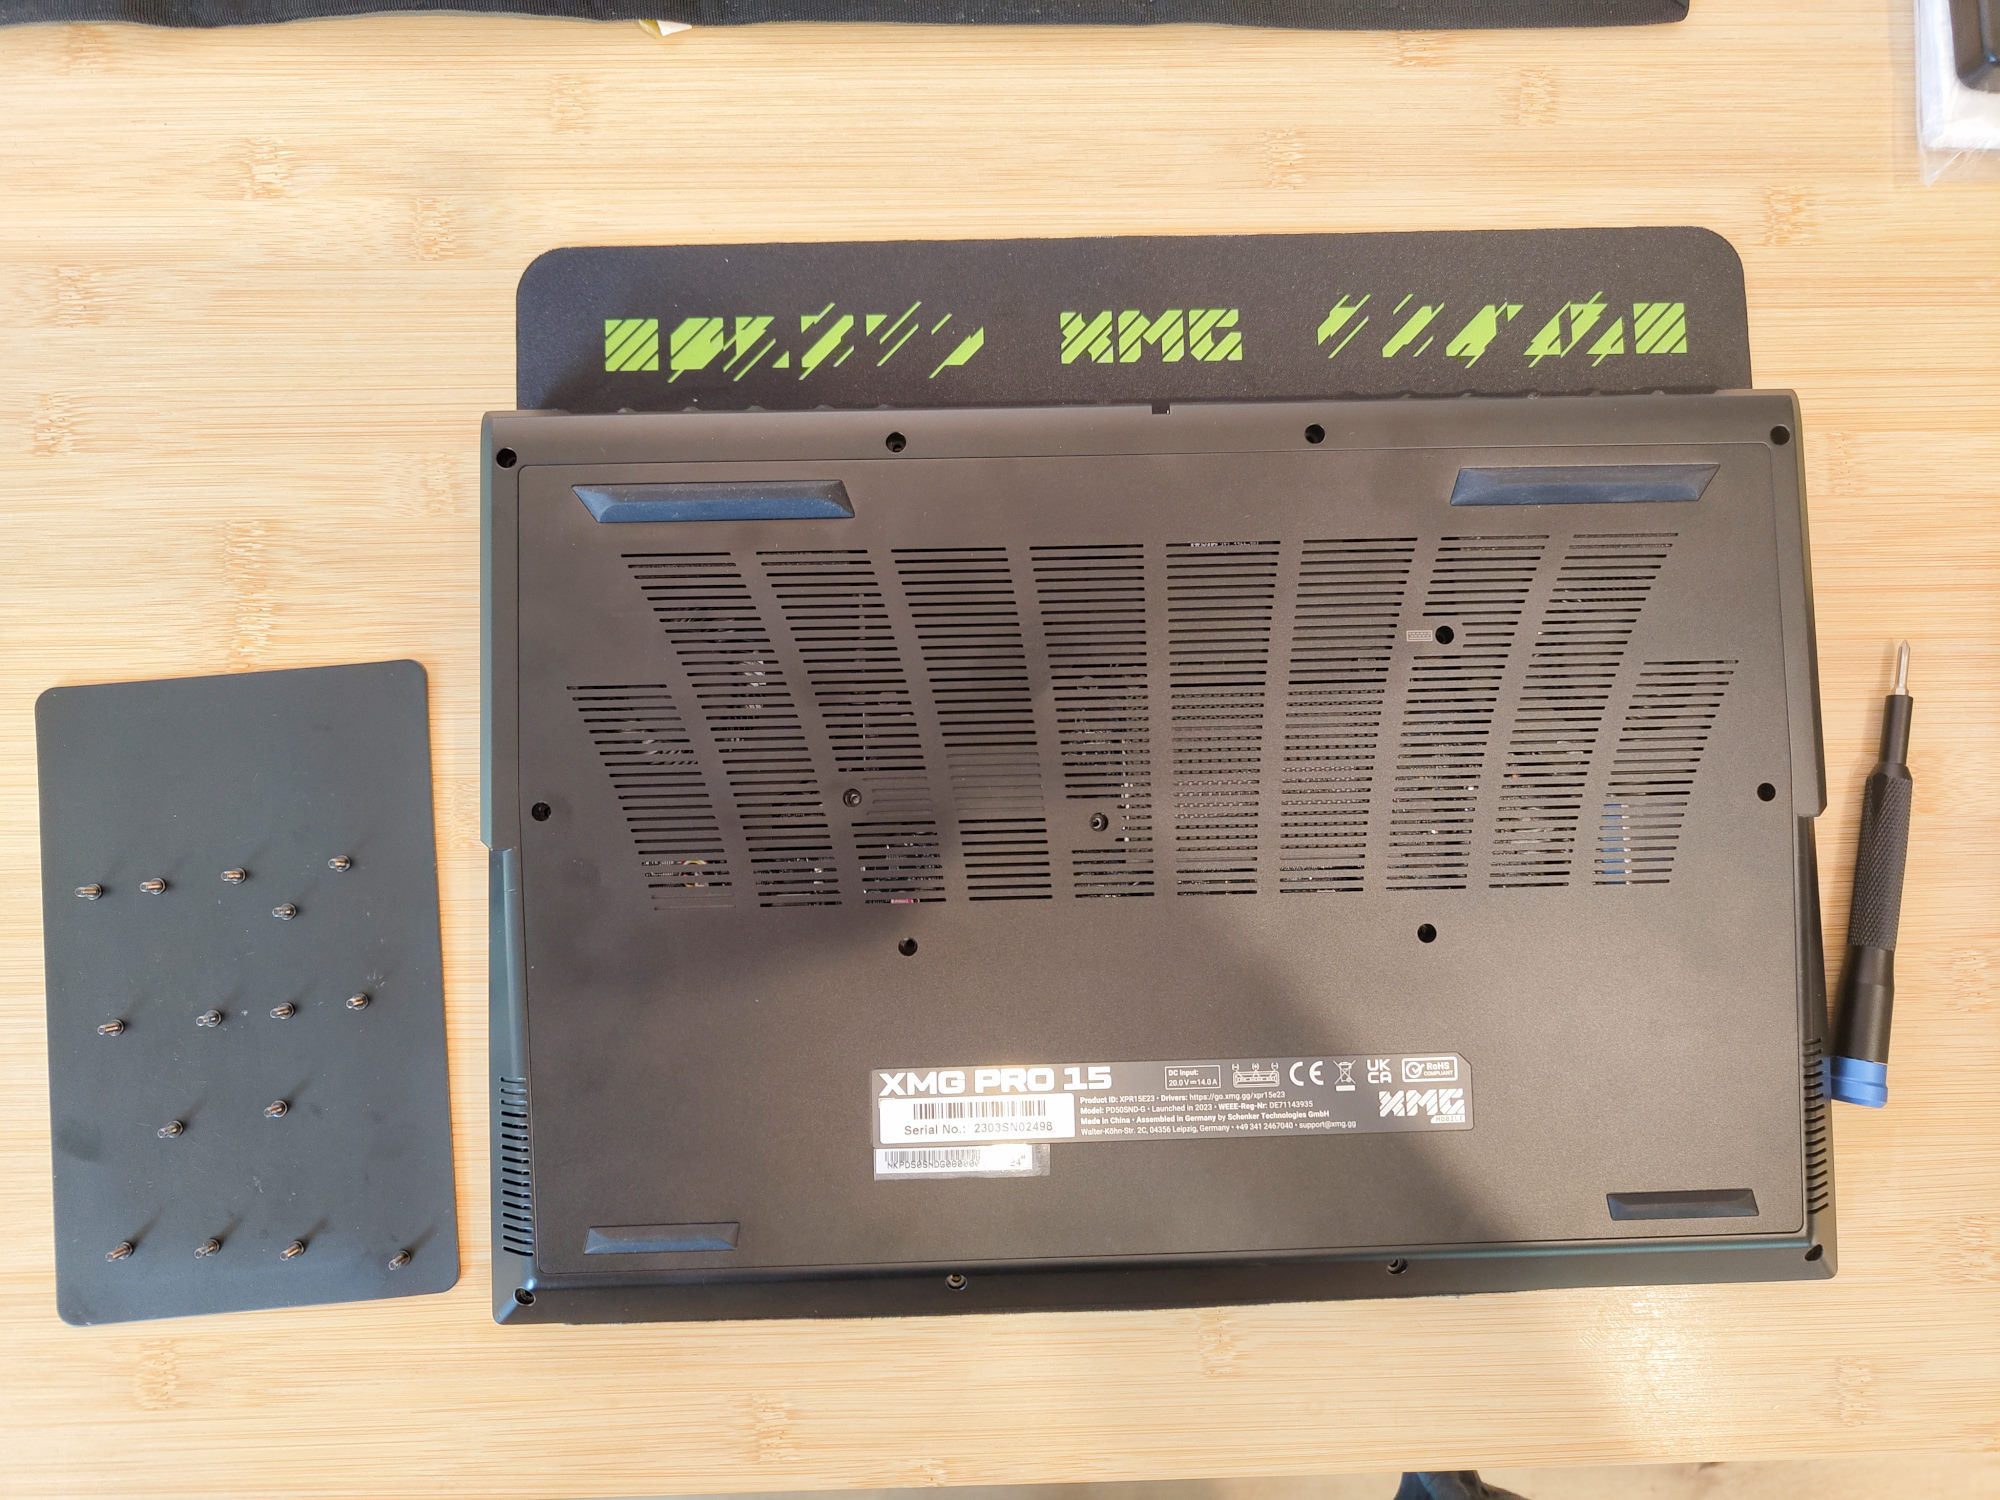
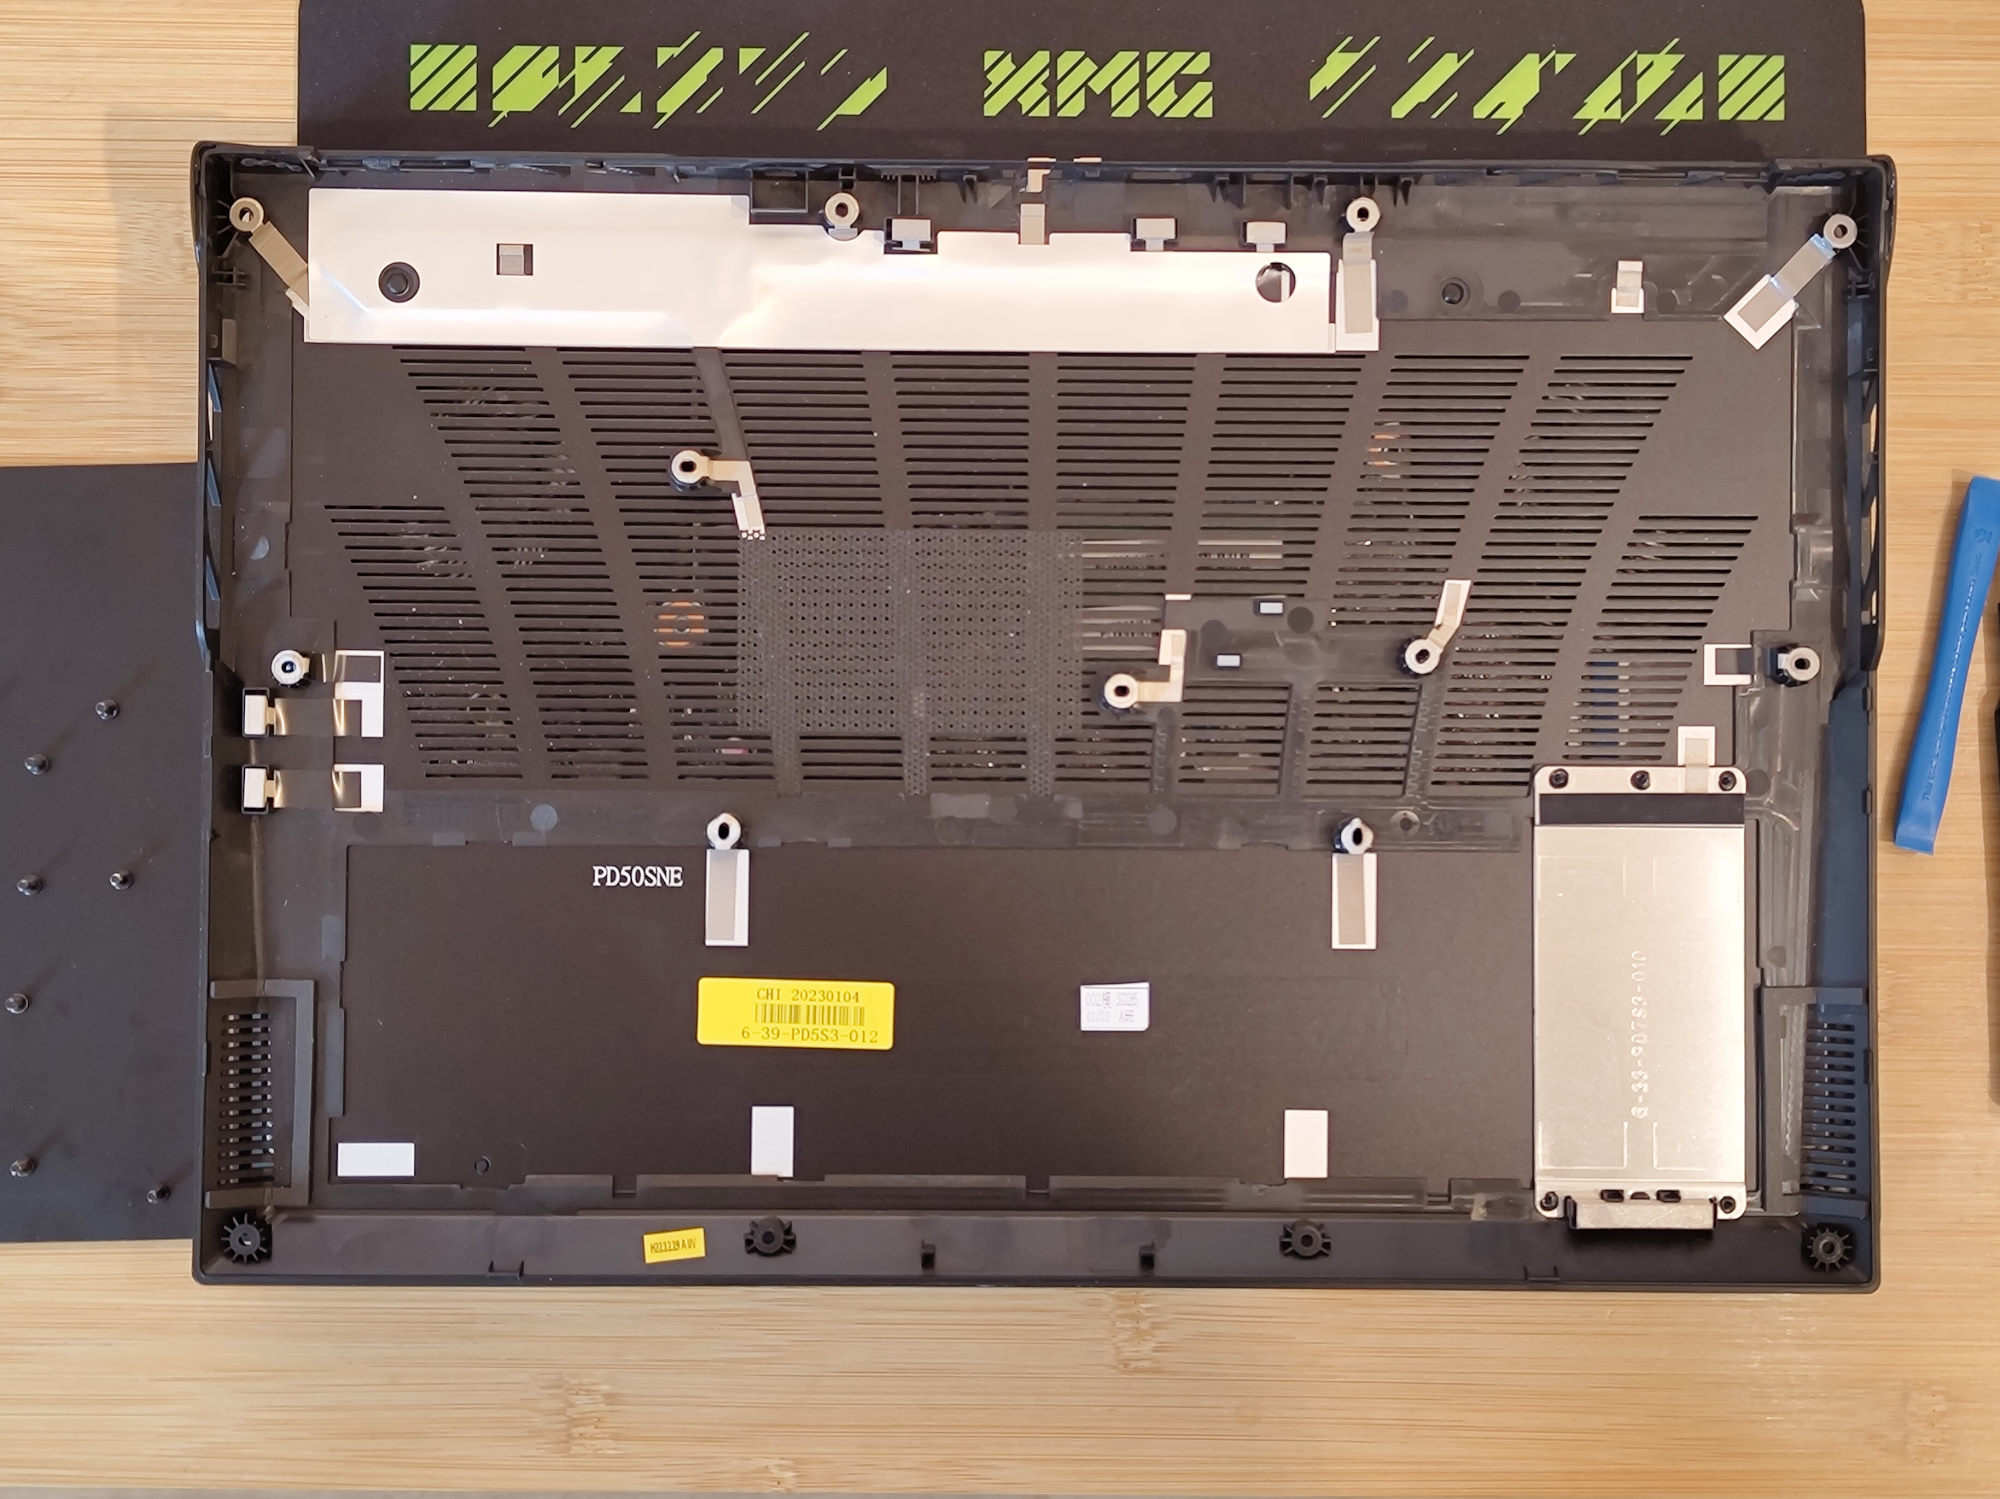
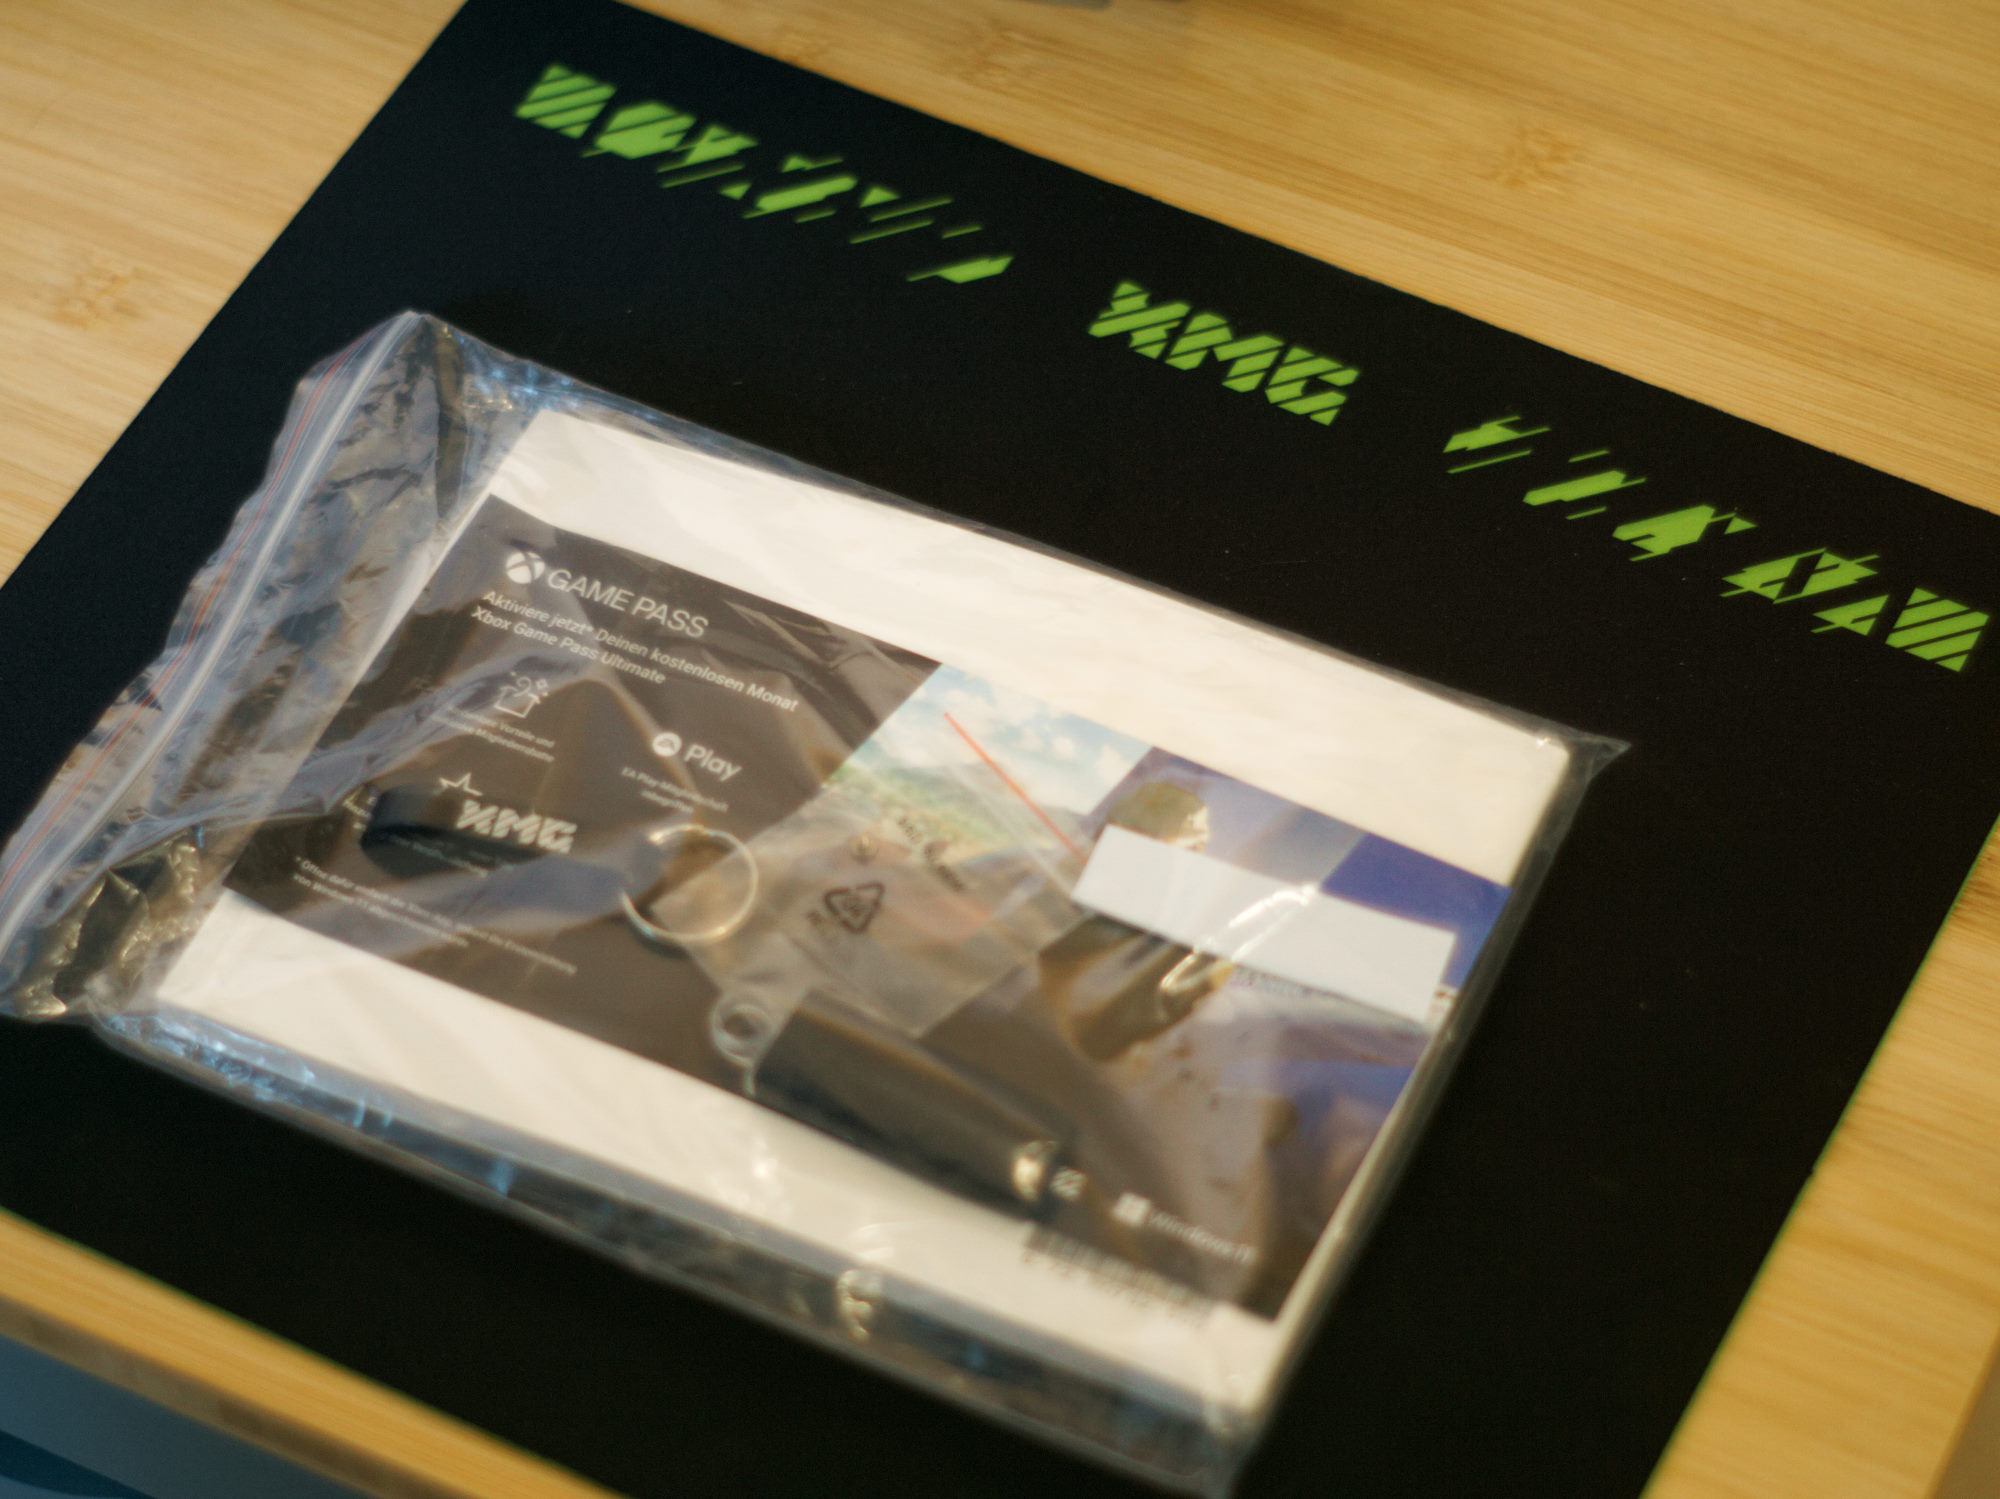
Le couvercle de la base est fixé par 15 vis. En les dévissant, le couvercle peut être facilement ouvert par l'avant à l'aide d'un outil d'ouverture en plastique. Sous le capot, vous trouverez de la RAM interchangeable et un emplacement M.2 libre pour un SSD supplémentaire. Le coussin thermique approprié est fourni avec l'ordinateur portable, ainsi qu'un CD avec les pilotes, une clé USB avec le même contenu, un grand tapis de souris et un décapsuleur.
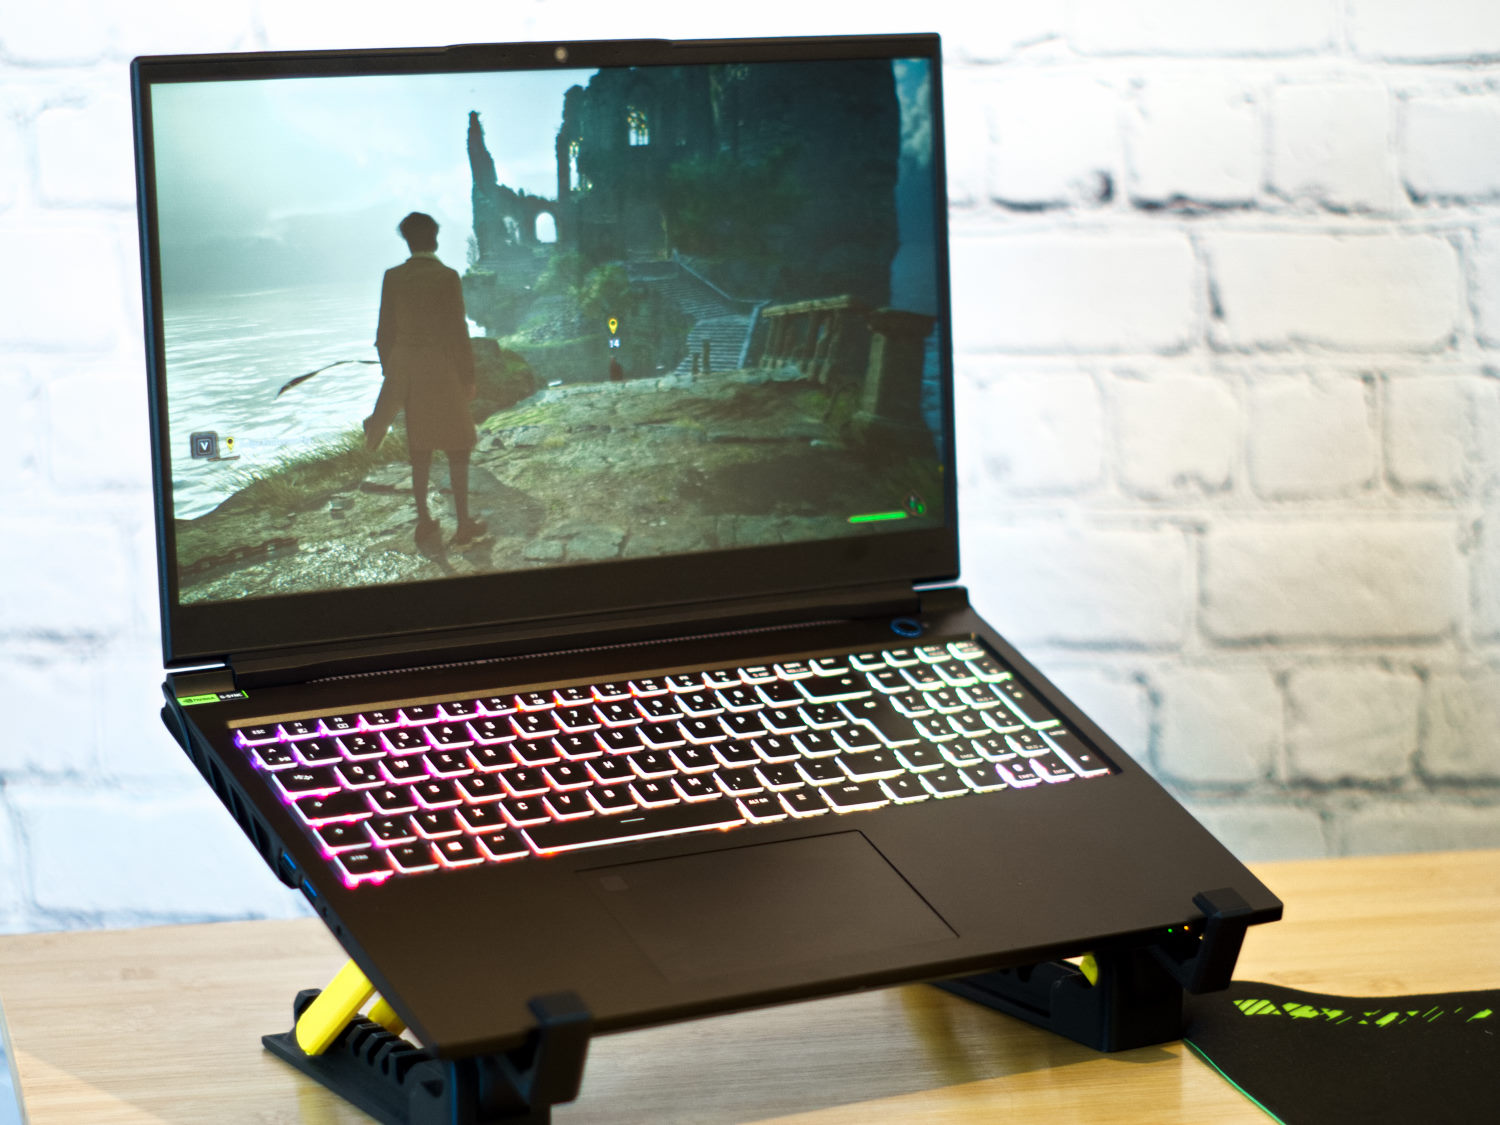
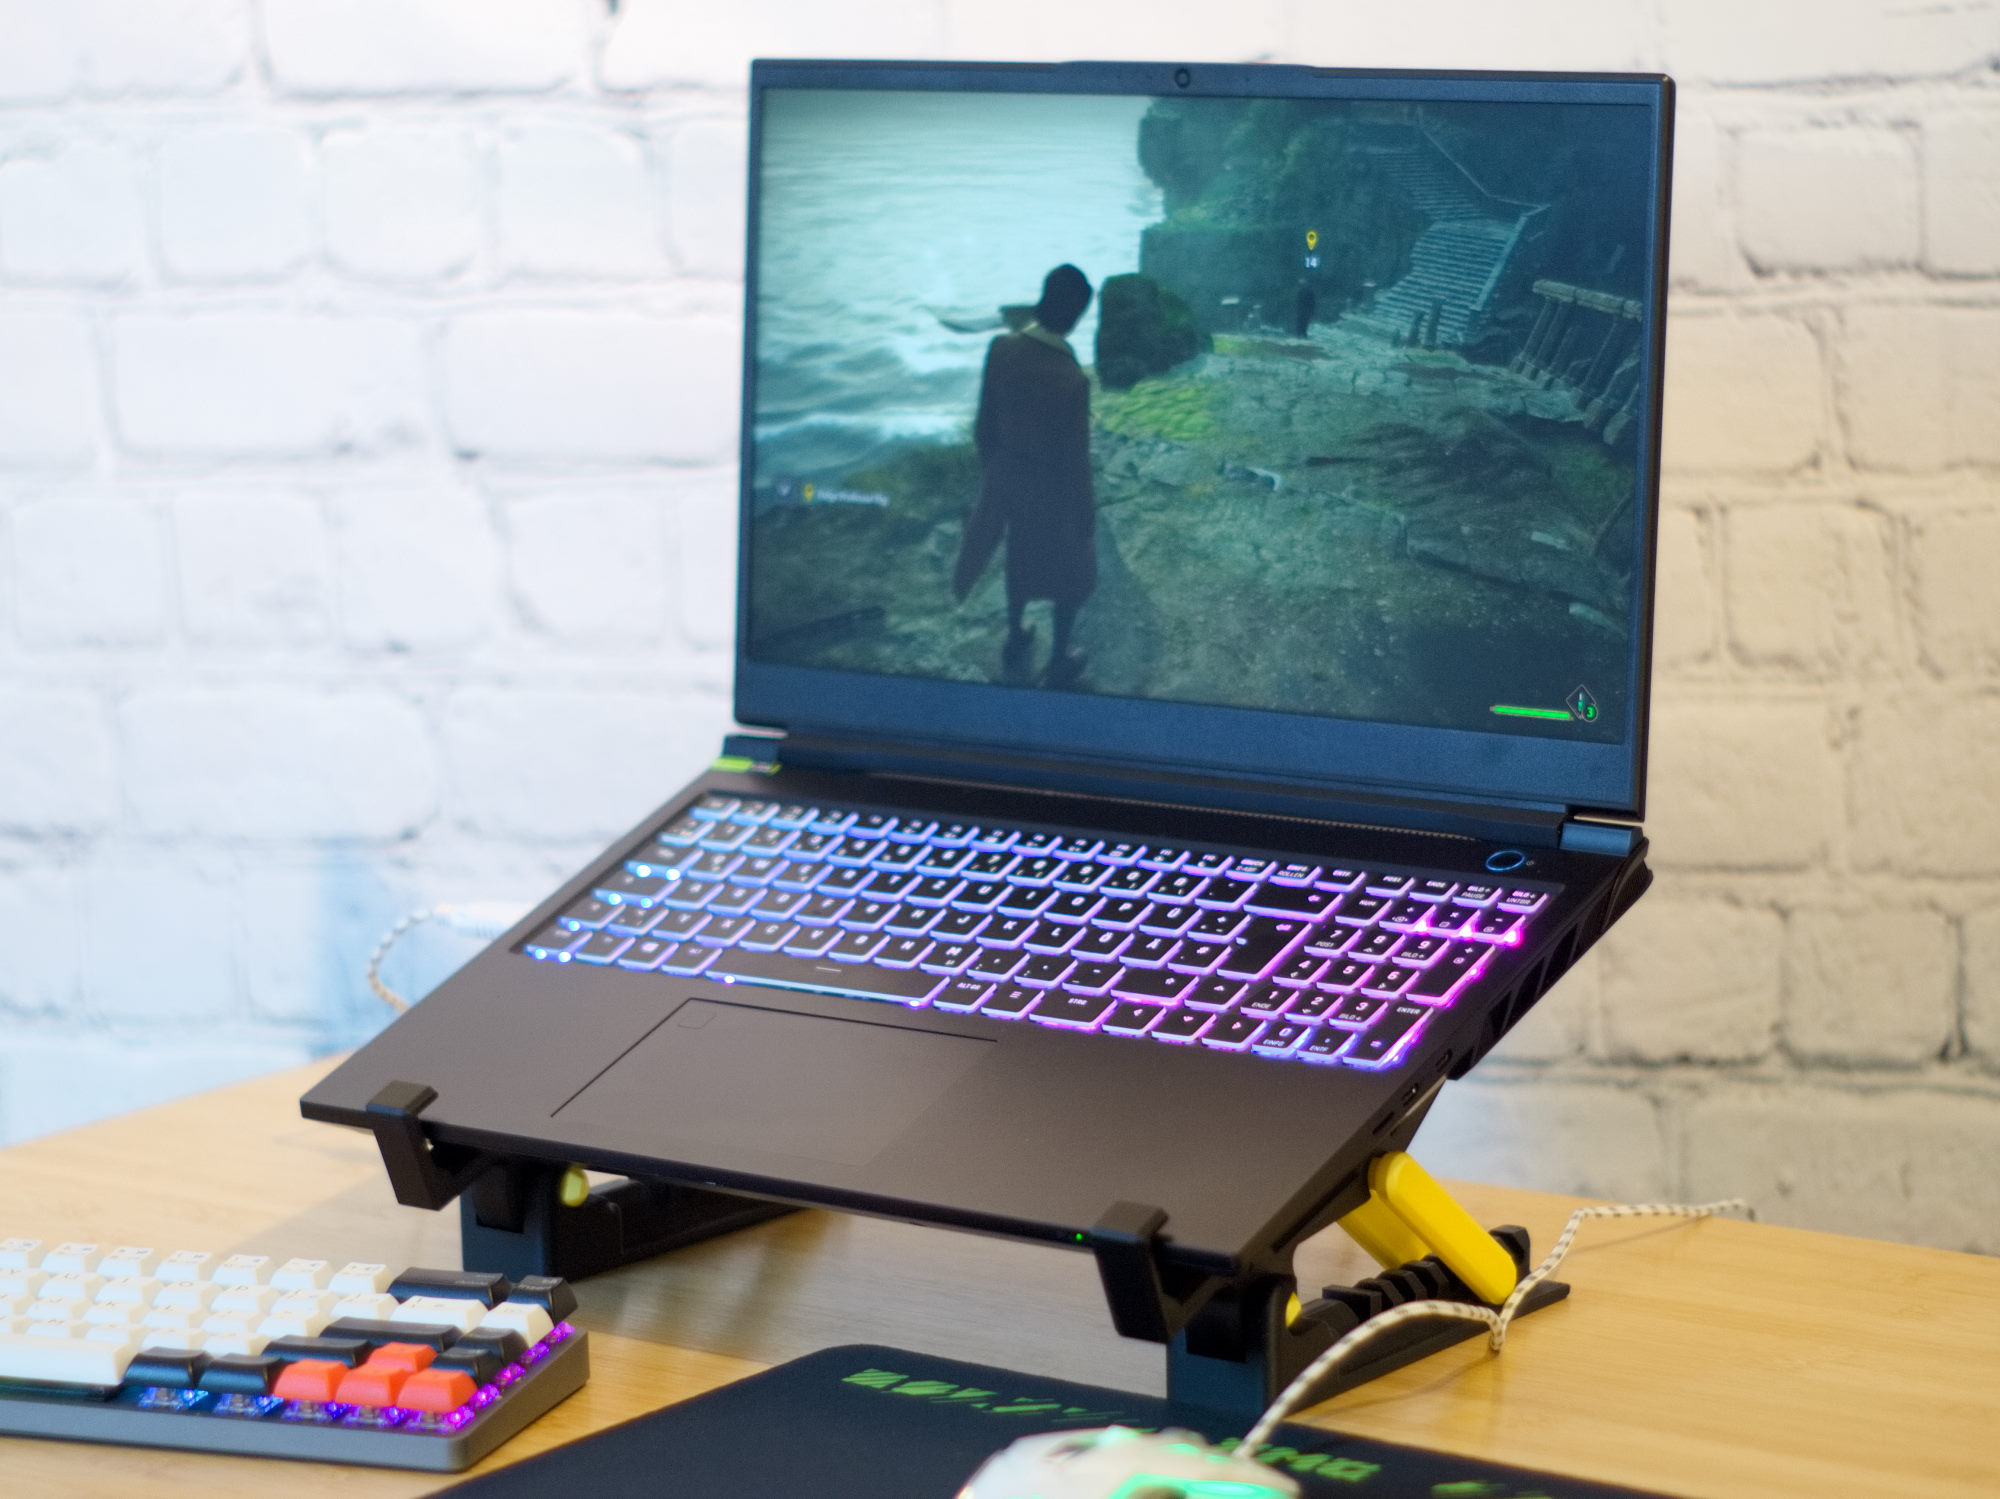
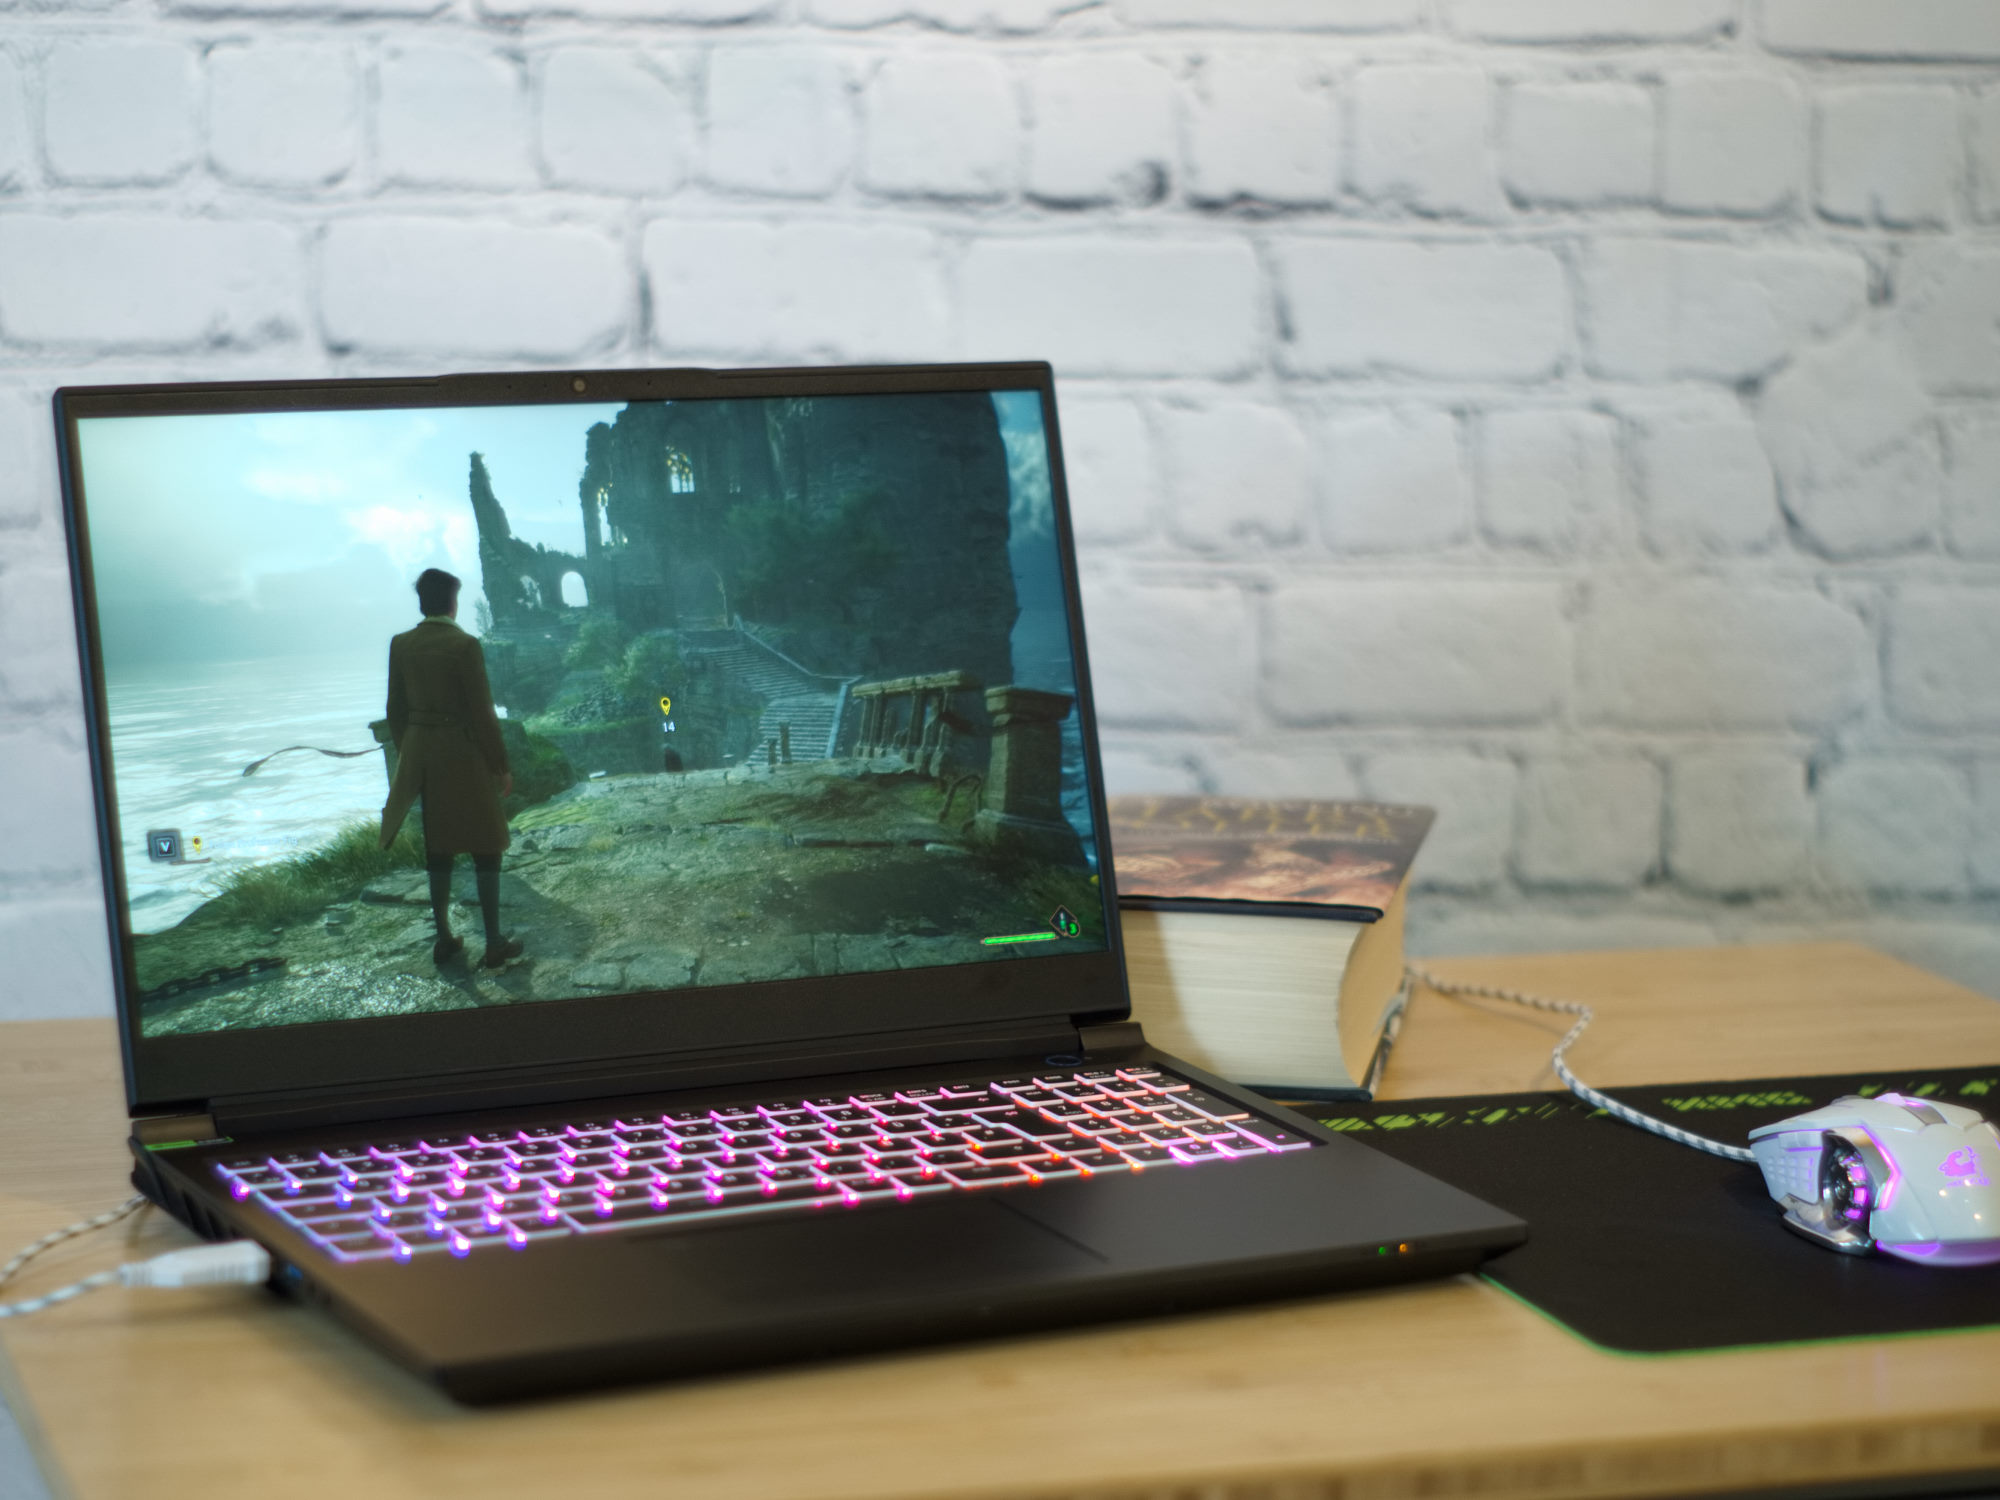
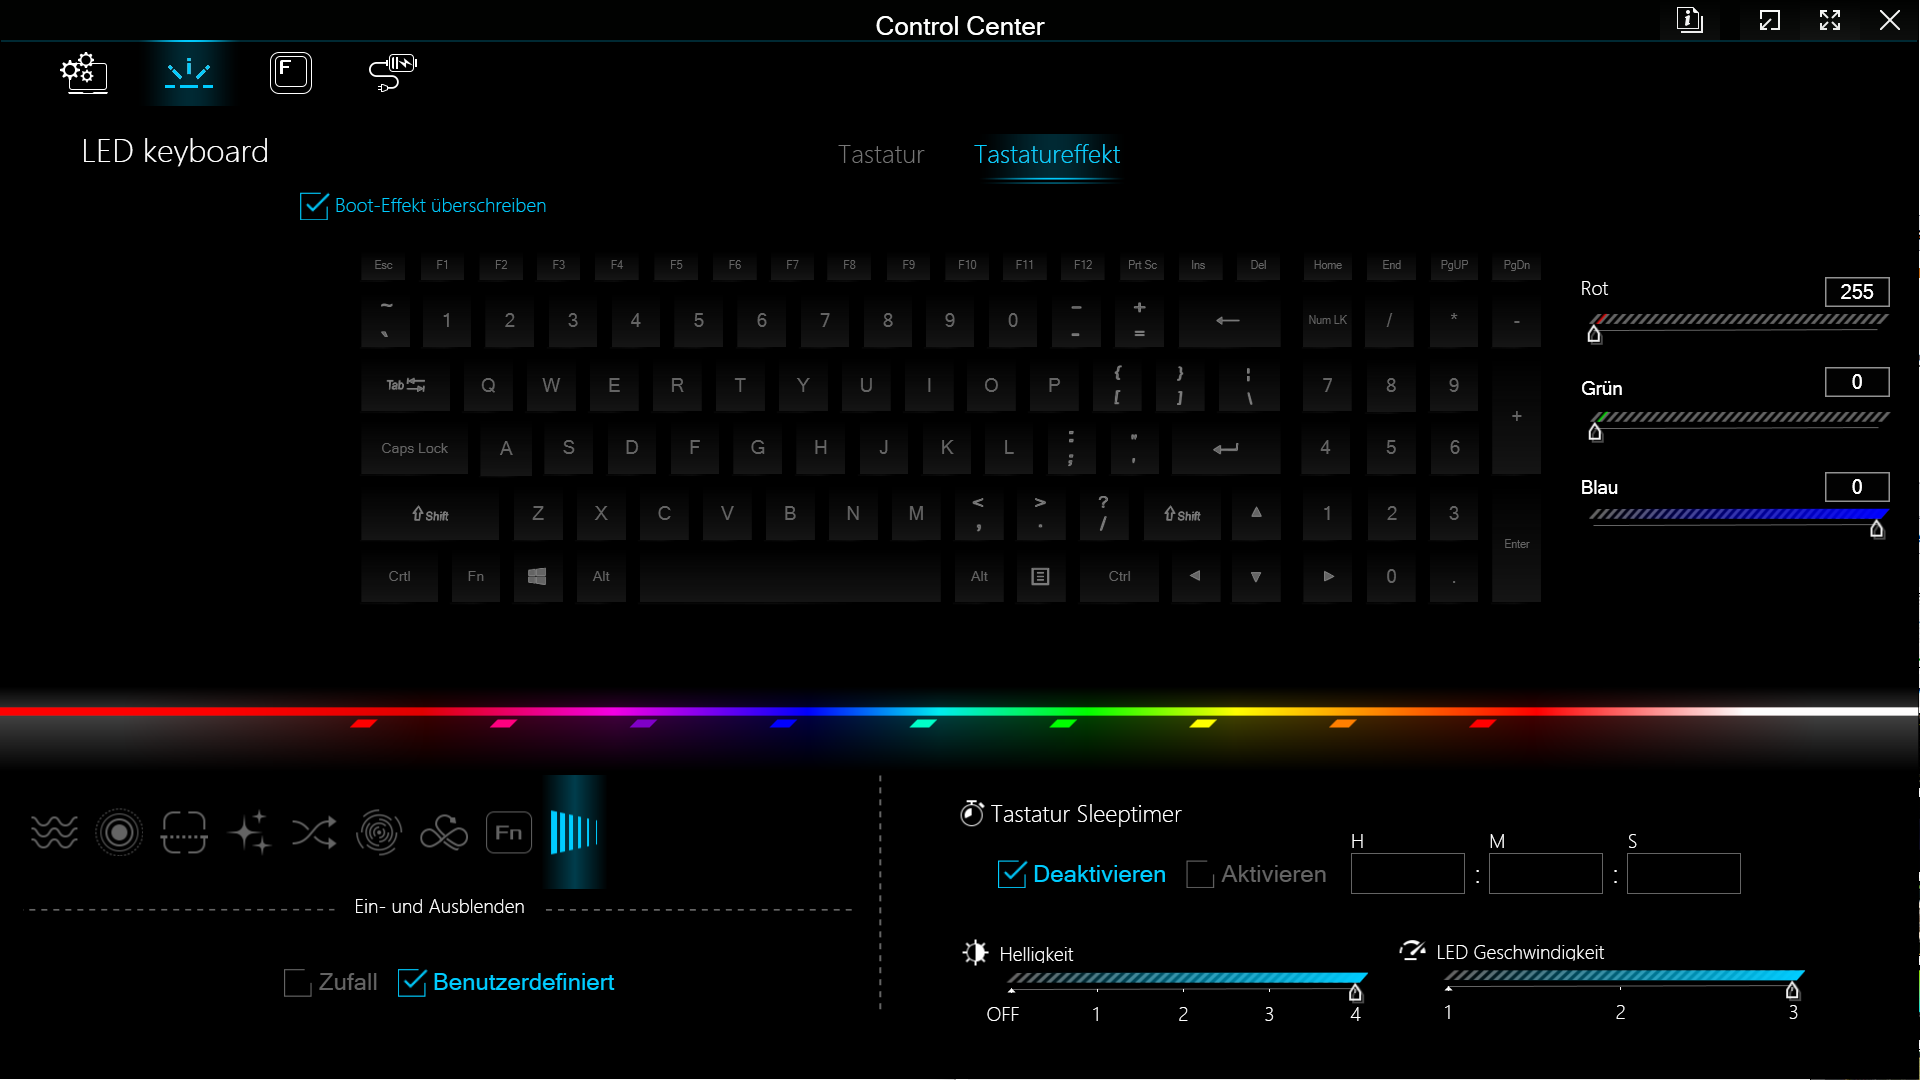
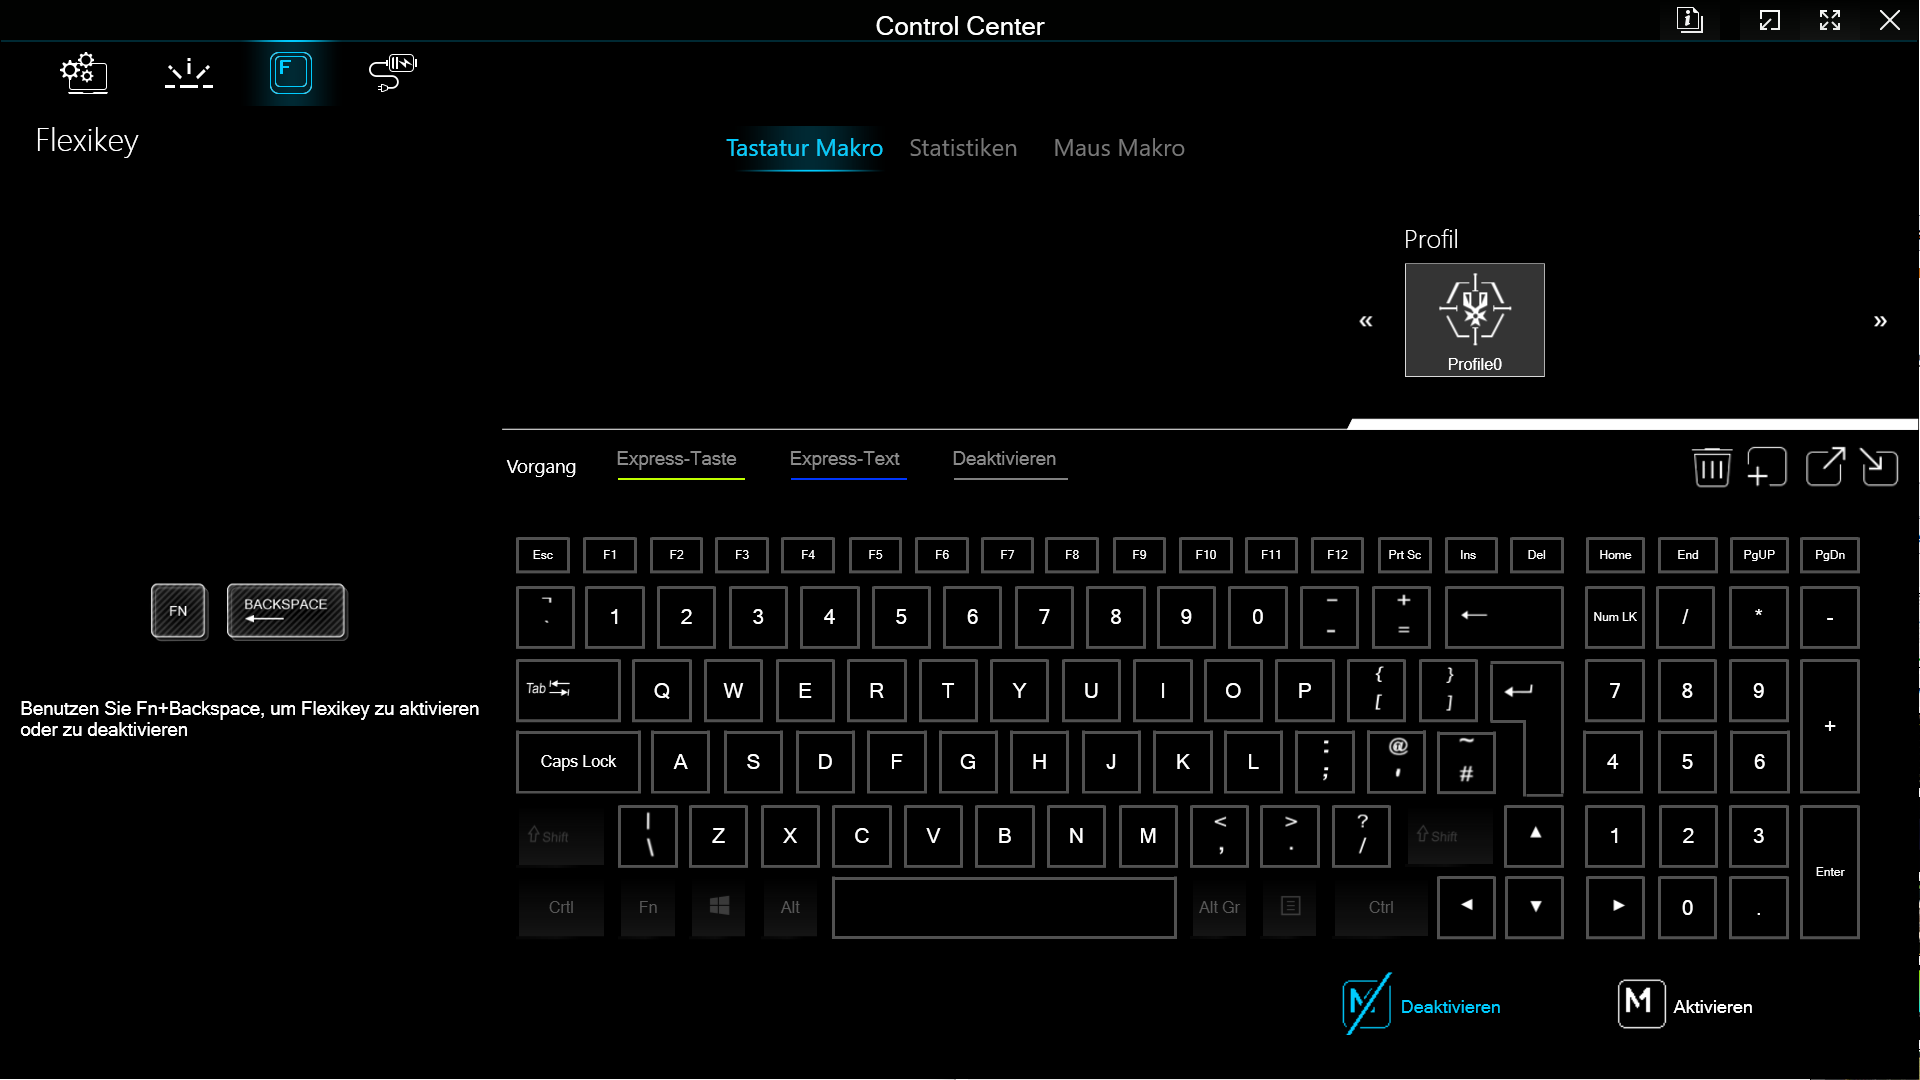
Périphériques d'entrée - Un clavier RGB de taille normale
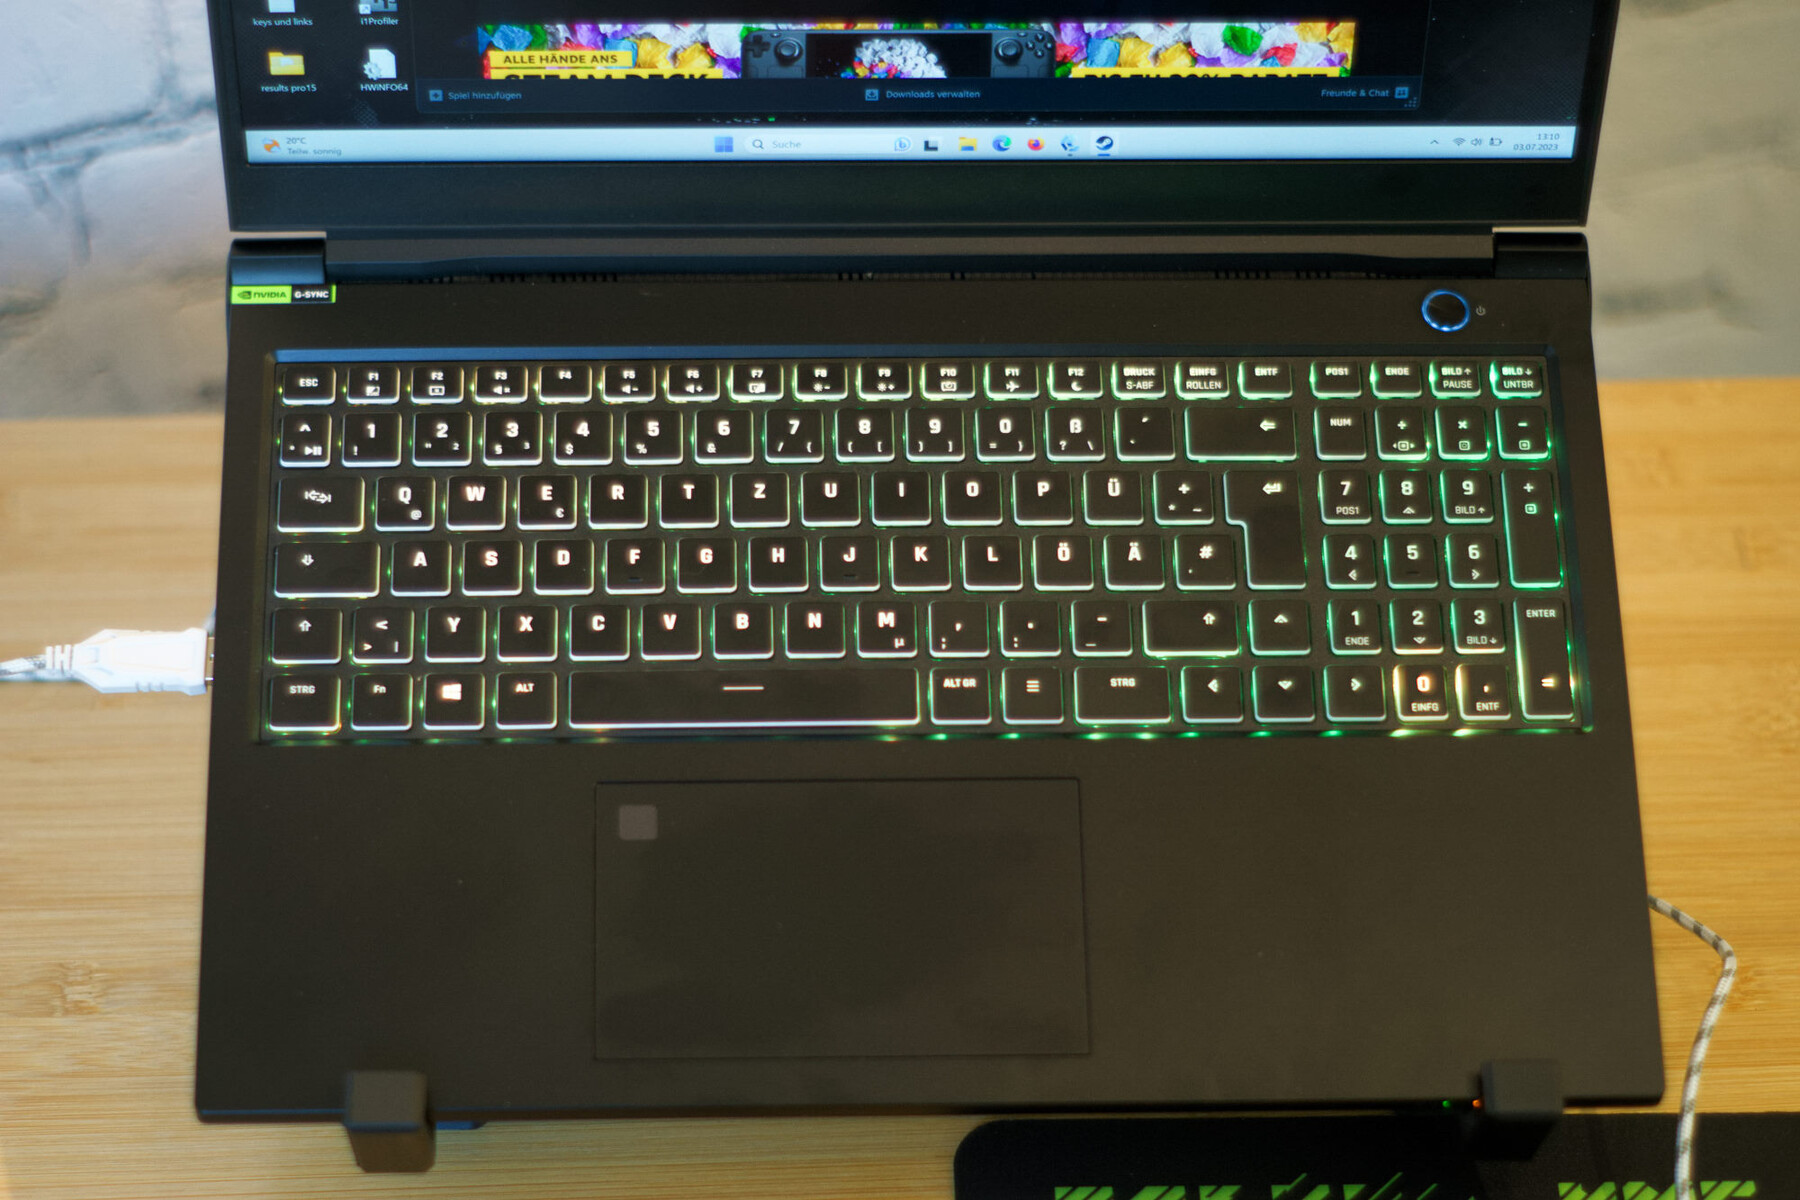
Le XMG Pro 15 est équipé d'un Clickpad de 12 × 7 cm avec lecteur d'empreintes digitales et d'un clavier de taille normale avec pavé numérique. Tous deux présentent une haptique agréable et un point de pression tangible. En ce qui concerne le clavier, la course des touches est d'environ 1,5 mm. Toutes les touches peuvent être éclairées individuellement grâce à l'éclairage RGB.
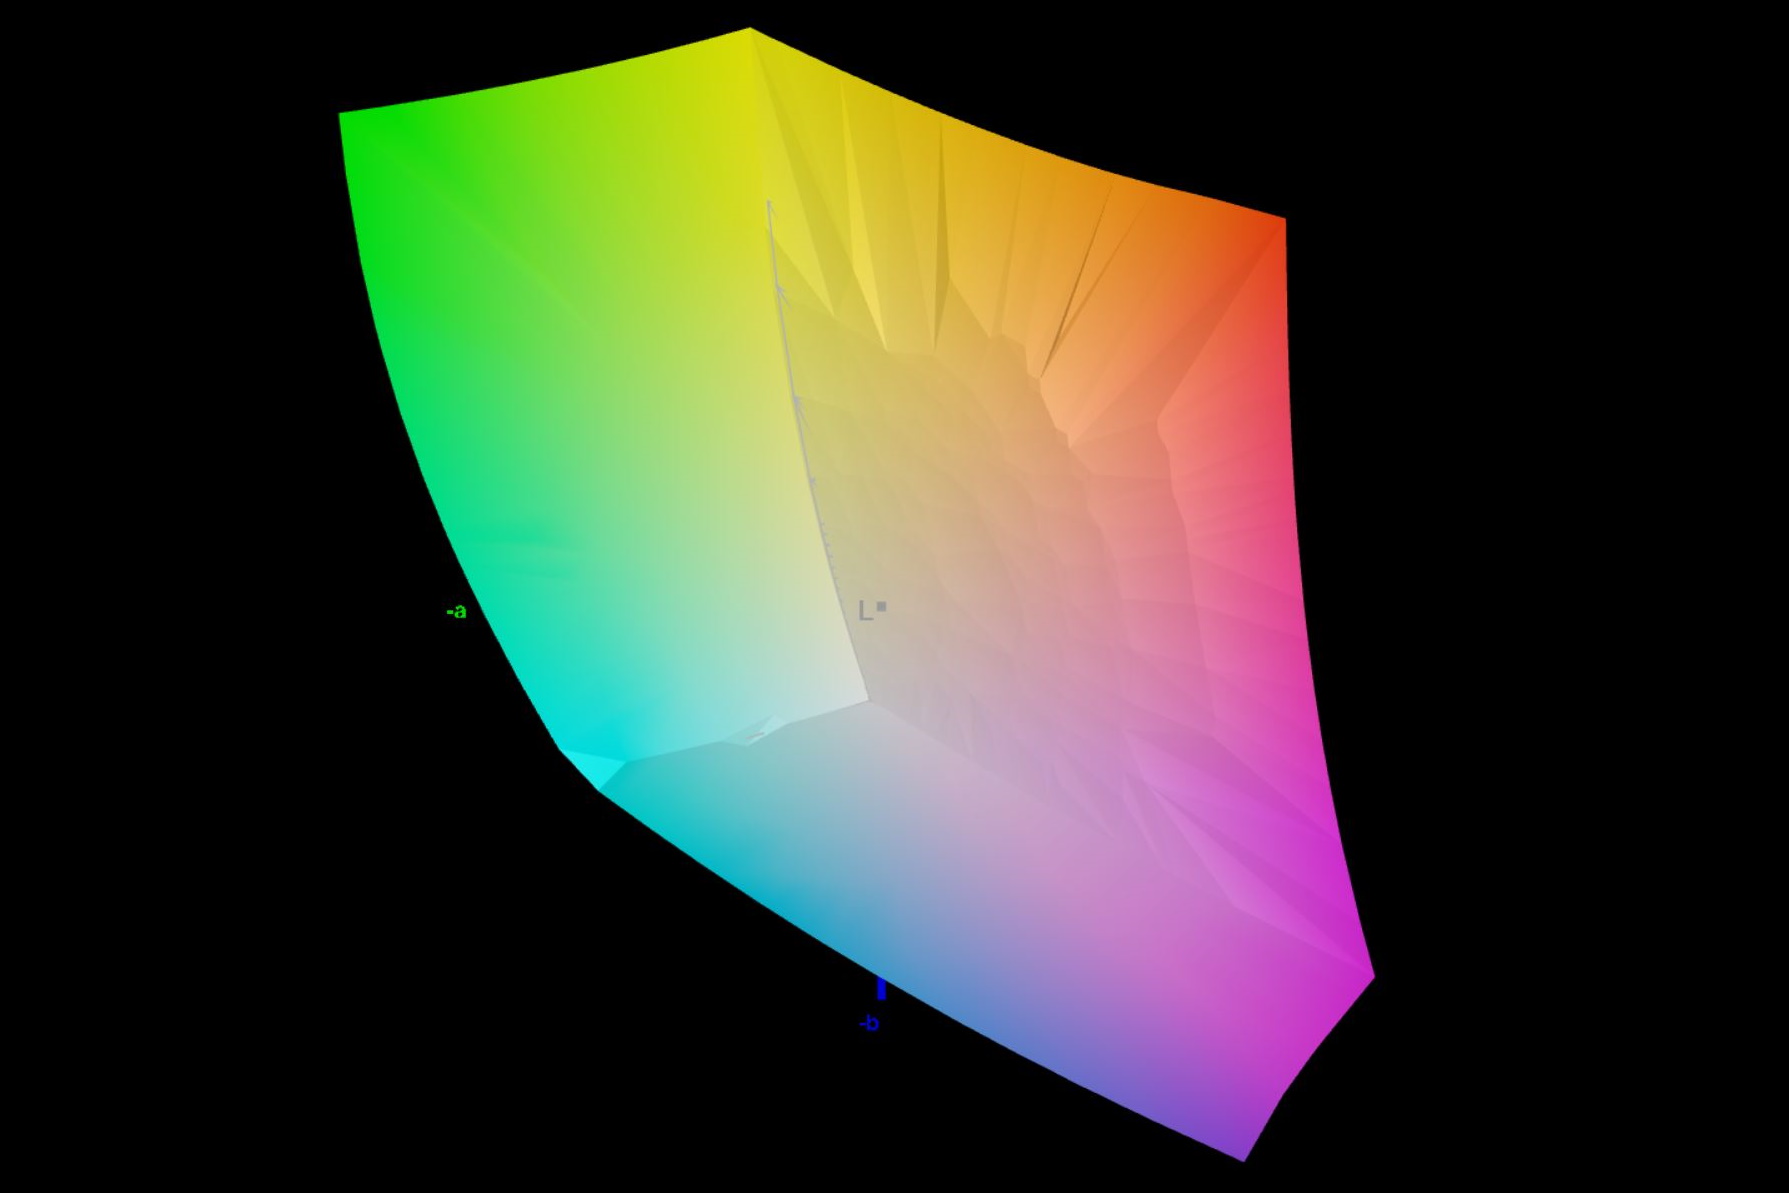
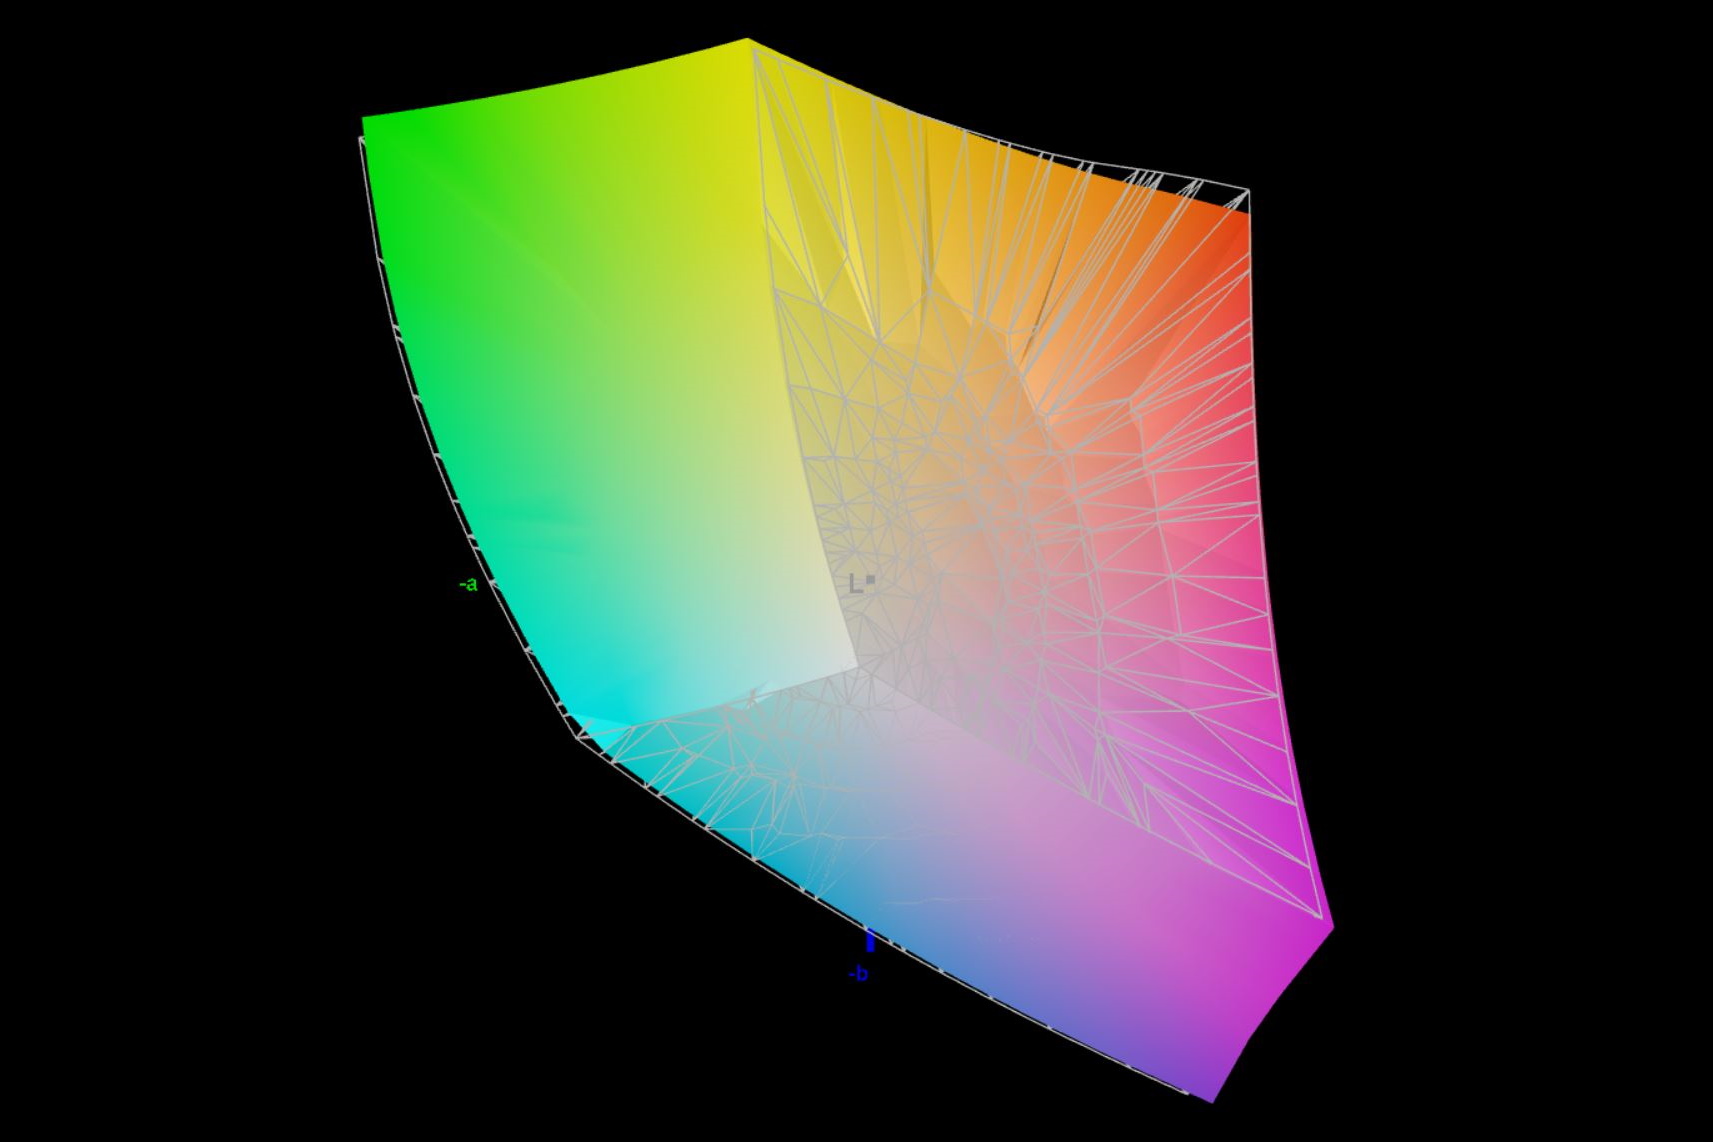
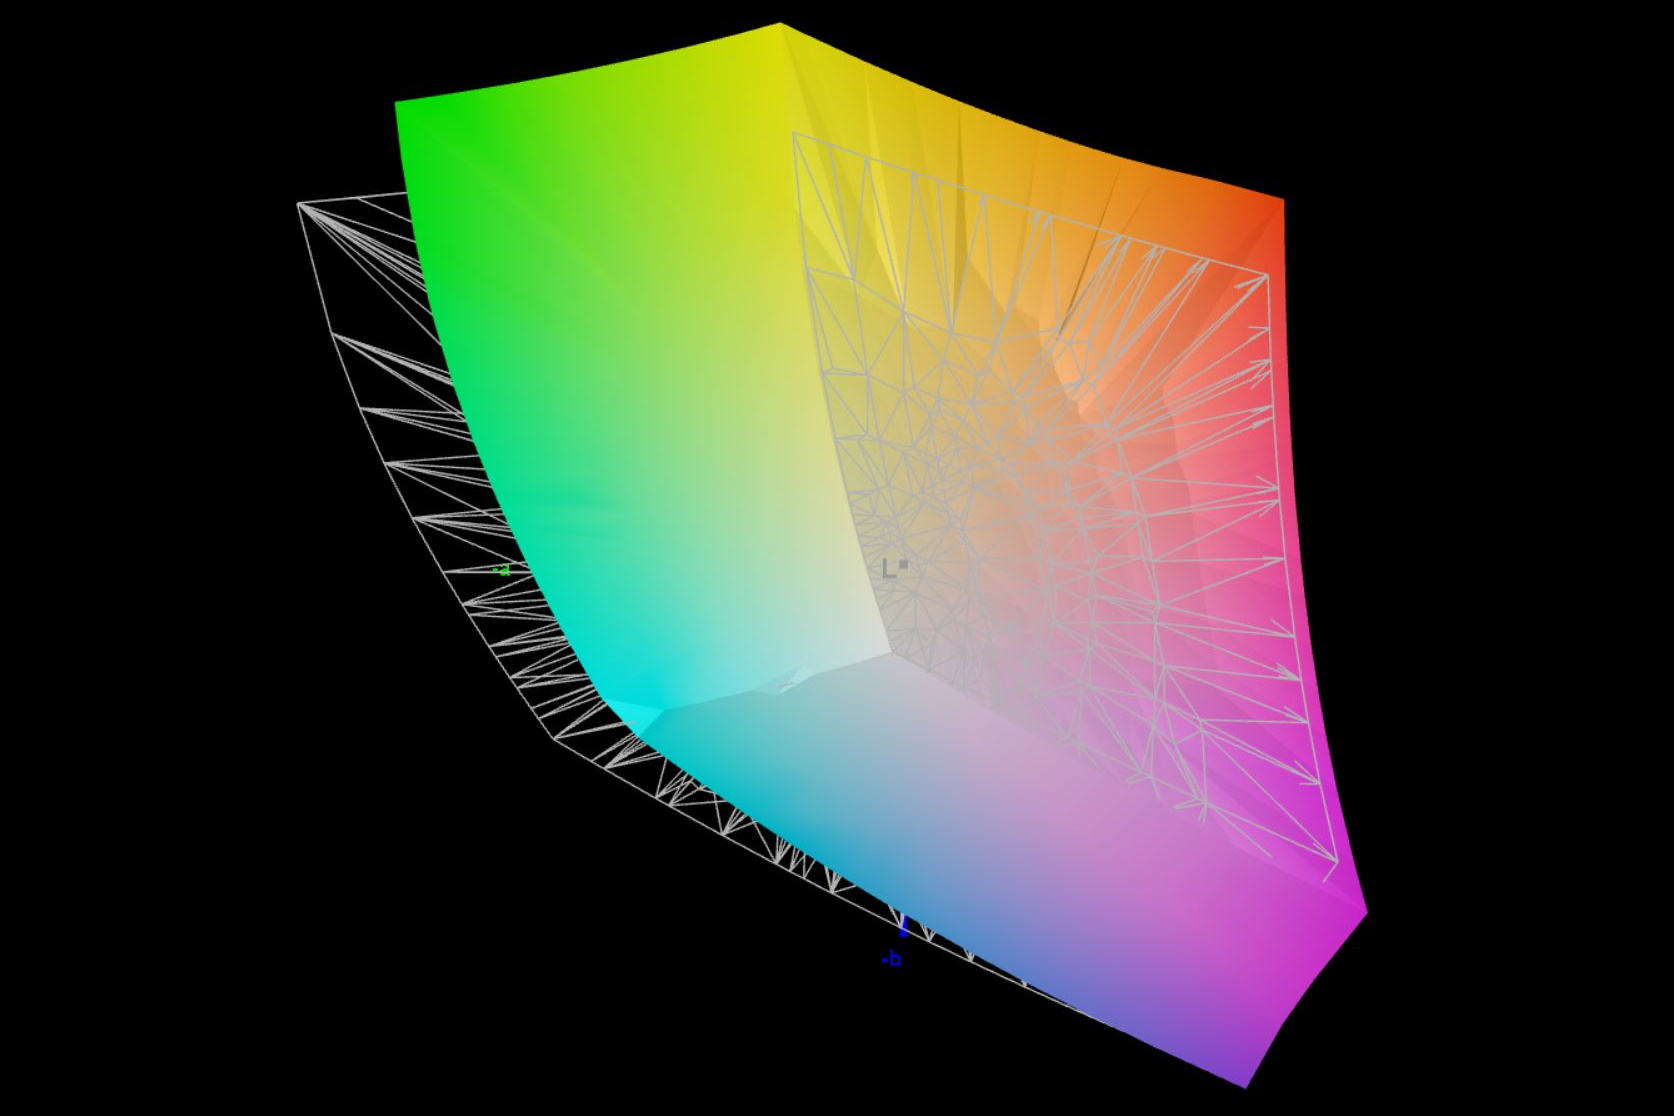
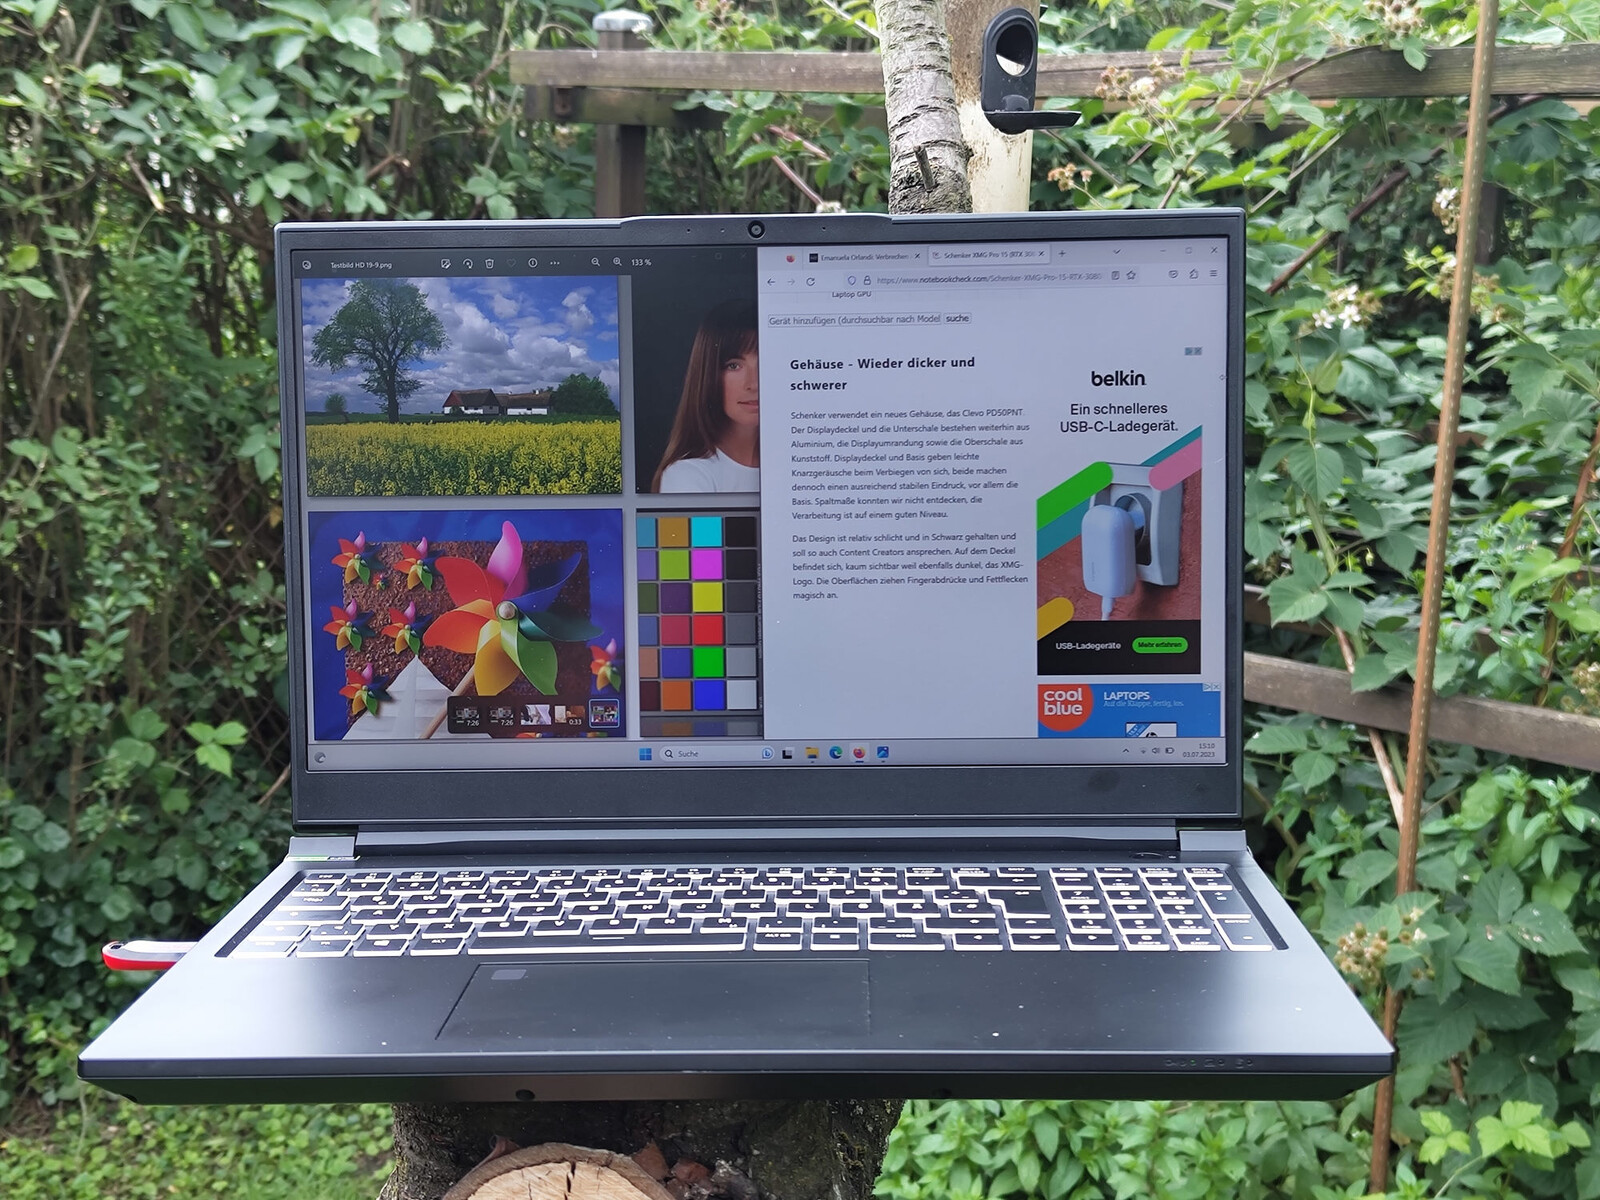
Affichage - QHD 240 Hz et DisplayP3
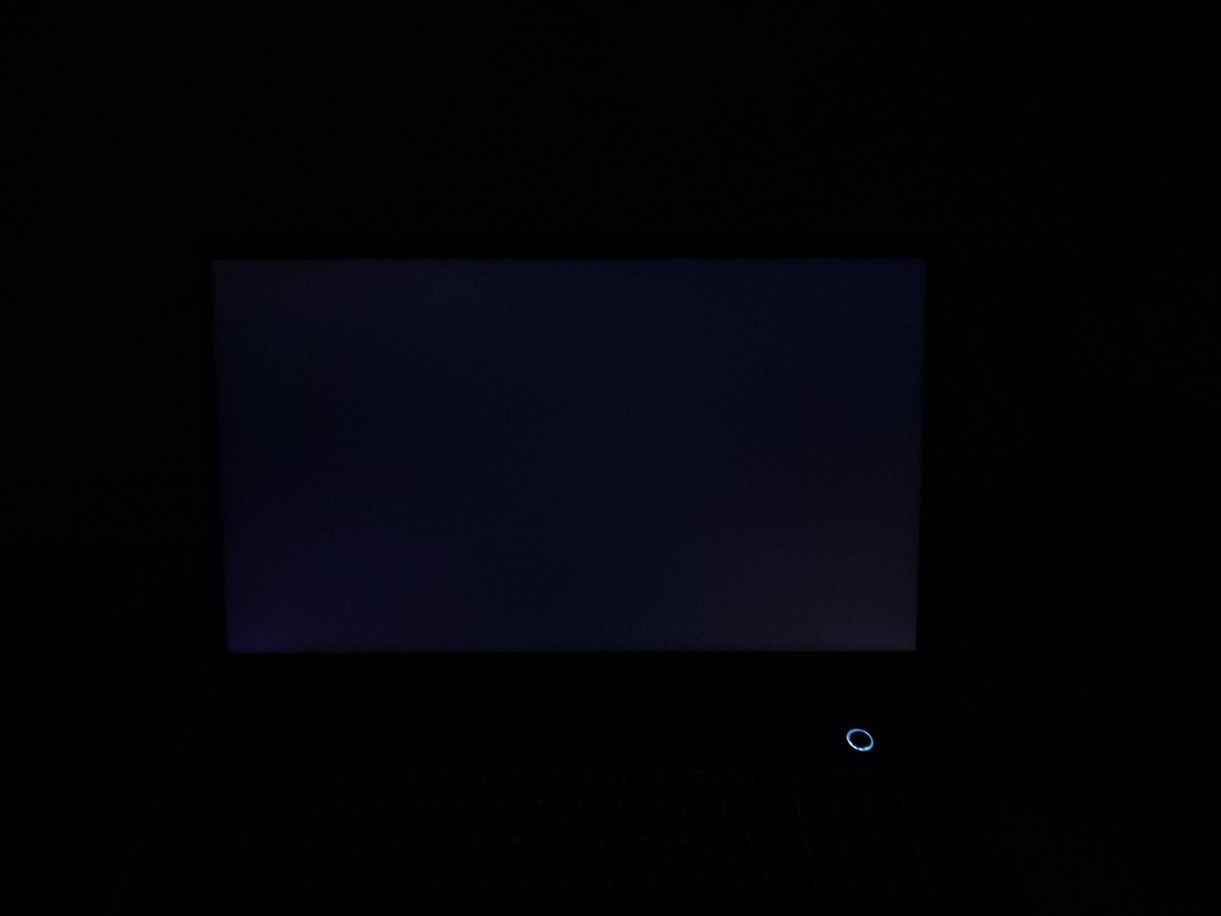
Bien qu'il ne s'agisse pas d'un OLED, le XMG Pro 15 possède un bon écran IPS G-Sync. À 240 Hz et 2 560 × 1 660 pixels, les espaces colorimétriques sRGB et DisplayP3 sont presque entièrement couverts. À pleine luminosité, on remarque toutefois que l'écran de 300 cd/m² est nettement plus éclairé au milieu de l'écran que sur les bords. Cependant, contrairement à son prédécesseur, ce phénomène ne se manifeste pas par un saignement d'écran clairement visible.
Par rapport au modèle précédent, les temps de réponse de l'écran n'ont pratiquement pas changé. La fréquence d'images est passée de 165 Hz à 240 Hz. Nous n'avons détecté aucun scintillement de l'écran.
| |||||||||||||||||||||||||
Homogénéité de la luminosité: 85 %
Contraste: 894:1 (Valeurs des noirs: 0.36 cd/m²)
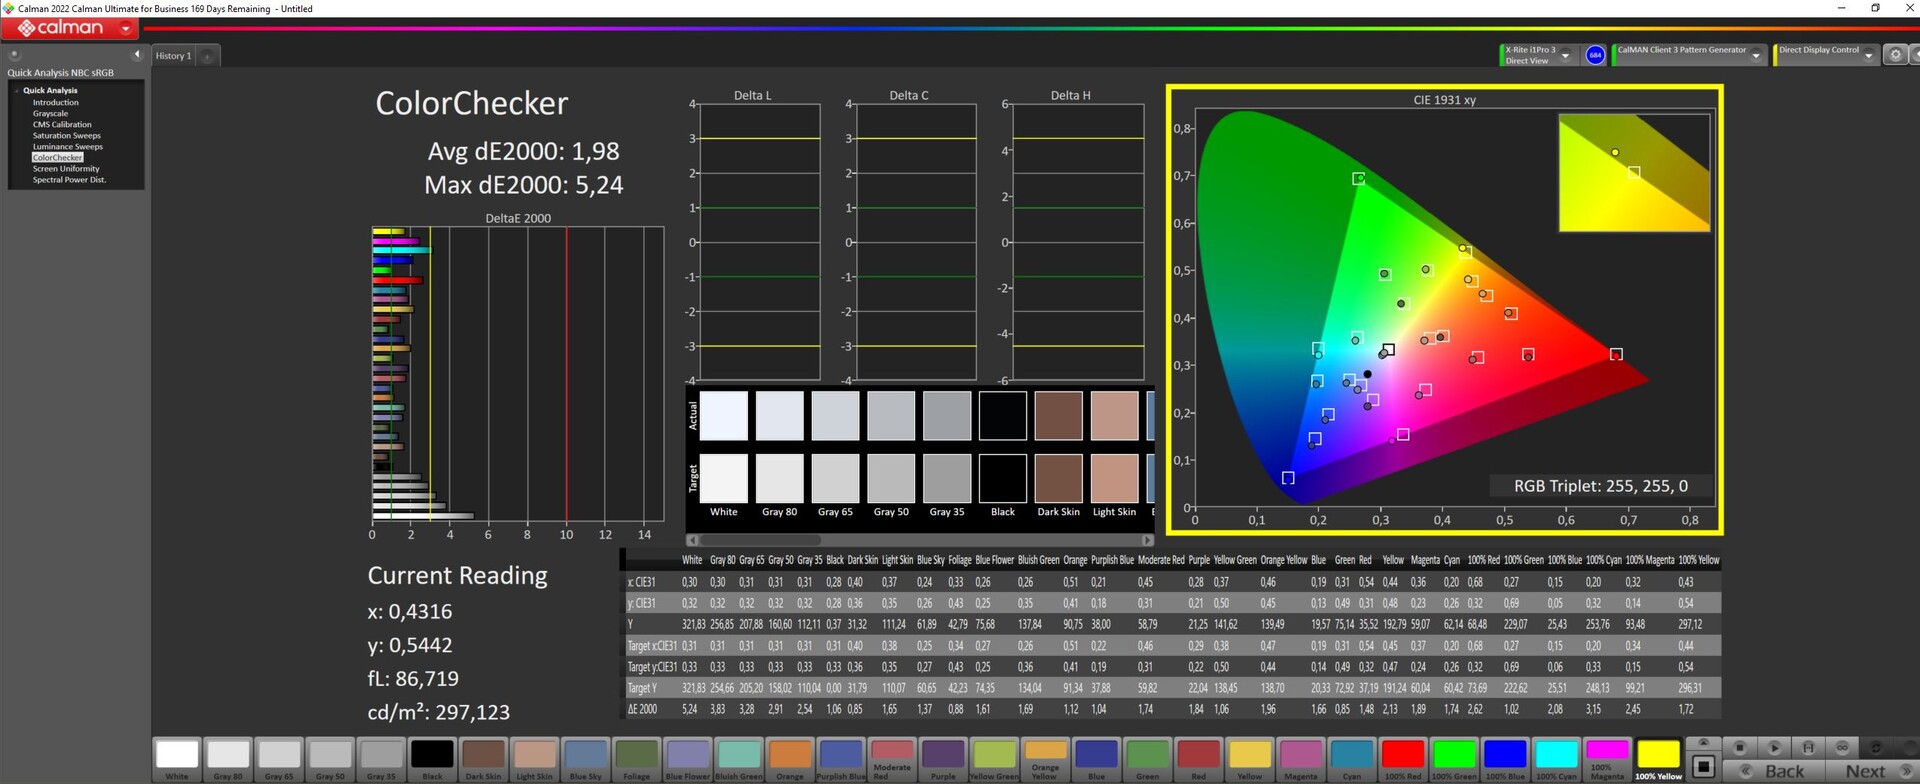
ΔE ColorChecker Calman: 1.98 | ∀{0.5-29.43 Ø4.71}
calibrated: 1.98
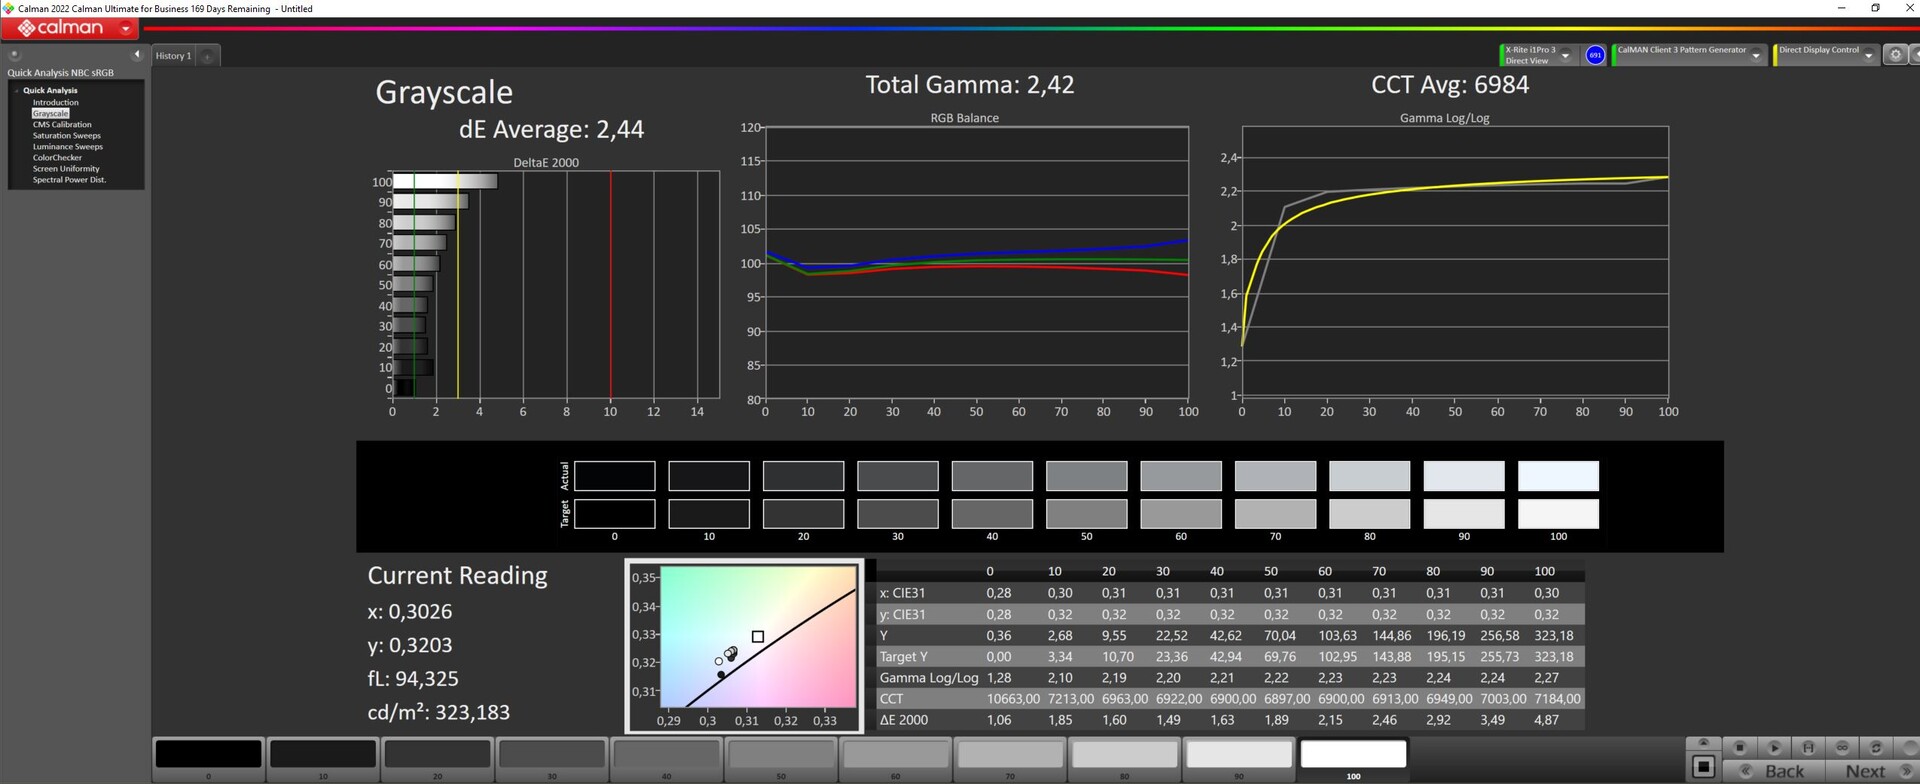
ΔE Greyscale Calman: 2.44 | ∀{0.09-98 Ø4.96}
85.4% AdobeRGB 1998 (Argyll 3D)
99.9% sRGB (Argyll 3D)
97.8% Display P3 (Argyll 3D)
Gamma: 2.42
CCT: 6984 K
| Schenker XMG Pro 15 (E23) BOE0AD1, IPS, 2560x1440, 15.6" | Schenker XMG Pro 15 (i7-12700H, RTX 3080 Ti) BOE09C2 (BOE CQ NE156QHM-NY1), IPS, 2560x1440, 15.6" | Dell G15 5530 AUO B156HAN, IPS, 1920x1080, 15.6" | Aorus 15X ASF BOE CQ NE156QHM-NZ1, IPS, 2560x1440, 15.6" | MSI Cyborg 15 A12VF AU Optronics B156HAN15.1, IPS, 1920x1080, 15.6" | Alienware x16 R1 BOE NE16NZ4, IPS, 2560x1600, 16" | |
|---|---|---|---|---|---|---|
| Display | 0% | -13% | -16% | -48% | 2% | |
| Display P3 Coverage (%) | 97.8 | 97.5 0% | 73.1 -25% | 69.3 -29% | 42.3 -57% | 99.2 1% |
| sRGB Coverage (%) | 99.9 | 99.9 0% | 98.4 -2% | 98.2 -2% | 62.6 -37% | 100 0% |
| AdobeRGB 1998 Coverage (%) | 85.4 | 85.2 0% | 74.4 -13% | 70.5 -17% | 43.7 -49% | 88.6 4% |
| Response Times | 7% | 60% | 7% | -52% | 29% | |
| Response Time Grey 50% / Grey 80% * (ms) | 14 ? | 13.2 ? 6% | 3.39 ? 76% | 12.4 ? 11% | 22 ? -57% | 5.1 ? 64% |
| Response Time Black / White * (ms) | 9.6 ? | 8.8 ? 8% | 5.35 ? 44% | 9.4 ? 2% | 14 ? -46% | 10.3 ? -7% |
| PWM Frequency (Hz) | 21620 ? | |||||
| Screen | -33% | -25% | 24% | -22% | 14% | |
| Brightness middle (cd/m²) | 322 | 317 -2% | 320 -1% | 316 -2% | 247 -23% | 302.2 -6% |
| Brightness (cd/m²) | 301 | 294 -2% | 316 5% | 301 0% | 234 -22% | 285 -5% |
| Brightness Distribution (%) | 85 | 83 -2% | 94 11% | 90 6% | 89 5% | 89 5% |
| Black Level * (cd/m²) | 0.36 | 0.32 11% | 0.21 42% | 0.28 22% | 0.25 31% | 0.26 28% |
| Contrast (:1) | 894 | 991 11% | 1524 70% | 1129 26% | 988 11% | 1162 30% |
| Colorchecker dE 2000 * | 1.98 | 4.22 -113% | 4.55 -130% | 1.54 22% | 3.78 -91% | 1.63 18% |
| Colorchecker dE 2000 max. * | 5.24 | 5.97 -14% | 9.83 -88% | 2.46 53% | 6.42 -23% | 4.13 21% |
| Colorchecker dE 2000 calibrated * | 1.98 | 4.09 -107% | 1.51 24% | 1.21 39% | 3.94 -99% | 1.17 41% |
| Greyscale dE 2000 * | 2.44 | 4.41 -81% | 6.2 -154% | 1.3 47% | 2.16 11% | 2.5 -2% |
| Gamma | 2.42 91% | 2.29 96% | 2.07 106% | 2.307 95% | 2.33 94% | 2.23 99% |
| CCT | 6984 93% | 6733 97% | 6479 100% | 6456 101% | 6906 94% | 6590 99% |
| Moyenne finale (programmes/paramètres) | -9% /
-20% | 7% /
-10% | 5% /
13% | -41% /
-32% | 15% /
14% |
* ... Moindre est la valeur, meilleures sont les performances
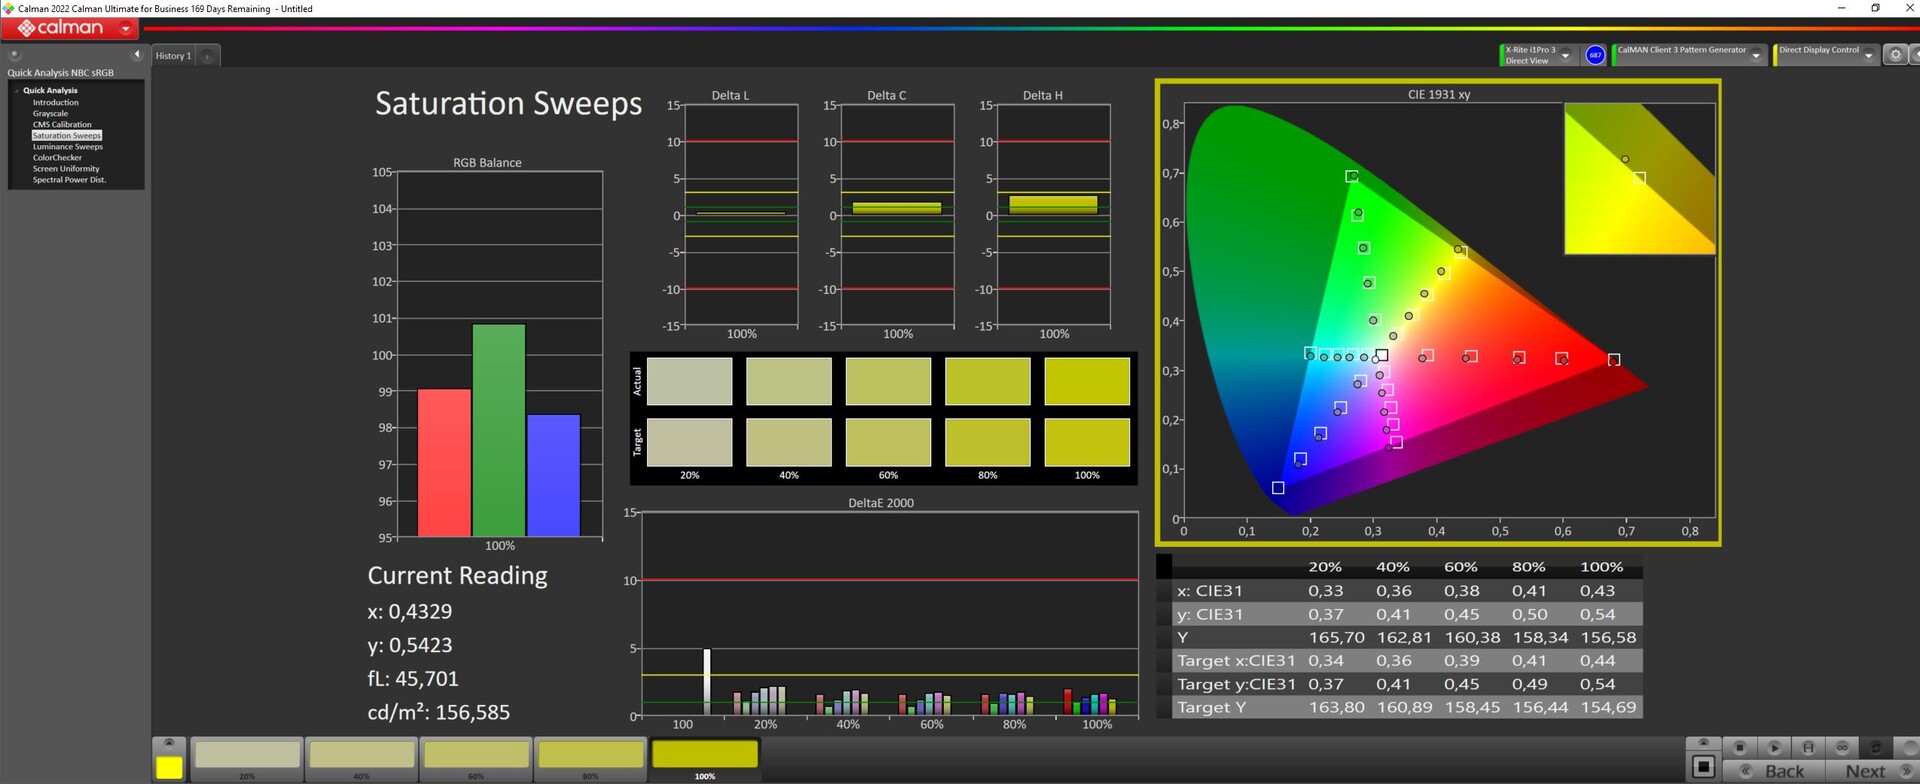
Avec les couleurs et les échelles de gris dans Calman ColorChecker, à ΔΕ 1,98 et ΔΕ 2,44, respectivement, le XMG Pro 15 se situe clairement dans la plage cible de ΔΕ < 3. Notre propre profil ICC (à télécharger dans la boîte d'information) devrait être en mesure de réduire légèrement le bleu trop accentué et d'améliorer considérablement les échelles de gris et la reproduction des couleurs. Avec l'espace colorimétrique DisplayP3 presque entièrement couvert, nous avons affaire à un écran qui semble convenir à l'édition vidéo professionnelle.
Temps de réponse de l'écran
| ↔ Temps de réponse noir à blanc | ||
|---|---|---|
| 9.6 ms ... hausse ↗ et chute ↘ combinées | ↗ 4.2 ms hausse | 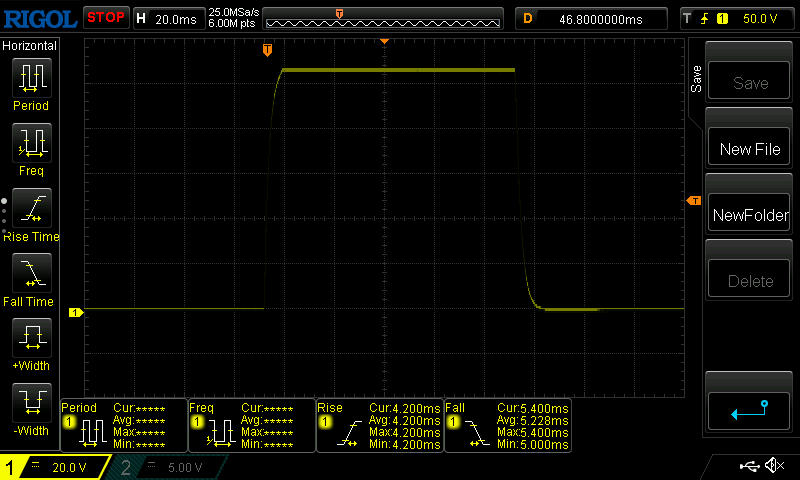 |
| ↘ 5.4 ms chute | ||
| L'écran montre de faibles temps de réponse, un bon écran pour jouer. En comparaison, tous les appareils testés affichent entre 0.1 (minimum) et 240 (maximum) ms. » 26 % des appareils testés affichent de meilleures performances. Cela signifie que les latences relevées sont meilleures que la moyenne (19.8 ms) de tous les appareils testés. | ||
| ↔ Temps de réponse gris 50% à gris 80% | ||
| 14 ms ... hausse ↗ et chute ↘ combinées | ↗ 6.6 ms hausse | 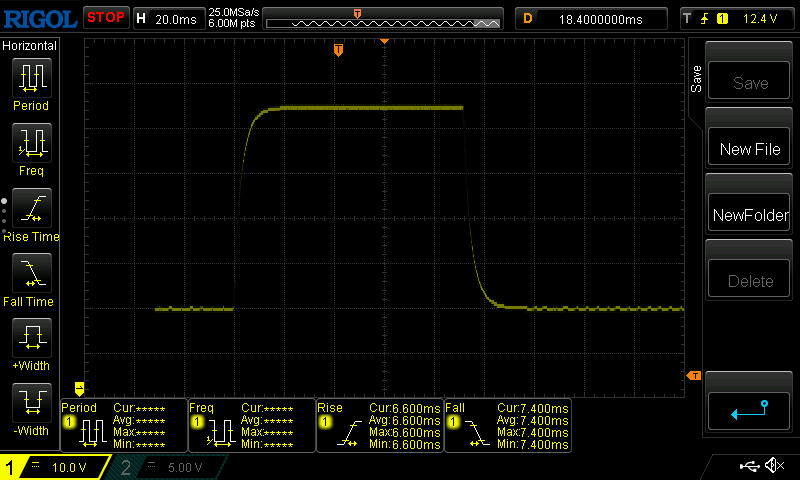 |
| ↘ 7.4 ms chute | ||
| L'écran montre de bons temps de réponse, mais insuffisant pour du jeu compétitif. En comparaison, tous les appareils testés affichent entre 0.165 (minimum) et 636 (maximum) ms. » 28 % des appareils testés affichent de meilleures performances. Cela signifie que les latences relevées sont meilleures que la moyenne (31 ms) de tous les appareils testés. | ||
Scintillement / MLI (Modulation de largeur d'impulsion)
| Scintillement / MLI (Modulation de largeur d'impulsion) non décelé | 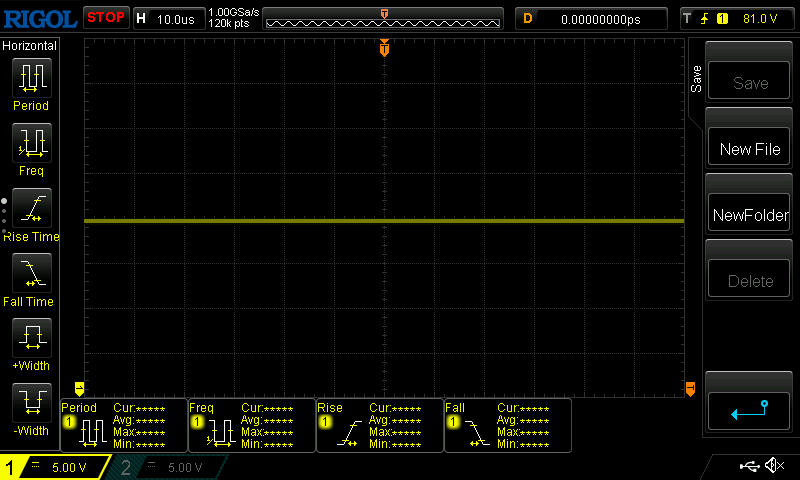 | ||
En comparaison, 52 % des appareils testés n'emploient pas MDI pour assombrir leur écran. Nous avons relevé une moyenne à 7754 (minimum : 5 - maximum : 343500) Hz dans le cas où une MDI était active. | |||
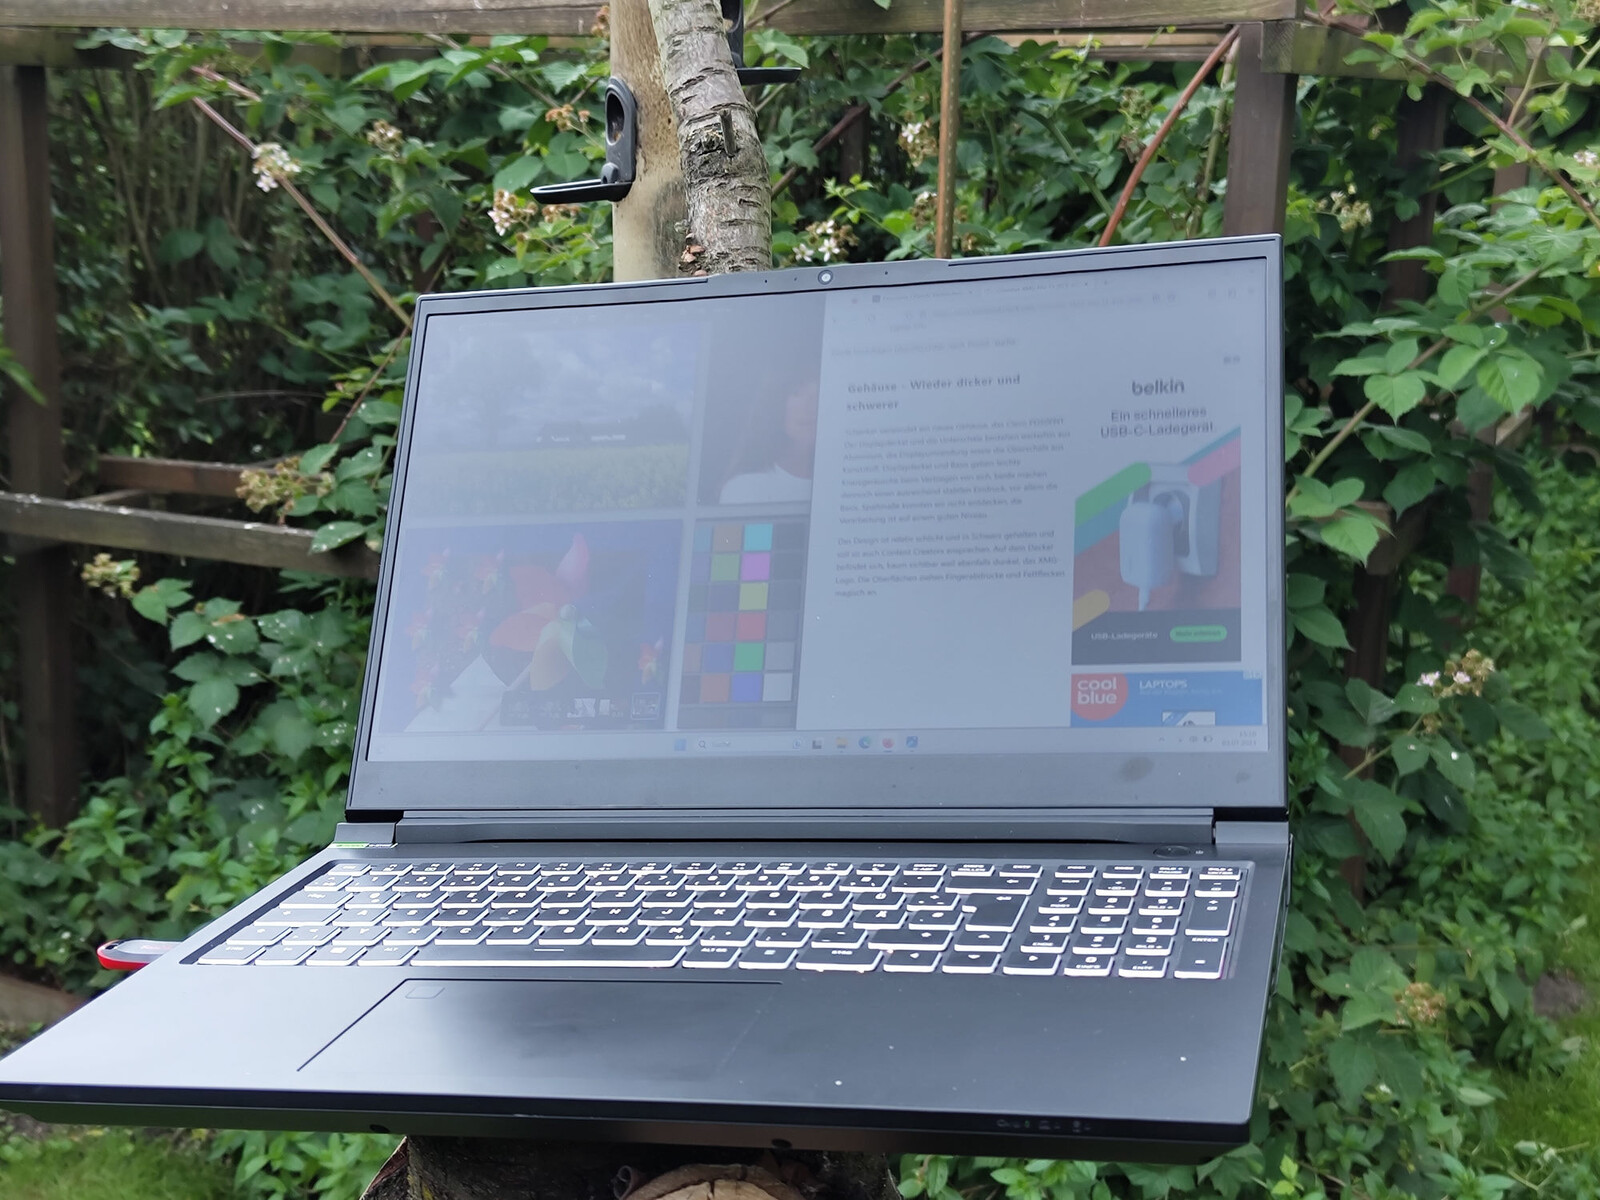
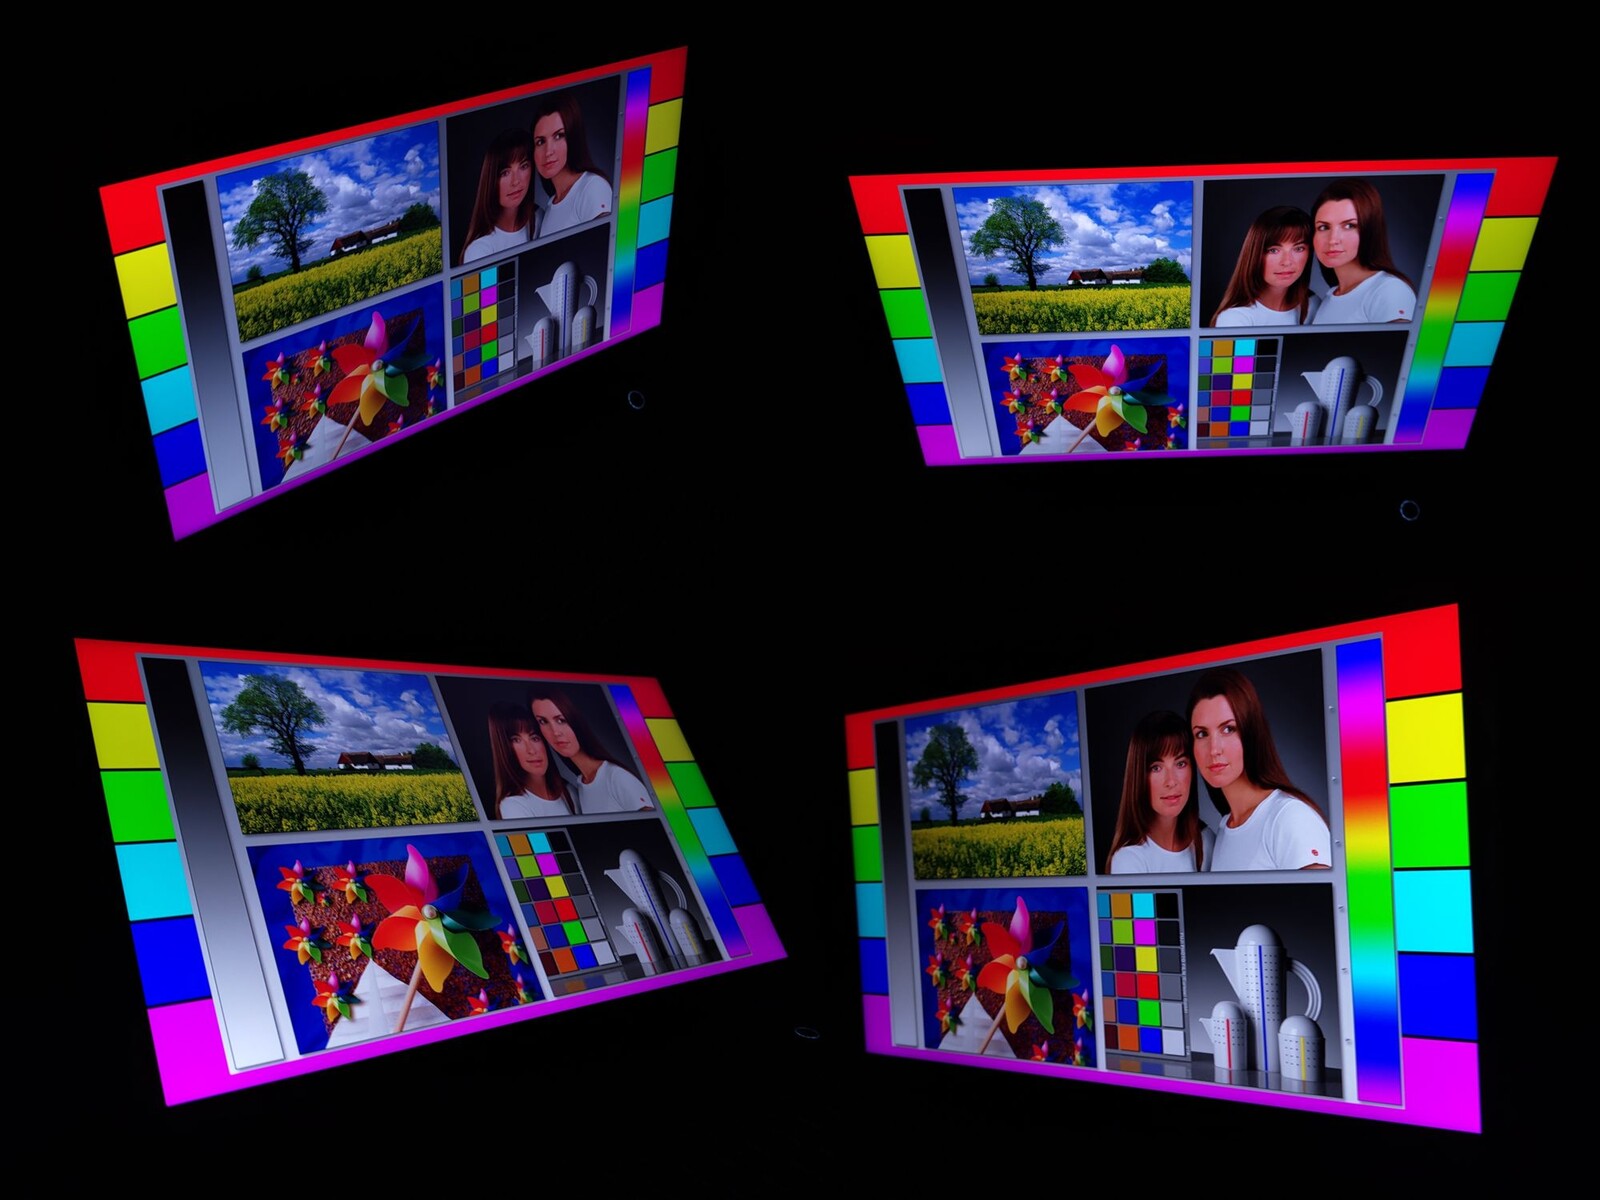
Il est également possible d'utiliser l'ordinateur portable de 15 pouces à l'extérieur, grâce à l'écran mat et relativement lumineux. En fonction de l'endroit où vous vous trouvez, vous devez choisir l'angle de vision approprié afin de réduire au maximum les reflets. Heureusement, la dalle IPS offre des angles de vision très stables.
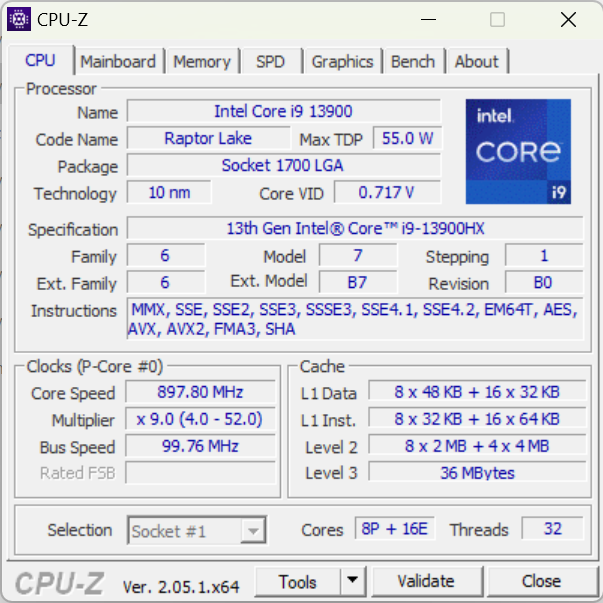
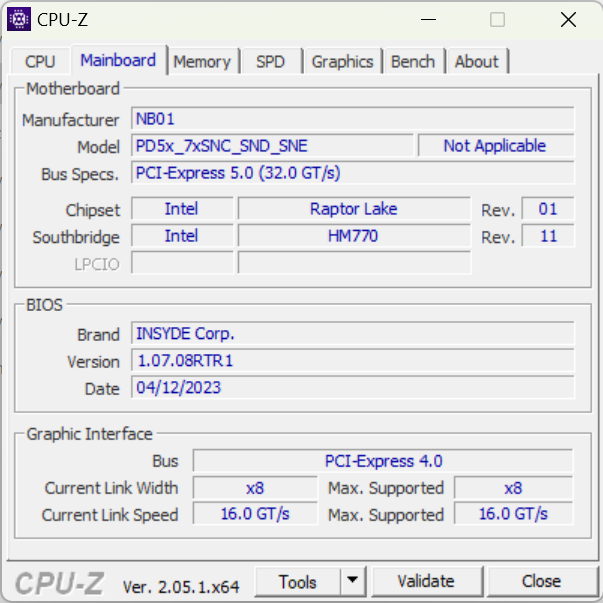
Performances - L'Intel Core i9 et la Nvidia GeForce RTX 4060 ont de la suite dans les idées
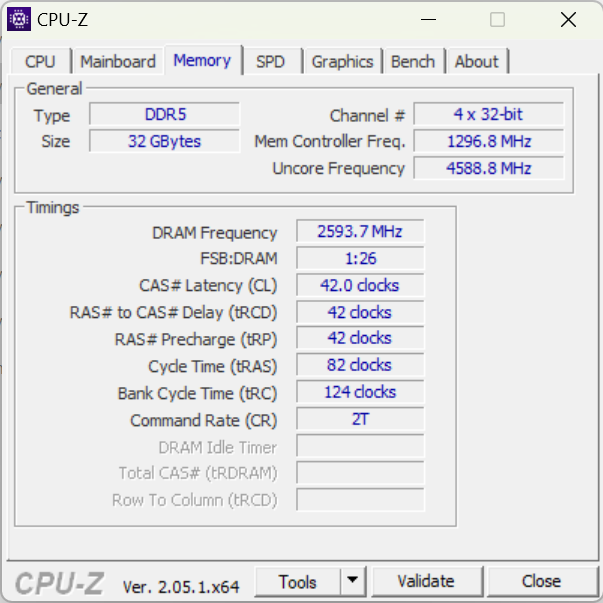
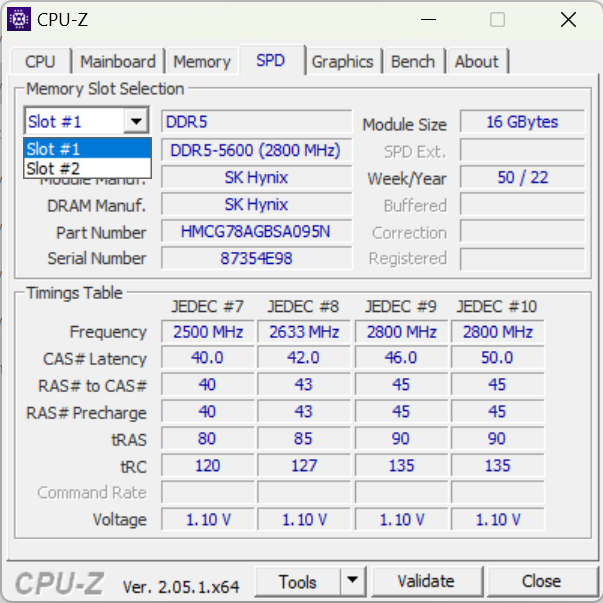
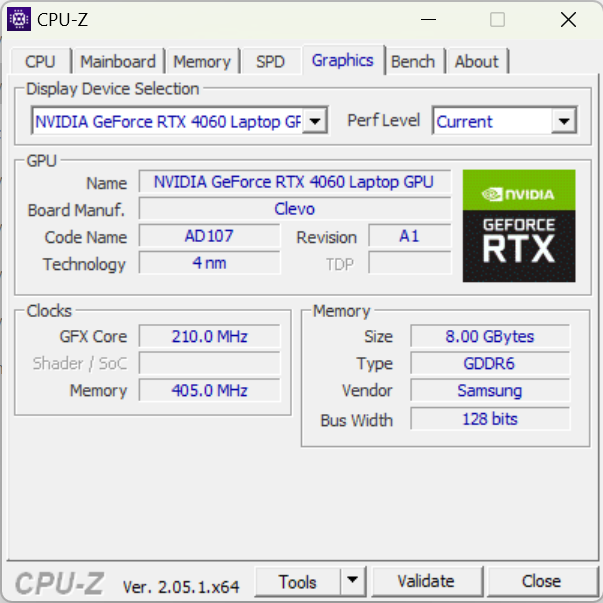
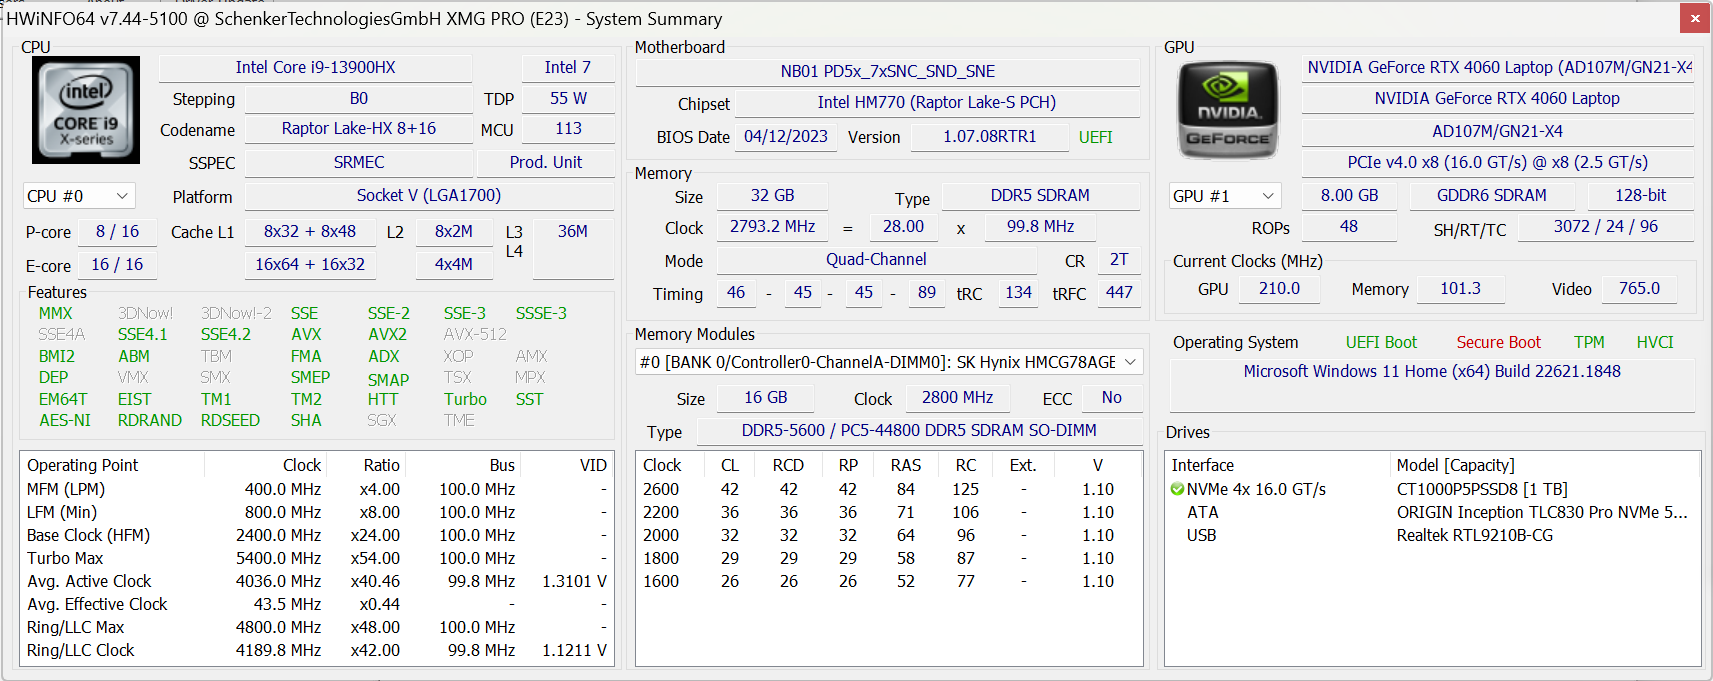
Dans notre appareil de référence, un puissantIntel Core i9-13900HX et laNvidia GeForce RTX 4060 sont responsables de la puissance suffisante pour gérer les jeux et la plupart des tâches créatives. L'ordinateur portable peut être configuré avec 8 à 64 Go de RAM DDR5. Notre modèle d'évaluation est équipé de 32 Go. Typiquement pour Schenker, de nombreuses options différentes peuvent être choisies dans le cadre du processus de commande de Bestware. En plus de la RTX 4060, une RTX 4070 est également configurable. En ce qui concerne les SSD et les options WiFi, un large choix est également disponible.
Conditions d'essai
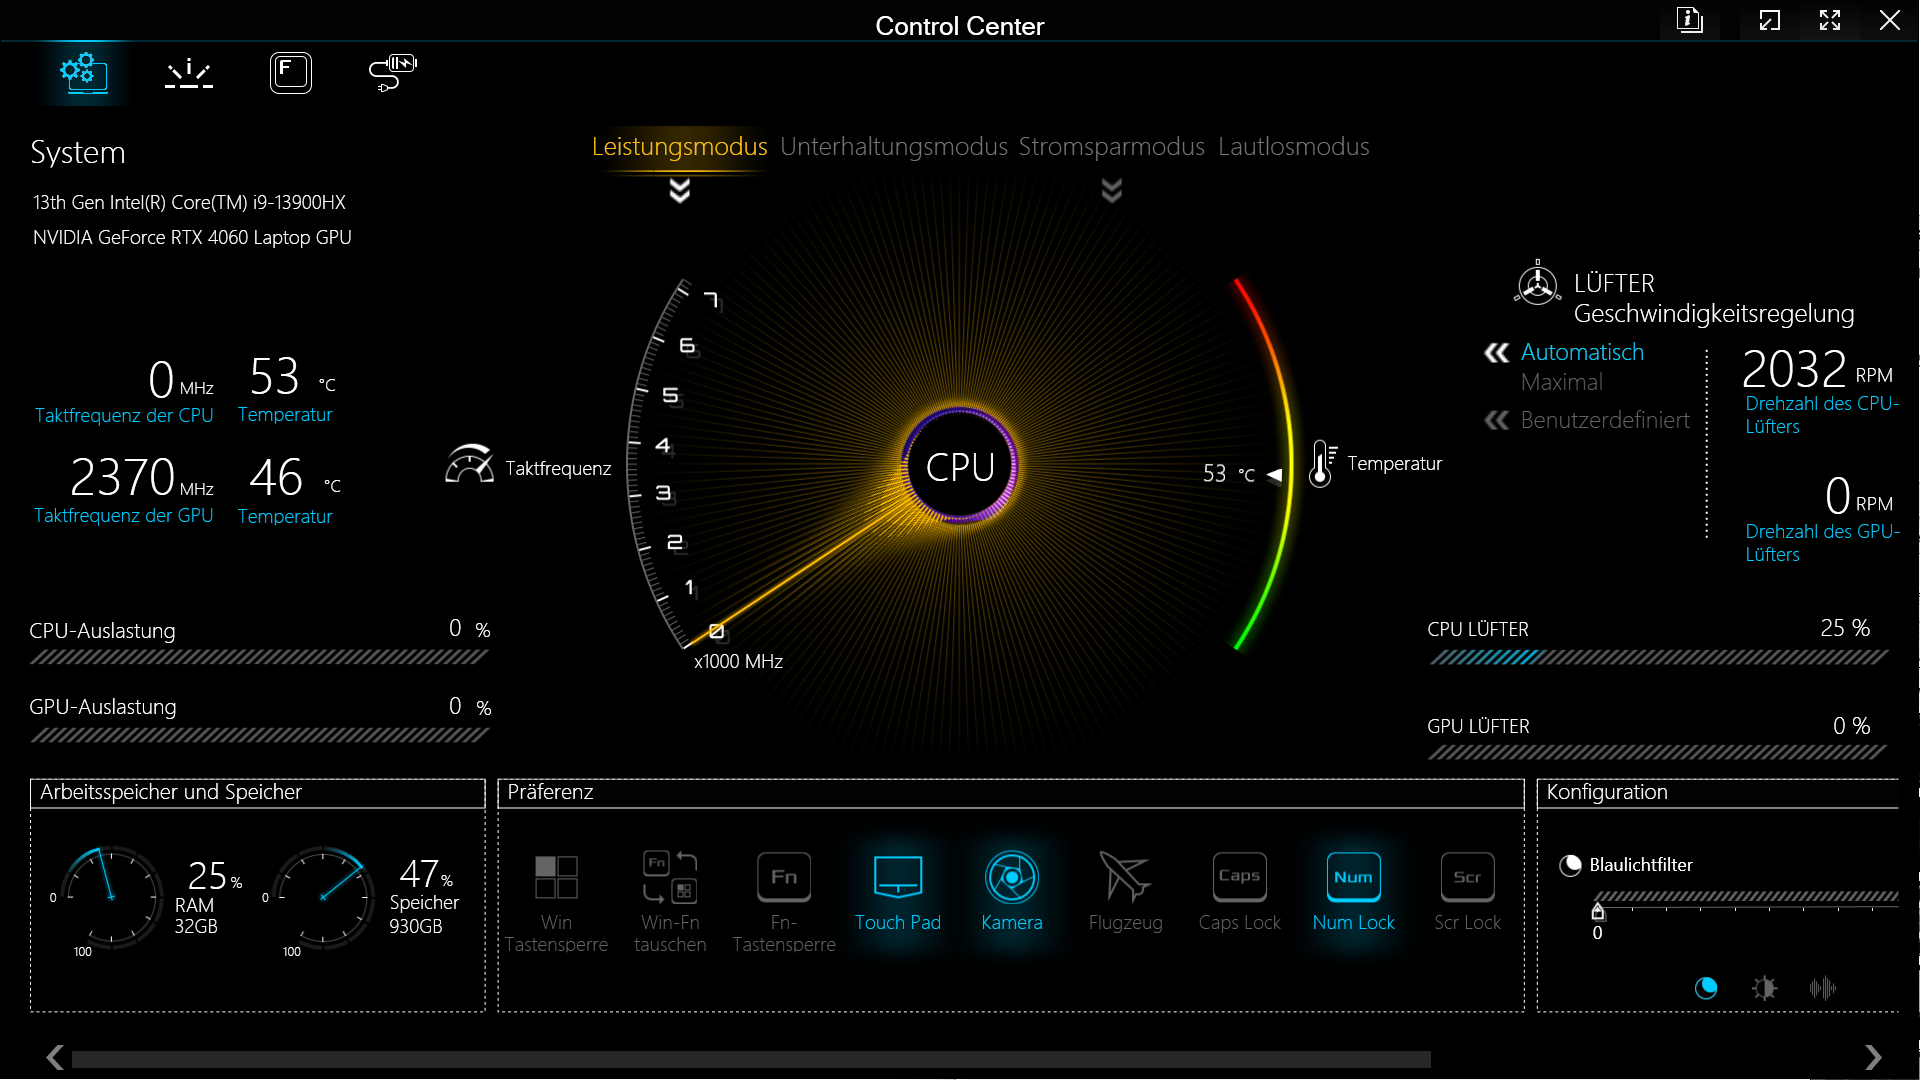
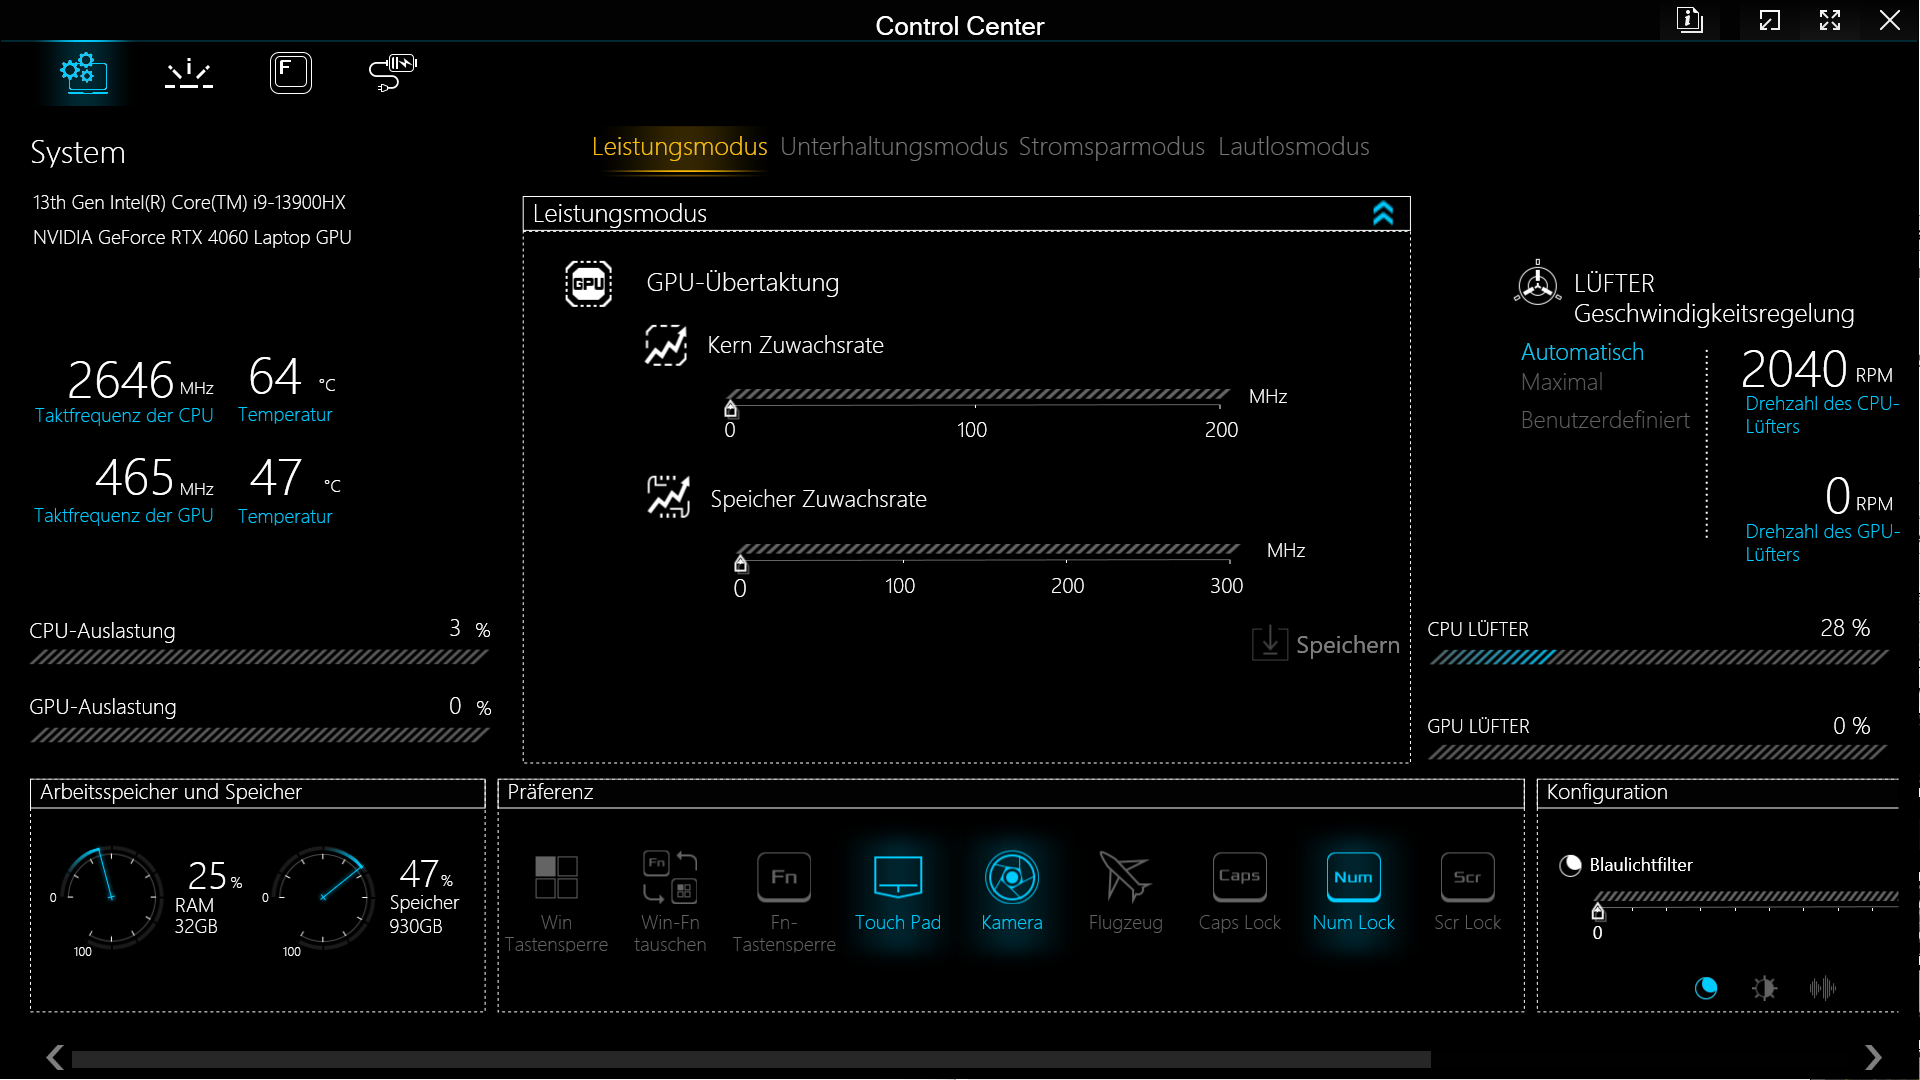
Les différents niveaux de performance - mode performance, mode divertissement, mode économie d'énergie et mode silencieux - peuvent être sélectionnés via le centre de contrôle. En outre, en mode performance, il est possible d'overclocker légèrement le GPU et la mémoire graphique. L'Intel Core i9 est alimenté avec un maximum de 135 watts et la GeForce RTX 4060 avec 140 watts, si 25 watts sont transférés du processeur à la carte graphique. Les valeurs cibles suivantes s'appliquent aux différents modes d'économie d'énergie :
| Modus : | Mode performance | Mode divertissement | Mode économie d'énergie | Mode silencieux |
|---|---|---|---|---|
| CPU PL1 | 135 W | 65 W | 55 W | 45 W |
| CPU PL2 | 162 W | 115 W | 115 W | 115 W |
| Température cible CPU | 93 °C | 87 °C | 85 °C | 85 °C |
| GPU TGP + Dynamic Boost | 115 W + 25 W | 115 W + 0 W | 115 W + 0 W | 115 W + 0 W |
| Température cible GPU | 87 °C | 87 °C | 87 °C | 87 °C |
Les journaux que nous avons compilés montrent que l'ordinateur portable de jeu peut supporter une très forte augmentation des performances pendant 90 secondes, aussi bien en mode divertissement qu'en mode performance. Schenker suggère d'effectuer les tâches quotidiennes en mode divertissement. Cependant, nous avons décidé d'effectuer tous les benchmarks en mode performance.
Processeur
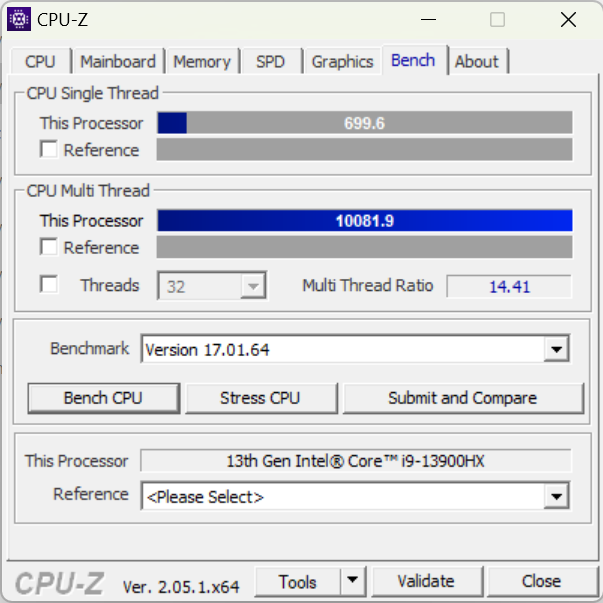
LeIntel Core i9-13900HX est le processeur pour ordinateur portable le plus puissant de la génération Raptor Lake actuelle. Ce processeur est capable de traiter simultanément 32 threads répartis sur 8 cœurs P et 16 cœurs E. Grâce à ses valeurs PL1 et PL2 élevées, l'i9 montre vraiment le potentiel qu'il possède avec le XMG Pro 15 qui surpasse tous les autres appareils dans les benchmarks de processeurs.
Cinebench R15 Multi Continuous Test
Cinebench R23: Multi Core | Single Core
Cinebench R20: CPU (Multi Core) | CPU (Single Core)
Cinebench R15: CPU Multi 64Bit | CPU Single 64Bit
Blender: v2.79 BMW27 CPU
7-Zip 18.03: 7z b 4 | 7z b 4 -mmt1
Geekbench 5.5: Multi-Core | Single-Core
HWBOT x265 Benchmark v2.2: 4k Preset
LibreOffice : 20 Documents To PDF
R Benchmark 2.5: Overall mean
| CPU Performance rating | |
| Moyenne Intel Core i9-13900HX | |
| Moyenne de la classe Gaming | |
| Schenker XMG Pro 15 (E23) | |
| Alienware x16 R1 -1! | |
| Aorus 15X ASF | |
| Dell G15 5530 | |
| Asus ZenBook Pro 14 Duo UX8402VV-P1021W | |
| Schenker XMG Pro 15 (i7-12700H, RTX 3080 Ti) | |
| MSI Cyborg 15 A12VF | |
| Asus TUF A15 FA507 | |
| Cinebench R23 / Multi Core | |
| Moyenne Intel Core i9-13900HX (24270 - 32623, n=23) | |
| Moyenne de la classe Gaming (10488 - 42661, n=107, 2 dernières années) | |
| Schenker XMG Pro 15 (E23) | |
| Dell G15 5530 | |
| Aorus 15X ASF | |
| Alienware x16 R1 | |
| Asus ZenBook Pro 14 Duo UX8402VV-P1021W | |
| Schenker XMG Pro 15 (i7-12700H, RTX 3080 Ti) | |
| MSI Cyborg 15 A12VF | |
| Asus TUF A15 FA507 | |
| Cinebench R23 / Single Core | |
| Moyenne Intel Core i9-13900HX (1867 - 2105, n=20) | |
| Moyenne de la classe Gaming (1166 - 2415, n=107, 2 dernières années) | |
| Asus ZenBook Pro 14 Duo UX8402VV-P1021W | |
| Alienware x16 R1 | |
| Aorus 15X ASF | |
| Schenker XMG Pro 15 (E23) | |
| Dell G15 5530 | |
| Schenker XMG Pro 15 (i7-12700H, RTX 3080 Ti) | |
| MSI Cyborg 15 A12VF | |
| Asus TUF A15 FA507 | |
| Cinebench R20 / CPU (Multi Core) | |
| Moyenne Intel Core i9-13900HX (9152 - 12541, n=21) | |
| Moyenne de la classe Gaming (4029 - 16433, n=106, 2 dernières années) | |
| Schenker XMG Pro 15 (E23) | |
| Dell G15 5530 | |
| Aorus 15X ASF | |
| Alienware x16 R1 | |
| Asus ZenBook Pro 14 Duo UX8402VV-P1021W | |
| Schenker XMG Pro 15 (i7-12700H, RTX 3080 Ti) | |
| MSI Cyborg 15 A12VF | |
| Asus TUF A15 FA507 | |
| Cinebench R20 / CPU (Single Core) | |
| Moyenne Intel Core i9-13900HX (722 - 810, n=21) | |
| Moyenne de la classe Gaming (442 - 913, n=106, 2 dernières années) | |
| Asus ZenBook Pro 14 Duo UX8402VV-P1021W | |
| Alienware x16 R1 | |
| Aorus 15X ASF | |
| Schenker XMG Pro 15 (E23) | |
| Dell G15 5530 | |
| Schenker XMG Pro 15 (i7-12700H, RTX 3080 Ti) | |
| MSI Cyborg 15 A12VF | |
| Asus TUF A15 FA507 | |
| Cinebench R15 / CPU Multi 64Bit | |
| Moyenne Intel Core i9-13900HX (3913 - 4970, n=22) | |
| Moyenne de la classe Gaming (1578 - 6330, n=105, 2 dernières années) | |
| Schenker XMG Pro 15 (E23) | |
| Aorus 15X ASF | |
| Dell G15 5530 | |
| Alienware x16 R1 | |
| Asus ZenBook Pro 14 Duo UX8402VV-P1021W | |
| Schenker XMG Pro 15 (i7-12700H, RTX 3080 Ti) | |
| Asus TUF A15 FA507 | |
| MSI Cyborg 15 A12VF | |
| Cinebench R15 / CPU Single 64Bit | |
| Moyenne de la classe Gaming (188.8 - 350, n=106, 2 dernières années) | |
| Moyenne Intel Core i9-13900HX (247 - 304, n=22) | |
| Asus ZenBook Pro 14 Duo UX8402VV-P1021W | |
| Alienware x16 R1 | |
| Aorus 15X ASF | |
| Dell G15 5530 | |
| Schenker XMG Pro 15 (i7-12700H, RTX 3080 Ti) | |
| Asus TUF A15 FA507 | |
| Schenker XMG Pro 15 (E23) | |
| MSI Cyborg 15 A12VF | |
| Blender / v2.79 BMW27 CPU | |
| MSI Cyborg 15 A12VF | |
| Asus TUF A15 FA507 | |
| Schenker XMG Pro 15 (i7-12700H, RTX 3080 Ti) | |
| Asus ZenBook Pro 14 Duo UX8402VV-P1021W | |
| Aorus 15X ASF | |
| Dell G15 5530 | |
| Moyenne de la classe Gaming (79 - 330, n=104, 2 dernières années) | |
| Schenker XMG Pro 15 (E23) | |
| Moyenne Intel Core i9-13900HX (101 - 153, n=22) | |
| 7-Zip 18.03 / 7z b 4 | |
| Moyenne Intel Core i9-13900HX (90675 - 127283, n=21) | |
| Schenker XMG Pro 15 (E23) | |
| Moyenne de la classe Gaming (33491 - 148086, n=105, 2 dernières années) | |
| Dell G15 5530 | |
| Alienware x16 R1 | |
| Aorus 15X ASF | |
| Asus ZenBook Pro 14 Duo UX8402VV-P1021W | |
| Schenker XMG Pro 15 (i7-12700H, RTX 3080 Ti) | |
| Asus TUF A15 FA507 | |
| MSI Cyborg 15 A12VF | |
| 7-Zip 18.03 / 7z b 4 -mmt1 | |
| Moyenne Intel Core i9-13900HX (6340 - 7177, n=21) | |
| Moyenne de la classe Gaming (4199 - 7436, n=105, 2 dernières années) | |
| Aorus 15X ASF | |
| Schenker XMG Pro 15 (E23) | |
| Asus ZenBook Pro 14 Duo UX8402VV-P1021W | |
| Alienware x16 R1 | |
| Dell G15 5530 | |
| Asus TUF A15 FA507 | |
| Schenker XMG Pro 15 (i7-12700H, RTX 3080 Ti) | |
| MSI Cyborg 15 A12VF | |
| Geekbench 5.5 / Multi-Core | |
| Moyenne Intel Core i9-13900HX (17614 - 21075, n=22) | |
| Schenker XMG Pro 15 (E23) | |
| Moyenne de la classe Gaming (6460 - 28263, n=105, 2 dernières années) | |
| Aorus 15X ASF | |
| Alienware x16 R1 | |
| Dell G15 5530 | |
| Asus ZenBook Pro 14 Duo UX8402VV-P1021W | |
| Schenker XMG Pro 15 (i7-12700H, RTX 3080 Ti) | |
| MSI Cyborg 15 A12VF | |
| Asus TUF A15 FA507 | |
| Geekbench 5.5 / Single-Core | |
| Moyenne de la classe Gaming (986 - 2474, n=105, 2 dernières années) | |
| Moyenne Intel Core i9-13900HX (1345 - 2093, n=22) | |
| Alienware x16 R1 | |
| Asus ZenBook Pro 14 Duo UX8402VV-P1021W | |
| Aorus 15X ASF | |
| Dell G15 5530 | |
| Schenker XMG Pro 15 (E23) | |
| MSI Cyborg 15 A12VF | |
| Schenker XMG Pro 15 (i7-12700H, RTX 3080 Ti) | |
| Asus TUF A15 FA507 | |
| HWBOT x265 Benchmark v2.2 / 4k Preset | |
| Moyenne Intel Core i9-13900HX (23.5 - 34.4, n=22) | |
| Moyenne de la classe Gaming (11.5 - 44.4, n=105, 2 dernières années) | |
| Schenker XMG Pro 15 (E23) | |
| Dell G15 5530 | |
| Alienware x16 R1 | |
| Aorus 15X ASF | |
| Schenker XMG Pro 15 (i7-12700H, RTX 3080 Ti) | |
| Asus ZenBook Pro 14 Duo UX8402VV-P1021W | |
| Asus TUF A15 FA507 | |
| MSI Cyborg 15 A12VF | |
| MSI Cyborg 15 A12VF | |
| LibreOffice / 20 Documents To PDF | |
| Schenker XMG Pro 15 (E23) | |
| Asus TUF A15 FA507 | |
| Moyenne de la classe Gaming (33.2 - 88.8, n=105, 2 dernières années) | |
| Schenker XMG Pro 15 (i7-12700H, RTX 3080 Ti) | |
| Dell G15 5530 | |
| Alienware x16 R1 | |
| Aorus 15X ASF | |
| Moyenne Intel Core i9-13900HX (32.8 - 51.1, n=21) | |
| Asus ZenBook Pro 14 Duo UX8402VV-P1021W | |
| MSI Cyborg 15 A12VF | |
| R Benchmark 2.5 / Overall mean | |
| Asus TUF A15 FA507 | |
| MSI Cyborg 15 A12VF | |
| Schenker XMG Pro 15 (E23) | |
| Schenker XMG Pro 15 (i7-12700H, RTX 3080 Ti) | |
| Aorus 15X ASF | |
| Asus ZenBook Pro 14 Duo UX8402VV-P1021W | |
| Moyenne de la classe Gaming (0.3439 - 0.759, n=106, 2 dernières années) | |
| Alienware x16 R1 | |
| Dell G15 5530 | |
| Moyenne Intel Core i9-13900HX (0.375 - 0.4564, n=22) | |
* ... Moindre est la valeur, meilleures sont les performances
AIDA64: FP32 Ray-Trace | FPU Julia | CPU SHA3 | CPU Queen | FPU SinJulia | FPU Mandel | CPU AES | CPU ZLib | FP64 Ray-Trace | CPU PhotoWorxx
| Performance rating | |
| Moyenne de la classe Gaming | |
| Moyenne Intel Core i9-13900HX | |
| Schenker XMG Pro 15 (E23) | |
| Alienware x16 R1 | |
| Aorus 15X ASF | |
| Dell G15 5530 | |
| Asus TUF A15 FA507 | |
| Asus ZenBook Pro 14 Duo UX8402VV-P1021W | |
| MSI Cyborg 15 A12VF | |
| Schenker XMG Pro 15 (i7-12700H, RTX 3080 Ti) | |
| AIDA64 / FP32 Ray-Trace | |
| Moyenne de la classe Gaming (10227 - 85542, n=105, 2 dernières années) | |
| Moyenne Intel Core i9-13900HX (17589 - 27615, n=22) | |
| Alienware x16 R1 | |
| Dell G15 5530 | |
| Schenker XMG Pro 15 (E23) | |
| Aorus 15X ASF | |
| Asus TUF A15 FA507 | |
| Asus ZenBook Pro 14 Duo UX8402VV-P1021W | |
| MSI Cyborg 15 A12VF | |
| Schenker XMG Pro 15 (i7-12700H, RTX 3080 Ti) | |
| AIDA64 / FPU Julia | |
| Moyenne de la classe Gaming (51376 - 238426, n=105, 2 dernières années) | |
| Moyenne Intel Core i9-13900HX (88686 - 137015, n=22) | |
| Asus TUF A15 FA507 | |
| Schenker XMG Pro 15 (E23) | |
| Alienware x16 R1 | |
| Dell G15 5530 | |
| Aorus 15X ASF | |
| Asus ZenBook Pro 14 Duo UX8402VV-P1021W | |
| MSI Cyborg 15 A12VF | |
| Schenker XMG Pro 15 (i7-12700H, RTX 3080 Ti) | |
| AIDA64 / CPU SHA3 | |
| Moyenne de la classe Gaming (2180 - 10115, n=105, 2 dernières années) | |
| Moyenne Intel Core i9-13900HX (4362 - 7029, n=22) | |
| Schenker XMG Pro 15 (E23) | |
| Dell G15 5530 | |
| Alienware x16 R1 | |
| Aorus 15X ASF | |
| Asus TUF A15 FA507 | |
| Asus ZenBook Pro 14 Duo UX8402VV-P1021W | |
| MSI Cyborg 15 A12VF | |
| Schenker XMG Pro 15 (i7-12700H, RTX 3080 Ti) | |
| AIDA64 / CPU Queen | |
| Moyenne Intel Core i9-13900HX (125644 - 141385, n=22) | |
| Schenker XMG Pro 15 (E23) | |
| Alienware x16 R1 | |
| Moyenne de la classe Gaming (49785 - 173351, n=90, 2 dernières années) | |
| Aorus 15X ASF | |
| Asus ZenBook Pro 14 Duo UX8402VV-P1021W | |
| Dell G15 5530 | |
| Asus TUF A15 FA507 | |
| Schenker XMG Pro 15 (i7-12700H, RTX 3080 Ti) | |
| MSI Cyborg 15 A12VF | |
| AIDA64 / FPU SinJulia | |
| Moyenne Intel Core i9-13900HX (12334 - 17179, n=22) | |
| Moyenne de la classe Gaming (4424 - 33636, n=105, 2 dernières années) | |
| Asus TUF A15 FA507 | |
| Schenker XMG Pro 15 (E23) | |
| Aorus 15X ASF | |
| Alienware x16 R1 | |
| Dell G15 5530 | |
| Schenker XMG Pro 15 (i7-12700H, RTX 3080 Ti) | |
| Asus ZenBook Pro 14 Duo UX8402VV-P1021W | |
| MSI Cyborg 15 A12VF | |
| AIDA64 / FPU Mandel | |
| Moyenne de la classe Gaming (25115 - 128721, n=105, 2 dernières années) | |
| Moyenne Intel Core i9-13900HX (43850 - 69202, n=22) | |
| Asus TUF A15 FA507 | |
| Alienware x16 R1 | |
| Schenker XMG Pro 15 (E23) | |
| Dell G15 5530 | |
| Aorus 15X ASF | |
| Asus ZenBook Pro 14 Duo UX8402VV-P1021W | |
| MSI Cyborg 15 A12VF | |
| Schenker XMG Pro 15 (i7-12700H, RTX 3080 Ti) | |
| AIDA64 / CPU AES | |
| Aorus 15X ASF | |
| Moyenne Intel Core i9-13900HX (89413 - 237881, n=22) | |
| Moyenne de la classe Gaming (39258 - 247074, n=105, 2 dernières années) | |
| Schenker XMG Pro 15 (E23) | |
| Dell G15 5530 | |
| Alienware x16 R1 | |
| Asus TUF A15 FA507 | |
| MSI Cyborg 15 A12VF | |
| Asus ZenBook Pro 14 Duo UX8402VV-P1021W | |
| Schenker XMG Pro 15 (i7-12700H, RTX 3080 Ti) | |
| AIDA64 / CPU ZLib | |
| Moyenne Intel Core i9-13900HX (1284 - 1958, n=22) | |
| Moyenne de la classe Gaming (574 - 2531, n=105, 2 dernières années) | |
| Schenker XMG Pro 15 (E23) | |
| Dell G15 5530 | |
| Alienware x16 R1 | |
| Aorus 15X ASF | |
| Schenker XMG Pro 15 (i7-12700H, RTX 3080 Ti) | |
| MSI Cyborg 15 A12VF | |
| Asus ZenBook Pro 14 Duo UX8402VV-P1021W | |
| Asus TUF A15 FA507 | |
| AIDA64 / FP64 Ray-Trace | |
| Moyenne de la classe Gaming (5509 - 45446, n=105, 2 dernières années) | |
| Moyenne Intel Core i9-13900HX (9481 - 15279, n=22) | |
| Alienware x16 R1 | |
| Dell G15 5530 | |
| Schenker XMG Pro 15 (E23) | |
| Aorus 15X ASF | |
| Asus TUF A15 FA507 | |
| Asus ZenBook Pro 14 Duo UX8402VV-P1021W | |
| MSI Cyborg 15 A12VF | |
| Schenker XMG Pro 15 (i7-12700H, RTX 3080 Ti) | |
| AIDA64 / CPU PhotoWorxx | |
| Schenker XMG Pro 15 (E23) | |
| Alienware x16 R1 | |
| Moyenne Intel Core i9-13900HX (42994 - 51994, n=22) | |
| Moyenne de la classe Gaming (12271 - 89891, n=105, 2 dernières années) | |
| Asus ZenBook Pro 14 Duo UX8402VV-P1021W | |
| Dell G15 5530 | |
| MSI Cyborg 15 A12VF | |
| Aorus 15X ASF | |
| Schenker XMG Pro 15 (i7-12700H, RTX 3080 Ti) | |
| Asus TUF A15 FA507 | |
Performance du système
En ce qui concerne les performances du système, l'appareil testé a également obtenu de bons résultats et a même surpassé l'Aorus 15X ASF Aorus 15X ASFmalgré des valeurs de TDP et de TGP similaires. Dans PCMark 10, le XMG Pro 15 n'est qu'à quelques points du mince Asus ZenBook Pro 14 Duo ce qui montre qu'un ordinateur portable de jeu puissant ne doit pas nécessairement être un ordinateur portable de jeu lourd.
CrossMark: Overall | Productivity | Creativity | Responsiveness
| PCMark 10 / Score | |
| Moyenne de la classe Gaming (5828 - 12414, n=93, 2 dernières années) | |
| Alienware x16 R1 | |
| Asus ZenBook Pro 14 Duo UX8402VV-P1021W | |
| Schenker XMG Pro 15 (E23) | |
| Moyenne Intel Core i9-13900HX, NVIDIA GeForce RTX 4060 Laptop GPU (n=1) | |
| Asus TUF A15 FA507 | |
| Aorus 15X ASF | |
| MSI Cyborg 15 A12VF | |
| Dell G15 5530 | |
| Schenker XMG Pro 15 (i7-12700H, RTX 3080 Ti) | |
| PCMark 10 / Essentials | |
| Schenker XMG Pro 15 (E23) | |
| Moyenne Intel Core i9-13900HX, NVIDIA GeForce RTX 4060 Laptop GPU (n=1) | |
| Asus ZenBook Pro 14 Duo UX8402VV-P1021W | |
| Alienware x16 R1 | |
| Dell G15 5530 | |
| Schenker XMG Pro 15 (i7-12700H, RTX 3080 Ti) | |
| Aorus 15X ASF | |
| MSI Cyborg 15 A12VF | |
| Moyenne de la classe Gaming (8810 - 11935, n=97, 2 dernières années) | |
| Asus TUF A15 FA507 | |
| PCMark 10 / Productivity | |
| Moyenne de la classe Gaming (6845 - 25323, n=95, 2 dernières années) | |
| Schenker XMG Pro 15 (E23) | |
| Moyenne Intel Core i9-13900HX, NVIDIA GeForce RTX 4060 Laptop GPU (n=1) | |
| Dell G15 5530 | |
| MSI Cyborg 15 A12VF | |
| Alienware x16 R1 | |
| Asus ZenBook Pro 14 Duo UX8402VV-P1021W | |
| Aorus 15X ASF | |
| Asus TUF A15 FA507 | |
| Schenker XMG Pro 15 (i7-12700H, RTX 3080 Ti) | |
| PCMark 10 / Digital Content Creation | |
| Alienware x16 R1 | |
| Moyenne de la classe Gaming (7602 - 19954, n=95, 2 dernières années) | |
| Asus ZenBook Pro 14 Duo UX8402VV-P1021W | |
| Asus TUF A15 FA507 | |
| Aorus 15X ASF | |
| Schenker XMG Pro 15 (E23) | |
| Moyenne Intel Core i9-13900HX, NVIDIA GeForce RTX 4060 Laptop GPU (n=1) | |
| MSI Cyborg 15 A12VF | |
| Schenker XMG Pro 15 (i7-12700H, RTX 3080 Ti) | |
| Dell G15 5530 | |
| CrossMark / Overall | |
| Aorus 15X ASF | |
| Moyenne de la classe Gaming (1366 - 2409, n=94, 2 dernières années) | |
| Schenker XMG Pro 15 (E23) | |
| Moyenne Intel Core i9-13900HX, NVIDIA GeForce RTX 4060 Laptop GPU (n=1) | |
| Alienware x16 R1 | |
| Asus ZenBook Pro 14 Duo UX8402VV-P1021W | |
| Dell G15 5530 | |
| MSI Cyborg 15 A12VF | |
| Asus TUF A15 FA507 | |
| CrossMark / Productivity | |
| Aorus 15X ASF | |
| Moyenne de la classe Gaming (1386 - 2254, n=94, 2 dernières années) | |
| Alienware x16 R1 | |
| Schenker XMG Pro 15 (E23) | |
| Moyenne Intel Core i9-13900HX, NVIDIA GeForce RTX 4060 Laptop GPU (n=1) | |
| Asus ZenBook Pro 14 Duo UX8402VV-P1021W | |
| Dell G15 5530 | |
| MSI Cyborg 15 A12VF | |
| Asus TUF A15 FA507 | |
| CrossMark / Creativity | |
| Moyenne de la classe Gaming (1343 - 2786, n=94, 2 dernières années) | |
| Schenker XMG Pro 15 (E23) | |
| Moyenne Intel Core i9-13900HX, NVIDIA GeForce RTX 4060 Laptop GPU (n=1) | |
| Aorus 15X ASF | |
| Asus ZenBook Pro 14 Duo UX8402VV-P1021W | |
| Dell G15 5530 | |
| Alienware x16 R1 | |
| MSI Cyborg 15 A12VF | |
| Asus TUF A15 FA507 | |
| CrossMark / Responsiveness | |
| Aorus 15X ASF | |
| Alienware x16 R1 | |
| Schenker XMG Pro 15 (E23) | |
| Moyenne Intel Core i9-13900HX, NVIDIA GeForce RTX 4060 Laptop GPU (n=1) | |
| Moyenne de la classe Gaming (1226 - 2334, n=94, 2 dernières années) | |
| MSI Cyborg 15 A12VF | |
| Asus ZenBook Pro 14 Duo UX8402VV-P1021W | |
| Dell G15 5530 | |
| Asus TUF A15 FA507 | |
| PCMark 10 Score | 7521 points | |
Aide | ||
| AIDA64 / Memory Copy | |
| Schenker XMG Pro 15 (E23) | |
| Moyenne Intel Core i9-13900HX (67716 - 79193, n=22) | |
| Alienware x16 R1 | |
| Moyenne de la classe Gaming (21750 - 129946, n=105, 2 dernières années) | |
| Asus ZenBook Pro 14 Duo UX8402VV-P1021W | |
| Dell G15 5530 | |
| Aorus 15X ASF | |
| MSI Cyborg 15 A12VF | |
| Asus TUF A15 FA507 | |
| Schenker XMG Pro 15 (i7-12700H, RTX 3080 Ti) | |
| AIDA64 / Memory Read | |
| Schenker XMG Pro 15 (E23) | |
| Moyenne Intel Core i9-13900HX (73998 - 88462, n=22) | |
| Moyenne de la classe Gaming (22956 - 118858, n=105, 2 dernières années) | |
| Dell G15 5530 | |
| Alienware x16 R1 | |
| Aorus 15X ASF | |
| MSI Cyborg 15 A12VF | |
| Asus ZenBook Pro 14 Duo UX8402VV-P1021W | |
| Asus TUF A15 FA507 | |
| Schenker XMG Pro 15 (i7-12700H, RTX 3080 Ti) | |
| AIDA64 / Memory Write | |
| Alienware x16 R1 | |
| Moyenne de la classe Gaming (22297 - 135096, n=105, 2 dernières années) | |
| Schenker XMG Pro 15 (E23) | |
| Moyenne Intel Core i9-13900HX (65472 - 77045, n=22) | |
| Asus ZenBook Pro 14 Duo UX8402VV-P1021W | |
| Dell G15 5530 | |
| MSI Cyborg 15 A12VF | |
| Aorus 15X ASF | |
| Asus TUF A15 FA507 | |
| Schenker XMG Pro 15 (i7-12700H, RTX 3080 Ti) | |
| AIDA64 / Memory Latency | |
| Moyenne de la classe Gaming (75.3 - 259, n=105, 2 dernières années) | |
| Alienware x16 R1 | |
| Asus ZenBook Pro 14 Duo UX8402VV-P1021W | |
| MSI Cyborg 15 A12VF | |
| Dell G15 5530 | |
| Aorus 15X ASF | |
| Moyenne Intel Core i9-13900HX (75.3 - 91.1, n=22) | |
| Schenker XMG Pro 15 (E23) | |
| Asus TUF A15 FA507 | |
* ... Moindre est la valeur, meilleures sont les performances
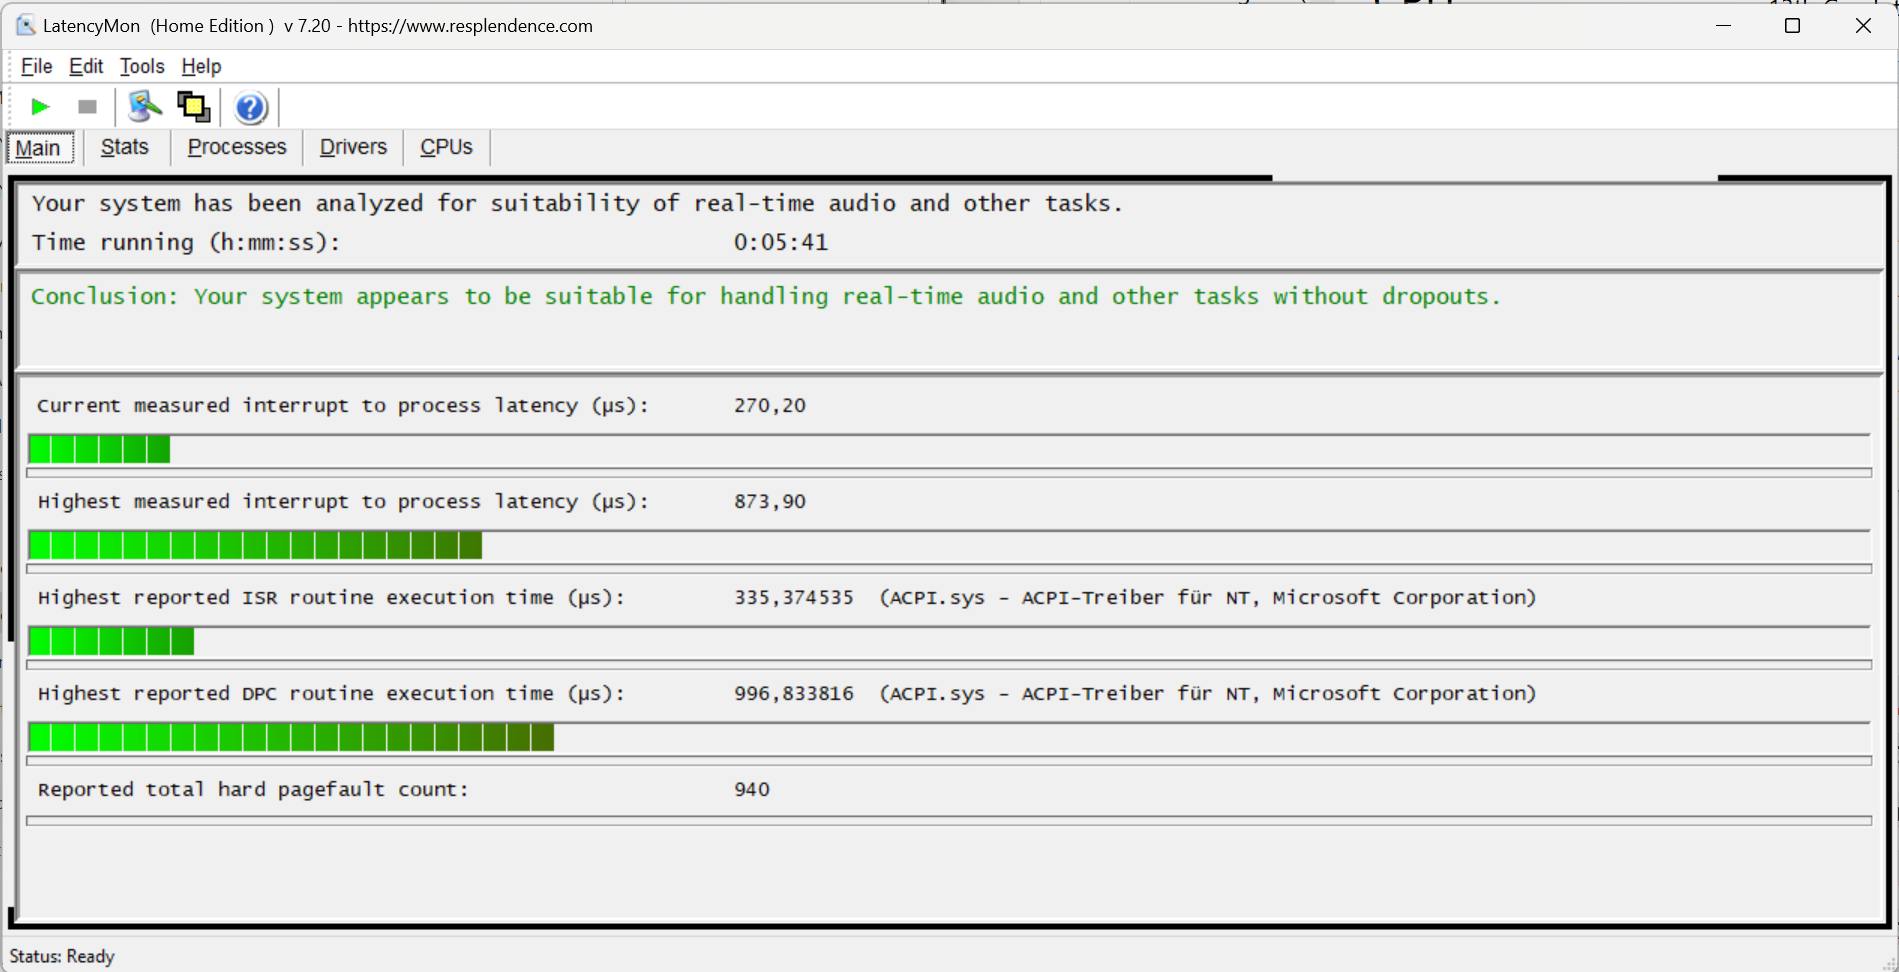
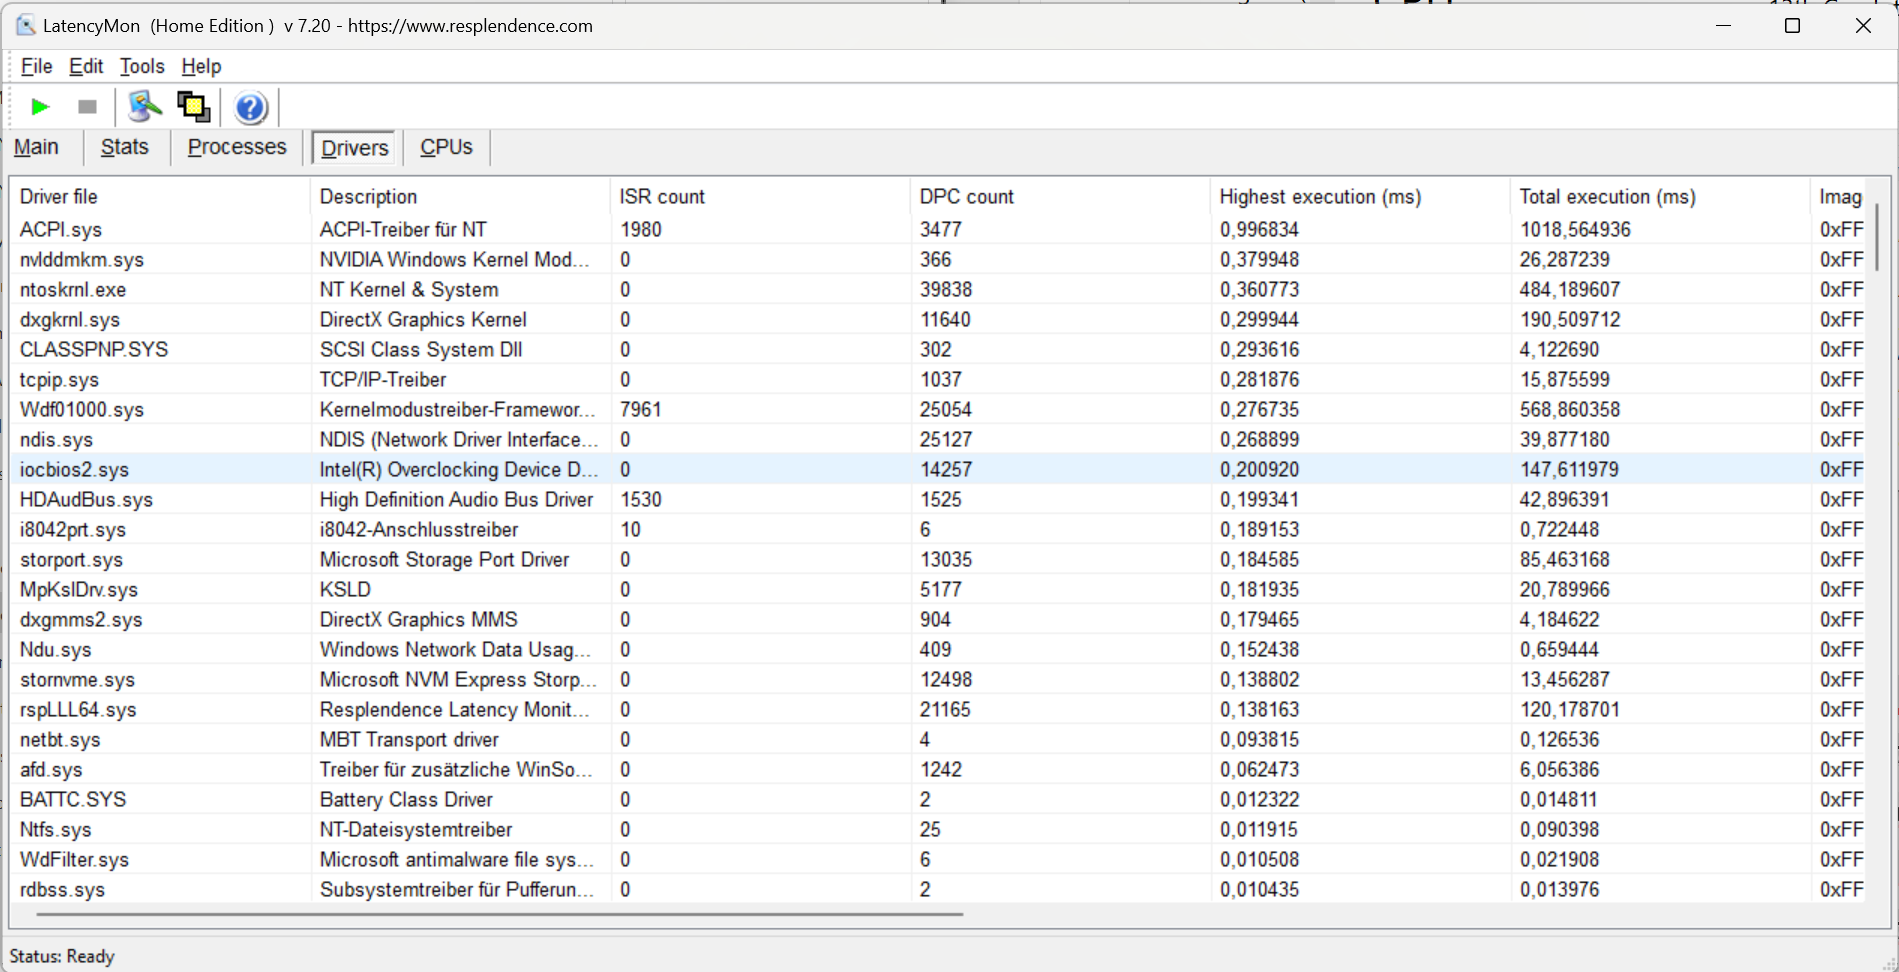
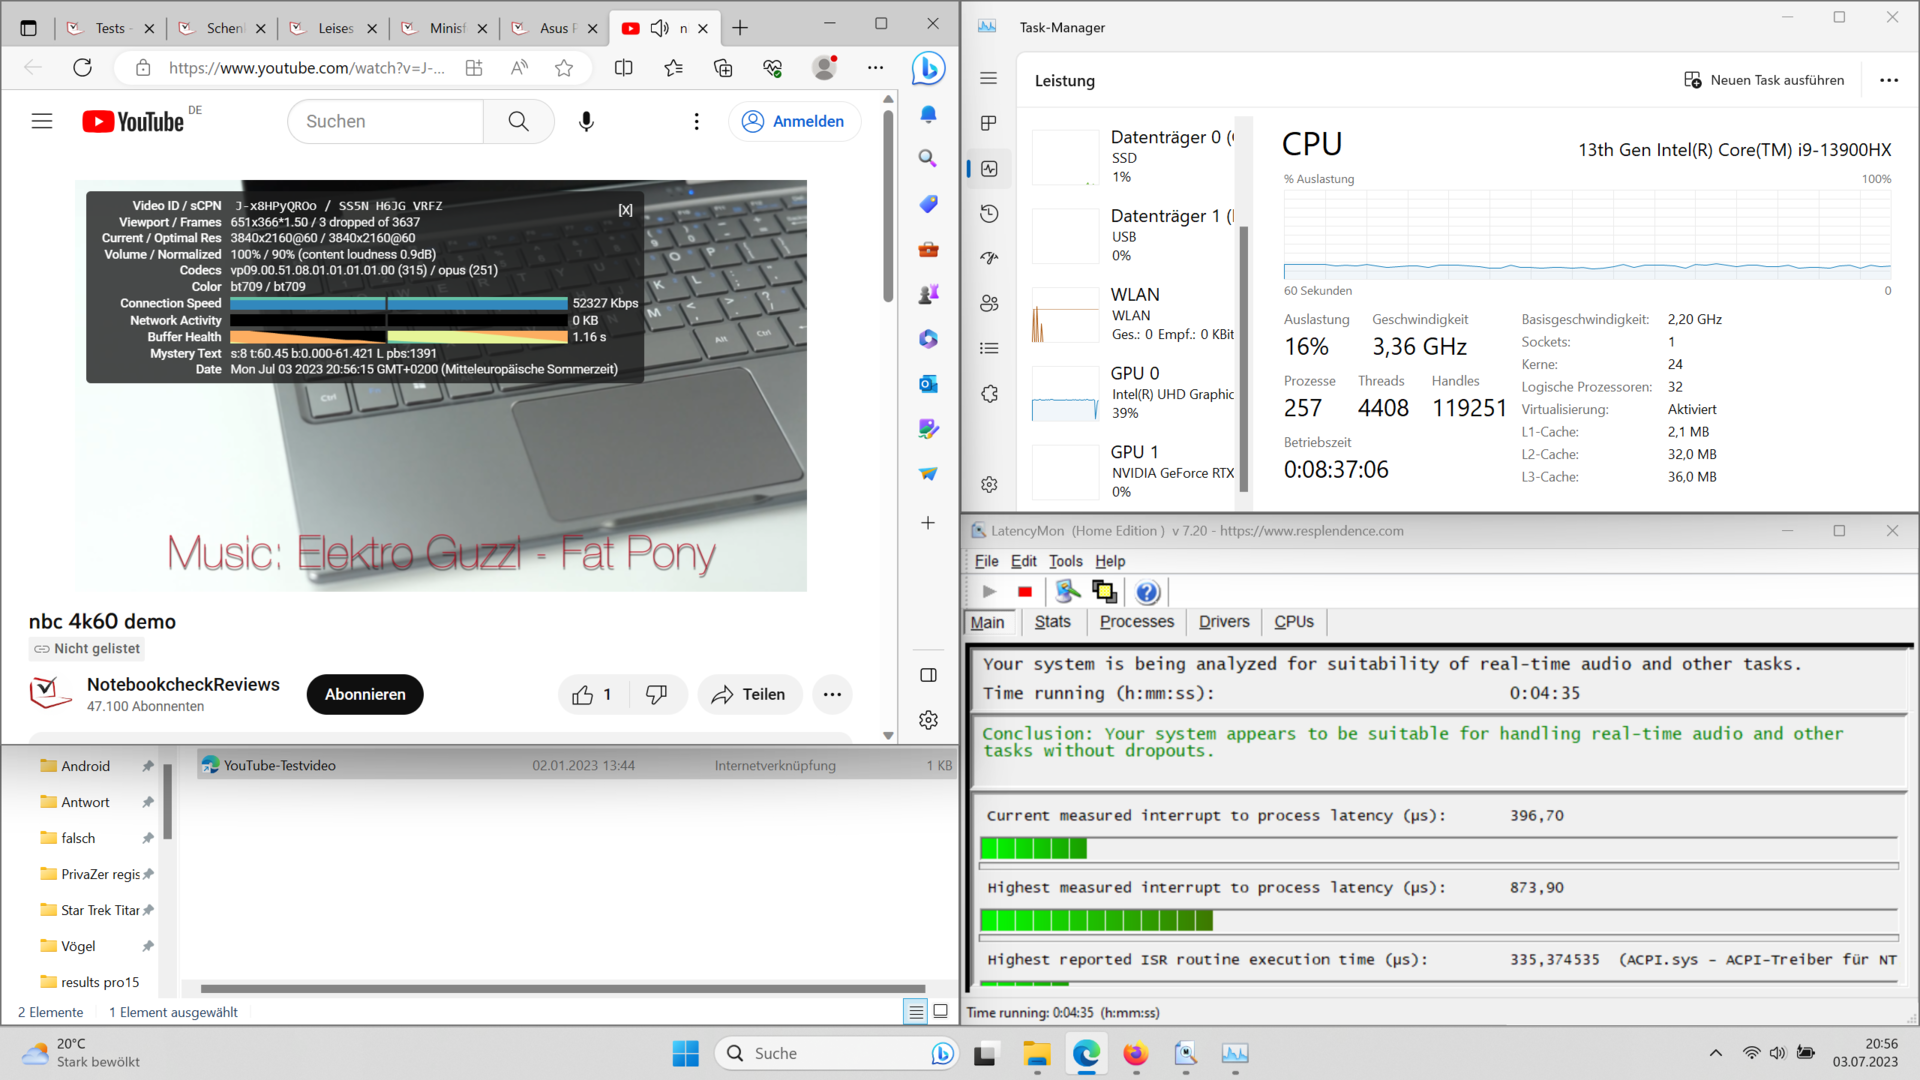
Latences DPC
Dans ce domaine, on remarque que les problèmes d'interaction entre les pilotes Nvidia et les autres pilotes ont été surmontés entre-temps. Dans cet ordinateur portable, au moment du test, les latences DPC se situent à un niveau bas avec les pilotes et les microprogrammes actuels.
| DPC Latencies / LatencyMon - interrupt to process latency (max), Web, Youtube, Prime95 | |
| Dell G15 5530 | |
| Aorus 15X ASF | |
| Schenker XMG Pro 15 (i7-12700H, RTX 3080 Ti) | |
| Alienware x16 R1 | |
| MSI Cyborg 15 A12VF | |
| Asus ZenBook Pro 14 Duo UX8402VV-P1021W | |
| Schenker XMG Pro 15 (E23) | |
* ... Moindre est la valeur, meilleures sont les performances
Mémoire de masse
De tous les disques durs NVMe que Schenker propose pour le XMG Pro 15, le Crucial P5 Plus n'est probablement pas l'option la plus rapide. Cependant, lors des tests, il a fourni de bonnes valeurs qu'il a maintenues sur des périodes plus longues. Dans la boucle DiskSpd, nous n'avons observé qu'un étranglement minimal après un certain nombre d'exécutions.

* ... Moindre est la valeur, meilleures sont les performances
Continuous Performance Read: DiskSpd Read Loop, Queue Depth 8
Carte graphique
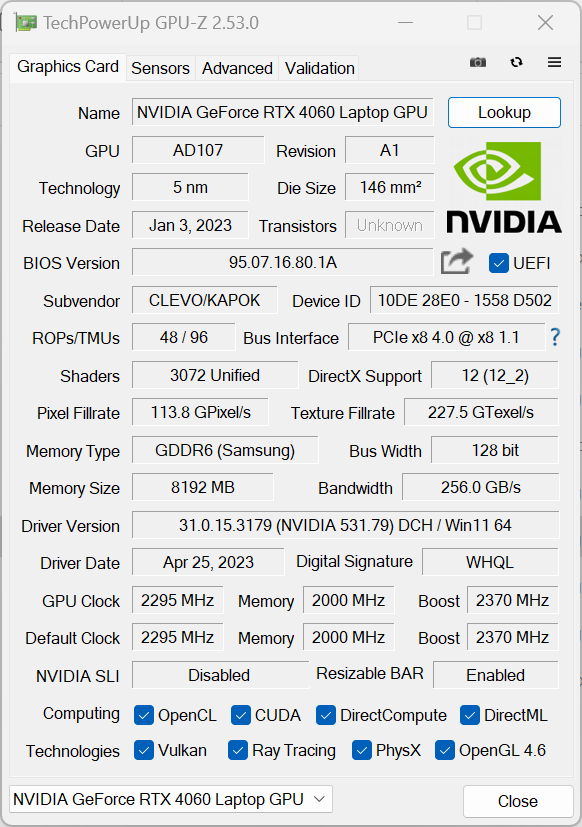
Nous en arrivons maintenant à la question centrale de notre examen. LaNvidia GeForce RTX 4060 de notre dispositif d'évaluation peut-elle rivaliser avec laRTX 3080 Ti? La réponse à cette question est clairement oui et non. En fonction du benchmark, vous devrez compter avec 10 % à 20 % de performances en moins. Dans les jeux, la différence de performance entre le XMG Pro 15 actuel et son prédécesseur dépend plutôt du jeu. Alors qu'un jeu comme The Witcher 3 profite de la vitesse d'horloge plus élevée du 4060 et atteint des taux de rafraîchissement plus élevés, dans GTA V, le Pro 15 E23 est quelque peu à la traîne par rapport à son prédécesseur. Cependant, la XMG Pro 15 peut également être configurée avec uneRTX 4070. L'Aorus 15X ASFAorus 15X ASFmontre que la différence de performance entre une RTX 3080 Ti et une RTX 4070 est très faible - dans toutes les situations. Puisque l'Aorus et le XMG Pro 15 fonctionnent avec des valeurs TDP et TGP presque identiques, cela indique la performance possible à laquelle on peut s'attendre dans le XMG Pro 15 avec une RTX 4070.
| 3DMark 11 Performance | 29518 points | |
| 3DMark Ice Storm Standard Score | 146918 points | |
| 3DMark Cloud Gate Standard Score | 54429 points | |
| 3DMark Fire Strike Score | 23131 points | |
| 3DMark Time Spy Score | 10776 points | |
Aide | ||
* ... Moindre est la valeur, meilleures sont les performances
| The Witcher 3 - 1920x1080 Ultra Graphics & Postprocessing (HBAO+) | |
| Moyenne de la classe Gaming (104.7 - 240, n=7, 2 dernières années) | |
| Alienware x16 R1 | |
| Schenker XMG Pro 15 (E23) | |
| Asus ZenBook Pro 14 Duo UX8402VV-P1021W | |
| Schenker XMG Pro 15 (i7-12700H, RTX 3080 Ti) | |
| Aorus 15X ASF | |
| Dell G15 5530 | |
| Asus TUF A15 FA507 | |
| MSI Cyborg 15 A12VF | |
| Hogwarts Legacy | |
| 2560x1440 Ultra Preset AA:High T | |
| Moyenne de la classe Gaming (n=12 dernières années) | |
| Schenker XMG Pro 15 (E23) | |
| Moyenne NVIDIA GeForce RTX 4060 Laptop GPU (42.8 - 45, n=4) | |
| 1920x1080 Ultra Preset AA:High T | |
| Moyenne de la classe Gaming (n=12 dernières années) | |
| Moyenne NVIDIA GeForce RTX 4060 Laptop GPU (61.9 - 91.9, n=6) | |
| Schenker XMG Pro 15 (E23) | |
| MSI Cyborg 15 A12VF | |
| Asus TUF A15 FA507 | |
| 1920x1080 High Preset AA:High T | |
| Asus TUF A15 FA507 | |
| Moyenne NVIDIA GeForce RTX 4060 Laptop GPU (70.8 - 107.7, n=6) | |
| MSI Cyborg 15 A12VF | |
| Schenker XMG Pro 15 (E23) | |
| Bas | Moyen | Élevé | Ultra | QHD | 4K | |
|---|---|---|---|---|---|---|
| GTA V (2015) | 184.5 | 178.9 | 170.6 | 107.2 | 87 | |
| The Witcher 3 (2015) | 112 | 159.7 | ||||
| Dota 2 Reborn (2015) | 210 | 182.9 | 176.1 | 154.3 | 126.4 | |
| X-Plane 11.11 (2018) | 154.9 | 135.9 | 111 | 102 | ||
| Strange Brigade (2018) | 377 | 267 | 213 | 183.3 | 127.5 | |
| Shadow of the Tomb Raider (2018) | 142 | 94 | ||||
| Cyberpunk 2077 1.6 (2022) | 80.6 | 48.56 | ||||
| Tiny Tina's Wonderlands (2022) | 89.29 | 60.01 | ||||
| F1 22 (2022) | 245 | 235 | 179.8 | 66.4 | 43 | |
| Call of Duty Modern Warfare 2 2022 (2022) | 91 | 66 | ||||
| Hogwarts Legacy (2023) | 90.4 | 70.8 | 64 | 44.4 |
Émissions et énergie - haut-parleurs silencieux et ventilateurs bruyants
Émissions sonores
Malheureusement, lors des tests, le XMG Pro 15 s'est révélé très bruyant. En utilisant le mode performance activé à pleine charge et à une distance de 15 centimètres, nous avons mesuré 53 dB(A) dans Prime95 et Furmark. Les ventilateurs ont d'autres atouts dans leur manche. Notre expérience montre que le mode divertissement offre également des performances suffisantes pour de nombreux jeux. Cela réduit considérablement le niveau de bruit émis par l'ordinateur portable. En utilisation normale, sans applications 3D, on peut même s'attendre à un fonctionnement très silencieux, voire silencieux. Cela lui permet au moins d'être un peu plus performant que son prédécesseur.
Degré de la nuisance sonore
| Au repos |
| 24 / 24 / 24 dB(A) |
| Fortement sollicité |
| 53.65 / 53.65 dB(A) |
 | ||
30 dB silencieux 40 dB(A) audible 50 dB(A) bruyant |
||
min: | ||
| Schenker XMG Pro 15 (E23) GeForce RTX 4060 Laptop GPU, i9-13900HX, Crucial P5 Plus 1TB CT1000P5PSSD8 | Schenker XMG Pro 15 (i7-12700H, RTX 3080 Ti) GeForce RTX 3080 Ti Laptop GPU, i7-12700H, Samsung SSD 980 Pro 1TB MZ-V8P1T0BW | Dell G15 5530 GeForce RTX 4060 Laptop GPU, i7-13650HX, SSTC CL4-3D512-Q11 | Asus TUF A15 FA507 GeForce RTX 4050 Laptop GPU, R7 7735HS, Micron 2400 MTFDKBA512QFM | Aorus 15X ASF GeForce RTX 4070 Laptop GPU, i7-13700HX, Gigabyte AG470S1TB-SI B10 | Asus ZenBook Pro 14 Duo UX8402VV-P1021W GeForce RTX 4060 Laptop GPU, i9-13900H, Samsung PM9A1 MZVL22T0HBLB | MSI Cyborg 15 A12VF GeForce RTX 4060 Laptop GPU, i7-12650H, Samsung PM9B1 1024GB MZVL41T0HBLB | Alienware x16 R1 GeForce RTX 4080 Laptop GPU, i9-13900HK, SK hynix PC801 HFS001TEJ9X101N | |
|---|---|---|---|---|---|---|---|---|
| Noise | -11% | 7% | 14% | -13% | -13% | -25% | 4% | |
| arrêt / environnement * (dB) | 24 | 23 4% | 20.41 15% | 23.3 3% | 25 -4% | 25.2 -5% | 27 -13% | 22.7 5% |
| Idle Minimum * (dB) | 24 | 23 4% | 26.85 -12% | 23.3 3% | 28 -17% | 25.2 -5% | 27 -13% | 23.1 4% |
| Idle Average * (dB) | 24 | 31.22 -30% | 26.85 -12% | 23.3 3% | 29 -21% | 25.2 -5% | 37.5 -56% | 25.8 -8% |
| Idle Maximum * (dB) | 24 | 33.09 -38% | 26.85 -12% | 23.3 3% | 36 -50% | 32.5 -35% | 38 -58% | 25.8 -8% |
| Load Average * (dB) | 53.65 | 56.35 -5% | 27.65 48% | 29.6 45% | 50 7% | 59.7 -11% | 56.3 -5% | 39.3 27% |
| Witcher 3 ultra * (dB) | 53.53 | 56.89 -6% | 47.9 11% | 43 20% | 54 -1% | 49.9 7% | ||
| Load Maximum * (dB) | 53.65 | 56.89 -6% | 47.86 11% | 43 20% | 58 -8% | 60.9 -14% | 56.3 -5% | 54.8 -2% |
* ... Moindre est la valeur, meilleures sont les performances
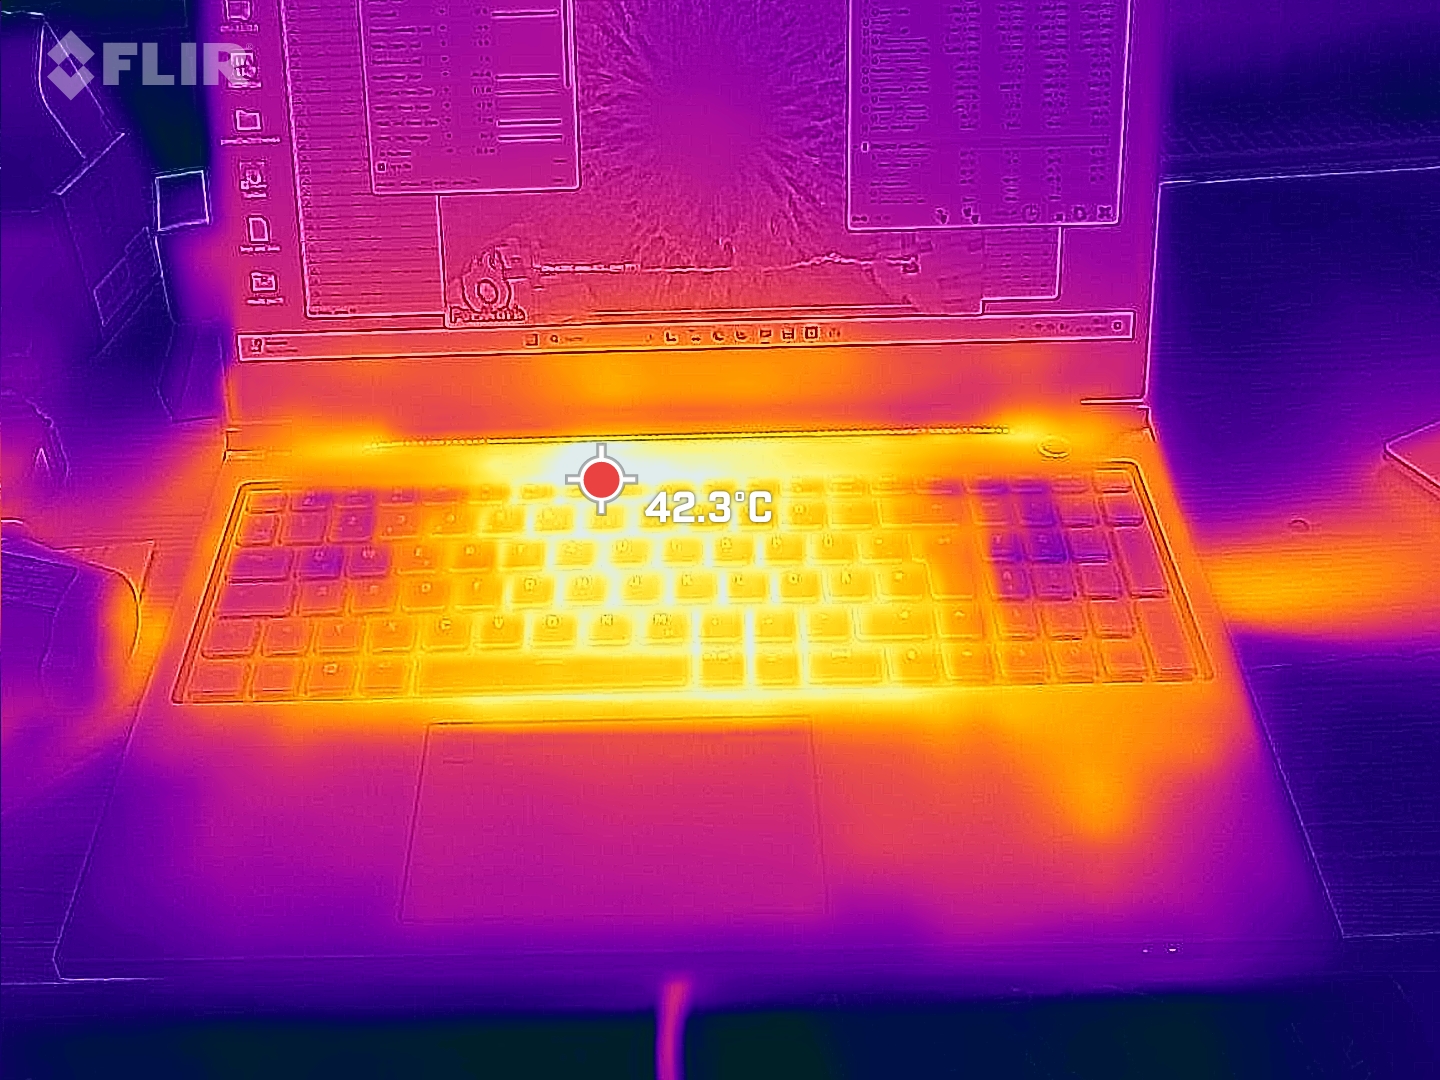
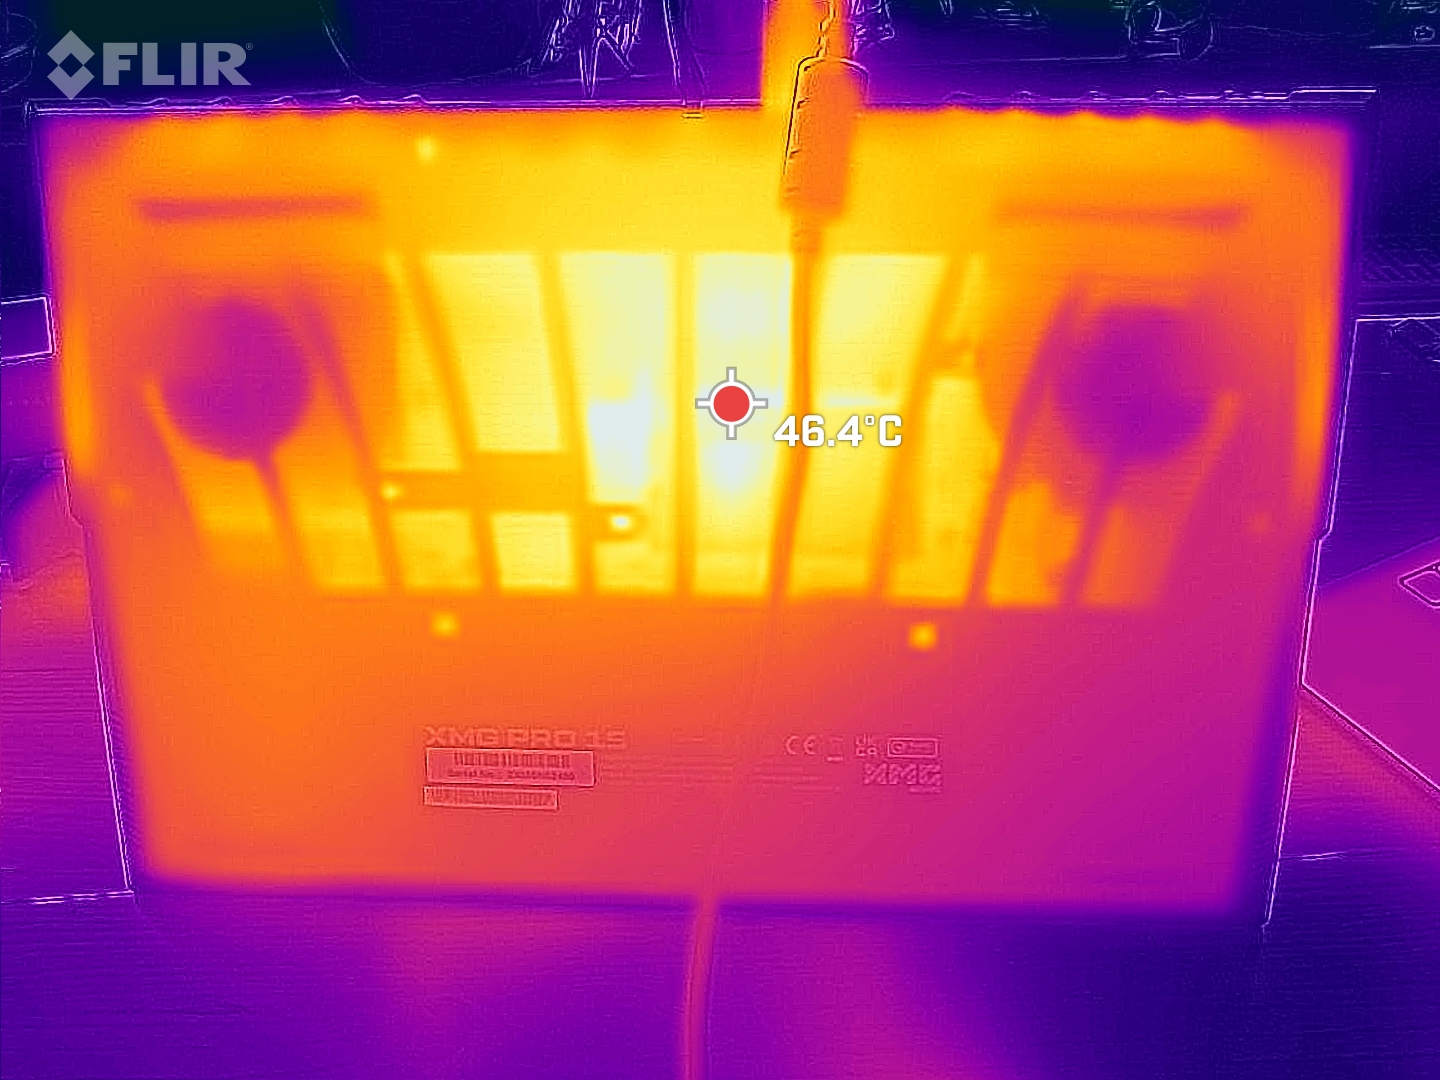
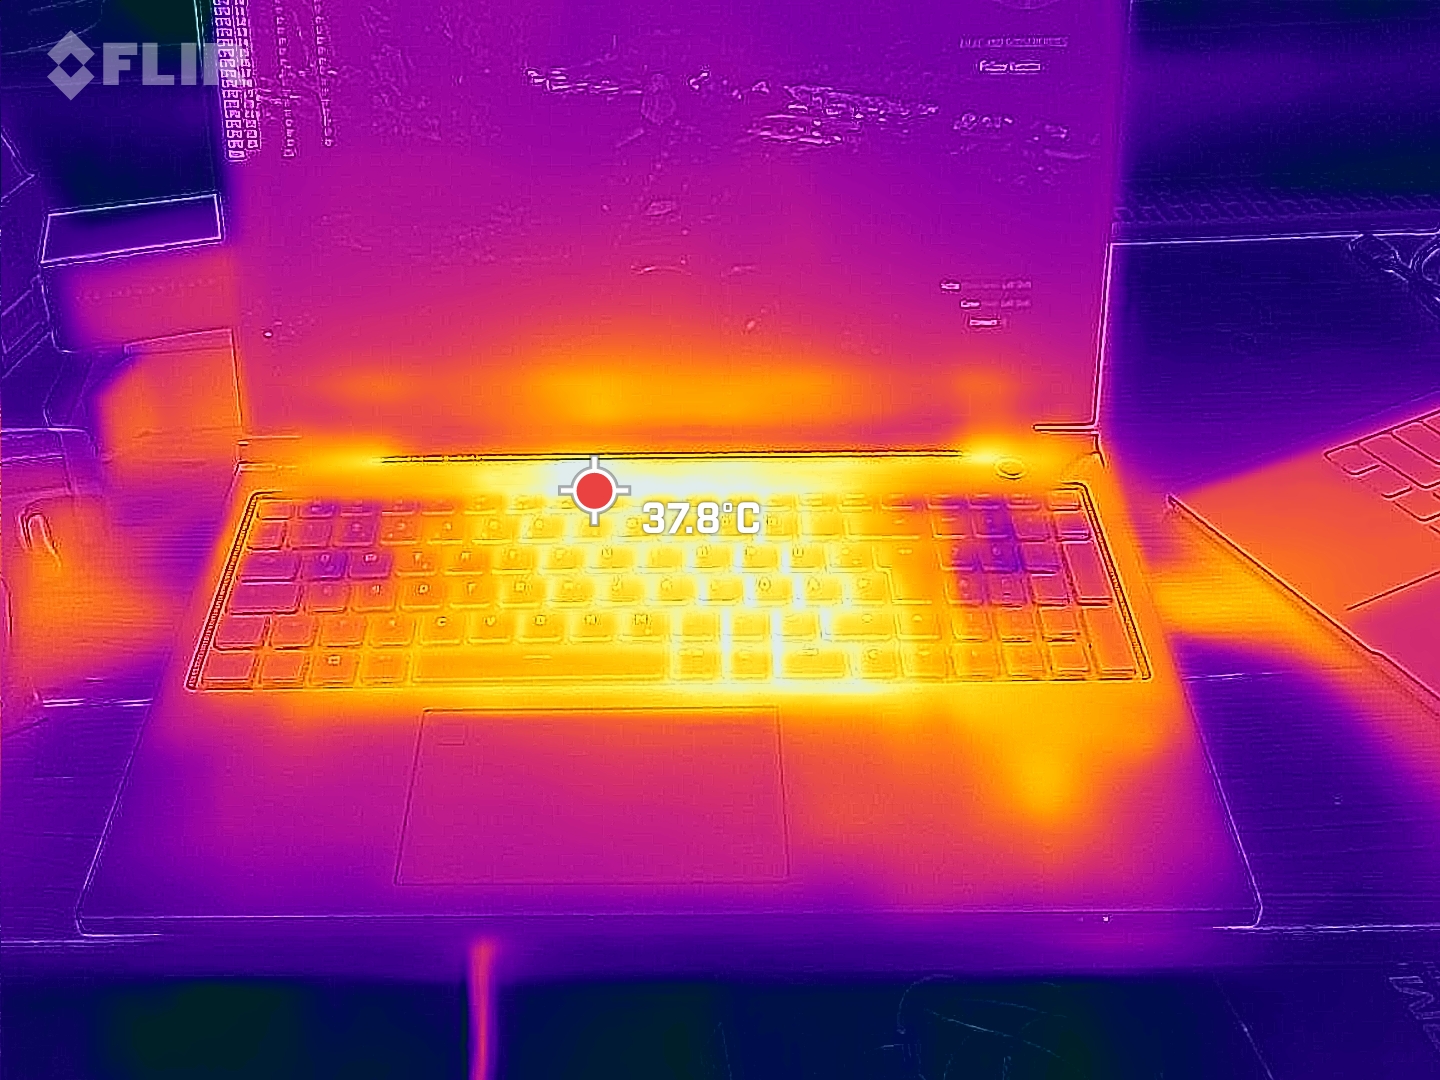
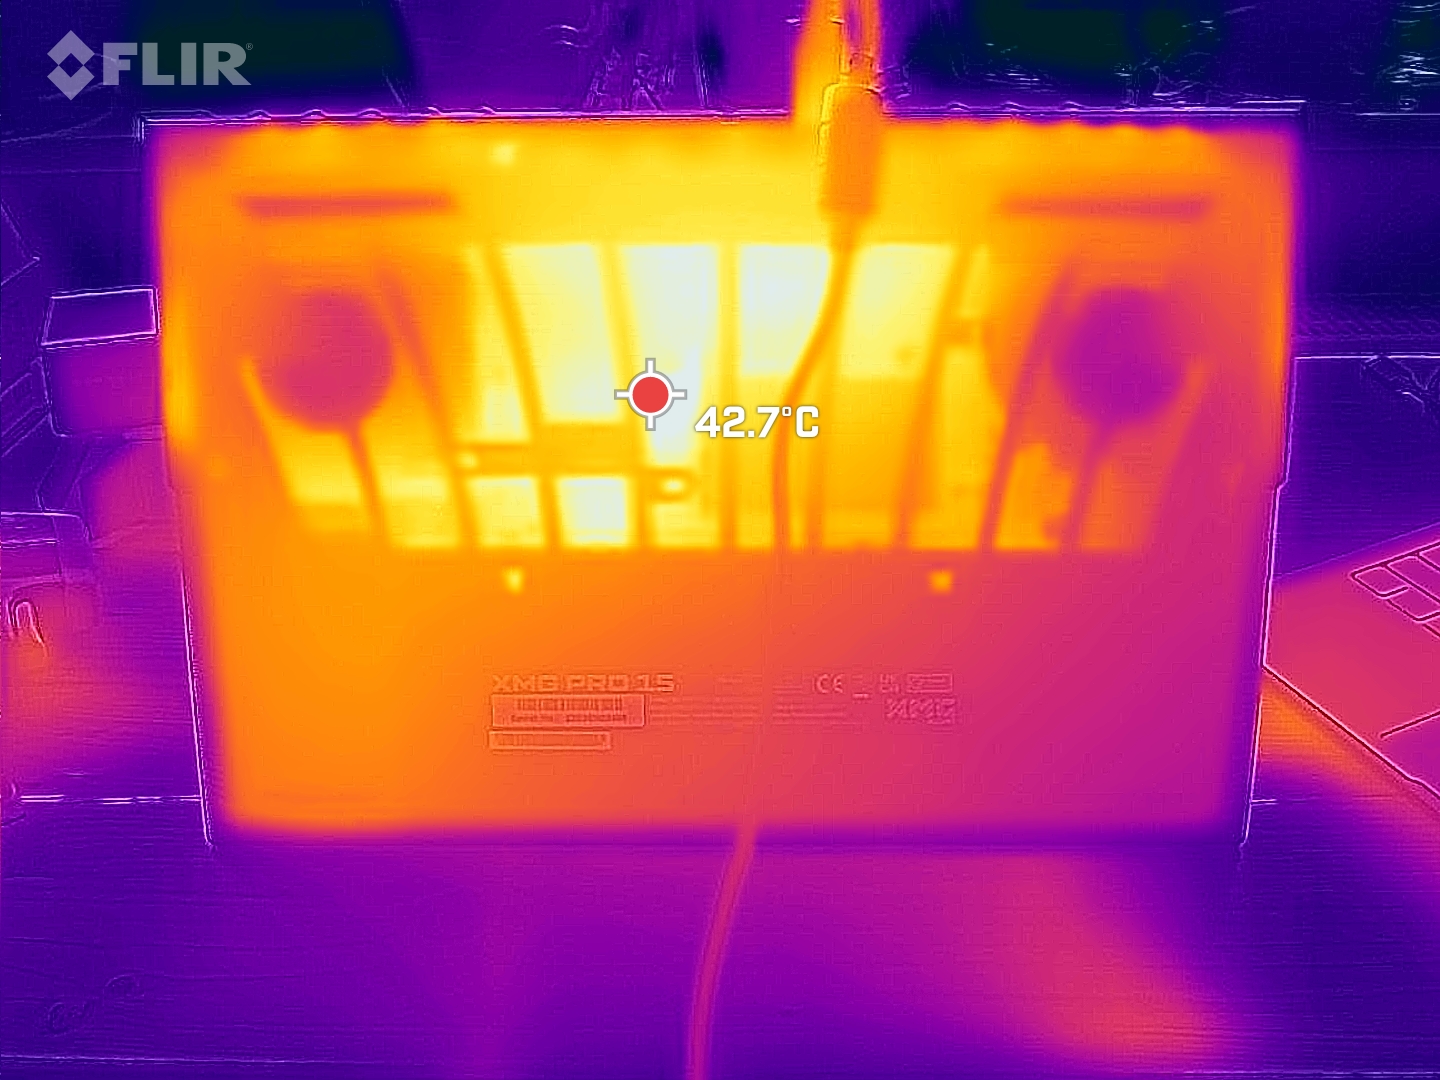
Température
Avec des températures de surface allant jusqu'à 50 °C lors du test de stress, le XMG Pro 15 est nettement plus chaud que beaucoup de ses concurrents. Mais d'une part, il ne s'agit que de points chauds relativement petits et d'autre part, la surface de l'unité de base est en plastique. Au contact, les températures élevées paraissent nettement plus basses. En jouant, il serait faux de dire que le clavier est froid, mais il n'est pas désagréablement chaud. Les performances de l'ordinateur portable ne sont pas ralenties au fil du temps.
(-) La température maximale du côté supérieur est de 50 °C / 122 F, par rapport à la moyenne de 40.4 °C / 105 F, allant de 21.2 à 68.8 °C pour la classe Gaming.
(-) Le fond chauffe jusqu'à un maximum de 50 °C / 122 F, contre une moyenne de 43.2 °C / 110 F
(+) En utilisation inactive, la température moyenne du côté supérieur est de 28.7 °C / 84 F, par rapport à la moyenne du dispositif de 33.9 °C / 93 F.
(±) En jouant à The Witcher 3, la température moyenne du côté supérieur est de 35.6 °C / 96 F, alors que la moyenne de l'appareil est de 33.9 °C / 93 F.
(+) Les repose-poignets et le pavé tactile atteignent la température maximale de la peau (34 °C / 93.2 F) et ne sont donc pas chauds.
(-) La température moyenne de la zone de l'appui-paume de dispositifs similaires était de 28.8 °C / 83.8 F (-5.2 °C / #-9.4 F).
| Schenker XMG Pro 15 (E23) Intel Core i9-13900HX, NVIDIA GeForce RTX 4060 Laptop GPU | Schenker XMG Pro 15 (i7-12700H, RTX 3080 Ti) Intel Core i7-12700H, NVIDIA GeForce RTX 3080 Ti Laptop GPU | Dell G15 5530 Intel Core i7-13650HX, NVIDIA GeForce RTX 4060 Laptop GPU | Asus TUF A15 FA507 AMD Ryzen 7 7735HS, NVIDIA GeForce RTX 4050 Laptop GPU | Aorus 15X ASF Intel Core i7-13700HX, NVIDIA GeForce RTX 4070 Laptop GPU | Asus ZenBook Pro 14 Duo UX8402VV-P1021W Intel Core i9-13900H, NVIDIA GeForce RTX 4060 Laptop GPU | MSI Cyborg 15 A12VF Intel Core i7-12650H, NVIDIA GeForce RTX 4060 Laptop GPU | Alienware x16 R1 Intel Core i9-13900HK, NVIDIA GeForce RTX 4080 Laptop GPU | |
|---|---|---|---|---|---|---|---|---|
| Heat | -5% | -9% | 11% | 13% | 9% | 15% | -4% | |
| Maximum Upper Side * (°C) | 50 | 57 -14% | 54 -8% | 48.9 2% | 42 16% | 37.1 26% | 47.5 5% | 47.2 6% |
| Maximum Bottom * (°C) | 50 | 52 -4% | 62.2 -24% | 44.6 11% | 51 -2% | 49.4 1% | 35.5 29% | 47.8 4% |
| Idle Upper Side * (°C) | 33 | 32 3% | 33.4 -1% | 27.1 18% | 27 18% | 30 9% | 27.7 16% | 36.8 -12% |
| Idle Bottom * (°C) | 32 | 34 -6% | 33.4 -4% | 27.5 14% | 26 19% | 32.4 -1% | 29.5 8% | 35.8 -12% |
* ... Moindre est la valeur, meilleures sont les performances
Intervenants
Le volume moyen perçu par les deux haut-parleurs du XMG Pro 15 est de seulement 72,5 dB(A). De nombreuses gammes de fréquences sont nettement inférieures au volume du ventilateur en charge. C'est pourquoi un casque ou des haut-parleurs externes sont indispensables pour les jeux. Ceux-ci peuvent être connectés via la prise casque de 3,5 mm, Bluetooth ou S/PDIF optique via le connecteur de 3,5 mm. Grâce à cette méthode, il est également possible de connecter un système Surround Sound directement à l'ordinateur.
Schenker XMG Pro 15 (E23) analyse audio
(±) | le niveau sonore du haut-parleur est moyen mais bon (72.52# dB)
Basses 100 - 315 Hz
(±) | basse réduite - en moyenne 12.9% inférieure à la médiane
(±) | la linéarité des basses est moyenne (7.2% delta à la fréquence précédente)
Médiums 400 - 2000 Hz
(±) | médiane supérieure - en moyenne 6.2% supérieure à la médiane
(±) | la linéarité des médiums est moyenne (7.8% delta à la fréquence précédente)
Aiguës 2 - 16 kHz
(+) | des sommets équilibrés - à seulement 2.5% de la médiane
(+) | les aigus sont linéaires (4.6% delta à la fréquence précédente)
Globalement 100 - 16 000 Hz
(±) | la linéarité du son global est moyenne (18% de différence avec la médiane)
Par rapport à la même classe
» 56% de tous les appareils testés de cette catégorie étaient meilleurs, 9% similaires, 36% pires
» Le meilleur avait un delta de 6%, la moyenne était de 18%, le pire était de 132%.
Par rapport à tous les appareils testés
» 38% de tous les appareils testés étaient meilleurs, 8% similaires, 54% pires
» Le meilleur avait un delta de 4%, la moyenne était de 23%, le pire était de 134%.
Asus ZenBook Pro 14 Duo UX8402VV-P1021W analyse audio
(+) | les haut-parleurs peuvent jouer relativement fort (83.7# dB)
Basses 100 - 315 Hz
(-) | presque aucune basse - en moyenne 19.9% plus bas que la médiane
(±) | la linéarité des basses est moyenne (11.9% delta à la fréquence précédente)
Médiums 400 - 2000 Hz
(+) | médiane équilibrée - seulement 1.2% de la médiane
(+) | les médiums sont linéaires (4.7% delta à la fréquence précédente)
Aiguës 2 - 16 kHz
(±) | sommets plus élevés - en moyenne 5.5% plus élevés que la médiane
(+) | les aigus sont linéaires (5.9% delta à la fréquence précédente)
Globalement 100 - 16 000 Hz
(±) | la linéarité du son global est moyenne (16.1% de différence avec la médiane)
Par rapport à la même classe
» 41% de tous les appareils testés de cette catégorie étaient meilleurs, 6% similaires, 53% pires
» Le meilleur avait un delta de 5%, la moyenne était de 17%, le pire était de 45%.
Par rapport à tous les appareils testés
» 26% de tous les appareils testés étaient meilleurs, 5% similaires, 69% pires
» Le meilleur avait un delta de 4%, la moyenne était de 23%, le pire était de 134%.
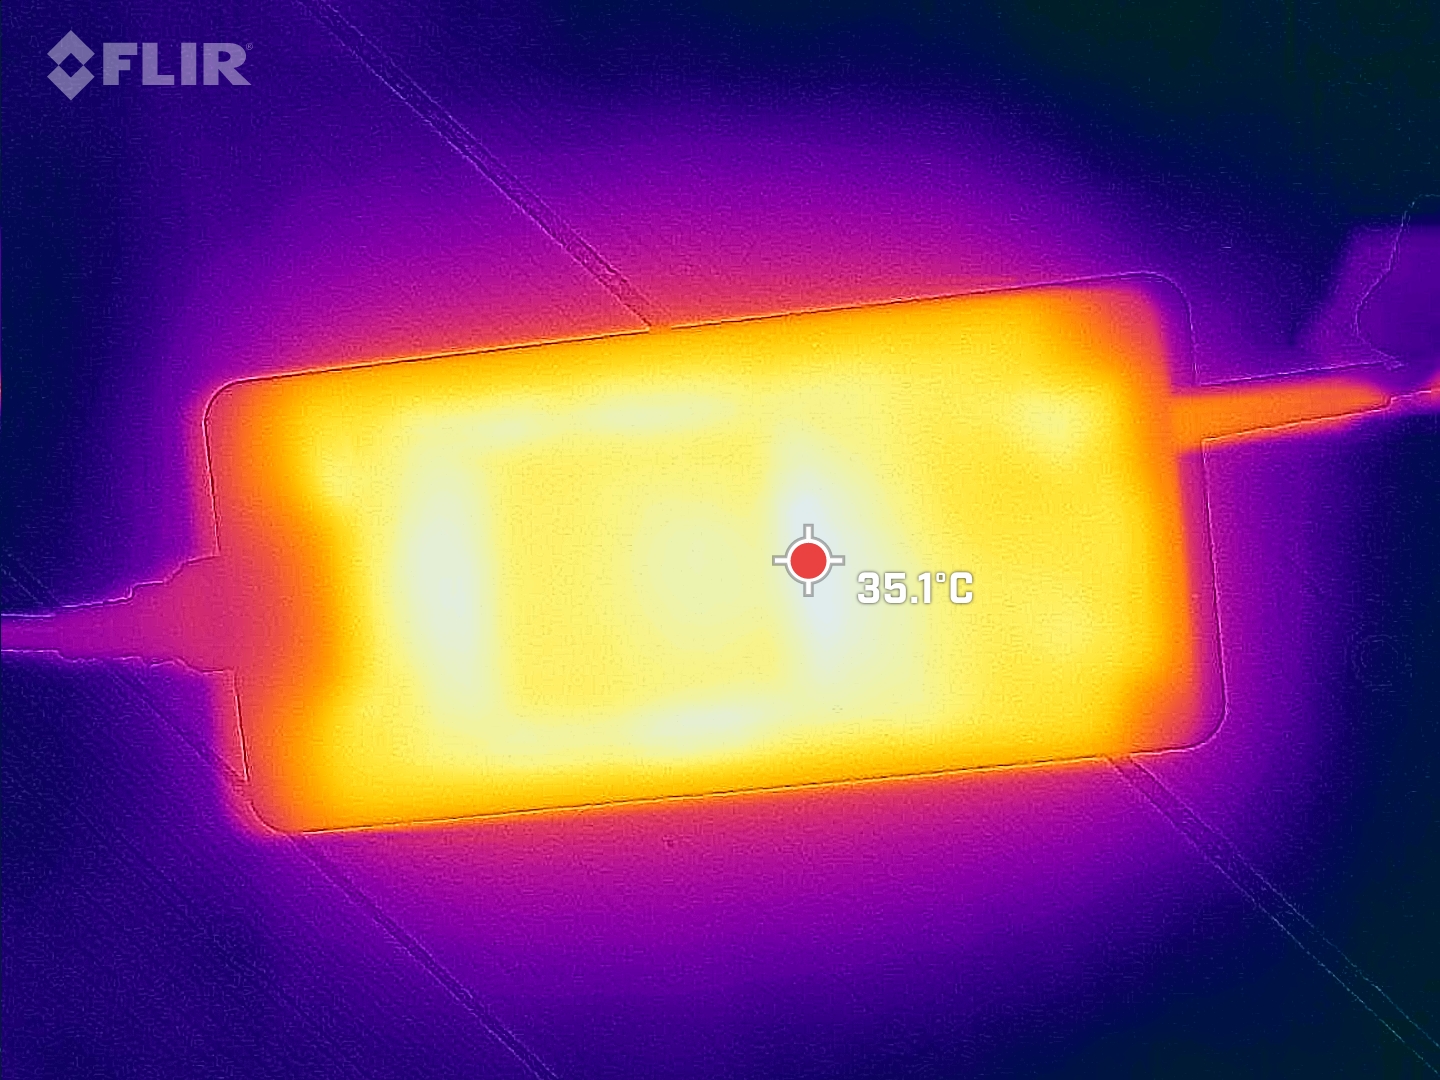
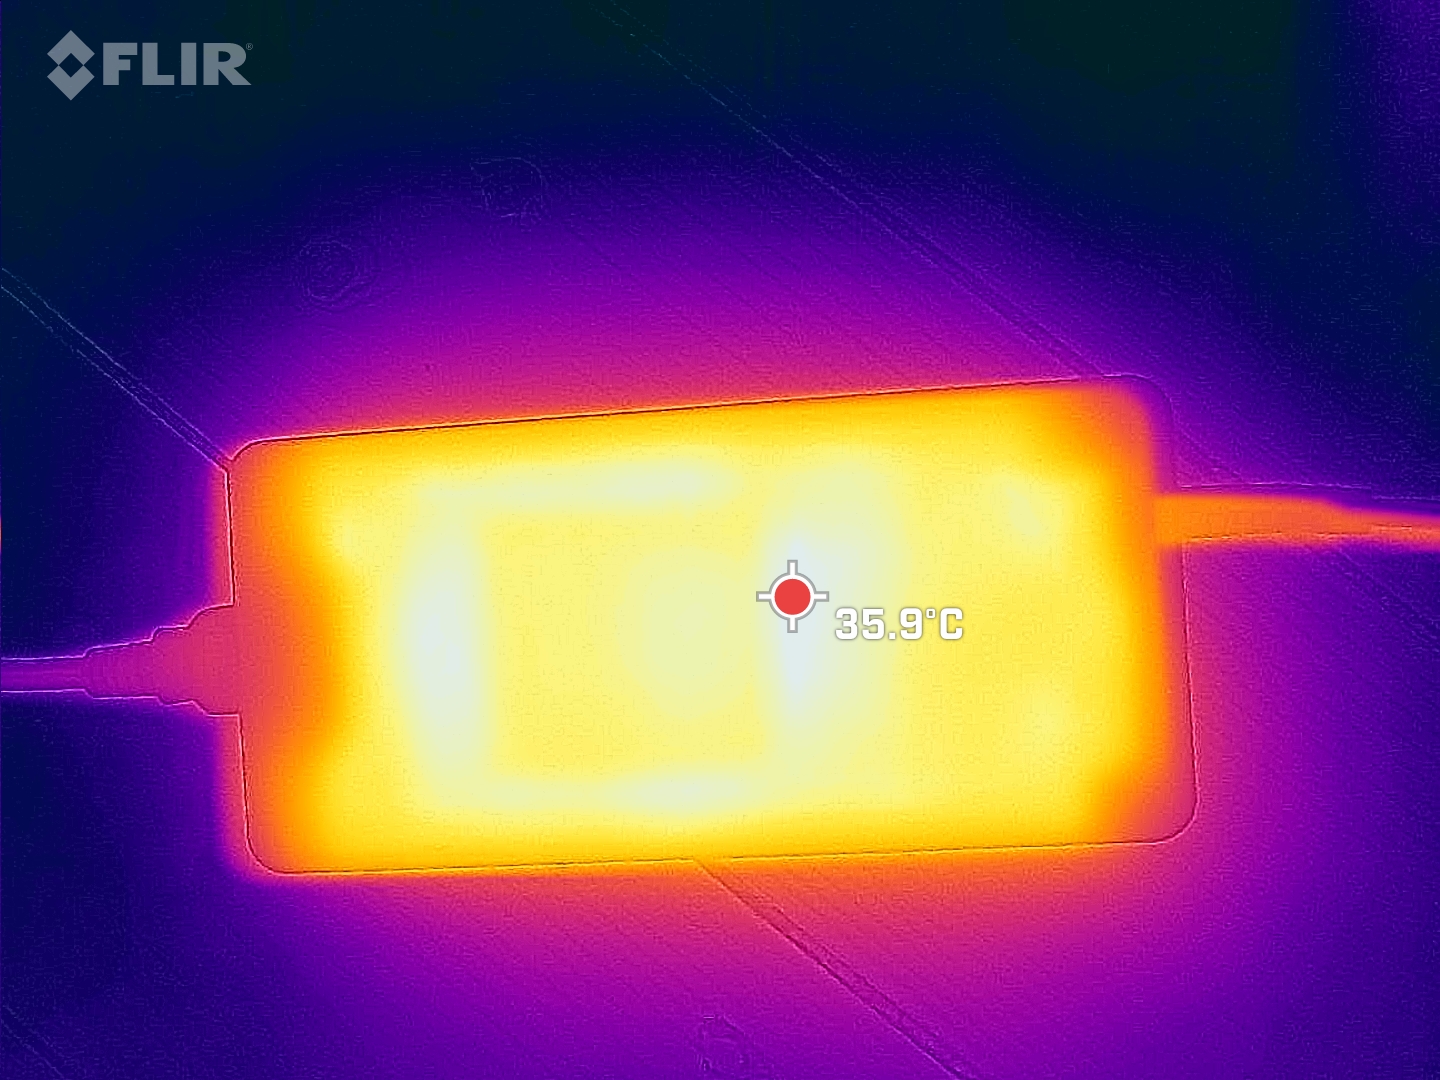
Consommation électrique
Conformément à sa catégorie, le Schenker XMG Pro 15 n'est pas un miracle d'économie d'énergie. Il est équipé d'un grand bloc d'alimentation qui peut fournir jusqu'à 280 watts. En combinaison avec l'ordinateur portable de jeu, cela signifie qu'il reste encore un peu de réserve. Dans le test de stress Prime95 et Furmark, il a consommé un maximum de 269 watts, mais plutôt 215 watts en moyenne.
| Éteint/en veille | |
| Au repos | |
| Fortement sollicité |
|
Légende:
min: | |
Power consumption Witcher 3 / stress test
Power consumption with an external monitor
Durée de vie de la batterie
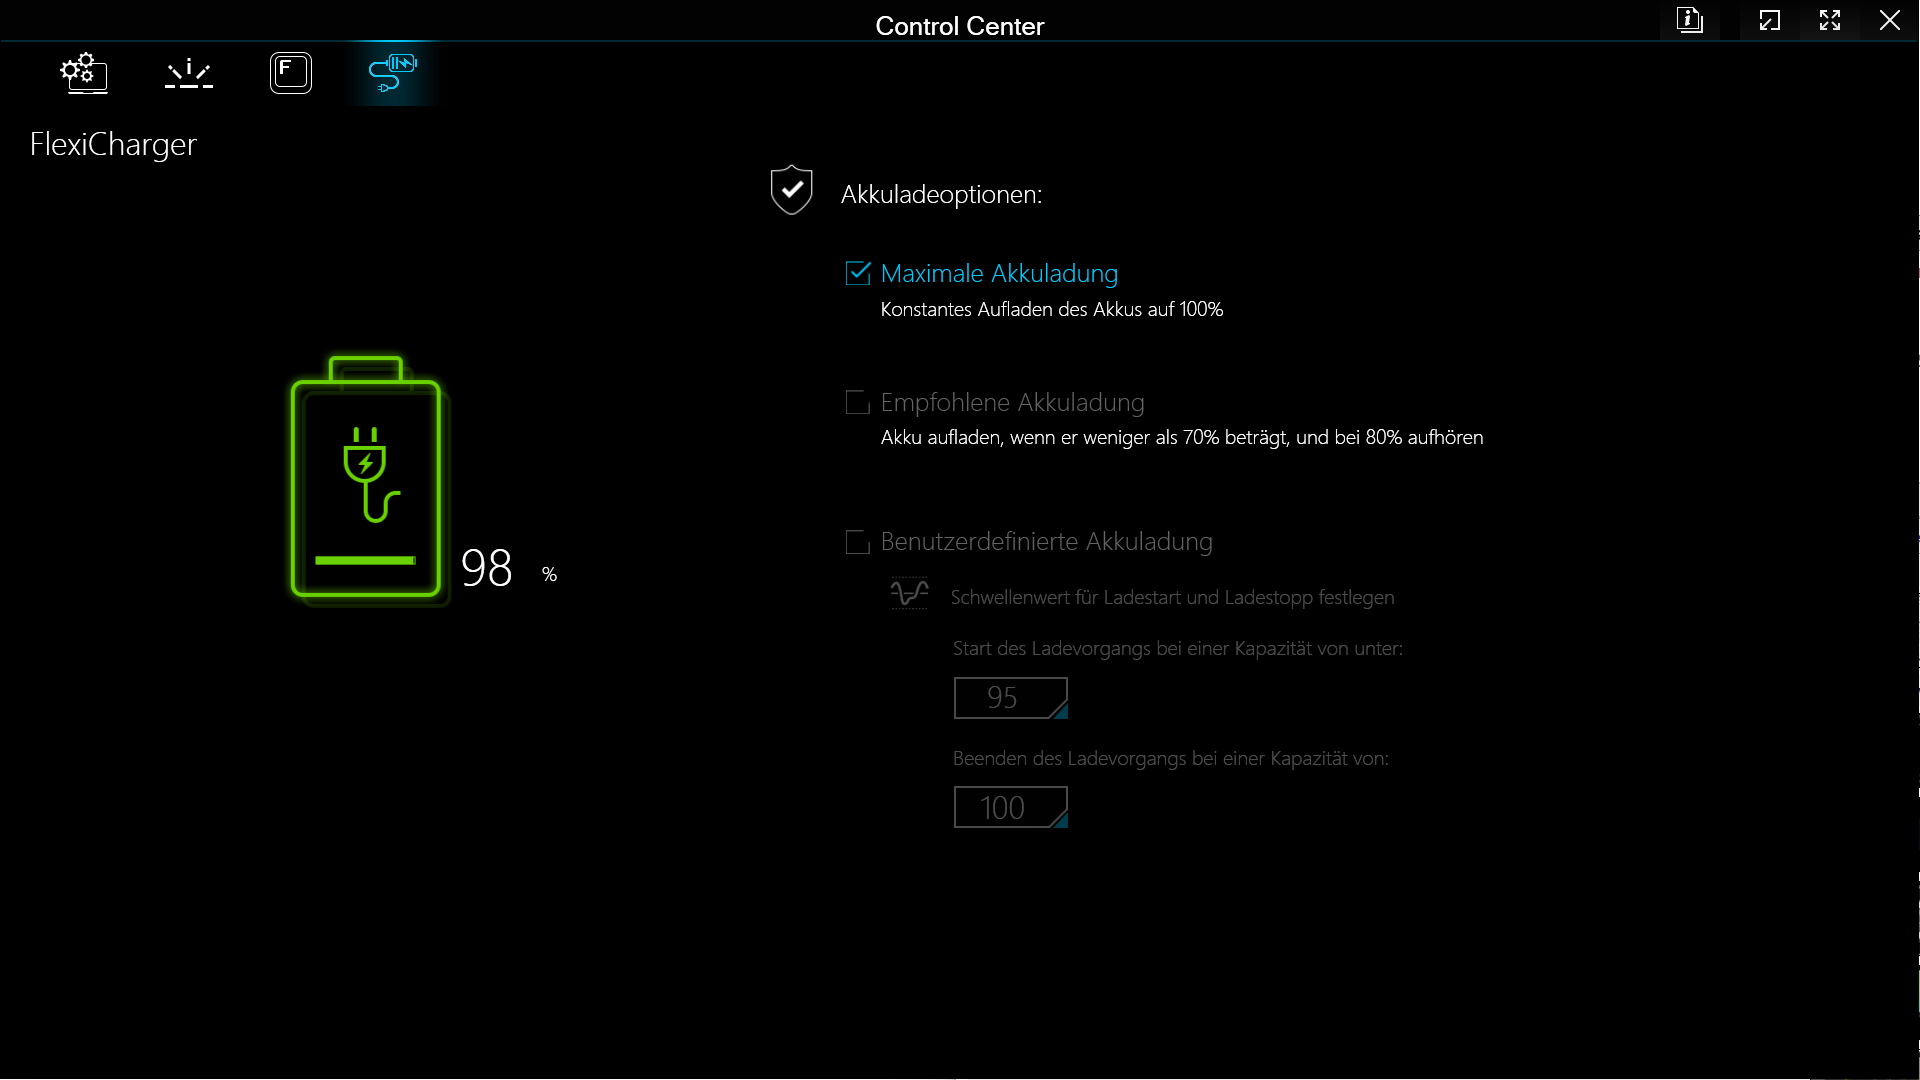
Lors de notre test de surf en Wi-Fi, le XMG Pro 15 E23 n'a pas réussi à tenir plus de six heures. Cependant, on ne peut pas attendre grand-chose d'autre d'une batterie de 80 Wh. Le mode veille du dGPU n'est pas toujours activé de manière fiable, mais Schenker est conscient du problème et travaille à une solution.
| Schenker XMG Pro 15 (E23) i9-13900HX, GeForce RTX 4060 Laptop GPU, 80 Wh | Schenker XMG Pro 15 (i7-12700H, RTX 3080 Ti) i7-12700H, GeForce RTX 3080 Ti Laptop GPU, 80 Wh | Dell G15 5530 i7-13650HX, GeForce RTX 4060 Laptop GPU, 86 Wh | Asus TUF A15 FA507 R7 7735HS, GeForce RTX 4050 Laptop GPU, 90 Wh | Aorus 15X ASF i7-13700HX, GeForce RTX 4070 Laptop GPU, 99 Wh | Asus ZenBook Pro 14 Duo UX8402VV-P1021W i9-13900H, GeForce RTX 4060 Laptop GPU, 76 Wh | MSI Cyborg 15 A12VF i7-12650H, GeForce RTX 4060 Laptop GPU, 53.5 Wh | Alienware x16 R1 i9-13900HK, GeForce RTX 4080 Laptop GPU, 90 Wh | Moyenne de la classe Gaming | |
|---|---|---|---|---|---|---|---|---|---|
| Autonomie de la batterie | -2% | -22% | 29% | 25% | 71% | 27% | -60% | 2% | |
| WiFi v1.3 (h) | 5.7 | 5.8 2% | 6.5 14% | 11.7 105% | 8.2 44% | 9 58% | 7.5 32% | 2.5 -56% | 7.11 ? 25% |
| Load (h) | 1.9 | 1.8 -5% | 0.8 -58% | 1 -47% | 2 5% | 3.5 84% | 2.3 21% | 0.7 -63% | 1.502 ? -21% |
| H.264 (h) | 5.3 | 6.8 | 12.5 | 7.9 | 8 | 8.32 ? | |||
| Witcher 3 ultra (h) | 0.8 | ||||||||
| Reader / Idle (h) | 11.3 | 13.6 | 7.3 | 8.27 ? |
Points positifs
Points négatifs
Verdict - parfait pour concilier travail et loisirs

Le XMG Pro 15 E23 est présenté comme une station de travail pour joueurs. Selon notre évaluation, il répond à toutes les exigences d'un bon ordinateur portable de jeu de milieu de gamme, mais aussi à de nombreux aspects qui en font un ordinateur portable décent pour le travail vidéo et cinématographique. Son design discret ne reflète en rien les performances impressionnantes de cet ordinateur de 15,6 pouces. Schenker a mis au point un ordinateur solide, doté de bons périphériques d'entrée et d'une solide sélection de ports, ainsi que de composants de qualité supérieure.
Certains des inconvénients de son prédécesseur ont été considérablement réduits ou complètement éliminés. Le SSD fonctionne désormais de manière stable à des vitesses élevées, l'écran est plus lumineux et le volume a été légèrement ajusté. L'ordinateur portable de jeu n'est peut-être pas encore silencieux, mais il sait maintenant quand se comporter correctement.
Les bords du XMG Pro 15 E23 ont été adoucis, ce qui signifie que l'ordinateur portable de jeu ne présente plus que quelques inconvénients mineurs.
Il n'y a pas de points négatifs qui ressortent. L'absence d'un port USB à l'arrière est plutôt regrettable, ce qui signifie que seule une configuration de souris et de clavier sans fil permettra d'obtenir un bureau sans câble. Ceux qui ne souhaitent pas pousser l'ordinateur portable jusqu'à ses limites de performance apprécieront le mode de divertissement silencieux. La plupart des jeux fonctionnent bien. Seul le temps de réponse lent de l'écran QHD 240 Hz nous dérange. En attendant, la différence avec des concurrents tels queAorus 15X ASF ou le MSI Cyborg 15 ne se trouve que dans les détails. Ceux qui recherchent un ordinateur portable de jeu plus excitant feraient mieux de jeter un coup d'œil à l'Alienware x16 R1 ou leAsus ROG Strix G16- mais vous ne serez pas récompensé par une puissance supérieure.
Prix et disponibilité
Le XMG Pro 15 peut être configuré chez Bestware. Sans Windows, un SSD et la quantité minimale de RAM, l'ordinateur portable démarre à 1 893 euros. Notre modèle d'essai sans Windows 11 coûte 2 150 euros. Pour un Windows 11 Home activé, Bestware demande 100 euros supplémentaires. Schenker ne suit manifestement pas la spirale des prix à la hausse. L'année dernière, le Pro 15 E22équipé d'une RTX 3070 Ti, de 32 Go de RAM et d'un disque dur SSD de 1 To coûtait 2 510 euros. Pour le E23 avec une RTX 4070, 32 Go de RAM et un SSD de 1 To, Bestware propose un prix de 2400 euros.
Schenker XMG Pro 15 (E23)
- 07/04/2023 v7 (old)
Marc Herter
Transparency
La sélection des appareils à examiner est effectuée par notre équipe éditoriale. L'échantillon de test a été prêté à l'auteur par le fabricant ou le détaillant pour les besoins de cet examen. Le prêteur n'a pas eu d'influence sur cette évaluation et le fabricant n'a pas reçu de copie de cette évaluation avant sa publication. Il n'y avait aucune obligation de publier cet article. En tant que média indépendant, Notebookcheck n'est pas soumis à l'autorité des fabricants, des détaillants ou des éditeurs.
Voici comment Notebookcheck teste
Chaque année, Notebookcheck examine de manière indépendante des centaines d'ordinateurs portables et de smartphones en utilisant des procédures standardisées afin de garantir que tous les résultats sont comparables. Nous avons continuellement développé nos méthodes de test depuis environ 20 ans et avons établi des normes industrielles dans le processus. Dans nos laboratoires de test, des équipements de mesure de haute qualité sont utilisés par des techniciens et des rédacteurs expérimentés. Ces tests impliquent un processus de validation en plusieurs étapes. Notre système d'évaluation complexe repose sur des centaines de mesures et de points de référence bien fondés, ce qui garantit l'objectivité.Price comparison

