Test de l'Alienware x16 R1 : premiers tests de l'Intel Core i9-13900HK

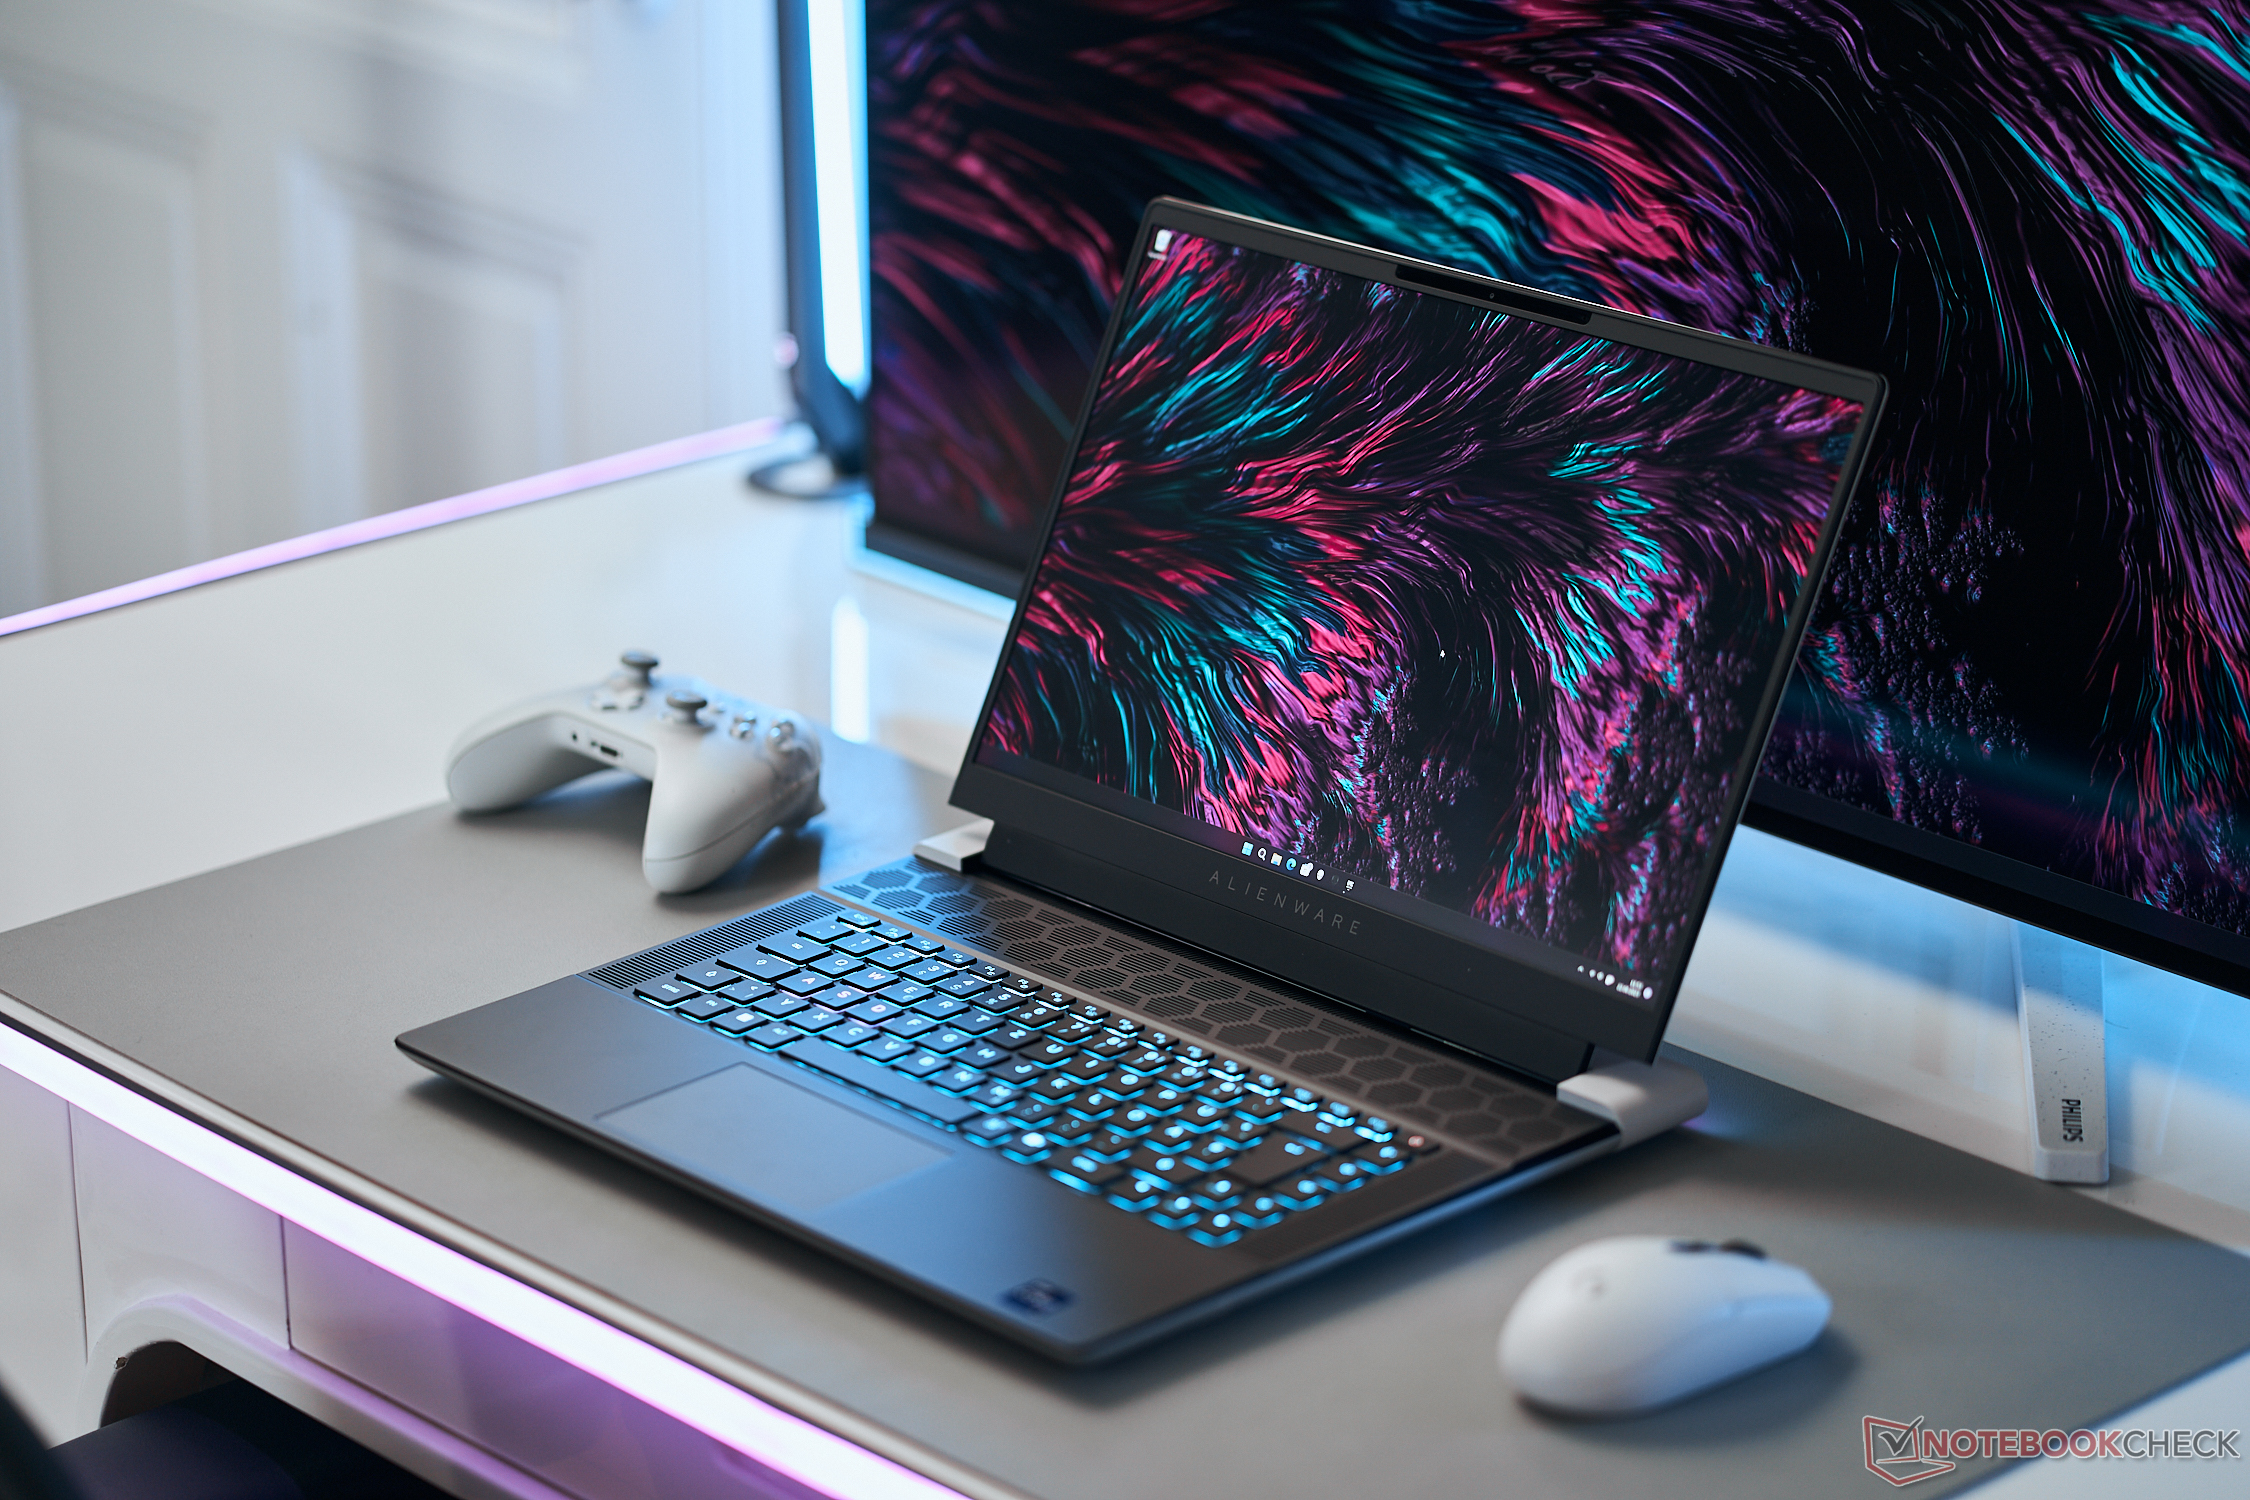
Dévoilé au CES 2023l'Alienware x16 R1 est le deuxième modèle 16 pouces de la famille, après l'Alienware m16, plus épais et plus puissant, que nous n'avons pas encore testé. Ces deux modèles complètent la gamme existante des 14 pouces, 15 pouces, 17 pouces et 18 pouces Alienware déjà sur le marché.
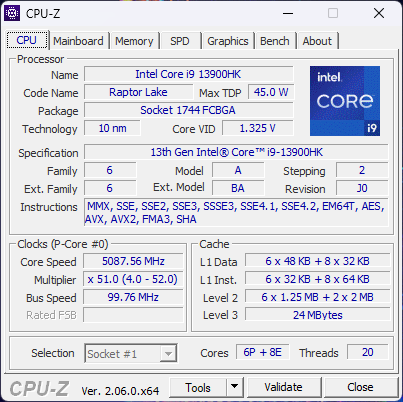
Notre unité de test est une configuration haut de gamme avec le CPU Core i9-13900HK Raptor Lake de 13ème génération, le GPU RTX 4080 ( GeForce ) et un écran IPS de 16,0 pouces 2560 x 1600 240 Hz pour un prix d'environ 3350 USD. Des configurations moins chères ou plus chères sont disponibles, allant du Core i7-13620H, de l'écran 1200p et du GPU RTX 4050 jusqu'à la RTX 4090 pour 2200 USD à plus de 4000 USD.
Les alternatives à l'Alienware x16 R1 comprennent d'autres ordinateurs portables de jeu de 16 pouces comme le Lenovo Legion Pro 7, Asus ROG Zephyrus M16, Razer Blade 16, ou le HP Omen 16. Cette catégorie de taille particulière a gagné en popularité au cours des deux dernières années.
Plus de commentaires sur Dell :
Comparaison avec les concurrents potentiels
Note | Date | Modèle | Poids | Épaisseur | Taille | Résolution | Prix |
|---|---|---|---|---|---|---|---|
| 88.4 % v7 (old) | 06/23 | Alienware x16 R1 i9-13900HK, GeForce RTX 4080 Laptop GPU | 2.6 kg | 18.57 mm | 16.00" | 2560x1600 | |
| 88.8 % v7 (old) | 06/23 | Lenovo Legion Pro 7 RTX4090 i9-13900HX, GeForce RTX 4090 Laptop GPU | 2.7 kg | 26 mm | 16.00" | 2560x1600 | |
| 89.4 % v7 (old) | 03/23 | Asus ROG Zephyrus M16 GU604VY-NM042X i9-13900H, GeForce RTX 4090 Laptop GPU | 2.3 kg | 22.9 mm | 16.00" | 2560x1600 | |
| 91.2 % v7 (old) | 02/23 | Razer Blade 16 Early 2023 i9-13950HX, GeForce RTX 4080 Laptop GPU | 2.4 kg | 21.99 mm | 16.00" | 2560x1600 | |
| 86.1 % v7 (old) | 10/22 | Dell G16 7620 i7-12700H, GeForce RTX 3060 Laptop GPU | 2.6 kg | 26.9 mm | 16.00" | 2560x1600 | |
| 86.1 % v7 (old) | 01/23 | Alienware m17 R5 (R9 6900HX, RX 6850M XT) R9 6900HX, Radeon RX 6850M XT | 3.4 kg | 26.7 mm | 17.00" | 3840x2160 |
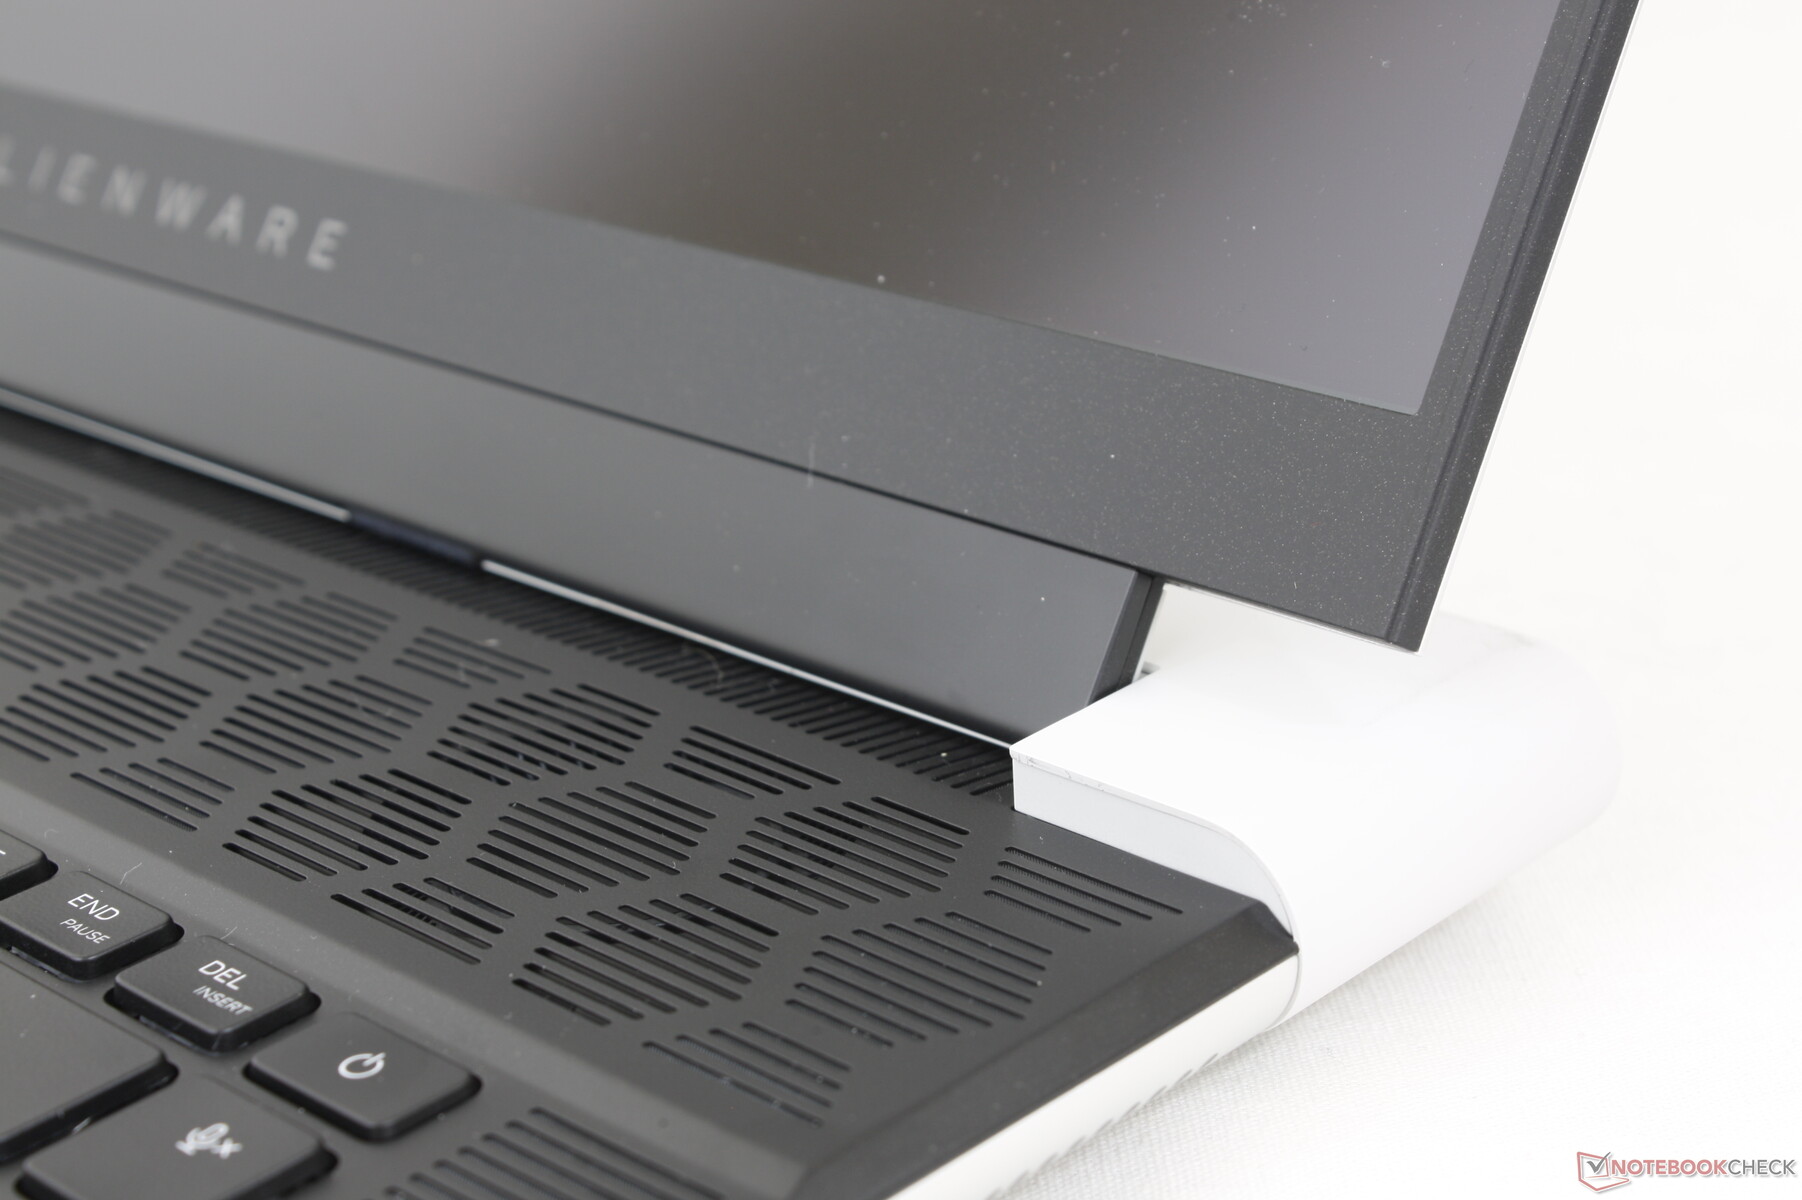
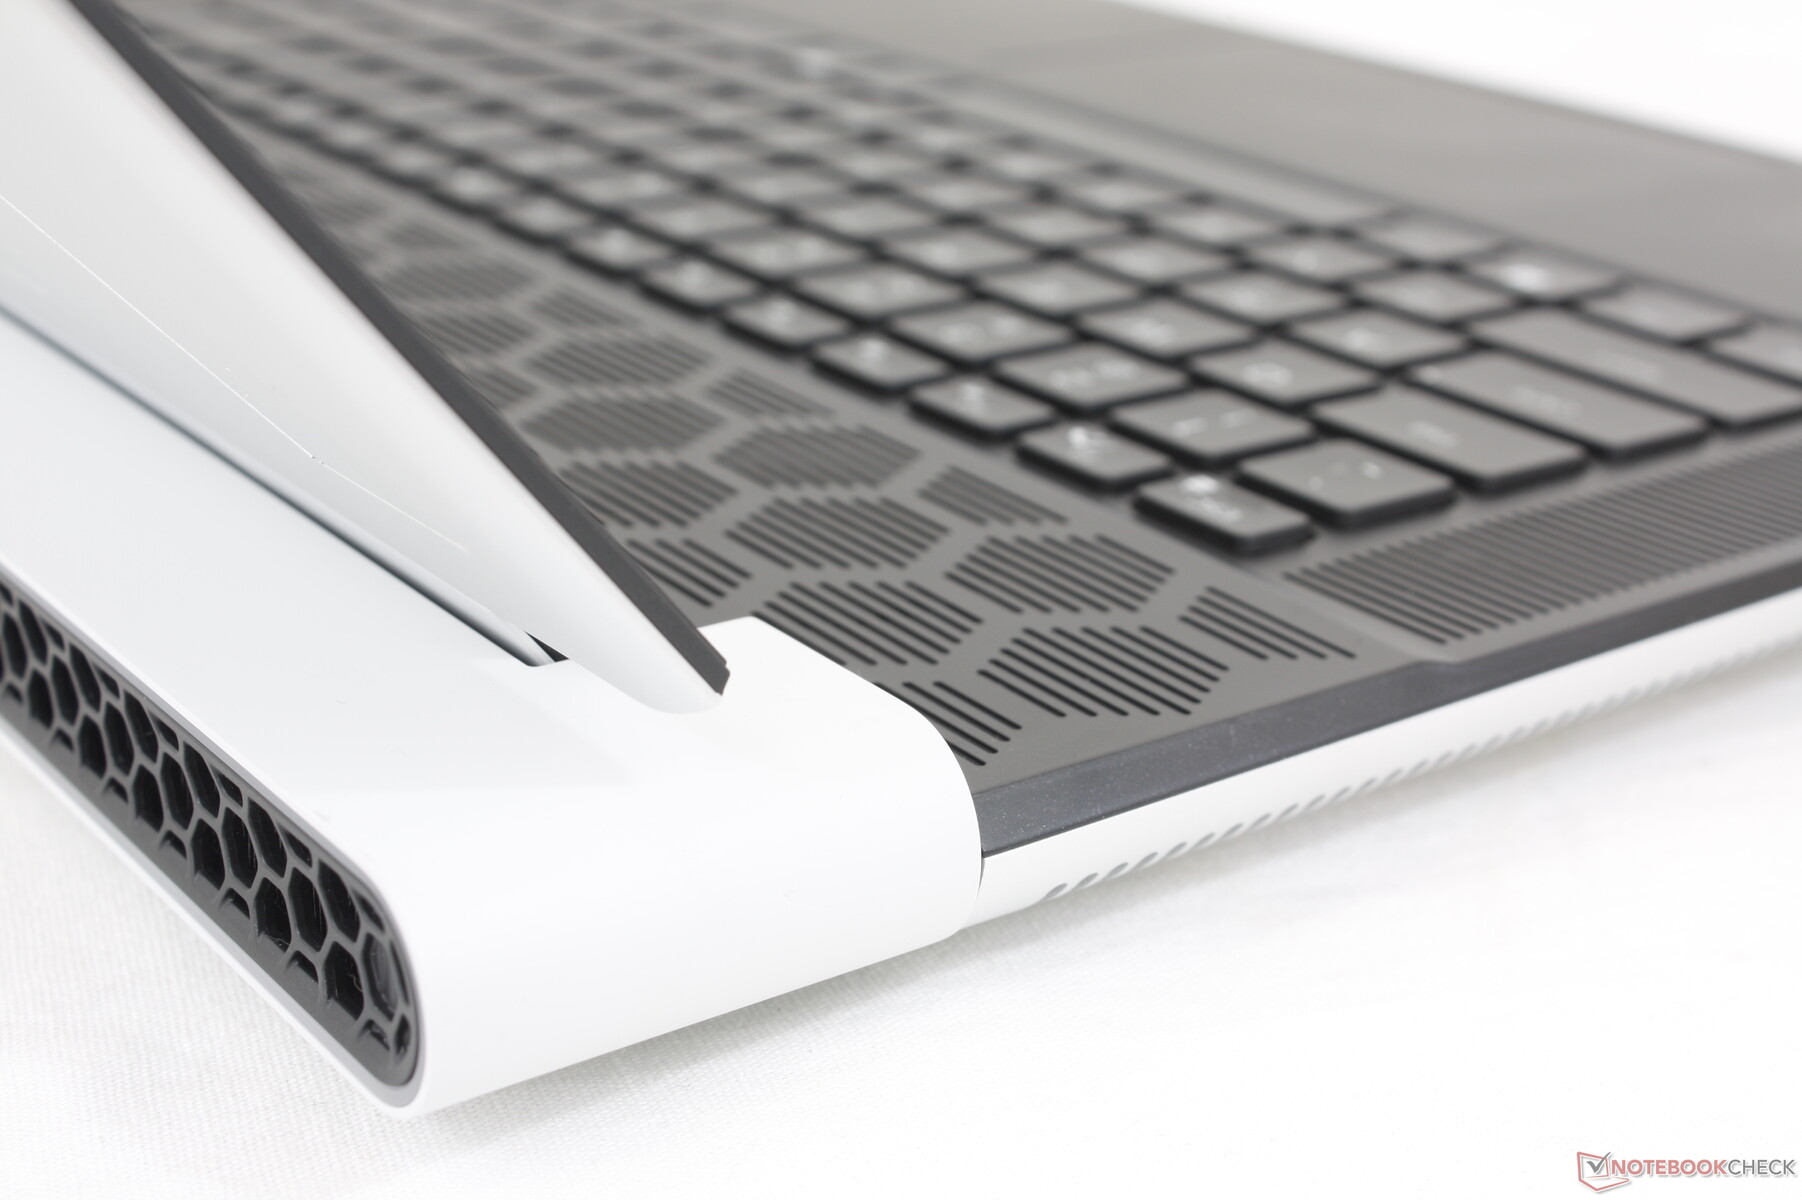
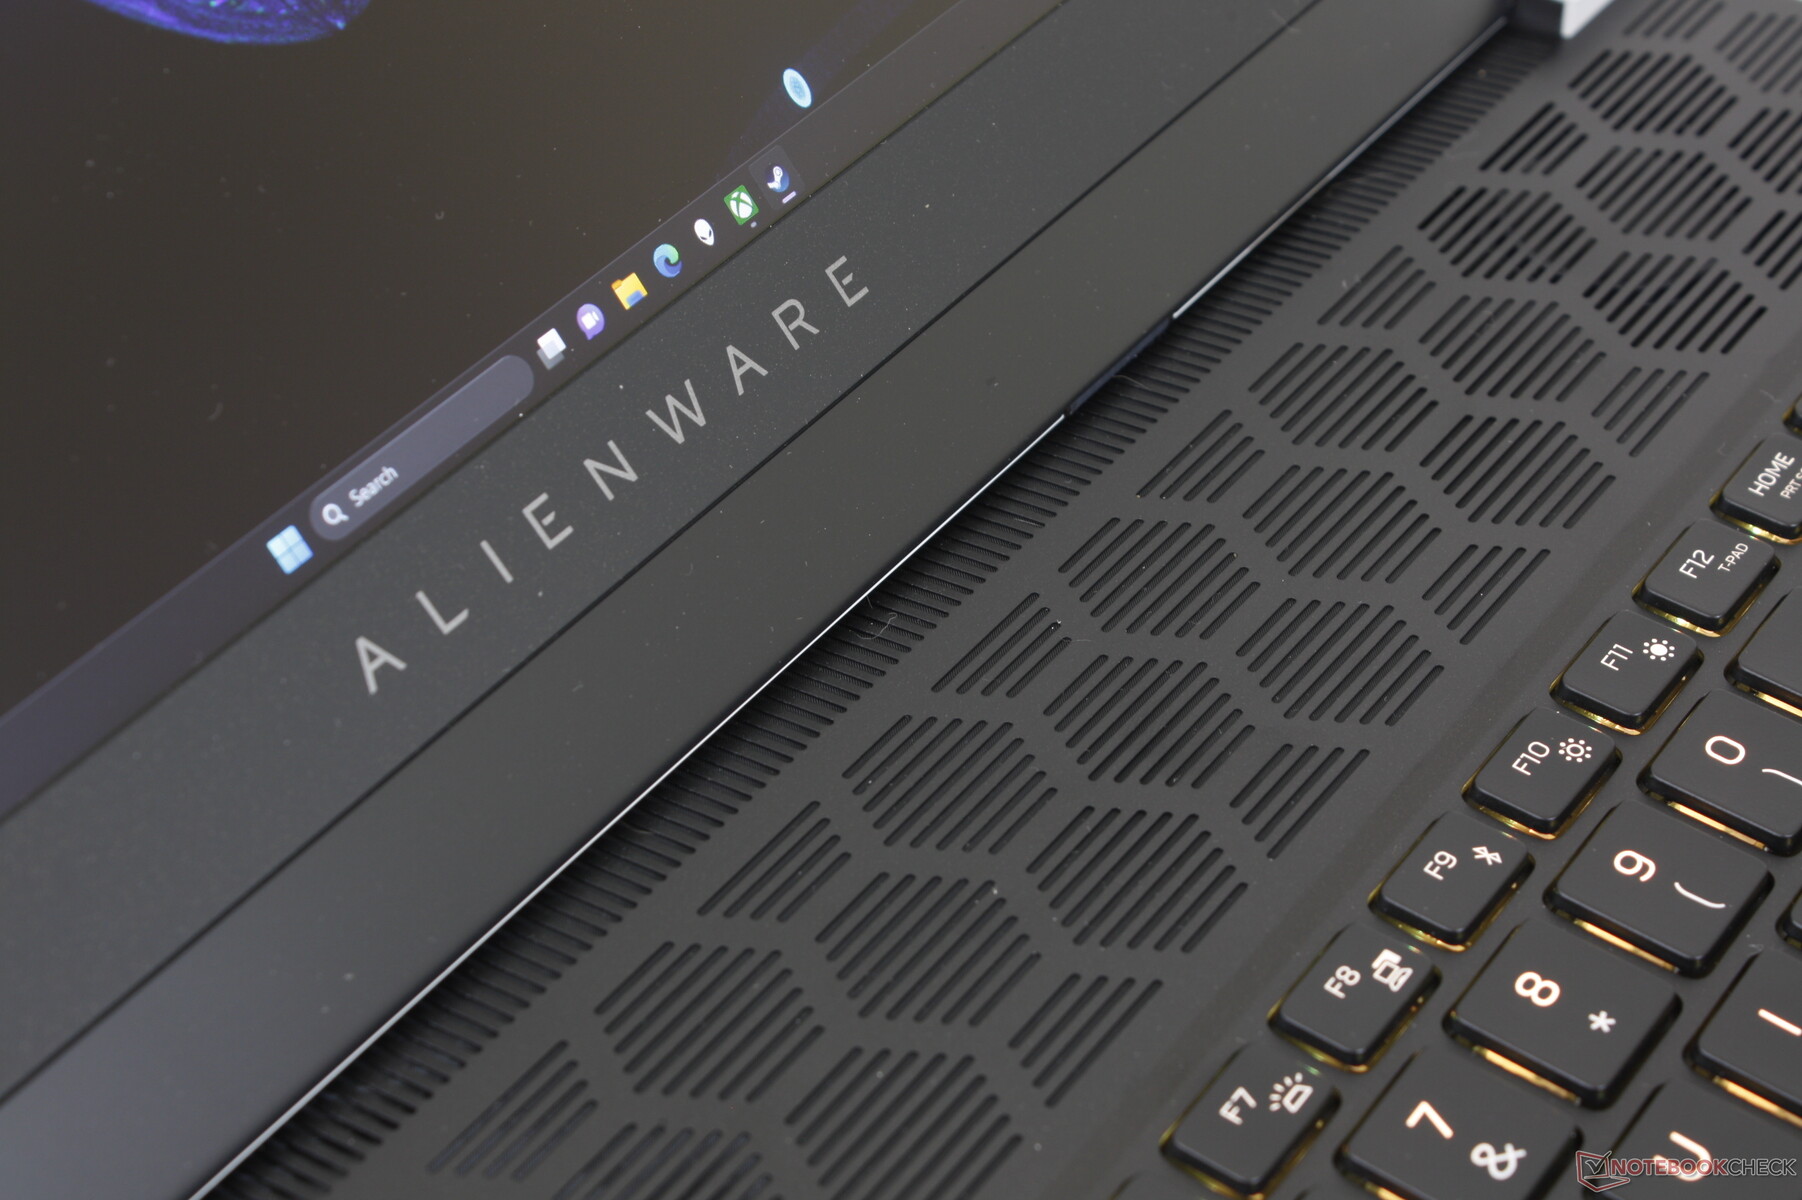
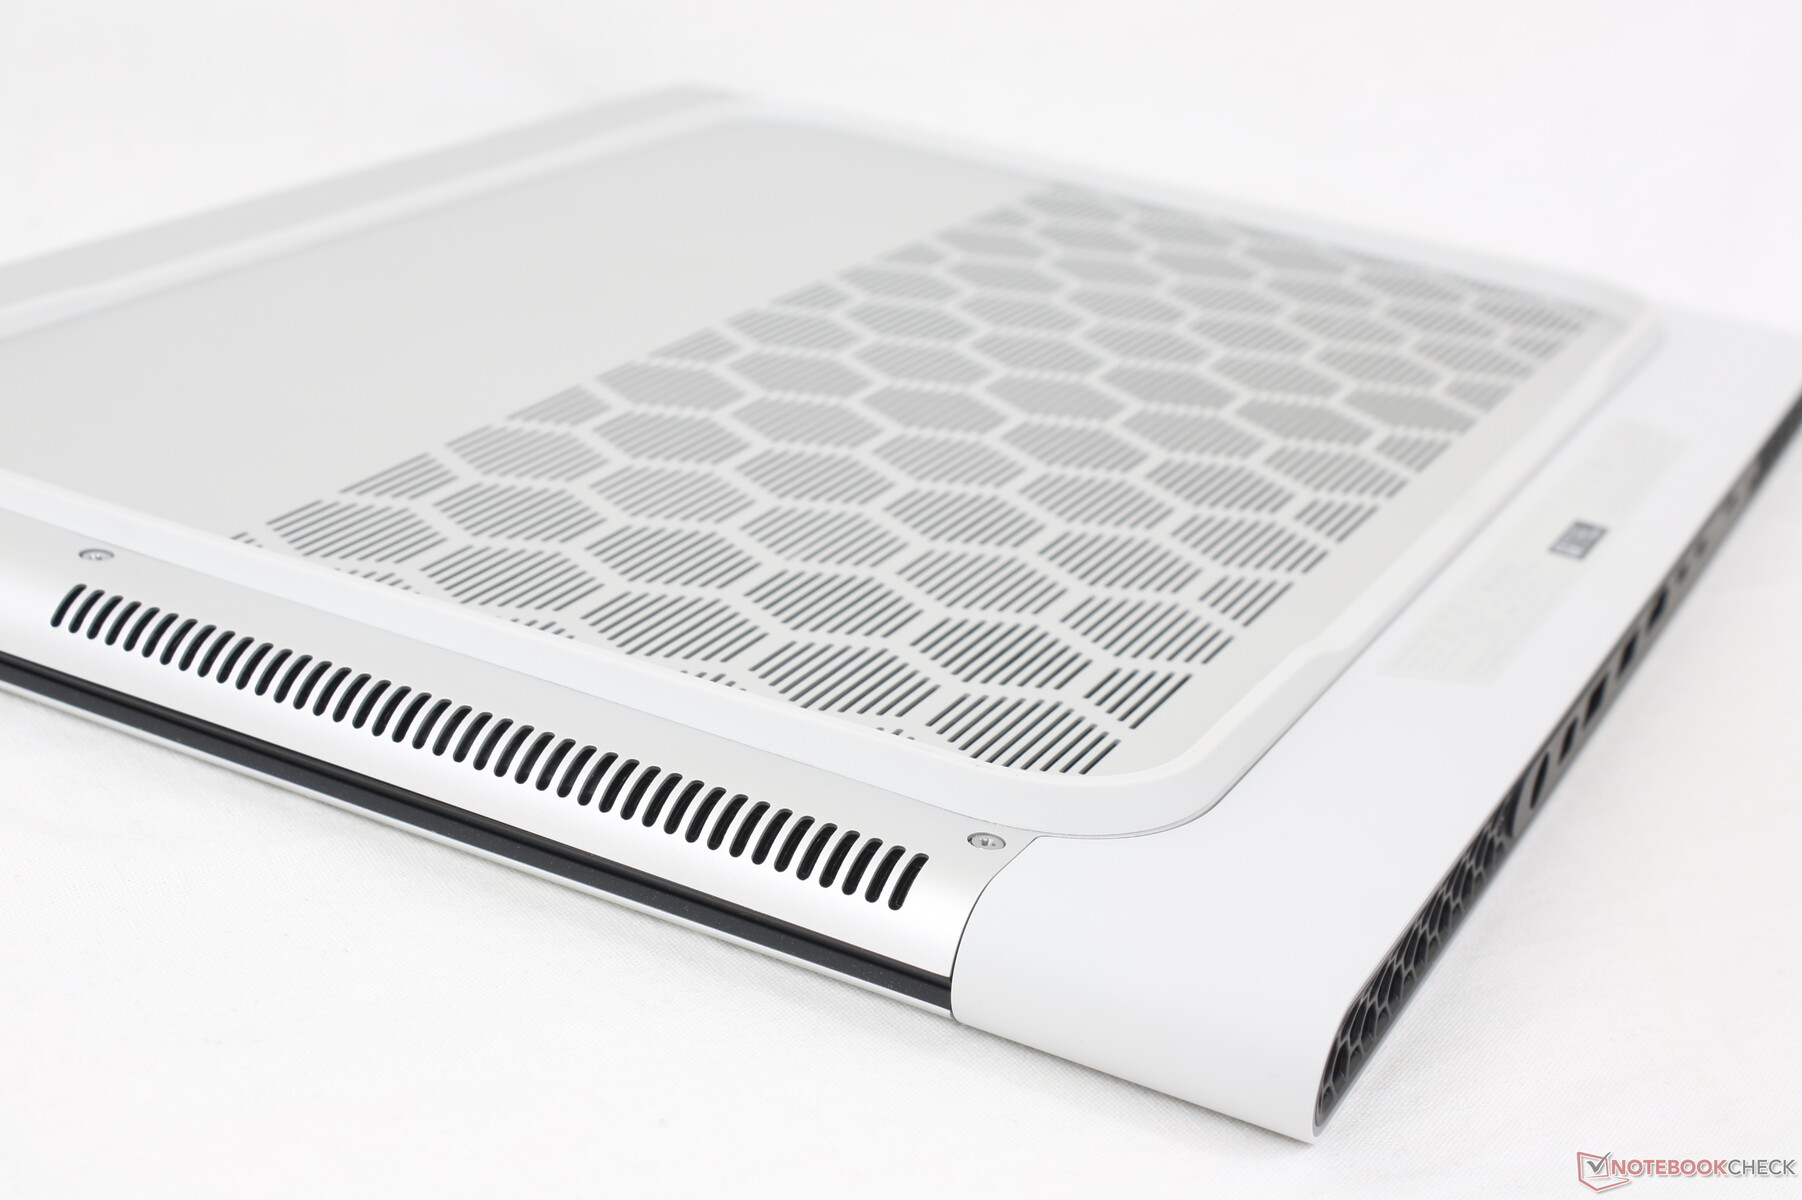
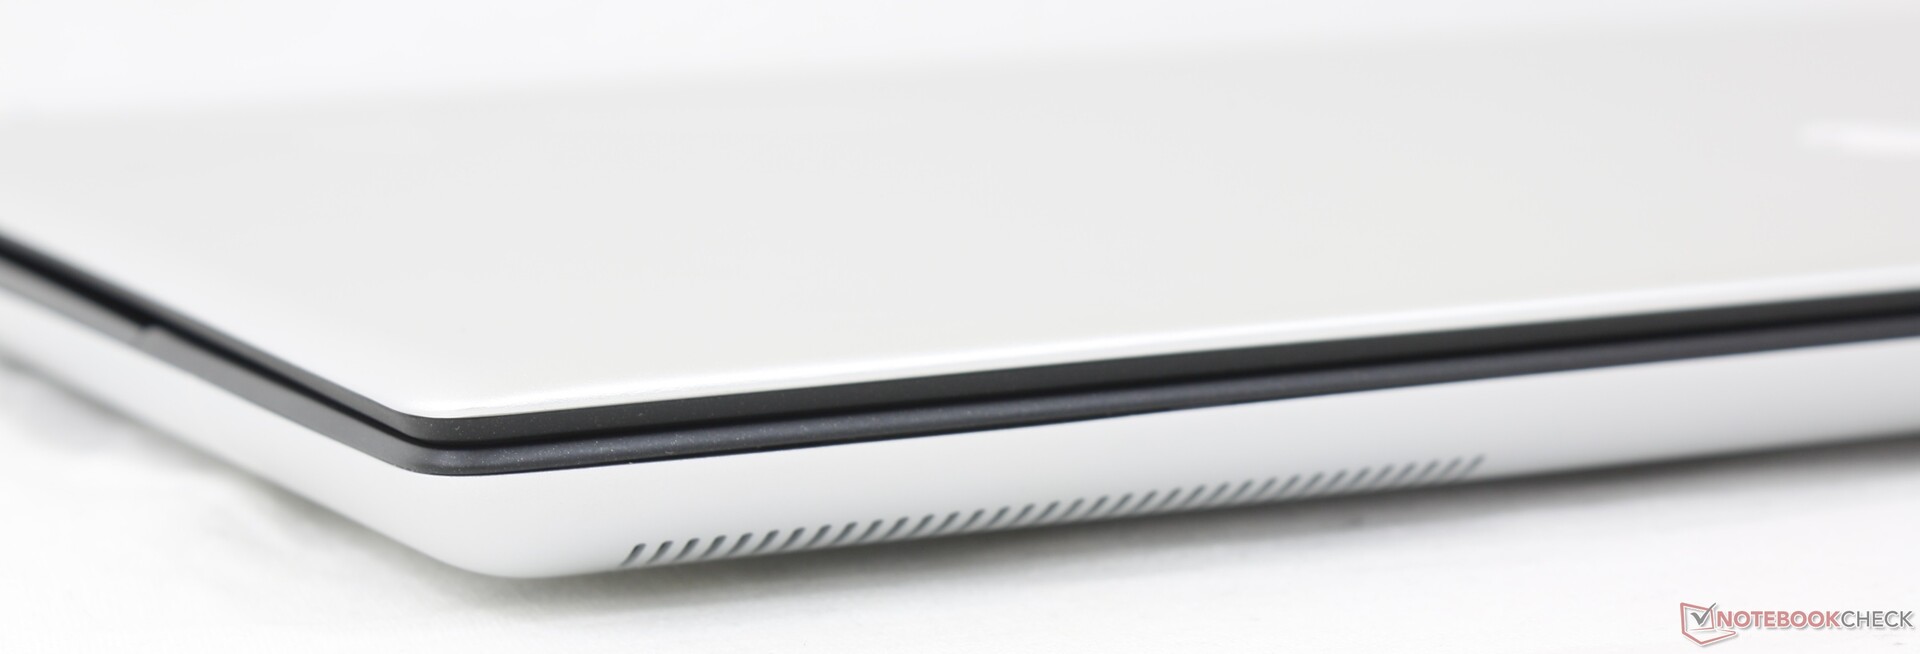
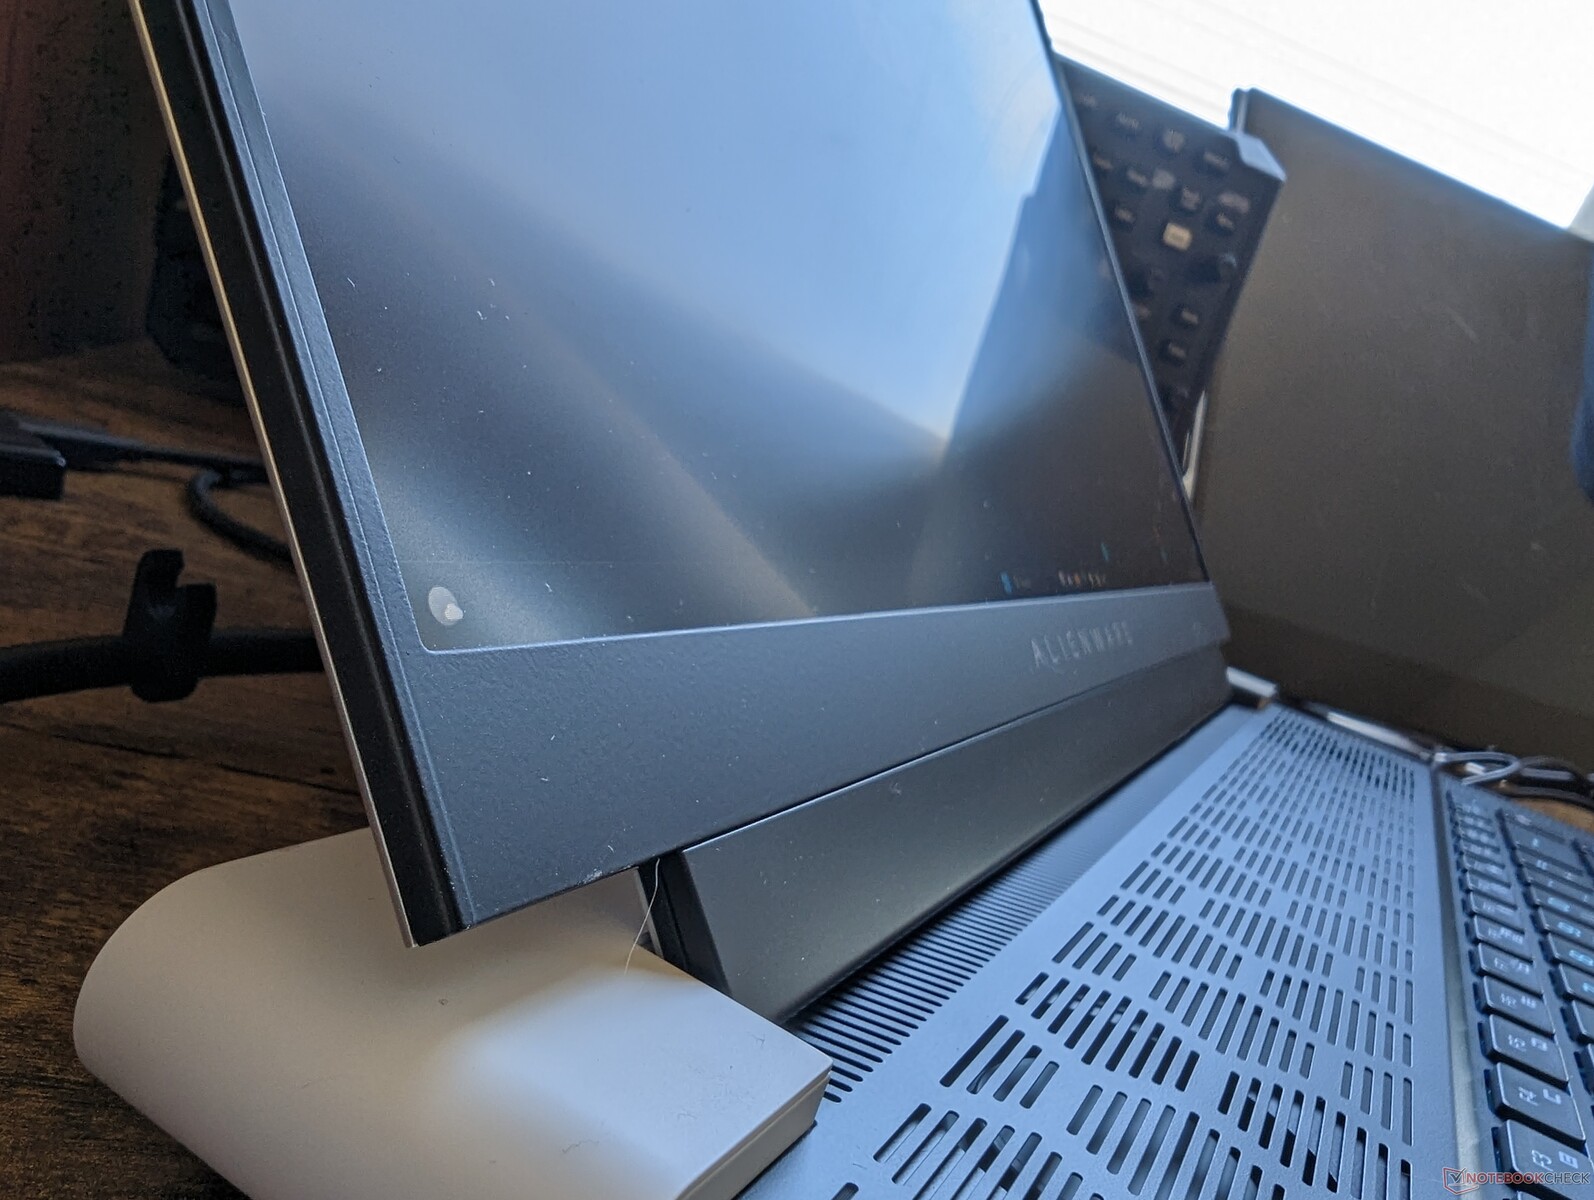
Boîtier - Distinctement Alienware
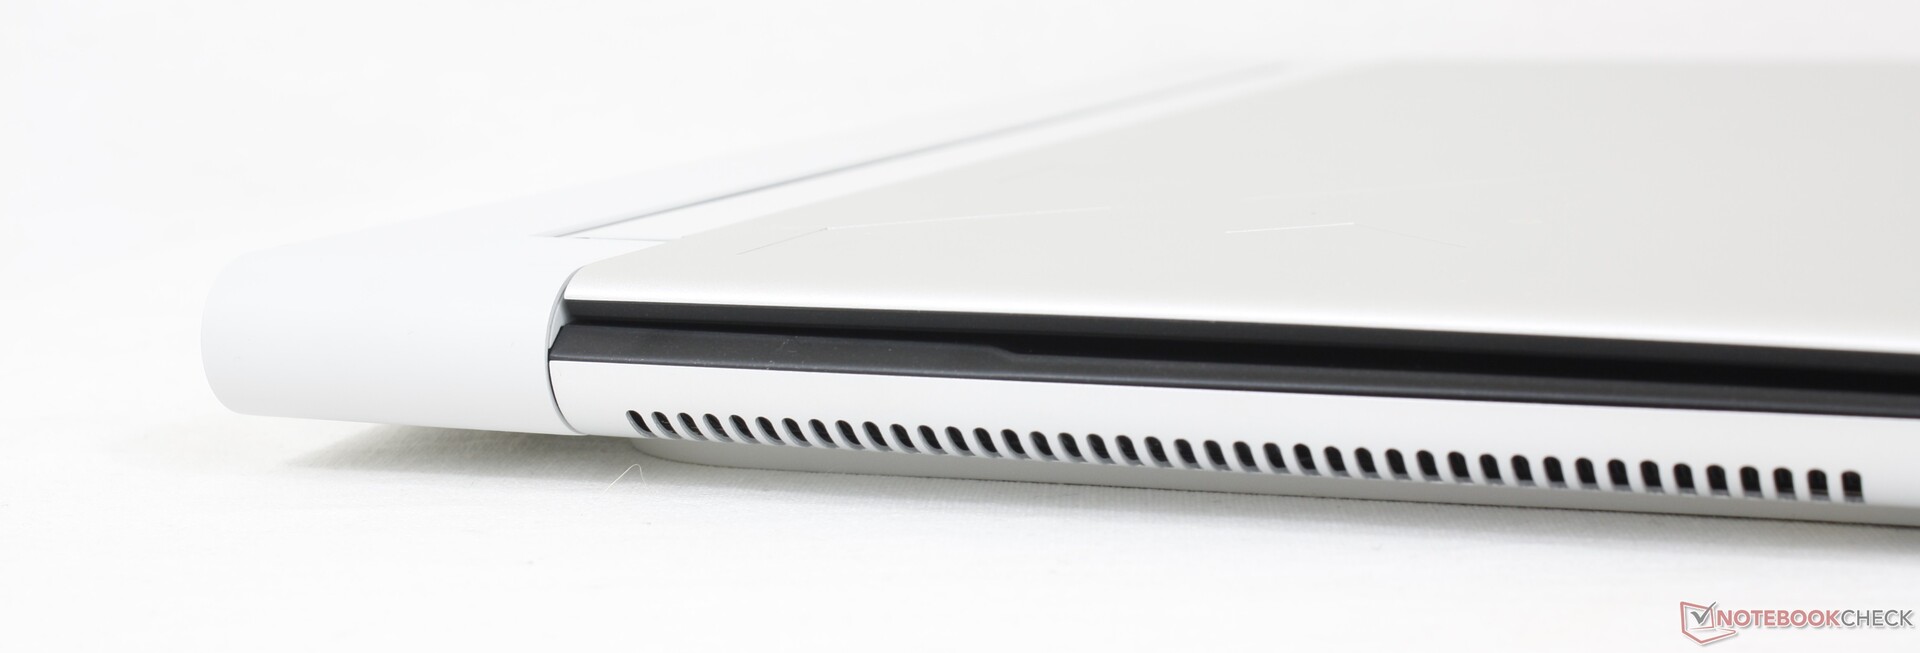
Le châssis a de nombreux points communs avec le Alienware x15 R2 et X17 R2 puisqu'ils partagent tous le langage de conception Legend 3. Les deux tons noir et blanc, l'aluminium anodisé et l'alliage de magnésium, ainsi que l'anneau RVB à l'arrière, permettent de distinguer visuellement la série Alienware de l'océan d'autres ordinateurs portables de jeu. Quant à savoir s'il est plus attrayant ou plus désirable que les modèles concurrents, cela dépend des préférences de l'utilisateur.
La rigidité du châssis est excellente, surtout au niveau de la base où les torsions et les déformations sont minimes. Le couvercle et les charnières ne sont cependant pas aussi rigides que nous l'aurions souhaité par rapport aux écrans plus rigides des modèles de la série Asus Strix Scar ou du Blade 16.
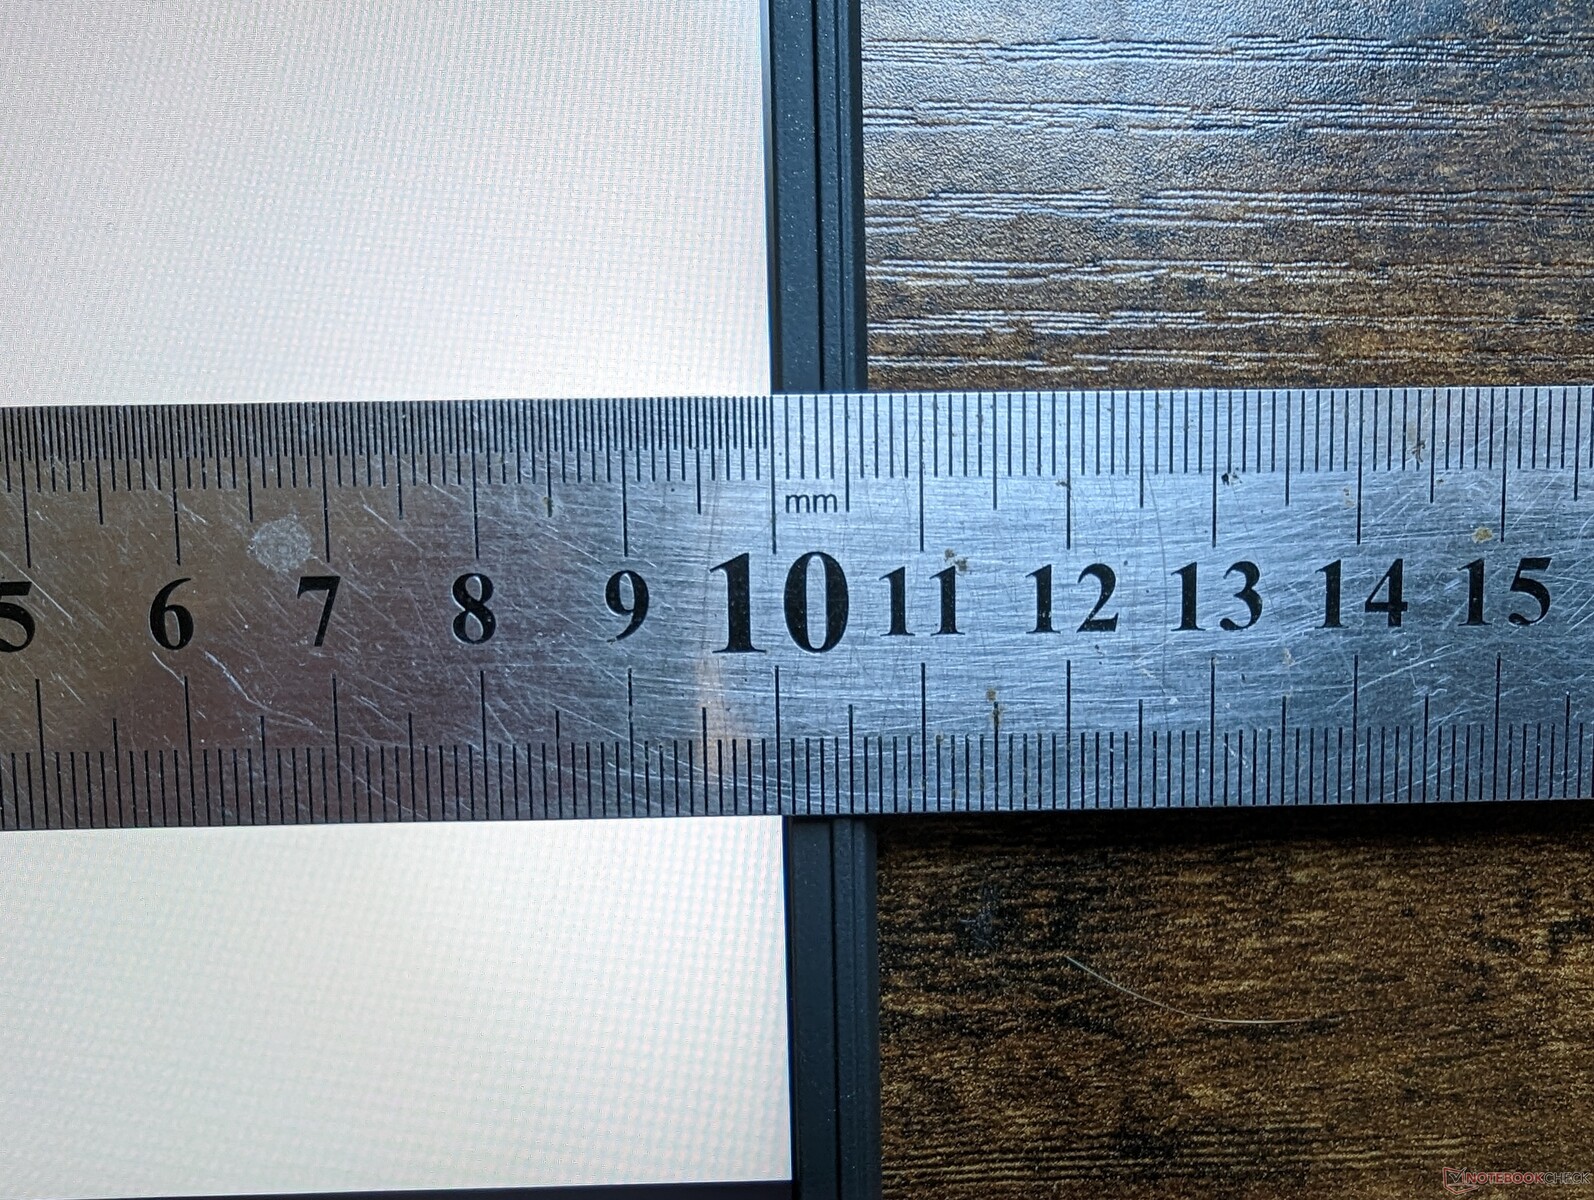
Avec moins de 19 mm, l'Alienware x16 est l'un des ordinateurs portables de jeu de 16 pouces les plus fins du marché, plus fin même que le Razer Blade 16. Malheureusement, le système est plus large et plus long pour un encombrement beaucoup plus important et son volume global n'est donc pas plus faible que celui de ses concurrents. Par exemple, l'Alienware est presque 4 mm plus fin que le Blade 16, mais il est plus long de plus de 40 mm et plus lourd d'environ 200 grammes.
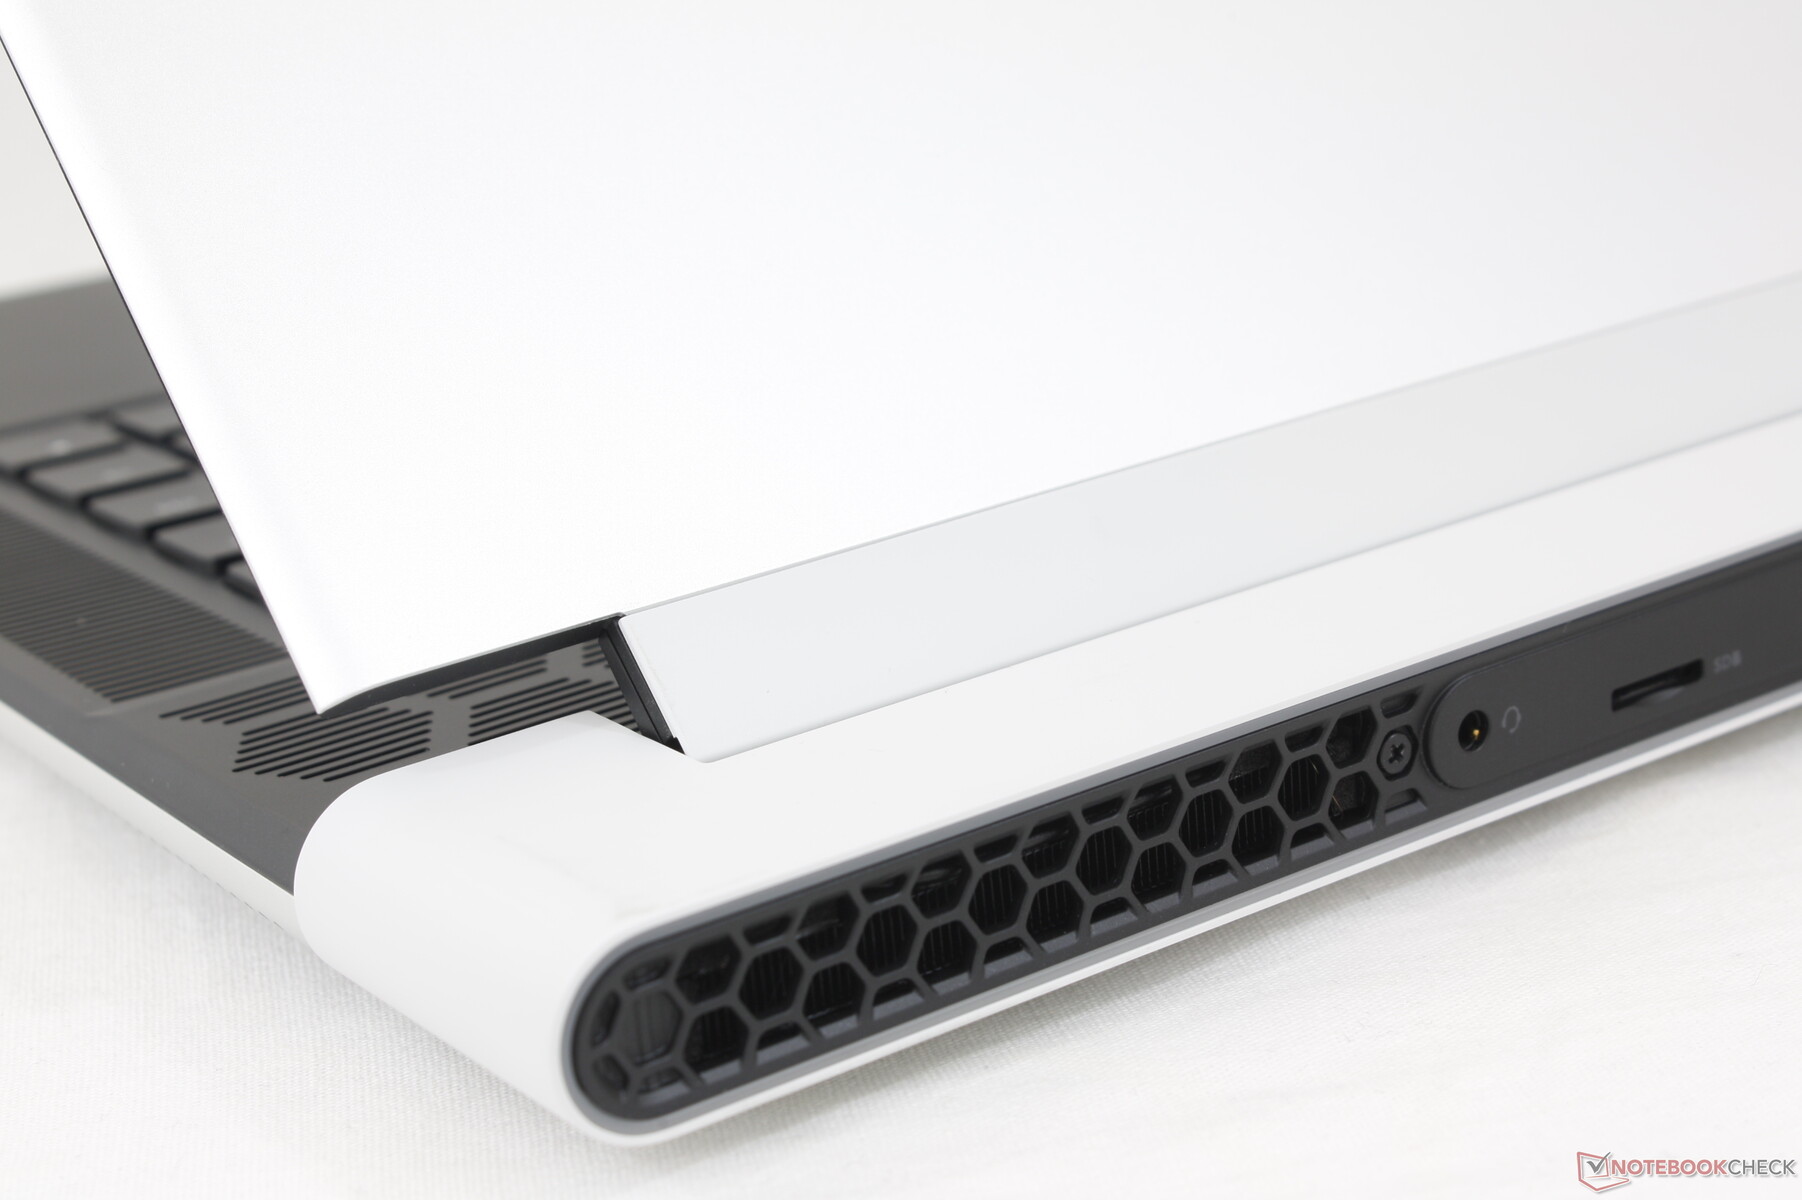
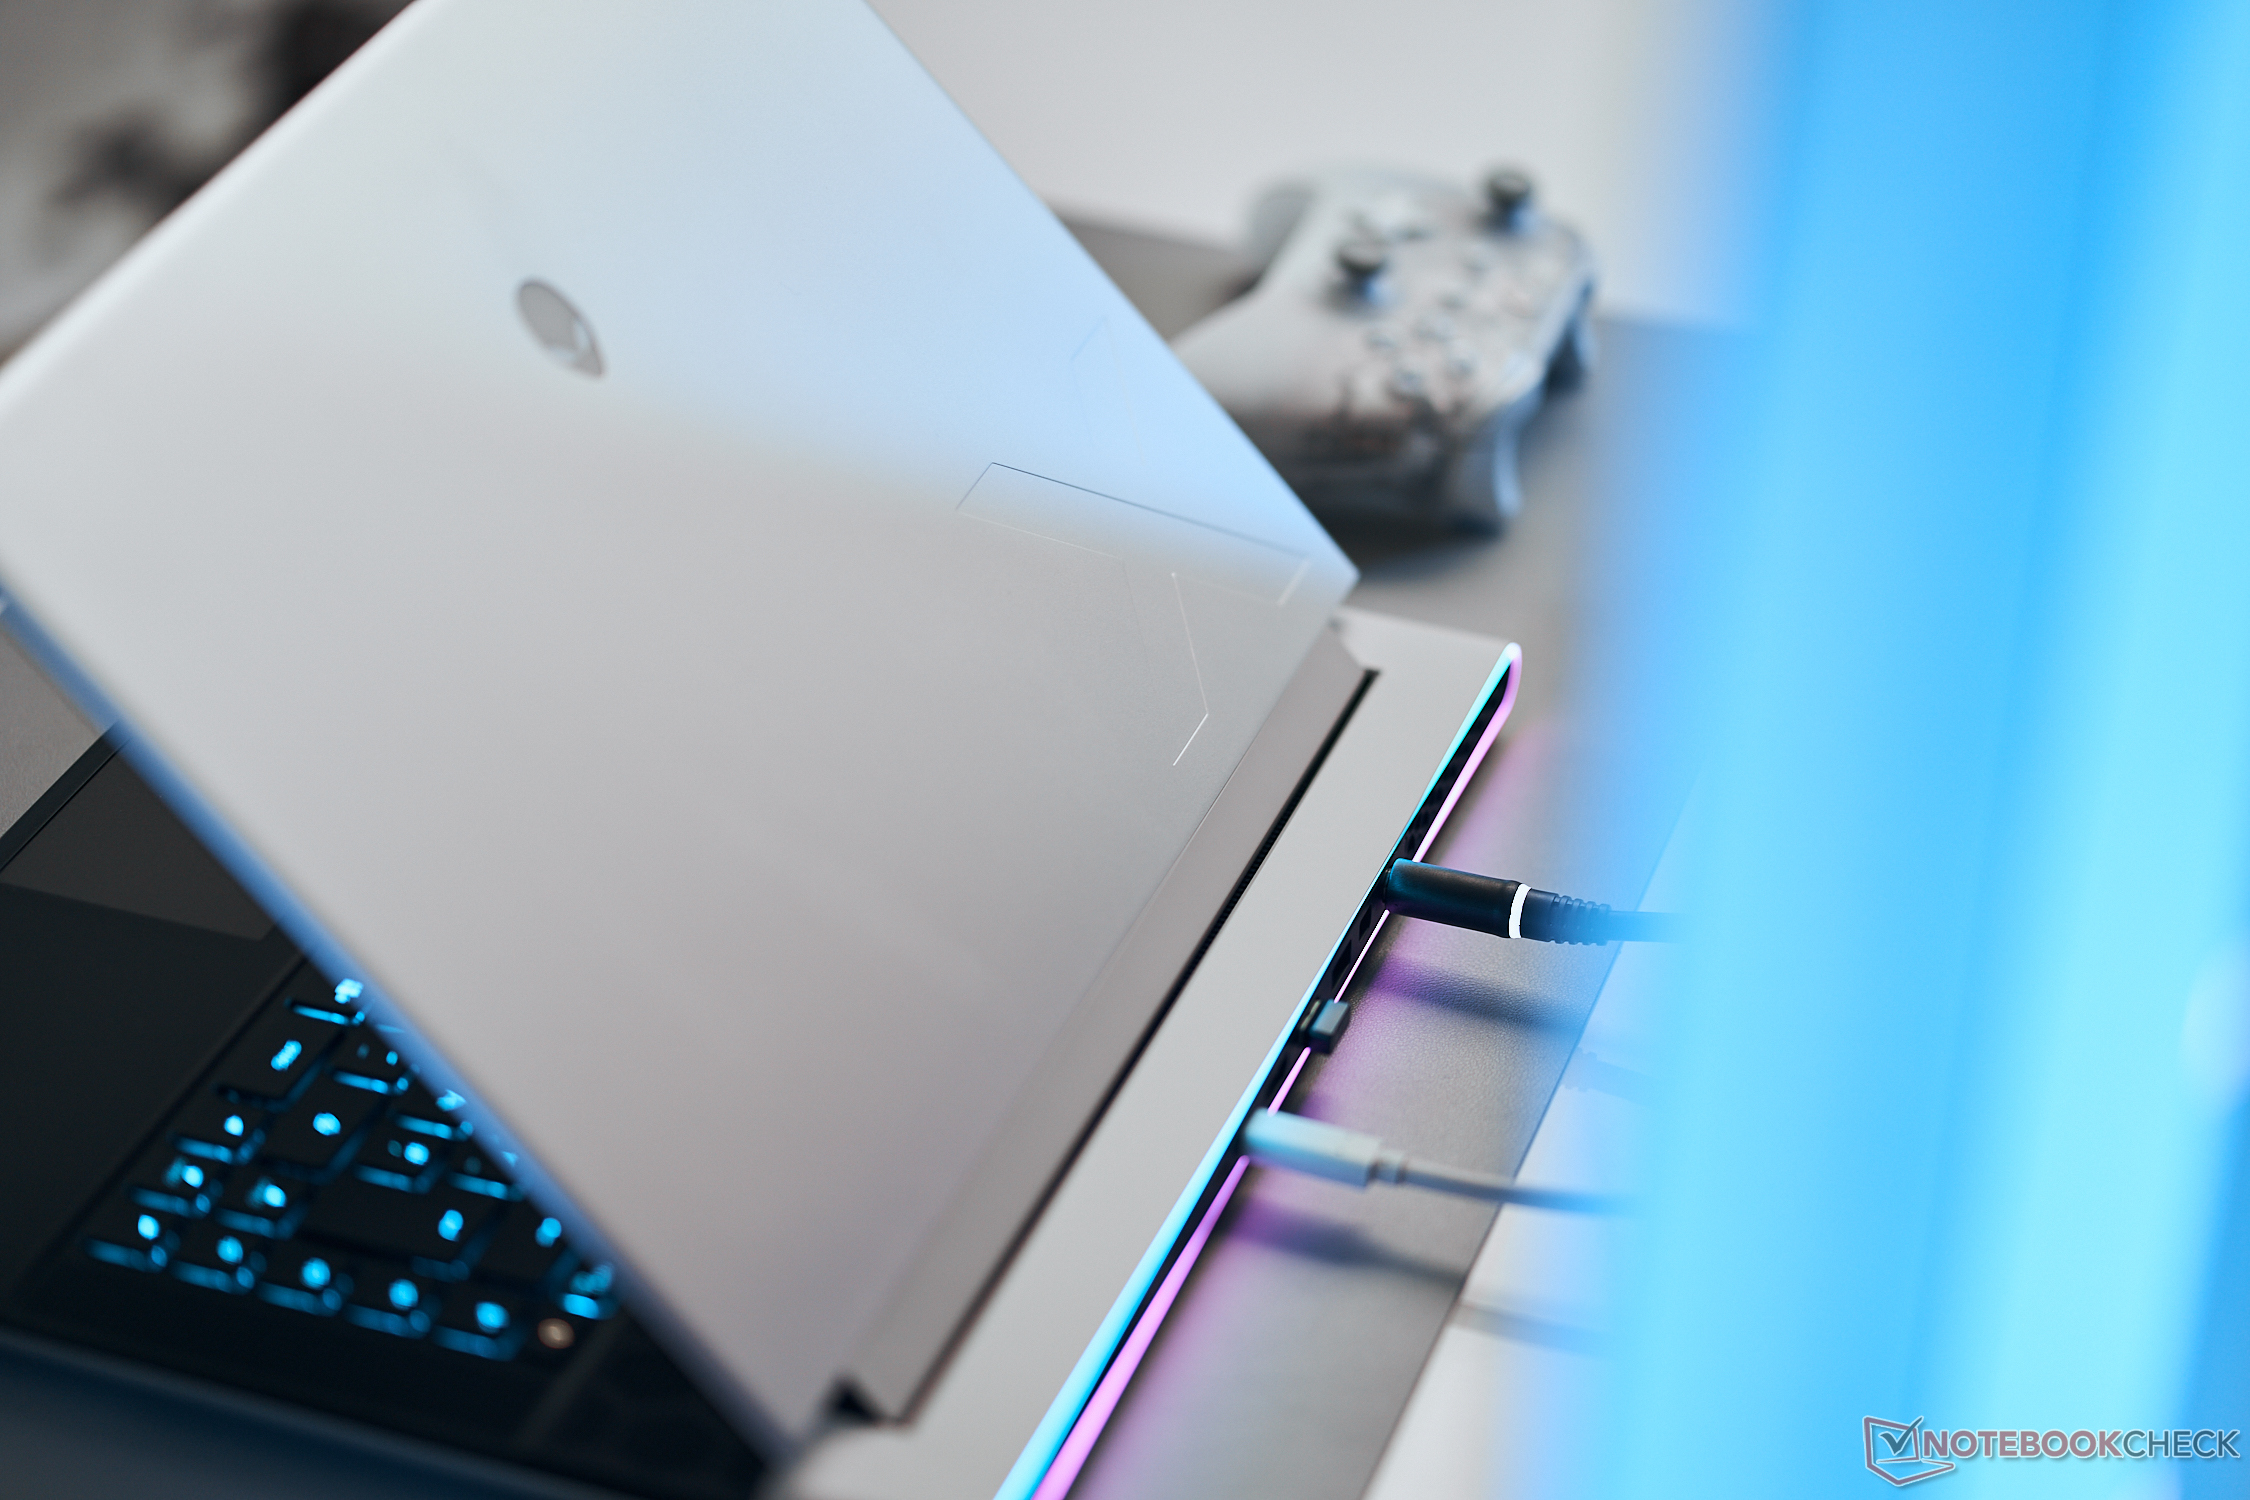
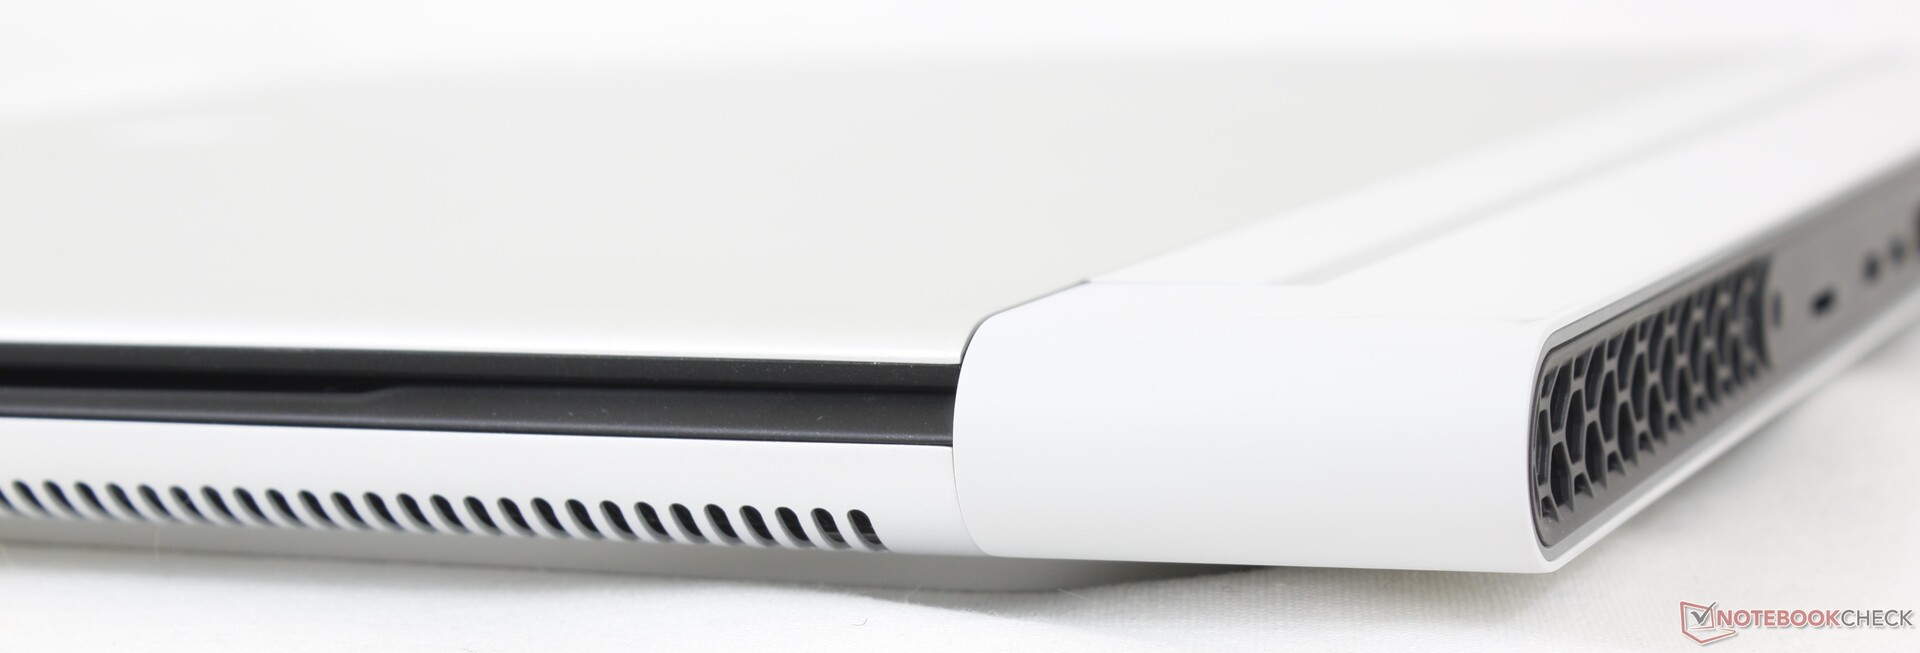
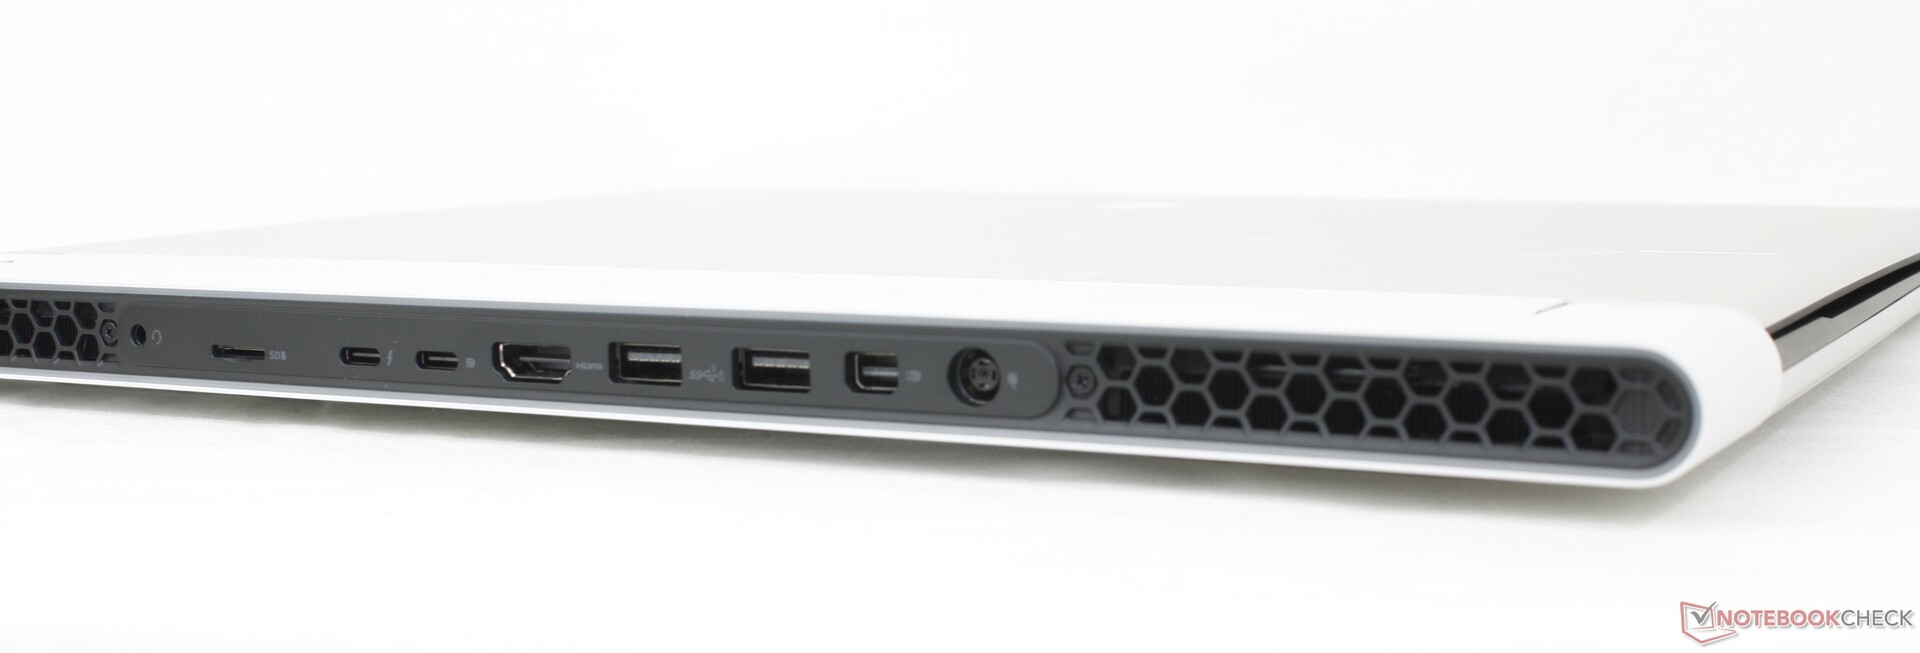
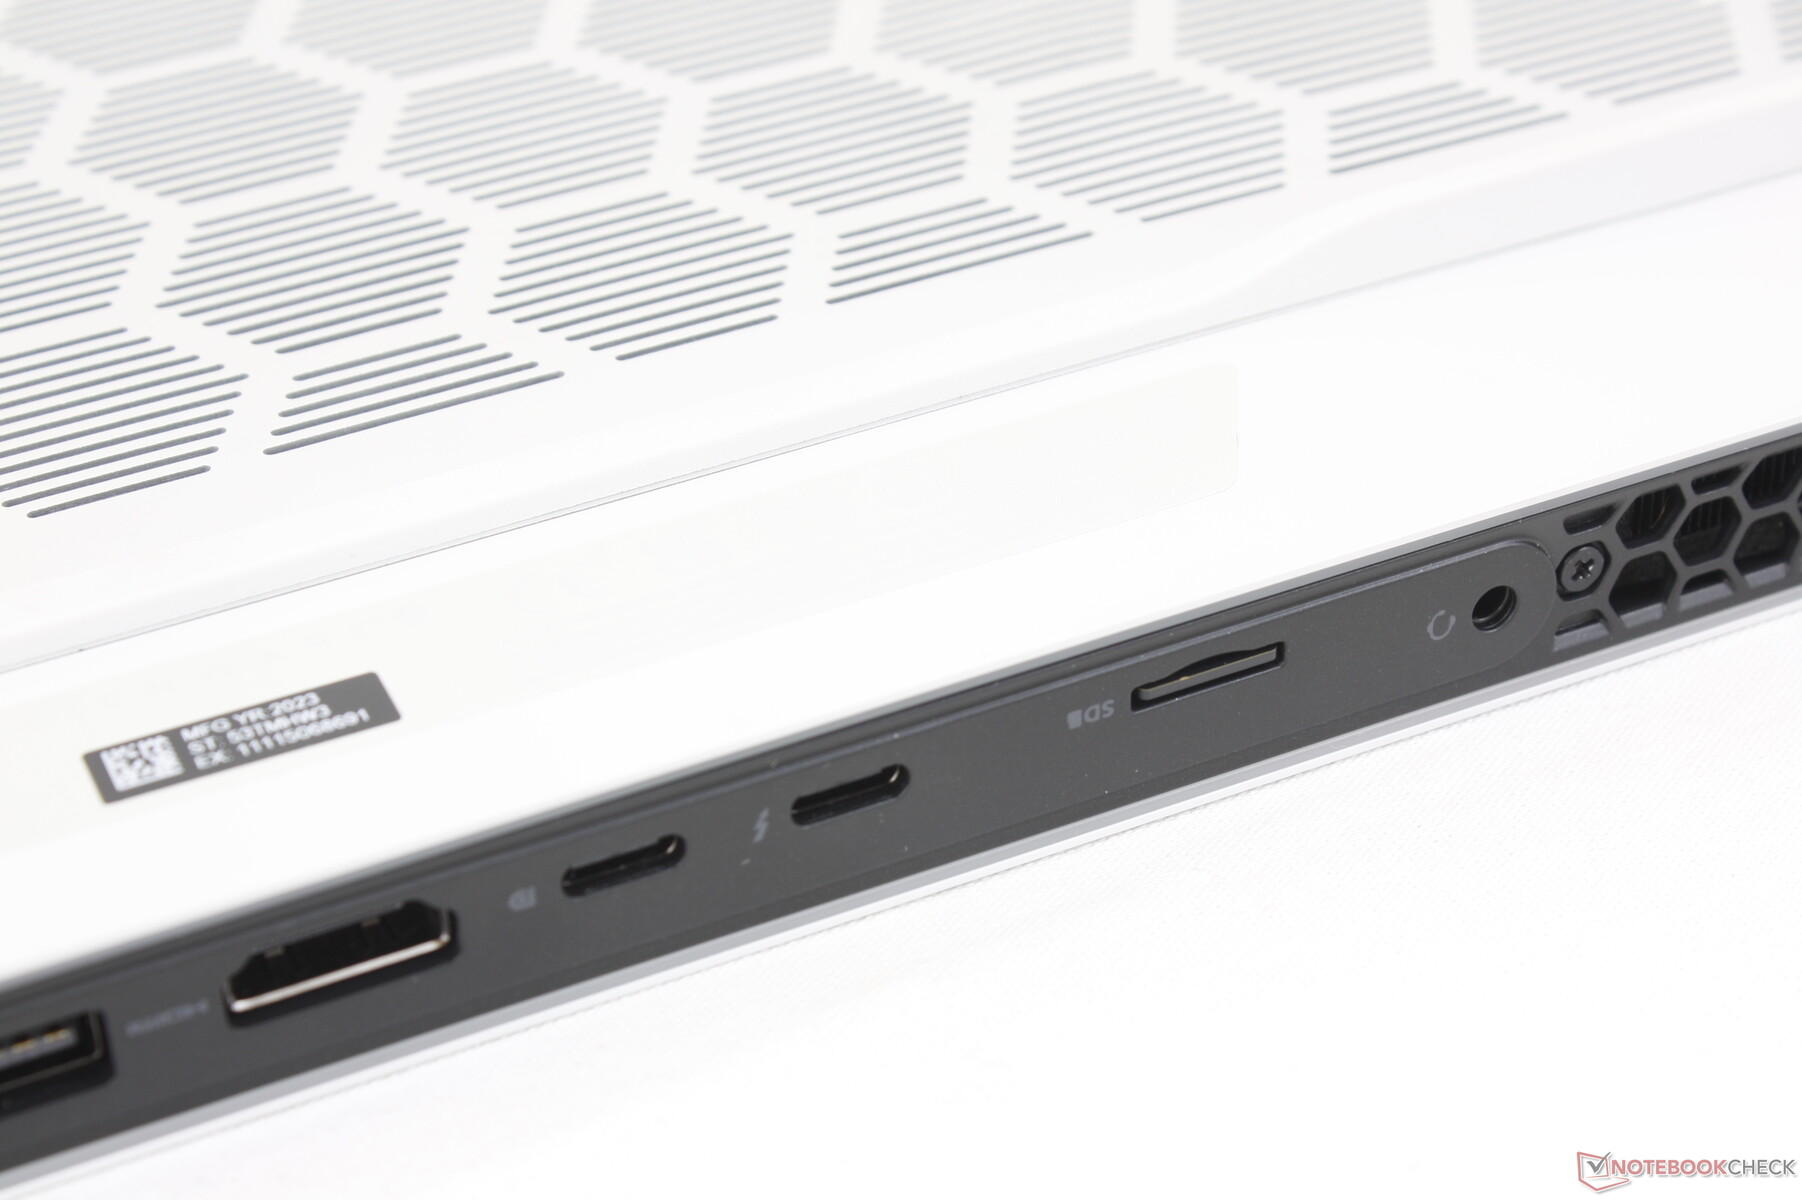
Connectivité - Rien sur les côtés
Tous les ports sont situés à l'arrière, ce qui peut être à la fois une bénédiction et un inconvénient. D'une part, l'absence de ports latéraux signifie qu'il n'y a pas de câbles disgracieux ou gênants. D'autre part, le positionnement des ports n'est pas idéal, en particulier pour les ports USB les plus utilisés.
N'oubliez pas que Thunderbolt 4 n'est pris en charge que sur l'un des deux ports USB-C.
Lecteur de carte SD
Le SSD affiche un taux de lecture séquentielle de 256,1 Mo/s, alors qu'un test réel de transfert de 1 Go de photos serait beaucoup plus lent, avec seulement 57 Mo/s avec notre carte MicroSD UHS-II de test, même après de multiples tentatives.
Contrairement à la plupart des autres ordinateurs portables, le lecteur MicroSD se trouve à l'arrière du châssis et non sur les côtés.
| SD Card Reader | |
| average JPG Copy Test (av. of 3 runs) | |
| Asus ROG Zephyrus M16 GU604VY-NM042X | |
| Razer Blade 16 Early 2023 (AV PRO microSD 128 GB V60) | |
| Alienware x16 R1 (AV PRO microSD 128 GB V60) | |
| maximum AS SSD Seq Read Test (1GB) | |
| Alienware x16 R1 (AV PRO microSD 128 GB V60) | |
| Razer Blade 16 Early 2023 (AV PRO microSD 128 GB V60) | |
| Asus ROG Zephyrus M16 GU604VY-NM042X | |
Communication
| Networking | |
| iperf3 transmit AXE11000 | |
| Lenovo Legion Pro 7 16IRX8H | |
| Razer Blade 16 Early 2023 | |
| Alienware x16 R1 | |
| Alienware m17 R5 (R9 6900HX, RX 6850M XT) | |
| Dell G16 7620 | |
| iperf3 receive AXE11000 | |
| Lenovo Legion Pro 7 16IRX8H | |
| Razer Blade 16 Early 2023 | |
| Alienware x16 R1 | |
| Dell G16 7620 | |
| Alienware m17 R5 (R9 6900HX, RX 6850M XT) | |
| iperf3 transmit AXE11000 6GHz | |
| Asus ROG Zephyrus M16 GU604VY-NM042X | |
| Razer Blade 16 Early 2023 | |
| Alienware x16 R1 | |
| iperf3 receive AXE11000 6GHz | |
| Asus ROG Zephyrus M16 GU604VY-NM042X | |
| Razer Blade 16 Early 2023 | |
| Alienware x16 R1 | |
Webcam
Une webcam de 2 mégapixels est fournie en standard, ainsi que la prise en charge de l'infrarouge pour Hello. En revanche, il n'y a pas d'obturateur de confidentialité.


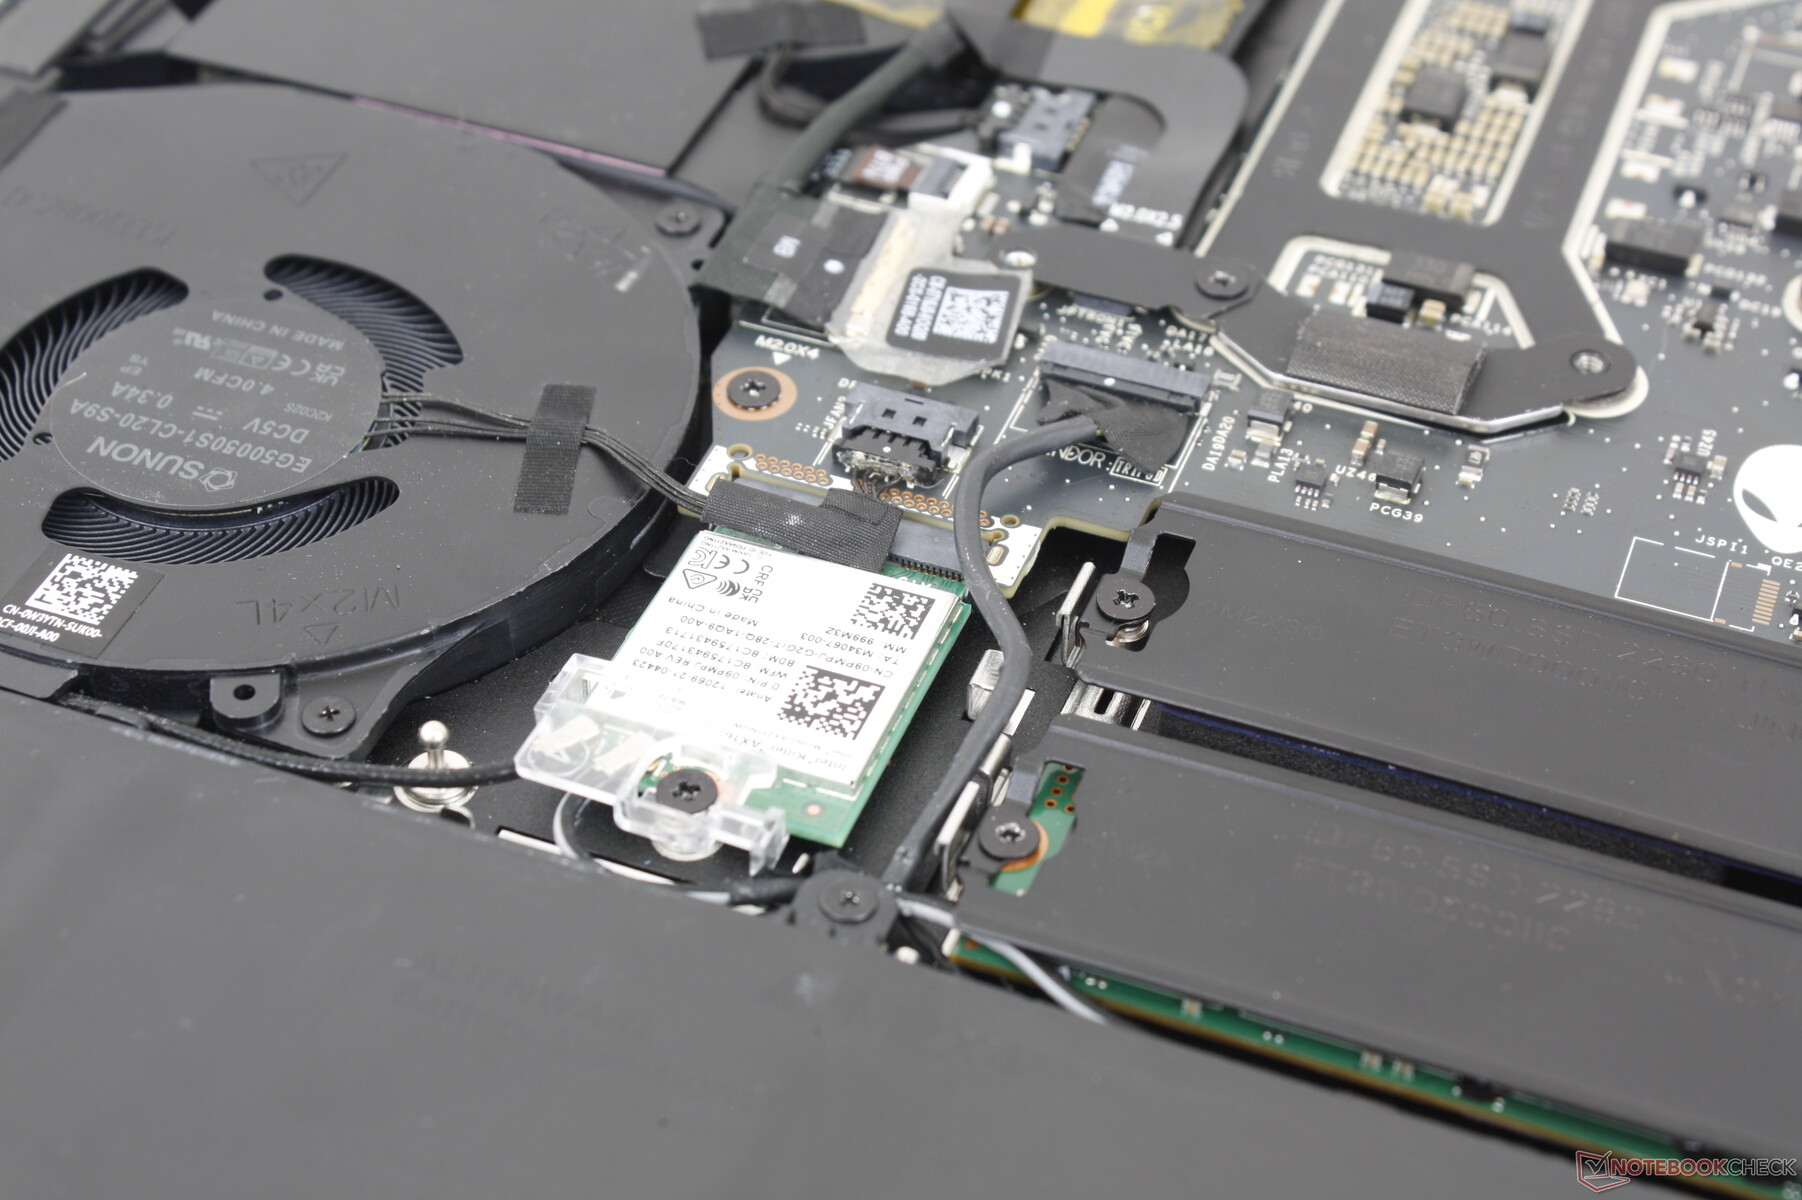
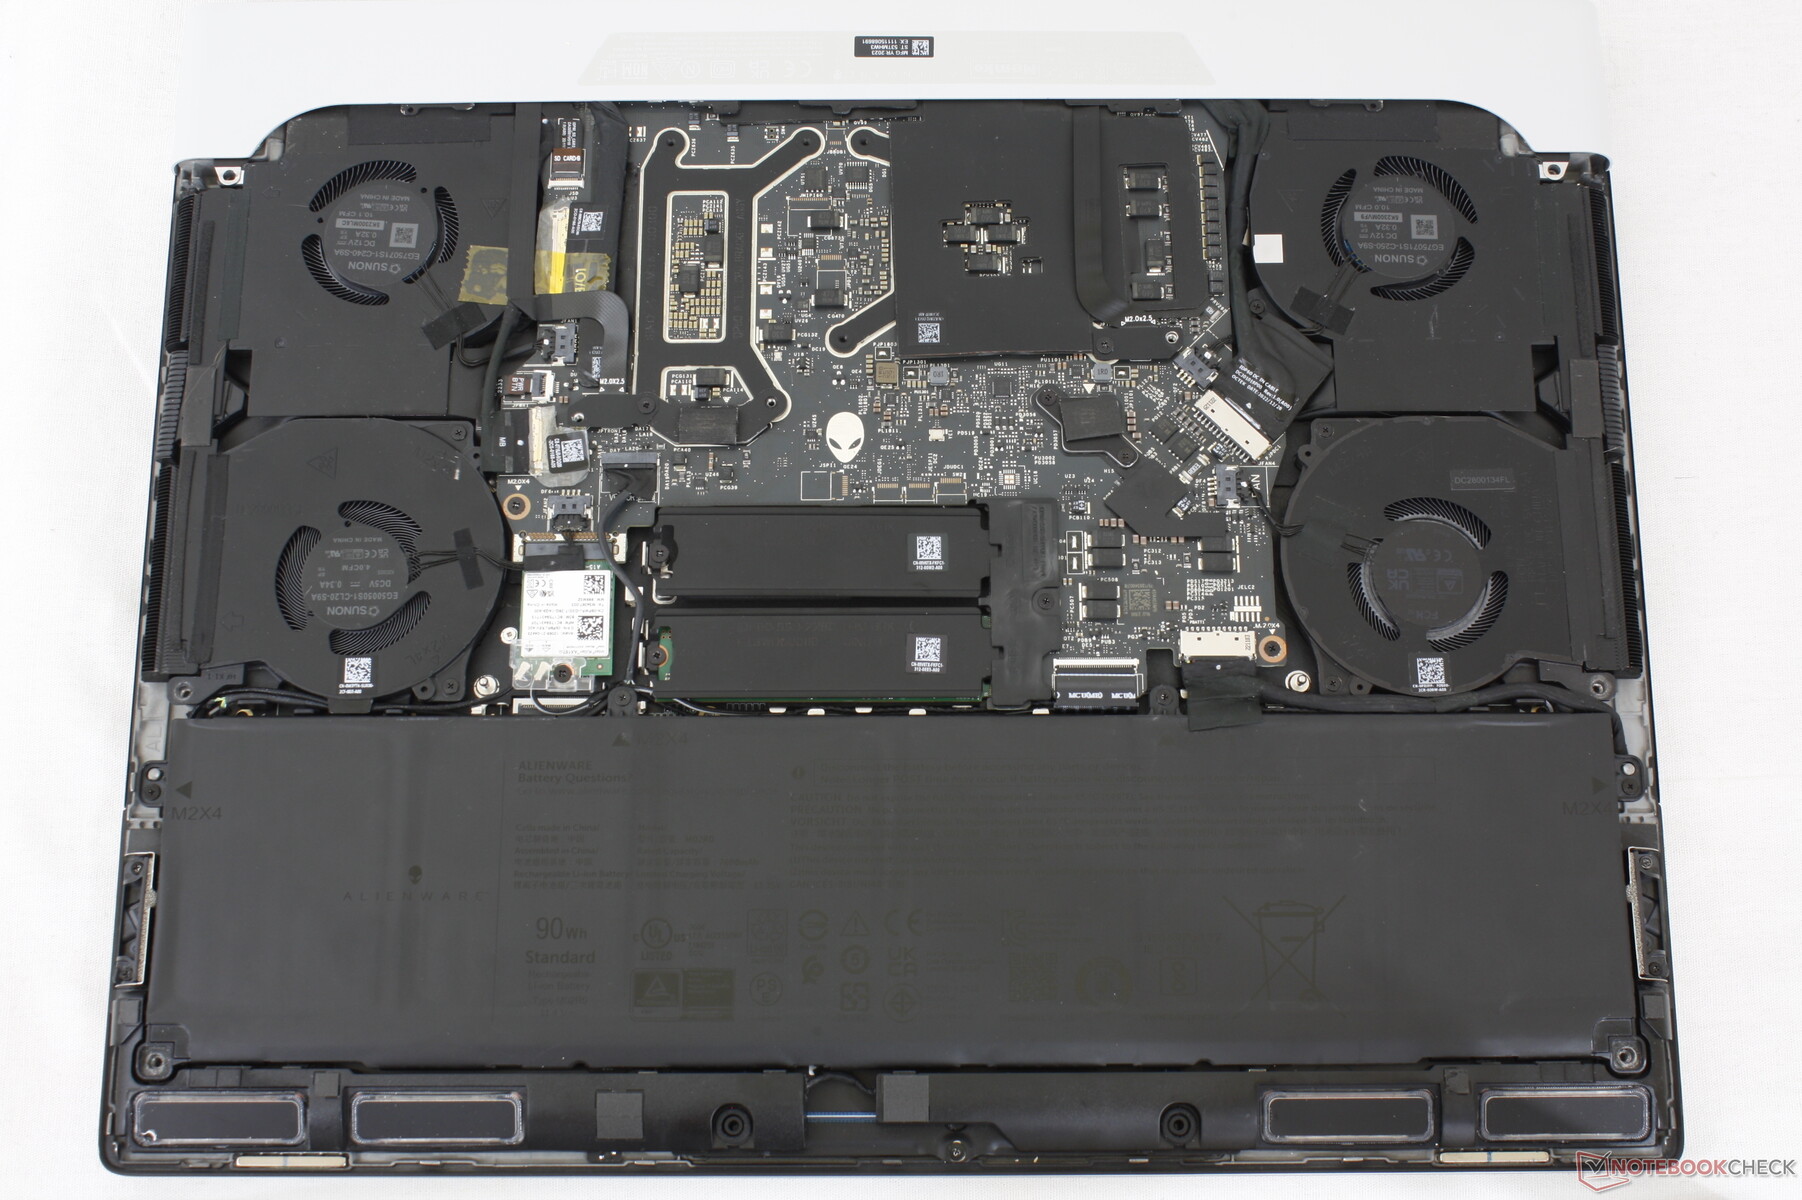
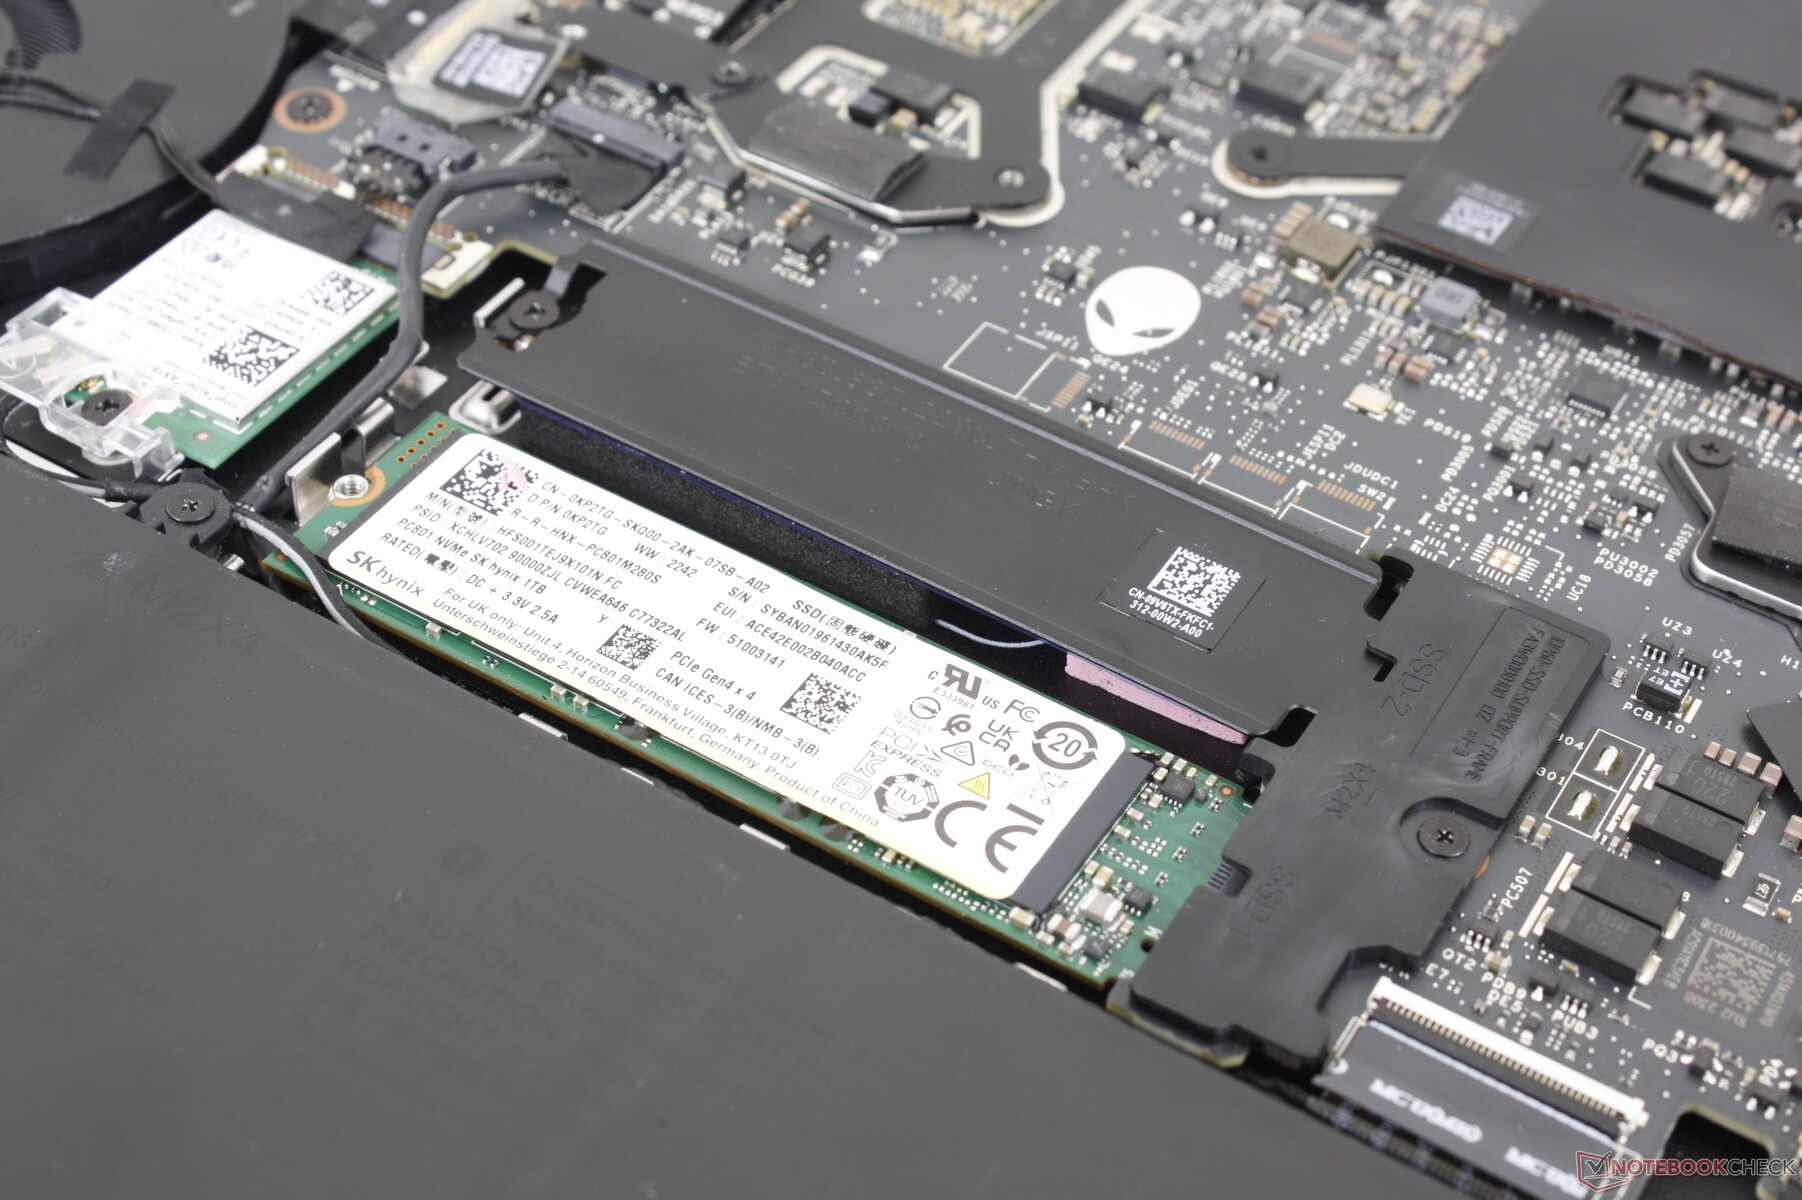
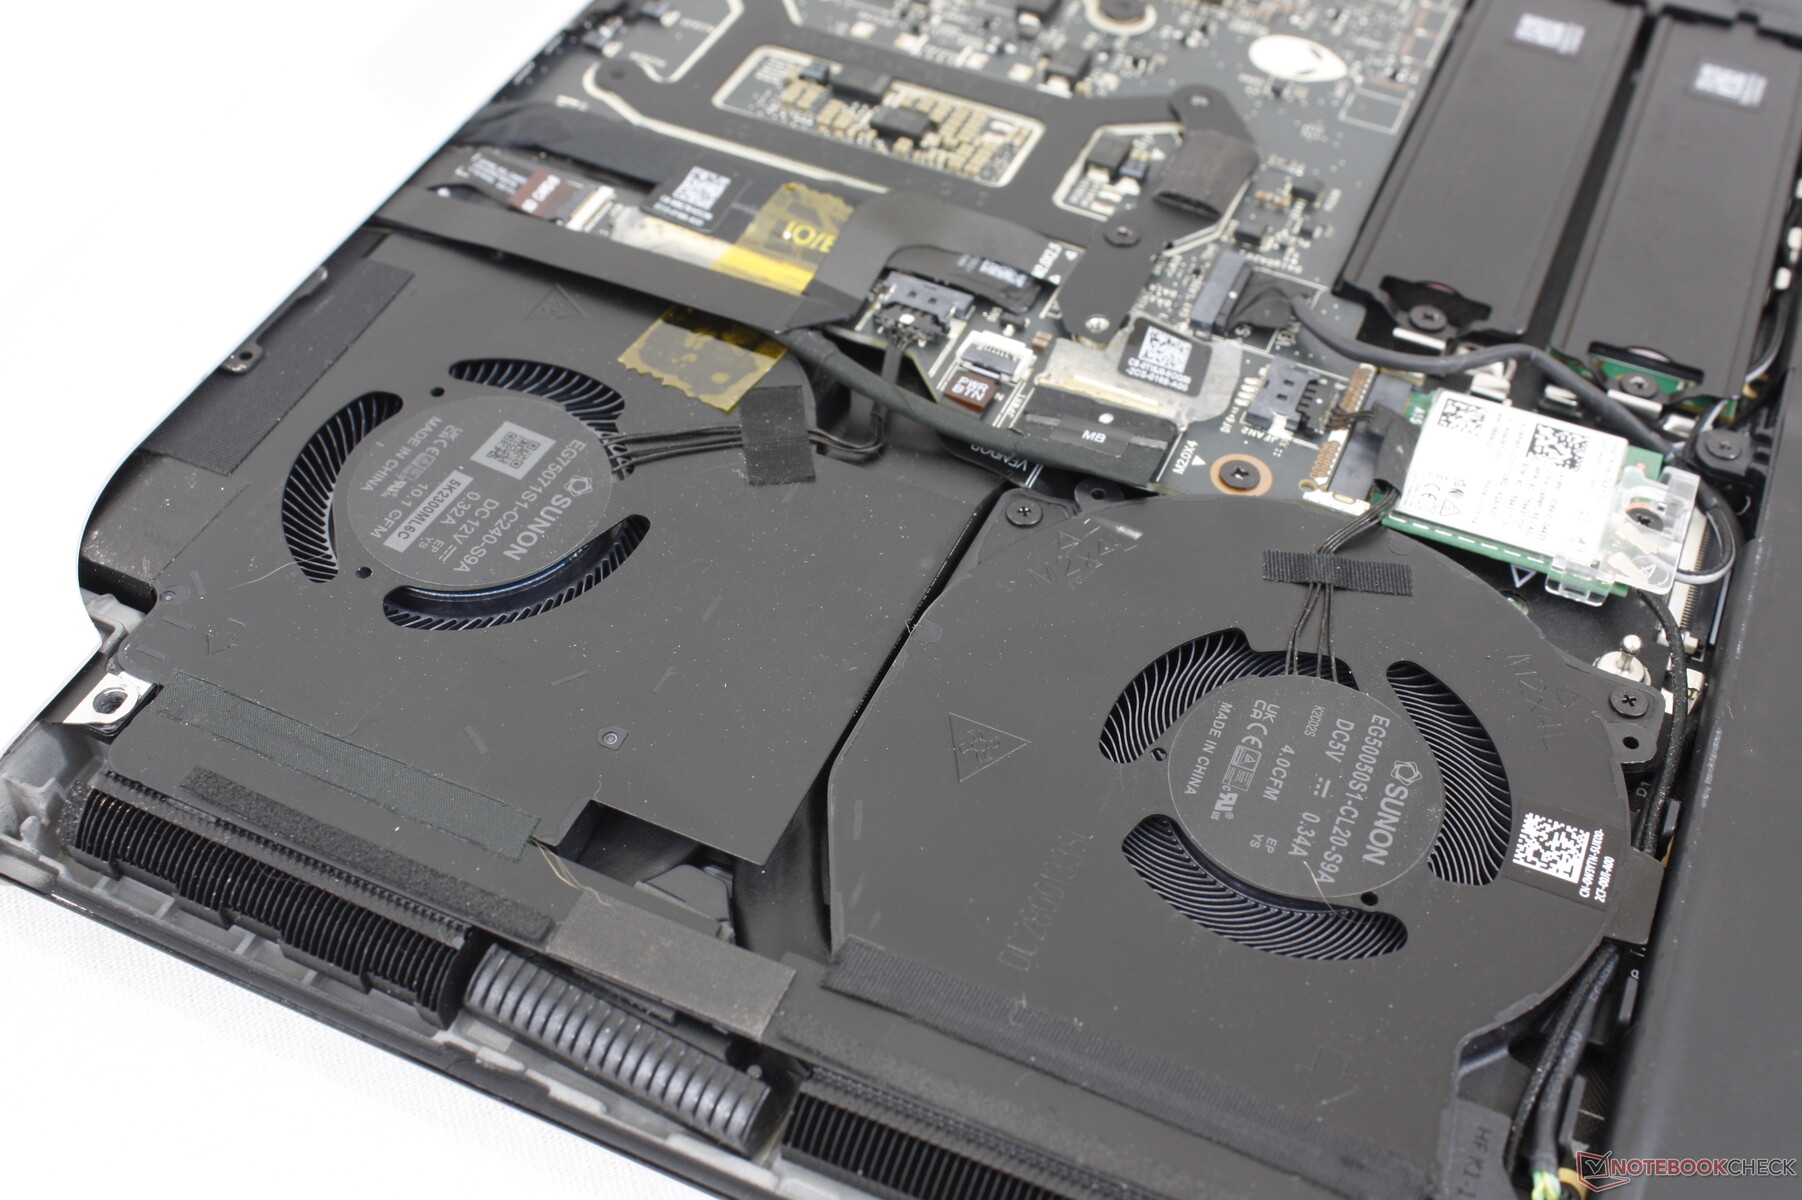
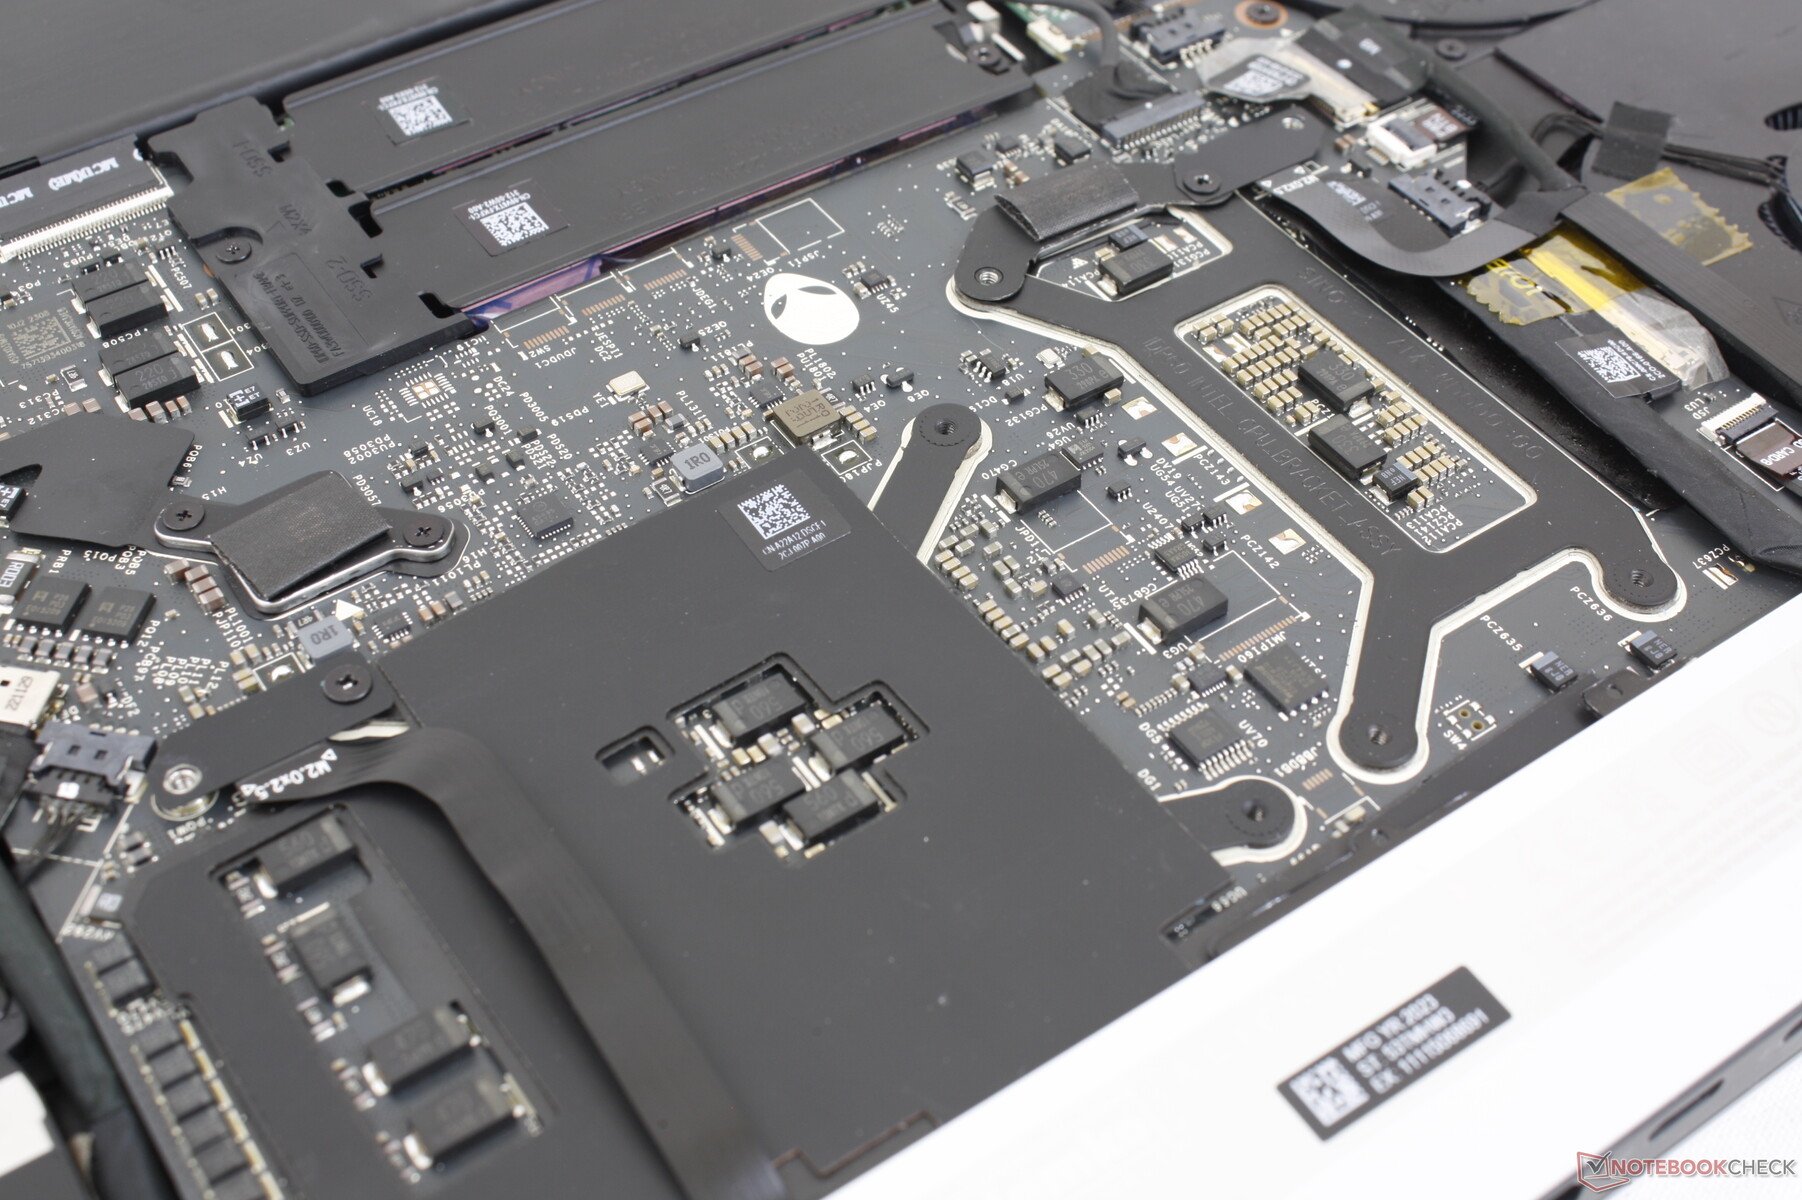
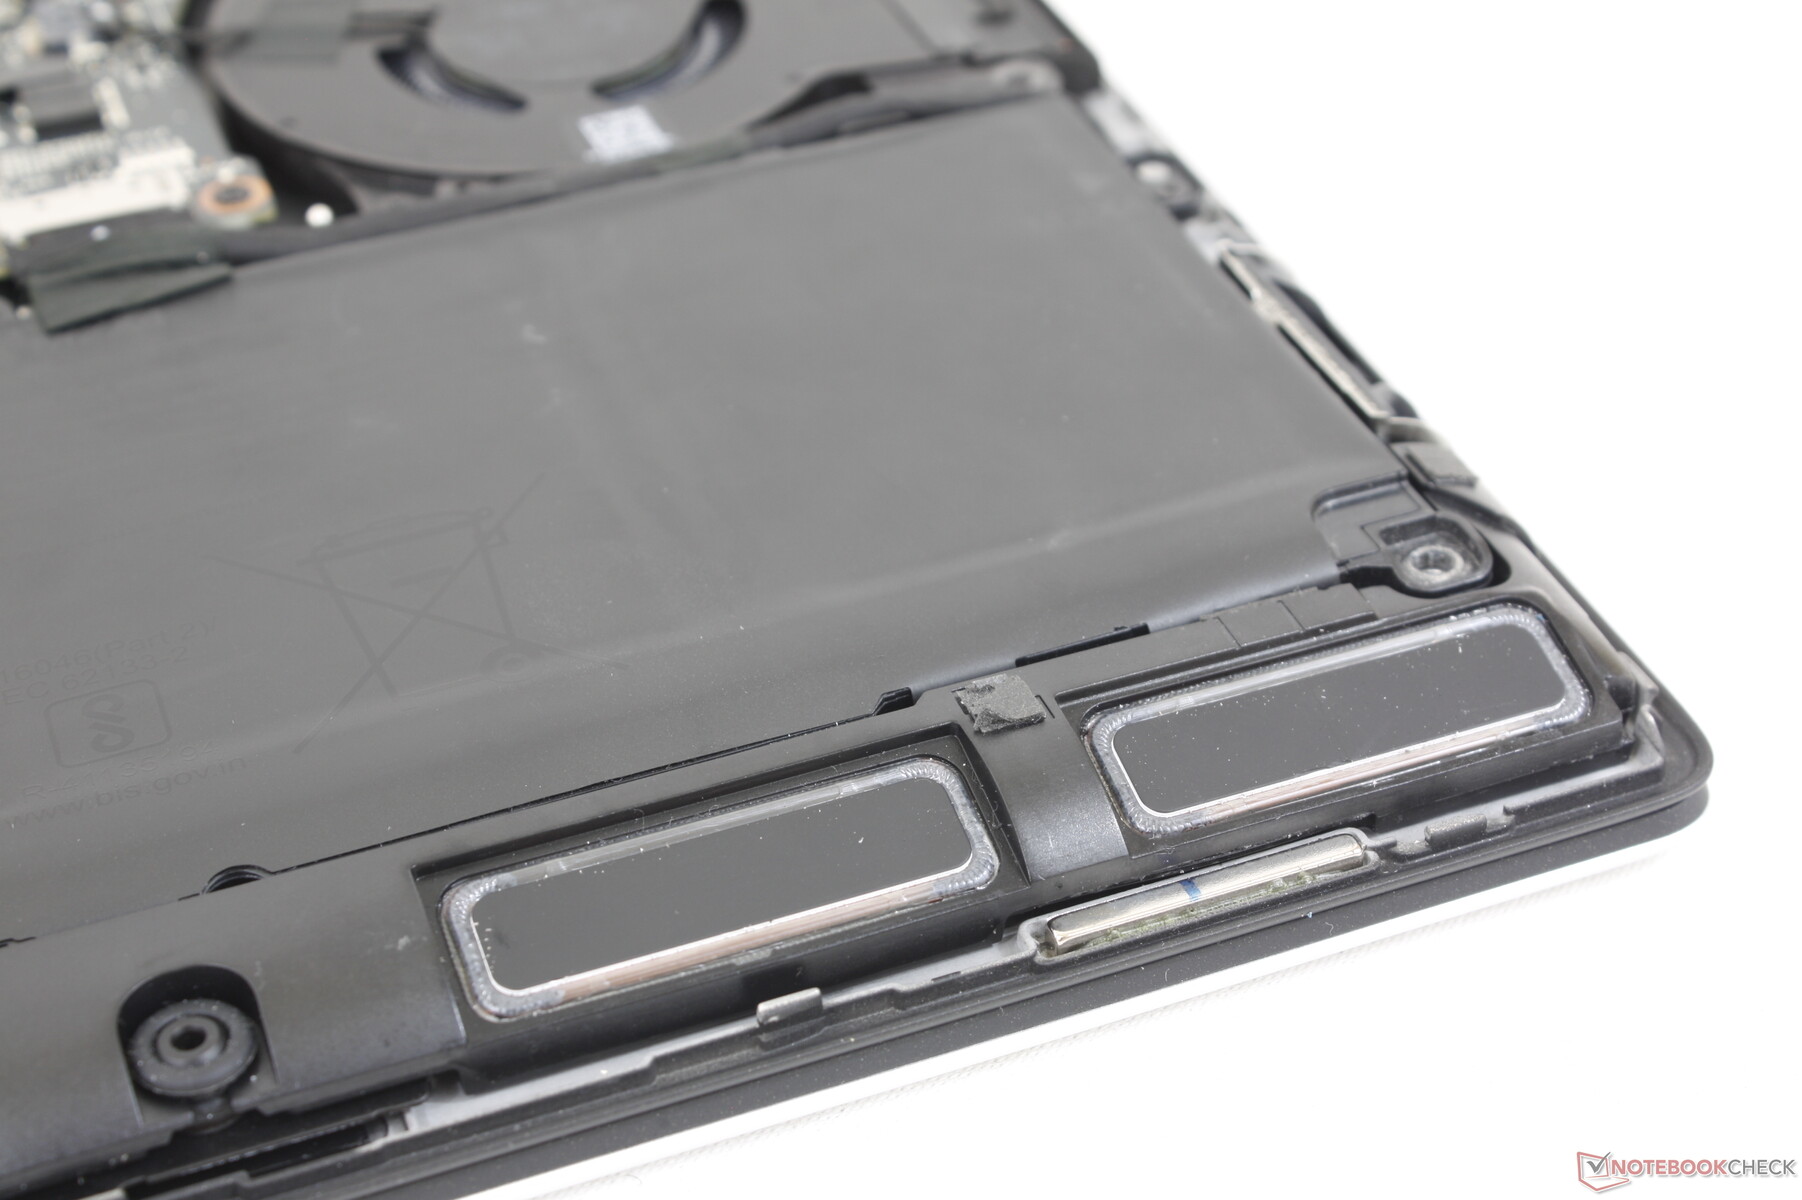
Maintenance
Le panneau inférieur est fixé par seulement six vis Phillips pour un retrait facile. Les propriétaires ont un accès direct aux deux emplacements M.2 2280 SSD, à la batterie et au module WLAN amovible.
Accessoires et garantie
La boîte ne contient pas d'autres éléments que l'adaptateur secteur et la documentation. La garantie limitée habituelle d'un an du fabricant s'applique si l'appareil est acheté aux États-Unis.
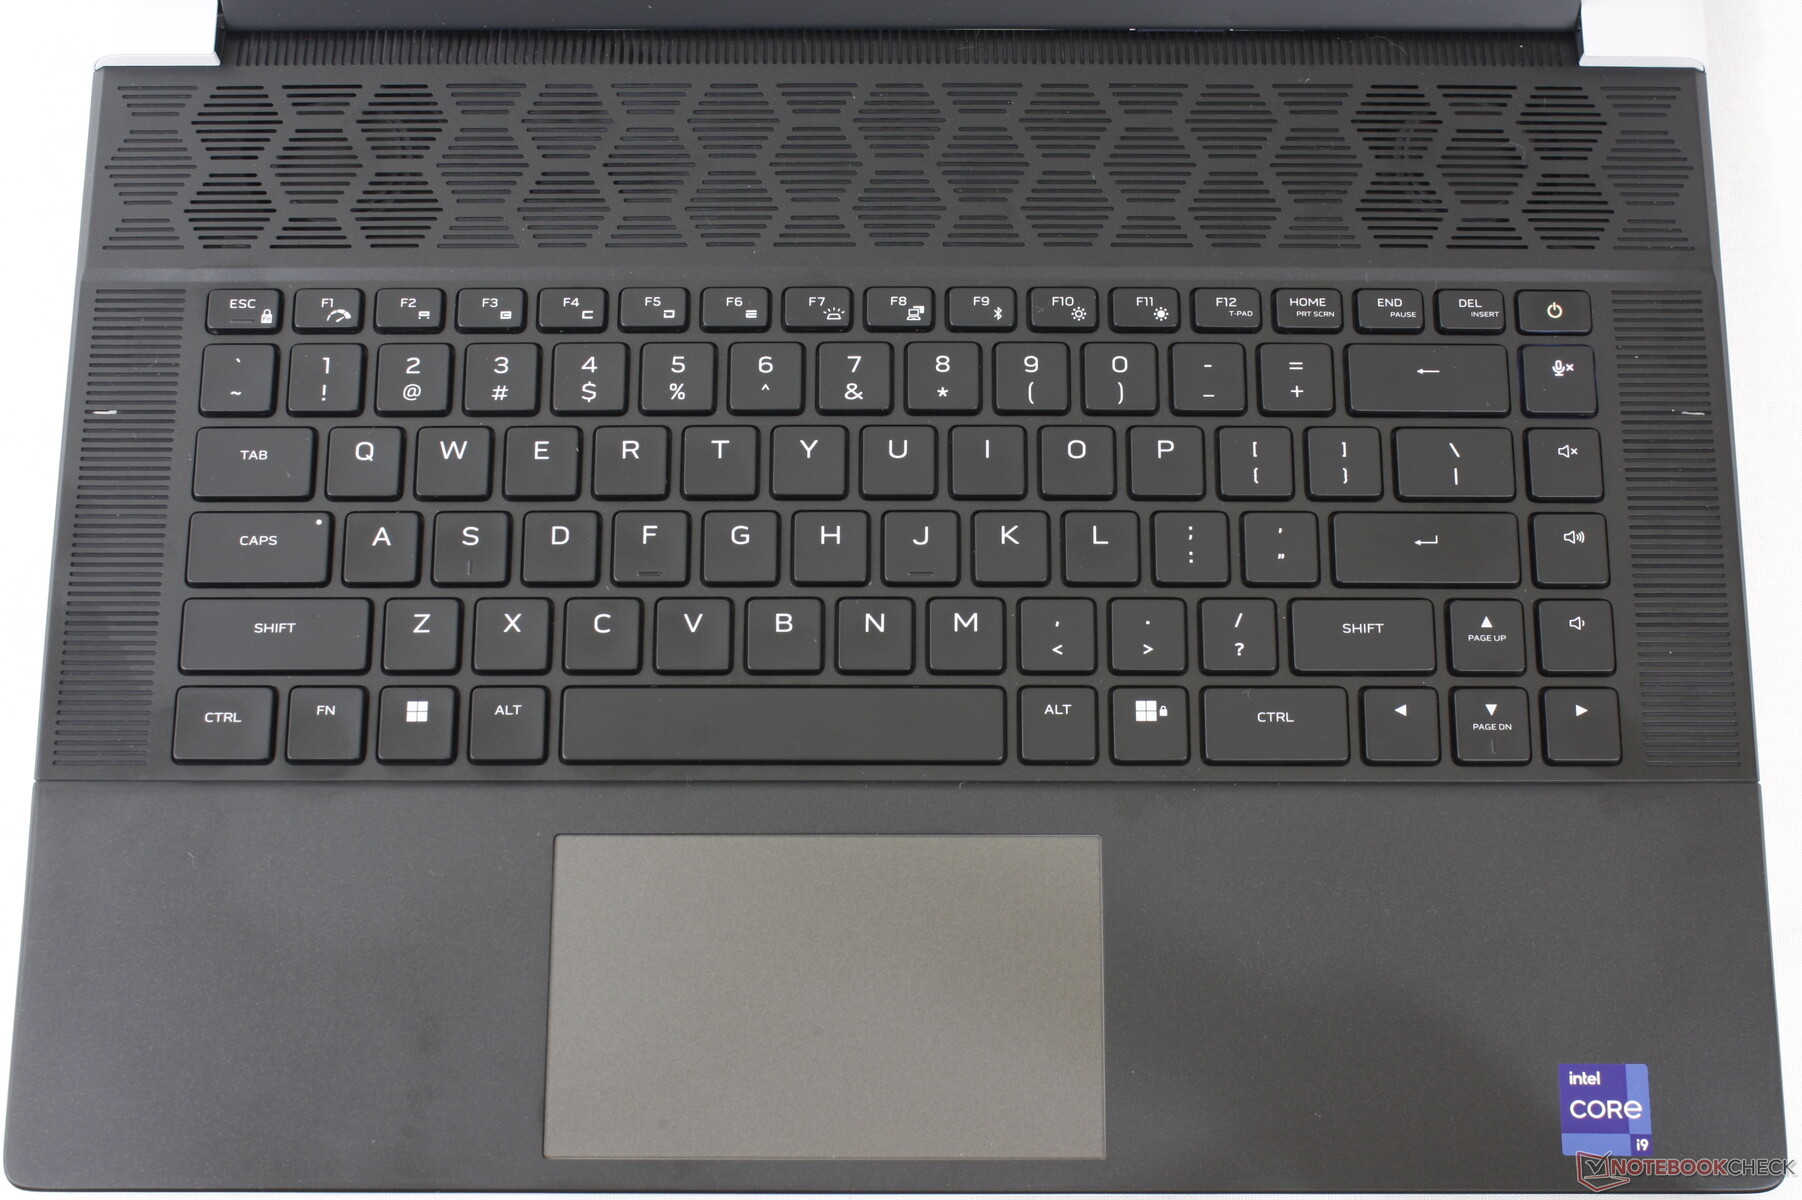
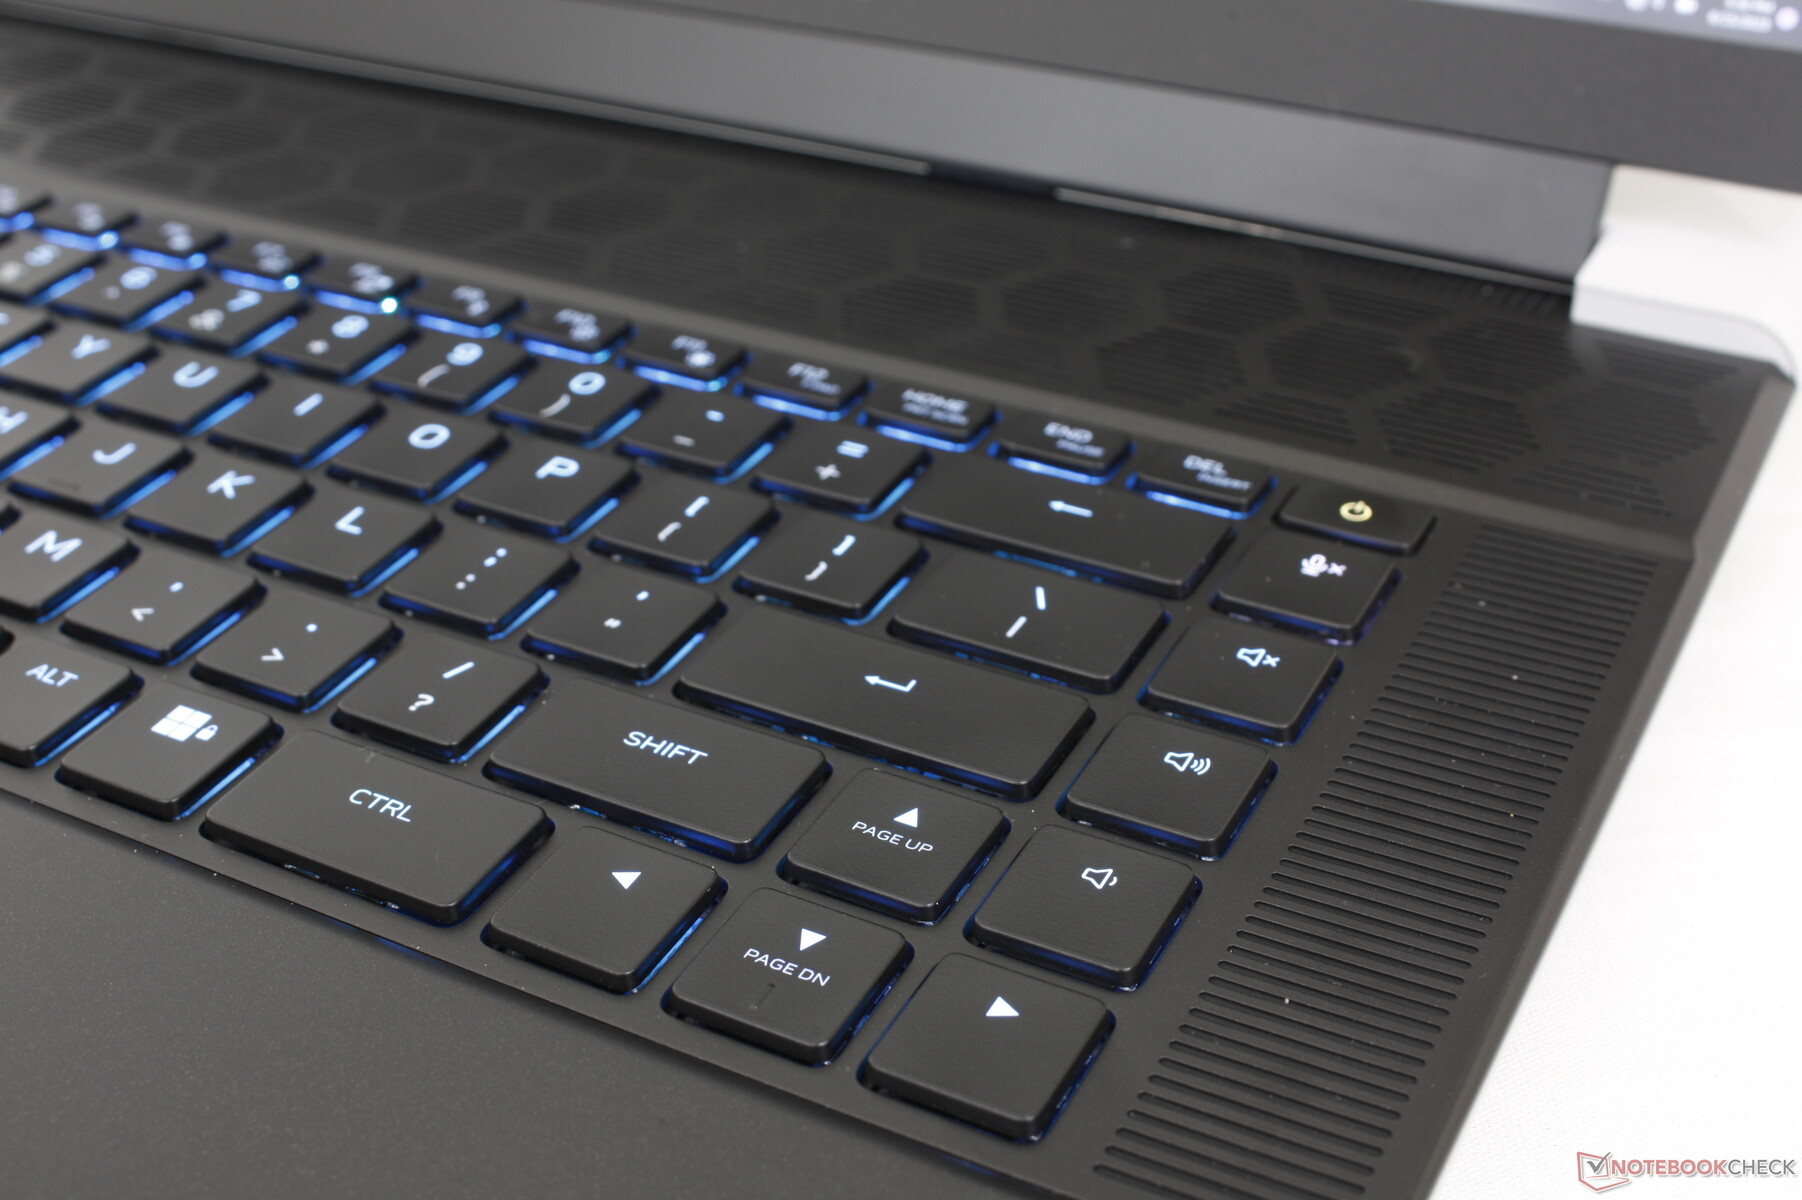
Périphériques d'entrée - Les touches mécaniques sont fières et bruyantes
Clavier
Dell propose deux options de clavier : des touches à membrane standard et des touches CherryMX à profil ultra bas, chacune dotée d'un éclairage RVB par touche. Notre unité de test est équipée de ce dernier et l'expérience de frappe est tout simplement incroyable par rapport aux touches à membrane de la plupart des autres ordinateurs portables de jeu. La course des touches de 1,8 mm est plus profonde que les 1,5 mm habituels, et le retour d'information est beaucoup plus ferme et plus percutant, pour une sensation plus satisfaisante. Il est difficile de revenir en arrière pour taper sur quelque chose comme le Razer Blade 16 après s'être habitué aux touches CherryMX de l'Alienware x16.
Le principal inconvénient, bien sûr, est le bruit nettement plus fort des touches mécaniques. Il est donc préférable d'opter pour l'option non mécanique standard si vous avez l'intention d'utiliser l'ordinateur portable dans des environnements sensibles au bruit, tels que des salles de classe ou des dortoirs étroits.
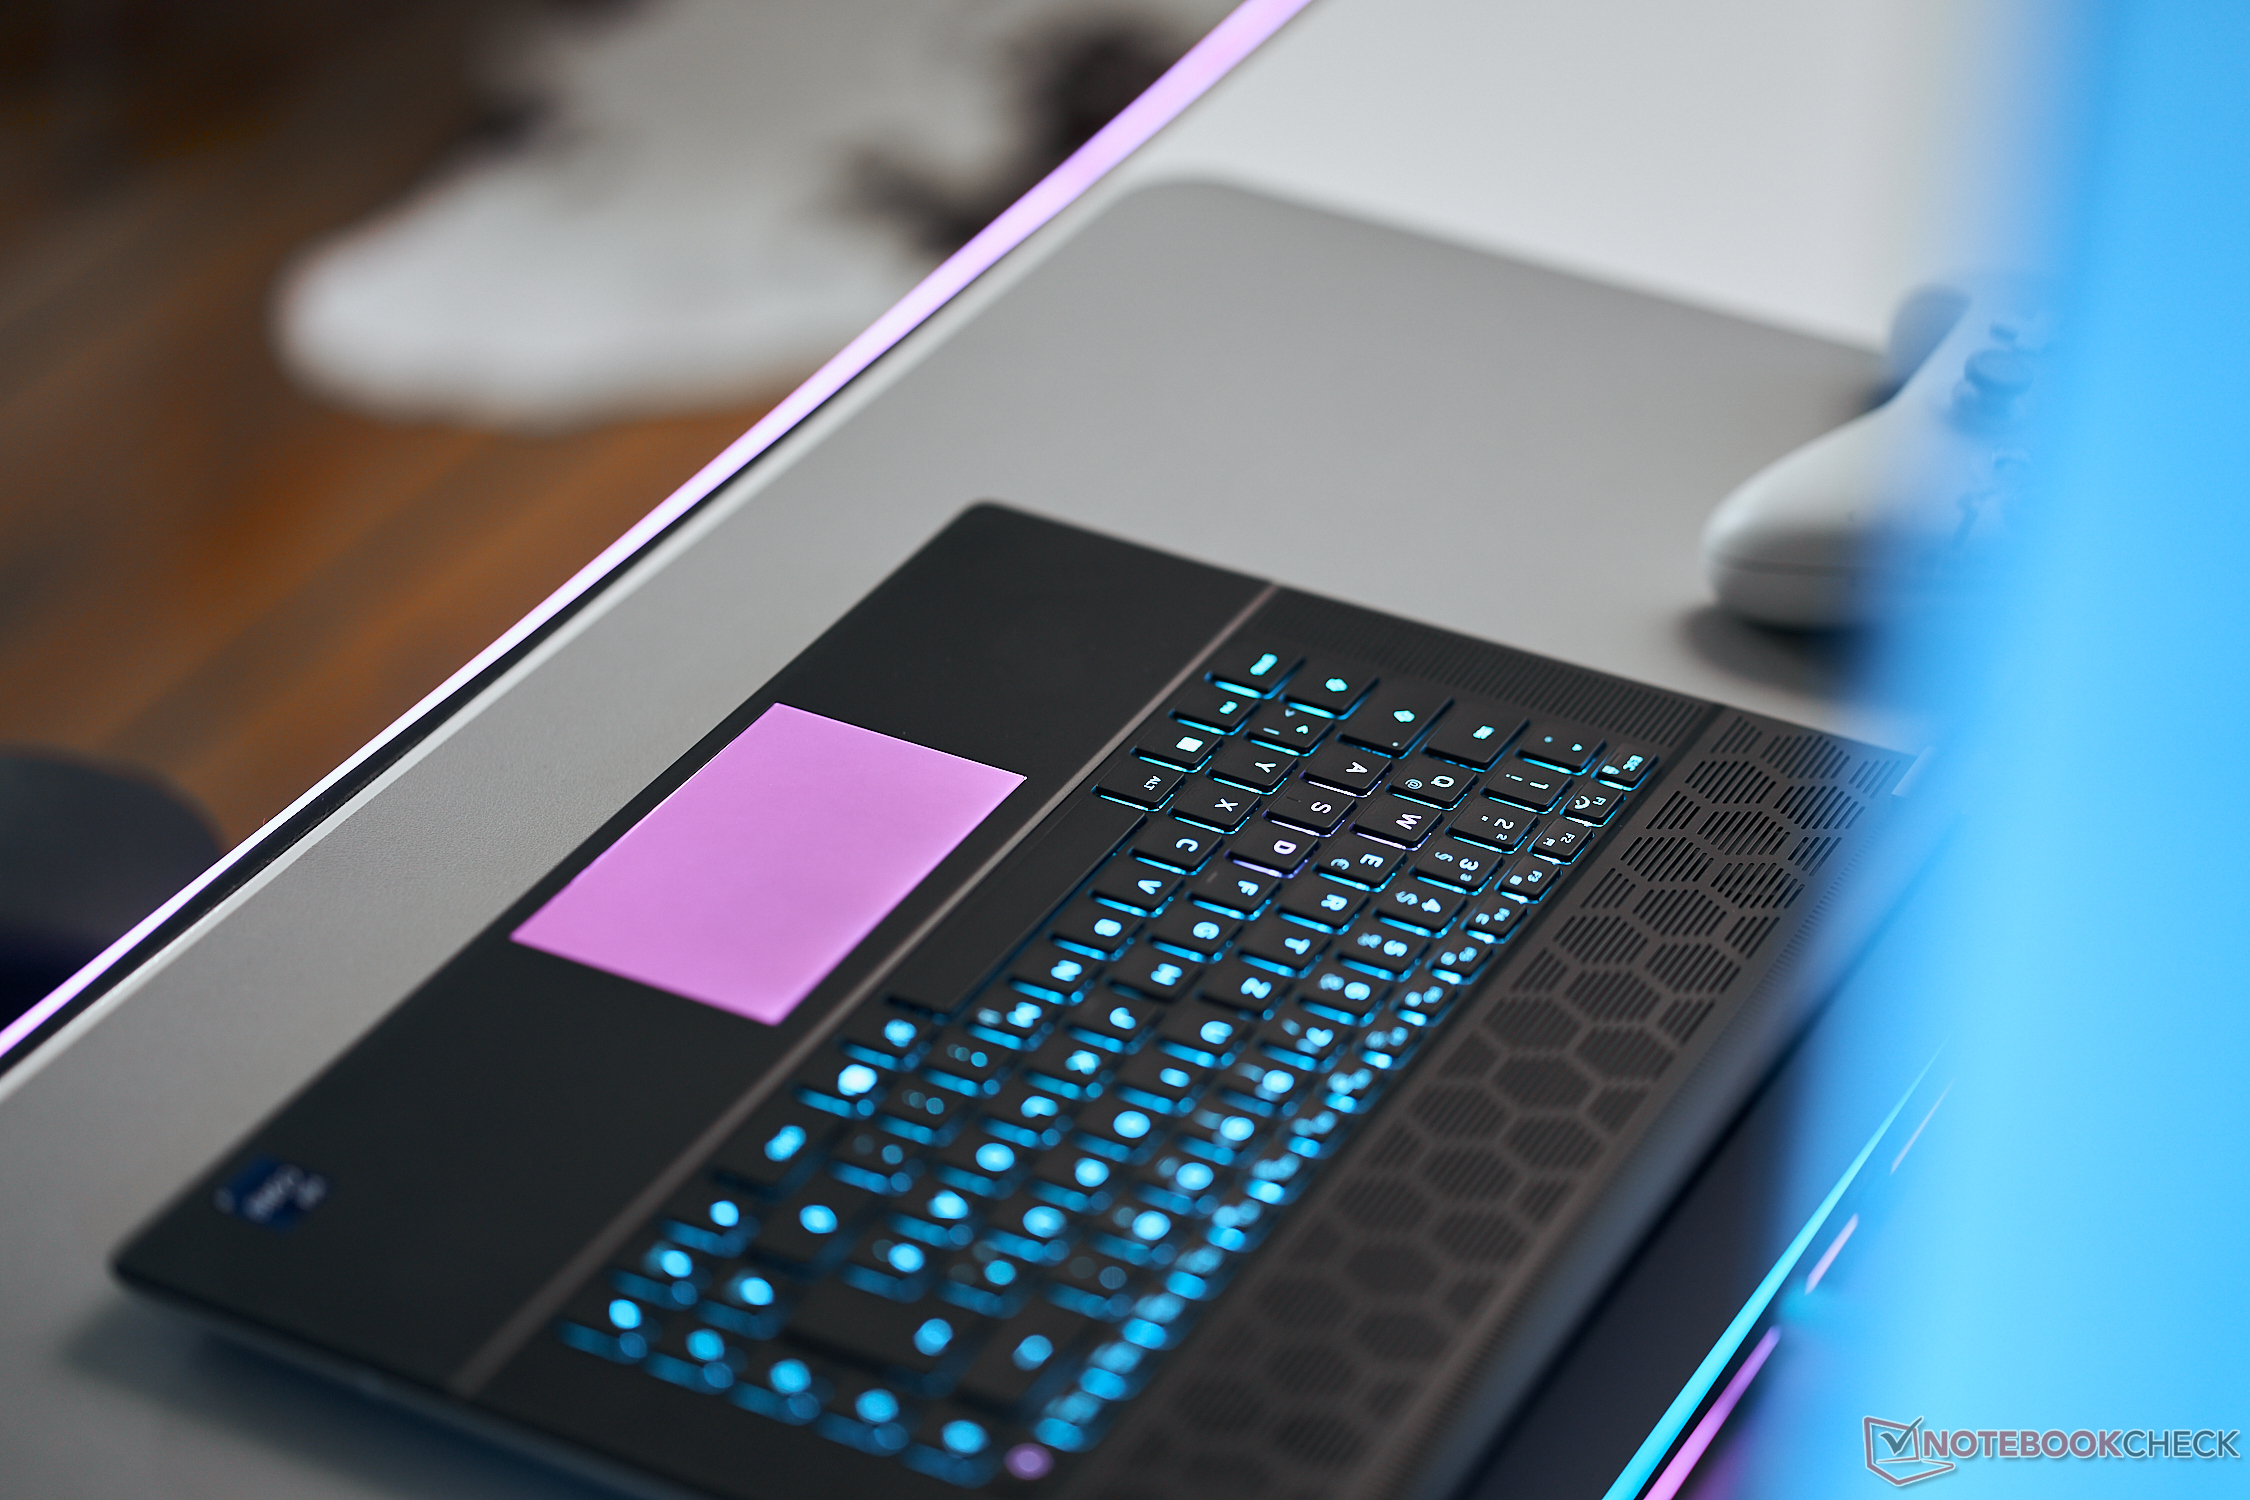
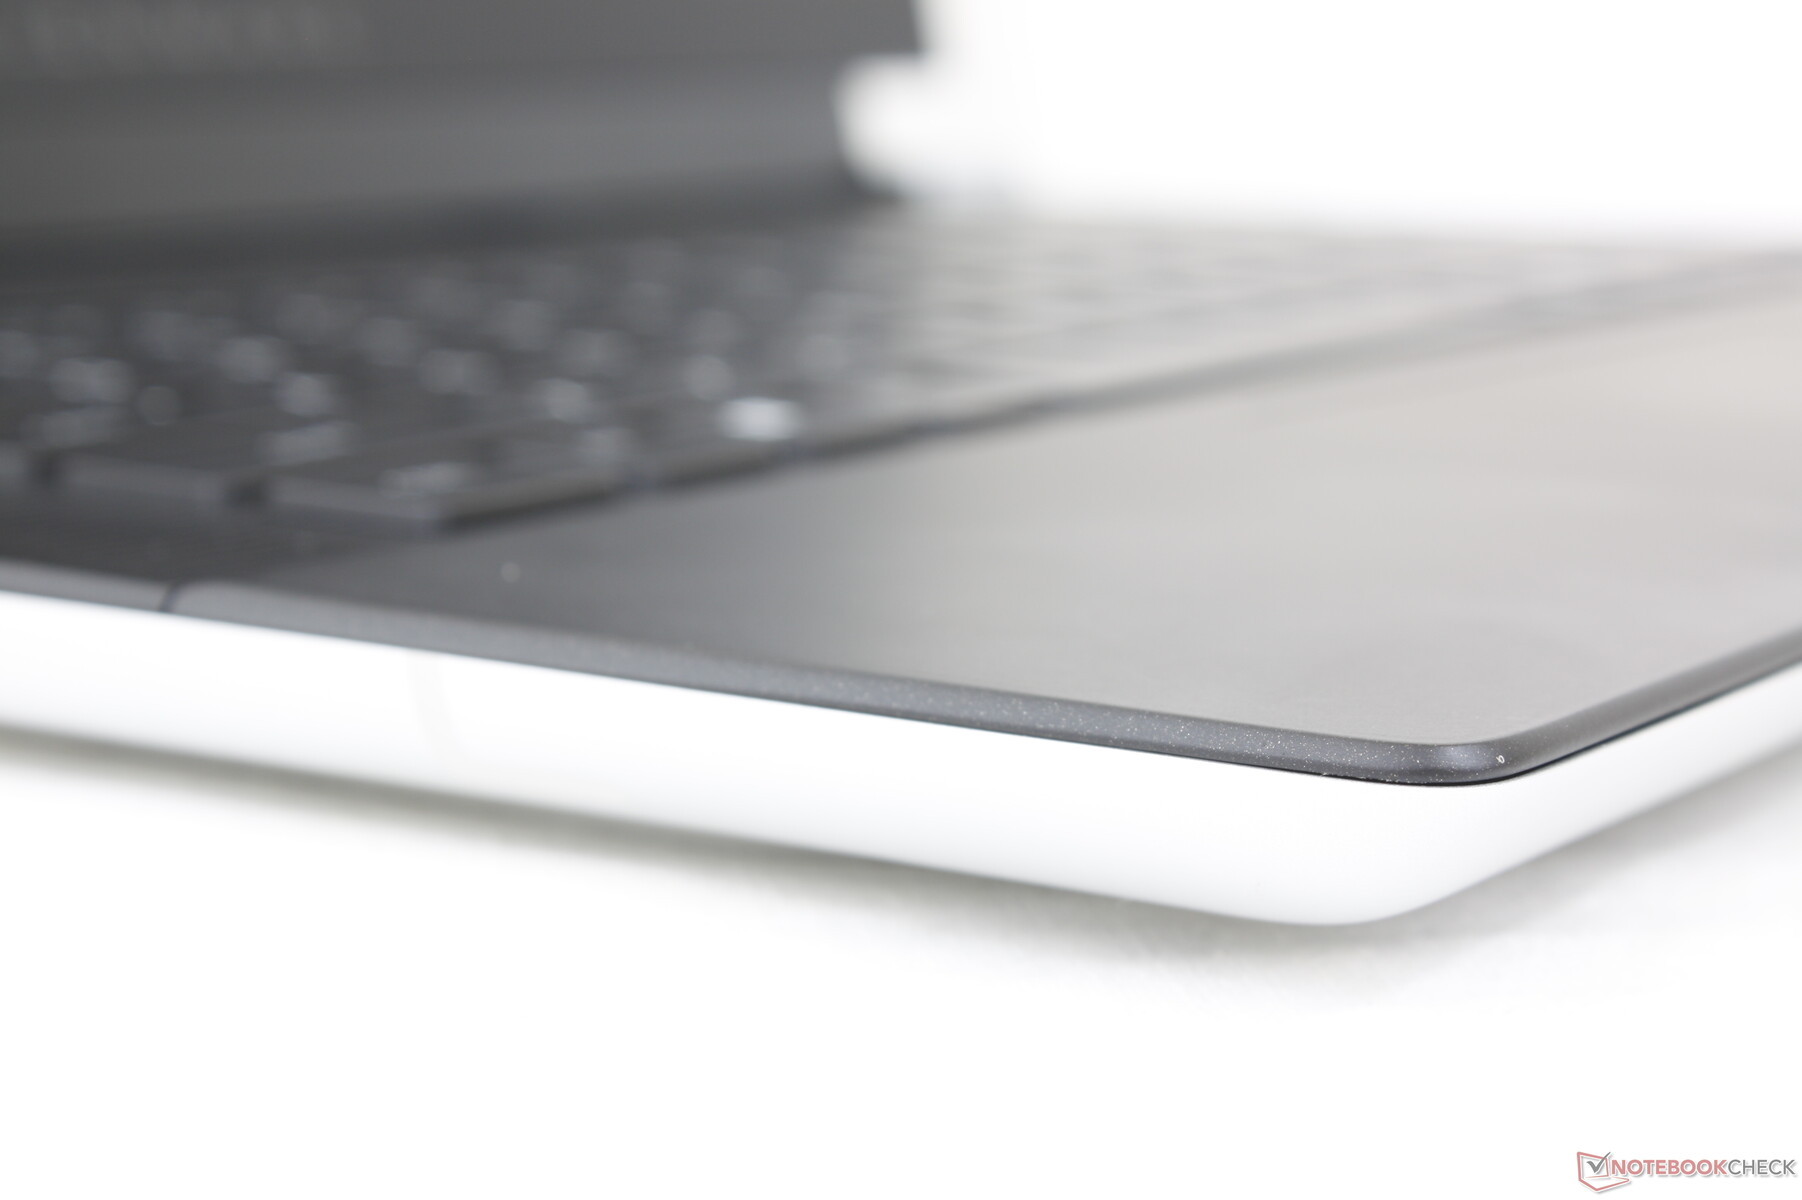
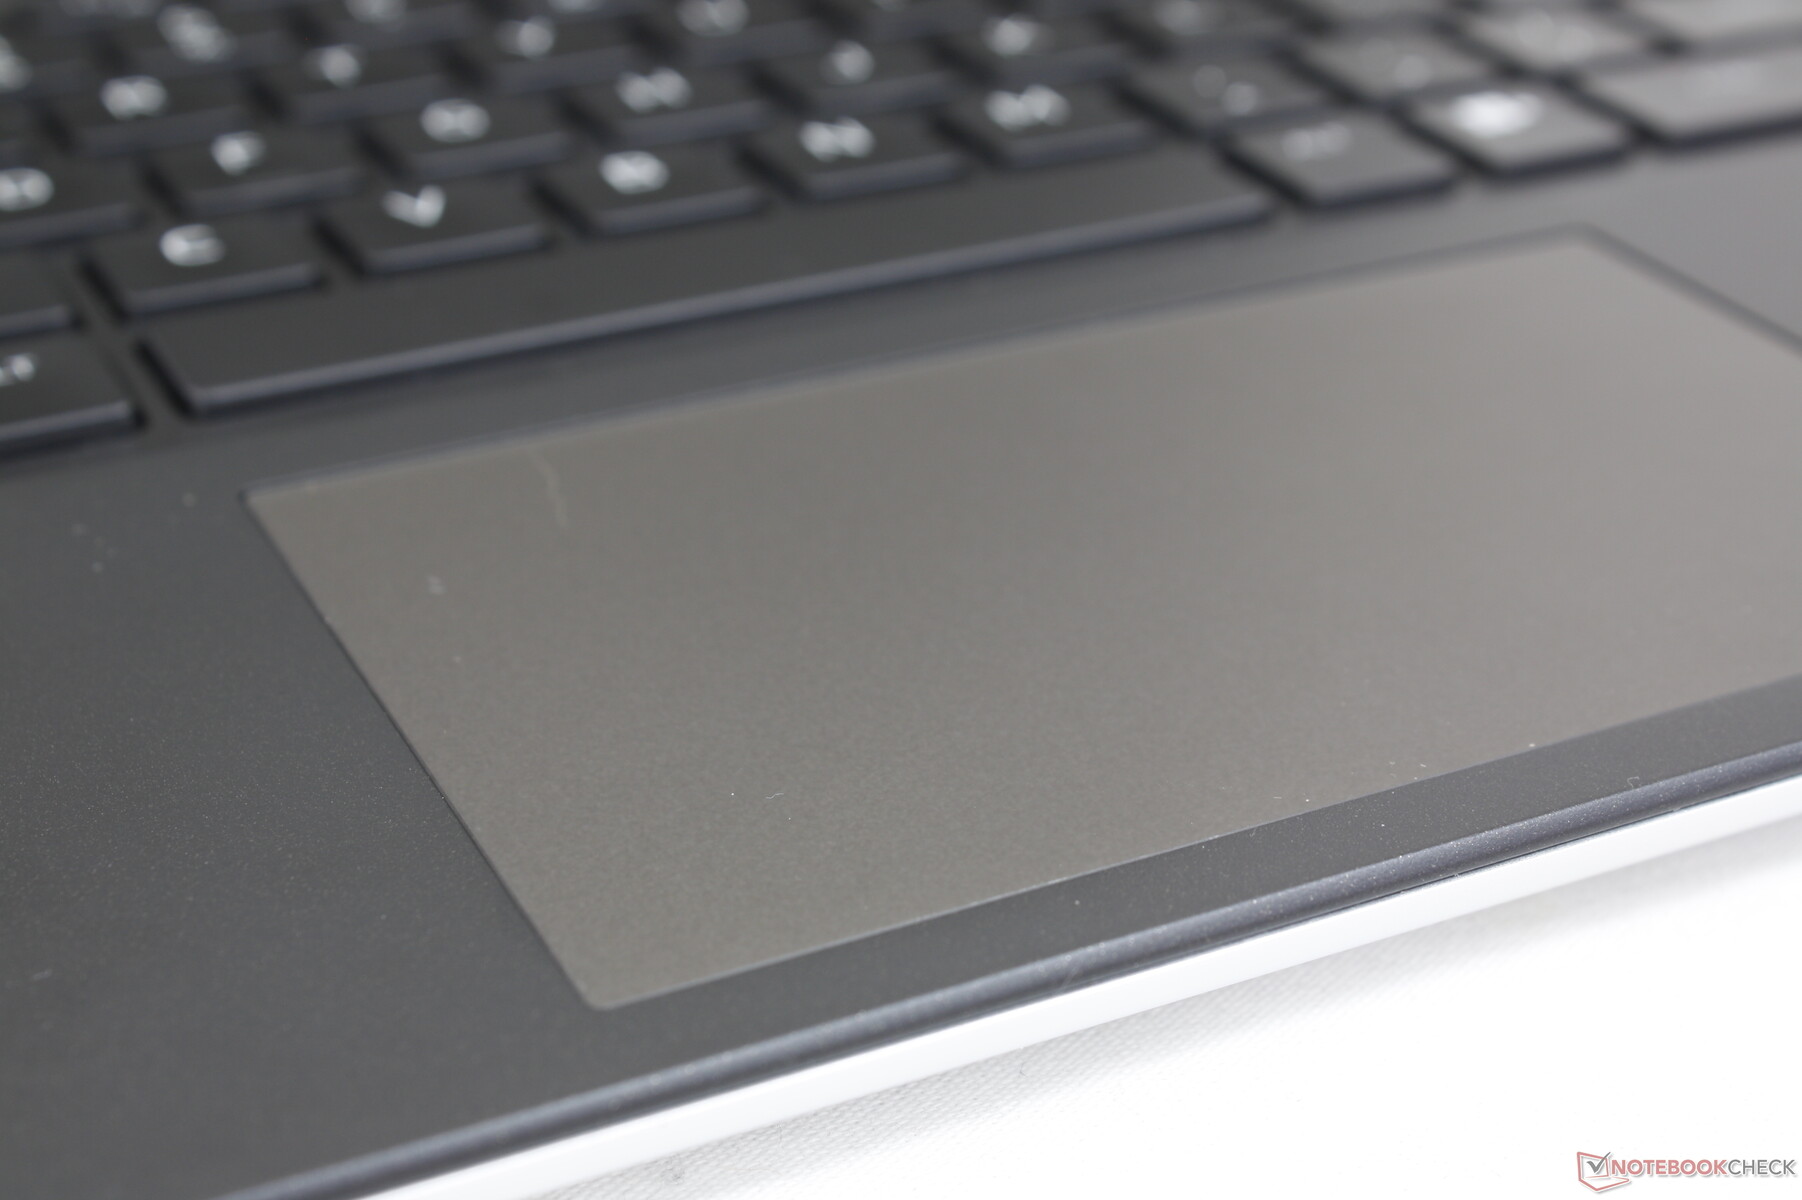
Pavé tactile
Le pavé tactile est l'un des plus petits pour un ordinateur portable de jeu de 16 pouces, avec seulement 11,2 x 6,5 cm, contre 17 x 9,7 cm et 12 x 7,5 cm sur le Blade 16 et le Pro 5 Legion Pro 5 16respectivement. La taille plus petite est due à la grande solution de refroidissement et aux grilles d'aération qui occupent plus d'espace à l'arrière du système. La glisse est fluide et ne présente qu'une légère adhérence lorsque l'on se déplace à faible vitesse pour obtenir des clics plus précis.
Le retour d'information lors du clic est léger et très superficiel, ce qui donne une sensation insatisfaisante. Compte tenu de ces éléments et de la faible surface d'accueil, il est clair que Dell s'attend à ce que la plupart des utilisateurs disposent d'une souris USB prête à l'emploi.

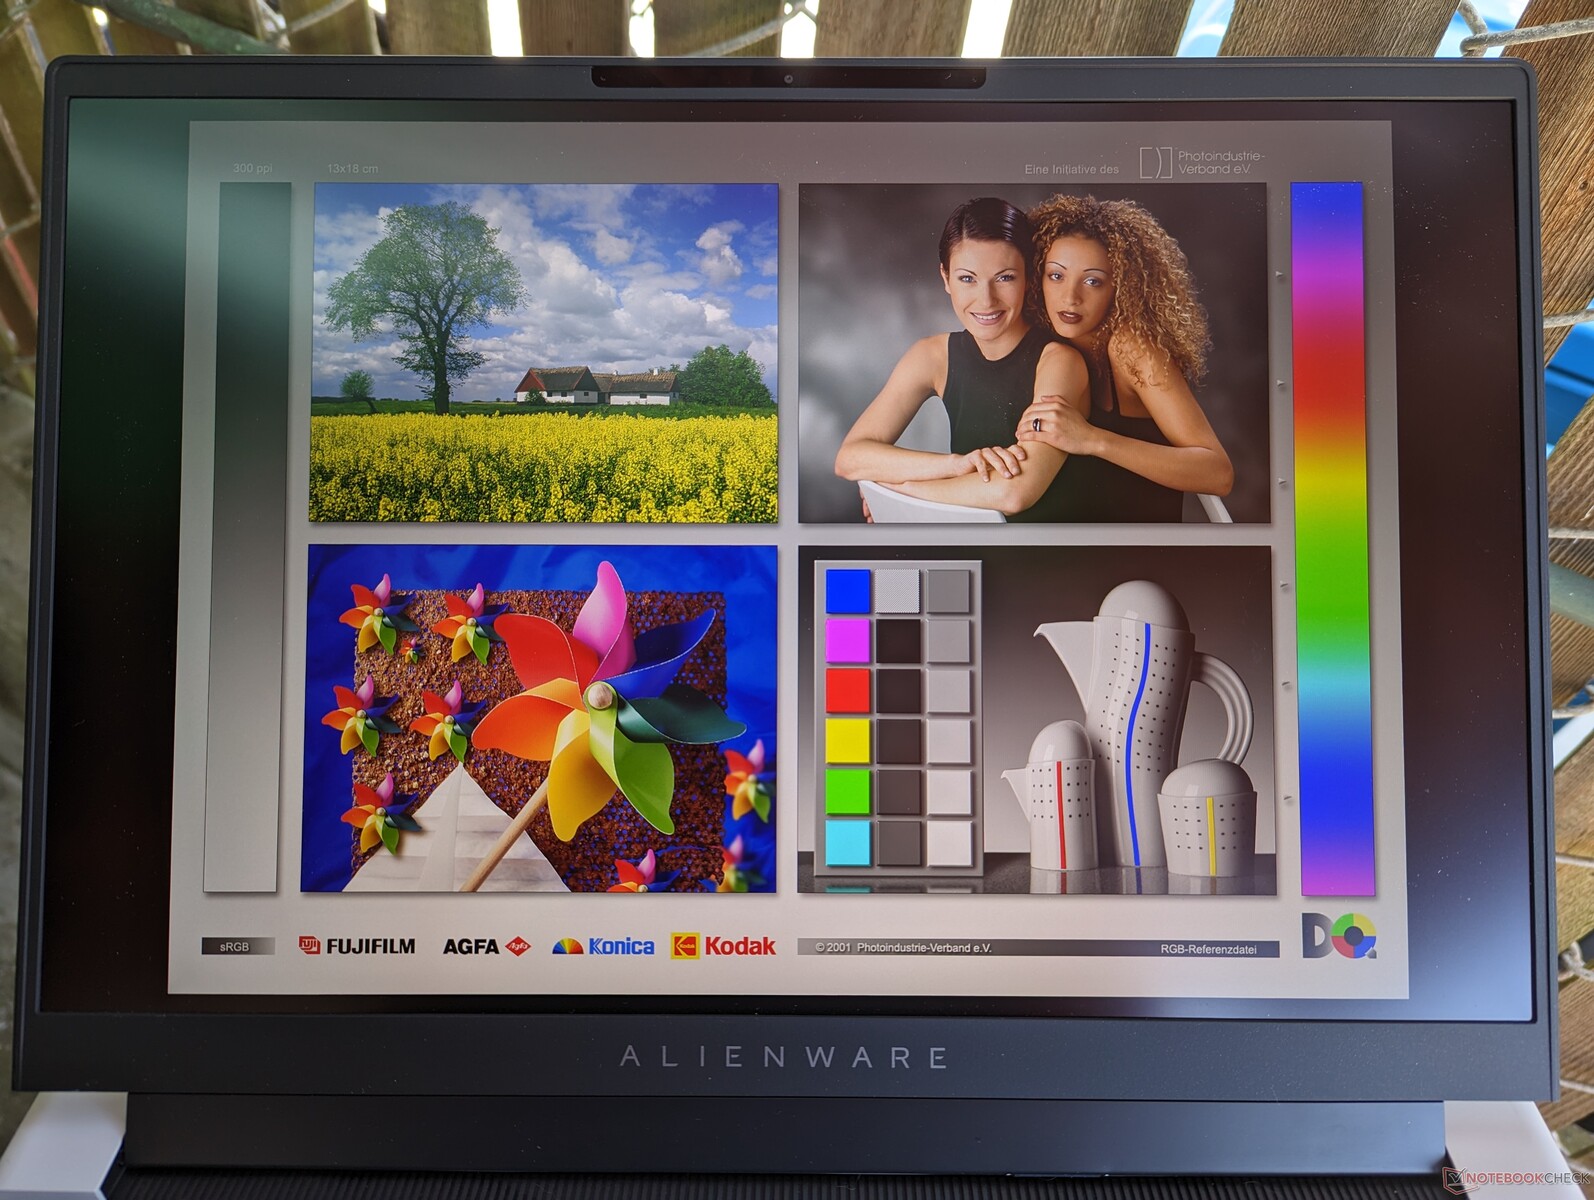
Affichage - Pas de mauvaise option
Trois options de présentation sont disponibles et nos mesures ne reflètent que l'option en gras :
- 2560 x 1600, 165 Hz, 3 ms, 100 % sRGB, G-Sync
- 1920 x 1200, 480 Hz, 3 ms, 100% DCI-P3, G-Sync
- 2560 x 1600, 240 Hz, 3 ms, 100% DCI-P3, G-Sync
Il n'y a certainement pas de mauvaise ou de "mauvaise" dalle puisque toutes les dalles sont adaptées aux jeux avec leurs taux de rafraîchissement et leurs temps de réponse rapides. Cela dit, notre écran 1600p240 est le meilleur pour la plupart des utilisateurs, car l'option 1200p480 sacrifie la résolution et l'option 1600p165 a des couleurs moins intenses. L'expérience visuelle est comparable à celle du Blade 16 tout en étant meilleure que celle du Dell G16 et du Lenovo Legion Pro 7 16 en termes de gamme de couleurs
.
| |||||||||||||||||||||||||
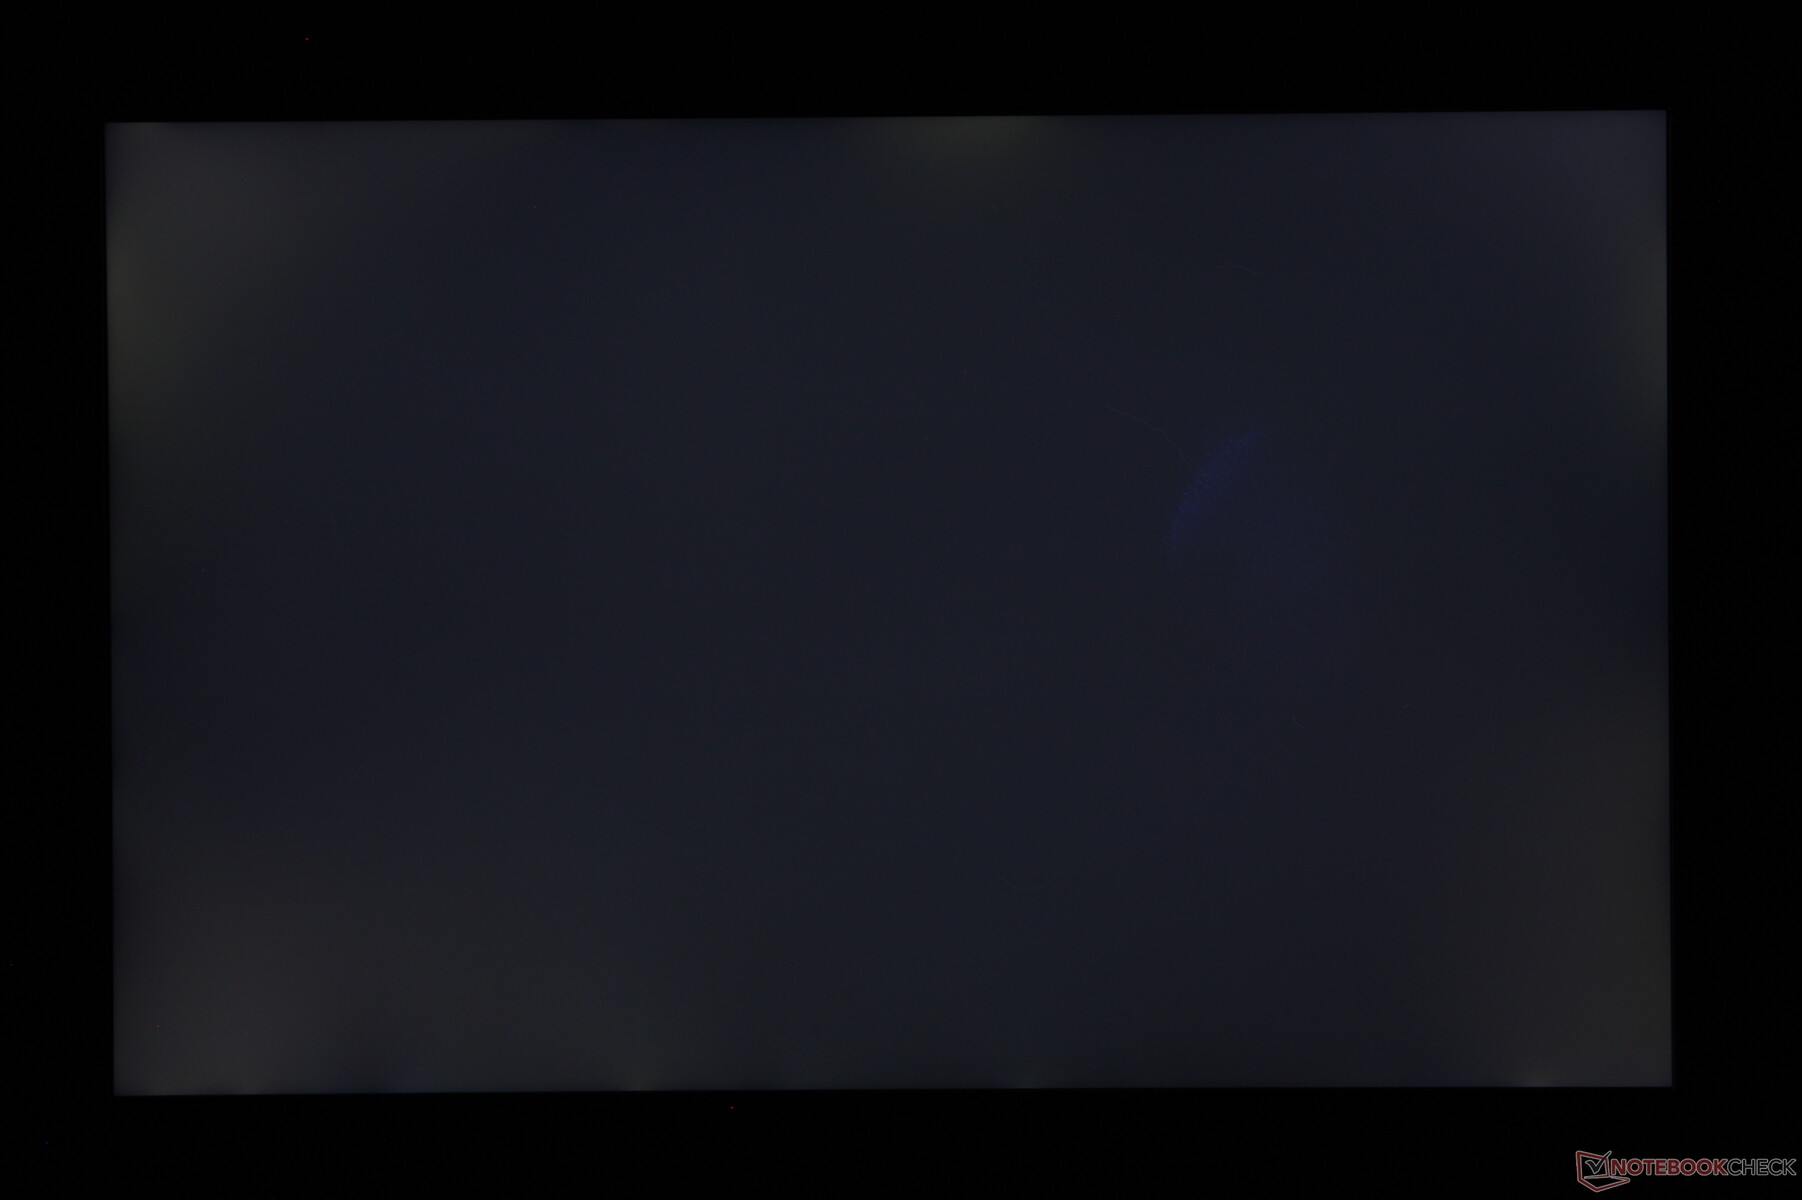
Homogénéité de la luminosité: 89 %
Valeur mesurée au centre, sur batterie: 302.2 cd/m²
Contraste: 1162:1 (Valeurs des noirs: 0.26 cd/m²)
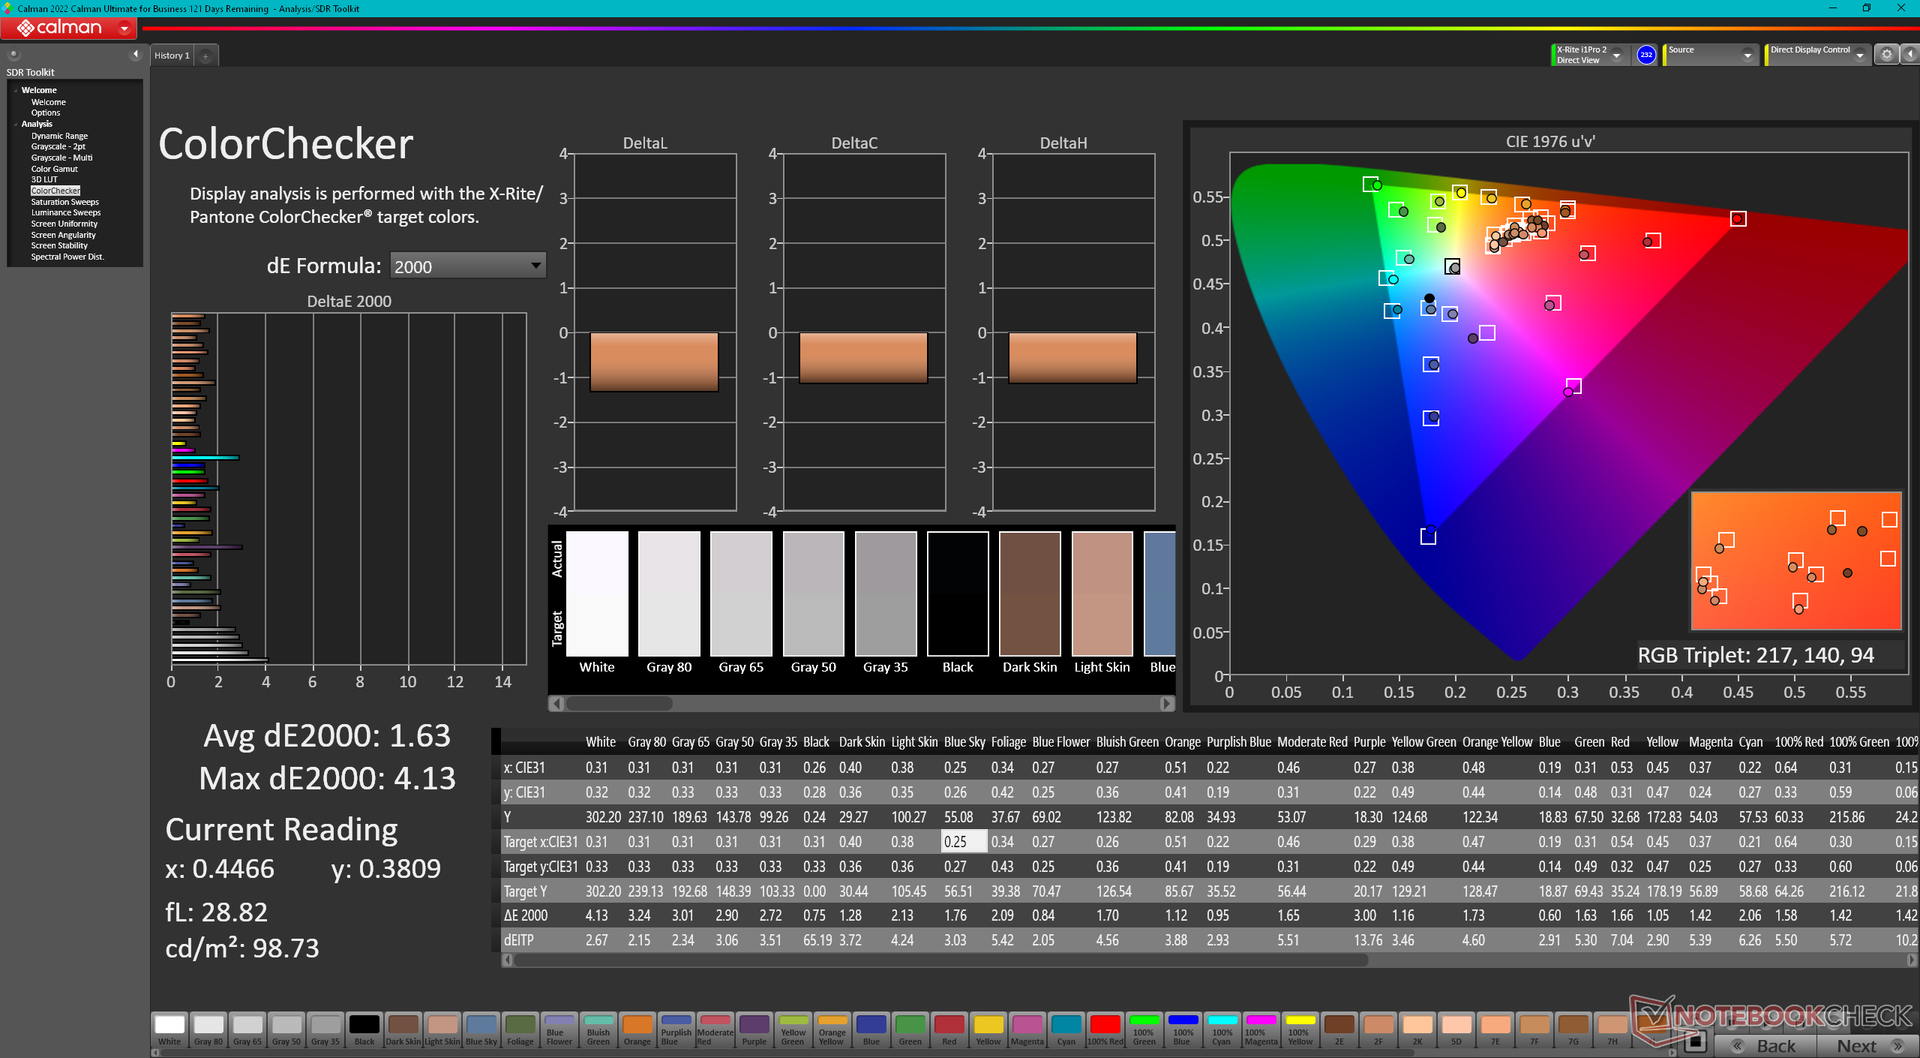
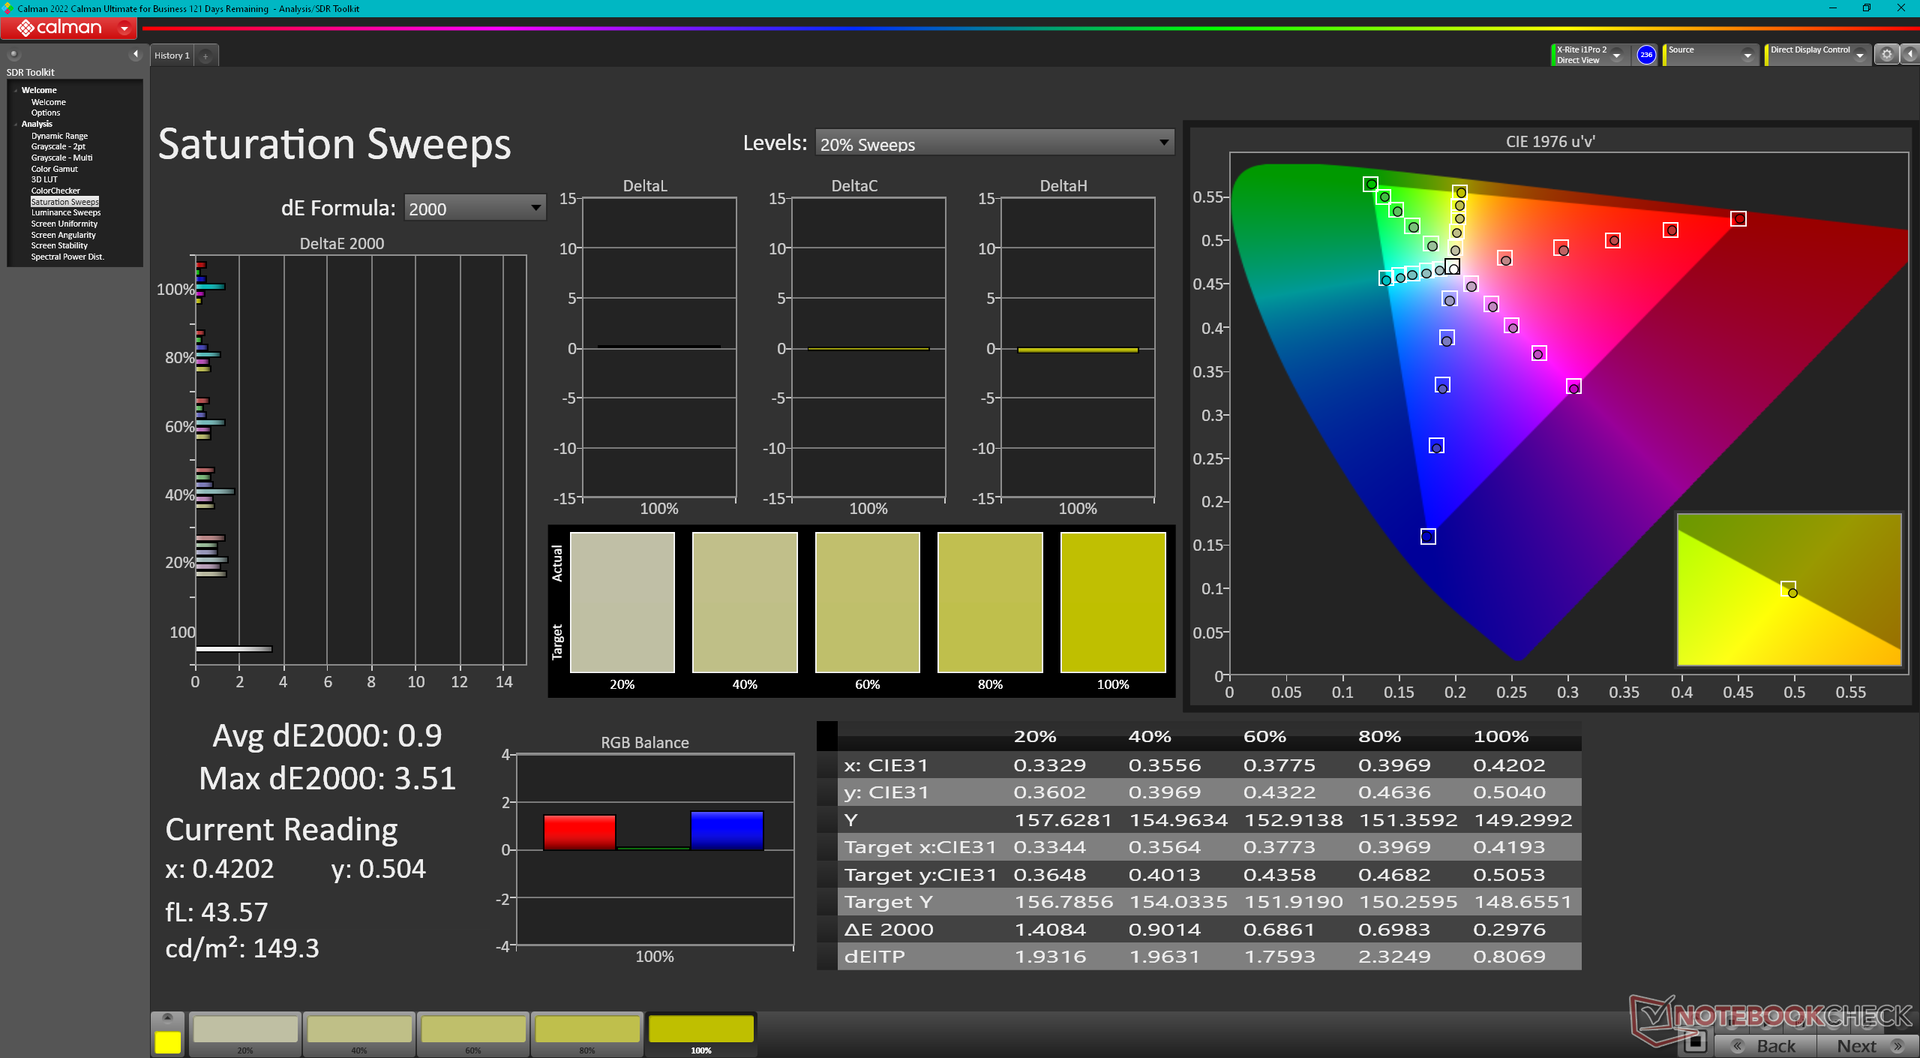
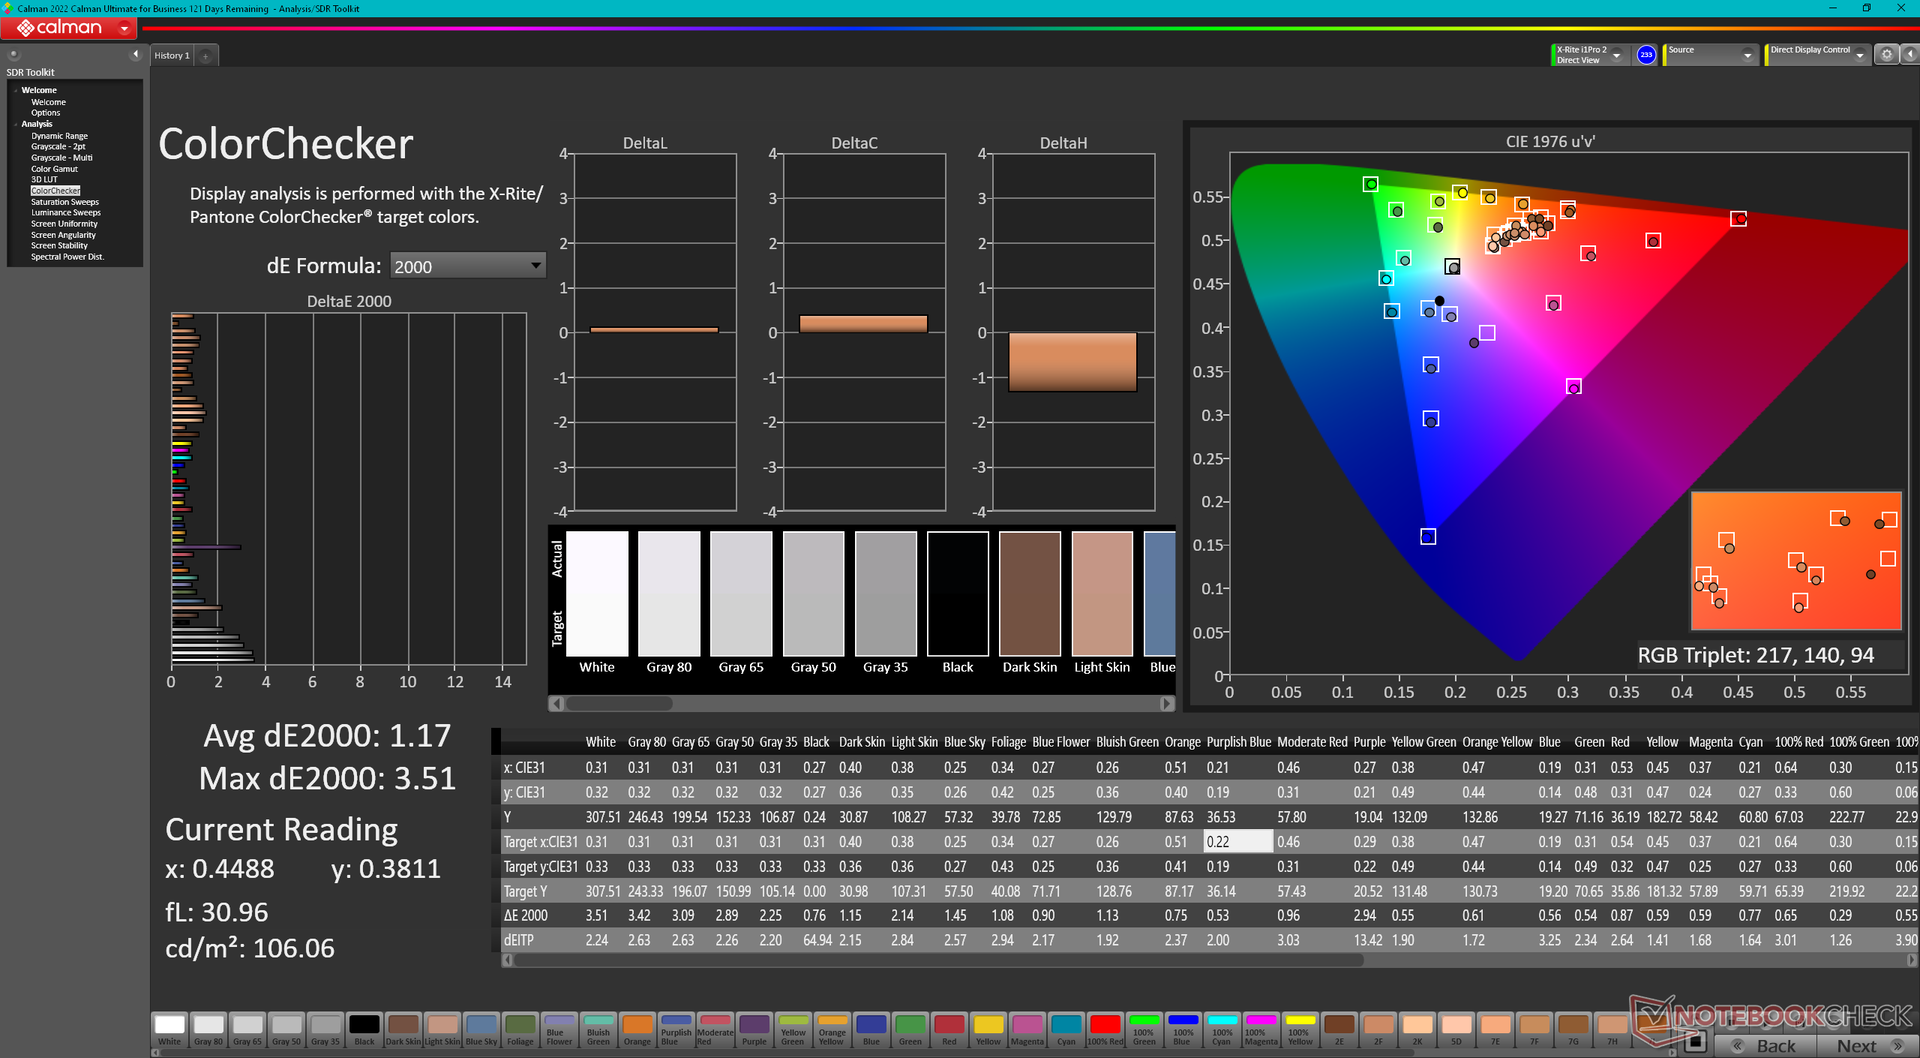
ΔE ColorChecker Calman: 1.63 | ∀{0.5-29.43 Ø4.71}
calibrated: 1.17
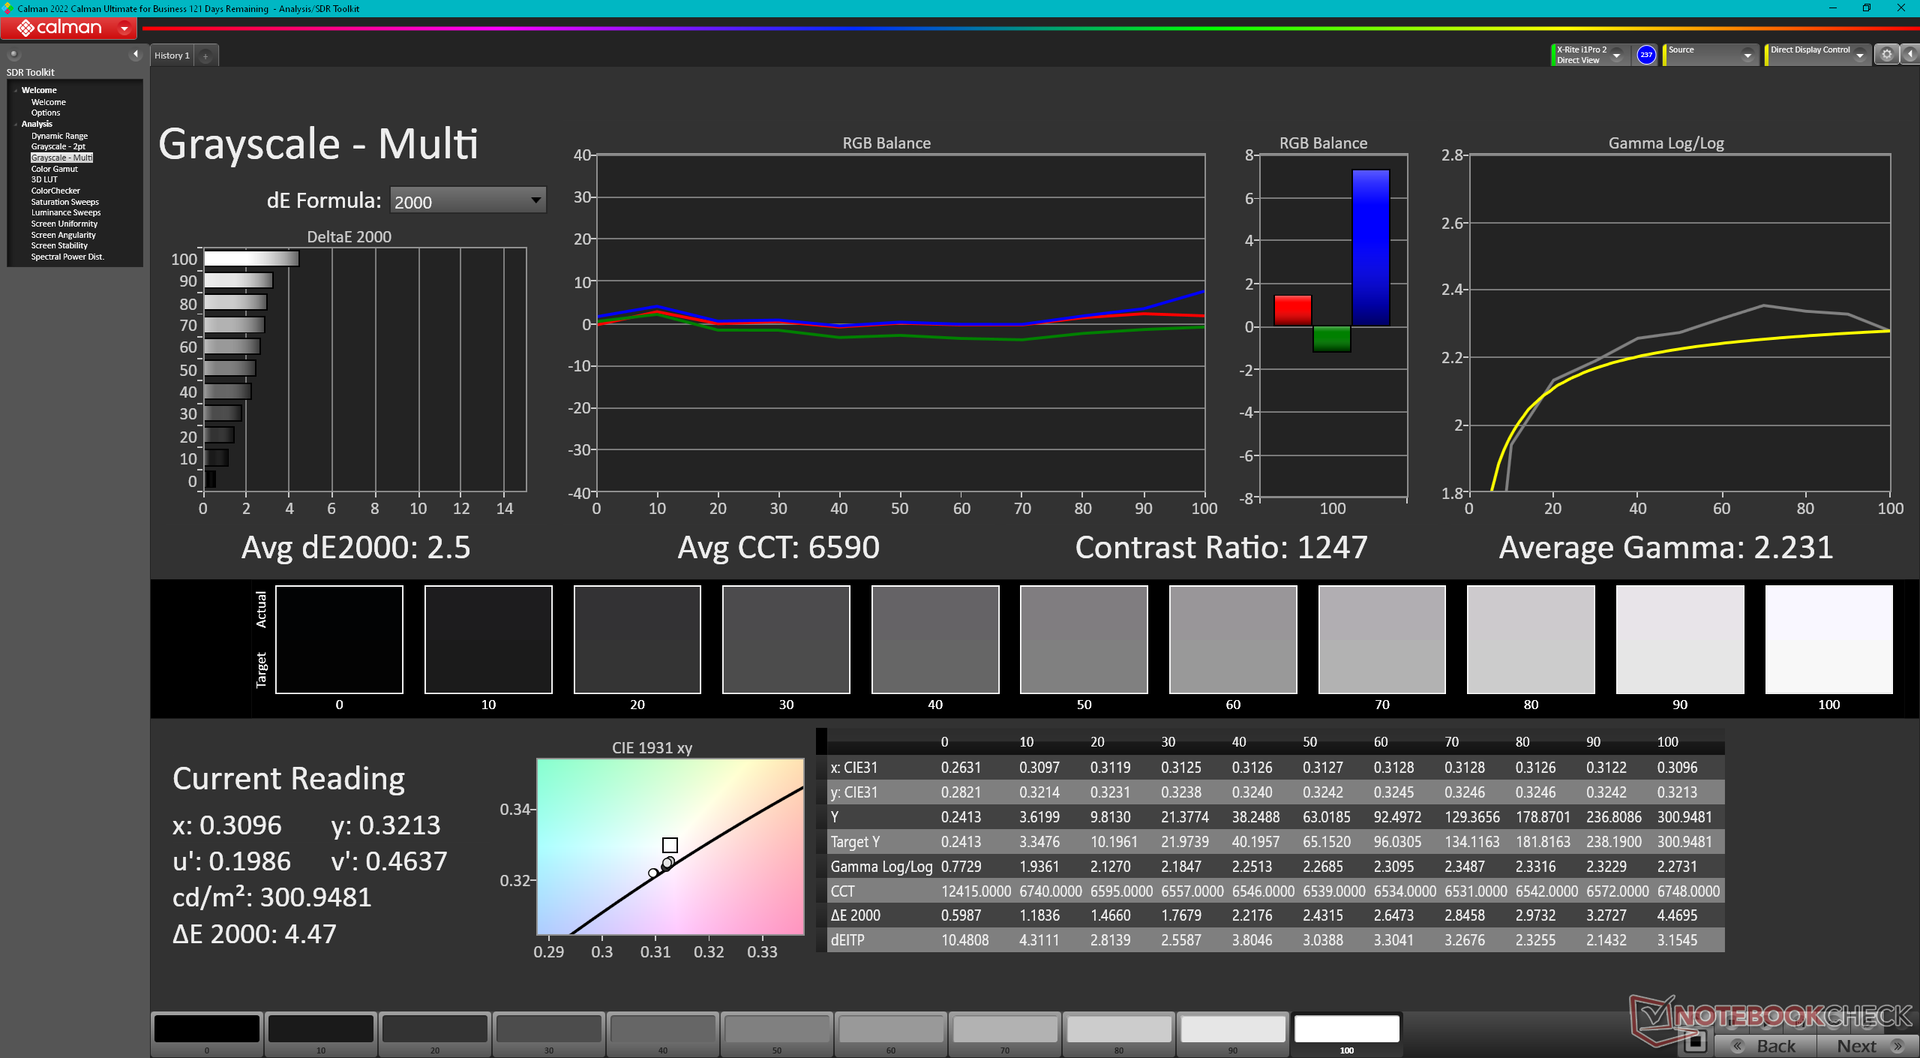
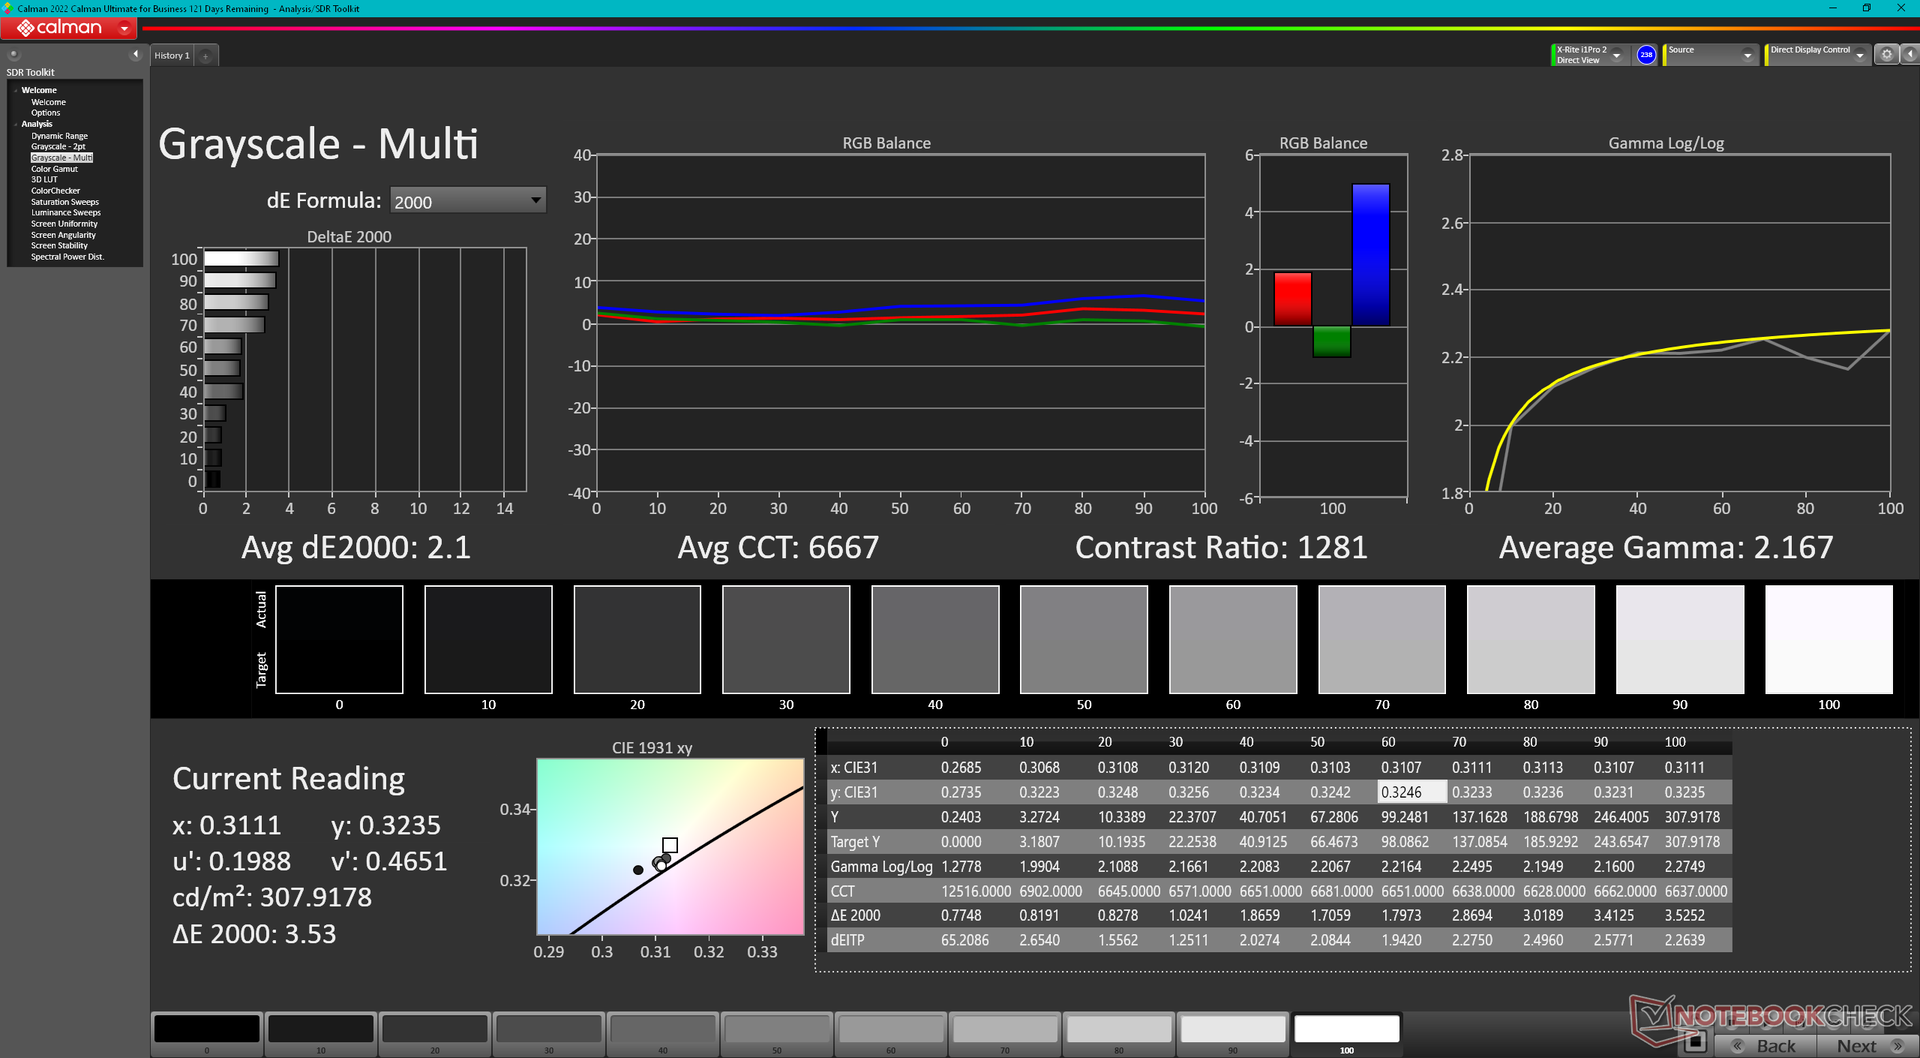
ΔE Greyscale Calman: 2.5 | ∀{0.09-98 Ø4.96}
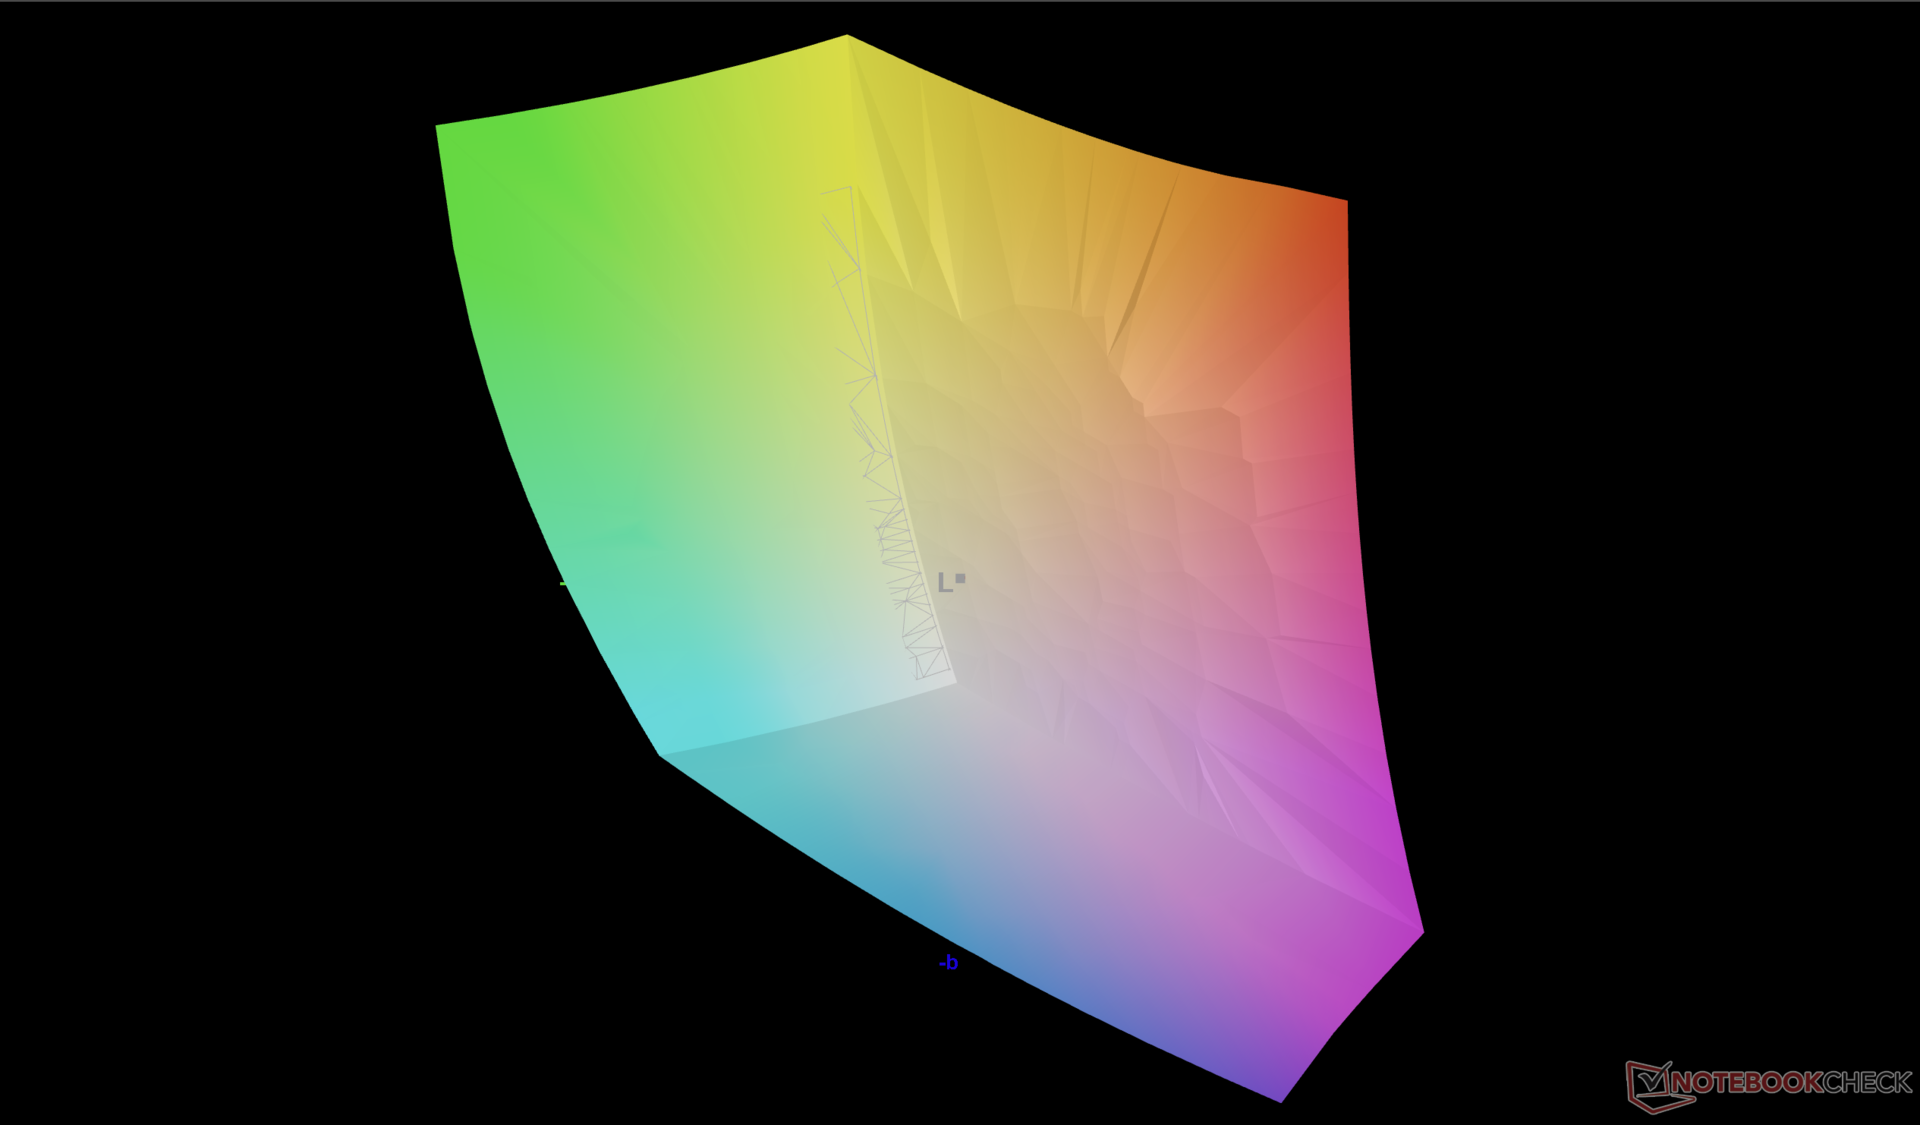
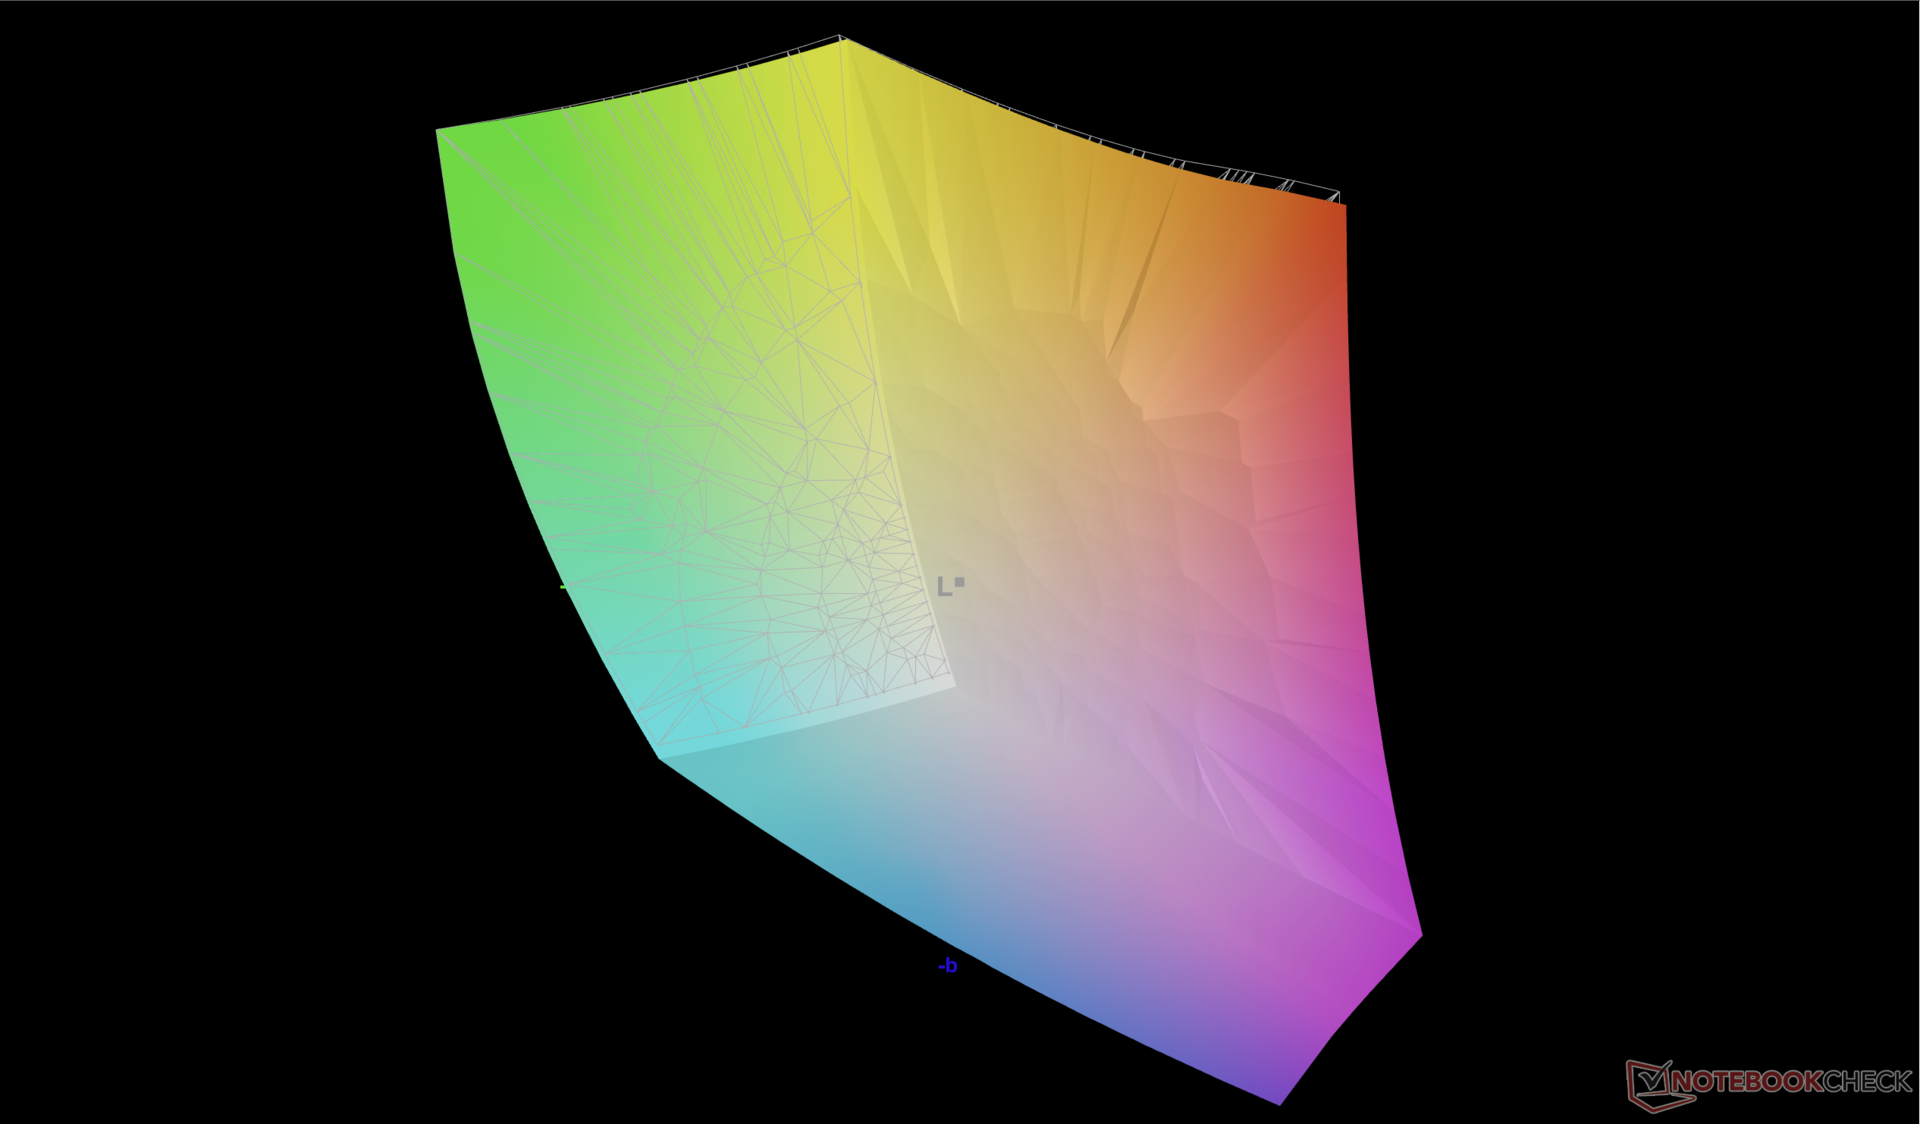
88.6% AdobeRGB 1998 (Argyll 3D)
100% sRGB (Argyll 3D)
99.2% Display P3 (Argyll 3D)
Gamma: 2.23
CCT: 6590 K
| Alienware x16 R1 BOE NE16NZ4, IPS, 2560x1600, 16" | Asus ROG Zephyrus M16 GU604VY-NM042X BOE0B74 (NE160QDM-NM4, IPS, 2560x1600, 16" | Razer Blade 16 Early 2023 CSOT T3 MNG007DA4-1, IPS, 2560x1600, 16" | Dell G16 7620 BOE NE16QDM, IPS, 2560x1600, 16" | Alienware m17 R5 (R9 6900HX, RX 6850M XT) AU Optronics AUODBA3, IPS, 3840x2160, 17" | Lenovo Legion Pro 7 16IRX8H MNG007DA2-3 (CSO1628), IPS, 2560x1600, 16" | |
|---|---|---|---|---|---|---|
| Display | 1% | 0% | -18% | -1% | -17% | |
| Display P3 Coverage (%) | 99.2 | 99.33 0% | 98.5 -1% | 68.3 -31% | 97.2 -2% | 69.1 -30% |
| sRGB Coverage (%) | 100 | 99.9 0% | 100 0% | 98 -2% | 99.6 0% | 99.7 0% |
| AdobeRGB 1998 Coverage (%) | 88.6 | 90.01 2% | 89.7 1% | 70.5 -20% | 88.4 0% | 71.2 -20% |
| Response Times | -542% | -23% | -35% | -118% | -49% | |
| Response Time Grey 50% / Grey 80% * (ms) | 5.1 ? | 50.8 ? -896% | 6.6 ? -29% | 8.6 ? -69% | 16.4 ? -222% | 12.3 ? -141% |
| Response Time Black / White * (ms) | 10.3 ? | 29.6 ? -187% | 12 ? -17% | 10.4 ? -1% | 11.6 ? -13% | 5.9 ? 43% |
| PWM Frequency (Hz) | 12000 | |||||
| Screen | 247% | -8% | -4% | -80% | 31% | |
| Brightness middle (cd/m²) | 302.2 | 634 110% | 456.8 51% | 369.4 22% | 484 60% | 511 69% |
| Brightness (cd/m²) | 285 | 627 120% | 437 53% | 348 22% | 449 58% | 469 65% |
| Brightness Distribution (%) | 89 | 92 3% | 83 -7% | 83 -7% | 87 -2% | 86 -3% |
| Black Level * (cd/m²) | 0.26 | 0.03 88% | 0.35 -35% | 0.32 -23% | 0.55 -112% | 0.4 -54% |
| Contrast (:1) | 1162 | 21133 1719% | 1305 12% | 1154 -1% | 880 -24% | 1278 10% |
| Colorchecker dE 2000 * | 1.63 | 0.89 45% | 3.7 -127% | 1.78 -9% | 4.8 -194% | 0.95 42% |
| Colorchecker dE 2000 max. * | 4.13 | 1.79 57% | 6.42 -55% | 4.41 -7% | 7.48 -81% | 2.07 50% |
| Colorchecker dE 2000 calibrated * | 1.17 | 0.91 22% | 0.66 44% | 1.22 -4% | 4.74 -305% | 0.91 22% |
| Greyscale dE 2000 * | 2.5 | 1.13 55% | 2.6 -4% | 3.2 -28% | 5.5 -120% | 0.6 76% |
| Gamma | 2.23 99% | 2.47 89% | 2.3 96% | 2.2 100% | 2.42 91% | 2.176 101% |
| CCT | 6590 99% | 6497 100% | 6108 106% | 6750 96% | 6148 106% | 6545 99% |
| Moyenne finale (programmes/paramètres) | -98% /
81% | -10% /
-8% | -19% /
-11% | -66% /
-68% | -12% /
9% |
* ... Moindre est la valeur, meilleures sont les performances
L'écran est bien calibré dès sa sortie de l'emballage, avec des valeurs moyennes de deltaE en niveaux de gris et en couleurs de seulement 2,5 et 1,63, respectivement. Tenter de calibrer davantage l'écran avec notre colorimètre X-Rite n'apporterait que des gains très mineurs et un calibrage par l'utilisateur final n'est donc pas nécessaire.

Temps de réponse de l'écran
| ↔ Temps de réponse noir à blanc | ||
|---|---|---|
| 10.3 ms ... hausse ↗ et chute ↘ combinées | ↗ 5.4 ms hausse |  |
| ↘ 4.9 ms chute | ||
| L'écran montre de bons temps de réponse, mais insuffisant pour du jeu compétitif. En comparaison, tous les appareils testés affichent entre 0.1 (minimum) et 240 (maximum) ms. » 28 % des appareils testés affichent de meilleures performances. Cela signifie que les latences relevées sont meilleures que la moyenne (19.8 ms) de tous les appareils testés. | ||
| ↔ Temps de réponse gris 50% à gris 80% | ||
| 5.1 ms ... hausse ↗ et chute ↘ combinées | ↗ 2.4 ms hausse | 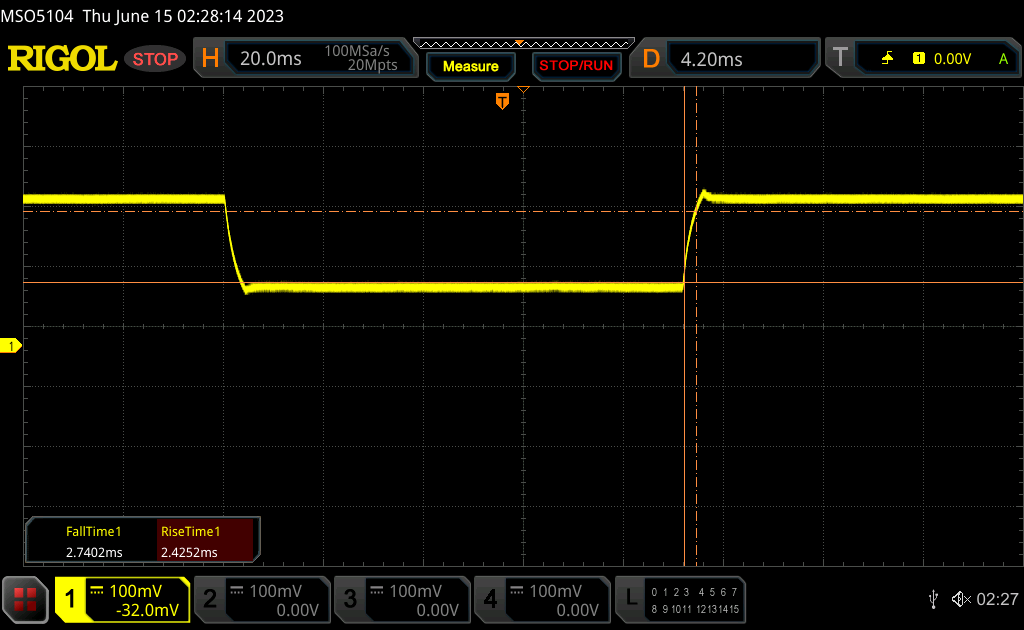 |
| ↘ 2.7 ms chute | ||
| L'écran montre de très faibles temps de réponse, parfait pour le jeu. En comparaison, tous les appareils testés affichent entre 0.165 (minimum) et 636 (maximum) ms. » 17 % des appareils testés affichent de meilleures performances. Cela signifie que les latences relevées sont meilleures que la moyenne (31 ms) de tous les appareils testés. | ||
Scintillement / MLI (Modulation de largeur d'impulsion)
| Scintillement / MLI (Modulation de largeur d'impulsion) non décelé | 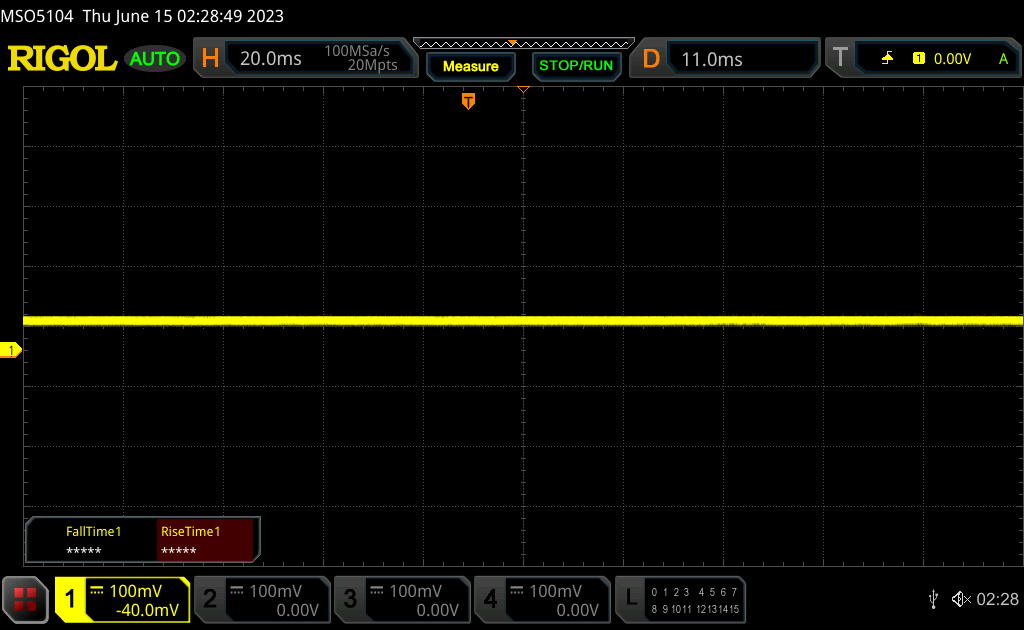 | ||
En comparaison, 52 % des appareils testés n'emploient pas MDI pour assombrir leur écran. Nous avons relevé une moyenne à 7754 (minimum : 5 - maximum : 343500) Hz dans le cas où une MDI était active. | |||
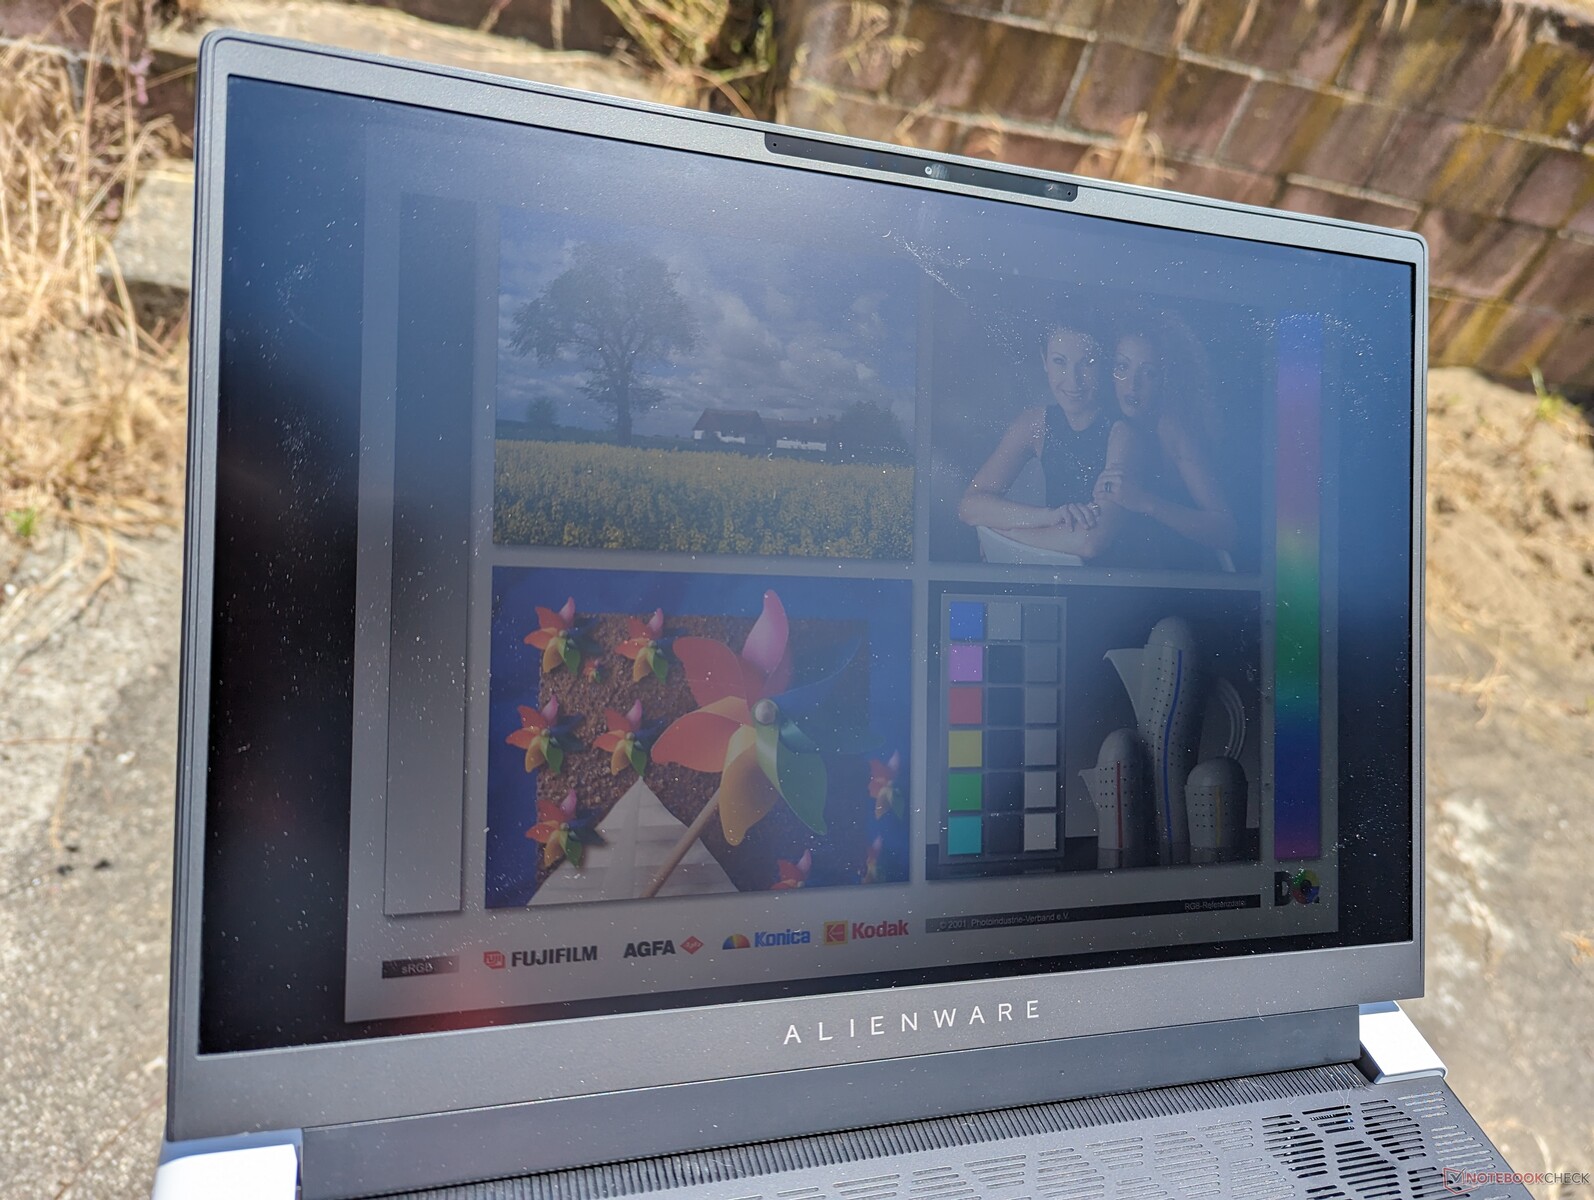
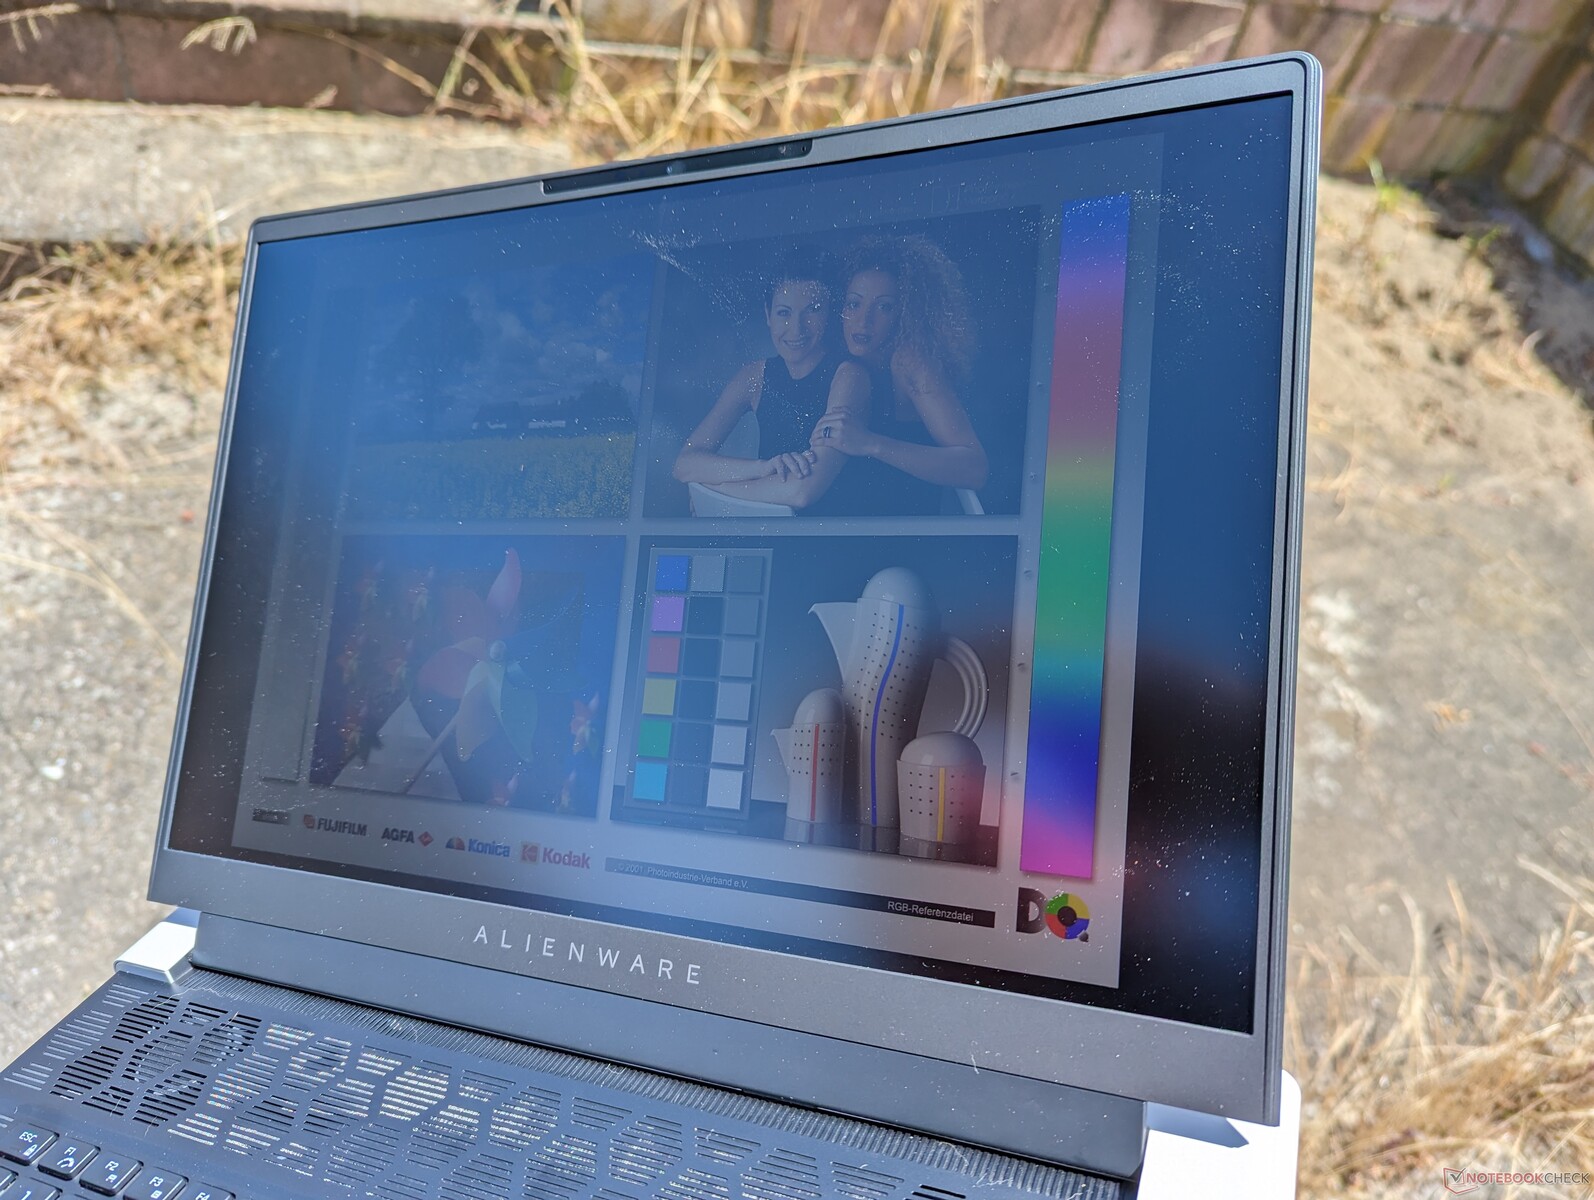
La visibilité en extérieur n'est pas aussi bonne que sur d'autres ordinateurs portables de jeu de 16 pouces comme leZephyrus M16blade 16 ou Legion Pro 7 16, car l'écran de l'Alienware est nettement moins lumineux. Combiné à un encombrement relativement important, l'Alienware x16 R1 n'est pas un ordinateur portable adapté à l'extérieur malgré son châssis fin.
Performances - Un processeur puissant, un processeur graphique impressionnant
Conditions d'essai
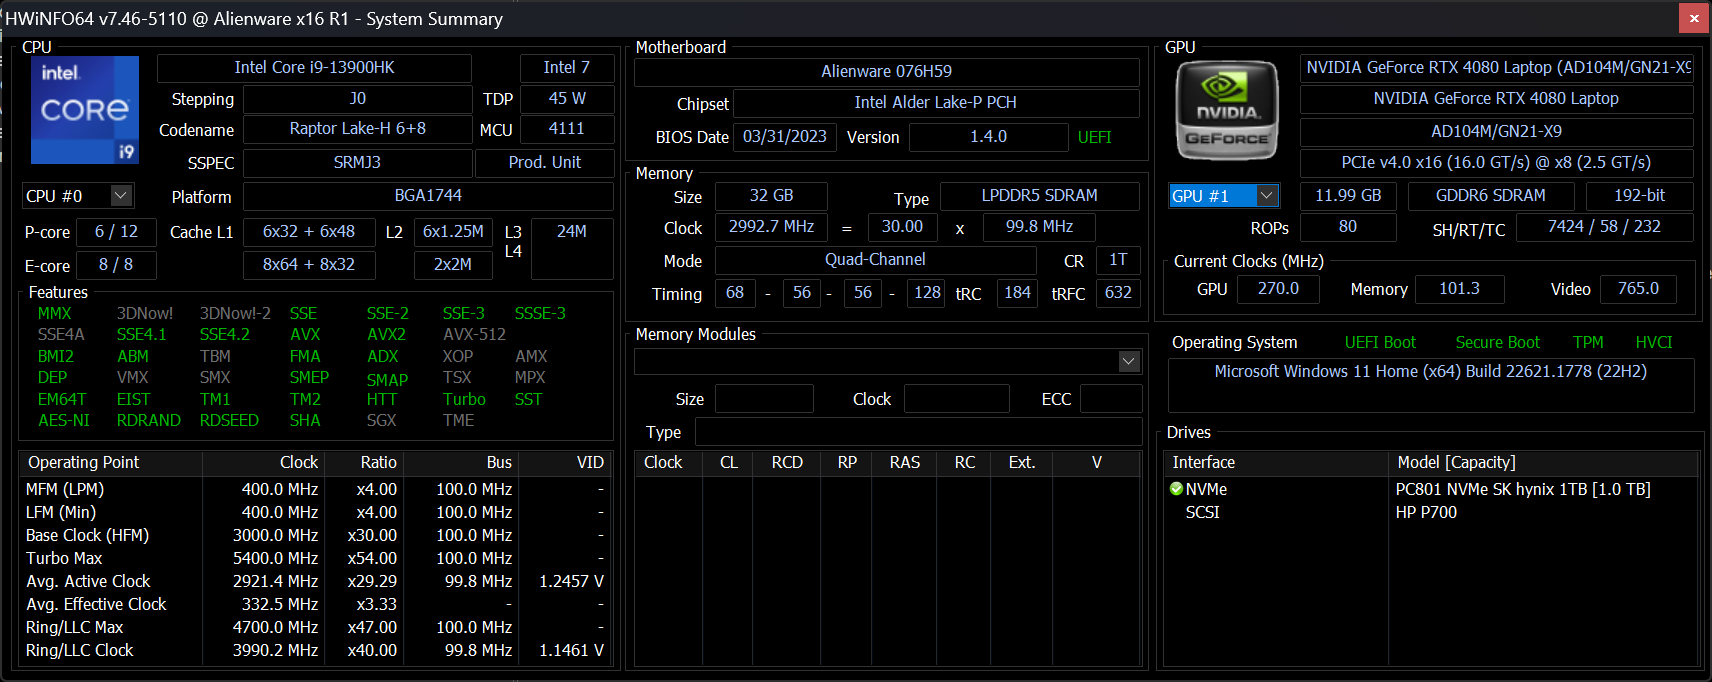
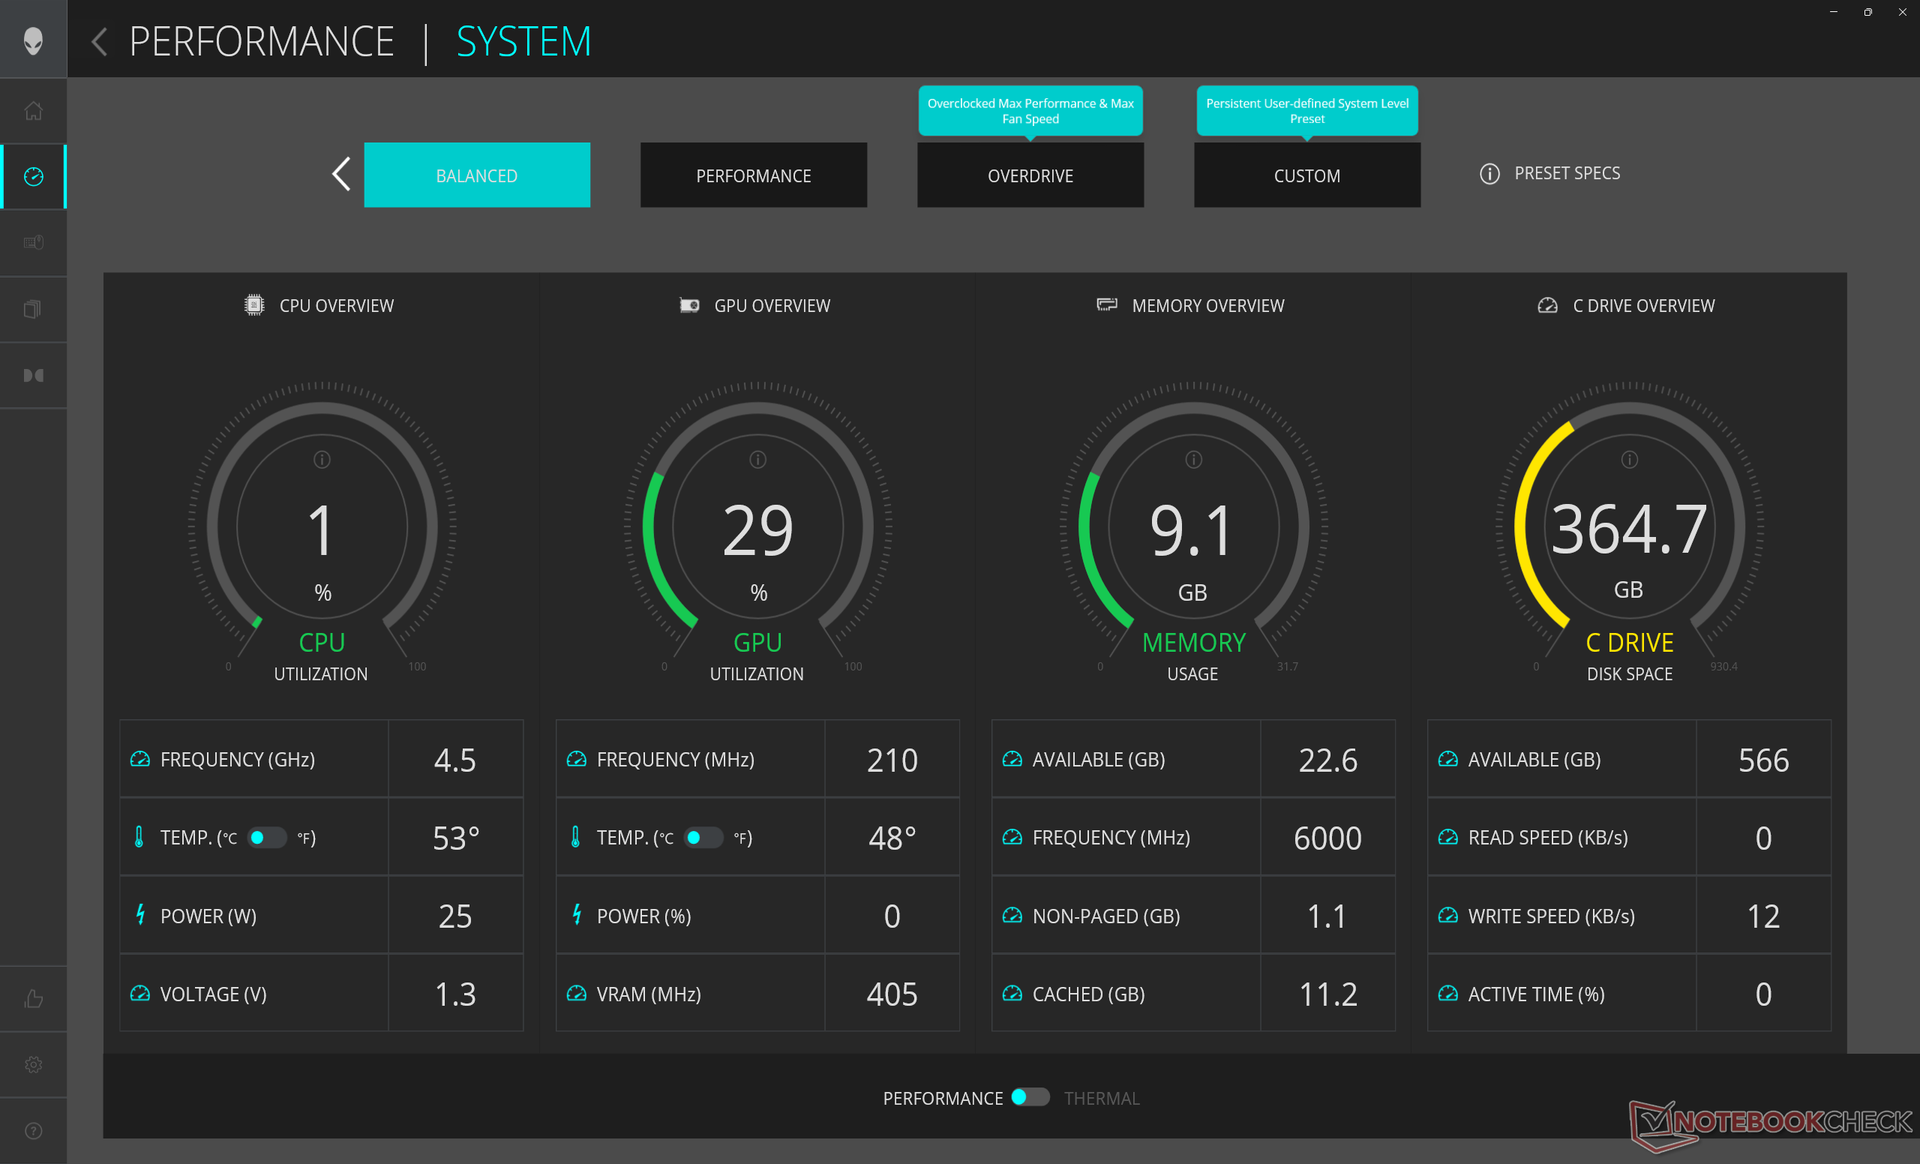
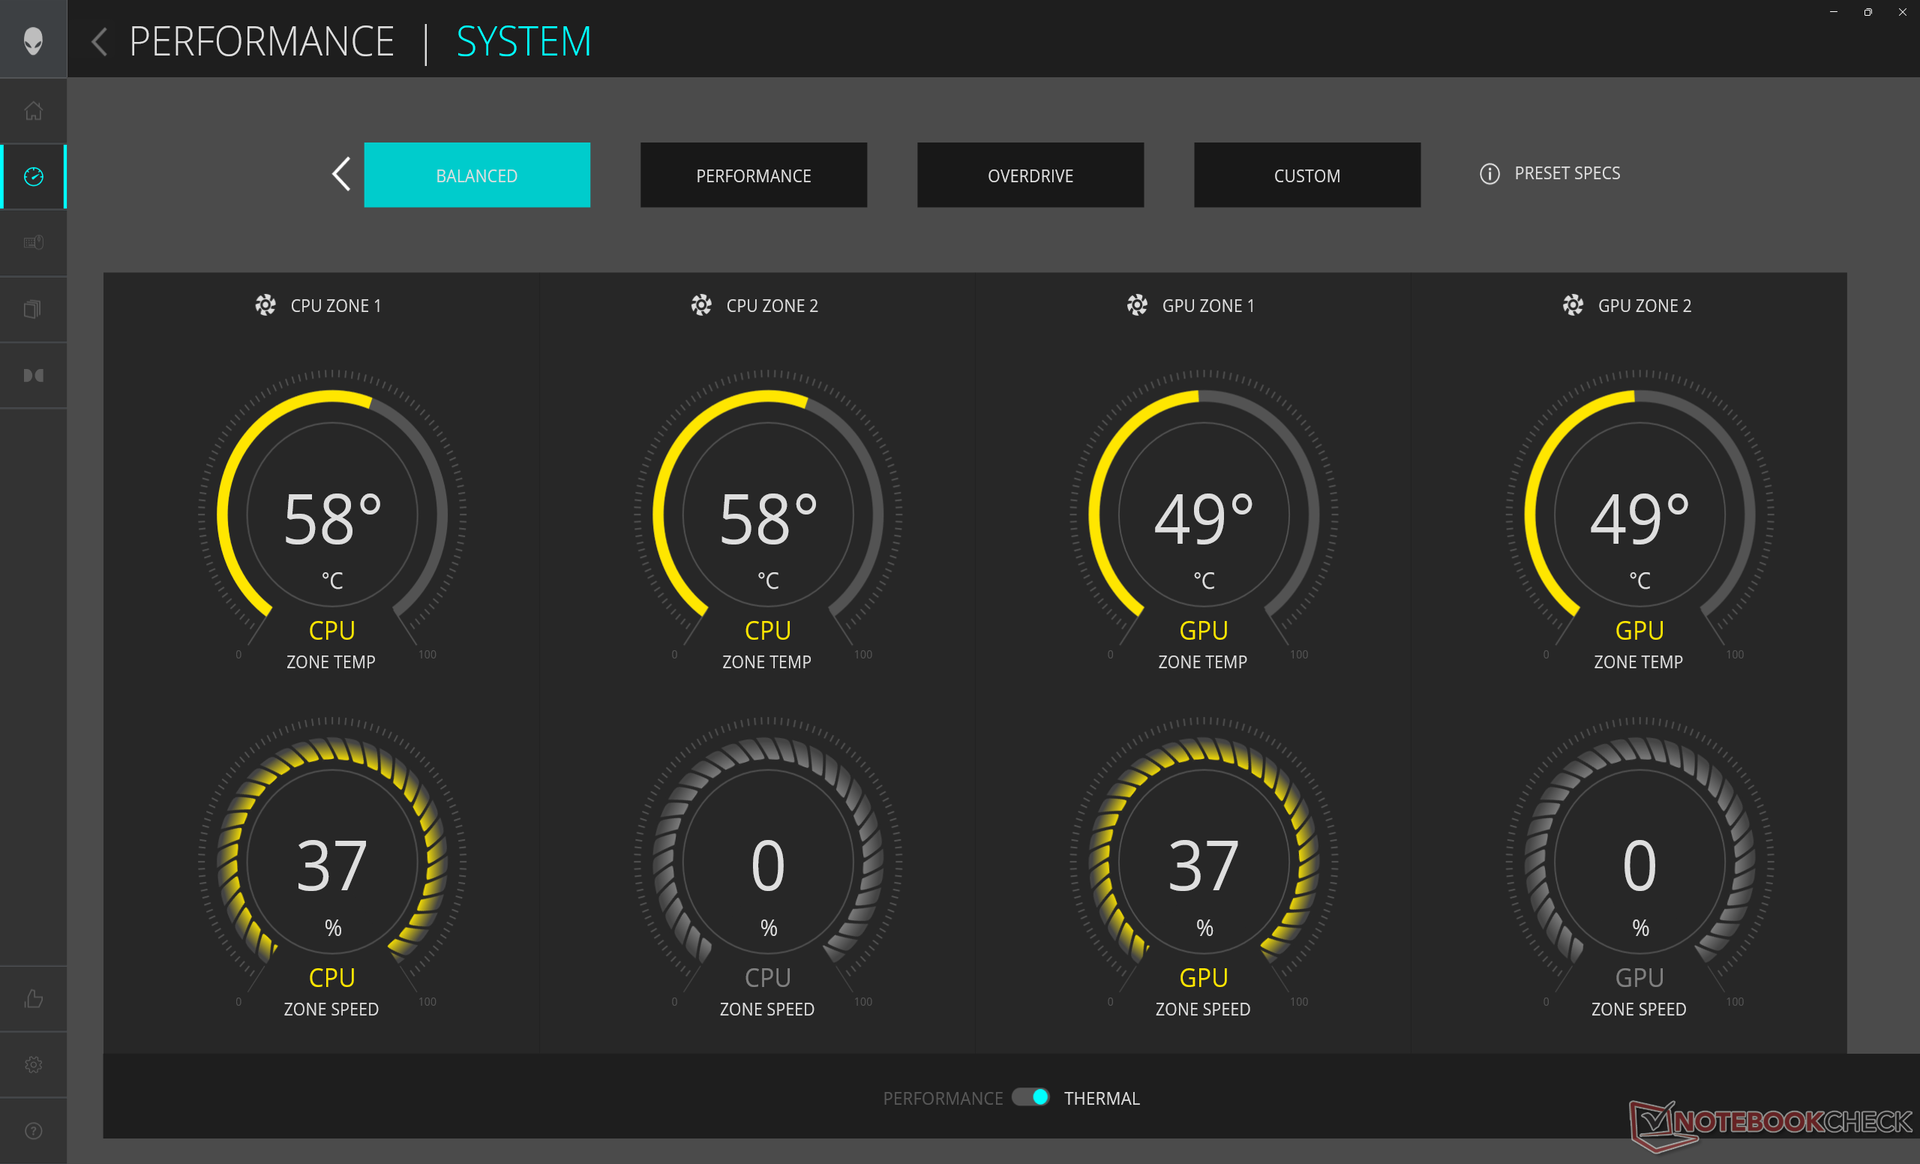
Nous avons réglé notre unité en mode Overdrive via Alienware Command Center (ACC) et en mode Haute performance via Windows avant d'effectuer les tests ci-dessous. Nous avons également veillé à régler les graphiques en mode dGPU uniquement, par opposition au mode Optimus, via le panneau de configuration Nvidia. Malheureusement, les profils d'alimentation de l'ACC ne sont pas synchronisés avec Windows et il est donc possible d'avoir des profils contradictoires (par exemple, l'un en mode économie d'énergie et l'autre en mode performance).
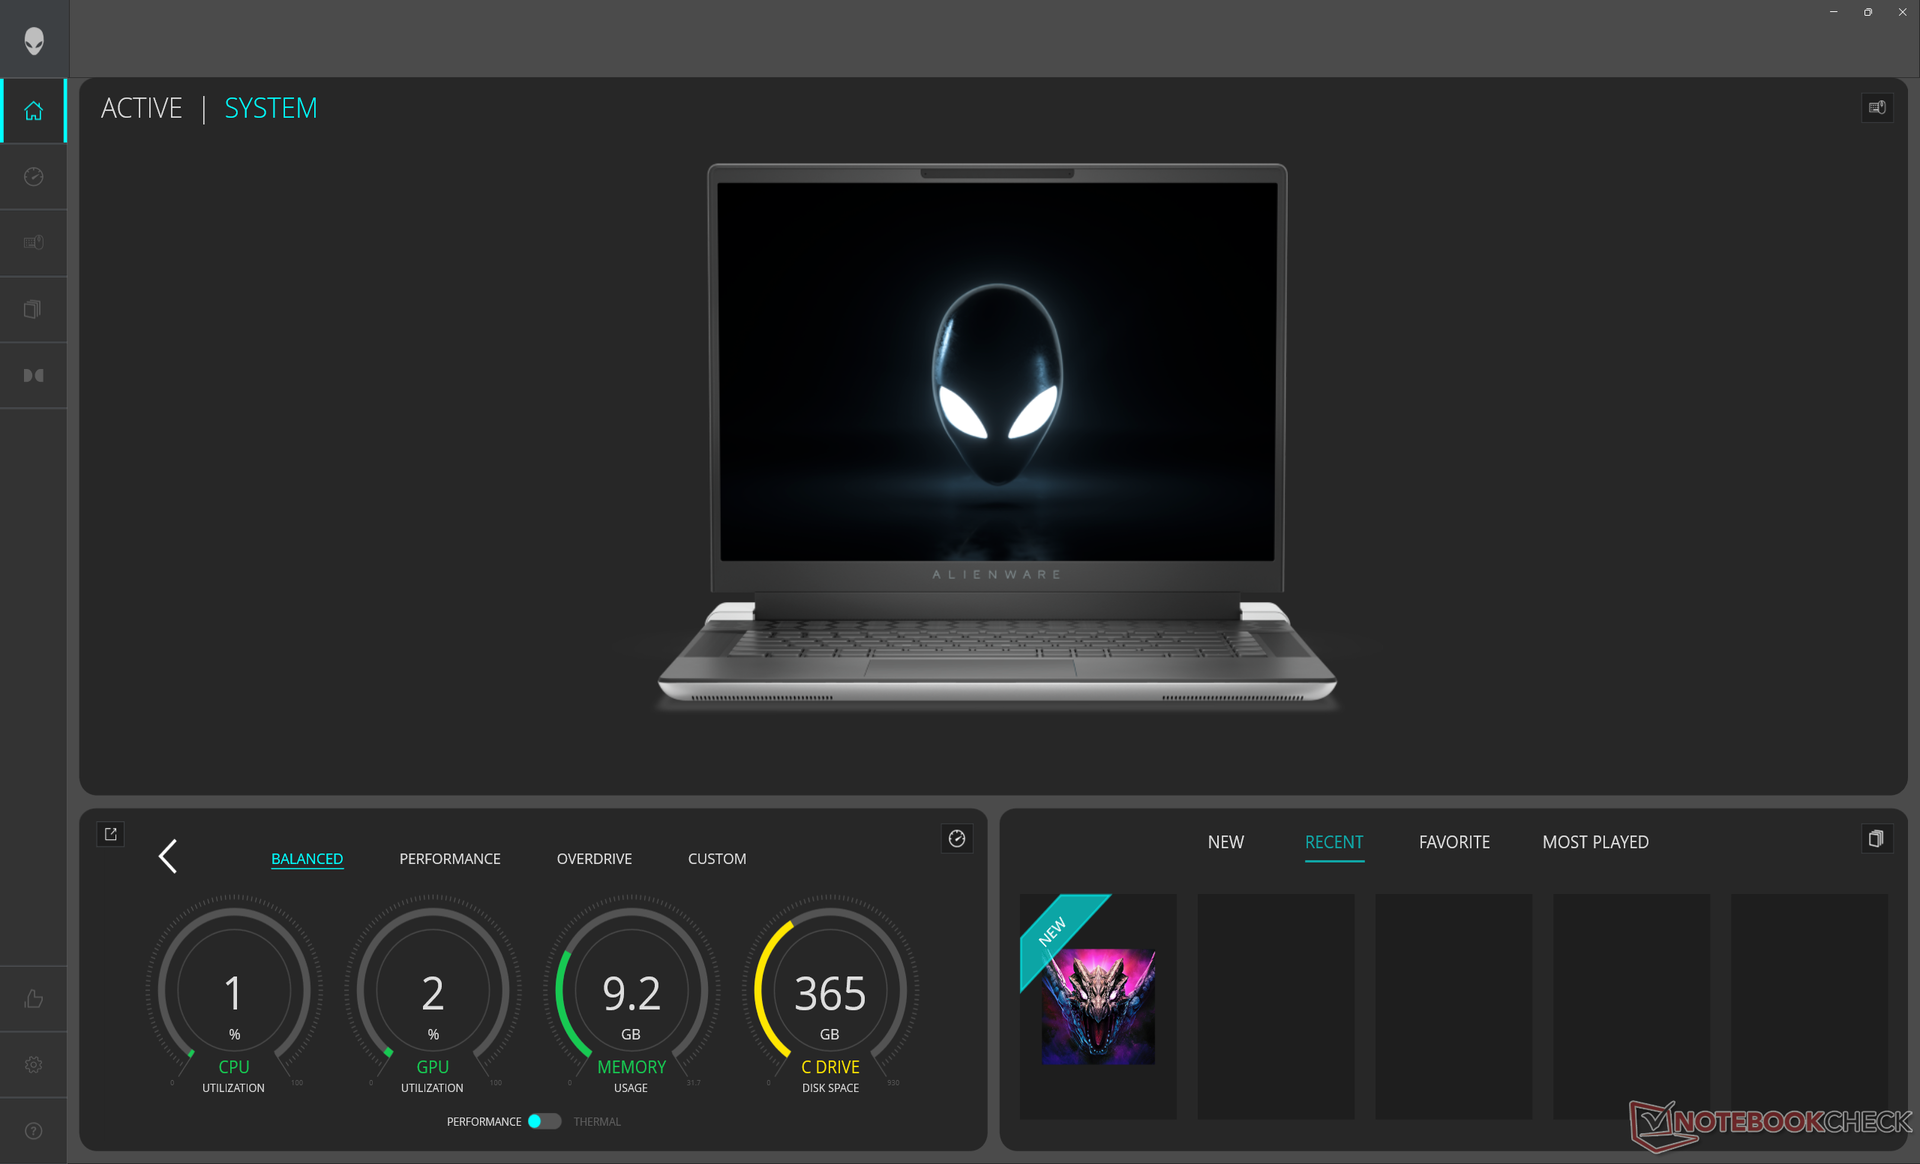
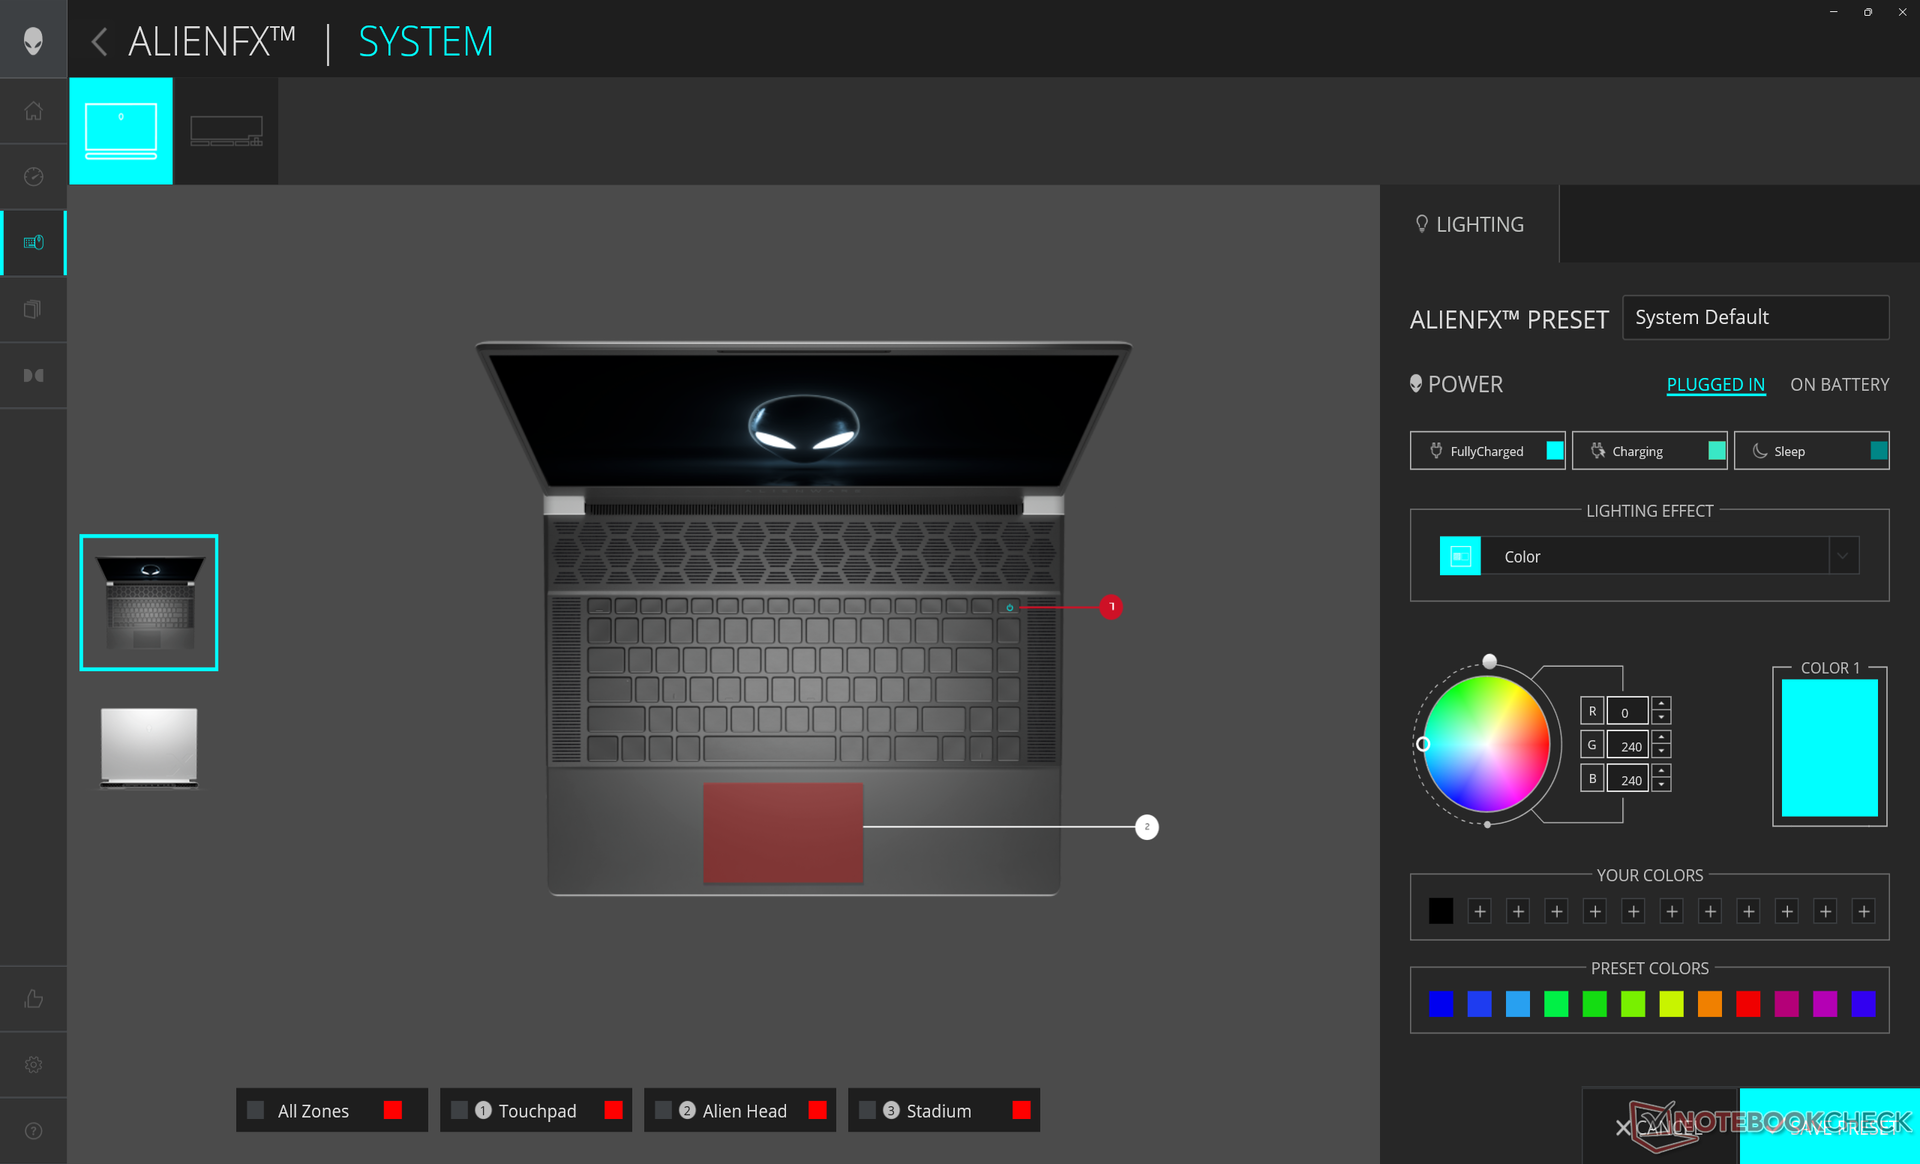
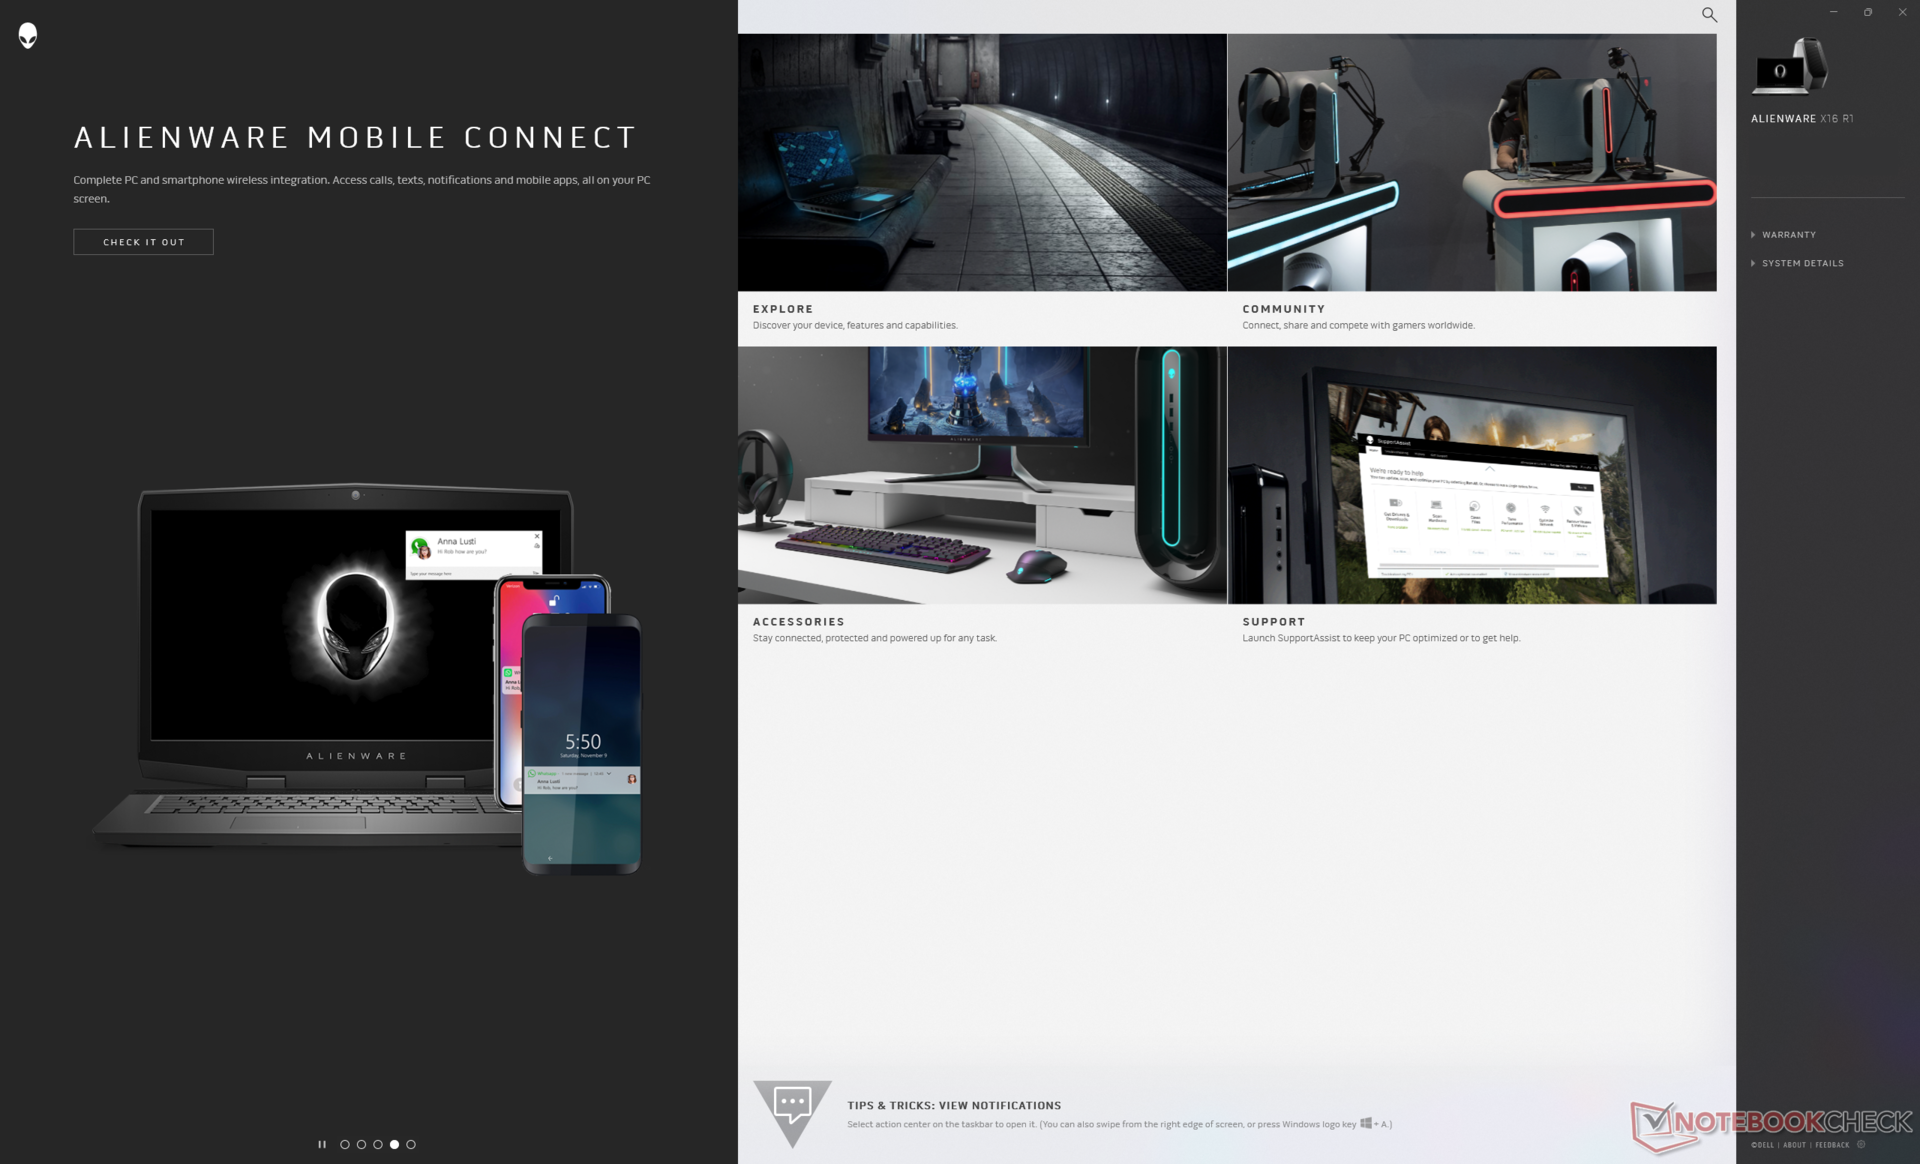
Il ne faut pas confondre ACC et My Alienware. Le premier est un centre de contrôle pour les données vitales du système, les paramètres RGB, les profils d'alimentation et les paramètres de jeu, tandis que le second est un nexus pour le support Dell, la connexion mobile et les accessoires en option.
La fonction Advanced Optimus ou MUX est prise en charge sur tous les modèles. Gardez à l'esprit que G-Sync est actif pour le moniteur interne s'il est configuré en mode dGPU uniquement.
Processeur
Il est important de noter que le modèle atteint son maximum avec le processeur Core i9-13900HK et non au Core i9-13900HX ce dernier pouvant offrir des performances multithread 50 à 60 % plus rapides. Les performances globales de notre Core i7-13900HK sont donc presque identiques à celles du Core i9-13900HX, moins cher Core i9-13900H moins onéreux, et comparables à celles du modèle concurrent Ryzen 7 7745HX. Pour des performances plus rapides, les joueurs peuvent considérer l'Alienware m16 plus épais ou le Lenovo Legion Pro 7 car ils peuvent être configurés avec le Core i7-13900HX.
La rétrogradation vers le modèle moins onéreux i7-13620H ou i7-13700H devrait avoir un impact sur les performances du processeur de l'ordre de 15 à 20 %, d'après notre expérience avec leMSI Katana 17 et le Dell XPS 17 9730.
Cinebench R15 Multi Loop
Cinebench R20: CPU (Multi Core) | CPU (Single Core)
Cinebench R23: Multi Core | Single Core
Cinebench R15: CPU Multi 64Bit | CPU Single 64Bit
Blender: v2.79 BMW27 CPU
7-Zip 18.03: 7z b 4 | 7z b 4 -mmt1
Geekbench 5.5: Multi-Core | Single-Core
HWBOT x265 Benchmark v2.2: 4k Preset
LibreOffice : 20 Documents To PDF
R Benchmark 2.5: Overall mean
* ... Moindre est la valeur, meilleures sont les performances
AIDA64: FP32 Ray-Trace | FPU Julia | CPU SHA3 | CPU Queen | FPU SinJulia | FPU Mandel | CPU AES | CPU ZLib | FP64 Ray-Trace | CPU PhotoWorxx
| Performance rating | |
| Lenovo Legion Pro 7 RTX4090 | |
| Razer Blade 16 Early 2023 | |
| Asus ROG Zephyrus M16 GU604VY-NM042X | |
| Alienware x16 R1 | |
| Alienware m17 R5 (R9 6900HX, RX 6850M XT) | |
| Dell G16 7620 | |
| Moyenne Intel Core i9-13900HK | |
| AIDA64 / CPU Queen | |
| Lenovo Legion Pro 7 RTX4090 | |
| Razer Blade 16 Early 2023 | |
| Razer Blade 16 Early 2023 | |
| Asus ROG Zephyrus M16 GU604VY-NM042X | |
| Alienware x16 R1 | |
| Alienware m17 R5 (R9 6900HX, RX 6850M XT) | |
| Dell G16 7620 | |
| Moyenne Intel Core i9-13900HK (75615 - 118166, n=4) | |
Performance du système
CrossMark: Overall | Productivity | Creativity | Responsiveness
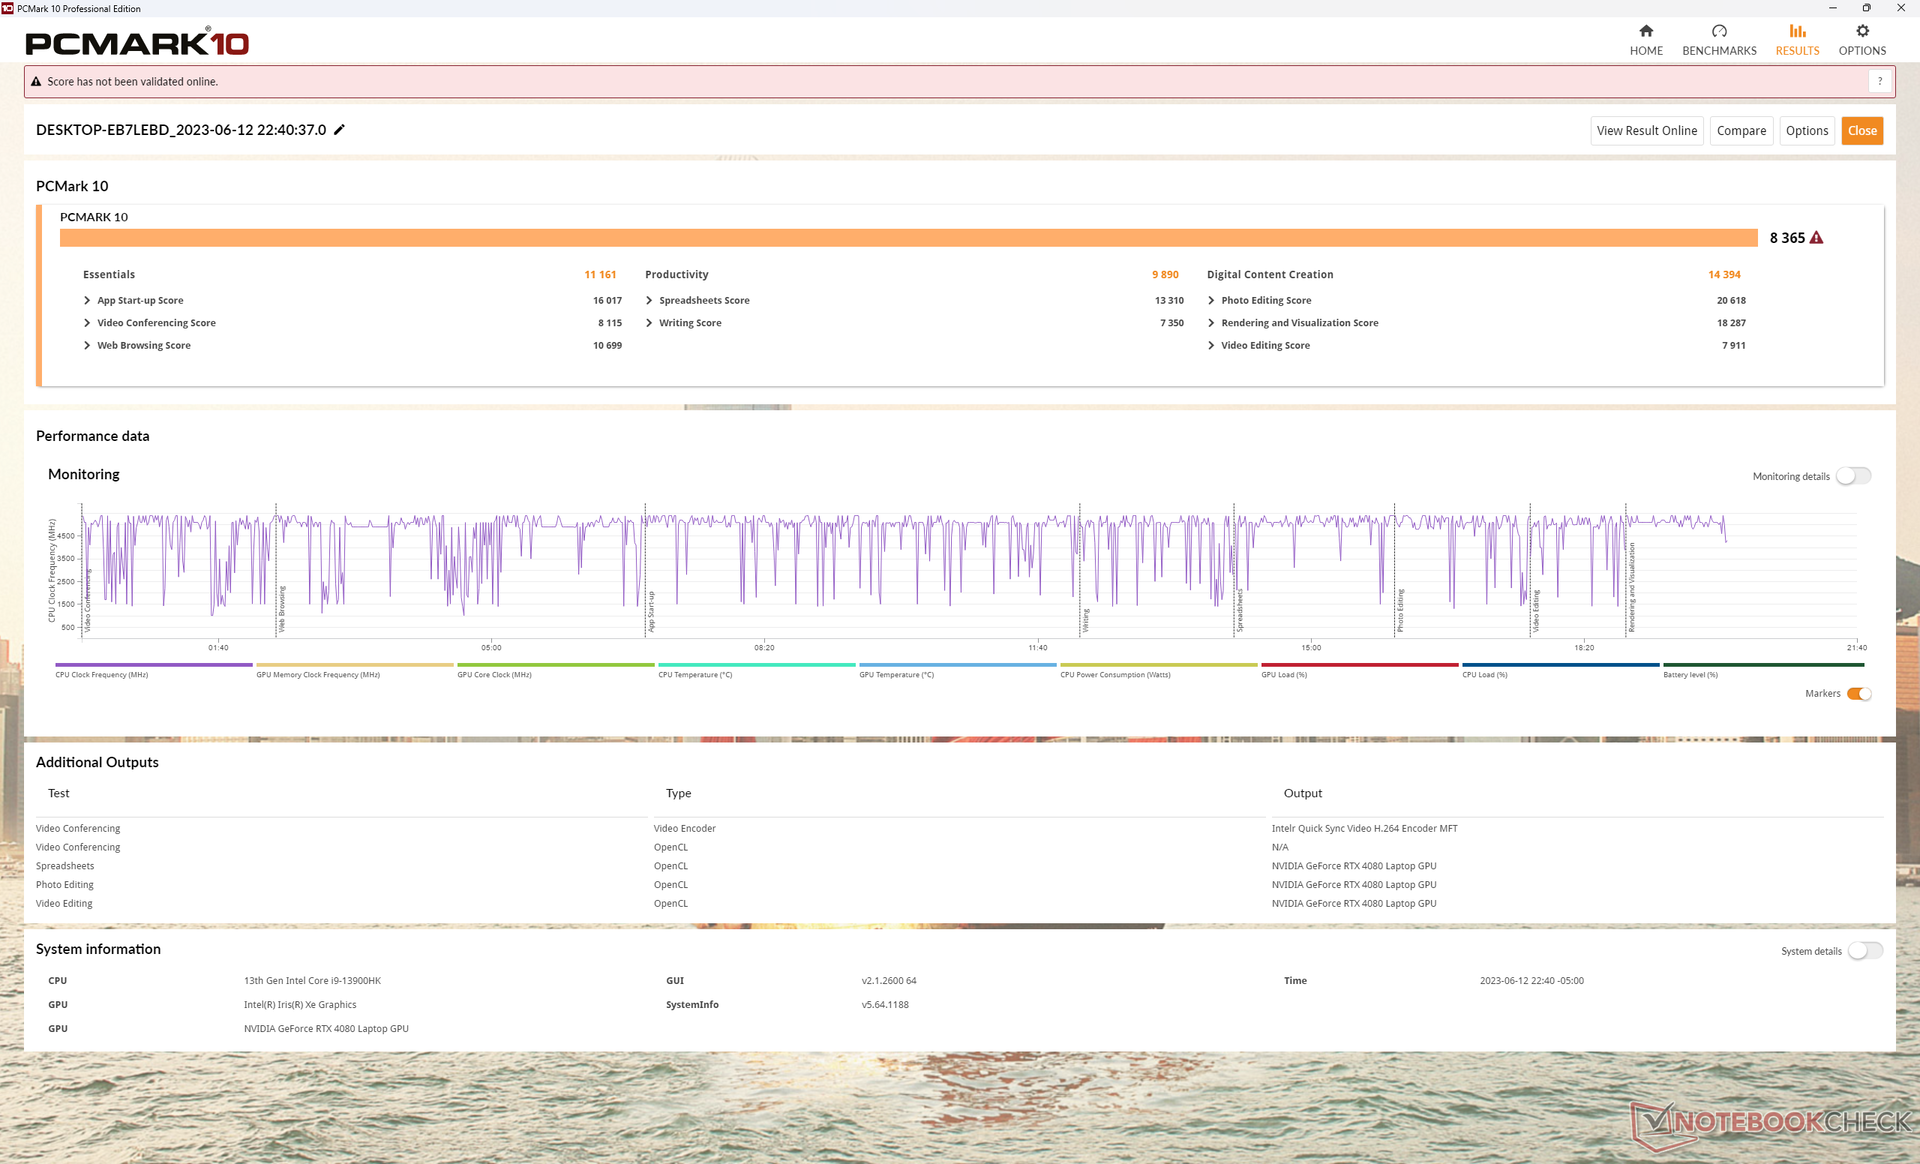
| PCMark 10 / Score | |
| Alienware x16 R1 | |
| Moyenne Intel Core i9-13900HK, NVIDIA GeForce RTX 4080 Laptop GPU (n=1) | |
| Asus ROG Zephyrus M16 GU604VY-NM042X | |
| Lenovo Legion Pro 7 RTX4090 | |
| Razer Blade 16 Early 2023 | |
| Alienware m17 R5 (R9 6900HX, RX 6850M XT) | |
| Dell G16 7620 | |
| PCMark 10 / Essentials | |
| Asus ROG Zephyrus M16 GU604VY-NM042X | |
| Alienware x16 R1 | |
| Moyenne Intel Core i9-13900HK, NVIDIA GeForce RTX 4080 Laptop GPU (n=1) | |
| Lenovo Legion Pro 7 RTX4090 | |
| Razer Blade 16 Early 2023 | |
| Dell G16 7620 | |
| Alienware m17 R5 (R9 6900HX, RX 6850M XT) | |
| PCMark 10 / Productivity | |
| Asus ROG Zephyrus M16 GU604VY-NM042X | |
| Alienware x16 R1 | |
| Moyenne Intel Core i9-13900HK, NVIDIA GeForce RTX 4080 Laptop GPU (n=1) | |
| Alienware m17 R5 (R9 6900HX, RX 6850M XT) | |
| Lenovo Legion Pro 7 RTX4090 | |
| Dell G16 7620 | |
| Razer Blade 16 Early 2023 | |
| PCMark 10 / Digital Content Creation | |
| Lenovo Legion Pro 7 RTX4090 | |
| Razer Blade 16 Early 2023 | |
| Alienware x16 R1 | |
| Moyenne Intel Core i9-13900HK, NVIDIA GeForce RTX 4080 Laptop GPU (n=1) | |
| Asus ROG Zephyrus M16 GU604VY-NM042X | |
| Alienware m17 R5 (R9 6900HX, RX 6850M XT) | |
| Dell G16 7620 | |
| CrossMark / Overall | |
| Asus ROG Zephyrus M16 GU604VY-NM042X | |
| Alienware x16 R1 | |
| Moyenne Intel Core i9-13900HK, NVIDIA GeForce RTX 4080 Laptop GPU (n=1) | |
| Dell G16 7620 | |
| Alienware m17 R5 (R9 6900HX, RX 6850M XT) | |
| Razer Blade 16 Early 2023 | |
| CrossMark / Productivity | |
| Asus ROG Zephyrus M16 GU604VY-NM042X | |
| Alienware x16 R1 | |
| Moyenne Intel Core i9-13900HK, NVIDIA GeForce RTX 4080 Laptop GPU (n=1) | |
| Dell G16 7620 | |
| Alienware m17 R5 (R9 6900HX, RX 6850M XT) | |
| Razer Blade 16 Early 2023 | |
| CrossMark / Creativity | |
| Asus ROG Zephyrus M16 GU604VY-NM042X | |
| Alienware x16 R1 | |
| Moyenne Intel Core i9-13900HK, NVIDIA GeForce RTX 4080 Laptop GPU (n=1) | |
| Dell G16 7620 | |
| Razer Blade 16 Early 2023 | |
| Alienware m17 R5 (R9 6900HX, RX 6850M XT) | |
| CrossMark / Responsiveness | |
| Alienware x16 R1 | |
| Moyenne Intel Core i9-13900HK, NVIDIA GeForce RTX 4080 Laptop GPU (n=1) | |
| Asus ROG Zephyrus M16 GU604VY-NM042X | |
| Dell G16 7620 | |
| Razer Blade 16 Early 2023 | |
| Alienware m17 R5 (R9 6900HX, RX 6850M XT) | |
| PCMark 10 Score | 8365 points | |
Aide | ||
| AIDA64 / Memory Latency | |
| Alienware x16 R1 | |
| Dell G16 7620 | |
| Razer Blade 16 Early 2023 | |
| Razer Blade 16 Early 2023 | |
| Razer Blade 16 Early 2023 | |
| Moyenne Intel Core i9-13900HK (83 - 115.3, n=4) | |
| Alienware m17 R5 (R9 6900HX, RX 6850M XT) | |
| Asus ROG Zephyrus M16 GU604VY-NM042X | |
| Lenovo Legion Pro 7 RTX4090 | |
* ... Moindre est la valeur, meilleures sont les performances
Latence DPC
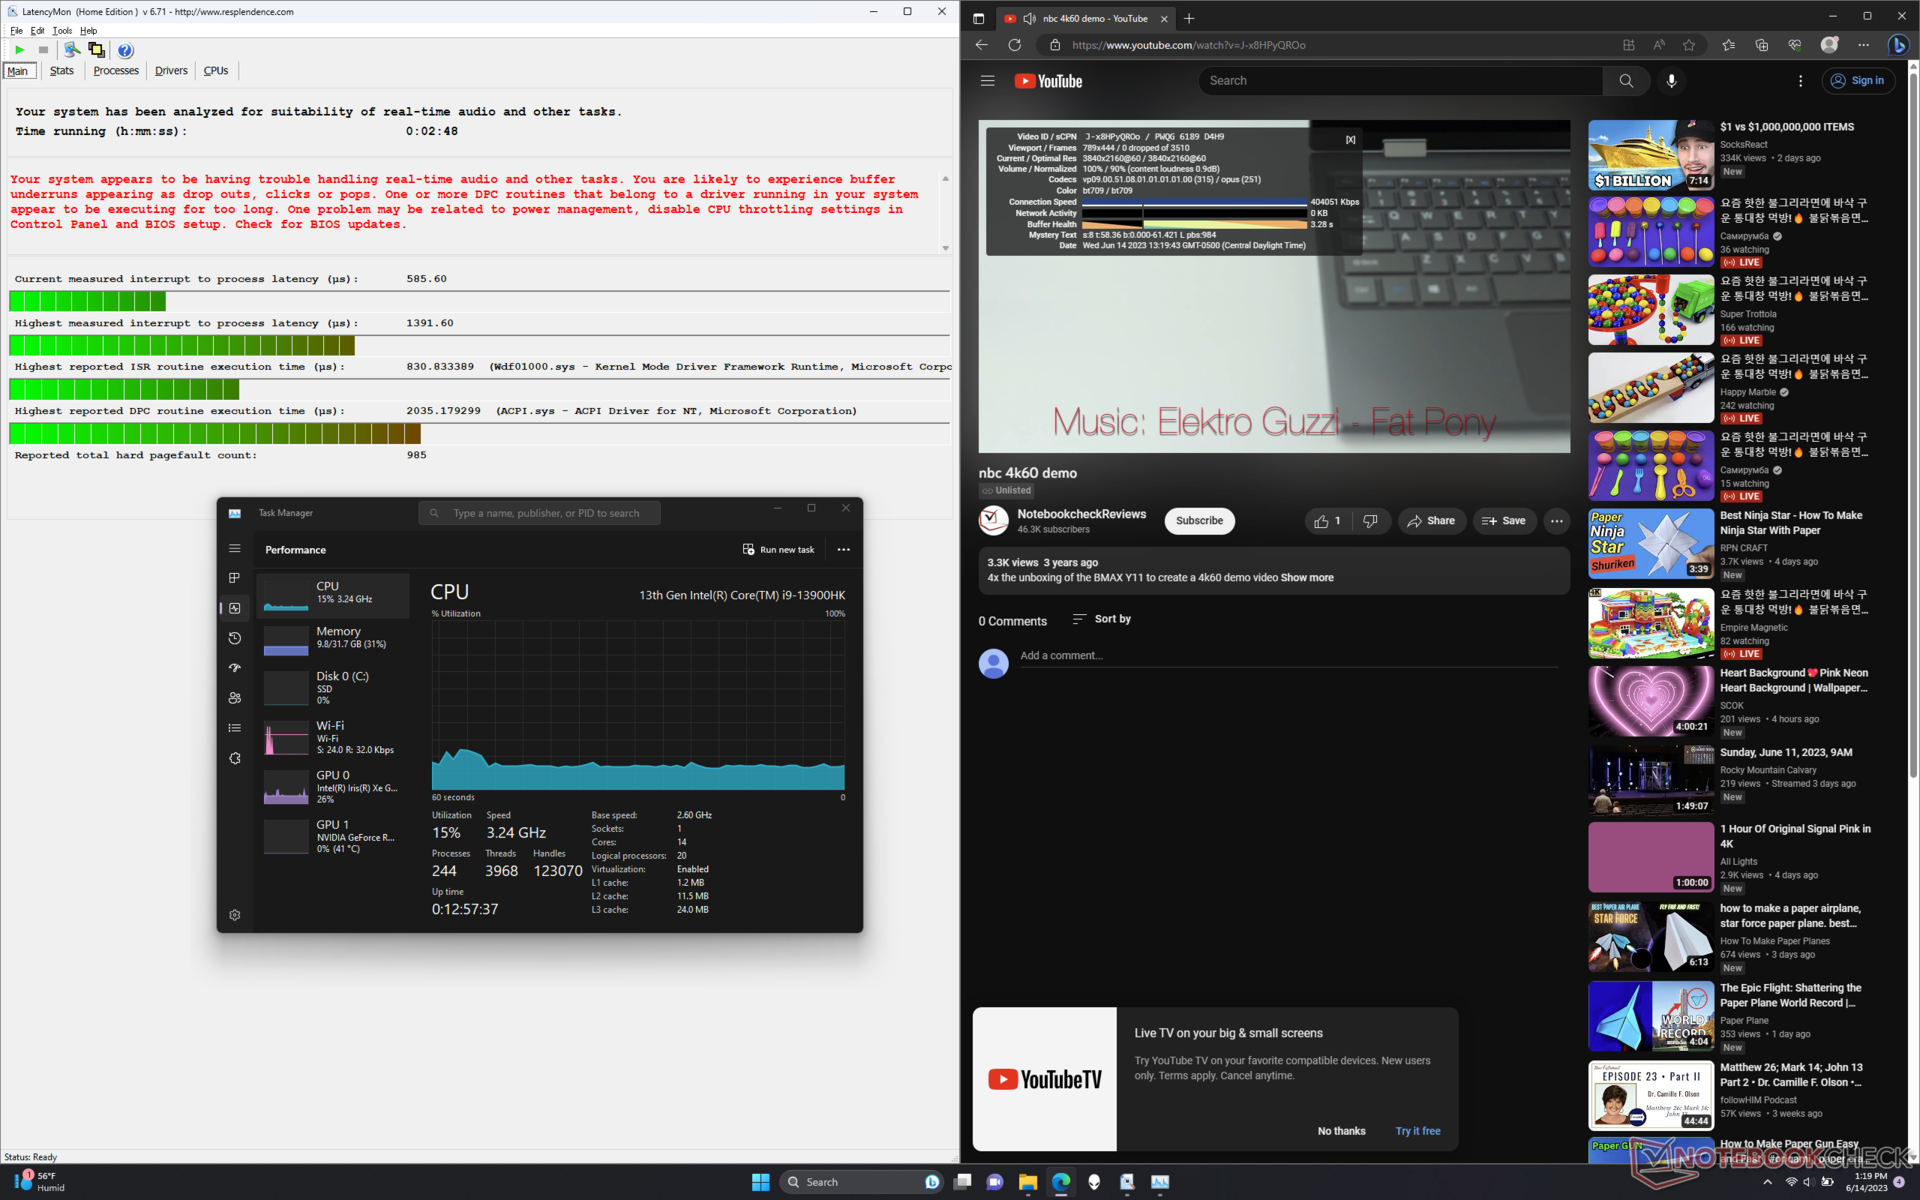
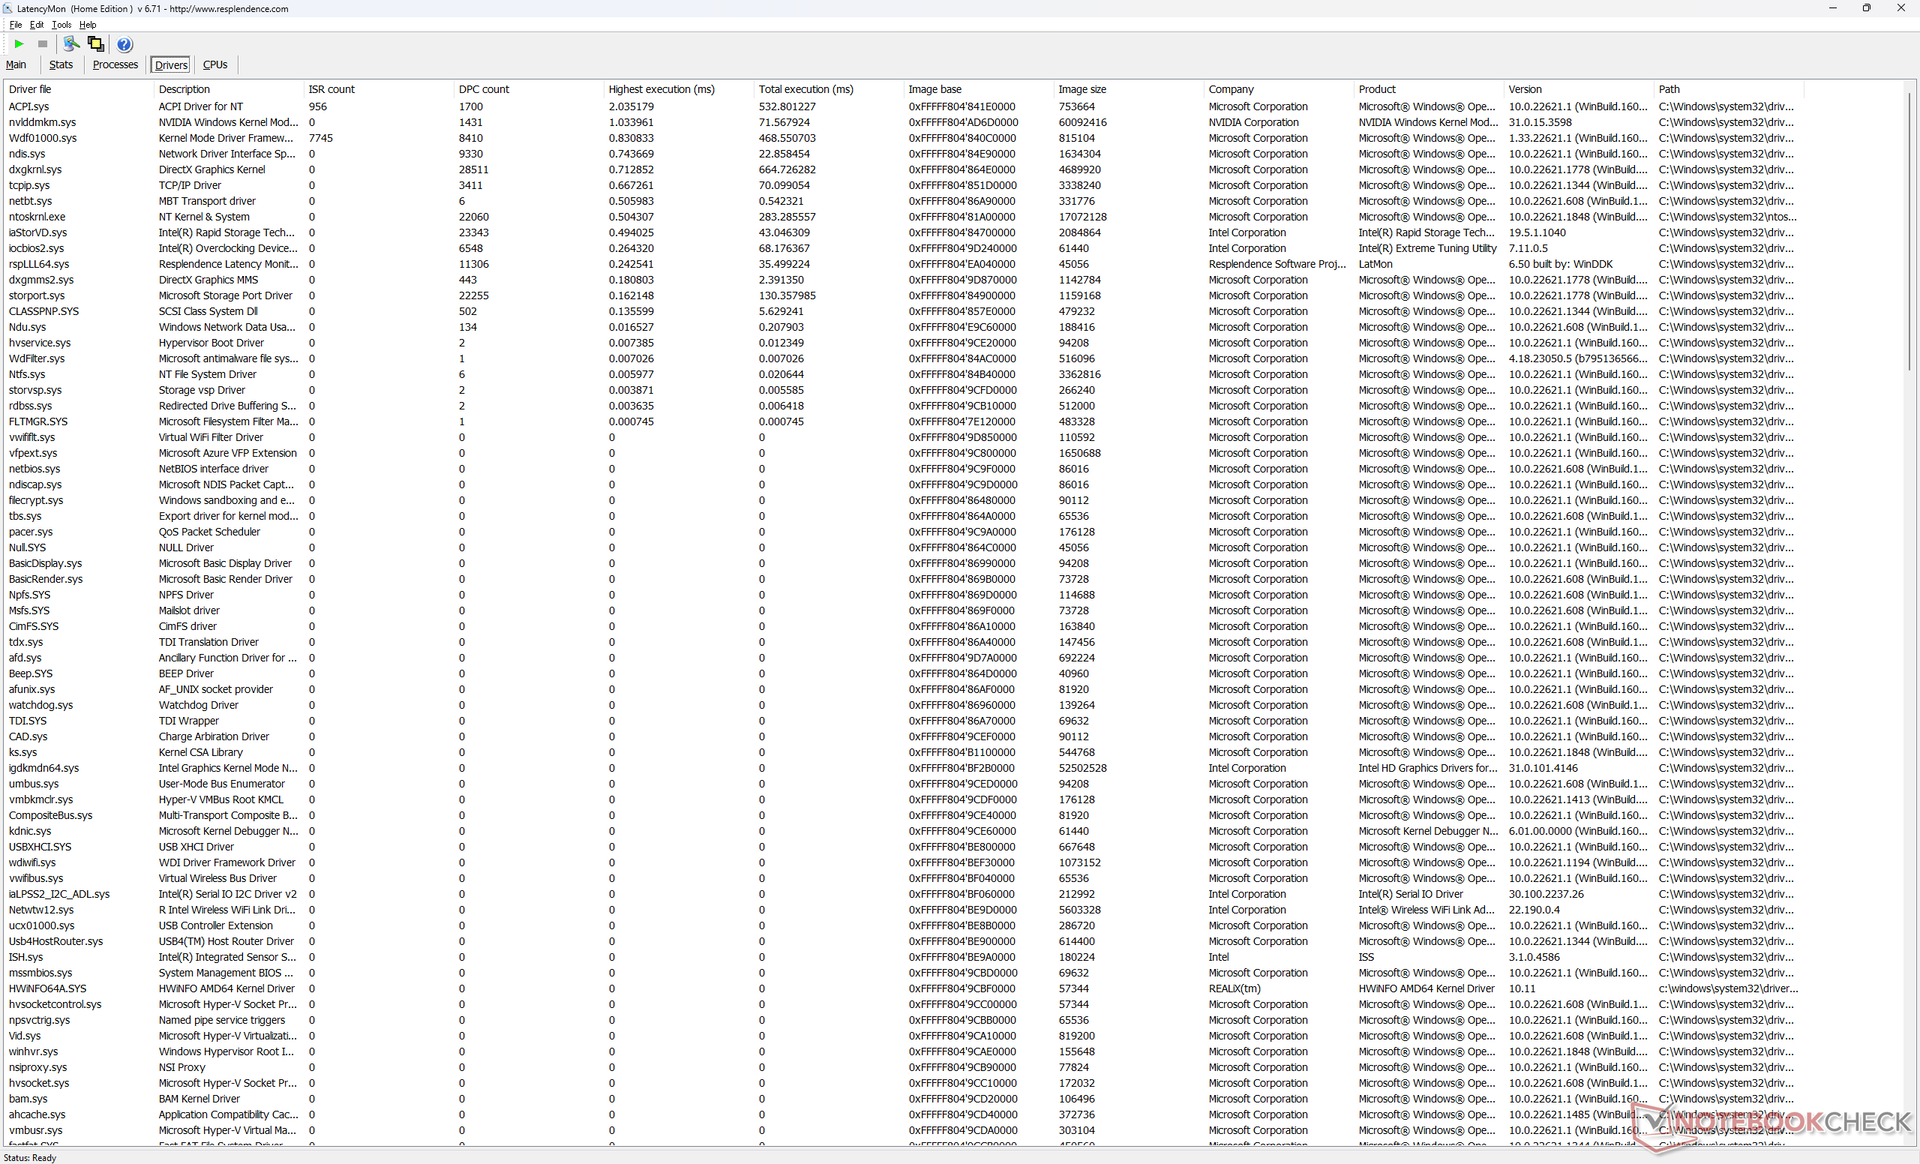
LatencyMon révèle des problèmes de DPC lors de l'ouverture de plusieurs onglets de notre page d'accueil. la lecture de vidéos 4K à 60 FPS est par ailleurs parfaite, sans aucune perte d'images.
| DPC Latencies / LatencyMon - interrupt to process latency (max), Web, Youtube, Prime95 | |
| Lenovo Legion Pro 7 RTX4090 | |
| Asus ROG Zephyrus M16 GU604VY-NM042X | |
| Razer Blade 16 Early 2023 | |
| Alienware x16 R1 | |
| Alienware m17 R5 (R9 6900HX, RX 6850M XT) | |
| Dell G16 7620 | |
* ... Moindre est la valeur, meilleures sont les performances
Dispositifs de stockage
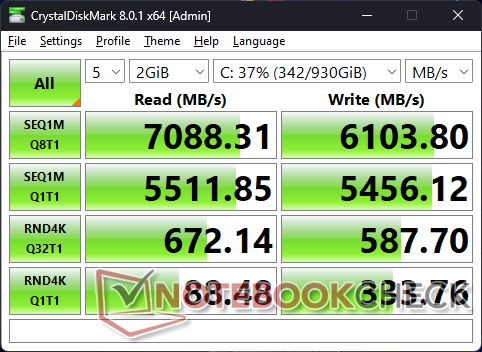
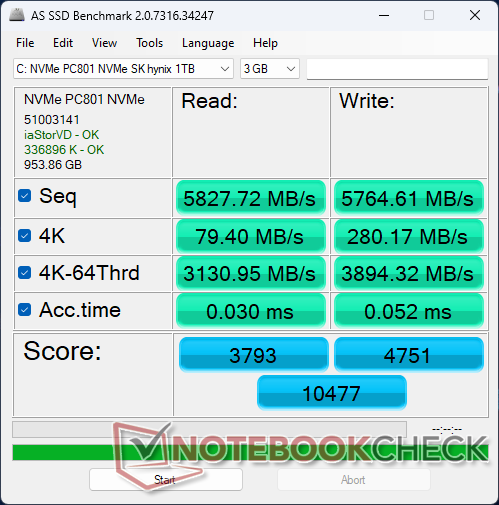
La carte PCIe4 x4 SK Hynix PC801 de notre unité peut atteindre des taux de lecture allant jusqu'à 7100 Mo/s, ce qui le rend comparable au populaire Samsung PM9A1. Malheureusement, le disque a du mal à maintenir son taux de transfert maximal pendant de longues périodes, probablement en raison d'un refroidissement insuffisant. En exécutant DiskSpd en boucle, par exemple, les taux de lecture descendaient jusqu'à 3400 Mo/s après seulement quelques minutes de test de stress, comme le montre le graphique ci-dessous. Les résultats ne s'amélioraient pas après plusieurs essais.

| Drive Performance rating - Percent | |
| Alienware x16 R1 | |
| Lenovo Legion Pro 7 RTX4090 | |
| Dell G16 7620 | |
| Asus ROG Zephyrus M16 GU604VY-NM042X | |
| Razer Blade 16 Early 2023 | |
| Alienware m17 R5 (R9 6900HX, RX 6850M XT) | |
* ... Moindre est la valeur, meilleures sont les performances
Disk Throttling: DiskSpd Read Loop, Queue Depth 8
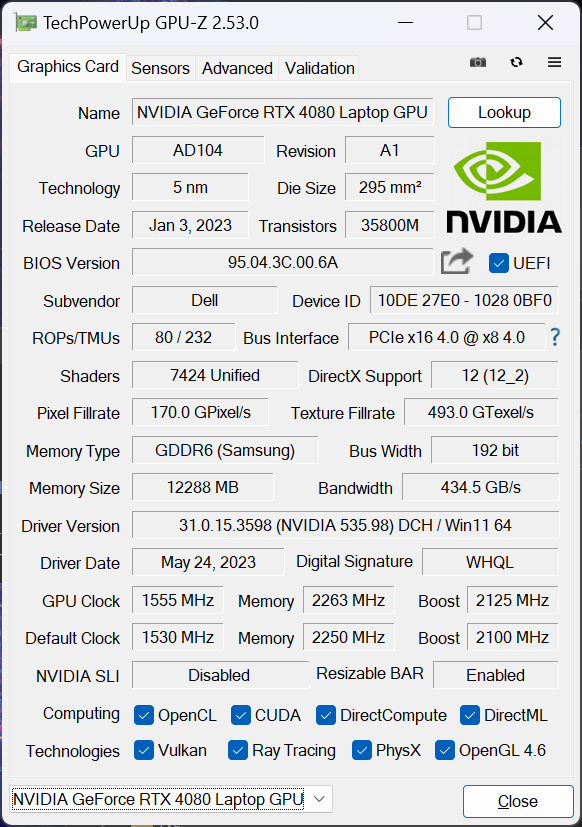
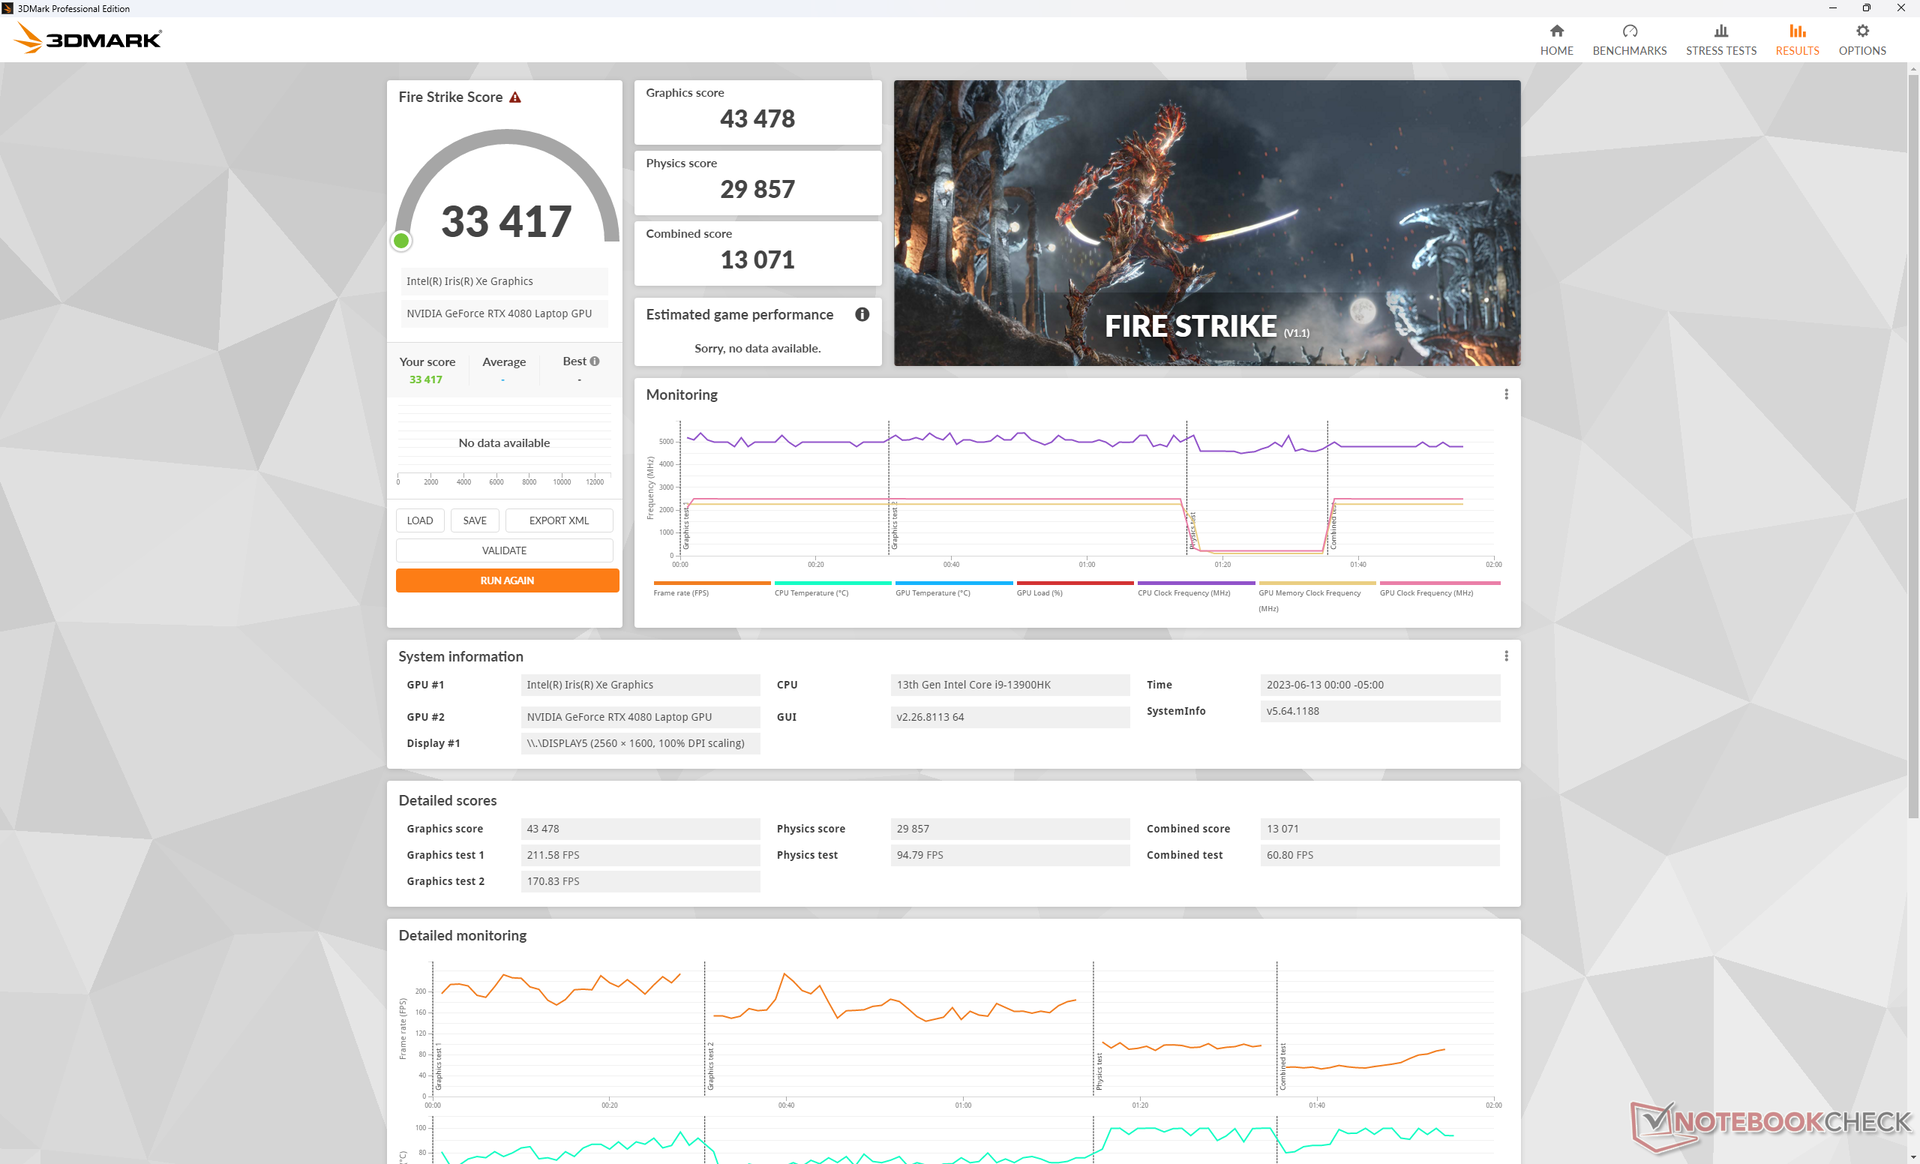
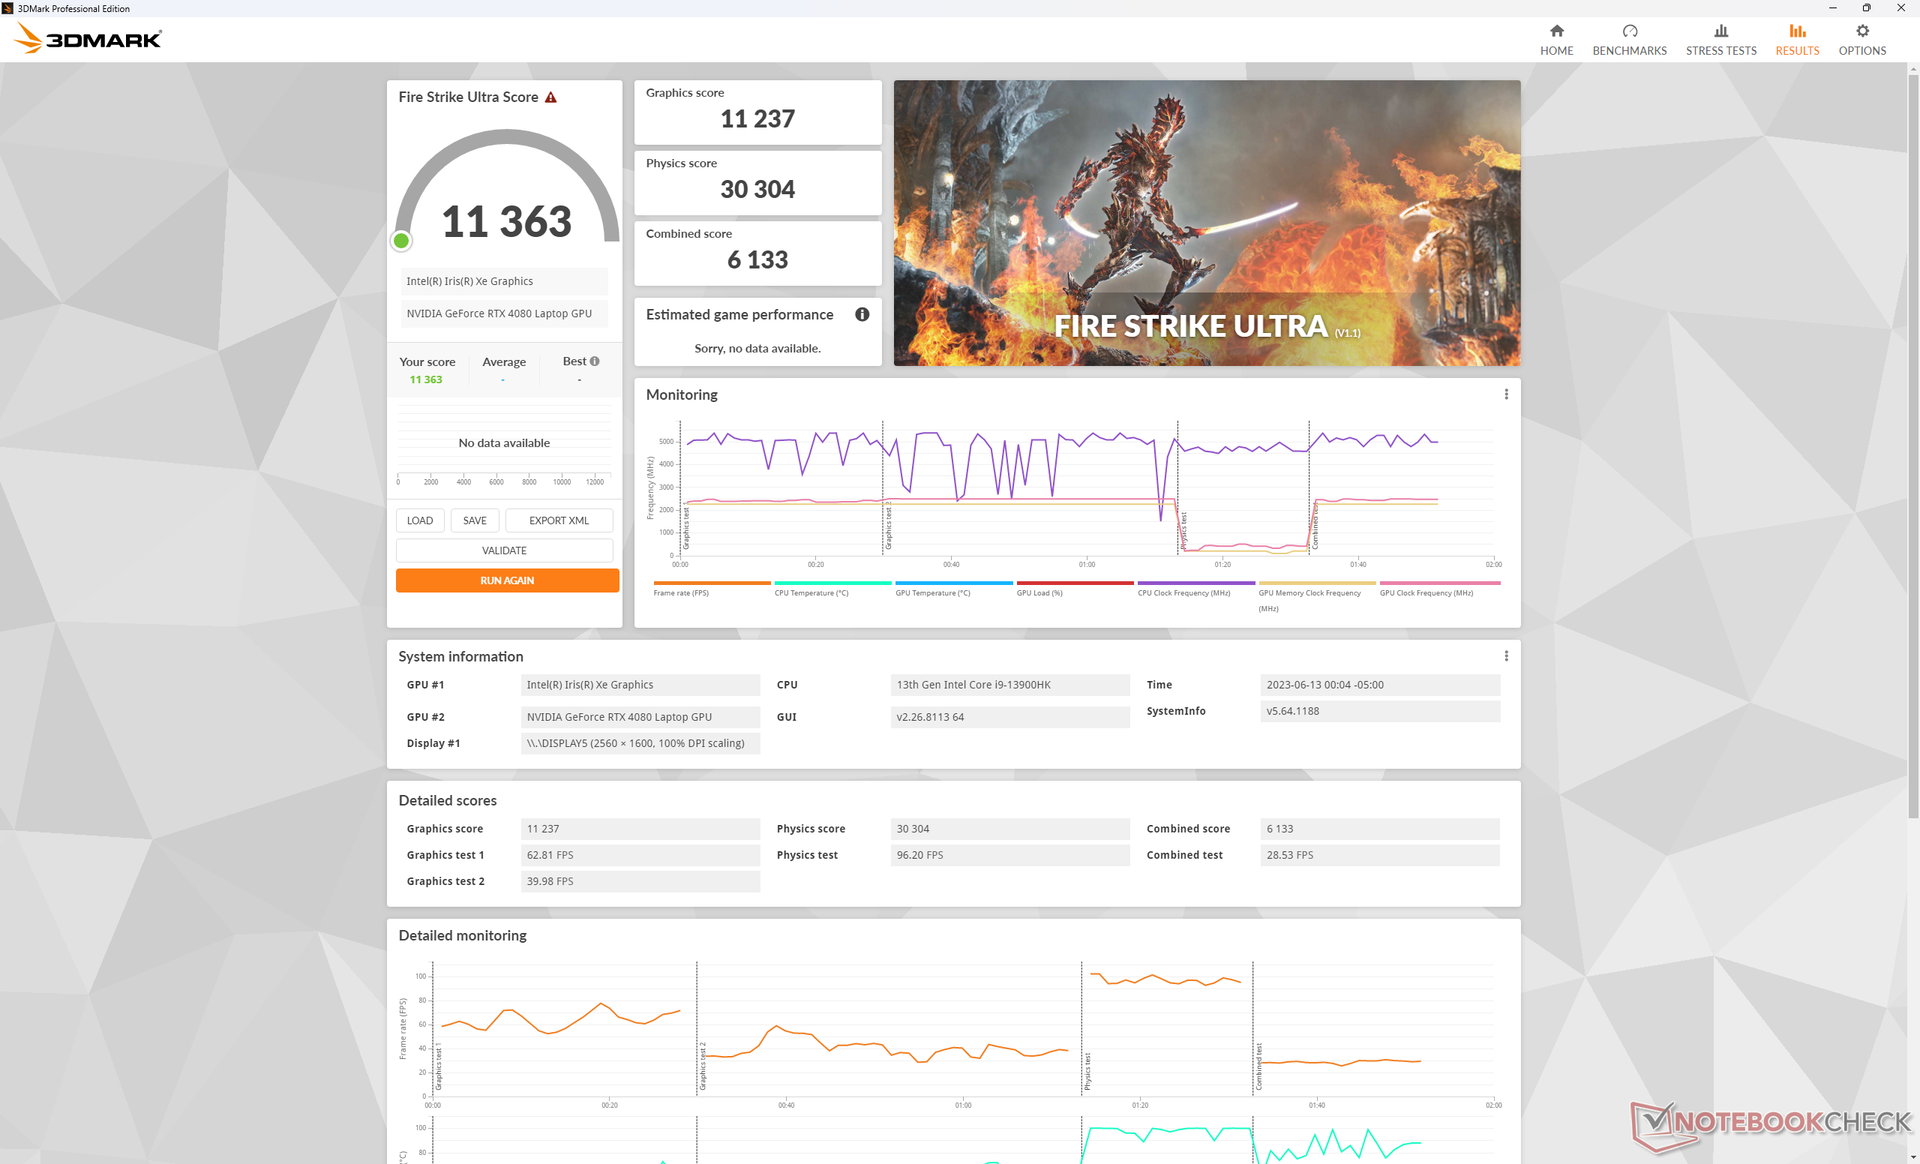
Performance du GPU - 175 W GeForce RTX 4080
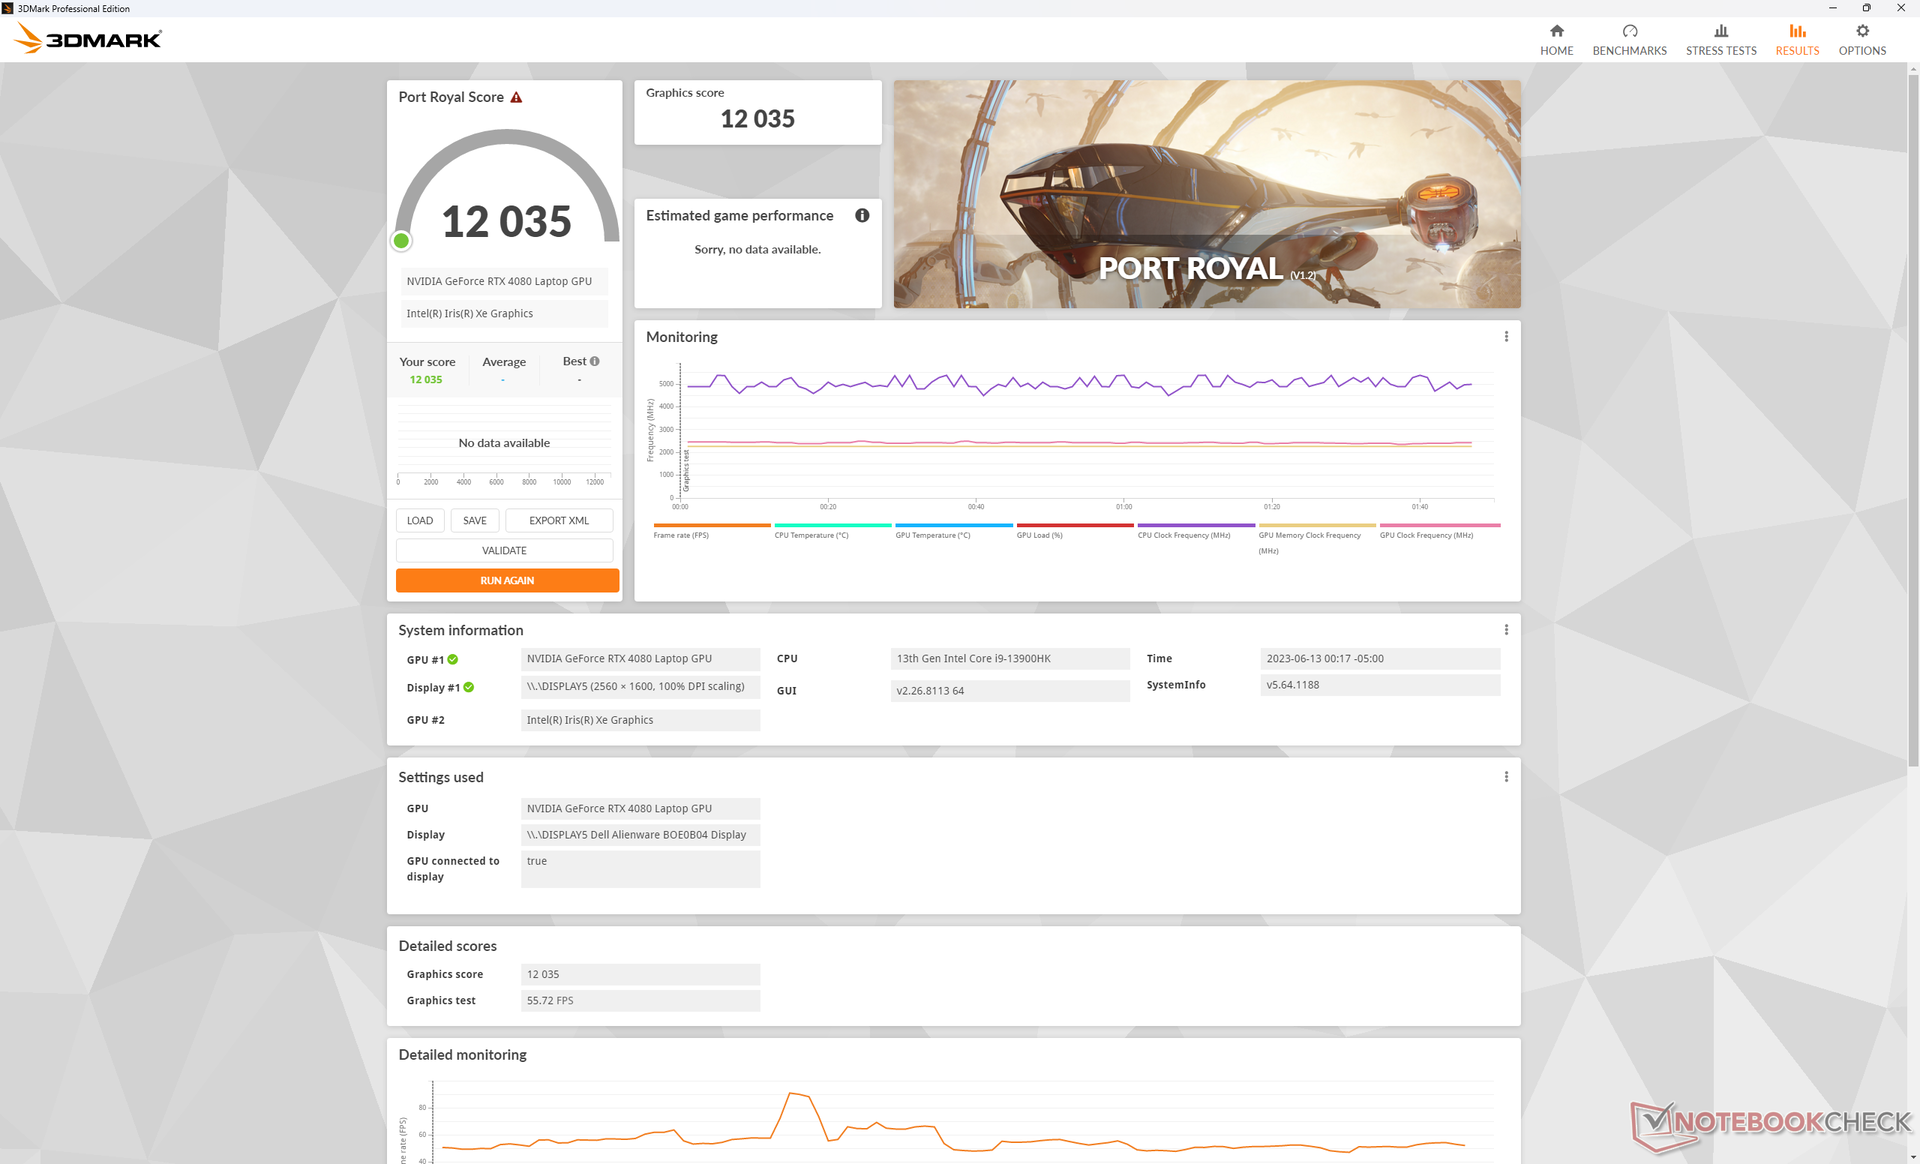
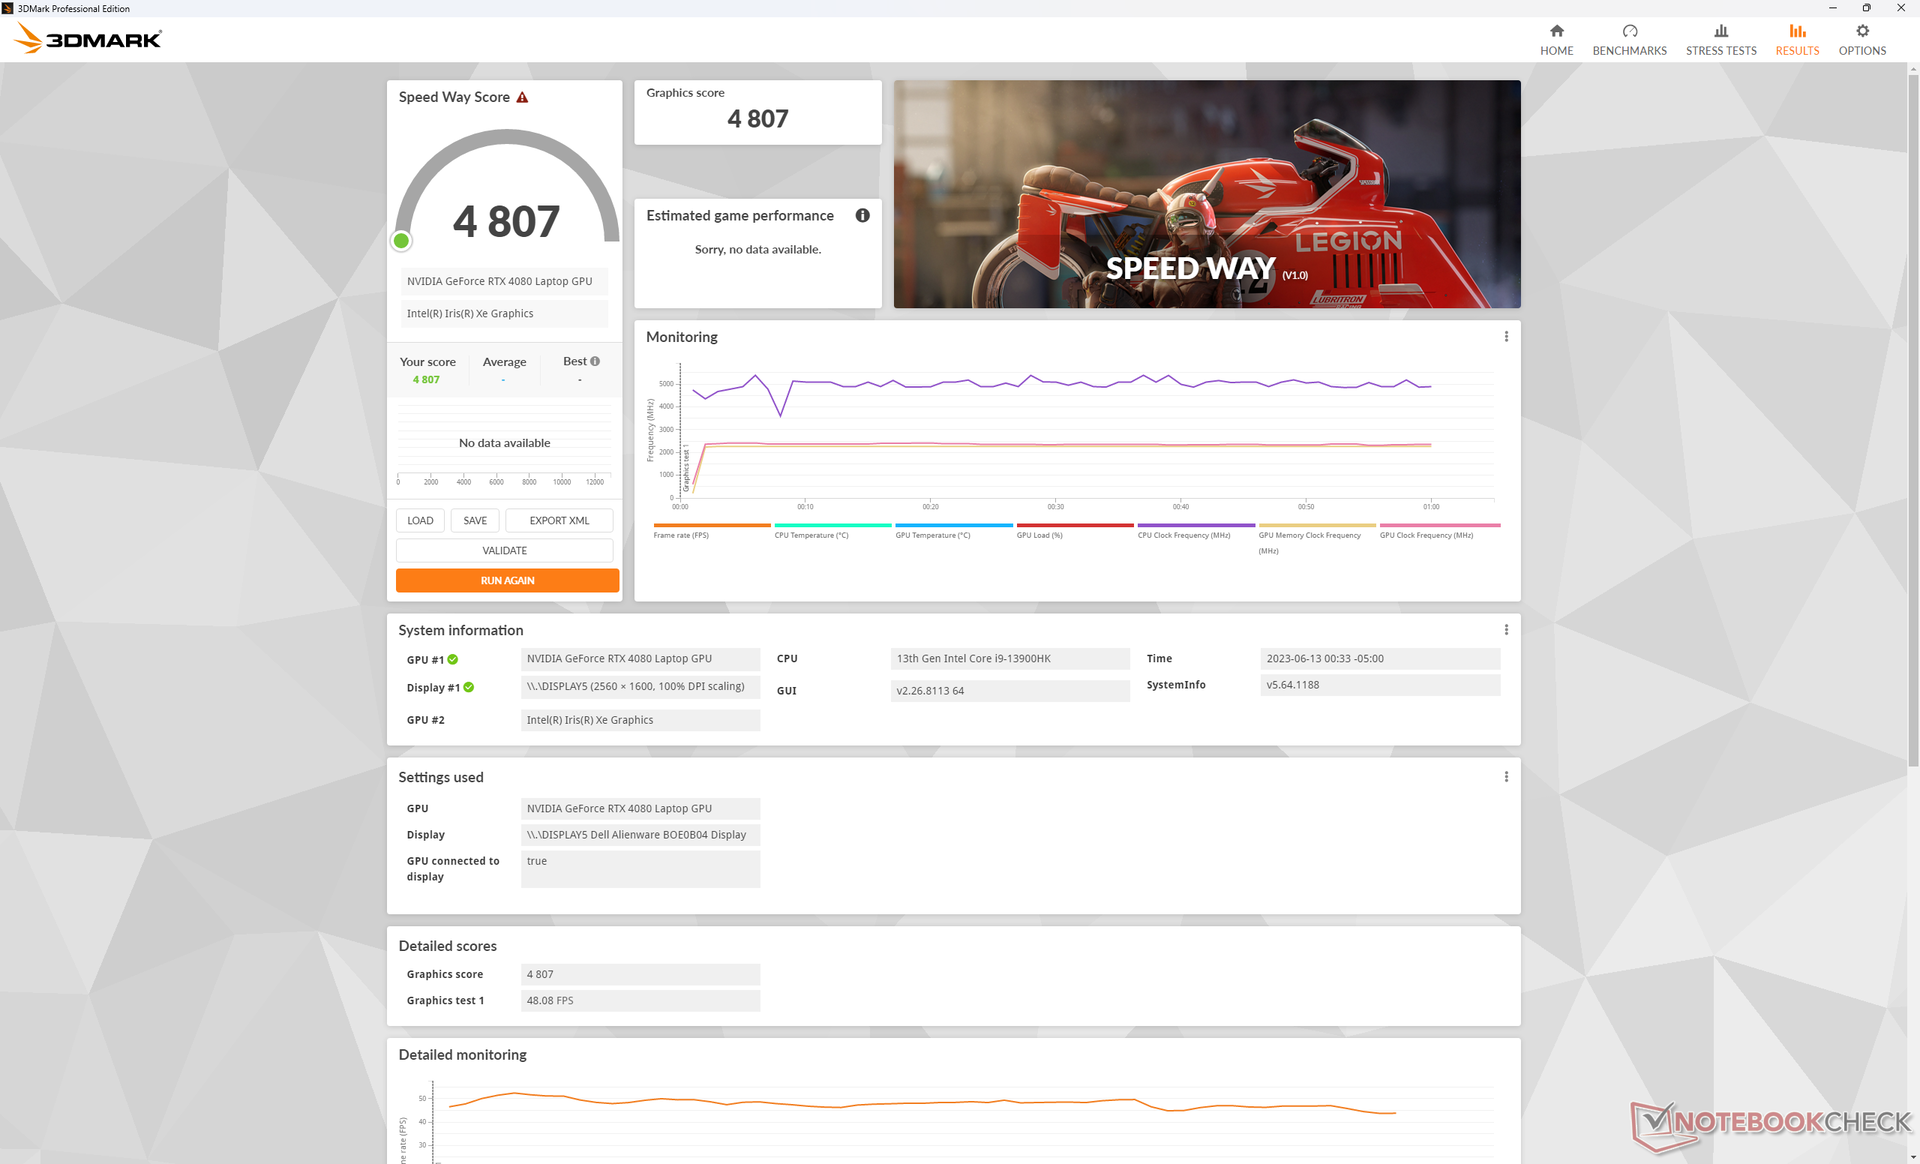
La GeForce RTX 4080 de notre Alienware x16 est 5 à 10 % plus rapide que la moyenne des ordinateurs portables de notre base de données équipés du même GPU RTX 4080. L'avantage peut sembler minime, mais il est suffisant pour faire de ce système l'un des ordinateurs portables RTX 4080 les plus rapides que vous puissiez acheter. les résultats de 3DMark ne sont qu'à 10 % de ceux de la RTX 4090 de l'ordinateur portableasus Zephyrus Duo 16par exemple.
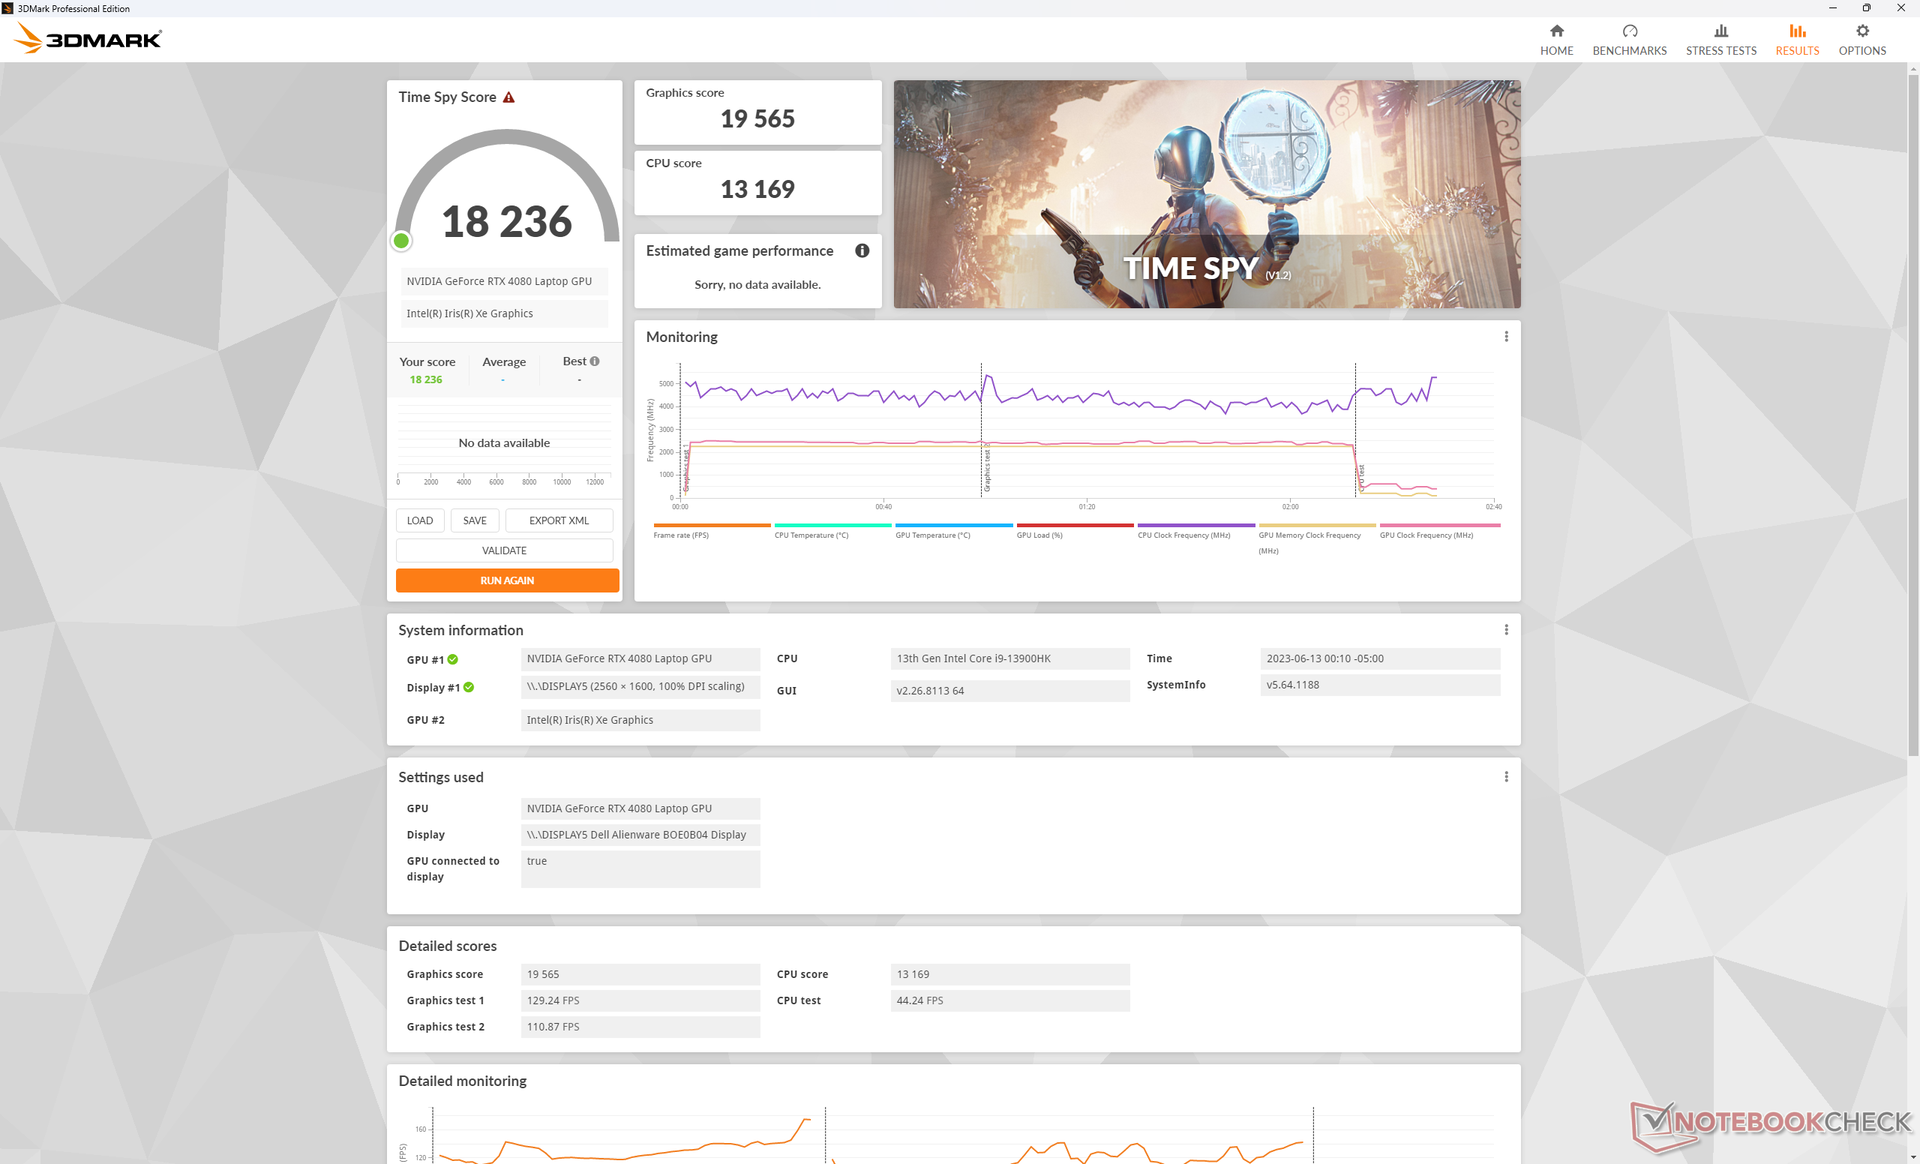
Il est intéressant de noter que les scores 3DMark ne baissent que de quelques points de pourcentage lorsque l'on utilise les modes Performance et Équilibré, plus silencieux, plutôt que le mode Overdrive, plus bruyant, comme le montre le tableau ci-dessous. Il est important de garder cela à l'esprit pour les sections Test de stress et Bruit du système ci-dessous.
Rétrogradation vers la RTX 4070 devrait avoir un impact sur les performances de 30 à 35 %, tandis que la mise à niveau vers la RTX 4090 devrait augmenter les performances d'environ 10 %.
| Paramètres du profil d'alimentation | Fire Strike Score physique | Fire Strike Score GPU | Fire Strike Score combiné |
| Survoltage | 29857 | 43478 | 13071 |
| Performance | 27890 (-7%) | 43605 (-0%) | 12961 (-1%) |
| Équilibré | 28704 (-4%) | 41909 (-4%) | 12476 (-5%) |
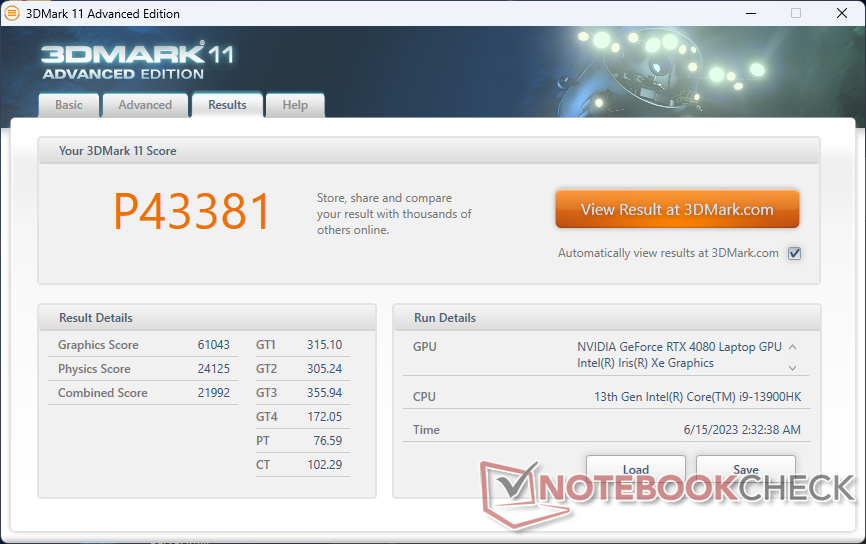
| 3DMark 11 Performance | 43381 points | |
| 3DMark Fire Strike Score | 33417 points | |
| 3DMark Time Spy Score | 18236 points | |
Aide | ||
* ... Moindre est la valeur, meilleures sont les performances
Performance des jeux
Tous les jeux sont jouables à la résolution native QHD+ avec des taux de rafraîchissement stables à 60 FPS ou plus. Il est même possible de jouer en 4K sur un moniteur externe en réglant la plupart des paramètres au maximum, y compris Returnal et F122. Cependant, pour obtenir des taux de rafraîchissement à trois chiffres, vous devrez activer DLSS 2 ou DLSS 3, le cas échéant, afin de mieux exploiter le taux de rafraîchissement élevé du moniteur.
Witcher 3 FPS Chart
| Bas | Moyen | Élevé | Ultra | QHD | 4K | |
|---|---|---|---|---|---|---|
| GTA V (2015) | 185.8 | 180.4 | 176.4 | 120.3 | 115.4 | 142.9 |
| The Witcher 3 (2015) | 425.6 | 352.7 | 306.5 | 160.2 | 115 | |
| Dota 2 Reborn (2015) | 178.8 | 164 | 159.7 | 146.8 | 129.4 | |
| Final Fantasy XV Benchmark (2018) | 211 | 195.5 | 164.2 | 132.4 | 76.2 | |
| X-Plane 11.11 (2018) | 145.3 | 134.5 | 104.2 | 90.5 | ||
| Strange Brigade (2018) | 469 | 373 | 350 | 325 | 237 | 120.5 |
| Shadow of the Tomb Raider (2018) | 165 | 143 | 84 | |||
| Far Cry 6 (2021) | 121 | 112 | 73 | |||
| Cyberpunk 2077 1.6 (2022) | 158 | 150.9 | 141.2 | 133.6 | 84.4 | 38.5 |
| Tiny Tina's Wonderlands (2022) | 256.6 | 217.3 | 183.3 | 156.4 | 111.1 | 58.6 |
| F1 22 (2022) | 265 | 259 | 244 | 110 | 79 | 39 |
| Call of Duty Modern Warfare 2 2022 (2022) | 139 | 110 | 67 | |||
| Returnal (2023) | 116 | 117 | 114 | 109 | 79 | 43 |
Émissions
Bruit du système - Nombreuses options de profil de puissance
Le bruit du ventilateur est directement lié aux paramètres du profil d'alimentation ACC. Si vous ne jouez pas, il est recommandé de régler l'ACC en mode équilibré ou en mode silencieux, car les ventilateurs ont tendance à pulser beaucoup plus fréquemment en mode Performance ou en mode Overdrive.
L'exécution Witcher 3 en mode Performance et en mode Overdrive, le bruit des ventilateurs atteint respectivement 50 dB(A) et 55 dB(A). Étant donné que la perte de fréquence d'images est minime entre les modes Performance et Overdrive, comme indiqué dans la section Performances du GPU ci-dessus, vous pouvez avoir une expérience de jeu nettement plus silencieuse lorsque vous êtes en mode Performance. Le bruit du ventilateur sera encore plus silencieux en mode Équilibré, sans impact significatif sur le nombre d'images par seconde. plus de 50 dB(A), c'est toujours très fort, bien sûr, mais c'est néanmoins une plage commune sur des modèles concurrents comme le Lenovo Legion Pro 7 ou le Razer Blade 16.
Degré de la nuisance sonore
| Au repos |
| 23.1 / 25.8 / 25.8 dB(A) |
| Fortement sollicité |
| 39.3 / 54.8 dB(A) |
 | ||
30 dB silencieux 40 dB(A) audible 50 dB(A) bruyant |
||
min: | ||
| Alienware x16 R1 GeForce RTX 4080 Laptop GPU, i9-13900HK, SK hynix PC801 HFS001TEJ9X101N | Lenovo Legion Pro 7 RTX4090 GeForce RTX 4090 Laptop GPU, i9-13900HX, Samsung PM9A1 MZVL21T0HCLR | Asus ROG Zephyrus M16 GU604VY-NM042X GeForce RTX 4090 Laptop GPU, i9-13900H, Samsung PM9A1 MZVL22T0HBLB | Razer Blade 16 Early 2023 GeForce RTX 4080 Laptop GPU, i9-13950HX, SSSTC CA6-8D1024 | Dell G16 7620 GeForce RTX 3060 Laptop GPU, i7-12700H, WDC PC SN810 512GB | Alienware m17 R5 (R9 6900HX, RX 6850M XT) Radeon RX 6850M XT, R9 6900HX, SSSTC CA6-8D1024 | |
|---|---|---|---|---|---|---|
| Noise | -17% | -10% | 3% | -2% | 2% | |
| arrêt / environnement * (dB) | 22.7 | 25 -10% | 24 -6% | 23 -1% | 23.2 -2% | 23 -1% |
| Idle Minimum * (dB) | 23.1 | 28 -21% | 24 -4% | 23 -0% | 28.3 -23% | 23 -0% |
| Idle Average * (dB) | 25.8 | 30 -16% | 29.96 -16% | 23 11% | 28.8 -12% | 28.11 -9% |
| Idle Maximum * (dB) | 25.8 | 38 -47% | 34.27 -33% | 23.6 9% | 28.9 -12% | 28.11 -9% |
| Load Average * (dB) | 39.3 | 48 -22% | 35.89 9% | 39 1% | 32.4 18% | 30.62 22% |
| Witcher 3 ultra * (dB) | 49.9 | 53 -6% | 57.5 -15% | 51.6 -3% | 48.3 3% | 49.75 -0% |
| Load Maximum * (dB) | 54.8 | 55 -0% | 57.54 -5% | 51.3 6% | 48.1 12% | 50.17 8% |
* ... Moindre est la valeur, meilleures sont les performances
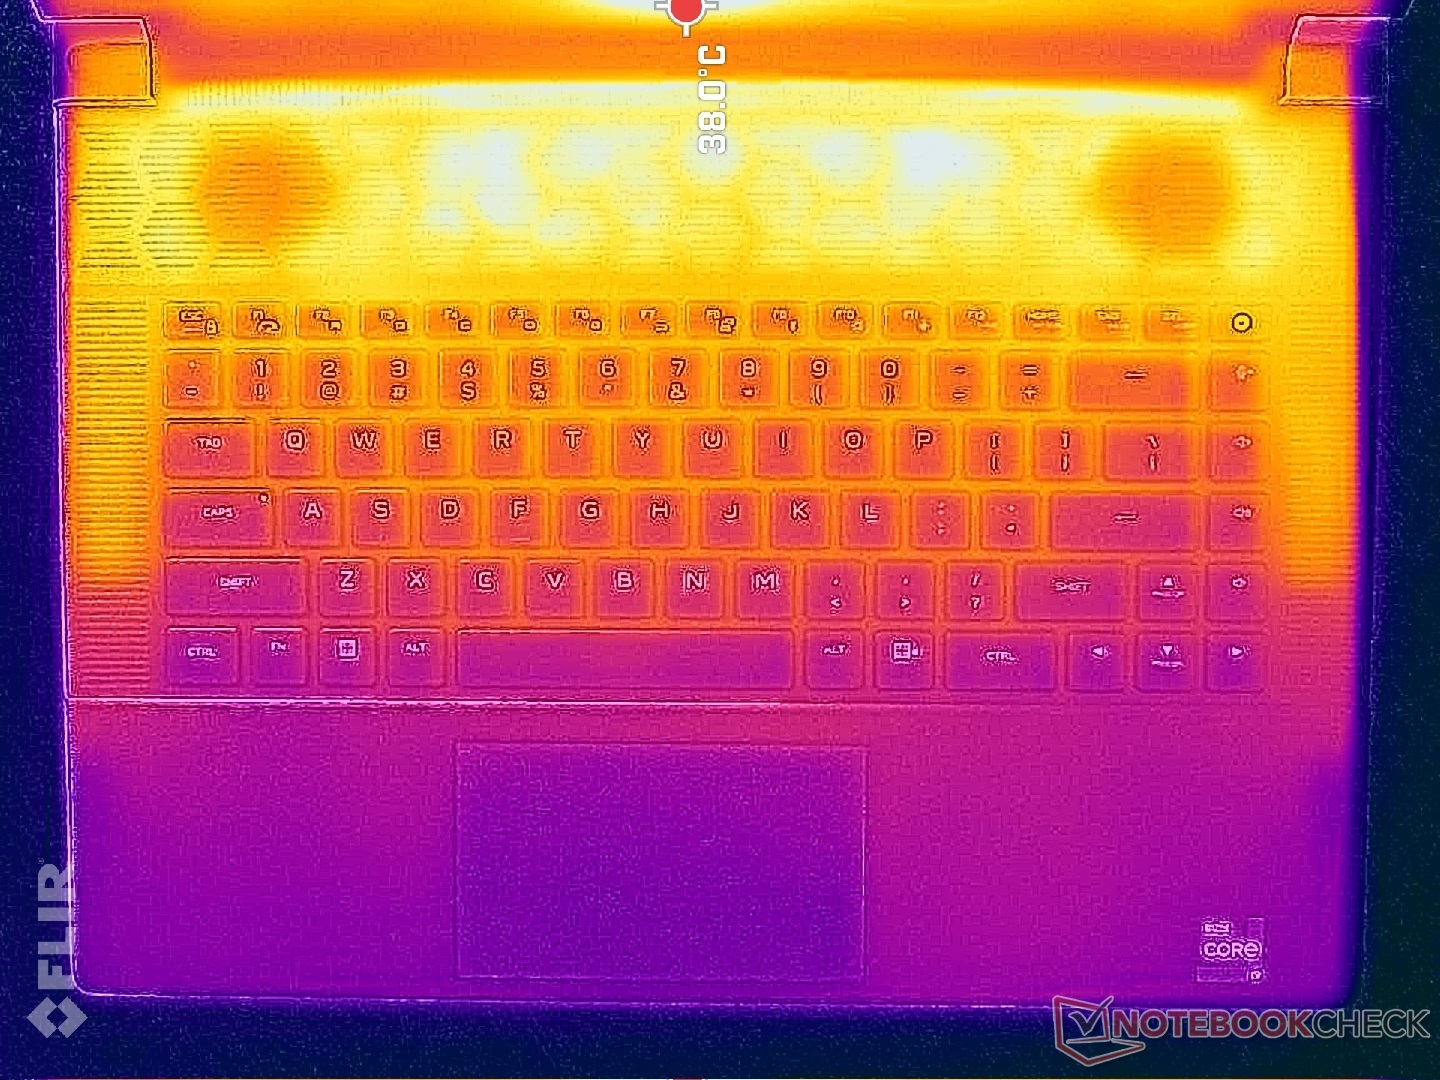
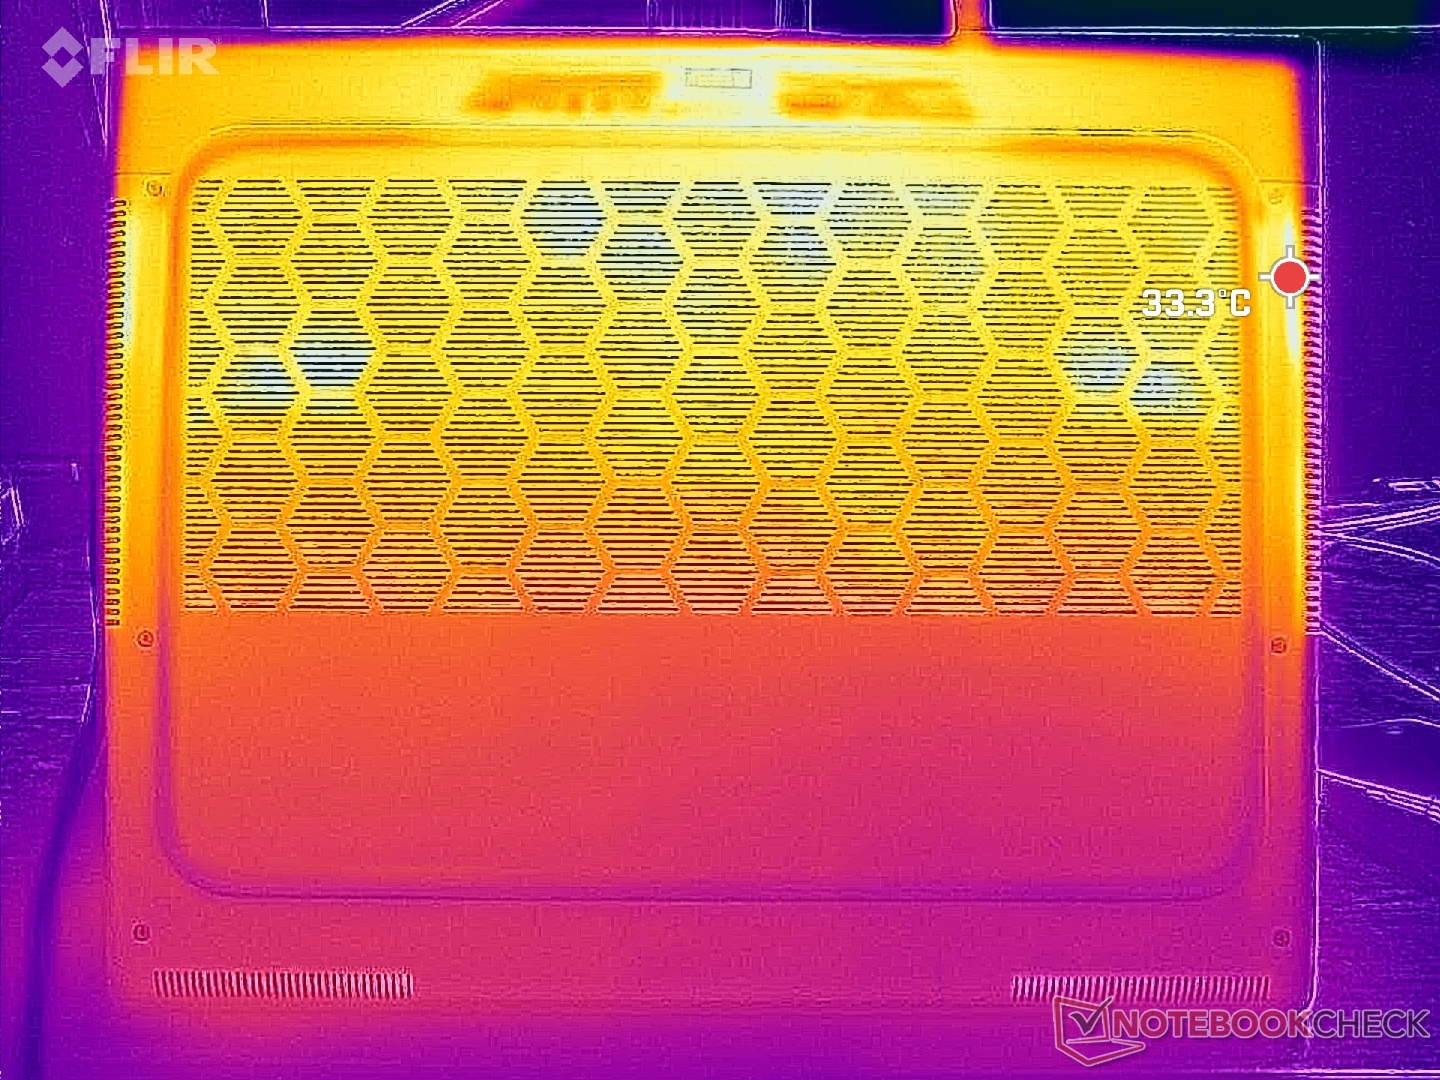
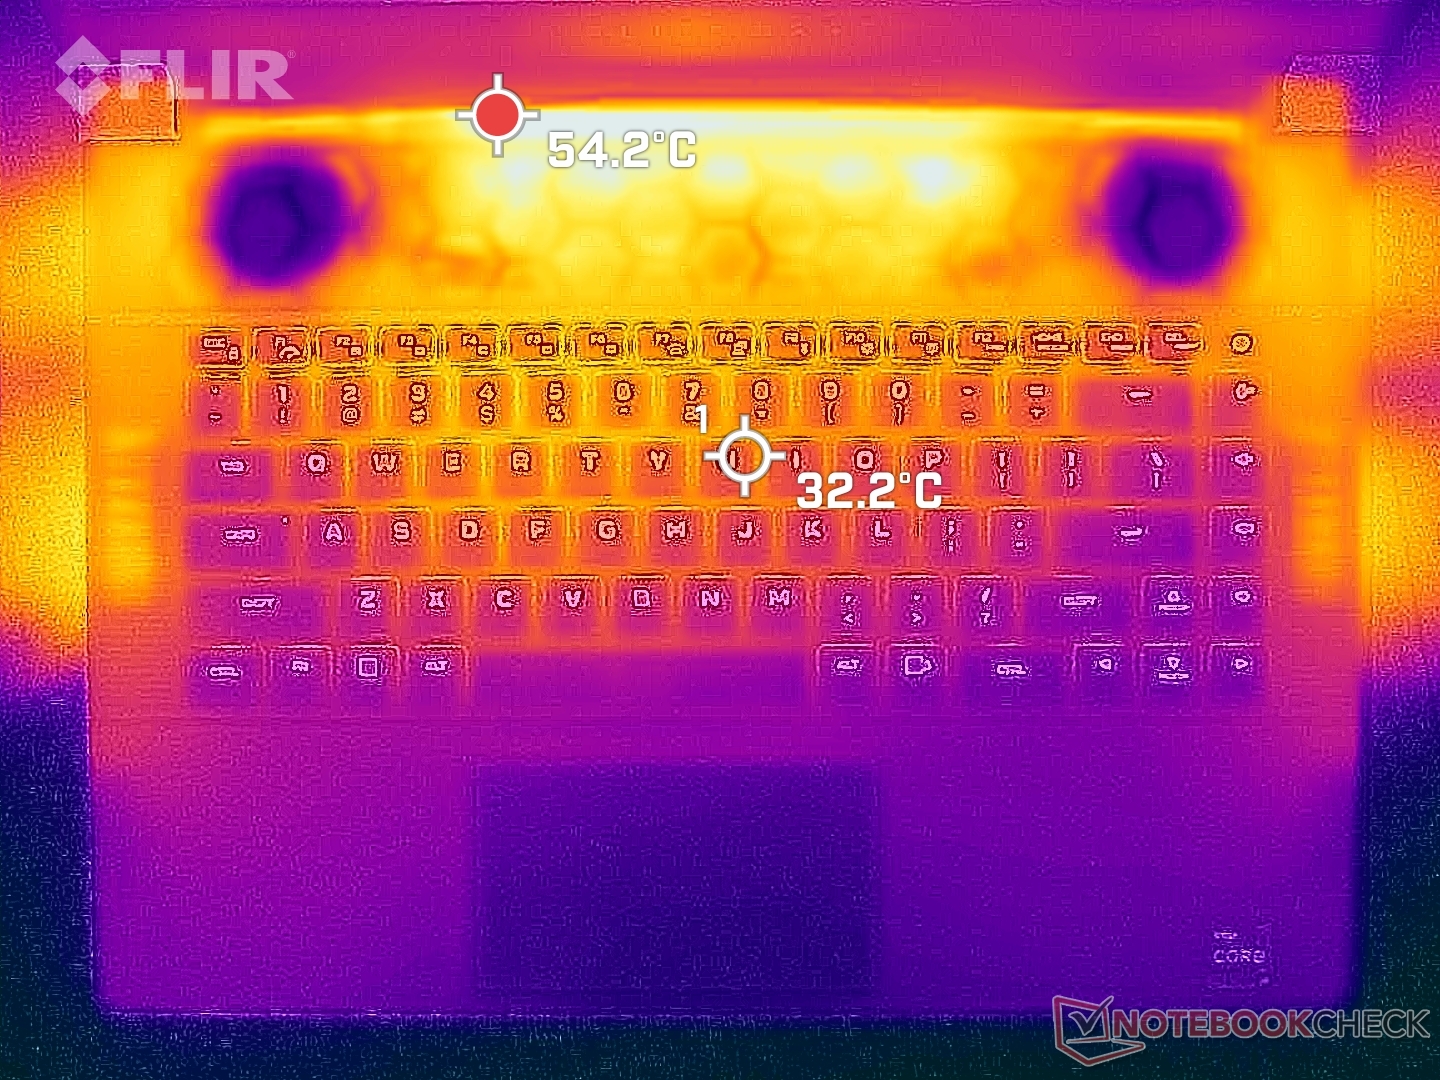
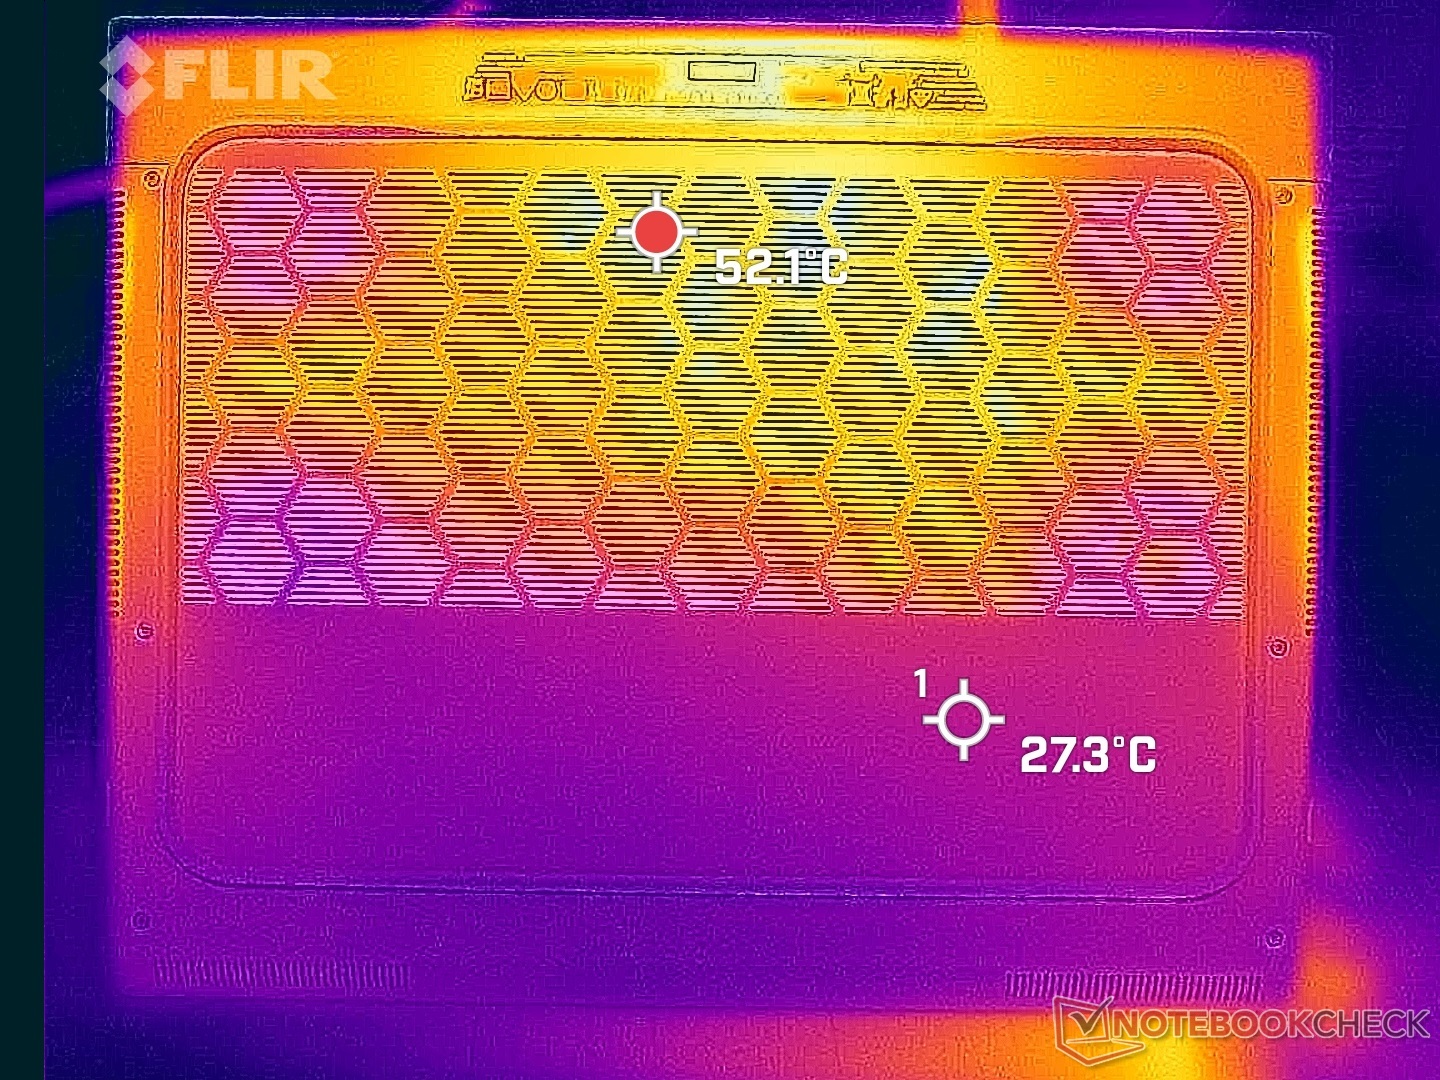
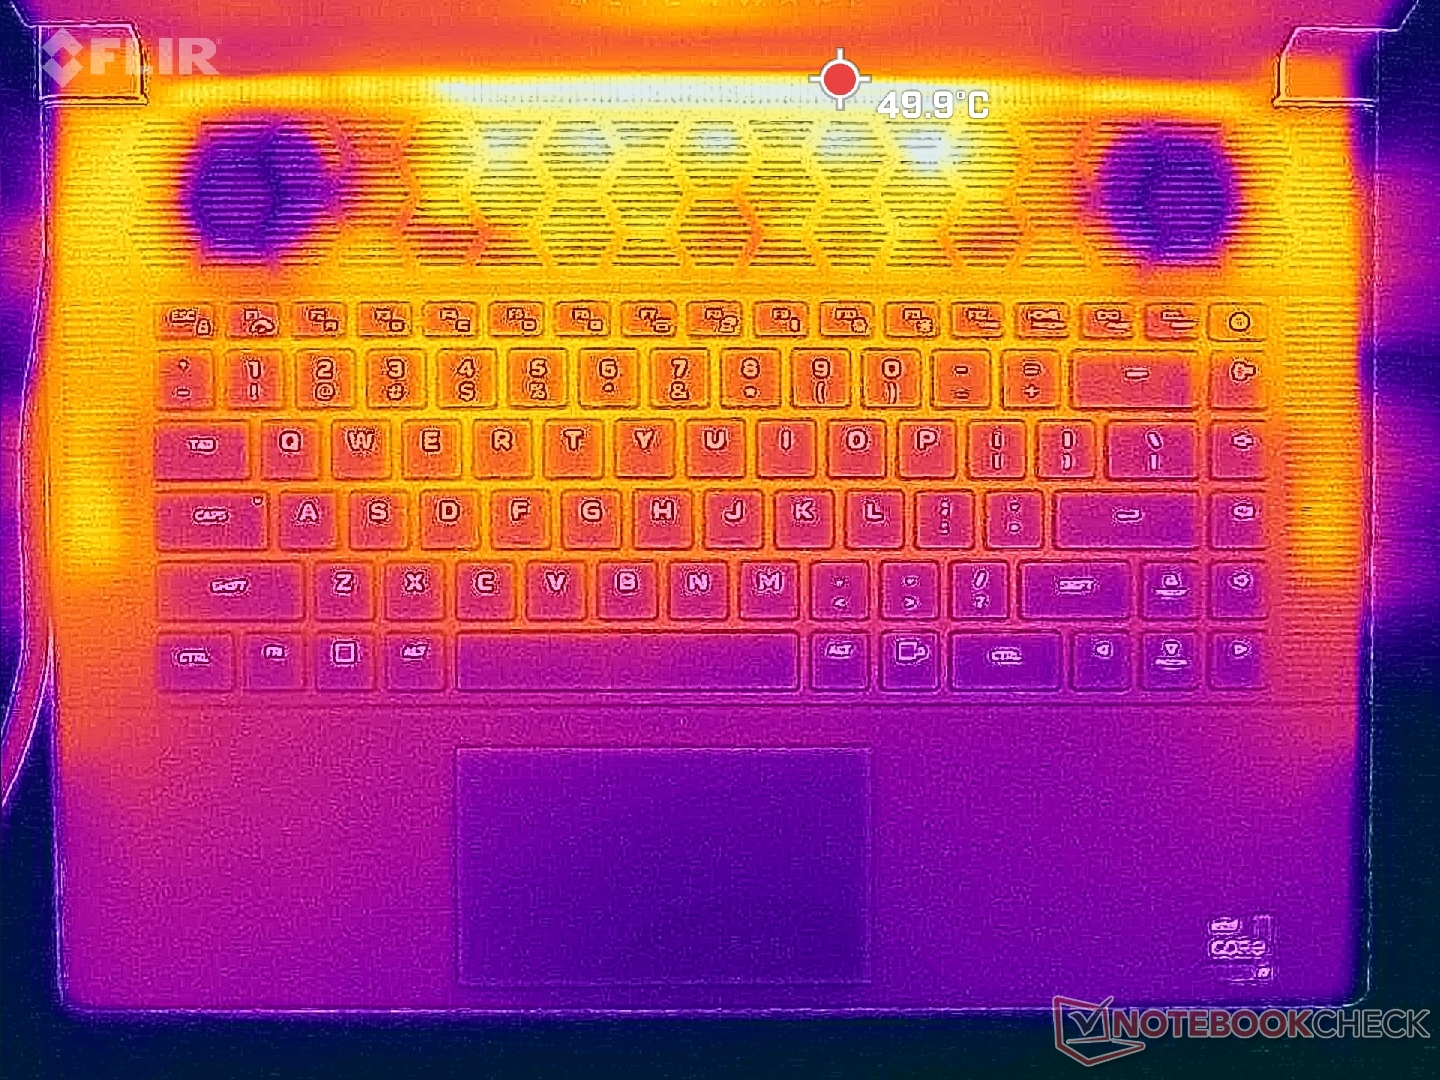
Température
Les températures de surface peuvent être très élevées en raison de la finesse du profil. Les points chauds peuvent atteindre environ 50°C en haut et en bas, contre seulement 40°C sur le Blade 16. Heureusement, ces points chauds sont situés à l'arrière et loin des repose-poignets.
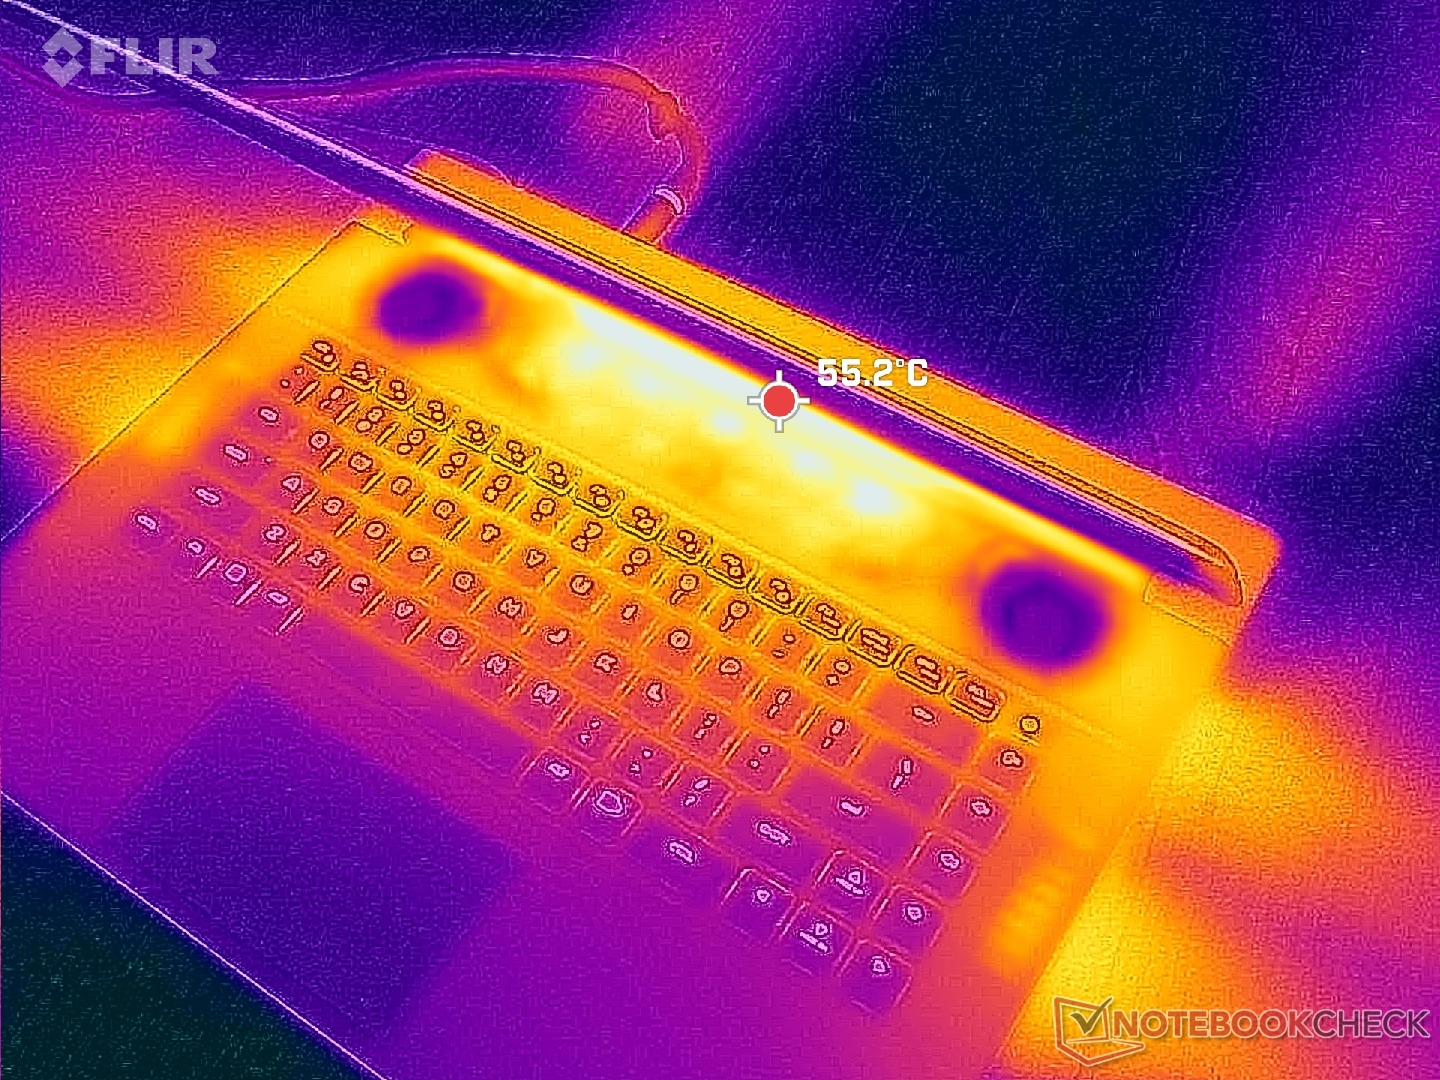
(-) La température maximale du côté supérieur est de 47.2 °C / 117 F, par rapport à la moyenne de 40.4 °C / 105 F, allant de 21.2 à 68.8 °C pour la classe Gaming.
(-) Le fond chauffe jusqu'à un maximum de 47.8 °C / 118 F, contre une moyenne de 43.2 °C / 110 F
(+) En utilisation inactive, la température moyenne du côté supérieur est de 30.8 °C / 87 F, par rapport à la moyenne du dispositif de 33.9 °C / 93 F.
(±) En jouant à The Witcher 3, la température moyenne du côté supérieur est de 38 °C / 100 F, alors que la moyenne de l'appareil est de 33.9 °C / 93 F.
(+) Les repose-poignets et le pavé tactile sont plus froids que la température de la peau avec un maximum de 30.6 °C / 87.1 F et sont donc froids au toucher.
(±) La température moyenne de la zone de l'appui-paume de dispositifs similaires était de 28.8 °C / 83.8 F (-1.8 °C / #-3.3 F).

| Alienware x16 R1 Intel Core i9-13900HK, NVIDIA GeForce RTX 4080 Laptop GPU | Lenovo Legion Pro 7 RTX4090 Intel Core i9-13900HX, NVIDIA GeForce RTX 4090 Laptop GPU | Asus ROG Zephyrus M16 GU604VY-NM042X Intel Core i9-13900H, NVIDIA GeForce RTX 4090 Laptop GPU | Razer Blade 16 Early 2023 Intel Core i9-13950HX, NVIDIA GeForce RTX 4080 Laptop GPU | Dell G16 7620 Intel Core i7-12700H, NVIDIA GeForce RTX 3060 Laptop GPU | Alienware m17 R5 (R9 6900HX, RX 6850M XT) AMD Ryzen 9 6900HX, AMD Radeon RX 6850M XT | |
|---|---|---|---|---|---|---|
| Heat | -4% | 6% | 15% | 14% | 2% | |
| Maximum Upper Side * (°C) | 47.2 | 53 -12% | 50 -6% | 40 15% | 47.6 -1% | 53 -12% |
| Maximum Bottom * (°C) | 47.8 | 59 -23% | 58 -21% | 37.6 21% | 54 -13% | 56 -17% |
| Idle Upper Side * (°C) | 36.8 | 34 8% | 26 29% | 32.4 12% | 23 37% | 30 18% |
| Idle Bottom * (°C) | 35.8 | 32 11% | 28 22% | 31.4 12% | 24.6 31% | 29 19% |
* ... Moindre est la valeur, meilleures sont les performances
Test de stress
La fréquence d'horloge du processeur, la consommation d'énergie de la carte et la température du cœur atteignaient respectivement 4,5 GHz, 178 W et 99 C lors de l'initialisation du stress Prime95. Le processeur se stabilise à 3,8 GHz, 123 W et 99 C après quelques minutes. Avec des températures de cœur aussi élevées, il est clair que le processeur pousse la solution de refroidissement à ses limites afin de maintenir les taux d'horloge Turbo Boost les plus élevés possibles. En répétant ce même test sur le Blade 16, par exemple, on obtiendrait une température de cœur stable et plus froide de 82°C.
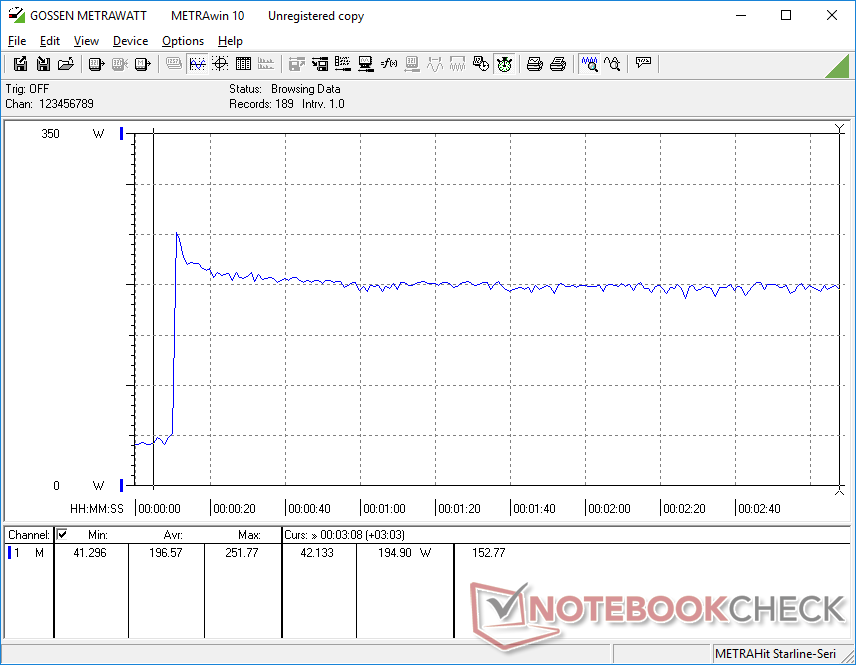
En exécutant Witcher 3 en mode Overdrive pour représenter les charges de jeu typiques, le GPU se stabiliserait à environ 166 W pour un objectif de 175 W. Il est intéressant de noter que la consommation d'énergie de la carte tomberait à peine à 161 W en mode Balanced, comme le montrent les captures d'écran ci-dessous, ce qui représente un déficit de performance très marginal par rapport au bruit du ventilateur nettement plus silencieux en comparaison avec le mode Overdrive. Les utilisateurs peuvent donc envisager de jouer en mode équilibré plutôt qu'en mode Performance ou Overdrive, plus bruyants.
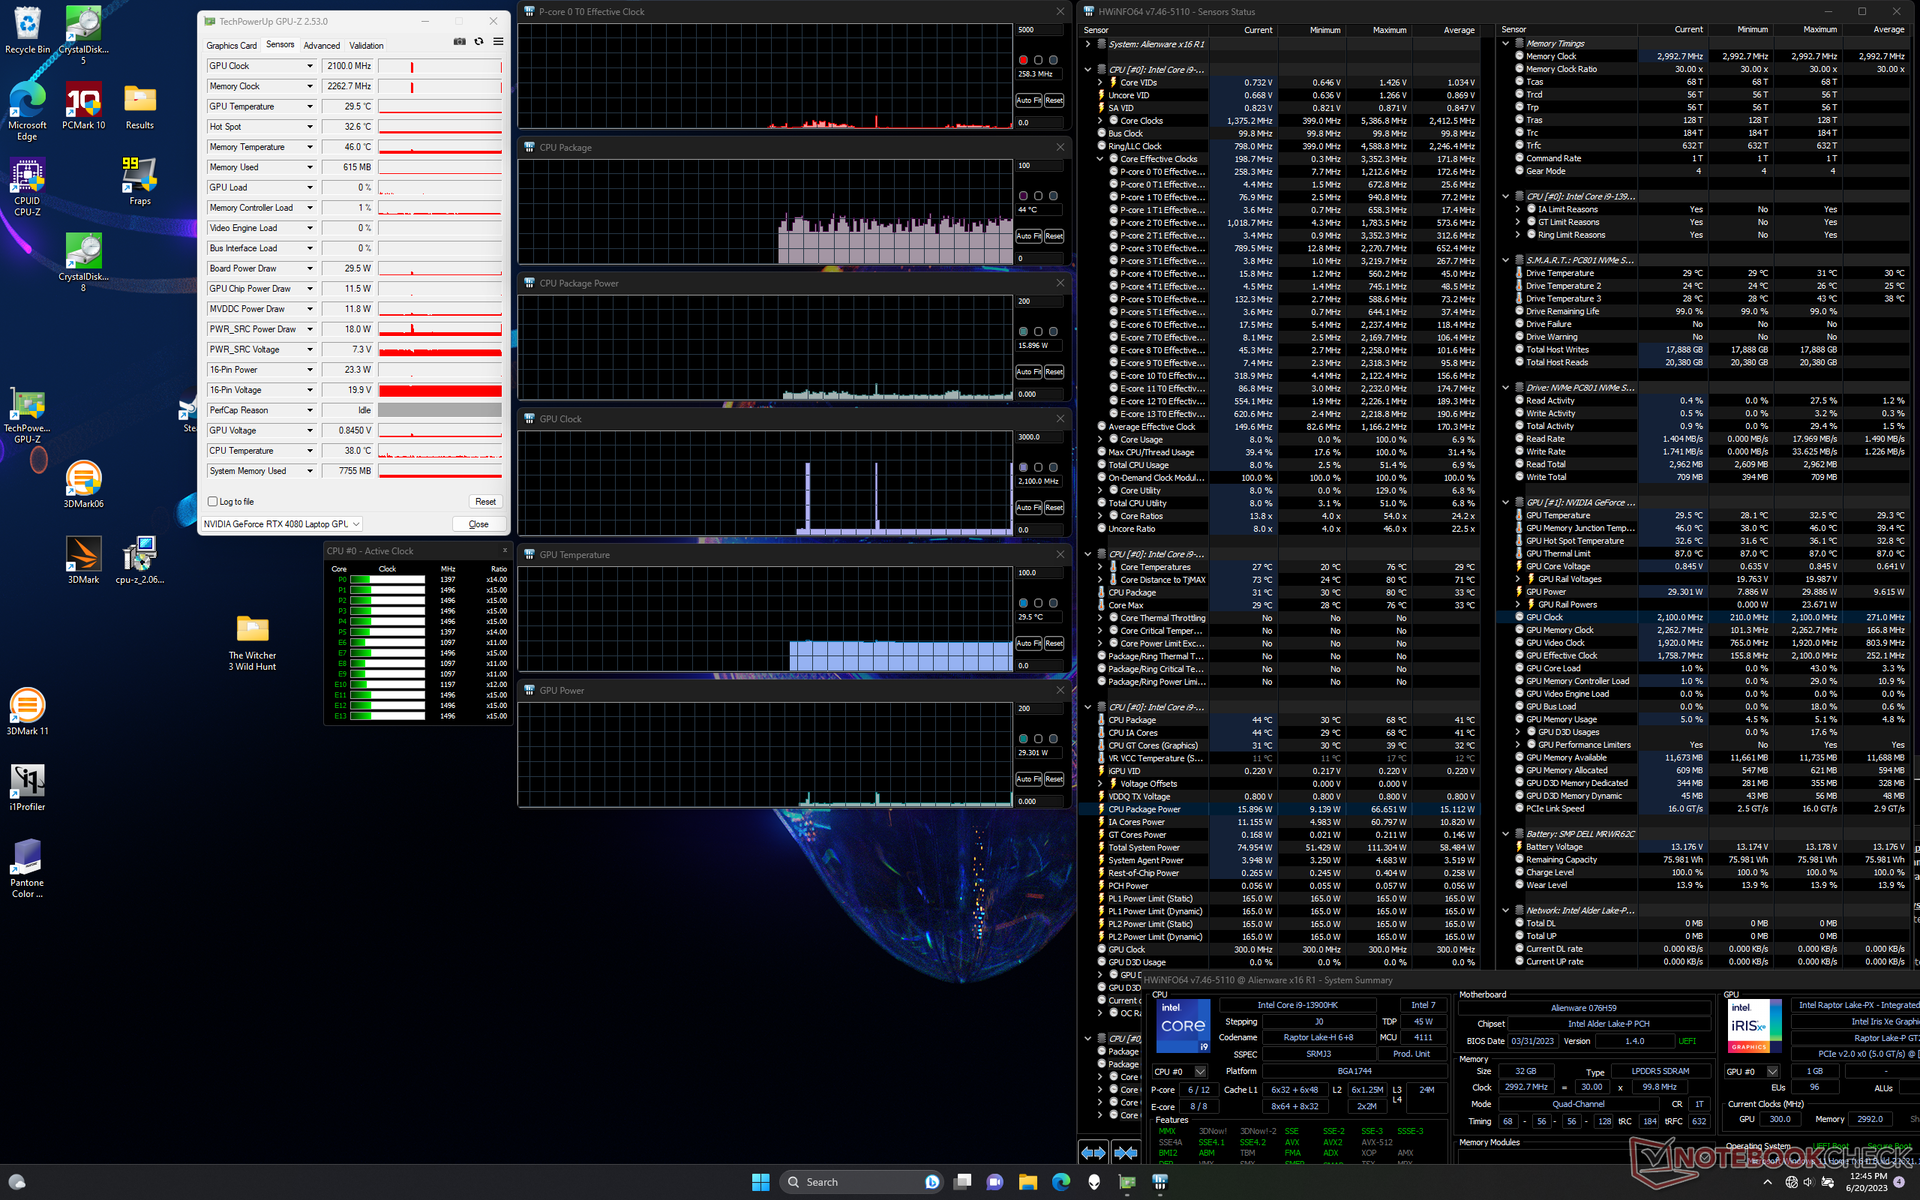
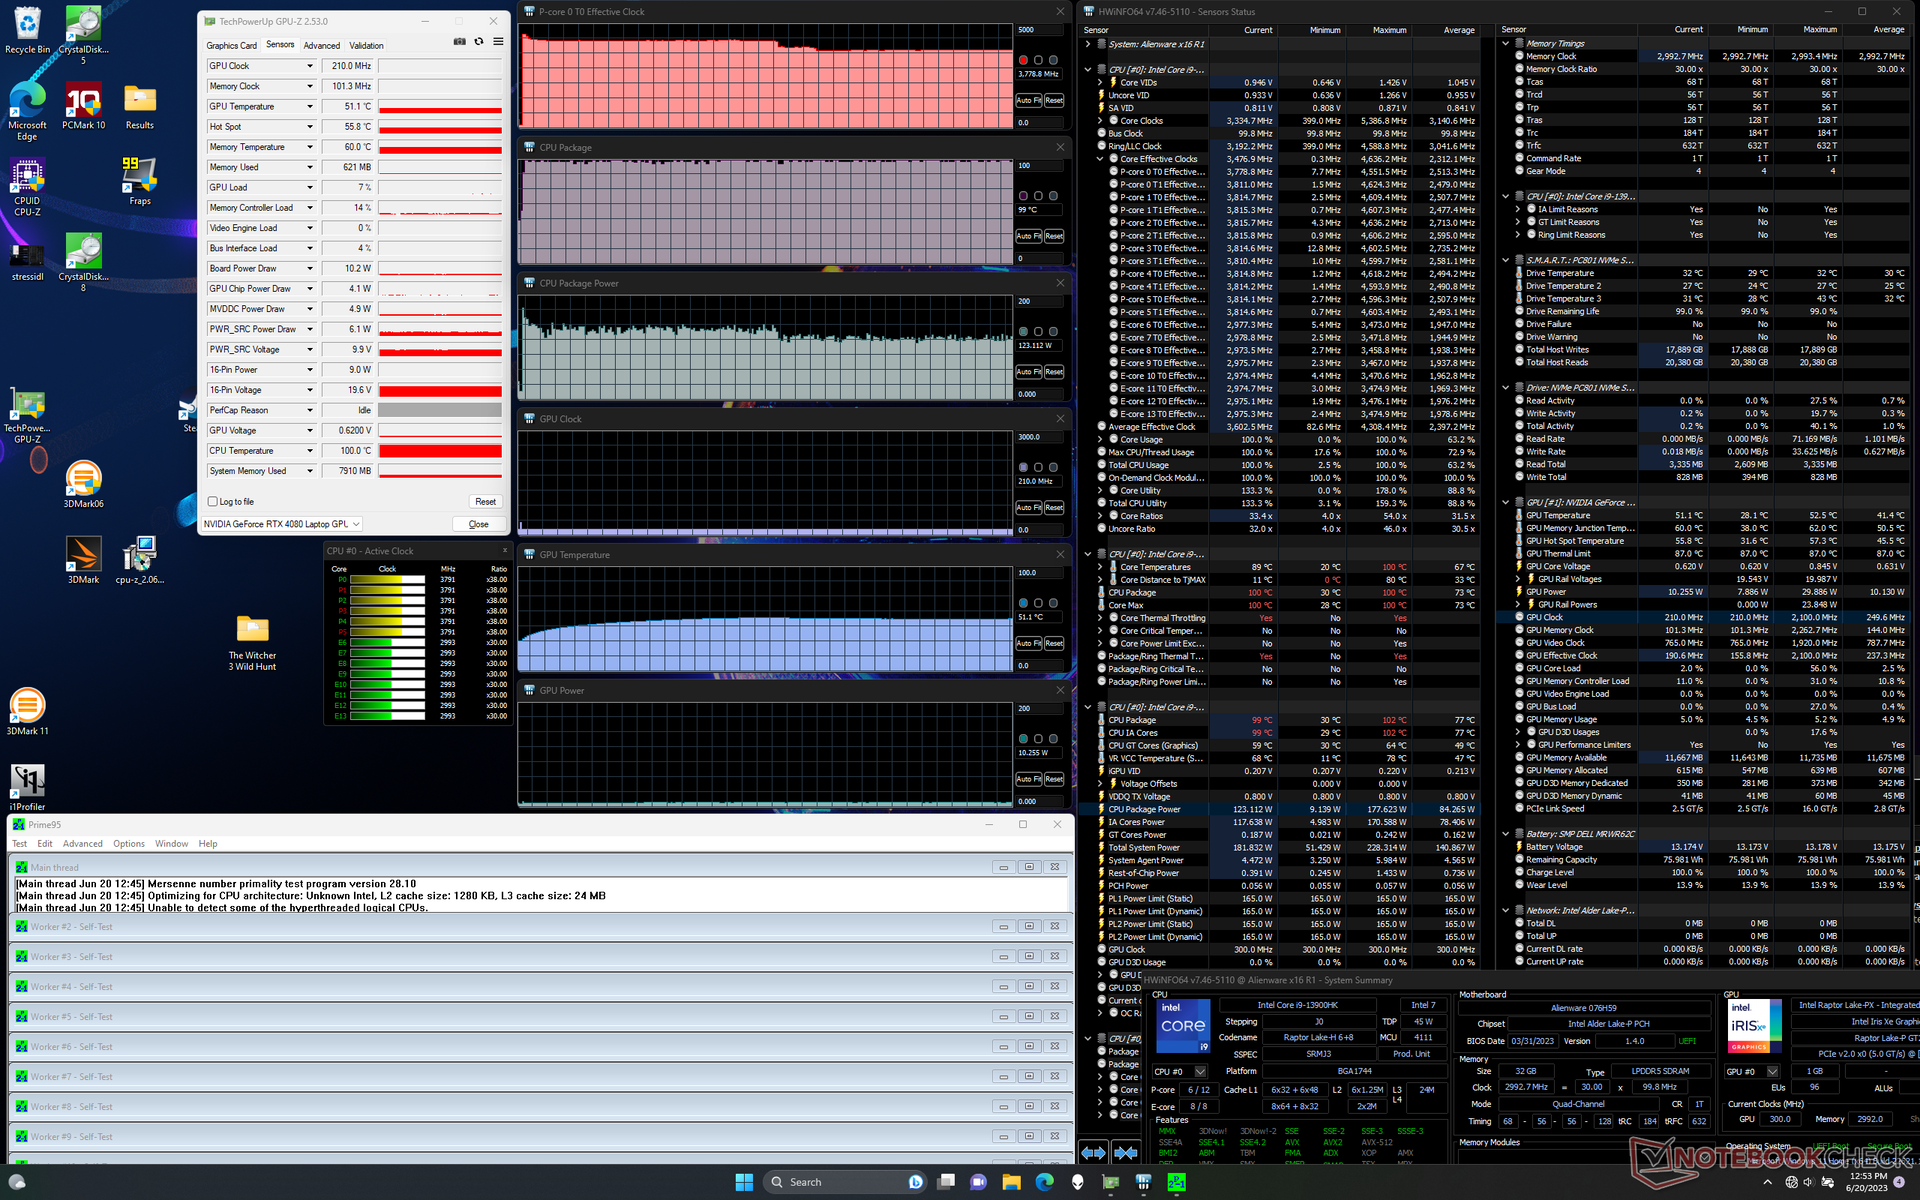
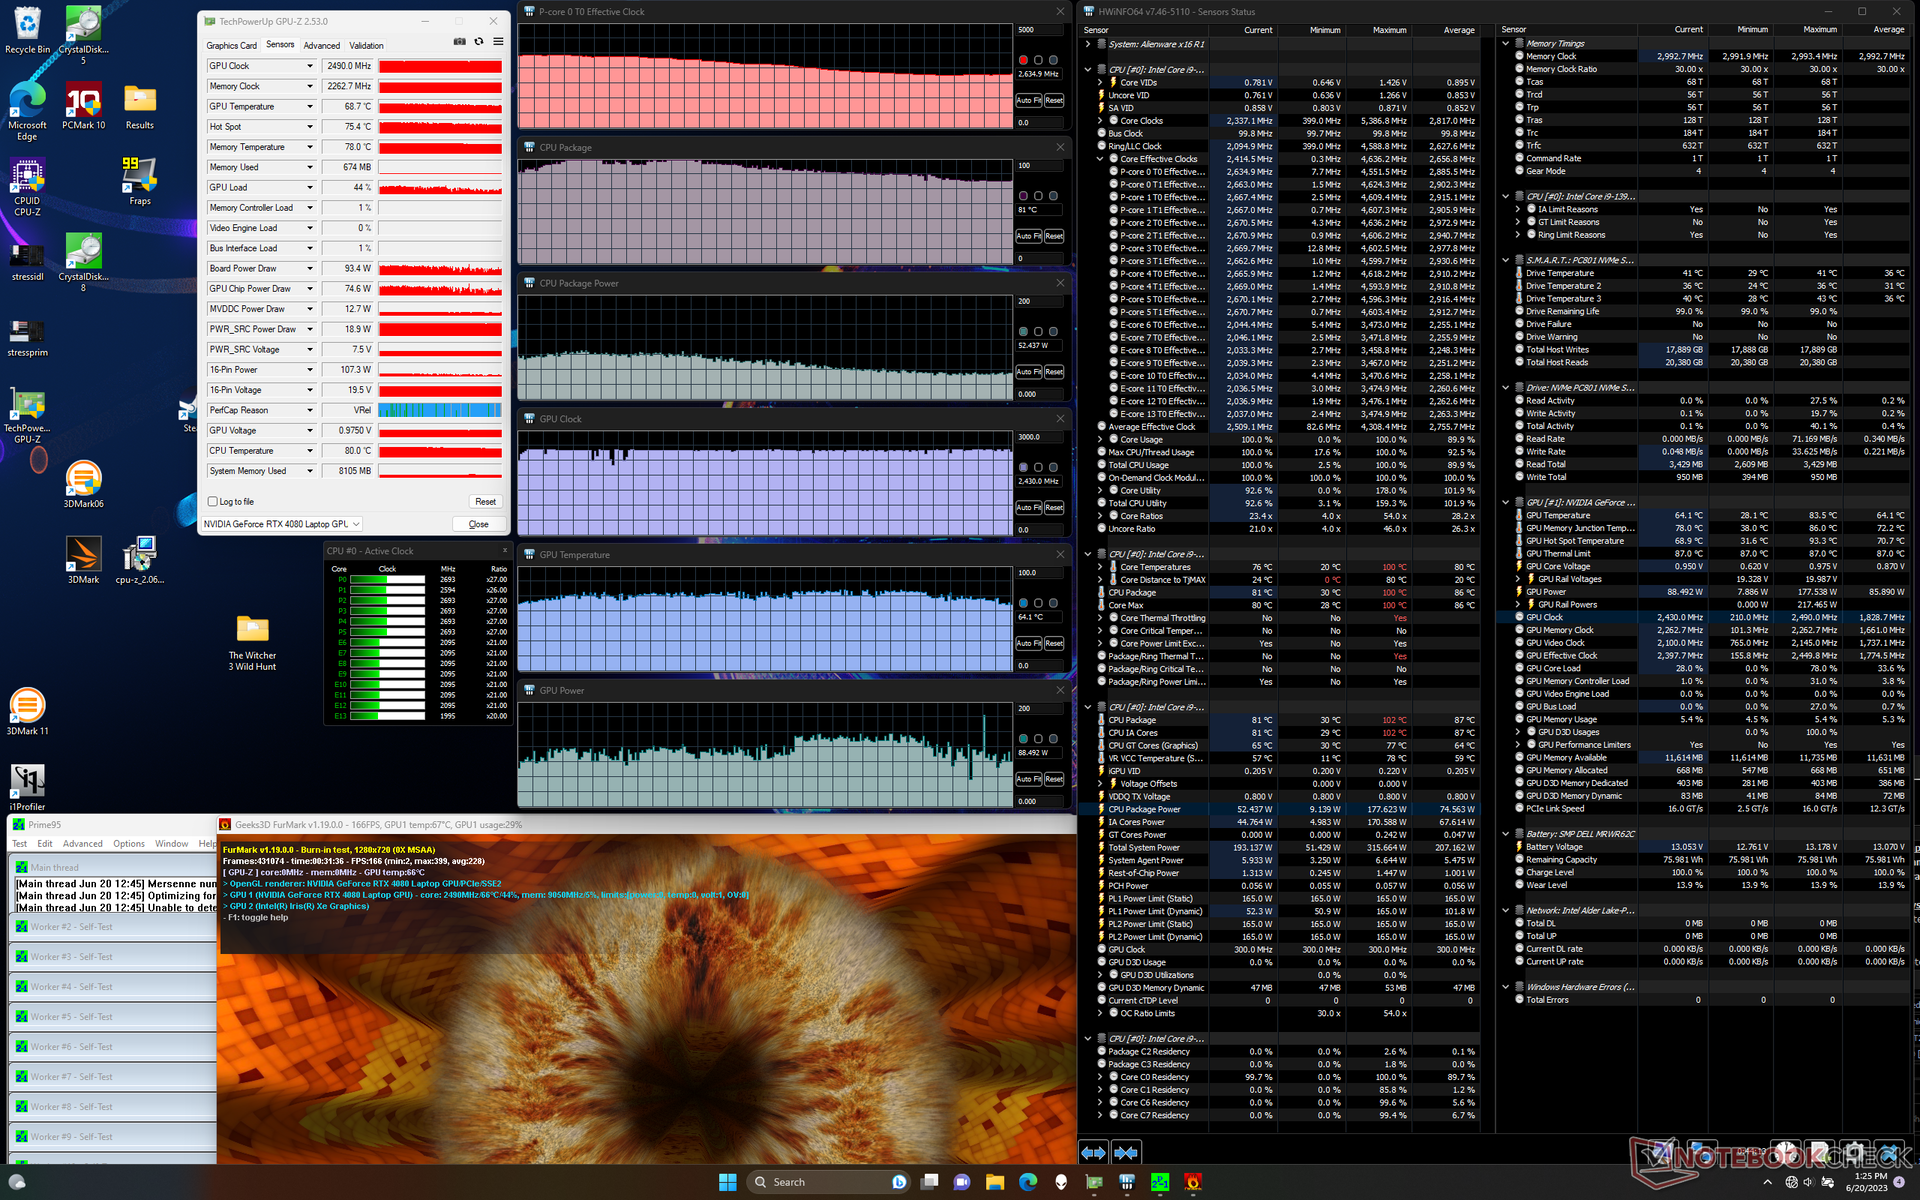

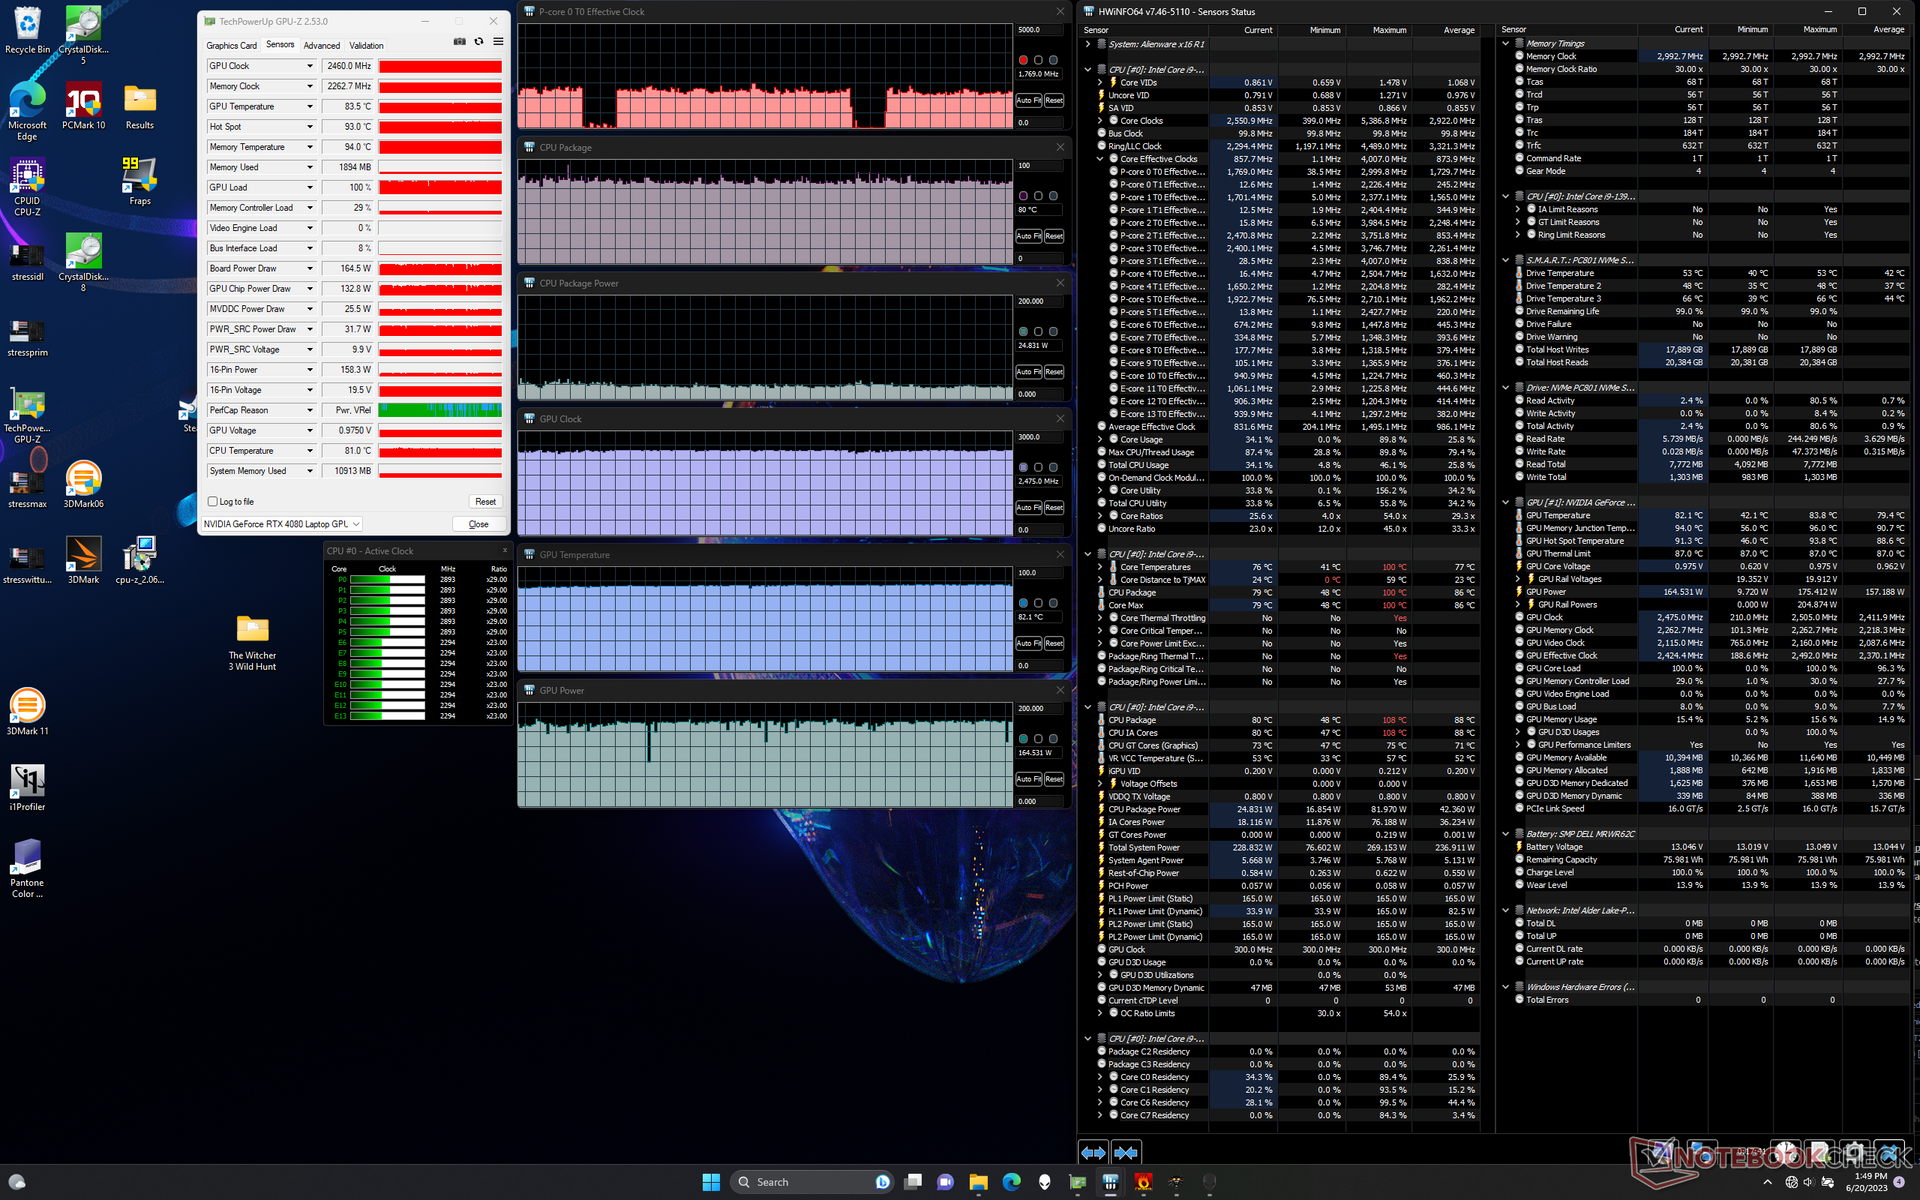
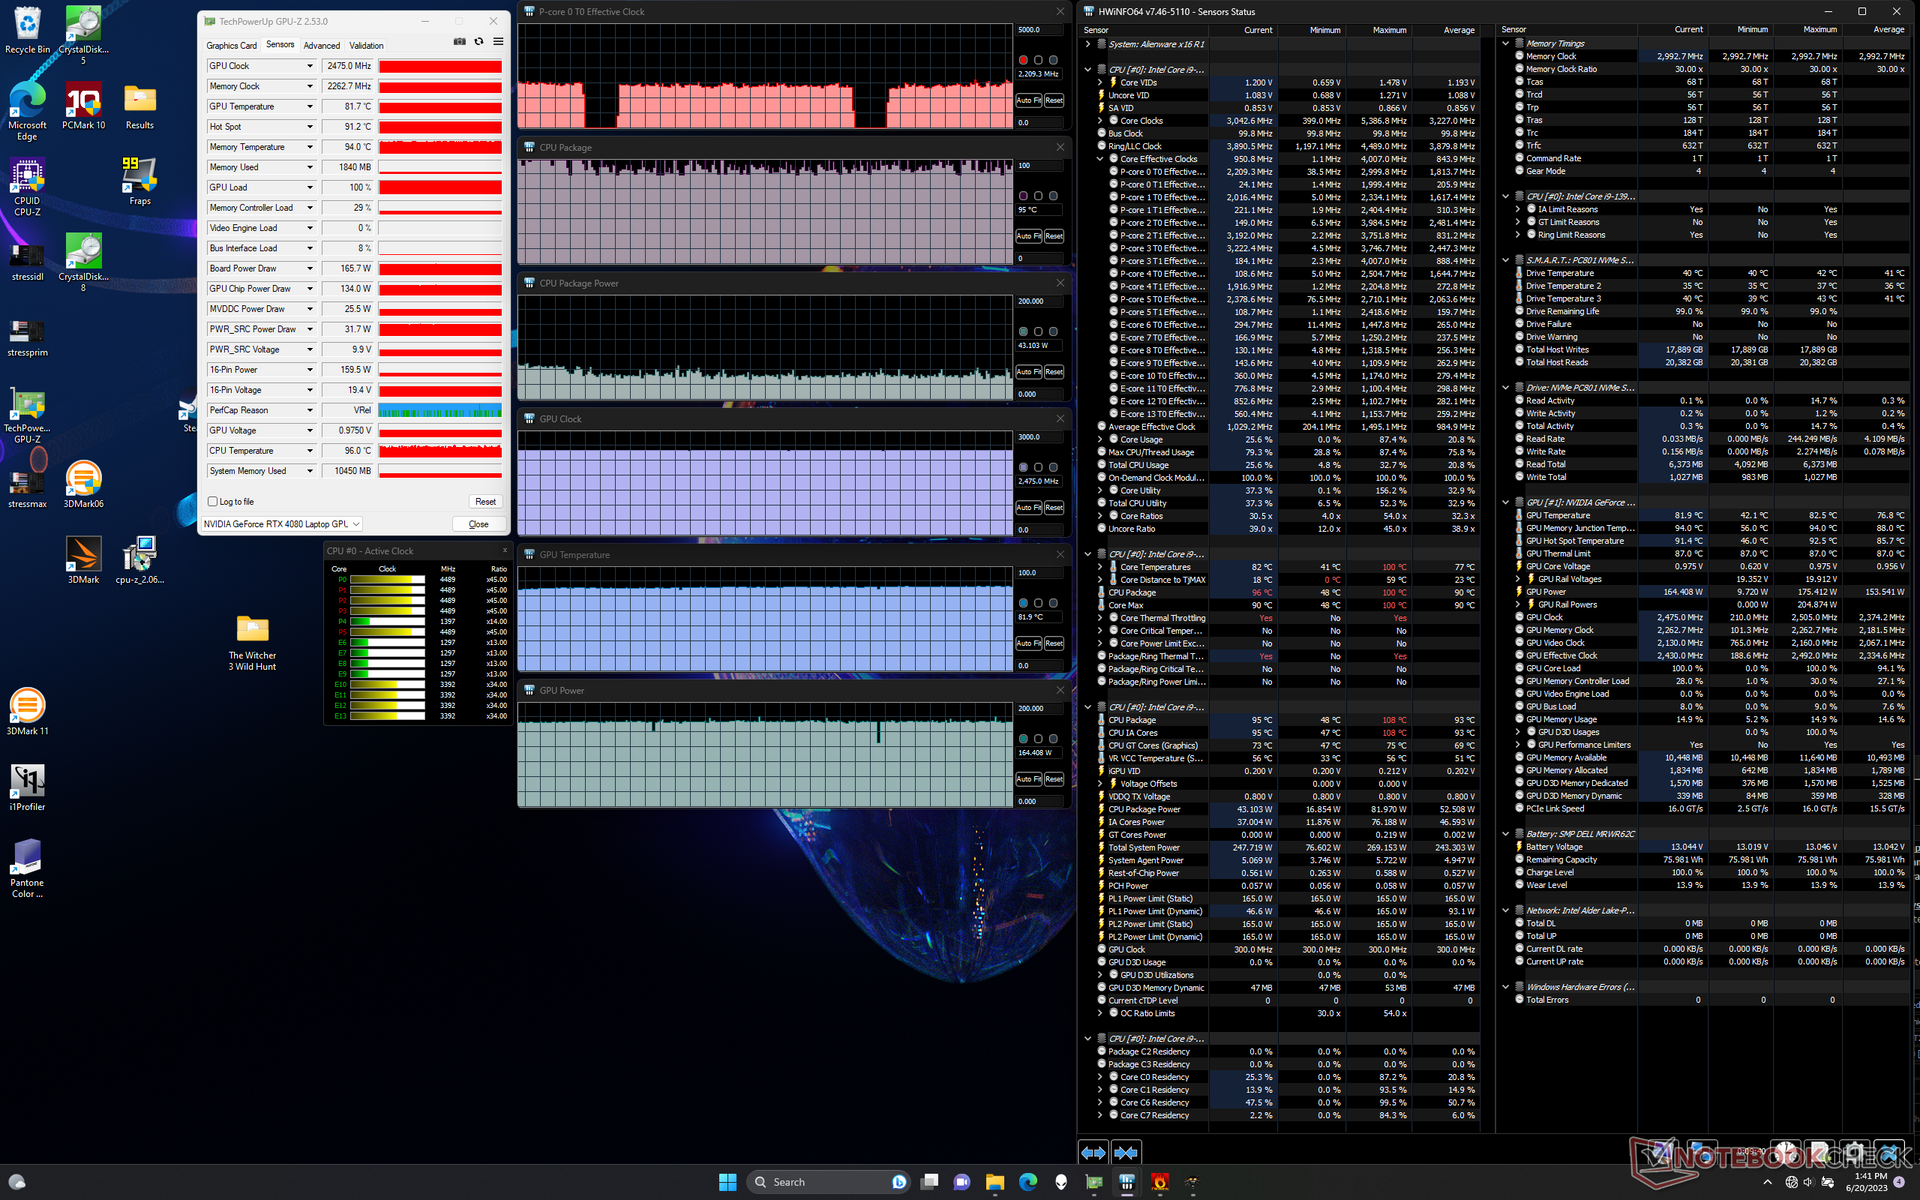
| Horloge du CPU (GHz) | Horloge du GPU (MHz) | Température moyenne du CPU (°C) | Température moyenne du GPU (°C) | |
| Système en veille | -- | -- | 44 | 30 |
| Prime95 Stress | 3.8 | -- | 99 | 51 |
| Prime95 + FurMark Stress | 2.5 - 3.6 | 2475 | 82 - 100 | 72 - 77 |
| Witcher 3 Stress(mode équilibré) | ~1.8 | 2460 | 81 | 85 |
| Witcher 3 Stress (mode Performance) | ~1,8 | 2460 | 80 | 82 |
| Witcher 3 Stress (mode Overdrive) | ~2.2 | 2475 | 95 | 82 |
Intervenants
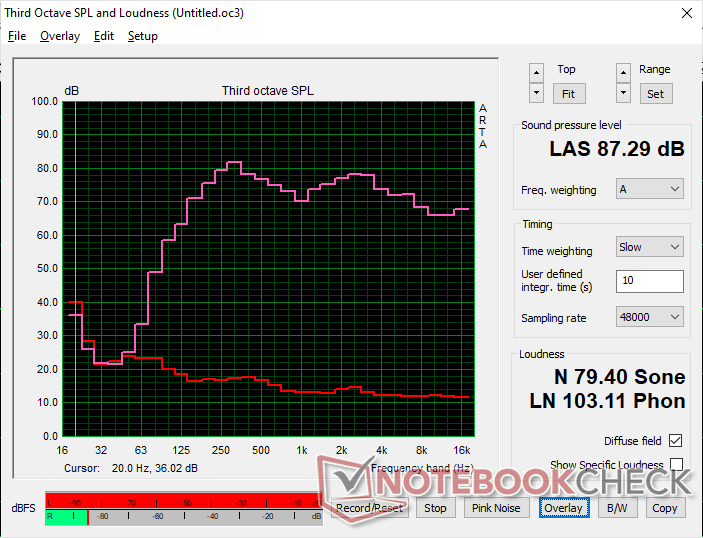
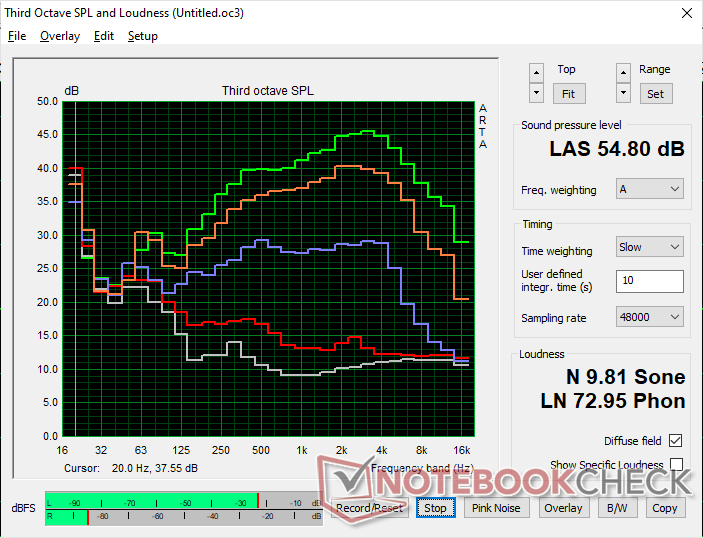
Alienware x16 R1 analyse audio
(+) | les haut-parleurs peuvent jouer relativement fort (87.3# dB)
Basses 100 - 315 Hz
(±) | basse réduite - en moyenne 7.3% inférieure à la médiane
(±) | la linéarité des basses est moyenne (9.1% delta à la fréquence précédente)
Médiums 400 - 2000 Hz
(+) | médiane équilibrée - seulement 2.2% de la médiane
(+) | les médiums sont linéaires (3.8% delta à la fréquence précédente)
Aiguës 2 - 16 kHz
(+) | des sommets équilibrés - à seulement 3.6% de la médiane
(+) | les aigus sont linéaires (3.3% delta à la fréquence précédente)
Globalement 100 - 16 000 Hz
(+) | le son global est linéaire (7.9% différence à la médiane)
Par rapport à la même classe
» 1% de tous les appareils testés de cette catégorie étaient meilleurs, 1% similaires, 98% pires
» Le meilleur avait un delta de 6%, la moyenne était de 18%, le pire était de 132%.
Par rapport à tous les appareils testés
» 2% de tous les appareils testés étaient meilleurs, 1% similaires, 98% pires
» Le meilleur avait un delta de 4%, la moyenne était de 23%, le pire était de 134%.
Apple MacBook Pro 16 2021 M1 Pro analyse audio
(+) | les haut-parleurs peuvent jouer relativement fort (84.7# dB)
Basses 100 - 315 Hz
(+) | bonne basse - seulement 3.8% loin de la médiane
(+) | les basses sont linéaires (5.2% delta à la fréquence précédente)
Médiums 400 - 2000 Hz
(+) | médiane équilibrée - seulement 1.3% de la médiane
(+) | les médiums sont linéaires (2.1% delta à la fréquence précédente)
Aiguës 2 - 16 kHz
(+) | des sommets équilibrés - à seulement 1.9% de la médiane
(+) | les aigus sont linéaires (2.7% delta à la fréquence précédente)
Globalement 100 - 16 000 Hz
(+) | le son global est linéaire (4.6% différence à la médiane)
Par rapport à la même classe
» 0% de tous les appareils testés de cette catégorie étaient meilleurs, 0% similaires, 100% pires
» Le meilleur avait un delta de 5%, la moyenne était de 17%, le pire était de 45%.
Par rapport à tous les appareils testés
» 0% de tous les appareils testés étaient meilleurs, 0% similaires, 100% pires
» Le meilleur avait un delta de 4%, la moyenne était de 23%, le pire était de 134%.
Gestion de l'énergie
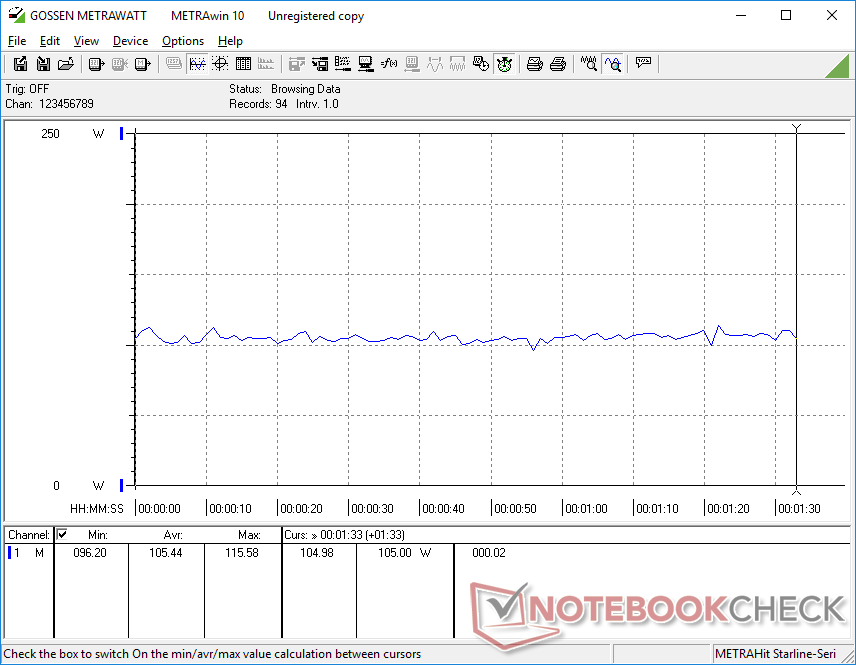
Consommation d'énergie - élevée comme prévu
La consommation d'énergie est comprise entre 25 et 50 W en mode veille, en fonction du profil d'alimentation, du GPU et des paramètres de luminosité. Cette fourchette est élevée, même pour la catégorie, car d'autres modèles de 16 pouces, comme le Razer Blade 16 ou l'Alienware m17, ont une consommation plus élevée Alienware m17 peuvent atteindre 15 W avec des paramètres de puissance minimale similaires.
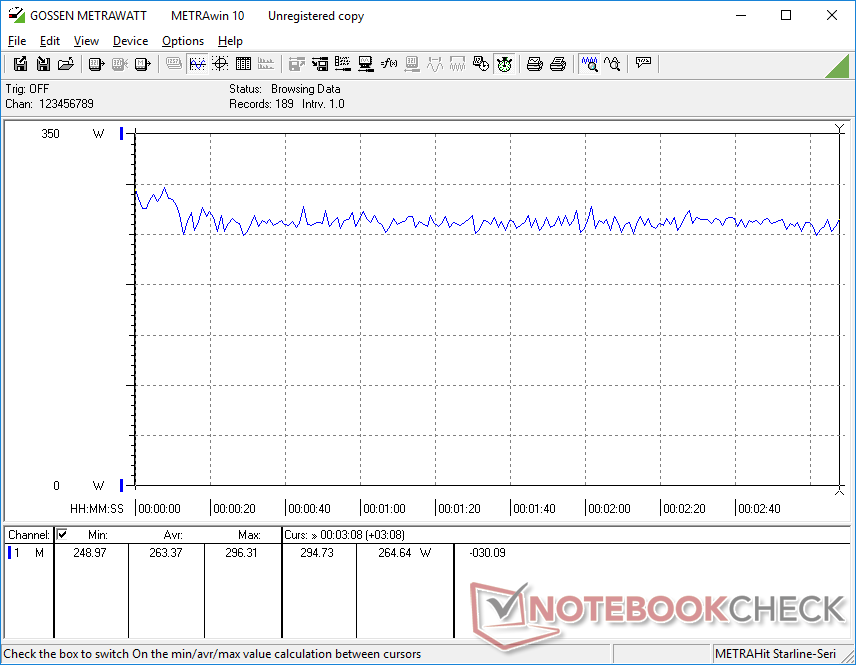
Le jeu demande environ 263 W, ce qui se situe entre l'Asus ROG Strix G16 et le MSI GE78 HX MSI GE78 HX tous deux équipés du même GPU RTX 4080. Plus important encore, le GPU RTX 4090 de l'Asus ROG Zephyrus est plus puissant que le GPU RTX 4080 Asus ROG Zephyrus M16 consomme 20 % d'énergie en moins tout en offrant à peu près les mêmes performances graphiques que notre Alienware équipé d'un GPU RTX 4080.
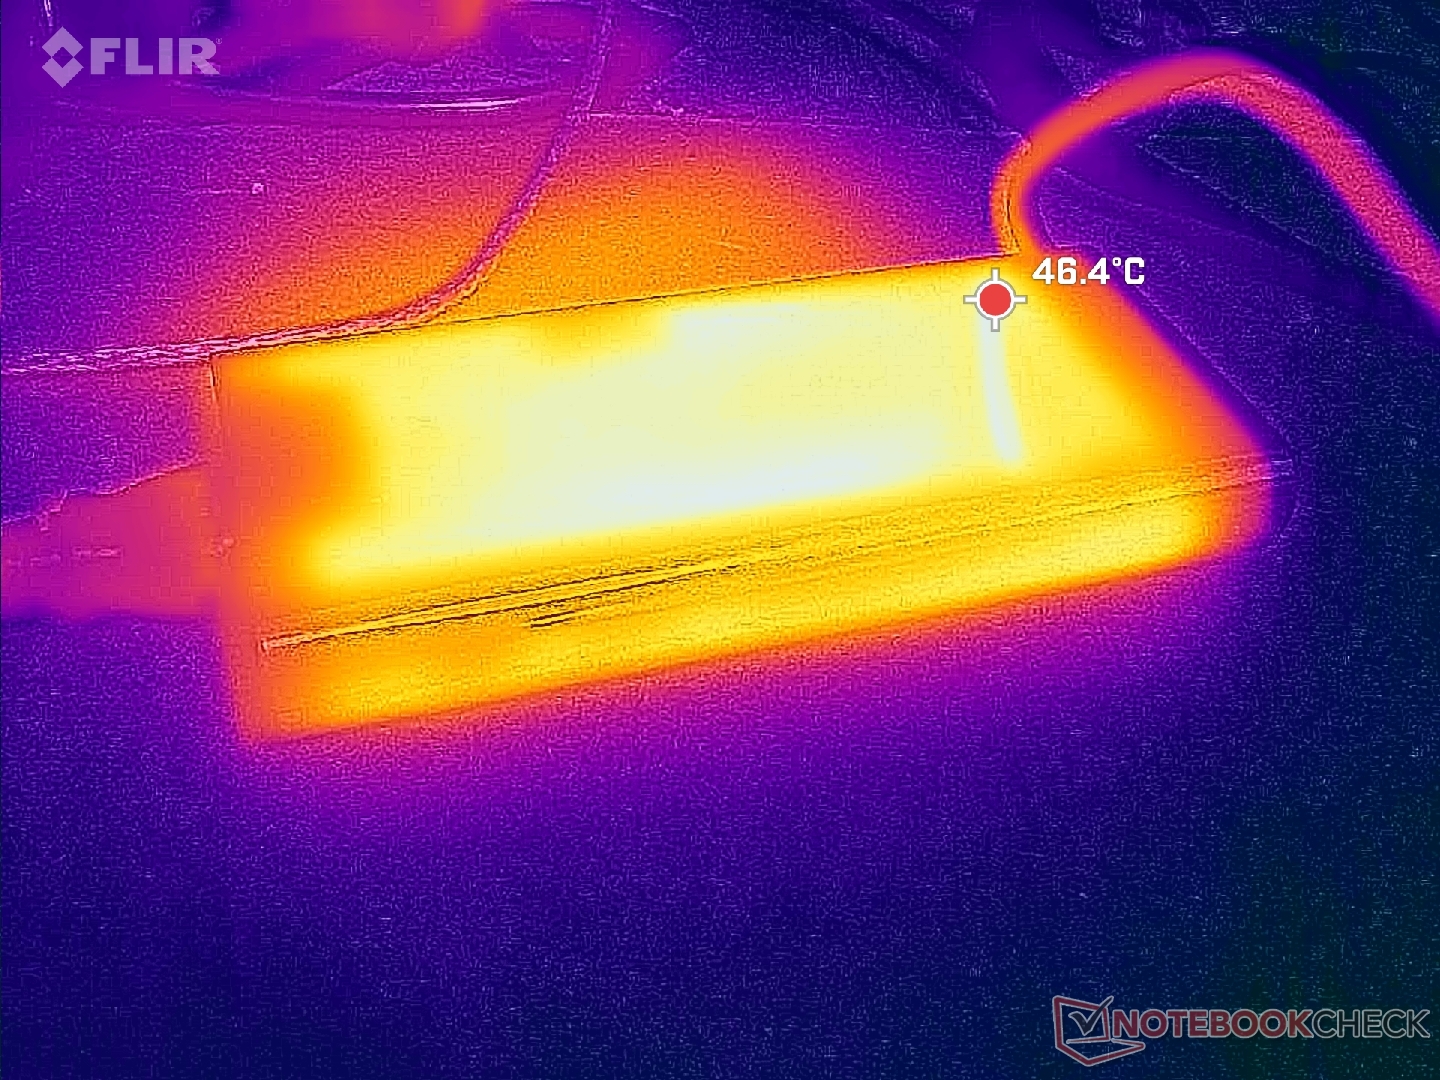
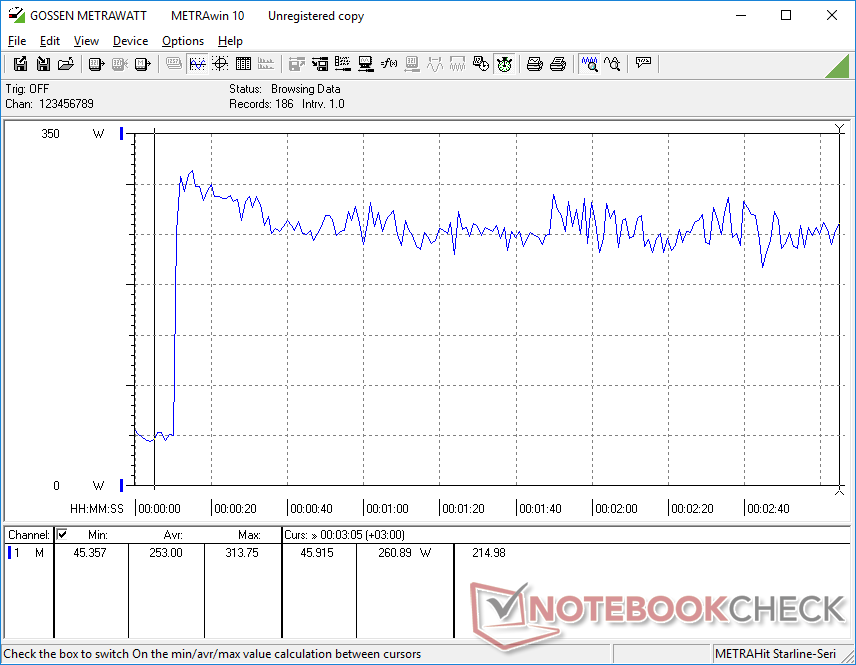
Nous avons pu mesurer une consommation maximale temporaire de 313 W à partir de l'adaptateur secteur de taille moyenne (~18,3 x 8,6 x 2,6 cm) de 330 W lorsque le CPU et le GPU sont utilisés à 100 %. Le taux de charge ralentit lors de l'exécution de charges aussi exigeantes.
| Éteint/en veille | |
| Au repos | |
| Fortement sollicité |
|
Légende:
min: | |
| Alienware x16 R1 i9-13900HK, GeForce RTX 4080 Laptop GPU, SK hynix PC801 HFS001TEJ9X101N, IPS, 2560x1600, 16" | Lenovo Legion Pro 7 RTX4090 i9-13900HX, GeForce RTX 4090 Laptop GPU, Samsung PM9A1 MZVL21T0HCLR, IPS, 2560x1600, 16" | Asus ROG Zephyrus M16 GU604VY-NM042X i9-13900H, GeForce RTX 4090 Laptop GPU, Samsung PM9A1 MZVL22T0HBLB, IPS, 2560x1600, 16" | Razer Blade 16 Early 2023 i9-13950HX, GeForce RTX 4080 Laptop GPU, SSSTC CA6-8D1024, IPS, 2560x1600, 16" | Dell G16 7620 i7-12700H, GeForce RTX 3060 Laptop GPU, WDC PC SN810 512GB, IPS, 2560x1600, 16" | Alienware m17 R5 (R9 6900HX, RX 6850M XT) R9 6900HX, Radeon RX 6850M XT, SSSTC CA6-8D1024, IPS, 3840x2160, 17" | |
|---|---|---|---|---|---|---|
| Power Consumption | 5% | 21% | 12% | 30% | 33% | |
| Idle Minimum * (Watt) | 25.2 | 20 21% | 20 21% | 15.2 40% | 14.4 43% | 13 48% |
| Idle Average * (Watt) | 29.9 | 25 16% | 24 20% | 22.8 24% | 17.8 40% | 16.5 45% |
| Idle Maximum * (Watt) | 49.8 | 35 30% | 25 50% | 49.8 -0% | 31.5 37% | 17 66% |
| Load Average * (Watt) | 105.4 | 136 -29% | 107 -2% | 121.2 -15% | 101.2 4% | 93 12% |
| Witcher 3 ultra * (Watt) | 263 | 282 -7% | 208 21% | 242 8% | 176.9 33% | 239 9% |
| Load Maximum * (Watt) | 313.8 | 320 -2% | 267 15% | 273.7 13% | 242.9 23% | 251 20% |
* ... Moindre est la valeur, meilleures sont les performances
Power Consumption Witcher 3 / Stresstest
Power Consumption external Monitor
Autonomie de la batterie
Nous n'avons pu enregistrer que 2,5 heures d'autonomie lors de notre test de navigation WLAN, même si l'ACC est réglé sur le mode Batterie et le système sur le mode iGPU Optimus. Des tests répétés donneraient des résultats similaires. Nous ne nous attendons pas à des durées d'utilisation longues pour les ordinateurs portables de jeu, mais cela reste beaucoup plus court par rapport aux plateformes concurrentes. Dell annonce une autonomie de plus de 7 heures en navigation, ce qui n'est possible que lorsque l'ordinateur est au ralenti et que la luminosité est au plus bas. Les résultats sont inhabituels car notreAlienware x17 durait deux fois plus longtemps que notre Alienware x16 lors du même test WLAN.
Le chargement de la batterie vide à la batterie pleine prend environ deux heures avec l'adaptateur secteur fourni. Le système peut également se recharger via des adaptateurs USB-C, y compris les adaptateurs de 130 W livrés avec les modèles XPS.
| Alienware x16 R1 i9-13900HK, GeForce RTX 4080 Laptop GPU, 90 Wh | Asus ROG Zephyrus M16 GU604VY-NM042X i9-13900H, GeForce RTX 4090 Laptop GPU, 90 Wh | Razer Blade 16 Early 2023 i9-13950HX, GeForce RTX 4080 Laptop GPU, 95.2 Wh | Dell G16 7620 i7-12700H, GeForce RTX 3060 Laptop GPU, 84 Wh | Alienware m17 R5 (R9 6900HX, RX 6850M XT) R9 6900HX, Radeon RX 6850M XT, 97 Wh | Lenovo Legion Pro 7 16IRX8H i9-13900HX, GeForce RTX 4080 Laptop GPU, 99.9 Wh | |
|---|---|---|---|---|---|---|
| Autonomie de la batterie | 193% | 89% | 32% | 125% | 97% | |
| Reader / Idle (h) | 7.3 | 8.9 22% | 7.1 -3% | 6.4 -12% | ||
| WiFi v1.3 (h) | 2.5 | 4.3 72% | 6.1 144% | 5 100% | 4.8 92% | 5.1 104% |
| Load (h) | 0.7 | 2.9 314% | 1.4 100% | 0.7 0% | 1.8 157% | 2.1 200% |
| H.264 (h) | 4.8 | 4.9 |
Points positifs
Points négatifs
Verdict - La finesse et le graphisme sont au rendez-vous
Il est communément admis que les performances d'un ordinateur portable sont inversement proportionnelles à sa finesse. L'Alienware x16 remet en cause cette idée en étant l'un des plus fins de sa catégorie tout en surpassant des concurrents majeurs tels que le Razer Blade 16, Asus ROG Strix G16ou le HP Omen 17 en termes de performances graphiques. Il est impressionnant que ce modèle soit capable d'intégrer un GPU RTX GeForce de 175 W, compte tenu de son profil ultra-mince.
Si vous cherchez à maximiser les performances du GPU tout en minimisant la finesse, l'Alienware x16 devrait figurer en haut de votre liste.
Il y a néanmoins plusieurs inconvénients, dont certains sont propres à l'Alienware x16. Tout d'abord, ce n'est pas parce qu'il est super fin qu'il est super petit ou léger, car le système est très grand en termes de longueur et de largeur pour compenser la hauteur Z plus fine. Ensuite, l'absence de ports sur les côtés peut compliquer la connexion de moniteurs ou d'accessoires. Enfin, le Core i9-13900HK n'offre que des améliorations marginales par rapport à la dernière générationCore i9-12900H de dernière génération, puisqu'il est loin d'être aussi puissant que leCore i9-13900HX qui est disponible sur l'Alienware m16, plus épais, mais pas sur l'Alienware x16. Des concessions en termes d'encombrement, de positionnement des ports et de performances du processeur ont probablement été nécessaires pour maximiser la puissance du GPU.
Prix et disponibilité
Dell livre maintenant l'Alienware x16 aux consommateurs à partir de 2200 $ pour la configuration de base et jusqu'à 3350 $ pour la configuration que nous avons examinée.
Alienware x16 R1
- 06/22/2023 v7 (old)
Allen Ngo
Transparency
La sélection des appareils à examiner est effectuée par notre équipe éditoriale. L'échantillon de test a été prêté à l'auteur par le fabricant ou le détaillant pour les besoins de cet examen. Le prêteur n'a pas eu d'influence sur cette évaluation et le fabricant n'a pas reçu de copie de cette évaluation avant sa publication. Il n'y avait aucune obligation de publier cet article. En tant que média indépendant, Notebookcheck n'est pas soumis à l'autorité des fabricants, des détaillants ou des éditeurs.
Voici comment Notebookcheck teste
Chaque année, Notebookcheck examine de manière indépendante des centaines d'ordinateurs portables et de smartphones en utilisant des procédures standardisées afin de garantir que tous les résultats sont comparables. Nous avons continuellement développé nos méthodes de test depuis environ 20 ans et avons établi des normes industrielles dans le processus. Dans nos laboratoires de test, des équipements de mesure de haute qualité sont utilisés par des techniciens et des rédacteurs expérimentés. Ces tests impliquent un processus de validation en plusieurs étapes. Notre système d'évaluation complexe repose sur des centaines de mesures et de points de référence bien fondés, ce qui garantit l'objectivité.Price comparison

