Test du Surface Book 3 13.5 (i7-1065G7, GTX 1650 Max-Q, UHD+) : le convertible Microsoft vieillit petit à petit...
Note | Date | Modèle | Poids | Épaisseur | Taille | Résolution | Prix |
|---|---|---|---|---|---|---|---|
| 86.9 % v7 (old) | 08/20 | Microsoft Surface Book 3 13.5 i7-1065G7, GeForce GTX 1650 Max-Q | 1.6 kg | 23 mm | 13.50" | 3000x2000 | |
| 85 % v7 (old) | 07/20 | Asus ZenBook Flip 14 UX463FA-AI039T i5-10210U, UHD Graphics 620 | 1.4 kg | 18 mm | 14.00" | 1920x1080 | |
| 89.8 % v7 (old) | 05/20 | Lenovo ThinkPad X1 Yoga 20SA000GUS i7-10510U, UHD Graphics 620 | 1.3 kg | 15.5 mm | 14.00" | 2560x1440 | |
| 88.1 % v7 (old) | 03/20 | Microsoft Surface Pro 7 i7-1065G7, Iris Plus Graphics G7 (Ice Lake 64 EU) | 790 g | 8.5 mm | 12.30" | 2736x1824 | |
| 88.4 % v7 (old) | 01/20 | HP Spectre x360 13-aw0013dx i7-1065G7, Iris Plus Graphics G7 (Ice Lake 64 EU) | 1.2 kg | 16.9 mm | 13.30" | 1920x1080 | |
| 87.4 % v6 (old) | 12/17 | Microsoft Surface Book 2 i7-8650U, GeForce GTX 1050 Mobile | 1.6 kg | 23 mm | 13.50" | 3000x2000 |
| SD Card Reader | |
| average JPG Copy Test (av. of 3 runs) | |
| HP Spectre x360 13-aw0013dx (Toshiba Exceria Pro M501 microSDXC 64GB) | |
| Microsoft Surface Book 3 13.5 (Toshiba Exceria Pro M501 microSDXC 64GB) | |
| Microsoft Surface Pro 7 (Toshiba Exceria Pro M501 microSDXC 64GB) | |
| Moyenne de la classe Convertible (28.1 - 197, n=23, 2 dernières années) | |
| Asus ZenBook Flip 14 UX463FA-AI039T (Toshiba Exceria Pro M501 microSDXC 64GB) | |
| maximum AS SSD Seq Read Test (1GB) | |
| Microsoft Surface Book 3 13.5 (Toshiba Exceria Pro M501 microSDXC 64GB) | |
| HP Spectre x360 13-aw0013dx (Toshiba Exceria Pro M501 microSDXC 64GB) | |
| Moyenne de la classe Convertible (28.9 - 254, n=22, 2 dernières années) | |
| Microsoft Surface Pro 7 (Toshiba Exceria Pro M501 microSDXC 64GB) | |
| Asus ZenBook Flip 14 UX463FA-AI039T (Toshiba Exceria Pro M501 microSDXC 64GB) | |


| |||||||||||||||||||||||||
Homogénéité de la luminosité: 86 %
Valeur mesurée au centre, sur batterie: 391 cd/m²
Contraste: 2058:1 (Valeurs des noirs: 0.19 cd/m²)
ΔE ColorChecker Calman: 3.07 | ∀{0.5-29.43 Ø4.72}
calibrated: 1.52
ΔE Greyscale Calman: 3.6 | ∀{0.09-98 Ø4.97}
95% sRGB (Argyll 1.6.3 3D)
61% AdobeRGB 1998 (Argyll 1.6.3 3D)
65.7% AdobeRGB 1998 (Argyll 3D)
95.1% sRGB (Argyll 3D)
63.5% Display P3 (Argyll 3D)
Gamma: 2.29
CCT: 6330 K
| Microsoft Surface Book 3 13.5 Panasonic MEI96A2, IPS, 3000x2000, 13.5" | Microsoft Surface Book 2 Panasonic MEI96A2 , IPS, 3000x2000, 13.5" | Asus ZenBook Flip 14 UX463FA-AI039T AU AUO323D, IPS, 1920x1080, 14" | Lenovo ThinkPad X1 Yoga 20SA000GUS AU Optronics B140QAN02.2, IPS, 2560x1440, 14" | HP Spectre x360 13-aw0013dx AU Optronics AUO5E2D, IPS, 1920x1080, 13.3" | |
|---|---|---|---|---|---|
| Display | 5% | -7% | 3% | 8% | |
| Display P3 Coverage (%) | 63.5 | 67.9 7% | 60.1 -5% | 66.6 5% | 69.6 10% |
| sRGB Coverage (%) | 95.1 | 95.7 1% | 85.5 -10% | 95.9 1% | 98.9 4% |
| AdobeRGB 1998 Coverage (%) | 65.7 | 69.4 6% | 61.1 -7% | 67.5 3% | 71.5 9% |
| Response Times | 14% | 32% | 41% | -2% | |
| Response Time Grey 50% / Grey 80% * (ms) | 57 ? | 52.8 ? 7% | 36 ? 37% | 32 ? 44% | 60.8 ? -7% |
| Response Time Black / White * (ms) | 38 ? | 30 ? 21% | 28 ? 26% | 23.6 ? 38% | 36.8 ? 3% |
| PWM Frequency (Hz) | |||||
| Screen | 10% | -30% | -7% | -22% | |
| Brightness middle (cd/m²) | 391 | 385 -2% | 280 -28% | 284.6 -27% | 447.4 14% |
| Brightness (cd/m²) | 367 | 372 1% | 286 -22% | 269 -27% | 420 14% |
| Brightness Distribution (%) | 86 | 89 3% | 78 -9% | 86 0% | 85 -1% |
| Black Level * (cd/m²) | 0.19 | 0.21 -11% | 0.208 -9% | 0.28 -47% | 0.31 -63% |
| Contrast (:1) | 2058 | 1833 -11% | 1346 -35% | 1016 -51% | 1443 -30% |
| Colorchecker dE 2000 * | 3.07 | 1.6 48% | 3.97 -29% | 2.07 33% | 4.23 -38% |
| Colorchecker dE 2000 max. * | 4.74 | 4.5 5% | 8.29 -75% | 3.75 21% | 9.34 -97% |
| Colorchecker dE 2000 calibrated * | 1.52 | 3.42 -125% | 2.05 -35% | 1.32 13% | |
| Greyscale dE 2000 * | 3.6 | 1.5 58% | 2.83 21% | 1.7 53% | 6.1 -69% |
| Gamma | 2.29 96% | 2.22 99% | 2.34 94% | 2.17 101% | 2.11 104% |
| CCT | 6330 103% | 6502 100% | 6556 99% | 6627 98% | 6136 106% |
| Color Space (Percent of AdobeRGB 1998) (%) | 61 | 64 5% | 56 -8% | 61.7 1% | 64.8 6% |
| Color Space (Percent of sRGB) (%) | 95 | 95.9 1% | 85 -11% | 95.8 1% | 98.9 4% |
| Moyenne finale (programmes/paramètres) | 10% /
9% | -2% /
-18% | 12% /
1% | -5% /
-14% |
* ... Moindre est la valeur, meilleures sont les performances
Temps de réponse de l'écran
| ↔ Temps de réponse noir à blanc | ||
|---|---|---|
| 38 ms ... hausse ↗ et chute ↘ combinées | ↗ 22 ms hausse | 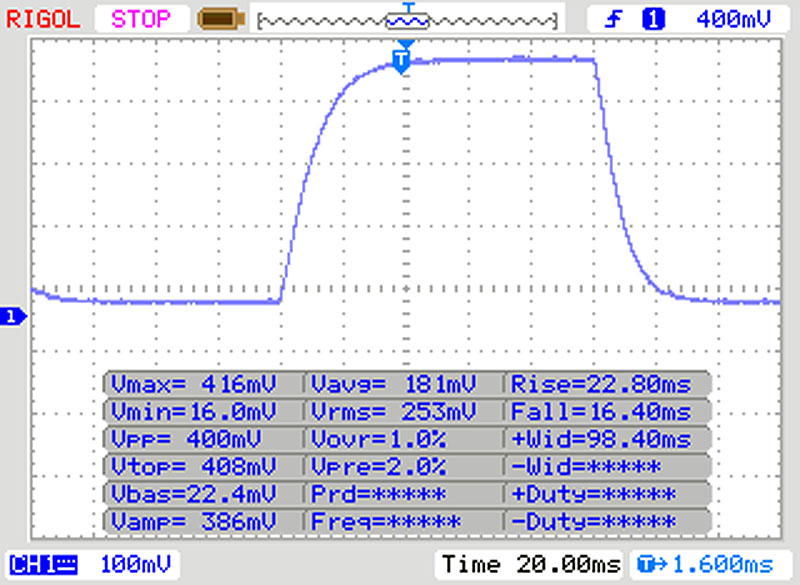 |
| ↘ 16 ms chute | ||
| L'écran souffre de latences très élevées, à éviter pour le jeu. En comparaison, tous les appareils testés affichent entre 0.1 (minimum) et 240 (maximum) ms. » 96 % des appareils testés affichent de meilleures performances. Cela signifie que les latences relevées sont moins bonnes que la moyenne (19.8 ms) de tous les appareils testés. | ||
| ↔ Temps de réponse gris 50% à gris 80% | ||
| 57 ms ... hausse ↗ et chute ↘ combinées | ↗ 28 ms hausse | 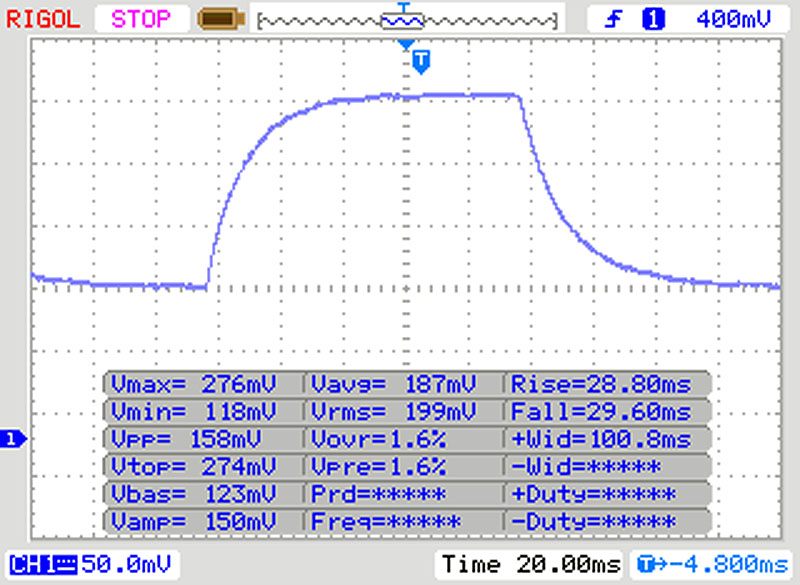 |
| ↘ 29 ms chute | ||
| L'écran souffre de latences très élevées, à éviter pour le jeu. En comparaison, tous les appareils testés affichent entre 0.165 (minimum) et 636 (maximum) ms. » 94 % des appareils testés affichent de meilleures performances. Cela signifie que les latences relevées sont moins bonnes que la moyenne (31 ms) de tous les appareils testés. | ||
Scintillement / MLI (Modulation de largeur d'impulsion)
| Scintillement / MLI (Modulation de largeur d'impulsion) non décelé |  | ||
En comparaison, 52 % des appareils testés n'emploient pas MDI pour assombrir leur écran. Nous avons relevé une moyenne à 7763 (minimum : 5 - maximum : 343500) Hz dans le cas où une MDI était active. | |||
Cinebench R15: CPU Single 64Bit | CPU Multi 64Bit
Blender: v2.79 BMW27 CPU
7-Zip 18.03: 7z b 4 -mmt1 | 7z b 4
Geekbench 5.5: Single-Core | Multi-Core
HWBOT x265 Benchmark v2.2: 4k Preset
LibreOffice : 20 Documents To PDF
R Benchmark 2.5: Overall mean
| Cinebench R20 / CPU (Single Core) | |
| Moyenne de la classe Convertible (273 - 834, n=51, 2 dernières années) | |
| Microsoft Surface Pro 7 | |
| Lenovo ThinkPad X1 Yoga 20SA000GUS | |
| Moyenne Intel Core i7-1065G7 (358 - 474, n=31) | |
| Microsoft Surface Book 3 13.5 | |
| HP Spectre x360 13-aw0013dx | |
| Cinebench R20 / CPU (Multi Core) | |
| Moyenne de la classe Convertible (595 - 12102, n=51, 2 dernières années) | |
| Microsoft Surface Pro 7 | |
| HP Spectre x360 13-aw0013dx | |
| Lenovo ThinkPad X1 Yoga 20SA000GUS | |
| Moyenne Intel Core i7-1065G7 (1081 - 2024, n=31) | |
| Microsoft Surface Book 3 13.5 | |
| Cinebench R15 / CPU Single 64Bit | |
| Moyenne de la classe Convertible (149.8 - 317, n=50, 2 dernières années) | |
| Microsoft Surface Pro 7 | |
| Lenovo ThinkPad X1 Yoga 20SA000GUS | |
| Microsoft Surface Book 3 13.5 | |
| HP Spectre x360 13-aw0013dx | |
| Microsoft Surface Book 2 | |
| Moyenne Intel Core i7-1065G7 (141 - 190, n=35) | |
| Asus ZenBook Flip 14 UX463FA-AI039T | |
| Cinebench R15 / CPU Multi 64Bit | |
| Moyenne de la classe Convertible (478 - 4940, n=50, 2 dernières années) | |
| Microsoft Surface Pro 7 | |
| Lenovo ThinkPad X1 Yoga 20SA000GUS | |
| Asus ZenBook Flip 14 UX463FA-AI039T | |
| Microsoft Surface Book 2 | |
| Moyenne Intel Core i7-1065G7 (288 - 836, n=36) | |
| HP Spectre x360 13-aw0013dx | |
| Microsoft Surface Book 3 13.5 | |
| Blender / v2.79 BMW27 CPU | |
| Microsoft Surface Book 3 13.5 | |
| Moyenne Intel Core i7-1065G7 (675 - 1650, n=23) | |
| Lenovo ThinkPad X1 Yoga 20SA000GUS | |
| Moyenne de la classe Convertible (105 - 1051, n=50, 2 dernières années) | |
| 7-Zip 18.03 / 7z b 4 -mmt1 | |
| Moyenne de la classe Convertible (3672 - 6655, n=50, 2 dernières années) | |
| Lenovo ThinkPad X1 Yoga 20SA000GUS | |
| Moyenne Intel Core i7-1065G7 (3289 - 4589, n=24) | |
| Microsoft Surface Book 3 13.5 | |
| 7-Zip 18.03 / 7z b 4 | |
| Moyenne de la classe Convertible (12977 - 121368, n=50, 2 dernières années) | |
| Moyenne Intel Core i7-1065G7 (10406 - 22898, n=24) | |
| Lenovo ThinkPad X1 Yoga 20SA000GUS | |
| Microsoft Surface Book 3 13.5 | |
| Geekbench 5.5 / Single-Core | |
| Moyenne de la classe Convertible (806 - 2275, n=50, 2 dernières années) | |
| Microsoft Surface Book 3 13.5 | |
| Moyenne Intel Core i7-1065G7 (948 - 1348, n=18) | |
| Lenovo ThinkPad X1 Yoga 20SA000GUS | |
| Geekbench 5.5 / Multi-Core | |
| Moyenne de la classe Convertible (1608 - 22023, n=50, 2 dernières années) | |
| Lenovo ThinkPad X1 Yoga 20SA000GUS | |
| Moyenne Intel Core i7-1065G7 (2464 - 4855, n=18) | |
| Microsoft Surface Book 3 13.5 | |
| HWBOT x265 Benchmark v2.2 / 4k Preset | |
| Moyenne de la classe Convertible (3.43 - 36.2, n=50, 2 dernières années) | |
| Lenovo ThinkPad X1 Yoga 20SA000GUS | |
| Moyenne Intel Core i7-1065G7 (2.2 - 6.38, n=22) | |
| Microsoft Surface Book 3 13.5 | |
| LibreOffice / 20 Documents To PDF | |
| Microsoft Surface Book 3 13.5 | |
| Moyenne Intel Core i7-1065G7 (46.9 - 85.3, n=19) | |
| Moyenne de la classe Convertible (42.5 - 84.3, n=50, 2 dernières années) | |
| Lenovo ThinkPad X1 Yoga 20SA000GUS | |
| R Benchmark 2.5 / Overall mean | |
| Microsoft Surface Book 3 13.5 | |
| Moyenne Intel Core i7-1065G7 (0.661 - 0.798, n=18) | |
| Lenovo ThinkPad X1 Yoga 20SA000GUS | |
| Moyenne de la classe Convertible (0.3915 - 0.84, n=50, 2 dernières années) | |
* ... Moindre est la valeur, meilleures sont les performances
| PCMark 8 Home Score Accelerated v2 | 3369 points | |
| PCMark 8 Work Score Accelerated v2 | 4466 points | |
| PCMark 10 Score | 4184 points | |
Aide | ||
| DPC Latencies / LatencyMon - interrupt to process latency (max), Web, Youtube, Prime95 | |
| Lenovo ThinkPad X1 Yoga 20SA000GUS | |
| Microsoft Surface Book 3 13.5 | |
| Asus ZenBook Flip 14 UX463FA-AI039T | |
* ... Moindre est la valeur, meilleures sont les performances
| Microsoft Surface Book 3 13.5 SK Hynix BC501 HFM512GDJTNG | Microsoft Surface Book 2 Samsung PM961 MZVLW256HEHP | Asus ZenBook Flip 14 UX463FA-AI039T Kingston RBUSNS8154P3512GJ1 | Lenovo ThinkPad X1 Yoga 20SA000GUS WDC PC SN730 SDBQNTY-512GB | HP Spectre x360 13-aw0013dx Intel Optane Memory H10 with Solid State Storage 32GB + 512GB HBRPEKNX0202A(L/H) | Microsoft Surface Pro 7 Toshiba KBG40ZNS256G NVMe | Moyenne SK Hynix BC501 HFM512GDJTNG | |
|---|---|---|---|---|---|---|---|
| CrystalDiskMark 5.2 / 6 | 17% | -0% | 94% | 45% | 65% | 4% | |
| Write 4K (MB/s) | 88.4 | 140.6 59% | 54.6 -38% | 152 72% | 112.6 27% | 131.3 49% | 95.5 ? 8% |
| Read 4K (MB/s) | 39.53 | 43.62 10% | 28.19 -29% | 45.96 16% | 131 231% | 52.4 33% | 38.3 ? -3% |
| Write Seq (MB/s) | 691 | 343.3 -50% | 840 22% | 2069 199% | 458.9 -34% | 1613 133% | 759 ? 10% |
| Read Seq (MB/s) | 1032 | 1452 41% | 905 -12% | 1708 66% | 1355 31% | 1613 56% | 1022 ? -1% |
| Write 4K Q32T1 (MB/s) | 279.6 | 344.4 23% | 409.5 46% | 465.4 66% | 341.3 22% | 411.6 47% | 303 ? 8% |
| Read 4K Q32T1 (MB/s) | 261.6 | 457.2 75% | 292.4 12% | 410.1 57% | 320.6 23% | 415.6 59% | 317 ? 21% |
| Write Seq Q32T1 (MB/s) | 868 | 344.3 -60% | 1038 20% | 2713 213% | 1219 40% | 2340 170% | 885 ? 2% |
| Read Seq Q32T1 (MB/s) | 2075 | 2885 39% | 1607 -23% | 3399 64% | 2462 19% | 1568 -24% | 1803 ? -13% |
| Write 4K Q8T8 (MB/s) | 410.9 | 306 ? | |||||
| Read 4K Q8T8 (MB/s) | 1033 | 698 ? | |||||
| AS SSD | -22% | 38% | -37% | -19% | 4% | ||
| Seq Read (MB/s) | 1707 | 1336 -22% | 1939 14% | 1039 -39% | 1881 10% | 1323 ? -22% | |
| Seq Write (MB/s) | 510 | 653 28% | 1380 171% | 310.1 -39% | 703 38% | 697 ? 37% | |
| 4K Read (MB/s) | 38.77 | 26.65 -31% | 41.38 7% | 76 96% | 52.3 35% | 40.4 ? 4% | |
| 4K Write (MB/s) | 100.9 | 52.7 -48% | 154.9 54% | 118 17% | 154.1 53% | 100.8 ? 0% | |
| 4K-64 Read (MB/s) | 630 | 644 2% | 970 54% | 371.8 -41% | 1048 66% | 686 ? 9% | |
| 4K-64 Write (MB/s) | 707 | 482.9 -32% | 990 40% | 469.5 -34% | 703 -1% | 660 ? -7% | |
| Access Time Read * (ms) | 0.085 | 0.074 13% | 0.055 35% | 0.067 21% | 0.069 19% | 0.06071 ? 29% | |
| Access Time Write * (ms) | 0.035 | 0.072 -106% | 0.07 -100% | 0.138 -294% | 0.221 -531% | 0.037 ? -6% | |
| Score Read (Points) | 839 | 804 -4% | 1205 44% | 552 -34% | 1288 54% | 858 ? 2% | |
| Score Write (Points) | 859 | 601 -30% | 1283 49% | 618 -28% | 927 8% | 830 ? -3% | |
| Score Total (Points) | 2077 | 1786 -14% | 3083 48% | 1448 -30% | 2826 36% | 2107 ? 1% | |
| Copy ISO MB/s (MB/s) | 2074 | 764 | 1160 | 802 ? | |||
| Copy Program MB/s (MB/s) | 630 | 465.8 | 454.7 | 265 ? | |||
| Copy Game MB/s (MB/s) | 1326 | 764 | 991 | 487 ? | |||
| Moyenne finale (programmes/paramètres) | 17% /
17% | -11% /
-13% | 66% /
62% | 4% /
-2% | 23% /
16% | 4% /
4% |
* ... Moindre est la valeur, meilleures sont les performances

Continuous reading: DiskSpd Read Loop, Queue Depth 8
| 3DMark 11 Performance | 9665 points | |
| 3DMark Cloud Gate Standard Score | 15476 points | |
| 3DMark Fire Strike Score | 6602 points | |
Aide | ||
| Bas | Moyen | Élevé | Ultra | |
|---|---|---|---|---|
| The Witcher 3 (2015) | 141.5 | 83.2 | 41.5 | 30.1 |
| Dota 2 Reborn (2015) | 61.2 | 85.6 | 81.6 | 68.3 |
| X-Plane 11.11 (2018) | 83.5 | 57.2 | 51.8 |
Degré de la nuisance sonore
| Au repos |
| 30.2 / 30.2 / 30.2 dB(A) |
| Fortement sollicité |
| 32.4 / 33.6 dB(A) |
 | ||
30 dB silencieux 40 dB(A) audible 50 dB(A) bruyant |
||
min: | ||
(±) La température maximale du côté supérieur est de 41 °C / 106 F, par rapport à la moyenne de 35.4 °C / 96 F, allant de 19.6 à 60 °C pour la classe Convertible.
(±) Le fond chauffe jusqu'à un maximum de 43.7 °C / 111 F, contre une moyenne de 36.9 °C / 98 F
(+) En utilisation inactive, la température moyenne du côté supérieur est de 27.2 °C / 81 F, par rapport à la moyenne du dispositif de 30.3 °C / 87 F.
(-) En jouant à The Witcher 3, la température moyenne du côté supérieur est de 38.9 °C / 102 F, alors que la moyenne de l'appareil est de 30.3 °C / 87 F.
(-) Les repose-poignets et le pavé tactile peuvent devenir très chauds au toucher, avec un maximum de 41.8 °C / 107.2# F.
(-) La température moyenne de la zone de l'appui-paume de dispositifs similaires était de 28 °C / 82.4 F (-13.8 °C / #-24.8 F).
Microsoft Surface Book 3 13.5 analyse audio
(-) | haut-parleurs pas très forts (61.8 dB)
Basses 100 - 315 Hz
(±) | basse réduite - en moyenne 10.4% inférieure à la médiane
(±) | la linéarité des basses est moyenne (8.2% delta à la fréquence précédente)
Médiums 400 - 2000 Hz
(+) | médiane équilibrée - seulement 4.7% de la médiane
(+) | les médiums sont linéaires (6% delta à la fréquence précédente)
Aiguës 2 - 16 kHz
(+) | des sommets équilibrés - à seulement 2.7% de la médiane
(+) | les aigus sont linéaires (6.8% delta à la fréquence précédente)
Globalement 100 - 16 000 Hz
(±) | la linéarité du son global est moyenne (19% de différence avec la médiane)
Par rapport à la même classe
» 45% de tous les appareils testés de cette catégorie étaient meilleurs, 7% similaires, 48% pires
» Le meilleur avait un delta de 6%, la moyenne était de 20%, le pire était de 57%.
Par rapport à tous les appareils testés
» 45% de tous les appareils testés étaient meilleurs, 7% similaires, 48% pires
» Le meilleur avait un delta de 4%, la moyenne était de 23%, le pire était de 134%.
Apple MacBook 12 (Early 2016) 1.1 GHz analyse audio
(+) | les haut-parleurs peuvent jouer relativement fort (83.6# dB)
Basses 100 - 315 Hz
(±) | basse réduite - en moyenne 11.3% inférieure à la médiane
(±) | la linéarité des basses est moyenne (14.2% delta à la fréquence précédente)
Médiums 400 - 2000 Hz
(+) | médiane équilibrée - seulement 2.4% de la médiane
(+) | les médiums sont linéaires (5.5% delta à la fréquence précédente)
Aiguës 2 - 16 kHz
(+) | des sommets équilibrés - à seulement 2% de la médiane
(+) | les aigus sont linéaires (4.5% delta à la fréquence précédente)
Globalement 100 - 16 000 Hz
(+) | le son global est linéaire (10.2% différence à la médiane)
Par rapport à la même classe
» 7% de tous les appareils testés de cette catégorie étaient meilleurs, 2% similaires, 91% pires
» Le meilleur avait un delta de 5%, la moyenne était de 18%, le pire était de 53%.
Par rapport à tous les appareils testés
» 5% de tous les appareils testés étaient meilleurs, 1% similaires, 94% pires
» Le meilleur avait un delta de 4%, la moyenne était de 23%, le pire était de 134%.
| Éteint/en veille | |
| Au repos | |
| Fortement sollicité |
|
Légende:
min: | |
| Microsoft Surface Book 3 13.5 i7-1065G7, GeForce GTX 1650 Max-Q, SK Hynix BC501 HFM512GDJTNG, IPS, 3000x2000, 13.5" | Microsoft Surface Book 2 i7-8650U, GeForce GTX 1050 Mobile, Samsung PM961 MZVLW256HEHP, IPS, 3000x2000, 13.5" | Asus ZenBook Flip 14 UX463FA-AI039T i5-10210U, UHD Graphics 620, Kingston RBUSNS8154P3512GJ1, IPS, 1920x1080, 14" | Lenovo ThinkPad X1 Yoga 20SA000GUS i7-10510U, UHD Graphics 620, WDC PC SN730 SDBQNTY-512GB, IPS, 2560x1440, 14" | HP Spectre x360 13-aw0013dx i7-1065G7, Iris Plus Graphics G7 (Ice Lake 64 EU), Intel Optane Memory H10 with Solid State Storage 32GB + 512GB HBRPEKNX0202A(L/H), IPS, 1920x1080, 13.3" | Microsoft Surface Pro 7 i7-1065G7, Iris Plus Graphics G7 (Ice Lake 64 EU), Toshiba KBG40ZNS256G NVMe, IPS, 2736x1824, 12.3" | Moyenne NVIDIA GeForce GTX 1650 Max-Q | Moyenne de la classe Convertible | |
|---|---|---|---|---|---|---|---|---|
| Power Consumption | -9% | 29% | 35% | 36% | 20% | -31% | 25% | |
| Idle Minimum * (Watt) | 4.8 | 4.7 2% | 3.6 25% | 3.5 27% | 3.9 19% | 4.4 8% | 7.75 ? -61% | 4.22 ? 12% |
| Idle Average * (Watt) | 9.4 | 10.6 -13% | 7.5 20% | 5.6 40% | 6.3 33% | 8.7 7% | 11.8 ? -26% | 6.97 ? 26% |
| Idle Maximum * (Watt) | 11.2 | 12.3 -10% | 9.4 16% | 6.5 42% | 6.8 39% | 9.6 14% | 16.6 ? -48% | 8.63 ? 23% |
| Load Average * (Watt) | 72 | 81 -13% | 42 42% | 42.7 41% | 32.6 55% | 44 39% | 75.2 ? -4% | 43.9 ? 39% |
| Load Maximum * (Watt) | 90 | 100.3 -11% | 51 43% | 66.5 26% | 59 34% | 61 32% | 105.5 ? -17% | 67.1 ? 25% |
| Witcher 3 ultra * (Watt) | 97 | 25.6 |
* ... Moindre est la valeur, meilleures sont les performances
| Microsoft Surface Book 3 13.5 i7-1065G7, GeForce GTX 1650 Max-Q, 69 Wh | Microsoft Surface Book 2 i7-8650U, GeForce GTX 1050 Mobile, 75 Wh | Asus ZenBook Flip 14 UX463FA-AI039T i5-10210U, UHD Graphics 620, 50 Wh | Lenovo ThinkPad X1 Yoga 20SA000GUS i7-10510U, UHD Graphics 620, 51 Wh | HP Spectre x360 13-aw0013dx i7-1065G7, Iris Plus Graphics G7 (Ice Lake 64 EU), 60 Wh | Microsoft Surface Pro 7 i7-1065G7, Iris Plus Graphics G7 (Ice Lake 64 EU), 45 Wh | Moyenne de la classe Convertible | |
|---|---|---|---|---|---|---|---|
| Autonomie de la batterie | 40% | 17% | 4% | 54% | -7% | 36% | |
| Reader / Idle (h) | 16.5 | 24.5 48% | 19.9 21% | 37.1 125% | 11.5 -30% | 27.7 ? 68% | |
| WiFi v1.3 (h) | 6.6 | 11.1 68% | 7.7 17% | 9.2 39% | 9.9 50% | 9.8 48% | 12.1 ? 83% |
| Load (h) | 3.1 | 3.2 3% | 1.6 -48% | 2.7 -13% | 1.9 -39% | 1.779 ? -43% | |
| Witcher 3 ultra (h) | 3.8 |
Points positifs
Points négatifs
Verdict
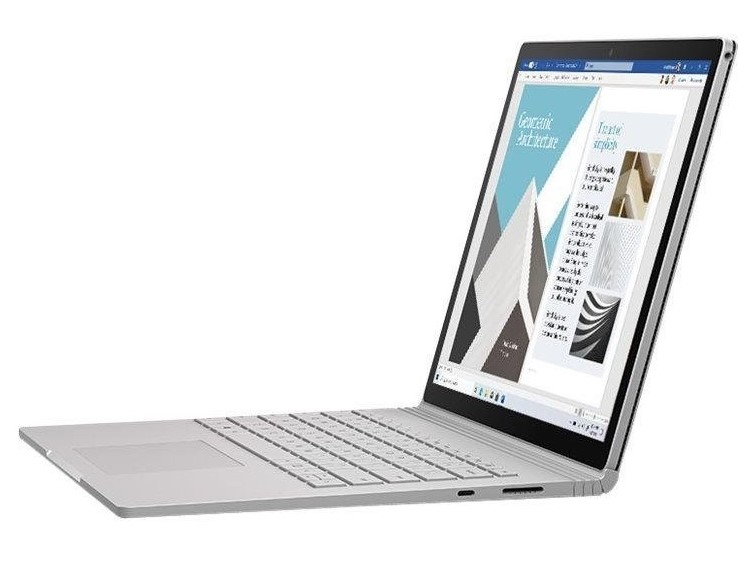
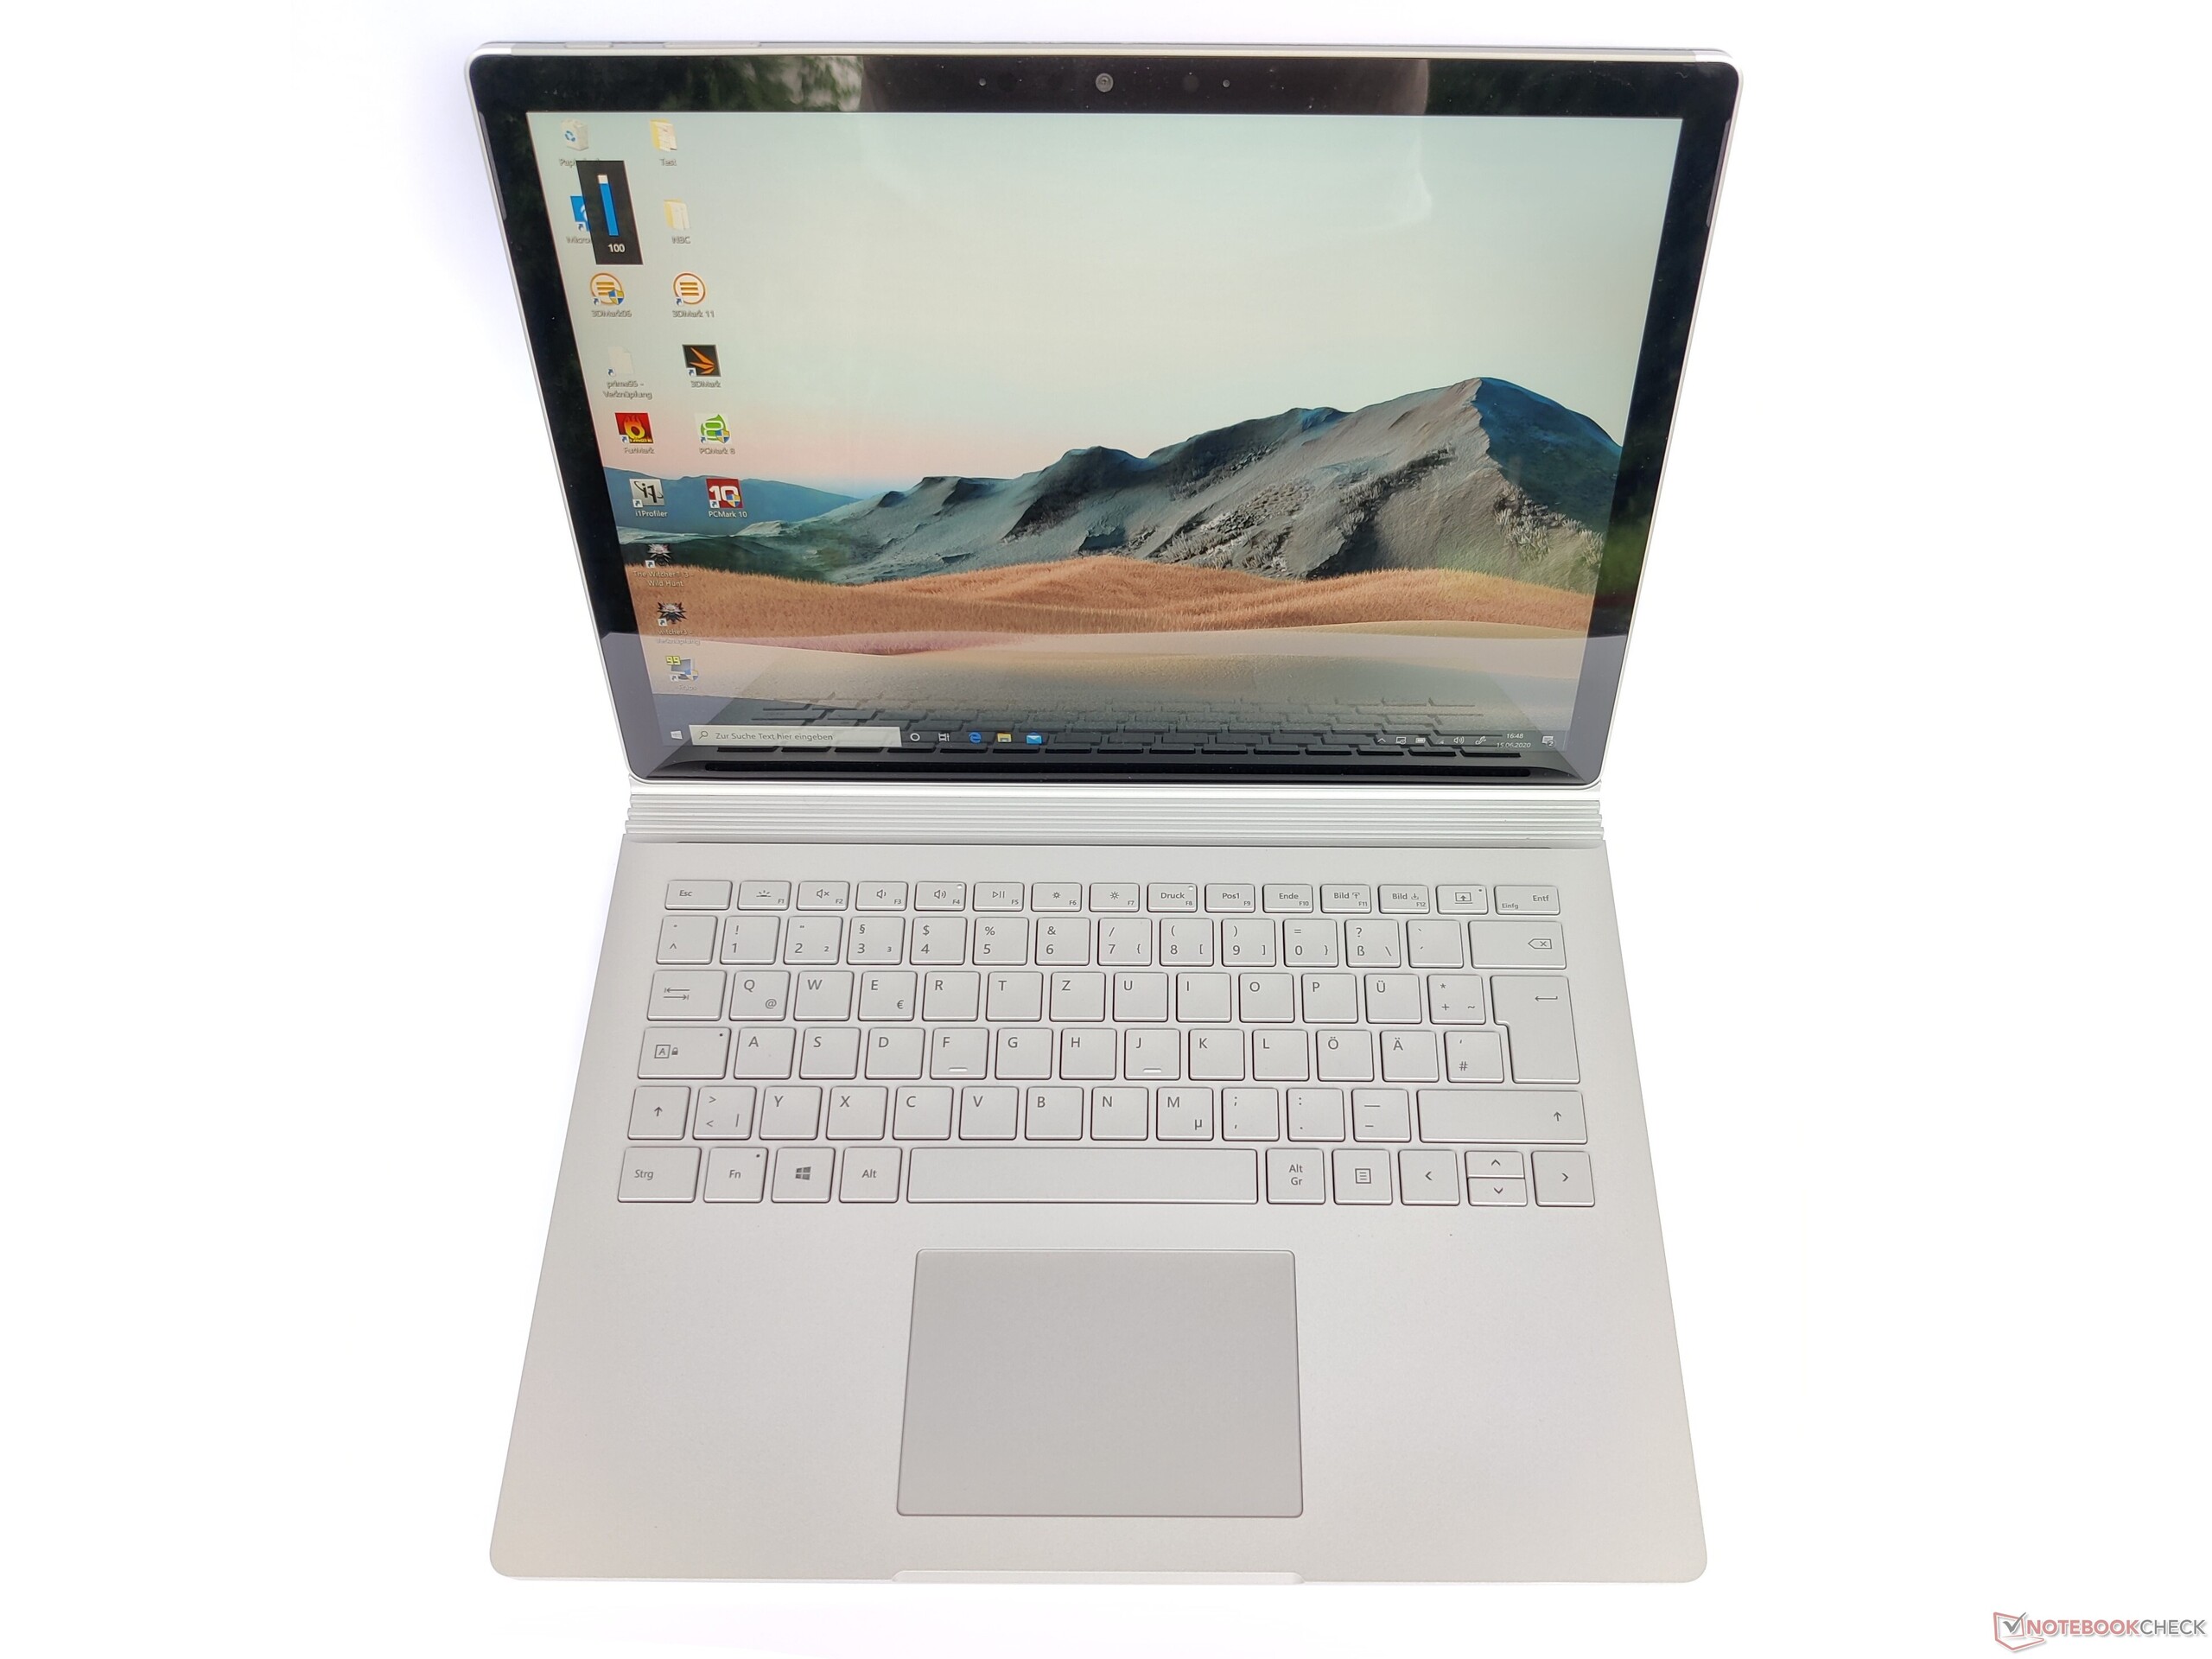
Le Microsoft Surface Book 3 13.5 possède de nombreuses qualités. Les finitions sont excellentes, et les charnières sont également uniques, en coordination avec le mécanisme d'accroche de l'écran. Mais l'ensemble devient de moins en moins original, pratiquement rien n'ayant changé dans le Surface Book. Une refonte du design bénéficierait ainsi fortement à l'appareil Windows.
Le Microsoft Surface Book 3 13.5 est un appareil de haute qualité, mais son potentiel de performances n'est pas exploité au mieux.
Microsoft cherche à séduire la clientèle en intégrant les derniers composants dans son convertible. Mais le processeur n'est pas vraiment plus performant que dans le modèle précédent, et le surcoût parfois élevé pour juste de la RAM et de l'espace de stockage ne séduira pas le portefeuille. L'achat ne vaudra donc vraiment le coup que pour ceux qui apprécient spécialement le concept du Surface Book 3 13.5, et qui sont prêts à payer le prix plus élevé d'un appareil original. Ceux qui ont le modèle précédent ne devraient penser à un changement que s'ils veulent profiter du gain de performances graphiques. En ce qui concerne les performances globales et l'autonomie, il n'y a pas de progrès.
L’intégralité de cette critique est disponible en anglais en suivant ce lien.
Microsoft Surface Book 3 13.5
- 06/29/2020 v7 (old)
Mike Wobker
Price comparison
