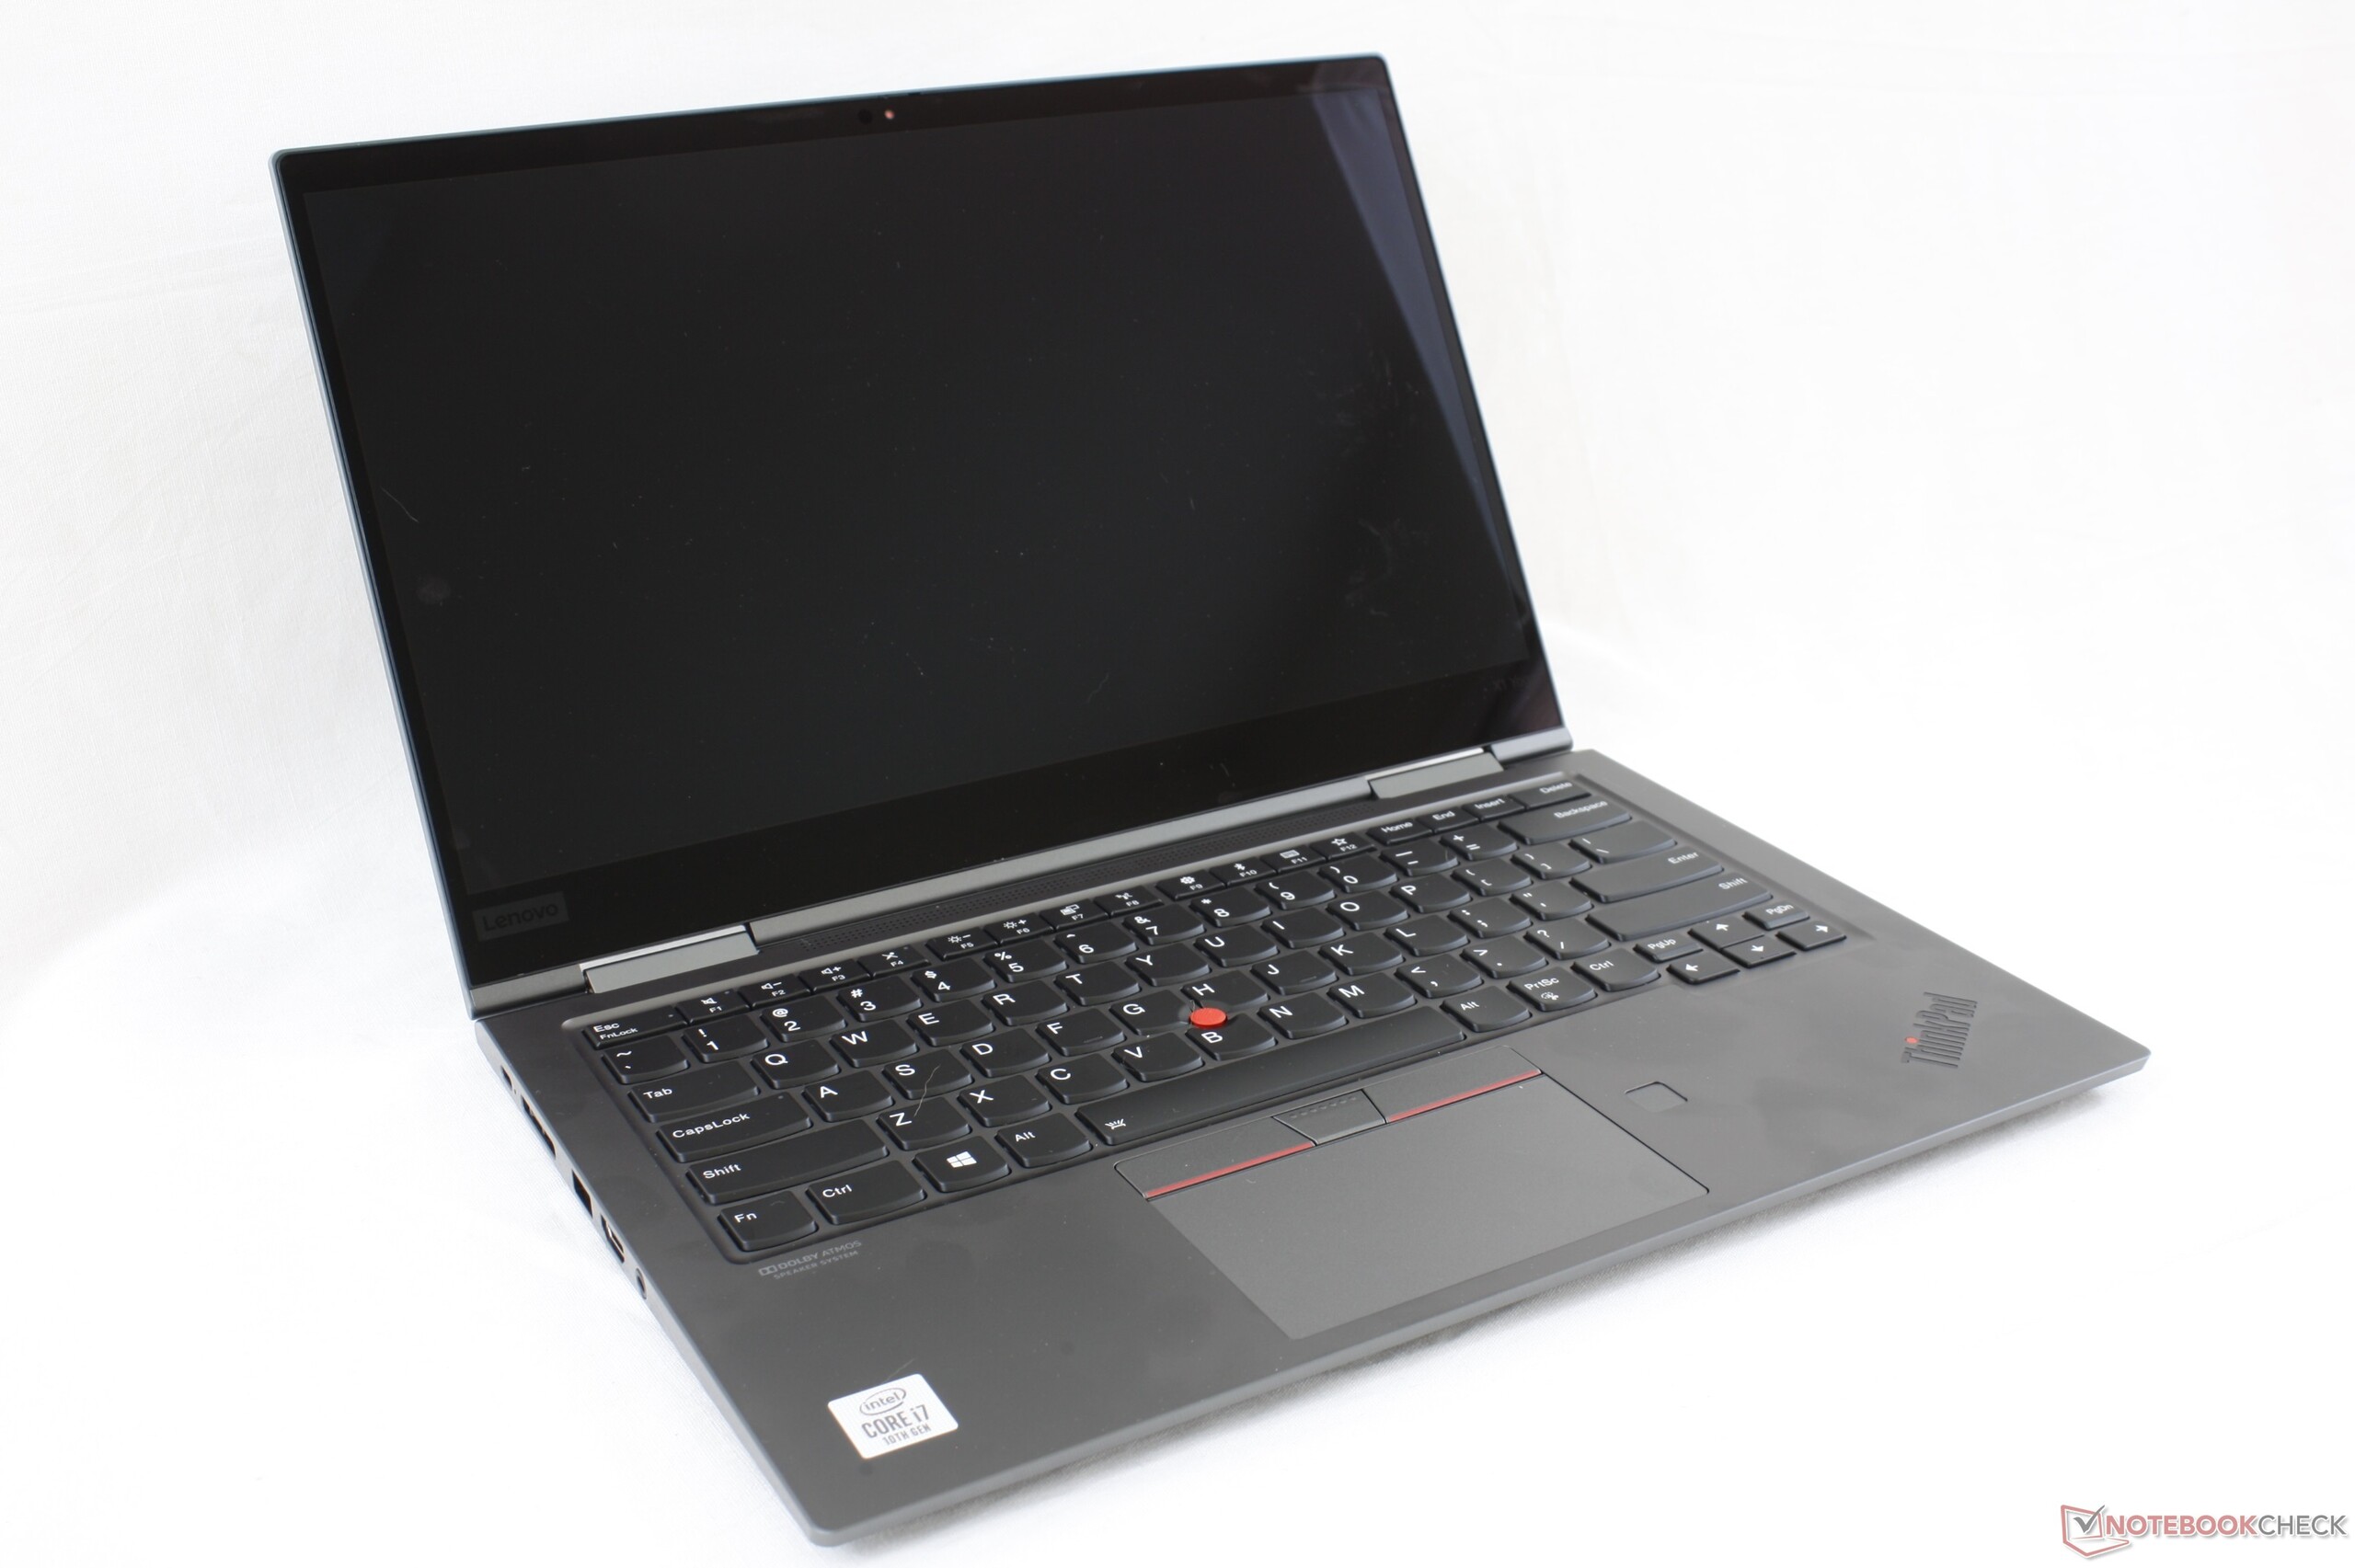
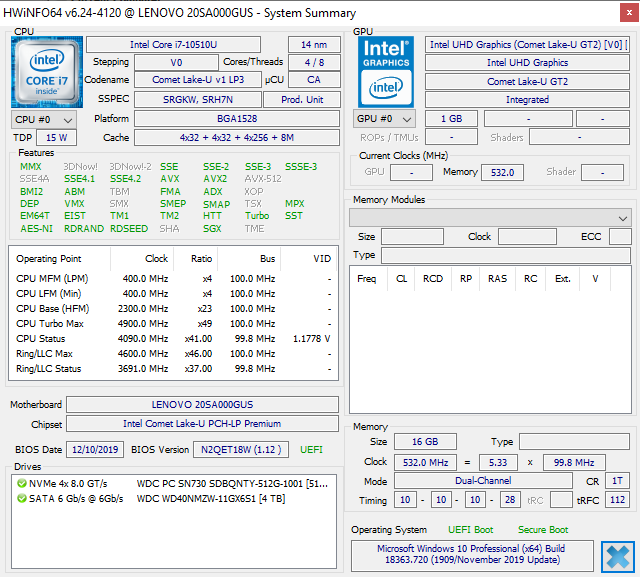
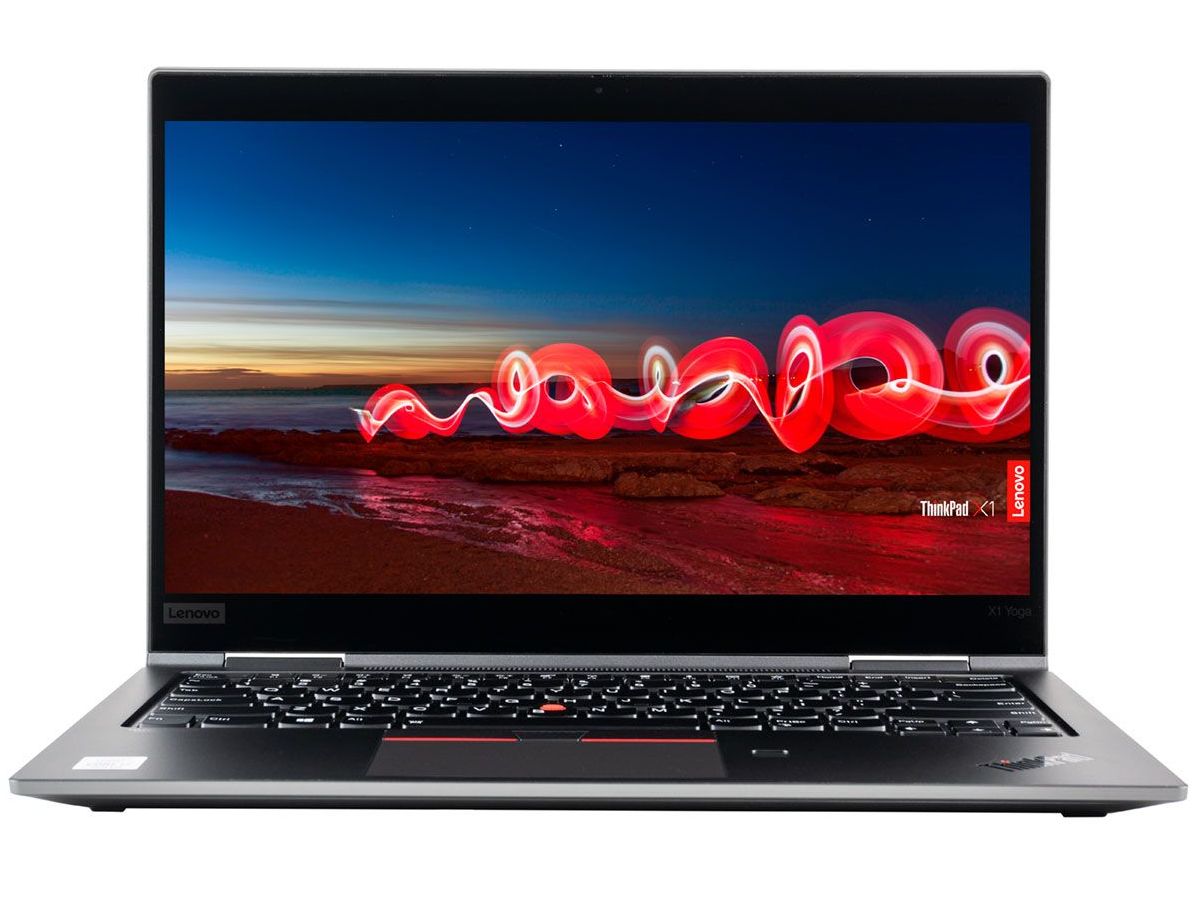
Test du Lenovo ThinkPad X1 Yoga 2020 (i7-10510U, UHD 620, FHD+) : un convertible Carbon déguisé
Note | Date | Modèle | Poids | Épaisseur | Taille | Résolution | Prix |
|---|---|---|---|---|---|---|---|
| 89.8 % v7 (old) | 05/20 | Lenovo ThinkPad X1 Yoga 20SA000GUS i7-10510U, UHD Graphics 620 | 1.3 kg | 15.5 mm | 14.00" | 2560x1440 | |
| 90.5 % v7 (old) | 02/19 | HP Elitebook x360 1040 G5 i7-8650U, UHD Graphics 620 | 1.4 kg | 16.9 mm | 14.00" | 1920x1080 | |
| 88.5 % v7 (old) | 05/20 | Lenovo ThinkPad X1 Carbon G7 20R1-000YUS i7-10510U, UHD Graphics 620 | 1.2 kg | 15.4 mm | 14.00" | 3840x2160 | |
| 87.8 % v7 (old) | 07/19 | Dell Latitude 7400 2-in-1 i7-8665U, UHD Graphics 620 | 1.5 kg | 15 mm | 14.00" | 1920x1080 | |
| 81.2 % v7 (old) | 09/19 | Asus ZenBook Flip 14 UM462DA-AI023T R7 3700U, Vega 10 | 1.6 kg | 18.9 mm | 14.00" | 1920x1080 | |
| 88 % v6 (old) | 08/17 | Lenovo ThinkPad X1 Yoga 2017 20JES03T00 i7-7600U, HD Graphics 620 | 1.4 kg | 17.4 mm | 14.00" | 2560x1440 |


| |||||||||||||||||||||||||
Homogénéité de la luminosité: 86 %
Valeur mesurée au centre, sur batterie: 284.6 cd/m²
Contraste: 1016:1 (Valeurs des noirs: 0.28 cd/m²)
ΔE ColorChecker Calman: 2.07 | ∀{0.5-29.43 Ø4.73}
calibrated: 2.05
ΔE Greyscale Calman: 1.7 | ∀{0.09-98 Ø4.97}
95.8% sRGB (Argyll 1.6.3 3D)
61.7% AdobeRGB 1998 (Argyll 1.6.3 3D)
67.5% AdobeRGB 1998 (Argyll 3D)
95.9% sRGB (Argyll 3D)
66.6% Display P3 (Argyll 3D)
Gamma: 2.17
CCT: 6627 K
| Lenovo ThinkPad X1 Yoga 20SA000GUS AU Optronics B140QAN02.2, IPS, 14", 2560x1440 | HP Elitebook x360 1040 G5 AU Optronics AUO533D, IPS, 14", 1920x1080 | Lenovo ThinkPad X1 Carbon G7 20R1-000YUS BOE NV140QUM-N53, IPS, 14", 3840x2160 | Dell Latitude 7400 2-in-1 SHP14A2, IPS, 14", 1920x1080 | Asus ZenBook Flip 14 UM462DA-AI023T IPS, 14", 1920x1080 | Lenovo ThinkPad X1 Yoga 2017 20JES03T00 LEN4140, OLED, 14", 2560x1440 | |
|---|---|---|---|---|---|---|
| Display | -3% | 17% | 4% | -7% | ||
| Display P3 Coverage (%) | 66.6 | 64.3 -3% | 83 25% | 68.6 3% | 65.5 -2% | |
| sRGB Coverage (%) | 95.9 | 94.1 -2% | 99.7 4% | 99.6 4% | 85.2 -11% | |
| AdobeRGB 1998 Coverage (%) | 67.5 | 65.5 -3% | 83.1 23% | 70 4% | 62.2 -8% | |
| Response Times | -84% | -45% | -68% | -38% | 88% | |
| Response Time Grey 50% / Grey 80% * (ms) | 32 ? | 70.8 ? -121% | 49.2 ? -54% | 56 ? -75% | 42 ? -31% | 3.6 ? 89% |
| Response Time Black / White * (ms) | 23.6 ? | 34.4 ? -46% | 32.2 ? -36% | 38 ? -61% | 34 ? -44% | 3.2 ? 86% |
| PWM Frequency (Hz) | 735 ? | 201.6 ? | 1667 ? | 240.4 ? | ||
| Screen | -1% | -75% | -4% | -62% | -48% | |
| Brightness middle (cd/m²) | 284.6 | 416.3 46% | 532 87% | 277.2 -3% | 306 8% | 243 -15% |
| Brightness (cd/m²) | 269 | 400 49% | 513 91% | 263 -2% | 294 9% | 240 -11% |
| Brightness Distribution (%) | 86 | 89 3% | 90 5% | 83 -3% | 81 -6% | 95 10% |
| Black Level * (cd/m²) | 0.28 | 0.29 -4% | 0.41 -46% | 0.2 29% | 0.39 -39% | |
| Contrast (:1) | 1016 | 1436 41% | 1298 28% | 1386 36% | 785 -23% | |
| Colorchecker dE 2000 * | 2.07 | 2.69 -30% | 6.88 -232% | 2.1 -1% | 5.16 -149% | 5.3 -156% |
| Colorchecker dE 2000 max. * | 3.75 | 4.95 -32% | 12.65 -237% | 5.91 -58% | 9.9 -164% | 8.9 -137% |
| Colorchecker dE 2000 calibrated * | 2.05 | 2.13 -4% | 2.52 -23% | 1.03 50% | 3.07 -50% | |
| Greyscale dE 2000 * | 1.7 | 2.9 -71% | 10.5 -518% | 3.4 -100% | 5.86 -245% | 3.7 -118% |
| Gamma | 2.17 101% | 2.4 92% | 1.98 111% | 2.241 98% | 2.31 95% | 1.78 124% |
| CCT | 6627 98% | 6623 98% | 7394 88% | 6030 108% | 6349 102% | 6202 105% |
| Color Space (Percent of AdobeRGB 1998) (%) | 61.7 | 60.1 -3% | 74.1 20% | 64 4% | 56 -9% | 84.8 37% |
| Color Space (Percent of sRGB) (%) | 95.8 | 94.5 -1% | 99.7 4% | 100 4% | 85 -11% | 100 4% |
| Moyenne finale (programmes/paramètres) | -29% /
-11% | -34% /
-54% | -23% /
-11% | -36% /
-48% | 20% /
-21% |
* ... Moindre est la valeur, meilleures sont les performances
Temps de réponse de l'écran
| ↔ Temps de réponse noir à blanc | ||
|---|---|---|
| 23.6 ms ... hausse ↗ et chute ↘ combinées | ↗ 12.8 ms hausse | 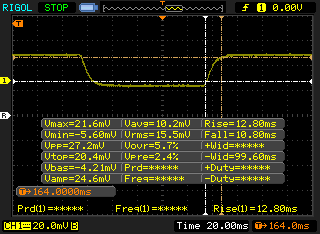 |
| ↘ 10.8 ms chute | ||
| L'écran montre de bons temps de réponse, mais insuffisant pour du jeu compétitif. En comparaison, tous les appareils testés affichent entre 0.1 (minimum) et 240 (maximum) ms. » 54 % des appareils testés affichent de meilleures performances. Cela signifie que les latences relevées sont moins bonnes que la moyenne (19.9 ms) de tous les appareils testés. | ||
| ↔ Temps de réponse gris 50% à gris 80% | ||
| 32 ms ... hausse ↗ et chute ↘ combinées | ↗ 16.4 ms hausse | 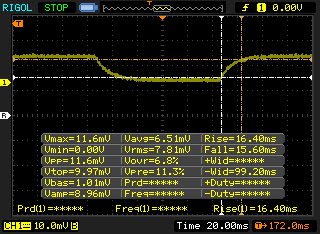 |
| ↘ 15.6 ms chute | ||
| L'écran souffre de latences très élevées, à éviter pour le jeu. En comparaison, tous les appareils testés affichent entre 0.165 (minimum) et 636 (maximum) ms. » 43 % des appareils testés affichent de meilleures performances. Cela signifie que les latences relevées sont similaires à la moyenne (31.1 ms) de tous les appareils testés. | ||
Scintillement / MLI (Modulation de largeur d'impulsion)
| Scintillement / MLI (Modulation de largeur d'impulsion) non décelé | 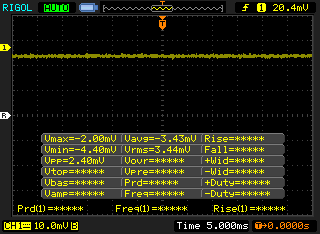 | ||
En comparaison, 52 % des appareils testés n'emploient pas MDI pour assombrir leur écran. Nous avons relevé une moyenne à 7798 (minimum : 5 - maximum : 343500) Hz dans le cas où une MDI était active. | |||
| wPrime 2.10 - 1024m | |
| Lenovo ThinkPad 13 20J1005TPB | |
| Microsoft Surface Laptop 3 13 Core i5-1035G7 | |
| Dell XPS 13 7390 Core i7-10710U | |
* ... Moindre est la valeur, meilleures sont les performances
| PCMark 8 Home Score Accelerated v2 | 3674 points | |
| PCMark 8 Work Score Accelerated v2 | 5059 points | |
| PCMark 10 Score | 4611 points | |
Aide | ||
| DPC Latencies / LatencyMon - interrupt to process latency (max), Web, Youtube, Prime95 | |
| Lenovo ThinkPad X1 Yoga 20SA000GUS | |
* ... Moindre est la valeur, meilleures sont les performances
| Lenovo ThinkPad X1 Yoga 20SA000GUS WDC PC SN730 SDBQNTY-512GB | HP Elitebook x360 1040 G5 Samsung SSD PM981 MZVLB512HAJQ | Lenovo ThinkPad X1 Carbon G7 20R1-000YUS WDC PC SN730 SDBPNTY-512G | Dell Latitude 7400 2-in-1 Toshiba XG6 KXG60ZNV512G | Lenovo ThinkPad X1 Yoga 2017 20JES03T00 Samsung SSD PM961 1TB M.2 PCIe 3.0 x4 NVMe (MZVLW1T0) | |
|---|---|---|---|---|---|
| AS SSD | 8% | -9% | -53% | 36% | |
| Seq Read (MB/s) | 1939 | 1816 -6% | 1786 -8% | 2289 18% | 2783 44% |
| Seq Write (MB/s) | 1380 | 1270 -8% | 1259 -9% | 1163 -16% | 1734 26% |
| 4K Read (MB/s) | 41.38 | 46.25 12% | 45.86 11% | 22.29 -46% | 56.4 36% |
| 4K Write (MB/s) | 154.9 | 104.1 -33% | 147.9 -5% | 28.92 -81% | 158.1 2% |
| 4K-64 Read (MB/s) | 970 | 1342 38% | 885 -9% | 415.6 -57% | 2140 121% |
| 4K-64 Write (MB/s) | 990 | 1209 22% | 950 -4% | 199.5 -80% | 1196 21% |
| Access Time Read * (ms) | 0.055 | 0.043 22% | 0.058 -5% | 0.122 -122% | 0.029 47% |
| Access Time Write * (ms) | 0.07 | 0.035 50% | 0.074 -6% | 0.143 -104% | 0.023 67% |
| Score Read (Points) | 1205 | 1569 30% | 1110 -8% | 667 -45% | 2475 105% |
| Score Write (Points) | 1283 | 1440 12% | 1224 -5% | 345 -73% | 1527 19% |
| Score Total (Points) | 3083 | 3790 23% | 2885 -6% | 1300 -58% | 5215 69% |
| Copy ISO MB/s (MB/s) | 2074 | 2034 -2% | 1384 -33% | 1767 -15% | 1807 -13% |
| Copy Program MB/s (MB/s) | 630 | 450.3 -29% | 525 -17% | 379.4 -40% | 444.3 -29% |
| Copy Game MB/s (MB/s) | 1326 | 1024 -23% | 1008 -24% | 1055 -20% | 1237 -7% |
| CrystalDiskMark 5.2 / 6 | -6% | 2% | -48% | ||
| Write 4K (MB/s) | 152 | 122.7 -19% | 151.5 0% | 35.06 -77% | |
| Read 4K (MB/s) | 45.96 | 46.57 1% | 45.83 0% | 23.64 -49% | |
| Write Seq (MB/s) | 2069 | 1725 -17% | 2060 0% | 1537 -26% | |
| Read Seq (MB/s) | 1708 | 2392 40% | 1973 16% | 1782 4% | |
| Write 4K Q32T1 (MB/s) | 465.4 | 470.6 1% | 489.8 5% | 100.3 -78% | |
| Read 4K Q32T1 (MB/s) | 410.1 | 313.2 -24% | 386.2 -6% | 62.7 -85% | |
| Write Seq Q32T1 (MB/s) | 2713 | 1869 -31% | 2703 0% | 2698 -1% | |
| Read Seq Q32T1 (MB/s) | 3399 | 3380 -1% | 3376 -1% | 1073 -68% | |
| Moyenne finale (programmes/paramètres) | 1% /
3% | -4% /
-5% | -51% /
-51% | 36% /
36% |
* ... Moindre est la valeur, meilleures sont les performances

| 3DMark 11 Performance | 2208 points | |
| 3DMark Ice Storm Standard Score | 70296 points | |
| 3DMark Cloud Gate Standard Score | 9942 points | |
| 3DMark Fire Strike Score | 1236 points | |
| 3DMark Time Spy Score | 495 points | |
Aide | ||
| Bas | Moyen | Élevé | Ultra | |
|---|---|---|---|---|
| The Witcher 3 (2015) | 16 | |||
| Dota 2 Reborn (2015) | 78.2 | 52.6 | 22.4 | 19.9 |
| X-Plane 11.11 (2018) | 12.2 | 10.6 | 9.46 |
| Lenovo ThinkPad X1 Yoga 20SA000GUS UHD Graphics 620, i7-10510U, WDC PC SN730 SDBQNTY-512GB | HP Elitebook x360 1040 G5 UHD Graphics 620, i7-8650U, Samsung SSD PM981 MZVLB512HAJQ | Lenovo ThinkPad X1 Carbon G7 20R1-000YUS UHD Graphics 620, i7-10510U, WDC PC SN730 SDBPNTY-512G | Dell Latitude 7400 2-in-1 UHD Graphics 620, i7-8665U, Toshiba XG6 KXG60ZNV512G | Asus ZenBook Flip 14 UM462DA-AI023T Vega 10, R7 3700U | Lenovo ThinkPad X1 Yoga 2017 20JES03T00 HD Graphics 620, i7-7600U, Samsung SSD PM961 1TB M.2 PCIe 3.0 x4 NVMe (MZVLW1T0) | |
|---|---|---|---|---|---|---|
| Noise | -1% | -2% | 6% | -6% | -8% | |
| arrêt / environnement * (dB) | 28.4 | 28.3 -0% | 28.2 1% | 28.2 1% | 30 -6% | 29.3 -3% |
| Idle Minimum * (dB) | 28.4 | 28.3 -0% | 28.2 1% | 28.2 1% | 30 -6% | 29.3 -3% |
| Idle Average * (dB) | 28.4 | 28.3 -0% | 28.2 1% | 28.2 1% | 30 -6% | 31.1 -10% |
| Idle Maximum * (dB) | 29.3 | 28.3 3% | 29.4 -0% | 28.3 3% | 30 -2% | 33.3 -14% |
| Load Average * (dB) | 29.3 | 32.6 -11% | 31.5 -8% | 28.2 4% | 34.2 -17% | 33.3 -14% |
| Load Maximum * (dB) | 38.2 | 36.6 4% | 41.2 -8% | 28.8 25% | 37.5 2% | 38.9 -2% |
* ... Moindre est la valeur, meilleures sont les performances
Degré de la nuisance sonore
| Au repos |
| 28.4 / 28.4 / 29.3 dB(A) |
| Fortement sollicité |
| 29.3 / 38.2 dB(A) |
 | ||
30 dB silencieux 40 dB(A) audible 50 dB(A) bruyant |
||
min: | ||
(±) La température maximale du côté supérieur est de 42.4 °C / 108 F, par rapport à la moyenne de 35.4 °C / 96 F, allant de 19.6 à 60 °C pour la classe Convertible.
(-) Le fond chauffe jusqu'à un maximum de 49.4 °C / 121 F, contre une moyenne de 36.9 °C / 98 F
(+) En utilisation inactive, la température moyenne du côté supérieur est de 23 °C / 73 F, par rapport à la moyenne du dispositif de 30.3 °C / 87 F.
(+) Les repose-poignets et le pavé tactile atteignent la température maximale de la peau (32.6 °C / 90.7 F) et ne sont donc pas chauds.
(-) La température moyenne de la zone de l'appui-paume de dispositifs similaires était de 28 °C / 82.4 F (-4.6 °C / #-8.3 F).
| Éteint/en veille | |
| Au repos | |
| Fortement sollicité |
|
Légende:
min: | |
| Lenovo ThinkPad X1 Yoga 20SA000GUS i7-10510U, UHD Graphics 620, WDC PC SN730 SDBQNTY-512GB, IPS, 2560x1440, 14" | HP Elitebook x360 1040 G5 i7-8650U, UHD Graphics 620, Samsung SSD PM981 MZVLB512HAJQ, IPS, 1920x1080, 14" | Lenovo ThinkPad X1 Carbon G7 20R1-000YUS i7-10510U, UHD Graphics 620, WDC PC SN730 SDBPNTY-512G, IPS, 3840x2160, 14" | Dell Latitude 7400 2-in-1 i7-8665U, UHD Graphics 620, Toshiba XG6 KXG60ZNV512G, IPS, 1920x1080, 14" | Asus ZenBook Flip 14 UM462DA-AI023T R7 3700U, Vega 10, , IPS, 1920x1080, 14" | Lenovo ThinkPad X1 Yoga 2017 20JES03T00 i7-7600U, HD Graphics 620, Samsung SSD PM961 1TB M.2 PCIe 3.0 x4 NVMe (MZVLW1T0), OLED, 2560x1440, 14" | |
|---|---|---|---|---|---|---|
| Power Consumption | -7% | -40% | 14% | -4% | -27% | |
| Idle Minimum * (Watt) | 3.5 | 2.7 23% | 3.5 -0% | 2.6 26% | 3.7 -6% | 4.9 -40% |
| Idle Average * (Watt) | 5.6 | 6.5 -16% | 10.8 -93% | 4.3 23% | 6.9 -23% | 7.6 -36% |
| Idle Maximum * (Watt) | 6.5 | 11.5 -77% | 12.5 -92% | 5.5 15% | 9.4 -45% | 13.8 -112% |
| Load Average * (Watt) | 42.7 | 38.7 9% | 47.2 -11% | 32 25% | 34 20% | 33.4 22% |
| Load Maximum * (Watt) | 66.5 | 50.5 24% | 68.8 -3% | 78.8 -18% | 44 34% | 46.5 30% |
* ... Moindre est la valeur, meilleures sont les performances
| Lenovo ThinkPad X1 Yoga 20SA000GUS i7-10510U, UHD Graphics 620, 51 Wh | HP Elitebook x360 1040 G5 i7-8650U, UHD Graphics 620, 56 Wh | Lenovo ThinkPad X1 Carbon G7 20R1-000YUS i7-10510U, UHD Graphics 620, 51 Wh | Dell Latitude 7400 2-in-1 i7-8665U, UHD Graphics 620, 78 Wh | Asus ZenBook Flip 14 UM462DA-AI023T R7 3700U, Vega 10, 42 Wh | Lenovo ThinkPad X1 Yoga 2017 20JES03T00 i7-7600U, HD Graphics 620, 56 Wh | |
|---|---|---|---|---|---|---|
| Autonomie de la batterie | 49% | 9% | 33% | -18% | -14% | |
| Reader / Idle (h) | 19.9 | 27.9 40% | 13.1 -34% | |||
| WiFi v1.3 (h) | 9.2 | 10.4 13% | 10 9% | 12.2 33% | 7.5 -18% | 6.1 -34% |
| Load (h) | 1.6 | 3.1 94% | 2 25% |
Points positifs
Points négatifs

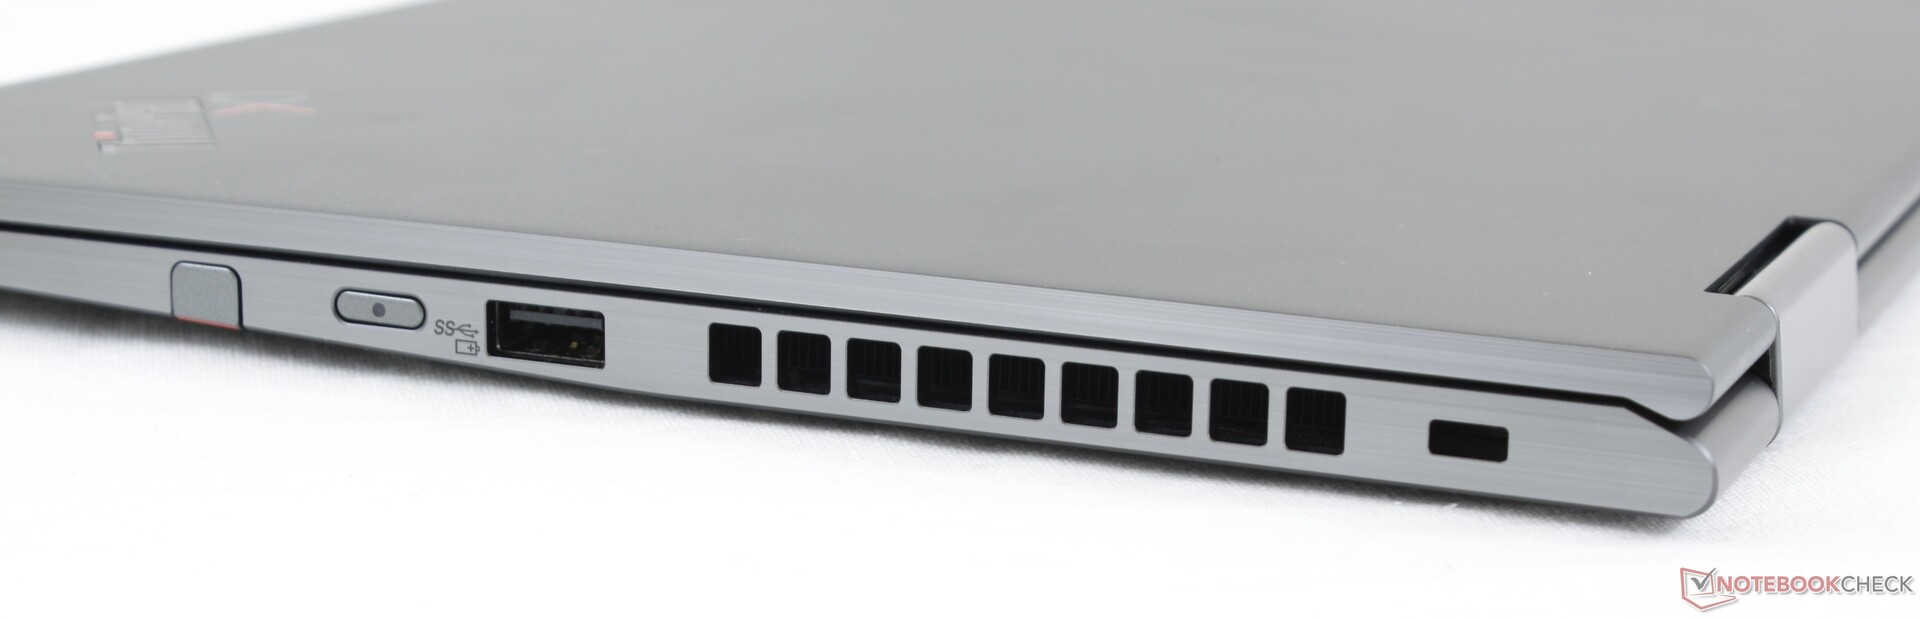
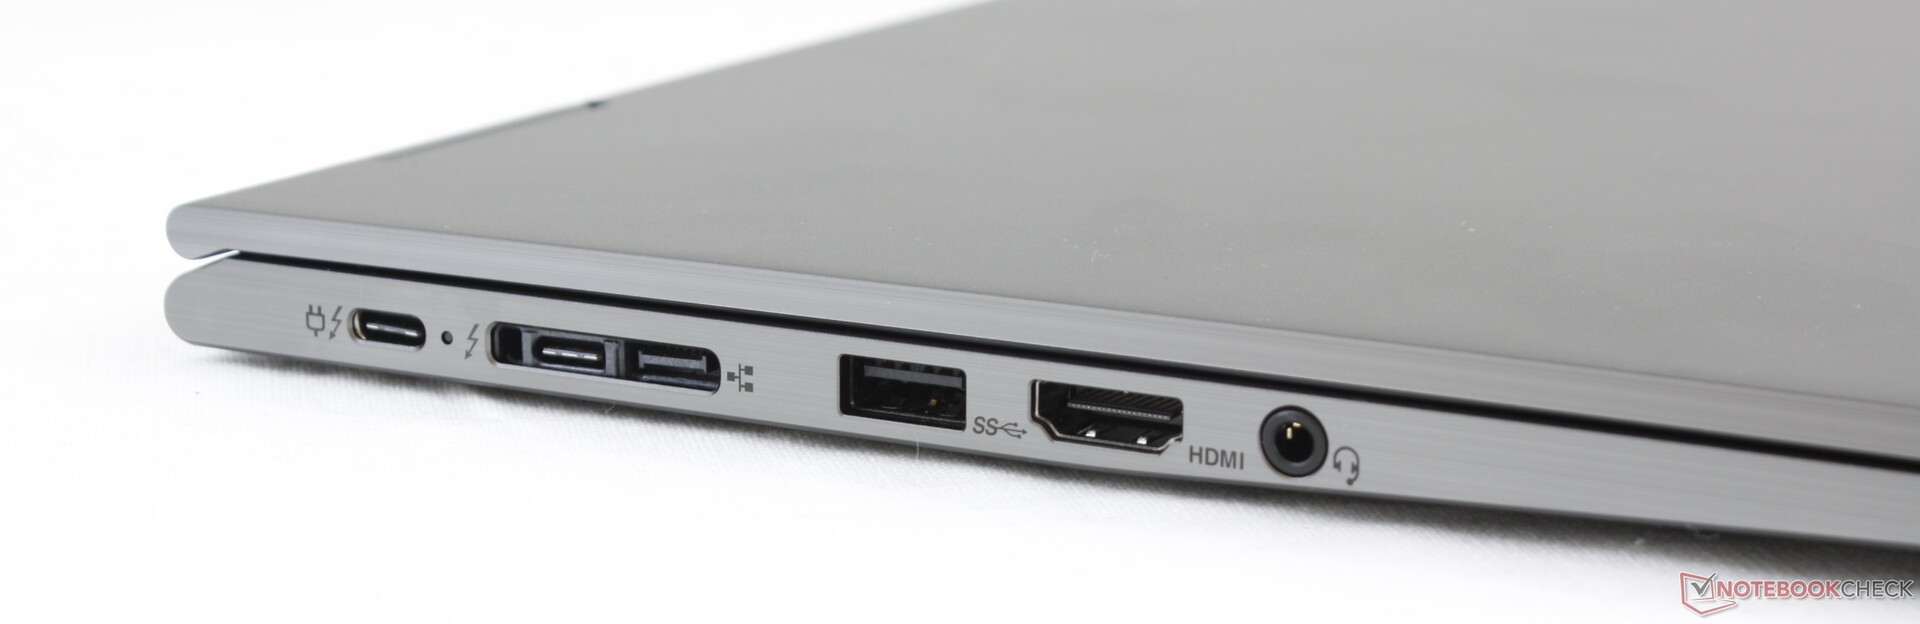
Ceux qui possèdent déjà un Lenovo ThinkPad X1 Extreme 2019 ont peu de raison de passer au modèle Comet Lake U : celui-ci n’est qu’une légère mise à jour de son prédécesseur. En revanche, ceux qui ont un PC portable pro plus ancien, devraient s’intéresser au ThinkPad convertible. Ses nombreux ports, sa bonne autonomie, son clavier confortable, son stylet intégré, son WAN optionnel, et sa légèreté en font une machine presque parfaite pour la bureautique en déplacements.
Il nous faut dire "presque parfait", parce que le système a deux défauts majeurs. Le premier, la luminosité de l’écran, qui plafonne à 300 cd/m², soit moitié-moins que les autres flagships de Dell, Apple, Samsung ou HP. Les reflets seront nombreux si vous utilisez l’appareil à l’extérieur… Lenovo propose une version à 500 cd/m², mais qui coûte plus cher. Le deuxième, les performances graphiques sont en retrait. Si l’on n'en attend pas trop d’un convertible, la UHD Graphics 620 est daté face aux AMD Ryzen et aux alternatives Ice Lake. Les éditeurs vidéo ou graphique devront laisser tomber le format 2-en-1, pour passer à un ThinkPad T490 / T495 à la place, avec des options GeForce ou Radeon.
Pour une version ultérieure, nous souhaiterions avoir le Wifi 6, des dalles à 600 ou 1 000 cd/m², et même un écran 16:10. Ces fonctionnalité auraient fait du ThinkPad X1 Yoga une machine plus facile à recommander, dans ce niveau de prix aux alentours des 2 000 €.
La différence de performances entre les versions Core i7-8565U et Core i7-10510U permettra d’économiser de l’argent sans perdre de la puissance processeur. Pour tirer profit du dernier modèle, mieux vaut regarder du côté du Core i7-10710U plus haut de gamme, ou d’une version plus lumineuse 4K UHD à 500 cd/m².
L’intégralité de cette critique est disponible en anglais en suivant ce lien.
Lenovo ThinkPad X1 Yoga 20SA000GUS
- 04/13/2020 v7 (old)
Allen Ngo
Price comparison
