Test de la Microsoft Surface Pro 7 (i7-1065G7, Iris Plus G4, FHD+) : Core i7 et performances graphiques en hausse
Note | Date | Modèle | Poids | Épaisseur | Taille | Résolution | Prix |
|---|---|---|---|---|---|---|---|
| 88.1 % v7 (old) | 03/20 | Microsoft Surface Pro 7 i7-1065G7, Iris Plus Graphics G7 (Ice Lake 64 EU) | 790 g | 8.5 mm | 12.30" | 2736x1824 | |
| 88.4 % v7 (old) | 04/20 | Microsoft Surface Pro 7 Core i5-1035G4 i5-1035G4, Iris Plus Graphics G4 (Ice Lake 48 EU) | 1.1 kg | 8.5 mm | 12.30" | 2736x1824 | |
| 89.6 % v6 (old) | 09/17 | Microsoft Surface Pro (2017) i7 i7-7660U, Iris Plus Graphics 640 | 1.1 kg | 8.5 mm | 12.30" | 2736x1824 | |
| 86.3 % v7 (old) | 10/19 | Dell XPS 13 7390 2-in-1 Core i7 i7-1065G7, Iris Plus Graphics G7 (Ice Lake 64 EU) | 1.3 kg | 13 mm | 13.40" | 1920x1200 | |
| 88.4 % v7 (old) | 01/20 | HP Spectre x360 13-aw0013dx i7-1065G7, Iris Plus Graphics G7 (Ice Lake 64 EU) | 1.2 kg | 16.9 mm | 13.30" | 1920x1080 |
| SD Card Reader | |
| average JPG Copy Test (av. of 3 runs) | |
| Microsoft Surface Book 2 15 (Toshiba Exceria Pro SDXC 64 GB UHS-II) | |
| Dell XPS 13 7390 2-in-1 Core i7 (Toshiba Exceria Pro M501 64 GB UHS-II) | |
| Microsoft Surface Pro 6, Core i7, 512 GB (Toshiba Exceria Pro M501 microSDXC 64GB) | |
| Microsoft Surface Pro 7 (Toshiba Exceria Pro M501 microSDXC 64GB) | |
| Chuwi UBook Pro (Toshiba Exceria Pro M501 64 GB UHS-II) | |
| Microsoft Surface Go MHN-00003 (Toshiba Exceria Pro M501) | |
| Moyenne de la classe Convertible (29.4 - 141, n=21, 2 dernières années) | |
| Microsoft Surface Pro (2017) i7 (Toshiba Exceria Pro M401 64 GB) | |
| maximum AS SSD Seq Read Test (1GB) | |
| Microsoft Surface Book 2 15 (Toshiba Exceria Pro SDXC 64 GB UHS-II) | |
| Dell XPS 13 7390 2-in-1 Core i7 (Toshiba Exceria Pro M501 64 GB UHS-II) | |
| Moyenne de la classe Convertible (67.5 - 254, n=20, 2 dernières années) | |
| Microsoft Surface Pro 7 (Toshiba Exceria Pro M501 microSDXC 64GB) | |
| Microsoft Surface Pro (2017) i7 (Toshiba Exceria Pro M401 64 GB) | |
| Microsoft Surface Pro 6, Core i7, 512 GB (Toshiba Exceria Pro M501 microSDXC 64GB) | |
| Microsoft Surface Go MHN-00003 (Toshiba Exceria Pro M501) | |
| Chuwi UBook Pro (Toshiba Exceria Pro M501 64 GB UHS-II) | |
| |||||||||||||||||||||||||
Homogénéité de la luminosité: 90 %
Valeur mesurée au centre, sur batterie: 435 cd/m²
Contraste: 1359:1 (Valeurs des noirs: 0.32 cd/m²)
ΔE ColorChecker Calman: 1.18 | ∀{0.5-29.43 Ø4.72}
calibrated: 3.49
ΔE Greyscale Calman: 1.12 | ∀{0.09-98 Ø4.97}
96% sRGB (Argyll 1.6.3 3D)
60% AdobeRGB 1998 (Argyll 1.6.3 3D)
65.7% AdobeRGB 1998 (Argyll 3D)
95.8% sRGB (Argyll 3D)
63.7% Display P3 (Argyll 3D)
Gamma: 2.3
CCT: 6502 K
| Microsoft Surface Pro 7 LG Philips LP123WQ112604, IPS, 2736x1824, 12.3" | Microsoft Surface Pro 7 Core i5-1035G4 LG Philips LP123WQ112604, IPS, 2736x1824, 12.3" | Dell XPS 13 7390 2-in-1 Core i7 Sharp LQ134N1, IPS, 1920x1200, 13.4" | Chuwi UBook Pro BOE TV123WAM-ND0, IPS, 1920x1280, 12.3" | Microsoft Surface Pro 6, Core i7, 512 GB LGPhilips LP123WQ112604, IPS, 2736x1824, 12.3" | |
|---|---|---|---|---|---|
| Display | 1% | 8% | -1% | 3% | |
| Display P3 Coverage (%) | 63.7 | 66 4% | 69.9 10% | 63.3 -1% | 67.1 5% |
| sRGB Coverage (%) | 95.8 | 93.8 -2% | 99.2 4% | 94 -2% | 95.5 0% |
| AdobeRGB 1998 Coverage (%) | 65.7 | 66.9 2% | 71.5 9% | 65.1 -1% | 67.9 3% |
| Response Times | 10% | -12% | 14% | 2% | |
| Response Time Grey 50% / Grey 80% * (ms) | 40 ? | 34.8 ? 13% | 47.6 ? -19% | 30.8 ? 23% | 43 ? -8% |
| Response Time Black / White * (ms) | 28 ? | 26.4 ? 6% | 29.2 ? -4% | 26.8 ? 4% | 25 ? 11% |
| PWM Frequency (Hz) | 250 ? | 21550 ? | 2500 ? | 22000 ? | |
| Screen | -92% | -16% | -90% | -58% | |
| Brightness middle (cd/m²) | 435 | 480.4 10% | 549.8 26% | 867.6 99% | 484 11% |
| Brightness (cd/m²) | 422 | 485 15% | 520 23% | 818 94% | 473 12% |
| Brightness Distribution (%) | 90 | 91 1% | 86 -4% | 83 -8% | 91 1% |
| Black Level * (cd/m²) | 0.32 | 0.48 -50% | 0.39 -22% | 0.78 -144% | 0.33 -3% |
| Contrast (:1) | 1359 | 1001 -26% | 1410 4% | 1112 -18% | 1467 8% |
| Colorchecker dE 2000 * | 1.18 | 5 -324% | 2.12 -80% | 4.64 -293% | 4.29 -264% |
| Colorchecker dE 2000 max. * | 2.27 | 7.72 -240% | 3.66 -61% | 9.22 -306% | 6.46 -185% |
| Colorchecker dE 2000 calibrated * | 3.49 | 2.44 30% | 1.37 61% | 2.31 34% | 1.34 62% |
| Greyscale dE 2000 * | 1.12 | 5.9 -427% | 2.6 -132% | 6.1 -445% | 4.3 -284% |
| Gamma | 2.3 96% | 2.38 92% | 2.3 96% | 2.22 99% | 2.51 88% |
| CCT | 6502 100% | 7805 83% | 6884 94% | 7346 88% | 7315 89% |
| Color Space (Percent of AdobeRGB 1998) (%) | 60 | 60.3 0% | 65.4 9% | 59 -2% | 62 3% |
| Color Space (Percent of sRGB) (%) | 96 | 93.2 -3% | 99.7 4% | 93.7 -2% | 95 -1% |
| Moyenne finale (programmes/paramètres) | -27% /
-62% | -7% /
-11% | -26% /
-61% | -18% /
-39% |
* ... Moindre est la valeur, meilleures sont les performances
Temps de réponse de l'écran
| ↔ Temps de réponse noir à blanc | ||
|---|---|---|
| 28 ms ... hausse ↗ et chute ↘ combinées | ↗ 16 ms hausse | 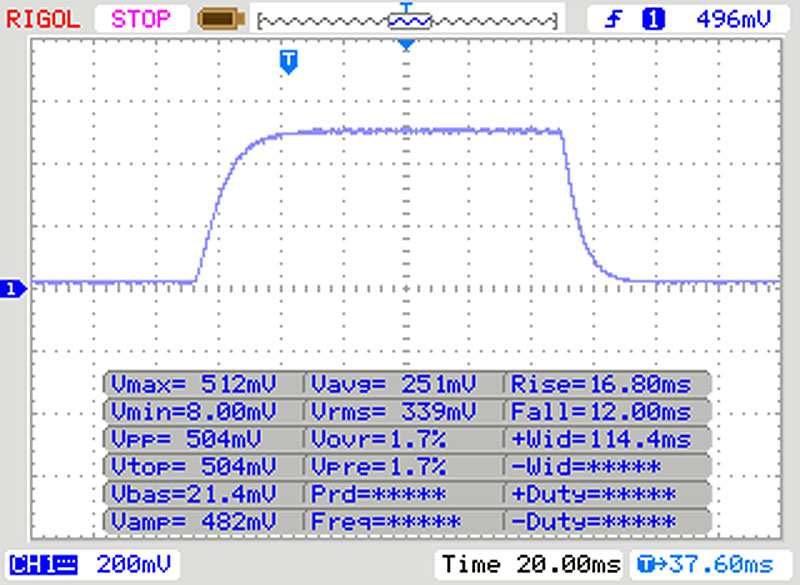 |
| ↘ 12 ms chute | ||
| L'écran souffre de latences relativement élevées, insuffisant pour le jeu. En comparaison, tous les appareils testés affichent entre 0.1 (minimum) et 240 (maximum) ms. » 71 % des appareils testés affichent de meilleures performances. Cela signifie que les latences relevées sont moins bonnes que la moyenne (19.8 ms) de tous les appareils testés. | ||
| ↔ Temps de réponse gris 50% à gris 80% | ||
| 40 ms ... hausse ↗ et chute ↘ combinées | ↗ 19 ms hausse | 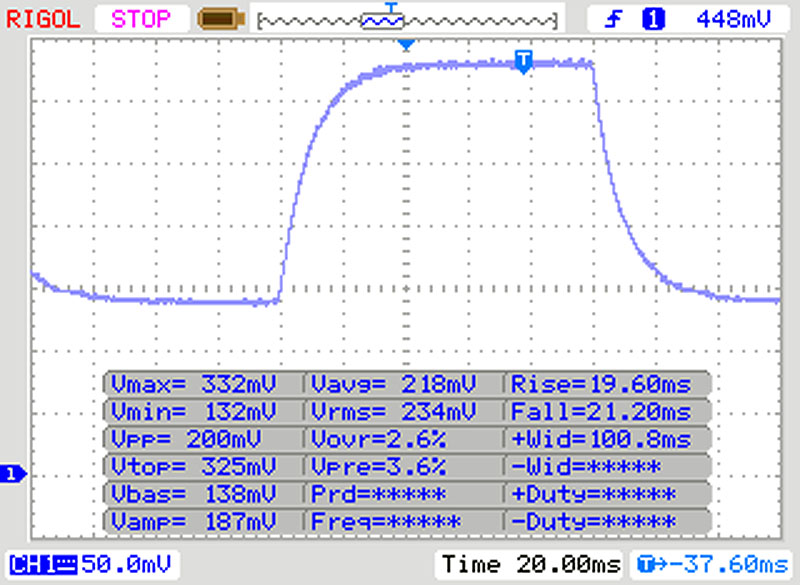 |
| ↘ 21 ms chute | ||
| L'écran souffre de latences très élevées, à éviter pour le jeu. En comparaison, tous les appareils testés affichent entre 0.165 (minimum) et 636 (maximum) ms. » 61 % des appareils testés affichent de meilleures performances. Cela signifie que les latences relevées sont moins bonnes que la moyenne (31 ms) de tous les appareils testés. | ||
Scintillement / MLI (Modulation de largeur d'impulsion)
| Scintillement / MLI (Modulation de largeur d'impulsion) décelé | 250 Hz | ≤ 50 Niveau de luminosité | 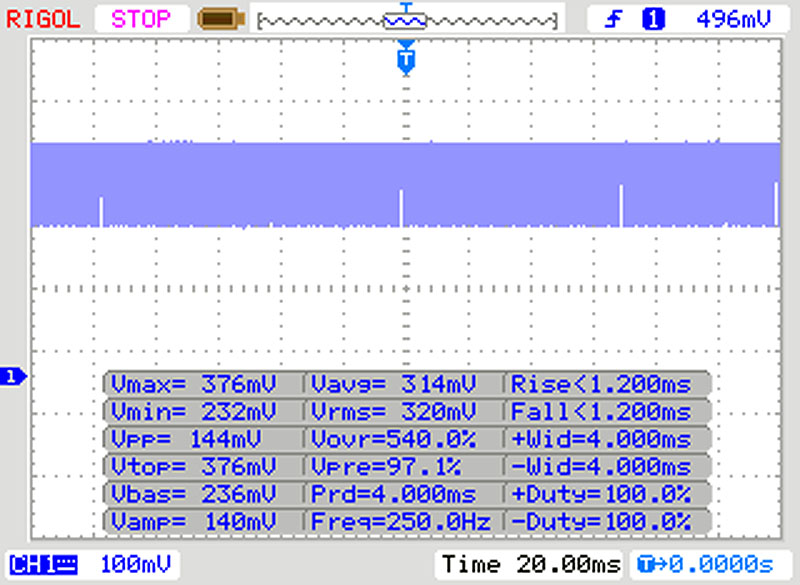 |
Le rétroéclairage de l'écran scintille à la fréquence de 250 Hz (certainement du fait de l'utilisation d'une MDI - Modulation de largeur d'impulsion) à un niveau de luminosité inférieur ou égal à 50 % . Aucun scintillement ne devrait être perceptible au-dessus de cette valeur. La fréquence de rafraîchissement de 250 Hz est relativement faible, les personnes les plus sensibles devraient percevoir un scintillement et être sujettes à une fatigue oculaire accrue (avec le niveau de luminosité indiqué) En comparaison, 52 % des appareils testés n'emploient pas MDI pour assombrir leur écran. Nous avons relevé une moyenne à 7750 (minimum : 5 - maximum : 343500) Hz dans le cas où une MDI était active. | |||
| PCMark 8 Home Score Accelerated v2 | 3660 points | |
| PCMark 8 Work Score Accelerated v2 | 3440 points | |
| PCMark 10 Score | 4367 points | |
Aide | ||
| Microsoft Surface Pro 7 Toshiba KBG40ZNS256G NVMe | Microsoft Surface Pro 7 Core i5-1035G4 Toshiba BG4 KBG40ZPZ256G | Microsoft Surface Pro (2017) i7 Samsung PM971 KUS040202M | Microsoft Surface Pro 6, Core i7, 512 GB Toshiba KBG30ZPZ512G | Moyenne Toshiba KBG40ZNS256G NVMe | |
|---|---|---|---|---|---|
| CrystalDiskMark 5.2 / 6 | -5% | -16% | -39% | -13% | |
| Write 4K (MB/s) | 131.3 | 118.5 -10% | 131.6 0% | 83.2 -37% | 112.1 ? -15% |
| Read 4K (MB/s) | 52.4 | 54.1 3% | 43.34 -17% | 43.84 -16% | 50.6 ? -3% |
| Write Seq (MB/s) | 1613 | 1166 -28% | 905 -44% | 636 -61% | 961 ? -40% |
| Read Seq (MB/s) | 1613 | 1676 4% | 985 -39% | 900 -44% | 1562 ? -3% |
| Write 4K Q32T1 (MB/s) | 411.6 | 330.5 -20% | 421.6 2% | 192.9 -53% | 299 ? -27% |
| Read 4K Q32T1 (MB/s) | 415.6 | 393.1 -5% | 498.9 20% | 247.4 -40% | 359 ? -14% |
| Write Seq Q32T1 (MB/s) | 2340 | 1569 -33% | 970 -59% | 861 -63% | 1366 ? -42% |
| Read Seq Q32T1 (MB/s) | 1568 | 2390 52% | 1670 7% | 1615 3% | 2170 ? 38% |
| Write 4K Q8T8 (MB/s) | 410.9 | 380 ? -8% | |||
| Read 4K Q8T8 (MB/s) | 1033 | 852 ? -18% | |||
| AS SSD | -31% | -275% | -60% | -23% | |
| Seq Read (MB/s) | 1881 | 1590 -15% | 1070 -43% | 1154 -39% | 1752 ? -7% |
| Seq Write (MB/s) | 703 | 714 2% | 171 -76% | 393.6 -44% | 720 ? 2% |
| 4K Read (MB/s) | 52.3 | 50.7 -3% | 41 -22% | 34.42 -34% | 47.3 ? -10% |
| 4K Write (MB/s) | 154.1 | 109.4 -29% | 0.2 -100% | 68.9 -55% | 118.6 ? -23% |
| 4K-64 Read (MB/s) | 1048 | 924 -12% | 1015 -3% | 494.1 -53% | 866 ? -17% |
| 4K-64 Write (MB/s) | 703 | 294.6 -58% | 34 -95% | 171.3 -76% | 402 ? -43% |
| Access Time Read * (ms) | 0.069 | 0.066 4% | 0.04 42% | 0.213 -209% | 0.1034 ? -50% |
| Access Time Write * (ms) | 0.221 | 0.697 -215% | 7.6 -3339% | 0.3 -36% | 0.3076 ? -39% |
| Score Read (Points) | 1288 | 1133 -12% | 1164 -10% | 644 -50% | 1088 ? -16% |
| Score Write (Points) | 927 | 475 -49% | 52 -94% | 280 -70% | 592 ? -36% |
| Score Total (Points) | 2826 | 2157 -24% | 1774 -37% | 1225 -57% | 2197 ? -22% |
| Copy ISO MB/s (MB/s) | 1160 | 1177 1% | 1036 -11% | 985 -15% | 926 ? -20% |
| Copy Program MB/s (MB/s) | 454.7 | 406 -11% | 386 -15% | 143.1 -69% | 372 ? -18% |
| Copy Game MB/s (MB/s) | 991 | 923 -7% | 582 -41% | 676 -32% | 714 ? -28% |
| Moyenne finale (programmes/paramètres) | -18% /
-21% | -146% /
-181% | -50% /
-52% | -18% /
-19% |
* ... Moindre est la valeur, meilleures sont les performances

| 3DMark 11 Performance | 4504 points | |
| 3DMark Cloud Gate Standard Score | 14315 points | |
| 3DMark Fire Strike Score | 2833 points | |
| 3DMark Time Spy Score | 793 points | |
Aide | ||
| Rocket League | |
| 1920x1080 Quality AA:Medium FX | |
| Microsoft Surface Pro 7 | |
| Dell XPS 13 7390 2-in-1 Core i7 | |
| HP Spectre x360 13-aw0013dx | |
| Microsoft Surface Pro (2017) i7 | |
| Microsoft Surface Pro 7 Core i5-1035G4 | |
| 1920x1080 High Quality AA:High FX | |
| Microsoft Surface Pro 7 | |
| Dell XPS 13 7390 2-in-1 Core i7 | |
| HP Spectre x360 13-aw0013dx | |
| Microsoft Surface Pro (2017) i7 | |
| Microsoft Surface Pro 7 Core i5-1035G4 | |
| Shadow of the Tomb Raider - 1280x720 Lowest Preset | |
| Microsoft Surface Pro 7 | |
| Dell XPS 13 7390 2-in-1 Core i7 | |
| HP Spectre x360 13-aw0013dx | |
| Microsoft Surface Pro 7 Core i5-1035G4 | |
| Microsoft Surface Pro 6, Core i7, 512 GB | |
| Bas | Moyen | Élevé | Ultra | |
|---|---|---|---|---|
| BioShock Infinite (2013) | 112.5 | 72.8 | 60.2 | 21.96 |
| Rise of the Tomb Raider (2016) | 49.16 | 30 | 15.97 | 12.56 |
| Rocket League (2017) | 95.7 | 67.5 | 44.7 | |
| Shadow of the Tomb Raider (2018) | 33 | 14 | 13 |
Degré de la nuisance sonore
| Au repos |
| 30.3 / 30.3 / 30.3 dB(A) |
| Fortement sollicité |
| 31.4 / 33.7 dB(A) |
 | ||
30 dB silencieux 40 dB(A) audible 50 dB(A) bruyant |
||
min: | ||
(±) La température maximale du côté supérieur est de 40.1 °C / 104 F, par rapport à la moyenne de 35.4 °C / 96 F, allant de 19.6 à 60 °C pour la classe Convertible.
(±) Le fond chauffe jusqu'à un maximum de 41 °C / 106 F, contre une moyenne de 36.9 °C / 98 F
(+) En utilisation inactive, la température moyenne du côté supérieur est de 28.7 °C / 84 F, par rapport à la moyenne du dispositif de 30.3 °C / 87 F.
(±) Les repose-poignets et le pavé tactile peuvent devenir très chauds au toucher, avec un maximum de 39.4 °C / 102.9# F.
(-) La température moyenne de la zone de l'appui-paume de dispositifs similaires était de 28 °C / 82.4 F (-11.4 °C / #-20.5 F).
Microsoft Surface Pro 7 analyse audio
(-) | haut-parleurs pas très forts (65.2 dB)
Basses 100 - 315 Hz
(±) | basse réduite - en moyenne 10.2% inférieure à la médiane
(±) | la linéarité des basses est moyenne (12.1% delta à la fréquence précédente)
Médiums 400 - 2000 Hz
(+) | médiane équilibrée - seulement 4.6% de la médiane
(±) | la linéarité des médiums est moyenne (10.2% delta à la fréquence précédente)
Aiguës 2 - 16 kHz
(+) | des sommets équilibrés - à seulement 3.1% de la médiane
(+) | les aigus sont linéaires (6.8% delta à la fréquence précédente)
Globalement 100 - 16 000 Hz
(±) | la linéarité du son global est moyenne (21.5% de différence avec la médiane)
Par rapport à la même classe
» 58% de tous les appareils testés de cette catégorie étaient meilleurs, 10% similaires, 31% pires
» Le meilleur avait un delta de 6%, la moyenne était de 20%, le pire était de 57%.
Par rapport à tous les appareils testés
» 61% de tous les appareils testés étaient meilleurs, 7% similaires, 32% pires
» Le meilleur avait un delta de 4%, la moyenne était de 23%, le pire était de 134%.
Apple MacBook 12 (Early 2016) 1.1 GHz analyse audio
(+) | les haut-parleurs peuvent jouer relativement fort (83.6# dB)
Basses 100 - 315 Hz
(±) | basse réduite - en moyenne 11.3% inférieure à la médiane
(±) | la linéarité des basses est moyenne (14.2% delta à la fréquence précédente)
Médiums 400 - 2000 Hz
(+) | médiane équilibrée - seulement 2.4% de la médiane
(+) | les médiums sont linéaires (5.5% delta à la fréquence précédente)
Aiguës 2 - 16 kHz
(+) | des sommets équilibrés - à seulement 2% de la médiane
(+) | les aigus sont linéaires (4.5% delta à la fréquence précédente)
Globalement 100 - 16 000 Hz
(+) | le son global est linéaire (10.2% différence à la médiane)
Par rapport à la même classe
» 7% de tous les appareils testés de cette catégorie étaient meilleurs, 2% similaires, 91% pires
» Le meilleur avait un delta de 5%, la moyenne était de 18%, le pire était de 53%.
Par rapport à tous les appareils testés
» 5% de tous les appareils testés étaient meilleurs, 1% similaires, 94% pires
» Le meilleur avait un delta de 4%, la moyenne était de 23%, le pire était de 134%.
| Éteint/en veille | |
| Au repos | |
| Fortement sollicité |
|
Légende:
min: | |
| Microsoft Surface Pro 7 i7-1065G7, Iris Plus Graphics G7 (Ice Lake 64 EU), Toshiba KBG40ZNS256G NVMe, IPS, 2736x1824, 12.3" | Microsoft Surface Pro 6, Core i7, 512 GB i7-8650U, UHD Graphics 620, Toshiba KBG30ZPZ512G, IPS, 2736x1824, 12.3" | Microsoft Surface Pro (2017) i7 i7-7660U, Iris Plus Graphics 640, Samsung PM971 KUS040202M, IPS, 2736x1824, 12.3" | Microsoft Surface Pro 7 Core i5-1035G4 i5-1035G4, Iris Plus Graphics G4 (Ice Lake 48 EU), Toshiba BG4 KBG40ZPZ256G, IPS, 2736x1824, 12.3" | Dell XPS 13 7390 2-in-1 Core i7 i7-1065G7, Iris Plus Graphics G7 (Ice Lake 64 EU), Toshiba BG4 KBG40ZPZ512G, IPS, 1920x1200, 13.4" | Moyenne Intel Iris Plus Graphics G7 (Ice Lake 64 EU) | Moyenne de la classe Convertible | |
|---|---|---|---|---|---|---|---|
| Power Consumption | 17% | 0% | -1% | 26% | 12% | 6% | |
| Idle Minimum * (Watt) | 4.4 | 3.2 27% | 4.2 5% | 4.5 -2% | 2.6 41% | 3.91 ? 11% | 4.2 ? 5% |
| Idle Average * (Watt) | 8.7 | 8.7 -0% | 10.1 -16% | 9.2 -6% | 5.3 39% | 7.33 ? 16% | 6.87 ? 21% |
| Idle Maximum * (Watt) | 9.6 | 10.4 -8% | 14 -46% | 9.6 -0% | 7 27% | 9.16 ? 5% | 8.57 ? 11% |
| Load Average * (Watt) | 44 | 29.2 34% | 37.4 15% | 42 5% | 43.1 2% | 39.2 ? 11% | 44.1 ? -0% |
| Load Maximum * (Watt) | 61 | 40.8 33% | 34 44% | 63.5 -4% | 49 20% | 49.8 ? 18% | 66.4 ? -9% |
| Witcher 3 ultra * (Watt) | 38.1 | 43.1 |
* ... Moindre est la valeur, meilleures sont les performances
| Microsoft Surface Pro 7 i7-1065G7, Iris Plus Graphics G7 (Ice Lake 64 EU), 45 Wh | Microsoft Surface Pro 7 Core i5-1035G4 i5-1035G4, Iris Plus Graphics G4 (Ice Lake 48 EU), 45 Wh | Microsoft Surface Pro (2017) i7 i7-7660U, Iris Plus Graphics 640, 45 Wh | Dell XPS 13 7390 2-in-1 Core i7 i7-1065G7, Iris Plus Graphics G7 (Ice Lake 64 EU), 51 Wh | Moyenne de la classe Convertible | |
|---|---|---|---|---|---|
| Autonomie de la batterie | 32% | 12% | -8% | 72% | |
| Reader / Idle (h) | 11.5 | 22.3 94% | 28.7 ? 150% | ||
| H.264 (h) | 6.7 | 10.2 52% | 15 ? 124% | ||
| WiFi v1.3 (h) | 9.8 | 10 2% | 8.2 -16% | 9 -8% | 12.1 ? 23% |
| Load (h) | 1.9 | 1.9 0% | 1.9 0% | 1.748 ? -8% | |
| Witcher 3 ultra (h) | 1.9 |
Points positifs
Points négatifs
Après notre test de la version i5 et 8 Go de la Microsoft Surface Pro 7, nous avons pu tester la version plus puissante, et avons vite constaté que celle-ci ne se différenciait pas beaucoup de son petit frère plus abordable. Et ce, surtout en ce qui concerne le niveau de performances du processeur lors de plus longues sollicitations. Les performances graphiques sont en revanche significativement améliorées. Et, cerise sur le gâteau, ni les températures réduites, ni l’autonomie, n’ont été sacrifiées.
La question demeure : cette version i7 vaut-elle le coup ?
La Surface Pro 7 équipée d’un Intel Core i7 est conçue pour les utilisateurs exigeants qui ont besoin d’un peu plus de performances, en particulier graphiques.
Comme nous l’avons constaté dans nos tests, ce ne sont pas les performances du processeur qui permettent à la version i7 de la Surface Pro de sortir du lot, mais bien les performances graphiques, où l’investissement supplémentaire est le plus rentabilisé. Pour plus de détails sur la série Surface, merci de voir nos tests précédents.
L’intégralité de cette critique est disponible en anglais en suivant ce lien.
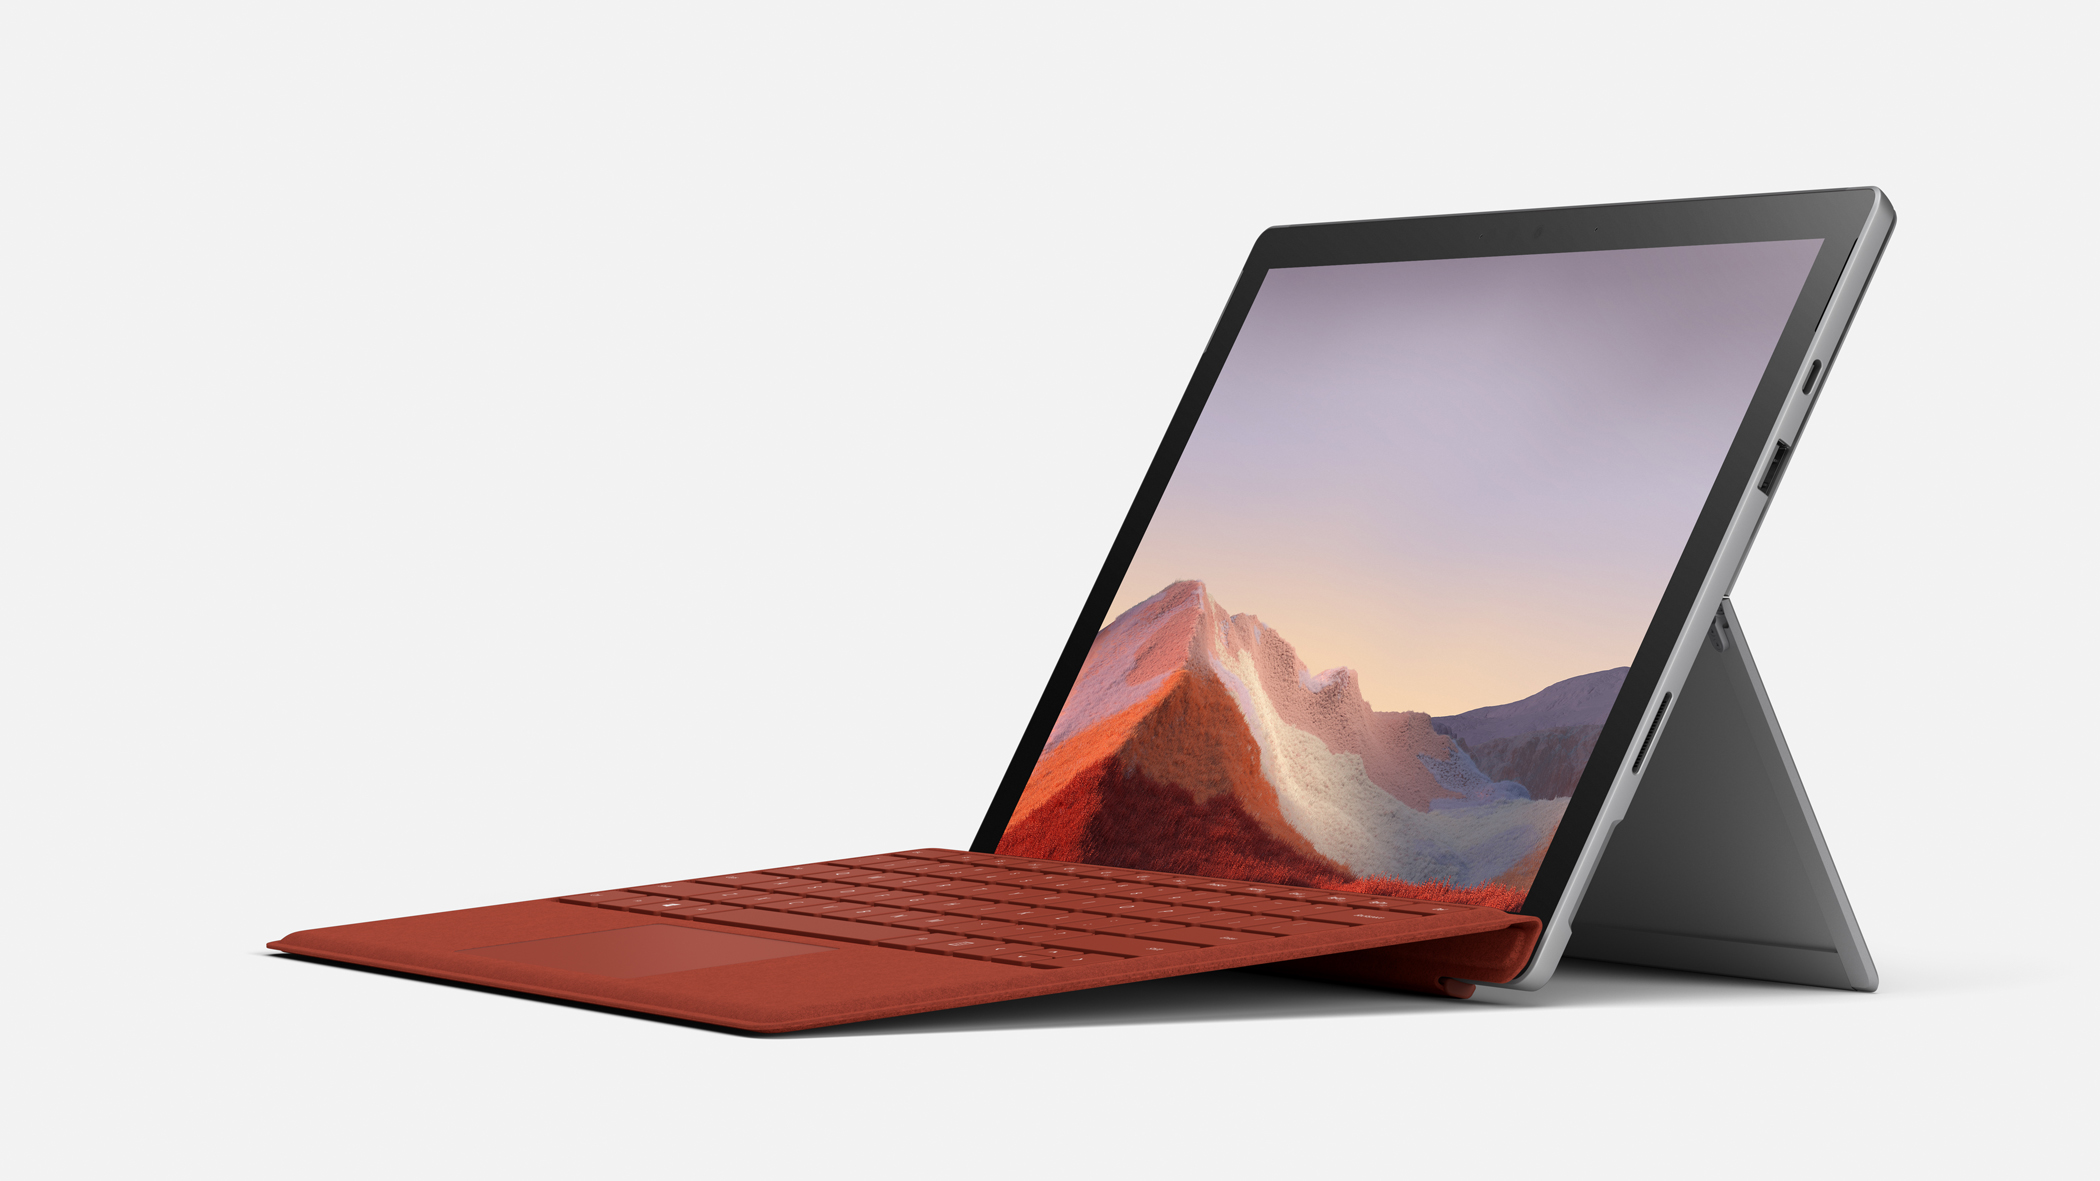
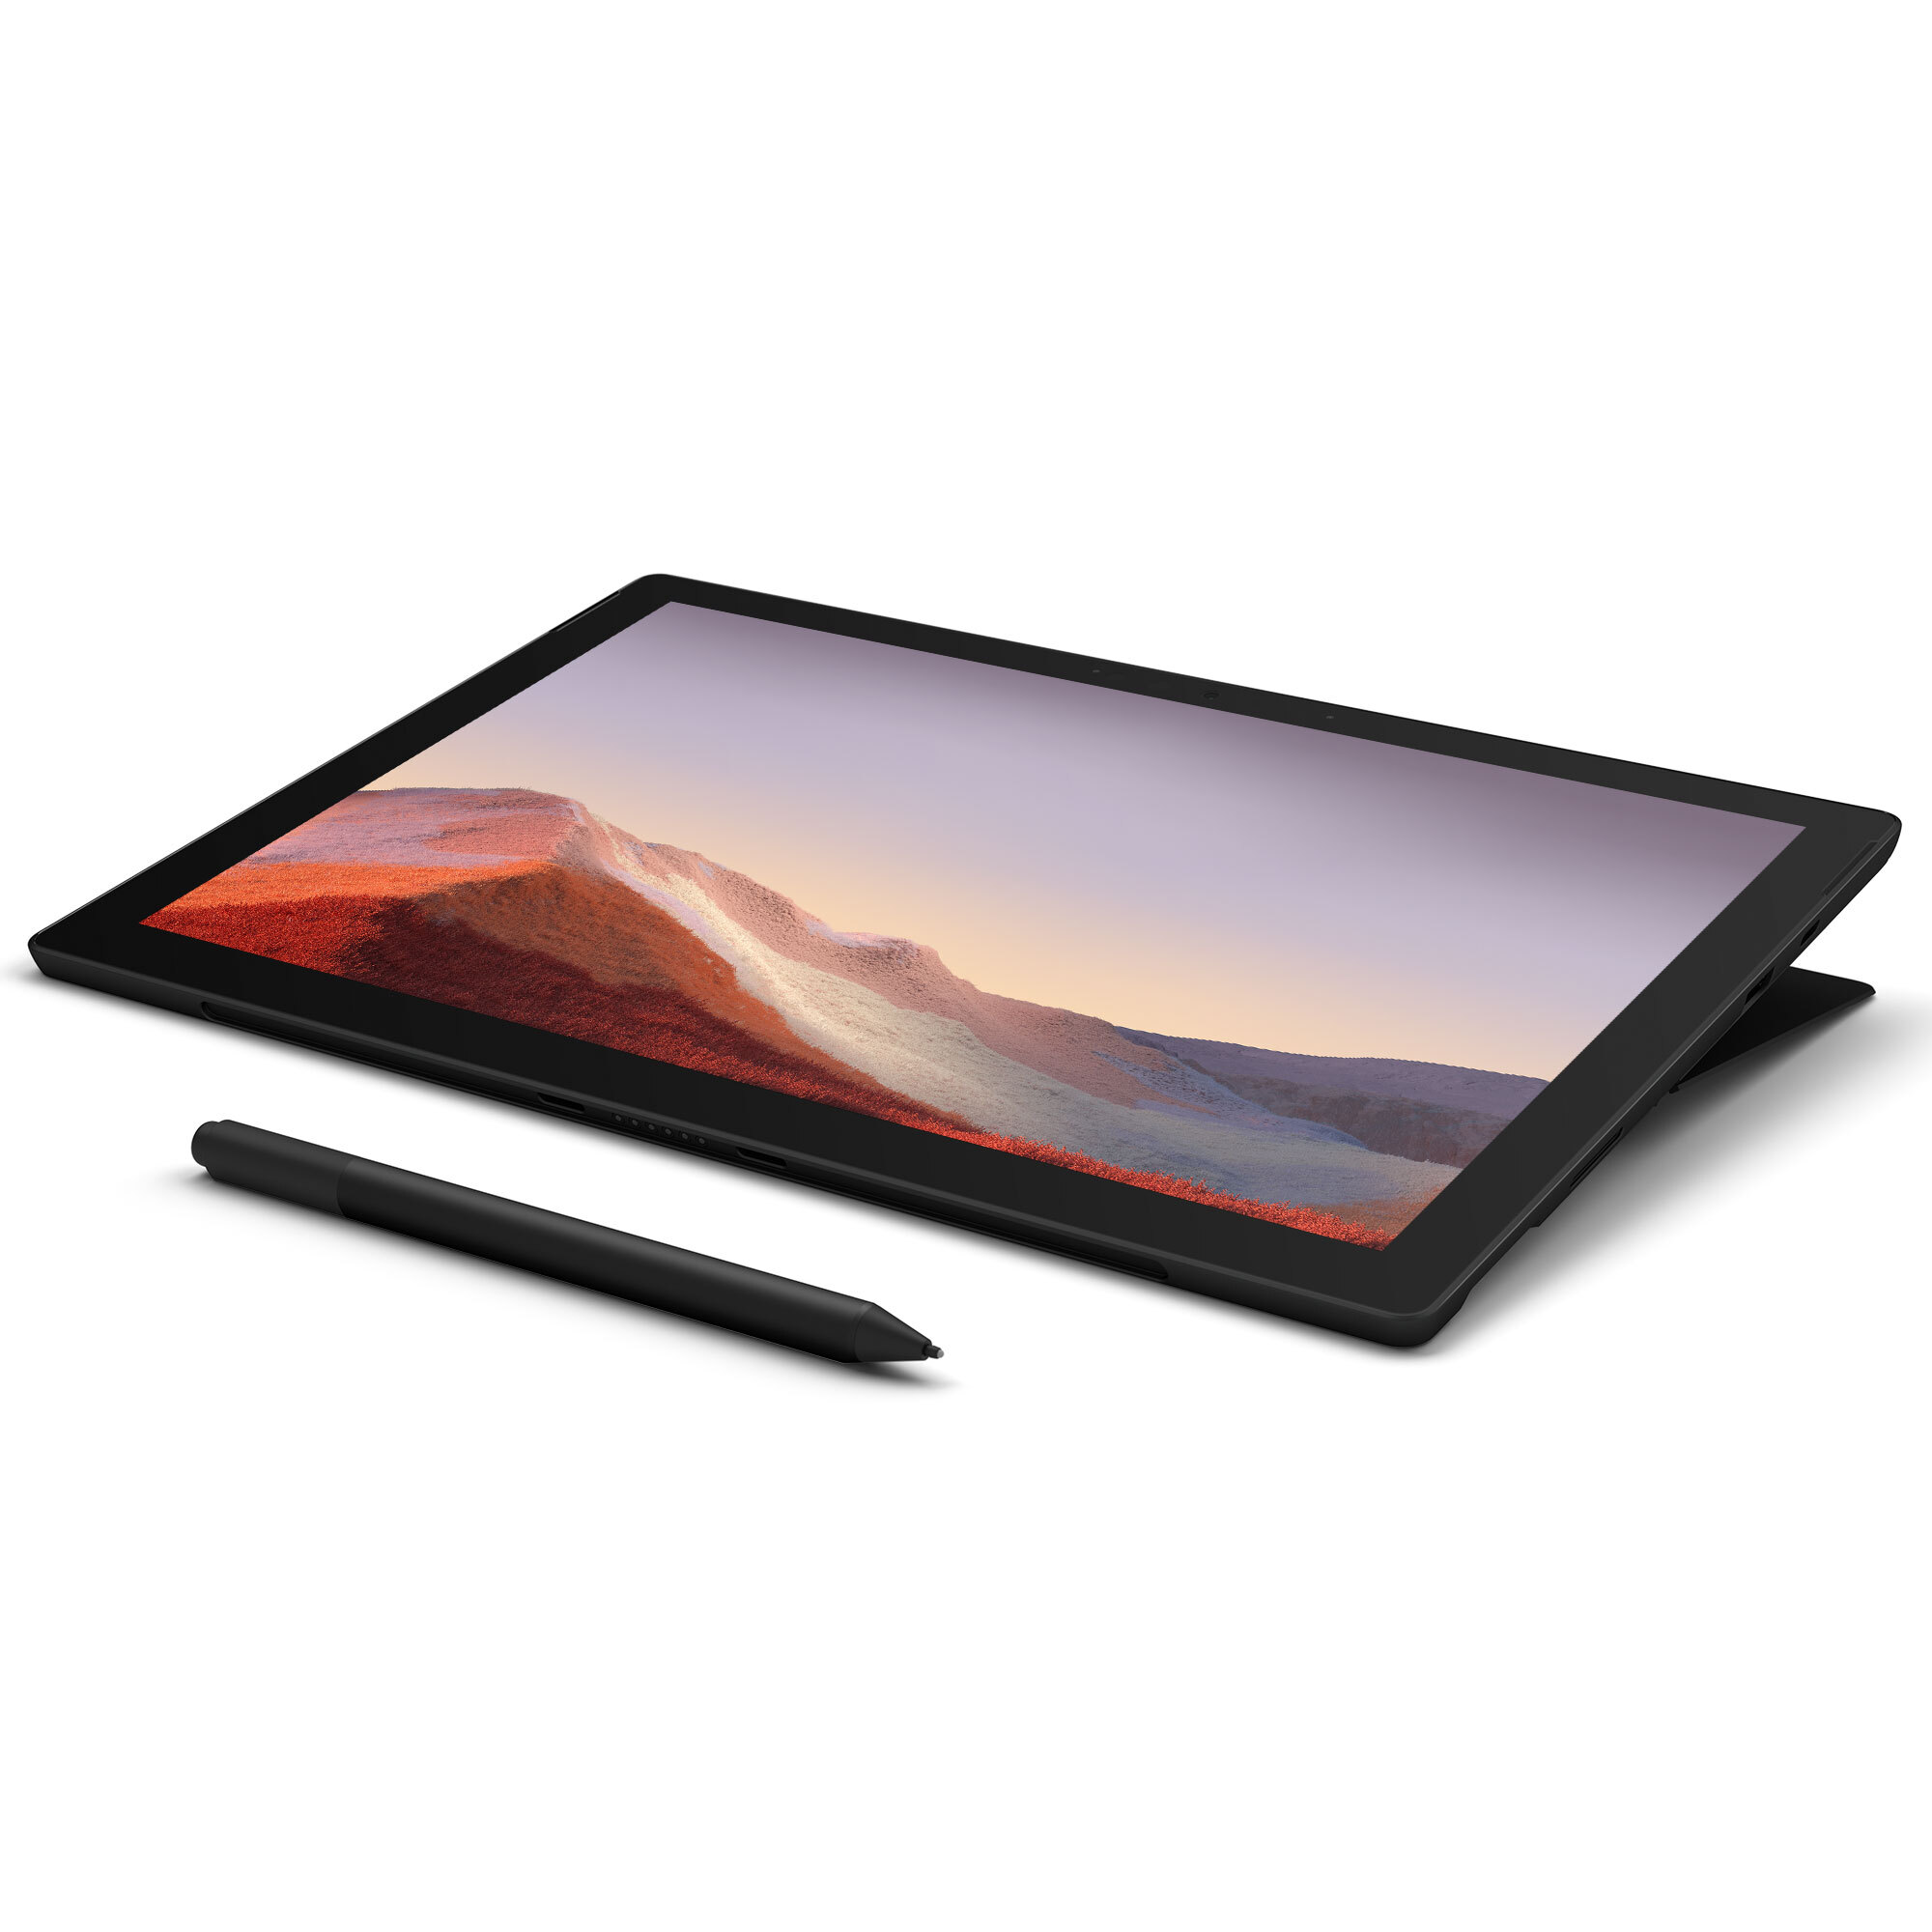
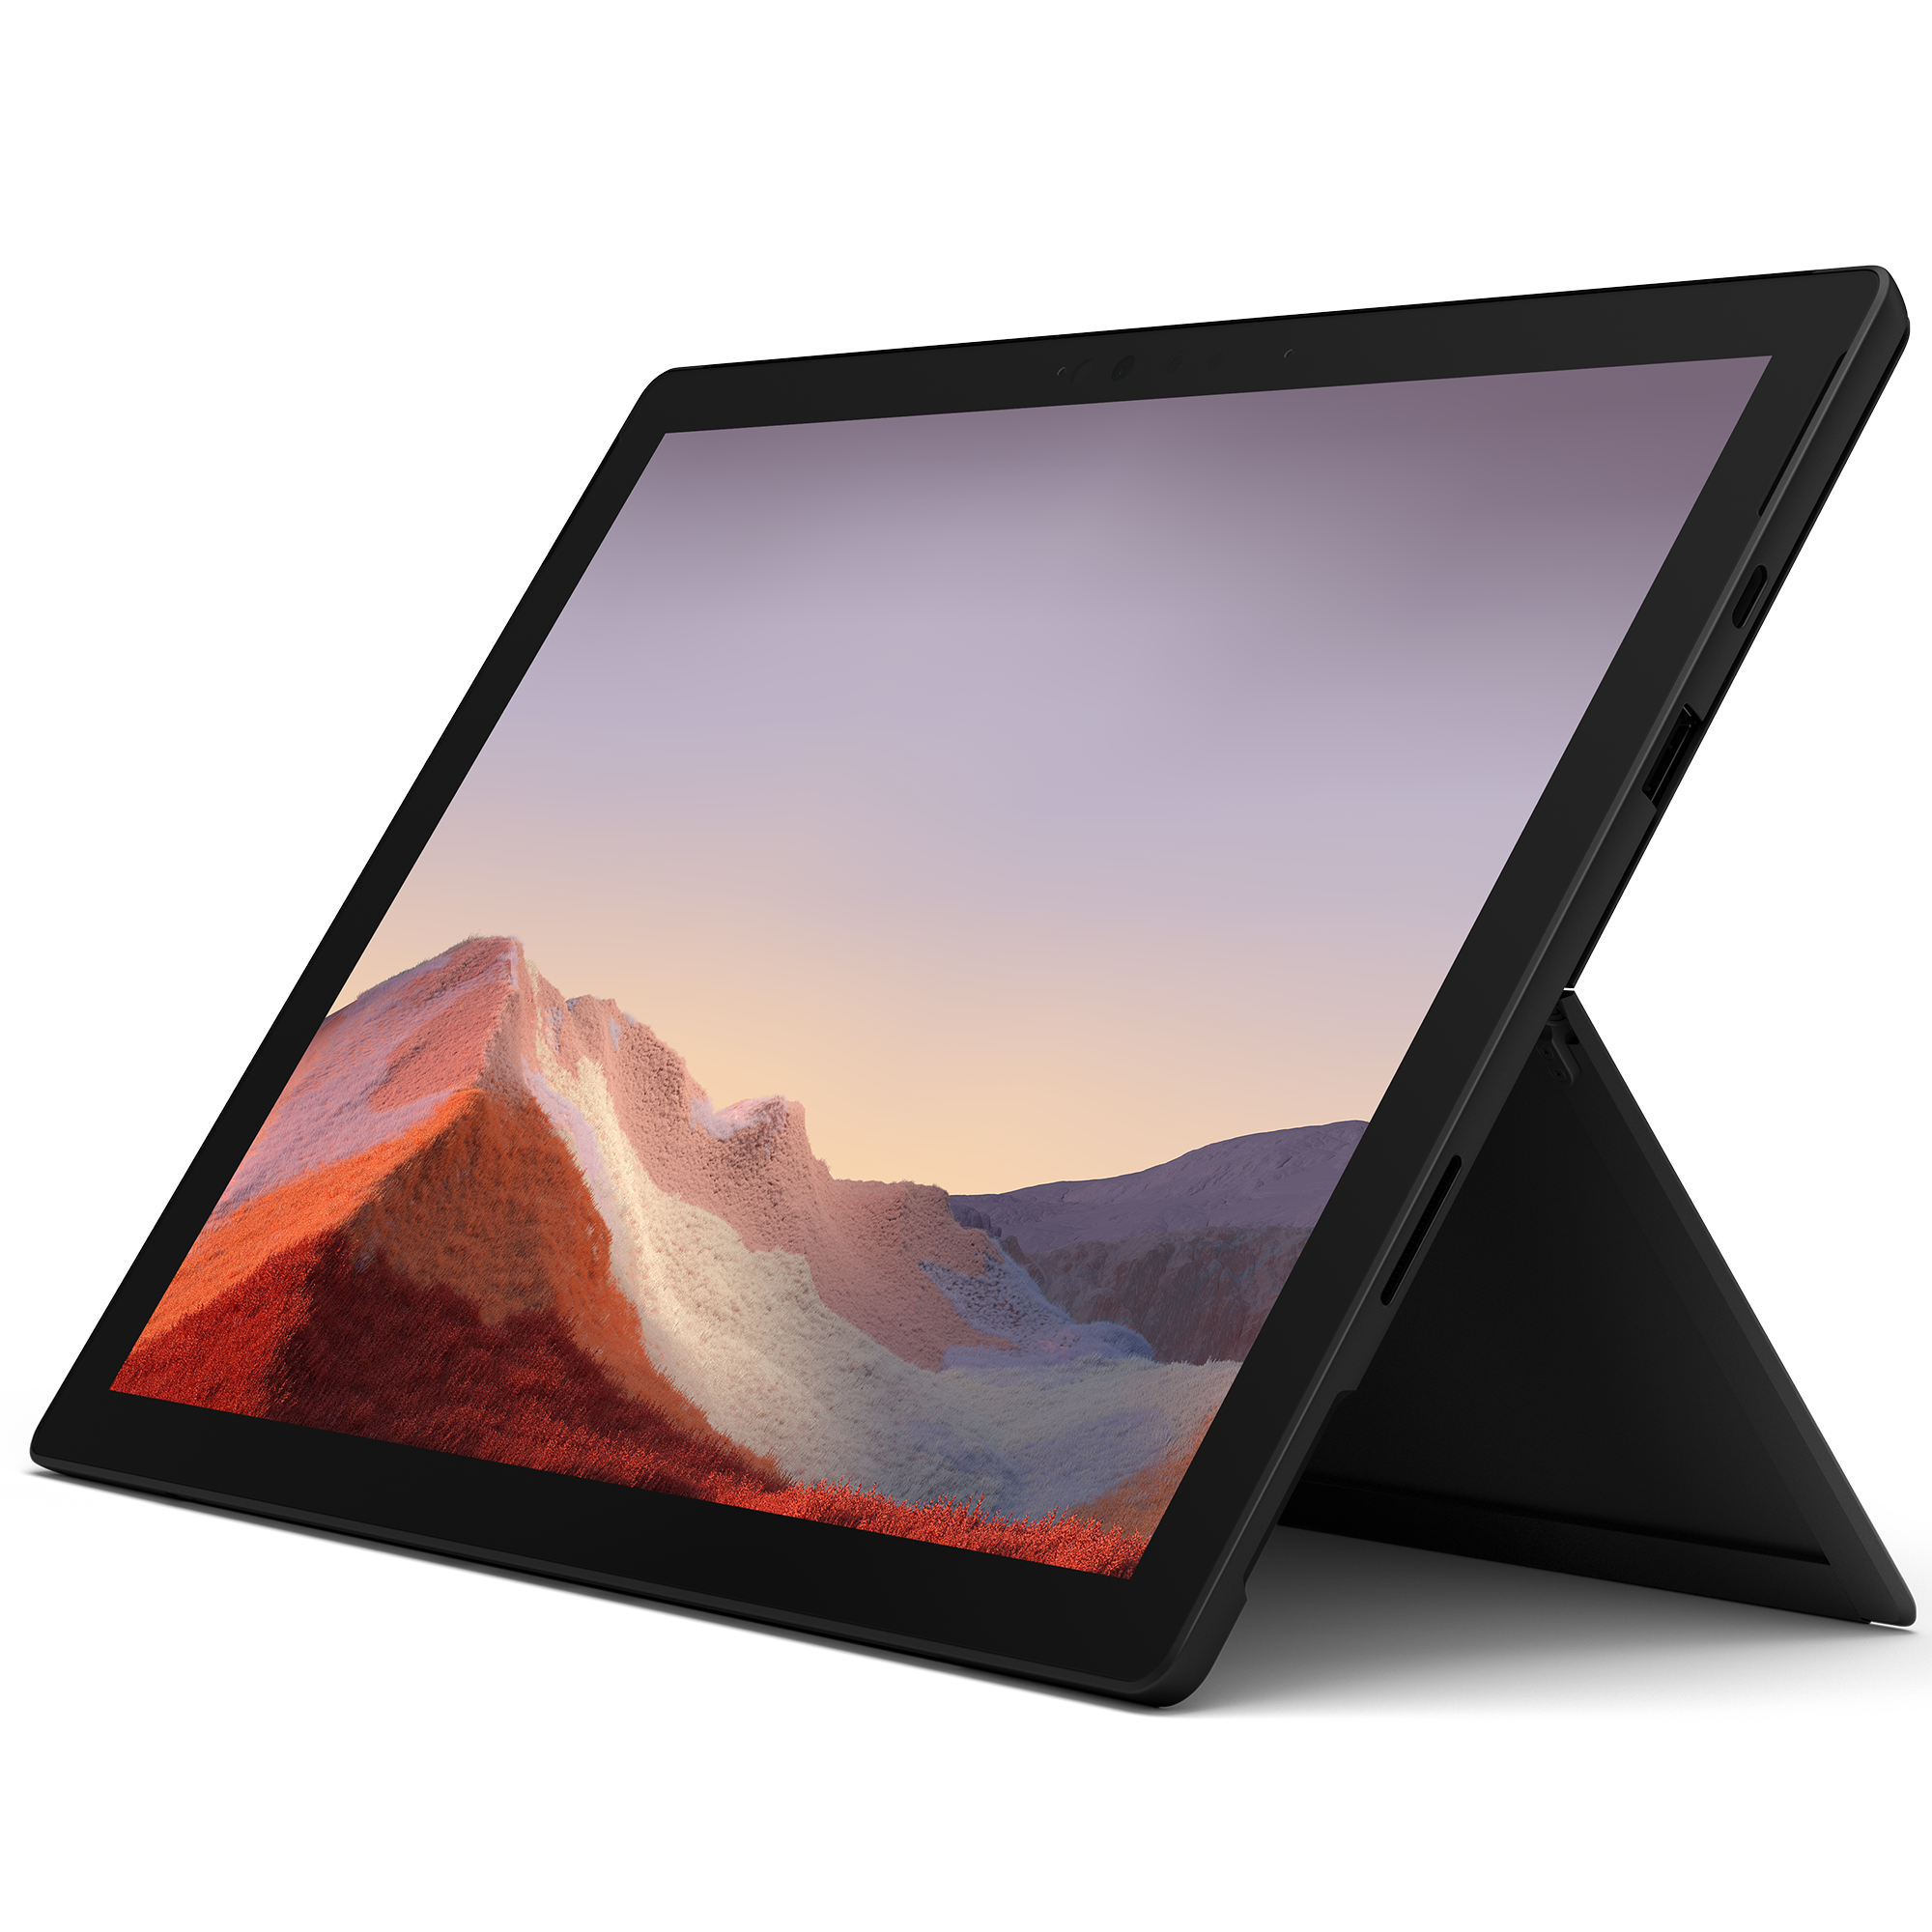
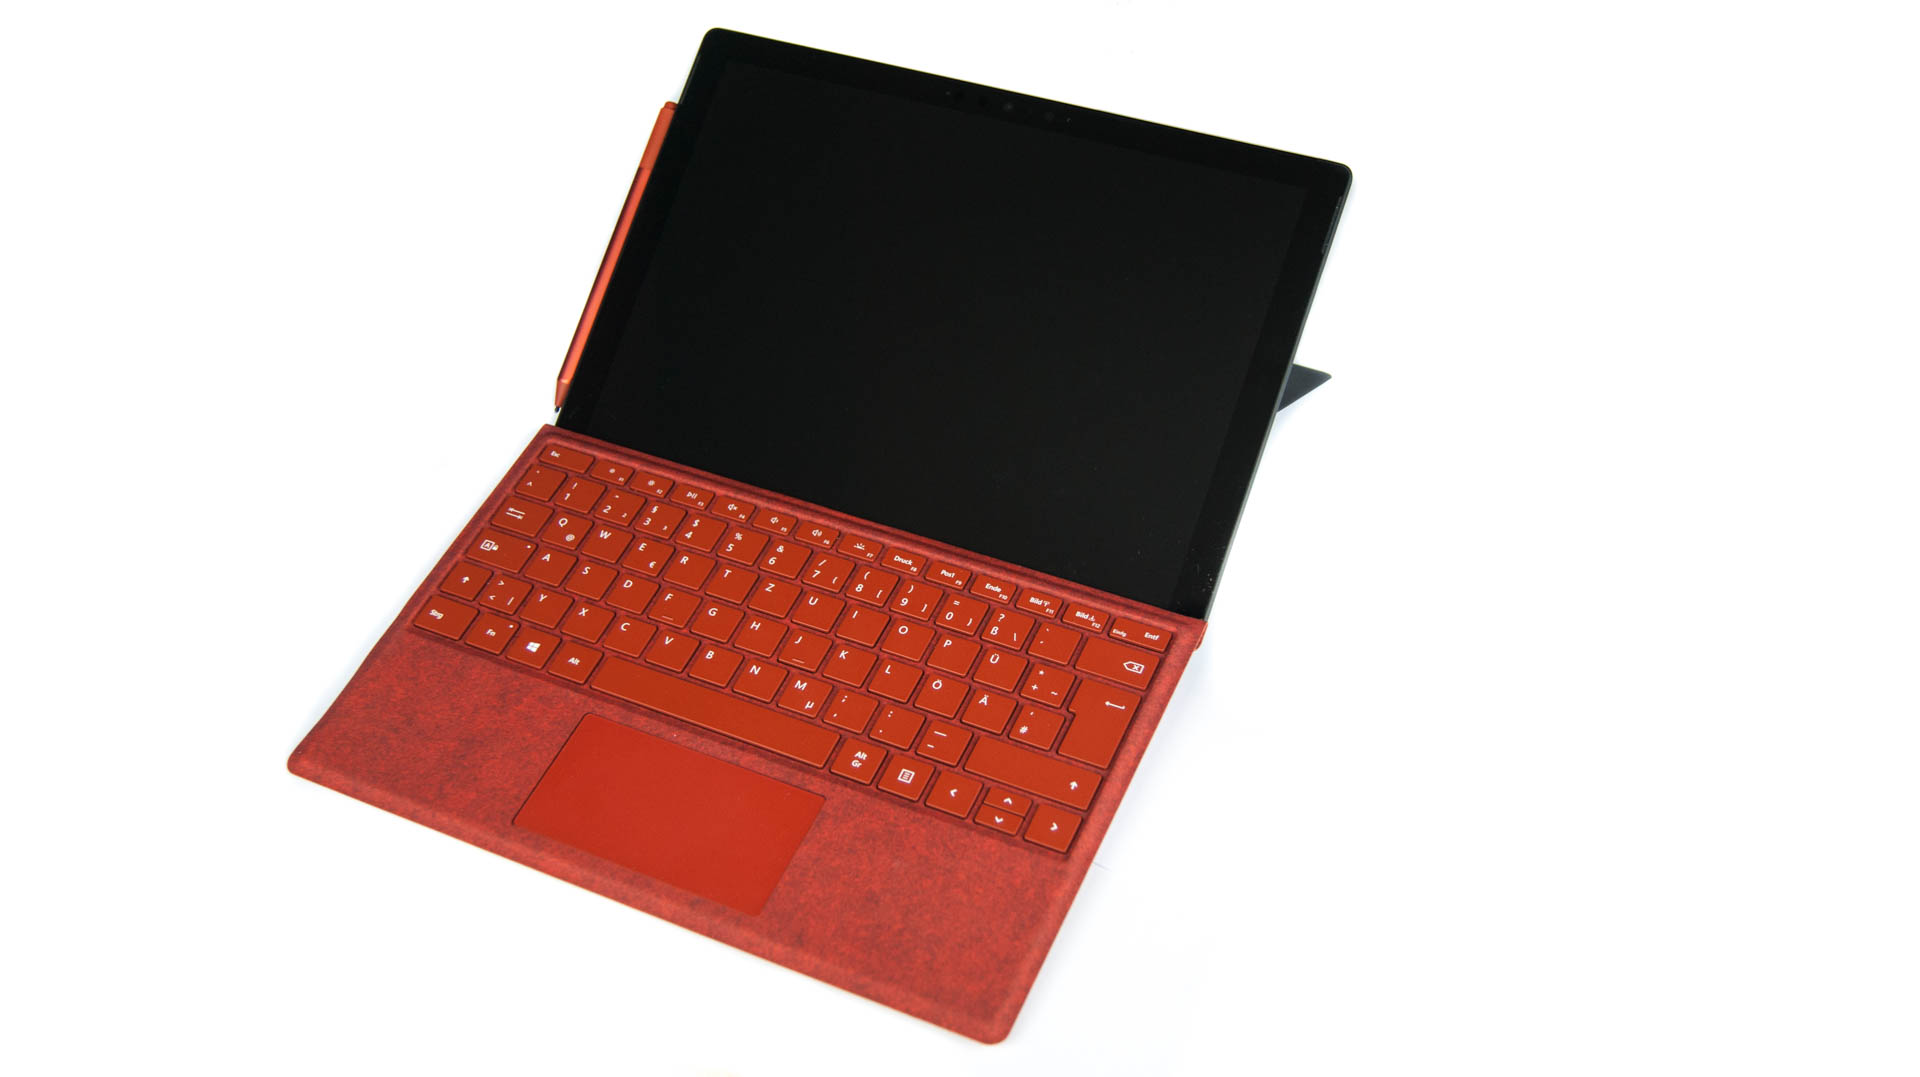
Microsoft Surface Pro 7
- 02/20/2020 v7 (old)
Nino Ricchizzi
Price comparison
