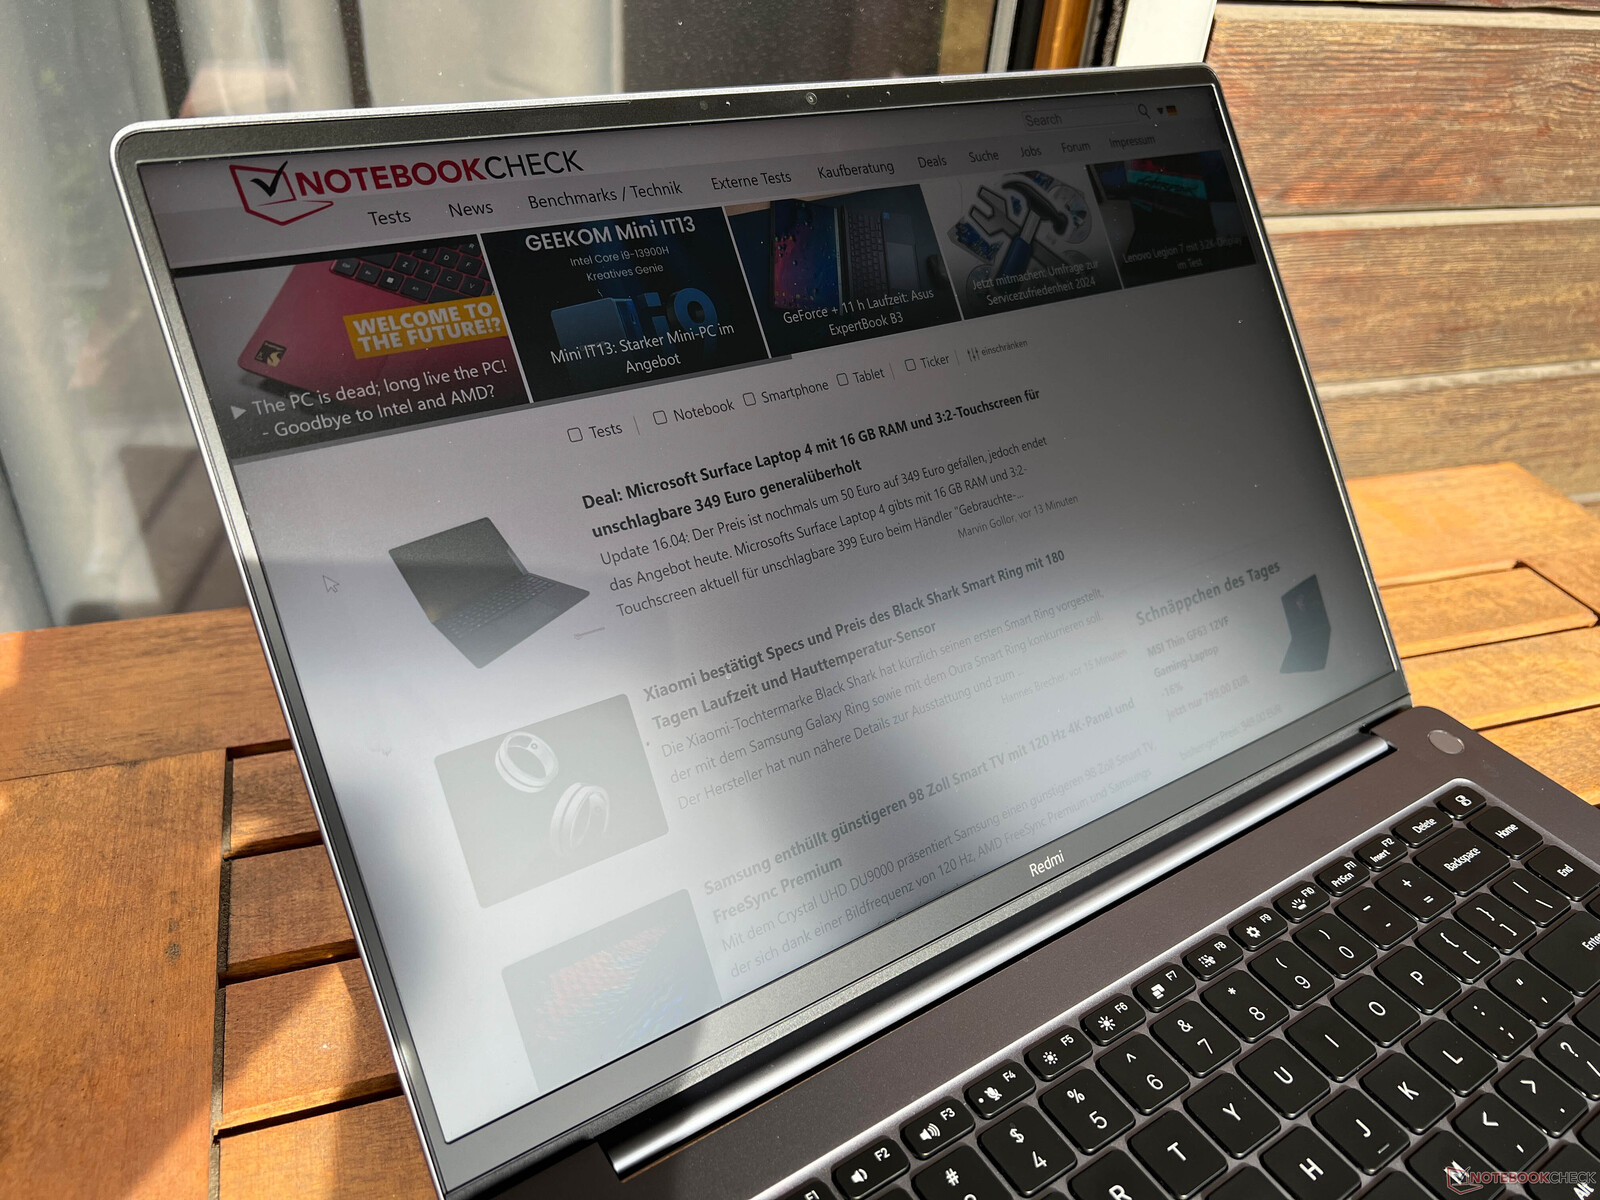
Test du Xiaomi RedmiBook Pro 16 2024 : peut-être le meilleur PC portable Meteor Lake avec une bonne autonomie
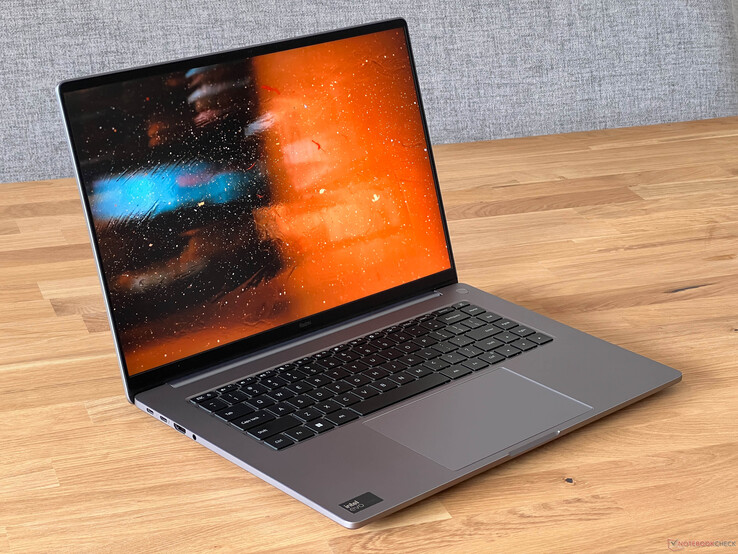
Avec le nouveau RedmiBook Pro 16, Xiaomi propose un ordinateur portable 16 pouces puissant et de haute qualité pour les utilisateurs multimédia et le bureau à domicile, si vous n'avez pas besoin d'une carte graphique dédiée. Le boîtier en aluminium abrite un puissant système de refroidissement, le nouveau processeur Intel Core Ultra 7 155H Meteor Lake d'Intel incluant la carte graphique Arc, 32 Go de RAM, un grand disque dur de 1 To et un écran IPS mat à haute résolution avec une luminosité de 500 Nits et un taux de rafraîchissement de 165 Hz.
En Allemagne, l'appareil peut être importé via TradingShenzen, par exemple, au prix de 997 euros (~ 1 062 $) avec la version allemande de Windows 11 Pro (prix de base : 957 euros, ~ 1 020 $). Alternativement, un modèle avec le Core Ultra 5 125H plus lent, mais avec un équipement identique, est disponible pour 907 euros (~967 $).
Notez que le RedmiBook Pro 16 est livré par défaut avec une version chinoise de Windows 11, dont vous ne pouvez pas changer la langue. C'était également le cas de notre unité de test, raison pour laquelle nous avons installé nous-mêmes la version allemande du système d'exploitation. Vous devez donc vous assurer que vous obtenez la bonne version de Windows avant d'acheter.
Comparaison avec les concurrents potentiels
Note | Date | Modèle | Poids | Épaisseur | Taille | Résolution | Prix |
|---|---|---|---|---|---|---|---|
| 89.7 % v7 (old) | 04/24 | Xiaomi RedmiBook Pro 16 2024 Ultra 7 155H, Arc 8-Core | 1.9 kg | 15.9 mm | 16.00" | 3072x1920 | |
| 85 % v7 (old) | 01/24 | Huawei MateBook D 16 2024 i9-13900H, Iris Xe G7 96EUs | 1.7 kg | 18.4 mm | 16.00" | 1920x1200 | |
| 88.9 % v7 (old) | 04/24 | Samsung Galaxy Book4 Pro 16 Ultra 7 155H, Arc 8-Core | 1.5 kg | 12.5 mm | 16.00" | 2880x1800 | |
| 88.1 % v7 (old) | 12/23 | MSI Prestige 16 B1MG-001US Ultra 7 155H, Arc 8-Core | 1.6 kg | 19.1 mm | 16.00" | 2560x1600 | |
| 88.6 % v7 (old) | 10/23 | Acer Swift Edge SFE16 Ryzen 7 7840U R7 7840U, Radeon 780M | 1.2 kg | 13 mm | 16.00" | 3200x2000 | |
| 84.9 % v7 (old) | 02/24 | Asus VivoBook S15 K5504 i9-13900H, Iris Xe G7 96EUs | 1.6 kg | 19 mm | 15.60" | 2880x1620 |
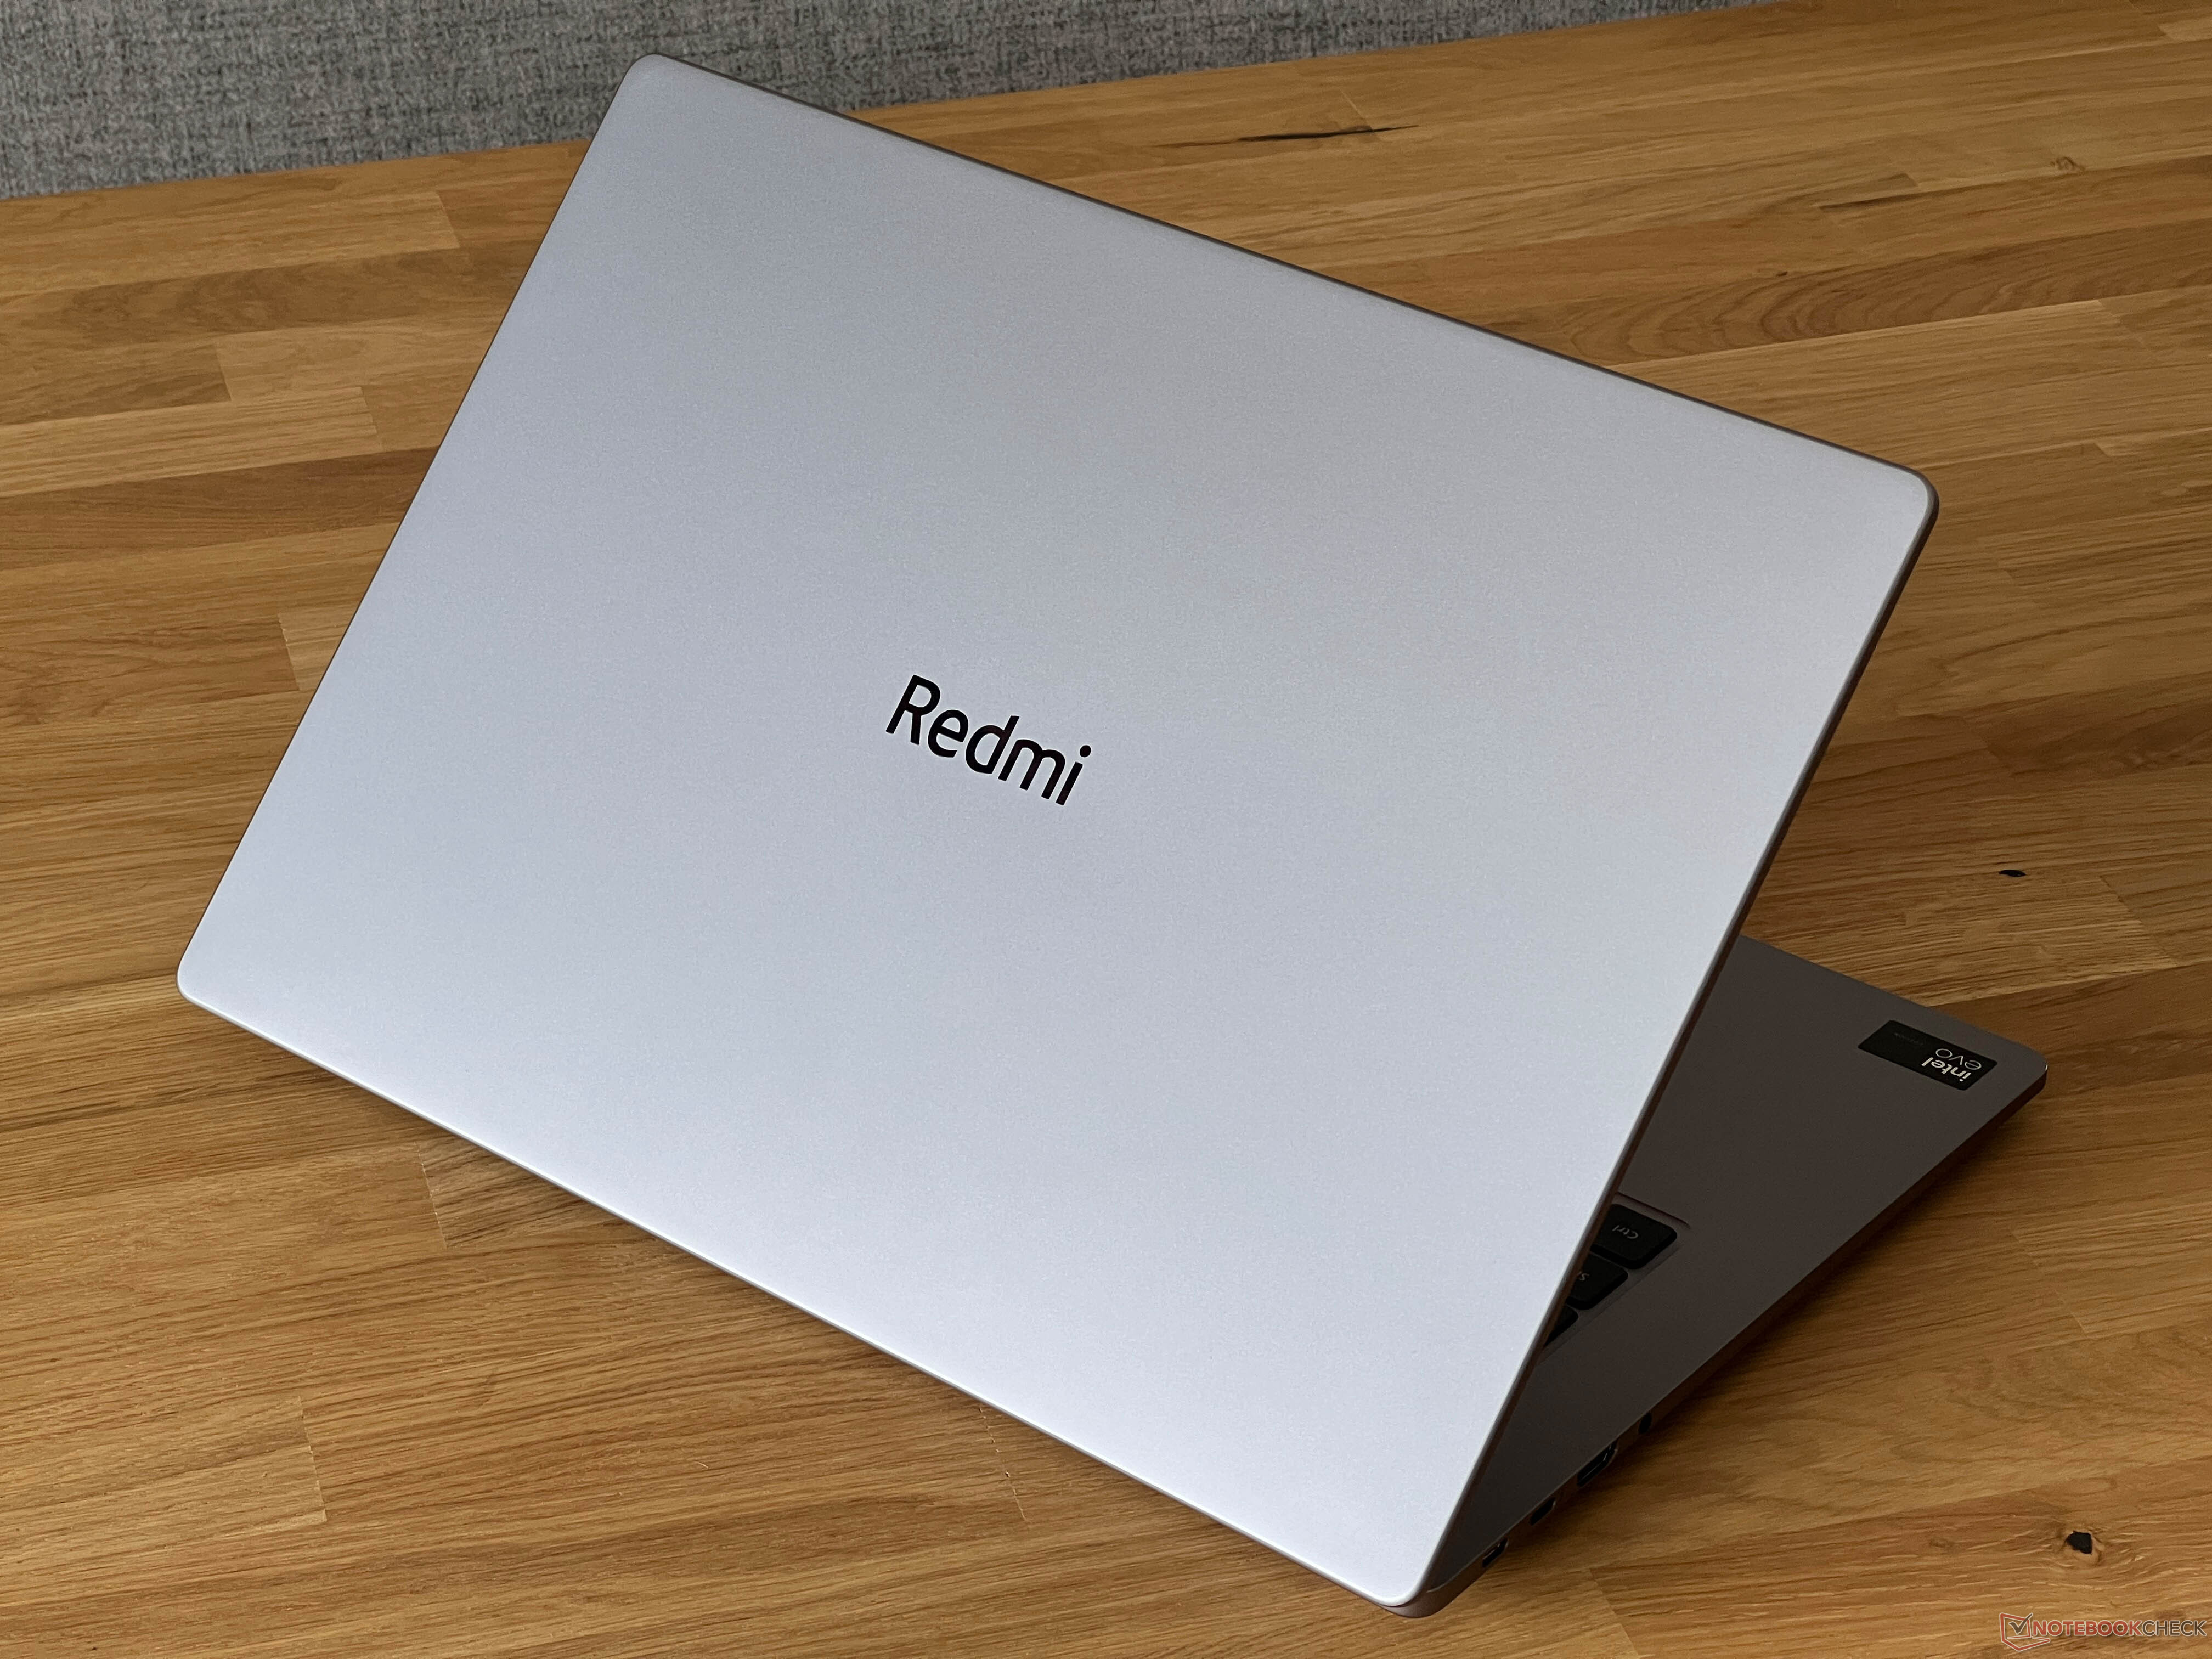
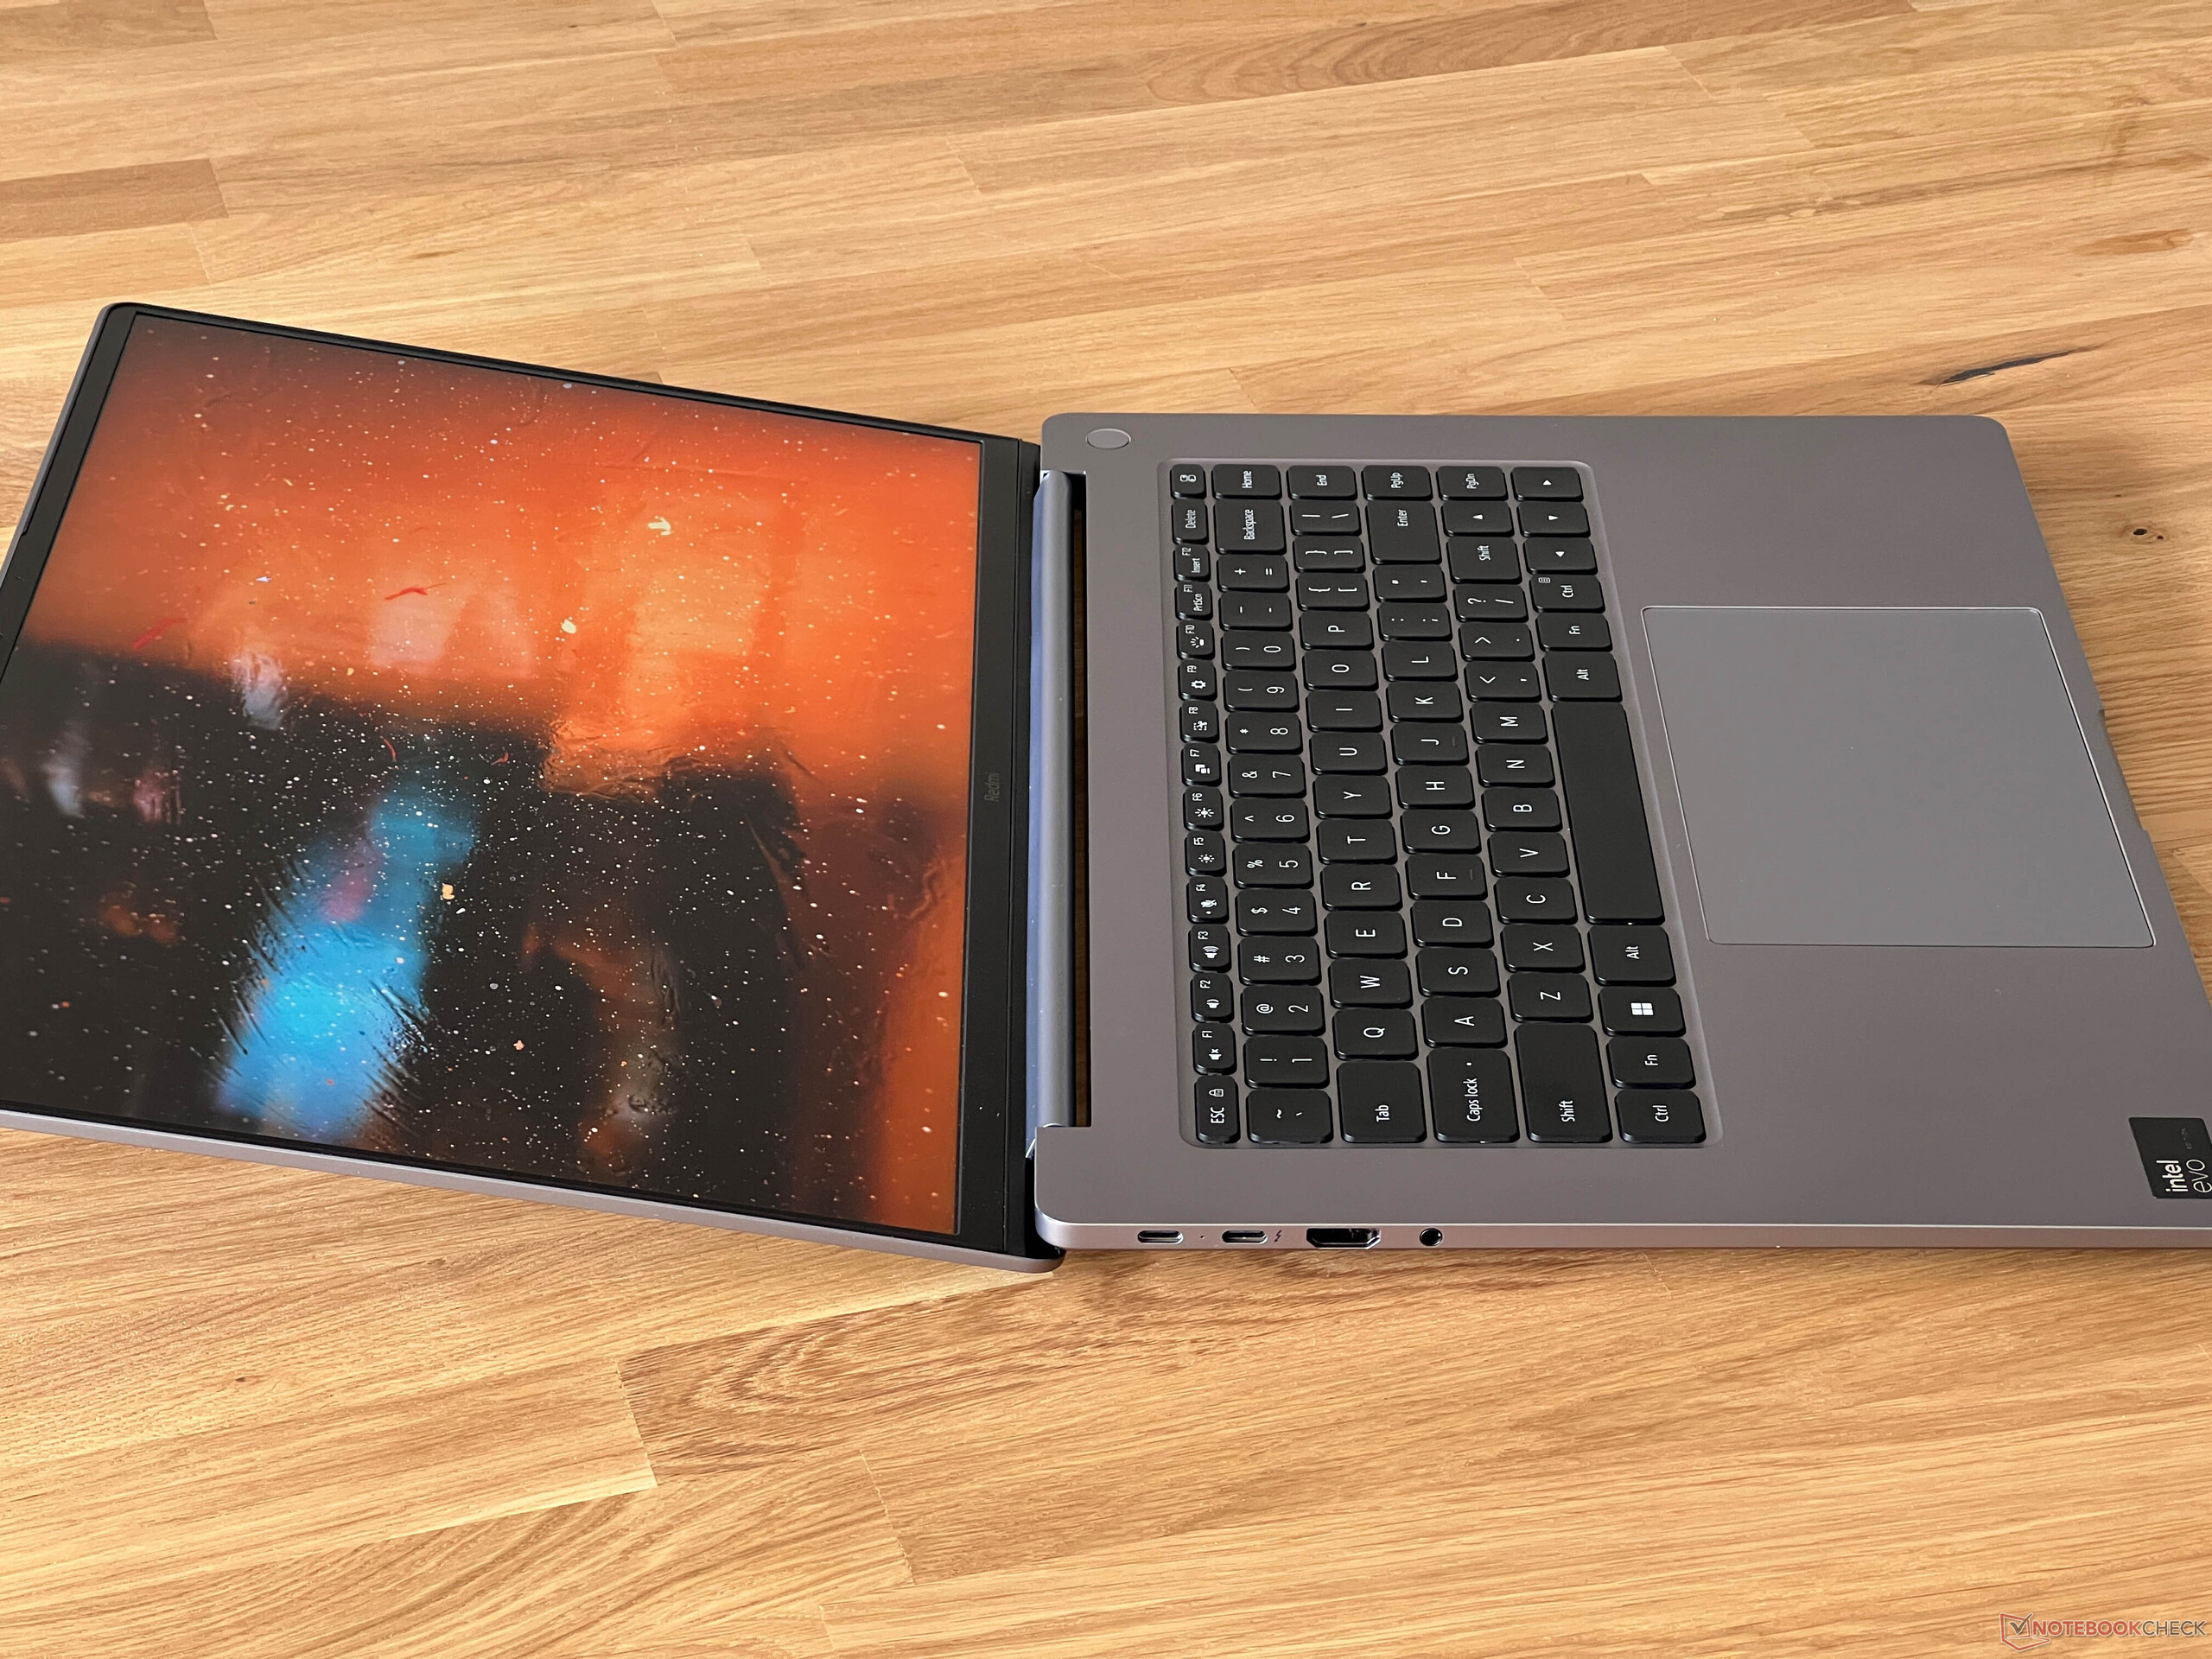
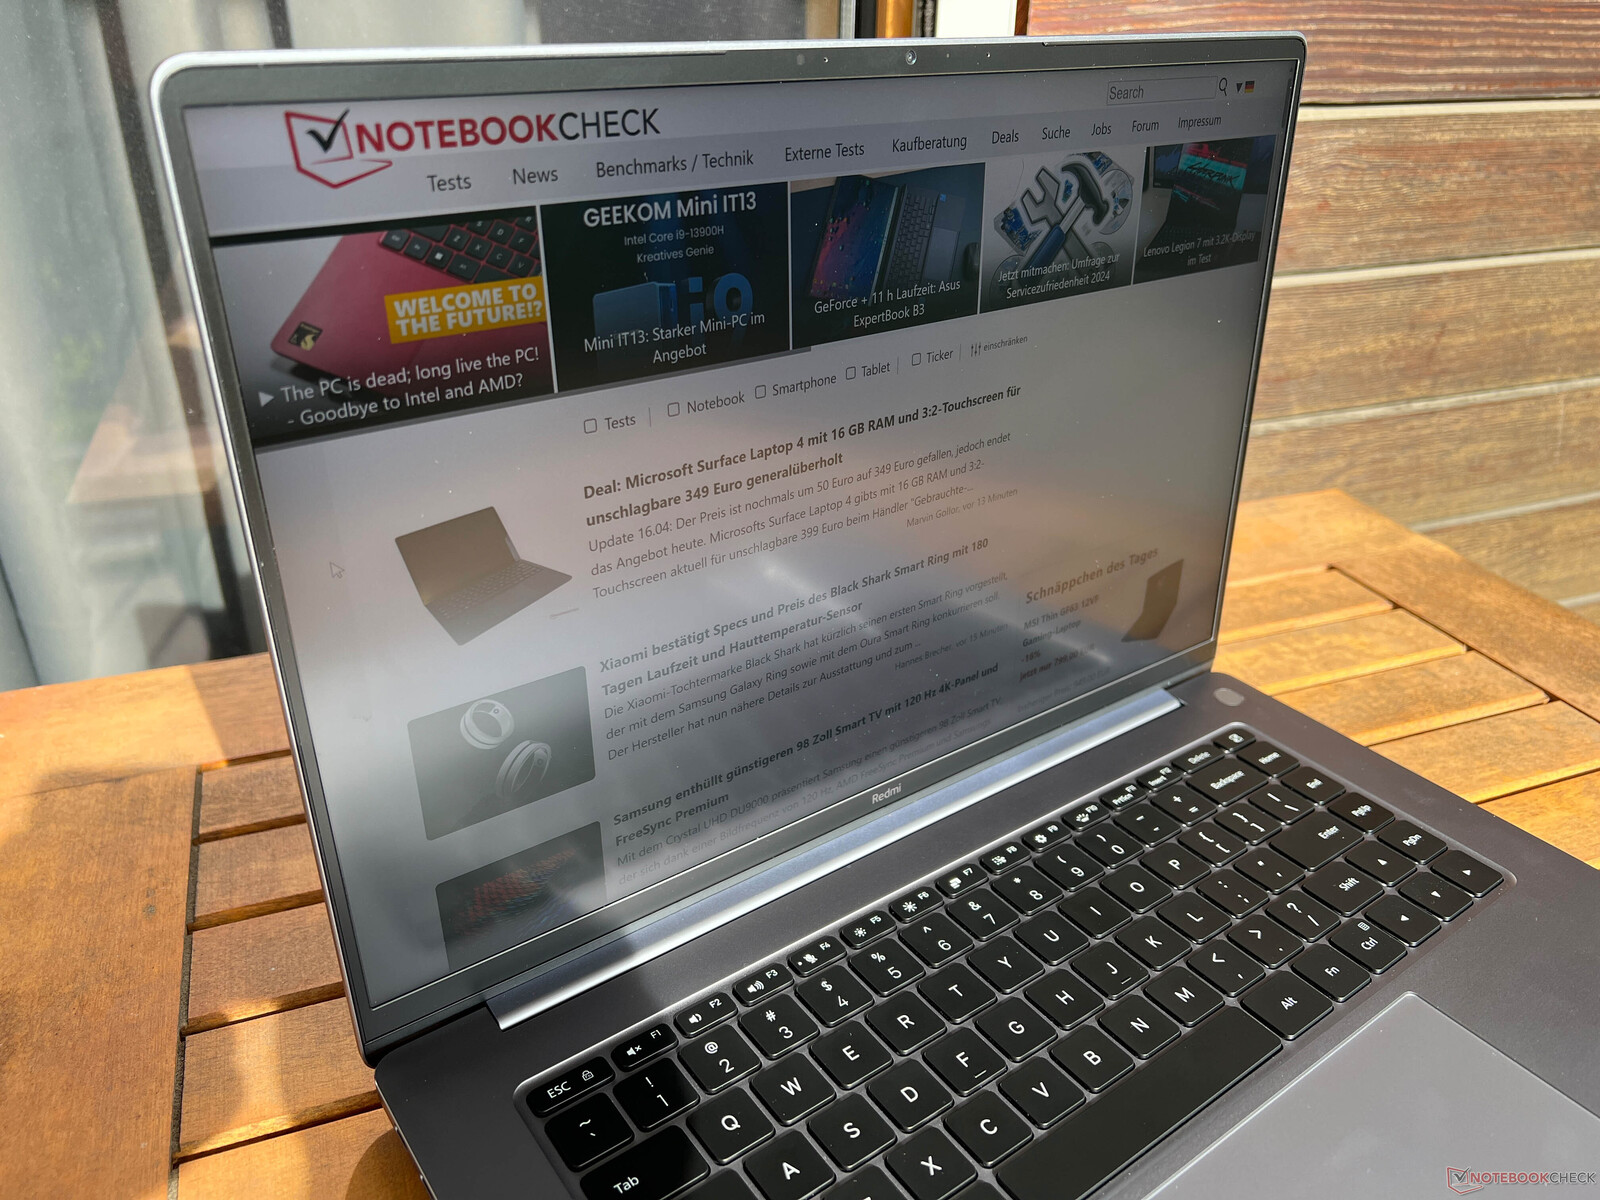
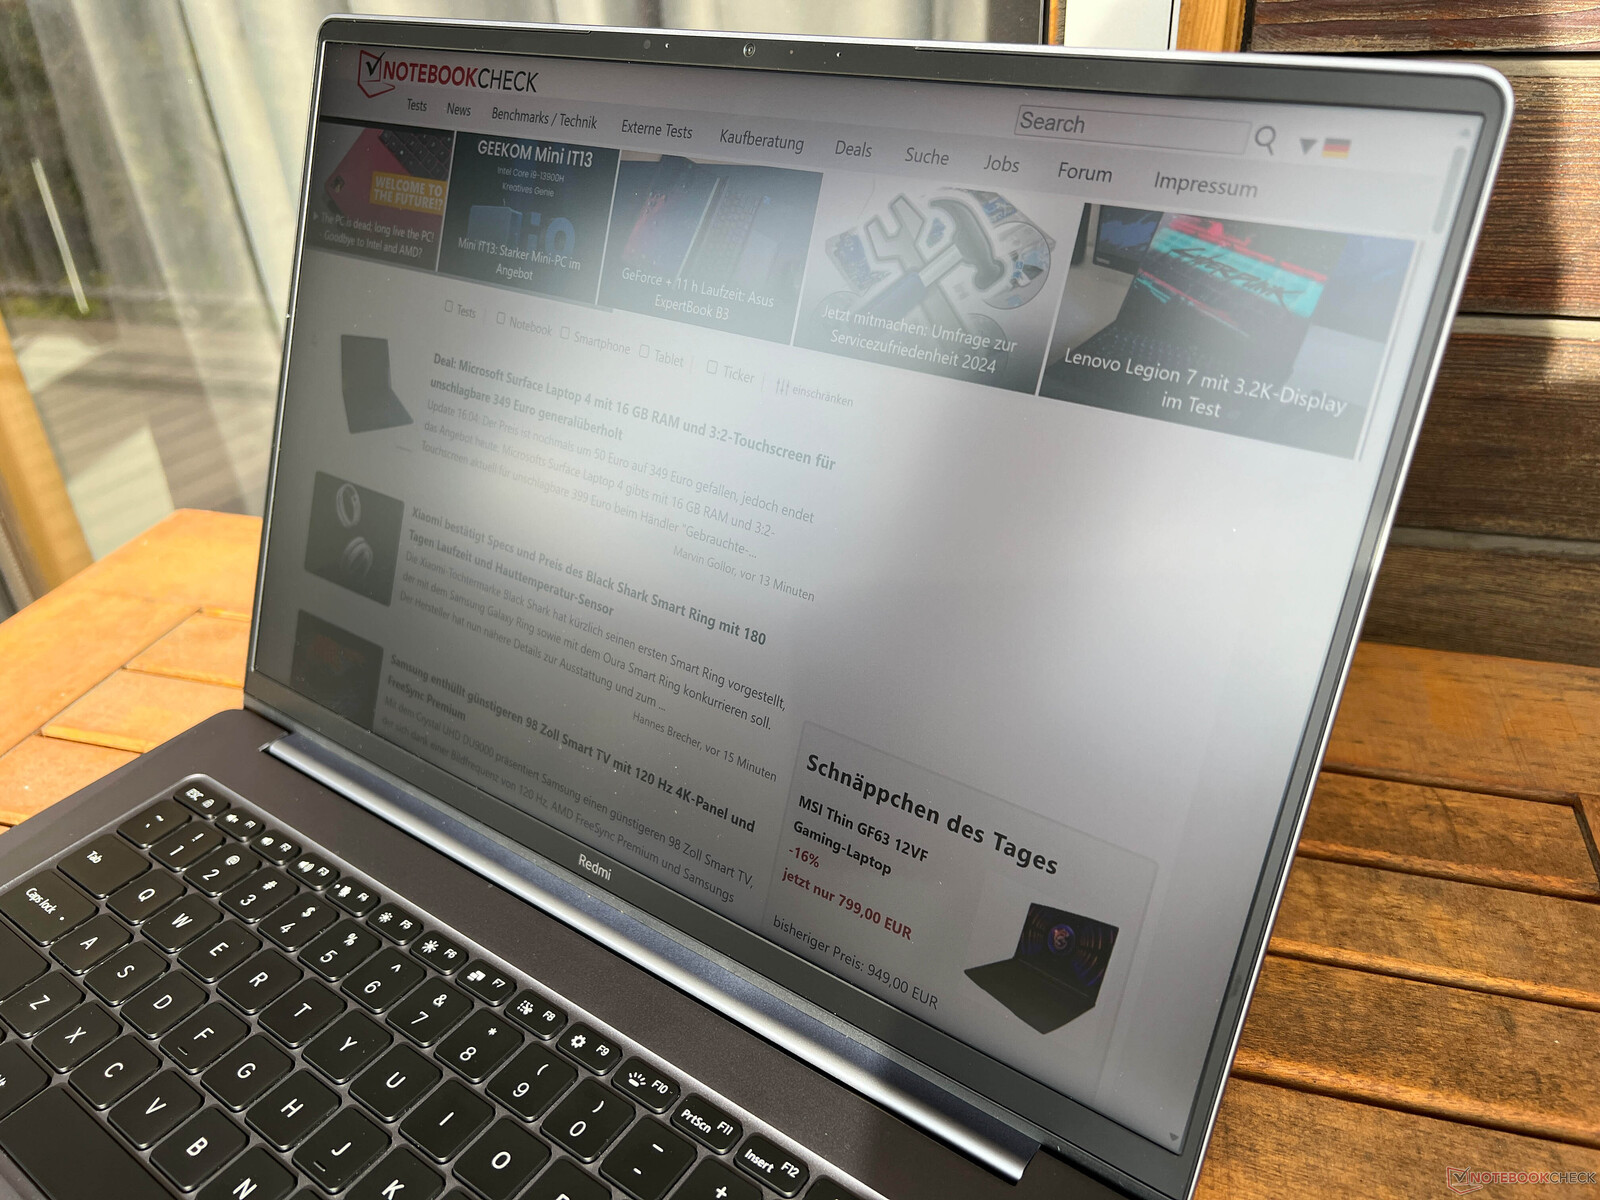
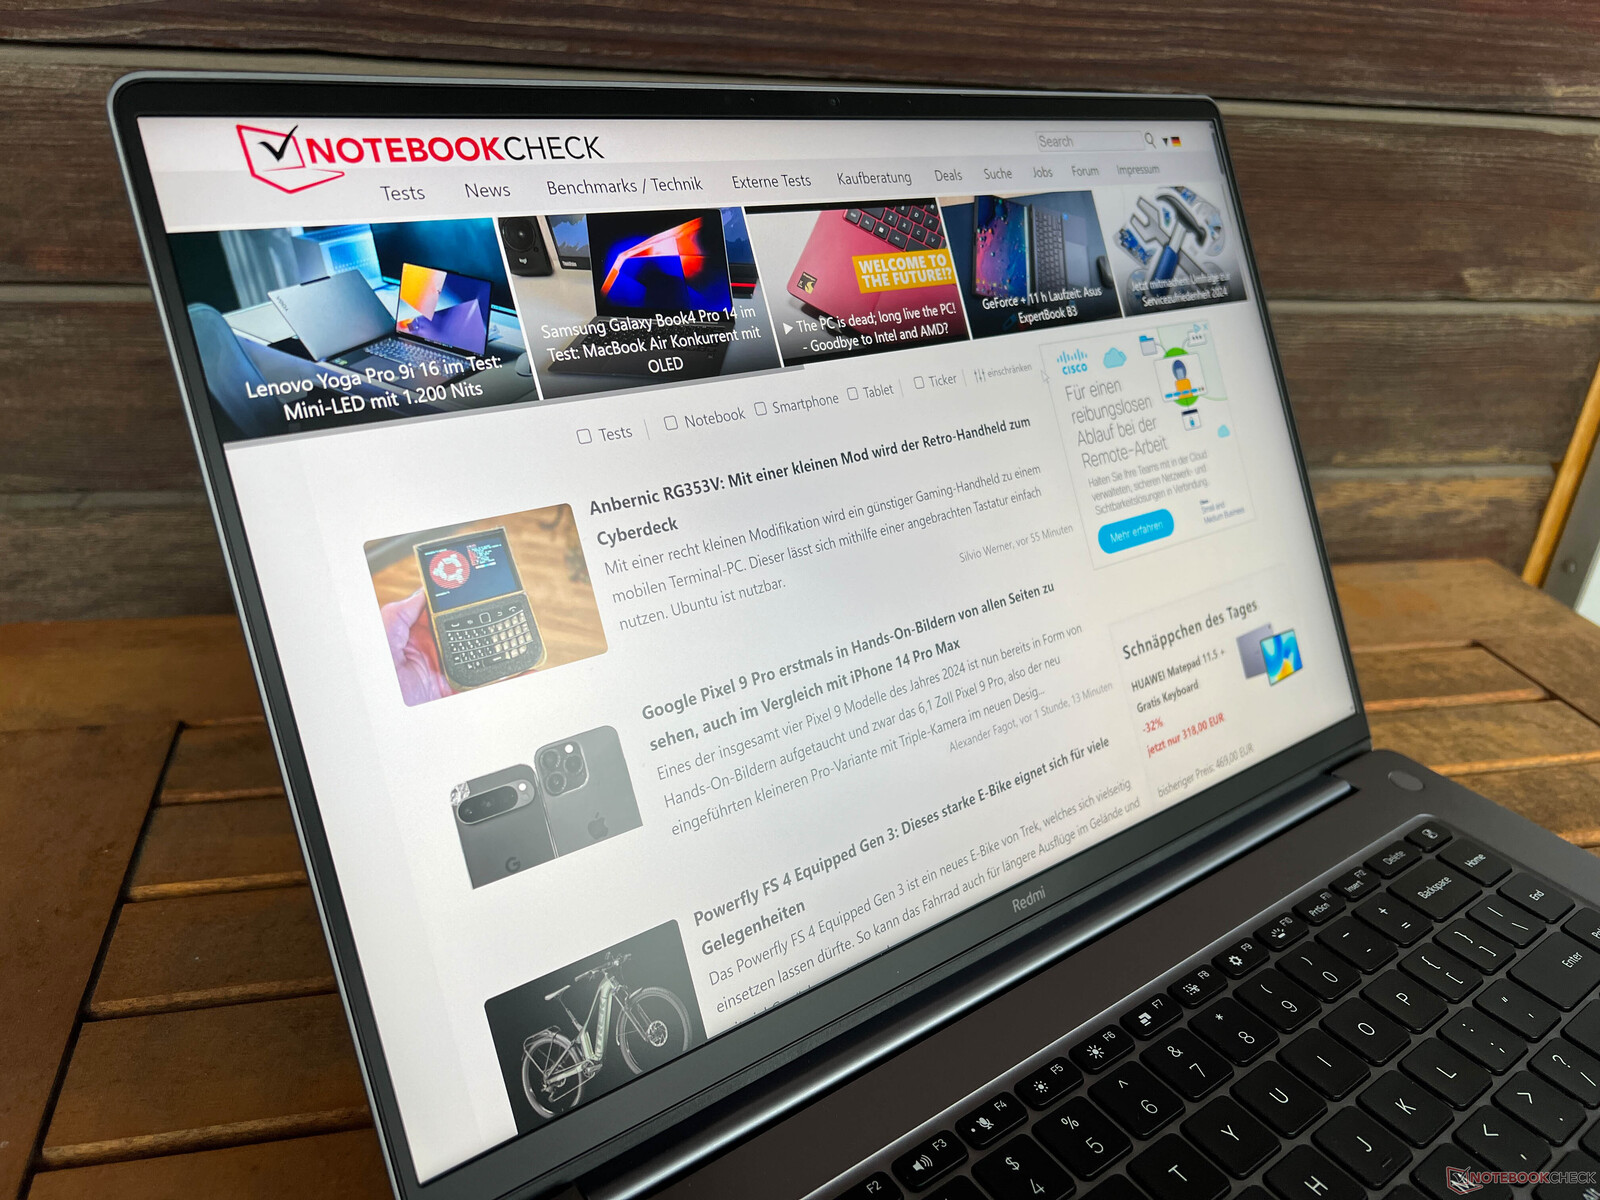
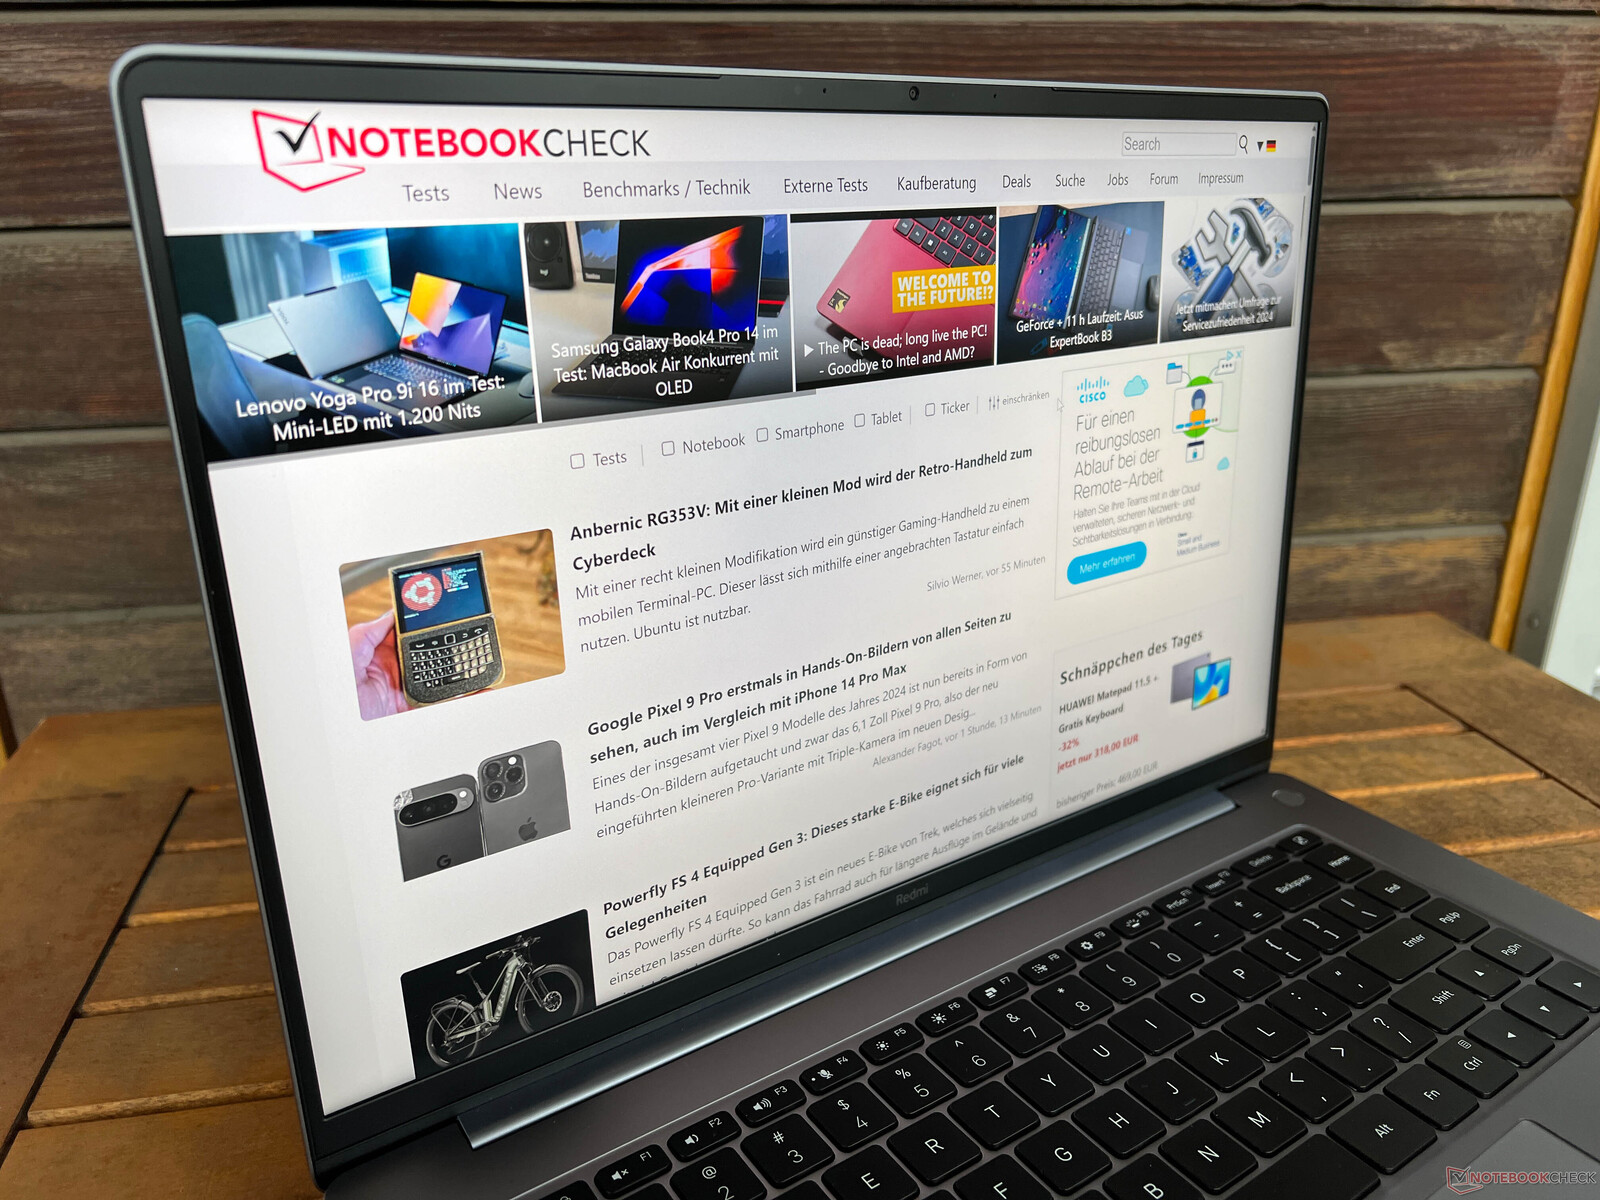
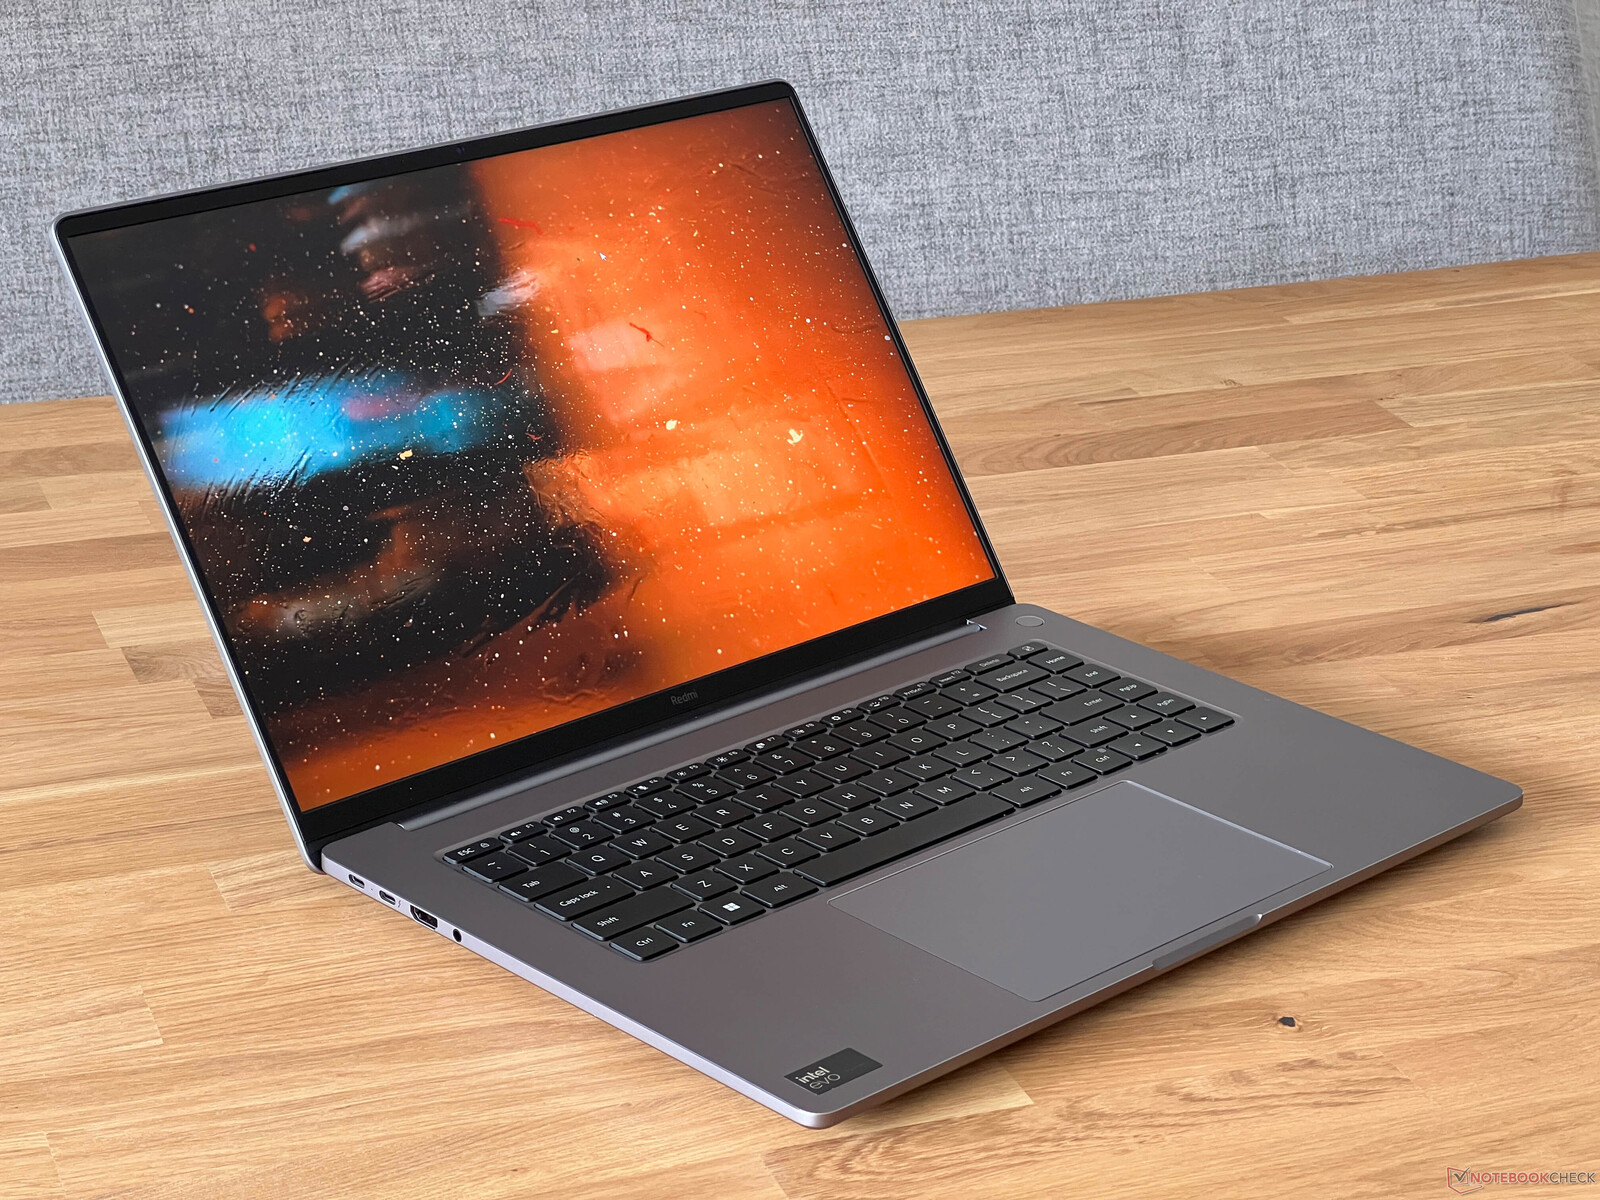
Boîtier - RedmiBook Pro avec boîtier robuste en aluminium
Xiaomi utilise un boîtier en aluminium de couleur argent pour le RedmiBook Pro 16. L'unité de base devient légèrement plus fine sur les côtés, ce qui donne à l'appareil un aspect très fin, bien qu'il n'essaie certainement pas d'être l'ordinateur portable le plus fin du marché. Avec ses bords d'écran minces, le design est moderne et les traces de doigts ne sont pas un problème sur la surface de l'appareil. Grâce à son look discret, le RedmiBook Pro peut être utilisé sans problème dans des environnements professionnels.
La qualité de notre unité de test donne également une bonne impression, sans aucun défaut de fabrication. La stabilité de l'étui est également bonne dans l'ensemble. Ce n'est qu'en essayant de déformer le boîtier que nous pouvons le forcer à produire quelques grincements minimes, et le centre du clavier peut être enfoncé de façon minimale. Le couvercle mince de l'écran est légèrement plus souple, mais nous n'avons pas réussi à provoquer d'artefacts sur l'écran. Les charnières sont bien ajustées et le couvercle peut être soulevé facilement d'une seule main. Toutefois, lorsque vous modifiez l'angle d'affichage (angle d'ouverture maximal ~170 degrés), les charnières ne parviennent pas à l'empêcher d'osciller légèrement.
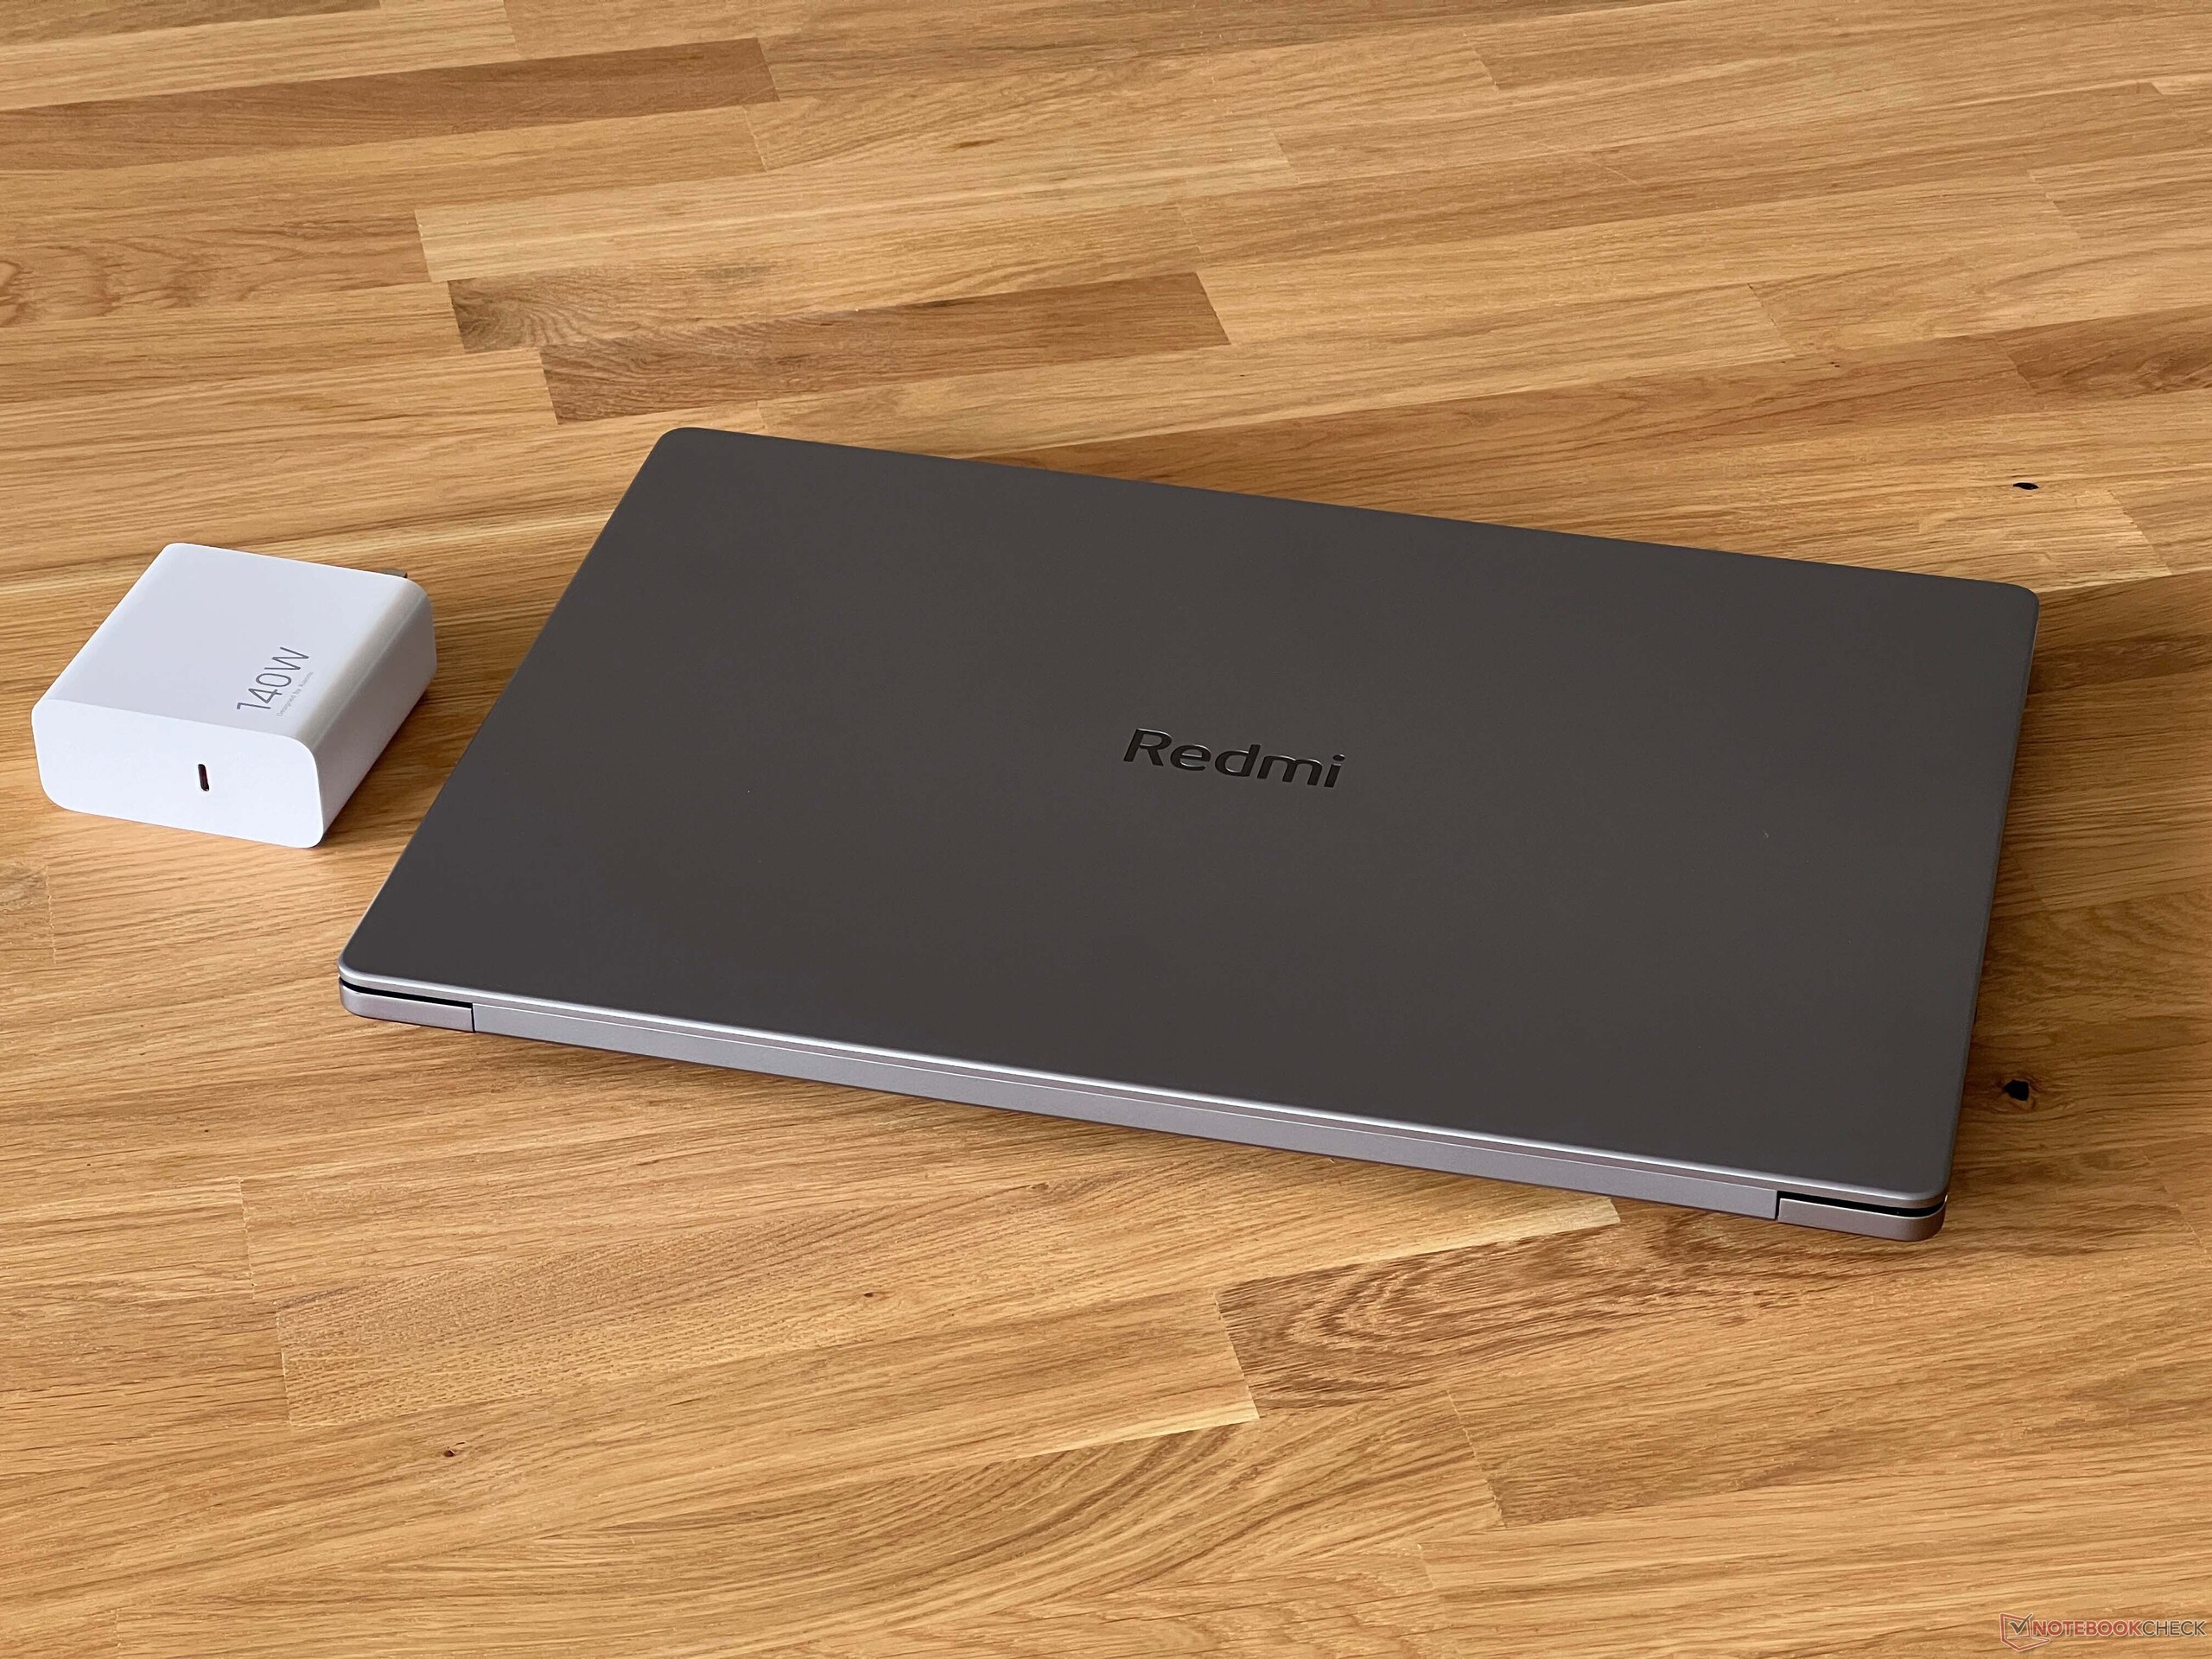
En termes d'encombrement, le RedmiBook Pro 16 est l'un des modèles les plus compacts de notre groupe de comparaison. Avec un poids d'environ 1,87 kg, il est légèrement plus lourd que ses concurrents directs. Mais avec une épaisseur d'environ 1,6 cm, le RedmiBook est aussi relativement fin. Avec son câble de charge USB-C, le chargeur de 140 watts pèse 382 grammes (~13,5 oz).
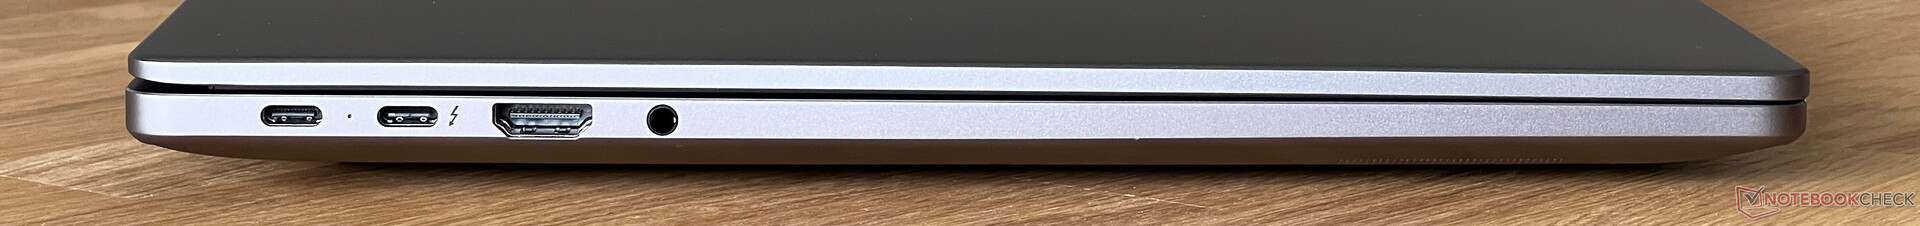
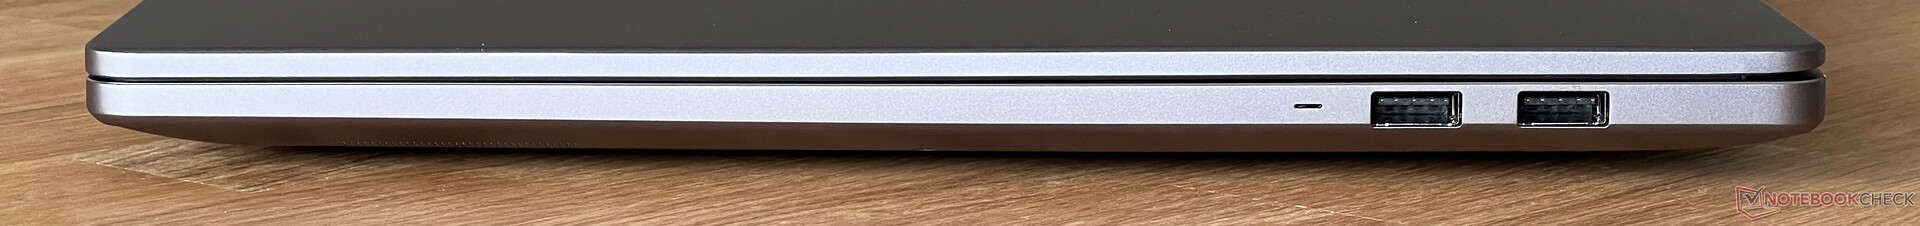
Équipement - Thunderbolt 4 et HDMI 2.1
Les connexions sont réparties sur la zone arrière des deux côtés, et il n'est pas nécessaire d'accepter un quelconque compromis à ce niveau. En plus d'un port USB-C, on trouve également un port Thunderbolt 4 et un port HDMI. Le côté droit offre deux ports USB-A ordinaires, de sorte que vous n'aurez pas besoin d'adaptateurs au quotidien. Cependant, le RedmiBook Pro ne comprend pas de lecteur de cartes ni de port Ethernet.
Communication
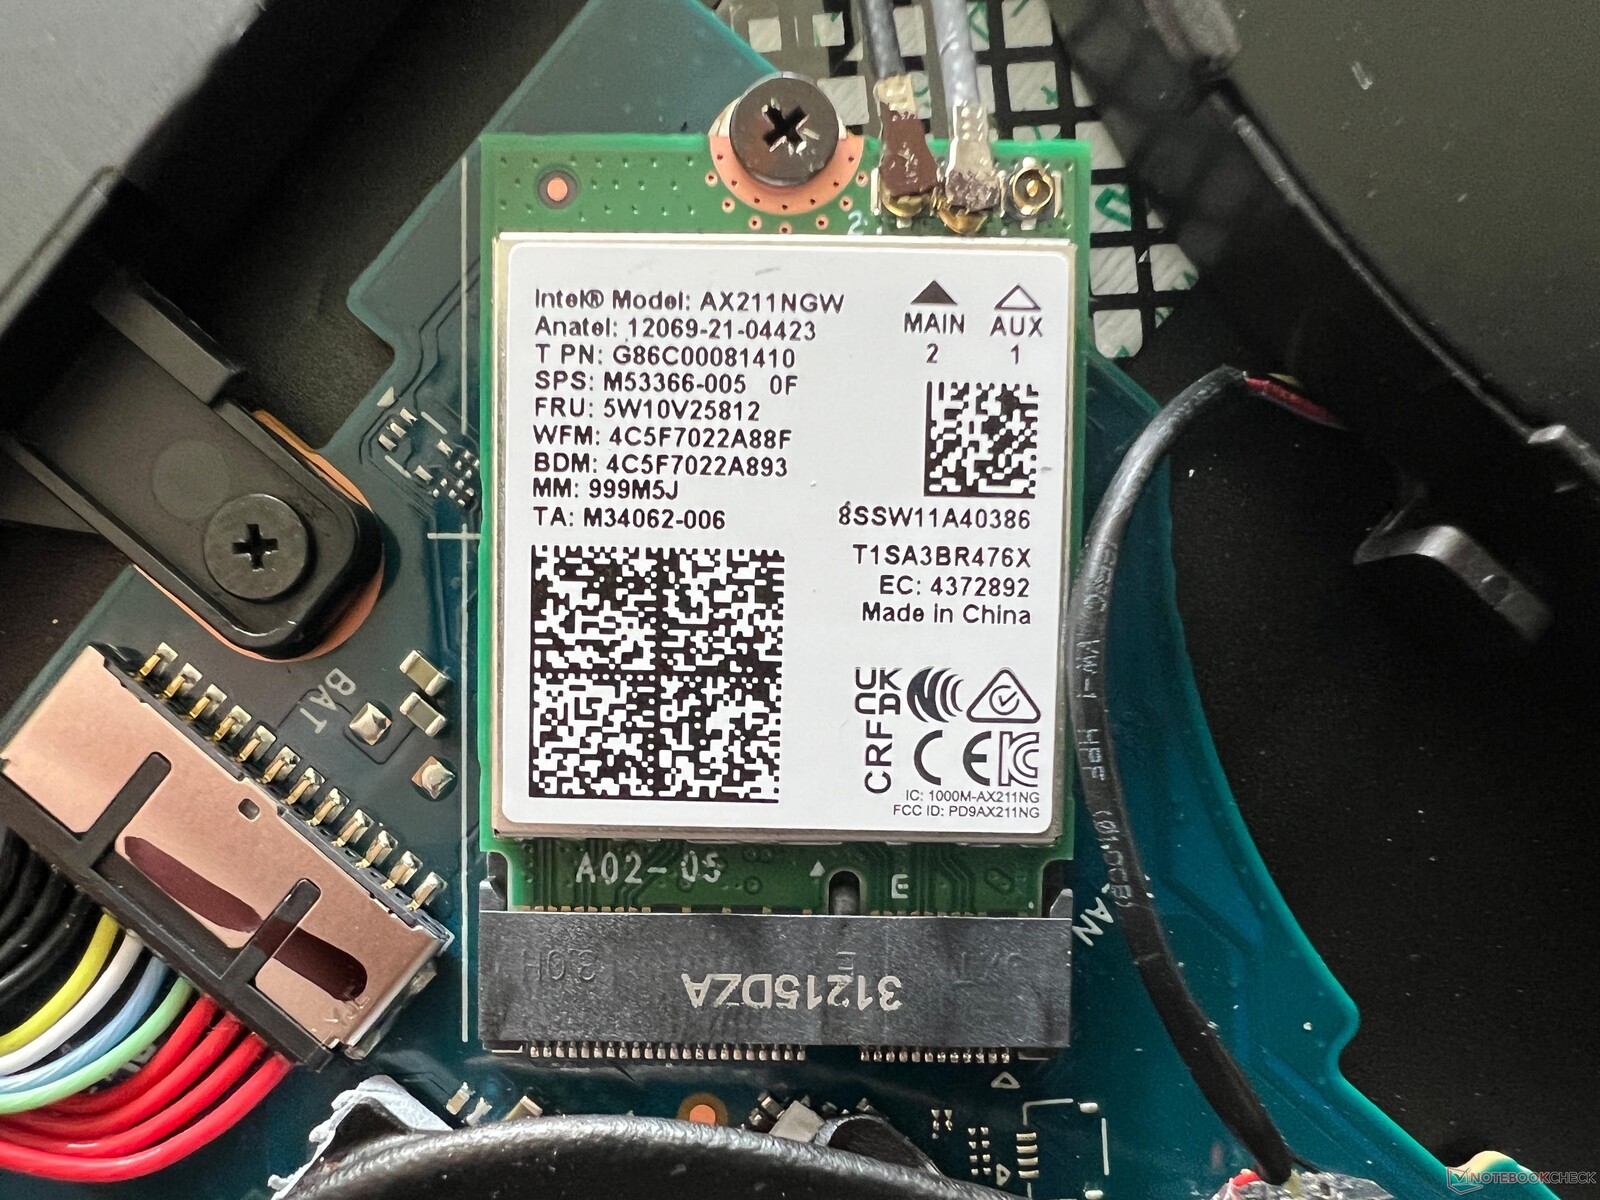
Xiaomi utilise le module WLAN Intel AX211 actuel qui, en plus de la norme Wi-Fi 6E, prend également en charge le Bluetooth 5.3. Mais le fabricant semble avoir rogné sur les antennes, car lors du test avec notre routeur de référence Asus, les taux de transfert maximaux se situent à peine autour de 850-900 MB/s, ce qui correspond à environ la moitié de la valeur habituelle. En fonction de la connexion Internet, vous ne pourrez pas utiliser tout son potentiel, même si cette limitation devrait être minime pour la plupart des utilisateurs.
| Networking | |
| Xiaomi RedmiBook Pro 16 2024 | |
| iperf3 transmit AXE11000 | |
| iperf3 receive AXE11000 | |
| Huawei MateBook D 16 2024 | |
| iperf3 transmit AXE11000 | |
| iperf3 receive AXE11000 | |
| Samsung Galaxy Book4 Pro 16 | |
| iperf3 transmit AXE11000 | |
| iperf3 receive AXE11000 | |
| MSI Prestige 16 B1MG-001US | |
| iperf3 transmit AXE11000 | |
| iperf3 receive AXE11000 | |
| iperf3 transmit AXE11000 6GHz | |
| iperf3 receive AXE11000 6GHz | |
| Acer Swift Edge SFE16 Ryzen 7 7840U | |
| iperf3 transmit AXE11000 | |
| iperf3 receive AXE11000 | |
| iperf3 transmit AXE11000 6GHz | |
| iperf3 receive AXE11000 6GHz | |
| Asus VivoBook S15 K5504 | |
| iperf3 transmit AXE11000 | |
| iperf3 receive AXE11000 | |
| iperf3 transmit AXE11000 6GHz | |
| iperf3 receive AXE11000 6GHz | |
Webcam
La webcam 1080p est un autre point faible du RedmiBook Pro 16, car la qualité de l'image n'est que moyenne, même dans de bonnes conditions de luminosité. En combinaison avec le processeur Meteor Lake, les effets de studio (comme un effet de flou pour l'arrière-plan, le suivi de la tête, etc.) sont pris en charge directement par le système d'exploitation et indépendamment de l'application.


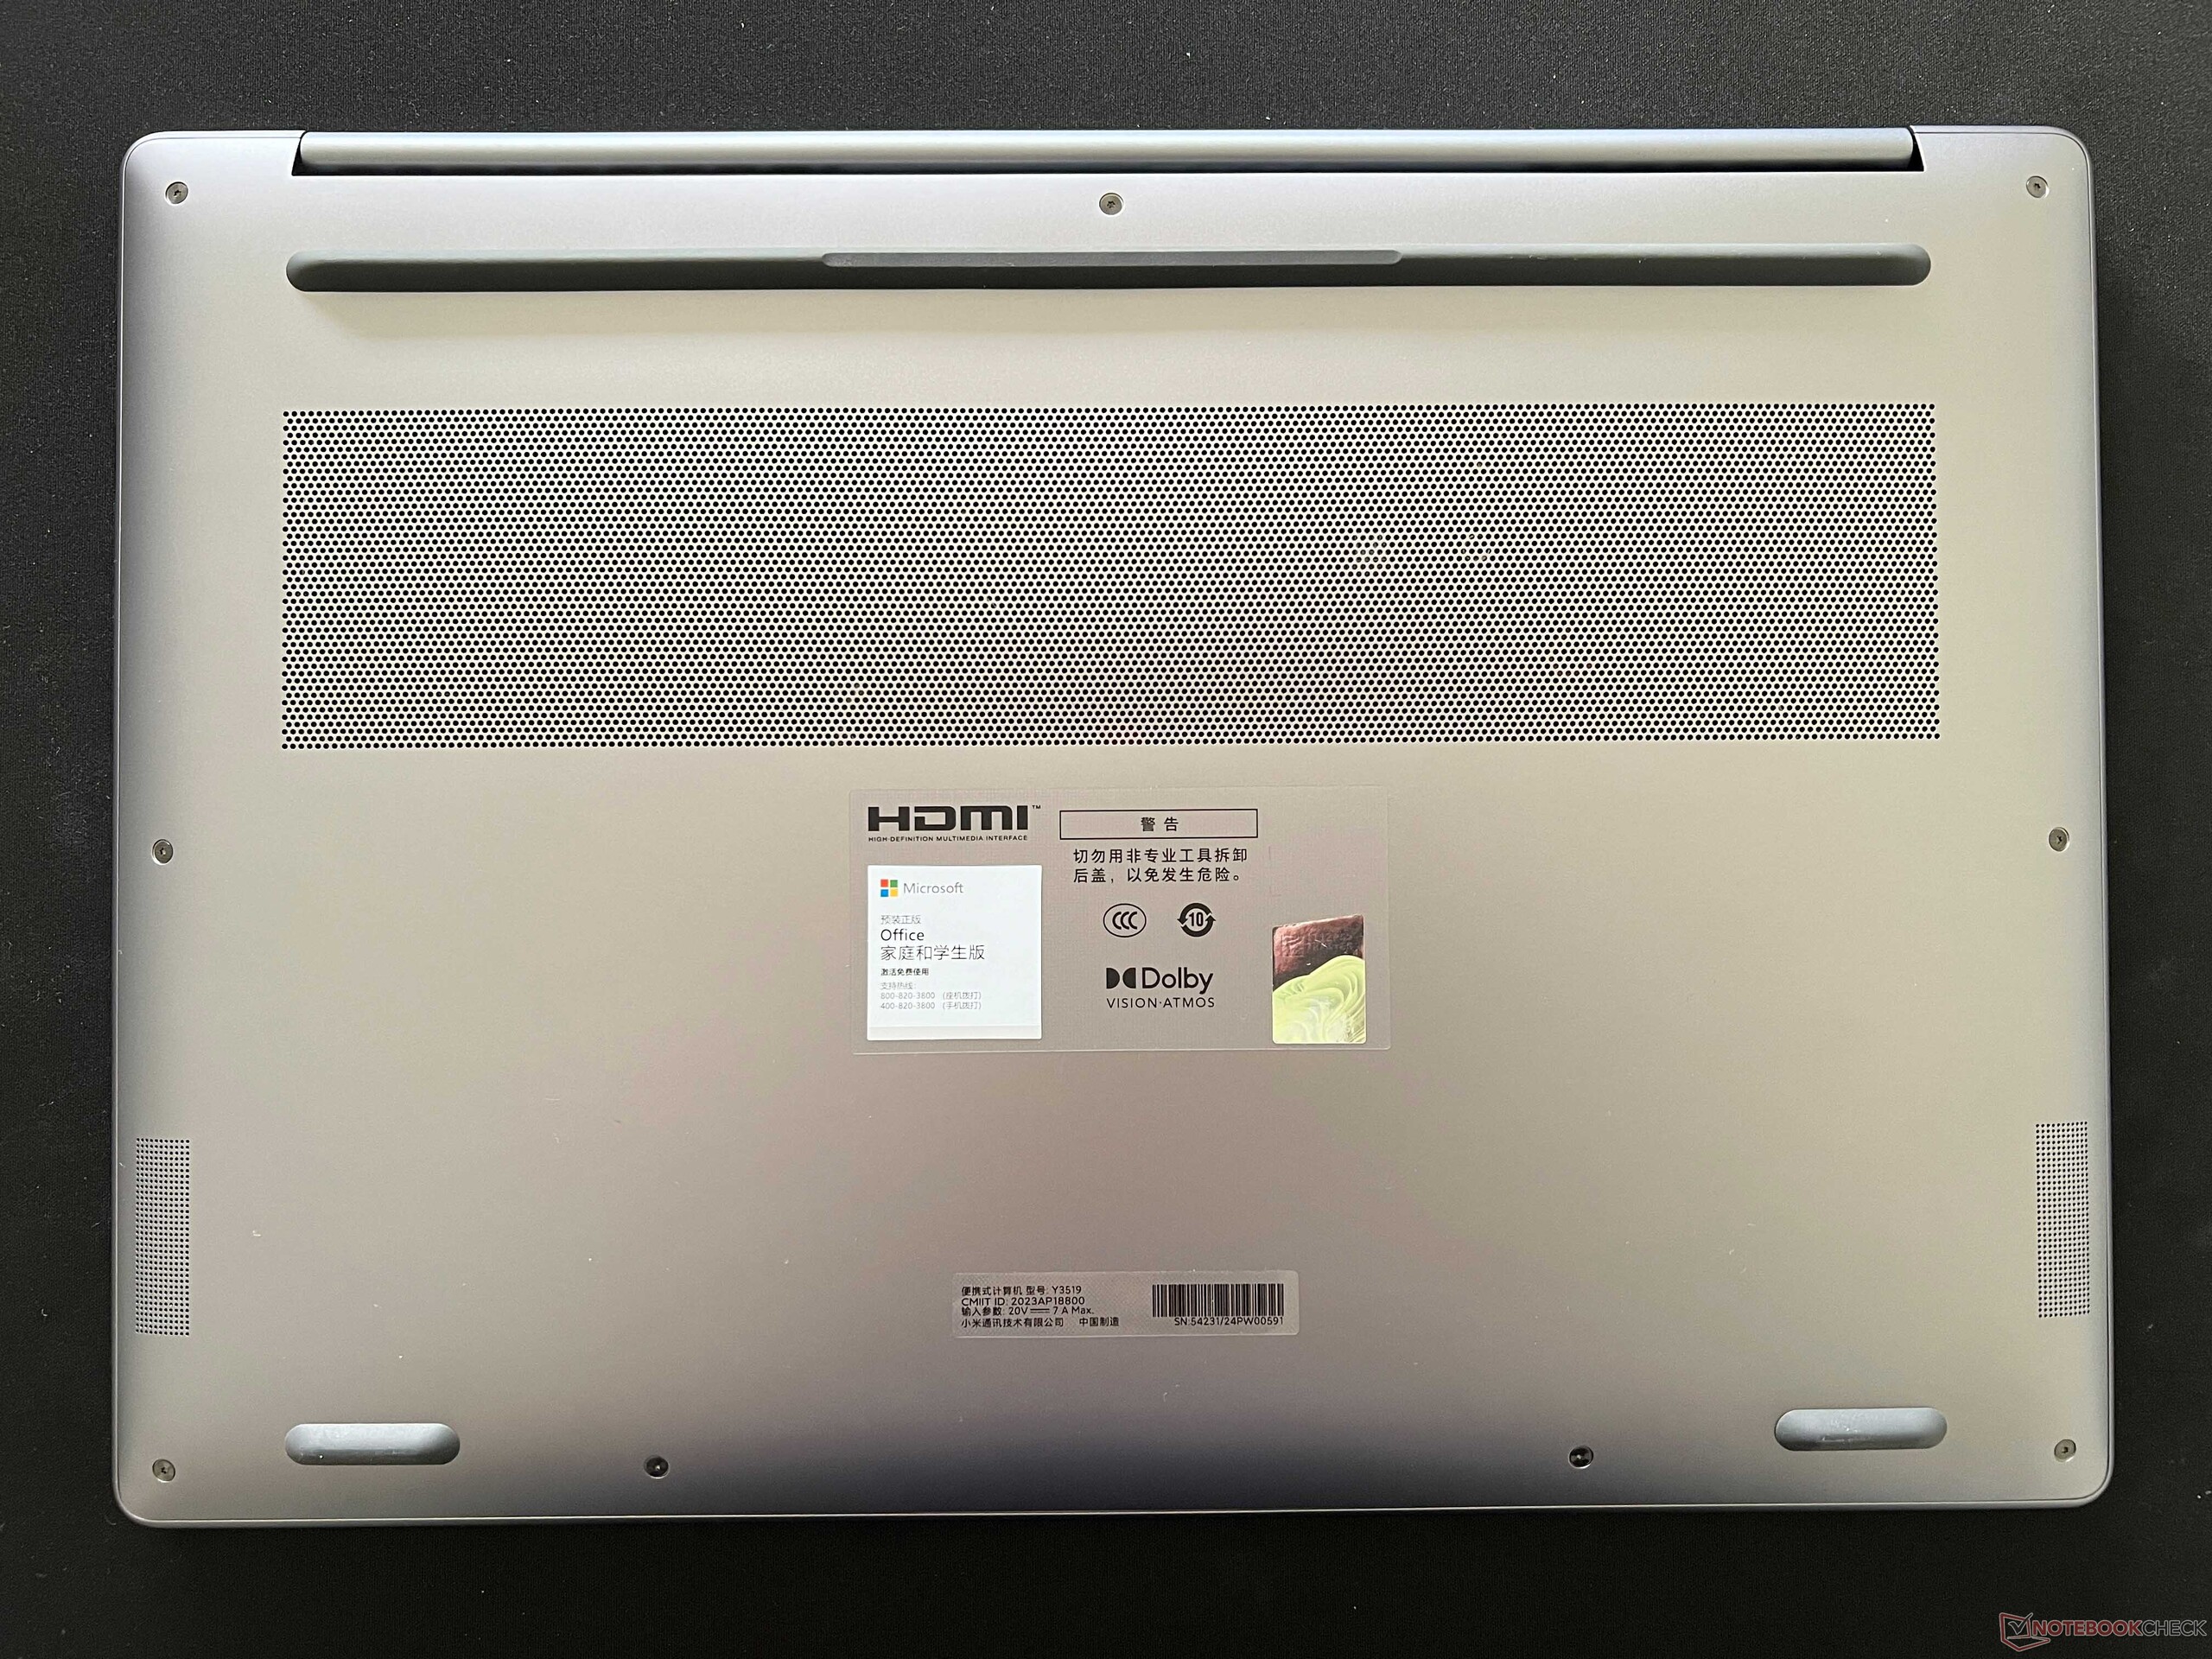
Maintenance
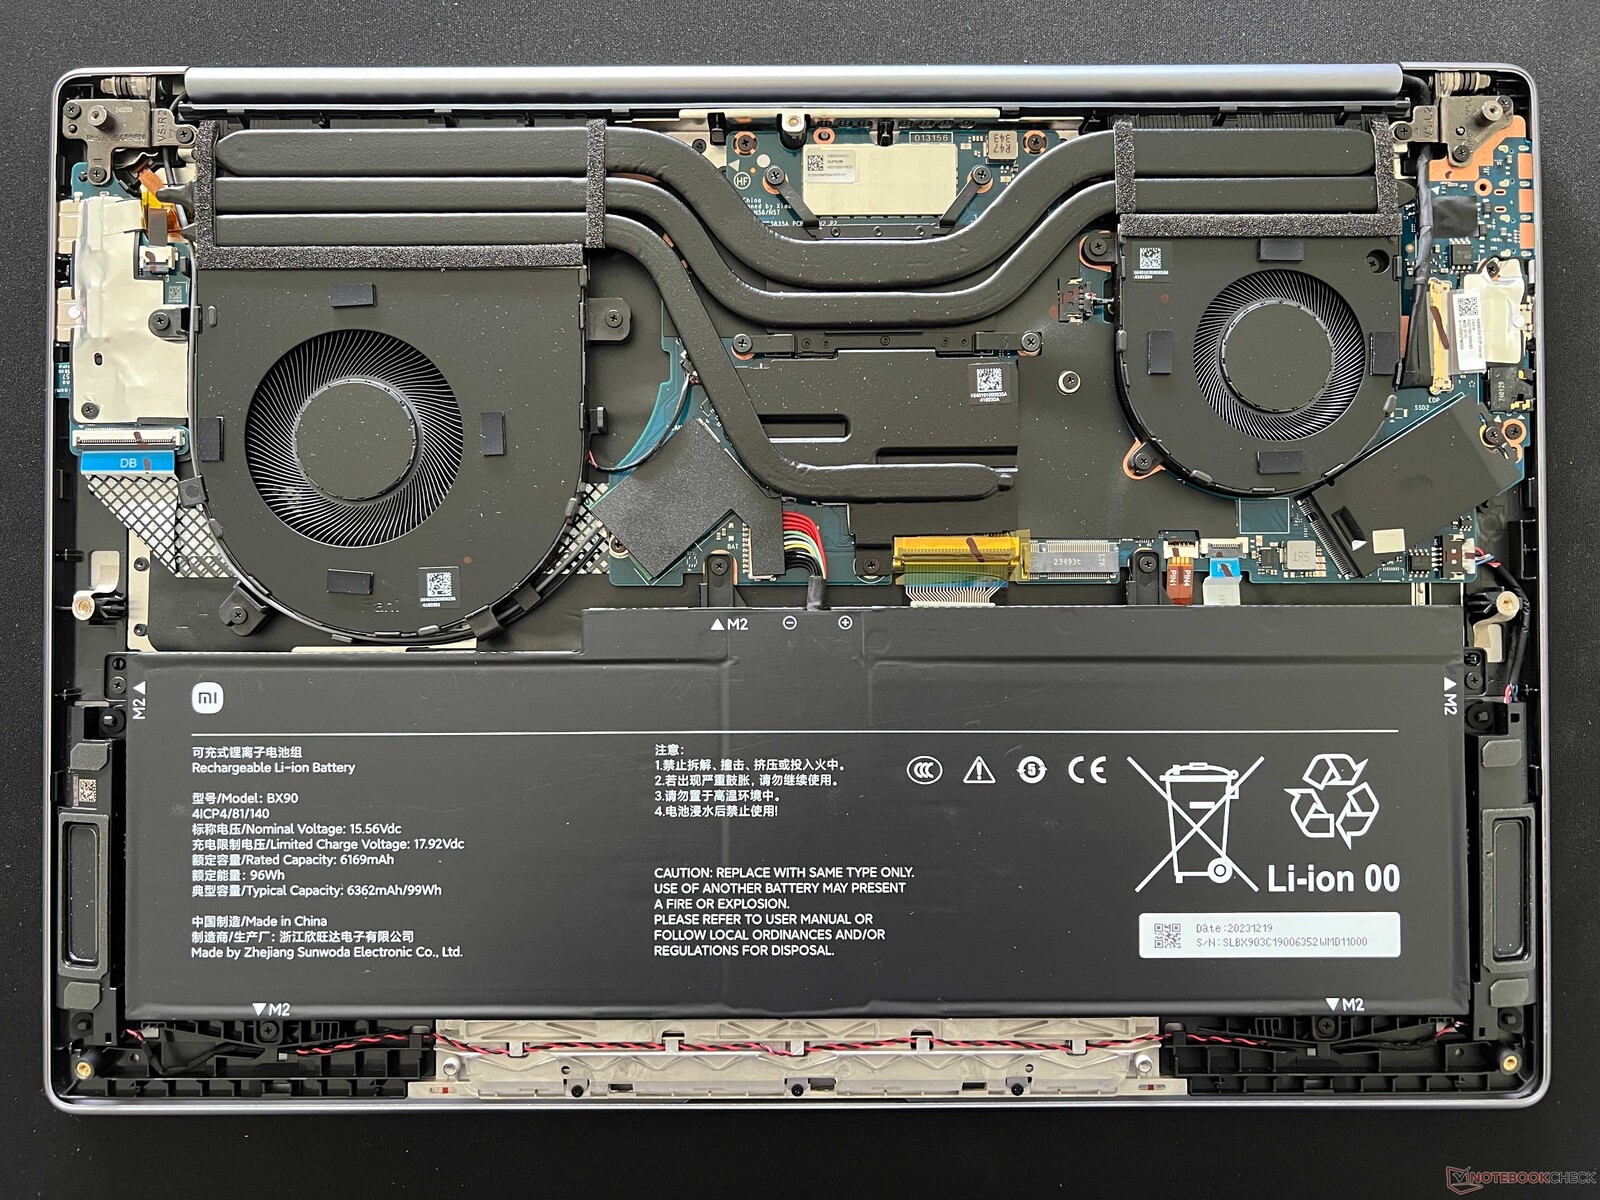
Le couvercle du boîtier en bas est fixé par plusieurs vis Torx (T5) et peut être retiré sans problème. À l'intérieur, vous trouverez deux emplacements pour des disques durs compacts M.2-2242 et un module WLAN remplaçable. La batterie est vissée et peut être remplacée si nécessaire, mais la mémoire de travail est soudée.
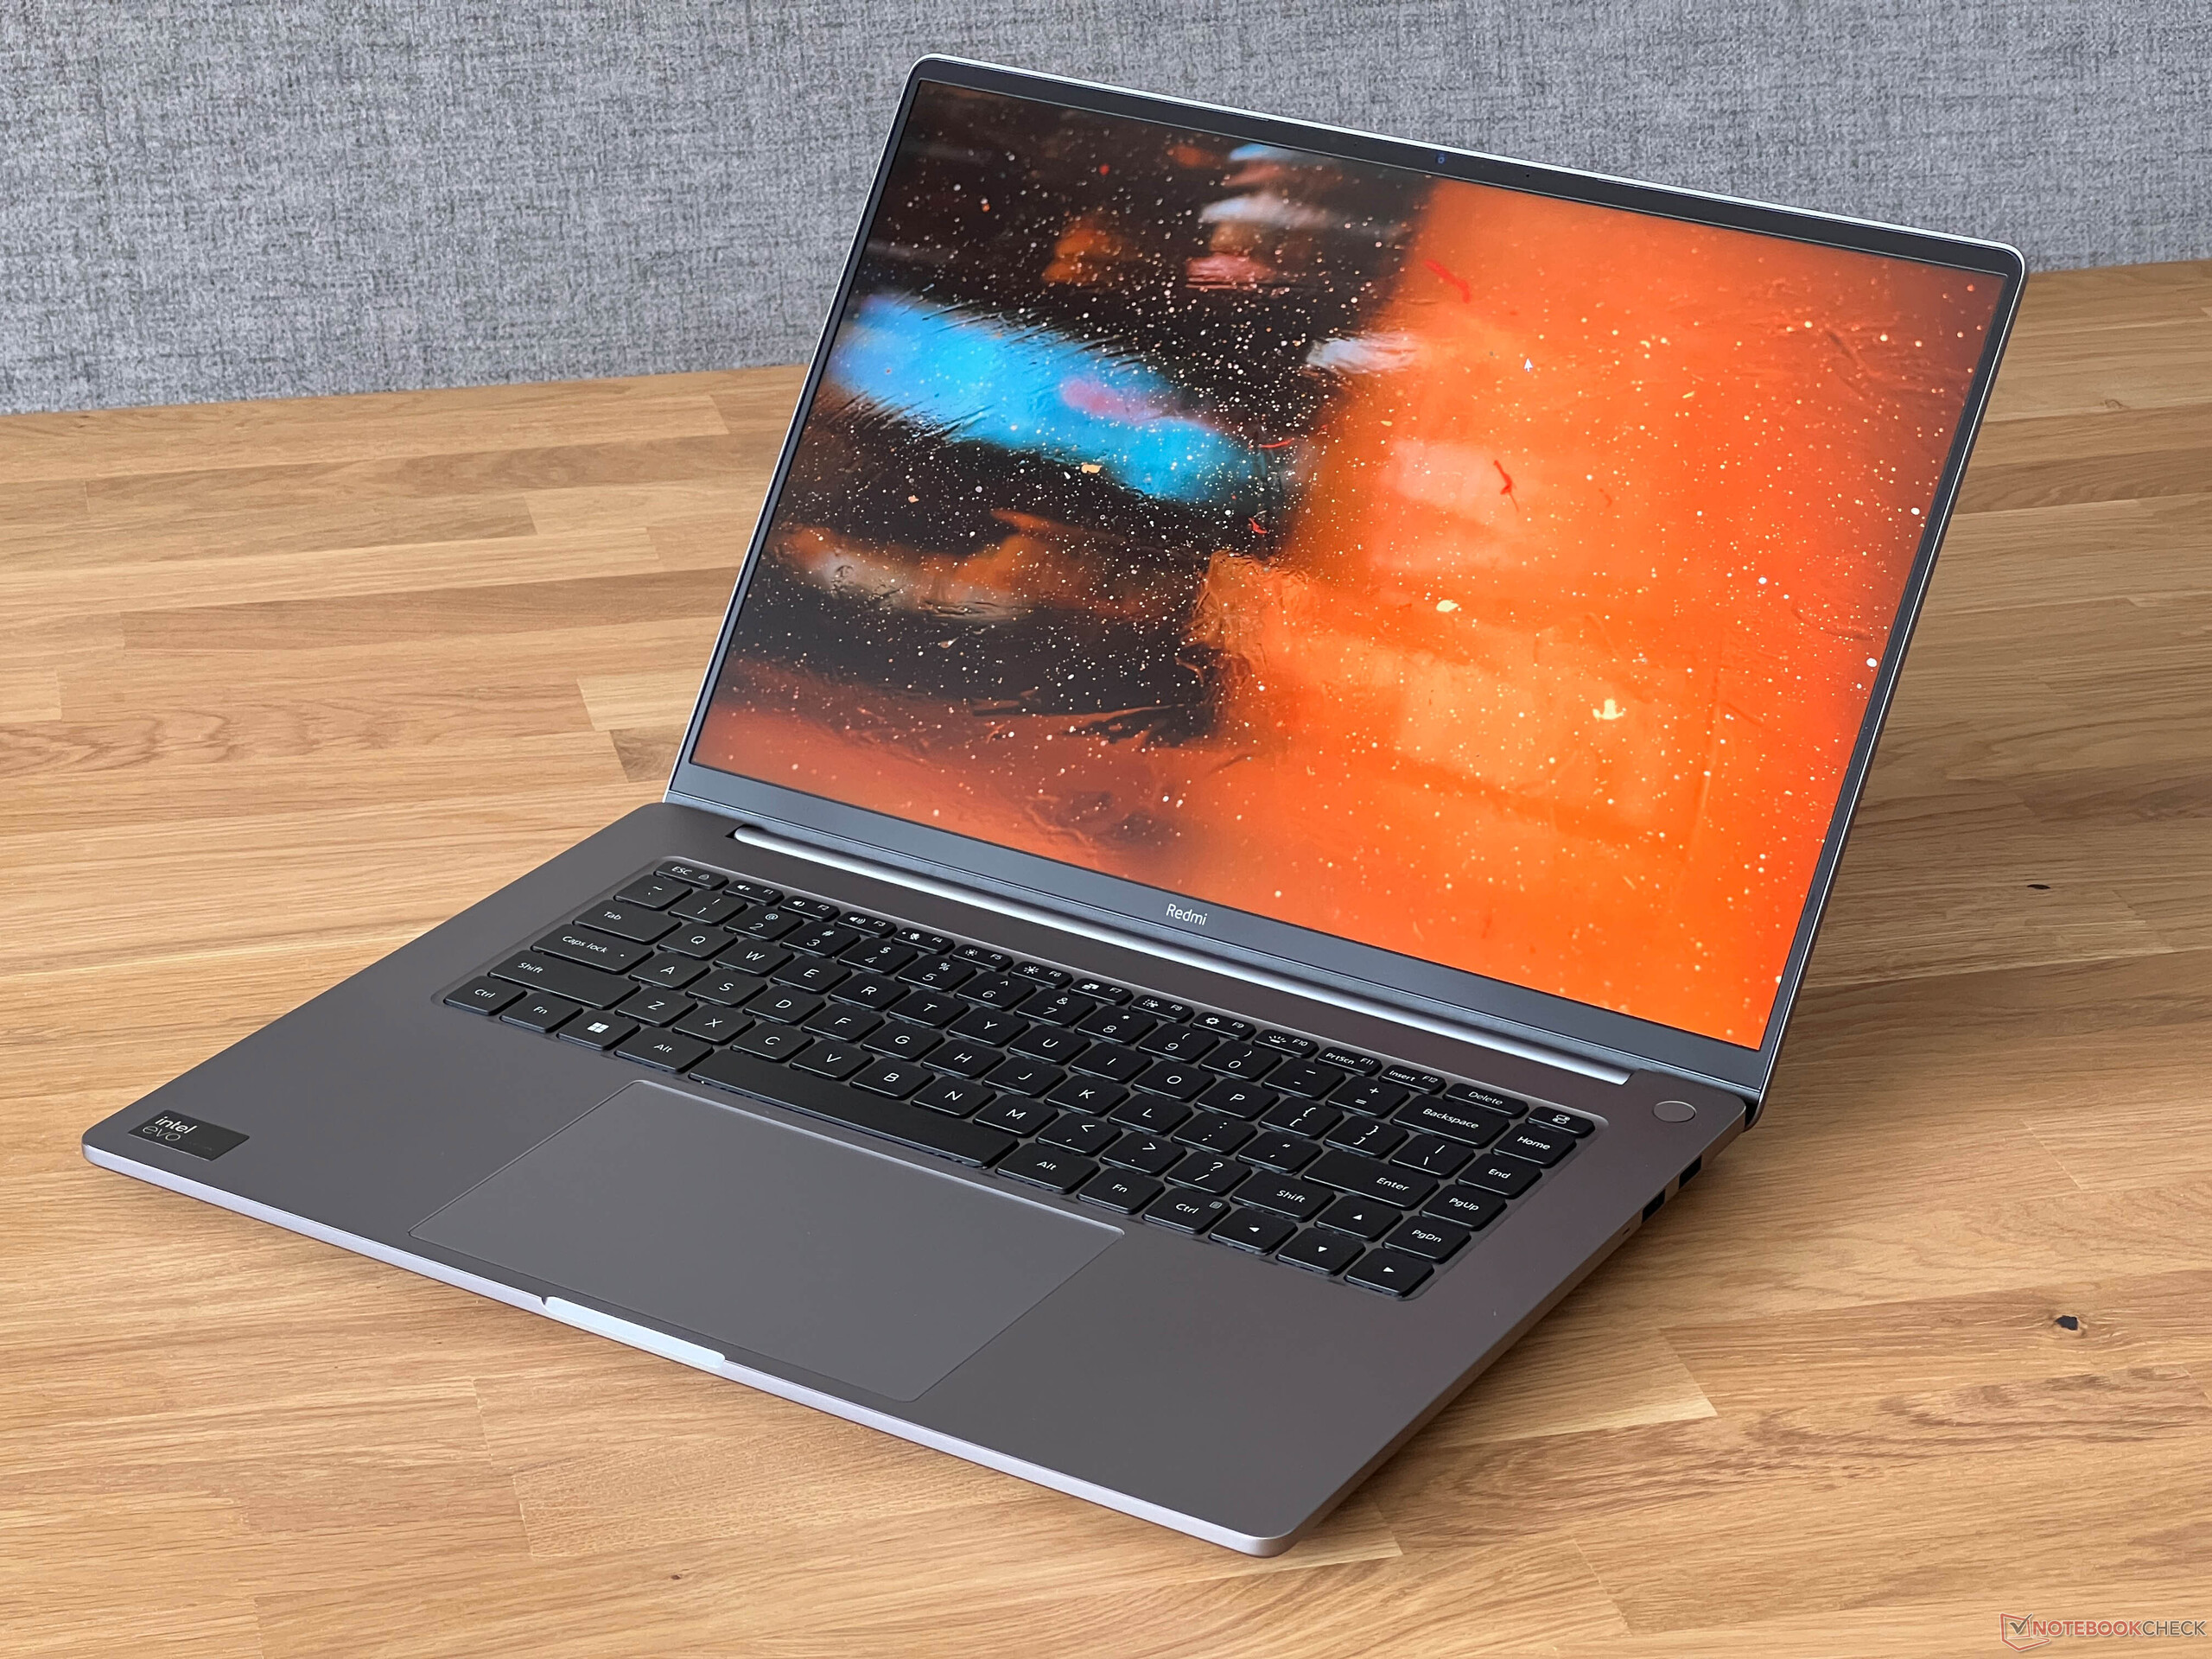
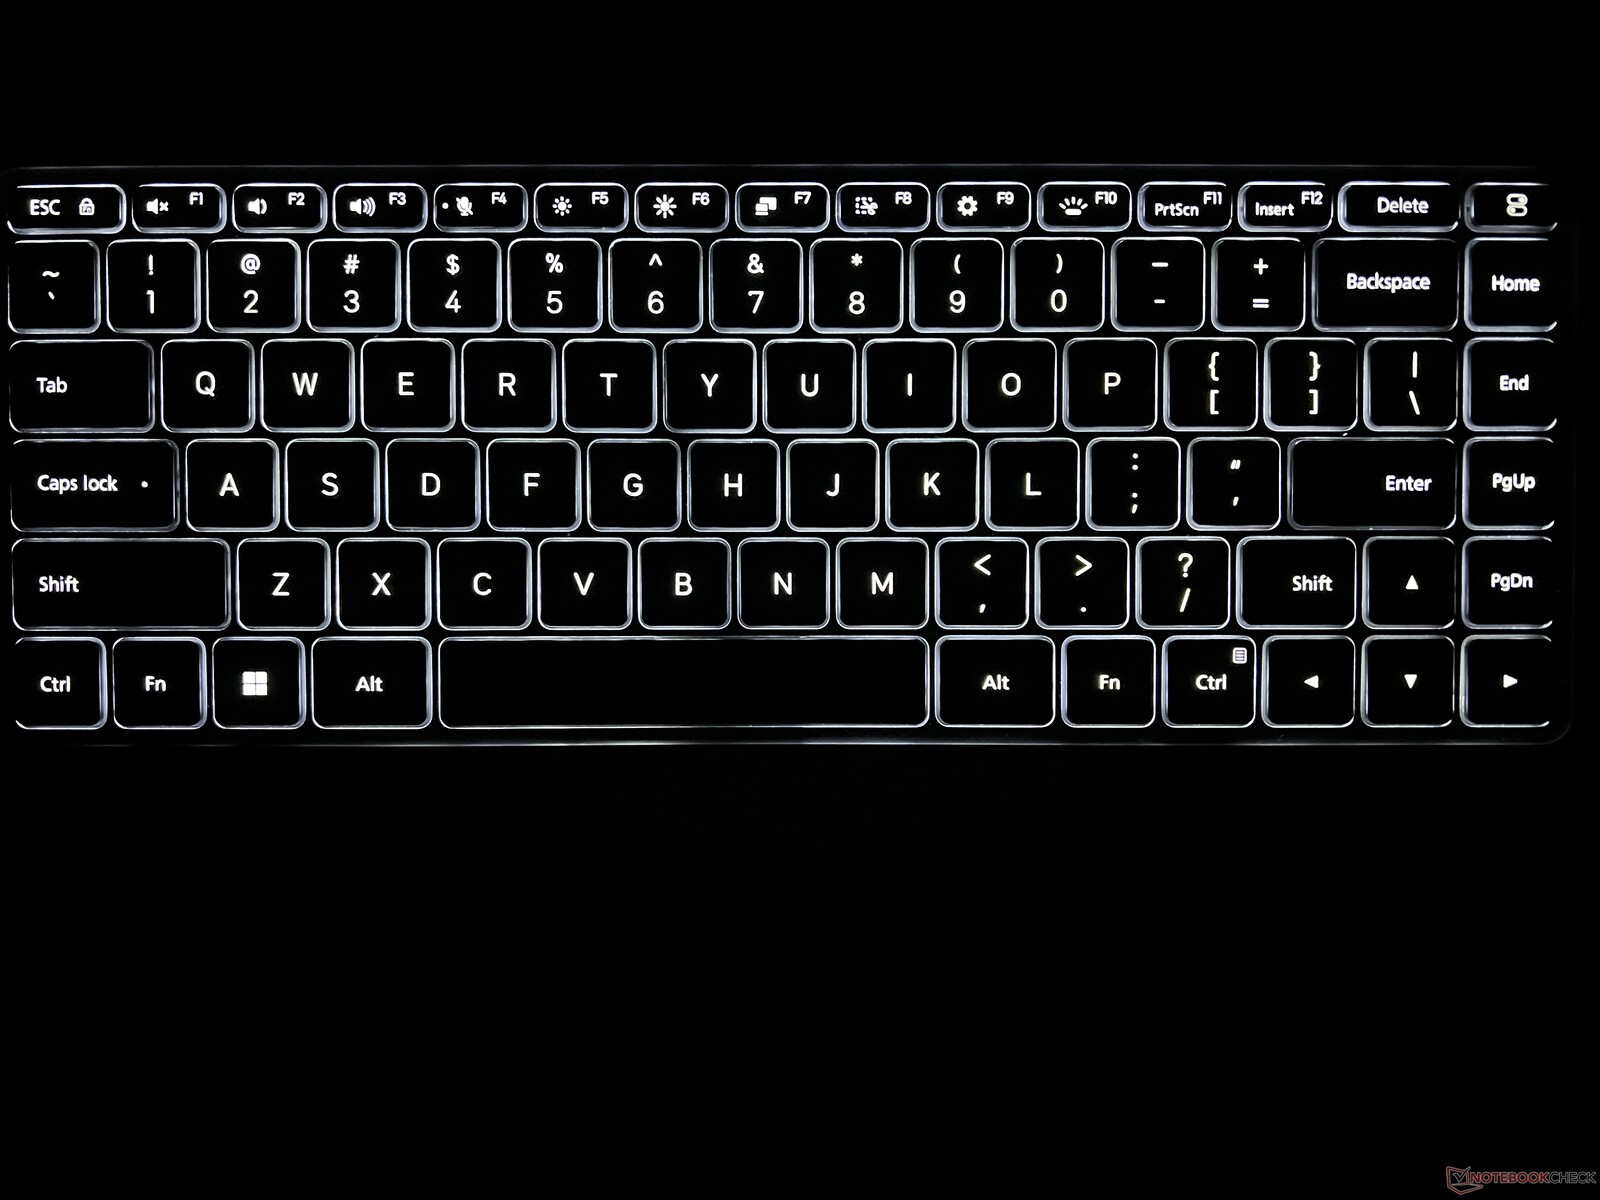
Périphériques d'entrée - Un très bon clavier avec éclairage
Le RedmiBook Pro 16 est équipé d'un clavier chiclet noir avec un éclairage blanc à trois niveaux. La qualité du clavier laisse une très bonne impression, offrant une longue course de touches et une expérience de frappe précise, et les touches ne s'entrechoquent pas non plus. Il s'agit donc d'un très bon clavier, que nous préférons à celui du Lenovo IdeaPad Pro 5 16 (article à paraître prochainement). Bien que notre unité de test ne comporte pas de bloc numérique dédié, il y a de grandes touches fléchées et des touches dédiées pour PgUp/PgDn. Le bouton d'alimentation se trouve en haut à droite, en dehors de la zone du clavier, et comprend également le capteur d'empreintes digitales.
Le seul problème pour les utilisateurs allemands est la disposition internationale du clavier. Vous pouvez bien sûr utiliser la saisie anglaise, mais cela se compliquera avec les trémas, par exemple. Vous pouvez également choisir la disposition allemande, mais vous devrez alors mémoriser l'affectation des touches (et peut-être apposer des autocollants sur les touches spéciales).
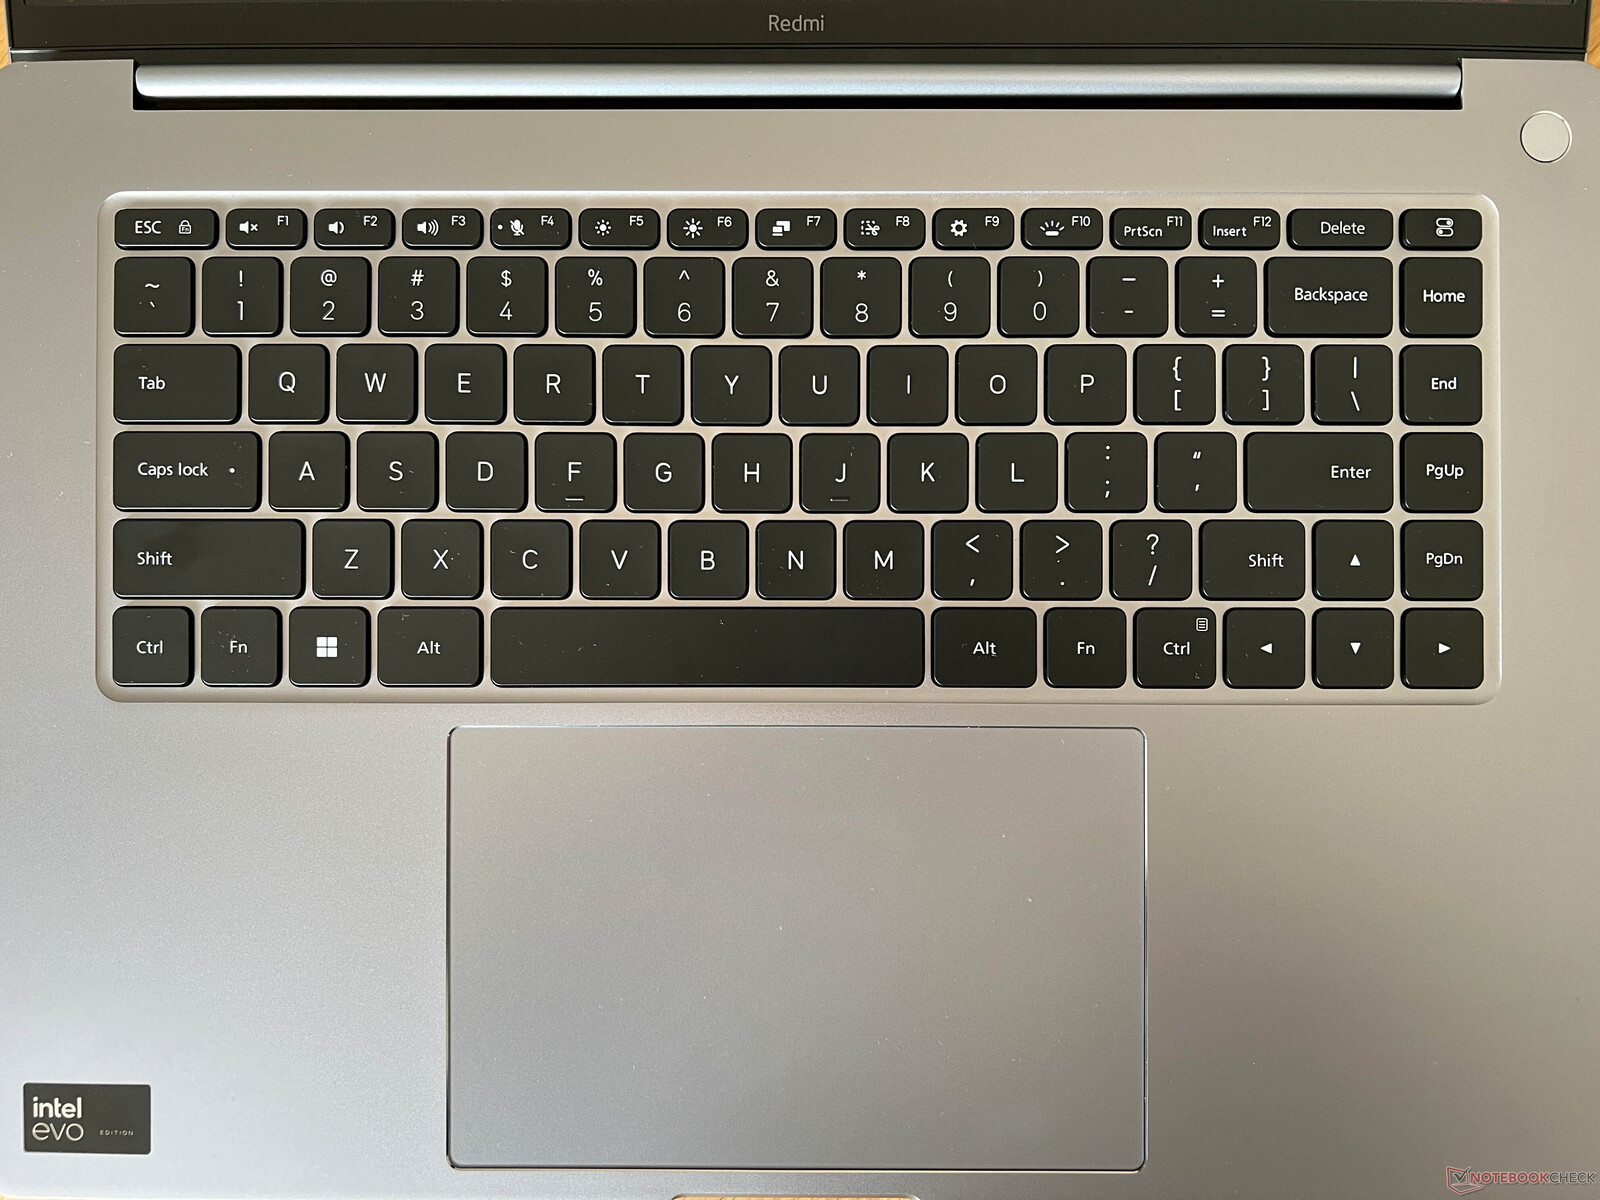
Avec ses 15 x 9,5 cm, le grand ClickPad offre beaucoup d'espace pour les saisies, et ses caractéristiques de glissement sont également très bonnes. Nous n'avons eu aucun problème de saisie pendant le test, et si nous devions nous plaindre de quelque chose, ce serait du bruit de clic un peu plus fort, si vous appuyez sur la partie inférieure du pavé.
Écran - 3K IPS avec 165 Hz
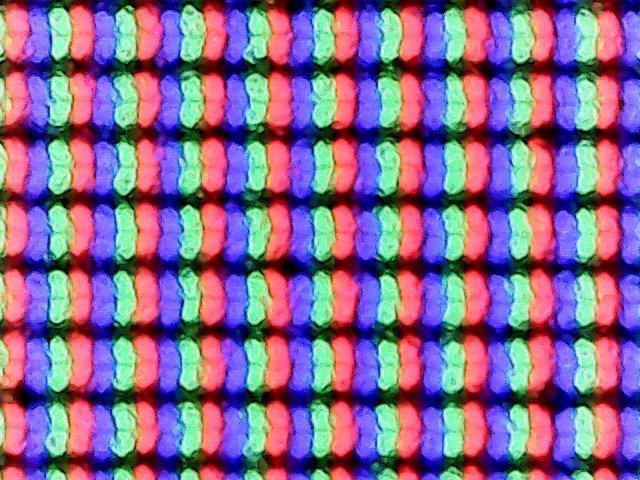
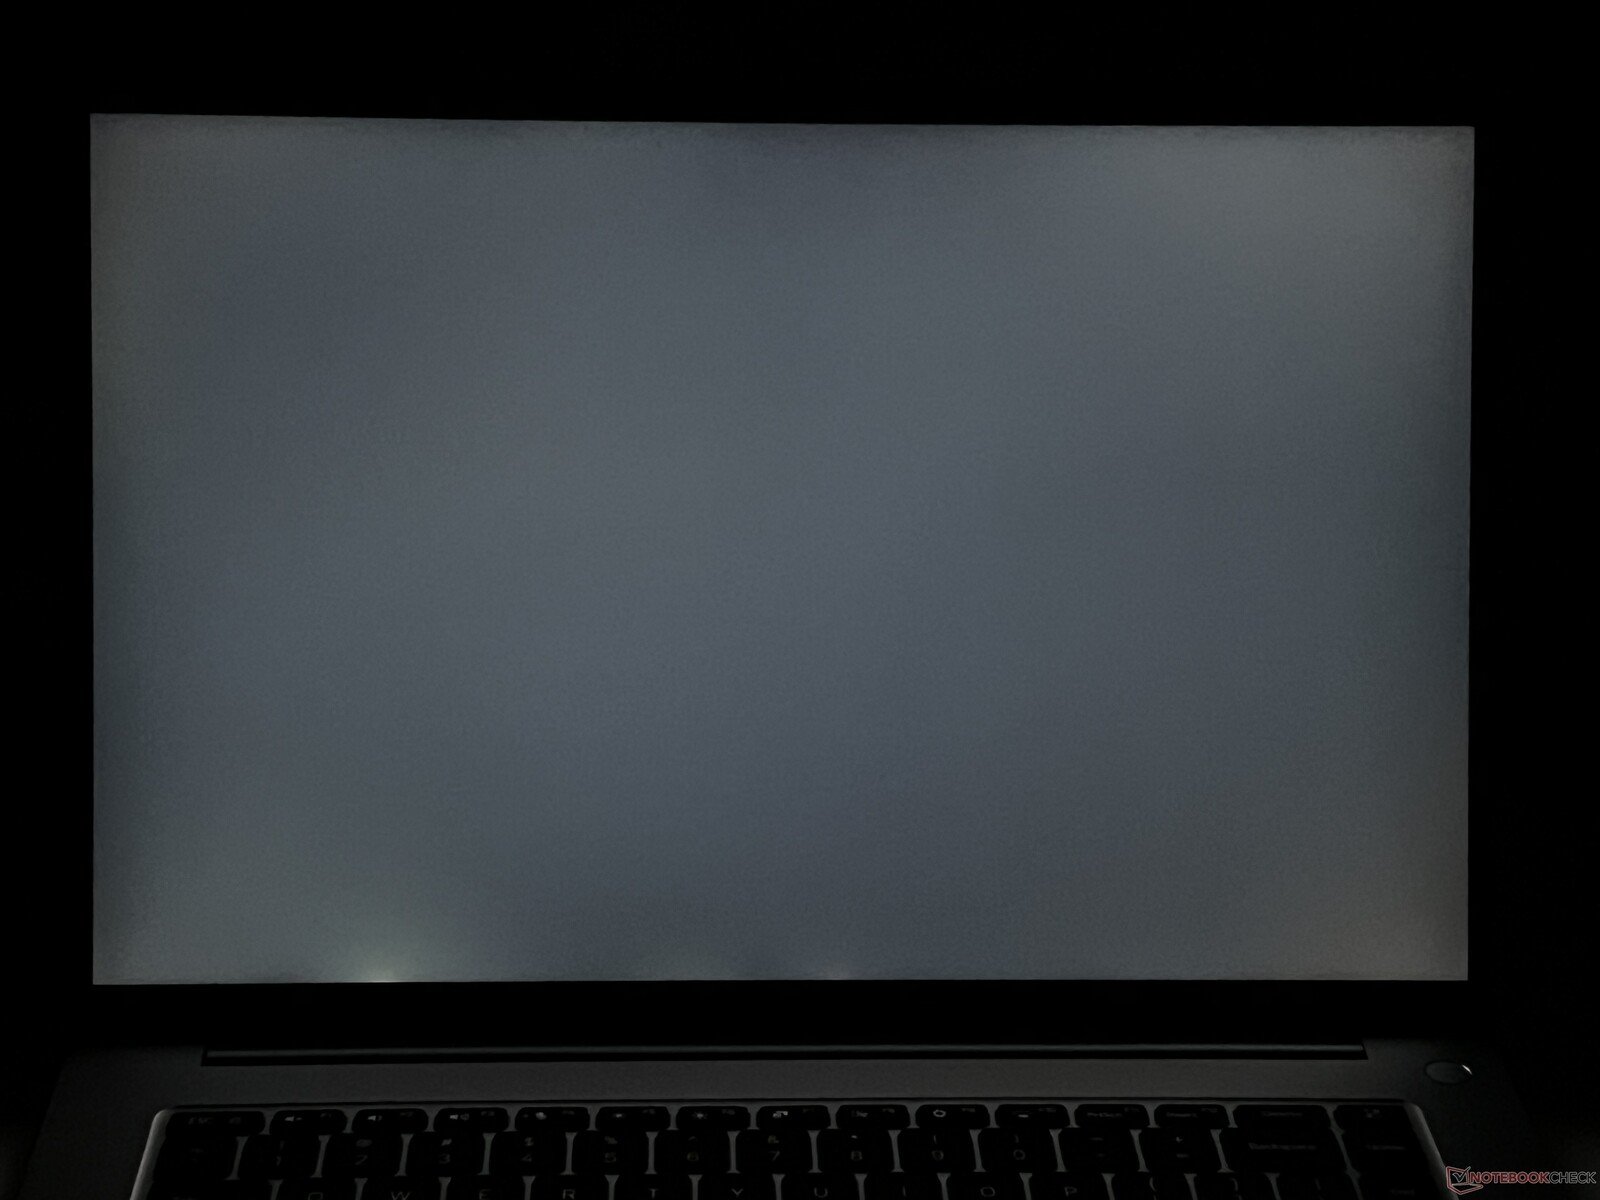
Le RedmiBook Pro est équipé d'un grand écran IPS de 16 pouces qui offre une résolution de 3072x1920 pixels au format 16:10. L'impression subjective de l'image est très bonne, avec des contenus très nets et des couleurs éclatantes, même si les panneaux OLED ont bien sûr un avantage ici. Mais cela signifie aussi que le RedmiBook Pro ne montre aucun scintillement IPS. Dans les zones claires de l'image, vous pouvez détecter une légère granulation, mais vous devez regarder de très près pour le remarquer, et ce n'est pas gênant dans l'utilisation quotidienne. Les halos lumineux ne posent pas de problème majeur et les temps de réponse sont discrets. Grâce au capteur de luminosité, la luminosité de l'image et la température de couleur peuvent être ajustées automatiquement aux conditions de luminosité environnantes.
La luminosité maximale est de 526 cd/m² et de 510 cd/m² en moyenne. La valeur noire est légèrement plus élevée à 0,35 cd/m², mais le rapport de contraste maximal est toujours très bon ~1,500:1. Le contenu HDR est également pris en charge, mais contrairement aux panneaux OLED ou mini-LED, la luminosité maximale reste inchangée.
| |||||||||||||||||||||||||
Homogénéité de la luminosité: 93 %
Valeur mesurée au centre, sur batterie: 520 cd/m²
Contraste: 1486:1 (Valeurs des noirs: 0.35 cd/m²)
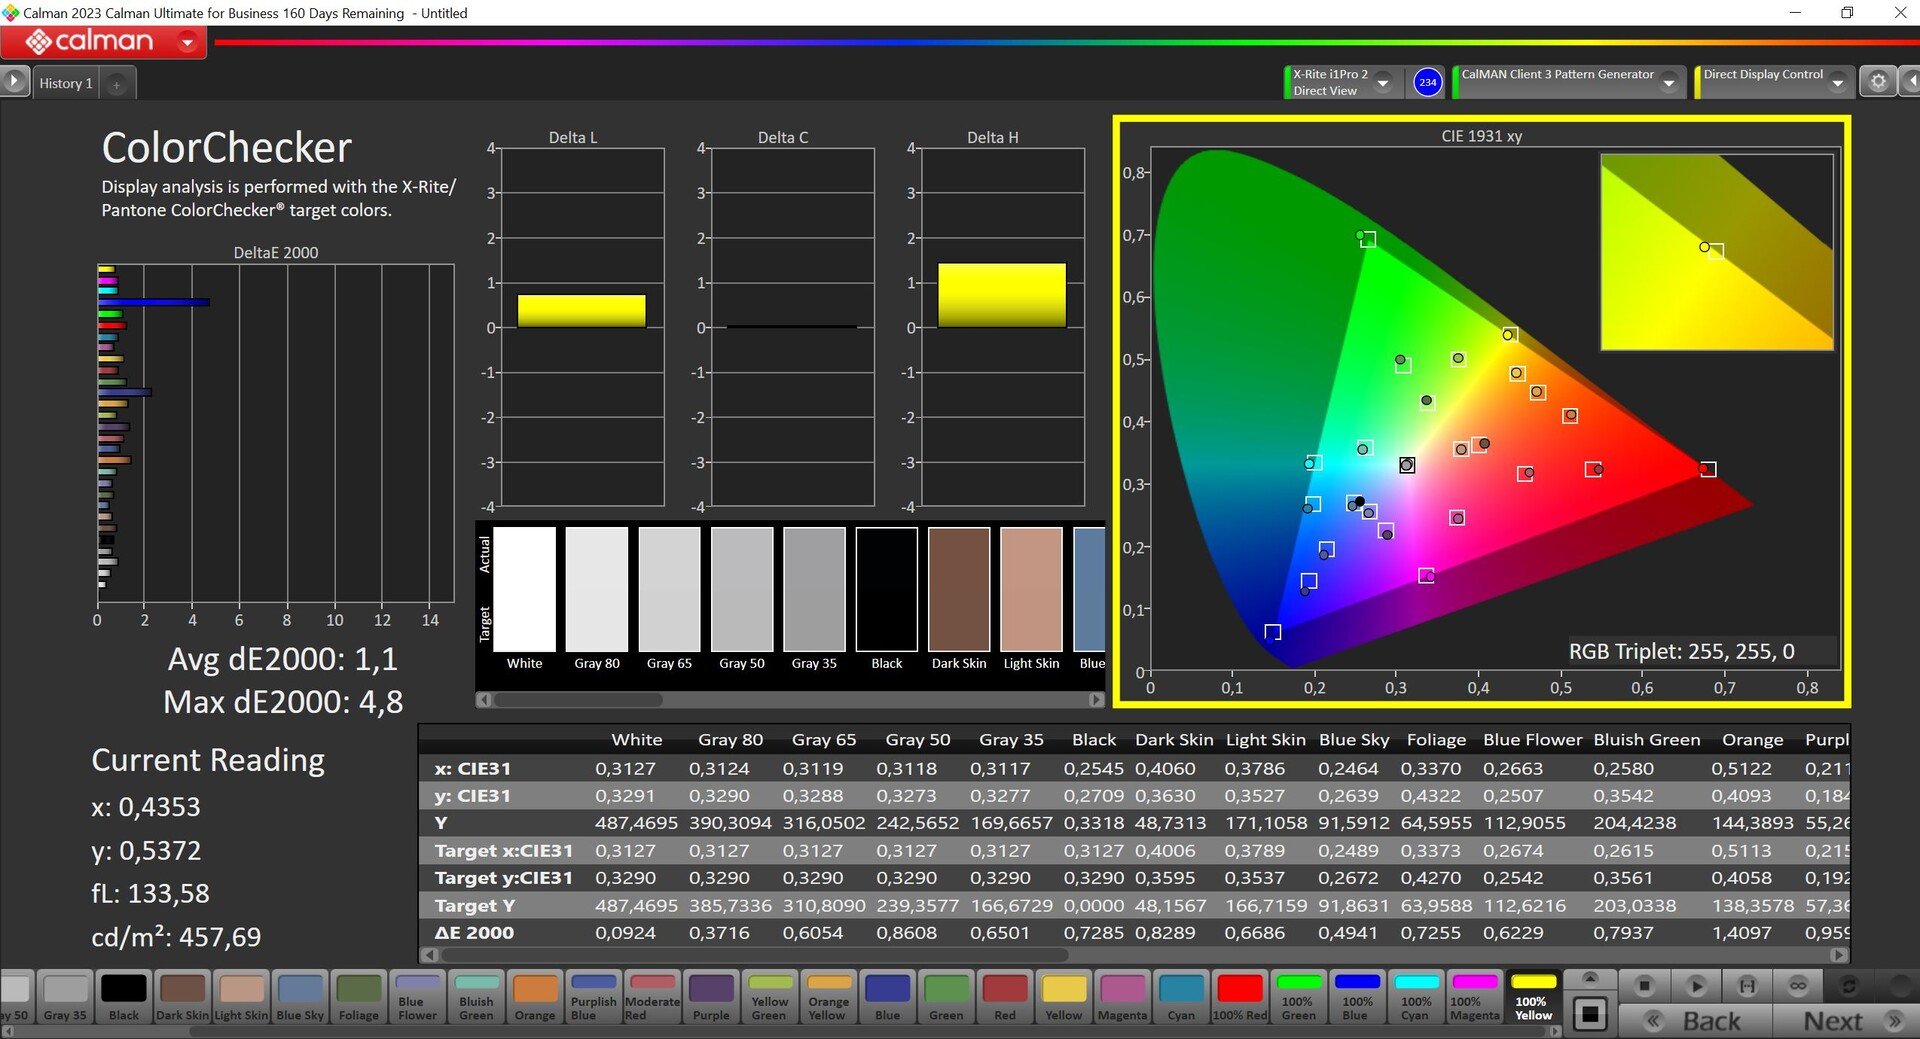
ΔE ColorChecker Calman: 2.9 | ∀{0.5-29.43 Ø4.73}
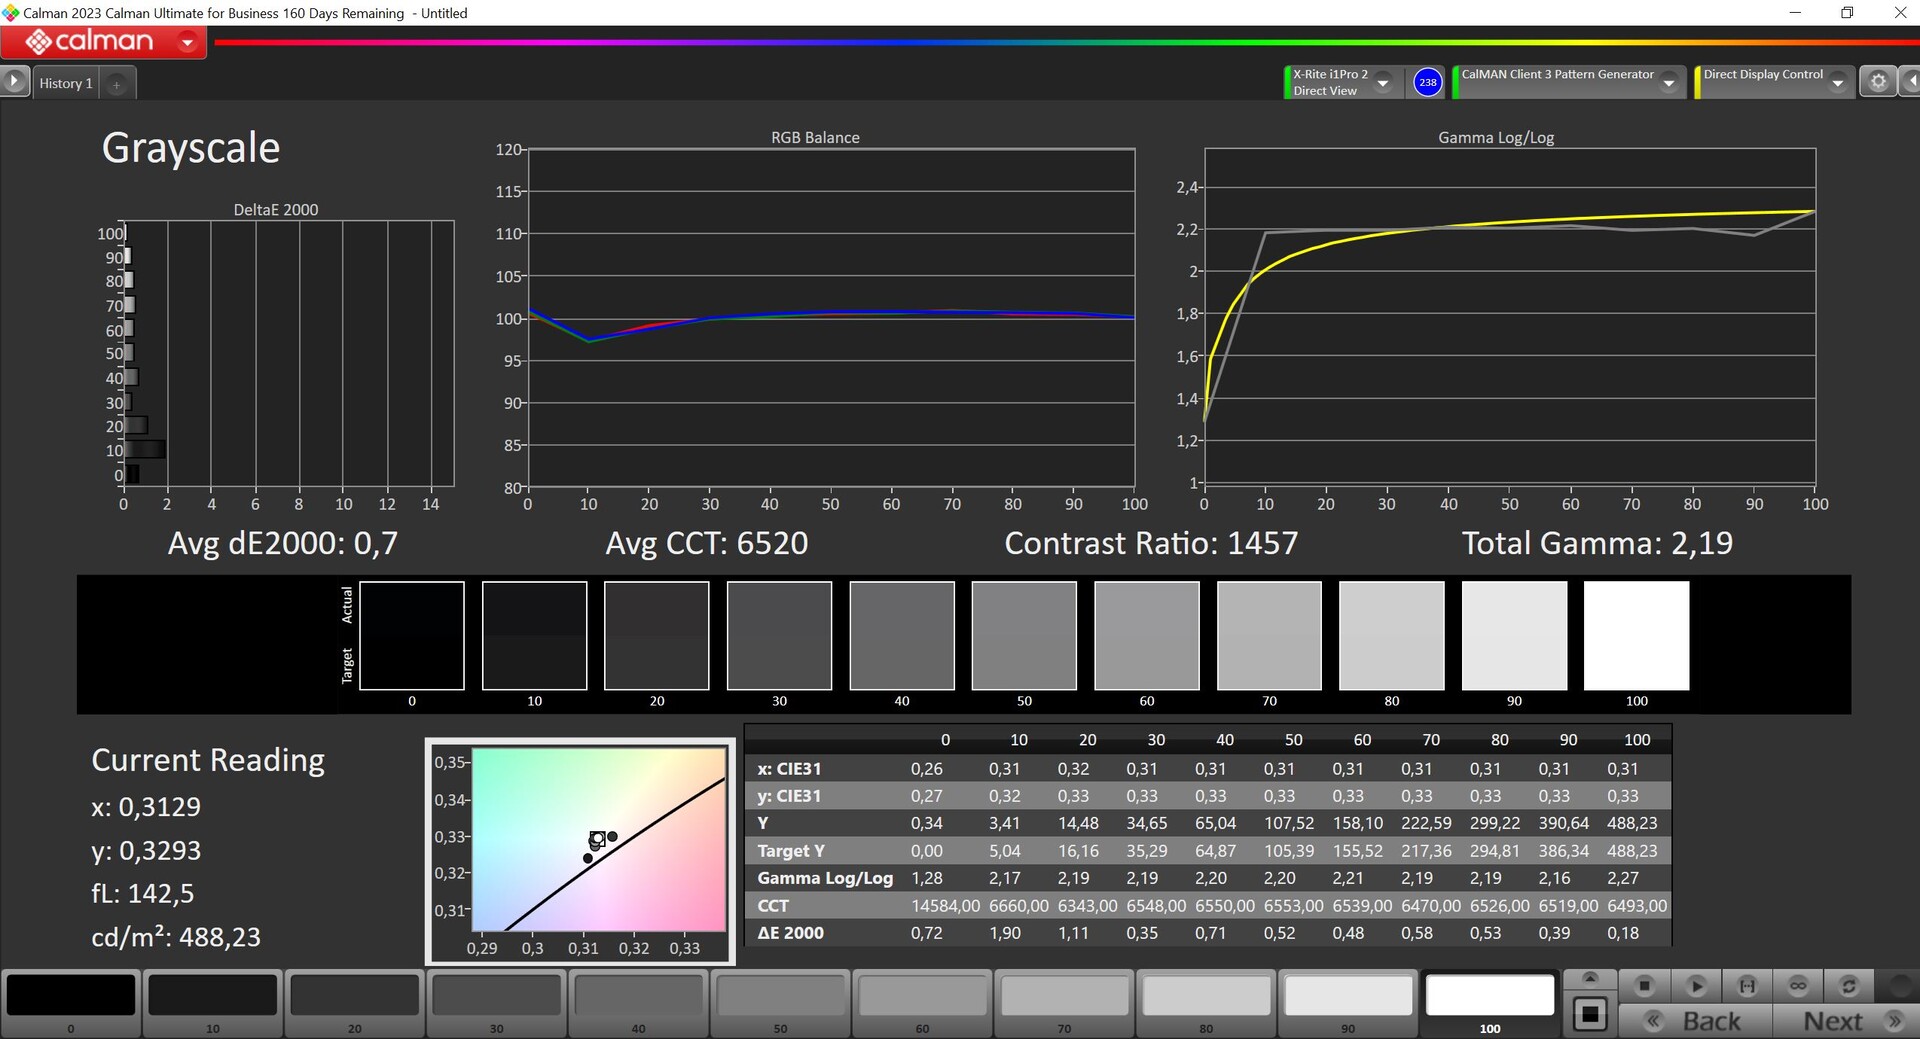
calibrated: 1.1
ΔE Greyscale Calman: 4.3 | ∀{0.09-98 Ø4.97}
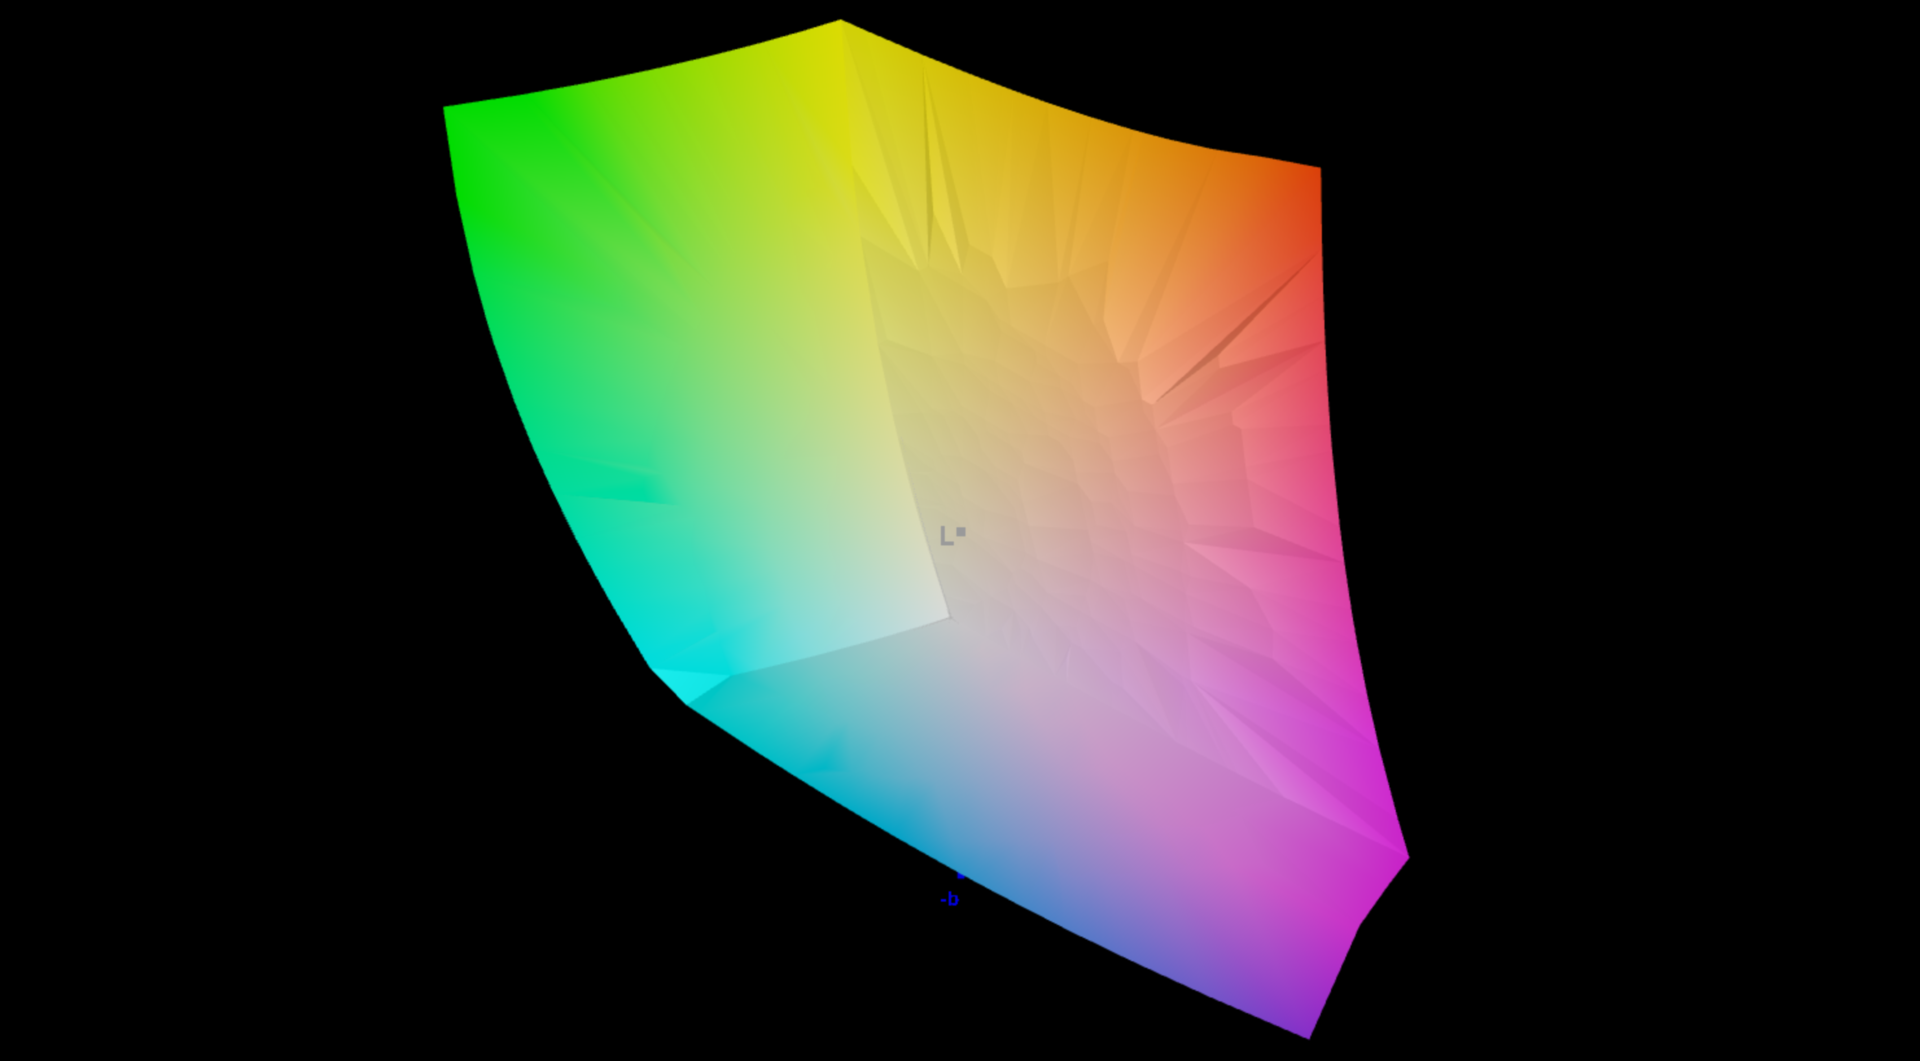
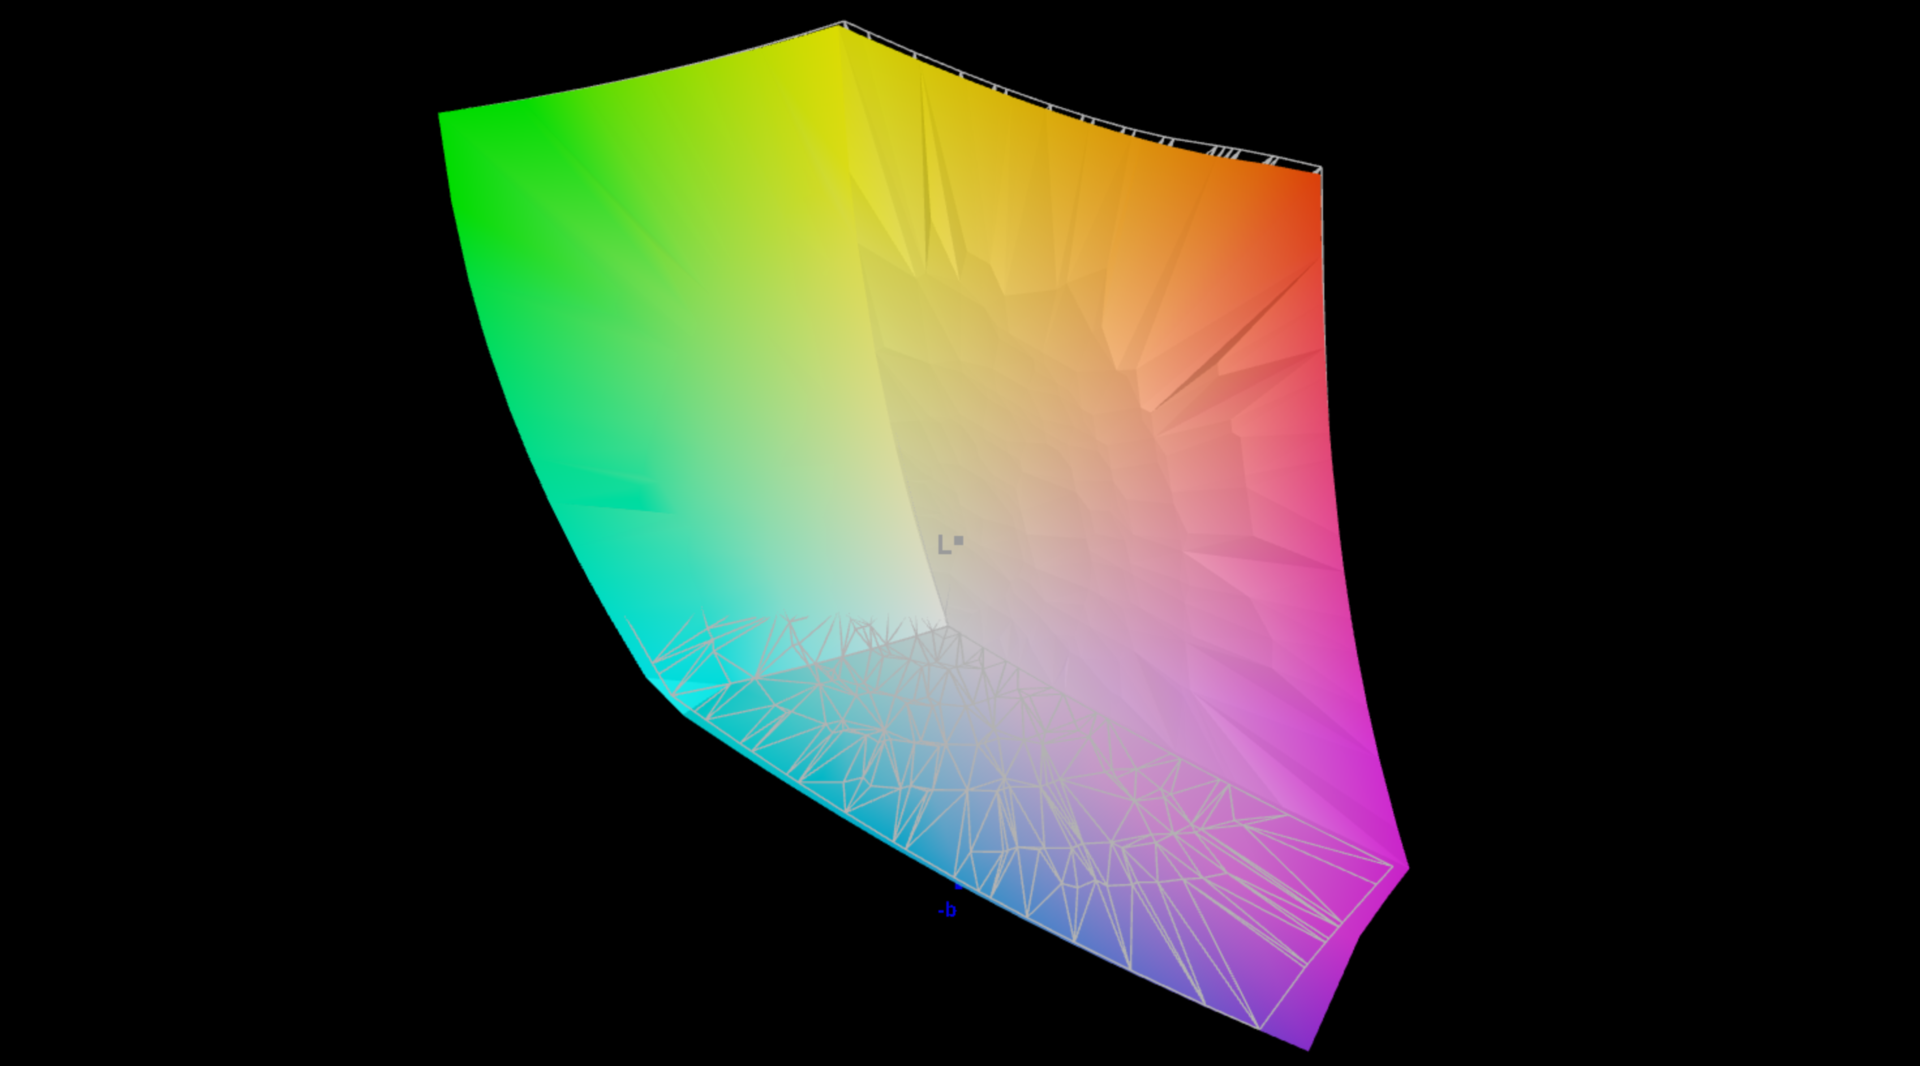
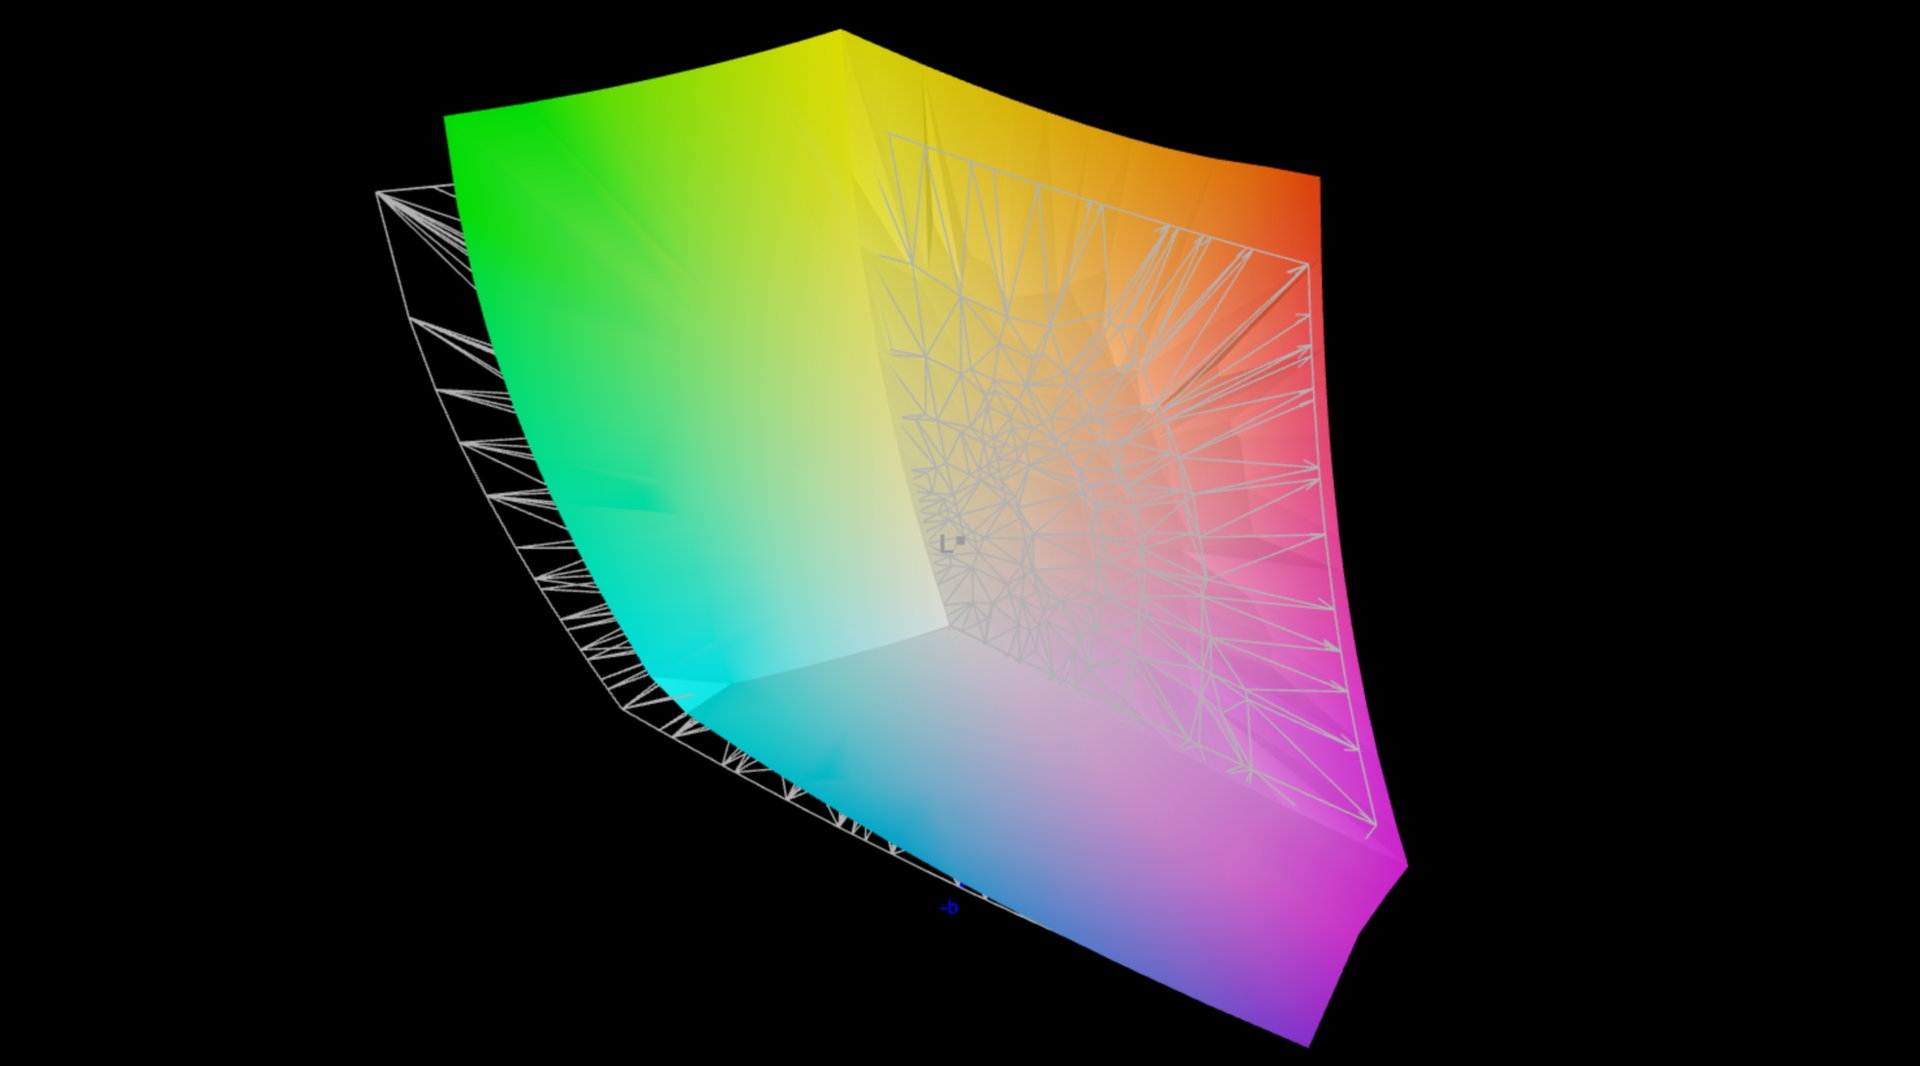
89.9% AdobeRGB 1998 (Argyll 3D)
100% sRGB (Argyll 3D)
98.8% Display P3 (Argyll 3D)
Gamma: 2.19
CCT: 7422 K
| Xiaomi RedmiBook Pro 16 2024 TL160MDMP03_0, IPS, 3072x1920, 16" | Huawei MateBook D 16 2024 NV160WUM-NH0, IPS, 1920x1200, 16" | Samsung Galaxy Book4 Pro 16 ATNA60CL07-0, OLED, 2880x1800, 16" | MSI Prestige 16 B1MG-001US AU Optronics B160QAN03.R, IPS, 2560x1600, 16" | Acer Swift Edge SFE16 Ryzen 7 7840U Samsung ATNA60BX03-0, OLED, 3200x2000, 16" | Asus VivoBook S15 K5504 Samsung SDC4180, OLED, 2880x1620, 15.6" | |
|---|---|---|---|---|---|---|
| Display | -19% | 3% | -3% | 4% | 2% | |
| Display P3 Coverage (%) | 98.8 | 66.7 -32% | 99.5 1% | 96.7 -2% | 99.9 1% | 99.93 1% |
| sRGB Coverage (%) | 100 | 96.5 -3% | 100 0% | 99.8 0% | 100 0% | 100 0% |
| AdobeRGB 1998 Coverage (%) | 89.9 | 68.8 -23% | 97.5 8% | 84.6 -6% | 100 11% | 95.52 6% |
| Response Times | -9% | 97% | -79% | 96% | 91% | |
| Response Time Grey 50% / Grey 80% * (ms) | 39.2 ? | 31 ? 21% | 0.64 ? 98% | 49.4 ? -26% | 0.57 ? 99% | 2 ? 95% |
| Response Time Black / White * (ms) | 14.6 ? | 20.3 ? -39% | 0.68 ? 95% | 33.9 ? -132% | 1 ? 93% | 2 ? 86% |
| PWM Frequency (Hz) | 240 ? | 238.8 | 240 | |||
| Screen | -5% | 26% | -13% | 0% | 126% | |
| Brightness middle (cd/m²) | 520 | 349 -33% | 385 -26% | 473.6 -9% | 379.8 -27% | 370.4 -29% |
| Brightness (cd/m²) | 510 | 340 -33% | 391 -23% | 456 -11% | 383 -25% | 376 -26% |
| Brightness Distribution (%) | 93 | 80 -14% | 97 4% | 87 -6% | 98 5% | 96 3% |
| Black Level * (cd/m²) | 0.35 | 0.24 31% | 0.19 46% | 0.02 94% | ||
| Contrast (:1) | 1486 | 1454 -2% | 2493 68% | 18520 1146% | ||
| Colorchecker dE 2000 * | 2.9 | 2.8 3% | 1.1 62% | 5.9 -103% | 4.7 -62% | 1.51 48% |
| Colorchecker dE 2000 max. * | 6.2 | 7.3 -18% | 1.8 71% | 9.37 -51% | 7.51 -21% | 2.89 53% |
| Colorchecker dE 2000 calibrated * | 1.1 | 0.7 36% | 0.89 19% | 0.55 50% | 3.36 -205% | |
| Greyscale dE 2000 * | 4.3 | 4.9 -14% | 1.4 67% | 7.3 -70% | 0.8 81% | 2.1 51% |
| Gamma | 2.19 100% | 2.2 100% | 2.24 98% | 1.9 116% | 2.22 99% | 2.2 100% |
| CCT | 7422 88% | 7328 89% | 6444 101% | 7260 90% | 6381 102% | 6536 99% |
| Moyenne finale (programmes/paramètres) | -11% /
-9% | 42% /
32% | -32% /
-20% | 33% /
17% | 73% /
95% |
* ... Moindre est la valeur, meilleures sont les performances
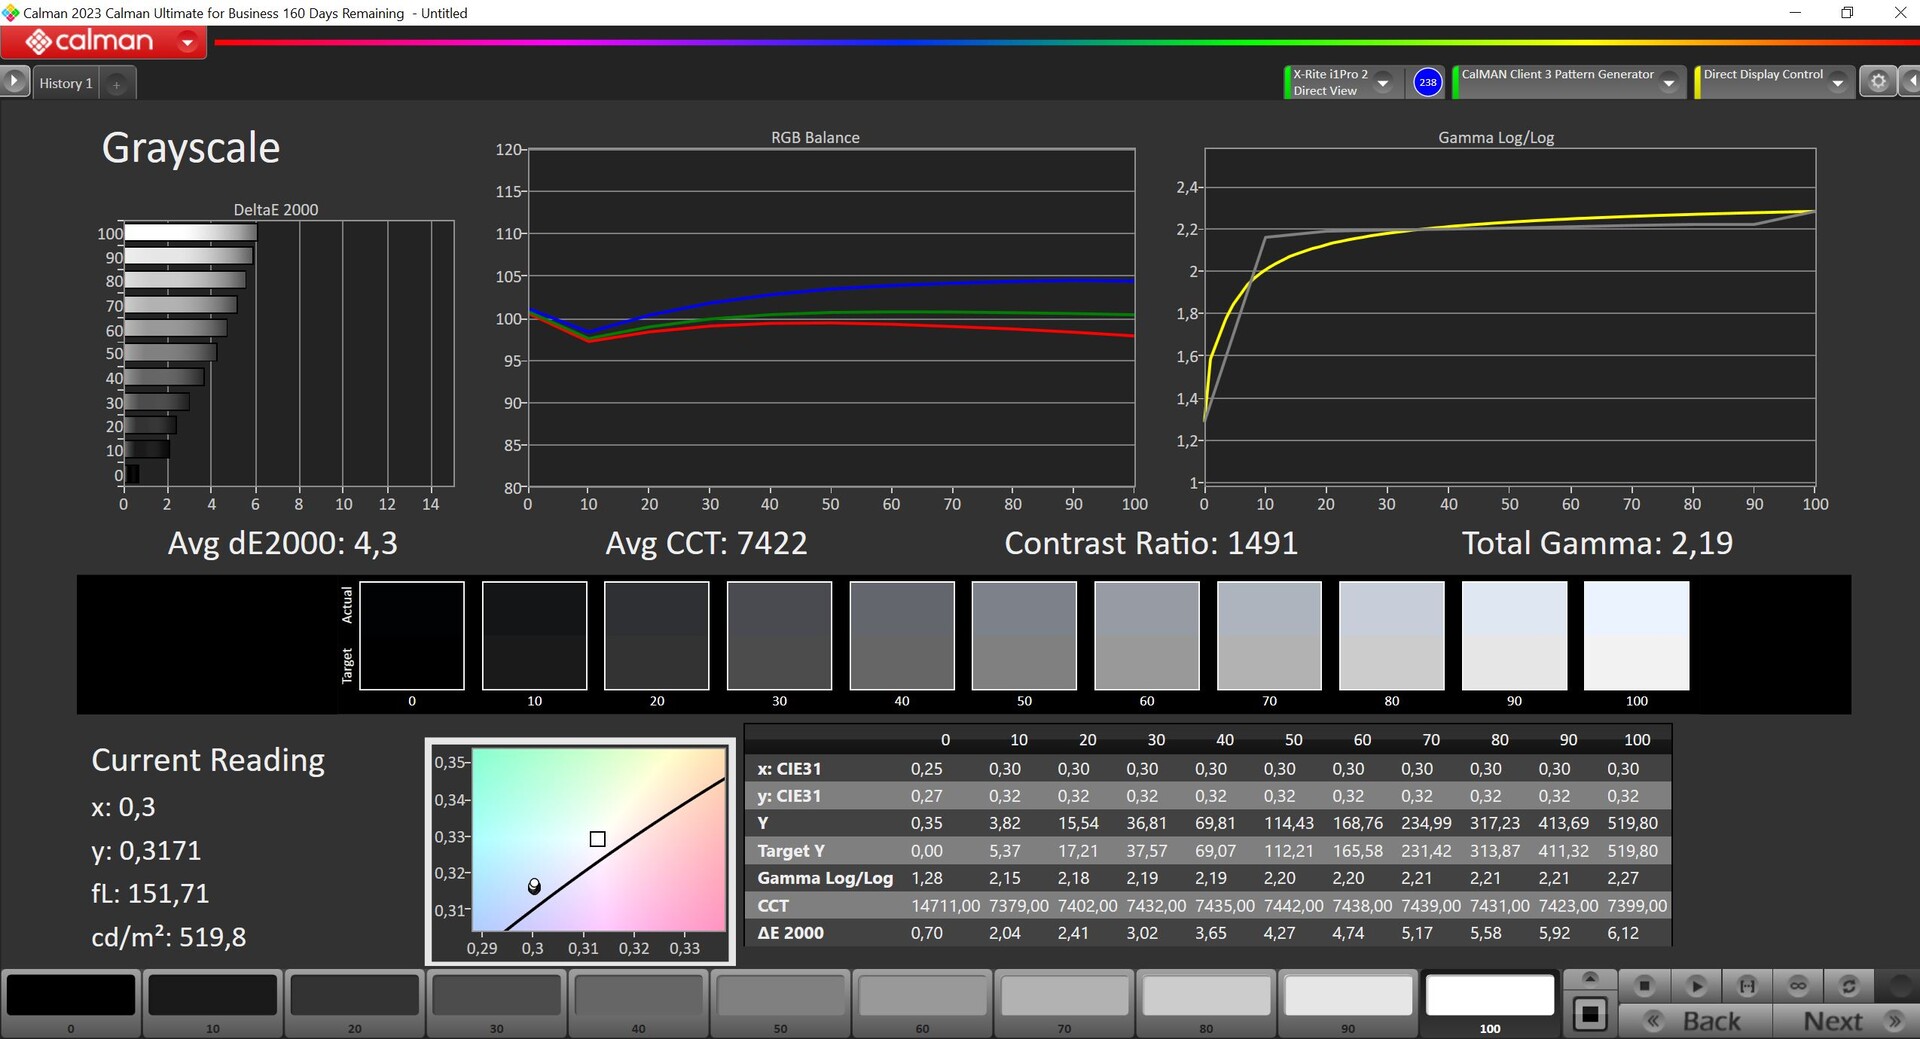
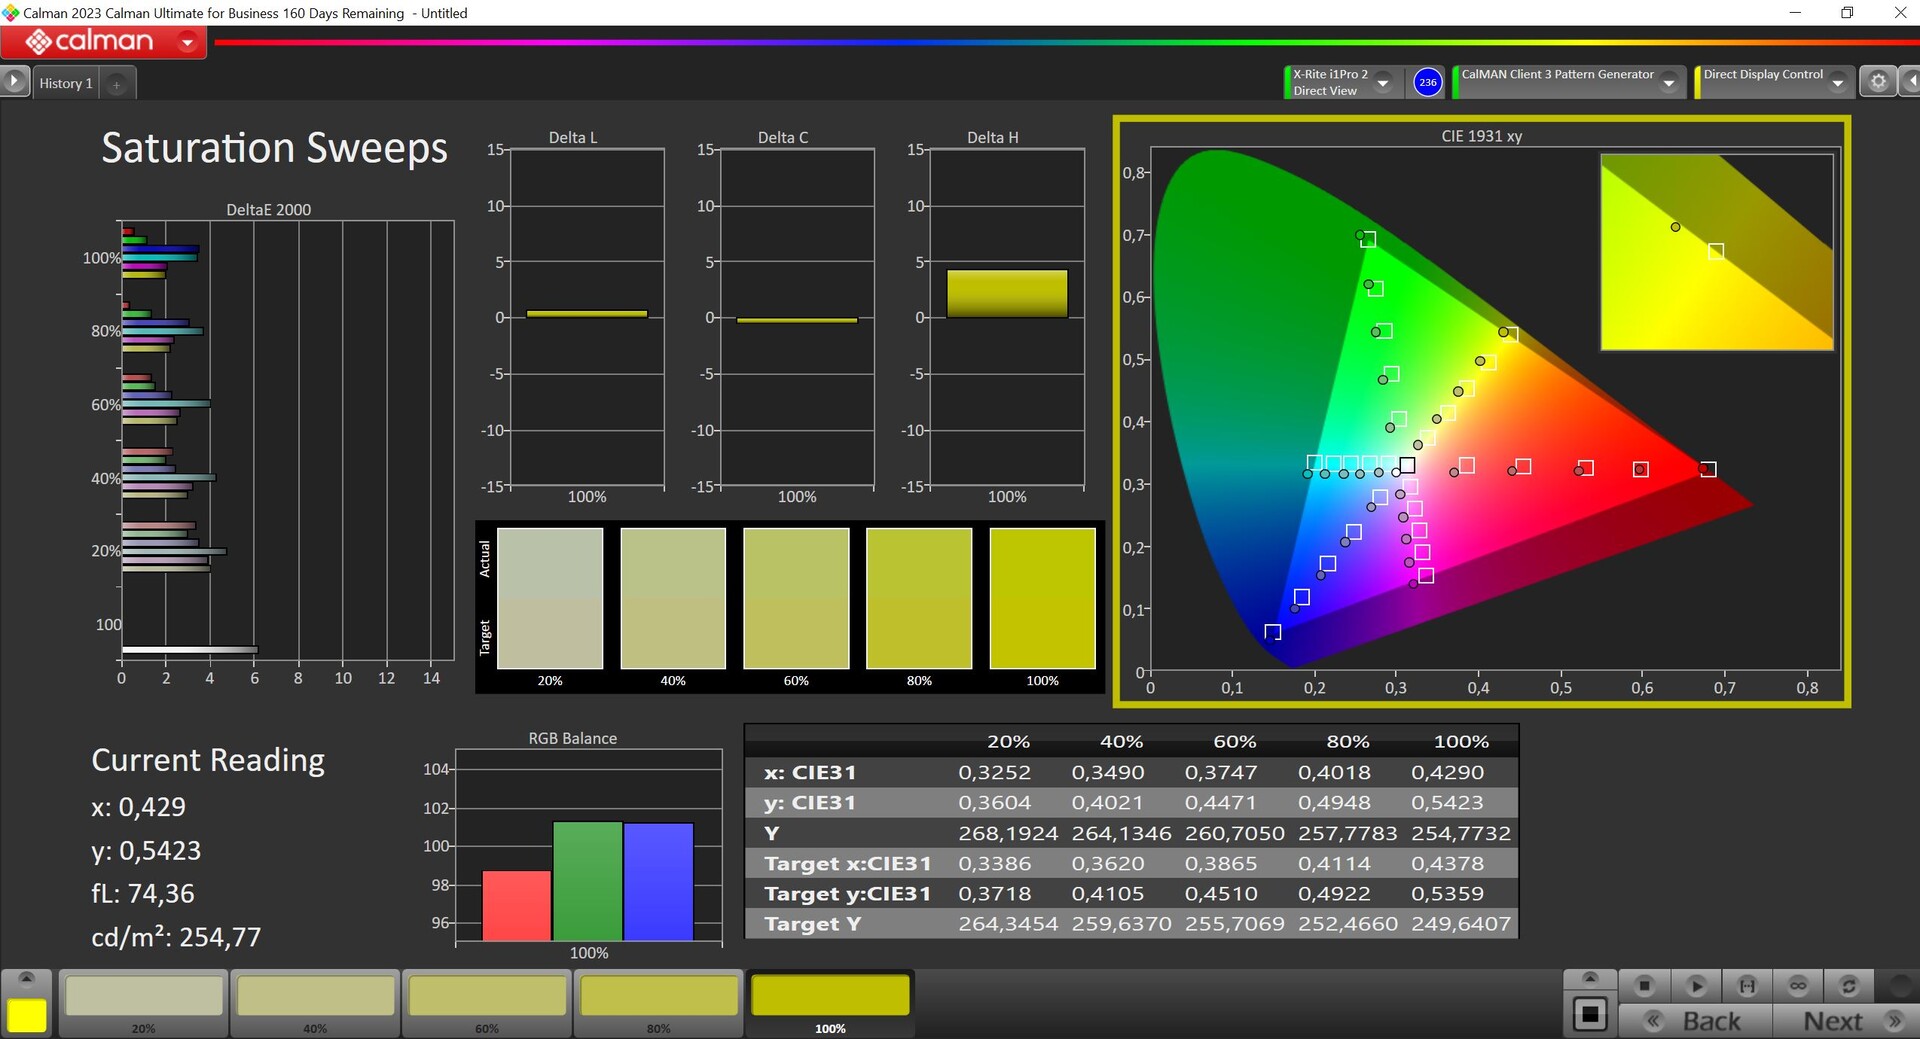
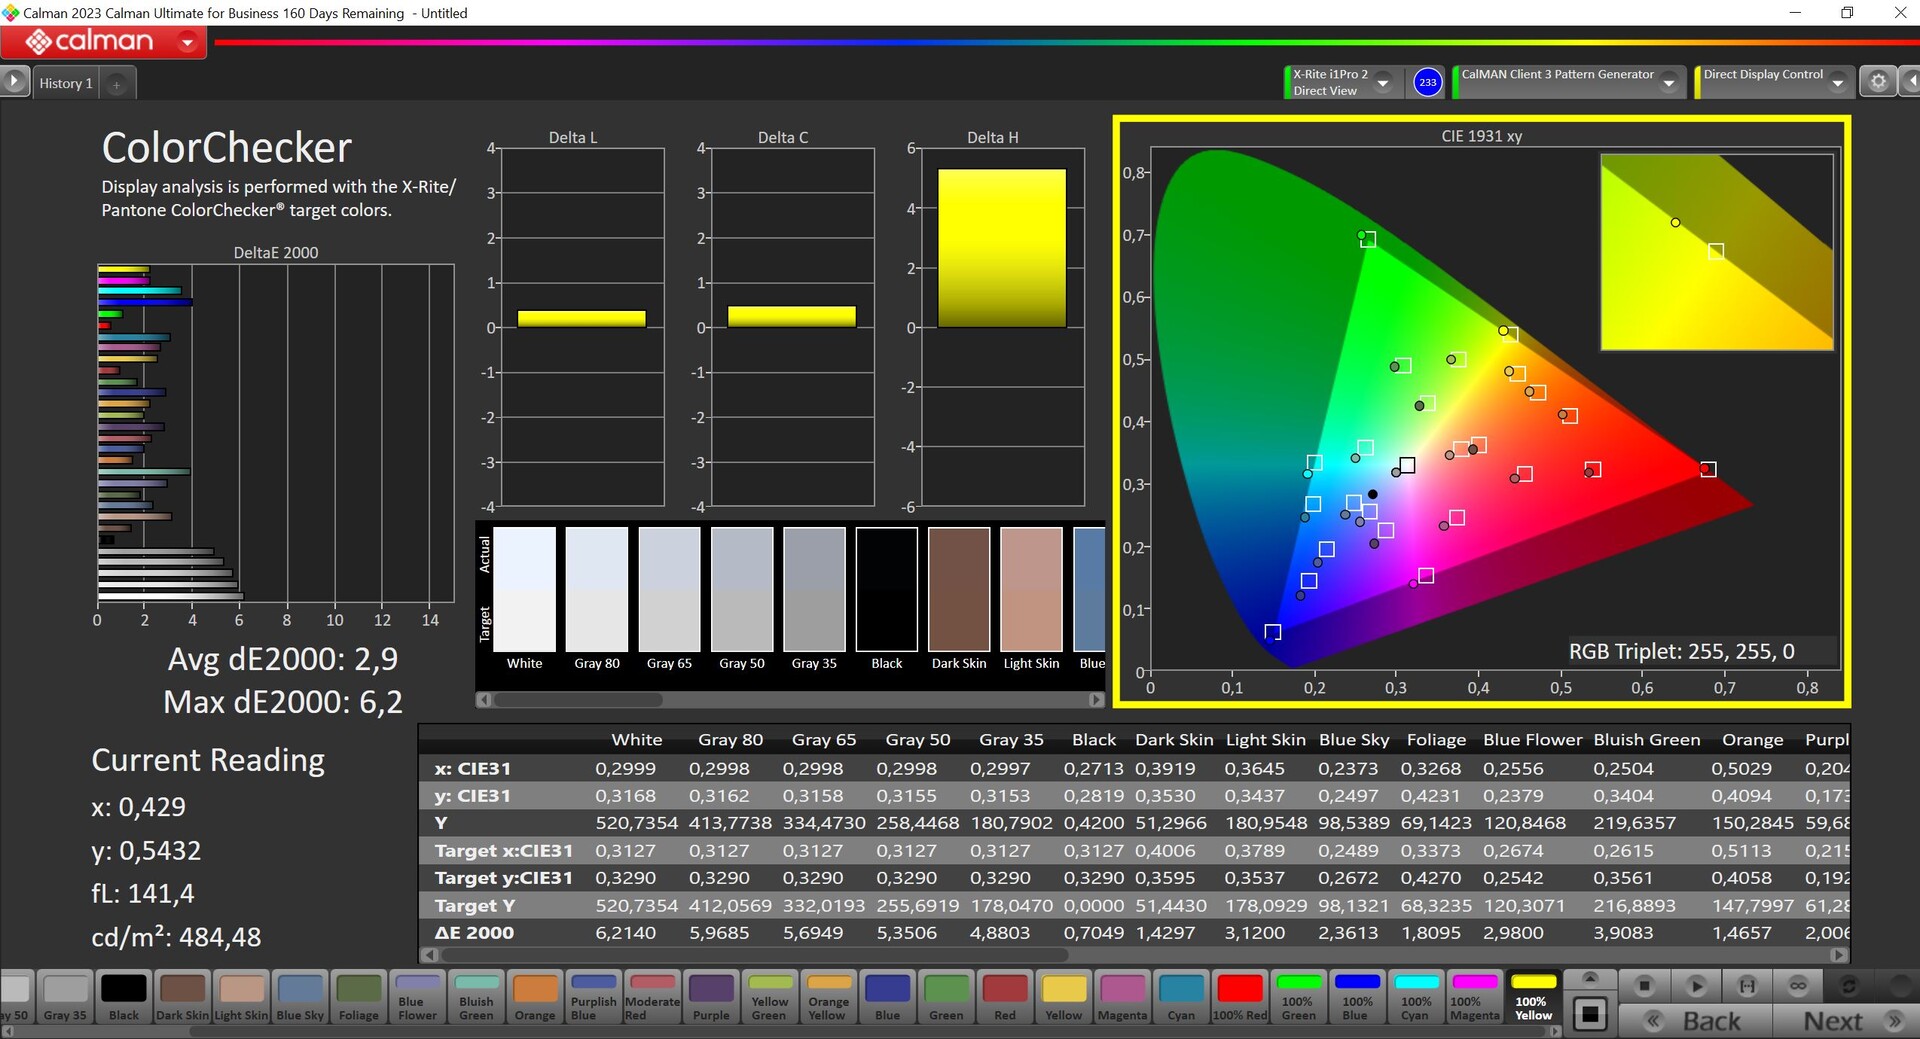
En analysant le panneau avec le logiciel professionnel CalMAN, nous constatons que l'étalonnage n'est pas optimal dans l'état de livraison. Il y a une teinte bleue visible, la température des couleurs est également trop froide et plusieurs couleurs s'écartent des valeurs cibles. Cependant, ces réglages permettent d'augmenter la luminosité maximale, puisqu'elle passe de 520 à environ 490 cd/m² après notre calibrage. D'un autre côté, la calibration permet d'obtenir des améliorations massives de l'écran dans son ensemble. Vous pouvez télécharger le profil gratuit correspondant à partir du lien ci-dessus. Mais même après notre étalonnage, l'écart élevé avec 100 % de bleu persiste. L'appareil n'est donc pas idéal pour le traitement d'images, puisqu'un profil sRGB n'est pas non plus disponible.

Temps de réponse de l'écran
| ↔ Temps de réponse noir à blanc | ||
|---|---|---|
| 14.6 ms ... hausse ↗ et chute ↘ combinées | ↗ 4.4 ms hausse | 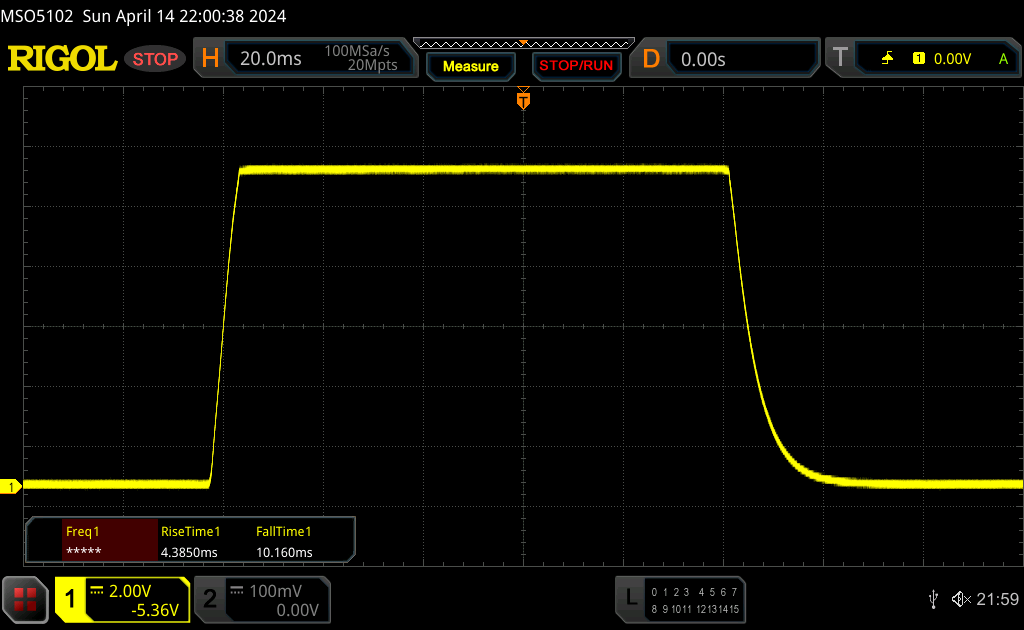 |
| ↘ 10.2 ms chute | ||
| L'écran montre de bons temps de réponse, mais insuffisant pour du jeu compétitif. En comparaison, tous les appareils testés affichent entre 0.1 (minimum) et 240 (maximum) ms. » 35 % des appareils testés affichent de meilleures performances. Cela signifie que les latences relevées sont meilleures que la moyenne (19.9 ms) de tous les appareils testés. | ||
| ↔ Temps de réponse gris 50% à gris 80% | ||
| 39.2 ms ... hausse ↗ et chute ↘ combinées | ↗ 15.8 ms hausse | 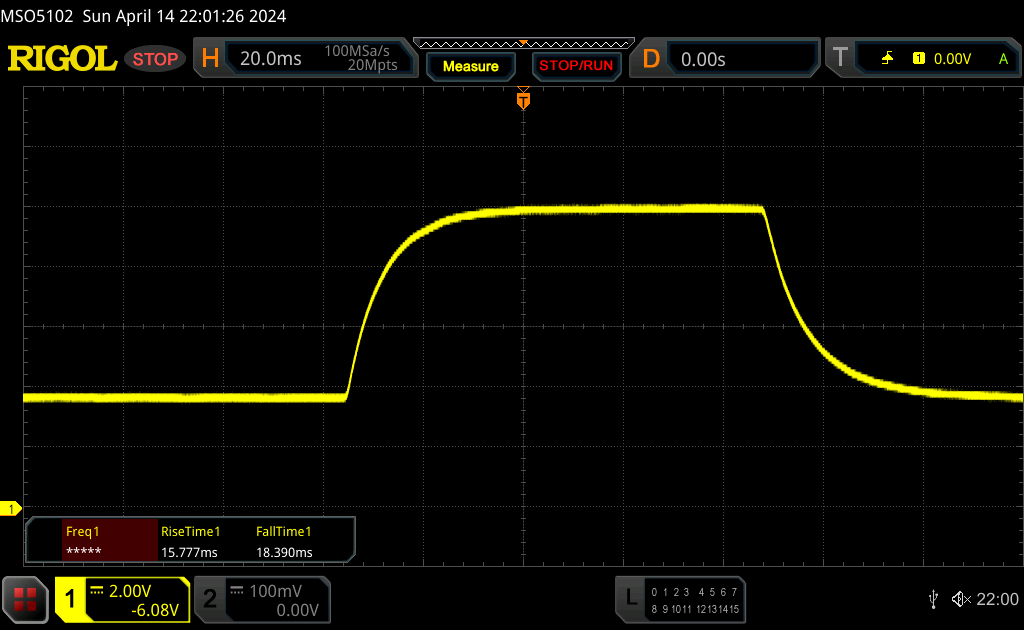 |
| ↘ 18.4 ms chute | ||
| L'écran souffre de latences très élevées, à éviter pour le jeu. En comparaison, tous les appareils testés affichent entre 0.165 (minimum) et 636 (maximum) ms. » 60 % des appareils testés affichent de meilleures performances. Cela signifie que les latences relevées sont moins bonnes que la moyenne (31.1 ms) de tous les appareils testés. | ||
Scintillement / MLI (Modulation de largeur d'impulsion)
| Scintillement / MLI (Modulation de largeur d'impulsion) non décelé | 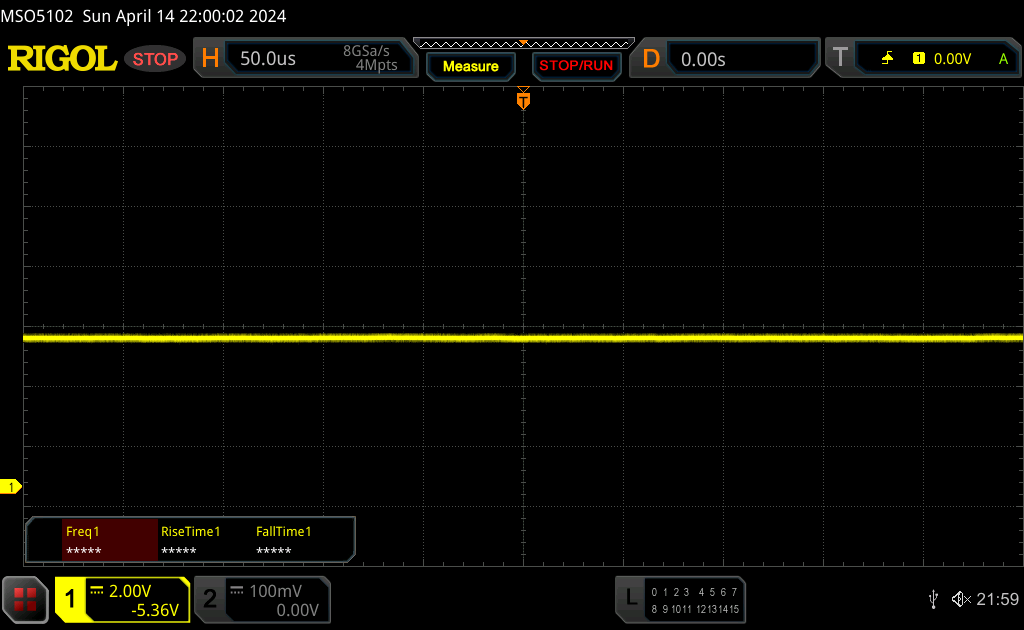 | ||
En comparaison, 52 % des appareils testés n'emploient pas MDI pour assombrir leur écran. Nous avons relevé une moyenne à 7784 (minimum : 5 - maximum : 343500) Hz dans le cas où une MDI était active. | |||
Le panneau mat fait du bon travail en extérieur, et nous souhaiterions seulement une luminosité plus élevée par temps ensoleillé. La stabilité de l'angle de vision de l'écran IPS est également bonne.

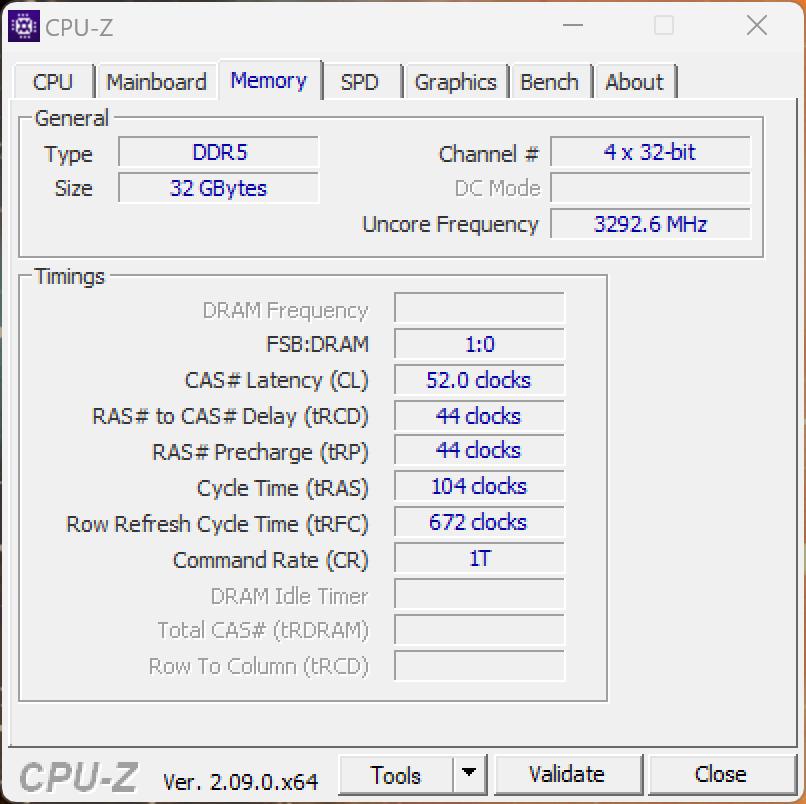
Performance - Meteor Lake et 32 Go de RAM
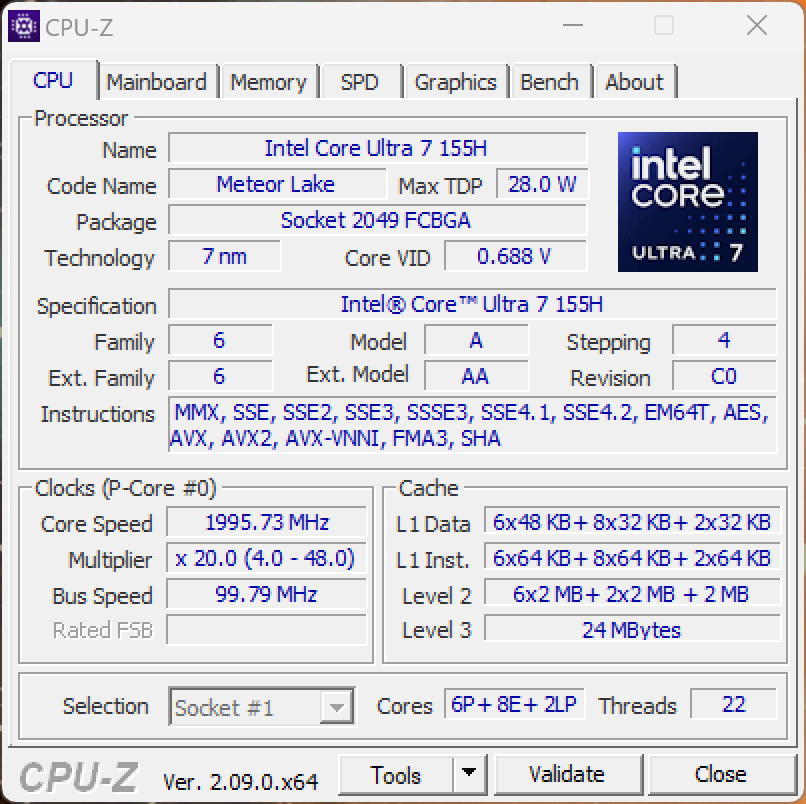
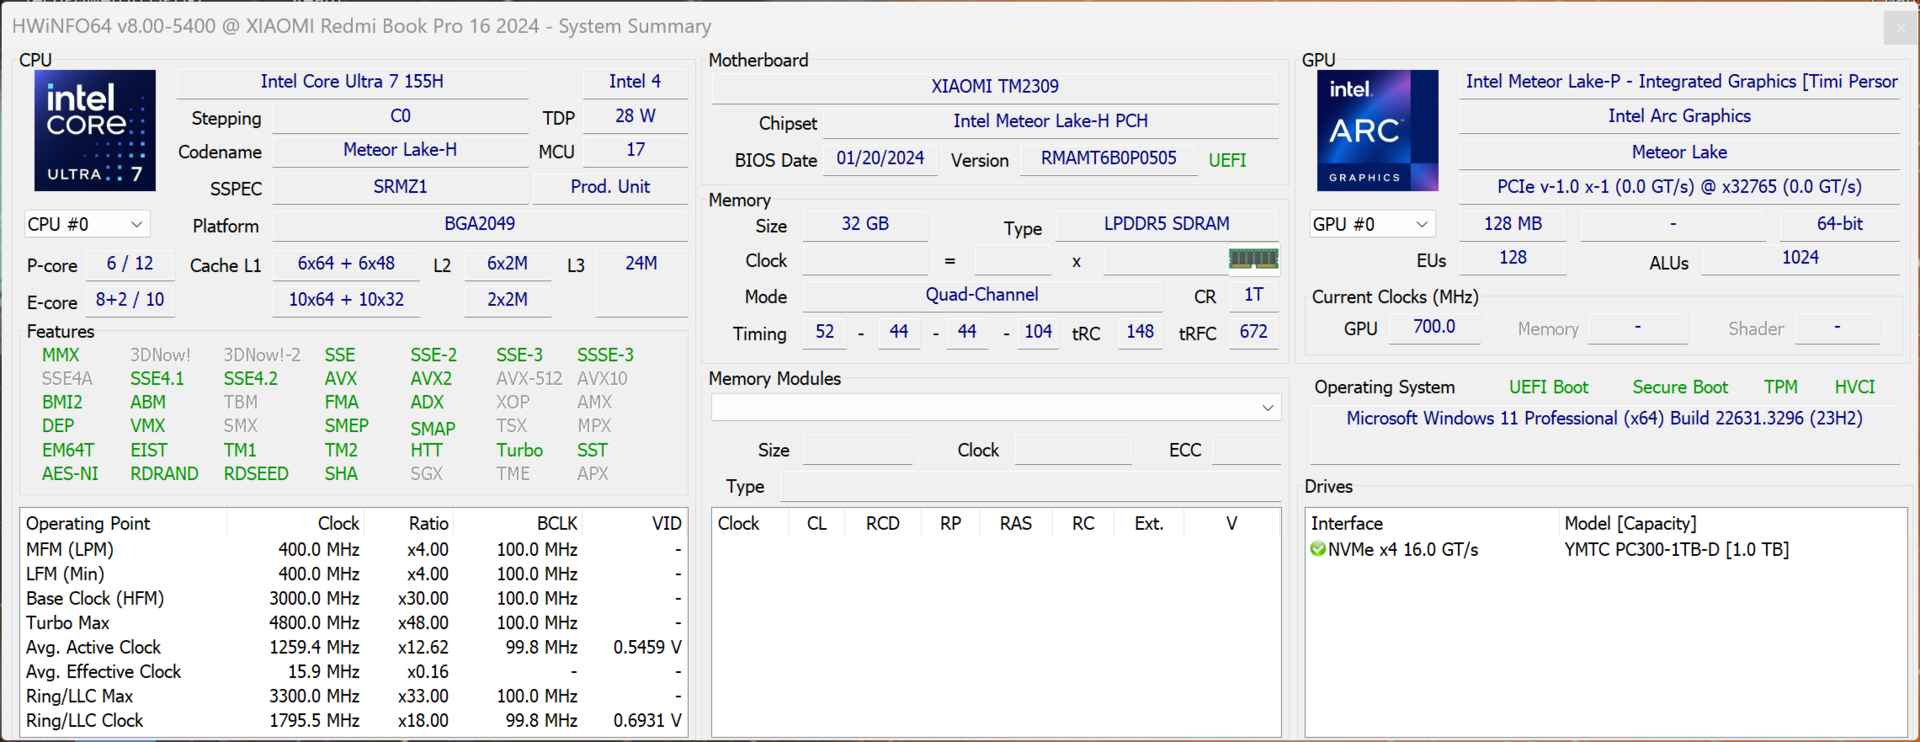
Processeur - Core Ultra 7 155H
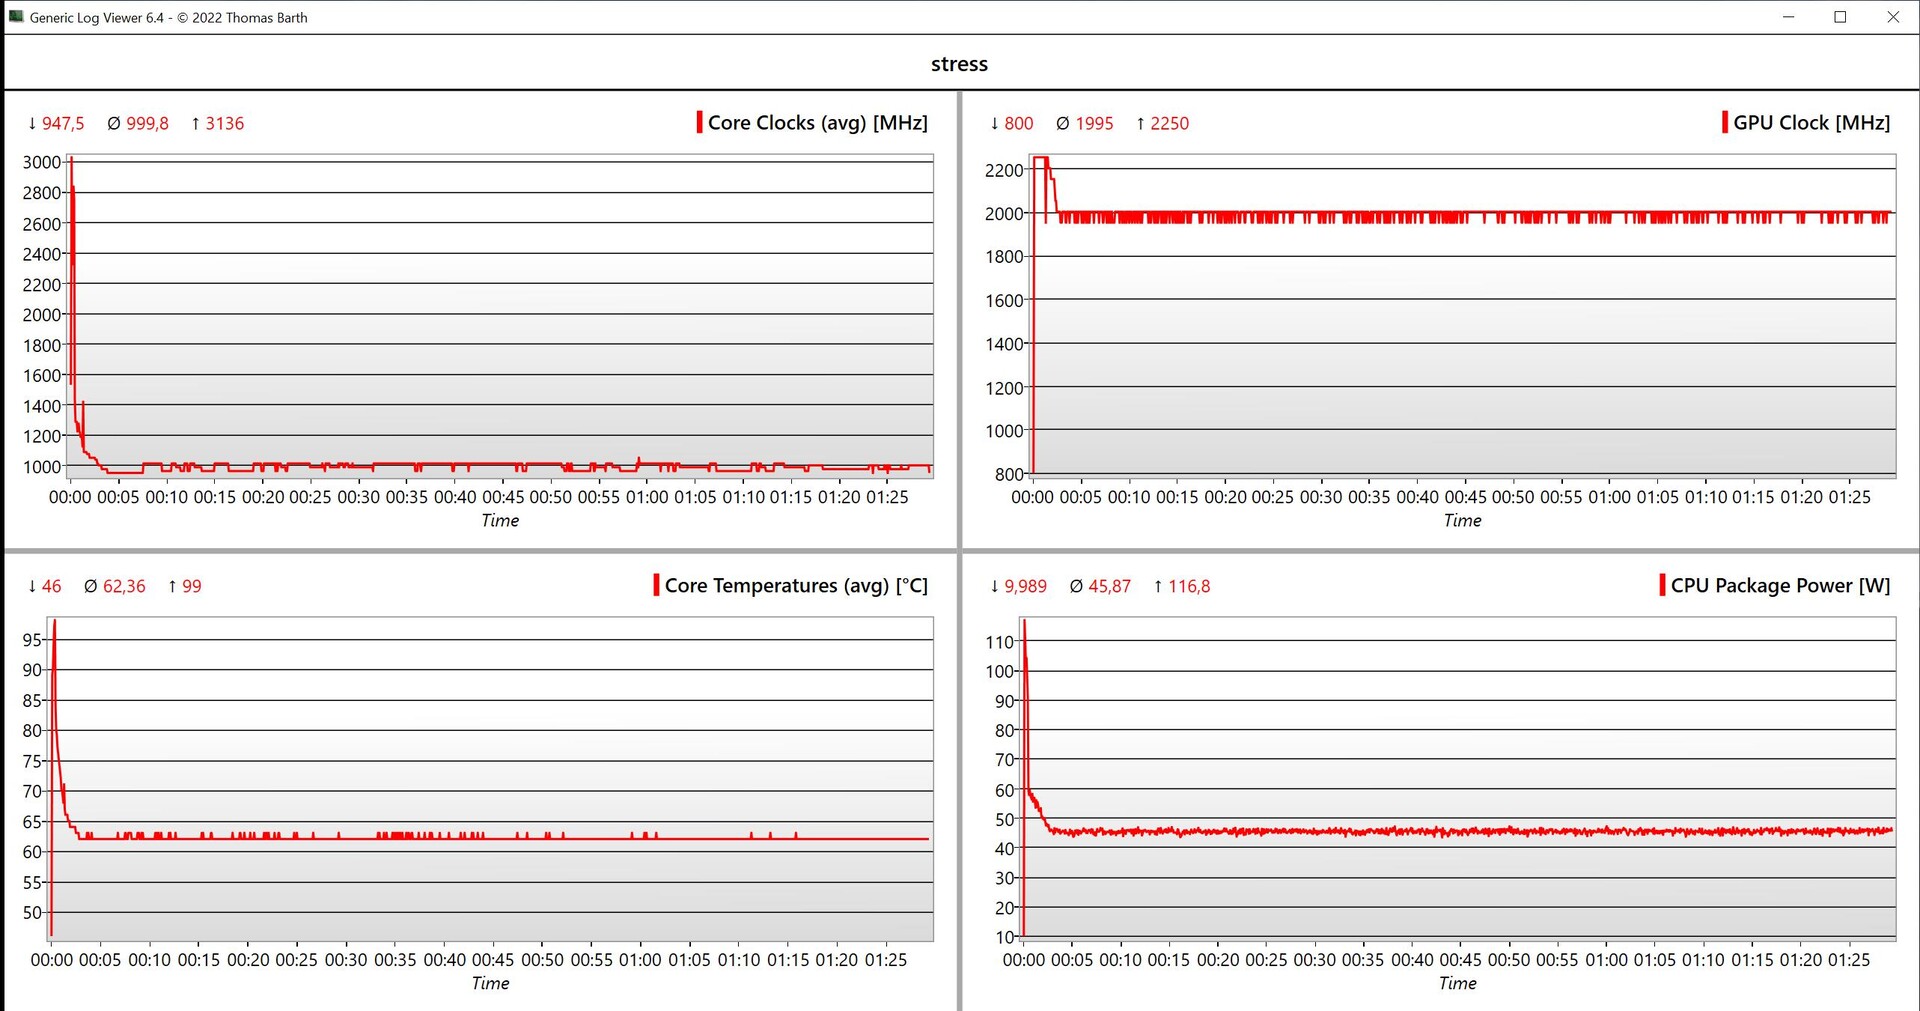
Le RedmiBook Pro 16 est équipé du nouveau Core Ultra 7 155H Meteor Lake. Il a 16 cœurs (22 threads), et les cœurs de performance peuvent fonctionner jusqu'à 4,8 GHz. Les limites de puissance dans notre unité de test sont à 90/45 watts, de sorte que la performance globale s'avère très bonne. Le MateBook D16 avec son Core i9-13900H a un léger avantage dans l'ensemble, mais cela est principalement dû à sa meilleure performance à cœur unique. En fait, les nouveaux processeurs Meteor Lake sont simplement un peu plus faibles que les anciens modèles Raptor Lake.
Sous charge constante, la performance multicœur baisse d'environ 15 %. En fonctionnement sur batterie, le processeur est autorisé à consommer 85/35 watts, ce qui explique que les performances multicœurs soient inférieures d'environ 13 %. Vous trouverez d'autres tests de performance du processeur dans notre section technique.
Cinebench R15 Multi Constant Load Test
Cinebench R23: Multi Core | Single Core
Cinebench R20: CPU (Multi Core) | CPU (Single Core)
Cinebench R15: CPU Multi 64Bit | CPU Single 64Bit
Blender: v2.79 BMW27 CPU
7-Zip 18.03: 7z b 4 | 7z b 4 -mmt1
Geekbench 6.7: Multi-Core | Single-Core
Geekbench 5.5: Multi-Core | Single-Core
HWBOT x265 Benchmark v2.2: 4k Preset
LibreOffice : 20 Documents To PDF
R Benchmark 2.5: Overall mean
| CPU Performance rating | |
| Moyenne de la classe Multimedia | |
| Xiaomi RedmiBook Pro 16 2024 | |
| Huawei MateBook D 16 2024 | |
| Asus VivoBook S15 K5504 | |
| Samsung Galaxy Book4 Pro 16 | |
| MSI Prestige 16 B1MG-001US | |
| Moyenne Intel Core Ultra 7 155H | |
| Acer Swift Edge SFE16 Ryzen 7 7840U | |
| Cinebench R23 / Multi Core | |
| Xiaomi RedmiBook Pro 16 2024 | |
| Moyenne de la classe Multimedia (4861 - 33362, n=81, 2 dernières années) | |
| Asus VivoBook S15 K5504 | |
| Samsung Galaxy Book4 Pro 16 | |
| MSI Prestige 16 B1MG-001US | |
| Moyenne Intel Core Ultra 7 155H (9769 - 19007, n=52) | |
| Huawei MateBook D 16 2024 | |
| Acer Swift Edge SFE16 Ryzen 7 7840U | |
| Cinebench R23 / Single Core | |
| Huawei MateBook D 16 2024 | |
| Moyenne de la classe Multimedia (1128 - 2459, n=73, 2 dernières années) | |
| Asus VivoBook S15 K5504 | |
| Xiaomi RedmiBook Pro 16 2024 | |
| Samsung Galaxy Book4 Pro 16 | |
| MSI Prestige 16 B1MG-001US | |
| Moyenne Intel Core Ultra 7 155H (1496 - 1815, n=52) | |
| Acer Swift Edge SFE16 Ryzen 7 7840U | |
| Cinebench R20 / CPU (Multi Core) | |
| Xiaomi RedmiBook Pro 16 2024 | |
| Moyenne de la classe Multimedia (1887 - 12912, n=64, 2 dernières années) | |
| Samsung Galaxy Book4 Pro 16 | |
| Asus VivoBook S15 K5504 | |
| Moyenne Intel Core Ultra 7 155H (3798 - 7409, n=50) | |
| MSI Prestige 16 B1MG-001US | |
| Huawei MateBook D 16 2024 | |
| Acer Swift Edge SFE16 Ryzen 7 7840U | |
| Cinebench R20 / CPU (Single Core) | |
| Huawei MateBook D 16 2024 | |
| Moyenne de la classe Multimedia (425 - 853, n=64, 2 dernières années) | |
| Samsung Galaxy Book4 Pro 16 | |
| MSI Prestige 16 B1MG-001US | |
| Acer Swift Edge SFE16 Ryzen 7 7840U | |
| Xiaomi RedmiBook Pro 16 2024 | |
| Moyenne Intel Core Ultra 7 155H (601 - 696, n=50) | |
| Asus VivoBook S15 K5504 | |
| Cinebench R15 / CPU Multi 64Bit | |
| Xiaomi RedmiBook Pro 16 2024 | |
| Moyenne de la classe Multimedia (856 - 5224, n=68, 2 dernières années) | |
| Samsung Galaxy Book4 Pro 16 | |
| Asus VivoBook S15 K5504 | |
| Huawei MateBook D 16 2024 | |
| Moyenne Intel Core Ultra 7 155H (1932 - 2880, n=56) | |
| MSI Prestige 16 B1MG-001US | |
| Acer Swift Edge SFE16 Ryzen 7 7840U | |
| Cinebench R15 / CPU Single 64Bit | |
| Huawei MateBook D 16 2024 | |
| Moyenne de la classe Multimedia (184.8 - 326, n=66, 2 dernières années) | |
| Acer Swift Edge SFE16 Ryzen 7 7840U | |
| MSI Prestige 16 B1MG-001US | |
| Xiaomi RedmiBook Pro 16 2024 | |
| Samsung Galaxy Book4 Pro 16 | |
| Moyenne Intel Core Ultra 7 155H (99.6 - 268, n=52) | |
| Asus VivoBook S15 K5504 | |
| Blender / v2.79 BMW27 CPU | |
| Acer Swift Edge SFE16 Ryzen 7 7840U | |
| Moyenne de la classe Multimedia (100 - 557, n=65, 2 dernières années) | |
| Huawei MateBook D 16 2024 | |
| Moyenne Intel Core Ultra 7 155H (175 - 381, n=47) | |
| Samsung Galaxy Book4 Pro 16 | |
| Asus VivoBook S15 K5504 | |
| MSI Prestige 16 B1MG-001US | |
| Xiaomi RedmiBook Pro 16 2024 | |
| 7-Zip 18.03 / 7z b 4 | |
| Xiaomi RedmiBook Pro 16 2024 | |
| MSI Prestige 16 B1MG-001US | |
| Asus VivoBook S15 K5504 | |
| Huawei MateBook D 16 2024 | |
| Samsung Galaxy Book4 Pro 16 | |
| Moyenne de la classe Multimedia (29095 - 130368, n=62, 2 dernières années) | |
| Moyenne Intel Core Ultra 7 155H (41739 - 70254, n=50) | |
| Acer Swift Edge SFE16 Ryzen 7 7840U | |
| 7-Zip 18.03 / 7z b 4 -mmt1 | |
| Huawei MateBook D 16 2024 | |
| Acer Swift Edge SFE16 Ryzen 7 7840U | |
| Moyenne de la classe Multimedia (3666 - 7545, n=63, 2 dernières années) | |
| Samsung Galaxy Book4 Pro 16 | |
| Xiaomi RedmiBook Pro 16 2024 | |
| Asus VivoBook S15 K5504 | |
| Moyenne Intel Core Ultra 7 155H (4594 - 5621, n=50) | |
| MSI Prestige 16 B1MG-001US | |
| Geekbench 6.7 / Multi-Core | |
| Moyenne de la classe Multimedia (4983 - 29415, n=76, 2 dernières années) | |
| Xiaomi RedmiBook Pro 16 2024 | |
| Huawei MateBook D 16 2024 | |
| MSI Prestige 16 B1MG-001US | |
| Asus VivoBook S15 K5504 | |
| Samsung Galaxy Book4 Pro 16 | |
| Moyenne Intel Core Ultra 7 155H (7732 - 13656, n=55) | |
| Acer Swift Edge SFE16 Ryzen 7 7840U | |
| Geekbench 6.7 / Single-Core | |
| Moyenne de la classe Multimedia (1534 - 4335, n=75, 2 dernières années) | |
| Huawei MateBook D 16 2024 | |
| Asus VivoBook S15 K5504 | |
| Acer Swift Edge SFE16 Ryzen 7 7840U | |
| Samsung Galaxy Book4 Pro 16 | |
| MSI Prestige 16 B1MG-001US | |
| Xiaomi RedmiBook Pro 16 2024 | |
| Moyenne Intel Core Ultra 7 155H (1901 - 2473, n=52) | |
| Geekbench 5.5 / Multi-Core | |
| Xiaomi RedmiBook Pro 16 2024 | |
| Moyenne de la classe Multimedia (4652 - 20422, n=62, 2 dernières années) | |
| Huawei MateBook D 16 2024 | |
| MSI Prestige 16 B1MG-001US | |
| Samsung Galaxy Book4 Pro 16 | |
| Moyenne Intel Core Ultra 7 155H (10017 - 13556, n=52) | |
| Asus VivoBook S15 K5504 | |
| Acer Swift Edge SFE16 Ryzen 7 7840U | |
| Geekbench 5.5 / Single-Core | |
| Huawei MateBook D 16 2024 | |
| Moyenne de la classe Multimedia (805 - 2974, n=62, 2 dernières années) | |
| Asus VivoBook S15 K5504 | |
| Acer Swift Edge SFE16 Ryzen 7 7840U | |
| Xiaomi RedmiBook Pro 16 2024 | |
| Samsung Galaxy Book4 Pro 16 | |
| Moyenne Intel Core Ultra 7 155H (1462 - 1824, n=52) | |
| MSI Prestige 16 B1MG-001US | |
| HWBOT x265 Benchmark v2.2 / 4k Preset | |
| Xiaomi RedmiBook Pro 16 2024 | |
| Moyenne de la classe Multimedia (5.26 - 36.1, n=63, 2 dernières années) | |
| Huawei MateBook D 16 2024 | |
| Asus VivoBook S15 K5504 | |
| MSI Prestige 16 B1MG-001US | |
| Samsung Galaxy Book4 Pro 16 | |
| Moyenne Intel Core Ultra 7 155H (9.93 - 21.2, n=50) | |
| Acer Swift Edge SFE16 Ryzen 7 7840U | |
| LibreOffice / 20 Documents To PDF | |
| Moyenne de la classe Multimedia (23.9 - 146.7, n=64, 2 dernières années) | |
| Moyenne Intel Core Ultra 7 155H (37.5 - 79.2, n=49) | |
| MSI Prestige 16 B1MG-001US | |
| Xiaomi RedmiBook Pro 16 2024 | |
| Acer Swift Edge SFE16 Ryzen 7 7840U | |
| Samsung Galaxy Book4 Pro 16 | |
| Huawei MateBook D 16 2024 | |
| Asus VivoBook S15 K5504 | |
| R Benchmark 2.5 / Overall mean | |
| Asus VivoBook S15 K5504 | |
| Moyenne Intel Core Ultra 7 155H (0.4457 - 0.53, n=49) | |
| MSI Prestige 16 B1MG-001US | |
| Xiaomi RedmiBook Pro 16 2024 | |
| Samsung Galaxy Book4 Pro 16 | |
| Moyenne de la classe Multimedia (0.3604 - 0.947, n=63, 2 dernières années) | |
| Acer Swift Edge SFE16 Ryzen 7 7840U | |
| Huawei MateBook D 16 2024 | |
* ... Moindre est la valeur, meilleures sont les performances
AIDA64: FP32 Ray-Trace | FPU Julia | CPU SHA3 | CPU Queen | FPU SinJulia | FPU Mandel | CPU AES | CPU ZLib | FP64 Ray-Trace | CPU PhotoWorxx
| Performance rating | |
| Moyenne de la classe Multimedia | |
| MSI Prestige 16 B1MG-001US | |
| Xiaomi RedmiBook Pro 16 2024 | |
| Acer Swift Edge SFE16 Ryzen 7 7840U | |
| Asus VivoBook S15 K5504 | |
| Samsung Galaxy Book4 Pro 16 | |
| Huawei MateBook D 16 2024 | |
| Moyenne Intel Core Ultra 7 155H | |
| AIDA64 / FP32 Ray-Trace | |
| Acer Swift Edge SFE16 Ryzen 7 7840U | |
| Moyenne de la classe Multimedia (2214 - 50388, n=60, 2 dernières années) | |
| MSI Prestige 16 B1MG-001US | |
| Asus VivoBook S15 K5504 | |
| Xiaomi RedmiBook Pro 16 2024 | |
| Samsung Galaxy Book4 Pro 16 | |
| Moyenne Intel Core Ultra 7 155H (6670 - 18470, n=50) | |
| Huawei MateBook D 16 2024 | |
| AIDA64 / FPU Julia | |
| Moyenne de la classe Multimedia (12867 - 201874, n=61, 2 dernières années) | |
| MSI Prestige 16 B1MG-001US | |
| Acer Swift Edge SFE16 Ryzen 7 7840U | |
| Xiaomi RedmiBook Pro 16 2024 | |
| Asus VivoBook S15 K5504 | |
| Moyenne Intel Core Ultra 7 155H (40905 - 93181, n=50) | |
| Samsung Galaxy Book4 Pro 16 | |
| Huawei MateBook D 16 2024 | |
| AIDA64 / CPU SHA3 | |
| Moyenne de la classe Multimedia (653 - 8623, n=61, 2 dernières années) | |
| MSI Prestige 16 B1MG-001US | |
| Xiaomi RedmiBook Pro 16 2024 | |
| Acer Swift Edge SFE16 Ryzen 7 7840U | |
| Asus VivoBook S15 K5504 | |
| Samsung Galaxy Book4 Pro 16 | |
| Moyenne Intel Core Ultra 7 155H (1940 - 4436, n=50) | |
| Huawei MateBook D 16 2024 | |
| AIDA64 / CPU Queen | |
| Huawei MateBook D 16 2024 | |
| Asus VivoBook S15 K5504 | |
| Acer Swift Edge SFE16 Ryzen 7 7840U | |
| MSI Prestige 16 B1MG-001US | |
| Xiaomi RedmiBook Pro 16 2024 | |
| Samsung Galaxy Book4 Pro 16 | |
| Moyenne Intel Core Ultra 7 155H (64698 - 94181, n=50) | |
| Moyenne de la classe Multimedia (13483 - 181505, n=49, 2 dernières années) | |
| AIDA64 / FPU SinJulia | |
| Acer Swift Edge SFE16 Ryzen 7 7840U | |
| MSI Prestige 16 B1MG-001US | |
| Xiaomi RedmiBook Pro 16 2024 | |
| Samsung Galaxy Book4 Pro 16 | |
| Asus VivoBook S15 K5504 | |
| Moyenne Intel Core Ultra 7 155H (5639 - 10647, n=50) | |
| Moyenne de la classe Multimedia (1240 - 28794, n=61, 2 dernières années) | |
| Huawei MateBook D 16 2024 | |
| AIDA64 / FPU Mandel | |
| Moyenne de la classe Multimedia (6395 - 105740, n=60, 2 dernières années) | |
| Acer Swift Edge SFE16 Ryzen 7 7840U | |
| MSI Prestige 16 B1MG-001US | |
| Xiaomi RedmiBook Pro 16 2024 | |
| Asus VivoBook S15 K5504 | |
| Samsung Galaxy Book4 Pro 16 | |
| Moyenne Intel Core Ultra 7 155H (18236 - 47685, n=50) | |
| Huawei MateBook D 16 2024 | |
| AIDA64 / CPU AES | |
| Huawei MateBook D 16 2024 | |
| Moyenne Intel Core Ultra 7 155H (45713 - 152179, n=50) | |
| MSI Prestige 16 B1MG-001US | |
| Xiaomi RedmiBook Pro 16 2024 | |
| Samsung Galaxy Book4 Pro 16 | |
| Asus VivoBook S15 K5504 | |
| Moyenne de la classe Multimedia (13243 - 126790, n=61, 2 dernières années) | |
| Acer Swift Edge SFE16 Ryzen 7 7840U | |
| AIDA64 / CPU ZLib | |
| MSI Prestige 16 B1MG-001US | |
| Xiaomi RedmiBook Pro 16 2024 | |
| Asus VivoBook S15 K5504 | |
| Moyenne de la classe Multimedia (167.2 - 2022, n=61, 2 dernières années) | |
| Samsung Galaxy Book4 Pro 16 | |
| Moyenne Intel Core Ultra 7 155H (557 - 1250, n=50) | |
| Huawei MateBook D 16 2024 | |
| Acer Swift Edge SFE16 Ryzen 7 7840U | |
| AIDA64 / FP64 Ray-Trace | |
| Moyenne de la classe Multimedia (1014 - 26875, n=61, 2 dernières années) | |
| Acer Swift Edge SFE16 Ryzen 7 7840U | |
| MSI Prestige 16 B1MG-001US | |
| Asus VivoBook S15 K5504 | |
| Xiaomi RedmiBook Pro 16 2024 | |
| Samsung Galaxy Book4 Pro 16 | |
| Huawei MateBook D 16 2024 | |
| Moyenne Intel Core Ultra 7 155H (3569 - 9802, n=50) | |
| AIDA64 / CPU PhotoWorxx | |
| Xiaomi RedmiBook Pro 16 2024 | |
| Samsung Galaxy Book4 Pro 16 | |
| Moyenne de la classe Multimedia (12860 - 88154, n=61, 2 dernières années) | |
| Moyenne Intel Core Ultra 7 155H (32719 - 54223, n=50) | |
| MSI Prestige 16 B1MG-001US | |
| Asus VivoBook S15 K5504 | |
| Huawei MateBook D 16 2024 | |
| Acer Swift Edge SFE16 Ryzen 7 7840U | |
Performance du système
Notre unité de test fait un excellent travail dans les benchmarks synthétiques du système, et notre impression subjective de performance est également très élevée. Nous n'avons remarqué aucun problème au cours de nos tests.
CrossMark: Overall | Productivity | Creativity | Responsiveness
WebXPRT 3: Overall
WebXPRT 4: Overall
Mozilla Kraken 1.1: Total
| PCMark 10 / Score | |
| Moyenne de la classe Multimedia (4325 - 10386, n=58, 2 dernières années) | |
| MSI Prestige 16 B1MG-001US | |
| Xiaomi RedmiBook Pro 16 2024 | |
| Acer Swift Edge SFE16 Ryzen 7 7840U | |
| Samsung Galaxy Book4 Pro 16 | |
| Moyenne Intel Core Ultra 7 155H, Intel Arc 8-Core iGPU (4809 - 7529, n=34) | |
| Huawei MateBook D 16 2024 | |
| Asus VivoBook S15 K5504 | |
| PCMark 10 / Essentials | |
| Huawei MateBook D 16 2024 | |
| Asus VivoBook S15 K5504 | |
| MSI Prestige 16 B1MG-001US | |
| Samsung Galaxy Book4 Pro 16 | |
| Xiaomi RedmiBook Pro 16 2024 | |
| Acer Swift Edge SFE16 Ryzen 7 7840U | |
| Moyenne de la classe Multimedia (8025 - 11664, n=57, 2 dernières années) | |
| Moyenne Intel Core Ultra 7 155H, Intel Arc 8-Core iGPU (7605 - 11289, n=34) | |
| PCMark 10 / Productivity | |
| Moyenne de la classe Multimedia (7323 - 18233, n=57, 2 dernières années) | |
| Acer Swift Edge SFE16 Ryzen 7 7840U | |
| MSI Prestige 16 B1MG-001US | |
| Moyenne Intel Core Ultra 7 155H, Intel Arc 8-Core iGPU (6042 - 10591, n=34) | |
| Xiaomi RedmiBook Pro 16 2024 | |
| Samsung Galaxy Book4 Pro 16 | |
| Huawei MateBook D 16 2024 | |
| Asus VivoBook S15 K5504 | |
| PCMark 10 / Digital Content Creation | |
| Moyenne de la classe Multimedia (3651 - 16240, n=57, 2 dernières années) | |
| Xiaomi RedmiBook Pro 16 2024 | |
| MSI Prestige 16 B1MG-001US | |
| Moyenne Intel Core Ultra 7 155H, Intel Arc 8-Core iGPU (4985 - 10709, n=34) | |
| Samsung Galaxy Book4 Pro 16 | |
| Acer Swift Edge SFE16 Ryzen 7 7840U | |
| Huawei MateBook D 16 2024 | |
| Asus VivoBook S15 K5504 | |
| CrossMark / Overall | |
| Huawei MateBook D 16 2024 | |
| Moyenne de la classe Multimedia (866 - 2728, n=67, 2 dernières années) | |
| Asus VivoBook S15 K5504 | |
| Acer Swift Edge SFE16 Ryzen 7 7840U | |
| Xiaomi RedmiBook Pro 16 2024 | |
| MSI Prestige 16 B1MG-001US | |
| Samsung Galaxy Book4 Pro 16 | |
| Moyenne Intel Core Ultra 7 155H, Intel Arc 8-Core iGPU (1366 - 1903, n=34) | |
| CrossMark / Productivity | |
| Huawei MateBook D 16 2024 | |
| Acer Swift Edge SFE16 Ryzen 7 7840U | |
| Moyenne de la classe Multimedia (931 - 2489, n=67, 2 dernières années) | |
| Asus VivoBook S15 K5504 | |
| Xiaomi RedmiBook Pro 16 2024 | |
| MSI Prestige 16 B1MG-001US | |
| Samsung Galaxy Book4 Pro 16 | |
| Moyenne Intel Core Ultra 7 155H, Intel Arc 8-Core iGPU (1291 - 1798, n=33) | |
| CrossMark / Creativity | |
| Huawei MateBook D 16 2024 | |
| Moyenne de la classe Multimedia (907 - 3465, n=67, 2 dernières années) | |
| Asus VivoBook S15 K5504 | |
| MSI Prestige 16 B1MG-001US | |
| Xiaomi RedmiBook Pro 16 2024 | |
| Samsung Galaxy Book4 Pro 16 | |
| Acer Swift Edge SFE16 Ryzen 7 7840U | |
| Moyenne Intel Core Ultra 7 155H, Intel Arc 8-Core iGPU (1519 - 1929, n=33) | |
| CrossMark / Responsiveness | |
| Huawei MateBook D 16 2024 | |
| Acer Swift Edge SFE16 Ryzen 7 7840U | |
| Xiaomi RedmiBook Pro 16 2024 | |
| MSI Prestige 16 B1MG-001US | |
| Samsung Galaxy Book4 Pro 16 | |
| Moyenne de la classe Multimedia (605 - 2024, n=67, 2 dernières années) | |
| Asus VivoBook S15 K5504 | |
| Moyenne Intel Core Ultra 7 155H, Intel Arc 8-Core iGPU (939 - 1802, n=33) | |
| WebXPRT 3 / Overall | |
| Moyenne de la classe Multimedia (136.4 - 596, n=70, 2 dernières années) | |
| Asus VivoBook S15 K5504 | |
| Huawei MateBook D 16 2024 | |
| Acer Swift Edge SFE16 Ryzen 7 7840U | |
| MSI Prestige 16 B1MG-001US | |
| Xiaomi RedmiBook Pro 16 2024 | |
| Moyenne Intel Core Ultra 7 155H, Intel Arc 8-Core iGPU (252 - 299, n=34) | |
| Samsung Galaxy Book4 Pro 16 | |
| WebXPRT 4 / Overall | |
| Huawei MateBook D 16 2024 | |
| Moyenne de la classe Multimedia (167.3 - 402, n=71, 2 dernières années) | |
| MSI Prestige 16 B1MG-001US | |
| Samsung Galaxy Book4 Pro 16 | |
| Xiaomi RedmiBook Pro 16 2024 | |
| Moyenne Intel Core Ultra 7 155H, Intel Arc 8-Core iGPU (166.4 - 309, n=29) | |
| Acer Swift Edge SFE16 Ryzen 7 7840U | |
| Mozilla Kraken 1.1 / Total | |
| Moyenne Intel Core Ultra 7 155H, Intel Arc 8-Core iGPU (517 - 614, n=35) | |
| Samsung Galaxy Book4 Pro 16 | |
| Xiaomi RedmiBook Pro 16 2024 | |
| MSI Prestige 16 B1MG-001US | |
| Acer Swift Edge SFE16 Ryzen 7 7840U | |
| Asus VivoBook S15 K5504 | |
| Moyenne de la classe Multimedia (228 - 835, n=74, 2 dernières années) | |
| Huawei MateBook D 16 2024 | |
* ... Moindre est la valeur, meilleures sont les performances
| PCMark 10 Score | 6994 points | |
Aide | ||
| AIDA64 / Memory Copy | |
| Xiaomi RedmiBook Pro 16 2024 | |
| Samsung Galaxy Book4 Pro 16 | |
| Moyenne Intel Core Ultra 7 155H (62397 - 96791, n=50) | |
| Moyenne de la classe Multimedia (21158 - 132135, n=61, 2 dernières années) | |
| MSI Prestige 16 B1MG-001US | |
| Acer Swift Edge SFE16 Ryzen 7 7840U | |
| Asus VivoBook S15 K5504 | |
| Huawei MateBook D 16 2024 | |
| AIDA64 / Memory Read | |
| Samsung Galaxy Book4 Pro 16 | |
| Xiaomi RedmiBook Pro 16 2024 | |
| Moyenne de la classe Multimedia (19699 - 174586, n=61, 2 dernières années) | |
| Moyenne Intel Core Ultra 7 155H (60544 - 90647, n=50) | |
| MSI Prestige 16 B1MG-001US | |
| Asus VivoBook S15 K5504 | |
| Huawei MateBook D 16 2024 | |
| Acer Swift Edge SFE16 Ryzen 7 7840U | |
| AIDA64 / Memory Write | |
| Acer Swift Edge SFE16 Ryzen 7 7840U | |
| Moyenne de la classe Multimedia (17733 - 134998, n=61, 2 dernières années) | |
| MSI Prestige 16 B1MG-001US | |
| Samsung Galaxy Book4 Pro 16 | |
| Moyenne Intel Core Ultra 7 155H (58692 - 93451, n=50) | |
| Asus VivoBook S15 K5504 | |
| Xiaomi RedmiBook Pro 16 2024 | |
| Huawei MateBook D 16 2024 | |
| AIDA64 / Memory Latency | |
| Moyenne Intel Core Ultra 7 155H (116.2 - 233, n=50) | |
| Xiaomi RedmiBook Pro 16 2024 | |
| MSI Prestige 16 B1MG-001US | |
| Samsung Galaxy Book4 Pro 16 | |
| Moyenne de la classe Multimedia (7 - 535, n=60, 2 dernières années) | |
| Acer Swift Edge SFE16 Ryzen 7 7840U | |
| Huawei MateBook D 16 2024 | |
| Asus VivoBook S15 K5504 | |
* ... Moindre est la valeur, meilleures sont les performances
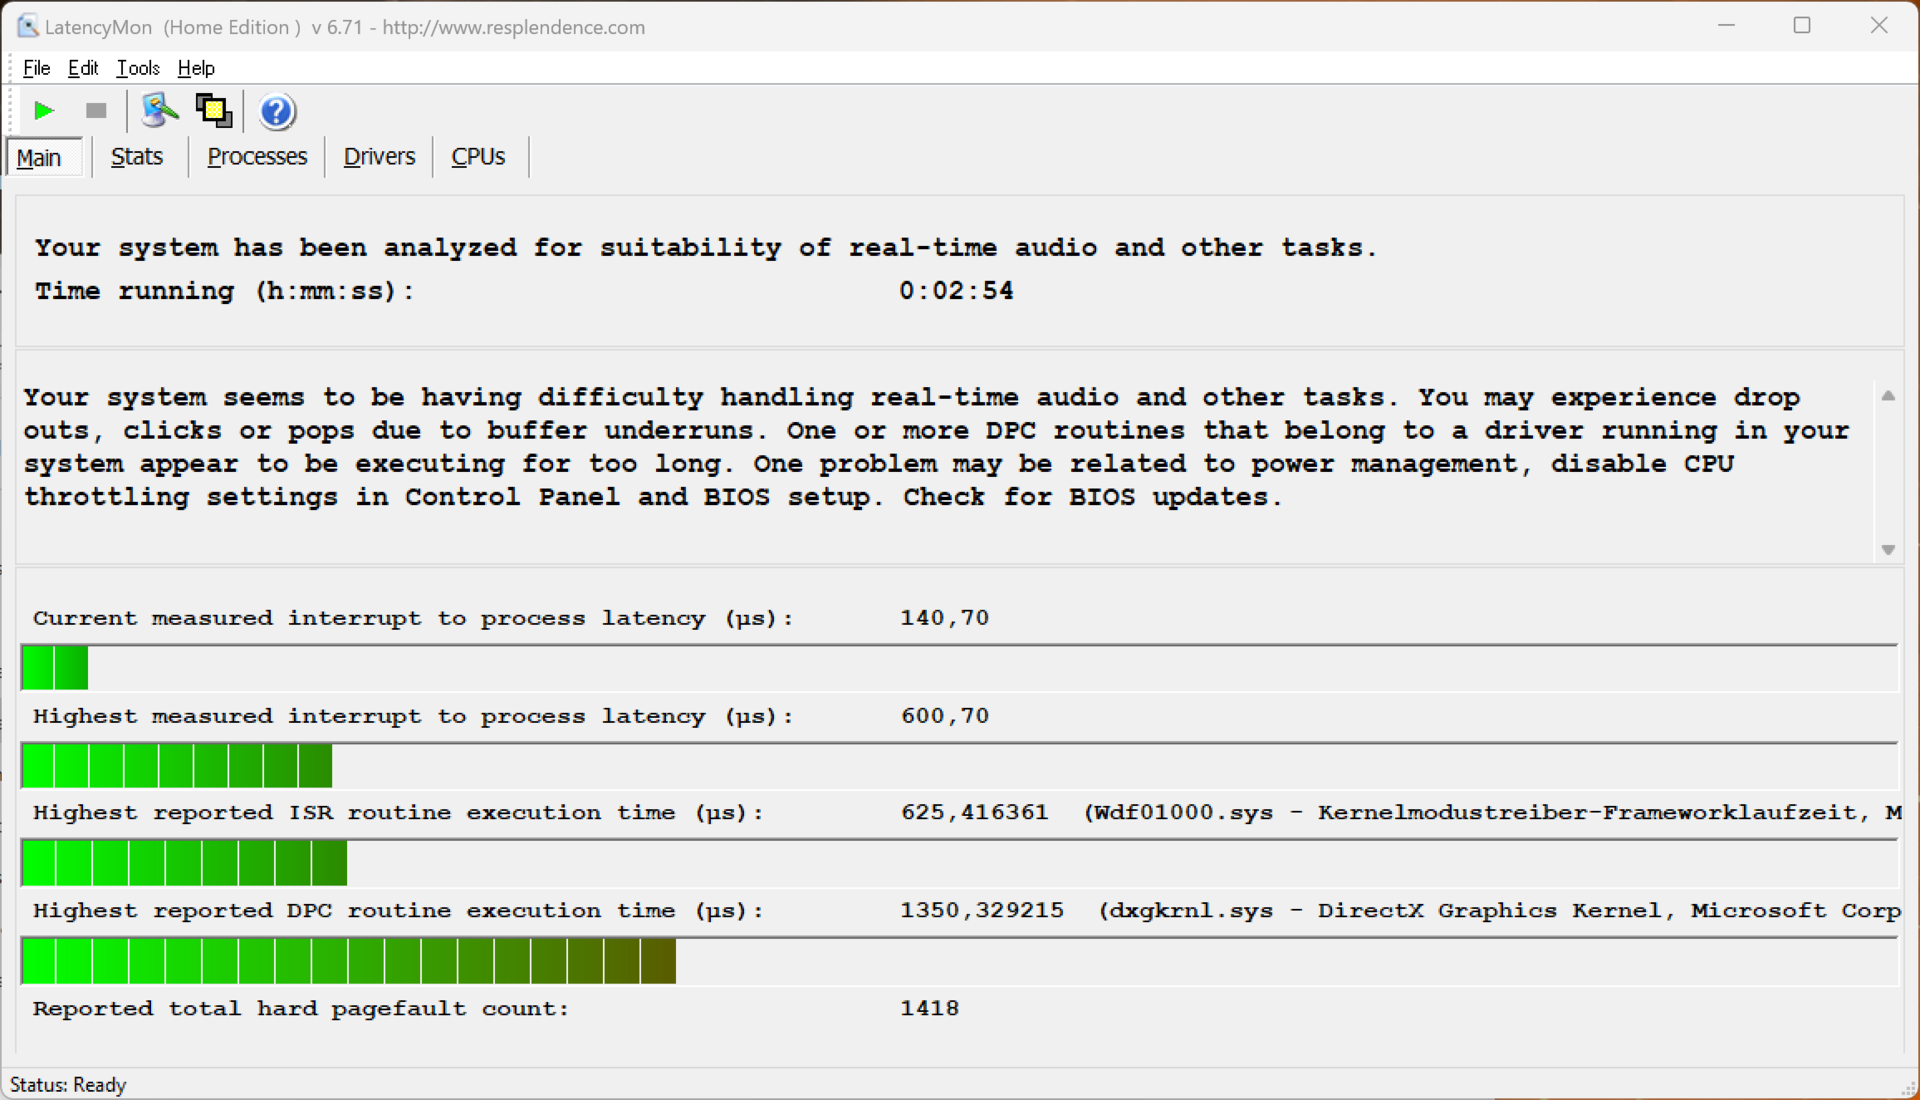
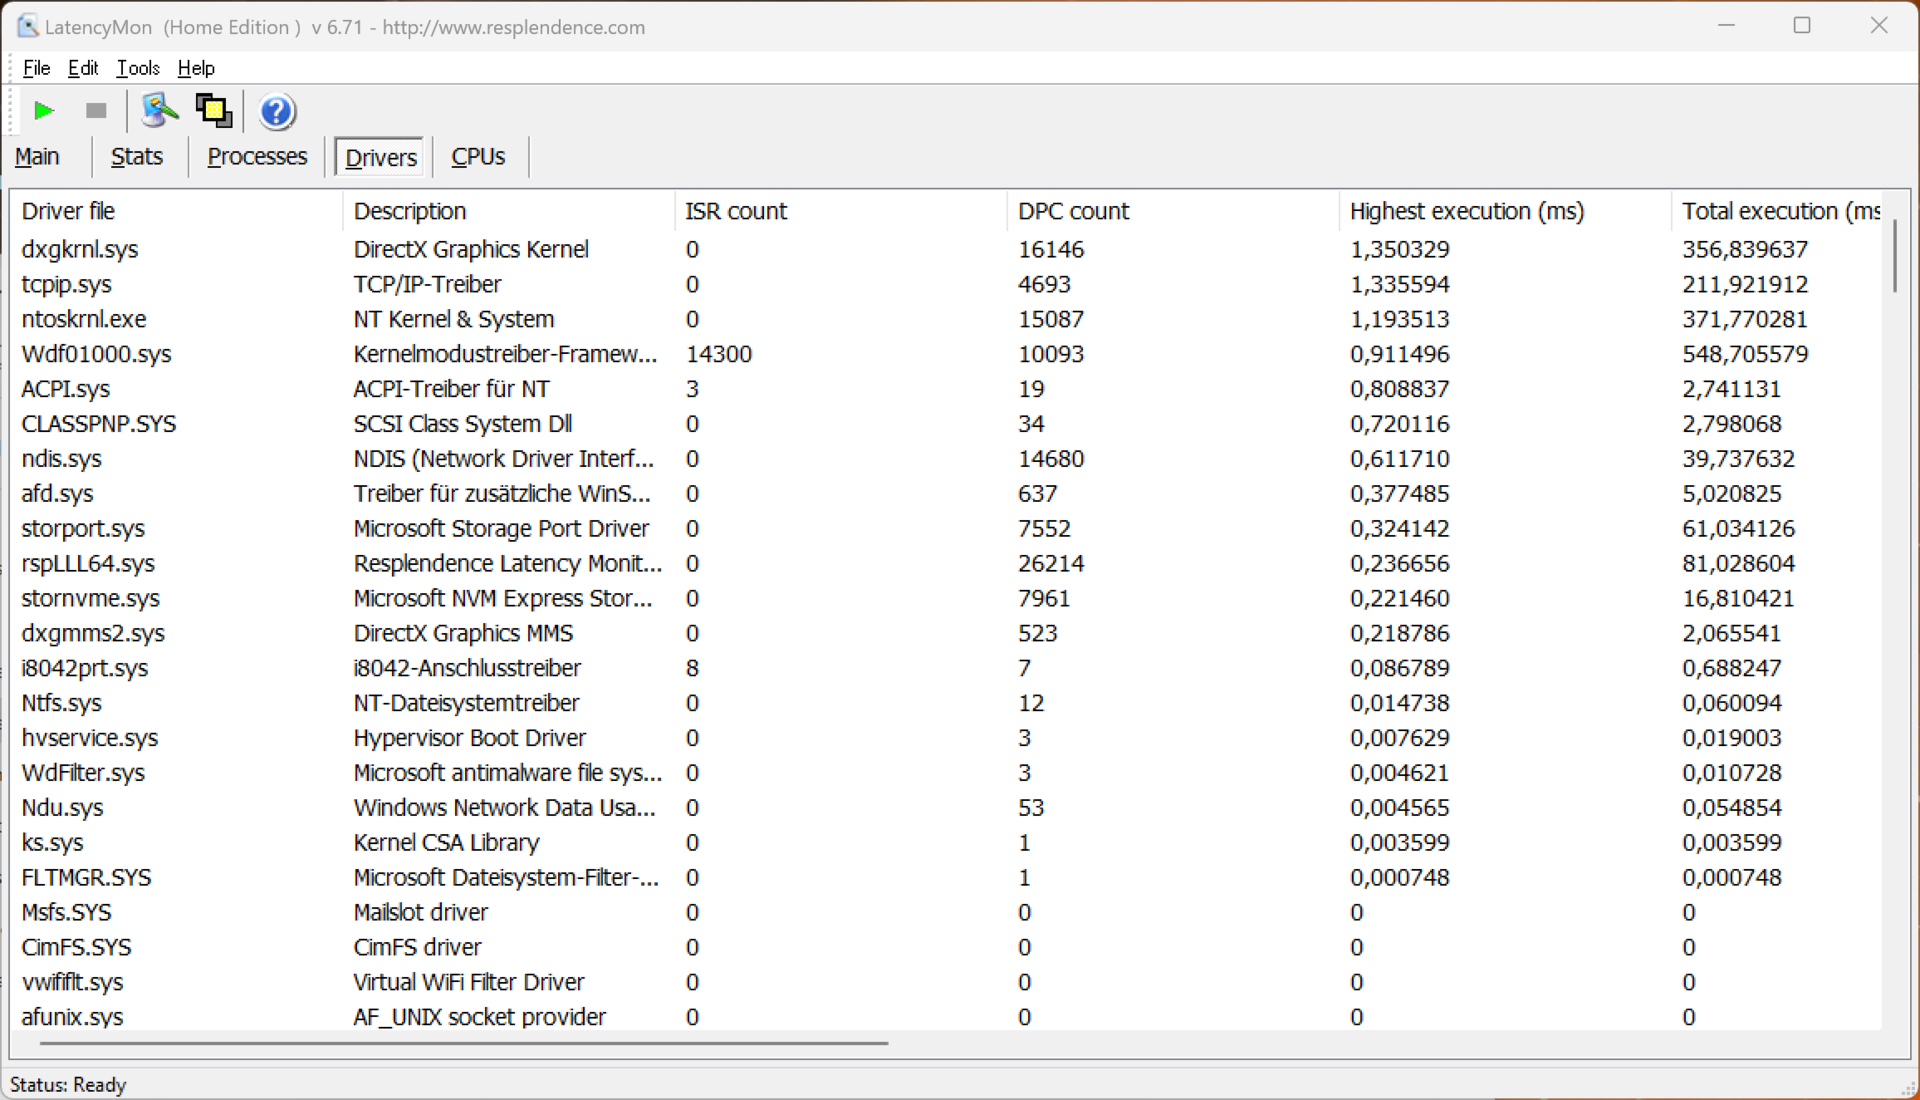
Latences DPC
Dans notre test de latence standardisé (surf sur Internet, lecture d'une vidéo YouTube 4K, charge du CPU), notre unité de test avec sa version actuelle du BIOS ne montre aucune limitation pour l'utilisation d'applications audio en temps réel. Même si l'un des pilotes affiche de légères hausses, la valeur importante "interrupt-to-process-latency" reste très faible.
| DPC Latencies / LatencyMon - interrupt to process latency (max), Web, Youtube, Prime95 | |
| Samsung Galaxy Book4 Pro 16 | |
| Asus VivoBook S15 K5504 | |
| Huawei MateBook D 16 2024 | |
| Xiaomi RedmiBook Pro 16 2024 | |
| Acer Swift Edge SFE16 Ryzen 7 7840U | |
| MSI Prestige 16 B1MG-001US | |
* ... Moindre est la valeur, meilleures sont les performances
Solution de stockage
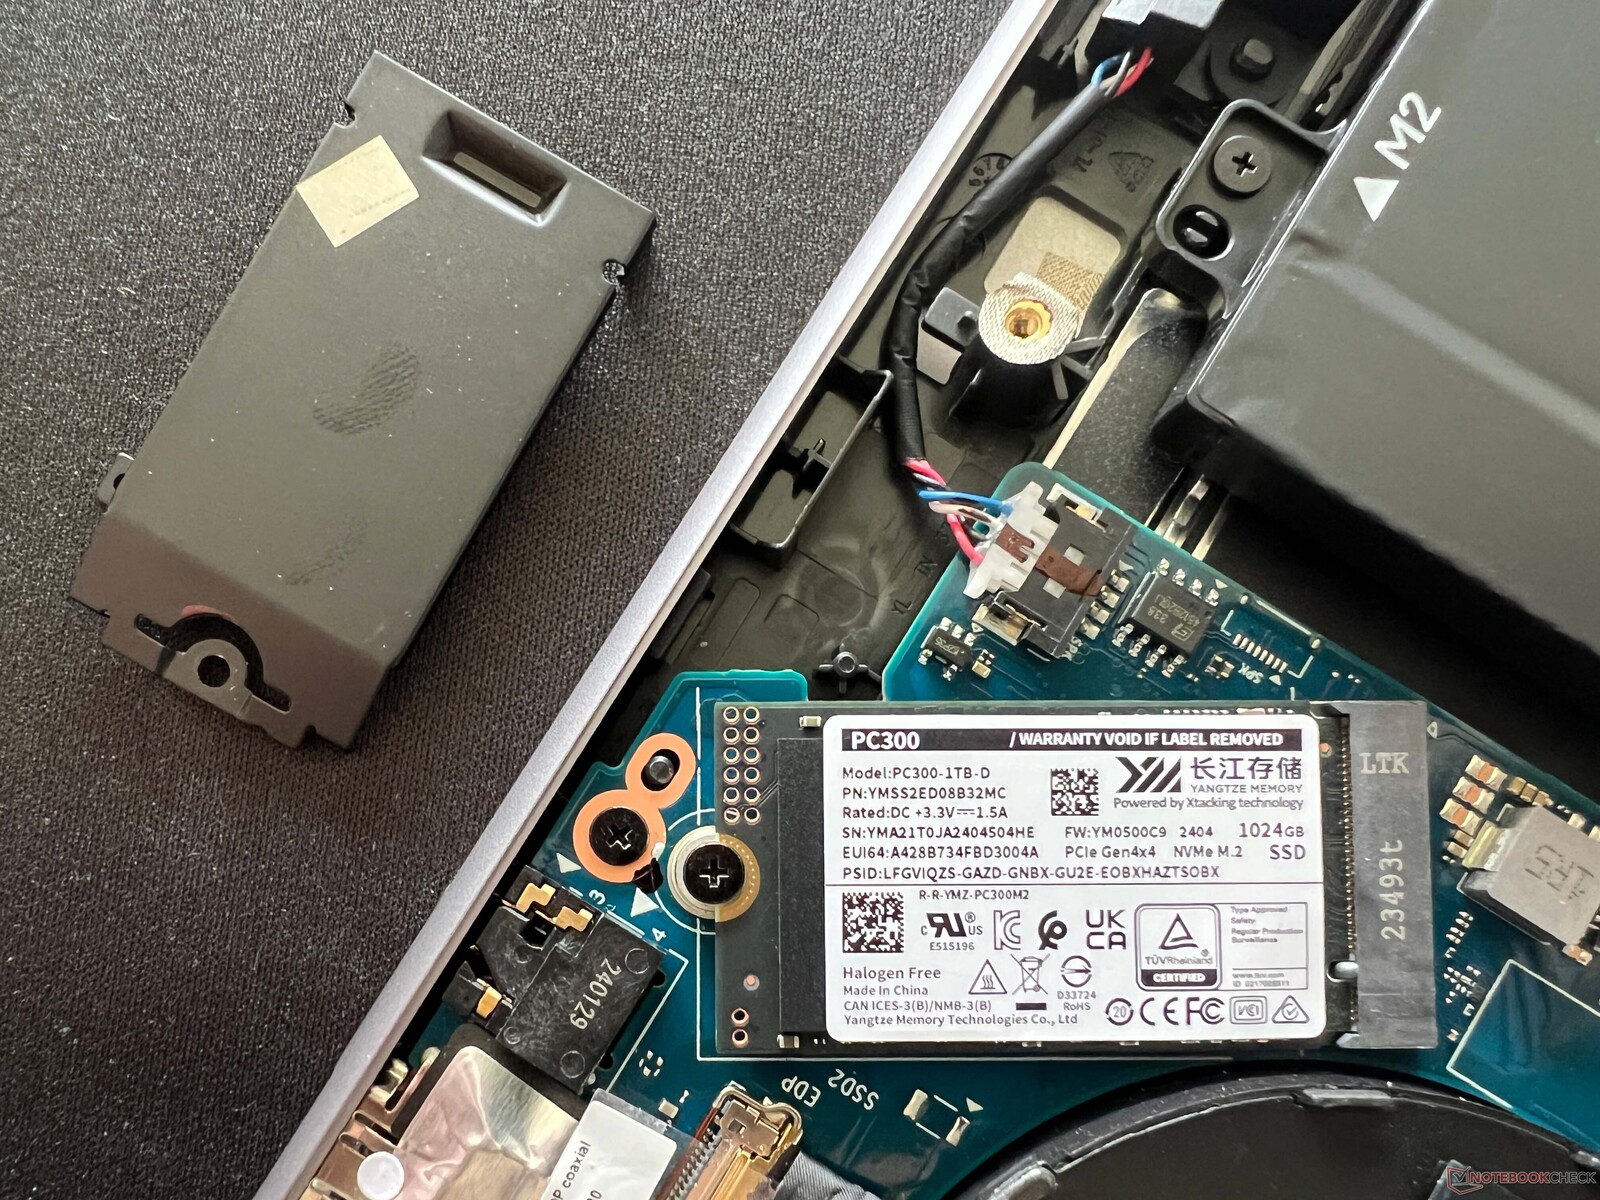
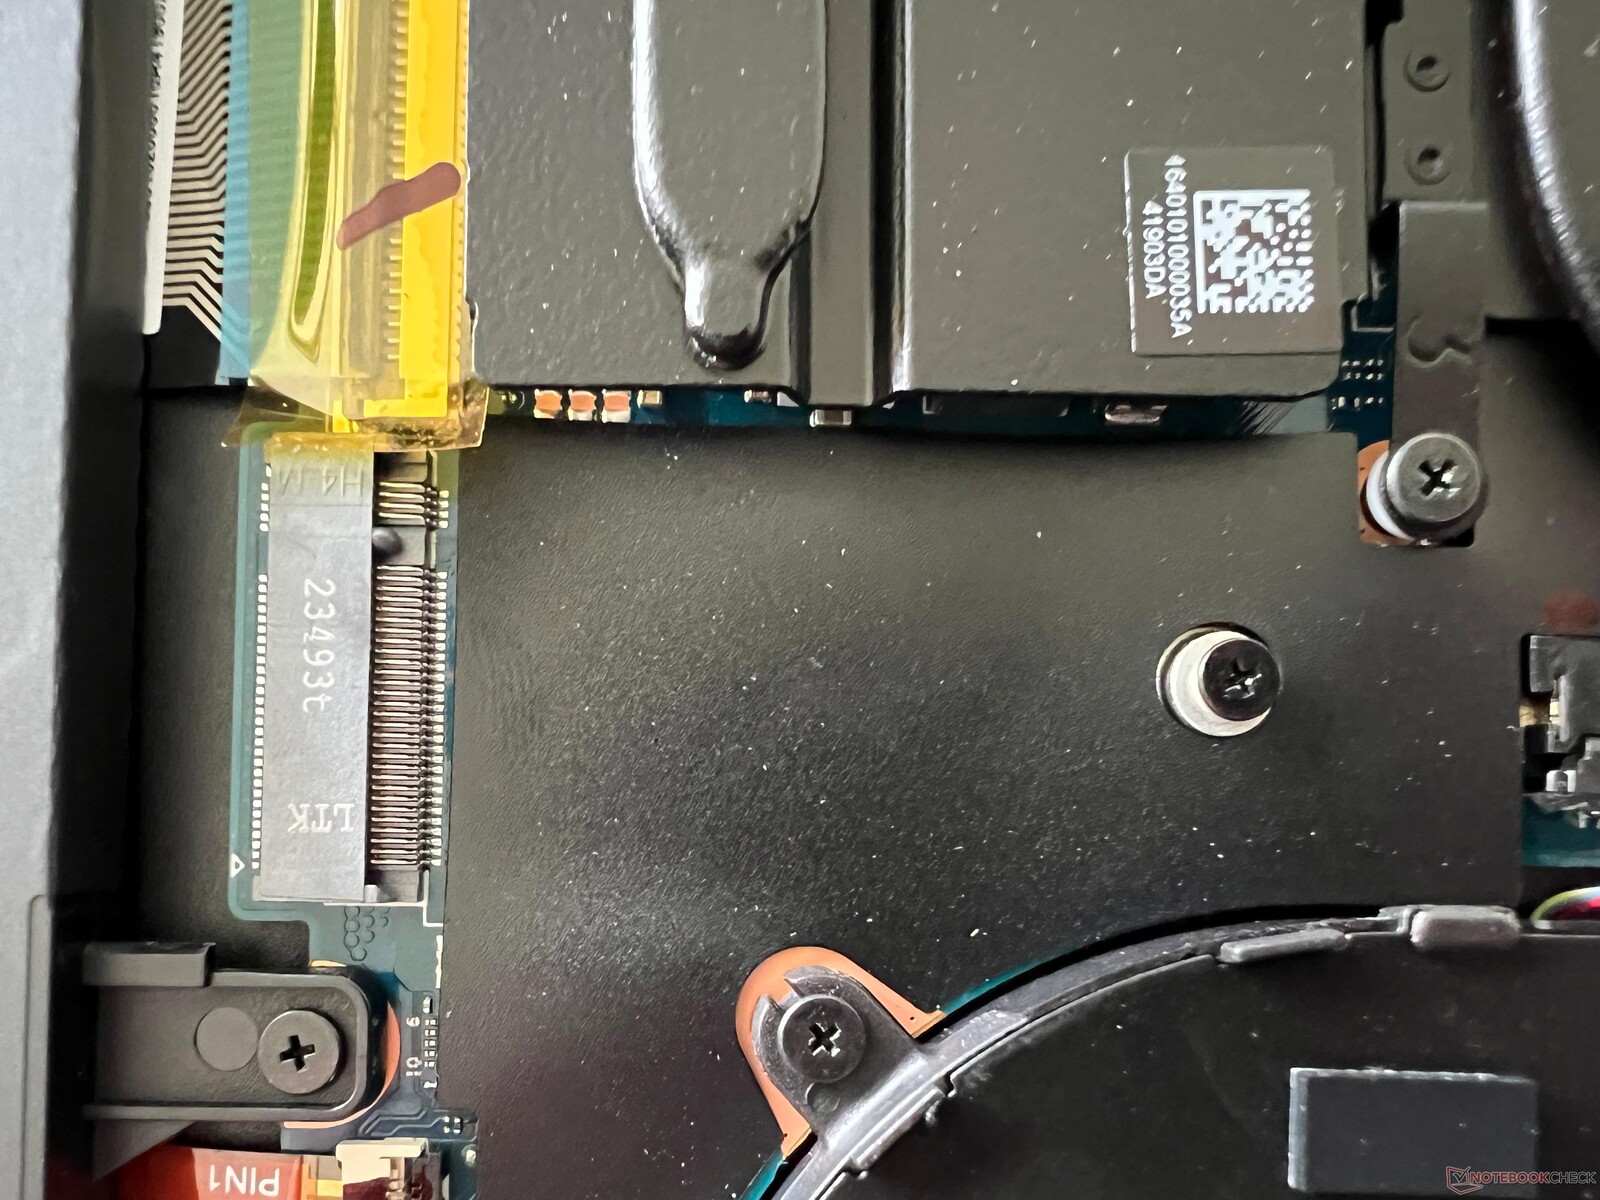
Xiaomi a équipé notre unité de test d'un SSD M.2-2242 court du fabricant chinois YMTC. Le PC300 offre une capacité de stockage de 1 TB, avec le SSD partitionné dans l'état de livraison. Après le premier démarrage, l'utilisateur dispose encore de 137 Go sur le disque système (et de 757 Go sur le disque D). Bien qu'il s'agisse d'un disque PCIe 4.0, les taux de transfert sont plus proches des niveaux PCIe 3.0. Mais ce n'est pas un problème au quotidien, et les performances restent stables même en cas de charge constante. Un emplacement M.2-2242 supplémentaire est également disponible pour l'extension du stockage. Vous trouverez d'autres tests de performance des disques durs SSD ici.

* ... Moindre est la valeur, meilleures sont les performances
Disk Throttling: DiskSpd Read Loop, Queue Depth 8
Carte graphique
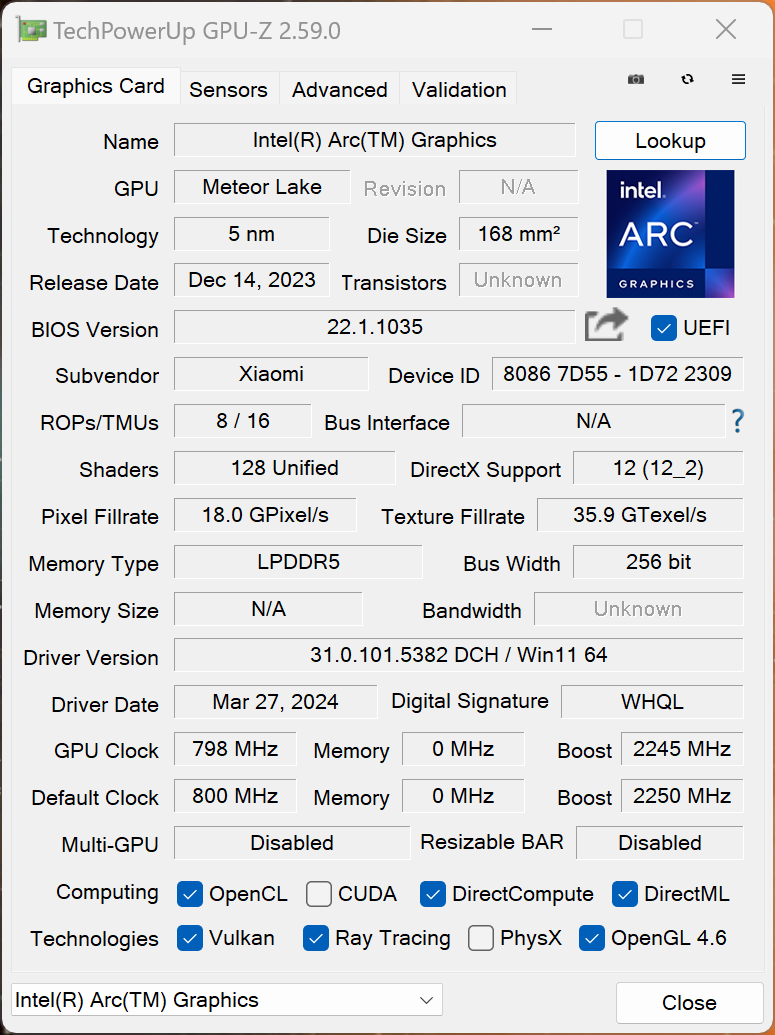
Le nouveau processeur Meteor Lake comprend également la nouvelle carte graphique Graphique Arc. En combinaison avec le Core Ultra 7 155Hla version la plus rapide avec 8 cœurs Xe est utilisée, et l'iGPU profite bien sûr aussi de la mémoire de travail rapide (LPDDR5x-7467). Les performances du RedmiBook Pro 16 sont très bonnes, et c'est l'un des iGPU Arc les plus rapides que nous ayons testés jusqu'à présent. Nous n'avons détecté aucun problème de chute d'images dans les benchmarks, ce qui était encore le cas avec certains concurrents (et en particulier les CPU Meteor Lake avec des limites de puissance inférieures).
Dans les tests synthétiques, la AMD Radeon 780M peut être dépassée, mais dans les benchmarks de jeu réels, les versions rapides de la 780M ont encore quelques avantages. Mais nous pensons que la situation va encore s'améliorer avec les prochaines mises à jour. De nombreux jeux plus anciens peuvent être joués confortablement en 1080p avec des détails élevés, et même certains jeux actuels tels que Cyberpunk 2077 peuvent être joués de manière assez fluide avec des détails faibles. Si possible, vous devriez utiliser l'upscaling pour améliorer encore les performances. À faible niveau de détails en 1080p, vous pouvez par exemple augmenter les performances de 34,7 à 42 FPS en activant XeSS.
En charge constante comme en fonctionnement sur batterie, les performances graphiques restent tout à fait stables. Vous trouverez d'autres tests de performance du GPU ici.
| 3DMark 11 Performance | 13729 points | |
| 3DMark Fire Strike Score | 9001 points | |
| 3DMark Time Spy Score | 4042 points | |
Aide | ||
| Blender / v3.3 Classroom CPU | |
| Acer Swift Edge SFE16 Ryzen 7 7840U | |
| Moyenne Intel Arc 8-Core iGPU (294 - 692, n=42) | |
| Huawei MateBook D 16 2024 | |
| Samsung Galaxy Book4 Pro 16 | |
| Moyenne de la classe Multimedia (134.5 - 1042, n=68, 2 dernières années) | |
| Asus VivoBook S15 K5504 | |
| MSI Prestige 16 B1MG-001US | |
| Xiaomi RedmiBook Pro 16 2024 | |
* ... Moindre est la valeur, meilleures sont les performances
| The Witcher 3 - 1920x1080 Ultra Graphics & Postprocessing (HBAO+) | |
| Moyenne de la classe Multimedia (11 - 121, n=13, 2 dernières années) | |
| MSI Prestige 16 B1MG-001US | |
| Xiaomi RedmiBook Pro 16 2024 | |
| Samsung Galaxy Book4 Pro 16 | |
| Acer Swift Edge SFE16 Ryzen 7 7840U | |
| Asus VivoBook S15 K5504 | |
| Huawei MateBook D 16 2024 | |
The Witcher 3 FPS Chart
| Bas | Moyen | Élevé | Ultra | QHD | |
|---|---|---|---|---|---|
| GTA V (2015) | 171.5 | 164.4 | 41.2 | 15.9 | |
| The Witcher 3 (2015) | 157 | 97 | 57 | 25.1 | |
| Dota 2 Reborn (2015) | 102.4 | 96.9 | 83 | 79.8 | |
| Final Fantasy XV Benchmark (2018) | 84.1 | 45 | 30.6 | 23 | |
| X-Plane 11.11 (2018) | 56.1 | 40.1 | 32.4 | ||
| Far Cry 5 (2018) | 84 | 52 | 48 | 45 | 32 |
| Strange Brigade (2018) | 205 | 84 | 64 | 53 | 42 |
| F1 23 (2023) | 80.1 | 74.2 | 50.4 | 14 | |
| Cyberpunk 2077 (2023) | 34.7 | 29.5 | 25 | 21.2 |
Émissions - Bon refroidissement grâce à des ventilateurs silencieux
Niveaux de bruit
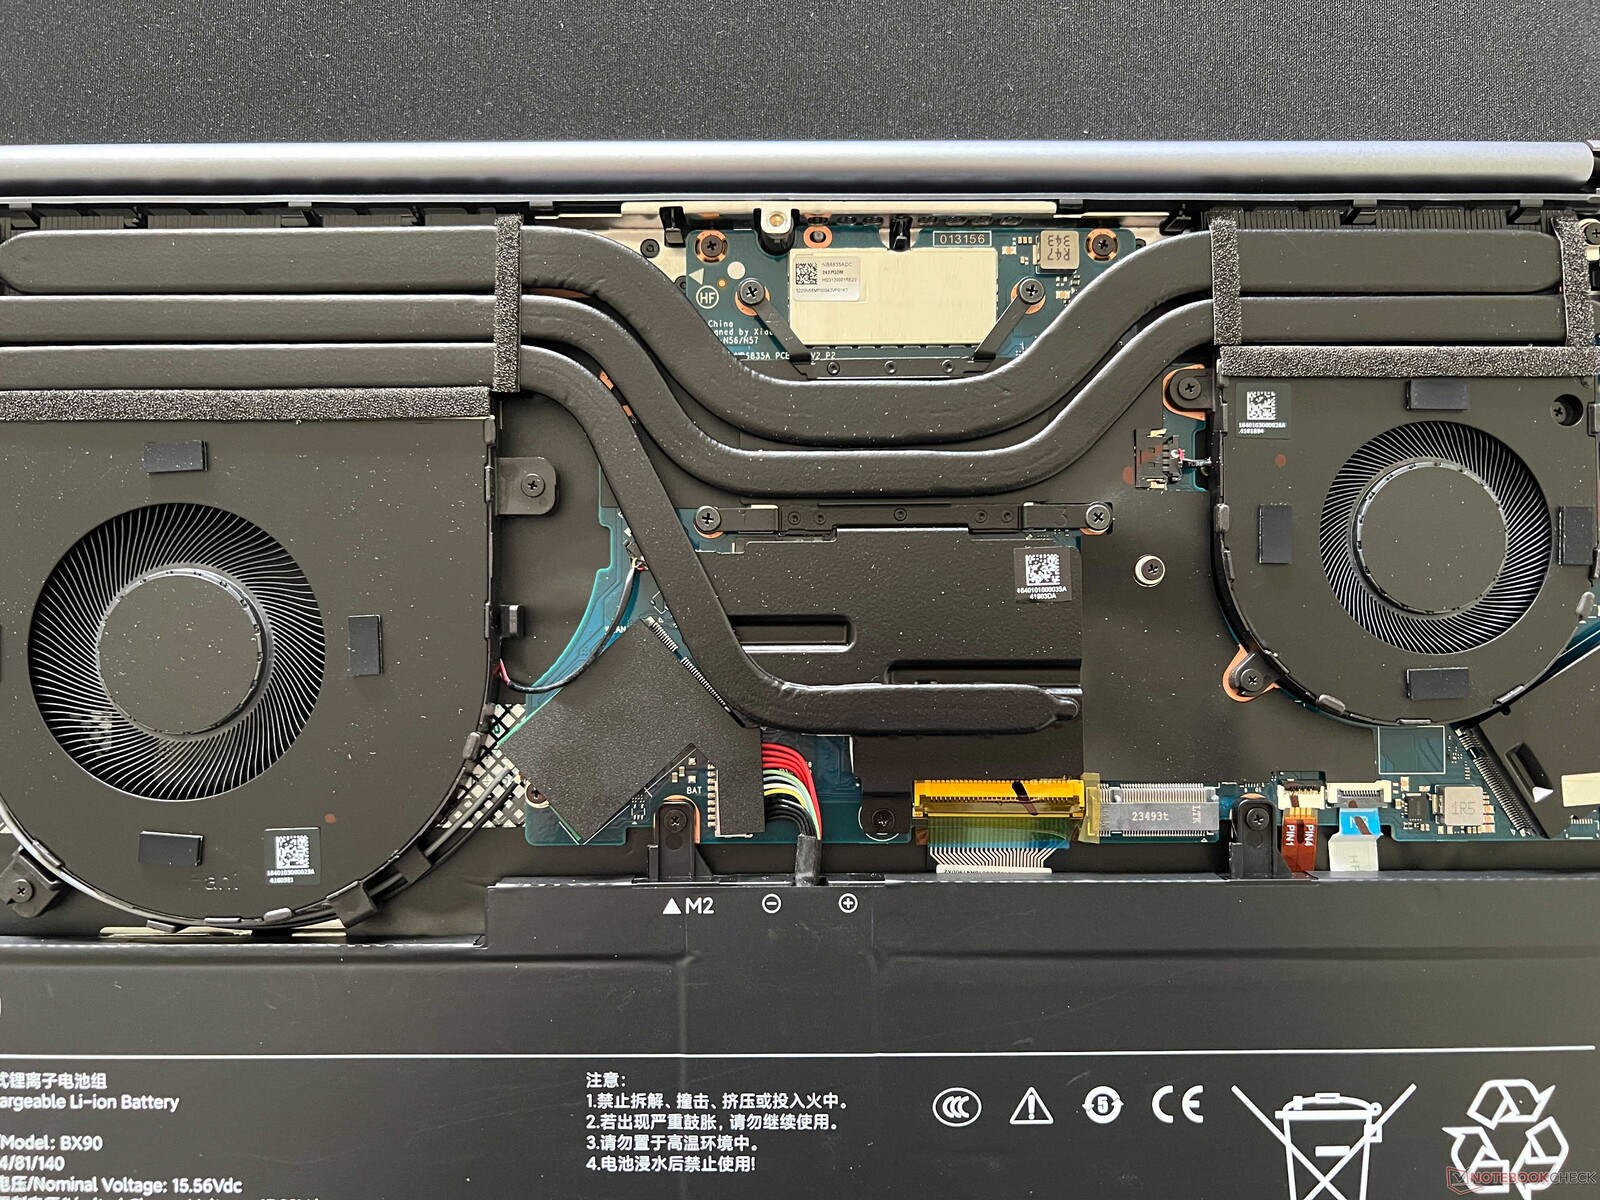
Xiaomi utilise un système de refroidissement puissant avec deux ventilateurs et deux caloducs. Les ventilateurs restent souvent désactivés ou fonctionnent très silencieusement au quotidien. En outre, les courbes des ventilateurs sont bien ajustées et, malgré les limites de puissance élevées du processeur, certains pics de charge courts n'entraînent pas immédiatement une montée en régime des ventilateurs. Même sous charge, l'appareil reste très silencieux dans l'ensemble, en particulier dans les jeux (~31-35 dB(A) selon la charge du processeur) ou sous charge pure du processeur. Ce n'est que lors de notre test de stress avec une charge combinée CPU/GPU que les ventilateurs deviennent brièvement plus bruyants avec un maximum de 39,7 dB(A), puisque le processeur est capable de consommer jusqu'à 115 watts. Mais dès que la consommation est réduite, le bruit des ventilateurs redescend à 38 dB(A). En principe, les ventilateurs se désactivent rapidement après les phases de charge. Il n'y a pas d'autres bruits électroniques dans notre unité de test.
Degré de la nuisance sonore
| Au repos |
| 24.4 / 24.4 / 24.4 dB(A) |
| Fortement sollicité |
| 32 / 39.7 dB(A) |
 | ||
30 dB silencieux 40 dB(A) audible 50 dB(A) bruyant |
||
min: | ||
| Xiaomi RedmiBook Pro 16 2024 Arc 8-Core, Ultra 7 155H, YMTC PC300-1TB | Huawei MateBook D 16 2024 Iris Xe G7 96EUs, i9-13900H, 321JN1024GB-TX01 | Samsung Galaxy Book4 Pro 16 Arc 8-Core, Ultra 7 155H, Samsung PM9B1 512GB MZVL4512HBLU | MSI Prestige 16 B1MG-001US Arc 8-Core, Ultra 7 155H, Samsung PM9A1 MZVL22T0HBLB | Acer Swift Edge SFE16 Ryzen 7 7840U Radeon 780M, R7 7840U, SK hynix HFS512GEJ9X125N | Asus VivoBook S15 K5504 Iris Xe G7 96EUs, i9-13900H, WD PC SN560 SDDPNQE-1T00 | |
|---|---|---|---|---|---|---|
| Noise | 5% | -10% | -16% | -11% | -13% | |
| arrêt / environnement * (dB) | 24.4 | 23.2 5% | 24.6 -1% | 24.5 -0% | 23.4 4% | 25.3 -4% |
| Idle Minimum * (dB) | 24.4 | 23.2 5% | 24.6 -1% | 24.5 -0% | 24.1 1% | 25.3 -4% |
| Idle Average * (dB) | 24.4 | 23.2 5% | 24.6 -1% | 26.3 -8% | 24.3 -0% | 25.3 -4% |
| Idle Maximum * (dB) | 24.4 | 24 2% | 26.4 -8% | 26.3 -8% | 28 -15% | 25.3 -4% |
| Load Average * (dB) | 32 | 28 12% | 40 -25% | 36.5 -14% | 41 -28% | 43.5 -36% |
| Witcher 3 ultra * (dB) | 30.6 | 31.9 -4% | 40 -31% | 46.3 -51% | 40.9 -34% | |
| Load Maximum * (dB) | 39.7 | 36.2 9% | 40 -1% | 52.9 -33% | 40.9 -3% | 50.75 -28% |
* ... Moindre est la valeur, meilleures sont les performances
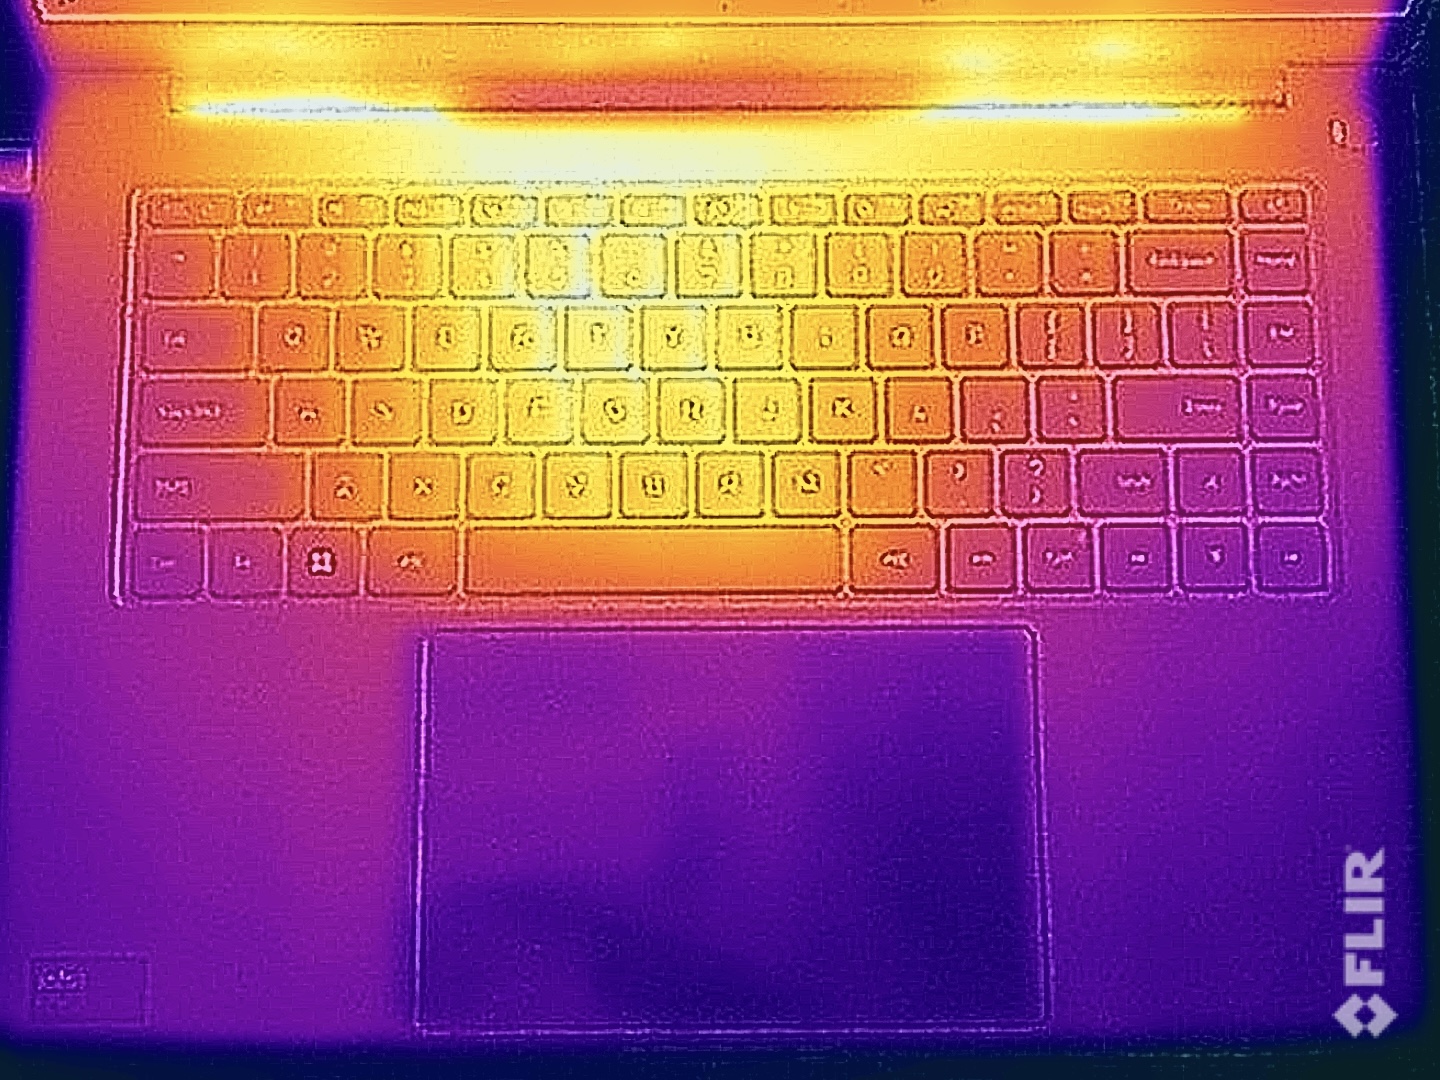
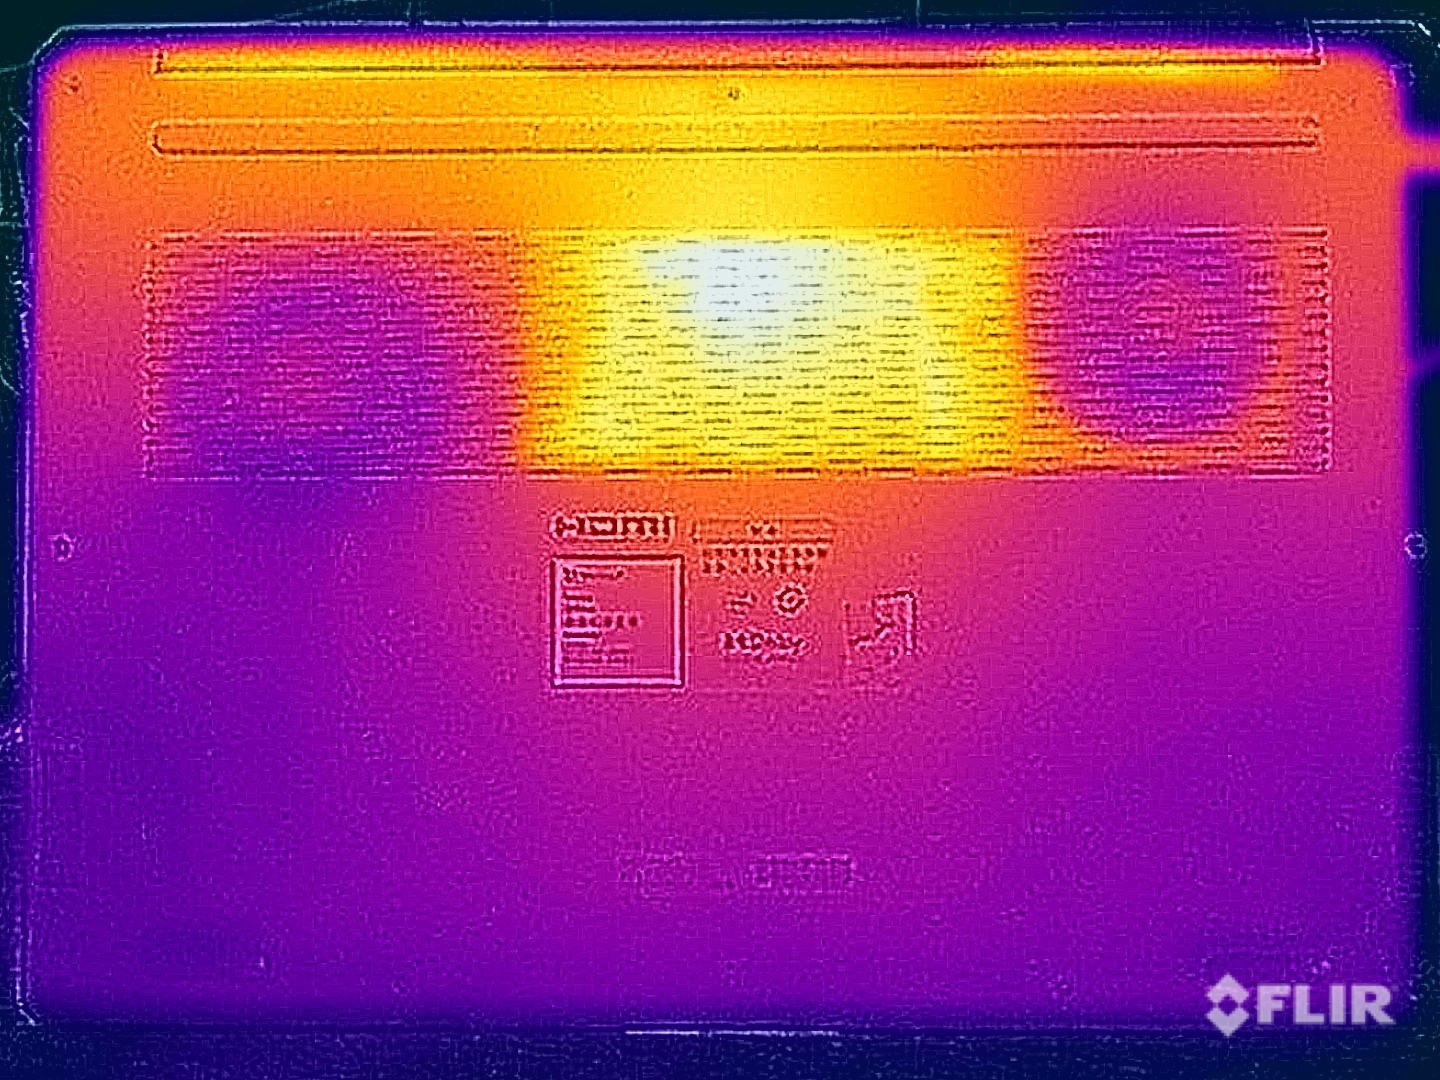
Températures
En mode veille et sous faible charge, le boîtier métallique reste très froid, et aucun problème n'est à déplorer, même sous charge. Bien qu'il y ait un point chaud sur le dessous qui atteint 46 °C, il se trouve dans la zone centrale à l'arrière, de sorte que même dans ce cas, vous pouvez toujours placer l'appareil sur vos cuisses. La température dans la zone du clavier reste inférieure à 40 °C et le repose-paume ne chauffe pratiquement pas, même en cas de charge élevée.
Comme nous l'avons déjà mentionné, le Core Ultra 7 155H est autorisé à consommer jusqu'à 115 watts en charge combinée CPU/GPU, mais il se stabilise à 45 watts après quelques minutes.
(±) La température maximale du côté supérieur est de 40.3 °C / 105 F, par rapport à la moyenne de 36.8 °C / 98 F, allant de 21 à 71 °C pour la classe Multimedia.
(-) Le fond chauffe jusqu'à un maximum de 45.9 °C / 115 F, contre une moyenne de 39.1 °C / 102 F
(+) En utilisation inactive, la température moyenne du côté supérieur est de 25.4 °C / 78 F, par rapport à la moyenne du dispositif de 31.3 °C / 88 F.
(±) En jouant à The Witcher 3, la température moyenne du côté supérieur est de 32.7 °C / 91 F, alors que la moyenne de l'appareil est de 31.3 °C / 88 F.
(+) Les repose-poignets et le pavé tactile sont plus froids que la température de la peau avec un maximum de 27.1 °C / 80.8 F et sont donc froids au toucher.
(±) La température moyenne de la zone de l'appui-paume de dispositifs similaires était de 28.7 °C / 83.7 F (+1.6 °C / #2.9 F).
| Xiaomi RedmiBook Pro 16 2024 Intel Core Ultra 7 155H, Intel Arc 8-Core iGPU | Huawei MateBook D 16 2024 Intel Core i9-13900H, Intel Iris Xe Graphics G7 96EUs | Samsung Galaxy Book4 Pro 16 Intel Core Ultra 7 155H, Intel Arc 8-Core iGPU | MSI Prestige 16 B1MG-001US Intel Core Ultra 7 155H, Intel Arc 8-Core iGPU | Acer Swift Edge SFE16 Ryzen 7 7840U AMD Ryzen 7 7840U, AMD Radeon 780M | Asus VivoBook S15 K5504 Intel Core i9-13900H, Intel Iris Xe Graphics G7 96EUs | |
|---|---|---|---|---|---|---|
| Heat | 1% | 6% | -1% | -8% | -39% | |
| Maximum Upper Side * (°C) | 40.3 | 40.3 -0% | 40.9 -1% | 48.8 -21% | 41.6 -3% | 51.5 -28% |
| Maximum Bottom * (°C) | 45.9 | 45.1 2% | 42.6 7% | 47.6 -4% | 46.6 -2% | 62.4 -36% |
| Idle Upper Side * (°C) | 26.3 | 26.6 -1% | 24.5 7% | 24.2 8% | 30.4 -16% | 41.7 -59% |
| Idle Bottom * (°C) | 27.9 | 27.1 3% | 24.8 11% | 23.6 15% | 31 -11% | 37.2 -33% |
* ... Moindre est la valeur, meilleures sont les performances
Intervenants
Les haut-parleurs stéréo du RedmiBook Pro 16 laissent une bonne impression. Même s'il existe des ordinateurs portables multimédias dotés d'un meilleur système audio, ils sont beaucoup plus chers. Notre appareil de test n'a pas à se cacher et produit un son qui est au même niveau que celui d'un Samsung Galaxy Book4 Pro(qui coûte deux fois plus cher).
Xiaomi RedmiBook Pro 16 2024 analyse audio
(+) | les haut-parleurs peuvent jouer relativement fort (83.8# dB)
Basses 100 - 315 Hz
(±) | basse réduite - en moyenne 13.6% inférieure à la médiane
(±) | la linéarité des basses est moyenne (7.9% delta à la fréquence précédente)
Médiums 400 - 2000 Hz
(±) | médiane supérieure - en moyenne 5.3% supérieure à la médiane
(+) | les médiums sont linéaires (5% delta à la fréquence précédente)
Aiguës 2 - 16 kHz
(+) | des sommets équilibrés - à seulement 2.8% de la médiane
(+) | les aigus sont linéaires (5.3% delta à la fréquence précédente)
Globalement 100 - 16 000 Hz
(+) | le son global est linéaire (13% différence à la médiane)
Par rapport à la même classe
» 26% de tous les appareils testés de cette catégorie étaient meilleurs, 5% similaires, 70% pires
» Le meilleur avait un delta de 5%, la moyenne était de 17%, le pire était de 45%.
Par rapport à tous les appareils testés
» 13% de tous les appareils testés étaient meilleurs, 2% similaires, 85% pires
» Le meilleur avait un delta de 4%, la moyenne était de 24%, le pire était de 134%.
Samsung Galaxy Book4 Pro 16 analyse audio
(+) | les haut-parleurs peuvent jouer relativement fort (83.4# dB)
Basses 100 - 315 Hz
(±) | basse réduite - en moyenne 12.4% inférieure à la médiane
(±) | la linéarité des basses est moyenne (11.4% delta à la fréquence précédente)
Médiums 400 - 2000 Hz
(+) | médiane équilibrée - seulement 4.7% de la médiane
(+) | les médiums sont linéaires (4.7% delta à la fréquence précédente)
Aiguës 2 - 16 kHz
(+) | des sommets équilibrés - à seulement 3.1% de la médiane
(+) | les aigus sont linéaires (5.4% delta à la fréquence précédente)
Globalement 100 - 16 000 Hz
(+) | le son global est linéaire (12.5% différence à la médiane)
Par rapport à la même classe
» 24% de tous les appareils testés de cette catégorie étaient meilleurs, 3% similaires, 73% pires
» Le meilleur avait un delta de 5%, la moyenne était de 17%, le pire était de 45%.
Par rapport à tous les appareils testés
» 11% de tous les appareils testés étaient meilleurs, 2% similaires, 87% pires
» Le meilleur avait un delta de 4%, la moyenne était de 24%, le pire était de 134%.
Gestion de l'énergie - Durée de vie extrême de la batterie
Consommation électrique
Nos mesures de la consommation d'énergie sont sans surprise et, avec un maximum de 12 watts en mode veille, notre unité de test est assez efficace compte tenu des bonnes valeurs de luminosité. La consommation maximale est de 140,6 watts au début du test de stress, après quoi elle se stabilise à environ 102 watts, puis à 78 watts pendant la suite du test. Nous devons également mentionner comme point positif que Xiaomi n'a pas lésiné sur le chargeur, en utilisant un adaptateur de 140 watts, de sorte que la batterie n'a pas besoin d'être utilisée, même pendant le test de stress. De plus, il s'agit d'un chargeur GaN moderne et très compact. Le chargeur lui-même est doté d'une prise américaine, mais un adaptateur européen est également inclus.
| Éteint/en veille | |
| Au repos | |
| Fortement sollicité |
|
Légende:
min: | |
| Xiaomi RedmiBook Pro 16 2024 Ultra 7 155H, Arc 8-Core, YMTC PC300-1TB, IPS, 3072x1920, 16" | Huawei MateBook D 16 2024 i9-13900H, Iris Xe G7 96EUs, 321JN1024GB-TX01, IPS, 1920x1200, 16" | Samsung Galaxy Book4 Pro 16 Ultra 7 155H, Arc 8-Core, Samsung PM9B1 512GB MZVL4512HBLU, OLED, 2880x1800, 16" | MSI Prestige 16 B1MG-001US Ultra 7 155H, Arc 8-Core, Samsung PM9A1 MZVL22T0HBLB, IPS, 2560x1600, 16" | Acer Swift Edge SFE16 Ryzen 7 7840U R7 7840U, Radeon 780M, SK hynix HFS512GEJ9X125N, OLED, 3200x2000, 16" | Asus VivoBook S15 K5504 i9-13900H, Iris Xe G7 96EUs, WD PC SN560 SDDPNQE-1T00, OLED, 2880x1620, 15.6" | Moyenne Intel Arc 8-Core iGPU | Moyenne de la classe Multimedia | |
|---|---|---|---|---|---|---|---|---|
| Power Consumption | 15% | 34% | 10% | 2% | -9% | 11% | -2% | |
| Idle Minimum * (Watt) | 4.2 | 4.7 -12% | 3.6 14% | 3 29% | 7.1 -69% | 5.73 -36% | 5.36 ? -28% | 5.71 ? -36% |
| Idle Average * (Watt) | 11.6 | 9.5 18% | 5.7 51% | 9.5 18% | 10.1 13% | 14.5 -25% | 8.53 ? 26% | 10.1 ? 13% |
| Idle Maximum * (Watt) | 12.3 | 10.1 18% | 6.1 50% | 12 2% | 18.6 -51% | 15.6 -27% | 11.8 ? 4% | 12.4 ? -1% |
| Load Average * (Watt) | 61.9 | 49.7 20% | 52.5 15% | 68.3 -10% | 45.3 27% | 40.5 35% | 53.7 ? 13% | 65 ? -5% |
| Witcher 3 ultra * (Watt) | 57 | 60 -5% | 46.6 18% | 59.8 -5% | 39.5 31% | 74.9 -31% | ||
| Load Maximum * (Watt) | 140.6 | 66.3 53% | 64.7 54% | 104.8 25% | 52.9 62% | 94 33% | 84.4 ? 40% | 112.2 ? 20% |
* ... Moindre est la valeur, meilleures sont les performances
Power Consumption The Witcher 3 / Stress Test
Power Consumption With External Monitor
Autonomie de la batterie
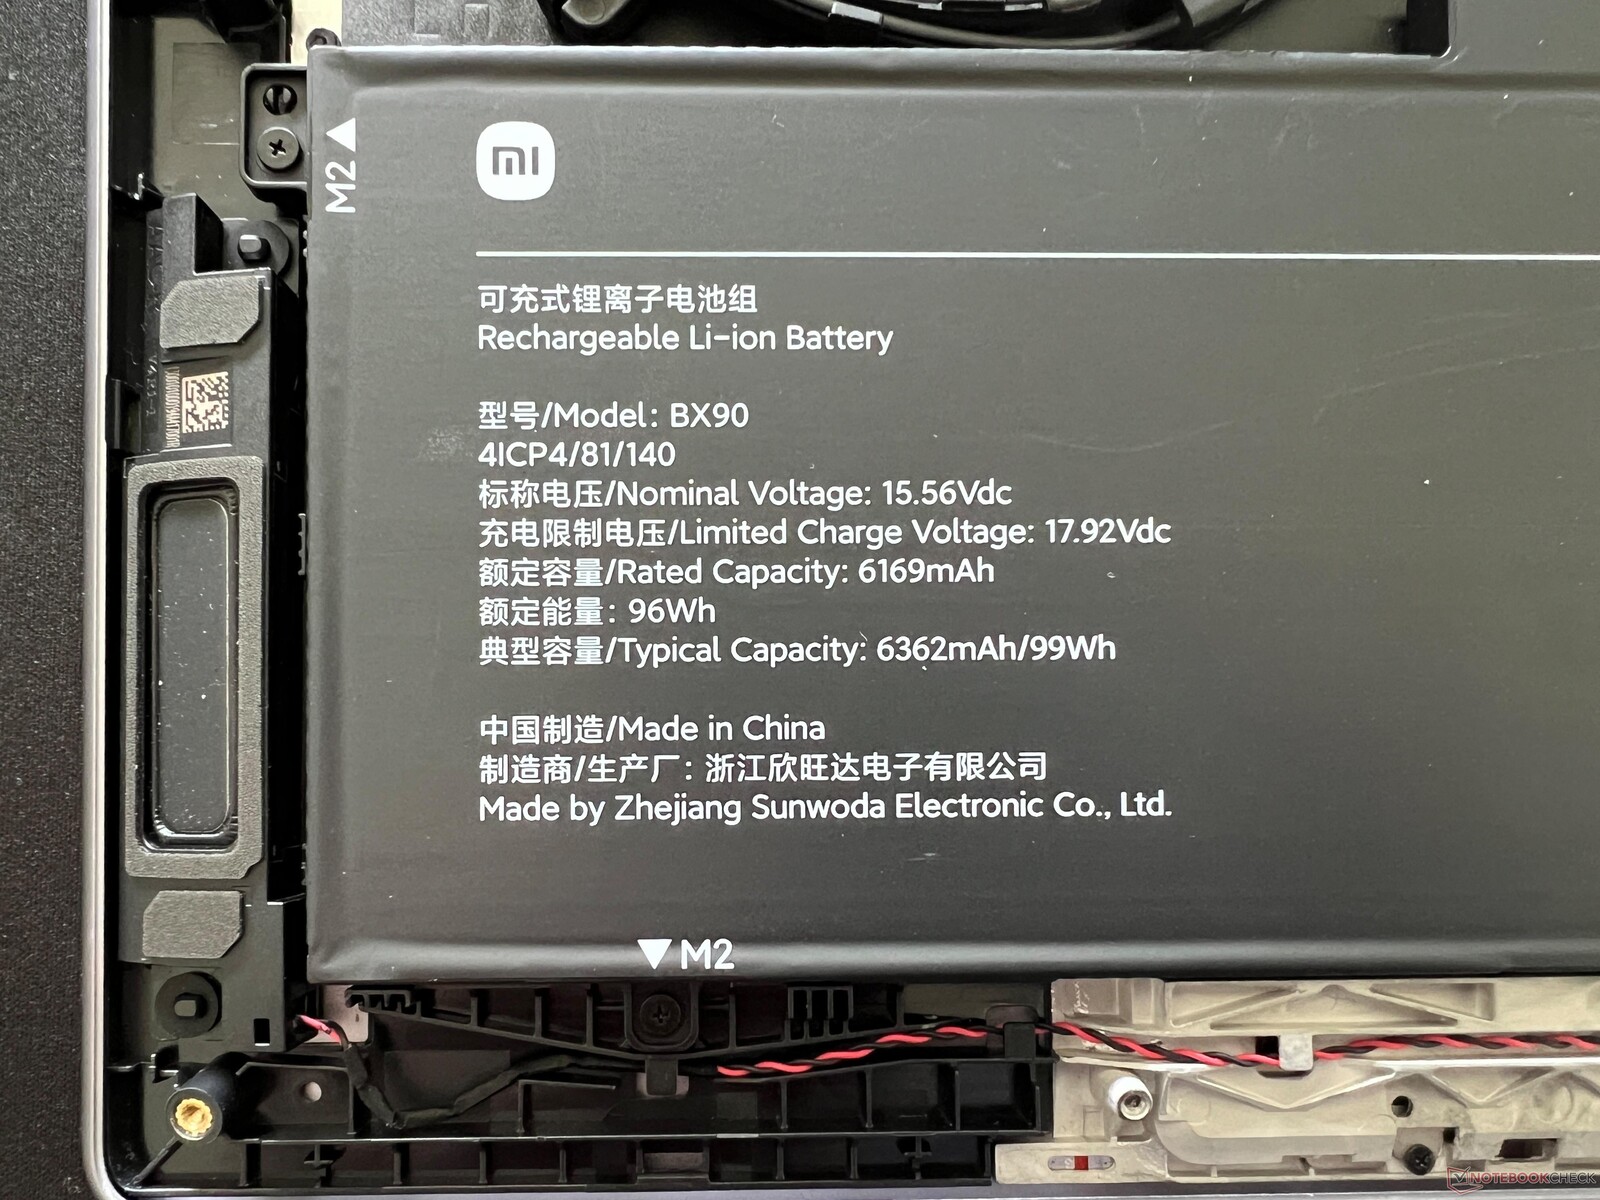
Le RedmiBook Pro 16 est doté d'une batterie de 99 Wh, ce qui lui permet d'atteindre des durées d'utilisation extrêmement longues. Il n'est surpassé dans le test WLAN que par le MSI Prestige 16 (dont la résolution d'affichage est toutefois inférieure). Avec une luminosité de 150 cd/m² (correspondant à 60 % de la luminosité maximale de notre unité de test) et 60 Hz, notre unité de test atteint une très bonne autonomie de 16:23 heures (13:46 heures à 165 Hz) dans notre test WLAN. À pleine luminosité, les besoins en énergie du panneau augmentent et l'autonomie de la batterie est réduite à 9:39 heures à 60 Hz (ou 9 heures à 165 Hz), ce qui reste un très bon résultat. Le test vidéo montre à nouveau l'avantage des nouveaux processeurs Meteor Lake, et les vidéos peuvent être lues pendant près de 22 heures à 150 cd/m². Dans le pire des cas en charge (luminosité maximale), les lumières s'éteignent après un peu plus de 2 heures. Un processus de recharge complet avec l'appareil allumé prend 89 minutes, 80 % de la capacité étant déjà disponible après 43 minutes.
| Xiaomi RedmiBook Pro 16 2024 Ultra 7 155H, Arc 8-Core, 99 Wh | Huawei MateBook D 16 2024 i9-13900H, Iris Xe G7 96EUs, 70 Wh | Samsung Galaxy Book4 Pro 16 Ultra 7 155H, Arc 8-Core, 76 Wh | MSI Prestige 16 B1MG-001US Ultra 7 155H, Arc 8-Core, 99.9 Wh | Acer Swift Edge SFE16 Ryzen 7 7840U R7 7840U, Radeon 780M, 54 Wh | Asus VivoBook S15 K5504 i9-13900H, Iris Xe G7 96EUs, 75 Wh | Moyenne de la classe Multimedia | |
|---|---|---|---|---|---|---|---|
| Autonomie de la batterie | -34% | -22% | 23% | -66% | -13% | -24% | |
| H.264 (h) | 21.8 | 13.9 -36% | 19.1 -12% | 9 -59% | 16.4 ? -25% | ||
| WiFi v1.3 (h) | 16.4 | 11.2 -32% | 10.7 -35% | 18.3 12% | 5.6 -66% | 8.5 -48% | 12 ? -27% |
| Load (h) | 2.1 | 1.4 -33% | 1.7 -19% | 2.8 33% | 3.5 67% | 1.675 ? -20% |
Points positifs
Points négatifs
Verdict - Le RedmiBook Pro 16 est un excellent ordinateur portable multimédia
Le nouveau Xiaomi RedmiBook Pro 16 a laissé une très bonne impression dans notre test (pas seulement par rapport à son prix), et l'ordinateur portable multimédia n'a pas besoin de se cacher même des appareils beaucoup plus chers. Le boîtier en aluminium est robuste et de haute qualité, il n'y a pas eu de compromis avec l'équipement de connexion, et le clavier est également très confortable avec sa longue course de touche et son point de pression précis. La dalle IPS mate impressionne également par sa bonne qualité d'image subjective, sa luminosité élevée et son affichage fluide grâce à une fréquence de 165 Hz. Cependant, il doit être calibré pour une performance optimale et un profil sRGB n'est malheureusement pas disponible. L'autonomie de la batterie de 99 Wh est exceptionnelle.
Les bonnes nouvelles se poursuivent avec les performances, puisqu'il s'agit de l'une des meilleures implémentations de Meteor Lake que nous ayons testées jusqu'à présent. Les limites de puissance sont très élevées, avec seulement 90 watts, mais cela apporte bien sûr beaucoup de performances. Malgré cela, le refroidissement ne s'accélère pas immédiatement lors des pics de charge. Les performances graphiques du nouvel iGPU Arc sont également très bonnes et bénéficient de la mémoire de travail rapide.
Un boîtier de haute qualité avec un clavier confortable, un processeur rapide, 32 Go de RAM, une longue durée de vie de la batterie et un très bon écran IPS : Avec le RedmiBook Pro 16, Xiaomi propose l'un des meilleurs ordinateurs portables multimédias si vous n'avez pas besoin d'une carte graphique dédiée. Pour moins de 1.000 euros (~$1.066), l'ensemble est pratiquement imbattable.
En termes de faiblesses, il y a quelques aspects mais rien de grave. Les performances du réseau local sans fil sont étonnamment faibles, ce qui peut entraîner de légères limitations avec des connexions internet très rapides à partir de 1 GB/s. En outre, la qualité de la webcam pourrait être légèrement meilleure, et le bruit de clic du ClickPad est un peu fort. Mais il s'agit là de plaintes d'un niveau très élevé. La mémoire de travail est soudée, mais cela ne devrait pas poser de problème avec 32 Go de RAM. Pour les utilisateurs allemands, la disposition du clavier américain peut bien sûr devenir un problème, mais vous pouvez vous y habituer ou y remédier avec des autocollants pour les touches spéciales.
Comparé à ses concurrents, le RedmiBook Pro 16 fait mieux dans la plupart des catégories, et l'ensemble est pratiquement impossible à battre compte tenu du prix de moins de 1.000 euros (~$1.066). Actuellement, nous testons également le Lenovo IdeaPad Pro 16, qui est également équipé d'un Core Ultra 7 155H. Mais son prix est plus élevé, et notamment en termes de qualité d'image, l'IdeaPad n'arrive pas à la cheville du RedmiBook Pro 16.
Prix et disponibilité
Vous pouvez acheter le RedmiBook Pro 16 chez TradingShenzen pour environ 1059 $, par exemple (y compris la version anglaise de Windows Pro).
Xiaomi RedmiBook Pro 16 2024
- 04/21/2024 v7 (old)
Andreas Osthoff
Transparency
La sélection des appareils à examiner est effectuée par notre équipe éditoriale. L'échantillon de test a été prêté à l'auteur par le fabricant ou le détaillant pour les besoins de cet examen. Le prêteur n'a pas eu d'influence sur cette évaluation et le fabricant n'a pas reçu de copie de cette évaluation avant sa publication. Il n'y avait aucune obligation de publier cet article. En tant que média indépendant, Notebookcheck n'est pas soumis à l'autorité des fabricants, des détaillants ou des éditeurs.
Voici comment Notebookcheck teste
Chaque année, Notebookcheck examine de manière indépendante des centaines d'ordinateurs portables et de smartphones en utilisant des procédures standardisées afin de garantir que tous les résultats sont comparables. Nous avons continuellement développé nos méthodes de test depuis environ 20 ans et avons établi des normes industrielles dans le processus. Dans nos laboratoires de test, des équipements de mesure de haute qualité sont utilisés par des techniciens et des rédacteurs expérimentés. Ces tests impliquent un processus de validation en plusieurs étapes. Notre système d'évaluation complexe repose sur des centaines de mesures et de points de référence bien fondés, ce qui garantit l'objectivité.Price comparison

