Test du MSI Prestige 16 B1MG : du Core i7 Xe au Core Ultra 7 Arc

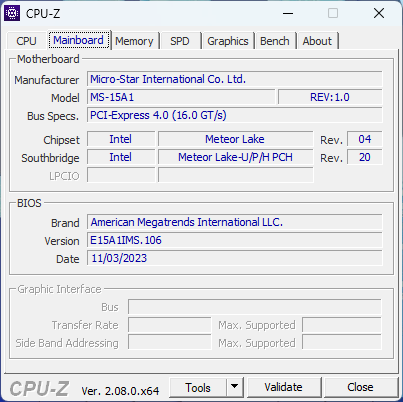
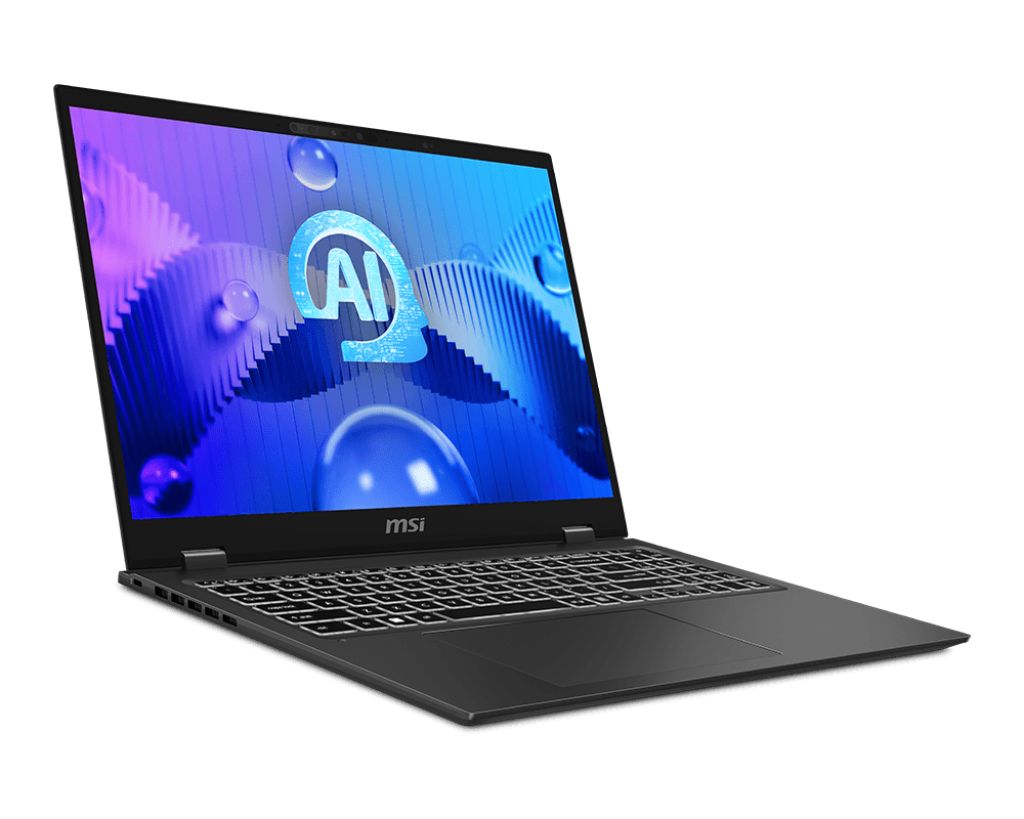
Le MSI Prestige 16 AI B1MG de 16 pouces est l'un des premiers ordinateurs portables du marché à disposer d'options de CPU Core Ultra Meteor Lake de 14e génération. Il succède à l'ancien modèle 15,6 pouces Prestige 15 avec des éléments internes et externes revus pour une toute nouvelle expérience utilisateur. La famille Prestige de MSI se compose d'ordinateurs portables de milieu de gamme supérieur, situés entre les modèles bas de gamme Famille Modern et les modèles plus haut de gamme Summit, plus haut de gamme.
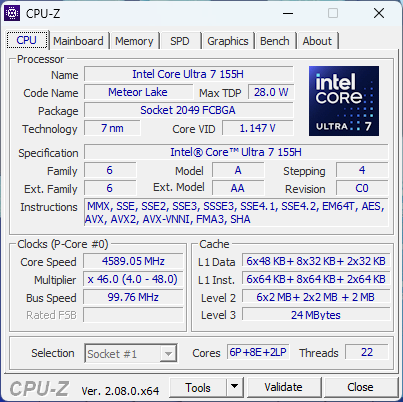
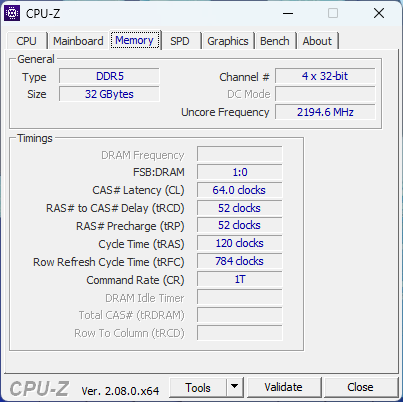
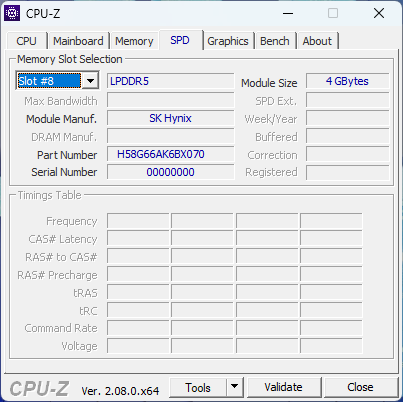
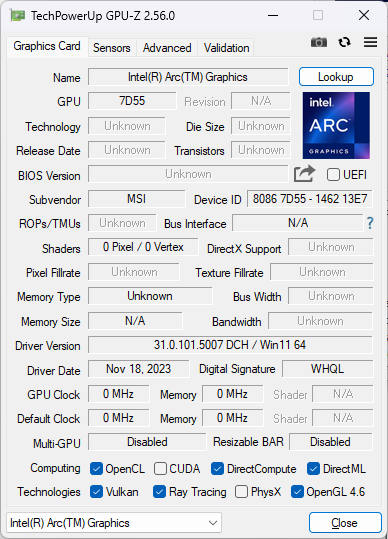
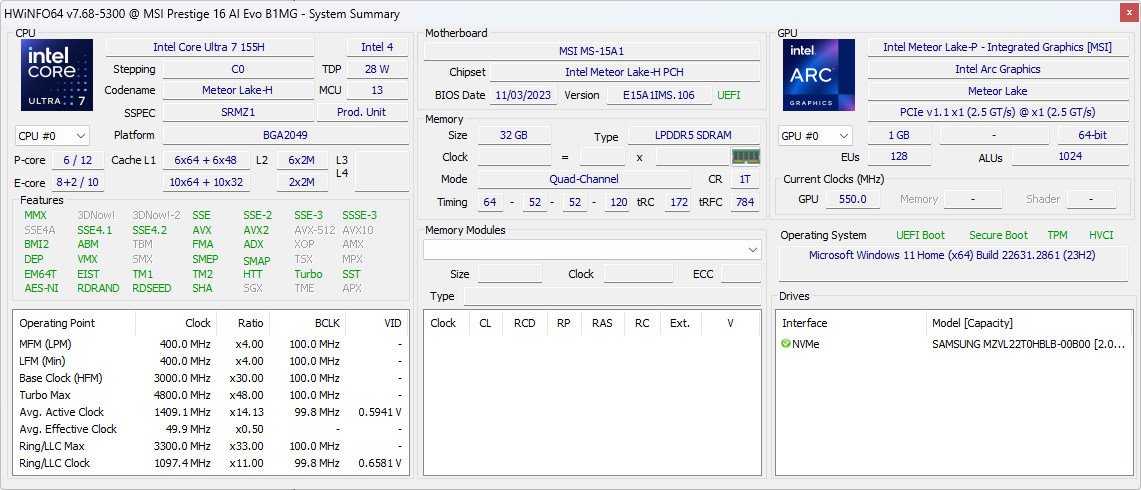
Notre configuration est une unité de vente au détail au prix de 1400 USD avec le CPU Core Ultra 7 155H, la carte graphique Arc 8 intégrée, un écran IPS 1600p, 32 Go de RAM LPDDR5-6400 MHz et un SSD NVMe de 2 To. Des SKUs plus haut de gamme avec le Core Ultra 9 185H, GeForce RTX 4060 ou 4070, Arc 370M graphics, et 4K (2400p) OLED sont également disponibles.
Parmi les concurrents du Prestige 16, on trouve d'autres ordinateurs portables multimédias ou créateurs de contenu, minces et légers, tels que les modèles suivants Dell XPS series, Asus VivoBook Pro 16,LG Gram 16 2-en-1ou le Lenovo Yoga Pro 9i 16.
Plus d'avis sur MSI :
Comparaison avec les concurrents potentiels
Note | Date | Modèle | Poids | Épaisseur | Taille | Résolution | Prix |
|---|---|---|---|---|---|---|---|
| 88.1 % v7 (old) | 12/23 | MSI Prestige 16 B1MG-001US Ultra 7 155H, Arc 8-Core | 1.6 kg | 19.1 mm | 16.00" | 2560x1600 | |
| 85.4 % v7 (old) | 12/22 | MSI Prestige 15 A12UD-093 i7-1280P, GeForce RTX 3050 Ti Laptop GPU | 1.8 kg | 20.1 mm | 15.60" | 3840x2160 | |
| 85.8 % v7 (old) | 11/23 | LG Gram 2in1 16 16T90R - G.AA78G i7-1360P, Iris Xe G7 96EUs | 1.5 kg | 17.2 mm | 16.00" | 2560x1600 | |
| 85.7 % v7 (old) | 11/23 | Lenovo ThinkBook 16 G6 ABP R5 7530U, Vega 7 | 1.8 kg | 17.5 mm | 16.00" | 1920x1200 | |
| 87.6 % v7 (old) | 11/23 | Asus VivoBook Pro 16 K6602VU i9-13900H, GeForce RTX 4050 Laptop GPU | 1.9 kg | 19 mm | 16.00" | 3200x2000 | |
| 87.1 % v7 (old) | 08/23 | Dell Inspiron 16 Plus 7630 i7-13700H, GeForce RTX 4060 Laptop GPU | 2.2 kg | 19.95 mm | 16.00" | 2560x1600 |
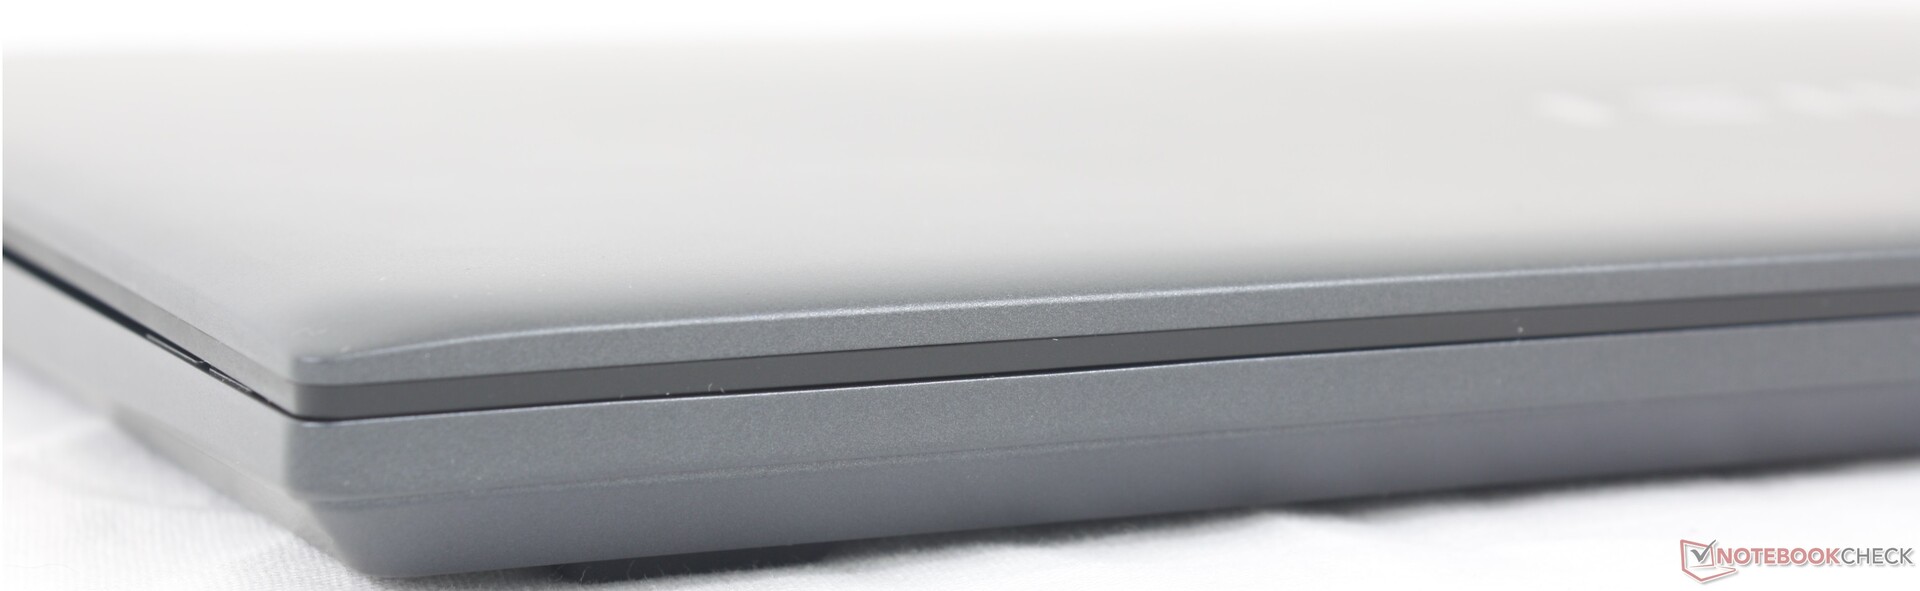
Boîtier - aspect mince, matériaux minces
Le châssis métallique est plus ferme et plus robuste que celui d'un MSI Modern ou d'un Asus VivoBook moins onéreux. Une pression sur le centre du clavier, par exemple, déformerait à peine la surface. Le couvercle est comparativement plus susceptible de se tordre et d'être endommagé, d'autant plus qu'il n'est pas renforcé par du verre Gorilla Glass. L'application d'une pression sur le centre du couvercle extérieur déformerait sa surface plus que nous ne le souhaiterions. Dans ce cas, les alternatives comme le HP Spectre ou le Razer Blade sont beaucoup plus résistantes même si elles sont plus lourdes.
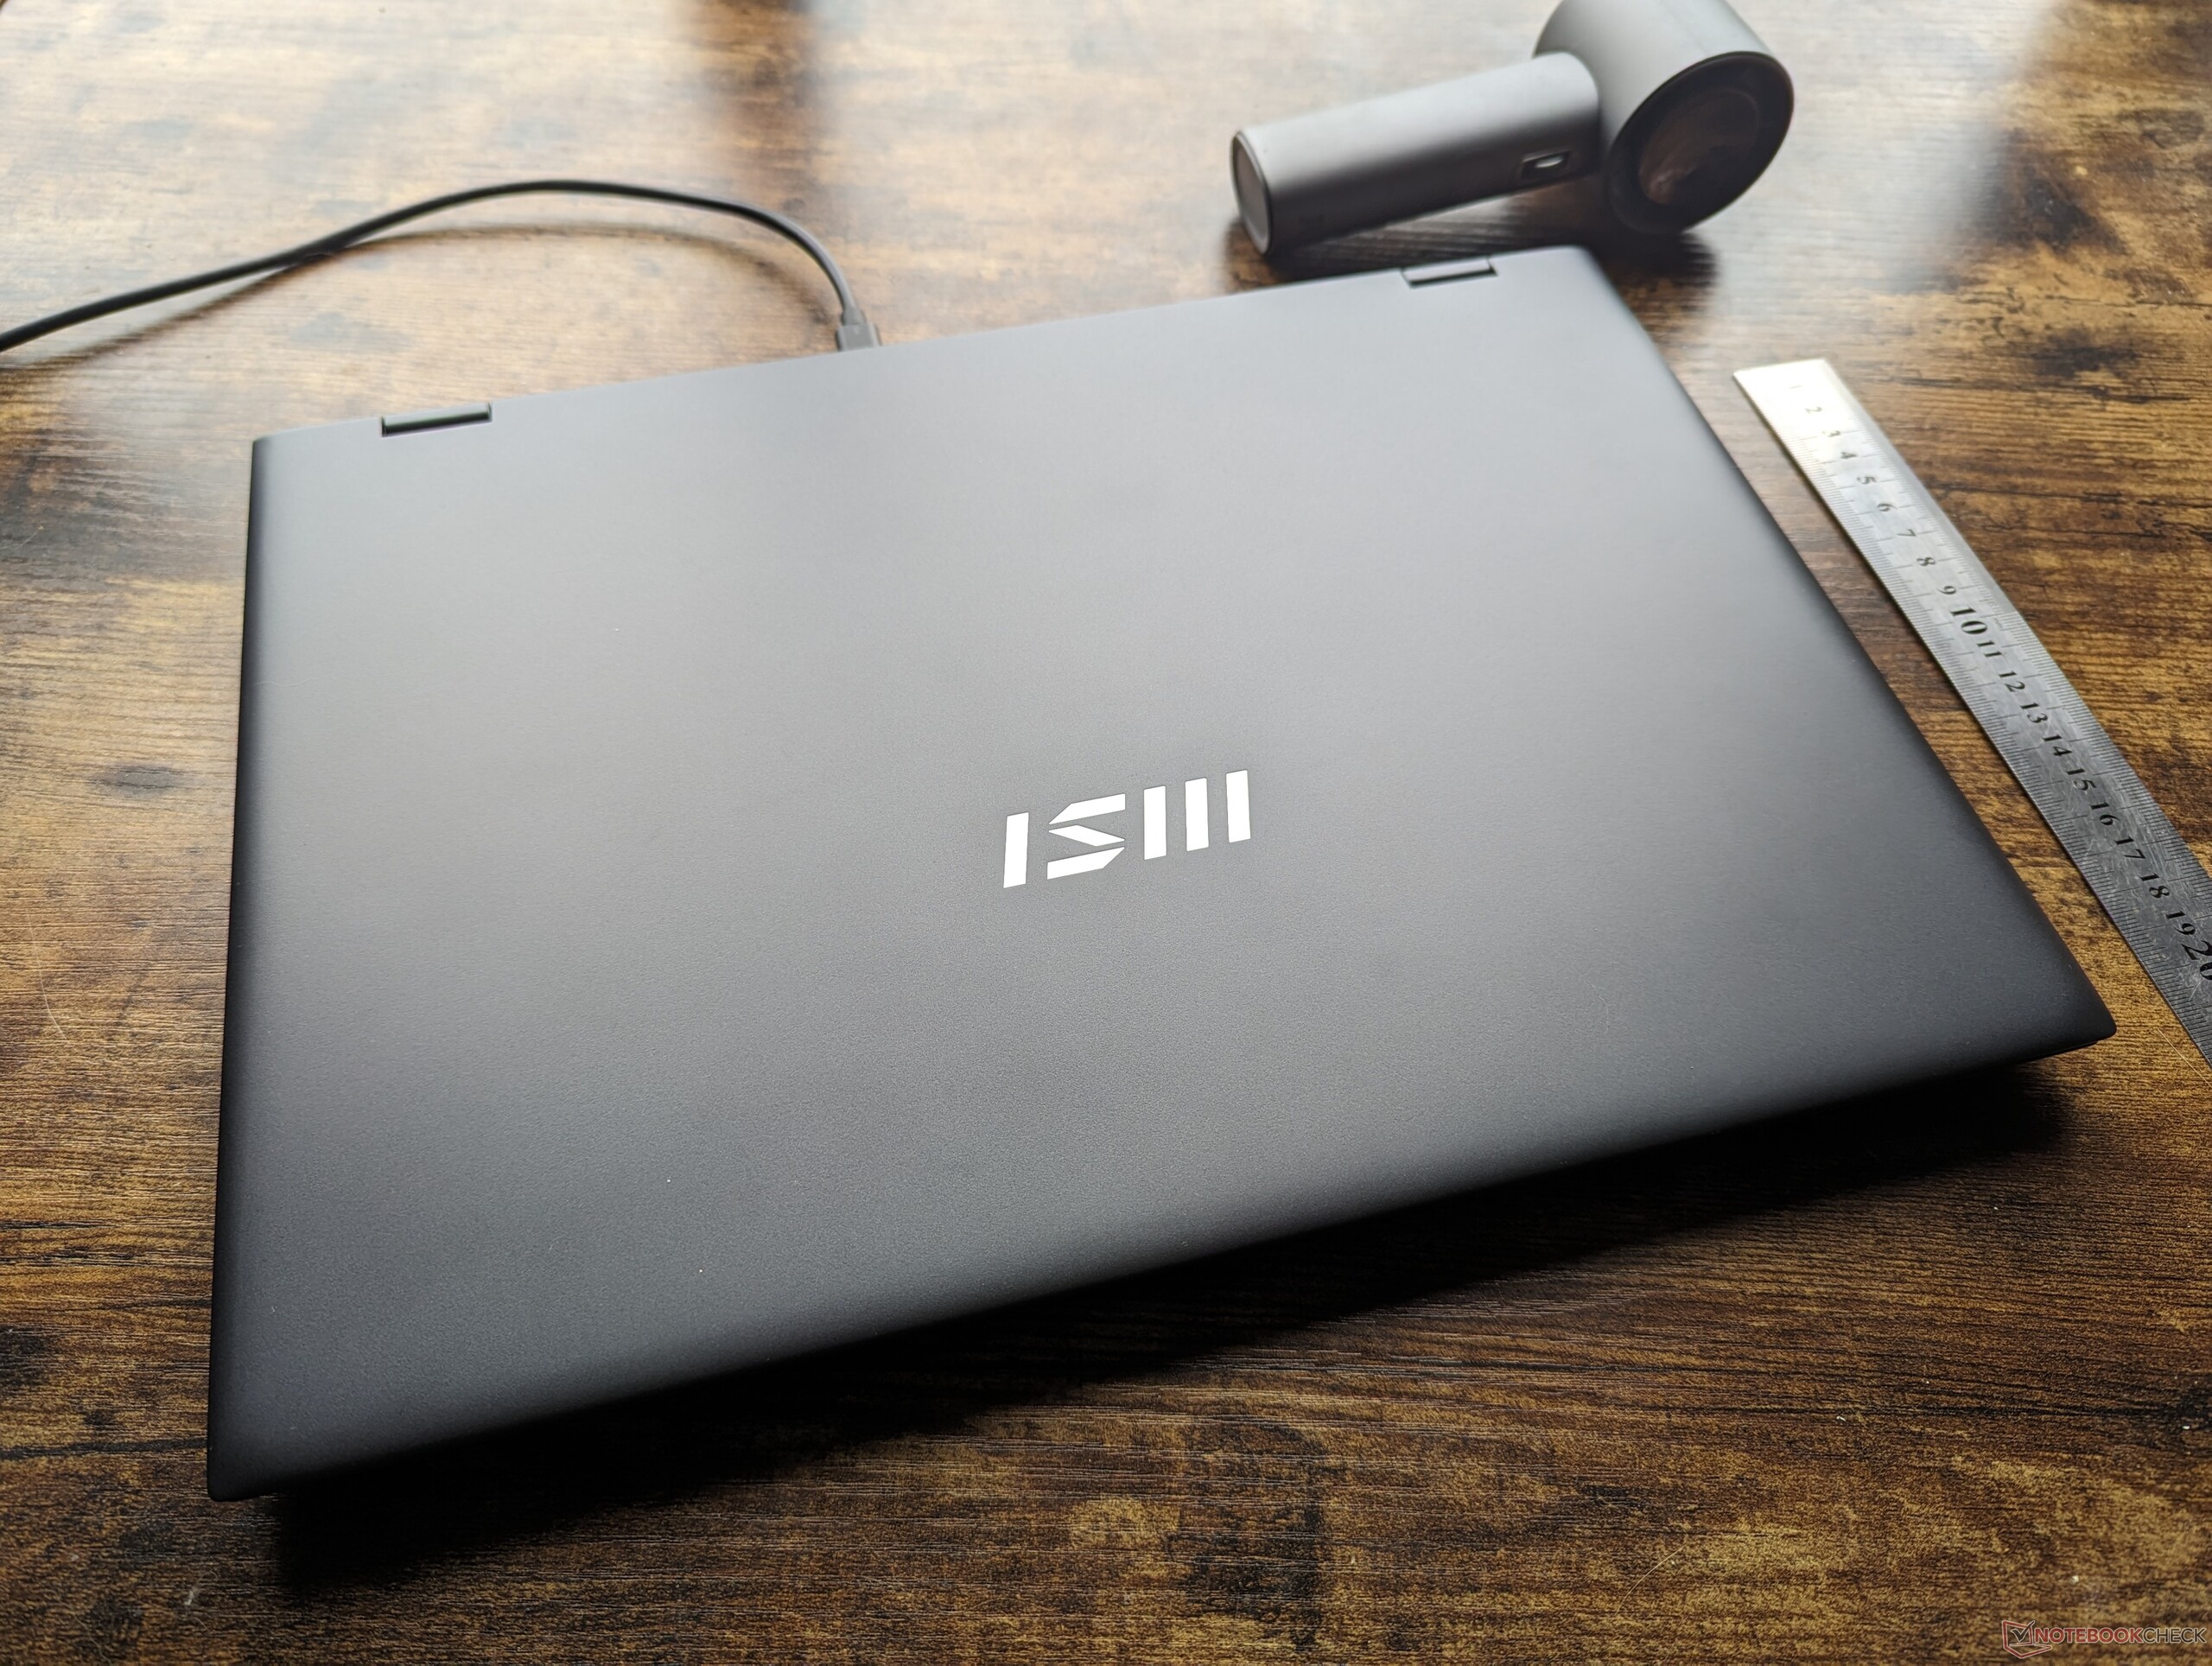
Le format 16:10 plus carré confère à la Prestige 16 un encombrement plus important que celui de la Prestige 15 sortante. Cependant, il compense la différence par un profil plus fin et un poids plus léger. En fait, la Prestige 16 est l'un des ordinateurs portables multimédias de 16 pouces les plus légers, rivalisant avec le LG Gram 16 2-en-1. Nous nous attendons cependant à ce que les UGS dotées d'une carte graphique discrète soient un peu plus lourdes.
Connectivité - Prêt pour le Wi-Fi 7
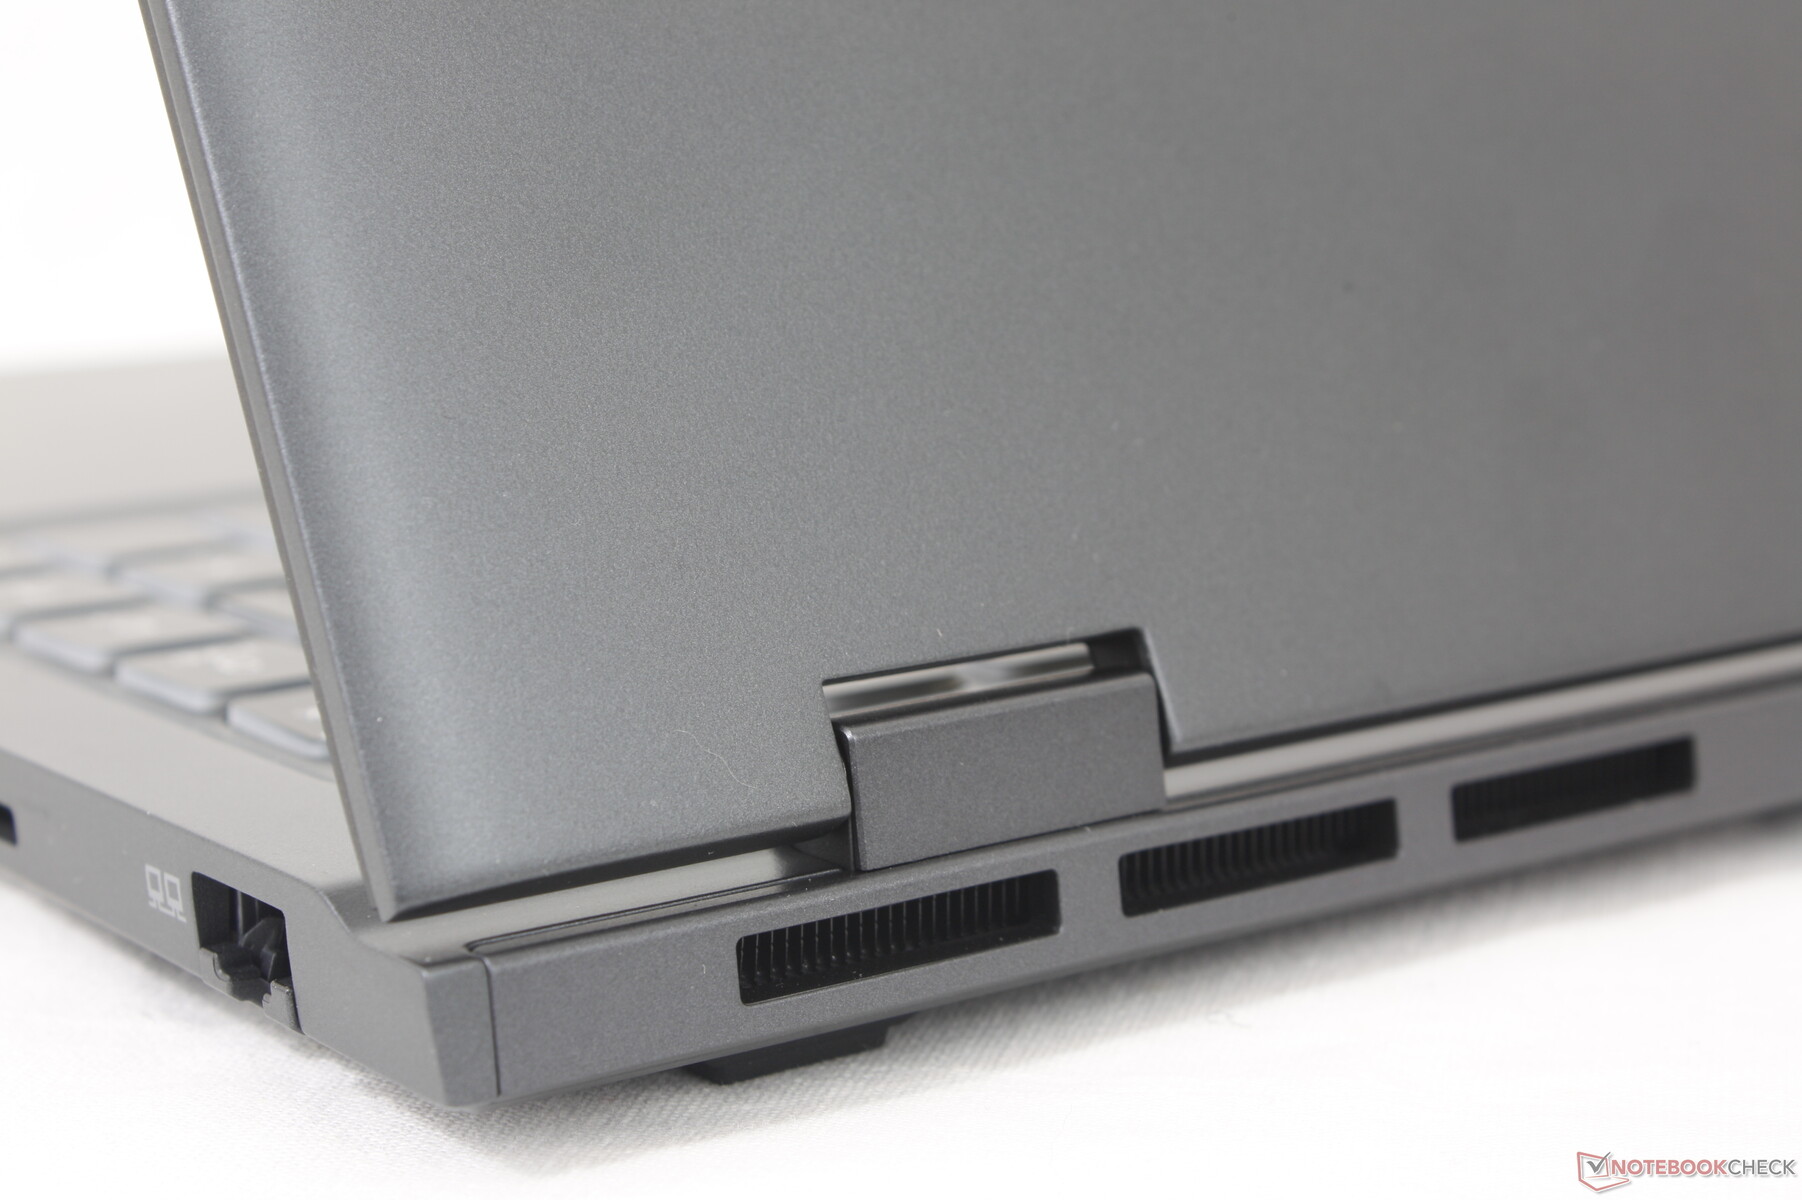
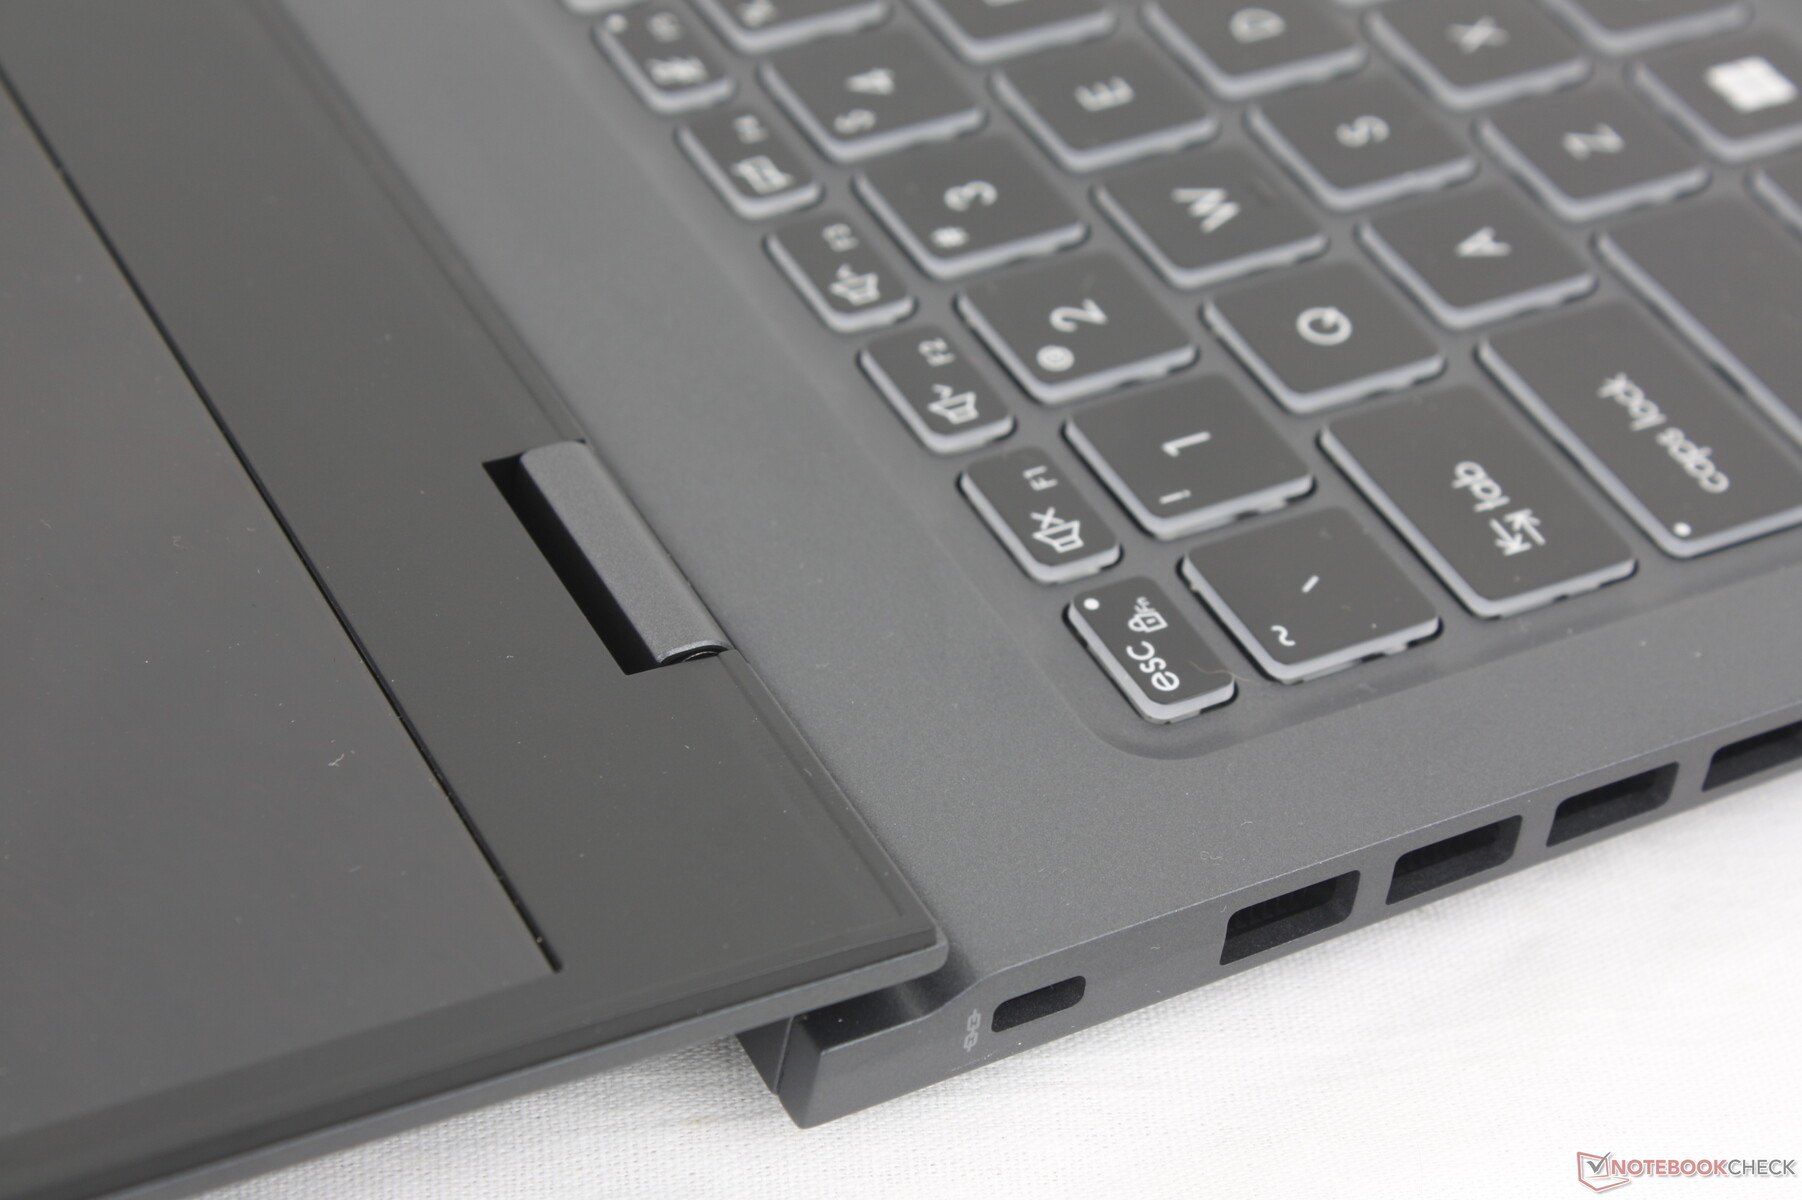
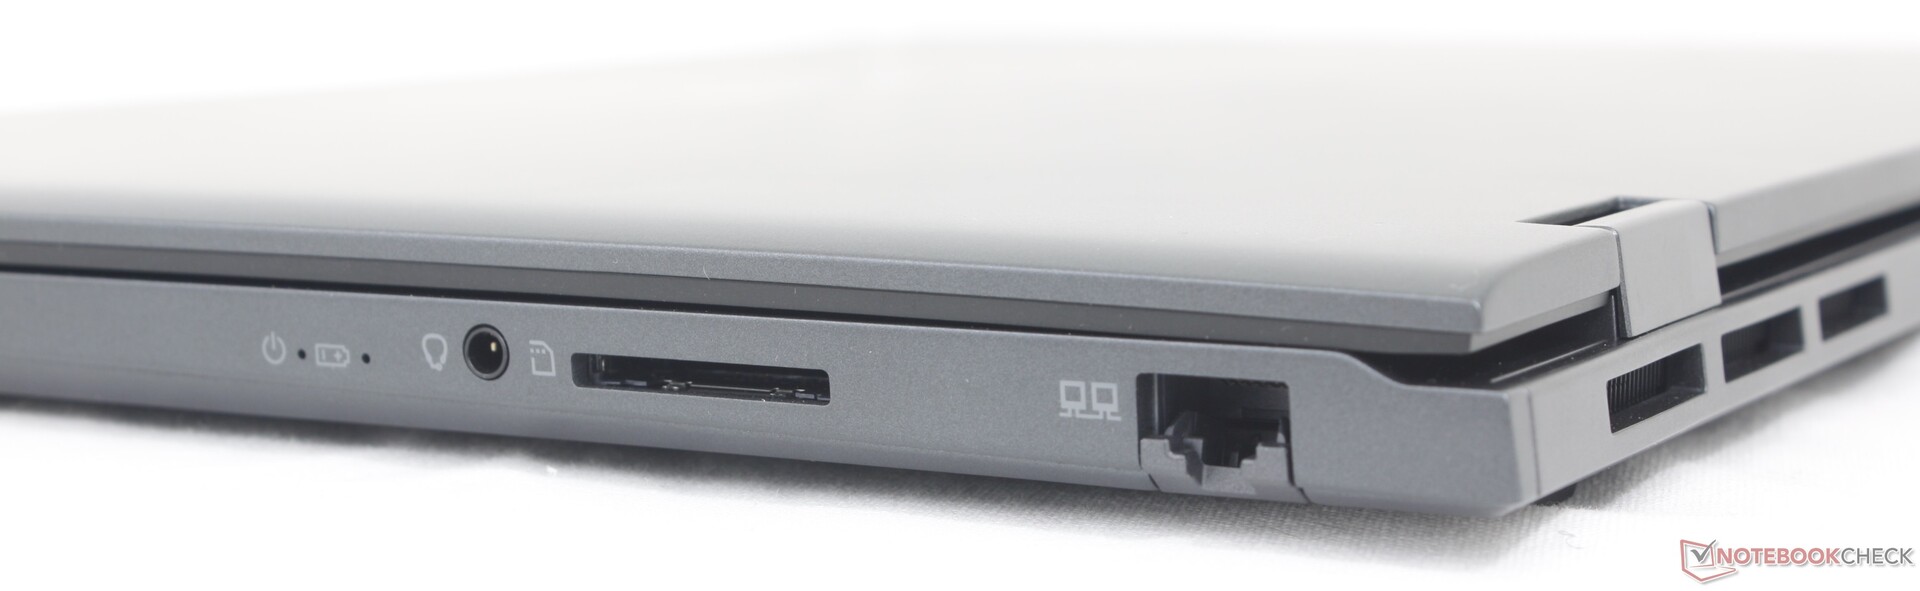
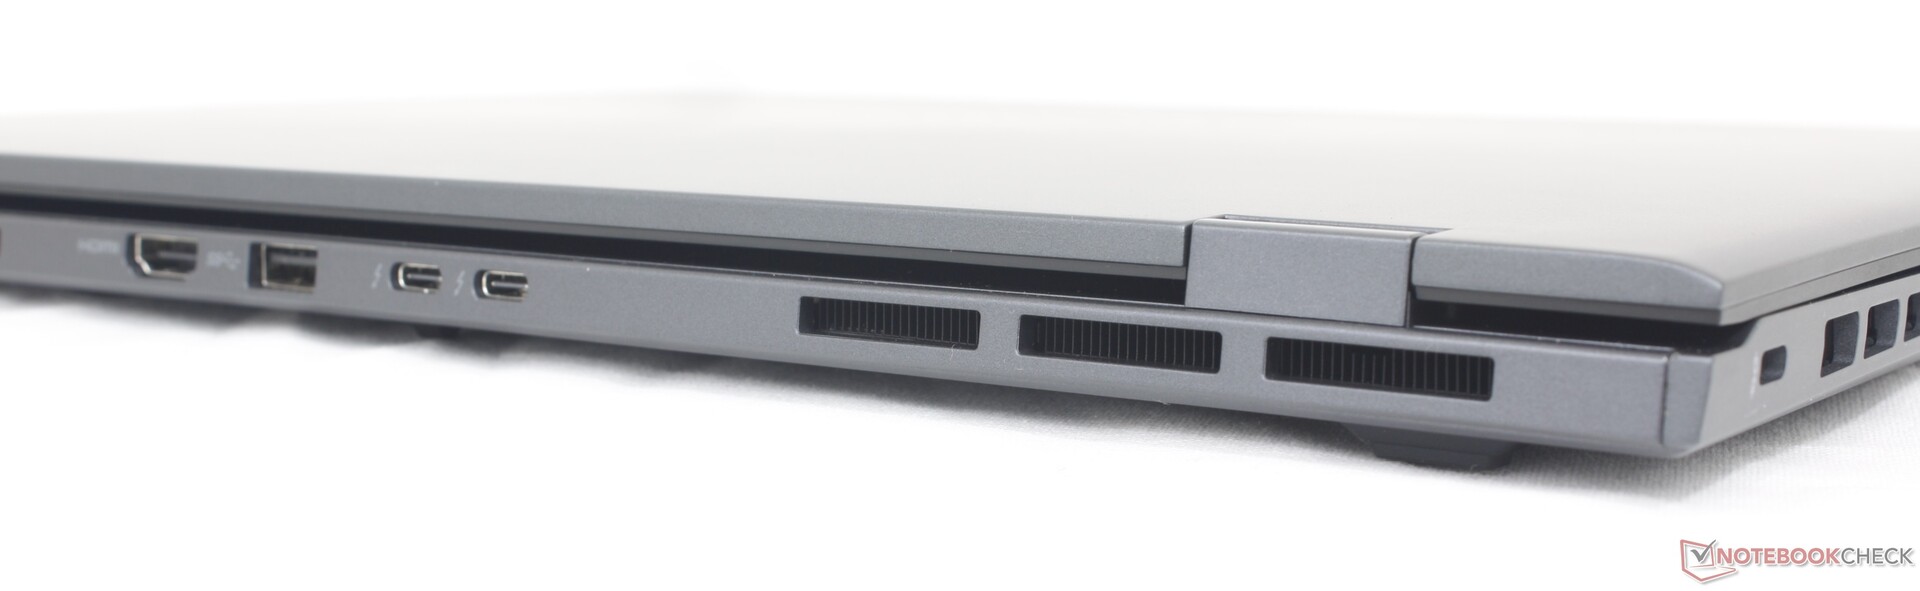
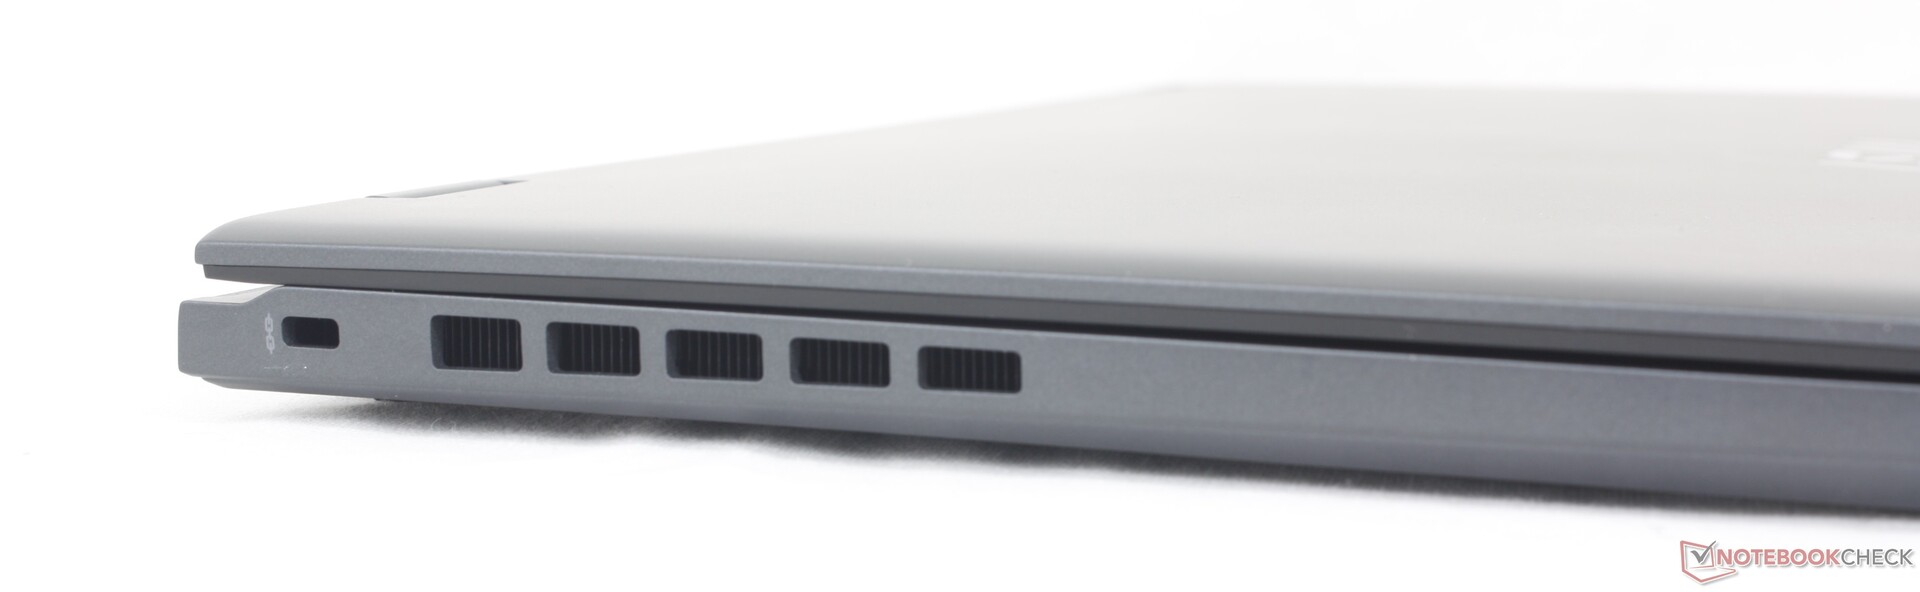
Contrairement à la plupart des autres ultrabooks, les ports de la Prestige 16 sont concentrés à l'arrière et non sur les côtés. Cette approche de conception permet une meilleure ventilation sur les côtés, mais au prix d'une moins bonne accessibilité aux ports. Les ports couramment utilisés comme HDMI, USB-C et même USB-A sont tous situés à l'arrière, ce qui n'est pas forcément idéal pour la plupart des utilisateurs.
Par rapport à la Prestige 15, la Prestige 16 a remplacé un port USB-A par un port RJ-45. Les deux ports Thunderbolt 4 restent intacts pour les modèles dotés uniquement d'une carte graphique intégrée. S'ils sont configurés avec une carte graphique discrète, un seul des deux ports USB-C est compatible avec Thunderbolt.
Lecteur de carte SD
Le lecteur de carte SD intégré a été amélioré pour offrir des vitesses beaucoup plus rapides. Le transfert de 1 Go de photos depuis notre carte de test UHS-II vers le bureau prend un peu moins de 6 secondes, contre plus de 12 secondes sur la Prestige 15.
| SD Card Reader | |
| average JPG Copy Test (av. of 3 runs) | |
| MSI Prestige 16 B1MG-001US (Toshiba Exceria Pro SDXC 64 GB UHS-II) | |
| Asus VivoBook Pro 16 K6602VU (Angelbird AV Pro V60) | |
| Lenovo ThinkBook 16 G6 ABP (Angelbird AV Pro V60) | |
| MSI Prestige 15 A12UD-093 (AV Pro SD microSD 128 GB V60) | |
| LG Gram 2in1 16 16T90R - G.AA78G | |
| Dell Inspiron 16 Plus 7630 (AV Pro SD microSD 128 GB V60) | |
| maximum AS SSD Seq Read Test (1GB) | |
| Asus VivoBook Pro 16 K6602VU (Angelbird AV Pro V60) | |
| MSI Prestige 16 B1MG-001US (Toshiba Exceria Pro SDXC 64 GB UHS-II) | |
| Lenovo ThinkBook 16 G6 ABP (Angelbird AV Pro V60) | |
| MSI Prestige 15 A12UD-093 (AV Pro SD microSD 128 GB V60) | |
| Dell Inspiron 16 Plus 7630 (AV Pro SD microSD 128 GB V60) | |
| LG Gram 2in1 16 16T90R - G.AA78G | |
Communication
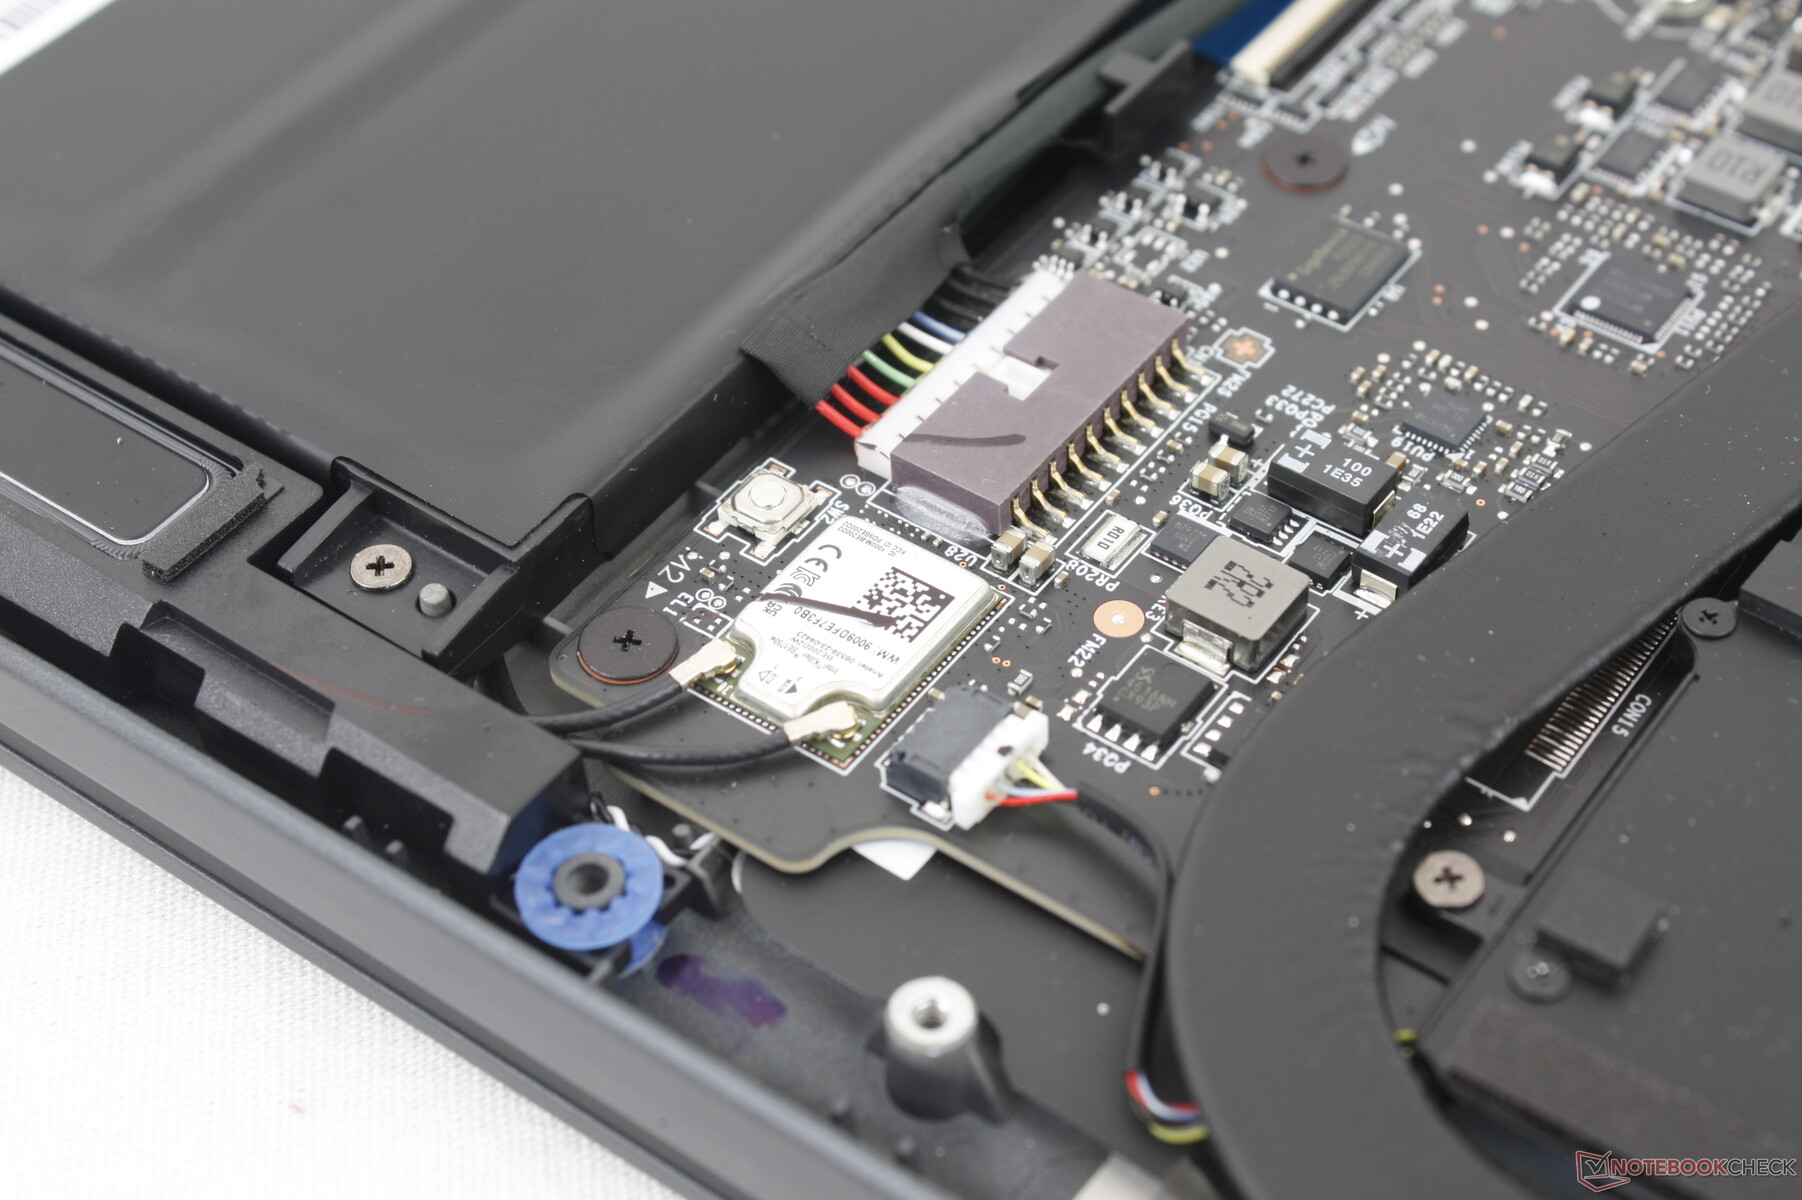
La Prestige 16 est l'un des premiers ordinateurs portables à être livré avec le module WLAN Killer BE1750W pour la compatibilité Wi-Fi 7. Cependant, les routeurs Wi-Fi 7 ne sont pas encore très répandus, et l'inclusion du Wi-Fi 7 à l'heure actuelle est plus une question de sécurité pour l'avenir que d'avantages immédiats. Néanmoins, nous n'avons rencontré aucun problème de connectivité lorsque nous l'avons couplé à notre routeur de test Wi-Fi 6E.
Webcam
Une webcam de 2 mégapixels avec infrarouge et obturateur physique est fournie en standard. Des alternatives comme le HP Spectre ont déjà commencé à être livrés avec des capteurs de 5 MP à plus haute résolution.


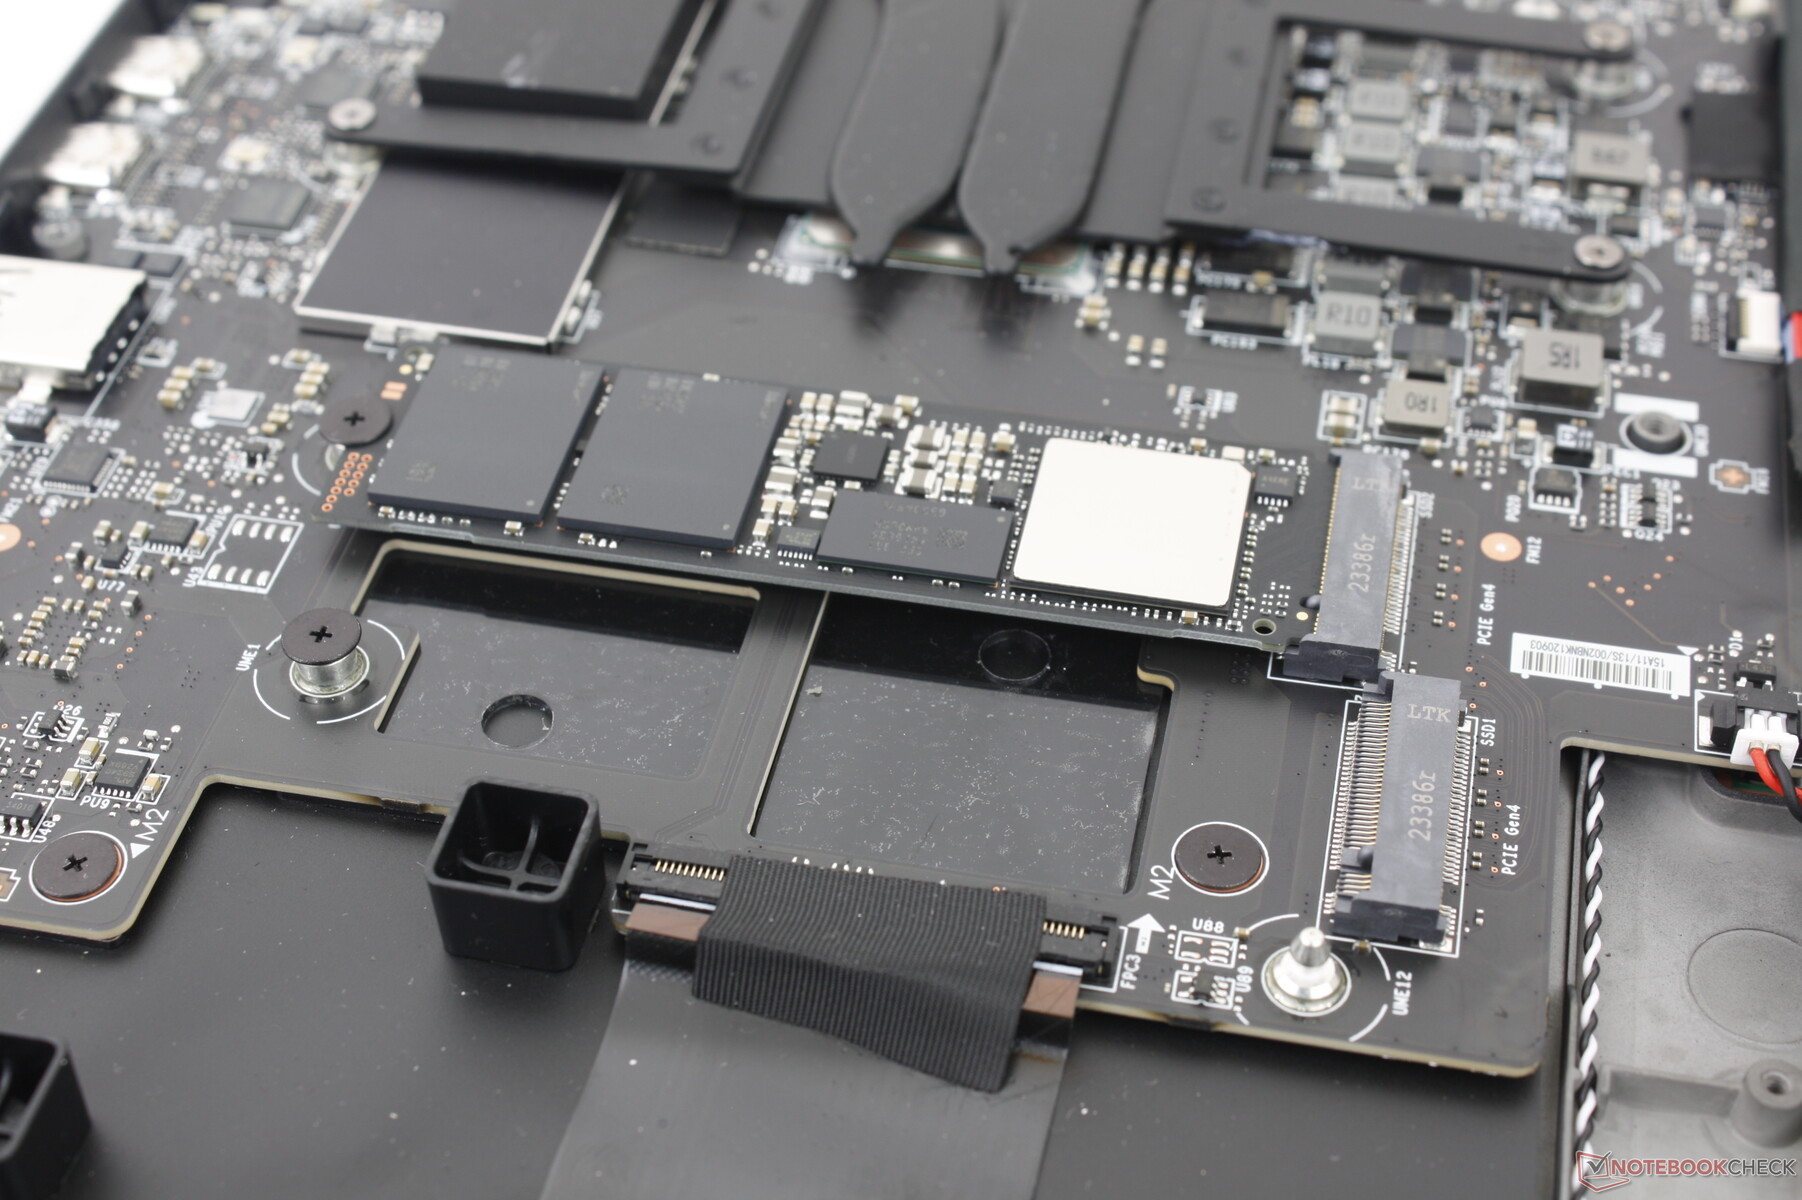
Maintenance
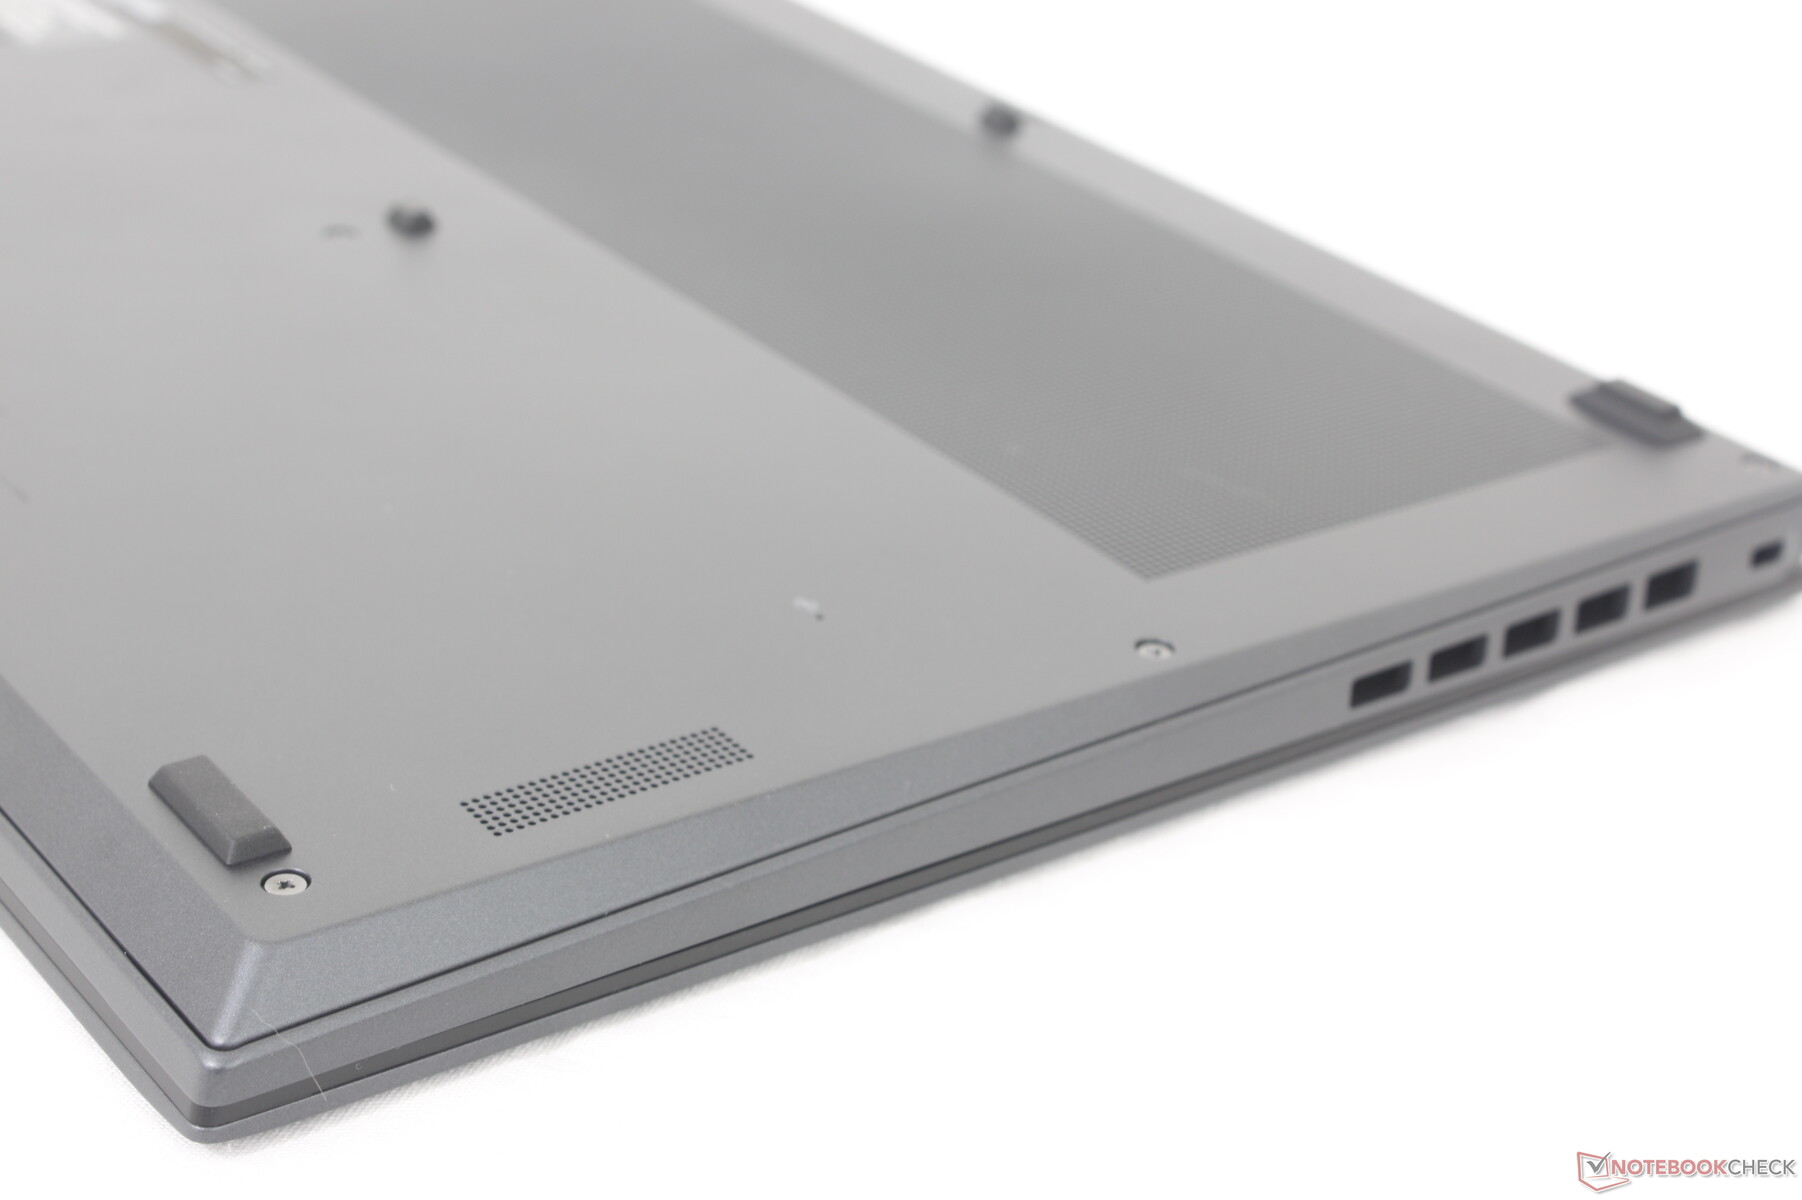
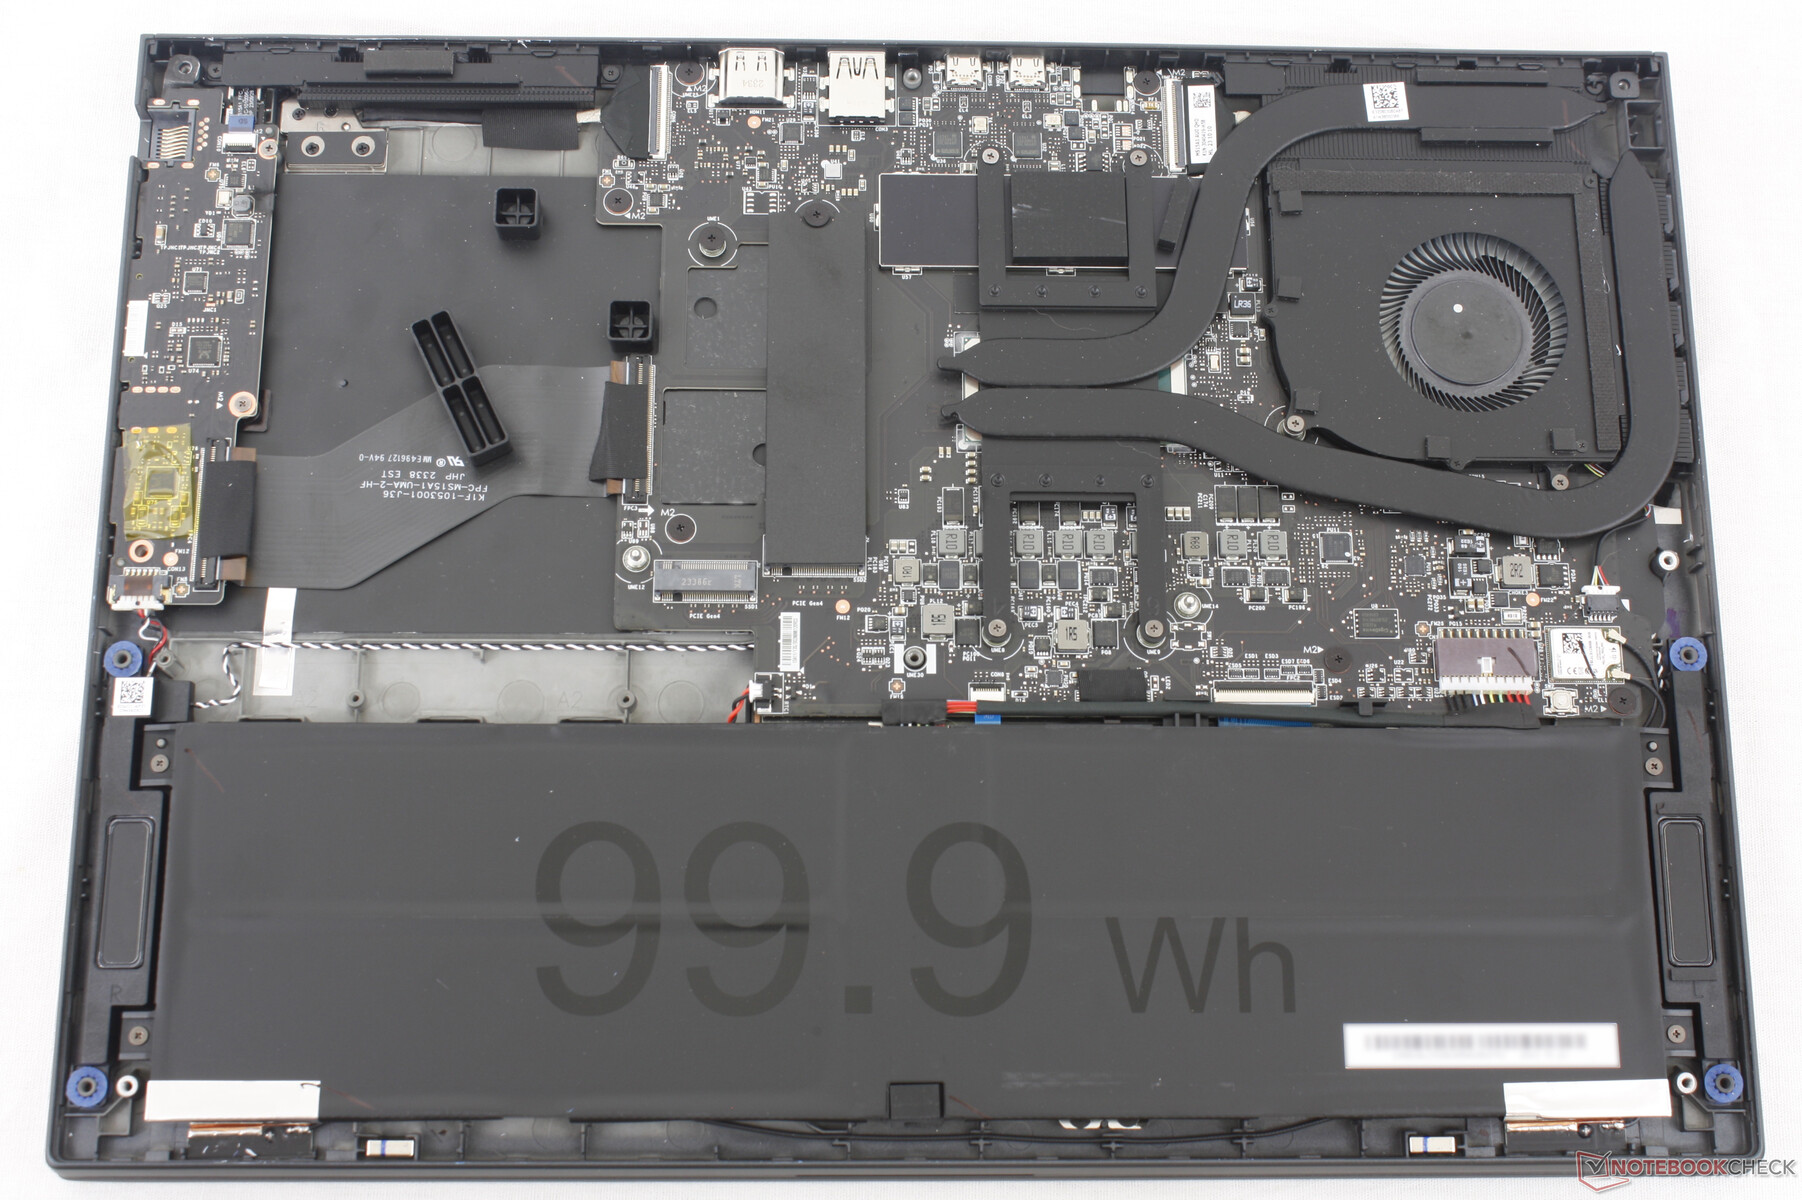
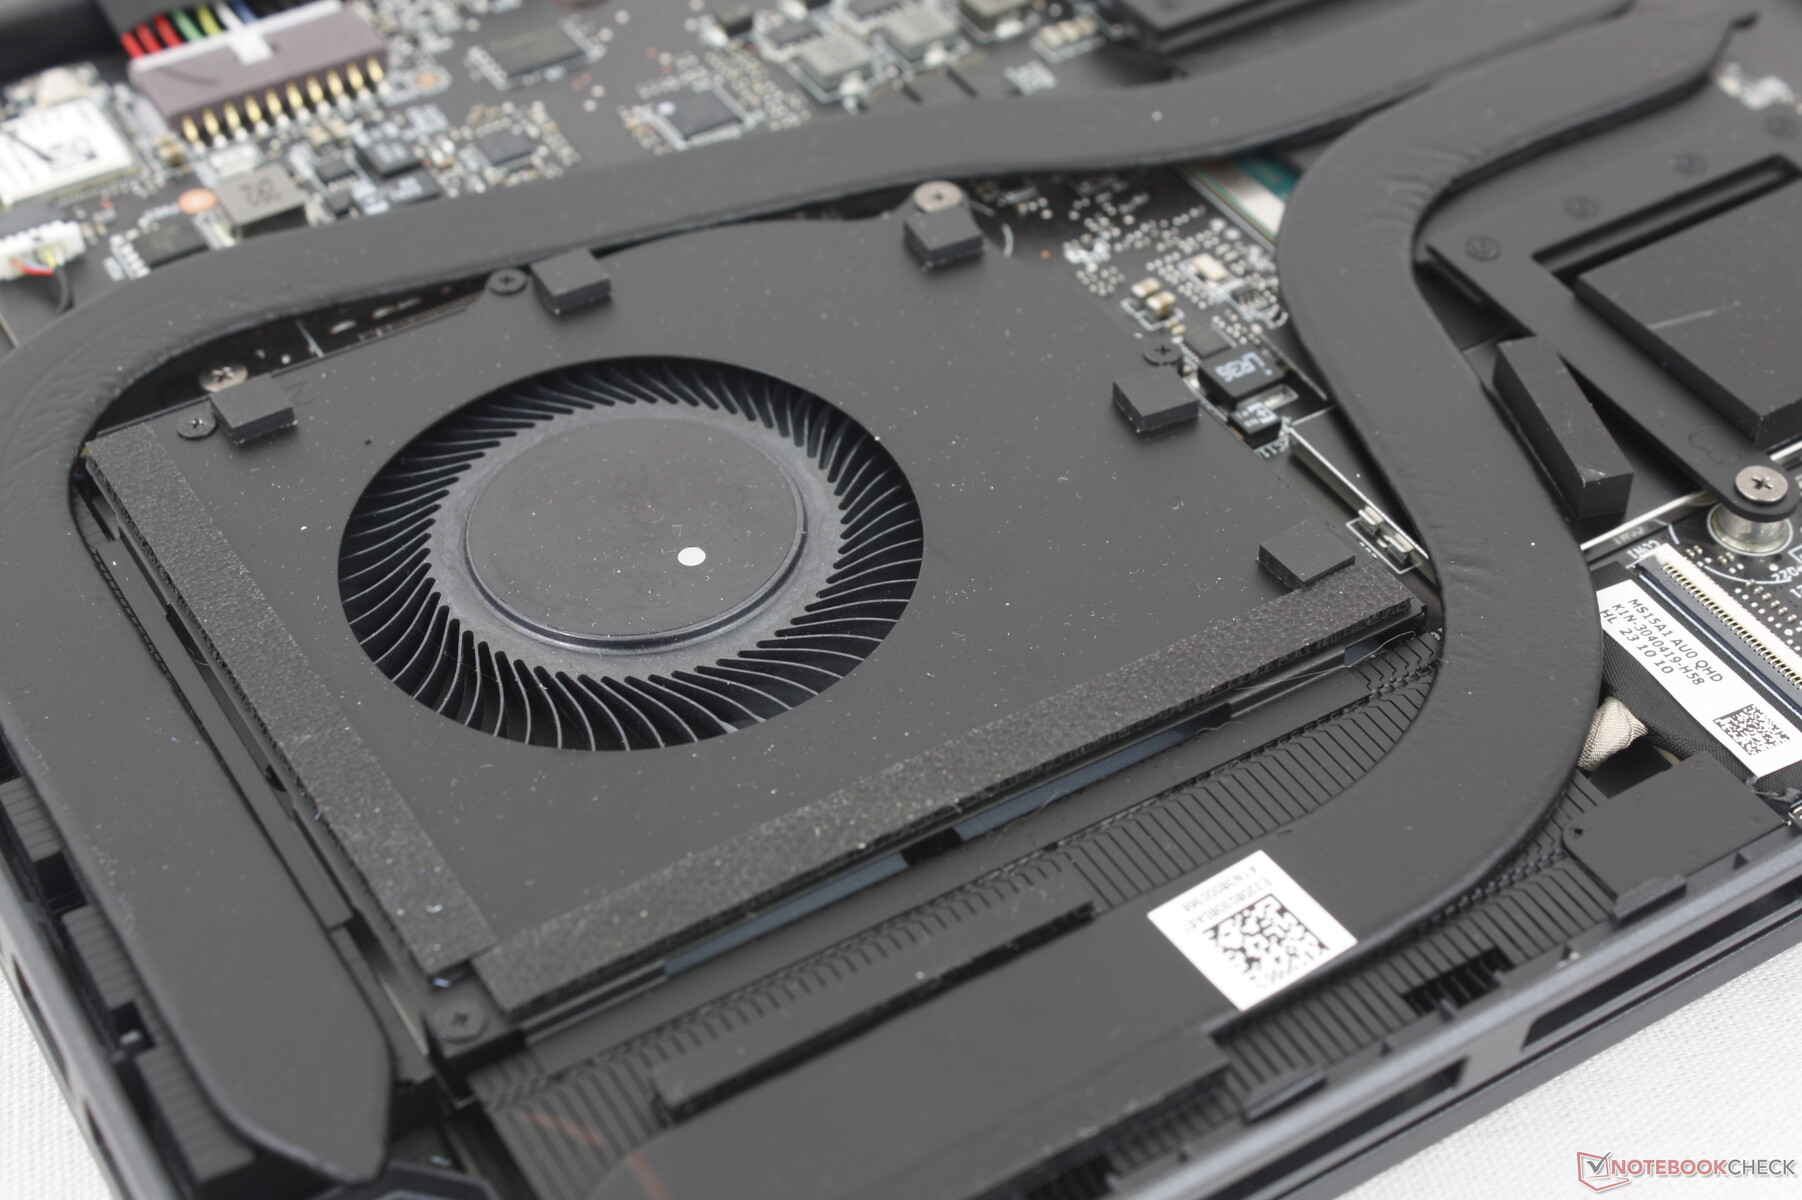
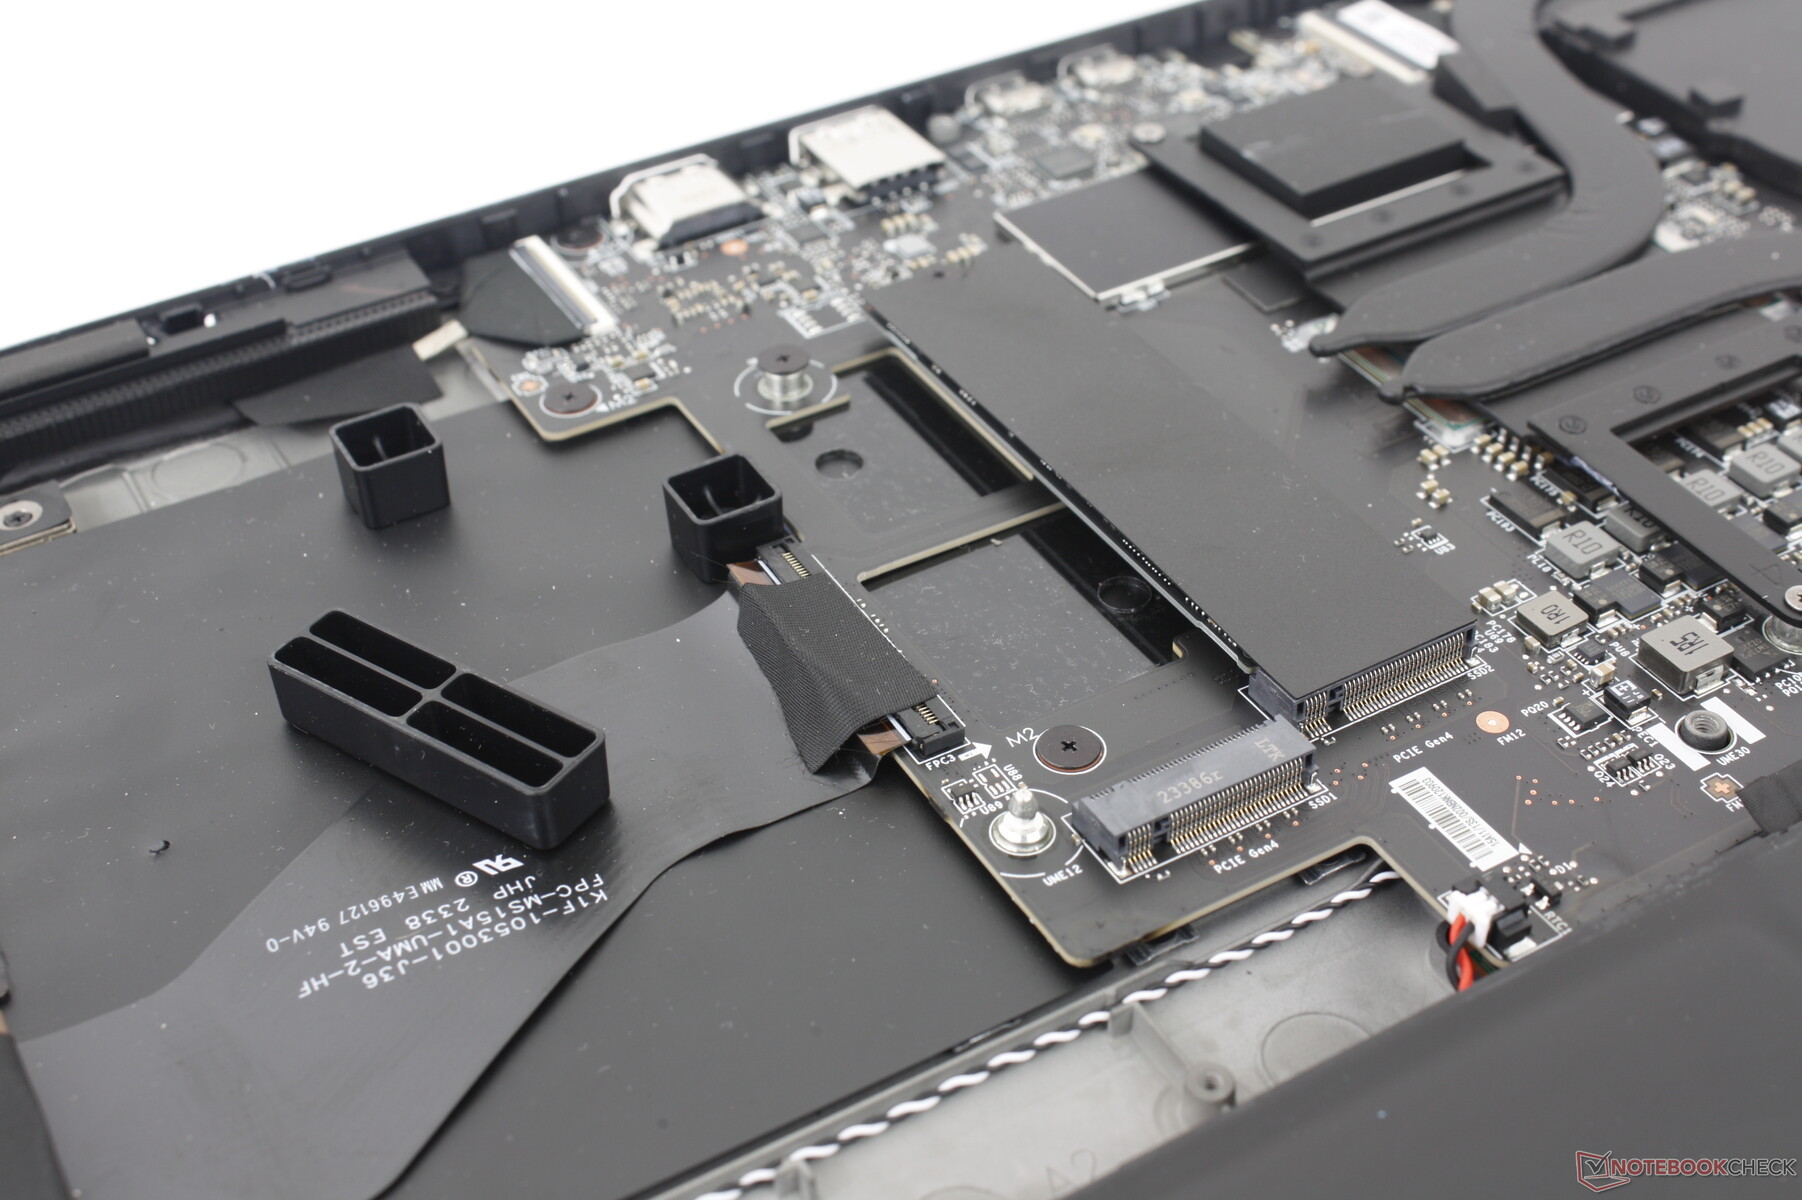
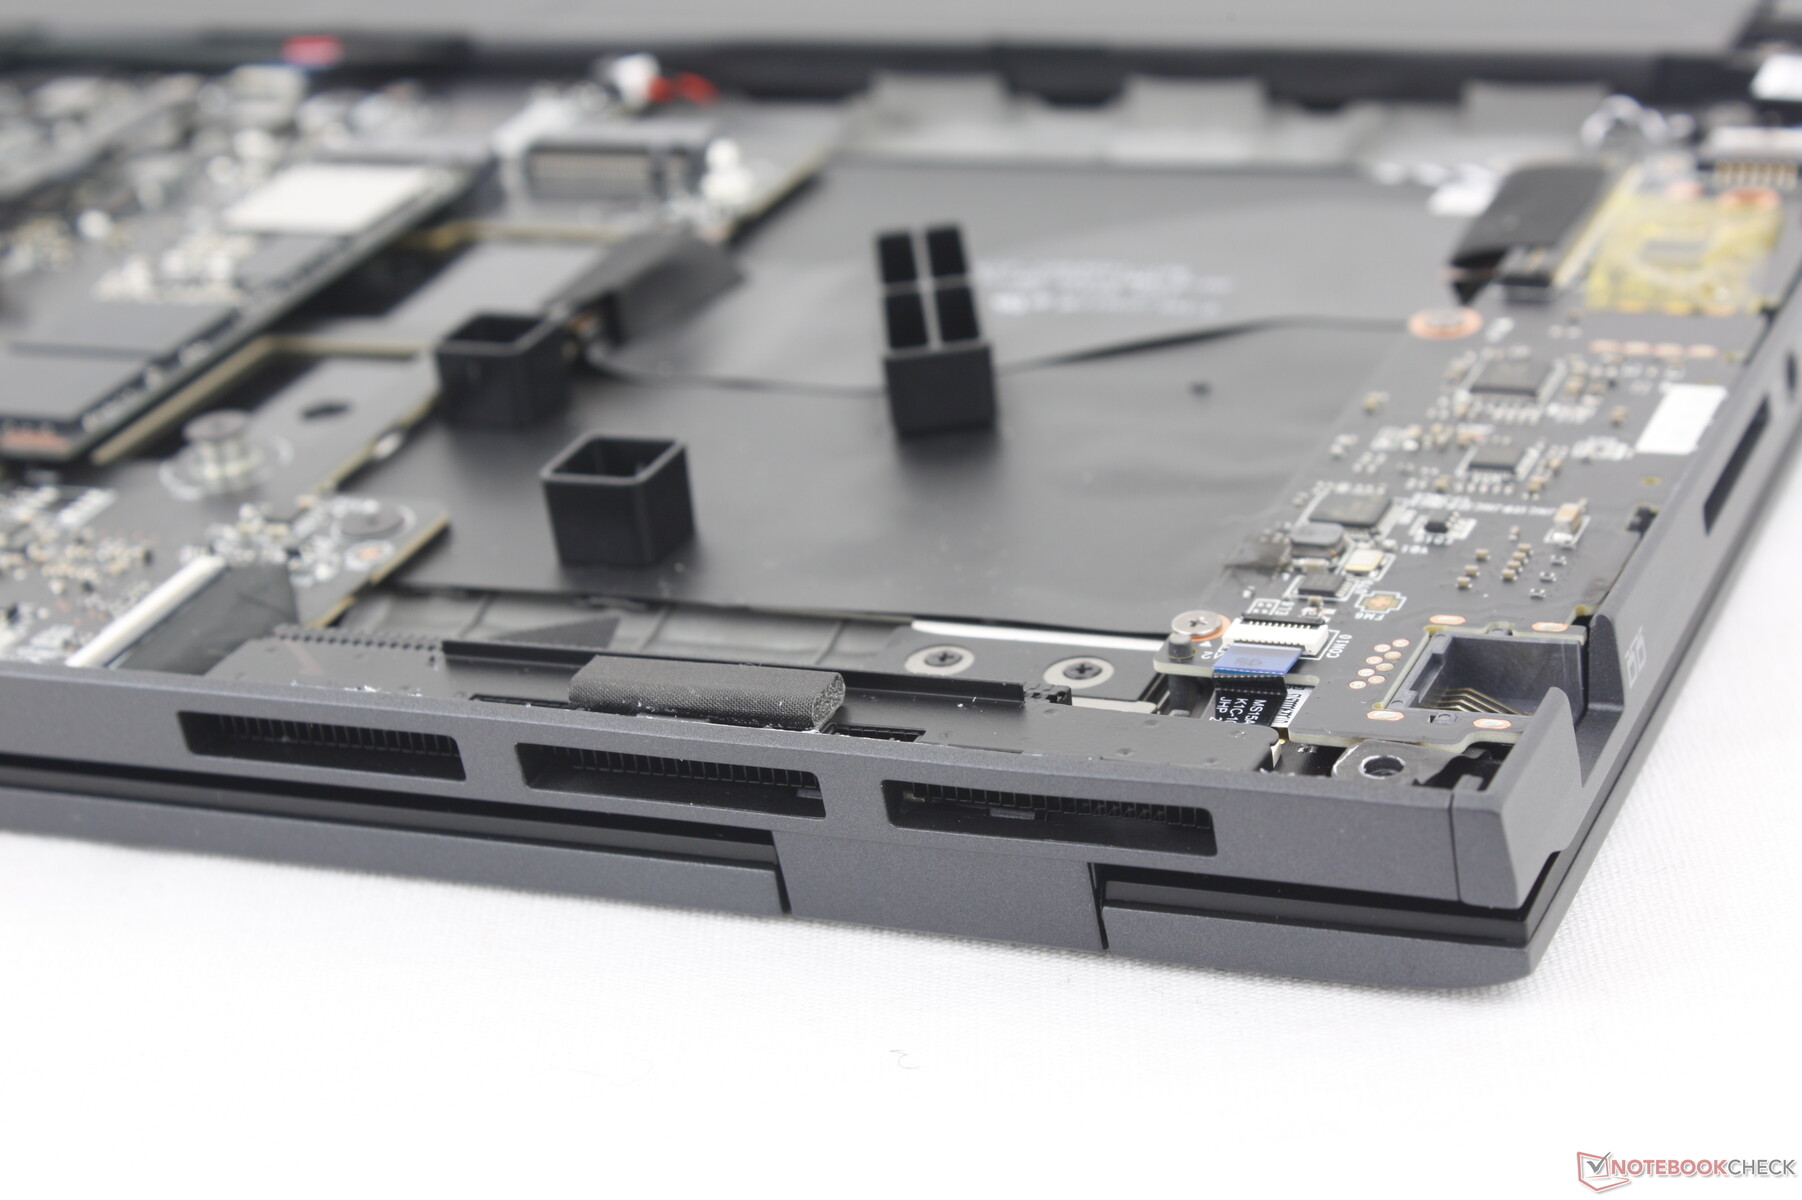
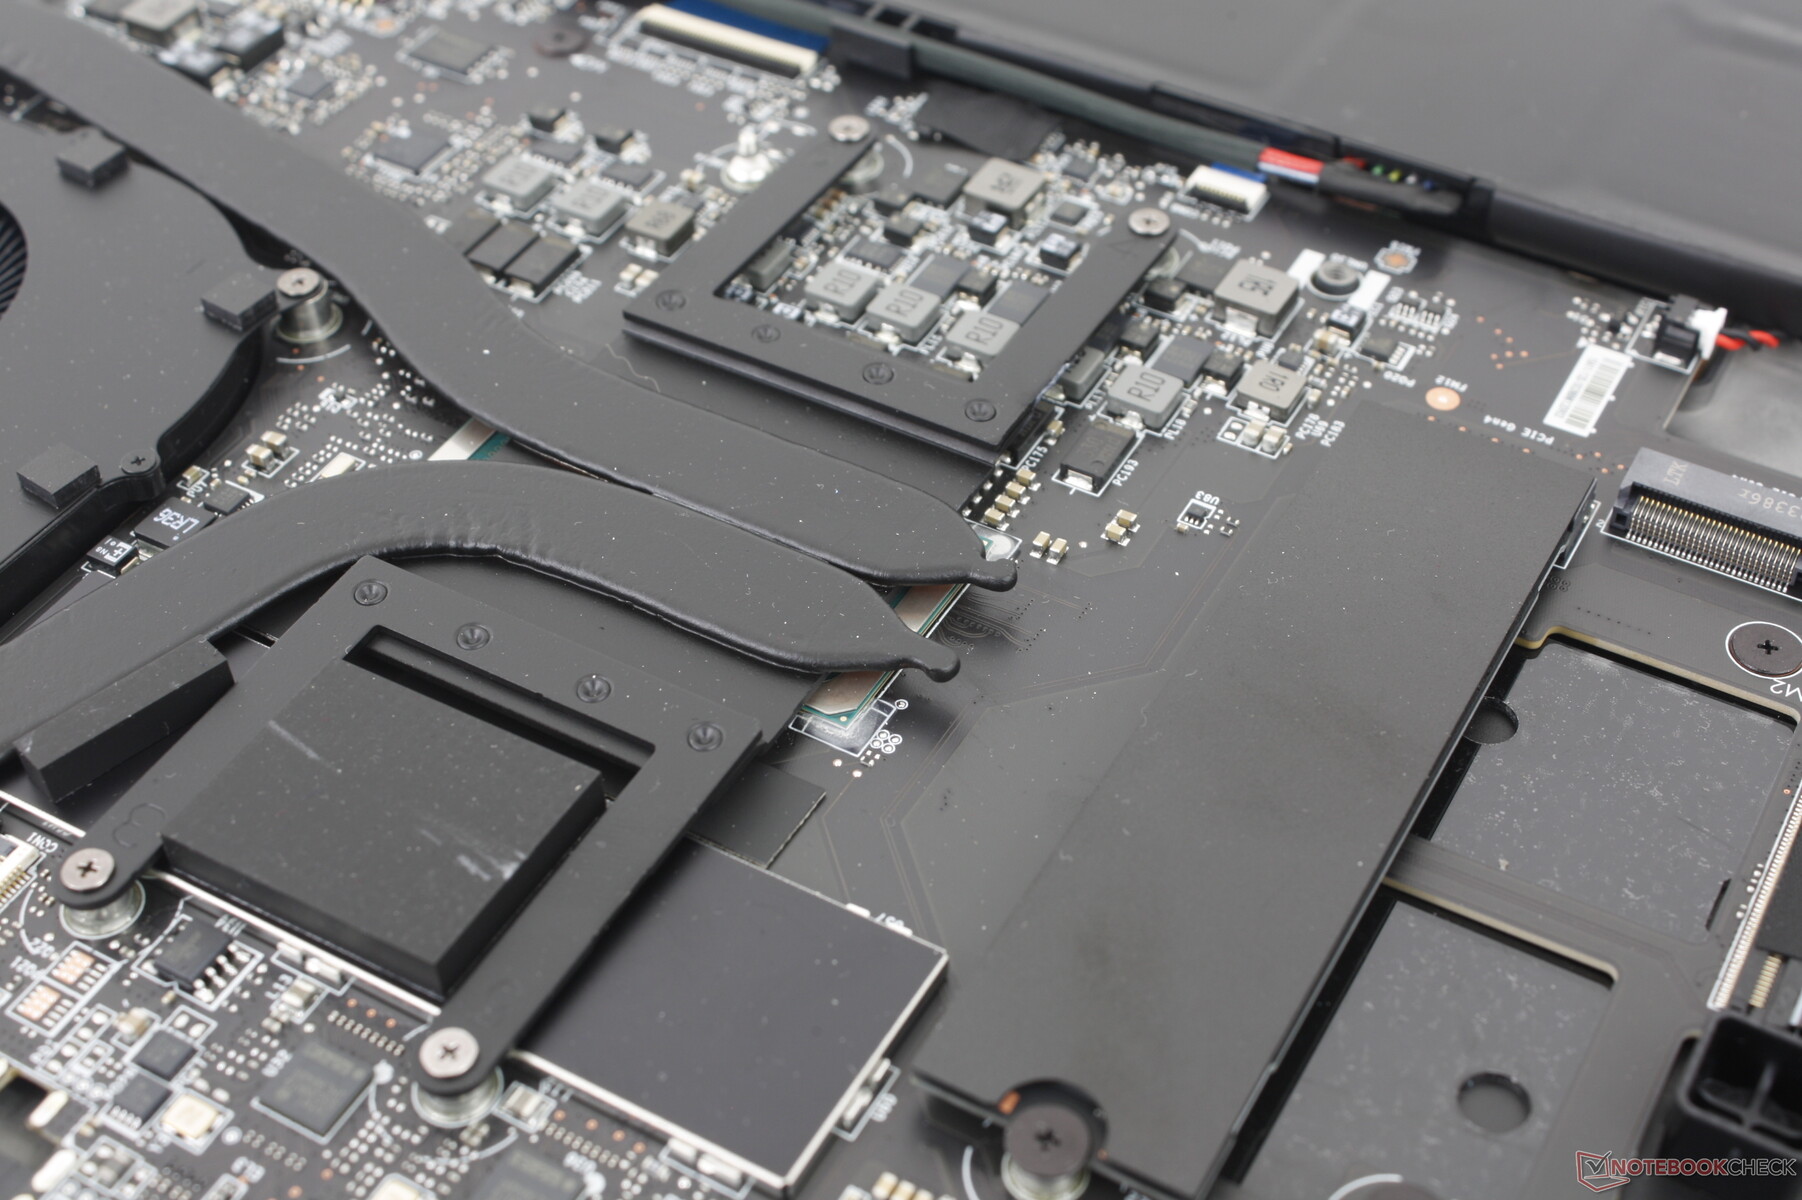
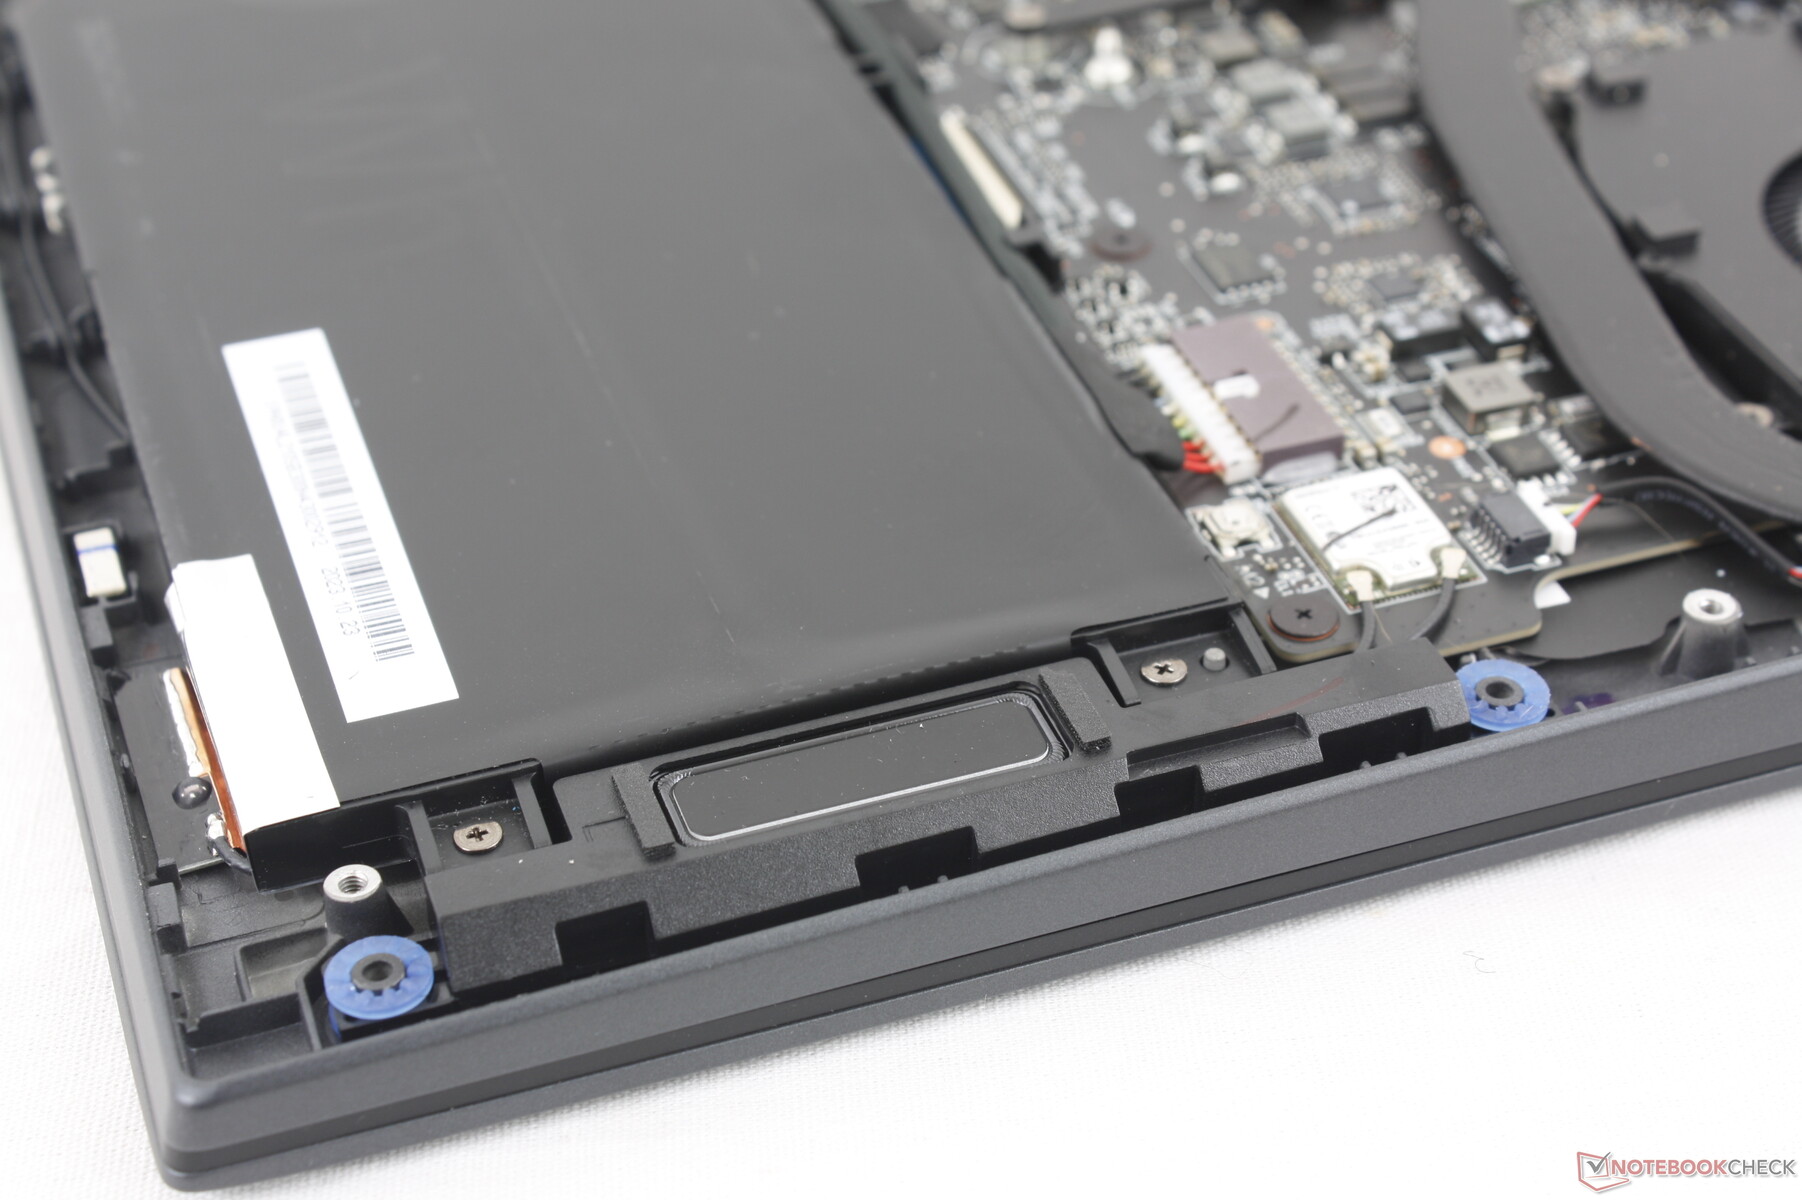
Le panneau inférieur se détache assez facilement après avoir retiré les huit vis Phillips. N'oubliez pas qu'un sceau d'usine doit être brisé pour accéder aux composants internes.
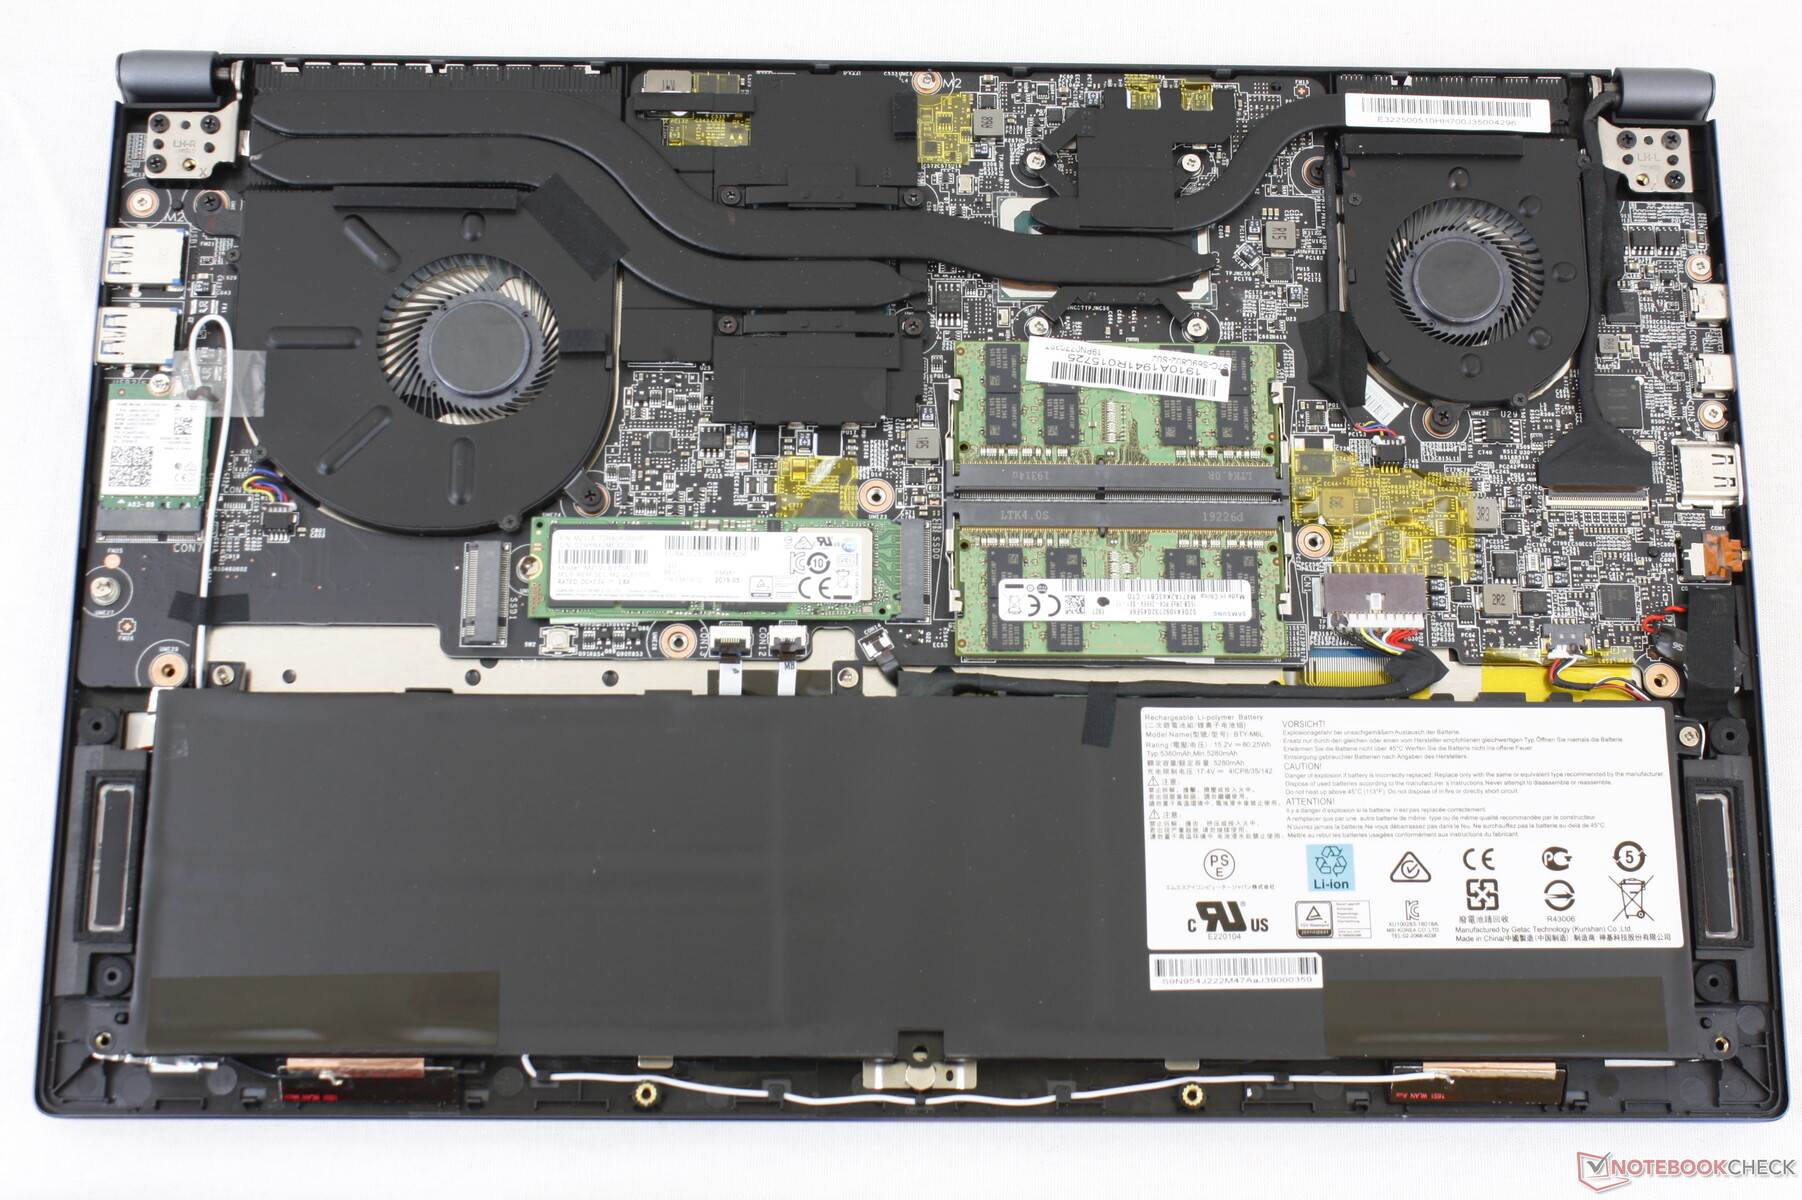
Une fois à l'intérieur, les propriétaires auront accès à deux emplacements M.2 2280 PCIe4 x4 NVMe SSD tandis que les modules RAM et WLAN sont tous soudés. En comparaison, tous ces modules sont amovibles sur l'ancien modèle Prestige 15.
Notez le grand espace vide réservé aux UGS dotées d'une carte graphique discrète. Le modèle est équipé de plus de caloducs, d'un ventilateur supplémentaire et de disques SSD M.2 réorganisés s'il est configuré avec un GPU dédié.
Accessoires et garantie
La boîte ne contient rien d'autre que l'adaptateur secteur et la documentation. La garantie limitée habituelle d'un an s'applique si l'appareil est acheté aux États-Unis.
Périphériques d'entrée - plus grands qu'avant
Clavier
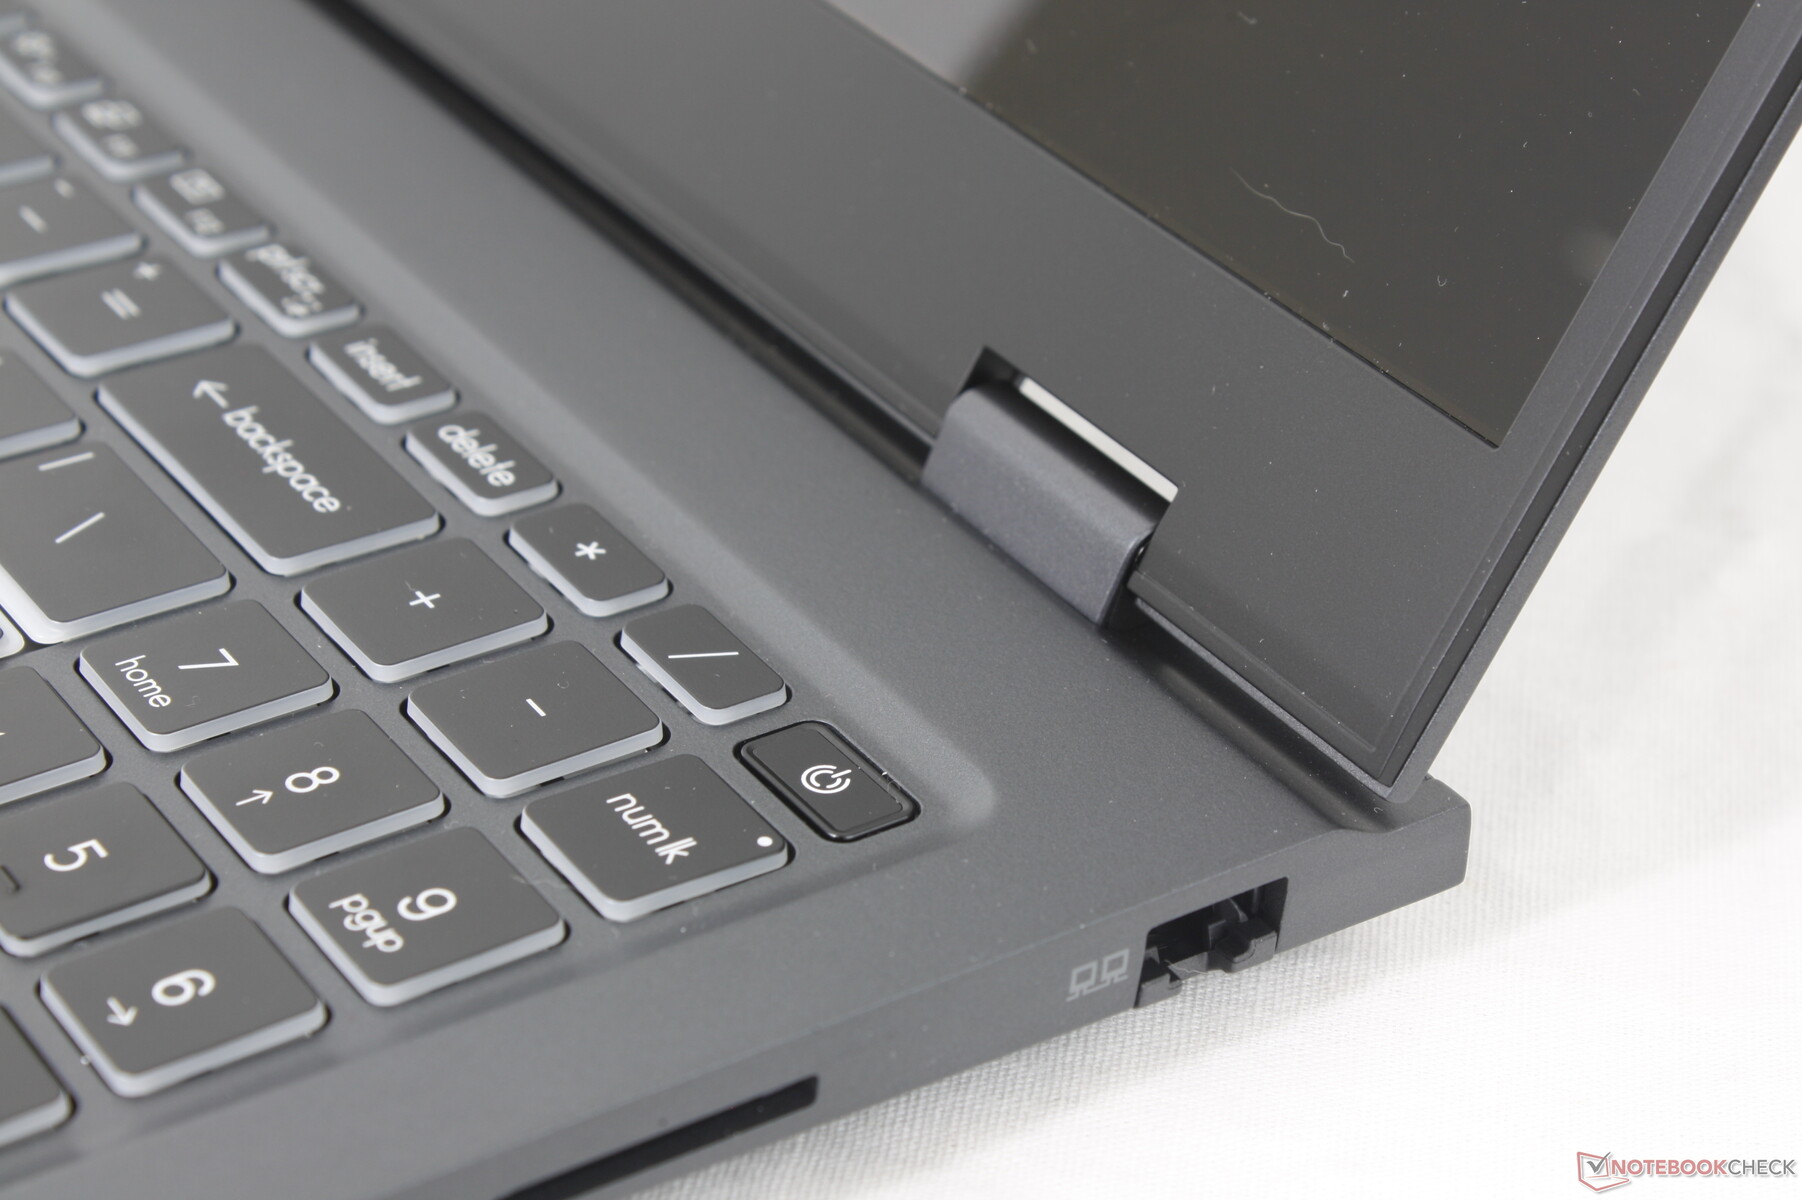
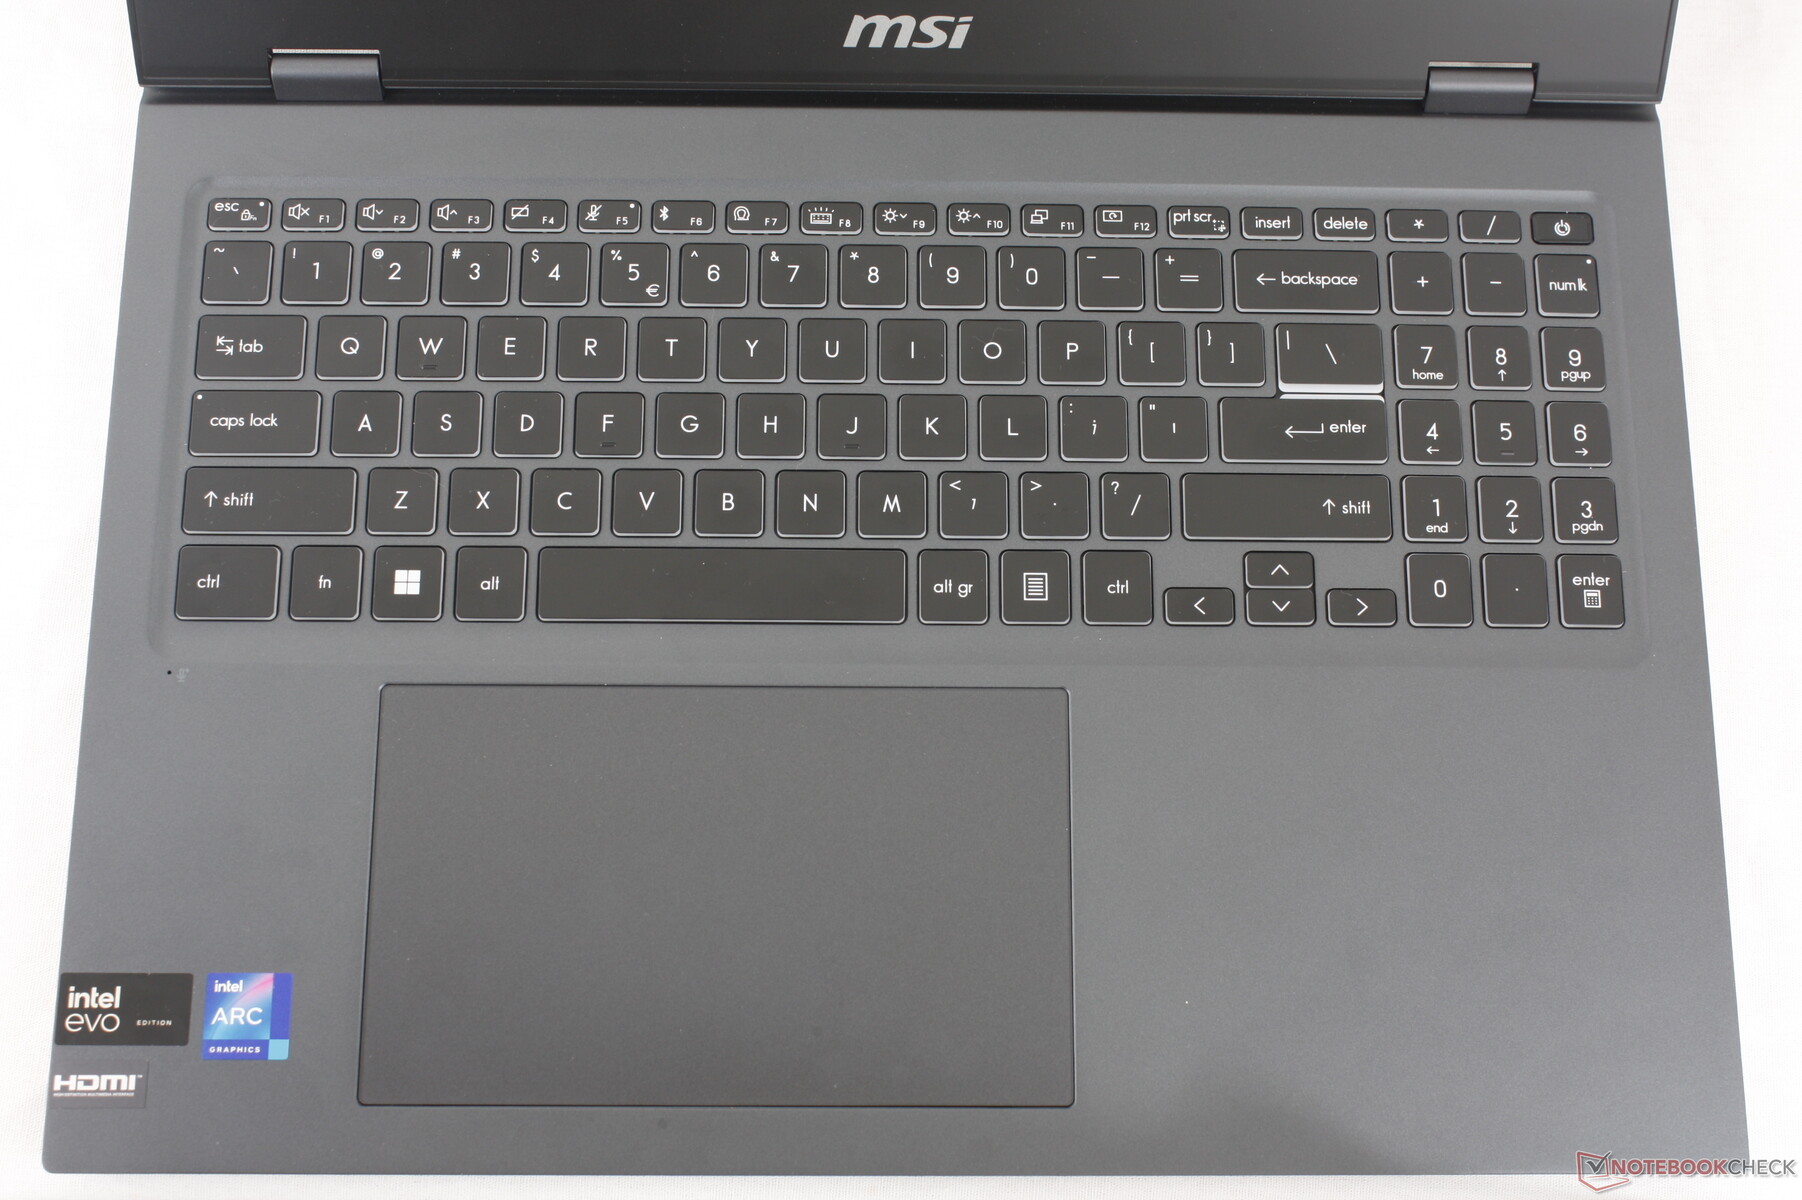
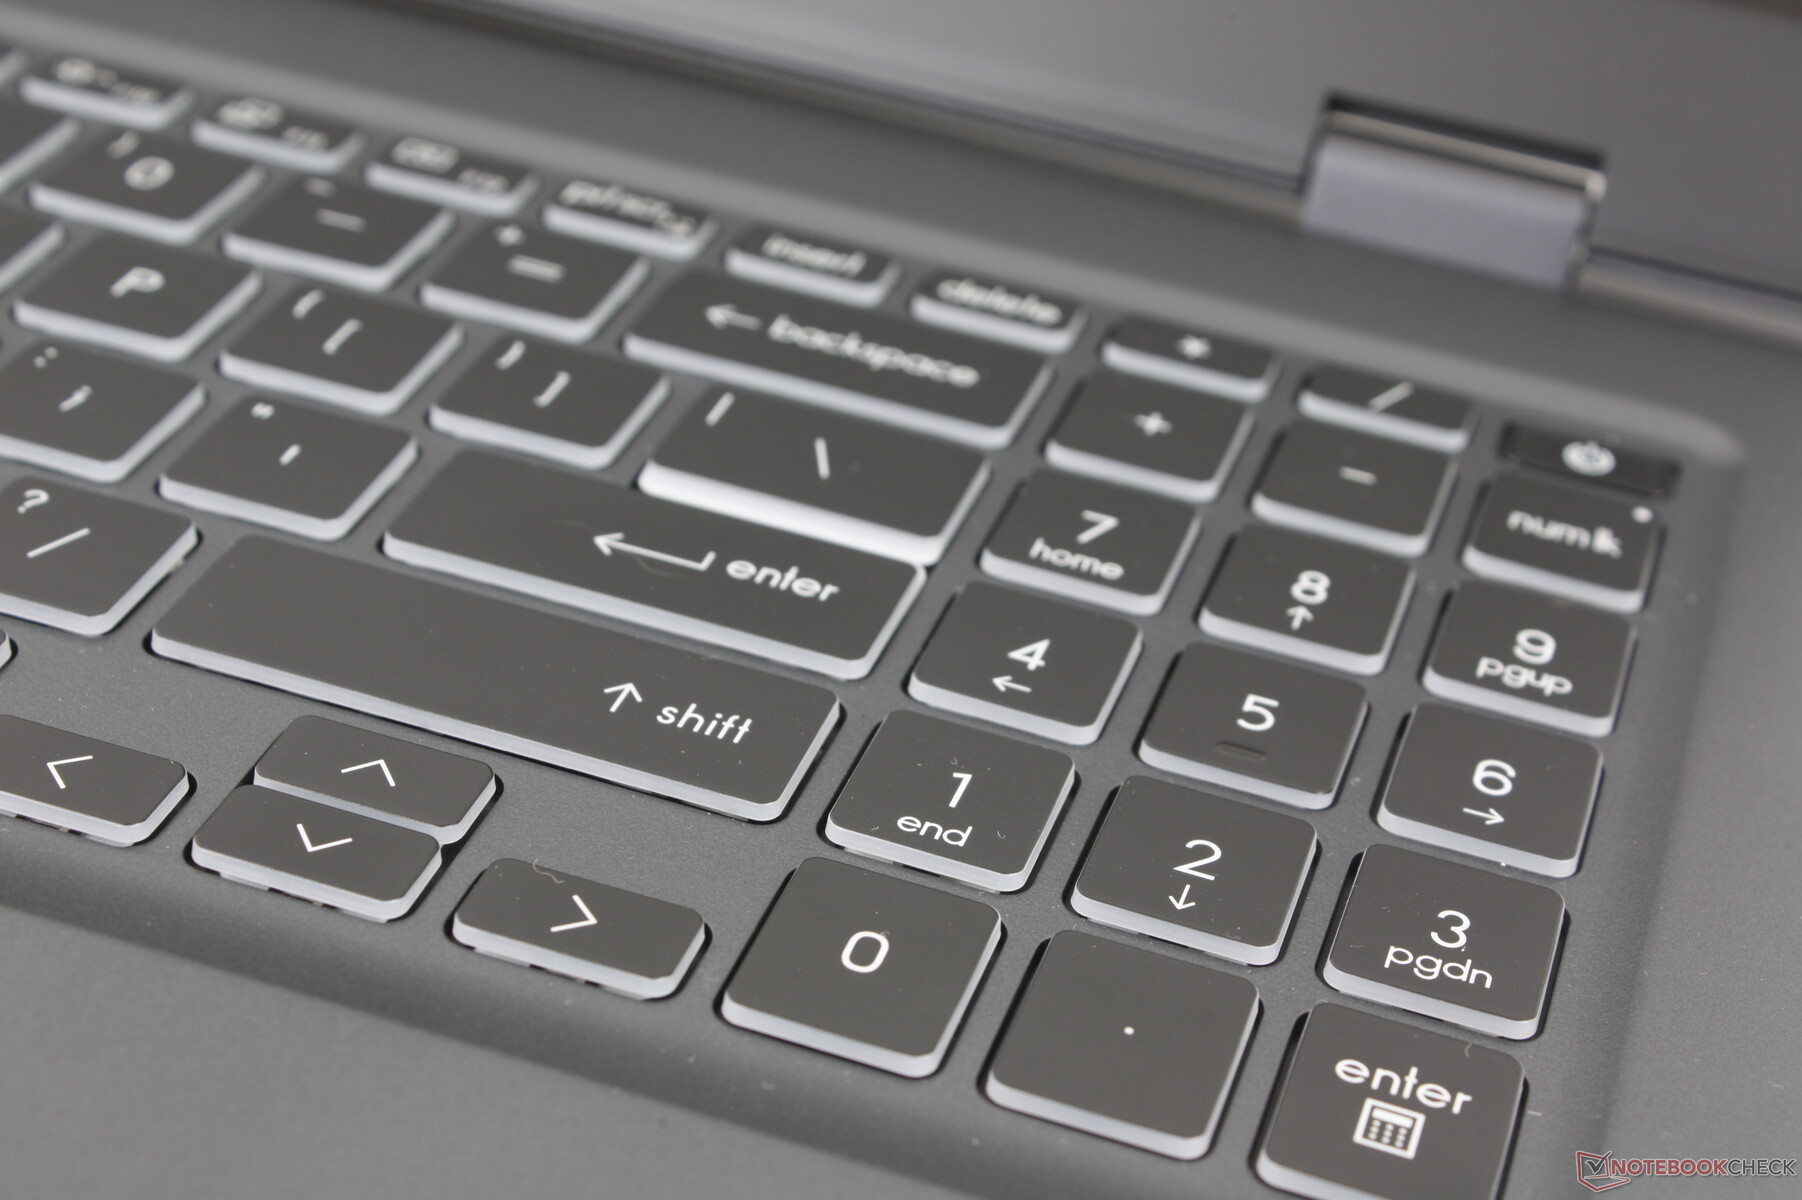
Le clavier a été revu pour inclure un pavé numérique intégré. Pour le reste, le retour des touches est le même que sur le Prestige 15, pour une expérience de frappe similaire malgré les changements de disposition. Nous trouvons toujours que la course des touches est nettement moins profonde que celle des touches des ordinateurs portables de jeu MSI ou des ordinateurs portables concurrents de la série HP Spectre HP Spectre concurrents. Elles ne sont pas trop molles ou inconfortables, mais un retour d'information plus ferme ou plus net à chaque pression ne ferait pas de mal non plus.
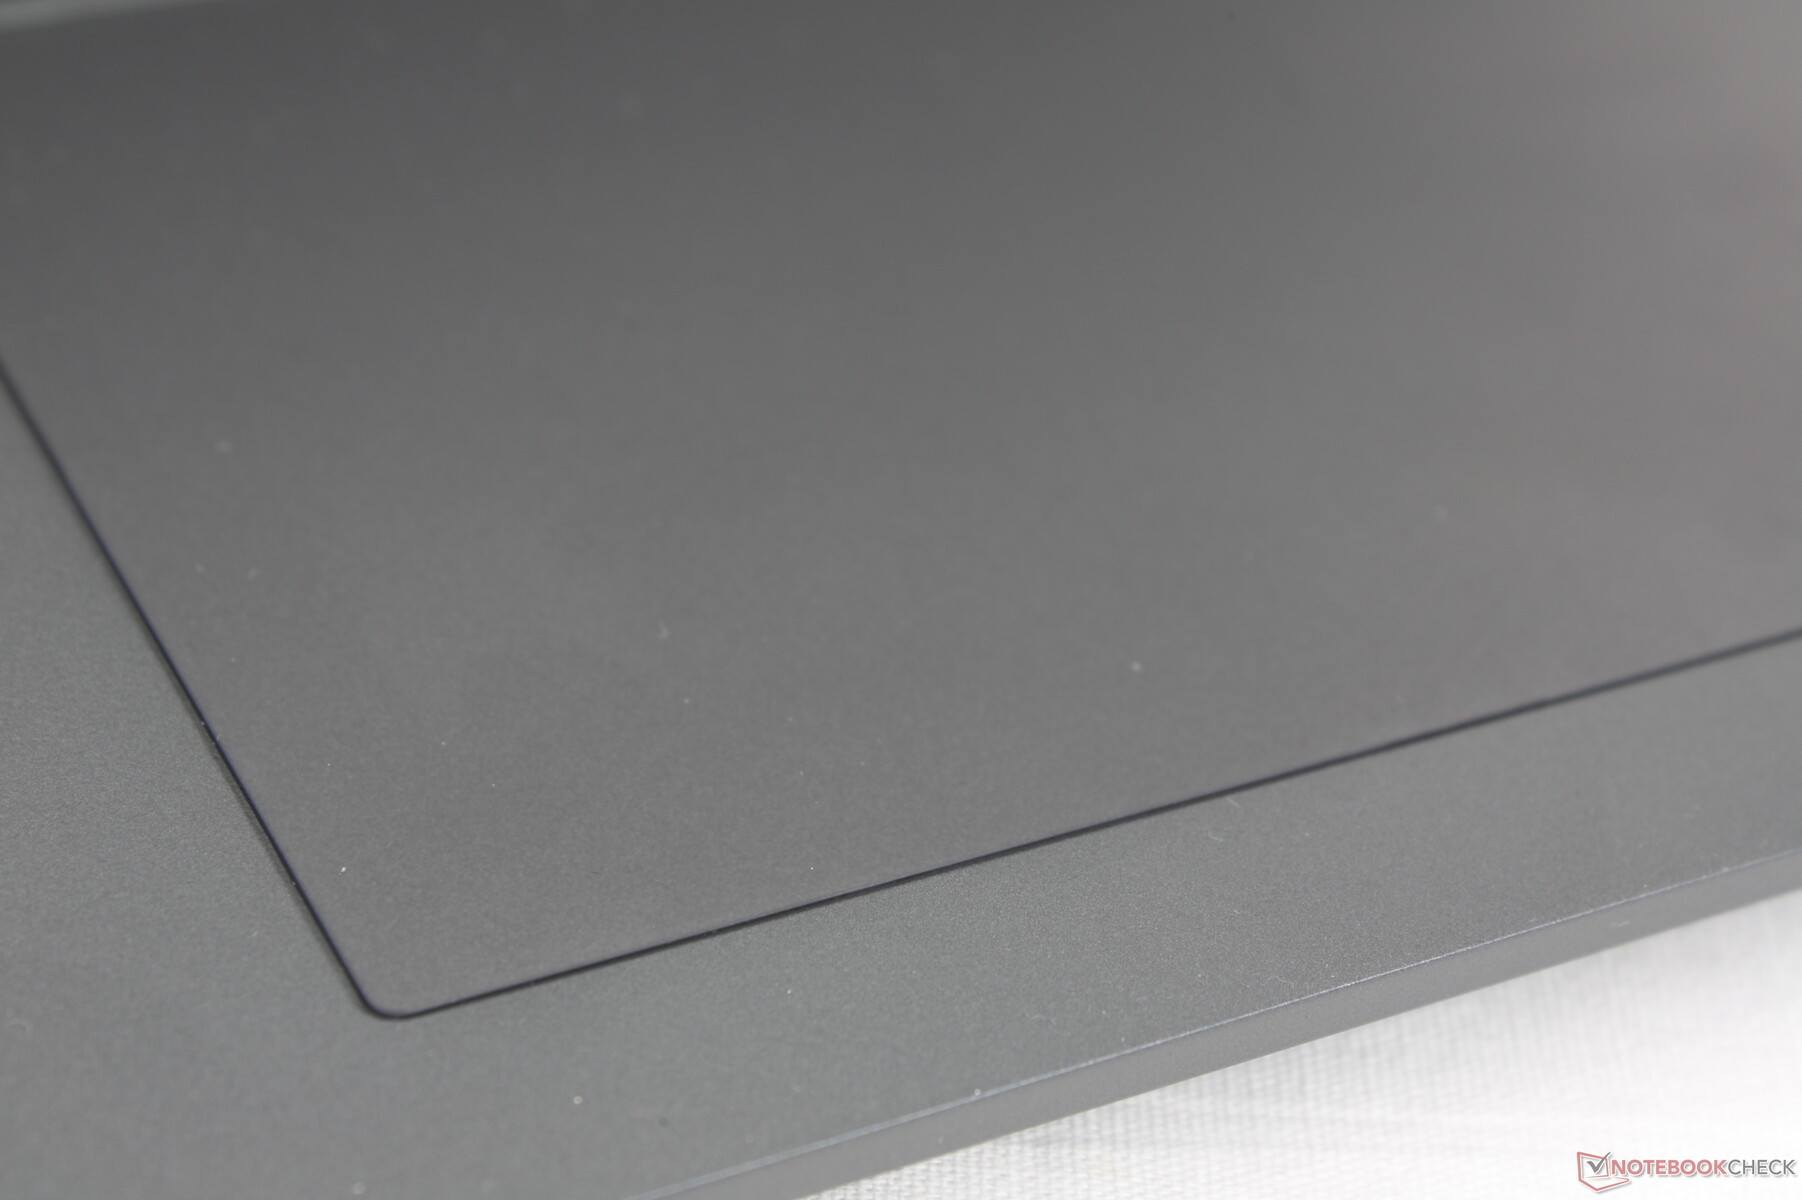
Pavé tactile
Le pavé numérique est désormais beaucoup plus grand (15 x 9 cm), ce qui permet de remédier aux dimensions étroites et gênantes du pavé numérique de l'ancien modèle Prestige 15 le design. La traction est fluide et fiable, sans adhérence, même lorsque l'on glisse à faible vitesse.
Le retour d'information lors du clic est moyen, voire un peu spongieux. L'appui sur la souris nécessite beaucoup de force de la part du doigt et les actions peuvent devenir fatigantes sans souris externe.

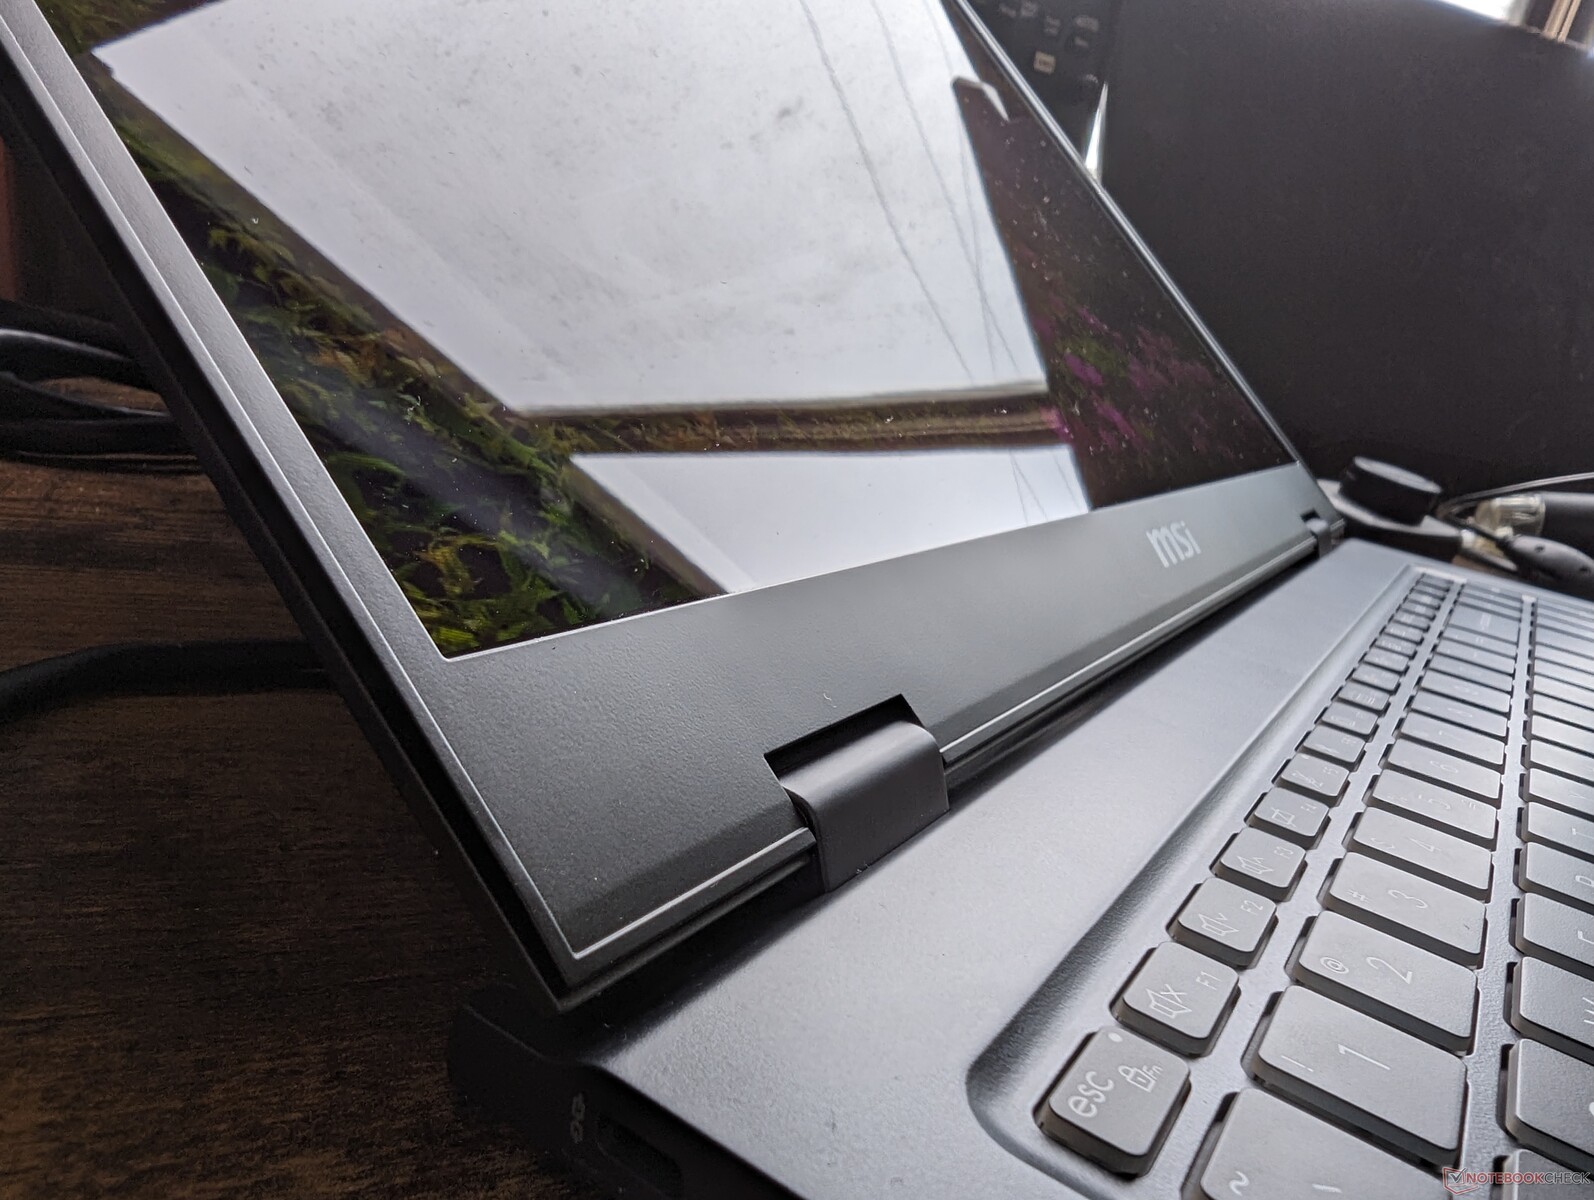
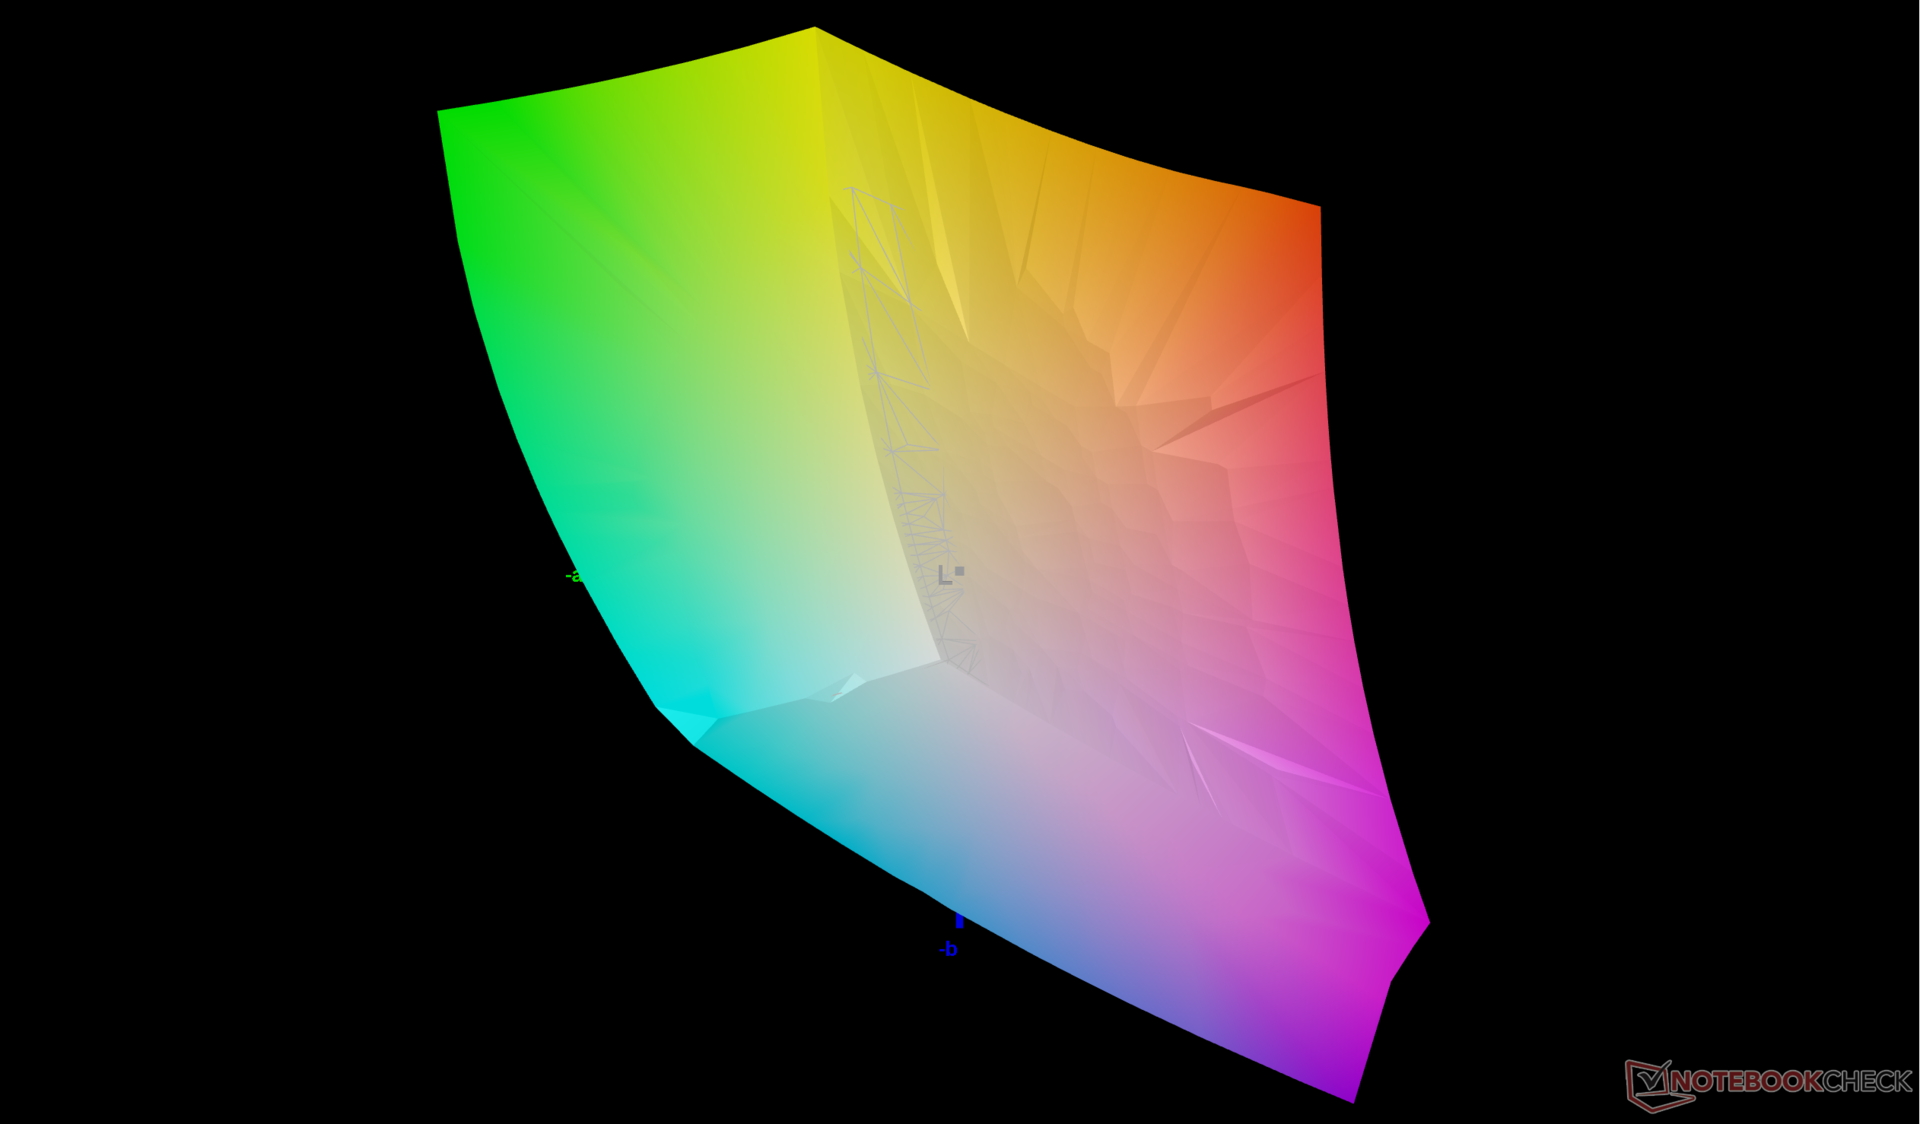
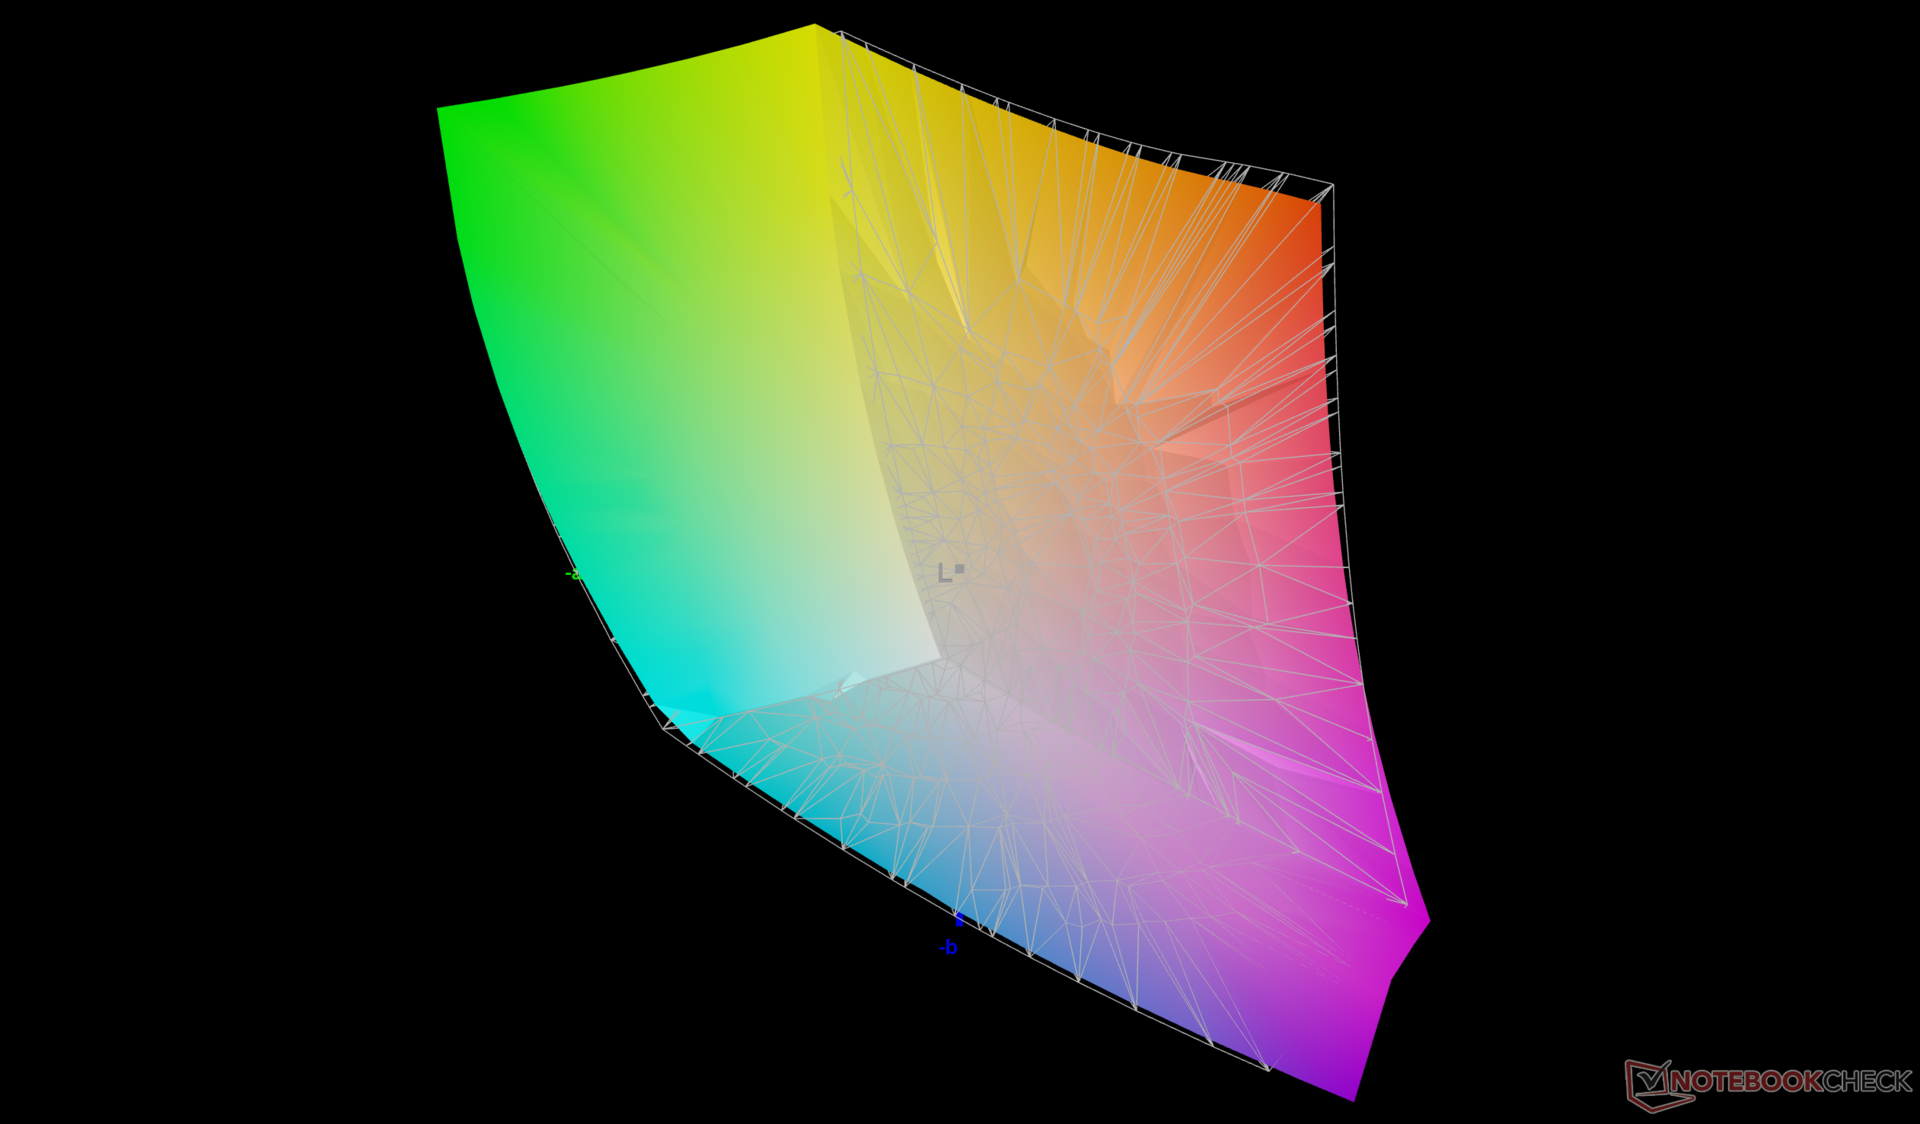
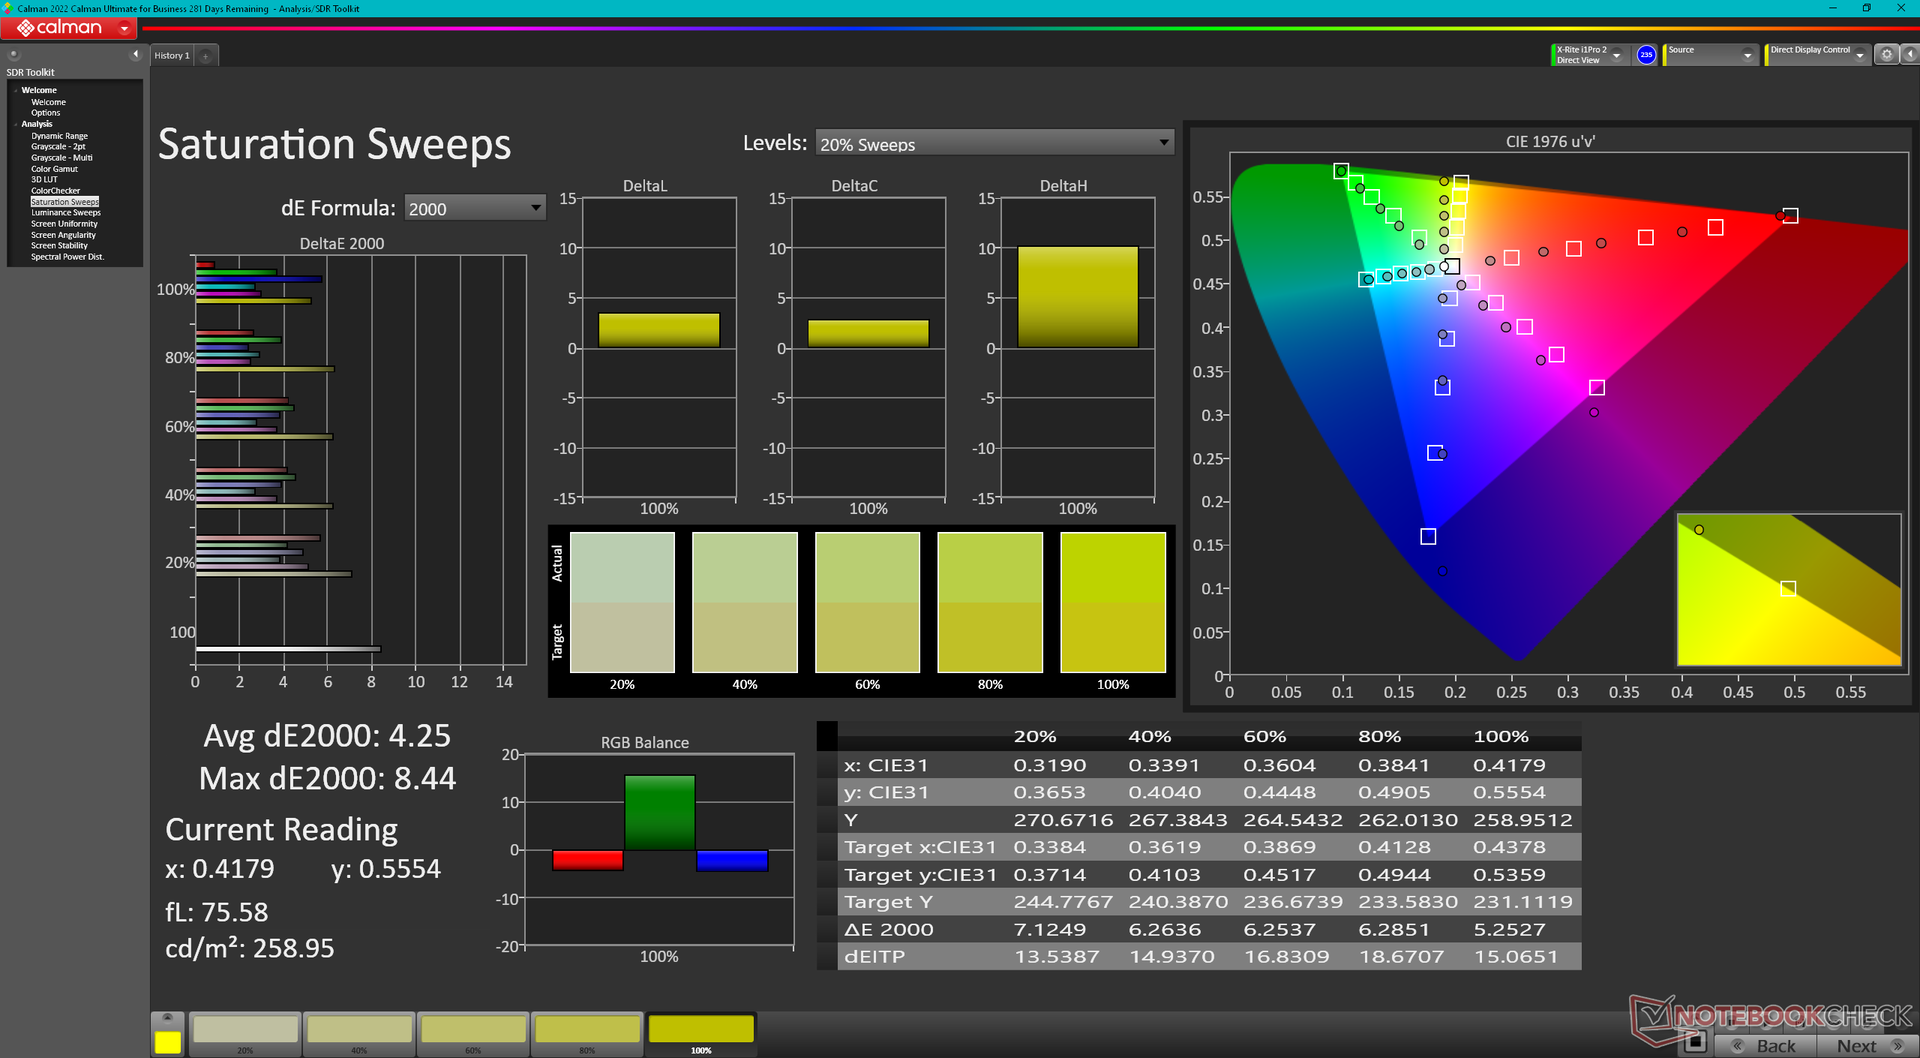
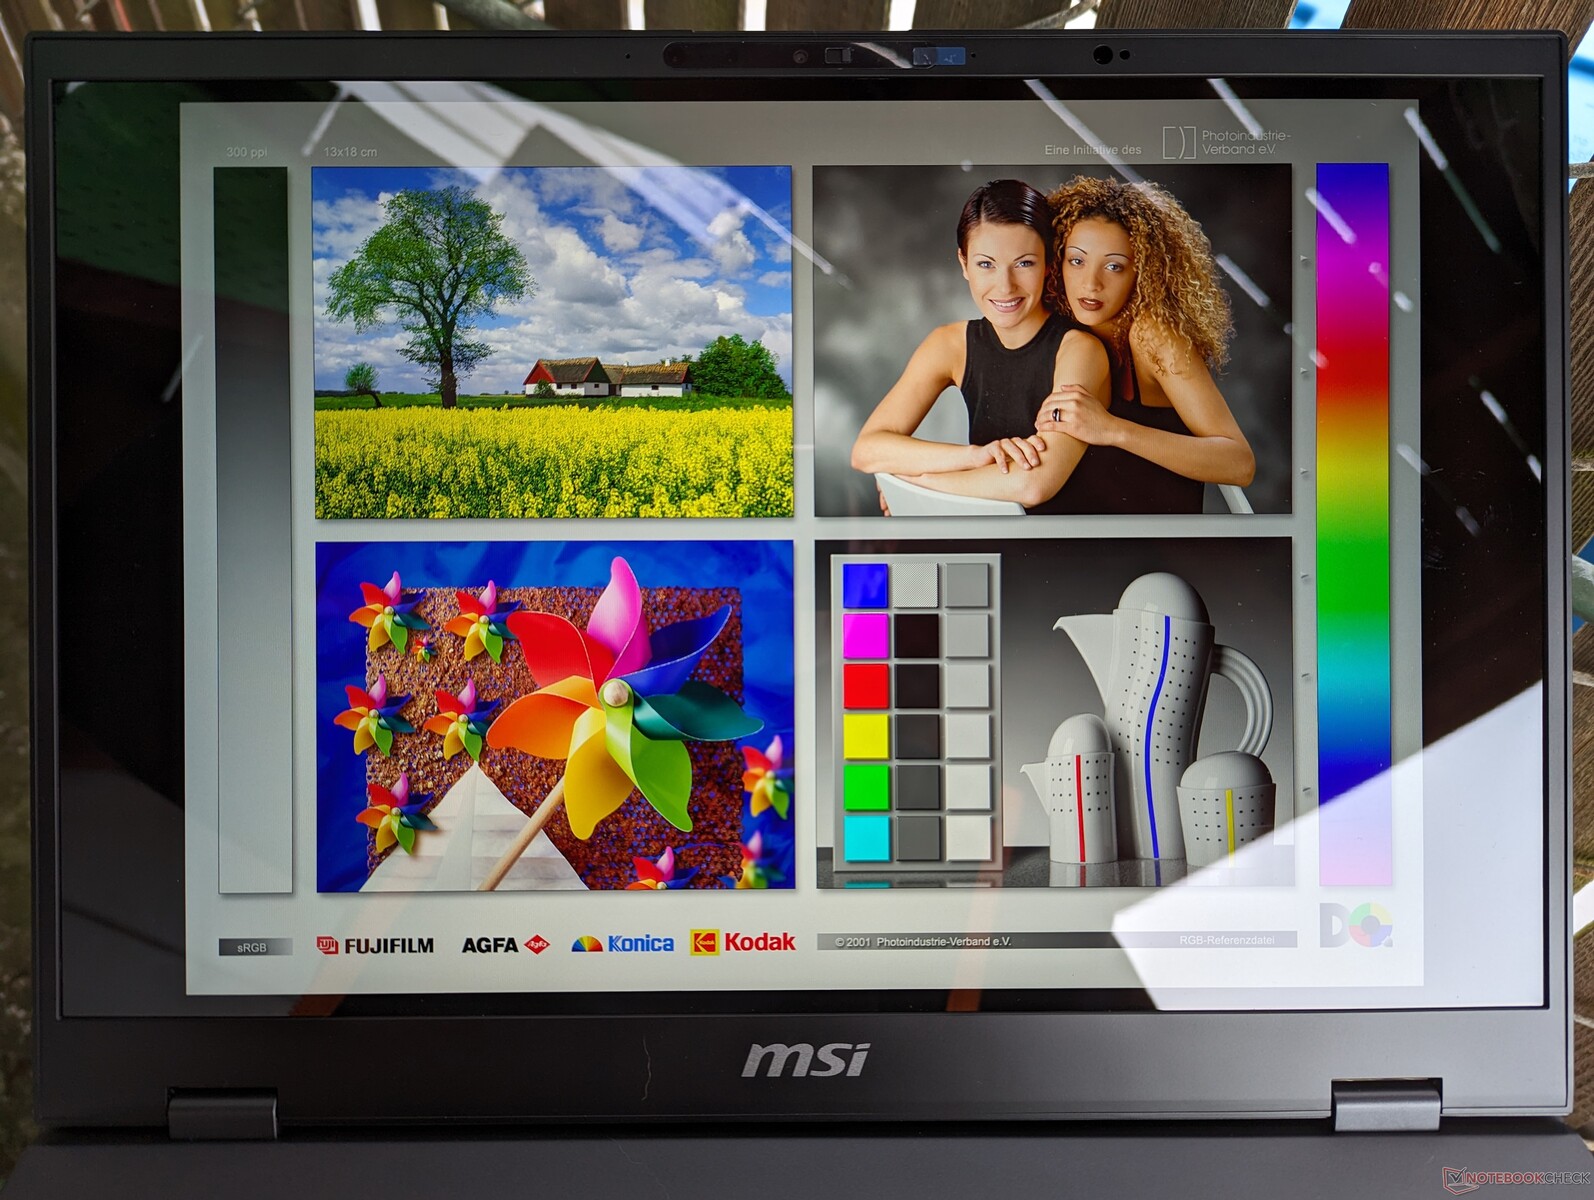
Affichage - DCI-P3 complet sur toutes les UGS
Le Prestige 16 est le premier de notre base de données à être équipé de la dalle AU Optronics B160QAN03.R. Cette dalle IPS lumineuse et brillante est de très haute qualité avec des couleurs DCI-P3 complètes et aucun problème de grain. Cependant, les temps de réponse noir-blanc lents, l'absence de synchronisation adaptative et le taux de rafraîchissement modeste de 60 Hz en font un écran plus adapté à l'édition graphique qu'aux jeux.
Une deuxième option d'affichage est disponible avec un écran OLED et une résolution native plus élevée. Aucun des deux écrans ne prend en charge les fonctionnalités tactiles.


| |||||||||||||||||||||||||
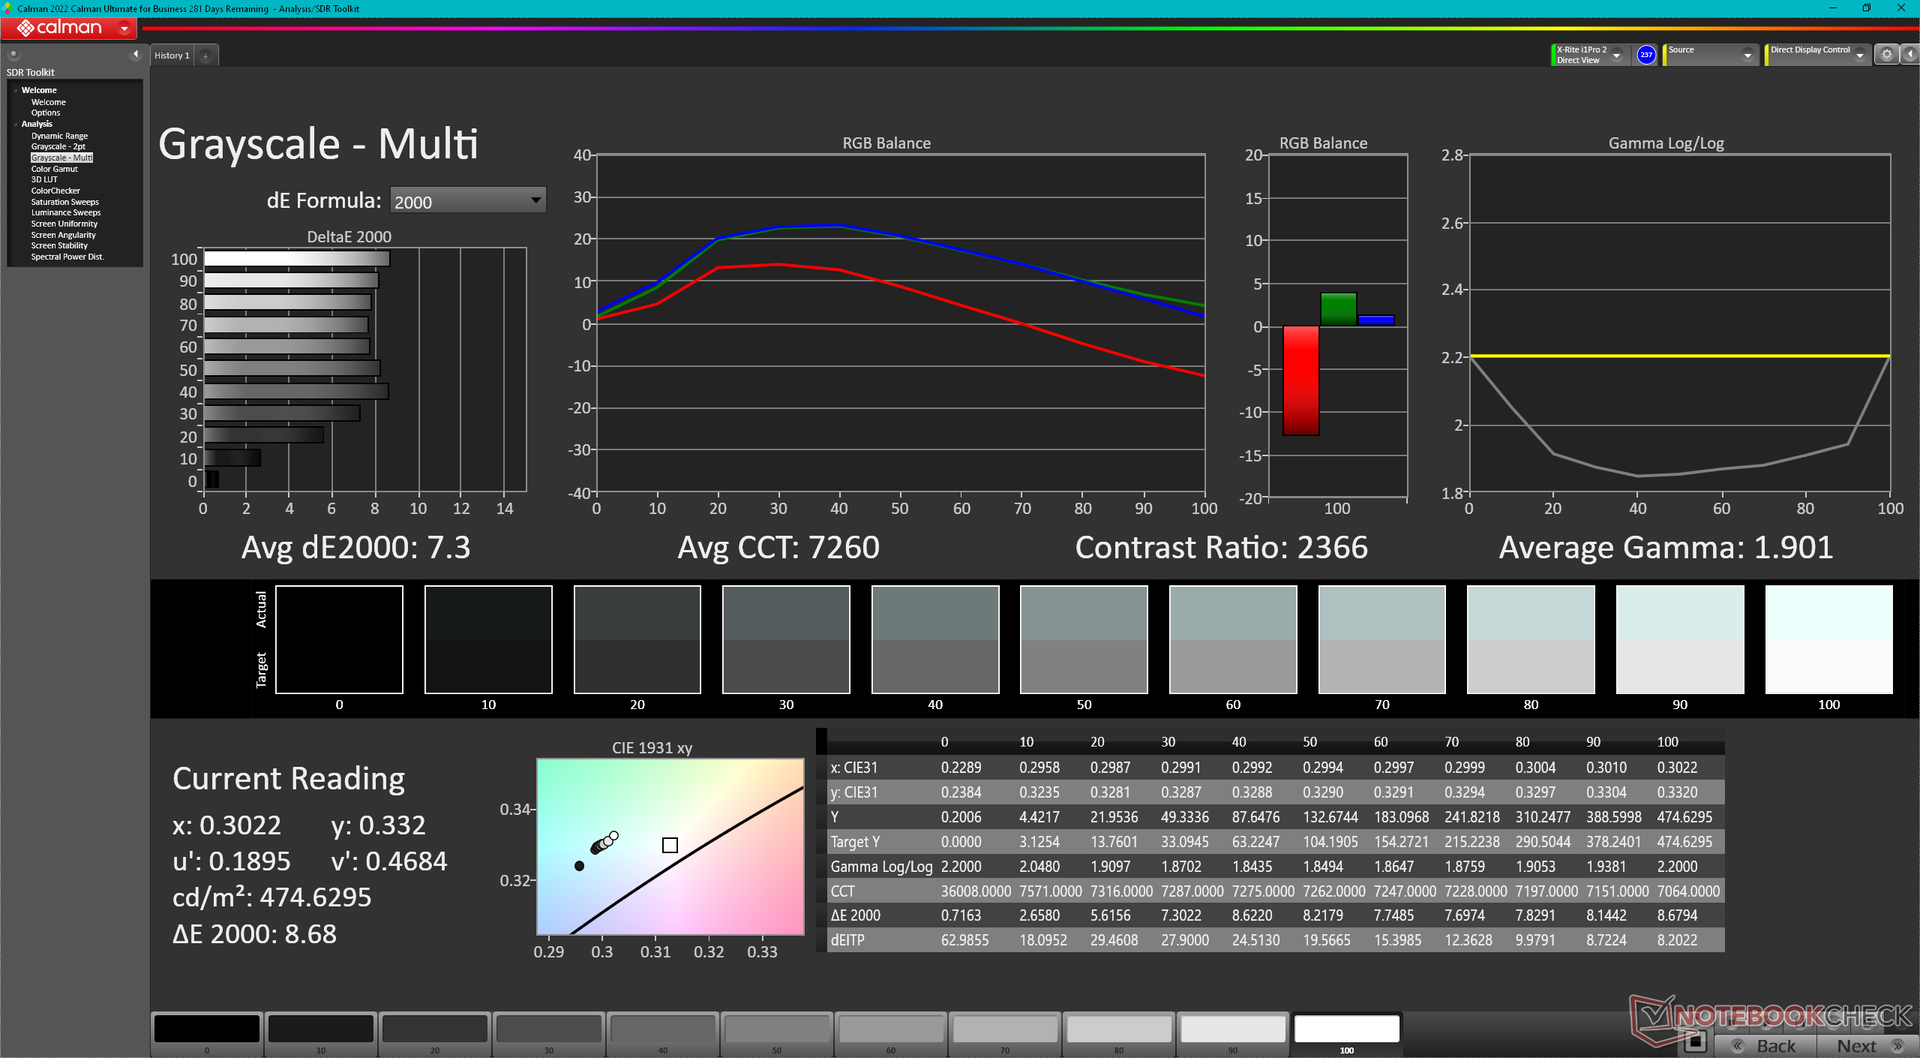
Homogénéité de la luminosité: 87 %
Valeur mesurée au centre, sur batterie: 473.6 cd/m²
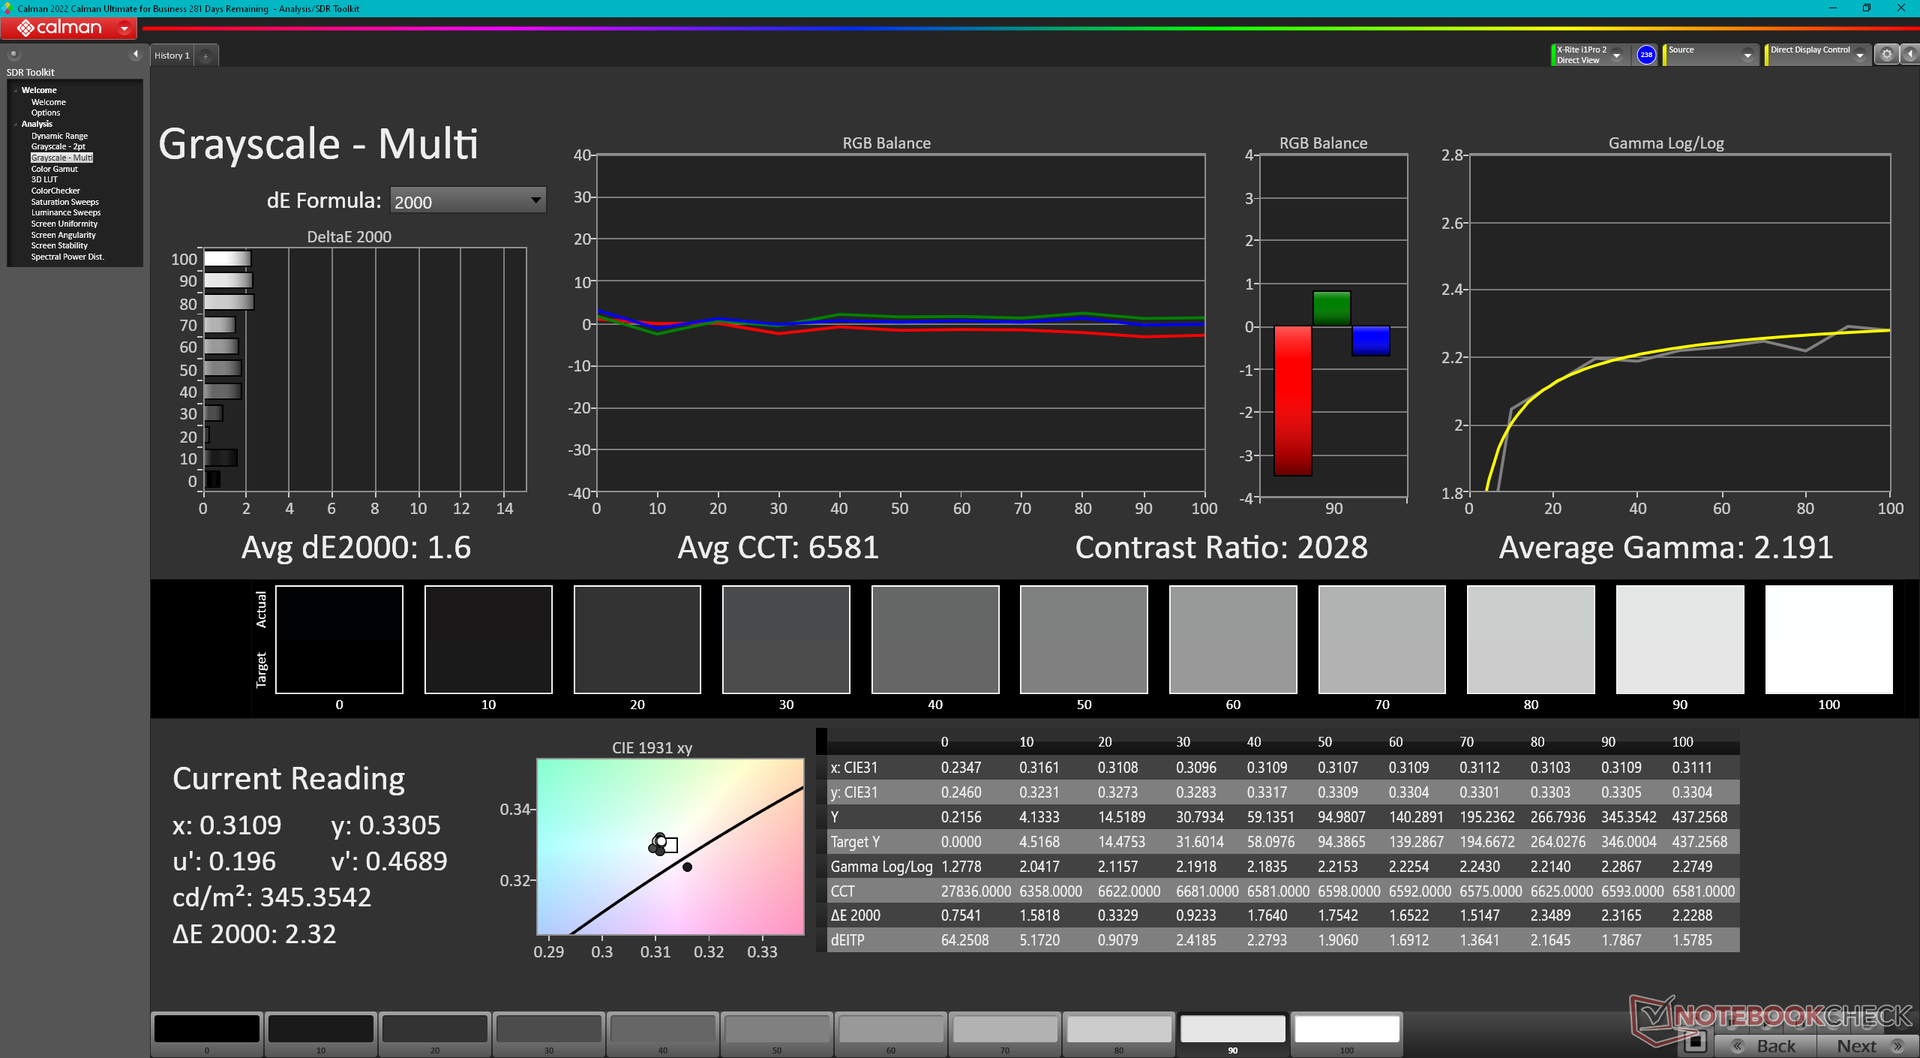
Contraste: 2493:1 (Valeurs des noirs: 0.19 cd/m²)
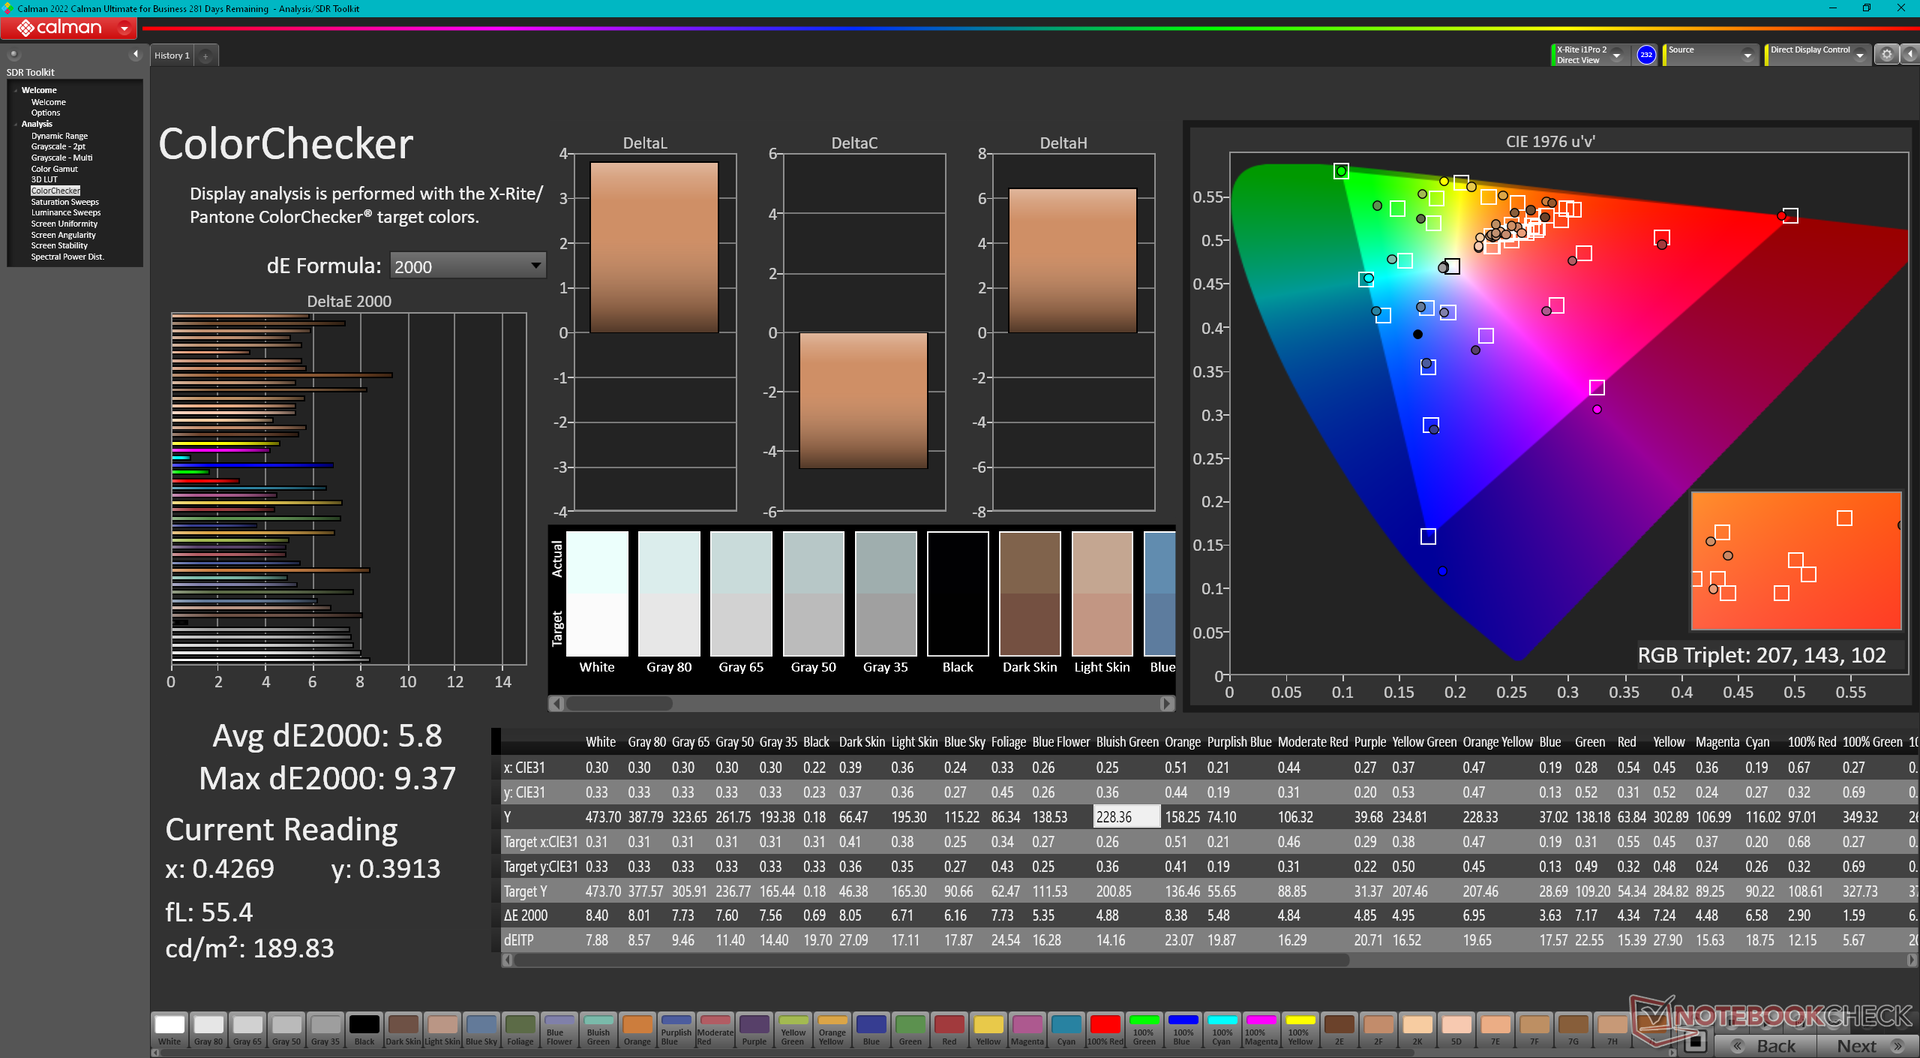
ΔE ColorChecker Calman: 5.9 | ∀{0.5-29.43 Ø4.72}
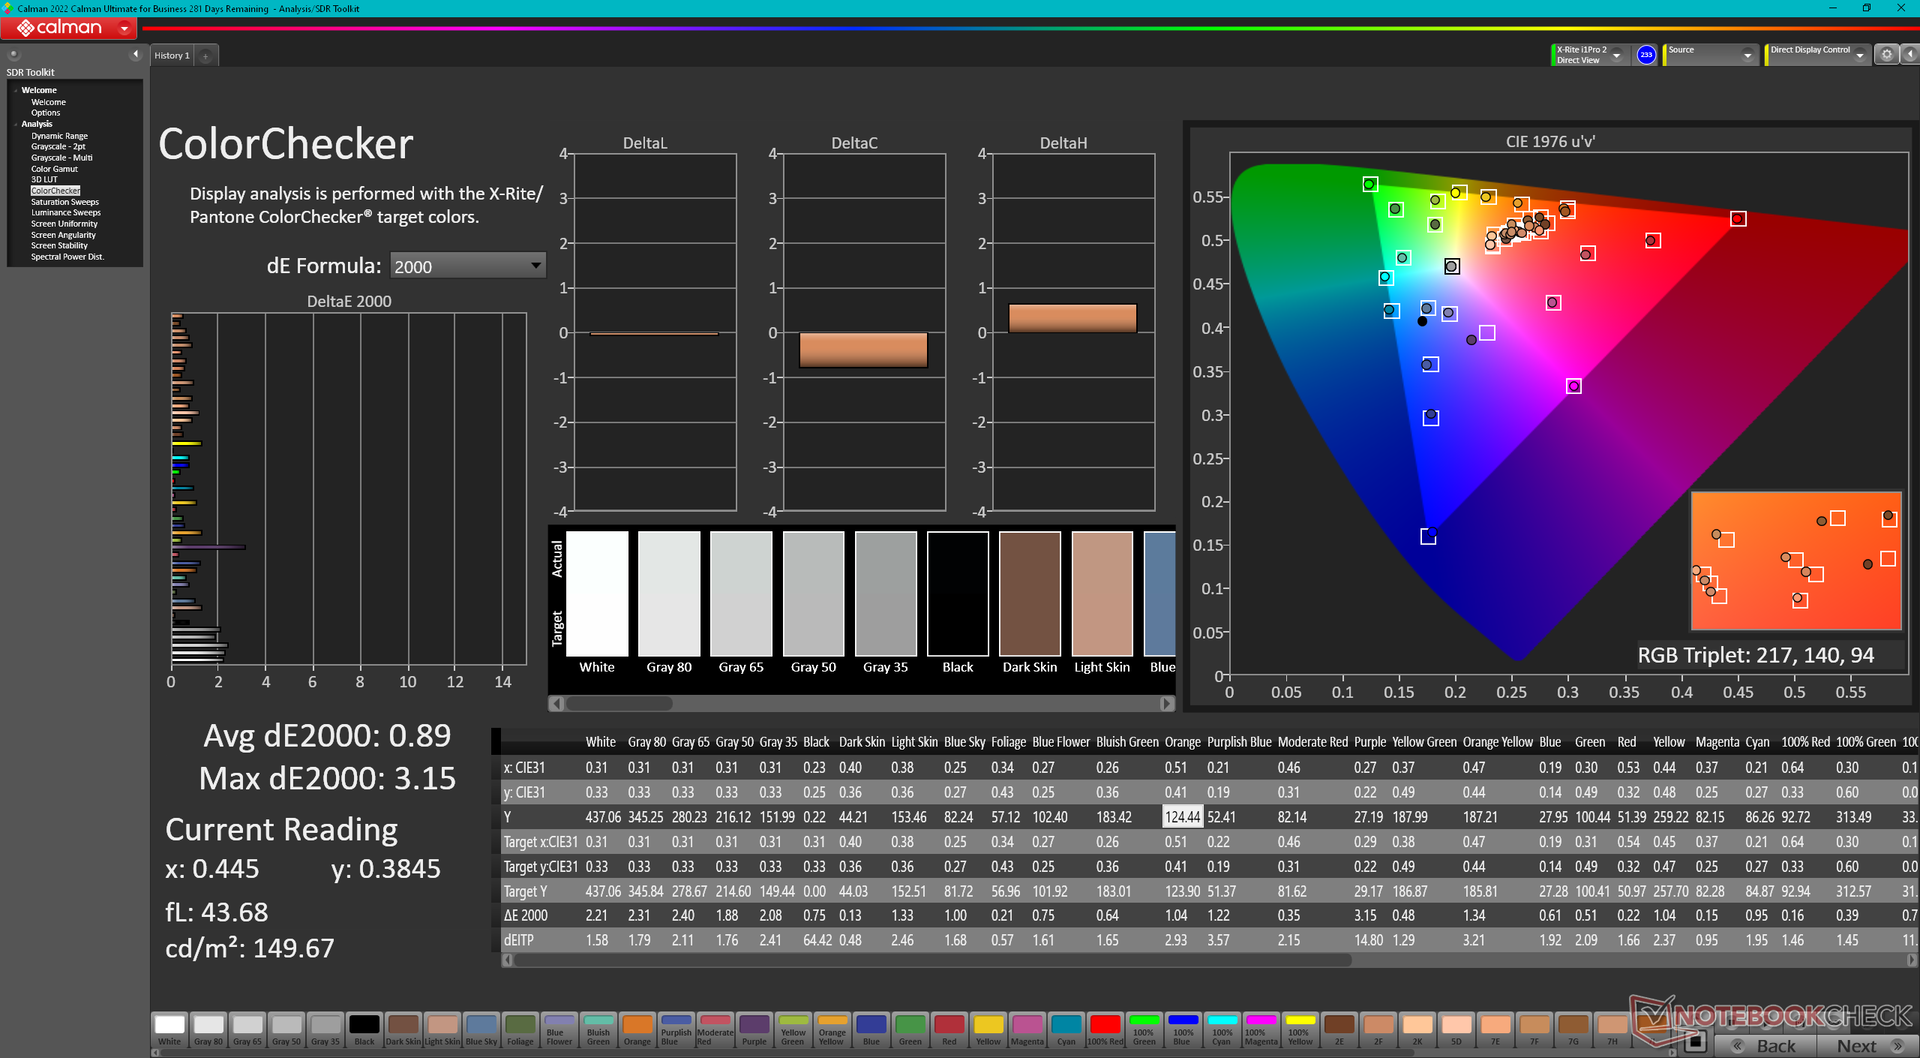
calibrated: 0.89
ΔE Greyscale Calman: 7.3 | ∀{0.09-98 Ø4.97}
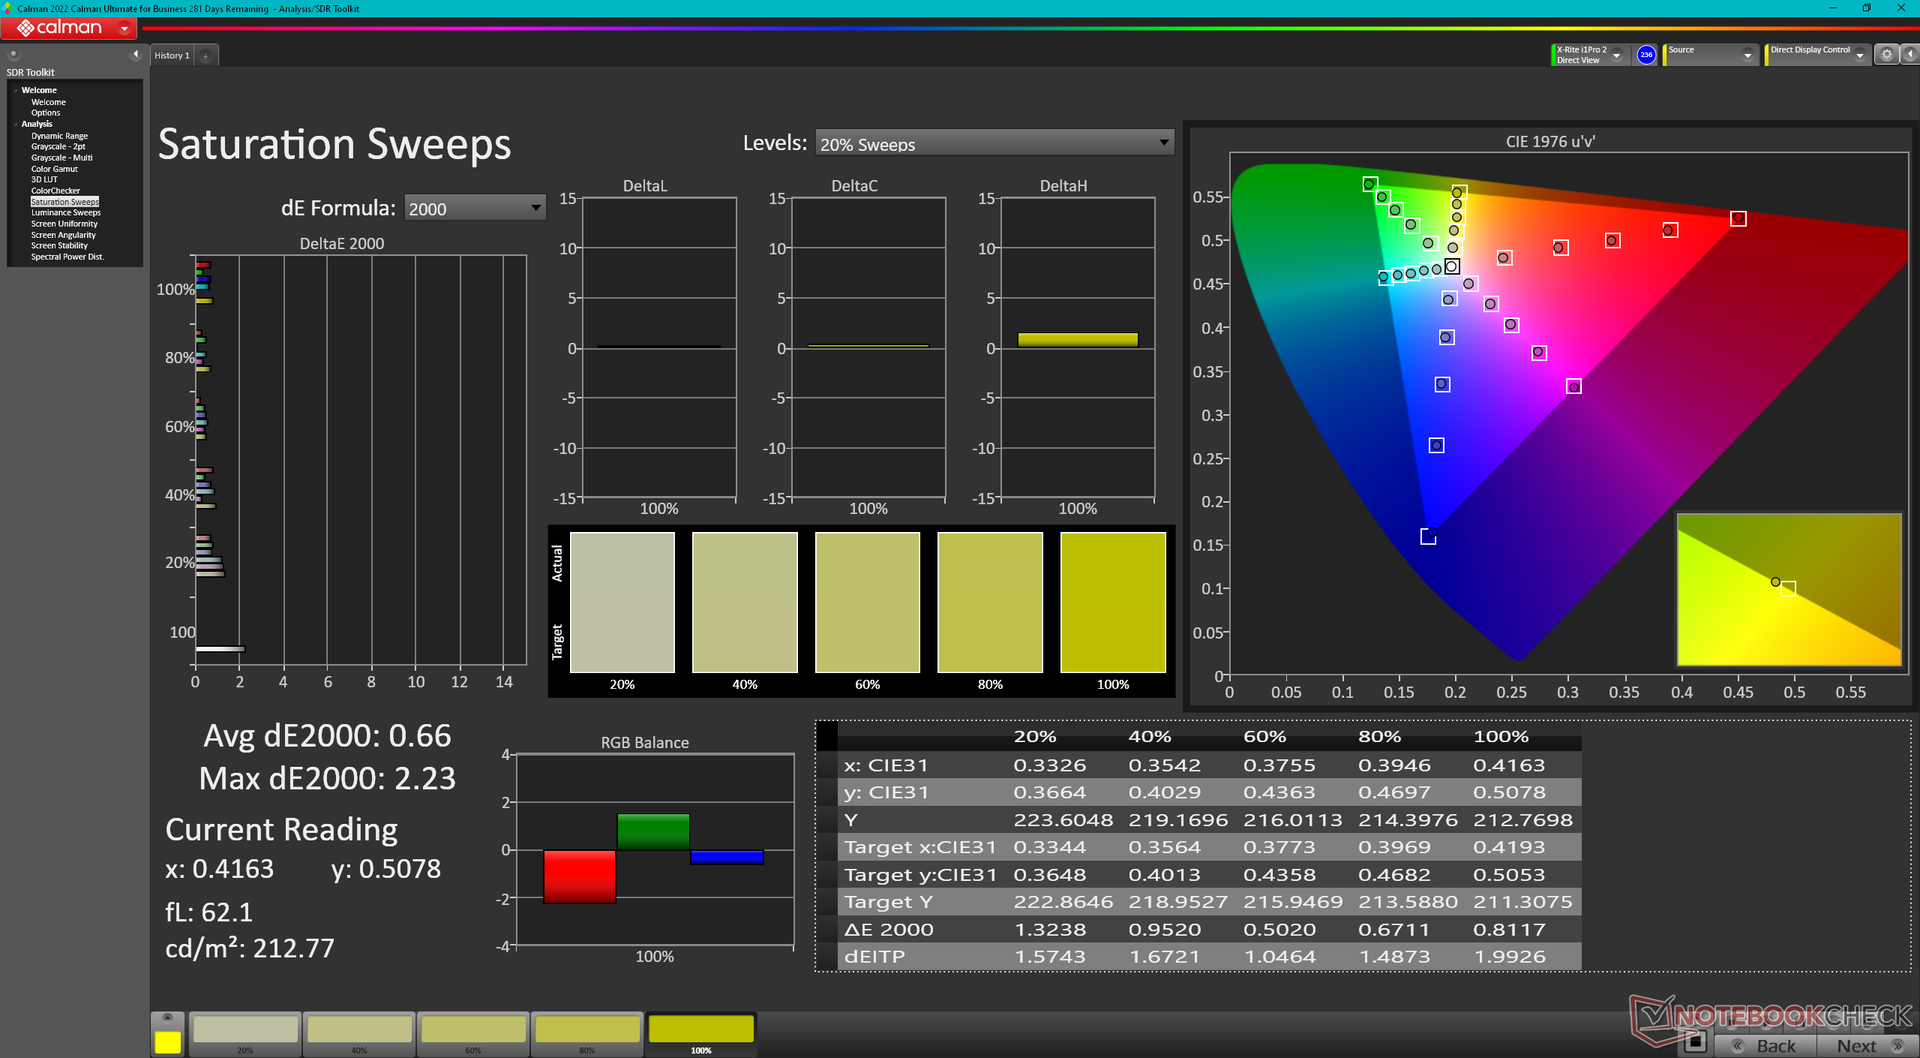
84.6% AdobeRGB 1998 (Argyll 3D)
99.8% sRGB (Argyll 3D)
96.7% Display P3 (Argyll 3D)
Gamma: 1.9
CCT: 7260 K
| MSI Prestige 16 B1MG-001US AU Optronics B160QAN03.R, IPS, 2560x1600, 16" | MSI Prestige 15 A12UD-093 Sharp LQ156D1JW42, IPS, 3840x2160, 15.6" | LG Gram 2in1 16 16T90R - G.AA78G LP160WQ1-SPB2, IPS, 2560x1600, 16" | Lenovo ThinkBook 16 G6 ABP LEN160WUXGA, IPS, 1920x1200, 16" | Asus VivoBook Pro 16 K6602VU Samsung ATNA60BX01-1, OLED, 3200x2000, 16" | Dell Inspiron 16 Plus 7630 LG Philips 160WQ2, IPS, 2560x1600, 16" | |
|---|---|---|---|---|---|---|
| Display | -3% | 0% | -49% | 5% | -14% | |
| Display P3 Coverage (%) | 96.7 | 80.48 -17% | 96.5 0% | 40.4 -58% | 98.7 2% | 70.1 -28% |
| sRGB Coverage (%) | 99.8 | 96.95 -3% | 99.9 0% | 59.8 -40% | 99.7 0% | 99.6 0% |
| AdobeRGB 1998 Coverage (%) | 84.6 | 94.02 11% | 84.6 0% | 42 -50% | 96.5 14% | 72.3 -15% |
| Response Times | 10% | 30% | 32% | 80% | 29% | |
| Response Time Grey 50% / Grey 80% * (ms) | 49.4 ? | 51 ? -3% | 38.4 ? 22% | 32.8 ? 34% | 0.68 ? 99% | 35 ? 29% |
| Response Time Black / White * (ms) | 33.9 ? | 26 ? 23% | 21.4 ? 37% | 23.9 ? 29% | 13.2 ? 61% | 24.2 ? 29% |
| PWM Frequency (Hz) | 240 ? | |||||
| Screen | 27% | -19% | -83% | -13% | 0% | |
| Brightness middle (cd/m²) | 473.6 | 441 -7% | 329 -31% | 310 -35% | 353 -25% | 299.4 -37% |
| Brightness (cd/m²) | 456 | 416 -9% | 310 -32% | 290 -36% | 354 -22% | 290 -36% |
| Brightness Distribution (%) | 87 | 85 -2% | 88 1% | 86 -1% | 98 13% | 92 6% |
| Black Level * (cd/m²) | 0.19 | 0.155 18% | 0.39 -105% | 0.22 -16% | 0.21 -11% | |
| Contrast (:1) | 2493 | 2845 14% | 844 -66% | 1409 -43% | 1426 -43% | |
| Colorchecker dE 2000 * | 5.9 | 1.51 74% | 3.52 40% | 6.2 -5% | 4.23 28% | 4.25 28% |
| Colorchecker dE 2000 max. * | 9.37 | 3.56 62% | 6.96 26% | 24.7 -164% | 7.13 24% | 6.71 28% |
| Colorchecker dE 2000 calibrated * | 0.89 | 1.15 -29% | 5.3 -496% | 2.42 -172% | 0.52 42% | |
| Greyscale dE 2000 * | 7.3 | 2.49 66% | 5.75 21% | 3.8 48% | 2.5 66% | 5.5 25% |
| Gamma | 1.9 116% | 2.17 101% | 2.137 103% | 2.22 99% | 2.4 92% | 2.35 94% |
| CCT | 7260 90% | 6292 103% | 7584 86% | 6011 108% | 6642 98% | 6368 102% |
| Moyenne finale (programmes/paramètres) | 11% /
17% | 4% /
-8% | -33% /
-60% | 24% /
7% | 5% /
1% |
* ... Moindre est la valeur, meilleures sont les performances
L'écran n'est pas pré-calibré, ce qui est dommage puisque tous les modèles prennent en charge les couleurs DCI-P3. La température des couleurs est trop froide pour des valeurs moyennes de DeltaE en niveaux de gris et en couleurs relativement élevées de 7,3 et 5,8, respectivement. En calibrant nous-mêmes le panneau, nous pourrions réduire ces valeurs moyennes à <2 chacune. Notre profil ICM calibré peut être téléchargé gratuitement ci-dessus.
Temps de réponse de l'écran
| ↔ Temps de réponse noir à blanc | ||
|---|---|---|
| 33.9 ms ... hausse ↗ et chute ↘ combinées | ↗ 15.6 ms hausse | 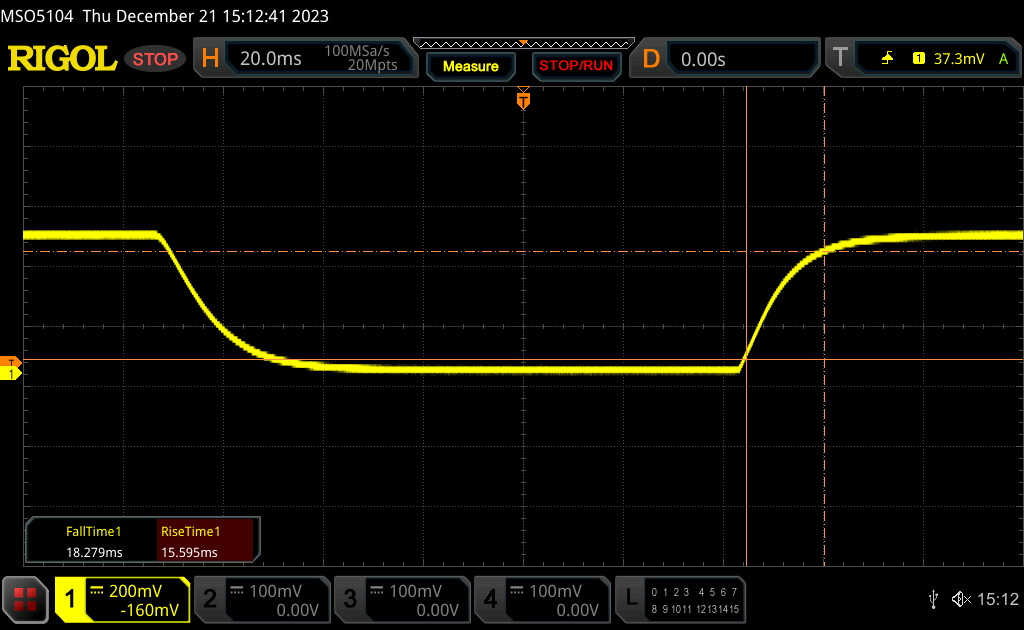 |
| ↘ 18.3 ms chute | ||
| L'écran souffre de latences très élevées, à éviter pour le jeu. En comparaison, tous les appareils testés affichent entre 0.1 (minimum) et 240 (maximum) ms. » 91 % des appareils testés affichent de meilleures performances. Cela signifie que les latences relevées sont moins bonnes que la moyenne (19.8 ms) de tous les appareils testés. | ||
| ↔ Temps de réponse gris 50% à gris 80% | ||
| 49.4 ms ... hausse ↗ et chute ↘ combinées | ↗ 22.6 ms hausse | 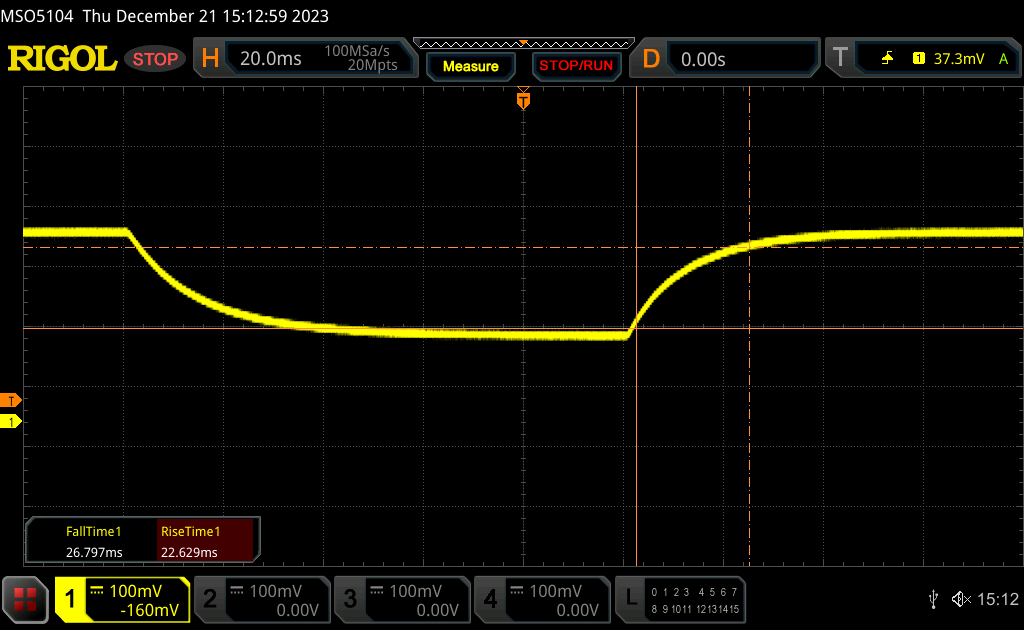 |
| ↘ 26.8 ms chute | ||
| L'écran souffre de latences très élevées, à éviter pour le jeu. En comparaison, tous les appareils testés affichent entre 0.165 (minimum) et 636 (maximum) ms. » 85 % des appareils testés affichent de meilleures performances. Cela signifie que les latences relevées sont moins bonnes que la moyenne (31 ms) de tous les appareils testés. | ||
Scintillement / MLI (Modulation de largeur d'impulsion)
| Scintillement / MLI (Modulation de largeur d'impulsion) non décelé | 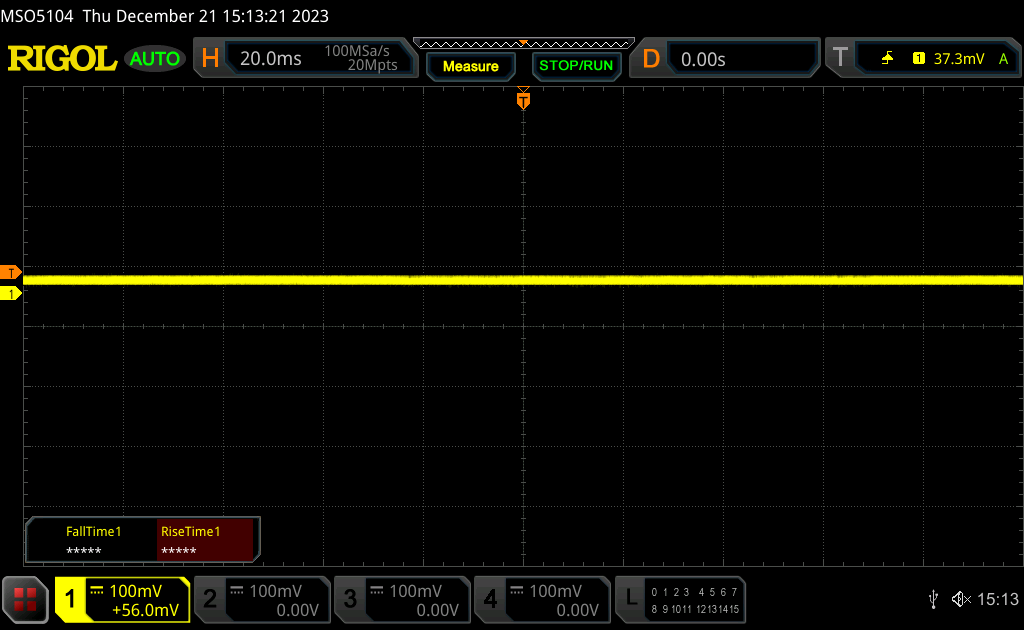 | ||
En comparaison, 52 % des appareils testés n'emploient pas MDI pour assombrir leur écran. Nous avons relevé une moyenne à 7778 (minimum : 5 - maximum : 343500) Hz dans le cas où une MDI était active. | |||
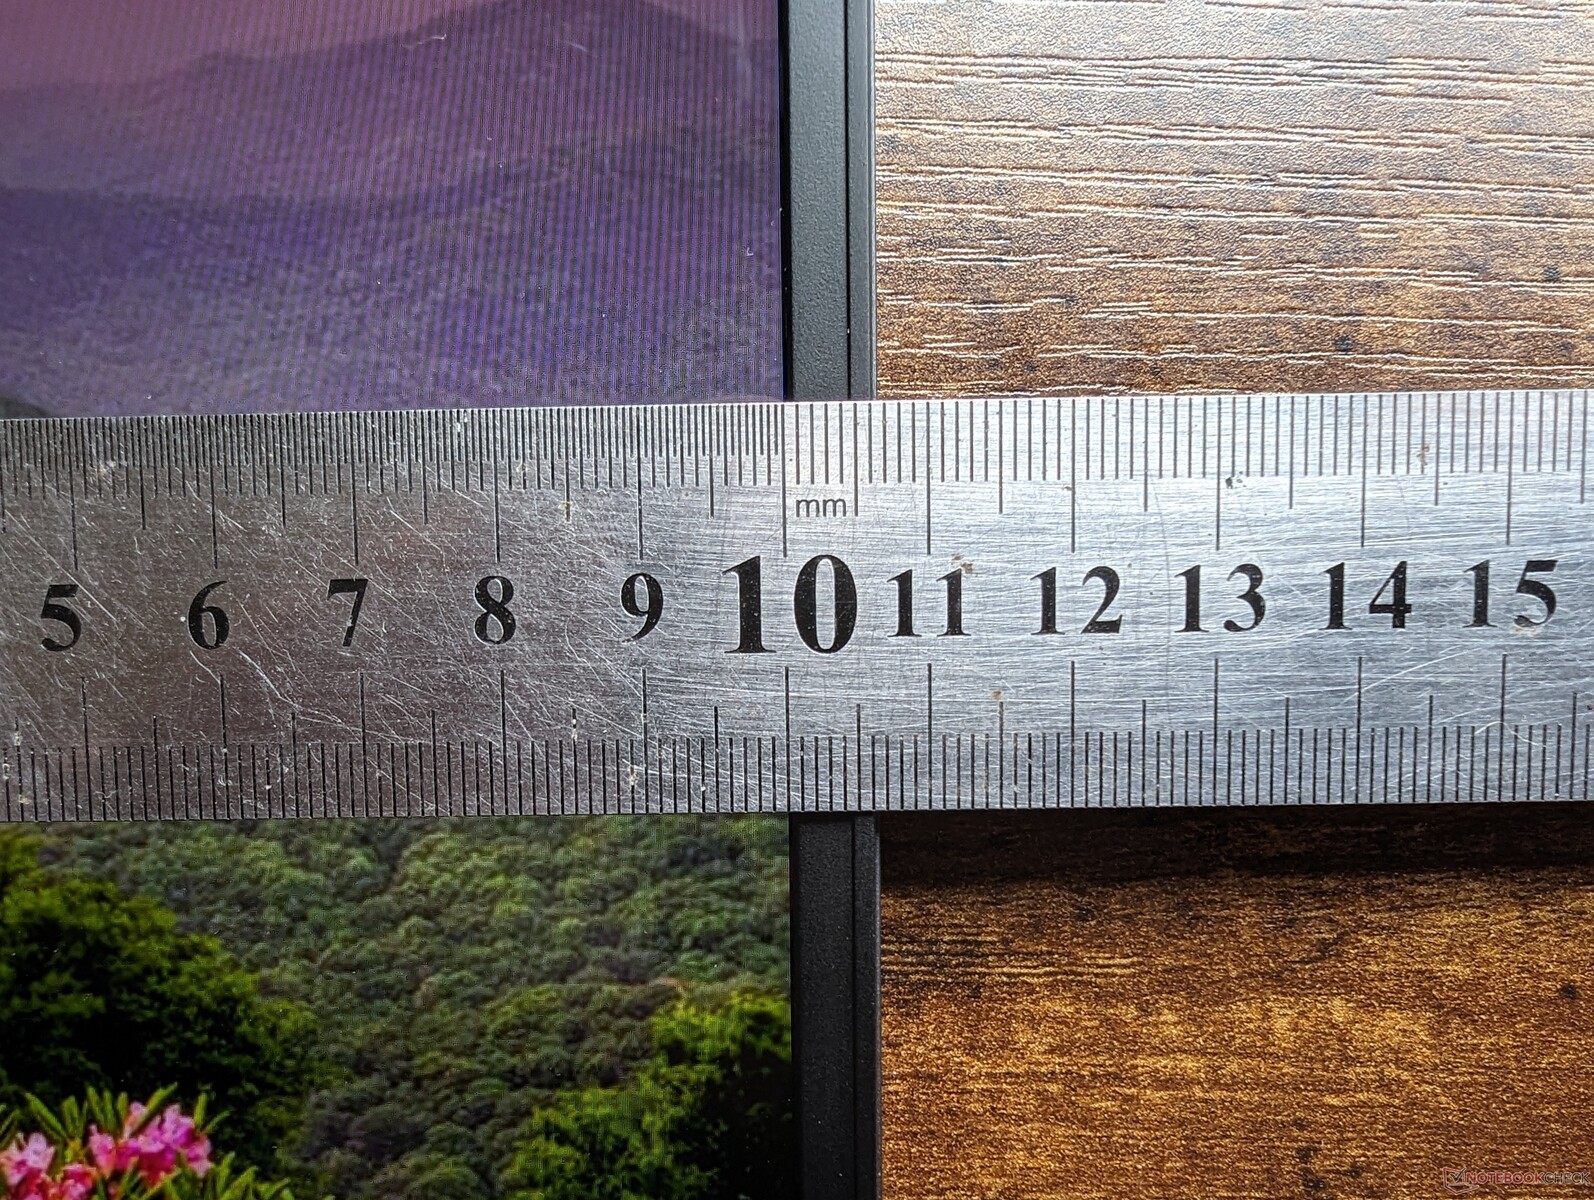
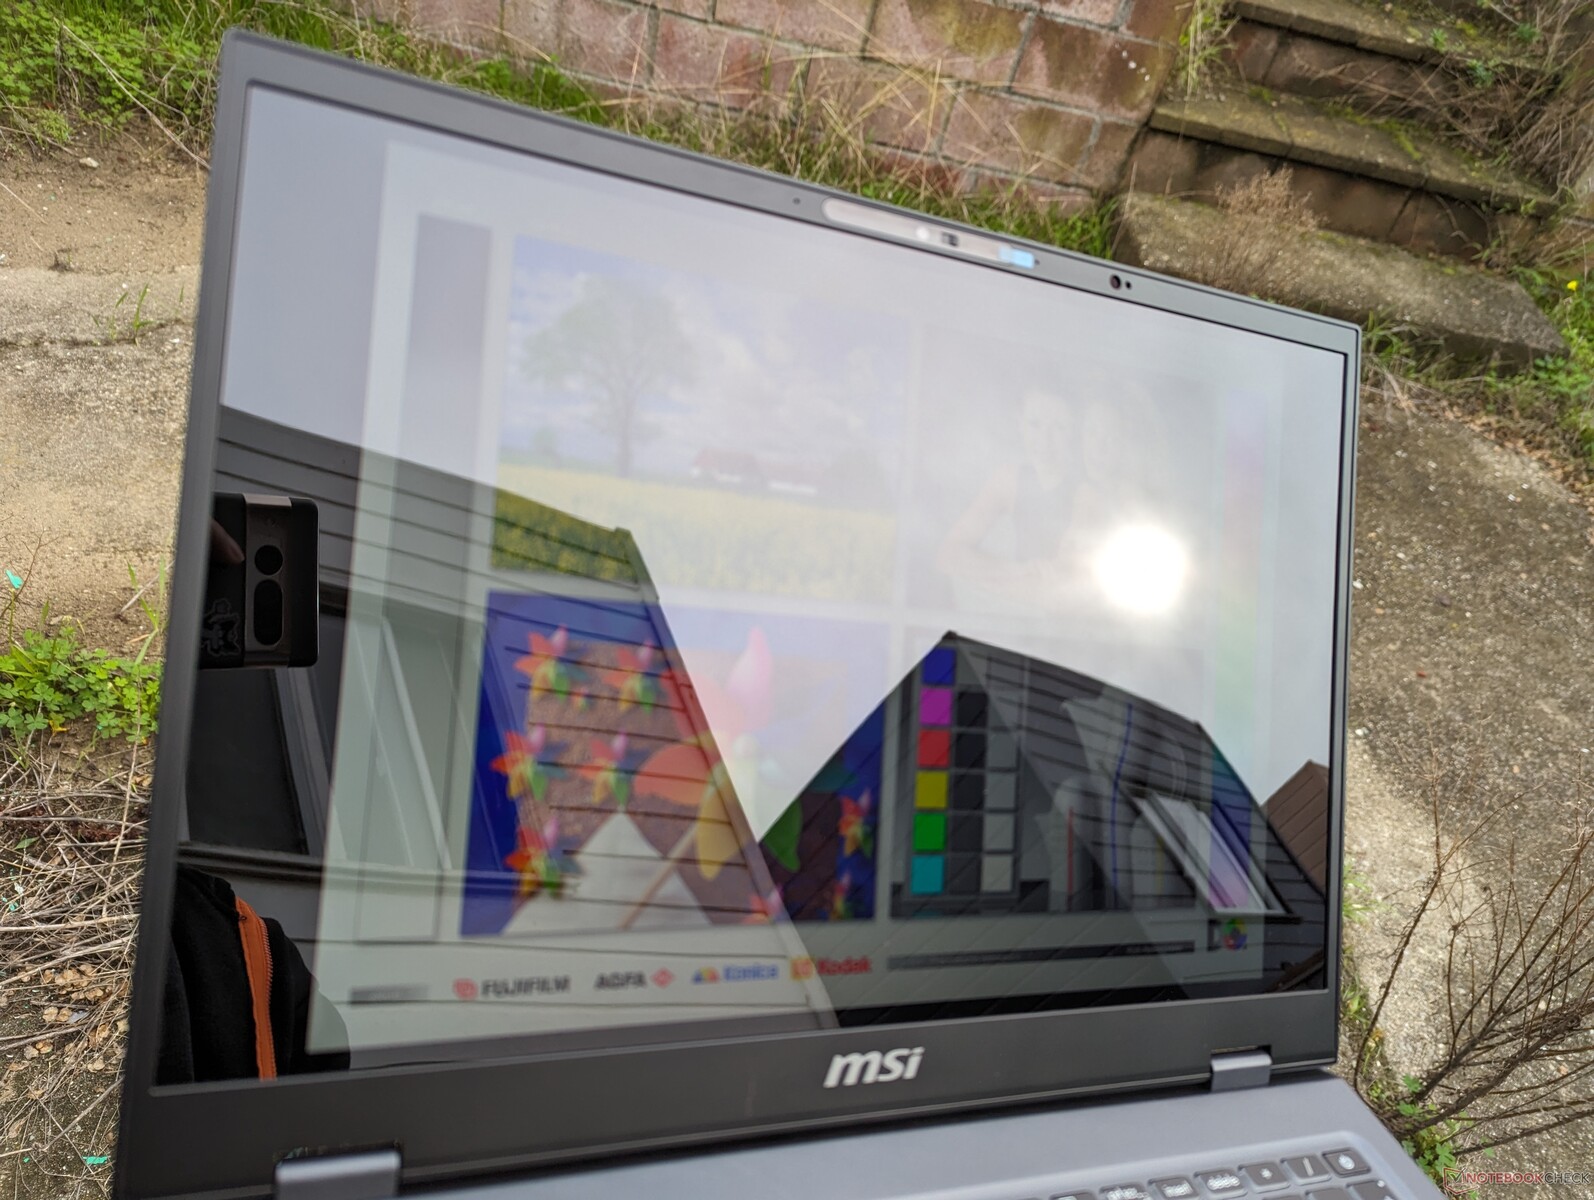
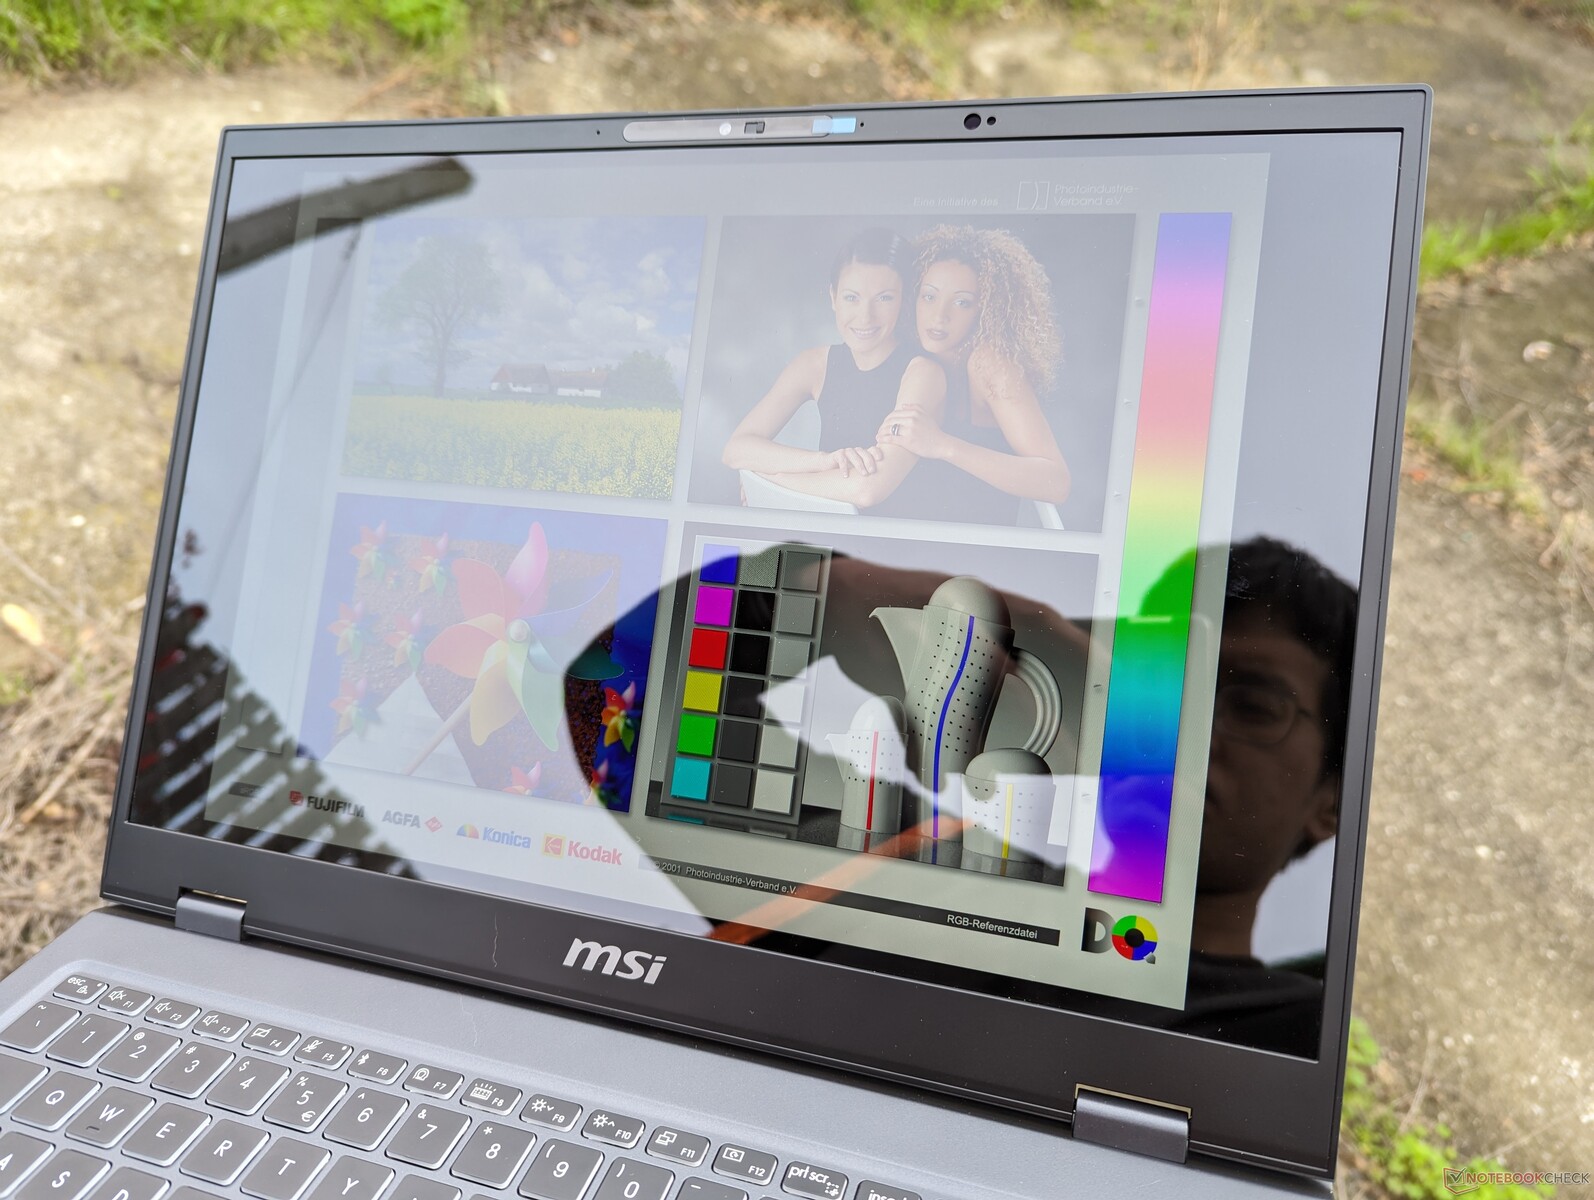
L'écran super brillant peut contribuer à une image plus nette, mais il contribue également à un éblouissement excessif dans la plupart des scénarios d'utilisation, en particulier à l'extérieur. L'écran Mini-LED du MacBook Pro 16 est environ 30 % plus lumineux que celui de notre MSI, ce qui améliore généralement la visibilité en cas d'éclairage ambiant intense.

Performance - Une ascension fulgurante
Conditions d'essai
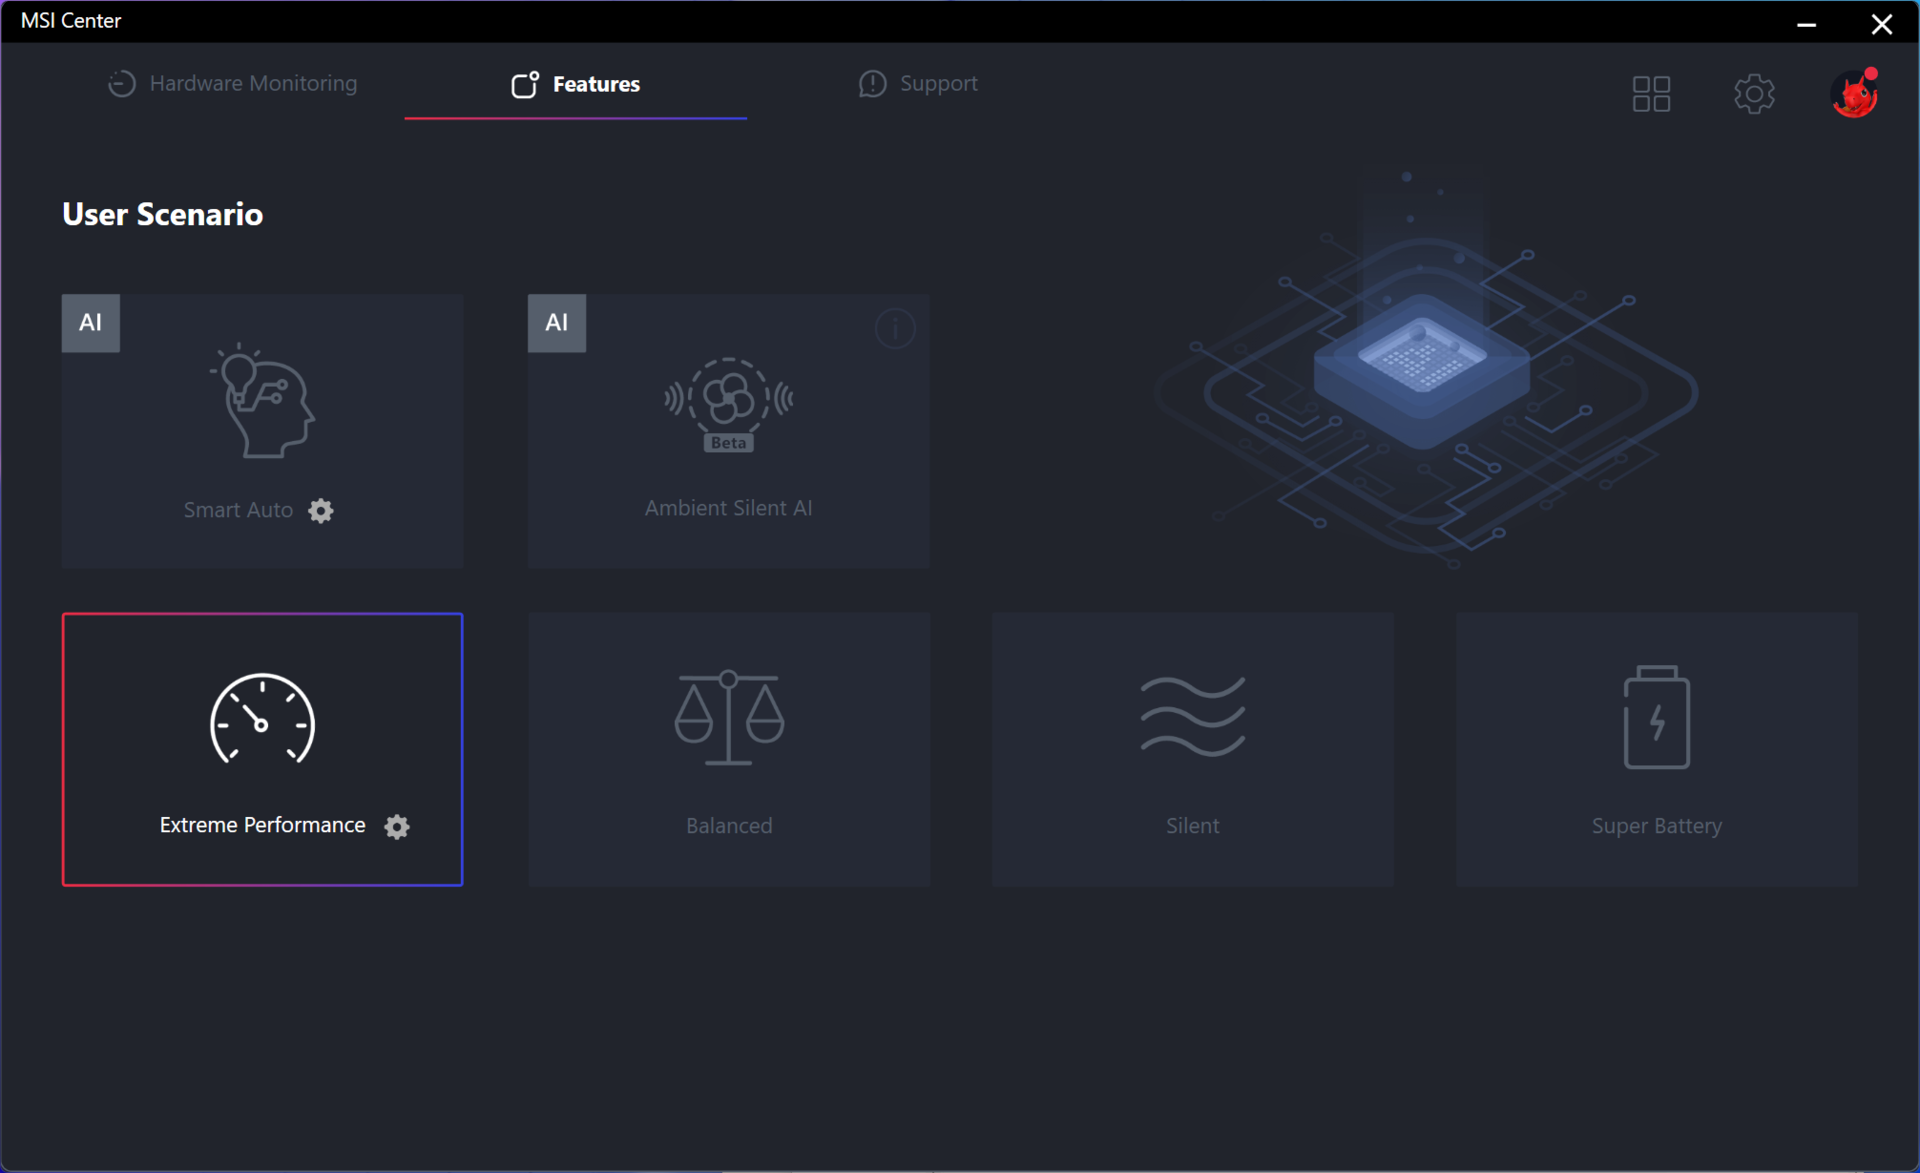
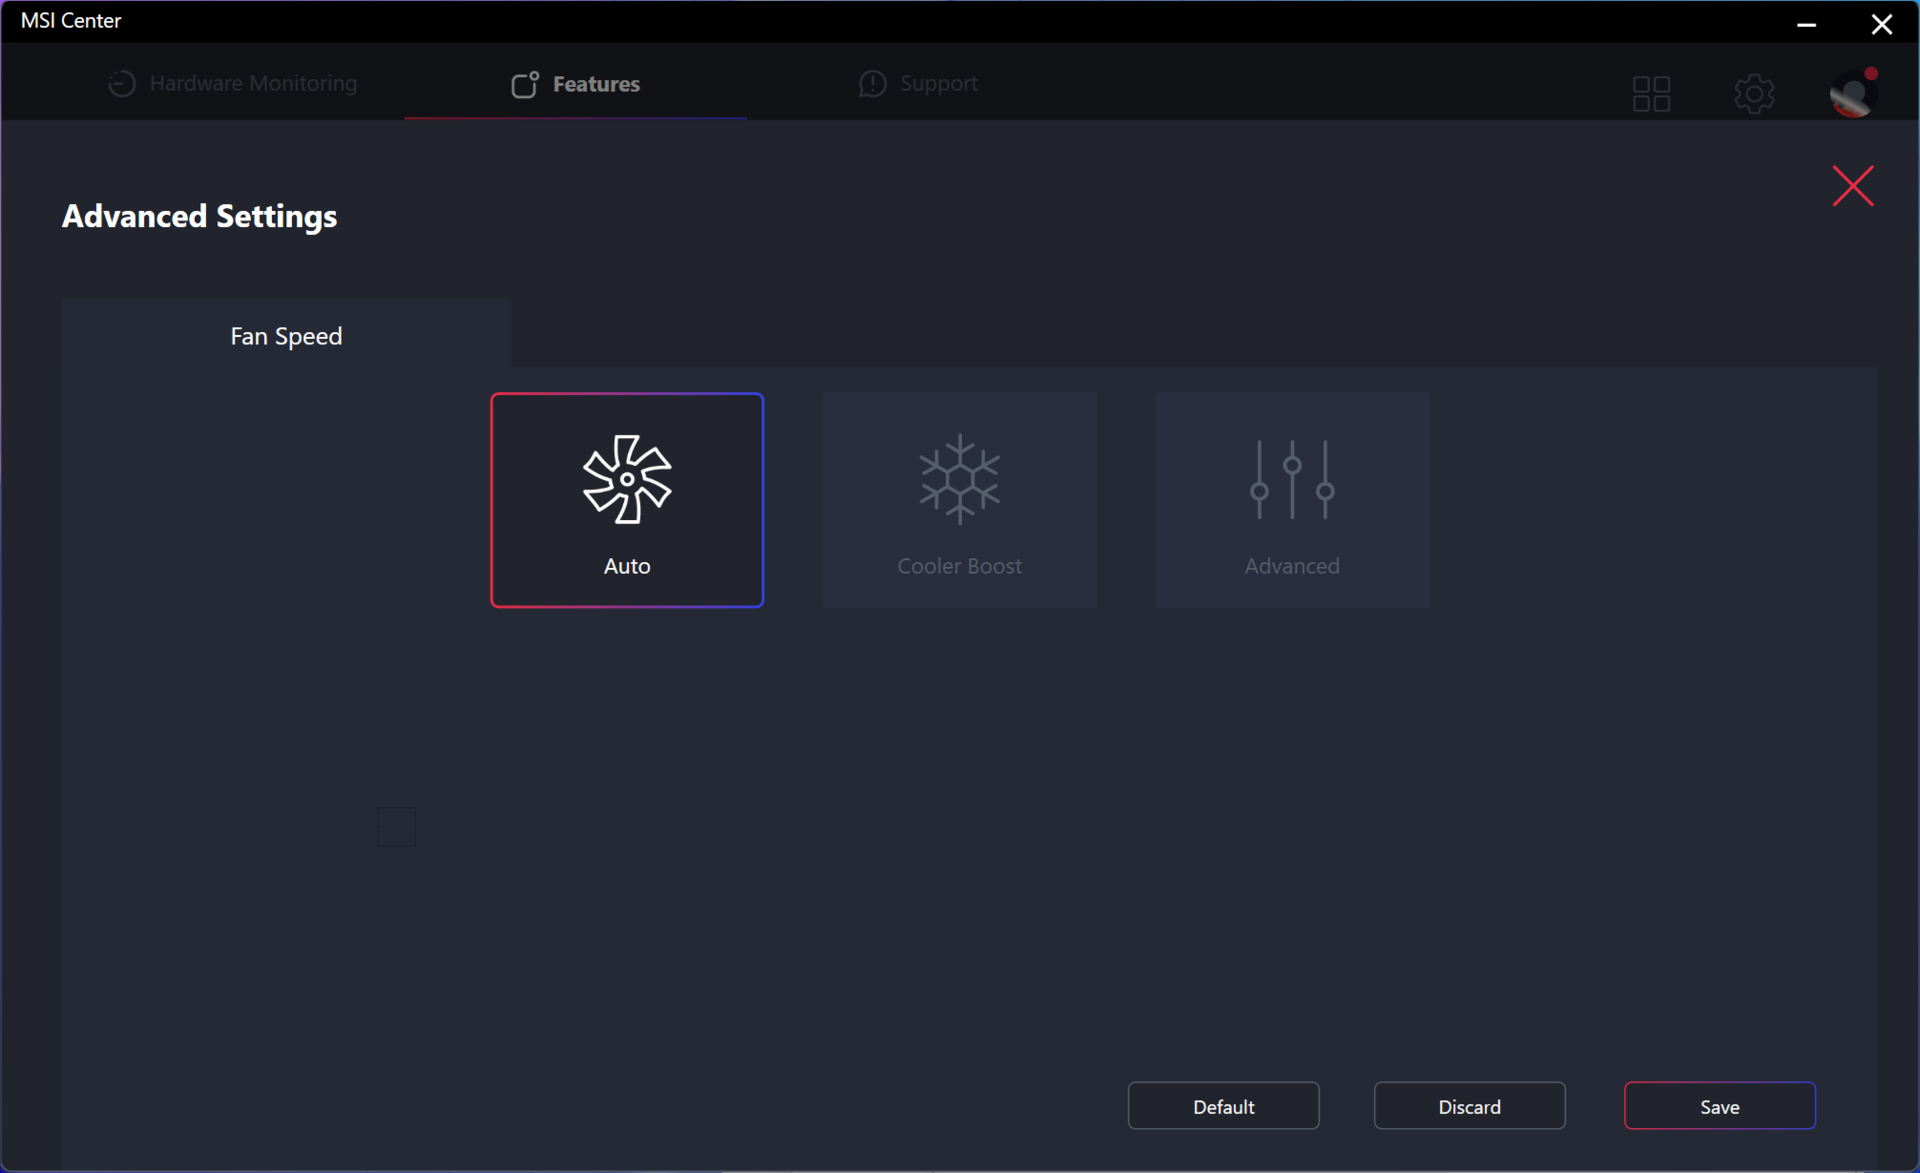
Nous avons réglé Windows sur le mode Performance et MSI Center sur le mode Performance extrême avant d'effectuer les tests de référence ci-dessous. Les propriétaires devraient se familiariser avec le MSI Center, car c'est le centre des mises à jour et des fonctionnalités spécifiques à MSI.
Processeur
Les performances du processeur ont fait un énorme bond en avant par rapport aux options Core U et Core P de la dernière génération. Notre Core Ultra 7 155H a une avance confortable de 20 à 25 % sur le Core i7-1360P et l'option la plus rapide de la série Zen 4 U d'AMD, le Ryzen 7 7840U.
Les utilisateurs qui s'attendent à des gains notables par rapport aux Core H de la 13e génération risquent d'être déçus. Par exemple, les performances brutes mono et multithread sont légèrement inférieures à celles du Core i7-13700H. Les différences les plus importantes entre les Core H de 13e et 14e génération sont liées à l'amélioration de l'iGPU et de l'accélération de l'intelligence artificielle des nouvelles options.
Un Core Ultra 9 185H plus haut de gamme Core Ultra 9 185H Est également disponible pour la Prestige 16, mais nous ne nous attendons pas à ce qu'il soit beaucoup plus rapide que notre configuration Core Ultra 7 155H, car les deux CPU ont exactement le même nombre de cœurs avec seulement de légères différences dans les fréquences d'horloge.
Cinebench R15 Multi Loop
Cinebench R23: Multi Core | Single Core
Cinebench R20: CPU (Multi Core) | CPU (Single Core)
Cinebench R15: CPU Multi 64Bit | CPU Single 64Bit
Blender: v2.79 BMW27 CPU
7-Zip 18.03: 7z b 4 | 7z b 4 -mmt1
Geekbench 5.5: Multi-Core | Single-Core
HWBOT x265 Benchmark v2.2: 4k Preset
LibreOffice : 20 Documents To PDF
R Benchmark 2.5: Overall mean
* ... Moindre est la valeur, meilleures sont les performances
AIDA64: FP32 Ray-Trace | FPU Julia | CPU SHA3 | CPU Queen | FPU SinJulia | FPU Mandel | CPU AES | CPU ZLib | FP64 Ray-Trace | CPU PhotoWorxx
| Performance rating | |
| MSI Prestige 16 B1MG-001US | |
| Asus VivoBook Pro 16 K6602VU | |
| Moyenne Intel Core Ultra 7 155H | |
| Dell Inspiron 16 Plus 7630 | |
| MSI Prestige 15 A12UD-093 | |
| LG Gram 2in1 16 16T90R - G.AA78G | |
| Lenovo ThinkBook 16 G6 ABP | |
| AIDA64 / FP32 Ray-Trace | |
| MSI Prestige 16 B1MG-001US | |
| Dell Inspiron 16 Plus 7630 | |
| Asus VivoBook Pro 16 K6602VU | |
| Moyenne Intel Core Ultra 7 155H (6670 - 18470, n=50) | |
| Lenovo ThinkBook 16 G6 ABP | |
| MSI Prestige 15 A12UD-093 | |
| LG Gram 2in1 16 16T90R - G.AA78G | |
| LG Gram 2in1 16 16T90R - G.AA78G | |
| AIDA64 / FPU Julia | |
| MSI Prestige 16 B1MG-001US | |
| Asus VivoBook Pro 16 K6602VU | |
| Moyenne Intel Core Ultra 7 155H (40905 - 93181, n=50) | |
| Lenovo ThinkBook 16 G6 ABP | |
| Dell Inspiron 16 Plus 7630 | |
| MSI Prestige 15 A12UD-093 | |
| LG Gram 2in1 16 16T90R - G.AA78G | |
| AIDA64 / CPU SHA3 | |
| MSI Prestige 16 B1MG-001US | |
| Asus VivoBook Pro 16 K6602VU | |
| Moyenne Intel Core Ultra 7 155H (1940 - 4436, n=50) | |
| Dell Inspiron 16 Plus 7630 | |
| MSI Prestige 15 A12UD-093 | |
| LG Gram 2in1 16 16T90R - G.AA78G | |
| Lenovo ThinkBook 16 G6 ABP | |
| AIDA64 / CPU Queen | |
| Dell Inspiron 16 Plus 7630 | |
| Asus VivoBook Pro 16 K6602VU | |
| MSI Prestige 16 B1MG-001US | |
| Moyenne Intel Core Ultra 7 155H (64698 - 94181, n=50) | |
| LG Gram 2in1 16 16T90R - G.AA78G | |
| MSI Prestige 15 A12UD-093 | |
| Lenovo ThinkBook 16 G6 ABP | |
| AIDA64 / FPU SinJulia | |
| MSI Prestige 16 B1MG-001US | |
| Lenovo ThinkBook 16 G6 ABP | |
| Moyenne Intel Core Ultra 7 155H (5639 - 10647, n=50) | |
| Dell Inspiron 16 Plus 7630 | |
| Asus VivoBook Pro 16 K6602VU | |
| MSI Prestige 15 A12UD-093 | |
| LG Gram 2in1 16 16T90R - G.AA78G | |
| AIDA64 / FPU Mandel | |
| MSI Prestige 16 B1MG-001US | |
| Lenovo ThinkBook 16 G6 ABP | |
| Moyenne Intel Core Ultra 7 155H (18236 - 47685, n=50) | |
| Asus VivoBook Pro 16 K6602VU | |
| Dell Inspiron 16 Plus 7630 | |
| MSI Prestige 15 A12UD-093 | |
| LG Gram 2in1 16 16T90R - G.AA78G | |
| AIDA64 / CPU AES | |
| Asus VivoBook Pro 16 K6602VU | |
| MSI Prestige 15 A12UD-093 | |
| LG Gram 2in1 16 16T90R - G.AA78G | |
| Moyenne Intel Core Ultra 7 155H (45713 - 152179, n=50) | |
| MSI Prestige 16 B1MG-001US | |
| Dell Inspiron 16 Plus 7630 | |
| Lenovo ThinkBook 16 G6 ABP | |
| AIDA64 / CPU ZLib | |
| MSI Prestige 16 B1MG-001US | |
| Asus VivoBook Pro 16 K6602VU | |
| Moyenne Intel Core Ultra 7 155H (557 - 1250, n=50) | |
| Dell Inspiron 16 Plus 7630 | |
| LG Gram 2in1 16 16T90R - G.AA78G | |
| MSI Prestige 15 A12UD-093 | |
| Lenovo ThinkBook 16 G6 ABP | |
| AIDA64 / FP64 Ray-Trace | |
| MSI Prestige 16 B1MG-001US | |
| Asus VivoBook Pro 16 K6602VU | |
| Dell Inspiron 16 Plus 7630 | |
| Moyenne Intel Core Ultra 7 155H (3569 - 9802, n=50) | |
| Lenovo ThinkBook 16 G6 ABP | |
| MSI Prestige 15 A12UD-093 | |
| LG Gram 2in1 16 16T90R - G.AA78G | |
| AIDA64 / CPU PhotoWorxx | |
| Moyenne Intel Core Ultra 7 155H (32719 - 54223, n=50) | |
| MSI Prestige 16 B1MG-001US | |
| MSI Prestige 15 A12UD-093 | |
| LG Gram 2in1 16 16T90R - G.AA78G | |
| Asus VivoBook Pro 16 K6602VU | |
| Dell Inspiron 16 Plus 7630 | |
| Lenovo ThinkBook 16 G6 ABP | |
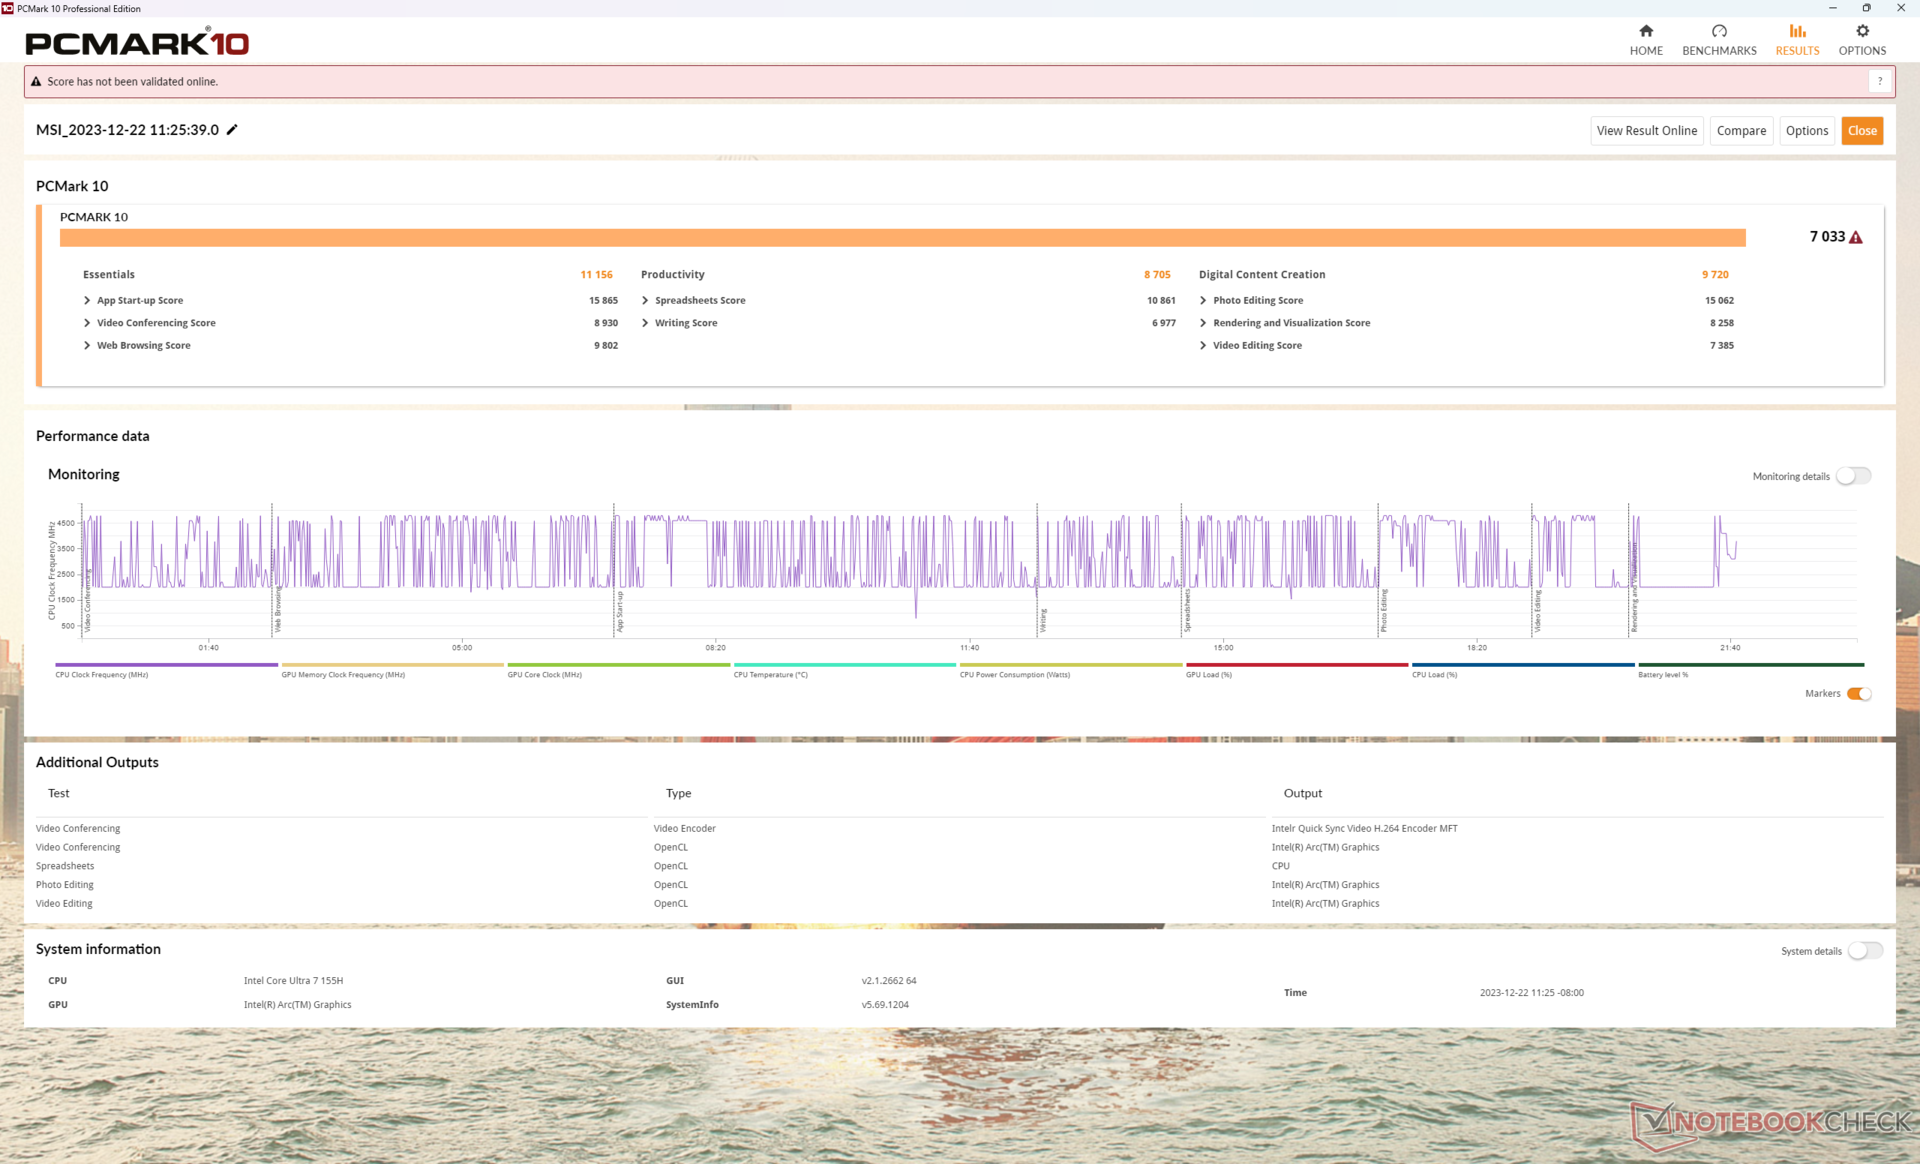
Performance du système
Les résultats de PCMark sont comparables à ceux d'ordinateurs portables multimédias dotés d'une carte graphique discrète de milieu de gamme, comme le Asus VivoBook Pro 16. Cependant, la signification des scores est discutable car les chiffres sont difficiles à comparer directement entre les ordinateurs portables équipés d'un iGPU et d'un dGPU.
La mémoire vive rapide de 6400 MHz mérite d'être mentionnée, d'autant plus que les performances de l'iGPU sont étroitement liées à celles de la mémoire vive.
CrossMark: Overall | Productivity | Creativity | Responsiveness
WebXPRT 3: Overall
WebXPRT 4: Overall
Mozilla Kraken 1.1: Total
| PCMark 10 / Score | |
| Dell Inspiron 16 Plus 7630 | |
| Asus VivoBook Pro 16 K6602VU | |
| MSI Prestige 16 B1MG-001US | |
| Moyenne Intel Core Ultra 7 155H, Intel Arc 8-Core iGPU (4809 - 7529, n=34) | |
| MSI Prestige 15 A12UD-093 | |
| Lenovo ThinkBook 16 G6 ABP | |
| LG Gram 2in1 16 16T90R - G.AA78G | |
| PCMark 10 / Essentials | |
| LG Gram 2in1 16 16T90R - G.AA78G | |
| Dell Inspiron 16 Plus 7630 | |
| MSI Prestige 16 B1MG-001US | |
| Lenovo ThinkBook 16 G6 ABP | |
| Moyenne Intel Core Ultra 7 155H, Intel Arc 8-Core iGPU (7605 - 11289, n=34) | |
| Asus VivoBook Pro 16 K6602VU | |
| MSI Prestige 15 A12UD-093 | |
| PCMark 10 / Productivity | |
| Dell Inspiron 16 Plus 7630 | |
| Lenovo ThinkBook 16 G6 ABP | |
| MSI Prestige 15 A12UD-093 | |
| MSI Prestige 16 B1MG-001US | |
| Asus VivoBook Pro 16 K6602VU | |
| Moyenne Intel Core Ultra 7 155H, Intel Arc 8-Core iGPU (6042 - 10591, n=34) | |
| LG Gram 2in1 16 16T90R - G.AA78G | |
| PCMark 10 / Digital Content Creation | |
| Dell Inspiron 16 Plus 7630 | |
| Asus VivoBook Pro 16 K6602VU | |
| MSI Prestige 16 B1MG-001US | |
| Moyenne Intel Core Ultra 7 155H, Intel Arc 8-Core iGPU (4985 - 10709, n=34) | |
| MSI Prestige 15 A12UD-093 | |
| LG Gram 2in1 16 16T90R - G.AA78G | |
| Lenovo ThinkBook 16 G6 ABP | |
| CrossMark / Overall | |
| Dell Inspiron 16 Plus 7630 | |
| MSI Prestige 16 B1MG-001US | |
| Asus VivoBook Pro 16 K6602VU | |
| MSI Prestige 15 A12UD-093 | |
| Moyenne Intel Core Ultra 7 155H, Intel Arc 8-Core iGPU (1366 - 1903, n=34) | |
| LG Gram 2in1 16 16T90R - G.AA78G | |
| Lenovo ThinkBook 16 G6 ABP | |
| CrossMark / Productivity | |
| Dell Inspiron 16 Plus 7630 | |
| MSI Prestige 16 B1MG-001US | |
| Asus VivoBook Pro 16 K6602VU | |
| MSI Prestige 15 A12UD-093 | |
| Moyenne Intel Core Ultra 7 155H, Intel Arc 8-Core iGPU (1291 - 1798, n=33) | |
| LG Gram 2in1 16 16T90R - G.AA78G | |
| Lenovo ThinkBook 16 G6 ABP | |
| CrossMark / Creativity | |
| Dell Inspiron 16 Plus 7630 | |
| MSI Prestige 16 B1MG-001US | |
| Asus VivoBook Pro 16 K6602VU | |
| Moyenne Intel Core Ultra 7 155H, Intel Arc 8-Core iGPU (1519 - 1929, n=33) | |
| MSI Prestige 15 A12UD-093 | |
| LG Gram 2in1 16 16T90R - G.AA78G | |
| Lenovo ThinkBook 16 G6 ABP | |
| CrossMark / Responsiveness | |
| MSI Prestige 15 A12UD-093 | |
| Dell Inspiron 16 Plus 7630 | |
| MSI Prestige 16 B1MG-001US | |
| Asus VivoBook Pro 16 K6602VU | |
| LG Gram 2in1 16 16T90R - G.AA78G | |
| Moyenne Intel Core Ultra 7 155H, Intel Arc 8-Core iGPU (939 - 1802, n=33) | |
| Lenovo ThinkBook 16 G6 ABP | |
| WebXPRT 3 / Overall | |
| Dell Inspiron 16 Plus 7630 | |
| MSI Prestige 16 B1MG-001US | |
| Moyenne Intel Core Ultra 7 155H, Intel Arc 8-Core iGPU (252 - 299, n=34) | |
| Lenovo ThinkBook 16 G6 ABP | |
| LG Gram 2in1 16 16T90R - G.AA78G | |
| MSI Prestige 15 A12UD-093 | |
| WebXPRT 4 / Overall | |
| Dell Inspiron 16 Plus 7630 | |
| MSI Prestige 16 B1MG-001US | |
| Moyenne Intel Core Ultra 7 155H, Intel Arc 8-Core iGPU (166.4 - 309, n=29) | |
| Asus VivoBook Pro 16 K6602VU | |
| Lenovo ThinkBook 16 G6 ABP | |
| Mozilla Kraken 1.1 / Total | |
| MSI Prestige 15 A12UD-093 | |
| LG Gram 2in1 16 16T90R - G.AA78G | |
| Lenovo ThinkBook 16 G6 ABP | |
| Asus VivoBook Pro 16 K6602VU | |
| Moyenne Intel Core Ultra 7 155H, Intel Arc 8-Core iGPU (517 - 614, n=35) | |
| MSI Prestige 16 B1MG-001US | |
| Dell Inspiron 16 Plus 7630 | |
* ... Moindre est la valeur, meilleures sont les performances
| PCMark 10 Score | 7033 points | |
Aide | ||
| AIDA64 / Memory Copy | |
| Moyenne Intel Core Ultra 7 155H (62397 - 96791, n=50) | |
| MSI Prestige 16 B1MG-001US | |
| MSI Prestige 15 A12UD-093 | |
| LG Gram 2in1 16 16T90R - G.AA78G | |
| Dell Inspiron 16 Plus 7630 | |
| Asus VivoBook Pro 16 K6602VU | |
| Lenovo ThinkBook 16 G6 ABP | |
| AIDA64 / Memory Read | |
| Moyenne Intel Core Ultra 7 155H (60544 - 90647, n=50) | |
| MSI Prestige 16 B1MG-001US | |
| Dell Inspiron 16 Plus 7630 | |
| Asus VivoBook Pro 16 K6602VU | |
| MSI Prestige 15 A12UD-093 | |
| LG Gram 2in1 16 16T90R - G.AA78G | |
| Lenovo ThinkBook 16 G6 ABP | |
| AIDA64 / Memory Write | |
| LG Gram 2in1 16 16T90R - G.AA78G | |
| MSI Prestige 16 B1MG-001US | |
| Moyenne Intel Core Ultra 7 155H (58692 - 93451, n=50) | |
| MSI Prestige 15 A12UD-093 | |
| Asus VivoBook Pro 16 K6602VU | |
| Dell Inspiron 16 Plus 7630 | |
| Lenovo ThinkBook 16 G6 ABP | |
| AIDA64 / Memory Latency | |
| Moyenne Intel Core Ultra 7 155H (116.2 - 233, n=50) | |
| MSI Prestige 16 B1MG-001US | |
| LG Gram 2in1 16 16T90R - G.AA78G | |
| MSI Prestige 15 A12UD-093 | |
| Lenovo ThinkBook 16 G6 ABP | |
| Dell Inspiron 16 Plus 7630 | |
| Asus VivoBook Pro 16 K6602VU | |
* ... Moindre est la valeur, meilleures sont les performances
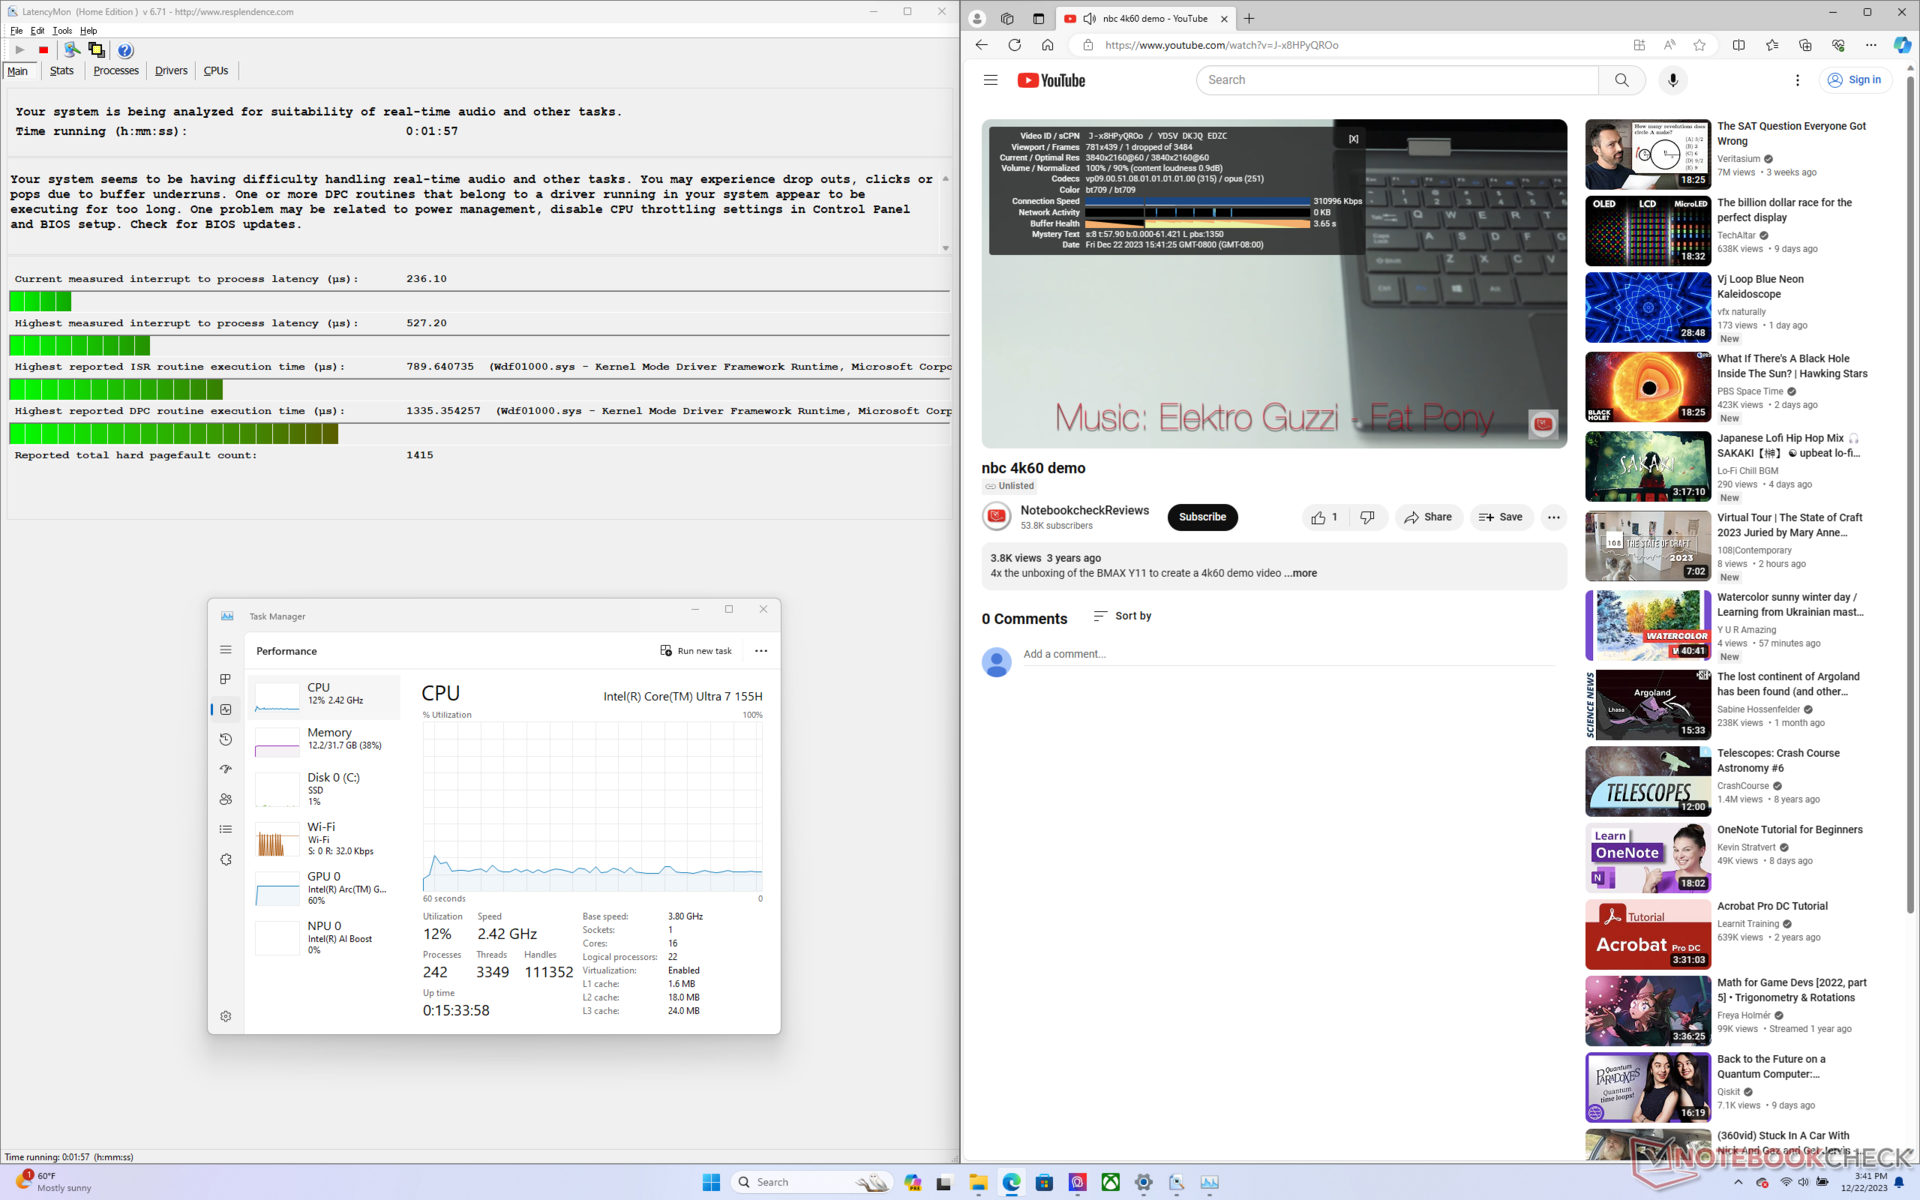
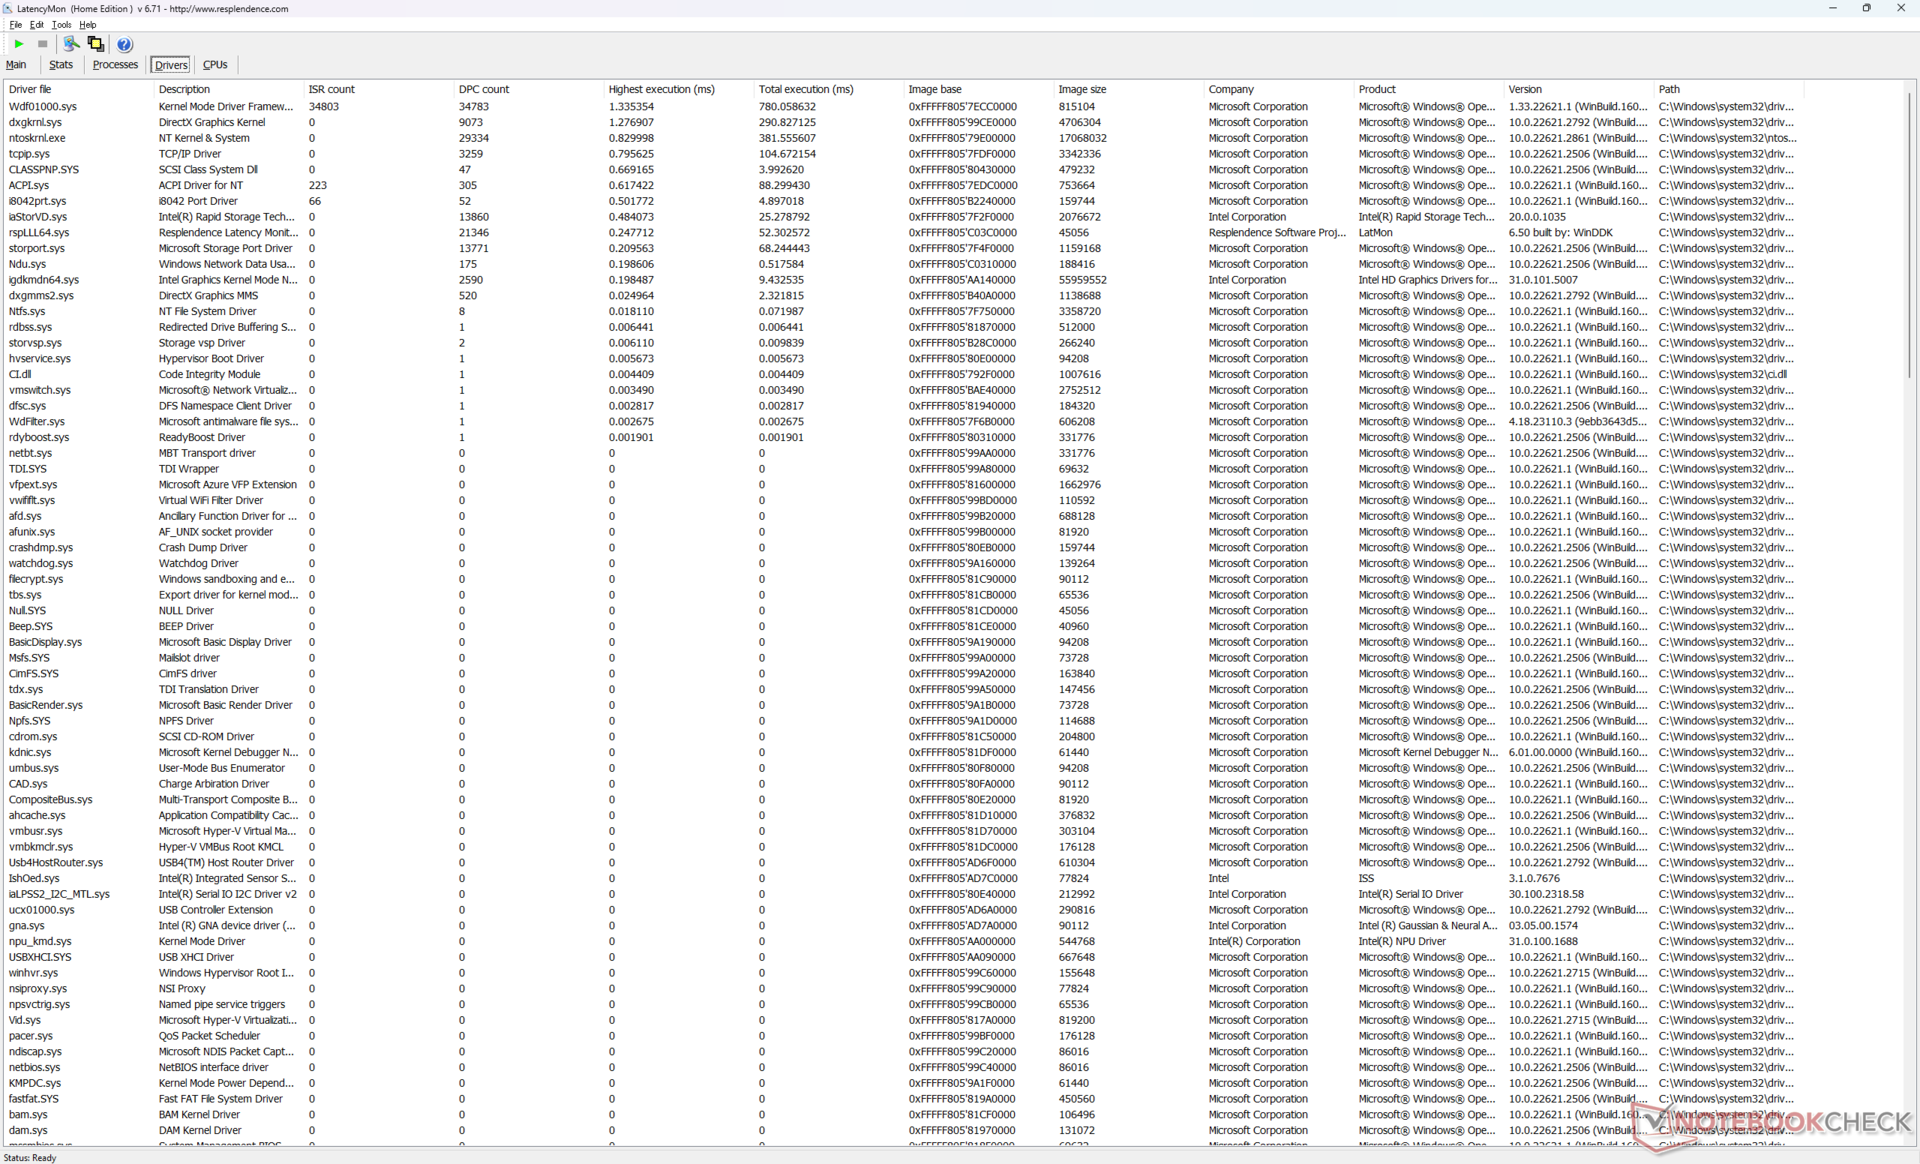
Latence DPC
LatencyMon ne révèle que des problèmes mineurs de DPC lors de l'ouverture de plusieurs onglets de notre page d'accueil. la lecture de vidéos 4K à 60 FPS est presque parfaite, avec une seule image perdue enregistrée au cours d'un test vidéo de 60 secondes.
| DPC Latencies / LatencyMon - interrupt to process latency (max), Web, Youtube, Prime95 | |
| LG Gram 2in1 16 16T90R - G.AA78G | |
| Asus VivoBook Pro 16 K6602VU | |
| MSI Prestige 15 A12UD-093 | |
| Lenovo ThinkBook 16 G6 ABP | |
| Dell Inspiron 16 Plus 7630 | |
| MSI Prestige 16 B1MG-001US | |
* ... Moindre est la valeur, meilleures sont les performances
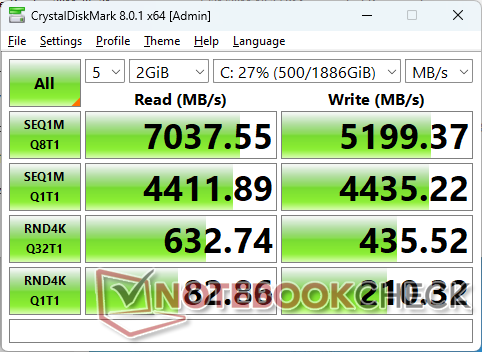
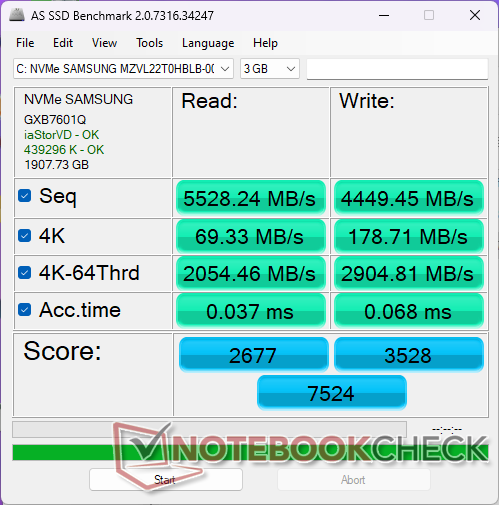
Dispositifs de stockage
Notre unité est équipée d'un disque dur de 2 To Samsung PM9A1 qui est l'un des disques durs NVMe PCIe4 x4 les plus rapides disponibles pour le grand public et une mise à niveau par rapport au Micron 3400 de notre ancienne Prestige 15. Le disque est capable de maintenir des vitesses de ~7100 MB/s même lorsqu'il est sollicité, ce qui est impressionnant compte tenu de la finesse du châssis.

| Drive Performance rating - Percent | |
| MSI Prestige 16 B1MG-001US | |
| LG Gram 2in1 16 16T90R - G.AA78G | |
| MSI Prestige 15 A12UD-093 | |
| Dell Inspiron 16 Plus 7630 | |
| Lenovo ThinkBook 16 G6 ABP | |
| Asus VivoBook Pro 16 K6602VU | |
* ... Moindre est la valeur, meilleures sont les performances
Disk Throttling: DiskSpd Read Loop, Queue Depth 8
Performances des GPU - Reprendre la couronne des cartes graphiques intégrées
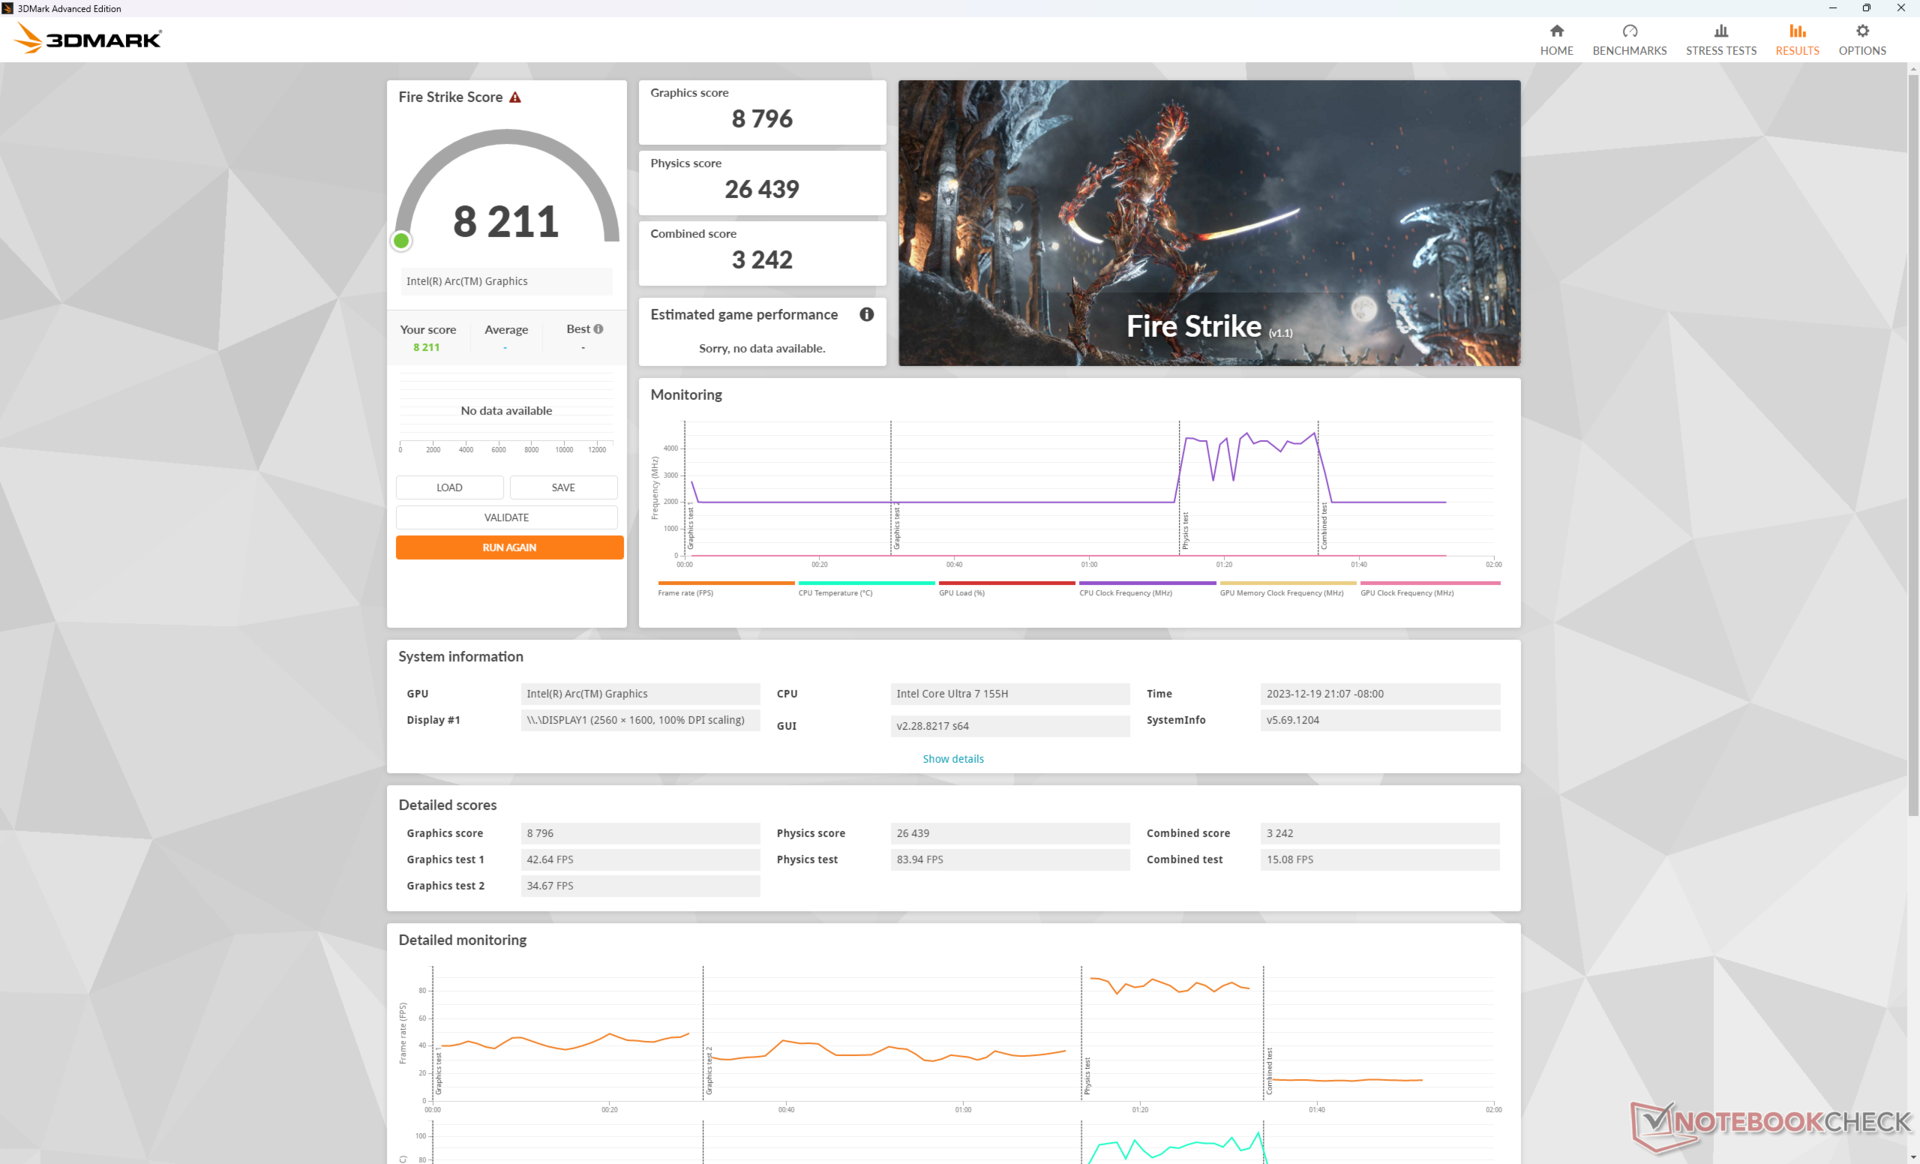
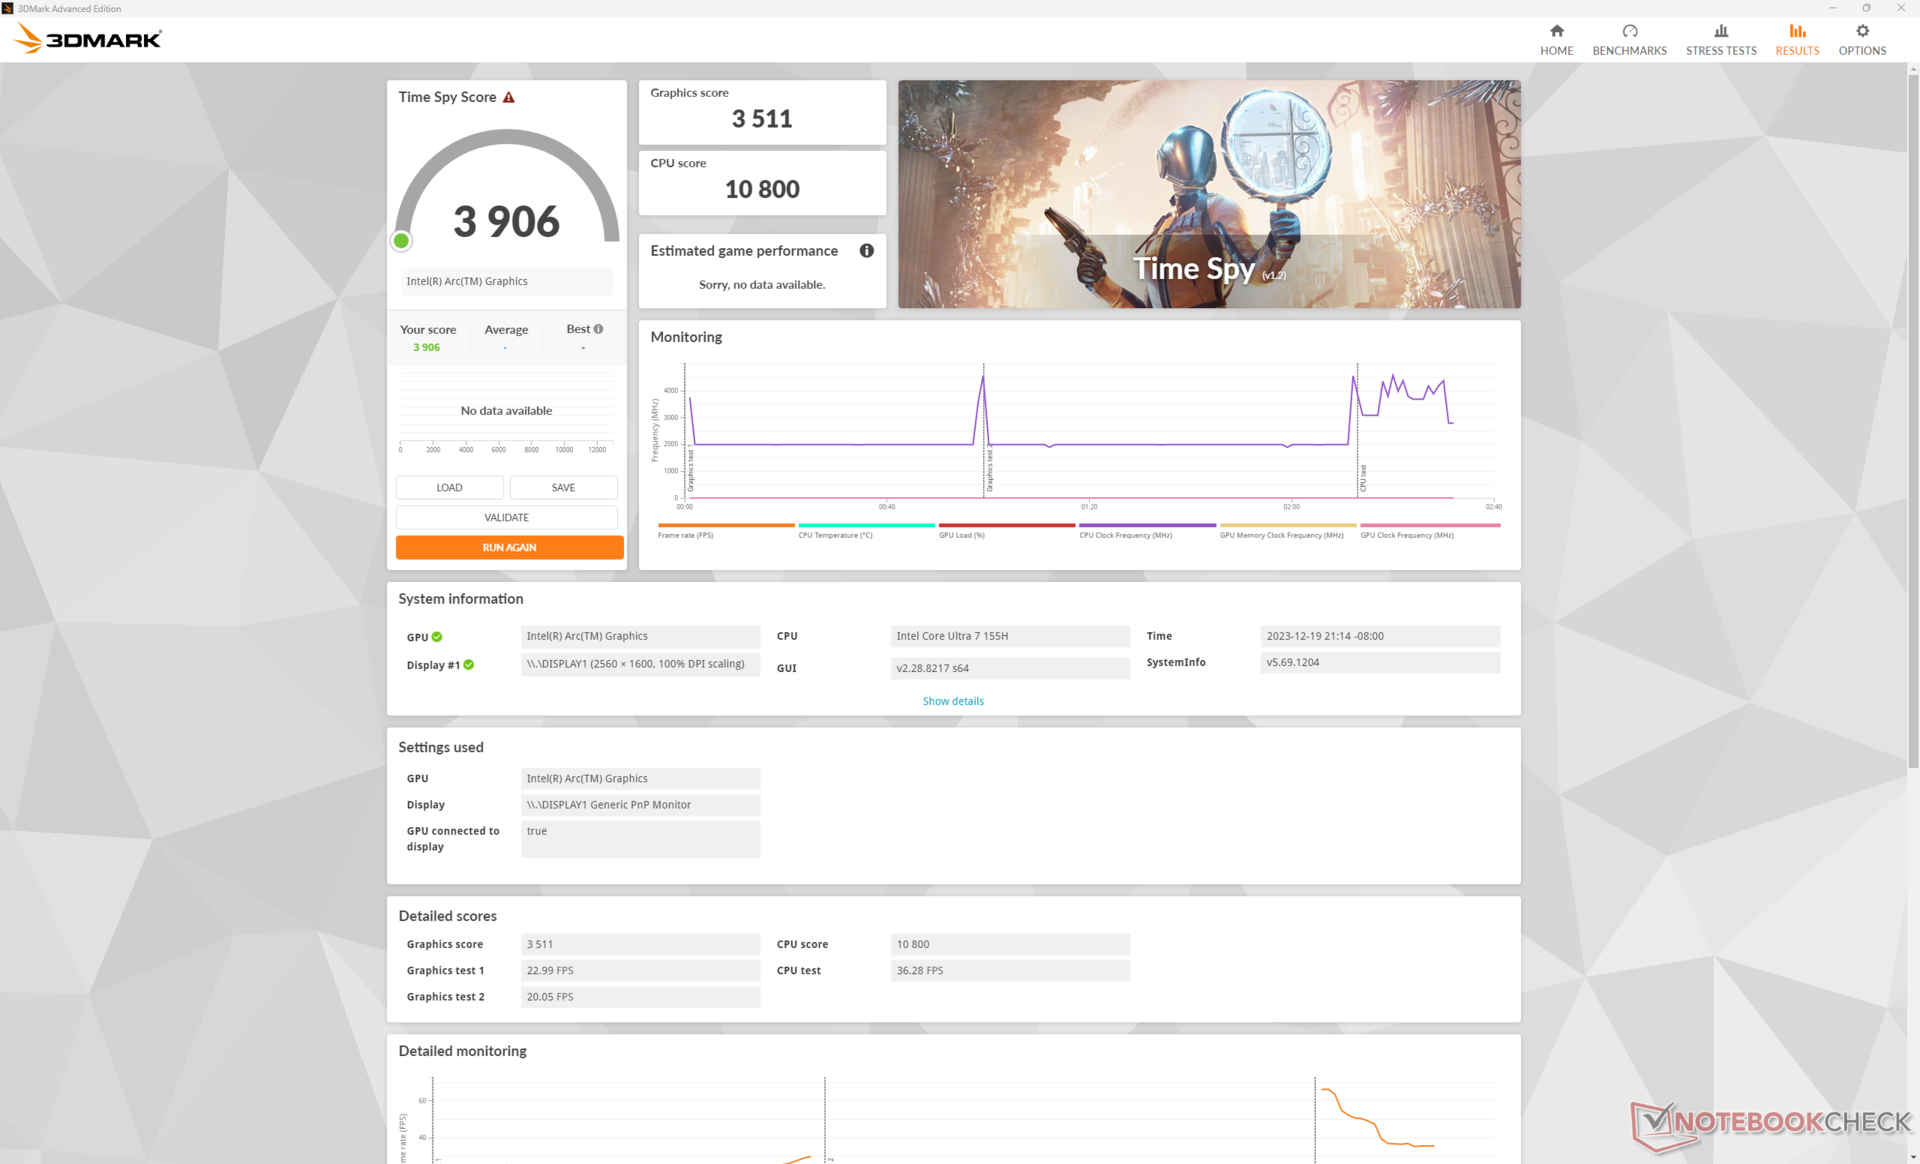
Après quelques années de stagnation, Intel a enfin revu son GPU intégré pour être plus compétitif face aux concurrentes Radeon 680M et 780M concurrentes. les résultats de 3DMark placent notre Arc 8 devant la Radeon 780M d'environ 20 %, voire jusqu'à 50 % sur les titres compatibles DX12. Les utilisateurs qui passent d'une carte Iris Xe 96 EUs doivent s'attendre à une augmentation des performances brutes d'environ 1,5 à 2 fois. Ce n'est pas tout à fait au niveau d'une GeForce RTX 3050 Ti, mais les scores se rapprochent nettement d'une GeForce RTX 2050.
| Profil de puissance | Score physique | Score graphique | Score combiné |
| Performances extrêmes (Cooler Boost activé) | 26439 | 8796 | 3242 |
| Performances extrêmes (Cooler Boost désactivé) | 26460 (-0%) | 8614 (-2%) | 3187 (-2%) |
| Mode équilibré | 25110 (-5%) | 8814 (-0%) | 3306 (-0%) |
| Mode batterie | 21717 (-18%) | 7425 (-16%) | 2761 (-15%) |
L'activation de Cooler Boost ne semble pas avoir d'impact significatif sur les performances selon notre tableau de résultats Fire Strike ci-dessus. L'exécution en mode équilibré n'aurait qu'un léger impact sur les performances du processeur, tandis que le mode batterie réduirait les performances de manière plus significative, d'environ 15 %.
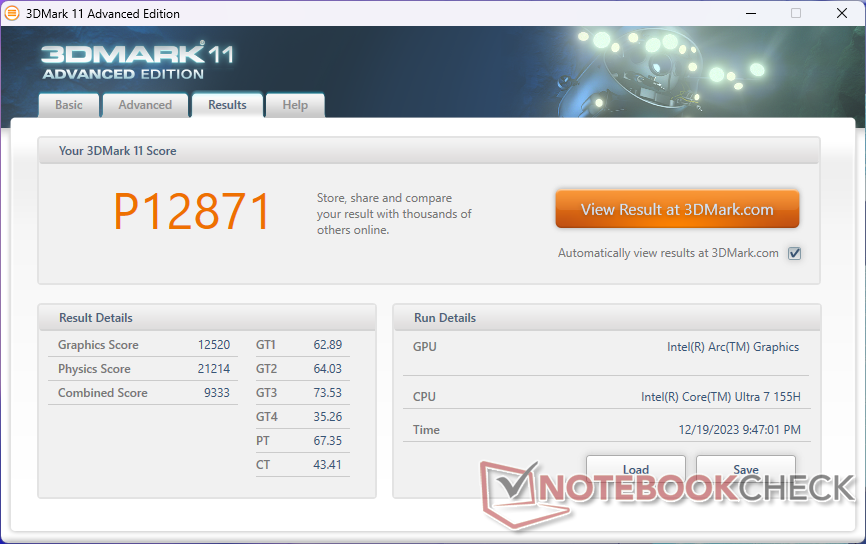
| 3DMark 11 Performance | 12871 points | |
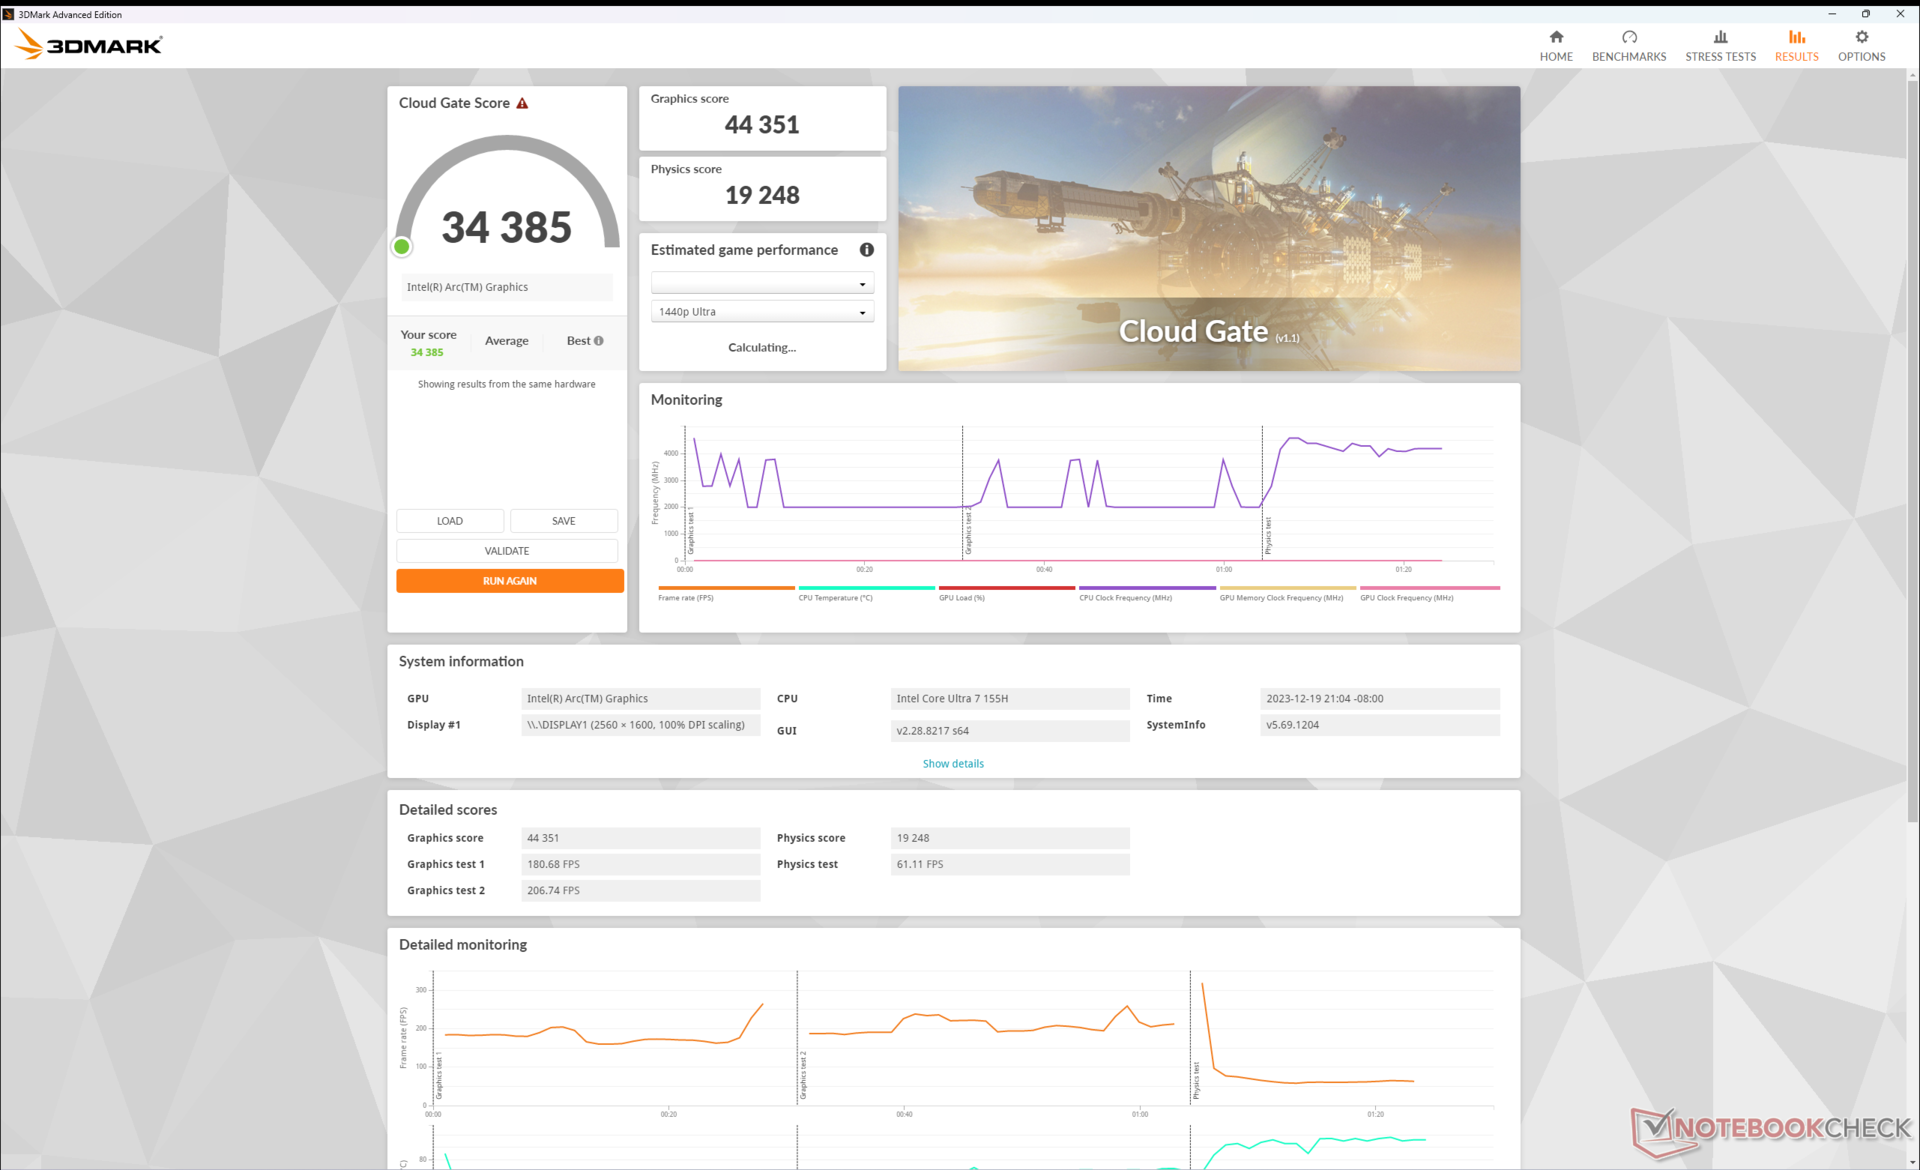
| 3DMark Cloud Gate Standard Score | 34385 points | |
| 3DMark Fire Strike Score | 8211 points | |
| 3DMark Time Spy Score | 3906 points | |
Aide | ||
* ... Moindre est la valeur, meilleures sont les performances
Performances des jeux
Les performances en situation réelle lors de l'exécution de jeux sont excellentes, avec des résultats qui rivalisent avec ceux de la GeForce 3050 Ti de la Prestige 15 de l'année dernière, comme l'indiquent les résultats des tests synthétiques ci-dessus. Far Cry 5 et F1 22, par exemple, se situent dans une fourchette de 5 à 15 % par rapport à la Prestige 15. Gardez à l'esprit que le GPU GeForce de la Prestige 15 présentait des problèmes d'étranglement notables qui ont eu un impact considérable sur ses performances ; la grande majorité des autres ordinateurs portables GeForce RTX 3050 Ti, tels que le Asus Vivobook Pro 16Xont tout de même réussi à faire tourner des jeux beaucoup plus rapidement que notre Arc 8 intégré.
Les performances globales sont néanmoins toujours supérieures à celles de la Radeon 780M dans tous les jeux testés, de l'ordre de 5 à 20 %. Quelques jeux DX12, tels que Tiny Tina's Wonderlands et F1 22, fonctionneraient même jusqu'à 50 à 60 % mieux sur le nouveau GPU Intel.
| The Witcher 3 - 1920x1080 Ultra Graphics & Postprocessing (HBAO+) | |
| Dell Inspiron 16 Plus 7630 | |
| Asus VivoBook Pro 16 K6602VU | |
| MSI Prestige 16 B1MG-001US | |
| MSI Prestige 15 A12UD-093 | |
| LG Gram 2in1 16 16T90R - G.AA78G | |
| Lenovo ThinkBook 16 G6 ABP | |
| GTA V - 1920x1080 Highest AA:4xMSAA + FX AF:16x | |
| Asus VivoBook Pro 16 K6602VU | |
| MSI Prestige 15 A12UD-093 | |
| Lenovo ThinkBook 16 G6 ABP | |
| LG Gram 2in1 16 16T90R - G.AA78G | |
| Final Fantasy XV Benchmark - 1920x1080 High Quality | |
| Dell Inspiron 16 Plus 7630 | |
| Asus VivoBook Pro 16 K6602VU | |
| MSI Prestige 16 B1MG-001US | |
| MSI Prestige 15 A12UD-093 | |
| LG Gram 2in1 16 16T90R - G.AA78G | |
| Lenovo ThinkBook 16 G6 ABP | |
| Strange Brigade - 1920x1080 ultra AA:ultra AF:16 | |
| Dell Inspiron 16 Plus 7630 | |
| Asus VivoBook Pro 16 K6602VU | |
| MSI Prestige 16 B1MG-001US | |
| MSI Prestige 15 A12UD-093 | |
| LG Gram 2in1 16 16T90R - G.AA78G | |
| Lenovo ThinkBook 16 G6 ABP | |
| Dota 2 Reborn - 1920x1080 ultra (3/3) best looking | |
| Dell Inspiron 16 Plus 7630 | |
| Asus VivoBook Pro 16 K6602VU | |
| MSI Prestige 16 B1MG-001US | |
| MSI Prestige 15 A12UD-093 | |
| LG Gram 2in1 16 16T90R - G.AA78G | |
| Lenovo ThinkBook 16 G6 ABP | |
| X-Plane 11.11 - 1920x1080 high (fps_test=3) | |
| Dell Inspiron 16 Plus 7630 | |
| Asus VivoBook Pro 16 K6602VU | |
| MSI Prestige 15 A12UD-093 | |
| LG Gram 2in1 16 16T90R - G.AA78G | |
| MSI Prestige 16 B1MG-001US | |
| Lenovo ThinkBook 16 G6 ABP | |
| Baldur's Gate 3 | |
| 1280x720 Low Preset AA:SM | |
| MSI Prestige 16 B1MG-001US | |
| Moyenne Intel Arc 8-Core iGPU (31.8 - 57.6, n=14) | |
| 1920x1080 Low Preset AA:SM | |
| MSI Prestige 16 B1MG-001US | |
| Moyenne Intel Arc 8-Core iGPU (21 - 40.3, n=26) | |
| 1920x1080 Medium Preset AA:T | |
| MSI Prestige 16 B1MG-001US | |
| Moyenne Intel Arc 8-Core iGPU (16.3 - 31.1, n=27) | |
| 1920x1080 High Preset AA:T | |
| MSI Prestige 16 B1MG-001US | |
| Moyenne Intel Arc 8-Core iGPU (15.4 - 27.7, n=26) | |
| 1920x1080 Ultra Preset AA:T | |
| MSI Prestige 16 B1MG-001US | |
| Moyenne Intel Arc 8-Core iGPU (14.2 - 26.2, n=25) | |
| Cyberpunk 2077 | |
| 1280x720 Low Preset (FSR off) | |
| MSI Prestige 16 B1MG-001US | |
| Moyenne Intel Arc 8-Core iGPU (34.5 - 58, n=19) | |
| LG Gram 2in1 16 16T90R - G.AA78G | |
| 1920x1080 Low Preset (FSR off) | |
| MSI Prestige 16 B1MG-001US | |
| Moyenne Intel Arc 8-Core iGPU (11.3 - 38, n=37) | |
| LG Gram 2in1 16 16T90R - G.AA78G | |
| 1920x1080 Medium Preset (FSR off) | |
| MSI Prestige 16 B1MG-001US | |
| Moyenne Intel Arc 8-Core iGPU (9.42 - 31.4, n=35) | |
| LG Gram 2in1 16 16T90R - G.AA78G | |
| 1920x1080 High Preset (FSR off) | |
| MSI Prestige 16 B1MG-001US | |
| Moyenne Intel Arc 8-Core iGPU (7.3 - 27.6, n=35) | |
| LG Gram 2in1 16 16T90R - G.AA78G | |
| 1920x1080 Ultra Preset (FSR off) | |
| MSI Prestige 16 B1MG-001US | |
| Moyenne Intel Arc 8-Core iGPU (13 - 24.7, n=27) | |
| LG Gram 2in1 16 16T90R - G.AA78G | |
Witcher 3 FPS Chart
| Bas | Moyen | Élevé | Ultra | |
|---|---|---|---|---|
| The Witcher 3 (2015) | 135.6 | 88.2 | 54.1 | 25.2 |
| Dota 2 Reborn (2015) | 101.7 | 92.8 | 79.1 | 75.6 |
| Final Fantasy XV Benchmark (2018) | 61 | 37.3 | 24.6 | |
| X-Plane 11.11 (2018) | 52.2 | 46.7 | 37.8 | |
| Far Cry 5 (2018) | 63 | 39 | 36 | 34 |
| Strange Brigade (2018) | 179.5 | 71 | 57.8 | 46.1 |
| Tiny Tina's Wonderlands (2022) | 53.3 | 41.2 | 30.1 | 25.1 |
| F1 22 (2022) | 77.7 | 71.6 | 53.3 | 15.3 |
| Baldur's Gate 3 (2023) | 31.9 | 28.2 | 24.1 | 23.4 |
| Cyberpunk 2077 (2023) | 35.7 | 29.5 | 25.2 | 22.1 |
Émissions - Fortes pour un ordinateur portable à carte graphique intégrée
Bruit du système
Le bruit du ventilateur est plus silencieux que celui de la Prestige 15 lorsqu'il fonctionne à faible charge, alors que c'est l'inverse lorsqu'il fonctionne à forte charge. Lors de la navigation ou du streaming vidéo, par exemple, le bruit du ventilateur tend à se situer entre 26 et 37 dB(A), contre 31 à 42 dB(A) sur l'ancien modèle. L'exécution de charges exigeantes telles que Witcher 3 augmente le bruit du ventilateur à 46 dB(A), voire à 53 dB(A) si Cooler Boost est activé. Le niveau moyen de 40 dB(A) est plutôt élevé pour un ordinateur portable fonctionnant uniquement avec des cartes graphiques intégrées.
Nous nous attendons à ce que le bruit du ventilateur sur les SKUs avec des graphiques discrets se comporte différemment de ce que nous avons expérimenté sur notre unité de test iGPU.
Degré de la nuisance sonore
| Au repos |
| 24.5 / 26.3 / 26.3 dB(A) |
| Fortement sollicité |
| 36.5 / 52.9 dB(A) |
 | ||
30 dB silencieux 40 dB(A) audible 50 dB(A) bruyant |
||
min: | ||
| MSI Prestige 16 B1MG-001US Arc 8-Core, Ultra 7 155H, Samsung PM9A1 MZVL22T0HBLB | MSI Prestige 15 A12UD-093 GeForce RTX 3050 Ti Laptop GPU, i7-1280P, Micron 3400 1TB MTFDKBA1T0TFH | LG Gram 2in1 16 16T90R - G.AA78G Iris Xe G7 96EUs, i7-1360P, Samsung PM9A1 MZVL21T0HCLR | Lenovo ThinkBook 16 G6 ABP Vega 7, R5 7530U, SK hynix HFS512GEJ9X125N | Asus VivoBook Pro 16 K6602VU GeForce RTX 4050 Laptop GPU, i9-13900H, Micron 2400 MTFDKBA1T0QFM | Dell Inspiron 16 Plus 7630 GeForce RTX 4060 Laptop GPU, i7-13700H, WD PC SN740 SDDPTQD-1T00 | |
|---|---|---|---|---|---|---|
| Noise | -6% | 8% | 13% | -4% | 4% | |
| arrêt / environnement * (dB) | 24.5 | 26 -6% | 25.1 -2% | 24.3 1% | 20.96 14% | 23.2 5% |
| Idle Minimum * (dB) | 24.5 | 26 -6% | 25.1 -2% | 24.3 1% | 25.28 -3% | 23.2 5% |
| Idle Average * (dB) | 26.3 | 30.7 -17% | 25.1 5% | 24.3 8% | 25.28 4% | 23.2 12% |
| Idle Maximum * (dB) | 26.3 | 30.7 -17% | 26.1 1% | 24.3 8% | 25.28 4% | 23.2 12% |
| Load Average * (dB) | 36.5 | 41.9 -15% | 31.4 14% | 29.7 19% | 51.88 -42% | 35.1 4% |
| Witcher 3 ultra * (dB) | 46.3 | 41.1 11% | 32.1 31% | 49 -6% | 52.5 -13% | |
| Load Maximum * (dB) | 52.9 | 40.7 23% | 36.6 31% | 41.4 22% | 51.8 2% | 52.5 1% |
* ... Moindre est la valeur, meilleures sont les performances
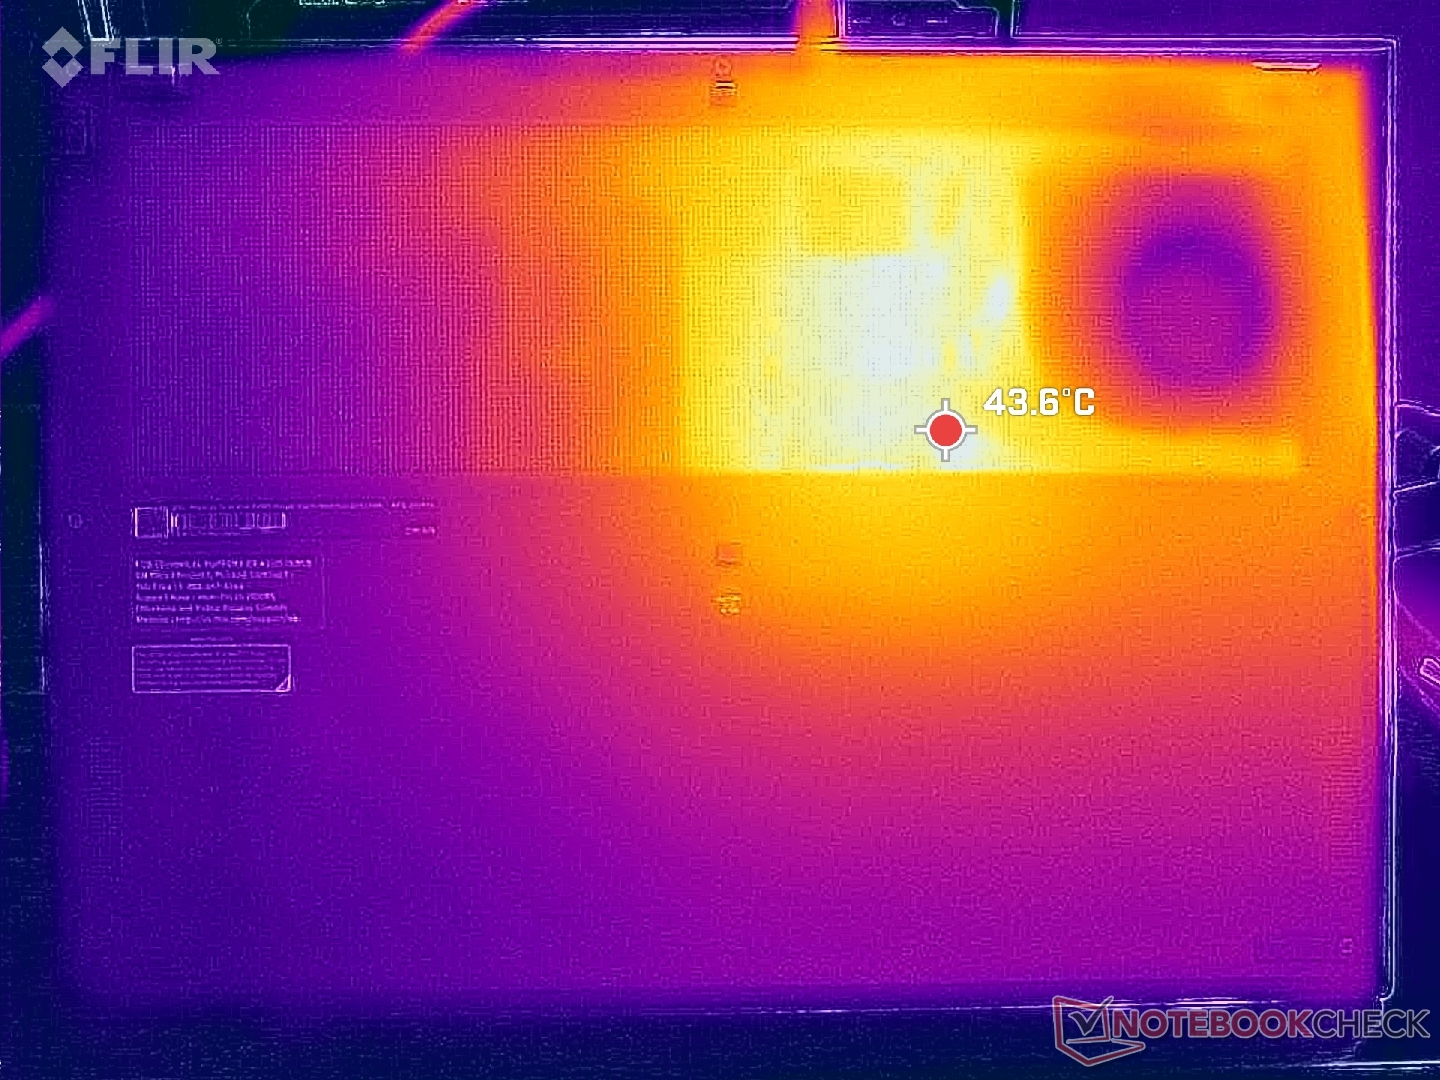
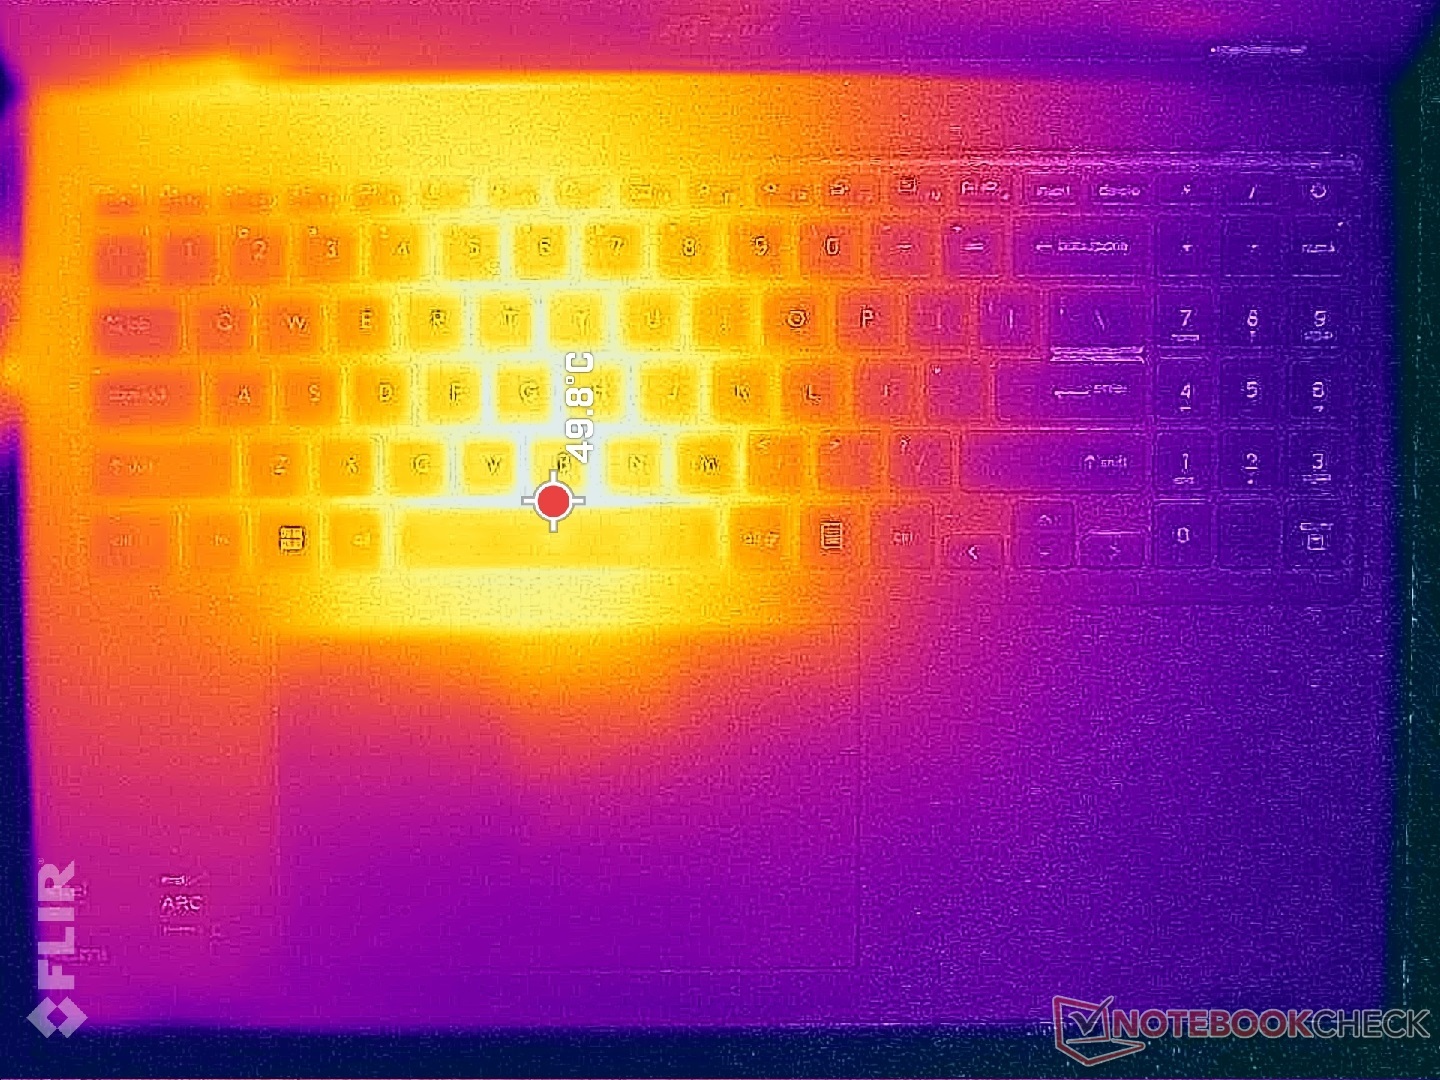
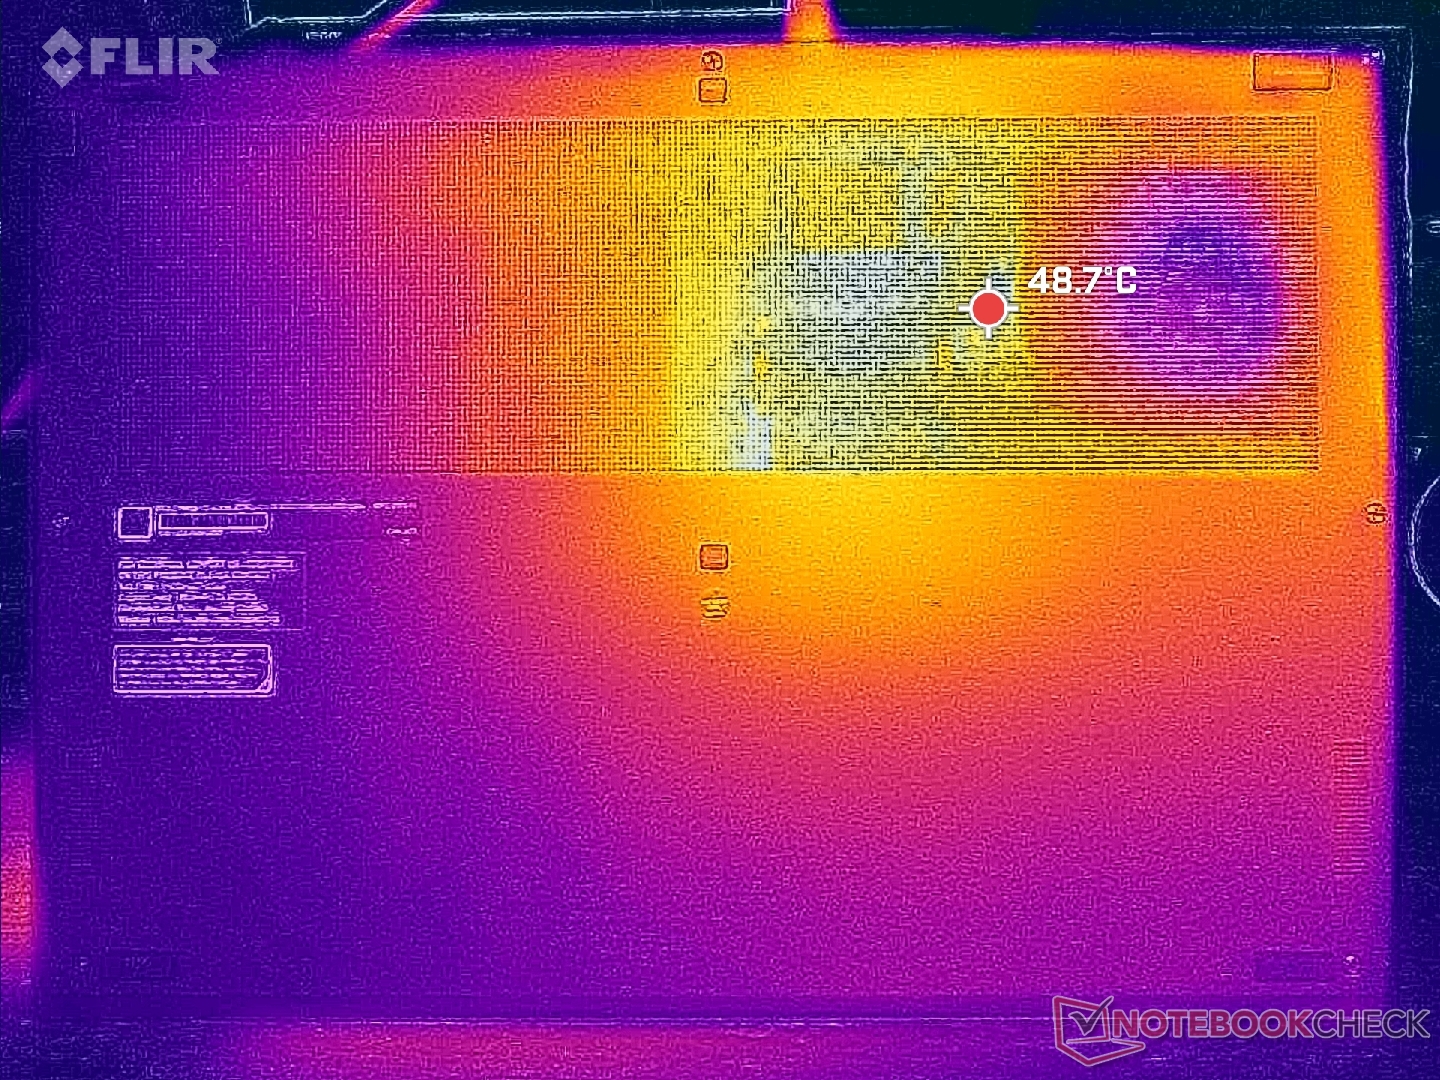
Température
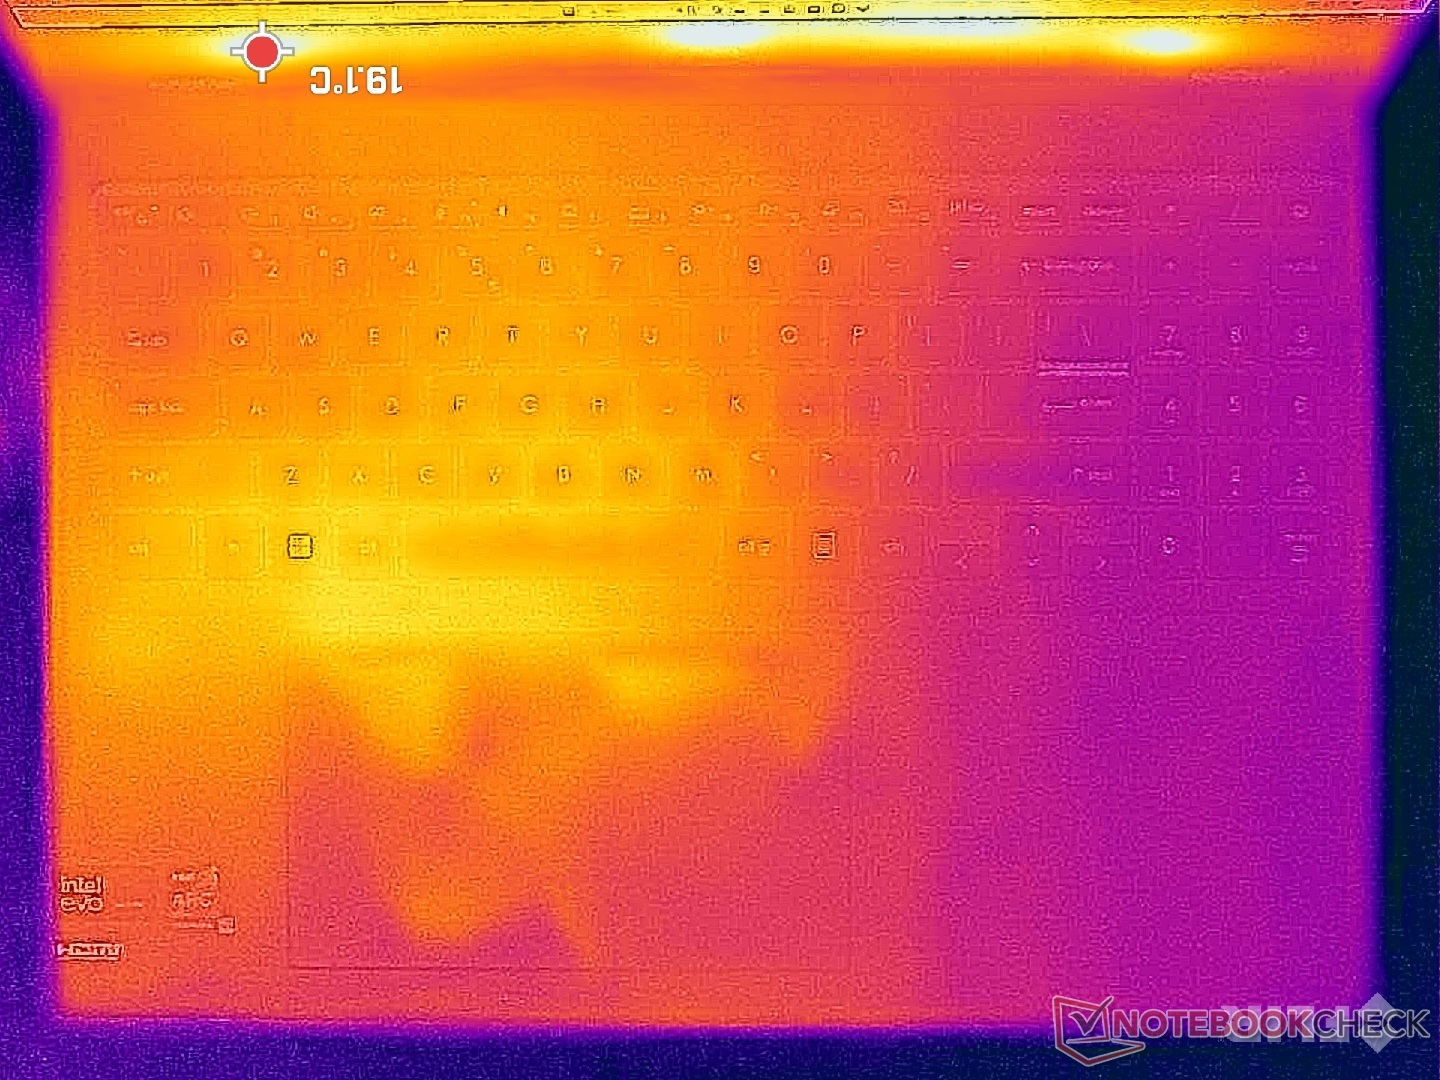
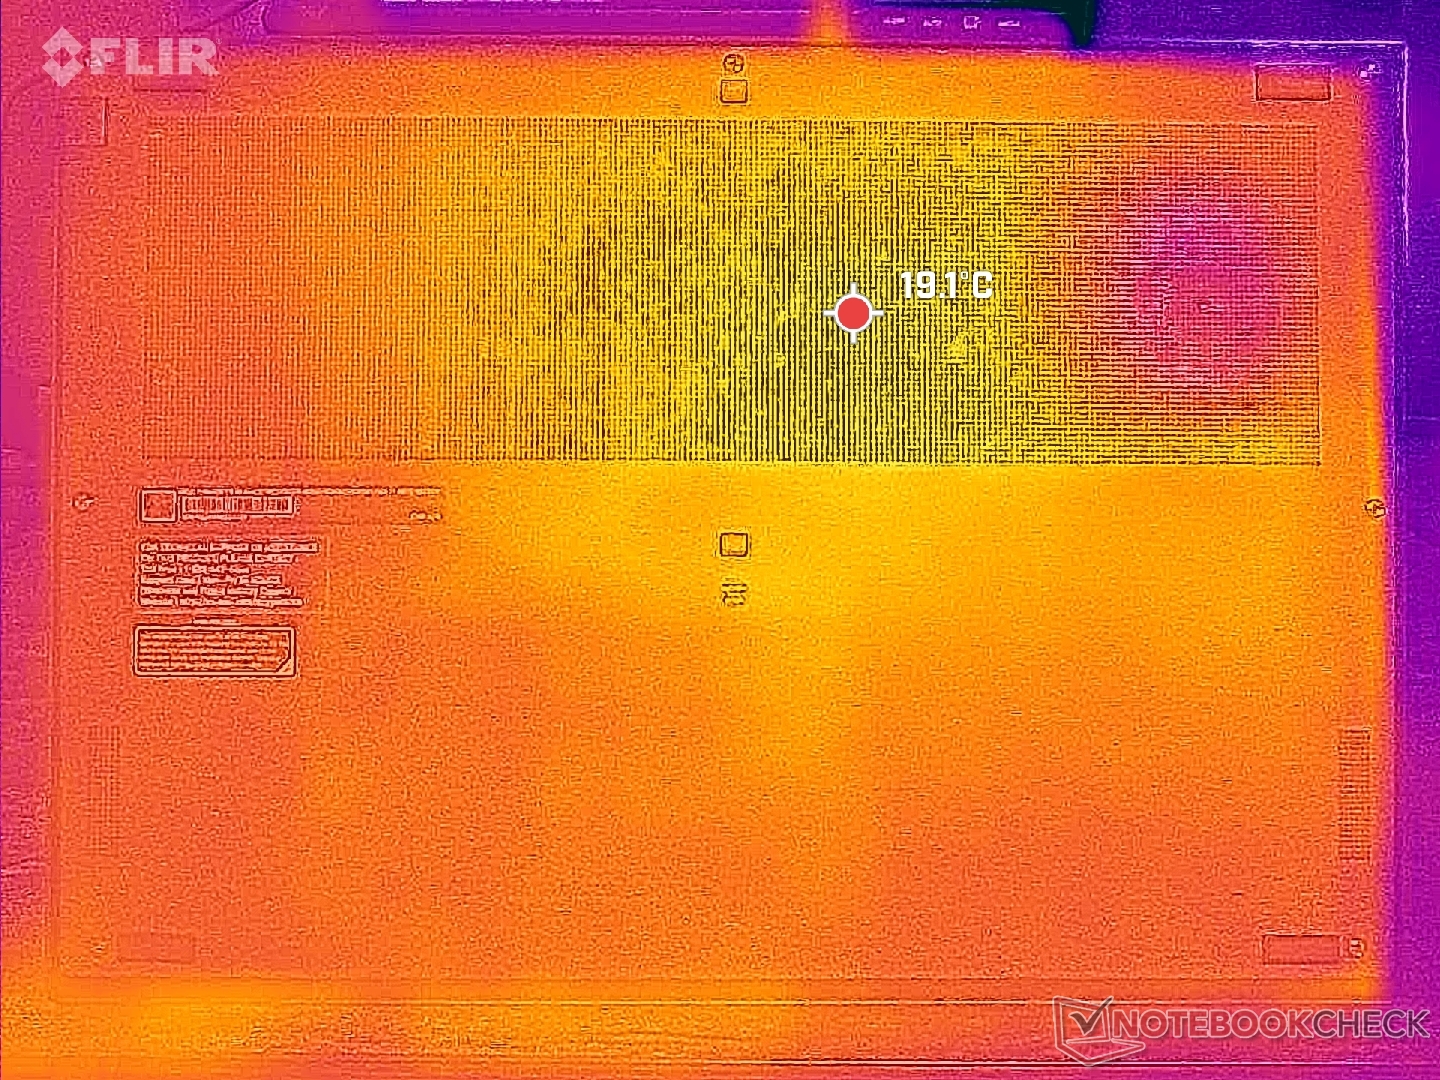
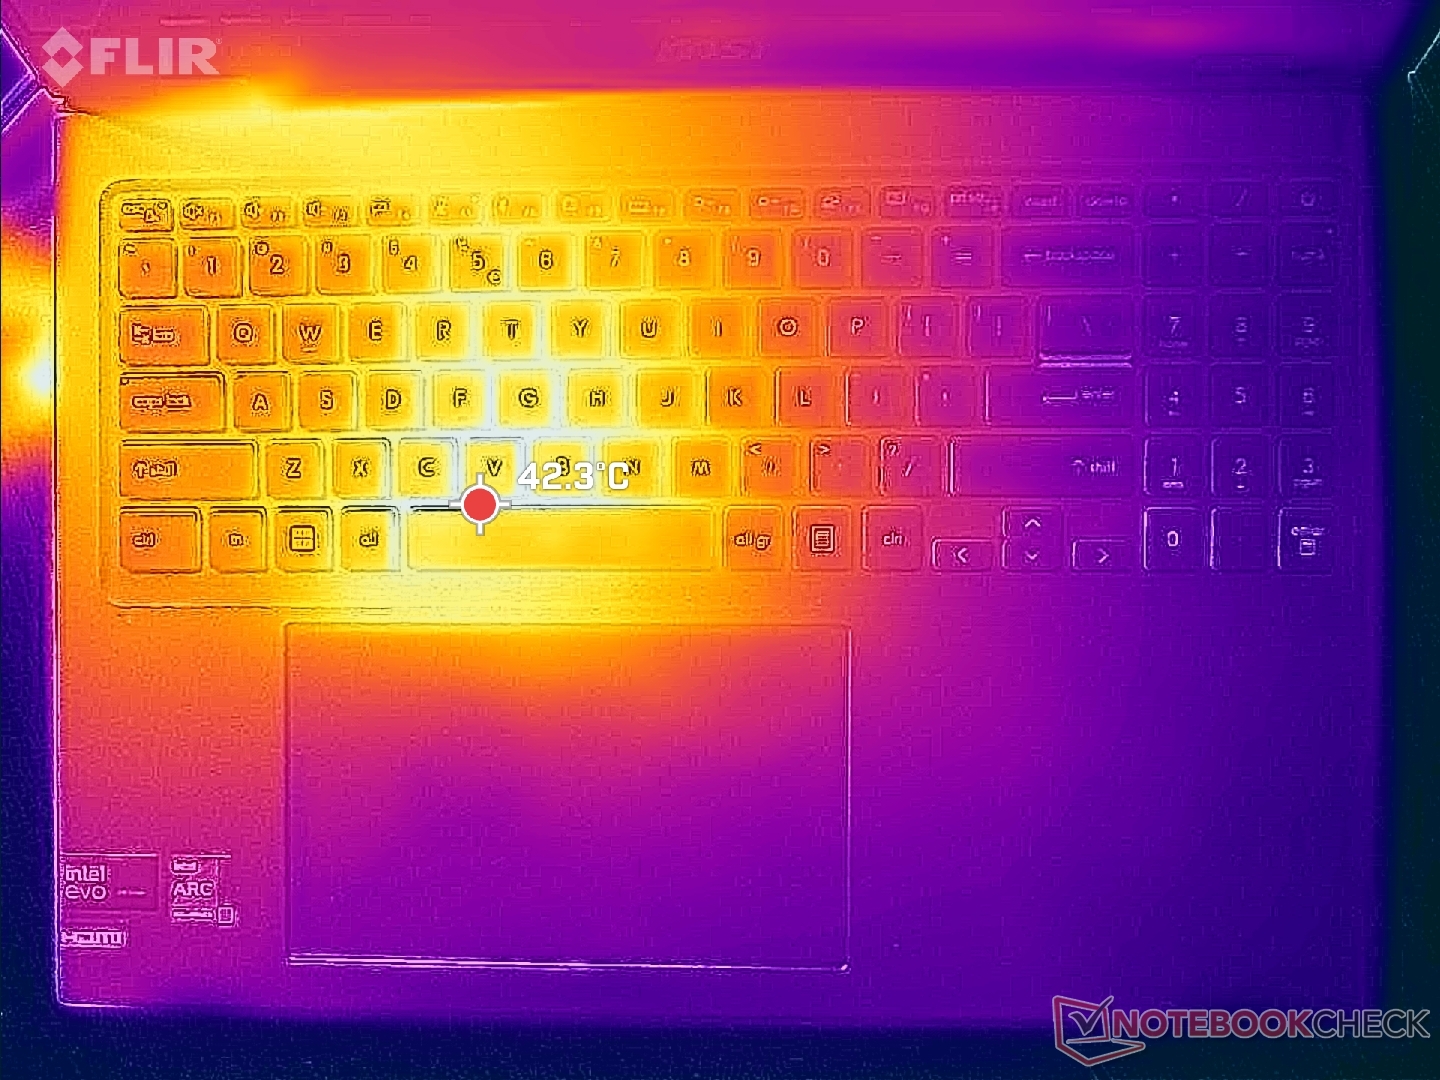
Les températures de surface sont plus chaudes sur la moitié gauche du portable que sur la droite en raison du positionnement du processeur et de la solution de refroidissement à l'intérieur. Le point chaud près de la touche Espace peut atteindre jusqu'à 50°C lors de l'exécution de charges exigeantes, ce qui est similaire au point chaud sur la Prestige 15 de l'année dernière avec le GPU RTX dédié GeForce. En conséquence, les touches WASD peuvent être assez chaudes pendant les jeux, mais les appuis palmaires et les touches fléchées restent beaucoup plus froids. Les ordinateurs portables Prestige sont généralement plus chauds que la moyenne des Ultrabooks sous charge en raison de leur conception compacte et la Prestige 16 ne fait pas exception.
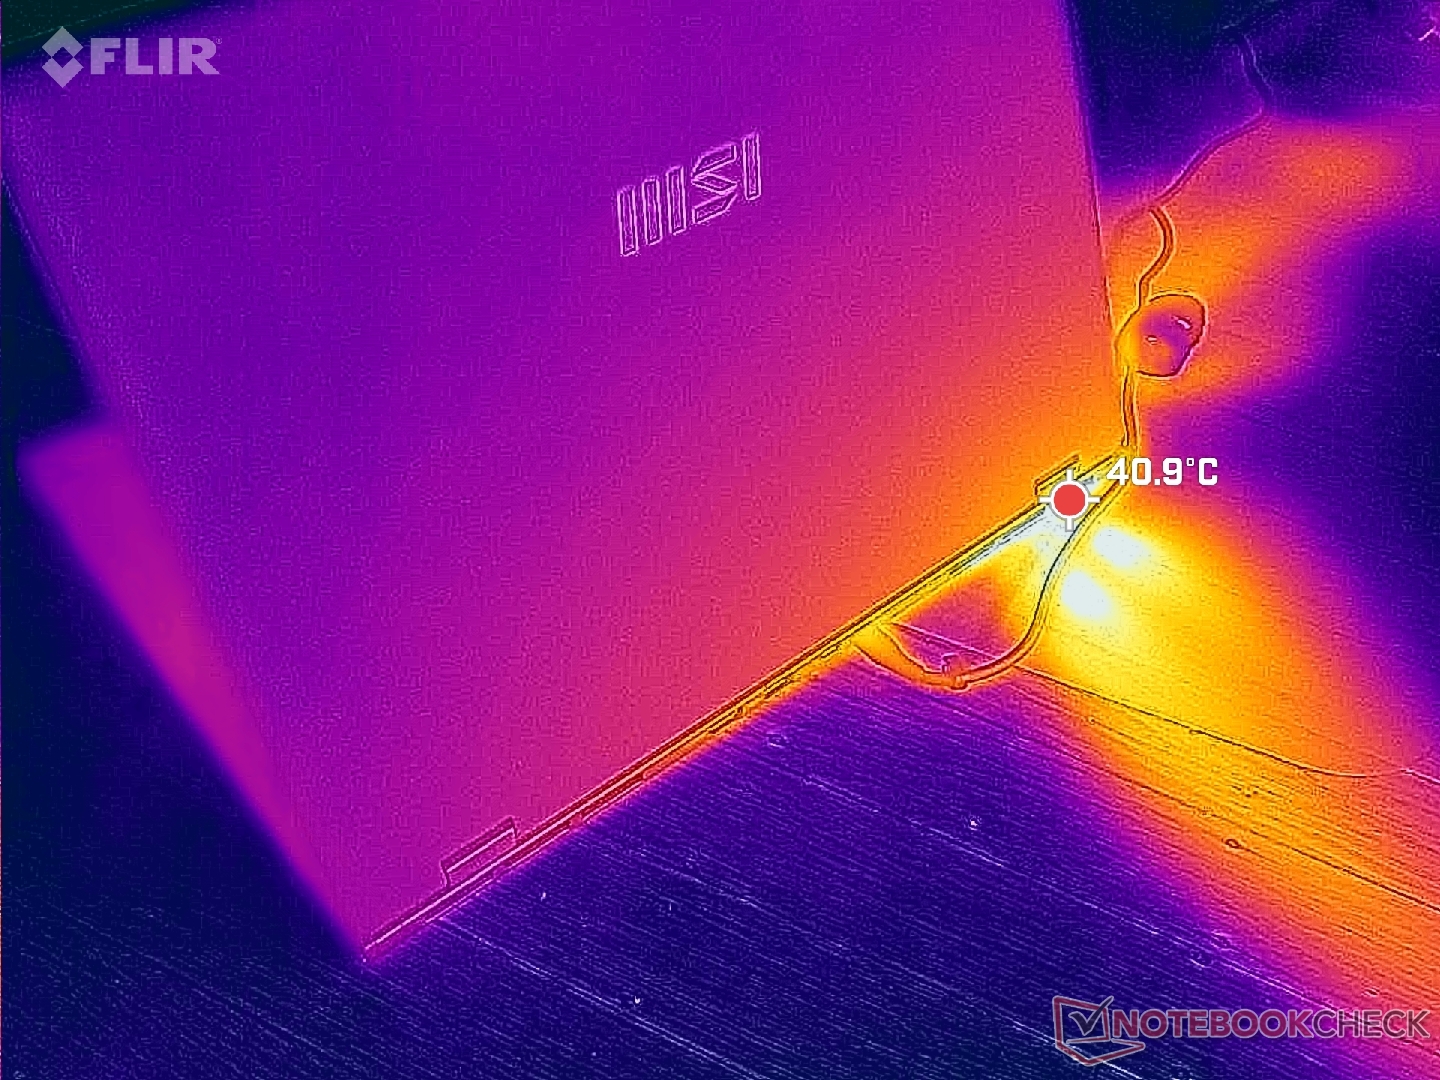
(-) La température maximale du côté supérieur est de 48.8 °C / 120 F, par rapport à la moyenne de 36.8 °C / 98 F, allant de 21 à 71 °C pour la classe Multimedia.
(-) Le fond chauffe jusqu'à un maximum de 47.6 °C / 118 F, contre une moyenne de 39.1 °C / 102 F
(+) En utilisation inactive, la température moyenne du côté supérieur est de 23 °C / 73 F, par rapport à la moyenne du dispositif de 31.3 °C / 88 F.
(±) En jouant à The Witcher 3, la température moyenne du côté supérieur est de 33.3 °C / 92 F, alors que la moyenne de l'appareil est de 31.3 °C / 88 F.
(+) Les repose-poignets et le pavé tactile sont plus froids que la température de la peau avec un maximum de 30 °C / 86 F et sont donc froids au toucher.
(±) La température moyenne de la zone de l'appui-paume de dispositifs similaires était de 28.7 °C / 83.7 F (-1.3 °C / #-2.3 F).
| MSI Prestige 16 B1MG-001US Intel Core Ultra 7 155H, Intel Arc 8-Core iGPU | MSI Prestige 15 A12UD-093 Intel Core i7-1280P, NVIDIA GeForce RTX 3050 Ti Laptop GPU | LG Gram 2in1 16 16T90R - G.AA78G Intel Core i7-1360P, Intel Iris Xe Graphics G7 96EUs | Lenovo ThinkBook 16 G6 ABP AMD Ryzen 5 7530U, AMD Radeon RX Vega 7 | Asus VivoBook Pro 16 K6602VU Intel Core i9-13900H, NVIDIA GeForce RTX 4050 Laptop GPU | Dell Inspiron 16 Plus 7630 Intel Core i7-13700H, NVIDIA GeForce RTX 4060 Laptop GPU | |
|---|---|---|---|---|---|---|
| Heat | -16% | -25% | -15% | -30% | -20% | |
| Maximum Upper Side * (°C) | 48.8 | 49 -0% | 55 -13% | 40.8 16% | 42.6 13% | 47.8 2% |
| Maximum Bottom * (°C) | 47.6 | 52.6 -11% | 55.4 -16% | 50.5 -6% | 48.4 -2% | 42.2 11% |
| Idle Upper Side * (°C) | 24.2 | 29.7 -23% | 34.9 -44% | 29.3 -21% | 39.4 -63% | 35.2 -45% |
| Idle Bottom * (°C) | 23.6 | 30.7 -30% | 30 -27% | 35.2 -49% | 39.8 -69% | 35 -48% |
* ... Moindre est la valeur, meilleures sont les performances
Test de stress
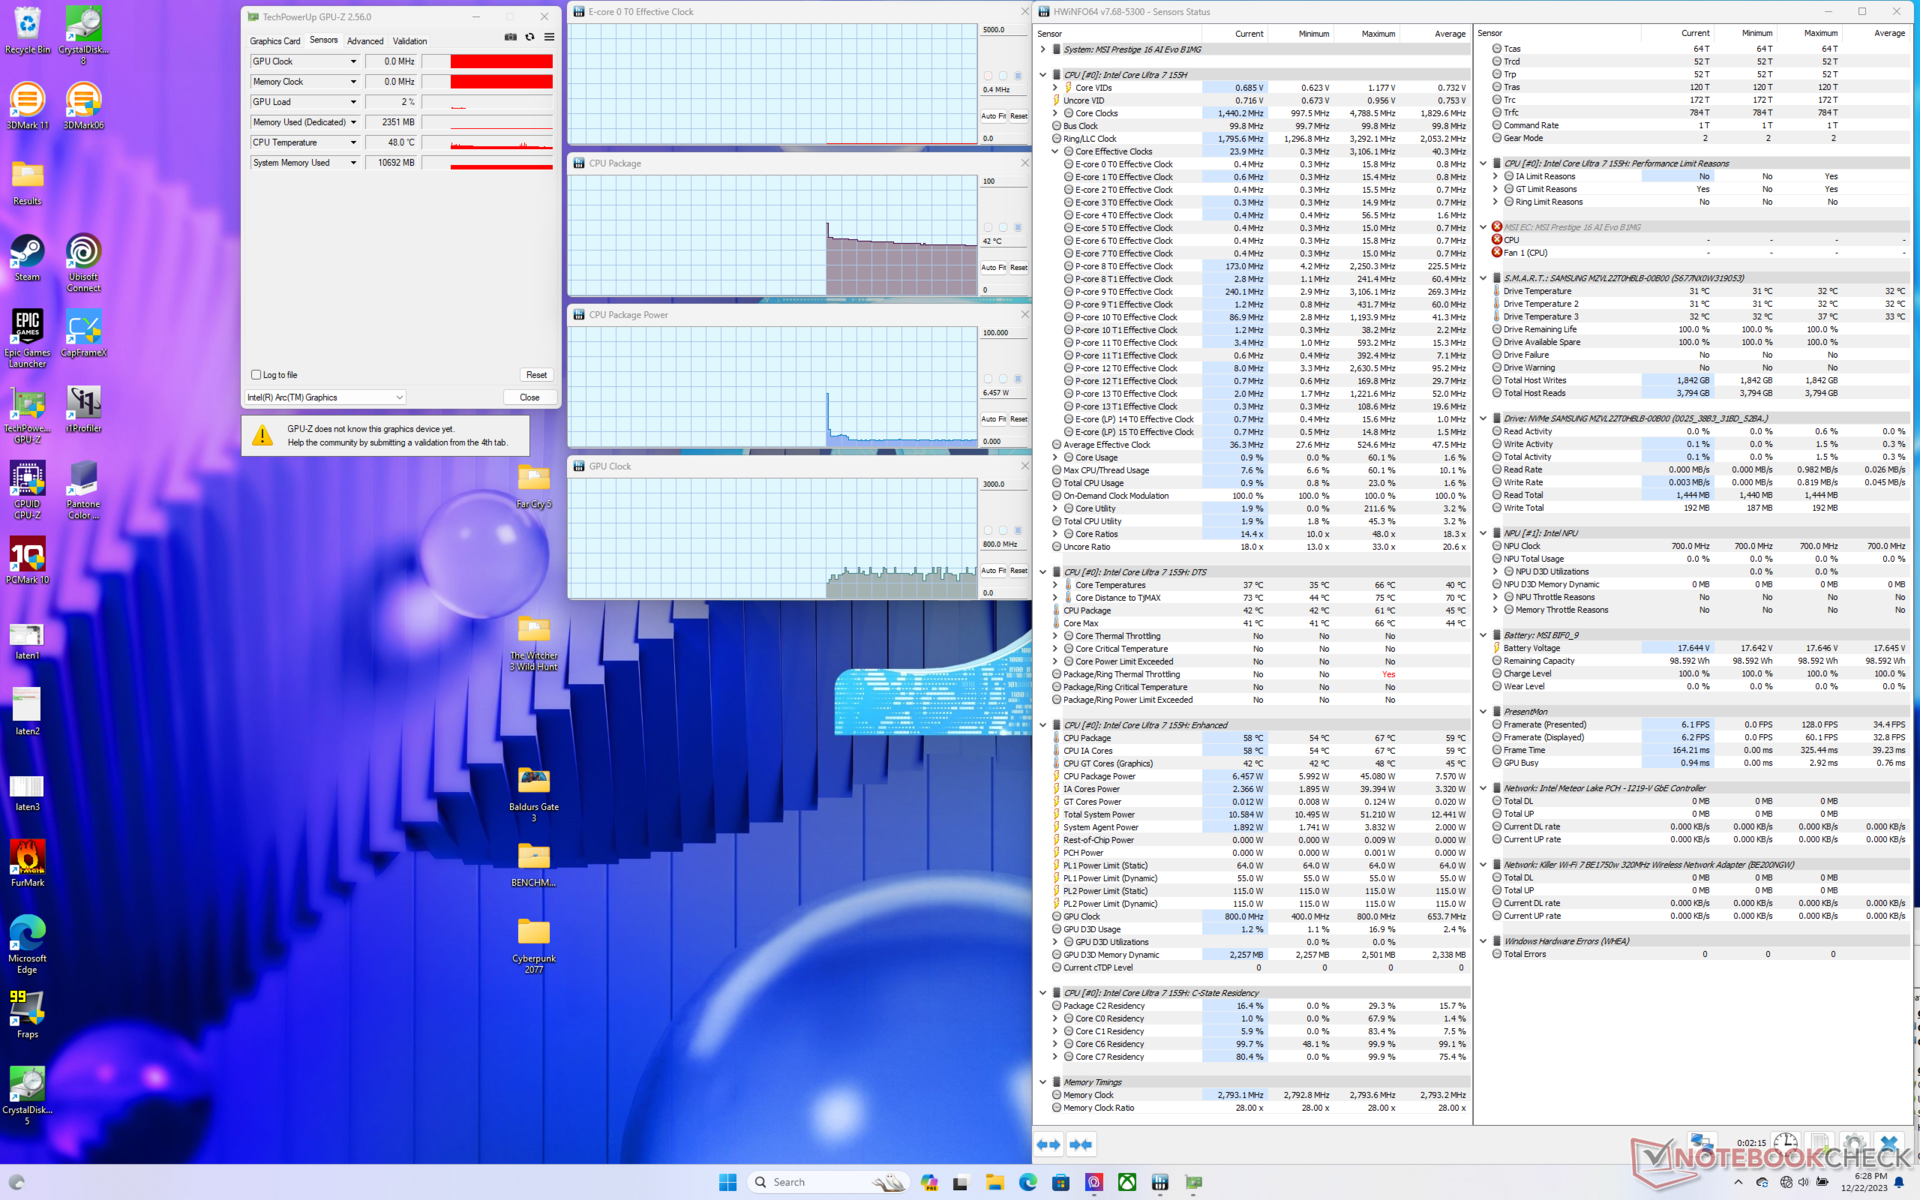
La puissance du processeur atteint 110 W, 2,8 GHz et 96 °C pendant quelques secondes lors de l'exécution du test Prime95, avant de redescendre rapidement et de se stabiliser à 2,2 GHz, 44 W et 83 °C. Cette plage est plus chaude que la moyenne pour un ultrabook, mais elle est typique d'un modèle Prestige. L'Acer Swift Edge SFE16 Acer Swift Edge SFE16 équipé d'un Ryzen 7 7840U, par exemple, se stabiliserait à une température plus froide de 64 °C, tandis que le modèle Lenovo Slim Pro 9i 16IRR, équipé d'un Core H, se stabiliserait à une température plus froide de 83 °C Lenovo Slim Pro 9i 16IRP8 se stabiliserait à 77°C dans des conditions similaires.
L'exécution avec Cooler Boost actif ne semble pas avoir d'impact sur les performances. Par exemple, le processeur se stabilise à 85 °C lorsqu'il fonctionne avec Cooler Boost désactivé, contre 77 °C dans le cas contraire Witcher 3 avec Cooler Boost désactivé contre 77 C avec Cooler Boost activé alors que les fréquences d'horloge du GPU restent inchangées. À moins que la température du cœur ne soit un problème, le mode Cooler Boost n'est généralement pas nécessaire pour obtenir des performances maximales. Cette observation est conforme à notre expérience sur de nombreux autres ordinateurs portables MSI dotés du Cooler Boost.
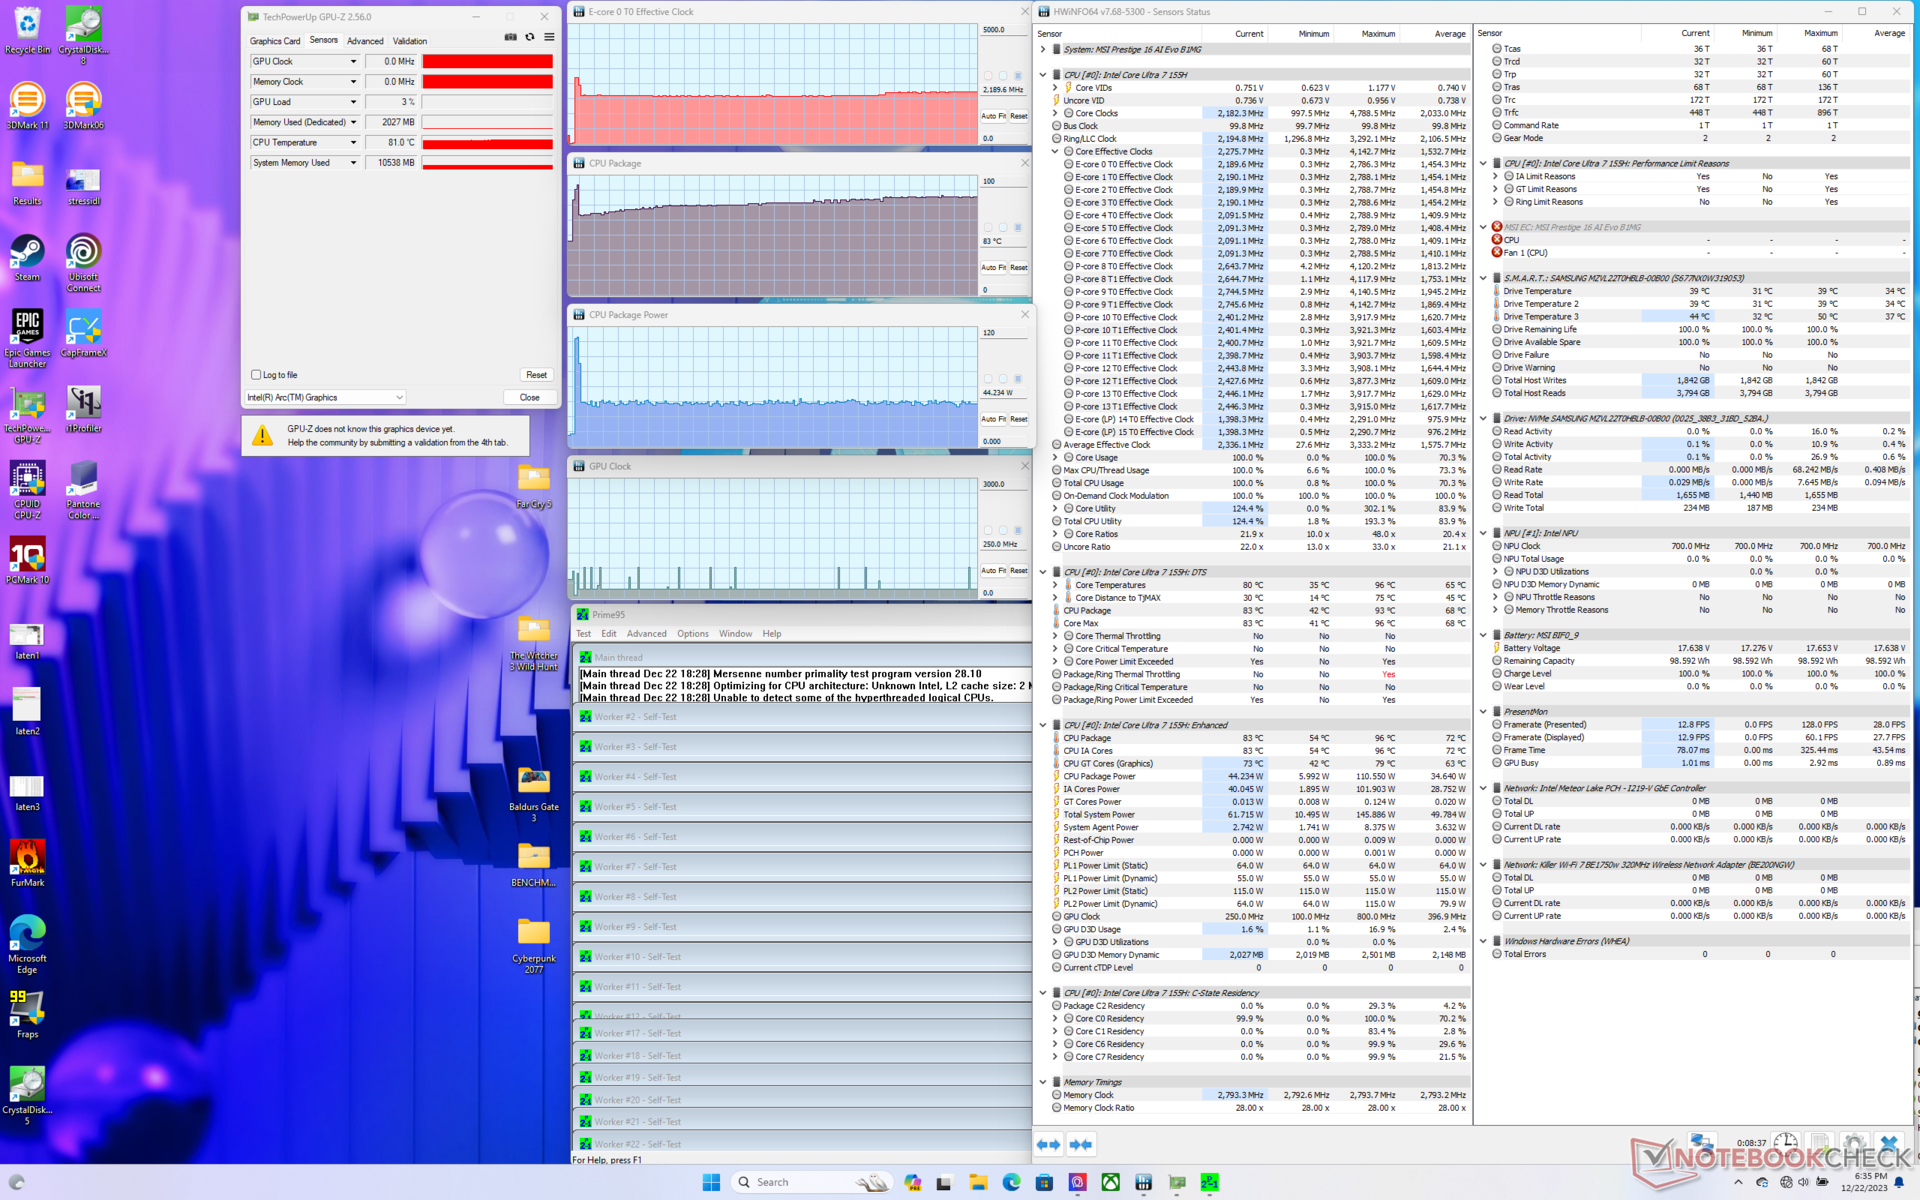
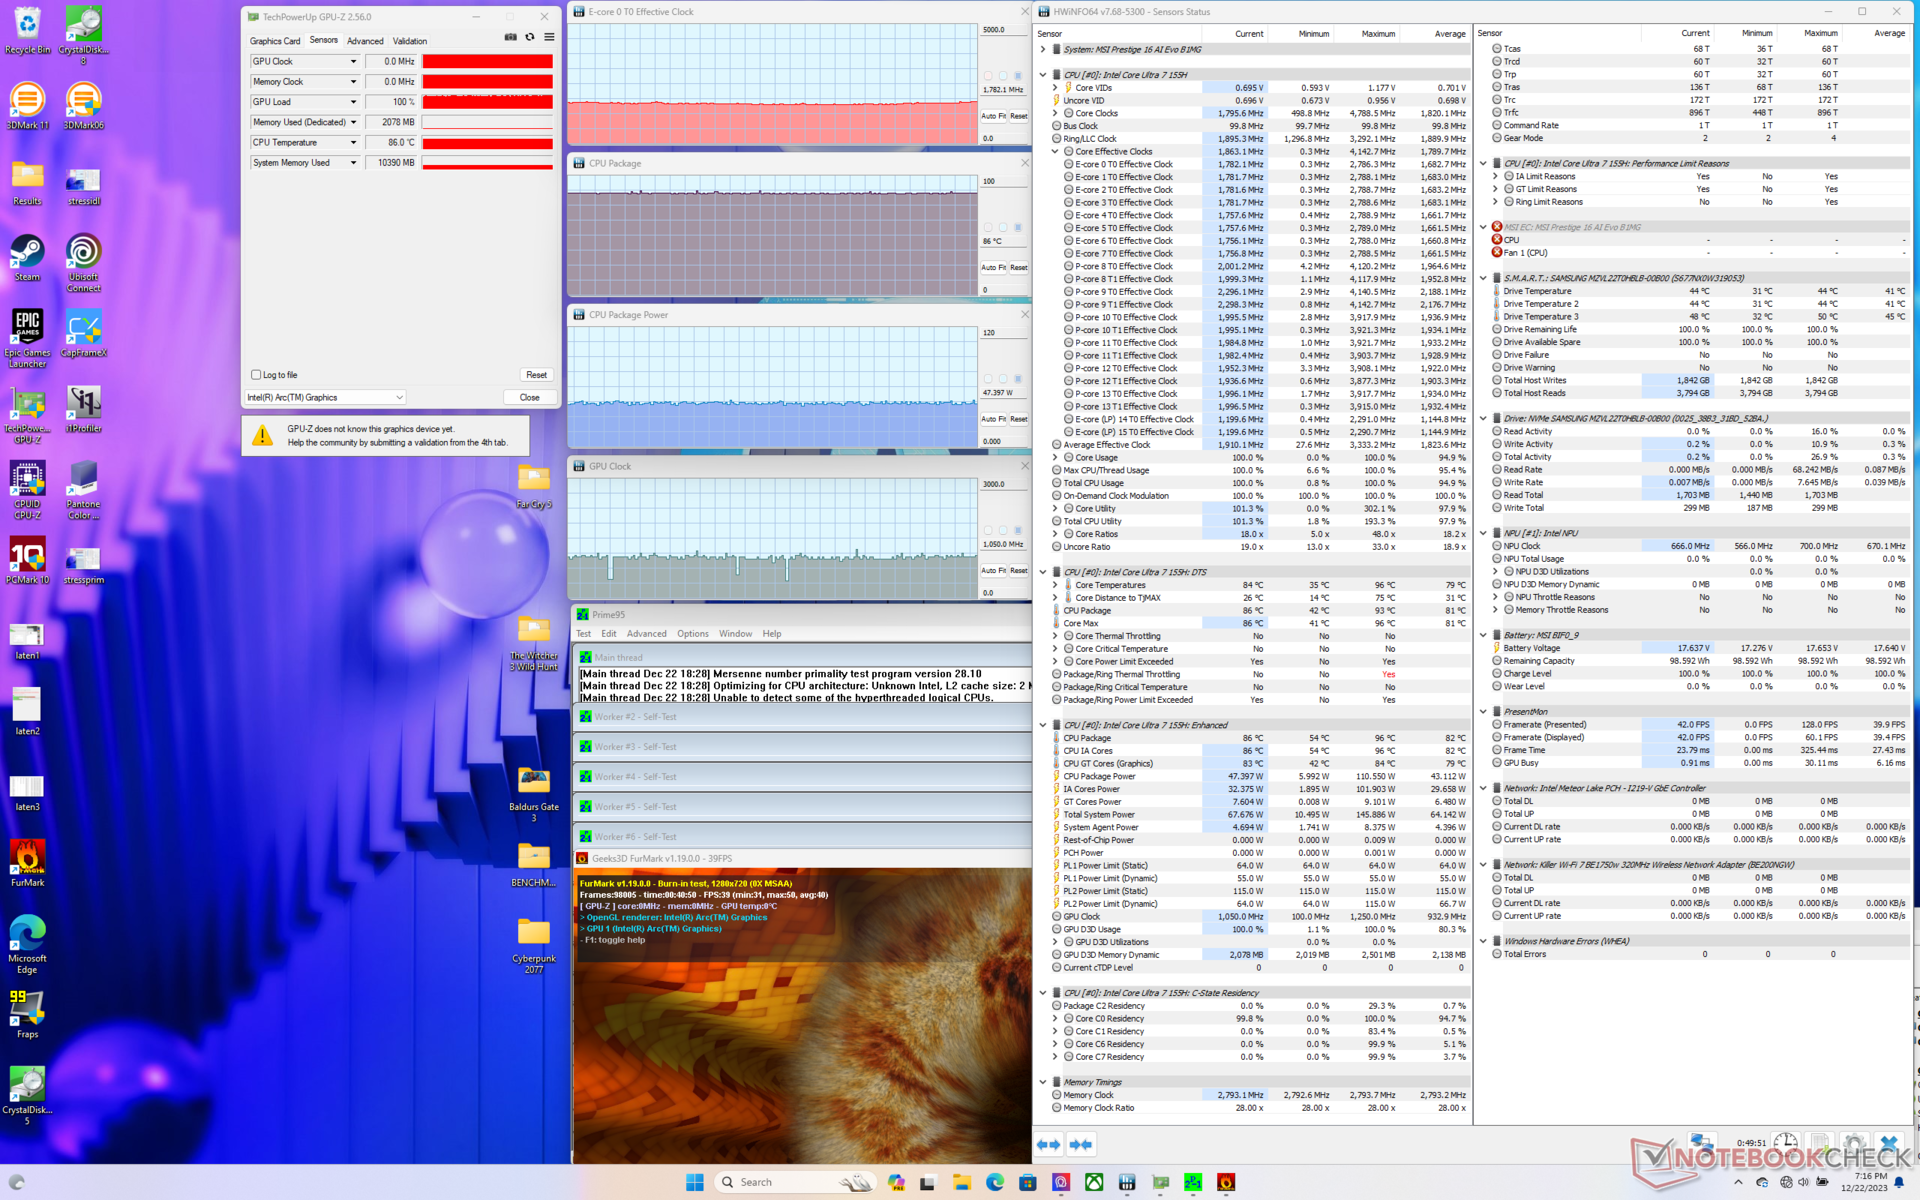
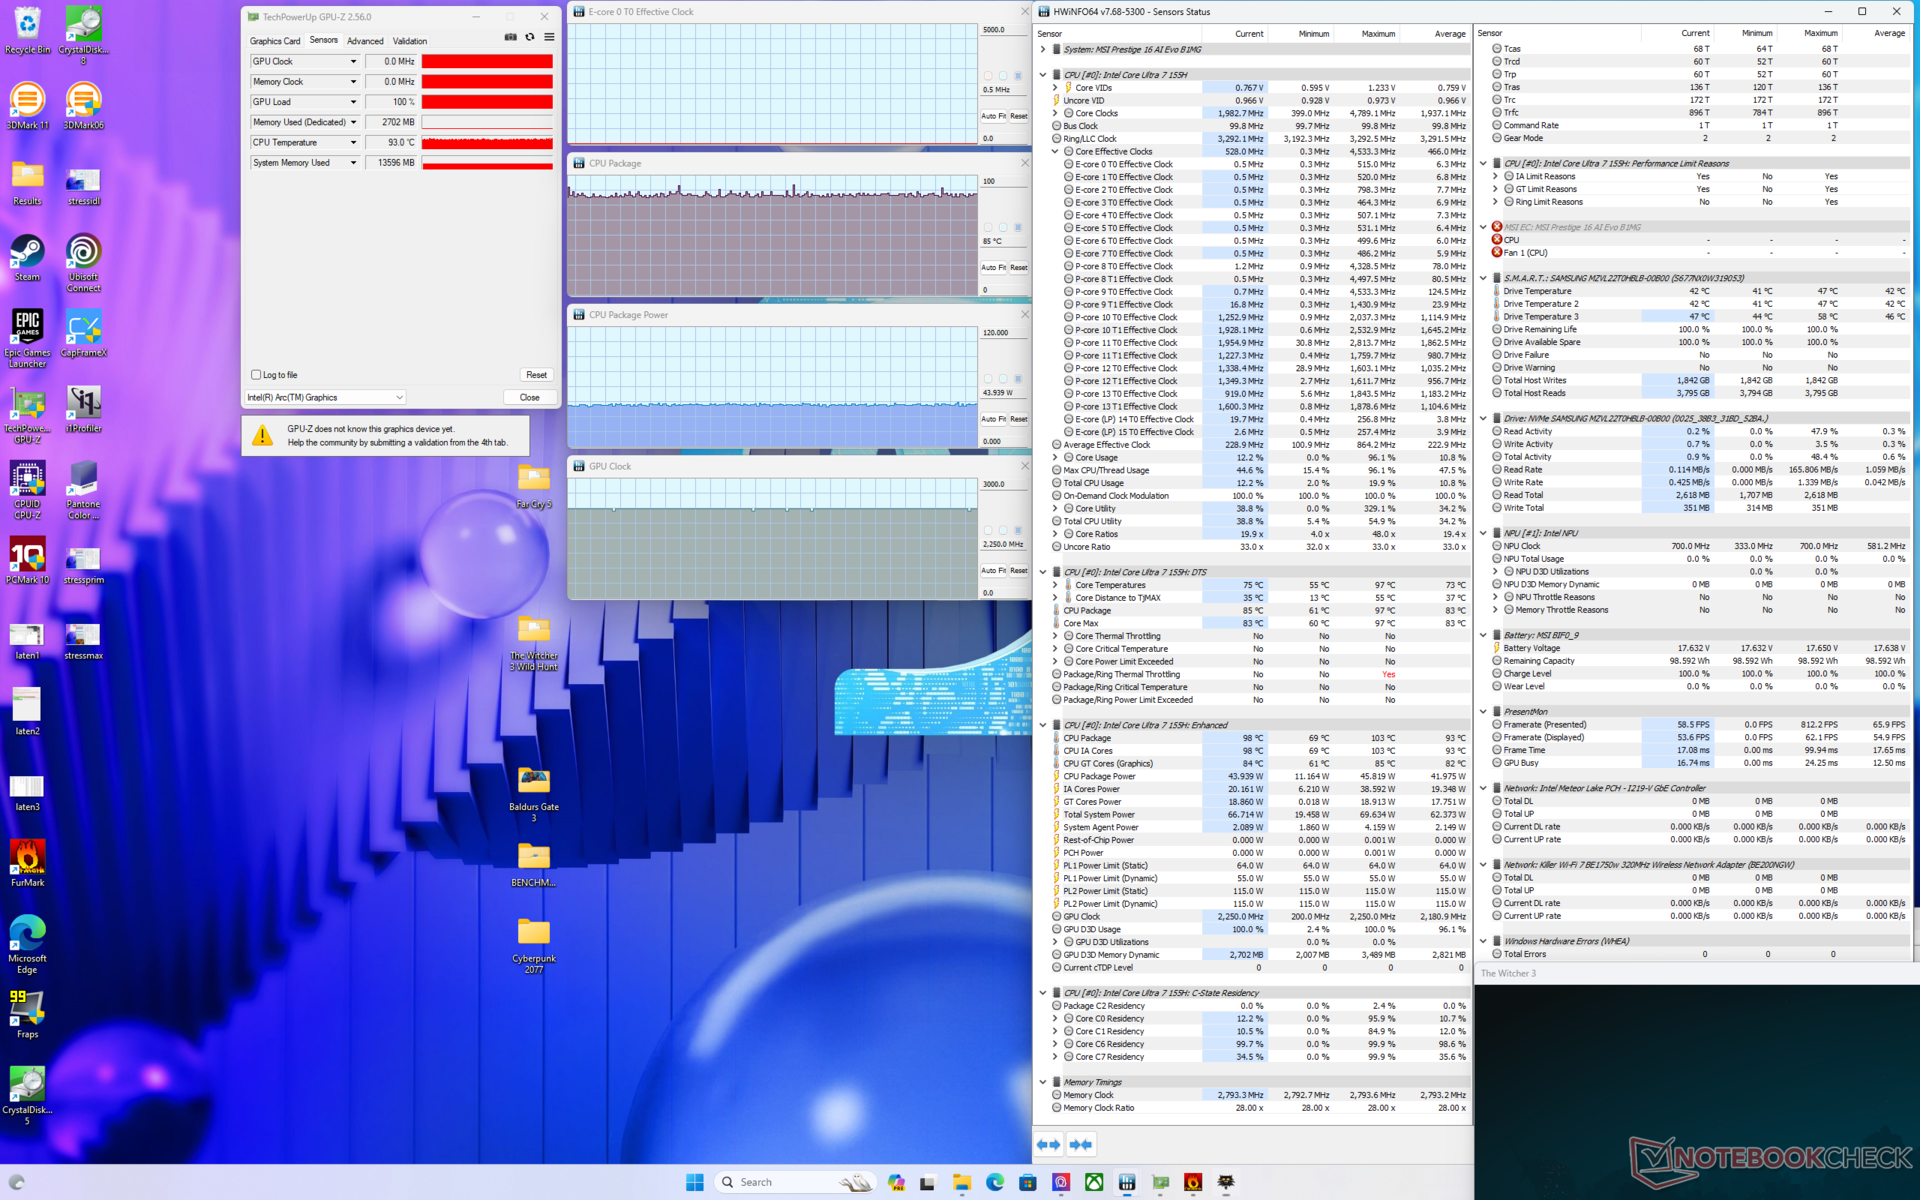

| Horloge du CPU (GHz) | Horloge du GPU (MHz) | Température moyenne du CPU (°C) | |
| Système au repos | -- | -- | 42 |
| Prime95 Stress | 2.2 | -- | 83 |
| Prime95 + FurMark Stress | 1.8 | 1050 | 86 |
| Witcher 3 Stress(Extreme Performance w/ Cooler Boost off) | 0.5 | 2250 | 85 |
| Witcher 3 Stress (ExtremePerformance w/ Cooler Boost on) | 0.5 | 2250 | 77 |
Intervenants
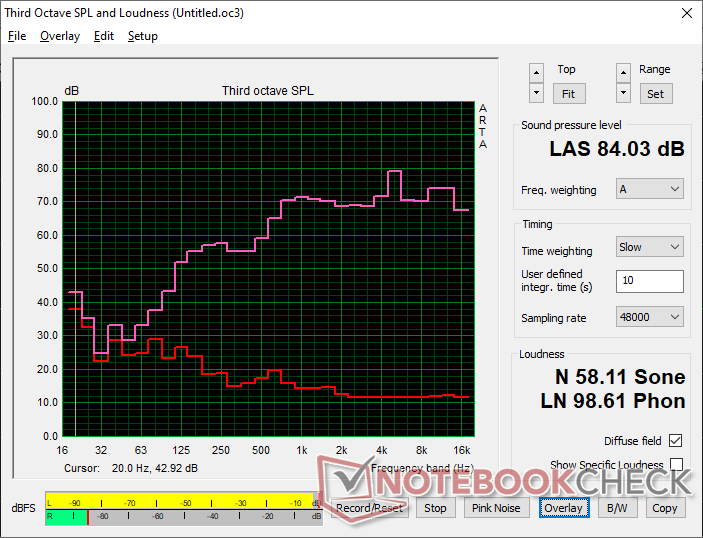
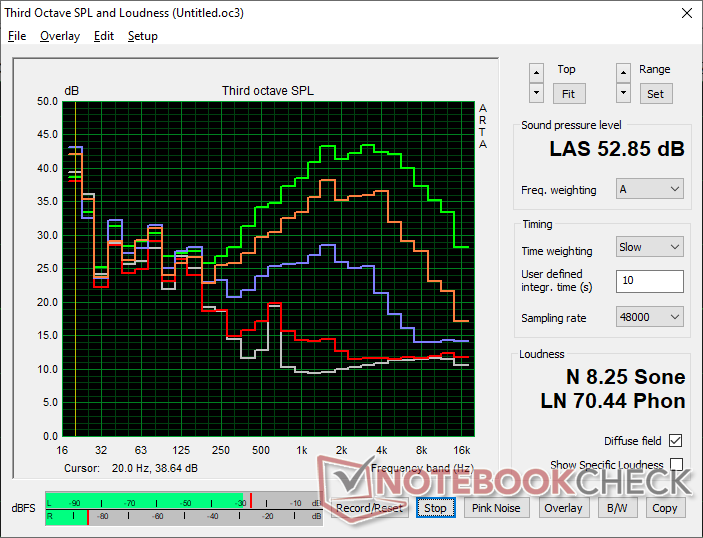
MSI Prestige 16 B1MG-001US analyse audio
(+) | les haut-parleurs peuvent jouer relativement fort (84# dB)
Basses 100 - 315 Hz
(-) | presque aucune basse - en moyenne 15.3% plus bas que la médiane
(±) | la linéarité des basses est moyenne (7% delta à la fréquence précédente)
Médiums 400 - 2000 Hz
(+) | médiane équilibrée - seulement 4.3% de la médiane
(+) | les médiums sont linéaires (4.3% delta à la fréquence précédente)
Aiguës 2 - 16 kHz
(+) | des sommets équilibrés - à seulement 3.2% de la médiane
(+) | les aigus sont linéaires (6.5% delta à la fréquence précédente)
Globalement 100 - 16 000 Hz
(+) | le son global est linéaire (13.3% différence à la médiane)
Par rapport à la même classe
» 28% de tous les appareils testés de cette catégorie étaient meilleurs, 4% similaires, 68% pires
» Le meilleur avait un delta de 5%, la moyenne était de 17%, le pire était de 45%.
Par rapport à tous les appareils testés
» 14% de tous les appareils testés étaient meilleurs, 3% similaires, 83% pires
» Le meilleur avait un delta de 4%, la moyenne était de 24%, le pire était de 134%.
Apple MacBook Pro 16 2021 M1 Pro analyse audio
(+) | les haut-parleurs peuvent jouer relativement fort (84.7# dB)
Basses 100 - 315 Hz
(+) | bonne basse - seulement 3.8% loin de la médiane
(+) | les basses sont linéaires (5.2% delta à la fréquence précédente)
Médiums 400 - 2000 Hz
(+) | médiane équilibrée - seulement 1.3% de la médiane
(+) | les médiums sont linéaires (2.1% delta à la fréquence précédente)
Aiguës 2 - 16 kHz
(+) | des sommets équilibrés - à seulement 1.9% de la médiane
(+) | les aigus sont linéaires (2.7% delta à la fréquence précédente)
Globalement 100 - 16 000 Hz
(+) | le son global est linéaire (4.6% différence à la médiane)
Par rapport à la même classe
» 0% de tous les appareils testés de cette catégorie étaient meilleurs, 0% similaires, 100% pires
» Le meilleur avait un delta de 5%, la moyenne était de 17%, le pire était de 45%.
Par rapport à tous les appareils testés
» 0% de tous les appareils testés étaient meilleurs, 0% similaires, 100% pires
» Le meilleur avait un delta de 4%, la moyenne était de 24%, le pire était de 134%.
Gestion de l'énergie - Des bas plus bas et des hauts plus hauts
Consommation électrique
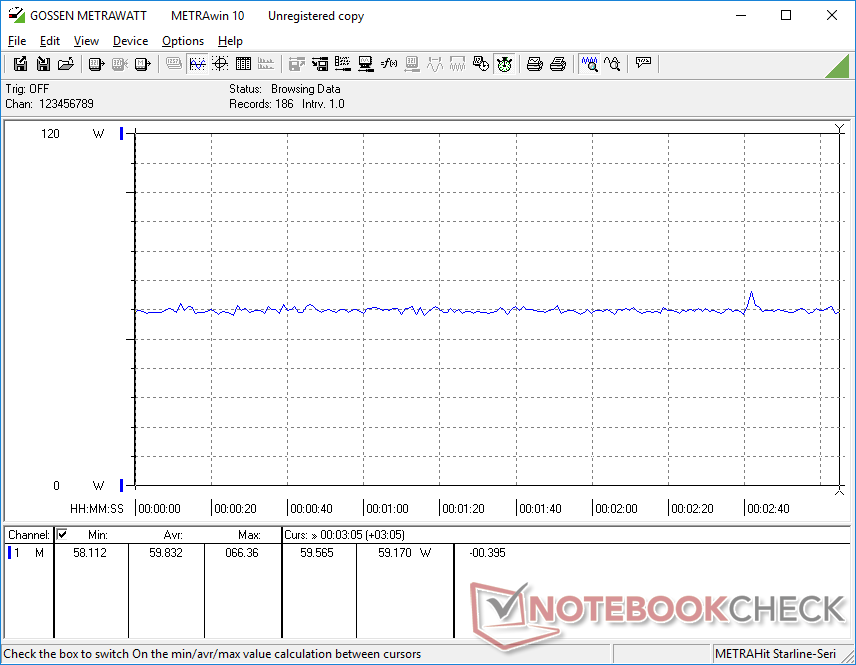
La consommation d'énergie peut descendre jusqu'à 3 W au ralenti, ce qui est l'une des plus faibles de tous les ordinateurs portables Intel de 16 pouces que nous avons testés. Ce plancher très bas est probablement à l'origine de la très longue durée de vie de la batterie décrite dans la section suivante.
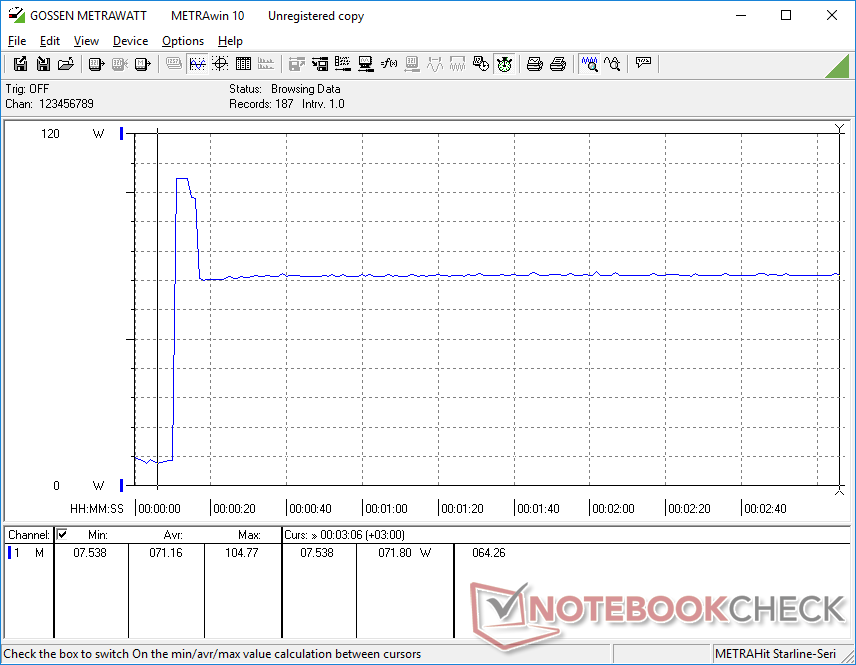
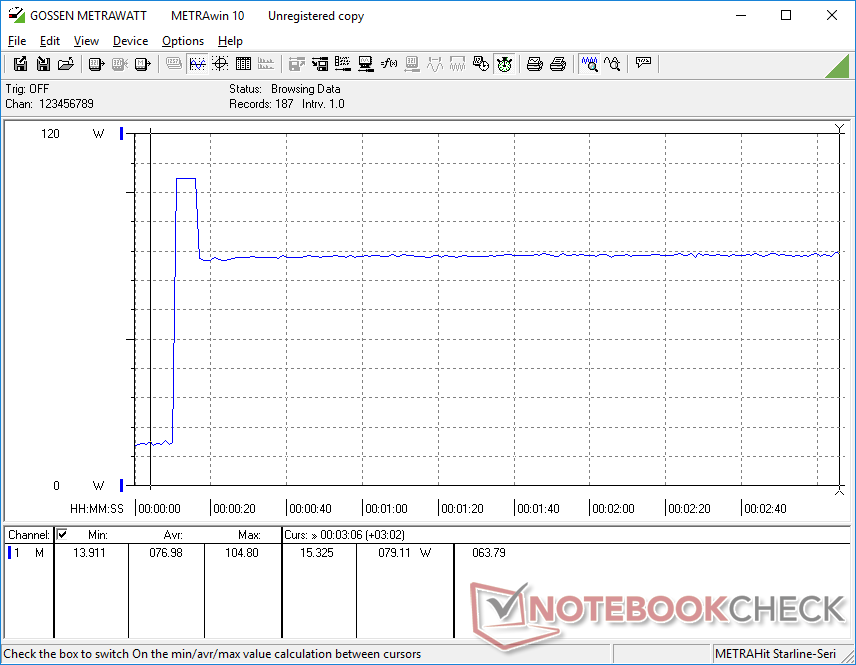
D'un autre côté, la consommation semble être plus importante que celle de la plupart des autres ordinateurs portables de la série U lorsque l'on utilise des charges plus exigeantes. L'exécution de 3DMark 06 ou de jeux, par exemple, consommerait entre 60 W et 70 W, contre 40 W à 55 W sur le MSI Prestige 15, LG Gram 16 2-en-1acer Swift Edge SFE16, ou l'ordinateur de bureau Schenker Vision 14 équipé d'un Core H Schenker Vision 14 dans des conditions similaires. Il en va de même lorsque le processeur est pleinement sollicité avec Prime95. Néanmoins, les performances par watt sont toujours en faveur du nouveau processeur de 14e génération et la consommation d'énergie plus élevée n'est donc pas nécessairement un inconvénient.
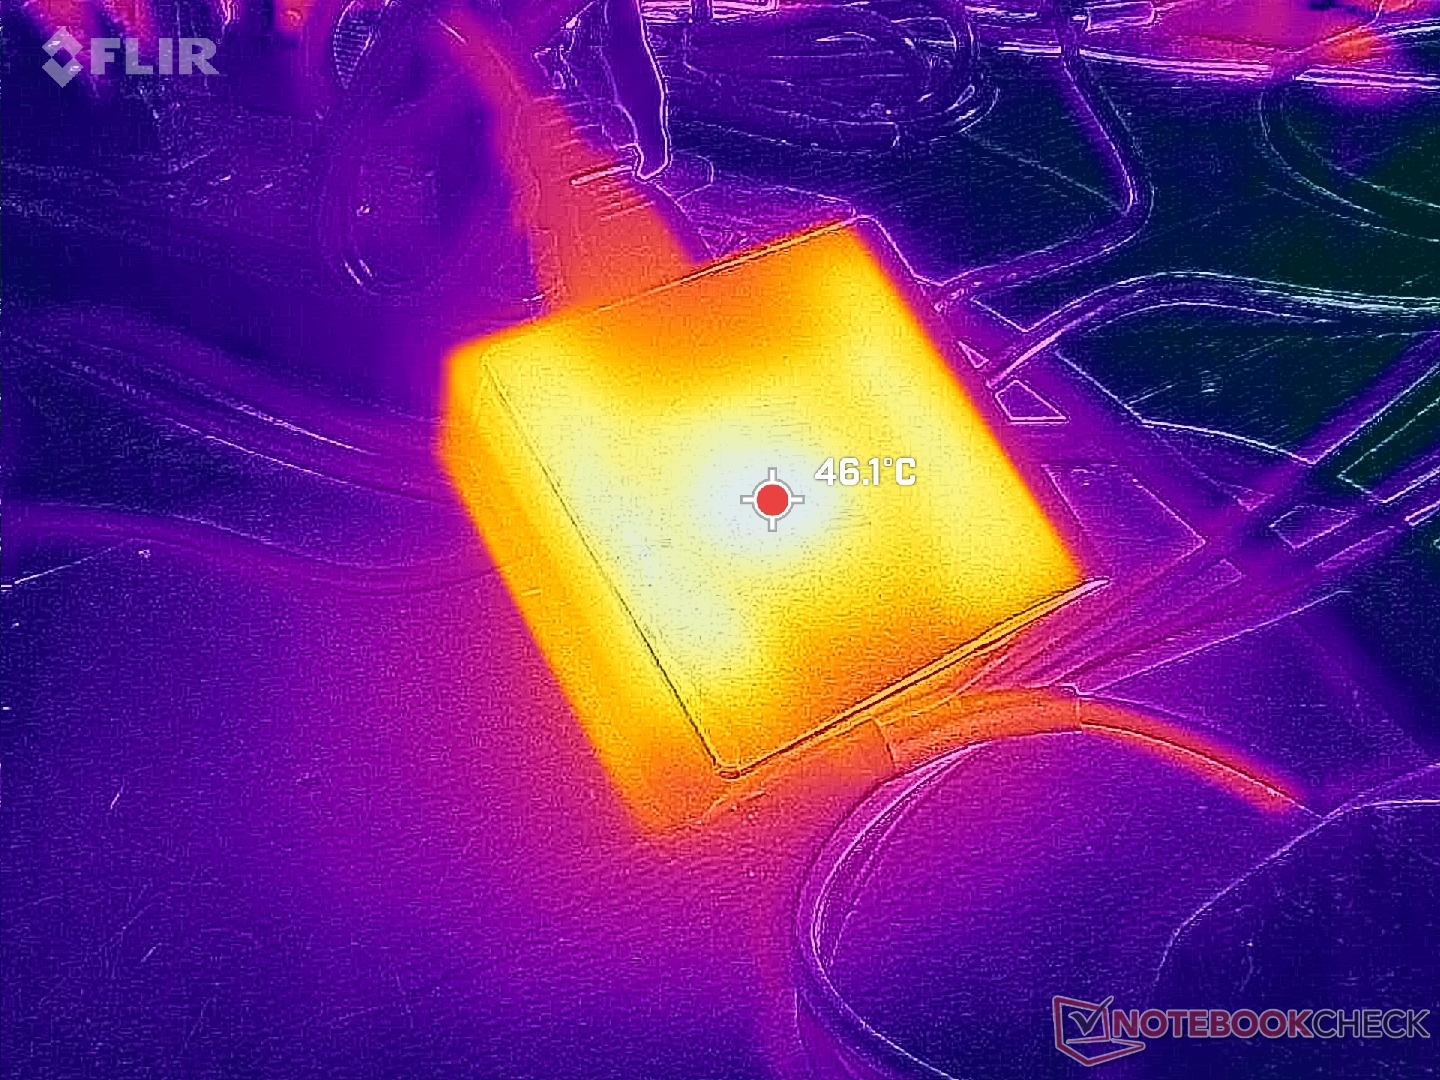
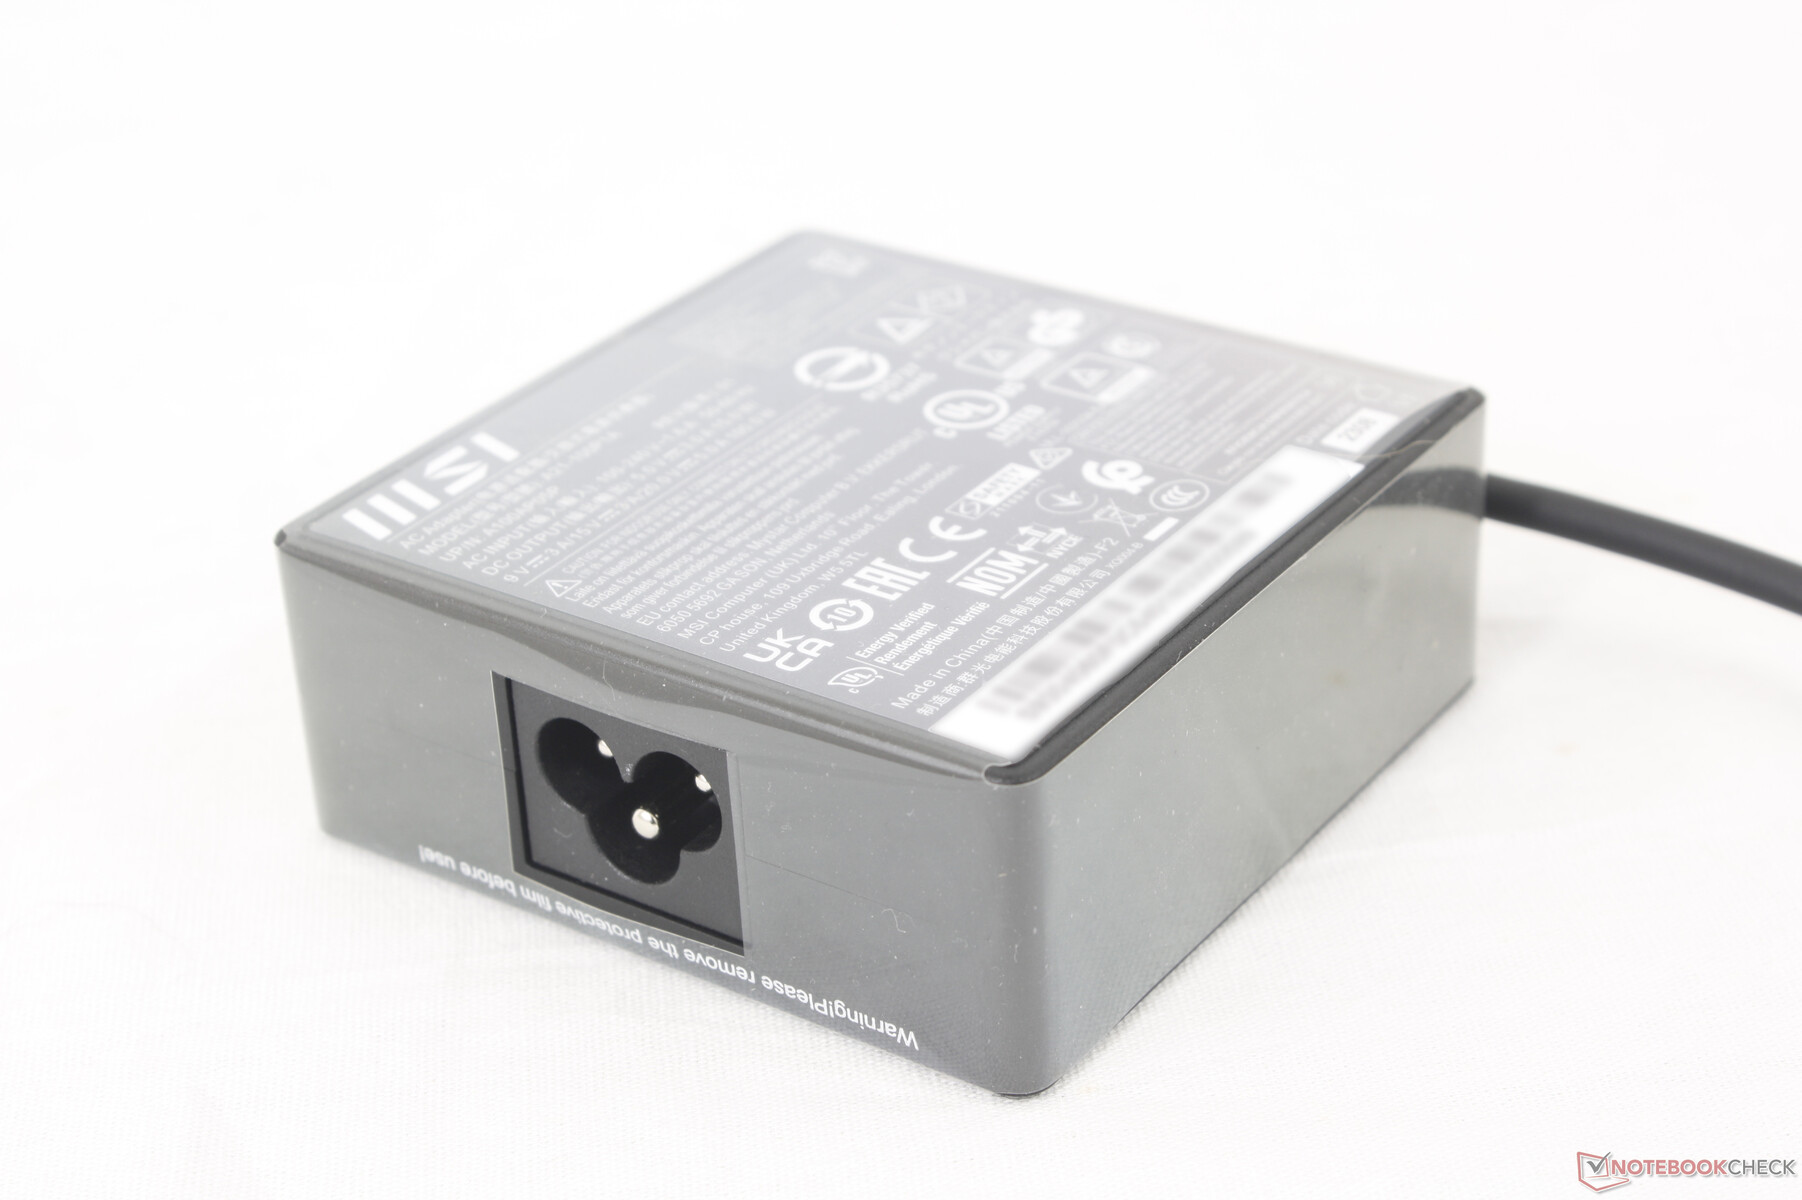
Nous sommes en mesure d'enregistrer une consommation maximale de 105 W à partir du petit (~7,5 x 7,5 x 3 cm) adaptateur secteur USB-C de 100 W lorsque le CPU est à 100 % d'utilisation. Ce taux n'est que temporaire en raison du potentiel limité de Turbo Boost et tend donc à se stabiliser autour de 70 W lors de l'exécution de charges lourdes. Notez que les UGS avec des cartes graphiques RTX 4060 ou 4070 discrètes sont livrées avec un adaptateur secteur USB-C plus grand de 140 W à la place.

| Éteint/en veille | |
| Au repos | |
| Fortement sollicité |
|
Légende:
min: | |
| MSI Prestige 16 B1MG-001US Ultra 7 155H, Arc 8-Core, Samsung PM9A1 MZVL22T0HBLB, IPS, 2560x1600, 16" | MSI Prestige 15 A12UD-093 i7-1280P, GeForce RTX 3050 Ti Laptop GPU, Micron 3400 1TB MTFDKBA1T0TFH, IPS, 3840x2160, 15.6" | LG Gram 2in1 16 16T90R - G.AA78G i7-1360P, Iris Xe G7 96EUs, Samsung PM9A1 MZVL21T0HCLR, IPS, 2560x1600, 16" | Lenovo ThinkBook 16 G6 ABP R5 7530U, Vega 7, SK hynix HFS512GEJ9X125N, IPS, 1920x1200, 16" | Asus VivoBook Pro 16 K6602VU i9-13900H, GeForce RTX 4050 Laptop GPU, Micron 2400 MTFDKBA1T0QFM, OLED, 3200x2000, 16" | Dell Inspiron 16 Plus 7630 i7-13700H, GeForce RTX 4060 Laptop GPU, WD PC SN740 SDDPTQD-1T00, IPS, 2560x1600, 16" | |
|---|---|---|---|---|---|---|
| Power Consumption | -2% | 2% | 24% | -161% | -124% | |
| Idle Minimum * (Watt) | 3 | 5.4 -80% | 5.5 -83% | 3.7 -23% | 21.06 -602% | 15.6 -420% |
| Idle Average * (Watt) | 9.5 | 11.8 -24% | 7.2 24% | 7.1 25% | 24.27 -155% | 17.7 -86% |
| Idle Maximum * (Watt) | 12 | 12.7 -6% | 12.9 -8% | 7.7 36% | 25.12 -109% | 20.6 -72% |
| Load Average * (Watt) | 68.3 | 45.9 33% | 55 19% | 43.9 36% | 52.4 23% | 87.4 -28% |
| Witcher 3 ultra * (Watt) | 59.8 | 45.7 24% | 47 21% | 40.8 32% | 110.2 -84% | 121.7 -104% |
| Load Maximum * (Watt) | 104.8 | 63 40% | 63.6 39% | 66.6 36% | 146 -39% | 138 -32% |
* ... Moindre est la valeur, meilleures sont les performances
Power Consumption Witcher 3 / Stresstest
Power Consumption external Monitor
Autonomie de la batterie
La capacité de la batterie est passée de 80 Wh sur la Prestige 15 à 99 Wh sur notre Prestige 16. Combinez cela à l'efficacité du nouveau processeur Intel de 14e génération et vous obtiendrez des durées d'utilisation extrêmement longues de près de 18,5 heures de navigation WLAN dans le monde réel. Il s'agit de l'un des ordinateurs portables Windows les plus endurants que nous ayons testés, avec des résultats qui rivalisent avec ceux de la série MacBook.
Le chargement de la batterie vide à sa pleine capacité prend environ 90 minutes.
| MSI Prestige 16 B1MG-001US Ultra 7 155H, Arc 8-Core, 99.9 Wh | MSI Prestige 15 A12UD-093 i7-1280P, GeForce RTX 3050 Ti Laptop GPU, 80 Wh | LG Gram 2in1 16 16T90R - G.AA78G i7-1360P, Iris Xe G7 96EUs, 80 Wh | Lenovo ThinkBook 16 G6 ABP R5 7530U, Vega 7, 45 Wh | Asus VivoBook Pro 16 K6602VU i9-13900H, GeForce RTX 4050 Laptop GPU, 96 Wh | Dell Inspiron 16 Plus 7630 i7-13700H, GeForce RTX 4060 Laptop GPU, 86 Wh | |
|---|---|---|---|---|---|---|
| Autonomie de la batterie | -51% | -32% | -45% | -45% | -43% | |
| Reader / Idle (h) | 25.1 | 17.6 -30% | ||||
| WiFi v1.3 (h) | 18.3 | 8.9 -51% | 11.9 -35% | 10.1 -45% | 10.1 -45% | 9.4 -49% |
| Load (h) | 2.8 | 1.4 -50% | 2 -29% | 1.4 -50% | ||
| H.264 (h) | 7.1 | 11.6 | 9.8 |
Points positifs
Points négatifs
Verdict - La série Prestige à son meilleur
la 14e génération d'Intel devrait s'avérer être un atout majeur pour les ultrabooks tels que le MSI Prestige 16. Si les performances brutes du processeur ne sont pas beaucoup plus élevées que celles de la génération précédente, les gains en termes de performances graphiques intégrées et d'autonomie sont sans doute tout aussi importants pour la catégorie des ultrabooks. L'Intel Arc 8 a réussi à évincer l'AMD Radeon 780M par des marges notables, au point que la plupart des joueurs occasionnels et des éditeurs de photos devraient être satisfaits de ses performances.
Quelques aspects du modèle peuvent être améliorés. Tout d'abord, l'absence de taux de rafraîchissement élevé ou d'options d'écran tactile signifie que les alternatives telles que le HP Spectre ou le Asus Vivobook Test de l'Asus VivoBook Pro 16 (2023) : i9-13900H, RTX 4050, et OLED 3.2K pour les créatifs amateurs ont encore quelques avantages. Deuxièmement, les images fantômes sont très visibles sur la configuration IPS, à tel point que même les joueurs occasionnels peuvent être gênés par leurs effets. Le SKU OLED peut donc être intéressant malgré l'impact inévitable sur la durée de vie de la batterie. Enfin, les performances supérieures de l'iGPU s'accompagnent d'une consommation d'énergie plus élevée et d'un bruit de ventilateur plus fort que sur la plupart des autres Ultrabooks de la série U lors de l'exécution de tâches gourmandes en GPU.
Les étudiants en particulier apprécieront la longue durée de vie de la batterie, la netteté de l'écran DCI-P3 et le large éventail d'options graphiques du Prestige 16, qui constitue une alternative intéressante au MacBook Pro.
Le design portable, l'écran coloré, la longue durée de vie de la batterie, les graphiques intégrés rapides et le lecteur de carte SD rapide sont les points forts de la Prestige 16. Les utilisateurs voudront exploiter ces atouts pour tirer le meilleur parti de ce modèle MSI.
Prix et disponibilité
La MSI Prestige 16 avec CPU 14ème génération est maintenant disponible sur Amazon avec OLED pour $1650 USD ou Best Buy avec la carte graphique discrète Arc A370M pour $1400.
MSI Prestige 16 B1MG-001US
- 12/28/2023 v7 (old)
Allen Ngo
Transparency
La sélection des appareils à examiner est effectuée par notre équipe éditoriale. L'échantillon de test a été acheté gratuitement par l'auteur, à ses propres frais. Le prêteur n'a eu aucune influence sur cette évaluation et le fabricant n'a pas reçu de copie de cette évaluation avant sa publication. Il n'y avait aucune obligation de publier cet article. En tant que média indépendant, Notebookcheck n'est pas soumis à l'autorité des fabricants, des détaillants ou des éditeurs.
Voici comment Notebookcheck teste
Chaque année, Notebookcheck examine de manière indépendante des centaines d'ordinateurs portables et de smartphones en utilisant des procédures standardisées afin de garantir que tous les résultats sont comparables. Nous avons continuellement développé nos méthodes de test depuis environ 20 ans et avons établi des normes industrielles dans le processus. Dans nos laboratoires de test, des équipements de mesure de haute qualité sont utilisés par des techniciens et des rédacteurs expérimentés. Ces tests impliquent un processus de validation en plusieurs étapes. Notre système d'évaluation complexe repose sur des centaines de mesures et de points de référence bien fondés, ce qui garantit l'objectivité.Price comparison

