 Deutsch
 English
 Español
 Français
 Italiano
 Nederlands
 Polski
 Português
 Русский
 Türkçe
 Svenska
 Chinese
 Magyar
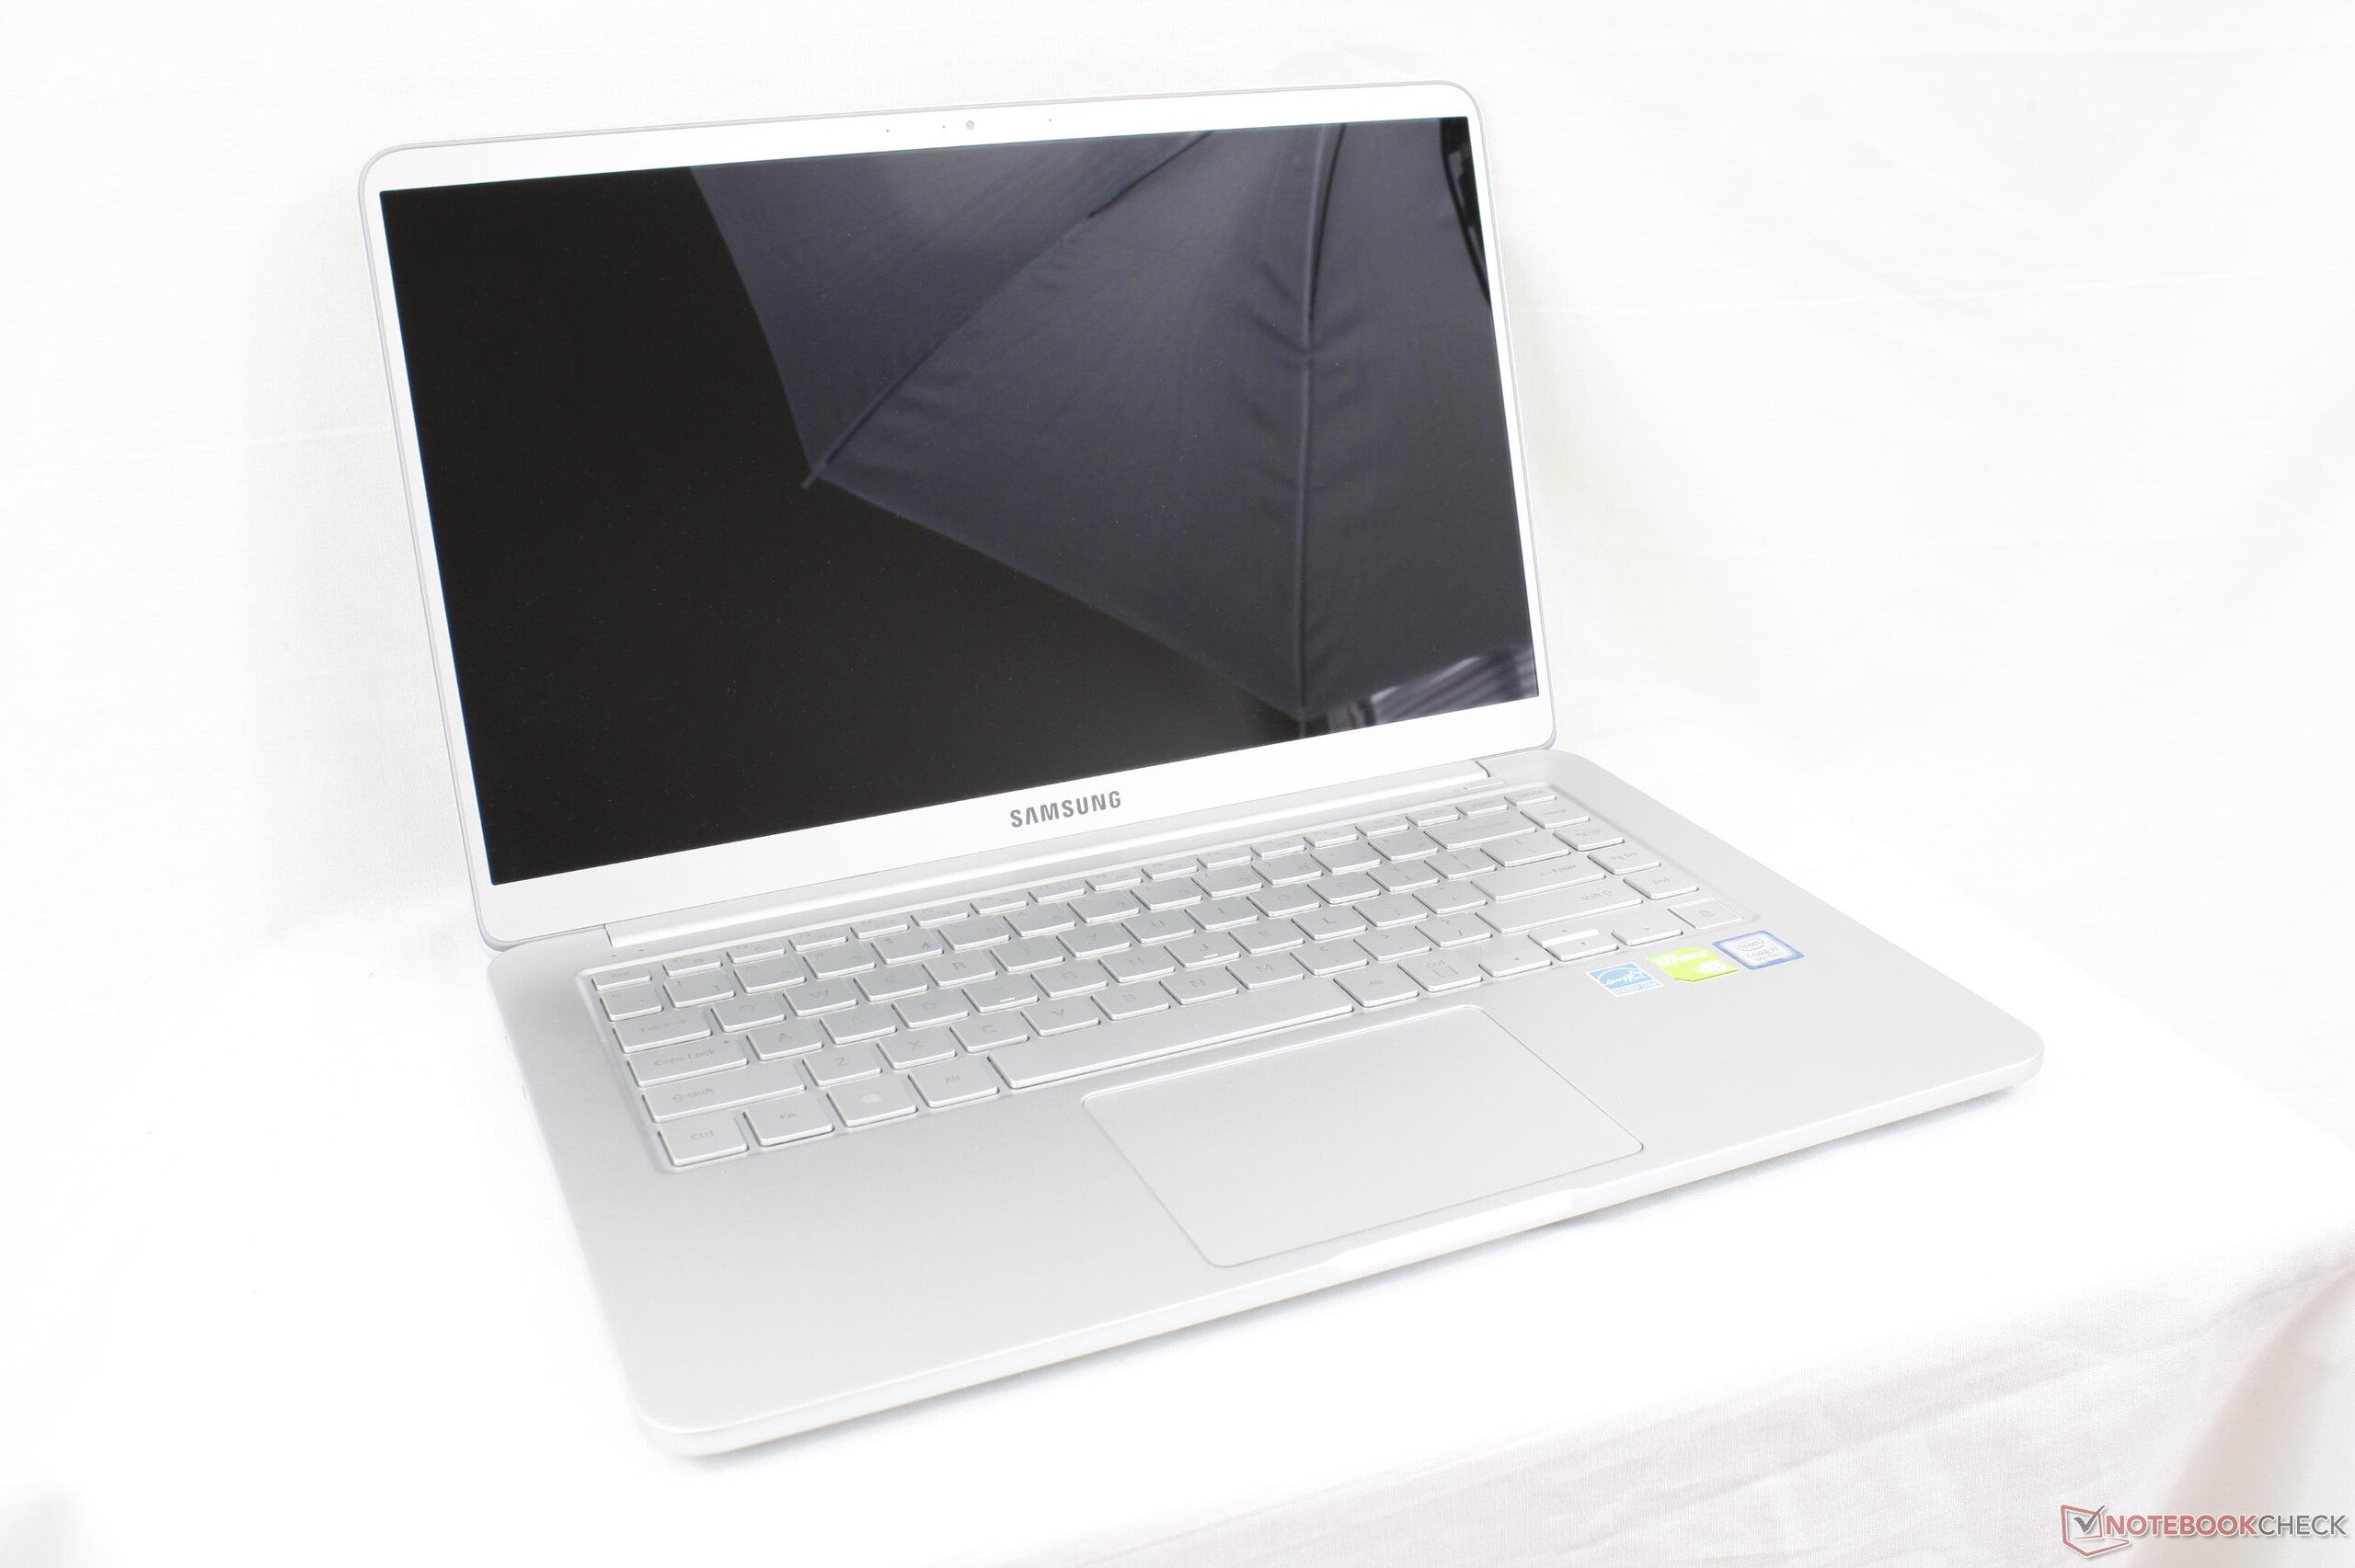
Courte critique du PC portable Samsung Notebook 9 NP900X5T (i7-8550U, GeForce MX150)
| SD Card Reader | |
| average JPG Copy Test (av. of 3 runs) | |
| HP Spectre x360 15t-bl100 (Toshiba Exceria Pro SDXC 64 GB UHS-II) | |
| Dell XPS 15 9560 (i7-7700HQ, UHD) (Toshiba Exceria Pro SDXC 64 GB UHS-II) | |
| Moyenne de la classe Multimedia (17.6 - 205, n=66, 2 dernières années) | |
| Samsung Notebook 9 NP900X5T-X01US (Toshiba Exceria Pro M501 UHS-II) | |
| maximum AS SSD Seq Read Test (1GB) | |
| Dell XPS 15 9560 (i7-7700HQ, UHD) (Toshiba Exceria Pro SDXC 64 GB UHS-II) | |
| HP Spectre x360 15t-bl100 (Toshiba Exceria Pro SDXC 64 GB UHS-II) | |
| Moyenne de la classe Multimedia (16.8 - 266, n=62, 2 dernières années) | |
| Samsung Notebook 9 NP900X5T-X01US (Toshiba Exceria Pro M501 UHS-II) | |
| Networking | |
| iperf3 transmit AX12 | |
| Dell XPS 15 9560 (i7-7700HQ, UHD) | |
| Microsoft Surface Book 2 15 | |
| Samsung Notebook 9 NP900X5T-X01US | |
| iperf3 receive AX12 | |
| Samsung Notebook 9 NP900X5T-X01US | |
| Dell XPS 15 9560 (i7-7700HQ, UHD) | |
| Microsoft Surface Book 2 15 | |
| |||||||||||||||||||||||||
Homogénéité de la luminosité: 92 %
Valeur mesurée au centre, sur batterie: 558.2 cd/m²
Contraste: 1213:1 (Valeurs des noirs: 0.46 cd/m²)
ΔE Color 4.41 | 0.5-29.43 Ø5
ΔE Greyscale 6.6 | 0.57-98 Ø5.3
97.2% sRGB (Argyll 1.6.3 3D)
61.3% AdobeRGB 1998 (Argyll 1.6.3 3D)
66.8% AdobeRGB 1998 (Argyll 2.2.0 3D)
97.4% sRGB (Argyll 2.2.0 3D)
65.2% Display P3 (Argyll 2.2.0 3D)
Gamma: 2.19
| Samsung Notebook 9 NP900X5T-X01US ID: BOE06E8, Name: BOE HF NV150FHB-N31, IPS, 15.00, 1920x1080 | Dell XPS 15 9560 (i7-7700HQ, UHD) IGZO IPS, 15.60, 3840x2160 | LG Gram 15Z975 ID: LGD052A, Name: LG Philips LP156WFA-SPC1, IPS, 15.60, 1920x1080 | Apple MacBook Pro 15 2017 (2.9 GHz, 560) 15.40, 2880x1800 | Microsoft Surface Book 2 15 LG Philips LGD0554, IPS, 15.00, 3240x2160 | Samsung Notebook 9 NP900X5N-X01US ID: BOE06E8, Name: BOE HF NV150FHB-N31, IPS, 15.00, 1920x1080 | |
|---|---|---|---|---|---|---|
| Display | 30% | -18% | 0% | |||
| Display P3 Coverage | 65.2 | 89.7 38% | 54.9 -16% | 65.2 0% | ||
| sRGB Coverage | 97.4 | 100 3% | 77.1 -21% | 97.7 0% | ||
| AdobeRGB 1998 Coverage | 66.8 | 100 50% | 56.3 -16% | 67.2 1% | ||
| Response Times | -41% | 19% | 7% | 226% | -30% | |
| Response Time Grey 50% / Grey 80% * | 46 ? | 57.2 ? -24% | 35.2 ? 23% | 42.4 ? 8% | 37.6 ? 18% | 40.8 ? 11% |
| Response Time Black / White * | 29.6 ? | 39.2 ? -32% | 25.6 ? 14% | 28 ? 5% | 22.4 ? 24% | 32.4 ? -9% |
| PWM Frequency | 2976 ? | 962 -68% | 21930 ? 637% | 208.3 ? -93% | ||
| Screen | -0% | -12% | 28% | 26% | 16% | |
| Brightness middle | 558.2 | 370.1 -34% | 273 -51% | 534 -4% | 446 -20% | 565.6 1% |
| Brightness | 528 | 356 -33% | 276 -48% | 502 -5% | 444 -16% | 524 -1% |
| Brightness Distribution | 92 | 87 -5% | 89 -3% | 86 -7% | 89 -3% | 88 -4% |
| Black Level * | 0.46 | 0.37 20% | 0.22 52% | 0.31 33% | 0.25 46% | 0.49 -7% |
| Contrast | 1213 | 1000 -18% | 1241 2% | 1723 42% | 1784 47% | 1154 -5% |
| Colorchecker dE 2000 * | 4.41 | 5.3 -20% | 4.77 -8% | 1.8 59% | 1.7 61% | 2 55% |
| Colorchecker dE 2000 max. * | 10.91 | 9.9 9% | 10.76 1% | 3.8 65% | 2.7 75% | 5 54% |
| Greyscale dE 2000 * | 6.6 | 4.6 30% | 8.6 -30% | 2.4 64% | 1.7 74% | 2.5 62% |
| Gamma | 2.19 100% | 2.31 95% | 1.7 129% | 2.27 97% | 2.11 104% | 2.21 100% |
| CCT | 7615 85% | 6284 103% | 6678 97% | 6563 99% | 6384 102% | 6896 94% |
| Color Space (Percent of AdobeRGB 1998) | 61.3 | 88.3 44% | 50.2 -18% | 77.92 27% | 58.6 -4% | 61.2 0% |
| Color Space (Percent of sRGB) | 97.2 | 100 3% | 76.9 -21% | 99.94 3% | 92.9 -4% | 97.5 0% |
| Moyenne finale (programmes/paramètres) | -4% /
-2% | -4% /
-9% | 18% /
24% | 126% /
72% | -5% /
4% |
* ... Moindre est la valeur, meilleures sont les performances
Temps de réponse de l'écran
| ↔ Temps de réponse noir à blanc | ||
|---|---|---|
| 29.6 ms ... hausse ↗ et chute ↘ combinées | ↗ 16.4 ms hausse | 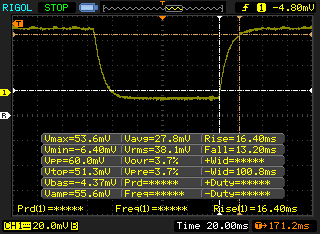 |
| ↘ 13.2 ms chute | ||
| L'écran souffre de latences relativement élevées, insuffisant pour le jeu. En comparaison, tous les appareils testés affichent entre 0.1 (minimum) et 240 (maximum) ms. » 76 % des appareils testés affichent de meilleures performances. Cela signifie que les latences relevées sont moins bonnes que la moyenne (21.5 ms) de tous les appareils testés. | ||
| ↔ Temps de réponse gris 50% à gris 80% | ||
| 46 ms ... hausse ↗ et chute ↘ combinées | ↗ 25.2 ms hausse | 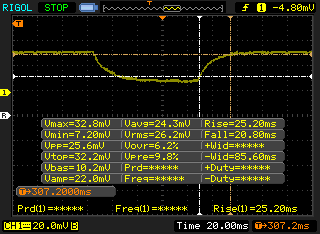 |
| ↘ 20.8 ms chute | ||
| L'écran souffre de latences très élevées, à éviter pour le jeu. En comparaison, tous les appareils testés affichent entre 0.2 (minimum) et 636 (maximum) ms. » 76 % des appareils testés affichent de meilleures performances. Cela signifie que les latences relevées sont moins bonnes que la moyenne (33.7 ms) de tous les appareils testés. | ||
Scintillement / MLI (Modulation de largeur d'impulsion)
| Scintillement / MLI (Modulation de largeur d'impulsion) décelé | 2976 Hz | ≤ 91 Niveau de luminosité | 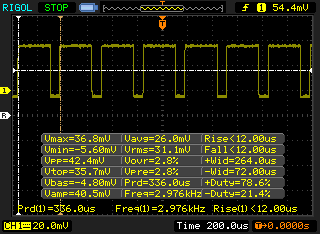 |
Le rétroéclairage de l'écran scintille à la fréquence de 2976 Hz (certainement du fait de l'utilisation d'une MDI - Modulation de largeur d'impulsion) à un niveau de luminosité inférieur ou égal à 91 % . Aucun scintillement ne devrait être perceptible au-dessus de cette valeur. La fréquence de rafraîchissement de 2976 Hz est élevée, la grande majorité des utilisateurs ne devrait pas percevoir de scintillements et être sujette à une fatigue oculaire accrue. En comparaison, 53 % des appareils testés n'emploient pas MDI pour assombrir leur écran. Nous avons relevé une moyenne à 17903 (minimum : 5 - maximum : 3846000) Hz dans le cas où une MDI était active. | |||
* ... Moindre est la valeur, meilleures sont les performances
| PCMark 10 - Score | |
| Samsung Notebook 9 NP900X5T-X01US | |
| HP Spectre x360 15t-bl100 | |
| Moyenne Intel Core i7-8550U, NVIDIA GeForce MX150 (3056 - 4106, n=19) | |
| LG Gram 15Z975 | |
| PCMark 8 Home Score Accelerated v2 | 4130 points | |
| PCMark 8 Creative Score Accelerated v2 | 5325 points | |
| PCMark 8 Work Score Accelerated v2 | 5228 points | |
| PCMark 10 Score | 4106 points | |
Aide | ||
| Samsung Notebook 9 NP900X5T-X01US Samsung PM961 MZVLW256HEHP | Dell XPS 15 9560 (i7-7700HQ, UHD) Lite-On CX2-8B512-Q11 | Samsung Notebook 9 NP900X5N-X01US Samsung PM961 MZVLW256HEHP | LG Gram 15Z975 SK Hynix HFS256G39TND-N210A | HP Spectre x360 15t-bl100 Samsung PM961 NVMe MZVLW512HMJP | |
|---|---|---|---|---|---|
| AS SSD | 4% | 20% | -103% | 40% | |
| Copy Game MB/s | 1058 | 540 -49% | 648 -39% | 179.8 -83% | 1134 7% |
| Copy Program MB/s | 479.5 | 411.5 -14% | 497.9 4% | 141.2 -71% | 534 11% |
| Copy ISO MB/s | 1751 | 1272 -27% | 1685 -4% | 197.5 -89% | 1936 11% |
| Score Total | 2646 | 2810 6% | 3906 48% | 1003 -62% | 3781 43% |
| Score Write | 628 | 1022 63% | 928 48% | 339 -46% | 1556 148% |
| Score Read | 1367 | 1206 -12% | 2011 47% | 442 -68% | 1493 9% |
| Access Time Write * | 0.032 | 0.034 -6% | 0.03 6% | 0.232 -625% | 0.026 19% |
| Access Time Read * | 0.054 | 0.034 37% | 0.043 20% | 0.08 -48% | 0.04 26% |
| 4K-64 Write | 392.6 | 789 101% | 674 72% | 246.7 -37% | 1262 221% |
| 4K-64 Read | 1085 | 962 -11% | 1709 58% | 366.5 -66% | 1206 11% |
| 4K Write | 115 | 112.2 -2% | 124.1 8% | 67.6 -41% | 141.1 23% |
| 4K Read | 48.71 | 41.34 -15% | 48.71 0% | 26.24 -46% | 51.9 7% |
| Seq Write | 1206 | 1207 0% | 1299 8% | 248.5 -79% | 1530 27% |
| Seq Read | 2337 | 2026 -13% | 2533 8% | 488.1 -79% | 2342 0% |
* ... Moindre est la valeur, meilleures sont les performances

| 3DMark 11 Performance | 4642 points | |
| 3DMark Ice Storm Standard Score | 46087 points | |
| 3DMark Cloud Gate Standard Score | 13207 points | |
| 3DMark Fire Strike Score | 3104 points | |
| 3DMark Fire Strike Extreme Score | 1595 points | |
Aide | ||
| Bas | Moyen | Élevé | Ultra | |
| BioShock Infinite (2013) | 132.2 | 60 | 59.7 | 30.9 |
| Metro: Last Light (2013) | 53.4 | 41.6 | 36.3 | 17.2 |
| Thief (2014) | 58 | 32.5 | 31.1 | 18.8 |
| The Witcher 3 (2015) | 46.8 | 33.7 | 20.5 | 11 |
| Batman: Arkham Knight (2015) | 41 | 36 | 20 | |
| Metal Gear Solid V (2015) | 60 | 50.9 | 37.2 | 23.2 |
| Fallout 4 (2015) | 55 | 34.5 | 18.6 | 17.4 |
| Rise of the Tomb Raider (2016) | 60.9 | 35.4 | 19.2 | 16.4 |
| Ashes of the Singularity (2016) | 25.2 | 16.2 | 14.1 | |
| Overwatch (2016) | 60 | 60 | 46.1 | 27.5 |
| Prey (2017) | 50.6 | 19.2 | 14 | 10.5 |
| F1 2017 (2017) | 55 | 24 | 19 | 14 |
| Middle-earth: Shadow of War (2017) | 47 | 21 | 15 | 11 |
| Destiny 2 (2017) | 29.1 | 10.8 |
Degré de la nuisance sonore
| Au repos |
| 29.6 / 29.6 / 30.3 dB(A) |
| Fortement sollicité |
| 40 / 40 dB(A) |
 | ||
30 dB silencieux 40 dB(A) audible 50 dB(A) bruyant |
||
min: | ||
| Samsung Notebook 9 NP900X5T-X01US GeForce MX150, i5-8550U, Samsung PM961 MZVLW256HEHP | Dell XPS 15 9560 (i7-7700HQ, UHD) GeForce GTX 1050 Mobile, i7-7700HQ, Lite-On CX2-8B512-Q11 | Samsung Notebook 9 NP900X5N-X01US GeForce 940MX, i7-7500U, Samsung PM961 MZVLW256HEHP | LG Gram 15Z975 UHD Graphics 620, i5-8250U, SK Hynix HFS256G39TND-N210A | HP Spectre x360 15t-bl100 GeForce MX150, i5-8550U, Samsung PM961 NVMe MZVLW512HMJP | |
|---|---|---|---|---|---|
| Noise | -9% | 5% | 6% | 3% | |
| off / environment * | 29.6 | 28.4 4% | 28.3 4% | 29.2 1% | 28.4 4% |
| Idle Minimum * | 29.6 | 29 2% | 28.3 4% | 29.2 1% | 28.4 4% |
| Idle Average * | 29.6 | 29 2% | 28.3 4% | 29.2 1% | 28.4 4% |
| Idle Maximum * | 30.3 | 32.2 -6% | 28.3 7% | 29.2 4% | 28.4 6% |
| Load Average * | 40 | 47.1 -18% | 38.3 4% | 32.5 19% | 41.6 -4% |
| Witcher 3 ultra * | 40 | 52 -30% | 36.1 10% | ||
| Load Maximum * | 40 | 47.1 -18% | 38.3 4% | 37.2 7% | 41.6 -4% |
* ... Moindre est la valeur, meilleures sont les performances
(+) La température maximale du côté supérieur est de 39 °C / 102 F, par rapport à la moyenne de 36.9 °C / 98 F, allant de 21.1 à 71 °C pour la classe Multimedia.
(±) Le fond chauffe jusqu'à un maximum de 40.4 °C / 105 F, contre une moyenne de 39.1 °C / 102 F
(+) En utilisation inactive, la température moyenne du côté supérieur est de 26.6 °C / 80 F, par rapport à la moyenne du dispositif de 31.2 °C / 88 F.
(±) En jouant à The Witcher 3, la température moyenne du côté supérieur est de 32.7 °C / 91 F, alors que la moyenne de l'appareil est de 31.2 °C / 88 F.
(+) Les repose-poignets et le pavé tactile sont plus froids que la température de la peau avec un maximum de 28.4 °C / 83.1 F et sont donc froids au toucher.
(±) La température moyenne de la zone de l'appui-paume de dispositifs similaires était de 28.8 °C / 83.8 F (+0.4 °C / #0.7 F).
Samsung Notebook 9 NP900X5T-X01US analyse audio
(-) | haut-parleurs pas très forts (64.5 dB)
Bass 100 - 315 Hz
(-) | presque aucune basse - en moyenne 21.3% plus bas que la médiane
(±) | la linéarité des basses est moyenne (12.6% delta à la fréquence précédente)
Mids 400 - 2000 Hz
(+) | médiane équilibrée - seulement 3.4% de la médiane
(+) | les médiums sont linéaires (4.2% delta à la fréquence précédente)
Aiguës 2 - 16 kHz
(+) | des sommets équilibrés - à seulement 3.3% de la médiane
(±) | la linéarité des aigus est moyenne (9.3% delta à la fréquence précédente)
Overall 100 - 16.000 Hz
(±) | la linéarité du son global est moyenne (25.1% de différence avec la médiane)
Par rapport à la même classe
» 88% de tous les appareils testés de cette catégorie étaient meilleurs, 3% similaires, 9% pires
» Le meilleur avait un delta de 5%, la moyenne était de 18%, le pire était de 45%.
Par rapport à tous les appareils testés
» 73% de tous les appareils testés étaient meilleurs, 6% similaires, 21% pires
» Le meilleur avait un delta de 4%, la moyenne était de 25%, le pire était de 134%.
Apple MacBook 12 (Early 2016) 1.1 GHz analyse audio
(+) | les haut-parleurs peuvent jouer relativement fort (83.6# dB)
Bass 100 - 315 Hz
(±) | basse réduite - en moyenne 11.3% inférieure à la médiane
(±) | la linéarité des basses est moyenne (14.2% delta à la fréquence précédente)
Mids 400 - 2000 Hz
(+) | médiane équilibrée - seulement 2.4% de la médiane
(+) | les médiums sont linéaires (5.5% delta à la fréquence précédente)
Aiguës 2 - 16 kHz
(+) | des sommets équilibrés - à seulement 2% de la médiane
(+) | les aigus sont linéaires (4.5% delta à la fréquence précédente)
Overall 100 - 16.000 Hz
(+) | le son global est linéaire (10.2% différence à la médiane)
Par rapport à la même classe
» 5% de tous les appareils testés de cette catégorie étaient meilleurs, 2% similaires, 93% pires
» Le meilleur avait un delta de 5%, la moyenne était de 19%, le pire était de 53%.
Par rapport à tous les appareils testés
» 3% de tous les appareils testés étaient meilleurs, 1% similaires, 96% pires
» Le meilleur avait un delta de 4%, la moyenne était de 25%, le pire était de 134%.
| Éteint/en veille | |
| Au repos | |
| Fortement sollicité |
|
| Samsung Notebook 9 NP900X5T-X01US i5-8550U, GeForce MX150, Samsung PM961 MZVLW256HEHP, IPS, 1920x1080, 15.00 | Dell XPS 15 9560 (i7-7700HQ, UHD) i7-7700HQ, GeForce GTX 1050 Mobile, Lite-On CX2-8B512-Q11, IGZO IPS, 3840x2160, 15.60 | Samsung Notebook 9 NP900X5N-X01US i7-7500U, GeForce 940MX, Samsung PM961 MZVLW256HEHP, IPS, 1920x1080, 15.00 | LG Gram 15Z975 i5-8250U, UHD Graphics 620, SK Hynix HFS256G39TND-N210A, IPS, 1920x1080, 15.60 | HP Envy x360 15m-bq121dx R5 2500U, Vega 8, HGST Travelstar 7K1000 HTS721010A9E630, IPS, 1920x1080, 15.60 | Microsoft Surface Laptop i7 i7-7660U, Iris Plus Graphics 640, Samsung PM971 KUS040202M, IPS, 2256x1504, 13.50 | |
|---|---|---|---|---|---|---|
| Power Consumption | -103% | -4% | 19% | 3% | 32% | |
| Idle Minimum * | 3.5 | 11.9 -240% | 5 -43% | 4.4 -26% | 5.9 -69% | 2.7 23% |
| Idle Average * | 11.3 | 17.1 -51% | 11.6 -3% | 9.1 19% | 8.7 23% | 7.6 33% |
| Idle Maximum * | 14.2 | 17.3 -22% | 12.2 14% | 9.6 32% | 10.5 26% | 7.8 45% |
| Load Average * | 53.3 | 94.7 -78% | 47.8 10% | 34.8 35% | 45.7 14% | 37.5 30% |
| Witcher 3 ultra * | 50.6 | 104.8 -107% | 51.9 -3% | 45.8 9% | 31.7 37% | |
| Load Maximum * | 56.2 | 122 -117% | 55.7 1% | 36 36% | 49.4 12% | 41.6 26% |
* ... Moindre est la valeur, meilleures sont les performances
| Samsung Notebook 9 NP900X5T-X01US i5-8550U, GeForce MX150, 75 Wh | Dell XPS 15 9560 (i7-7700HQ, UHD) i7-7700HQ, GeForce GTX 1050 Mobile, 97 Wh | Samsung Notebook 9 NP900X5N-X01US i7-7500U, GeForce 940MX, 66 Wh | LG Gram 15Z975 i5-8250U, UHD Graphics 620, 60 Wh | HP Spectre x360 15t-bl100 i5-8550U, GeForce MX150, 79.2 Wh | HP Envy x360 15m-bq121dx R5 2500U, Vega 8, 55.8 Wh | |
|---|---|---|---|---|---|---|
| Autonomie de la batterie | -35% | -8% | -23% | -20% | -47% | |
| Reader / Idle | 1810 | 831 -54% | 1642 -9% | 1078 -40% | 934 -48% | 655 -64% |
| WiFi v1.3 | 635 | 434 -32% | 604 -5% | 435 -31% | 511 -20% | 398 -37% |
| Load | 127 | 103 -19% | 116 -9% | 131 3% | 136 7% | 77 -39% |
Points positifs
Points négatifs
Nous avions précisé dans notre critique du NP900X5N qu’il serait dommage d’acheter cette version du Notebook 9, puisque la configuration avec un processeur Kaby Lake Refresh et une carte graphique Pascal devait bientôt arriver. Maintenant que les deux versions sont disponibles, les patients peuvent maintenant profiter du bond de performances d’environ 60 % du CPU et d’environ 115 % du GPU, par rapport au i7-7500U et à la GeForce 940MX de l’ancien modèle. Cela devient vraiment impressionnant quand on voit que le nouveau modèle n’est pas plus bruyant, ne chauffe pas plus, ou n’a pas une autonomie moindre, grâce à l’amélioration des performances par watt. La capacité supérieure de la batterie en particulier est une surprise, celle du modèle de l’an dernier étant déjà meilleure que la moyenne.
Le plus gros inconvénient de la machine est la grosse limitation de bande passante du GPU durant les jeux. C’est étrange d’avoir des résultats classiques aux tests synthétiques, pour voir dans le détail des performances de jeu aberrantes avec des taux d’image bien trop variables. Jusqu’à ce que Samsung se prononce sur le sujet, ou qu’une mise à jour vienne résoudre le problème, nous ne pouvons pas recommander la version plus chère de la machine avec une MX150.
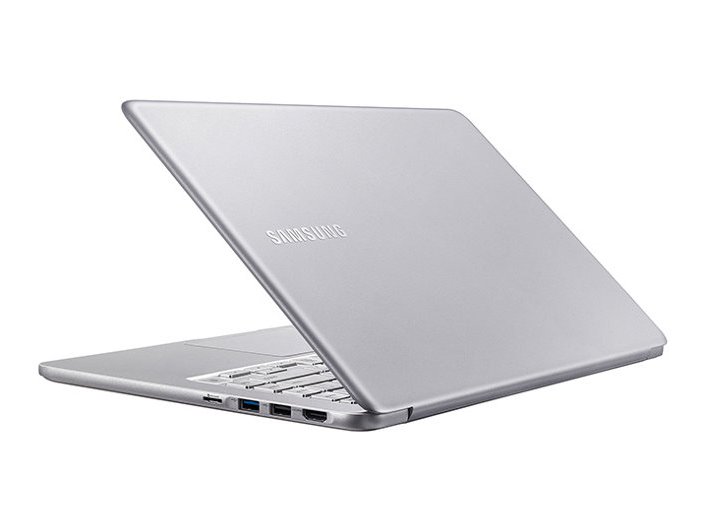
Tout le reste est inchangé, pour le meilleur et pour le pire. Le Notebook 9 est toujours adapté aux utilisateurs qui veulent l’ultraportable de 15 pouces le plus léger et le plus lumineux possible en déplacement. Mais la rigidité du châssis n’est pas suffisante, et les utilisateurs n’auront pas la flexibilité d’une série Spectre, avec ses appareils 2 en 1 avec écran tactile. Nous sommes impatients d’avoir une mise à jour intégrale des Notebook 9, Samsung pouvant faire encore mieux, en abandonnant le port propriétaire pour la charge au profit d’un port USB C universel, en fusionnant le lecteur d’empreintes digitales avec le bouton de démarrage, et en intégrant une eSIM pour booster la portabilité du système.
Il faut être très prudent en achetant la version avec la MX150, à cause du throttle durant les jeux. La version avec uniquement une carte graphique intégrée plus abordable est toujours un excellent choix, pour ceux qui veulent un écran plus grand que celui du XPS 13, tout en voulant une machine plus légère, lumineuse et compacte que le XPS 15.
L’intégralité de cette critique est disponible en anglais en suivant ce lien.
Samsung Notebook 9 NP900X5T-X01US
-
03/13/2018 v6(old)
Allen Ngo
Pricecompare
