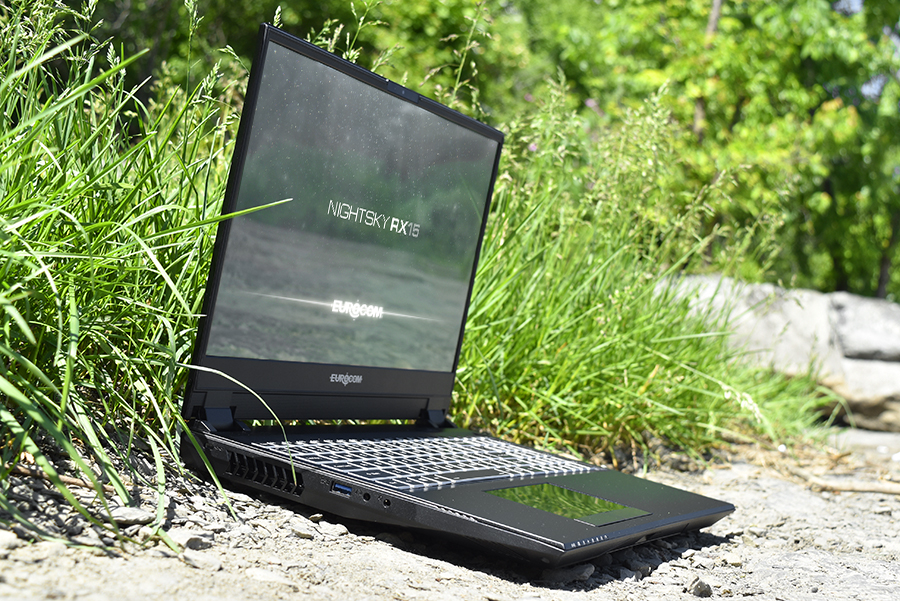
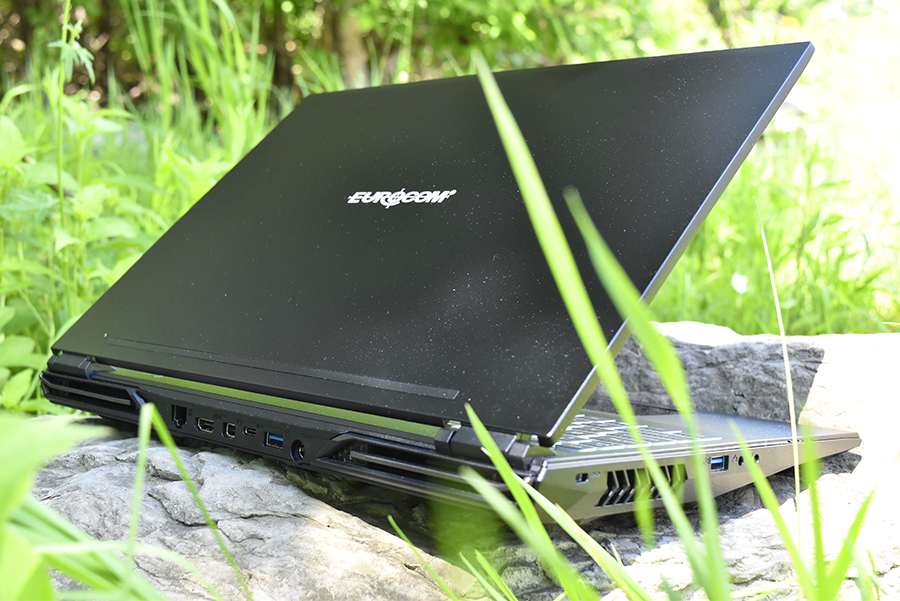
Courte critique de l'Eurocom Nightsky RX15 (i9-9980HK, RTX 2070, 4K OLED, Clevo PB51RF)
| SD Card Reader | |
| average JPG Copy Test (av. of 3 runs) | |
| Eurocom Sky X4C (Toshiba Exceria Pro SDXC 64 GB UHS-II) | |
| Eurocom Nightsky RX15 (Toshiba Exceria Pro SDXC 64 GB UHS-II) | |
| HP Omen 15-dc1303ng (Toshiba Exceria Pro SDXC 64 GB UHS-II) | |
| HP Gaming Pavilion 15-dk0009ng (Toshiba Exceria Pro SDXC 64 GB UHS-II) | |
| MSI GE63 Raider RGB 8RF-008 (Toshiba Exceria Pro SDXC 64 GB UHS-II) | |
| maximum AS SSD Seq Read Test (1GB) | |
| Eurocom Nightsky RX15 (Toshiba Exceria Pro SDXC 64 GB UHS-II) | |
| Eurocom Sky X4C (Toshiba Exceria Pro SDXC 64 GB UHS-II) | |
| HP Omen 15-dc1303ng (Toshiba Exceria Pro SDXC 64 GB UHS-II) | |
| HP Gaming Pavilion 15-dk0009ng (Toshiba Exceria Pro SDXC 64 GB UHS-II) | |
| MSI GE63 Raider RGB 8RF-008 (Toshiba Exceria Pro SDXC 64 GB UHS-II) | |
| |||||||||||||||||||||||||
Homogénéité de la luminosité: 88 %
Valeur mesurée au centre, sur batterie: 414.9 cd/m²
Contraste: ∞:1 (Valeurs des noirs: 0 cd/m²)
ΔE ColorChecker Calman: 7.58 | ∀{0.5-29.43 Ø4.72}
ΔE Greyscale Calman: 2.9 | ∀{0.09-98 Ø4.97}
100% sRGB (Argyll 1.6.3 3D)
88.2% AdobeRGB 1998 (Argyll 1.6.3 3D)
99.1% AdobeRGB 1998 (Argyll 3D)
100% sRGB (Argyll 3D)
99.9% Display P3 (Argyll 3D)
Gamma: 2.05
CCT: 6538 K
| Eurocom Nightsky RX15 Samsung SDCA029, OLED, 15.6", 3840x2160 | Eurocom Nightsky Ti15 AU Optronics B156HAN, IPS, 15.6", 1920x1080 | Eurocom Sky X4C ID: SHP142A, Name: LQ156D1JX01B, IPS, 15.6", 3840x2160 | Dell XPS 15 7590 9980HK GTX 1650 Samsung 156WR04, SDCA029, OLED, 15.6", 3840x2160 | HP Omen 15-dc1303ng LG Philips LGD05C0, IPS, 15.6", 1920x1080 | MSI GE63 Raider RGB 8RF-008 CMN N156HHE-GA1 (CMN15F4), TN, 15.6", 1920x1080 | |
|---|---|---|---|---|---|---|
| Display | -26% | -23% | -6% | -26% | -8% | |
| Display P3 Coverage (%) | 99.9 | 65.2 -35% | 65.1 -35% | 88.1 -12% | 63.8 -36% | 90 -10% |
| sRGB Coverage (%) | 100 | 90.9 -9% | 96.5 -3% | 99.6 0% | 93.4 -7% | 100 0% |
| AdobeRGB 1998 Coverage (%) | 99.1 | 66.3 -33% | 67.2 -32% | 91.8 -7% | 65 -34% | 86 -13% |
| Response Times | -385% | -1239% | 6% | -403% | -713% | |
| Response Time Grey 50% / Grey 80% * (ms) | 2.4 ? | 14.4 ? -500% | 33.6 ? -1300% | 2.3 ? 4% | 14 ? -483% | 24.4 ? -917% |
| Response Time Black / White * (ms) | 2.6 ? | 9.6 ? -269% | 33.2 ? -1177% | 2.4 ? 8% | 11 ? -323% | 15.8 ? -508% |
| PWM Frequency (Hz) | 59.5 ? | 1000 ? | 59.5 ? | 25510 ? | ||
| Screen | -3% | -13% | 6% | 6% | -11% | |
| Brightness middle (cd/m²) | 414.9 | 331 -20% | 324.7 -22% | 421.2 2% | 316 -24% | 292 -30% |
| Brightness (cd/m²) | 404 | 327 -19% | 318 -21% | 417 3% | 295 -27% | 258 -36% |
| Brightness Distribution (%) | 88 | 83 -6% | 81 -8% | 94 7% | 84 -5% | 81 -8% |
| Black Level * (cd/m²) | 0.35 | 0.26 | 0.42 | 0.23 | ||
| Colorchecker dE 2000 * | 7.58 | 4.22 44% | 4.67 38% | 6.06 20% | 2.7 64% | 5.82 23% |
| Colorchecker dE 2000 max. * | 14.85 | 6.95 53% | 8.16 45% | 11.89 20% | 5.65 62% | 9.05 39% |
| Greyscale dE 2000 * | 2.9 | 3.9 -34% | 5.9 -103% | 2.8 3% | 2.35 19% | 4.61 -59% |
| Gamma | 2.05 107% | 2.26 97% | 2.14 103% | 2.15 102% | 2.41 91% | 2.65 83% |
| CCT | 6538 99% | 7392 88% | 7176 91% | 6235 104% | 6904 94% | 6950 94% |
| Color Space (Percent of AdobeRGB 1998) (%) | 88.2 | 59 -33% | 61.1 -31% | 81 -8% | 60 -32% | 76 -14% |
| Color Space (Percent of sRGB) (%) | 100 | 90.5 -9% | 96.1 -4% | 99.6 0% | 93 -7% | 100 0% |
| Contrast (:1) | 946 | 1249 | 752 | 1270 | ||
| Colorchecker dE 2000 calibrated * | 3.27 | 1.58 | 2.82 | |||
| Moyenne finale (programmes/paramètres) | -138% /
-67% | -425% /
-204% | 2% /
3% | -141% /
-64% | -244% /
-118% |
* ... Moindre est la valeur, meilleures sont les performances
Temps de réponse de l'écran
| ↔ Temps de réponse noir à blanc | ||
|---|---|---|
| 2.6 ms ... hausse ↗ et chute ↘ combinées | ↗ 1.3 ms hausse | 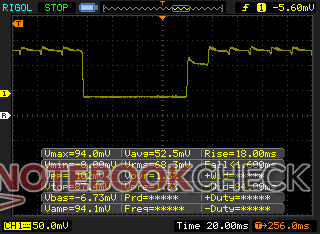 |
| ↘ 1.3 ms chute | ||
| L'écran montre de très faibles temps de réponse, parfait pour le jeu. En comparaison, tous les appareils testés affichent entre 0.1 (minimum) et 240 (maximum) ms. » 13 % des appareils testés affichent de meilleures performances. Cela signifie que les latences relevées sont meilleures que la moyenne (19.8 ms) de tous les appareils testés. | ||
| ↔ Temps de réponse gris 50% à gris 80% | ||
| 2.4 ms ... hausse ↗ et chute ↘ combinées | ↗ 1.2 ms hausse | 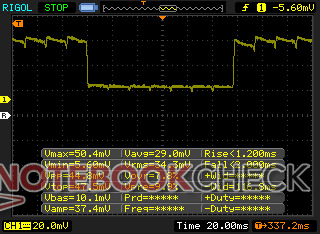 |
| ↘ 1.2 ms chute | ||
| L'écran montre de très faibles temps de réponse, parfait pour le jeu. En comparaison, tous les appareils testés affichent entre 0.165 (minimum) et 636 (maximum) ms. » 11 % des appareils testés affichent de meilleures performances. Cela signifie que les latences relevées sont meilleures que la moyenne (31 ms) de tous les appareils testés. | ||
Scintillement / MLI (Modulation de largeur d'impulsion)
| Scintillement / MLI (Modulation de largeur d'impulsion) décelé | 59.5 Hz | ≤ 100 Niveau de luminosité | 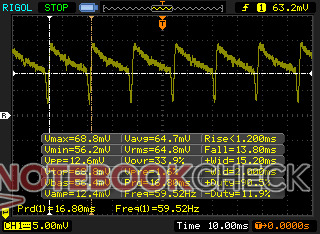 |
Le rétroéclairage de l'écran scintille à la fréquence de 59.5 Hz (certainement du fait de l'utilisation d'une MDI - Modulation de largeur d'impulsion) à un niveau de luminosité inférieur ou égal à 100 % . Aucun scintillement ne devrait être perceptible au-dessus de cette valeur. La fréquence de rafraîchissement de 59.5 Hz est extrêmement faible, de grands risques de fatigue oculaire accrue et de maux de tête en cas d'utilisation prolongée. En comparaison, 52 % des appareils testés n'emploient pas MDI pour assombrir leur écran. Nous avons relevé une moyenne à 7778 (minimum : 5 - maximum : 343500) Hz dans le cas où une MDI était active. | |||
| PCMark 8 Home Score Accelerated v2 | 3758 points | |
| PCMark 8 Work Score Accelerated v2 | 4677 points | |
| PCMark 10 Score | 6283 points | |
Aide | ||
| Eurocom Nightsky RX15 Samsung SSD 970 Pro 512GB | Eurocom Sky X4C Samsung SSD 960 Pro 1TB m.2 NVMe | Razer Blade 15 RTX 2080 Max-Q Samsung SSD PM981 MZVLB512HAJQ | MSI GE63 Raider RGB 8RF-008 Samsung SSD PM871a MZNLN256HMHQ | Dell XPS 15 7590 9980HK GTX 1650 Toshiba XG6 KXG60ZNV1T02 | |
|---|---|---|---|---|---|
| AS SSD | 13% | 6% | -44% | 8% | |
| Seq Read (MB/s) | 2352 | 2541 8% | 1832 -22% | 512 -78% | 1723 -27% |
| Seq Write (MB/s) | 2184 | 1989 -9% | 1864 -15% | 462.8 -79% | 1386 -37% |
| 4K Read (MB/s) | 28.65 | 44.83 56% | 52.1 82% | 32.36 13% | 43.25 51% |
| 4K Write (MB/s) | 61.3 | 129.6 111% | 108.3 77% | 68.6 12% | 98.3 60% |
| 4K-64 Read (MB/s) | 1317 | 1646 25% | 1159 -12% | 348.6 -74% | 1078 -18% |
| 4K-64 Write (MB/s) | 2156 | 1375 -36% | 1807 -16% | 294.3 -86% | 1456 -32% |
| Access Time Read * (ms) | 0.101 | 0.032 68% | 0.05 50% | 0.101 -0% | 0.05 50% |
| Access Time Write * (ms) | 0.09 | 0.03 67% | 0.034 62% | 0.051 43% | 0.039 57% |
| Score Read (Points) | 1581 | 1945 23% | 1394 -12% | 432 -73% | 1294 -18% |
| Score Write (Points) | 2435 | 1703 -30% | 2102 -14% | 409 -83% | 1693 -30% |
| Score Total (Points) | 4813 | 4615 -4% | 4221 -12% | 1071 -78% | 3638 -24% |
| Copy ISO MB/s (MB/s) | 2705 | 1908 -29% | 2083 -23% | 3182 18% | |
| Copy Program MB/s (MB/s) | 666 | 467.2 -30% | 496.5 -25% | 984 48% | |
| Copy Game MB/s (MB/s) | 1583 | 1055 -33% | 977 -38% | 1824 15% |
* ... Moindre est la valeur, meilleures sont les performances

| 3DMark 11 Performance | 23371 points | |
| 3DMark Cloud Gate Standard Score | 40808 points | |
| 3DMark Fire Strike Score | 18283 points | |
| 3DMark Time Spy Score | 7968 points | |
Aide | ||
| Bas | Moyen | Élevé | Ultra | 4K | |
|---|---|---|---|---|---|
| BioShock Infinite (2013) | 391.4 | 345.6 | 320.2 | 181.3 | |
| The Witcher 3 (2015) | 329.3 | 244.8 | 155.8 | 80.6 | 57.4 |
| Shadow of the Tomb Raider (2018) | 160 | 114 | 107 | 97 | 34 |
| Eurocom Nightsky RX15 GeForce RTX 2070 Mobile, i9-9980HK, Samsung SSD 970 Pro 512GB | Eurocom Sky X4C GeForce GTX 1080 Mobile, i7-8700K, Samsung SSD 960 Pro 1TB m.2 NVMe | HP Omen 15-dc1303ng GeForce RTX 2070 Max-Q, i7-8750H, Samsung SSD PM981 MZVLB256HAHQ | Razer Blade 15 RTX 2080 Max-Q GeForce RTX 2080 Max-Q, i7-9750H, Samsung SSD PM981 MZVLB512HAJQ | MSI GE63 Raider RGB 8RF-008 GeForce GTX 1070 Mobile, i7-8750H, Samsung SSD PM871a MZNLN256HMHQ | Eurocom Nightsky Ti15 GeForce GTX 1660 Ti Mobile, i7-9750H, Samsung SSD 970 Pro 512GB | Dell XPS 15 7590 9980HK GTX 1650 GeForce GTX 1650 Mobile, i9-9980HK, Toshiba XG6 KXG60ZNV1T02 | |
|---|---|---|---|---|---|---|---|
| Noise | 4% | -2% | 11% | -5% | 3% | 7% | |
| arrêt / environnement * (dB) | 28.2 | 28.6 -1% | 30.5 -8% | 28.3 -0% | 30 -6% | 28.4 -1% | 28.2 -0% |
| Idle Minimum * (dB) | 28.2 | 28.6 -1% | 32.8 -16% | 28.8 -2% | 30 -6% | 28.6 -1% | 28.2 -0% |
| Idle Average * (dB) | 28.2 | 28.6 -1% | 32.8 -16% | 28.8 -2% | 35 -24% | 28.6 -1% | 28.2 -0% |
| Idle Maximum * (dB) | 31.7 | 31.1 2% | 32.8 -3% | 29 9% | 36 -14% | 28.6 10% | 30.4 4% |
| Load Average * (dB) | 53.7 | 42.2 21% | 42.5 21% | 33.5 38% | 42 22% | 47.8 11% | 43.8 18% |
| Witcher 3 ultra * (dB) | 53.7 | 53.8 -0% | 45 16% | 54 -1% | 53.7 -0% | 47.2 12% | |
| Load Maximum * (dB) | 53.7 | 50 7% | 47.5 12% | 45.2 16% | 56 -4% | 53.7 -0% | 47.2 12% |
* ... Moindre est la valeur, meilleures sont les performances
Degré de la nuisance sonore
| Au repos |
| 28.2 / 28.2 / 31.7 dB(A) |
| Disque dur |
| 0 dB(A) |
| Fortement sollicité |
| 53.7 / 53.7 dB(A) |
 | ||
30 dB silencieux 40 dB(A) audible 50 dB(A) bruyant |
||
min: | ||
(±) La température maximale du côté supérieur est de 40.2 °C / 104 F, par rapport à la moyenne de 40.4 °C / 105 F, allant de 21.2 à 68.8 °C pour la classe Gaming.
(-) Le fond chauffe jusqu'à un maximum de 53 °C / 127 F, contre une moyenne de 43.2 °C / 110 F
(+) En utilisation inactive, la température moyenne du côté supérieur est de 30.6 °C / 87 F, par rapport à la moyenne du dispositif de 33.9 °C / 93 F.
(±) En jouant à The Witcher 3, la température moyenne du côté supérieur est de 34.9 °C / 95 F, alors que la moyenne de l'appareil est de 33.9 °C / 93 F.
(+) Les repose-poignets et le pavé tactile sont plus froids que la température de la peau avec un maximum de 29.4 °C / 84.9 F et sont donc froids au toucher.
(±) La température moyenne de la zone de l'appui-paume de dispositifs similaires était de 28.8 °C / 83.8 F (-0.6 °C / #-1.1 F).
Eurocom Nightsky RX15 analyse audio
(+) | les haut-parleurs peuvent jouer relativement fort (85.6# dB)
Basses 100 - 315 Hz
(-) | presque aucune basse - en moyenne 28.4% plus bas que la médiane
(±) | la linéarité des basses est moyenne (12.4% delta à la fréquence précédente)
Médiums 400 - 2000 Hz
(+) | médiane équilibrée - seulement 4.5% de la médiane
(±) | la linéarité des médiums est moyenne (7% delta à la fréquence précédente)
Aiguës 2 - 16 kHz
(+) | des sommets équilibrés - à seulement 1.6% de la médiane
(+) | les aigus sont linéaires (5.7% delta à la fréquence précédente)
Globalement 100 - 16 000 Hz
(±) | la linéarité du son global est moyenne (24.4% de différence avec la médiane)
Par rapport à la même classe
» 88% de tous les appareils testés de cette catégorie étaient meilleurs, 3% similaires, 8% pires
» Le meilleur avait un delta de 6%, la moyenne était de 18%, le pire était de 132%.
Par rapport à tous les appareils testés
» 74% de tous les appareils testés étaient meilleurs, 6% similaires, 20% pires
» Le meilleur avait un delta de 4%, la moyenne était de 24%, le pire était de 134%.
Apple MacBook 12 (Early 2016) 1.1 GHz analyse audio
(+) | les haut-parleurs peuvent jouer relativement fort (83.6# dB)
Basses 100 - 315 Hz
(±) | basse réduite - en moyenne 11.3% inférieure à la médiane
(±) | la linéarité des basses est moyenne (14.2% delta à la fréquence précédente)
Médiums 400 - 2000 Hz
(+) | médiane équilibrée - seulement 2.4% de la médiane
(+) | les médiums sont linéaires (5.5% delta à la fréquence précédente)
Aiguës 2 - 16 kHz
(+) | des sommets équilibrés - à seulement 2% de la médiane
(+) | les aigus sont linéaires (4.5% delta à la fréquence précédente)
Globalement 100 - 16 000 Hz
(+) | le son global est linéaire (10.2% différence à la médiane)
Par rapport à la même classe
» 7% de tous les appareils testés de cette catégorie étaient meilleurs, 2% similaires, 91% pires
» Le meilleur avait un delta de 5%, la moyenne était de 18%, le pire était de 53%.
Par rapport à tous les appareils testés
» 5% de tous les appareils testés étaient meilleurs, 1% similaires, 94% pires
» Le meilleur avait un delta de 4%, la moyenne était de 24%, le pire était de 134%.
| Éteint/en veille | |
| Au repos | |
| Fortement sollicité |
|
Légende:
min: | |
| Eurocom Nightsky RX15 i9-9980HK, GeForce RTX 2070 Mobile, Samsung SSD 970 Pro 512GB, OLED, 3840x2160, 15.6" | Eurocom Sky X4C i7-8700K, GeForce GTX 1080 Mobile, Samsung SSD 960 Pro 1TB m.2 NVMe, IPS, 3840x2160, 15.6" | Razer Blade 15 RTX 2080 Max-Q i7-9750H, GeForce RTX 2080 Max-Q, Samsung SSD PM981 MZVLB512HAJQ, IPS, 1920x1080, 15.6" | MSI GE63 Raider RGB 8RF-008 i7-8750H, GeForce GTX 1070 Mobile, Samsung SSD PM871a MZNLN256HMHQ, TN, 1920x1080, 15.6" | Eurocom Nightsky Ti15 i7-9750H, GeForce GTX 1660 Ti Mobile, Samsung SSD 970 Pro 512GB, IPS, 1920x1080, 15.6" | Asus Strix Scar III G531GW i9-9880H, GeForce RTX 2070 Mobile, Intel SSD 660p 1TB SSDPEKNW010T8, IPS, 1920x1080, 15.6" | |
|---|---|---|---|---|---|---|
| Power Consumption | -33% | 21% | 24% | 3% | -32% | |
| Idle Minimum * (Watt) | 12.6 | 30.2 -140% | 12.5 1% | 9 29% | 16.8 -33% | 29 -130% |
| Idle Average * (Watt) | 21.4 | 34.7 -62% | 15.3 29% | 14 35% | 29 -36% | 32 -50% |
| Idle Maximum * (Watt) | 34.4 | 37.8 -10% | 20.7 40% | 19 45% | 30.8 10% | 37 -8% |
| Load Average * (Watt) | 123.2 | 130.3 -6% | 90.2 27% | 91 26% | 89.2 28% | 157 -27% |
| Witcher 3 ultra * (Watt) | 192.4 | 172.2 10% | 162 16% | 182 5% | 141.1 27% | 173 10% |
| Load Maximum * (Watt) | 246.6 | 217.7 12% | 209.3 15% | 238 3% | 192.3 22% | 217 12% |
* ... Moindre est la valeur, meilleures sont les performances
| Eurocom Nightsky RX15 i9-9980HK, GeForce RTX 2070 Mobile, 62 Wh | Eurocom Sky X4C i7-8700K, GeForce GTX 1080 Mobile, 82 Wh | HP Omen 15-dc1303ng i7-8750H, GeForce RTX 2070 Max-Q, 70 Wh | Razer Blade 15 RTX 2080 Max-Q i7-9750H, GeForce RTX 2080 Max-Q, 80 Wh | MSI GE63 Raider RGB 8RF-008 i7-8750H, GeForce GTX 1070 Mobile, 51 Wh | Eurocom Nightsky Ti15 i7-9750H, GeForce GTX 1660 Ti Mobile, 62 Wh | Dell XPS 15 7590 9980HK GTX 1650 i9-9980HK, GeForce GTX 1650 Mobile, 97 Wh | |
|---|---|---|---|---|---|---|---|
| Autonomie de la batterie | -24% | -3% | 94% | 18% | 6% | 129% | |
| WiFi v1.3 (h) | 3.4 | 2.6 -24% | 3.3 -3% | 6.6 94% | 4 18% | 3.6 6% | 7.8 129% |
| Reader / Idle (h) | 3 | 5 | 15.9 | 5.7 | 15.2 | ||
| Load (h) | 1.4 | 1.2 | 1.7 | 0.8 | 3.3 |
Points positifs
Points négatifs
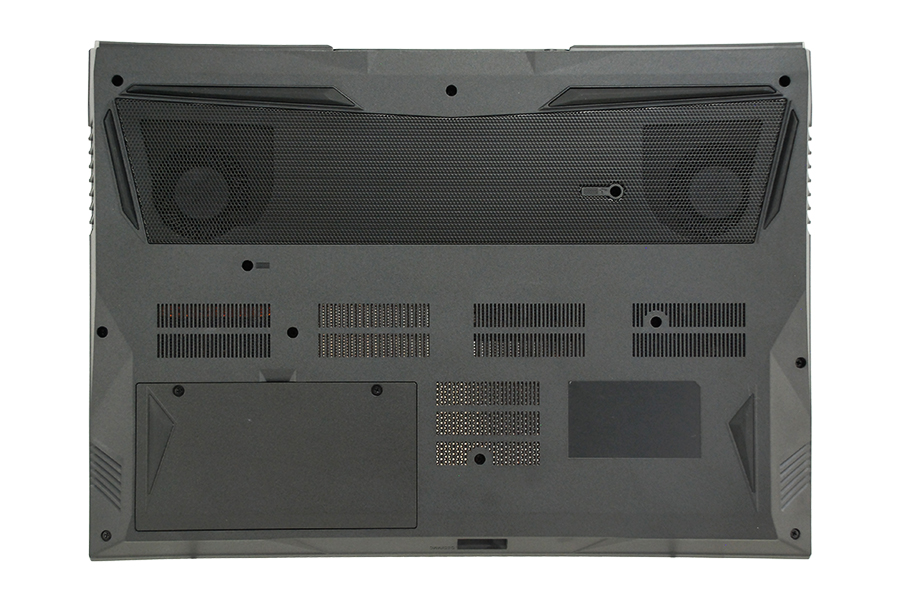
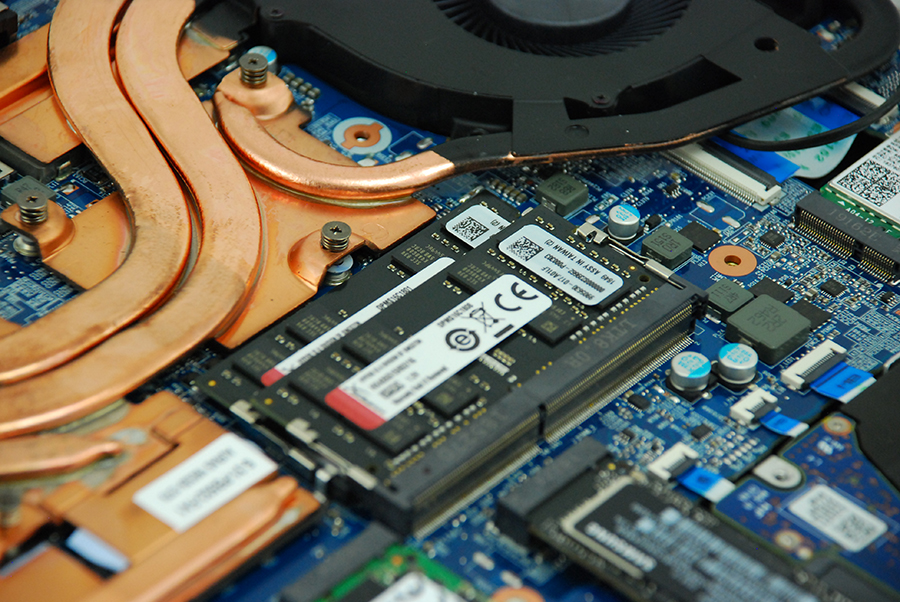
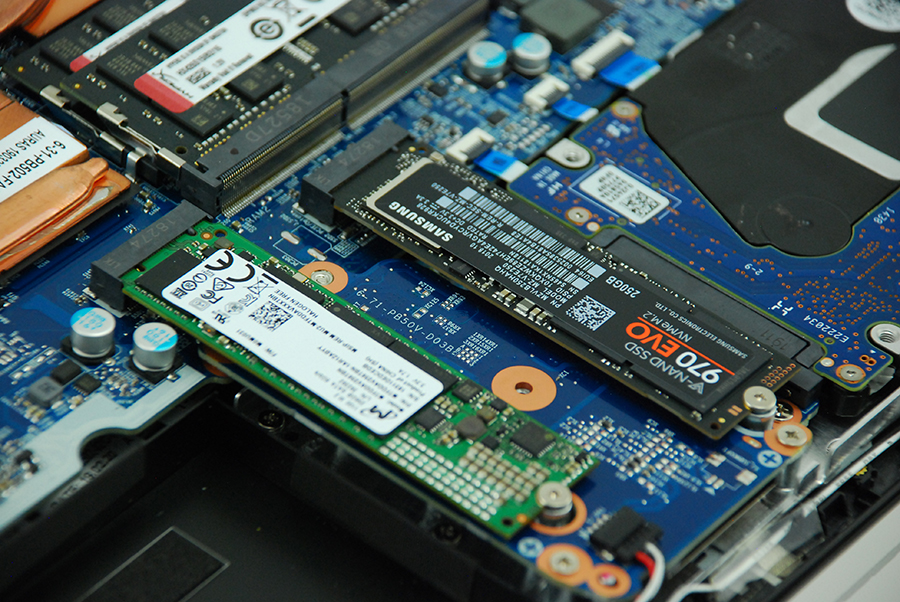
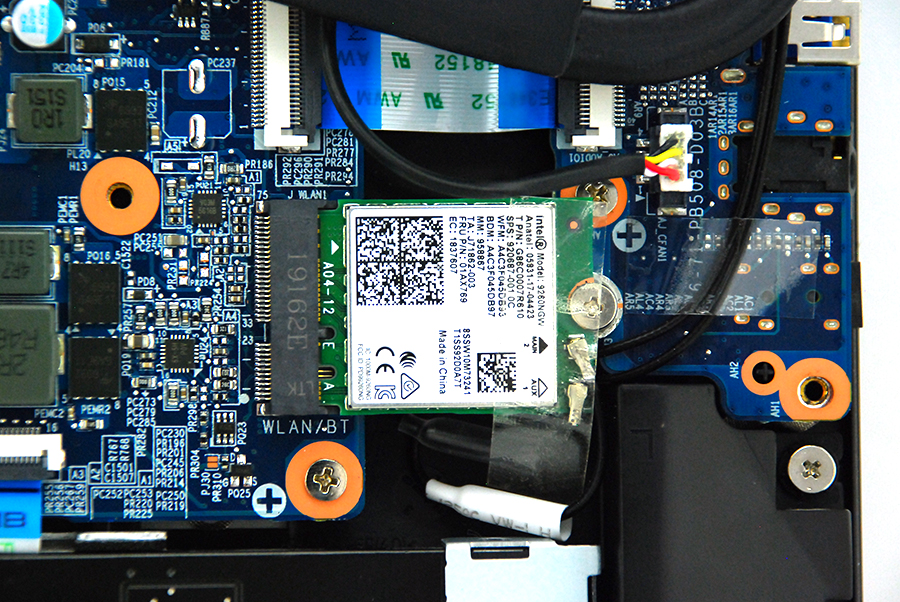
Beaucoup de nos conclusions à propos du Nightsky Ti15 s’appliquent toujours pour le Nightsky RX15, incluant la maintenance difficile, l’excellent retour du clavier, l’autonomie moyenne, les excellentes performances, et les ventilateurs bruyants en jeu. Deux autres questions nous intéressent plus : est-ce que le Core i9 et l’OLED valent le coup par rapport au Core i7 et à l’IPS de la version de base ?
La version la plus adaptée dépendra de l’usage de l’utilisateur. Si l’on pense utiliser le Nightsky RX15 avant tout pour jouer en 60 IPS, alors le Core i7 avec écran IPS ou OLED fera l’affaire. Mais ceux qui visent plus de 60 IPS auront besoin de la puissance supplémentaire du Core i9, et du taux de rafraîchissement natif plus élevé des dalles IPS 144 ou 240 Hz. Pour un usage mixte avec des sollicitations professionnelles élevées, du montage vidéo et du jeu, le Core i9 avec écran OLED serait l’idéal. C’est juste dommage que la maintenance soit plus complexe que nécessaire pour une telle offre.
L’OLED offre des couleurs et des noirs notablement plus profonds, moins de ghosting, une densité de pixels plus élevée, une image plus lumineuse et plus nette que les alternatives IPS 144 ou 240 Hz. Pour les joueurs invétérés qui veulent avant tout avoir des taux d’image élevés, l’écran IPS reste la meilleure option.
L’intégralité de cette critique est disponible en anglais en suivant ce lien.
Eurocom Nightsky RX15
- 08/27/2019 v6 (old)
Allen Ngo
Price comparison
