Test de l'Eurocom Nightsky ARX15 : l'AMD Ryzen 9 5900X sur un PC portable
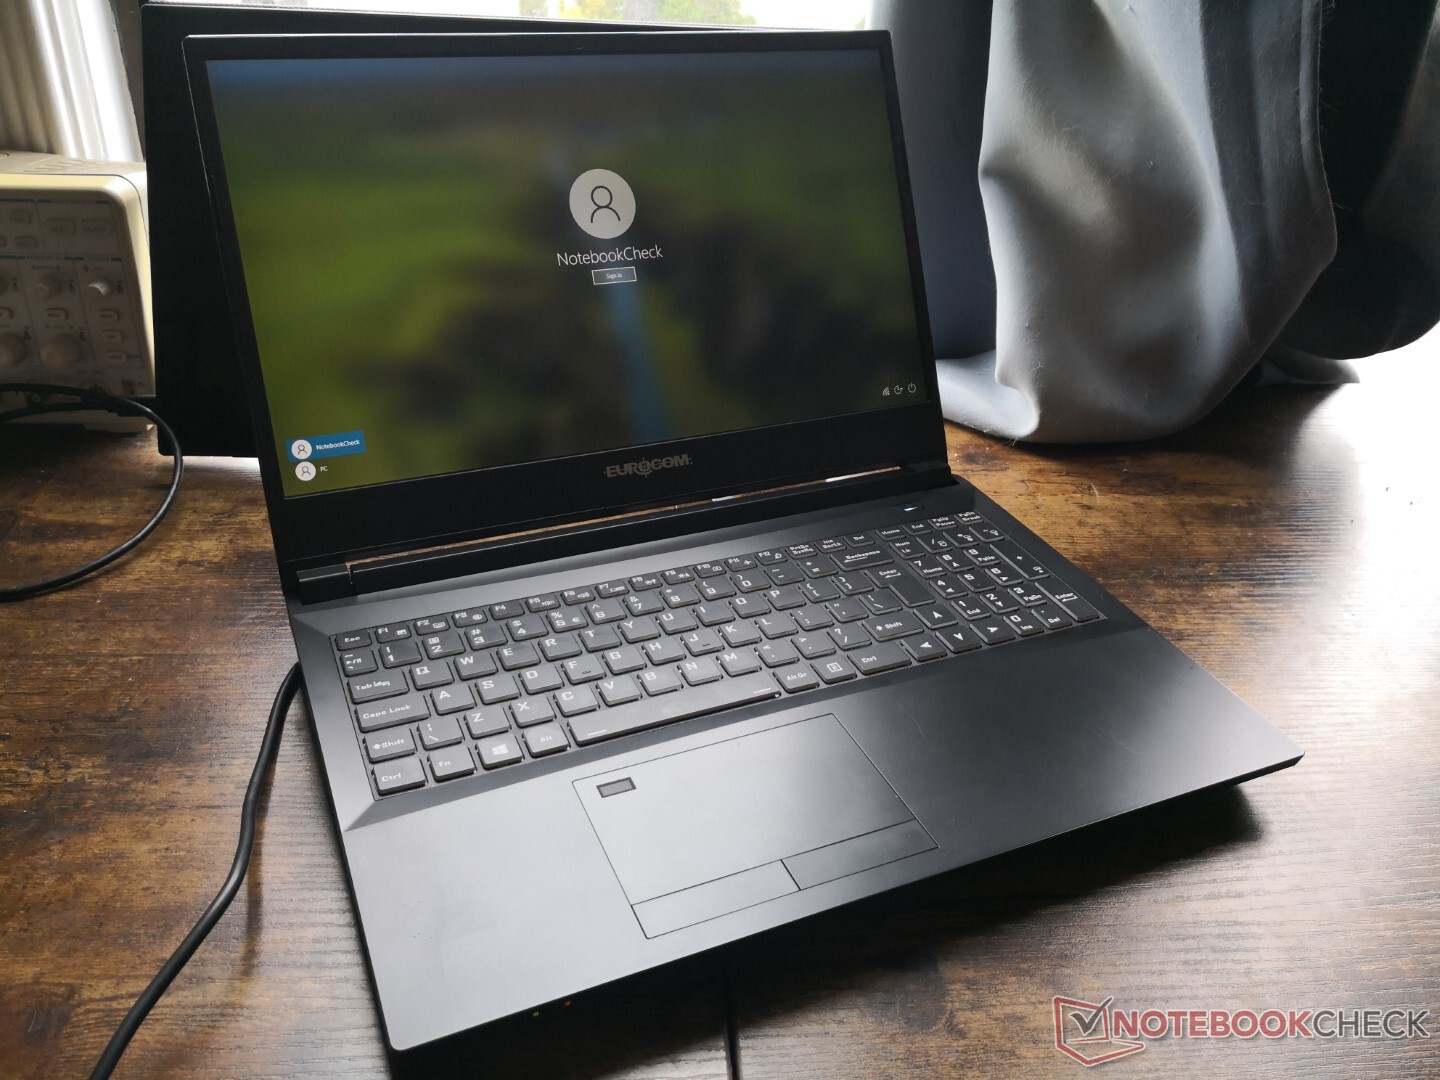
À ne pas confondre avec le Nightsky RX15, le Nightsky ARX15 utilise des processeurs AMD de bureau et un châssis différent de celui de son homologue Intel. Rien que ses spécifications papier devraient faire de l'ARX15 l'un des ordinateurs portables de 15,6 pouces les plus rapides que vous puissiez acheter en termes de performances brutes du CPU. La configuration que nous avons examinée est vendue au détail aux alentours de 3 400 dollars américains, avec des prix beaucoup plus bas ou plus élevés en fonction du stockage.
Des informations supplémentaires sur le Nightsky ARX15 sont disponibles sur sa page officielle ici. Le châssis est basé sur le Clevo NH57AF1 et les utilisateurs trouveront donc de nombreuses similitudes entre le Eurocom Nightsky ARX15 et le Schenker XMG Apex 15.
Plus de commentaires sur Eurocom
Potential Competitors in Comparison
Note | Date | Modèle | Poids | Épaisseur | Taille | Résolution | Prix |
|---|---|---|---|---|---|---|---|
| 83 % v7 (old) | 01/22 | Eurocom Nightsky ARX315 R9 5900X, GeForce RTX 3070 Laptop GPU | 2.6 kg | 32.5 mm | 15.60" | 1920x1080 | |
| 84.1 % v7 (old) | 01/22 | Gigabyte A5 X1 R9 5900HX, GeForce RTX 3070 Laptop GPU | 2.2 kg | 25.3 mm | 15.60" | 1920x1080 | |
| 81.4 % v7 (old) | 12/21 | Medion Erazer Deputy P25 R7 5800H, GeForce RTX 3060 Laptop GPU | 2.3 kg | 26 mm | 15.60" | 1920x1080 | |
| 82.9 % v7 (old) | 10/21 | MSI Delta 15 A5EFK R9 5900HX, Radeon RX 6700M | 2 kg | 19 mm | 15.60" | 1920x1080 | |
| 84.4 % v7 (old) | 11/21 | Schenker XMG Apex 15 NH57E PS R7 5800H, GeForce RTX 3060 Laptop GPU | 2.1 kg | 29 mm | 15.60" | 1920x1080 | |
| 84.6 % v7 (old) | 08/20 | MSI GE66 Raider 10SFS i9-10980HK, GeForce RTX 2070 Super Mobile | 2.4 kg | 23 mm | 15.60" | 1920x1080 |
Cas
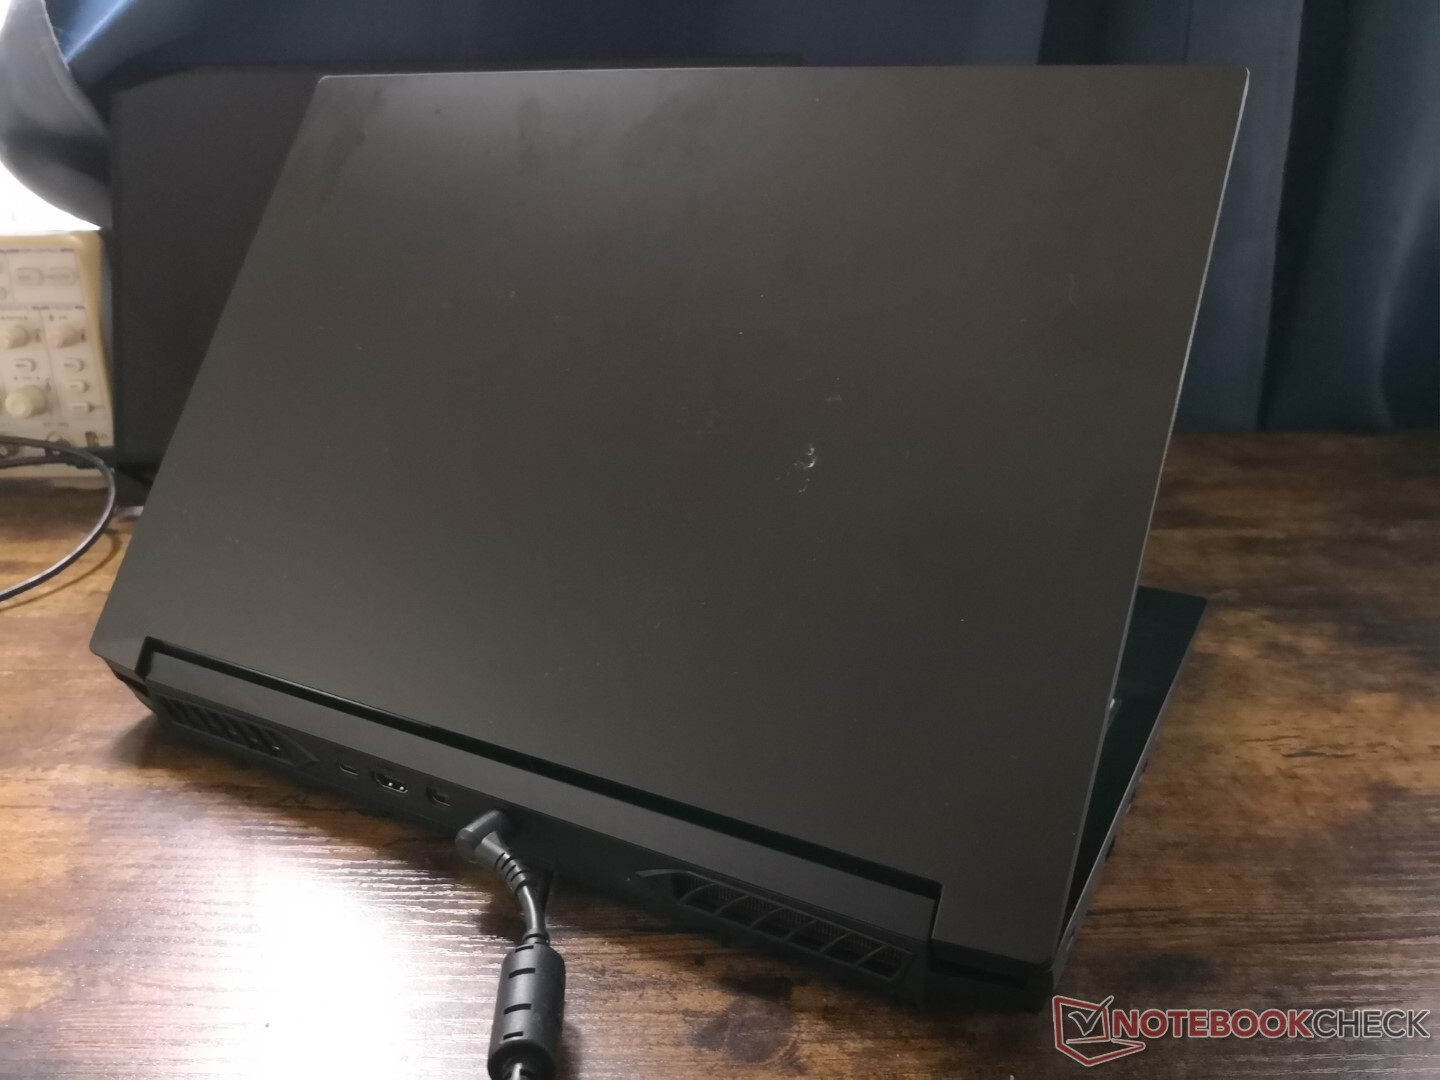
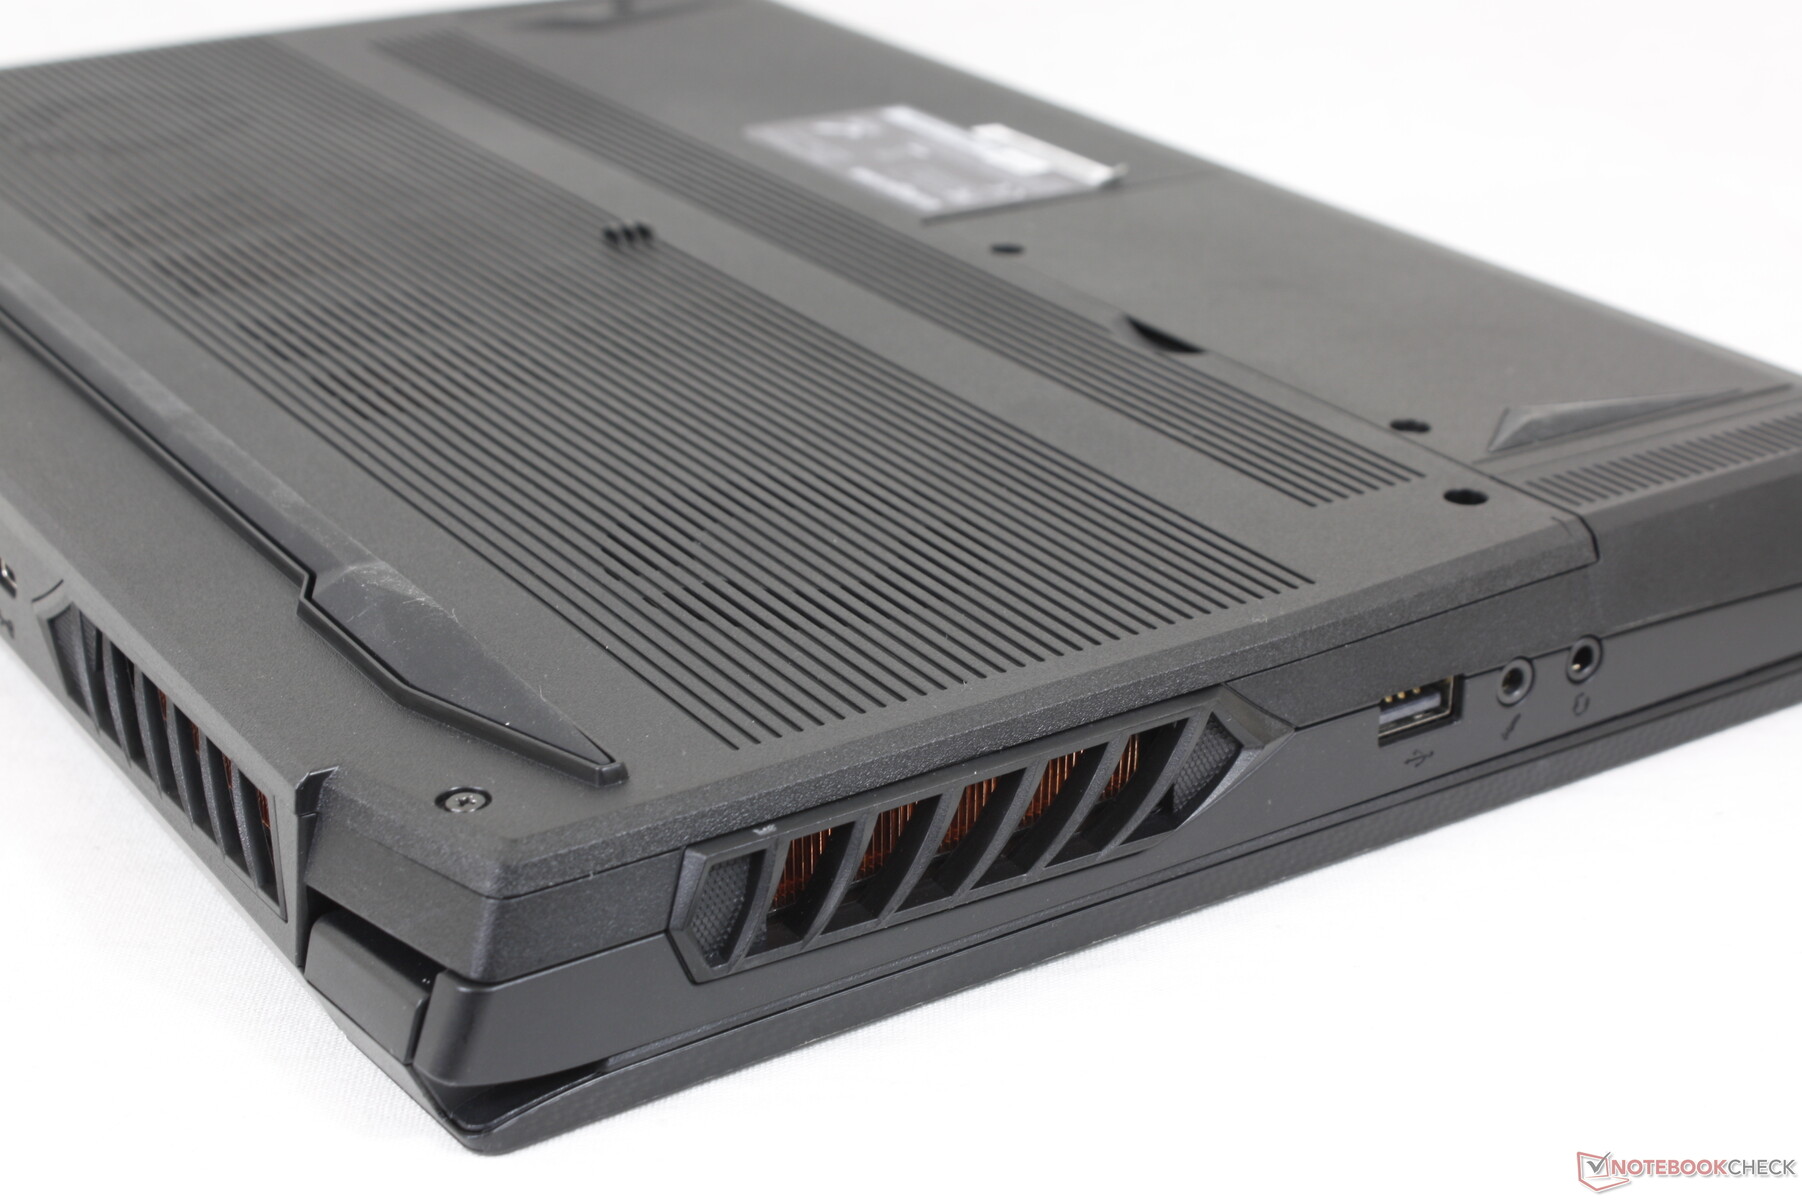
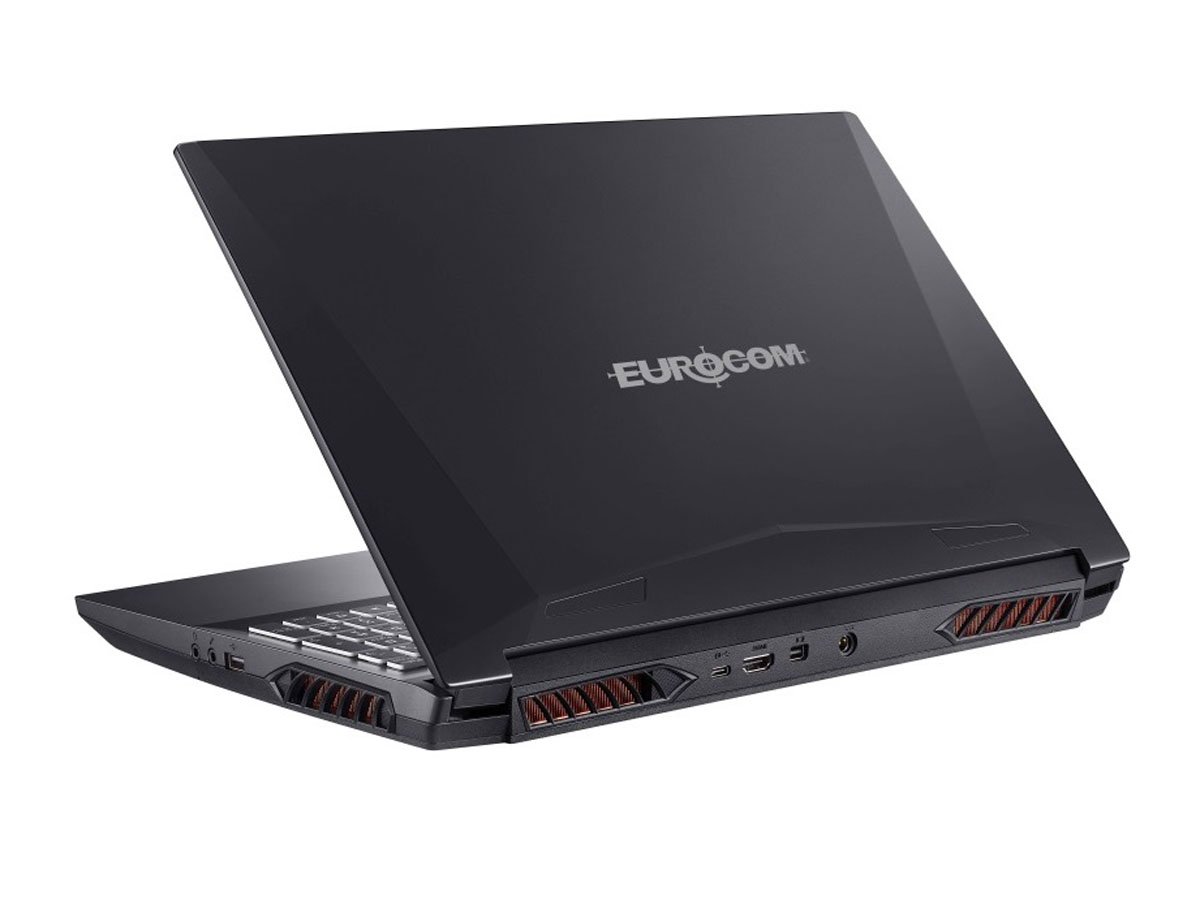
Le châssis reste plus grand et plus lourd par rapport à d'autres ordinateurs portables de jeu de 15,6 pouces équipés de CPU mobiles plus traditionnels de la série H, comme leMSI GE66 ouAsus ROG Strix G15. Nos impressions sur le châssis du Schenker Apex 15 s'appliquent ici pour le Nightsky ARX15.
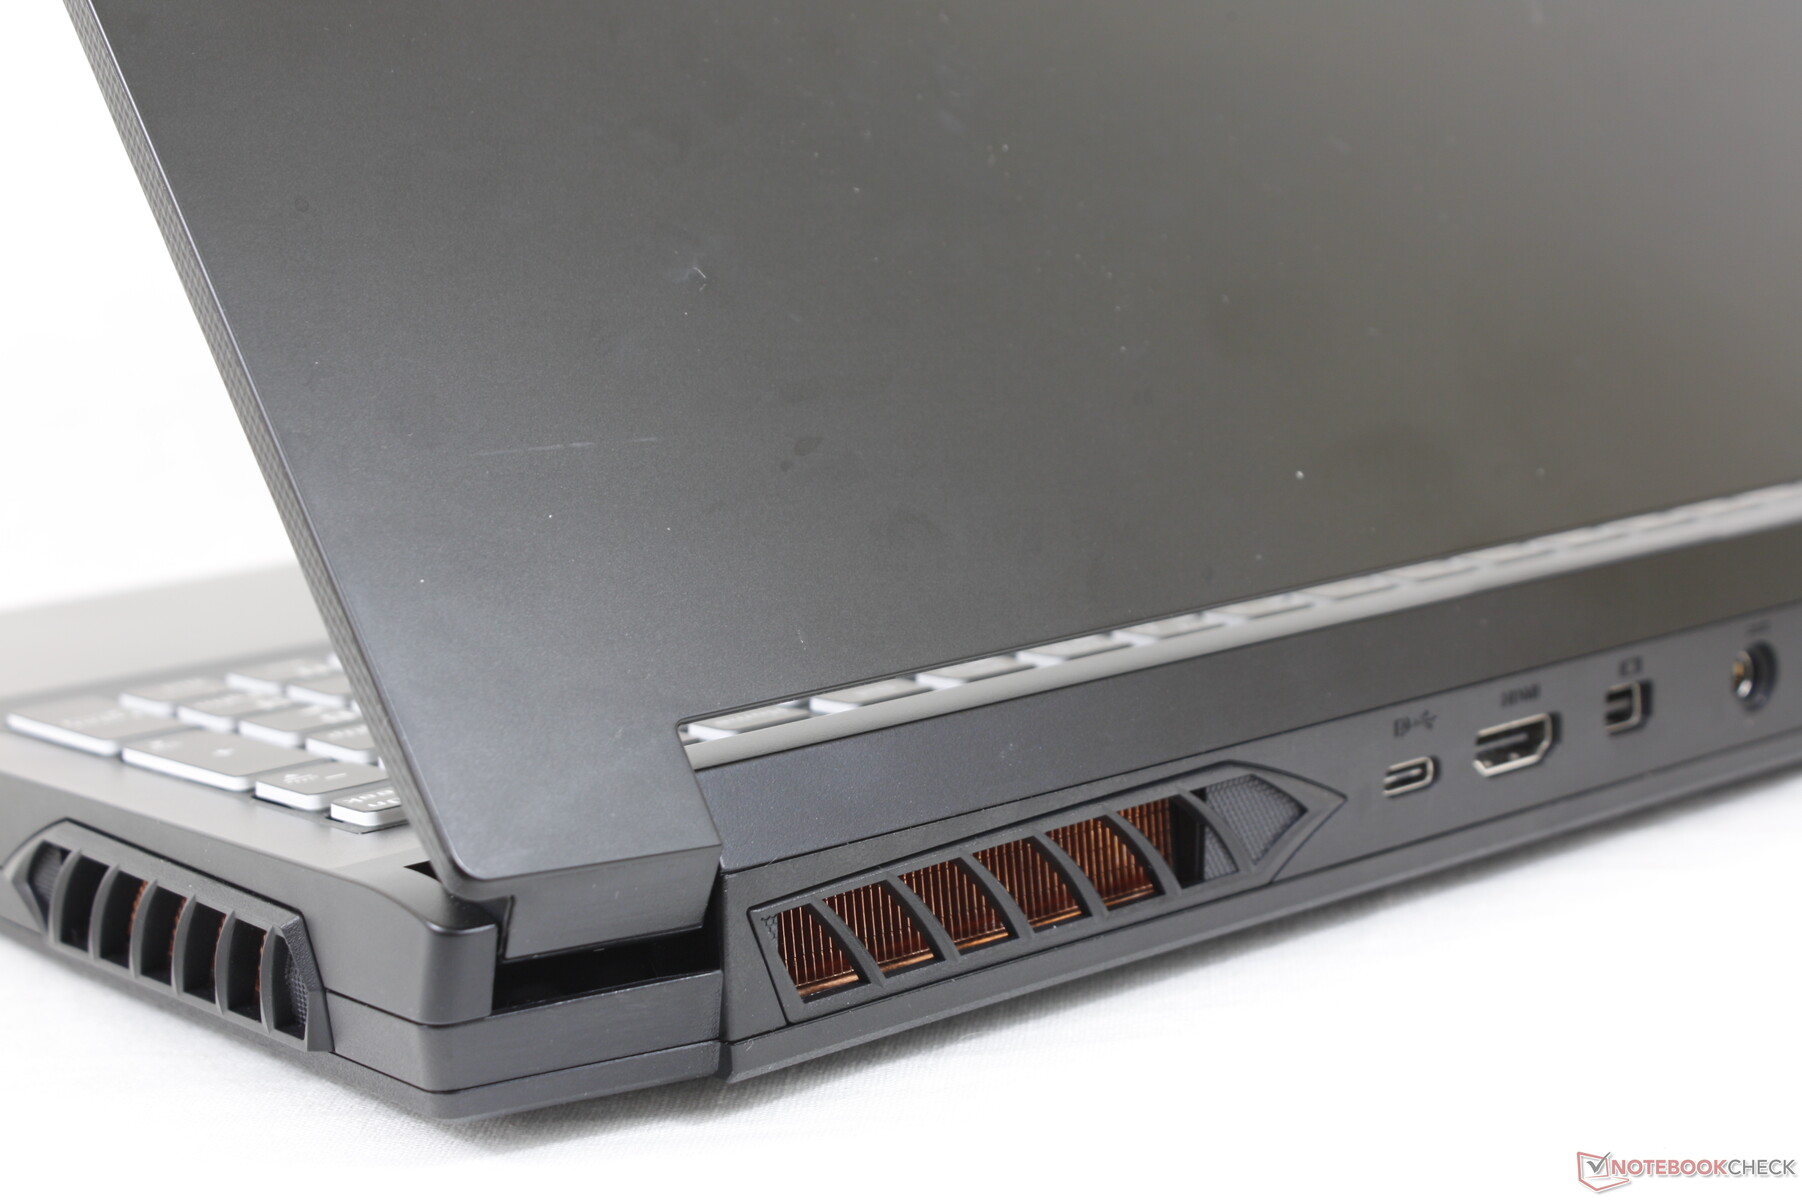
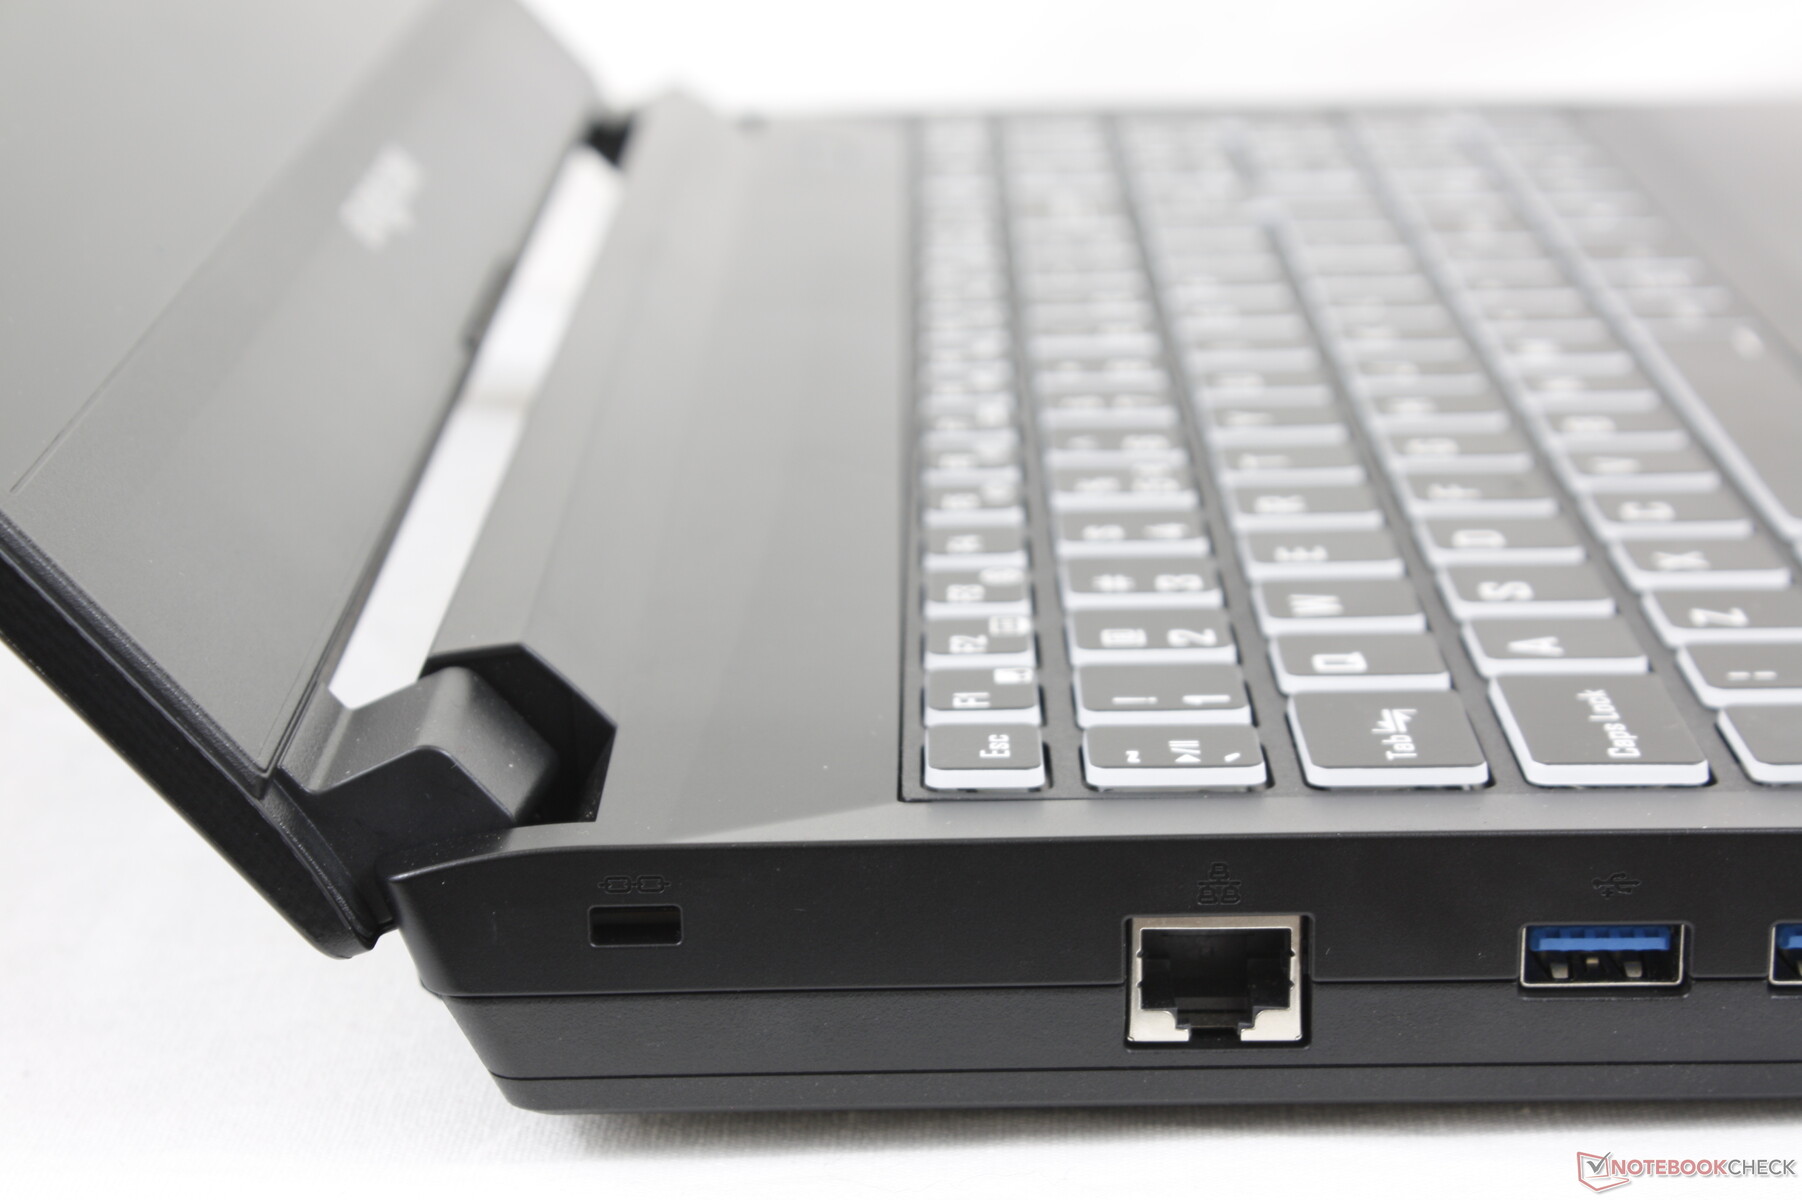
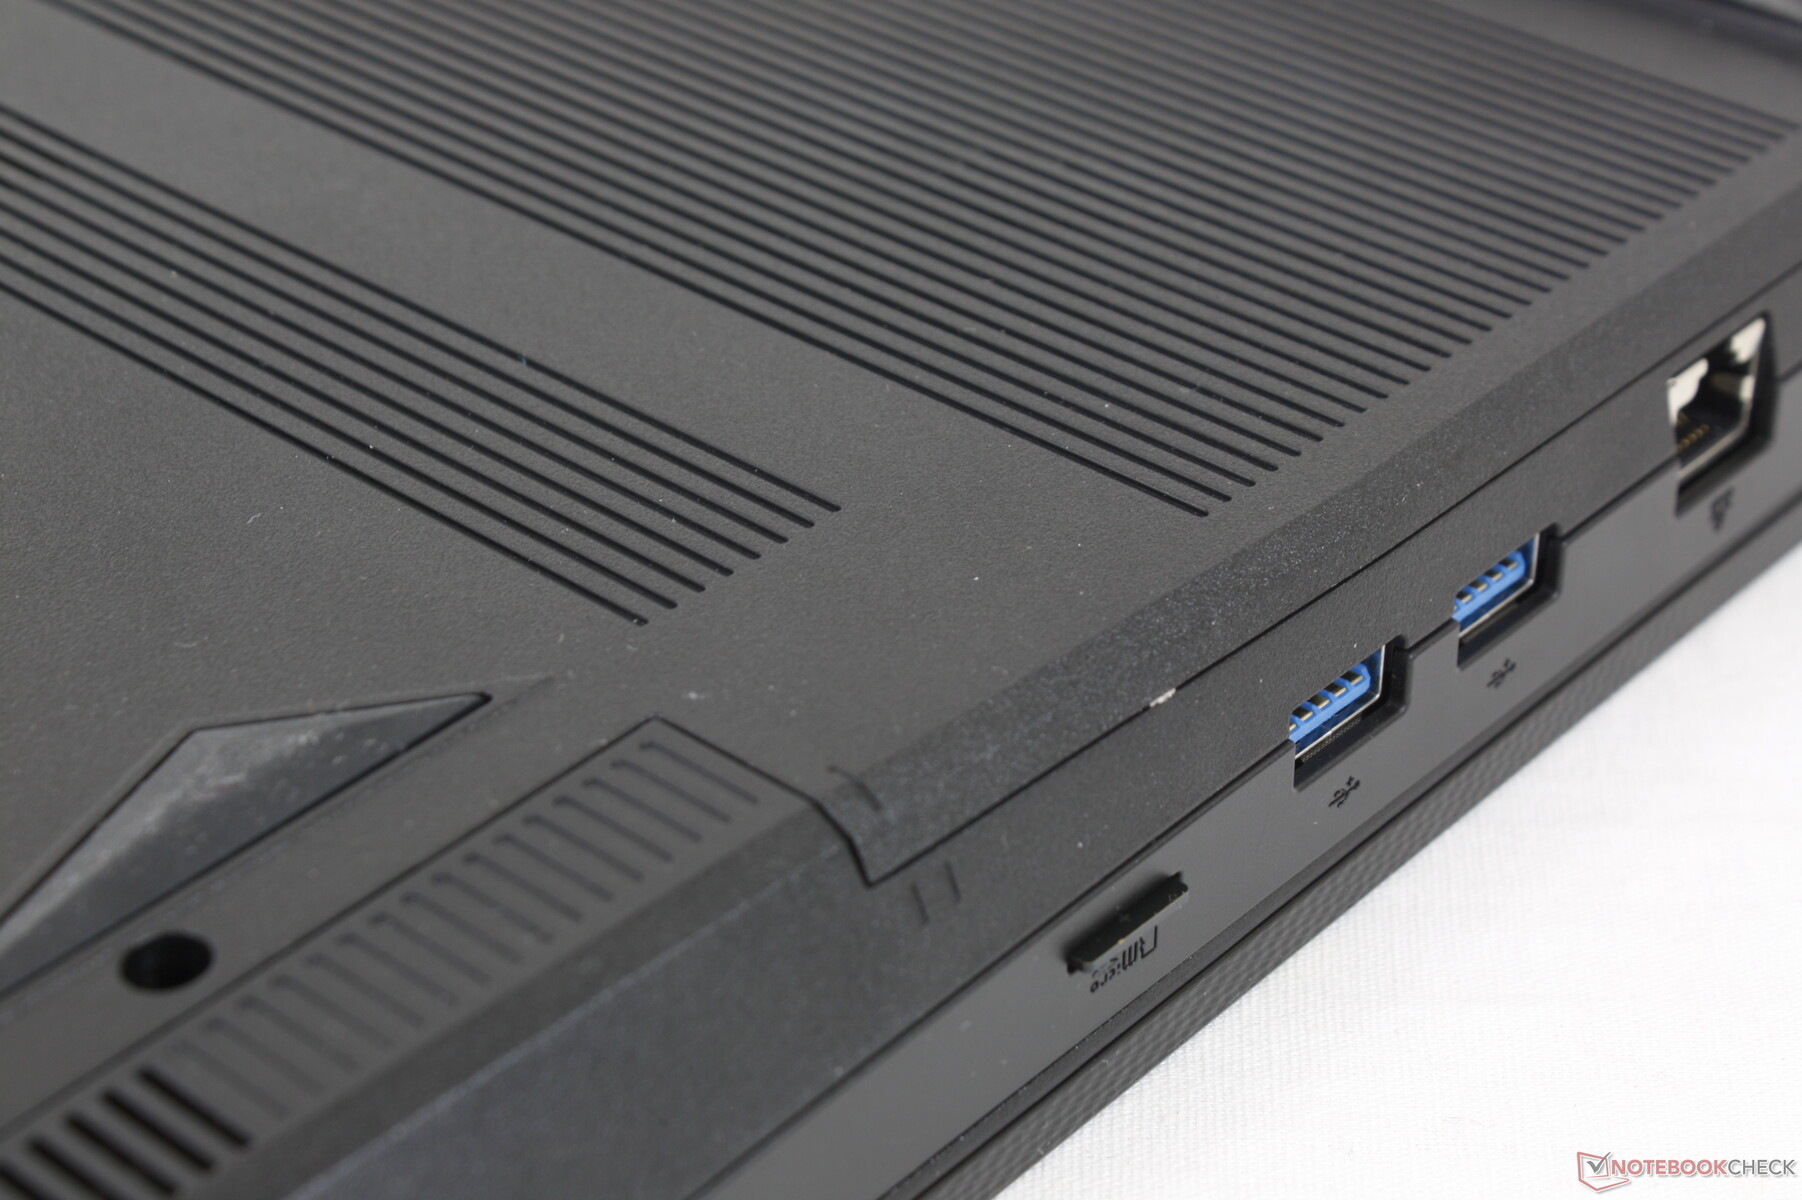
Connectivité
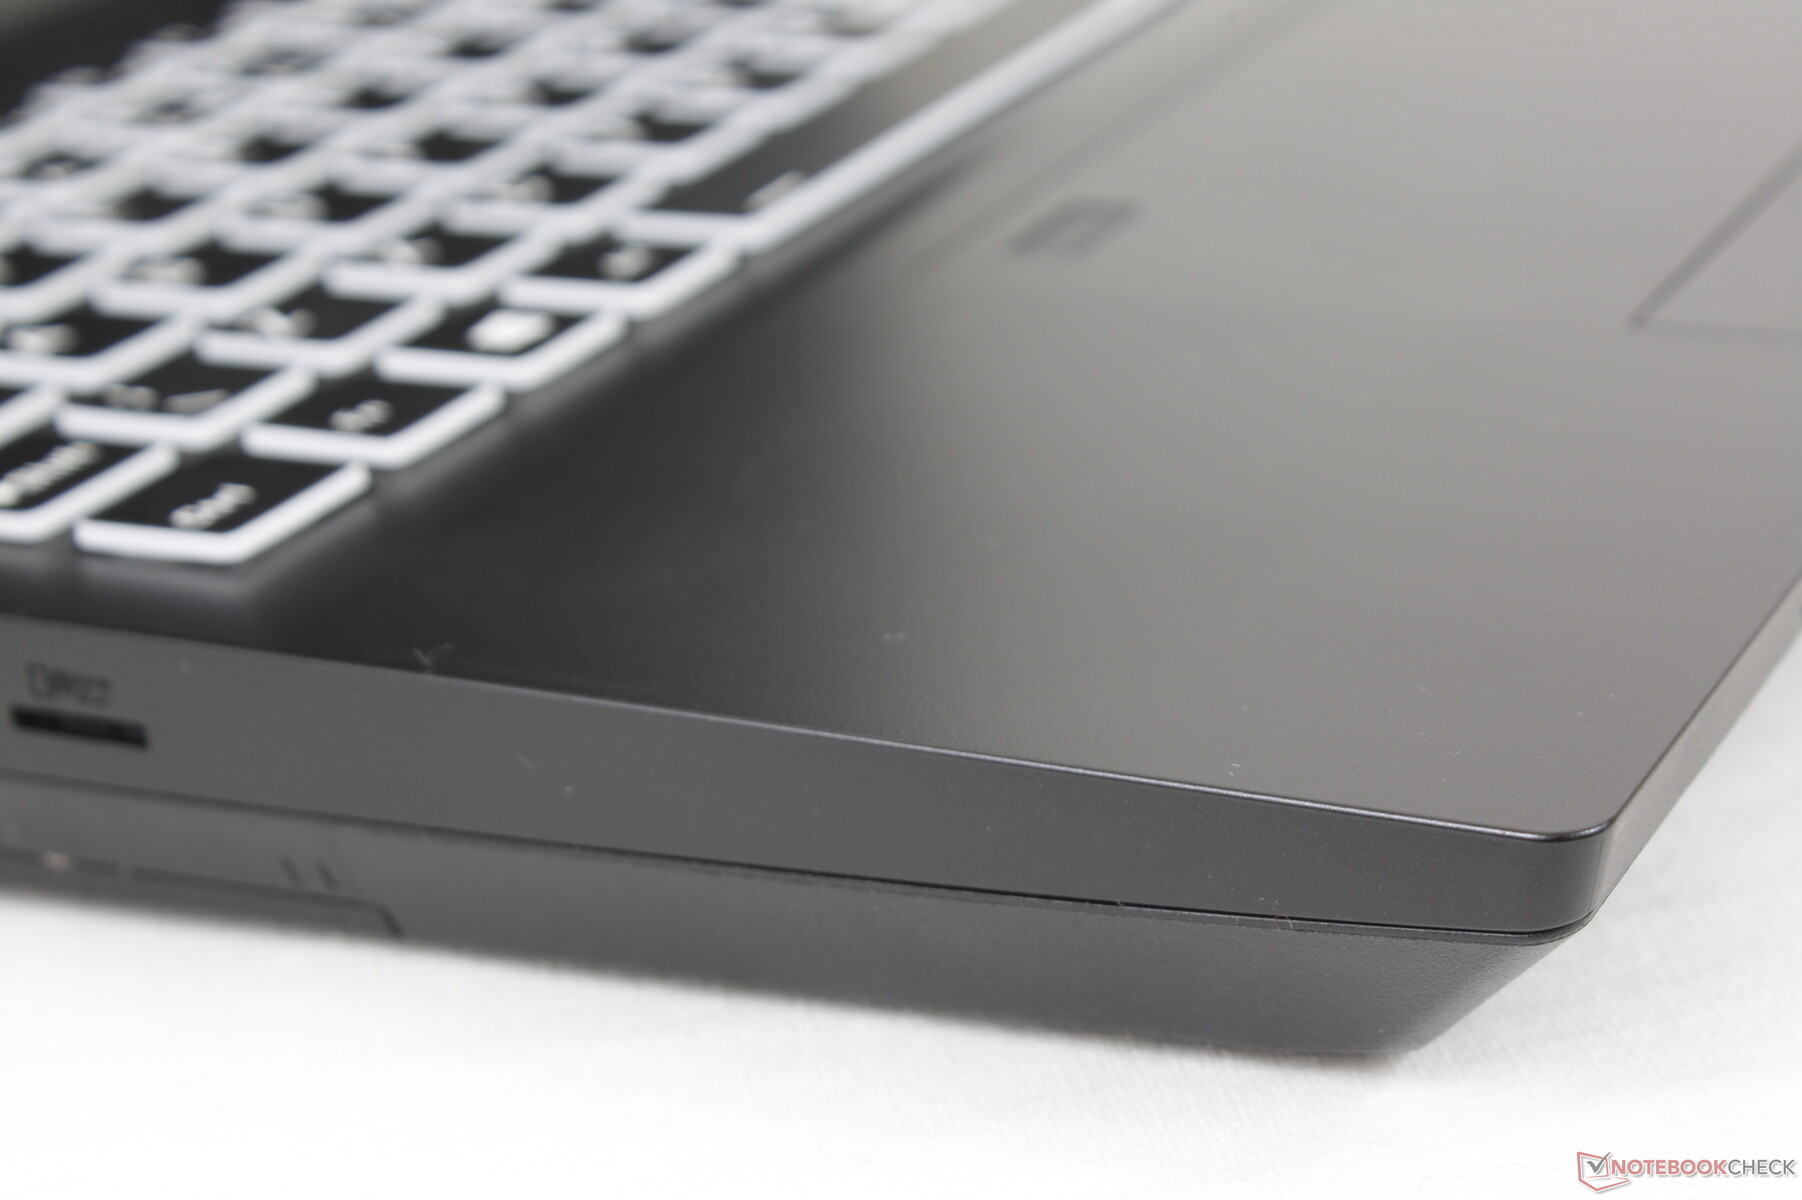
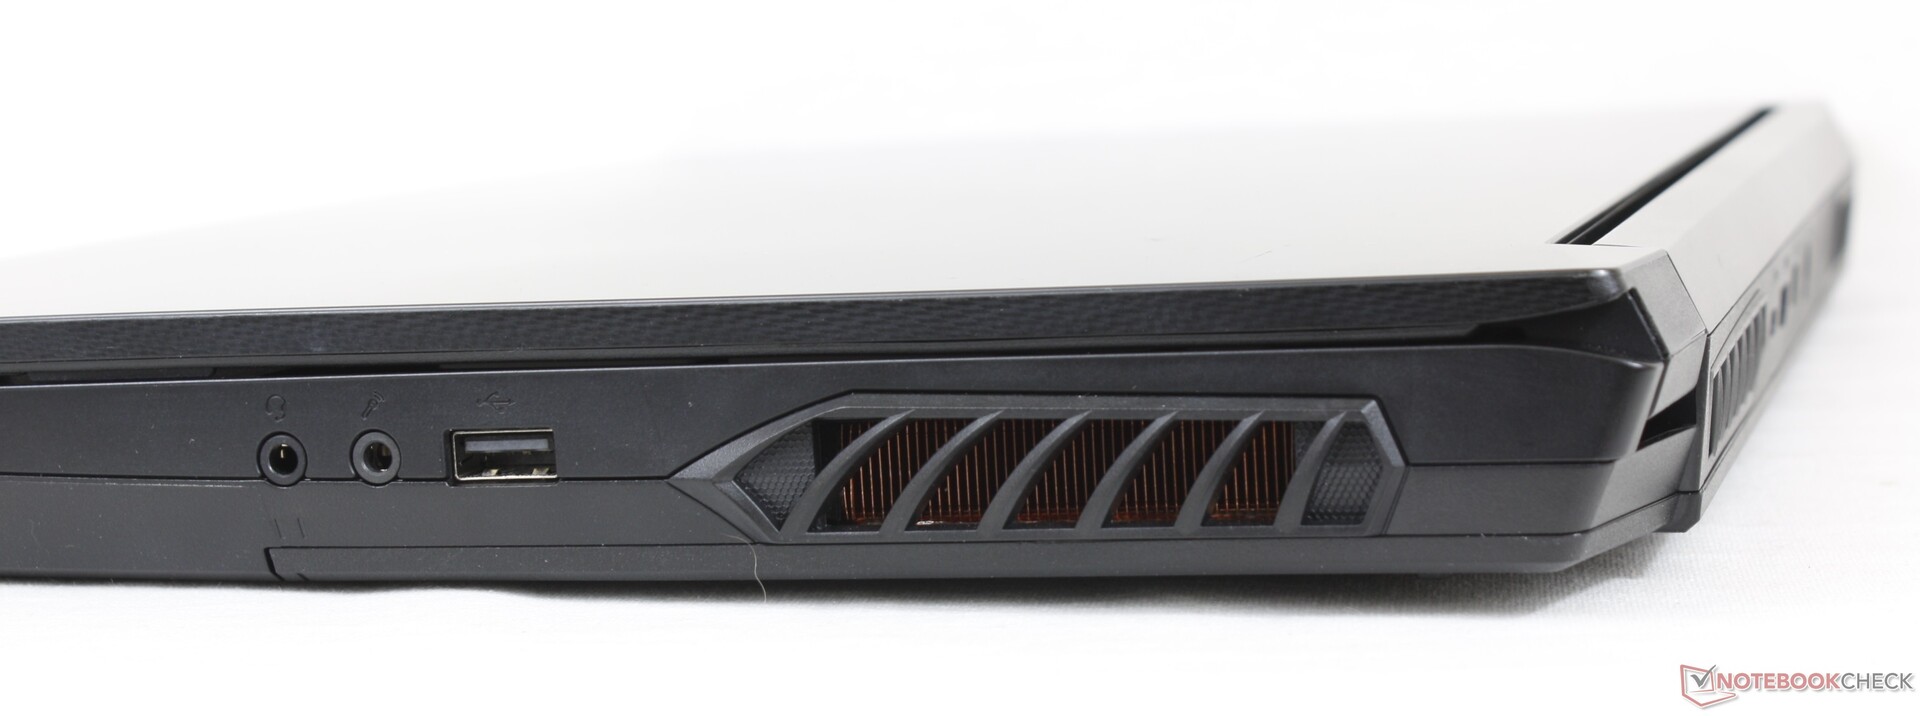
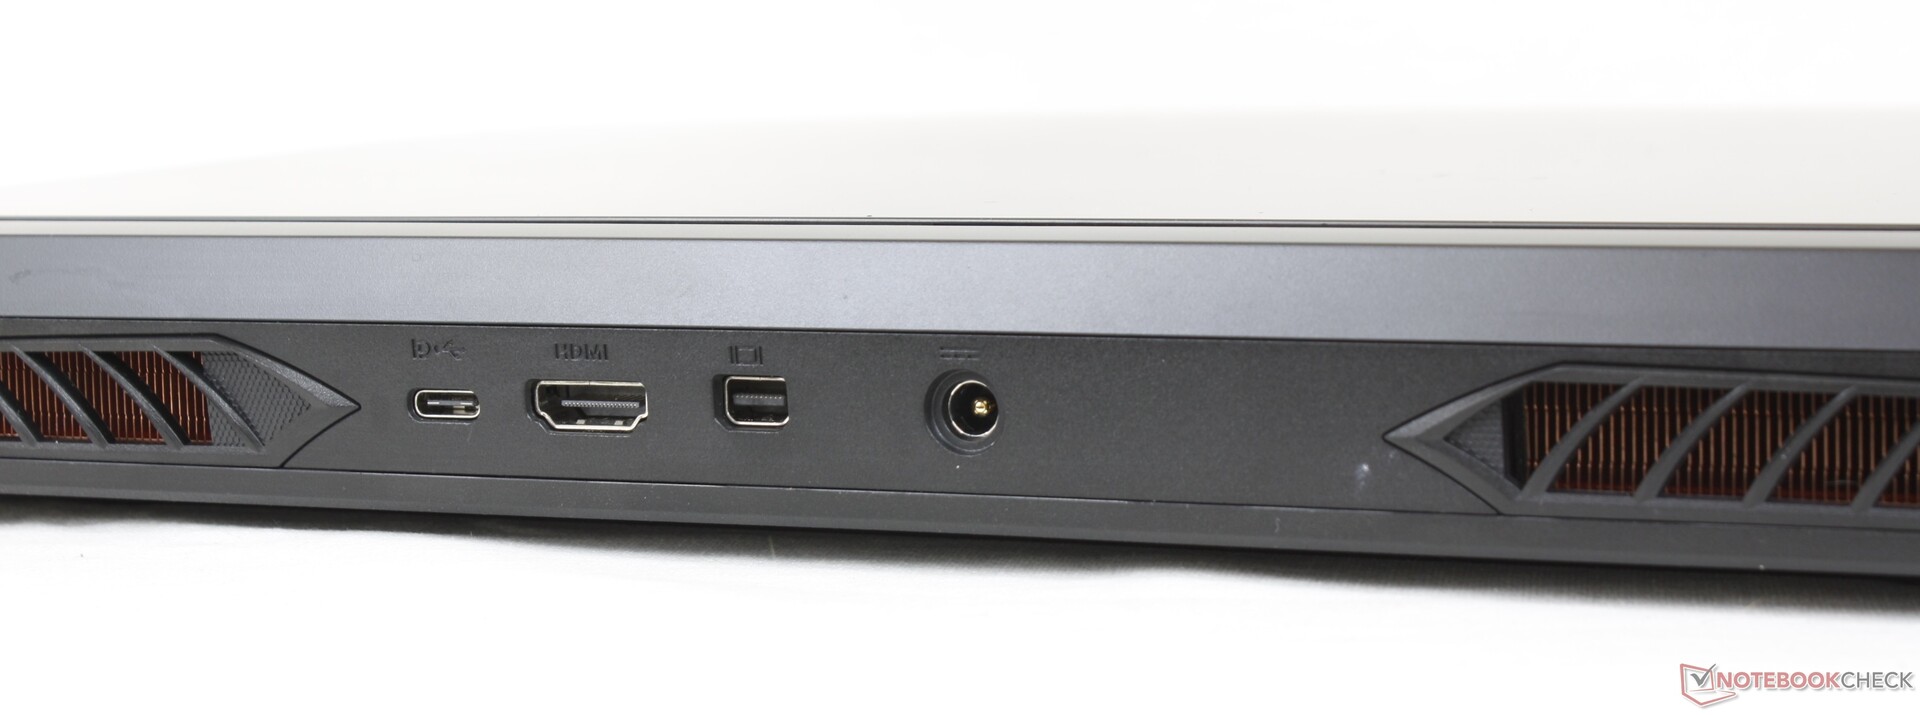
Il y a moins d'options de port ici par rapport au RX15. Il n'y a qu'un seul port USB-C au lieu de deux, par exemple, et il ne prend pas en charge Thunderbolt ou Power Delivery. En revanche, la plupart des ordinateurs portables MSI, Asus et Alienware ont la possibilité de se recharger via USB-C.
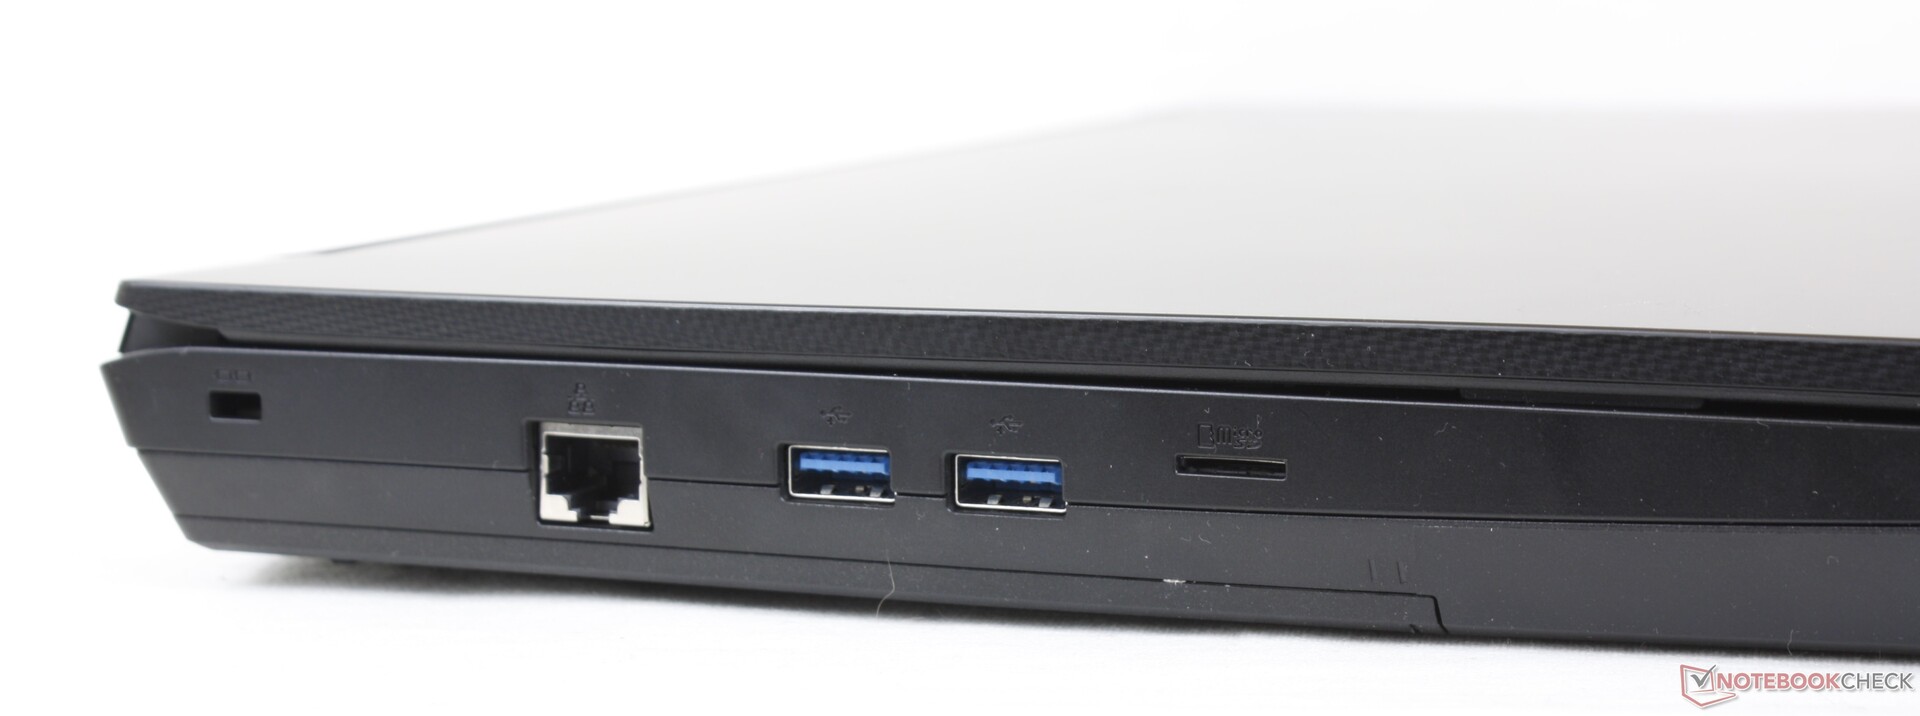
Lecteur de carte SD
Les taux de transfert à partir du lecteur MicroSD intégré sont décents mais encore décevants par rapport au prix du système. Déplacer 1 Go de photos de notre carte de test UHS-II vers le bureau prend environ 15 secondes, contre moins de la moitié sur leMSI GE66 Raider 10SFS.
| SD Card Reader | |
| average JPG Copy Test (av. of 3 runs) | |
| MSI GE66 Raider 10SFS (Toshiba Exceria Pro SDXC 64 GB UHS-II) | |
| Eurocom Nightsky ARX315 (AV Pro V60) | |
| maximum AS SSD Seq Read Test (1GB) | |
| MSI GE66 Raider 10SFS (Toshiba Exceria Pro SDXC 64 GB UHS-II) | |
| Eurocom Nightsky ARX315 (AV Pro V60) | |
Communication
Webcam
Le système est équipé d'une webcam 720p alors que l'Eurocom Sky X4C est équipé d'une webcam 1080p de plus haute résolution. Il n'y a pas d'obturateur de confidentialité ou de caméra IR. Au lieu de cela, il y a une touche Fn pour désactiver la caméra électroniquement.


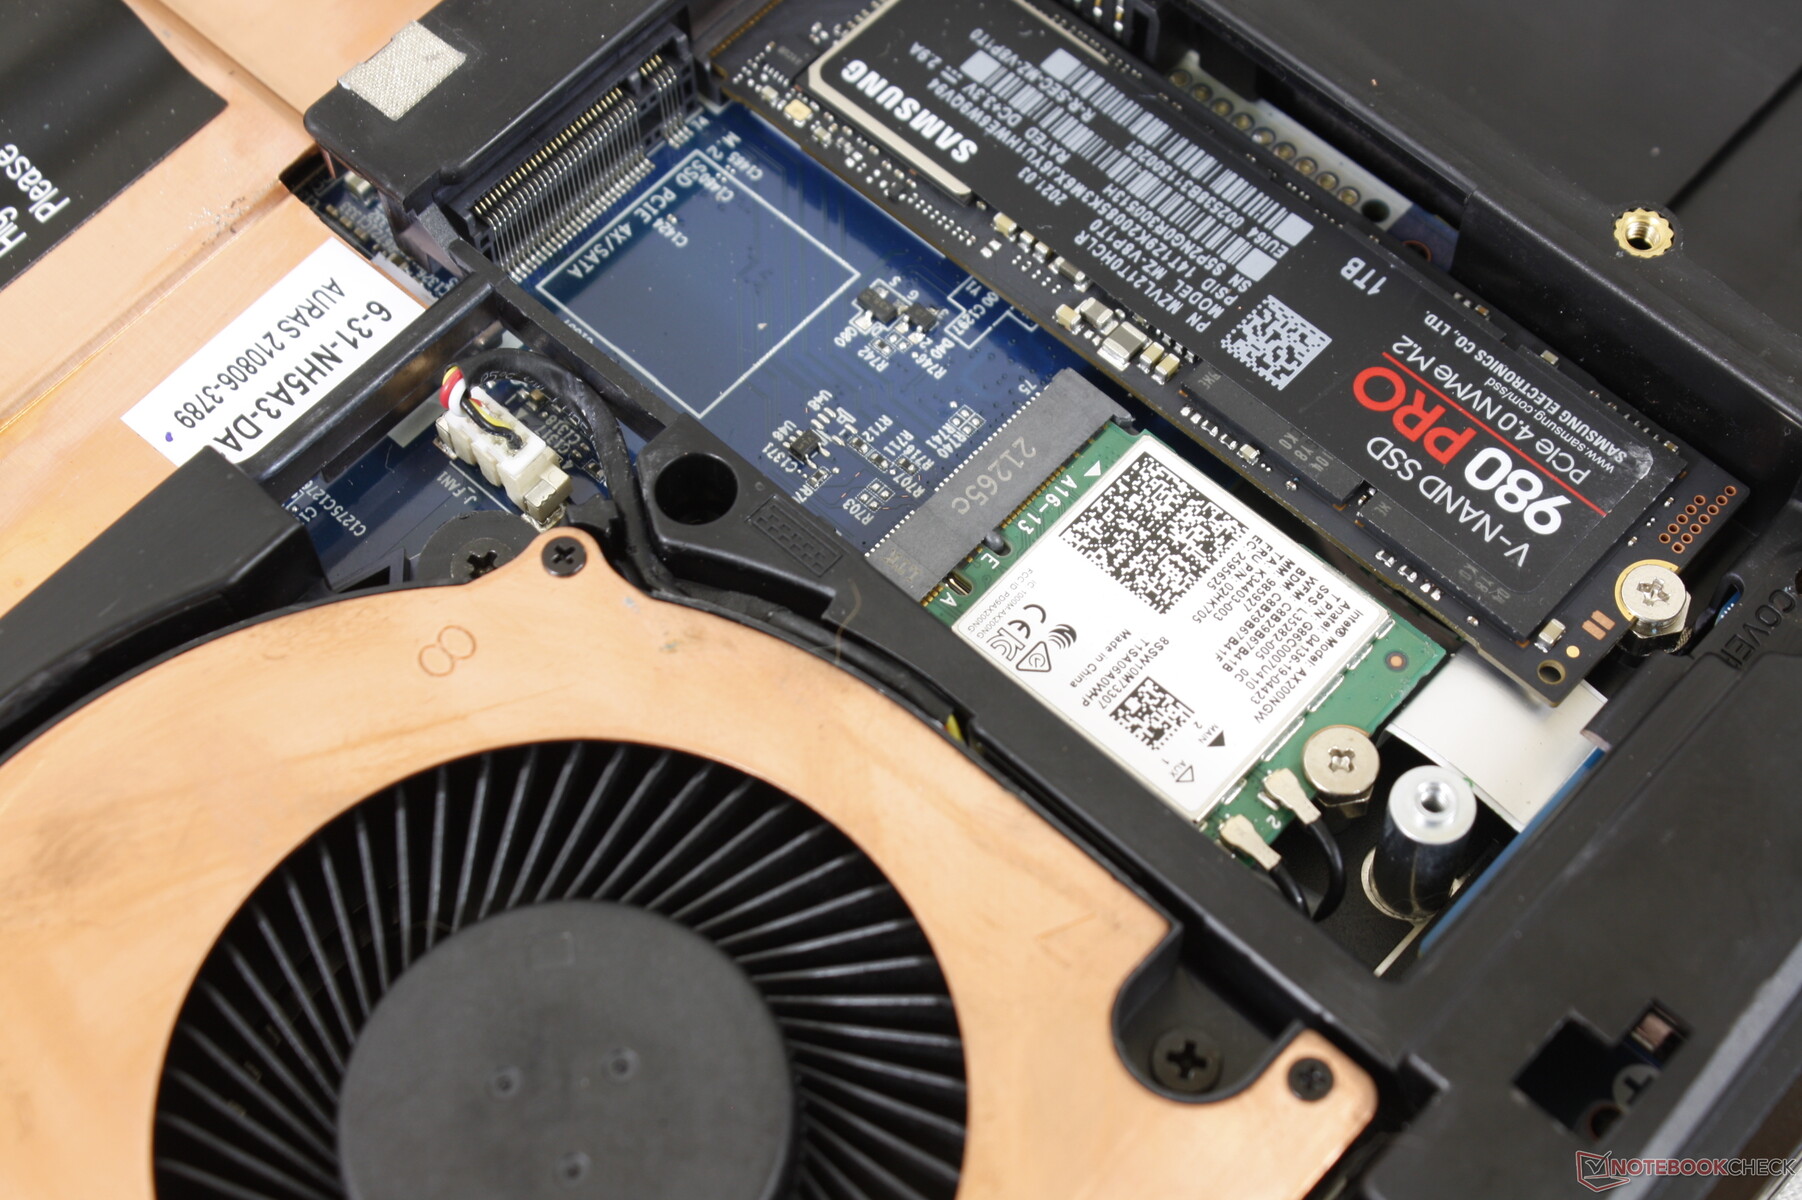
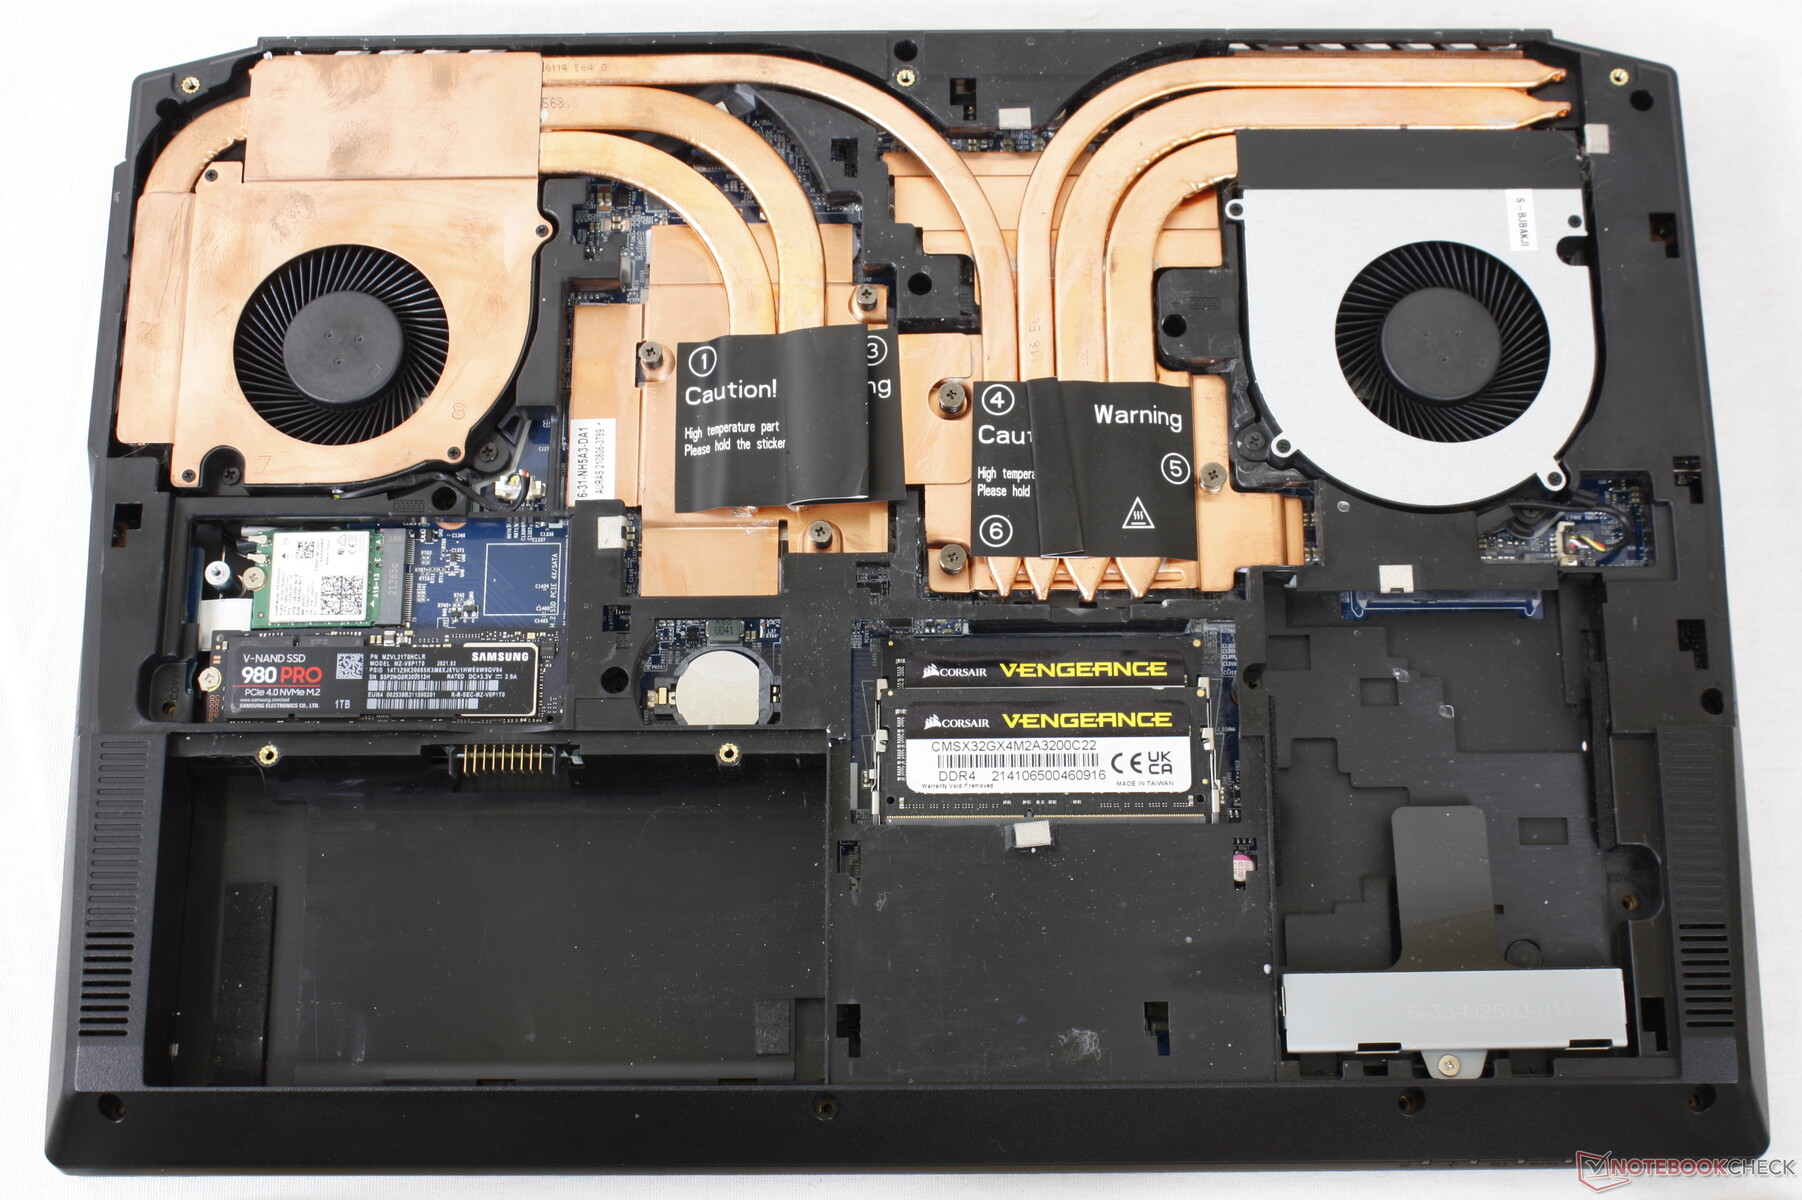
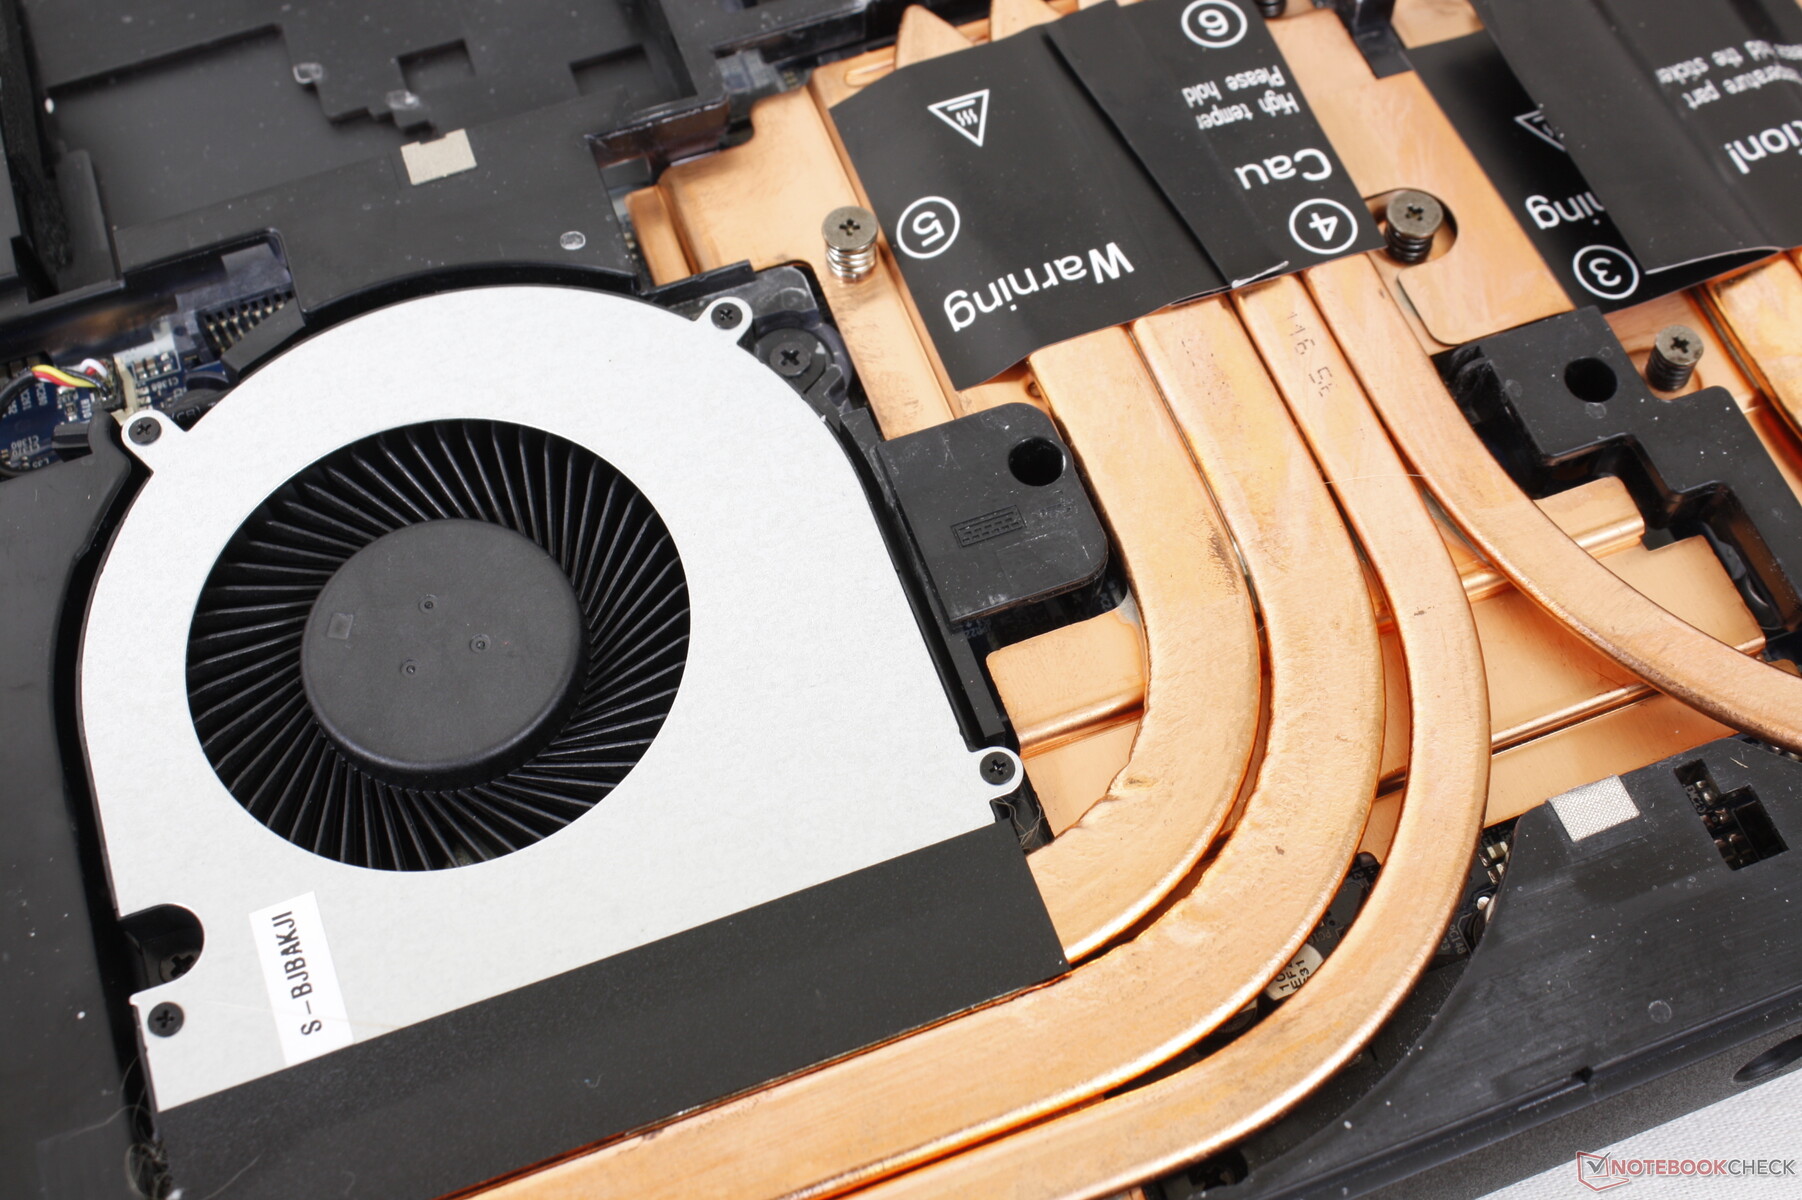
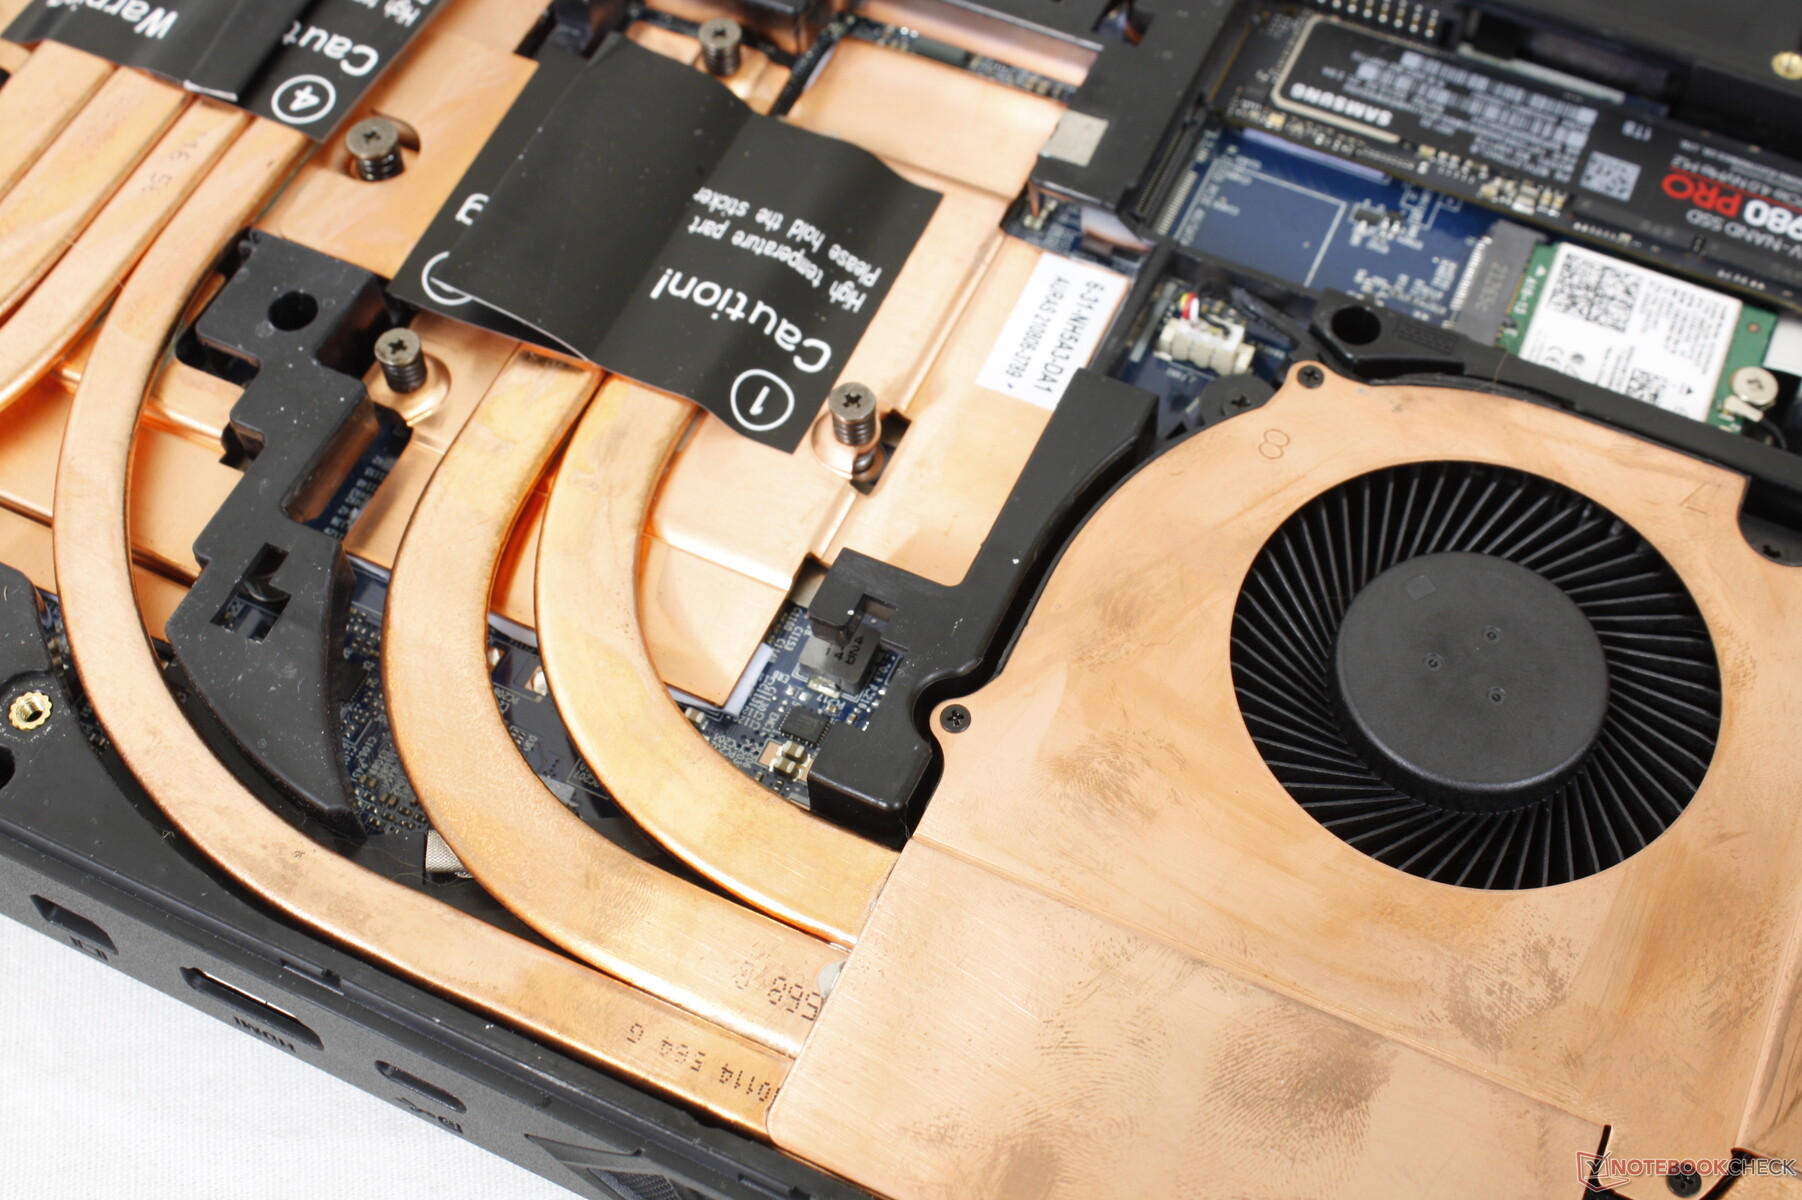
Maintenance
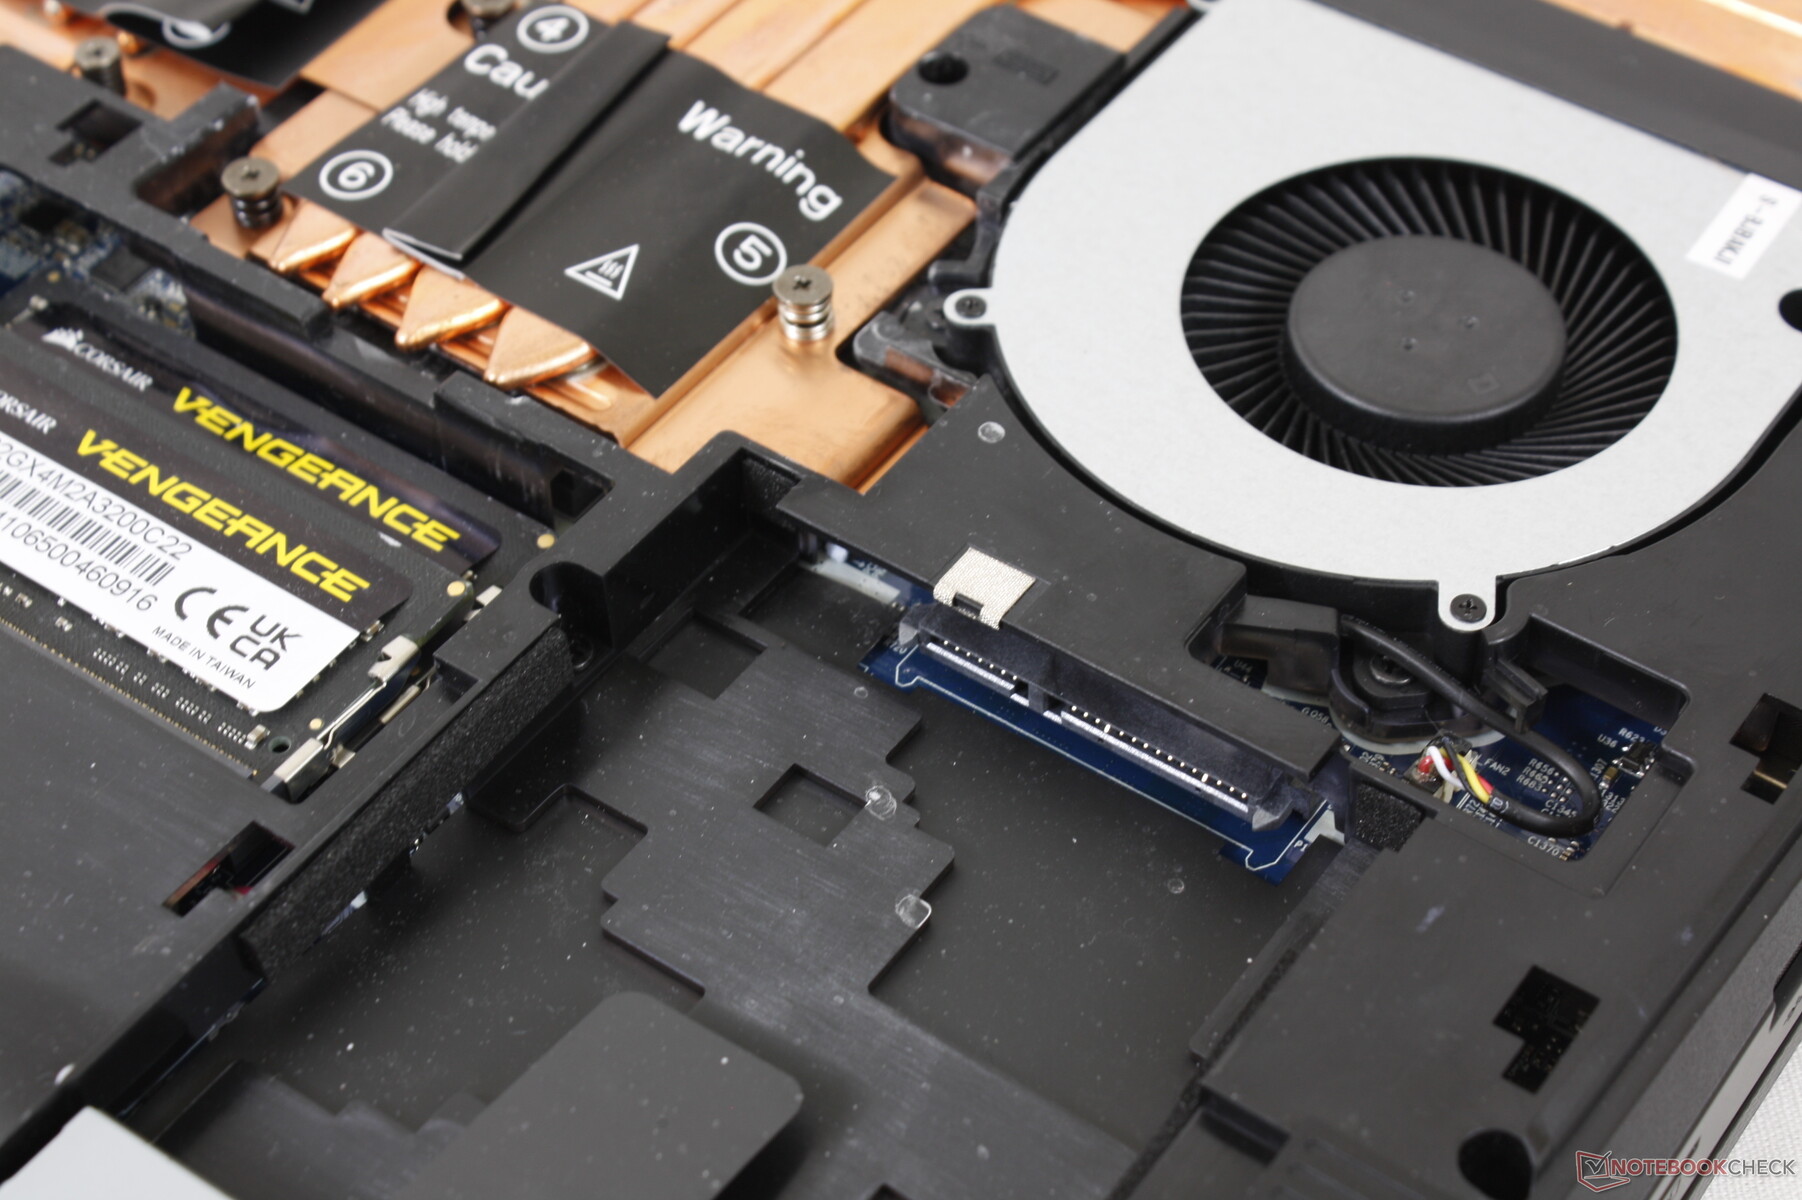
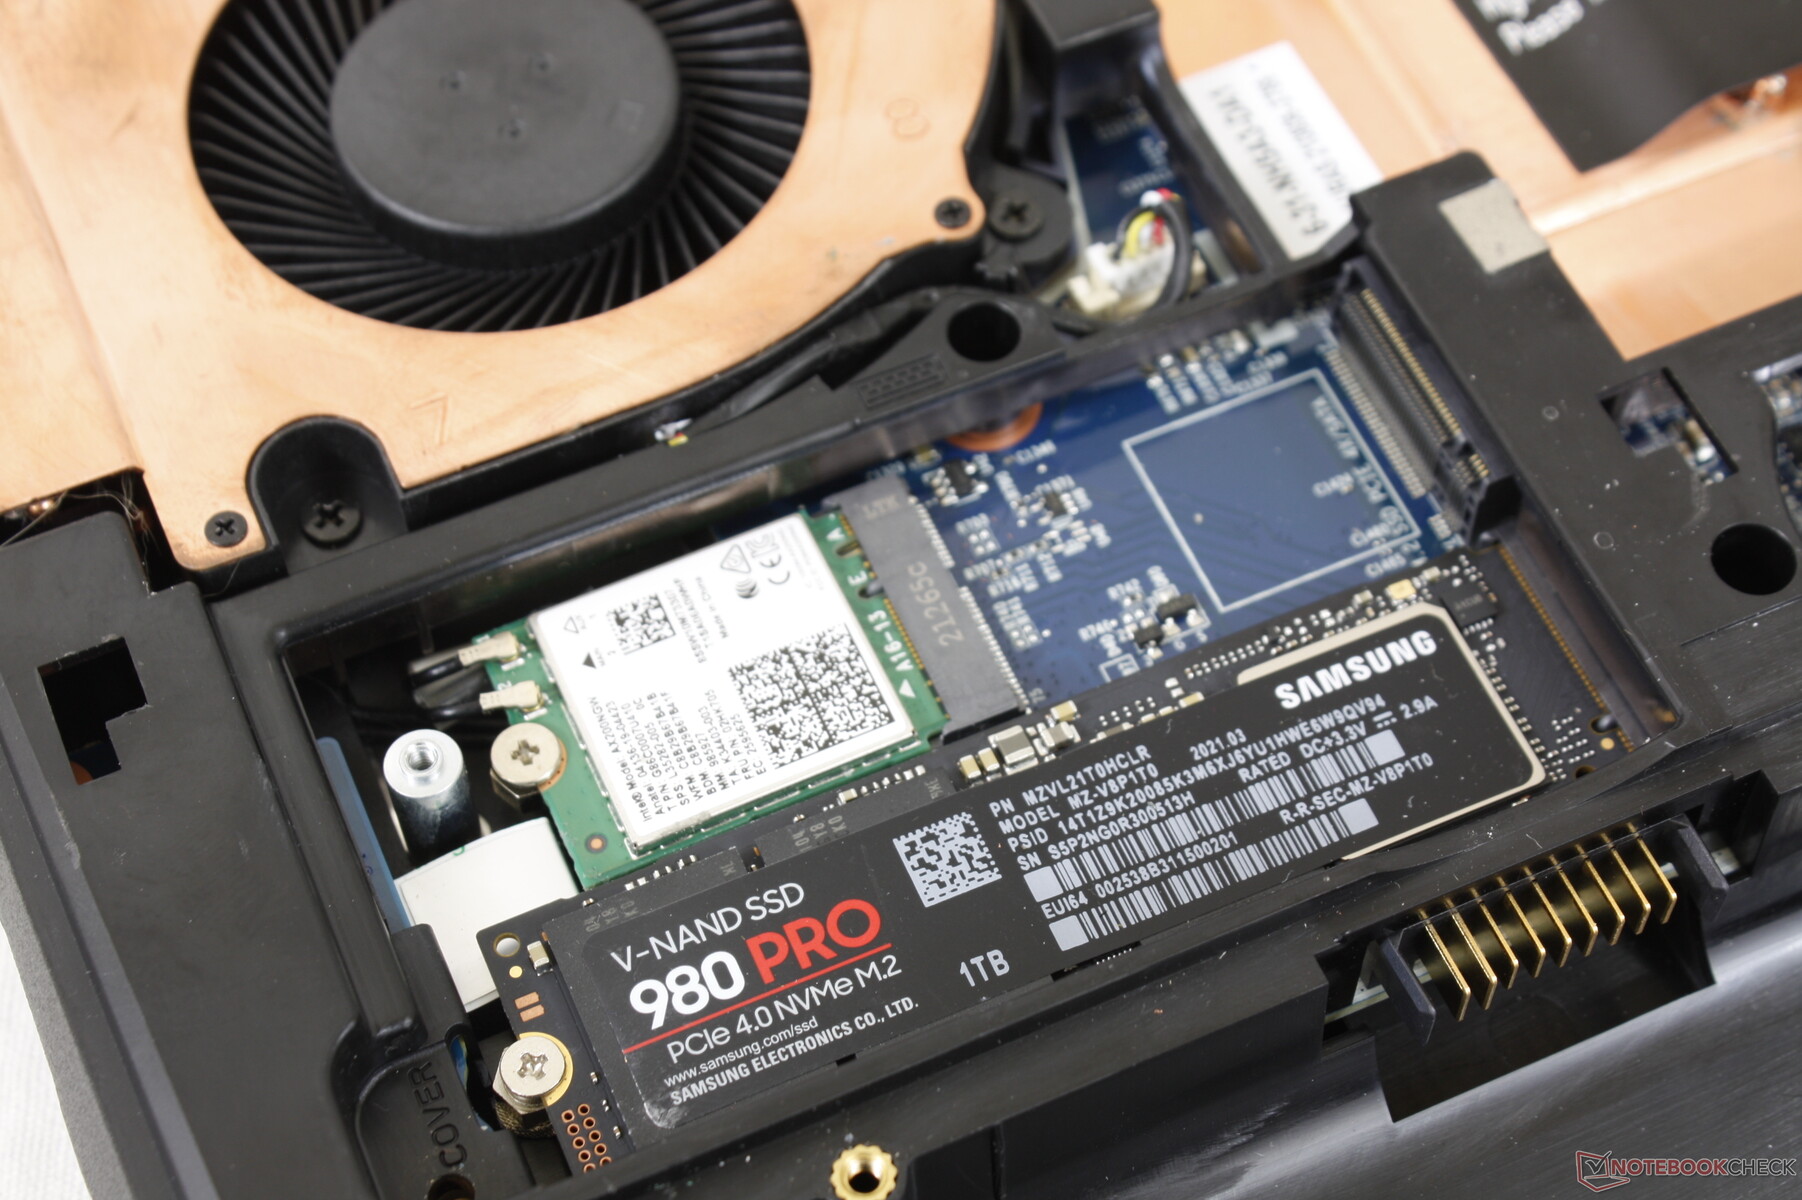
Le panneau inférieur se détache facilement après avoir retiré les cinq vis Philips. Les utilisateurs ont un accès direct à tous les composants communs, notamment les deux emplacements SODIMM DDR4 et les trois baies de stockage.
Accessoires et garantie
La boîte de détail comprend un manuel, un disque de pilotes, une clé USB Windows 10, des vis supplémentaires, un tampon thermique pour SSD et deux seringues de pâte thermique de 0,6 g. La garantie limitée standard d'un an s'applique avec l'option d'extension jusqu'à 3 ans
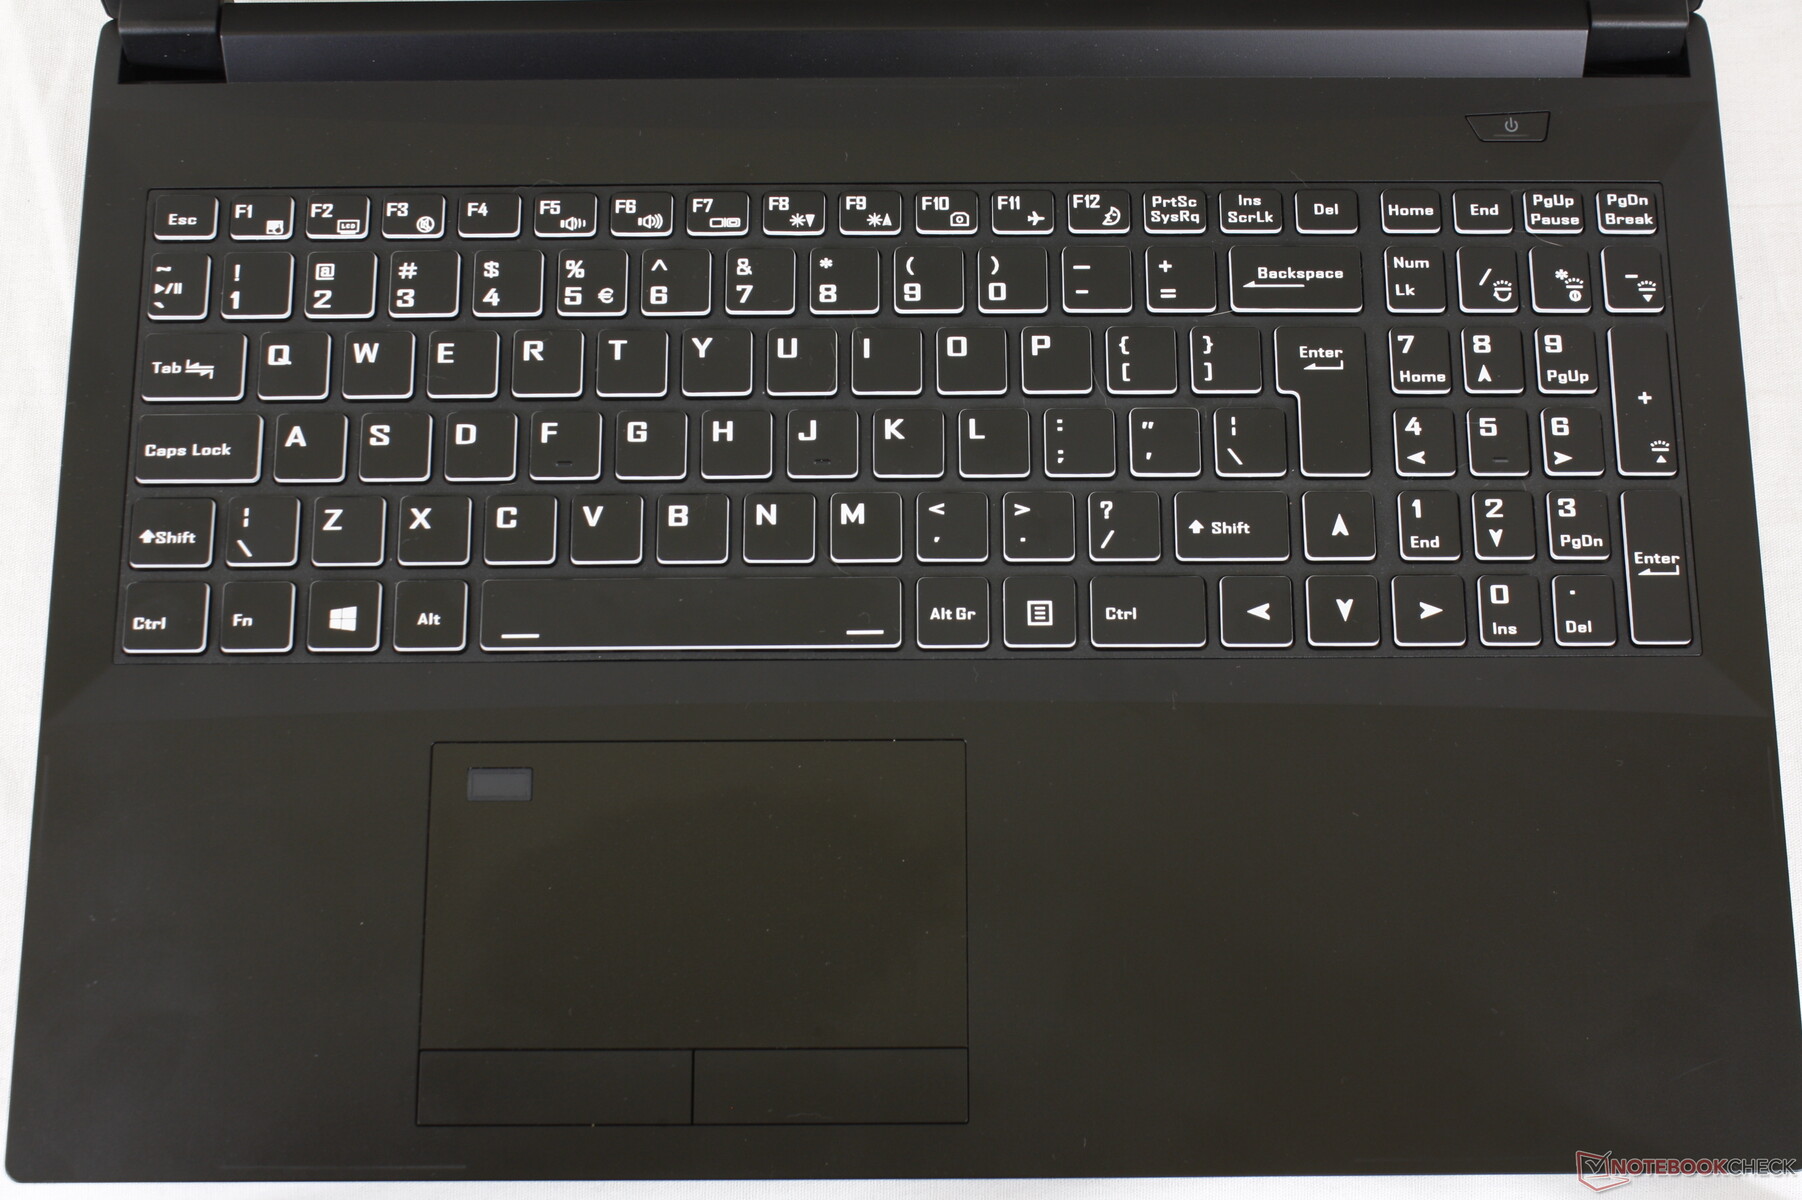
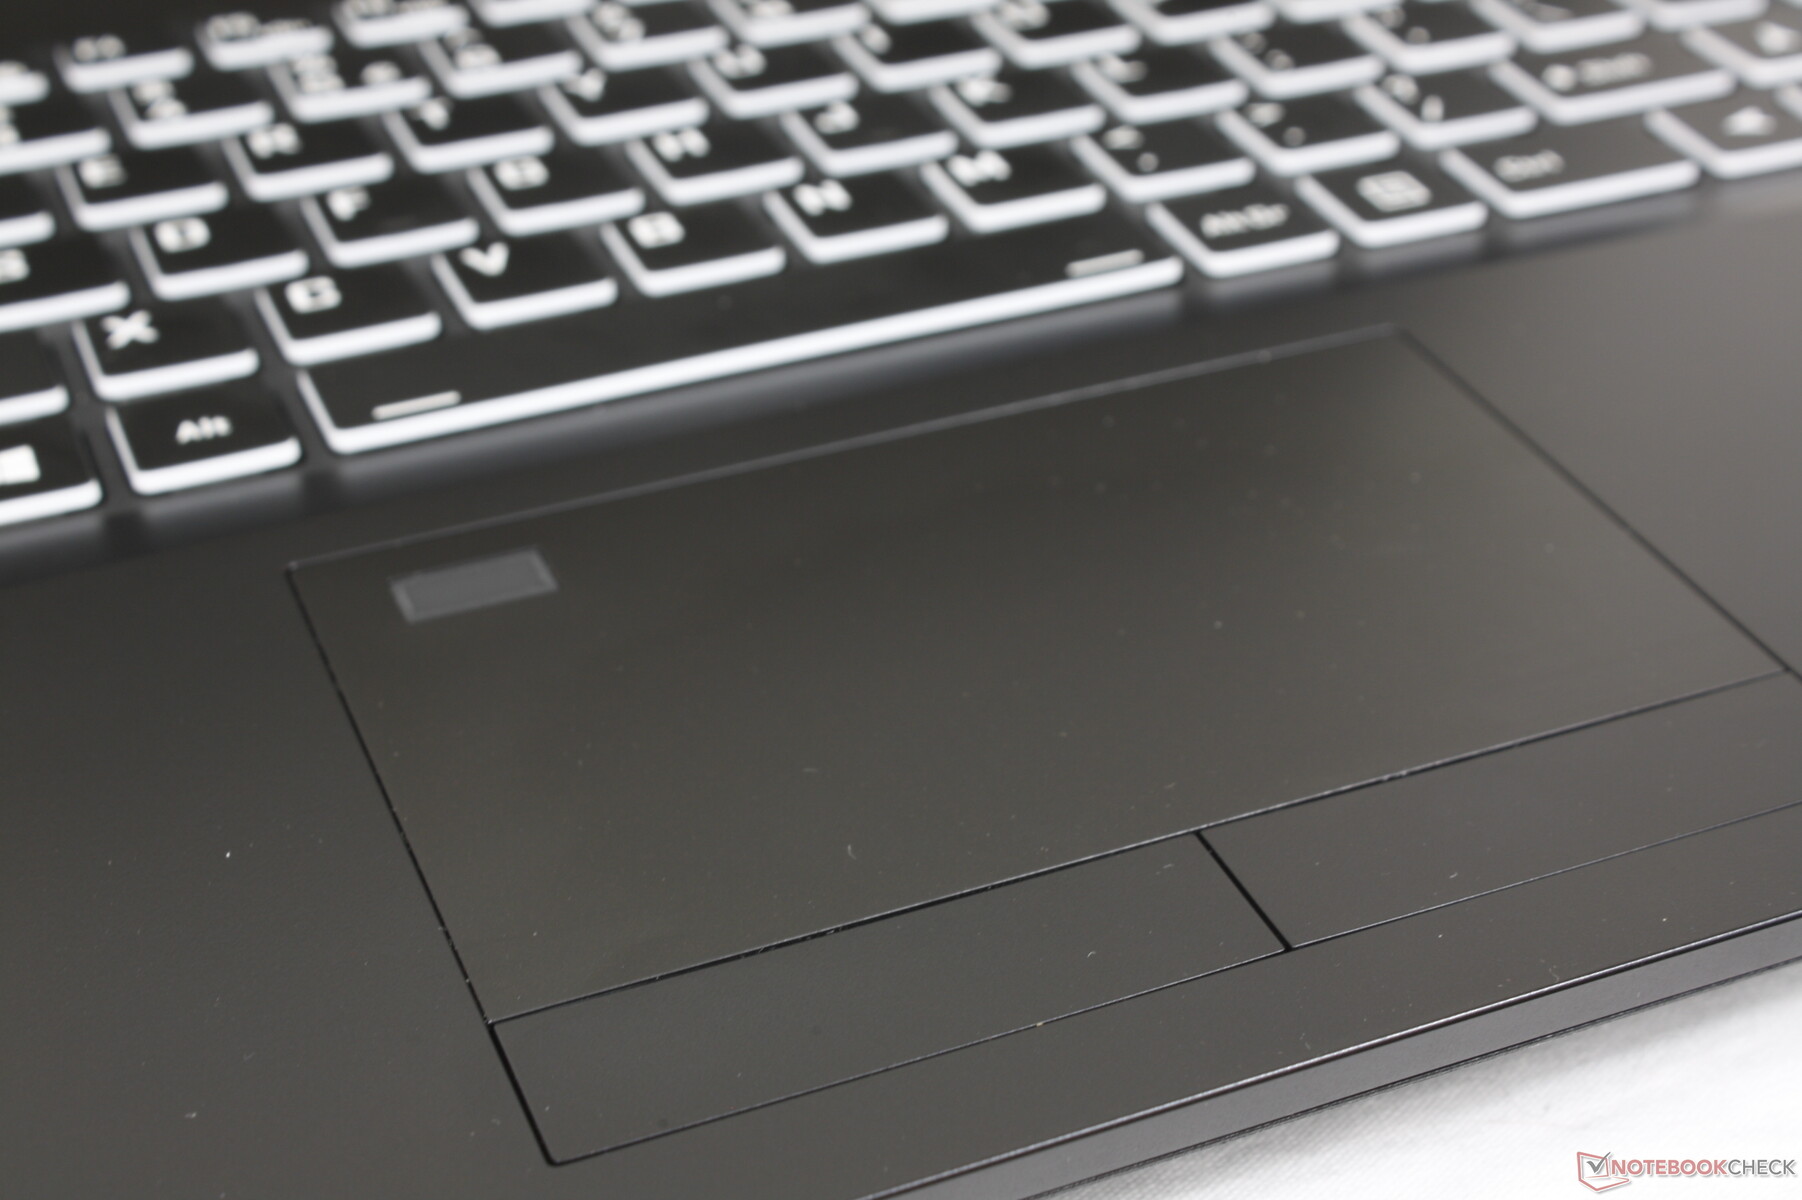
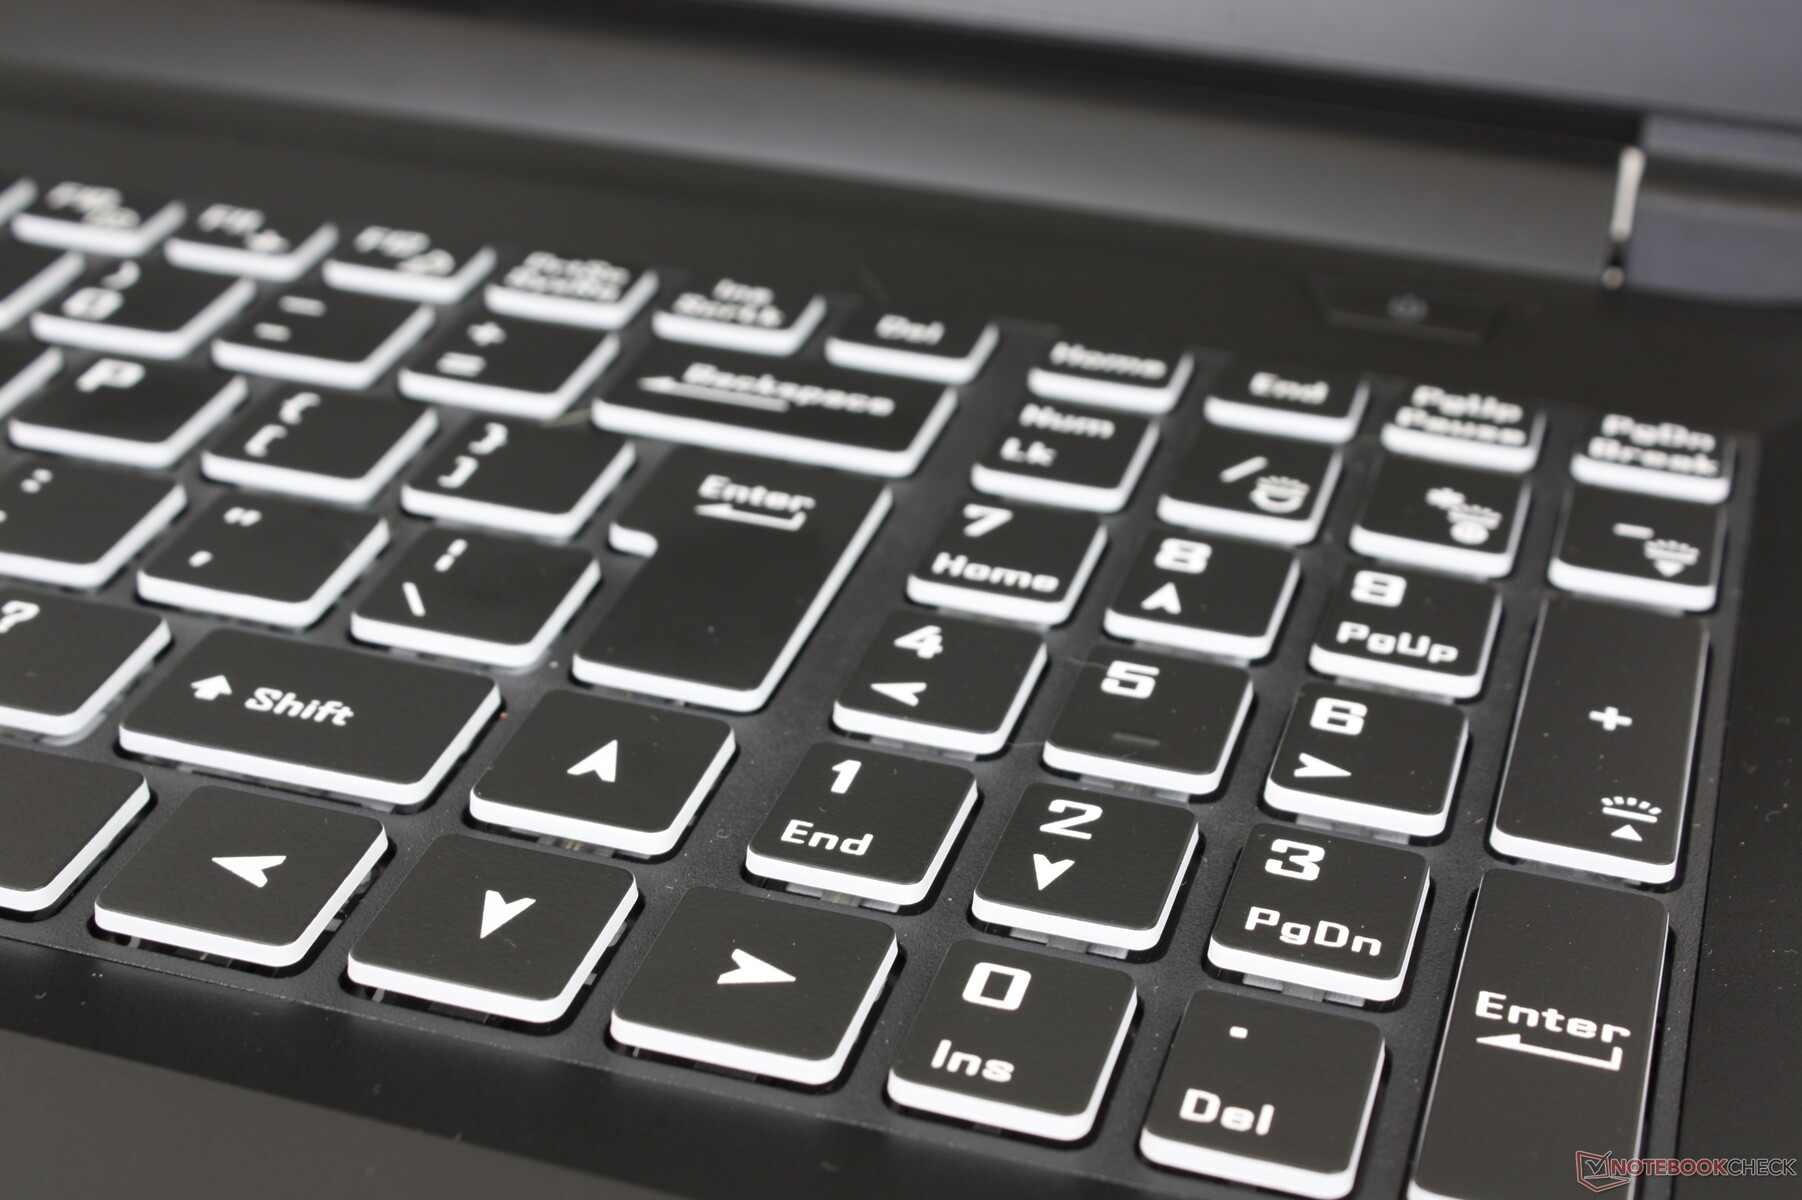
Périphériques d'entrée

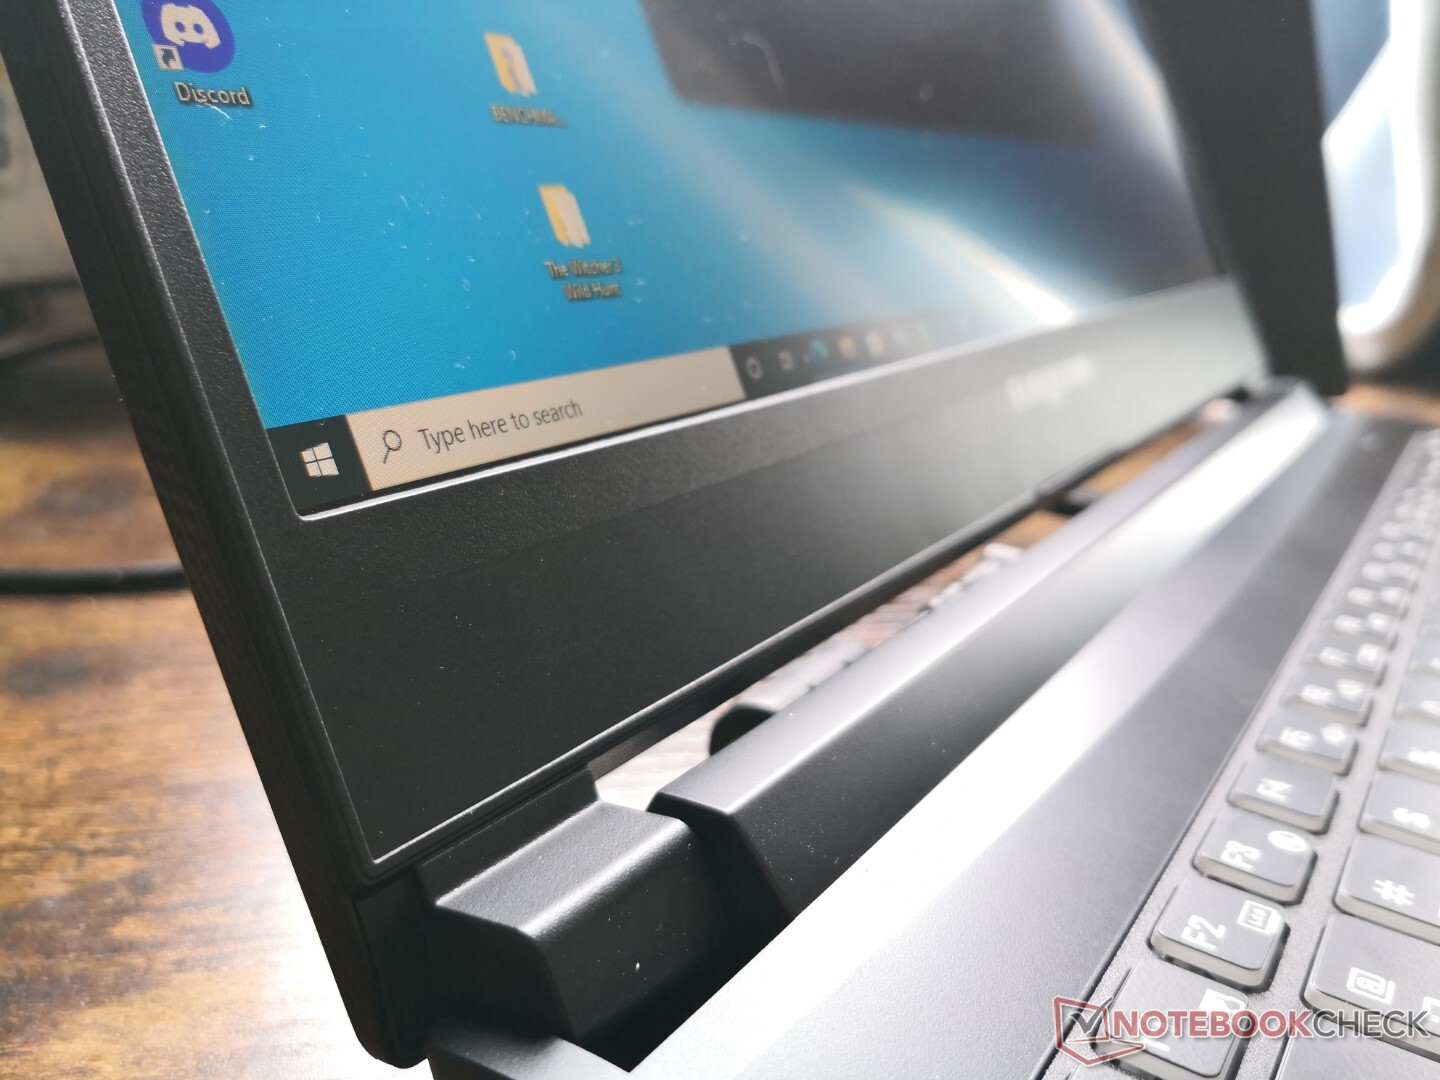
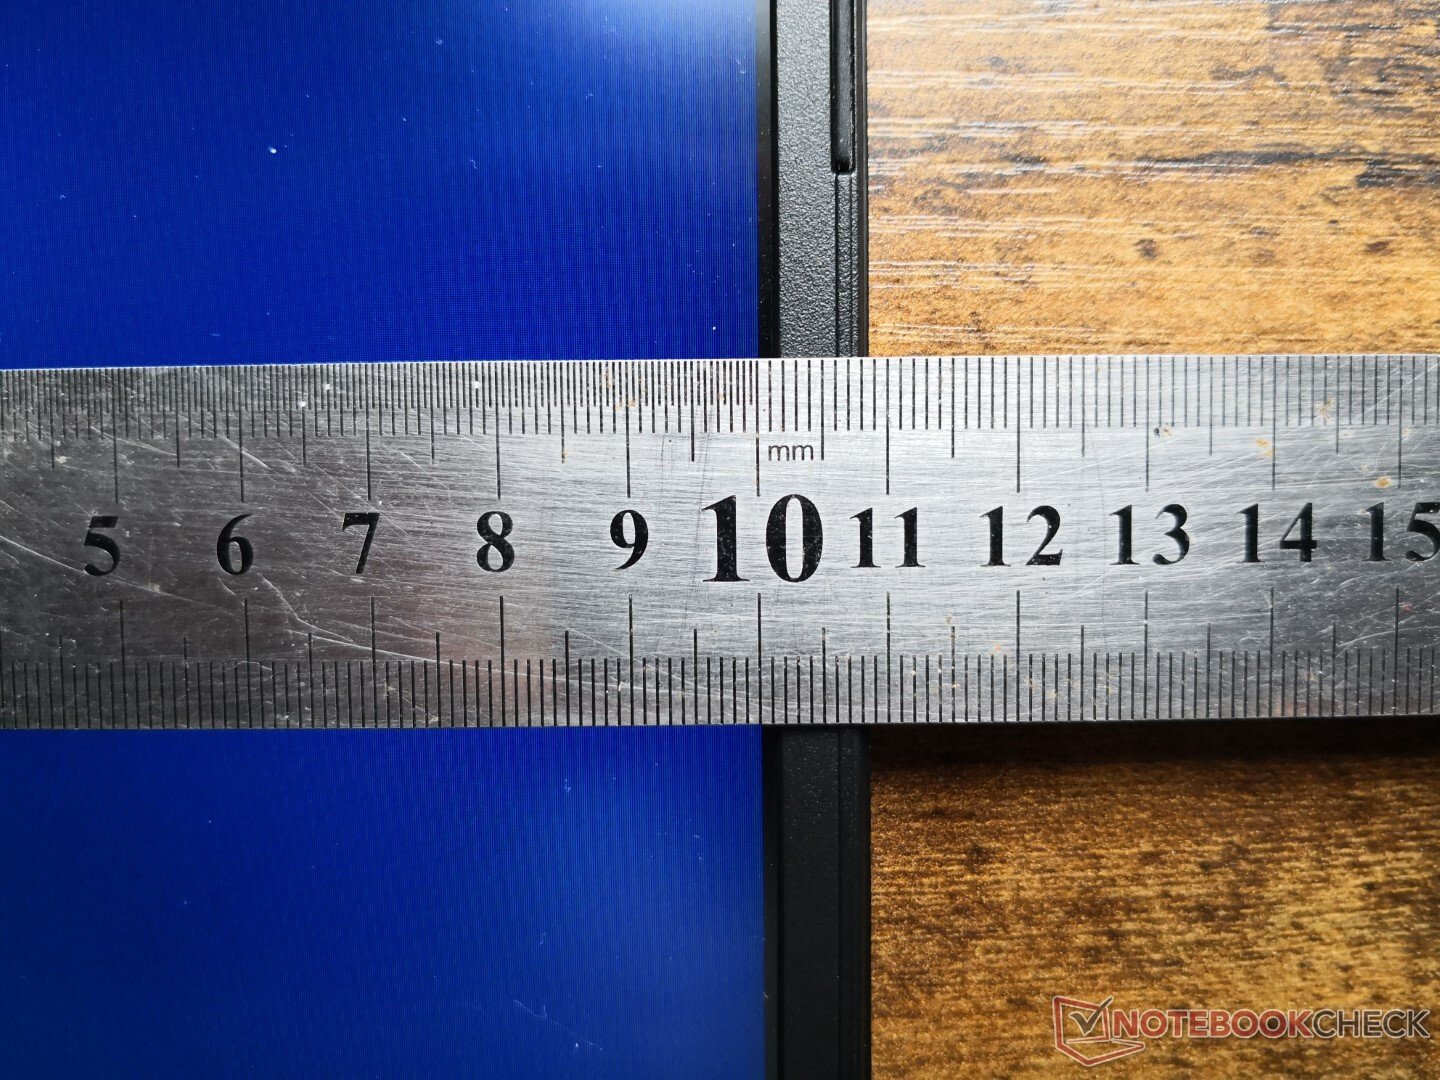
Afficher
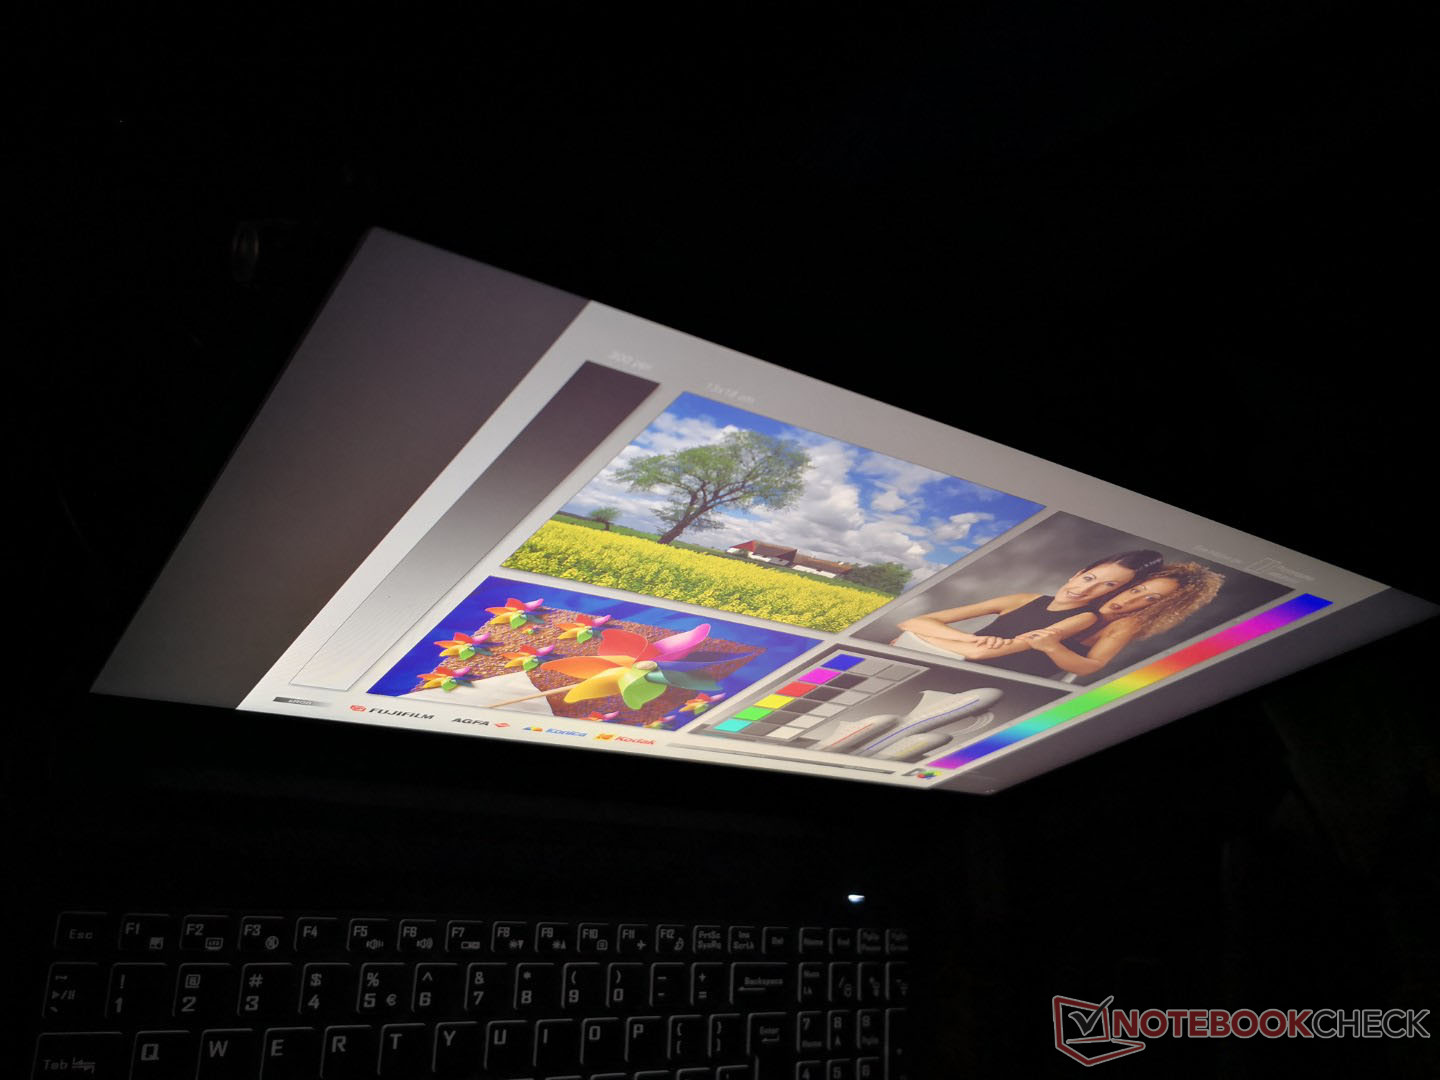
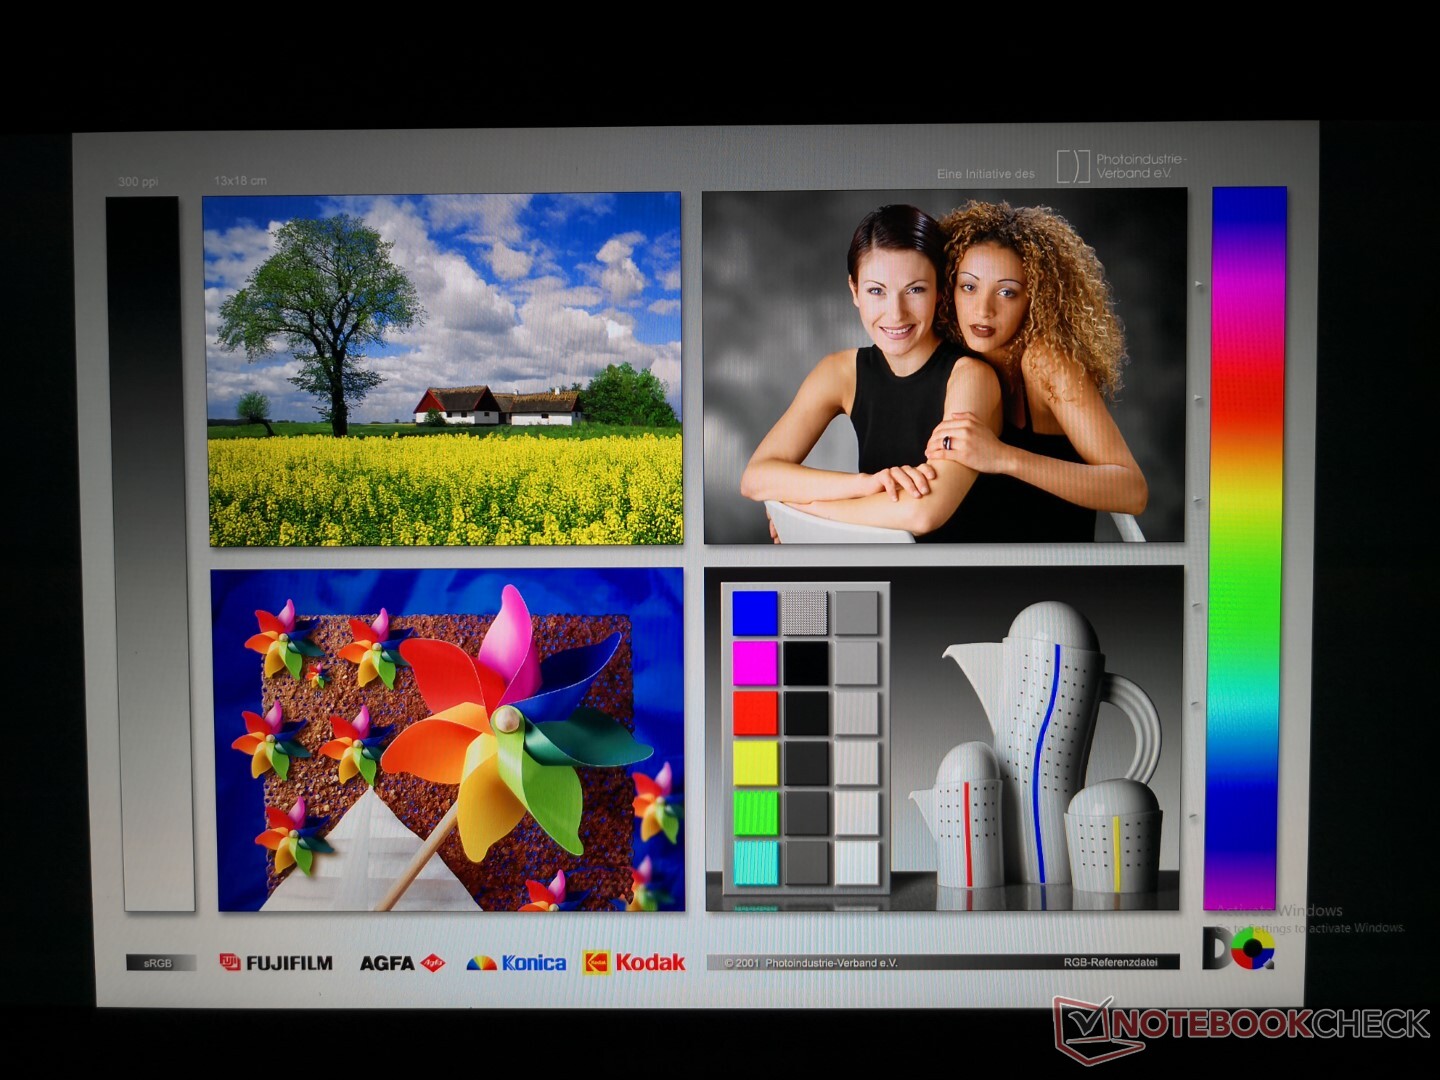
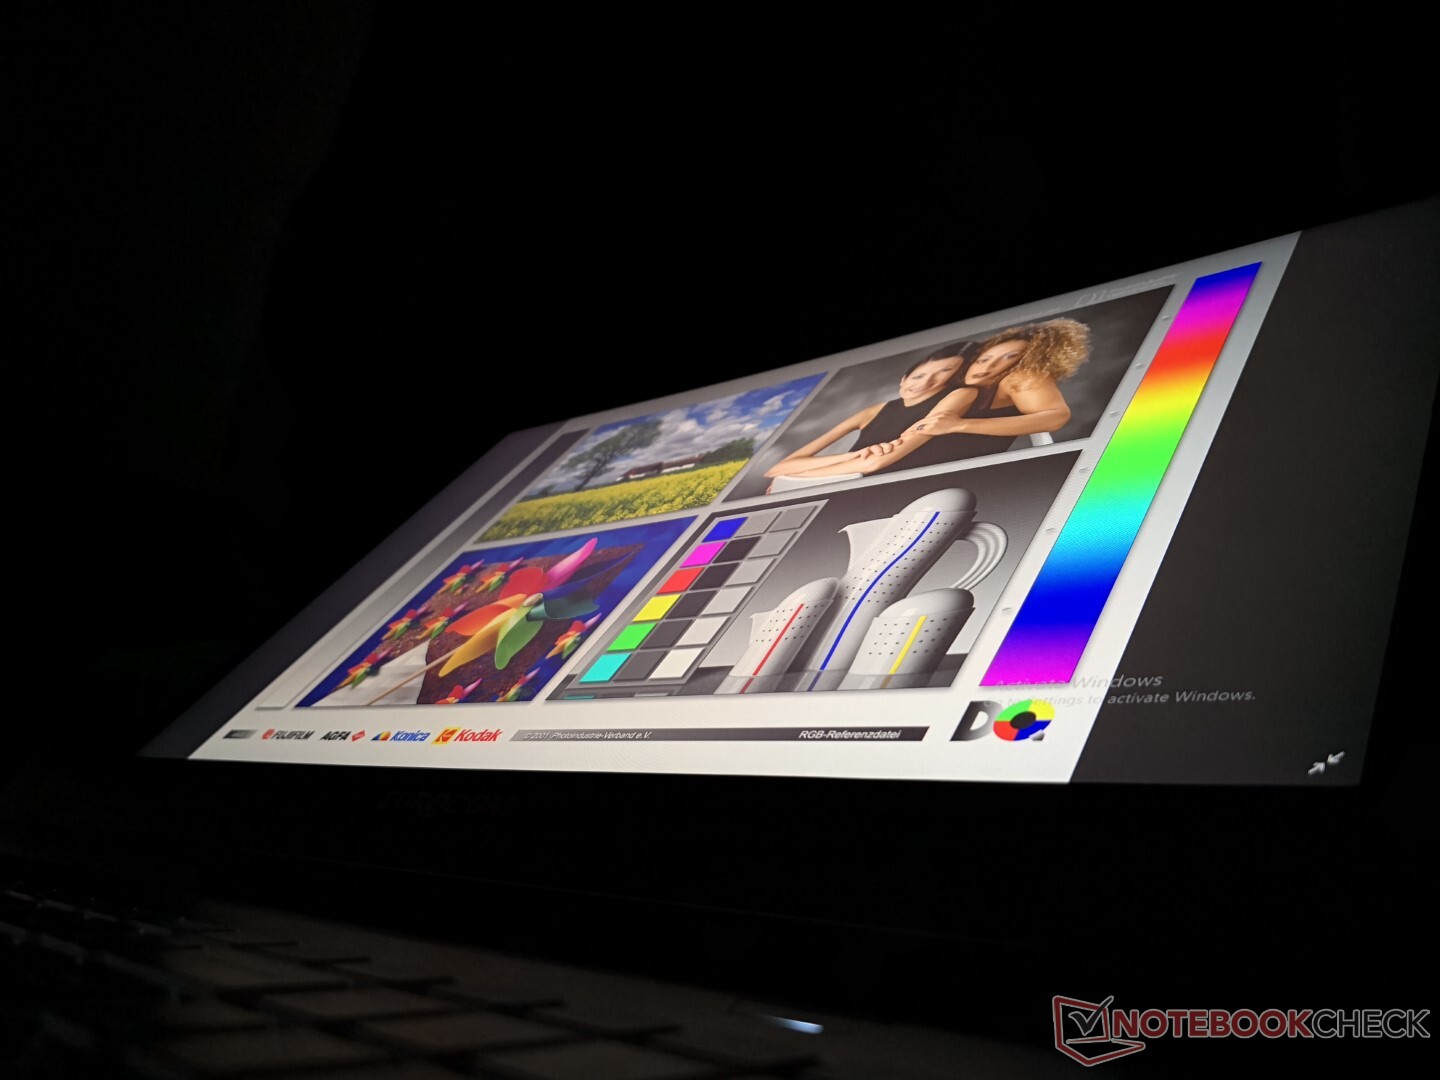
Le Nightsky ARX15 utilise un panneau IPS Sharp LQ156M1JW03 très similaire à ceux que l'on trouve sur le MSI GE66 ou le Delta 15 Delta 15. Ainsi, l'expérience visuelle est presque identique entre ces trois modèles avec leurs taux de rafraîchissement natifs de 240 Hz, leurs rapports de contraste de ~1000:1, leur couverture sRGB complète, leurs temps de réponse rapides et même leurs fréquences de modulation de largeur d'impulsion similaires. Il s'agit d'un panneau haut de gamme doté d'excellentes caractéristiques, même si ses couleurs et son contraste n'atteignent pas tout à fait les mêmes niveaux que ceux des panneaux OLED.

| |||||||||||||||||||||||||
Homogénéité de la luminosité: 90 %
Valeur mesurée au centre, sur batterie: 312.8 cd/m²
Contraste: 1117:1 (Valeurs des noirs: 0.28 cd/m²)
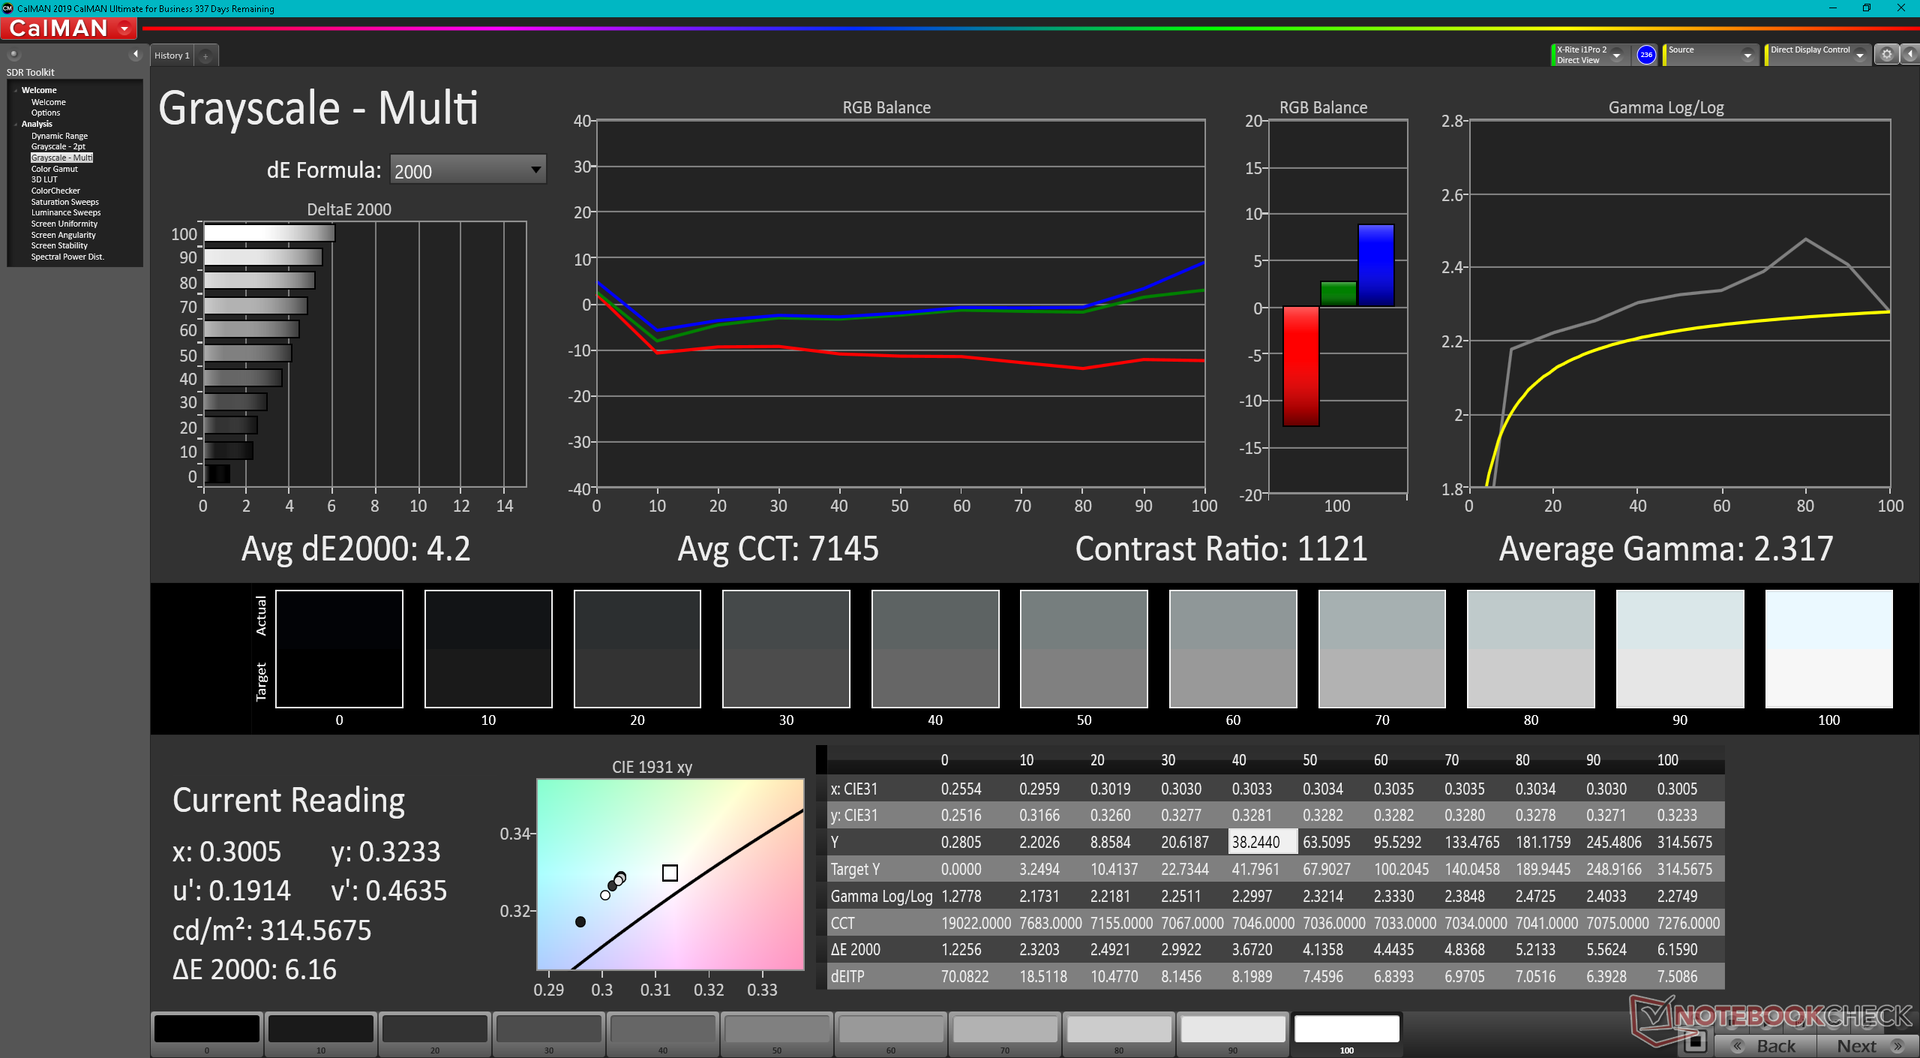
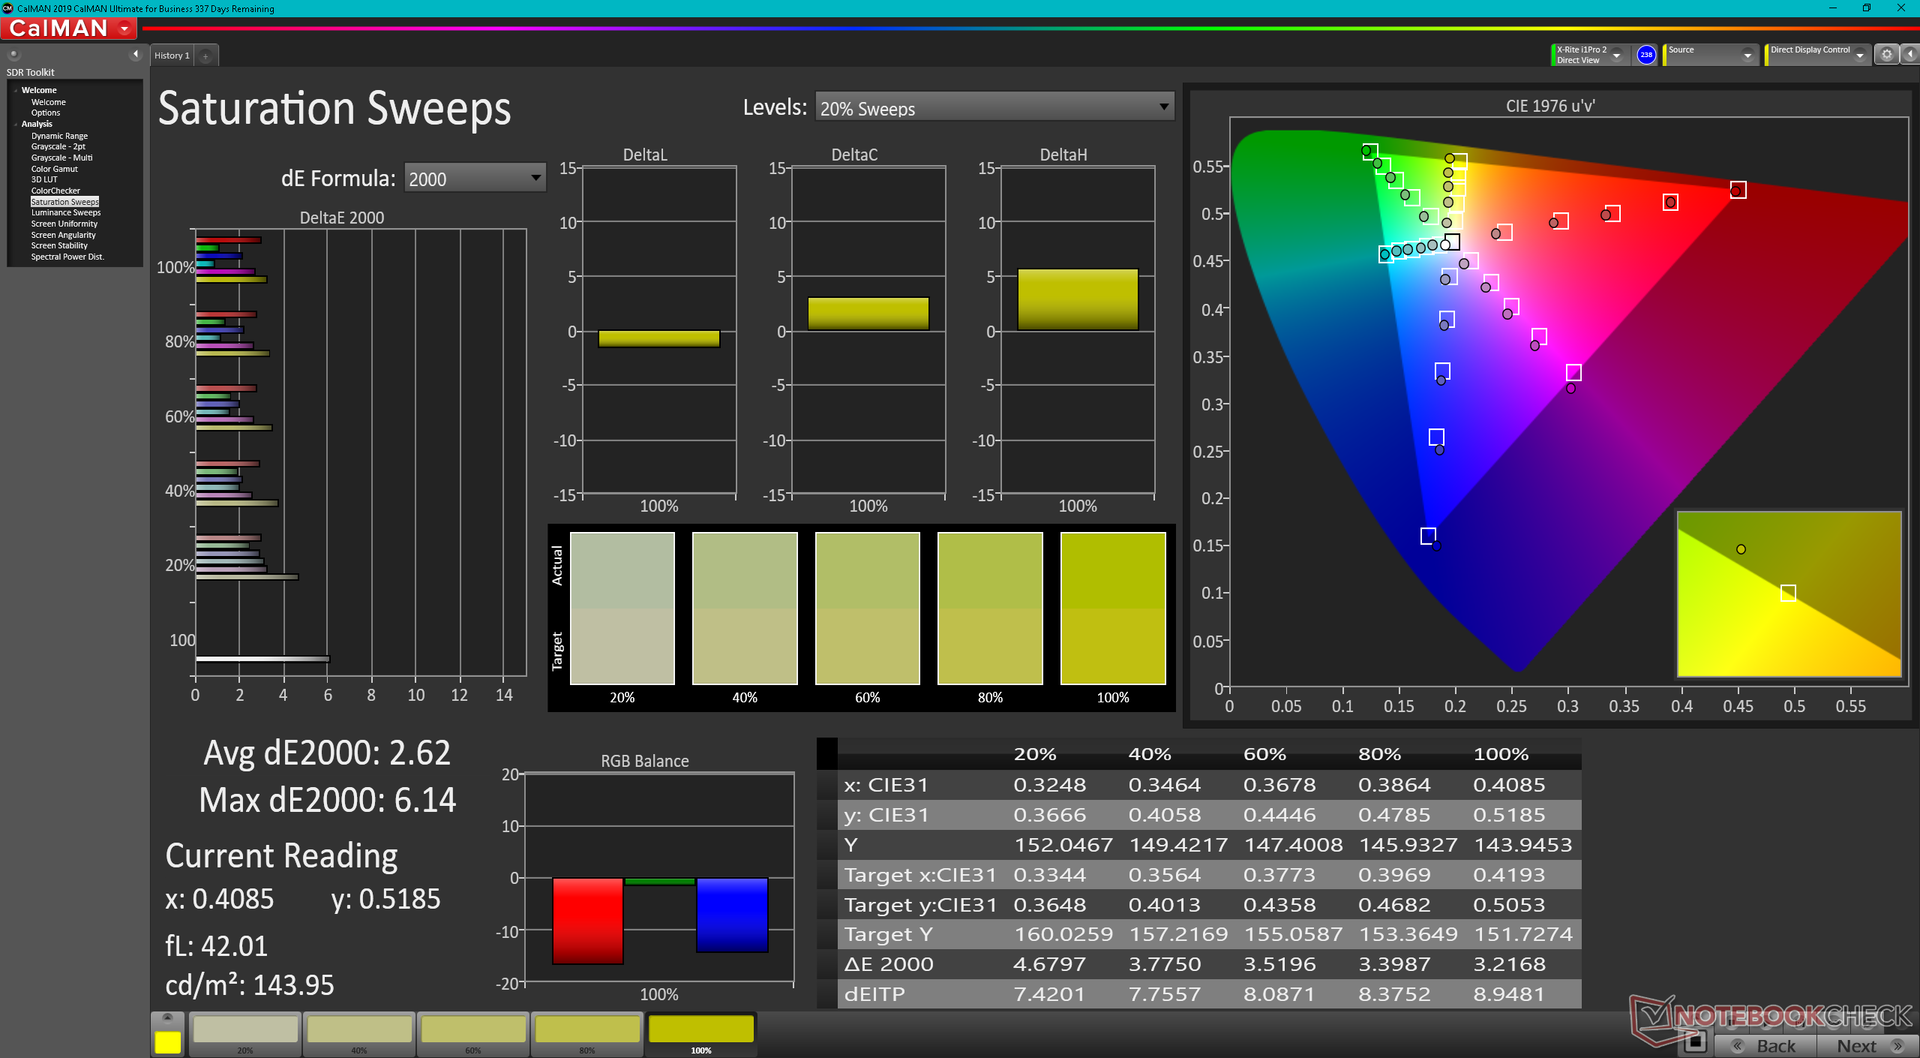
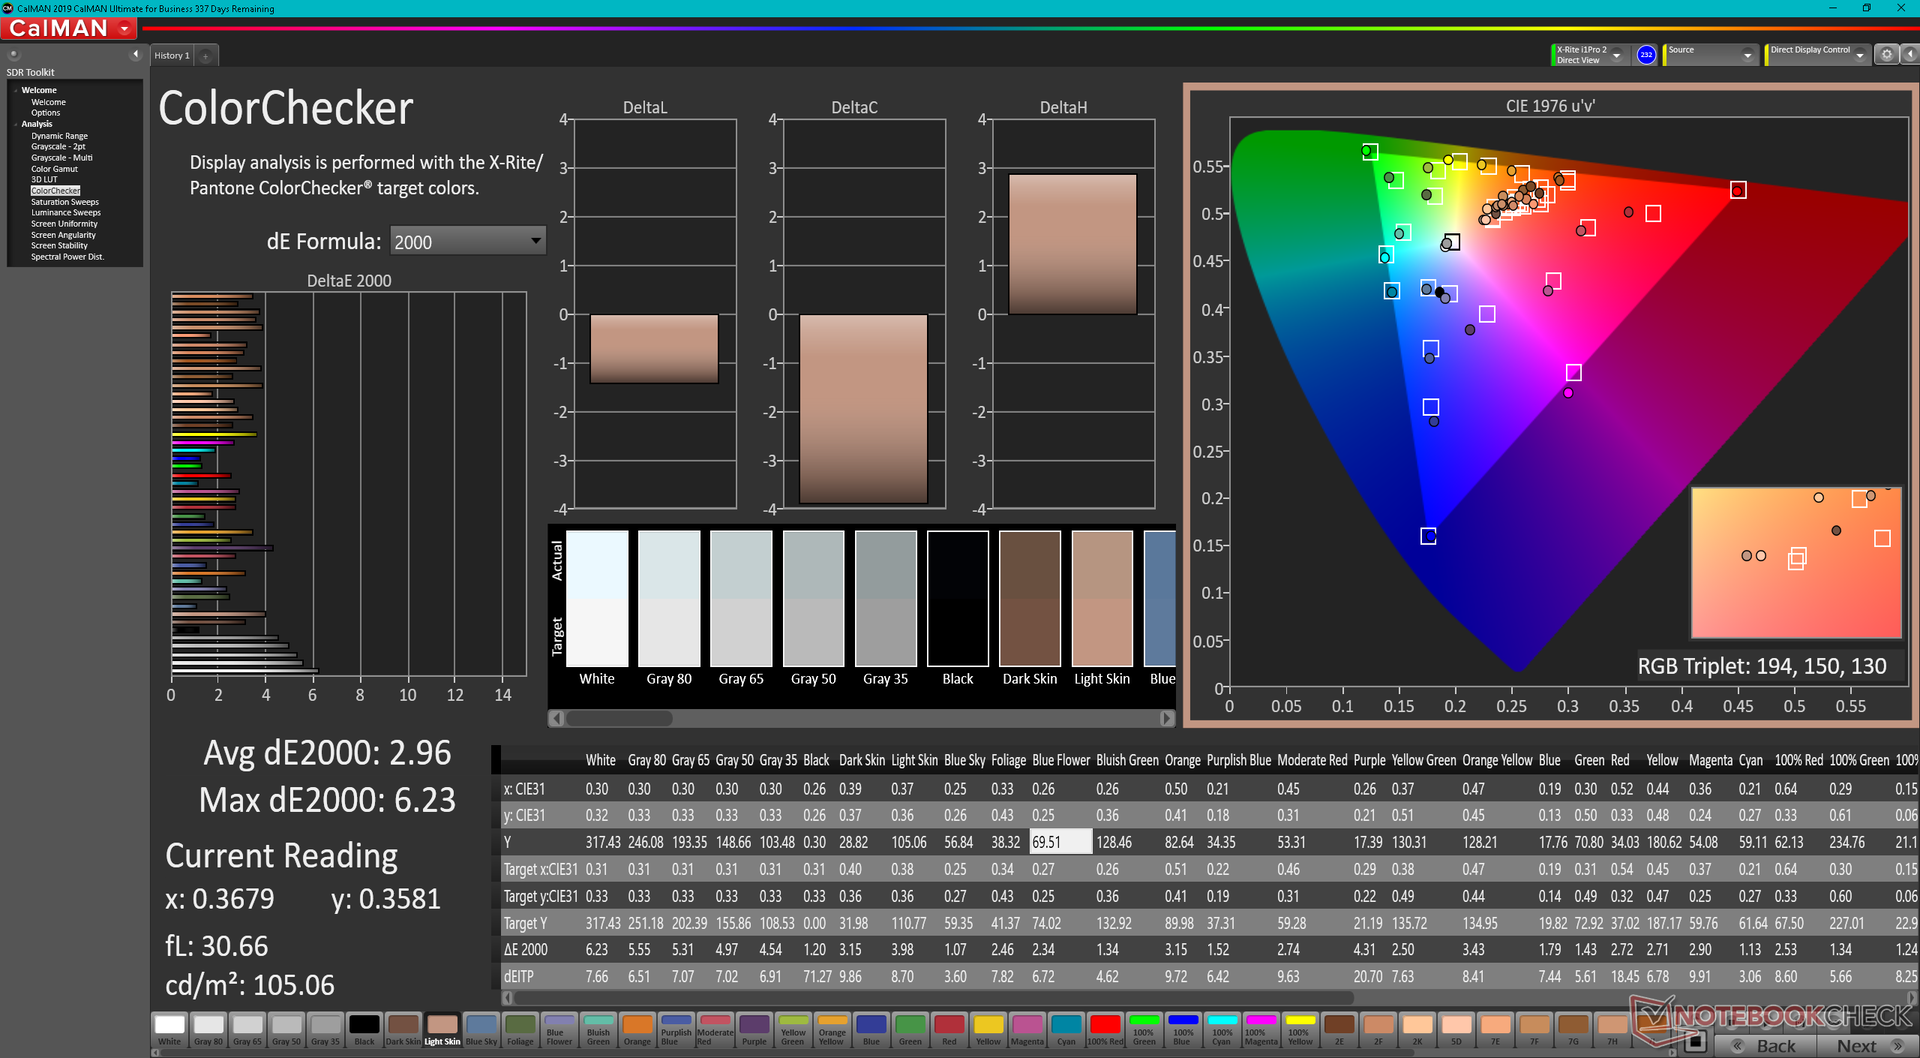
ΔE ColorChecker Calman: 2.96 | ∀{0.5-29.43 Ø4.71}
ΔE Greyscale Calman: 4.2 | ∀{0.09-98 Ø4.96}
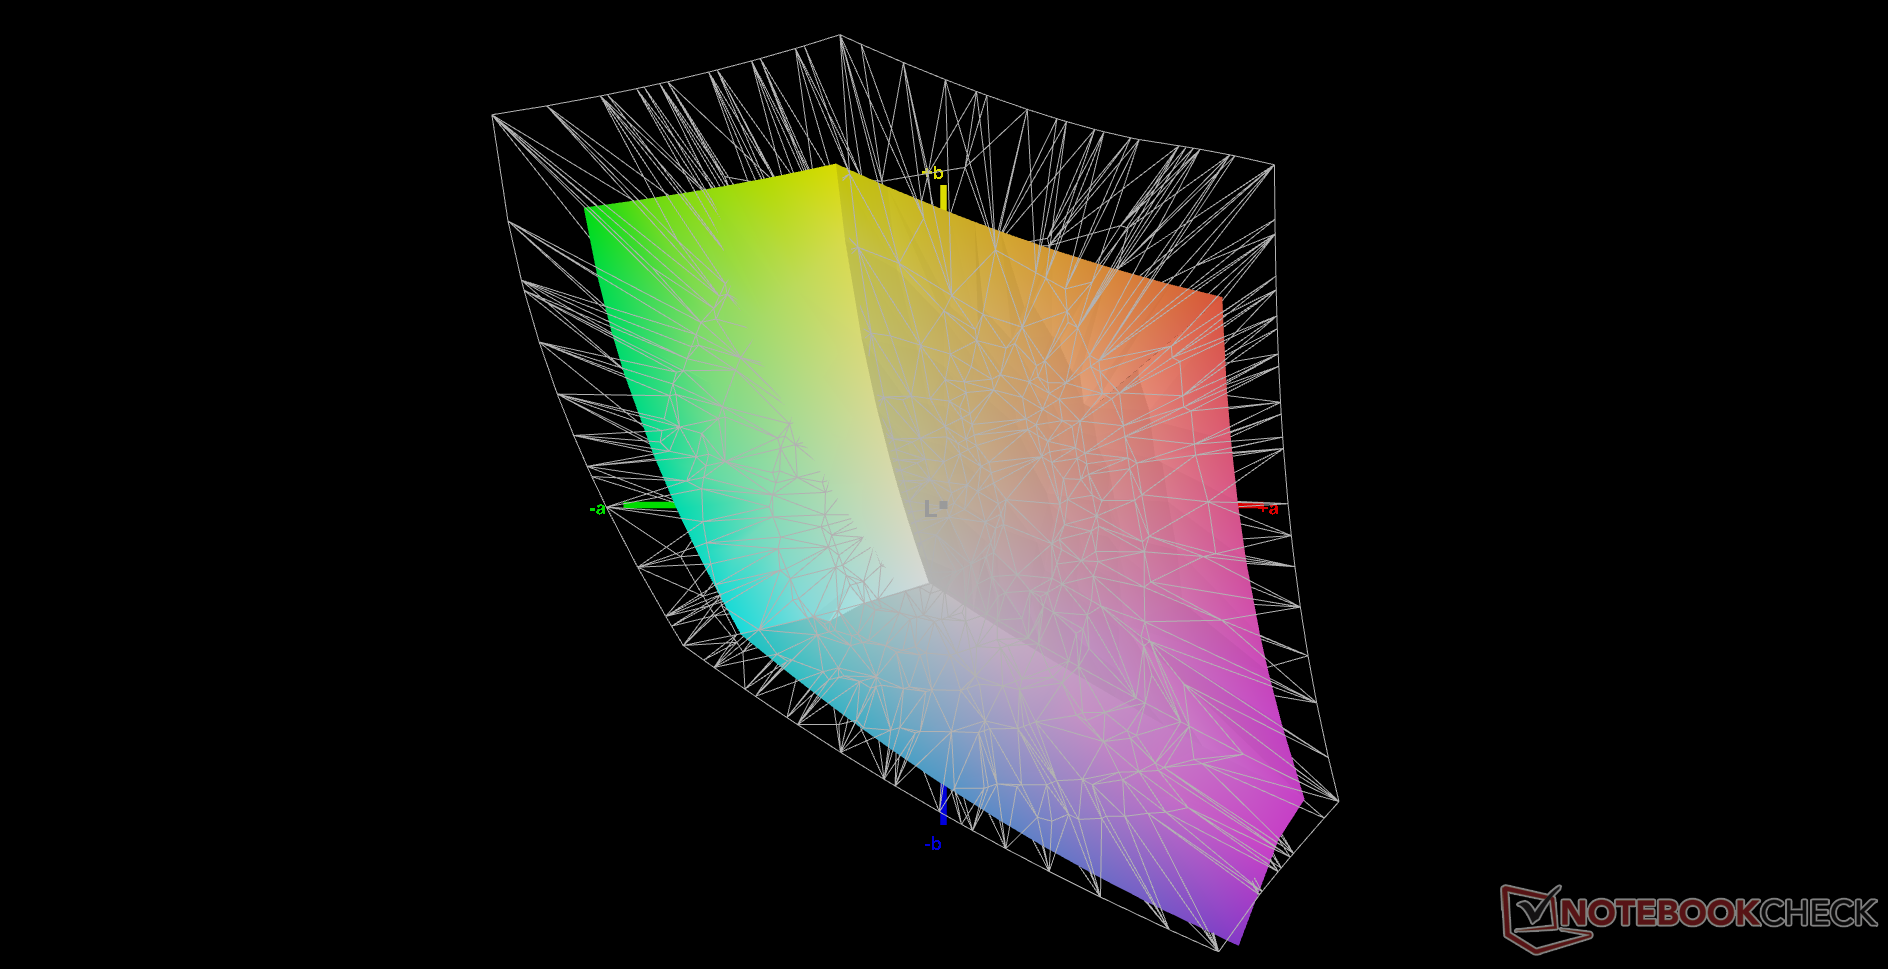
73.7% AdobeRGB 1998 (Argyll 3D)
99.7% sRGB (Argyll 3D)
67.9% Display P3 (Argyll 3D)
Gamma: 2.32
CCT: 7145 K
| Eurocom Nightsky ARX315 Sharp LQ156M1JW03, IPS, 1920x1080, 15.6" | Gigabyte A5 X1 AU Optronics B156HAN12.0, IPS, 1920x1080, 15.6" | Medion Erazer Deputy P25 Panda LM156LF-2F03, IPS, 1920x1080, 15.6" | MSI Delta 15 A5EFK LQ156M1JW03 (SHP155D), IPS-Level, 1920x1080, 15.6" | Schenker XMG Apex 15 NH57E PS LG Philips LGD0625 (LP156WFG-SPB3), IPS, 1920x1080, 15.6" | MSI GE66 Raider 10SFS Sharp LQ156M1JW03 (SHP14C5), IPS-Level, 1920x1080, 15.6" | |
|---|---|---|---|---|---|---|
| Display | -1% | -42% | -4% | -7% | -2% | |
| Display P3 Coverage (%) | 67.9 | 69.6 3% | 39.7 -42% | 66.5 -2% | 64.5 -5% | 68 0% |
| sRGB Coverage (%) | 99.7 | 98.6 -1% | 59.7 -40% | 97.8 -2% | 95.9 -4% | 99 -1% |
| AdobeRGB 1998 Coverage (%) | 73.7 | 70.8 -4% | 41.1 -44% | 67.6 -8% | 65.8 -11% | 69.8 -5% |
| Response Times | 34% | -169% | 12% | -2% | -1% | |
| Response Time Grey 50% / Grey 80% * (ms) | 15.2 ? | 4.8 ? 68% | 40.4 ? -166% | 12.8 ? 16% | 15 1% | 16.4 ? -8% |
| Response Time Black / White * (ms) | 11.2 ? | 11.2 ? -0% | 30.4 ? -171% | 10.4 ? 7% | 11.6 -4% | 10.4 ? 7% |
| PWM Frequency (Hz) | 23150 ? | 23580 ? | 23580 ? | |||
| Screen | -7% | -25% | -12% | -7% | 21% | |
| Brightness middle (cd/m²) | 312.8 | 335 7% | 283 -10% | 291 -7% | 393 26% | 291 -7% |
| Brightness (cd/m²) | 294 | 325 11% | 266 -10% | 266 -10% | 353 20% | 278 -5% |
| Brightness Distribution (%) | 90 | 90 0% | 85 -6% | 88 -2% | 83 -8% | 91 1% |
| Black Level * (cd/m²) | 0.28 | 0.4 -43% | 0.2 29% | 0.36 -29% | 0.47 -68% | 0.25 11% |
| Contrast (:1) | 1117 | 838 -25% | 1415 27% | 808 -28% | 836 -25% | 1164 4% |
| Colorchecker dE 2000 * | 2.96 | 2.63 11% | 5.32 -80% | 2.98 -1% | 2.84 4% | 1.19 60% |
| Colorchecker dE 2000 max. * | 6.23 | 7.71 -24% | 17.68 -184% | 7.59 -22% | 7.15 -15% | 3.04 51% |
| Greyscale dE 2000 * | 4.2 | 4 5% | 2.9 31% | 4.2 -0% | 3.73 11% | 1.9 55% |
| Gamma | 2.32 95% | 2.129 103% | 2.062 107% | 2.293 96% | 2.53 87% | 2.216 99% |
| CCT | 7145 91% | 7434 87% | 7167 91% | 7624 85% | 7312 89% | 7018 93% |
| Colorchecker dE 2000 calibrated * | 0.97 | 3.94 | 0.91 | 0.67 | ||
| Color Space (Percent of AdobeRGB 1998) (%) | 70 | |||||
| Color Space (Percent of sRGB) (%) | 92 | |||||
| Moyenne finale (programmes/paramètres) | 9% /
1% | -79% /
-51% | -1% /
-7% | -5% /
-6% | 6% /
13% |
* ... Moindre est la valeur, meilleures sont les performances
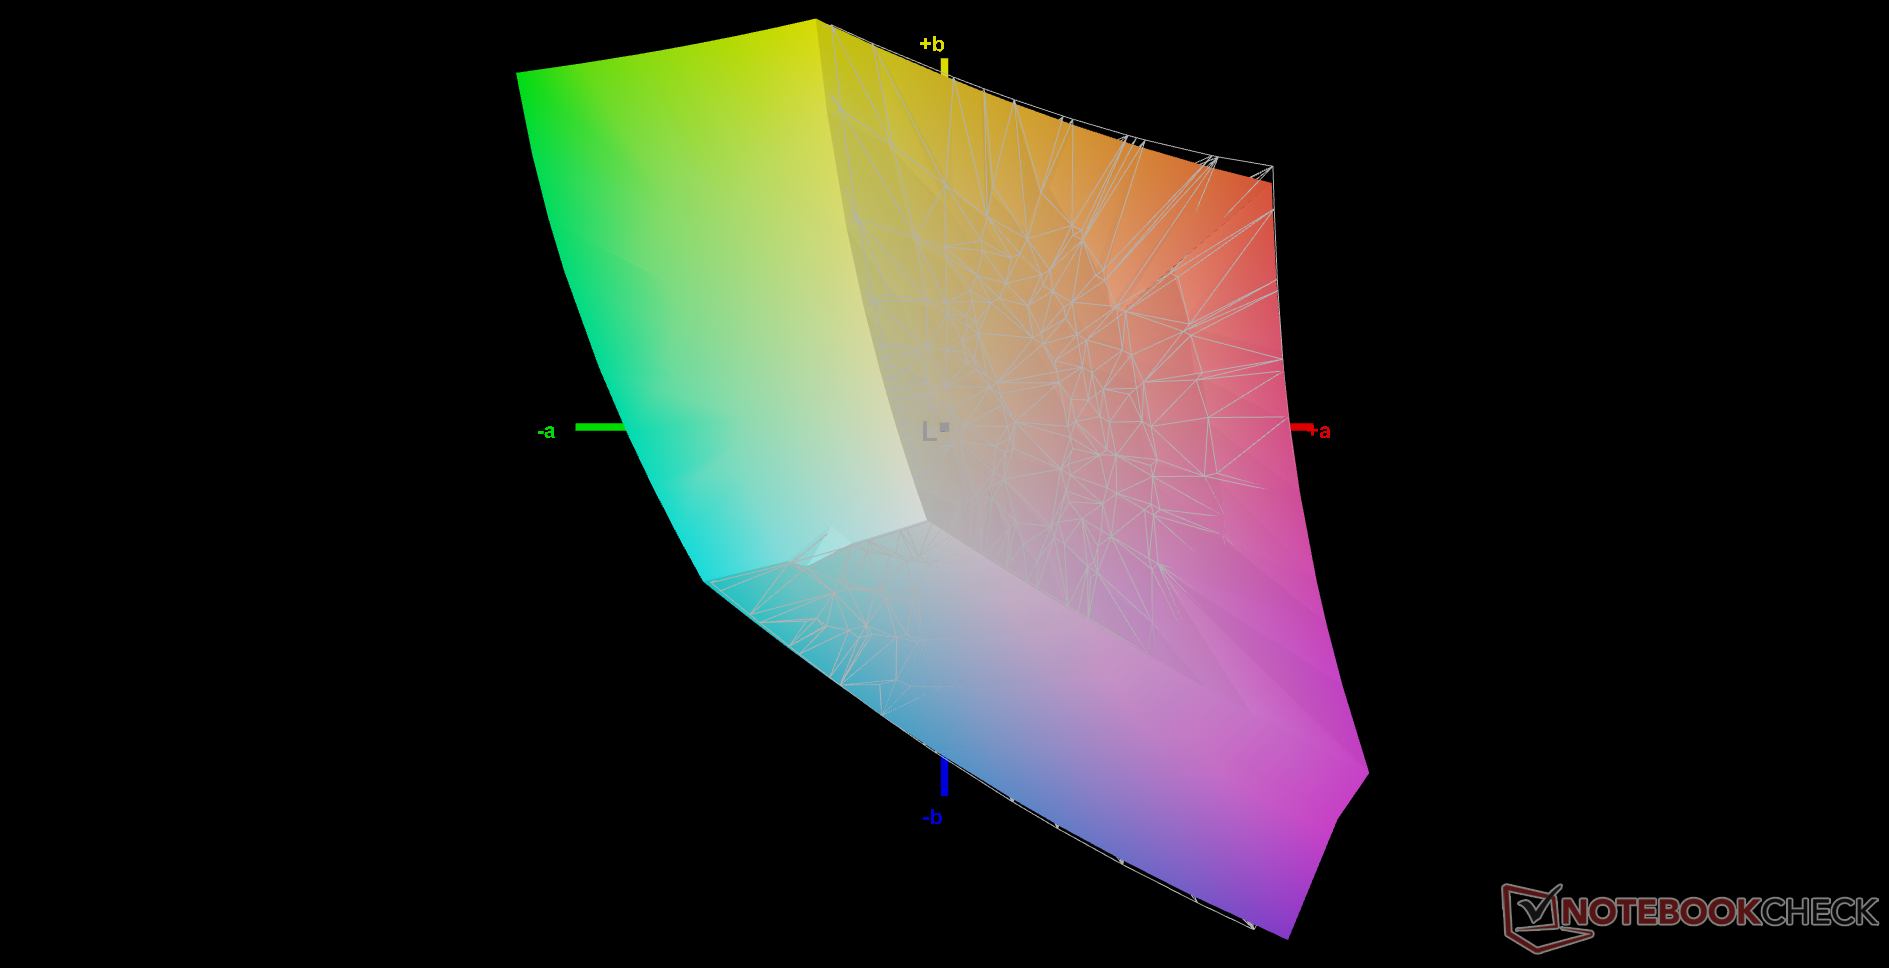
La température des couleurs est plus froide que prévu, ce qui a un impact sur la précision des couleurs et les valeurs Delta E globales. Eurocom se chargera personnellement de calibrer l'écran moyennant des frais supplémentaires. Nous recommandons de calibrer l'écran afin de mieux exploiter la couverture sRGB complète du panneau
Temps de réponse de l'écran
| ↔ Temps de réponse noir à blanc | ||
|---|---|---|
| 11.2 ms ... hausse ↗ et chute ↘ combinées | ↗ 6 ms hausse | 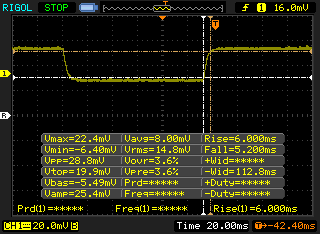 |
| ↘ 5.2 ms chute | ||
| L'écran montre de bons temps de réponse, mais insuffisant pour du jeu compétitif. En comparaison, tous les appareils testés affichent entre 0.1 (minimum) et 240 (maximum) ms. » 30 % des appareils testés affichent de meilleures performances. Cela signifie que les latences relevées sont meilleures que la moyenne (19.8 ms) de tous les appareils testés. | ||
| ↔ Temps de réponse gris 50% à gris 80% | ||
| 15.2 ms ... hausse ↗ et chute ↘ combinées | ↗ 7.6 ms hausse | 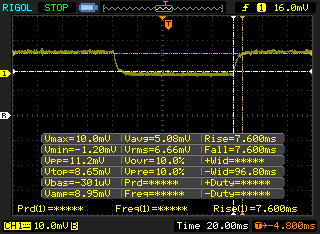 |
| ↘ 7.6 ms chute | ||
| L'écran montre de bons temps de réponse, mais insuffisant pour du jeu compétitif. En comparaison, tous les appareils testés affichent entre 0.165 (minimum) et 636 (maximum) ms. » 29 % des appareils testés affichent de meilleures performances. Cela signifie que les latences relevées sont meilleures que la moyenne (31 ms) de tous les appareils testés. | ||
Scintillement / MLI (Modulation de largeur d'impulsion)
| Scintillement / MLI (Modulation de largeur d'impulsion) décelé | 23150 Hz | ≤ 34 Niveau de luminosité | 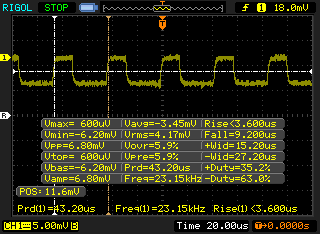 |
Le rétroéclairage de l'écran scintille à la fréquence de 23150 Hz (certainement du fait de l'utilisation d'une MDI - Modulation de largeur d'impulsion) à un niveau de luminosité inférieur ou égal à 34 % . Aucun scintillement ne devrait être perceptible au-dessus de cette valeur. La fréquence de rafraîchissement de 23150 Hz est élevée, la grande majorité des utilisateurs ne devrait pas percevoir de scintillements et être sujette à une fatigue oculaire accrue. En comparaison, 52 % des appareils testés n'emploient pas MDI pour assombrir leur écran. Nous avons relevé une moyenne à 7757 (minimum : 5 - maximum : 343500) Hz dans le cas où une MDI était active. | |||
Performance
Conditions d'essai
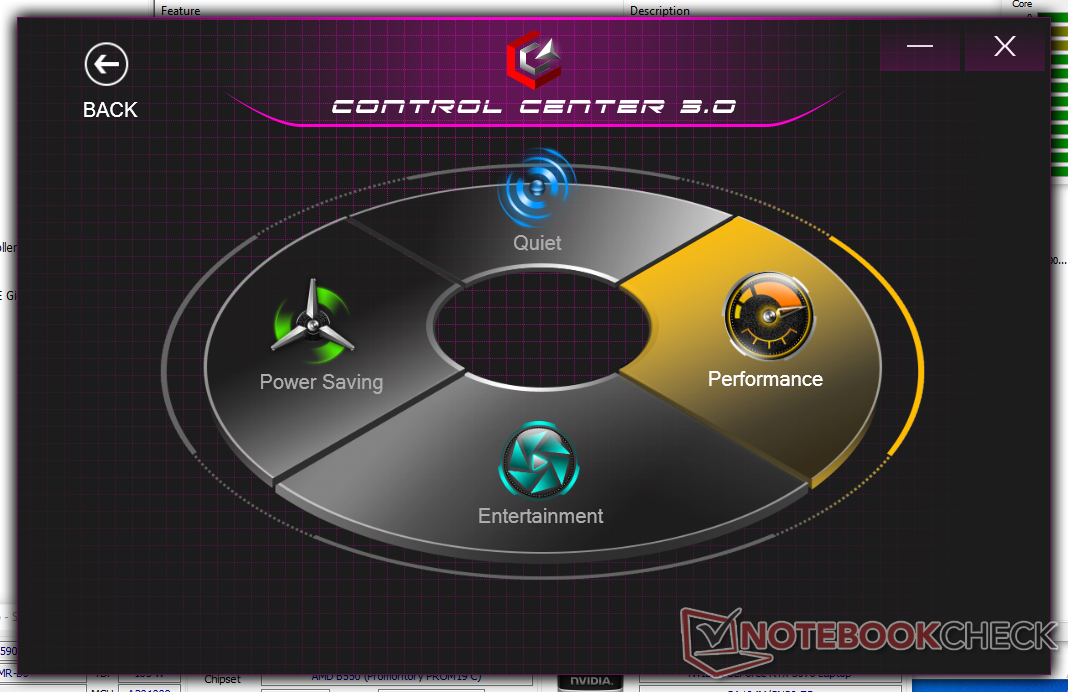
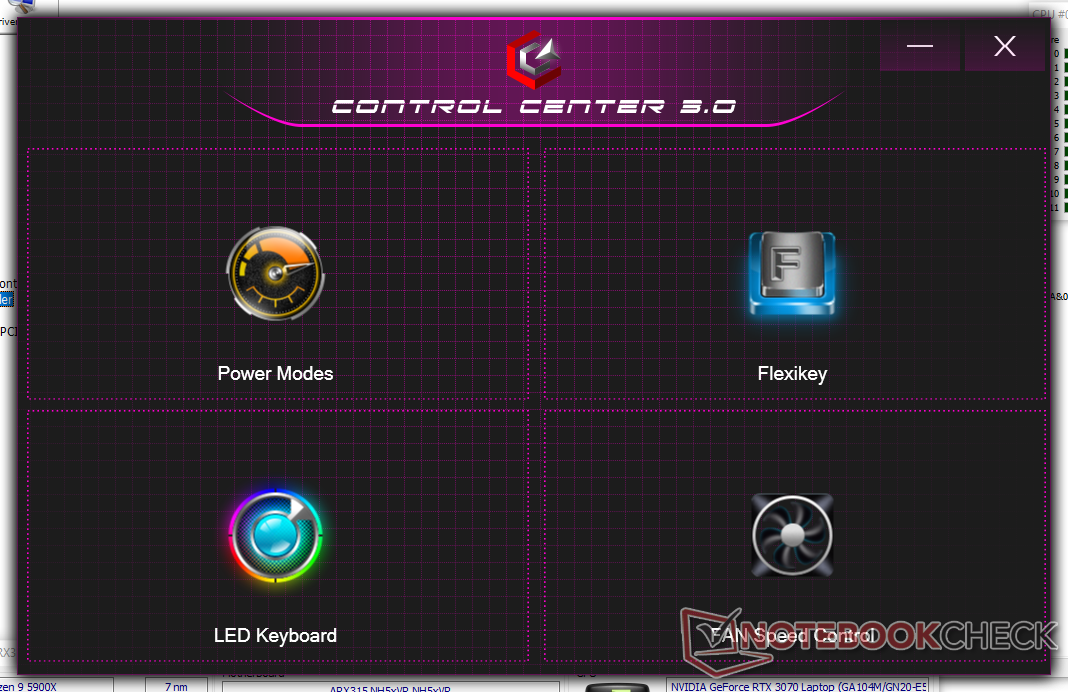
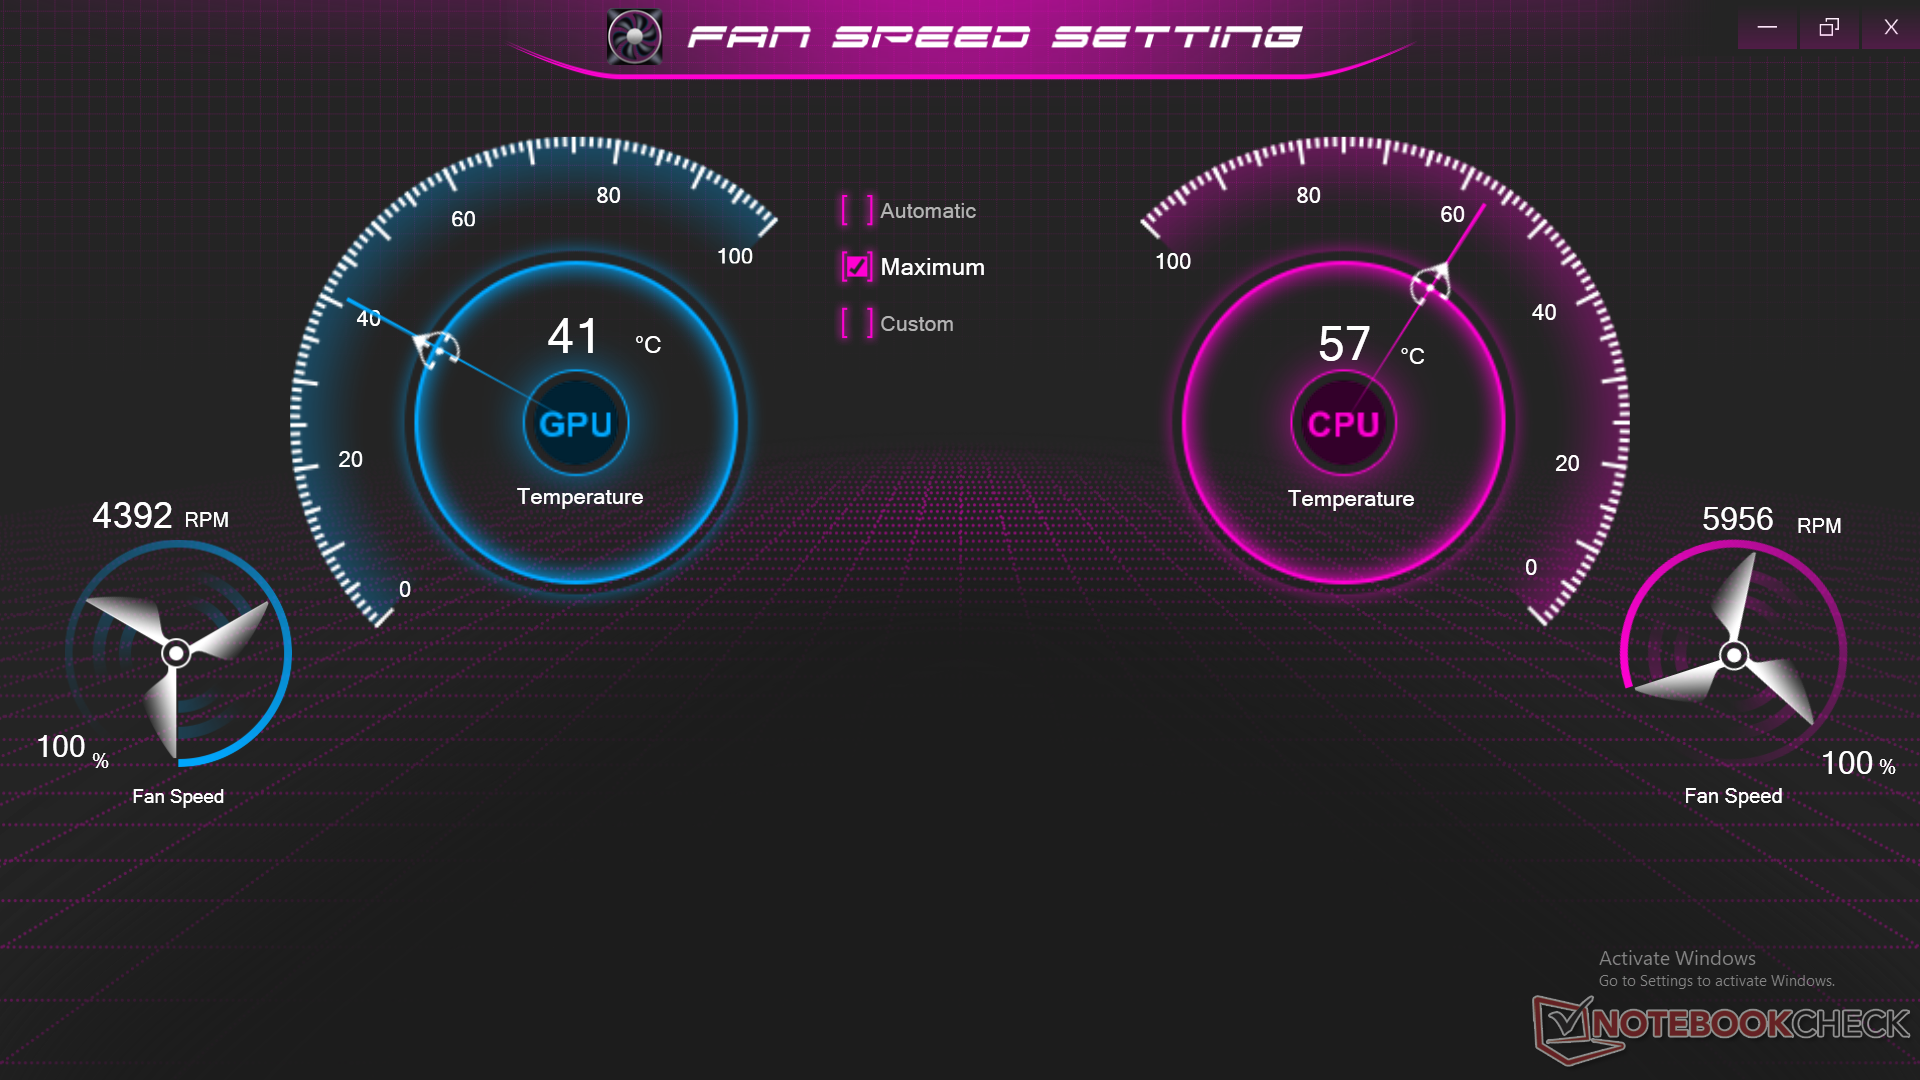
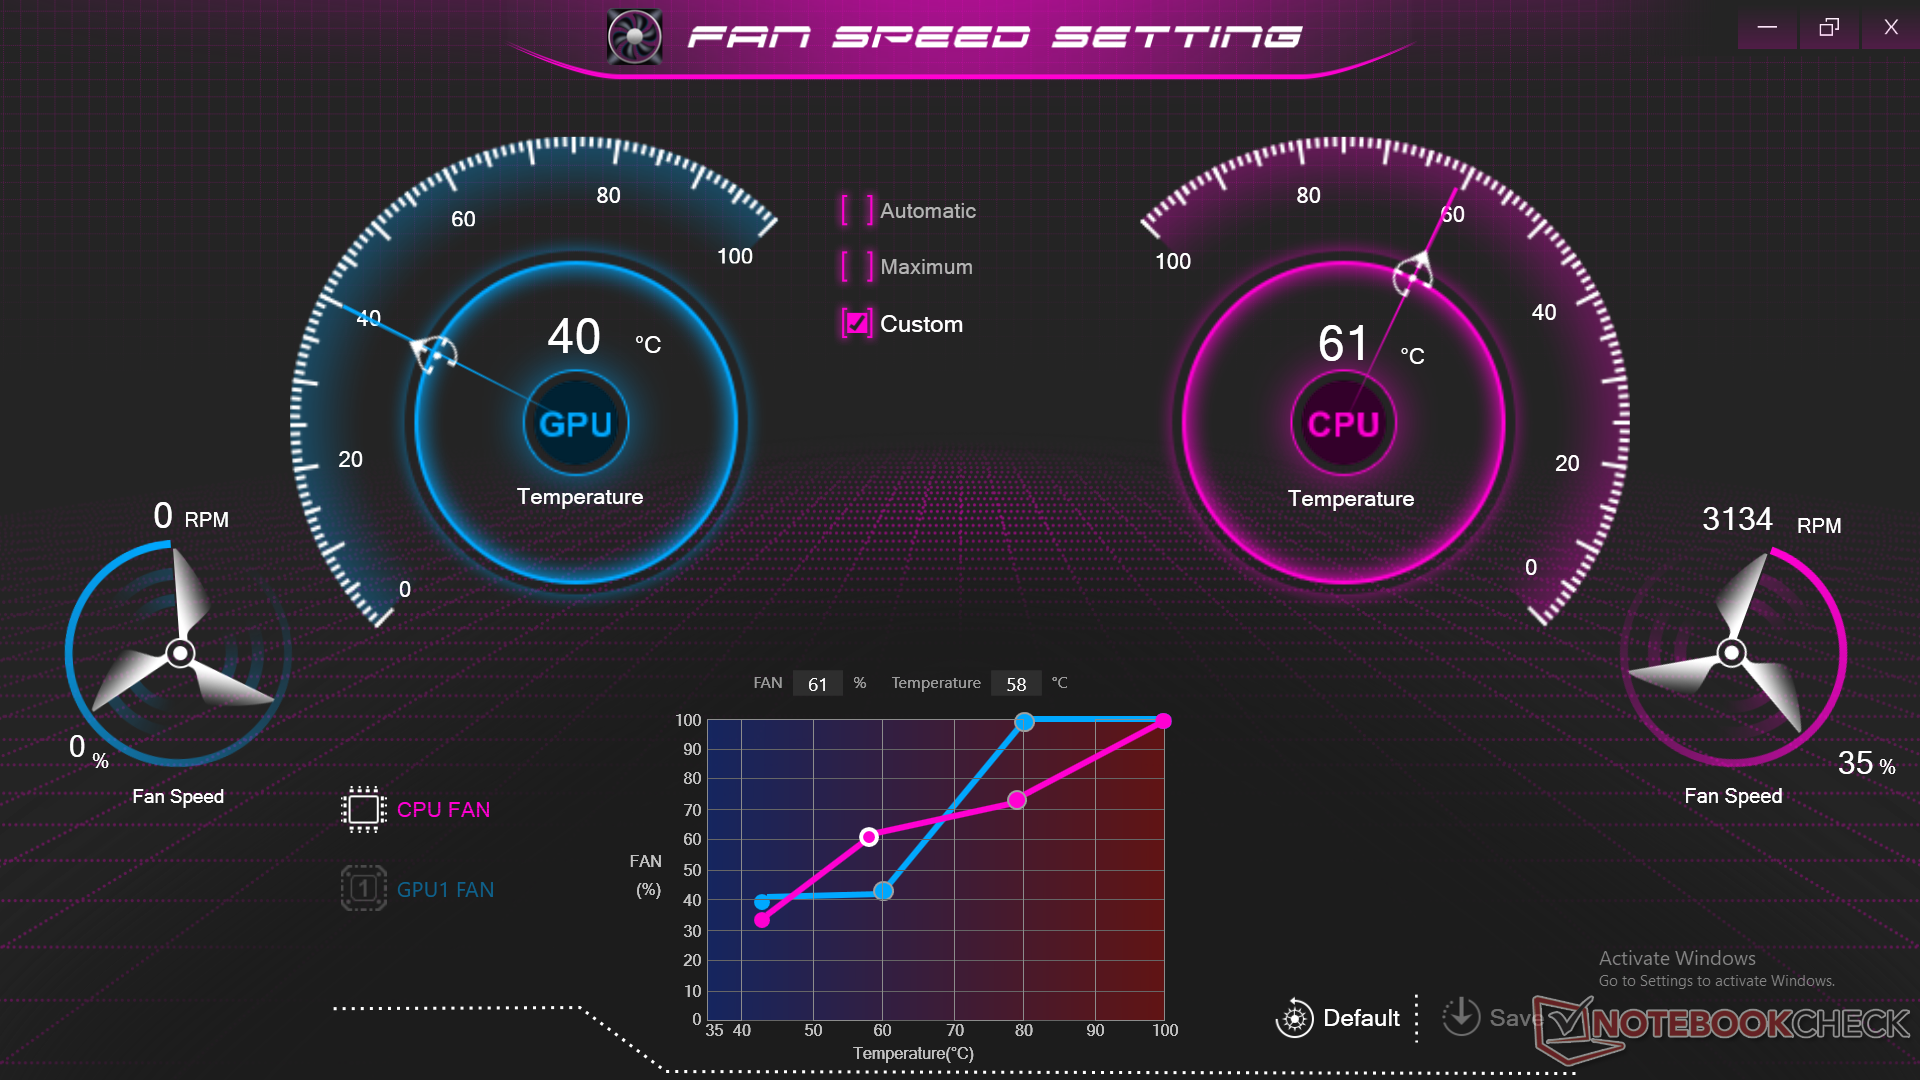
Notre appareil a été réglé à la fois sur le mode Haute performance via Windows et sur le mode Performance avec le mode Ventilateur maximum actif via le Control Center 3.0 pour obtenir les meilleurs résultats possibles avec les réglages OEM d'origine. Nous recommandons aux utilisateurs de se familiariser avec le logiciel Control Center car de nombreuses fonctions auxiliaires peuvent y être activées
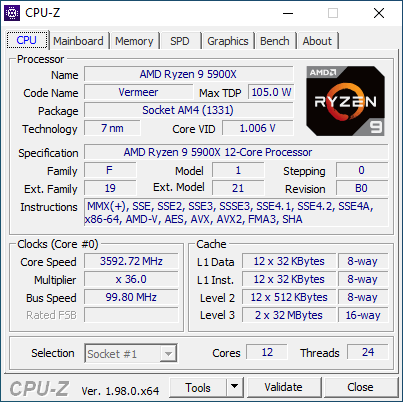
Processeur
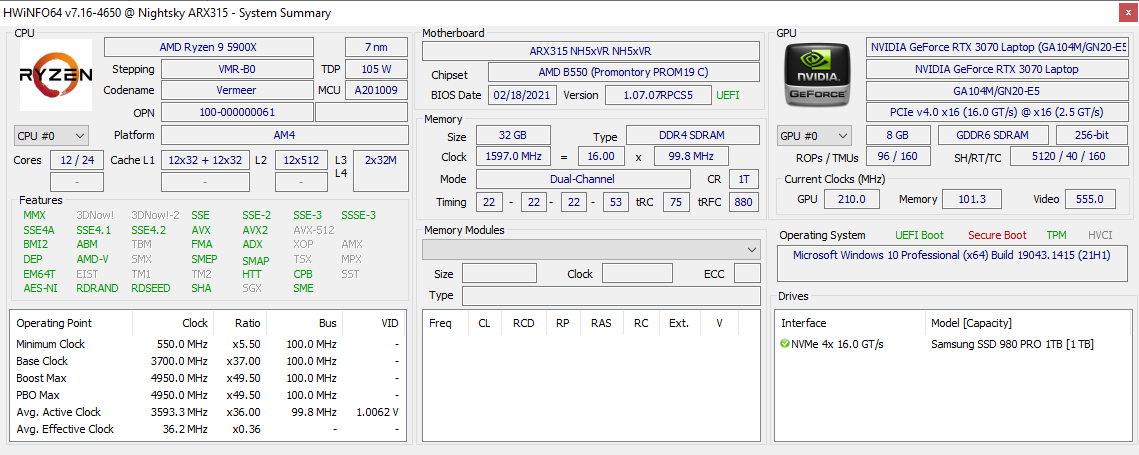
Les performances multi-thread sont décevantes par rapport à notre ryzen 9 5900X de bureau de référence. Notre Eurocom Ryzen 9 5900X est constamment plus lent d'environ 30 à 40 pour cent pour être plus en ligne avec le mobile Ryzen 9 5900HX.
Cinebench R15 Multi Loop
Cinebench R23: Multi Core | Single Core
Cinebench R20: CPU (Multi Core) | CPU (Single Core)
Cinebench R15: CPU Multi 64Bit | CPU Single 64Bit
Blender: v2.79 BMW27 CPU
7-Zip 18.03: 7z b 4 | 7z b 4 -mmt1
Geekbench 5.5: Multi-Core | Single-Core
HWBOT x265 Benchmark v2.2: 4k Preset
LibreOffice : 20 Documents To PDF
R Benchmark 2.5: Overall mean
* ... Moindre est la valeur, meilleures sont les performances
AIDA64: FP32 Ray-Trace | FPU Julia | CPU SHA3 | CPU Queen | FPU SinJulia | FPU Mandel | CPU AES | CPU ZLib | FP64 Ray-Trace | CPU PhotoWorxx
| Performance rating | |
| Moyenne AMD Ryzen 9 5900X | |
| Eurocom Nightsky ARX315 | |
| Gigabyte A5 X1 | |
| MSI Delta 15 A5EFK | |
| Schenker XMG Apex 15 NH57E PS | |
| Medion Erazer Deputy P25 | |
| MSI GE66 Raider 10SFS | |
| AIDA64 / FP32 Ray-Trace | |
| Moyenne AMD Ryzen 9 5900X (3069 - 24659, n=15) | |
| Gigabyte A5 X1 | |
| MSI Delta 15 A5EFK | |
| Medion Erazer Deputy P25 | |
| Schenker XMG Apex 15 NH57E PS | |
| Eurocom Nightsky ARX315 | |
| MSI GE66 Raider 10SFS | |
| AIDA64 / FPU Julia | |
| Moyenne AMD Ryzen 9 5900X (18567 - 155529, n=15) | |
| Gigabyte A5 X1 | |
| Medion Erazer Deputy P25 | |
| MSI Delta 15 A5EFK | |
| Schenker XMG Apex 15 NH57E PS | |
| Eurocom Nightsky ARX315 | |
| MSI GE66 Raider 10SFS | |
| AIDA64 / CPU SHA3 | |
| Moyenne AMD Ryzen 9 5900X (629 - 5329, n=15) | |
| Gigabyte A5 X1 | |
| MSI Delta 15 A5EFK | |
| Schenker XMG Apex 15 NH57E PS | |
| Medion Erazer Deputy P25 | |
| Eurocom Nightsky ARX315 | |
| MSI GE66 Raider 10SFS | |
| AIDA64 / CPU Queen | |
| Eurocom Nightsky ARX315 | |
| Moyenne AMD Ryzen 9 5900X (15371 - 138889, n=15) | |
| MSI Delta 15 A5EFK | |
| Gigabyte A5 X1 | |
| Schenker XMG Apex 15 NH57E PS | |
| Medion Erazer Deputy P25 | |
| MSI GE66 Raider 10SFS | |
| AIDA64 / FPU SinJulia | |
| Eurocom Nightsky ARX315 | |
| Moyenne AMD Ryzen 9 5900X (2137 - 19465, n=15) | |
| Gigabyte A5 X1 | |
| MSI Delta 15 A5EFK | |
| Schenker XMG Apex 15 NH57E PS | |
| Medion Erazer Deputy P25 | |
| MSI GE66 Raider 10SFS | |
| AIDA64 / FPU Mandel | |
| Moyenne AMD Ryzen 9 5900X (10291 - 85469, n=15) | |
| Gigabyte A5 X1 | |
| MSI Delta 15 A5EFK | |
| Medion Erazer Deputy P25 | |
| Schenker XMG Apex 15 NH57E PS | |
| Eurocom Nightsky ARX315 | |
| MSI GE66 Raider 10SFS | |
| AIDA64 / CPU AES | |
| Moyenne AMD Ryzen 9 5900X (24327 - 212390, n=15) | |
| Eurocom Nightsky ARX315 | |
| Gigabyte A5 X1 | |
| MSI Delta 15 A5EFK | |
| Schenker XMG Apex 15 NH57E PS | |
| Medion Erazer Deputy P25 | |
| MSI GE66 Raider 10SFS | |
| AIDA64 / CPU ZLib | |
| Moyenne AMD Ryzen 9 5900X (150.9 - 1345, n=15) | |
| Eurocom Nightsky ARX315 | |
| Gigabyte A5 X1 | |
| MSI Delta 15 A5EFK | |
| Schenker XMG Apex 15 NH57E PS | |
| Medion Erazer Deputy P25 | |
| MSI GE66 Raider 10SFS | |
| AIDA64 / FP64 Ray-Trace | |
| Moyenne AMD Ryzen 9 5900X (1518 - 13196, n=15) | |
| Gigabyte A5 X1 | |
| MSI Delta 15 A5EFK | |
| Medion Erazer Deputy P25 | |
| Schenker XMG Apex 15 NH57E PS | |
| MSI GE66 Raider 10SFS | |
| Eurocom Nightsky ARX315 | |
| AIDA64 / CPU PhotoWorxx | |
| Moyenne AMD Ryzen 9 5900X (11451 - 32849, n=15) | |
| MSI GE66 Raider 10SFS | |
| Eurocom Nightsky ARX315 | |
| MSI Delta 15 A5EFK | |
| Schenker XMG Apex 15 NH57E PS | |
| Gigabyte A5 X1 | |
| Medion Erazer Deputy P25 | |
Performance du système
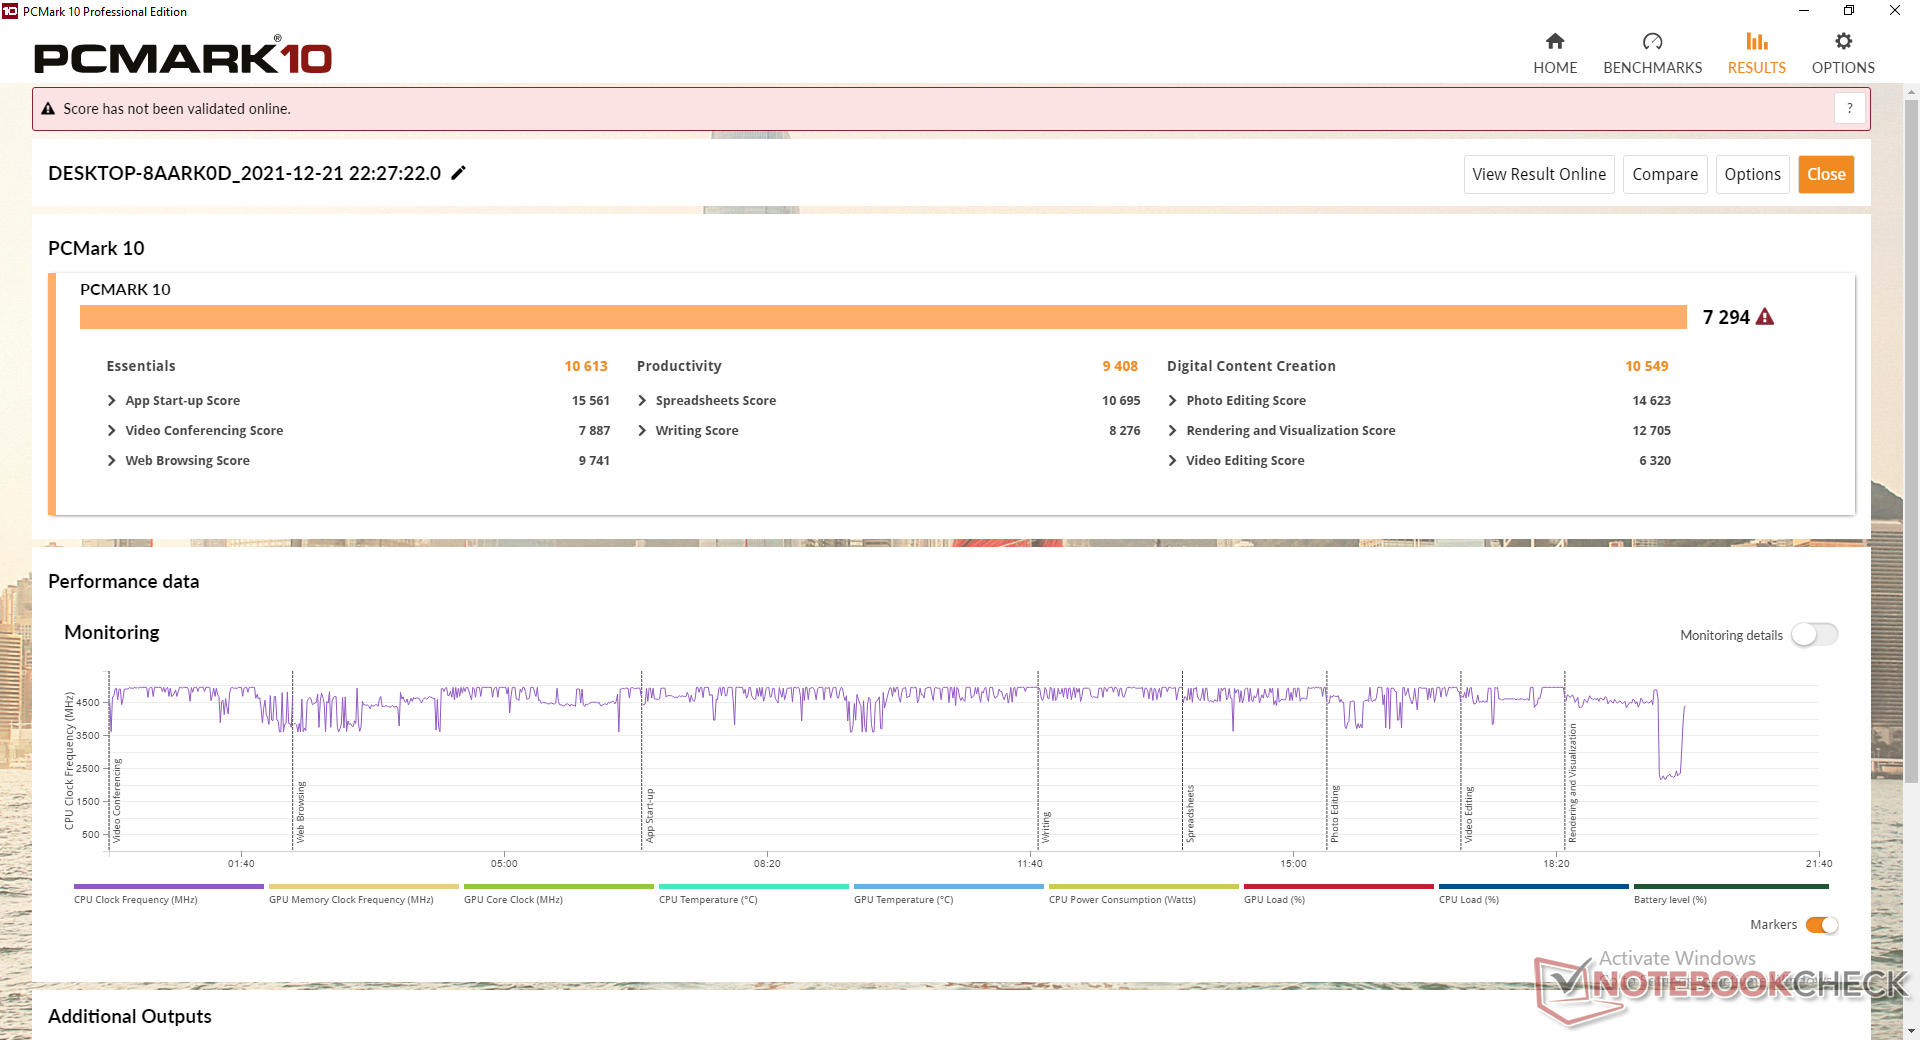
Les scores PCMark 10 sont excellents et comparables à ceux du MSI Delta 15. Cependant, nous ne recommandons pas de régler le Control Center en mode économie d'énergie ou en mode silencieux, car les performances du système vont ralentir. La navigation simple ou la navigation dans le système d'exploitation seront très lentes, avec des sauts constants du curseur de la souris et des sauts d'images. Les utilisateurs doivent plutôt rester en mode Divertissement ou Performance pour une expérience plus fluide.
En outre, le système prend un temps anormalement long pour sortir de sa veille. Les ordinateurs portables ou Ultrabooks typiques mettent moins de quelques secondes, alors que notre Eurocom met toujours plus de 10 secondes.
| PCMark 10 / Score | |
| MSI Delta 15 A5EFK | |
| Eurocom Nightsky ARX315 | |
| Gigabyte A5 X1 | |
| Schenker XMG Apex 15 NH57E PS | |
| Medion Erazer Deputy P25 | |
| MSI GE66 Raider 10SFS | |
| PCMark 10 / Essentials | |
| Eurocom Nightsky ARX315 | |
| MSI Delta 15 A5EFK | |
| Gigabyte A5 X1 | |
| Schenker XMG Apex 15 NH57E PS | |
| Medion Erazer Deputy P25 | |
| MSI GE66 Raider 10SFS | |
| PCMark 10 / Productivity | |
| MSI Delta 15 A5EFK | |
| Eurocom Nightsky ARX315 | |
| Gigabyte A5 X1 | |
| Medion Erazer Deputy P25 | |
| Schenker XMG Apex 15 NH57E PS | |
| MSI GE66 Raider 10SFS | |
| PCMark 10 / Digital Content Creation | |
| MSI Delta 15 A5EFK | |
| Eurocom Nightsky ARX315 | |
| Gigabyte A5 X1 | |
| Schenker XMG Apex 15 NH57E PS | |
| Medion Erazer Deputy P25 | |
| MSI GE66 Raider 10SFS | |
| PCMark 10 Score | 7294 points | |
Aide | ||
| AIDA64 / Memory Copy | |
| Moyenne AMD Ryzen 9 5900X (31315 - 72008, n=15) | |
| Schenker XMG Apex 15 NH57E PS | |
| MSI Delta 15 A5EFK | |
| Gigabyte A5 X1 | |
| Eurocom Nightsky ARX315 | |
| MSI GE66 Raider 10SFS | |
| Medion Erazer Deputy P25 | |
| AIDA64 / Memory Read | |
| Moyenne AMD Ryzen 9 5900X (32972 - 70692, n=15) | |
| Schenker XMG Apex 15 NH57E PS | |
| Gigabyte A5 X1 | |
| MSI Delta 15 A5EFK | |
| Eurocom Nightsky ARX315 | |
| MSI GE66 Raider 10SFS | |
| Medion Erazer Deputy P25 | |
| AIDA64 / Memory Write | |
| Moyenne AMD Ryzen 9 5900X (21619 - 57070, n=15) | |
| MSI GE66 Raider 10SFS | |
| Eurocom Nightsky ARX315 | |
| Schenker XMG Apex 15 NH57E PS | |
| MSI Delta 15 A5EFK | |
| Gigabyte A5 X1 | |
| Medion Erazer Deputy P25 | |
| AIDA64 / Memory Latency | |
| Medion Erazer Deputy P25 | |
| Schenker XMG Apex 15 NH57E PS | |
| MSI Delta 15 A5EFK | |
| Gigabyte A5 X1 | |
| Moyenne AMD Ryzen 9 5900X (58.4 - 107.6, n=15) | |
| Eurocom Nightsky ARX315 | |
| MSI GE66 Raider 10SFS | |
* ... Moindre est la valeur, meilleures sont les performances
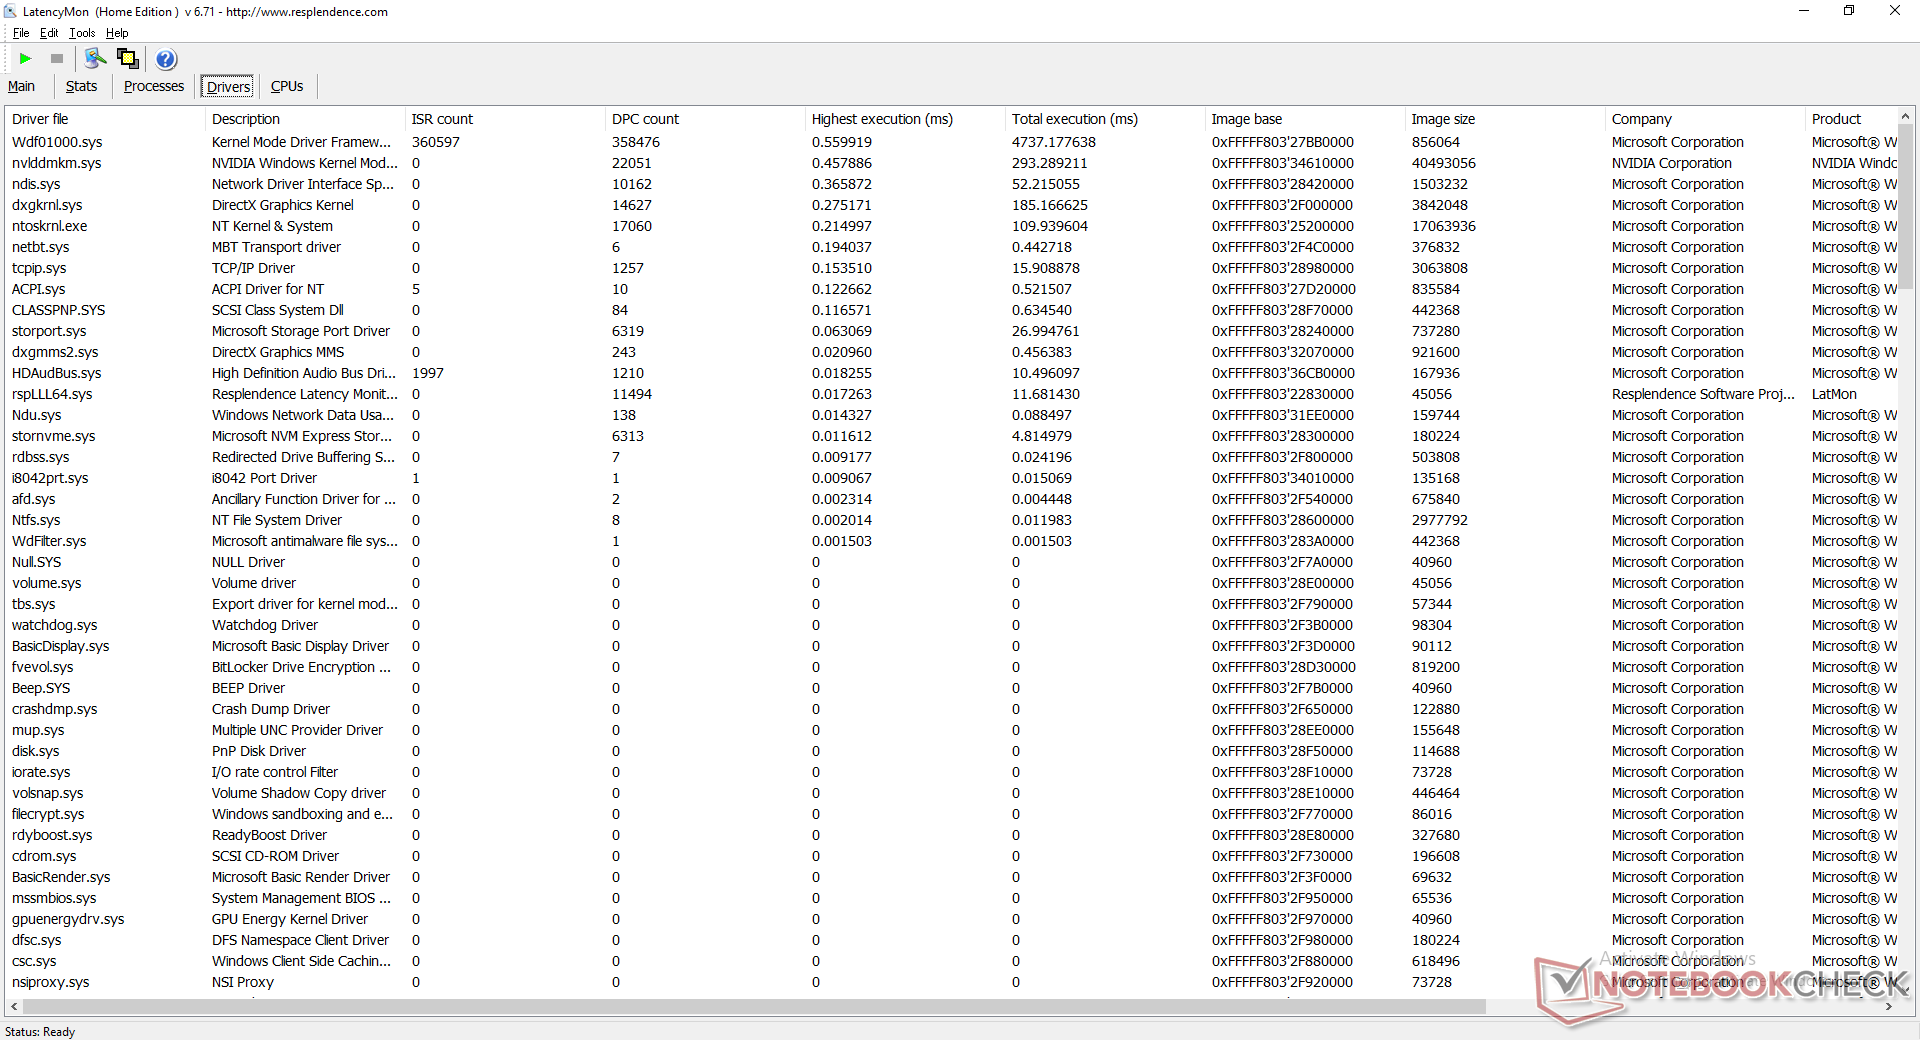
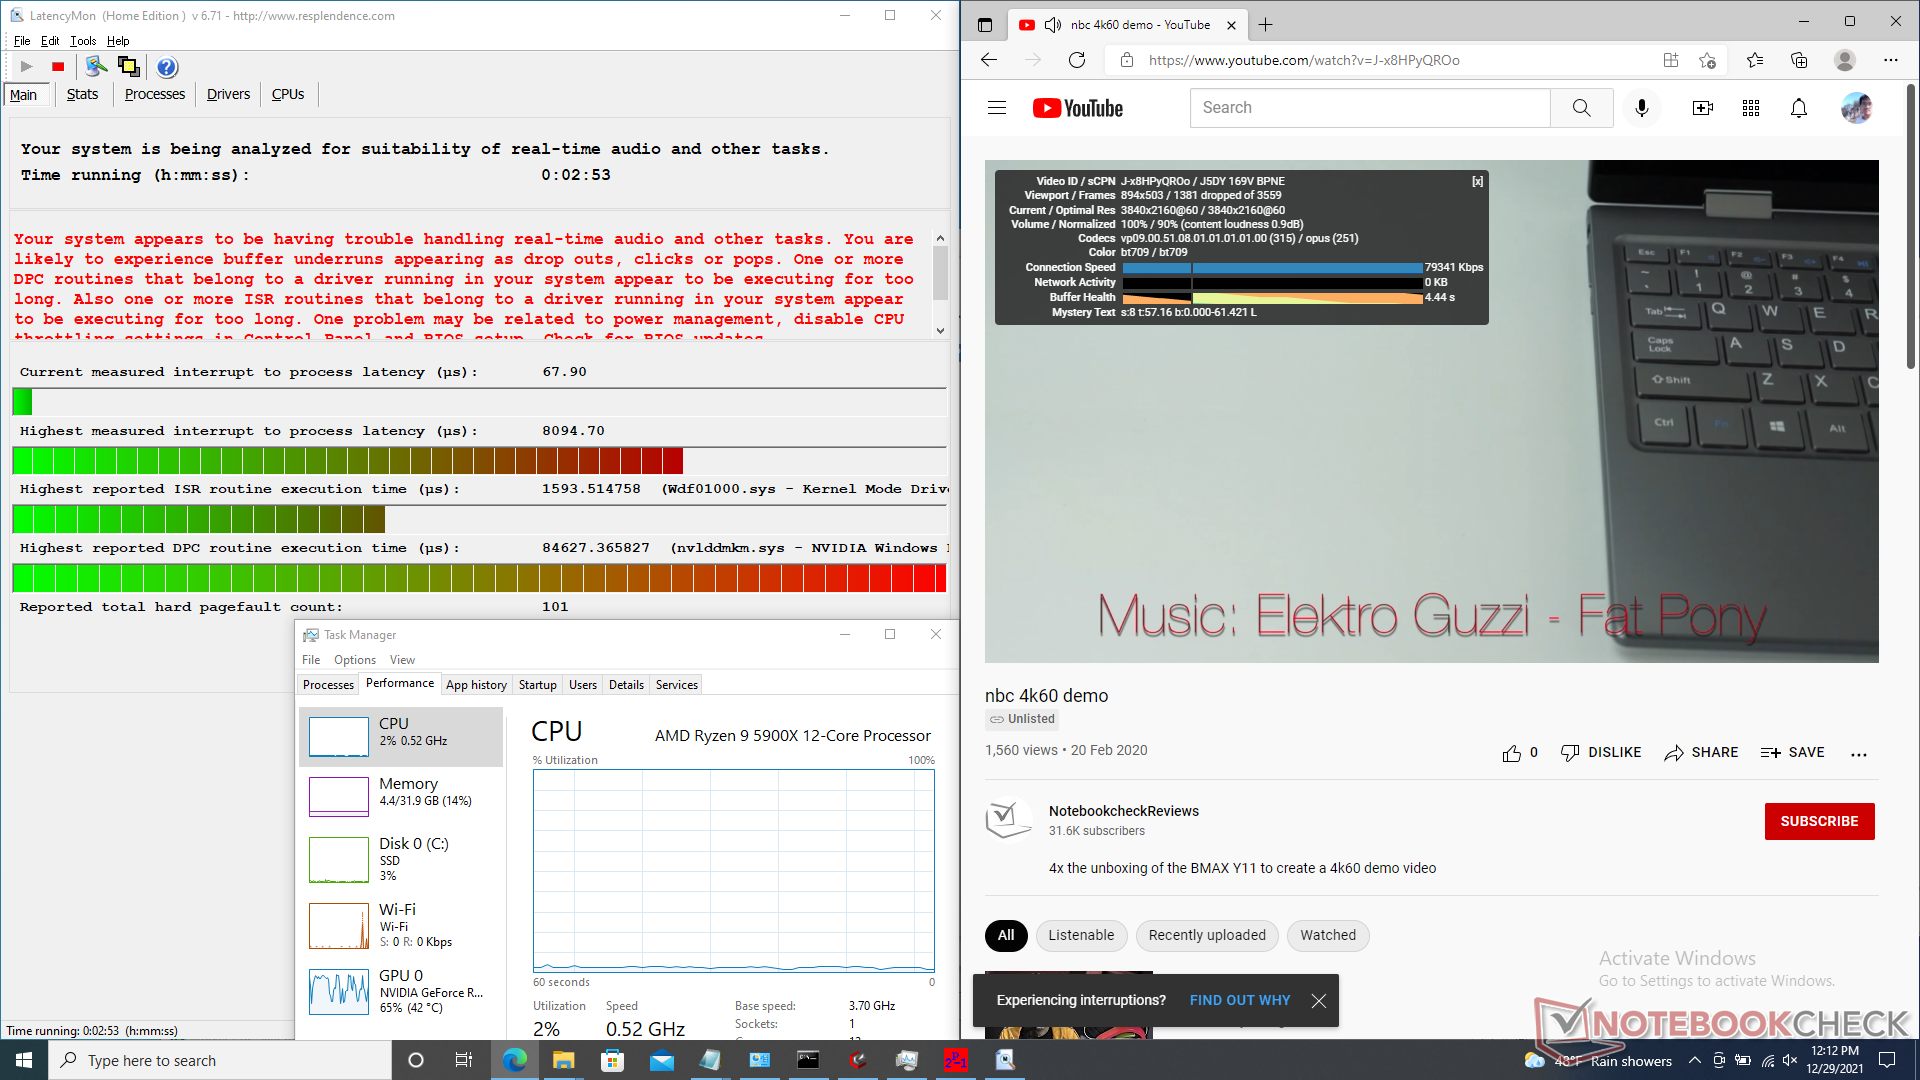
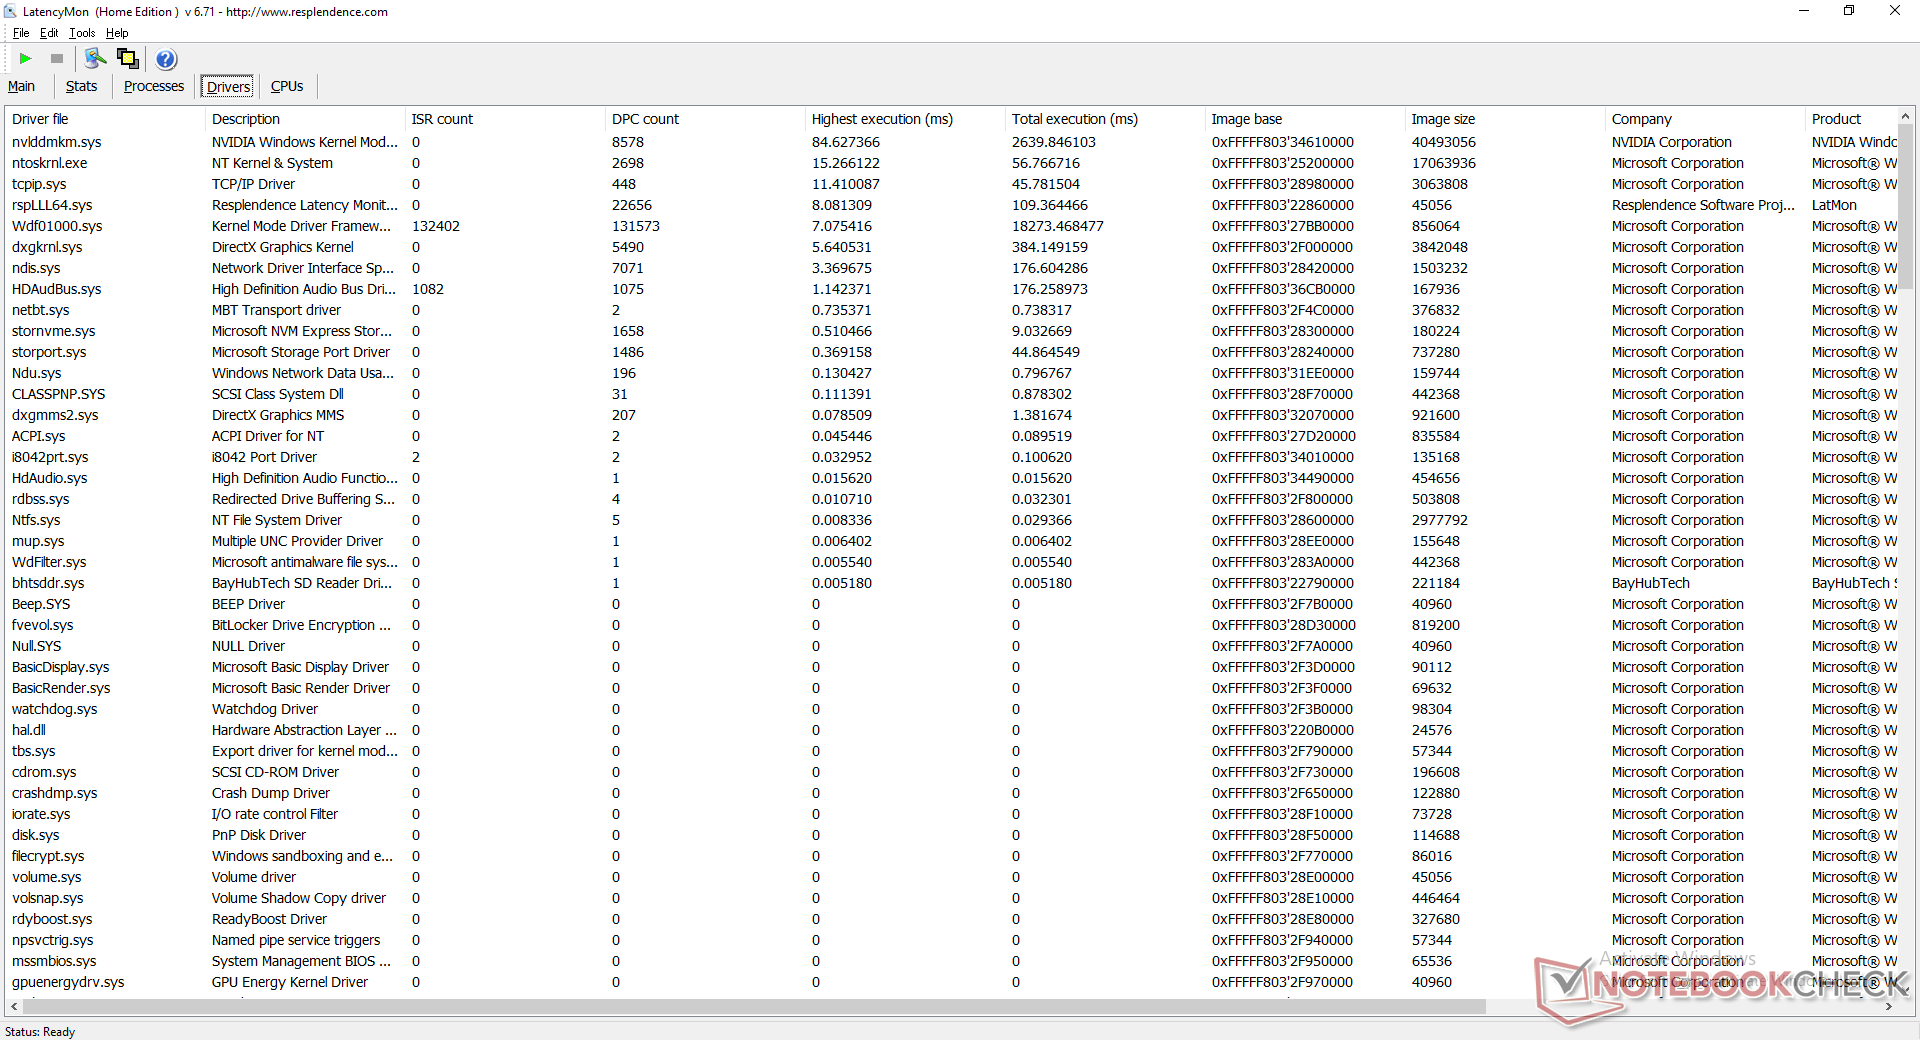
Latence DPC
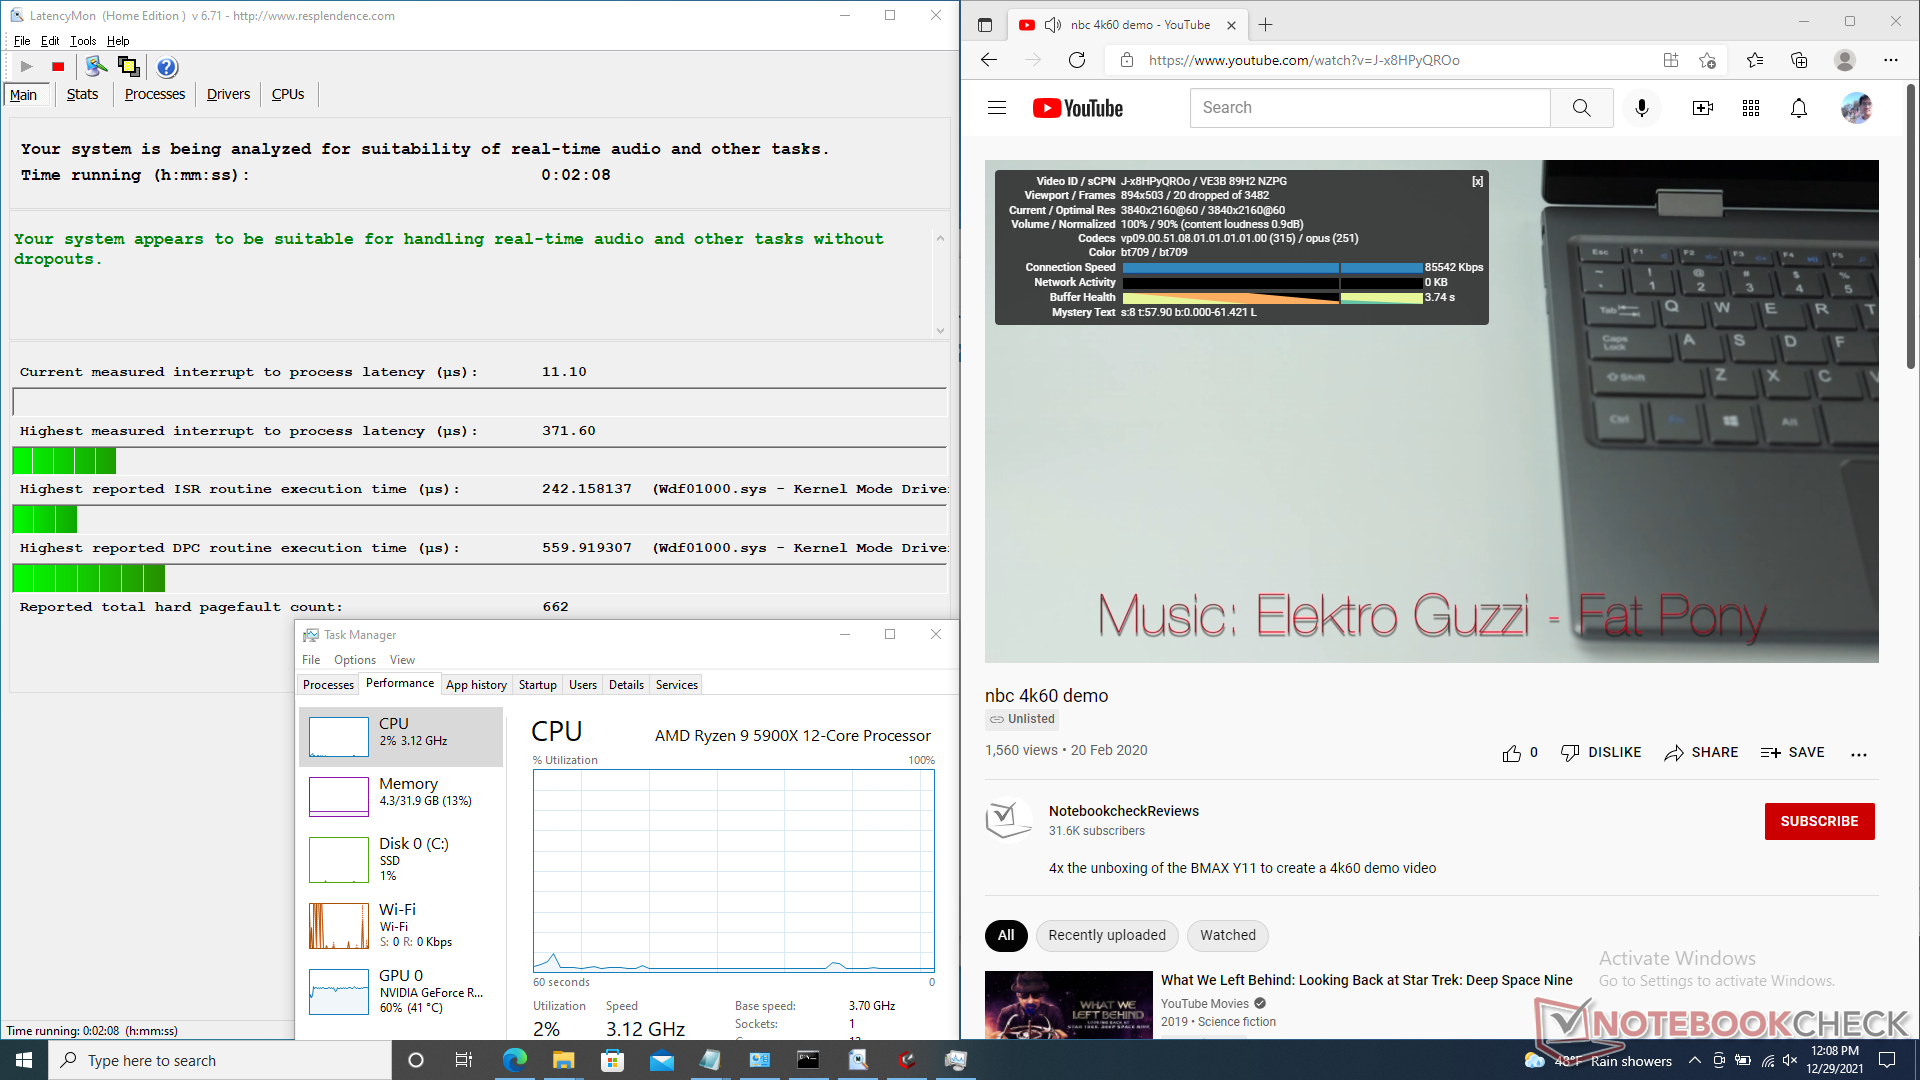
Il n'y a pas de problème de latence en mode divertissement ou performance. Malheureusement, la situation est différente en mode Économie d'énergie ou en mode Silence. Notre vidéo de test 4K60 d'une minute présentait plus de 1 500 images perdues en mode économie d'énergie ou silencieux, contre seulement 20 en mode divertissement ou performance.
| DPC Latencies / LatencyMon - interrupt to process latency (max), Web, Youtube, Prime95 | |
| MSI Delta 15 A5EFK | |
| Medion Erazer Deputy P25 | |
| Schenker XMG Apex 15 NH57E PS | |
| MSI GE66 Raider 10SFS | |
| Gigabyte A5 X1 | |
| Eurocom Nightsky ARX315 | |
* ... Moindre est la valeur, meilleures sont les performances
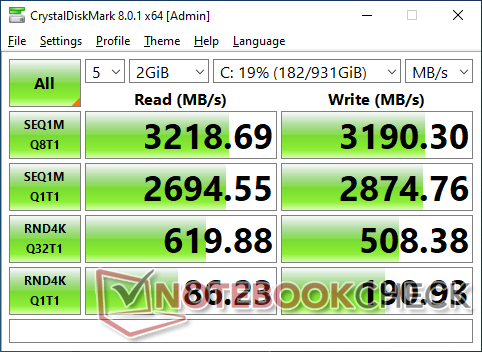
Périphériques de stockage
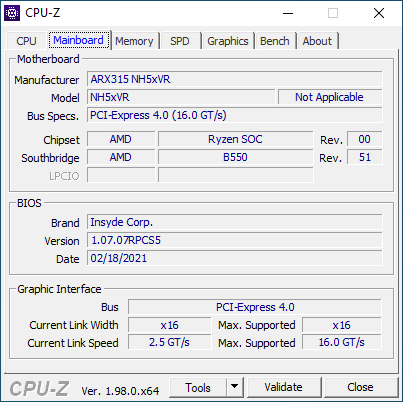
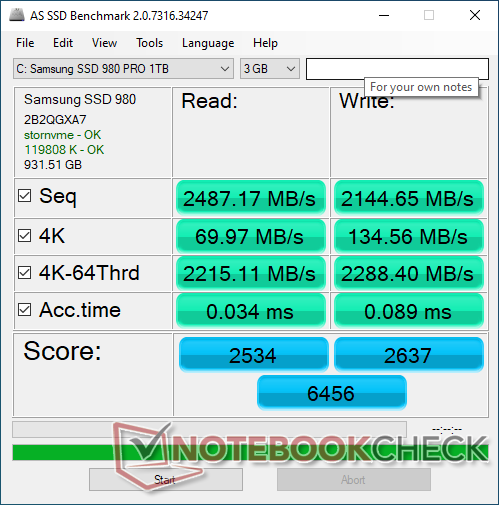
Eurocom propose une large sélection de SSD NVMe allant de 250 Go à 8 To. Notre unité a été configurée avec leSamsung SSD 980 Pro qui est un SSD NVMe PCIe4 x4 capable d'atteindre des taux de transfert de 7000 Mo/s. Malheureusement, les emplacements M.2 du Nightsky ARX15 sont uniquement PCIe3 x4 et les taux de transfert seront donc beaucoup plus lents, jusqu'à environ 3200 Mo/s. Vous voudrez peut-être économiser de l'argent et ne configurer qu'avec des disques PCIe3 moins chers, car la carte mère ne peut pas exploiter pleinement les avantages en termes de performances des disques PCIe4 plus coûteux.

* ... Moindre est la valeur, meilleures sont les performances
Disk Throttling: DiskSpd Read Loop, Queue Depth 8
Performances du GPU
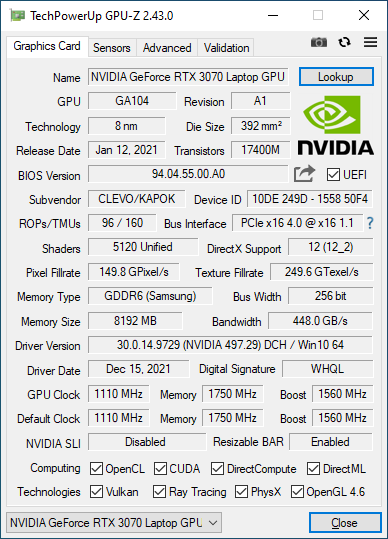
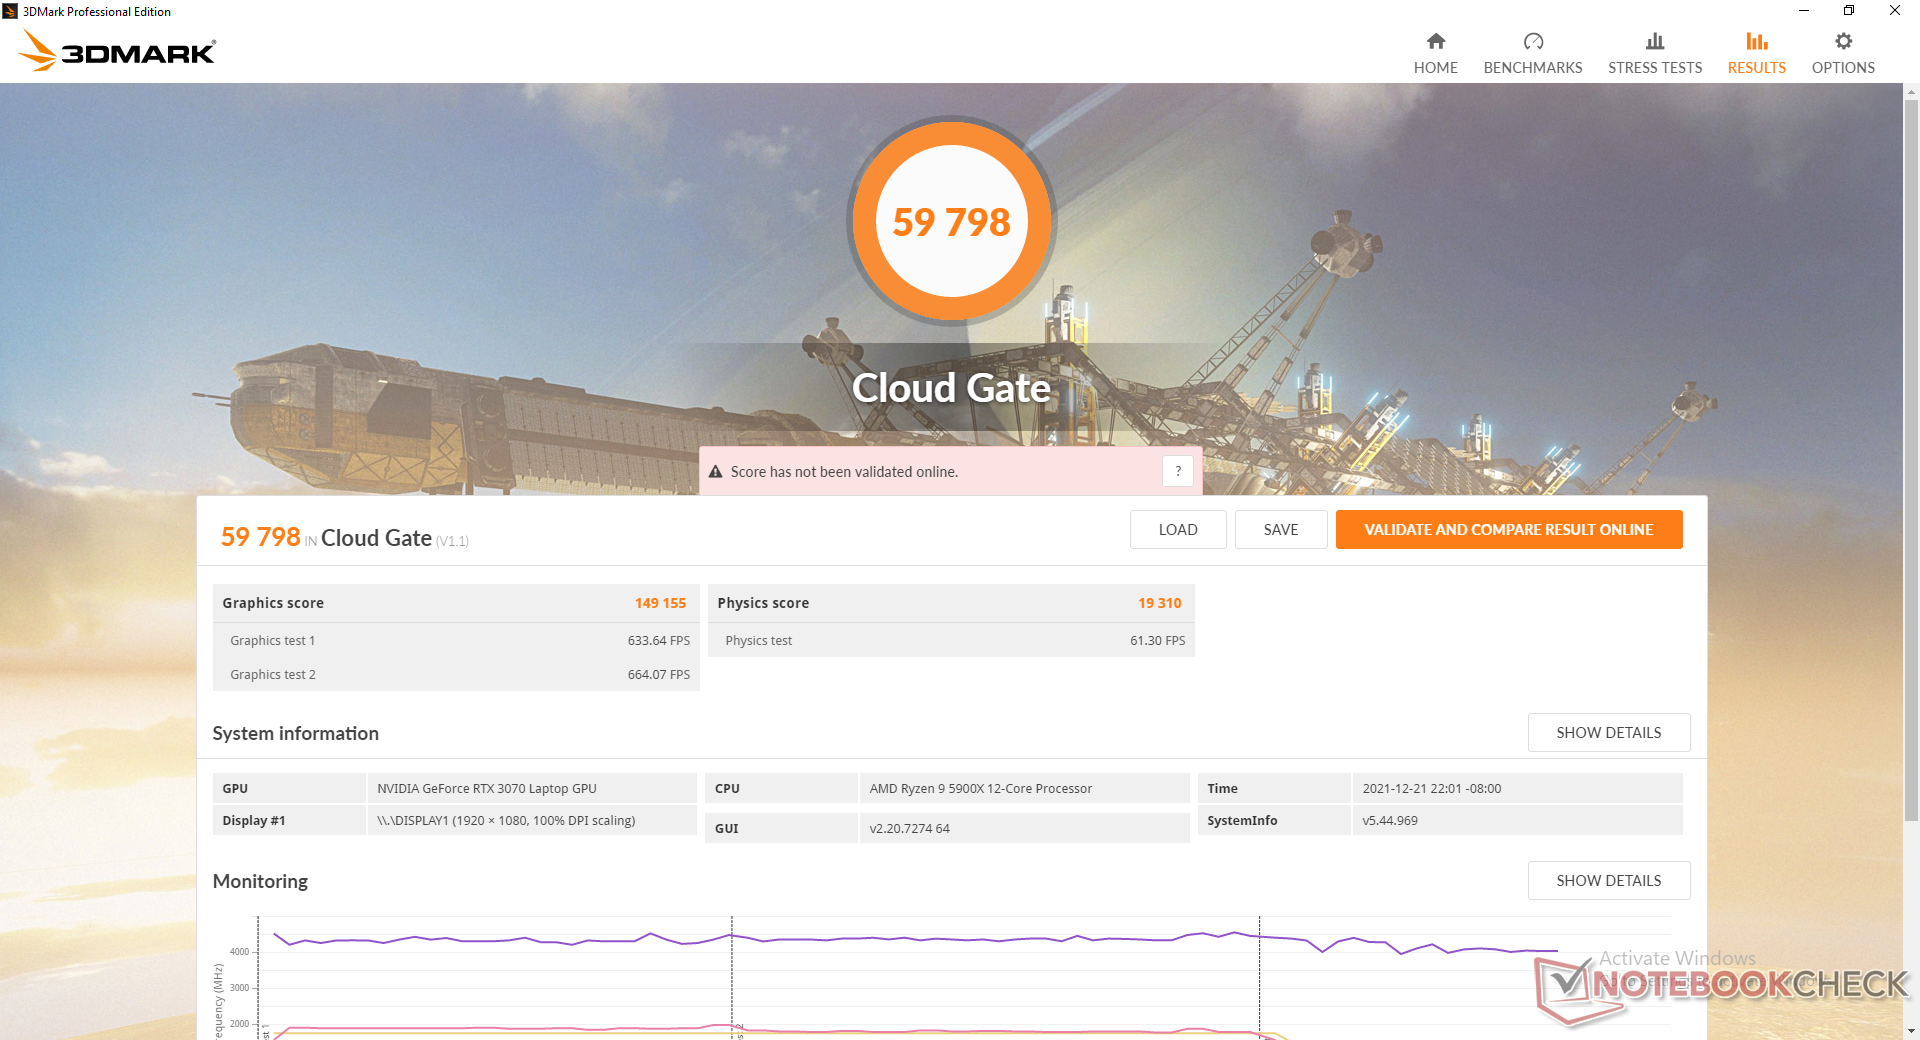
Le TGP 115 W mobile GeForce RTX 3070 a les performances que l'on attend d'elle par rapport aux autres ordinateurs portables équipés du même GPU. Il ne semble pas y avoir d'avantages en termes de performances du GPU si le mode Ventilateur maximum est activé
G-Sync n'est pas pris en charge sur l'écran principal et il n'y a pas non plus d'Advanced Optimus
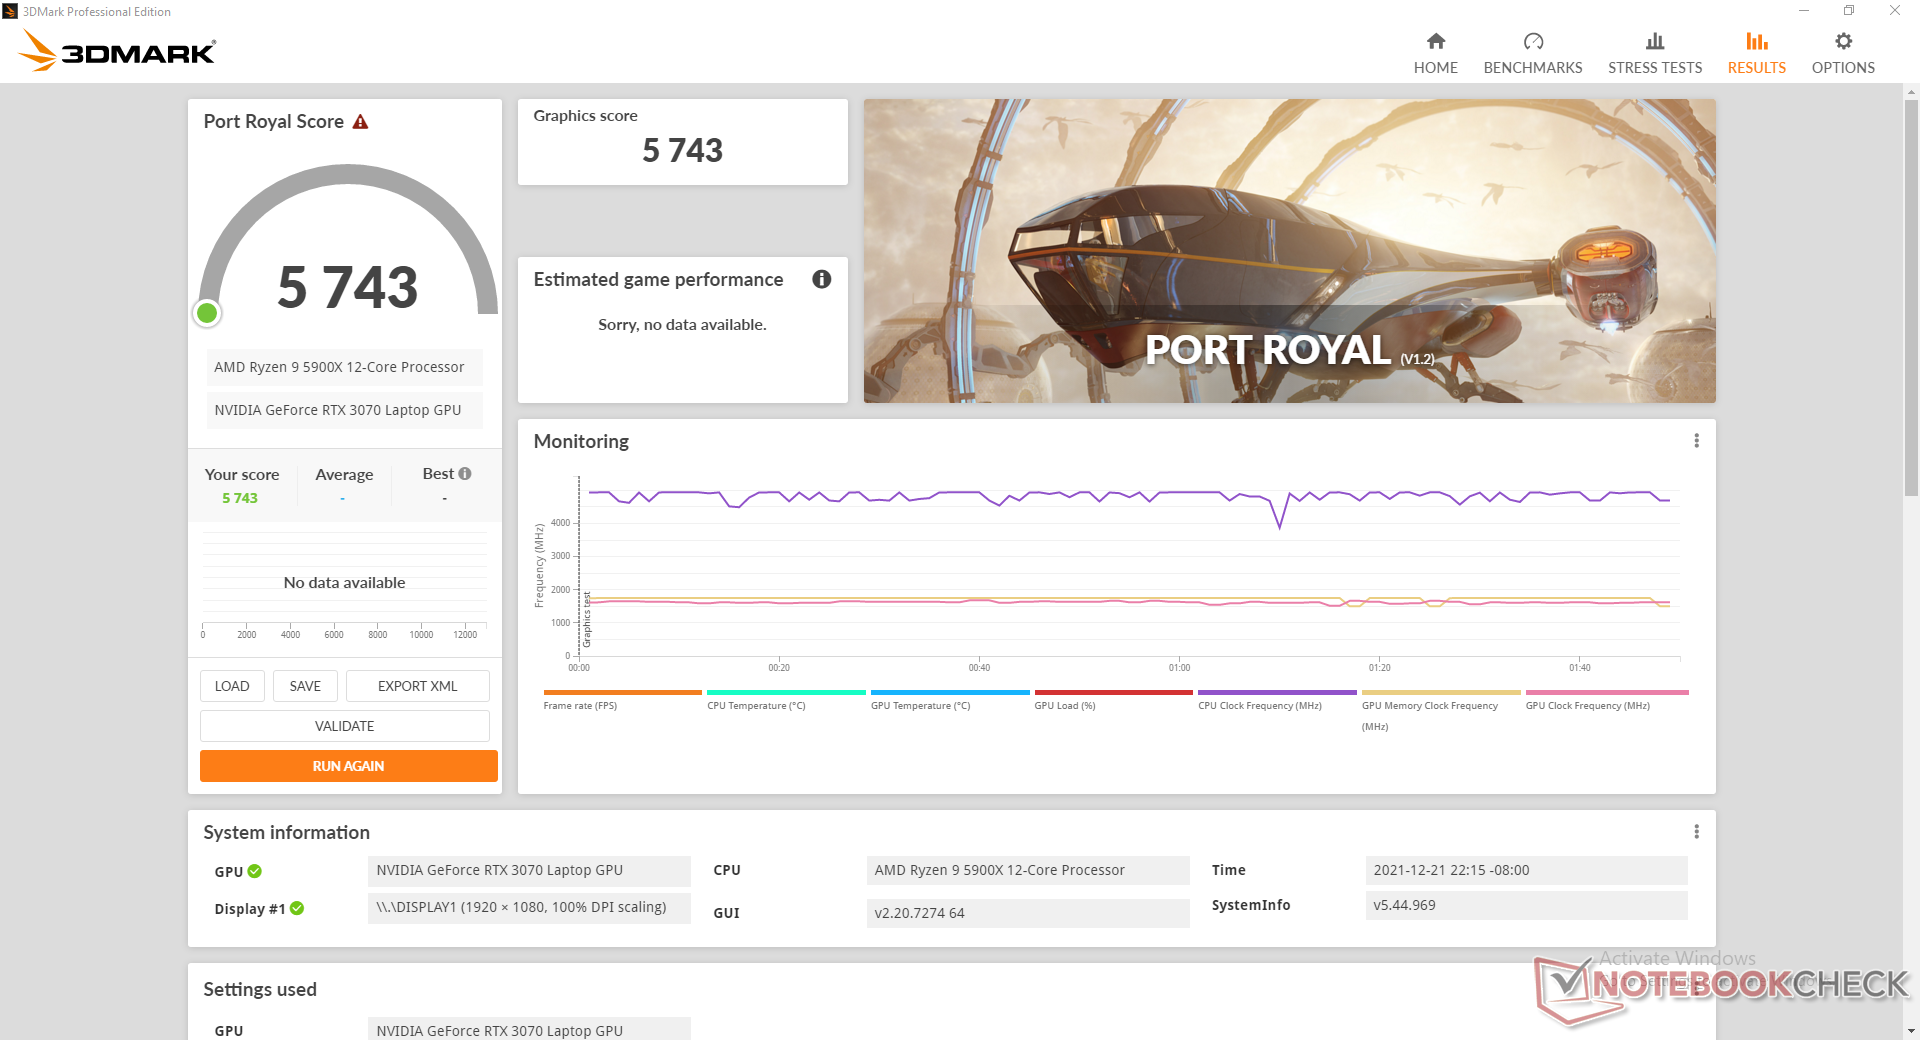
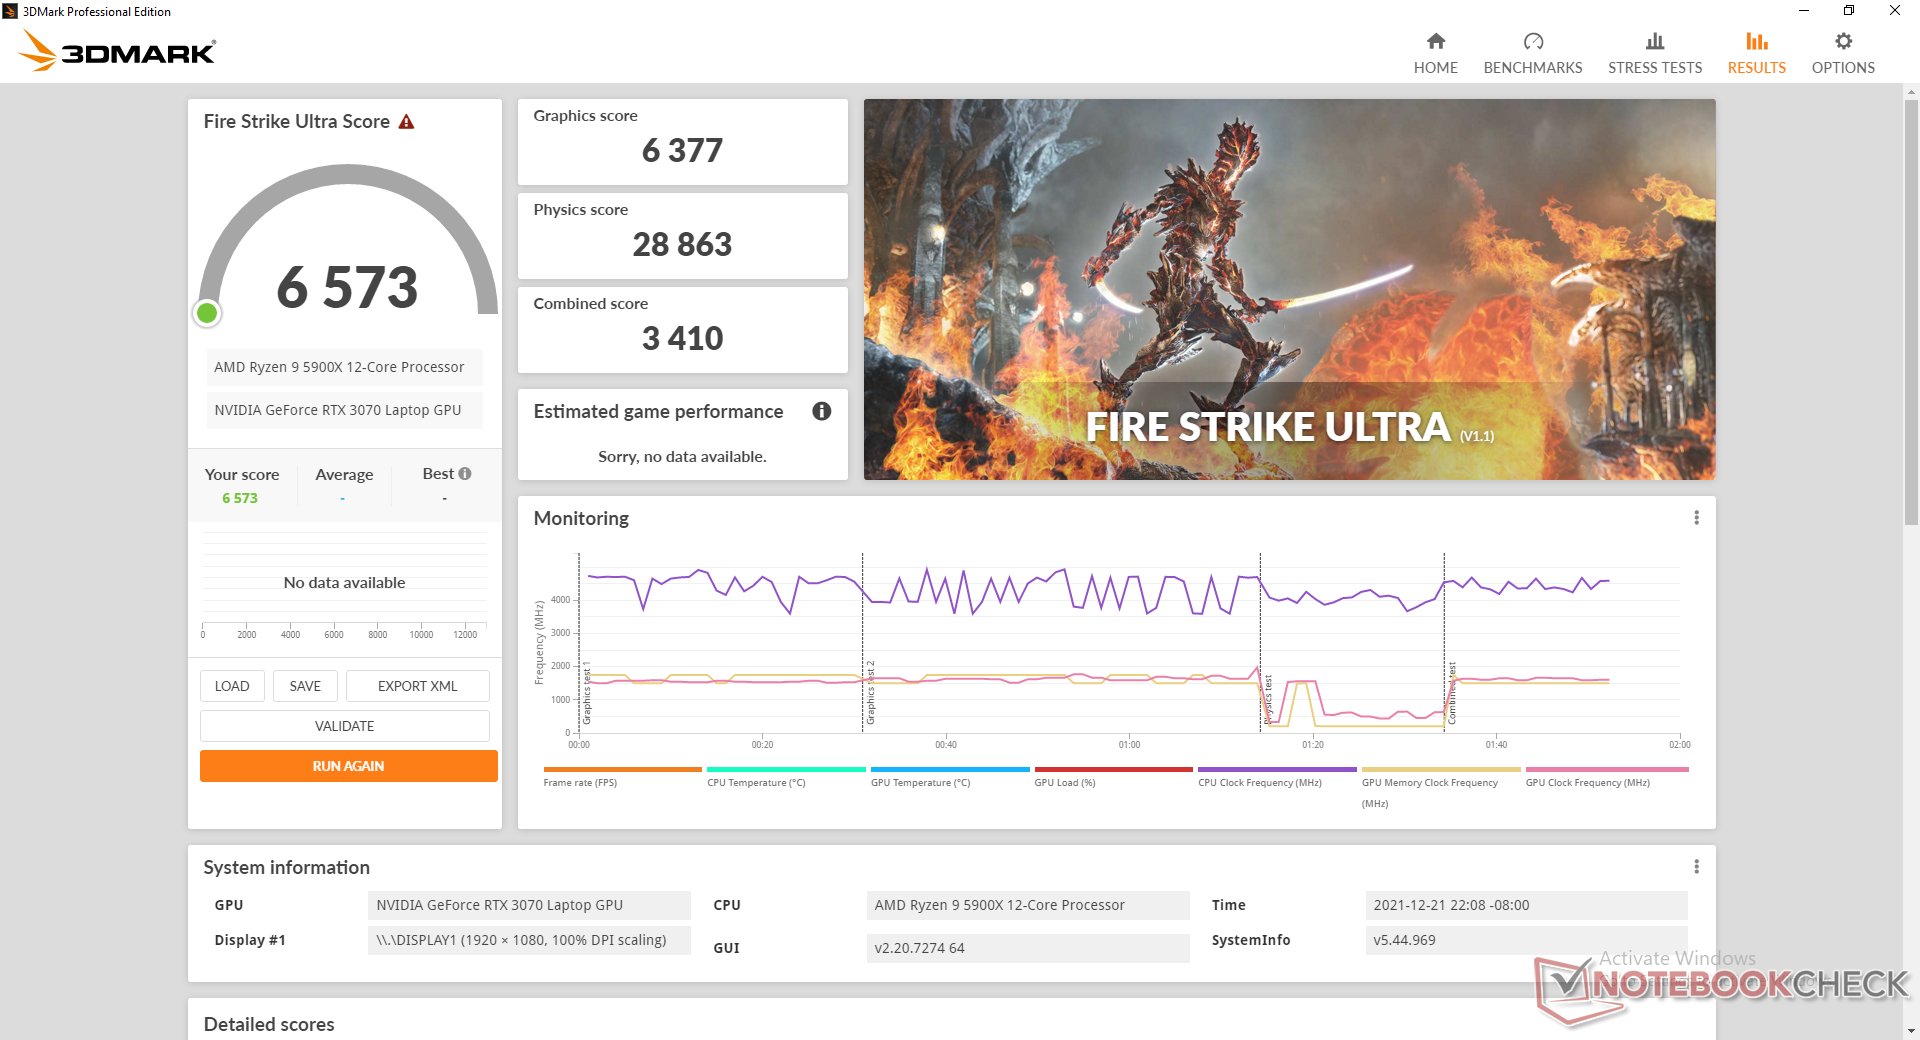
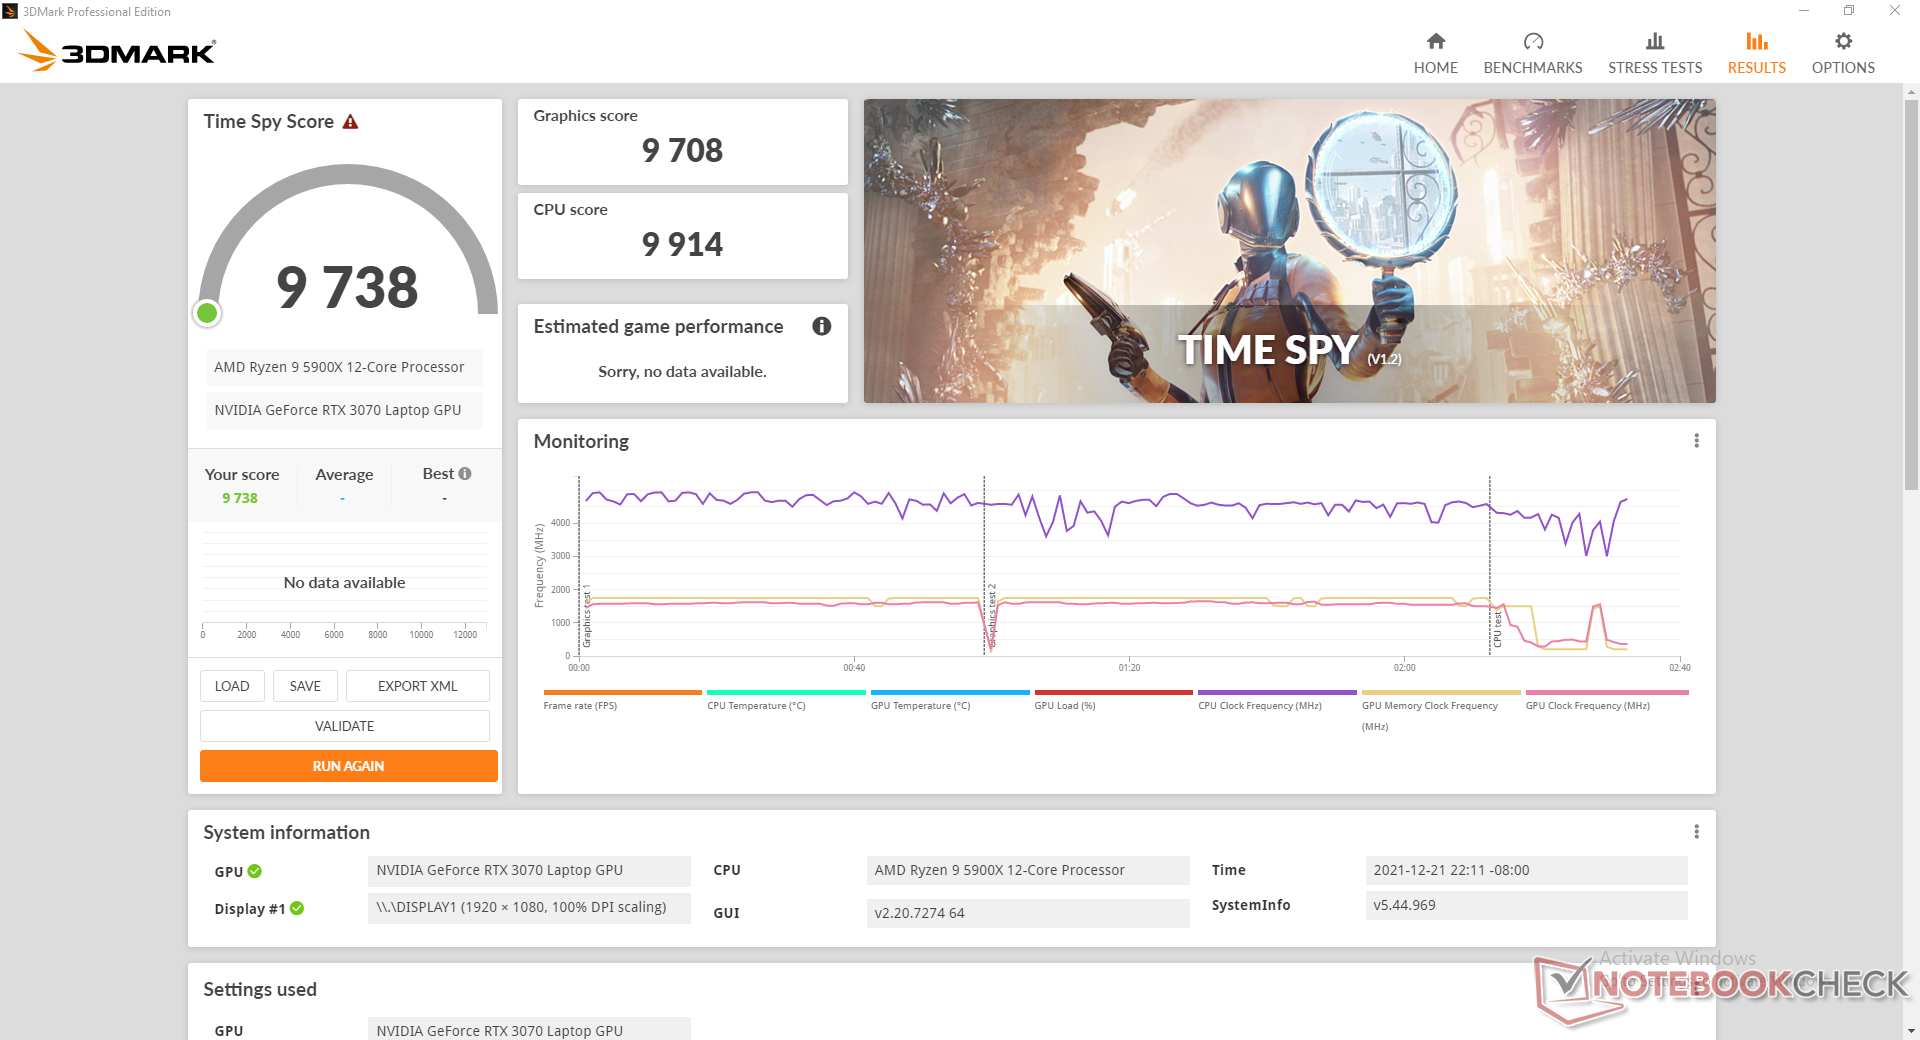
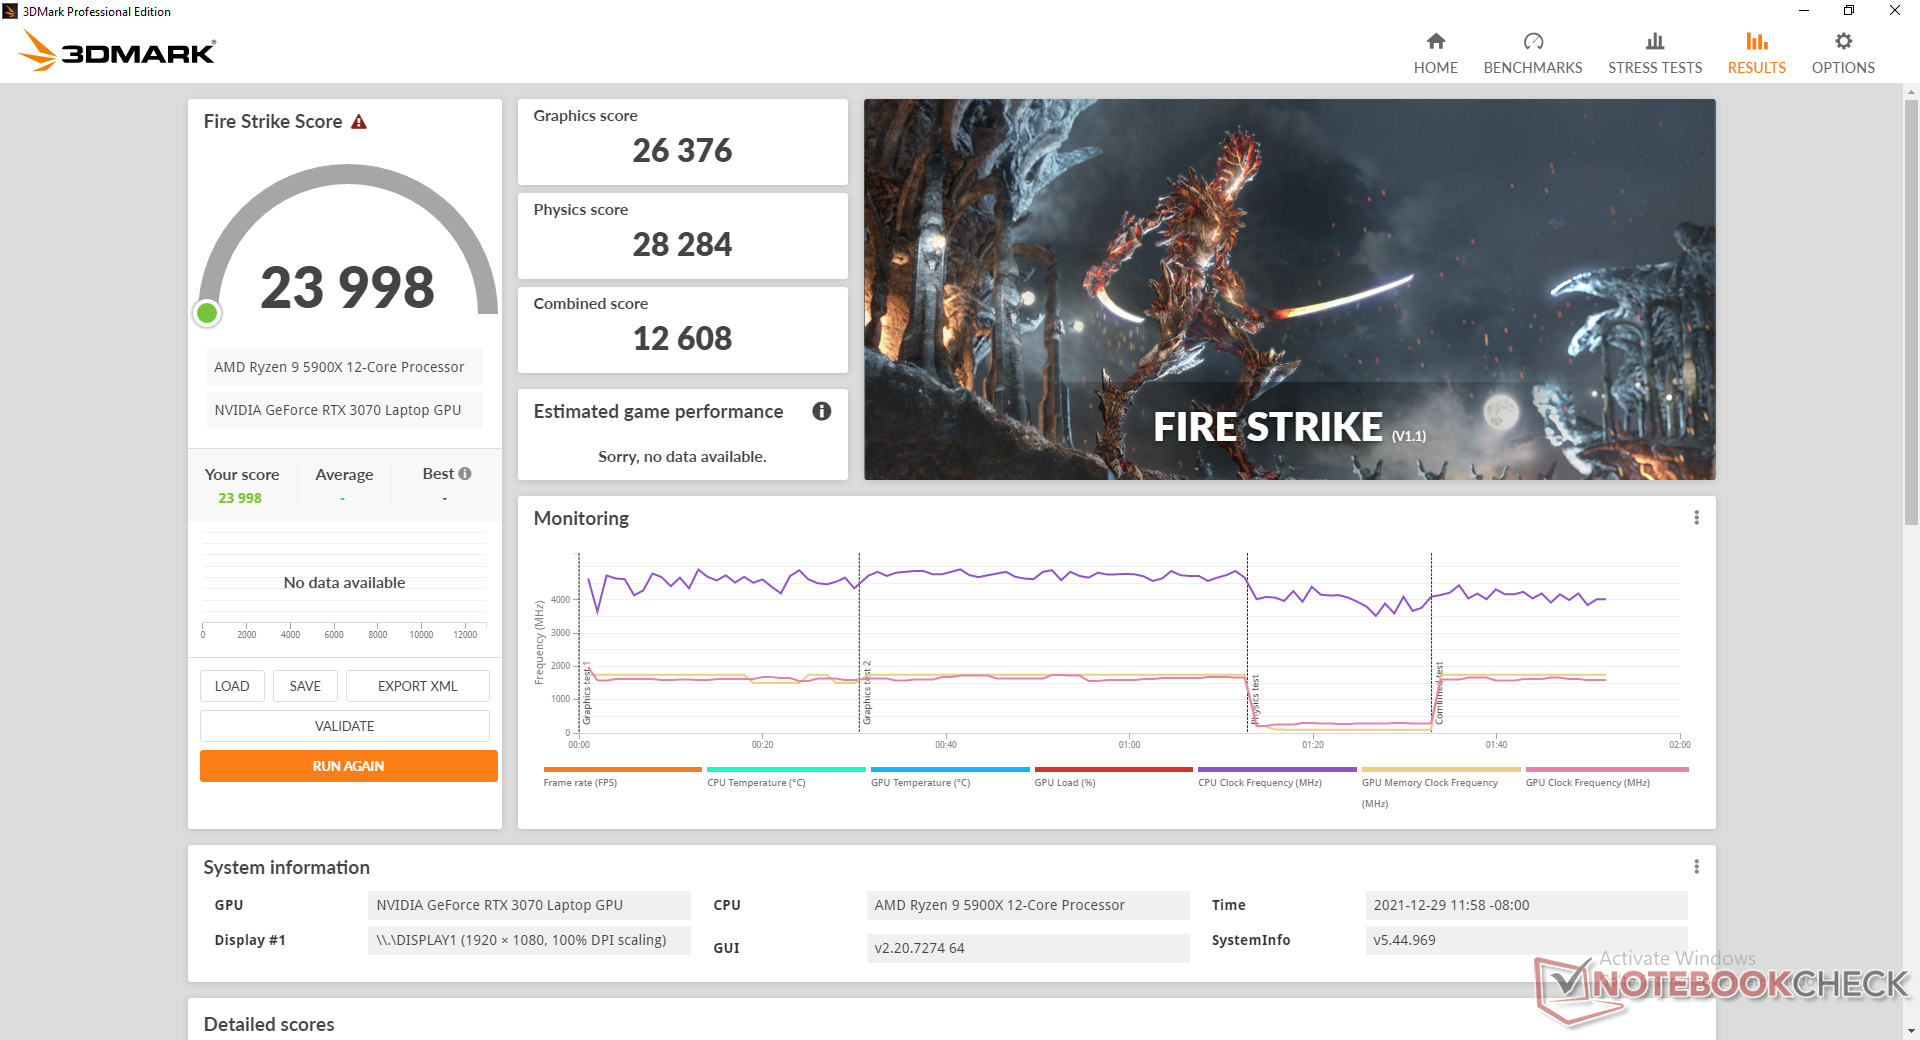
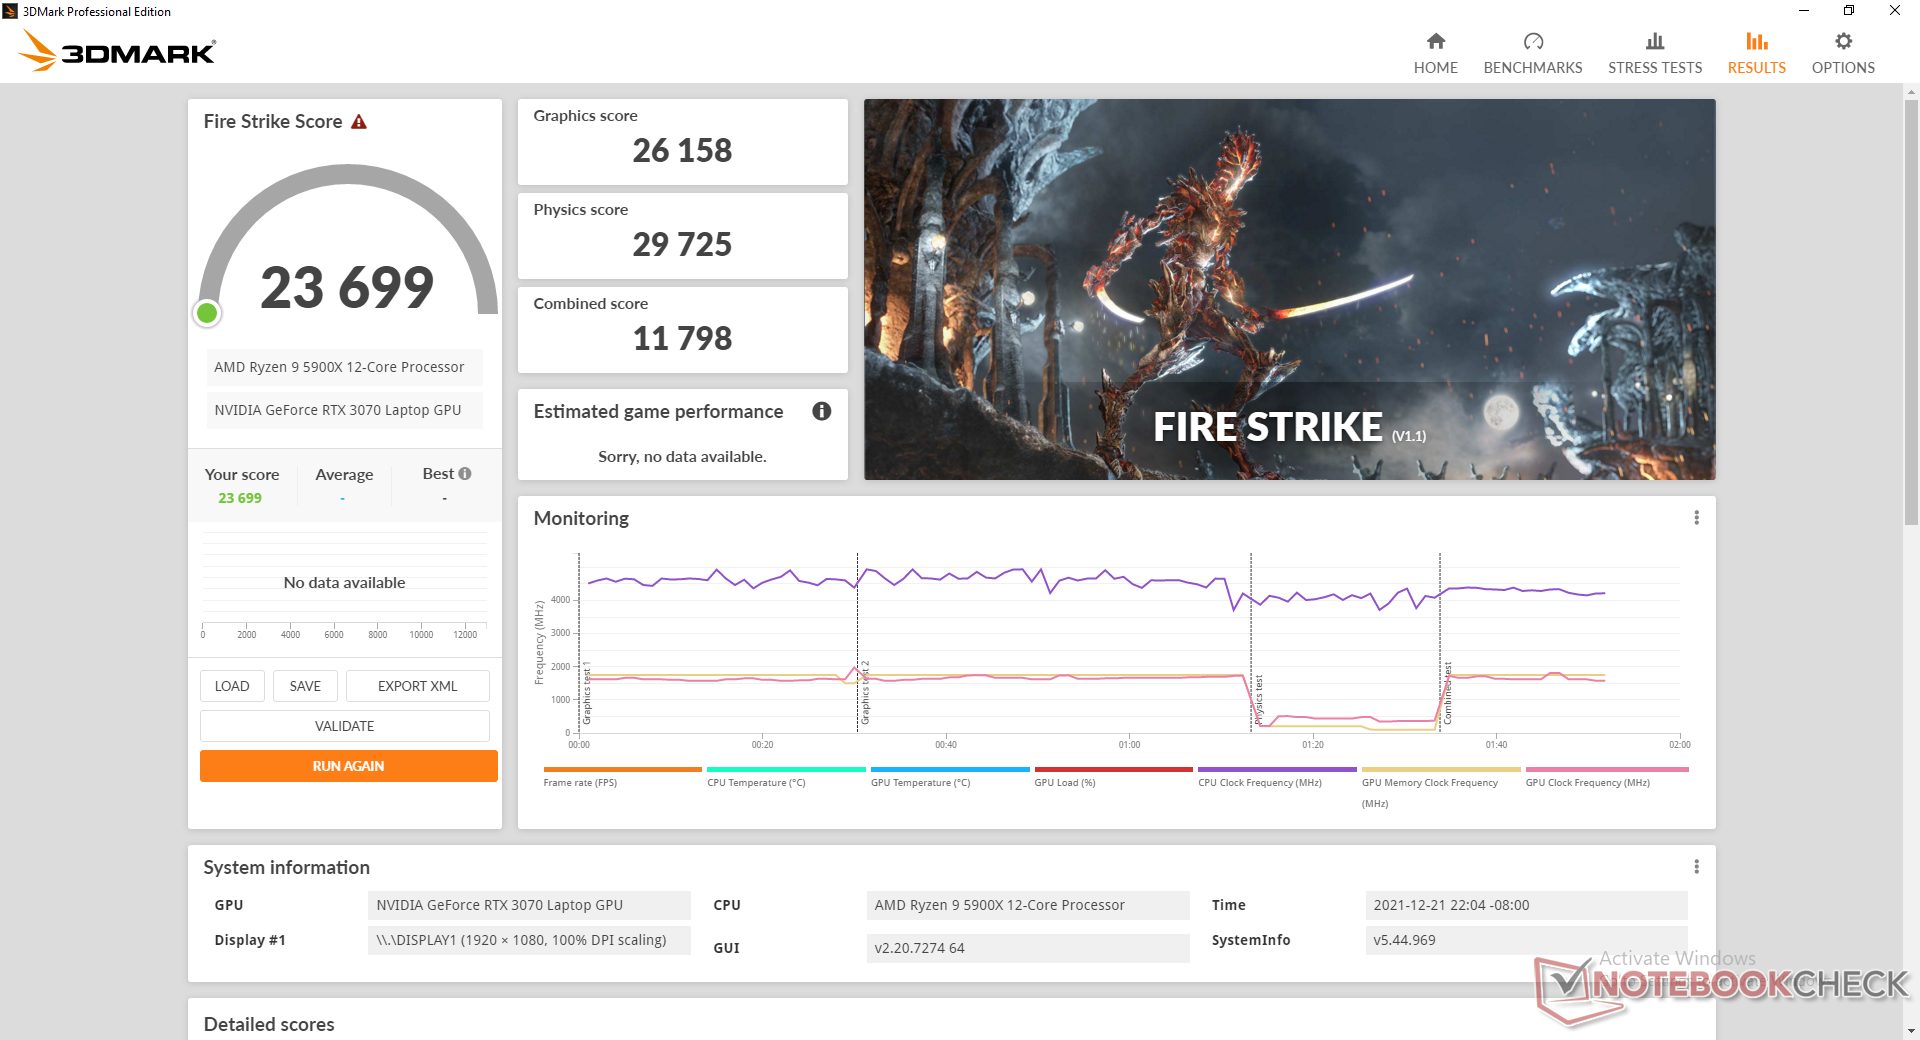
| 3DMark 11 Performance | 29688 points | |
| 3DMark Cloud Gate Standard Score | 59798 points | |
| 3DMark Fire Strike Score | 23699 points | |
| 3DMark Time Spy Score | 9738 points | |
Aide | ||
| Final Fantasy XV Benchmark | |
| 1280x720 Lite Quality | |
| Eurocom Nightsky ARX315 | |
| Gigabyte A5 X1 | |
| Moyenne NVIDIA GeForce RTX 3070 Laptop GPU (137 - 207, n=30) | |
| MSI GeForce RTX 3080 Gaming X Trio | |
| 1920x1080 Standard Quality | |
| Eurocom Nightsky ARX315 | |
| MSI GeForce RTX 3080 Gaming X Trio | |
| Gigabyte A5 X1 | |
| Moyenne NVIDIA GeForce RTX 3070 Laptop GPU (67 - 144, n=32) | |
| 1920x1080 High Quality | |
| MSI GeForce RTX 3080 Gaming X Trio | |
| Eurocom Nightsky ARX315 | |
| Gigabyte A5 X1 | |
| Moyenne NVIDIA GeForce RTX 3070 Laptop GPU (27.9 - 107, n=49) | |
| Strange Brigade | |
| 1280x720 lowest AF:1 | |
| Eurocom Nightsky ARX315 | |
| MSI GeForce RTX 3080 Gaming X Trio | |
| Moyenne NVIDIA GeForce RTX 3070 Laptop GPU (106.8 - 522, n=34) | |
| Gigabyte A5 X1 | |
| 1920x1080 medium AA:medium AF:4 | |
| MSI GeForce RTX 3080 Gaming X Trio | |
| Eurocom Nightsky ARX315 | |
| Moyenne NVIDIA GeForce RTX 3070 Laptop GPU (44.1 - 279, n=35) | |
| Gigabyte A5 X1 | |
| 1920x1080 high AA:high AF:8 | |
| MSI GeForce RTX 3080 Gaming X Trio | |
| Eurocom Nightsky ARX315 | |
| Moyenne NVIDIA GeForce RTX 3070 Laptop GPU (39.6 - 225, n=35) | |
| Gigabyte A5 X1 | |
| 1920x1080 ultra AA:ultra AF:16 | |
| MSI GeForce RTX 3080 Gaming X Trio | |
| Eurocom Nightsky ARX315 | |
| Gigabyte A5 X1 | |
| Moyenne NVIDIA GeForce RTX 3070 Laptop GPU (36.2 - 194, n=46) | |
Witcher 3 FPS Chart
| Bas | Moyen | Élevé | Ultra | |
|---|---|---|---|---|
| GTA V (2015) | 185 | 182 | 175 | 114 |
| The Witcher 3 (2015) | 505 | 327.3 | 199 | 96.6 |
| Dota 2 Reborn (2015) | 211 | 180 | 178 | 158 |
| Final Fantasy XV Benchmark (2018) | 207 | 144 | 107 | |
| X-Plane 11.11 (2018) | 146 | 131 | 105 | |
| Far Cry 5 (2018) | 165 | 140 | 135 | 126 |
| Strange Brigade (2018) | 519 | 275 | 221 | 192 |
Émissions
Bruit du système
Le bruit du ventilateur dépend des quatre paramètres de profil d'alimentation du Control Center : Power Saving, Quiet, Entertainment, ou Performance. Le système fonctionne de manière très silencieuse (~27,9 dB(A)) sur les deux premiers réglages, mais les performances globales sont tellement réduites que le système peut donner l'impression d'être dans la mélasse. Par ailleurs, le bruit du ventilateur atteint souvent 40,8 dB(A), même en cas d'utilisation de charges peu exigeantes en mode Performance. Nous vous recommandons d'utiliser le mode Divertissement car il offre un meilleur équilibre entre les performances du système et le bruit constant des ventilateurs.
Le jeu induit un bruit de ventilateur compris entre 52 et 56 dB(A), ce qui n'est pas sans rappeler la plupart des autres ordinateurs portables de jeu 15,6 pouces hautes performances. Le bruit du ventilateur peut atteindre plus de 60 dB(A) lorsque le mode Ventilateur maximum est activé.
Degré de la nuisance sonore
| Au repos |
| 25.9 / 27.9 / 40.8 dB(A) |
| Fortement sollicité |
| 55.2 / 60.3 dB(A) |
 | ||
30 dB silencieux 40 dB(A) audible 50 dB(A) bruyant |
||
min: | ||
| Eurocom Nightsky ARX315 GeForce RTX 3070 Laptop GPU, R9 5900X, Samsung SSD 980 Pro 1TB MZ-V8P1T0BW | Gigabyte A5 X1 GeForce RTX 3070 Laptop GPU, R9 5900HX, ADATA XPG SX8200 Pro (ASX8200PNP-512GT) | Medion Erazer Deputy P25 GeForce RTX 3060 Laptop GPU, R7 5800H, Phison E12S-512GB-Phison-SSD-BICS4 | MSI Delta 15 A5EFK Radeon RX 6700M, R9 5900HX, Micron 2210 MTFDHBA1T0QFD | Schenker XMG Apex 15 NH57E PS GeForce RTX 3060 Laptop GPU, R7 5800H, Samsung SSD 980 500GB (MZ-V8V500BW) | MSI GE66 Raider 10SFS GeForce RTX 2070 Super Mobile, i9-10980HK, WDC PC SN730 SDBPNTY-1T00 | |
|---|---|---|---|---|---|---|
| Noise | 1% | 2% | 5% | 15% | -8% | |
| arrêt / environnement * (dB) | 25.3 | 25 1% | 25 1% | 25 1% | 23 9% | 30 -19% |
| Idle Minimum * (dB) | 25.9 | 27 -4% | 27 -4% | 25 3% | 23 11% | 30 -16% |
| Idle Average * (dB) | 27.9 | 29 -4% | 29 -4% | 30 -8% | 23 18% | 35 -25% |
| Idle Maximum * (dB) | 40.8 | 32 22% | 31 24% | 40 2% | 26.4 35% | 44 -8% |
| Load Average * (dB) | 55.2 | 57 -3% | 57 -3% | 47 15% | 34.25 38% | 53 4% |
| Witcher 3 ultra * (dB) | 52.4 | 56 -7% | 56 -7% | 48 8% | 58.4 -11% | 53 -1% |
| Load Maximum * (dB) | 60.3 | 58 4% | 58 4% | 51 15% | 58.42 3% | 55 9% |
* ... Moindre est la valeur, meilleures sont les performances
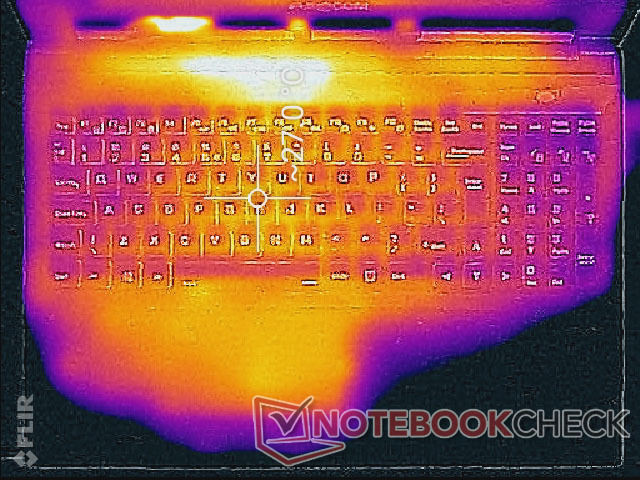
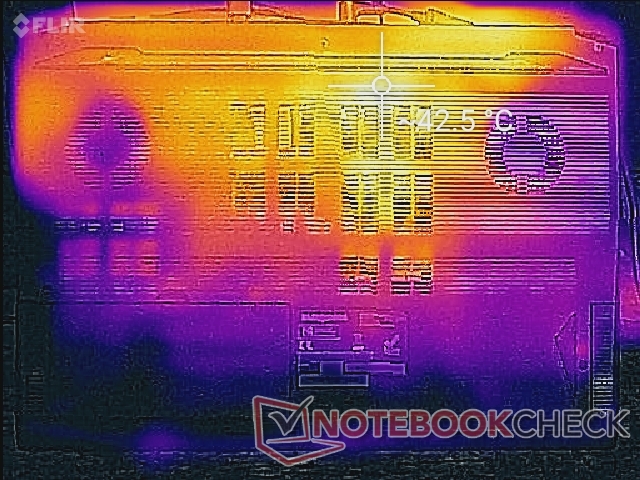
Température
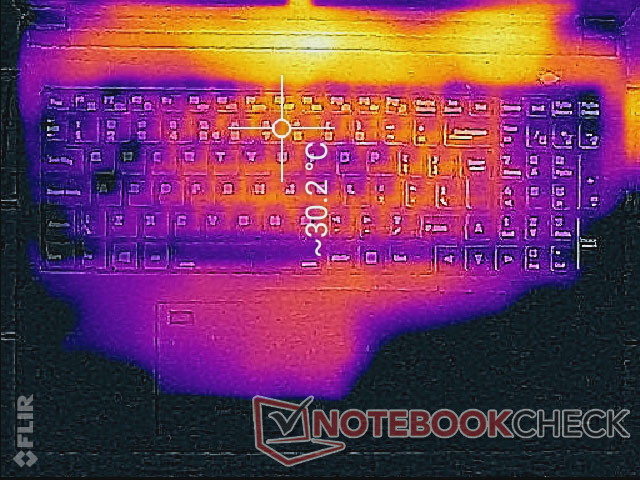
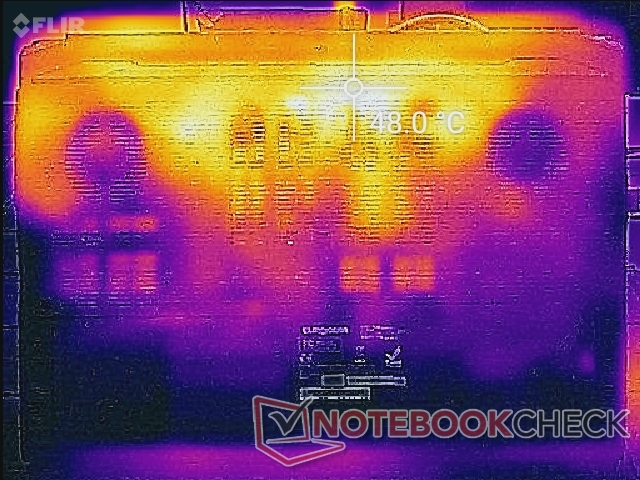
Les températures de surface sont élevées même en mode économie d'énergie ou en mode silencieux, car le bruit du ventilateur est poussé à des limites beaucoup plus basses. Les points chauds peuvent atteindre 27 C et 43 C sur le dessus et le dessous, respectivement. Les touches du clavier sont donc toujours chaudes mais heureusement jamais de manière inconfortable lors de l'exécution de charges élevées, car les ventilateurs bruyants font un bon travail pour garder les températures de surface sous contrôle.
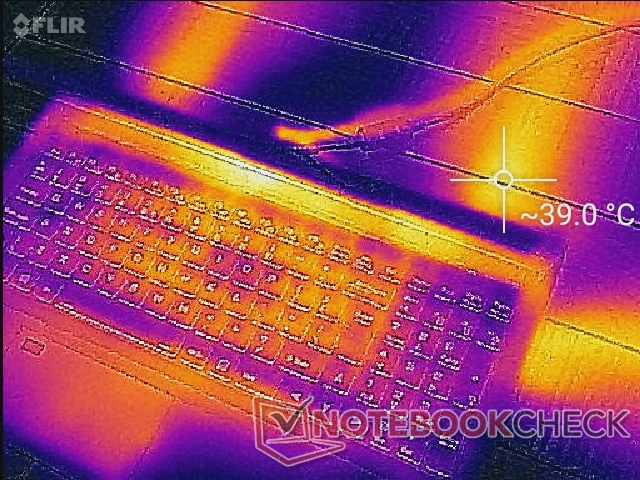
(+) La température maximale du côté supérieur est de 36.2 °C / 97 F, par rapport à la moyenne de 40.4 °C / 105 F, allant de 21.2 à 68.8 °C pour la classe Gaming.
(-) Le fond chauffe jusqu'à un maximum de 49.6 °C / 121 F, contre une moyenne de 43.2 °C / 110 F
(+) En utilisation inactive, la température moyenne du côté supérieur est de 27 °C / 81 F, par rapport à la moyenne du dispositif de 33.9 °C / 93 F.
(+) Les repose-poignets et le pavé tactile sont plus froids que la température de la peau avec un maximum de 30 °C / 86 F et sont donc froids au toucher.
(±) La température moyenne de la zone de l'appui-paume de dispositifs similaires était de 28.8 °C / 83.8 F (-1.2 °C / #-2.2 F).
| Eurocom Nightsky ARX315 AMD Ryzen 9 5900X, NVIDIA GeForce RTX 3070 Laptop GPU | Gigabyte A5 X1 AMD Ryzen 9 5900HX, NVIDIA GeForce RTX 3070 Laptop GPU | Medion Erazer Deputy P25 AMD Ryzen 7 5800H, NVIDIA GeForce RTX 3060 Laptop GPU | MSI Delta 15 A5EFK AMD Ryzen 9 5900HX, AMD Radeon RX 6700M | Schenker XMG Apex 15 NH57E PS AMD Ryzen 7 5800H, NVIDIA GeForce RTX 3060 Laptop GPU | MSI GE66 Raider 10SFS Intel Core i9-10980HK, NVIDIA GeForce RTX 2070 Super Mobile | |
|---|---|---|---|---|---|---|
| Heat | 4% | 17% | -3% | 13% | -3% | |
| Maximum Upper Side * (°C) | 36.2 | 47 -30% | 37 -2% | 50 -38% | 36 1% | 49 -35% |
| Maximum Bottom * (°C) | 49.6 | 51 -3% | 40 19% | 55 -11% | 38 23% | 52 -5% |
| Idle Upper Side * (°C) | 32.6 | 27 17% | 27 17% | 31 5% | 31 5% | 30 8% |
| Idle Bottom * (°C) | 43.2 | 30 31% | 29 33% | 30 31% | 33 24% | 34 21% |
* ... Moindre est la valeur, meilleures sont les performances
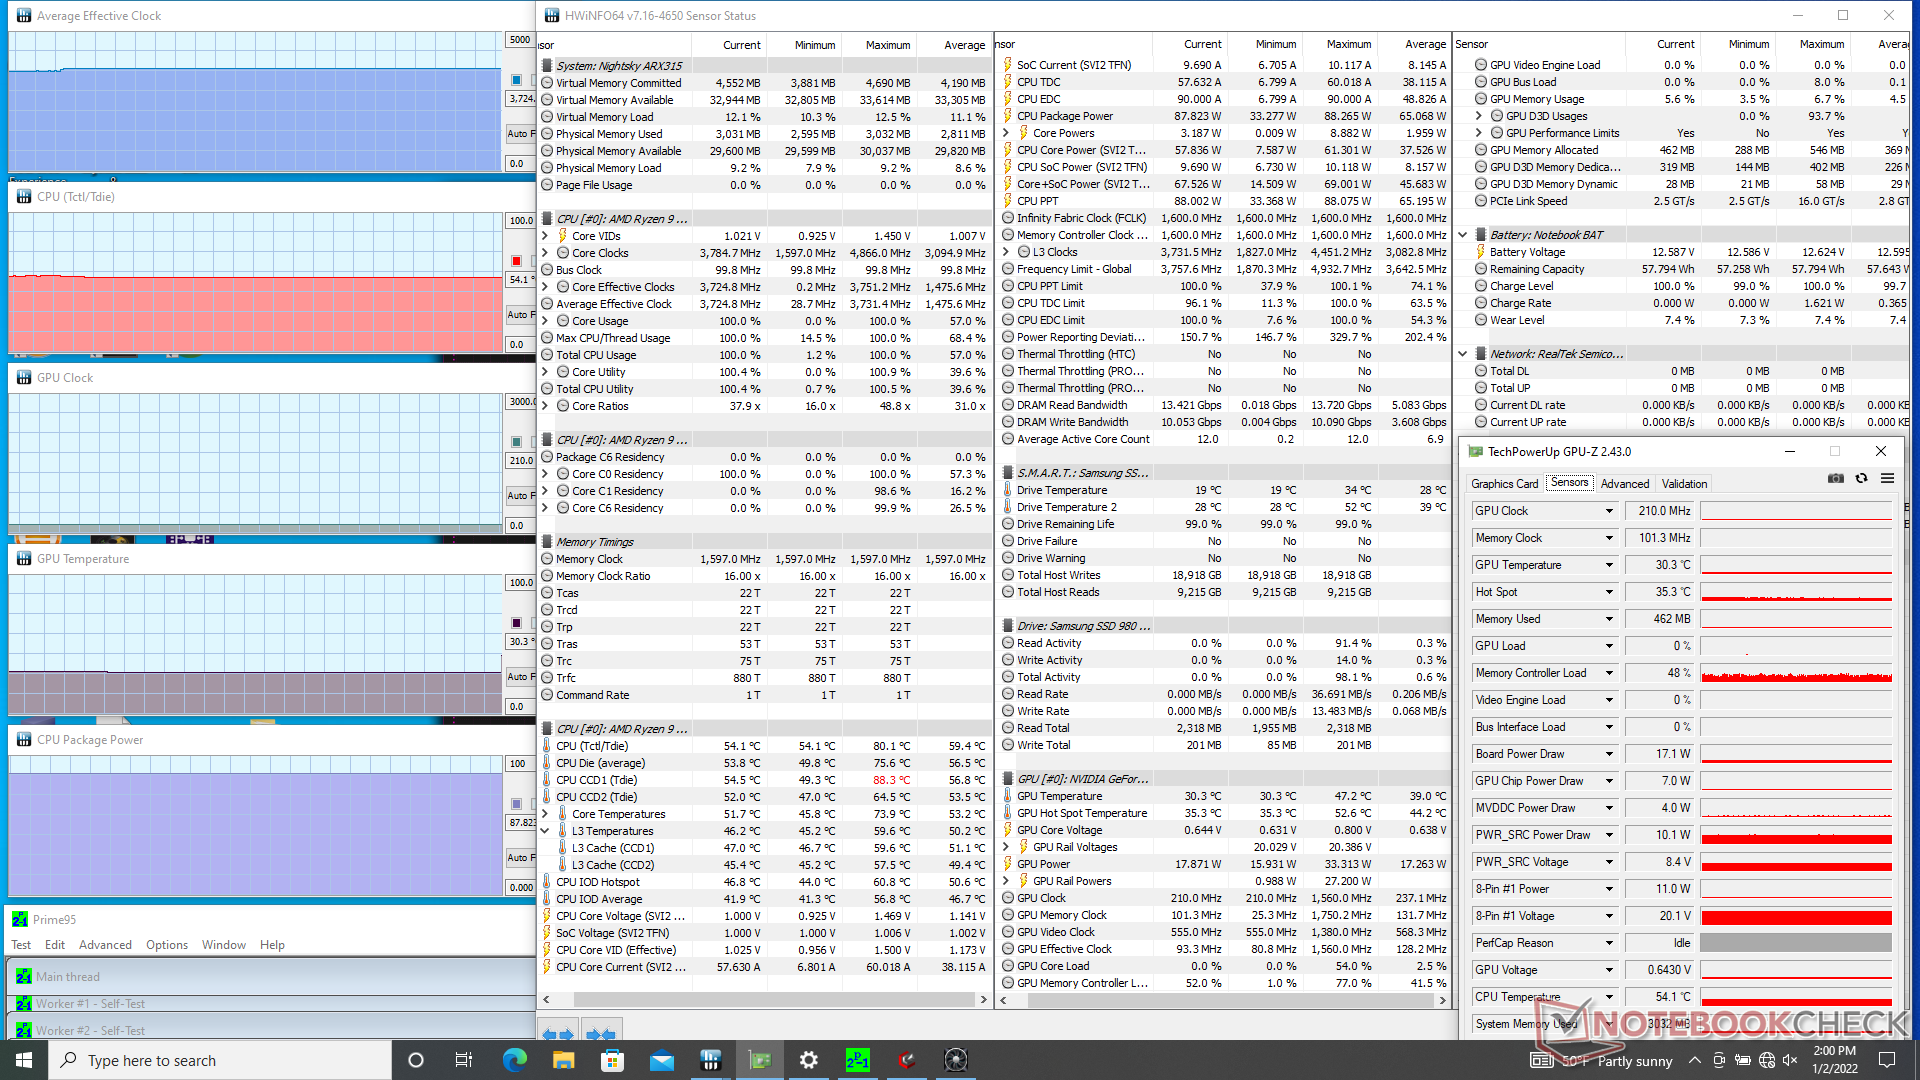
Test de stress
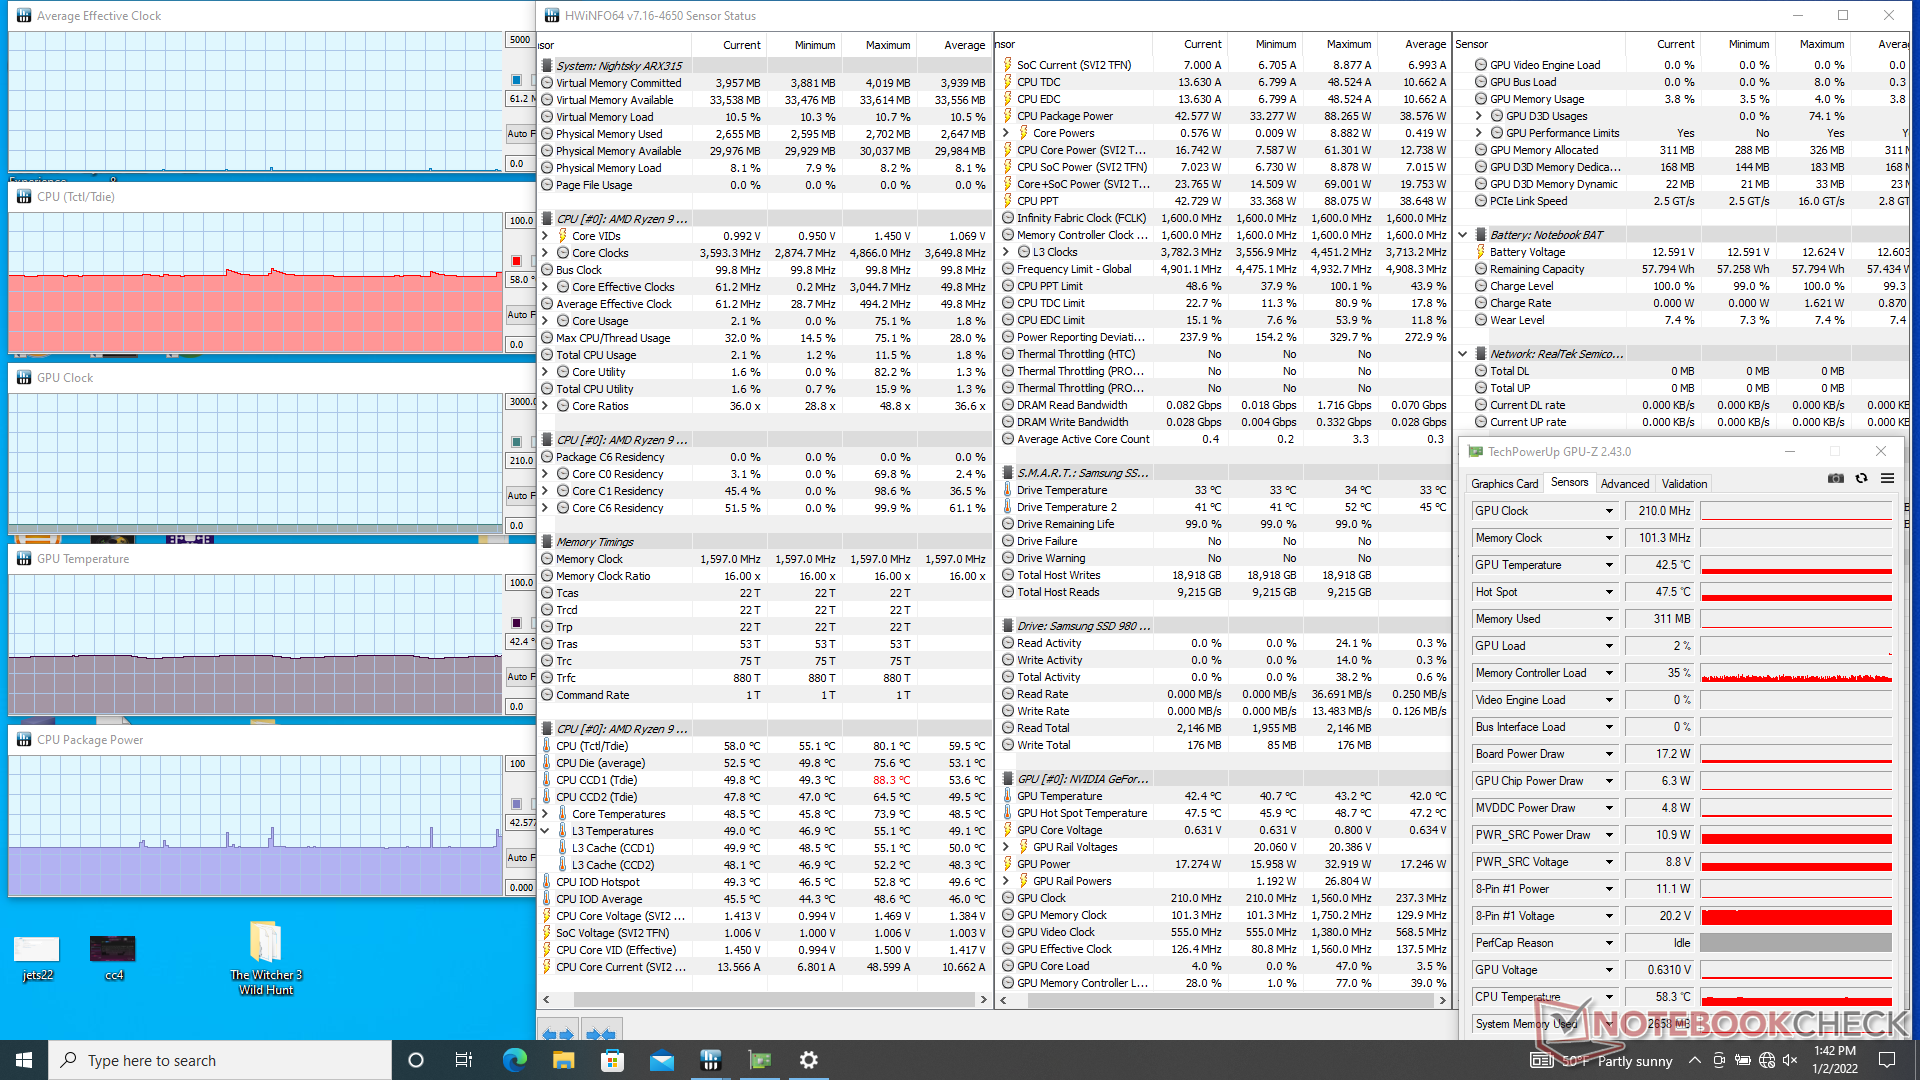
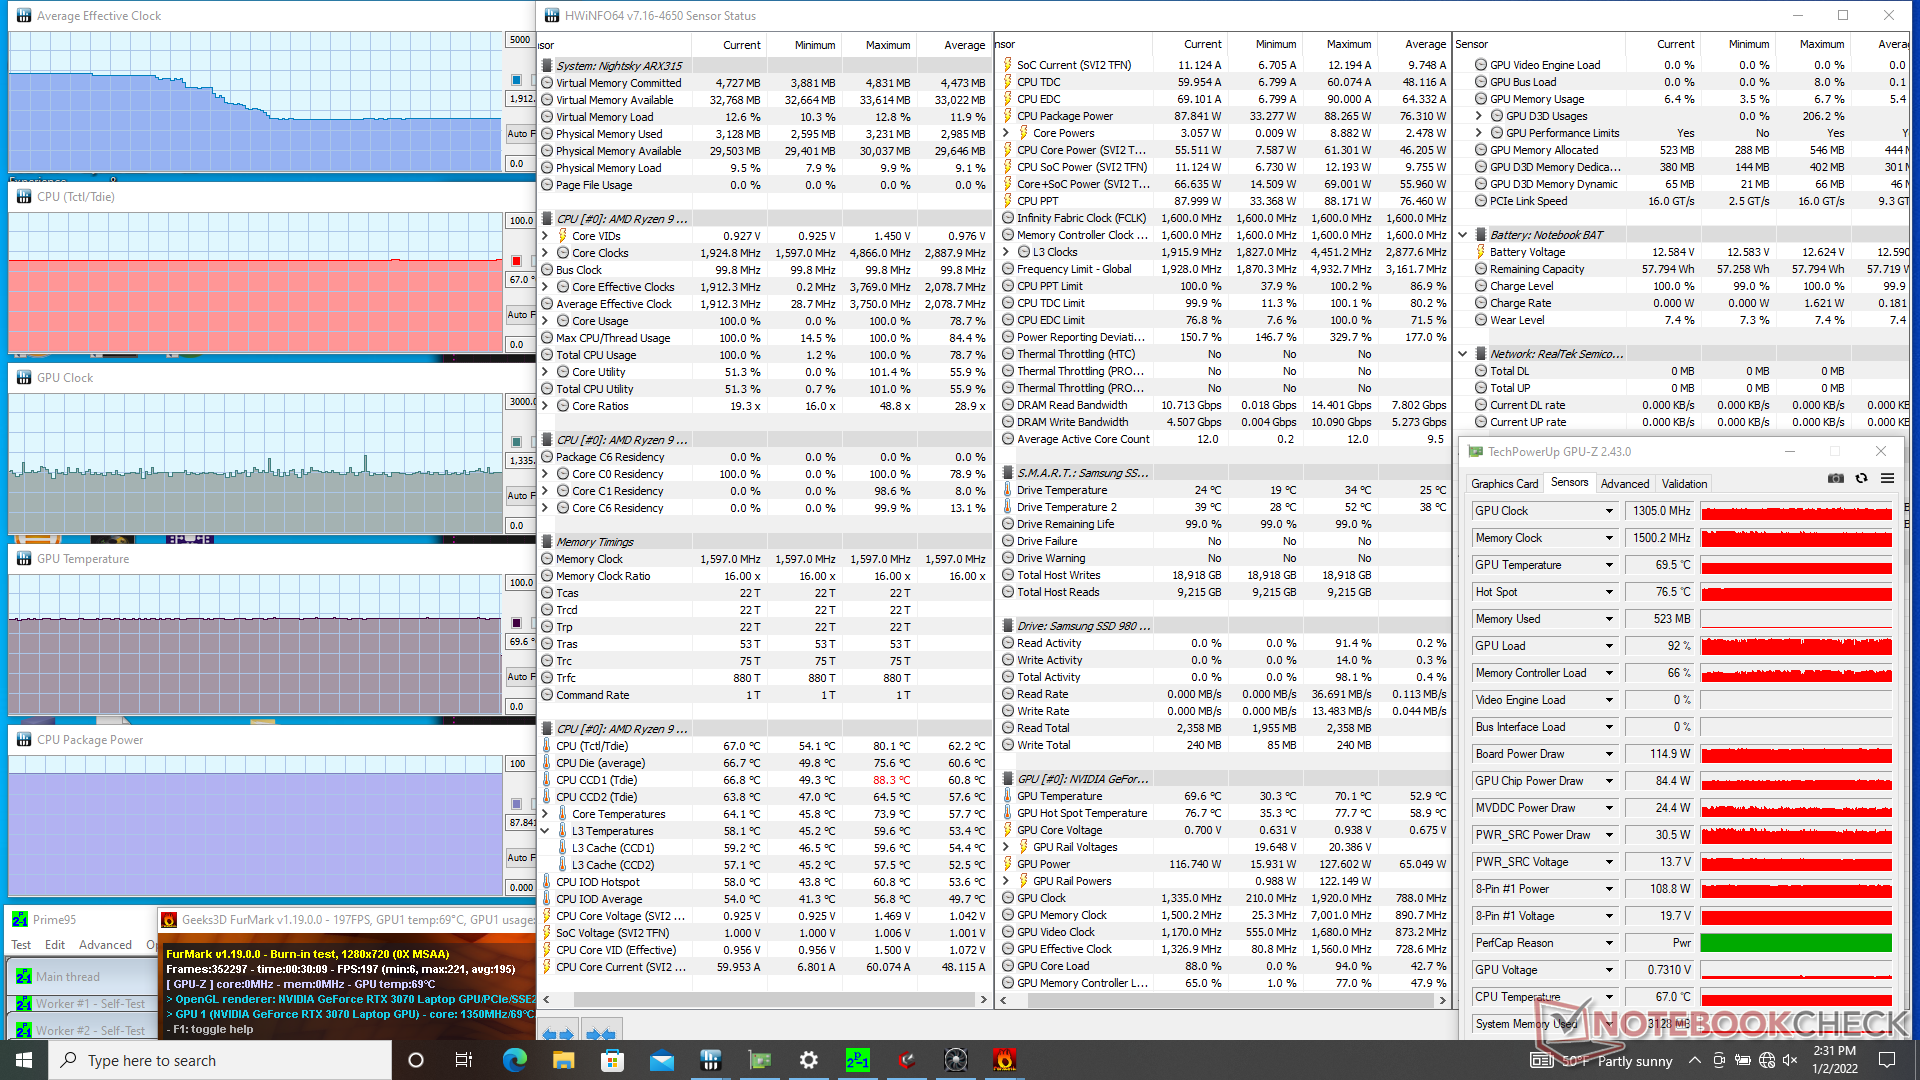
Lors de l'exécution de Prime95 avec le mode Maximum Fan désactivé, le CPU se stabilise à environ 1,9 GHz et à une température centrale de 67 C. En activant le mode Maximum Fan, les fréquences d'horloge se stabilisent à 3,8 GHz et avec une température centrale plus basse de 54 C. En comparaison, notre référence de bureau Ryzen 9 5900X se stabilise à une fréquence d'horloge beaucoup plus élevée de 4,5 GHz lorsqu'il est soumis aux mêmes conditions Prime95, ce qui expliquerait les résultats plus lents que prévu de notre Eurocom mentionné ci-dessus. Heureusement, il y a assez de marge de température pour un overclocking de l'utilisateur final si désiré, mais au prix d'un bruit de ventilateur très fort. La puissance du processeur se stabilise dans une fourchette de 82 W à 88 W avec les paramètres de base.
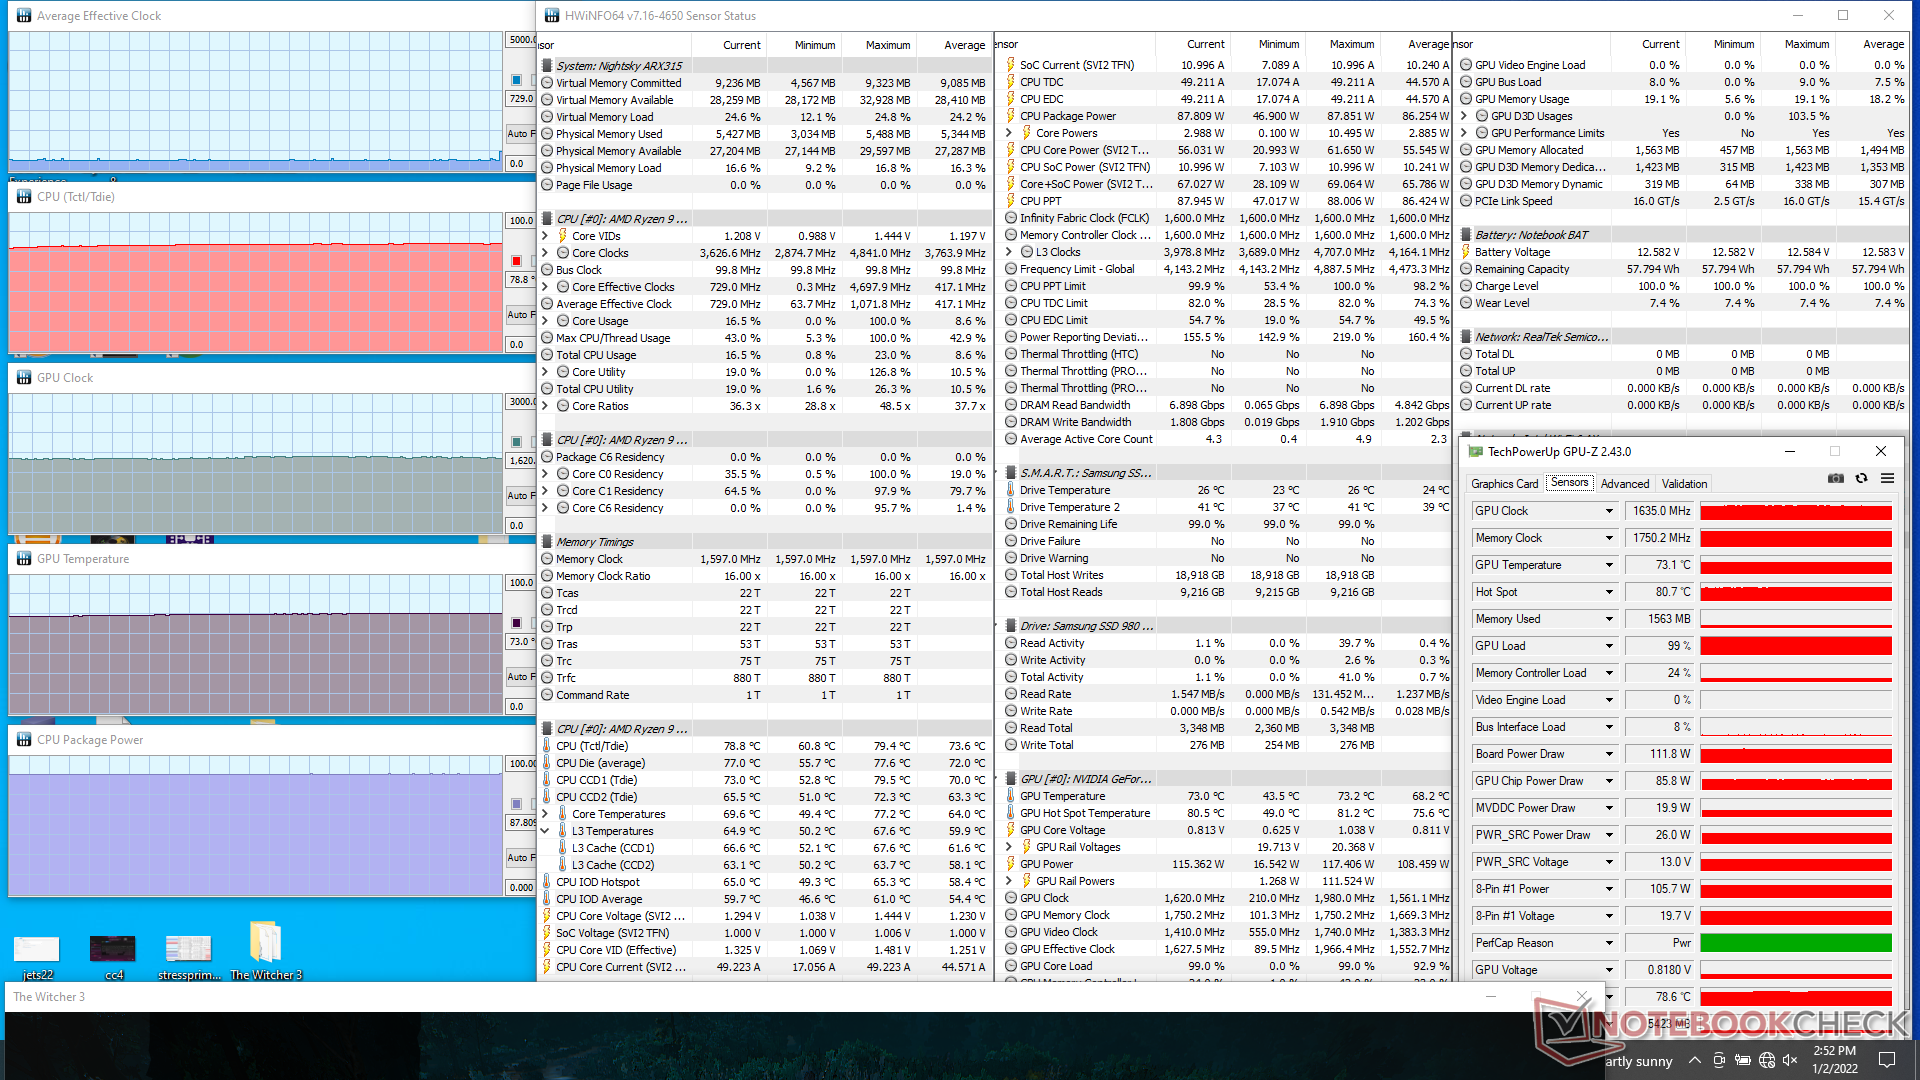
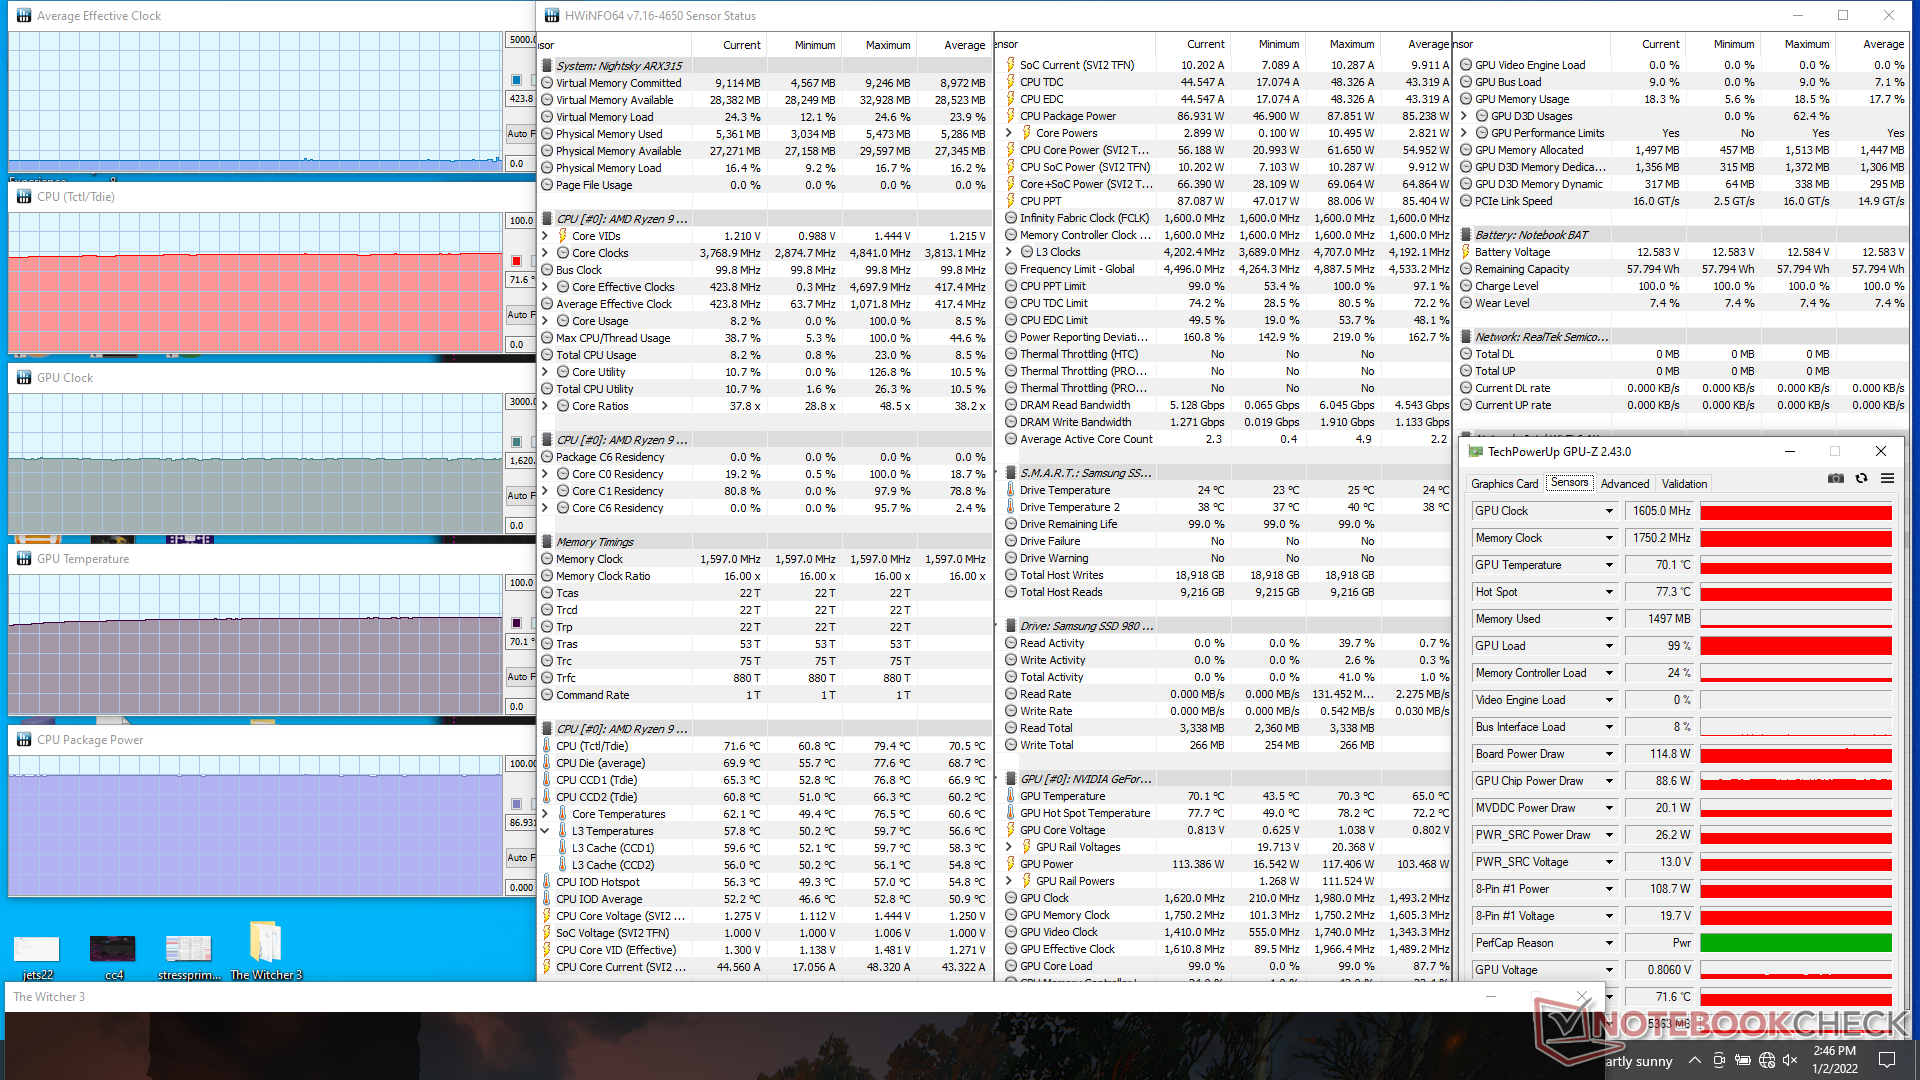
L'exécution de Witcher 3 en mode Ventilateur maximum, la fréquence d'horloge du GPU est stable et la température est de 1605 MHz et 70°C, respectivement, contre 1365 MHz et 74°C sur l'Asus DUF F15.Asus TUF Dash F15 équipé du même GPU GeForce RTX 3070.
Le fonctionnement sur batterie limitera les performances. Un test 3DMark 11 sur batterie donnerait des scores de physique et de graphisme de 3398 et 7357 points, respectivement, contre 19082 et 36118 points sur secteur.
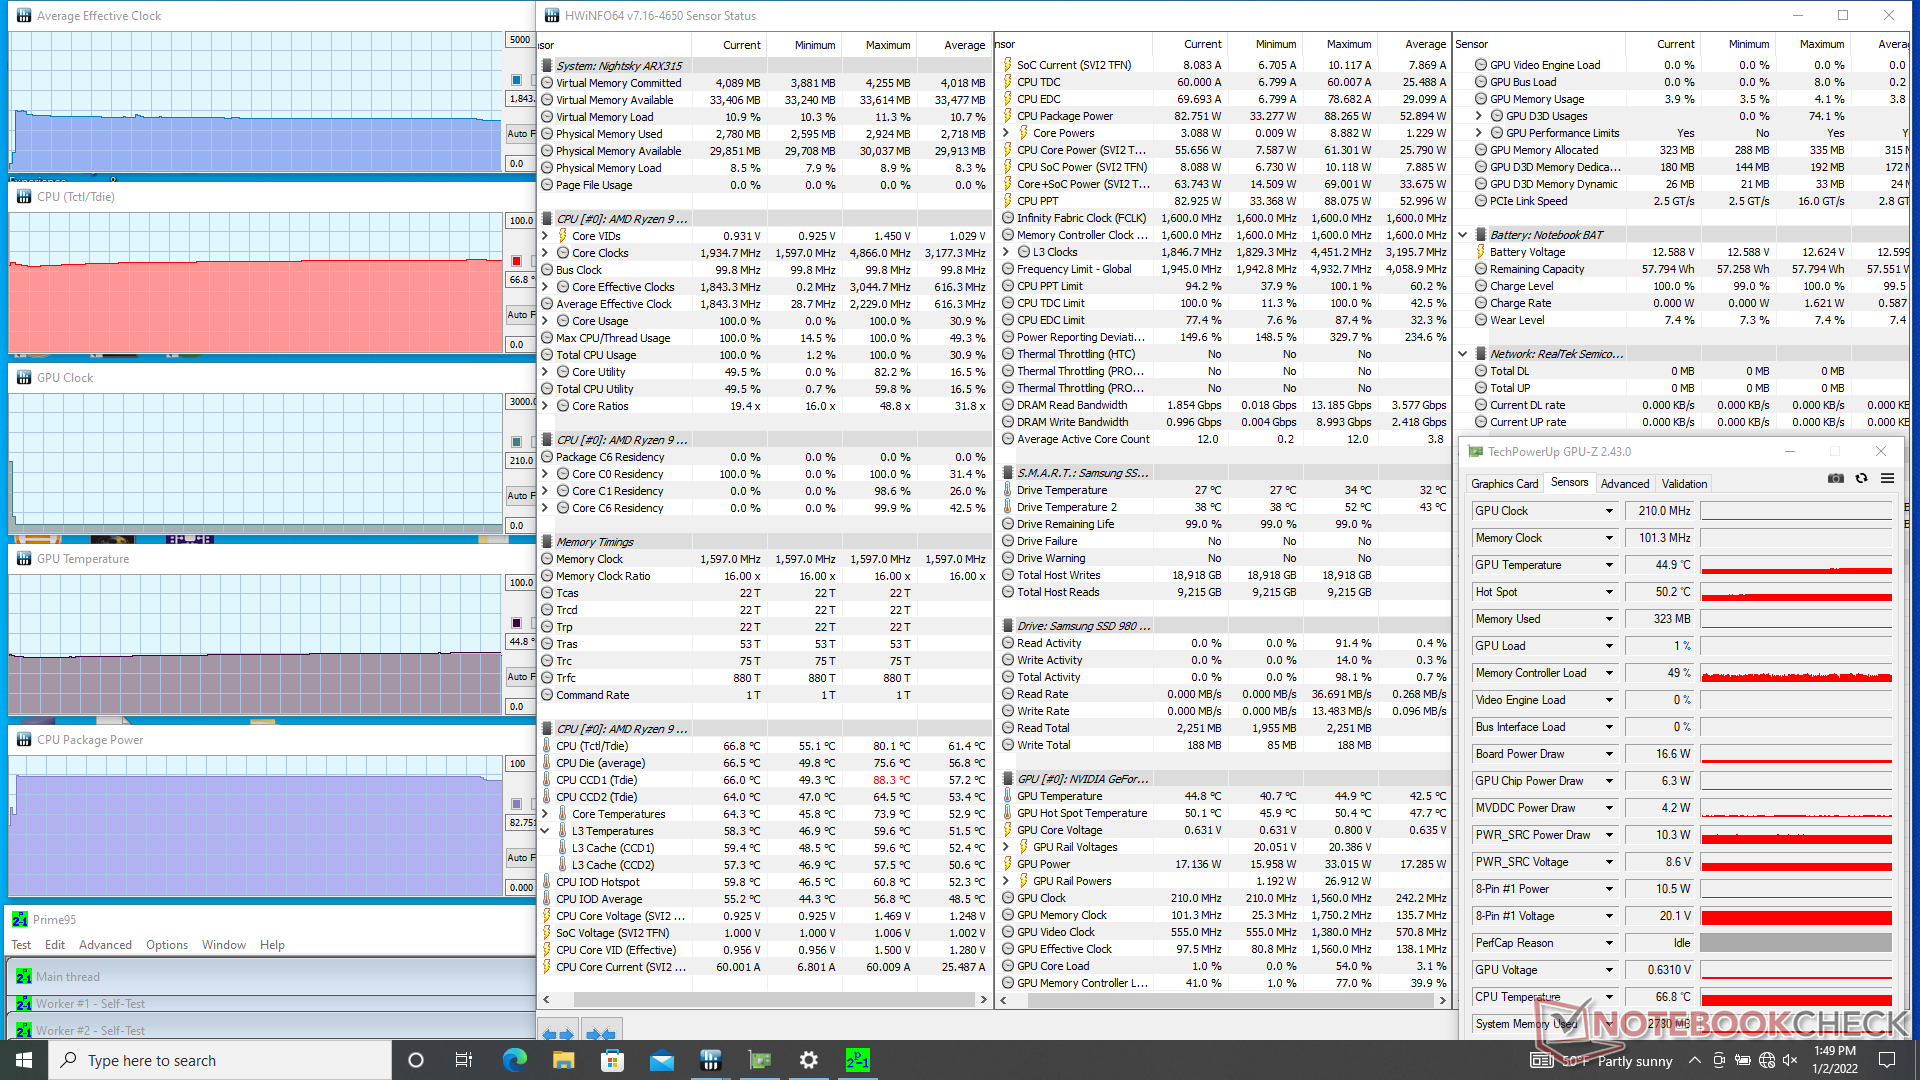
| Fréquence CPU(GHz) | Fréquence GPU(MHz) | Température CPU moyenne(°C) | Température GPUmoyenne(°C) | |
| Système en veille (mode ventilateur maximum désactivé) | -- | 58 | ||
| Prime95 Stress (mode ventilateur maximum désactivé) | 1.8 | -- | 67 | 45 |
| Prime95Stress (Mode ventilateur maximum activé) | 3.8 | -- | 54 | 30 |
| Prime95+ FurMark Stress (Mode ventilateur maximum activé) | 1.9 - 3.6 | 1305 | 67 | 70 |
| Witcher 3 Stress (Mode ventilateur maximum désactivé) | 0.8 | 1635 | 79 | 73 |
| Witcher 3 Stress (Mode ventilateur maximum activé) | 0.4 | 1605 | 72 | 70 |
Haut-parleurs
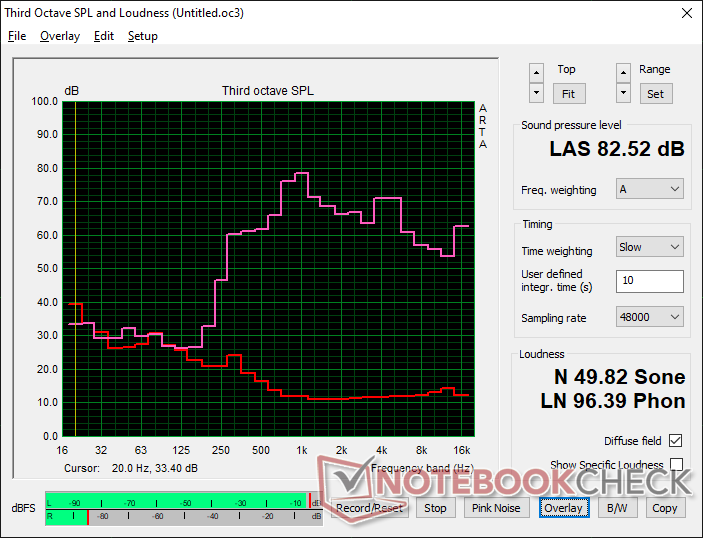
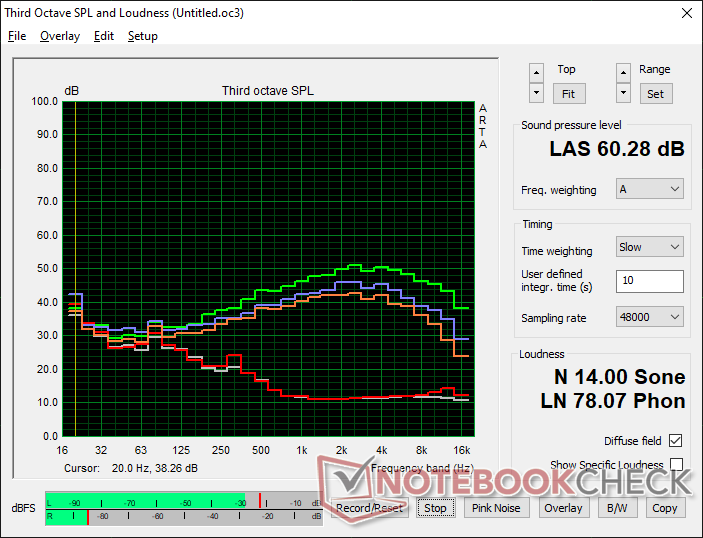
Eurocom Nightsky ARX315 analyse audio
(+) | les haut-parleurs peuvent jouer relativement fort (82.5# dB)
Basses 100 - 315 Hz
(-) | presque aucune basse - en moyenne 25.1% plus bas que la médiane
(±) | la linéarité des basses est moyenne (12.8% delta à la fréquence précédente)
Médiums 400 - 2000 Hz
(±) | médiane supérieure - en moyenne 7.1% supérieure à la médiane
(±) | la linéarité des médiums est moyenne (7.7% delta à la fréquence précédente)
Aiguës 2 - 16 kHz
(±) | sommets plus élevés - en moyenne 5.2% plus élevés que la médiane
(±) | la linéarité des aigus est moyenne (7.7% delta à la fréquence précédente)
Globalement 100 - 16 000 Hz
(±) | la linéarité du son global est moyenne (23.2% de différence avec la médiane)
Par rapport à la même classe
» 84% de tous les appareils testés de cette catégorie étaient meilleurs, 4% similaires, 11% pires
» Le meilleur avait un delta de 6%, la moyenne était de 18%, le pire était de 132%.
Par rapport à tous les appareils testés
» 70% de tous les appareils testés étaient meilleurs, 5% similaires, 25% pires
» Le meilleur avait un delta de 4%, la moyenne était de 23%, le pire était de 134%.
Apple MacBook 12 (Early 2016) 1.1 GHz analyse audio
(+) | les haut-parleurs peuvent jouer relativement fort (83.6# dB)
Basses 100 - 315 Hz
(±) | basse réduite - en moyenne 11.3% inférieure à la médiane
(±) | la linéarité des basses est moyenne (14.2% delta à la fréquence précédente)
Médiums 400 - 2000 Hz
(+) | médiane équilibrée - seulement 2.4% de la médiane
(+) | les médiums sont linéaires (5.5% delta à la fréquence précédente)
Aiguës 2 - 16 kHz
(+) | des sommets équilibrés - à seulement 2% de la médiane
(+) | les aigus sont linéaires (4.5% delta à la fréquence précédente)
Globalement 100 - 16 000 Hz
(+) | le son global est linéaire (10.2% différence à la médiane)
Par rapport à la même classe
» 7% de tous les appareils testés de cette catégorie étaient meilleurs, 2% similaires, 90% pires
» Le meilleur avait un delta de 5%, la moyenne était de 18%, le pire était de 53%.
Par rapport à tous les appareils testés
» 5% de tous les appareils testés étaient meilleurs, 1% similaires, 94% pires
» Le meilleur avait un delta de 4%, la moyenne était de 23%, le pire était de 134%.
Gestion de l'énergie
Consommation d'énergie
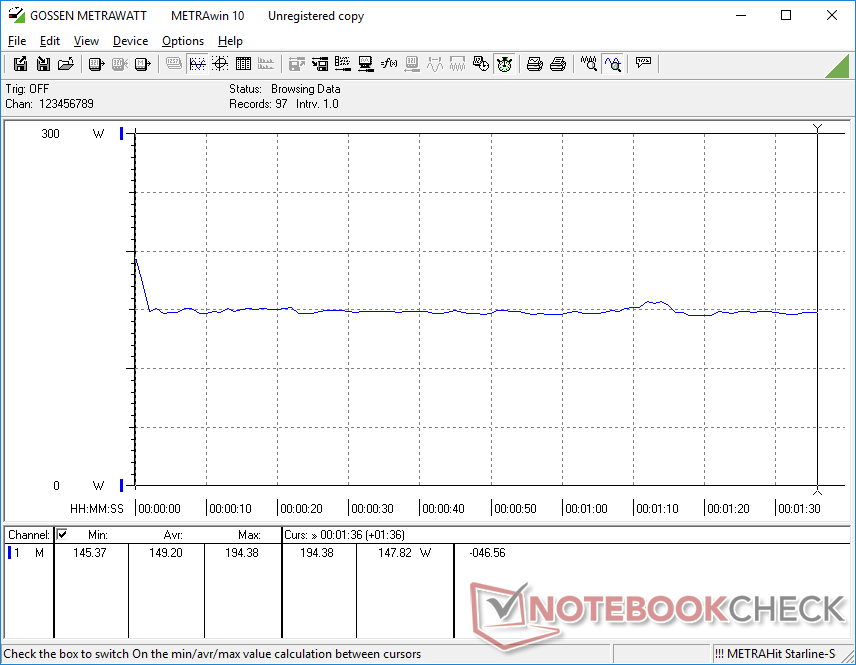
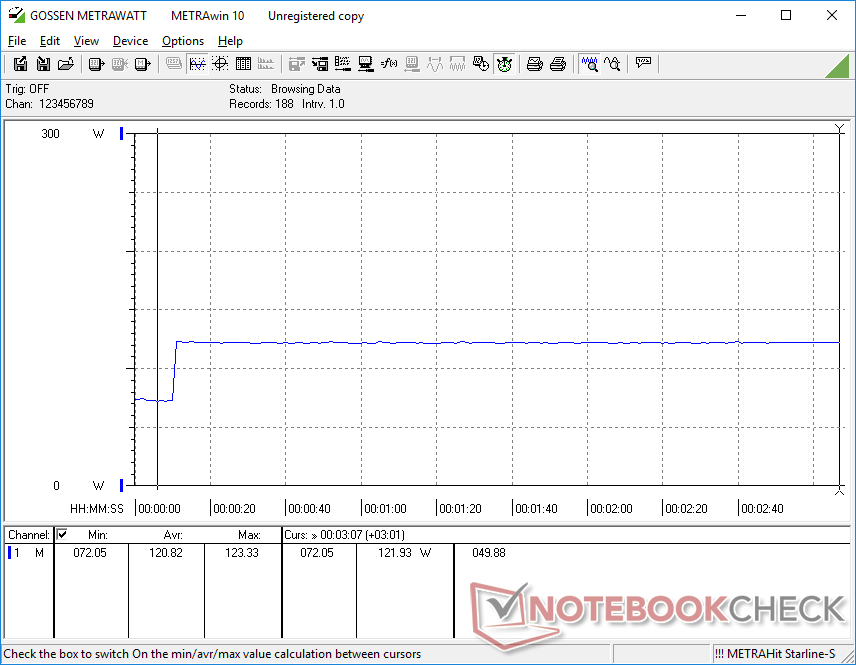
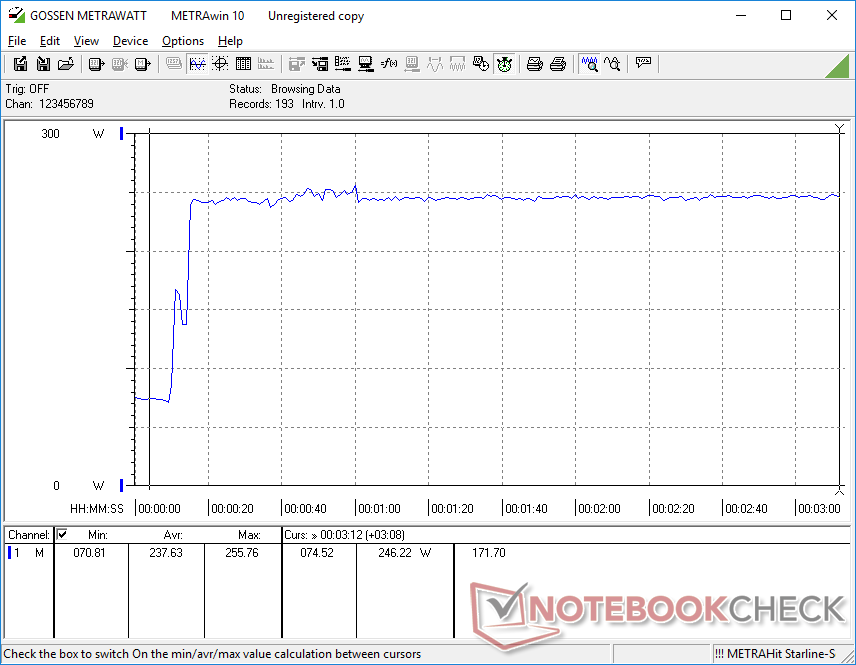
La consommation d'énergie est très élevée quelle que soit l'activité, ce qui peut expliquer la faible autonomie de la batterie dans la section suivante. Le simple fait de tourner au ralenti sur le bureau consomme entre 55 W et 73 W, contre 12 W et 35 W sur l'ancien Nightsky RX15 à processeur Intel. Cet écart important ne se réduit pas lors de l'exécution de charges plus élevées comme les jeux. Le Gigabyte A5 X1, qui utilise le même GPU RTX 3070 mais le CPU mobile Ryzen 9 5900HX à la place, demanderait environ 25 à 30 W de moins que notre Eurocom en cas de charges plus lourdes
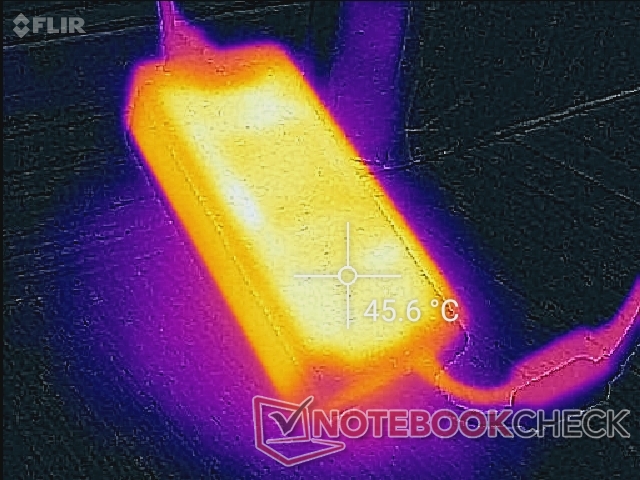
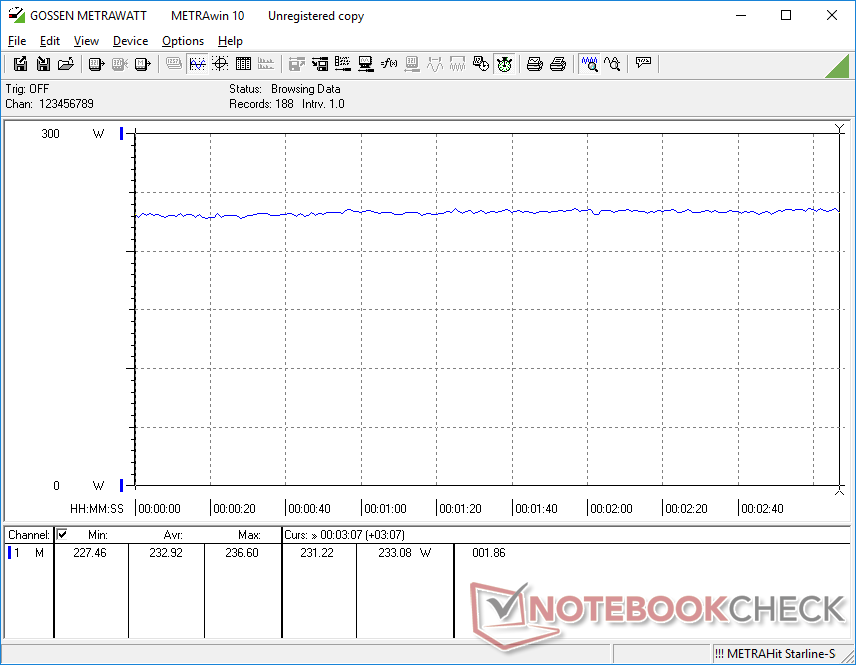
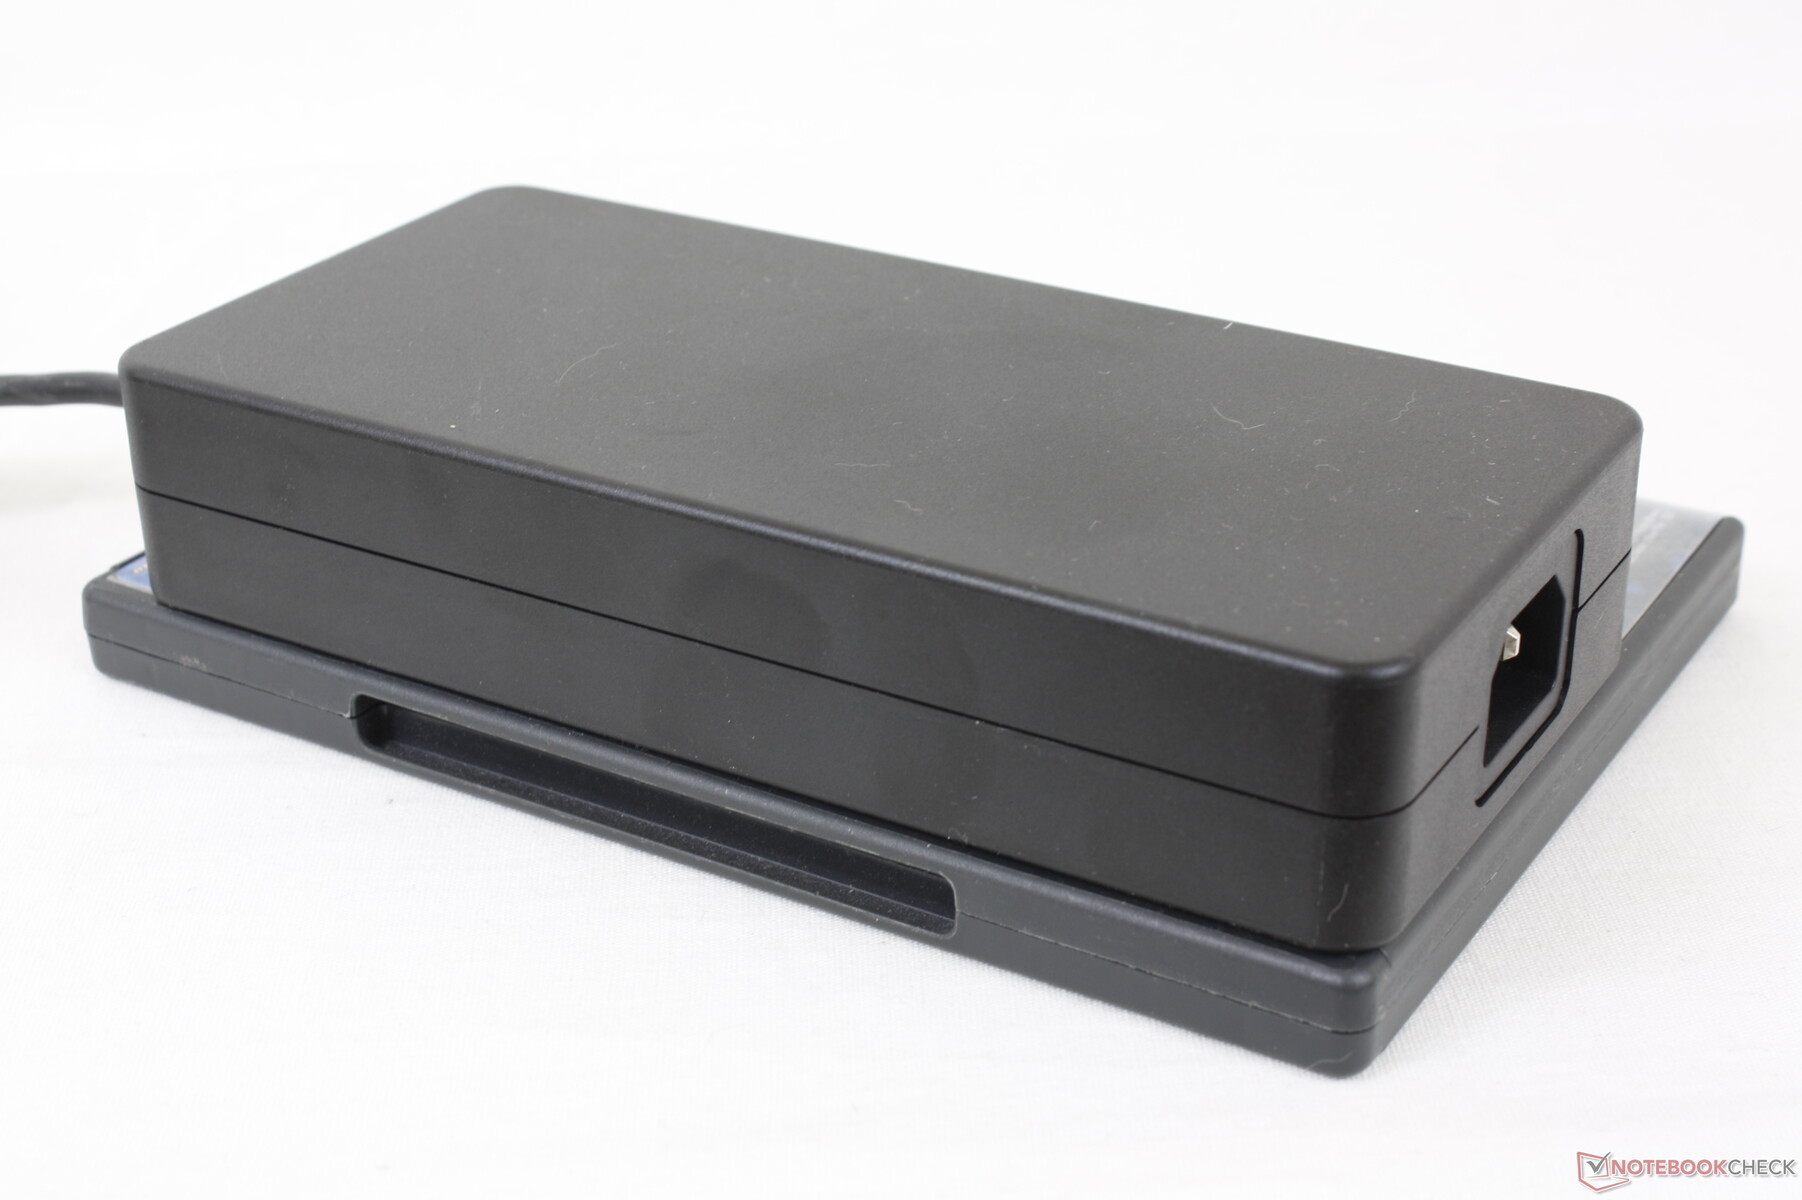
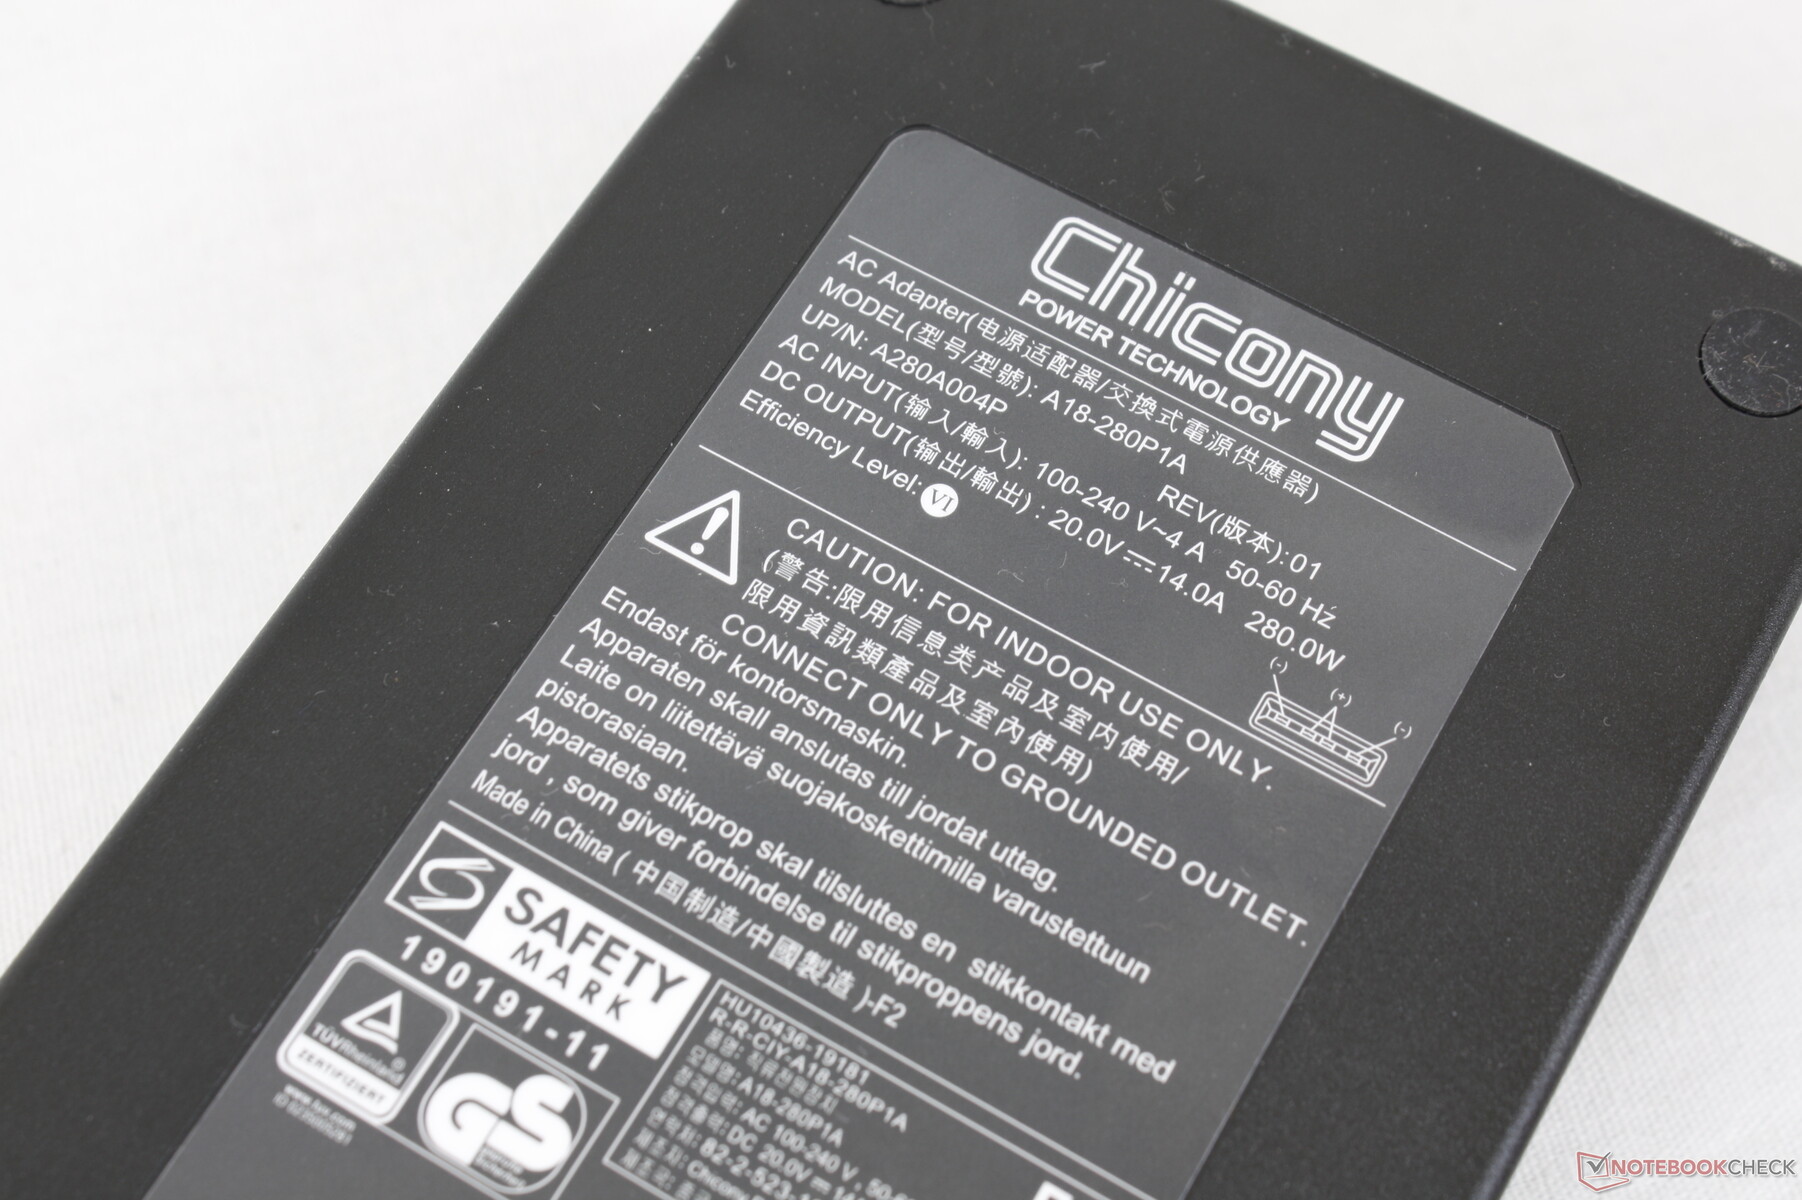
Nous avons pu enregistrer une consommation maximale de 256 W sur le grand adaptateur secteur de 280 W (~18 x 8,5 x 3,5 cm) en utilisant Prime95 et FurMark simultanément.
| Éteint/en veille | |
| Au repos | |
| Fortement sollicité |
|
Légende:
min: | |
| Eurocom Nightsky ARX315 R9 5900X, GeForce RTX 3070 Laptop GPU, Samsung SSD 980 Pro 1TB MZ-V8P1T0BW, IPS, 1920x1080, 15.6" | Gigabyte A5 X1 R9 5900HX, GeForce RTX 3070 Laptop GPU, ADATA XPG SX8200 Pro (ASX8200PNP-512GT), IPS, 1920x1080, 15.6" | Medion Erazer Deputy P25 R7 5800H, GeForce RTX 3060 Laptop GPU, Phison E12S-512GB-Phison-SSD-BICS4, IPS, 1920x1080, 15.6" | MSI Delta 15 A5EFK R9 5900HX, Radeon RX 6700M, Micron 2210 MTFDHBA1T0QFD, IPS-Level, 1920x1080, 15.6" | Schenker XMG Apex 15 NH57E PS R7 5800H, GeForce RTX 3060 Laptop GPU, Samsung SSD 980 500GB (MZ-V8V500BW), IPS, 1920x1080, 15.6" | MSI GE66 Raider 10SFS i9-10980HK, GeForce RTX 2070 Super Mobile, WDC PC SN730 SDBPNTY-1T00, IPS-Level, 1920x1080, 15.6" | |
|---|---|---|---|---|---|---|
| Power Consumption | 44% | 52% | 48% | 52% | 45% | |
| Idle Minimum * (Watt) | 55 | 10 82% | 8 85% | 10 82% | 10.5 81% | 6 89% |
| Idle Average * (Watt) | 68.2 | 12 82% | 11 84% | 18 74% | 15 78% | 14 79% |
| Idle Maximum * (Watt) | 72.5 | 16 78% | 16 78% | 25 66% | 17 77% | 25 66% |
| Load Average * (Watt) | 149.2 | 124 17% | 109 27% | 101 32% | 109 27% | 108 28% |
| Witcher 3 ultra * (Watt) | 233 | 204 12% | 183 21% | 187 20% | 186 20% | 195 16% |
| Load Maximum * (Watt) | 255.8 | 272 -6% | 211 18% | 217 15% | 186 27% | 280 -9% |
* ... Moindre est la valeur, meilleures sont les performances
Power Consumption Witcher 3 / Stresstest
Power Consumption external Monitor
Autonomie de la batterie
Les durées d'exécution en profil équilibré (ou silencieux) sont si faibles qu'il faut beaucoup plus de temps pour charger la batterie de son état vide à son état plein que pour la décharger lors d'une simple navigation sur Internet (120 minutes contre 61 minutes). La batterie est facilement amovible, contrairement à la plupart des autres ordinateurs portables, mais sa capacité est plutôt faible (62 Wh) par rapport à d'autres grands ordinateurs portables de 15,6 pouces comme le MSI GE66.
| Eurocom Nightsky ARX315 R9 5900X, GeForce RTX 3070 Laptop GPU, 62 Wh | Gigabyte A5 X1 R9 5900HX, GeForce RTX 3070 Laptop GPU, 48.96 Wh | Medion Erazer Deputy P25 R7 5800H, GeForce RTX 3060 Laptop GPU, 49 Wh | MSI Delta 15 A5EFK R9 5900HX, Radeon RX 6700M, 82 Wh | Schenker XMG Apex 15 NH57E PS R7 5800H, GeForce RTX 3060 Laptop GPU, 49 Wh | MSI GE66 Raider 10SFS i9-10980HK, GeForce RTX 2070 Super Mobile, 99.99 Wh | |
|---|---|---|---|---|---|---|
| Autonomie de la batterie | 540% | 570% | 690% | 550% | 510% | |
| WiFi v1.3 (h) | 1 | 6.4 540% | 6.7 570% | 7.9 690% | 6.5 550% | 6.1 510% |
| Reader / Idle (h) | 10.1 | 10.5 | 11.1 | 7.6 | ||
| H.264 (h) | 7.3 | 4.6 | ||||
| Load (h) | 1.3 | 1.1 | 1.6 | 1.4 | 1.8 |
Points positifs
Points négatifs
Verdict
Il y a quelques problèmes qui doivent être résolus : les temps de réveil très lents et les performances terriblement lentes lorsqu'on passe en mode économie d'énergie ou en mode silence. Ces deux fonctions sont nettement plus lentes sur le Nightsky ARX15 par rapport à un Ultrabook standard qui coûte une fraction du prix.
Il n'est pas recommandé de faire tourner ce système avec les paramètres d'origine pour ceux qui souhaitent exploiter le Ryzen 9 5900X au maximum de son potentiel. Les performances du CPU seront inférieures à celles d'un ordinateur de bureau équipé du même Ryzen 9 5900X, ce qui signifie que les utilisateurs doivent overclocker notre Ryzen 9 5900X mobile pour le mettre au niveau. Nos tests montrent qu'il y a effectivement une certaine marge de manœuvre disponible, mais le bruit du ventilateur résultant sera très fort et potentiellement gênant. Néanmoins, Eurocom continue d'être l'une des très rares sociétés à proposer des ordinateurs portables avec des CPU de bureau, alors que de nombreux grands fabricants comme MSI et Alienware se sont moins concentrés sur ces ordinateurs portables "super performants".
Prix et disponibilité
Les utilisateurs peuvent configurer le Nightsky ARX15 directement depuis le fabricant ici.
Eurocom Nightsky ARX315
- 01/06/2022 v7 (old)
Allen Ngo
Price comparison

