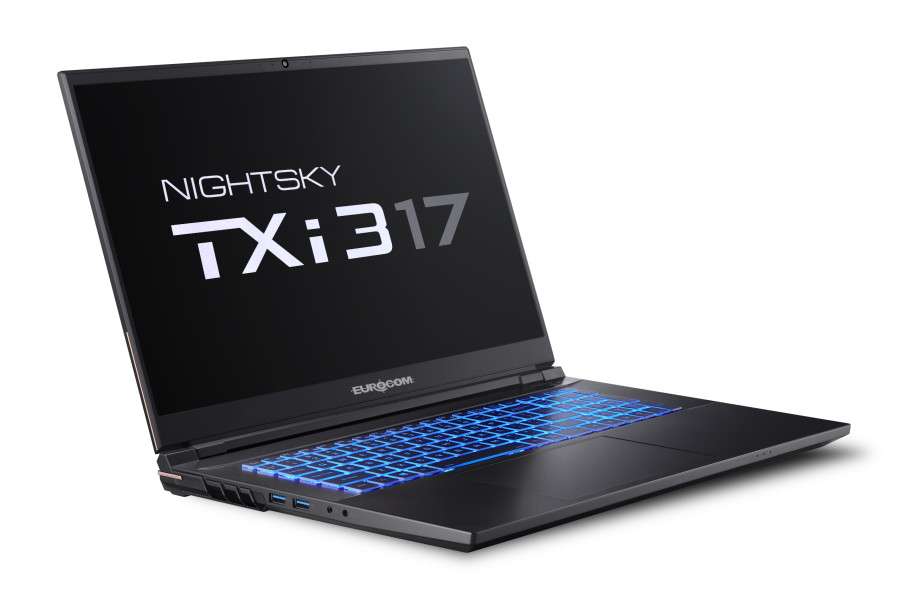
Test de l'ordinateur portable Eurocom Nightsky TXi317 : un accélérateur RTX 3080 Ti de 125 W GeForce
")
Le Nightsky TXi317 est le dernier portable de jeu de 17,3 pouces d'Eurocom qui utilise les CPU Alder Lake-H de 12e génération d'Intel et un GPU TGP GeForce RTX 3080 Ti de 155 W pour être l'un des portables de jeu les plus rapides actuellement disponibles. Il partage le même design de châssis Tongfang que le Schenker XMG Pro 17 E22 et nous vous recommandons donc de consulter notre critique existante ici pour plus de détails sur le châssis et ses caractéristiques physiques.
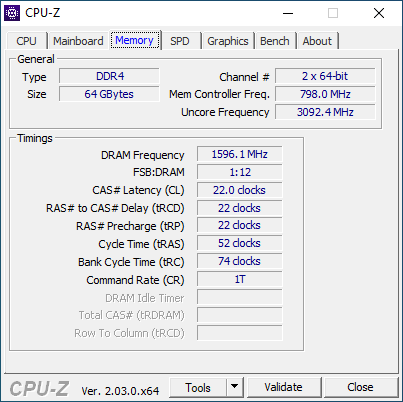
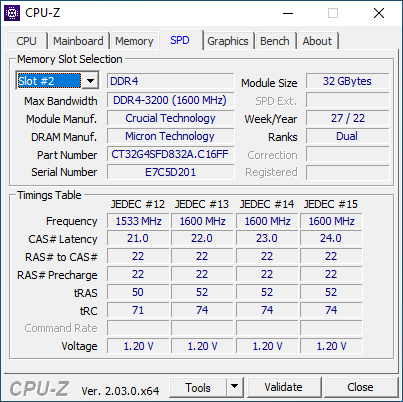
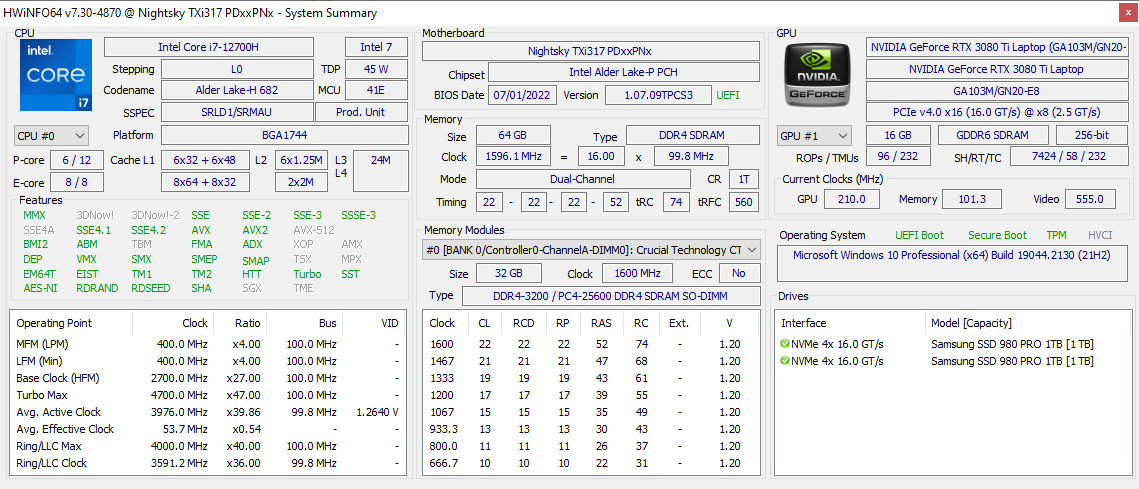
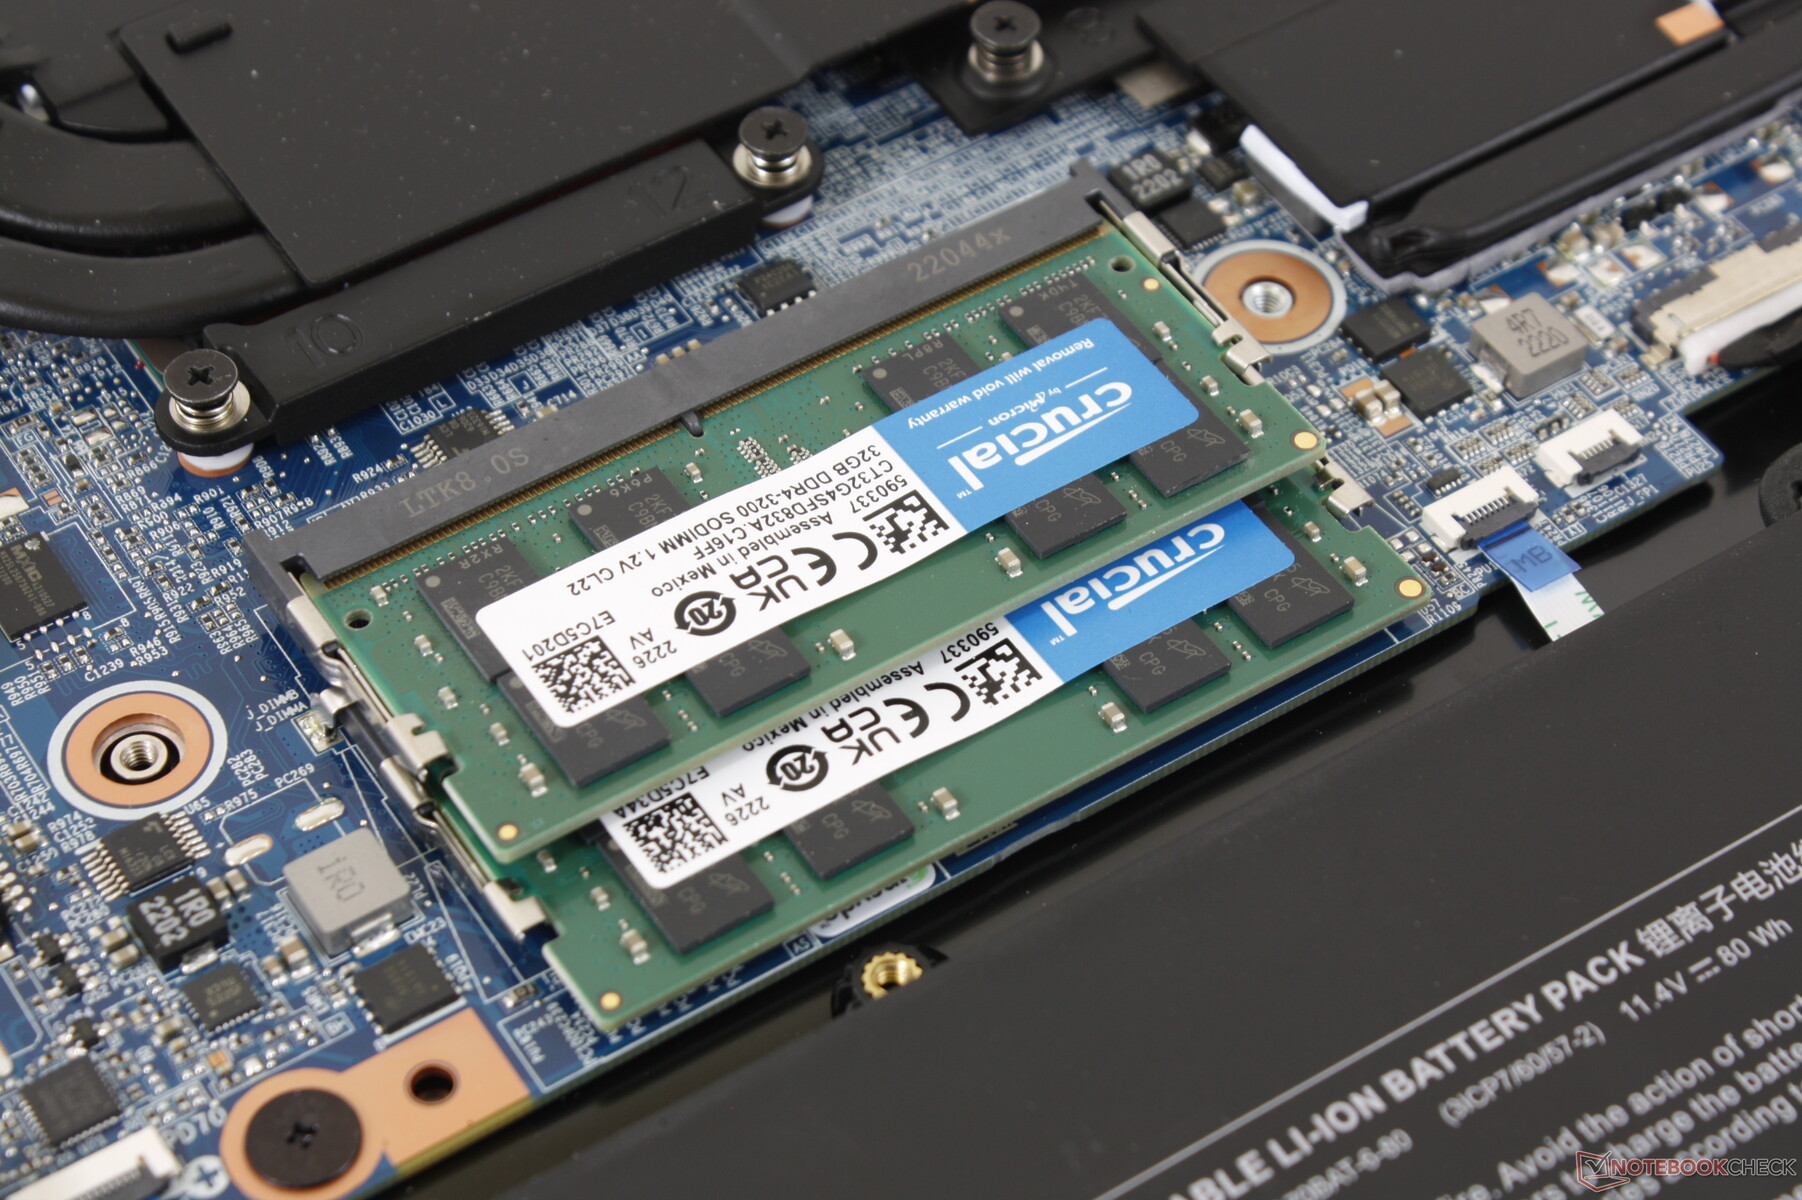
Notre configuration est équipée d'un processeur Core i7-12700H, d'un écran IPS 1080p 144 Hz, d'un GPU RTX 3080 Ti GeForce et de 64 Go de RAM pour environ 4100 USD. Le GPU le plus bas de gamme est le GeForce RTX 3070 Ti, ce qui place le Nightsky TXi317 sur le marché des ordinateurs portables de jeu pour les passionnés.
Parmi les concurrents directs, on trouve d'autres ordinateurs portables de 17 pouces très performants pour les jeux, tels que le Aorus 17X,Le MSI Raider GE77ouAlienware x17 R2.
Plus de commentaires sur Eurocom :
Comparaison avec les concurrents potentiels
Note | Date | Modèle | Poids | Épaisseur | Taille | Résolution | Prix |
|---|---|---|---|---|---|---|---|
| 85.3 % v7 (old) | 10/22 | Eurocom Nightsky TXi317 i7-12700H, GeForce RTX 3080 Ti Laptop GPU | 2.9 kg | 27 mm | 17.30" | 1920x1080 | |
| 85.4 % v7 (old) | 07/22 | Schenker XMG Pro 17 E22 i9-12900H, GeForce RTX 3080 Ti Laptop GPU | 2.8 kg | 27 mm | 17.30" | 2560x1440 | |
| 83.7 % v7 (old) | 08/22 | Aorus 17X XES i9-12900HX, GeForce RTX 3070 Ti Laptop GPU | 2.7 kg | 30 mm | 17.30" | 1920x1080 | |
| 86.8 % v7 (old) | 07/22 | MSI Raider GE77 HX 12UHS i9-12900HX, GeForce RTX 3080 Ti Laptop GPU | 3.1 kg | 25.9 mm | 17.30" | 3840x2160 | |
| 89.9 % v7 (old) | 07/22 | Razer Blade 17 Early 2022 i9-12900H, GeForce RTX 3080 Ti Laptop GPU | 2.8 kg | 19.9 mm | 17.30" | 3840x2160 | |
| 89.2 % v7 (old) | 05/22 | Alienware x17 R2 P48E i9-12900HK, GeForce RTX 3080 Ti Laptop GPU | 3.1 kg | 20.9 mm | 17.30" | 1920x1080 |
Cas
Il existe une différence superficielle entre le Nightsky TXi317 et le XMG Pro 17 E22 : les coins arrière du modèle Eurocom comportent des garnitures brillantes de couleur bronze, ce qui n'est pas le cas du modèle Schenker. Sinon, leurs châssis sont identiques.
Lecteur de carte SD
| SD Card Reader | |
| average JPG Copy Test (av. of 3 runs) | |
| Alienware x17 R2 P48E (AV Pro V60) | |
| Razer Blade 17 Early 2022 (AV PRO microSD 128 GB V60) | |
| Schenker XMG Pro 17 E22 (AV PRO microSD 128 GB V60) | |
| MSI Raider GE77 HX 12UHS (AV PRO microSD 128 GB V60) | |
| Eurocom Nightsky TXi317 (AV Pro V60) | |
| maximum AS SSD Seq Read Test (1GB) | |
| Alienware x17 R2 P48E (AV Pro V60) | |
| Eurocom Nightsky TXi317 (AV Pro V60) | |
| Schenker XMG Pro 17 E22 (AV PRO microSD 128 GB V60) | |
Communication
Le Wi-Fi 6 est fourni en standard, sans option Wi-Fi 6E de la part du fabricant, malgré la gamme de prix élevée du modèle. Les taux de transfert sont néanmoins réguliers et sans problème de connectivité.
| Networking | |
| iperf3 transmit AX12 | |
| Alienware x17 R2 P48E | |
| iperf3 receive AX12 | |
| Alienware x17 R2 P48E | |
| iperf3 receive AXE11000 6GHz | |
| Aorus 17X XES | |
| MSI Raider GE77 HX 12UHS | |
| iperf3 receive AXE11000 | |
| Schenker XMG Pro 17 E22 | |
| Razer Blade 17 Early 2022 | |
| Eurocom Nightsky TXi317 | |
| iperf3 transmit AXE11000 6GHz | |
| Aorus 17X XES | |
| iperf3 transmit AXE11000 | |
| Eurocom Nightsky TXi317 | |
Webcam
L'appareil photo n'est que de 1 MP et il n'y a pas d'option de 2 MP, ce qui est encore une fois décevant compte tenu de la gamme de prix élevée du modèle.


Maintenance
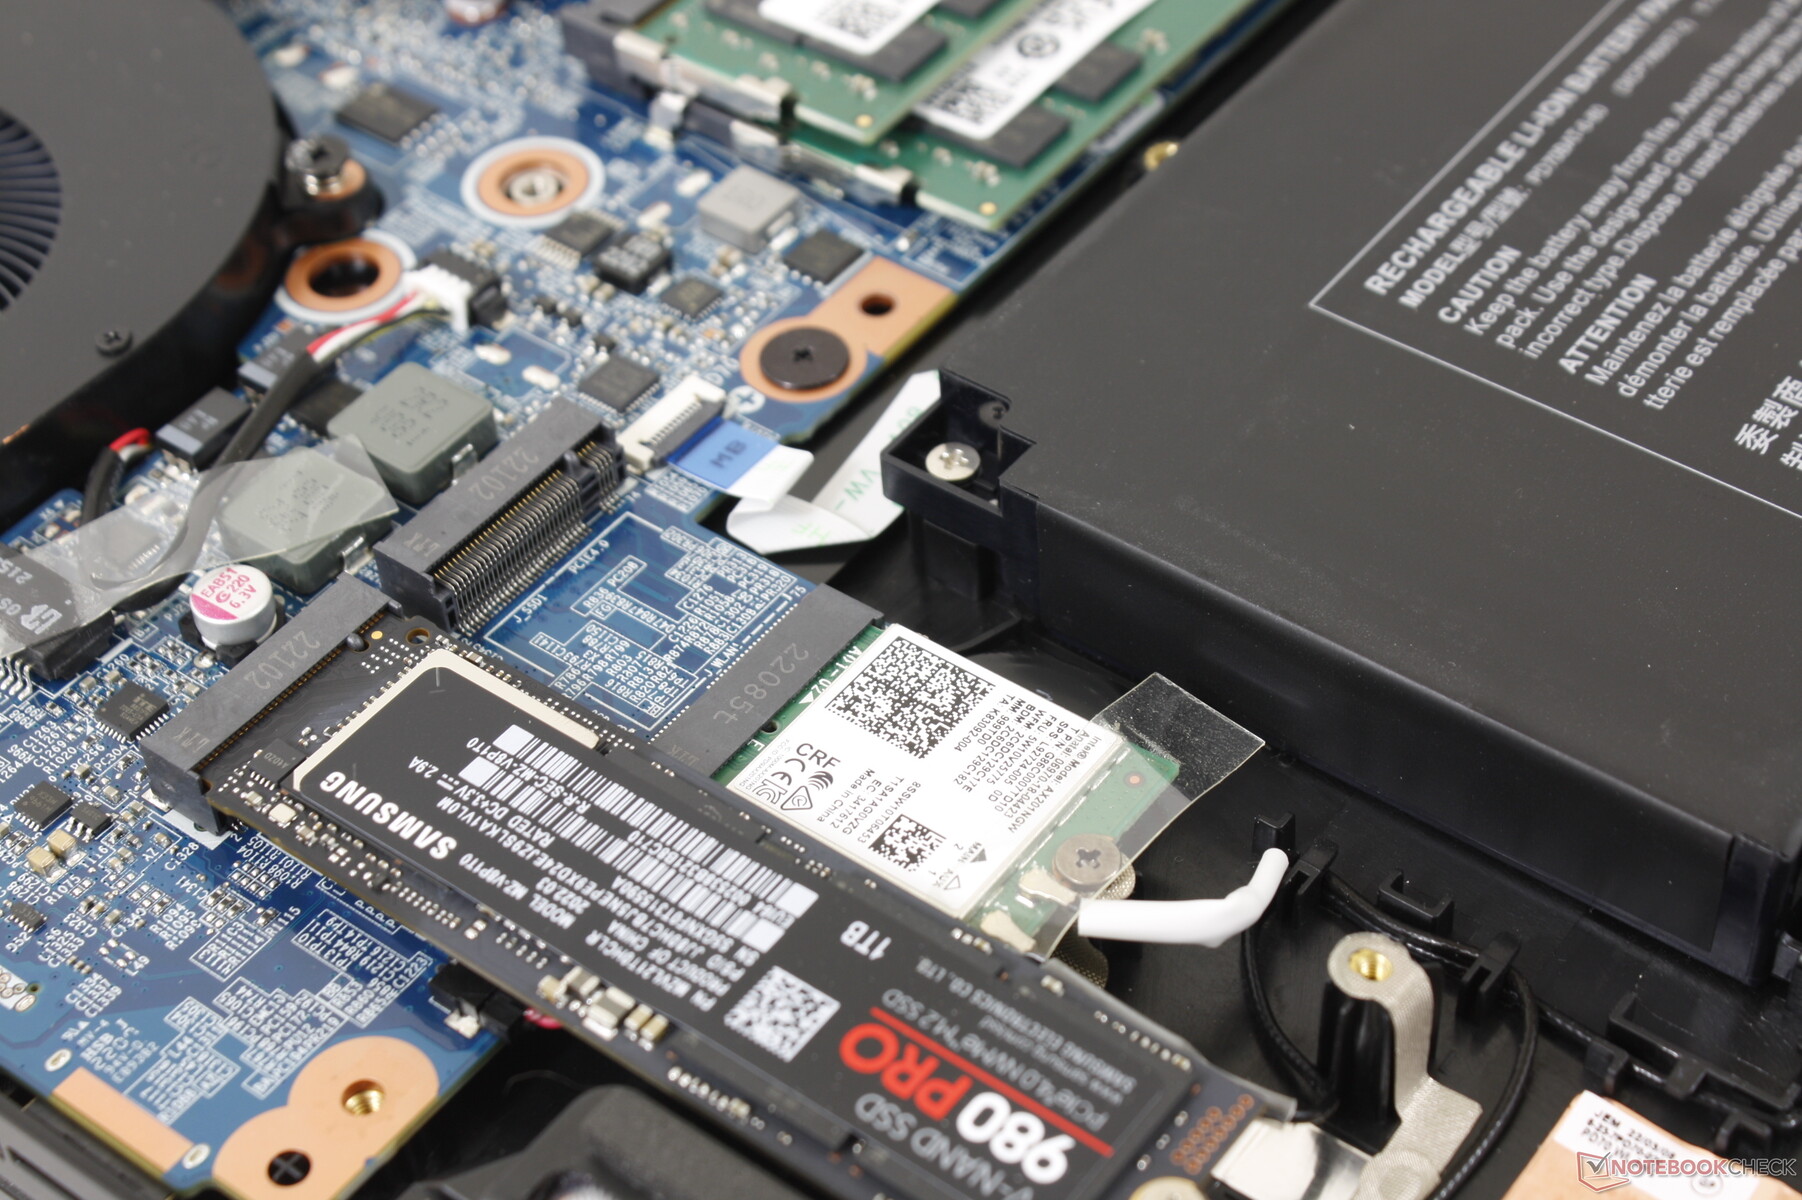
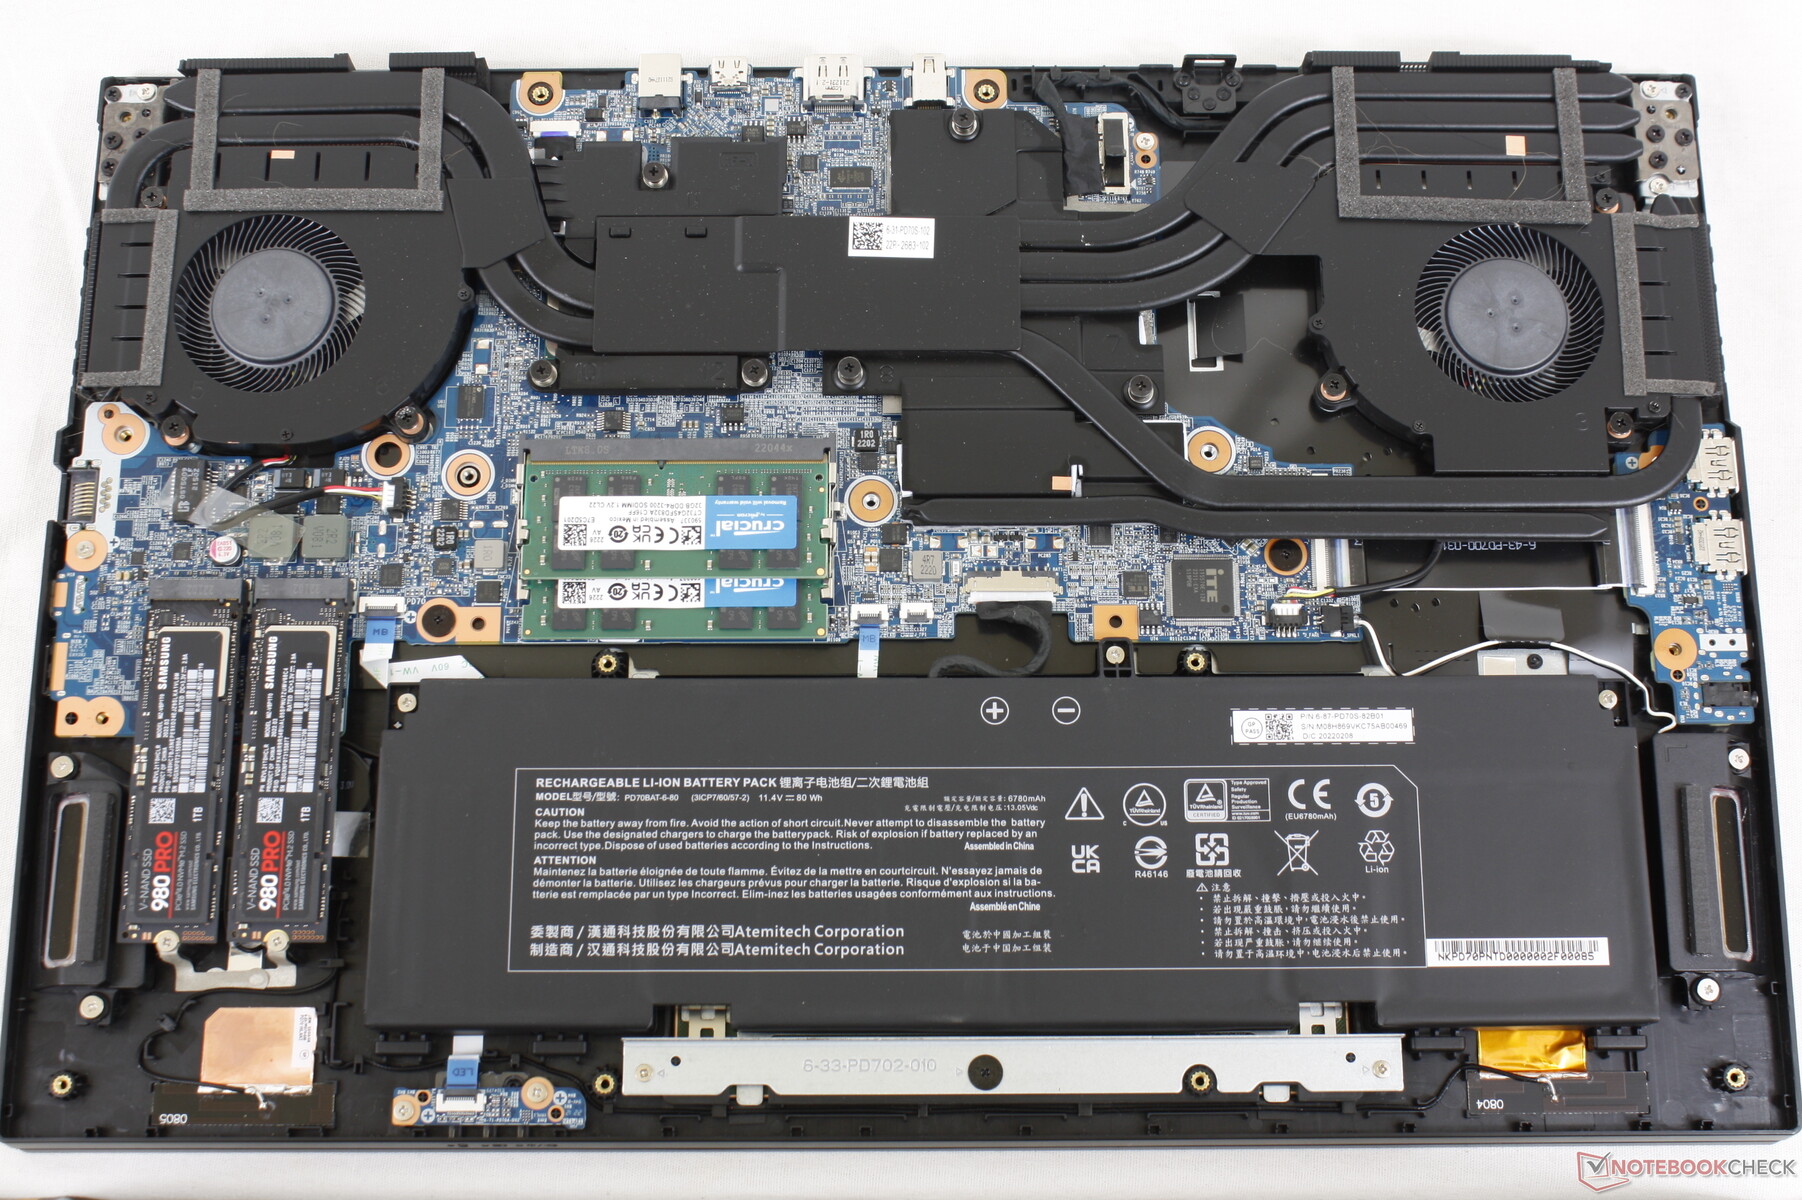
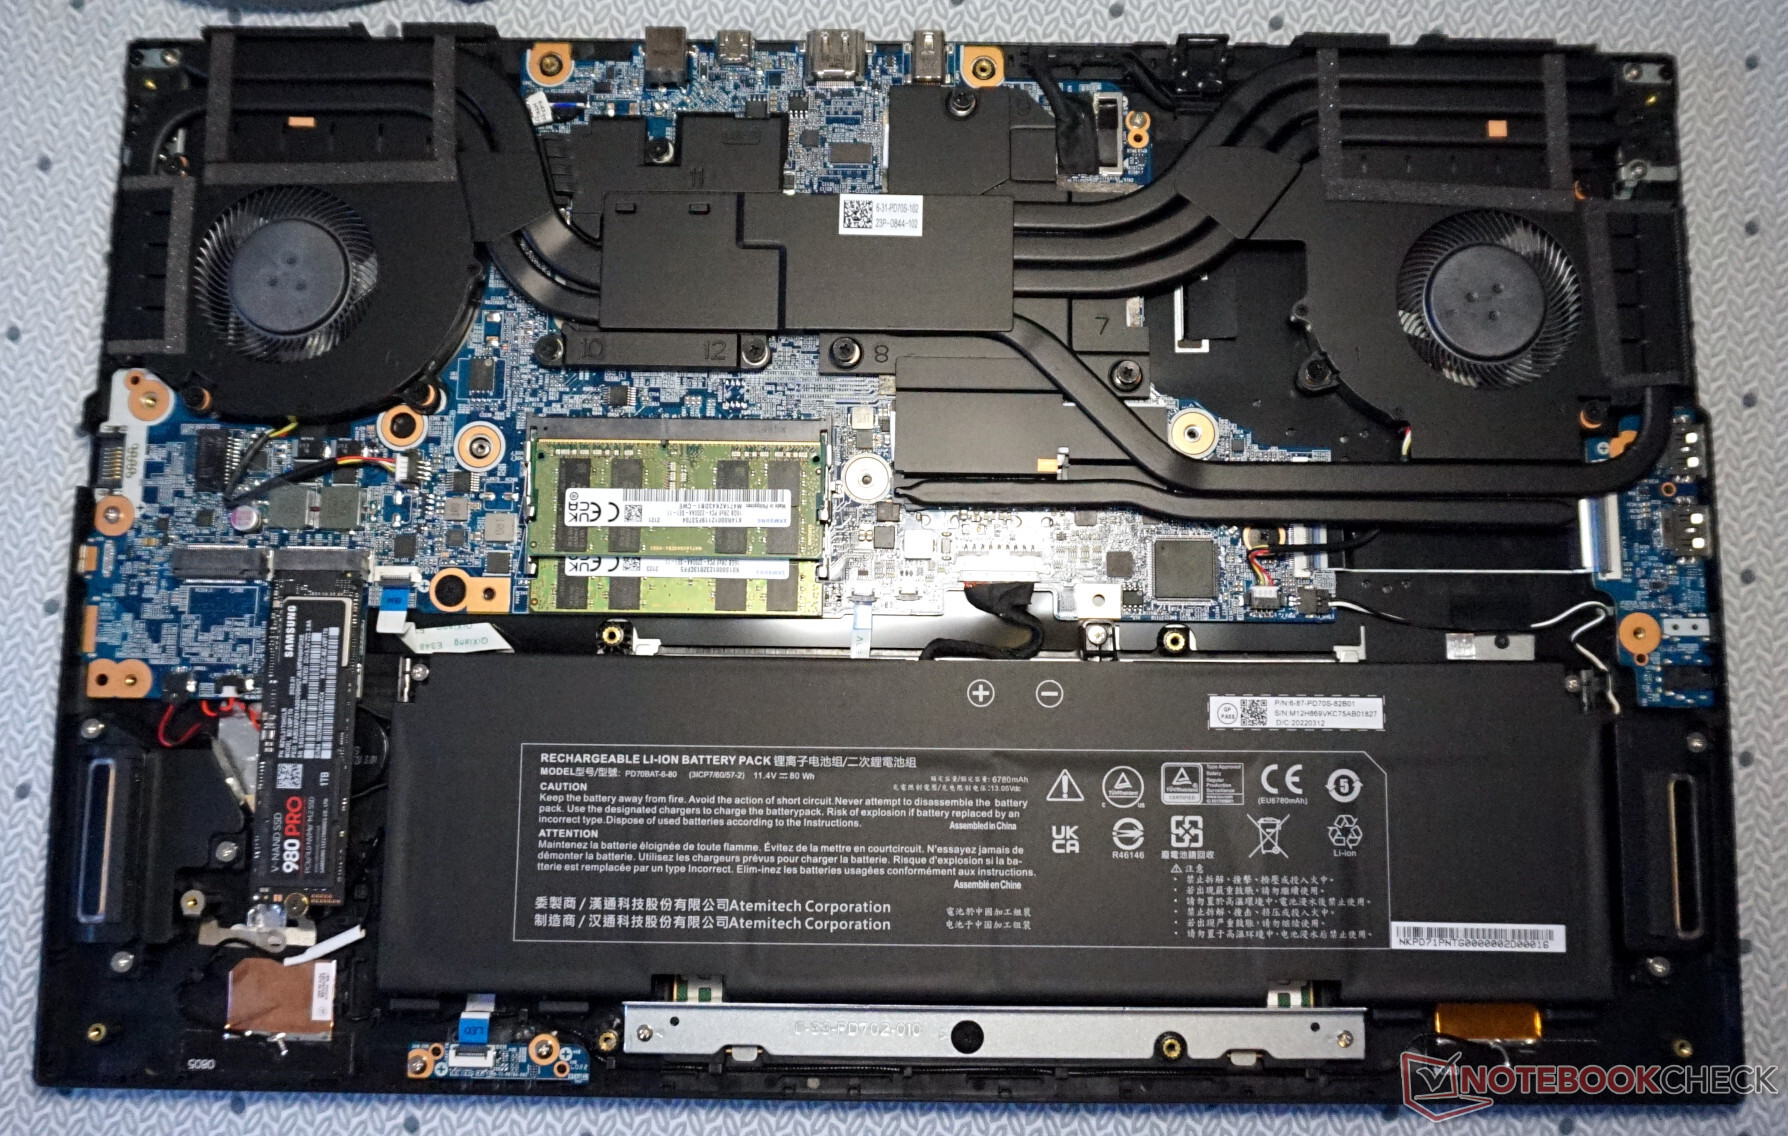
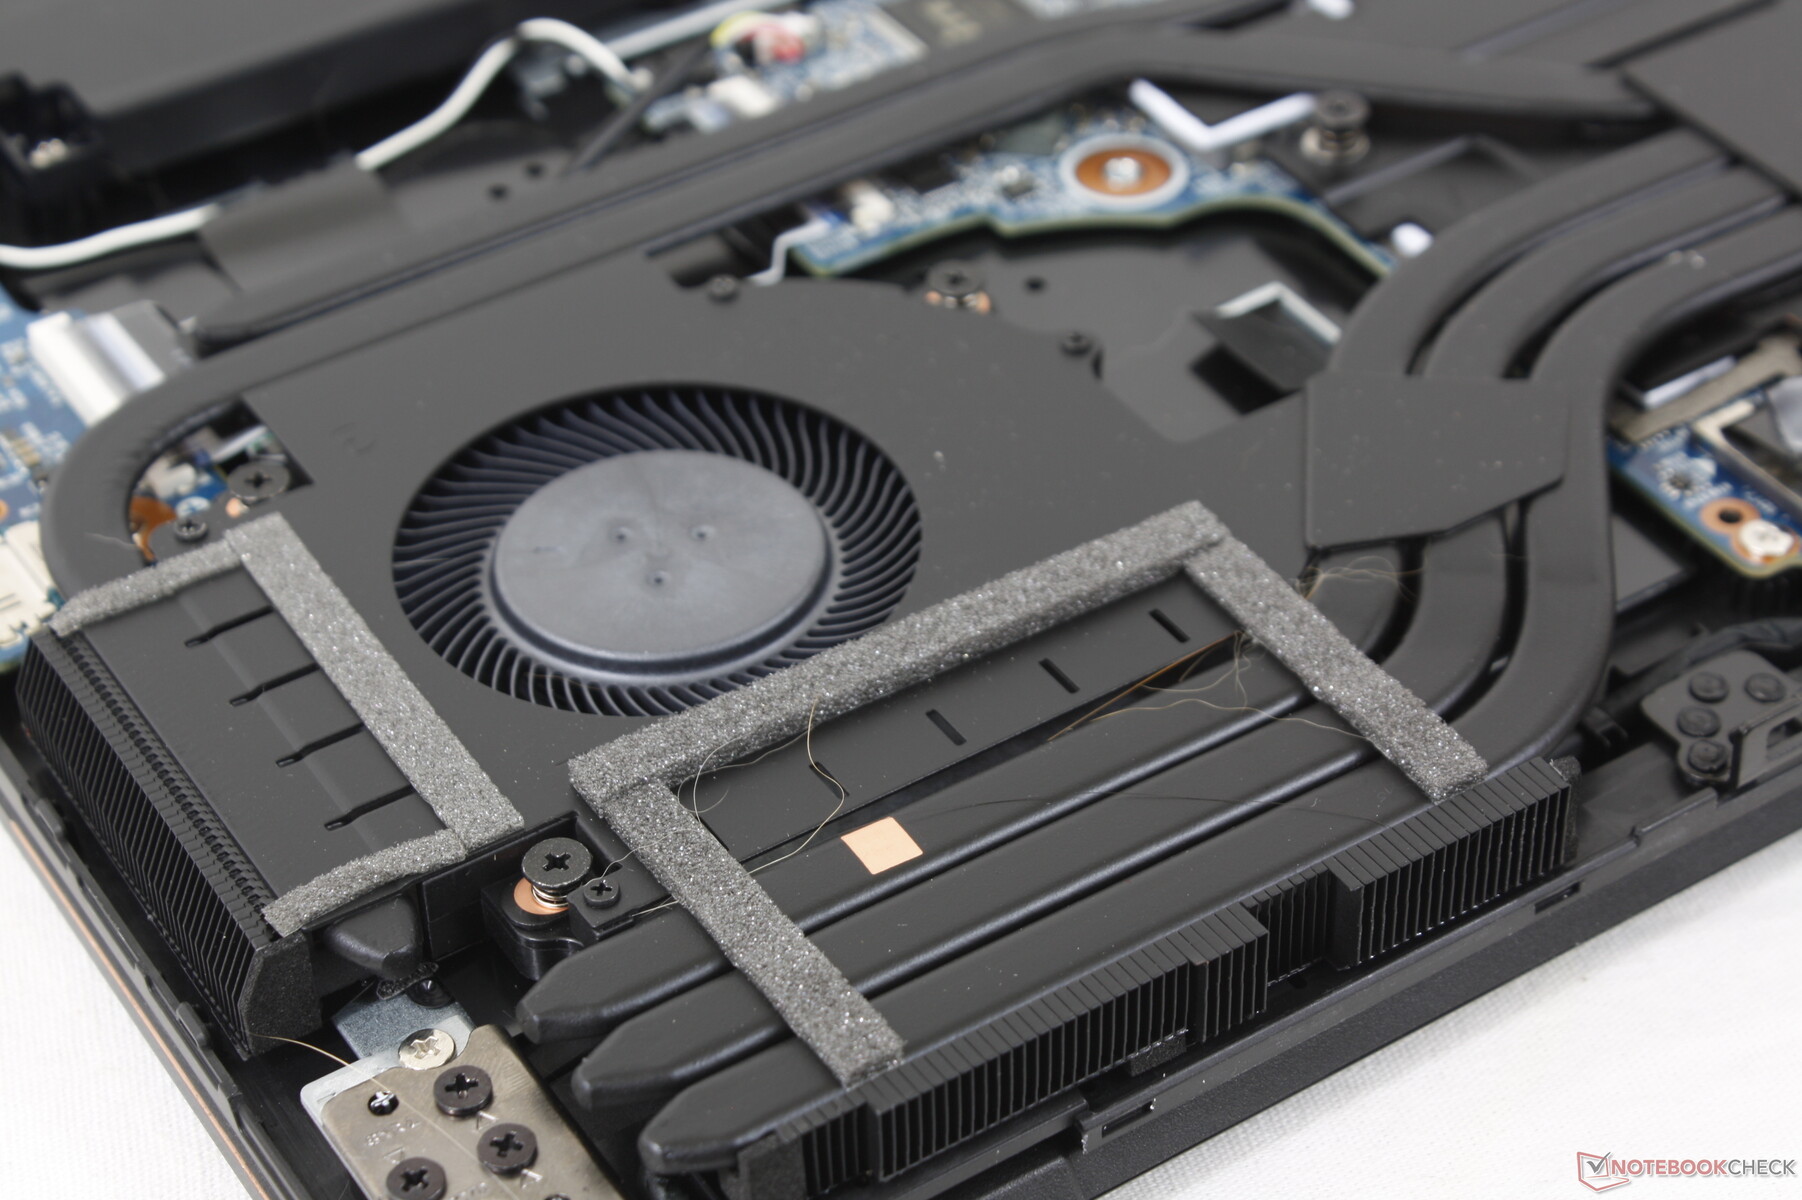
Le panneau inférieur est fixé par 16 vis Philips pour faciliter l'entretien. La plupart des autres ordinateurs portables de jeu ont beaucoup moins de vis, cependant, et il faut donc un peu plus de patience pour ouvrir l'Eurocom.
Accessoires et garantie
La boîte de détail ne comprend pas d'autres éléments que l'adaptateur secteur et les documents administratifs. La garantie standard limitée d'un an du fabricant s'applique si l'appareil est acheté aux États-Unis.
Afficher
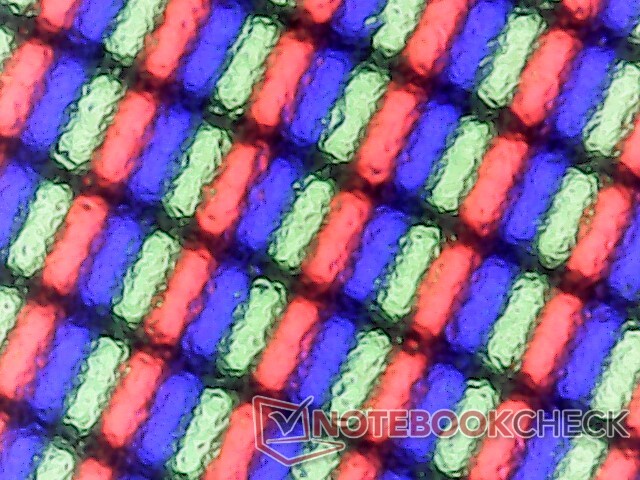
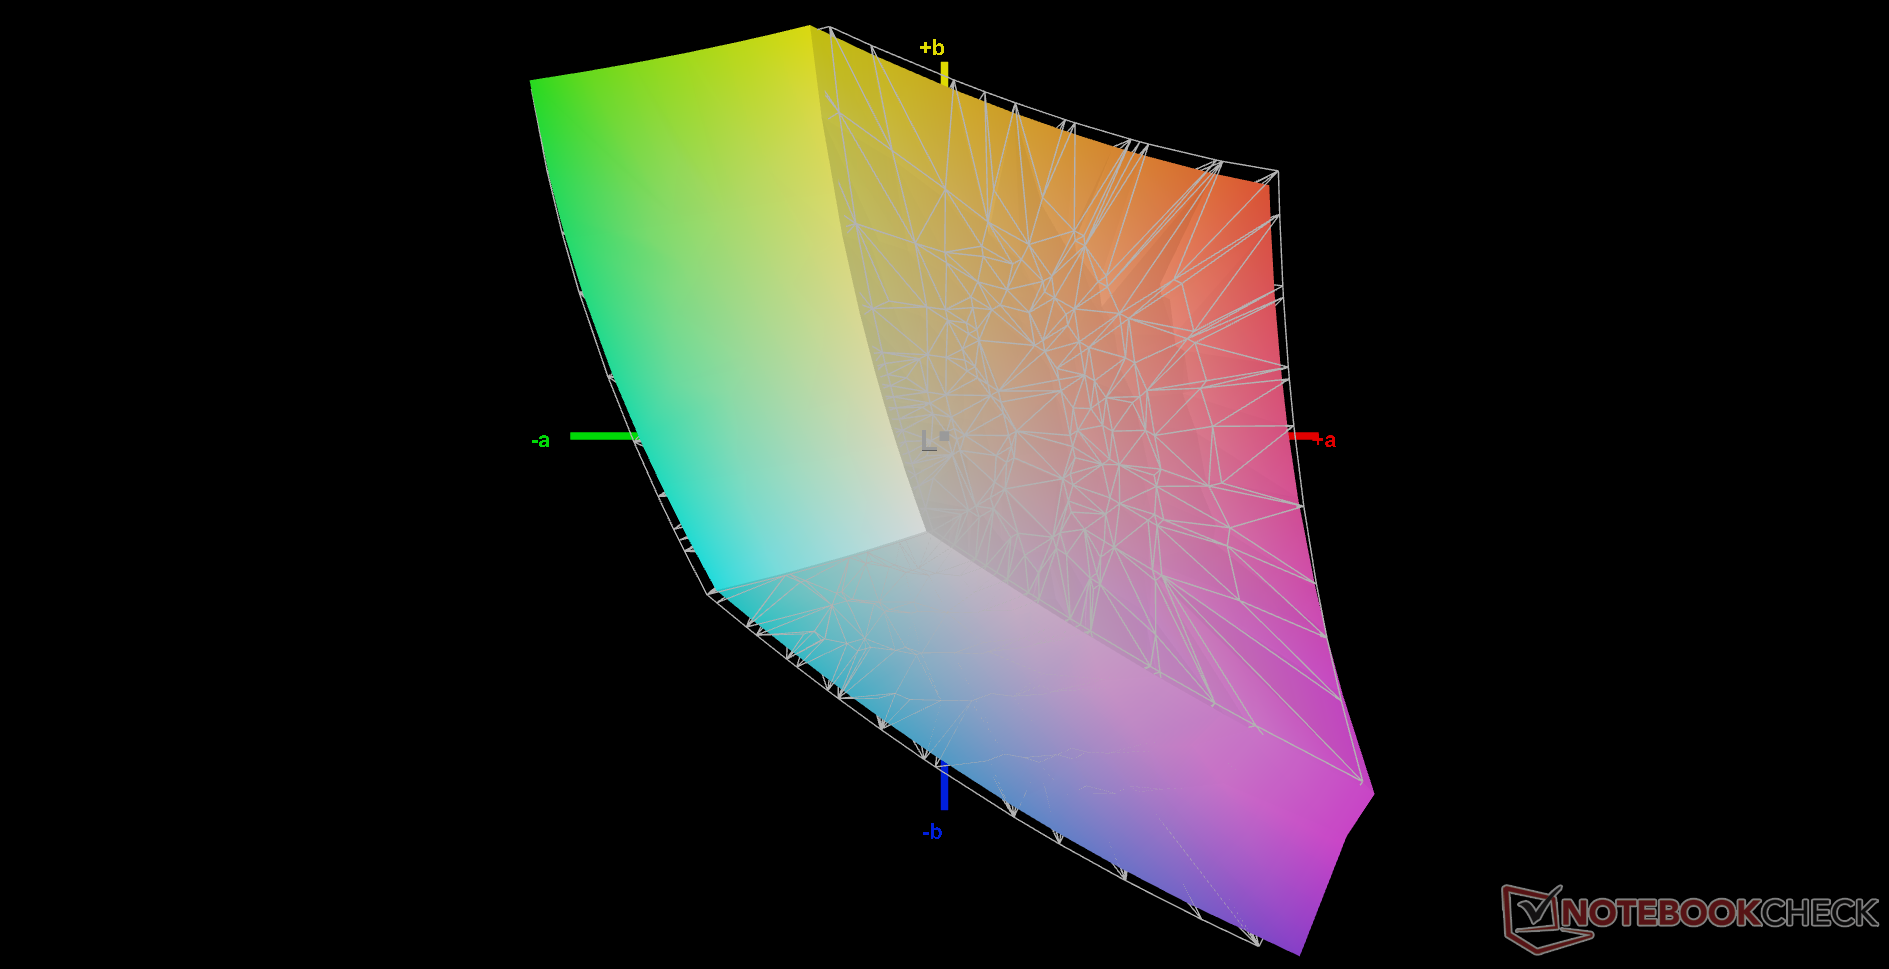
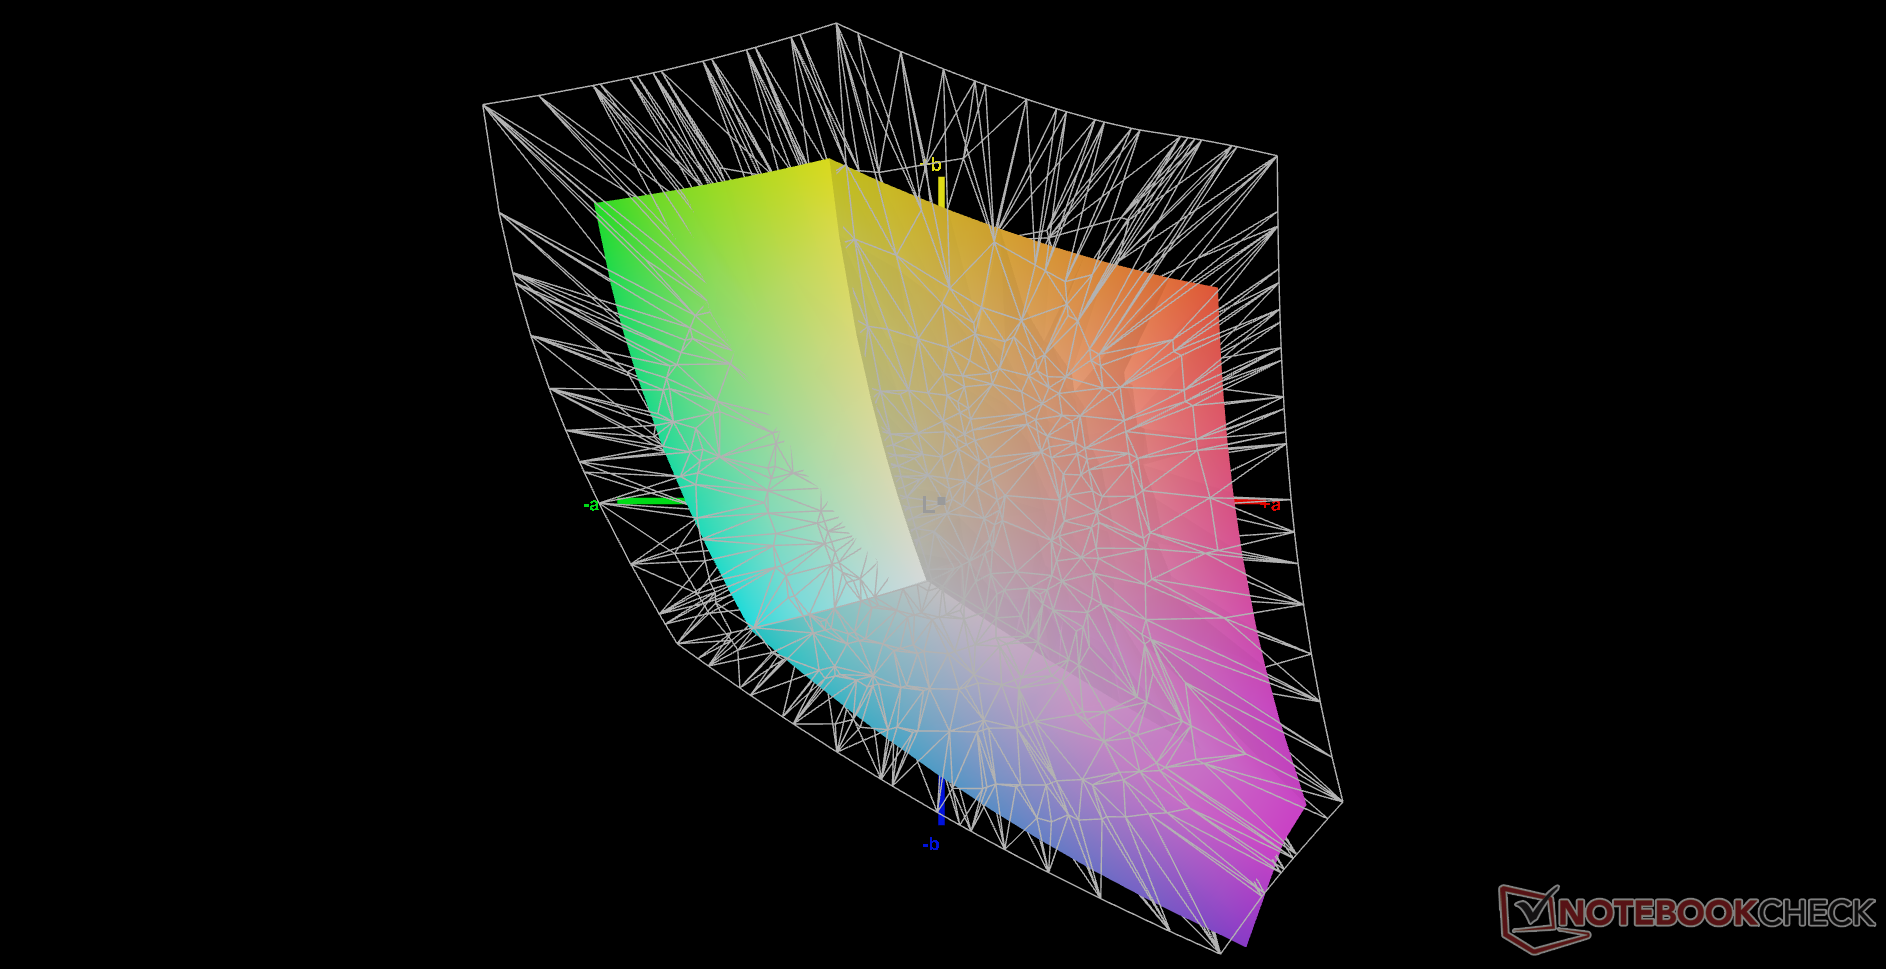
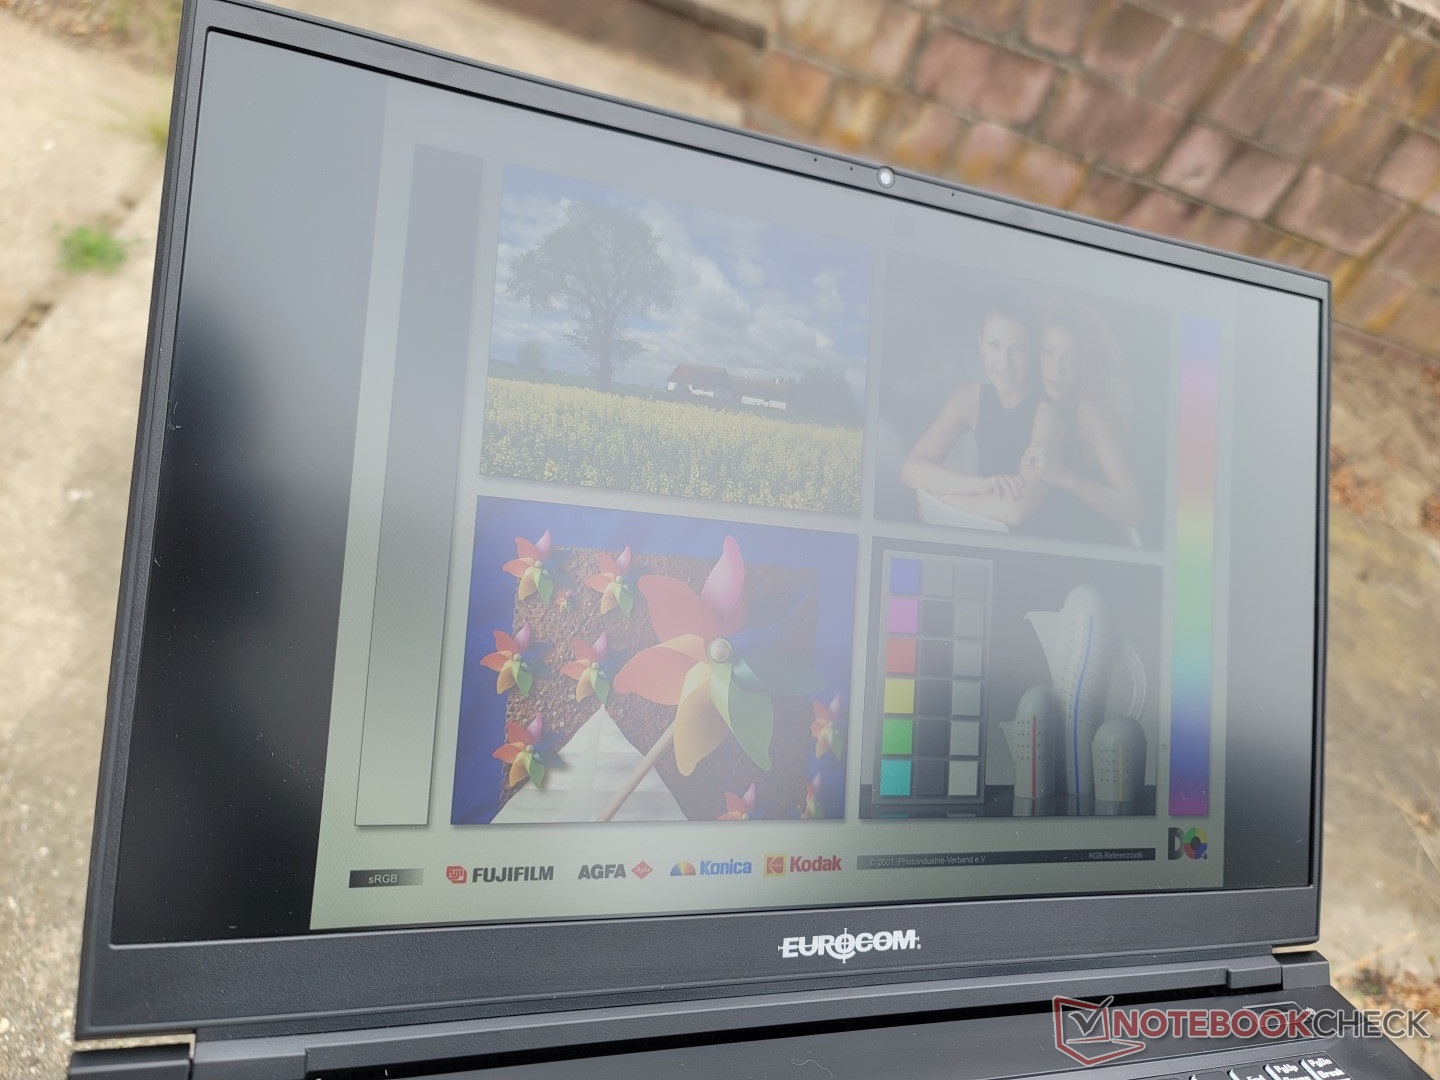
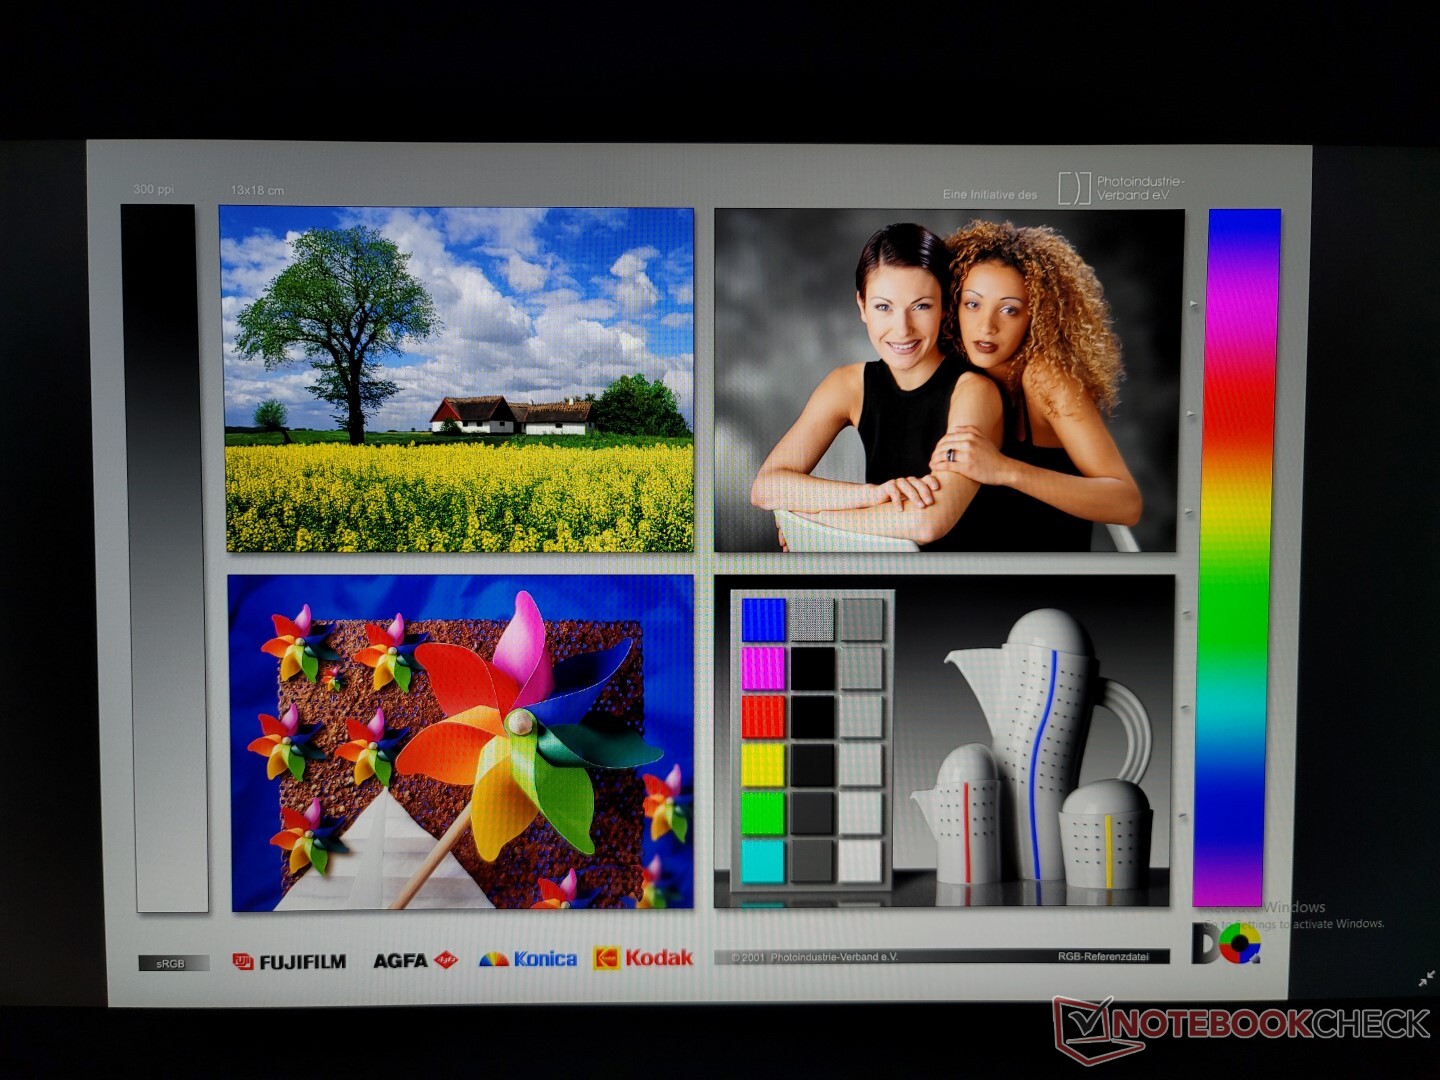
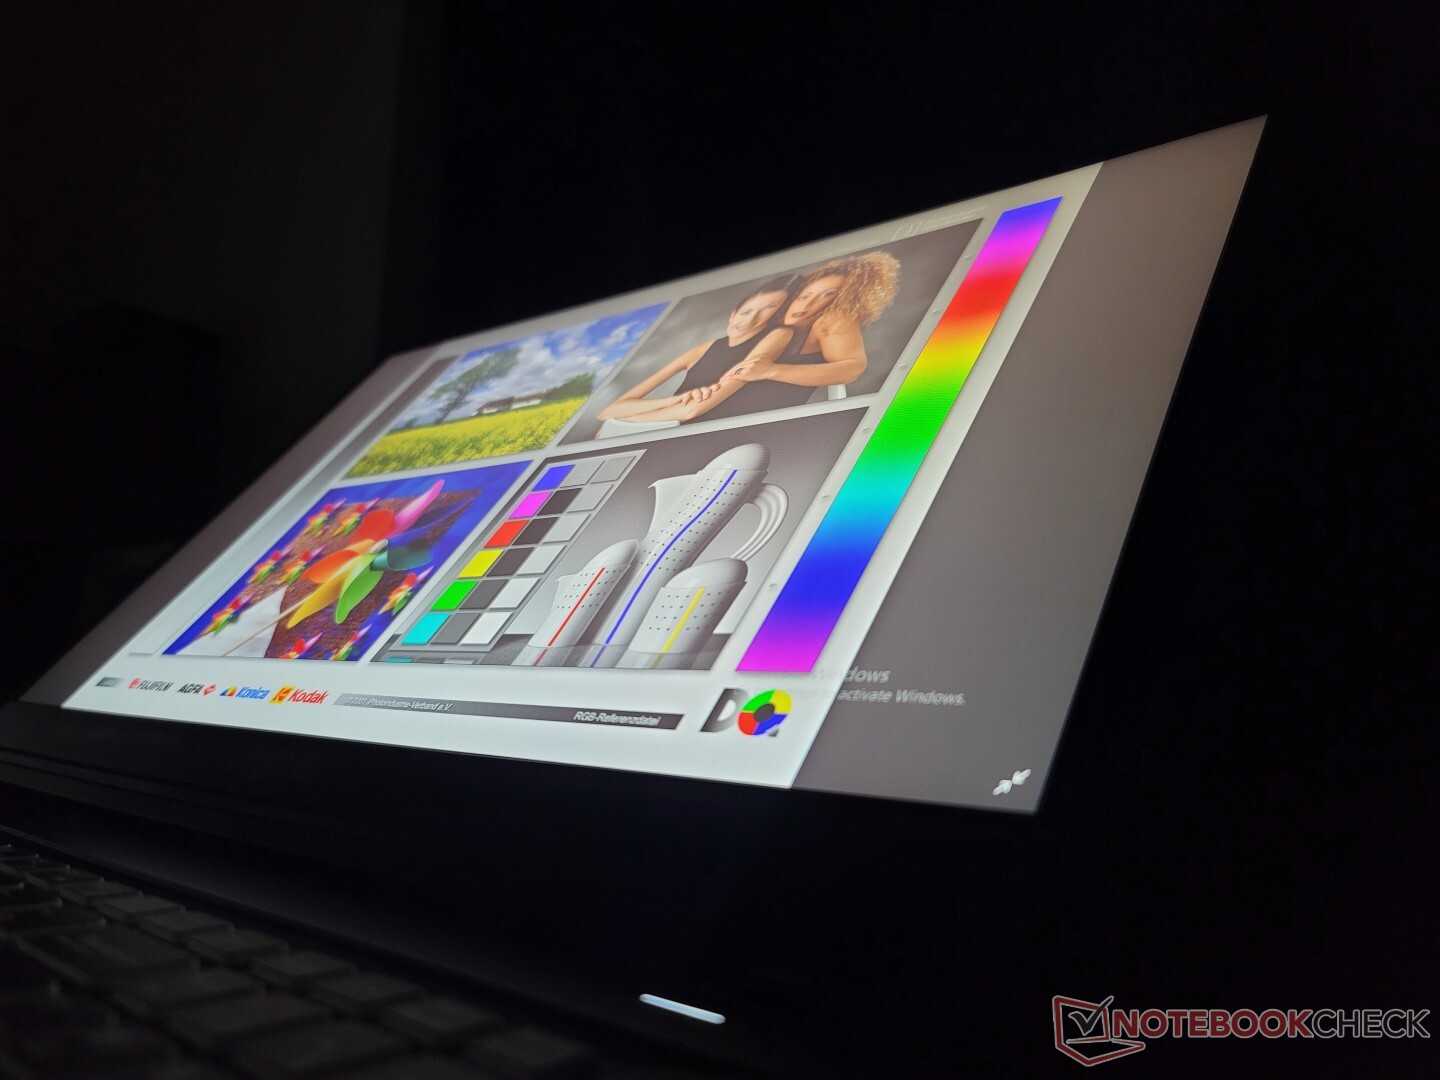
Notre unité de test utilise la même dalle IPS LG Philips LP173WFG-SPB3 que celle que l'on retrouve sur le modèle Schenker XMG Focus 17. Comparé à la dalle BOE 1440p du XMG Pro 17 E22, notre dalle LG Philips 1080p offre des couleurs plus étroites, une fréquence de rafraîchissement plus lente et des temps de réponse noir-blanc plus lents, ce qui en fait davantage un écran de milieu de gamme qu'un écran haut de gamme. Il reste néanmoins très bon, mais le 1440p est définitivement plus adapté que le 1080p pour un ordinateur portable fonctionnant avec un GPU RTX 3080 Ti GeForce.
Heureusement, le TXi317 est livré avec trois panneaux au choix, allant de 1080p à 4K. Gardez à l'esprit qu'aucun n'est OLED et qu'ils ne peuvent pas non plus offrir une couverture AdobeRGB complète.
- 1080p, 144 Hz, 100% sRGB, IPS
- 1440p, 165 Hz, 100% sRGB, IPS
- 2160p, 60 Hz, 100% sRGB, IPS
| |||||||||||||||||||||||||
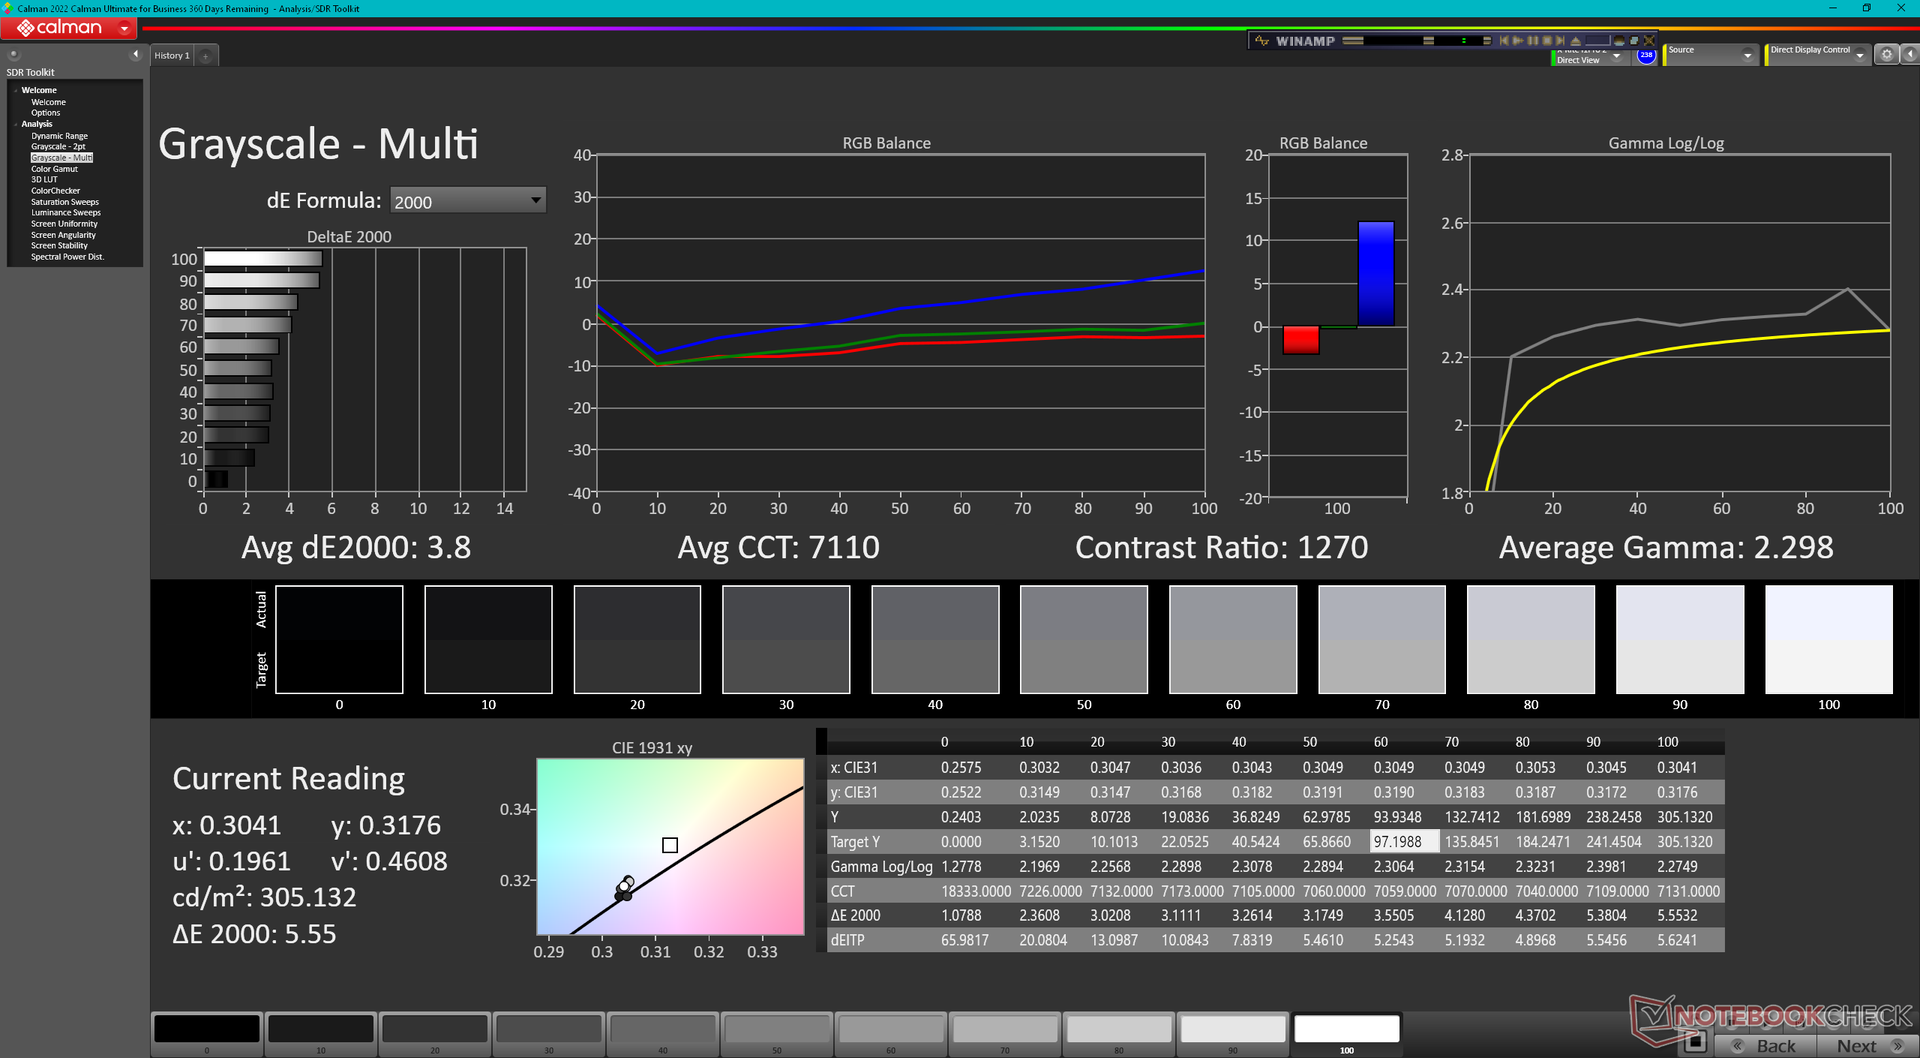
Homogénéité de la luminosité: 88 %
Valeur mesurée au centre, sur batterie: 303.9 cd/m²
Contraste: 1013:1 (Valeurs des noirs: 0.3 cd/m²)
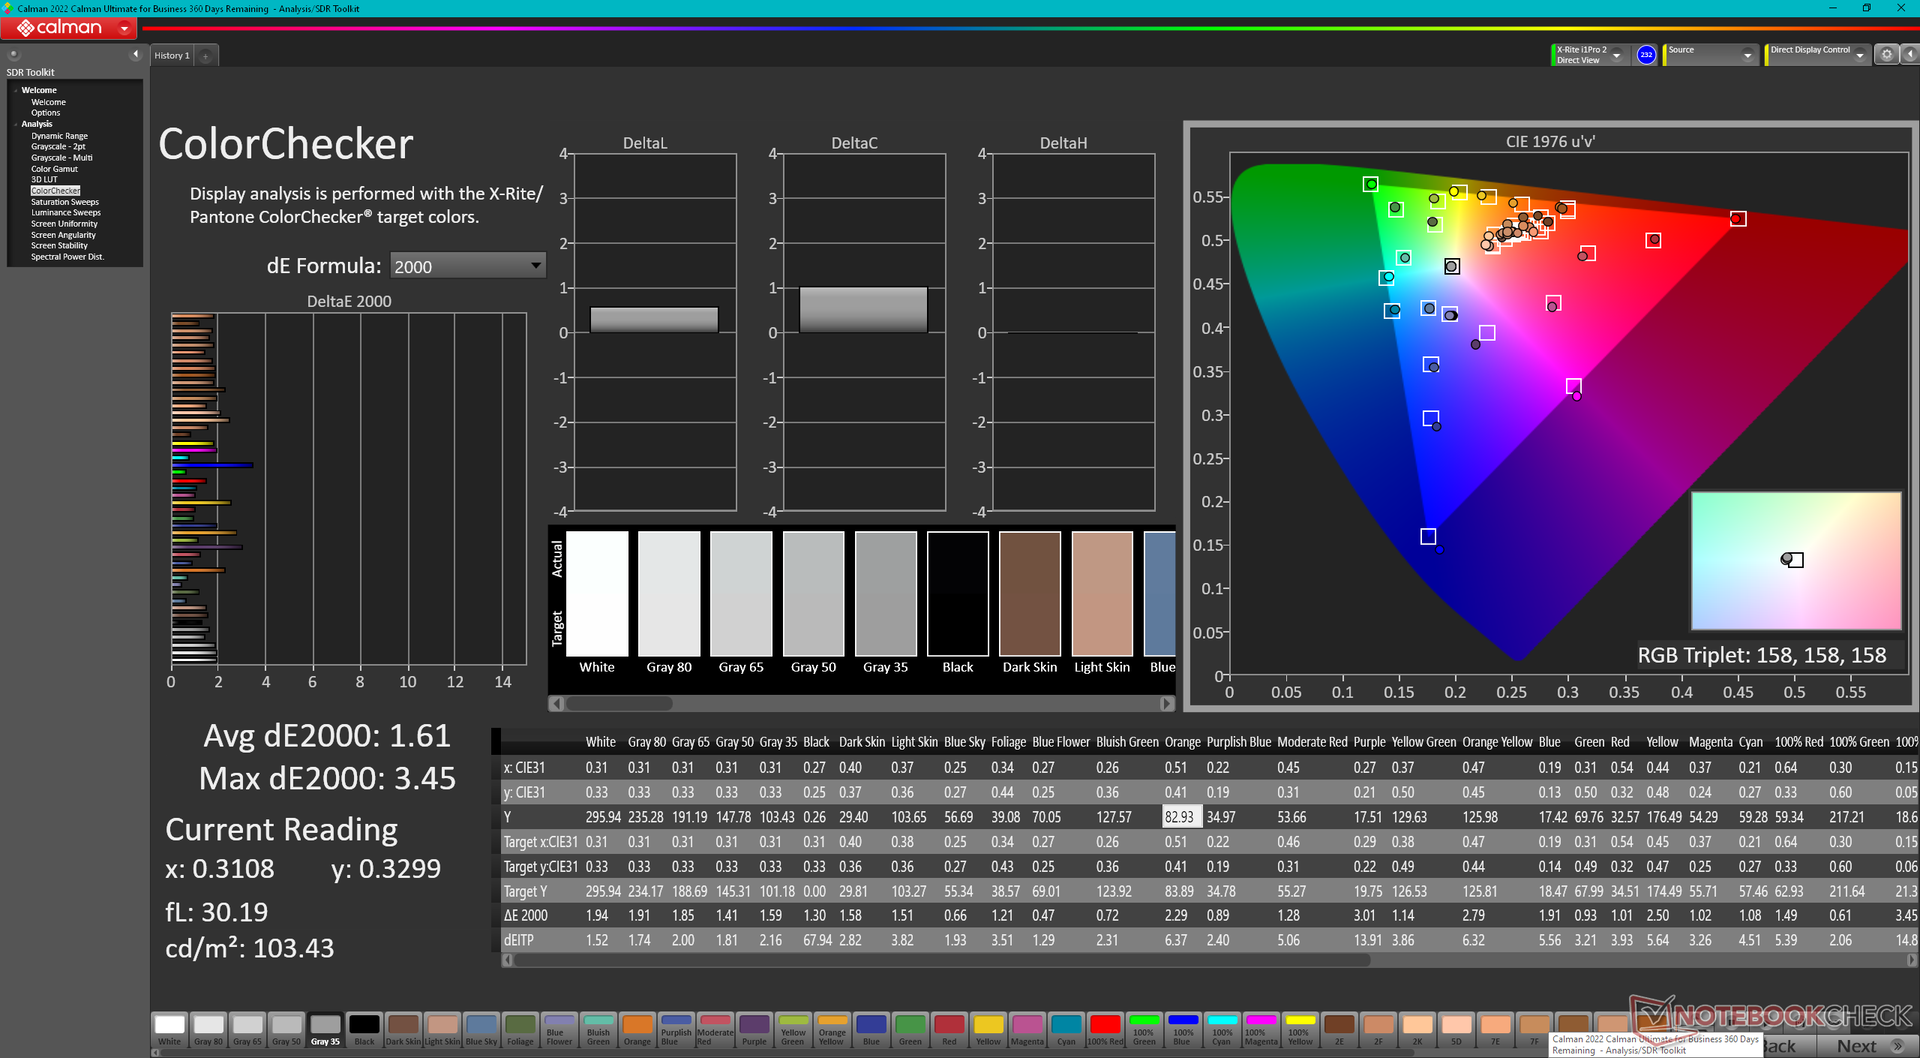
ΔE ColorChecker Calman: 2.35 | ∀{0.5-29.43 Ø4.71}
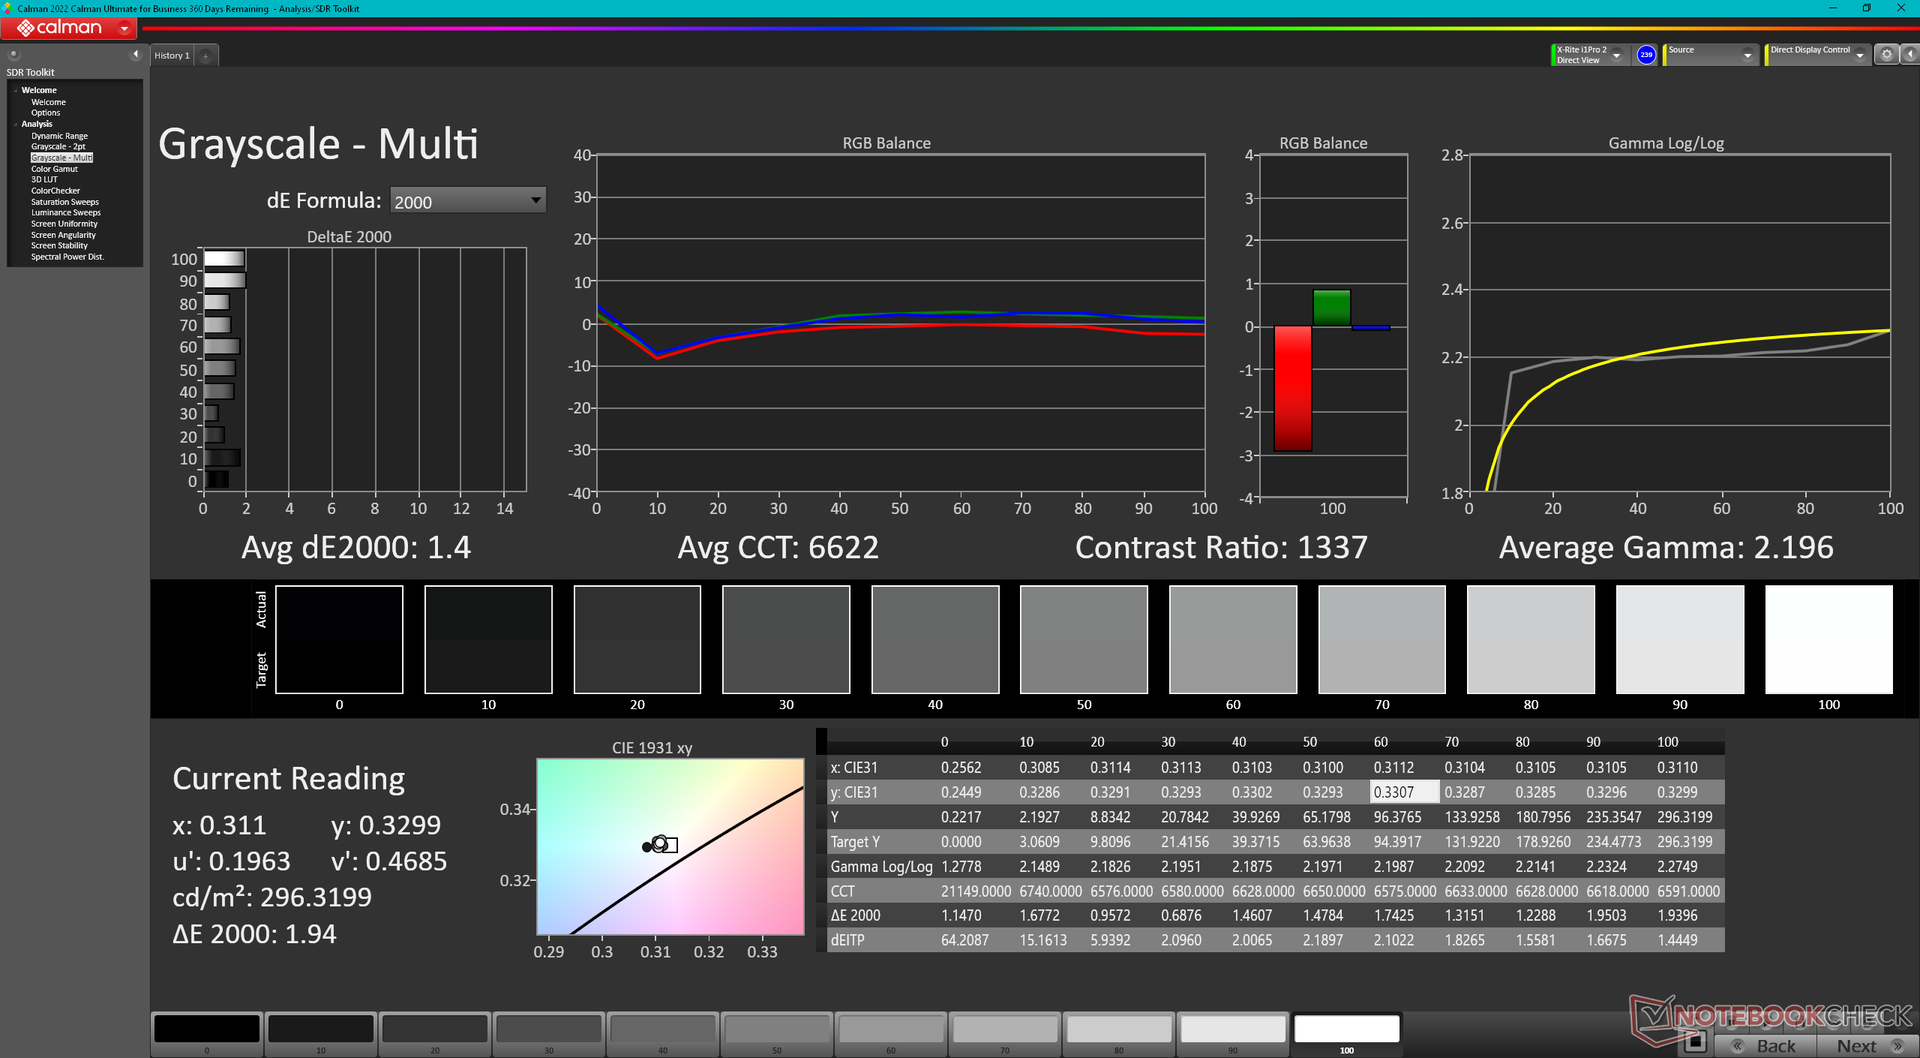
calibrated: 1.61
ΔE Greyscale Calman: 3.8 | ∀{0.09-98 Ø4.96}
65.4% AdobeRGB 1998 (Argyll 3D)
95.2% sRGB (Argyll 3D)
64.5% Display P3 (Argyll 3D)
Gamma: 2.3
CCT: 7110 K
| Eurocom Nightsky TXi317 LG Philips LP173WFG-SPB3, IPS, 1920x1080, 17.3" | Schenker XMG Pro 17 E22 BOE099D, IPS, 2560x1440, 17.3" | Aorus 17X XES Sharp SHP1563, IPS, 1920x1080, 17.3" | MSI Raider GE77 HX 12UHS AU Optronics B173ZAN06.1, IPS, 3840x2160, 17.3" | Razer Blade 17 Early 2022 AU Optronics B173ZAN06.9, IPS, 3840x2160, 17.3" | Alienware x17 R2 P48E AU Optronics B173HAN, IPS, 1920x1080, 17.3" | |
|---|---|---|---|---|---|---|
| Display | 29% | 8% | 29% | 31% | 17% | |
| Display P3 Coverage (%) | 64.5 | 97.5 51% | 70.1 9% | 96.6 50% | 99.4 54% | 79.2 23% |
| sRGB Coverage (%) | 95.2 | 99.9 5% | 99.9 5% | 99.8 5% | 100 5% | 99.8 5% |
| AdobeRGB 1998 Coverage (%) | 65.4 | 85.2 30% | 71.9 10% | 85.8 31% | 87.3 33% | 79.6 22% |
| Response Times | 44% | 58% | 47% | 39% | -1% | |
| Response Time Grey 50% / Grey 80% * (ms) | 10.4 ? | 5.4 ? 48% | 3.4 ? 67% | 5.8 ? 44% | 7.5 ? 28% | 12.4 ? -19% |
| Response Time Black / White * (ms) | 11.2 ? | 6.8 ? 39% | 5.8 ? 48% | 5.6 ? 50% | 5.6 ? 50% | 9.2 ? 18% |
| PWM Frequency (Hz) | ||||||
| Screen | 5% | -24% | -19% | 33% | 2% | |
| Brightness middle (cd/m²) | 303.9 | 349 15% | 278 -9% | 381 25% | 503 66% | 365.4 20% |
| Brightness (cd/m²) | 292 | 319 9% | 273 -7% | 371 27% | 486 66% | 344 18% |
| Brightness Distribution (%) | 88 | 83 -6% | 79 -10% | 84 -5% | 84 -5% | 85 -3% |
| Black Level * (cd/m²) | 0.3 | 0.32 -7% | 0.26 13% | 0.52 -73% | 0.44 -47% | 0.29 3% |
| Contrast (:1) | 1013 | 1091 8% | 1069 6% | 733 -28% | 1143 13% | 1260 24% |
| Colorchecker dE 2000 * | 2.35 | 2.5 -6% | 3.96 -69% | 1.08 54% | 3.17 -35% | |
| Colorchecker dE 2000 max. * | 5.63 | 6.87 -22% | 10.78 -91% | 4.54 19% | 7.69 -37% | |
| Colorchecker dE 2000 calibrated * | 1.61 | 0.64 60% | 1.07 34% | 2.53 -57% | 0.6 63% | 0.51 68% |
| Greyscale dE 2000 * | 3.8 | 3.9 -3% | 6.8 -79% | 1.3 66% | 5.3 -39% | |
| Gamma | 2.3 96% | 2.09 105% | 2.224 99% | 2.151 102% | 2.18 101% | |
| CCT | 7110 91% | 7192 90% | 7651 85% | 6541 99% | 5879 111% | |
| Moyenne finale (programmes/paramètres) | 26% /
16% | 14% /
-5% | 19% /
6% | 34% /
33% | 6% /
5% |
* ... Moindre est la valeur, meilleures sont les performances
Eurocom étalonnera l'écran pour vous moyennant des frais. Notre unité de test est arrivée non calibrée avec des valeurs moyennes de deltaE en niveaux de gris et en couleurs de 3,8 et 2,35, respectivement, ce qui n'est pas si mal. En calibrant nous-mêmes le panneau, nous pourrions améliorer ces moyennes encore davantage, à 1,4 et 1,61. Notre profil calibré peut être téléchargé gratuitement ci-dessus.

Temps de réponse de l'écran
| ↔ Temps de réponse noir à blanc | ||
|---|---|---|
| 11.2 ms ... hausse ↗ et chute ↘ combinées | ↗ 6 ms hausse | 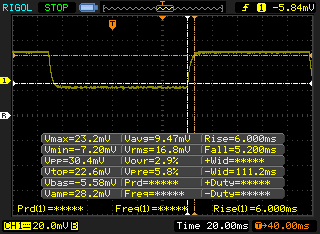 |
| ↘ 5.2 ms chute | ||
| L'écran montre de bons temps de réponse, mais insuffisant pour du jeu compétitif. En comparaison, tous les appareils testés affichent entre 0.1 (minimum) et 240 (maximum) ms. » 30 % des appareils testés affichent de meilleures performances. Cela signifie que les latences relevées sont meilleures que la moyenne (19.8 ms) de tous les appareils testés. | ||
| ↔ Temps de réponse gris 50% à gris 80% | ||
| 10.4 ms ... hausse ↗ et chute ↘ combinées | ↗ 6 ms hausse | 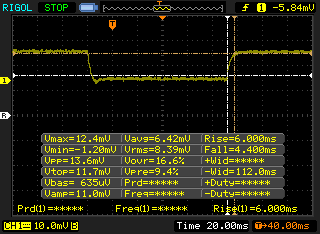 |
| ↘ 4.4 ms chute | ||
| L'écran montre de bons temps de réponse, mais insuffisant pour du jeu compétitif. En comparaison, tous les appareils testés affichent entre 0.165 (minimum) et 636 (maximum) ms. » 24 % des appareils testés affichent de meilleures performances. Cela signifie que les latences relevées sont meilleures que la moyenne (31 ms) de tous les appareils testés. | ||
Scintillement / MLI (Modulation de largeur d'impulsion)
| Scintillement / MLI (Modulation de largeur d'impulsion) non décelé | 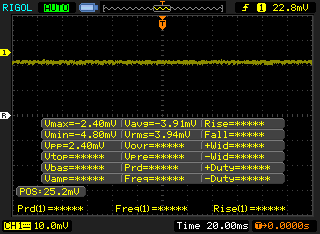 | ||
En comparaison, 52 % des appareils testés n'emploient pas MDI pour assombrir leur écran. Nous avons relevé une moyenne à 7757 (minimum : 5 - maximum : 343500) Hz dans le cas où une MDI était active. | |||
Avec un maximum de 300 nits, l'écran se situe dans la moyenne en matière de visibilité extérieure par rapport aux autres ordinateurs portables de jeu de 17 pouces. Quelques alternatives, telles que leRazer Blade 17ont des écrans beaucoup plus lumineux de plus de 500 nits pour une meilleure lisibilité en extérieur.
Performance
Conditions d'essai
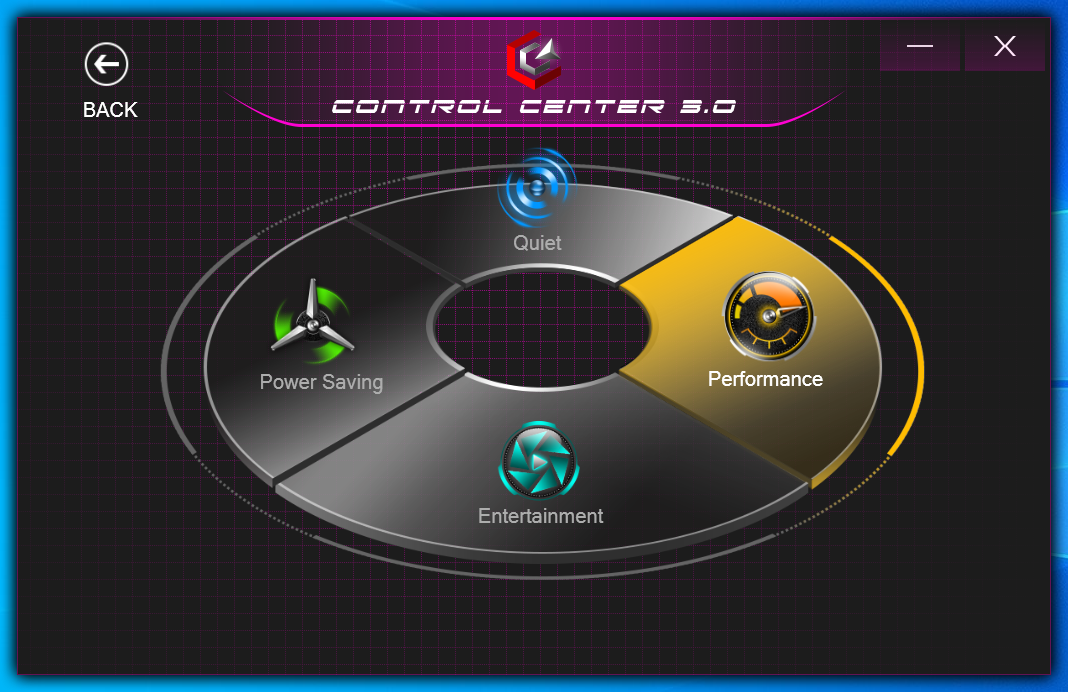
Notre appareil a été réglé en mode Performance via Windows et le logiciel Control Center 3.0 préinstallé avant d'exécuter les benchmarks ci-dessous pour obtenir les meilleurs résultats possibles. Nous nous sommes également assurés de régler Nvidia Optimus sur les graphiques discrets ; MUX n'est malheureusement pas pris en charge ici.
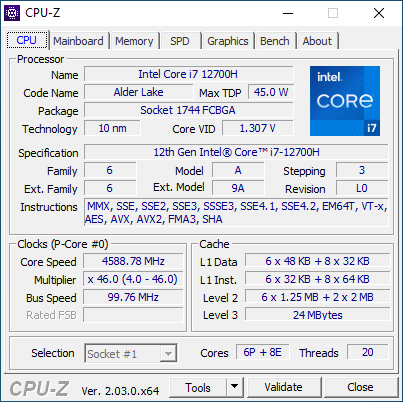
Processeur
La performance multithread brute est environ 10 % plus rapide que celle de l'ordinateur portable moyen de notre base de données équipé du même Core i7-12700H. Le processeur du HP Envy 16par exemple, est beaucoup plus lent que notre Eurocom, même en tenant compte de la limitation des performances
La mise à niveau vers le Core i9-12900H devrait améliorer les performances du processeur de façon marginale, d'environ 5 à 10 %, d'après notre expérience avec l Alienware x15 R2 et le Schenker XMG Pro 17 E22
CineBench R15 n'a pas fonctionné correctement sur notre unité, tout comme sur le dernier système Eurocom que nous avons examiné plus tôt cette année. Nous avons contacté le fabricant et ils ont pu confirmer nos résultats. Le benchmark a été omis pour cette revue.
Cinebench R23 Multi Loop
Cinebench R23: Multi Core | Single Core
Cinebench R15: CPU Multi 64Bit | CPU Single 64Bit
Blender: v2.79 BMW27 CPU
7-Zip 18.03: 7z b 4 | 7z b 4 -mmt1
Geekbench 5.5: Multi-Core | Single-Core
HWBOT x265 Benchmark v2.2: 4k Preset
LibreOffice : 20 Documents To PDF
R Benchmark 2.5: Overall mean
Cinebench R23: Multi Core | Single Core
Cinebench R15: CPU Multi 64Bit | CPU Single 64Bit
Blender: v2.79 BMW27 CPU
7-Zip 18.03: 7z b 4 | 7z b 4 -mmt1
Geekbench 5.5: Multi-Core | Single-Core
HWBOT x265 Benchmark v2.2: 4k Preset
LibreOffice : 20 Documents To PDF
R Benchmark 2.5: Overall mean
* ... Moindre est la valeur, meilleures sont les performances
AIDA64: FP32 Ray-Trace | FPU Julia | CPU SHA3 | CPU Queen | FPU SinJulia | FPU Mandel | CPU AES | CPU ZLib | FP64 Ray-Trace | CPU PhotoWorxx
| Performance rating | |
| MSI Raider GE77 HX 12UHS | |
| Aorus 17X XES | |
| Eurocom Nightsky TXi317 | |
| Alienware x17 R2 P48E | |
| Moyenne Intel Core i7-12700H | |
| Schenker XMG Pro 17 E22 | |
| Razer Blade 17 Early 2022 | |
| AIDA64 / FP32 Ray-Trace | |
| MSI Raider GE77 HX 12UHS | |
| Eurocom Nightsky TXi317 | |
| Aorus 17X XES | |
| Moyenne Intel Core i7-12700H (2585 - 17957, n=64) | |
| Alienware x17 R2 P48E | |
| Schenker XMG Pro 17 E22 | |
| Razer Blade 17 Early 2022 | |
| AIDA64 / FPU Julia | |
| MSI Raider GE77 HX 12UHS | |
| Eurocom Nightsky TXi317 | |
| Aorus 17X XES | |
| Moyenne Intel Core i7-12700H (12439 - 90760, n=64) | |
| Alienware x17 R2 P48E | |
| Schenker XMG Pro 17 E22 | |
| Razer Blade 17 Early 2022 | |
| AIDA64 / CPU SHA3 | |
| MSI Raider GE77 HX 12UHS | |
| Eurocom Nightsky TXi317 | |
| Aorus 17X XES | |
| Alienware x17 R2 P48E | |
| Moyenne Intel Core i7-12700H (833 - 4242, n=64) | |
| Schenker XMG Pro 17 E22 | |
| Razer Blade 17 Early 2022 | |
| AIDA64 / CPU Queen | |
| Alienware x17 R2 P48E | |
| Schenker XMG Pro 17 E22 | |
| Aorus 17X XES | |
| Eurocom Nightsky TXi317 | |
| MSI Raider GE77 HX 12UHS | |
| Moyenne Intel Core i7-12700H (57923 - 103202, n=63) | |
| Razer Blade 17 Early 2022 | |
| AIDA64 / FPU SinJulia | |
| MSI Raider GE77 HX 12UHS | |
| Aorus 17X XES | |
| Alienware x17 R2 P48E | |
| Eurocom Nightsky TXi317 | |
| Schenker XMG Pro 17 E22 | |
| Moyenne Intel Core i7-12700H (3249 - 9939, n=64) | |
| Razer Blade 17 Early 2022 | |
| AIDA64 / FPU Mandel | |
| MSI Raider GE77 HX 12UHS | |
| Aorus 17X XES | |
| Eurocom Nightsky TXi317 | |
| Moyenne Intel Core i7-12700H (7135 - 44760, n=64) | |
| Alienware x17 R2 P48E | |
| Schenker XMG Pro 17 E22 | |
| Razer Blade 17 Early 2022 | |
| AIDA64 / CPU AES | |
| MSI Raider GE77 HX 12UHS | |
| Eurocom Nightsky TXi317 | |
| Aorus 17X XES | |
| Alienware x17 R2 P48E | |
| Schenker XMG Pro 17 E22 | |
| Moyenne Intel Core i7-12700H (31839 - 144360, n=64) | |
| Razer Blade 17 Early 2022 | |
| AIDA64 / CPU ZLib | |
| MSI Raider GE77 HX 12UHS | |
| Alienware x17 R2 P48E | |
| Eurocom Nightsky TXi317 | |
| Schenker XMG Pro 17 E22 | |
| Aorus 17X XES | |
| Moyenne Intel Core i7-12700H (305 - 1171, n=64) | |
| Razer Blade 17 Early 2022 | |
| AIDA64 / FP64 Ray-Trace | |
| MSI Raider GE77 HX 12UHS | |
| Aorus 17X XES | |
| Eurocom Nightsky TXi317 | |
| Moyenne Intel Core i7-12700H (1437 - 9692, n=64) | |
| Alienware x17 R2 P48E | |
| Schenker XMG Pro 17 E22 | |
| Razer Blade 17 Early 2022 | |
| AIDA64 / CPU PhotoWorxx | |
| MSI Raider GE77 HX 12UHS | |
| Aorus 17X XES | |
| Razer Blade 17 Early 2022 | |
| Alienware x17 R2 P48E | |
| Moyenne Intel Core i7-12700H (12863 - 52207, n=64) | |
| Eurocom Nightsky TXi317 | |
| Schenker XMG Pro 17 E22 | |
Performance du système
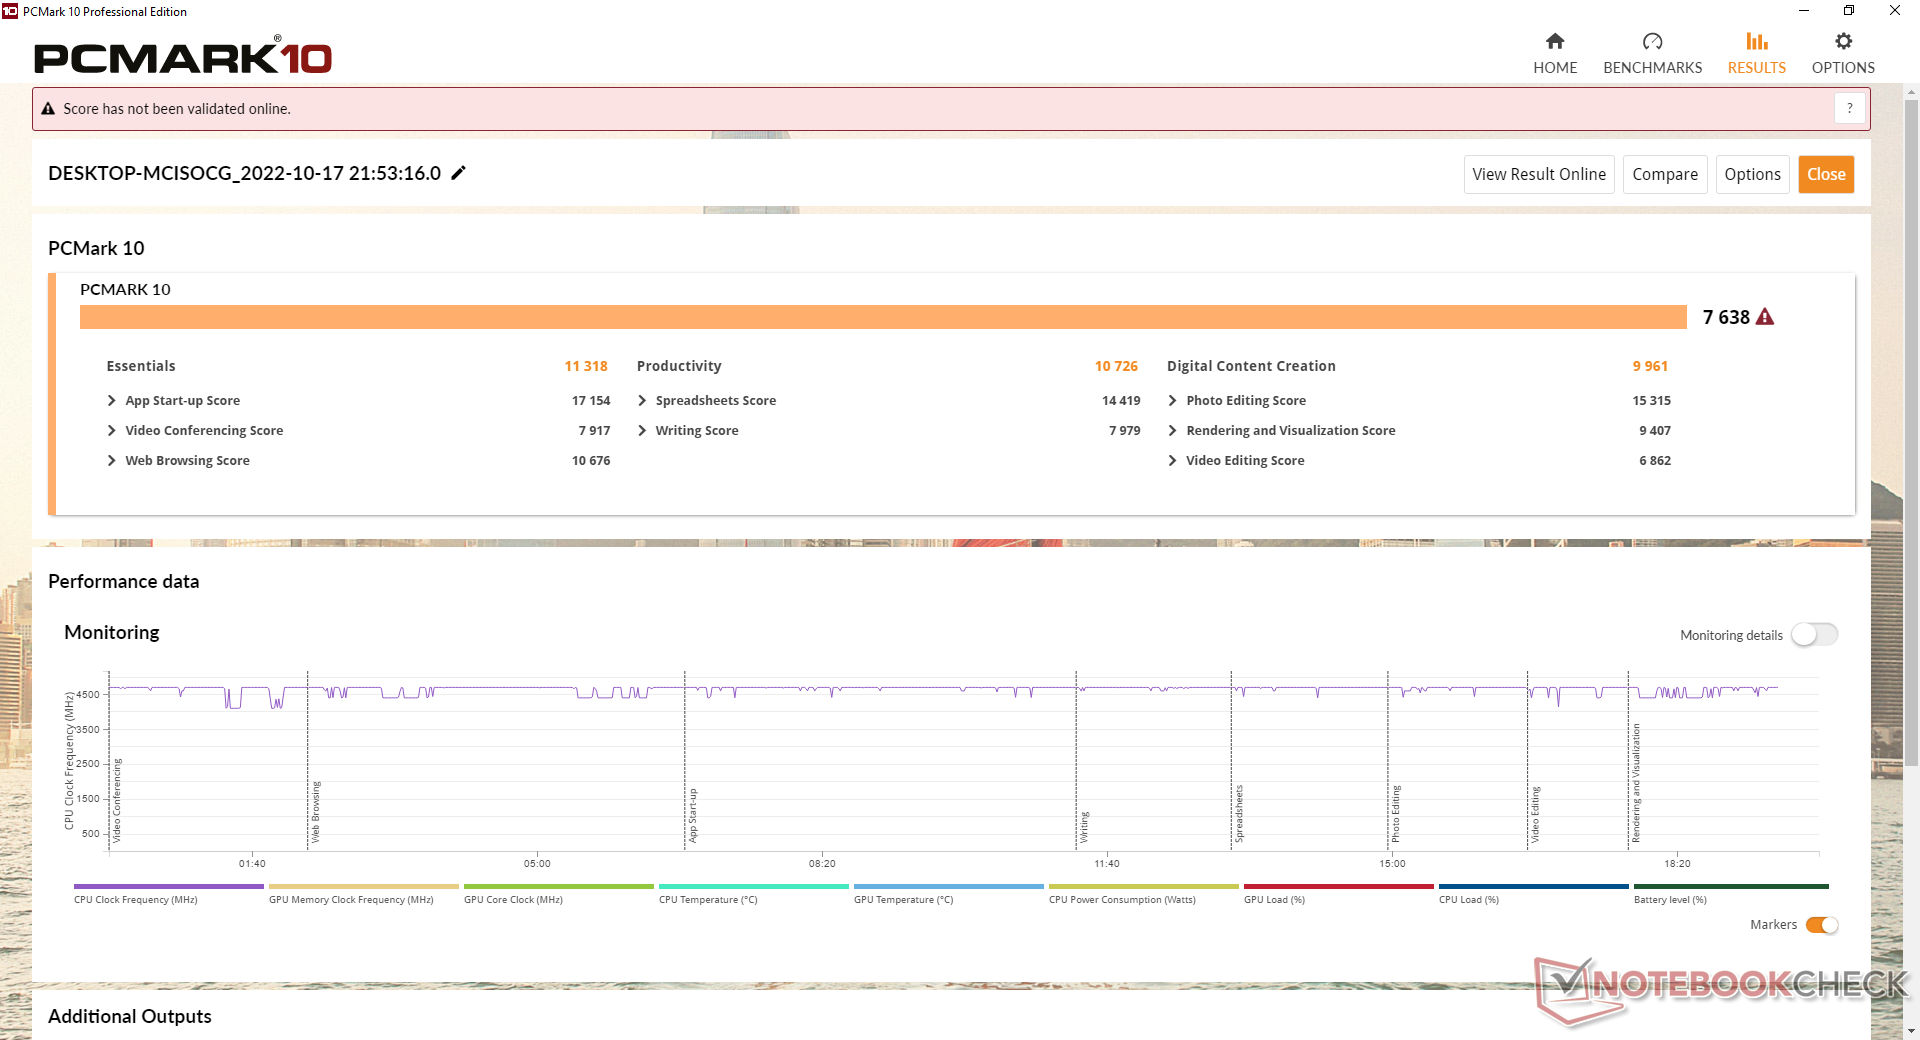
CrossMark: Overall | Productivity | Creativity | Responsiveness
| PCMark 10 / Score | |
| Alienware x17 R2 P48E | |
| Aorus 17X XES | |
| Schenker XMG Pro 17 E22 | |
| Eurocom Nightsky TXi317 | |
| Moyenne Intel Core i7-12700H, NVIDIA GeForce RTX 3080 Ti Laptop GPU (6868 - 7638, n=7) | |
| Razer Blade 17 Early 2022 | |
| MSI Raider GE77 HX 12UHS | |
| PCMark 10 / Essentials | |
| Eurocom Nightsky TXi317 | |
| Alienware x17 R2 P48E | |
| Schenker XMG Pro 17 E22 | |
| Aorus 17X XES | |
| Moyenne Intel Core i7-12700H, NVIDIA GeForce RTX 3080 Ti Laptop GPU (9987 - 11318, n=7) | |
| Razer Blade 17 Early 2022 | |
| MSI Raider GE77 HX 12UHS | |
| PCMark 10 / Productivity | |
| Eurocom Nightsky TXi317 | |
| Aorus 17X XES | |
| Schenker XMG Pro 17 E22 | |
| Alienware x17 R2 P48E | |
| MSI Raider GE77 HX 12UHS | |
| Moyenne Intel Core i7-12700H, NVIDIA GeForce RTX 3080 Ti Laptop GPU (8944 - 10726, n=7) | |
| Razer Blade 17 Early 2022 | |
| PCMark 10 / Digital Content Creation | |
| Alienware x17 R2 P48E | |
| Aorus 17X XES | |
| Schenker XMG Pro 17 E22 | |
| Moyenne Intel Core i7-12700H, NVIDIA GeForce RTX 3080 Ti Laptop GPU (8956 - 12249, n=7) | |
| Razer Blade 17 Early 2022 | |
| Eurocom Nightsky TXi317 | |
| MSI Raider GE77 HX 12UHS | |
| CrossMark / Overall | |
| MSI Raider GE77 HX 12UHS | |
| Aorus 17X XES | |
| Alienware x17 R2 P48E | |
| Eurocom Nightsky TXi317 | |
| Moyenne Intel Core i7-12700H, NVIDIA GeForce RTX 3080 Ti Laptop GPU (1761 - 1861, n=4) | |
| Razer Blade 17 Early 2022 | |
| CrossMark / Productivity | |
| MSI Raider GE77 HX 12UHS | |
| Aorus 17X XES | |
| Alienware x17 R2 P48E | |
| Eurocom Nightsky TXi317 | |
| Razer Blade 17 Early 2022 | |
| Moyenne Intel Core i7-12700H, NVIDIA GeForce RTX 3080 Ti Laptop GPU (1645 - 1800, n=4) | |
| CrossMark / Creativity | |
| MSI Raider GE77 HX 12UHS | |
| Aorus 17X XES | |
| Alienware x17 R2 P48E | |
| Moyenne Intel Core i7-12700H, NVIDIA GeForce RTX 3080 Ti Laptop GPU (1936 - 2041, n=4) | |
| Eurocom Nightsky TXi317 | |
| Razer Blade 17 Early 2022 | |
| CrossMark / Responsiveness | |
| Aorus 17X XES | |
| MSI Raider GE77 HX 12UHS | |
| Eurocom Nightsky TXi317 | |
| Alienware x17 R2 P48E | |
| Moyenne Intel Core i7-12700H, NVIDIA GeForce RTX 3080 Ti Laptop GPU (1461 - 1868, n=4) | |
| Razer Blade 17 Early 2022 | |
| PCMark 10 Score | 7638 points | |
Aide | ||
| AIDA64 / Memory Copy | |
| MSI Raider GE77 HX 12UHS | |
| Aorus 17X XES | |
| Razer Blade 17 Early 2022 | |
| Alienware x17 R2 P48E | |
| Moyenne Intel Core i7-12700H (25615 - 80511, n=64) | |
| Eurocom Nightsky TXi317 | |
| Schenker XMG Pro 17 E22 | |
| AIDA64 / Memory Read | |
| MSI Raider GE77 HX 12UHS | |
| Aorus 17X XES | |
| Razer Blade 17 Early 2022 | |
| Alienware x17 R2 P48E | |
| Moyenne Intel Core i7-12700H (25586 - 79442, n=64) | |
| Eurocom Nightsky TXi317 | |
| Schenker XMG Pro 17 E22 | |
| AIDA64 / Memory Write | |
| MSI Raider GE77 HX 12UHS | |
| Aorus 17X XES | |
| Razer Blade 17 Early 2022 | |
| Moyenne Intel Core i7-12700H (23679 - 88660, n=64) | |
| Alienware x17 R2 P48E | |
| Eurocom Nightsky TXi317 | |
| Schenker XMG Pro 17 E22 | |
| AIDA64 / Memory Latency | |
| Alienware x17 R2 P48E | |
| Schenker XMG Pro 17 E22 | |
| Eurocom Nightsky TXi317 | |
| Aorus 17X XES | |
| MSI Raider GE77 HX 12UHS | |
| Moyenne Intel Core i7-12700H (76.2 - 133.9, n=62) | |
* ... Moindre est la valeur, meilleures sont les performances
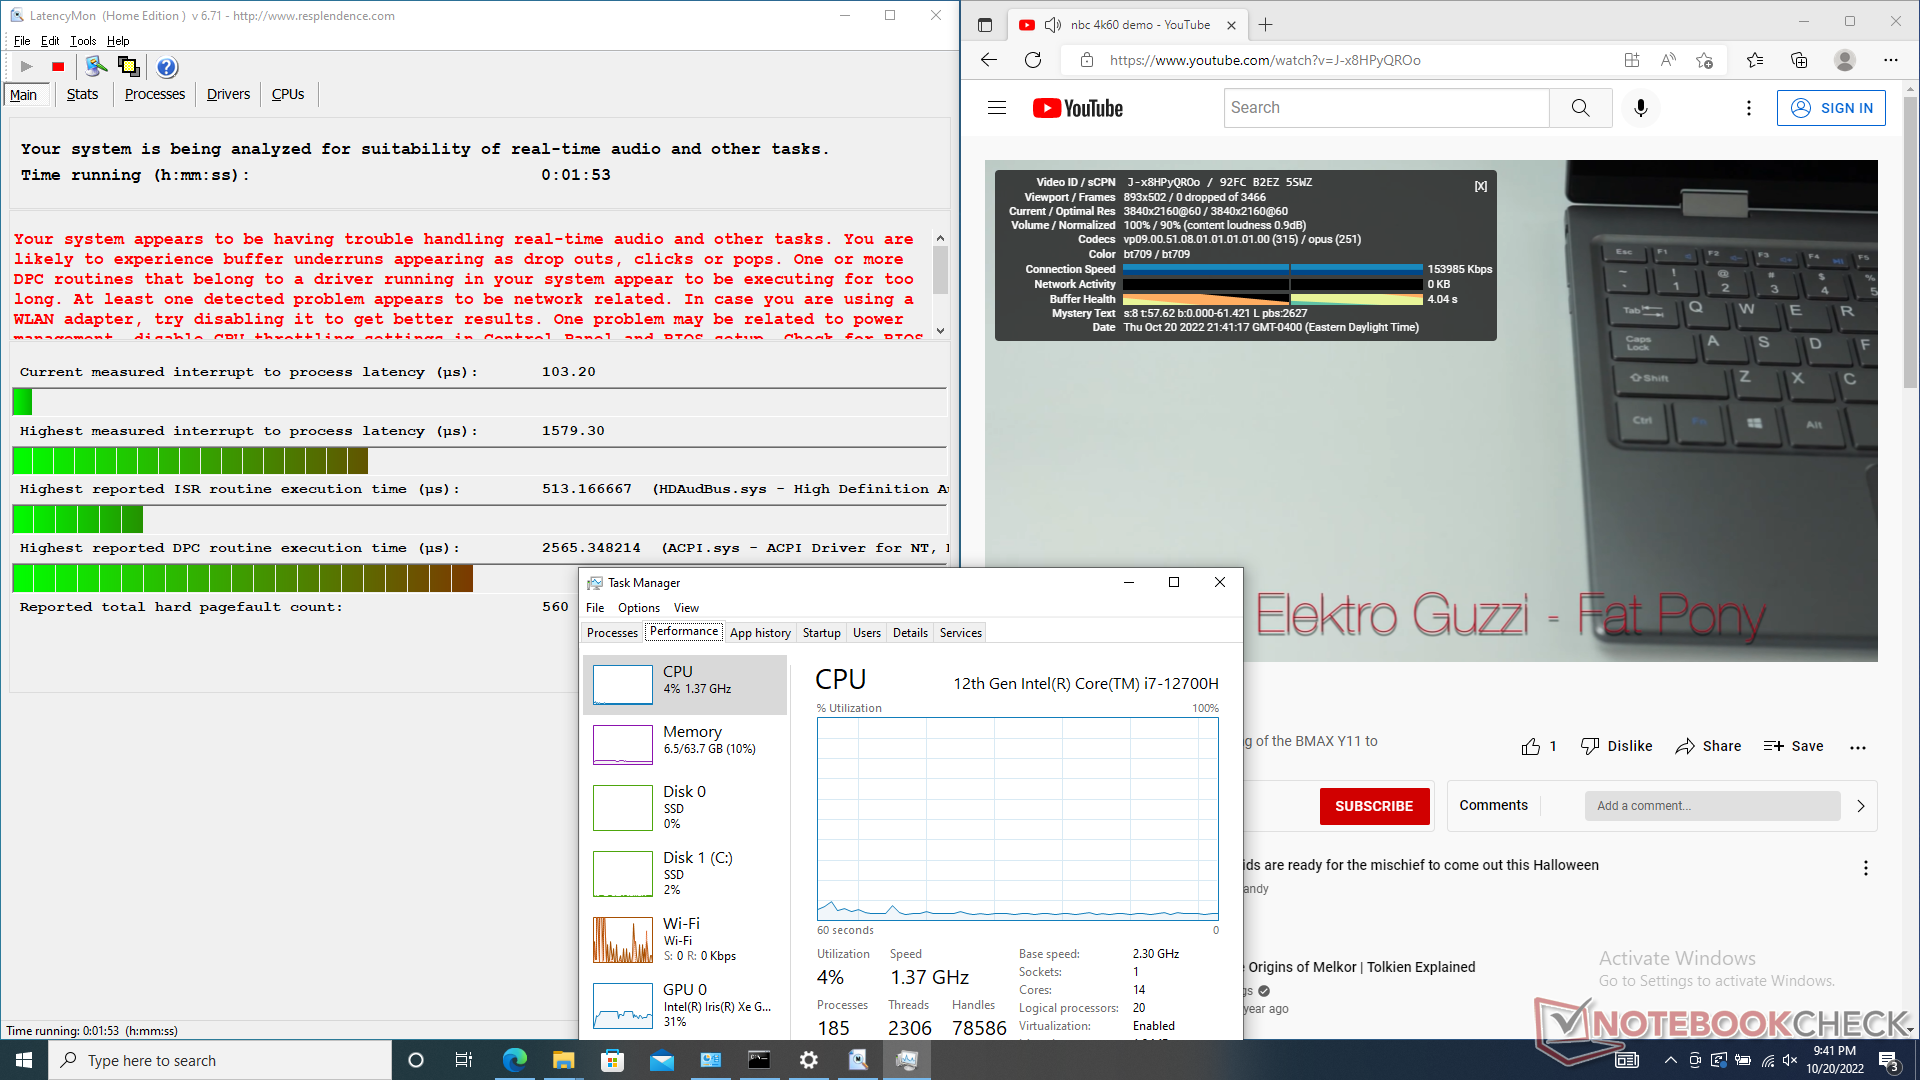
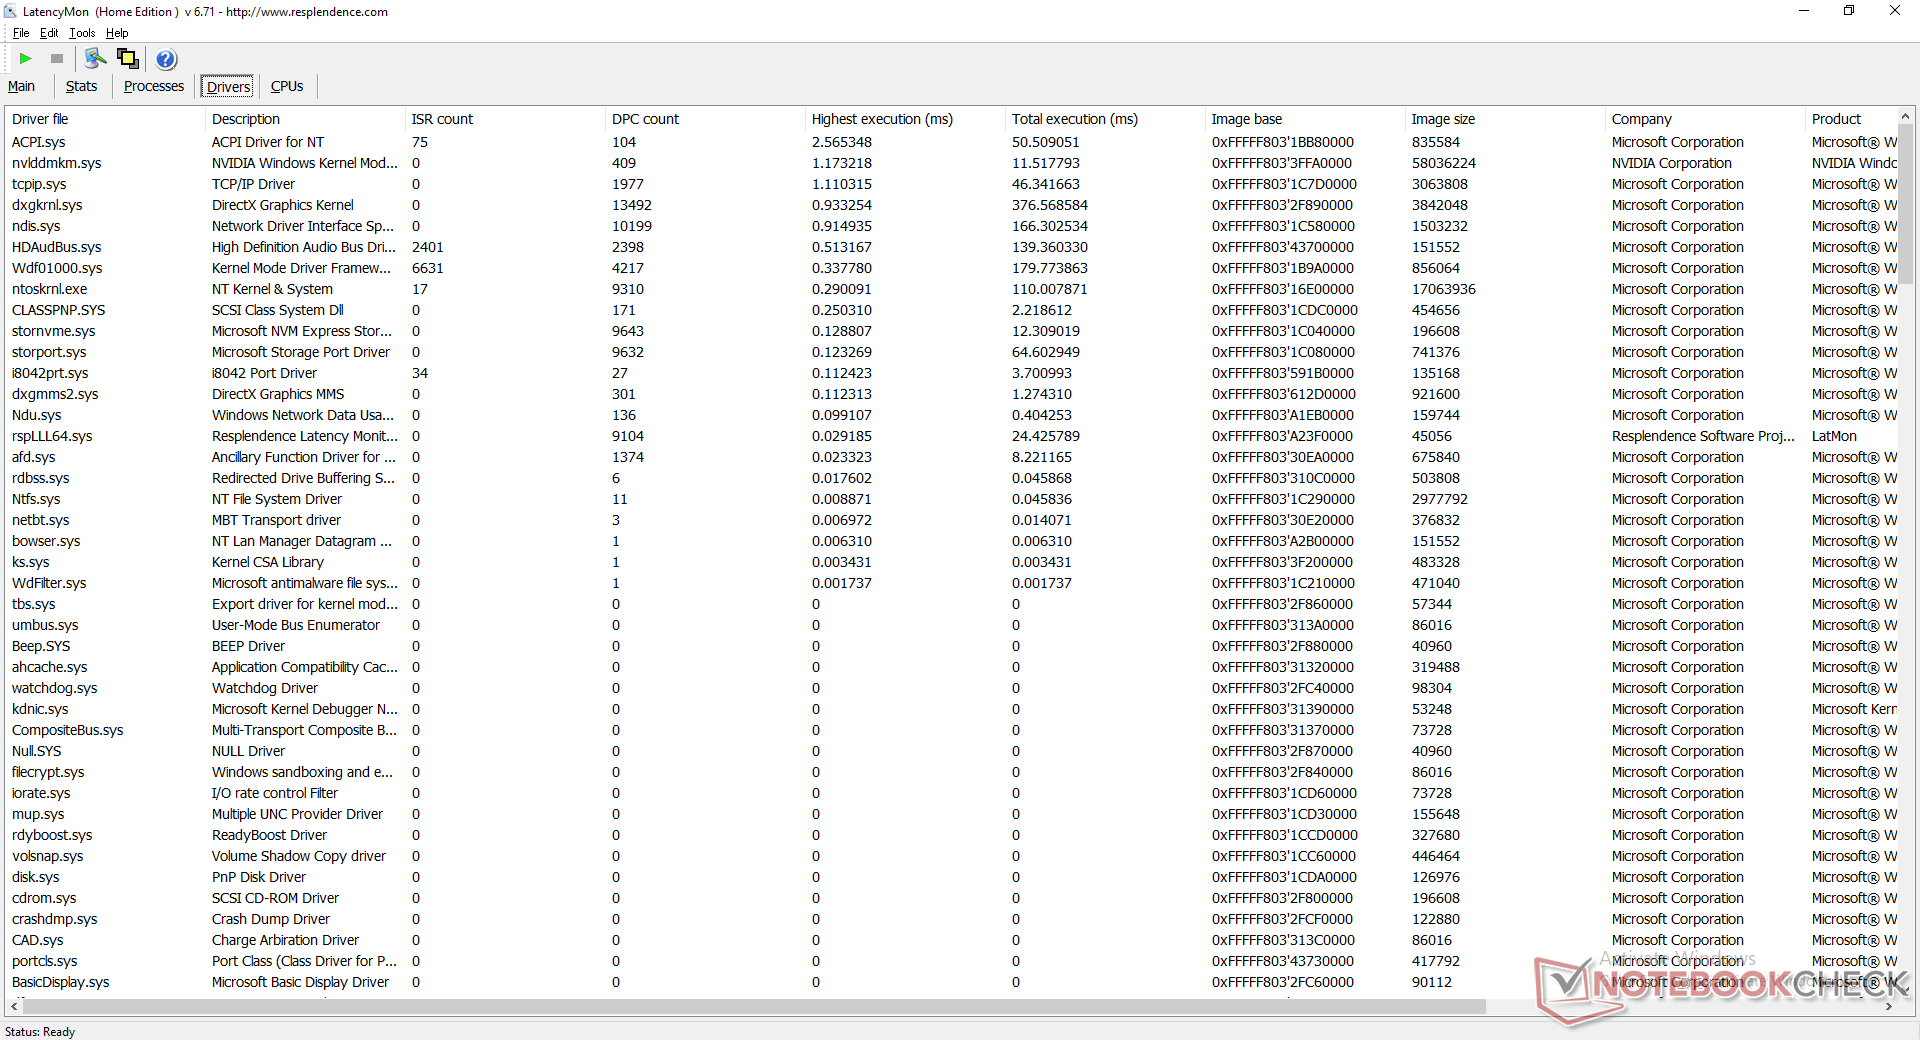
Latence DPC
LatencyMon révèle des problèmes de DPC lors de l'ouverture de plusieurs onglets de navigateur sur notre page d'accueil. la lecture de vidéos 4K à 60 FPS est par ailleurs parfaite, sans aucune perte d'images.
| DPC Latencies / LatencyMon - interrupt to process latency (max), Web, Youtube, Prime95 | |
| MSI Raider GE77 HX 12UHS | |
| Eurocom Nightsky TXi317 | |
| Aorus 17X XES | |
| Alienware x17 R2 P48E | |
| Schenker XMG Pro 17 E22 | |
| Razer Blade 17 Early 2022 | |
* ... Moindre est la valeur, meilleures sont les performances
Périphériques de stockage
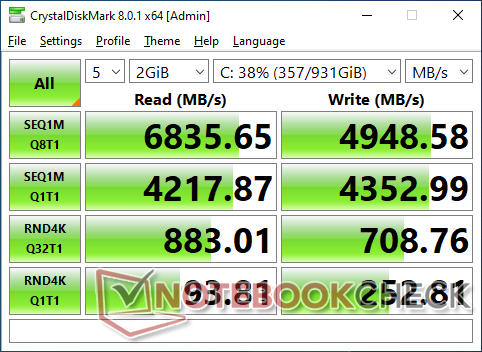
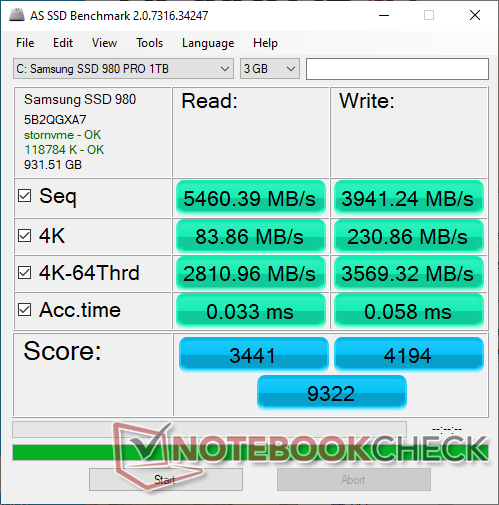
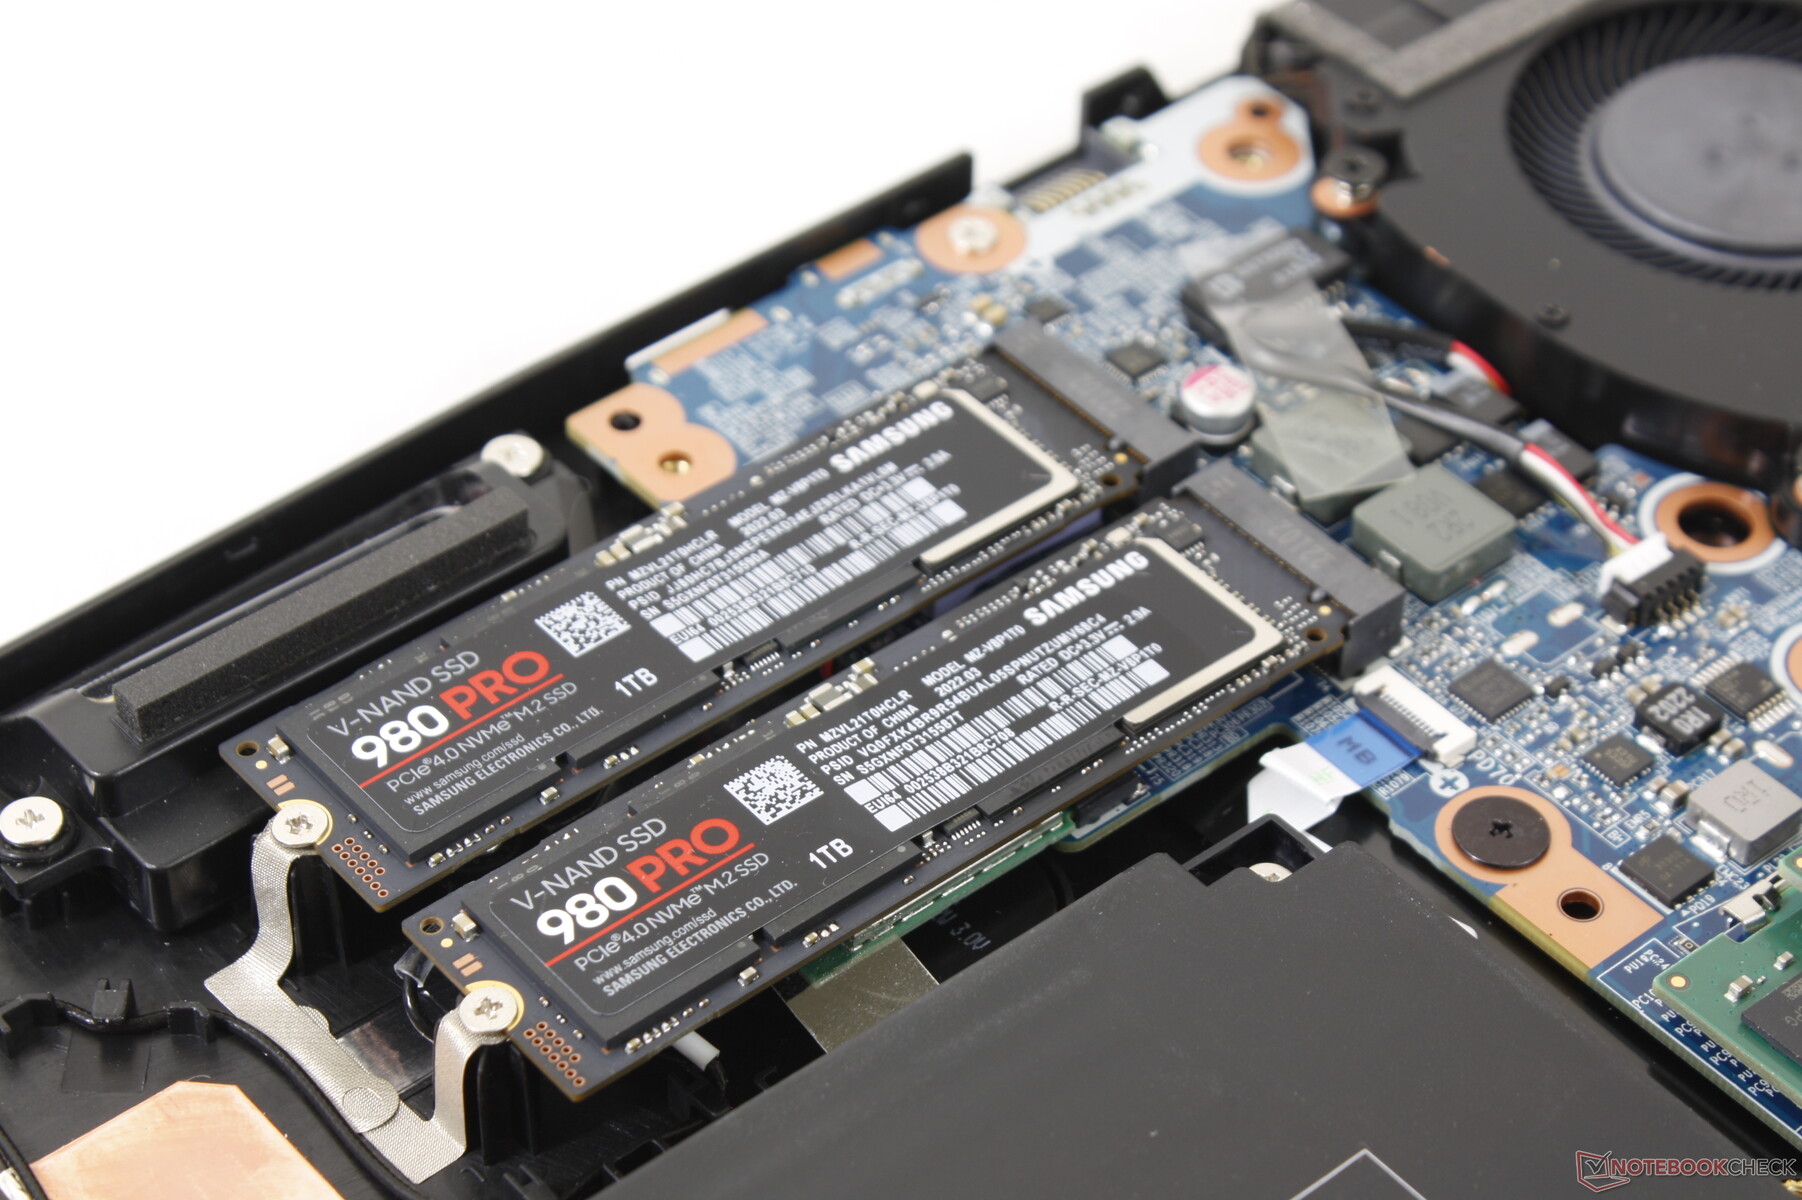
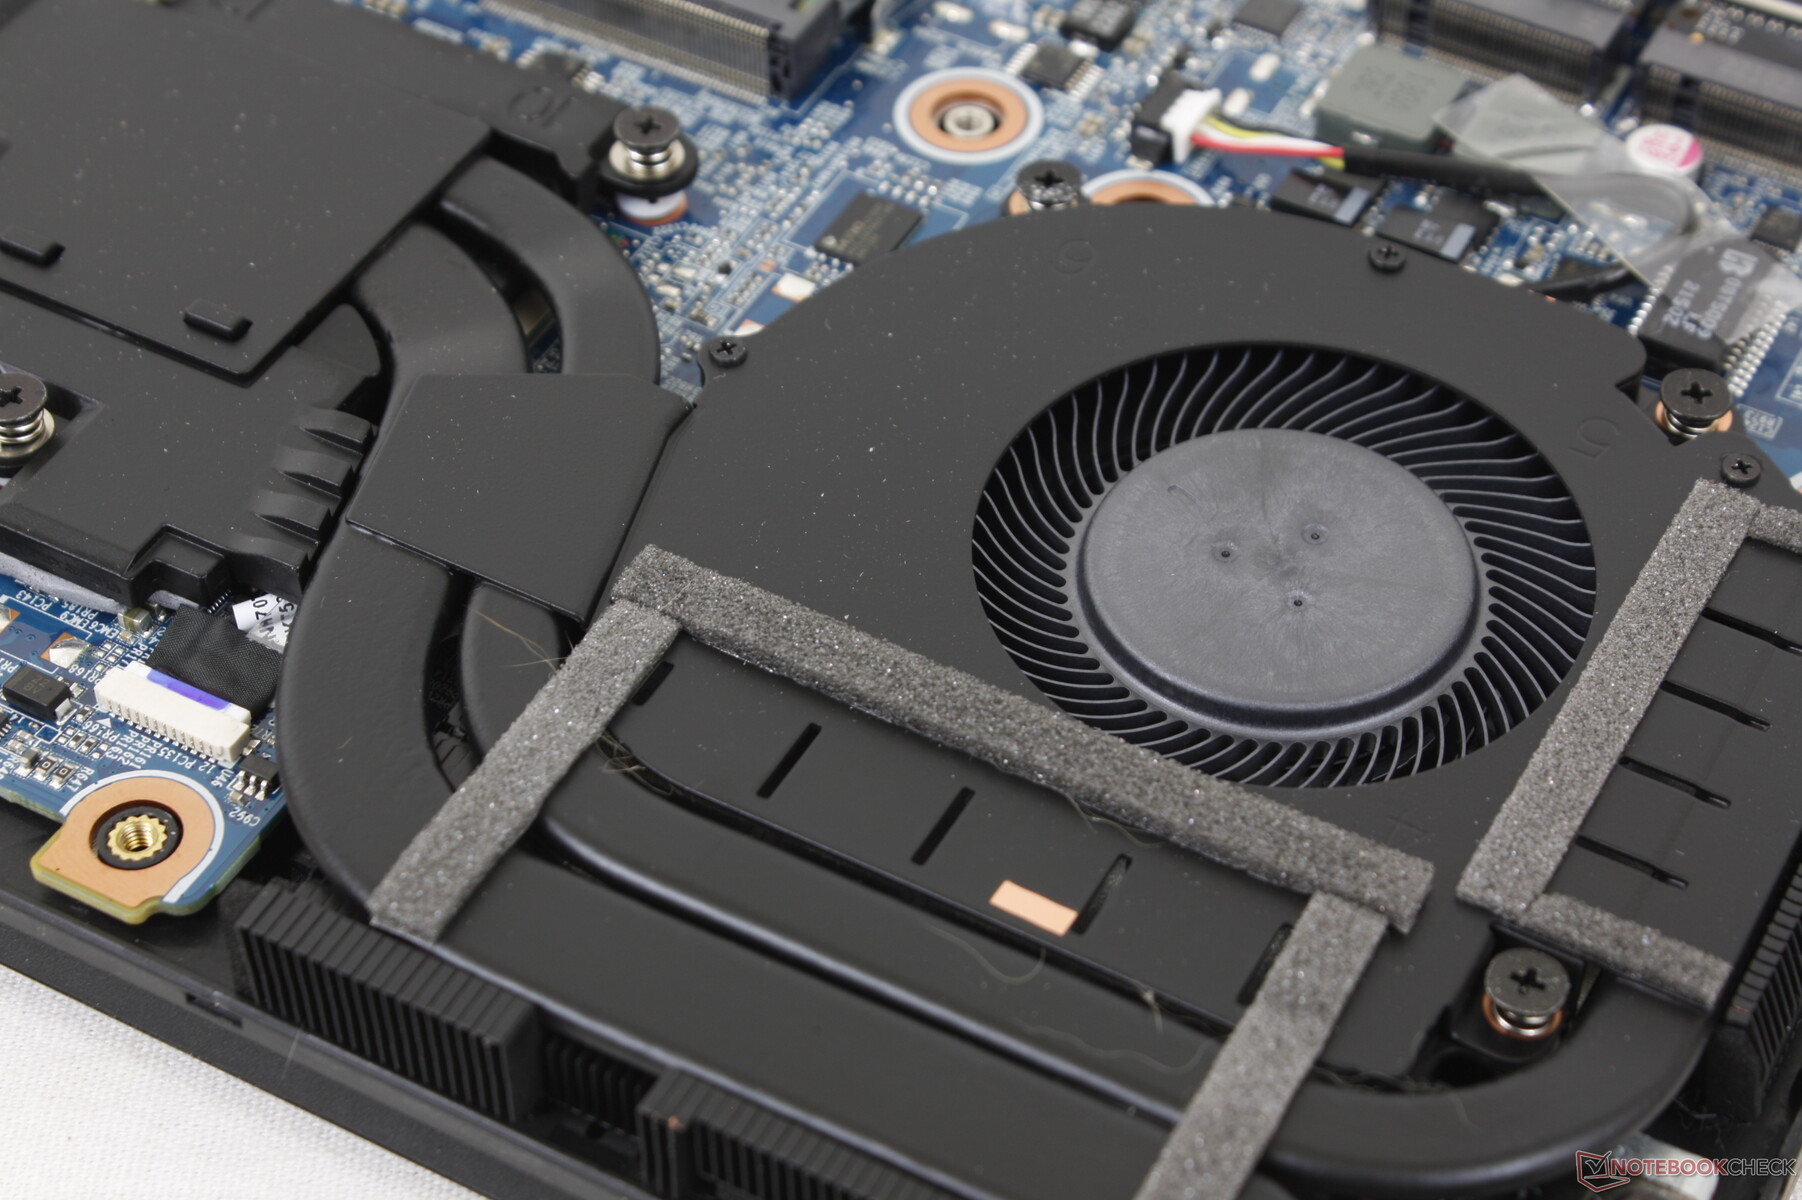
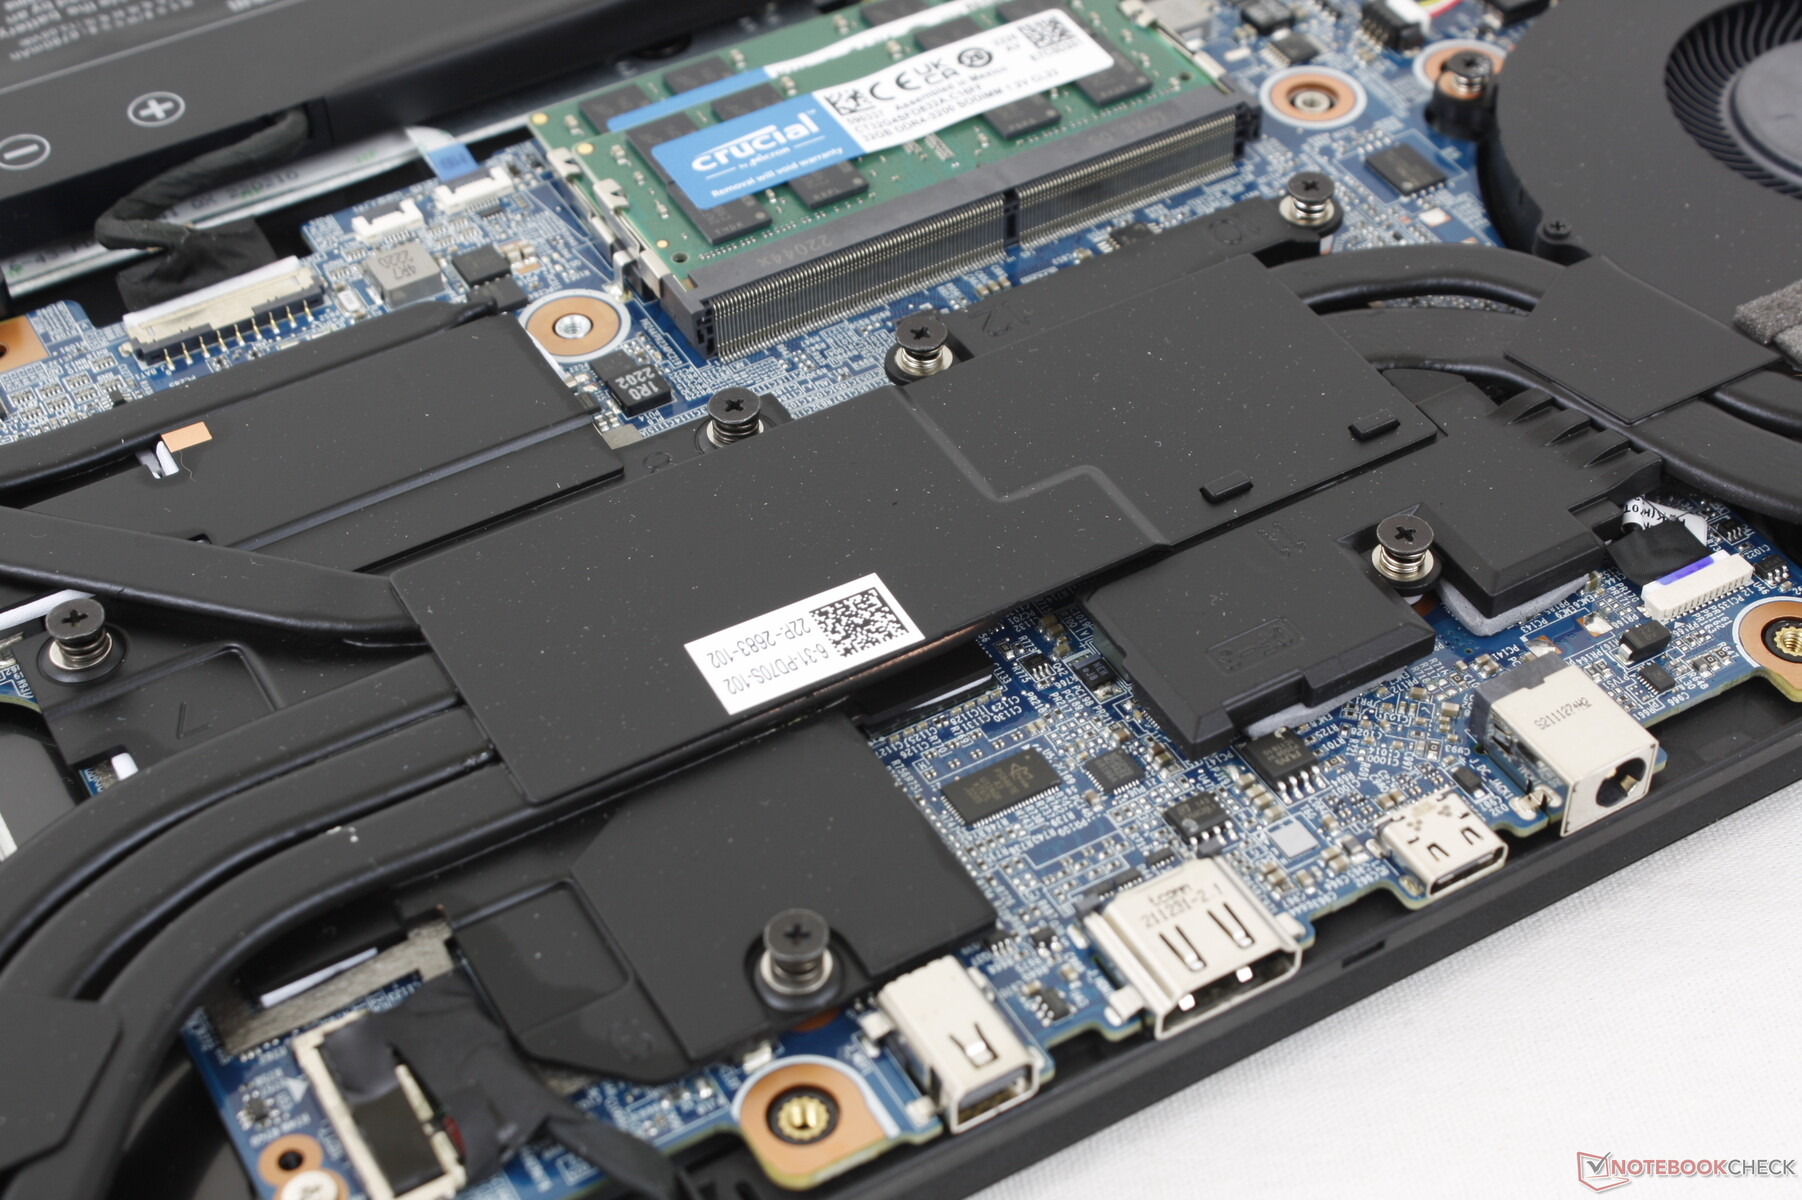
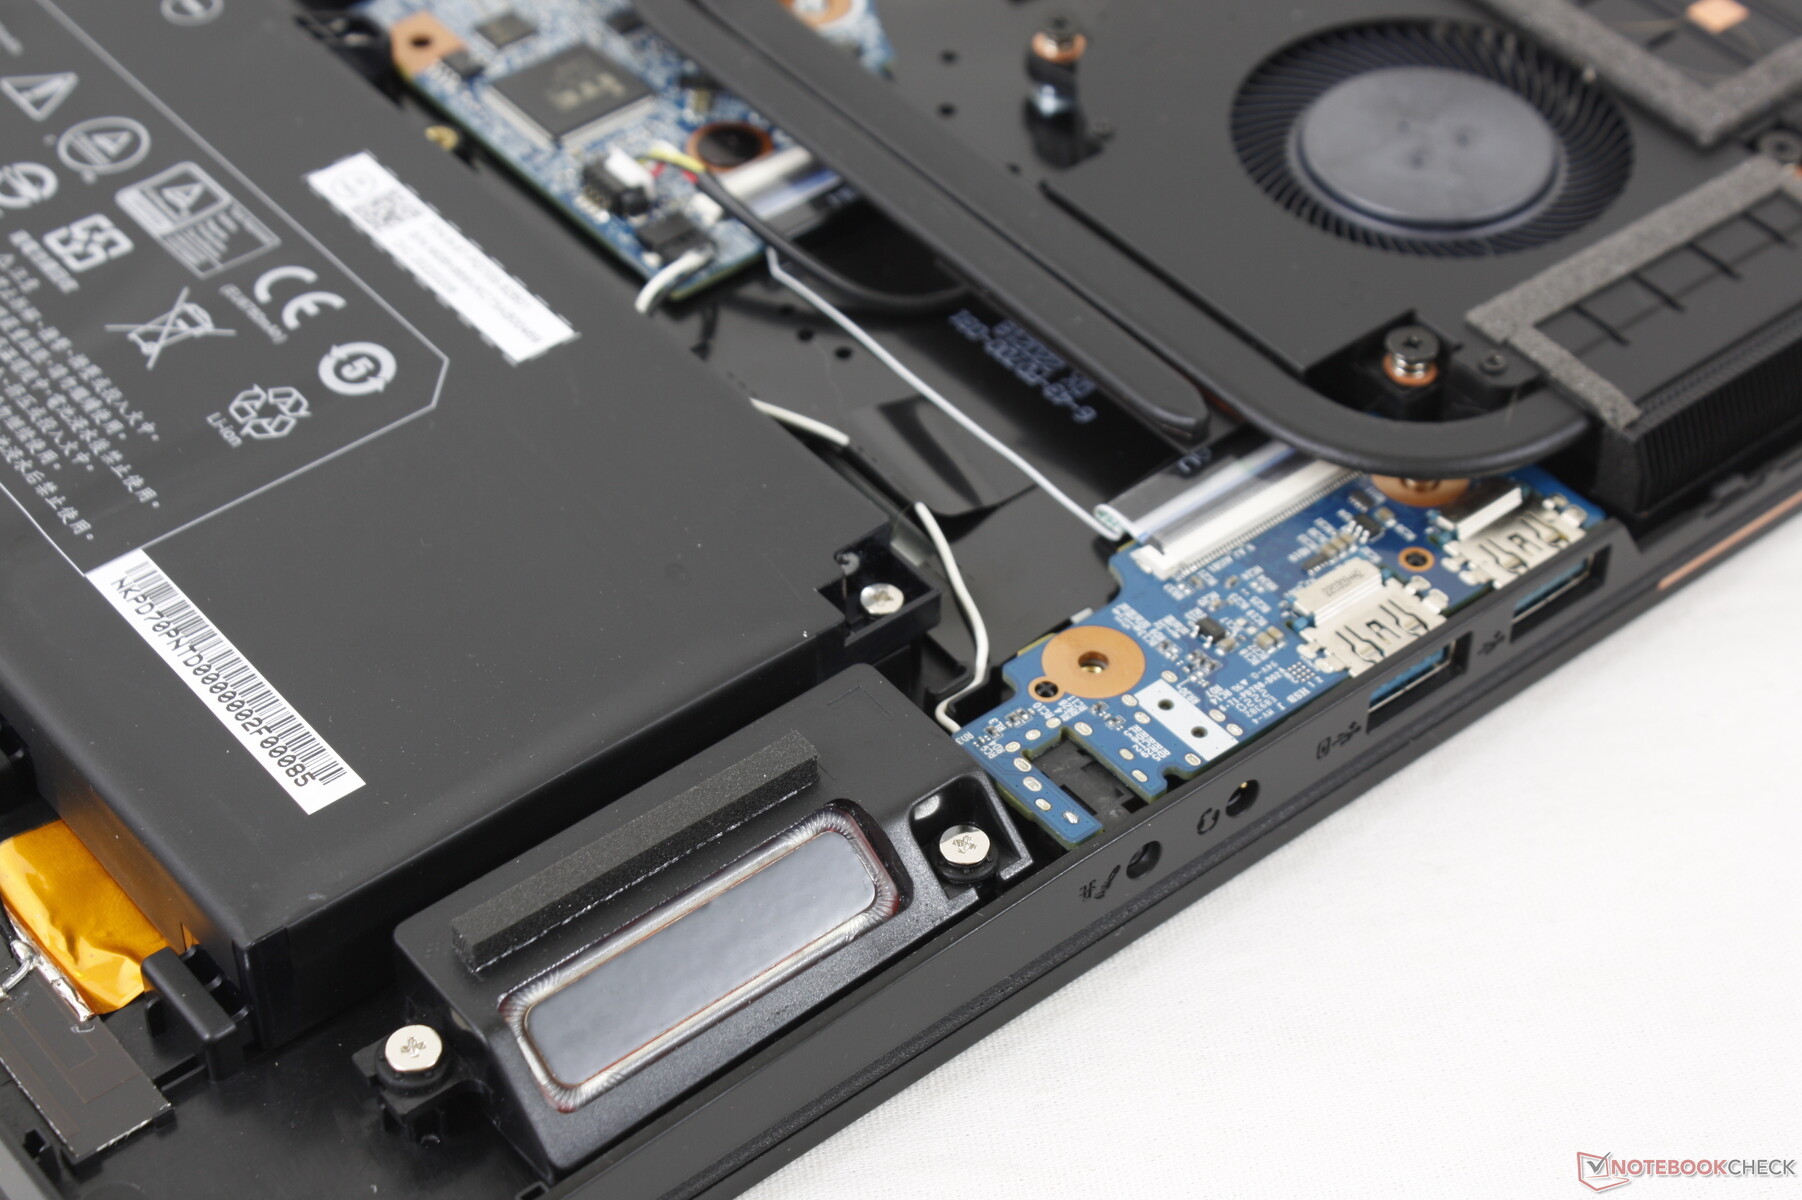
Les deux emplacements internes M.2 2280 peuvent chacun supporter des SSD PCIe4 x4 pour des vitesses folles, du moins en théorie. Dans la réalité, cependant, les disques risquent de s'emballer car le châssis n'a pas de dissipateur thermique intégré pour les SSD. Le 1 TB Samsung 980 Pro PCIe4 x4 NVMe SSD dans notre unité de test a chuté à 1400 Mo/s à partir d'un sommet initial de 6800 Mo/s lors de l'exécution de DiskSpd dans une boucle comme le montre notre graphique ci-dessous. De tels résultats sont généralement acceptables pour les ordinateurs portables de jeu à petit budget, mais ils sont décevants à voir sur des machines haut de gamme comme celle-ci.

| Drive Performance rating - Percent | |
| MSI Raider GE77 HX 12UHS | |
| Eurocom Nightsky TXi317 | |
| Aorus 17X XES | |
| Schenker XMG Pro 17 E22 | |
| Razer Blade 17 Early 2022 | |
| Alienware x17 R2 P48E | |
* ... Moindre est la valeur, meilleures sont les performances
Disk Throttling: DiskSpd Read Loop, Queue Depth 8
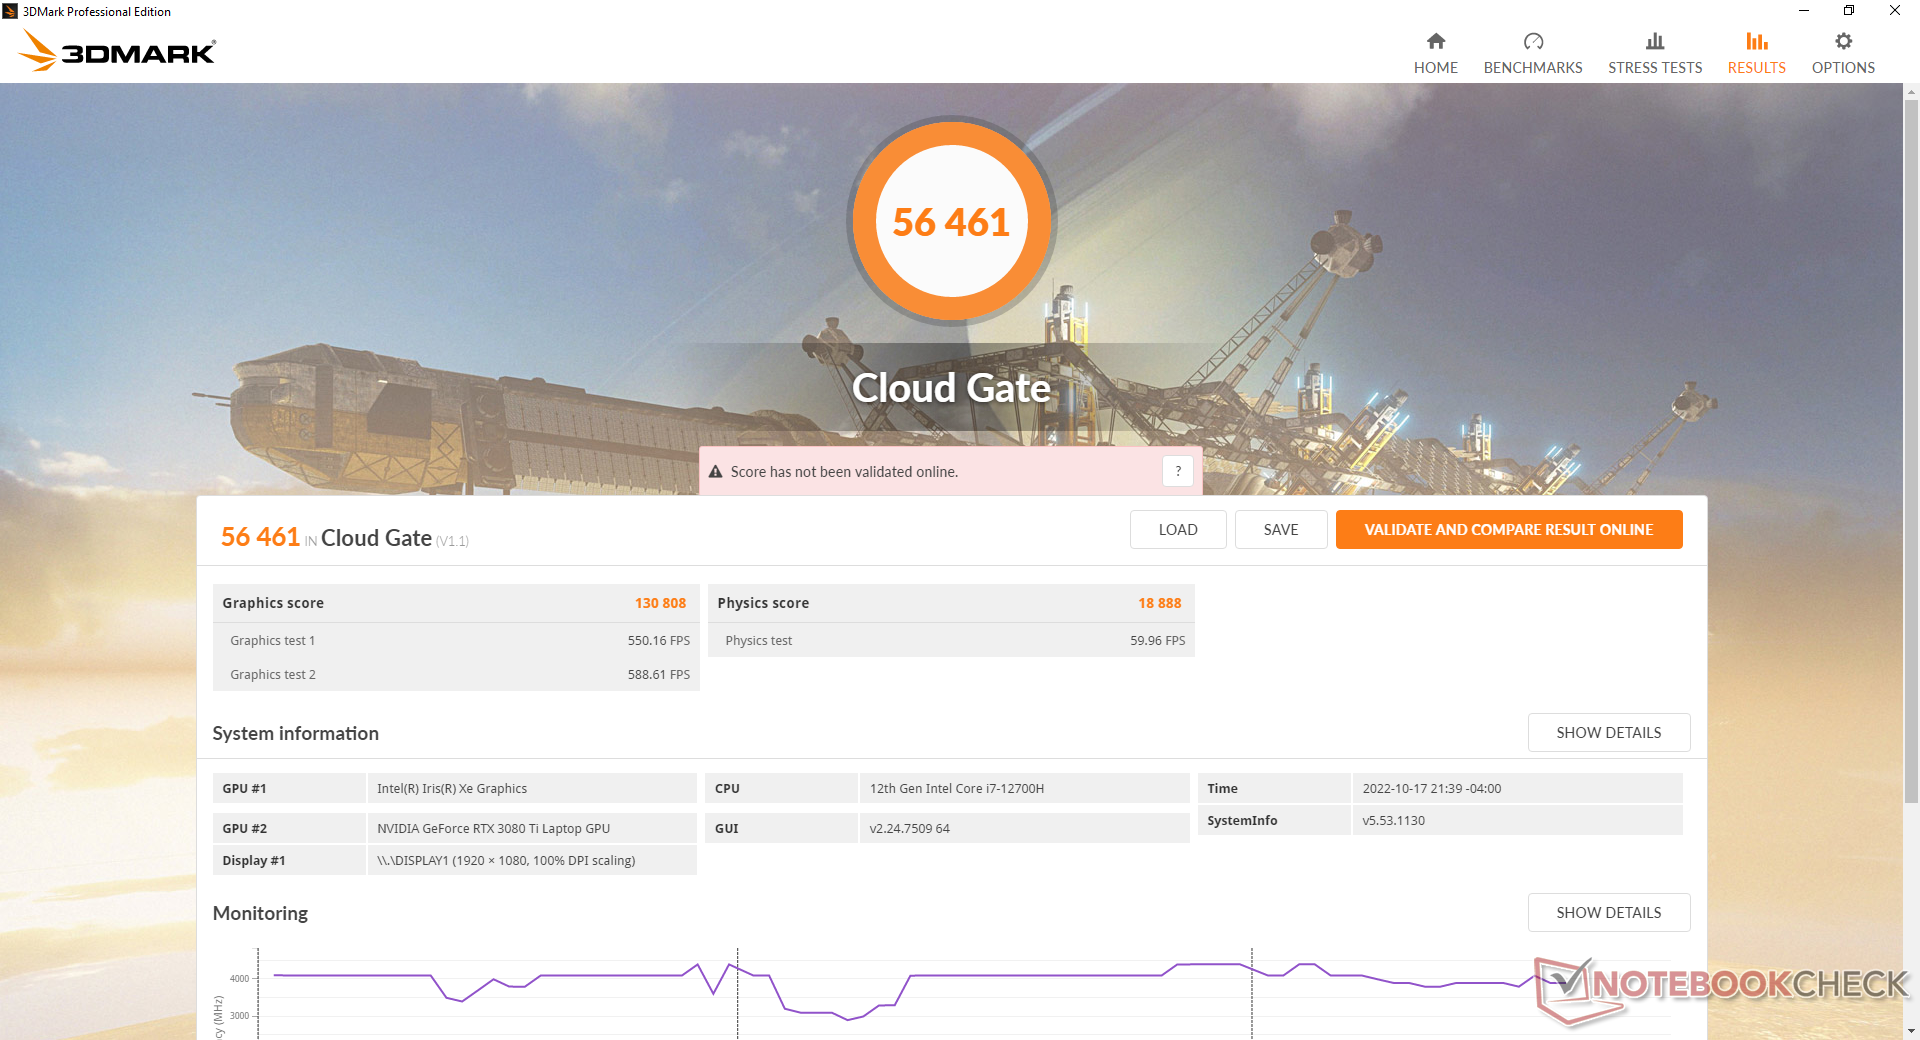
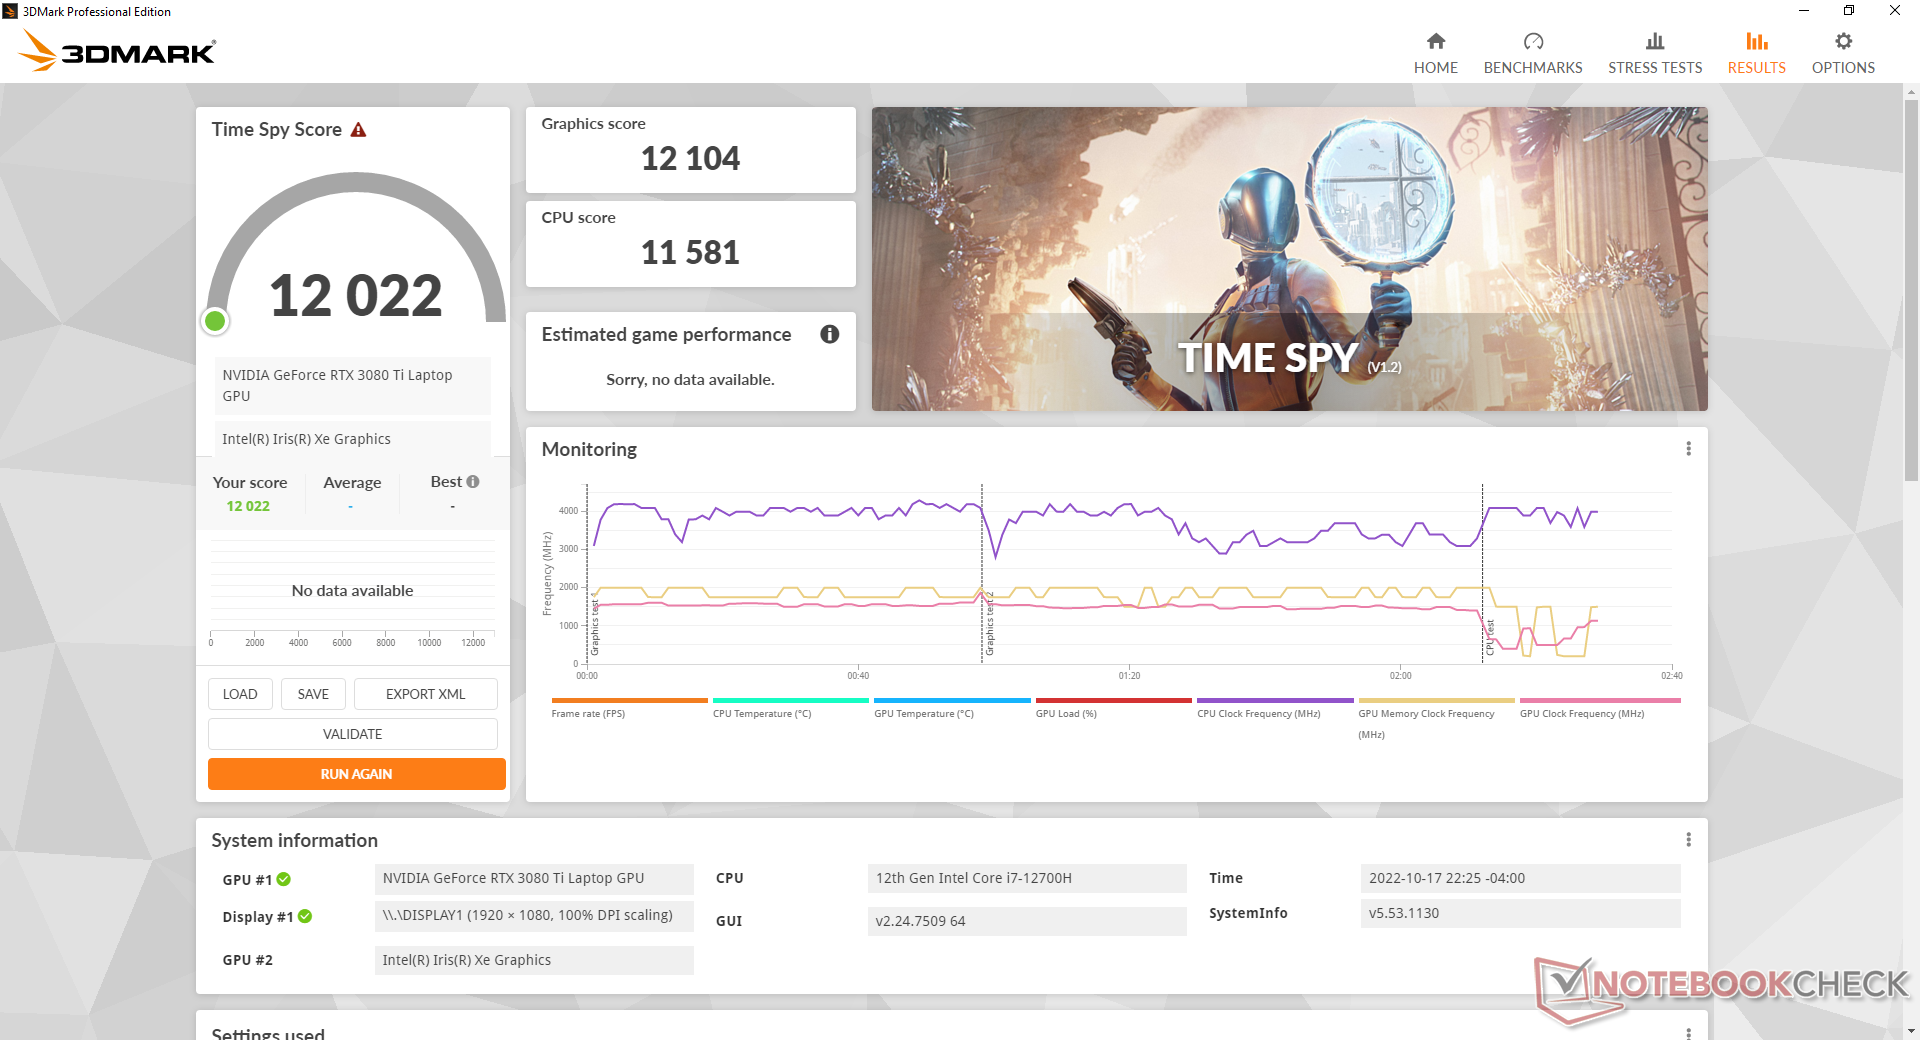
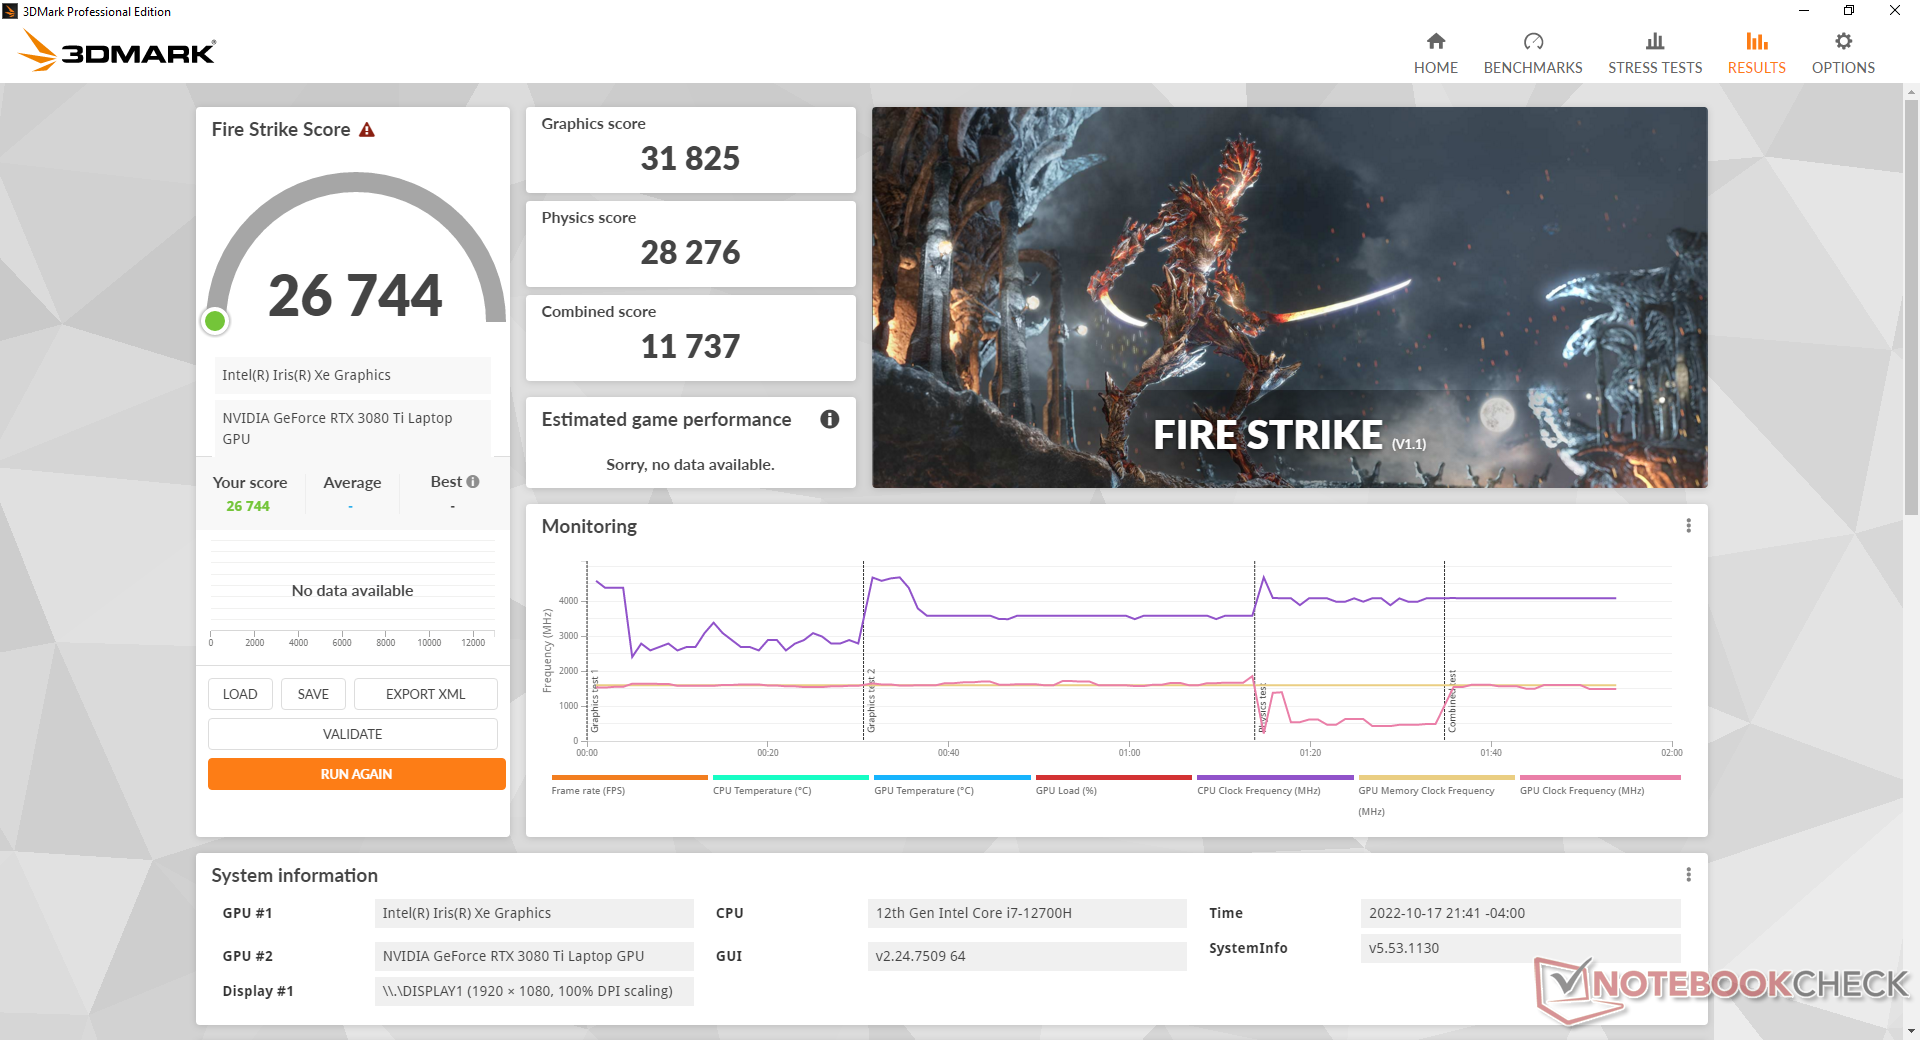
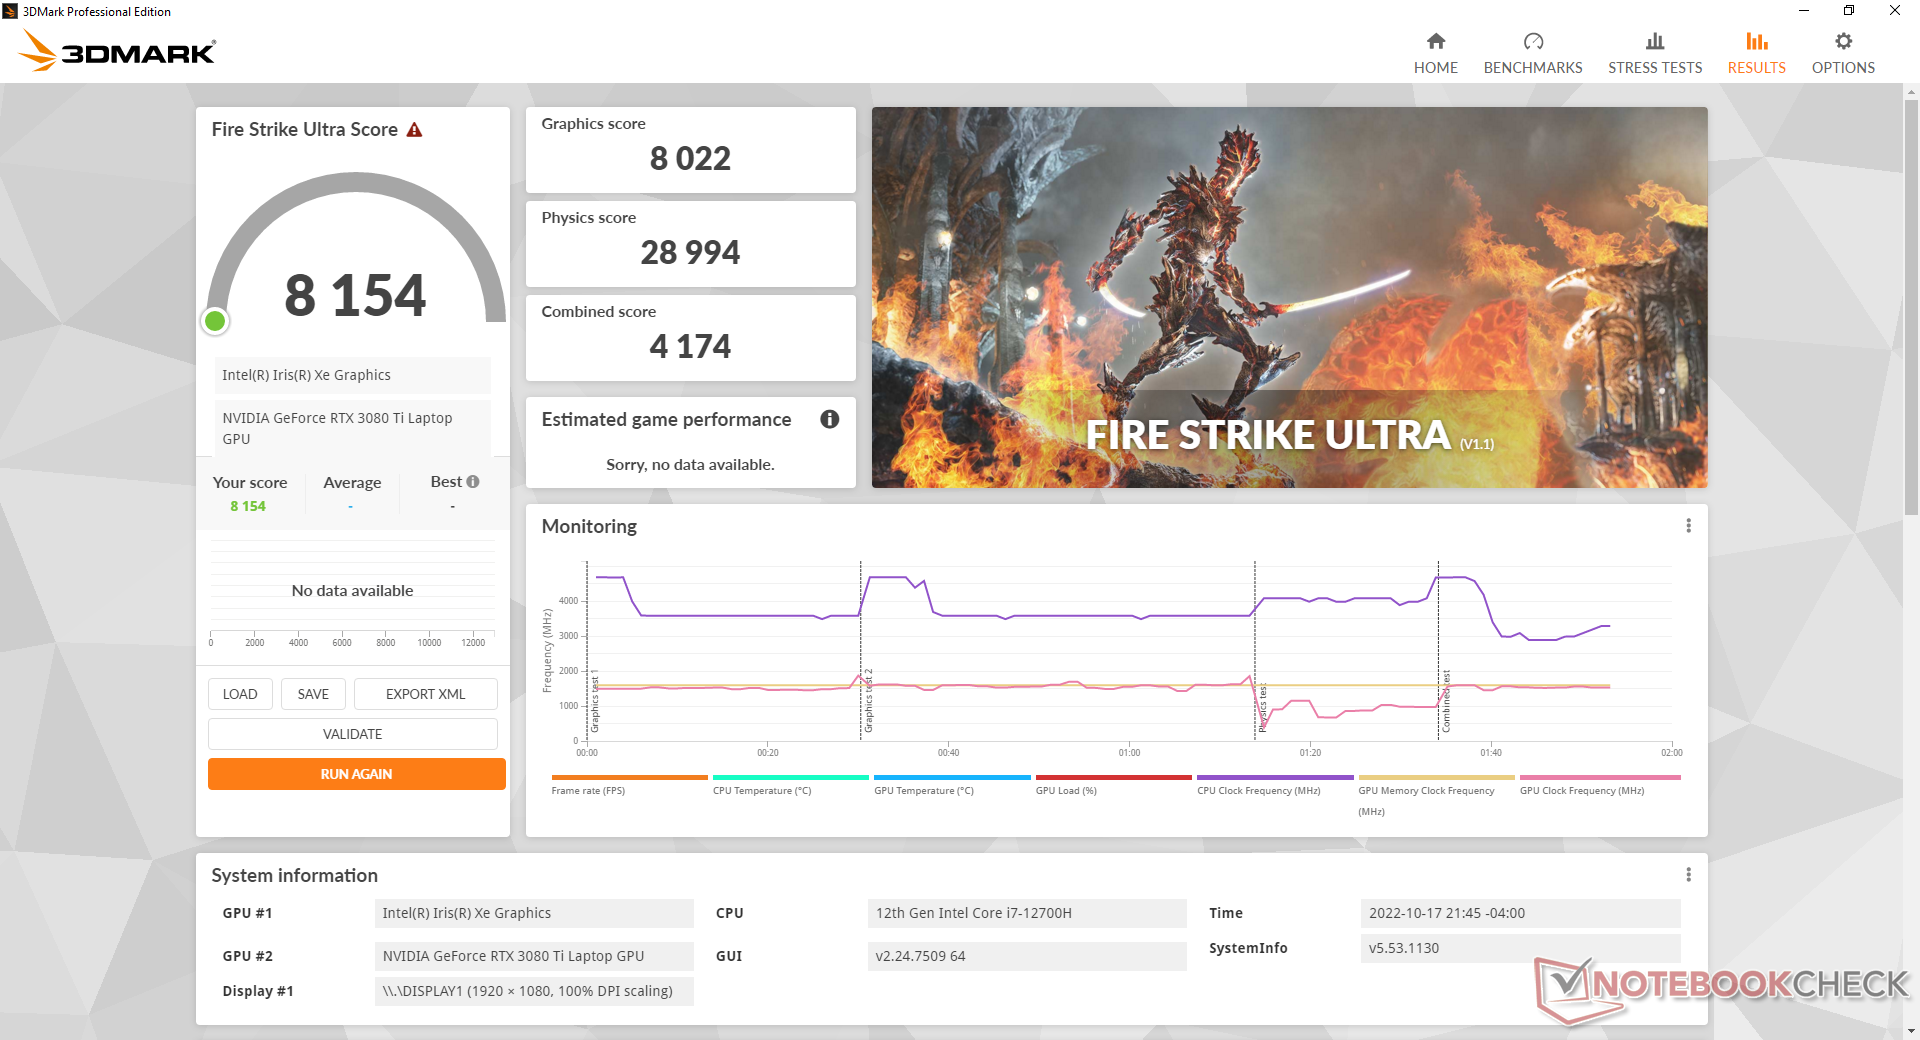
Performances du GPU
Les performances graphiques sont excellentes, avec des résultats légèrement supérieurs à ceux de la plupart des autres ordinateurs portables de même catégorie GeForce RTX 3080 Ti GPU. Le TGP de 125 W n'est pas le plus élevé que l' Alienware x17 R2 et même le Razer Blade 17 ont des objectifs plus élevés, mais il est au moins plus élevé que sur de nombreux ordinateurs portables ultra-minces comme la série GS de MSI.
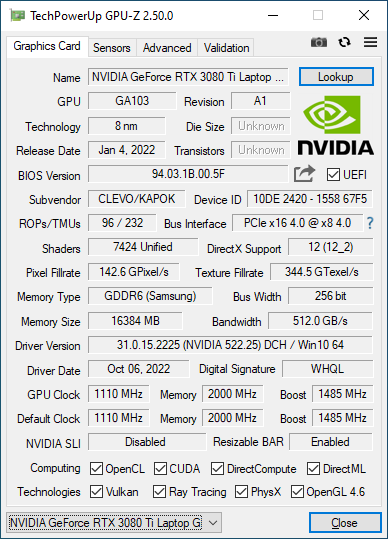
Il est intéressant de noter que le panneau de contrôle Nvidia revendique un TGP de 155 W alors que Eurocom revendique un TGP de 125 W. Ce dernier chiffre semble être l'objectif le plus précis comme le montrera notre section Stress Test ci-dessous.
En passant à la GeForce RTX 3070 Ti n'aura qu'un impact d'environ 10 % sur les performances graphiques. Les performances globales sont environ 20 à 30 % plus faibles que celles de notre ordinateur de référence bureau GeForce RTX 3080.
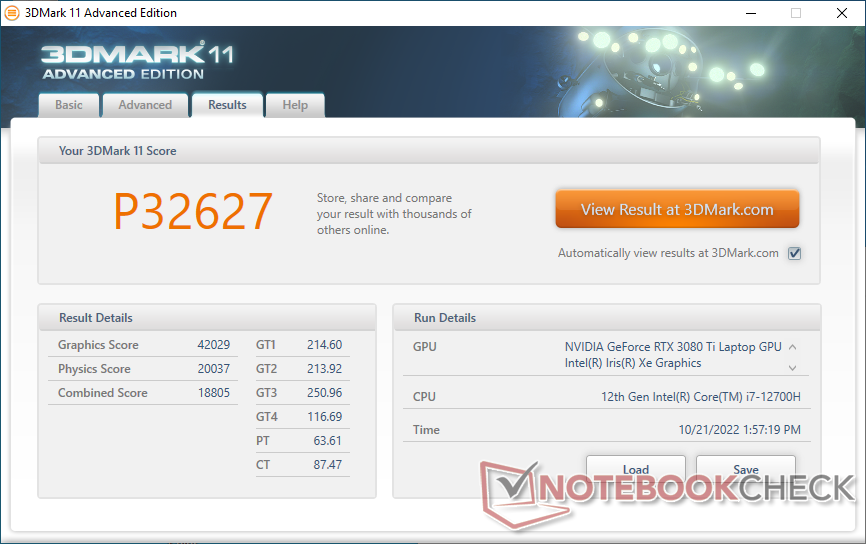
| 3DMark 11 Performance | 32627 points | |
| 3DMark Cloud Gate Standard Score | 56461 points | |
| 3DMark Fire Strike Score | 26744 points | |
| 3DMark Time Spy Score | 12022 points | |
Aide | ||
* ... Moindre est la valeur, meilleures sont les performances
Witcher 3 FPS Chart
| Bas | Moyen | Élevé | Ultra | |
|---|---|---|---|---|
| GTA V (2015) | 186.2 | 181.3 | 169.5 | 107.4 |
| The Witcher 3 (2015) | 391.9 | 313.9 | 212.5 | 109.4 |
| Dota 2 Reborn (2015) | 176.1 | 157.9 | 148.6 | 140.8 |
| Final Fantasy XV Benchmark (2018) | 200 | 147.4 | 115.1 | |
| X-Plane 11.11 (2018) | 124.3 | 106.6 | 96.4 | |
| Strange Brigade (2018) | 416 | 273 | 226 | 199.8 |
| Cyberpunk 2077 1.6 (2022) | 135.4 | 123.2 | 96.2 | 80 |
Émissions
Bruit du système
Il y a presque toujours un bruit de ventilateur provenant de la machine. Les ventilateurs ont tendance à tourner au ralenti sur le bureau, mais même les charges les plus légères, comme la navigation sur Internet, induisent un bruit de ventilateur de 30 dB(A) sur un fond silencieux de 23 dB(A). Le bruit du ventilateur atteint rapidement son maximum de 56 dB(A) lors de l'exécution de charges plus exigeantes comme 3DMark 06 ou des jeux, même s'il est réglé sur le profil d'alimentation équilibré. C'est un ordinateur portable de jeu qui n'a pas peur d'être bruyant, quel que soit le réglage du profil d'alimentation.
La plupart des autres portables de jeu de 17 pouces atteignent également 50 dB(A) ou plus dans des conditions similaires et ce problème n'est donc pas unique à Eurocom. Néanmoins, l'ordinateur d'Eurocom a tendance à devenir plus bruyant plus soudainement et à un rythme plus rapide.
Degré de la nuisance sonore
| Au repos |
| 23.3 / 30.7 / 30.7 dB(A) |
| Fortement sollicité |
| 56.2 / 55.9 dB(A) |
 | ||
30 dB silencieux 40 dB(A) audible 50 dB(A) bruyant |
||
min: | ||
| Eurocom Nightsky TXi317 GeForce RTX 3080 Ti Laptop GPU, i7-12700H, Samsung SSD 980 Pro 1TB MZ-V8P1T0BW | Schenker XMG Pro 17 E22 GeForce RTX 3080 Ti Laptop GPU, i9-12900H, Samsung SSD 980 Pro 1TB MZ-V8P1T0BW | Aorus 17X XES GeForce RTX 3070 Ti Laptop GPU, i9-12900HX, Gigabyte AG470S1TB-SI B10 | MSI Raider GE77 HX 12UHS GeForce RTX 3080 Ti Laptop GPU, i9-12900HX, Samsung PM9A1 MZVL22T0HBLB | Razer Blade 17 Early 2022 GeForce RTX 3080 Ti Laptop GPU, i9-12900H, Samsung PM9A1 MZVL21T0HCLR | Alienware x17 R2 P48E GeForce RTX 3080 Ti Laptop GPU, i9-12900HK, 2x Samsung PM9A1 1TB (RAID 0) | |
|---|---|---|---|---|---|---|
| Noise | -12% | -7% | -11% | 2% | 16% | |
| arrêt / environnement * (dB) | 23.3 | 26 -12% | 26 -12% | 26 -12% | 26 -12% | 22.7 3% |
| Idle Minimum * (dB) | 23.3 | 26 -12% | 28 -20% | 26 -12% | 26 -12% | 23.1 1% |
| Idle Average * (dB) | 30.7 | 34 -11% | 32 -4% | 34 -11% | 27 12% | 23.1 25% |
| Idle Maximum * (dB) | 30.7 | 42 -37% | 38 -24% | 46 -50% | 32 -4% | 23.1 25% |
| Load Average * (dB) | 56.2 | 58 -3% | 53 6% | 50 11% | 50 11% | 31.9 43% |
| Witcher 3 ultra * (dB) | 56.1 | 57 -2% | 54 4% | 55 2% | 51 9% | 52.5 6% |
| Load Maximum * (dB) | 55.9 | 58 -4% | 55 2% | 57 -2% | 51 9% | 52.5 6% |
* ... Moindre est la valeur, meilleures sont les performances
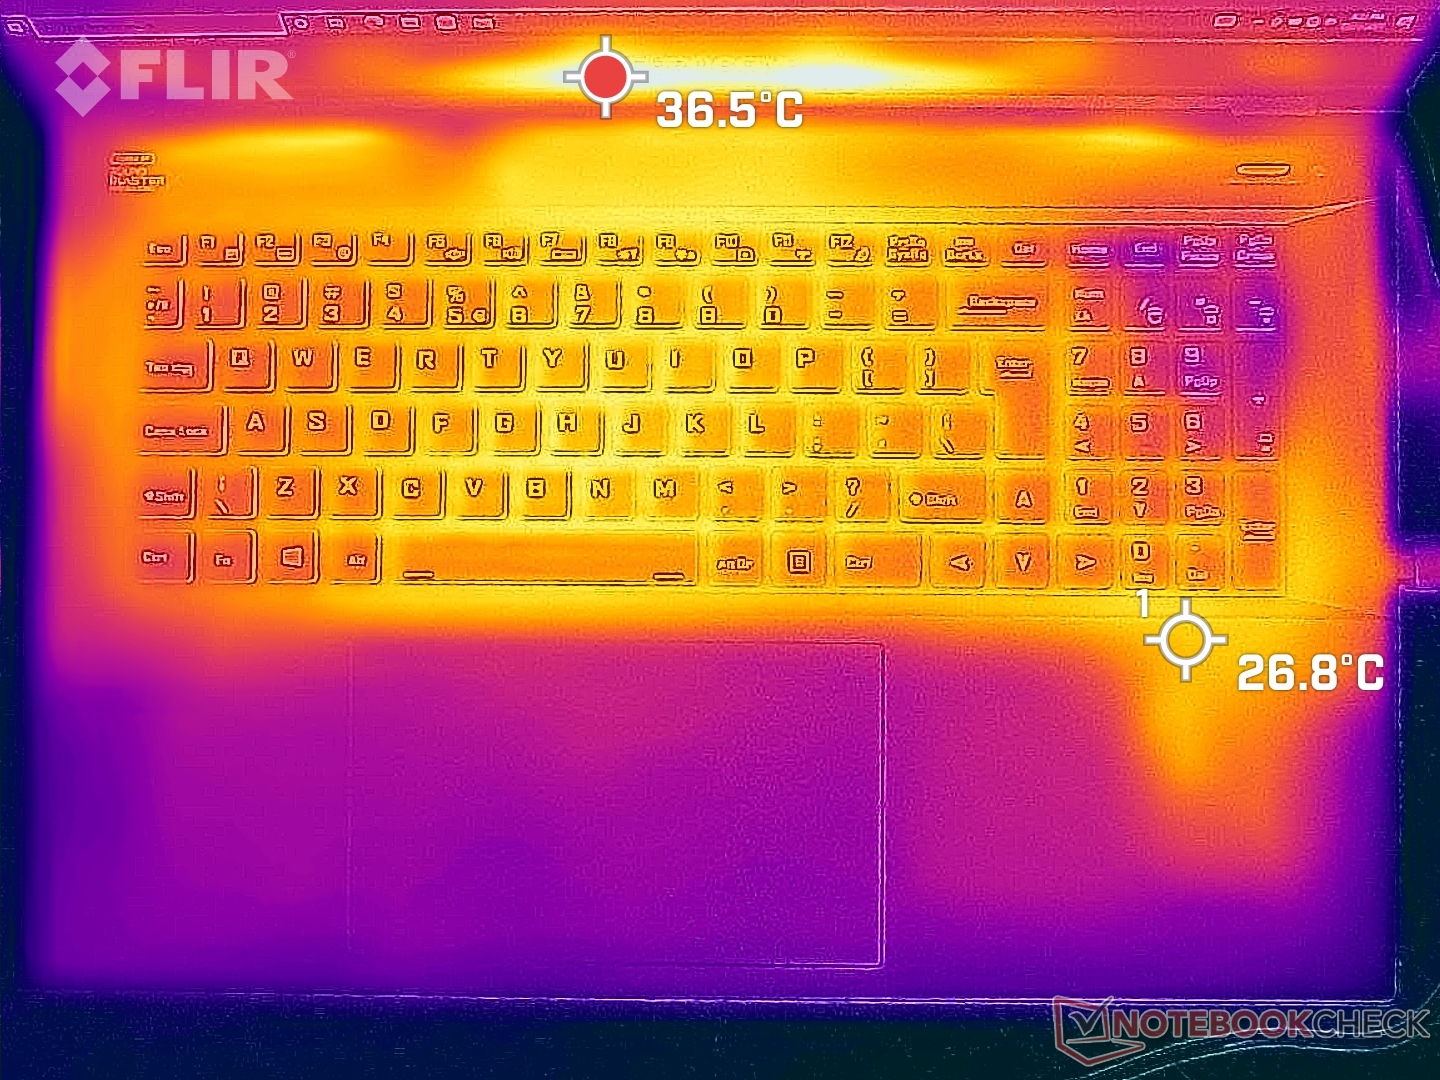
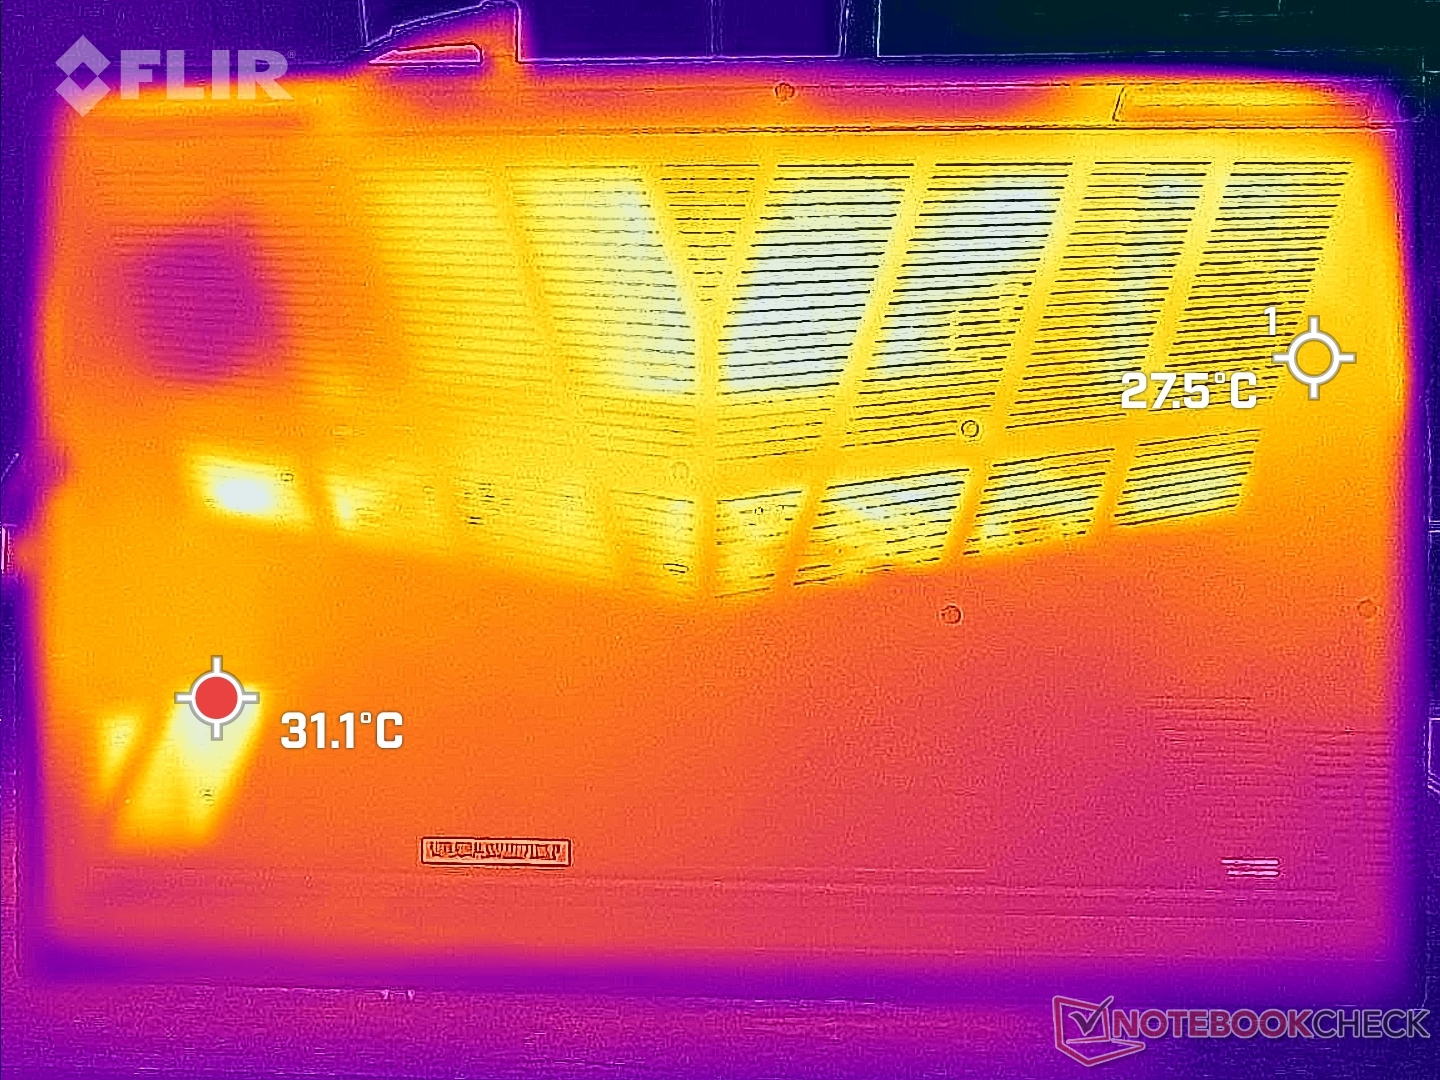
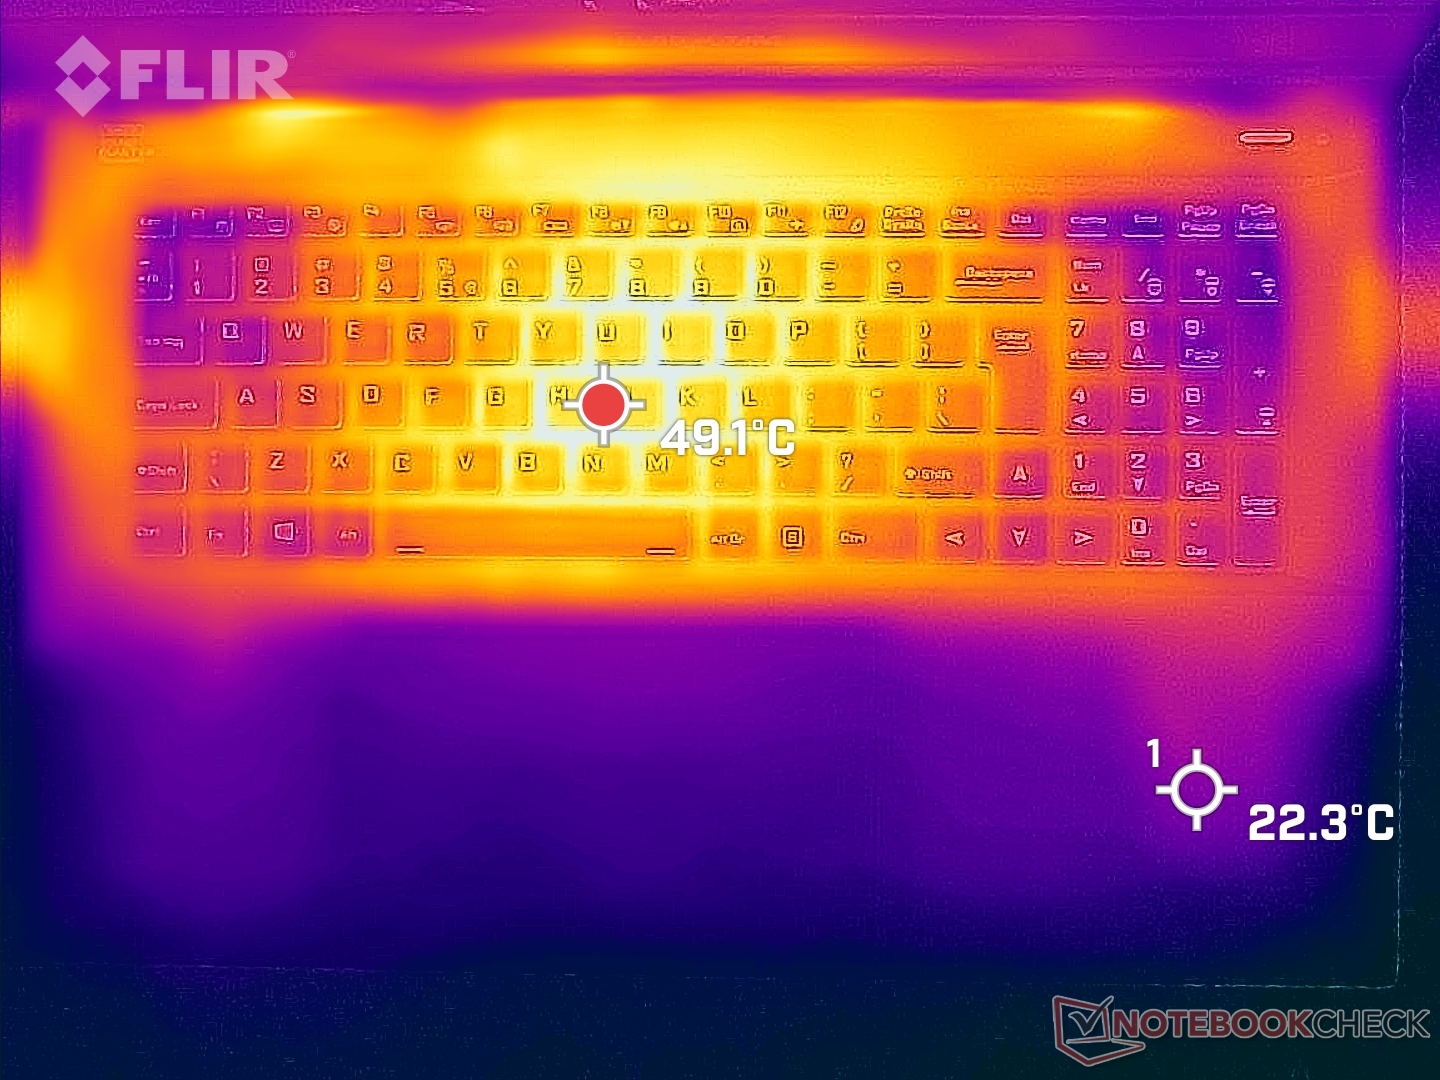
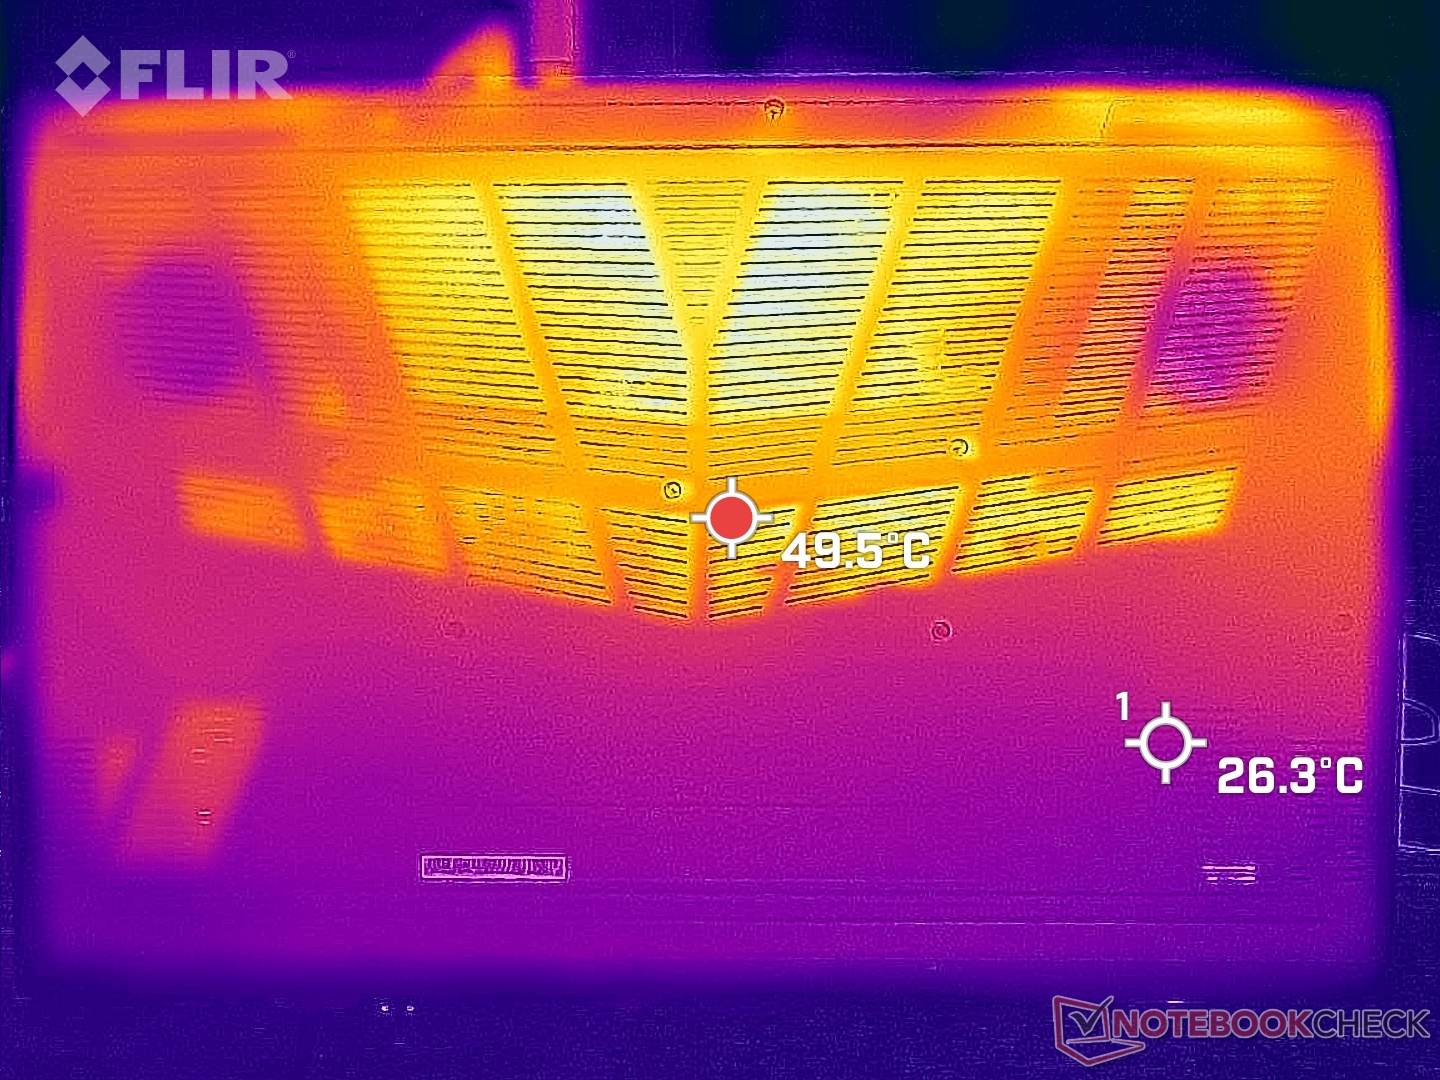
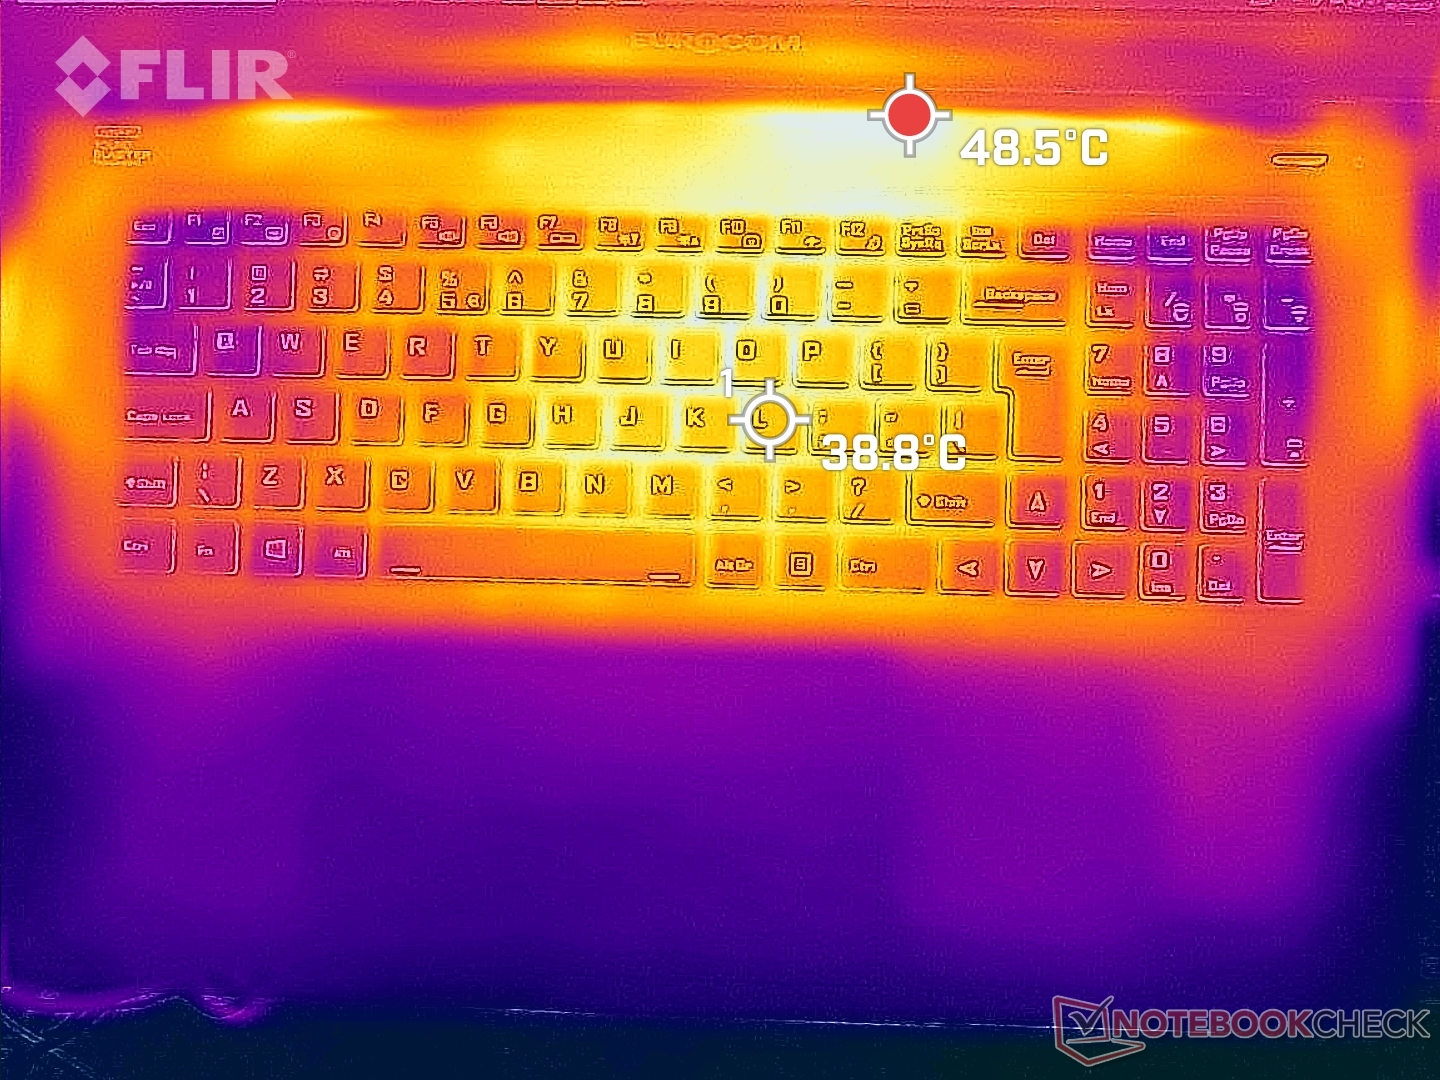
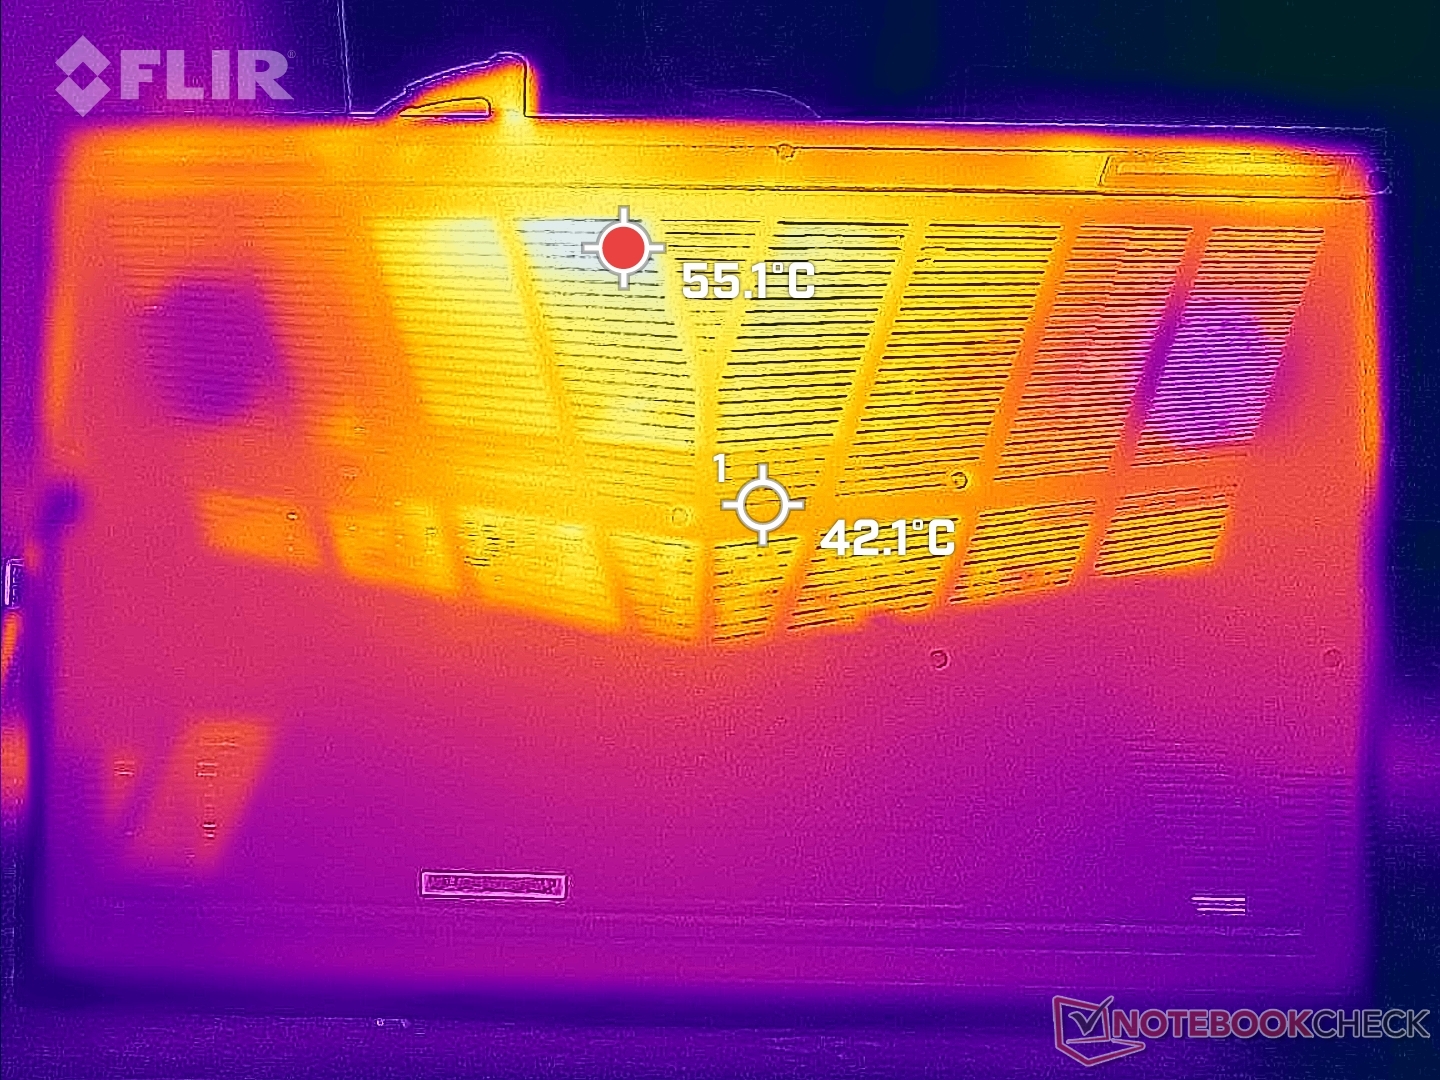
Température
La température de la surface est la plus élevée au centre du clavier, tandis que les repose-poignets sont beaucoup plus frais pour un jeu plus confortable. Les ordinateurs portables plus minces comme le Razer Blade 17 ont des repose-poignets nettement plus chauds qui sont plus inconfortables pour la main
Notez que le repose-paume droit du Nightsky TXi317 sera toujours un peu plus chaud que le repose-paume gauche car les SSD M.2 sont situés sous le repose-paume droit.
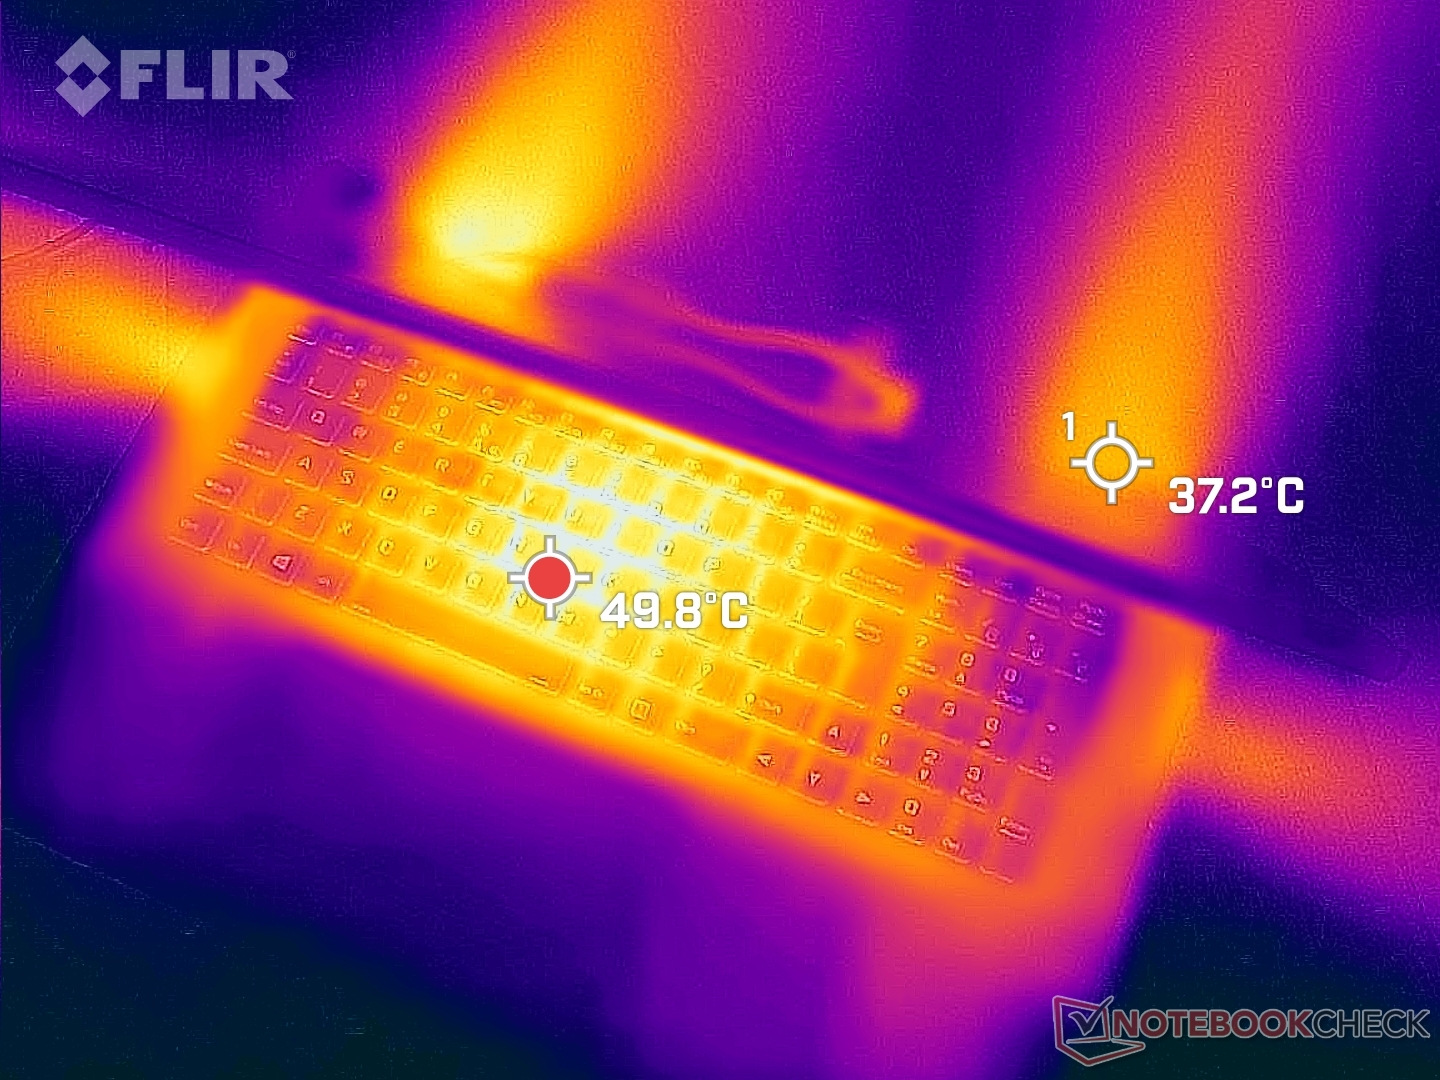
(-) La température maximale du côté supérieur est de 50.4 °C / 123 F, par rapport à la moyenne de 40.4 °C / 105 F, allant de 21.2 à 68.8 °C pour la classe Gaming.
(-) Le fond chauffe jusqu'à un maximum de 47.6 °C / 118 F, contre une moyenne de 43.2 °C / 110 F
(+) En utilisation inactive, la température moyenne du côté supérieur est de 29.4 °C / 85 F, par rapport à la moyenne du dispositif de 33.9 °C / 93 F.
(-) En jouant à The Witcher 3, la température moyenne du côté supérieur est de 39.2 °C / 103 F, alors que la moyenne de l'appareil est de 33.9 °C / 93 F.
(+) Les repose-poignets et le pavé tactile sont plus froids que la température de la peau avec un maximum de 31.2 °C / 88.2 F et sont donc froids au toucher.
(-) La température moyenne de la zone de l'appui-paume de dispositifs similaires était de 28.8 °C / 83.8 F (-2.4 °C / #-4.4 F).
| Eurocom Nightsky TXi317 Intel Core i7-12700H, NVIDIA GeForce RTX 3080 Ti Laptop GPU | Schenker XMG Pro 17 E22 Intel Core i9-12900H, NVIDIA GeForce RTX 3080 Ti Laptop GPU | Aorus 17X XES Intel Core i9-12900HX, NVIDIA GeForce RTX 3070 Ti Laptop GPU | MSI Raider GE77 HX 12UHS Intel Core i9-12900HX, NVIDIA GeForce RTX 3080 Ti Laptop GPU | Razer Blade 17 Early 2022 Intel Core i9-12900H, NVIDIA GeForce RTX 3080 Ti Laptop GPU | Alienware x17 R2 P48E Intel Core i9-12900HK, NVIDIA GeForce RTX 3080 Ti Laptop GPU | |
|---|---|---|---|---|---|---|
| Heat | -12% | -15% | -19% | -10% | 7% | |
| Maximum Upper Side * (°C) | 50.4 | 56 -11% | 54 -7% | 53 -5% | 50 1% | 49.6 2% |
| Maximum Bottom * (°C) | 47.6 | 60 -26% | 58 -22% | 58 -22% | 56 -18% | 42.4 11% |
| Idle Upper Side * (°C) | 32.6 | 34 -4% | 37 -13% | 38 -17% | 36 -10% | 29.2 10% |
| Idle Bottom * (°C) | 33.2 | 36 -8% | 39 -17% | 43 -30% | 38 -14% | 32 4% |
* ... Moindre est la valeur, meilleures sont les performances
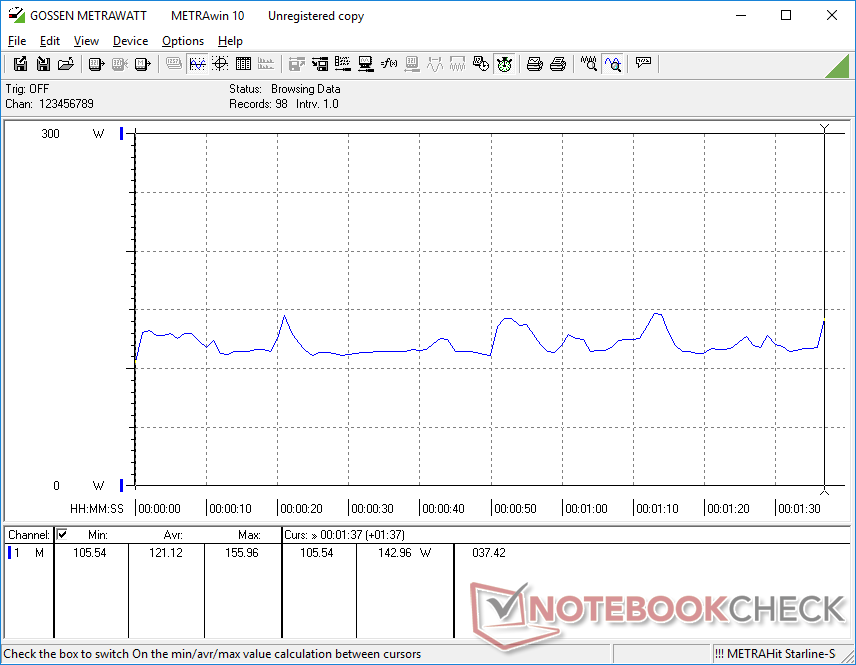
Test de stress
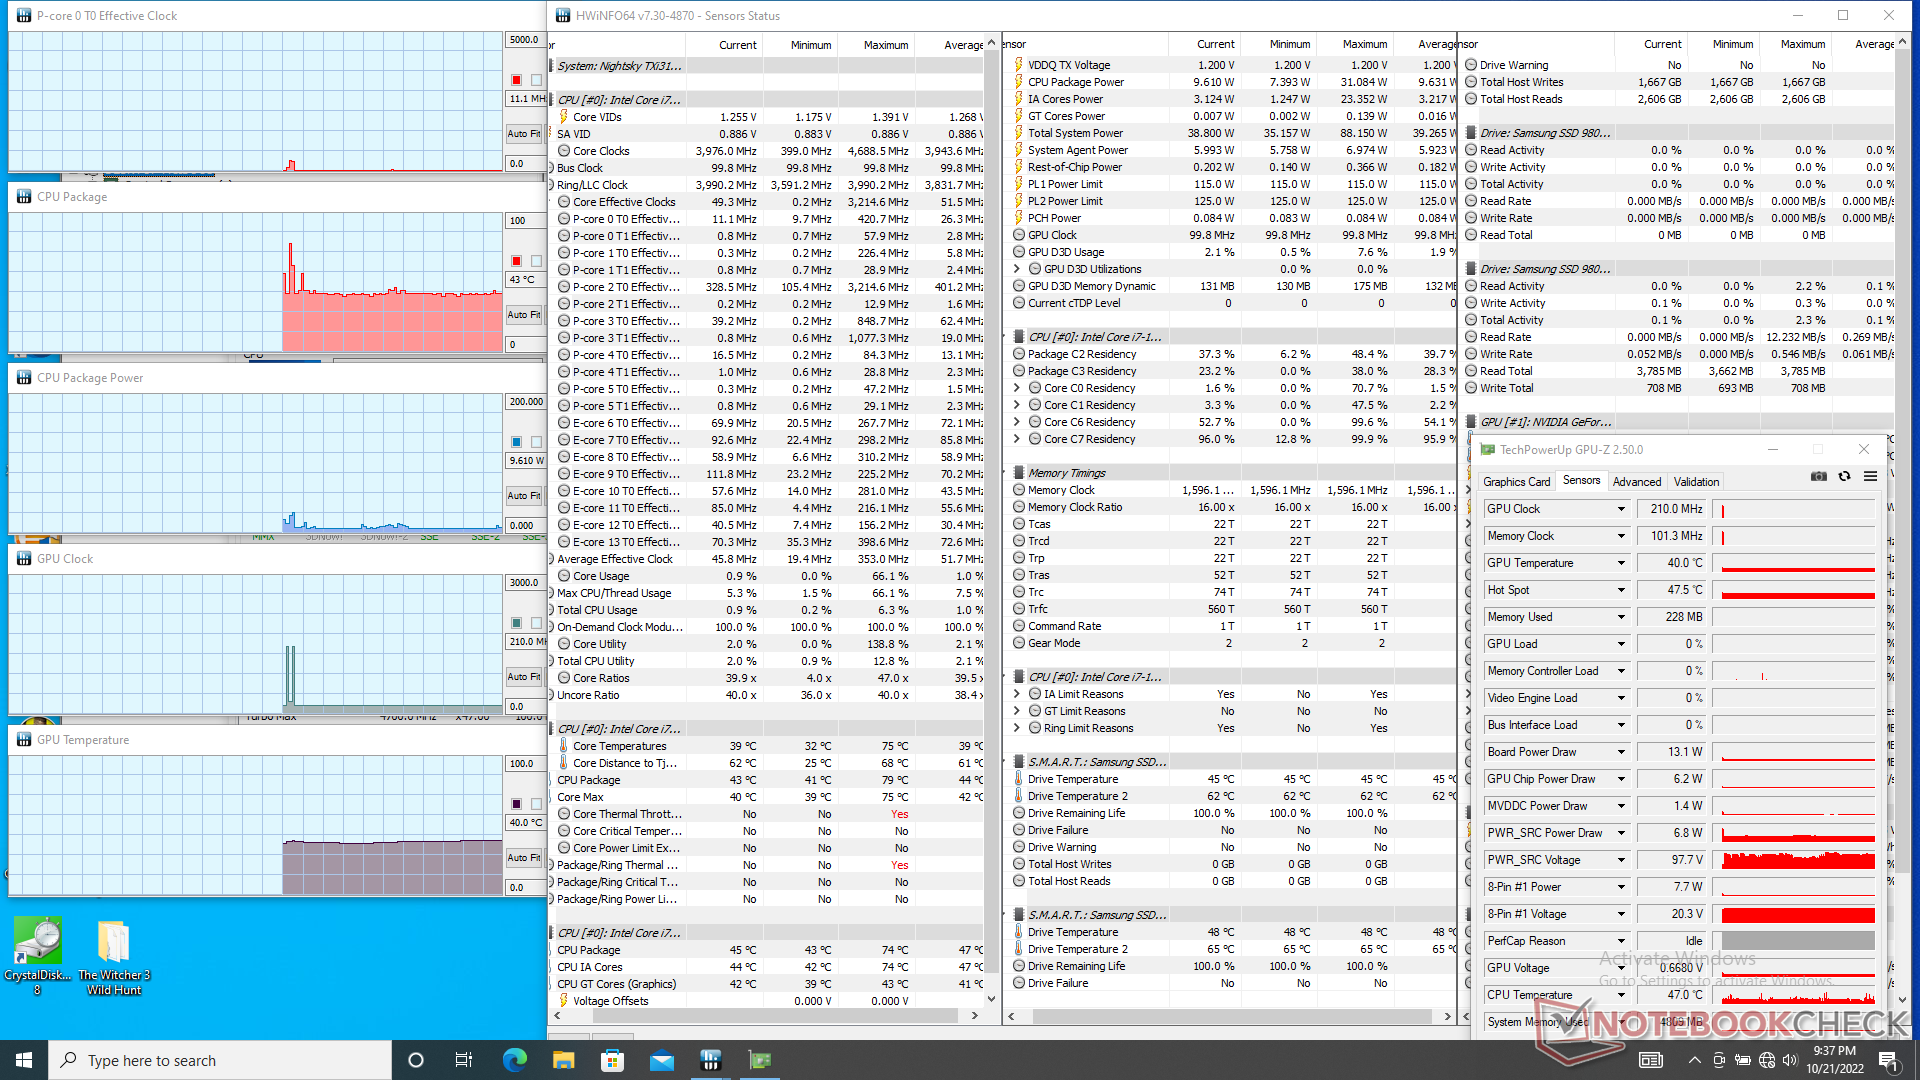
Les fréquences d'horloge du CPU, la température et la consommation d'énergie de la carte atteignent respectivement 4 GHz, 97 C et 110 W au début du test Prime95. Les fréquences d'horloge et la consommation d'énergie ont ensuite baissé régulièrement avant de se stabiliser à 2,8 GHz et 76 W, respectivement, sans changement de la température du cœur. En répétant ce même test sur leDell G16 7620 avec un processeur identique, on obtient des fréquences d'horloge stables légèrement plus élevées d'environ 3,3 GHz, mais des températures du cœur similaires de près de 100 °C.
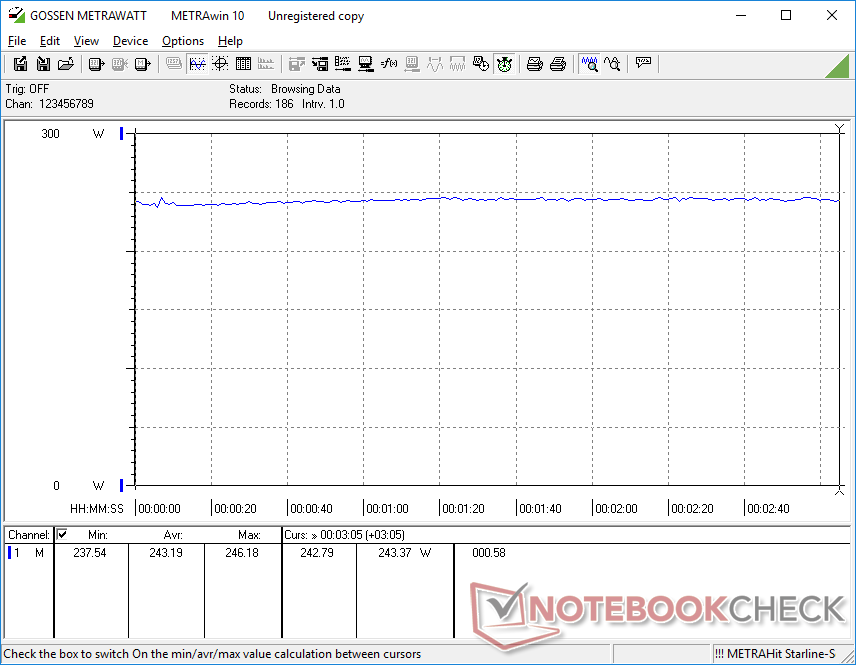
Les fréquences d'horloge, la température et la consommation d'énergie de la carte graphique se stabilisent à 1432 MHz, 87 C et 121 W, respectivement, lors de l'exécution du test Witcher 3. En répétant ce test avec le profil d'alimentation "Entertainment", les performances du GPU sont légèrement réduites : la fréquence d'horloge et la consommation d'énergie tombent à 1327 MHz et 110 W, respectivement, sans changement de température. Il est regrettable que nous ne puissions pas nous rapprocher de l'objectif annoncé de 125 W à 155 W pour le TGP.
L'exécution de Witcher 3 sur le MSI GS77 avec le même GPU RTX 3080 Ti se traduirait par une fréquence d'horloge du GPU plus lente, une température centrale plus froide, et une consommation électrique de la carte plus faible de 1432 MHz, 75 C, et 105 W, respectivement, par rapport à notre Eurocom.
Les performances sont limitées si l'ordinateur fonctionne sur batterie. Un test Fire Strike sur batterie donne des scores de physique et de graphisme de 12300 et 5071 points, respectivement, contre 28276 et 31825 points sur secteur.
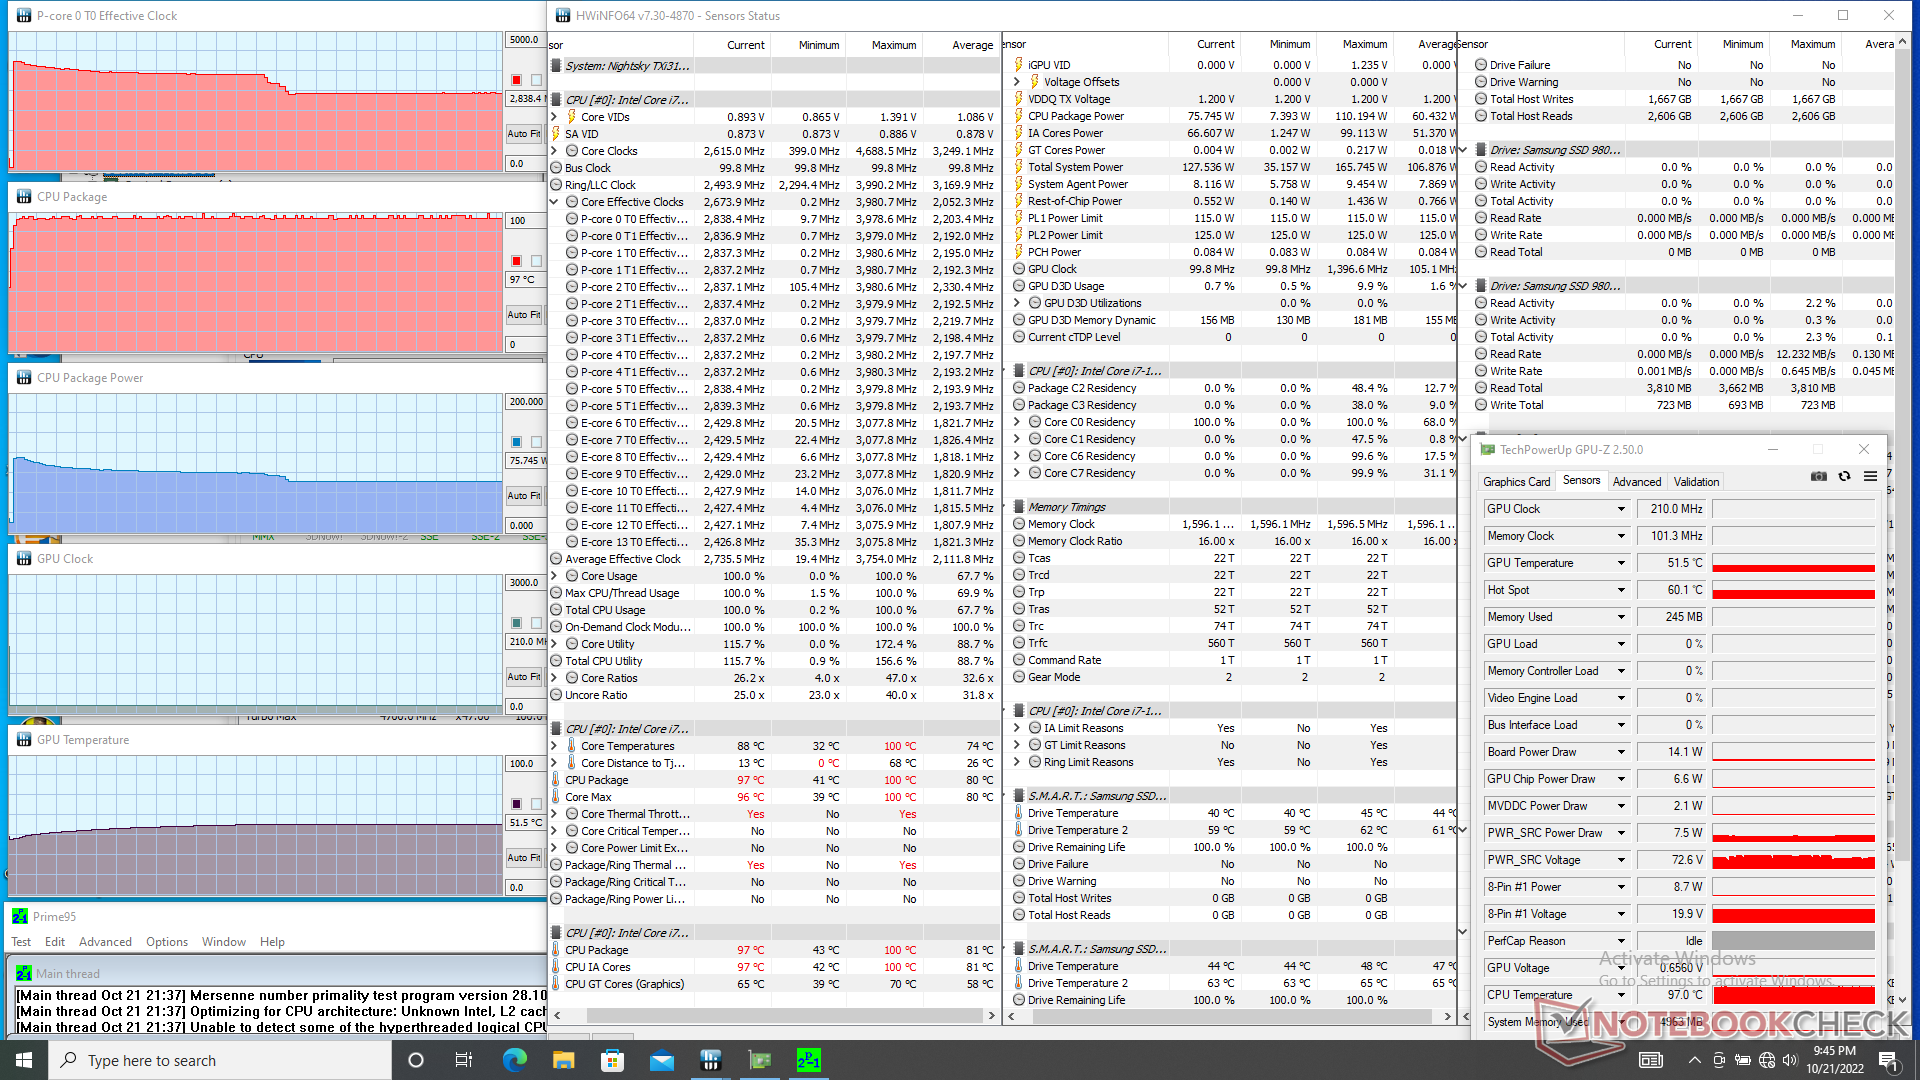
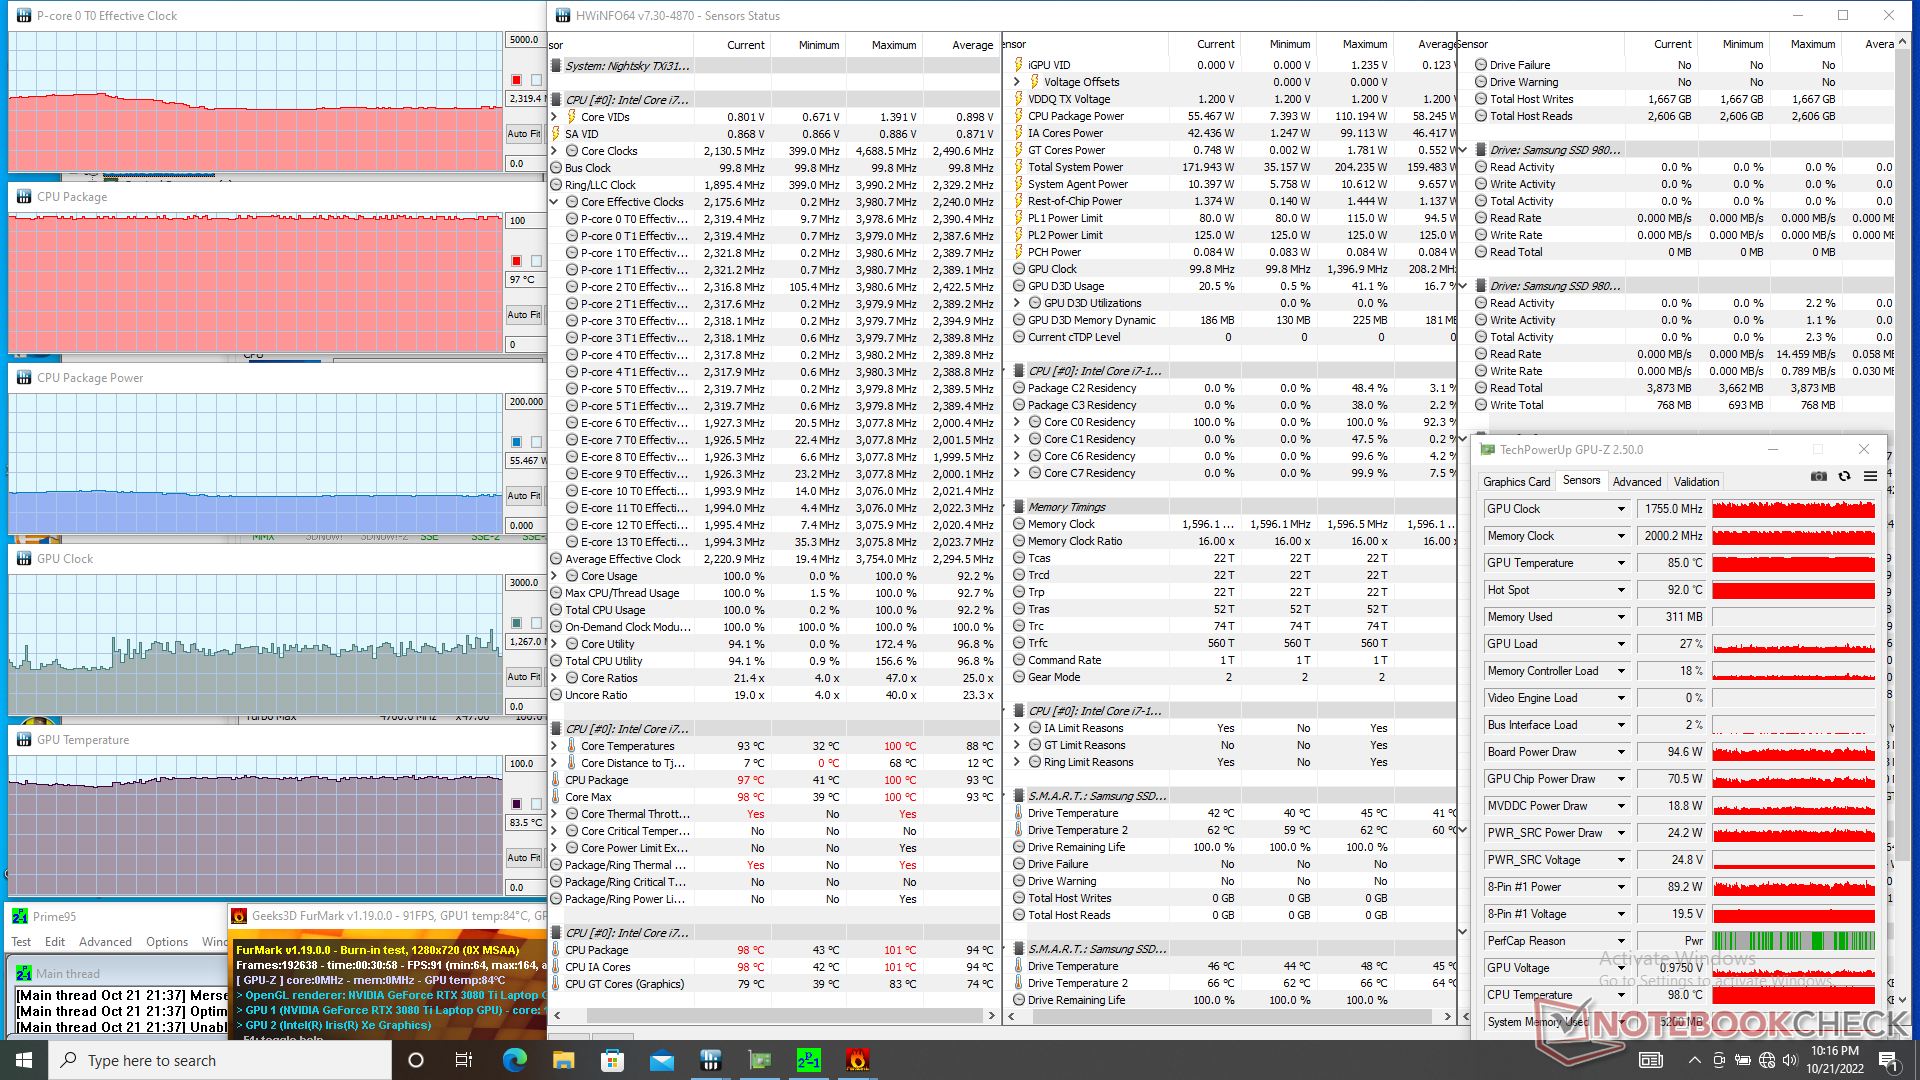
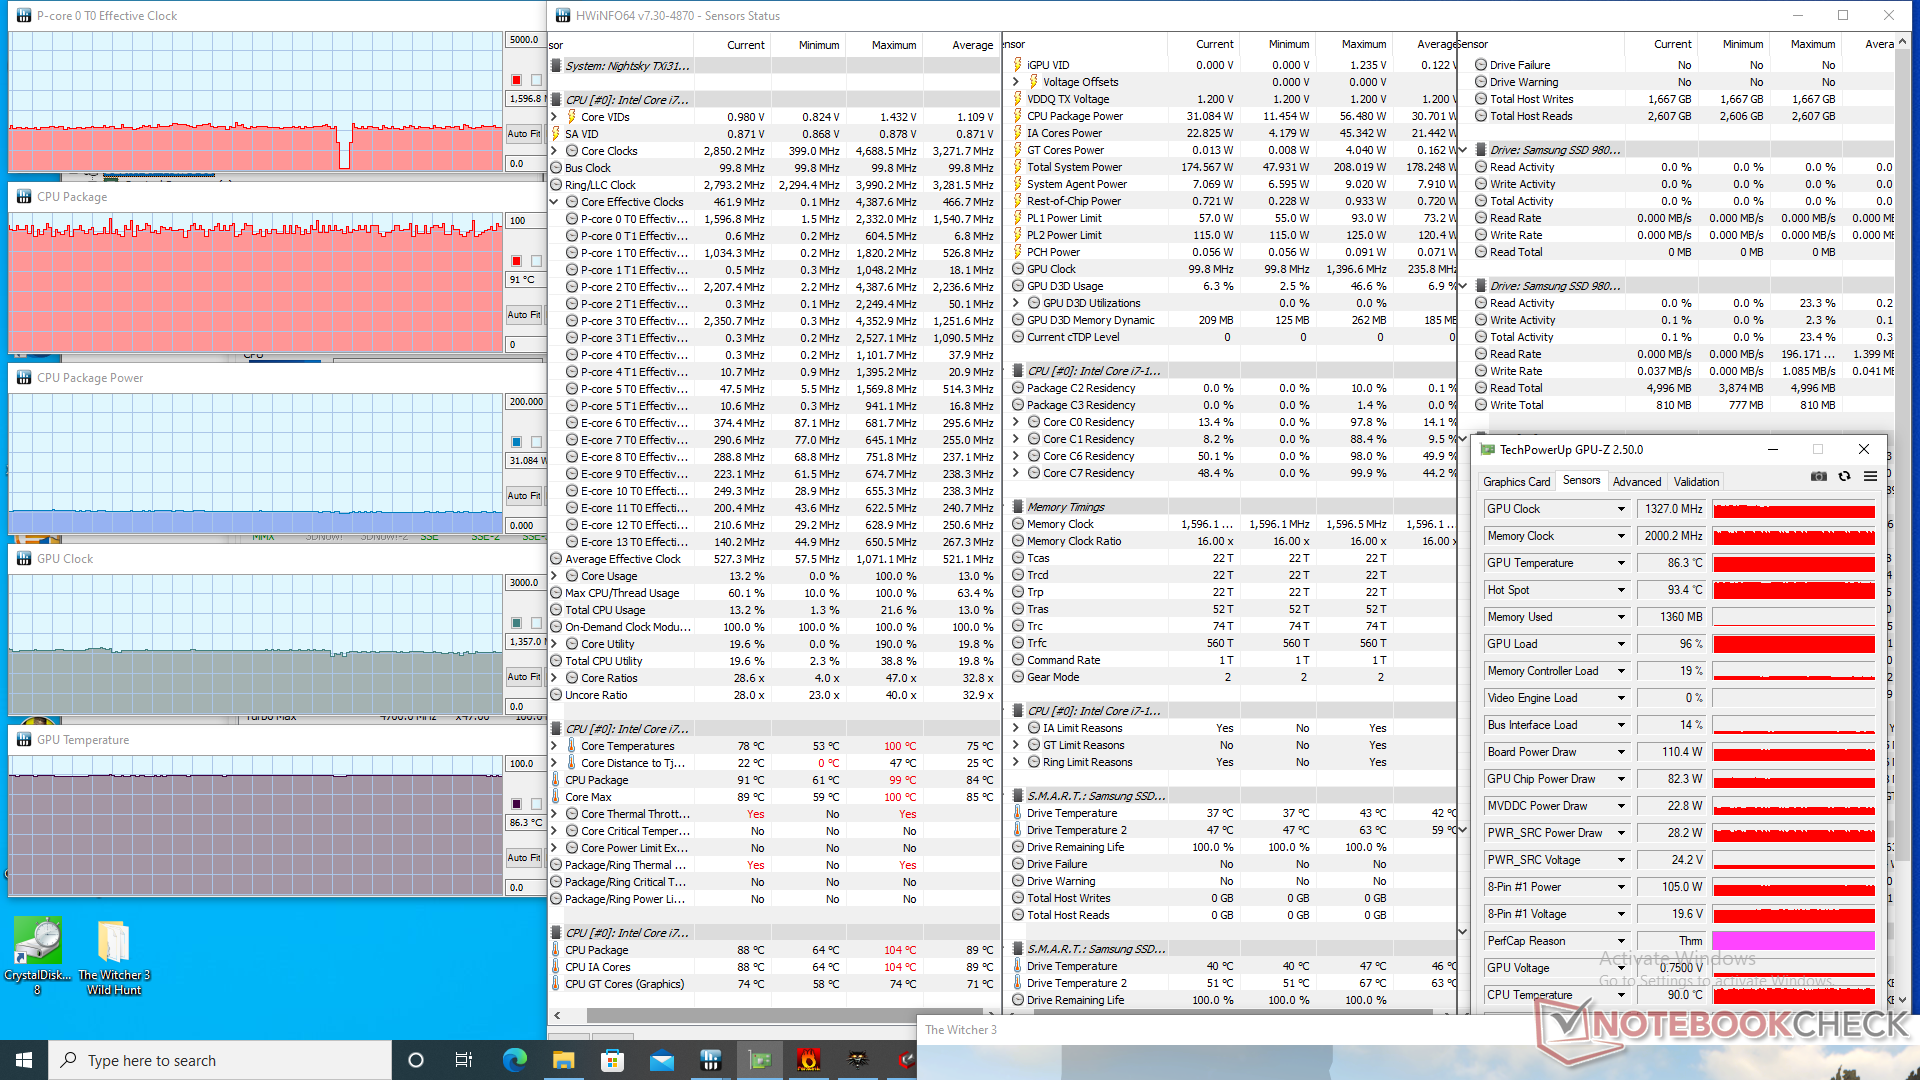
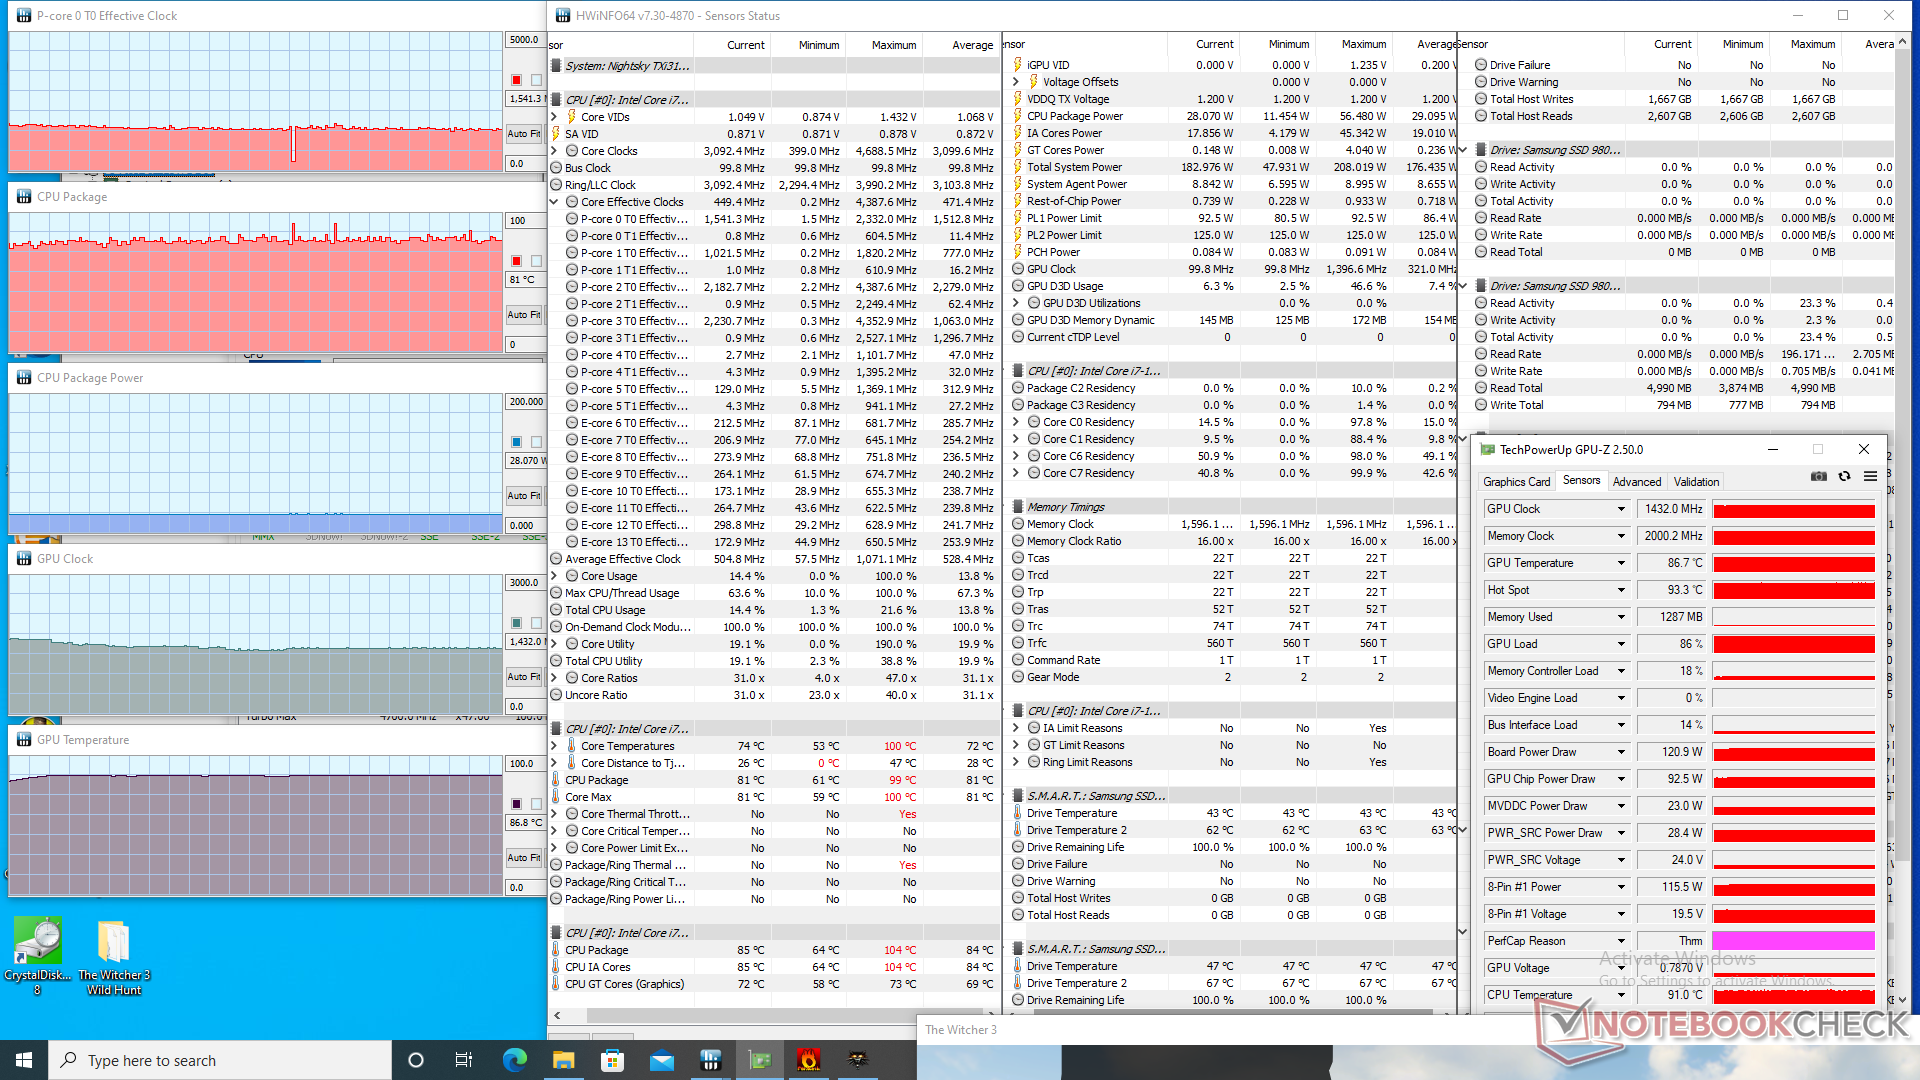
| Fréquence du CPU (GHz) | Fréquence du GPU (MHz) | Température moyenne du CPU (°C) | Température moyenne du GPU (°C) | |
| Système au repos | -- | -- | 43 | 40 |
| Prime95 Stress | 2.8 | -- | 97 | 52 |
| Prime95 + FurMark Stress | 2.3 - 2.8 | 1267 - 1755 | 97 | 84 |
| Witcher 3 Stress | 1.5 | 1432 | 81 | 87 |
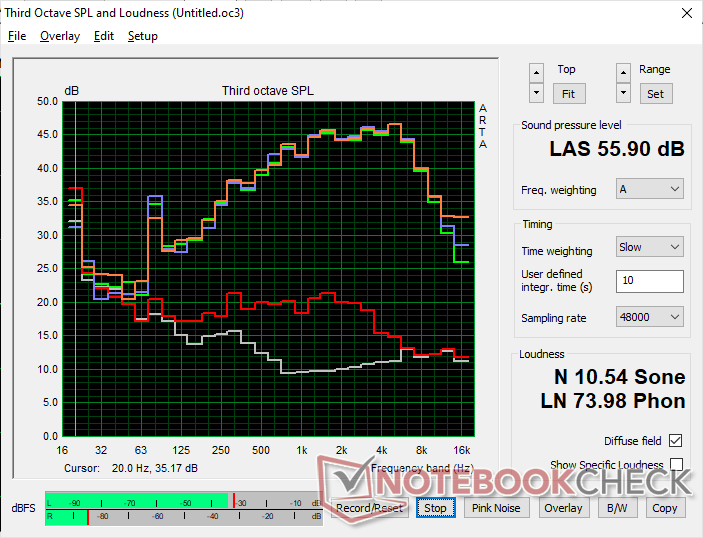
Haut-parleurs
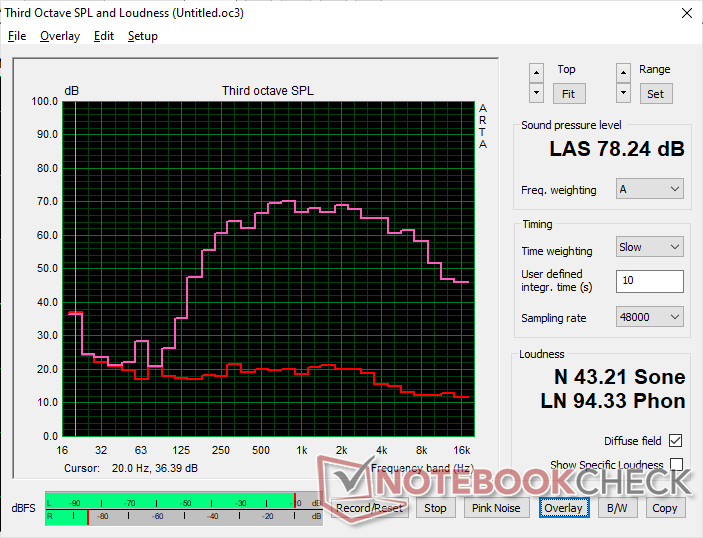
Eurocom Nightsky TXi317 analyse audio
(±) | le niveau sonore du haut-parleur est moyen mais bon (78.2# dB)
Basses 100 - 315 Hz
(±) | basse réduite - en moyenne 14.6% inférieure à la médiane
(-) | les basses ne sont pas linéaires (16.5% delta à la fréquence précédente)
Médiums 400 - 2000 Hz
(±) | médiane supérieure - en moyenne 5.1% supérieure à la médiane
(+) | les médiums sont linéaires (5% delta à la fréquence précédente)
Aiguës 2 - 16 kHz
(+) | des sommets équilibrés - à seulement 4% de la médiane
(+) | les aigus sont linéaires (6.2% delta à la fréquence précédente)
Globalement 100 - 16 000 Hz
(±) | la linéarité du son global est moyenne (20.4% de différence avec la médiane)
Par rapport à la même classe
» 72% de tous les appareils testés de cette catégorie étaient meilleurs, 6% similaires, 22% pires
» Le meilleur avait un delta de 6%, la moyenne était de 18%, le pire était de 132%.
Par rapport à tous les appareils testés
» 54% de tous les appareils testés étaient meilleurs, 8% similaires, 38% pires
» Le meilleur avait un delta de 4%, la moyenne était de 23%, le pire était de 134%.
Apple MacBook Pro 16 2021 M1 Pro analyse audio
(+) | les haut-parleurs peuvent jouer relativement fort (84.7# dB)
Basses 100 - 315 Hz
(+) | bonne basse - seulement 3.8% loin de la médiane
(+) | les basses sont linéaires (5.2% delta à la fréquence précédente)
Médiums 400 - 2000 Hz
(+) | médiane équilibrée - seulement 1.3% de la médiane
(+) | les médiums sont linéaires (2.1% delta à la fréquence précédente)
Aiguës 2 - 16 kHz
(+) | des sommets équilibrés - à seulement 1.9% de la médiane
(+) | les aigus sont linéaires (2.7% delta à la fréquence précédente)
Globalement 100 - 16 000 Hz
(+) | le son global est linéaire (4.6% différence à la médiane)
Par rapport à la même classe
» 0% de tous les appareils testés de cette catégorie étaient meilleurs, 0% similaires, 100% pires
» Le meilleur avait un delta de 5%, la moyenne était de 17%, le pire était de 45%.
Par rapport à tous les appareils testés
» 0% de tous les appareils testés étaient meilleurs, 0% similaires, 100% pires
» Le meilleur avait un delta de 4%, la moyenne était de 23%, le pire était de 134%.
Gestion de l'énergie
Consommation d'énergie
Le fonctionnement au ralenti sur le bureau avec le réglage de la luminosité et le profil d'alimentation les plus bas nécessiterait un peu moins de 13 W pour être comparable au XMG Pro 17 E22. Cependant, cette consommation peut atteindre 40 W en cas de luminosité maximale et de profil d'alimentation de performance avec le GPU Nvidia discret actif. Il est recommandé d'utiliser des paramètres d'alimentation plus bas si les performances supplémentaires ne sont pas nécessaires en raison des économies d'énergie significatives.
La consommation d'énergie en fonctionnement Witcher 3 est presque identique à celle que nous avons enregistrée sur leMSI Raider GE77 équipé du même GPU. Le système est beaucoup plus exigeant que les anciens ordinateurs portables de jeu fonctionnant avec le RTX 2080 de GeForce, tels que leLenovo Legion 7 15 de plus de 80 W
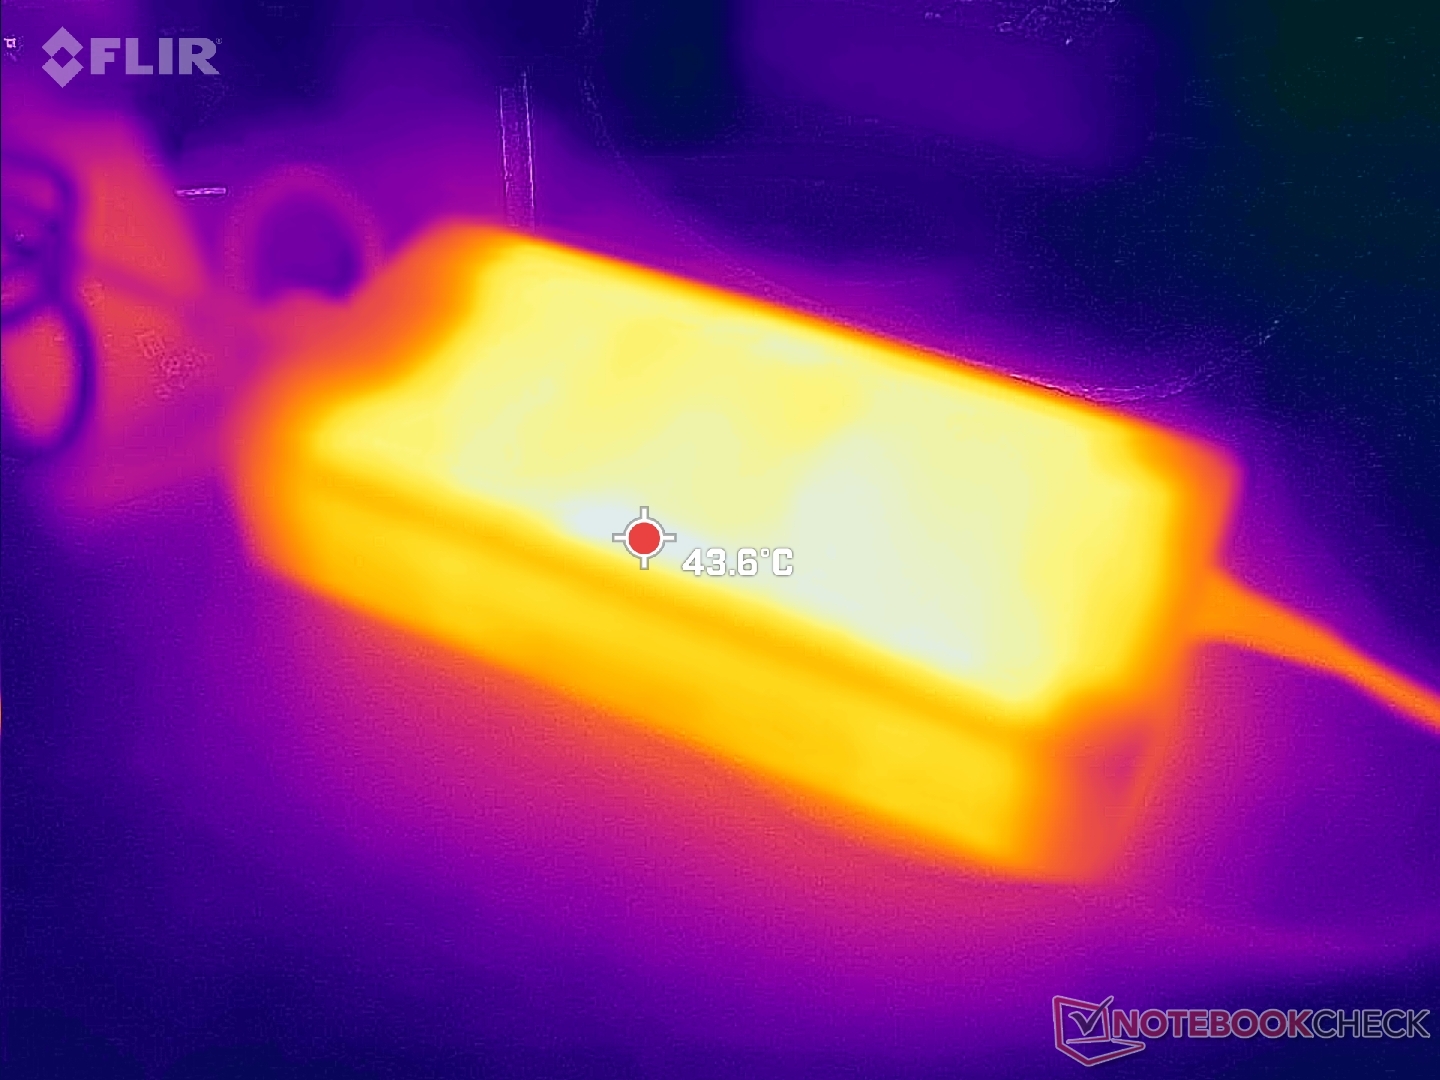
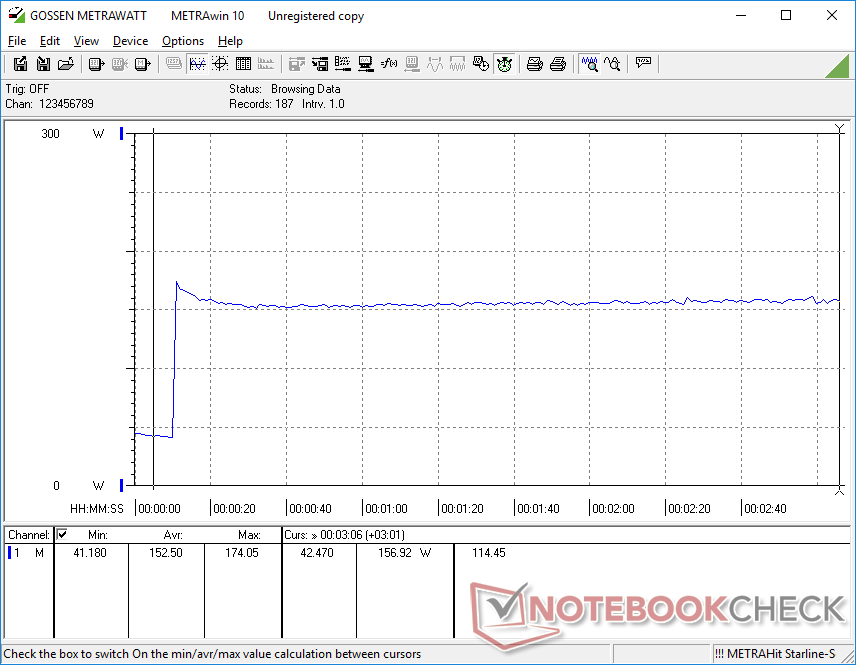
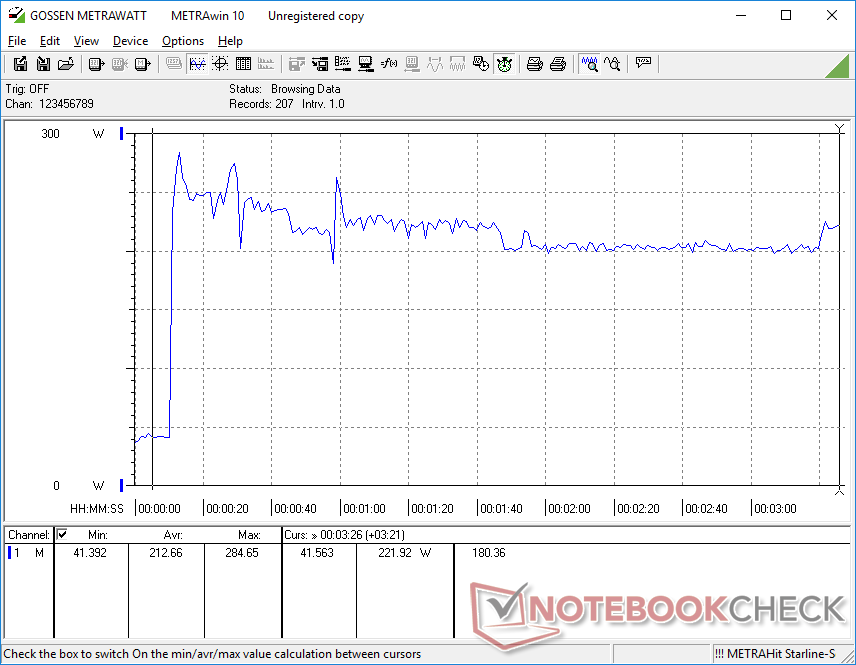
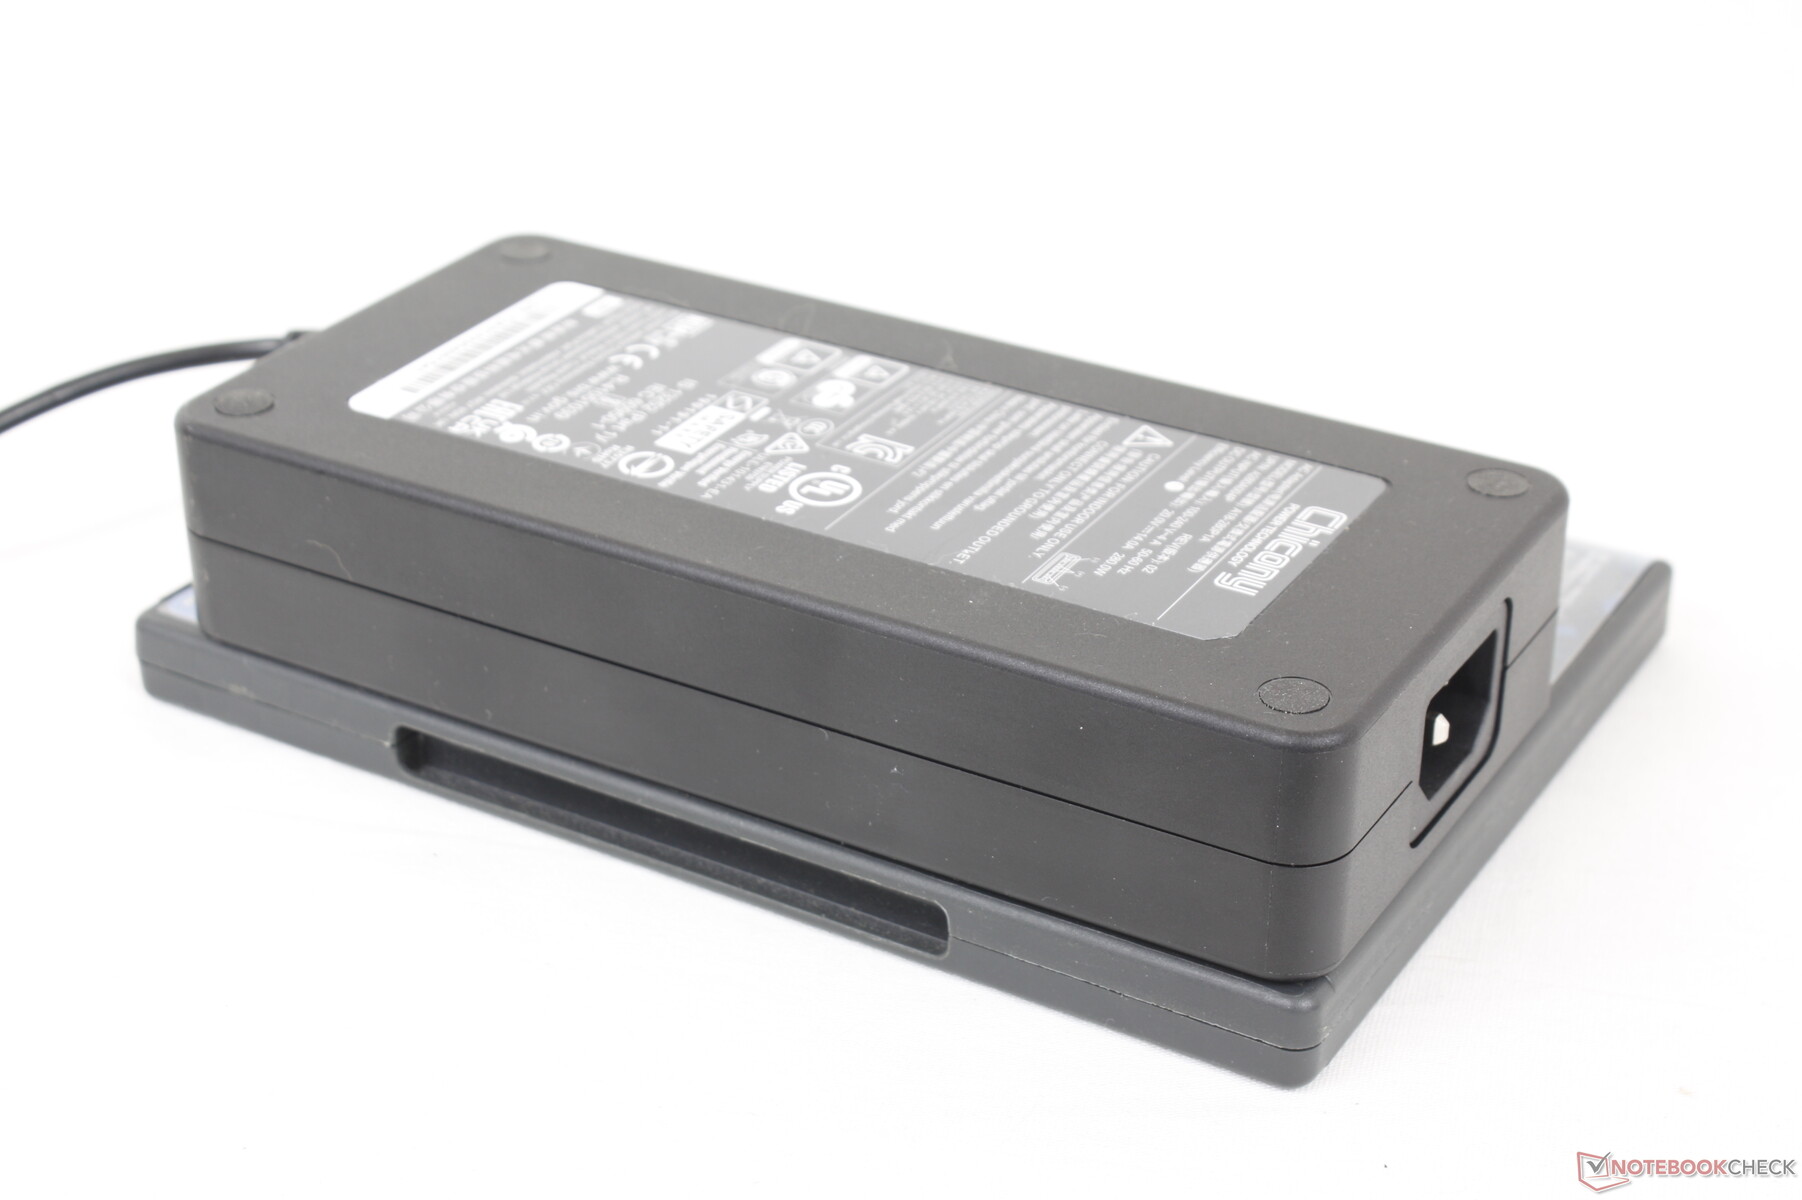
Nous avons pu enregistrer une consommation maximale de 285 W sur le grand adaptateur secteur de 280 W (~18 x 8,5 x 3,5 cm) lorsque le CPU et le GPU sont utilisés à 100 %. Ce taux n'est que temporaire comme le montre notre graphique ci-dessous en raison des limitations thermiques. Le système peut toujours exécuter des jeux et se recharger à un taux raisonnable simultanément.
| Éteint/en veille | |
| Au repos | |
| Fortement sollicité |
|
Légende:
min: | |
| Eurocom Nightsky TXi317 i7-12700H, GeForce RTX 3080 Ti Laptop GPU, Samsung SSD 980 Pro 1TB MZ-V8P1T0BW, IPS, 1920x1080, 17.3" | Schenker XMG Pro 17 E22 i9-12900H, GeForce RTX 3080 Ti Laptop GPU, Samsung SSD 980 Pro 1TB MZ-V8P1T0BW, IPS, 2560x1440, 17.3" | Aorus 17X XES i9-12900HX, GeForce RTX 3070 Ti Laptop GPU, Gigabyte AG470S1TB-SI B10, IPS, 1920x1080, 17.3" | MSI Raider GE77 HX 12UHS i9-12900HX, GeForce RTX 3080 Ti Laptop GPU, Samsung PM9A1 MZVL22T0HBLB, IPS, 3840x2160, 17.3" | Razer Blade 17 Early 2022 i9-12900H, GeForce RTX 3080 Ti Laptop GPU, Samsung PM9A1 MZVL21T0HCLR, IPS, 3840x2160, 17.3" | Alienware x17 R2 P48E i9-12900HK, GeForce RTX 3080 Ti Laptop GPU, 2x Samsung PM9A1 1TB (RAID 0), IPS, 1920x1080, 17.3" | |
|---|---|---|---|---|---|---|
| Power Consumption | 17% | -6% | 4% | 6% | -25% | |
| Idle Minimum * (Watt) | 12.8 | 13 -2% | 18 -41% | 13 -2% | 17 -33% | 24.1 -88% |
| Idle Average * (Watt) | 33.9 | 17 50% | 28 17% | 19 44% | 23 32% | 28.5 16% |
| Idle Maximum * (Watt) | 39.1 | 26 34% | 36 8% | 29 26% | 34 13% | 60 -53% |
| Load Average * (Watt) | 121.1 | 120 1% | 153 -26% | 143 -18% | 120 1% | 128.7 -6% |
| Witcher 3 ultra * (Watt) | 243 | 221 9% | 221 9% | 247 -2% | 229 6% | 254 -5% |
| Load Maximum * (Watt) | 284.7 | 266 7% | 290 -2% | 352 -24% | 243 15% | 323 -13% |
* ... Moindre est la valeur, meilleures sont les performances
Power Consumption Witcher 3 / Stresstest
Power Consumption external Monitor
Autonomie de la batterie
La durée de fonctionnement du WLAN est courte, avec un peu plus de 4 heures de navigation dans le monde réel avant de devoir être rechargé. Notre appareil a été réglé sur le profil d'alimentation équilibré avec l'iGPU actif avant d'exécuter le test d'autonomie de la batterie. Les résultats sont similaires à ceux du Razer Blade 17 ou du Aorus 17X mais toujours plus de deux heures de moins que sur le Schenker XMG Pro 17 E22.
La charge de la batterie vide à la pleine capacité est très lente, environ 2,5 heures. La plupart des ordinateurs portables de jeu ne prennent que 1,5 à 2 heures en comparaison. Le système ne peut pas être rechargé via USB-C.
| Eurocom Nightsky TXi317 i7-12700H, GeForce RTX 3080 Ti Laptop GPU, 80 Wh | Schenker XMG Pro 17 E22 i9-12900H, GeForce RTX 3080 Ti Laptop GPU, 80 Wh | Aorus 17X XES i9-12900HX, GeForce RTX 3070 Ti Laptop GPU, 99 Wh | MSI Raider GE77 HX 12UHS i9-12900HX, GeForce RTX 3080 Ti Laptop GPU, 99.99 Wh | Razer Blade 17 Early 2022 i9-12900H, GeForce RTX 3080 Ti Laptop GPU, 82 Wh | Alienware x17 R2 P48E i9-12900HK, GeForce RTX 3080 Ti Laptop GPU, 87 Wh | |
|---|---|---|---|---|---|---|
| Autonomie de la batterie | 62% | 5% | 29% | -10% | -52% | |
| WiFi v1.3 (h) | 4.2 | 6.8 62% | 4.4 5% | 5.4 29% | 3.8 -10% | 2 -52% |
| H.264 (h) | 4.6 | 3.8 | 6.5 | 4.8 | ||
| Load (h) | 1.5 | 1.4 | 2 | 1.7 | 0.8 | |
| Reader / Idle (h) | 9.8 | 7.1 | 3.9 |
Points positifs
Points négatifs
Verdict : le châssis a besoin d'être rafraîchi
L'Eurocom Nightsky TXi317 possède les performances de l'unité centrale et du processeur graphique d'un grand ordinateur portable de jeu phare, mais il est dépourvu de nombreuses fonctions auxiliaires que nous attendons d'un modèle de taille moyenne. Plus particulièrement, ce modèle est incapable de faire fonctionner des disques SSD pendant de longues périodes sans avoir besoin d'étrangler les taux de transfert. Le public cible des utilisateurs de performances est plus susceptible d'être déçu de ne pas pouvoir exploiter pleinement leurs nouveaux disques PCIe4 x4. Des alternatives comme l Alienware x17ou MSI GE66 ont généralement des dissipateurs thermiques au-dessus de leurs disques SSD internes pour cette raison précise.
L'Eurocom Nightsky TXi317 a les performances d'un ordinateur portable de jeu coûteux, mais il lui manque de nombreuses fonctions auxiliaires de base et avancées.
Parmi les inconvénients mineurs, citons la webcam à très faible résolution, l'absence de volet de confidentialité, l'absence de prise en charge de l'USB-C PD, l'absence d'Advanced Optimus, l'absence d'options Wi-Fi 6E et les températures centrales très élevées, qui atteignent presque 90 °C en mode jeu. Le châssis est même à la traîne en matière d'entretien, car le panneau inférieur est plus long à retirer que sur la plupart des autres ordinateurs portables de jeu actuels. Pour 3 000 $ et plus, le Nightsky TXi317 n'offre tout simplement pas autant que d'autres concurrents haut de gamme.
Prix et disponibilité
Le Nightsky TXi317 peut être acheté directement auprès d'Eurocom ici dans différentes configurations à partir de 3 000 USD.
Eurocom Nightsky TXi317
- 10/26/2022 v7 (old)
Allen Ngo
Price comparison

