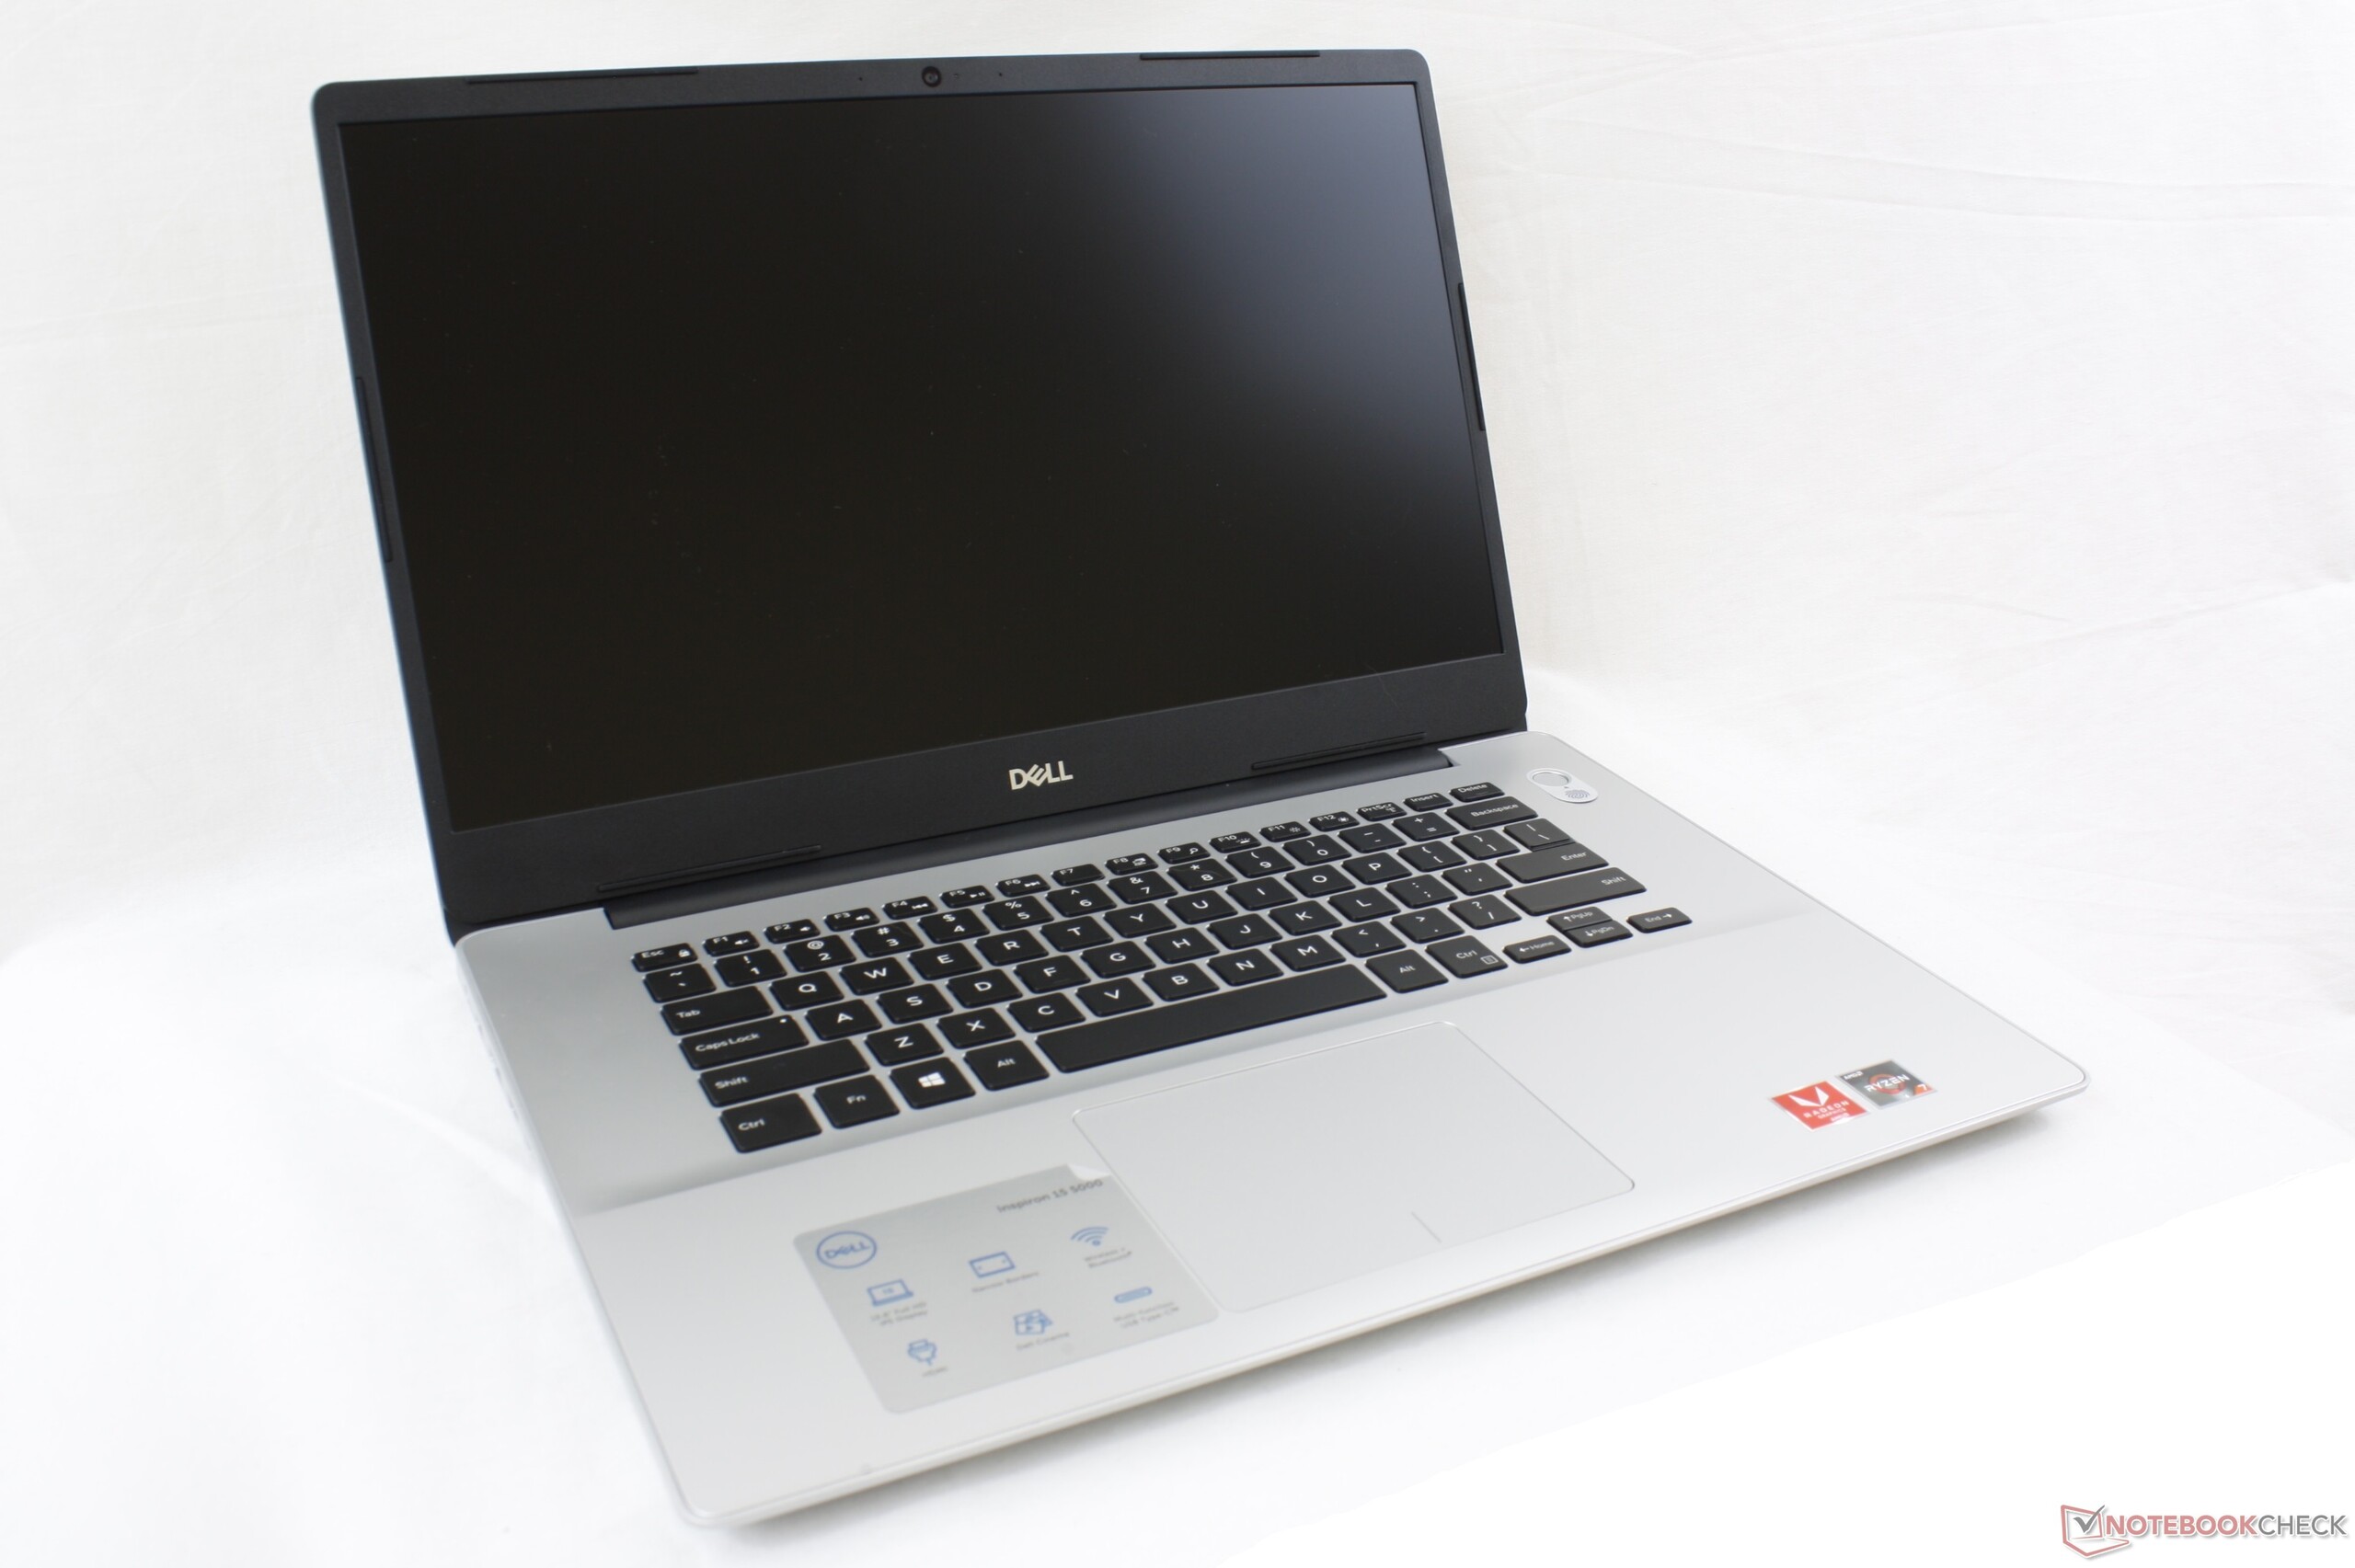
Courte critique du Dell Inspiron 15 5000 5585 (Ryzen 7, Vega 10, FHD) : une excellente alternative à Intel
| SD Card Reader | |
| average JPG Copy Test (av. of 3 runs) | |
| Dell XPS 15 9570 Core i9 UHD (Toshiba Exceria Pro SDXC 64 GB UHS-II) | |
| Lenovo Ideapad 330S-15ARR-81FB00C7GE (Toshiba Exceria Pro SDXC 64 GB UHS-II) | |
| Dell Inspiron 15 5000 5585 (Toshiba Exceria Pro SDXC 64 GB UHS-II) | |
| Dell Inspiron 15 3585 (2300U, Vega 6) (Toshiba Exceria Pro SDXC 64 GB UHS-II) | |
| Dell Inspiron 15 5000 5584 (Toshiba Exceria Pro SDXC 64 GB UHS-II) | |
| maximum AS SSD Seq Read Test (1GB) | |
| Dell XPS 15 9570 Core i9 UHD (Toshiba Exceria Pro SDXC 64 GB UHS-II) | |
| Lenovo Ideapad 330S-15ARR-81FB00C7GE (Toshiba Exceria Pro SDXC 64 GB UHS-II) | |
| Dell Inspiron 15 5000 5585 (Toshiba Exceria Pro SDXC 64 GB UHS-II) | |
| Dell Inspiron 15 3585 (2300U, Vega 6) (Toshiba Exceria Pro SDXC 64 GB UHS-II) | |
| Dell Inspiron 15 5000 5584 (Toshiba Exceria Pro SDXC 64 GB UHS-II) | |
| |||||||||||||||||||||||||
Homogénéité de la luminosité: 84 %
Valeur mesurée au centre, sur batterie: 179.5 cd/m²
Contraste: 939:1 (Valeurs des noirs: 0.27 cd/m²)
ΔE ColorChecker Calman: 6.05 | ∀{0.5-29.43 Ø4.72}
calibrated: 4.97
ΔE Greyscale Calman: 3.2 | ∀{0.09-98 Ø4.97}
55.6% sRGB (Argyll 1.6.3 3D)
35.5% AdobeRGB 1998 (Argyll 1.6.3 3D)
38.55% AdobeRGB 1998 (Argyll 3D)
56.2% sRGB (Argyll 3D)
37.31% Display P3 (Argyll 3D)
Gamma: 2
CCT: 6820 K
| Dell Inspiron 15 5000 5585 LG Philips 156WFC, IPS, 15.6", 1920x1080 | Dell Inspiron 15 3585 (2300U, Vega 6) BOE0802, TN, 15.6", 1920x1080 | Dell Inspiron 15 5000 5584 AU Optronics AUO22ED, B156HAK, IPS, 15.6", 1920x1080 | Dell XPS 15 9570 Core i9 UHD LQ156D1, IPS, 15.6", 3840x2160 | Asus VivoBook S15 S532F LG Philips LP156WFC-SPD1, IPS, 15.6", 1920x1080 | Lenovo Ideapad 330S-15ARR-81FB00C7GE LG Philips LP156WFC-SPD1, IPS, 15.6", 1920x1080 | |
|---|---|---|---|---|---|---|
| Display | 5% | 5% | 98% | -1% | 2% | |
| Display P3 Coverage (%) | 37.31 | 39.22 5% | 39.17 5% | 79.6 113% | 37.12 -1% | 38.1 2% |
| sRGB Coverage (%) | 56.2 | 58.9 5% | 58.8 5% | 98.4 75% | 55.9 -1% | 57.2 2% |
| AdobeRGB 1998 Coverage (%) | 38.55 | 40.52 5% | 40.48 5% | 79.7 107% | 38.35 -1% | 39.4 2% |
| Response Times | 10% | -40% | -51% | 13% | -4% | |
| Response Time Grey 50% / Grey 80% * (ms) | 28.4 ? | 39 ? -37% | 48.8 ? -72% | 52.4 ? -85% | 24.8 ? 13% | 34 ? -20% |
| Response Time Black / White * (ms) | 27.2 ? | 12 ? 56% | 29.2 ? -7% | 31.6 ? -16% | 24 ? 12% | 24 ? 12% |
| PWM Frequency (Hz) | 250 ? | 1000 ? | ||||
| Screen | -48% | -8% | 22% | -7% | -2% | |
| Brightness middle (cd/m²) | 253.6 | 225 -11% | 227 -10% | 451.9 78% | 262.3 3% | 265 4% |
| Brightness (cd/m²) | 227 | 213 -6% | 230 1% | 414 82% | 250 10% | 242 7% |
| Brightness Distribution (%) | 84 | 88 5% | 92 10% | 81 -4% | 89 6% | 74 -12% |
| Black Level * (cd/m²) | 0.27 | 0.535 -98% | 0.21 22% | 0.36 -33% | 0.43 -59% | 0.215 20% |
| Contrast (:1) | 939 | 421 -55% | 1081 15% | 1255 34% | 610 -35% | 1233 31% |
| Colorchecker dE 2000 * | 6.05 | 10.37 -71% | 6.55 -8% | 5.62 7% | 5.81 4% | 6.16 -2% |
| Colorchecker dE 2000 max. * | 14.03 | 19.75 -41% | 23.45 -67% | 19.1 -36% | 14.7 -5% | 18 -28% |
| Colorchecker dE 2000 calibrated * | 4.97 | 3.89 22% | 4.61 7% | 2.69 46% | 5.36 -8% | 6.18 -24% |
| Greyscale dE 2000 * | 3.2 | 12.09 -278% | 5.2 -63% | 6.9 -116% | 2.8 13% | 3.79 -18% |
| Gamma | 2 110% | 2.72 81% | 2.66 83% | 2.2 100% | 2.15 102% | 2.34 94% |
| CCT | 6820 95% | 13335 49% | 6434 101% | 6254 104% | 7016 93% | 7258 90% |
| Color Space (Percent of AdobeRGB 1998) (%) | 35.5 | 37 4% | 37 4% | 71.8 102% | 35.2 -1% | 36 1% |
| Color Space (Percent of sRGB) (%) | 55.6 | 59 6% | 58.2 5% | 98.5 77% | 55.6 0% | 57 3% |
| Moyenne finale (programmes/paramètres) | -11% /
-31% | -14% /
-9% | 23% /
27% | 2% /
-3% | -1% /
-1% |
* ... Moindre est la valeur, meilleures sont les performances
Temps de réponse de l'écran
| ↔ Temps de réponse noir à blanc | ||
|---|---|---|
| 27.2 ms ... hausse ↗ et chute ↘ combinées | ↗ 16.4 ms hausse | 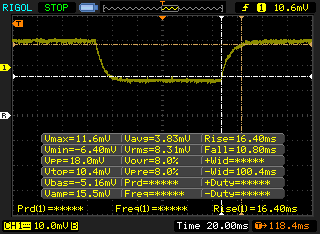 |
| ↘ 10.8 ms chute | ||
| L'écran souffre de latences relativement élevées, insuffisant pour le jeu. En comparaison, tous les appareils testés affichent entre 0.1 (minimum) et 240 (maximum) ms. » 69 % des appareils testés affichent de meilleures performances. Cela signifie que les latences relevées sont moins bonnes que la moyenne (19.8 ms) de tous les appareils testés. | ||
| ↔ Temps de réponse gris 50% à gris 80% | ||
| 28.4 ms ... hausse ↗ et chute ↘ combinées | ↗ 10.4 ms hausse | 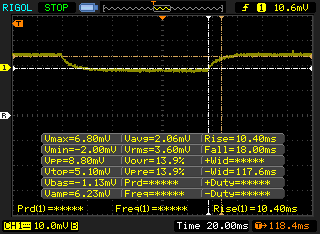 |
| ↘ 18 ms chute | ||
| L'écran souffre de latences relativement élevées, insuffisant pour le jeu. En comparaison, tous les appareils testés affichent entre 0.165 (minimum) et 636 (maximum) ms. » 38 % des appareils testés affichent de meilleures performances. Cela signifie que les latences relevées sont similaires à la moyenne (31 ms) de tous les appareils testés. | ||
Scintillement / MLI (Modulation de largeur d'impulsion)
| Scintillement / MLI (Modulation de largeur d'impulsion) non décelé | 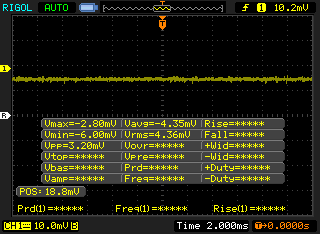 | ||
En comparaison, 52 % des appareils testés n'emploient pas MDI pour assombrir leur écran. Nous avons relevé une moyenne à 7781 (minimum : 5 - maximum : 343500) Hz dans le cas où une MDI était active. | |||
| Cinebench R10 | |
| Rendering Multiple CPUs 32Bit | |
| HP Omen 15-dc1020ng | |
| Lenovo Ideapad 330S-15ARR-81FB00C7GE | |
| Moyenne AMD Ryzen 7 3700U (12881 - 18041, n=2) | |
| Rendering Single 32Bit | |
| HP Omen 15-dc1020ng | |
| Moyenne AMD Ryzen 7 3700U (4045 - 4776, n=2) | |
| Lenovo Ideapad 330S-15ARR-81FB00C7GE | |
| PCMark 8 Home Score Accelerated v2 | 3504 points | |
| PCMark 8 Work Score Accelerated v2 | 4429 points | |
| PCMark 10 Score | 3903 points | |
Aide | ||
| Dell Inspiron 15 5000 5585 WDC PC SN520 SDAPNUW-512G | Dell Inspiron 15 3585 (2300U, Vega 6) Toshiba BG3 KBG30ZMS256G | Dell Inspiron 15 5000 5584 Toshiba BG3 KBG30ZMS512G | Dell XPS 15 9570 Core i9 UHD Samsung SSD PM981 MZVLB1T0HALR | Asus VivoBook S15 S532F WDC PC SN520 SDAPNUW-256G | Lenovo Ideapad 330S-15ARR-81FB00C7GE WDC PC SN520 SDAPNUW-256G | |
|---|---|---|---|---|---|---|
| AS SSD | -73% | -12% | 77% | 24% | -6% | |
| Seq Read (MB/s) | 398.9 | 1291 224% | 1115 180% | 1320 231% | 1147 188% | 1530 284% |
| Seq Write (MB/s) | 884 | 688 -22% | 841 -5% | 1500 70% | 752 -15% | 1087 23% |
| 4K Read (MB/s) | 34.54 | 21.87 -37% | 46.39 34% | 30.73 -11% | 41.52 20% | 34.7 0% |
| 4K Write (MB/s) | 82.1 | 35.62 -57% | 87.6 7% | 94.4 15% | 149.7 82% | 79.9 -3% |
| 4K-64 Read (MB/s) | 647 | 632 -2% | 904 40% | 1453 125% | 605 -6% | 464.7 -28% |
| 4K-64 Write (MB/s) | 985 | 221.2 -78% | 326.5 -67% | 1815 84% | 453.2 -54% | 326.1 -67% |
| Access Time Read * (ms) | 0.072 | 0.33 -358% | 0.048 33% | 0.061 15% | 0.073 -1% | 0.102 -42% |
| Access Time Write * (ms) | 0.047 | 0.234 -398% | 0.24 -411% | 0.044 6% | 0.025 47% | 0.047 -0% |
| Score Read (Points) | 721 | 783 9% | 1062 47% | 1616 124% | 761 6% | 652 -10% |
| Score Write (Points) | 1155 | 326 -72% | 498 -57% | 2059 78% | 678 -41% | 515 -55% |
| Score Total (Points) | 2279 | 1489 -35% | 2100 -8% | 4507 98% | 1821 -20% | 1489 -35% |
| Copy ISO MB/s (MB/s) | 862 | 432.6 -50% | 1090 26% | 2577 199% | 1093 27% | 690 -20% |
| Copy Program MB/s (MB/s) | 457 | 95.6 -79% | 618 35% | 515 13% | 775 70% | 153.9 -66% |
| Copy Game MB/s (MB/s) | 902 | 263.4 -71% | 750 -17% | 1120 24% | 1196 33% | 339.7 -62% |
* ... Moindre est la valeur, meilleures sont les performances

| 3DMark 11 Performance | 4318 points | |
| 3DMark Ice Storm Standard Score | 70349 points | |
| 3DMark Cloud Gate Standard Score | 11390 points | |
| 3DMark Fire Strike Score | 2694 points | |
| 3DMark Time Spy Score | 955 points | |
Aide | ||
| Bas | Moyen | Élevé | Ultra | |
|---|---|---|---|---|
| BioShock Infinite (2013) | 123.7 | 21.3 | ||
| The Witcher 3 (2015) | 53.8 | 18.8 | 11.5 | |
| Rocket League (2017) | 119.7 | 59.9 | 38.9 | |
| Shadow of the Tomb Raider (2018) | 38 | 15 | 13 |
| Dell Inspiron 15 5000 5585 Vega 10, R7 3700U, WDC PC SN520 SDAPNUW-512G | Dell Inspiron 15 3585 (2300U, Vega 6) Vega 6, R3 2300U, Toshiba BG3 KBG30ZMS256G | Dell Inspiron 15 5000 5584 UHD Graphics 620, i7-8565U, Toshiba BG3 KBG30ZMS512G | Dell XPS 15 9570 Core i9 UHD GeForce GTX 1050 Ti Max-Q, i9-8950HK, Samsung SSD PM981 MZVLB1T0HALR | Asus VivoBook S15 S532F GeForce MX250, i7-8565U, WDC PC SN520 SDAPNUW-256G | Lenovo Ideapad 330S-15ARR-81FB00C7GE Vega 8, R5 2500U, WDC PC SN520 SDAPNUW-256G | |
|---|---|---|---|---|---|---|
| Noise | -8% | 4% | -7% | -5% | -5% | |
| arrêt / environnement * (dB) | 28.3 | 30.6 -8% | 28.4 -0% | 28.2 -0% | 28 1% | 30.6 -8% |
| Idle Minimum * (dB) | 28.3 | 30.6 -8% | 28.4 -0% | 28.5 -1% | 28 1% | 30.6 -8% |
| Idle Average * (dB) | 28.3 | 30.6 -8% | 28.4 -0% | 28.6 -1% | 28 1% | 31.3 -11% |
| Idle Maximum * (dB) | 28.3 | 30.6 -8% | 28.4 -0% | 28.8 -2% | 30 -6% | 31.3 -11% |
| Load Average * (dB) | 31.4 | 36.7 -17% | 28.9 8% | 36.2 -15% | 41.4 -32% | 33.2 -6% |
| Witcher 3 ultra * (dB) | 41.4 | 47.6 -15% | 41.5 -0% | |||
| Load Maximum * (dB) | 41.4 | 41.1 1% | 36 13% | 47.6 -15% | 41.5 -0% | 35.2 15% |
* ... Moindre est la valeur, meilleures sont les performances
Degré de la nuisance sonore
| Au repos |
| 28.3 / 28.3 / 28.3 dB(A) |
| Fortement sollicité |
| 31.4 / 41.4 dB(A) |
 | ||
30 dB silencieux 40 dB(A) audible 50 dB(A) bruyant |
||
min: | ||
(±) La température maximale du côté supérieur est de 41 °C / 106 F, par rapport à la moyenne de 36.8 °C / 98 F, allant de 21 à 71 °C pour la classe Multimedia.
(-) Le fond chauffe jusqu'à un maximum de 47 °C / 117 F, contre une moyenne de 39.1 °C / 102 F
(+) En utilisation inactive, la température moyenne du côté supérieur est de 25.6 °C / 78 F, par rapport à la moyenne du dispositif de 31.3 °C / 88 F.
(±) En jouant à The Witcher 3, la température moyenne du côté supérieur est de 34.7 °C / 94 F, alors que la moyenne de l'appareil est de 31.3 °C / 88 F.
(+) Les repose-poignets et le pavé tactile sont plus froids que la température de la peau avec un maximum de 28.6 °C / 83.5 F et sont donc froids au toucher.
(±) La température moyenne de la zone de l'appui-paume de dispositifs similaires était de 28.7 °C / 83.7 F (+0.1 °C / #0.2 F).
Dell Inspiron 15 5000 5585 analyse audio
(±) | le niveau sonore du haut-parleur est moyen mais bon (79.1# dB)
Basses 100 - 315 Hz
(±) | basse réduite - en moyenne 12.4% inférieure à la médiane
(±) | la linéarité des basses est moyenne (13.1% delta à la fréquence précédente)
Médiums 400 - 2000 Hz
(+) | médiane équilibrée - seulement 3.5% de la médiane
(±) | la linéarité des médiums est moyenne (9.6% delta à la fréquence précédente)
Aiguës 2 - 16 kHz
(+) | des sommets équilibrés - à seulement 2.4% de la médiane
(±) | la linéarité des aigus est moyenne (11.1% delta à la fréquence précédente)
Globalement 100 - 16 000 Hz
(±) | la linéarité du son global est moyenne (17.2% de différence avec la médiane)
Par rapport à la même classe
» 49% de tous les appareils testés de cette catégorie étaient meilleurs, 7% similaires, 44% pires
» Le meilleur avait un delta de 5%, la moyenne était de 17%, le pire était de 45%.
Par rapport à tous les appareils testés
» 32% de tous les appareils testés étaient meilleurs, 8% similaires, 60% pires
» Le meilleur avait un delta de 4%, la moyenne était de 24%, le pire était de 134%.
Apple MacBook 12 (Early 2016) 1.1 GHz analyse audio
(+) | les haut-parleurs peuvent jouer relativement fort (83.6# dB)
Basses 100 - 315 Hz
(±) | basse réduite - en moyenne 11.3% inférieure à la médiane
(±) | la linéarité des basses est moyenne (14.2% delta à la fréquence précédente)
Médiums 400 - 2000 Hz
(+) | médiane équilibrée - seulement 2.4% de la médiane
(+) | les médiums sont linéaires (5.5% delta à la fréquence précédente)
Aiguës 2 - 16 kHz
(+) | des sommets équilibrés - à seulement 2% de la médiane
(+) | les aigus sont linéaires (4.5% delta à la fréquence précédente)
Globalement 100 - 16 000 Hz
(+) | le son global est linéaire (10.2% différence à la médiane)
Par rapport à la même classe
» 7% de tous les appareils testés de cette catégorie étaient meilleurs, 2% similaires, 91% pires
» Le meilleur avait un delta de 5%, la moyenne était de 18%, le pire était de 53%.
Par rapport à tous les appareils testés
» 5% de tous les appareils testés étaient meilleurs, 1% similaires, 94% pires
» Le meilleur avait un delta de 4%, la moyenne était de 24%, le pire était de 134%.
| Éteint/en veille | |
| Au repos | |
| Fortement sollicité |
|
Légende:
min: | |
| Dell Inspiron 15 5000 5585 R7 3700U, Vega 10, WDC PC SN520 SDAPNUW-512G, IPS, 1920x1080, 15.6" | Dell Inspiron 15 3585 (2300U, Vega 6) R3 2300U, Vega 6, Toshiba BG3 KBG30ZMS256G, TN, 1920x1080, 15.6" | Dell Inspiron 15 5000 5584 i7-8565U, UHD Graphics 620, Toshiba BG3 KBG30ZMS512G, IPS, 1920x1080, 15.6" | Dell XPS 15 9570 Core i9 UHD i9-8950HK, GeForce GTX 1050 Ti Max-Q, Samsung SSD PM981 MZVLB1T0HALR, IPS, 3840x2160, 15.6" | Asus VivoBook S15 S532F i7-8565U, GeForce MX250, WDC PC SN520 SDAPNUW-256G, IPS, 1920x1080, 15.6" | Lenovo Ideapad 330S-15ARR-81FB00C7GE R5 2500U, Vega 8, WDC PC SN520 SDAPNUW-256G, IPS, 1920x1080, 15.6" | |
|---|---|---|---|---|---|---|
| Power Consumption | -26% | -5% | -138% | -64% | -15% | |
| Idle Minimum * (Watt) | 4.2 | 6.3 -50% | 3.6 14% | 7.1 -69% | 6 -43% | 5.2 -24% |
| Idle Average * (Watt) | 6.8 | 9.2 -35% | 7.4 -9% | 13.6 -100% | 10.3 -51% | 8.3 -22% |
| Idle Maximum * (Watt) | 7 | 9.6 -37% | 8.3 -19% | 14.1 -101% | 10.5 -50% | 8.2 -17% |
| Load Average * (Watt) | 36.5 | 38 -4% | 38 -4% | 103.9 -185% | 69.1 -89% | 38 -4% |
| Witcher 3 ultra * (Watt) | 37.9 | 103 -172% | 57.8 -53% | |||
| Load Maximum * (Watt) | 44 | 46 -5% | 47.9 -9% | 130.9 -198% | 88 -100% | 46.6 -6% |
* ... Moindre est la valeur, meilleures sont les performances
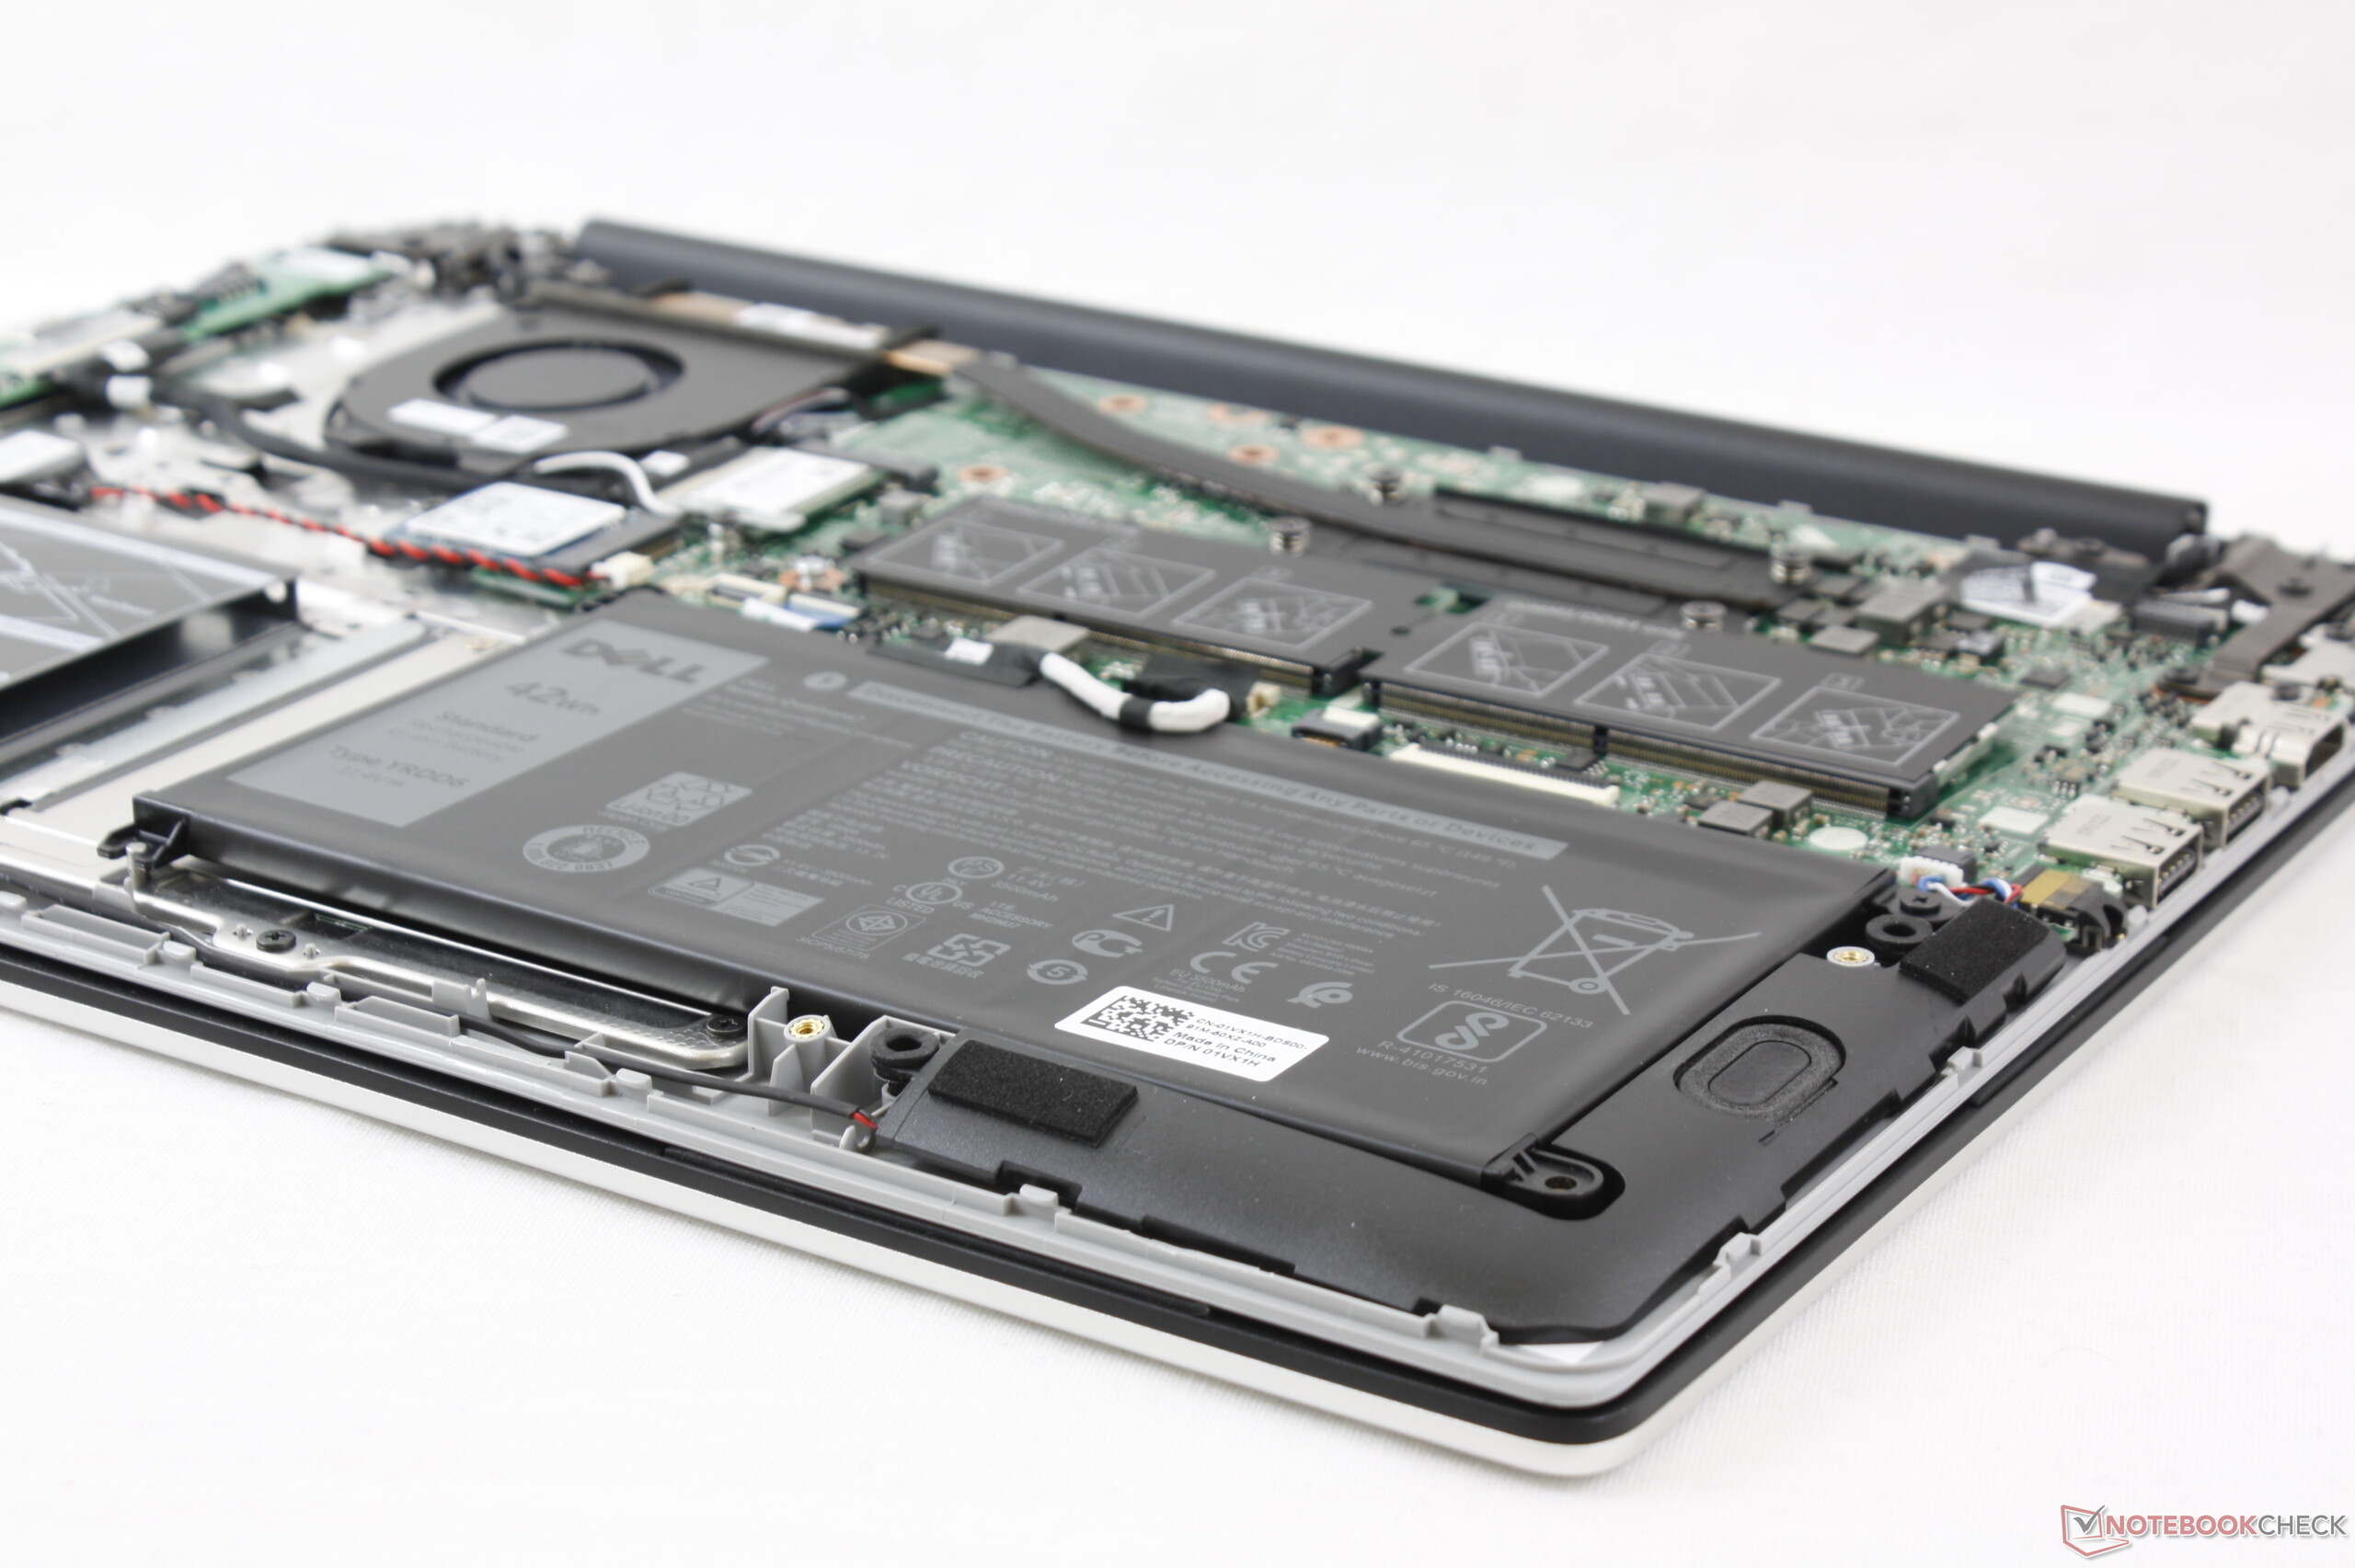
| Dell Inspiron 15 5000 5585 R7 3700U, Vega 10, 42 Wh | Dell Inspiron 15 3585 (2300U, Vega 6) R3 2300U, Vega 6, 42 Wh | Dell Inspiron 15 5000 5584 i7-8565U, UHD Graphics 620, 42 Wh | Dell XPS 15 9570 Core i9 UHD i9-8950HK, GeForce GTX 1050 Ti Max-Q, 97 Wh | Asus VivoBook S15 S532F i7-8565U, GeForce MX250, 42 Wh | Lenovo Ideapad 330S-15ARR-81FB00C7GE R5 2500U, Vega 8, 30 Wh | |
|---|---|---|---|---|---|---|
| Autonomie de la batterie | -15% | -17% | -0% | -17% | -28% | |
| Reader / Idle (h) | 14.3 | 7.3 -49% | 15.3 7% | 15 5% | 10.9 -24% | 7.3 -49% |
| WiFi v1.3 (h) | 7 | 5.3 -24% | 3.5 -50% | 8.6 23% | 5.1 -27% | 4.1 -41% |
| Load (h) | 1.4 | 1.8 29% | 1.3 -7% | 1 -29% | 1.4 0% | 1.5 7% |
Points positifs
Points négatifs
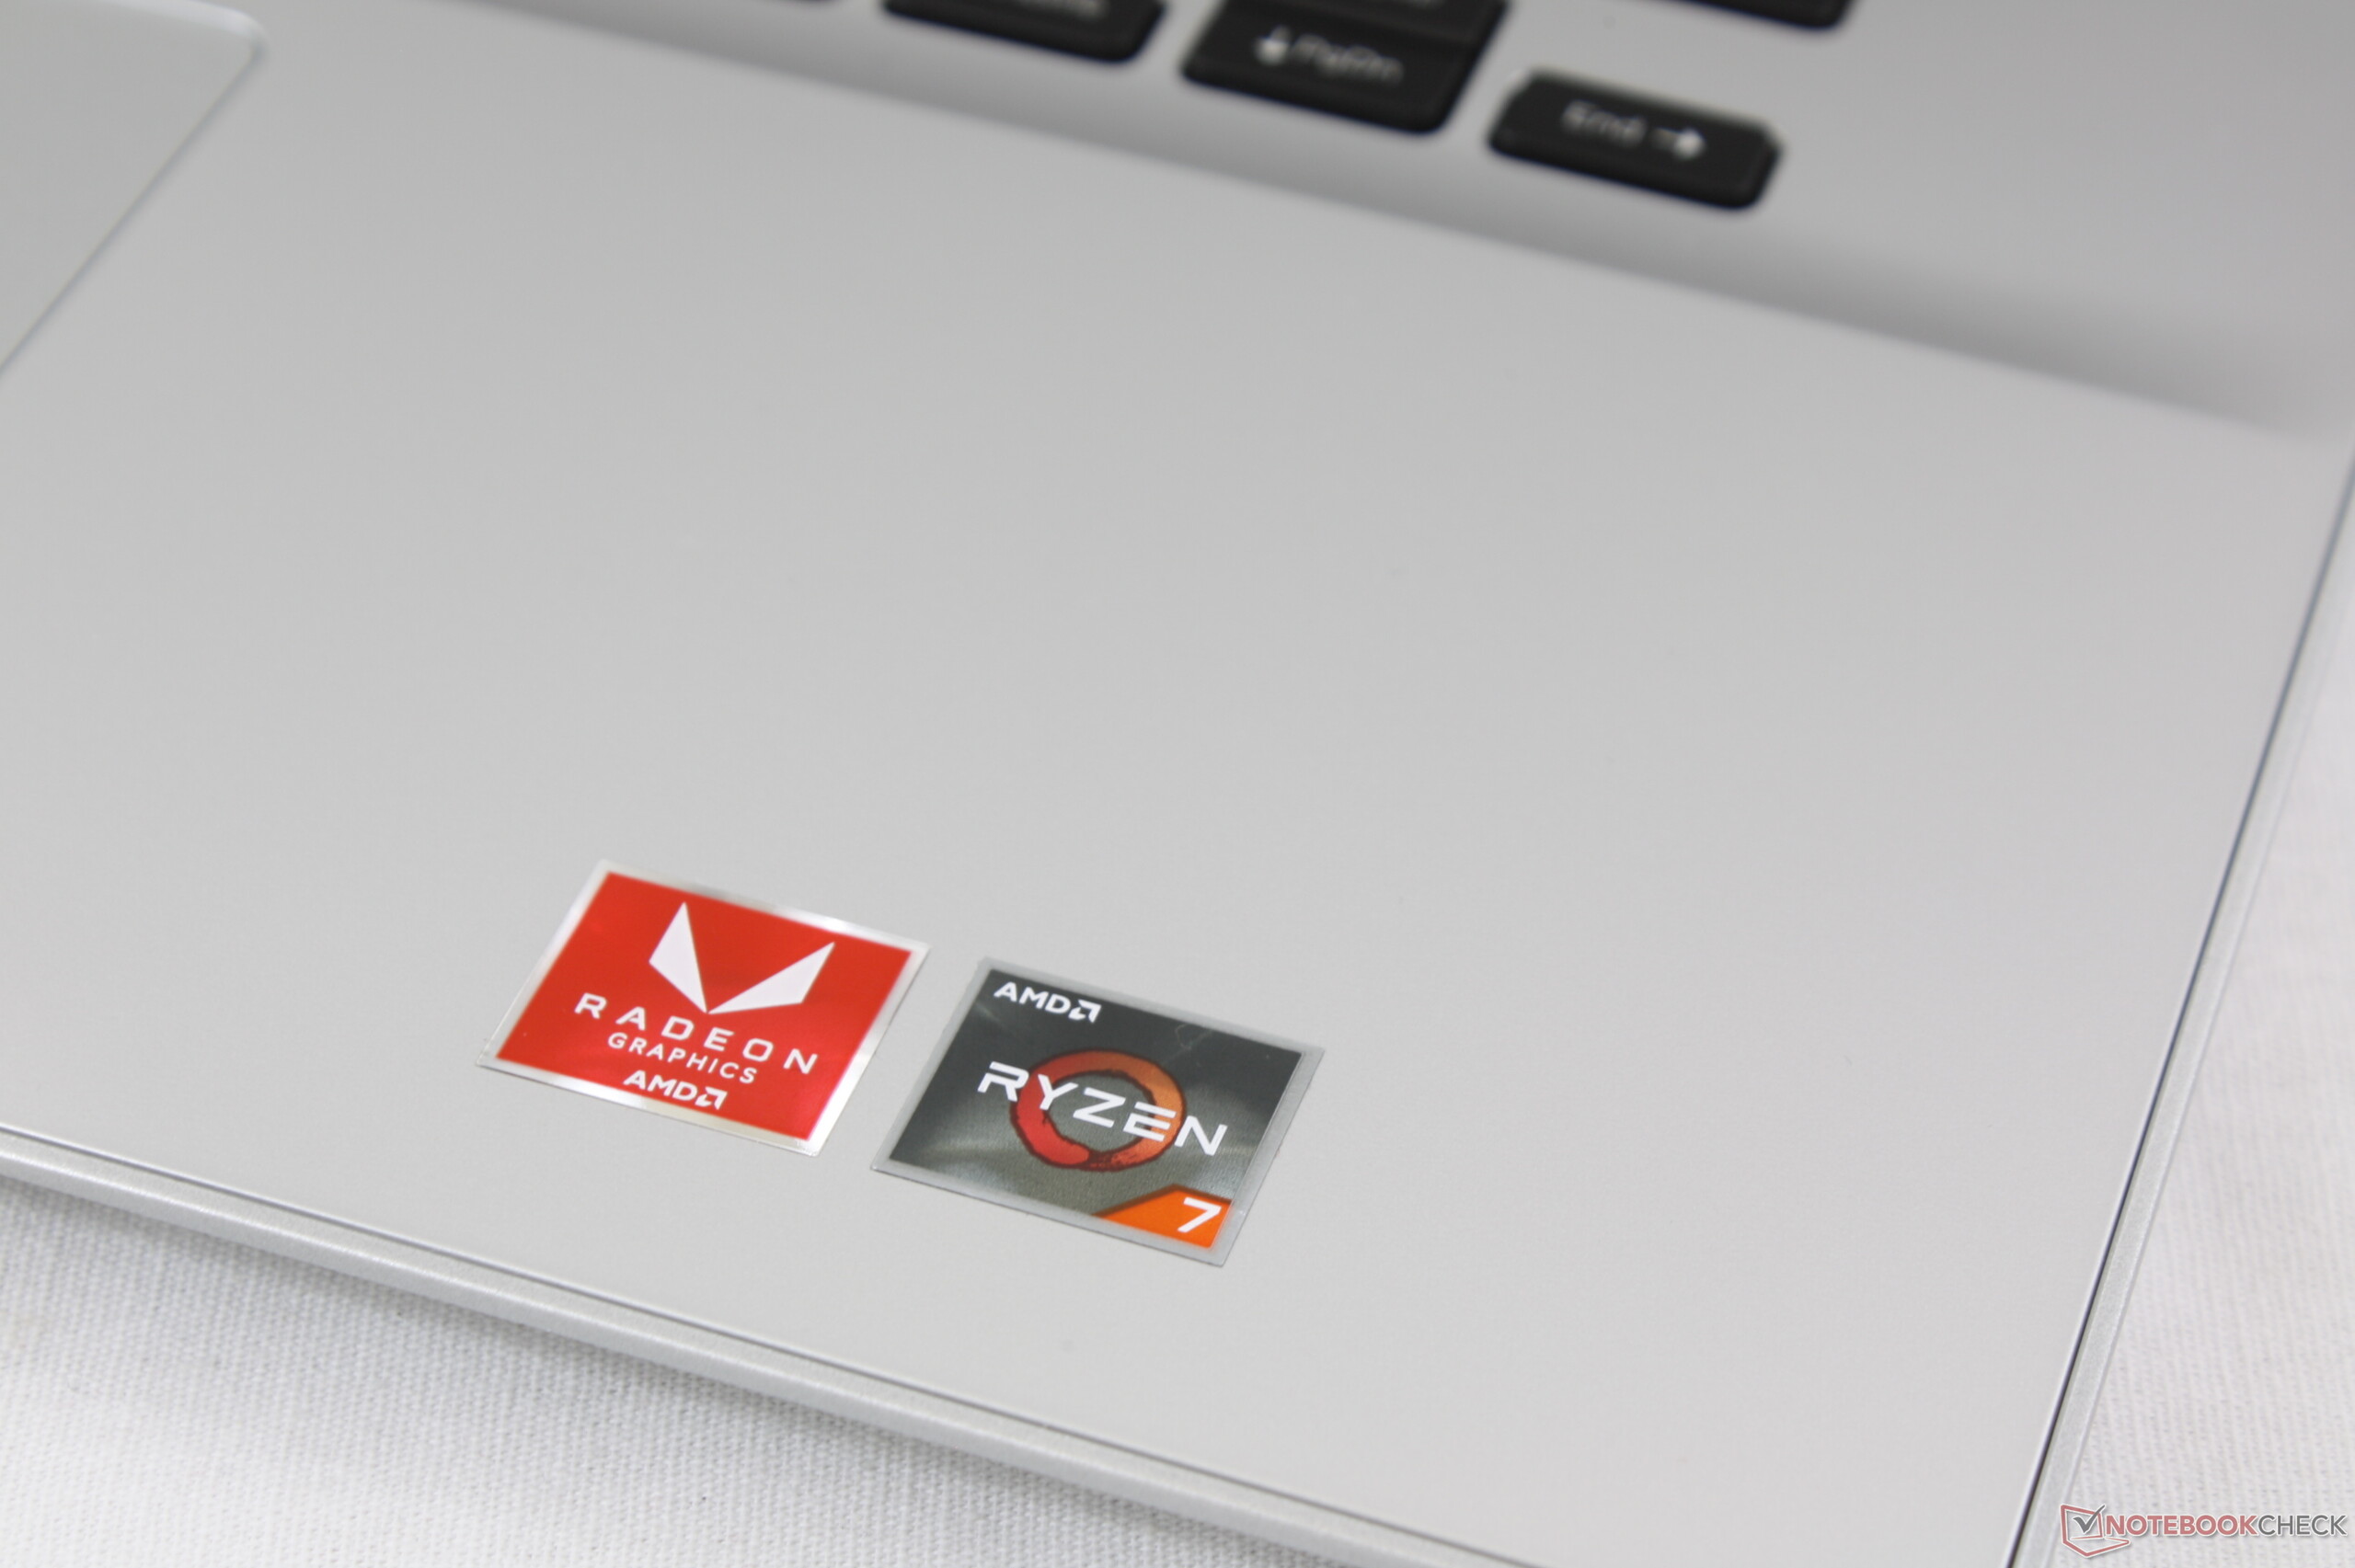
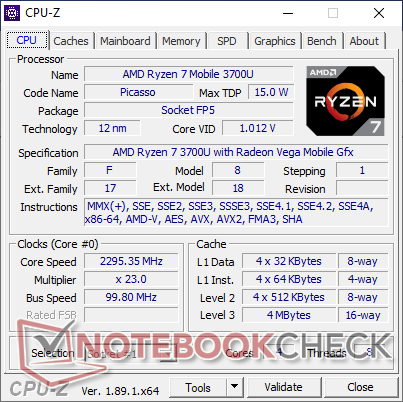
Nous n’en attendions pas trop d’un Inspiron, mais nous avons été agréablement surpris par les performances de l’appareil. Le processeur AMD en particulier propose des performances CPU similaires à un Core i7-8565U, tout en étant bien meilleur en ce qui concerne les performances graphiques. Les joueurs occasionnels qui apprécient jouer de temps en temps à Rocket League ou à LoL entre deux cours ou deux réunions, trouveront cet Inspiron AMD bien plus puissant pour leurs besoins qu’un XPS 13 ou HP Spectre x360 13 plus chers.
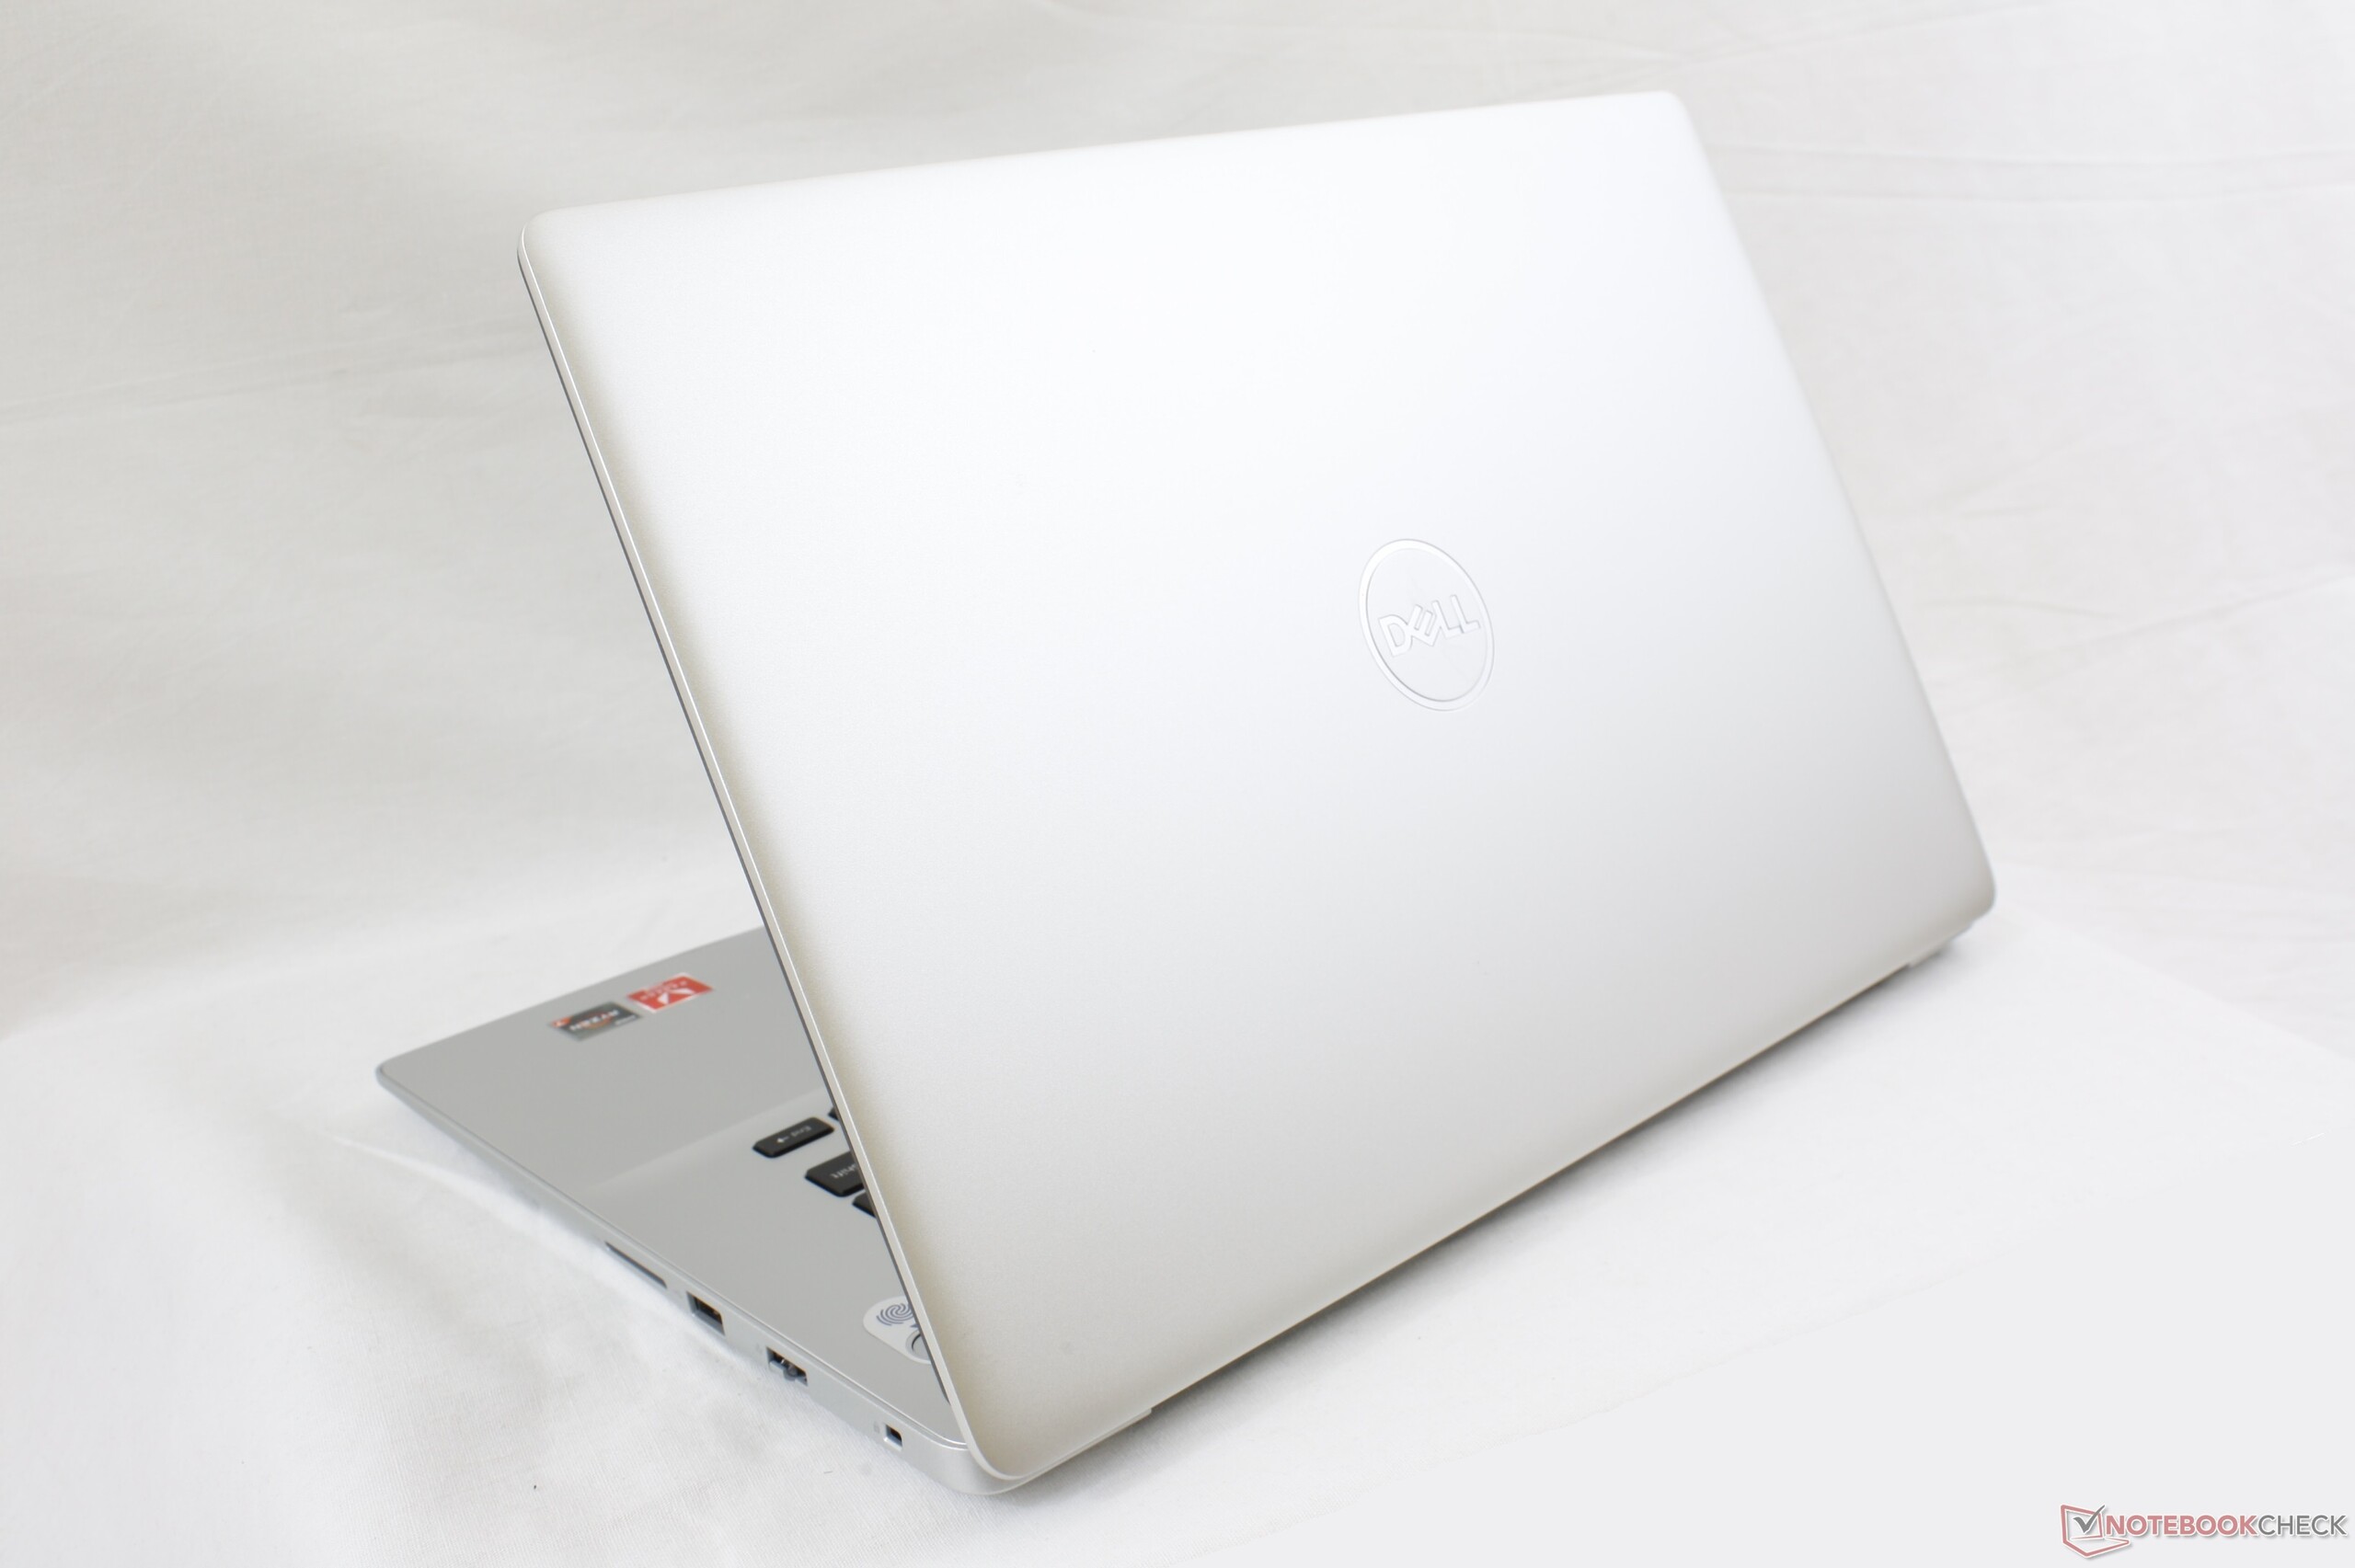
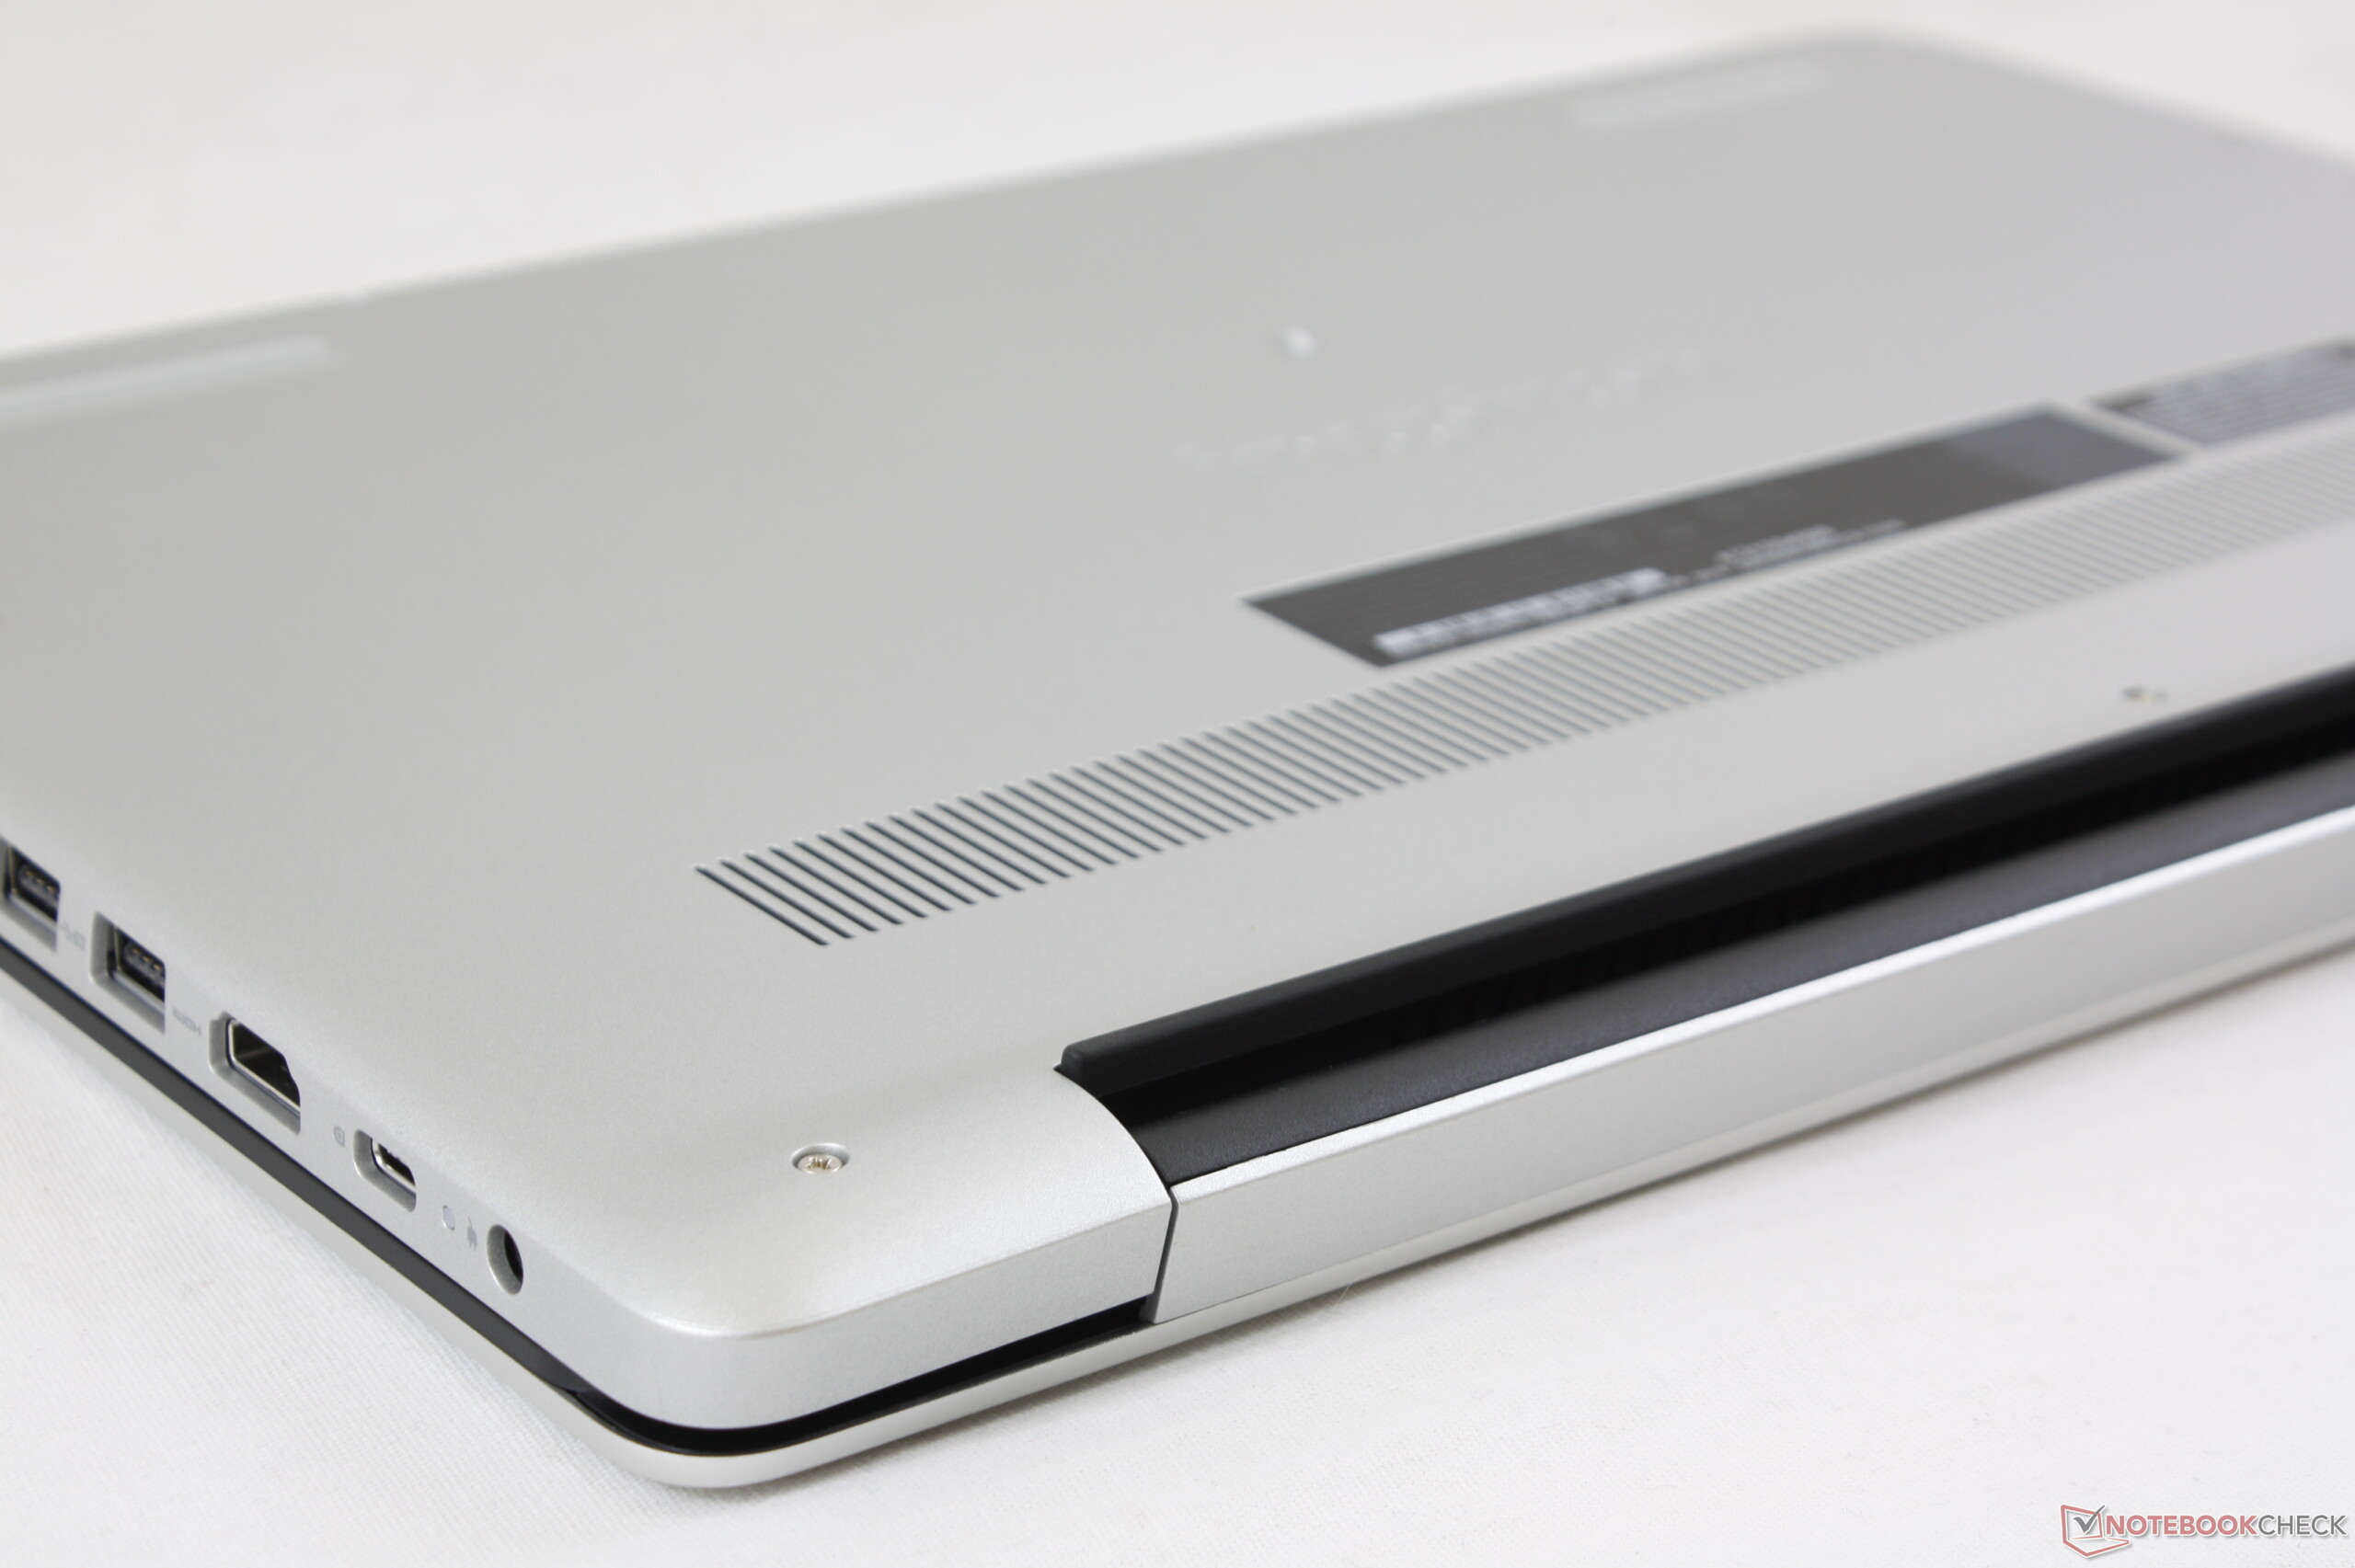
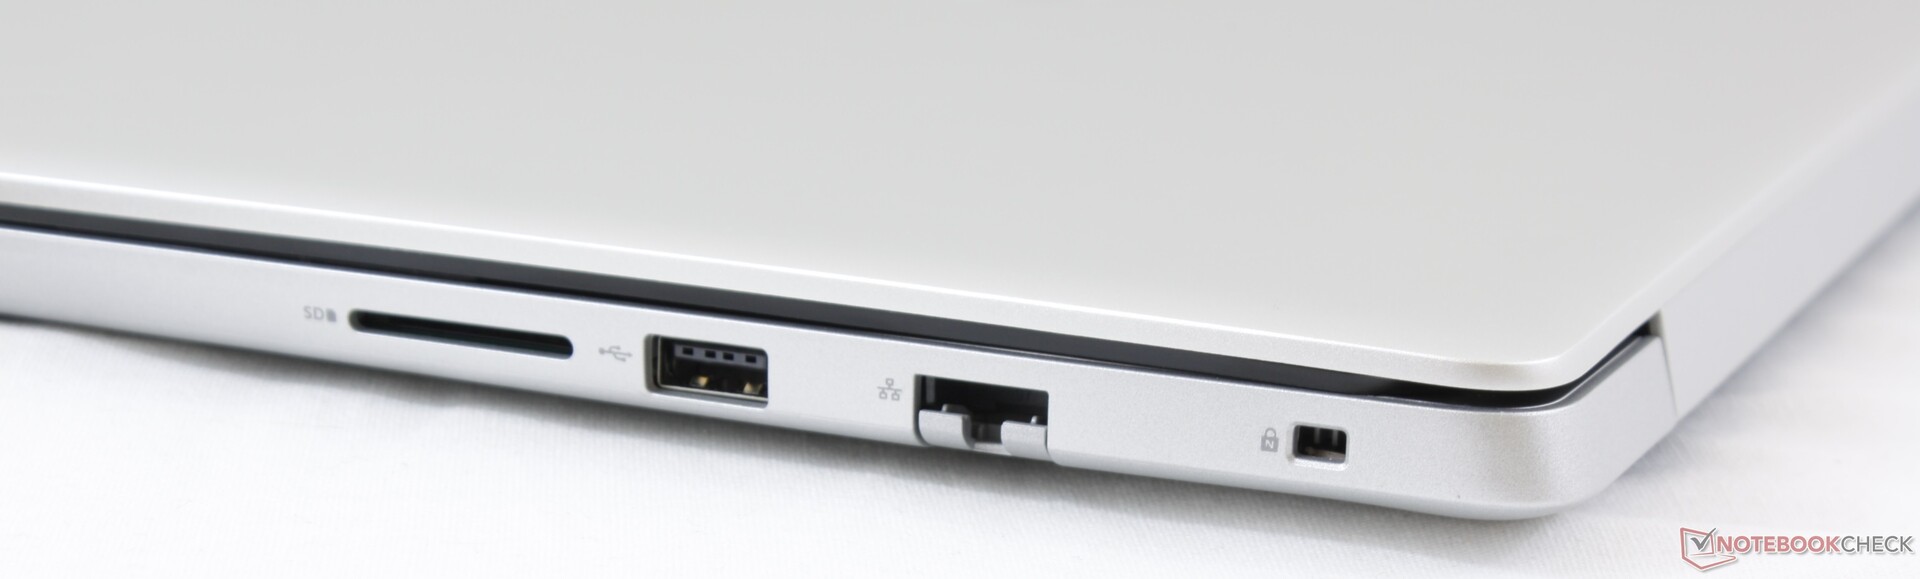
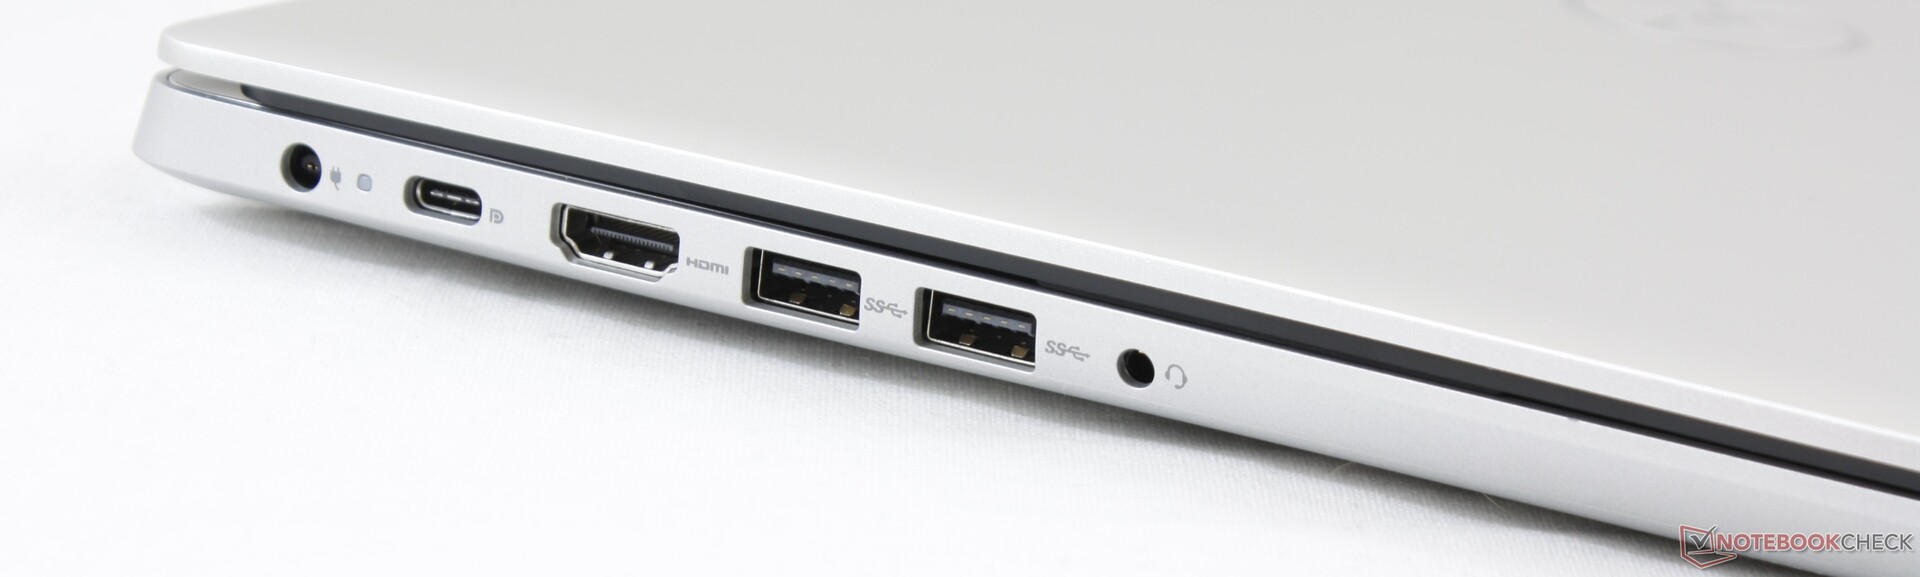
Malheureusement, le processeur impressionnant est gâché par un châssis peu réussi. Après tout c’est un portable à petit prix, avec un écran plutôt sombre, des couleurs peu fidèles, et des plastiques qui n’ont rien de luxueux. L’autonomie est meilleure que celle de l’Inspiron 15 5584 Intel, et le retour des touches est plutôt bon, ce qui ravira à coup sûr la cible des personnes soucieuses du prix. Si Dell propose un successeur, il devrait proposer un écran plus lumineux, et passer à la charge USB C universelle.
Un CPU AMD intégré dans un Inspiron pour des performances de XPS. En bref, on a là une puissance d’ultrabook haut de gamme avec un des performances graphiques intégrées étonnantes, dans un châssis à petit prix.
L’intégralité de cette critique est disponible en anglais en suivant ce lien.
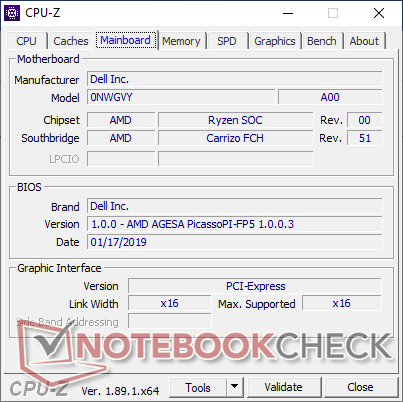
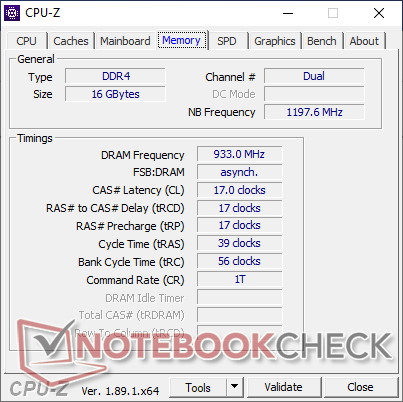
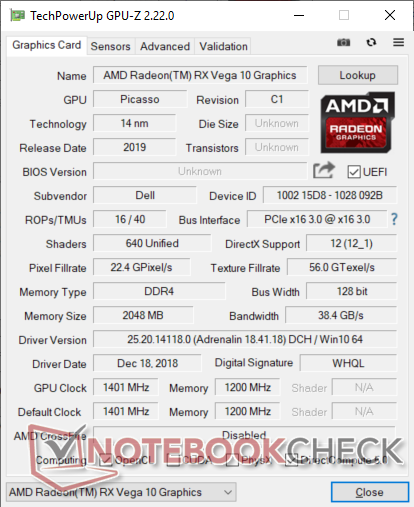
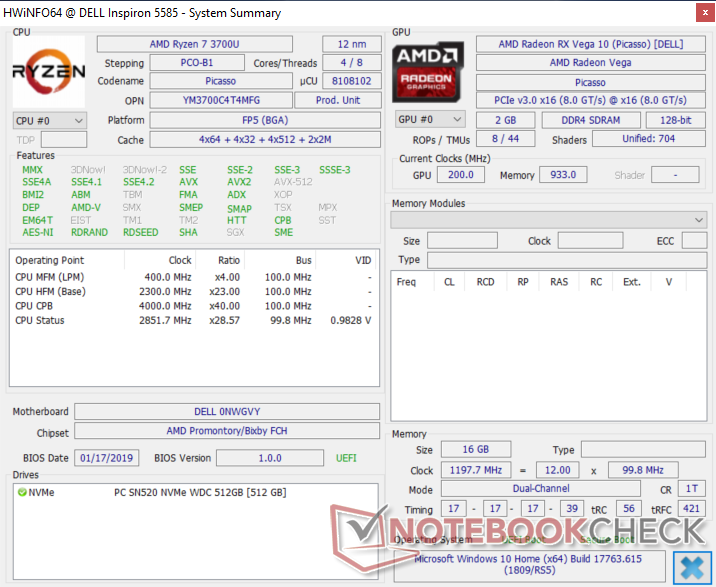
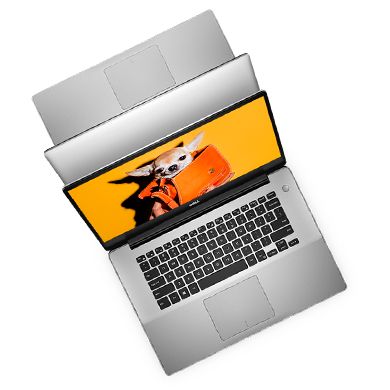
Dell Inspiron 15 5000 5585
- 08/08/2019 v6 (old)
Allen Ngo
Price comparison
