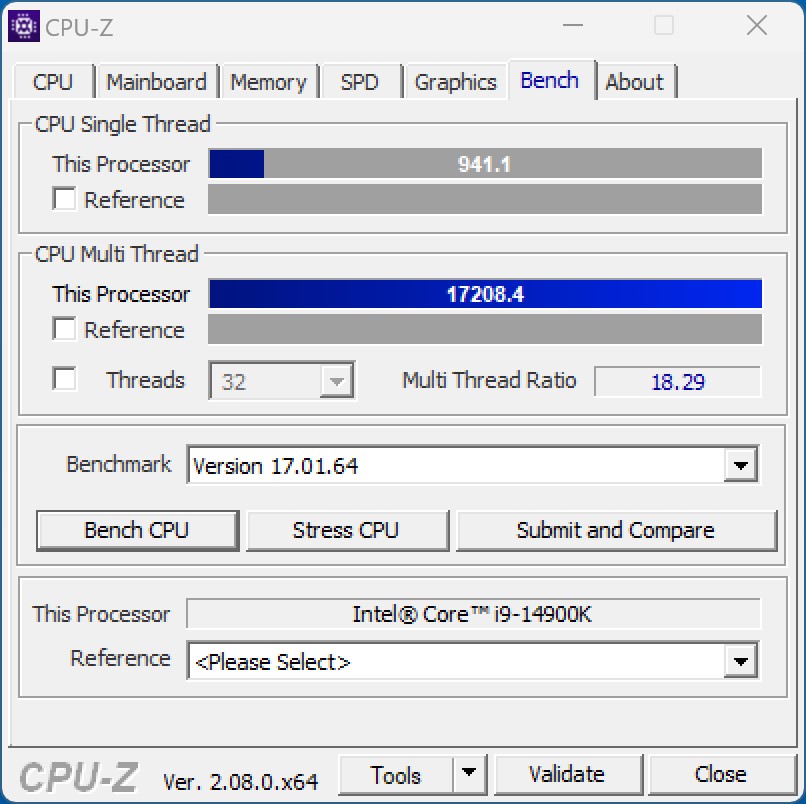
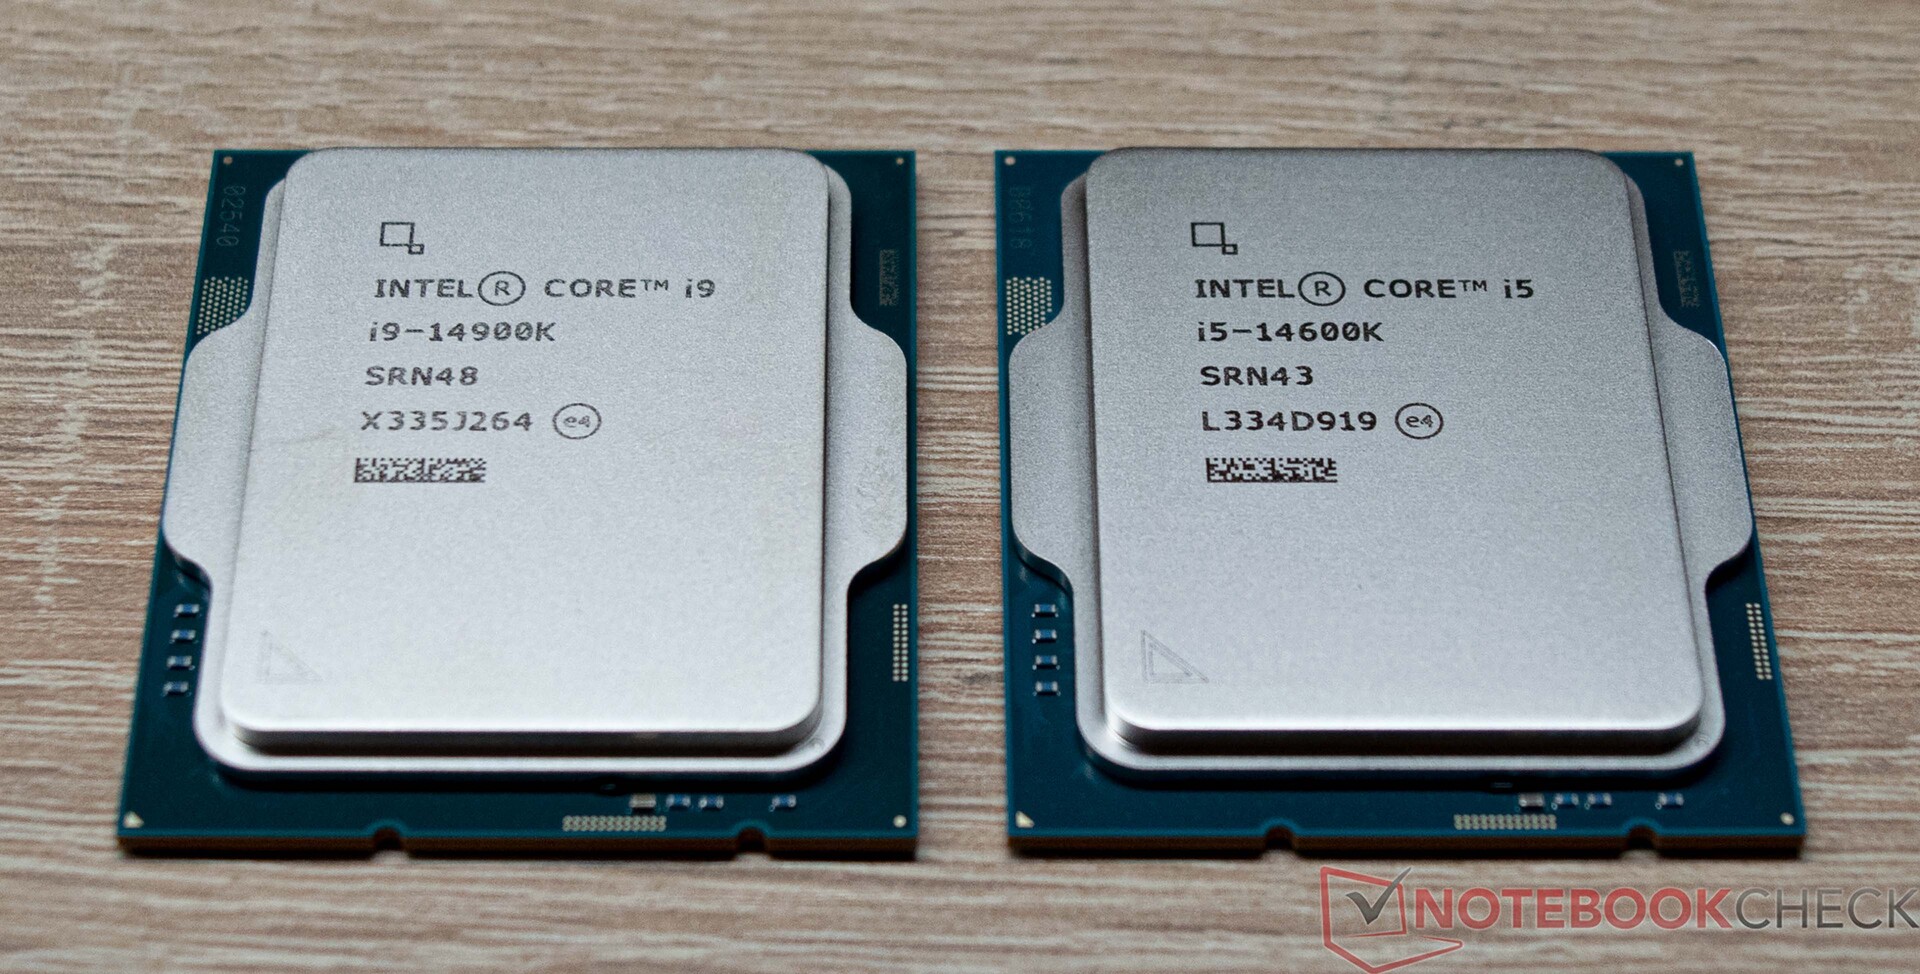
Intel Core i9-14900K et i5-14600K : 6 GHz en sortie de boîte pour contrer les X3D d'AMD
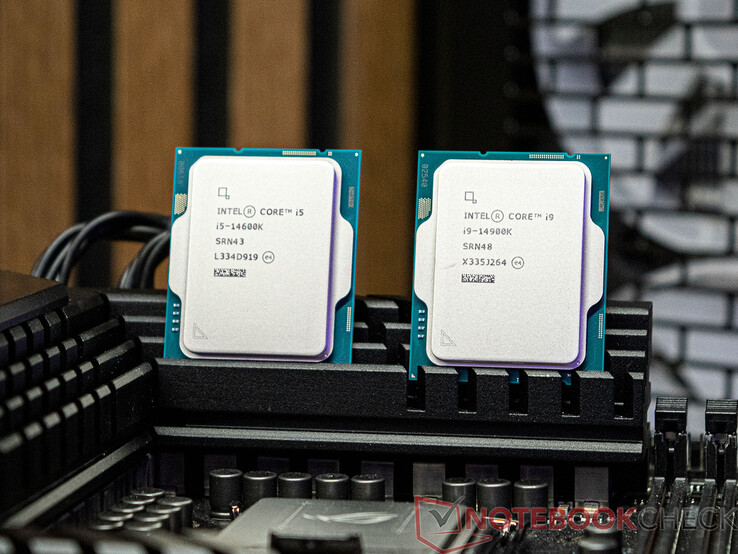
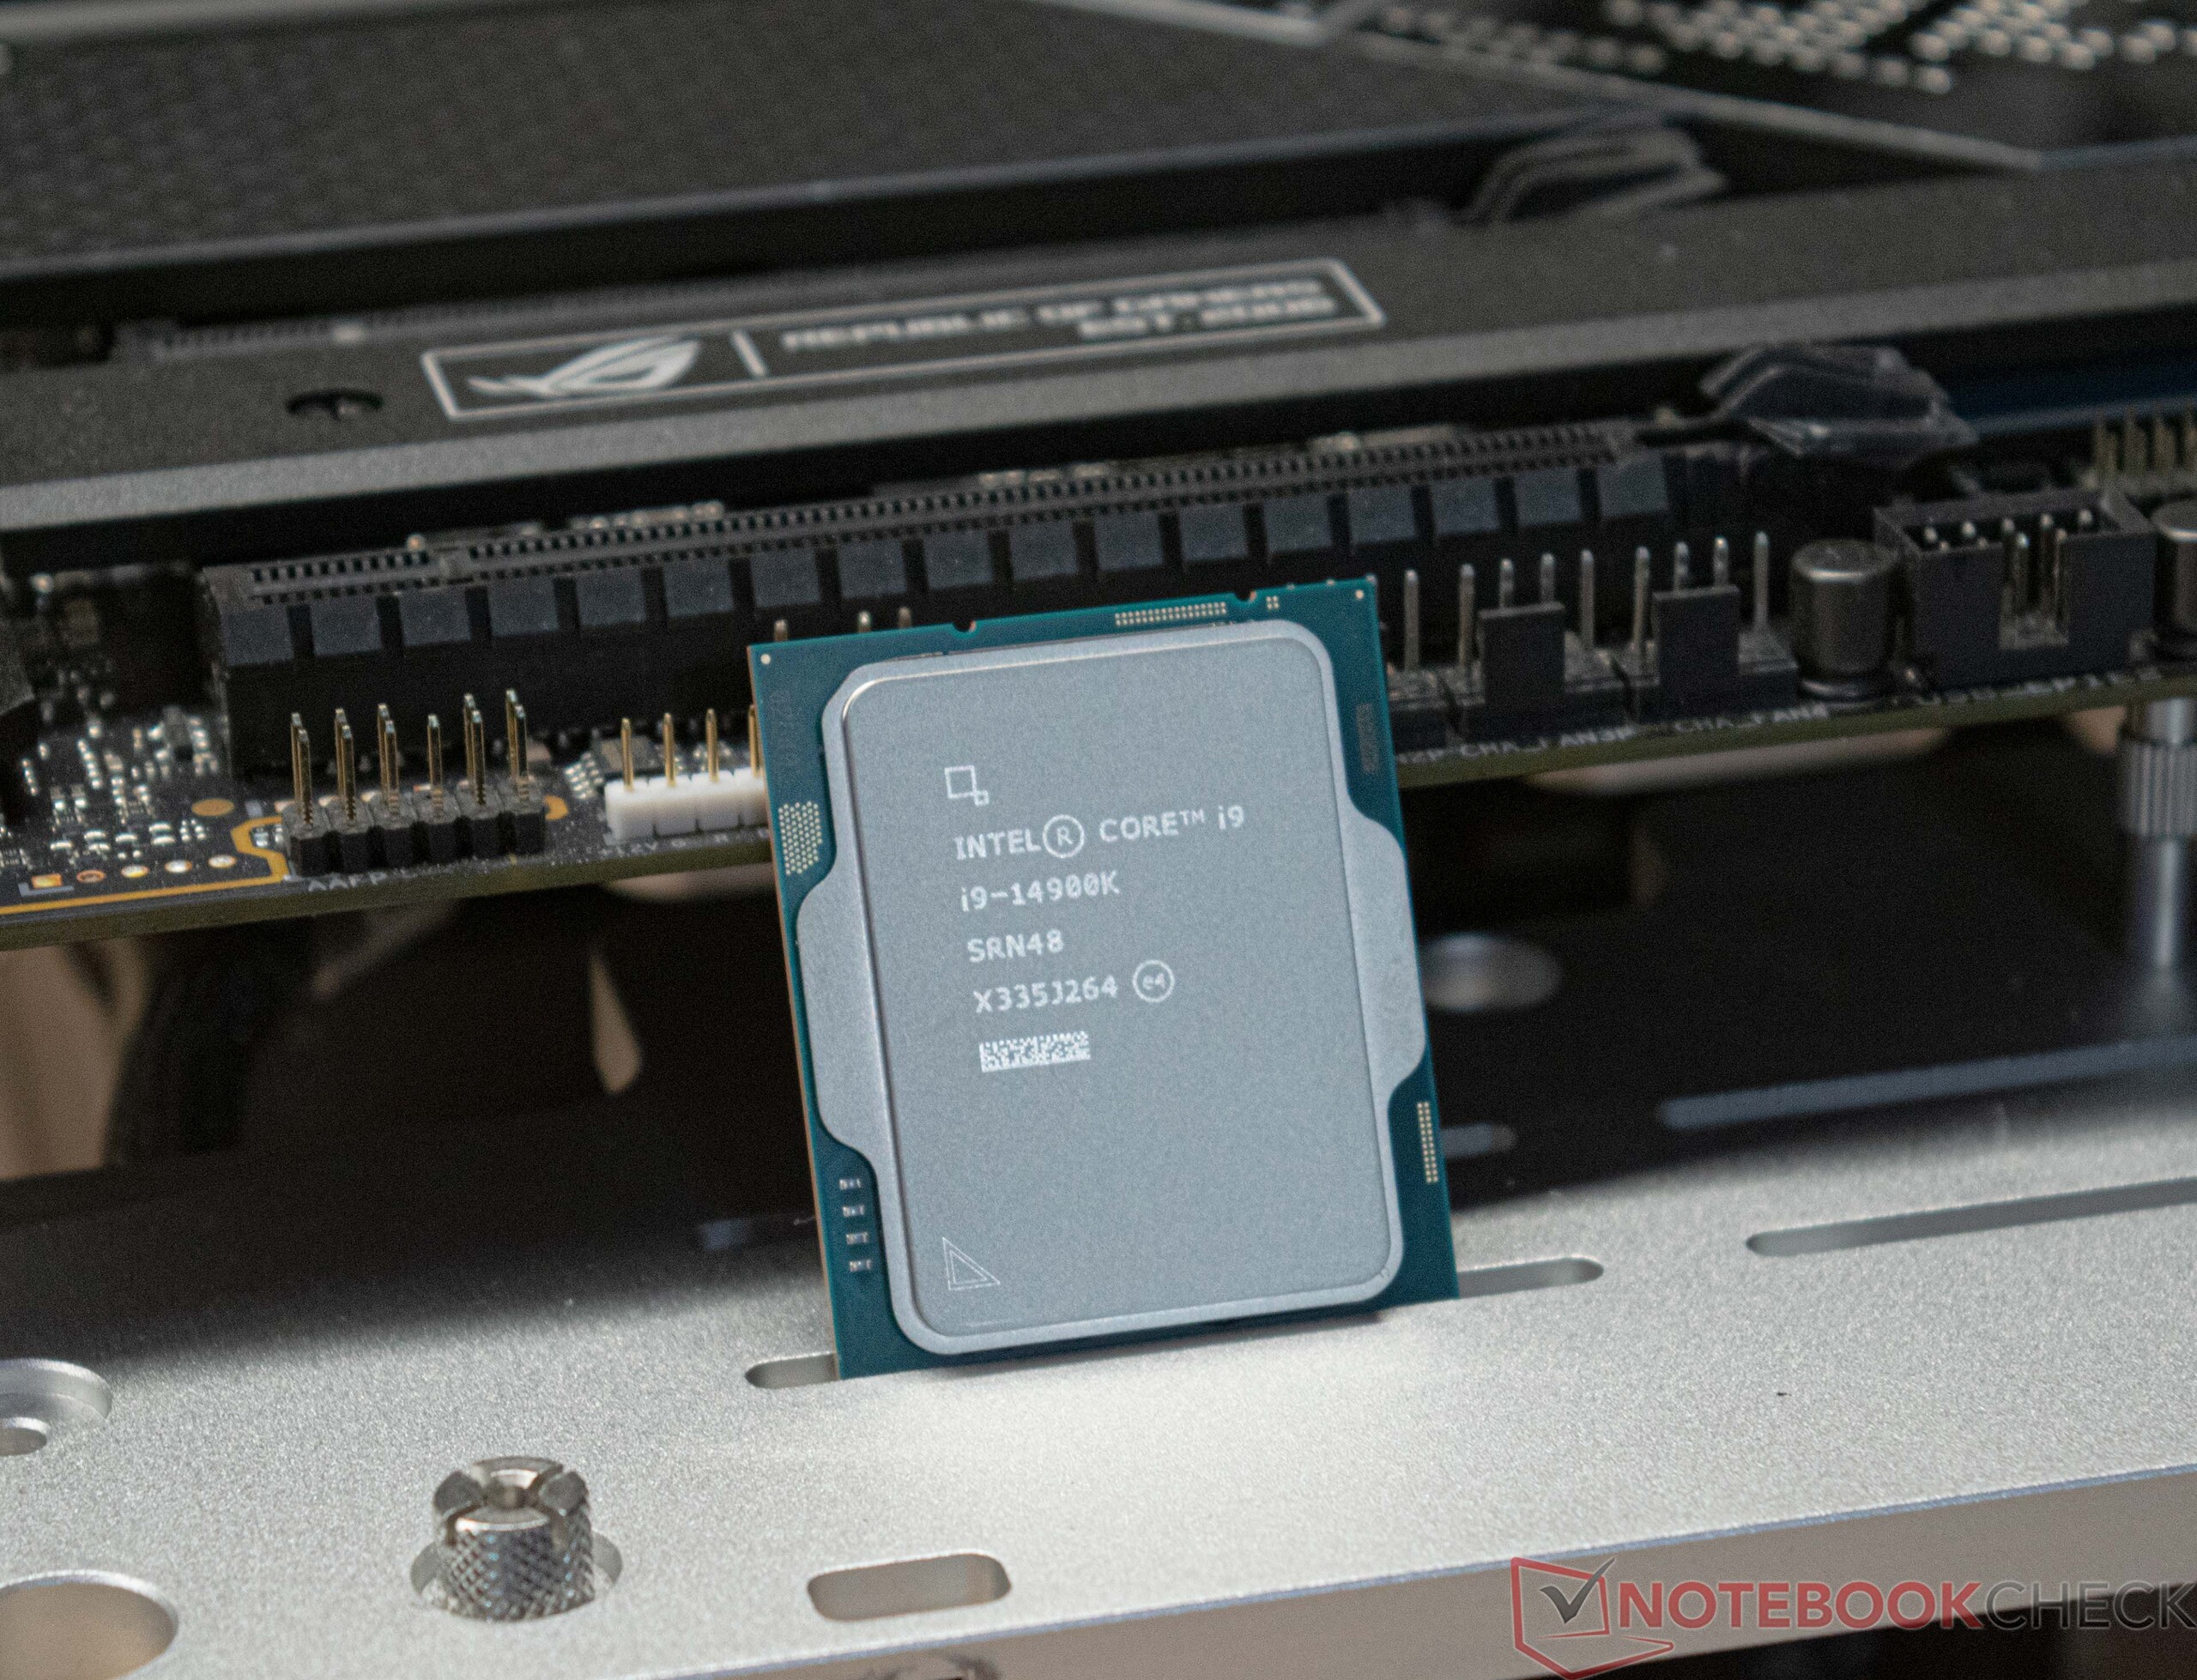
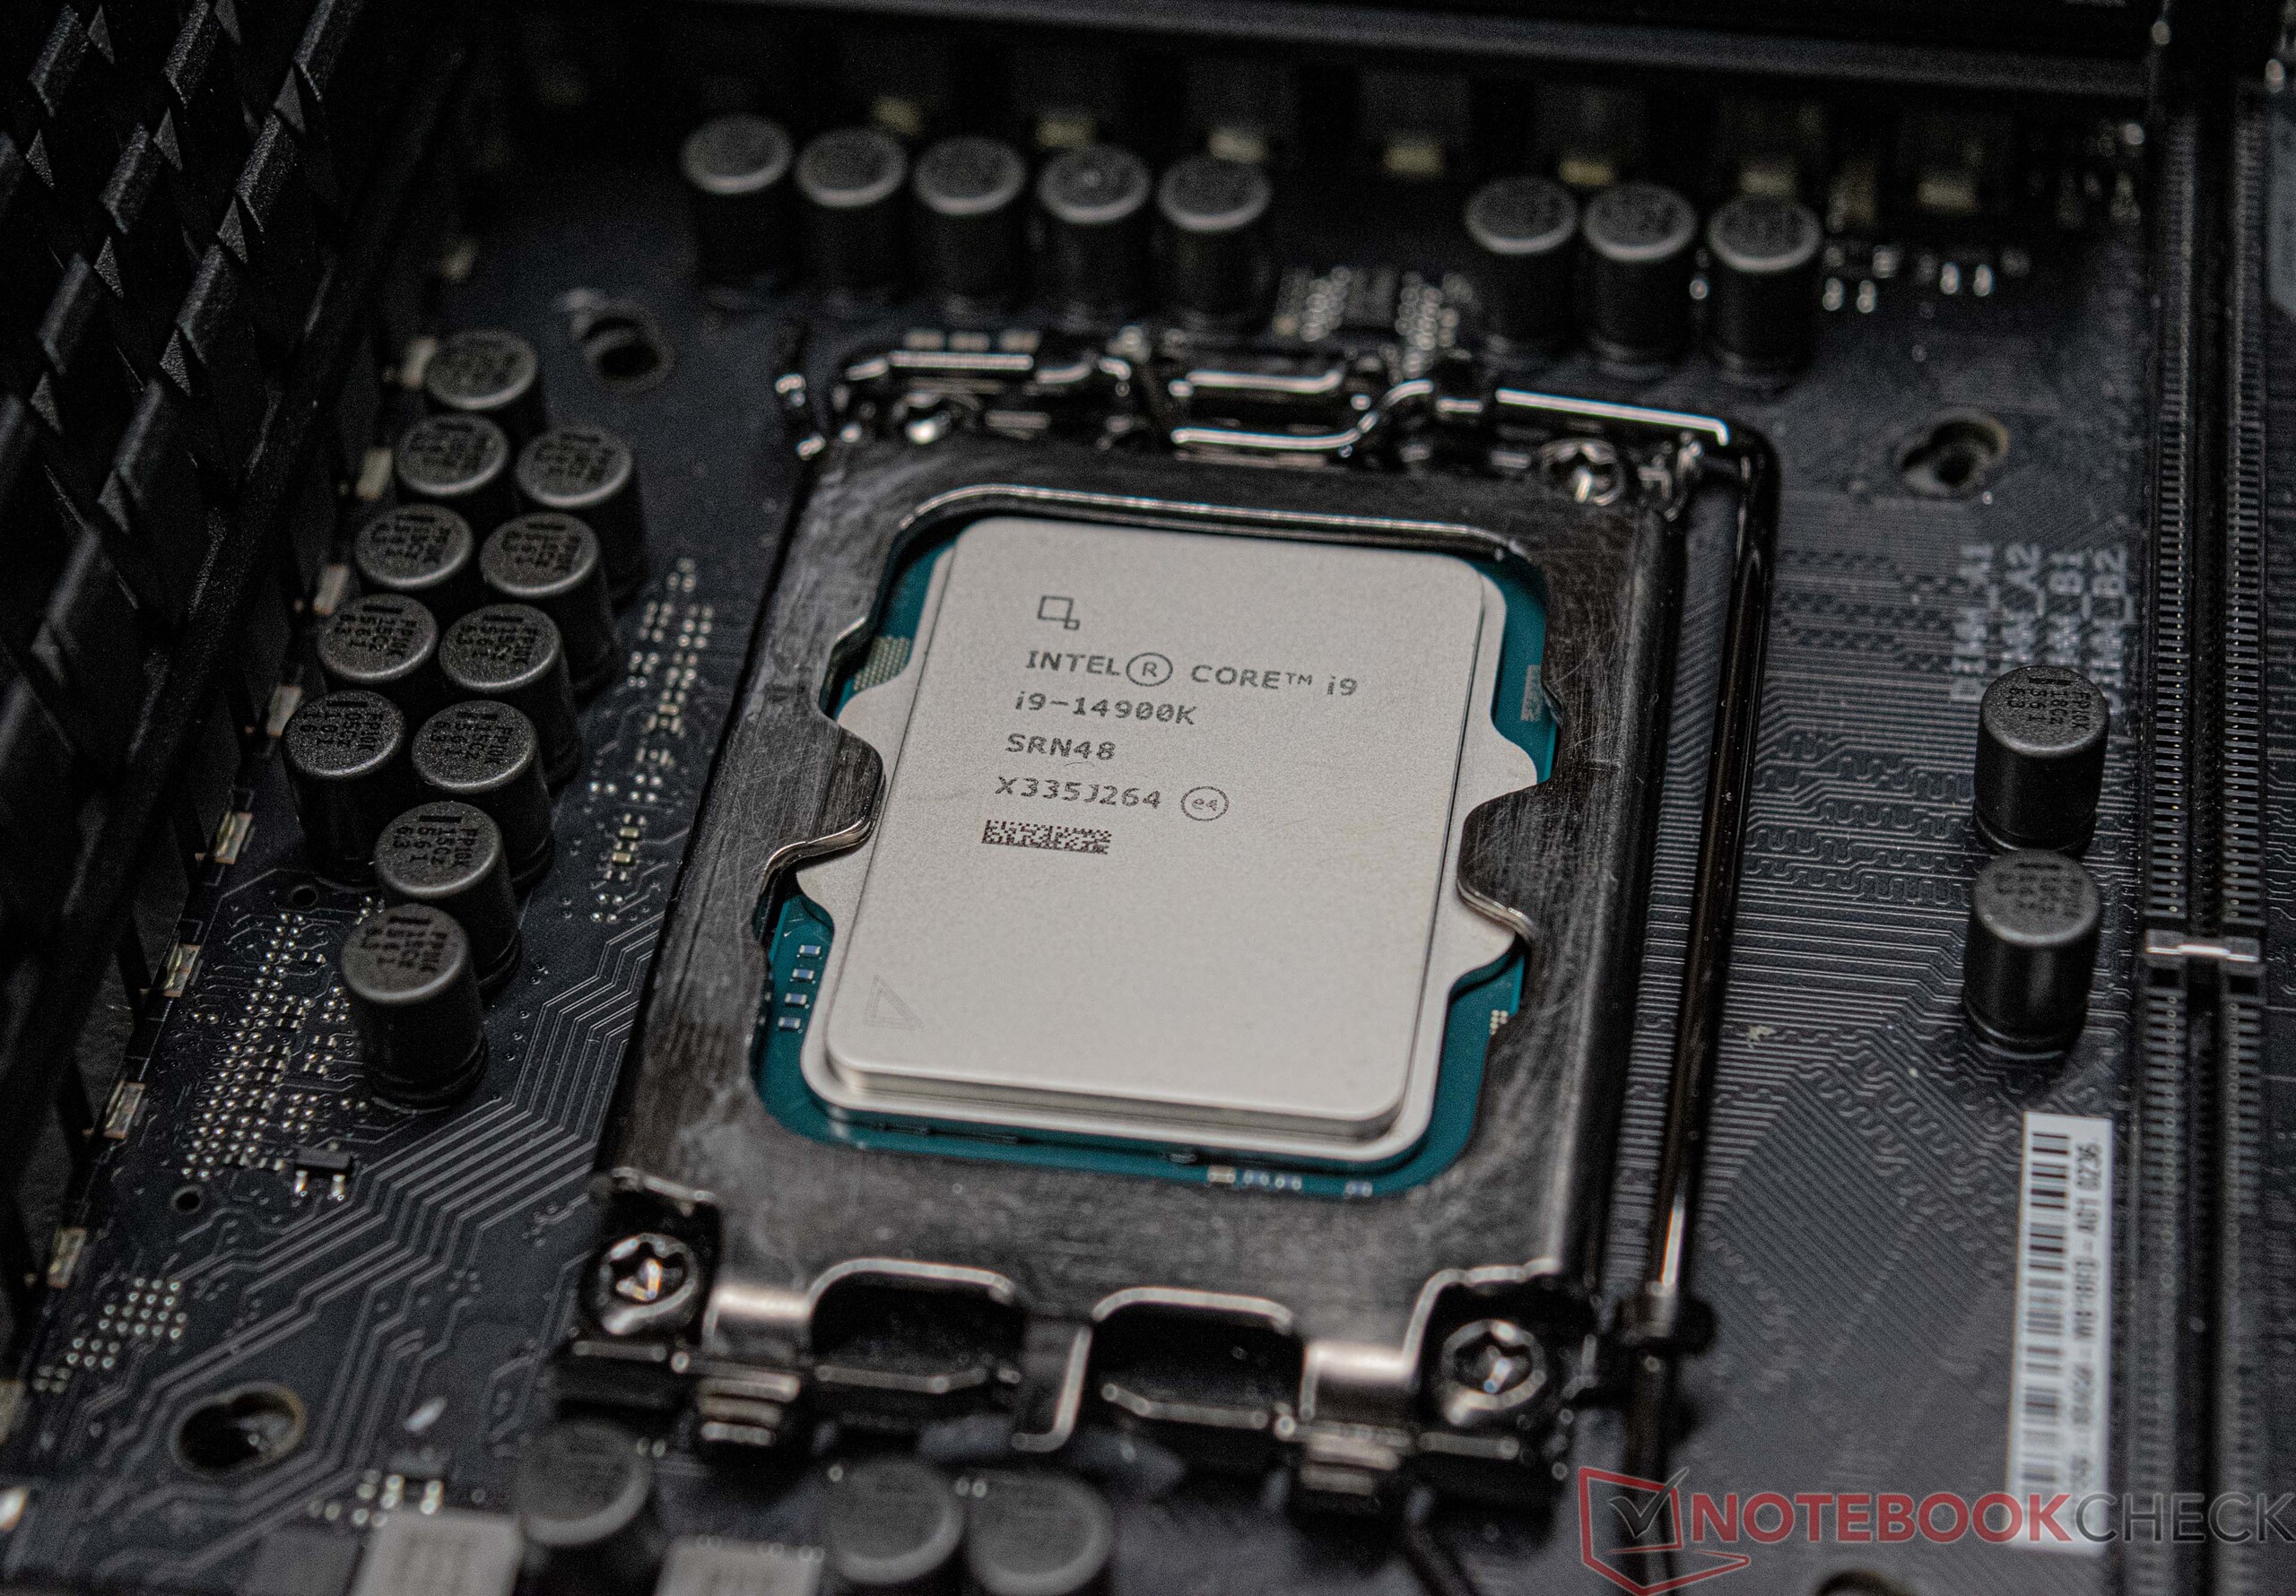
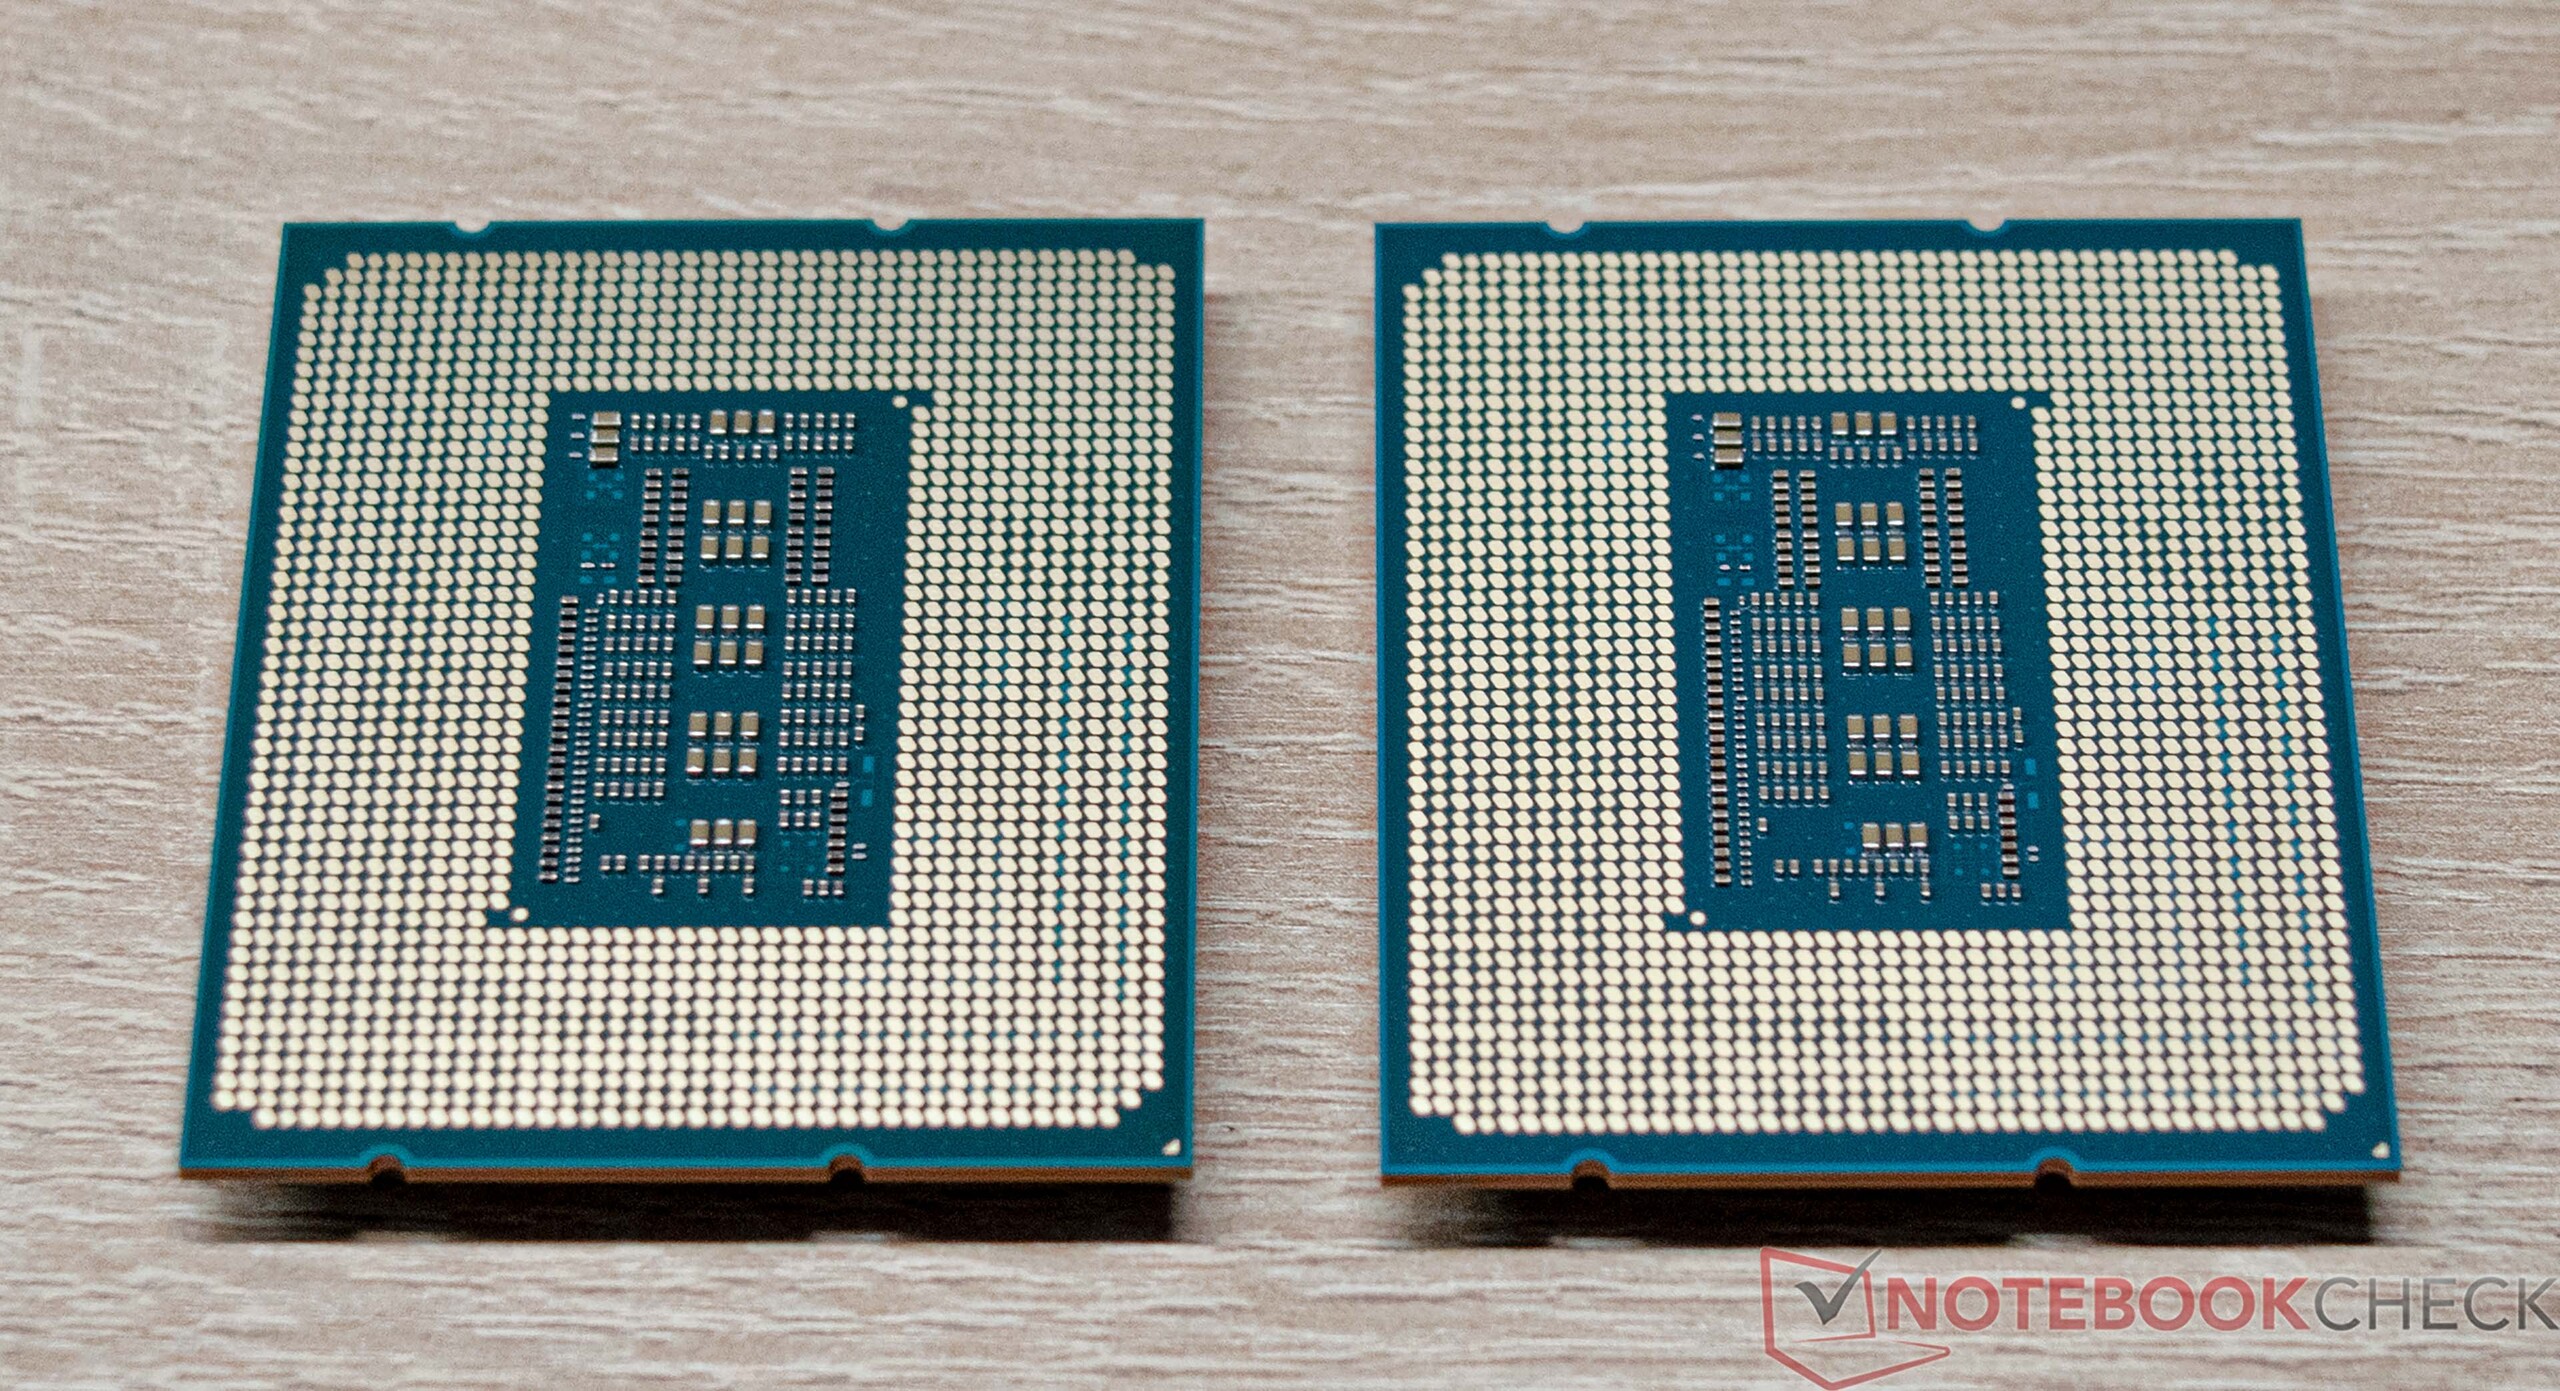
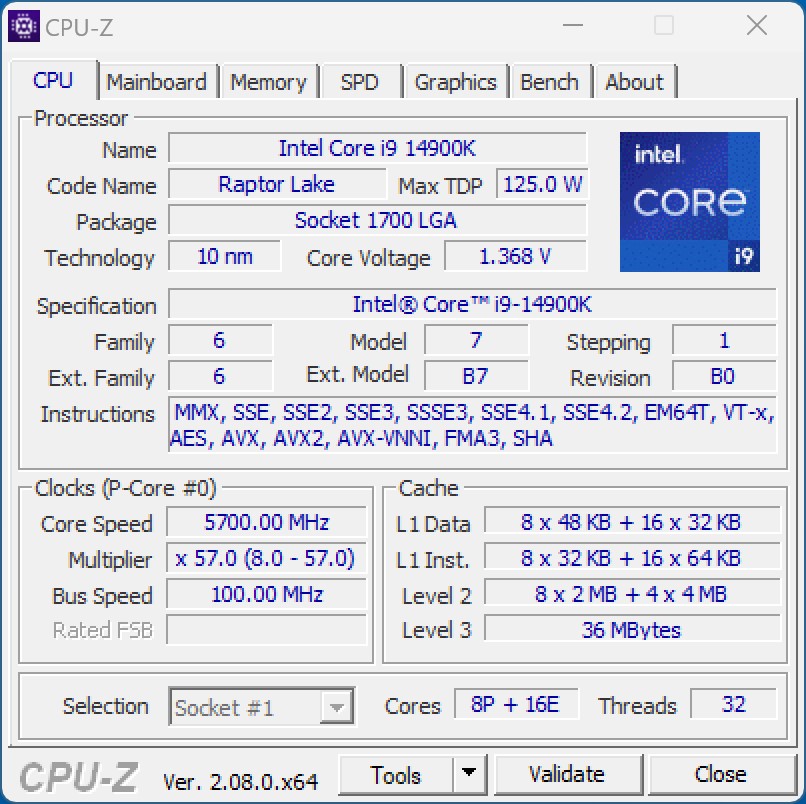
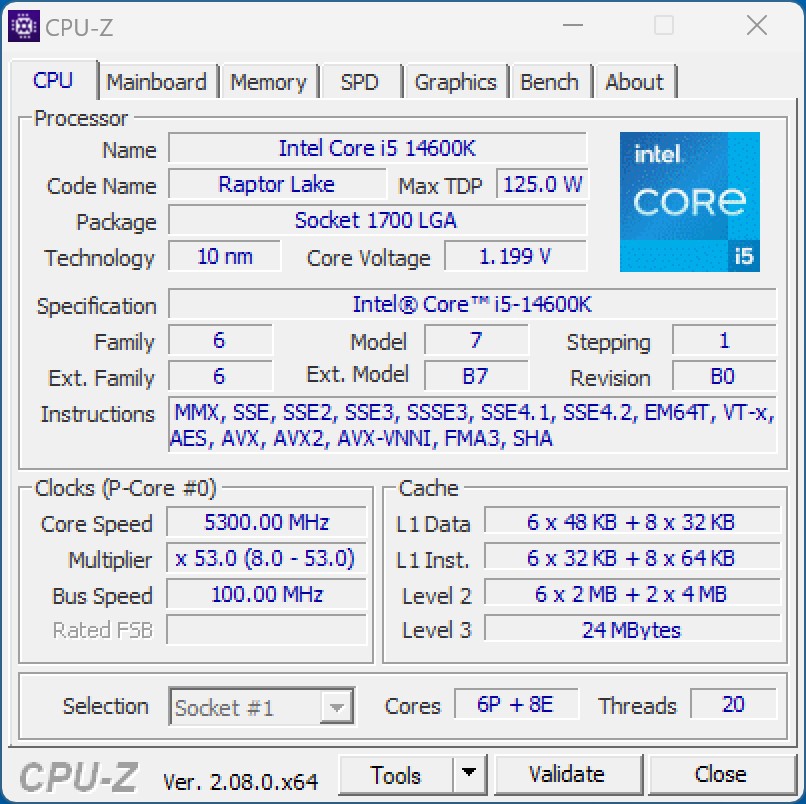
Alors qu'on s'attendait à ce qu'il introduise un nouveau socket au bout de deux ans, Intel continue d'utiliser le socket 1700 pour sa 14e génération de processeurs Core. Le modèle supérieur, l'Intel Core i9-14900K, dispose d'un total de 24 cœurs de calcul natifs et de 32 threads, ce qui correspond à ce qui était déjà disponible dans l'Intel Core i9-13900K Intel Core i9-13900K. Cependant, Intel a apporté quelques améliorations au niveau de la vitesse d'horloge, qui atteint désormais directement la limite des 6,0 GHz. Nous avons pu le constater lors de notre test, il ne s'agit donc pas de promesses vides de la part du fabricant. Malheureusement, Intel n'a pas apporté beaucoup de modifications à la consommation d'énergie, de sorte qu'avec 253 watts, le nouveau fleuron se voit attribuer la même valeur PL2 que celle que nous connaissons déjà. Si vous désactivez en plus toutes les restrictions dans le BIOS, sa consommation d'énergie continue d'augmenter de manière significative, comme nous le verrons plus loin dans notre test. Outre le modèle haut de gamme, nous allons également examiner de plus près l'Intel Core i5-14600K dans ce test. Avec 14 cœurs et 20 threads, il atteint les mêmes chiffres que l'Intel Core i5-13600K Intel Core i5-13600K. Mais Intel a également augmenté la vitesse d'horloge sur ce modèle, afin d'obtenir un peu plus de performances de ses cœurs P et E.
Avec cela, nous ne nous attendons pas à de plus grands sauts de performance, et Intel n'a pas non plus changé quoi que ce soit à la construction de base de l'unité centrale. Pour l'instant, Intel n'offre pas de contrepartie à la technologie 3D V Cache d'AMD, qui a permis à AMD d'obtenir de bien meilleurs résultats dans un passé récent et de mettre la pression sur ses concurrents.
Les prix d'Intel montrent également que nous sommes au même niveau que lors du lancement des modèles Raptor Lake S de l'année dernière. En raison de la demande, qui augmente généralement au cours du quatrième trimestre, il reste à voir où les nouveaux modèles aboutiront. Ce qui joue également un rôle ici (en Europe), c'est le taux de change entre l'euro et le dollar.
Petites améliorations dans les processeurs Intel de la 14e génération
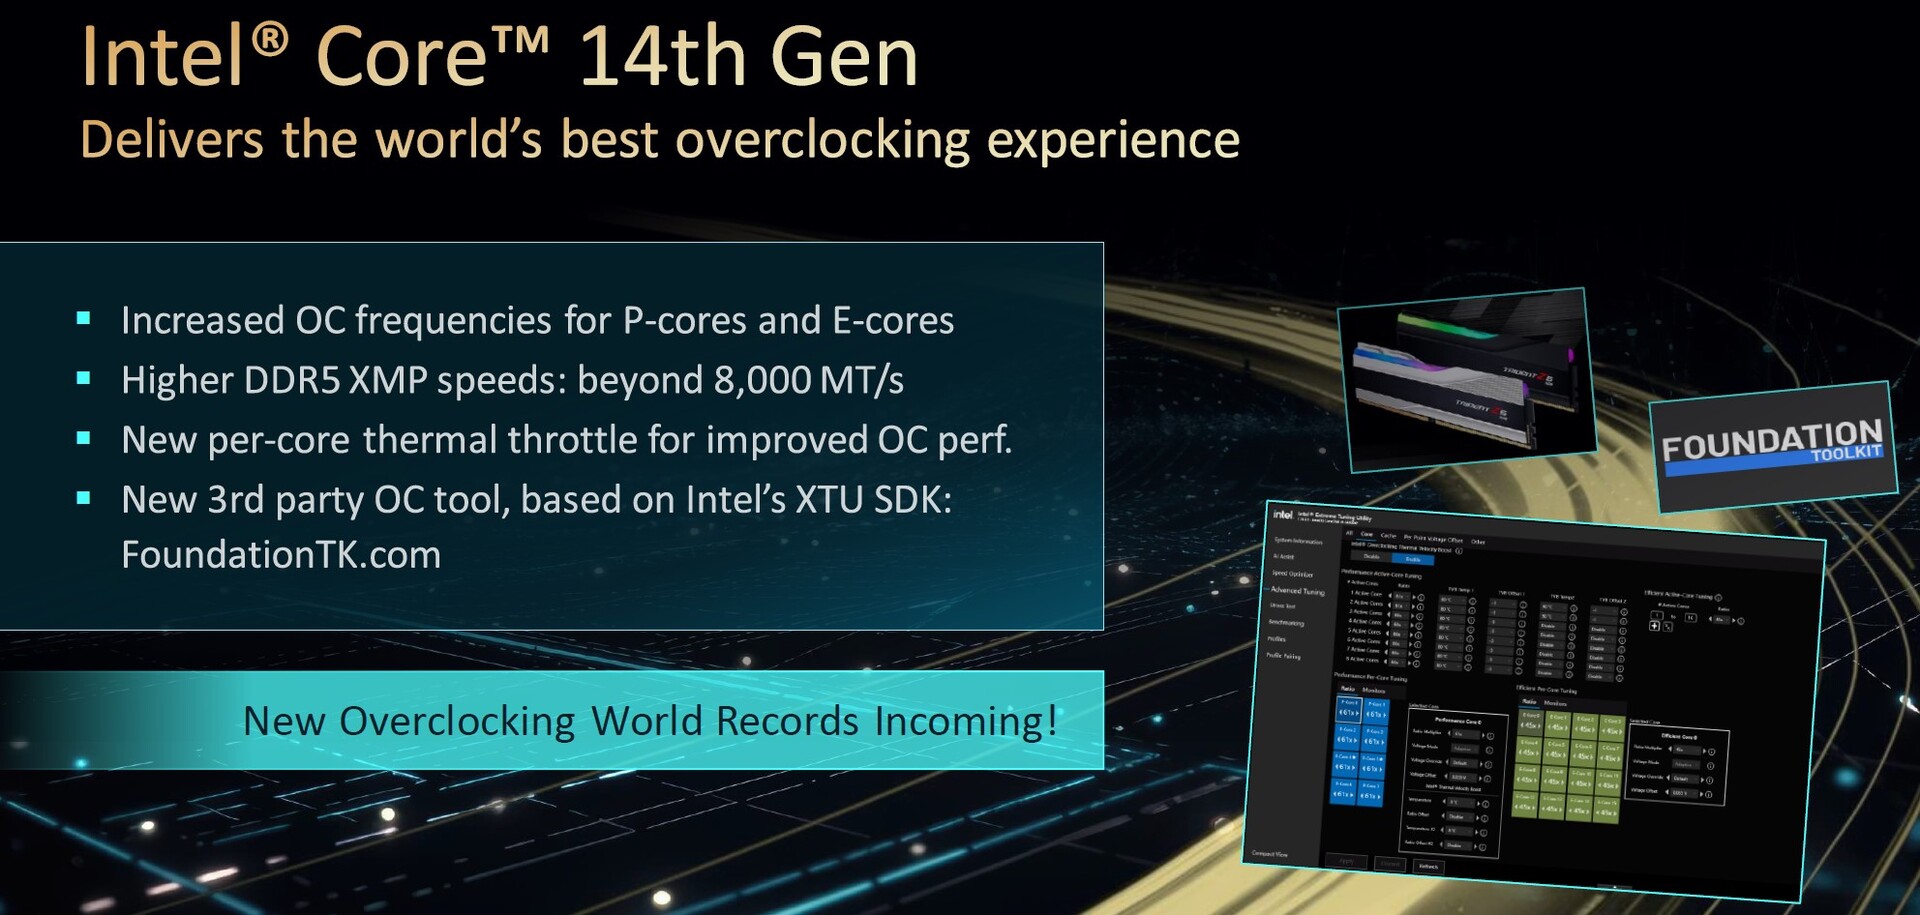
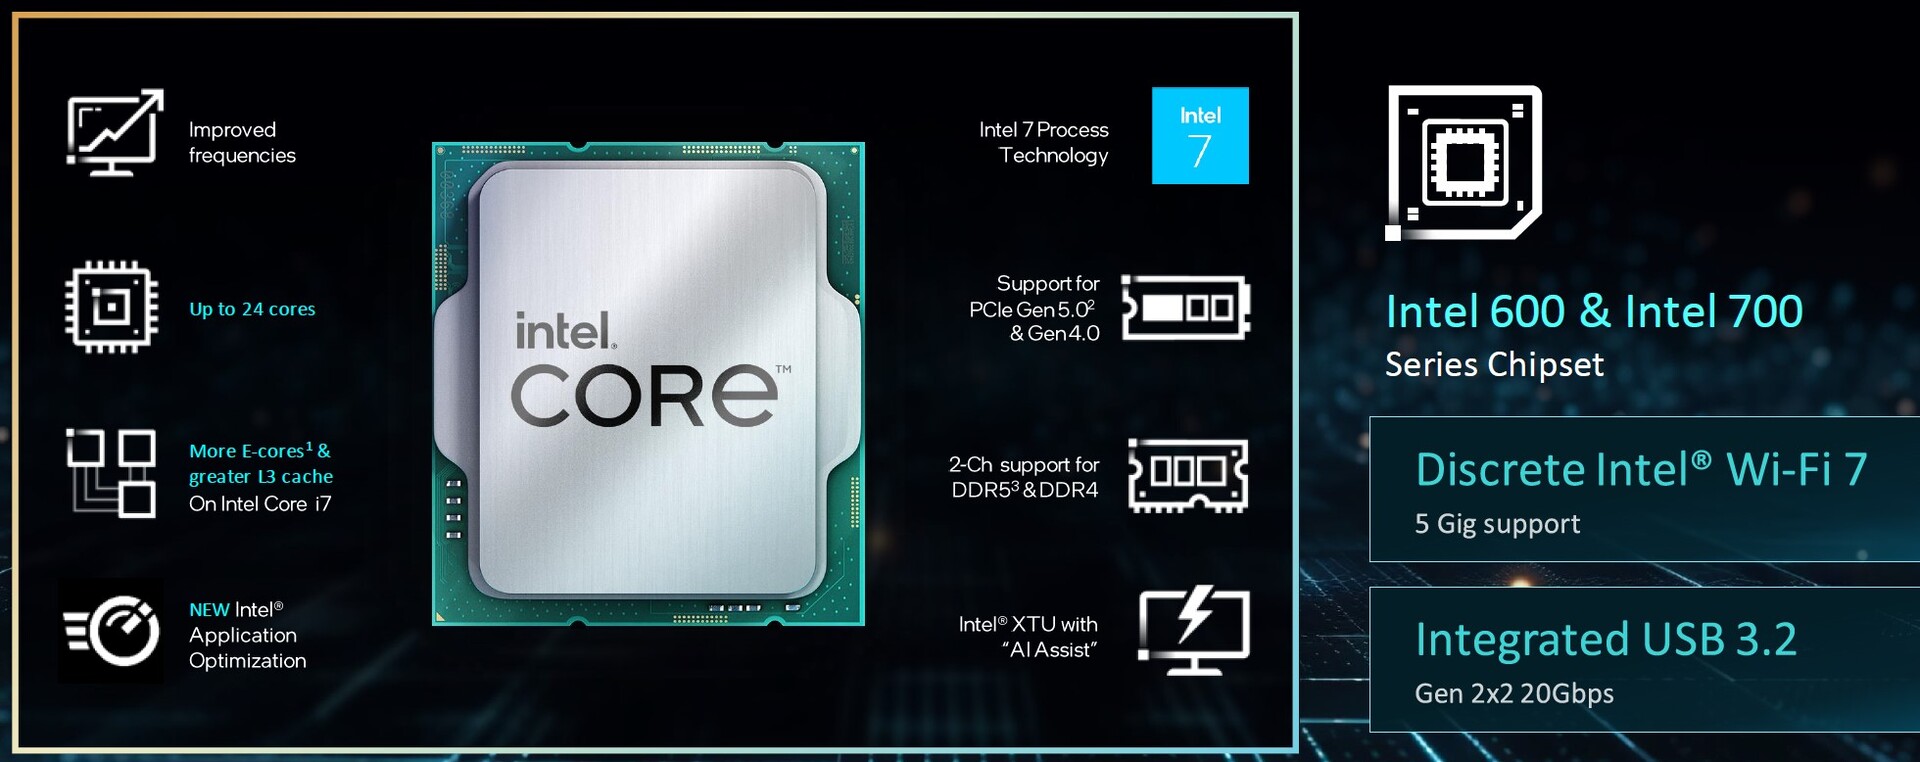
Outre les vitesses d'horloge accrues, Intel met également l'accent sur les vitesses de mémoire vive annoncées, avec XMP et jusqu'à 8 000 MT/s. Cependant, dans le passé, ces vitesses d'horloge élevées ont souvent entraîné des problèmes au niveau de la mémoire de travail. C'est probablement la raison pour laquelle les cartes mères ont été redessinées, les améliorations devant permettre d'atteindre ces vitesses d'horloge. Intel lui-même autorise l'Intel Core i9-14900K pour la DDR5 à 5 600 MT/s. Mais dans la pratique, l'utilisation de la mémoire de travail avec des vitesses d'horloge plus élevées ne pose aucun problème, même si la stabilité peut en souffrir. Un coup d'œil aux listes QVL des fabricants de cartes mères permet de savoir quels modules de mémoire vive sont pris en charge.
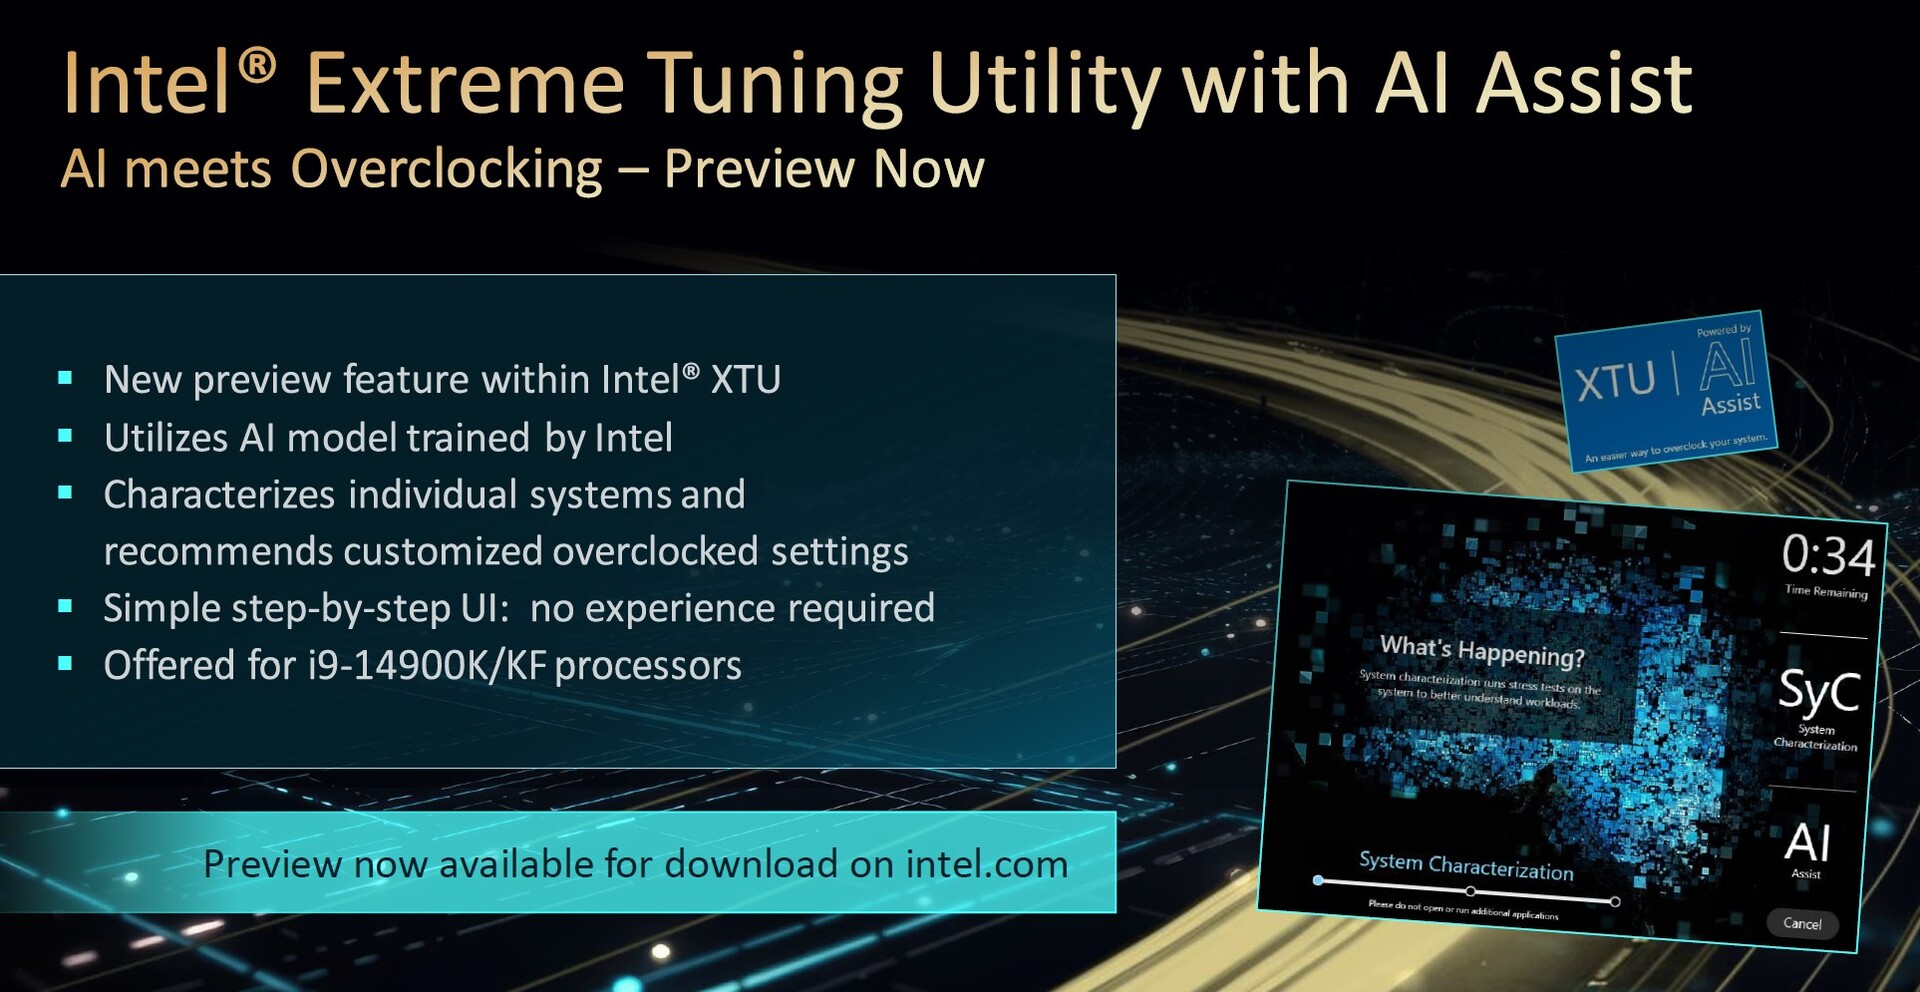
En outre, Intel mise de plus en plus sur l'utilisation de l'IA, qui doit notamment faciliter l'overclocking. La version actuelle de l'Intel Extreme Utility (XTU) prend cela en charge. D'un simple clic, l'ensemble du système est analysé afin de trouver les meilleurs réglages en termes de tension, de multiplicateur et d'objectif de puissance.
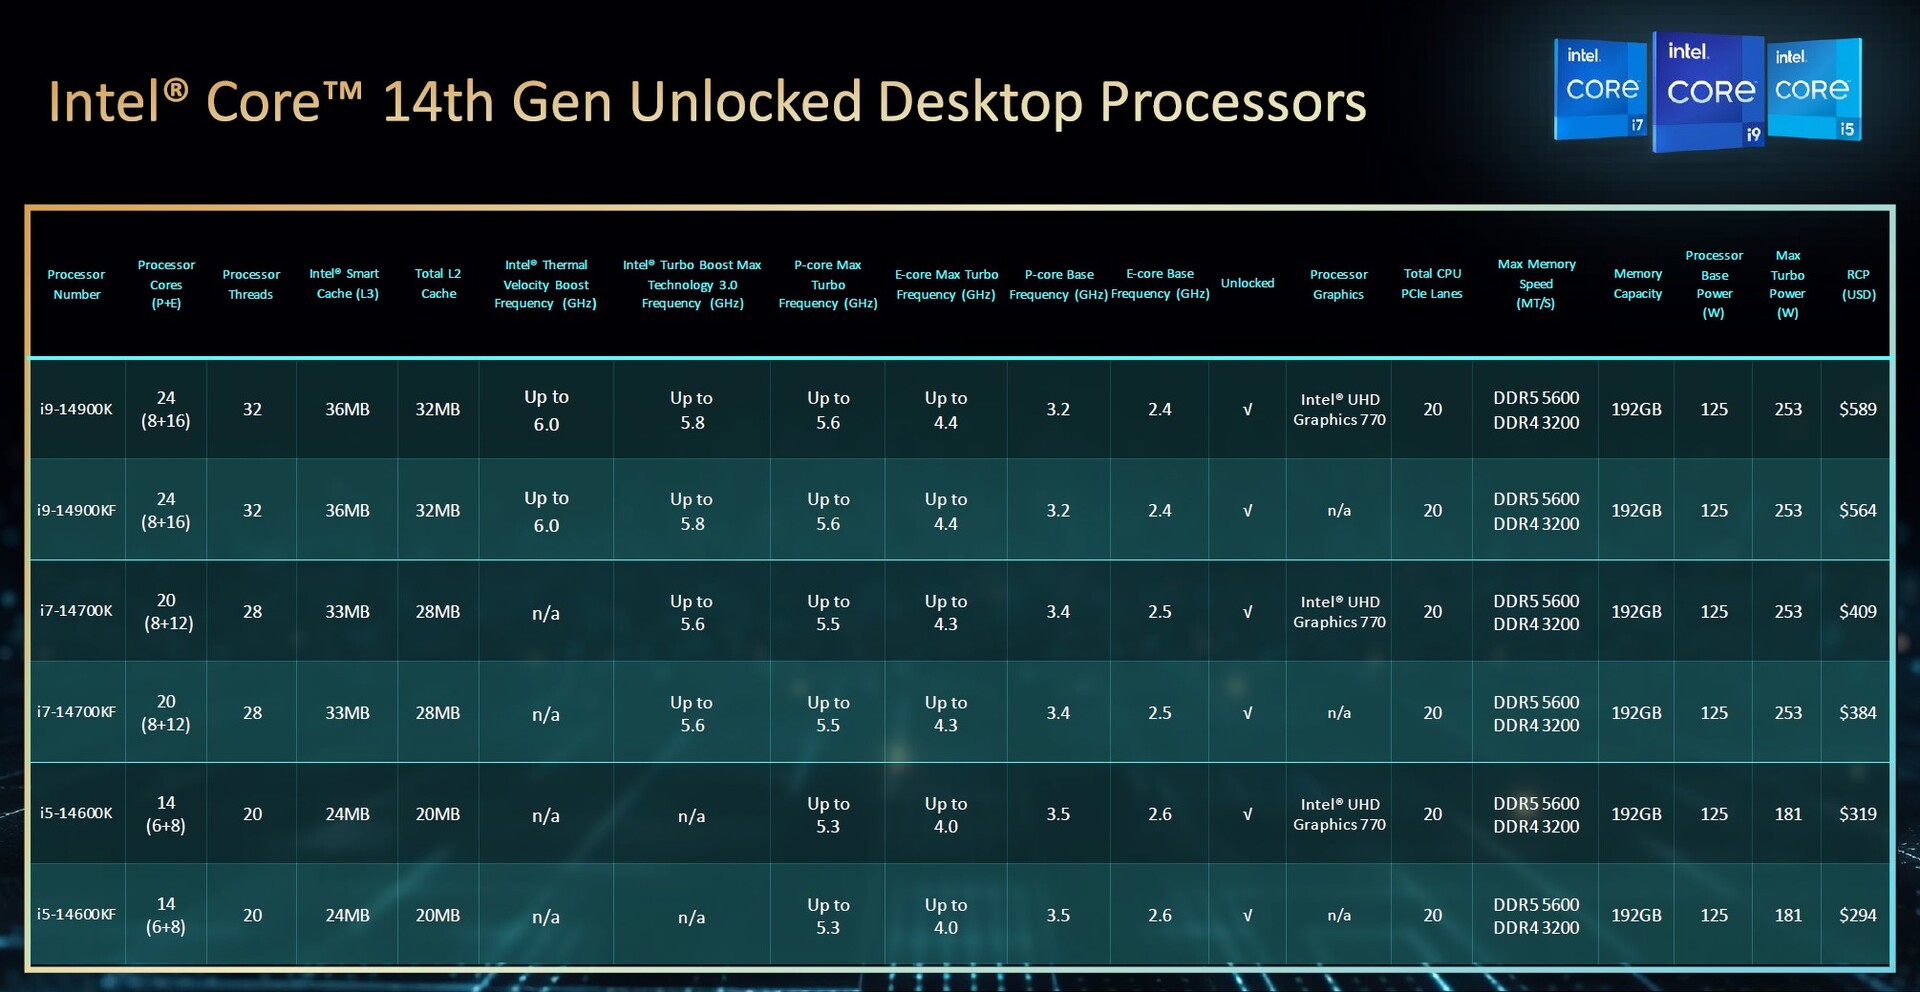
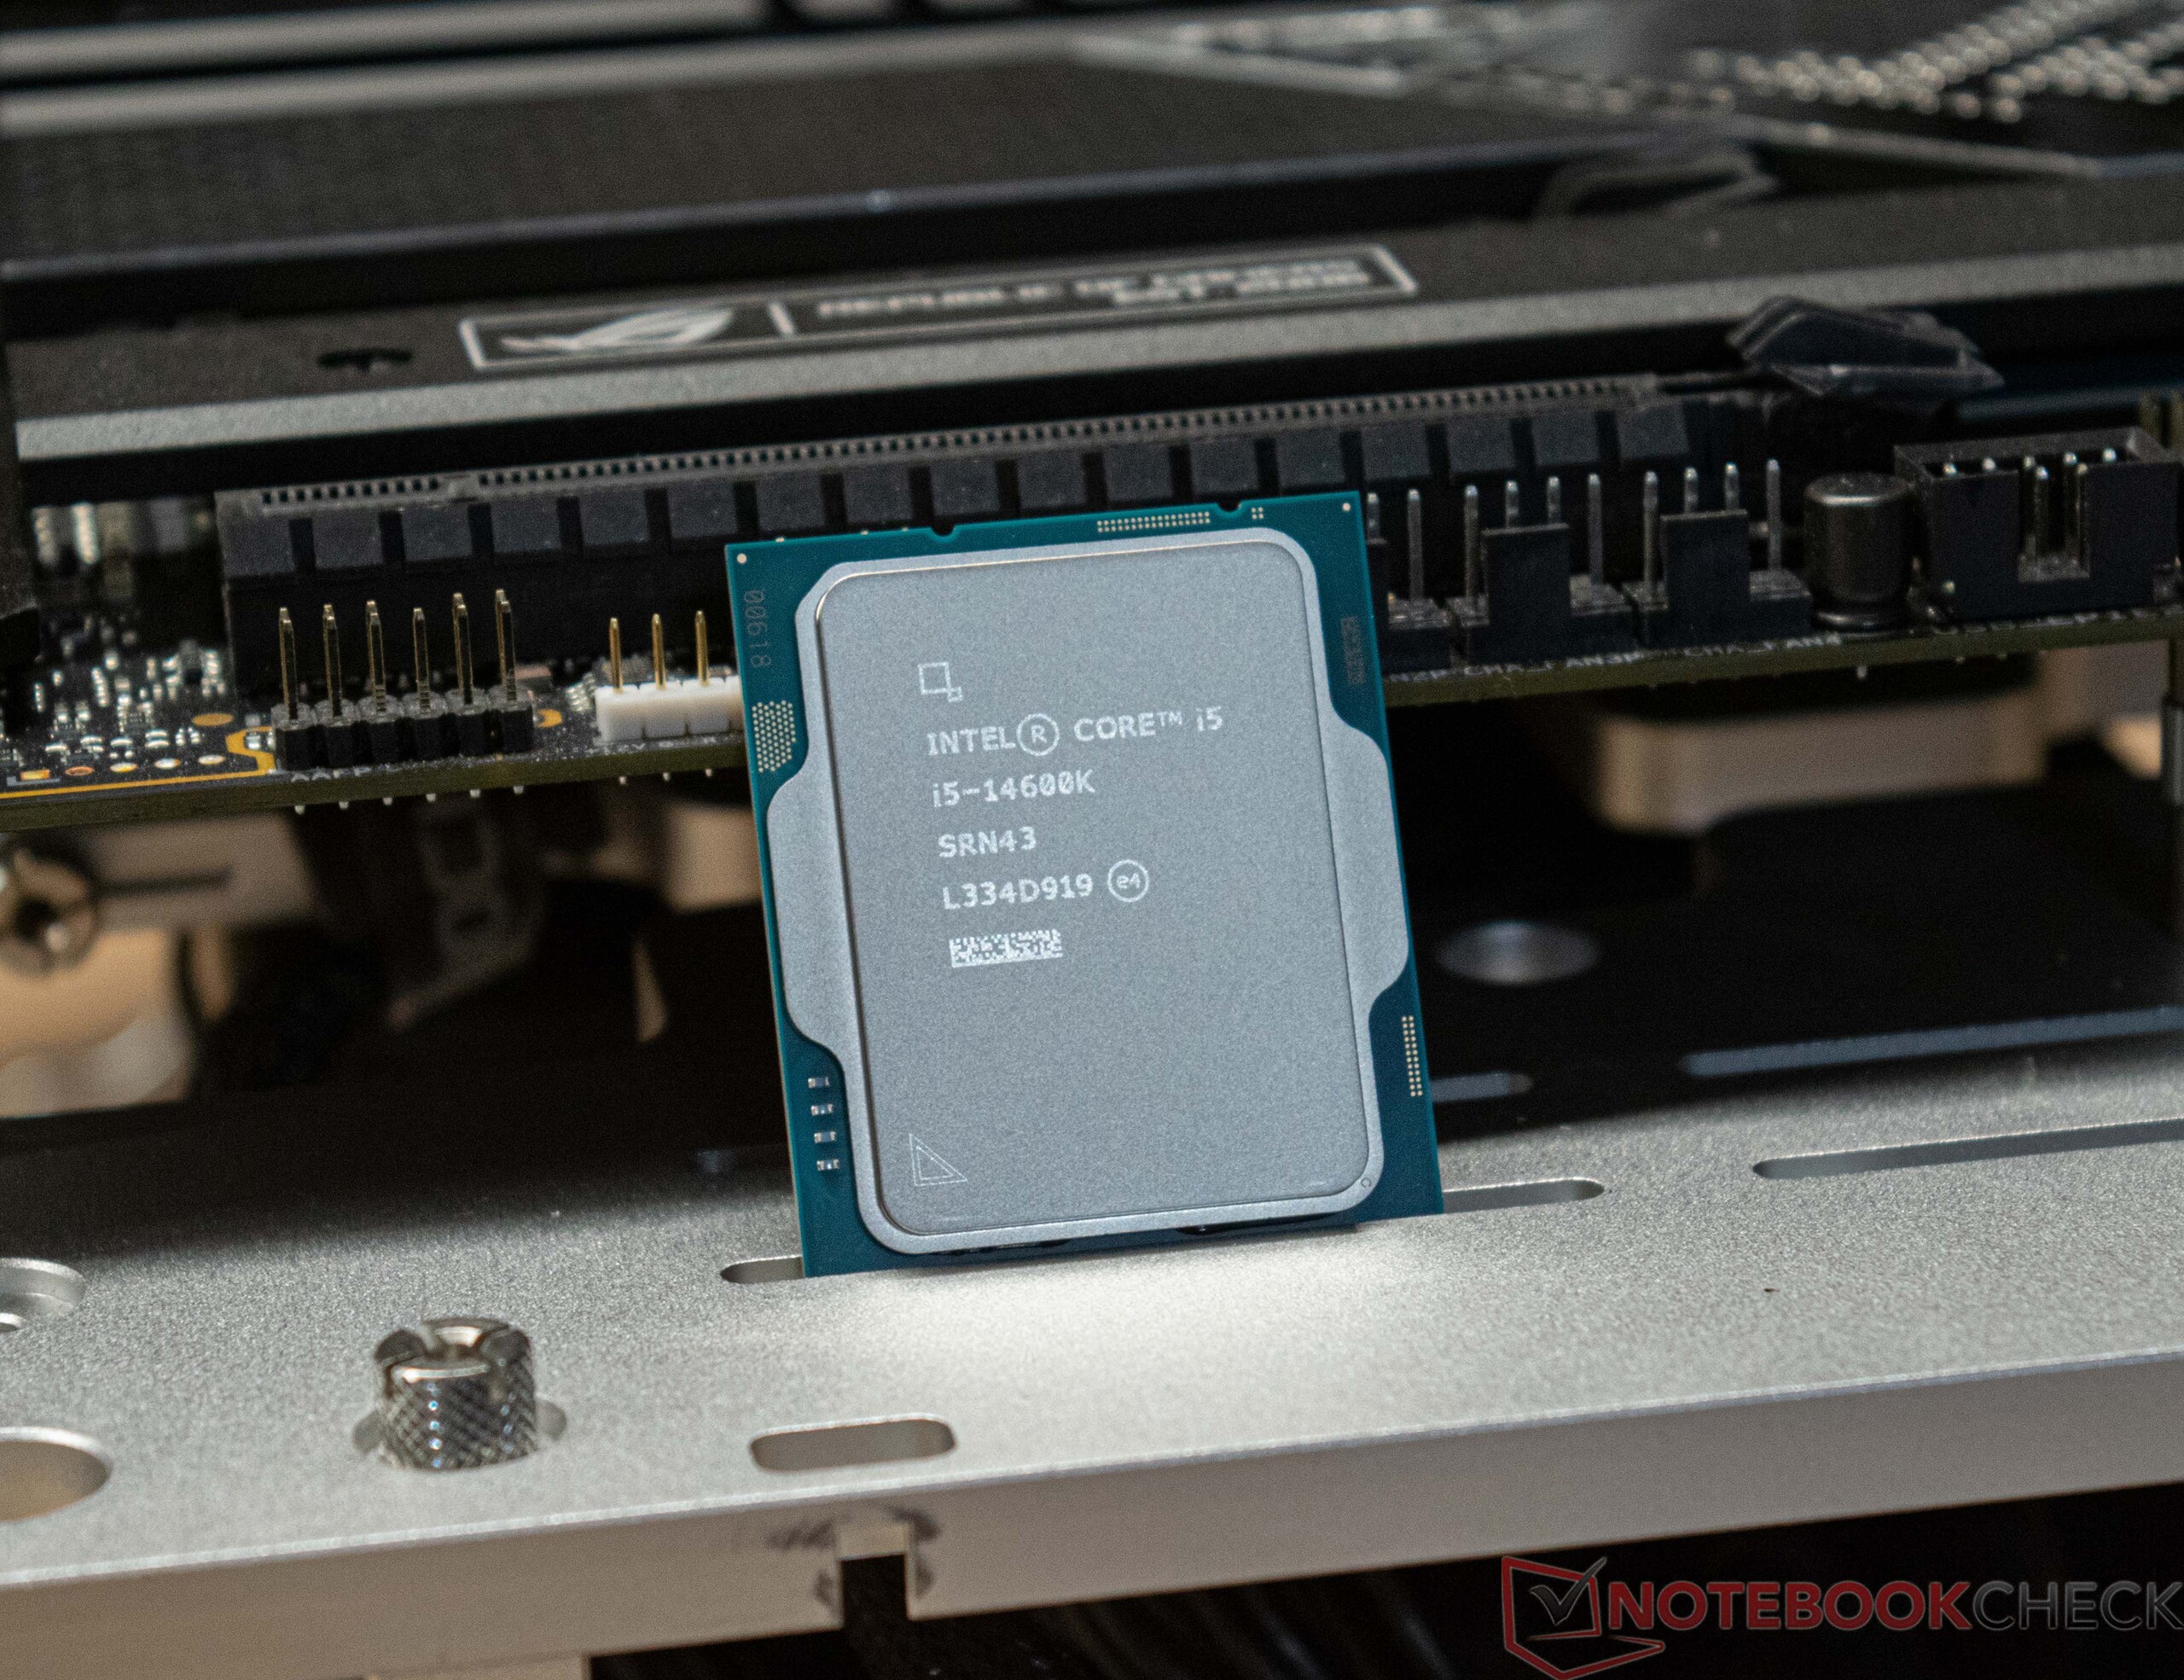
Pour ce test, Intel a mis à notre disposition l'Intel Core i9-14900K et l'Intel Core i5-14600K. Toutefois, un coup d'œil au tableau des nouveaux processeurs montre rapidement que l'Intel Core i7-14700K est clairement le produit le plus intéressant de la série. Le Core i7 est le seul modèle à recevoir plus de cœurs, de sorte que l'augmentation de ses performances par rapport à l'Intel Core i7-13700K devrait être nettement plus importante en comparaison directe. Nous essaierons d'obtenir un échantillon de ce processeur pour le soumettre à nos tests.
Détails sur notre système de test
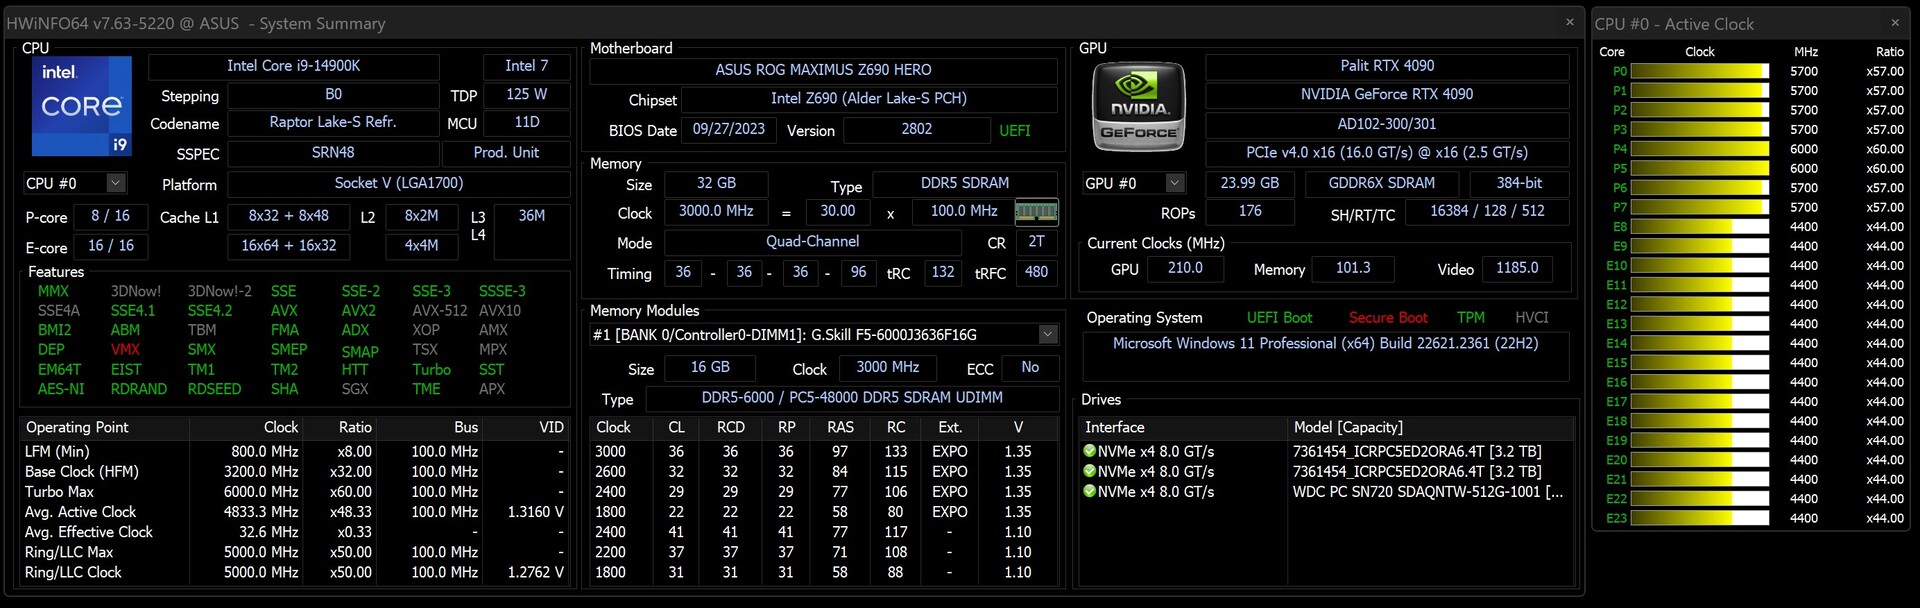
Nous utilisons le système suivant pour nos tests et analyses comparatives :
- Table de banc ouverte Streacom BC1 V2
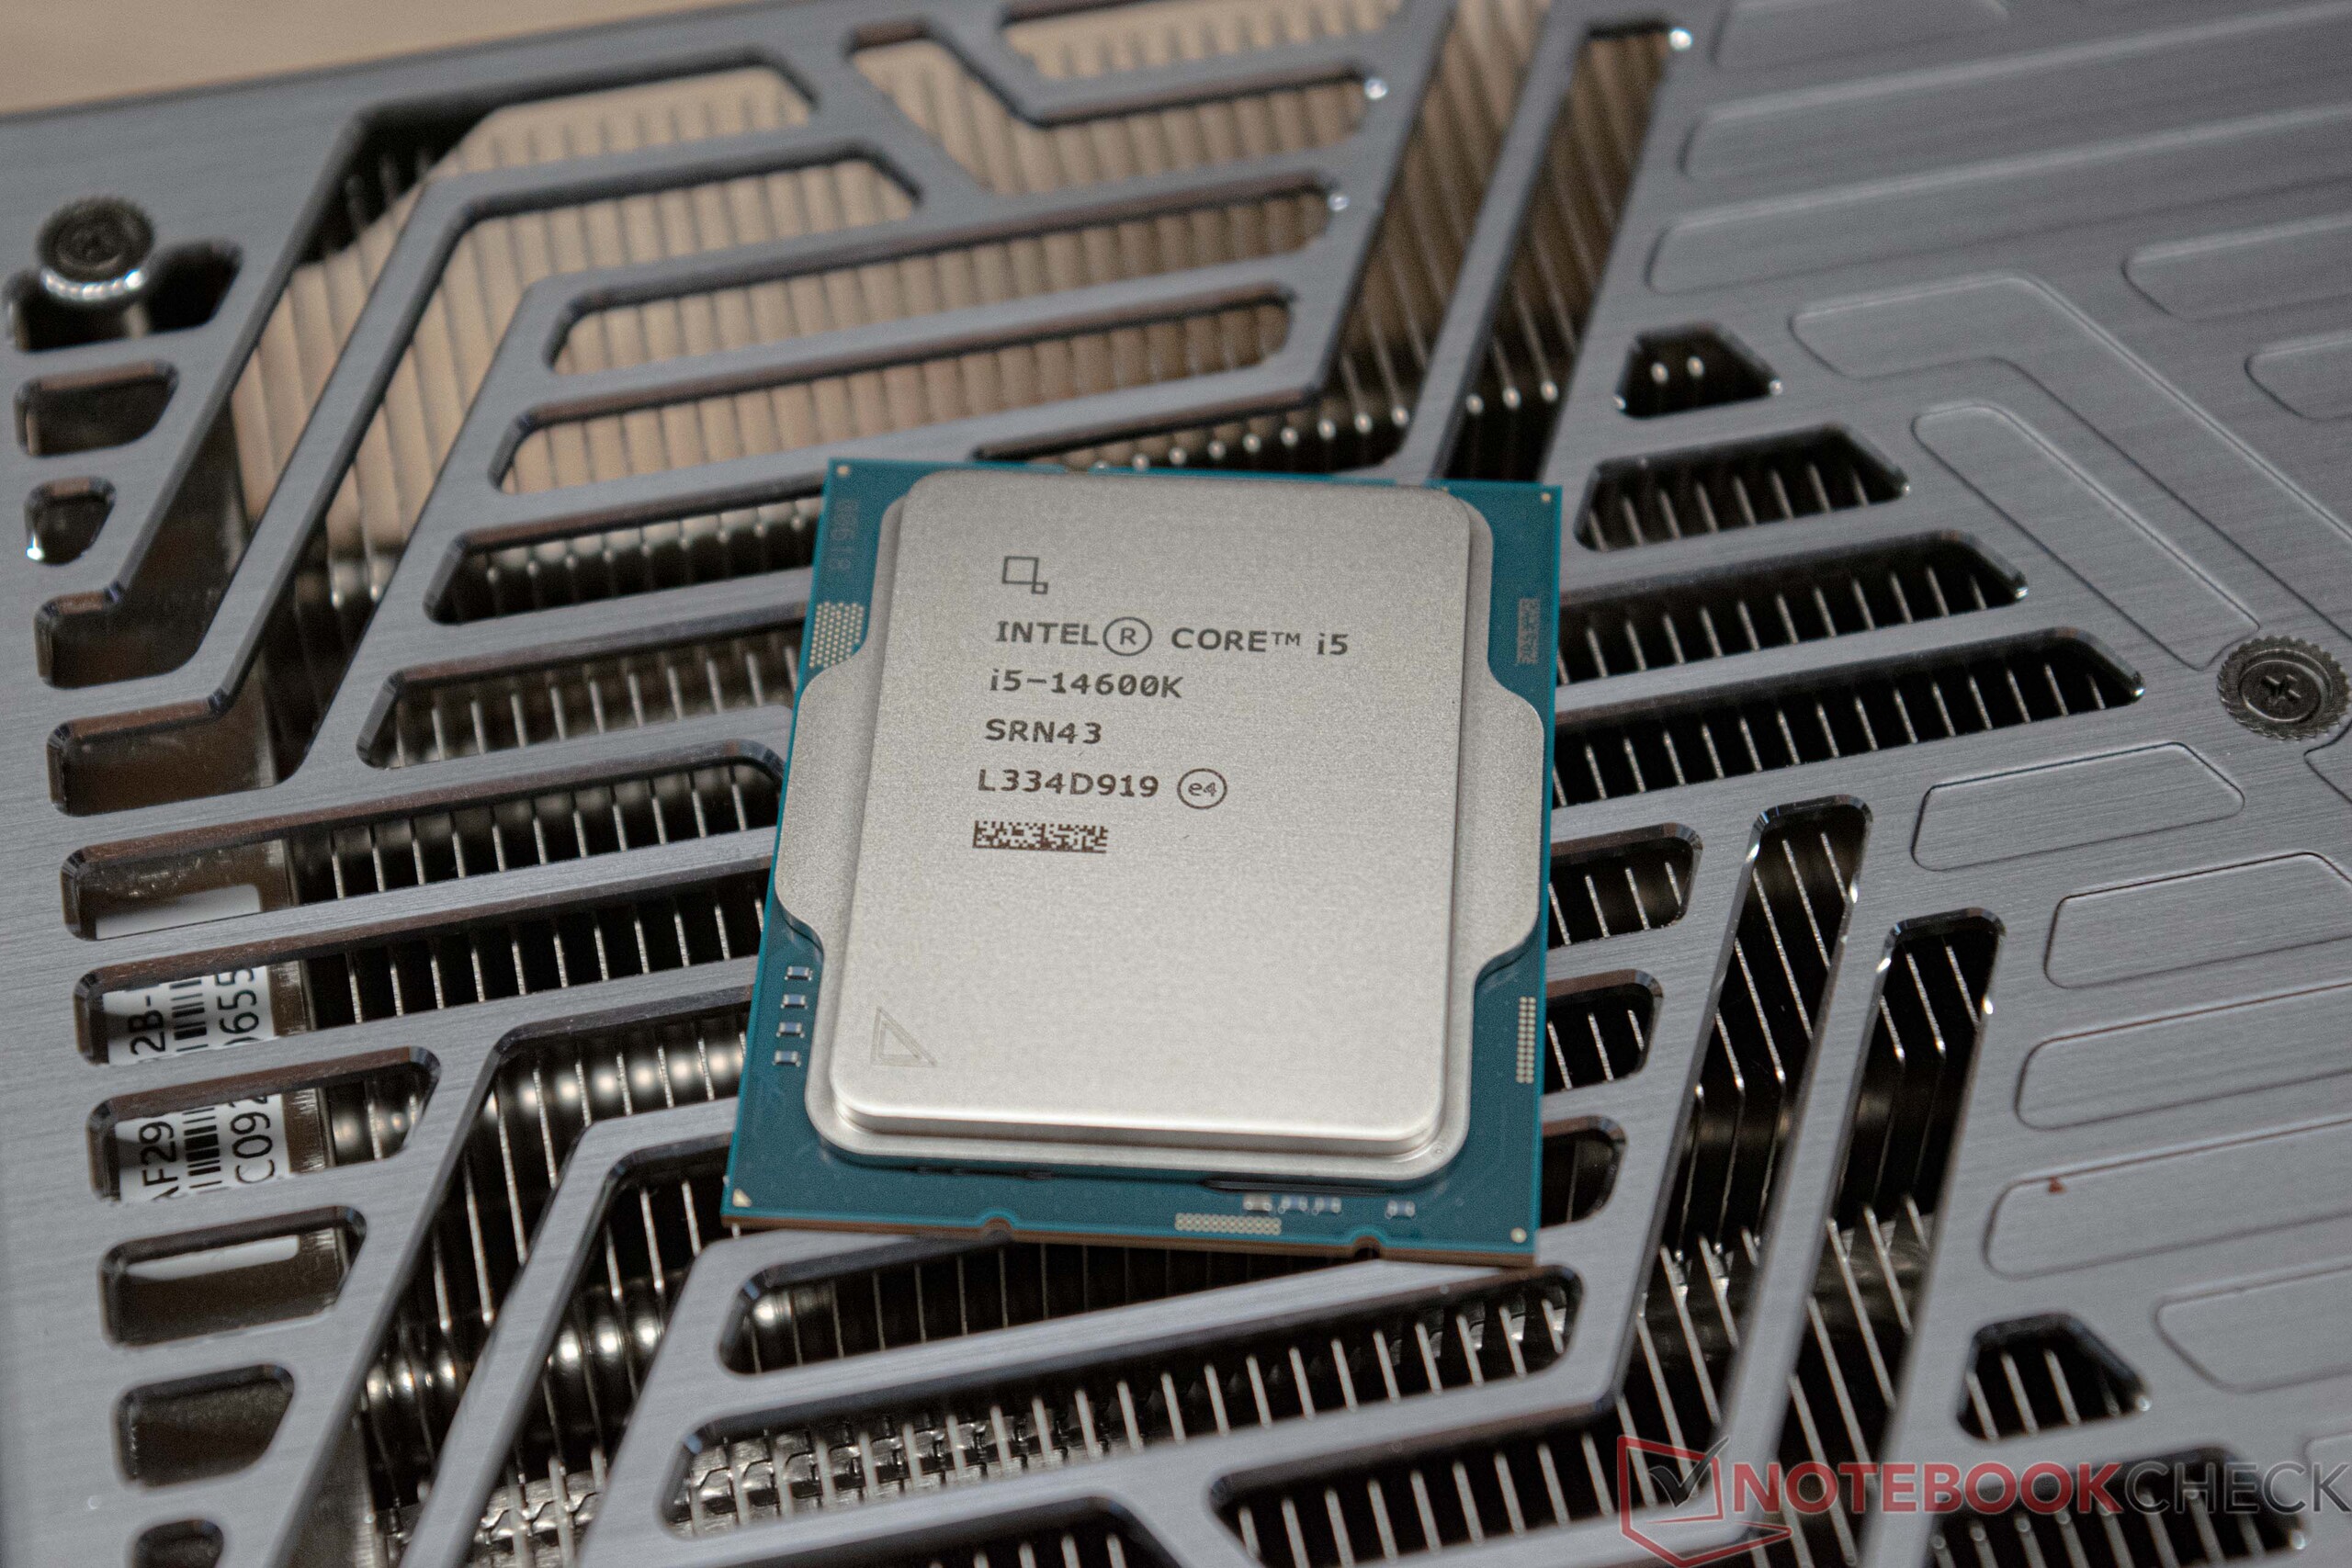
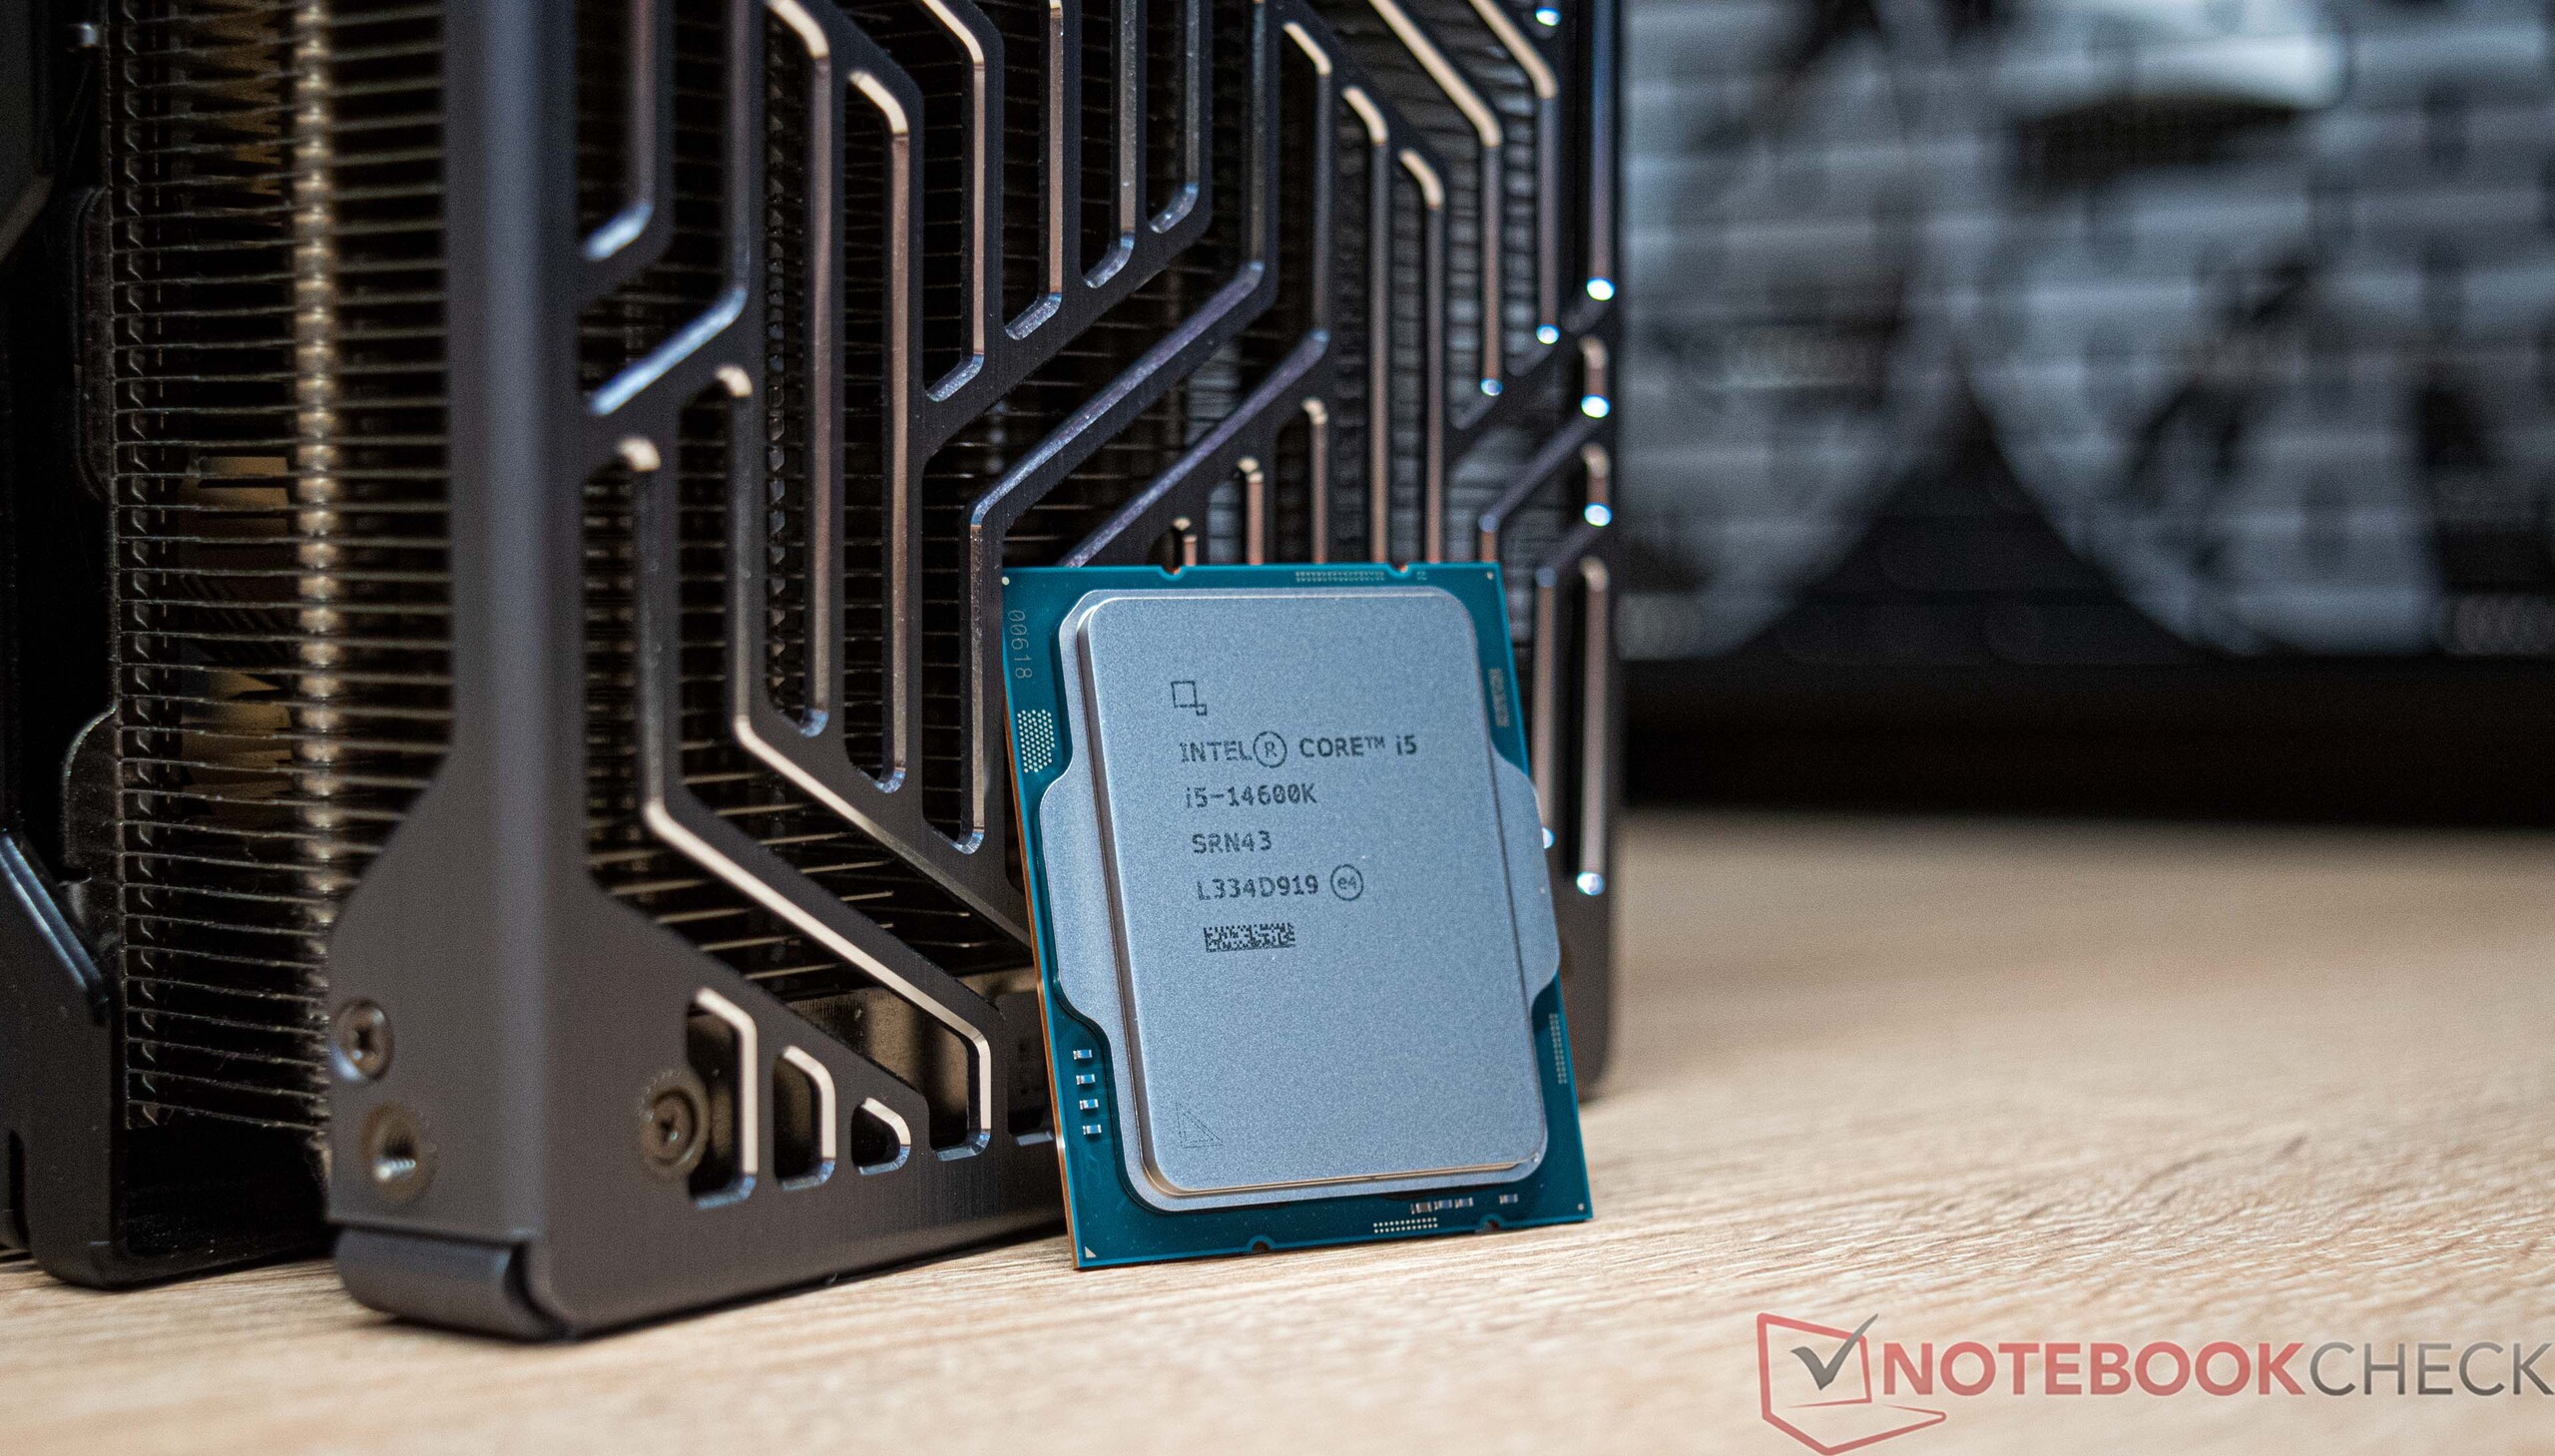
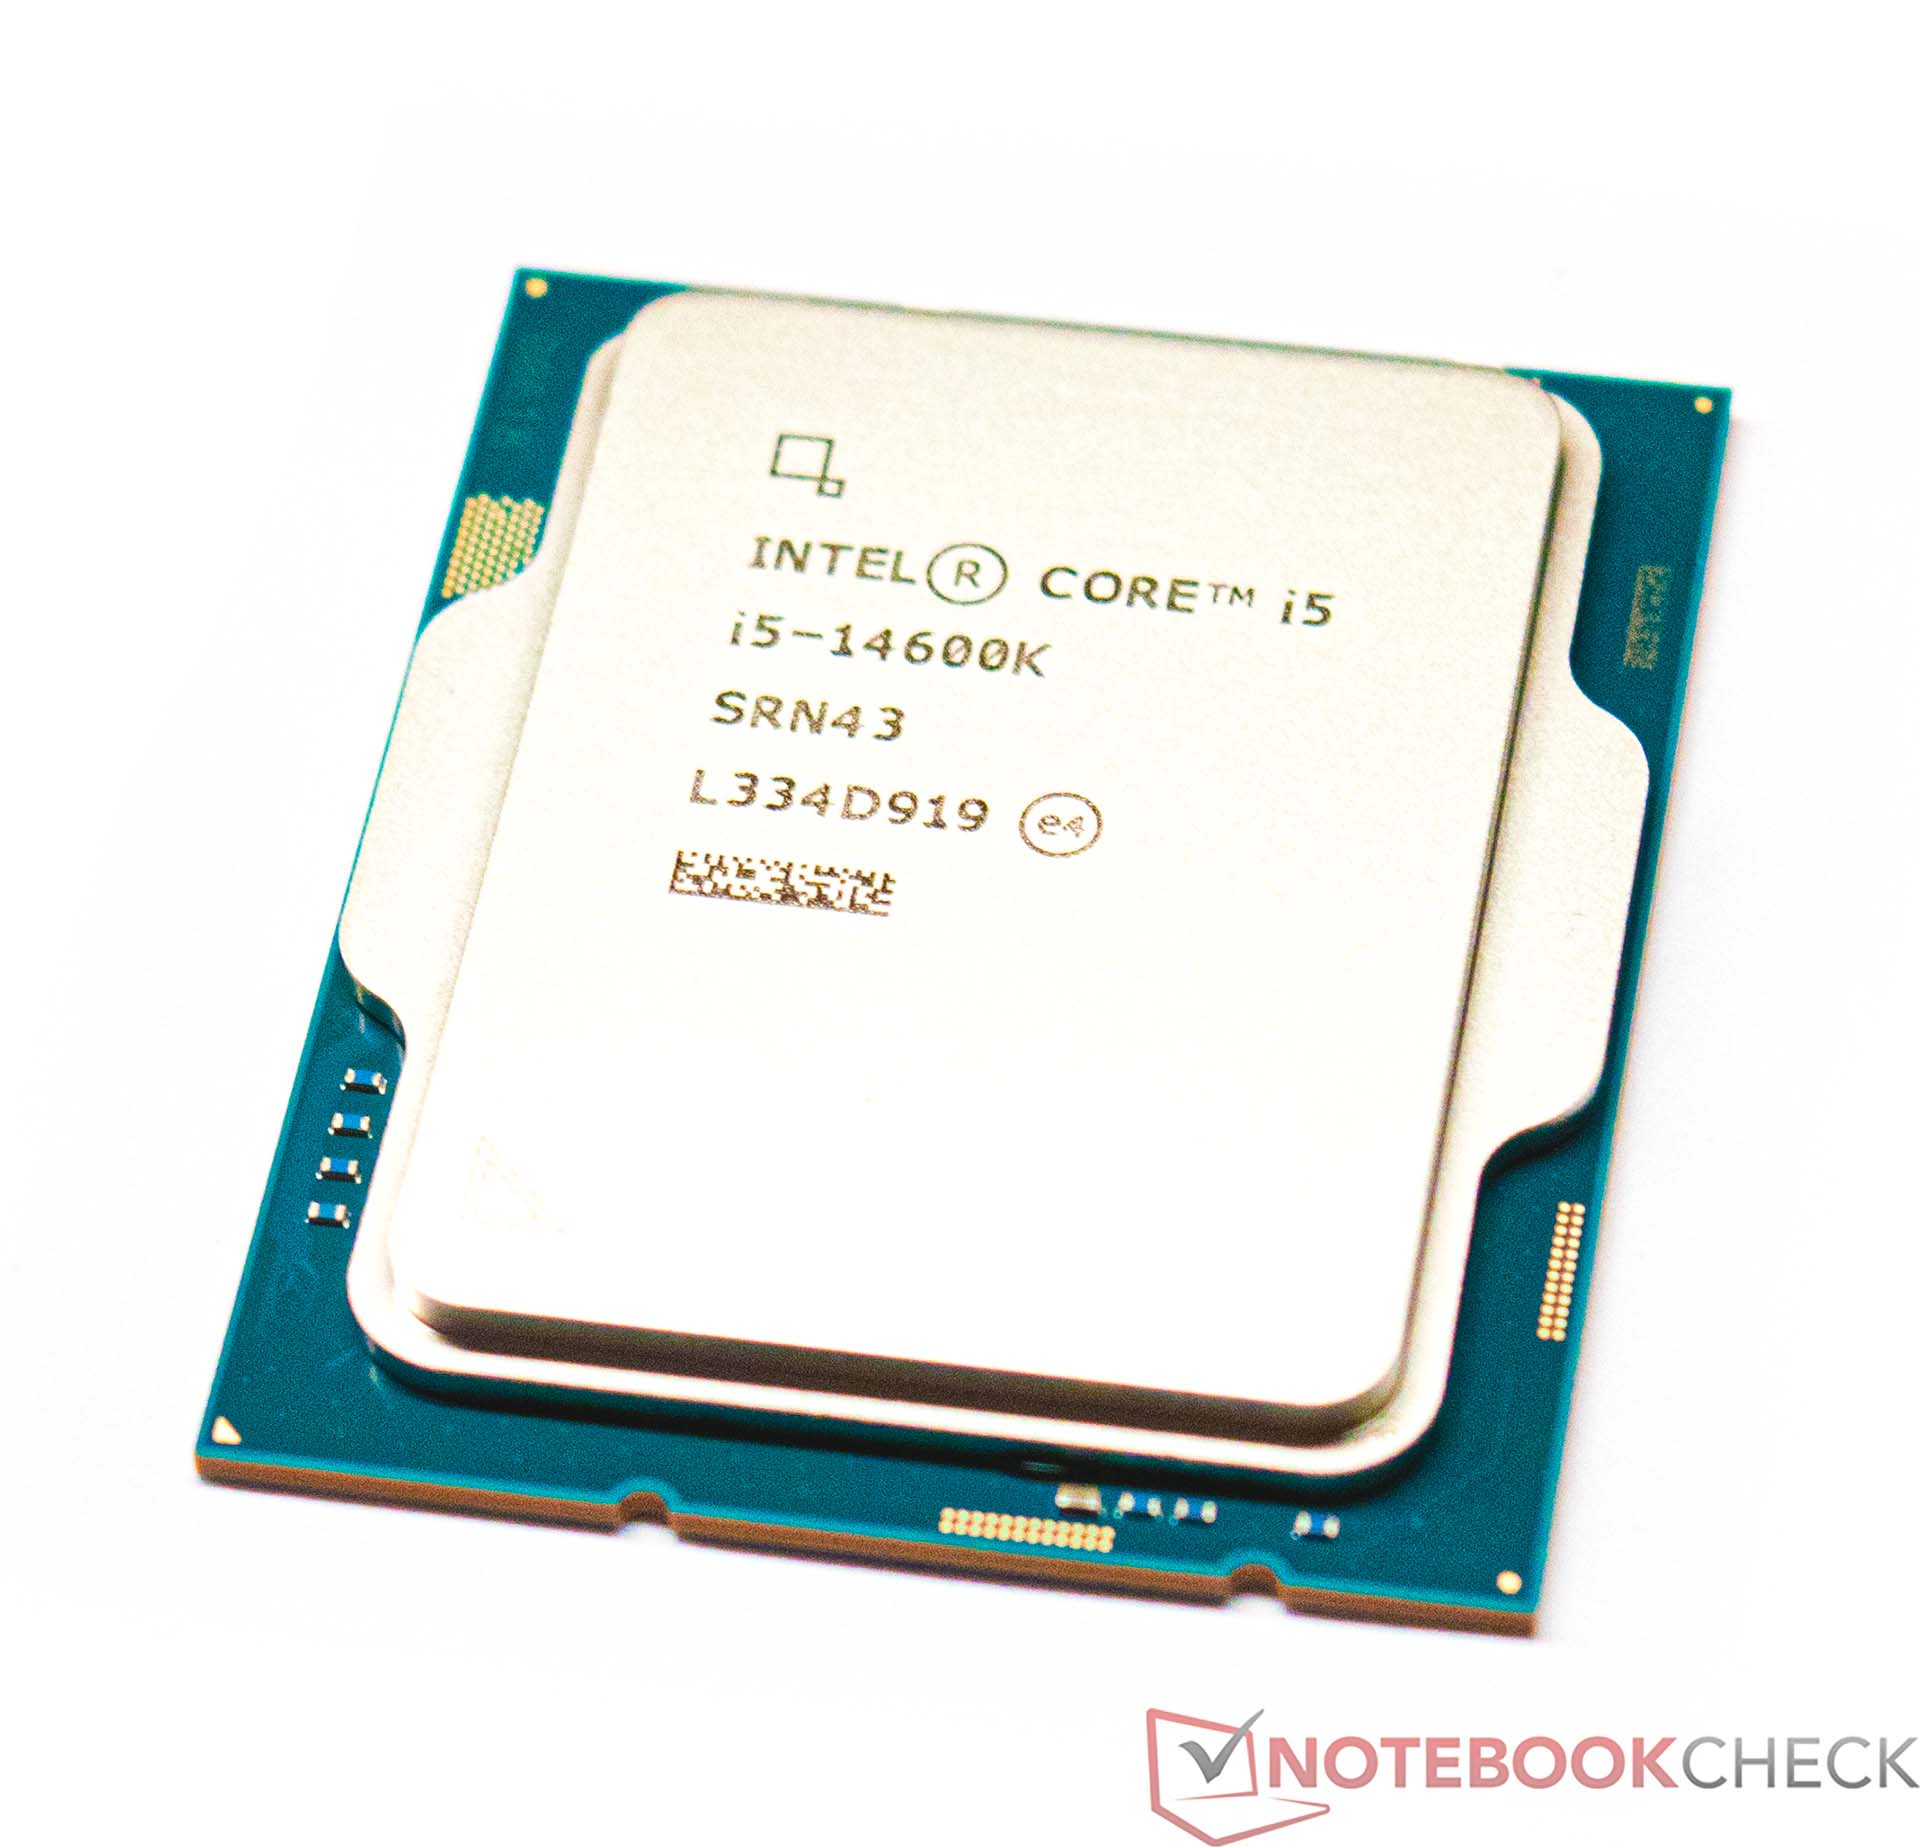
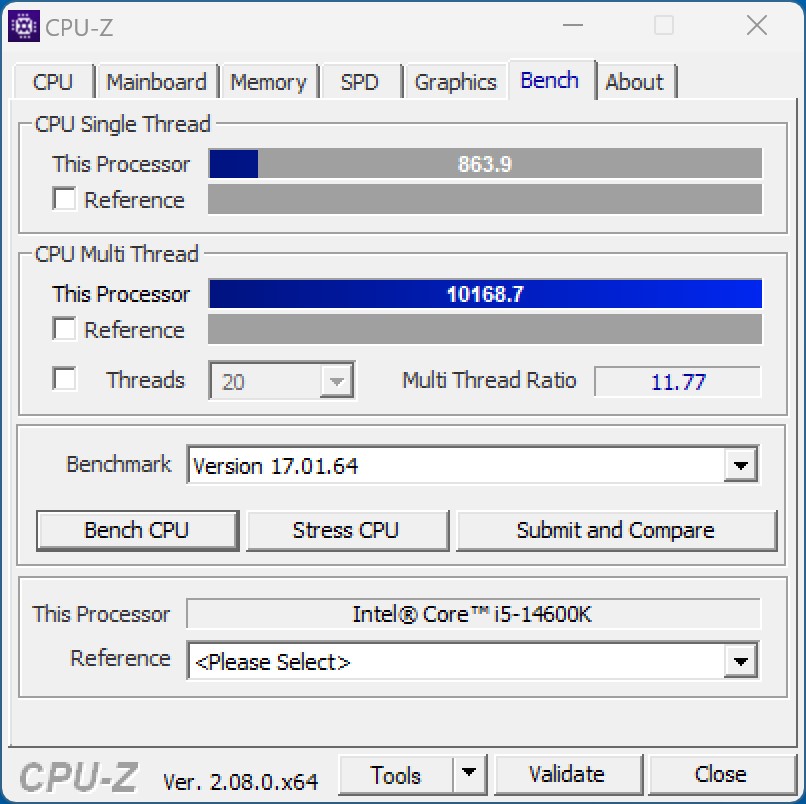
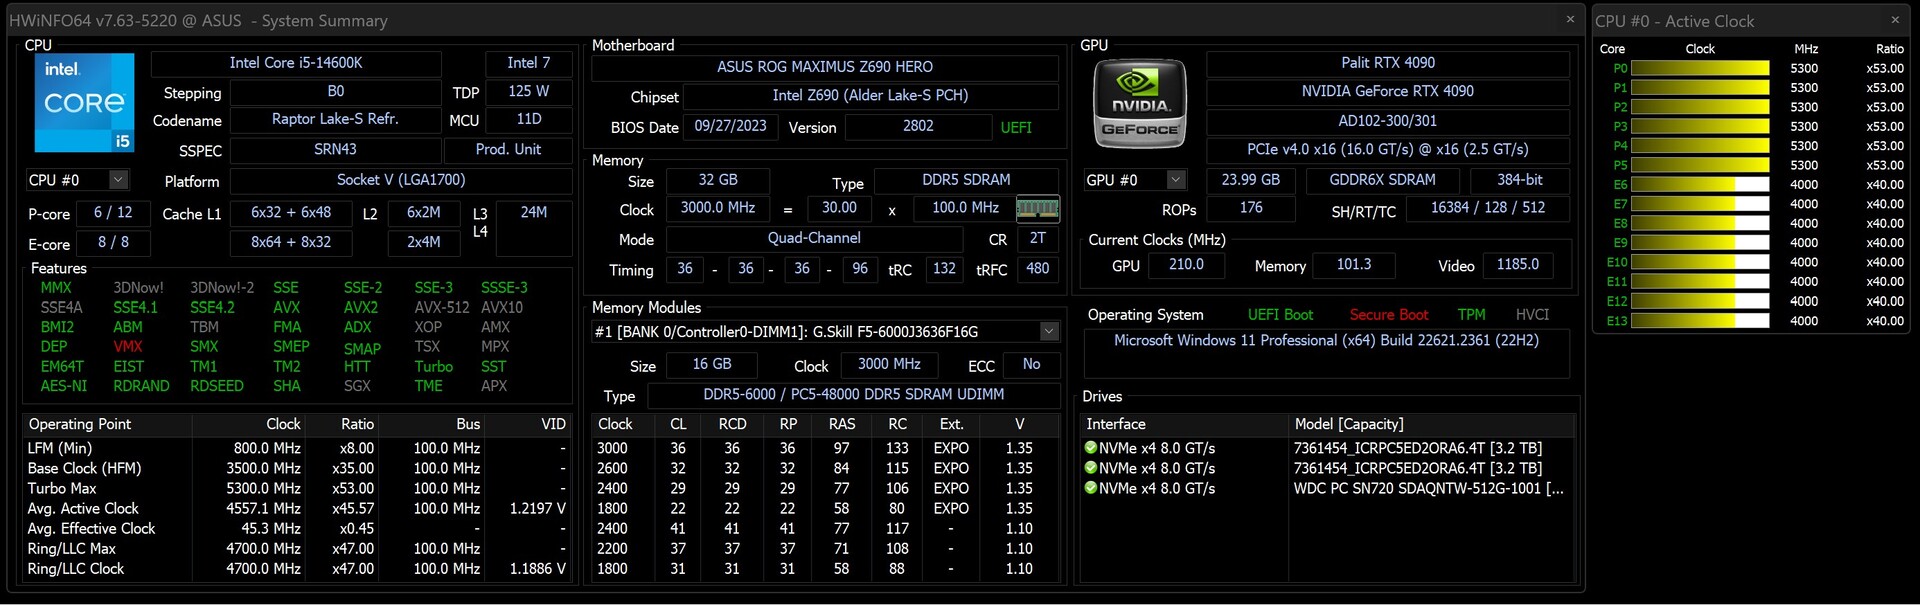
- Intel Core i9-14900K, Intel Core i5-14600K
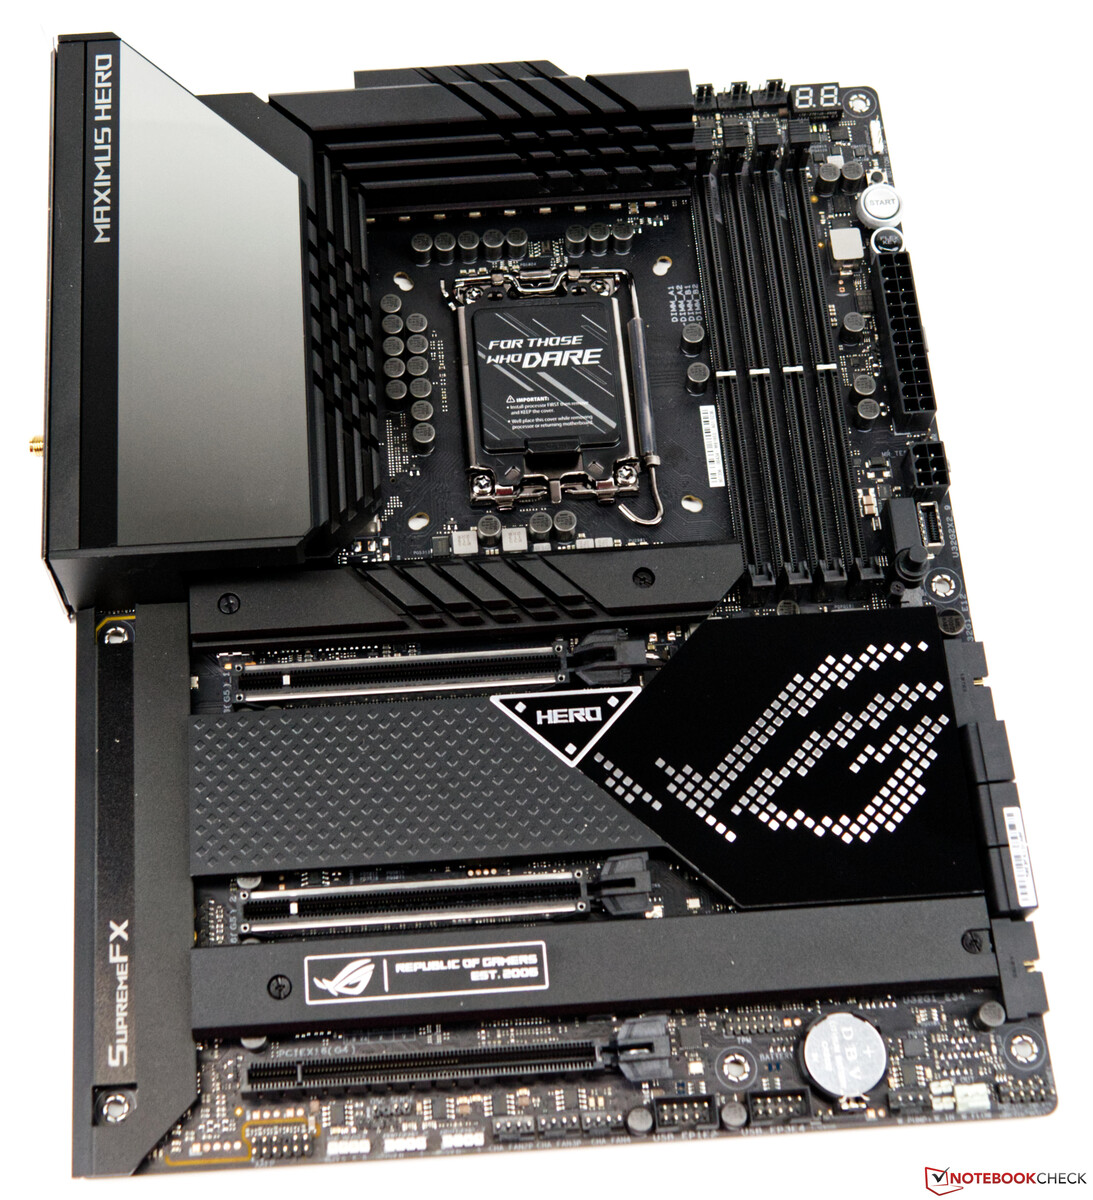
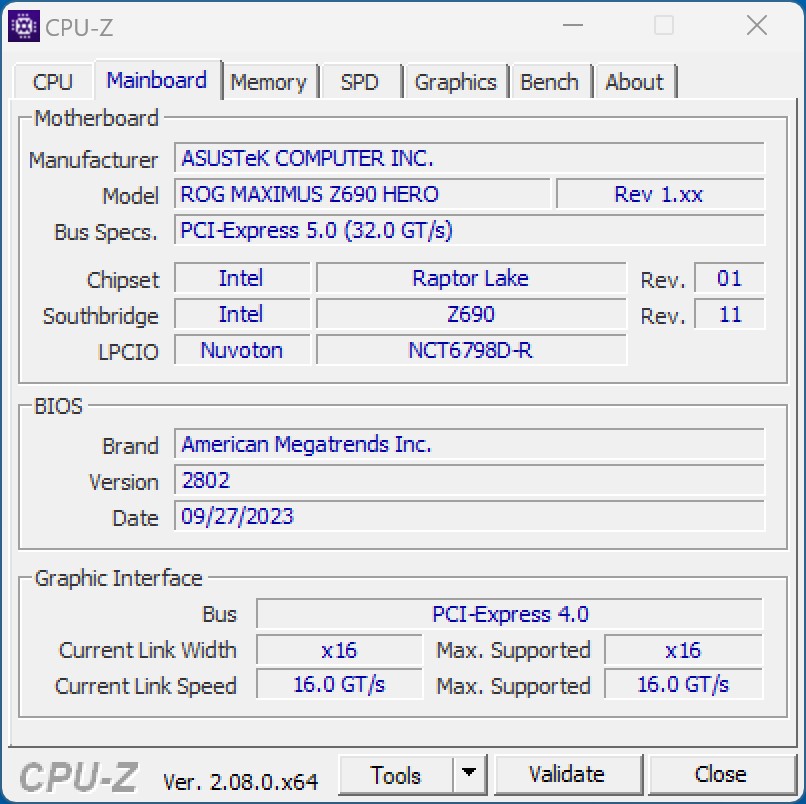
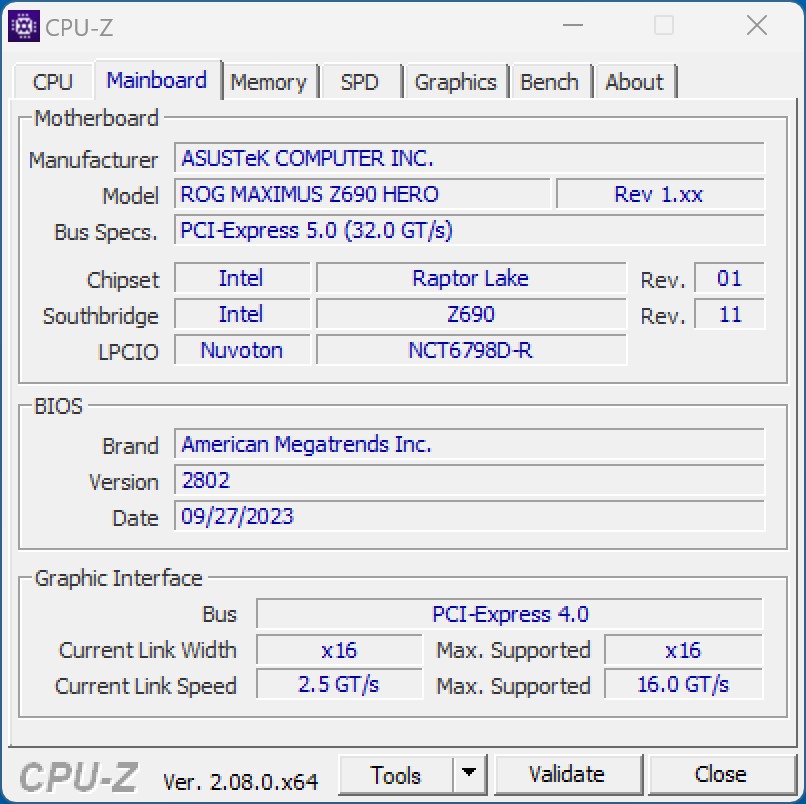
- Asus ROG Maximus Z690 Hero (BIOS v2802)
- Refroidissement à l'eau personnalisé (pompe : Watercool WCP D5, radiateur : EK MO-RA3 420 Pro)
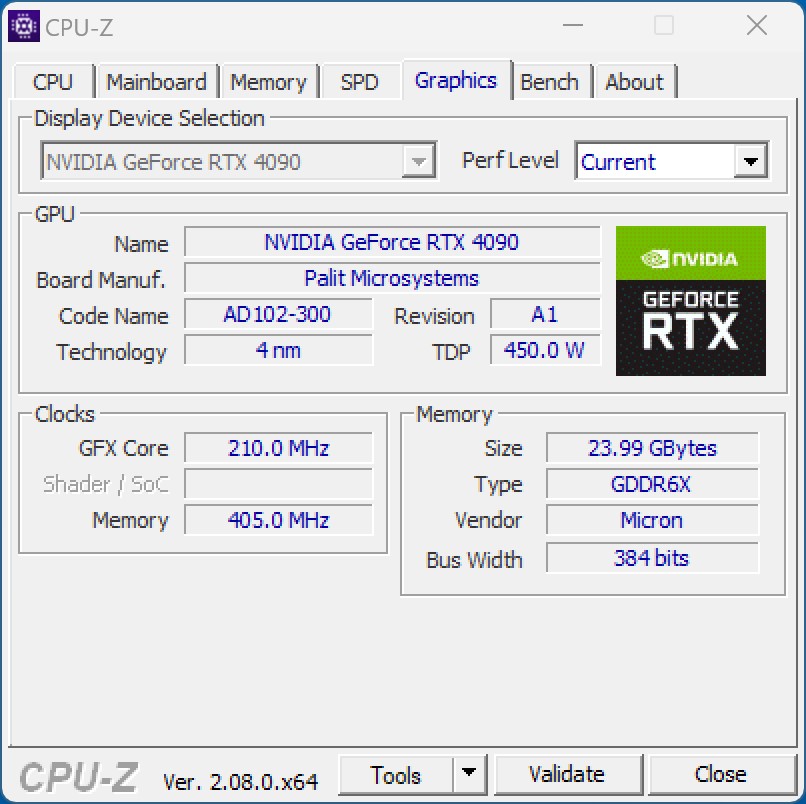
- Nvidia GeForce RTX 4090 Founder's Edition (Pilote : 537.42)
- EVGA SuperNOVA P+ 1,600 W
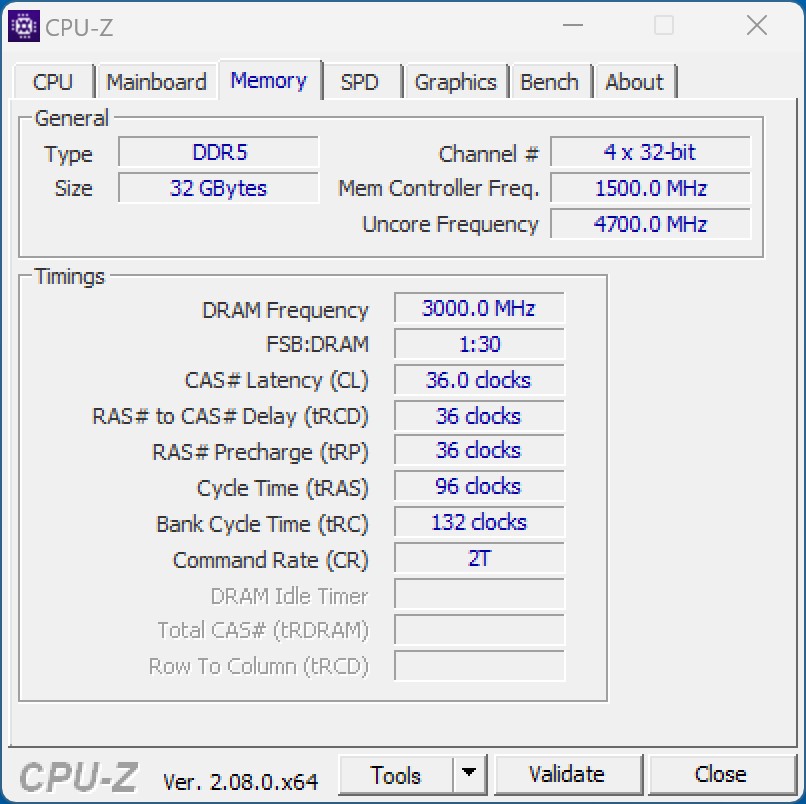
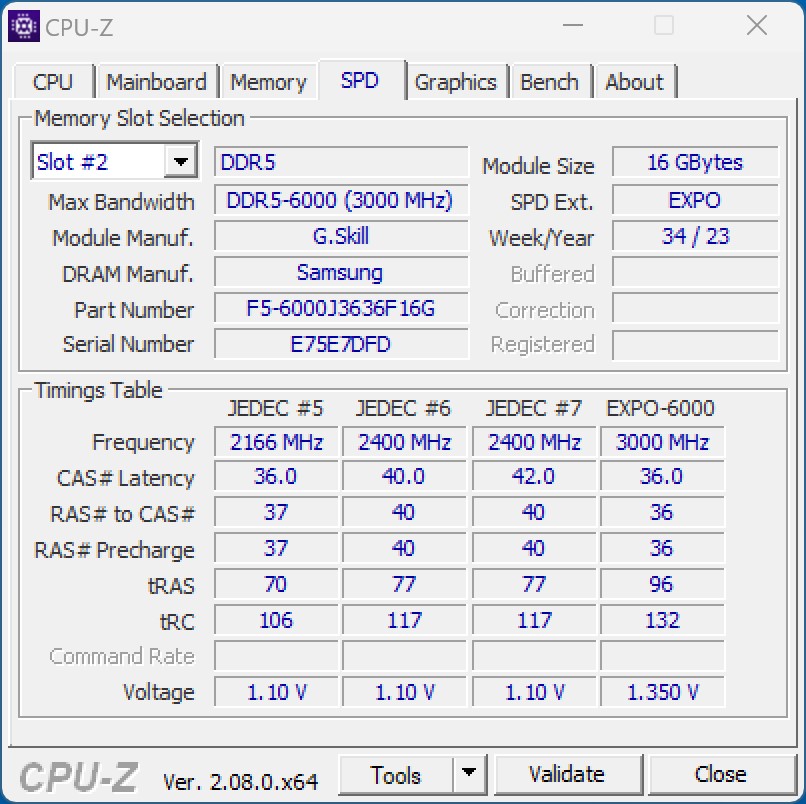
- G.Skill Ripjaws S5 (2x 16 Go - DDR5 6000 XMP)
- Western Digital SN720 - 512 GB (système)
- Intel SSD DC P4618 - 6,4 TB (benchmarks)
- Microsoft Windows 11 Professional 64 bit (version 22H2)
Comparaison des processeurs Intel
| Modèle | Cœurs / Threads |
P Vitesse d'horloge du cœur / Turbo | E Vitesse d'horloge du cœur / Turbo | Cache L2 + L3 | Graphique | PBP | MTB | Prix (MSRP) |
| Core i9-14900K | 24 (8P + 16E) /32 | 3.4 GHz / 6.0 GHz | 2.4 GHz / 4.4 GHz | 32 + 36 MB | UHD770 | 125 Watt | 253 Watt | 589 US Dollar |
| Core i9-13900K | 24 (8P + 16E) /32 | 3.0 GHz / 5.8 GHz | 2.2 GHz / 4.3 GHz | 32 + 36 MB | UHD 770 | 125 Watt | 253 Watt | 589 US Dollar |
| Core i9-12900K | 16 (8P + 8E) /24 | 3,2 GHz / 5,1 GHz | 2,4 GHz / 3,9 GHz | 14 + 30 Mo | UHD 770 | 125 Watt | 241 Watt | 589 US Dollar |
| Core i7-14700K | 20 (8P + 12E) /28 | 3,4 GHz / 5,6 GHz | 2,5 GHz / 4,3 GHz | 24 + 30 MB | UHD 770 | 125 Watt | 253 Watt | 409 US Dollar |
| Core i7-13700K | 16 (8P + 8E) /24 | 3,4 GHz / 5,4 GHz | 2,5 GHz / 4,2 GHz | 24 + 30 Mo | UHD 770 | 125 Watt | 253 Watt | 409 US Dollar |
| Core i7-12700K | 12 (8P + 4E) /20 | 3,6 GHz / 4,9 GHz | 2,7 GHz / 3,8 GHz | 12 + 25 Mo | UHD 770 | 125 Watt | 190 Watt | 409 US Dollar |
| Core i5-14600K | 14 (6P + 8E) /20 | 3,5 GHz / 5,3 GHz | 2,6 GHz / 4,0 GHz | 20 + 24 Mo | UHD770 | 125 Watt | 181 Watt | 319 US Dollar |
| Core i5-13600K | 14 (6P + 8E) /20 | 3,5 GHz / 5,1 GHz | 2,6 GHz / 3,9 GHz | 20 + 24 Mo | UHD 770 | 125 Watt | 181 Watt | 319 US Dollar |
| Core i5-12600K | 10 (6P + 4E) /16 | 3,7 GHz / 4,9 GHz | 2,8 GHz / 3,6 GHz | 9,5 + 20 Mo | UHD 770 | 125 Watt | 150 Watt | 289 US-Dollar |

Test Conditions - Z690 toujours utilisable après la mise à jour du BIOS
Avec l'Asus ROG Maximus Z690 Hero, nous utilisons pour ce test la même base que celle utilisée pour les processeurs Alder Lake S et Raptor Lake S. Cependant, avec le chipset Z790, il existe également des cartes mères redessinées qui sont censées tirer des performances encore plus élevées du processeur grâce à de meilleures fonctions d'overclocking. Mais ceux qui ne cherchent pas à battre des records peuvent également faire fonctionner les nouveaux processeurs de la 14e génération avec un chipset de la série 600. Pour ce faire, vous devez d'abord télécharger le BIOS correspondant auprès du fabricant de la carte mère et le mettre à jour. Nous avons d'abord reçu du fabricant une nouvelle version du BIOS pour l'Asus ROG Maximus Z690 Hero. Nous n'avons rencontré aucun problème en termes de stabilité et de compatibilité avec la RAM dans notre cas.
Tous les tests ont été effectués avec la dernière version du BIOS (2802) et le profil XMP activé. De plus, toutes les limitations de puissance ont été désactivées afin d'obtenir les performances maximales des processeurs.
Analyse comparative des processeurs
Dans nos tests de CPU, Intel a réussi à surpasser les performances de l'Intel Core i9-13900K Test des Intel Core i9-13900K et i5-13600K : cœurs et vitesse en hausse avec Raptor Lake - mais avec seulement 3 points de pourcentage de plus dans l'évaluation moyenne des performances, l'avantage de l'Intel Core i9-14900K s'avère très faible. L'Intel Core i5-14600K a également devancé de peu l'ancien Intel Core i5-13600K. Par rapport à Alder Lake, le nouveau modèle Core-i5 peut rivaliser avec un Intel Core i9-12900K.
Par rapport à AMD, les performances du Ryzen 9 7950Xa de nouveau été surpassé, bien que la différence soit également très faible et qu'on ne puisse pas parler d'un avantage notable. Le plus petit Intel Core i5-14600K a presque réussi à suivre le rythme de l'AMD Ryzen 9 7900X.AMD Ryzen 9 7900Xet ces deux concurrents n'ont été séparés que de 6 % dans notre évaluation des performances.
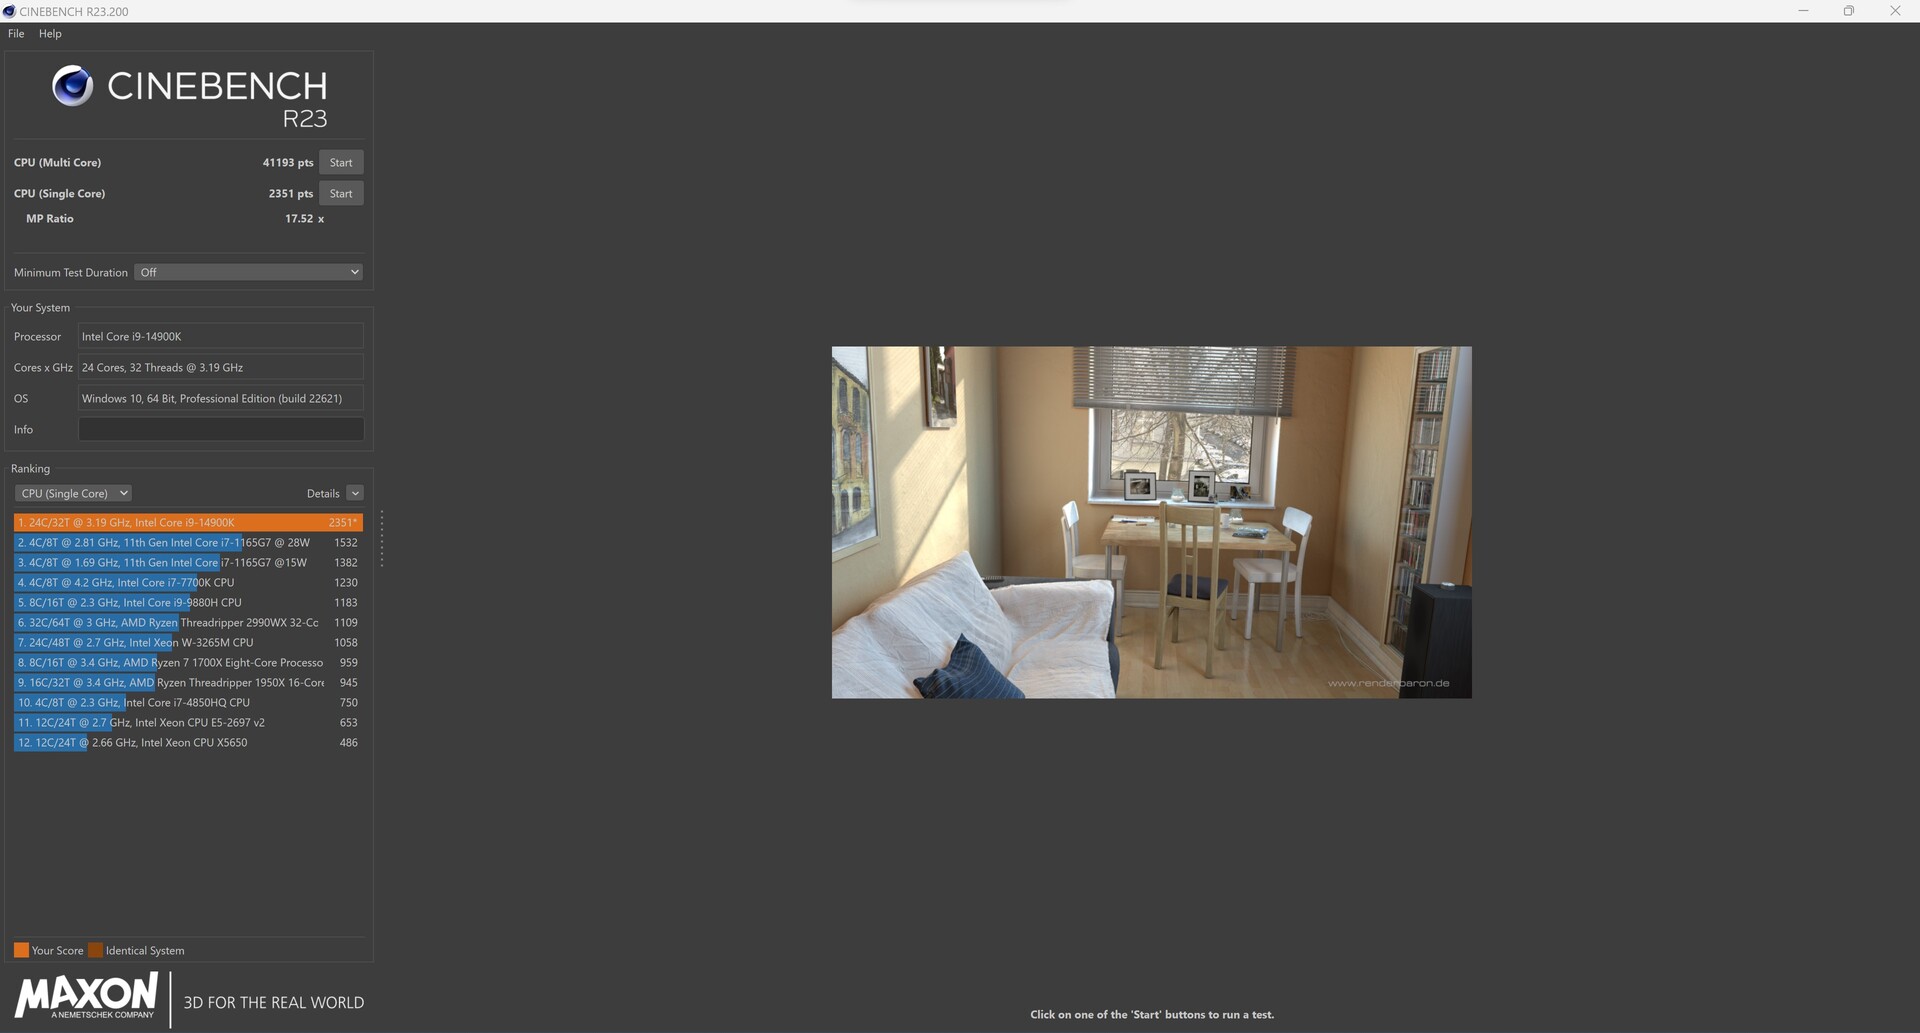
Toutefois, les différences de performances sont nettement plus importantes en fonction du test. Dans l'ensemble, nous avons constaté une nette augmentation des performances à un seul cœur de l'Intel Core i9-14900K, qui ne peut être battu avec ses 6 GHz.
Vous trouverez d'autres benchmarks sur les processeurs
ici.Intel Core i9-14900K


Intel Core i5-14600K
| Performance rating - Percent | |
| Intel Core i9-14900K | |
| Intel Core i9-13900K | |
| AMD Ryzen 9 7950X | |
| AMD Ryzen 9 7950X3D | |
| AMD Ryzen 9 7900X | |
| Intel Core i5-14600K | |
| Intel Core i9-12900K | |
| AMD Ryzen 9 5950X | |
| Intel Core i5-13600K | |
| AMD Ryzen 7 7800X3D | |
| AMD Ryzen 5 7600X | |
| Intel Core i5-12600K | |
| Intel Core i5-13400 | |
| Intel Core i5-12400F | |
| Cinebench R15 | |
| CPU Single 64Bit | |
| Intel Core i9-14900K | |
| AMD Ryzen 9 7950X | |
| Intel Core i9-13900K | |
| AMD Ryzen 9 7950X3D | |
| AMD Ryzen 9 7900X | |
| AMD Ryzen 5 7600X | |
| Intel Core i5-14600K | |
| AMD Ryzen 7 7800X3D | |
| Intel Core i5-13600K | |
| Intel Core i9-12900K | |
| Intel Core i5-12600K | |
| AMD Ryzen 9 5950X | |
| Intel Core i5-13400 | |
| Intel Core i5-12400F | |
| CPU Multi 64Bit | |
| Intel Core i9-14900K | |
| AMD Ryzen 9 7950X | |
| Intel Core i9-13900K | |
| AMD Ryzen 9 7950X3D | |
| AMD Ryzen 9 7900X | |
| AMD Ryzen 9 5950X | |
| Intel Core i9-12900K | |
| Intel Core i5-13600K | |
| Intel Core i5-14600K | |
| AMD Ryzen 7 7800X3D | |
| Intel Core i5-12600K | |
| AMD Ryzen 5 7600X | |
| Intel Core i5-13400 | |
| Intel Core i5-12400F | |
| Cinebench R20 | |
| CPU (Single Core) | |
| Intel Core i9-14900K | |
| Intel Core i9-13900K | |
| AMD Ryzen 9 7950X | |
| AMD Ryzen 9 7950X3D | |
| Intel Core i5-14600K | |
| AMD Ryzen 9 7900X | |
| Intel Core i5-13600K | |
| Intel Core i9-12900K | |
| AMD Ryzen 5 7600X | |
| Intel Core i5-12600K | |
| AMD Ryzen 7 7800X3D | |
| Intel Core i5-13400 | |
| Intel Core i5-12400F | |
| AMD Ryzen 9 5950X | |
| CPU (Multi Core) | |
| Intel Core i9-14900K | |
| Intel Core i9-13900K | |
| AMD Ryzen 9 7950X | |
| AMD Ryzen 9 7950X3D | |
| AMD Ryzen 9 7900X | |
| AMD Ryzen 9 5950X | |
| Intel Core i9-12900K | |
| Intel Core i5-14600K | |
| Intel Core i5-13600K | |
| AMD Ryzen 7 7800X3D | |
| Intel Core i5-12600K | |
| Intel Core i5-13400 | |
| AMD Ryzen 5 7600X | |
| Intel Core i5-12400F | |
| Cinebench R23 | |
| Single Core | |
| Intel Core i9-14900K | |
| Intel Core i9-13900K | |
| Intel Core i5-14600K | |
| AMD Ryzen 9 7950X3D | |
| AMD Ryzen 9 7950X | |
| AMD Ryzen 9 7900X | |
| Intel Core i5-13600K | |
| Intel Core i9-12900K | |
| AMD Ryzen 5 7600X | |
| Intel Core i5-12600K | |
| AMD Ryzen 7 7800X3D | |
| Intel Core i5-13400 | |
| Intel Core i5-12400F | |
| AMD Ryzen 9 5950X | |
| Multi Core | |
| Intel Core i9-14900K | |
| Intel Core i9-13900K | |
| AMD Ryzen 9 7950X | |
| AMD Ryzen 9 7950X3D | |
| AMD Ryzen 9 7900X | |
| AMD Ryzen 9 5950X | |
| Intel Core i9-12900K | |
| Intel Core i5-14600K | |
| Intel Core i5-13600K | |
| AMD Ryzen 7 7800X3D | |
| Intel Core i5-12600K | |
| Intel Core i5-13400 | |
| AMD Ryzen 5 7600X | |
| Intel Core i5-12400F | |
| Cinebench R11.5 | |
| CPU Single 64Bit | |
| Intel Core i9-14900K | |
| Intel Core i9-13900K | |
| AMD Ryzen 9 7950X | |
| AMD Ryzen 9 7950X3D | |
| AMD Ryzen 9 7900X | |
| AMD Ryzen 5 7600X | |
| Intel Core i5-14600K | |
| Intel Core i9-12900K | |
| Intel Core i5-13600K | |
| AMD Ryzen 7 7800X3D | |
| Intel Core i5-12600K | |
| AMD Ryzen 9 5950X | |
| Intel Core i5-13400 | |
| Intel Core i5-12400F | |
| CPU Multi 64Bit | |
| Intel Core i9-14900K | |
| Intel Core i9-13900K | |
| AMD Ryzen 9 7950X | |
| AMD Ryzen 9 7950X3D | |
| AMD Ryzen 9 7900X | |
| AMD Ryzen 9 5950X | |
| Intel Core i9-12900K | |
| Intel Core i5-13600K | |
| Intel Core i5-14600K | |
| AMD Ryzen 7 7800X3D | |
| Intel Core i5-12600K | |
| AMD Ryzen 5 7600X | |
| Intel Core i5-13400 | |
| Intel Core i5-12400F | |
| Cinebench R10 | |
| Rendering Single CPUs 64Bit | |
| Intel Core i9-14900K | |
| Intel Core i9-13900K | |
| Intel Core i5-14600K | |
| AMD Ryzen 9 7900X | |
| AMD Ryzen 9 7950X | |
| Intel Core i5-13600K | |
| Intel Core i9-12900K | |
| AMD Ryzen 5 7600X | |
| Intel Core i5-12600K | |
| AMD Ryzen 7 7800X3D | |
| Intel Core i5-13400 | |
| Intel Core i5-12400F | |
| AMD Ryzen 9 5950X | |
| AMD Ryzen 9 7950X3D | |
| Rendering Multiple CPUs 64Bit | |
| Intel Core i9-14900K | |
| Intel Core i9-13900K | |
| AMD Ryzen 9 7950X | |
| AMD Ryzen 9 7900X | |
| Intel Core i5-14600K | |
| Intel Core i9-12900K | |
| Intel Core i5-13600K | |
| AMD Ryzen 9 5950X | |
| AMD Ryzen 7 7800X3D | |
| AMD Ryzen 5 7600X | |
| Intel Core i5-12600K | |
| Intel Core i5-13400 | |
| AMD Ryzen 9 7950X3D | |
| Intel Core i5-12400F | |
| Blender - v2.79 BMW27 CPU | |
| Intel Core i5-12400F | |
| Intel Core i5-13400 | |
| AMD Ryzen 5 7600X | |
| Intel Core i5-12600K | |
| AMD Ryzen 7 7800X3D | |
| Intel Core i5-13600K | |
| Intel Core i5-14600K | |
| Intel Core i9-12900K | |
| AMD Ryzen 9 5950X | |
| AMD Ryzen 9 7900X | |
| AMD Ryzen 9 7950X3D | |
| AMD Ryzen 9 7950X | |
| Intel Core i9-13900K | |
| Intel Core i9-14900K | |
| wPrime 2.10 | |
| 32m | |
| Intel Core i9-12900K | |
| Intel Core i5-12600K | |
| Intel Core i5-12400F | |
| Intel Core i5-13400 | |
| AMD Ryzen 5 7600X | |
| AMD Ryzen 9 5950X | |
| Intel Core i5-13600K | |
| AMD Ryzen 7 7800X3D | |
| Intel Core i5-14600K | |
| Intel Core i9-14900K | |
| AMD Ryzen 9 7950X3D | |
| Intel Core i9-13900K | |
| AMD Ryzen 9 7900X | |
| AMD Ryzen 9 7950X | |
| 1024m | |
| Intel Core i5-13400 | |
| Intel Core i5-12600K | |
| Intel Core i9-12900K | |
| Intel Core i5-13600K | |
| Intel Core i5-14600K | |
| Intel Core i5-12400F | |
| Intel Core i9-13900K | |
| AMD Ryzen 5 7600X | |
| Intel Core i9-14900K | |
| AMD Ryzen 9 5950X | |
| AMD Ryzen 7 7800X3D | |
| AMD Ryzen 9 7900X | |
| AMD Ryzen 9 7950X3D | |
| AMD Ryzen 9 7950X | |
| X264 HD Benchmark 4.0 | |
| Pass 1 | |
| Intel Core i9-14900K | |
| Intel Core i9-13900K | |
| Intel Core i5-14600K | |
| AMD Ryzen 9 7950X3D | |
| Intel Core i5-13600K | |
| AMD Ryzen 9 7950X | |
| AMD Ryzen 9 7900X | |
| Intel Core i9-12900K | |
| AMD Ryzen 5 7600X | |
| AMD Ryzen 7 7800X3D | |
| AMD Ryzen 9 5950X | |
| Intel Core i5-12600K | |
| Intel Core i5-13400 | |
| Intel Core i5-12400F | |
| Pass 2 | |
| Intel Core i9-14900K | |
| Intel Core i9-13900K | |
| AMD Ryzen 9 7950X | |
| AMD Ryzen 9 7950X3D | |
| AMD Ryzen 9 7900X | |
| AMD Ryzen 9 5950X | |
| Intel Core i5-14600K | |
| Intel Core i9-12900K | |
| Intel Core i5-13600K | |
| AMD Ryzen 7 7800X3D | |
| Intel Core i5-12600K | |
| AMD Ryzen 5 7600X | |
| Intel Core i5-13400 | |
| Intel Core i5-12400F | |
| WinRAR - Result | |
| AMD Ryzen 9 7900X | |
| AMD Ryzen 7 7800X3D | |
| AMD Ryzen 9 7950X | |
| AMD Ryzen 5 7600X | |
| Intel Core i9-14900K | |
| AMD Ryzen 9 7950X3D | |
| Intel Core i9-13900K | |
| AMD Ryzen 9 5950X | |
| Intel Core i5-14600K | |
| Intel Core i5-13600K | |
| Intel Core i9-12900K | |
| Intel Core i5-13400 | |
| Intel Core i5-12400F | |
| Intel Core i5-12600K | |
| TrueCrypt | |
| AES Mean 100MB | |
| AMD Ryzen 9 7950X | |
| Intel Core i9-13900K | |
| AMD Ryzen 9 5950X | |
| AMD Ryzen 9 7950X3D | |
| Intel Core i9-14900K | |
| Intel Core i5-14600K | |
| Intel Core i5-13600K | |
| Intel Core i9-12900K | |
| AMD Ryzen 7 7800X3D | |
| AMD Ryzen 9 7900X | |
| AMD Ryzen 5 7600X | |
| Intel Core i5-12600K | |
| Intel Core i5-13400 | |
| Intel Core i5-12400F | |
| Twofish Mean 100MB | |
| Intel Core i9-14900K | |
| Intel Core i9-13900K | |
| AMD Ryzen 9 7950X | |
| AMD Ryzen 9 7950X3D | |
| AMD Ryzen 9 5950X | |
| Intel Core i9-12900K | |
| Intel Core i5-14600K | |
| Intel Core i5-13600K | |
| AMD Ryzen 9 7900X | |
| Intel Core i5-12600K | |
| AMD Ryzen 7 7800X3D | |
| Intel Core i5-13400 | |
| AMD Ryzen 5 7600X | |
| Intel Core i5-12400F | |
| Serpent Mean 100MB | |
| Intel Core i9-13900K | |
| AMD Ryzen 9 7950X | |
| AMD Ryzen 9 7950X3D | |
| Intel Core i9-14900K | |
| AMD Ryzen 9 5950X | |
| Intel Core i9-12900K | |
| Intel Core i5-14600K | |
| Intel Core i5-13600K | |
| AMD Ryzen 9 7900X | |
| Intel Core i5-12600K | |
| AMD Ryzen 7 7800X3D | |
| Intel Core i5-13400 | |
| AMD Ryzen 5 7600X | |
| Intel Core i5-12400F | |
| Geekbench 5.5 | |
| Multi-Core | |
| Intel Core i9-14900K | |
| AMD Ryzen 9 7950X | |
| AMD Ryzen 9 7950X3D | |
| Intel Core i9-13900K | |
| AMD Ryzen 9 7900X | |
| Intel Core i9-12900K | |
| Intel Core i5-14600K | |
| AMD Ryzen 9 5950X | |
| Intel Core i5-13600K | |
| AMD Ryzen 7 7800X3D | |
| Intel Core i5-12600K | |
| Intel Core i5-13400 | |
| AMD Ryzen 5 7600X | |
| Intel Core i5-12400F | |
| Single-Core | |
| AMD Ryzen 9 7950X | |
| AMD Ryzen 9 7950X3D | |
| Intel Core i9-13900K | |
| AMD Ryzen 9 7900X | |
| Intel Core i9-14900K | |
| AMD Ryzen 5 7600X | |
| Intel Core i9-12900K | |
| AMD Ryzen 7 7800X3D | |
| Intel Core i5-14600K | |
| Intel Core i5-13600K | |
| Intel Core i5-12600K | |
| Intel Core i5-13400 | |
| Intel Core i5-12400F | |
| AMD Ryzen 9 5950X | |
| Geekbench 5.0 | |
| 5.0 Multi-Core | |
| Intel Core i9-14900K | |
| AMD Ryzen 9 7950X | |
| Intel Core i9-13900K | |
| AMD Ryzen 9 7950X3D | |
| AMD Ryzen 9 7900X | |
| Intel Core i9-12900K | |
| Intel Core i5-14600K | |
| Intel Core i5-13600K | |
| AMD Ryzen 9 5950X | |
| AMD Ryzen 7 7800X3D | |
| Intel Core i5-12600K | |
| AMD Ryzen 5 7600X | |
| Intel Core i5-13400 | |
| Intel Core i5-12400F | |
| 5.0 Single-Core | |
| Intel Core i9-14900K | |
| AMD Ryzen 9 7950X | |
| Intel Core i9-13900K | |
| AMD Ryzen 9 7900X | |
| AMD Ryzen 9 7950X3D | |
| AMD Ryzen 5 7600X | |
| Intel Core i5-14600K | |
| Intel Core i9-12900K | |
| AMD Ryzen 7 7800X3D | |
| Intel Core i5-13600K | |
| Intel Core i5-12600K | |
| Intel Core i5-13400 | |
| AMD Ryzen 9 5950X | |
| Intel Core i5-12400F | |
| Geekbench 4.4 | |
| 64 Bit Single-Core Score | |
| Intel Core i9-14900K | |
| Intel Core i9-13900K | |
| AMD Ryzen 9 7950X | |
| AMD Ryzen 9 7950X3D | |
| AMD Ryzen 9 7900X | |
| AMD Ryzen 7 7800X3D | |
| AMD Ryzen 5 7600X | |
| Intel Core i5-14600K | |
| Intel Core i9-12900K | |
| Intel Core i5-13600K | |
| Intel Core i5-12600K | |
| Intel Core i5-13400 | |
| Intel Core i5-12400F | |
| AMD Ryzen 9 5950X | |
| 64 Bit Multi-Core Score | |
| AMD Ryzen 9 7950X | |
| Intel Core i9-14900K | |
| AMD Ryzen 9 7950X3D | |
| Intel Core i9-13900K | |
| AMD Ryzen 9 7900X | |
| Intel Core i5-14600K | |
| Intel Core i9-12900K | |
| AMD Ryzen 9 5950X | |
| Intel Core i5-13600K | |
| AMD Ryzen 7 7800X3D | |
| AMD Ryzen 5 7600X | |
| Intel Core i5-12600K | |
| Intel Core i5-13400 | |
| Intel Core i5-12400F | |
| 3DMark 11 - 1280x720 Performance Physics | |
| AMD Ryzen 9 7950X3D | |
| AMD Ryzen 7 7800X3D | |
| Intel Core i9-13900K | |
| Intel Core i9-14900K | |
| Intel Core i5-14600K | |
| Intel Core i5-13600K | |
| AMD Ryzen 9 7900X | |
| AMD Ryzen 9 7950X | |
| Intel Core i9-12900K | |
| AMD Ryzen 5 7600X | |
| AMD Ryzen 9 5950X | |
| Intel Core i5-12600K | |
| Intel Core i5-13400 | |
| Intel Core i5-12400F | |
| 7-Zip 18.03 | |
| 7z b 4 | |
| AMD Ryzen 9 7950X | |
| AMD Ryzen 9 7950X3D | |
| Intel Core i9-14900K | |
| Intel Core i9-13900K | |
| AMD Ryzen 9 5950X | |
| AMD Ryzen 9 7900X | |
| Intel Core i9-12900K | |
| Intel Core i5-14600K | |
| Intel Core i5-13600K | |
| AMD Ryzen 7 7800X3D | |
| AMD Ryzen 5 7600X | |
| Intel Core i5-12600K | |
| Intel Core i5-13400 | |
| Intel Core i5-12400F | |
| 7z b 4 -mmt1 | |
| AMD Ryzen 9 7950X | |
| AMD Ryzen 9 7950X3D | |
| AMD Ryzen 9 7900X | |
| AMD Ryzen 7 7800X3D | |
| AMD Ryzen 5 7600X | |
| Intel Core i9-14900K | |
| Intel Core i9-13900K | |
| AMD Ryzen 9 5950X | |
| Intel Core i5-14600K | |
| Intel Core i9-12900K | |
| Intel Core i5-13600K | |
| Intel Core i5-12600K | |
| Intel Core i5-13400 | |
| Intel Core i5-12400F | |
| HWBOT x265 Benchmark v2.2 - 4k Preset | |
| AMD Ryzen 9 7950X | |
| Intel Core i9-14900K | |
| Intel Core i9-13900K | |
| AMD Ryzen 9 7950X3D | |
| AMD Ryzen 9 7900X | |
| AMD Ryzen 9 5950X | |
| Intel Core i5-12600K | |
| Intel Core i9-12900K | |
| Intel Core i5-14600K | |
| Intel Core i5-13600K | |
| AMD Ryzen 7 7800X3D | |
| AMD Ryzen 5 7600X | |
| Intel Core i5-13400 | |
| Intel Core i5-12400F | |
| R Benchmark 2.5 - Overall mean | |
| Intel Core i5-12400F | |
| Intel Core i5-13400 | |
| AMD Ryzen 9 5950X | |
| Intel Core i5-12600K | |
| Intel Core i9-12900K | |
| AMD Ryzen 7 7800X3D | |
| Intel Core i5-13600K | |
| Intel Core i5-14600K | |
| AMD Ryzen 5 7600X | |
| AMD Ryzen 9 7900X | |
| AMD Ryzen 9 7950X3D | |
| AMD Ryzen 9 7950X | |
| Intel Core i9-13900K | |
| Intel Core i9-14900K | |
| LibreOffice - 20 Documents To PDF | |
| Intel Core i5-12600K | |
| Intel Core i5-12400F | |
| AMD Ryzen 9 5950X | |
| AMD Ryzen 7 7800X3D | |
| Intel Core i9-12900K | |
| Intel Core i5-13400 | |
| AMD Ryzen 9 7950X3D | |
| AMD Ryzen 5 7600X | |
| Intel Core i9-13900K | |
| AMD Ryzen 9 7950X | |
| Intel Core i5-13600K | |
| AMD Ryzen 9 7900X | |
| Intel Core i9-14900K | |
| Intel Core i5-14600K | |
| WebXPRT 3 - Overall | |
| AMD Ryzen 9 7950X3D | |
| Intel Core i9-14900K | |
| AMD Ryzen 9 7900X | |
| AMD Ryzen 9 7950X | |
| AMD Ryzen 5 7600X | |
| Intel Core i9-13900K | |
| Intel Core i5-14600K | |
| AMD Ryzen 7 7800X3D | |
| Intel Core i5-13600K | |
| Intel Core i9-12900K | |
| Intel Core i5-13400 | |
| Intel Core i5-12600K | |
| AMD Ryzen 9 5950X | |
| Intel Core i5-12400F | |
| Mozilla Kraken 1.1 - Total | |
| Intel Core i5-12400F | |
| AMD Ryzen 9 5950X | |
| Intel Core i5-13400 | |
| Intel Core i5-12600K | |
| AMD Ryzen 7 7800X3D | |
| Intel Core i9-12900K | |
| Intel Core i5-13600K | |
| Intel Core i5-14600K | |
| AMD Ryzen 5 7600X | |
| AMD Ryzen 9 7950X3D | |
| AMD Ryzen 9 7950X | |
| Intel Core i9-13900K | |
| AMD Ryzen 9 7900X | |
| Intel Core i9-14900K | |
| 3DMark | |
| 3840x2160 Fire Strike Ultra Physics | |
| Intel Core i9-14900K | |
| Intel Core i9-13900K | |
| AMD Ryzen 9 7950X3D | |
| AMD Ryzen 9 7900X | |
| AMD Ryzen 9 7950X | |
| Intel Core i5-14600K | |
| Intel Core i9-12900K | |
| AMD Ryzen 9 5950X | |
| Intel Core i5-13600K | |
| AMD Ryzen 7 7800X3D | |
| AMD Ryzen 5 7600X | |
| Intel Core i5-12600K | |
| Intel Core i5-13400 | |
| Intel Core i5-12400F | |
| 1920x1080 Fire Strike Physics | |
| Intel Core i9-14900K | |
| Intel Core i9-13900K | |
| AMD Ryzen 9 7950X3D | |
| AMD Ryzen 9 7900X | |
| AMD Ryzen 9 7950X | |
| Intel Core i5-14600K | |
| AMD Ryzen 9 5950X | |
| Intel Core i9-12900K | |
| Intel Core i5-13600K | |
| AMD Ryzen 7 7800X3D | |
| AMD Ryzen 5 7600X | |
| Intel Core i5-12600K | |
| Intel Core i5-13400 | |
| Intel Core i5-12400F | |
| 2560x1440 Time Spy CPU | |
| Intel Core i9-14900K | |
| Intel Core i9-13900K | |
| Intel Core i5-14600K | |
| Intel Core i9-12900K | |
| AMD Ryzen 9 7950X3D | |
| Intel Core i5-13600K | |
| AMD Ryzen 9 7900X | |
| AMD Ryzen 9 7950X | |
| AMD Ryzen 7 7800X3D | |
| Intel Core i5-12600K | |
| AMD Ryzen 9 5950X | |
| Intel Core i5-13400 | |
| AMD Ryzen 5 7600X | |
| Intel Core i5-12400F | |
* ... Moindre est la valeur, meilleures sont les performances
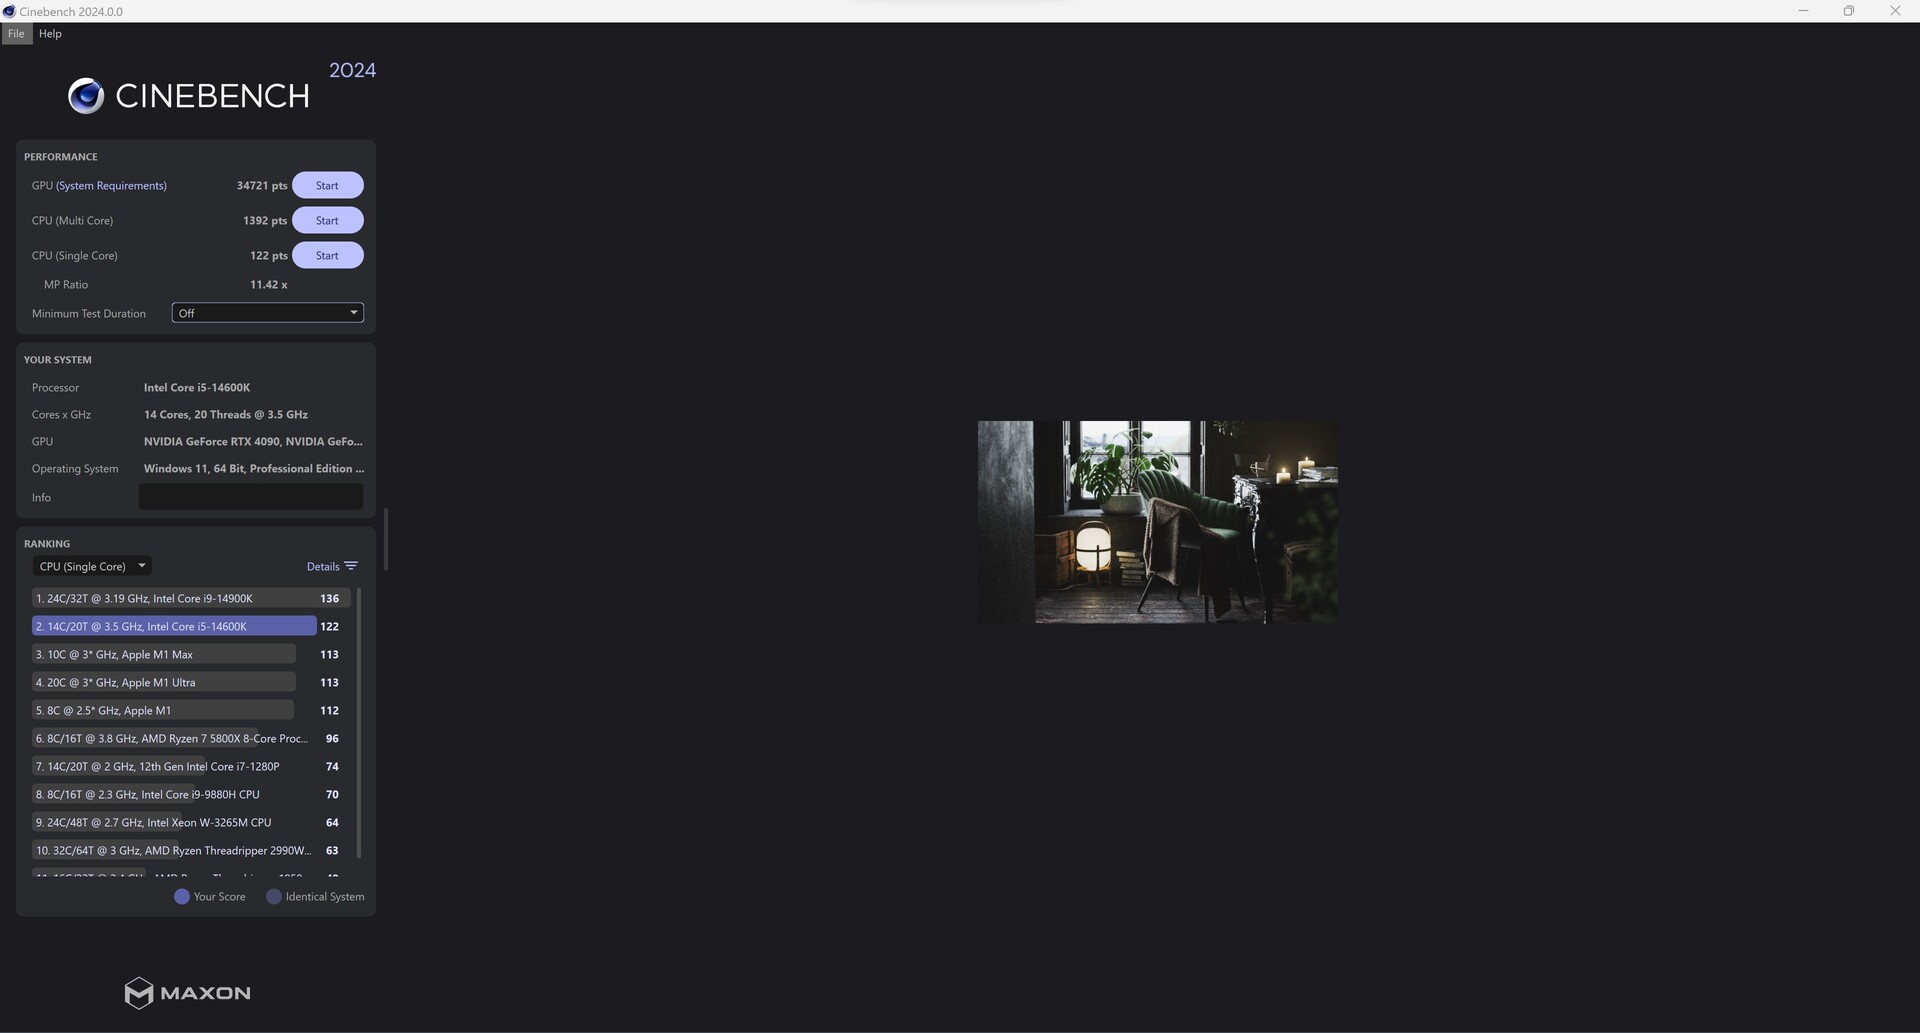
Résultats Cinebench de l'Intel Core i9-14900K
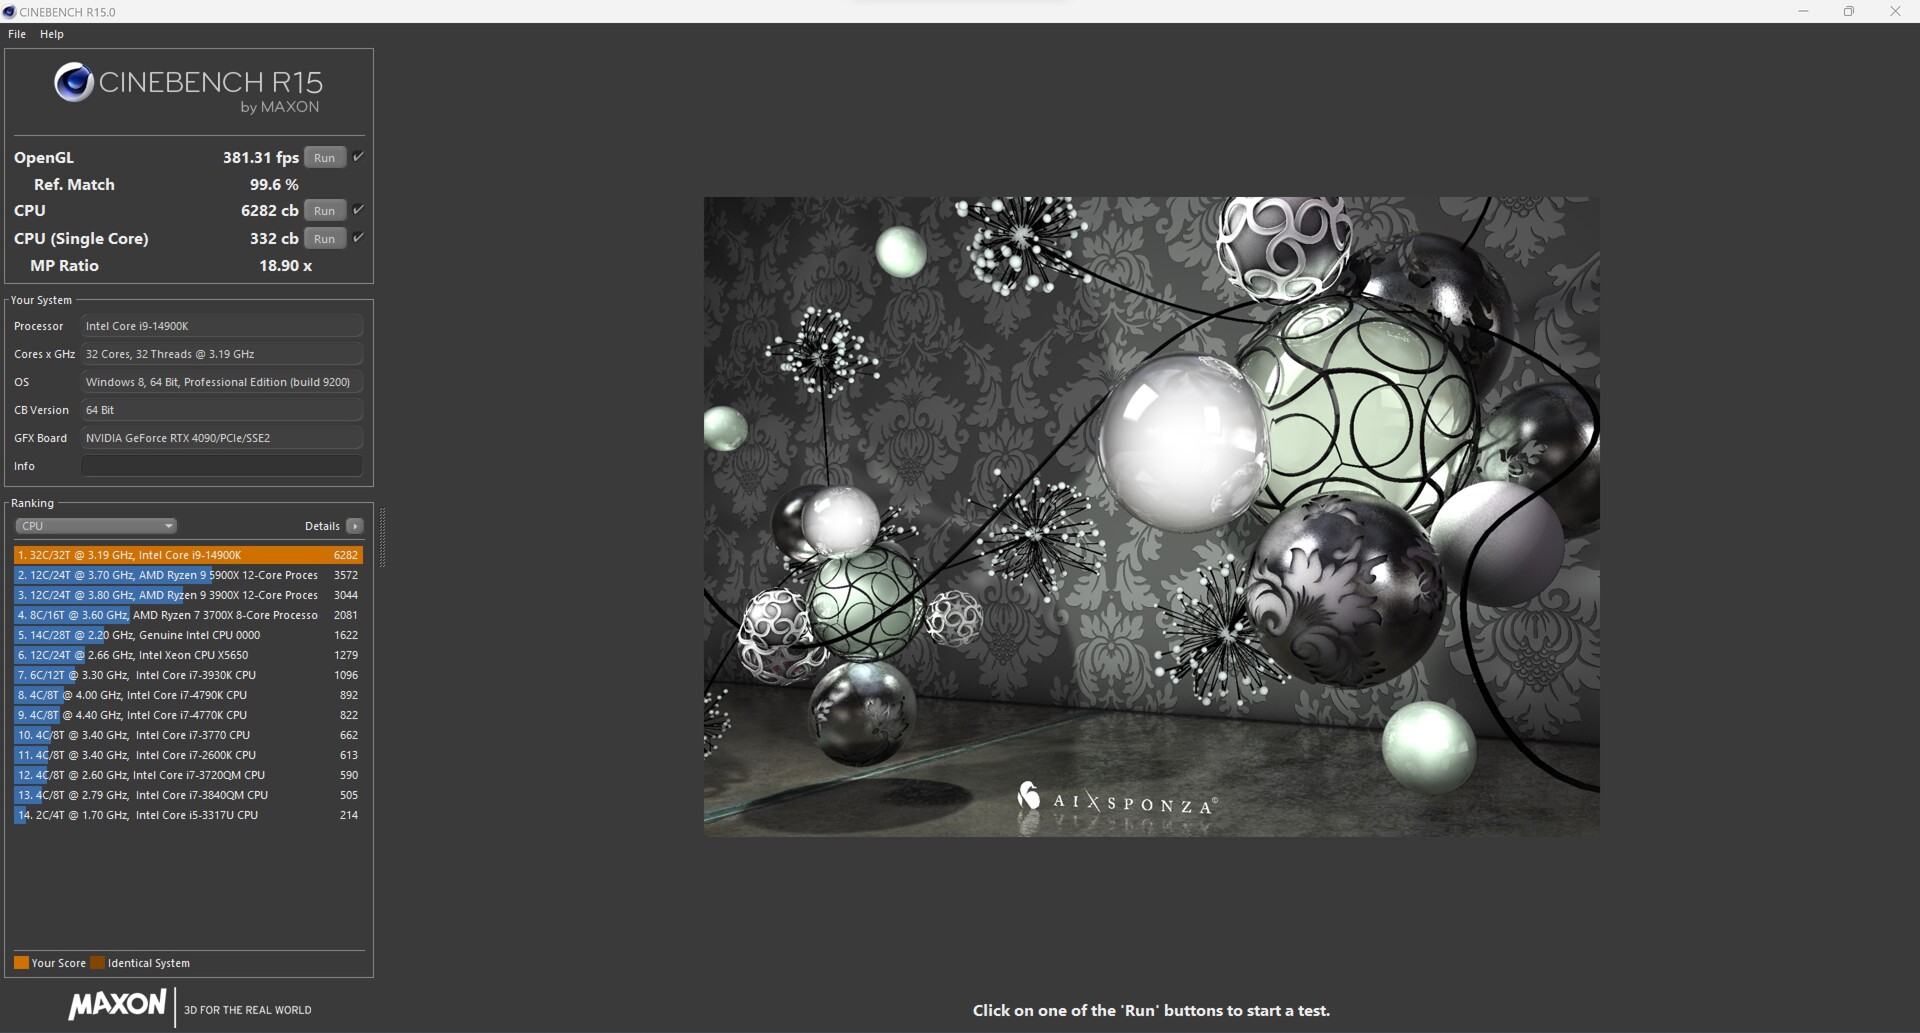
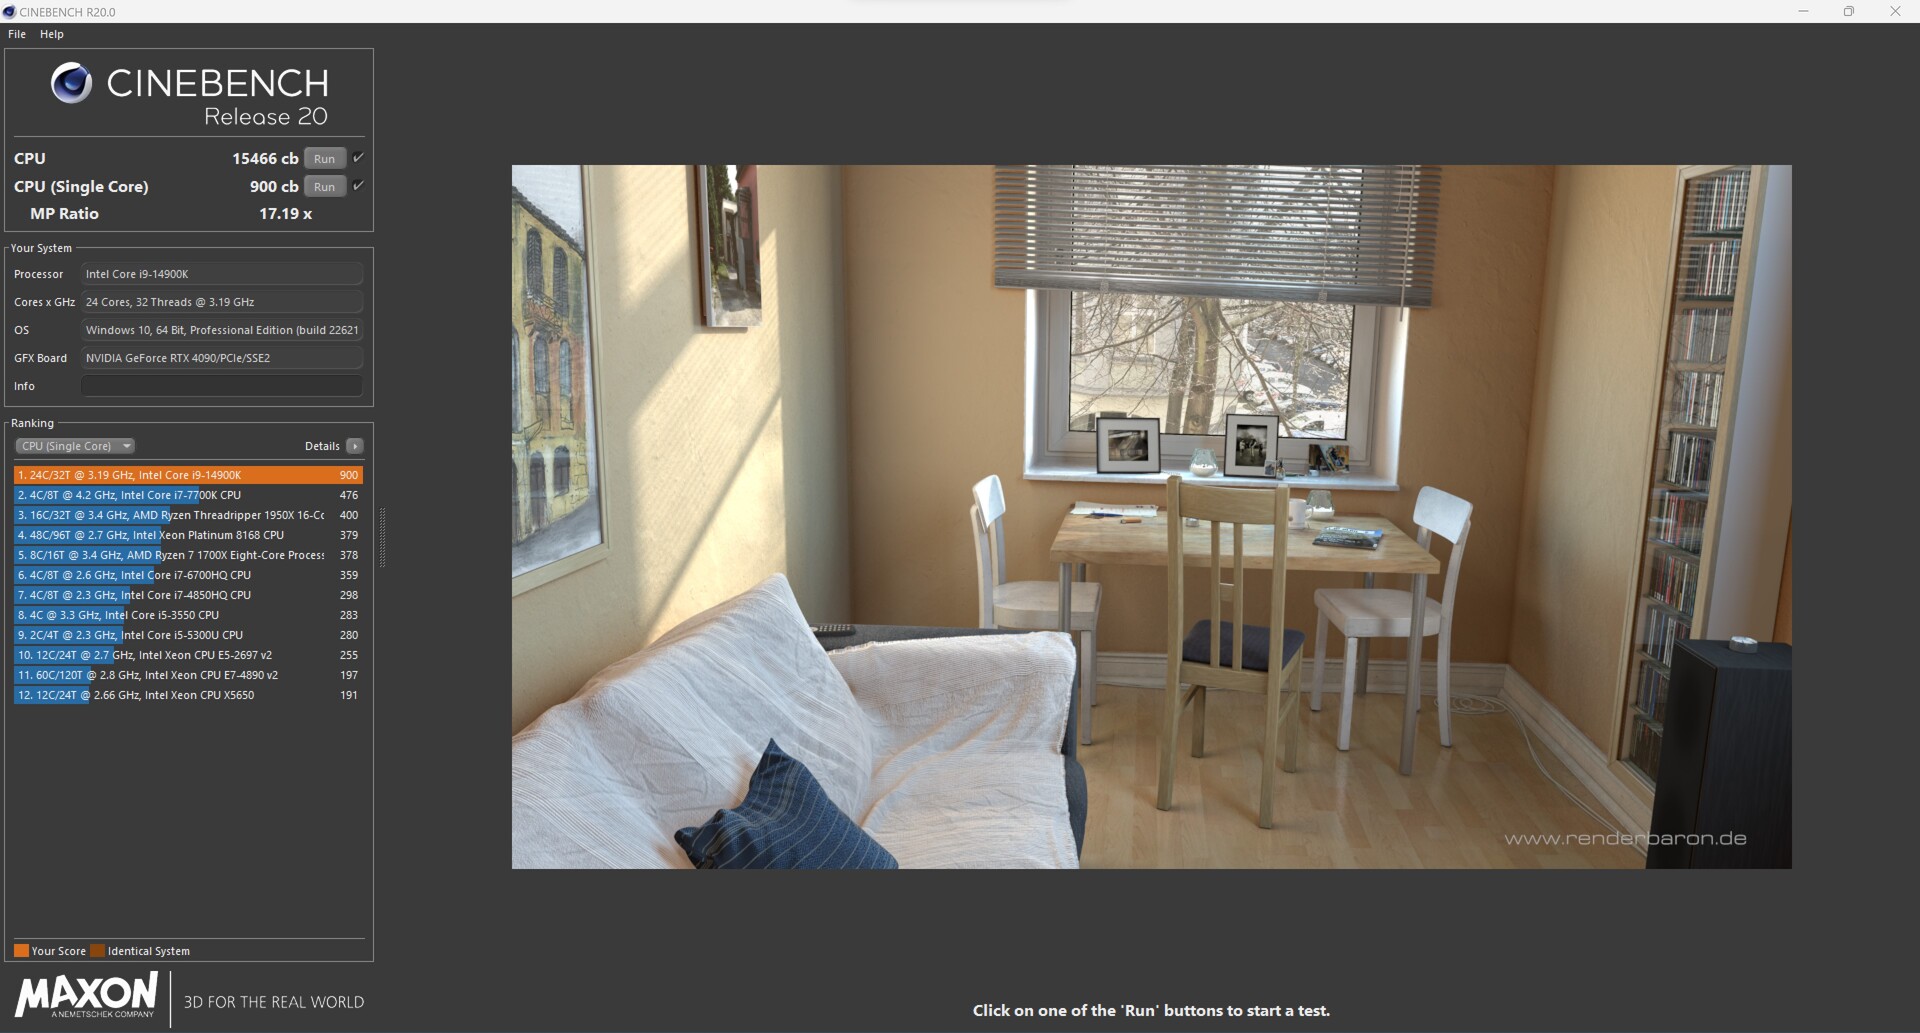

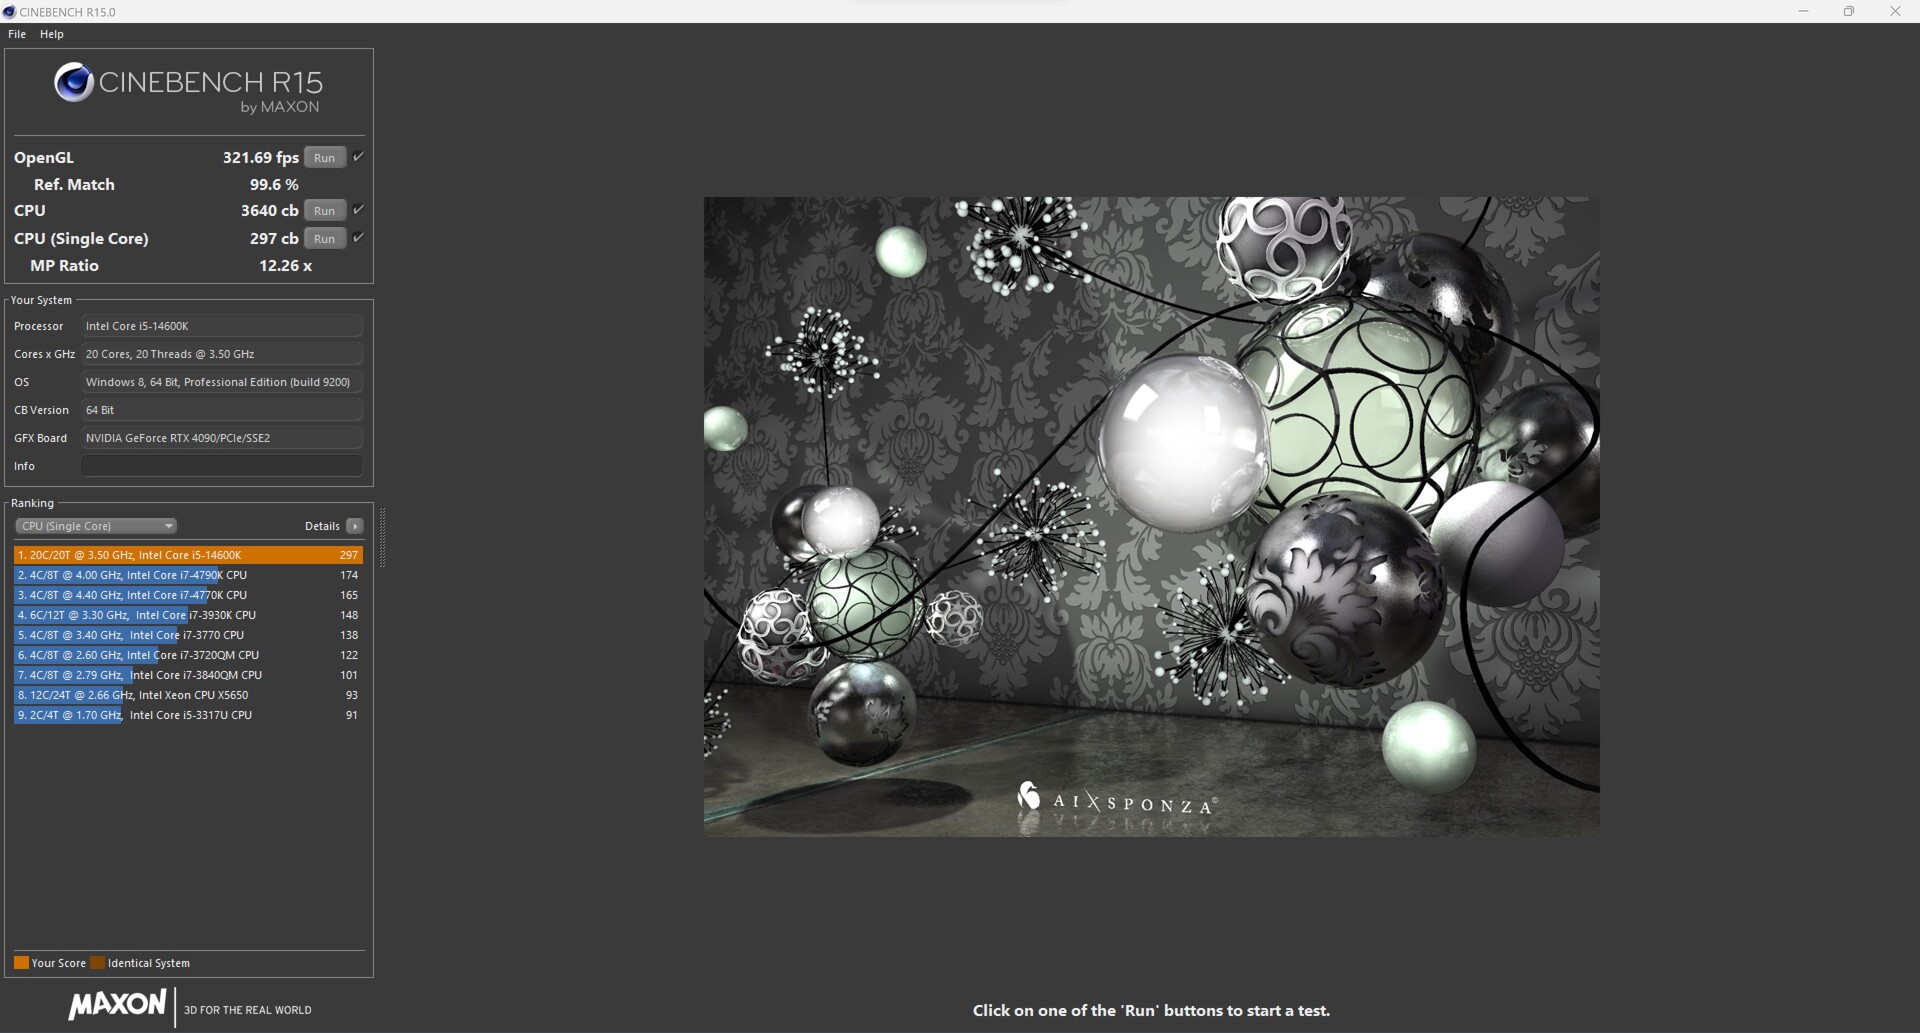
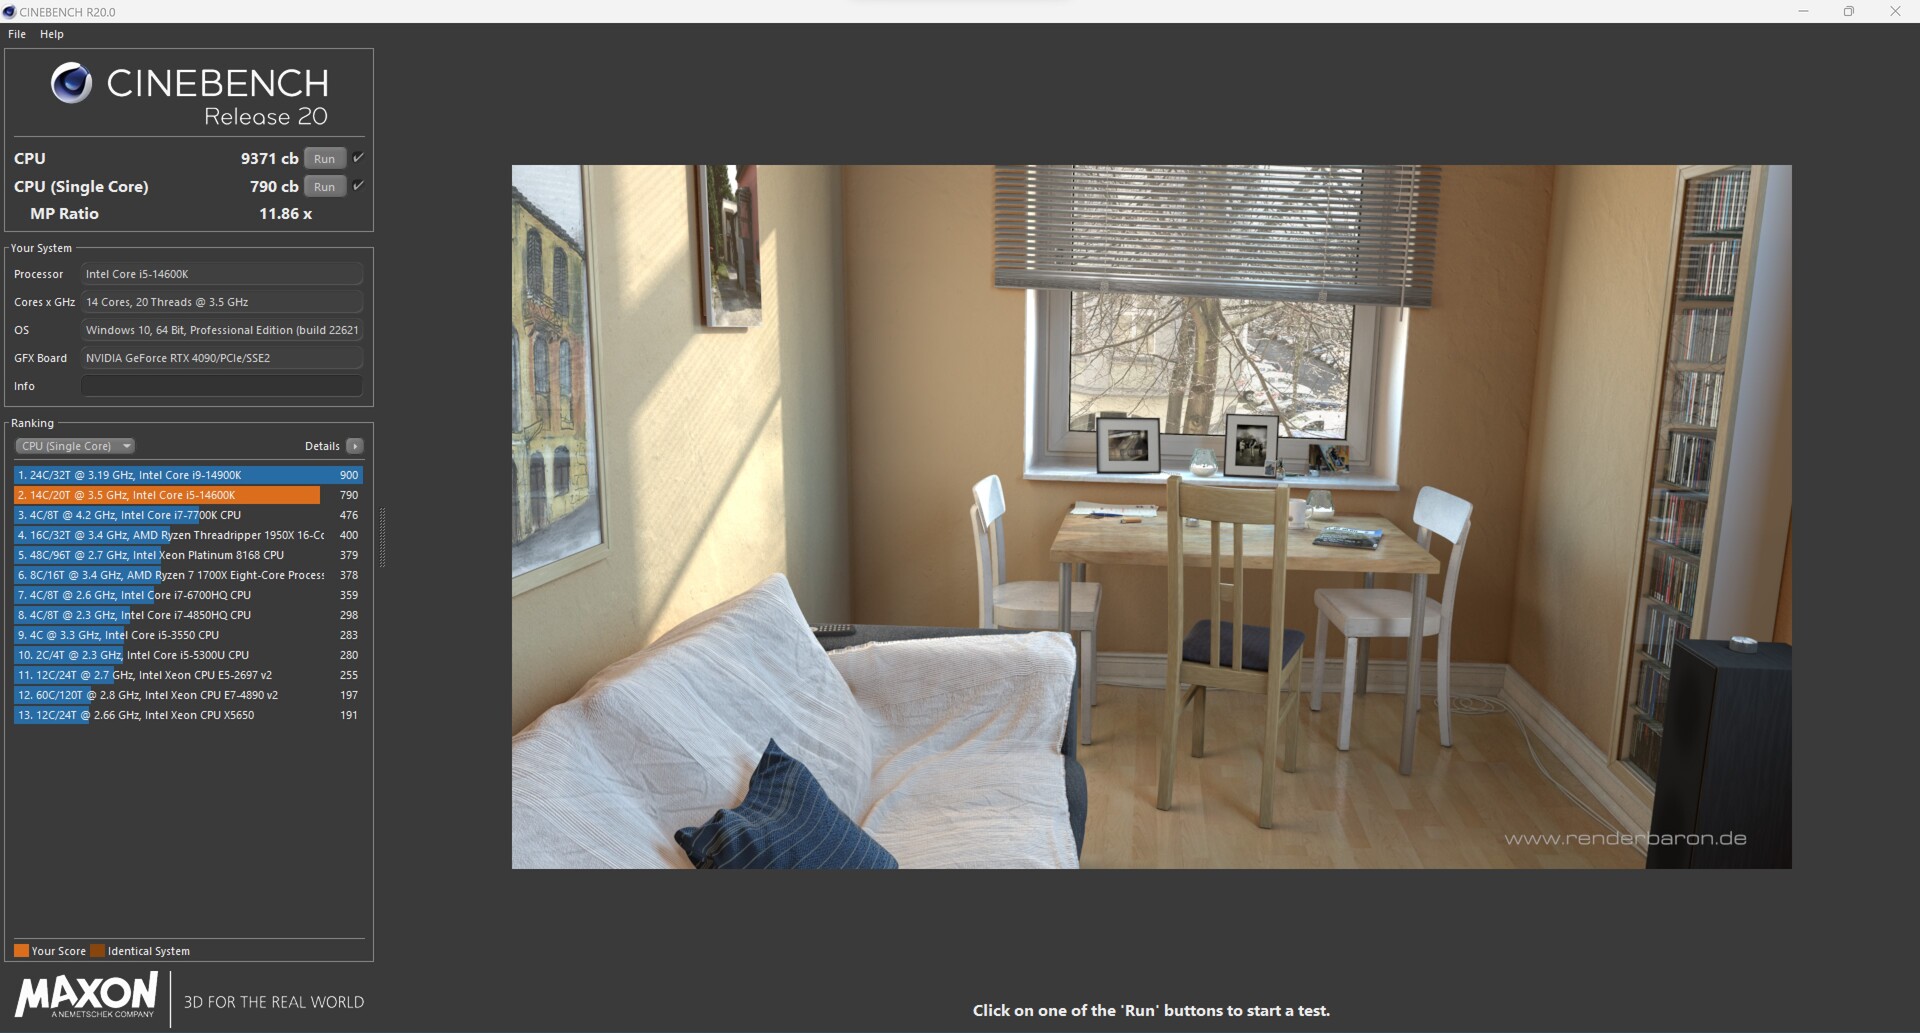
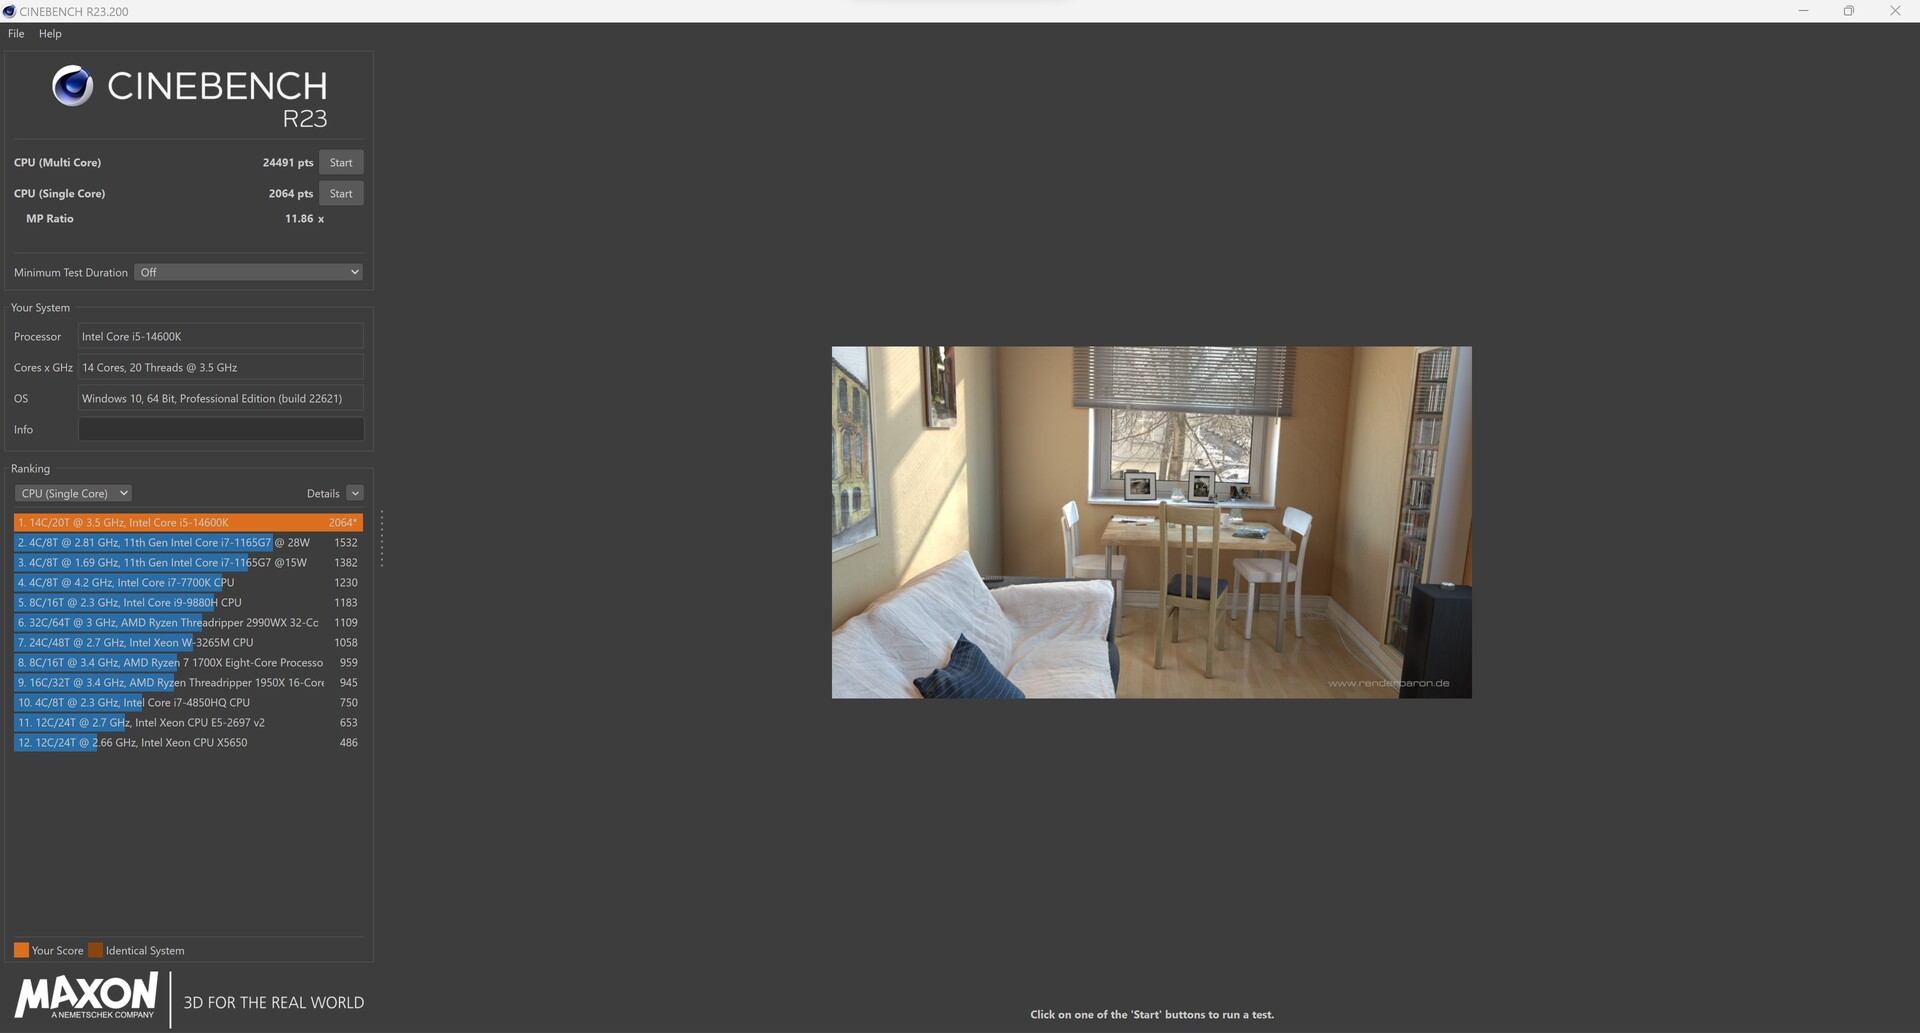
Résultats Cinebench de l'Intel Core i5-14600K
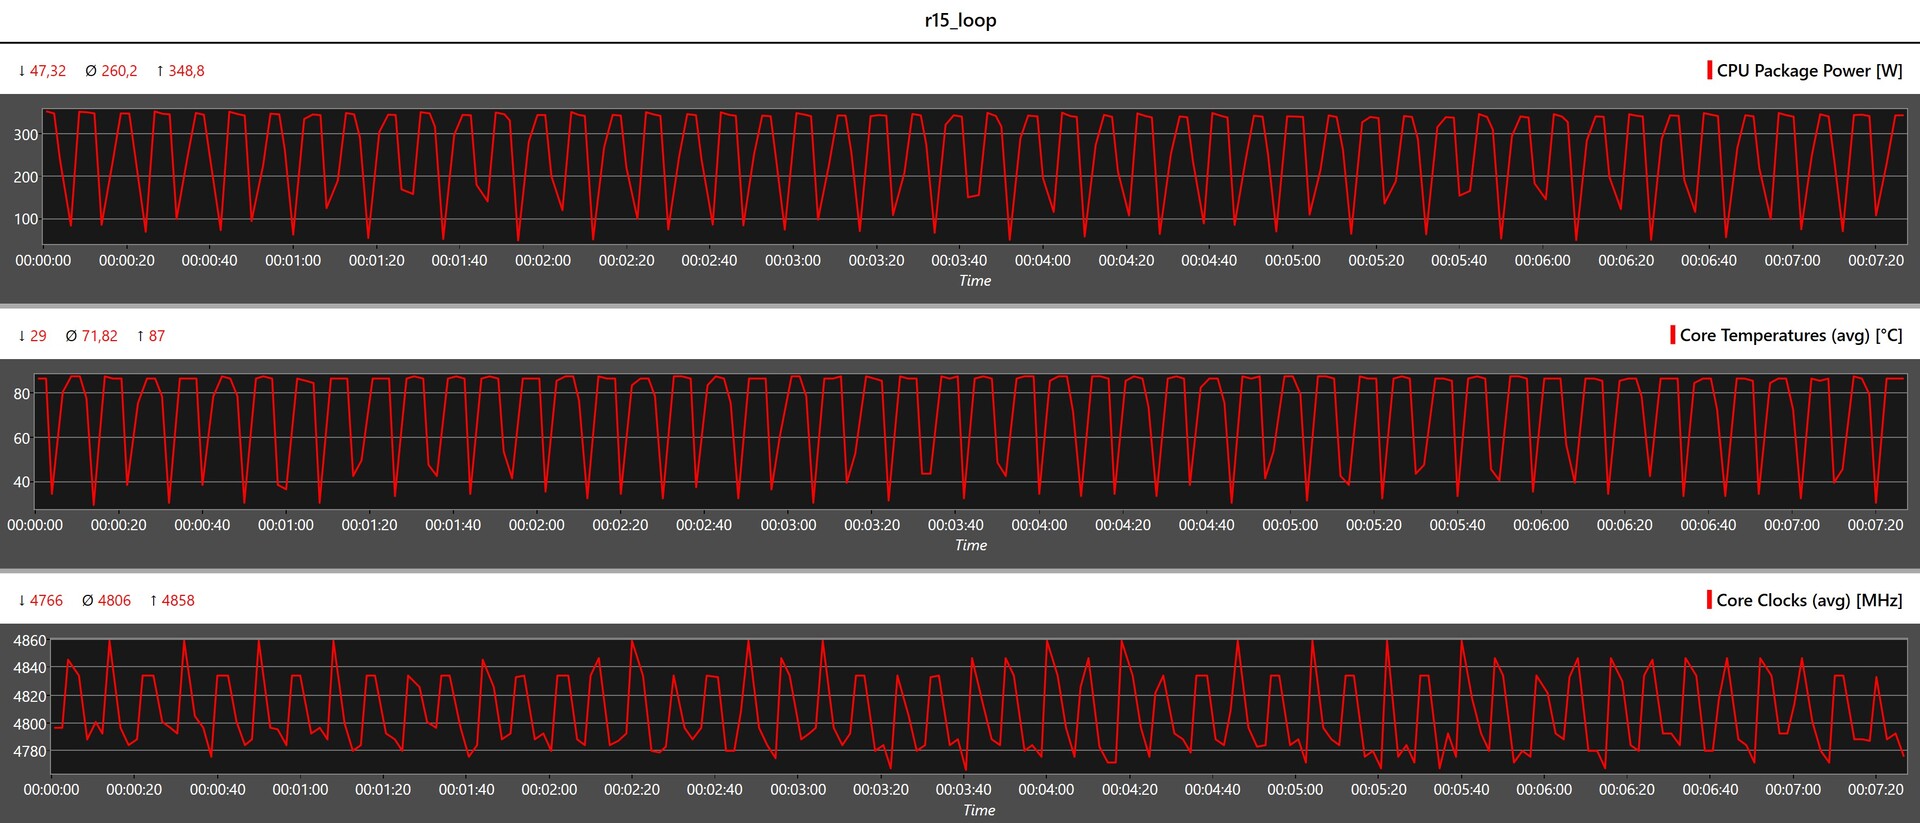
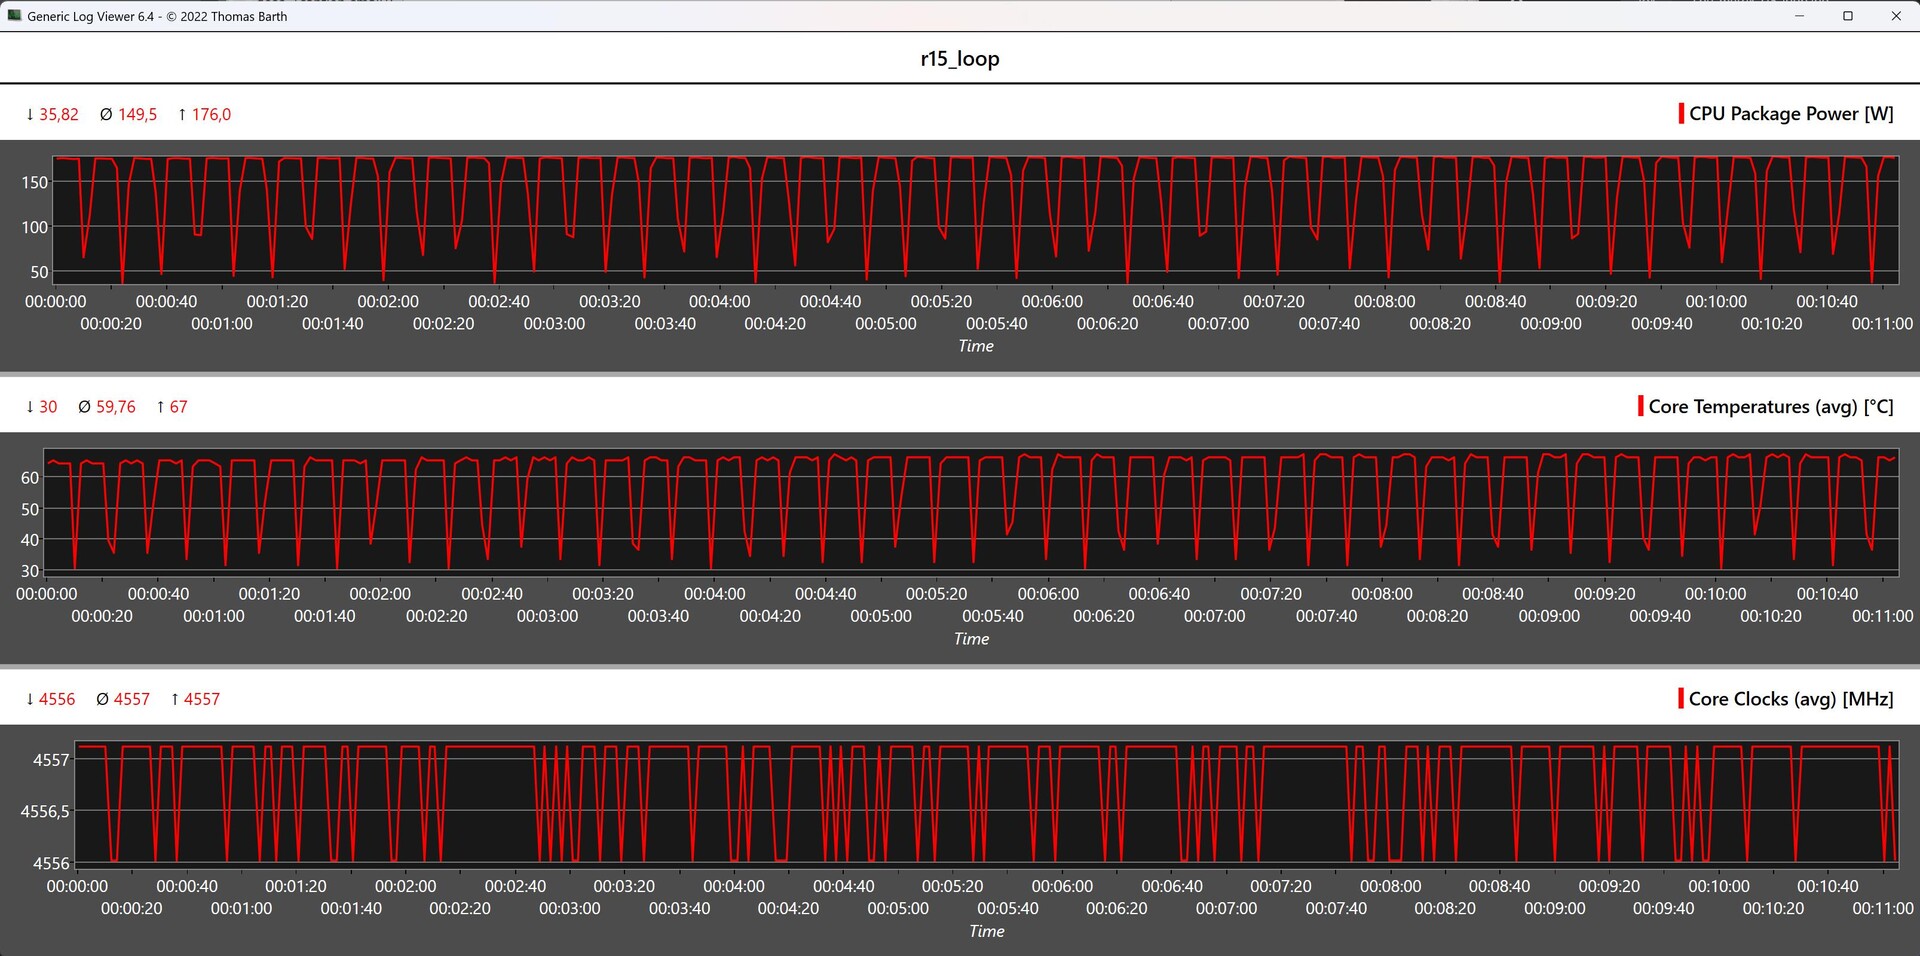
Core i9-14900K et Core i5-14600K vs. Cinebench R15 Multi Loop
Pour notre premier test de charge plus long, nous avons examiné le comportement du processeur pendant la boucle constante de Cinebench R15. Nous avons d'abord constaté une performance stable de tous les modèles de notre test. Cependant, l'Intel Core i9-14900K n'a pas réussi à rester à la première place. Il faut beaucoup d'efforts pour refroidir le processeur, car l'Intel Core i9-14900K est très gourmand en énergie, consommant jusqu'à 348 watts. Par conséquent, le processeur a atteint à plusieurs reprises sa limite thermique de 100 °C, ce qui signifie également qu'il n'a obtenu que le troisième meilleur résultat de notre comparaison.
Avec l'Intel Core i5-14600K, nous avons constaté une légère amélioration par rapport à l'Intel Core i5-13600K, mais l'avantage est si faible que nous pouvons le mettre sur le compte des tolérances de mesure. Consommant un peu plus de 180 watts, il est nettement plus facile de refroidir l'Intel Core i5-13600K.
Tous les tests de CPU ont été effectués dans les mêmes conditions, ce qui signifie également qu'aucune limite de puissance n'a été définie dans le BIOS.
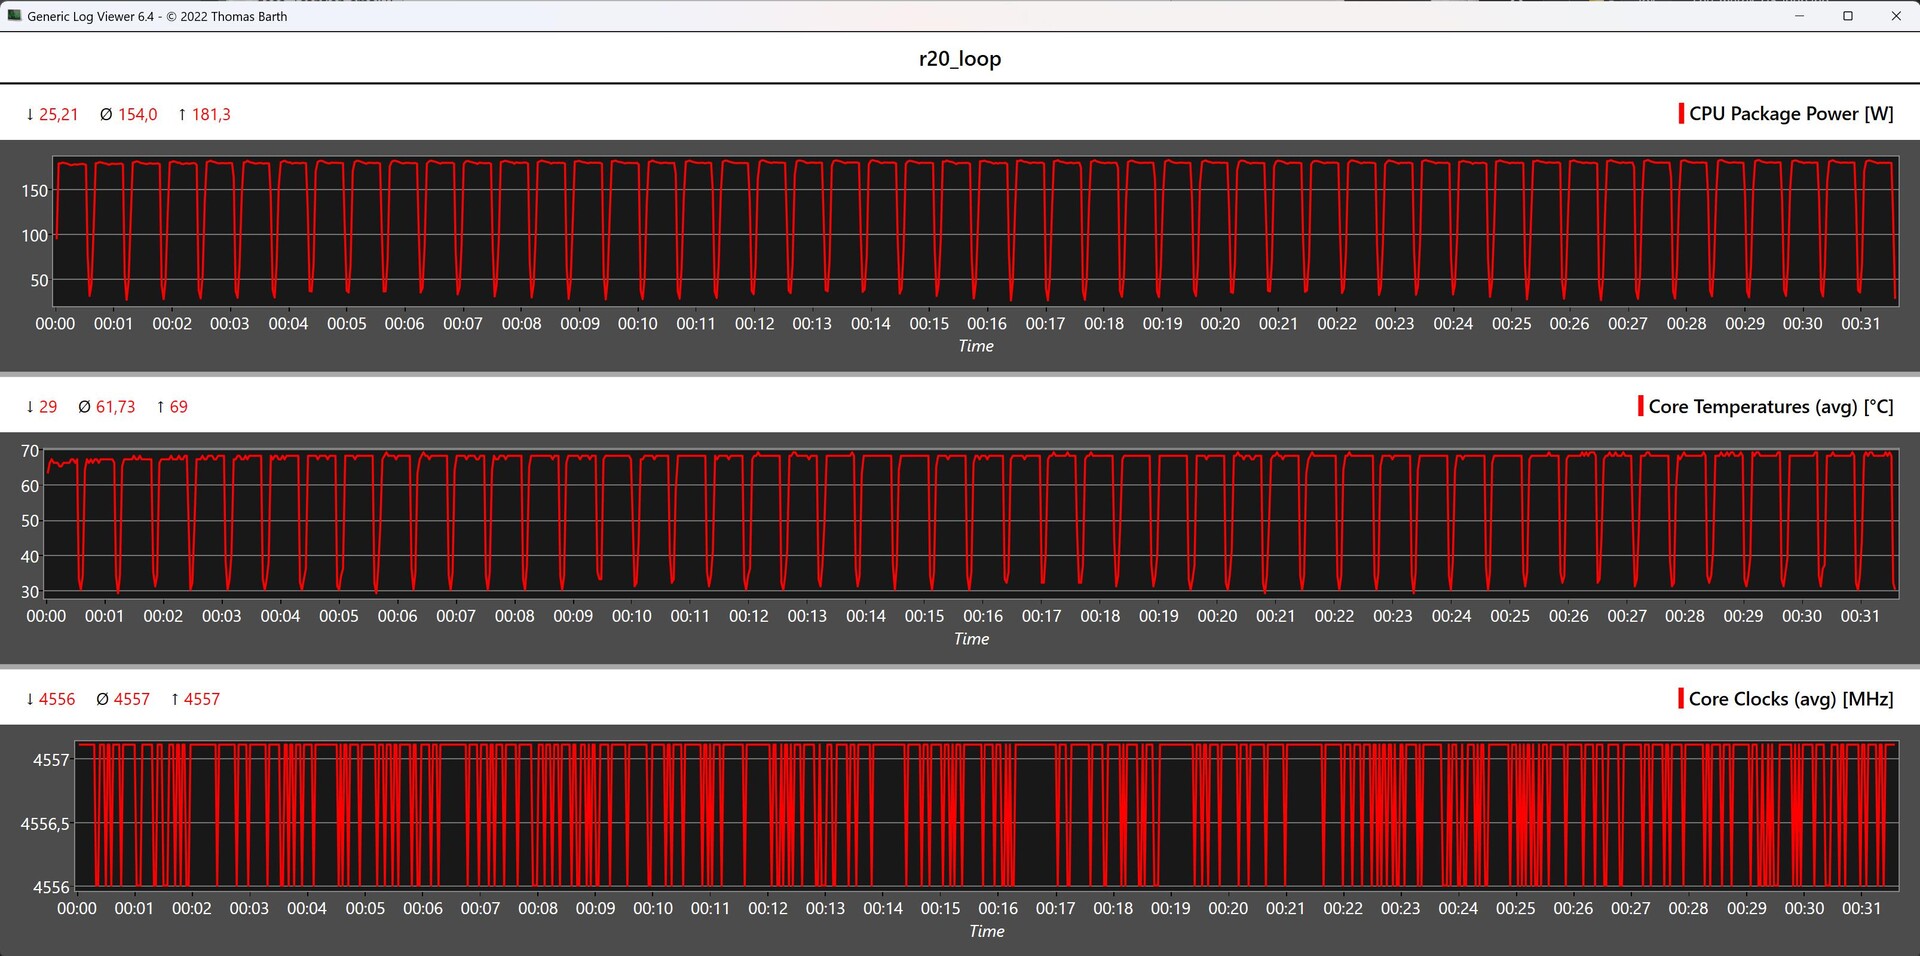
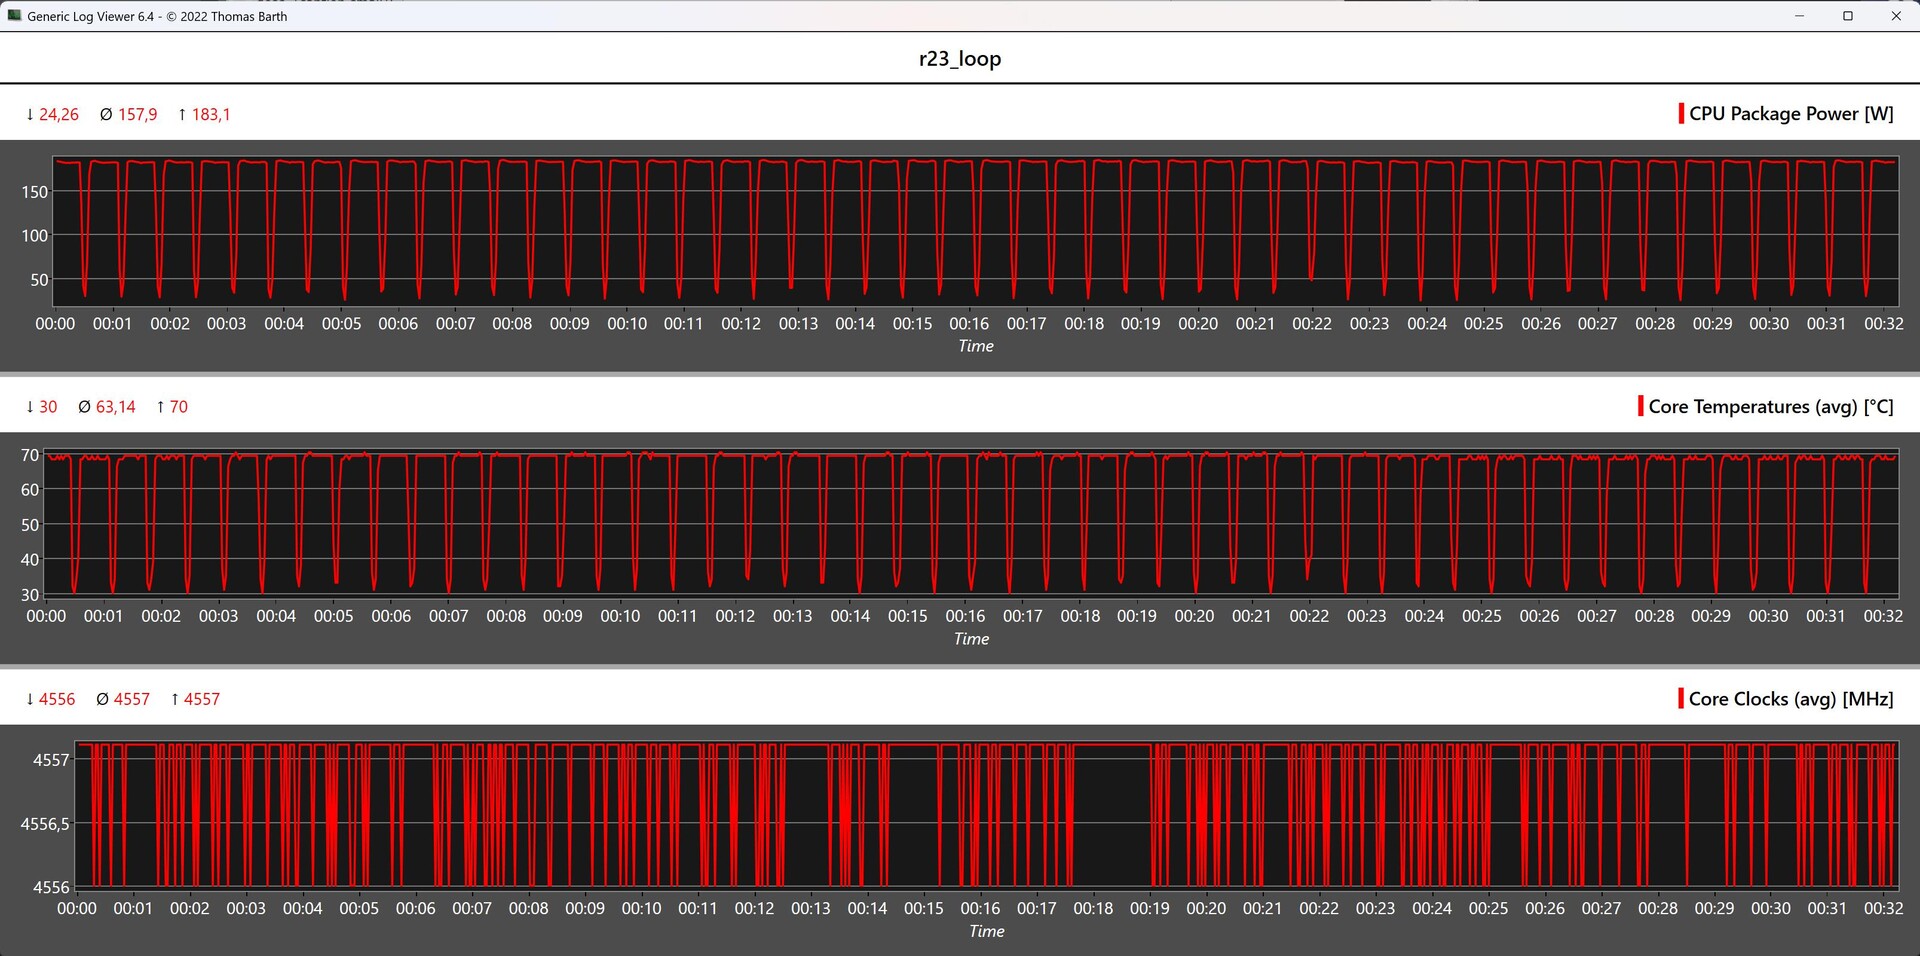
Mesures du processeur pendant les boucles Cinebench (R15, R20, R23)
Intel Core i9-14900K
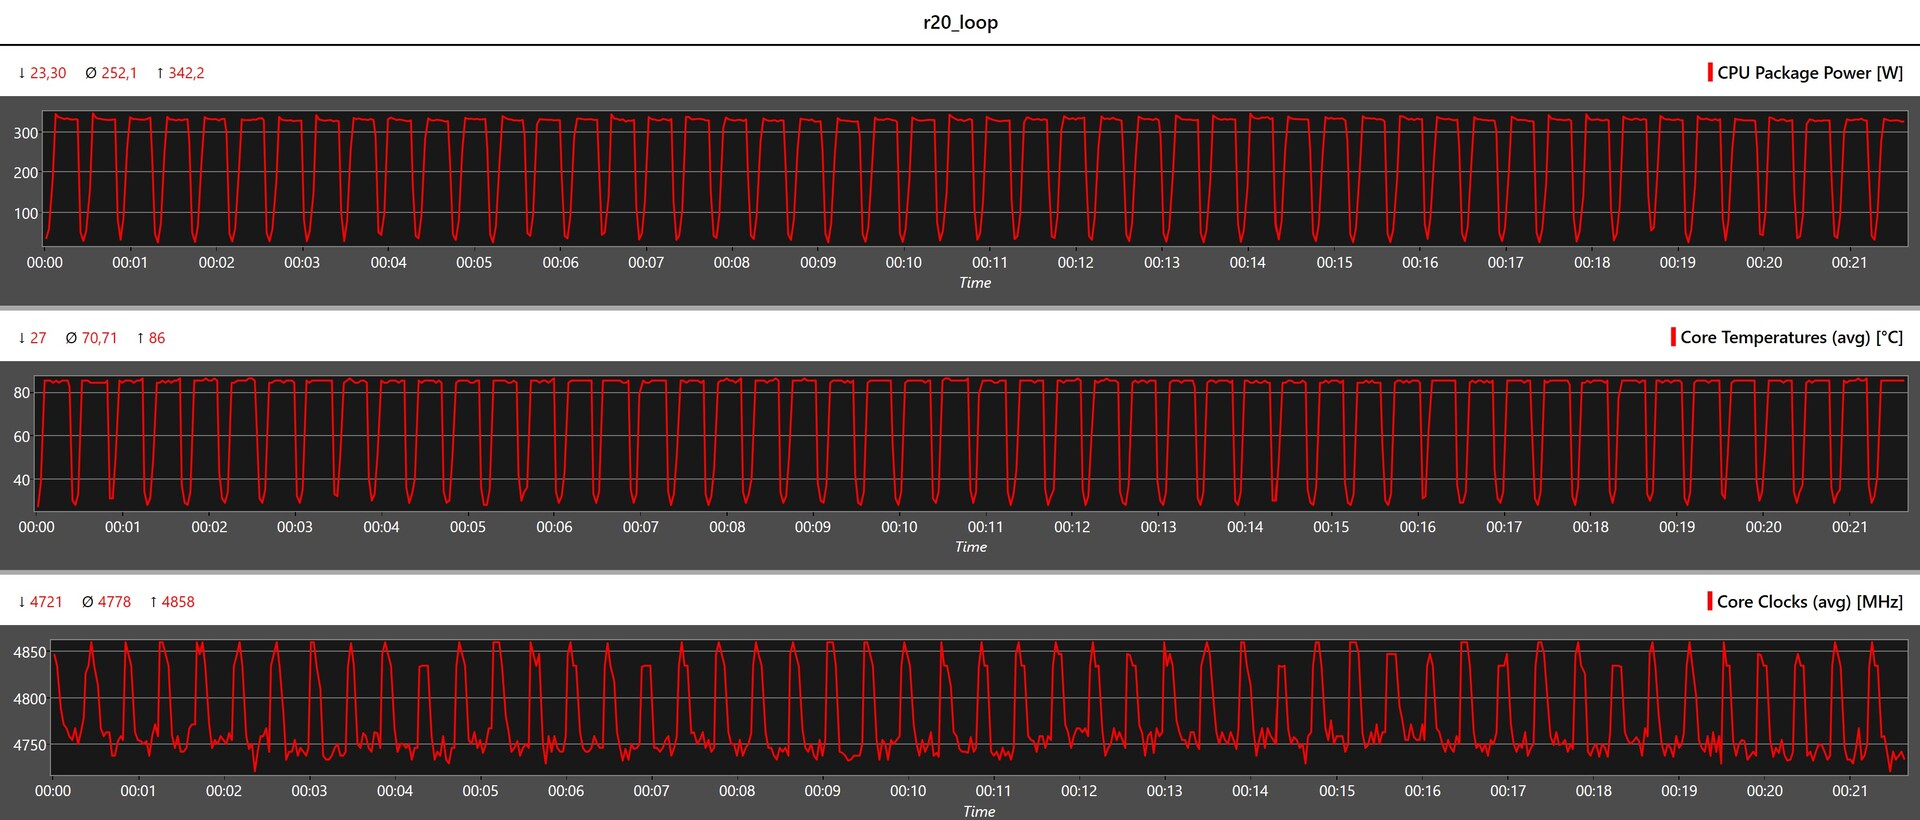
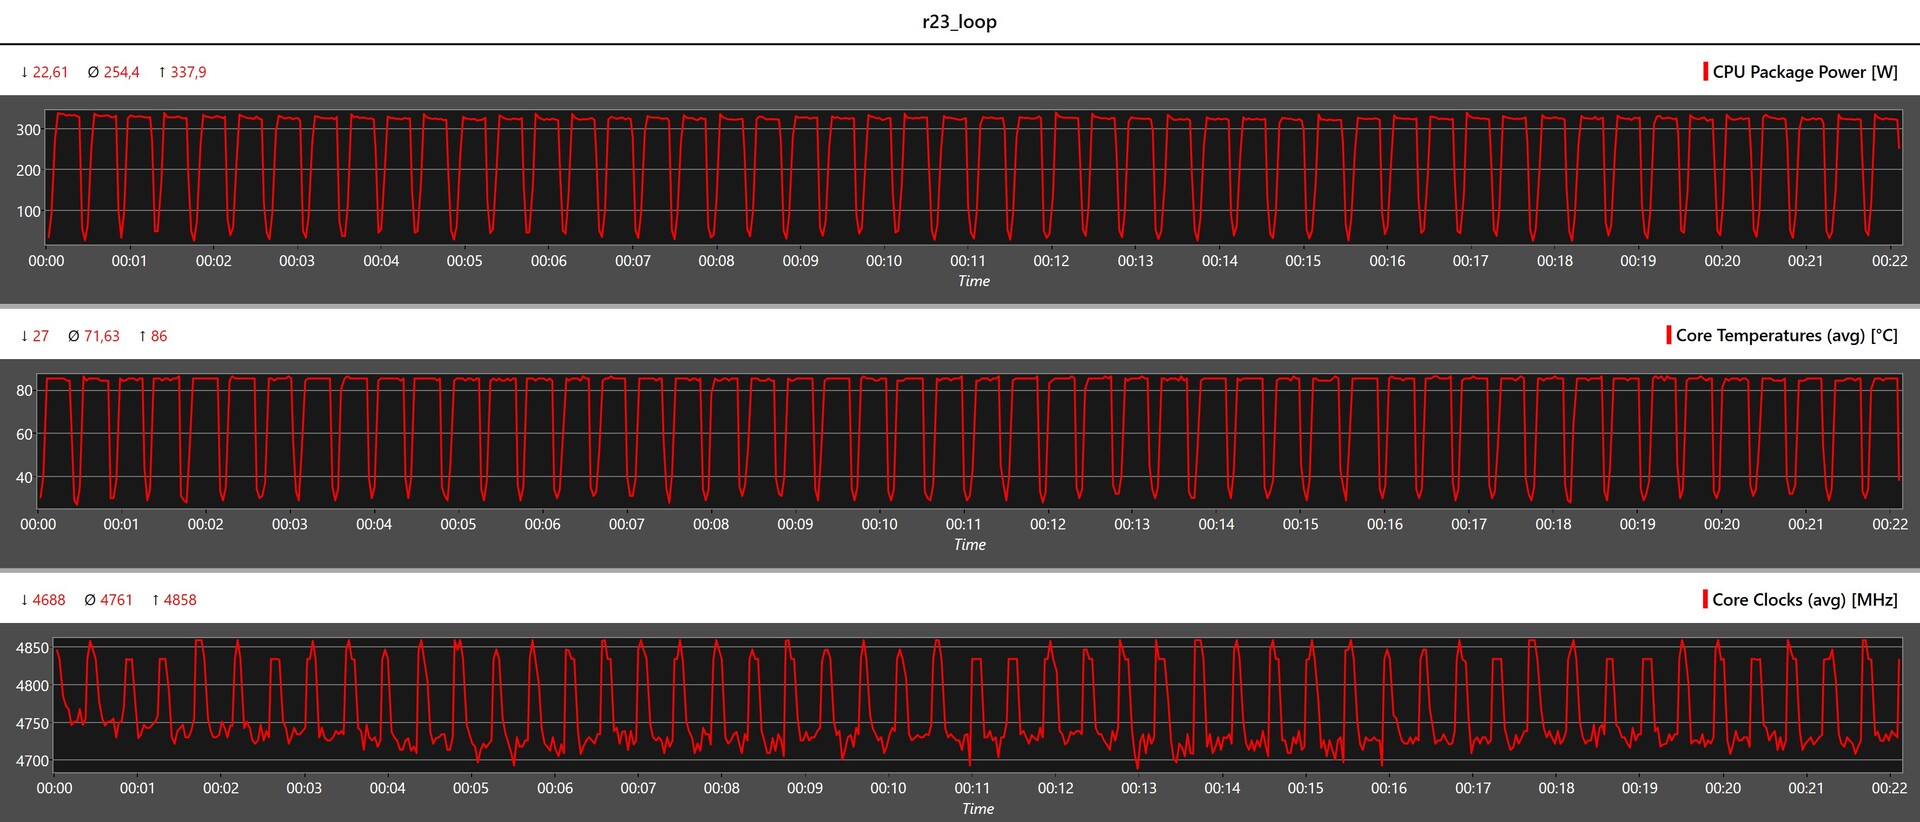
Intel Core i5-14600K
Benchmarks synthétiques et performances des applications
Après qu'AMD ait réussi à surpasser l'Intel Core i9-13900K avec le Ryzen 9 7950X, les rôles sont à nouveau inversés, donnant l'avantage à Intel. Mais cet avantage est également très limité si l'on regarde de plus près les résultats du benchmark PCMark 10.
Les deux modèles Raptor Lake Refresh ont passé les tests de mémoire vive avec brio. Avec sa mémoire vive DDR5-6000, l'Intel Core i9-14900K s'est assuré la première place. AMD a été dépassé de manière significative, même si les vitesses d'horloge sont les mêmes.
| PCMark 10 - Score | |
| Intel Core i9-14900K | |
| AMD Ryzen 9 7950X | |
| Intel Core i9-13900K | |
| Intel Core i5-14600K | |
| AMD Ryzen 7 7800X3D | |
| AMD Ryzen 5 7600X | |
| Intel Core i5-13600K | |
| Intel Core i9-12900K | |
| Intel Core i5-12600K | |
| 3DMark | |
| 1920x1080 Fire Strike Physics | |
| Intel Core i9-14900K | |
| Intel Core i9-13900K | |
| AMD Ryzen 9 7950X | |
| Intel Core i5-14600K | |
| Intel Core i9-12900K | |
| Intel Core i5-13600K | |
| AMD Ryzen 7 7800X3D | |
| AMD Ryzen 5 7600X | |
| Intel Core i5-12600K | |
| 2560x1440 Time Spy CPU | |
| Intel Core i9-14900K | |
| Intel Core i9-13900K | |
| Intel Core i5-14600K | |
| Intel Core i9-12900K | |
| Intel Core i5-13600K | |
| AMD Ryzen 9 7950X | |
| AMD Ryzen 7 7800X3D | |
| Intel Core i5-12600K | |
| AMD Ryzen 5 7600X | |
| 3DMark 11 - 1280x720 Performance Physics | |
| AMD Ryzen 7 7800X3D | |
| Intel Core i9-13900K | |
| Intel Core i9-14900K | |
| Intel Core i5-14600K | |
| Intel Core i5-13600K | |
| AMD Ryzen 9 7950X | |
| Intel Core i9-12900K | |
| AMD Ryzen 5 7600X | |
| Intel Core i5-12600K | |
| CrossMark - Overall | |
| Intel Core i9-14900K | |
| Intel Core i9-13900K | |
| AMD Ryzen 9 7950X | |
| Intel Core i5-14600K | |
| Intel Core i5-13600K | |
| AMD Ryzen 5 7600X | |
| AMD Ryzen 7 7800X3D | |
| AIDA64 / Memory Copy | |
| Intel Core i9-14900K | |
| Intel Core i9-14900K | |
| Intel Core i5-14600K | |
| Intel Core i9-13900K | |
| AMD Ryzen 9 7950X3D | |
| Intel Core i9-12900K | |
| AMD Ryzen 9 7950X | |
| Intel Core i5-13600K | |
| Intel Core i5-12600K | |
| AMD Ryzen 7 7800X3D | |
| AMD Ryzen 5 7600X | |
| Moyenne de la classe (4514 - 234662, n=2206) | |
| AIDA64 / Memory Read | |
| Intel Core i9-14900K | |
| Intel Core i9-14900K | |
| Intel Core i5-14600K | |
| Intel Core i9-13900K | |
| Intel Core i9-12900K | |
| AMD Ryzen 9 7950X3D | |
| AMD Ryzen 9 7950X | |
| Intel Core i5-12600K | |
| Intel Core i5-13600K | |
| AMD Ryzen 7 7800X3D | |
| AMD Ryzen 5 7600X | |
| Moyenne de la classe (4031 - 271066, n=2168) | |
| AIDA64 / Memory Write | |
| AMD Ryzen 7 7800X3D | |
| AMD Ryzen 9 7950X3D | |
| Intel Core i5-14600K | |
| Intel Core i9-14900K | |
| Intel Core i9-14900K | |
| AMD Ryzen 5 7600X | |
| AMD Ryzen 9 7950X | |
| Intel Core i9-13900K | |
| Intel Core i5-12600K | |
| Intel Core i9-12900K | |
| Intel Core i5-13600K | |
| Moyenne de la classe (3506 - 242868, n=2173) | |
| AIDA64 / Memory Latency | |
| Moyenne de la classe (6.1 - 536, n=2235) | |
| Intel Core i5-13600K | |
| Intel Core i9-13900K | |
| Intel Core i9-14900K | |
| Intel Core i9-14900K | |
| Intel Core i5-14600K | |
| AMD Ryzen 7 7800X3D | |
| AMD Ryzen 9 7950X3D | |
| AMD Ryzen 5 7600X | |
| AMD Ryzen 9 7950X | |
* ... Moindre est la valeur, meilleures sont les performances
| Performance rating - Percent | |
| Intel Core i9-14900K | |
| Intel Core i5-14600K | |
| AMD Ryzen 7 7800X3D | |
| AMD Ryzen 9 7950X3D | |
| AMD Ryzen 9 7950X | |
| Intel Core i9-13900K | |
| 3DMark | |
| 2560x1440 Time Spy Graphics | |
| Intel Core i5-14600K | |
| Intel Core i9-14900K | |
| AMD Ryzen 7 7800X3D | |
| AMD Ryzen 9 7950X | |
| AMD Ryzen 9 7950X3D | |
| Intel Core i9-13900K | |
| Fire Strike Extreme Graphics | |
| AMD Ryzen 7 7800X3D | |
| Intel Core i5-14600K | |
| Intel Core i9-14900K | |
| AMD Ryzen 9 7950X | |
| AMD Ryzen 9 7950X3D | |
| Intel Core i9-13900K | |
| 3840x2160 Fire Strike Ultra Graphics | |
| AMD Ryzen 7 7800X3D | |
| Intel Core i5-14600K | |
| Intel Core i9-14900K | |
| AMD Ryzen 9 7950X | |
| AMD Ryzen 9 7950X3D | |
| Intel Core i9-13900K | |
| 1920x1080 Fire Strike Graphics | |
| Intel Core i5-14600K | |
| AMD Ryzen 7 7800X3D | |
| AMD Ryzen 9 7950X3D | |
| AMD Ryzen 9 7950X | |
| Intel Core i9-14900K | |
| Intel Core i9-13900K | |
| Unigine Heaven 4.0 | |
| Extreme Preset DX11 | |
| AMD Ryzen 9 7950X3D | |
| AMD Ryzen 9 7950X | |
| Intel Core i9-14900K | |
| Intel Core i5-14600K | |
| Intel Core i9-13900K | |
| AMD Ryzen 7 7800X3D | |
| Extreme Preset OpenGL | |
| Intel Core i9-14900K | |
| AMD Ryzen 9 7950X3D | |
| Intel Core i5-14600K | |
| AMD Ryzen 9 7950X | |
| Intel Core i9-13900K | |
| AMD Ryzen 7 7800X3D | |
| Unigine Valley 1.0 | |
| 1920x1080 Extreme HD DirectX AA:x8 | |
| Intel Core i9-14900K | |
| Intel Core i5-14600K | |
| Intel Core i9-13900K | |
| AMD Ryzen 9 7950X3D | |
| AMD Ryzen 9 7950X | |
| AMD Ryzen 7 7800X3D | |
| 1920x1080 Extreme HD Preset OpenGL AA:x8 | |
| Intel Core i9-14900K | |
| Intel Core i9-13900K | |
| Intel Core i5-14600K | |
| AMD Ryzen 9 7950X3D | |
| AMD Ryzen 9 7950X | |
| AMD Ryzen 7 7800X3D | |
| Intel Core i9-14900K, NVIDIA GeForce RTX 4090 GeForce RTX 4090, i9-14900K, WDC PC SN720 SDAQNTW-512G | Intel Core i5-14600K, NVIDIA GeForce RTX 4090 GeForce RTX 4090, i5-14600K, WDC PC SN720 SDAQNTW-512G | Intel Core i9-13900K, NVIDIA GeForce RTX 4090 GeForce RTX 4090, i9-13900K | Intel Core i7-13700K, NVIDIA GeForce RTX 4090 GeForce RTX 4090, i7-13700K, Intel Optane 905P 480GB 2.5 | AMD Ryzen 9 7950X, NVIDIA GeForce RTX 4090 GeForce RTX 4090, R9 7950X, Corsair MP600 GS | AMD Ryzen 9 7950X3D, NVIDIA GeForce RTX 4090 GeForce RTX 4090, R9 7950X3D | AMD Ryzen 7 7800X3D, NVIDIA GeForce RTX 4090 GeForce RTX 4090, R7 7800X3D, Corsair MP600 | |
|---|---|---|---|---|---|---|---|
| SPECviewperf 12 | -2% | -14% | -4% | -15% | -7% | -7% | |
| 1900x1060 3ds Max (3dsmax-05) (fps) | 565 | 563 0% | 543 -4% | 543 -4% | 571 1% | 560 -1% | 564 0% |
| 1900x1060 Catia (catia-04) (fps) | 291 | 277 -5% | 263 -10% | 273 -6% | 257 -12% | 274 -6% | 263 -10% |
| 1900x1060 Creo (creo-01) (fps) | 127 | 122 -4% | 123 -3% | 124 -2% | 115 -9% | 118 -7% | 114 -10% |
| 1900x1060 Energy (energy-01) (fps) | 84.7 | 84.5 0% | 56.7 -33% | 83.8 -1% | 54.7 -35% | 80.1 -5% | 83.1 -2% |
| 1900x1060 Maya (maya-04) (fps) | 340 | 314 -8% | 290 -15% | 304 -11% | 317 -7% | 329 -3% | 306 -10% |
| 1900x1060 Medical (medical-01) (fps) | 303 | 299 -1% | 131 -57% | 284 -6% | 119 -61% | 212 -30% | 238 -21% |
| 1900x1060 Showcase (showcase-01) (fps) | 398 | 440 11% | 432 9% | 434 9% | 457 15% | 427 7% | 442 11% |
| 1900x1060 Siemens NX (snx-02) (fps) | 31.4 | 30 -4% | 28.7 -9% | 28.3 -10% | 27.1 -14% | 27.4 -13% | 28.8 -8% |
| 1900x1060 Solidworks (sw-03) (fps) | 139 | 133 -4% | 132 -5% | 132 -5% | 126 -9% | 130 -6% | 127 -9% |
| SPECviewperf 13 | -2% | -4% | -3% | -5% | -2% | -4% | |
| 3ds Max (3dsmax-06) (fps) | 567 | 563 -1% | 542 -4% | 529 -7% | 563 -1% | 573 1% | 575 1% |
| Catia (catia-05) (fps) | 428 | 406 -5% | 398 -7% | 408 -5% | 402 -6% | 427 0% | 412 -4% |
| Creo (creo-02) (fps) | 618 | 584 -6% | 570 -8% | 599 -3% | 552 -11% | 577 -7% | 562 -9% |
| Energy (energy-02) (fps) | 127 | 127 0% | 126 -1% | 127 0% | 126 -1% | 127 0% | 127 0% |
| Maya (maya-05) (fps) | 881 | 829 -6% | 736 -16% | 807 -8% | 715 -19% | 748 -15% | 679 -23% |
| Medical (medical-02) (fps) | 180 | 179 -1% | 190 6% | 190 6% | 186 3% | 189 5% | 186 3% |
| Showcase (showcase-02) (fps) | 400 | 440 10% | 436 9% | 430 8% | 455 14% | 456 14% | 438 10% |
| Siemens NX (snx-03) (fps) | 56.3 | 53.8 -4% | 51.9 -8% | 51.4 -9% | 49.1 -13% | 49.3 -12% | 51.6 -8% |
| Solidworks (sw-04) (fps) | 199 | 189 -5% | 189 -5% | 188 -6% | 186 -7% | 191 -4% | 182 -9% |
| SPECviewperf 2020 | -2% | -7% | -2% | -9% | -7% | -8% | |
| 3840x2160 Siemens NX (snx-04) (fps) | 47.2 | 46.3 -2% | 44.7 -5% | 43.4 -8% | 41.3 -13% | 42.5 -10% | 44.3 -6% |
| 3840x2160 Medical (medical-03) (fps) | 40.3 | 40.2 0% | 42 4% | 43.7 8% | 45.9 14% | 46.2 15% | 46.2 15% |
| 3840x2160 Energy (energy-03) (fps) | 230 | 229 0% | 141 -39% | 228 -1% | 141 -39% | 140 -39% | 140 -39% |
| 3840x2160 Creo (creo-03) (fps) | 148 | 139 -6% | 146 -1% | 139 -6% | 133 -10% | 140 -5% | 129 -13% |
| 3840x2160 CATIA (catia-06) (fps) | 97.1 | 94.3 -3% | 99.8 3% | 97.9 1% | 95.3 -2% | 95.9 -1% | 93.3 -4% |
| 3840x2160 3ds Max (3dsmax-07) (fps) | 236 | 235 0% | 231 -2% | 229 -3% | 228 -3% | 236 0% | 237 0% |
| Moyenne finale (programmes/paramètres) | -2% /
-2% | -8% /
-8% | -3% /
-3% | -10% /
-9% | -5% /
-5% | -6% /
-6% |
Points de repère pour les jeux
Auparavant, les processeurs d'Intel occupaient toujours le trône des performances dans les benchmarks de jeux, mais avec l'introduction de la plateforme AM5 et des processeurs Ryzen de la série 7000, qui sont désormais équipés de cache 3D V, les choses ont changé. Mais avec l'introduction de la plateforme AM5 et des processeurs Ryzen de la série 7000, qui sont désormais également dotés d'un cache 3D V, la donne a changé. Avec son Core i9-14900K, Intel réduit un peu l'écart avec AMD, mais cela ne suffit toujours pas pour obtenir la troisième place dans notre comparaison. En termes de performances de jeu pures, vous êtes actuellement équipé de manière optimale avec leRyzen 7 7800X3D. Le nouveau fleuron d'Intel se trouve à une petite distance d'environ 10 points de pourcentage. En revanche, l'Intel Core i9-14900K a remporté le duel contre l'AMD Ryzen 9 7950X.
Avec l'Intel Core i5-14600K, vous disposez actuellement d'un processeur très puissant, capable de surpasser l'Intel Core i7-13700K Intel Core i7-13700K.
Tous les systèmes présentés dans ce comparatif ont été testés avec la même carte graphique, à savoir une carte Pait GeForce RTX 4090 Gamerock OC.
| Performance rating - Percent | |
| AMD Ryzen 7 7800X3D | |
| AMD Ryzen 9 7950X3D | |
| Intel Core i9-14900K | |
| AMD Ryzen 9 7950X | |
| Intel Core i9-13900K | |
| AMD Ryzen 5 7600X | |
| Intel Core i5-14600K | |
| Intel Core i7-13700K | |
| Intel Core i7-13700 | |
| Intel Core i7-12700 | |
| Intel Core i5-13400 | |
| Intel Core i5-12400F | |
| F1 22 | |
| 1920x1080 Low Preset AA:T AF:16x | |
| AMD Ryzen 7 7800X3D | |
| AMD Ryzen 9 7950X3D | |
| Intel Core i9-14900K | |
| AMD Ryzen 9 7950X | |
| AMD Ryzen 5 7600X | |
| Intel Core i9-13900K | |
| Intel Core i7-13700K | |
| Intel Core i5-14600K | |
| Intel Core i7-13700 | |
| Intel Core i7-12700 | |
| Intel Core i5-12400F | |
| Intel Core i5-13400 | |
| 1920x1080 Ultra High Preset AA:T AF:16x | |
| AMD Ryzen 7 7800X3D | |
| Intel Core i9-14900K | |
| Intel Core i5-14600K | |
| AMD Ryzen 5 7600X | |
| AMD Ryzen 9 7950X3D | |
| AMD Ryzen 9 7950X | |
| Intel Core i9-13900K | |
| Intel Core i7-13700K | |
| Intel Core i7-13700 | |
| Intel Core i7-12700 | |
| Intel Core i5-12400F | |
| Intel Core i5-13400 | |
| Far Cry 5 | |
| 1920x1080 Ultra Preset AA:T | |
| AMD Ryzen 7 7800X3D | |
| AMD Ryzen 9 7950X3D | |
| Intel Core i9-14900K | |
| Intel Core i9-13900K | |
| Intel Core i5-14600K | |
| AMD Ryzen 9 7950X | |
| AMD Ryzen 5 7600X | |
| Intel Core i7-13700 | |
| Intel Core i7-13700K | |
| Intel Core i7-12700 | |
| Intel Core i5-13400 | |
| Intel Core i5-12400F | |
| 1280x720 Low Preset AA:T | |
| AMD Ryzen 7 7800X3D | |
| AMD Ryzen 9 7950X3D | |
| Intel Core i9-14900K | |
| Intel Core i9-13900K | |
| Intel Core i5-14600K | |
| Intel Core i7-13700K | |
| AMD Ryzen 5 7600X | |
| AMD Ryzen 9 7950X | |
| Intel Core i7-13700 | |
| Intel Core i7-12700 | |
| Intel Core i5-13400 | |
| Intel Core i5-12400F | |
| X-Plane 11.11 | |
| 1920x1080 high (fps_test=3) | |
| AMD Ryzen 7 7800X3D | |
| AMD Ryzen 9 7950X3D | |
| Intel Core i9-14900K | |
| Intel Core i9-13900K | |
| AMD Ryzen 9 7950X | |
| AMD Ryzen 5 7600X | |
| Intel Core i5-14600K | |
| Intel Core i7-13700K | |
| Intel Core i7-13700 | |
| Intel Core i7-12700 | |
| Intel Core i5-13400 | |
| Intel Core i5-12400F | |
| 1280x720 low (fps_test=1) | |
| Intel Core i9-13900K | |
| Intel Core i9-14900K | |
| Intel Core i5-14600K | |
| AMD Ryzen 9 7950X3D | |
| Intel Core i7-13700K | |
| AMD Ryzen 9 7950X | |
| AMD Ryzen 7 7800X3D | |
| Intel Core i7-13700 | |
| AMD Ryzen 5 7600X | |
| Intel Core i7-12700 | |
| Intel Core i5-13400 | |
| Intel Core i5-12400F | |
| Final Fantasy XV Benchmark | |
| 1920x1080 High Quality | |
| Intel Core i9-14900K | |
| AMD Ryzen 9 7950X | |
| AMD Ryzen 7 7800X3D | |
| Intel Core i5-14600K | |
| Intel Core i9-13900K | |
| AMD Ryzen 9 7950X3D | |
| Intel Core i7-13700K | |
| AMD Ryzen 5 7600X | |
| Intel Core i7-13700 | |
| Intel Core i7-12700 | |
| Intel Core i5-13400 | |
| Intel Core i5-12400F | |
| 1280x720 Lite Quality | |
| Intel Core i9-13900K | |
| AMD Ryzen 9 7950X | |
| AMD Ryzen 5 7600X | |
| Intel Core i7-13700 | |
| Intel Core i7-13700K | |
| AMD Ryzen 7 7800X3D | |
| Intel Core i5-14600K | |
| Intel Core i9-14900K | |
| AMD Ryzen 9 7950X3D | |
| Intel Core i7-12700 | |
| Intel Core i5-12400F | |
| Intel Core i5-13400 | |
| Dota 2 Reborn | |
| 1920x1080 ultra (3/3) best looking | |
| AMD Ryzen 7 7800X3D | |
| AMD Ryzen 9 7950X3D | |
| AMD Ryzen 9 7950X | |
| Intel Core i9-13900K | |
| Intel Core i9-14900K | |
| AMD Ryzen 5 7600X | |
| Intel Core i5-14600K | |
| Intel Core i7-13700K | |
| Intel Core i7-13700 | |
| Intel Core i7-12700 | |
| Intel Core i5-13400 | |
| Intel Core i5-12400F | |
| 1280x720 min (0/3) fastest | |
| AMD Ryzen 7 7800X3D | |
| AMD Ryzen 9 7950X3D | |
| AMD Ryzen 9 7950X | |
| Intel Core i9-14900K | |
| Intel Core i9-13900K | |
| AMD Ryzen 5 7600X | |
| Intel Core i5-14600K | |
| Intel Core i7-13700K | |
| Intel Core i7-13700 | |
| Intel Core i7-12700 | |
| Intel Core i5-12400F | |
| Intel Core i5-13400 | |
| The Witcher 3 | |
| 1920x1080 Ultra Graphics & Postprocessing (HBAO+) | |
| Intel Core i9-13900K | |
| AMD Ryzen 9 7950X | |
| Intel Core i5-14600K | |
| AMD Ryzen 7 7800X3D | |
| Intel Core i9-14900K | |
| AMD Ryzen 5 7600X | |
| Intel Core i7-13700K | |
| Intel Core i7-13700 | |
| AMD Ryzen 9 7950X3D | |
| Intel Core i7-12700 | |
| Intel Core i5-13400 | |
| Intel Core i5-12400F | |
| 1024x768 Low Graphics & Postprocessing | |
| AMD Ryzen 9 7950X3D | |
| AMD Ryzen 7 7800X3D | |
| Intel Core i9-14900K | |
| AMD Ryzen 9 7950X | |
| Intel Core i9-13900K | |
| AMD Ryzen 5 7600X | |
| Intel Core i7-13700K | |
| Intel Core i7-13700 | |
| Intel Core i5-14600K | |
| Intel Core i7-12700 | |
| Intel Core i5-13400 | |
| Intel Core i5-12400F | |
| GTA V | |
| 1920x1080 Highest AA:4xMSAA + FX AF:16x | |
| AMD Ryzen 7 7800X3D | |
| Intel Core i9-14900K | |
| Intel Core i9-13900K | |
| Intel Core i5-14600K | |
| AMD Ryzen 9 7950X | |
| AMD Ryzen 9 7950X3D | |
| Intel Core i7-13700K | |
| AMD Ryzen 5 7600X | |
| Intel Core i7-13700 | |
| Intel Core i7-12700 | |
| Intel Core i5-13400 | |
| Intel Core i5-12400F | |
| 1024x768 Lowest Settings possible | |
| AMD Ryzen 7 7800X3D | |
| AMD Ryzen 9 7950X | |
| AMD Ryzen 9 7950X3D | |
| AMD Ryzen 5 7600X | |
| Intel Core i9-14900K | |
| Intel Core i9-13900K | |
| Intel Core i7-13700 | |
| Intel Core i5-14600K | |
| Intel Core i7-13700K | |
| Intel Core i7-12700 | |
| Intel Core i5-13400 | |
| Intel Core i5-12400F | |
| Borderlands 3 | |
| 1280x720 Very Low Overall Quality (DX11) | |
| AMD Ryzen 7 7800X3D | |
| AMD Ryzen 9 7950X3D | |
| Intel Core i9-14900K | |
| Intel Core i9-13900K | |
| AMD Ryzen 9 7950X | |
| Intel Core i5-14600K | |
| AMD Ryzen 5 7600X | |
| Intel Core i7-13700 | |
| Intel Core i7-13700K | |
| Intel Core i7-12700 | |
| Intel Core i5-13400 | |
| Intel Core i5-12400F | |
| 1920x1080 Badass Overall Quality (DX11) | |
| AMD Ryzen 9 7950X3D | |
| AMD Ryzen 7 7800X3D | |
| Intel Core i9-14900K | |
| AMD Ryzen 9 7950X | |
| Intel Core i9-13900K | |
| Intel Core i5-14600K | |
| AMD Ryzen 5 7600X | |
| Intel Core i7-13700K | |
| Intel Core i7-13700 | |
| Intel Core i7-12700 | |
| Intel Core i5-13400 | |
| Intel Core i5-12400F | |
| Far Cry New Dawn | |
| 1280x720 Low Preset | |
| AMD Ryzen 7 7800X3D | |
| AMD Ryzen 9 7950X3D | |
| Intel Core i9-14900K | |
| Intel Core i9-13900K | |
| Intel Core i5-14600K | |
| Intel Core i7-13700 | |
| Intel Core i7-13700K | |
| AMD Ryzen 9 7950X | |
| AMD Ryzen 5 7600X | |
| Intel Core i7-12700 | |
| Intel Core i5-13400 | |
| Intel Core i5-12400F | |
| 1920x1080 Ultra Preset | |
| AMD Ryzen 7 7800X3D | |
| AMD Ryzen 9 7950X3D | |
| Intel Core i9-14900K | |
| Intel Core i9-13900K | |
| Intel Core i5-14600K | |
| AMD Ryzen 9 7950X | |
| Intel Core i7-13700K | |
| AMD Ryzen 5 7600X | |
| Intel Core i7-13700 | |
| Intel Core i7-12700 | |
| Intel Core i5-13400 | |
| Intel Core i5-12400F | |
| Shadow of the Tomb Raider | |
| 1280x720 Lowest Preset | |
| AMD Ryzen 7 7800X3D | |
| AMD Ryzen 9 7950X3D | |
| AMD Ryzen 9 7950X | |
| Intel Core i9-14900K | |
| AMD Ryzen 5 7600X | |
| Intel Core i9-13900K | |
| Intel Core i5-14600K | |
| Intel Core i7-13700 | |
| Intel Core i7-13700K | |
| Intel Core i7-12700 | |
| Intel Core i5-13400 | |
| Intel Core i5-12400F | |
| 1920x1080 Highest Preset AA:T | |
| AMD Ryzen 7 7800X3D | |
| AMD Ryzen 9 7950X3D | |
| Intel Core i9-14900K | |
| AMD Ryzen 9 7950X | |
| Intel Core i9-13900K | |
| AMD Ryzen 5 7600X | |
| Intel Core i5-14600K | |
| Intel Core i7-13700K | |
| Intel Core i7-13700 | |
| Intel Core i7-12700 | |
| Intel Core i5-13400 | |
| Intel Core i5-12400F | |
| Tiny Tina's Wonderlands | |
| 1920x1080 Low Preset (DX12) | |
| AMD Ryzen 7 7800X3D | |
| Intel Core i9-14900K | |
| AMD Ryzen 9 7950X3D | |
| Intel Core i5-14600K | |
| AMD Ryzen 9 7950X | |
| AMD Ryzen 5 7600X | |
| Intel Core i9-13900K | |
| Intel Core i7-13700 | |
| Intel Core i7-13700K | |
| Intel Core i7-12700 | |
| Intel Core i5-13400 | |
| Intel Core i5-12400F | |
| 1920x1080 Badass Preset (DX12) | |
| AMD Ryzen 7 7800X3D | |
| Intel Core i9-14900K | |
| AMD Ryzen 9 7950X3D | |
| Intel Core i5-14600K | |
| AMD Ryzen 9 7950X | |
| AMD Ryzen 5 7600X | |
| Intel Core i9-13900K | |
| Intel Core i7-13700 | |
| Intel Core i7-13700K | |
| Intel Core i7-12700 | |
| Intel Core i5-13400 | |
| Intel Core i5-12400F | |
| Strange Brigade | |
| 1280x720 lowest AF:1 | |
| AMD Ryzen 5 7600X | |
| Intel Core i9-14900K | |
| AMD Ryzen 7 7800X3D | |
| Intel Core i5-14600K | |
| AMD Ryzen 9 7950X | |
| Intel Core i9-13900K | |
| AMD Ryzen 9 7950X3D | |
| Intel Core i7-13700K | |
| Intel Core i7-13700 | |
| Intel Core i7-12700 | |
| Intel Core i5-12400F | |
| Intel Core i5-13400 | |
| 1920x1080 ultra AA:ultra AF:16 | |
| Intel Core i9-14900K | |
| AMD Ryzen 5 7600X | |
| AMD Ryzen 7 7800X3D | |
| AMD Ryzen 9 7950X | |
| Intel Core i9-13900K | |
| Intel Core i5-14600K | |
| AMD Ryzen 9 7950X3D | |
| Intel Core i7-13700K | |
| Intel Core i7-13700 | |
| Intel Core i7-12700 | |
| Intel Core i5-12400F | |
| Intel Core i5-13400 | |
| Metro Exodus | |
| 1280x720 Low Quality AF:4x | |
| AMD Ryzen 7 7800X3D | |
| Intel Core i9-14900K | |
| AMD Ryzen 5 7600X | |
| AMD Ryzen 9 7950X | |
| Intel Core i5-14600K | |
| AMD Ryzen 9 7950X3D | |
| Intel Core i7-13700 | |
| Intel Core i9-13900K | |
| Intel Core i7-13700K | |
| Intel Core i7-12700 | |
| Intel Core i5-12400F | |
| Intel Core i5-13400 | |
| 1920x1080 Ultra Quality AF:16x | |
| AMD Ryzen 7 7800X3D | |
| Intel Core i9-14900K | |
| Intel Core i5-14600K | |
| AMD Ryzen 9 7950X | |
| AMD Ryzen 5 7600X | |
| AMD Ryzen 9 7950X3D | |
| Intel Core i9-13900K | |
| Intel Core i7-13700 | |
| Intel Core i7-13700K | |
| Intel Core i7-12700 | |
| Intel Core i5-13400 | |
| Intel Core i5-12400F | |
| F1 2020 | |
| 1280x720 Ultra Low Preset | |
| AMD Ryzen 7 7800X3D | |
| Intel Core i9-14900K | |
| AMD Ryzen 9 7950X3D | |
| AMD Ryzen 9 7950X | |
| AMD Ryzen 5 7600X | |
| Intel Core i9-13900K | |
| Intel Core i7-13700K | |
| Intel Core i7-13700 | |
| Intel Core i5-14600K | |
| Intel Core i7-12700 | |
| Intel Core i5-12400F | |
| Intel Core i5-13400 | |
| 1920x1080 Ultra High Preset AA:T AF:16x | |
| AMD Ryzen 7 7800X3D | |
| AMD Ryzen 9 7950X3D | |
| Intel Core i9-14900K | |
| AMD Ryzen 5 7600X | |
| AMD Ryzen 9 7950X | |
| Intel Core i9-13900K | |
| Intel Core i5-14600K | |
| Intel Core i7-13700K | |
| Intel Core i7-13700 | |
| Intel Core i7-12700 | |
| Intel Core i5-12400F | |
| Intel Core i5-13400 | |
| F1 2021 | |
| 1280x720 Ultra Low Preset | |
| AMD Ryzen 7 7800X3D | |
| Intel Core i9-14900K | |
| AMD Ryzen 5 7600X | |
| AMD Ryzen 9 7950X3D | |
| AMD Ryzen 9 7950X | |
| Intel Core i9-13900K | |
| Intel Core i7-13700K | |
| Intel Core i7-13700 | |
| Intel Core i5-14600K | |
| Intel Core i7-12700 | |
| Intel Core i5-12400F | |
| Intel Core i5-13400 | |
| 1920x1080 Ultra High Preset + Raytracing AA:T AF:16x | |
| AMD Ryzen 7 7800X3D | |
| Intel Core i9-14900K | |
| Intel Core i5-14600K | |
| AMD Ryzen 5 7600X | |
| Intel Core i9-13900K | |
| AMD Ryzen 9 7950X | |
| AMD Ryzen 9 7950X3D | |
| Intel Core i7-13700K | |
| Intel Core i7-13700 | |
| Intel Core i7-12700 | |
| Intel Core i5-12400F | |
| Intel Core i5-13400 | |
Intel Core i9-14900K with Nvidia GeForce RTX 4090
| Bas | Moyen | Élevé | Ultra | QHD | 4K DLSS | 4K | |
|---|---|---|---|---|---|---|---|
| GTA V (2015) | 187.9 | 187.8 | 187.6 | 170.9 | 171.9 | 187.6 | |
| The Witcher 3 (2015) | 829 | 750 | 661 | 314 | 273 | 293 | |
| Dota 2 Reborn (2015) | 299.9 | 258.2 | 248.2 | 231.4 | 227.8 | ||
| Final Fantasy XV Benchmark (2018) | 235 | 233 | 234 | 229 | 161.9 | ||
| X-Plane 11.11 (2018) | 244 | 212 | 161 | 136.3 | |||
| Far Cry 5 (2018) | 280 | 246 | 234 | 217 | 216 | 187 | |
| Strange Brigade (2018) | 762 | 619 | 612 | 602 | 542 | 291 | |
| Shadow of the Tomb Raider (2018) | 332 | 326 | 318 | 313 | 293 | 189.7 | |
| Far Cry New Dawn (2019) | 235 | 202 | 194 | 175 | 174 | 161 | |
| Metro Exodus (2019) | 319 | 288 | 250 | 214 | 194.6 | 143.4 | |
| Borderlands 3 (2019) | 263 | 232 | 215 | 204 | 198.4 | 137.9 | |
| F1 2020 (2020) | 598 | 503 | 497 | 450 | 426 | 289 | |
| F1 2021 (2021) | 733 | 683 | 586 | 307 | 291 | 203 | |
| Far Cry 6 (2021) | 264 | 228 | 202 | 204 | 195.6 | 141.9 | |
| Forza Horizon 5 (2021) | 416 | 337 | 317 | 224 | 207 | 162 | |
| God of War (2022) | 283 | 283 | 274 | 215 | 183.3 | 134 | |
| GRID Legends (2022) | 290 | 257 | 238 | 230 | 225 | 191.2 | |
| Tiny Tina's Wonderlands (2022) | 502 | 427 | 359 | 305 | 234 | 131.7 | |
| F1 22 (2022) | 462 | 483 | 429 | 217 | 161.1 | 83.4 | |
| The Quarry (2022) | 432 | 343 | 297 | 261 | 198.7 | 81.8 | |
| The Witcher 3 v4 (2023) | 378 | 325 | 289 | 270 | 266 | 170.7 | |
| F1 23 (2023) | 454 | 472 | 453 | 213 | 155.5 | 134.4 | 80.1 |
| Cyberpunk 2077 (2023) | 198.8 | 199.9 | 188.4 | 179.5 | 161.7 | 78.9 | |
| F1 24 (2024) | 377 | 408 | 389 | 217 | 177.5 | 93.9 | |
| F1 25 (2025) | 299 | 290 | 277 | 95.9 | 60.4 | 29.4 |
Intel Core i5-14600K with Nvidia GeForce RTX 4090
| Bas | Moyen | Élevé | Ultra | QHD | 4K DLSS | 4K | |
|---|---|---|---|---|---|---|---|
| GTA V (2015) | 187.7 | 187.6 | 186.9 | 162.3 | 163.5 | 187.4 | |
| The Witcher 3 (2015) | 632 | 585 | 550 | 316 | 275 | 288 | |
| Dota 2 Reborn (2015) | 261.5 | 239.2 | 229.9 | 217 | 211.5 | ||
| Final Fantasy XV Benchmark (2018) | 236 | 237 | 233 | 226 | 161.5 | ||
| X-Plane 11.11 (2018) | 228 | 196.9 | 147.8 | 124.6 | |||
| Far Cry 5 (2018) | 255 | 219 | 211 | 196 | 195 | 181 | |
| Strange Brigade (2018) | 717 | 542 | 548 | 546 | 514 | 289 | |
| Shadow of the Tomb Raider (2018) | 281 | 272 | 279 | 272 | 266 | 188.8 | |
| Far Cry New Dawn (2019) | 216 | 189 | 180 | 163 | 162 | 153 | |
| Metro Exodus (2019) | 296 | 271 | 238 | 202 | 188.8 | 142.1 | |
| Borderlands 3 (2019) | 237 | 209 | 192.9 | 182 | 179.3 | 136.1 | |
| F1 2020 (2020) | 403 | 402 | 406 | 373 | 368 | 288 | |
| F1 2021 (2021) | 562 | 541 | 468 | 278 | 268 | 201 | |
| Far Cry 6 (2021) | 230 | 199.8 | 178.3 | 182.4 | 175.5 | 139.4 | |
| Forza Horizon 5 (2021) | 364 | 300 | 292 | 214 | 199 | 162 | |
| God of War (2022) | 244 | 245 | 244 | 214 | 180 | 130.9 | |
| GRID Legends (2022) | 248 | 220 | 208 | 201 | 201 | 181.6 | |
| Tiny Tina's Wonderlands (2022) | 429 | 372 | 319 | 291 | 232 | 130.4 | |
| F1 22 (2022) | 379 | 390 | 380 | 210 | 160.3 | 83.5 | |
| The Quarry (2022) | 359 | 312 | 277 | 252 | 197.1 | 82.9 | |
| The Witcher 3 v4 (2023) | 317 | 285 | 313 | 226 | 225 | 169 | |
| F1 23 (2023) | 376 | 393 | 374 | 199.7 | 154.5 | 134 | 79.9 |
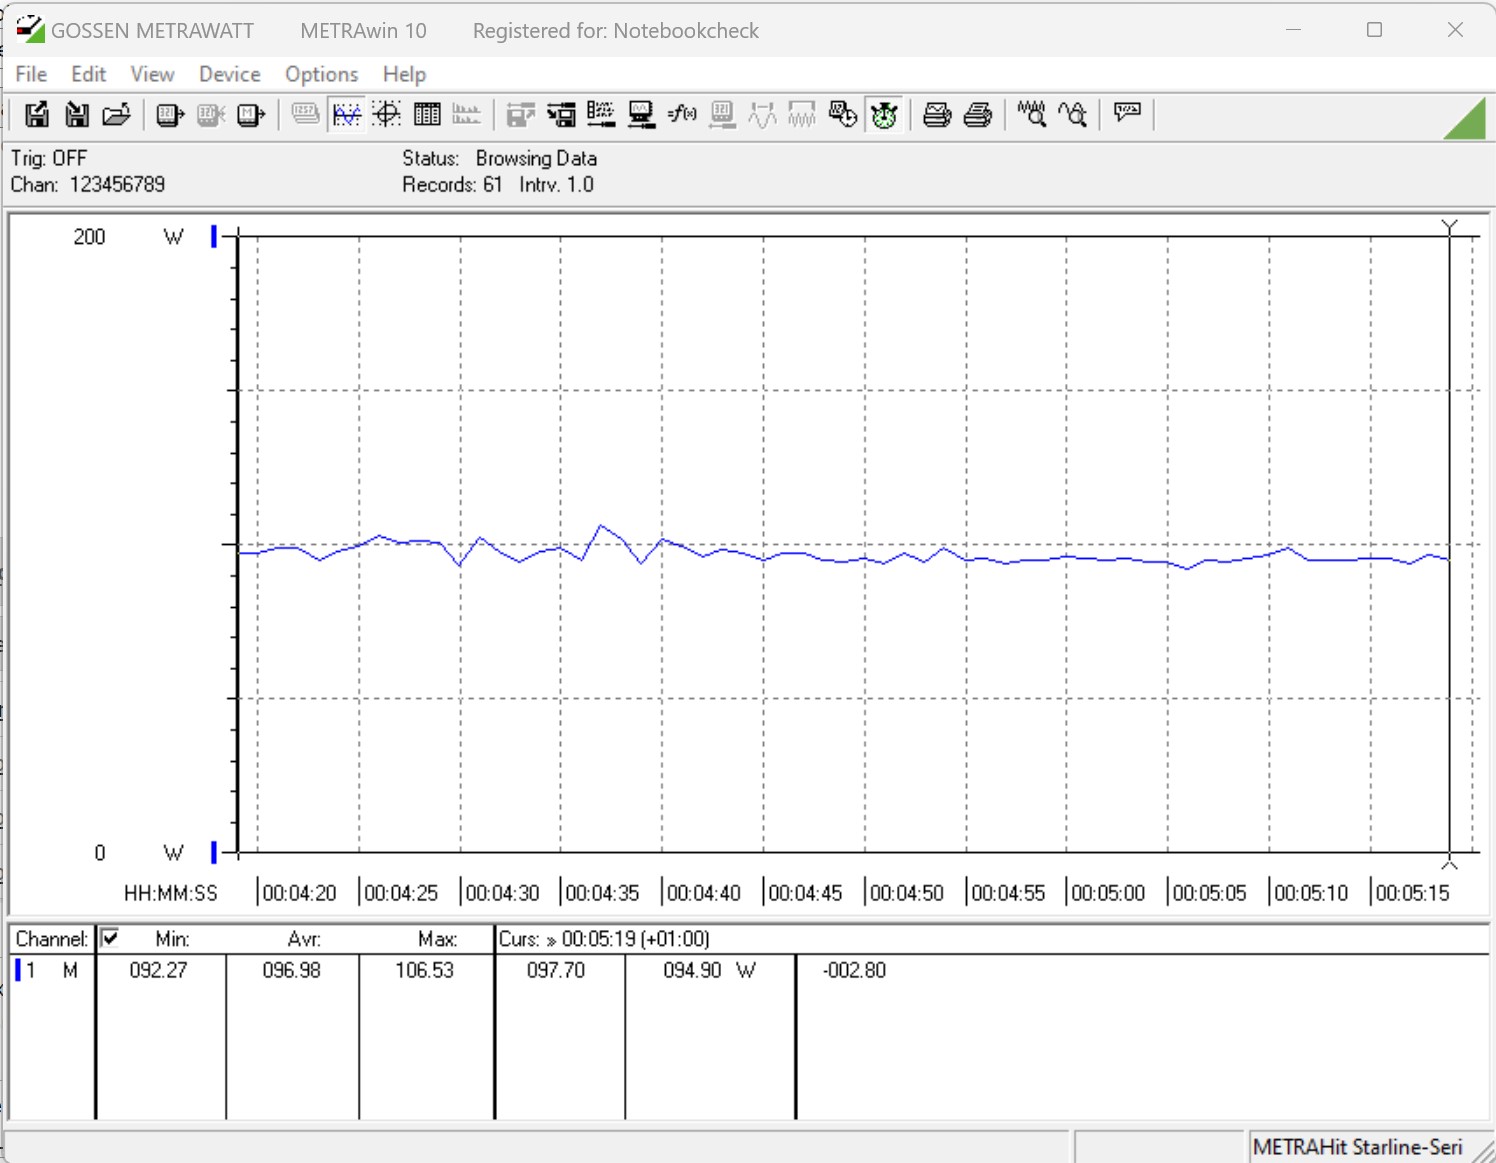
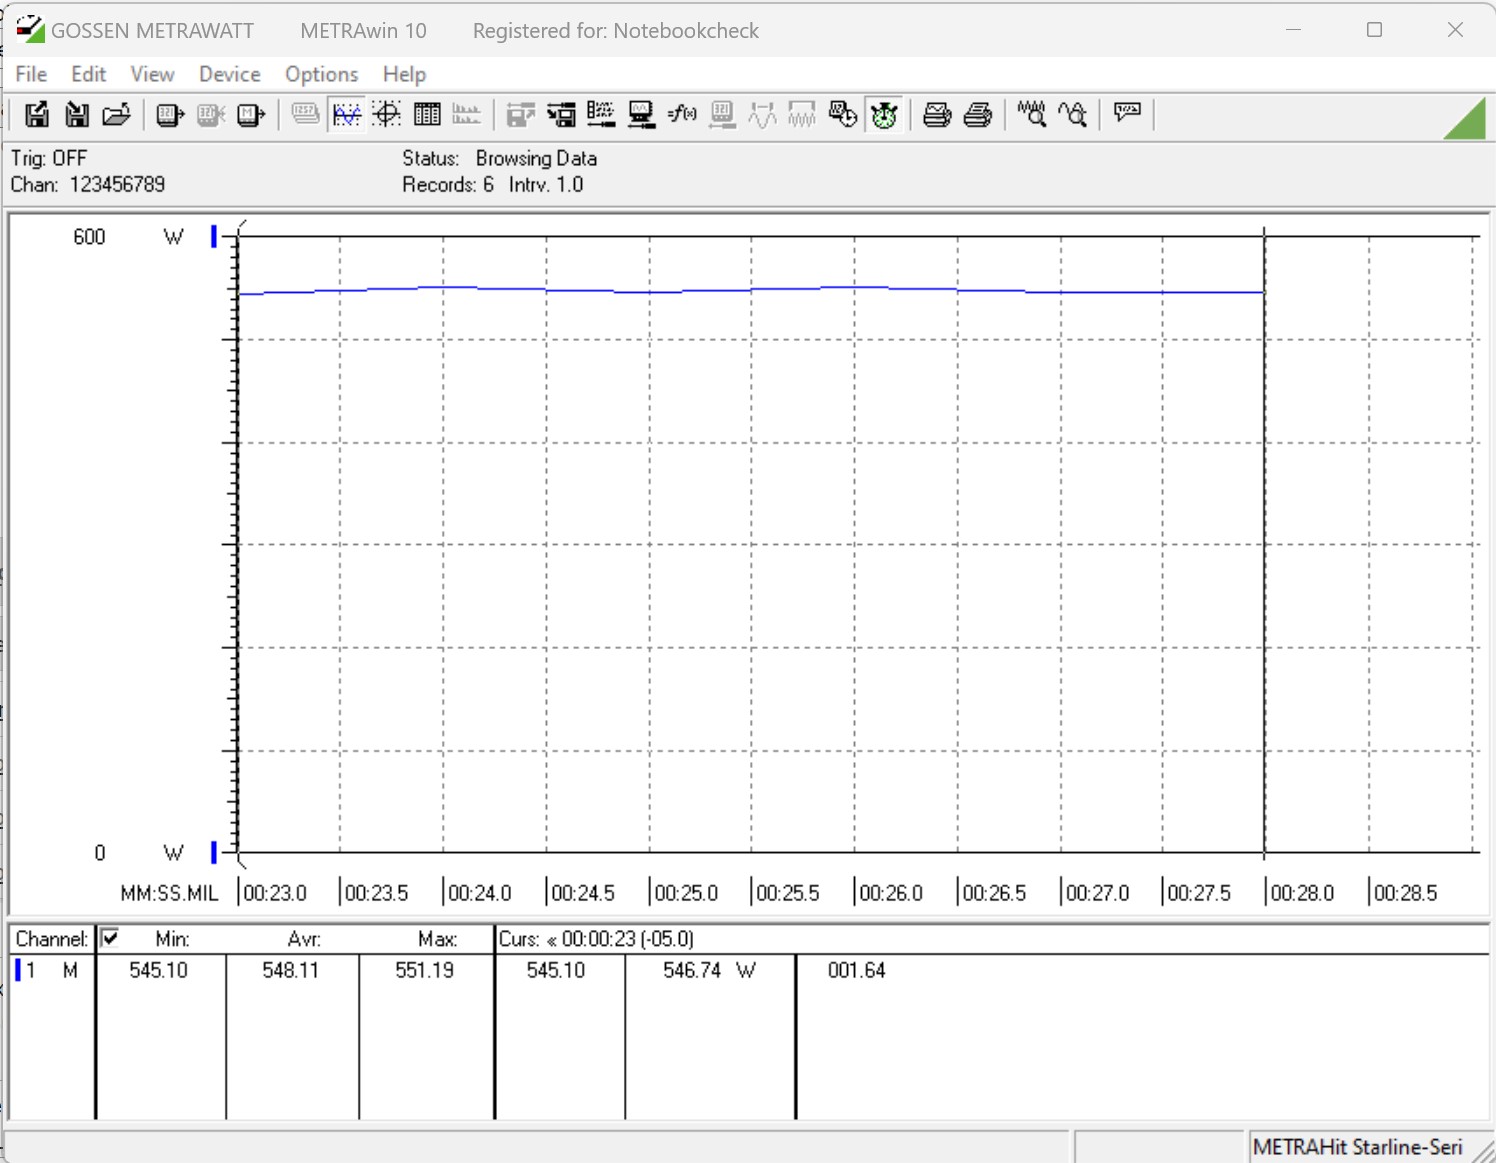
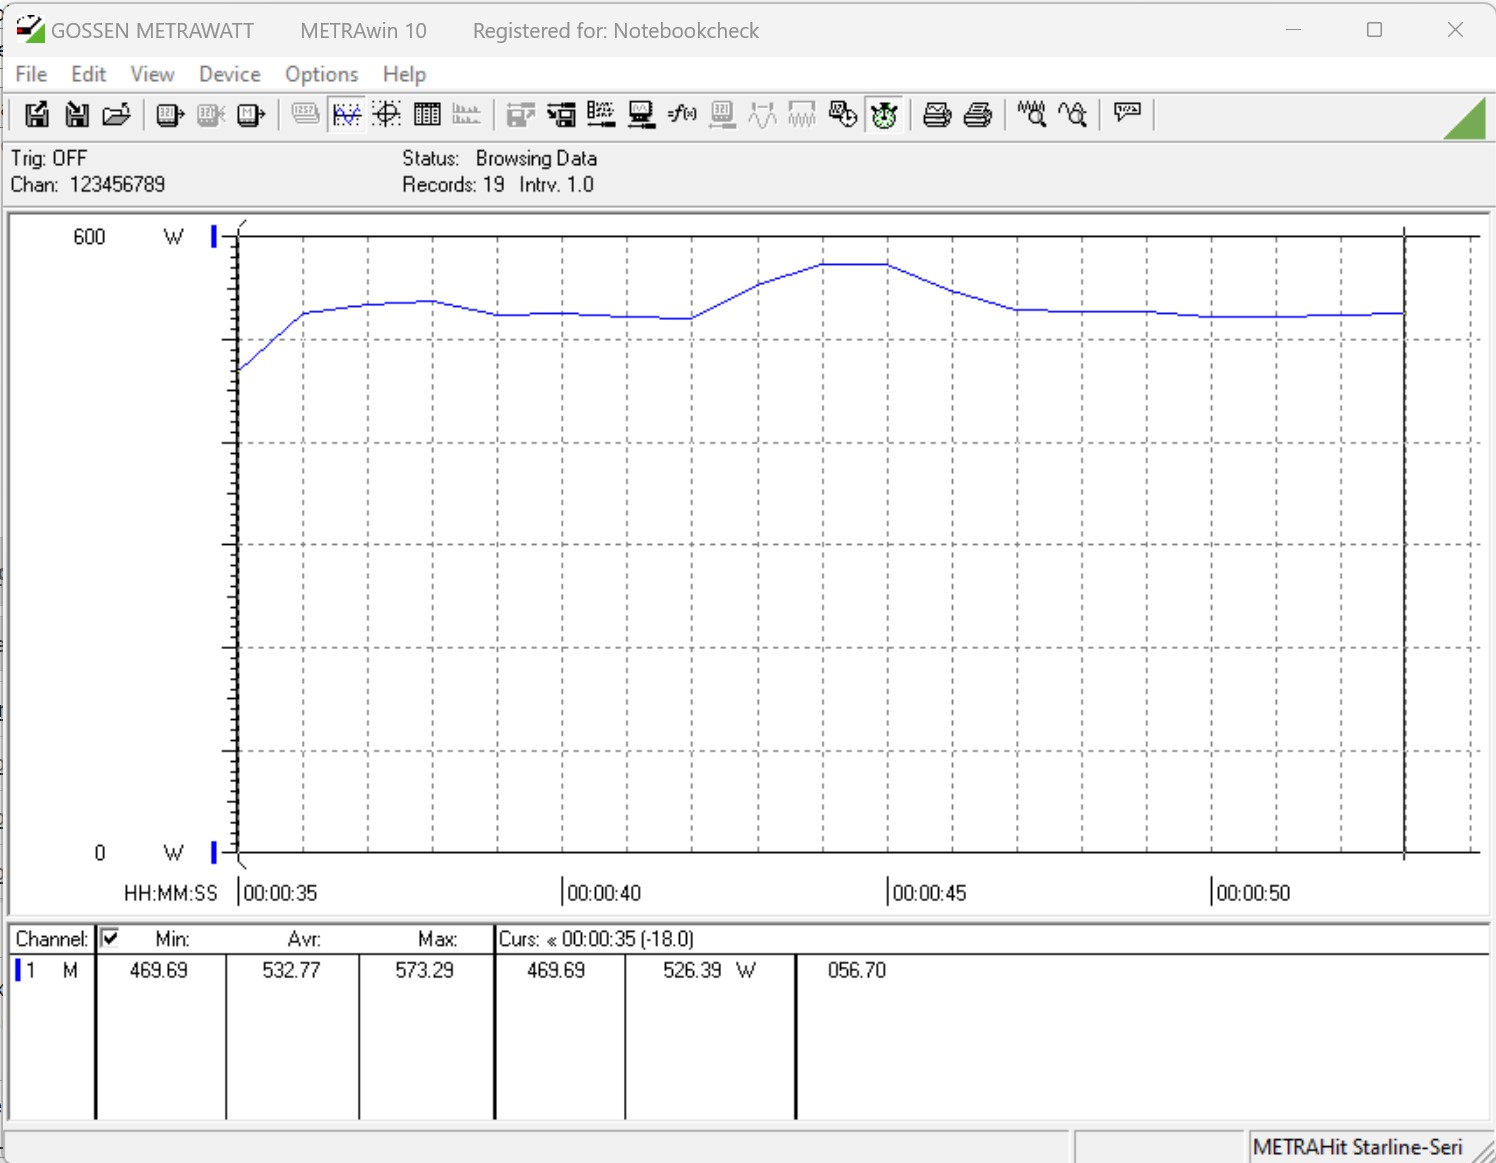
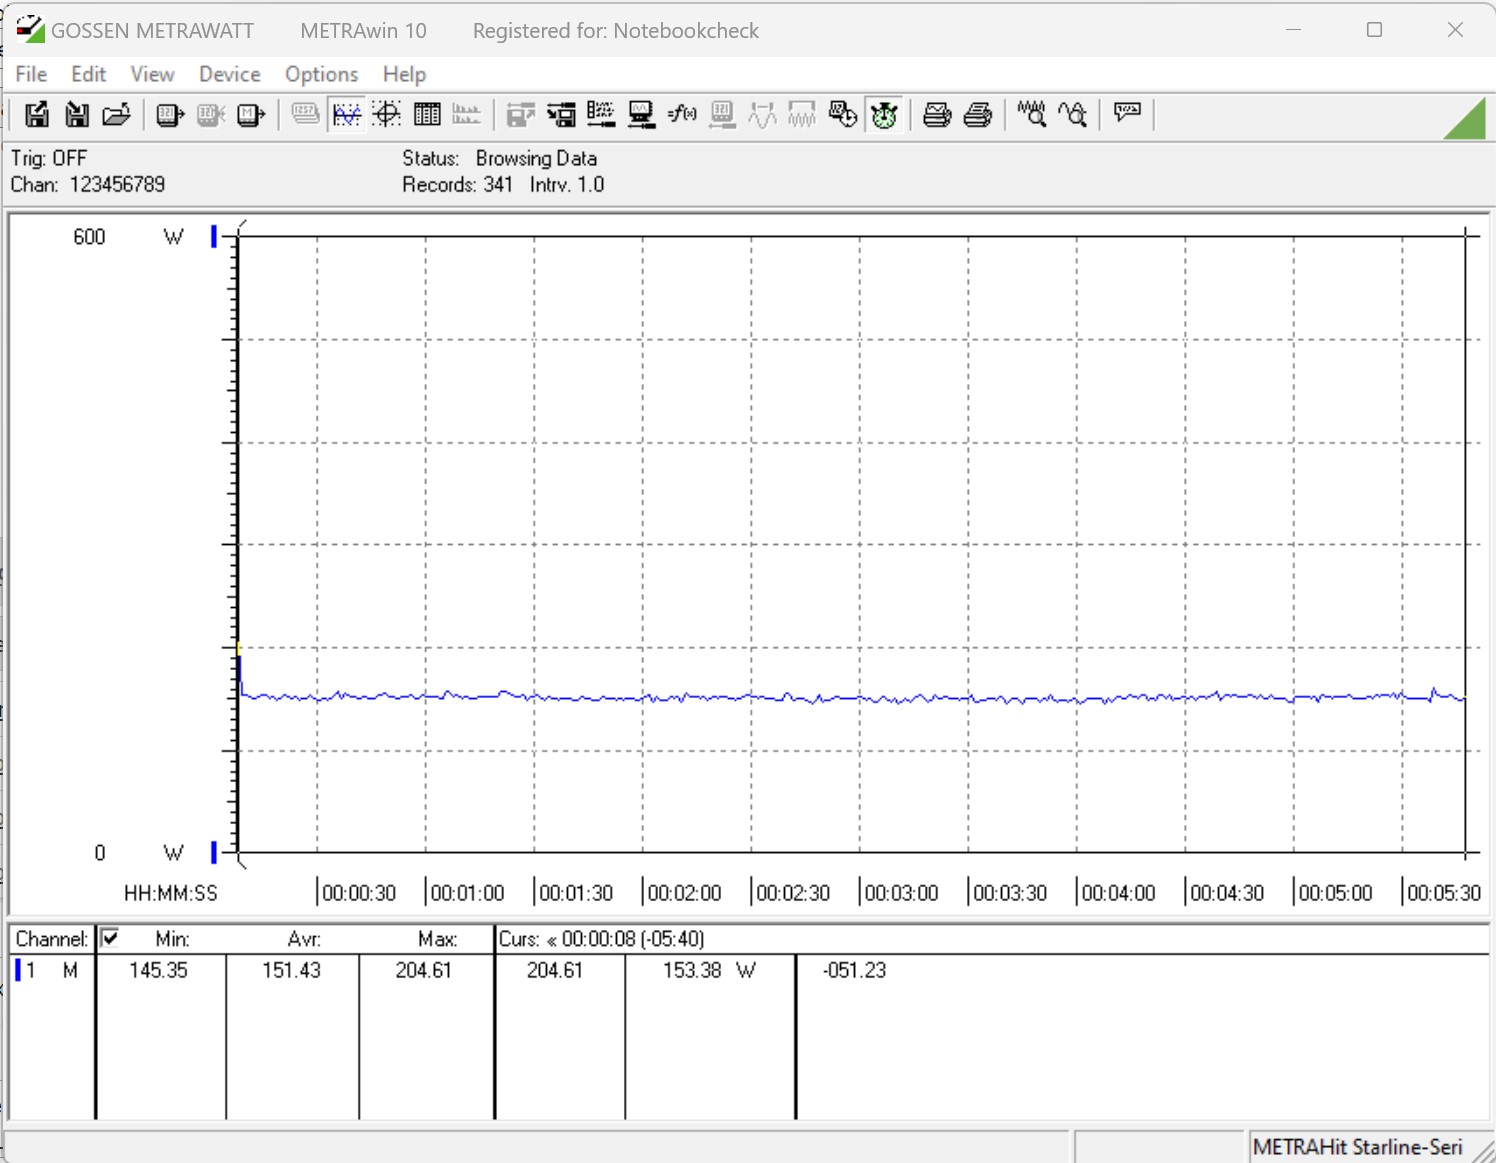
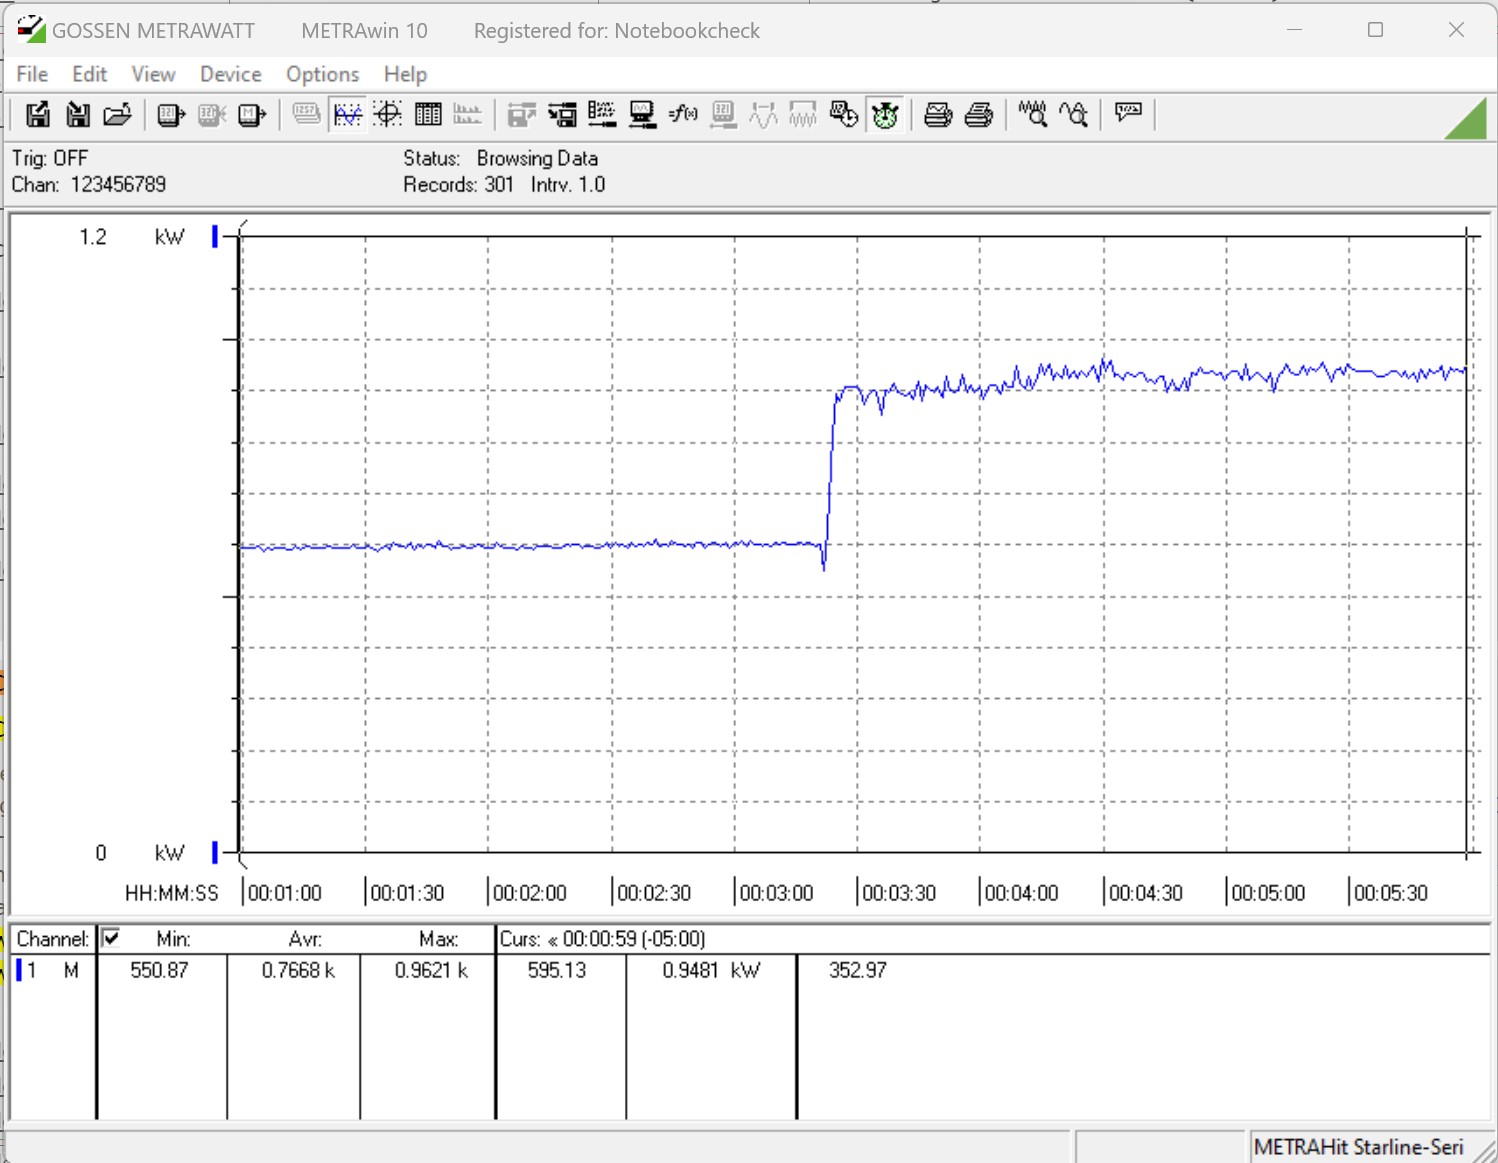
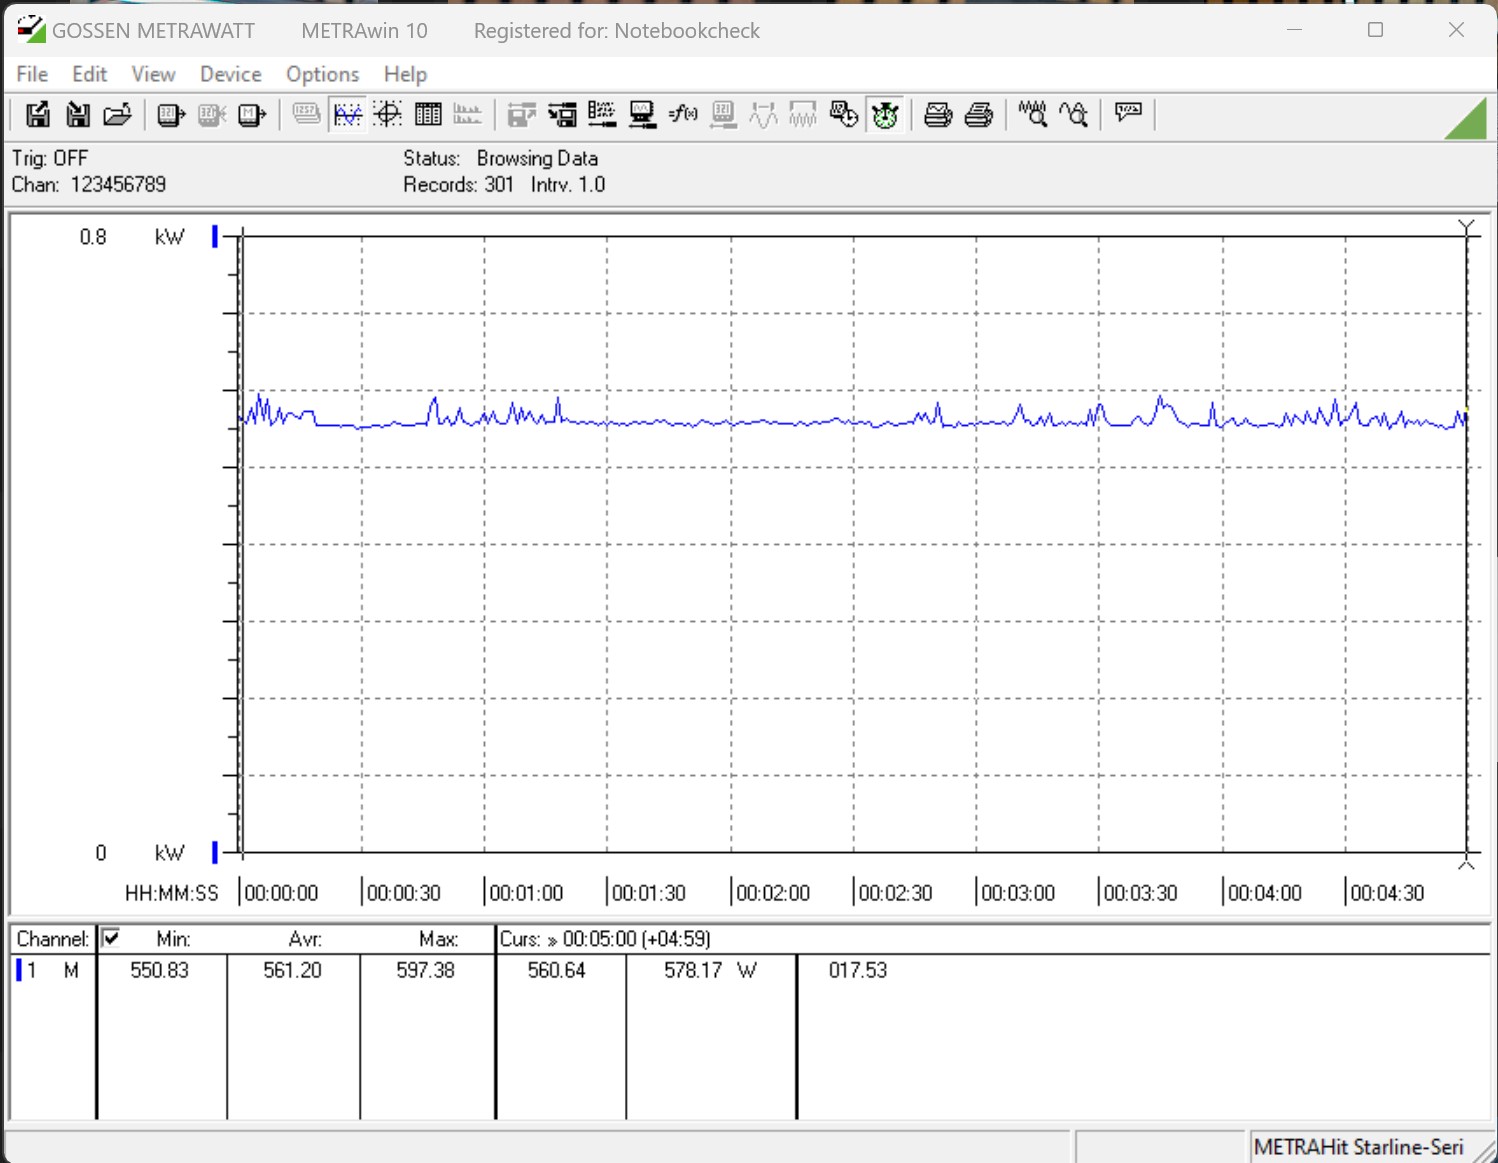
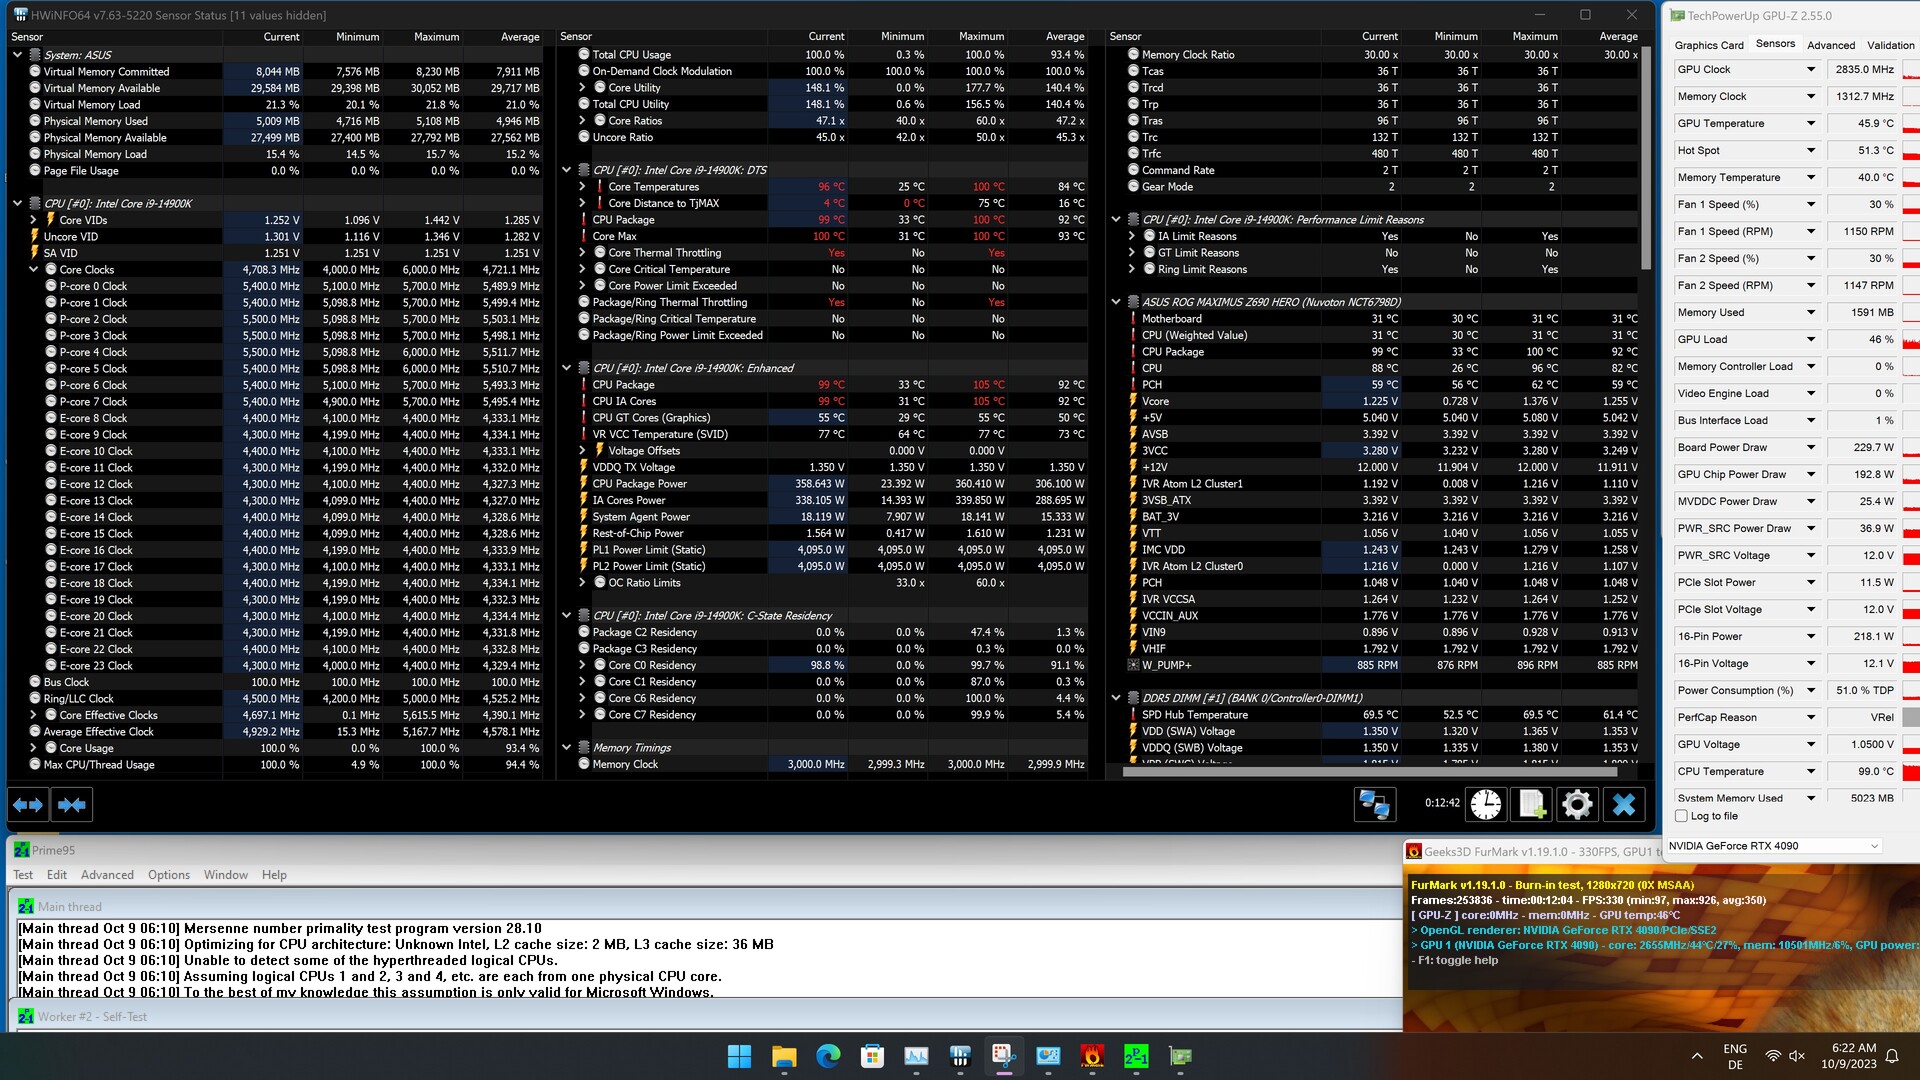
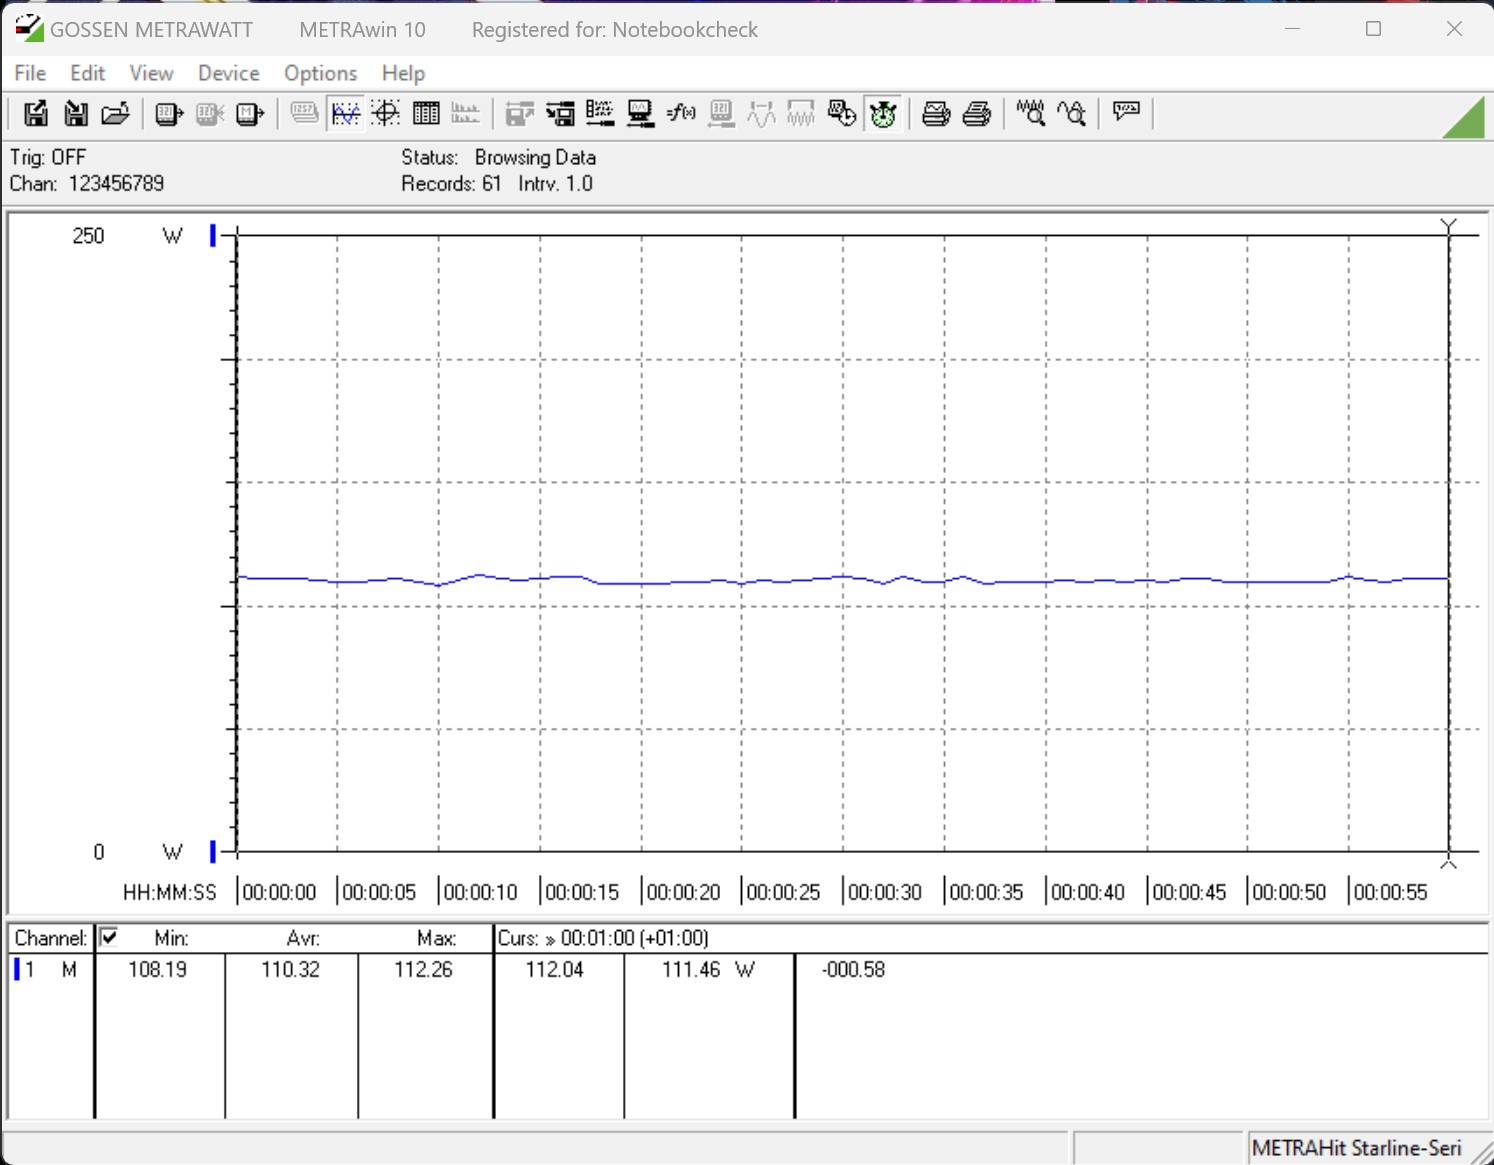
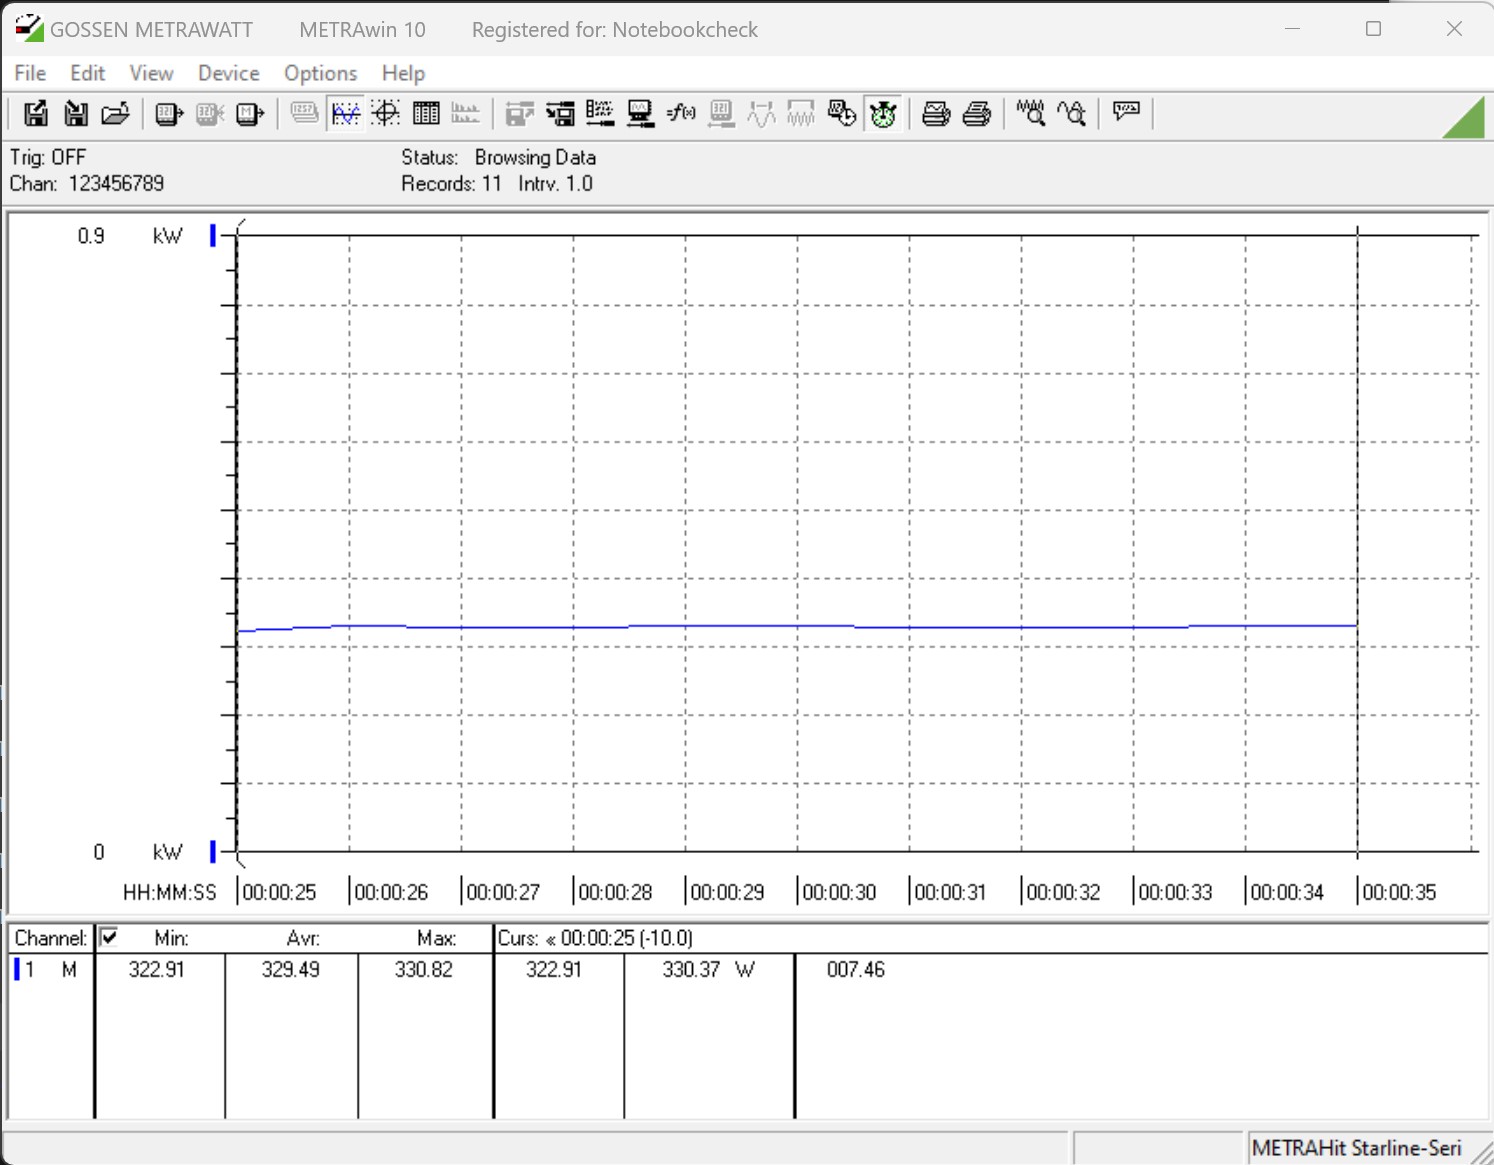
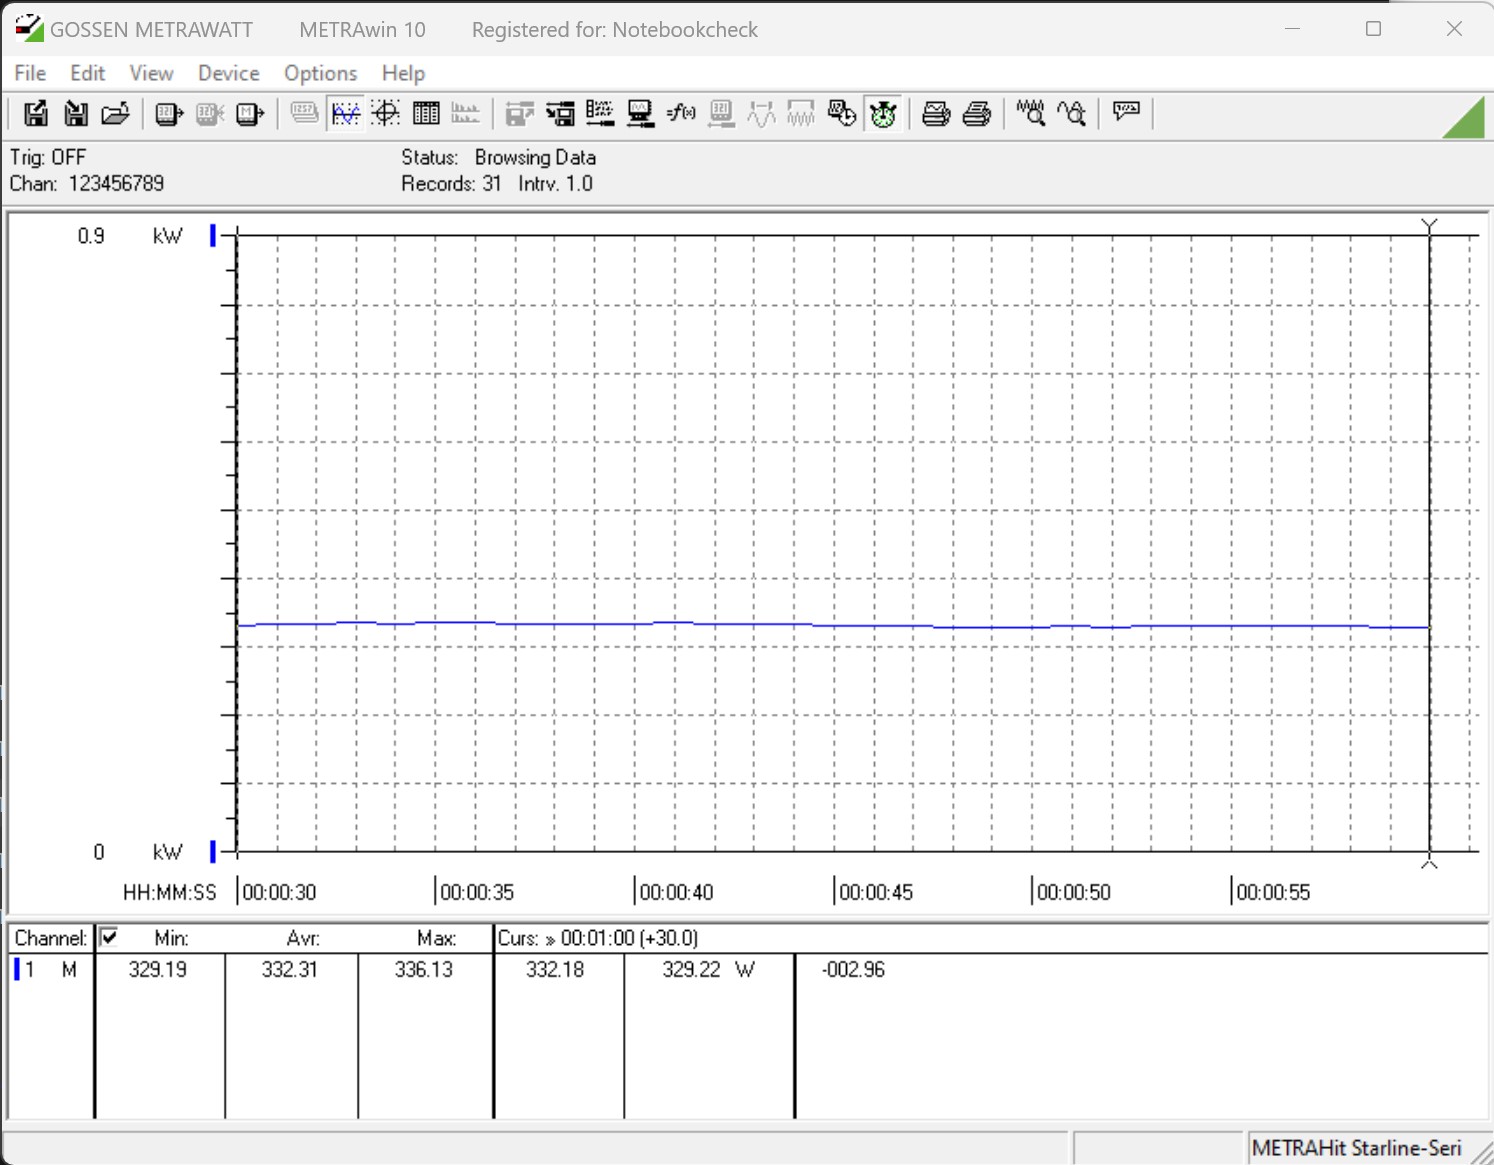
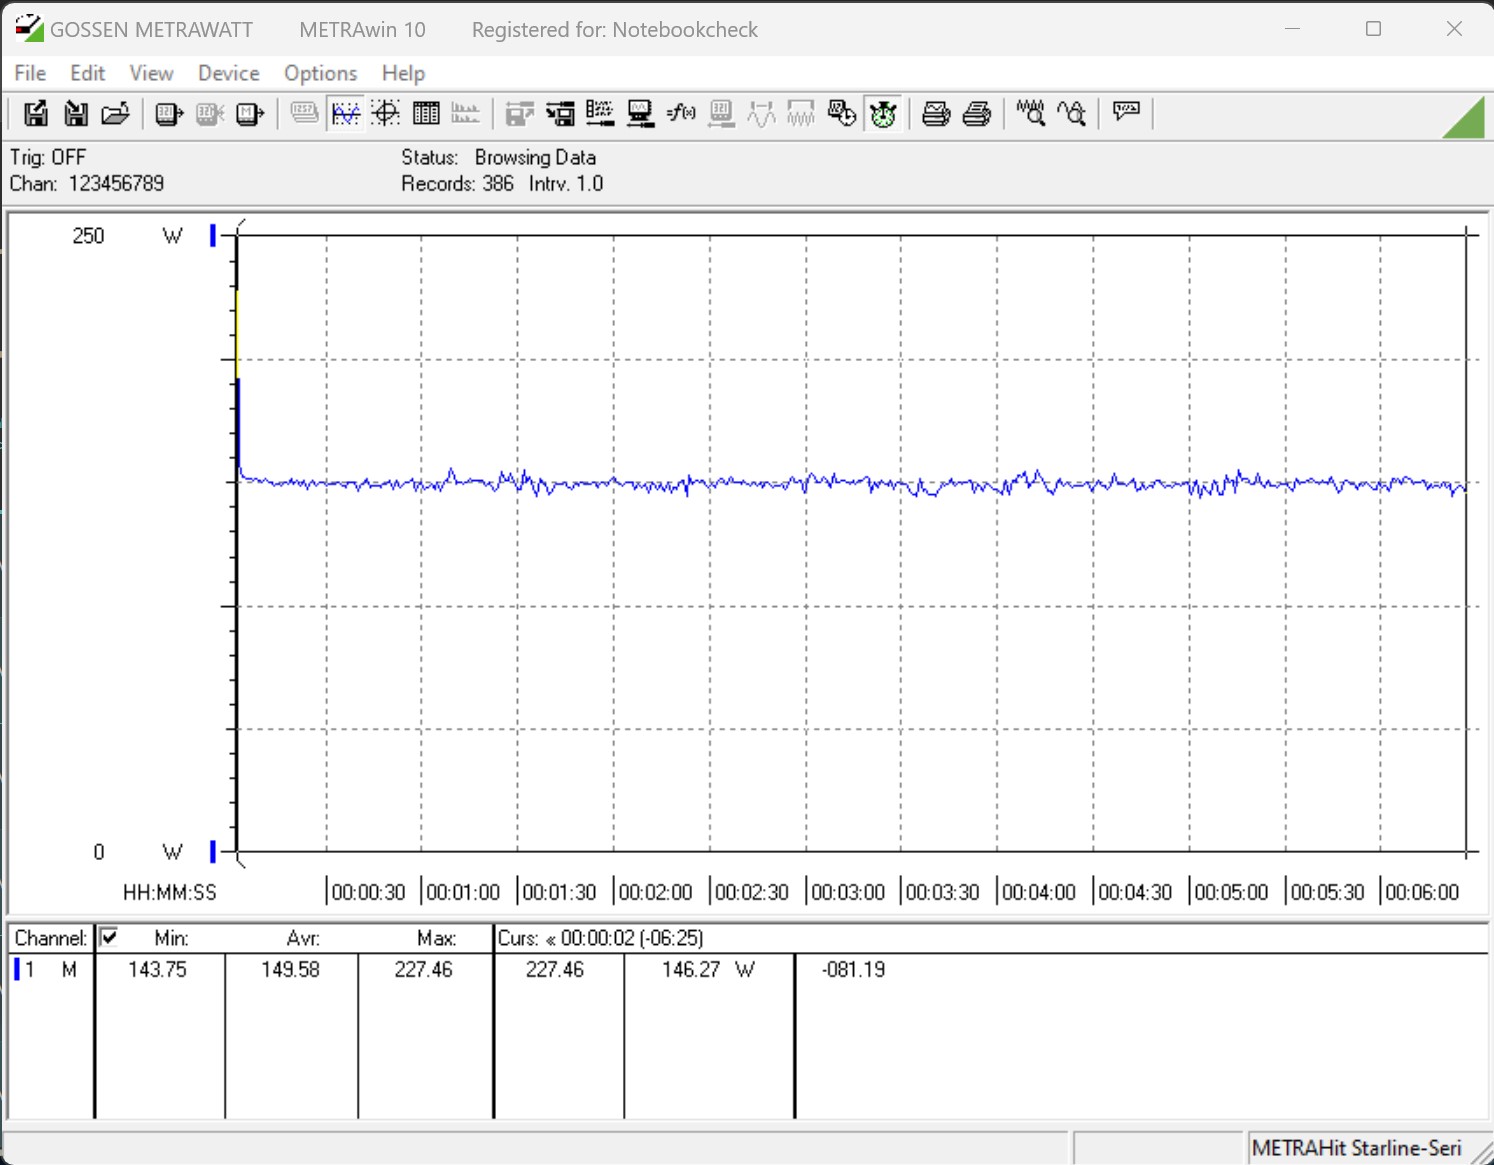
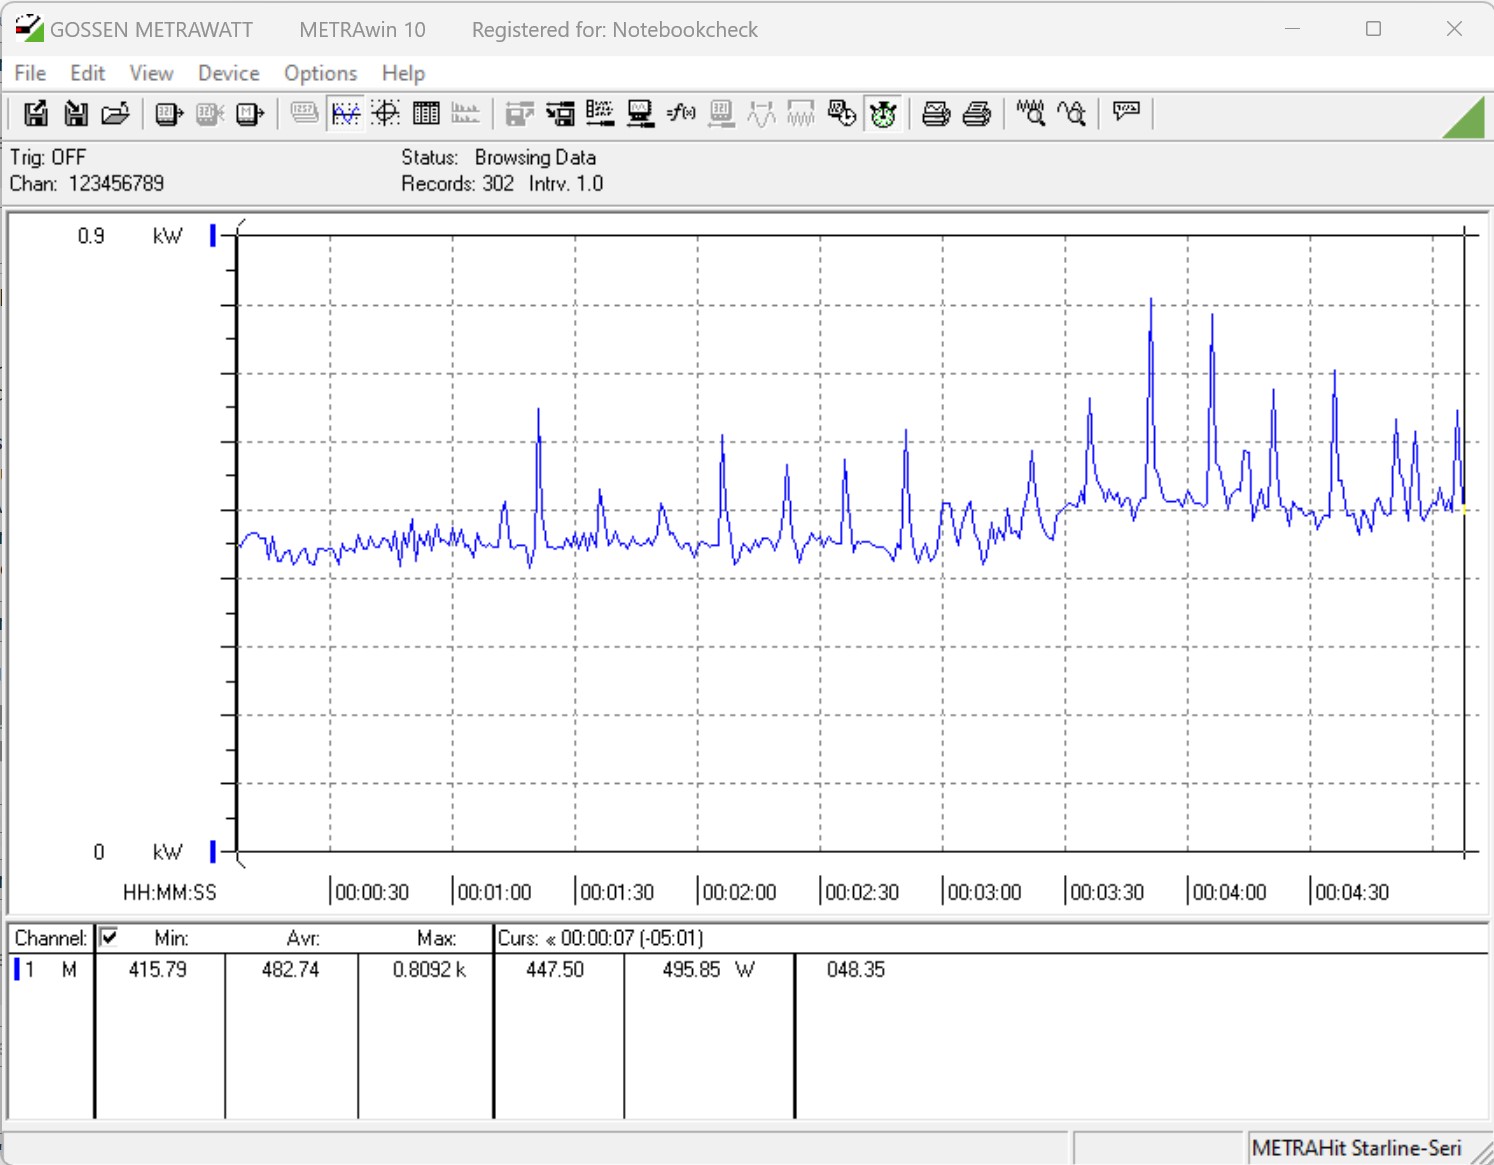
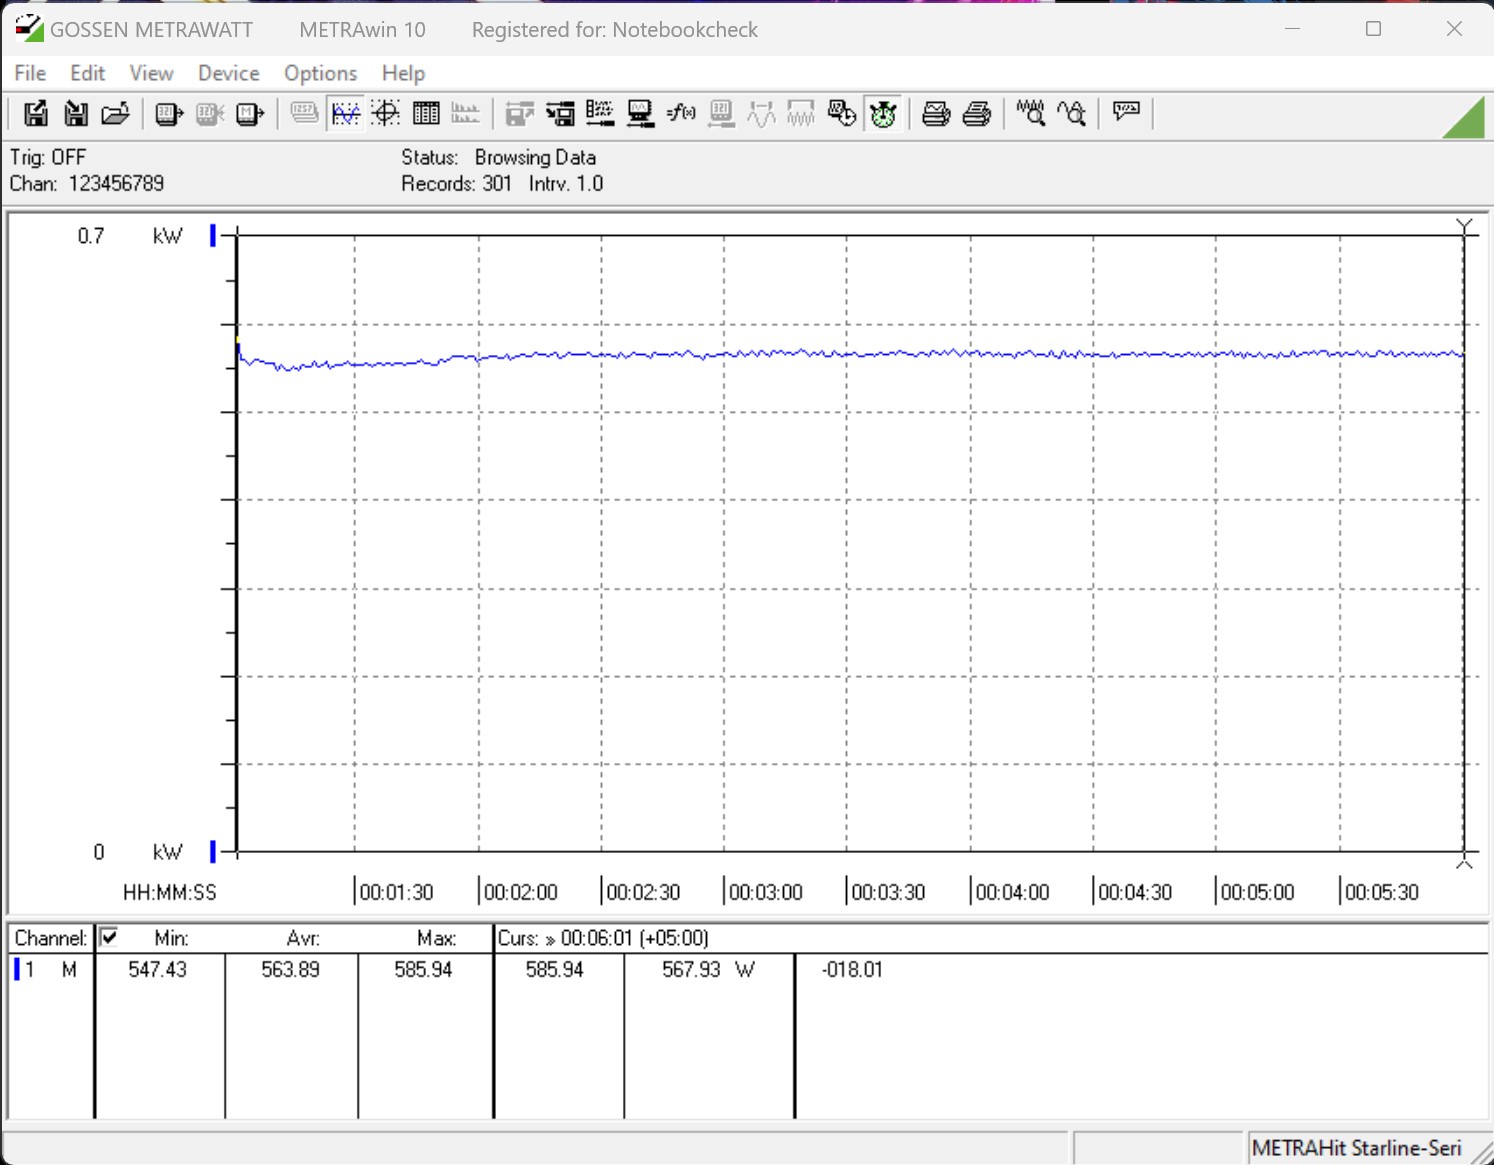
Consommation électrique
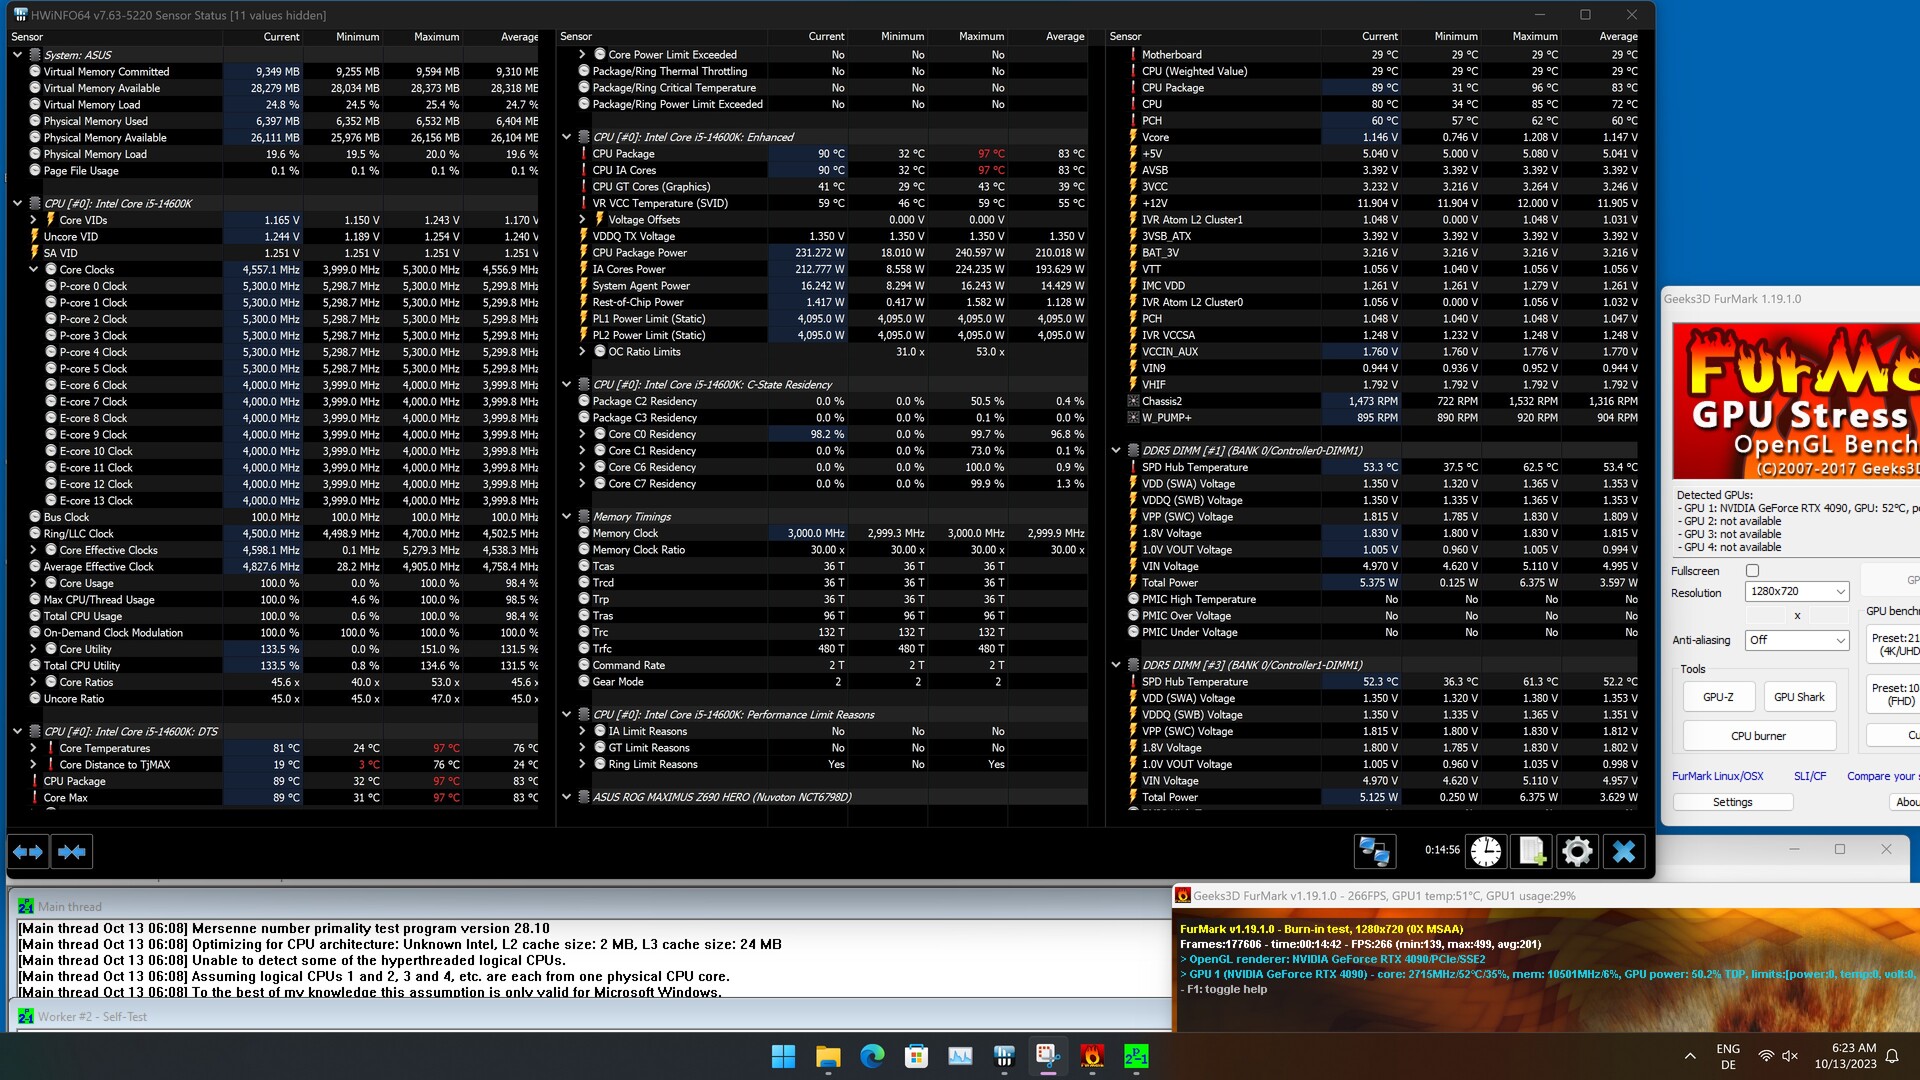
Selon les données techniques du fabricant, il n'y a pas de changement dans les spécifications de la consommation d'énergie : Alors que la limite PL1 reste à 125 watts, la valeur PL2 du Core i9-14900K est de 253 watts. Pour l'Intel Core i5-14600K, le fabricant continue de spécifier 181 watts comme limite PL2. Comme indiqué ci-dessus, nous avons effectué tous les tests avec des limites de puissance ouvertes. Cela signifie également que seule la limite de température est en mesure d'étrangler le CPU. Il n'est donc pas surprenant que nous ayons atteint à plusieurs reprises la barre des 100 °C pendant notre test de stress. Nous l'avions déjà constaté dans la boucle Cinebench. En termes de consommation d'énergie, nous avons noté une consommation maximale du CPU de 360 watts pour le Core i9-14900K et de 240 watts pour le Core i5-14600K. En raison du puissant système de refroidissement par eau, la consommation d'énergie augmente considérablement.
Si l'on compare ces valeurs avec les systèmes AMD, Intel a encore beaucoup de retard à rattraper. L'AMD Ryzen 9 7950X, tout aussi gourmand en énergie, est encore nettement plus efficace, avec une consommation de 364 watts, et si l'on prend également en compte la contrepartie X3D, les perspectives s'assombrissent encore plus pour Intel.
C'est pourquoi nous vous recommandons de limiter la puissance à 253 watts maximum sous charge constante, conformément aux spécifications du fabricant. Dans le même temps, vous devriez toujours utiliser une solution de refroidissement AiO puissante avec un radiateur de 360 millimètres. Ceux qui envisagent d'acheter l'Intel Core i5-14600K devraient pouvoir le contrôler assez facilement en raison de sa faible consommation d'énergie. Mais si vous supprimez toutes les limites, vous devrez également utiliser un système de refroidissement AiO de 360 mm.
Intel Core i9-14900K
Intel Core i5-14600K
| Power Consumption / Cinebench R15 Multi (external Monitor) | |
| Intel Core i9-14900K | |
| Intel Core i9-13900K | |
| AMD Ryzen 9 7950X (Idle: 95.2 W) | |
| Intel Core i7-13700K | |
| Intel Core i5-14600K | |
| Intel Core i5-13600K | |
| Intel Core i7-12700 | |
| AMD Ryzen 9 7950X3D | |
| AMD Ryzen 7 7800X3D | |
| Intel Core i5-13400 | |
| Intel Core i5-12400F | |
| Power Consumption / Prime95 V2810 Stress (external Monitor) | |
| Intel Core i9-14900K | |
| Intel Core i9-13900K | |
| Intel Core i5-14600K | |
| Intel Core i7-13700K | |
| Intel Core i5-13600K | |
| AMD Ryzen 9 7950X (Idle: 95.2 W) | |
| Intel Core i7-12700 | |
| AMD Ryzen 9 7950X3D | |
| Intel Core i5-12400F | |
| Intel Core i5-13400 | |
| AMD Ryzen 7 7800X3D | |
| Power Consumption / Cinebench R23 Multi (external Monitor) | |
| Intel Core i9-14900K | |
| AMD Ryzen 9 7950X (95.2) | |
| Intel Core i5-14600K | |
| AMD Ryzen 9 7950X3D | |
| AMD Ryzen 7 7800X3D | |
| Power Consumption / Cinebench R23 Single (external Monitor) | |
| AMD Ryzen 7 7800X3D | |
| AMD Ryzen 9 7950X (95.2) | |
| Intel Core i9-14900K | |
| Intel Core i5-14600K | |
* ... Moindre est la valeur, meilleures sont les performances
| Power Consumption / The Witcher 3 ultra (external Monitor) | |
| Intel Core i5-14600K | |
| Intel Core i9-14900K | |
| Intel Core i7-13700 | |
| Intel Core i7-13700K | |
| AMD Ryzen 9 7950X | |
| AMD Ryzen 9 7950X3D | |
| Intel Core i9-13900K | |
| Intel Core i7-12700 | |
| Intel Core i5-13400 | |
| AMD Ryzen 7 7800X3D | |
| Intel Core i5-12400F | |
* ... Moindre est la valeur, meilleures sont les performances
Power Consumption With External Monitor
Points positifs
Points négatifs
Verdict - Plus les performances sont élevées, plus la consommation d'énergie l'est aussi
La nouvelle version de la série Raptor Lake d'Intel a encore légèrement augmenté ses performances. Toutefois, les gains de performance par rapport à la 13e génération se sont avérés relativement faibles. Dans l'ensemble, l'Intel Core i9-14900K est un processeur très rapide, capable de marquer des points dans tous les domaines. Le nouveau modèle haut de gamme est capable de maîtriser les tâches multithread aussi bien que les tâches à cœur unique, et avec 6 GHz en boost, les jeux profitent également de cette performance. En revanche, la consommation d'énergie élevée est le principal inconvénient de ce modèle. Mais la consommation d'énergie ne sera probablement pas aussi élevée au quotidien, et les jeux ne nécessiteront probablement pas les performances maximales du processeur. AMD fait clairement un meilleur travail ici, en montrant comment les choses peuvent être faites avec ses processeurs X3D.
Les nouvelles versions des processeurs Intel Raptor Lake sont clairement de bons talents multiples. Mais l'Intel Core i9-14900K ne remportera certainement pas la couronne en termes d'efficacité.
Avec une vitesse d'horloge plus élevée et une consommation d'énergie plus importante, Intel a travaillé dur pour obtenir cette position. Avec 253 watts, Intel n'a heureusement pas augmenté les limites de consommation d'énergie. Le plus petit Intel Core i5-14600K consomme encore 181 watts à pleine charge. Cela nécessite en outre un système de refroidissement optimal pour pouvoir exploiter toutes les performances. Les coûts sont également plus élevés, et les 162 watts duAMD Ryzen 9 7950X3Dsont nettement plus faciles à contrôler que les 253 watts de l'Intel Core i9-14900K.
Nous nous félicitons de sa compatibilité avec les cartes mères à socket 1700 déjà utilisées. Mais nous ne savons pas si c'était intentionnel ou si c'était une nécessité. Dans le passé, Intel a changé de socket après deux générations de CPU. Ce n'est qu'avec la génération suivante de CPU qu'Intel commencera à utiliser le socket 1851, introduisant des changements supplémentaires avec Arrow Lake. Nous ne pouvons donc qu'espérer qu'Intel s'inspirera d'AMD et utilisera également une sorte de cache 3D et améliorera l'efficacité de manière significative.
Transparency
La sélection des appareils à examiner est effectuée par notre équipe éditoriale. L'échantillon d'essai a été remis gratuitement à l'auteur par le fabricant à des fins d'évaluation. Cet examen n'a pas été influencé par des tiers et le fabricant n'a pas reçu de copie de cet examen avant sa publication. Il n'y avait aucune obligation de publier cet article. En tant que média indépendant, Notebookcheck n'est pas soumis à l'autorité des fabricants, des détaillants ou des éditeurs.
Voici comment Notebookcheck teste
Chaque année, Notebookcheck examine de manière indépendante des centaines d'ordinateurs portables et de smartphones en utilisant des procédures standardisées afin de garantir que tous les résultats sont comparables. Nous avons continuellement développé nos méthodes de test depuis environ 20 ans et avons établi des normes industrielles dans le processus. Dans nos laboratoires de test, des équipements de mesure de haute qualité sont utilisés par des techniciens et des rédacteurs expérimentés. Ces tests impliquent un processus de validation en plusieurs étapes. Notre système d'évaluation complexe repose sur des centaines de mesures et de points de référence bien fondés, ce qui garantit l'objectivité.
