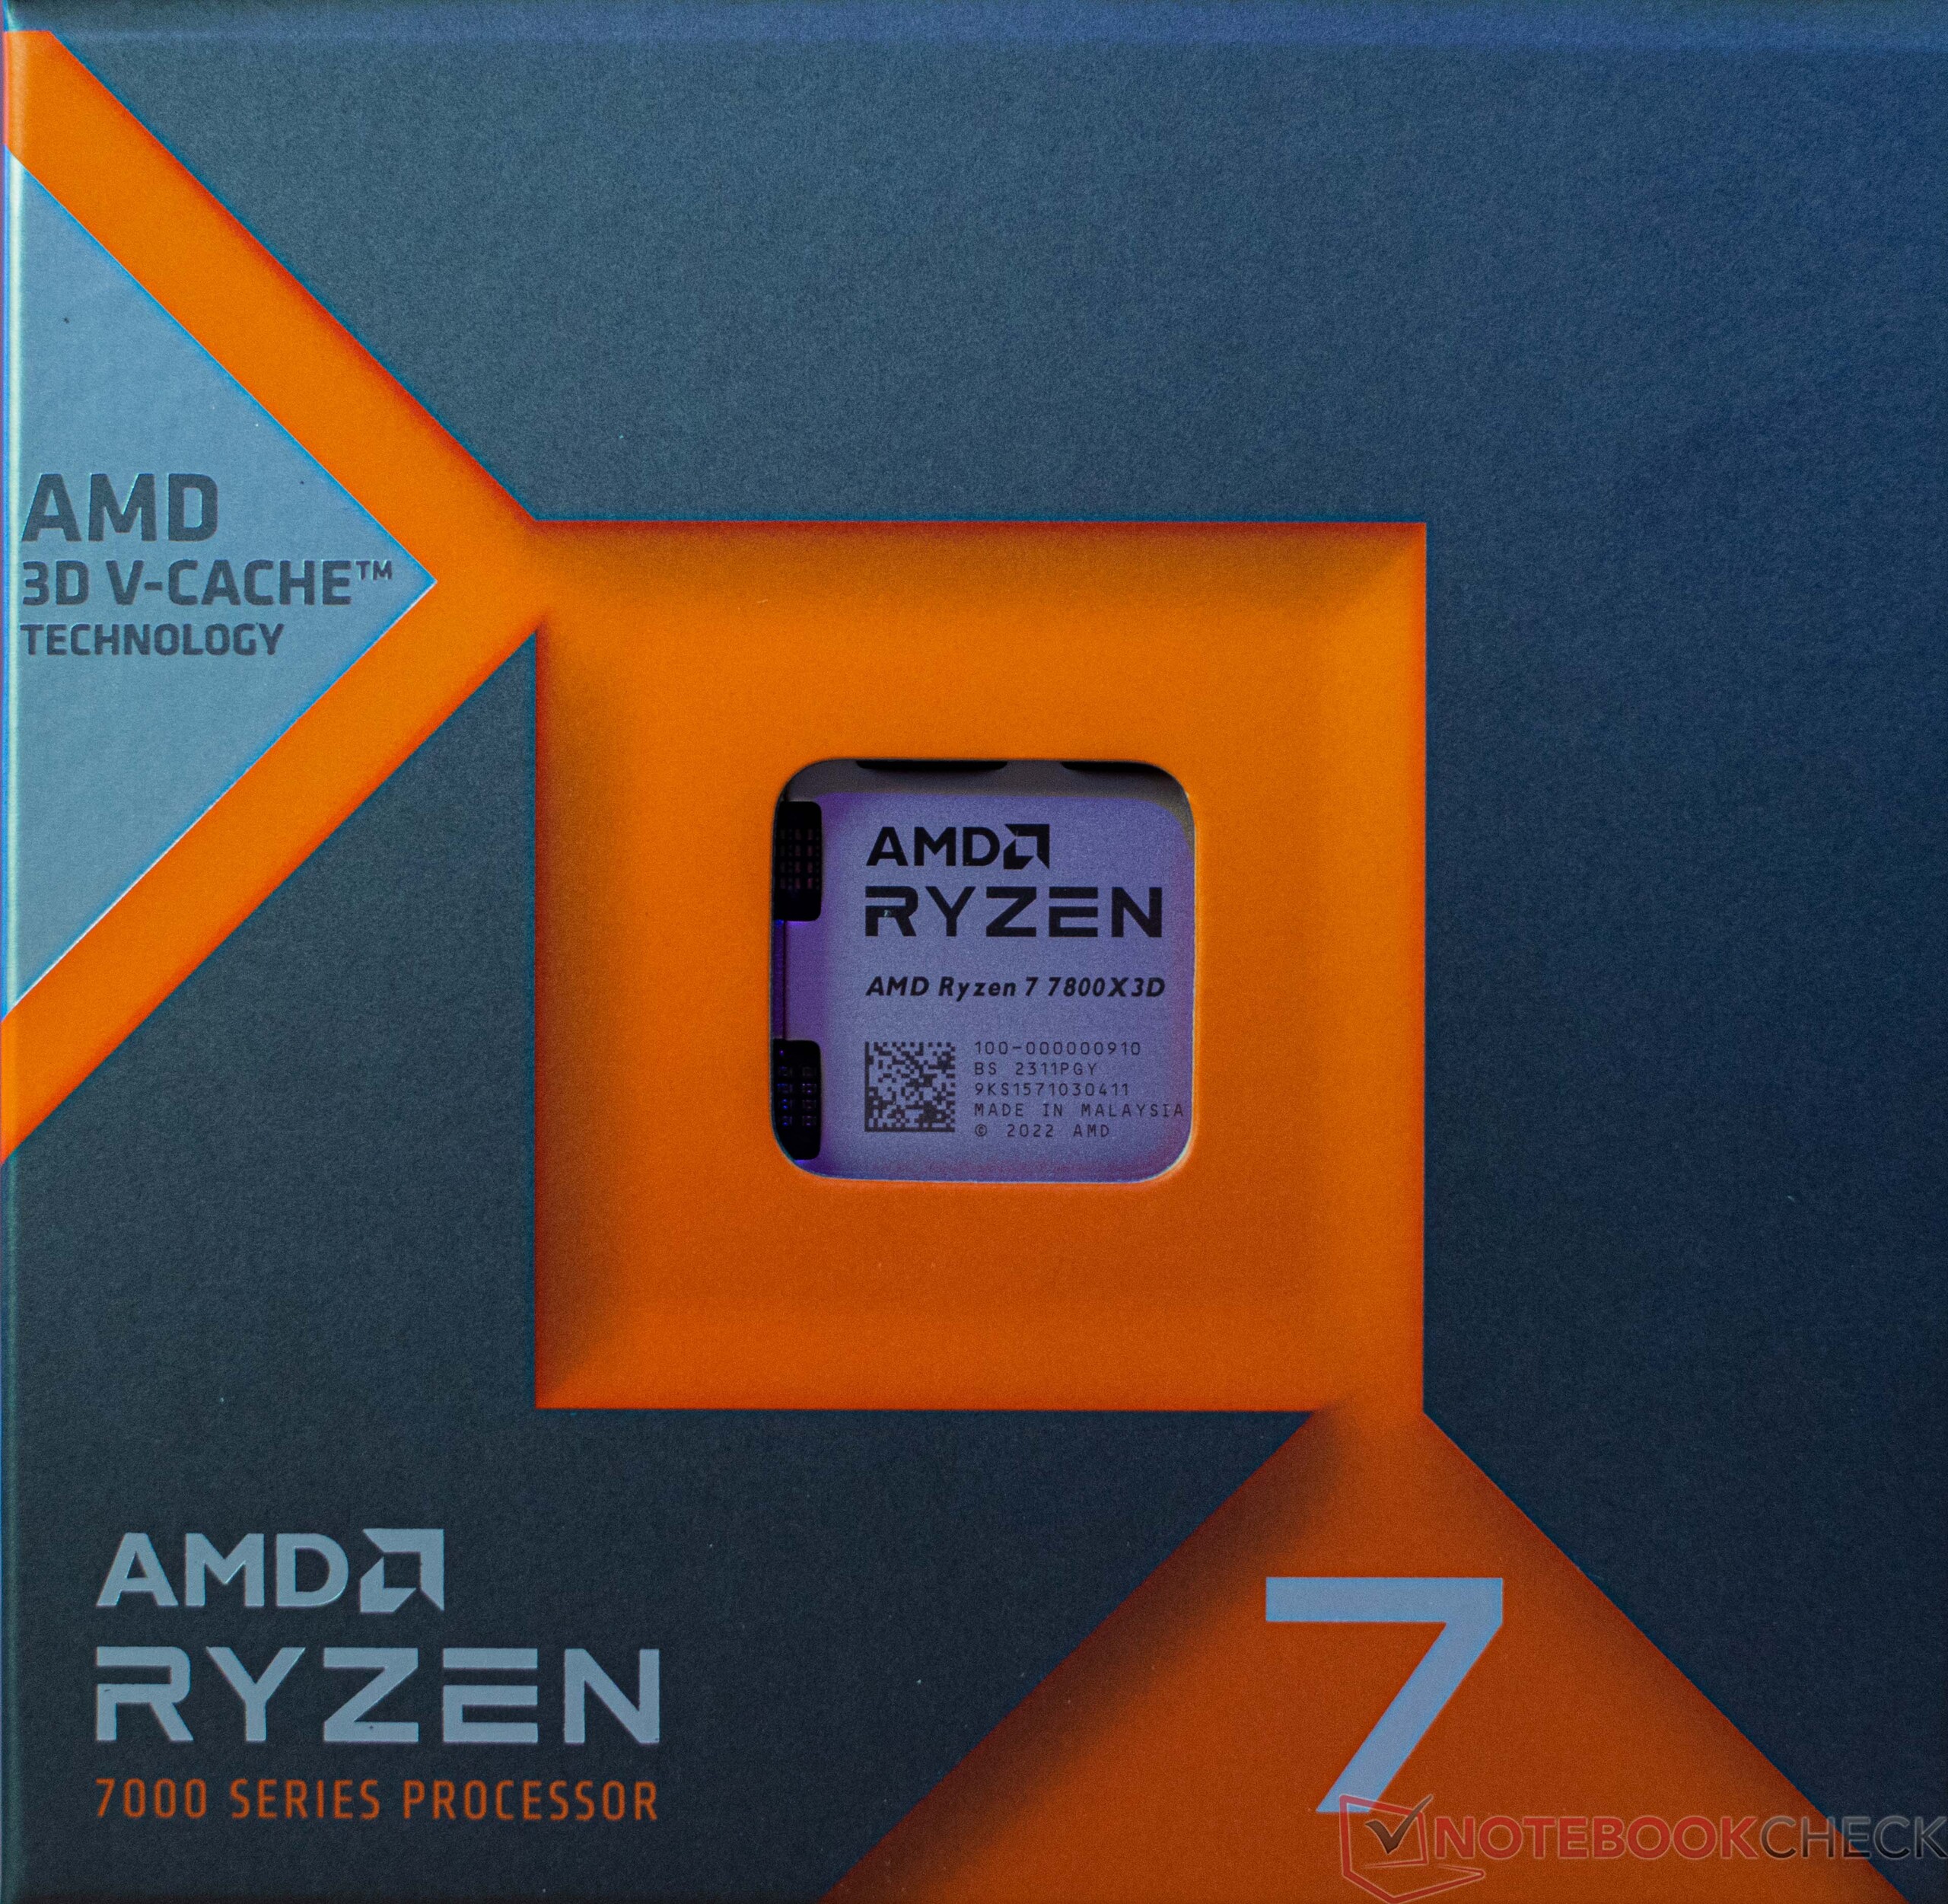
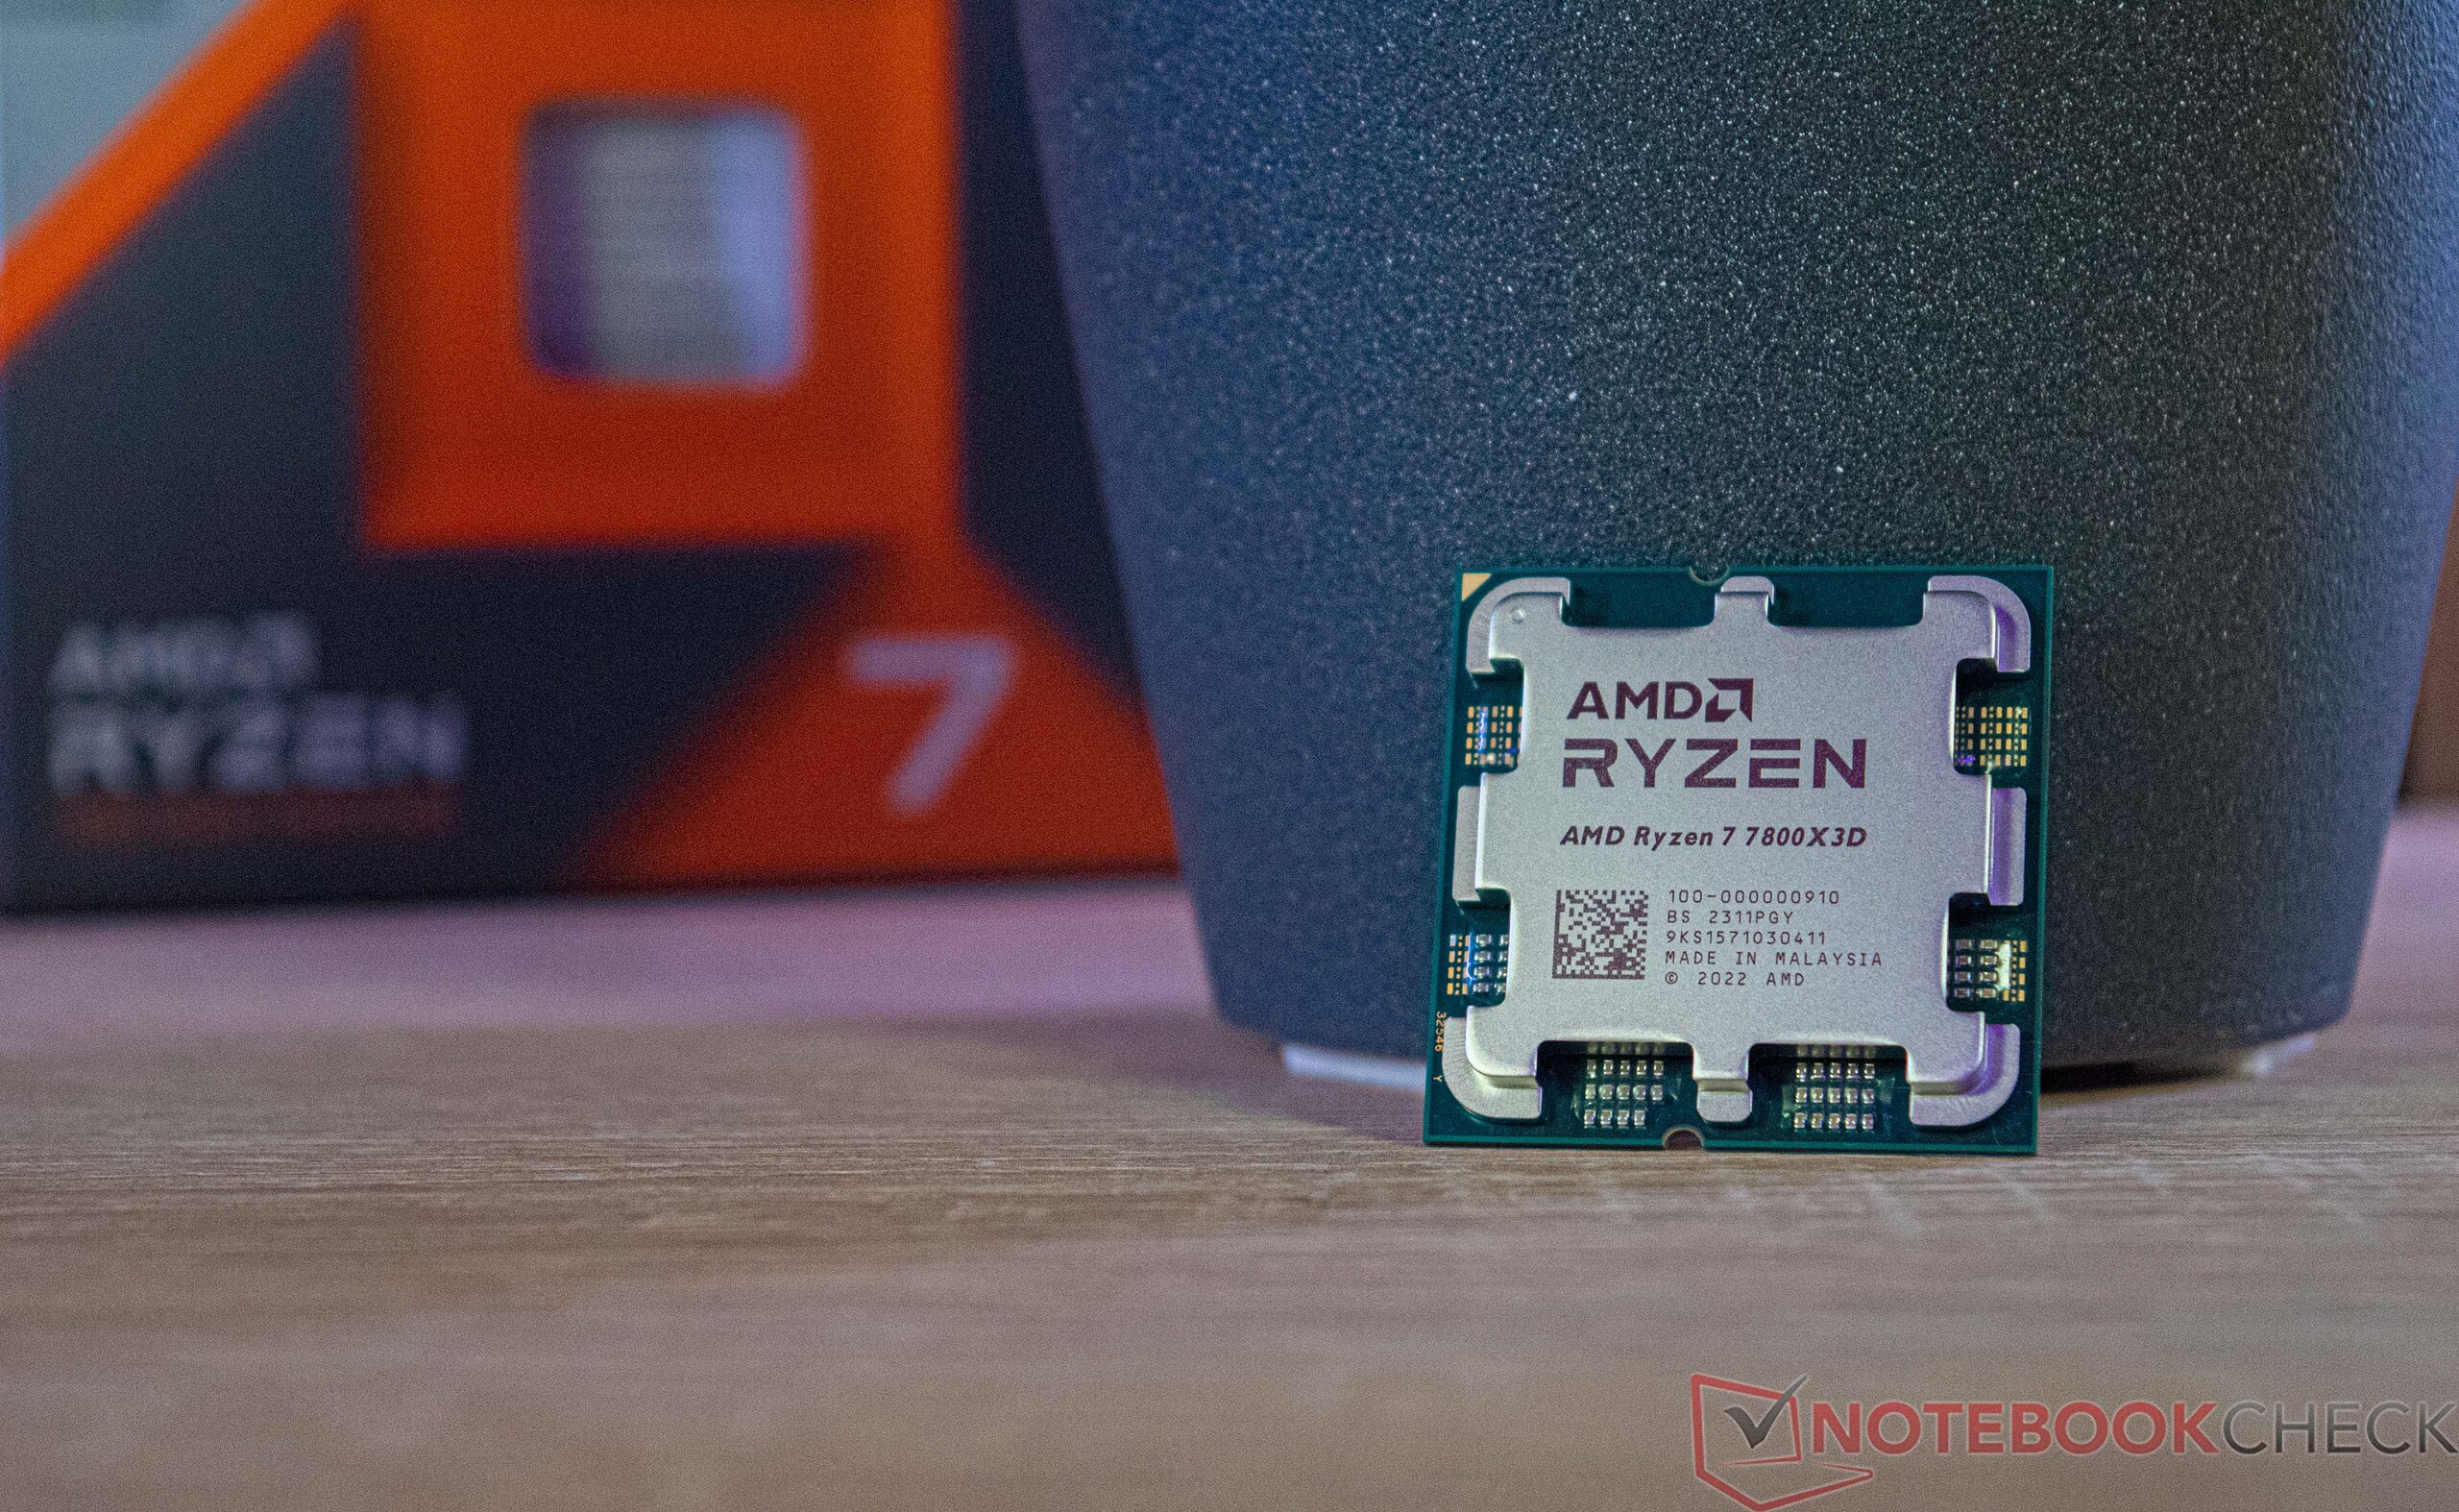
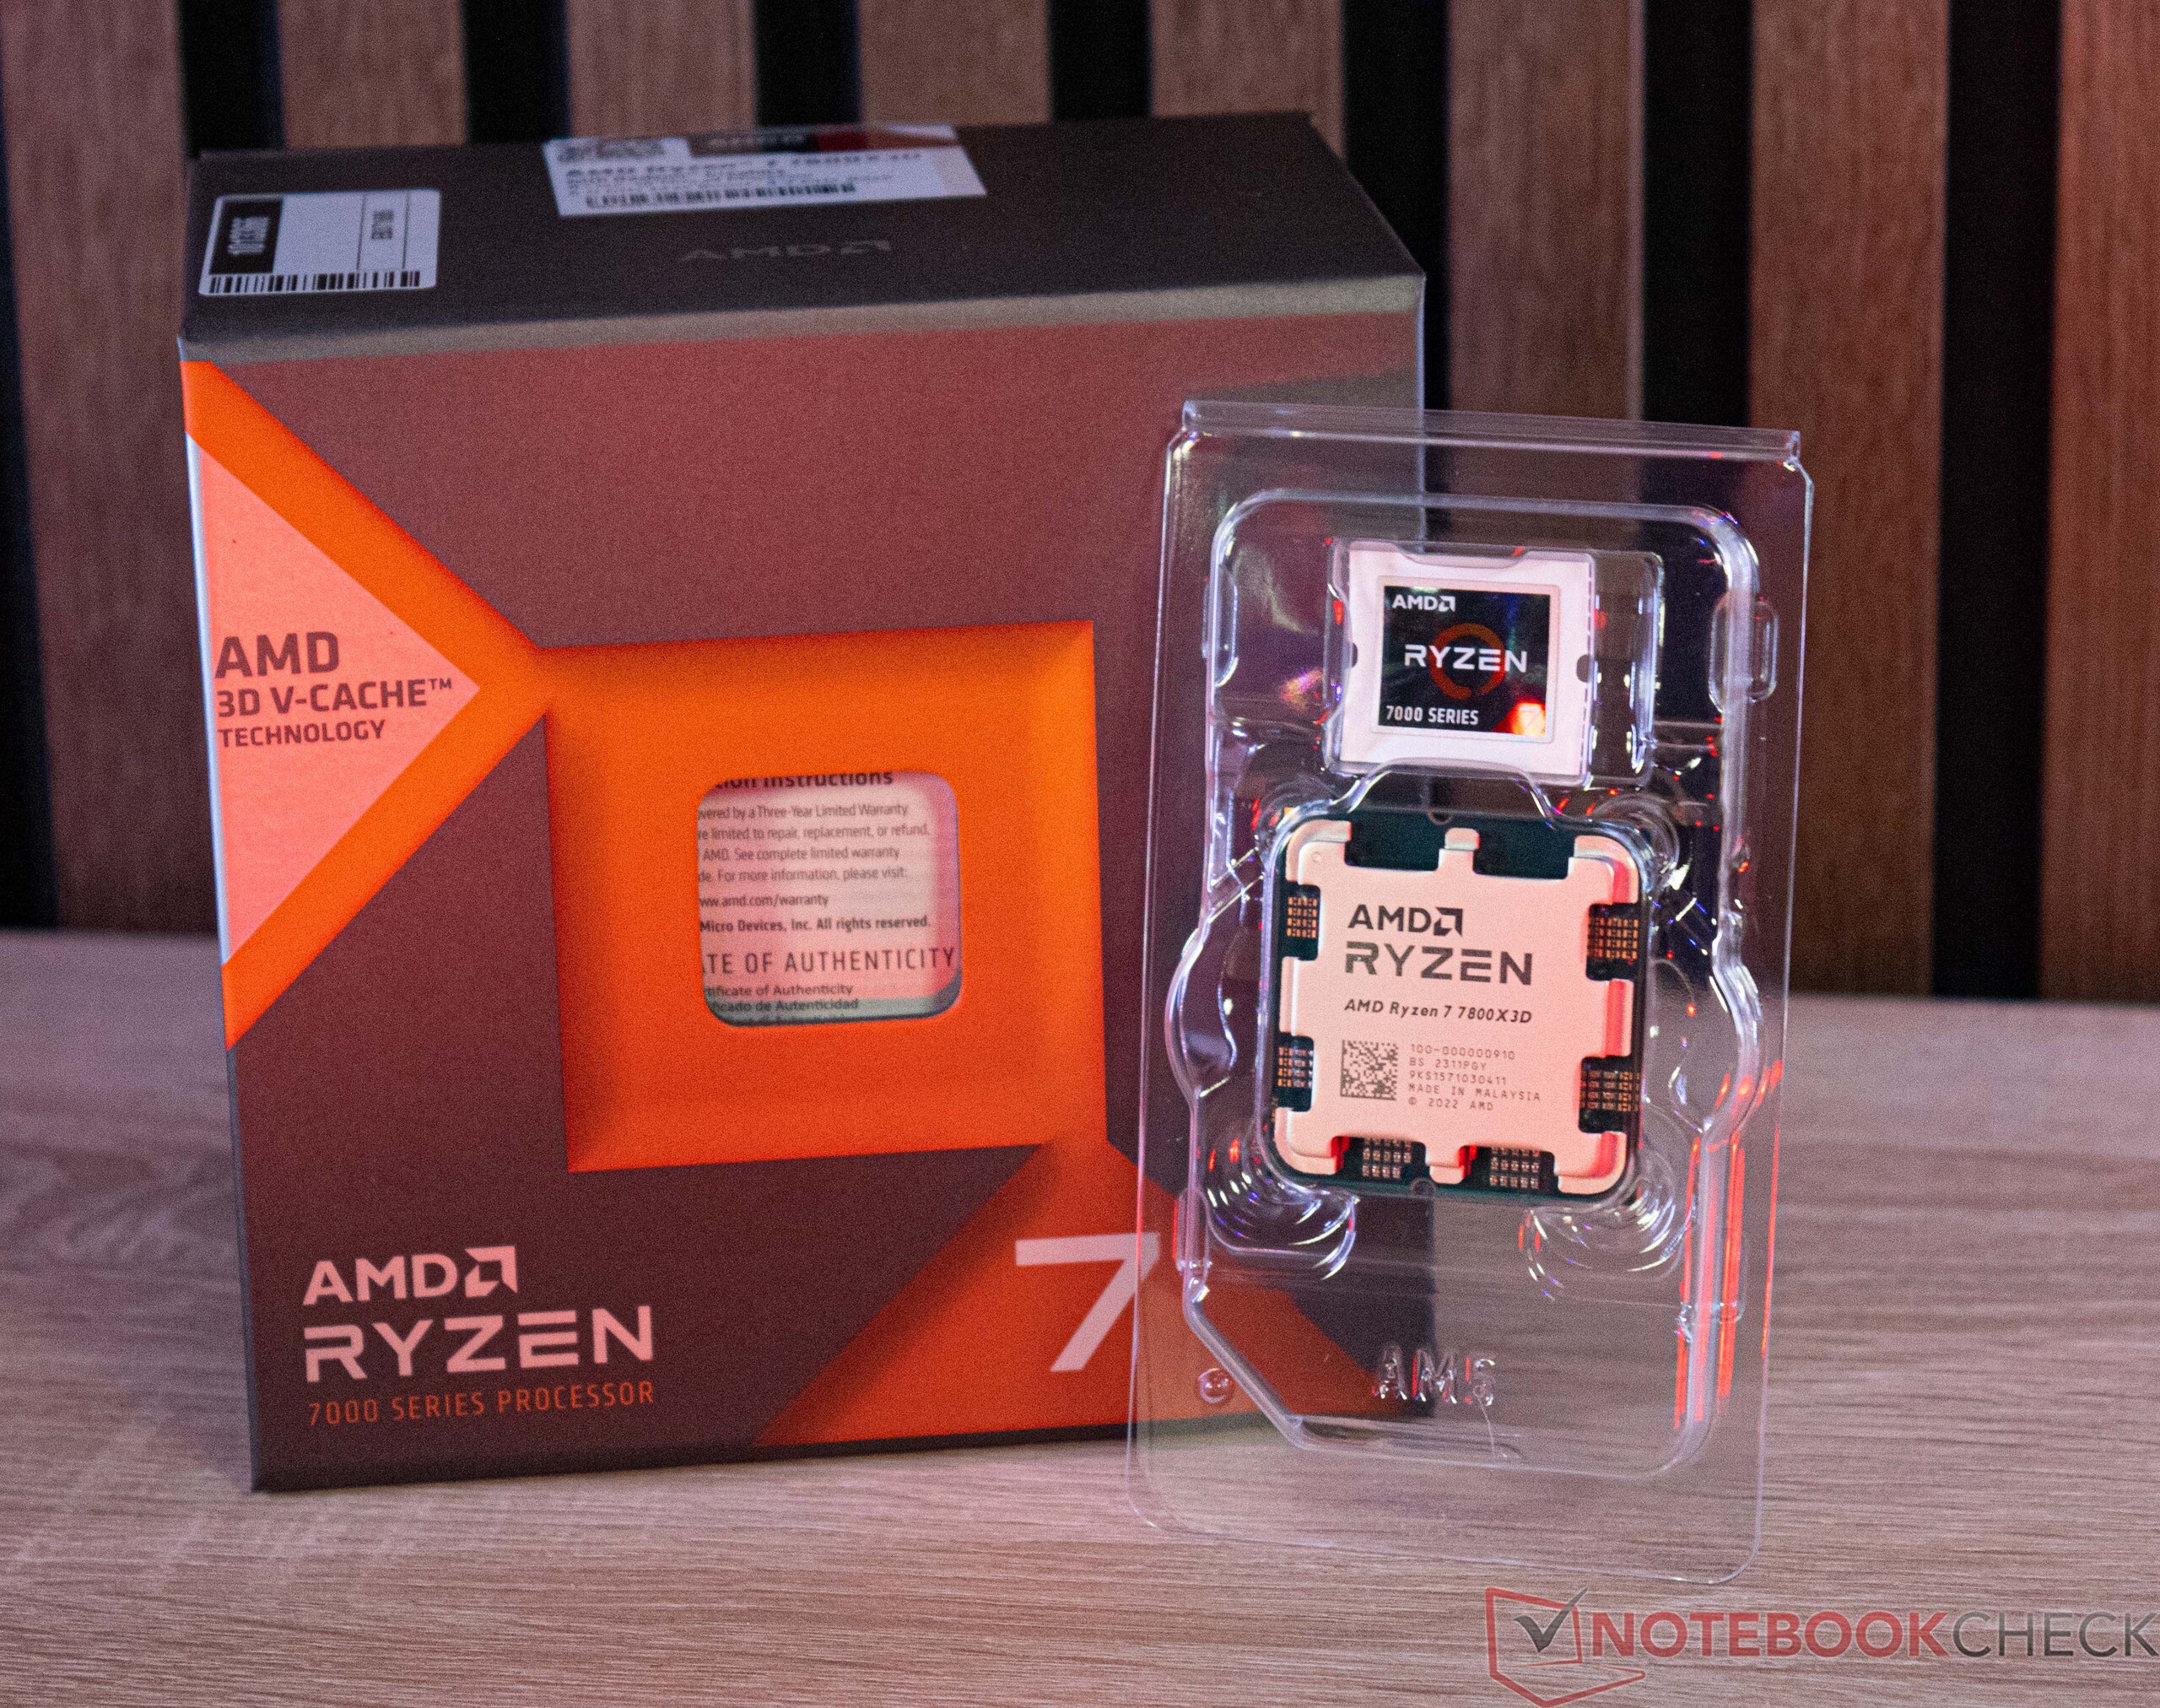
Test de l'AMD Ryzen 7 7800X3D : plus puissant qu'un Core i9-13900K grâce au 3D V-Cache et à seulement 8 cœurs
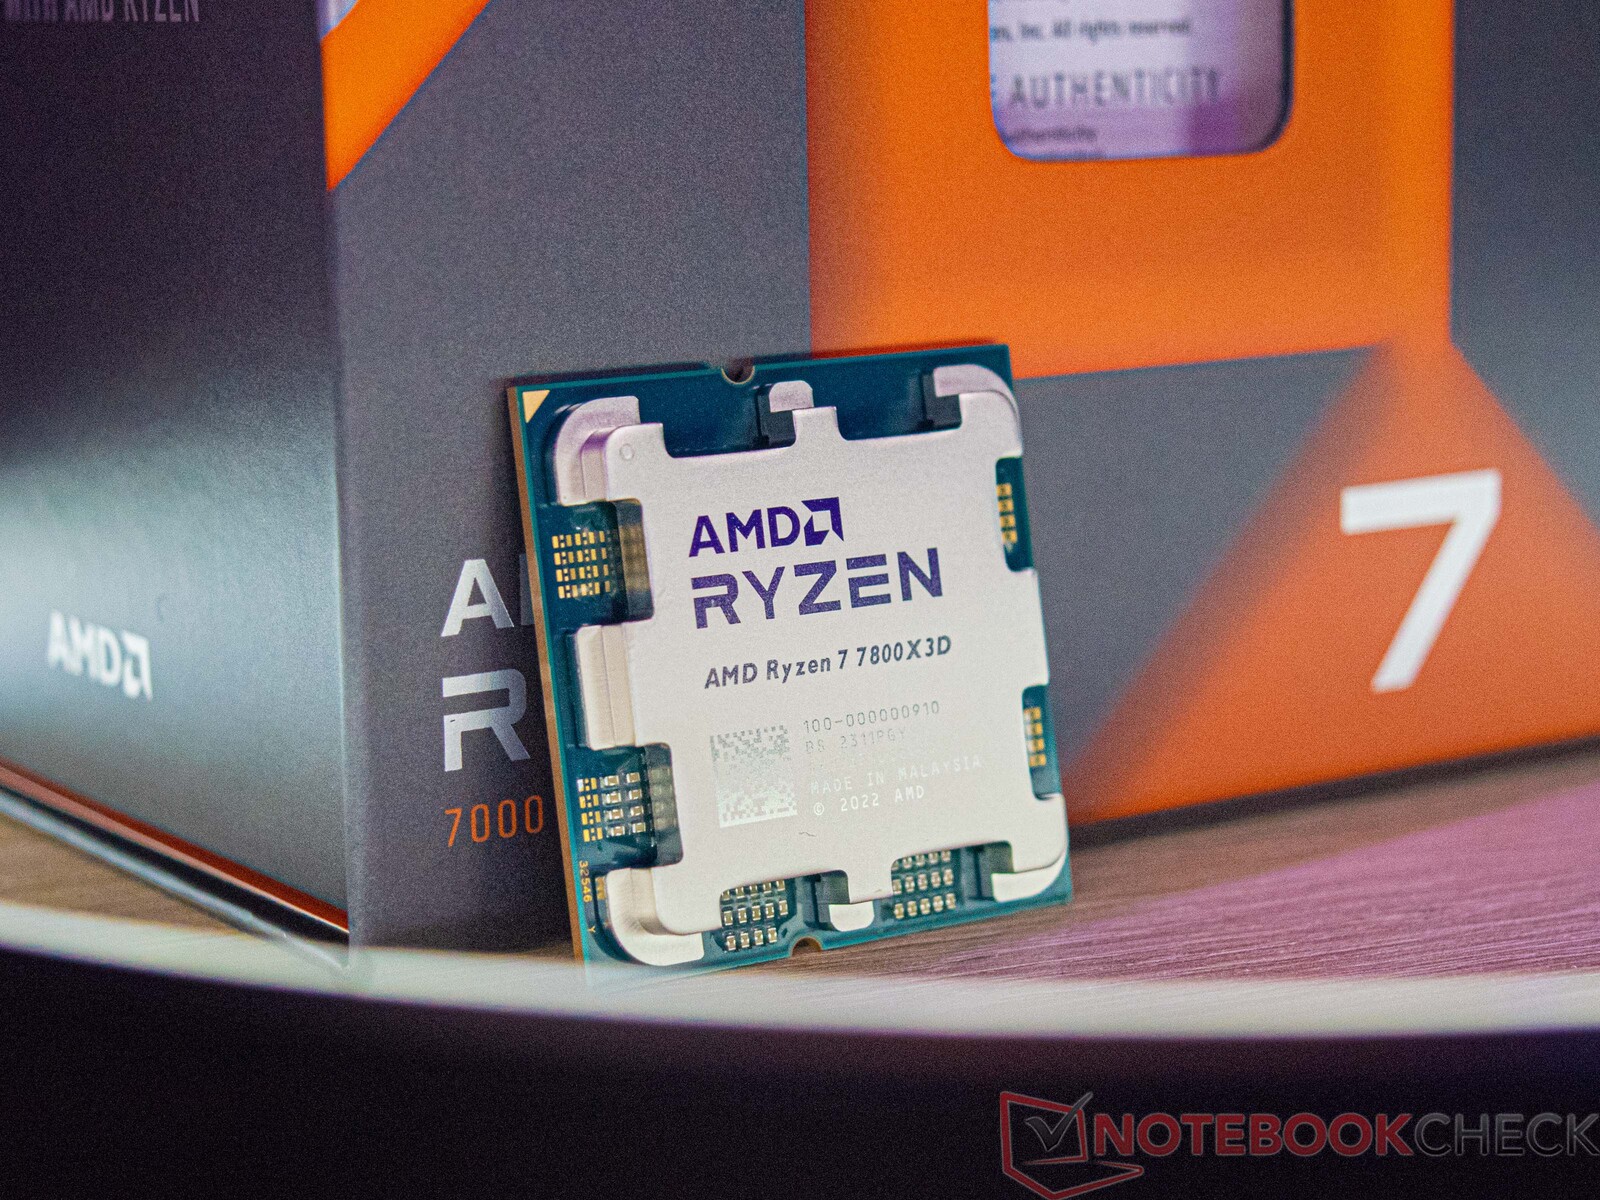
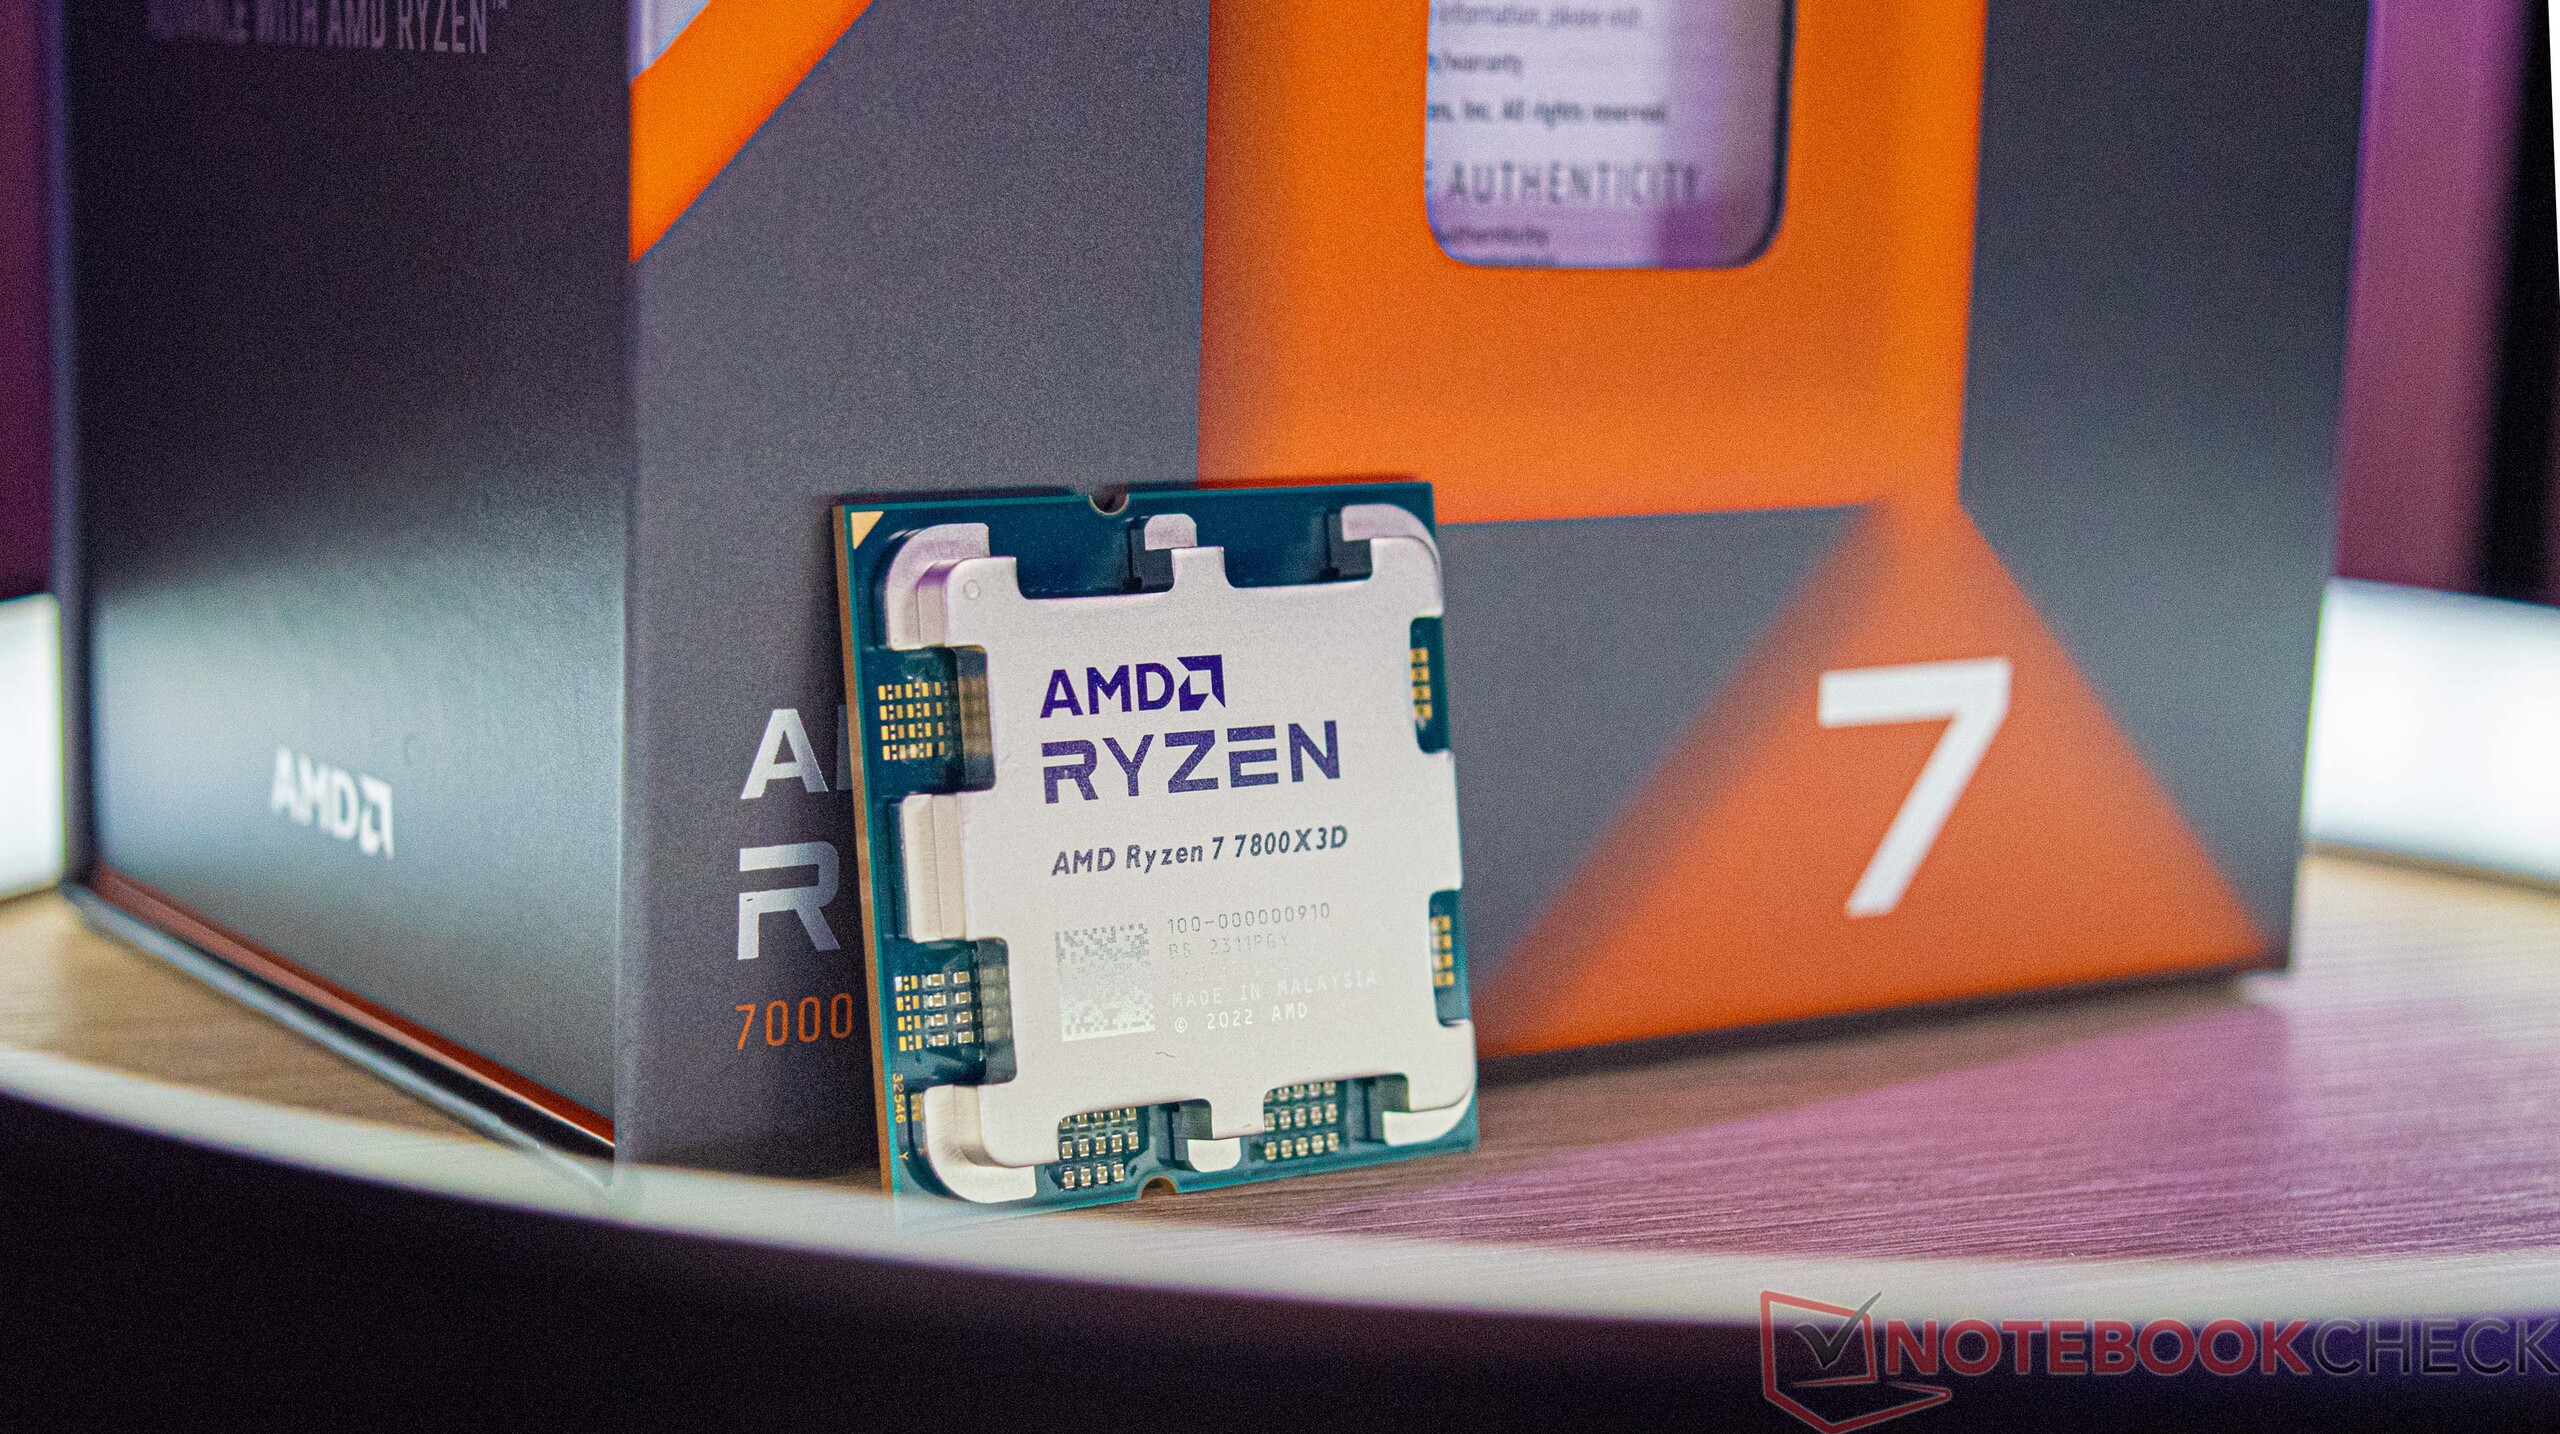
L'AMD Ryzen 7 7800X3D est désormais le troisième processeur AMD basé sur AM 5 avec 3D V-Sync - après les deux modèles Ryzen 9 (AMD Ryzen 9 7950X3Det AMD Ryzen 9 7900X3D). Avec les deux plus grands modèles, le processeur natif à 8 cœurs a été présenté en janvier dernier au CES de Las Vegas. Il a fallu attendre un certain temps avant que le composant ne soit finalement mis sur le marché le 6 avril 2023.
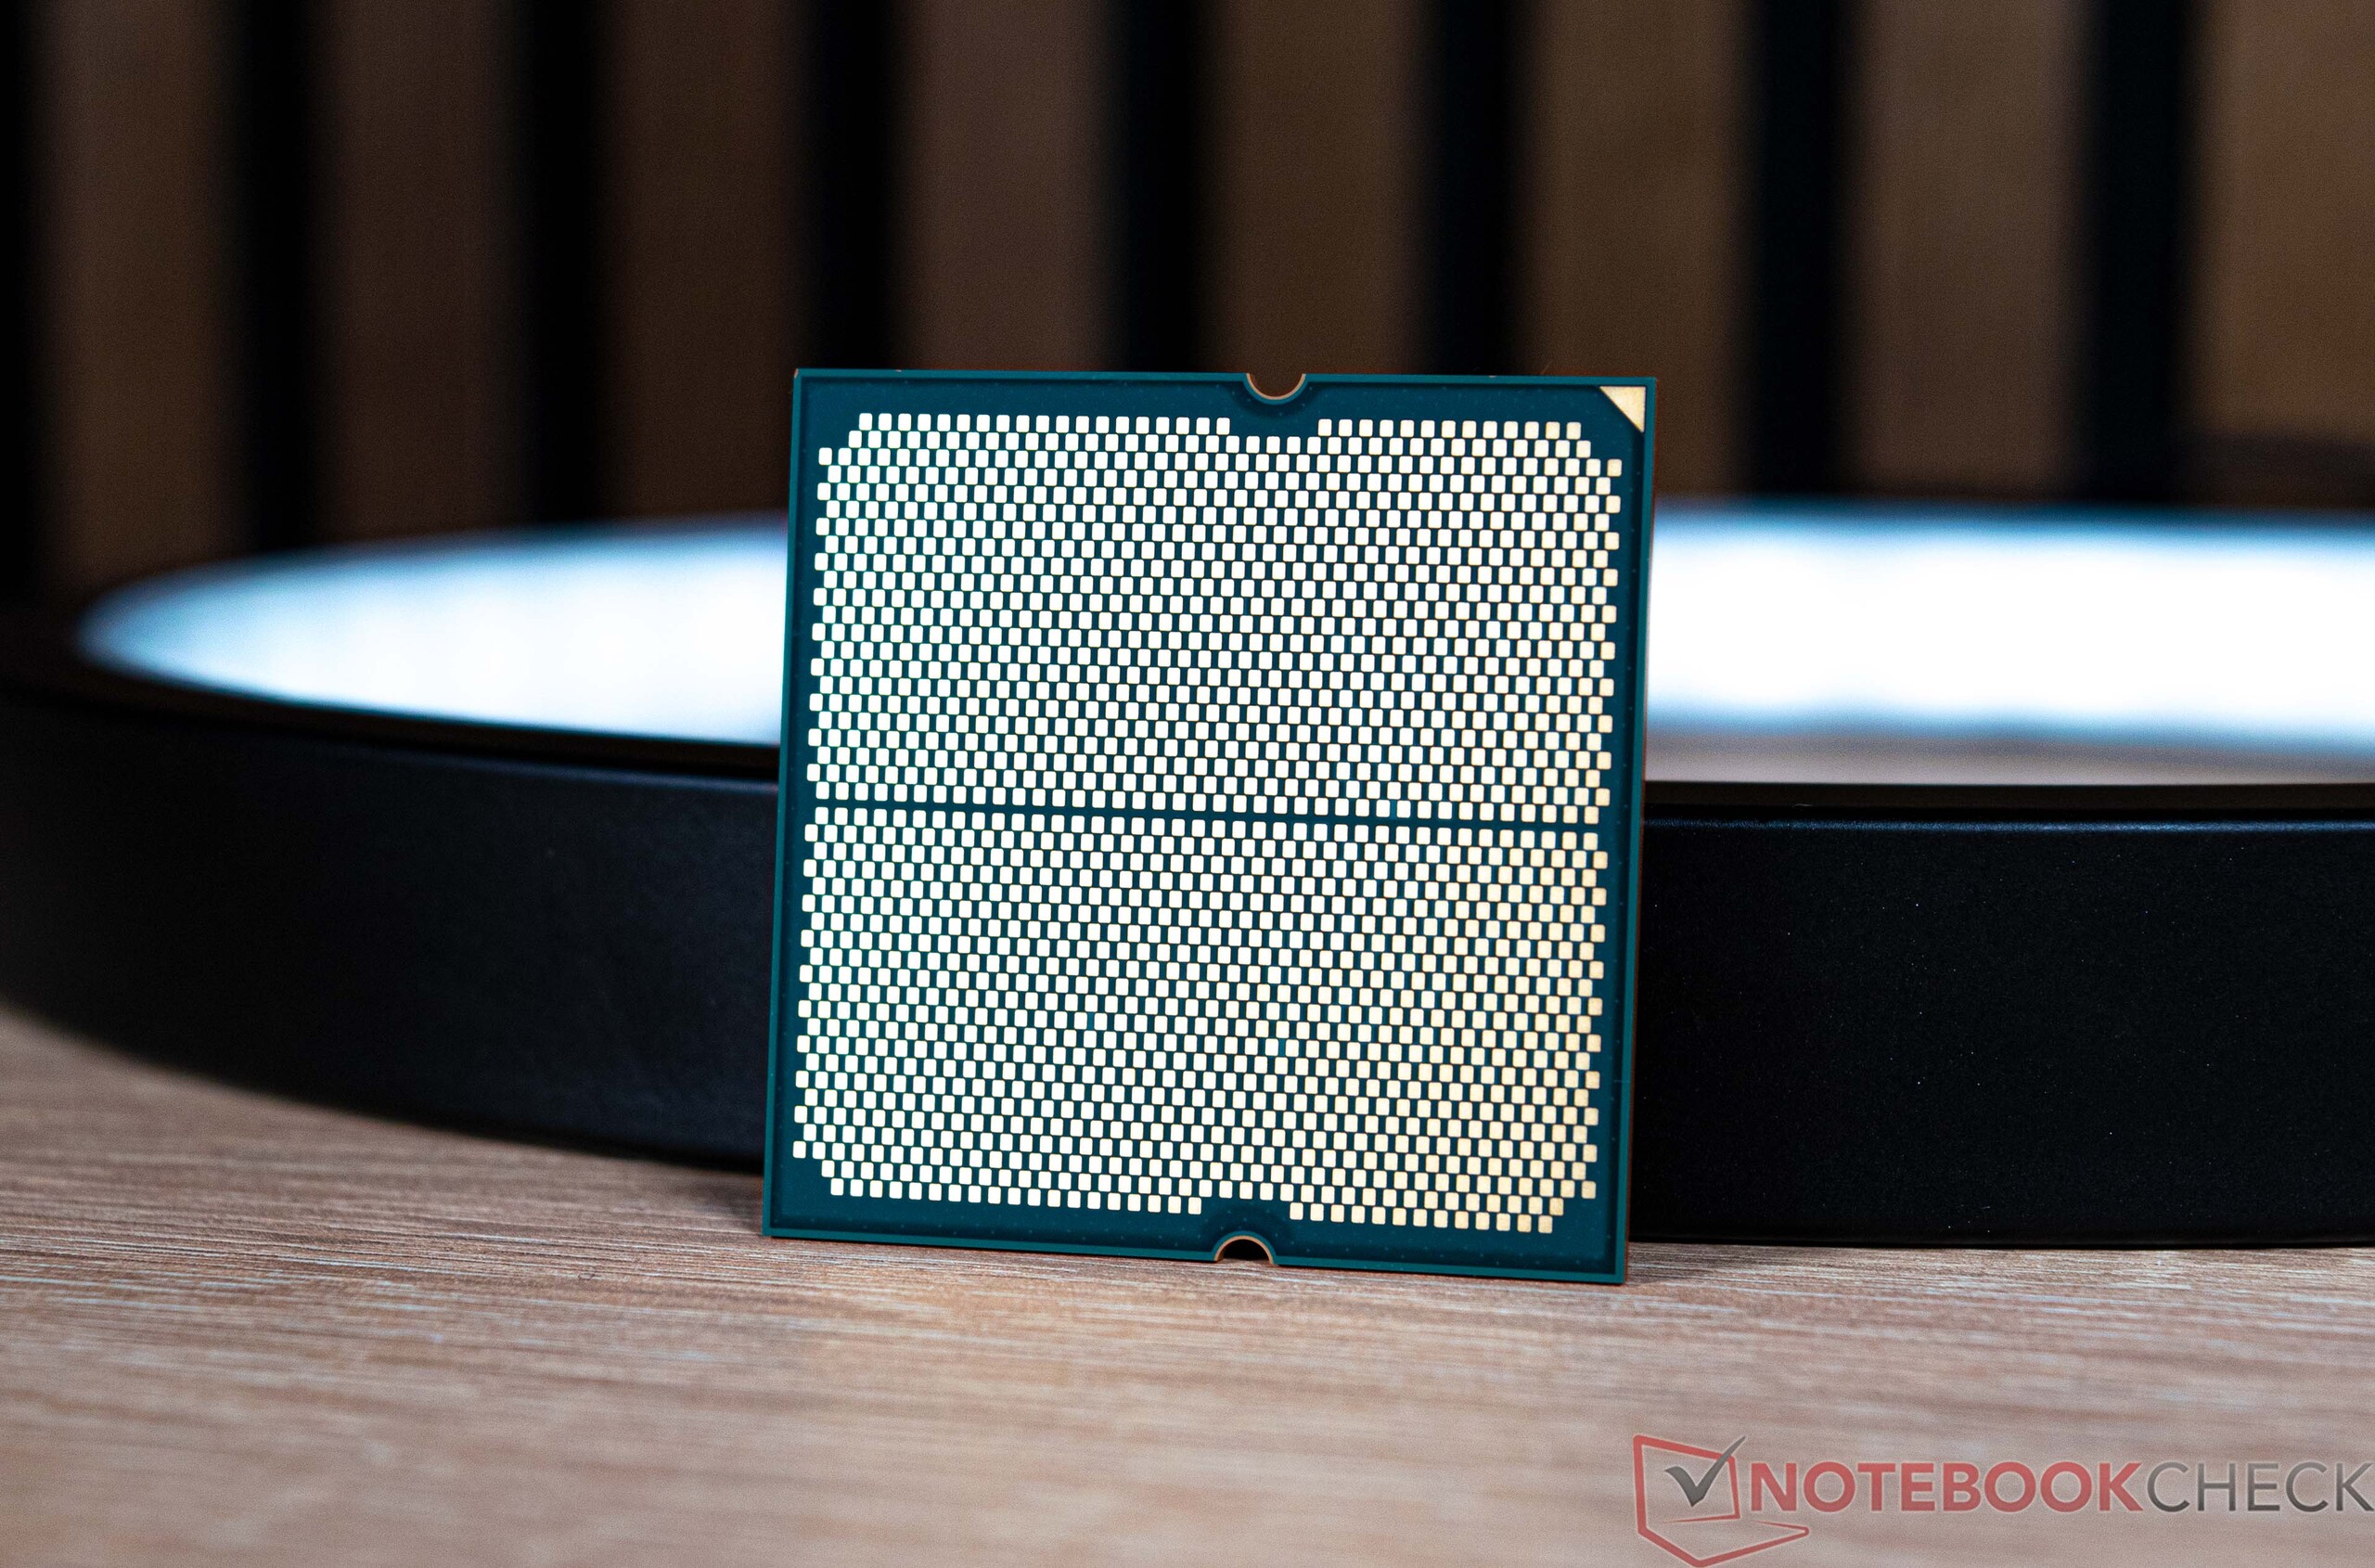
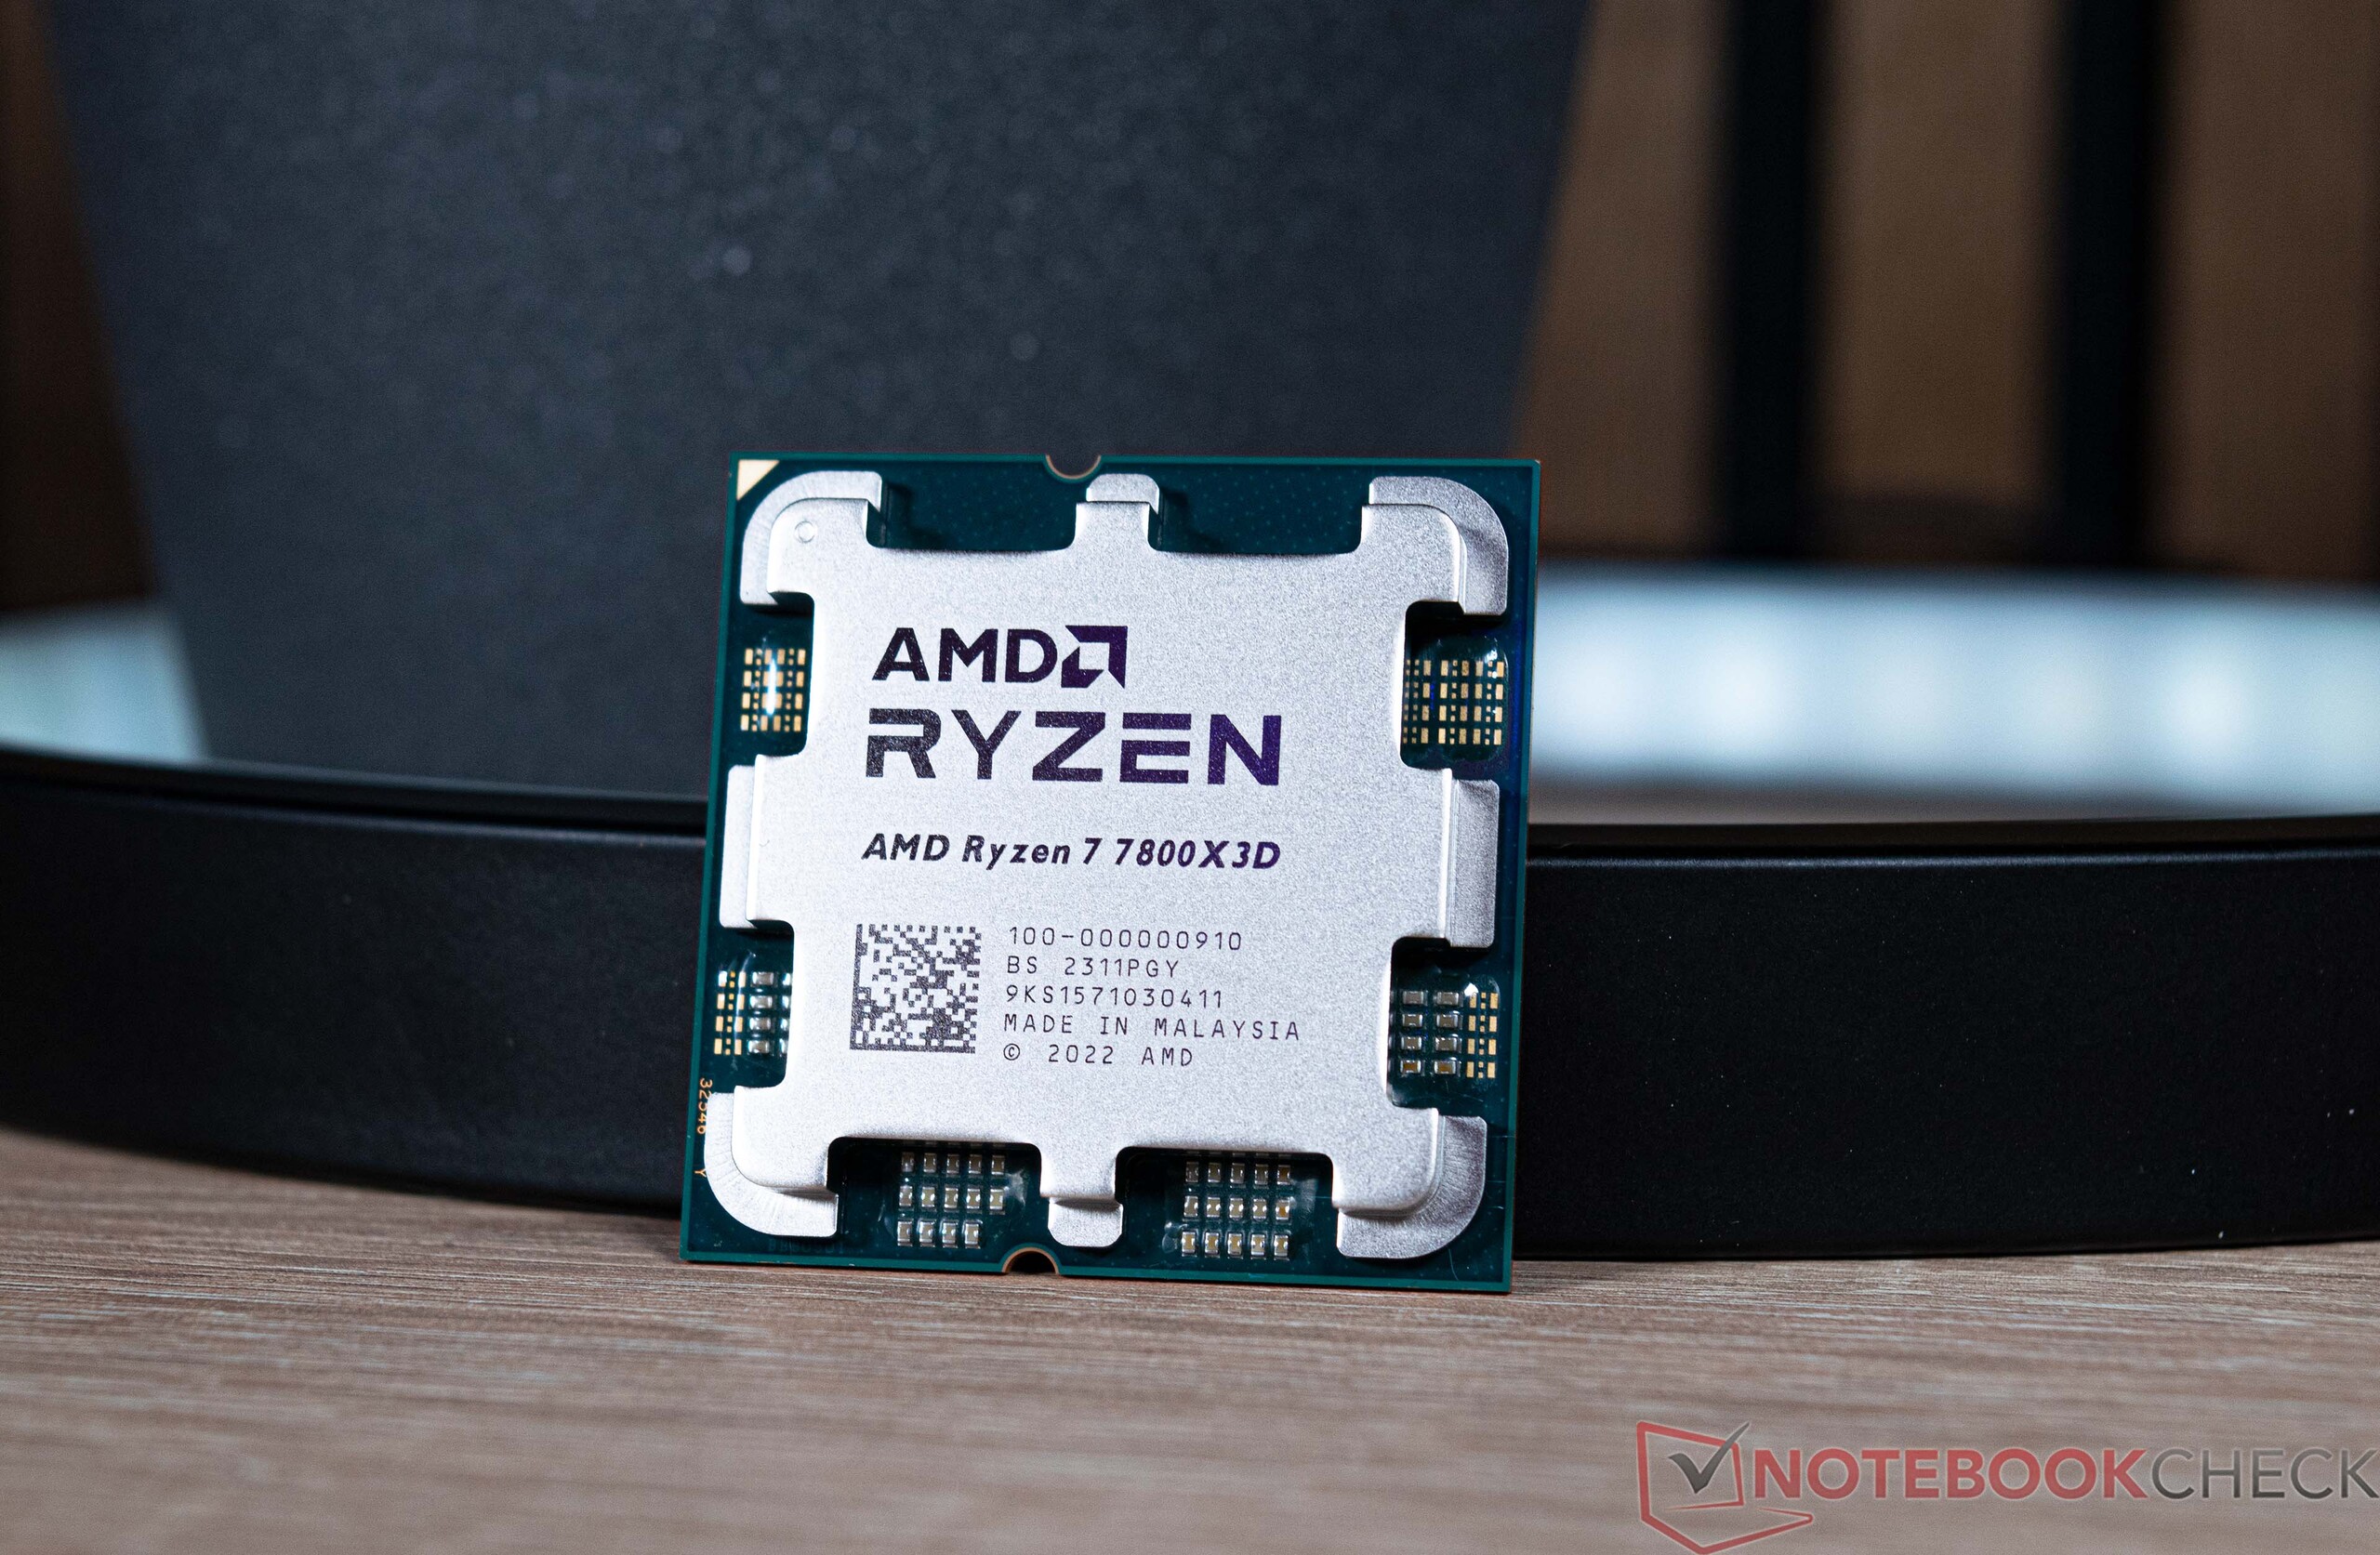
Nous avons déjà testé l'AMD Ryzen 9 7950X3D et avons été impressionnés par ses excellentes performances et sa faible consommation d'énergie. Nous verrons ce qu'il en est de l'AMD Ryzen 7 7800X3D en comparaison. En général, son 3D V-Cache devrait se traduire par une augmentation des performances, ce qui signifie que l'AMD Ryzen 7 5800X3D est plus performant que l'autre.AMD Ryzen 7 5800X3Dbasé sur AM4 devrait encore être très populaire. Cependant, sa construction interne est différente de celle des deux modèles Ryzen 9 qui disposent de ce V-Cache 3D. L'AMD Ryzen 7 7800X3D n'a qu'un seul CCD avec 8 cœurs y compris le cache rapide, alors que les modèles Ryzen 9 ont deux CCD avec 6 et 8 cœurs de CPU, respectivement. Cependant, seul un des DCC est équipé du 3D V-Cache, alors que l'autre DCC est bien connu des modèles Ryzen 9 7950X3D.AMD Ryzen 9 7950X. Un CCD est le die CPU réel sous le répartiteur de chaleur, qui combine un maximum de huit cœurs.
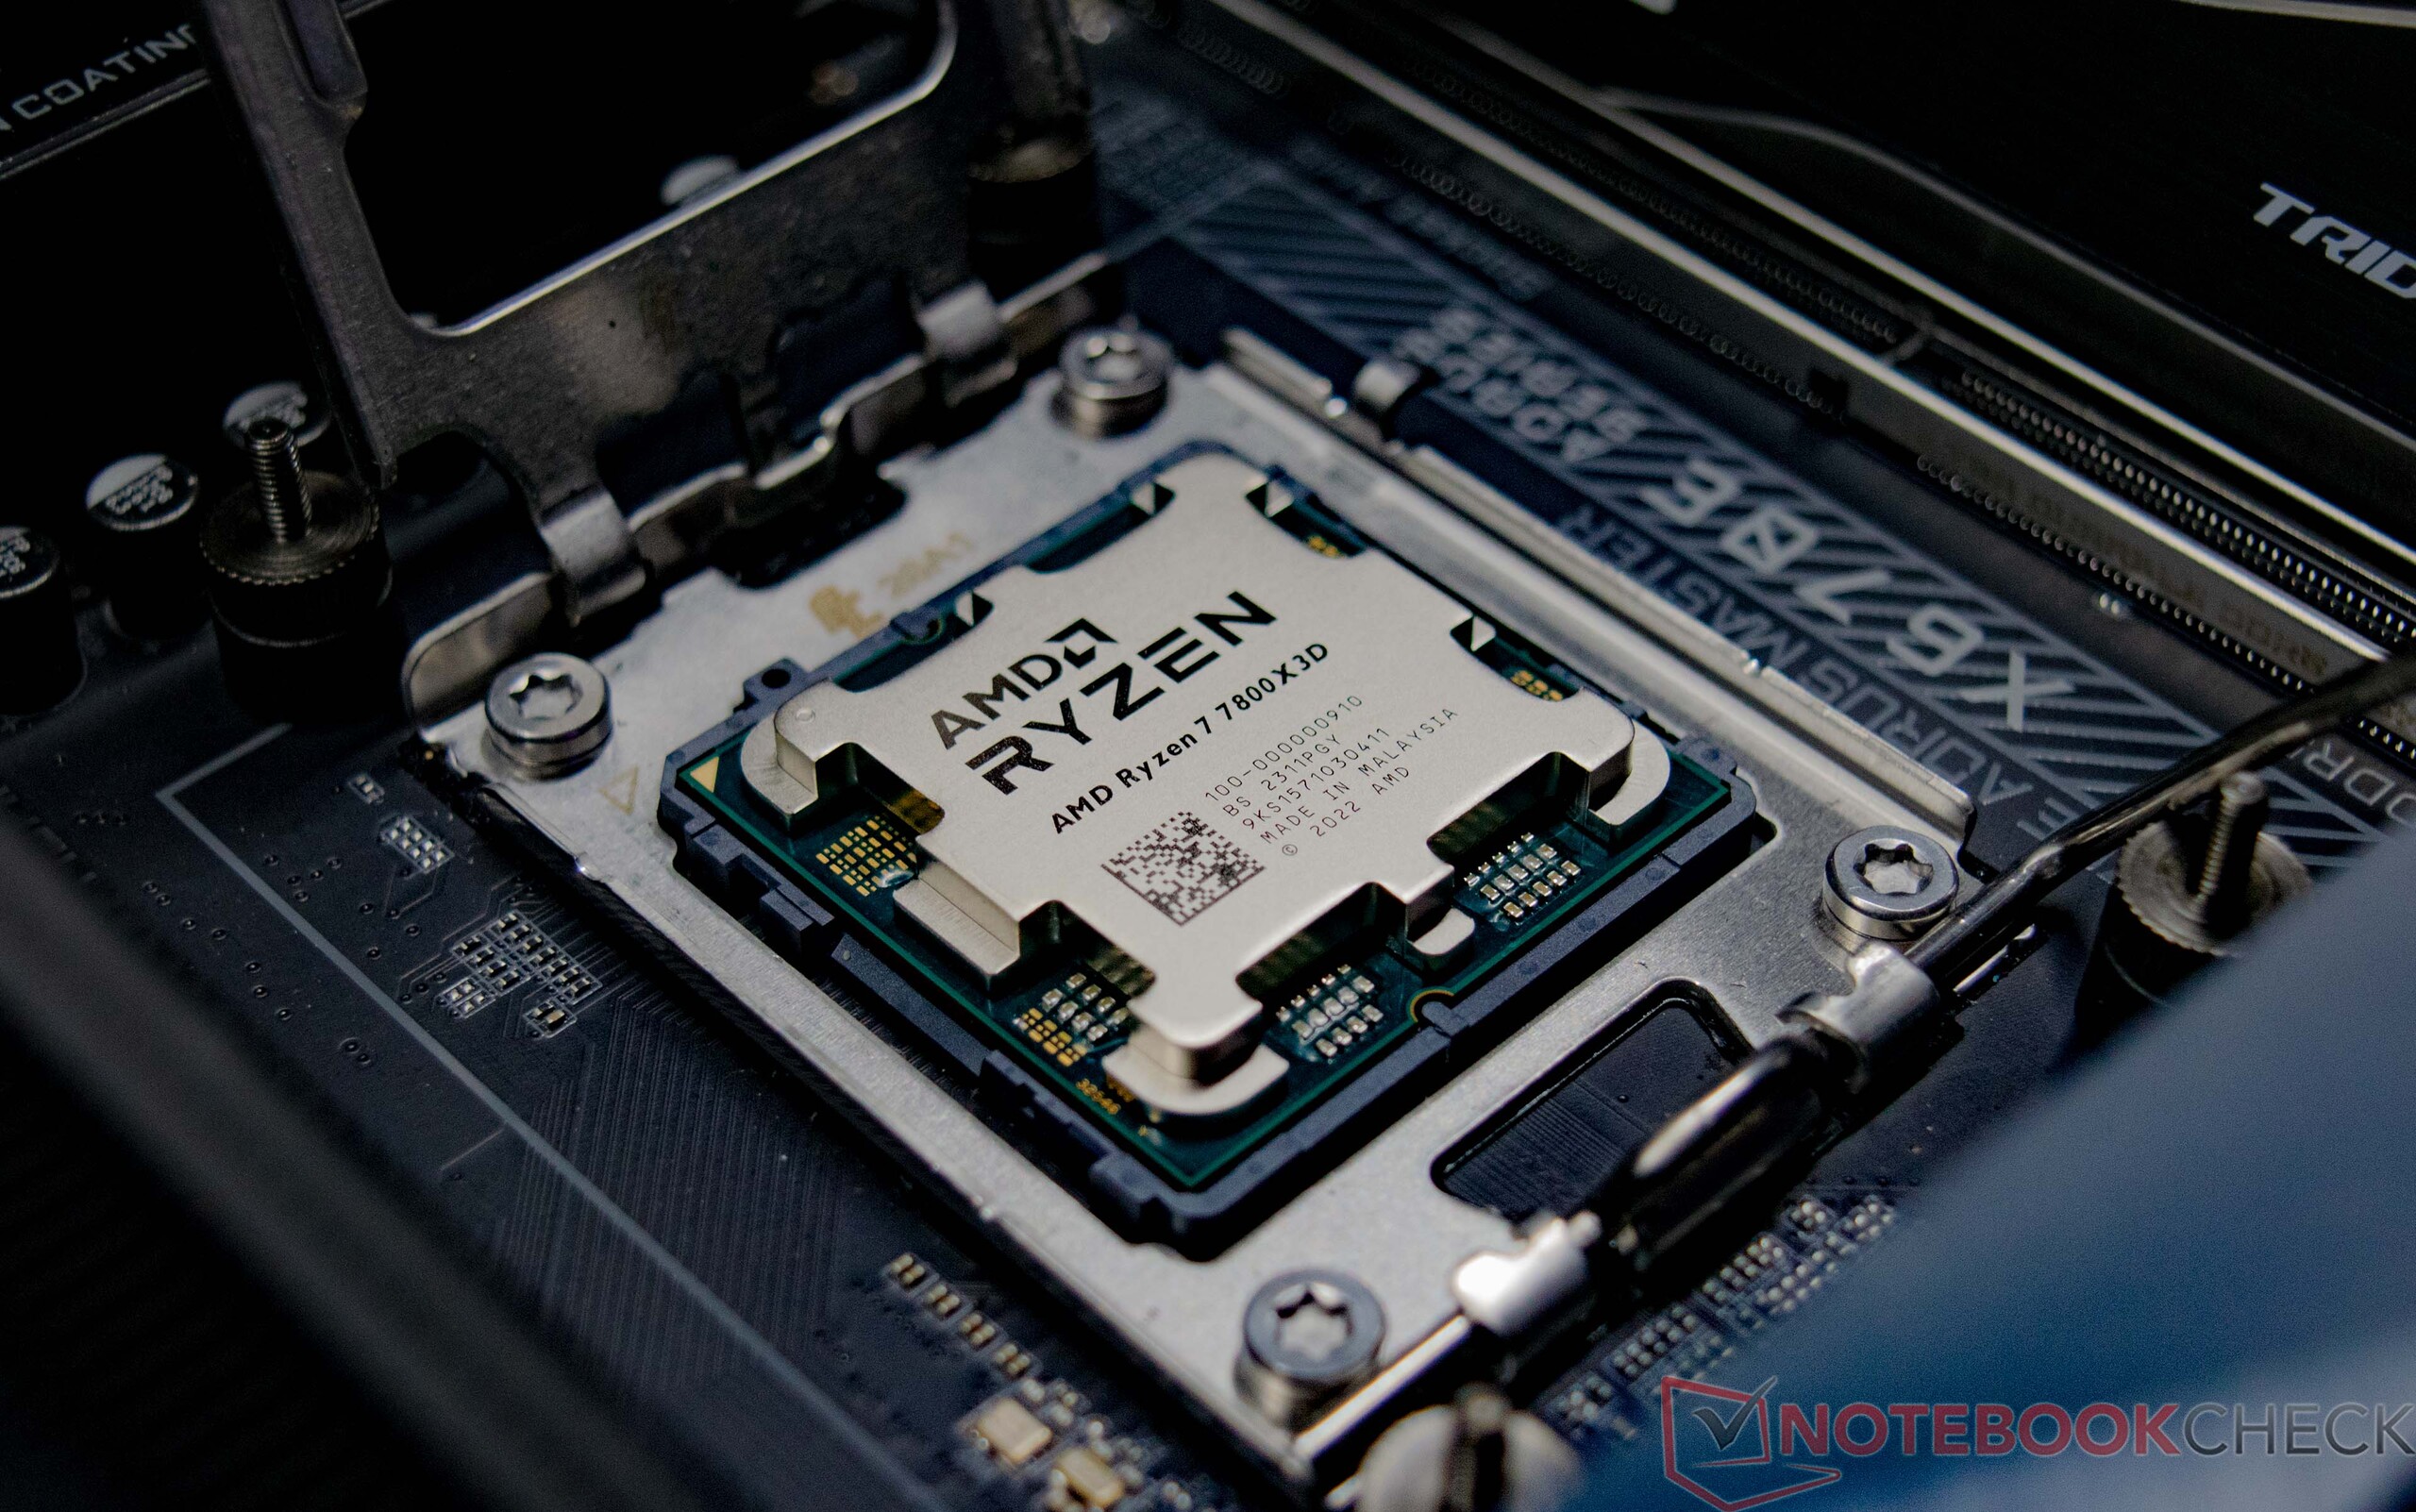
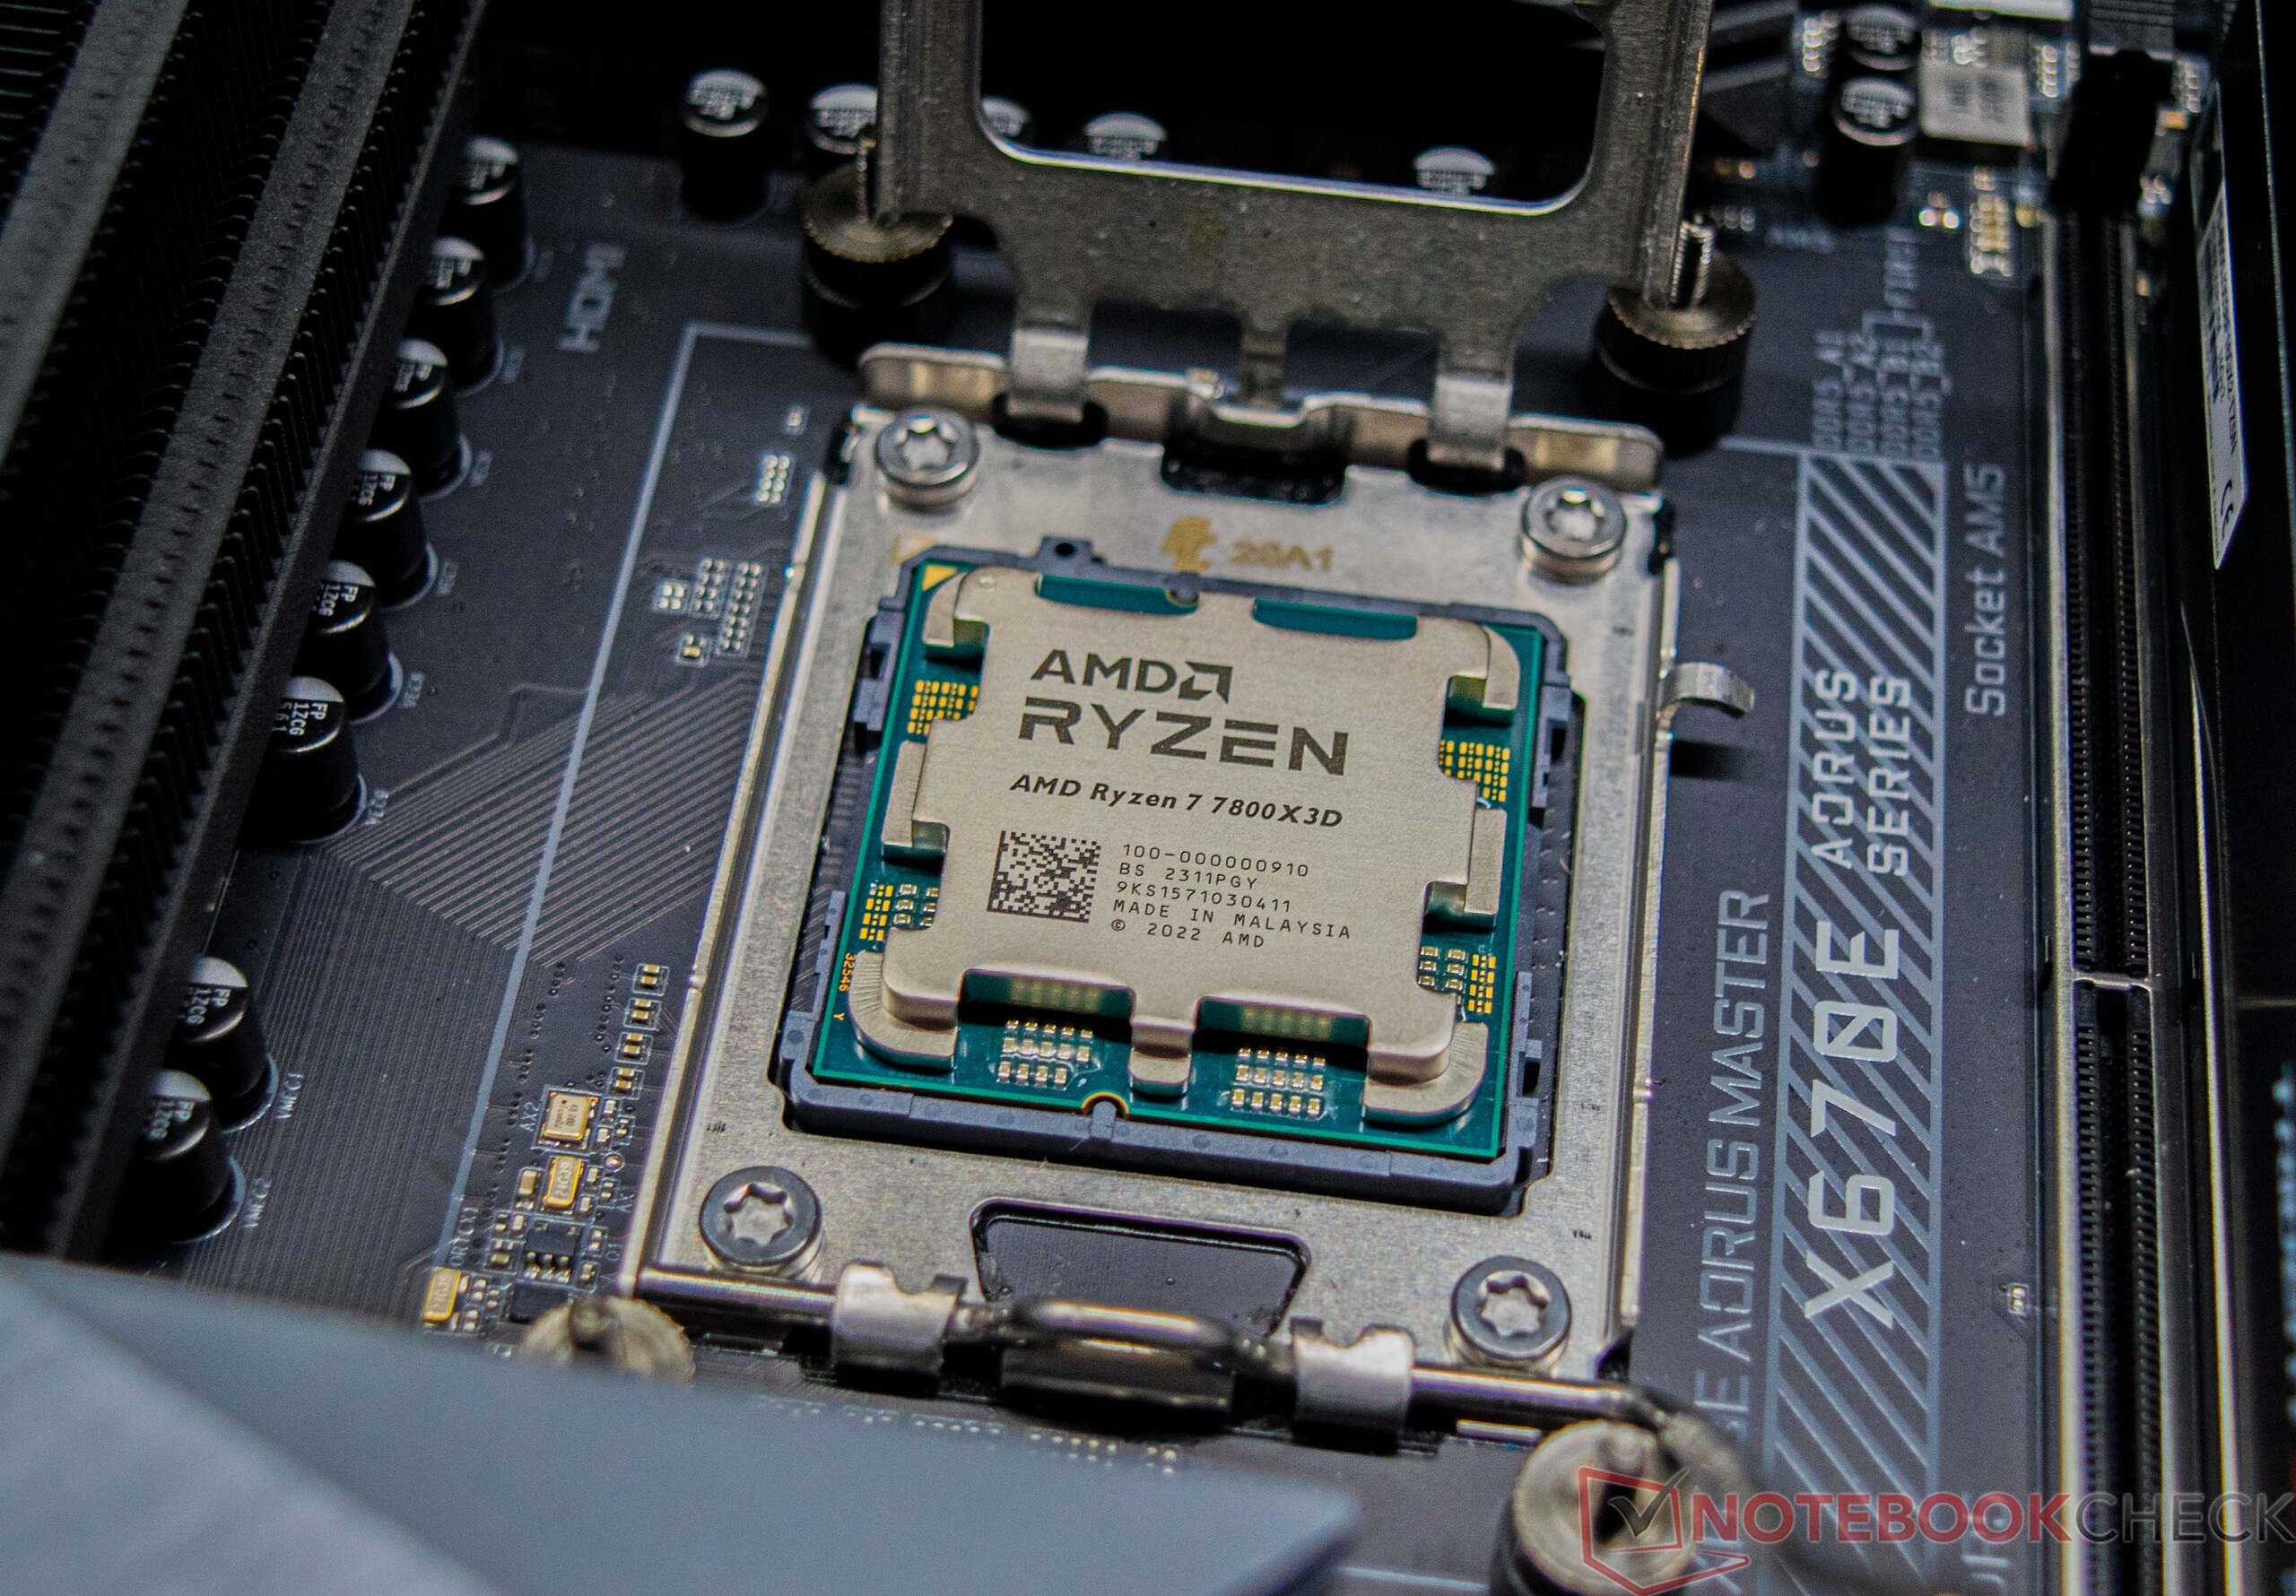
L'AMD Ryzen 7 7800X3D, comme tous les processeurs de la série Ryzen 7000, nécessite le socket AM5 (1 718 contacts). La mise à niveau à partir d'un Ryzen de la série 5000 ou plus ancien implique l'achat d'une nouvelle carte mère et la nécessité d'investir dans une nouvelle mémoire vive. En ce qui concerne la consommation d'énergie, le fabricant indique un TDP de 120 watts. La consommation maximale est toutefois limitée à 162 watts par le PPT (Package Power Tracking).
La famille AMD-Ryzen-7000 en bref
| Modèle | Cœurs/fils | Horloge de base | Horloge turbo | Cache L2 | Cache L3 | TDP | PPT | Prix de lancement |
|---|---|---|---|---|---|---|---|---|
| Ryzen 9 7950X3D | 16/32 | 4,2 GHz | 5,7 GHz | 16x 1 Mo | 128 Mo | 120 watts | 162 watts | 699 USD |
| Ryzen 9 7950X | 16/32 | 4,5 GHz | 5,7 GHz | 16x 1 Mo | 64 Mo | 170 watts | 230 watts | 699 USD |
| Ryzen 9 7900X3D | 12/24 | 4,4 GHz | 5,6 GHz | 12x 1 Mo | 128 Mo | 120 watts | 162 watts | 599 USD |
| Ryzen 9 7900X | 12/24 | 4,7 GHz | 5,6 GHz | 12x 1 Mo | 64 Mo | 170 watts | 230 watts | 549 USD |
| Ryzen 7 7800X3D | 8/16 | 4.2 GHz | 5.0 GHz | 8x1 Mo | 96 Mo | 120 watts | 162 watts | 549 USD |
| Ryzen 7 7700X | 8/16 | 4,5 GHz | 5,4 GHz | 8x 1 Mo | 32 Mo | 105 watts | 142 watts | 399 USD |
| Ryzen 5 7600X | 6/12 | 4,7 GHz | 5,3 GHz | 6x 1 Mo | 32 Mo | 105 watts | 142 watts | 299 USD |
Notre système de test en détail
Nous avons utilisé ce système pour les tests suivants :
- Lian Li O11 Dynamic
- AMD Ryzen 7 7800X3D
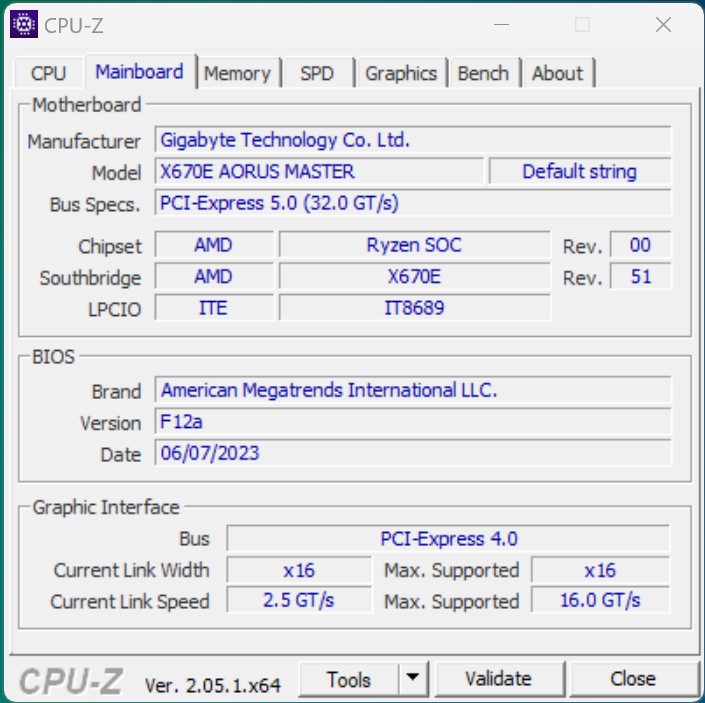
- Gigabyte X670E Aorus Master, BIOS : F12a
- Palit GeForce RTX 4090 GameRock OC
- DeepCool LT360
- Corsair HX1200i
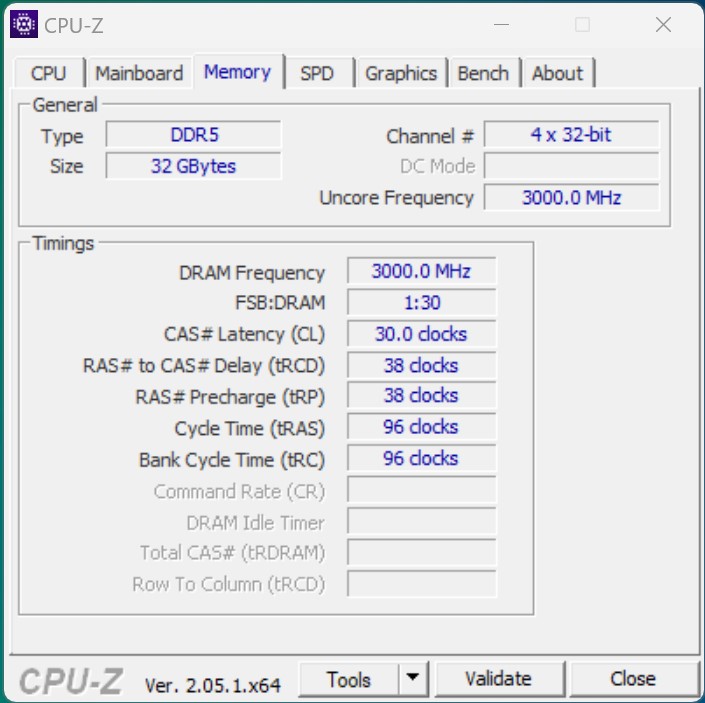
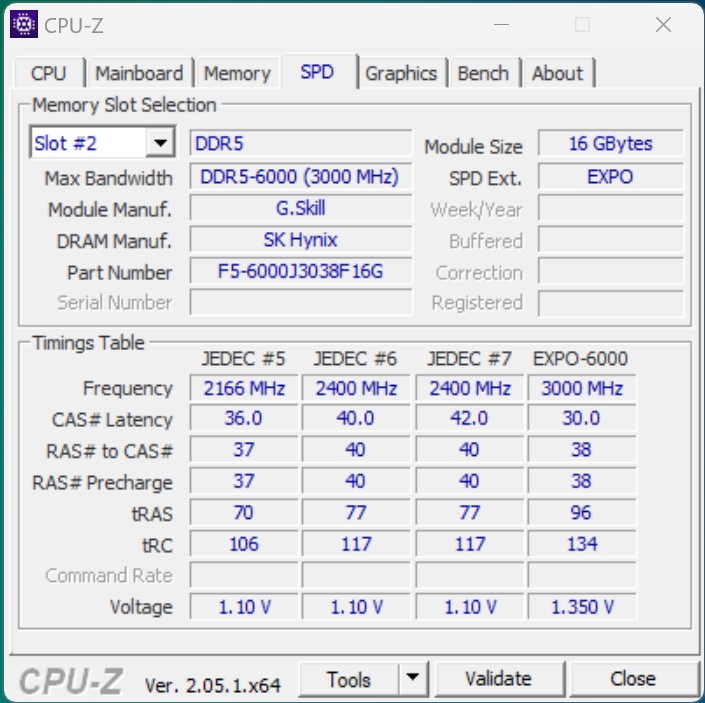
- G.Skill Trident Z5 Neo DDR5-6000 2x 16 Go, EXPO (DDR5-6000 CL30-38-38-96)
- Corsair MP600
- Microsoft Windows 11 Professionnel 64 Bit (Version 22H2)

Conditions d'essai
Nous avons effectué tous les tests de performance en utilisant le profil énergétique "Highest Performance". Nous ne nous en sommes écartés que pour les mesures de la consommation d'énergie. Une solution DeepCool LT360 AiO a été utilisée comme unité de refroidissement dans ce test. D'après le fabricant, cette solution figure parmi les unités de refroidissement compatibles avec les processeurs AMD Ryzen 7000. Par conséquent, vous serez en sécurité en utilisant cette solution afin de ne pas enfreindre les spécifications du fabricant.
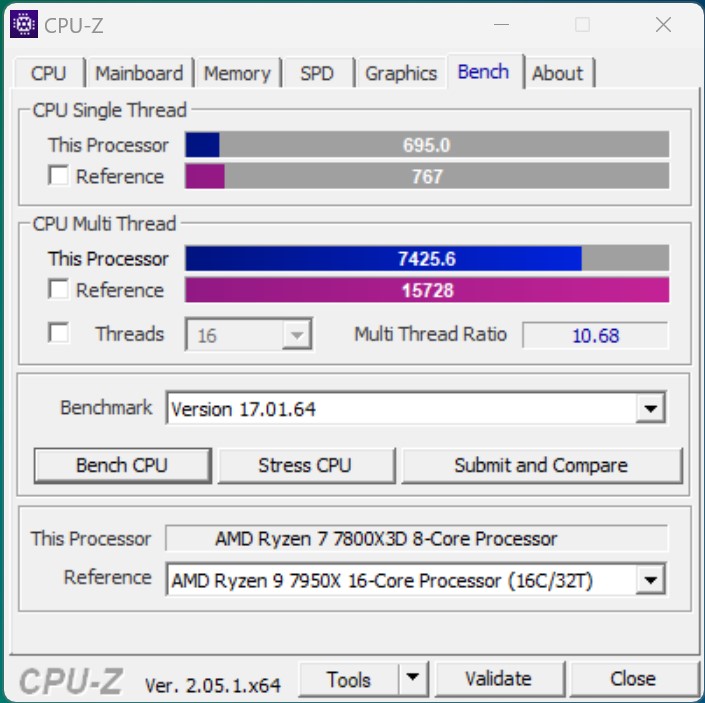
Benchmark des processeurs - Une Ryzen 7 7800X3D moyenne
Avant de nous pencher sur les benchmarks de jeu, nous allons d'abord jeter un coup d'œil sur les performances pures du processeur. A l'aide de différents benchmarks, nous avons constaté que l'AMD Ryzen 7 7800X3D atteignait à peu près le même niveau de performance que l'AMD Ryzen 9 5950XX.AMD Ryzen 9 5950X. Par rapport à Intel, c'est suffisant pour battre l'AMD Ryzen 9 5950X.AMD Ryzen 9 5950X. Nous tenons ici à rappeler que l'AMD Ryzen 7 7800X3D est un processeur à 8 cœurs. Cela signifie qu'il est nettement moins performant dans les benchmarks multithreads que beaucoup de ses concurrents.
Comparé à l'AMD Ryzen 9 7950X3D Test des AMD Ryzen 9 7950X et 7 7700X : performances et gains d'efficacité qui contrecarrent Raptor Lake , le plus petit Ryzen 7 7800X3D a un retard d'environ 24 %. À ce stade, le Intel Core i9-13900K a obtenu les meilleurs résultats, avec un point de pourcentage de mieux que le modèle haut de gamme d'AMD.
D'autres benchmarks de processeurs sont disponibles sur ici.
| Performance rating - Percent | |
| Intel Core i9-13900K | |
| AMD Ryzen 9 7950X | |
| AMD Ryzen 9 7950X3D | |
| Intel Core i7-13700K | |
| AMD Ryzen 9 7900X | |
| AMD Ryzen 9 5950X | |
| Intel Core i5-13600K | |
| AMD Ryzen 7 7800X3D | |
| Intel Core i7-12700 | |
| Intel Core i5-12600K | |
| Intel Core i5-13400 | |
| Cinebench R15 | |
| CPU Single 64Bit | |
| Intel Core i9-13900K | |
| AMD Ryzen 9 7950X3D | |
| AMD Ryzen 9 7900X | |
| AMD Ryzen 9 7950X | |
| Intel Core i7-13700K | |
| AMD Ryzen 7 7800X3D | |
| Intel Core i5-13600K | |
| Intel Core i5-12600K | |
| AMD Ryzen 9 5950X | |
| Intel Core i7-12700 | |
| Intel Core i5-13400 | |
| CPU Multi 64Bit | |
| AMD Ryzen 9 7950X | |
| Intel Core i9-13900K | |
| AMD Ryzen 9 7950X3D | |
| AMD Ryzen 9 7900X | |
| Intel Core i7-13700K | |
| AMD Ryzen 9 5950X | |
| Intel Core i5-13600K | |
| Intel Core i7-12700 | |
| AMD Ryzen 7 7800X3D | |
| Intel Core i5-12600K | |
| Intel Core i5-13400 | |
| Cinebench R20 | |
| CPU (Single Core) | |
| Intel Core i9-13900K | |
| Intel Core i7-13700K | |
| AMD Ryzen 9 7950X3D | |
| AMD Ryzen 9 7900X | |
| AMD Ryzen 9 7950X | |
| Intel Core i5-13600K | |
| Intel Core i5-12600K | |
| Intel Core i7-12700 | |
| AMD Ryzen 7 7800X3D | |
| Intel Core i5-13400 | |
| AMD Ryzen 9 5950X | |
| CPU (Multi Core) | |
| Intel Core i9-13900K | |
| AMD Ryzen 9 7950X | |
| AMD Ryzen 9 7950X3D | |
| Intel Core i7-13700K | |
| AMD Ryzen 9 7900X | |
| AMD Ryzen 9 5950X | |
| Intel Core i5-13600K | |
| Intel Core i7-12700 | |
| AMD Ryzen 7 7800X3D | |
| Intel Core i5-12600K | |
| Intel Core i5-13400 | |
| Cinebench R23 | |
| Single Core | |
| Intel Core i9-13900K | |
| Intel Core i7-13700K | |
| AMD Ryzen 9 7950X3D | |
| AMD Ryzen 9 7900X | |
| AMD Ryzen 9 7950X | |
| Intel Core i5-13600K | |
| Intel Core i5-12600K | |
| Intel Core i7-12700 | |
| AMD Ryzen 7 7800X3D | |
| Intel Core i5-13400 | |
| AMD Ryzen 9 5950X | |
| Multi Core | |
| Intel Core i9-13900K | |
| AMD Ryzen 9 7950X | |
| AMD Ryzen 9 7950X3D | |
| Intel Core i7-13700K | |
| AMD Ryzen 9 7900X | |
| AMD Ryzen 9 5950X | |
| Intel Core i5-13600K | |
| Intel Core i7-12700 | |
| AMD Ryzen 7 7800X3D | |
| Intel Core i5-12600K | |
| Intel Core i5-13400 | |
| Cinebench R11.5 | |
| CPU Single 64Bit | |
| Intel Core i9-13900K | |
| AMD Ryzen 9 7950X3D | |
| AMD Ryzen 9 7900X | |
| AMD Ryzen 9 7950X | |
| Intel Core i7-13700K | |
| Intel Core i5-13600K | |
| AMD Ryzen 7 7800X3D | |
| Intel Core i5-12600K | |
| Intel Core i7-12700 | |
| AMD Ryzen 9 5950X | |
| Intel Core i5-13400 | |
| CPU Multi 64Bit | |
| Intel Core i9-13900K | |
| AMD Ryzen 9 7950X | |
| AMD Ryzen 9 7950X3D | |
| AMD Ryzen 9 7900X | |
| Intel Core i7-13700K | |
| AMD Ryzen 9 5950X | |
| Intel Core i5-13600K | |
| Intel Core i7-12700 | |
| AMD Ryzen 7 7800X3D | |
| Intel Core i5-12600K | |
| Intel Core i5-13400 | |
| Blender - v2.79 BMW27 CPU | |
| Intel Core i5-13400 | |
| Intel Core i5-12600K | |
| AMD Ryzen 7 7800X3D | |
| Intel Core i7-12700 | |
| Intel Core i5-13600K | |
| AMD Ryzen 9 5950X | |
| AMD Ryzen 9 7900X | |
| Intel Core i7-13700K | |
| AMD Ryzen 9 7950X3D | |
| AMD Ryzen 9 7950X | |
| Intel Core i9-13900K | |
| wPrime 2.10 | |
| 32m | |
| Intel Core i5-12600K | |
| Intel Core i5-13400 | |
| Intel Core i7-12700 | |
| AMD Ryzen 9 5950X | |
| Intel Core i5-13600K | |
| AMD Ryzen 7 7800X3D | |
| Intel Core i7-13700K | |
| AMD Ryzen 9 7950X3D | |
| Intel Core i9-13900K | |
| AMD Ryzen 9 7900X | |
| AMD Ryzen 9 7950X | |
| 1024m | |
| Intel Core i5-13400 | |
| Intel Core i7-12700 | |
| Intel Core i5-12600K | |
| Intel Core i5-13600K | |
| Intel Core i7-13700K | |
| Intel Core i9-13900K | |
| AMD Ryzen 9 5950X | |
| AMD Ryzen 7 7800X3D | |
| AMD Ryzen 9 7900X | |
| AMD Ryzen 9 7950X3D | |
| AMD Ryzen 9 7950X | |
| X264 HD Benchmark 4.0 | |
| Pass 1 | |
| Intel Core i9-13900K | |
| Intel Core i7-13700K | |
| AMD Ryzen 9 7950X3D | |
| Intel Core i5-13600K | |
| AMD Ryzen 9 7950X | |
| AMD Ryzen 9 7900X | |
| Intel Core i7-12700 | |
| AMD Ryzen 7 7800X3D | |
| AMD Ryzen 9 5950X | |
| Intel Core i5-12600K | |
| Intel Core i5-13400 | |
| Pass 2 | |
| AMD Ryzen 9 7950X | |
| Intel Core i9-13900K | |
| AMD Ryzen 9 7950X3D | |
| AMD Ryzen 9 7900X | |
| Intel Core i7-13700K | |
| AMD Ryzen 9 5950X | |
| Intel Core i5-13600K | |
| Intel Core i7-12700 | |
| AMD Ryzen 7 7800X3D | |
| Intel Core i5-12600K | |
| Intel Core i5-13400 | |
| WinRAR - Result | |
| AMD Ryzen 9 7900X | |
| AMD Ryzen 7 7800X3D | |
| AMD Ryzen 9 7950X3D | |
| AMD Ryzen 9 7950X | |
| Intel Core i9-13900K | |
| Intel Core i7-13700K | |
| AMD Ryzen 9 5950X | |
| Intel Core i5-13600K | |
| Intel Core i7-12700 | |
| Intel Core i5-13400 | |
| Intel Core i5-12600K | |
| TrueCrypt | |
| AES Mean 100MB | |
| AMD Ryzen 9 7950X | |
| Intel Core i9-13900K | |
| AMD Ryzen 9 5950X | |
| AMD Ryzen 9 7950X3D | |
| Intel Core i5-13600K | |
| Intel Core i7-13700K | |
| AMD Ryzen 7 7800X3D | |
| AMD Ryzen 9 7900X | |
| Intel Core i7-12700 | |
| Intel Core i5-12600K | |
| Intel Core i5-13400 | |
| Twofish Mean 100MB | |
| Intel Core i9-13900K | |
| AMD Ryzen 9 7950X | |
| AMD Ryzen 9 7950X3D | |
| Intel Core i7-13700K | |
| AMD Ryzen 9 5950X | |
| Intel Core i5-13600K | |
| AMD Ryzen 9 7900X | |
| Intel Core i7-12700 | |
| Intel Core i5-12600K | |
| AMD Ryzen 7 7800X3D | |
| Intel Core i5-13400 | |
| Serpent Mean 100MB | |
| Intel Core i9-13900K | |
| AMD Ryzen 9 7950X | |
| AMD Ryzen 9 7950X3D | |
| AMD Ryzen 9 5950X | |
| Intel Core i7-13700K | |
| Intel Core i5-13600K | |
| AMD Ryzen 9 7900X | |
| Intel Core i7-12700 | |
| Intel Core i5-12600K | |
| AMD Ryzen 7 7800X3D | |
| Intel Core i5-13400 | |
| Geekbench 5.5 | |
| Multi-Core | |
| AMD Ryzen 9 7950X3D | |
| Intel Core i9-13900K | |
| AMD Ryzen 9 7950X | |
| AMD Ryzen 9 7900X | |
| Intel Core i7-13700K | |
| AMD Ryzen 9 5950X | |
| Intel Core i5-13600K | |
| Intel Core i7-12700 | |
| AMD Ryzen 7 7800X3D | |
| Intel Core i5-12600K | |
| Intel Core i5-13400 | |
| Single-Core | |
| AMD Ryzen 9 7950X3D | |
| Intel Core i9-13900K | |
| AMD Ryzen 9 7900X | |
| AMD Ryzen 9 7950X | |
| Intel Core i7-13700K | |
| AMD Ryzen 7 7800X3D | |
| Intel Core i5-13600K | |
| Intel Core i7-12700 | |
| Intel Core i5-12600K | |
| Intel Core i5-13400 | |
| AMD Ryzen 9 5950X | |
| Geekbench 5.0 | |
| 5.0 Multi-Core | |
| Intel Core i9-13900K | |
| AMD Ryzen 9 7950X3D | |
| AMD Ryzen 9 7950X | |
| AMD Ryzen 9 7900X | |
| Intel Core i7-13700K | |
| Intel Core i5-13600K | |
| AMD Ryzen 9 5950X | |
| Intel Core i7-12700 | |
| AMD Ryzen 7 7800X3D | |
| Intel Core i5-12600K | |
| Intel Core i5-13400 | |
| 5.0 Single-Core | |
| Intel Core i9-13900K | |
| AMD Ryzen 9 7900X | |
| AMD Ryzen 9 7950X3D | |
| AMD Ryzen 9 7950X | |
| Intel Core i7-13700K | |
| AMD Ryzen 7 7800X3D | |
| Intel Core i5-13600K | |
| Intel Core i7-12700 | |
| Intel Core i5-12600K | |
| Intel Core i5-13400 | |
| AMD Ryzen 9 5950X | |
| Geekbench 4.4 | |
| 64 Bit Single-Core Score | |
| Intel Core i9-13900K | |
| AMD Ryzen 9 7950X3D | |
| AMD Ryzen 9 7900X | |
| AMD Ryzen 7 7800X3D | |
| AMD Ryzen 9 7950X | |
| Intel Core i7-13700K | |
| Intel Core i5-13600K | |
| Intel Core i5-12600K | |
| Intel Core i7-12700 | |
| Intel Core i5-13400 | |
| AMD Ryzen 9 5950X | |
| 64 Bit Multi-Core Score | |
| AMD Ryzen 9 7950X3D | |
| Intel Core i9-13900K | |
| AMD Ryzen 9 7950X | |
| AMD Ryzen 9 7900X | |
| Intel Core i7-13700K | |
| AMD Ryzen 9 5950X | |
| Intel Core i5-13600K | |
| AMD Ryzen 7 7800X3D | |
| Intel Core i7-12700 | |
| Intel Core i5-12600K | |
| Intel Core i5-13400 | |
| 3DMark 11 - 1280x720 Performance Physics | |
| AMD Ryzen 9 7950X3D | |
| AMD Ryzen 7 7800X3D | |
| AMD Ryzen 9 7950X | |
| Intel Core i9-13900K | |
| Intel Core i7-13700K | |
| Intel Core i5-13600K | |
| AMD Ryzen 9 7900X | |
| Intel Core i7-12700 | |
| AMD Ryzen 9 5950X | |
| Intel Core i5-12600K | |
| Intel Core i5-13400 | |
| 7-Zip 18.03 | |
| 7z b 4 | |
| AMD Ryzen 9 7950X3D | |
| AMD Ryzen 9 7950X | |
| Intel Core i9-13900K | |
| AMD Ryzen 9 5950X | |
| AMD Ryzen 9 7900X | |
| Intel Core i7-13700K | |
| Intel Core i5-13600K | |
| AMD Ryzen 7 7800X3D | |
| Intel Core i7-12700 | |
| Intel Core i5-12600K | |
| Intel Core i5-13400 | |
| 7z b 4 -mmt1 | |
| AMD Ryzen 9 7950X3D | |
| AMD Ryzen 9 7900X | |
| AMD Ryzen 7 7800X3D | |
| AMD Ryzen 9 7950X | |
| Intel Core i9-13900K | |
| Intel Core i7-13700K | |
| AMD Ryzen 9 5950X | |
| Intel Core i5-13600K | |
| Intel Core i7-12700 | |
| Intel Core i5-12600K | |
| Intel Core i5-13400 | |
| HWBOT x265 Benchmark v2.2 - 4k Preset | |
| AMD Ryzen 9 7950X | |
| Intel Core i9-13900K | |
| AMD Ryzen 9 7950X3D | |
| AMD Ryzen 9 7900X | |
| Intel Core i7-13700K | |
| AMD Ryzen 9 5950X | |
| Intel Core i5-12600K | |
| Intel Core i5-13600K | |
| Intel Core i7-12700 | |
| AMD Ryzen 7 7800X3D | |
| Intel Core i5-13400 | |
| R Benchmark 2.5 - Overall mean | |
| Intel Core i5-13400 | |
| AMD Ryzen 9 5950X | |
| Intel Core i5-12600K | |
| Intel Core i7-12700 | |
| AMD Ryzen 7 7800X3D | |
| Intel Core i5-13600K | |
| Intel Core i7-13700K | |
| AMD Ryzen 9 7950X | |
| AMD Ryzen 9 7900X | |
| AMD Ryzen 9 7950X3D | |
| Intel Core i9-13900K | |
| LibreOffice - 20 Documents To PDF | |
| Intel Core i5-12600K | |
| AMD Ryzen 9 5950X | |
| AMD Ryzen 7 7800X3D | |
| Intel Core i5-13400 | |
| AMD Ryzen 9 7950X3D | |
| Intel Core i7-12700 | |
| Intel Core i9-13900K | |
| AMD Ryzen 9 7950X | |
| Intel Core i5-13600K | |
| AMD Ryzen 9 7900X | |
| Intel Core i7-13700K | |
| WebXPRT 3 - Overall | |
| AMD Ryzen 9 7950X3D | |
| AMD Ryzen 9 7900X | |
| Intel Core i9-13900K | |
| AMD Ryzen 9 7950X | |
| AMD Ryzen 7 7800X3D | |
| Intel Core i7-13700K | |
| Intel Core i5-13600K | |
| Intel Core i7-12700 | |
| Intel Core i5-13400 | |
| Intel Core i5-12600K | |
| AMD Ryzen 9 5950X | |
| Mozilla Kraken 1.1 - Total | |
| AMD Ryzen 9 5950X | |
| Intel Core i5-13400 | |
| Intel Core i5-12600K | |
| Intel Core i7-12700 | |
| AMD Ryzen 7 7800X3D | |
| Intel Core i5-13600K | |
| Intel Core i7-13700K | |
| AMD Ryzen 9 7950X | |
| AMD Ryzen 9 7950X3D | |
| Intel Core i9-13900K | |
| AMD Ryzen 9 7900X | |
| 3DMark | |
| 1920x1080 Fire Strike Physics | |
| Intel Core i9-13900K | |
| AMD Ryzen 9 7950X | |
| Intel Core i7-13700K | |
| AMD Ryzen 9 7950X3D | |
| AMD Ryzen 9 7900X | |
| AMD Ryzen 9 5950X | |
| Intel Core i5-13600K | |
| Intel Core i7-12700 | |
| AMD Ryzen 7 7800X3D | |
| Intel Core i5-12600K | |
| Intel Core i5-13400 | |
| 2560x1440 Time Spy CPU | |
| Intel Core i9-13900K | |
| Intel Core i7-13700K | |
| AMD Ryzen 9 7950X3D | |
| Intel Core i5-13600K | |
| AMD Ryzen 9 7900X | |
| Intel Core i7-12700 | |
| AMD Ryzen 9 7950X | |
| AMD Ryzen 7 7800X3D | |
| Intel Core i5-12600K | |
| AMD Ryzen 9 5950X | |
| Intel Core i5-13400 | |
* ... Moindre est la valeur, meilleures sont les performances
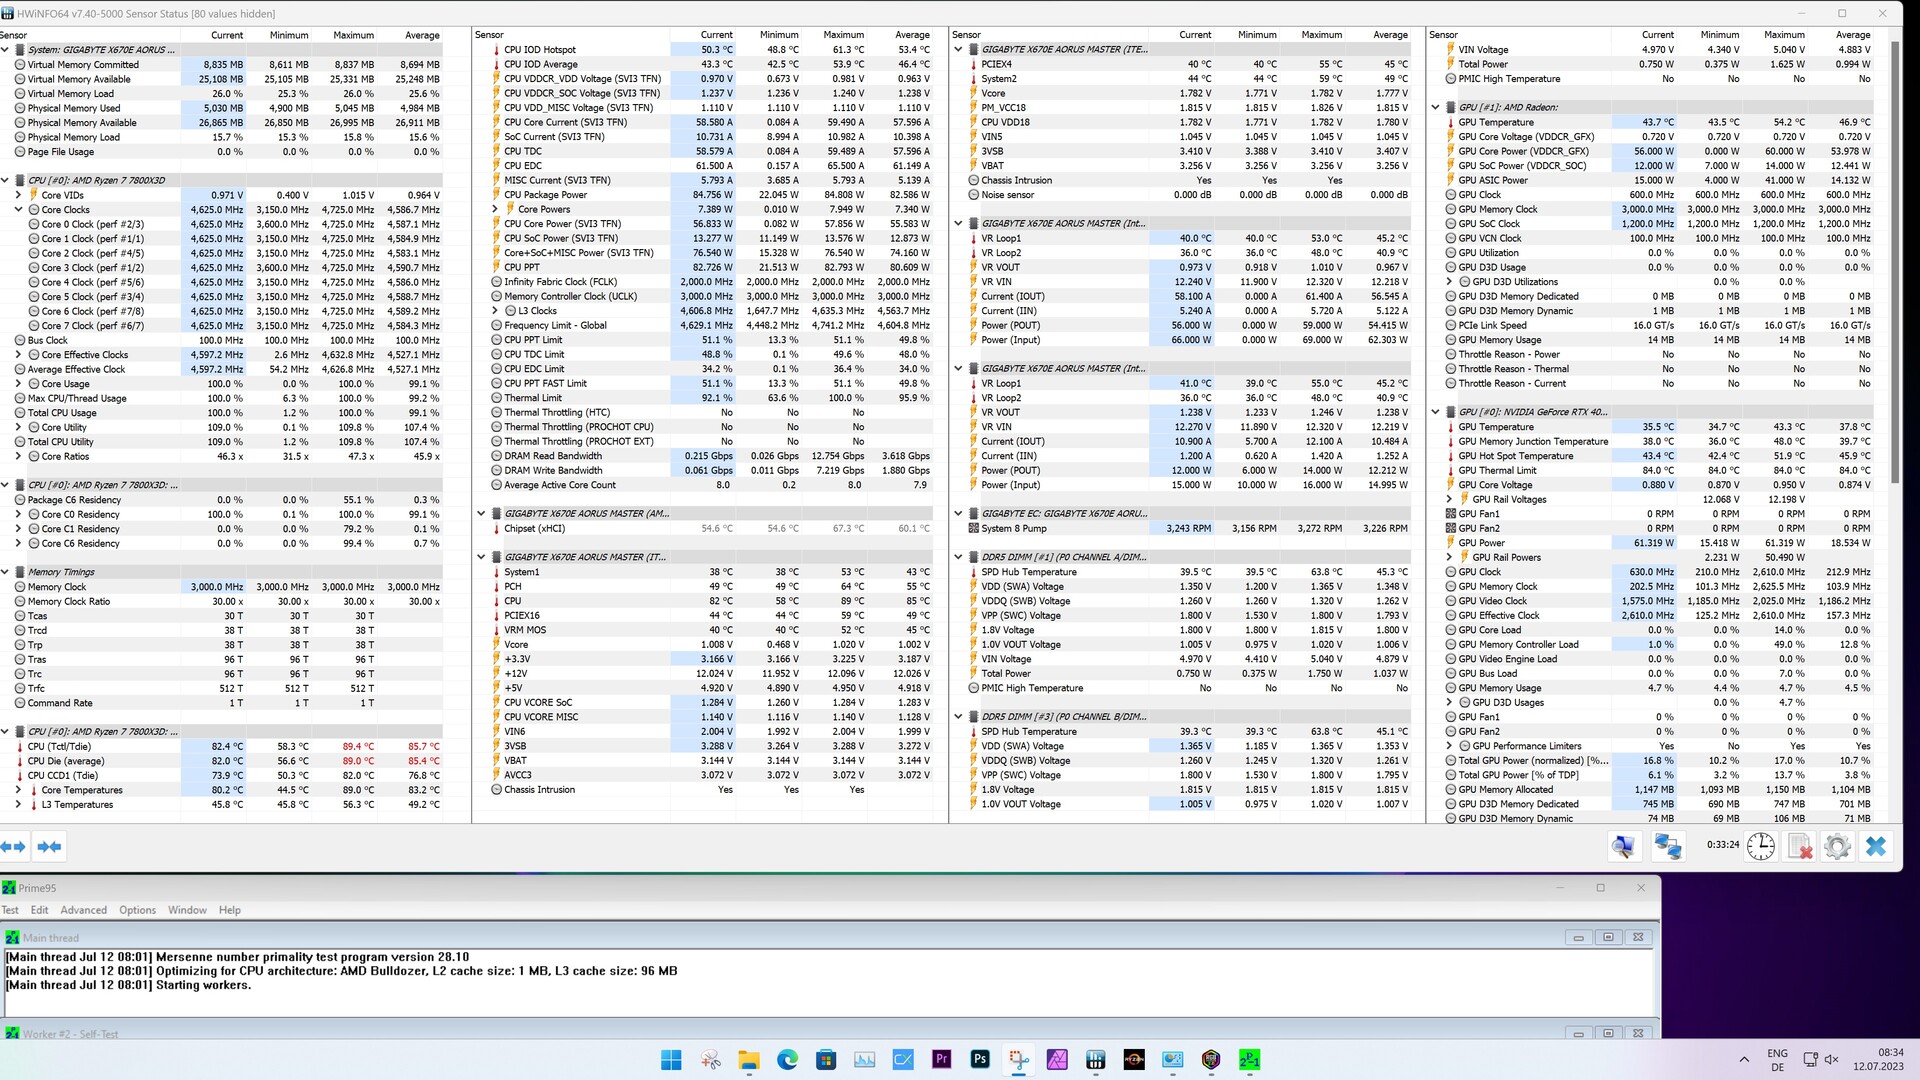
AMD Ryzen 7 7800X3D vs. Cinebench R15 Multi Loop
Avec l'aide du Cinebench R15 Multi Loop, nous pouvons à ce stade constater que le système de refroidissement DeepCool est suffisant pour refroidir l'AMD Ryzen 7 7800X3D de manière fiable. Pour une divulgation complète, nous devons noter que tous les tests ont été effectués avec le boîtier fermé. La circulation de l'air dans le Lian Li O11 Dynamic n'était pas la meilleure dans notre système de test, car il n'y avait pas de ventilateurs installés qui avaient accès à l'air frais.
Critères de référence synthétiques et performances des applications
Les benchmarks d'applications synthétiques de l'AMD Ryzen 7 7800X3D sont déjà un peu meilleurs que ceux du processeur. Il n'est pas loin d'être derrière l'Intel Core i5-13600K.Intel Core i5-13600Ket leAMD Ryzen 9 5950Xa pu être clairement surpassé.
Lors des tests de mémoire vive, nous aurions pu nous attendre à des résultats similaires à ceux de l'AMD Ryzen 9 7950X3D
, puisque la plateforme de test est la même et que la fréquence d'horloge de la mémoire vive de 6 000 MT/s reste également la même. Cependant, vous devez savoir que l'AMD Ryzen 7 7800X3D fonctionne en dehors des spécifications du fabricant lorsque le profil EXPO est activé. La fréquence d'horloge habituelle de l'AMD Ryzen 7 7800X3D est de 5 200 MT/s.<br>| Performance rating - Percent | |
| Intel Core i9-13900K | |
| AMD Ryzen 9 7950X | |
| AMD Ryzen 9 7950X3D | |
| Intel Core i7-13700K | |
| AMD Ryzen 9 7900X | |
| Intel Core i5-13600K | |
| AMD Ryzen 7 7800X3D | |
| Intel Core i7-12700 | |
| AMD Ryzen 9 5950X | |
| Intel Core i5-13400 | |
| PCMark 10 | |
| Productivity | |
| AMD Ryzen 9 7950X3D | |
| AMD Ryzen 9 7950X | |
| Intel Core i7-13700K | |
| AMD Ryzen 7 7800X3D | |
| AMD Ryzen 9 7900X | |
| Intel Core i5-13600K | |
| Intel Core i9-13900K | |
| Intel Core i7-12700 | |
| AMD Ryzen 9 5950X | |
| Intel Core i5-13400 | |
| Essentials | |
| Intel Core i9-13900K | |
| AMD Ryzen 9 7900X | |
| AMD Ryzen 9 7950X | |
| Intel Core i5-13600K | |
| AMD Ryzen 9 7950X3D | |
| Intel Core i7-13700K | |
| AMD Ryzen 7 7800X3D | |
| AMD Ryzen 9 5950X | |
| Intel Core i7-12700 | |
| Intel Core i5-13400 | |
| 3DMark | |
| 1920x1080 Fire Strike Physics | |
| Intel Core i9-13900K | |
| AMD Ryzen 9 7950X | |
| Intel Core i7-13700K | |
| AMD Ryzen 9 7950X3D | |
| AMD Ryzen 9 7900X | |
| AMD Ryzen 9 5950X | |
| Intel Core i5-13600K | |
| Intel Core i7-12700 | |
| AMD Ryzen 7 7800X3D | |
| Intel Core i5-13400 | |
| 2560x1440 Time Spy CPU | |
| Intel Core i9-13900K | |
| Intel Core i7-13700K | |
| AMD Ryzen 9 7950X3D | |
| Intel Core i5-13600K | |
| AMD Ryzen 9 7900X | |
| Intel Core i7-12700 | |
| AMD Ryzen 9 7950X | |
| AMD Ryzen 7 7800X3D | |
| AMD Ryzen 9 5950X | |
| Intel Core i5-13400 | |
| 3DMark 11 - 1280x720 Performance Physics | |
| AMD Ryzen 9 7950X3D | |
| AMD Ryzen 7 7800X3D | |
| AMD Ryzen 9 7950X | |
| Intel Core i9-13900K | |
| Intel Core i7-13700K | |
| Intel Core i5-13600K | |
| AMD Ryzen 9 7900X | |
| Intel Core i7-12700 | |
| AMD Ryzen 9 5950X | |
| Intel Core i5-13400 | |
| CrossMark - Overall | |
| Intel Core i9-13900K | |
| AMD Ryzen 9 7950X | |
| AMD Ryzen 9 7900X | |
| Intel Core i7-13700K | |
| Intel Core i5-13600K | |
| AMD Ryzen 7 7800X3D | |
| AMD Ryzen 9 7950X3D | |
| Intel Core i7-12700 | |
| Intel Core i5-13400 | |
| AMD Ryzen 9 5950X | |
| AIDA64 / Memory Copy | |
| Intel Core i9-13900K | |
| AMD Ryzen 9 7950X3D | |
| Intel Core i7-13700K | |
| Intel Core i7-12700 | |
| Intel Core i5-13400 | |
| Intel Core i5-13600K | |
| Intel Core i5-12600K | |
| AMD Ryzen 9 7900X | |
| AMD Ryzen 9 7950X | |
| AMD Ryzen 7 7800X3D | |
| AMD Ryzen 9 5950X | |
| Moyenne de la classe (4514 - 234662, n=2211) | |
| AIDA64 / Memory Read | |
| Intel Core i9-13900K | |
| Intel Core i7-13700K | |
| Intel Core i7-12700 | |
| AMD Ryzen 9 7950X3D | |
| Intel Core i5-13400 | |
| Intel Core i5-12600K | |
| Intel Core i5-13600K | |
| AMD Ryzen 9 7950X | |
| AMD Ryzen 9 7900X | |
| AMD Ryzen 9 5950X | |
| AMD Ryzen 7 7800X3D | |
| Moyenne de la classe (4031 - 271066, n=2173) | |
| AIDA64 / Memory Write | |
| AMD Ryzen 7 7800X3D | |
| Intel Core i7-12700 | |
| AMD Ryzen 9 7950X3D | |
| AMD Ryzen 9 7900X | |
| AMD Ryzen 9 7950X | |
| Intel Core i9-13900K | |
| Intel Core i5-13400 | |
| Intel Core i5-12600K | |
| Intel Core i5-13600K | |
| Intel Core i7-13700K | |
| Moyenne de la classe (3506 - 242868, n=2178) | |
| AMD Ryzen 9 5950X | |
| AIDA64 / Memory Latency | |
| Moyenne de la classe (6.1 - 536, n=2239) | |
| Intel Core i5-13600K | |
| Intel Core i5-13400 | |
| Intel Core i9-13900K | |
| Intel Core i7-12700 | |
| Intel Core i7-13700K | |
| AMD Ryzen 7 7800X3D | |
| AMD Ryzen 9 5950X | |
| AMD Ryzen 9 7950X3D | |
| AMD Ryzen 9 7950X | |
| AMD Ryzen 9 7900X | |
* ... Moindre est la valeur, meilleures sont les performances
Tests de jeu - Très rapide pour seulement 8 cœurs
Lors de nos tests de jeu, nous avons constaté que l'AMD Ryzen 7 7800X3D a excellé dans son rôle principal. Le processeur à 8 cœurs a même été en mesure de déloger le fleuron maison de la première place, en le reléguant à la deuxième place. Bien sûr, son avance est minime et non perceptible dans une utilisation quotidienne, mais lorsqu'il s'agit de couronner le roi de la performance, nous devons nous en tenir aux chiffres purs. Notre échantillon de test a gagné sa comparaison avec leIntel Core i9-13900Kavec une avance de 13 points de pourcentage.
L'AMD Ryzen 9 7950X3D a parfois rencontré des problèmes de répartition de la charge entre les deux CCD dans certains des jeux que nous avons testés car, comme nous le savons, seul un CCD du composant à 16 cœurs est doté du cache 3D-V. L'AMD Ryzen 7 7800X3D n'a pas ce problème, ce qui explique sans doute ses performances légèrement supérieures dans les jeux. Grâce à ses benchmarks CPU, nous pouvons comparer notre échantillon de test avec un Intel Core i7-12700 à ce stade. Il était à égalité avec l'AMD Ryzen 7 7800X3D auparavant, mais maintenant nous pouvons documenter un écart de 30 pour cent.
En combinaison avec la carte Palit GeForce RTX 4090 GameRock OC, la plateforme AM5 basée sur l'AMD Ryzen 7 7800X3D offre actuellement la meilleure combinaison en matière de jeu pur. L'aperçu de tous les jeux que nous avons testés avec cette plateforme montre qu'ils sont tous jouables en 2.160p avec un maximum de détails. En principe, cela est également possible avec un Intel Core i9-13900K ou un AMD Ryzen 9 7590X3D. Cependant, il faudra payer plus cher pour ces deux modèles.
| Performance rating - Percent | |
| AMD Ryzen 7 7800X3D | |
| AMD Ryzen 9 7950X3D | |
| Intel Core i9-13900K | |
| Intel Core i7-13700K | |
| Intel Core i7-13700 | |
| Intel Core i7-12700 | |
| Intel Core i5-13400 | |
| Intel Core i5-12400F | |
| F1 22 | |
| 1920x1080 Low Preset AA:T AF:16x | |
| AMD Ryzen 7 7800X3D | |
| AMD Ryzen 9 7950X3D | |
| Intel Core i9-13900K | |
| Intel Core i7-13700K | |
| Intel Core i7-13700 | |
| Intel Core i7-12700 | |
| Intel Core i5-12400F | |
| Intel Core i5-13400 | |
| 3840x2160 Ultra High Preset AA:T AF:16x | |
| AMD Ryzen 7 7800X3D | |
| Intel Core i7-13700K | |
| AMD Ryzen 9 7950X3D | |
| Intel Core i5-12400F | |
| Intel Core i7-13700 | |
| Intel Core i7-12700 | |
| Intel Core i5-13400 | |
| Intel Core i9-13900K | |
| Far Cry 5 | |
| 1280x720 Low Preset AA:T | |
| AMD Ryzen 7 7800X3D | |
| AMD Ryzen 9 7950X3D | |
| Intel Core i7-13700K | |
| Intel Core i9-13900K | |
| Intel Core i7-13700 | |
| Intel Core i7-12700 | |
| Intel Core i5-13400 | |
| Intel Core i5-12400F | |
| 3840x2160 Ultra Preset AA:T | |
| AMD Ryzen 7 7800X3D | |
| AMD Ryzen 9 7950X3D | |
| Intel Core i9-13900K | |
| Intel Core i7-13700K | |
| Intel Core i7-13700 | |
| Intel Core i7-12700 | |
| Intel Core i5-13400 | |
| Intel Core i5-12400F | |
| X-Plane 11.11 | |
| 1280x720 low (fps_test=1) | |
| Intel Core i9-13900K | |
| AMD Ryzen 9 7950X3D | |
| Intel Core i7-13700K | |
| AMD Ryzen 7 7800X3D | |
| Intel Core i7-13700 | |
| Intel Core i7-12700 | |
| Intel Core i5-13400 | |
| Intel Core i5-12400F | |
| 3840x2160 high (fps_test=3) | |
| AMD Ryzen 7 7800X3D | |
| AMD Ryzen 9 7950X3D | |
| Intel Core i9-13900K | |
| Intel Core i7-13700K | |
| Intel Core i7-13700 | |
| Intel Core i7-12700 | |
| Intel Core i5-13400 | |
| Intel Core i5-12400F | |
| Final Fantasy XV Benchmark | |
| 1280x720 Lite Quality | |
| Intel Core i7-13700 | |
| Intel Core i7-13700K | |
| AMD Ryzen 7 7800X3D | |
| Intel Core i9-13900K | |
| AMD Ryzen 9 7950X3D | |
| Intel Core i7-12700 | |
| Intel Core i5-12400F | |
| Intel Core i5-13400 | |
| 3840x2160 High Quality | |
| AMD Ryzen 7 7800X3D | |
| Intel Core i7-13700 | |
| AMD Ryzen 9 7950X3D | |
| Intel Core i7-13700K | |
| Intel Core i9-13900K | |
| Intel Core i7-12700 | |
| Intel Core i5-12400F | |
| Intel Core i5-13400 | |
| Dota 2 Reborn | |
| 1280x720 min (0/3) fastest | |
| AMD Ryzen 7 7800X3D | |
| AMD Ryzen 9 7950X3D | |
| Intel Core i9-13900K | |
| Intel Core i7-13700K | |
| Intel Core i7-13700 | |
| Intel Core i7-12700 | |
| Intel Core i5-12400F | |
| Intel Core i5-13400 | |
| 3840x2160 ultra (3/3) best looking | |
| AMD Ryzen 7 7800X3D | |
| AMD Ryzen 9 7950X3D | |
| Intel Core i9-13900K | |
| Intel Core i7-13700K | |
| Intel Core i7-13700 | |
| Intel Core i7-12700 | |
| Intel Core i5-12400F | |
| Intel Core i5-13400 | |
| The Witcher 3 | |
| 1024x768 Low Graphics & Postprocessing | |
| AMD Ryzen 9 7950X3D | |
| AMD Ryzen 7 7800X3D | |
| Intel Core i9-13900K | |
| Intel Core i7-13700K | |
| Intel Core i7-13700 | |
| Intel Core i7-12700 | |
| Intel Core i5-13400 | |
| Intel Core i5-12400F | |
| 3840x2160 High Graphics & Postprocessing (Nvidia HairWorks Off) | |
| Intel Core i5-13400 | |
| Intel Core i7-13700 | |
| Intel Core i7-12700 | |
| Intel Core i9-13900K | |
| AMD Ryzen 7 7800X3D | |
| Intel Core i7-13700K | |
| AMD Ryzen 9 7950X3D | |
| Intel Core i5-12400F | |
| F1 2021 | |
| 3840x2160 Ultra High Preset + Raytracing AA:T AF:16x | |
| AMD Ryzen 7 7800X3D | |
| AMD Ryzen 9 7950X3D | |
| Intel Core i7-13700K | |
| Intel Core i7-13700 | |
| Intel Core i9-13900K | |
| Intel Core i7-12700 | |
| Intel Core i5-12400F | |
| Intel Core i5-13400 | |
| 1280x720 Ultra Low Preset | |
| AMD Ryzen 7 7800X3D | |
| AMD Ryzen 9 7950X3D | |
| Intel Core i9-13900K | |
| Intel Core i7-13700K | |
| Intel Core i7-13700 | |
| Intel Core i7-12700 | |
| Intel Core i5-12400F | |
| Intel Core i5-13400 | |
| Shadow of the Tomb Raider | |
| 1280x720 Lowest Preset | |
| AMD Ryzen 7 7800X3D | |
| AMD Ryzen 9 7950X3D | |
| Intel Core i9-13900K | |
| Intel Core i7-13700 | |
| Intel Core i7-13700K | |
| Intel Core i7-12700 | |
| Intel Core i5-13400 | |
| Intel Core i5-12400F | |
| 3840x2160 Highest Preset AA:T | |
| Intel Core i7-13700K | |
| AMD Ryzen 7 7800X3D | |
| Intel Core i7-13700 | |
| AMD Ryzen 9 7950X3D | |
| Intel Core i9-13900K | |
| Intel Core i7-12700 | |
| Intel Core i5-13400 | |
| Intel Core i5-12400F | |
| Borderlands 3 | |
| 1280x720 Very Low Overall Quality (DX11) | |
| AMD Ryzen 7 7800X3D | |
| AMD Ryzen 9 7950X3D | |
| Intel Core i9-13900K | |
| Intel Core i7-13700 | |
| Intel Core i7-13700K | |
| Intel Core i7-12700 | |
| Intel Core i5-13400 | |
| Intel Core i5-12400F | |
| 3840x2160 Badass Overall Quality (DX11) | |
| Intel Core i7-13700K | |
| AMD Ryzen 7 7800X3D | |
| AMD Ryzen 9 7950X3D | |
| Intel Core i9-13900K | |
| Intel Core i7-13700 | |
| Intel Core i7-12700 | |
| Intel Core i5-13400 | |
| Intel Core i5-12400F | |
| Tiny Tina's Wonderlands | |
| 1280x720 Lowest Preset (DX12) | |
| AMD Ryzen 7 7800X3D | |
| AMD Ryzen 9 7950X3D | |
| Intel Core i9-13900K | |
| Intel Core i7-13700 | |
| Intel Core i7-13700K | |
| Intel Core i7-12700 | |
| Intel Core i5-13400 | |
| Intel Core i5-12400F | |
| 3840x2160 Badass Preset (DX12) | |
| AMD Ryzen 9 7950X3D | |
| Intel Core i7-13700 | |
| AMD Ryzen 7 7800X3D | |
| Intel Core i7-12700 | |
| Intel Core i5-13400 | |
| Intel Core i7-13700K | |
| Intel Core i9-13900K | |
| Intel Core i5-12400F | |
| God of War | |
| 1280x720 Low Preset | |
| AMD Ryzen 9 7950X3D | |
| AMD Ryzen 7 7800X3D | |
| Intel Core i9-13900K | |
| Intel Core i7-13700K | |
| Intel Core i7-13700 | |
| Intel Core i7-12700 | |
| Intel Core i5-13400 | |
| Intel Core i5-12400F | |
| 3840x2160 Ultra Preset | |
| AMD Ryzen 7 7800X3D | |
| AMD Ryzen 9 7950X3D | |
| Intel Core i7-13700 | |
| Intel Core i5-13400 | |
| Intel Core i7-13700K | |
| Intel Core i9-13900K | |
| Intel Core i7-12700 | |
| Intel Core i5-12400F | |
| Far Cry New Dawn | |
| 1280x720 Low Preset | |
| AMD Ryzen 7 7800X3D | |
| AMD Ryzen 9 7950X3D | |
| Intel Core i9-13900K | |
| Intel Core i7-13700 | |
| Intel Core i7-13700K | |
| Intel Core i7-12700 | |
| Intel Core i5-13400 | |
| Intel Core i5-12400F | |
| 3840x2160 Ultra Preset | |
| AMD Ryzen 7 7800X3D | |
| AMD Ryzen 9 7950X3D | |
| Intel Core i9-13900K | |
| Intel Core i7-13700 | |
| Intel Core i7-13700K | |
| Intel Core i7-12700 | |
| Intel Core i5-13400 | |
| Intel Core i5-12400F | |
| Far Cry 6 | |
| 1280x720 Low Graphics Quality | |
| AMD Ryzen 7 7800X3D | |
| AMD Ryzen 9 7950X3D | |
| Intel Core i9-13900K | |
| Intel Core i7-13700 | |
| Intel Core i7-13700K | |
| Intel Core i7-12700 | |
| Intel Core i5-13400 | |
| Intel Core i5-12400F | |
| 3840x2160 Ultra Graphics Quality + HD Textures AA:T | |
| AMD Ryzen 7 7800X3D | |
| AMD Ryzen 9 7950X3D | |
| Intel Core i7-13700K | |
| Intel Core i7-13700 | |
| Intel Core i9-13900K | |
| Intel Core i7-12700 | |
| Intel Core i5-13400 | |
| Intel Core i5-12400F | |
AMD Ryzen 7 78003D with an Nvidia GeForce RTX 4090
| Bas | Moyen | Élevé | Ultra | QHD | 4K DLSS | 4K | |
|---|---|---|---|---|---|---|---|
| GTA V (2015) | 188.5 | 188.5 | 188.1 | 182 | 181.1 | 188 | |
| The Witcher 3 (2015) | 858.4 | 820.4 | 658.8 | 314.3 | 281 | ||
| Dota 2 Reborn (2015) | 322.9 | 299.6 | 288.9 | 267.5 | 258.2 | ||
| Final Fantasy XV Benchmark (2018) | 236 | 234 | 233 | 231 | 158.2 | ||
| X-Plane 11.11 (2018) | 219 | 214 | 188.1 | 160.5 | |||
| Far Cry 5 (2018) | 344 | 303 | 303 | 278 | 268 | 187 | |
| Strange Brigade (2018) | 760 | 618 | 601 | 589 | 534 | 289 | |
| Shadow of the Tomb Raider (2018) | 407 | 383 | 387 | 375 | 322 | 187.7 | |
| Far Cry New Dawn (2019) | 291 | 258 | 253 | 226 | 223 | 180 | |
| Metro Exodus (2019) | 374 | 326 | 268 | 219 | 199.8 | 141.6 | |
| Control (2019) | 240 | 240 | 240 | 220 | 137.5 | 114 | |
| Borderlands 3 (2019) | 310 | 271 | 252 | 241 | 224 | 137.4 | |
| F1 2020 (2020) | 681 | 571 | 563 | 503 | 446 | 288 | |
| F1 2021 (2021) | 830 | 763 | 667 | 369 | 324 | 207 | |
| Far Cry 6 (2021) | 285 | 256 | 230 | 223 | 211 | 141.4 | |
| Guardians of the Galaxy (2021) | 268 | 266 | 267 | 267 | 263 | 194 | |
| God of War (2022) | 315 | 313 | 287 | 212 | 181.5 | 132 | |
| Cyberpunk 2077 1.6 (2022) | 272 | 268 | 251 | 241 | 166.6 | 82.3 | |
| Tiny Tina's Wonderlands (2022) | 506 | 434 | 371 | 309 | 233 | 129.8 | |
| F1 22 (2022) | 533 | 483 | 477 | 221 | 162.9 | 84.5 | |
| The Quarry (2022) | 462 | 355 | 309 | 267 | 198.1 | 82.6 | |
| A Plague Tale Requiem (2022) | 231 | 209 | 189.9 | 168.8 | 132.5 | 148.3 | 76.3 |
| Uncharted Legacy of Thieves Collection (2022) | 159.8 | 164.5 | 163 | 156.9 | 155.8 | 103.5 | |
| Spider-Man Miles Morales (2022) | 233 | 233 | 196.7 | 191.6 | 245 | 134.9 | |
| The Callisto Protocol (2022) | 279.1 | 279.7 | 280.8 | 281.1 | 274.5 | 237.1 | |
| High On Life (2023) | 446 | 404 | 345 | 312 | 225 | 107.8 | |
| The Witcher 3 v4 (2023) | 367 | 300 | 279 | 261 | 260 | 169.9 | |
| Dead Space Remake (2023) | 291 | 282 | 262 | 259 | 201 | 106.7 | |
| Hogwarts Legacy (2023) | 218 | 200 | 164.4 | 163.3 | 146.7 | 82.4 | |
| Returnal (2023) | 262 | 256 | 237 | 211 | 172 | 112 | |
| Atomic Heart (2023) | 360 | 306 | 274 | 228 | 184.1 | 112.4 | |
| Company of Heroes 3 (2023) | 465.1 | 429.6 | 376.5 | 373.3 | 314.6 | 215.4 | |
| Sons of the Forest (2023) | 184.7 | 176.4 | 171.4 | 165.4 | 159.1 | 132.1 | |
| Resident Evil 4 Remake (2023) | 383 | 344 | 336 | 237 | 199.9 | 124.2 | |
| The Last of Us (2023) | 241 | 215 | 202 | 191.1 | 146 | 122.9 | 82.6 |
| Dead Island 2 (2023) | 379 | 369 | 336 | 315 | 284 | 161.6 | |
| Star Wars Jedi Survivor (2023) | 197.7 | 197.3 | 196.1 | 193.8 | 157.6 | 82.3 | |
| Diablo 4 (2023) | 399 | 399 | 398 | 397 | 390 | 238 | 216 |
| F1 23 (2023) | 576 | 594 | 542 | 226 | 152 | 80 |
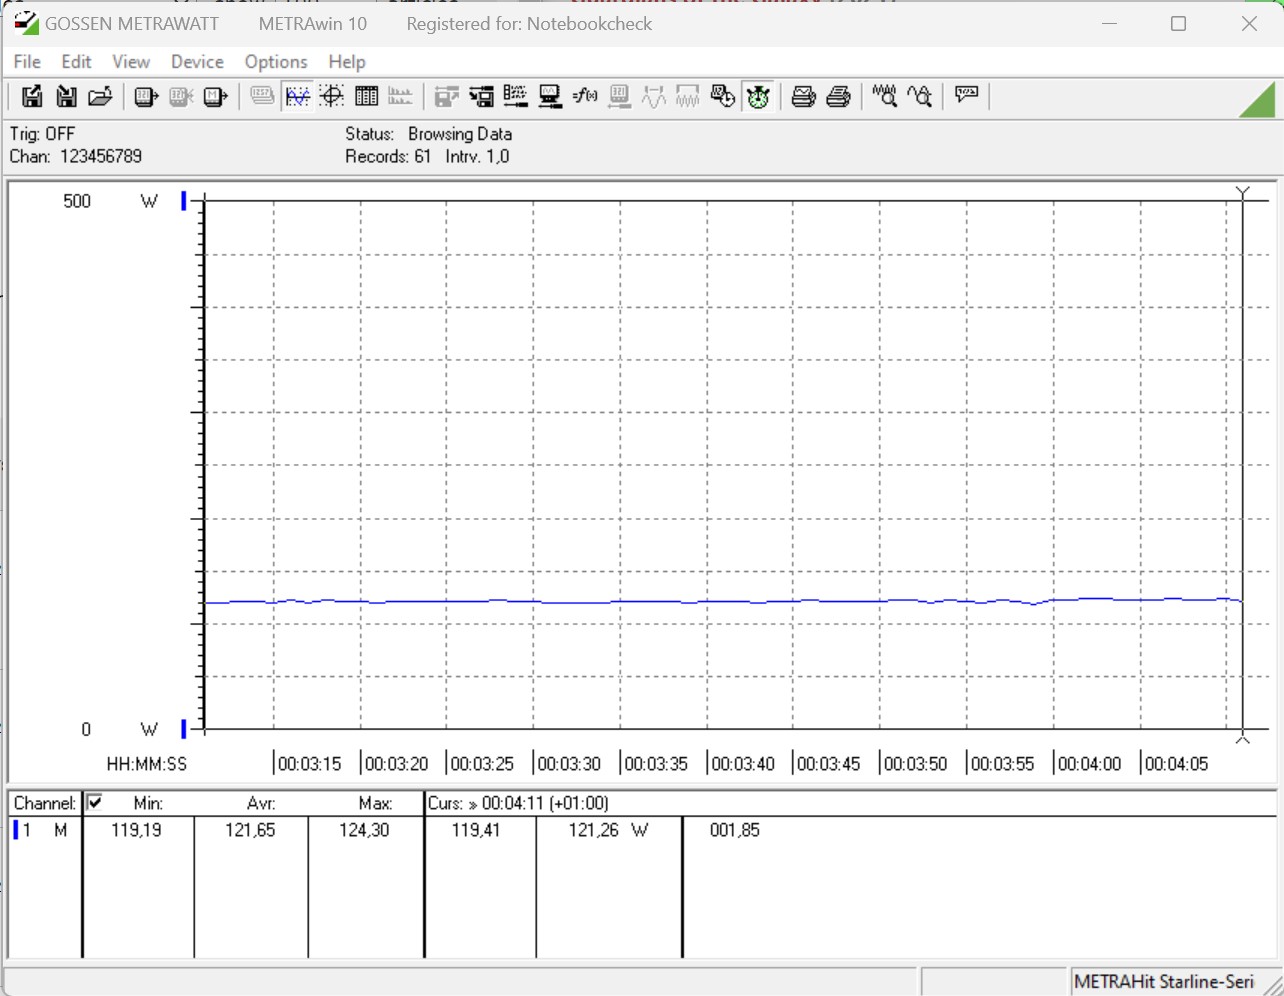
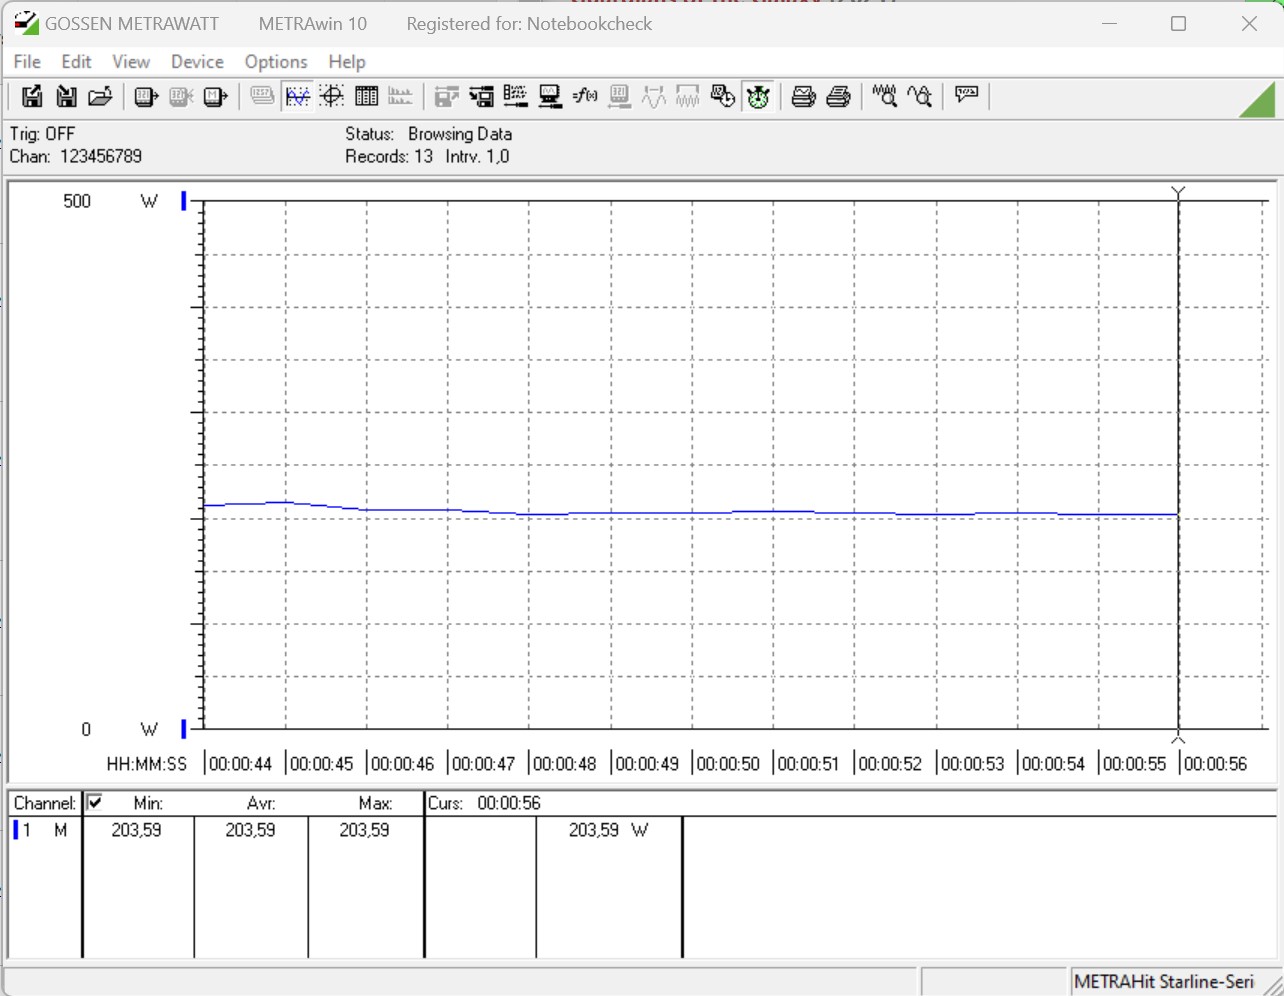
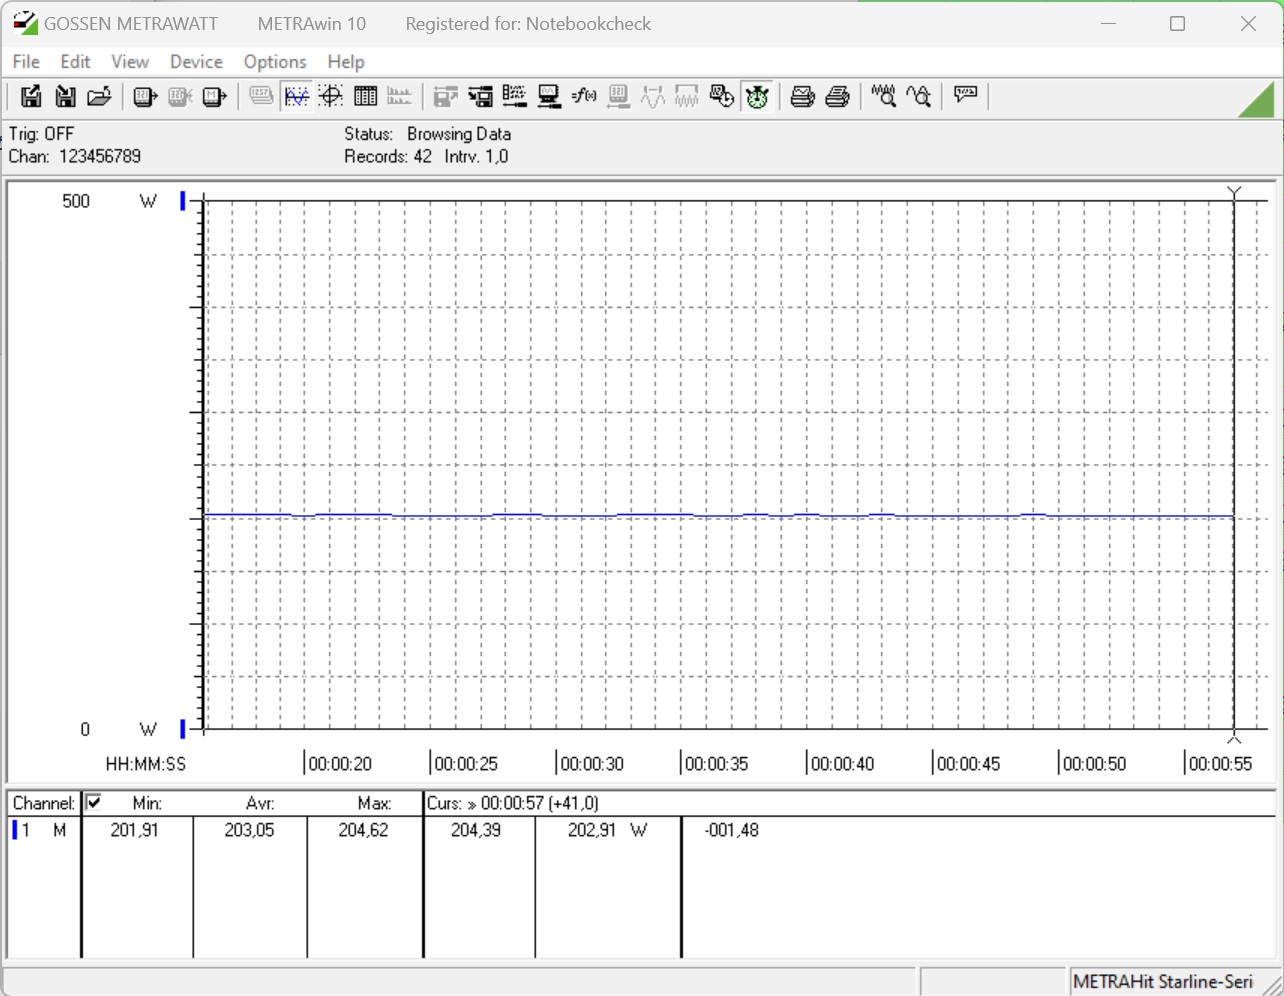
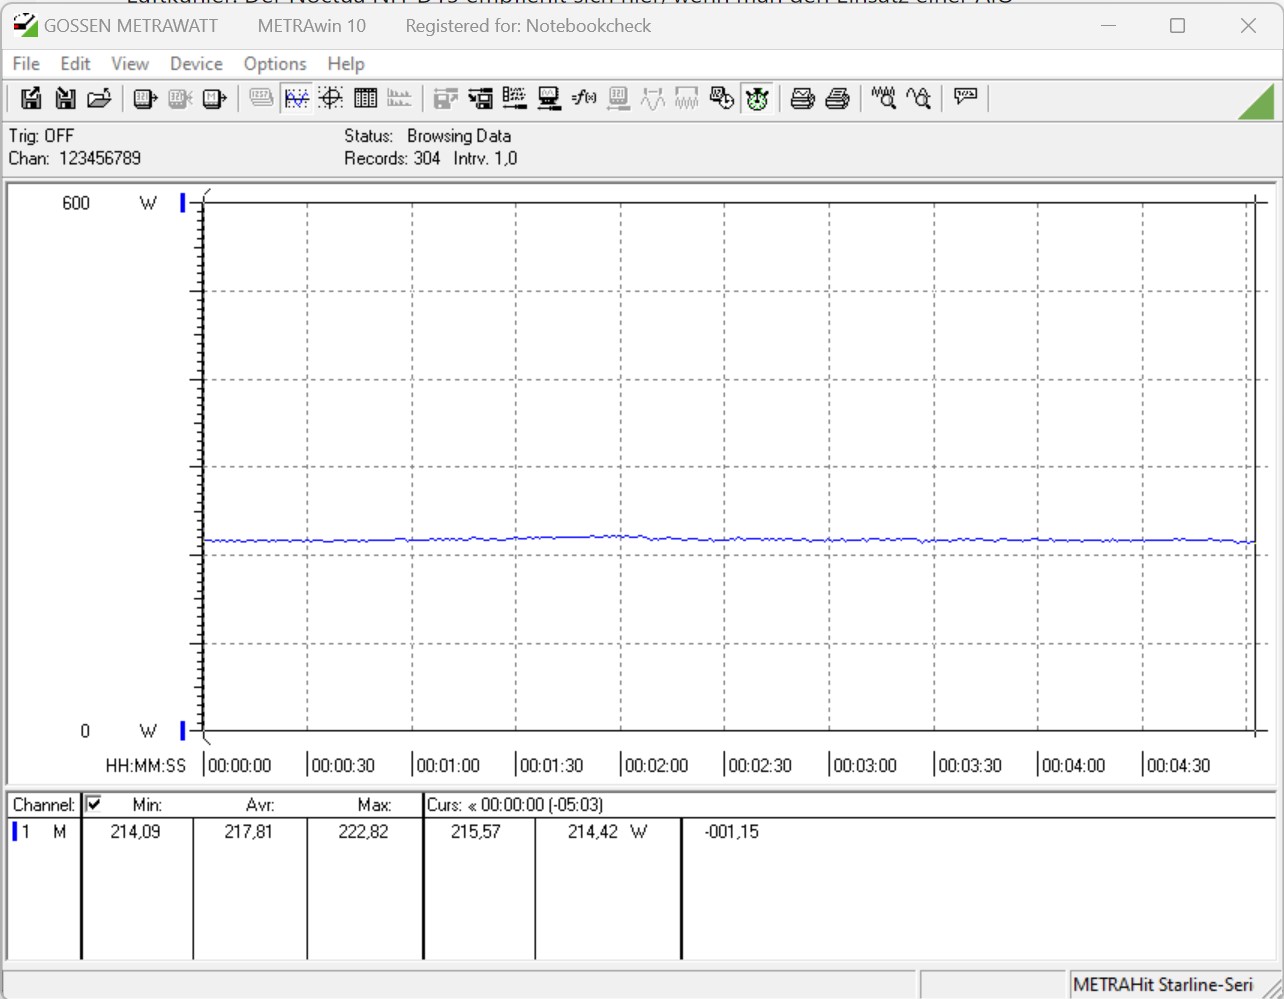
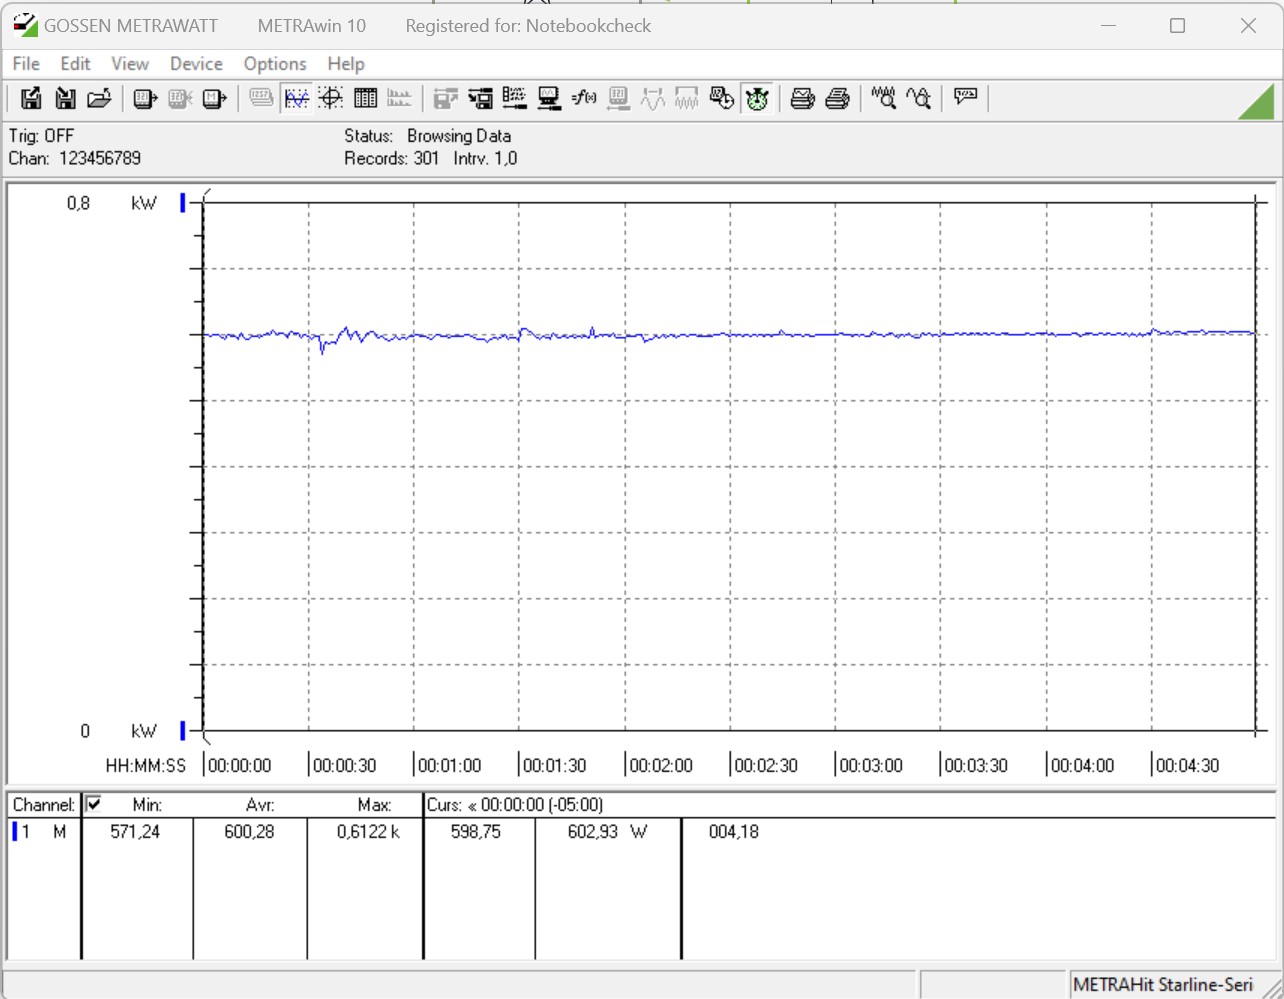
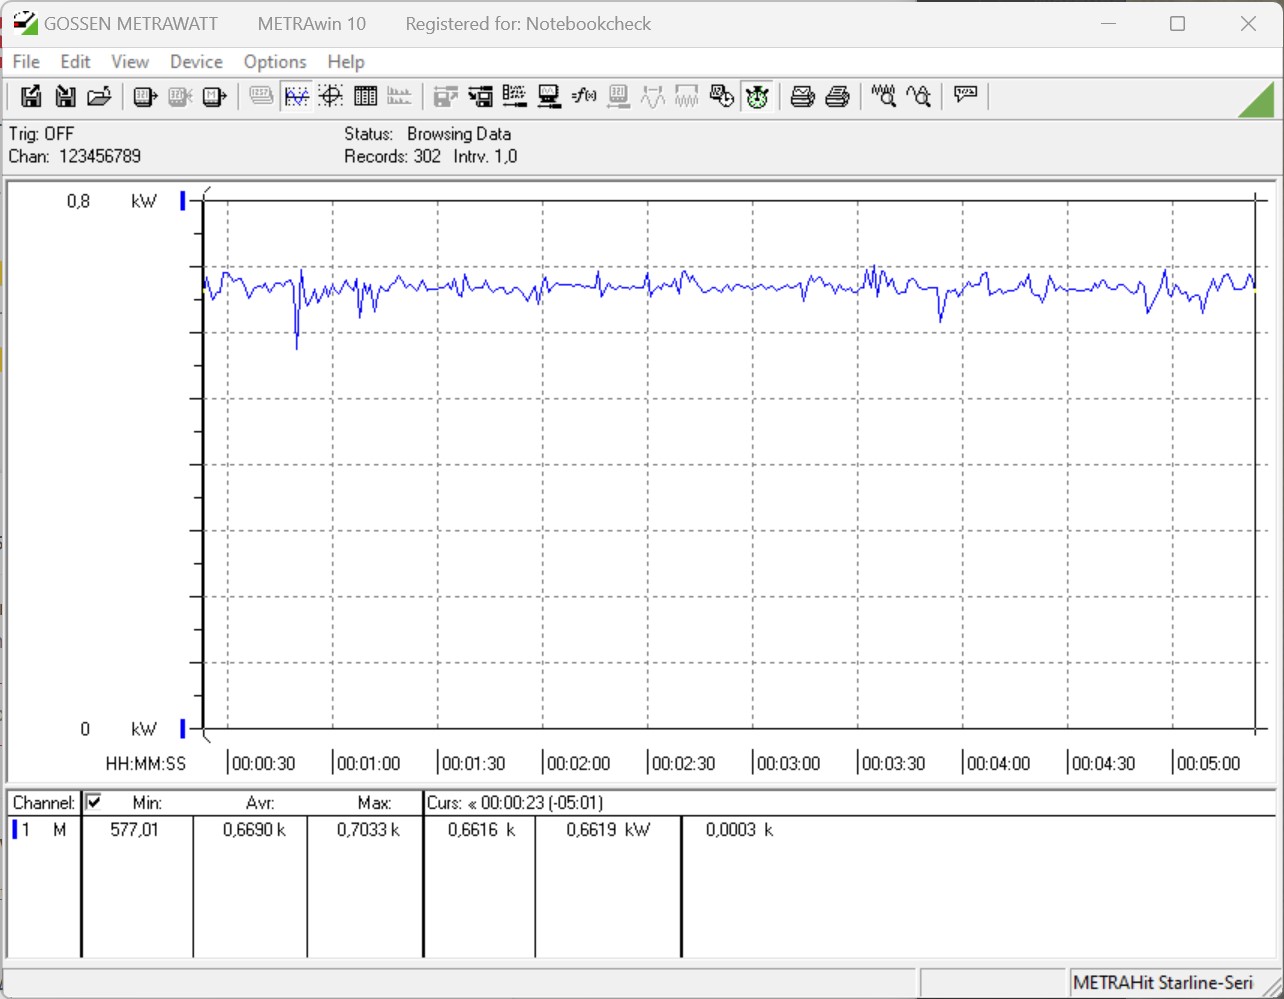
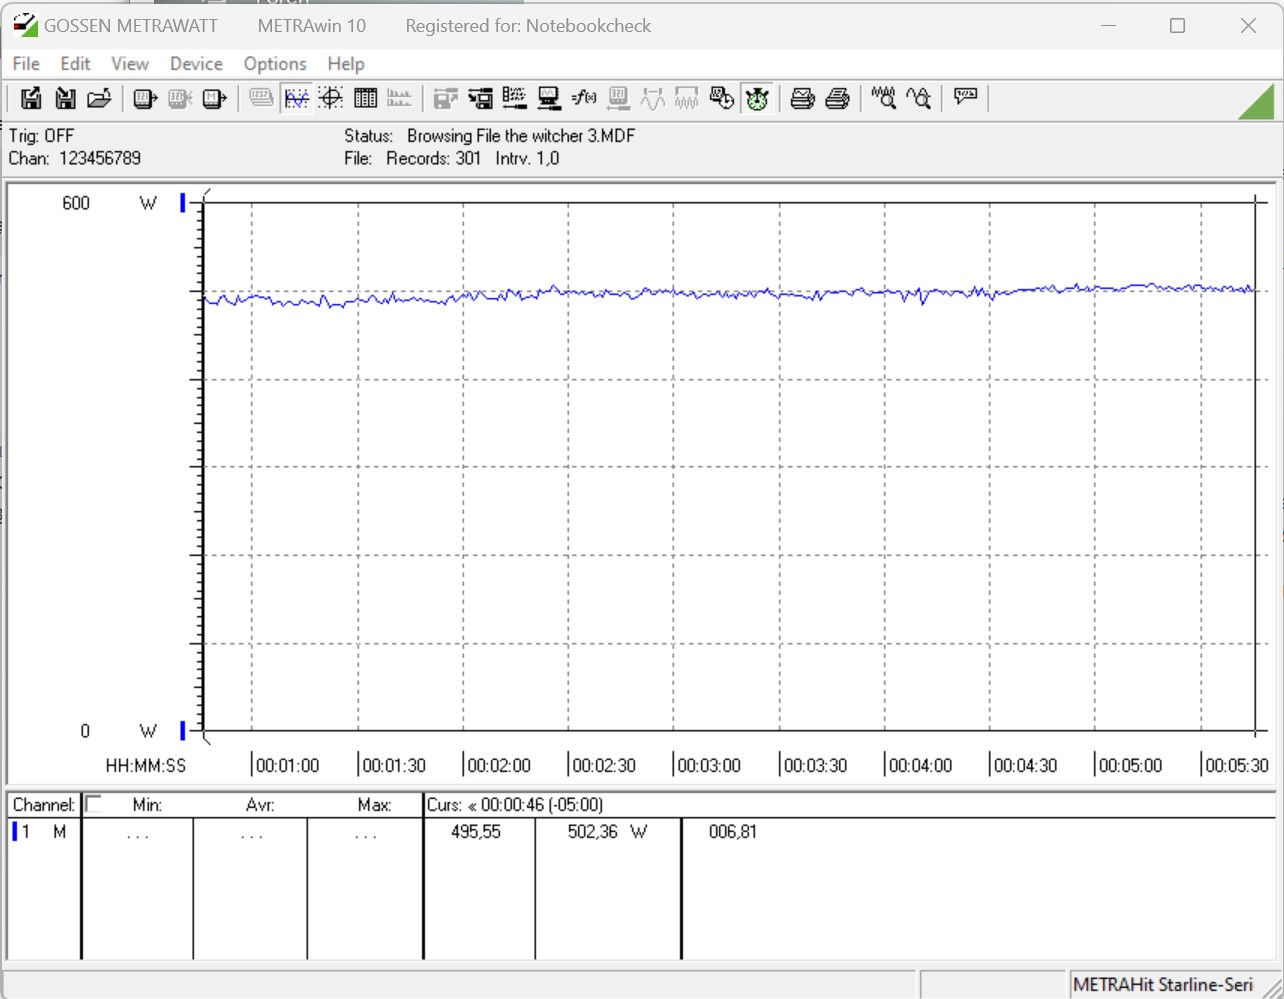
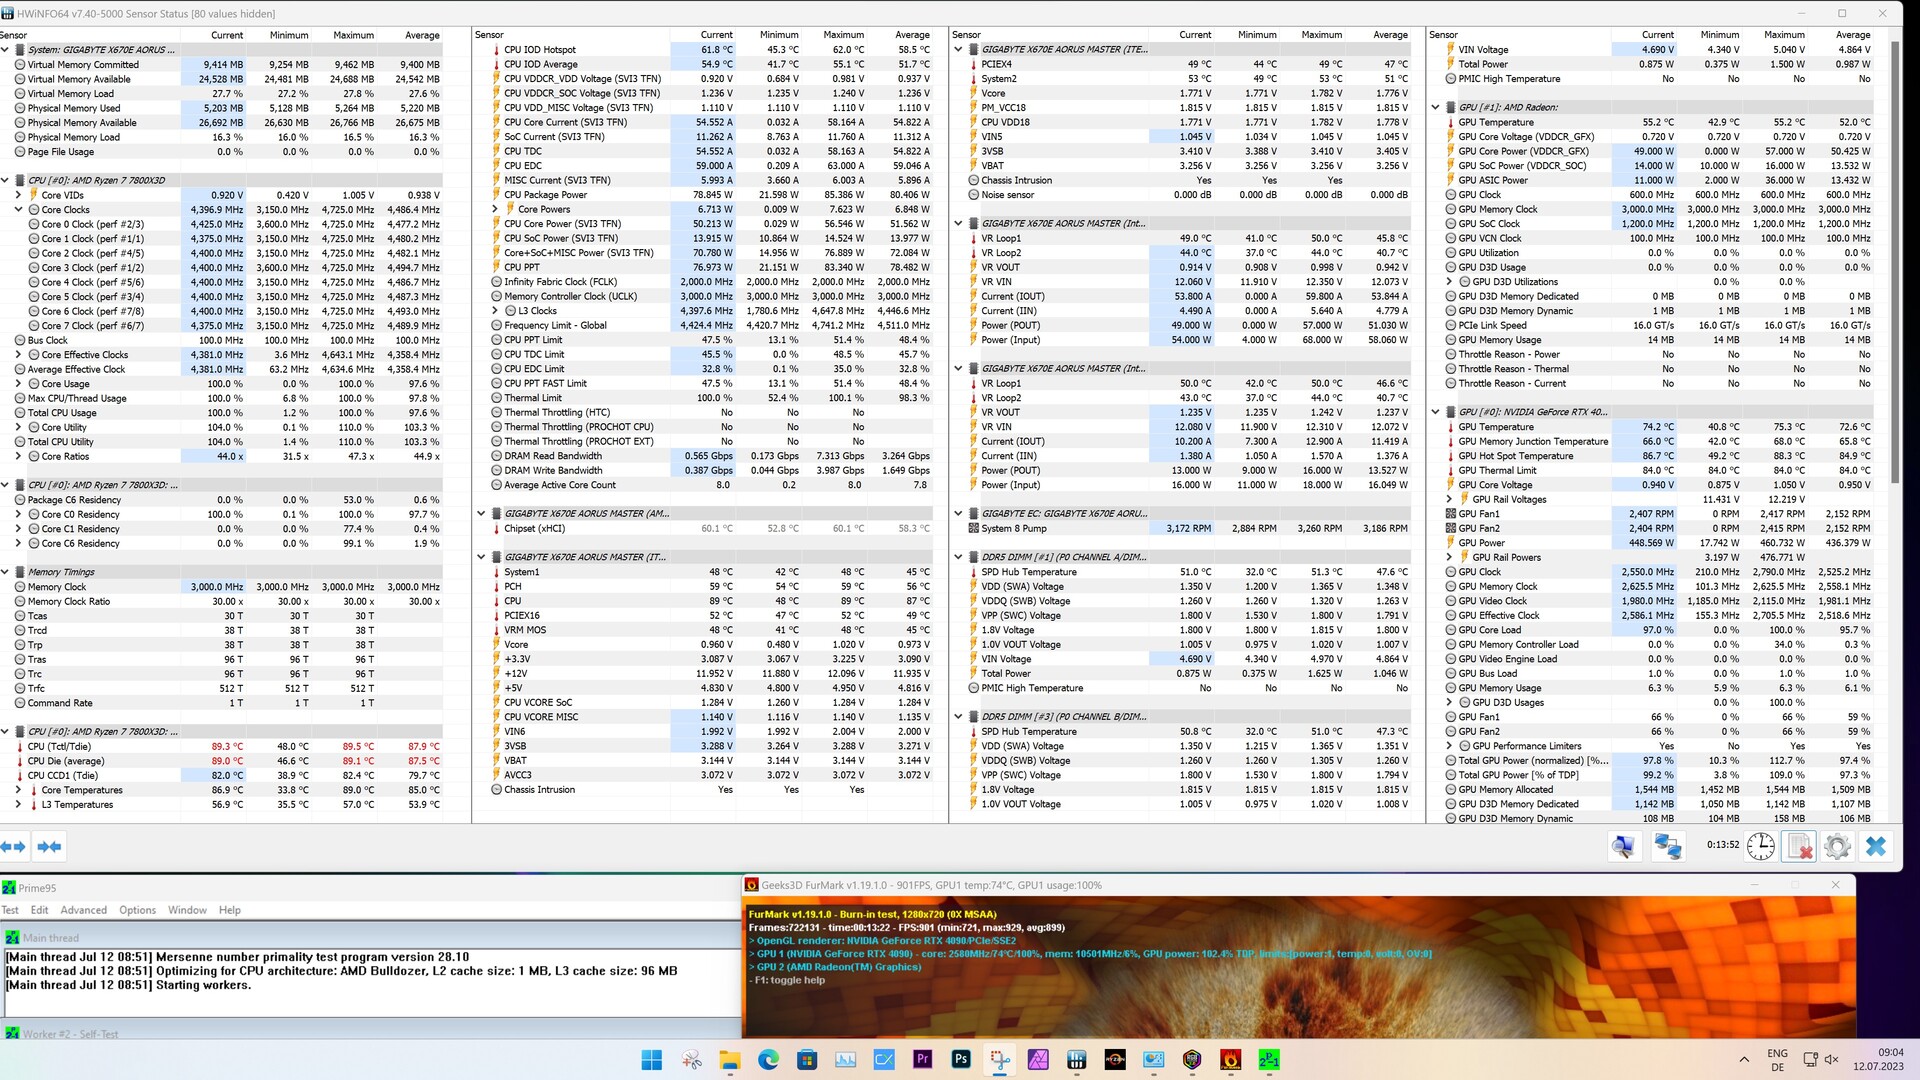
Consommation d'énergie - Frugale, mais une bonne circulation de l'air est indispensable
Tous les processeurs X3D de la série 7000 sont limités à une consommation maximale de 162 watts (PPT). Il en va donc de même pour notre AMD Ryzen 7 7800X3D. En mode ralenti, nous n'avons pas noté de valeurs record à 120 watts, mais en comparaison avec l'AMD Ryzen 9 7950X3D, la consommation d'énergie de ce processeur est plus élevée.AMD Ryzen 9 7950X3Dnos valeurs mesurées étaient presque identiques. En mode jeu, nous avons enregistré une moyenne de 497 watts pendant notre scène de jeu Witcher 3 scène de jeu. Cela signifie que notre système de test est à peu près au même niveau qu'un système basé sur unIntel Core i5-13400. Lors de notre test de stress Prime95, le système basé sur un AMD Ryzen 7 7800X3D était en fait le plus économe. Sa valeur médiane n'était que de 218 watts.
Pour nos mesures en charge, il faut tenir compte de la consommation de la carte graphique. LaPalit GeForce RTX 4090 GameRock OCconsomme déjà à elle seule 450 watts.
Nous avons noté des températures assez élevées qui résultent d'un mauvais refroidissement du boîtier. Dans ce scénario catastrophe, l'AMD Ryzen 7 7800X3D a atteint sa limite thermique et a dû être bridé. Afin de ne pas fausser nos mesures, nous n'avons pas effectué ce test avec le boîtier ouvert. Nous avons enlevé la partie latérale, ce qui a fait chuter la température du processeur assez rapidement à des valeurs non critiques. Un boîtier avec une bonne circulation d'air refroidit bien le processeur à 8 cœurs. Cependant, nous ne recommandons pas de renoncer à un AiO. À ce stade, nous vous conseillons de consulter la liste des refroidisseurs recommandés par le fabricant https://www.amd.com/de/technologies/cpu-cooler-solution#AMD-FL%C3%9CSSIGK%C3%9CHLER-ANIMATIONEN pour les processeurs AMD Ryzen 7000.
| Power Consumption / Cinebench R15 Multi (external Monitor) | |
| Schenker XMG SECTOR, i9 13900K, RTX 4090 | |
| Intel Core i7-13700 | |
| Intel Core i7-13700K | |
| Intel Core i7-12700 | |
| AMD Ryzen 9 7950X3D | |
| AMD Ryzen 7 7800X3D | |
| Intel Core i5-13400 | |
| Intel Core i5-12400F | |
| Power Consumption / Cinebench R15 Multi Efficiency (external Monitor) | |
| AMD Ryzen 9 7950X3D | |
| AMD Ryzen 7 7800X3D | |
| Power Consumption / Prime95 V2810 Stress (external Monitor) | |
| Intel Core i7-13700 | |
| Schenker XMG SECTOR, i9 13900K, RTX 4090 | |
| Intel Core i7-13700K | |
| Intel Core i7-12700 | |
| AMD Ryzen 9 7950X3D | |
| Intel Core i5-12400F | |
| Intel Core i5-13400 | |
| AMD Ryzen 7 7800X3D | |
| Power Consumption / The Witcher 3 ultra (external Monitor) | |
| Intel Core i7-13700 | |
| Intel Core i7-13700K | |
| AMD Ryzen 9 7950X3D | |
| Schenker XMG SECTOR, i9 13900K, RTX 4090 | |
| Intel Core i7-12700 | |
| Intel Core i5-13400 | |
| AMD Ryzen 7 7800X3D | |
| Intel Core i5-12400F | |
* ... Moindre est la valeur, meilleures sont les performances
| Power Consumption - Cinebench R15 Multi Efficiency (external Monitor) | |
| AMD Ryzen 9 7950X3D | |
| AMD Ryzen 9 5950X | |
| AMD Ryzen 9 7950X | |
| AMD Ryzen 9 7900X | |
| AMD Ryzen 7 7800X3D | |
| Intel Core i9-13900K | |
Power consumption with external monitor
Points positifs
Points négatifs
Verdict - Un excellent processeur pour les joueurs exigeants
Dans cet article, nous avons examiné de plus près l'AMD Ryzen 7 7800X3D, le premier processeur X3D de la nouvelle plateforme AM5. Ce que nous voulons dire par là, c'est qu'il s'agit d'un nouveau processeur qui n'est pas construit sur un design hybride - au lieu de cela, il n'a qu'un seul die CCD sous la forme de son 3D V-Cache. C'est un avantage pour de nombreux jeux et, par conséquent, le processeur à 8 cœurs est en mesure de devancer légèrement l'AMD Ryzen 9 7950X3D.
Cela ne veut pas dire que l'AMD Ryzen 7 7800X3D peut être considéré comme une machine à tout faire. Le processeur à 8 cœurs n'a pas fait assez bien dans les tests de performance du CPU et, en raison de ses performances multicœurs limitées, le composant n'a pas pu rivaliser avec les modèles haut de gamme. Mais ce n'est pas nécessaire. En tant que CPU de jeu pur, le 7800X3D peut faire exactement ce pour quoi il a été conçu. Un aspect positif est sa faible consommation d'énergie.
L'AMD Ryzen 7 7800X3D offre d'excellentes performances de jeu. Au niveau du prix, le processeur à 8 cœurs aura encore un peu de mal à convaincre les acheteurs de choisir ce modèle.
En résumé, nous pouvons dire que l'AMD Ryzen 7 7800X3D est, en l'état, l'un des CPU de jeu les plus rapides du marché. On ne peut pas dire qu'il s'agit du processeur le plus rapide - par exemple, l'AMD Ryzen 9 7950X3D est le plus rapide du marché.AMD Ryzen 9 7950X3Doffre des performances légèrement supérieures dans de nombreux jeux, à condition que l'allocation correcte des threads permette de tirer parti de toutes les performances du processeur. En raison de la structure hybride des modèles Ryzen 9 avec 3D V-Cache, il n'est malheureusement pas toujours garanti que le DCC avec 3D V-Cache soit prioritaire. Ici, l'AMD Ryzen 7 7800X3D bénéficie d'une construction interne plus simple. Tous les jeux que nous avons testés ont pu être exécutés, quel que soit le processeur utilisé.
Le plus gros problème de ce composant est, à nos yeux, son prix. Actuellement, il est vendu au minimum 441,99 $. UnIntel Core i7-13700Kcoûte à peu près le même prix et offre des niveaux de performance similaires - mais il offre une meilleure performance totale du processeur. Si l'on tient compte de l'évolutivité de ces processeurs, personne ne peut battre AMD. Qu'on le croie ou non, des rumeurs suggèrent que la plate-forme AM5 continuera d'être prise en charge jusqu'en 2025. Le socket 1.700, qui est actuellement utilisé pour les systèmes Intel, sera probablement remplacé par son successeur l'année prochaine et aucun autre processeur ne sera commercialisé pour le socket 1.700.
Prix et disponibilité
Actuellement, vous pouvez acheter l'AMD Ryzen 7 7800X3D sur Amazon pour 441,99 $.
Transparency
La sélection des appareils à examiner est effectuée par notre équipe éditoriale. L'échantillon de test a été acheté gratuitement par l'auteur, à ses propres frais. Le prêteur n'a eu aucune influence sur cette évaluation et le fabricant n'a pas reçu de copie de cette évaluation avant sa publication. Il n'y avait aucune obligation de publier cet article. En tant que média indépendant, Notebookcheck n'est pas soumis à l'autorité des fabricants, des détaillants ou des éditeurs.
Voici comment Notebookcheck teste
Chaque année, Notebookcheck examine de manière indépendante des centaines d'ordinateurs portables et de smartphones en utilisant des procédures standardisées afin de garantir que tous les résultats sont comparables. Nous avons continuellement développé nos méthodes de test depuis environ 20 ans et avons établi des normes industrielles dans le processus. Dans nos laboratoires de test, des équipements de mesure de haute qualité sont utilisés par des techniciens et des rédacteurs expérimentés. Ces tests impliquent un processus de validation en plusieurs étapes. Notre système d'évaluation complexe repose sur des centaines de mesures et de points de référence bien fondés, ce qui garantit l'objectivité.
