

Verdict : La puissance et les pièges se payent au prix fort
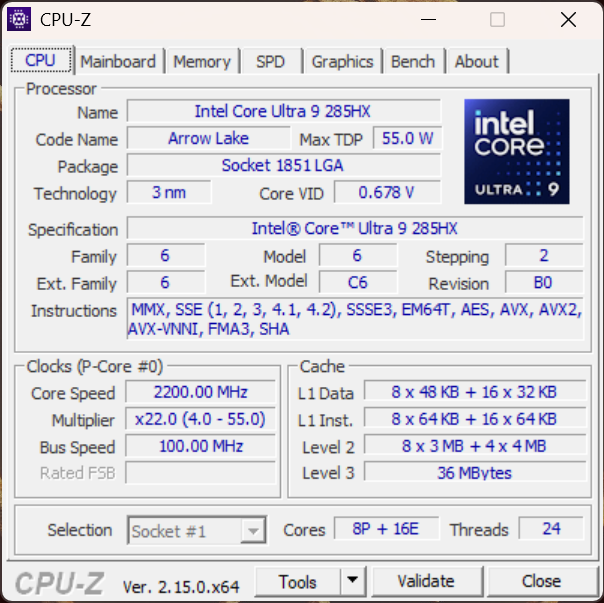
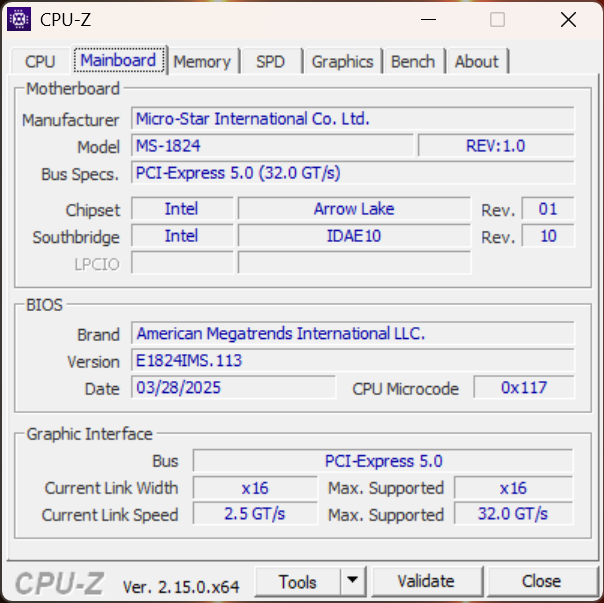
Le MSI Titan 18 HX AI présente le Core Ultra 9 285HX d'Intel et le GPU RTX 5090 de Nvidia dans un châssis habituel en magnésium-aluminium. Les principaux changements apportés cette année sont les suivants : deux ports Thunderbolt 5, un dissipateur thermique pour le SSD Gen5 et un emplacement NVMe supplémentaire.
Le Core Ultra 9 285HX correspond au Core Ultra 9 275HX des ordinateurs portables concurrents, mais ne le dépasse pas toujours. Le rendu natif du GPU RTX 5090 pour ordinateur portable est à peine supérieur à celui de la RTX 4090, bien que la génération d'images multiples permette un jeu plus fluide avec des paramètres maximums.
Le refroidissement par chambre à vapeur de MSI peut supporter une consommation d'énergie combinée de 261 W, mais au prix d'émissions de chaleur et de bruit significatives.
L'écran mini-LED 4K 120 Hz est parfait pour le HDR mais ne dispose d'aucune forme de synchronisation adaptative, ce qui est une grave lacune à notre avis. La consommation d'énergie en veille en mode dGPU est presque aussi importante que le TDP des CPU de la série U et doit être corrigée immédiatement.
L'absence d'Advanced Optimus, la lenteur du lecteur de carte SD, la médiocrité de la webcam et la médiocrité du pavé tactile haptique sont autant d'autres aspects qui nous ont semblé compromettants. Le clavier mécanique SteelSeries limite les commutateurs Cherry MX à la zone de frappe, ce qui semble être une mesure de réduction des coûts inutile.
Pour ceux qui disposent de plus de 6 000 $ pour remplacer leur ordinateur de bureau, le MSI Titan 18 HX AI offre une puissance sans compromis malgré quelques compromis flagrants. Les autres seront mieux servis par des alternatives plus équilibrées.
Points positifs
Points négatifs
Prix et disponibilité
La configuration testée de la MSI Titan 18 HX AI avec 2 To de stockage est disponible sur Amazon US pour 4 899 $. Une variante de 6 To est disponible chez Best Buy à 6 599,99 $.
Le MSI Titan 18 HX AI avec 4 To de stockage est listé sur Amazon Inde mais les informations de prix ne sont pas encore disponibles.
Table des matières
- Verdict : La puissance et les pièges se payent au prix fort
- Spécifications
- Châssis : Le design haut de gamme de son prédécesseur a été préservé
- Connectivité : Le Titan 18 bénéficie d'une mise à niveau Thunderbolt 5
- Périphériques d'entrée : Clavier mécanique Cherry MX associé à un pavé tactile haptique délicat
- Affichage : Mini-LED 4K 120 Hz brillant qui rivalise avec les OLED, mais pas de G-Sync
- Performance : Le modèle phare Core Ultra 9 285HX est pratiquement impossible à distinguer du Core Ultra 9 275HX
- Émissions : Niveaux de bruit et températures de surface élevés malgré la présence d'une chambre à vapeur
- Gestion de l'énergie : Une forte consommation d'énergie avec une faible endurance de la batterie
- Impressions de Notebookcheck sur la MSI Titan 18 HX AI
- Potential competitors in comparison
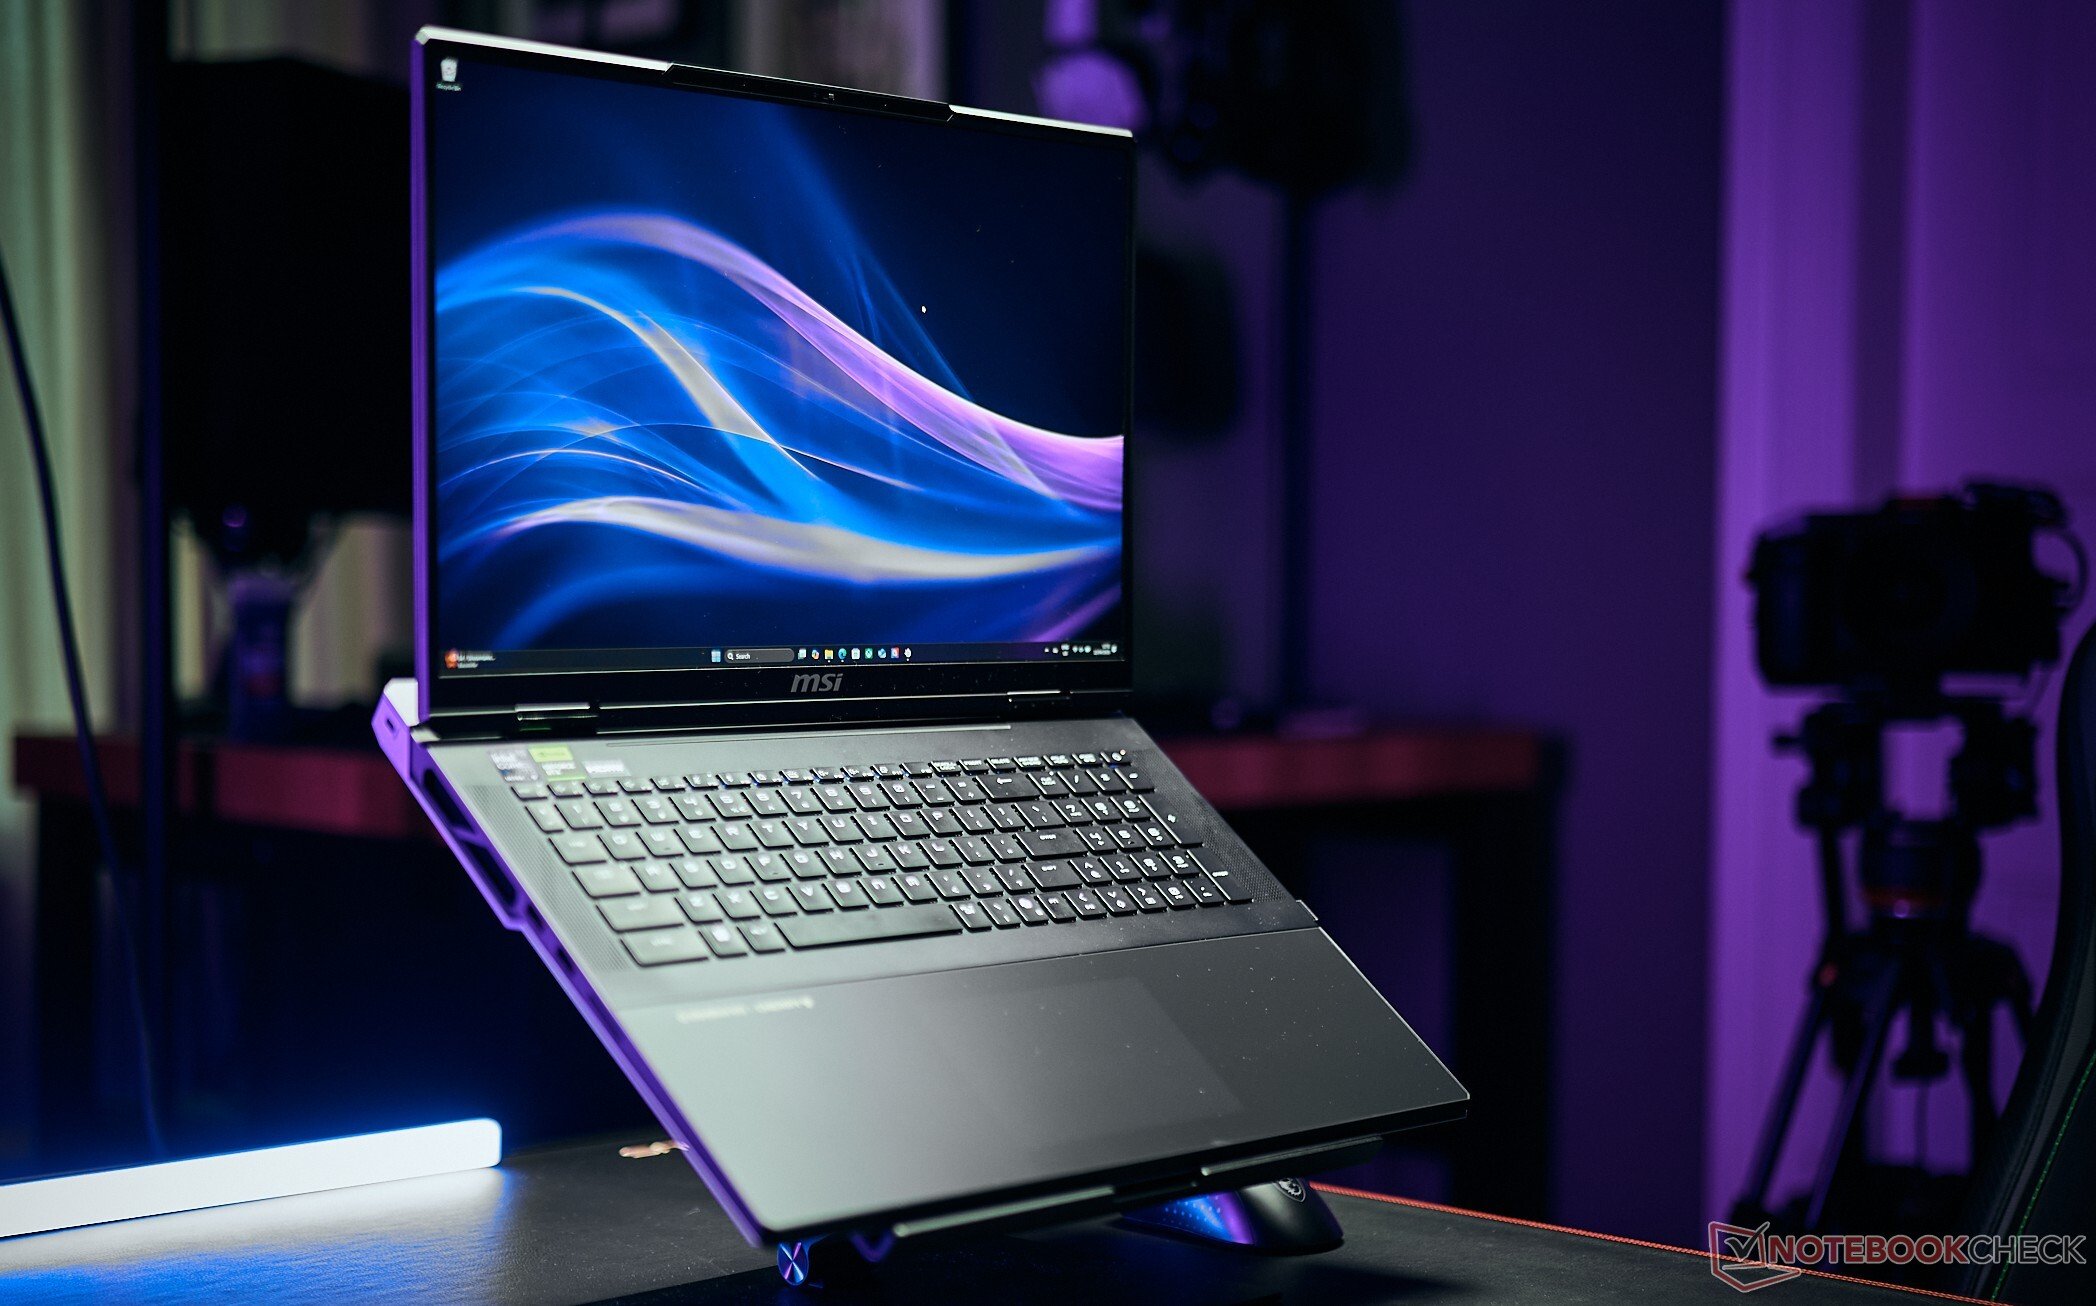
Le rafraîchissement annuel de la Titan par MSI continue de mettre en valeur les produits phares d'Intel et de Nvidia.
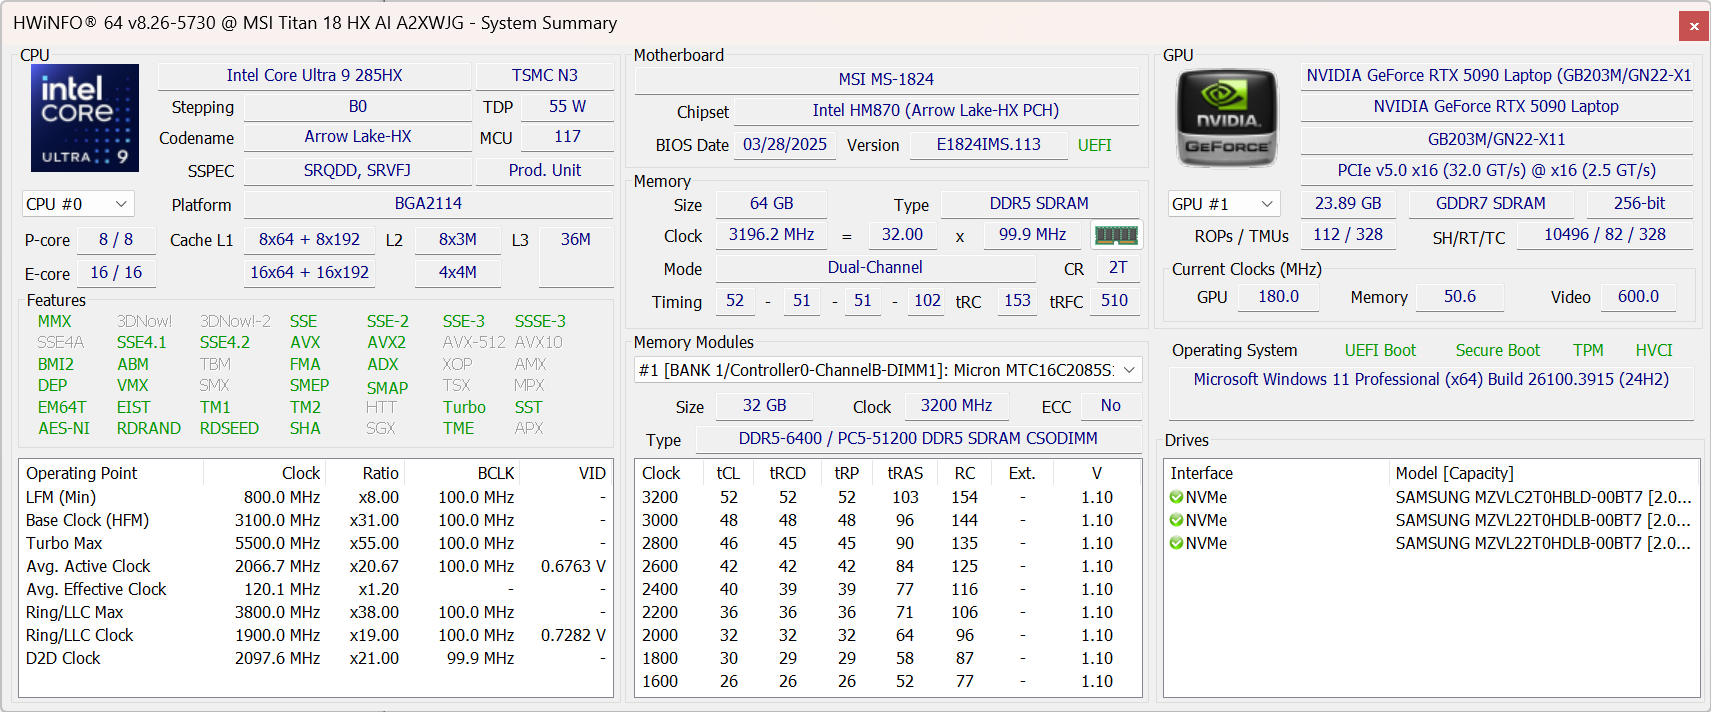
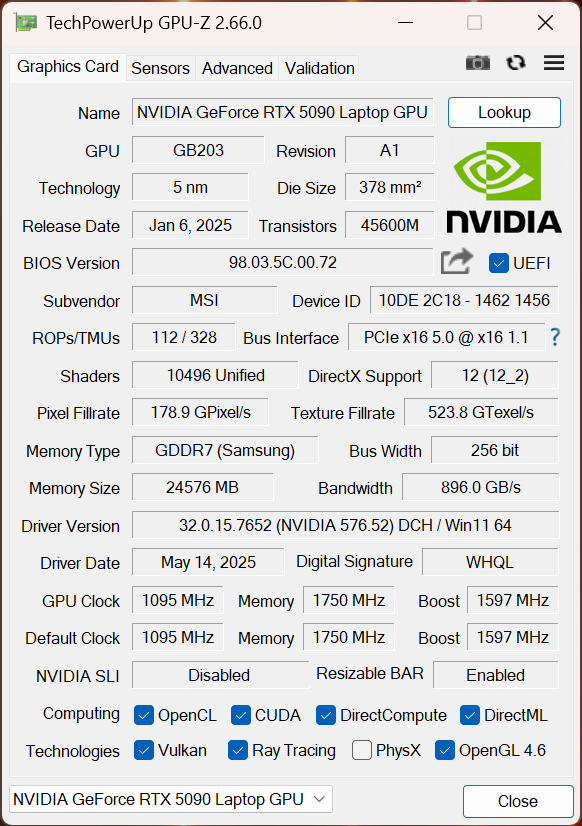
Tout en conservant la Titan 18 HX A14VIGle Titan 18 HX AI de cette année présente le Core Ultra 9 285HX d'Intel Arrow Lake-HX Intel Arrow Lake-HX Core Ultra 9 285HX associé à un processeur de 175 W Nvidia Blackwell GeForce GPU RTX 5090 pour ordinateur portable.
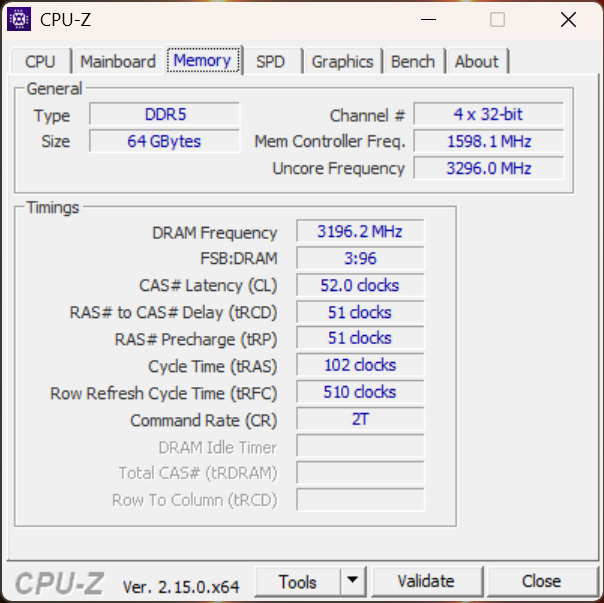
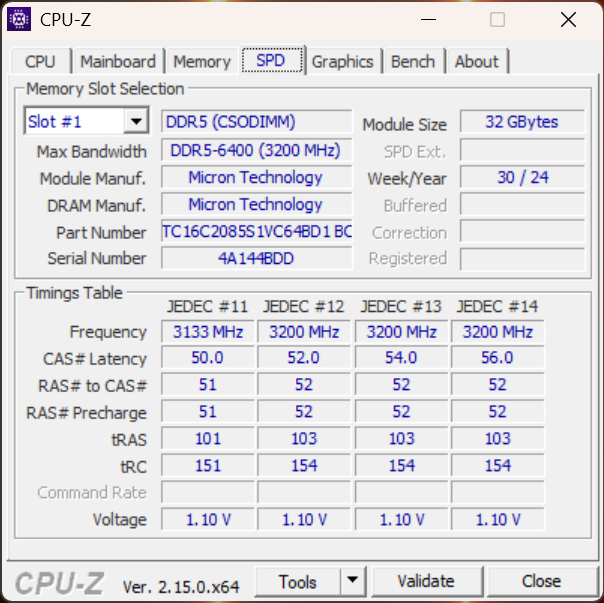
Notre unité dispose également de 64 Go de RAM DDR5-6400, d'un énorme stockage SSD NVMe de 6 To et d'un clavier mécanique SteelSeries Cherry MX Ultra Low Profile.
Cette configuration vous coûtera la bagatelle de 6 600 $.
Dans cet article, nous allons voir si le MSI Titan 18 HX AI A2XWJG mérite vraiment de mettre une telle bosse dans votre portefeuille.
Spécifications
Châssis : Le design haut de gamme de son prédécesseur a été préservé
Le châssis reste inchangé par rapport au Titan 18 HX A14VIG de l'année dernière. Vous obtenez la même construction en alliage de magnésium et d'aluminium dans une finition Core Black et un ton argenté sur l'extension arrière avec des accents bleus. L'éclairage RVB est limité au logo MSI sur le couvercle de l'écran.
Le pavé tactile haptique, qui s'intègre parfaitement au repose-paume en verre qui s'étend sur toute la longueur de l'ordinateur portable, est un élément de conception remarquable. Tout en contribuant à créer une esthétique épurée, cette surface en verre est un aimant à empreintes digitales.
L'écran s'ouvre d'un seul doigt malgré son poids important et ses charnières de haute qualité. L'écran et le clavier ne présentent que peu ou pas de flexion, même sous une pression délibérée.


Connectivité : Le Titan 18 bénéficie d'une mise à niveau Thunderbolt 5
La sélection et l'emplacement des ports restent en grande partie les mêmes, avec l'amélioration notable des ports Thunderbolt 5 dans cette itération.
Les ports USB sont répartis sur les côtés et suffisamment espacés pour ne pas gêner la connectivité.


Lecteur de carte SD
Le lecteur SD Express intégré de la Titan 18 HX AI ne présente pas d'amélioration majeure des vitesses de lecture moyenne et séquentielle par rapport à la génération précédente.
Les performances du lecteur de carte sont très éloignées de celles des modèles Aorus Master 18 et du Schenker XMG Neo 16 E25.
| SD Card Reader | |
| average JPG Copy Test (av. of 3 runs) | |
| Medion Erazer Beast 18 X1 MD62731 (AV PRO microSD 128 GB V60) | |
| Aorus Master 18 AM8H (AV PRO microSD 128 GB V60) | |
| Razer Blade 16 2025 RTX 5090 (Angelbird AV Pro V60) | |
| SCHENKER XMG Neo 16 E25 RTX 5090 Laptop (Angelbird AV Pro V60) | |
| Moyenne de la classe Gaming (19 - 204, n=72, 2 dernières années) | |
| MSI Titan 18 HX A14VIG (Toshiba Exceria Pro SDXC 64 GB UHS-II) | |
| MSI Titan 18 HX AI A2XWJG (AV PRO microSD 128 GB V60) | |
| maximum AS SSD Seq Read Test (1GB) | |
| SCHENKER XMG Neo 16 E25 RTX 5090 Laptop (Angelbird AV Pro V60) | |
| Aorus Master 18 AM8H (AV PRO microSD 128 GB V60) | |
| Razer Blade 16 2025 RTX 5090 (Angelbird AV Pro V60) | |
| Medion Erazer Beast 18 X1 MD62731 (AV PRO microSD 128 GB V60) | |
| Moyenne de la classe Gaming (25.8 - 261, n=71, 2 dernières années) | |
| MSI Titan 18 HX AI A2XWJG (AV PRO microSD 128 GB V60) | |
| MSI Titan 18 HX A14VIG (Toshiba Exceria Pro SDXC 64 GB UHS-II) | |
Communication
La bande 6 GHz 6E offre des performances légèrement supérieures à celles de la bande 5 GHz, avec des vitesses moyennes et maximales légèrement plus élevées en émission et en réception lors des tests effectués avec notre routeur de référence Asus ROG Rapture GT-AXE11000.
Les bandes 5 GHz et 6 GHz 6E présentent des performances irrégulières en émission, avec des fluctuations notables.
| Networking / iperf3 transmit AXE11000 | |
| Razer Blade 16 2025 RTX 5090 | |
| SCHENKER XMG Neo 16 E25 RTX 5090 Laptop (iperf 3.1.3) | |
| Asus Strix Scar 18 G835LX | |
| Asus ROG Strix Scar 16 2025 (iperf 3.1.3) | |
| MSI Titan 18 HX AI A2XWJG (iperf 3.1.3) | |
| Aorus Master 18 AM8H (iperf 3.1.3) | |
| Moyenne Intel Killer Wi-Fi 7 BE1750x BE200NGW (665 - 1814, n=8) | |
| Moyenne de la classe Gaming (469 - 1862, n=121, 2 dernières années) | |
| MSI Titan 18 HX A14VIG (iperf 3.1.3) | |
| Medion Erazer Beast 18 X1 MD62731 (iperf 3.1.3) | |
| Networking / iperf3 receive AXE11000 | |
| Aorus Master 18 AM8H (iperf 3.1.3) | |
| SCHENKER XMG Neo 16 E25 RTX 5090 Laptop (iperf 3.1.3) | |
| Razer Blade 16 2025 RTX 5090 | |
| MSI Titan 18 HX AI A2XWJG (iperf 3.1.3) | |
| Medion Erazer Beast 18 X1 MD62731 (iperf 3.1.3) | |
| Asus Strix Scar 18 G835LX | |
| Asus ROG Strix Scar 16 2025 (iperf 3.1.3) | |
| Moyenne de la classe Gaming (680 - 1741, n=121, 2 dernières années) | |
| Moyenne Intel Killer Wi-Fi 7 BE1750x BE200NGW (777 - 1696, n=8) | |
| MSI Titan 18 HX A14VIG (iperf 3.1.3) | |
| Networking / iperf3 transmit AXE11000 6GHz | |
| MSI Titan 18 HX AI A2XWJG (iperf 3.1.3) | |
| Moyenne de la classe Gaming (648 - 2355, n=54, 2 dernières années) | |
| Moyenne Intel Killer Wi-Fi 7 BE1750x BE200NGW (648 - 2355, n=7) | |
| MSI Titan 18 HX A14VIG (iperf 3.1.3) | |
| Networking / iperf3 receive AXE11000 6GHz | |
| MSI Titan 18 HX AI A2XWJG (iperf 3.1.3) | |
| Moyenne de la classe Gaming (853 - 1788, n=54, 2 dernières années) | |
| MSI Titan 18 HX A14VIG (iperf 3.1.3) | |
| Moyenne Intel Killer Wi-Fi 7 BE1750x BE200NGW (1045 - 1723, n=7) | |
Webcam
Malheureusement, la qualité d'image de la webcam FHD n'a rien d'extraordinaire. Elle vous permet de réaliser des vidéoconférences de base, mais les images manquent de mise au point et de netteté, même lorsque l'éclairage ambiant est satisfaisant.
Un obturateur physique est proposé pour plus de confidentialité.

")
")
Sécurité
En plus de la puce TPM 2.0 désormais omniprésente, le Titan 18 HX AI est équipé de la reconnaissance faciale Windows Hello pour les connexions biométriques.
Accessoires et garantie
Les accessoires inclus dans la boîte comprennent une souris de jeu sans fil/filaire MSI M18 et un disque OTG MSI USB 3.2 Type-A/Type-C de 256 Go, en plus de la paperasse habituelle et de l'adaptateur d'alimentation de 400 W.
MSI offre une garantie standard d'un an ou de deux ans selon la région d'achat.
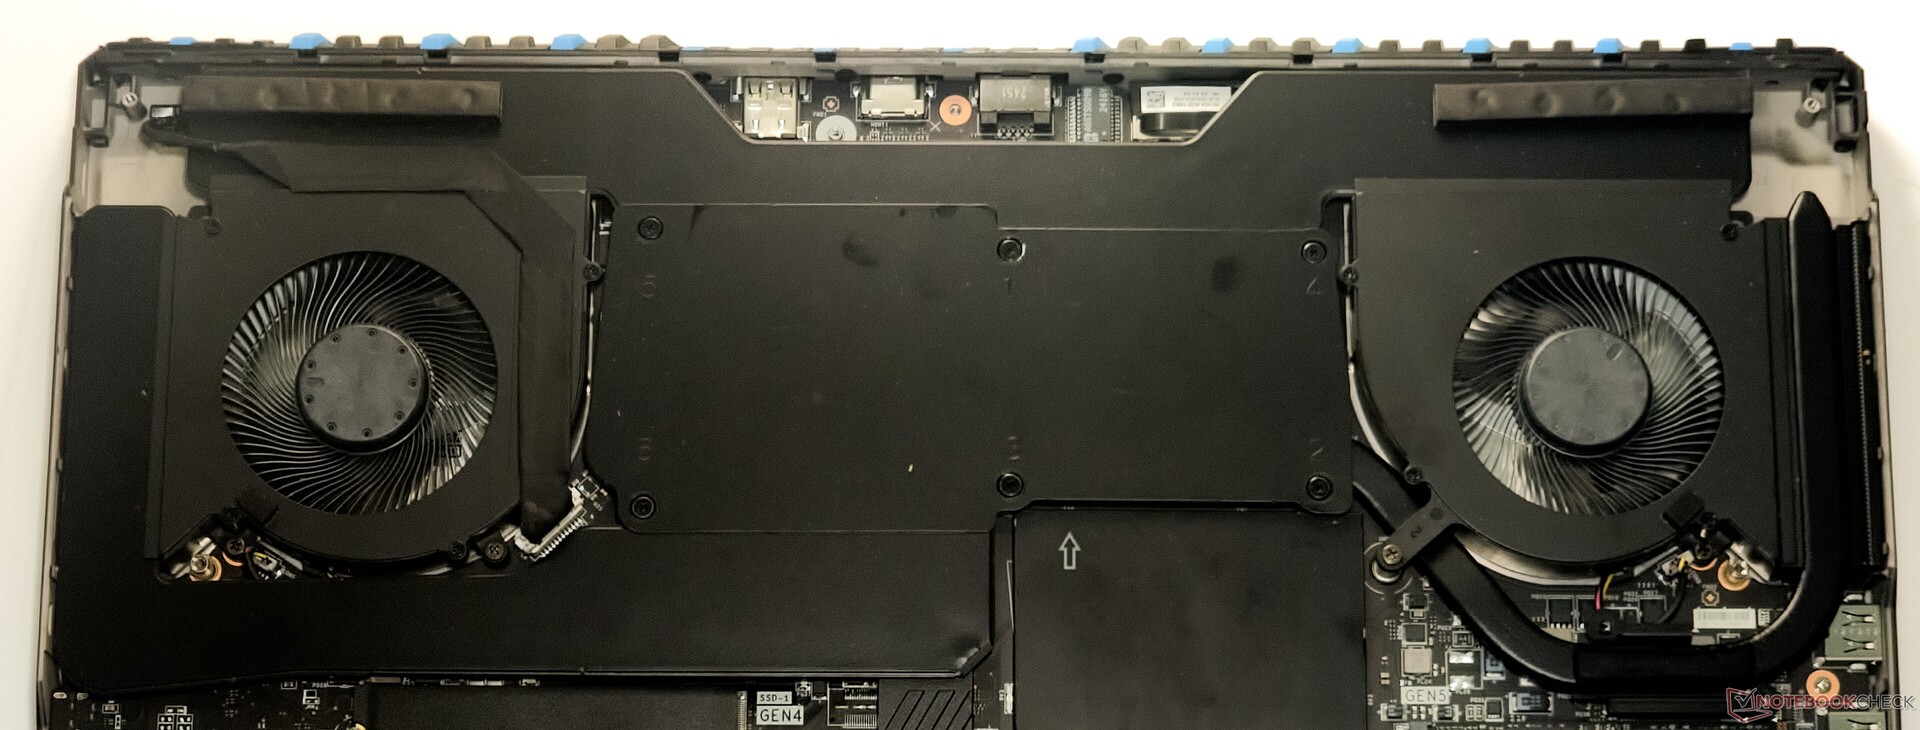
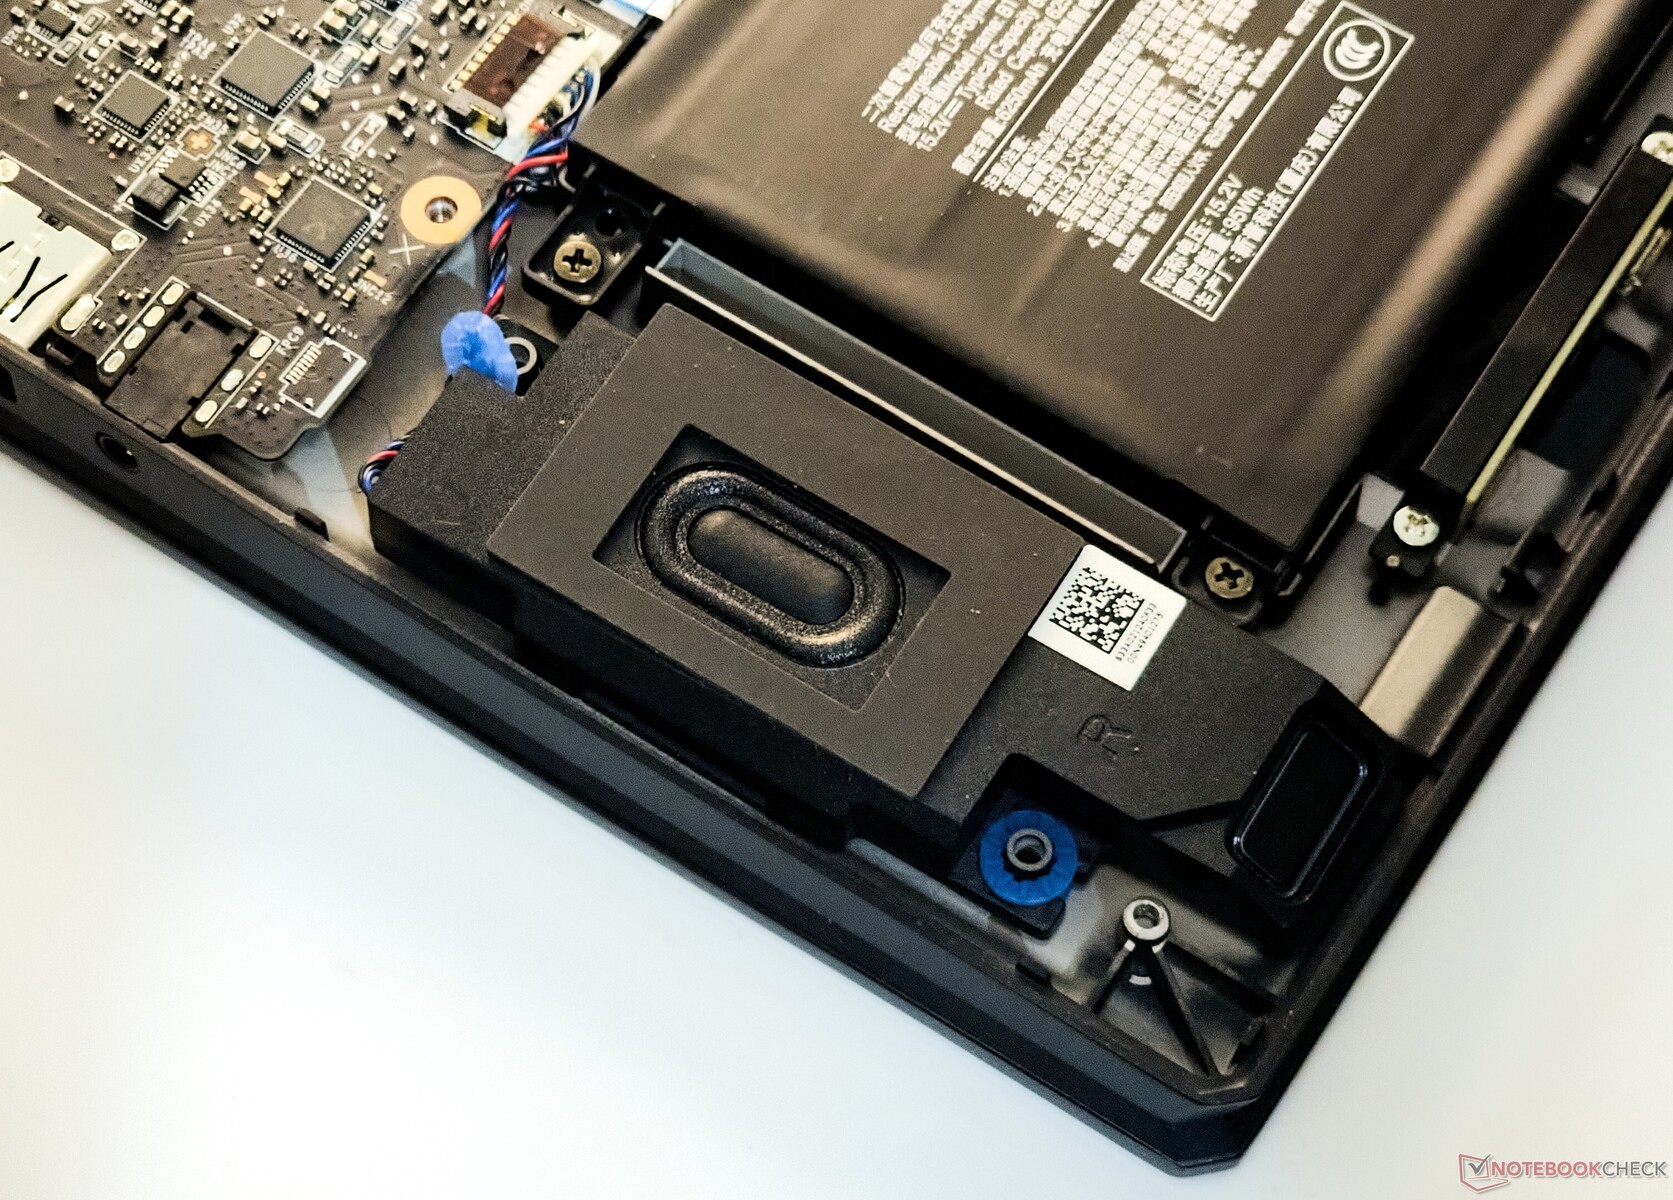
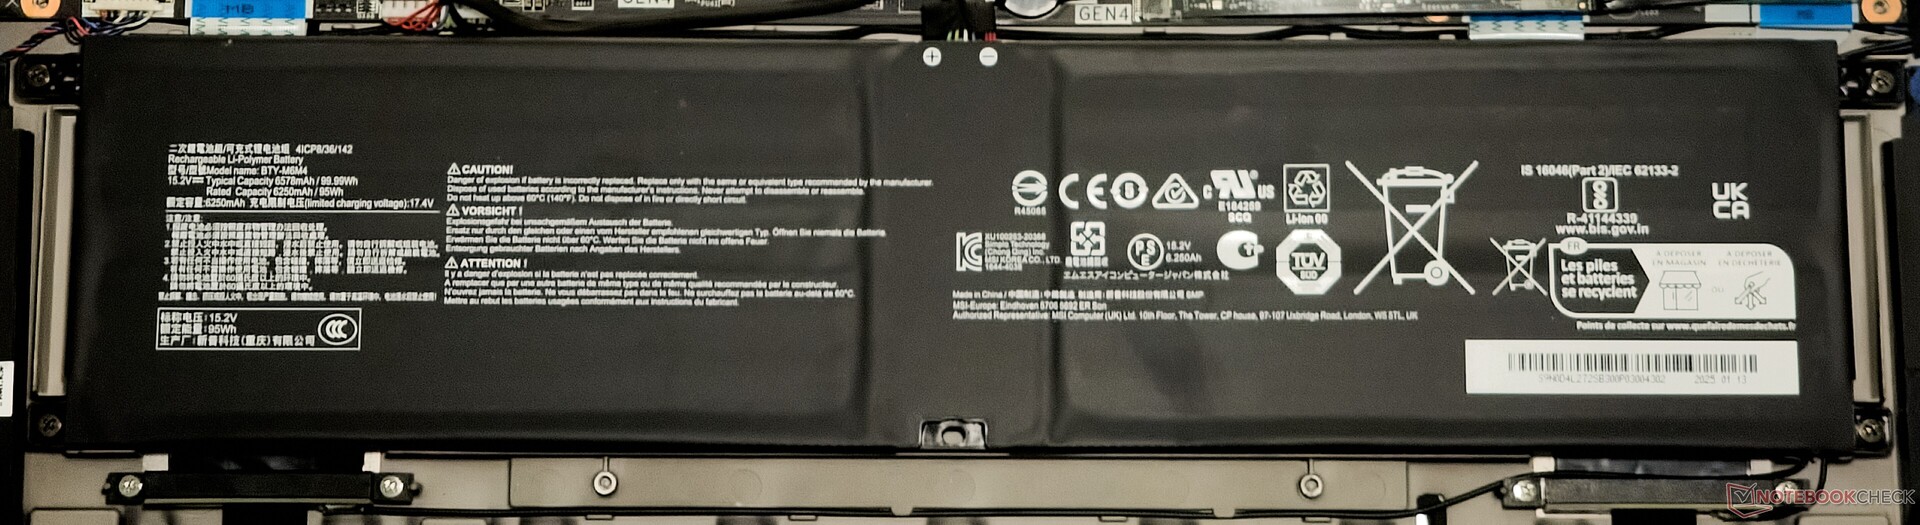
Maintenance
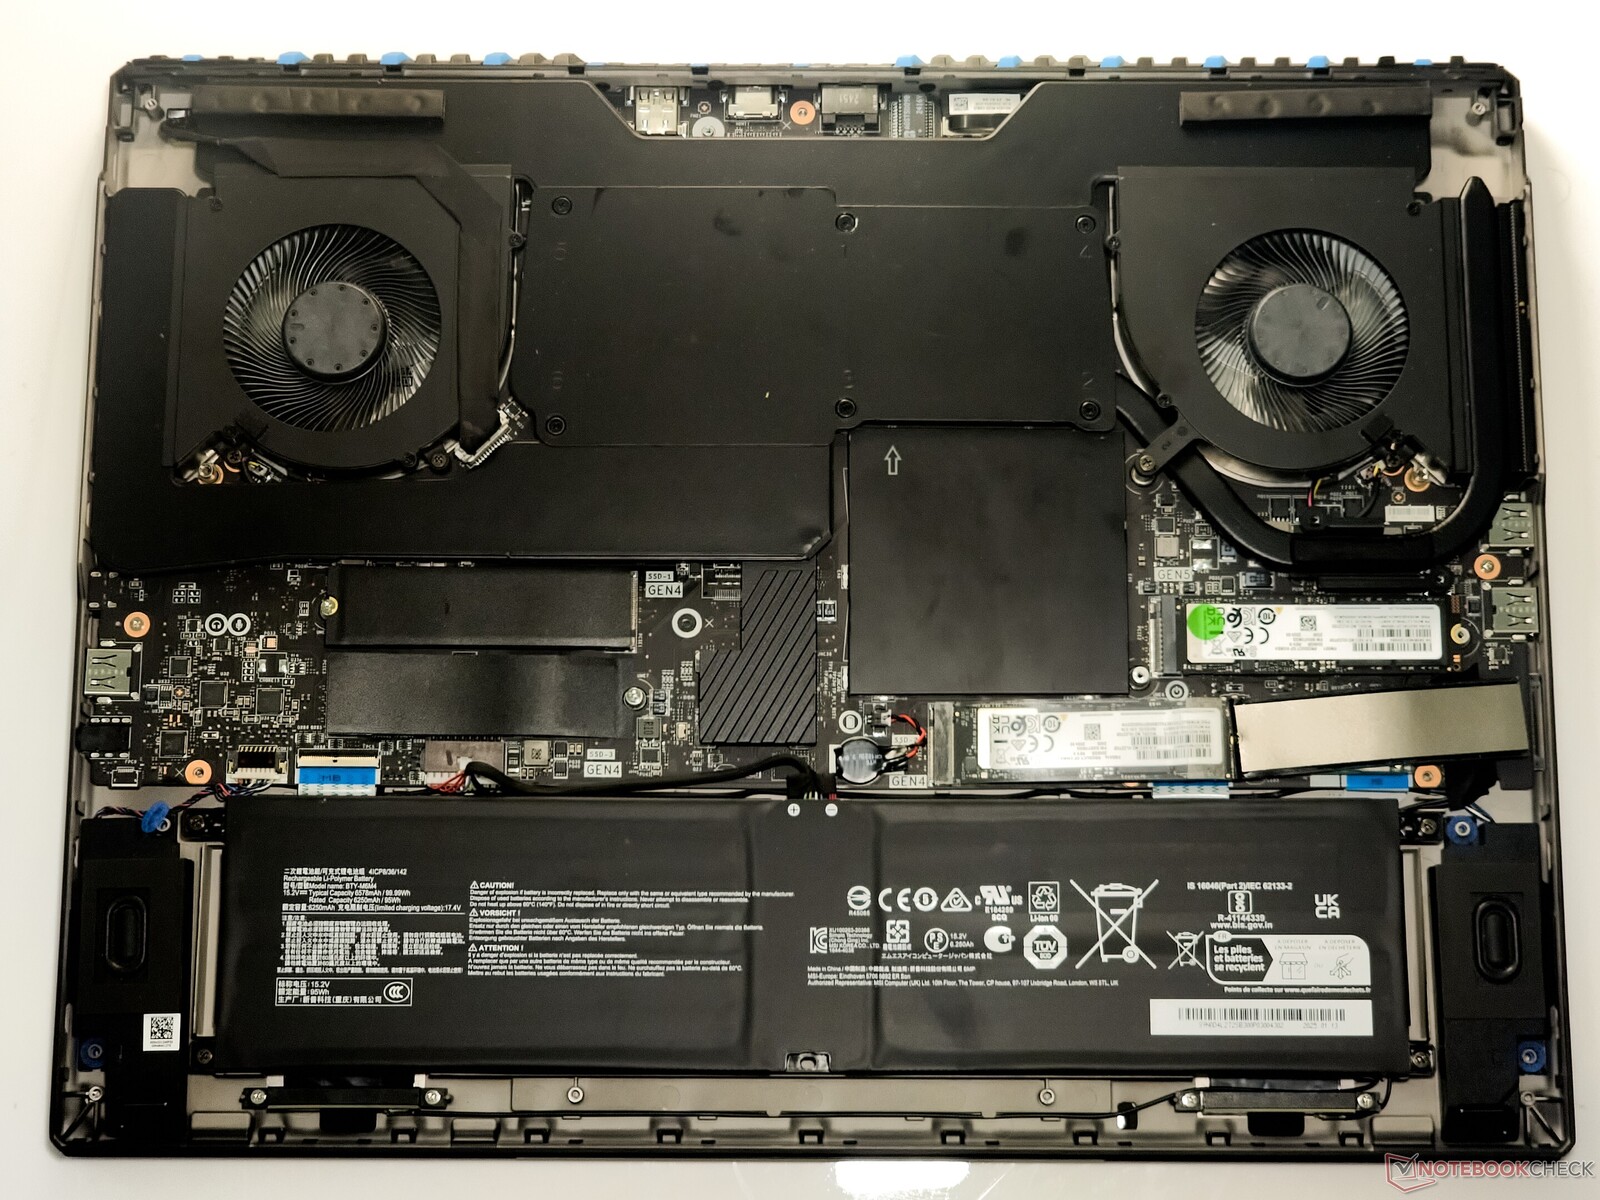
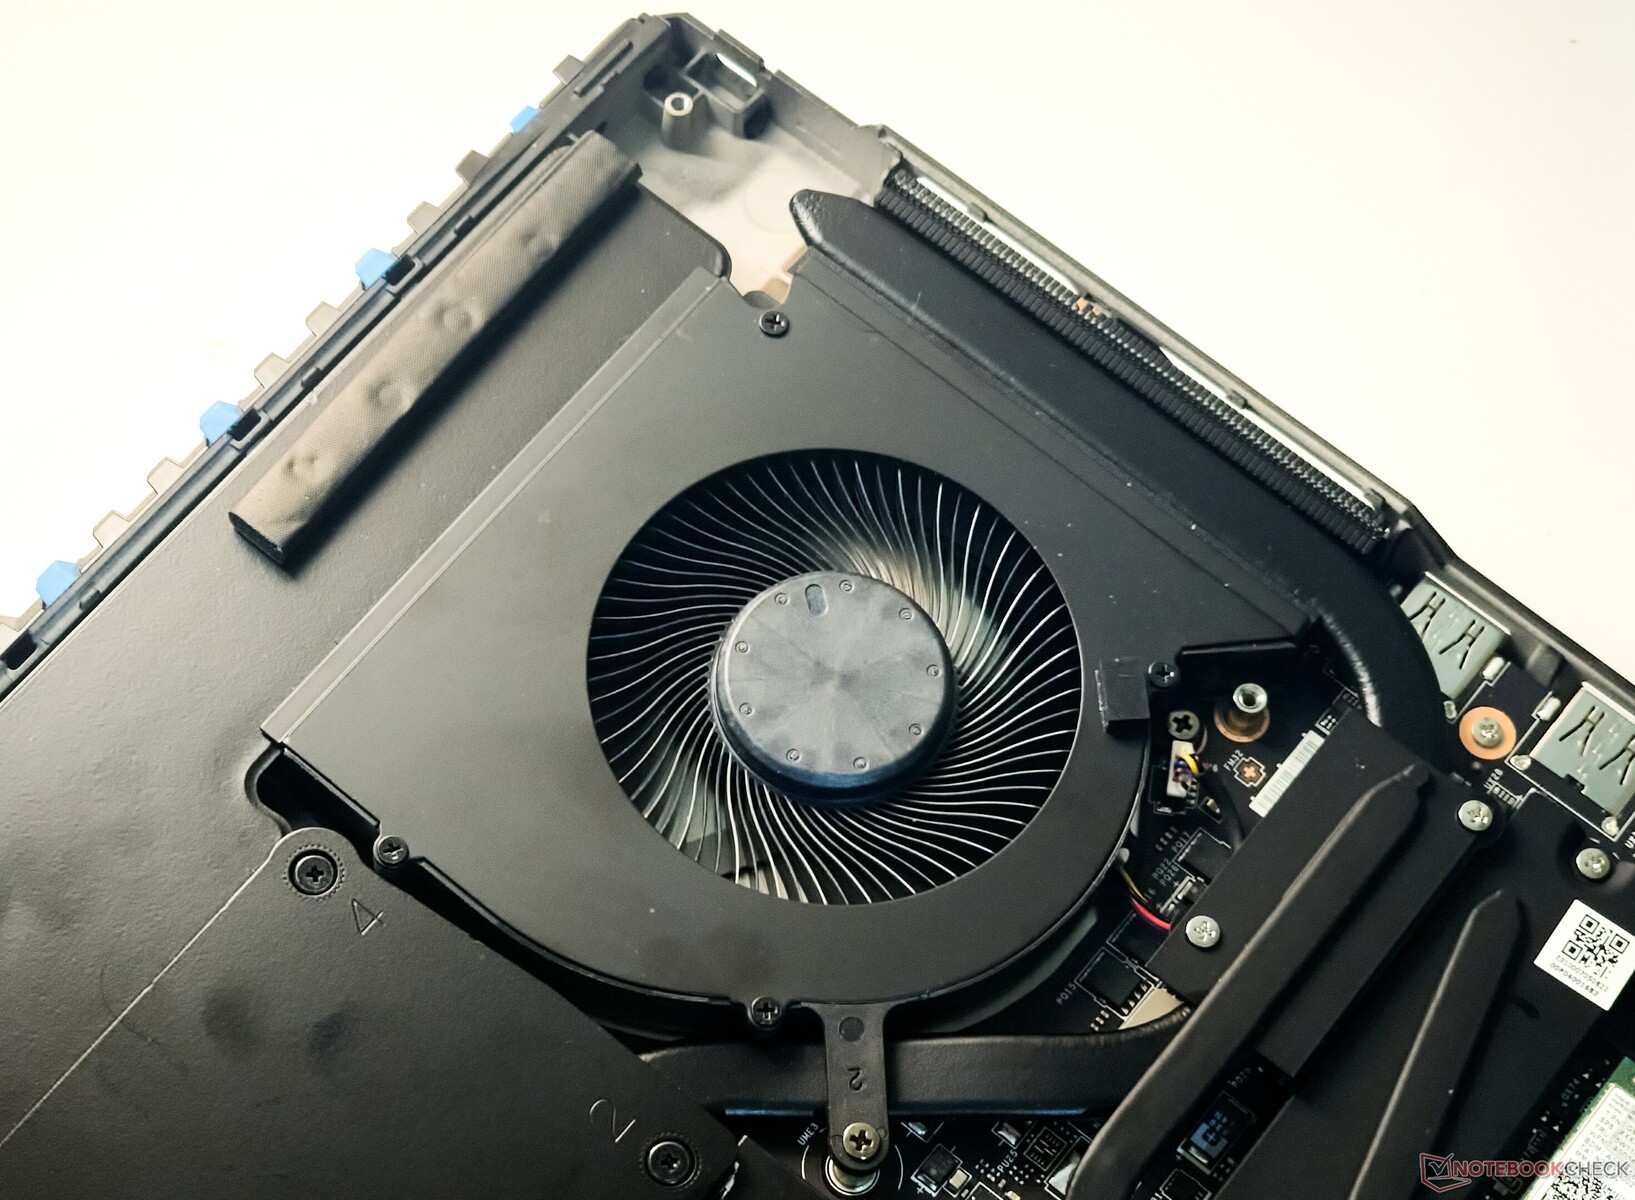
L'accès à l'intérieur de la Titan 18 HX AI est assez simple - il suffit de défaire les 12 vis Philips de même longueur et le panneau arrière peut être ouvert avec un peu d'effort.
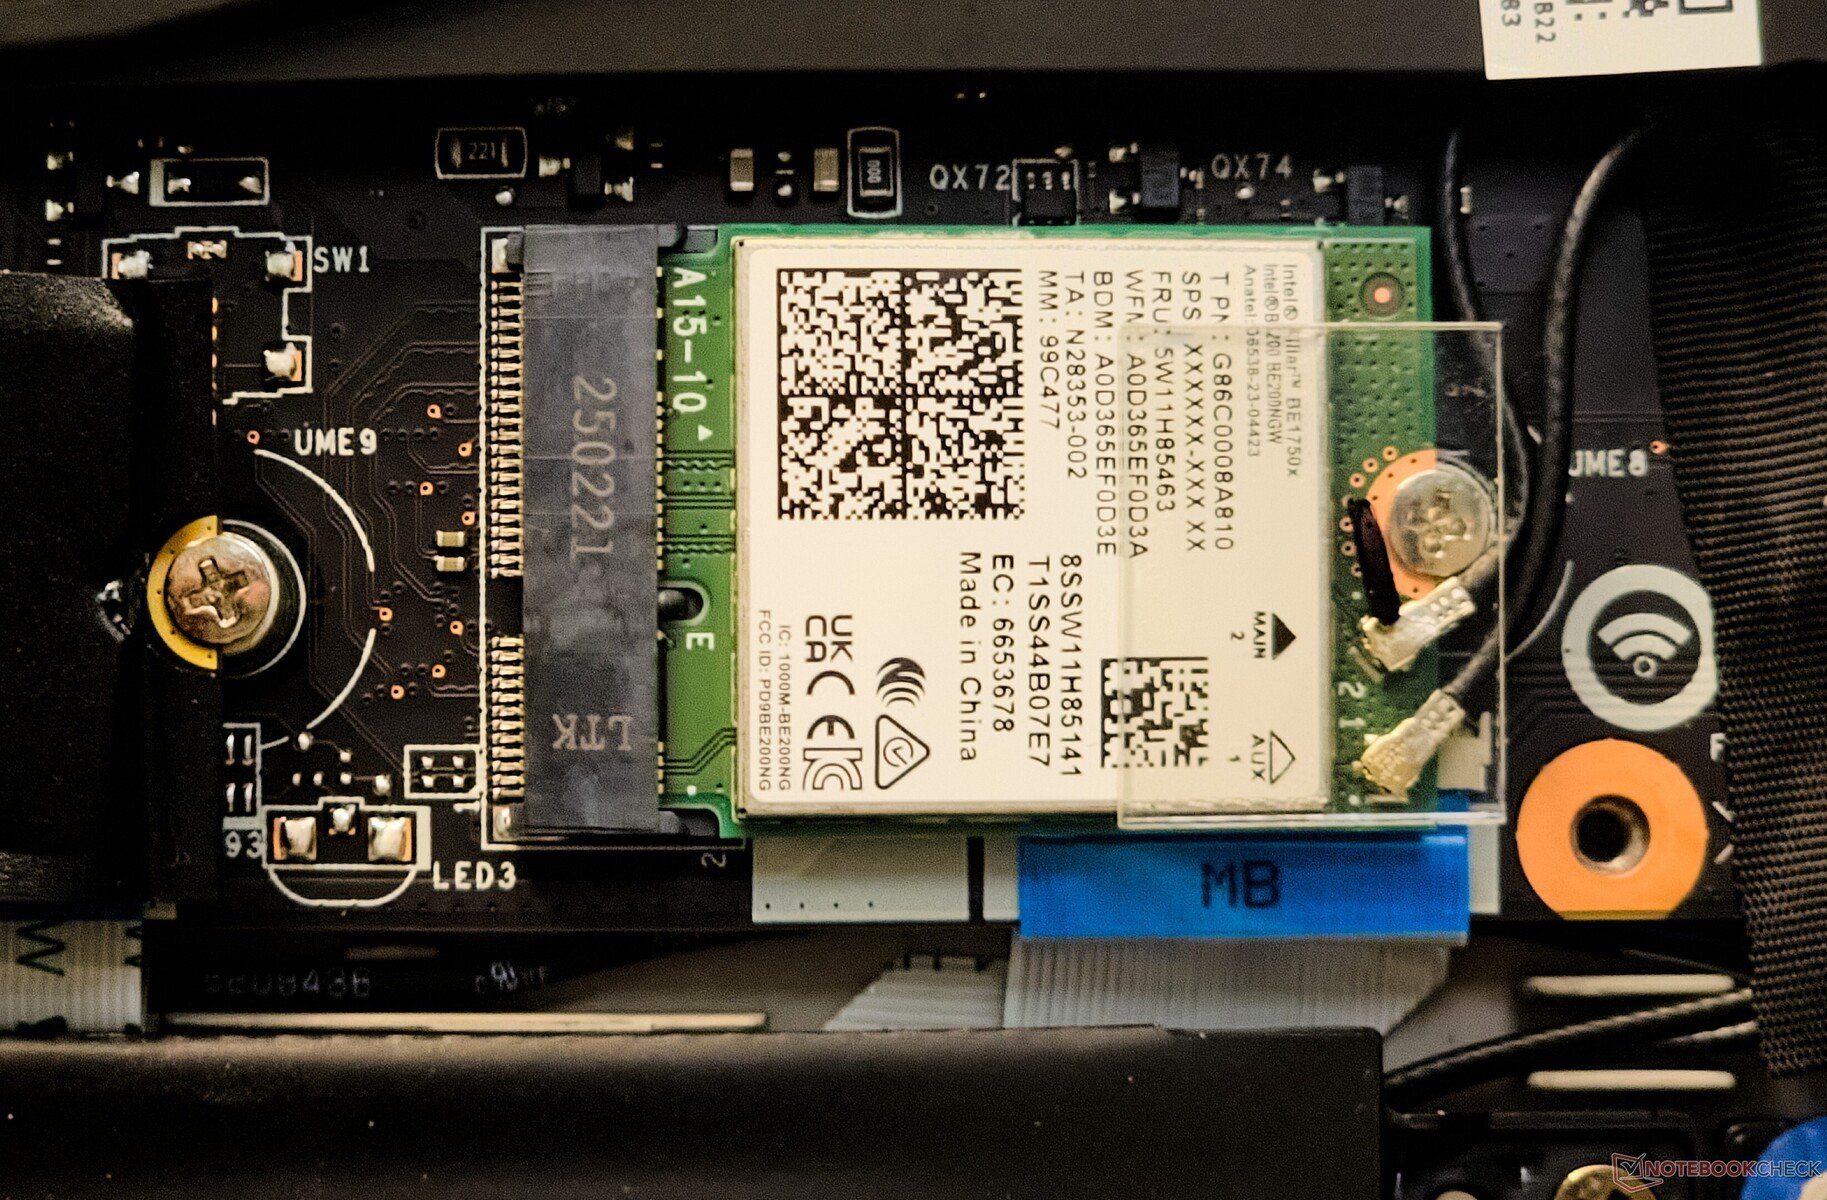
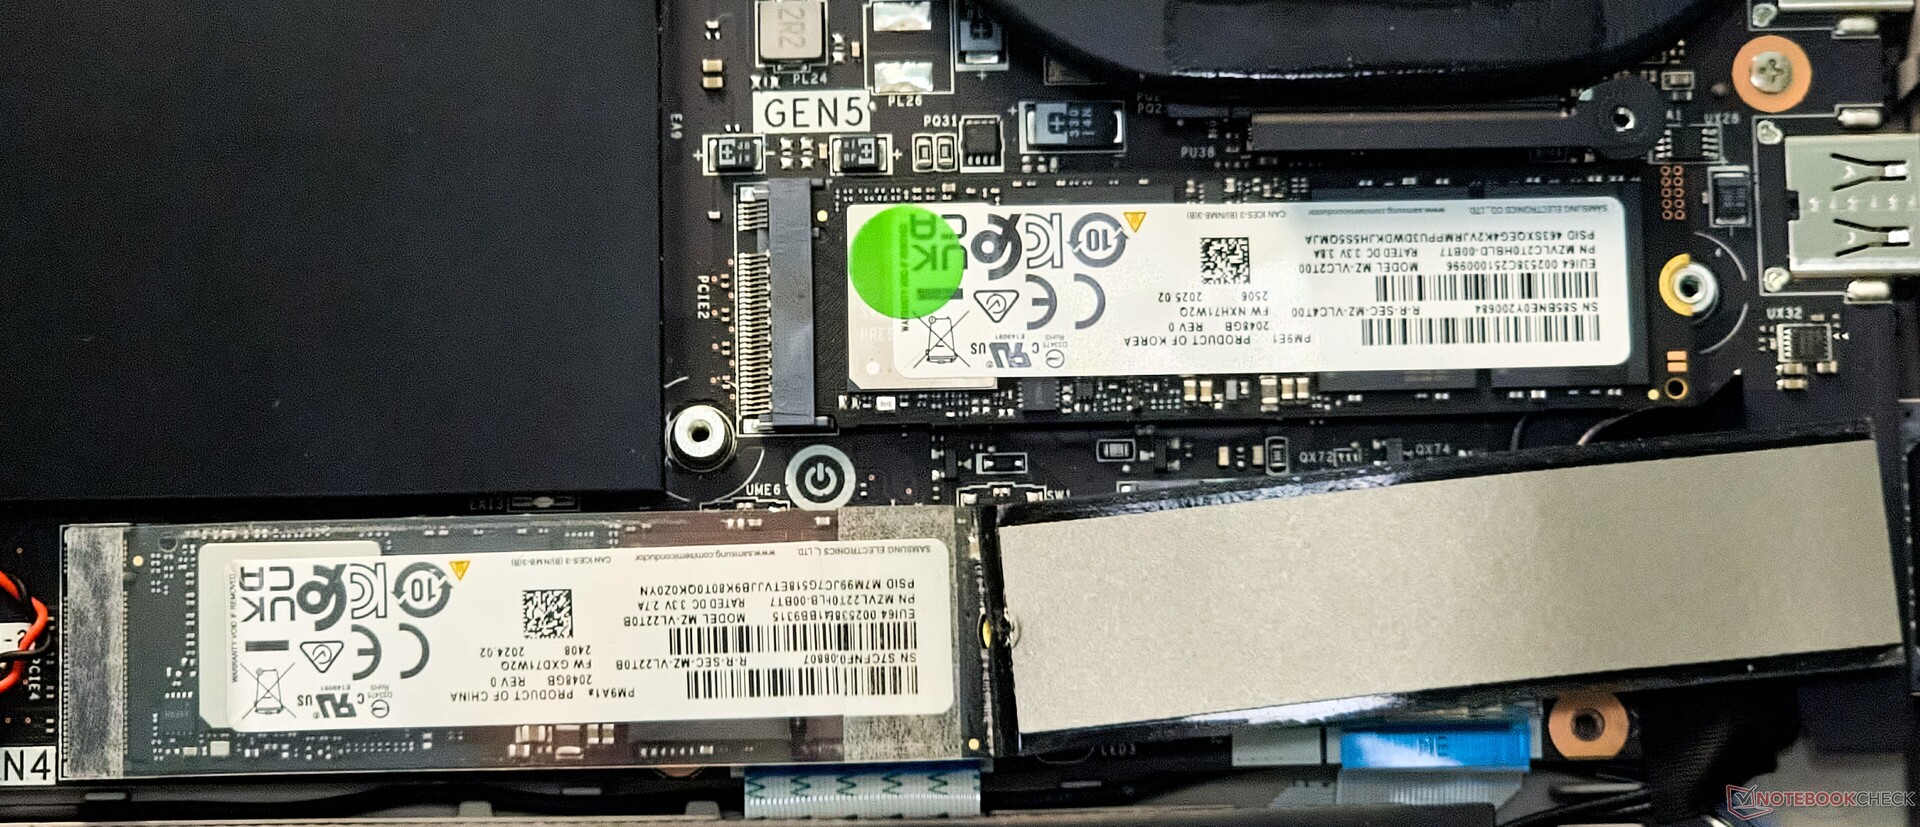
La disposition interne diffère légèrement de celle du Titan 18 de l'année dernière en raison de la présence d'un emplacement PCIe Gen4 NVMe M.2 supplémentaire (au total, 3 emplacements PCIe Gen4 et 1 emplacement PCIe Gen5). Le SSD Gen5 bénéficie d'un heatpipe dédié.
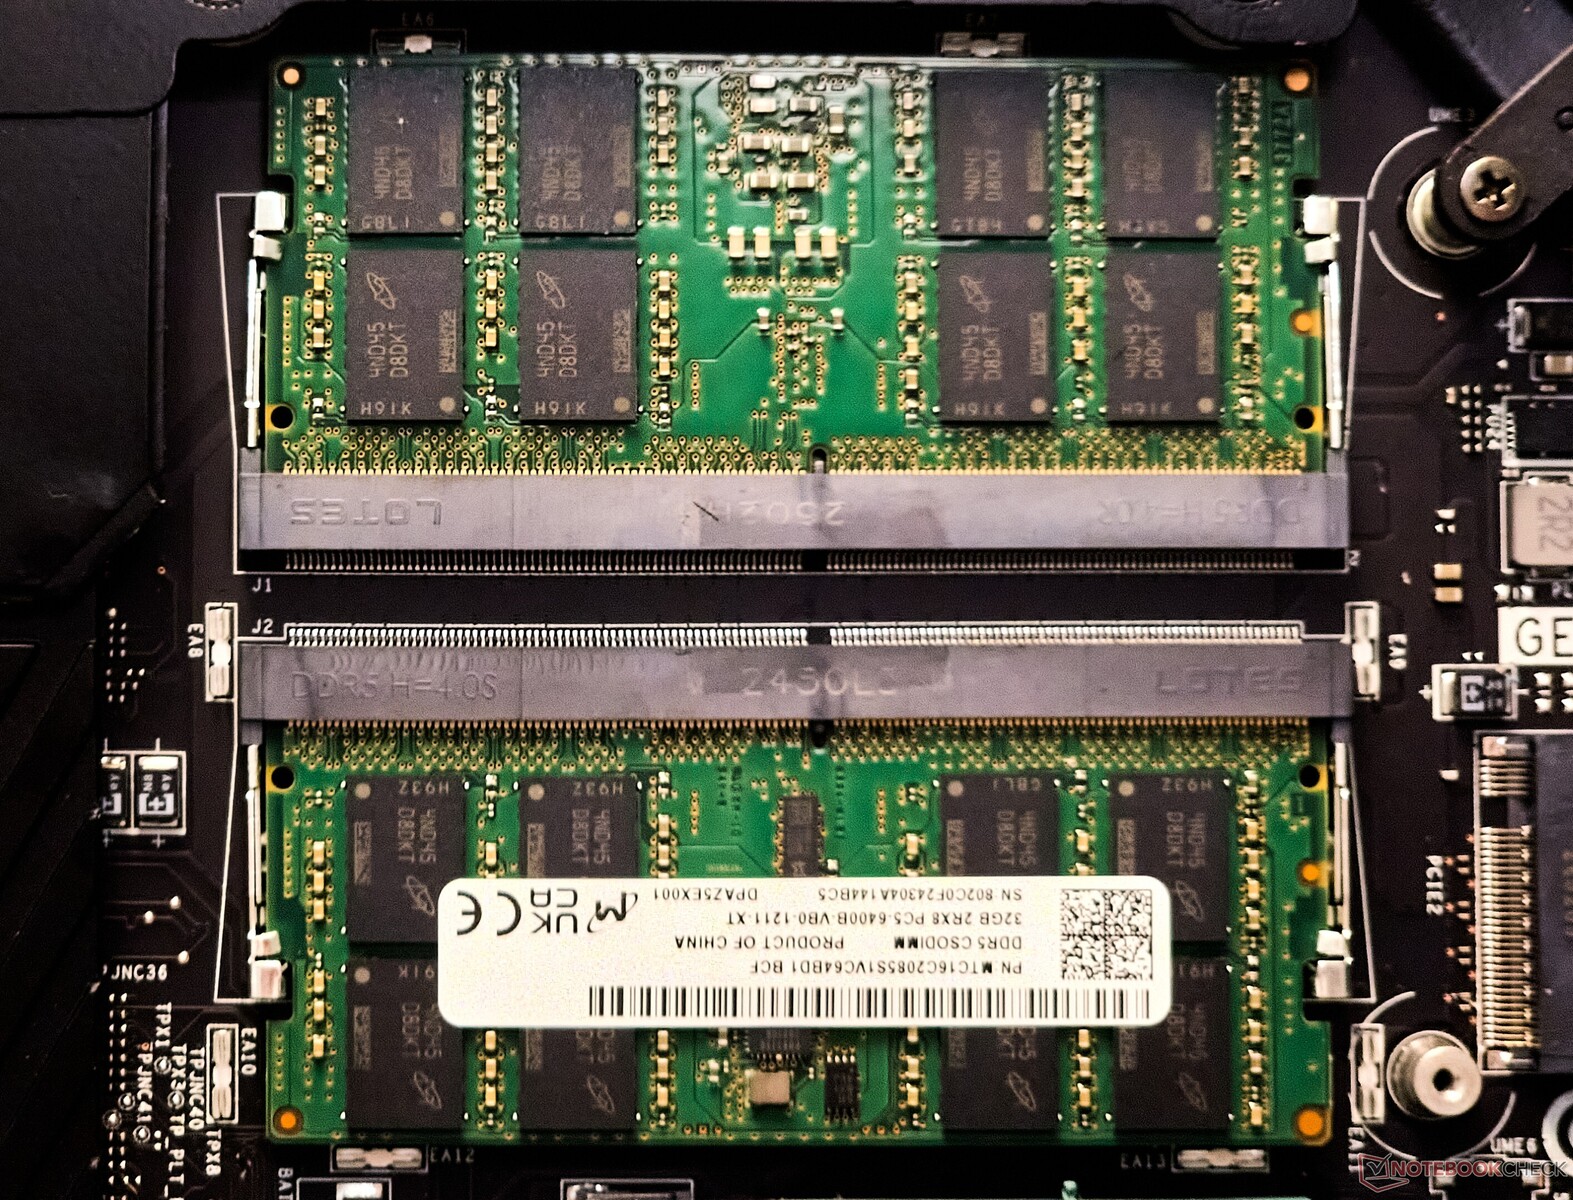
Les 2 CSODIMM (au lieu de 4 dans la génération précédente) sont enfermés dans un bouclier métallique fixé par de l'adhésif et des clips, ce qui rend leur retrait quelque peu fastidieux.
Le module WLAN Intel Killer Wi-Fi 7 BE1750x peut être remplacé, et la batterie peut être dévissée si nécessaire.
Durabilité
MSI déclare qu'elle a pour objectif d'atteindre des émissions nettes d'ici 2050. Le Titan 18 HX AI est livré dans un emballage en carton recyclable avec une utilisation minimale de plastique. L'ordinateur portable est ErP-ready et est conforme aux normes Energy Star et RoHS.
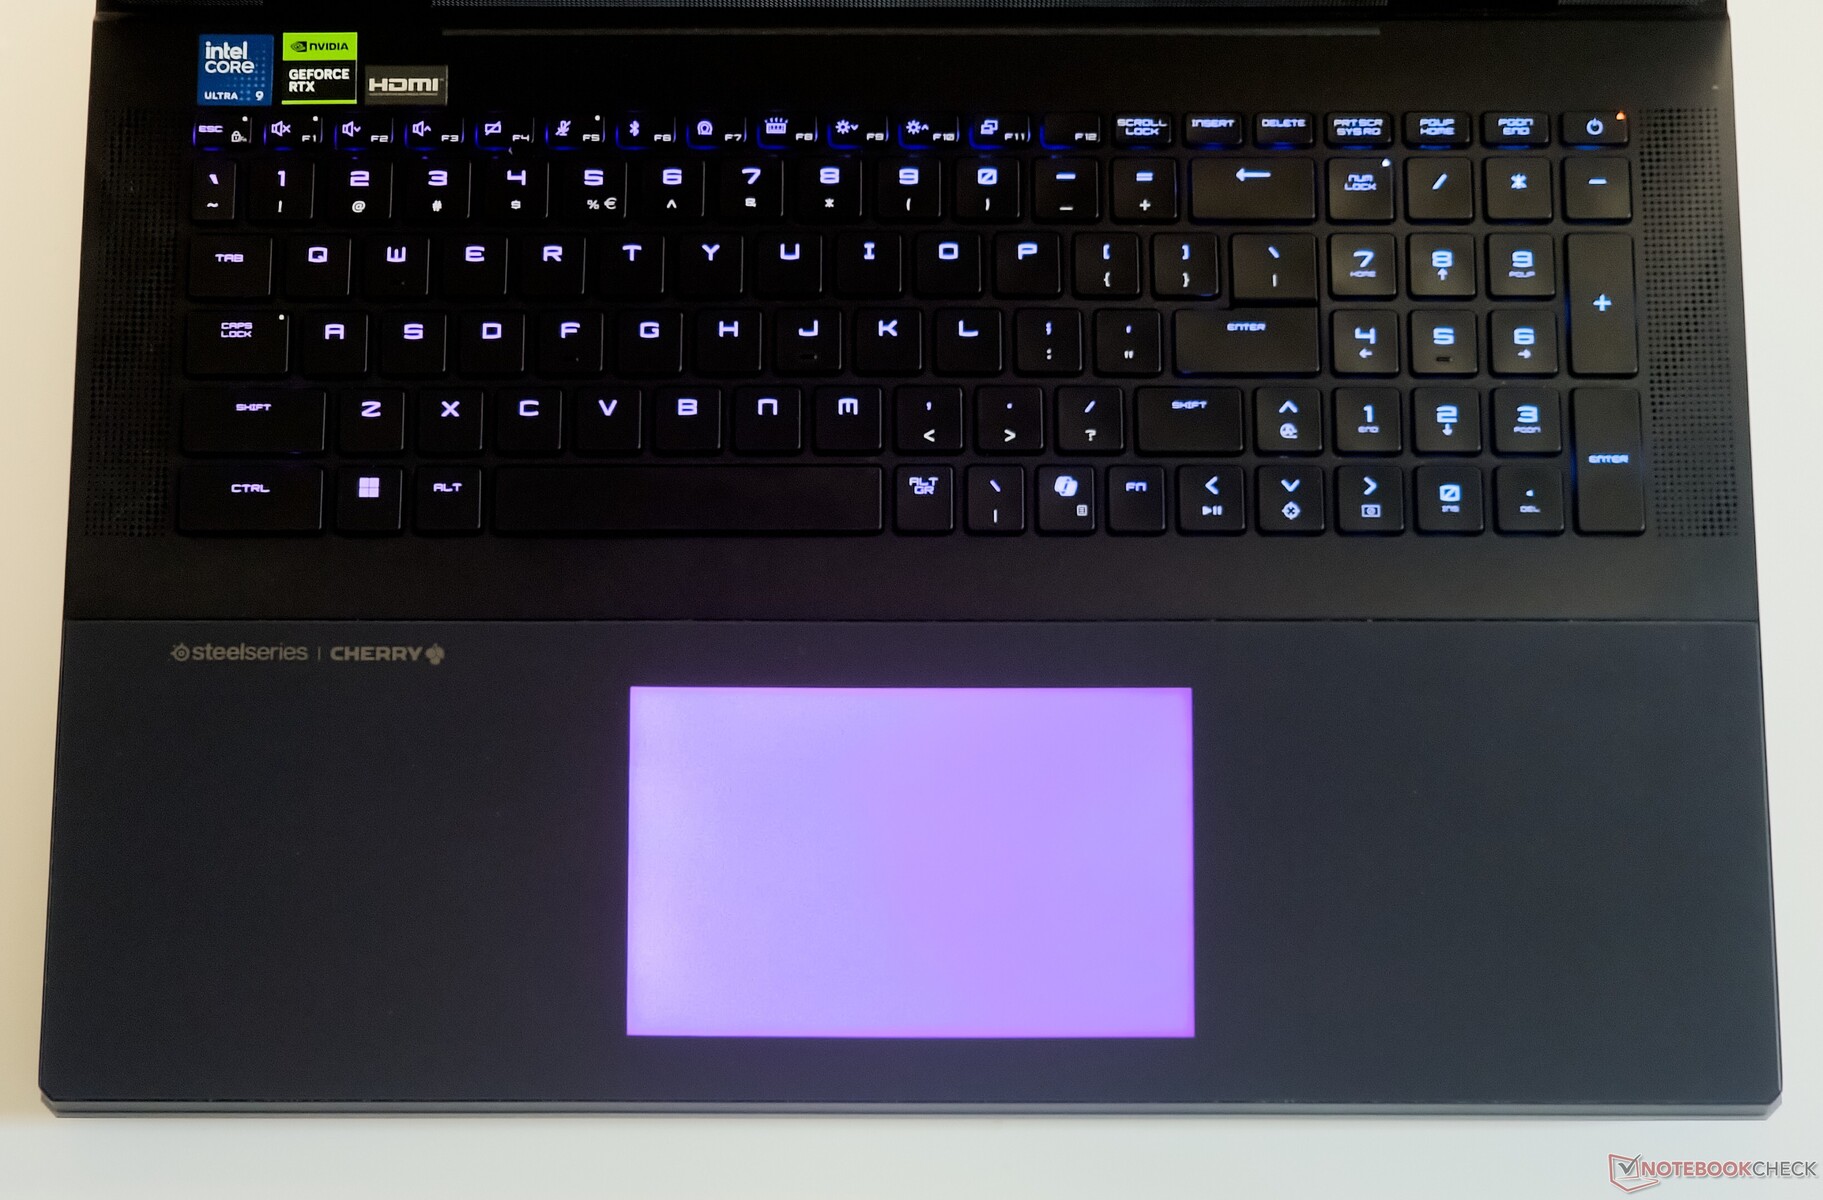
Périphériques d'entrée : Clavier mécanique Cherry MX associé à un pavé tactile haptique délicat
Clavier
Le clavier mécanique SteelSeries doté de touches Cherry MX Ultra-Low Profile offre une course profonde et une tactilité satisfaisante, ce qui est de très bon augure pour la frappe et le jeu. Cependant, il faut un peu de temps pour s'habituer à la courte touche Shift de droite et il n'y a pas de touches Home et End autonomes.
Un rétroéclairage à quatre niveaux permet une illumination RGB glorieuse qui peut être personnalisée via l'application SteelSeries GG. Les touches de fonction secondaires s'allument distinctement lorsque vous appuyez sur la touche Fn.
Contrairement à ce que nous avons vu avec l Alienware m18 R1par exemple, toutes les touches ne bénéficient pas de l'amour de Cherry MX - la rangée de fonctions, le pavé numérique, les touches fléchées et les touches à droite de la barre d'espacement restent toutes basées sur des membranes.
Pavé tactile
Le pavé tactile haptique de 13 cm x 8,5 cm, éclairé par RGB, se trouve au même niveau que les repose-poignets. Bien qu'il soit esthétiquement agréable, il n'a pas beaucoup d'utilité pratique et il est difficile de le localiser en l'absence d'éclairage.
L'haptique n'est pas particulièrement convaincante et il n'y a pas de contrôle logiciel pour ajuster le retour d'information.
Les clics et les clics droits peuvent parfois ne pas être enregistrés et le glisser-déposer multi-touch peut rapidement devenir une corvée. Les gestes de Windows Precision sont entièrement pris en charge.
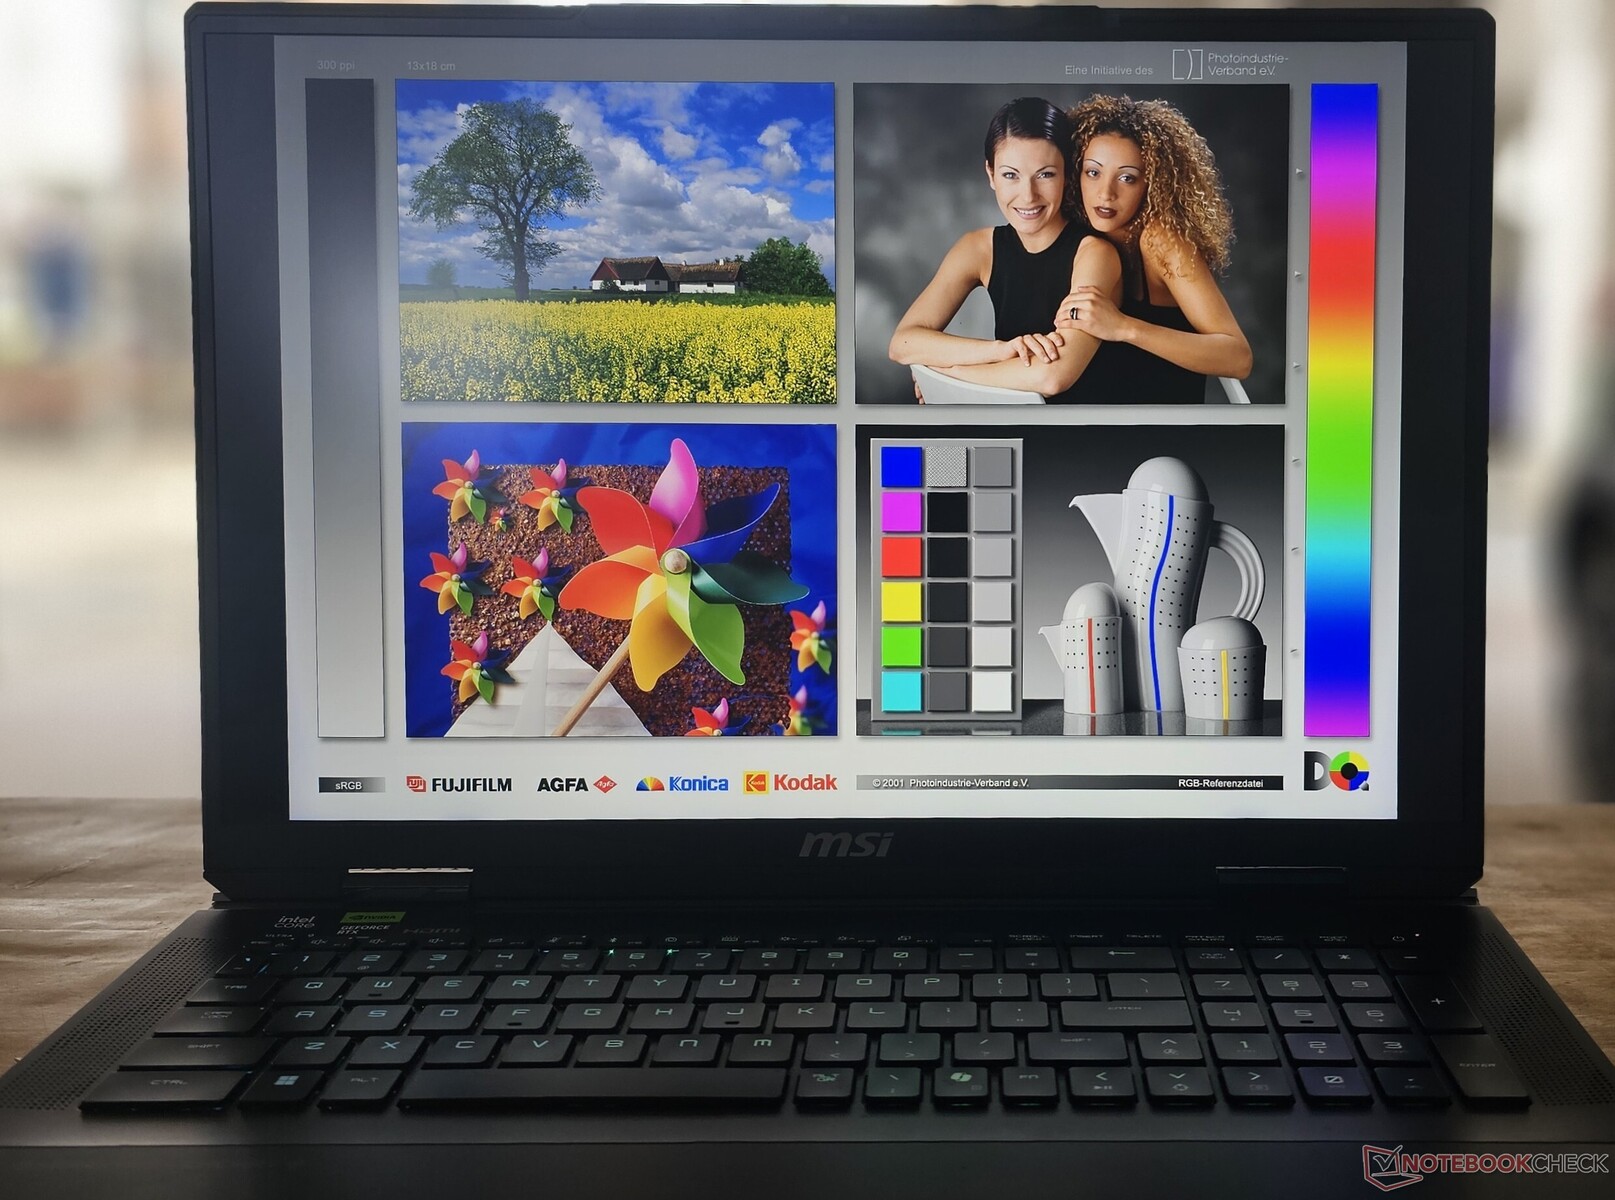
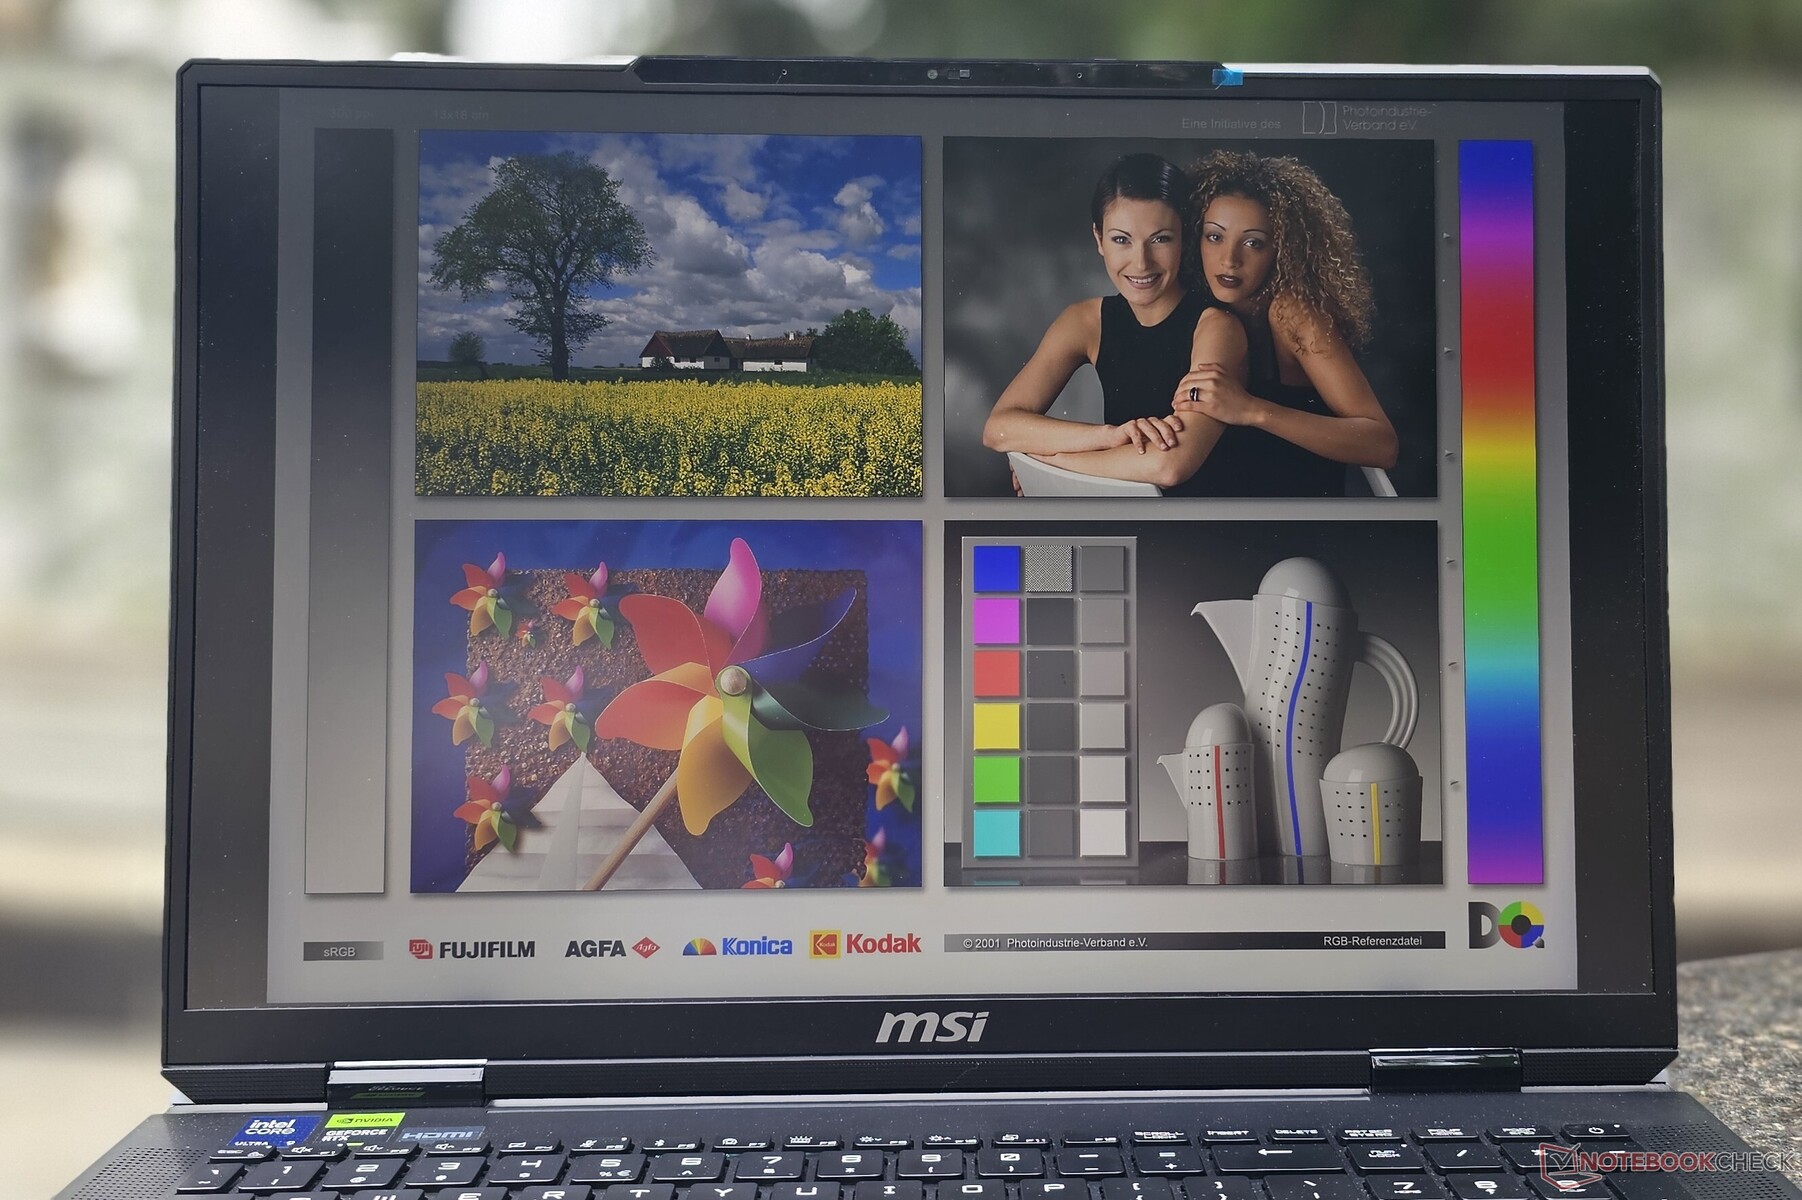
Affichage : Mini-LED 4K 120 Hz brillant qui rivalise avec les OLED, mais pas de G-Sync
Le Titan 18 HX AI est équipé du même panneau AUO mini-LED que le modèle de l'année dernière, de sorte que les caractéristiques de l'écran restent largement similaires.
L'écran atteint une luminosité moyenne de 680 nits en mode SDR lorsqu'il est branché, avec un pic de luminosité mesuré à 717 nits. Sur batterie, cette luminosité descend à 456 nits, ce qui reste dans le domaine des valeurs SDR typiques offertes par la plupart des ordinateurs portables.
Le panneau mini-LED offre une excellente uniformité de la luminosité et un contraste quasi infini avec des noirs de qualité OLED.
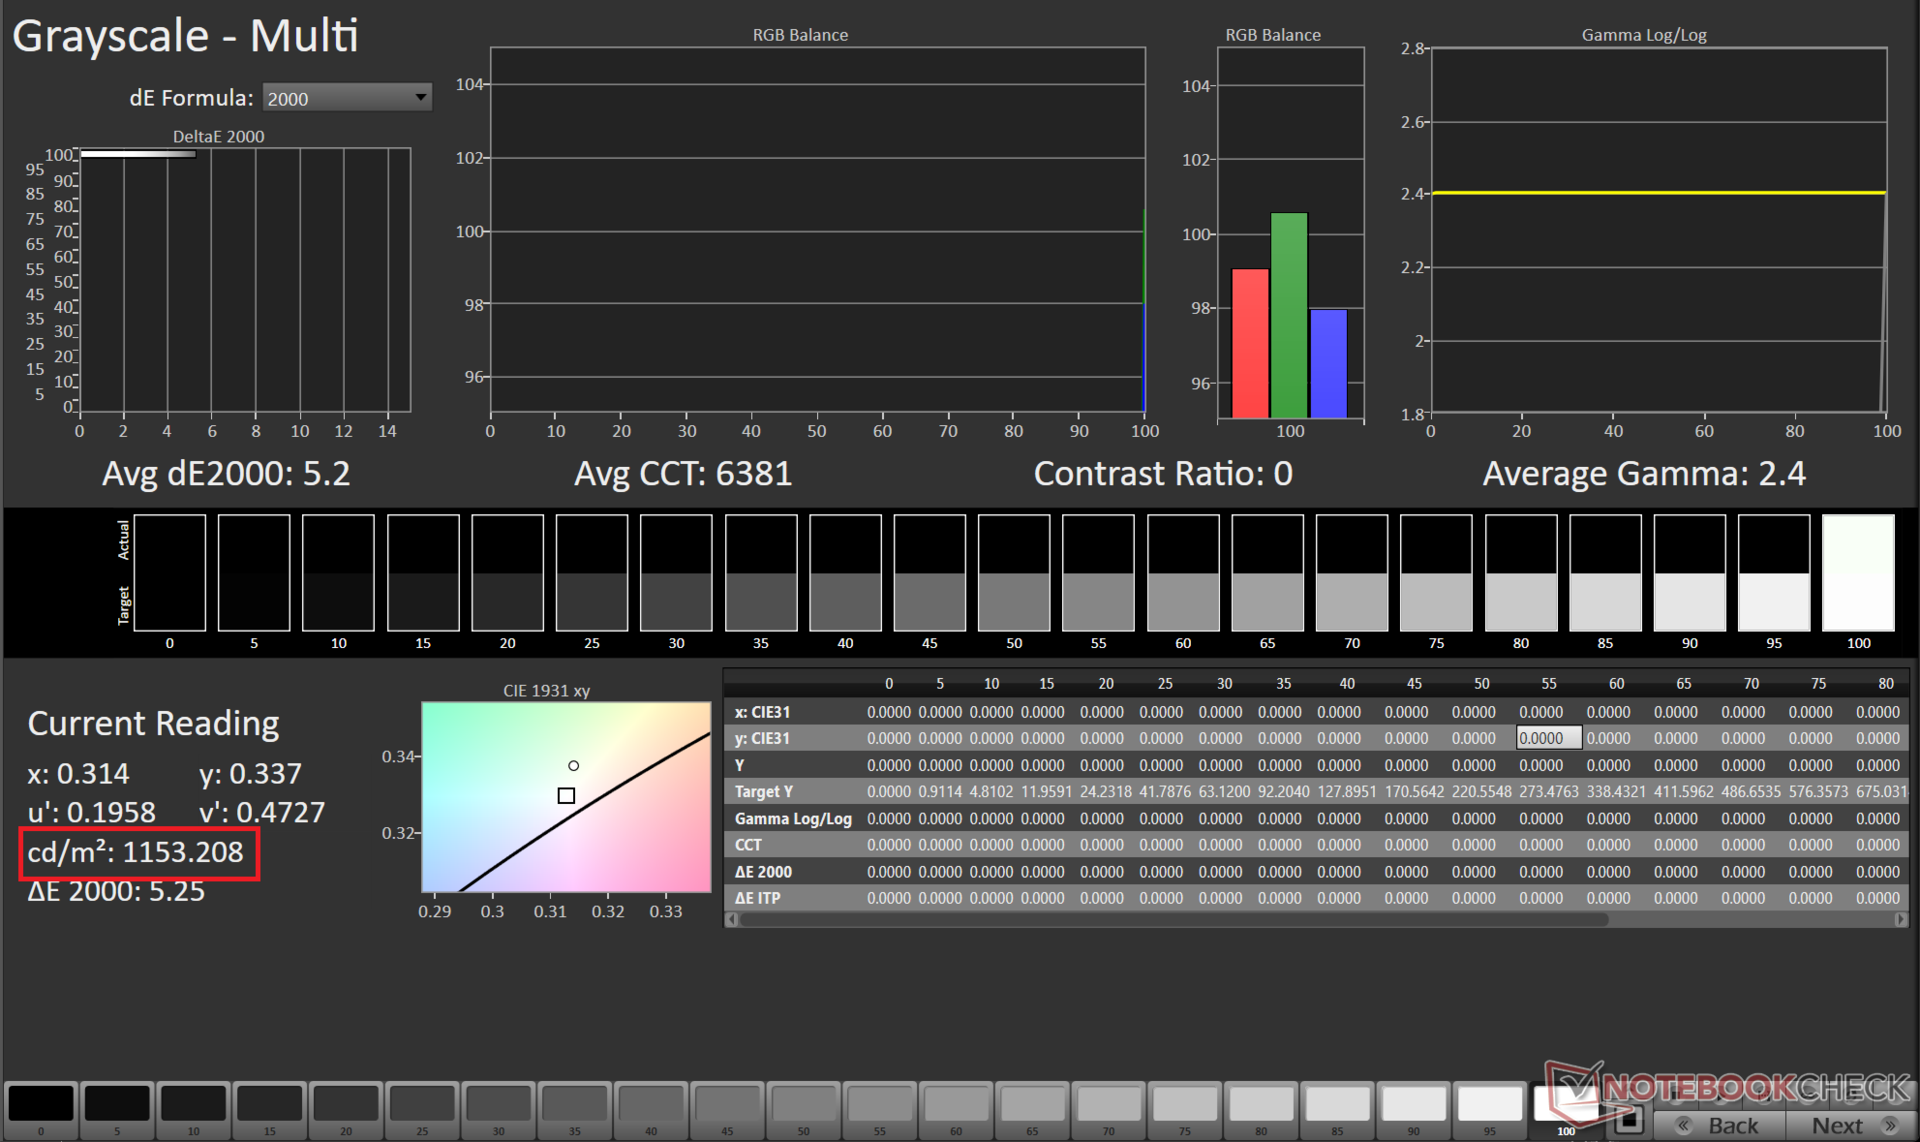
L'écran est certifié VESA DisplayHDR 1000 - nous avons mesuré 1 153 nits en mode HDR avec une fenêtre de 10 %. Nous n'avons observé aucune perte de rétroéclairage perceptible, mais le pointeur de la souris présentait un léger halo sur un écran complètement noir.
Malheureusement, l'écran de la Titan 18 ne dispose pas de la synchronisation adaptative ou de la G-Sync de Nvidia, ce qui est une lacune importante pour un ordinateur portable de ce type.

| |||||||||||||||||||||||||
Homogénéité de la luminosité: 88 %
Valeur mesurée au centre, sur batterie: 456 cd/m²
Contraste: ∞:1 (Valeurs des noirs: 0 cd/m²)
ΔE Color 4.11 | 0.5-29.43 Ø4.85, calibrated: 2.5
ΔE Greyscale 4.9 | 0.09-98 Ø5.1
90.4% AdobeRGB 1998 (Argyll 2.2.0 3D)
99.9% sRGB (Argyll 2.2.0 3D)
99.7% Display P3 (Argyll 2.2.0 3D)
Gamma: 2.03
| MSI Titan 18 HX AI A2XWJG AU Optronics B180ZAN01.0, Mini-LED, 3840x2160, 18", 120 Hz | Aorus Master 18 AM8H NE180QDM-NM1 (BOE0C58), Mini-LED, 2560x1600, 18", 240 Hz | Asus Strix Scar 18 G835LX N180QDM-NM2, Mini-LED, 2560x1600, 18", 240 Hz | Medion Erazer Beast 18 X1 MD62731 BOEhydis NE180QDM-NZ2, IPS, 2560x1600, 18", 240 Hz | Razer Blade 16 2025 RTX 5090 ATNA60DL04-0, OLED, 2560x1600, 16", 240 Hz | MSI Titan 18 HX A14VIG AU Optronics B180ZAN01.0, Mini-LED, 3840x2400, 18", 120 Hz | |
|---|---|---|---|---|---|---|
| Display | -1% | -2% | -3% | -3% | -2% | |
| Display P3 Coverage | 99.7 | 99.9 0% | 99 -1% | 97.1 -3% | 96.1 -4% | 98.1 -2% |
| sRGB Coverage | 99.9 | 100 0% | 100 0% | 99.9 0% | 99.9 0% | 99.8 0% |
| AdobeRGB 1998 Coverage | 90.4 | 87.7 -3% | 87.2 -4% | 84.7 -6% | 85 -6% | 86.2 -5% |
| Response Times | -47% | -18% | 44% | 69% | -222% | |
| Response Time Grey 50% / Grey 80% * | 8.8 ? | 16.4 ? -86% | 7.4 ? 16% | 5.6 ? 36% | 0.2 ? 98% | 8.6 ? 2% |
| Response Time Black / White * | 15 ? | 8.1 ? 46% | 10.4 ? 31% | 7.3 ? 51% | 0.25 ? 98% | 81.8 ? -445% |
| PWM Frequency | 15430 ? | 1398 ? | 20610 ? | 960 ? | 2592 ? | |
| PWM Amplitude * | 50 | 100 -100% | 100 -100% | 44 12% | ||
| Screen | 15% | 37% | -5% | 18% | -5% | |
| Brightness middle | 704 | 438 -38% | 764 9% | 478 -32% | 391 -44% | 467.5 -34% |
| Brightness | 680 | 451 -34% | 747 10% | 456 -33% | 393 -42% | 459 -32% |
| Brightness Distribution | 88 | 90 2% | 93 6% | 89 1% | 98 11% | 90 2% |
| Black Level * | 0.13 | 0.1 | 0.4 | |||
| Colorchecker dE 2000 * | 4.11 | 1.25 70% | 1.2 71% | 3.94 4% | 1.2 71% | 3.77 8% |
| Colorchecker dE 2000 max. * | 6.43 | 4.93 23% | 2.8 56% | 8.6 -34% | 3.2 50% | 6.12 5% |
| Colorchecker dE 2000 calibrated * | 2.5 | 0.75 70% | 2.94 -18% | |||
| Greyscale dE 2000 * | 4.9 | 1.7 65% | 1.5 69% | 5.5 -12% | 1.8 63% | 3.2 35% |
| Gamma | 2.03 108% | 2.173 101% | 2.17 101% | 2.212 99% | 2.2 100% | 2.43 91% |
| CCT | 6331 103% | 6518 100% | 6556 99% | 7059 92% | 6493 100% | 6478 100% |
| Contrast | 3369 | 7640 | 1195 | |||
| Moyenne finale (programmes/paramètres) | -11% /
-5% | 6% /
14% | 12% /
4% | 28% /
26% | -76% /
-40% |
* ... Moindre est la valeur, meilleures sont les performances
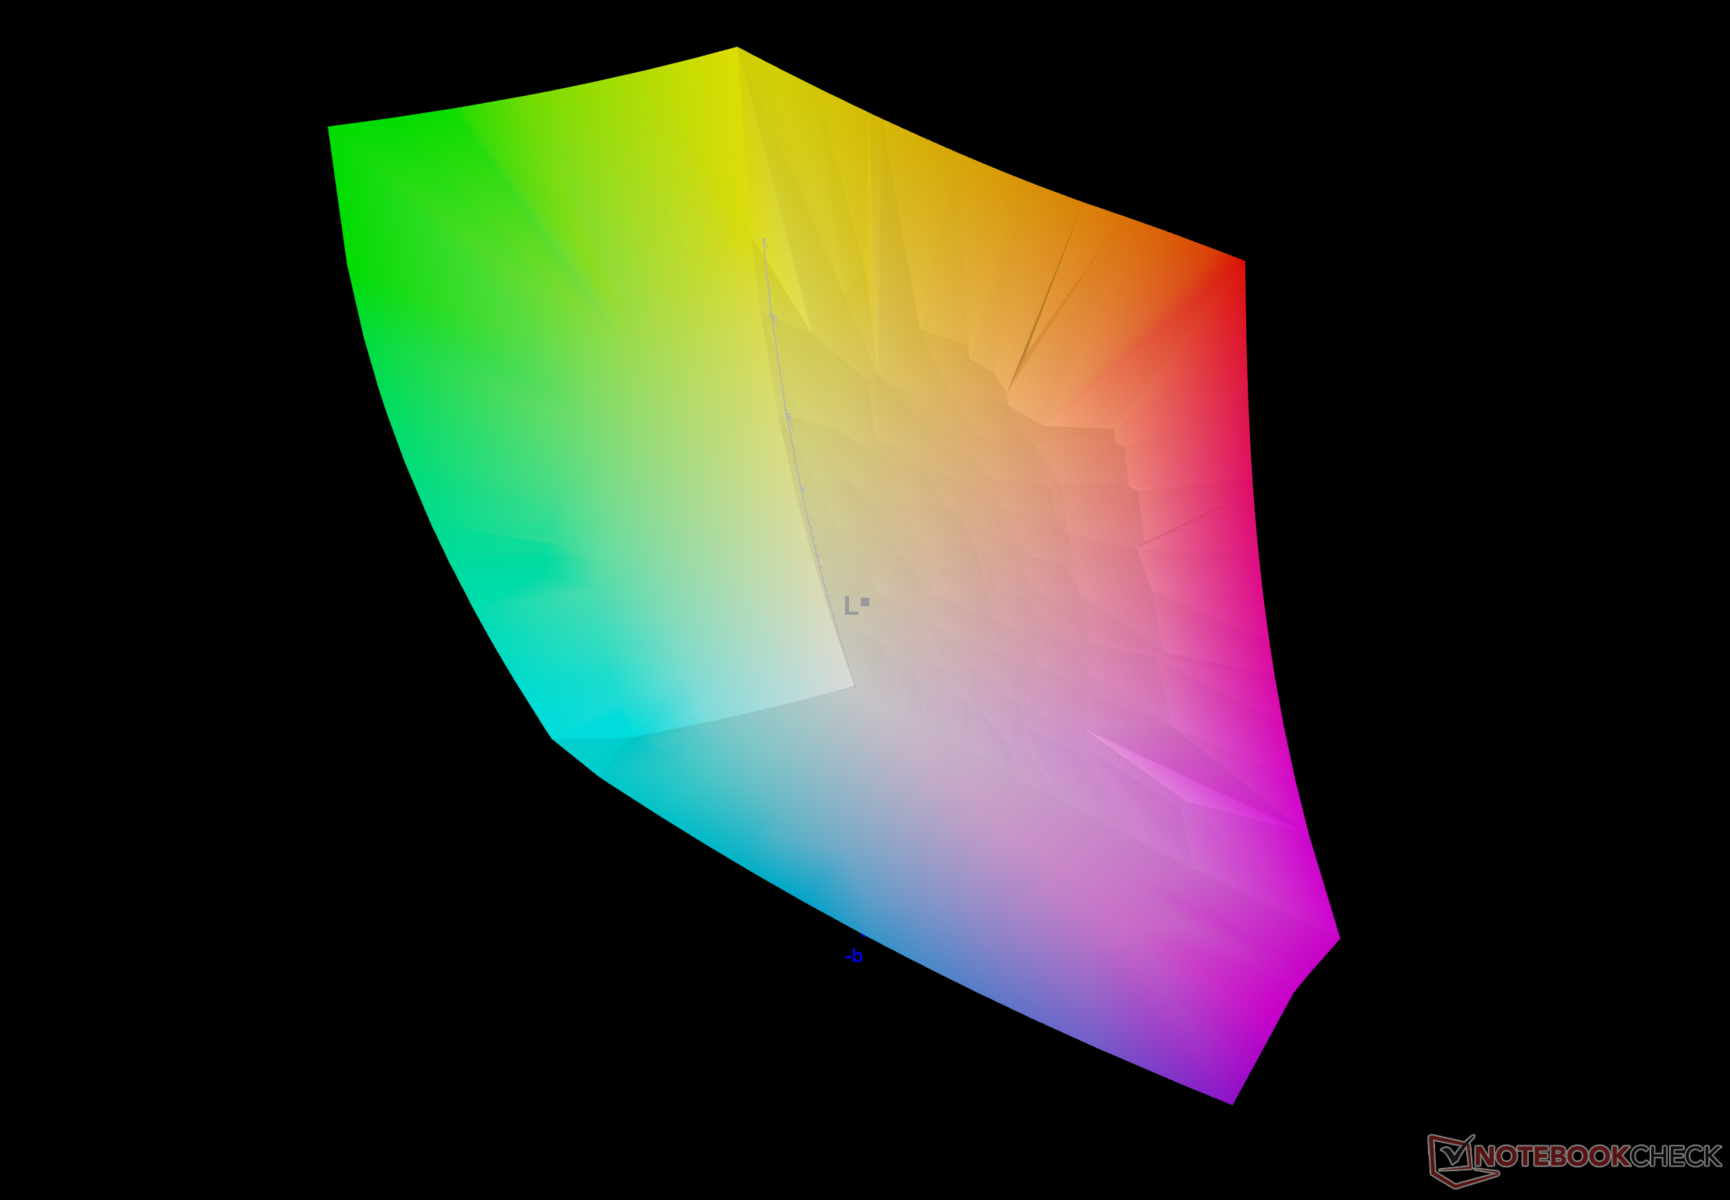
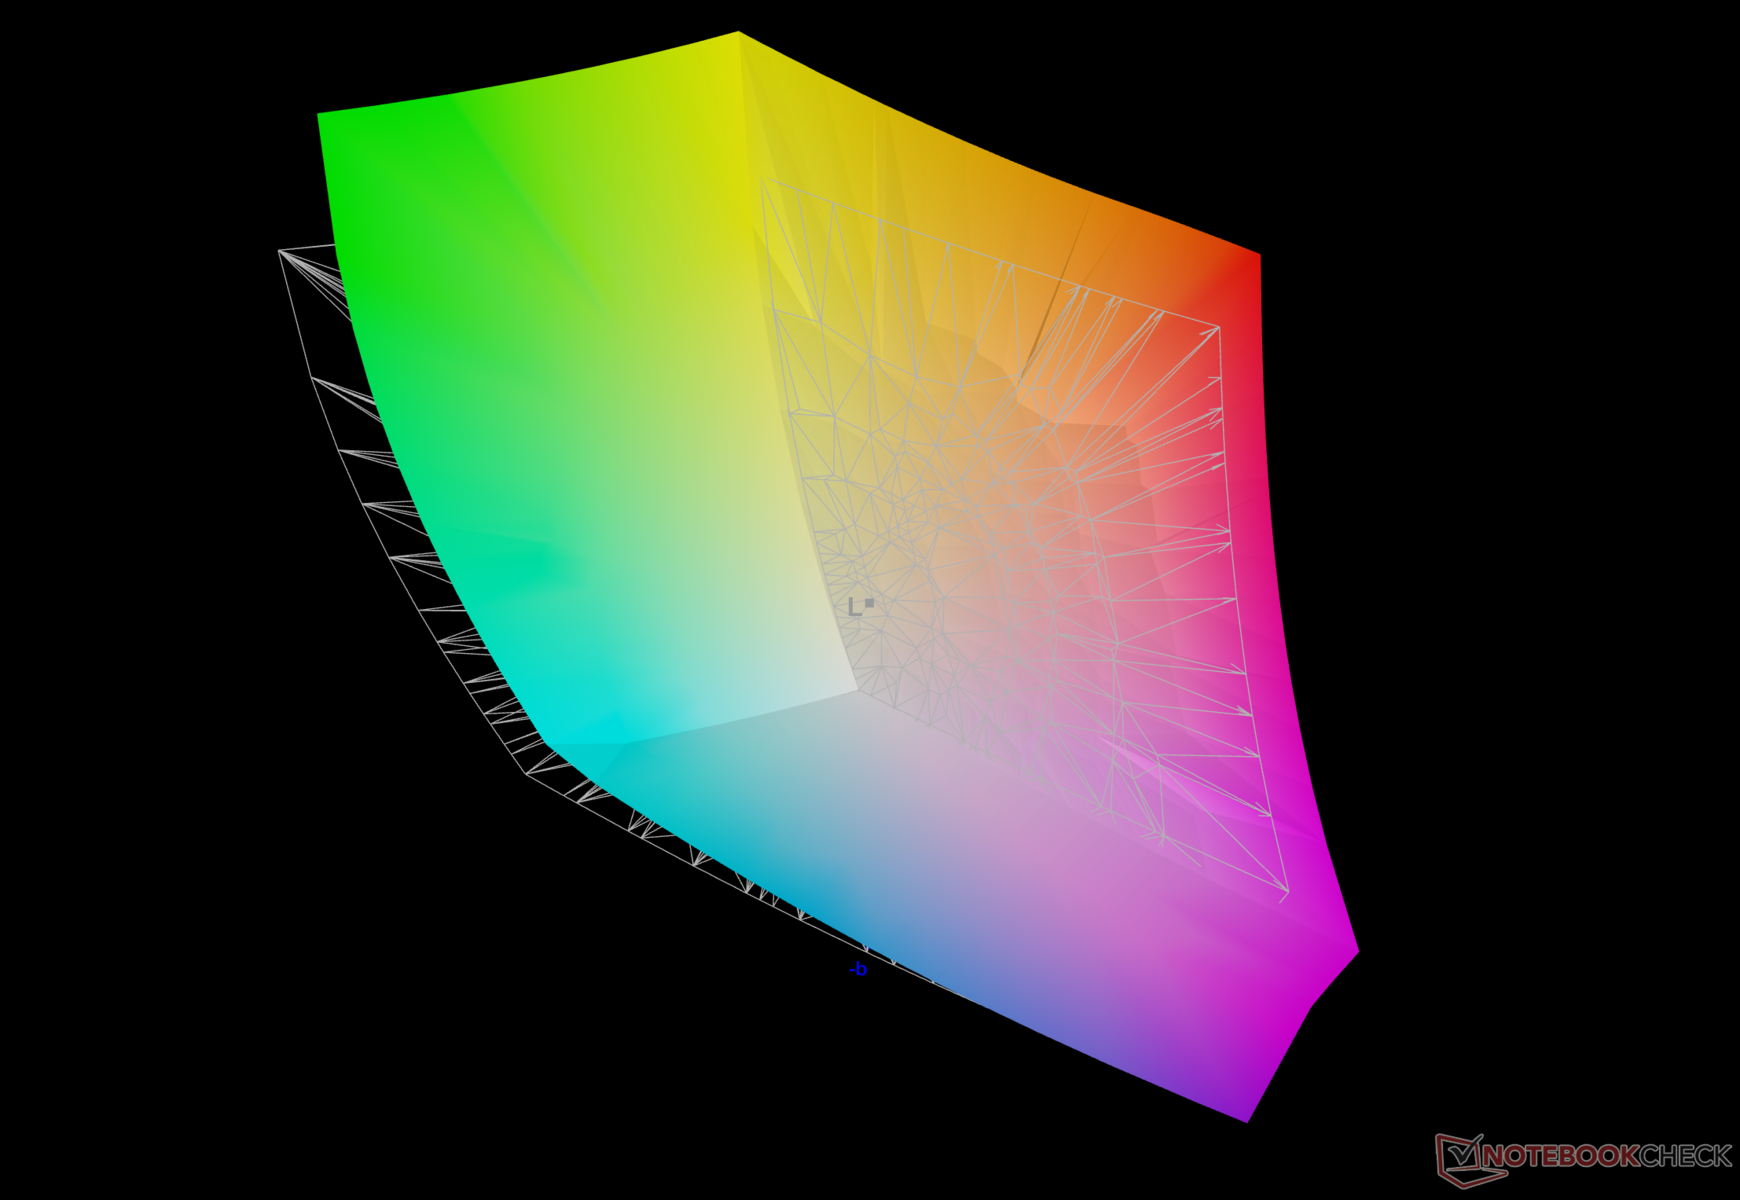
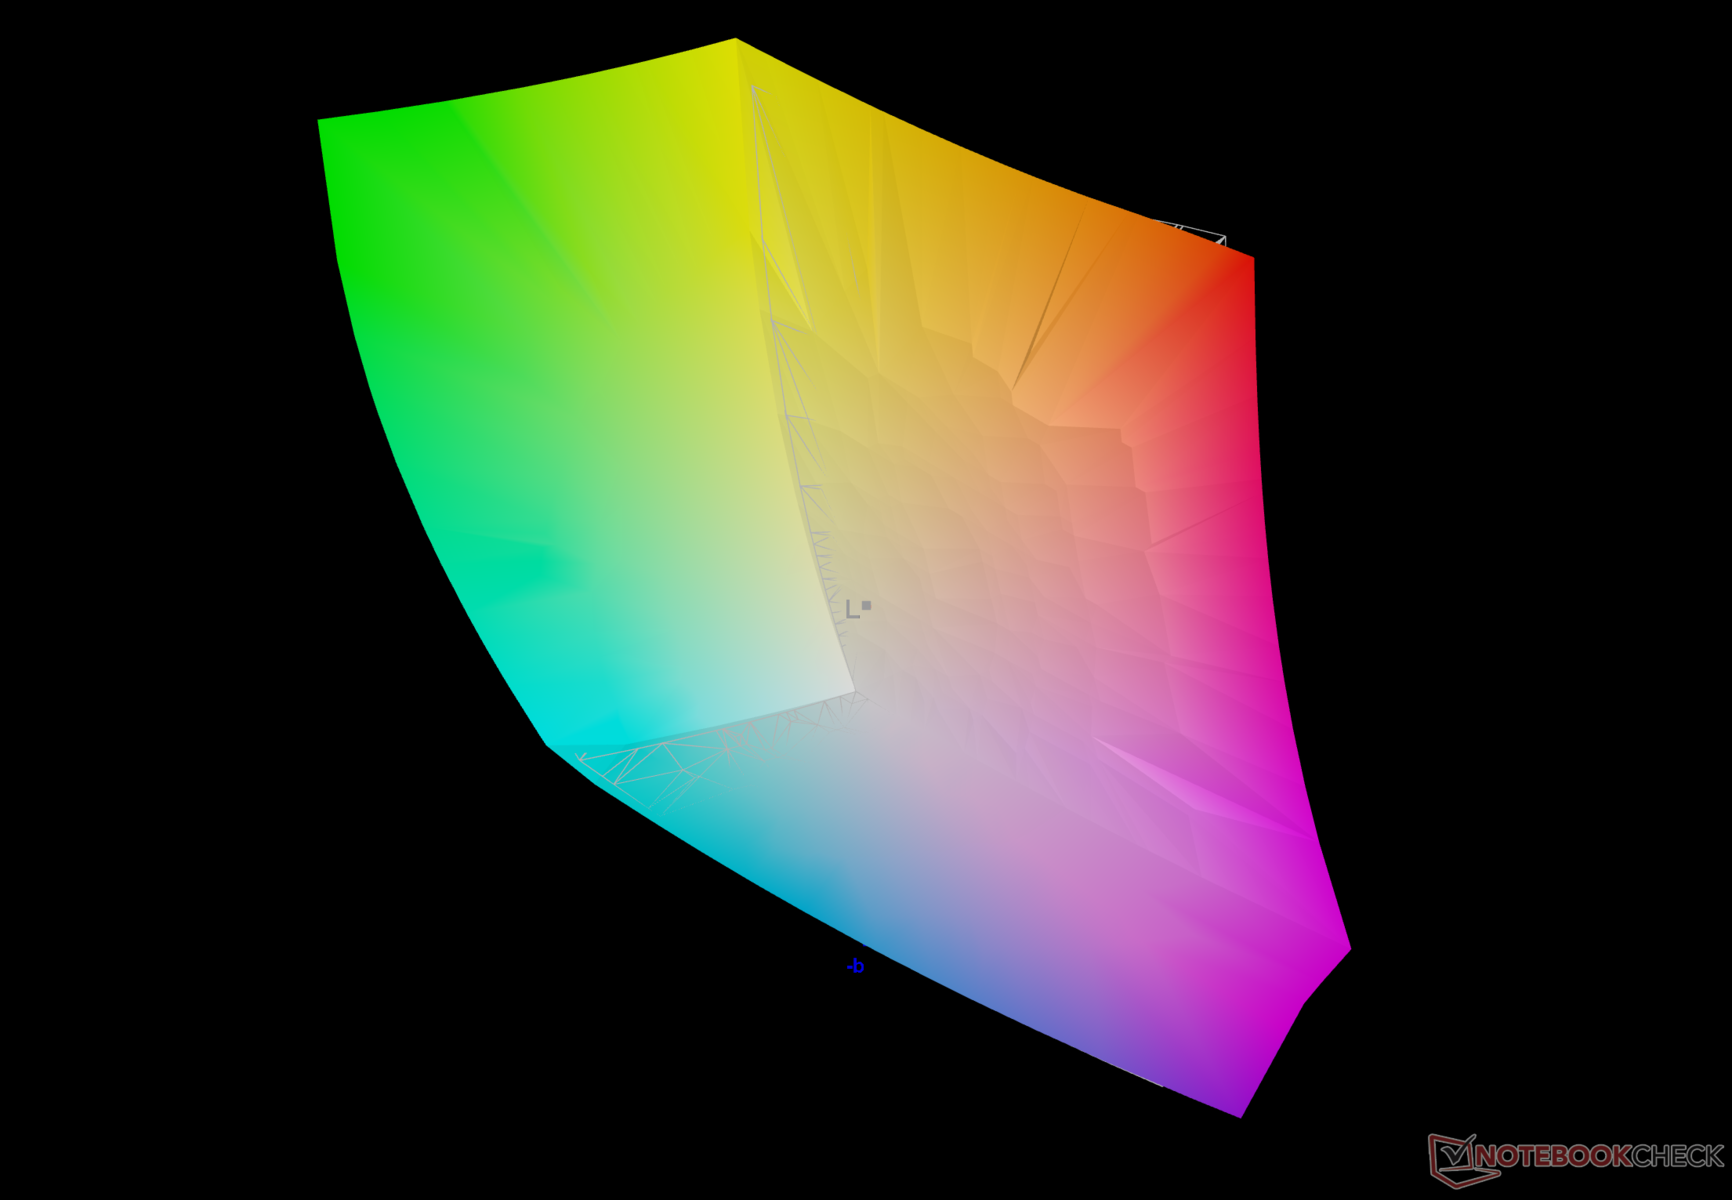
Le panneau mini-LED couvre entièrement les espaces colorimétriques sRGB et Display P3, ainsi que 90 % de la gamme Adobe RGB. Il en résulte une excellente expérience visuelle et facilite les flux de travail d'édition photo et vidéo qui nécessitent des espaces colorimétriques étendus.
Notre routine d'étalonnage utilisant le spectrophotomètre X-Rite i1Basic Pro 3 et le logiciel Calman Ultimate de Portrait Displays montre une nette amélioration de la valeur DeltaE 2000 moyenne en niveaux de gris, qui passe de 4,9 à 1,4, et de celle du ColorChecker, qui passe de 4,11 à 2,5.
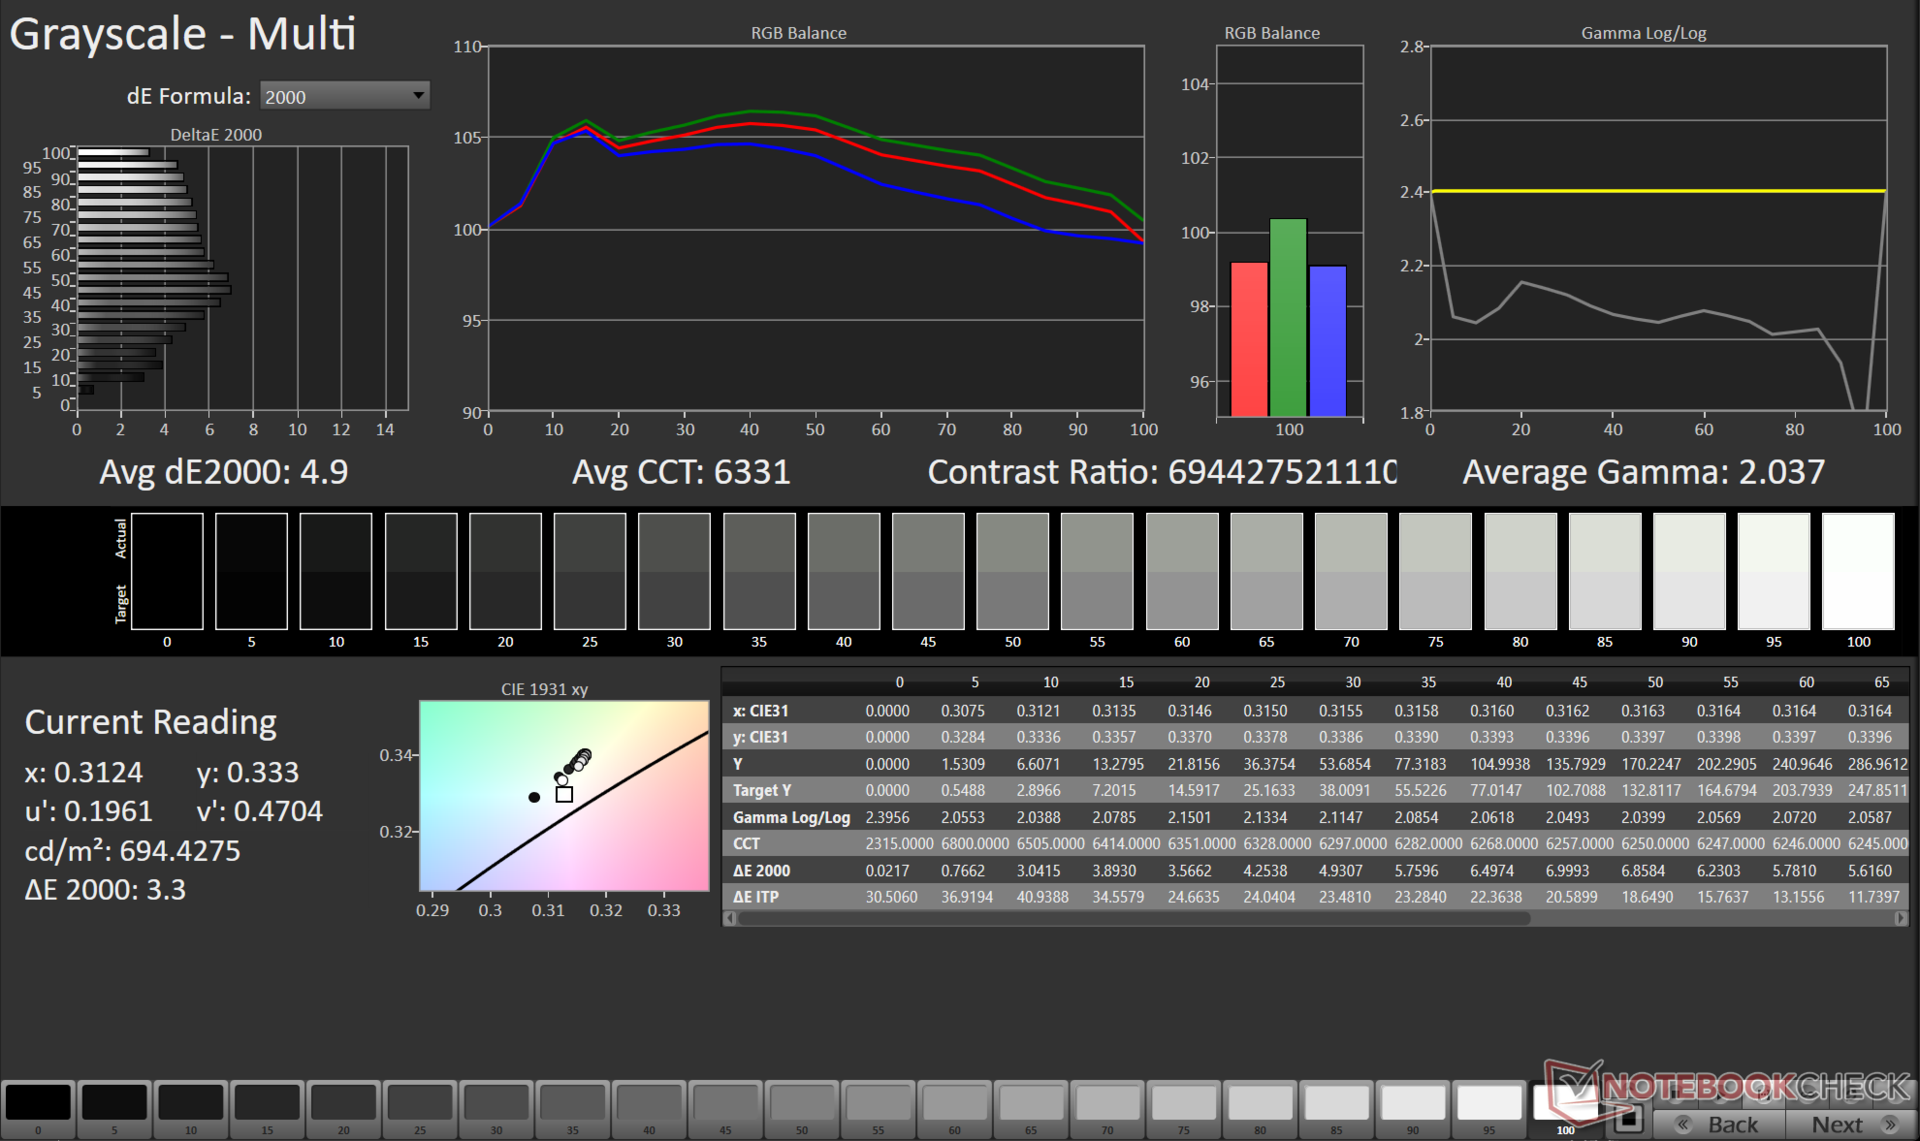

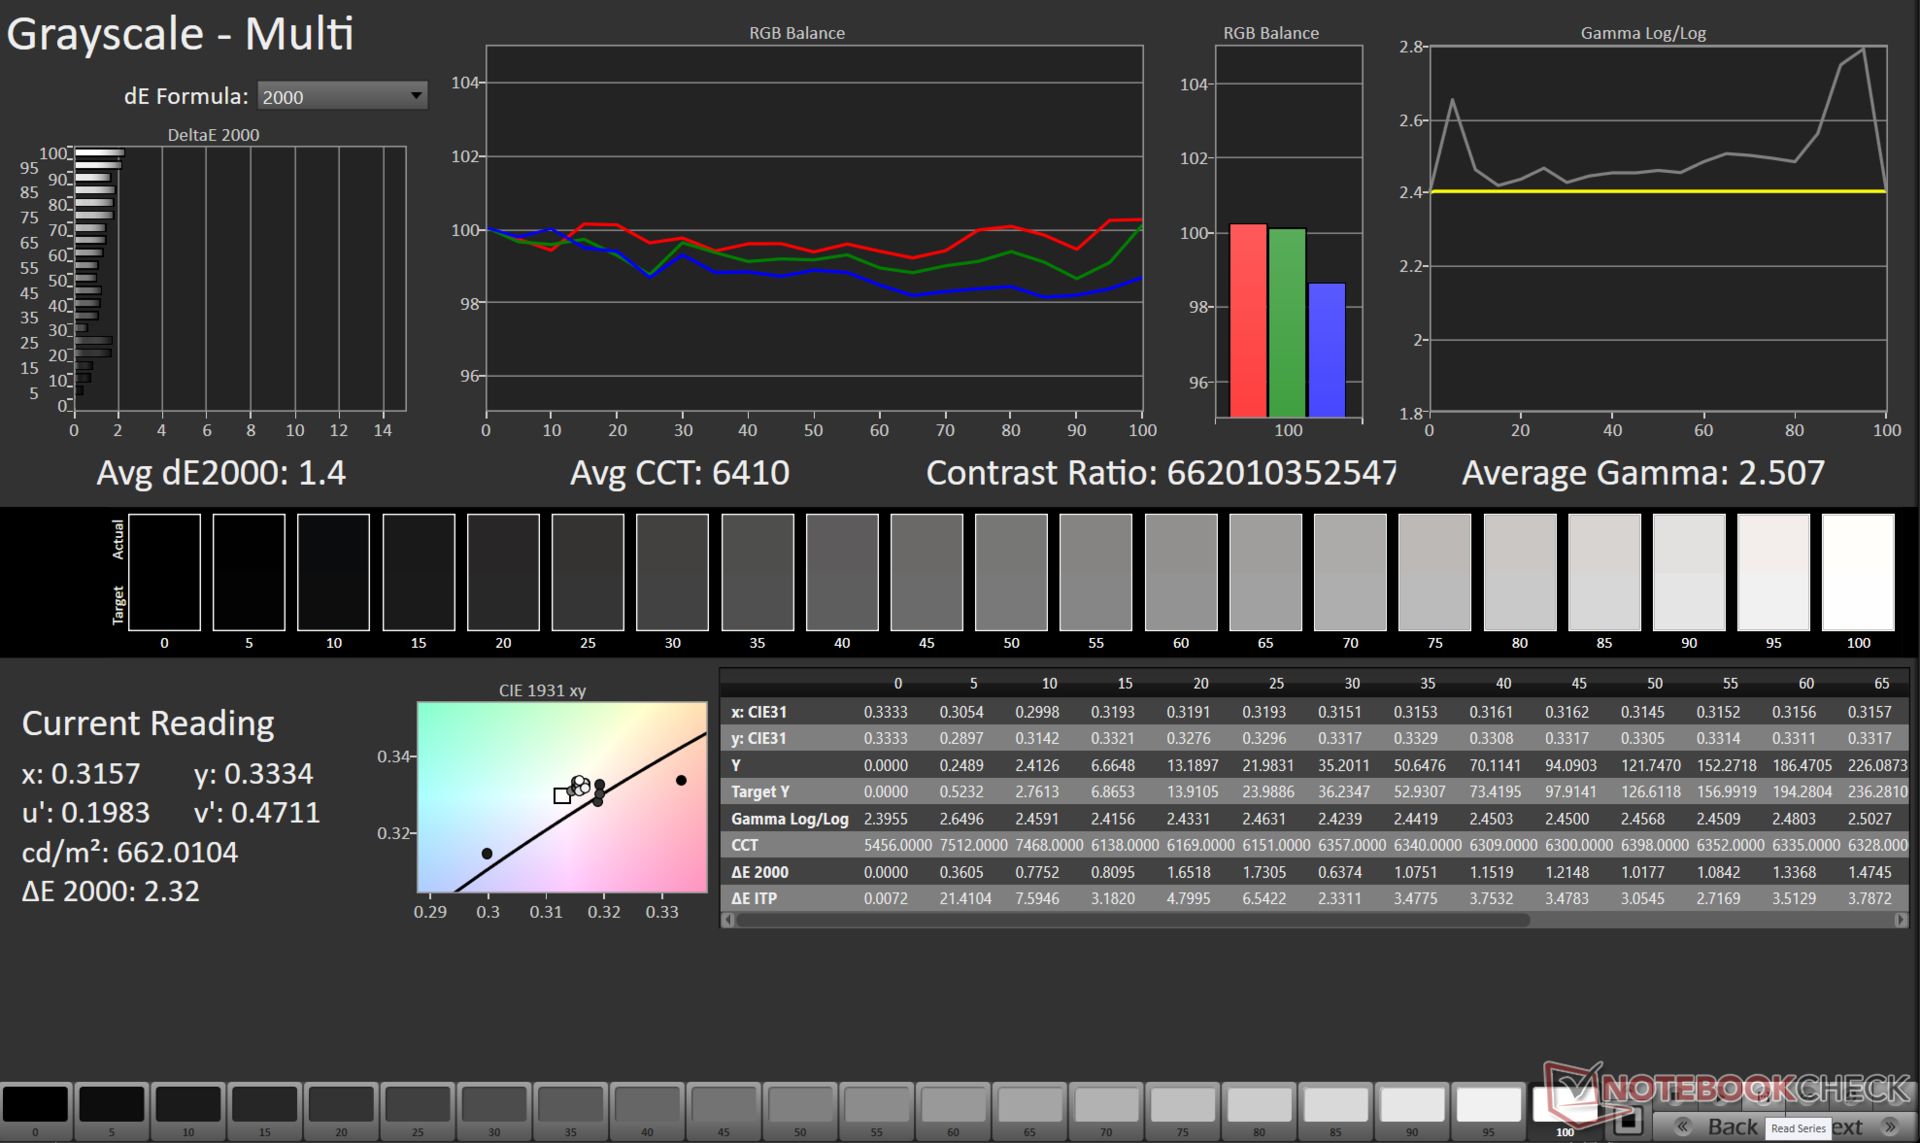
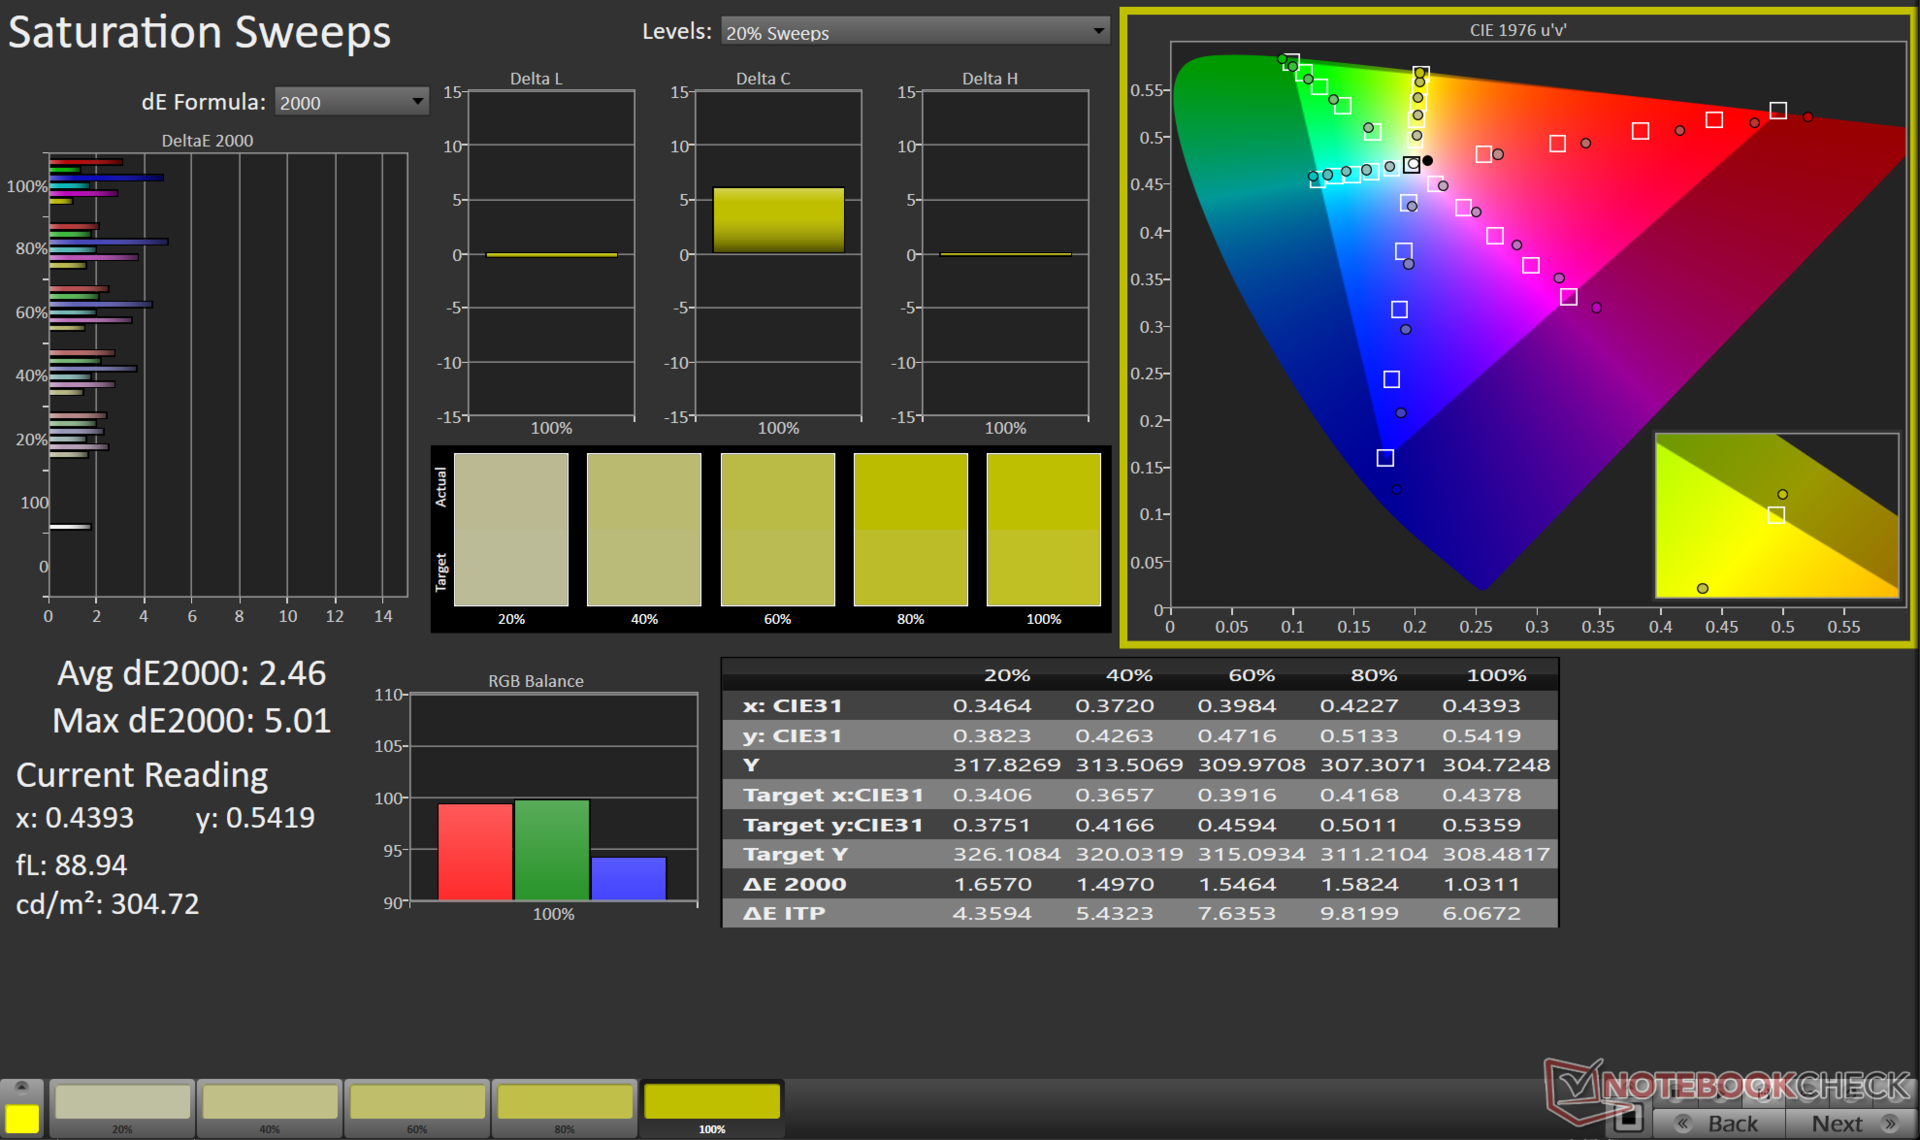

Notre fichier ICC calibré peut être téléchargé à partir du lien ci-dessus.
Temps de réponse de l'écran
| ↔ Temps de réponse noir à blanc | ||
|---|---|---|
| 15 ms ... hausse ↗ et chute ↘ combinées | ↗ 8.8 ms hausse | 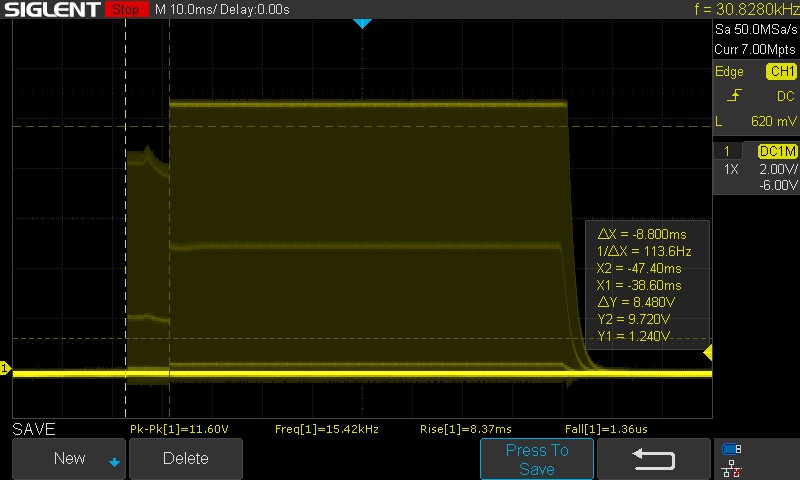  |
| ↘ 6.2 ms chute | ||
| L'écran montre de bons temps de réponse, mais insuffisant pour du jeu compétitif. En comparaison, tous les appareils testés affichent entre 0.1 (minimum) et 240 (maximum) ms. » 33 % des appareils testés affichent de meilleures performances. Cela signifie que les latences relevées sont meilleures que la moyenne (20.6 ms) de tous les appareils testés. | ||
| ↔ Temps de réponse gris 50% à gris 80% | ||
| 8.8 ms ... hausse ↗ et chute ↘ combinées | ↗ 3.8 ms hausse | 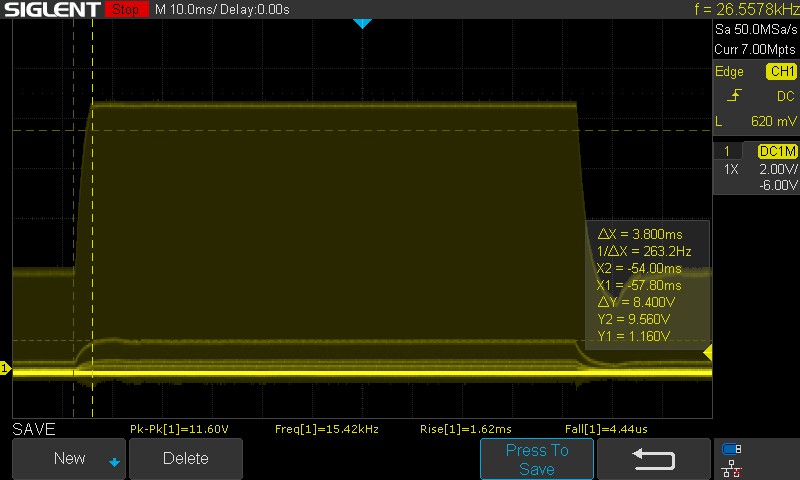  |
| ↘ 5 ms chute | ||
| L'écran montre de faibles temps de réponse, un bon écran pour jouer. En comparaison, tous les appareils testés affichent entre 0.165 (minimum) et 636 (maximum) ms. » 20 % des appareils testés affichent de meilleures performances. Cela signifie que les latences relevées sont meilleures que la moyenne (32.3 ms) de tous les appareils testés. | ||
Nous avons dû estimer manuellement les temps de réponse en raison de l'important bruit de fond PWM caractéristique des panneaux mini-LED.
Le panneau utilise l'overdrive par défaut. La désactivation de l'overdrive augmente les temps de réponse de 50 % de gris à 80 % de gris de 8,8 ms à 12,6 ms.
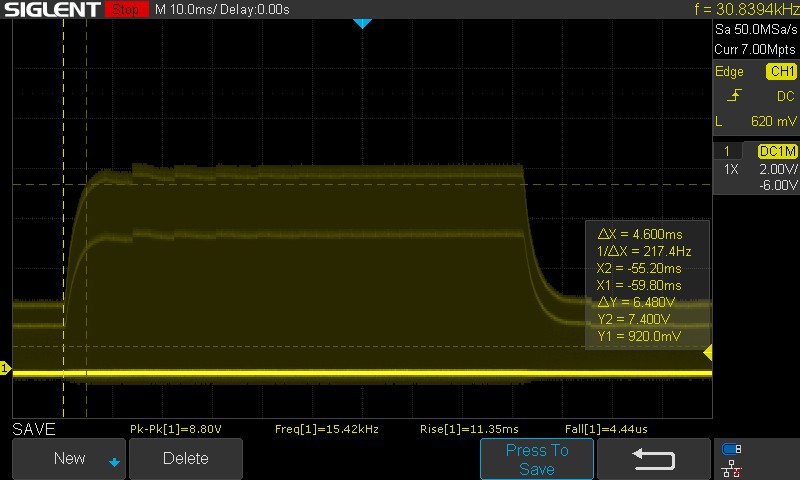
Scintillement / MLI (Modulation de largeur d'impulsion)
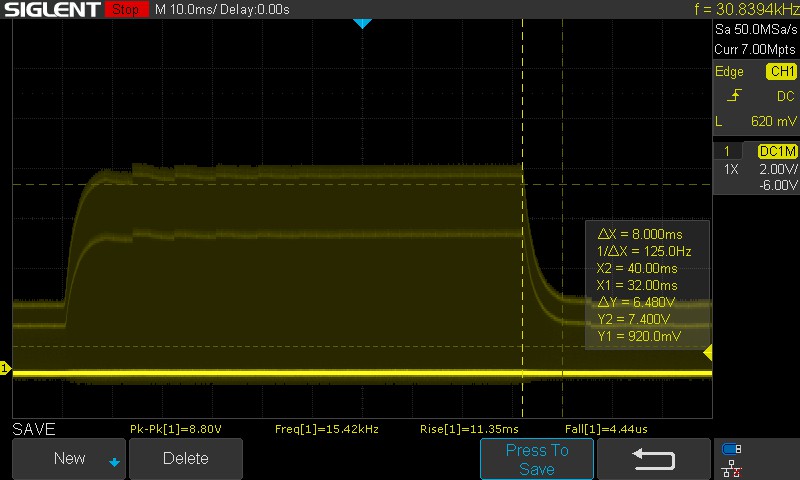
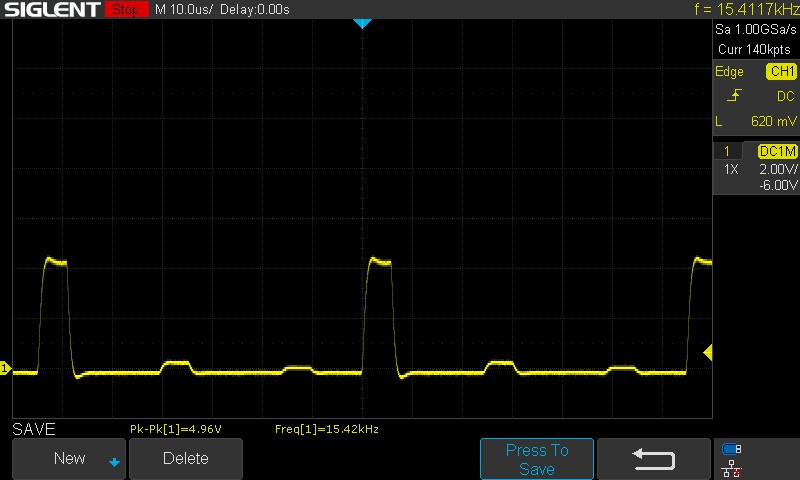
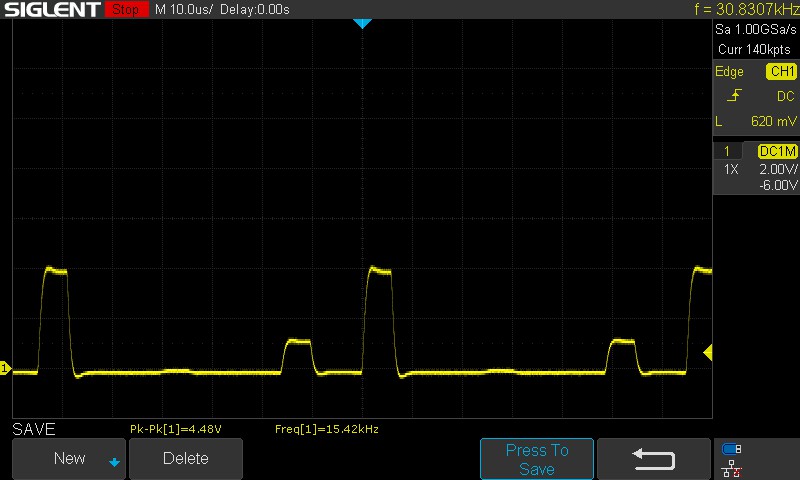
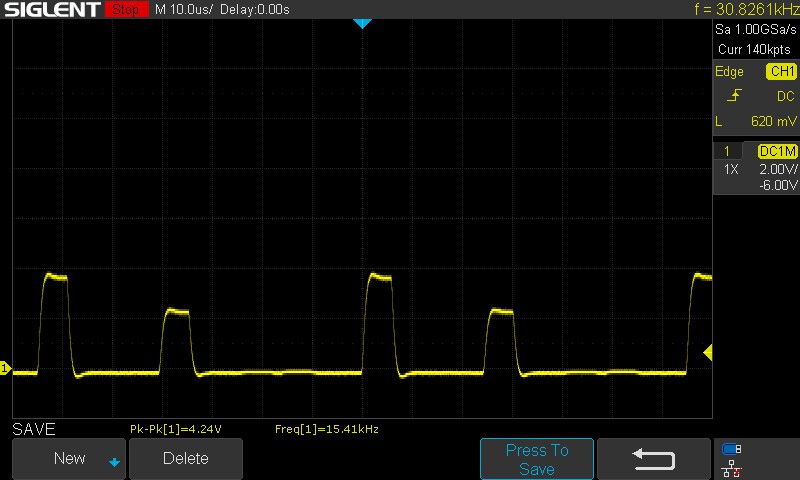
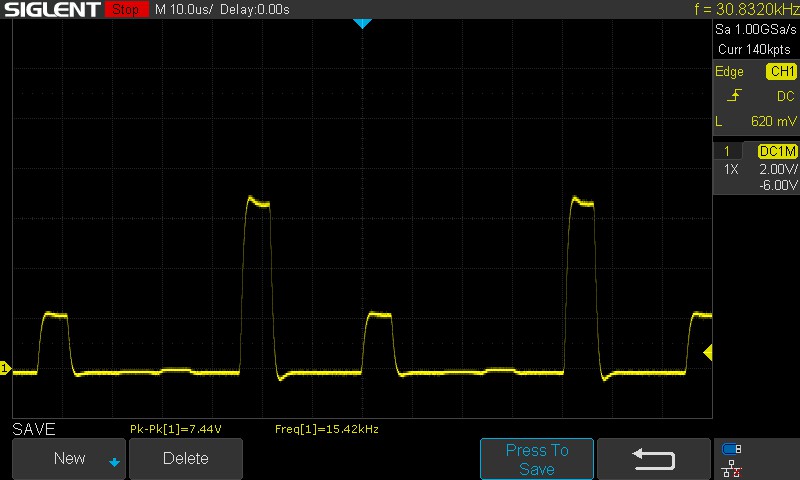
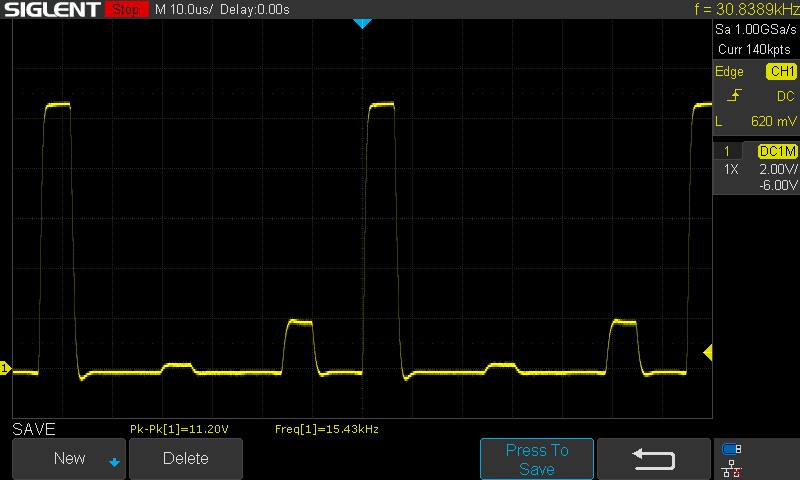
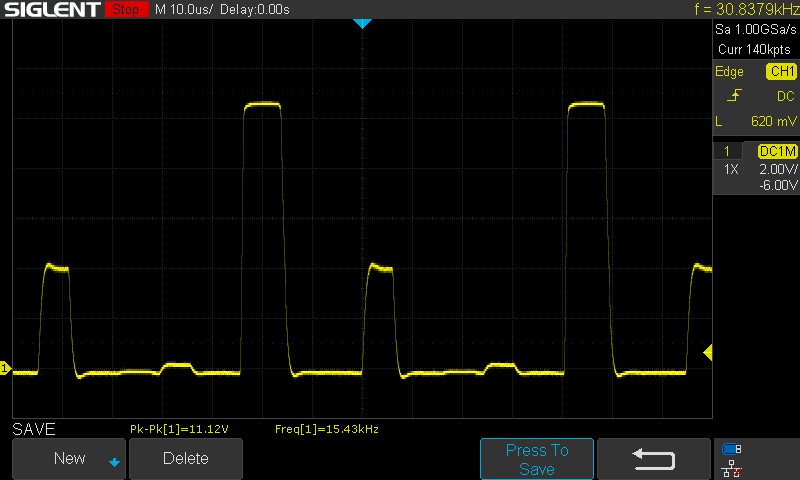
| Scintillement / MLI (Modulation de largeur d'impulsion) décelé | 15430 Hz Amplitude: 50 % | ≤ 100 Niveau de luminosité |  |
Le rétroéclairage de l'écran scintille à la fréquence de 15430 Hz (certainement du fait de l'utilisation d'une MDI - Modulation de largeur d'impulsion) à un niveau de luminosité inférieur ou égal à 100 % . Aucun scintillement ne devrait être perceptible au-dessus de cette valeur. La fréquence de rafraîchissement de 15430 Hz est élevée, la grande majorité des utilisateurs ne devrait pas percevoir de scintillements et être sujette à une fatigue oculaire accrue. En comparaison, 53 % des appareils testés n'emploient pas MDI pour assombrir leur écran. Nous avons relevé une moyenne à 8429 (minimum : 5 - maximum : 343500) Hz dans le cas où une MDI était active. | |||
La fréquence PWM détectée reste à un niveau élevé de 15,42 kHz pour tous les niveaux de luminosité testés.
Pour plus d'informations, consultez notre introduction "Pourquoi le PWM est un tel casse-tête". Notre Tableau de classement PWM fournit une liste des PWM mesurés dans tous les appareils examinés.
L'écran lumineux se prête à une visualisation lisible en extérieur. Les angles de vision sont assez stables, avec une perte de luminosité minime aux extrêmes.

Performance : Le modèle phare Core Ultra 9 285HX est pratiquement impossible à distinguer du Core Ultra 9 275HX
MSI propose la Titan 18 HX AI A2XWJG en deux versions. Les deux offrent le même Intel Core Ultra 9 285HX et Ordinateur portable Nvidia GeForce RTX 5090 et ne diffèrent qu'en termes de mémoire maximale configurée (48 Gox2 ou 32 Gox2).
Conditions d'essai
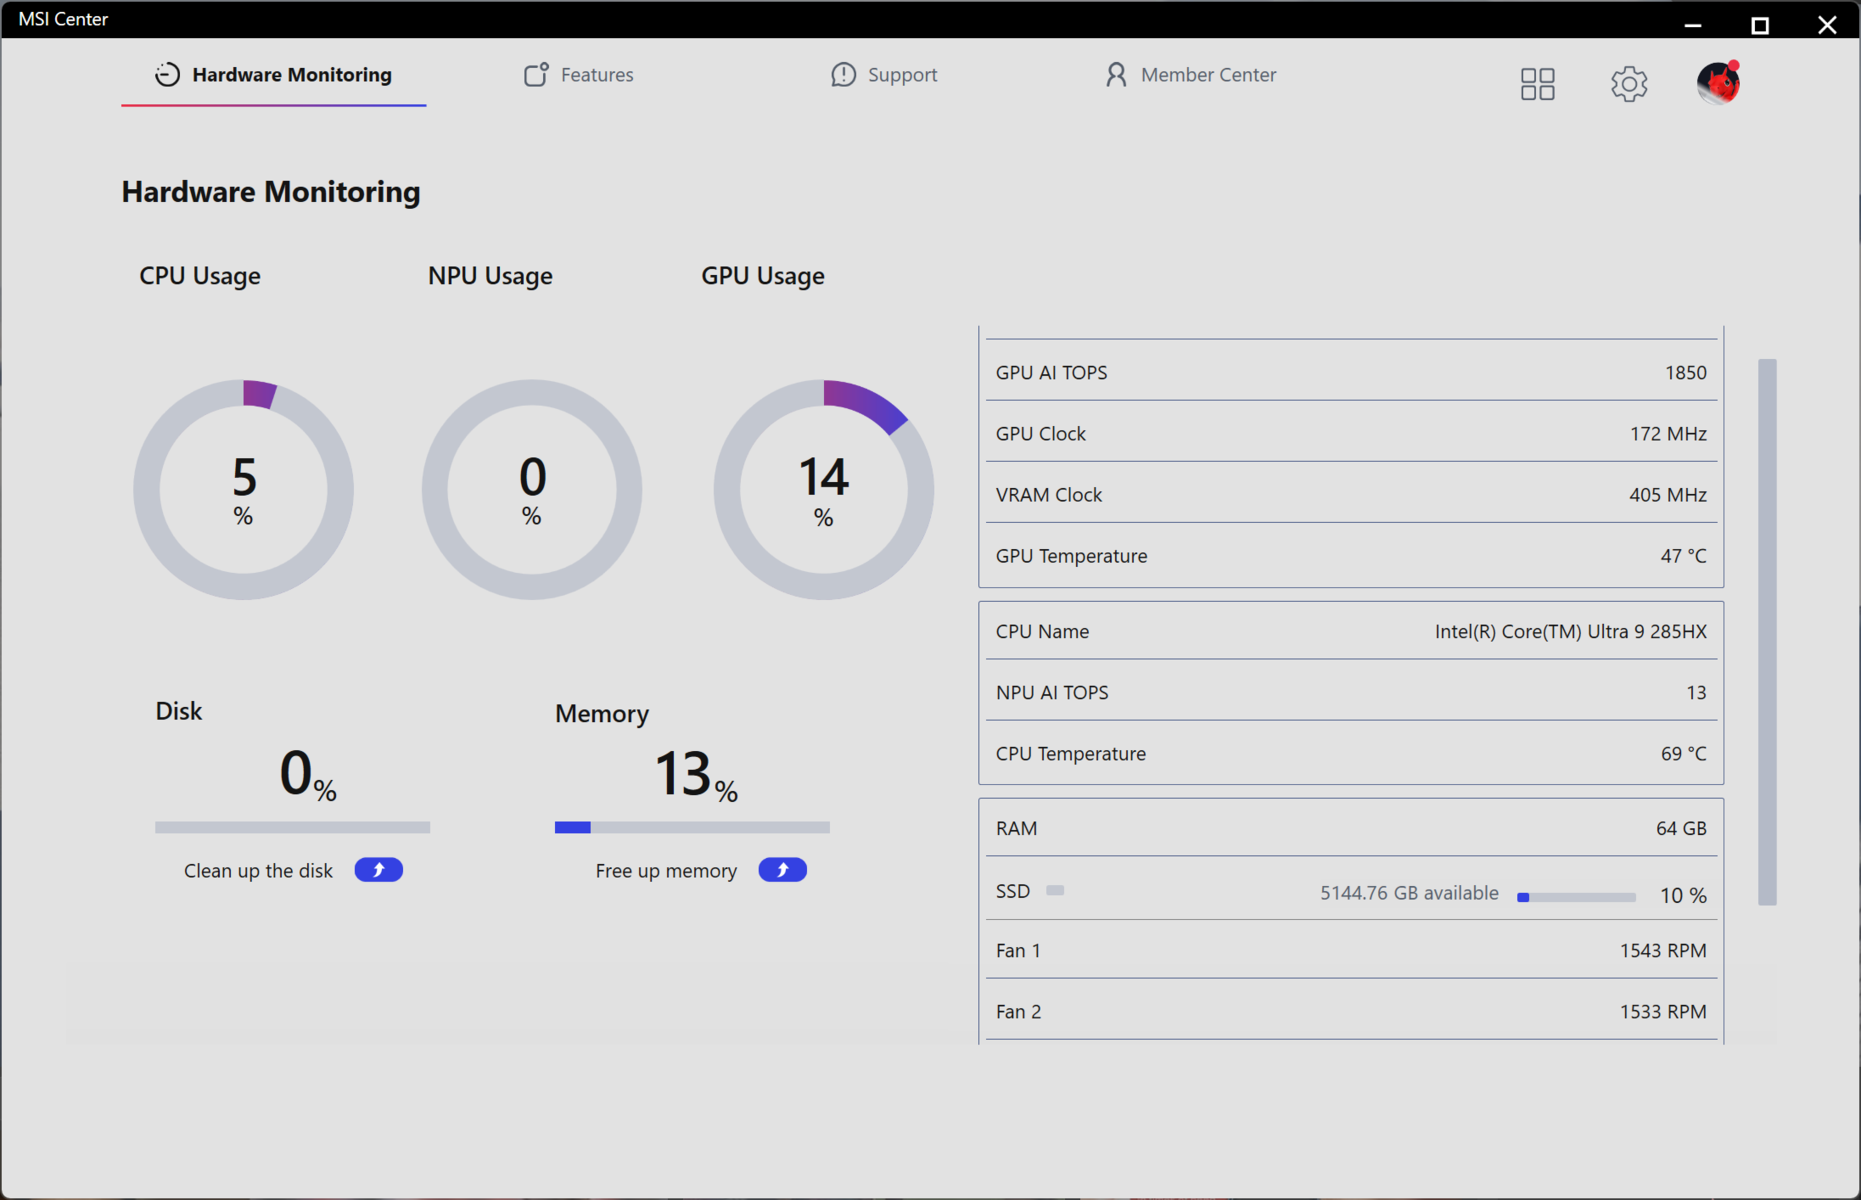
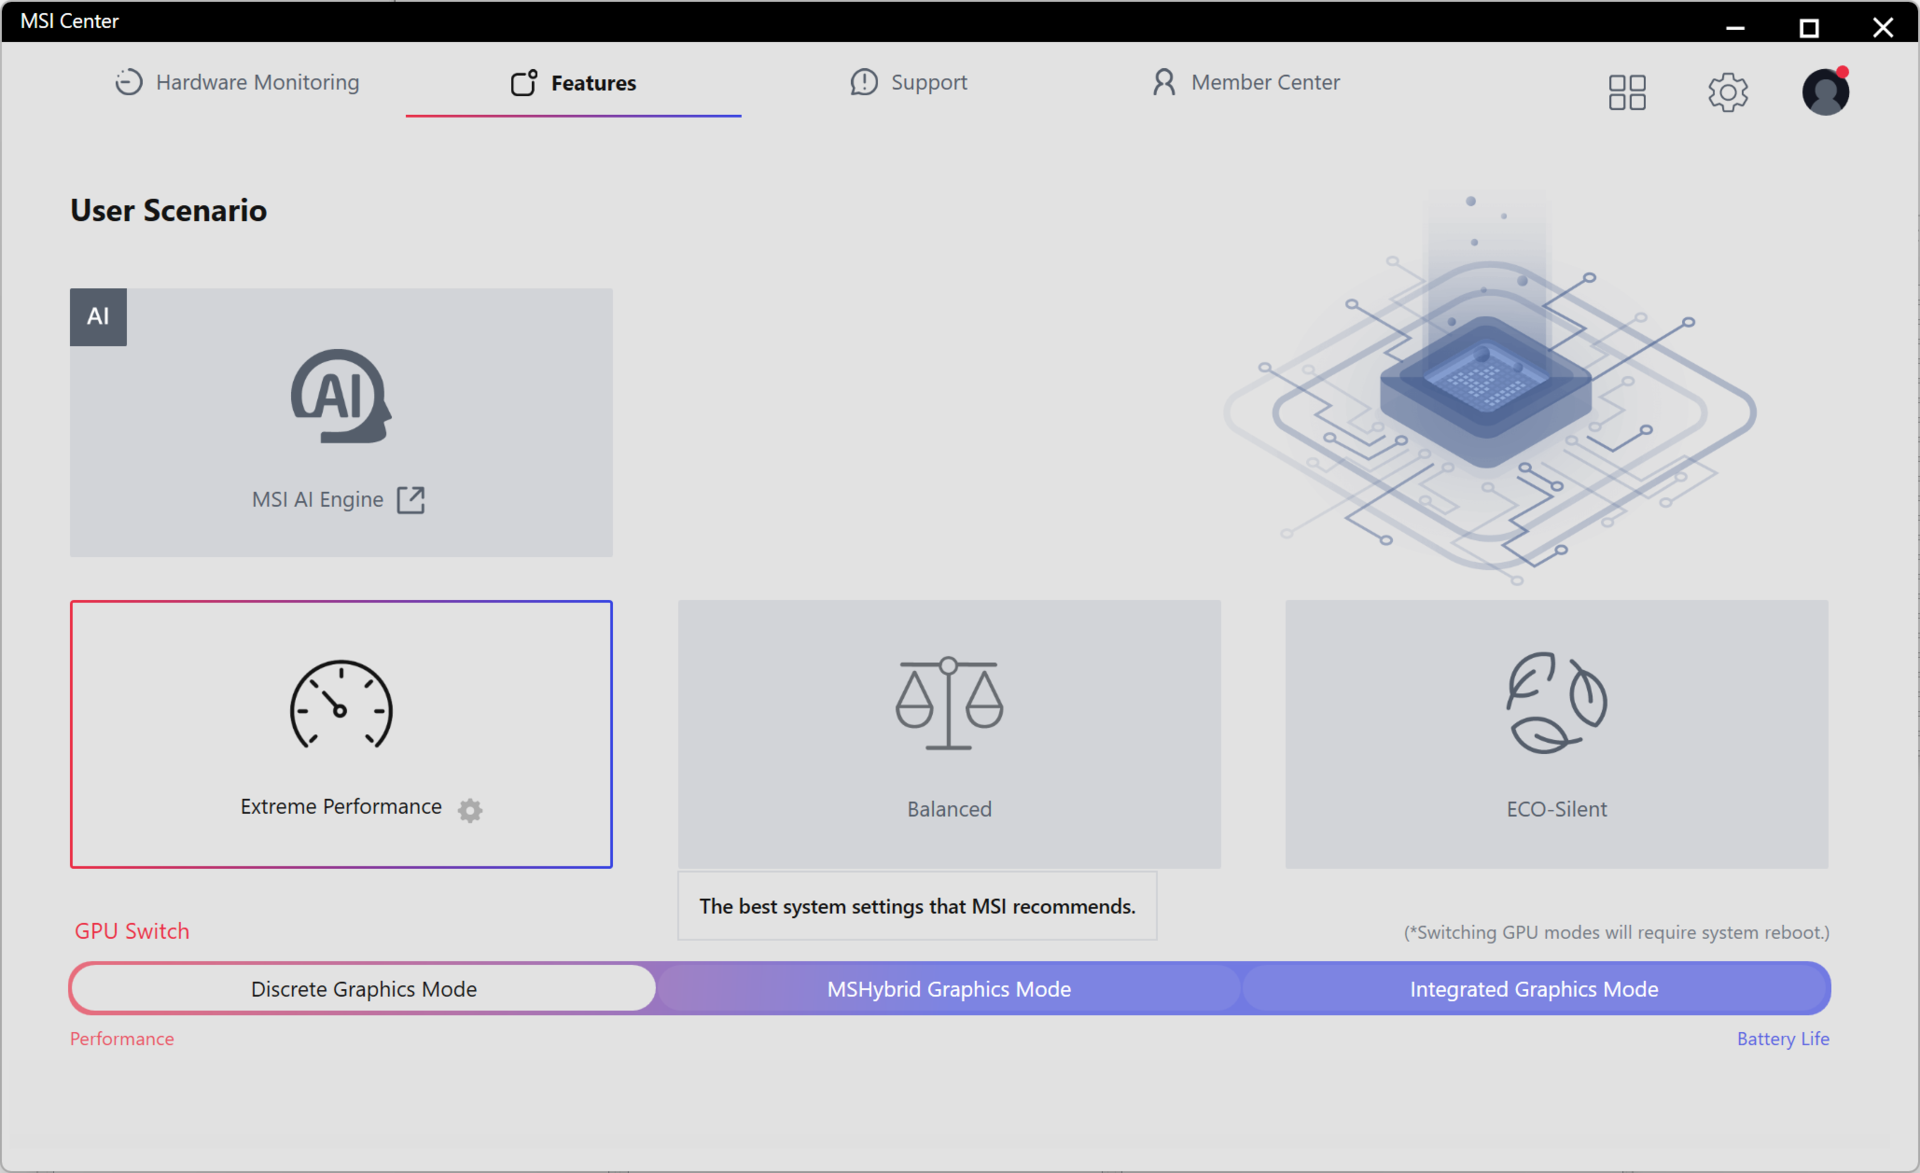
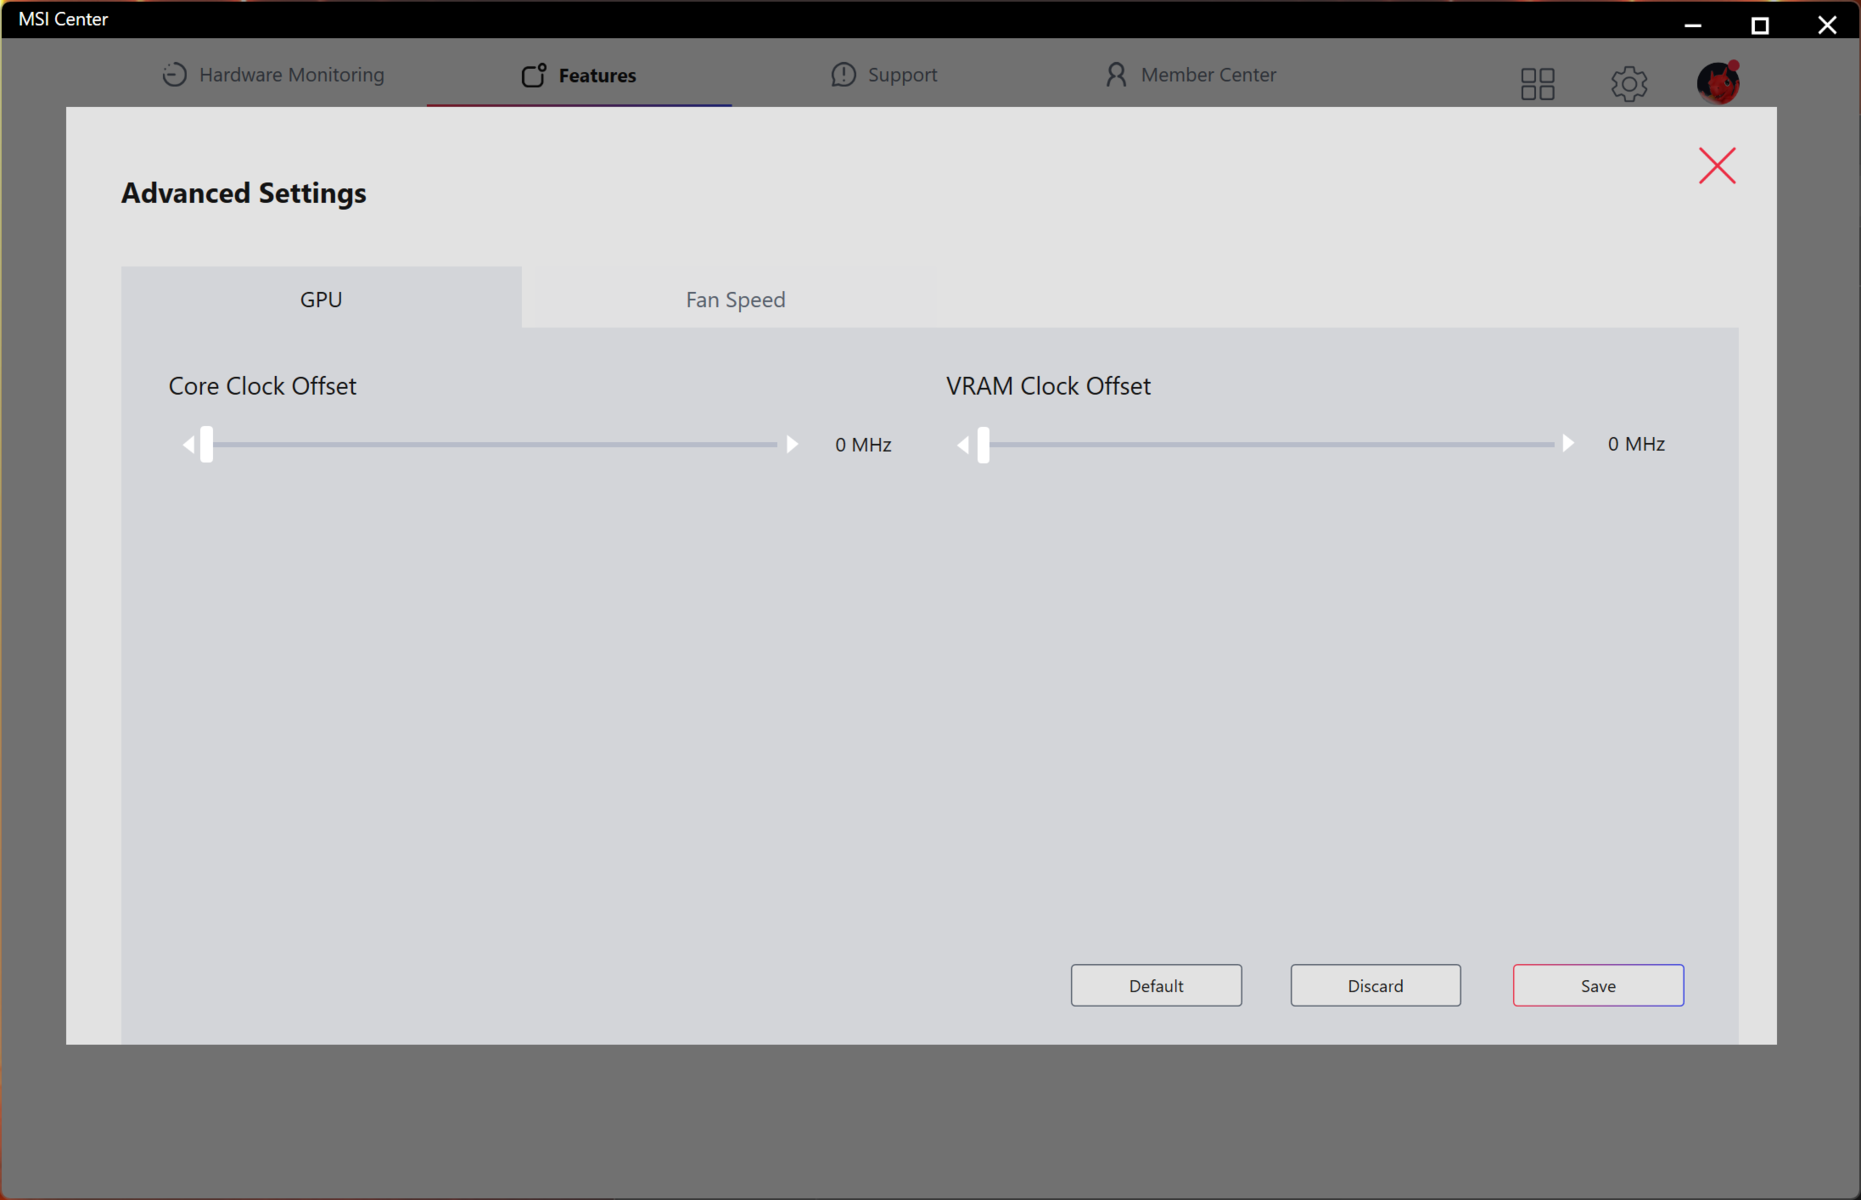
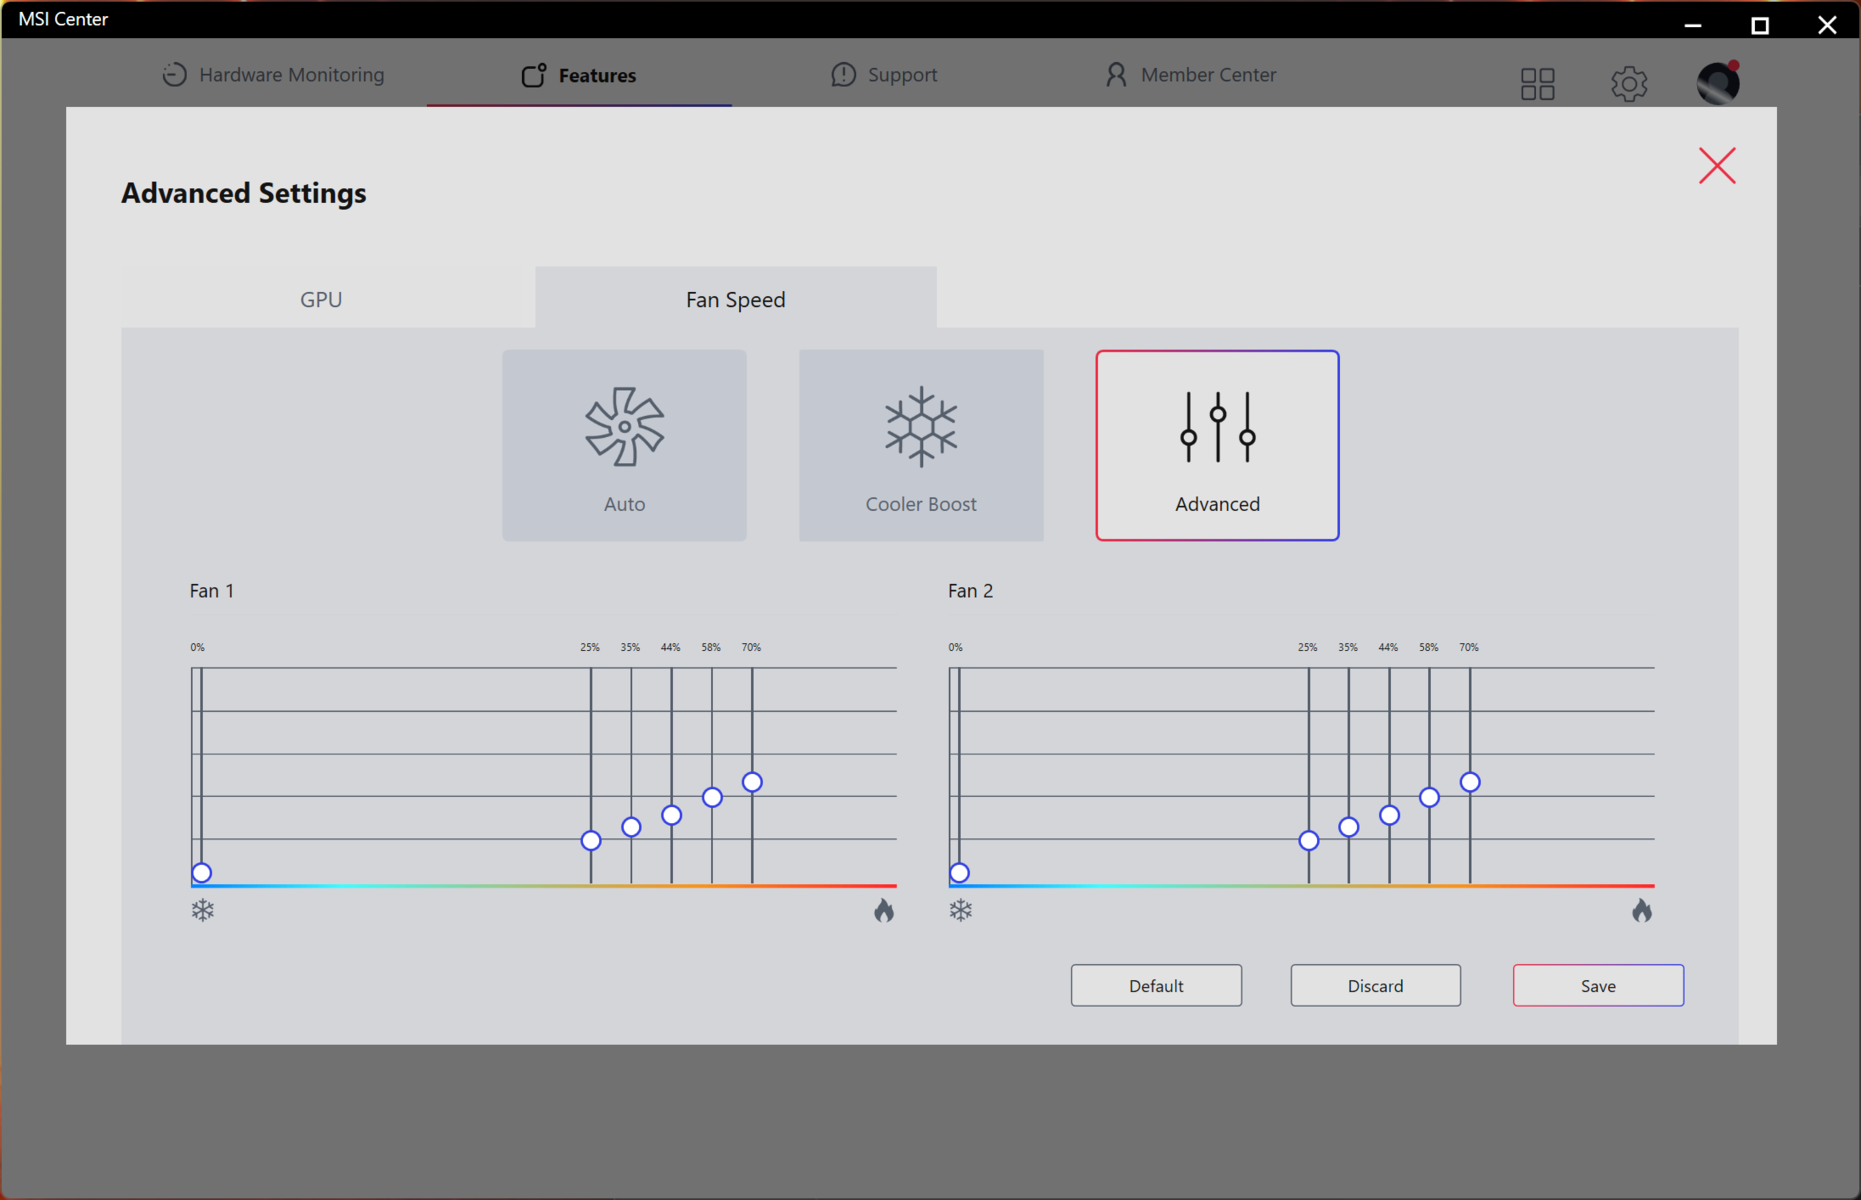
Le MSI Center offre une interface centralisée pour configurer les performances de la Titan 18 HX AI. Nous avons eu quelques difficultés à initialiser le logiciel, mais quelques désinstallations et réinstallations ont suffi.
Nous avons utilisé le mode Extreme Performance pour tous les benchmarks et le mode ECO-Silent pour les tests de batterie.
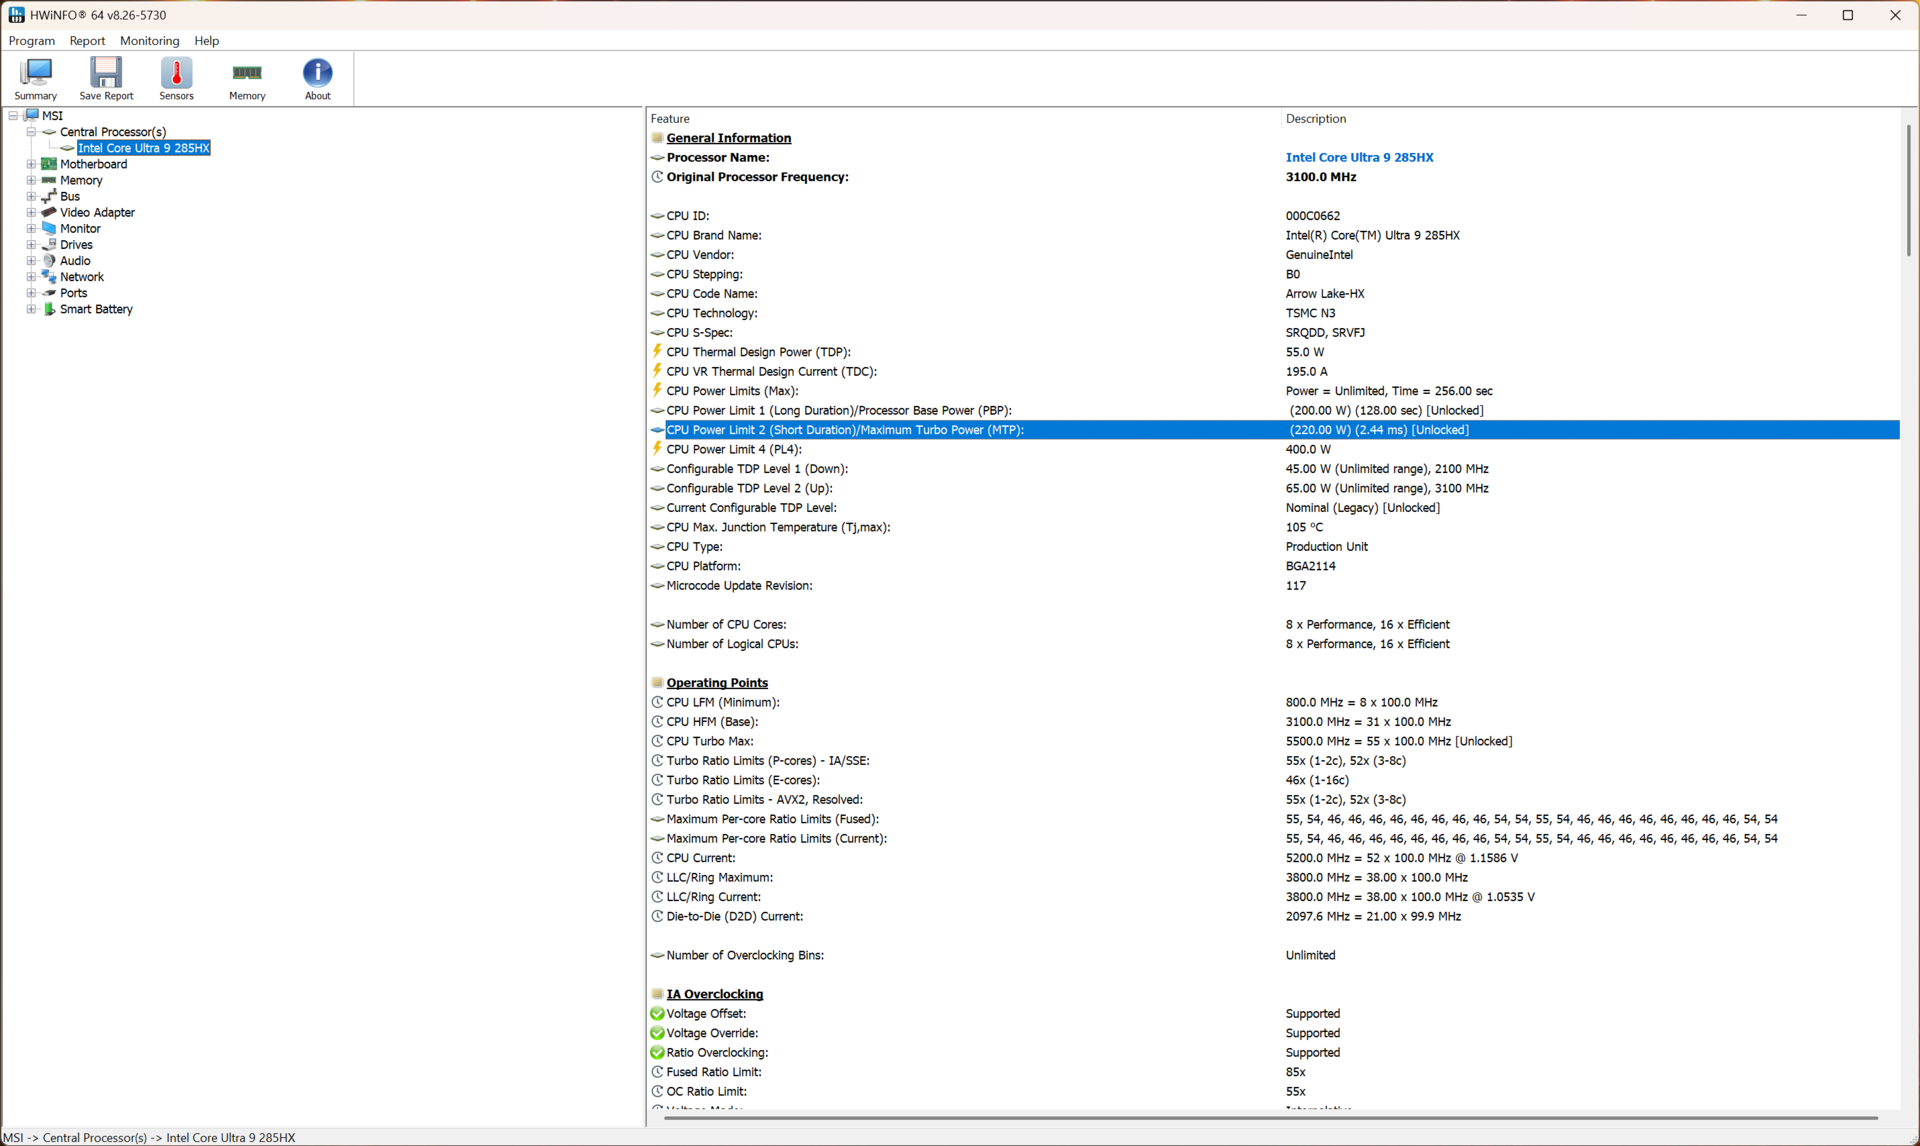
| Mode de performance | PL1 (PBP) / Tau | PL2 (MTP) / Tau | GPU TGP | Cinebench R15 Multi score | Cinebench R15 Multi score (30 boucles) |
|---|---|---|---|---|---|
| ECO-Silent | 15 W / 128 s | 15 W / 2,44 ms | 96 W | 660 (-88,5%) | 683 (-87,97%) |
| MSI AI Engine | 140 W / 128 s | 220 W / 2.44 ms | 150 W | 5744 (-0.27%) | 5600 (-1.37%) |
| Équilibré | 140 W / 128 s | 220 W / 2.44 ms | 150 W | 5726 (-0.59%) | 5605 (-1.28%) |
| Performance extrême | 200 W / 128 s | 220 W / 2.44 ms | 175 W | 5760 (100%) | 5678 (100%) |
| Sur batterie | 55 W / 128 s | 55 W / 2,44 ms | 24 W | 1648 (-71%) | 1404 (-75%) |
Processeur
Le Core Ultra 9 285HX est presque identique au Core Ultra 9 275HXà l'exception des horloges des cœurs P qui sont 100 MHz plus élevées.
Dans les tests Cinebench et Geekbench à cœur unique, le Titan 18 HX AI se situe derrière les ordinateurs portables équipés du Core Ultra 9 275HX comme le Schenker XMG Neo 16 E25 et le Asus ROG Strix Scar 18bien qu'il compense en performance multi-cœur.
Le Titan 18 HX AI basé sur Arrow Lake est 17% plus rapide que l'itération de l'année dernière basée sur le processeur Intel Core i9-14900HX Intel Core i9-14900HXtout en faisant jeu égal avec le XMG Neo 16 A25's AMD Ryzen 9 9955HX3D en termes de performances cumulées du processeur.
Aucun ralentissement du processeur n'a été observé au cours d'une boucle multi-cœur de Cinebench R15, à l'exception d'une légère baisse au cours de la 8ème boucle de l'exécution.
Sur batterie, le Core Ultra 9 285HX fonctionne à 55 W PL1=PL2. Cela se traduit par une chute de 70,8 % des performances multicœur de Cinebench R23, tandis que la baisse du score monocœur est plus gérable (13,8 %).
Cinebench R15 Multi Loop
Cinebench R23: Multi Core | Single Core
Cinebench R20: CPU (Multi Core) | CPU (Single Core)
Cinebench R15: CPU Multi 64Bit | CPU Single 64Bit
Blender: v2.79 BMW27 CPU
7-Zip 18.03: 7z b 4 | 7z b 4 -mmt1
Geekbench 6.4: Multi-Core | Single-Core
Geekbench 5.5: Multi-Core | Single-Core
HWBOT x265 Benchmark v2.2: 4k Preset
LibreOffice : 20 Documents To PDF
R Benchmark 2.5: Overall mean
| CPU Performance Rating | |
| SCHENKER XMG Neo 16 E25 RTX 5090 Laptop | |
| SCHENKER XMG Neo 16 A25 5090 | |
| Asus Strix Scar 18 G835LX | |
| MSI Titan 18 HX AI A2XWJG | |
| Moyenne Intel Core Ultra 9 285HX | |
| Asus ROG Strix Scar 16 2025 | |
| Aorus Master 18 AM8H | |
| Medion Erazer Beast 18 X1 MD62731 | |
| MSI Titan 18 HX A14VIG | |
| Razer Blade 16 2025 RTX 5090 | |
| Moyenne de la classe Gaming | |
| Cinebench R23 / Multi Core | |
| SCHENKER XMG Neo 16 E25 RTX 5090 Laptop | |
| MSI Titan 18 HX AI A2XWJG | |
| Moyenne Intel Core Ultra 9 285HX (n=1) | |
| SCHENKER XMG Neo 16 A25 5090 | |
| Asus Strix Scar 18 G835LX | |
| Asus ROG Strix Scar 16 2025 | |
| Aorus Master 18 AM8H | |
| MSI Titan 18 HX A14VIG | |
| Medion Erazer Beast 18 X1 MD62731 | |
| Razer Blade 16 2025 RTX 5090 | |
| Moyenne de la classe Gaming (5668 - 40970, n=145, 2 dernières années) | |
| Cinebench R23 / Single Core | |
| SCHENKER XMG Neo 16 E25 RTX 5090 Laptop | |
| Medion Erazer Beast 18 X1 MD62731 | |
| Asus Strix Scar 18 G835LX | |
| MSI Titan 18 HX AI A2XWJG | |
| Moyenne Intel Core Ultra 9 285HX (n=1) | |
| SCHENKER XMG Neo 16 A25 5090 | |
| MSI Titan 18 HX A14VIG | |
| Asus ROG Strix Scar 16 2025 | |
| Aorus Master 18 AM8H | |
| Razer Blade 16 2025 RTX 5090 | |
| Moyenne de la classe Gaming (1136 - 2267, n=145, 2 dernières années) | |
| Cinebench R20 / CPU (Multi Core) | |
| SCHENKER XMG Neo 16 E25 RTX 5090 Laptop | |
| MSI Titan 18 HX AI A2XWJG | |
| Moyenne Intel Core Ultra 9 285HX (n=1) | |
| Asus Strix Scar 18 G835LX | |
| SCHENKER XMG Neo 16 A25 5090 | |
| Asus ROG Strix Scar 16 2025 | |
| Aorus Master 18 AM8H | |
| Medion Erazer Beast 18 X1 MD62731 | |
| MSI Titan 18 HX A14VIG | |
| Razer Blade 16 2025 RTX 5090 | |
| Moyenne de la classe Gaming (2179 - 16108, n=145, 2 dernières années) | |
| Cinebench R20 / CPU (Single Core) | |
| SCHENKER XMG Neo 16 E25 RTX 5090 Laptop | |
| Asus Strix Scar 18 G835LX | |
| Medion Erazer Beast 18 X1 MD62731 | |
| SCHENKER XMG Neo 16 A25 5090 | |
| Asus ROG Strix Scar 16 2025 | |
| MSI Titan 18 HX AI A2XWJG | |
| Moyenne Intel Core Ultra 9 285HX (n=1) | |
| MSI Titan 18 HX A14VIG | |
| Aorus Master 18 AM8H | |
| Razer Blade 16 2025 RTX 5090 | |
| Moyenne de la classe Gaming (439 - 870, n=145, 2 dernières années) | |
| Cinebench R15 / CPU Multi 64Bit | |
| SCHENKER XMG Neo 16 E25 RTX 5090 Laptop | |
| MSI Titan 18 HX AI A2XWJG | |
| Moyenne Intel Core Ultra 9 285HX (n=1) | |
| Asus Strix Scar 18 G835LX | |
| SCHENKER XMG Neo 16 A25 5090 | |
| Asus ROG Strix Scar 16 2025 | |
| Aorus Master 18 AM8H | |
| Medion Erazer Beast 18 X1 MD62731 | |
| MSI Titan 18 HX A14VIG | |
| Moyenne de la classe Gaming (1537 - 6271, n=147, 2 dernières années) | |
| Razer Blade 16 2025 RTX 5090 | |
| Cinebench R15 / CPU Single 64Bit | |
| Asus Strix Scar 18 G835LX | |
| Asus ROG Strix Scar 16 2025 | |
| SCHENKER XMG Neo 16 E25 RTX 5090 Laptop | |
| Medion Erazer Beast 18 X1 MD62731 | |
| SCHENKER XMG Neo 16 A25 5090 | |
| Aorus Master 18 AM8H | |
| MSI Titan 18 HX AI A2XWJG | |
| Moyenne Intel Core Ultra 9 285HX (n=1) | |
| Razer Blade 16 2025 RTX 5090 | |
| MSI Titan 18 HX A14VIG | |
| Moyenne de la classe Gaming (191.9 - 343, n=145, 2 dernières années) | |
| Blender / v2.79 BMW27 CPU | |
| Moyenne de la classe Gaming (80 - 517, n=139, 2 dernières années) | |
| Razer Blade 16 2025 RTX 5090 | |
| Medion Erazer Beast 18 X1 MD62731 | |
| MSI Titan 18 HX A14VIG | |
| Aorus Master 18 AM8H | |
| Asus Strix Scar 18 G835LX | |
| Asus ROG Strix Scar 16 2025 | |
| MSI Titan 18 HX AI A2XWJG | |
| SCHENKER XMG Neo 16 E25 RTX 5090 Laptop | |
| Moyenne Intel Core Ultra 9 285HX (n=1) | |
| SCHENKER XMG Neo 16 A25 5090 | |
| 7-Zip 18.03 / 7z b 4 | |
| SCHENKER XMG Neo 16 A25 5090 | |
| MSI Titan 18 HX AI A2XWJG | |
| Moyenne Intel Core Ultra 9 285HX (n=1) | |
| SCHENKER XMG Neo 16 E25 RTX 5090 Laptop | |
| Asus Strix Scar 18 G835LX | |
| MSI Titan 18 HX A14VIG | |
| Asus ROG Strix Scar 16 2025 | |
| Aorus Master 18 AM8H | |
| Medion Erazer Beast 18 X1 MD62731 | |
| Moyenne de la classe Gaming (23795 - 148086, n=143, 2 dernières années) | |
| Razer Blade 16 2025 RTX 5090 | |
| 7-Zip 18.03 / 7z b 4 -mmt1 | |
| SCHENKER XMG Neo 16 A25 5090 | |
| SCHENKER XMG Neo 16 E25 RTX 5090 Laptop | |
| Medion Erazer Beast 18 X1 MD62731 | |
| Asus Strix Scar 18 G835LX | |
| MSI Titan 18 HX AI A2XWJG | |
| Aorus Master 18 AM8H | |
| Moyenne Intel Core Ultra 9 285HX (n=1) | |
| Asus ROG Strix Scar 16 2025 | |
| MSI Titan 18 HX A14VIG | |
| Moyenne de la classe Gaming (4199 - 7573, n=143, 2 dernières années) | |
| Razer Blade 16 2025 RTX 5090 | |
| Geekbench 6.4 / Multi-Core | |
| MSI Titan 18 HX AI A2XWJG | |
| Moyenne Intel Core Ultra 9 285HX (n=1) | |
| Asus Strix Scar 18 G835LX | |
| Asus ROG Strix Scar 16 2025 | |
| SCHENKER XMG Neo 16 E25 RTX 5090 Laptop | |
| SCHENKER XMG Neo 16 A25 5090 | |
| Aorus Master 18 AM8H | |
| Medion Erazer Beast 18 X1 MD62731 | |
| MSI Titan 18 HX A14VIG | |
| Razer Blade 16 2025 RTX 5090 | |
| Moyenne de la classe Gaming (5340 - 22104, n=134, 2 dernières années) | |
| Geekbench 6.4 / Single-Core | |
| SCHENKER XMG Neo 16 A25 5090 | |
| Asus Strix Scar 18 G835LX | |
| Medion Erazer Beast 18 X1 MD62731 | |
| SCHENKER XMG Neo 16 E25 RTX 5090 Laptop | |
| MSI Titan 18 HX AI A2XWJG | |
| Moyenne Intel Core Ultra 9 285HX (n=1) | |
| Asus ROG Strix Scar 16 2025 | |
| Aorus Master 18 AM8H | |
| Razer Blade 16 2025 RTX 5090 | |
| MSI Titan 18 HX A14VIG | |
| Moyenne de la classe Gaming (1490 - 3219, n=134, 2 dernières années) | |
| Geekbench 5.5 / Multi-Core | |
| MSI Titan 18 HX AI A2XWJG | |
| Moyenne Intel Core Ultra 9 285HX (n=1) | |
| Asus Strix Scar 18 G835LX | |
| SCHENKER XMG Neo 16 E25 RTX 5090 Laptop | |
| Asus ROG Strix Scar 16 2025 | |
| SCHENKER XMG Neo 16 A25 5090 | |
| Aorus Master 18 AM8H | |
| MSI Titan 18 HX A14VIG | |
| Medion Erazer Beast 18 X1 MD62731 | |
| Moyenne de la classe Gaming (4557 - 27010, n=142, 2 dernières années) | |
| Razer Blade 16 2025 RTX 5090 | |
| Geekbench 5.5 / Single-Core | |
| SCHENKER XMG Neo 16 A25 5090 | |
| Asus Strix Scar 18 G835LX | |
| SCHENKER XMG Neo 16 E25 RTX 5090 Laptop | |
| Medion Erazer Beast 18 X1 MD62731 | |
| Asus ROG Strix Scar 16 2025 | |
| MSI Titan 18 HX AI A2XWJG | |
| Moyenne Intel Core Ultra 9 285HX (n=1) | |
| Aorus Master 18 AM8H | |
| Razer Blade 16 2025 RTX 5090 | |
| MSI Titan 18 HX A14VIG | |
| Moyenne de la classe Gaming (986 - 2423, n=142, 2 dernières années) | |
| HWBOT x265 Benchmark v2.2 / 4k Preset | |
| MSI Titan 18 HX AI A2XWJG | |
| Moyenne Intel Core Ultra 9 285HX (n=1) | |
| SCHENKER XMG Neo 16 E25 RTX 5090 Laptop | |
| SCHENKER XMG Neo 16 A25 5090 | |
| Asus Strix Scar 18 G835LX | |
| Asus ROG Strix Scar 16 2025 | |
| Aorus Master 18 AM8H | |
| Medion Erazer Beast 18 X1 MD62731 | |
| MSI Titan 18 HX A14VIG | |
| Razer Blade 16 2025 RTX 5090 | |
| Moyenne de la classe Gaming (7.7 - 44.3, n=143, 2 dernières années) | |
| LibreOffice / 20 Documents To PDF | |
| Aorus Master 18 AM8H | |
| Medion Erazer Beast 18 X1 MD62731 | |
| Moyenne de la classe Gaming (19 - 96.6, n=141, 2 dernières années) | |
| MSI Titan 18 HX AI A2XWJG | |
| Moyenne Intel Core Ultra 9 285HX (n=1) | |
| Razer Blade 16 2025 RTX 5090 | |
| SCHENKER XMG Neo 16 A25 5090 | |
| MSI Titan 18 HX A14VIG | |
| Asus Strix Scar 18 G835LX | |
| SCHENKER XMG Neo 16 E25 RTX 5090 Laptop | |
| Asus ROG Strix Scar 16 2025 | |
| R Benchmark 2.5 / Overall mean | |
| Moyenne de la classe Gaming (0.3551 - 0.759, n=144, 2 dernières années) | |
| Asus ROG Strix Scar 16 2025 | |
| Aorus Master 18 AM8H | |
| SCHENKER XMG Neo 16 E25 RTX 5090 Laptop | |
| MSI Titan 18 HX AI A2XWJG | |
| Medion Erazer Beast 18 X1 MD62731 | |
| Moyenne Intel Core Ultra 9 285HX (n=1) | |
| Razer Blade 16 2025 RTX 5090 | |
| Asus Strix Scar 18 G835LX | |
| MSI Titan 18 HX A14VIG | |
| SCHENKER XMG Neo 16 A25 5090 | |
* ... Moindre est la valeur, meilleures sont les performances
AIDA64: FP32 Ray-Trace | FPU Julia | CPU SHA3 | CPU Queen | FPU SinJulia | FPU Mandel | CPU AES | CPU ZLib | FP64 Ray-Trace | CPU PhotoWorxx
| Performance Rating | |
| SCHENKER XMG Neo 16 A25 5090 | |
| MSI Titan 18 HX AI A2XWJG | |
| Moyenne Intel Core Ultra 9 285HX | |
| SCHENKER XMG Neo 16 E25 RTX 5090 Laptop | |
| Asus Strix Scar 18 G835LX | |
| Asus ROG Strix Scar 16 2025 | |
| Aorus Master 18 AM8H | |
| MSI Titan 18 HX A14VIG | |
| Razer Blade 16 2025 RTX 5090 | |
| Medion Erazer Beast 18 X1 MD62731 | |
| Moyenne de la classe Gaming | |
| AIDA64 / FP32 Ray-Trace | |
| SCHENKER XMG Neo 16 A25 5090 | |
| MSI Titan 18 HX AI A2XWJG | |
| Moyenne Intel Core Ultra 9 285HX (n=1) | |
| SCHENKER XMG Neo 16 E25 RTX 5090 Laptop | |
| Asus ROG Strix Scar 16 2025 | |
| Asus Strix Scar 18 G835LX | |
| Razer Blade 16 2025 RTX 5090 | |
| Aorus Master 18 AM8H | |
| MSI Titan 18 HX A14VIG | |
| Medion Erazer Beast 18 X1 MD62731 | |
| Moyenne de la classe Gaming (7192 - 85542, n=142, 2 dernières années) | |
| AIDA64 / FPU Julia | |
| SCHENKER XMG Neo 16 A25 5090 | |
| MSI Titan 18 HX AI A2XWJG | |
| Moyenne Intel Core Ultra 9 285HX (n=1) | |
| SCHENKER XMG Neo 16 E25 RTX 5090 Laptop | |
| Asus Strix Scar 18 G835LX | |
| Asus ROG Strix Scar 16 2025 | |
| Aorus Master 18 AM8H | |
| MSI Titan 18 HX A14VIG | |
| Razer Blade 16 2025 RTX 5090 | |
| Medion Erazer Beast 18 X1 MD62731 | |
| Moyenne de la classe Gaming (35040 - 252486, n=142, 2 dernières années) | |
| AIDA64 / CPU SHA3 | |
| MSI Titan 18 HX AI A2XWJG | |
| Moyenne Intel Core Ultra 9 285HX (n=1) | |
| SCHENKER XMG Neo 16 E25 RTX 5090 Laptop | |
| SCHENKER XMG Neo 16 A25 5090 | |
| Asus Strix Scar 18 G835LX | |
| Asus ROG Strix Scar 16 2025 | |
| Aorus Master 18 AM8H | |
| MSI Titan 18 HX A14VIG | |
| Medion Erazer Beast 18 X1 MD62731 | |
| Razer Blade 16 2025 RTX 5090 | |
| Moyenne de la classe Gaming (1728 - 10389, n=142, 2 dernières années) | |
| AIDA64 / CPU Queen | |
| SCHENKER XMG Neo 16 A25 5090 | |
| MSI Titan 18 HX A14VIG | |
| MSI Titan 18 HX AI A2XWJG | |
| Moyenne Intel Core Ultra 9 285HX (n=1) | |
| SCHENKER XMG Neo 16 E25 RTX 5090 Laptop | |
| Asus Strix Scar 18 G835LX | |
| Asus ROG Strix Scar 16 2025 | |
| Aorus Master 18 AM8H | |
| Moyenne de la classe Gaming (50699 - 200651, n=142, 2 dernières années) | |
| Medion Erazer Beast 18 X1 MD62731 | |
| Razer Blade 16 2025 RTX 5090 | |
| AIDA64 / FPU SinJulia | |
| SCHENKER XMG Neo 16 A25 5090 | |
| Razer Blade 16 2025 RTX 5090 | |
| MSI Titan 18 HX A14VIG | |
| MSI Titan 18 HX AI A2XWJG | |
| Moyenne Intel Core Ultra 9 285HX (n=1) | |
| SCHENKER XMG Neo 16 E25 RTX 5090 Laptop | |
| Asus Strix Scar 18 G835LX | |
| Moyenne de la classe Gaming (5020 - 33636, n=142, 2 dernières années) | |
| Asus ROG Strix Scar 16 2025 | |
| Aorus Master 18 AM8H | |
| Medion Erazer Beast 18 X1 MD62731 | |
| AIDA64 / FPU Mandel | |
| SCHENKER XMG Neo 16 A25 5090 | |
| MSI Titan 18 HX AI A2XWJG | |
| Moyenne Intel Core Ultra 9 285HX (n=1) | |
| Asus Strix Scar 18 G835LX | |
| Asus ROG Strix Scar 16 2025 | |
| SCHENKER XMG Neo 16 E25 RTX 5090 Laptop | |
| Aorus Master 18 AM8H | |
| Razer Blade 16 2025 RTX 5090 | |
| Medion Erazer Beast 18 X1 MD62731 | |
| MSI Titan 18 HX A14VIG | |
| Moyenne de la classe Gaming (17585 - 134044, n=142, 2 dernières années) | |
| AIDA64 / CPU AES | |
| SCHENKER XMG Neo 16 A25 5090 | |
| MSI Titan 18 HX A14VIG | |
| SCHENKER XMG Neo 16 E25 RTX 5090 Laptop | |
| Asus Strix Scar 18 G835LX | |
| MSI Titan 18 HX AI A2XWJG | |
| Moyenne Intel Core Ultra 9 285HX (n=1) | |
| Asus ROG Strix Scar 16 2025 | |
| Aorus Master 18 AM8H | |
| Moyenne de la classe Gaming (19065 - 328679, n=142, 2 dernières années) | |
| Medion Erazer Beast 18 X1 MD62731 | |
| Razer Blade 16 2025 RTX 5090 | |
| AIDA64 / CPU ZLib | |
| SCHENKER XMG Neo 16 A25 5090 | |
| MSI Titan 18 HX AI A2XWJG | |
| Moyenne Intel Core Ultra 9 285HX (n=1) | |
| SCHENKER XMG Neo 16 E25 RTX 5090 Laptop | |
| Asus Strix Scar 18 G835LX | |
| Asus ROG Strix Scar 16 2025 | |
| MSI Titan 18 HX A14VIG | |
| Aorus Master 18 AM8H | |
| Medion Erazer Beast 18 X1 MD62731 | |
| Razer Blade 16 2025 RTX 5090 | |
| Moyenne de la classe Gaming (373 - 2531, n=142, 2 dernières années) | |
| AIDA64 / FP64 Ray-Trace | |
| SCHENKER XMG Neo 16 A25 5090 | |
| MSI Titan 18 HX AI A2XWJG | |
| Moyenne Intel Core Ultra 9 285HX (n=1) | |
| Asus Strix Scar 18 G835LX | |
| Asus ROG Strix Scar 16 2025 | |
| SCHENKER XMG Neo 16 E25 RTX 5090 Laptop | |
| Razer Blade 16 2025 RTX 5090 | |
| Aorus Master 18 AM8H | |
| MSI Titan 18 HX A14VIG | |
| Medion Erazer Beast 18 X1 MD62731 | |
| Moyenne de la classe Gaming (3856 - 45446, n=142, 2 dernières années) | |
| AIDA64 / CPU PhotoWorxx | |
| MSI Titan 18 HX AI A2XWJG | |
| Moyenne Intel Core Ultra 9 285HX (n=1) | |
| Asus ROG Strix Scar 16 2025 | |
| Asus Strix Scar 18 G835LX | |
| SCHENKER XMG Neo 16 E25 RTX 5090 Laptop | |
| Razer Blade 16 2025 RTX 5090 | |
| Aorus Master 18 AM8H | |
| Medion Erazer Beast 18 X1 MD62731 | |
| SCHENKER XMG Neo 16 A25 5090 | |
| Moyenne de la classe Gaming (10805 - 62274, n=142, 2 dernières années) | |
| MSI Titan 18 HX A14VIG | |
Consultez notre site dédié Intel Core Ultra 9 285HX pour plus d'informations et des comparaisons de performances.
Performance du système
Le Titan 18 HX AI ne transpire pas beaucoup dans les tâches de productivité quotidiennes. Nous constatons une amélioration de 18 % des résultats globaux par rapport à la Titan 18 HX de l'année dernière.
PCMark 10: Score | Essentials | Productivity | Digital Content Creation
CrossMark: Overall | Productivity | Creativity | Responsiveness
AIDA64: Memory Copy | Memory Read | Memory Write | Memory Latency
WebXPRT 3: Overall
WebXPRT 4: Overall
Mozilla Kraken 1.1: Total
| Performance Rating | |
| SCHENKER XMG Neo 16 E25 RTX 5090 Laptop | |
| MSI Titan 18 HX AI A2XWJG | |
| Moyenne Intel Core Ultra 9 285HX, Nvidia GeForce RTX 5090 Laptop | |
| Asus Strix Scar 18 G835LX | |
| Asus ROG Strix Scar 16 2025 | |
| SCHENKER XMG Neo 16 A25 5090 | |
| Aorus Master 18 AM8H | |
| Razer Blade 16 2025 RTX 5090 -4! | |
| Medion Erazer Beast 18 X1 MD62731 | |
| Moyenne de la classe Gaming | |
| MSI Titan 18 HX A14VIG | |
| PCMark 10 / Score | |
| SCHENKER XMG Neo 16 A25 5090 | |
| SCHENKER XMG Neo 16 E25 RTX 5090 Laptop | |
| MSI Titan 18 HX A14VIG | |
| Asus ROG Strix Scar 16 2025 | |
| MSI Titan 18 HX AI A2XWJG | |
| Moyenne Intel Core Ultra 9 285HX, Nvidia GeForce RTX 5090 Laptop (n=1) | |
| Asus Strix Scar 18 G835LX | |
| Aorus Master 18 AM8H | |
| Medion Erazer Beast 18 X1 MD62731 | |
| Razer Blade 16 2025 RTX 5090 | |
| Moyenne de la classe Gaming (5776 - 9852, n=128, 2 dernières années) | |
| PCMark 10 / Essentials | |
| SCHENKER XMG Neo 16 A25 5090 | |
| MSI Titan 18 HX A14VIG | |
| SCHENKER XMG Neo 16 E25 RTX 5090 Laptop | |
| Asus ROG Strix Scar 16 2025 | |
| Aorus Master 18 AM8H | |
| Asus Strix Scar 18 G835LX | |
| MSI Titan 18 HX AI A2XWJG | |
| Moyenne Intel Core Ultra 9 285HX, Nvidia GeForce RTX 5090 Laptop (n=1) | |
| Moyenne de la classe Gaming (9057 - 12600, n=128, 2 dernières années) | |
| Razer Blade 16 2025 RTX 5090 | |
| Medion Erazer Beast 18 X1 MD62731 | |
| PCMark 10 / Productivity | |
| SCHENKER XMG Neo 16 A25 5090 | |
| Razer Blade 16 2025 RTX 5090 | |
| MSI Titan 18 HX A14VIG | |
| Moyenne de la classe Gaming (6662 - 14612, n=128, 2 dernières années) | |
| Medion Erazer Beast 18 X1 MD62731 | |
| MSI Titan 18 HX AI A2XWJG | |
| Moyenne Intel Core Ultra 9 285HX, Nvidia GeForce RTX 5090 Laptop (n=1) | |
| Asus Strix Scar 18 G835LX | |
| SCHENKER XMG Neo 16 E25 RTX 5090 Laptop | |
| Aorus Master 18 AM8H | |
| Asus ROG Strix Scar 16 2025 | |
| PCMark 10 / Digital Content Creation | |
| SCHENKER XMG Neo 16 E25 RTX 5090 Laptop | |
| SCHENKER XMG Neo 16 A25 5090 | |
| Asus ROG Strix Scar 16 2025 | |
| MSI Titan 18 HX AI A2XWJG | |
| Moyenne Intel Core Ultra 9 285HX, Nvidia GeForce RTX 5090 Laptop (n=1) | |
| Asus Strix Scar 18 G835LX | |
| Aorus Master 18 AM8H | |
| MSI Titan 18 HX A14VIG | |
| Medion Erazer Beast 18 X1 MD62731 | |
| Razer Blade 16 2025 RTX 5090 | |
| Moyenne de la classe Gaming (7440 - 19351, n=128, 2 dernières années) | |
| CrossMark / Overall | |
| Aorus Master 18 AM8H | |
| SCHENKER XMG Neo 16 E25 RTX 5090 Laptop | |
| MSI Titan 18 HX AI A2XWJG | |
| Moyenne Intel Core Ultra 9 285HX, Nvidia GeForce RTX 5090 Laptop (n=1) | |
| Asus Strix Scar 18 G835LX | |
| SCHENKER XMG Neo 16 A25 5090 | |
| Asus ROG Strix Scar 16 2025 | |
| Moyenne de la classe Gaming (1247 - 2344, n=110, 2 dernières années) | |
| MSI Titan 18 HX A14VIG | |
| Medion Erazer Beast 18 X1 MD62731 | |
| CrossMark / Productivity | |
| Aorus Master 18 AM8H | |
| SCHENKER XMG Neo 16 E25 RTX 5090 Laptop | |
| Asus Strix Scar 18 G835LX | |
| MSI Titan 18 HX AI A2XWJG | |
| Moyenne Intel Core Ultra 9 285HX, Nvidia GeForce RTX 5090 Laptop (n=1) | |
| SCHENKER XMG Neo 16 A25 5090 | |
| Asus ROG Strix Scar 16 2025 | |
| Moyenne de la classe Gaming (1299 - 2204, n=110, 2 dernières années) | |
| Medion Erazer Beast 18 X1 MD62731 | |
| MSI Titan 18 HX A14VIG | |
| CrossMark / Creativity | |
| MSI Titan 18 HX AI A2XWJG | |
| Moyenne Intel Core Ultra 9 285HX, Nvidia GeForce RTX 5090 Laptop (n=1) | |
| SCHENKER XMG Neo 16 A25 5090 | |
| SCHENKER XMG Neo 16 E25 RTX 5090 Laptop | |
| Asus Strix Scar 18 G835LX | |
| Asus ROG Strix Scar 16 2025 | |
| Aorus Master 18 AM8H | |
| MSI Titan 18 HX A14VIG | |
| Moyenne de la classe Gaming (1275 - 2729, n=110, 2 dernières années) | |
| Medion Erazer Beast 18 X1 MD62731 | |
| CrossMark / Responsiveness | |
| Aorus Master 18 AM8H | |
| SCHENKER XMG Neo 16 E25 RTX 5090 Laptop | |
| Asus Strix Scar 18 G835LX | |
| SCHENKER XMG Neo 16 A25 5090 | |
| MSI Titan 18 HX AI A2XWJG | |
| Moyenne Intel Core Ultra 9 285HX, Nvidia GeForce RTX 5090 Laptop (n=1) | |
| Moyenne de la classe Gaming (1030 - 2330, n=110, 2 dernières années) | |
| Asus ROG Strix Scar 16 2025 | |
| MSI Titan 18 HX A14VIG | |
| Medion Erazer Beast 18 X1 MD62731 | |
| AIDA64 / Memory Copy | |
| MSI Titan 18 HX AI A2XWJG | |
| Moyenne Intel Core Ultra 9 285HX, Nvidia GeForce RTX 5090 Laptop (n=1) | |
| Razer Blade 16 2025 RTX 5090 | |
| SCHENKER XMG Neo 16 E25 RTX 5090 Laptop | |
| Asus Strix Scar 18 G835LX | |
| Asus ROG Strix Scar 16 2025 | |
| Medion Erazer Beast 18 X1 MD62731 | |
| Aorus Master 18 AM8H | |
| Moyenne de la classe Gaming (21750 - 97515, n=142, 2 dernières années) | |
| SCHENKER XMG Neo 16 A25 5090 | |
| MSI Titan 18 HX A14VIG | |
| AIDA64 / Memory Read | |
| Razer Blade 16 2025 RTX 5090 | |
| MSI Titan 18 HX AI A2XWJG | |
| Moyenne Intel Core Ultra 9 285HX, Nvidia GeForce RTX 5090 Laptop (n=1) | |
| SCHENKER XMG Neo 16 E25 RTX 5090 Laptop | |
| Asus ROG Strix Scar 16 2025 | |
| Medion Erazer Beast 18 X1 MD62731 | |
| Asus Strix Scar 18 G835LX | |
| Aorus Master 18 AM8H | |
| Moyenne de la classe Gaming (22956 - 103347, n=142, 2 dernières années) | |
| SCHENKER XMG Neo 16 A25 5090 | |
| MSI Titan 18 HX A14VIG | |
| AIDA64 / Memory Write | |
| Razer Blade 16 2025 RTX 5090 | |
| MSI Titan 18 HX AI A2XWJG | |
| Moyenne Intel Core Ultra 9 285HX, Nvidia GeForce RTX 5090 Laptop (n=1) | |
| SCHENKER XMG Neo 16 E25 RTX 5090 Laptop | |
| Asus Strix Scar 18 G835LX | |
| Asus ROG Strix Scar 16 2025 | |
| Medion Erazer Beast 18 X1 MD62731 | |
| Aorus Master 18 AM8H | |
| SCHENKER XMG Neo 16 A25 5090 | |
| Moyenne de la classe Gaming (22297 - 108954, n=142, 2 dernières années) | |
| MSI Titan 18 HX A14VIG | |
| AIDA64 / Memory Latency | |
| Aorus Master 18 AM8H | |
| Asus ROG Strix Scar 16 2025 | |
| Medion Erazer Beast 18 X1 MD62731 | |
| Asus Strix Scar 18 G835LX | |
| SCHENKER XMG Neo 16 E25 RTX 5090 Laptop | |
| MSI Titan 18 HX A14VIG | |
| MSI Titan 18 HX AI A2XWJG | |
| Moyenne Intel Core Ultra 9 285HX, Nvidia GeForce RTX 5090 Laptop (n=1) | |
| Razer Blade 16 2025 RTX 5090 | |
| SCHENKER XMG Neo 16 A25 5090 | |
| Moyenne de la classe Gaming (59.5 - 259, n=142, 2 dernières années) | |
| WebXPRT 3 / Overall | |
| MSI Titan 18 HX AI A2XWJG | |
| Moyenne Intel Core Ultra 9 285HX, Nvidia GeForce RTX 5090 Laptop (n=1) | |
| SCHENKER XMG Neo 16 E25 RTX 5090 Laptop | |
| Asus Strix Scar 18 G835LX | |
| Asus ROG Strix Scar 16 2025 | |
| SCHENKER XMG Neo 16 A25 5090 | |
| Medion Erazer Beast 18 X1 MD62731 | |
| MSI Titan 18 HX A14VIG | |
| Razer Blade 16 2025 RTX 5090 | |
| Aorus Master 18 AM8H | |
| Moyenne de la classe Gaming (235 - 480, n=123, 2 dernières années) | |
| WebXPRT 4 / Overall | |
| Asus ROG Strix Scar 16 2025 | |
| Asus Strix Scar 18 G835LX | |
| SCHENKER XMG Neo 16 E25 RTX 5090 Laptop | |
| Medion Erazer Beast 18 X1 MD62731 | |
| SCHENKER XMG Neo 16 A25 5090 | |
| Aorus Master 18 AM8H | |
| MSI Titan 18 HX AI A2XWJG | |
| Moyenne Intel Core Ultra 9 285HX, Nvidia GeForce RTX 5090 Laptop (n=1) | |
| MSI Titan 18 HX A14VIG | |
| Moyenne de la classe Gaming (176.4 - 341, n=111, 2 dernières années) | |
| Razer Blade 16 2025 RTX 5090 | |
| Mozilla Kraken 1.1 / Total | |
| Moyenne de la classe Gaming (397 - 674, n=133, 2 dernières années) | |
| MSI Titan 18 HX A14VIG | |
| Razer Blade 16 2025 RTX 5090 | |
| Aorus Master 18 AM8H | |
| Medion Erazer Beast 18 X1 MD62731 | |
| Asus ROG Strix Scar 16 2025 | |
| Asus Strix Scar 18 G835LX | |
| MSI Titan 18 HX AI A2XWJG | |
| Moyenne Intel Core Ultra 9 285HX, Nvidia GeForce RTX 5090 Laptop (n=1) | |
| SCHENKER XMG Neo 16 E25 RTX 5090 Laptop | |
| SCHENKER XMG Neo 16 A25 5090 | |
* ... Moindre est la valeur, meilleures sont les performances
| PCMark 8 Home Score Accelerated v2 | 5564 points | |
| PCMark 8 Work Score Accelerated v2 | 3012 points | |
| PCMark 10 Score | 8795 points | |
Aide | ||
Latence DPC
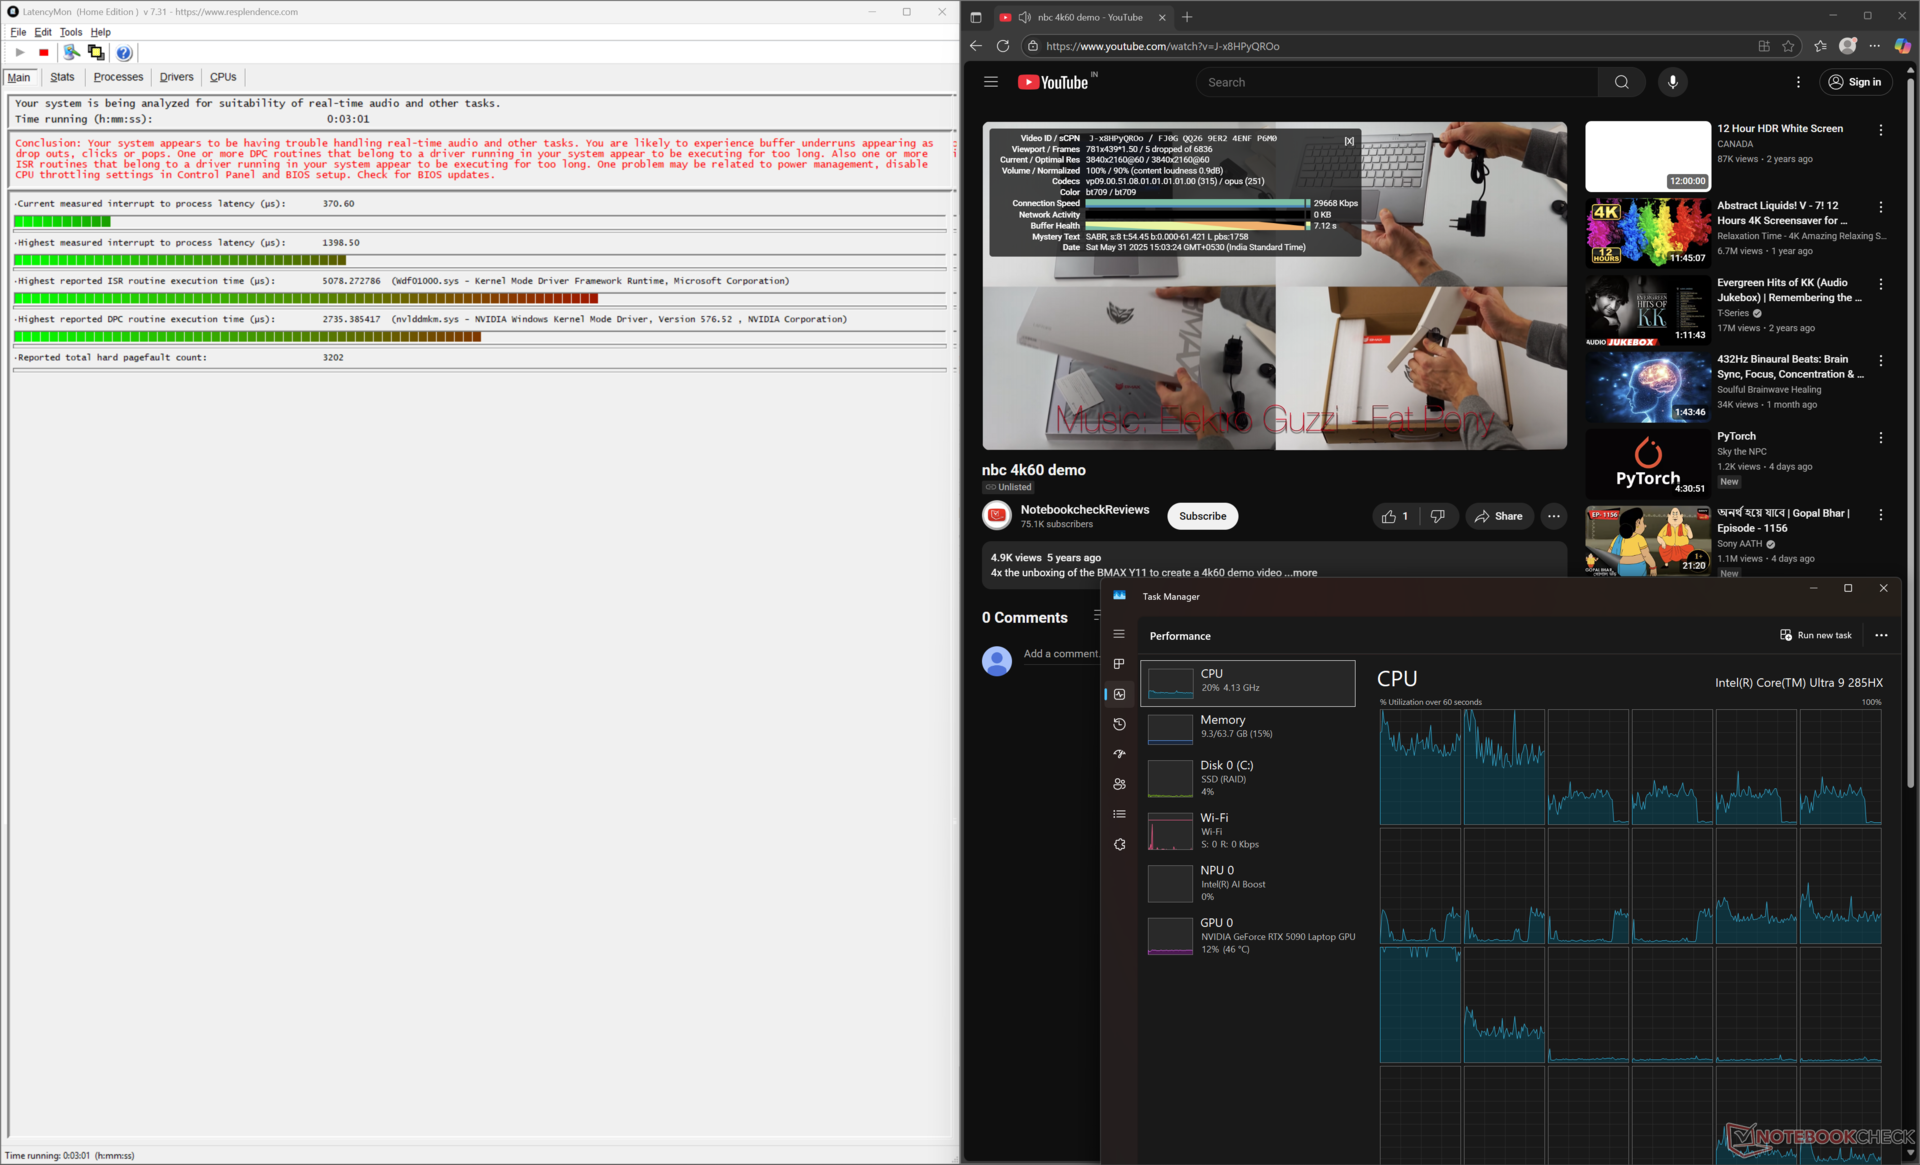
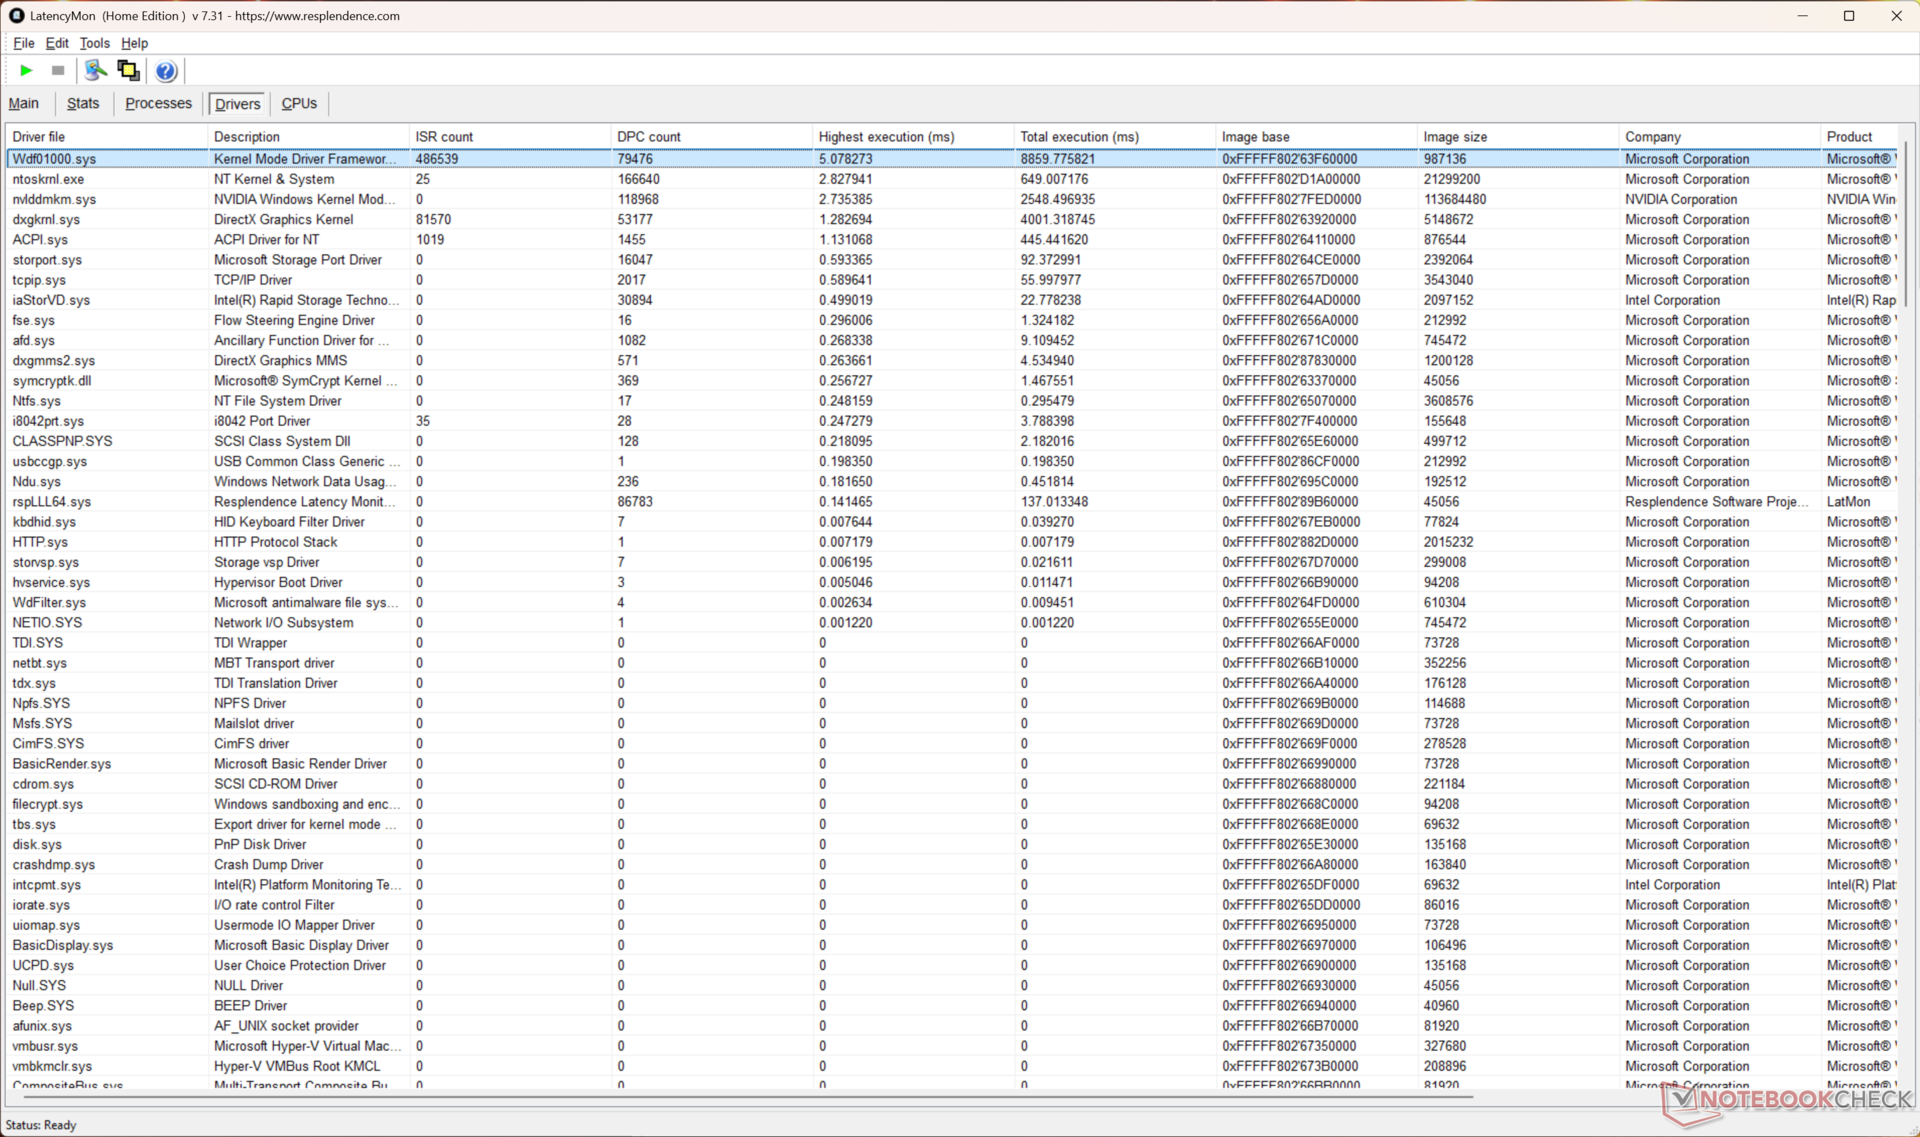
La Titan 18 HX AI affiche une latence élevée de 1 398,5 μs entre l'interruption et le processus lors de notre mesure de latence de routine.
Bien qu'elle soit bien meilleure que celle de la concurrence, elle pourrait encore potentiellement poser des problèmes dans les flux de travail audio et vidéo en temps réel.
| DPC Latencies / LatencyMon - interrupt to process latency (max), Web, Youtube, Prime95 | |
| Medion Erazer Beast 18 X1 MD62731 | |
| MSI Titan 18 HX A14VIG | |
| Asus ROG Strix Scar 16 2025 | |
| Aorus Master 18 AM8H | |
| SCHENKER XMG Neo 16 E25 RTX 5090 Laptop | |
| MSI Titan 18 HX AI A2XWJG | |
| Asus Strix Scar 18 G835LX | |
| Razer Blade 16 2025 RTX 5090 | |
| SCHENKER XMG Neo 16 A25 5090 | |
* ... Moindre est la valeur, meilleures sont les performances
Vous trouverez une vue d'ensemble de la latence mesurée sur les ordinateurs portables examinés dans notre Tableau de classement de la latence DPC.
Dispositifs de stockage
Un total de trois disques SSD NVMe (1x PCIe Gen5 et 2x PCIe Gen4) configurés en RAID 0 ont été installés dans notre unité. Cela permet d'obtenir des vitesses de lecture séquentielle extrêmement élevées allant jusqu'à 15 Go/s avec une profondeur de file d'attente de 8.
Cependant, les performances de la baie diminuent considérablement dans les lectures et les écritures en 4K, ainsi que dans les tests séquentiels à faible profondeur de file d'attente.
Notre unité avait encore de la place pour accueillir un autre SSD PCIe Gen4, mais il n'est pas possible d'installer des disques SATA de 2,5 pouces en interne.

* ... Moindre est la valeur, meilleures sont les performances
Disk Throttling: DiskSpd Read Loop, Queue Depth 8
Consultez nos Comparaisons de SSD pour d'autres comparaisons de performances de stockage.
Performance du GPU
Le GPU pour ordinateur portable Nvidia GeForce RTX 5090 de la Titan 18 HX AI fonctionne à 175 W dans le profil de performance extrême.
Cependant, les gains de performance par rapport à un GPU pour ordinateur portable RTX 4090 de 175 W RTX 4090 pour ordinateur portable sont à peine perceptibles dans les tests 3DMark.
Advanced Optimus n'est pas pris en charge. Time Spy Les scores graphiques chutent de 78,8 % sur batterie.
| 3DMark 11 Performance | 50365 points | |
| 3DMark Ice Storm Standard Score | 298917 points | |
| 3DMark Cloud Gate Standard Score | 80657 points | |
| 3DMark Fire Strike Score | 39279 points | |
| 3DMark Fire Strike Extreme Score | 30016 points | |
| 3DMark Time Spy Score | 22155 points | |
| 3DMark Steel Nomad Score | 6163 points | |
| 3DMark Steel Nomad Light Score | 26098 points | |
| 3DMark Steel Nomad Light Unlimited Score | 26099 points | |
Aide | ||
| Blender / v3.3 Classroom OPTIX/RTX | |
| Moyenne de la classe Gaming (9 - 95, n=137, 2 dernières années) | |
| Asus ROG Strix Scar 16 2025 | |
| Asus Strix Scar 18 G835LX | |
| Asus Strix Scar 18 G835LX | |
| Razer Blade 16 2025 RTX 5090 | |
| Medion Erazer Beast 18 X1 MD62731 | |
| Moyenne Nvidia GeForce RTX 5090 Laptop (9 - 18, n=12) | |
| SCHENKER XMG Neo 16 E25 RTX 5090 Laptop | |
| MSI Titan 18 HX A14VIG | |
| MSI Titan 18 HX AI A2XWJG | |
| SCHENKER XMG Neo 16 A25 5090 | |
| Blender / v3.3 Classroom CUDA | |
| Moyenne de la classe Gaming (15 - 110, n=138, 2 dernières années) | |
| Asus ROG Strix Scar 16 2025 | |
| Razer Blade 16 2025 RTX 5090 | |
| Medion Erazer Beast 18 X1 MD62731 | |
| Moyenne Nvidia GeForce RTX 5090 Laptop (15 - 37, n=10) | |
| MSI Titan 18 HX A14VIG | |
| SCHENKER XMG Neo 16 E25 RTX 5090 Laptop | |
| Asus Strix Scar 18 G835LX | |
| MSI Titan 18 HX AI A2XWJG | |
| SCHENKER XMG Neo 16 A25 5090 | |
| Blender / v3.3 Classroom CPU | |
| Moyenne de la classe Gaming (122 - 962, n=143, 2 dernières années) | |
| Razer Blade 16 2025 RTX 5090 | |
| Medion Erazer Beast 18 X1 MD62731 | |
| MSI Titan 18 HX A14VIG | |
| Aorus Master 18 AM8H | |
| Moyenne Nvidia GeForce RTX 5090 Laptop (123 - 259, n=12) | |
| Asus ROG Strix Scar 16 2025 | |
| Asus Strix Scar 18 G835LX | |
| SCHENKER XMG Neo 16 E25 RTX 5090 Laptop | |
| MSI Titan 18 HX AI A2XWJG | |
| SCHENKER XMG Neo 16 A25 5090 | |
* ... Moindre est la valeur, meilleures sont les performances
Performances des jeux
La combinaison du Core Ultra 9 285HX et du GPU RTX 5090 pour ordinateur portable permet à la Titan 18 HX AI de prendre de l'avance sur la concurrence dans les jeux, mais reste juste en deçà de la XMG Neo 16 A25 équipée du Ryzen 9 9955HX3D.
Les gains globaux par rapport à la variante RTX 4090 de l'année dernière sont modestes (11% en 1080p Ultra).
Le GPU RTX 5090 pour ordinateur portable a du mal à atteindre 60 fps en 4K Ultra natif dans les titres AAA modernes.
L'activation du ray tracing complet ou du path tracing nécessitera inévitablement l'utilisation de technologies d'upscaling telles que DLSS4, Ray reconstruction, et multi frame generation (MFG) pour atteindre des taux d'images élevés qui correspondent au taux de rafraîchissement de 120 Hz de l'écran.
| Black Myth: Wukong | |
| 2560x1440 cinematic TSR 100 | |
| MSI Titan 18 HX AI A2XWJG | |
| Moyenne Nvidia GeForce RTX 5090 Laptop (44 - 48, n=3) | |
| Razer Blade 16 2025 RTX 5090 | |
| Moyenne de la classe Gaming (19 - 48, n=12, 2 dernières années) | |
| 3840x2160 cinematic TSR 100 | |
| MSI Titan 18 HX AI A2XWJG | |
| Moyenne Nvidia GeForce RTX 5090 Laptop (27 - 33, n=3) | |
| Razer Blade 16 2025 RTX 5090 | |
| Moyenne de la classe Gaming (12.6 - 33, n=11, 2 dernières années) | |
| 2560x1440 cinematic RT: Very High DLSS 68 FG | |
| MSI Titan 18 HX AI A2XWJG | |
| Moyenne Nvidia GeForce RTX 5090 Laptop (76 - 82, n=3) | |
| Razer Blade 16 2025 RTX 5090 | |
| Moyenne de la classe Gaming (35 - 82, n=11, 2 dernières années) | |
| 3840x2160 cinematic RT: Very High DLSS 68 FG | |
| Moyenne Nvidia GeForce RTX 5090 Laptop (44 - 45, n=2) | |
| MSI Titan 18 HX AI A2XWJG | |
| Moyenne de la classe Gaming (25.1 - 45, n=6, 2 dernières années) | |
| Indiana Jones and the Great Circle | |
| 2560x1440 Very Ultra Preset | |
| SCHENKER XMG Neo 16 A25 5090 | |
| MSI Titan 18 HX AI A2XWJG | |
| Asus Strix Scar 18 G835LX | |
| Moyenne Nvidia GeForce RTX 5090 Laptop (66.1 - 115.9, n=13) | |
| SCHENKER XMG Neo 16 E25 RTX 5090 Laptop | |
| Asus ROG Strix Scar 16 2025 | |
| Razer Blade 16 2025 RTX 5090 | |
| Moyenne de la classe Gaming (66.1 - 115.9, n=21, 2 dernières années) | |
| 3840x2160 Very Ultra Preset | |
| MSI Titan 18 HX AI A2XWJG | |
| Asus Strix Scar 18 G835LX | |
| Moyenne Nvidia GeForce RTX 5090 Laptop (48.2 - 70.8, n=10) | |
| SCHENKER XMG Neo 16 E25 RTX 5090 Laptop | |
| Razer Blade 16 2025 RTX 5090 | |
| Moyenne de la classe Gaming (43.1 - 68.6, n=16, 2 dernières années) | |
| 2560x1440 Very Ultra Preset + Full Path Tracing + Quality DLSS + Frame Generation | |
| Moyenne Nvidia GeForce RTX 5090 Laptop (72.9 - 180, n=5) | |
| MSI Titan 18 HX AI A2XWJG | |
| Razer Blade 16 2025 RTX 5090 | |
| Moyenne de la classe Gaming (20.2 - 84.2, n=10, 2 dernières années) | |
Cyberpunk 2077 1080p Ultra FPS chart
Il n'y a pas eu de problèmes majeurs d'étranglement lors d'une utilisation prolongée de Cyberpunk 2077 : Phantom Liberty en 1080p Ultra, ce qui indique un bon refroidissement du GPU.
| Bas | Moyen | Élevé | Ultra | QHD DLSS | QHD FSR | QHD | 4K DLSS | 4K FSR | 4K | |
|---|---|---|---|---|---|---|---|---|---|---|
| GTA V (2015) | 185.2 | 184.5 | 180.4 | 162.4 | 160.1 | 179.9 | ||||
| Dota 2 Reborn (2015) | 229 | 207 | 198.3 | 184.7 | ||||||
| Final Fantasy XV Benchmark (2018) | 234 | 236 | 212 | 179.5 | 106.4 | |||||
| X-Plane 11.11 (2018) | 108.9 | 148.3 | 120.9 | |||||||
| Strange Brigade (2018) | 617 | 482 | 473 | 437 | 339 | 164.2 | ||||
| Baldur's Gate 3 (2023) | 225.3 | 158.4 | 135.5 | 84.1 | ||||||
| Cyberpunk 2077 2.2 Phantom Liberty (2023) | 178.7 | 177.3 | 166.4 | 157.5 | 128.1 | 115.6 | 79.5 | 46.2 | 53.1 | |
| Alan Wake 2 (2023) | 125.2 | 84.5 | 45.9 | |||||||
| F1 24 (2024) | 343 | 369 | 357 | 157.8 | 105 | 80.8 | 77.7 | 51.3 | ||
| Black Myth: Wukong (2024) | 63 | 70 | 49 | 48 | 33 | |||||
| Indiana Jones and the Great Circle (2024) | 133.9 | 105.9 | 66.4 | |||||||
| Monster Hunter Wilds (2025) | 88.9 | 73.3 | 46.8 | |||||||
| Assassin's Creed Shadows (2025) | 62 | 54 | 59 | 41 | ||||||
| F1 25 (2025) | 279 | 268 | 252 | 58.8 | 64 | 35.8 | 32.2 | 16.7 |
Pour plus d'informations, consultez notre site dédié Nvidia GeForce RTX 5090 GPU pour ordinateur portable page.
Consultez également notre analyse complète du GPU RTX 5090 pour ordinateur portable pour obtenir des chiffres supplémentaires sur les performances des fabricants et de la création de contenu.
Émissions : Niveaux de bruit et températures de surface élevés malgré la présence d'une chambre à vapeur
Bruit du système
Le bruit du ventilateur est logiquement plus élevé compte tenu de la puissance des composants internes.
Le mode ECO-Silent maintient le niveau de bruit en dessous de 40 db(A), ce qui en fait l'outil idéal pour les tâches moins exigeantes dans les environnements calmes.
Nous vous recommandons d'utiliser un casque lorsque vous utilisez le profil Extreme Performance, car les ventilateurs peuvent atteindre près de 60 db(A) en cas de charge intense et pendant les jeux.
Degré de la nuisance sonore
| Au repos |
| 27.68 / 27.68 / 31.54 dB(A) |
| Fortement sollicité |
| 44 / 58.9 dB(A) |
 | ||
30 dB silencieux 40 dB(A) audible 50 dB(A) bruyant |
||
min: | ||
| Mode performance (PL1 / PL2 / GPU TGP) | Ralenti dB(A) | Charge moyenne dB(A) | Charge maximale dB(A) | Cyberpunk 2077 1080p Ultra dB(A) |
|---|---|---|---|---|
| ECO-Silent (15 / 15 / 96 W) | 27.68 | 37.60 | 37.81 | 37.31 / 50 fps |
| Équilibré (140 / 220 / 150 W) | 27.68 | 43.71 | 51.90 | 52.61 / 160 fps |
| Performance extrême (200 / 220 / 175 W) | 31.54 | 44 | 58.87 | 58.70 / 173 fps |
| MSI Titan 18 HX AI A2XWJG Ultra 9 285HX, GeForce RTX 5090 Laptop | Aorus Master 18 AM8H Ultra 9 275HX, GeForce RTX 5090 Laptop | Asus Strix Scar 18 G835LX Ultra 9 275HX, GeForce RTX 5090 Laptop | SCHENKER XMG Neo 16 A25 5090 R9 9955HX3D, GeForce RTX 5090 Laptop | Medion Erazer Beast 18 X1 MD62731 Ultra 9 275HX, GeForce RTX 5080 Laptop | Razer Blade 16 2025 RTX 5090 Ryzen AI 9 HX 370, GeForce RTX 5090 Laptop | MSI Titan 18 HX A14VIG i9-14900HX, NVIDIA GeForce RTX 4090 Laptop GPU | |
|---|---|---|---|---|---|---|---|
| Noise | 0% | 3% | 6% | -9% | 5% | 10% | |
| arrêt / environnement * | 25.56 | 25 2% | 23.3 9% | 24.1 6% | 25 2% | 24.1 6% | 22.8 11% |
| Idle Minimum * | 27.68 | 26 6% | 29.8 -8% | 25.6 8% | 25 10% | 24.1 13% | 23.8 14% |
| Idle Average * | 27.68 | 29 -5% | 29.8 -8% | 25.6 8% | 39 -41% | 30.6 -11% | 23.8 14% |
| Idle Maximum * | 31.54 | 34 -8% | 29.8 6% | 25.6 19% | 42 -33% | 30.6 3% | 28 11% |
| Load Average * | 44 | 50 -14% | 42.9 2% | 47.2 -7% | 52 -18% | 45.5 -3% | 38 14% |
| Cyberpunk 2077 ultra * | 58.7 | 52 11% | 53.7 9% | 55.5 5% | 53 10% | 48.2 18% | |
| Load Maximum * | 58.9 | 53 10% | 53.7 9% | 55.5 6% | 55 7% | 53.4 9% | 62.8 -7% |
| Witcher 3 ultra * | 57.3 |
* ... Moindre est la valeur, meilleures sont les performances
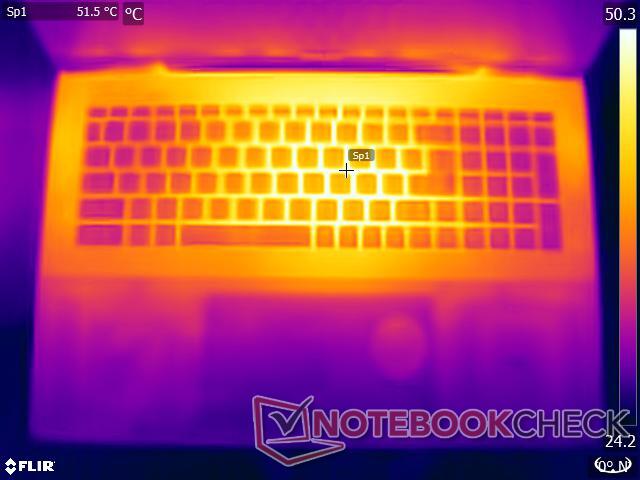
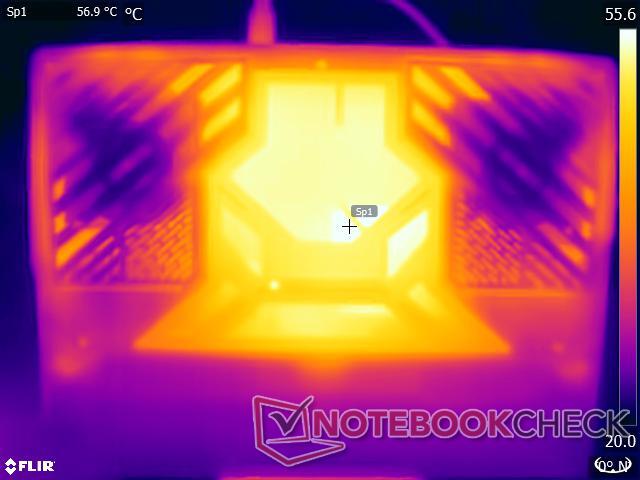
Température
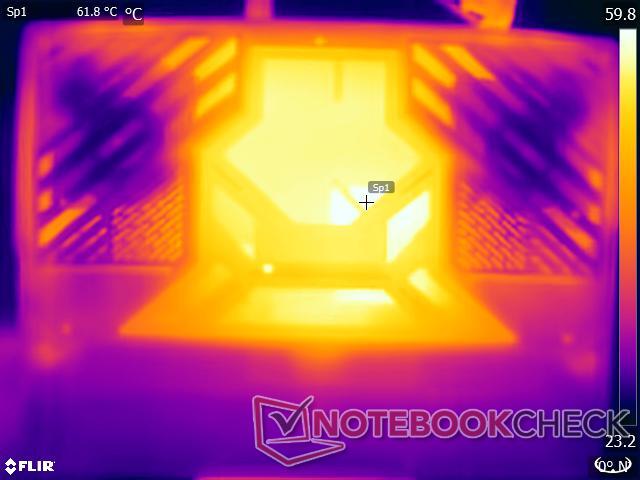
La chambre à vapeur de la Titan 18 HX AI permet au matériel de fonctionner sans ralentissement, mais au prix de températures de surface plus élevées en cas d'utilisation intensive.
Nous avons enregistré une température maximale de 53,6 °C sur le fond du châssis sous une charge combinée de Prime95 in-place large FFTs et FurMark (1,280x720, no AA). Le touchpad et le repose-paume sont restés relativement froids pendant les tests de stress.
Le Titan 18 HX AI n'est pas assez portable pour être utilisé en continu sur les genoux. Néanmoins, nous ne recommandons pas de placer l'appareil sur vos genoux lorsque vous exécutez des tâches intensives.
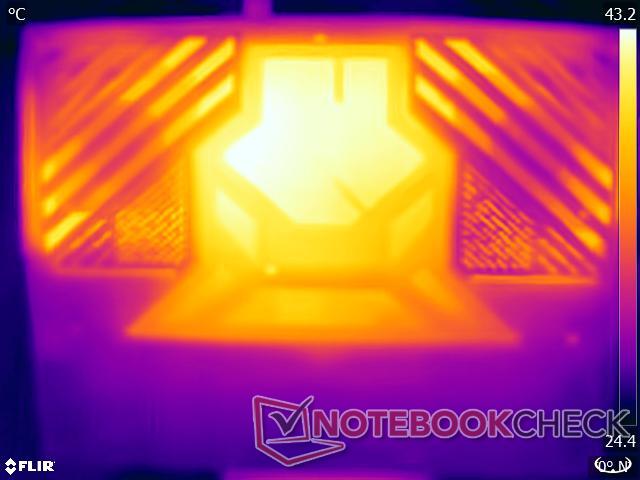
(-) La température maximale du côté supérieur est de 48.2 °C / 119 F, par rapport à la moyenne de 40.4 °C / 105 F, allant de 21.2 à 68.8 °C pour la classe Gaming.
(-) Le fond chauffe jusqu'à un maximum de 53.6 °C / 128 F, contre une moyenne de 43.3 °C / 110 F
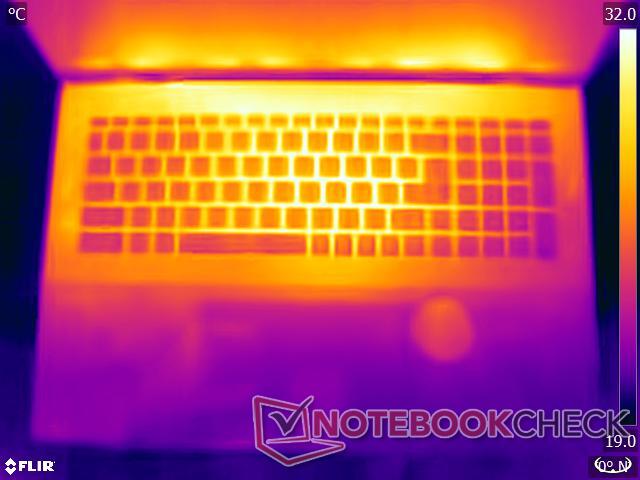
(±) En utilisation inactive, la température moyenne du côté supérieur est de 33.8 °C / 93 F, par rapport à la moyenne du dispositif de 33.9 °C / 93 F.
(-) 3: The average temperature for the upper side is 42.6 °C / 109 F, compared to the average of 33.9 °C / 93 F for the class Gaming.
(+) Les repose-poignets et le pavé tactile atteignent la température maximale de la peau (34.5 °C / 94.1 F) et ne sont donc pas chauds.
(-) La température moyenne de la zone de l'appui-paume de dispositifs similaires était de 28.9 °C / 84 F (-5.6 °C / #-10.1 F).

| MSI Titan 18 HX AI A2XWJG Intel Core Ultra 9 285HX, Nvidia GeForce RTX 5090 Laptop | Aorus Master 18 AM8H Intel Core Ultra 9 275HX, Nvidia GeForce RTX 5090 Laptop | Asus Strix Scar 18 G835LX Intel Core Ultra 9 275HX, Nvidia GeForce RTX 5090 Laptop | SCHENKER XMG Neo 16 A25 5090 AMD Ryzen 9 9955HX3D, Nvidia GeForce RTX 5090 Laptop | Medion Erazer Beast 18 X1 MD62731 Intel Core Ultra 9 275HX, Nvidia GeForce RTX 5080 Laptop | Razer Blade 16 2025 RTX 5090 AMD Ryzen AI 9 HX 370, Nvidia GeForce RTX 5090 Laptop | MSI Titan 18 HX A14VIG Intel Core i9-14900HX, NVIDIA GeForce RTX 4090 Laptop GPU | |
|---|---|---|---|---|---|---|---|
| Heat | 7% | 17% | 16% | 13% | 13% | 17% | |
| Maximum Upper Side * | 48.2 | 50 -4% | 45.6 5% | 46.3 4% | 47 2% | 48.3 -0% | 37.8 22% |
| Maximum Bottom * | 53.6 | 46 14% | 46 14% | 44.3 17% | 48 10% | 53.3 1% | 37.6 30% |
| Idle Upper Side * | 37.2 | 36 3% | 28.9 22% | 30 19% | 29 22% | 28.3 24% | 34.8 6% |
| Idle Bottom * | 40.4 | 35 13% | 29.2 28% | 31.1 23% | 33 18% | 30.3 25% | 36 11% |
* ... Moindre est la valeur, meilleures sont les performances
Test de stress
En sollicitant la Titan 18 HX AI avec Prime95, le Core Ultra 9 285HX atteint brièvement 4,29 GHz à 221 W avant de se stabiliser à 3,97 GHz à 174 W.
L'ordinateur portable donne la priorité aux performances graphiques en ajoutant FurMark qui étrangle le CPU à 3.2 GHz/91W tandis que la RTX 5090 maintient 1.8 GHz à 170W TGP.
Dans un test de stress plus réel avec Cyberpunk 2077 à 1080p Ultra, le GPU RTX 5090 de l'ordinateur portable maintient une fréquence plus élevée de 2,2 GHz tout en consommant 169 W en moyenne. Le Core Ultra 9 285HX tourne maintenant à 4,2 GHz en moyenne tout en consommant seulement 91 W.
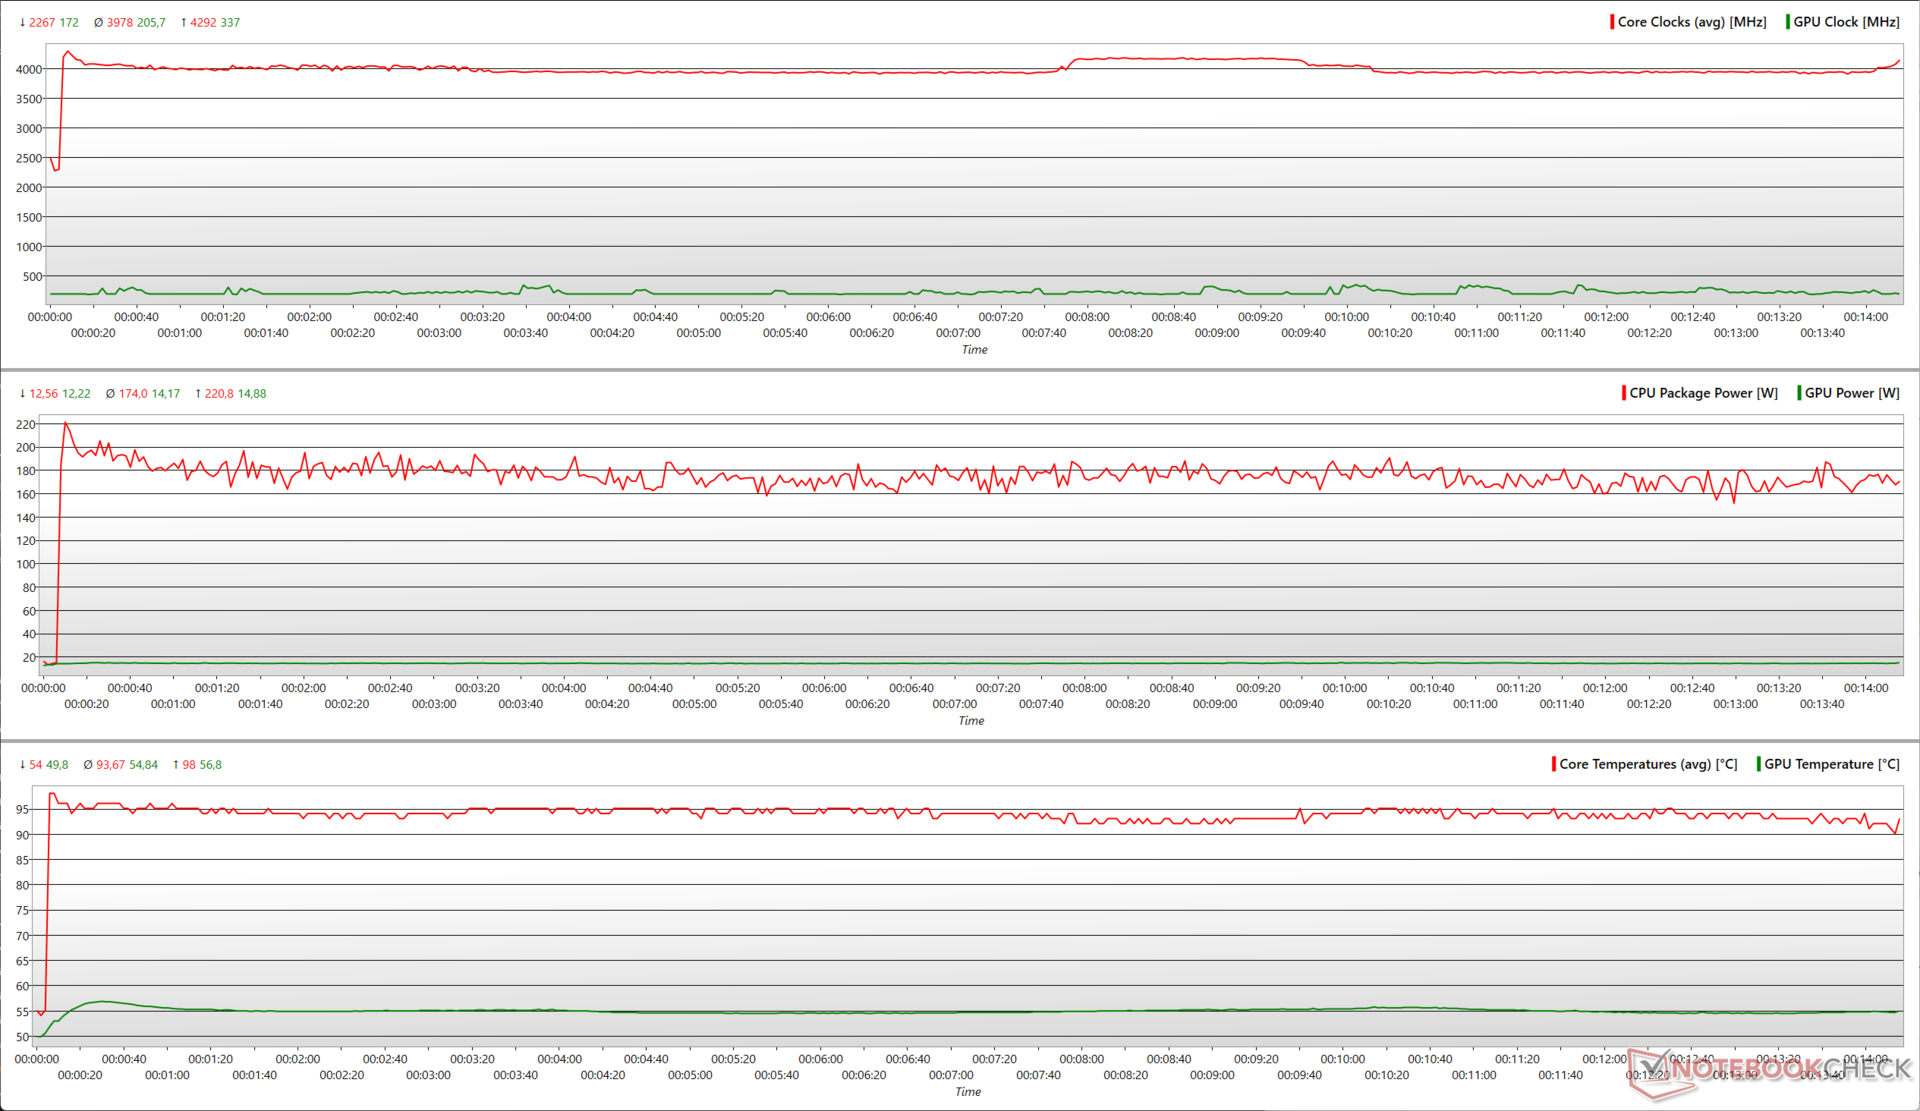
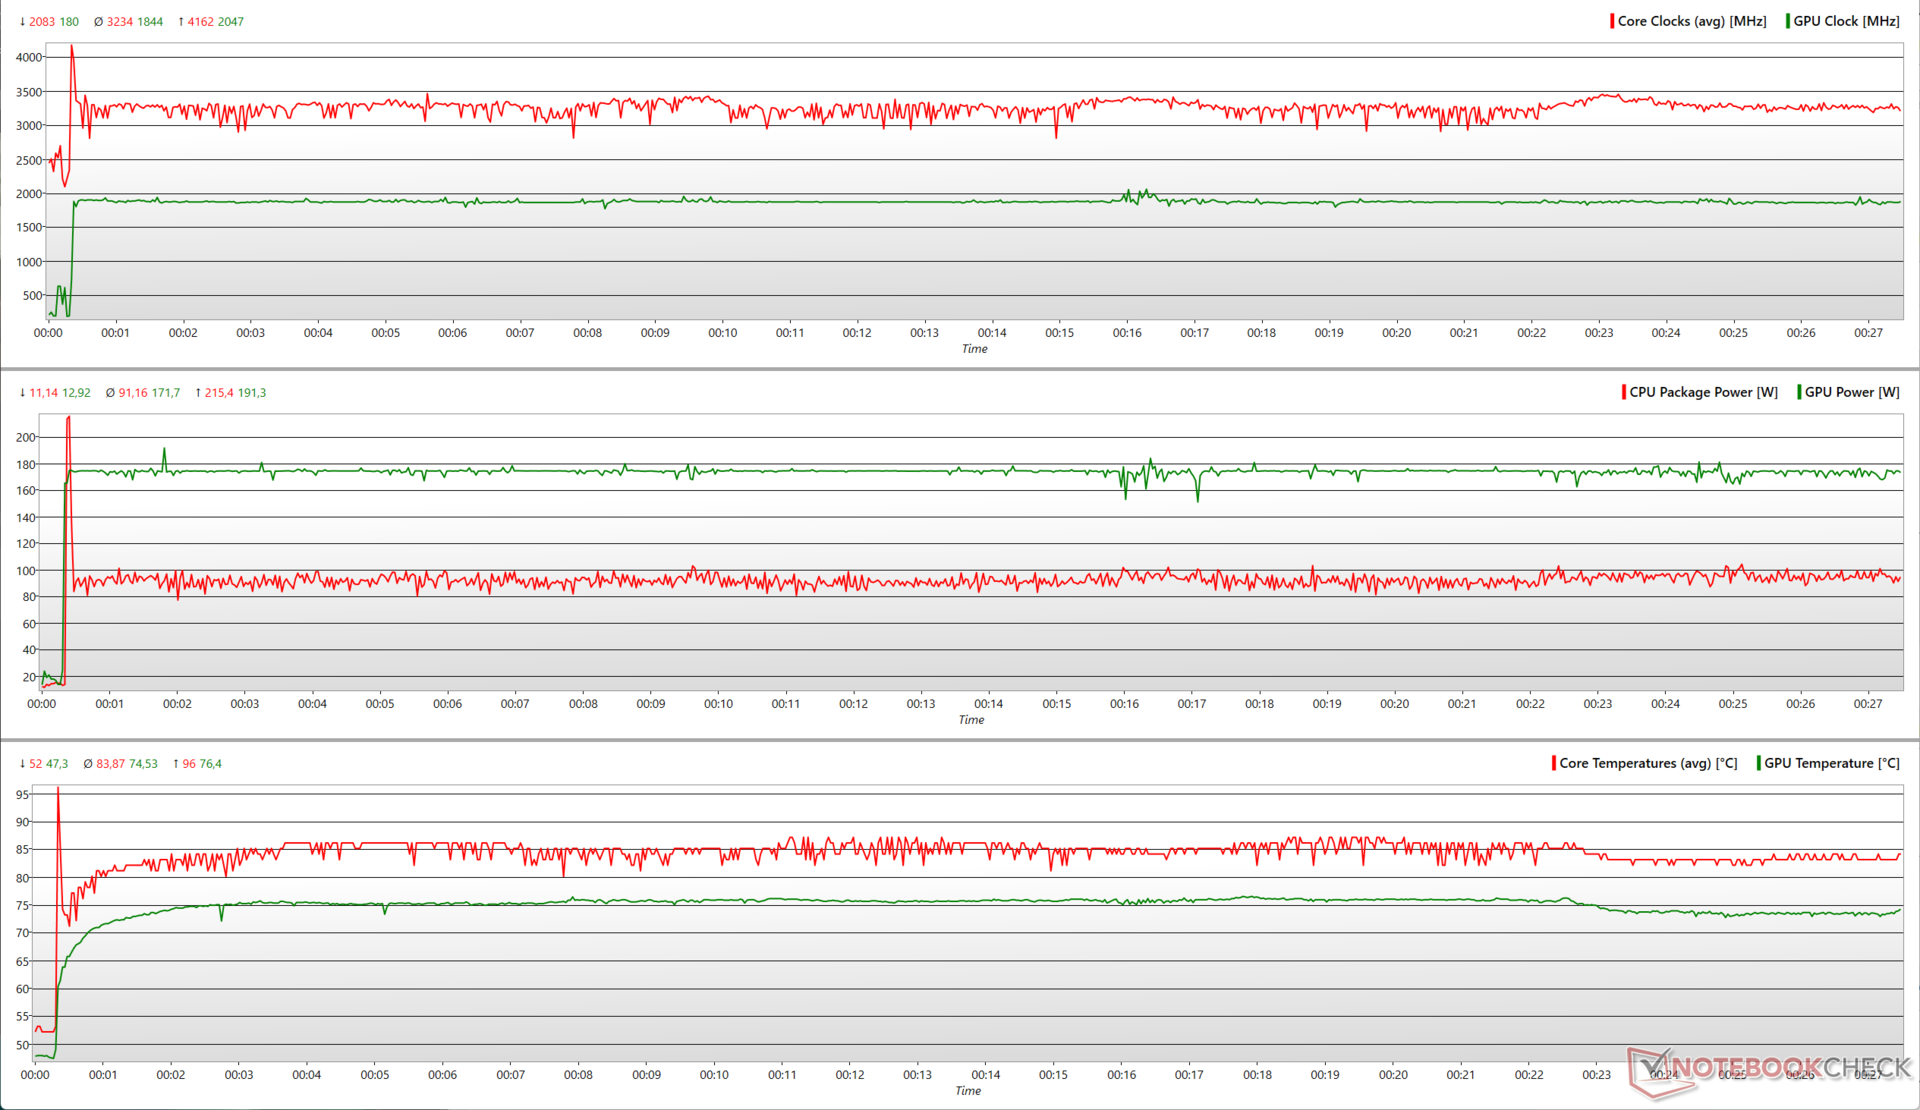
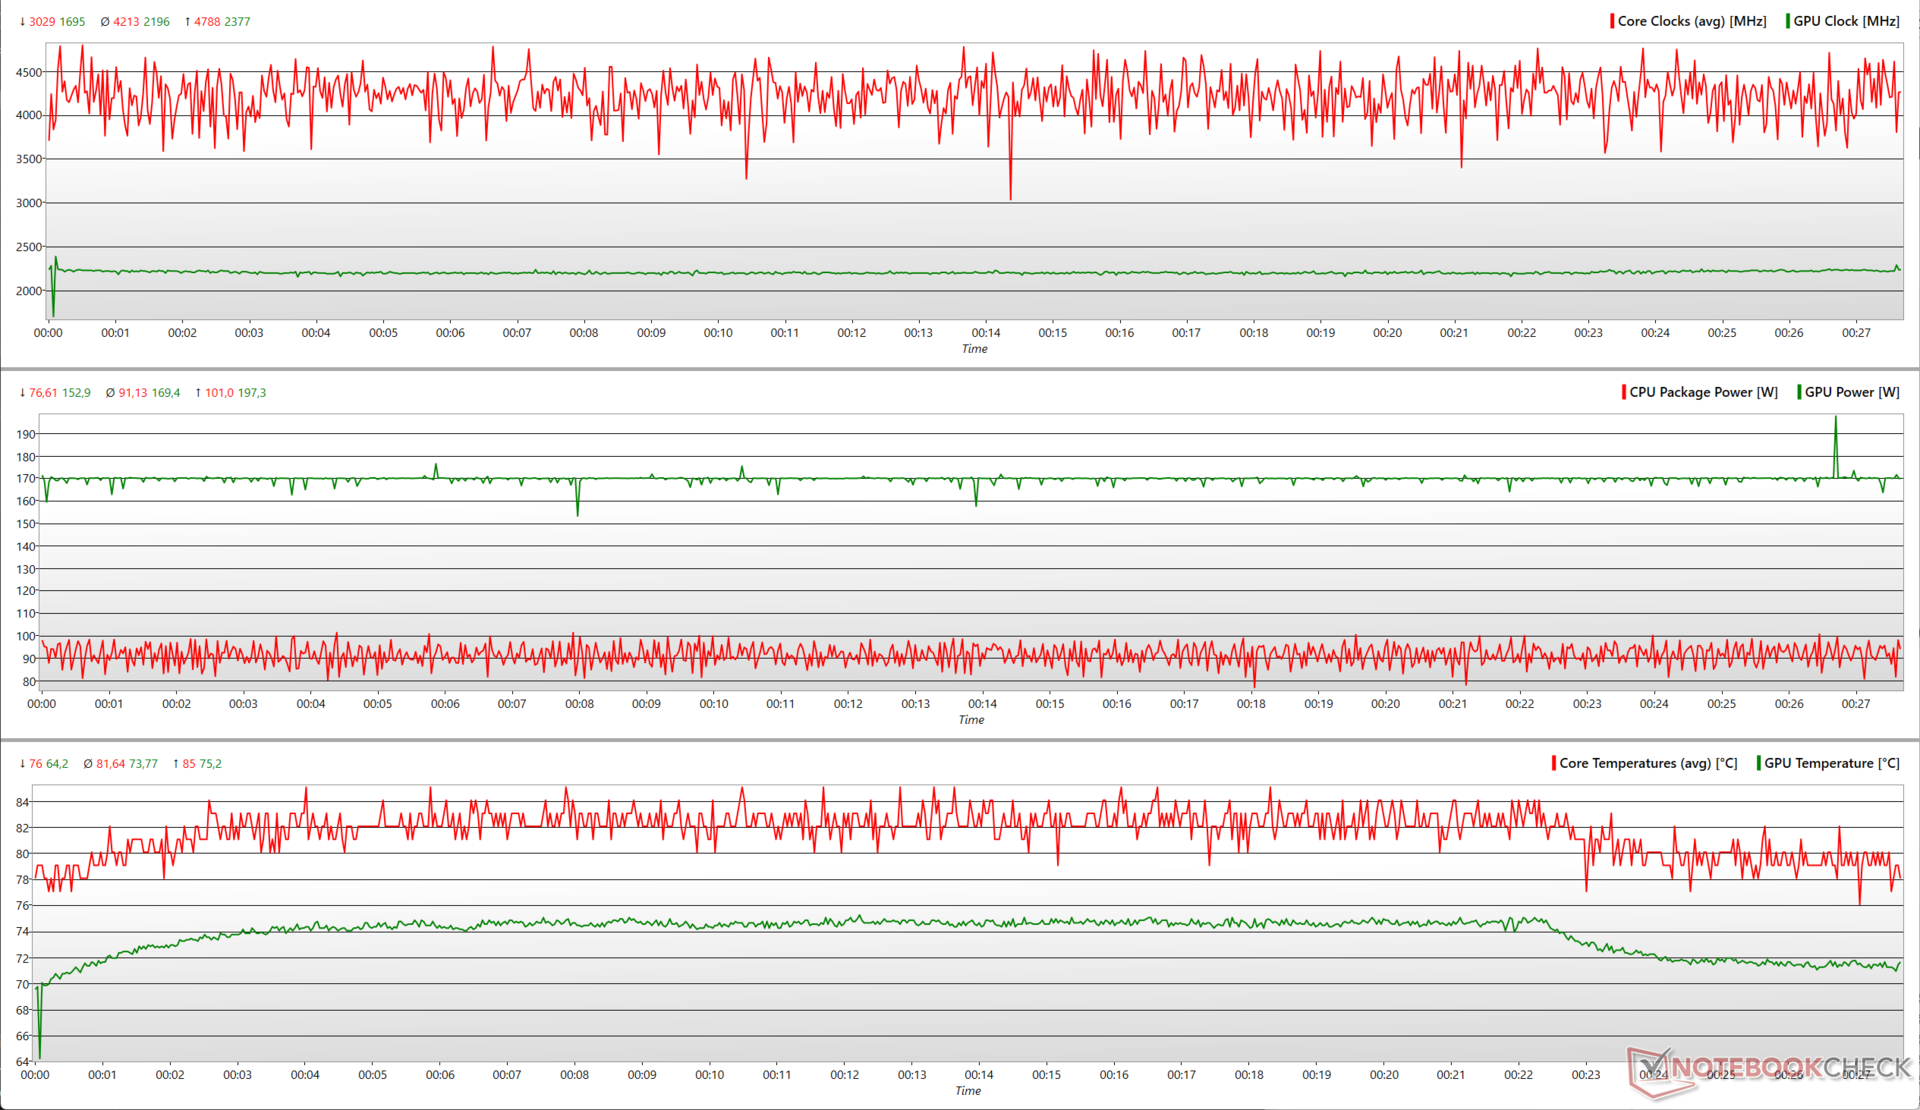
| Test de stress | Horloge du CPU (GHz) | Horloge du GPU (MHz) | Température moyenne du CPU (°C) | Température moyenne du GPU (°C) |
| Système au repos | 2.19 | 180 | 52 | 47 |
| Prime95 | 3.95 | 180 | 91 | 54.5 |
| Prime95 + FurMark | 3.07 | 1,860 | 83 | 74.2 |
| Cyberpunk 2077 1080p Ultra | 4.44 | 2.21 | 81 | 72.6 |
Intervenants
Le Titan 18 HX AI utilise un système à quatre haut-parleurs composé de deux haut-parleurs et de deux woofers. À un niveau de pression acoustique (SPL) de 87,4 db(A), les haut-parleurs produisent un son suffisamment fort sans distorsion perceptible.
Les woofers n'offrent pas une grande réponse dans les basses fréquences, mais le son n'est pas étouffé, contrairement à de nombreux haut-parleurs d'ordinateurs portables. Les médiums et les aigus sont assez bien reproduits.
Une prise audio combinée de 3,5 mm et le Bluetooth 5.4 permettent de connecter des haut-parleurs externes ou un casque pour une meilleure qualité audio.
MSI Titan 18 HX AI A2XWJG analyse audio
(+) | les haut-parleurs peuvent jouer relativement fort (87.4# dB)
Basses 100 - 315 Hz
(-) | presque aucune basse - en moyenne 20% plus bas que la médiane
(±) | la linéarité des basses est moyenne (8% delta à la fréquence précédente)
Médiums 400 - 2000 Hz
(±) | médiane supérieure - en moyenne 8.1% supérieure à la médiane
(+) | les médiums sont linéaires (6.7% delta à la fréquence précédente)
Aiguës 2 - 16 kHz
(+) | des sommets équilibrés - à seulement 2.5% de la médiane
(+) | les aigus sont linéaires (5.3% delta à la fréquence précédente)
Globalement 100 - 16 000 Hz
(±) | la linéarité du son global est moyenne (16.5% de différence avec la médiane)
Par rapport à la même classe
» 41% de tous les appareils testés de cette catégorie étaient meilleurs, 6% similaires, 53% pires
» Le meilleur avait un delta de 6%, la moyenne était de 18%, le pire était de 132%.
Par rapport à tous les appareils testés
» 26% de tous les appareils testés étaient meilleurs, 6% similaires, 68% pires
» Le meilleur avait un delta de 4%, la moyenne était de 24%, le pire était de 134%.
Apple MacBook Pro 16 2021 M1 Pro analyse audio
(+) | les haut-parleurs peuvent jouer relativement fort (84.7# dB)
Basses 100 - 315 Hz
(+) | bonne basse - seulement 3.8% loin de la médiane
(+) | les basses sont linéaires (5.2% delta à la fréquence précédente)
Médiums 400 - 2000 Hz
(+) | médiane équilibrée - seulement 1.3% de la médiane
(+) | les médiums sont linéaires (2.1% delta à la fréquence précédente)
Aiguës 2 - 16 kHz
(+) | des sommets équilibrés - à seulement 1.9% de la médiane
(+) | les aigus sont linéaires (2.7% delta à la fréquence précédente)
Globalement 100 - 16 000 Hz
(+) | le son global est linéaire (4.6% différence à la médiane)
Par rapport à la même classe
» 0% de tous les appareils testés de cette catégorie étaient meilleurs, 0% similaires, 100% pires
» Le meilleur avait un delta de 5%, la moyenne était de 18%, le pire était de 45%.
Par rapport à tous les appareils testés
» 0% de tous les appareils testés étaient meilleurs, 0% similaires, 100% pires
» Le meilleur avait un delta de 4%, la moyenne était de 24%, le pire était de 134%.
Gestion de l'énergie : Une forte consommation d'énergie avec une faible endurance de la batterie
Consommation électrique
La combinaison d'un Core Ultra 9 285HX et d'un GPU RTX 5090 pour ordinateur portable de 175 W avec une mini-LED 4K 120 Hz fait de la Titan 18 HX AI une machine énergivore.
Nous avons utilisé le mode MSHybrid pour enregistrer les mesures de consommation car le dGPU MUX a entraîné une consommation moyenne significativement élevée de 21,6 W en mode veille uniquement.
L'adaptateur 400 W fourni offre une marge de manœuvre suffisante pour répondre aux demandes de puissance maximale de la Titan 18 HX AI pendant les charges de travail intensives.
| Éteint/en veille | |
| Au repos | |
| Fortement sollicité |
|
Légende:
min: | |
| MSI Titan 18 HX AI A2XWJG Ultra 9 285HX, GeForce RTX 5090 Laptop, Mini-LED, 3840x2160, 18" | Aorus Master 18 AM8H Ultra 9 275HX, GeForce RTX 5090 Laptop, Mini-LED, 2560x1600, 18" | Asus Strix Scar 18 G835LX Ultra 9 275HX, GeForce RTX 5090 Laptop, Mini-LED, 2560x1600, 18" | SCHENKER XMG Neo 16 A25 5090 R9 9955HX3D, GeForce RTX 5090 Laptop, Mini-LED, 2560x1600, 16" | Medion Erazer Beast 18 X1 MD62731 Ultra 9 275HX, GeForce RTX 5080 Laptop, IPS, 2560x1600, 18" | Razer Blade 16 2025 RTX 5090 Ryzen AI 9 HX 370, GeForce RTX 5090 Laptop, OLED, 2560x1600, 16" | MSI Titan 18 HX A14VIG i9-14900HX, NVIDIA GeForce RTX 4090 Laptop GPU, Mini-LED, 3840x2400, 18" | Moyenne Nvidia GeForce RTX 5090 Laptop | Moyenne de la classe Gaming | |
|---|---|---|---|---|---|---|---|---|---|
| Power Consumption | -14% | -8% | 13% | 30% | 38% | -13% | 5% | 21% | |
| Idle Minimum * | 19.01 | 29 -53% | 11.4 40% | 13.2 31% | 7.9 58% | 10.9 43% | 13.2 31% | 15.9 ? 16% | 14.2 ? 25% |
| Idle Average * | 30.92 | 33 -7% | 39.2 -27% | 16.8 46% | 11.5 63% | 13.5 56% | 25.4 18% | 24.5 ? 21% | 20.2 ? 35% |
| Idle Maximum * | 33.84 | 48 -42% | 40.2 -19% | 17.1 49% | 16.6 51% | 13.7 60% | 53.5 -58% | 29.1 ? 14% | 27.3 ? 19% |
| Load Average * | 105.4 | 141 -34% | 161.2 -53% | 164.2 -56% | 130 -23% | 120.2 -14% | 151.4 -44% | 134.6 ? -28% | 105.7 ? -0% |
| Cyberpunk 2077 ultra * | 343 | 283 17% | 303 12% | 284 17% | 253 26% | 178.2 48% | |||
| Cyberpunk 2077 ultra external monitor * | 330 | 283 14% | 295 11% | 282 15% | 245 26% | 177.6 46% | |||
| Load Maximum * | 354 | 340 4% | 430.9 -22% | 392.8 -11% | 330 7% | 246.1 30% | 395.2 -12% | 341 ? 4% | 256 ? 28% |
| Witcher 3 ultra * | 336 |
* ... Moindre est la valeur, meilleures sont les performances
Power consumption: Cyberpunk 2077 / Stress test
Power consumption: External monitor
Autonomie de la batterie
Malgré une batterie de 99 Whr et un fonctionnement en mode ECO-Silent en mode MSHybrid à un taux de rafraîchissement de 60 Hz, le Titan 18 HX AI tient à peine trois heures en lecture vidéo 1080p H.264 à 150 nits.
La navigation Wi-Fi à la même luminosité prolonge l'autonomie à moins de 4,5 heures.
Les autres ordinateurs portables du comparatif équipés d'un Core Ultra 9 275HX offrent des durées d'autonomie beaucoup plus longues.
Il faut environ deux heures pour recharger complètement l'ordinateur portable à partir d'une batterie vide. Les deux ports Thunderbolt 5 peuvent également être utilisés pour la recharge, mais à un rythme nettement plus lent.
| MSI Titan 18 HX AI A2XWJG Ultra 9 285HX, GeForce RTX 5090 Laptop, 99 Wh | Aorus Master 18 AM8H Ultra 9 275HX, GeForce RTX 5090 Laptop, 99 Wh | Asus Strix Scar 18 G835LX Ultra 9 275HX, GeForce RTX 5090 Laptop, 90 Wh | SCHENKER XMG Neo 16 A25 5090 R9 9955HX3D, GeForce RTX 5090 Laptop, 99.8 Wh | Medion Erazer Beast 18 X1 MD62731 Ultra 9 275HX, GeForce RTX 5080 Laptop, 99 Wh | Razer Blade 16 2025 RTX 5090 Ryzen AI 9 HX 370, GeForce RTX 5090 Laptop, 90 Wh | MSI Titan 18 HX A14VIG i9-14900HX, NVIDIA GeForce RTX 4090 Laptop GPU, 99.9 Wh | Moyenne de la classe Gaming | |
|---|---|---|---|---|---|---|---|---|
| Autonomie de la batterie | 19% | 15% | 36% | 84% | 103% | -12% | 65% | |
| H.264 | 180 | 347 93% | 592 229% | 457 ? 154% | ||||
| WiFi v1.3 | 259 | 296 14% | 332 28% | 352 36% | 476 84% | 475 83% | 252 -3% | 384 ? 48% |
| Cyberpunk 2077 ultra 150cd | 73 | 44 -40% | 71 -3% | |||||
| Load | 90 | 112 24% | 70 -22% | 72 -20% | 84.8 ? -6% | |||
| Reader / Idle | 348 | 353 | 570 ? |
Impressions de Notebookcheck sur la MSI Titan 18 HX AI
Bien qu'il y ait quelques améliorations tangibles, le MSI Titan 18 HX AI ne justifie pas encore une dépense immédiate de 6 600 $, car il y a encore des points à améliorer.
MSI Titan 18 HX AI A2XWJG
- 06/02/2025 v8
Vaidyanathan Subramaniam
 Total Sustainability Score:
 Potential competitors in comparison
Image | Modèle | Prix | Poids | Épaisseur | Écran |
|---|---|---|---|---|---|
1. 86.1%  | MSI Titan 18 HX AI A2XWJG Intel Core Ultra 9 285HX ⎘ Nvidia GeForce RTX 5090 Laptop ⎘ 64 Go Mémoire, 6000 Go SSD | Amazon: $5,799.99 Prix de liste: 6600 USD | 3.6 kg | 32.05 mm | 18.00" 3840x2160 245 PPI Mini-LED |
2. 86.8%  | Aorus Master 18 AM8H Intel Core Ultra 9 275HX ⎘ Nvidia GeForce RTX 5090 Laptop ⎘ 64 Go Mémoire, 2048 Go SSD | Amazon: 1. $54.99 Smatree Hard EVA Protective ... 2. $54.99 Smatree Hard EVA Protective ... 3. $12.98 Puccy 2 Pack Touch Pad Film ... Prix de liste: 5000 EUR | 3.4 kg | 31 mm | 18.00" 2560x1600 168 PPI Mini-LED |
3. 88% 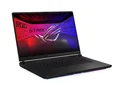 | Asus Strix Scar 18 G835LX Intel Core Ultra 9 275HX ⎘ Nvidia GeForce RTX 5090 Laptop ⎘ 64 Go Mémoire, 2048 Go SSD | Amazon: 1. $5,799.99 Asus ROG Strix Scar 18 (2025... 2. $3,299.99 ASUS ROG Strix SCAR 16 (2025... 3. $6.88 Keyboard Cover for ASUS ROG ... Prix de liste: 5799€ | 3.3 kg | 32 mm | 18.00" 2560x1600 168 PPI Mini-LED |
4. 82.5%  | Medion Erazer Beast 18 X1 MD62731 Intel Core Ultra 9 275HX ⎘ Nvidia GeForce RTX 5080 Laptop ⎘ 32 Go Mémoire, SSD | Prix de liste: 3700 EUR | 3.6 kg | 30.4 mm | 18.00" 2560x1600 168 PPI IPS |
5. 90%  | SCHENKER XMG Neo 16 E25 RTX 5090 Laptop Intel Core Ultra 9 275HX ⎘ Nvidia GeForce RTX 5090 Laptop ⎘ 32 Go Mémoire, 1024 Go SSD | Amazon: 1. $4,499.99 ASUS ROG Strix SCAR 18 (2025... 2. $4,299.99 ASUS ROG Strix SCAR 16 (2025... 3. $2,899.99 ASUS ROG Strix G16 (2025) Ga... Prix de liste: 4450€ | 2.9 kg | 27.9 mm | 16.00" 2560x1600 189 PPI Mini-LED |
6. 89.4%  | SCHENKER XMG Neo 16 A25 5090 AMD Ryzen 9 9955HX3D ⎘ Nvidia GeForce RTX 5090 Laptop ⎘ 32 Go Mémoire, 1024 Go NVMe | Prix de liste: 4480€ | 2.9 kg | 27.9 mm | 16.00" 2560x1600 189 PPI Mini-LED |
7. 88.4% 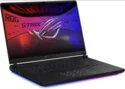 | Asus ROG Strix Scar 16 2025 Intel Core Ultra 9 275HX ⎘ Nvidia GeForce RTX 5090 Laptop ⎘ 64 Go Mémoire, 2048 Go SSD | Amazon: 1. $3,299.99 ASUS ROG Strix SCAR 16 (2025... 2. $4,299.99 ASUS ROG Strix SCAR 16 (2025... 3. $4,499.99 ASUS ROG Strix SCAR 18 (2025... Prix de liste: 4999€ | 2.8 kg | 30.8 mm | 16.00" 2560x1600 189 PPI Mini-LED |
8. 87%  | Razer Blade 16 2025 RTX 5090 AMD Ryzen AI 9 HX 370 ⎘ Nvidia GeForce RTX 5090 Laptop ⎘ 32 Go Mémoire, 2048 Go SSD | Amazon: 1. $4,199.99 Razer Blade 16 Gaming Laptop... 2. $5,495.00 Razer Blade 18 Gaming Laptop... Prix de liste: 4399€ | 2.1 kg | 17.4 mm | 16.00" 2560x1600 189 PPI OLED |
Transparency
La sélection des appareils à examiner est effectuée par notre équipe éditoriale. L'échantillon de test a été prêté à l'auteur par le fabricant ou le détaillant pour les besoins de cet examen. Le prêteur n'a pas eu d'influence sur cette évaluation et le fabricant n'a pas reçu de copie de cette évaluation avant sa publication. Il n'y avait aucune obligation de publier cet article. Nous n'acceptons jamais de compensation ou de paiement en échange de nos commentaires. En tant que média indépendant, Notebookcheck n'est pas soumis à l'autorité des fabricants, des détaillants ou des éditeurs.
Voici comment Notebookcheck teste
Chaque année, Notebookcheck examine de manière indépendante des centaines d'ordinateurs portables et de smartphones en utilisant des procédures standardisées afin de garantir que tous les résultats sont comparables. Nous avons continuellement développé nos méthodes de test depuis environ 20 ans et avons établi des normes industrielles dans le processus. Dans nos laboratoires de test, des équipements de mesure de haute qualité sont utilisés par des techniciens et des rédacteurs expérimentés. Ces tests impliquent un processus de validation en plusieurs étapes. Notre système d'évaluation complexe repose sur des centaines de mesures et de points de référence bien fondés, ce qui garantit l'objectivité.
