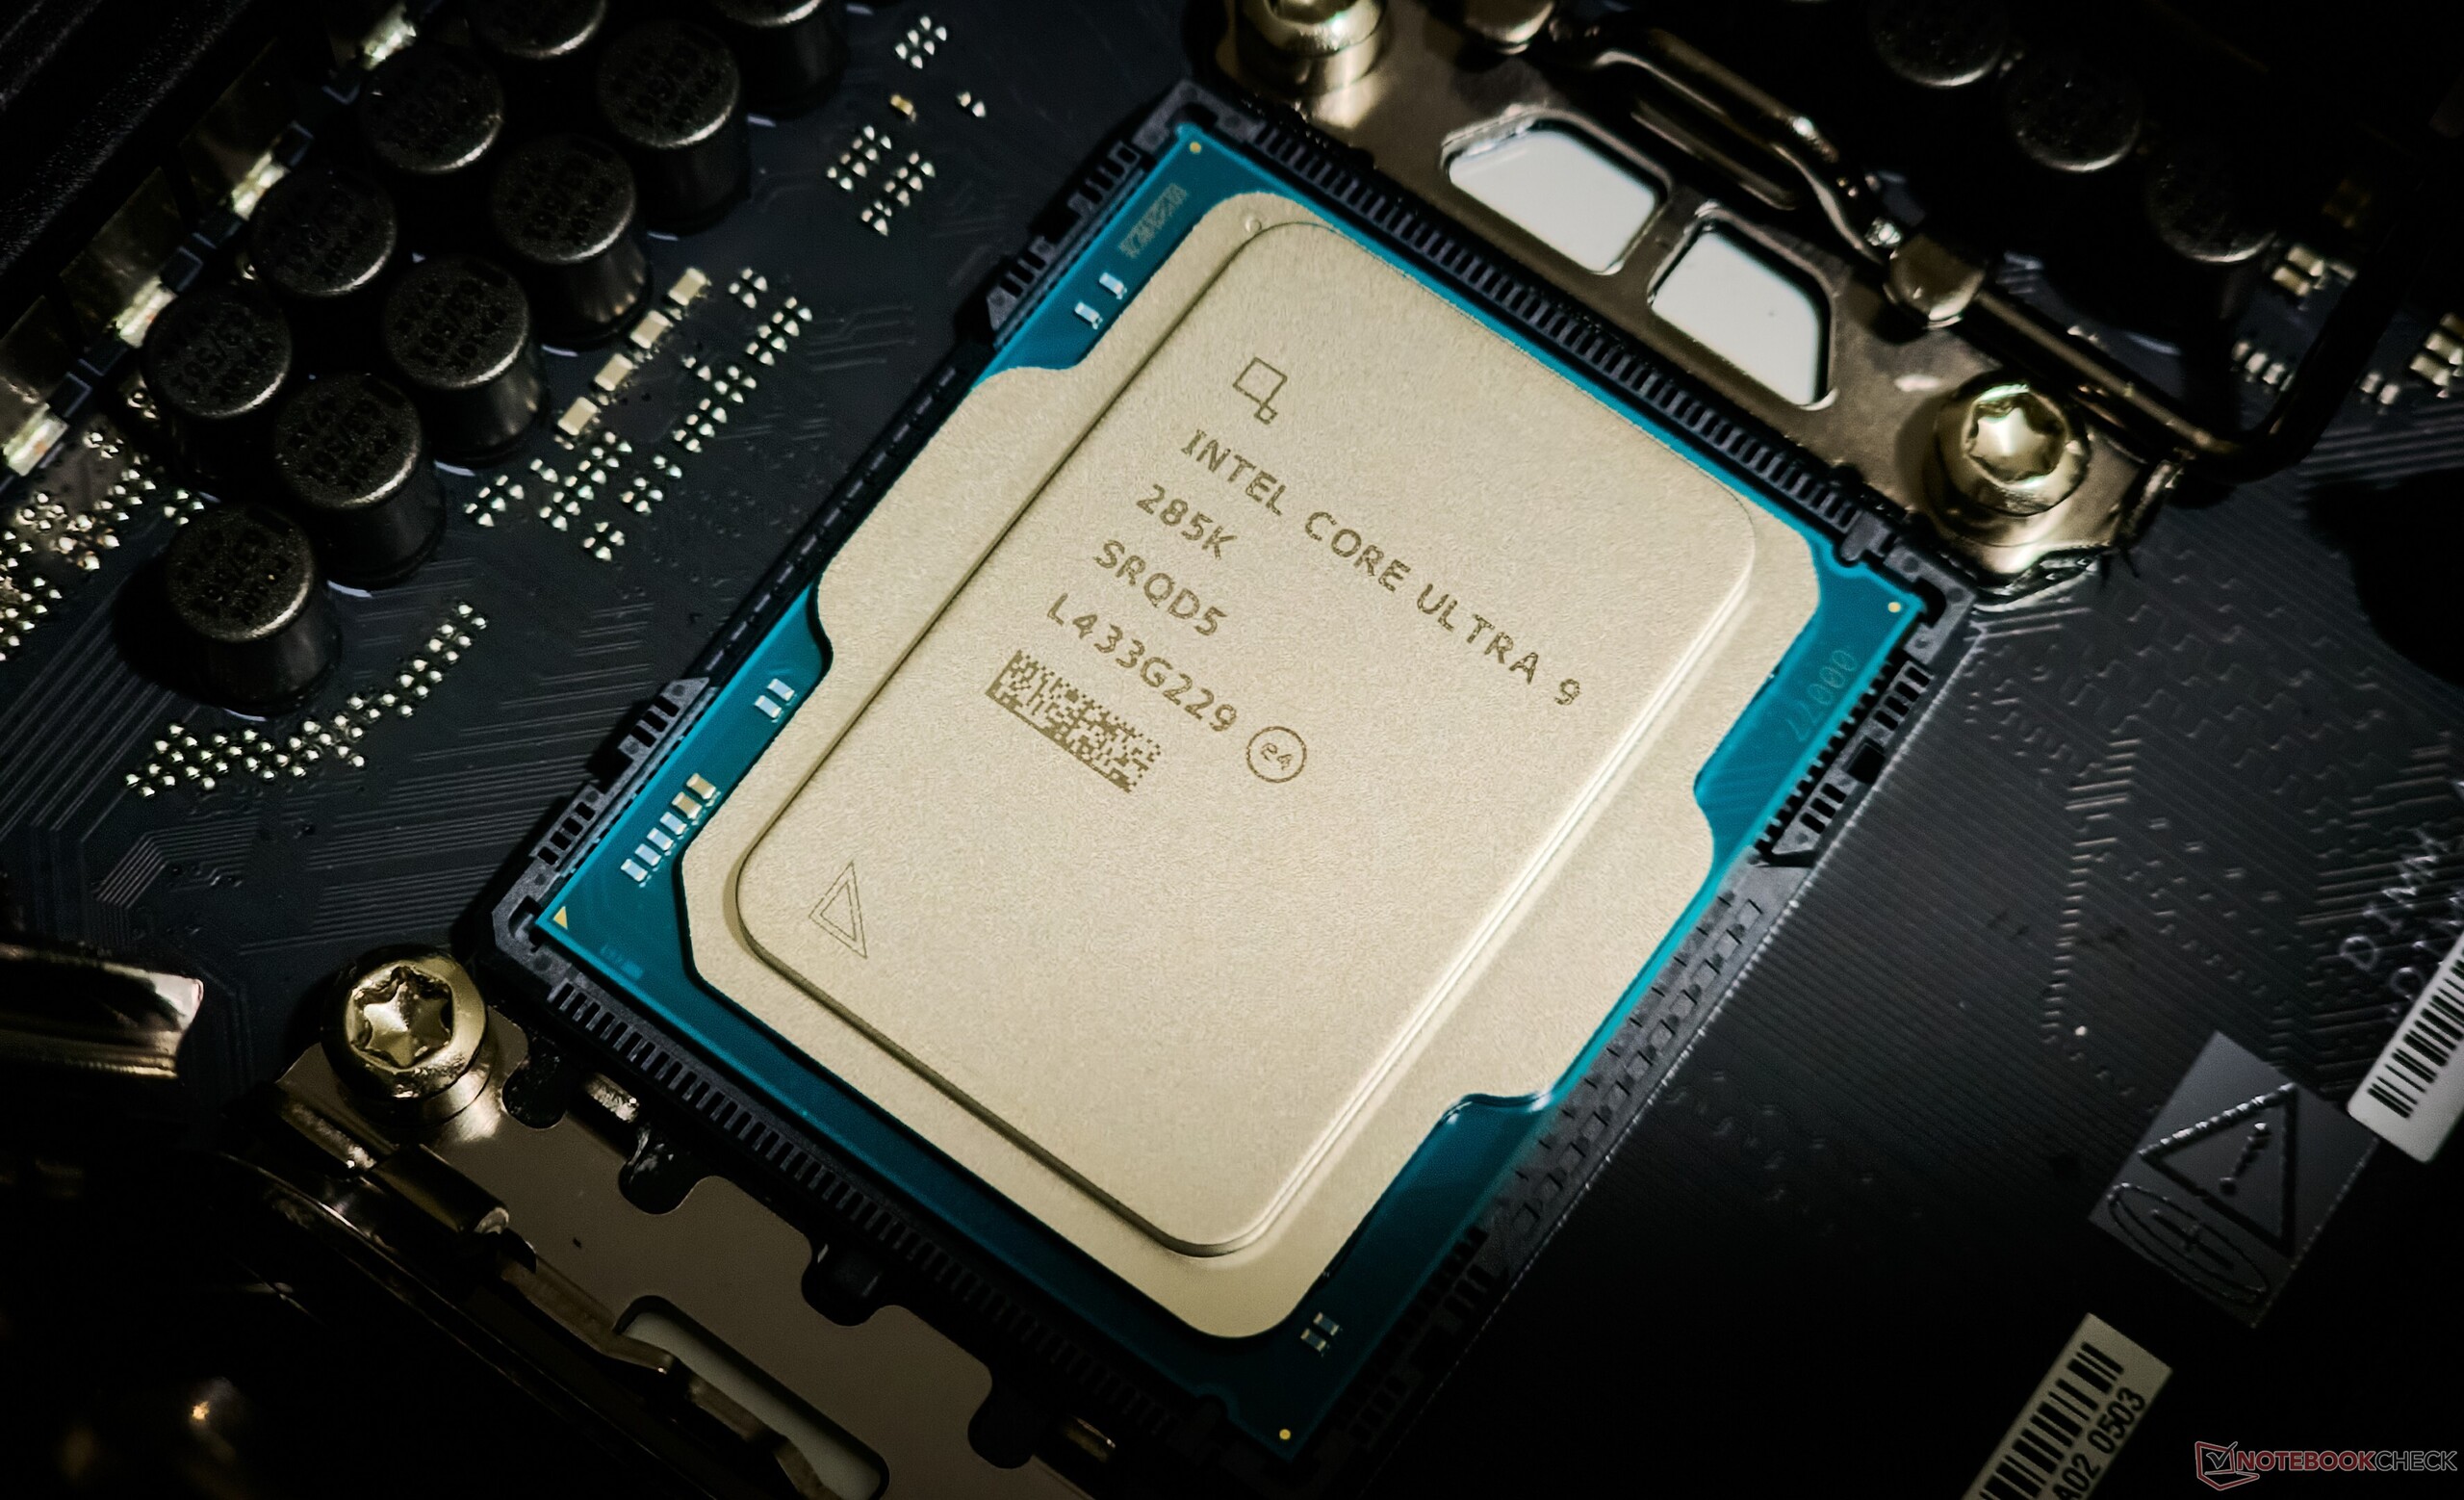
Test de l'Intel Core Ultra 9 285K Arrow Lake-S : efficacité énergétique plutôt que la 1re place en jeu
Peu gourmand en énergie, mais déficient en matière de jeux.
Le nouveau Core Ultra 9 285 Arrow Lake-S d'Intel introduit une nouvelle disposition des tuiles de calcul qui sacrifie l'hyperthreading et vise à séduire les passionnés avec des améliorations significatives en termes d'efficacité. Si le Core Ultra 9 285K est effectivement performant en termes de performances brutes et d'efficacité, il s'incline lourdement face aux Intel Raptor Lake-S Refresh et aux AMD Zen 5 Ryzen 9000 dans le domaine des jeux.Vaidyanathan Subramaniam (traduit par DeepL / Ninh Duy) Publié 🇺🇸 🇩🇪 ...
Verdict : l'efficacité d'Intel se heurte à un problème de jeu
Les puces d'ordinateur de bureau d'Intel ne sont pas vraiment réputées pour leur efficacité, mais l'entreprise espère réécrire l'histoire avec le lancement de l'Arrow Lake-S aujourd'hui.
La nouvelle gamme Arrow Lake-S d'Intel, menée par le Core Ultra 9 285K, marque un changement significatif en supprimant l'hyperthreading sur tous les modèles - une première depuis l'ère du Pentium 4. Dans les benchmarks cumulés de CPU, le Core Ultra 9 285K égale le Core i9-14900K et atteint presque les niveaux de performance du Ryzen 9 9950X.
Cela dit, le Core Ultra 9 285K surpasse ces deux processeurs dans les benchmarks individuels mono et multicœurs.
Ce que nous avons particulièrement apprécié, c'est la capacité d'Arrow Lake-S à réaliser des performances équivalentes, voire légèrement supérieures à celles de Raptor Lake-S Refresh, tout en atteignant une efficacité énergétique comparable à celle des processeurs Zen 5 d'AMD.
Cependant, malgré ces avancées, le Core Ultra 9 285K peine à offrir des performances de jeu, derrière le Core i9-14900K et les CPU Zen 5 dans toutes les résolutions testées.
Le Core Ultra 9 285K ne peut rivaliser qu'avec le Core i7-14700K dans les jeux. Ceci est surprenant étant donné les optimisations APO intégrées à Arrow Lake-S et l'absence d'hyperthreading, qui aurait théoriquement dû aider le CPU à obtenir de meilleurs résultats dans les jeux.
La nouvelle plateforme nécessite également des investissements supplémentaires dans de nouvelles cartes mères de la série 800 et de la mémoire DDR5, et c'est un élément que vous devez prendre en compte avant de procéder à une mise à niveau.
Points positifs
Points négatifs
Top 10
» Le Top 10 des PC portables multimédia
» Le Top 10 des PC portables de jeu
» Le Top 10 des PC portables de jeu légers
» Le Top 10 des ordinateurs portables bureautiques
» Le Top 10 des PC portables bureautiques premium/professionnels
» Le Top 10 des Stations de travail mobiles
» Le Top 10 des Ultraportables
» Le Top 10 des Ultrabooks
» Le Top 10 des Convertibles
» Le Top 10 des Tablettes
» Le Top 10 des Tablettes Windows
» Le Top 10 des Smartphones
» Le Top 10 des PC Portables á moins de 300 euros
» Le Top 10 des PC Portables á moins de 500 euros
» Le Top 25 des meilleurs écrans d'ordinateurs
Prix et disponibilité
L'Intel Core Ultra 9 285K sera disponible à partir d'aujourd'hui chez les détaillants du monde entier à un prix de vente conseillé de 589 $. Le Core i9-14900K Core i9-14900K reste viable si vous privilégiez à la fois le calcul et le jeu, malgré de légères pertes de performances dues à des BIOS plus récents.
Le Core i9-14900K AMD Ryzen 9 9950X(actuellement à 709 $ sur Amazon) et les Ryzen 9 9900X(429 $ sur Amazon) restent d'excellentes alternatives sans les problèmes de jeu du Core Ultra 9 285K.
Price comparison
Table des matières
- Verdict : l'efficacité d'Intel se heurte à un problème de jeu
- Le banc d'essai : GeForce La RTX 4090 est un excellent partenaire pour le Core Ultra 9 285K
- Performances du processeur : Au même niveau que le Core i9-14900K dans l'ensemble, avec de faibles gains par rapport au Ryzen 9 9950X
- Performances du système : Dans la même catégorie que le Core i9-14900K et l'AMD Zen 5
- 3D et performances de jeu : L'Arrow Lake-S déçoit largement
- Consommation électrique : Intel parvient enfin à améliorer l'efficacité énergétique
- L'impression générale de Notebookcheck sur le Core Ultra 9 285K
Les processeurs phares d'Intel des 13e et 14e générations pour ordinateurs de bureau ont fait parler d'eux pour de mauvaises raisons mauvaises raisons il n'y a pas si longtemps, mais il faut espérer que les choses changent pour le mieux aujourd'hui. Après avoir pris un bon départ avec Lunar Lake pour les ordinateurs portables, Intel se concentre désormais sur les processeurs Arrow Lake-S pour les ordinateurs de bureau.
Arrow Lake-S, ou Core Ultra 200S Series comme le veut le marketing, marque un changement de paradigme dans la stratégie d'Intel en matière de processeurs pour ordinateurs de bureau.
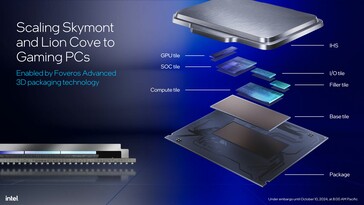
Cette génération voit le packaging 3D
Foveros d'Intel arriver pour la première fois sur les ordinateurs de bureau, l'utilisation des lignes de production 3 nm de TSMC au lieu de celles d'Intel, une nouvelle tuile Compute avec des P-cores Lion Cove réarrangés et des E-cores Skymont sans hyperthreading, un cache L2 plus important sur les P-cores, et l'arrivée de l'iGPU et du NPU Alchemist Xe - tous deux réutilisés depuis Meteor Lake. <br>Le fait d'avoir tous ces composants sur l'emballage nécessite inévitablement de nouvelles exigences en matière d'alimentation et, par conséquent, un nouveau socket. Les processeurs Arrow Lake-S nécessitent de nouvelles cartes mères de la série 800 dotées du nouveau socket LGA 1851. Malheureusement, Intel ne dit toujours pas si les prochaines générations de processeurs utiliseront ce nouveau schéma de brochage.
Ces processeurs ne disposant pas du contrôleur de mémoire hybride présent dans les processeurs Raptor Lake-S et Alder Lake-S, il est également nécessaire d'effectuer une transition complète vers la mémoire DDR5.
Dans cet article, nous examinons le nouveau Intel Core Ultra 9 285K et voyons si les décisions d'Intel sur les ordinateurs de bureau peuvent constituer un défi suffisant pour les dernières offres Ryzen 9000 d'AMD et les propres puces de la 14e génération d'Intel.
Vue d'ensemble des processeurs de bureau Intel Core Ultra 200S Series Arrow Lake-S
| SKU | Cœurs / Threads | P-Core Clock / Turbo | E-Core Clock / Turbo | Turbo Boost Max 3.0 | Total L2 Cache | L3 Cache | Integrated Graphics | NPU Peak TOPS | PBP (PL1) | MTP (PL2) | MSRP |
|---|---|---|---|---|---|---|---|---|---|---|---|
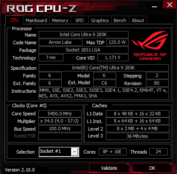
| Intel Core Ultra 9 285K | 24 (8P + 16E) /24 | 3,7 GHz / 5,5 GHz | 3,2 GHz / 4,6 GHz | 5,6 GHz | 40 Mo | 36 Mo | 4cœurs Xe, 2,0 GHz | 13 TOPS | 125 W | 250 W | $589 |
| Intel Core Ultra 7 265K | 20 (8P + 12E) /20 | 3,9 GHz / 5,4 GHz | 3,3 GHz / 4,6 GHz | 5,6 GHz | 36 MB | 30 MB | 4 Xe Cores, 2.0 GHz | 13 TOPS | 125 W | 250 W | $394 |
| Intel Core Ultra 7 265KF | 20 (8P + 12E) /20 | 3,9 GHz / 5,4 GHz | 3,3 GHz / 4,6 GHz | 5,6 GHz | 36 MB | 30 MB | - | 13 TOPS | 125 W | 250 W | $379 |
| Intel Core Ultra 5 245K | 14 (6P + 8E) /14 | 3,9 GHz / 5,4 GHz | 4,2 GHz / 5,2 GHz | 5,2 GHz | 26 Mo | 24 Mo | 4 cœurs Xe, 1,9 GHz | 13 TOPS | 125 W | 159 W | $309 |
| Intel Core Ultra 5 245KF | 14 (6P + 8E) /14 | 3,9 GHz / 5,4 GHz | 4,2 GHz / 5,2 GHz | 5,2 GHz | 26 MB | 24 MB | - | 13 TOPS | 125 W | 159 W | $294 |
Le banc d'essai : GeForce La RTX 4090 est un excellent partenaire pour le Core Ultra 9 285K
Nous avons utilisé les composants suivants pour tester le Core Ultra 9 285K :
- Banc d'essai ouvert Cooler Master MasterFrame 700
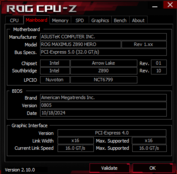
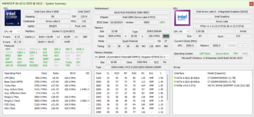
- Carte mère Asus ROG Maximus Z890 Hero avec BIOS version 0805
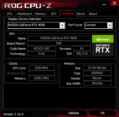
- Nvidia GeForce RTX 4090 Founders Edition GPU
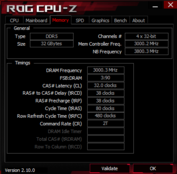
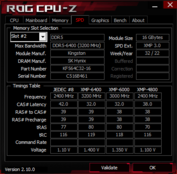
- 2x 16 GB Kingston Fury Beast DDR5-6400 RAM fonctionnant à DDR5-6000 avec timings 32-38-38-80 à 1.35 V
- Western Digital PC SN540 512 Go NVMe SSD et 2x Crucial MX500 1 TB SATA SSD pour OS, benchmarks et jeux
- Moniteur Alienware AW3225QF 4K 240 Hz QD-OLED
- Thermaltake TH420 V2 Ultra EX ARGB Refroidisseur AiO
- Bloc d'alimentation entièrement modulaire Cooler Master MVE Gold V2 1250 ATX 3.0
Nous tenons à remercier Intel pour avoir fourni l'échantillon de test Core Ultra 9 285K, Nvidia pour le GPU RTX 4090 Founders Edition, Asus pour la carte mère ROG Maximus Z890 Hero, Dell pour le moniteur AW3225QF, Kingston pour le kit mémoire DDR5, Thermaltake pour le TH420 V2 Ultra EX AIO, et enfin Cooler Master pour le banc de test et le bloc d'alimentation.
Tous les tests ont été effectués sur une nouvelle installation de Windows 11 24H2 (Build 26100.2033) avec les derniers pilotes de plateforme et le pilote Nvidia Game Ready 566.03.
Nous avons utilisé les paramètres de performance par défaut d'Intel dans le BIOS et réglé le plan d'alimentation de Windows sur Ultimate Performance, ce qui donne PL1=PL2=250 W.
Performances du processeur : Au même niveau que le Core i9-14900K dans l'ensemble, avec de faibles gains par rapport au Ryzen 9 9950X
Les tests CPU cumulés montrent que le Core Ultra 9 285K est à égalité avec le Core i9-14900K et seulement légèrement à la traîne de l'AMD Ryzen 9 9950X AMD Granite Ridge (Zen 5, AM5) Ryzen 9 9950X Notebook Processor . Cela est dû en grande partie au fait que le Core Ultra 9 285K est moins performant que le Ryzen 9 9950X dans des tests spécifiques tels que Blender 2.79 BMW27 CPU, les tests V-Ray, wPrime 2.1 et le benchmark R, bien que les différences ne soient pas très significatives.
Dans les tests Cinebench à cœur unique, l'Ultra 9 285K parvient à devancer légèrement le Core i9-14900K, avec l'Ultra 9 285K et le Core i9-14900K
Ryzen 9 9900X et le Ryzen 9 9950X. La situation est différente dans Geekbench, cependant, avec les puces Zen 5 réussissant des gains minuscules contre Arrow Lake-S.Les gains multicœurs sont plus palpables, le Core Ultra 9 285K 24C/24T affichant des gains de 4 à 6 % par rapport au Ryzen 9 9950X 16C/32T dans les tests multicœurs Cinebench, malgré l'absence d'hyperthreading. Le Core Ultra 9 285K, le Core i9-14900K et le Ryzen 9 9950X affichent tous des performances comparables dans le test multicœur Geekbench 6.3.
| CPU Performance rating - Percent | |
| AMD Ryzen 9 9950X | |
| Intel Core i9-14900K -1! | |
| Intel Core Ultra 9 285K | |
| AMD Ryzen 9 7950X -2! | |
| Intel Core i9-13900K | |
| AMD Ryzen 9 7950X3D | |
| AMD Ryzen 9 9900X -9! | |
| Intel Core i7-14700K | |
| AMD Ryzen 9 7900X -2! | |
| AMD Ryzen 7 9700X | |
| Intel Core i5-14600K | |
| Intel Core Ultra 5 245K | |
| Intel Core i9-12900K -1! | |
| Intel Core i5-13600K | |
| AMD Ryzen 5 9600X -2! | |
| AMD Ryzen 7 7800X3D -3! | |
| Intel Core i5-12600K -3! | |
* ... Moindre est la valeur, meilleures sont les performances
Cinebench R15 Multi Loop
Comme ses prédécesseurs, le Core Ultra 9 285K n'est pas livré avec un refroidisseur de CPU. Intel indique que les refroidisseurs conçus pour le LGA 1700 devraient être compatibles avec le LGA 1851. Nous n'avons eu aucun problème pour monter notre refroidisseur tout-en-un Thermaltake TH420 V2 Ultra EX ARGB en utilisant les mêmes supports de montage que ceux prévus pour le socket LGA 1700.
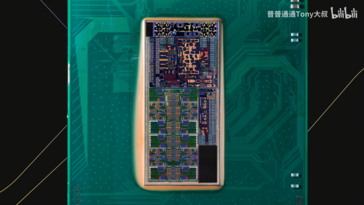
Ceci étant dit, attendez-vous à voir de nouveaux refroidisseurs spécifiques au LGA 1851 qui tiennent compte de la présence de la tuile Compute dans le sud-ouest de l'emballage. Les refroidisseurs conçus pour Arrow Lake-S peuvent offrir des performances de refroidissement légèrement supérieures, mais votre solution LGA 1700 existante fonctionnera parfaitement.
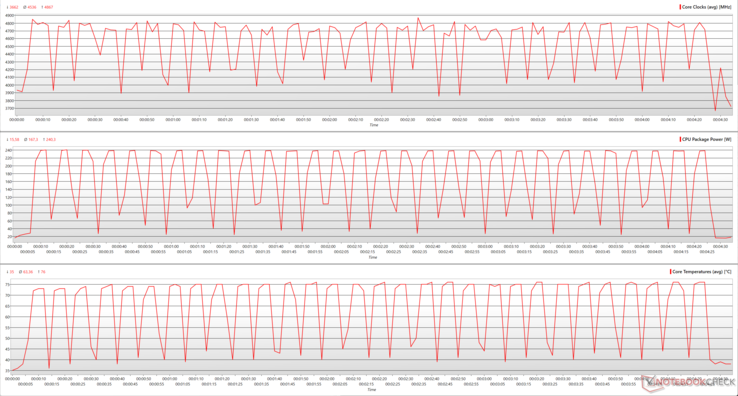
La capacité du TH420 V2 Ultra EX à refroidir efficacement le Core Ultra 9 285K est évidente si l'on en juge par les performances constantes de la boucle multicœur Cinebench R15 ci-dessous.
Nous constatons que le Core Ultra 9 285K peut atteindre 4,86 GHz lors de la boucle multicœur Cinebench R15, avec des horloges moyennes à 4,53 GHz.
Ces performances sont atteintes avec une consommation électrique de 240 W et une température maximale du cœur de 76 °C, ce qui est nettement inférieur aux 349 W et 87 °C du Core i9-14900K. En fait, même le Core i7-14700K affiche des chiffres plus élevés avec une consommation de 313 W et une température du cœur de 92 °C.
En moyenne, le Core Ultra 9 285K maintient une puissance de 167 W et une température de 63 °C, toutes deux inférieures aux valeurs respectives de 195 W et 76 °C du Core i7-14700K.
Performances du système : Dans la même catégorie que le Core i9-14900K et l'AMD Zen 5
Les performances globales du Core Ultra 9 285K sont comparables à celles du Core i9-14900K et du Ryzen 9 9950X et ne sont pas très différentes de celles que nous observons avec le Ryzen 9 7950X, Core i9-13900Ket la Ryzen 9 9900X.
Cependant, les benchmarks individuels montrent des gains légèrement supérieurs avec le Core i9-14900K dans 3DMark Time Spy CPU, 3DMark 11 Performance Physics, et CrossMark. PCMark 10 place le Core Ultra 9 285K un peu plus haut que le Core i9-14900K, mais surtout au même niveau que l'AMD Zen 5.
Les CPU AMD ont un avantage particulier dans les tests CPU AIDA64, à l'exception de CPU PhotoWorxx, où le Core Ultra 9 285K parvient à prendre une avance perceptible.
Néanmoins, les tâches régulières de productivité ne rencontrent aucun problème dans l'utilisation quotidienne.
3DMark 11: 1280x720 Performance Physics
3DMark: 1920x1080 Fire Strike Physics | 2560x1440 Time Spy CPU
CrossMark: Overall | Responsiveness | Creativity | Productivity
PCMark 10: Score | Essentials | Productivity | Digital Content Creation
AIDA64: FP32 Ray-Trace | FPU Julia | CPU SHA3 | CPU Queen | FPU SinJulia | FPU Mandel | CPU AES | CPU ZLib | FP64 Ray-Trace | CPU PhotoWorxx
| System Performance rating | |
| AMD Ryzen 9 9950X | |
| Intel Core i9-14900K | |
| Intel Core Ultra 9 285K | |
| AMD Ryzen 9 7950X | |
| Intel Core i9-13900K | |
| AMD Ryzen 9 9900X | |
| AMD Ryzen 9 7950X3D -2! | |
| Intel Core i7-14700K | |
| AMD Ryzen 9 7900X | |
| AMD Ryzen 7 9700X | |
| Intel Core i5-14600K | |
| AMD Ryzen 7 7800X3D | |
| Intel Core i5-13600K | |
| AMD Ryzen 5 9600X | |
| Intel Core Ultra 5 245K | |
| Intel Core i9-12900K -4! | |
| Intel Core i5-12600K -4! | |
| PCMark 10 / Digital Content Creation | |
| Intel Core Ultra 9 285K | |
| AMD Ryzen 9 9950X | |
| AMD Ryzen 9 9900X | |
| AMD Ryzen 7 9700X | |
| Intel Core i9-14900K | |
| Intel Core Ultra 5 245K | |
| AMD Ryzen 5 9600X | |
| Intel Core i7-14700K | |
| AMD Ryzen 9 7900X | |
| AMD Ryzen 9 7950X | |
| Intel Core i9-13900K | |
| Intel Core i5-14600K | |
| AMD Ryzen 7 7800X3D | |
| Intel Core i5-13600K | |
| Intel Core i9-12900K | |
| Intel Core i5-12600K | |
3DMark 11: 1280x720 Performance Physics
3DMark: 1920x1080 Fire Strike Physics | 2560x1440 Time Spy CPU
CrossMark: Overall | Responsiveness | Creativity | Productivity
PCMark 10: Score | Essentials | Productivity | Digital Content Creation
AIDA64: FP32 Ray-Trace | FPU Julia | CPU SHA3 | CPU Queen | FPU SinJulia | FPU Mandel | CPU AES | CPU ZLib | FP64 Ray-Trace | CPU PhotoWorxx
| PCMark 10 Score | 10514 points | |
Aide | ||
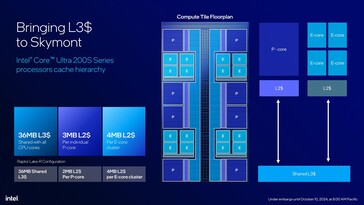
Intel a opté pour une conception radicalement nouvelle des tuiles de calcul avec Arrow Lake-S. Les P-cores et les E-cores ne sont plus dans leurs propres blocs contigus avec leurs propres caches. Au lieu de cela, les E-cores sont répartis en grappes de quatre entre les P-cores aux coins de la tuile.
Tous les cœurs partagent désormais un cache L3 unifié qui traverse le centre de la tuile et un bus annulaire unifié. Cette conception devrait théoriquement permettre de déplacer plus rapidement les données entre les cœurs et d'éviter que la chaleur ne se concentre autour d'un seul ou d'un groupe de cœurs.
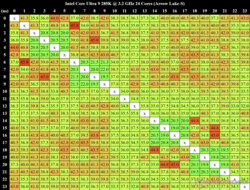
Nous avons utilisé MicrobenchX pour calculer la latence entre les cœurs. Les latences entre les cœurs atteignent 45,8 ns entre le cœur 2 et le cœur 7, ce qui indique une longue latence possible lorsque les données se déplacent du cœur E au cœur E. Les quatre grappes de cœurs E semblent toutefois présenter une latence minimale de l'ordre de 19 ns à 21,3 ns pour le transfert de données au sein de ces grappes.
Cependant, les quatre clusters E-core semblent présenter une latence minimale de l'ordre de 19 ns à 21,3 ns pour le transfert de données au sein de ces clusters.
Nous avons mesuré une latence médiane globale entre les cœurs de 38,25 ns.
| AIDA64 Memory Performance rating - Percent | |
| Intel Core i9-12900K -1! | |
| Intel Core i9-14900K | |
| Intel Core i7-14700K | |
| Intel Core i5-12600K -1! | |
| Intel Core i5-14600K | |
| Intel Core Ultra 9 285K | |
| AMD Ryzen 9 7950X3D | |
| AMD Ryzen 9 7950X | |
| AMD Ryzen 9 9950X | |
| Intel Core i9-13900K | |
| AMD Ryzen 9 9900X | |
| AMD Ryzen 9 7900X | |
| AMD Ryzen 7 7800X3D | |
| Intel Core i5-13600K | |
| AMD Ryzen 7 9700X | |
| AMD Ryzen 5 9600X | |
| Intel Core Ultra 5 245K | |
* ... Moindre est la valeur, meilleures sont les performances
3D et performances de jeu : L'Arrow Lake-S déçoit largement
On pourrait s'attendre à ce que les avantages liés à l'absence d'hyperthreading, à l'Intel APO et à l'augmentation de l'IPC, en particulier sur les cœurs Skymont, se traduisent par de bons résultats dans les jeux. Préparez-vous à être déçu.
Alors que le Core Ultra 9 285K a montré des performances CPU louables avec des besoins en énergie relativement faibles, la situation devient déséquilibrée lorsqu'il s'agit de tâches 3D et de jeux.
Le Core Ultra 9 285K, associé au GPU Nvidia GeForce RTX 4090, parvient à prendre 13% d'avance sur la Ryzen 9 9900X dans 3DMark 11 Performance GPU et 6% sur la Ryzen 9 9950X dans 3DMark Time Spy Graphics.
Le système est toutefois nettement moins performant que les autres modèles Raptor Lake-S Refresh et Zen 5 dans 3DMark Fire Strike Graphics, ce qui le place dans une position globalement désavantageuse.
| 3DMark Performance rating - Percent | |
| Intel Core i5-14600K | |
| AMD Ryzen 7 7800X3D | |
| AMD Ryzen 5 9600X | |
| Intel Core Ultra 5 245K | |
| AMD Ryzen 7 9700X | |
| AMD Ryzen 9 7950X3D | |
| Intel Core i9-14900K | |
| Intel Core i7-14700K | |
| AMD Ryzen 9 9950X | |
| AMD Ryzen 9 9900X | |
| Intel Core Ultra 9 285K | |
| 3DMark 11 - 1280x720 Performance GPU | |
| AMD Ryzen 7 7800X3D | |
| Intel Core i5-14600K | |
| AMD Ryzen 9 7950X3D | |
| Intel Core i9-14900K | |
| Intel Core Ultra 5 245K | |
| AMD Ryzen 5 9600X | |
| Intel Core i7-14700K | |
| AMD Ryzen 9 9950X | |
| AMD Ryzen 7 9700X | |
| Intel Core Ultra 9 285K | |
| AMD Ryzen 9 9900X | |
| 3DMark | |
| 2560x1440 Time Spy Graphics | |
| Intel Core i5-14600K | |
| Intel Core i9-14900K | |
| AMD Ryzen 7 7800X3D | |
| Intel Core i7-14700K | |
| AMD Ryzen 5 9600X | |
| Intel Core Ultra 5 245K | |
| AMD Ryzen 9 7950X3D | |
| AMD Ryzen 7 9700X | |
| AMD Ryzen 9 9900X | |
| Intel Core Ultra 9 285K | |
| AMD Ryzen 9 9950X | |
| 1920x1080 Fire Strike Graphics | |
| Intel Core i5-14600K | |
| AMD Ryzen 7 9700X | |
| AMD Ryzen 5 9600X | |
| Intel Core Ultra 5 245K | |
| AMD Ryzen 9 9950X | |
| AMD Ryzen 9 9900X | |
| AMD Ryzen 7 7800X3D | |
| AMD Ryzen 9 7950X3D | |
| Intel Core i9-14900K | |
| Intel Core i7-14700K | |
| Intel Core Ultra 9 285K | |
| 3DMark 11 Performance | 62846 points | |
| 3DMark Fire Strike Score | 44363 points | |
| 3DMark Time Spy Score | 30904 points | |
Aide | ||
Des tendances similaires sont observées dans les jeux. Contrairement aux affirmations d'Intel lors du lancement, le Core Ultra 9 285K associé à la RTX 4090 se classe au bas de notre tableau de comparaison des jeux, n'étant égalé que par le Core i7-14700K et se laissant distancer de manière significative par les offres Zen 5 (jusqu'à 12 %) dans les tests de jeux cumulés en 720p Low et 1080p Ultra.
Le Core Ultra 9 285K semble afficher des gains minimes par rapport au Core i7-14700K dans Far Cry 5, Dota 2 Reborn, et Metro Exodus (non Enhanced Edition), mais les différences sont minuscules et les performances globales sont encore loin derrière les Core i9-14700K et Core i9-14900K.
Même le Core i5-14600K semble être un meilleur processeur de jeu avec un gain de 7% par rapport au Core Ultra 9 285K
| Gaming Performance rating - Percent | |
| AMD Ryzen 7 7800X3D | |
| AMD Ryzen 9 7950X3D | |
| Intel Core i9-14900K | |
| AMD Ryzen 7 9700X | |
| AMD Ryzen 9 9900X | |
| AMD Ryzen 5 9600X | |
| AMD Ryzen 9 9950X | |
| Intel Core i5-14600K | |
| Intel Core i7-14700K | |
| Intel Core Ultra 9 285K | |
| Intel Core Ultra 5 245K | |
| F1 22 | |
| 1280x720 Ultra Low Preset AA:T AF:16x | |
| AMD Ryzen 7 7800X3D | |
| Intel Core i9-14900K | |
| AMD Ryzen 9 7950X3D | |
| AMD Ryzen 9 9950X | |
| AMD Ryzen 5 9600X | |
| AMD Ryzen 7 9700X | |
| AMD Ryzen 9 9900X | |
| Intel Core i5-14600K | |
| Intel Core i7-14700K | |
| Intel Core Ultra 9 285K | |
| Intel Core Ultra 5 245K | |
| 1920x1080 Low Preset AA:T AF:16x | |
| AMD Ryzen 7 7800X3D | |
| AMD Ryzen 9 7950X3D | |
| Intel Core i9-14900K | |
| AMD Ryzen 5 9600X | |
| AMD Ryzen 9 9950X | |
| AMD Ryzen 7 9700X | |
| AMD Ryzen 9 9900X | |
| Intel Core i5-14600K | |
| Intel Core i7-14700K | |
| Intel Core Ultra 9 285K | |
| Intel Core Ultra 5 245K | |
| 1920x1080 Ultra High Preset AA:T AF:16x | |
| AMD Ryzen 7 7800X3D | |
| Intel Core i9-14900K | |
| AMD Ryzen 7 9700X | |
| Intel Core i5-14600K | |
| AMD Ryzen 9 7950X3D | |
| AMD Ryzen 5 9600X | |
| AMD Ryzen 9 9900X | |
| AMD Ryzen 9 9950X | |
| Intel Core i7-14700K | |
| Intel Core Ultra 9 285K | |
| Intel Core Ultra 5 245K | |
| X-Plane 11.11 | |
| 1280x720 low (fps_test=1) | |
| AMD Ryzen 7 9700X | |
| AMD Ryzen 9 9900X | |
| AMD Ryzen 5 9600X | |
| Intel Core i9-14900K | |
| Intel Core i5-14600K | |
| Intel Core i7-14700K | |
| AMD Ryzen 9 7950X3D | |
| AMD Ryzen 7 7800X3D | |
| AMD Ryzen 9 9950X | |
| Intel Core Ultra 9 285K | |
| Intel Core Ultra 5 245K | |
| 1920x1080 high (fps_test=3) | |
| AMD Ryzen 7 7800X3D | |
| AMD Ryzen 9 7950X3D | |
| AMD Ryzen 7 9700X | |
| AMD Ryzen 9 9900X | |
| AMD Ryzen 5 9600X | |
| Intel Core i9-14900K | |
| AMD Ryzen 9 9950X | |
| Intel Core i7-14700K | |
| Intel Core i5-14600K | |
| Intel Core Ultra 9 285K | |
| Intel Core Ultra 5 245K | |
| Final Fantasy XV Benchmark | |
| 1280x720 Lite Quality | |
| AMD Ryzen 5 9600X | |
| AMD Ryzen 7 7800X3D | |
| Intel Core i5-14600K | |
| AMD Ryzen 9 9950X | |
| Intel Core i9-14900K | |
| Intel Core i7-14700K | |
| AMD Ryzen 7 9700X | |
| Intel Core Ultra 5 245K | |
| AMD Ryzen 9 9900X | |
| AMD Ryzen 9 7950X3D | |
| Intel Core Ultra 9 285K | |
| 1920x1080 High Quality | |
| Intel Core i9-14900K | |
| AMD Ryzen 7 7800X3D | |
| Intel Core i5-14600K | |
| AMD Ryzen 9 7950X3D | |
| AMD Ryzen 9 9900X | |
| AMD Ryzen 5 9600X | |
| Intel Core i7-14700K | |
| Intel Core Ultra 9 285K | |
| AMD Ryzen 7 9700X | |
| AMD Ryzen 9 9950X | |
| Intel Core Ultra 5 245K | |
| Dota 2 Reborn | |
| 1280x720 min (0/3) fastest | |
| AMD Ryzen 7 7800X3D | |
| AMD Ryzen 7 9700X | |
| AMD Ryzen 9 7950X3D | |
| AMD Ryzen 9 9900X | |
| AMD Ryzen 9 9950X | |
| Intel Core i9-14900K | |
| AMD Ryzen 5 9600X | |
| Intel Core i5-14600K | |
| Intel Core Ultra 9 285K | |
| Intel Core i7-14700K | |
| Intel Core Ultra 5 245K | |
| 1920x1080 ultra (3/3) best looking | |
| AMD Ryzen 7 7800X3D | |
| AMD Ryzen 9 7950X3D | |
| AMD Ryzen 9 9900X | |
| AMD Ryzen 9 9950X | |
| AMD Ryzen 7 9700X | |
| AMD Ryzen 5 9600X | |
| Intel Core i9-14900K | |
| Intel Core i5-14600K | |
| Intel Core Ultra 9 285K | |
| Intel Core i7-14700K | |
| Intel Core Ultra 5 245K | |
| The Witcher 3 | |
| 1024x768 Low Graphics & Postprocessing | |
| AMD Ryzen 9 7950X3D | |
| AMD Ryzen 7 7800X3D | |
| Intel Core i9-14900K | |
| AMD Ryzen 9 9950X | |
| AMD Ryzen 5 9600X | |
| AMD Ryzen 7 9700X | |
| AMD Ryzen 9 9900X | |
| Intel Core i7-14700K | |
| Intel Core i5-14600K | |
| Intel Core Ultra 9 285K | |
| Intel Core Ultra 5 245K | |
| 1920x1080 Ultra Graphics & Postprocessing (HBAO+) | |
| Intel Core i5-14600K | |
| AMD Ryzen 7 7800X3D | |
| Intel Core i9-14900K | |
| Intel Core Ultra 5 245K | |
| AMD Ryzen 9 7950X3D | |
| Intel Core Ultra 9 285K | |
| Intel Core i7-14700K | |
| AMD Ryzen 5 9600X | |
| AMD Ryzen 9 9950X | |
| AMD Ryzen 7 9700X | |
| AMD Ryzen 9 9900X | |
| GTA V | |
| 1024x768 Lowest Settings possible | |
| AMD Ryzen 7 7800X3D | |
| AMD Ryzen 5 9600X | |
| AMD Ryzen 9 7950X3D | |
| Intel Core i9-14900K | |
| AMD Ryzen 7 9700X | |
| AMD Ryzen 9 9900X | |
| Intel Core i5-14600K | |
| Intel Core Ultra 5 245K | |
| Intel Core i7-14700K | |
| AMD Ryzen 9 9950X | |
| Intel Core Ultra 9 285K | |
| 1920x1080 Highest AA:4xMSAA + FX AF:16x | |
| AMD Ryzen 7 7800X3D | |
| Intel Core i9-14900K | |
| AMD Ryzen 9 9900X | |
| AMD Ryzen 7 9700X | |
| AMD Ryzen 5 9600X | |
| AMD Ryzen 9 9950X | |
| Intel Core i5-14600K | |
| Intel Core Ultra 9 285K | |
| AMD Ryzen 9 7950X3D | |
| Intel Core i7-14700K | |
| Intel Core Ultra 5 245K | |
| Borderlands 3 | |
| 1280x720 Very Low Overall Quality (DX11) | |
| AMD Ryzen 7 7800X3D | |
| AMD Ryzen 9 7950X3D | |
| Intel Core i9-14900K | |
| AMD Ryzen 7 9700X | |
| AMD Ryzen 9 9900X | |
| AMD Ryzen 9 9950X | |
| Intel Core i5-14600K | |
| AMD Ryzen 5 9600X | |
| Intel Core i7-14700K | |
| Intel Core Ultra 9 285K | |
| Intel Core Ultra 5 245K | |
| 1920x1080 Very Low Overall Quality (DX11) | |
| AMD Ryzen 9 7950X3D | |
| AMD Ryzen 7 7800X3D | |
| Intel Core i9-14900K | |
| AMD Ryzen 9 9900X | |
| AMD Ryzen 7 9700X | |
| AMD Ryzen 9 9950X | |
| Intel Core i5-14600K | |
| AMD Ryzen 5 9600X | |
| Intel Core i7-14700K | |
| Intel Core Ultra 9 285K | |
| Intel Core Ultra 5 245K | |
| 1920x1080 Badass Overall Quality (DX11) | |
| AMD Ryzen 9 7950X3D | |
| AMD Ryzen 7 7800X3D | |
| Intel Core i9-14900K | |
| AMD Ryzen 7 9700X | |
| AMD Ryzen 9 9900X | |
| Intel Core i5-14600K | |
| AMD Ryzen 9 9950X | |
| AMD Ryzen 5 9600X | |
| Intel Core i7-14700K | |
| Intel Core Ultra 9 285K | |
| Intel Core Ultra 5 245K | |
| Shadow of the Tomb Raider | |
| 1280x720 Lowest Preset | |
| AMD Ryzen 7 7800X3D | |
| AMD Ryzen 9 7950X3D | |
| AMD Ryzen 7 9700X | |
| AMD Ryzen 9 9950X | |
| Intel Core i9-14900K | |
| AMD Ryzen 9 9900X | |
| AMD Ryzen 5 9600X | |
| Intel Core Ultra 9 285K | |
| Intel Core i5-14600K | |
| Intel Core i7-14700K | |
| Intel Core Ultra 5 245K | |
| 1920x1080 Highest Preset AA:T | |
| AMD Ryzen 7 7800X3D | |
| AMD Ryzen 9 7950X3D | |
| Intel Core i9-14900K | |
| AMD Ryzen 9 9900X | |
| AMD Ryzen 7 9700X | |
| AMD Ryzen 9 9950X | |
| AMD Ryzen 5 9600X | |
| Intel Core i5-14600K | |
| Intel Core Ultra 9 285K | |
| Intel Core i7-14700K | |
| Intel Core Ultra 5 245K | |
| Metro Exodus | |
| 1280x720 Low Quality AF:4x | |
| AMD Ryzen 7 7800X3D | |
| AMD Ryzen 7 9700X | |
| AMD Ryzen 5 9600X | |
| AMD Ryzen 9 9950X | |
| AMD Ryzen 9 9900X | |
| Intel Core i9-14900K | |
| Intel Core Ultra 9 285K | |
| Intel Core i5-14600K | |
| AMD Ryzen 9 7950X3D | |
| Intel Core i7-14700K | |
| Intel Core Ultra 5 245K | |
| 1920x1080 Ultra Quality AF:16x | |
| AMD Ryzen 7 7800X3D | |
| AMD Ryzen 5 9600X | |
| Intel Core i9-14900K | |
| AMD Ryzen 7 9700X | |
| AMD Ryzen 9 9900X | |
| AMD Ryzen 9 9950X | |
| Intel Core i5-14600K | |
| Intel Core i7-14700K | |
| Intel Core Ultra 9 285K | |
| AMD Ryzen 9 7950X3D | |
| Intel Core Ultra 5 245K | |
| F1 2021 | |
| 1280x720 Ultra Low Preset | |
| AMD Ryzen 7 7800X3D | |
| Intel Core i9-14900K | |
| AMD Ryzen 9 7950X3D | |
| AMD Ryzen 5 9600X | |
| AMD Ryzen 9 9950X | |
| AMD Ryzen 7 9700X | |
| AMD Ryzen 9 9900X | |
| Intel Core i5-14600K | |
| Intel Core i7-14700K | |
| Intel Core Ultra 9 285K | |
| Intel Core Ultra 5 245K | |
| 1920x1080 Ultra High Preset + Raytracing AA:T AF:16x | |
| AMD Ryzen 7 7800X3D | |
| Intel Core i9-14900K | |
| AMD Ryzen 7 9700X | |
| AMD Ryzen 5 9600X | |
| Intel Core i5-14600K | |
| AMD Ryzen 9 7950X3D | |
| AMD Ryzen 9 9900X | |
| AMD Ryzen 9 9950X | |
| Intel Core i7-14700K | |
| Intel Core Ultra 9 285K | |
| Intel Core Ultra 5 245K | |
Même les paramètres liés au GPU tels que QHD Ultra et UHD Ultra semblent avoir perdu l'amour du Core Ultra 9 285K. Cependant, le delta de performance cumulé par rapport au Core i9-14900K est maintenant de 10% à ces paramètres, comparé à 15% à des résolutions plus liées au CPU.
Bien qu'il soit un peu tiré par les cheveux de dire que le Core Ultra 9 285K est un goulot d'étranglement pour la RTX 4090, vous avez de meilleures options (et moins chères) si le jeu est votre principal cas d'utilisation.
| Gaming Performance rating - Percent | |
| AMD Ryzen 7 7800X3D | |
| AMD Ryzen 9 7950X3D | |
| Intel Core i9-14900K | |
| AMD Ryzen 7 9700X | |
| AMD Ryzen 9 9900X | |
| Intel Core i5-14600K | |
| AMD Ryzen 5 9600X | |
| AMD Ryzen 9 9950X | |
| Intel Core i7-14700K | |
| Intel Core Ultra 9 285K | |
| Intel Core Ultra 5 245K | |
| F1 22 | |
| 2560x1440 Ultra High Preset AA:T AF:16x | |
| AMD Ryzen 7 7800X3D | |
| AMD Ryzen 5 9600X | |
| Intel Core i9-14900K | |
| AMD Ryzen 9 9900X | |
| Intel Core i5-14600K | |
| AMD Ryzen 7 9700X | |
| AMD Ryzen 9 7950X3D | |
| AMD Ryzen 9 9950X | |
| Intel Core Ultra 5 245K | |
| Intel Core i7-14700K | |
| Intel Core Ultra 9 285K | |
| 3840x2160 Ultra High Preset AA:T AF:16x | |
| AMD Ryzen 9 9900X | |
| Intel Core Ultra 5 245K | |
| AMD Ryzen 5 9600X | |
| AMD Ryzen 7 9700X | |
| AMD Ryzen 7 7800X3D | |
| AMD Ryzen 9 9950X | |
| Intel Core i5-14600K | |
| Intel Core i9-14900K | |
| Intel Core Ultra 9 285K | |
| AMD Ryzen 9 7950X3D | |
| Intel Core i7-14700K | |
| Far Cry 5 | |
| 2560x1440 Ultra Preset AA:T | |
| AMD Ryzen 7 7800X3D | |
| AMD Ryzen 9 7950X3D | |
| AMD Ryzen 9 9900X | |
| Intel Core i9-14900K | |
| AMD Ryzen 5 9600X | |
| AMD Ryzen 7 9700X | |
| Intel Core i5-14600K | |
| AMD Ryzen 9 9950X | |
| Intel Core Ultra 9 285K | |
| Intel Core i7-14700K | |
| Intel Core Ultra 5 245K | |
| 3840x2160 Ultra Preset AA:T | |
| AMD Ryzen 7 7800X3D | |
| Intel Core i9-14900K | |
| AMD Ryzen 9 7950X3D | |
| Intel Core i5-14600K | |
| AMD Ryzen 5 9600X | |
| AMD Ryzen 9 9900X | |
| AMD Ryzen 9 9950X | |
| AMD Ryzen 7 9700X | |
| Intel Core Ultra 9 285K | |
| Intel Core Ultra 5 245K | |
| Intel Core i7-14700K | |
| X-Plane 11.11 - 3840x2160 high (fps_test=3) | |
| AMD Ryzen 7 7800X3D | |
| AMD Ryzen 9 7950X3D | |
| AMD Ryzen 7 9700X | |
| AMD Ryzen 5 9600X | |
| Intel Core i9-14900K | |
| AMD Ryzen 9 9900X | |
| Intel Core i7-14700K | |
| Intel Core i5-14600K | |
| AMD Ryzen 9 9950X | |
| Intel Core Ultra 9 285K | |
| Intel Core Ultra 5 245K | |
| Final Fantasy XV Benchmark | |
| 2560x1440 High Quality | |
| AMD Ryzen 7 7800X3D | |
| Intel Core i9-14900K | |
| Intel Core i5-14600K | |
| AMD Ryzen 9 7950X3D | |
| AMD Ryzen 9 9950X | |
| Intel Core Ultra 9 285K | |
| Intel Core i7-14700K | |
| AMD Ryzen 5 9600X | |
| Intel Core Ultra 5 245K | |
| AMD Ryzen 7 9700X | |
| AMD Ryzen 9 9900X | |
| 3840x2160 High Quality | |
| Intel Core Ultra 5 245K | |
| Intel Core i9-14900K | |
| Intel Core i5-14600K | |
| Intel Core i7-14700K | |
| AMD Ryzen 7 7800X3D | |
| AMD Ryzen 9 7950X3D | |
| Intel Core Ultra 9 285K | |
| AMD Ryzen 9 9950X | |
| AMD Ryzen 9 9900X | |
| AMD Ryzen 5 9600X | |
| AMD Ryzen 7 9700X | |
| Dota 2 Reborn - 3840x2160 ultra (3/3) best looking | |
| AMD Ryzen 7 7800X3D | |
| AMD Ryzen 9 7950X3D | |
| AMD Ryzen 9 9950X | |
| AMD Ryzen 7 9700X | |
| AMD Ryzen 9 9900X | |
| Intel Core i9-14900K | |
| AMD Ryzen 5 9600X | |
| Intel Core i5-14600K | |
| Intel Core i7-14700K | |
| Intel Core Ultra 9 285K | |
| Intel Core Ultra 5 245K | |
| The Witcher 3 - 3840x2160 Ultra Graphics & Postprocessing (HBAO+) | |
| Intel Core i9-14900K | |
| Intel Core Ultra 5 245K | |
| AMD Ryzen 7 7800X3D | |
| Intel Core i5-14600K | |
| AMD Ryzen 9 7950X3D | |
| AMD Ryzen 5 9600X | |
| Intel Core i7-14700K | |
| Intel Core Ultra 9 285K | |
| AMD Ryzen 7 9700X | |
| AMD Ryzen 9 9900X | |
| AMD Ryzen 9 9950X | |
| GTA V | |
| 2560x1440 Highest AA:4xMSAA + FX AF:16x | |
| AMD Ryzen 7 7800X3D | |
| Intel Core i9-14900K | |
| AMD Ryzen 9 9900X | |
| AMD Ryzen 7 9700X | |
| AMD Ryzen 5 9600X | |
| AMD Ryzen 9 9950X | |
| Intel Core i5-14600K | |
| AMD Ryzen 9 7950X3D | |
| Intel Core Ultra 9 285K | |
| Intel Core Ultra 5 245K | |
| Intel Core i7-14700K | |
| 3840x2160 Highest AA:4xMSAA + FX AF:16x | |
| AMD Ryzen 7 7800X3D | |
| Intel Core i9-14900K | |
| Intel Core i5-14600K | |
| AMD Ryzen 9 9900X | |
| AMD Ryzen 5 9600X | |
| AMD Ryzen 7 9700X | |
| AMD Ryzen 9 7950X3D | |
| Intel Core Ultra 9 285K | |
| Intel Core Ultra 5 245K | |
| Intel Core i7-14700K | |
| AMD Ryzen 9 9950X | |
| Borderlands 3 | |
| 2560x1440 Badass Overall Quality (DX11) | |
| AMD Ryzen 7 7800X3D | |
| AMD Ryzen 9 7950X3D | |
| Intel Core i9-14900K | |
| AMD Ryzen 7 9700X | |
| AMD Ryzen 9 9900X | |
| Intel Core i5-14600K | |
| AMD Ryzen 9 9950X | |
| Intel Core i7-14700K | |
| AMD Ryzen 5 9600X | |
| Intel Core Ultra 9 285K | |
| Intel Core Ultra 5 245K | |
| 3840x2160 Badass Overall Quality (DX11) | |
| Intel Core i9-14900K | |
| AMD Ryzen 7 7800X3D | |
| AMD Ryzen 9 7950X3D | |
| Intel Core i5-14600K | |
| Intel Core i7-14700K | |
| AMD Ryzen 9 9900X | |
| AMD Ryzen 5 9600X | |
| AMD Ryzen 7 9700X | |
| AMD Ryzen 9 9950X | |
| Intel Core Ultra 9 285K | |
| Intel Core Ultra 5 245K | |
| Shadow of the Tomb Raider | |
| 2560x1440 Highest Preset AA:T | |
| AMD Ryzen 7 7800X3D | |
| AMD Ryzen 9 7950X3D | |
| Intel Core i9-14900K | |
| AMD Ryzen 9 9900X | |
| AMD Ryzen 9 9950X | |
| AMD Ryzen 7 9700X | |
| AMD Ryzen 5 9600X | |
| Intel Core i5-14600K | |
| Intel Core i7-14700K | |
| Intel Core Ultra 9 285K | |
| Intel Core Ultra 5 245K | |
| 3840x2160 Highest Preset AA:T | |
| Intel Core i9-14900K | |
| Intel Core i5-14600K | |
| AMD Ryzen 5 9600X | |
| AMD Ryzen 7 7800X3D | |
| AMD Ryzen 9 7950X3D | |
| Intel Core Ultra 5 245K | |
| AMD Ryzen 9 9900X | |
| AMD Ryzen 7 9700X | |
| Intel Core i7-14700K | |
| Intel Core Ultra 9 285K | |
| AMD Ryzen 9 9950X | |
| Metro Exodus | |
| 2560x1440 Ultra Quality AF:16x | |
| AMD Ryzen 7 7800X3D | |
| Intel Core i9-14900K | |
| AMD Ryzen 5 9600X | |
| AMD Ryzen 7 9700X | |
| Intel Core i5-14600K | |
| AMD Ryzen 9 9900X | |
| Intel Core i7-14700K | |
| AMD Ryzen 9 9950X | |
| AMD Ryzen 9 7950X3D | |
| Intel Core Ultra 9 285K | |
| Intel Core Ultra 5 245K | |
| 3840x2160 Ultra Quality AF:16x | |
| Intel Core i9-14900K | |
| Intel Core i5-14600K | |
| AMD Ryzen 7 7800X3D | |
| AMD Ryzen 9 7950X3D | |
| AMD Ryzen 7 9700X | |
| Intel Core i7-14700K | |
| AMD Ryzen 9 9900X | |
| AMD Ryzen 5 9600X | |
| Intel Core Ultra 5 245K | |
| Intel Core Ultra 9 285K | |
| AMD Ryzen 9 9950X | |
| F1 2021 | |
| 2560x1440 Ultra High Preset + Raytracing AA:T AF:16x | |
| AMD Ryzen 7 7800X3D | |
| AMD Ryzen 7 9700X | |
| Intel Core i9-14900K | |
| AMD Ryzen 5 9600X | |
| AMD Ryzen 9 7950X3D | |
| Intel Core i5-14600K | |
| AMD Ryzen 9 9950X | |
| Intel Core i7-14700K | |
| AMD Ryzen 9 9900X | |
| Intel Core Ultra 9 285K | |
| Intel Core Ultra 5 245K | |
| 3840x2160 Ultra High Preset + Raytracing AA:T AF:16x | |
| AMD Ryzen 7 7800X3D | |
| AMD Ryzen 9 9950X | |
| AMD Ryzen 5 9600X | |
| AMD Ryzen 9 7950X3D | |
| Intel Core i9-14900K | |
| AMD Ryzen 7 9700X | |
| AMD Ryzen 9 9900X | |
| Intel Core i5-14600K | |
| Intel Core Ultra 9 285K | |
| Intel Core Ultra 5 245K | |
| Intel Core i7-14700K | |
| Bas | Moyen | Élevé | Ultra | QHD DLSS | QHD FSR | QHD | 4K DLSS | 4K FSR | 4K | |
|---|---|---|---|---|---|---|---|---|---|---|
| GTA V (2015) | 186.9 | 185.6 | 183.2 | 161.3 | 154.2 | 182.4 | ||||
| The Witcher 3 (2015) | 626 | 584 | 545 | 294 | 251 | 276 | ||||
| Dota 2 Reborn (2015) | 256 | 230 | 218 | 204 | 196.3 | |||||
| Final Fantasy XV Benchmark (2018) | 234 | 237 | 228 | 221 | 154.3 | |||||
| X-Plane 11.11 (2018) | 189.1 | 172.5 | 140.5 | 117.3 | ||||||
| Far Cry 5 (2018) | 225 | 194 | 186 | 171 | 172 | 162 | ||||
| Strange Brigade (2018) | 705 | 557 | 552 | 547 | 501 | 276 | ||||
| Shadow of the Tomb Raider (2018) | 282 | 273 | 275 | 270 | 255 | 178.4 | ||||
| Metro Exodus (2019) | 299 | 271 | 230 | 193.8 | 177.7 | 131.3 | ||||
| Borderlands 3 (2019) | 209 | 183 | 166.8 | 159.1 | 158.2 | 127.3 | ||||
| F1 2021 (2021) | 530 | 510 | 486 | 232 | 229 | 198.2 | ||||
| F1 22 (2022) | 357 | 388 | 373 | 174.6 | 149.9 | 83 | ||||
| F1 23 (2023) | 376 | 394 | 393 | 182.9 | 145.7 | 127 | 78.5 | |||
| Baldur's Gate 3 (2023) | 304 | 293 | 271 | 269 | 225 | 193.2 | 131.7 | |||
| Cyberpunk 2077 (2023) | 212 | 214 | 195.1 | 180.3 | 145.2 | 73.2 | ||||
| Assassin's Creed Mirage (2023) | 287 | 268 | 255 | 198 | 178 | 156 | 125 | |||
| F1 24 (2024) | 373 | 394 | 365 | 184.8 | 186.3 | 192.8 | 139.9 | 121 | 137.2 | 77 |
| Black Myth: Wukong (2024) | 214 | 162 | 128 | 81 | 89 | 65 | 68 | 42 |
Consommation électrique : Intel parvient enfin à améliorer l'efficacité énergétique
Intel présente l'efficacité énergétique comme le principal atout de l'Arrow Lake-S, et nous avons pu constater que le Core Ultra 9 285K répond aux attentes à cet égard.
Le Core Ultra 9 285K consomme 37 % d'énergie en moins lors de l'exécution du Cinebench R23 multi-cœur par rapport au Core i9-14900K, la consommation d'énergie du Cinebench R23 mono-cœur étant inférieure d'environ 27 %.
La consommation d'énergie lors d'une exécution Prime95 in-place large FFTs est également inférieure de 29% à ce que nous avions observé avec le Core i9-14900K, le Core Ultra 9 285K se rapprochant des niveaux du Core i5-14600K.
Ces gains sont également visibles dans les jeux, le système Core Ultra 9 285K consommant 18% de moins que le Core i9-14900K dans The Witcher 3 en 1080p Ultra et 22% de moins que le Ryzen 9 9950X dans Cyberpunk 2077 : Phantom Liberty en 1080p Ultra.
Power Consumption: External monitor
: Cyberpunk 2077 ultra external monitor
| Power Consumption / Cinebench R15 Multi (external Monitor) | |
| Intel Core i9-14900K, NVIDIA GeForce RTX 4090 | |
| Intel Core i9-13900K, NVIDIA GeForce RTX 3090 | |
| Intel Core i7-14700K, NVIDIA GeForce RTX 4090 | |
| Intel Core Ultra 9 285K, NVIDIA GeForce RTX 4090 (Idle: 76.2 W) | |
| Intel Core i5-14600K, NVIDIA GeForce RTX 4090 | |
| Intel Core i9-12900K, NVIDIA Titan RTX (Idle: 70.5 W) | |
| AMD Ryzen 9 7950X, NVIDIA GeForce RTX 3090 | |
| AMD Ryzen 9 7900X, NVIDIA GeForce RTX 3090 | |
| AMD Ryzen 9 9950X, NVIDIA GeForce RTX 4090 (Idle: 100 W) | |
| Intel Core i5-13600K, NVIDIA GeForce RTX 3090 | |
| AMD Ryzen 9 9900X, NVIDIA GeForce RTX 4090 (Idle: 85.1 W) | |
| AMD Ryzen 9 7950X3D, NVIDIA GeForce RTX 4090 | |
| Intel Core Ultra 5 245K, NVIDIA GeForce RTX 4090 | |
| AMD Ryzen 5 9600X, NVIDIA GeForce RTX 4090 | |
| AMD Ryzen 7 7800X3D, NVIDIA GeForce RTX 4090 | |
| Intel Core i5-12600K, NVIDIA Titan RTX (Idle: 70.45 W) | |
| AMD Ryzen 7 9700X, NVIDIA GeForce RTX 4090 (Idle: 83 W) | |
| Power Consumption / Cinebench R23 Single (external Monitor) | |
| AMD Ryzen 7 7800X3D, NVIDIA GeForce RTX 4090 | |
| Intel Core i7-14700K, NVIDIA GeForce RTX 4090 | |
| Intel Core i9-14900K, NVIDIA GeForce RTX 4090 | |
| Intel Core i5-14600K, NVIDIA GeForce RTX 4090 | |
| AMD Ryzen 5 9600X, NVIDIA GeForce RTX 4090 | |
| AMD Ryzen 9 9950X, NVIDIA GeForce RTX 4090 (100) | |
| AMD Ryzen 9 9900X, NVIDIA GeForce RTX 4090 (85.1) | |
| Intel Core Ultra 5 245K, NVIDIA GeForce RTX 4090 | |
| AMD Ryzen 7 9700X, NVIDIA GeForce RTX 4090 (83) | |
| Intel Core Ultra 9 285K, NVIDIA GeForce RTX 4090 (76.2) | |
| Power Consumption / Cinebench R23 Multi (external Monitor) | |
| Intel Core i9-14900K, NVIDIA GeForce RTX 4090 | |
| Intel Core i7-14700K, NVIDIA GeForce RTX 4090 | |
| Intel Core Ultra 9 285K, NVIDIA GeForce RTX 4090 (76.2) | |
| Intel Core i5-14600K, NVIDIA GeForce RTX 4090 | |
| AMD Ryzen 9 9950X, NVIDIA GeForce RTX 4090 (100) | |
| AMD Ryzen 9 7950X3D, NVIDIA GeForce RTX 4090 | |
| AMD Ryzen 9 9900X, NVIDIA GeForce RTX 4090 (85.1) | |
| Intel Core Ultra 5 245K, NVIDIA GeForce RTX 4090 | |
| AMD Ryzen 5 9600X, NVIDIA GeForce RTX 4090 | |
| AMD Ryzen 7 7800X3D, NVIDIA GeForce RTX 4090 | |
| AMD Ryzen 7 9700X, NVIDIA GeForce RTX 4090 (83) | |
| Power Consumption / Prime95 V2810 Stress (external Monitor) | |
| Intel Core i9-14900K, NVIDIA GeForce RTX 4090 | |
| Intel Core i9-13900K, NVIDIA GeForce RTX 3090 | |
| Intel Core i7-14700K, NVIDIA GeForce RTX 4090 | |
| Intel Core Ultra 9 285K, NVIDIA GeForce RTX 4090 (Idle: 76.2 W) | |
| Intel Core i5-14600K, NVIDIA GeForce RTX 4090 | |
| Intel Core i5-13600K, NVIDIA GeForce RTX 3090 | |
| AMD Ryzen 9 7950X, NVIDIA GeForce RTX 3090 | |
| AMD Ryzen 9 7900X, NVIDIA GeForce RTX 3090 | |
| AMD Ryzen 9 9950X, NVIDIA GeForce RTX 4090 (Idle: 100 W) | |
| Intel Core i9-12900K, NVIDIA Titan RTX (Idle: 70.5 W) | |
| AMD Ryzen 9 9900X, NVIDIA GeForce RTX 4090 (Idle: 85.1 W) | |
| AMD Ryzen 9 7950X3D, NVIDIA GeForce RTX 4090 | |
| Intel Core Ultra 5 245K, NVIDIA GeForce RTX 4090 | |
| Intel Core i5-12600K, NVIDIA Titan RTX (Idle: 70.45 W) | |
| AMD Ryzen 7 7800X3D, NVIDIA GeForce RTX 4090 | |
| AMD Ryzen 5 9600X, NVIDIA GeForce RTX 4090 | |
| AMD Ryzen 7 9700X, NVIDIA GeForce RTX 4090 (Idle: 83 W) | |
| Power Consumption / The Witcher 3 ultra (external Monitor) | |
| Intel Core i5-14600K, NVIDIA GeForce RTX 4090 | |
| Intel Core i9-14900K, NVIDIA GeForce RTX 4090 | |
| AMD Ryzen 9 7900X, NVIDIA GeForce RTX 3090 | |
| AMD Ryzen 9 7950X, NVIDIA GeForce RTX 3090 | |
| Intel Core i9-13900K, NVIDIA GeForce RTX 3090 | |
| Intel Core i7-14700K, NVIDIA GeForce RTX 4090 | |
| AMD Ryzen 9 7950X3D, NVIDIA GeForce RTX 4090 | |
| Intel Core i5-13600K, NVIDIA GeForce RTX 3090 | |
| AMD Ryzen 7 7800X3D, NVIDIA GeForce RTX 4090 | |
| Intel Core Ultra 5 245K, NVIDIA GeForce RTX 4090 | |
| AMD Ryzen 9 9950X, NVIDIA GeForce RTX 4090 (Idle: 100 W) | |
| AMD Ryzen 9 9900X, NVIDIA GeForce RTX 4090 (Idle: 85.1 W) | |
| Intel Core i9-12900K, NVIDIA Titan RTX (Idle: 70.5 W) | |
| Intel Core Ultra 9 285K, NVIDIA GeForce RTX 4090 (Idle: 76.2 W) | |
| AMD Ryzen 7 9700X, NVIDIA GeForce RTX 4090 (Idle: 83 W) | |
| Intel Core i5-12600K, NVIDIA Titan RTX (Idle: 70.45 W) | |
| Power Consumption | |
| Intel Core Ultra 9 285K, NVIDIA GeForce RTX 4090 | |
| AMD Ryzen 5 9600X, NVIDIA GeForce RTX 4090 | |
| AMD Ryzen 9 9900X, NVIDIA GeForce RTX 4090 | |
| AMD Ryzen 9 9950X, NVIDIA GeForce RTX 4090 | |
| AMD Ryzen 7 9700X, NVIDIA GeForce RTX 4090 | |
| Intel Core Ultra 5 245K, NVIDIA GeForce RTX 4090 | |
: Cyberpunk 2077 ultra external monitor
* ... Moindre est la valeur, meilleures sont les performances
Ces consommations réduites se traduisent naturellement par des gains d'efficacité élevés. Dans le Cinebench R15 multi-core, le Core Ultra 9 285K est 61% plus efficace que le Core i9-14900K et 64% plus efficace dans le Cinebench R23 multi-core.
Dans Cinebench R23 single-core, le Core Ultra 9 285K est 37% plus efficace avec 21,2 points par W contre 15,51 points par W pour le Core i9-14900K.
Même face au Ryzen 9 9950X, le Core Ultra 9 285K conserve une bonne avance de 32% à 34% en termes d'efficacité énergétique dans les tests Cinebench single-core.
Le processeur Arrow Lake-S affiche également un gain d'efficacité de 14 % par rapport au Core i9-14900K en jouant à The Witcher 3 en 1080p Ultra et est même légèrement meilleur qu'un Core i9-14900K en 1080p Ryzen 7 7800X3D à 1080p Ultra et est même légèrement meilleur qu'un Ryzen 7 7800X3D.
| Power Consumption / Cinebench R15 Multi Efficiency (external Monitor) | |
| AMD Ryzen 9 7950X3D, NVIDIA GeForce RTX 4090 | |
| AMD Ryzen 9 9950X, NVIDIA GeForce RTX 4090 | |
| Intel Core Ultra 9 285K, NVIDIA GeForce RTX 4090 | |
| AMD Ryzen 9 9900X, NVIDIA GeForce RTX 4090 | |
| Intel Core Ultra 5 245K, NVIDIA GeForce RTX 4090 | |
| AMD Ryzen 7 7800X3D, NVIDIA GeForce RTX 4090 | |
| Intel Core i7-14700K, NVIDIA GeForce RTX 4090 | |
| AMD Ryzen 5 9600X, NVIDIA GeForce RTX 4090 | |
| Intel Core i9-14900K, NVIDIA GeForce RTX 4090 | |
| Intel Core i5-14600K, NVIDIA GeForce RTX 4090 | |
| Power Consumption / Cinebench R23 Single Power Efficiency - external Monitor | |
| Intel Core Ultra 9 285K, NVIDIA GeForce RTX 4090 | |
| Intel Core Ultra 5 245K, NVIDIA GeForce RTX 4090 | |
| AMD Ryzen 9 9900X, NVIDIA GeForce RTX 4090 | |
| AMD Ryzen 9 9950X, NVIDIA GeForce RTX 4090 | |
| Intel Core i9-14900K, NVIDIA GeForce RTX 4090 | |
| AMD Ryzen 5 9600X, NVIDIA GeForce RTX 4090 | |
| Intel Core i7-14700K, NVIDIA GeForce RTX 4090 | |
| Intel Core i5-14600K, NVIDIA GeForce RTX 4090 | |
| AMD Ryzen 7 7800X3D, NVIDIA GeForce RTX 4090 | |
| Power Consumption / Cinebench R23 Multi Power Efficiency - external Monitor | |
| AMD Ryzen 9 9950X, NVIDIA GeForce RTX 4090 | |
| Intel Core Ultra 9 285K, NVIDIA GeForce RTX 4090 | |
| AMD Ryzen 9 7950X3D, NVIDIA GeForce RTX 4090 | |
| AMD Ryzen 9 9900X, NVIDIA GeForce RTX 4090 | |
| Intel Core Ultra 5 245K, NVIDIA GeForce RTX 4090 | |
| AMD Ryzen 7 7800X3D, NVIDIA GeForce RTX 4090 | |
| Intel Core i7-14700K, NVIDIA GeForce RTX 4090 | |
| AMD Ryzen 5 9600X, NVIDIA GeForce RTX 4090 | |
| Intel Core i9-14900K, NVIDIA GeForce RTX 4090 | |
| Intel Core i5-14600K, NVIDIA GeForce RTX 4090 | |
| Power Consumption / Cinebench 2024 Single Power Efficiency - external Monitor | |
| Intel Core Ultra 9 285K, NVIDIA GeForce RTX 4090 | |
| AMD Ryzen 9 9900X, NVIDIA GeForce RTX 4090 | |
| AMD Ryzen 9 9950X, NVIDIA GeForce RTX 4090 | |
| Power Consumption / Cinebench 2024 Multi Power Efficiency - external Monitor | |
| Intel Core Ultra 9 285K, NVIDIA GeForce RTX 4090 | |
| AMD Ryzen 9 9950X, NVIDIA GeForce RTX 4090 | |
| AMD Ryzen 9 9900X, NVIDIA GeForce RTX 4090 | |
| Power Consumption / Witcher 3 ultra Efficiency (external Monitor) | |
| Intel Core Ultra 9 285K, NVIDIA GeForce RTX 4090 | |
| AMD Ryzen 7 7800X3D, NVIDIA GeForce RTX 4090 | |
| Intel Core i5-12400F, NVIDIA GeForce RTX 4090 | |
| Intel Core Ultra 5 245K, NVIDIA GeForce RTX 4090 | |
| AMD Ryzen 9 7950X3D, NVIDIA GeForce RTX 4090 | |
| AMD Ryzen 9 9900X, NVIDIA GeForce RTX 4090 | |
| AMD Ryzen 9 9950X, NVIDIA GeForce RTX 4090 | |
| AMD Ryzen 9 7950X, NVIDIA GeForce RTX 4090 | |
| Intel Core i9-14900K, NVIDIA GeForce RTX 4090 | |
| Intel Core i5-14600K, NVIDIA GeForce RTX 4090 | |
| Intel Core i5-13400, NVIDIA GeForce RTX 4090 | |
| Intel Core i7-14700K, NVIDIA GeForce RTX 4090 | |
| Intel Core i9-14900K, NVIDIA GeForce RTX 4090 | |
L'impression générale de Notebookcheck sur le Core Ultra 9 285K
L'Intel Core Ultra 9 285K réussit à offrir les performances brutes d'un processeur Core i9-14900K à des niveaux de puissance inférieurs.
Les performances de jeu, cependant, ne sont pas à la hauteur, ce qui remet en question son prix de 589 $.
Les joueurs invétérés préféreront peut-être attendre la sortie des puces Ryzen 9000X3D, début novembre, avant de dépenser leur argent.
Transparency
La sélection des appareils à examiner est effectuée par notre équipe éditoriale. L'échantillon de test a été prêté à l'auteur par le fabricant ou le détaillant pour les besoins de cet examen. Le prêteur n'a pas eu d'influence sur cette évaluation et le fabricant n'a pas reçu de copie de cette évaluation avant sa publication. Il n'y avait aucune obligation de publier cet article. En tant que média indépendant, Notebookcheck n'est pas soumis à l'autorité des fabricants, des détaillants ou des éditeurs.
Voici comment Notebookcheck teste
Chaque année, Notebookcheck examine de manière indépendante des centaines d'ordinateurs portables et de smartphones en utilisant des procédures standardisées afin de garantir que tous les résultats sont comparables. Nous avons continuellement développé nos méthodes de test depuis environ 20 ans et avons établi des normes industrielles dans le processus. Dans nos laboratoires de test, des équipements de mesure de haute qualité sont utilisés par des techniciens et des rédacteurs expérimentés. Ces tests impliquent un processus de validation en plusieurs étapes. Notre système d'évaluation complexe repose sur des centaines de mesures et de points de référence bien fondés, ce qui garantit l'objectivité.


